UNITED STATES
SECURITIES AND EXCHANGE COMMISSION
Washington, D.C. 20549
FORM N-CSR
CERTIFIED SHAREHOLDER REPORT OF REGISTERED MANAGEMENT INVESTMENT COMPANIES
Investment Company Act File Number 811-58433
BMO Funds, Inc.
(Exact name of registrant as specified in charter)
111 East Kilbourn Avenue, Suite 200
Milwaukee, WI 53202
(Address of principal executive offices) (Zip code)
John M. Blaser
BMO Asset Management Corp.
111 East Kilbourn Avenue, Suite 200
Milwaukee, WI 53202
(Name and address of agent for service)
Copies to:
Michael P. O’Hare, Esq.
Stradley, Ronon, Stevens & Young, LLP
2005 Market Street, Suite 2600
Philadelphia, PA 19103
Registrant’s telephone number, including area code: (800) 236-3863
Date of fiscal year end: August 31
Date of reporting period: August 31, 2017
Item 1. Reports to Stockholders.
The following is a copy of the report transmitted to shareholders pursuant to Rule 30e-1 under the Investment Company Act of 1940, as amended (the “Act”) (17 CFR 270.30e-1).
Annual report
Equity Funds
International & Global Funds
Alternative Funds
Fixed Income Funds
Money Market Funds

Table of Contents
| | | | |
Not FDIC Insured | | No Bank Guarantee | | May Lose Value |
| | |
| Annual Report | | BMO Low Volatility Equity Fund |
| | | | | | | | |
Average annual total returns (%) | |
| | | 1-year | | | Since
inception* | |
| Advisor Class (A) NAV | | | 6.94 | | | | 8.69 | |
| Advisor Class (A) OFFER | | | 1.57 | | | | 7.00 | |
| Institutional Class (I) | | | 7.24 | | | | 11.82 | |
| Russell 1000® Index | | | 16.16 | | | | 14.01 | |
| Lipper Multi-Cap Core Funds Index | | | 14.49 | | | | 12.76 | |
| * | Benchmarks since inception reflect the inception date of the Institutional Class. |
The performance data quoted represents past performance which is no guarantee of future results. Investment return and principal value will fluctuate so that an investor’s shares, when redeemed, may be worth more or less than their original costs. Mutual fund performance changes over time and current performance may be lower or higher than what is stated. To receive current performance to the most recent month-end, please call 1-800-236-3863 or visit www.bmofunds.com.
Commentary
The fiscal year featured two distinct market environments. Immediately following the unanticipated outcome of the U.S. election, expectations of fiscal spending, deregulation, and tax cuts for individuals and corporations inspired a new sense of optimism among investors. That renewed outlook for future economic growth and inflation led to an increase in U.S. 10 year treasury yields, the repricing of expensive “bond proxy” stocks, and outperformance of more attractively valued pro-cyclical stocks. Since the end of 2016, however, the market experienced a partial reversal of post-election themes; with growth becoming scarce in the market, investors preferred stocks with higher growth rates over company valuations.
Consistent with our long term objective, the Fund provided upside participation during another positive year for equities. Our emphasis on stocks with attractive valuations was a detractor from performance, as investors favored more expensive growth companies. Sector positioning largely reflected our emphasis on risk reduction with significant weight in sectors like Consumer Staples and Utilities. An overweight to Consumer Staples and underweight to Information Technology were significant detractors from returns. An underweight position in Energy, however, was a positive contributor as a sudden pull back in oil prices caused the sector to trade lower.
Heading into the next fiscal year, we believe several themes will influence equity markets. From a policy standpoint, tax reform and infrastructure spending could support economic growth. These factors, combined with continued corporate earnings growth, could lead to positive stock market returns. However, markets could react negatively if fiscal or monetary policy falls short of expectations, including a more aggressive Federal Reserve. Accordingly, we have positioned your portfolio to participate in up markets while managing downside risks.
Fund Managers; Investment Experience
David A. Corris, CFA; since 1999
Jason C. Hans, CFA; since 1999
Jay Kaufman, CFA; since 2006
Ernesto Ramos, Ph.D.; since 1988
| | | | | | | | | | | | | | | | | | | | |
| | | | | | | | | Inception date | | | Expenses (%) | |
| Share class | | Ticker | | | Cusip | | | | Gross | | | Net | |
| Advisor (A) | | | BLVAX | | | | 09658W105 | | | | 5/27/2014 | | | | 1.06 | | | | 0.91 | |
| Institutional (I) | | | MLVEX | | | | 09658L208 | | | | 9/28/2012 | | | | 0.81 | | | | 0.66 | |
The net expense ratio shown reflects contractual expense limitations made by the Adviser, currently through December 31, 2017. The Adviser has committed to continue this arrangement through December 31, 2018. The Fund’s return would have been lower without these contractual expense limitations.
| | | | |
Portfolio sector allocation | |
| Sector | | Fund (%) | |
| Consumer Discretionary | | | 8.4 | |
| Consumer Staples | | | 17.9 | |
| Energy | | | 2.3 | |
| Financials | | | 18.1 | |
| Healthcare | | | 18.7 | |
| Industrials | | | 7.1 | |
| Information Technology | | | 7.8 | |
| Real Estate | | | 3.2 | |
| Telecommunication Services | | | 1.7 | |
| Utilities | | | 12.8 | |
| Other Assets & Liabilities, Net | | | 2.0 | |
| Total | | | 100.0 | |
Portfolio composition will change due to the ongoing management of the Fund. The percentages are based on net assets as of August 31, 2017 and may not necessarily reflect adjustments that are routinely made when presenting net assets for formal financial statement processes.
Growth of an assumed $10,000 investment
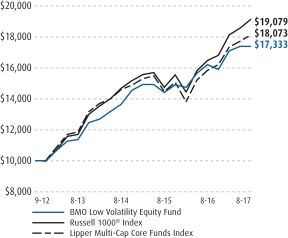
See Explanation of the Indices and Notes in the Commentary for additional information. The above graph relates to the Institutional Class shares of the Fund. Performance for the Advisor Class shares will vary from the performance of the Institutional Class shares shown above due to differences in charges and expenses. This graph illustrates the hypothetical investment of $10,000 in the Institutional Class shares of the Fund from the lesser of the Fund’s inception date or August 31, 2007 to August 31, 2017.
2
| | |
| Annual Report | | BMO Dividend Income Fund |
| | | | | | | | | | | | |
Average annual total returns (%) | |
| | | 1-year | | | 5-year | | | Since
inception* | |
| Advisor Class (A) NAV | | | 14.80 | | | | — | | | | 8.63 | |
| Advisor Class (A) OFFER | | | 9.07 | | | | — | | | | 6.95 | |
| Institutional Class (I) | | | 15.15 | | | | 12.52 | | | | 12.74 | |
| Russell 1000® Value Index | | | 11.58 | | | | 13.25 | | | | 14.02 | |
| Standard & Poor’s 500® Index | | | 16.23 | | | | 14.34 | | | | 15.00 | |
| Lipper Equity Income Funds Index | | | 12.26 | | | | 11.77 | | | | 12.20 | |
| * | Benchmarks since inception reflect the inception date of the Institutional Class. |
The performance data quoted represents past performance which is no guarantee of future results. Investment return and principal value will fluctuate so that an investor’s shares, when redeemed, may be worth more or less than their original costs. Mutual fund performance changes over time and current performance may be lower or higher than what is stated. To receive current performance to the most recent month-end, please call 1-800-236-3863 or visit www.bmofunds.com.
Commentary
The fiscal year featured two distinct market environments. Immediately following the unanticipated outcome of the U.S. election, expectations of fiscal spending, deregulation, and tax cuts for individuals and corporations inspired a new sense of optimism among investors. That renewed outlook for future economic growth and inflation led to an increase in U.S. 10 year treasury yields, the repricing of expensive “bond proxy” stocks, and outperformance of more attractively valued pro-cyclical stocks. Since the end of 2016, however, the market experienced a partial reversal of post-election themes; with growth becoming scarce in the market, investors preferred stocks with higher growth rates over company valuations.
The Fund benefited from strong stock selection within the Industrials sector. After the U.S. presidential election, industrial stocks performed well on the expectation of increased federal infrastructure spending. Boeing Co. (2.7% of the Fund, 90.8%) benefited from global growth and has thus seen demand for its airplanes grow. Investors have been attracted to the company’s cash flow generation and healthy capital return growth.
The Fund’s performance was hampered by weak stock selection and an underweight position within the Information Technology sector. The Fund’s Information Technology holdings are typically mature companies that offer less growth, yet higher capital returns via dividends. During the fiscal year, investors preferred Information Technology companies that offered above average growth and little or no dividend. Investors rewarded Apple, Inc. (1.1% of the Fund, 57.3%) ahead of its newest iPhone launch. Unfortunately, the company is held at a relative underweight due to its below market average dividend yield and was the Fund’s largest detractor from performance.
Heading into the next fiscal year, we believe several themes will influence equity markets. From a policy standpoint, tax reform and infrastructure spending could support economic growth. These factors, combined with continued corporate earnings growth, could lead to positive stock market returns. However, markets could react negatively if fiscal or monetary policy falls short of expectations, including a more aggressive Federal Reserve. Accordingly, we have positioned your portfolio to participate in up markets while managing downside risks.
Fund Managers; Investment Experience
Kenneth M. Conrad, Ph.D., CFA; since 2000
Casey J. Sambs, CFA; since 2004
| | | | | | | | | | | | | | | | | | | | |
| | | | | | | | | Inception date | | | Expenses (%) | |
| Share class | | Ticker | | | Cusip | | | | Gross | | | Net | |
| Advisor (A) | | | BADIX | | | | 09658W204 | | | | 5/27/2014 | | | | 1.08 | | | | 0.90 | |
| Institutional (I) | | | MDIVX | | | | 09658L604 | | | | 12/29/2011 | | | | 0.83 | | | | 0.65 | |
The net expense ratio shown reflects contractual expense limitations made by the Adviser, currently through December 31, 2017. The Adviser has committed to continue this arrangement through December 31, 2018. The Fund’s return would have been lower without these contractual expense limitations.
| | | | |
Portfolio sector allocation | |
| Sector | | Fund (%) | |
| Consumer Discretionary | | | 8.3 | |
| Consumer Staples | | | 7.7 | |
| Energy | | | 6.6 | |
| Financials | | | 14.3 | |
| Healthcare | | | 11.1 | |
| Industrials | | | 9.1 | |
| Information Technology | | | 18.2 | |
| Materials | | | 4.7 | |
| Real Estate | | | 5.4 | |
| Telecommunication Services | | | 4.8 | |
| Utilities | | | 8.0 | |
| Other Assets & Liabilities, Net | | | 1.8 | |
| Total | | | 100.0 | |
Portfolio composition will change due to the ongoing management of the Fund. The percentages are based on net assets as of August 31, 2017 and may not necessarily reflect adjustments that are routinely made when presenting net assets for formal financial statement processes.
Growth of an assumed $10,000 investment
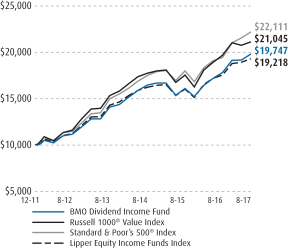
See Explanation of the Indices and Notes in the Commentary for additional information. The above graph relates to the Institutional Class shares of the Fund. Performance for the Advisor Class shares will vary from the performance of the Institutional Class shares shown above due to differences in charges and expenses. This graph illustrates the hypothetical investment of $10,000 in the Institutional Class shares of the Fund from the lesser of the Fund’s inception date or August 31, 2007 to August 31, 2017.
3
| | |
| Annual Report | | BMO Large-Cap Value Fund |
| | | | | | | | | | | | |
Average annual total returns (%) | |
| | | 1-year | | | 5-year | | | Since
inception* | |
| Advisor Class (A) NAV | | | 14.33 | | | | — | | | | 7.32 | |
| Advisor Class (A) OFFER | | | 8.64 | | | | — | | | | 5.65 | |
| Institutional Class (I) | | | 14.66 | | | | 13.06 | | | | 6.60 | |
| Retirement Class (R-6) | | | 14.75 | | | | — | | | | 10.97 | |
| Russell 1000® Value Index | | | 11.58 | | | | 13.25 | | | | 6.97 | |
| Lipper Multi-Cap Value Funds Index | | | 12.58 | | | | 12.63 | | | | 6.58 | |
| * | Benchmarks since inception reflect the inception date of the Institutional Class. |
The performance data quoted represents past performance which is no guarantee of future results. Investment return and principal value will fluctuate so that an investor’s shares, when redeemed, may be worth more or less than their original costs. Mutual fund performance changes over time and current performance may be lower or higher than what is stated. To receive current performance to the most recent month-end, please call 1-800-236-3863 or visit www.bmofunds.com.
Commentary
The fiscal year featured two distinct market environments. Immediately following the unanticipated outcome of the U.S. election, expectations of fiscal spending, deregulation, and tax cuts for individuals and corporations inspired a new sense of optimism among investors. That renewed outlook for future economic growth and inflation led to an increase in U.S. 10 year treasury yields, the repricing of expensive “bond proxy” stocks, and outperformance of more attractively valued pro-cyclical stocks. Since the end of 2016, however, the market experienced a partial reversal of post-election themes; with growth becoming scarce in the market, investors preferred stocks with higher growth rates over company valuations.
The Fund outperformed its benchmark due to our preference for companies with positive or improving investor interest. Additionally, our focus on fundamentals was rewarded as high-quality companies outperformed lower quality counterparts. The Fund’s performance also was enhanced by strong stock selection, as sector allocation was a modest contributor to returns. The Fund’s underweight position in Telecommunication Services added to performance, while an underweight position in Financials detracted. Stock selection was particularly strong in Industrials while selection in Consumer Staples detracted from performance. Within Industrials, Boeing Co. (1.9% of the Fund, 90.8%) was the top contributor to returns. Top detractors included Tyson Foods, Inc., Class A (0.0% of the Fund, -22.4%) and CVS Health Corp. (2.3% of the Fund, -15.2%) in Consumer Staples.
Heading into the next fiscal year, we believe several themes will influence equity markets. From a policy standpoint, tax reform and infrastructure spending could support economic growth. These factors, combined with continued corporate earnings growth, could lead to positive stock market returns. However, markets could react negatively if fiscal or monetary policy falls short of expectations, including a more aggressive Federal Reserve. Accordingly, we have positioned your portfolio to participate in up markets while managing downside risks.
Fund Managers; Investment Experience
David A. Corris, CFA; since 1999
Jason C. Hans, CFA; since 1999
Ernesto Ramos, Ph.D.; since 1988
| | | | | | | | | | | | | | | | | | | | |
| | | | | | | | | Inception date | | | Expenses (%) | |
| Share class | | Ticker | | | Cusip | | | | Gross | | | Net | |
| Advisor (A) | | | BALVX | | | | 09658W303 | | | | 5/27/2014 | | | | 1.03 | | | | 1.00 | |
| Institutional (I) | | | MLVIX | | | | 09658L844 | | | | 1/31/2008 | | | | 0.78 | | | | 0.75 | |
| Retirement (R-6) | | | BLCRX | | | | 09658W568 | | | | 12/28/2015 | | | | 0.63 | | | | 0.60 | |
The net expense ratio shown reflects contractual expense limitations made by the Adviser, currently through December 31, 2017. The Adviser has committed to continue this arrangement through December 31, 2018. The Fund’s return would have been lower without these contractual expense limitations.
| | | | |
Portfolio sector allocation | |
| Sector | | Fund (%) | |
| Consumer Discretionary | | | 6.4 | |
| Consumer Staples | | | 9.5 | |
| Energy | | | 9.3 | |
| Financials | | | 22.5 | |
| Healthcare | | | 11.8 | |
| Industrials | | | 11.4 | |
| Information Technology | | | 9.3 | |
| Materials | | | 4.0 | |
| Real Estate | | | 7.7 | |
| Telecommunication Services | | | 0.2 | |
| Utilities | | | 6.3 | |
| Other Assets & Liabilities, Net | | | 1.6 | |
| Total | | | 100.0 | |
Portfolio composition will change due to the ongoing management of the Fund. The percentages are based on net assets as of August 31, 2017 and may not necessarily reflect adjustments that are routinely made when presenting net assets for formal financial statement processes.
Growth of an assumed $10,000 investment
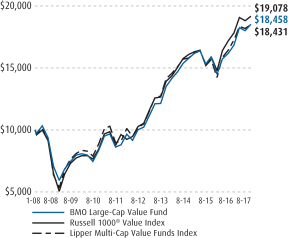
See Explanation of the Indices and Notes in the Commentary for additional information. The above graph relates to the Institutional Class shares of the Fund. Performance for the Advisor Class and Retirement R-6 shares will vary from the performance of the Institutional Class shares shown above due to differences in charges and expenses. This graph illustrates the hypothetical investment of $10,000 in the Institutional Class shares of the Fund from the lesser of the Fund’s inception date or August 31, 2007 to August 31, 2017.
| | |
| Annual Report | | BMO Large-Cap Growth Fund |
| | | | | | | | | | | | | | | | |
Average annual total returns (%) | |
| | | 1-year | | | 5-year | | | 10-year | | | Since
inception | |
| Investor Class (Y) | | | 21.30 | | | | 16.07 | | | | 9.00 | | | | — | |
| Advisor Class (A) NAV | | | 21.30 | | | | — | | | | — | | | | 13.21 | |
| Advisor Class (A) OFFER | | | 15.21 | | | | — | | | | — | | | | 11.45 | |
| Institutional Class (I) | | | 21.63 | | | | 16.37 | | | | — | | | | 10.31 | |
| Retirement Class (R-6) | | | 21.83 | | | | — | | | | — | | | | 15.83 | |
| Russell 1000® Growth Index | | | 20.82 | | | | 15.41 | | | | 9.39 | | | | — | |
| Lipper Multi-Cap Growth Funds Index | | | 20.14 | | | | 14.45 | | | | 7.96 | | | | — | |
The performance data quoted represents past performance which is no guarantee of future results. Investment return and principal value will fluctuate so that an investor’s shares, when redeemed, may be worth more or less than their original costs. Mutual fund performance changes over time and current performance may be lower or higher than what is stated. To receive current performance to the most recent month-end, please call 1-800-236-3863 or visit www.bmofunds.com.
Commentary
The fiscal year featured two distinct market environments. Immediately following the unanticipated outcome of the U.S. election, expectations of fiscal spending, deregulation, and tax cuts for individuals and corporations inspired a new sense of optimism among investors. That renewed outlook for future economic growth and inflation led to an increase in U.S. 10 year treasury yields, the repricing of expensive “bond proxy” stocks, and outperformance of more attractively valued pro-cyclical stocks. Since the end of 2016, however, the market experienced a partial reversal of post-election themes; with growth becoming scarce in the market, investors preferred stocks with higher growth rates over company valuations.
The Fund outperformed its benchmark due to our preference for companies with positive or improving investor interest. Additionally, our focus on fundamentals was rewarded as high-quality companies outperformed lower quality counterparts. The Fund’s performance also was enhanced by strong stock selection, as sector allocation was a modest detractor to returns. The Fund’s underweight position in Consumer Staples added to performance, while an overweight position in Telecommunication Services detracted. Stock selection was particularly strong in Consumer Discretionary while selection in Real Estate detracted from performance. Within Consumer Discretionary, Wyndham Worldwide Corp. (1.8% of the Fund, 44.5%) and Sirius XM Holdings, Inc. (2.0% of the Fund, 40.1%) were top contributors to returns. Top detractors included EPR Properties (0.6% of the Fund, -6.0%) in Real Estate.
Heading into the next fiscal year, we believe several themes will influence equity markets. From a policy standpoint, tax reform and infrastructure spending could support economic growth. These factors, combined with continued corporate earnings growth, could lead to positive stock market returns. However, markets could react negatively if fiscal or monetary policy falls short of expectations, including a more aggressive Federal Reserve. Accordingly, we have positioned your portfolio to participate in up markets while managing downside risks.
Fund Managers; Investment Experience
David A. Corris, CFA; since 1999
Jason C. Hans, CFA; since 1999
Ernesto Ramos, Ph.D.; since 1988
| | | | | | | | | | | | | | | | | | | | |
| | | | | | | | | Inception date | | | Expenses (%) | |
| Share class | | Ticker | | | Cusip | | | | Gross | | | Net | |
| Investor (Y) | | | MASTX | | | | 09658L745 | | | | 11/20/1992 | | | | 1.06 | | | | 1.00 | |
| Advisor (A) | | | BALGX | | | | 09658W402 | | | | 5/27/2014 | | | | 1.06 | | | | 1.00 | |
| Institutional (I) | | | MLCIX | | | | 09658L752 | | | | 1/31/2008 | | | | 0.81 | | | | 0.75 | |
| Retirement (R-6) | | | BLGRX | | | | 09658W576 | | | | 12/28/2015 | | | | 0.66 | | | | 0.60 | |
The net expense ratio shown reflects contractual expense limitations made by the Adviser, currently through December 31, 2017. The Adviser has committed to continue this arrangement through December 31, 2018. The Fund’s return would have been lower without these contractual expense limitations.
| | | | |
Portfolio sector allocation | |
| Sector | | Fund (%) | |
| Consumer Discretionary | | | 16.2 | |
| Consumer Staples | | | 4.3 | |
| Financials | | | 6.3 | |
| Healthcare | | | 16.2 | |
| Industrials | | | 11.5 | |
| Information Technology | | | 35.4 | |
| Materials | | | 2.4 | |
| Real Estate | | | 5.0 | |
| Telecommunication Services | | | 1.3 | |
| Other Assets & Liabilities, Net | | | 1.4 | |
| Total | | | 100.0 | |
Portfolio composition will change due to the ongoing management of the Fund. The percentages are based on net assets as of August 31, 2017 and may not necessarily reflect adjustments that are routinely made when presenting net assets for formal financial statement processes.
Growth of an assumed $10,000 investment
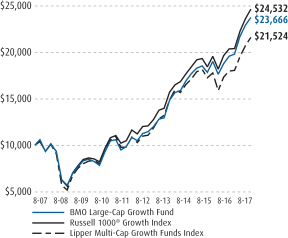
See Explanation of the Indices and Notes in the Commentary for additional information. The above graph relates to the Investor Class shares of the Fund. Performance for the Institutional Class, Advisor Class and Retirement R-6 shares will vary from the performance of the Investor Class shares shown above due to differences in charges and expenses. This graph illustrates the hypothetical investment of $10,000 in the Investor Class shares of the Fund from the lesser of the Fund’s inception date or August 31, 2007 to August 31, 2017.
5
| | |
| Annual Report | | BMO Mid-Cap Value Fund |
| | | | | | | | | | | | |
Average annual total returns (%) | |
| | | 1-year | | | 5-year | | | Since
inception | |
| Advisor Class (A)NAV | | | 12.88 | | | | — | | | | 6.86 | |
| Advisor Class (A)OFFER | | | 7.22 | | | | — | | | | 5.20 | |
| Institutional Class (I) | | | 13.10 | | | | 13.76 | | | | 8.67 | |
| Retirement Class (R-3) | | | 12.60 | | | | — | | | | 6.58 | |
| Retirement Class (R-6) | | | 13.31 | | | | — | | | | 7.26 | |
| Russell Midcap® Value Index | | | 10.82 | | | | 14.22 | | | | 9.35 | |
| Lipper Mid-Cap Value Funds Index | | | 10.18 | | | | 12.84 | | | | 8.05 | |
| * | Benchmarks since inception reflect the inception date of the Institutional Class. |
The performance data quoted represents past performance which is no guarantee of future results. Investment return and principal value will fluctuate so that an investor’s shares, when redeemed, may be worth more or less than their original costs. Mutual fund performance changes over time and current performance may be lower or higher than what is stated. To receive current performance to the most recent month-end, please call 1-800-236-3863 or visit www.bmofunds.com.
Commentary
The fiscal year featured two distinct market environments. Immediately following the unanticipated outcome of the U.S. election, expectations of fiscal spending, deregulation, and tax cuts for individuals and corporations inspired a new sense of optimism among investors. That renewed outlook for future economic growth and inflation led to an increase in U.S. 10 year treasury yields, the repricing of expensive “bond proxy” stocks, and outperformance of more attractively valued pro-cyclical stocks. Since the end of 2016, however, the market experienced a partial reversal of post-election themes; with growth becoming scarce in the market, investors preferred stocks with higher growth rates over company valuations.
The Fund outperformed its benchmark due to our preference for companies with positive or improving investor interest. Additionally, our focus on fundamentals was rewarded as high-quality companies outperformed lower quality counterparts. The Fund’s performance also was enhanced via strong stock selection, as sector allocation was a modest contributor to returns. The Fund’s overweight position in Information Technology added to performance, while an overweight position in Consumer Staples detracted. Stock selection was particularly strong in Information Technology while selection in Consumer Discretionary slightly detracted from performance. Within Information Technology, Western Digital Corp. (1.2% of the Fund, 94.4%) and Lam Research Corp. (1.5% of the Fund, 80.4%) were top contributors to returns. Top detractors included Brinker International, Inc. (0.0% of the Fund, -17.6%) and American Eagle Outfitters, Inc. (0.0% of the Fund, -21.8%) in Consumer Discretionary.
Heading into the next fiscal year, we believe several themes will influence equity markets. From a policy standpoint, tax reform and infrastructure spending could support economic growth. These factors, combined with continued corporate earnings growth, could lead to positive stock market returns. However, markets could react negatively if fiscal or monetary policy falls short of expectations, including a more aggressive Federal Reserve. Accordingly, we have positioned your portfolio to participate in up markets while managing downside risks.
Fund Managers; Investment Experience
David A. Corris, CFA; since 1999
Thomas Lettenberger, CFA; since 1994
| | | | | | | | | | | | | | | | | | | | |
| | | | | | | | | Inception date | | | Expenses (%) | |
| Share class | | Ticker | | | Cusip | | | | Gross | | | Net | |
| Advisor (A) | | | BAMCX | | | | 09658W501 | | | | 5/27/2014 | | | | 1.23 | | | | 1.23 | |
| Institutional (I) | | | MRVIX | | | | 09658L711 | | | | 1/31/2008 | | | | 0.98 | | | | 0.98 | |
| Retirement (R-3) | | | BMVDX | | | | 09658V446 | | | | 5/27/2014 | | | | 1.48 | | | | 1.48 | |
| Retirement (R-6) | | | BMVGX | | | | 09658V438 | | | | 5/27/2014 | | | | 0.83 | | | | 0.83 | |
| | | | |
Portfolio sector allocation | |
| Sector | | Fund (%) | |
| Consumer Discretionary | | | 9.5 | |
| Consumer Staples | | | 4.6 | |
| Energy | | | 7.3 | |
| Financials | | | 17.5 | |
| Healthcare | | | 6.2 | |
| Industrials | | | 14.5 | |
| Information Technology | | | 9.2 | |
| Materials | | | 5.9 | |
| Real Estate | | | 13.1 | |
| Utilities | | | 11.2 | |
| Other Assets & Liabilities, Net | | | 1.0 | |
| Total | | | 100.0 | |
Portfolio composition will change due to the ongoing management of the Fund. The percentages are based on net assets as of August 31, 2017 and may not necessarily reflect adjustments that are routinely made when presenting net assets for formal financial statement processes.
Growth of an assumed $10,000 investment
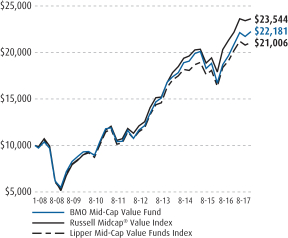
See Explanation of the Indices and Notes in the Commentary for additional information. The above graph relates to the Institutional Class shares of the Fund. Performance for the Advisor Class, Retirement R-3 and Retirement R-6 Class shares will vary from the performance of the Institutional Class shares shown above due to differences in charges and expenses. This graph illustrates the hypothetical investment of $10,000 in the Institutional Class shares of the Fund from the lesser of the Fund’s inception date or August 31, 2007 to August 31, 2017.
6
| | |
| Annual Report | | BMO Mid-Cap Growth Fund |
| | | | | | | | | | | | |
Average annual total returns (%) | |
| | | 1-year | | | 5-year | | | Since
inception | |
| Advisor Class (A)NAV | | | 16.73 | | | | — | | | | 3.96 | |
| Advisor Class (A)OFFER | | | 10.87 | | | | — | | | | 2.34 | |
| Institutional Class (I) | | | 17.07 | | | | 9.73 | | | | 7.51 | |
| Retirement Class (R-3) | | | 16.47 | | | | — | | | | 3.71 | |
| Retirement Class (R-6) | | | 17.22 | | | | — | | | | 4.37 | |
| Russell Midcap® Growth Index | | | 14.52 | | | | 13.99 | | | | 9.57 | |
| Lipper Mid-Cap Growth Funds Index | | | 16.89 | | | | 13.12 | | | | 8.25 | |
| * | Benchmarks since inception reflect the inception date of the Institutional Class. |
The performance data quoted represents past performance which is no guarantee of future results. Investment return and principal value will fluctuate so that an investor’s shares, when redeemed, may be worth more or less than their original costs. Mutual fund performance changes over time and current performance may be lower or higher than what is stated. To receive current performance to the most recent month-end, please call 1-800-236-3863 or visit www.bmofunds.com.
Commentary
The fiscal year featured two distinct market environments. Immediately following the unanticipated outcome of the U.S. election, expectations of fiscal spending, deregulation, and tax cuts for individuals and corporations inspired a new sense of optimism among investors. That renewed outlook for future economic growth and inflation led to an increase in U.S. 10 year treasury yields, the repricing of expensive “bond proxy” stocks, and outperformance of more attractively valued pro-cyclical stocks. Since the end of 2016, however, the market experienced a partial reversal of post-election themes; with growth becoming scarce in the market, investors preferred stocks with higher growth rates over company valuations.
The Fund outperformed its benchmark due to our preference for companies with positive or improving investor interest. Additionally, our focus on fundamentals was rewarded as high-quality companies outperformed lower quality counterparts. The Fund’s performance also was enhanced by strong stock selection, as sector allocation was a modest contributor to returns. The Fund’s overweight position in Information Technology added to performance, while an overweight position in Energy detracted. Stock selection was particularly strong in Healthcare while selection in Real Estate slightly detracted from performance. Within Healthcare, Align Technology, Inc. (1.7% of the Fund, 90.3%) and WellCare Health Plans, Inc. (1.8% of the Fund, 55.0%) were top contributors to returns. Top detractors included Boston Properties, Inc. (1.5% of the Fund, -12.0%) and EPR Properties (0.0% of the Fund, -1.8%) in Real Estate.
Heading into the next fiscal year, we believe several themes will influence equity markets. From a policy standpoint, tax reform and infrastructure spending could support economic growth. These factors, combined with continued corporate earnings growth, could lead to positive stock market returns. However, markets could react negatively if fiscal or monetary policy falls short of expectations, including a more aggressive Federal Reserve. Accordingly, we have positioned your portfolio to participate in up markets while managing downside risks.
Fund Managers; Investment Experience
David A. Corris, CFA; since 1999
Thomas Lettenberger, CFA; since 1994
| | | | | | | | | | | | | | | | |
| | | | | | | | | Inception date | | Expenses (%) | |
| Share class | | Ticker | | | Cusip | | | | Gross | | Net | |
| Advisor (A) | | | BGMAX | | | | 09658W600 | | | 5/27/2014 | | 1.30 | | | 1.25 | |
| Institutional (I) | | | MRMIX | | | | 09658L737 | | | 1/31/2008 | | 1.05 | | | 1.00 | |
| Retirement (R-3) | | | BMGDX | | | | 09658V420 | | | 5/27/2014 | | 1.55 | | | 1.50 | |
| Retirement (R-6) | | | BMGGX | | | | 09658V412 | | | 5/27/2014 | | 0.90 | | | 0.85 | |
The net expense ratio shown reflects contractual expense limitations made by the Adviser, currently through December 31, 2017. The Adviser has committed to continue this arrangement through December 31, 2018. The Fund’s return would have been lower without these contractual expense limitations.
| | | | |
Portfolio sector allocation | |
| Sector | | Fund (%) | |
| Consumer Discretionary | | | 15.6 | |
| Consumer Staples | | | 2.8 | |
| Energy | | | 1.7 | |
| Financials | | | 6.0 | |
| Healthcare | | | 15.2 | |
| Industrials | | | 16.2 | |
| Information Technology | | | 28.9 | |
| Materials | | | 5.4 | |
| Real Estate | | | 5.2 | |
| Telecommunication Services | | | 1.3 | |
| Other Assets & Liabilities, Net | | | 1.7 | |
| Total | | | 100.0 | |
Portfolio composition will change due to the ongoing management of the Fund. The percentages are based on net assets as of August 31, 2017 and may not necessarily reflect adjustments that are routinely made when presenting net assets for formal financial statement processes.
Growth of an assumed $10,000 investment
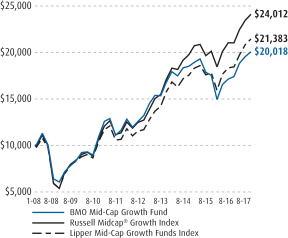
See Explanation of the Indices and Notes in the Commentary for additional information. The above graph relates to the Institutional Class shares of the Fund. Performance for the Advisor Class, Retirement R-3 and Retirement R-6 Class shares will vary from the performance of the Institutional Class shares shown above due to differences in charges and expenses. This graph illustrates the hypothetical investment of $10,000 in the Institutional Class shares of the Fund from the lesser of the Fund’s inception date or August 31, 2007 to August 31, 2017.
7
| | |
| Annual Report | | BMO Small-Cap Value Fund |
| | | | | | | | | | | | |
Average annual total returns (%) | |
| | | 1-year | | | 5-year | | | Since
inception* | |
| Advisor Class (A)NAV | | | 11.58 | | | | — | | | | 4.83 | |
| Advisor Class (A)OFFER | | | 5.96 | | | | — | | | | 3.18 | |
| Institutional Class (I) | | | 11.87 | | | | 12.38 | | | | 10.22 | |
| Retirement Class (R-3) | | | 11.32 | | | | — | | | | 4.56 | |
| Retirement Class (R-6) | | | 12.05 | | | | — | | | | 5.25 | |
| Russell 2000® Value Index | | | 13.47 | | | | 12.51 | | | | 9.36 | |
| Lipper Small-Cap Core Funds Index | | | 13.79 | | | | 12.71 | | | | 9.64 | |
| * | Benchmarks since inception reflect the inception date of the Institutional Class. |
The performance data quoted represents past performance which is no guarantee of future results. Investment return and principal value will fluctuate so that an investor’s shares, when redeemed, may be worth more or less than their original costs. Mutual fund performance changes over time and current performance may be lower or higher than what is stated. To receive current performance to the most recent month-end, please call 1-800-236-3863 or visit www.bmofunds.com.
Commentary
The fiscal year featured two distinct market environments. Immediately following the unanticipated outcome of the U.S. election, expectations of fiscal spending, deregulation, and tax cuts for individuals and corporations inspired a new sense of optimism among investors. That renewed outlook for future economic growth and inflation led to an increase in U.S. 10 year treasury yields, the repricing of expensive “bond proxy” stocks, and outperformance of more attractively valued pro-cyclical stocks. Since the end of 2016, however, the market experienced a partial reversal of post-election themes; with growth becoming scarce in the market, investors preferred stocks with higher growth rates over company valuations.
The Fund underperformed its benchmark due to stock selection, as sector allocation was a modest contributor to returns. The Fund’s underweight position in Energy added to performance, while an underweight position in Real Estate detracted. Stock selection was particularly strong in Industrials while selection in Health Care detracted from performance. Within Industrials, Brink’s Company (0.9% of the Fund, 116.9%) and ArcBest Corp. (0.9% of the fund, 64.3%) were top contributors to returns. Top detractors included Lannett Company, Inc. (0.2% of the Fund, -42.1%) and Acorda Therapeutics, Inc. (0.3% of the Fund, -33.1%) in Health Care.
Heading into the next fiscal year, we believe several themes will influence equity markets. From a policy standpoint, tax reform and infrastructure spending could support economic growth. These factors, combined with continued corporate earnings growth, could lead to positive stock market returns. However, markets could react negatively if fiscal or monetary policy falls short of expectations, including a more aggressive Federal Reserve. Accordingly, we have positioned your portfolio to participate in up markets while managing downside risks.
Fund Managers; Investment Experience
David A. Corris, CFA; since 1999
Thomas Lettenberger, CFA; since 1994
| | | | | | | | | | | | | | | | | | | | |
| | | | | | | | | Inception date | | | Expenses (%) | |
| Share class | | Ticker | | | Cusip | | | | Gross | | | Net | |
| Advisor (A) | | | BACVX | | | | 09658W709 | | | | 5/27/2014 | | | | 1.40 | | | | 1.25 | |
| Institutional (I) | | | MRSNX | | | | 09658L596 | | | | 2/28/2011 | | | | 1.15 | | | | 1.00 | |
| Retirement (R-3) | | | BSVDX | | | | 09658V396 | | | | 5/27/2014 | | | | 1.65 | | | | 1.50 | |
| Retirement (R-6) | | | BSVGX | | | | 09658V388 | | | | 5/27/2014 | | | | 1.00 | | | | 0.85 | |
The net expense ratio shown reflects contractual expense limitations made by the Adviser, currently through December 31, 2017. The Adviser has committed to continue this arrangement through December 31, 2018. The Fund’s return would have been lower without these contractual expense limitations.
| | | | |
Portfolio sector allocation | |
| Sector | | Fund (%) | |
| Consumer Discretionary | | | 7.4 | |
| Consumer Staples | | | 1.8 | |
| Energy | | | 4.9 | |
| Financials | | | 27.0 | |
| Healthcare | | | 9.1 | |
| Industrials | | | 14.6 | |
| Information Technology | | | 10.8 | |
| Materials | | | 7.1 | |
| Real Estate | | | 10.2 | |
| Utilities | | | 6.3 | |
| Other Assets & Liabilities, Net | | | 0.8 | |
| Total | | | 100.0 | |
Portfolio composition will change due to the ongoing management of the Fund. The percentages are based on net assets as of August 31, 2017 and may not necessarily reflect adjustments that are routinely made when presenting net assets for formal financial statement processes.
Growth of an assumed $10,000 investment
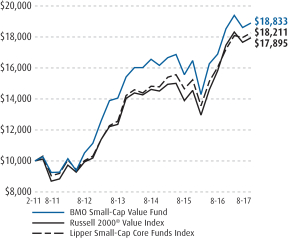
See Explanation of the Indices and Notes in the Commentary for additional information. The above graph relates to the Institutional Class shares of the Fund. Performance for the Advisor Class, Retirement R-3 and Retirement R-6 Class shares will vary from the performance of the Institutional Class shares shown above due to differences in charges and expenses. This graph illustrates the hypothetical investment of $10,000 in the Institutional Class shares of the Fund from the lesser of the Fund’s inception date or August 31, 2007 to August 31, 2017.
8
| | |
| Annual Report | | BMO Small-Cap Core Fund |
| | | | | | | | |
Average annual total returns (%) | |
| | | 1-year | | | Since
inception* | |
| Advisor Class (A)NAV | | | 16.09 | | | | 9.44 | |
| Advisor Class (A)OFFER | | | 10.28 | | | | 7.74 | |
| Institutional Class (I) | | | 16.33 | | | | 8.85 | |
| Russell 2000® Index | | | 14.92 | | | | 6.75 | |
| Lipper Small-Cap Core Funds Index | | | 13.79 | | | | 6.56 | |
| * | Benchmarks since inception reflect the inception date of the Institutional Class. |
The performance data quoted represents past performance which is no guarantee of future results. Investment return and principal value will fluctuate so that an investor’s shares, when redeemed, may be worth more or less than their original costs. Mutual fund performance changes over time and current performance may be lower or higher than what is stated. To receive current performance to the most recent month-end, please call 1-800-236-3863 or visit www.bmofunds.com.
Commentary
The fiscal year featured two distinct market environments. Immediately following the unanticipated outcome of the U.S. election, expectations of fiscal spending, deregulation, and tax cuts for individuals and corporations inspired a new sense of optimism among investors. That renewed outlook for future economic growth and inflation led to an increase in U.S. 10 year treasury yields, the repricing of expensive “bond proxy” stocks, and outperformance of more attractively valued pro-cyclical stocks. Since the end of 2016, however, the market experienced a partial reversal of post-election themes; with growth becoming scarce in the market, investors preferred stocks with higher growth rates over company valuations.
The Fund outperformed its benchmark due to strong stock selection, as sector allocation was a modest contributor to returns. The Fund’s overweight position in Health Care added to performance, with no significant detractors in terms of sector allocation. Stock selection was particularly strong in Industrials while selection in Consumer Discretionary detracted from performance. Within Industrials, Brink’s Company (0.9% of the Fund, 116.9%) and ArcBest Corp. (0.9% of the Fund, 64.3%) were top contributors to returns. Top detractors included Francesca’s Holding Corporation (0.4% of the Fund, -54.6%) and Express, Inc. (0.5% of the Fund, -46.2%) in Consumer Discretionary.
Heading into the next fiscal year, we believe several themes will influence equity markets. From a policy standpoint, tax reform and infrastructure spending could support economic growth. These factors, combined with continued corporate earnings growth, could lead to positive stock market returns. However, markets could react negatively if fiscal or monetary policy falls short of expectations, including a more aggressive Federal Reserve. Accordingly, we have positioned your portfolio to participate in up markets while managing downside risks.
Fund Managers; Investment Experience
David A. Corris, CFA; since 1999
Thomas Lettenberger, CFA; since 1994
| | | | | | | | | | | | | | |
| | | | | | | | Inception date | | Expenses (%) | |
| Share class | | Ticker | | Cusip | | | | Gross | | Net | |
| Advisor (A) | | BCCAX | | | 09658W808 | | | 5/27/2014 | | 2.54 | | | 1.15 | |
| Institutional (I) | | BSCNX | | | 09658V537 | | | 12/27/2013 | | 2.29 | | | 0.90 | |
The net expense ratio shown reflects contractual expense limitations made by the Adviser, currently through December 31, 2017. The Adviser has committed to continue this arrangement through December 31, 2018. The Fund’s return would have been lower without these contractual expense limitations.
| | | | |
Portfolio sector allocation | |
| Sector | | Fund (%) | |
| Consumer Discretionary | | | 9.3 | |
| Consumer Staples | | | 2.2 | |
| Energy | | | 2.0 | |
| Financials | | | 15.6 | |
| Healthcare | | | 18.6 | |
| Industrials | | | 14.8 | |
| Information Technology | | | 20.3 | |
| Materials | | | 6.0 | |
| Real Estate | | | 5.9 | |
| Telecommunication Services | | | 0.8 | |
| Utilities | | | 2.6 | |
| Other Assets & Liabilities, Net | | | 1.9 | |
| Total | | | 100.0 | |
Portfolio composition will change due to the ongoing management of the Fund. The percentages are based on net assets as of August 31, 2017 and may not necessarily reflect adjustments that are routinely made when presenting net assets for formal financial statement processes.
Growth of an assumed $10,000 investment
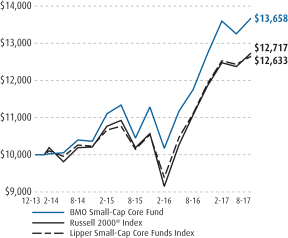
See Explanation of the Indices and Notes in the Commentary for additional information. The above graph relates to the Institutional Class shares of the Fund. Performance for the Advisor Class shares will vary from the performance of the Institutional Class shares shown above due to differences in charges and expenses. This graph illustrates the hypothetical investment of $10,000 in the Institutional Class shares of the Fund from the lesser of the Fund’s inception date or August 31, 2007 to August 31, 2017.
9
| | |
| Annual Report | | BMO Small-Cap Growth Fund |
| | | | | | | | | | | | |
Average annual total returns (%) | |
| | | 1-year | | | 5-year | | | Since
inception* | |
| Advisor Class (A) NAV | | | — | | | | — | | | | 3.26 | |
| Advisor Class (A) OFFER | | | — | | | | — | | | | (1.92 | ) |
| Institutional Class (I) | | | 14.32 | | | | 10.51 | | | | 8.47 | |
| Russell 2000® Growth Index | | | 16.39 | | | | 13.75 | | | | 9.82 | |
| Lipper Small-Cap Growth Funds Index | | | 14.49 | | | | 12.26 | | | | 8.19 | |
| * | Cumulative for periods less than one year. Benchmarks since inception reflect the inception date of the Institutional Class. |
The performance data quoted represents past performance which is no guarantee of future results. Investment return and principal value will fluctuate so that an investor’s shares, when redeemed, may be worth more or less than their original costs. Mutual fund performance changes over time and current performance may be lower or higher than what is stated. To receive current performance to the most recent month-end, please call 1-800-236-3863 or visit www.bmofunds.com.
Commentary
The fiscal year featured two distinct market environments. Immediately following the unanticipated outcome of the U.S. election, expectations of fiscal spending, deregulation, and tax cuts for individuals and corporations inspired a new sense of optimism among investors. That renewed outlook for future economic growth and inflation led to an increase in U.S. 10 year treasury yields, the repricing of expensive “bond proxy” stocks, and outperformance of more attractively valued pro-cyclical stocks. Since the end of 2016, however, the market experienced a partial reversal of post-election themes; with growth becoming scarce in the market, investors preferred stocks with higher growth rates over company valuations.
The Fund underperformed its benchmark due to stock selection, as sector allocation was a positive contributor to returns. The Fund’s overweight position in Healthcare added to performance, with no significant detractors in terms of sector allocation. Stock selection was particularly strong in Energy while selection in Consumer Discretionary detracted from performance. Within Energy, Sanchez Energy Corp. (0.0% of the Fund, 52.1%) was the top contributor to returns. Top detractors included Francesca’s Holding Corp. (0.4% of the Fund, -56.3%) and MarineMax, Inc. (0.8% of the Fund, -23.8%) in Consumer Discretionary.
Heading into the next fiscal year, we believe several themes will influence equity markets. From a policy standpoint, tax reform and infrastructure spending could support economic growth. These factors, combined with continued corporate earnings growth, could lead to positive stock market returns. However, markets could react negatively if fiscal or monetary policy falls short of expectations, including a more aggressive Federal Reserve. Accordingly, we have positioned your portfolio to participate in up markets while managing downside risks.
Fund Managers; Investment Experience
David A. Corris, CFA; since 1999
Thomas Lettenberger, CFA; since 1994
| | | | | | | | | | | | | | | | | | | | |
| | | | | | | | | Inception date | | | Expenses (%) | |
| Share class | | Ticker | | | Cusip | | | | Gross | | | Net | |
| Advisor (A) | | | BSLAX | | | | 09658V339 | | | | 5/31/2017 | | | | 1.17 | | | | 1.17 | |
| Institutional (I) | | | MSGIX | | | | 09658L620 | | | | 1/31/2008 | | | | 0.92 | | | | 0.92 | |
| | | | |
Portfolio sector allocation | |
| Sector | | Fund (%) | |
| Consumer Discretionary | | | 10.8 | |
| Consumer Staples | | | 2.8 | |
| Energy | | | 1.1 | |
| Financials | | | 4.5 | |
| Healthcare | | | 24.6 | |
| Industrials | | | 17.3 | |
| Information Technology | | | 27.0 | |
| Materials | | | 6.2 | |
| Real Estate | | | 2.5 | |
| Telecommunication Services | | | 1.0 | |
| Utilities | | | 1.0 | |
| Other Assets & Liabilities, Net | | | 1.2 | |
| Total | | | 100.0 | |
Portfolio composition will change due to the ongoing management of the Fund. The percentages are based on net assets as of August 31, 2017 and may not necessarily reflect adjustments that are routinely made when presenting net assets for formal financial statement processes.
Growth of an assumed $10,000 investment
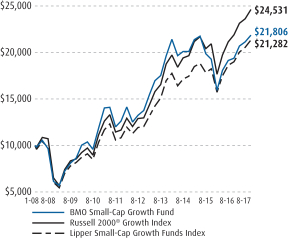
See Explanation of the Indices and Notes in the Commentary for additional information. The above graph relates to the Institutional Class shares of the Fund. Performance for the Advisor Class shares will vary from the performance of the Institutional Class shares shown above due to differences in charges and expenses. This graph illustrates the hypothetical investment of $10,000 in the Institutional Class shares of the Fund from the lesser of the Fund’s inception date or August 31, 2007 to August 31, 2017.
10
| | |
| Annual Report | | BMO Global Low Volatility Equity Fund |
| | | | | | | | |
Average annual total returns (%) | |
| | | 1-year | | | Since
inception* | |
| Advisor Class (A) NAV | | | 6.59 | | | | 6.52 | |
| Advisor Class (A) OFFER | | | 1.29 | | | | 4.85 | |
| Institutional Class (I) | | | 6.76 | | | | 8.56 | |
| Morgan Stanley Capital International All Country World Index | | | 17.75 | | | | 8.05 | |
| Lipper Global Multi-Cap Value Funds Index | | | 15.70 | | | | 6.32 | |
| * | Benchmarks since inception reflect the inception date of the Institutional Class. |
The performance data quoted represents past performance which is no guarantee of future results. Investment return and principal value will fluctuate so that an investor’s shares, when redeemed, may be worth more or less than their original costs. Mutual fund performance changes over time and current performance may be lower or higher than what is stated. To receive current performance to the most recent month-end, please call 1-800-236-3863 or visit www.bmofunds.com.
Commentary
The fiscal year featured two distinct market environments. Immediately following the unanticipated outcome of the U.S. election, expectations of fiscal spending, deregulation, and tax cuts for individuals and corporations inspired a new sense of optimism among investors. That renewed outlook for future economic growth and inflation led to an increase in U.S. 10 year treasury yields, the repricing of expensive “bond proxy” stocks, and outperformance of more attractively valued pro-cyclical stocks. Since the end of 2016, however, the market experienced a partial reversal of post-election themes; with growth becoming scarce in the market, investors preferred stocks with higher growth rates over company valuations.
Consistent with our long term objective, the Fund provided upside participation during another positive year for equities. Our emphasis on stocks with attractive valuations was a detractor from performance, as investors favored more expensive growth companies. Sector positioning largely reflects our emphasis on risk reduction with significant weight in sectors like Consumer Staples and Utilities. An overweight to Consumer Staples and underweight to Information Technology were significant detractors from returns. An underweight position in Energy, however, was a positive contributor as a sudden pull back in oil prices caused the sector to trade lower.
Heading into the next fiscal year, we believe several themes will influence equity markets. From a policy standpoint, tax reform and infrastructure spending could support economic growth. These factors, combined with continued corporate earnings growth, could lead to positive stock market returns. However, markets could react negatively if fiscal or monetary policy falls short of expectations, including a more aggressive Federal Reserve. Accordingly, we have positioned your portfolio to participate in up markets while managing downside risks.
Fund Managers; Investment Experience
Jay Kaufman, CFA; since 2006
Ernesto Ramos, Ph.D.; since 1988
David Rosenblatt, CFA; since 2007
| | | | | | | | | | | | | | | | |
| | | | | | | | | Inception date | | | Expenses (%) |
| Share class | | Ticker | | | Cusip | | | | Gross | | Net |
| Advisor (A) | | | BAEGX | | | | 09658W873 | | | | 5/27/2014 | | | 1.64 | | 1.11 |
| Institutional (I) | | | BGLBX | | | | 09658V768 | | | | 9/30/2013 | | | 1.39 | | 0.86 |
The net expense ratio shown reflects contractual expense limitations made by the Adviser, currently through December 31, 2017. The Adviser has committed to continue this arrangement through December 31, 2018. The Fund’s return would have been lower without these contractual expense limitations.
| | | | |
Portfolio sector allocation | |
| Sector | | Fund (%) | |
| Consumer Discretionary | | | 4.7 | |
| Consumer Staples | | | 16.2 | |
| Financials | | | 20.0 | |
| Healthcare | | | 21.4 | |
| Industrials | | | 4.2 | |
| Information Technology | | | 7.3 | |
| Real Estate | | | 6.2 | |
| Telecommunication Services | | | 6.3 | |
| Utilities | | | 11.8 | |
| Other Assets & Liabilities, Net | | | 1.9 | |
| Total | | | 100.0 | |
Portfolio composition will change due to the ongoing management of the Fund. The percentages are based on net assets as of August 31, 2017 and may not necessarily reflect adjustments that are routinely made when presenting net assets for formal financial statement processes.
Growth of an assumed $10,000 investment
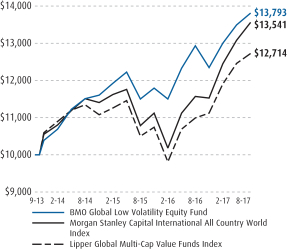
See Explanation of the Indices and Notes in the Commentary for additional information. The above graph relates to the Institutional Class shares of the Fund. Performance for the Advisor Class shares will vary from the performance of the Institutional Class shares shown above due to differences in charges and expenses. This graph illustrates the hypothetical investment of $10,000 in the Institutional Class shares of the Fund from the lesser of the Fund’s inception date or August 31, 2007 to August 31, 2017.
11
| | |
| Annual Report | | BMO Disciplined International Equity Fund |
| | | | | | | | |
Average annual total returns (%) | |
| | | 1-year | | | Since
inception* | |
| Advisor Class (A)NAV | | | 19.97 | | | | 7.26 | |
| Advisor Class (A)OFFER | | | 14.01 | | | | 4.47 | |
| Institutional Class (I) | | | 20.30 | | | | 7.52 | |
| Morgan Stanley Capital International Europe, Australasia, Far East Index | | | 17.64 | | | | 8.69 | |
| Lipper International Multi-Cap Core Funds Index | | | 17.28 | | | | 9.36 | |
| * | Benchmarks since inception reflect the inception date of the Institutional Class. |
The performance data quoted represents past performance which is no guarantee of future results. Investment return and principal value will fluctuate so that an investor’s shares, when redeemed, may be worth more or less than their original costs. Mutual fund performance changes over time and current performance may be lower or higher than what is stated. To receive current performance to the most recent month-end, please call 1-800-236-3863 or visit www.bmofunds.com.
Commentary
The fiscal year featured two distinct market environments. Immediately following the unanticipated outcome of the U.S. election, expectations of fiscal spending, deregulation, and tax cuts for individuals and corporations inspired a new sense of optimism among investors. That renewed outlook for future economic growth and inflation led to an increase in U.S. 10 year treasury yields, the repricing of expensive “bond proxy” stocks, and outperformance of more attractively valued pro-cyclical stocks. Since the end of 2016, however, international stocks in both developed and emerging markets outpaced U.S. stocks as corporate earnings and economic growth stabilized in international markets.
The Fund outperformed its benchmark due to our preference for fundamentally strong companies with reasonable valuations. The Fund’s relative performance was mostly driven by stock selection. An overweight position in Healthcare detracted from performance, while an underweight position in Real Estate contributed positively. In terms of country weights, an overweight position in France added to performance while an underweight position in Spain detracted. Stock selection was particularly strong in Financials, where Societe Generale SA (1.6% of the Fund, 61.0%) was a top contributor. Within Industrials, Royal Mail PLC (0.6% of the Fund, -20.5%) was the biggest detractor from returns.
As we look ahead, continued corporate earnings growth should lead to positive stock market returns. Any tax reform and infrastructure spending could further support economic growth, although with more uncertainty around these drivers. However, markets could react negatively with a slowdown in corporate earnings, or fiscal or monetary policy falls short of expectations. We also recognize a seeming disconnect between the equity and bond market that we continue to monitor. Accordingly, we have positioned your portfolio to participate in up markets while managing downside risks.
Fund Managers; Investment Experience
Jay Kaufman, CFA; since 2006
Ernesto Ramos, Ph.D.; since 1988
David Rosenblatt, CFA; since 2007
| | | | | | | | | | | | | | | | | | | | |
| | | | | | | | | Inception date | | | Expenses (%) | |
| Share class | | Ticker | | | Cusip | | | | Gross | | | Net | |
| Advisor (A) | | | BDAQX | | | | 09658W667 | | | | 9/17/2015 | | | | 1.45 | | | | 1.15 | |
| Institutional (I) | | | BDIQX | | | | 09658W659 | | | | 9/17/2015 | | | | 1.20 | | | | 0.90 | |
The net expense ratio shown reflects contractual expense limitations made by the Adviser, currently through December 31, 2017. The Adviser has committed to continue this arrangement through December 31, 2018. The Fund’s return would have been lower without these contractual expense limitations.
| | | | |
Portfolio sector allocation | |
| Sector | | Fund (%) | |
| Consumer Discretionary | | | 10.2 | |
| Consumer Staples | | | 11.0 | |
| Energy | | | 2.6 | |
| Financials | | | 19.4 | |
| Healthcare | | | 14.7 | |
| Industrials | | | 15.4 | |
| Information Technology | | | 7.9 | |
| Materials | | | 9.4 | |
| Telecommunication Services | | | 3.7 | |
| Utilities | | | 2.8 | |
| Real Estate | | | 1.6 | |
| Other Assets & Liabilities, Net | | | 1.3 | |
| Total | | | 100.0 | |
Portfolio composition will change due to the ongoing management of the Fund. The percentages are based on net assets as of August 31, 2017 and may not necessarily reflect adjustments that are routinely made when presenting net assets for formal financial statement processes.
Growth of an assumed $10,000 investment
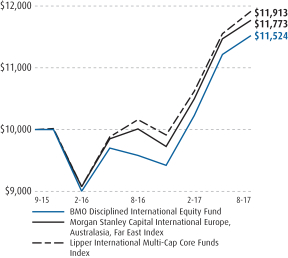
See Explanation of the Indices and Notes in the Commentary for additional information. The above graph relates to the Institutional Class shares of the Fund. Performance for the Advisor Class shares will vary from the performance of the Institutional Class shares shown above due to differences in charges and expenses. This graph illustrates the hypothetical investment of $10,000 in the Institutional Class shares of the Fund from the lesser of the Fund’s inception date or August 31, 2007 to August 31, 2017.
12
| | |
| Annual Report | | BMO Pyrford International Stock Fund |
| | | | | | | | | | | | |
Average annual total returns (%) | |
| | | 1-year | | | 5-year | | | Since
inception* | |
| Investor Class (Y) | | | 10.38 | | | | 6.63 | | | | 7.19 | |
| Advisor Class (A)NAV | | | 10.38 | | | | — | | | | 1.59 | |
| Advisor Class (A)OFFER | | | 4.87 | | | | — | | | | 0.00 | |
| Institutional Class (I) | | | 10.68 | | | | 6.90 | | | | 7.47 | |
| Retirement Class (R-3) | | | 10.17 | | | | — | | | | 1.34 | |
| Retirement Class (R-6) | | | 10.85 | | | | — | | | | 1.98 | |
| Class F-3 | | | — | | | | — | | | | 0.08 | |
| Morgan Stanley Capital International Europe, Australasia, Far East Index | | | 17.64 | | | | 8.48 | | | | 8.96 | |
| Lipper International Multi-Cap Core Funds Index | | | 17.28 | | | | 8.44 | | | | 9.03 | |
| * | Cumulative for periods less than one year. Benchmarks since inception reflect the inception date of the Institutional Class. |
The performance data quoted represents past performance which is no guarantee of future results. Investment return and principal value will fluctuate so that an investor’s shares, when redeemed, may be worth more or less than their original costs. Mutual fund performance changes over time and current performance may be lower or higher than what is stated. To receive current performance to the most recent month-end, please call 1-800-236-3863 or visit www.bmofunds.com.
Commentary
International equity markets were marked by a reflation trade over the second half of 2016 as investors looked to rotate out of defensive sectors into more cyclical areas of the market. Since the turn of the year, European equities have performed strongly though a strengthening Euro has the potential to tighten conditions. Concerns on economic growth remain with forecasts steadily being revised downward, though market sentiment has been helped by supportive central bank policy from Japan, Europe, and the U.S. Ordinarily, this liquidity would have translated into robust credit growth in the real economy, but in a world where banks are reluctant to lend because of capital constraints and asset quality concerns and the private sector is unwilling to borrow because of already high existing levels of debt, this traditional transmission mechanism is broken.
We maintained a very defensive stance during the year, concentrating on characteristics of value and quality—high dividend yield, low financial leverage, and high return on equity. The Fund underperformed during the period under review. Underperformance was predominantly driven by underweight financials and stock selection within Europe. Low quality cyclical stocks in peripheral Europe were buoyed by the potential for reflation and a steeper yield curve over the second half of 2016, an area we are underweight. We continue to be underweight as we remain concerned with asset quality. We strongly believe that the European debt crisis has not gone away and banks remain the most exposed when the structural problems of peripheral southern Europe resurface. Indeed, Italian banks have been the focus of the market given high levels of bad debts.
In Asia, Hong Kong stock selection was positive led by Information Technology names. The Hong Kong market has performed strongly year-to-date, leading us to reduce our country allocation on valuation concerns. Currency contribution was positive by being underweight the Japanese Yen, despite the best efforts of the Bank of Japan, the currency depreciated by more than 6% over the period.
Investment Adviser:
BMO Asset Management Corp.
Sub-adviser:
Pyrford International Ltd.
Fund Managers; Investment Experience
Tony Cousins, CFA; since 1985
Daniel McDonagh, CFA; since 1997
Paul Simons, CFA; since 1996
| | | | | | | | | | | | | | | | |
| | | | | | | | | Inception date | | | Expenses (%) |
| Share class | | Ticker | | | Cusip | | | | Gross | | Net |
| Investor (Y) | | | MISYX | | | | 09658L497 | | | | 12/29/2011 | | | 1.31 | | 1.19 |
| Advisor (A) | | | BPIAX | | | | 09658W840 | | | | 5/27/2014 | | | 1.31 | | 1.19 |
| Institutional (I) | | | MISNX | | | | 09658L513 | | | | 12/29/2011 | | | 1.06 | | 0.94 |
| Retirement (R-3) | | | BISDX | | | | 09658V370 | | | | 5/27/2014 | | | 1.56 | | 1.44 |
| Retirement (R-6) | | | BISGX | | | | 09658V362 | | | | 5/27/2014 | | | 0.91 | | 0.79 |
| Class F-3 | | | BISBX | | | | 09658V321 | | | | 5/31/2017 | | | 0.91 | | 0.79 |
The net expense ratio shown reflects contractual expense limitations made by the Adviser, currently through December 31, 2017. The Adviser has committed to continue this arrangement through December 31, 2018. The Fund’s return would have been lower without these contractual expense limitations.
| | | | |
Portfolio sector allocation | |
| Sector | | Fund (%) | |
| Consumer Discretionary | | | 3.0 | |
| Consumer Staples | | | 13.0 | |
| Energy | | | 9.9 | |
| Financials | | | 8.8 | |
| Healthcare | | | 9.9 | |
| Industrials | | | 18.5 | |
| Information Technology | | | 6.2 | |
| Materials | | | 4.1 | |
| Telecommunication Services | | | 11.9 | |
| Utilities | | | 6.5 | |
| Other Assets & Liabilities, Net | | | 8.2 | |
| Total | | | 100.0 | |
Portfolio composition will change due to the ongoing management of the Fund. The percentages are based on net assets as of August 31, 2017 and may not necessarily reflect adjustments that are routinely made when presenting net assets for formal financial statement processes.
Growth of an assumed $10,000 investment
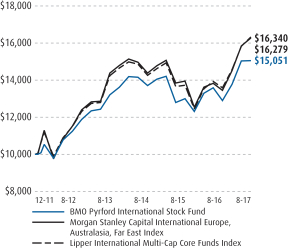
See Explanation of the Indices and Notes in the Commentary for additional information. The above graph relates to the Institutional Class shares of the Fund. Performance for the Investor Class, Advisor Class, Retirement R-3, Retirement R-6 and F-3 Class shares will vary from the performance of the Institutional Class shares shown above due to differences in charges and expenses. This graph illustrates the hypothetical investment of $10,000 in the Institutional Class shares of the Fund from the lesser of the Fund’s inception date or August 31, 2007 to August 31, 2017.
| | |
| Annual Report | | BMO LGM Emerging Markets Equity Fund |
| | | | | | | | | | | | |
Average annual total returns (%) | |
| | | 1-year | | | 5-year | | | Since
inception* | |
Advisor Class (A) NAV | | | 14.03 | | | | — | | | | 5.60 | |
Advisor Class (A) OFFER | | | 8.32 | | | | — | | | | 3.96 | |
Institutional Class (I) | | | 14.36 | | | | 5.70 | | | | 9.72 | |
Morgan Stanley Capital International Emerging Markets Index | | | 24.53 | | | | 5.30 | | | | 10.69 | |
Lipper Emerging Markets Funds Index | | | 23.67 | | | | 5.65 | | | | 10.88 | |
| * | Benchmarks since inception reflect the inception date of the Institutional Class. |
The performance data quoted represents past performance which is no guarantee of future results. Investment return and principal value will fluctuate so that an investor’s shares, when redeemed, may be worth more or less than their original costs. Mutual fund performance changes over time and current performance may be lower or higher than what is stated. To receive current performance to the most recent month-end, please call 1-800-236-3863 or visit www.bmofunds.com.
Commentary
Two major events occurred in the fourth quarter of 2016, demonetization in India and the impact of Trump’s election on certain emerging market countries, in particular Mexico. The Fund has several investments in both markets. While both caused a significant spike in volatility, we believed they did not diminish the investment case for the Fund’s holdings and, as such, we added to conviction positions. This action materially benefited the Fund’s return in 2017.
The Fund’s relative underperformance was primarily due to negative allocation effects from underweighting China and security selection in Indonesia, Vietnam, and the Philippines. In the Philippines, Universal Robina Corp. (URC) (3.6% of the Fund, -37.7%) was the largest detractor to the Fund’s performance. We raised our concerns with the stock in conversations with company management while in Manila in 2017. Our concerns included the high cost of recent acquisitions, the overall competitive environment, and lingering problems caused by product recalls in Vietnam. We came away greatly reassured, even though the competitive environment is likely to remain tough over the medium term. With URC’s market-leading brands in underpenetrated categories, superior distribution, robust balance sheet, and great management team, we remain confident in the long-term outlook for this business.
Adding to performance included security selection in India, South Africa, and Turkey. BIM Birlesik Magazalar AS (BIM), a Turkish discount retailer, (3.5% of the Fund, 31.7%) has a focus on the long-term and a ruthless attention to cost efficiency. BIM only operates in non-prime locations, has a narrow product offering (roughly 600 products of which about 70% are private label), and has a first-mover advantage, allowing them to build scale. This scale gives BIM bargaining power with suppliers and, combined with lower real estate costs and fewer product offerings, provides BIM with a much lower cost base than competitors.
Investment Adviser:
BMO Asset Management Corp.
Sub-adviser:
LGM Investments Limited
Fund Managers; Investment Experience
Damian Bird, CFA; since 2008
Irina Hunter; since 1994
Rishikesh Patel; since 2003
| | | | | | | | | | | | | | | | | | | | |
| | | | | | | | | Inception date | | | Expenses (%) | |
| Share class | | Ticker | | | Cusip | | | | Gross | | | Net | |
Advisor (A) | | | BAEMX | | | | 09658W824 | | | | 5/27/2014 | | | | 1.64 | | | | 1.40 | |
Institutional (I) | | | MIEMX | | | | 09658L489 | | | | 12/22/2008 | | | | 1.39 | | | | 1.15 | |
The net expense ratio shown reflects contractual expense limitations made by the Adviser, currently through December 31, 2017. The Adviser has committed to continue this arrangement through December 31, 2018. The Fund’s return would have been lower without these contractual expense limitations.
| | | | |
Portfolio sector allocation | |
| Sector | | Fund (%) | |
Consumer Discretionary | | | 11.7 | |
Consumer Staples | | | 39.0 | |
Financials | | | 32.7 | |
Healthcare | | | 1.5 | |
Industrials | | | 1.6 | |
Information Technology | | | 1.9 | |
Materials | | | 1.0 | |
Utilities | | | 1.7 | |
Common Stock Units | | | 2.4 | |
Participation Notes | | | 2.6 | |
| Other Assets & Liabilities, Net | | | 3.9 | |
| Total | | | 100.0 | |
Portfolio composition will change due to the ongoing management of the Fund. The percentages are based on net assets as of August 31, 2017 and may not necessarily reflect adjustments that are routinely made when presenting net assets for formal financial statement processes.
Growth of an assumed $10,000 investment
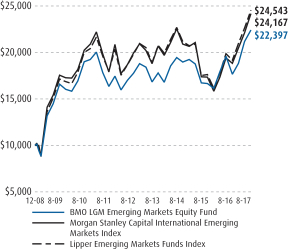
See Explanation of the Indices and Notes in the Commentary for additional information. The above graph relates to the Institutional Class shares of the Fund. Performance for the Advisor Class shares will vary from the performance of the Institutional Class shares shown above due to differences in charges and expenses. This graph illustrates the hypothetical investment of $10,000 in the Institutional Class shares of the Fund from the lesser of the Fund’s inception date or August 31, 2007 to August 31, 2017.
14
| | |
| Annual Report | | BMO TCH Emerging Markets Bond Fund |
| | | | | | | | |
Average annual total returns (%) | |
| | | 1-year | | | Since
inception* | |
| Advisor Class (A) NAV | | | 4.92 | | | | 3.91 | |
| Advisor Class (A) OFFER | | | 1.23 | | | | 2.78 | |
| Institutional Class (I) | | | 5.07 | | | | 5.75 | |
| JP Morgan Emerging Markets Bond Global Diversified Index | | | 5.02 | | | | 7.44 | |
| Lipper Emerging Markets Hard Currency Debt Funds Index | | | 7.67 | | | | 5.40 | |
| * | Benchmarks since inception reflect the inception date of the Institutional Class. |
The performance data quoted represents past performance which is no guarantee of future results. Investment return and principal value will fluctuate so that an investor’s shares, when redeemed, may be worth more or less than their original costs. Mutual fund performance changes over time and current performance may be lower or higher than what is stated. To receive current performance to the most recent month-end, please call 1-800-236-3863 or visit www.bmofunds.com.
Commentary
In our view, the moderate approach the Federal Reserve (the Fed) appears to be taking with regard to their balance sheet is positive for the emerging market debt sector. Many investors had feared that eventual policy normalization would withdraw liquidity and hurt the sector, but the slow, deliberate course the Fed is charting projects more stability for the sector. Emerging market debt performance has been more positive than many expected and with spread tightening in other sectors even more in the second quarter, emerging market debt continues to appear attractive on a relative basis. The dollar continued to weaken in the second quarter, erasing almost all of the rise post-election in 2016, despite the second rate hike of 2017. This weakening should benefit hard currency emerging market debt.
The Fund delivered strong absolute returns for the fiscal year, outperforming the benchmark, but lagged the peer group. The period was characterized by meaningful rate increases and spread compression that left overall yields in a similar position after a strong year of performance for the sector.
The Fund is diversified to various sectors relative to its benchmark, which is comprised primarily of sovereign and fully owned quasi-sovereign issuers. Corporate and quasi-sovereign sectors outperformed the sovereign benchmark, adding to the Fund’s relative returns. The Fund maintains a higher quality bias versus the benchmark. For the trailing period, non-investment grade outperformed investment grade emerging market debt by nearly 600 basis points, detracting from relative performance.
Regional allocations contributed to Fund performance. Below benchmark allocations to Asia benefited performance for the trailing twelve months, and increasing allocations to the Middle East and North Africa from approximately benchmark weight to overweight benefited the Fund as that was the top performing region for the Fund’s fiscal year. By country, the Fund was overweight Mexico which underperformed, but underweight Philippines, which underperformed.
While U.S. policy priorities appear less focused on trade than several months ago, potential further volatility around U.S. political rhetoric could continue to create opportunities. As a whole, current emerging market yields remain attractive and we expect sub-sector and security selection opportunities to be important drivers of returns in the coming quarters.
Investment Adviser:
BMO Asset Management Corp.
Sub-adviser:
Taplin, Canida & Habacht, LLC
Fund Managers; Investment Experience
Scott M. Kimball, CFA; since 2004
Daniela Mardarovici, CFA; since 2000
Frank J. Reda, CMT; since 2001
Janelle Woodward, CFA; since 2003
| | | | | | | | | | | | | | | | |
| | | | | | | | | Inception date | | | Expenses (%) |
| Share class | | Ticker | | | Cusip | | | | Gross | | Net |
| Advisor (A) | | | BAMEX | | | | 09658W816 | | | | 5/27/2014 | | | 2.84 | | 1.00 |
| Institutional (I) | | | MEBIX | | | | 09658L448 | | | | 9/30/2013 | | | 2.59 | | 0.85 |
The net expense ratio shown reflects contractual expense limitations made by the Adviser, currently through December 31, 2017. The Adviser has committed to continue this arrangement through December 31, 2018. The Fund’s return would have been lower without these contractual expense limitations.
| | | | |
Portfolio sector allocation | |
| Sector | | Fund (%) | |
| Corporate Bonds & Notes | | | 55.0 | |
| International Bonds | | | 41.5 | |
| Other Assets & Liabilities, Net | | | 3.5 | |
| Total | | | 100.0 | |
Portfolio composition will change due to the ongoing management of the Fund. The percentages are based on net assets as of August 31, 2017 and may not necessarily reflect adjustments that are routinely made when presenting net assets for formal financial statement processes.
Growth of an assumed $10,000 investment
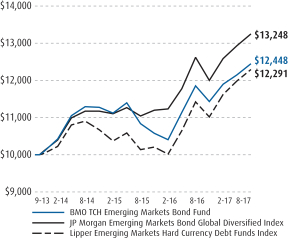
See Explanation of the Indices and Notes in the Commentary for additional information. The above graph relates to the Institutional Class shares of the Fund. Performance for the Advisor Class shares will vary from the performance of the Institutional Class shares shown above due to differences in charges and expenses. This graph illustrates the hypothetical investment of $10,000 in the Institutional Class shares of the Fund from the lesser of the Fund’s inception date or August 31, 2007 to August 31, 2017.
15
| | |
| Annual Report | | BMO Alternative Strategies Fund |
| | | | | | | | |
Average annual total returns (%) | |
| | | 1-year | | | Since
inception* | |
| Advisor Class (A) NAV | | | 4.27 | | | | 3.03 | |
| Advisor Class (A) OFFER | | | (0.92 | ) | | | 1.08 | |
| Institutional Class (I) | | | 4.65 | | | | 3.31 | |
| Bank of America Merrill Lynch 3-Month T-Bill Index | | | 0.62 | | | | 0.32 | |
| HFRX Global Hedge Fund Index | | | 5.57 | | | | 1.59 | |
| Lipper Alternative Multi-Strategy Funds Index | | | 3.75 | | | | 1.66 | |
| * | Benchmarks since inception reflect the inception date of the Institutional Class. |
The performance data quoted represents past performance which is no guarantee of future results. Investment return and principal value will fluctuate so that an investor’s shares, when redeemed, may be worth more or less than their original costs. Mutual fund performance changes over time and current performance may be lower or higher than what is stated. To receive current performance to the most recent month-end, please call 1-800-236-3863 or visit www.bmofunds.com.
Commentary
The fiscal year began with strength across global markets as China maintained a pro-growth stance and the markets welcomed Donald Trump’s unexpected victory. U.S. stocks led developed markets higher, while rising commodity prices fueled emerging markets. Global equities rallied into 2017 as strong corporate earnings growth and improving economic data continued in the United States, Europe and Japan. Several market indexes hit new highs, fueled by expectations that Trump would deliver business-friendly policies, including tax cuts and regulatory reforms. Fixed income also traded higher despite tightening U.S. monetary policy. The fiscal year ended with increased volatility as geopolitical concerns grew as mounting tension with both North Korea and Russia caused bouts of weakness in equity markets. U.S. and German government bonds ended on a strong note as demand for safe haven assets increased.
The Fund achieved its results with an average volatility that was approximately 40% of the market as measured by Morgan Stanley Capital International (MSCI) All Country World Index (ACWI). As such, the portfolio provided good downside protection in periods of stress while lagging in an upward moving market.
Given a relatively strong equity market during most of the year, equity hedged strategies were among the strongest contributors to portfolio performance. Our higher beta manager contributed significantly to returns while the lower beta manager provided protection in the more recent down drafts.
The relative value allocation turned in mixed results for the portfolio. Our volatility manager continued to capitalize predominantly on U.S. based returns where the relationship between implied volatility and realized remained the most attractive. The other manager in this allocation continued to struggle and was replaced at the end of February with a global long/short mandate.
The credit hedged sleeve of the portfolio enhanced performance as bank loans and long equities were strong. This manager continued to monitor the geopolitical environment and continued to look for opportunities that are more insulated from market turmoil and remain relatively defensively positioned.
Our macro allocation also managed to add value during this time period. Equity positioning was additive with long positions in U.S., China and Japan indices among the largest contributors to performance in this strategy.
Investment Adviser:
BMO Asset Management Corp.
Sub-advisers:
CTC myCFO, LLC
Capstone Investment Advisors, LLC
Cramer Rosenthan McGlynn, LLC
Graham Capital Management, L.P.
Iridian Asset Management LLC
Sound Point Capital Management, L.P.
| | | | | | | | | | |
| | | | | | | Inception date | | Expenses (%) |
| Share class | | Ticker | | Cusip | | | Gross | | Net |
| Advisor (A) | | BMATX | | 09658W683 | | 12/16/2014 | | 3.73 | | 2.92 |
| Institutional (I) | | BMASX | | 09658W675 | | 12/16/2014 | | 3.48 | | 2.67 |
The net expense ratio shown reflects contractual expense limitations made by the Adviser, currently through December 31, 2017. The Adviser has committed to continue this arrangement through December 31, 2018. The Fund’s return would have been lower without these contractual expense limitations.
| | | | | | | | |
Portfolio sector allocation | |
| Sector | | Fund (%) | |
| | | Short | | | Long | |
| Common Stocks Sold Short or Purchased Long | | | | | | | | |
Consumer Discretionary | | | (3.5 | ) | | | 8.9 | |
Consumer Staples | | | (1.4 | ) | | | 2.6 | |
Energy | | | (0.2 | ) | | | 0.7 | |
Financials | | | (0.7 | ) | | | 2.9 | |
Healthcare | | | (1.2 | ) | | | 5.4 | |
Industrials | | | (2.4 | ) | | | 8.7 | |
Information Technology | | | (1.6 | ) | | | 5.6 | |
Materials | | | (0.8 | ) | | | 4.9 | |
Real Estate | | | (1.0 | ) | | | 0.5 | |
Telecommunication Services | | | (0.1 | ) | | | 0.9 | |
Utilities | | | (0.7 | ) | | | 1.3 | |
| | | | |
| Total Common Stocks | | | (13.6 | ) | | | 42.4 | |
| Total Common Stocks Sold Short | | | | | | | (13.6 | ) |
| | | | | | | | |
| Total Net Sold Short and Purchased Long Common Stocks | | | | | | | 28.8 | |
| Other investments Purchased Long* | | | | | | | 7.9 | |
| Other investments Sold Short* | | | | | | | (6.1 | ) |
| Short-Term Investments | | | | | | | 51.9 | |
| Other Assets & Liabilities | | | | | | | 17.5 | |
| Total | | | | | | | 100.0 | |
| * | See Schedules of Investments for additional detail on investment type. |
Portfolio composition will change due to the ongoing management of the Fund. The percentages are based on net assets as of August 31, 2017 and may not necessarily reflect adjustments that are routinely made when presenting net assets for formal financial statement processes.
Growth of an assumed $10,000 investment

See Explanation of the Indices and Notes in the Commentary for additional information. The above graph relates to the Institutional Class shares of the Fund. Performance for the Advisor Class shares will vary from the performance of the Institutional Class shares shown above due to differences in charges and expenses. This graph illustrates the hypothetical investment of $10,000 in the Institutional Class shares of the Fund from the lesser of the Fund’s inception date or August 31, 2007 to August 31, 2017.
16
| | |
| Annual Report | | BMO Global Long/Short Equity Fund |
| | | | | | | | |
Average annual total returns (%) | |
| | | 1-year | | | Since
inception* | |
| Advisor Class (A) NAV | | | 15.77 | | | | 11.46 | |
| Advisor Class (A) OFFER | | | 10.00 | | | | 8.55 | |
| Institutional Class (I) | | | 16.10 | | | | 11.73 | |
| Morgan Stanley Capital International All Country World Index | | | 17.75 | | | | 12.01 | |
| Lipper Alternative Long/Short Equity Funds Index | | | 6.48 | | | | 3.55 | |
| * | Benchmarks since inception reflect the inception date of the Institutional Class. |
The performance data quoted represents past performance which is no guarantee of future results. Investment return and principal value will fluctuate so that an investor’s shares, when redeemed, may be worth more or less than their original costs. Mutual fund performance changes over time and current performance may be lower or higher than what is stated. To receive current performance to the most recent month-end, please call 1-800-236-3863 or visit www.bmofunds.com.
Commentary
The fiscal year featured two distinct market environments. Immediately following the unanticipated outcome of the U.S. election, expectations of fiscal spending, deregulation, and tax cuts for individuals and corporations inspired a new sense of optimism among investors. That renewed outlook for future economic growth and inflation led to an increase in U.S. 10 year treasury yields, the repricing of expensive “bond proxy” stocks, and outperformance of more attractively valued pro-cyclical stocks. Since the end of 2016, however, the market experienced a partial reversal of post-election themes; with growth becoming scarce in the market, investors preferred stocks with higher growth rates over company valuations. Contrary to expectations heading into 2017, international stocks in both developed and emerging markets outpaced U.S. stocks as corporate earnings and economic growth have stabilized in international markets.
Within the global investment universe, our emphasis on stock valuations detracted from returns in what was predominantly a growth-oriented market. However, the portfolio continues to display the intended risk characteristics, with volatility and drawdowns at a fraction of those of the Morgan Stanley Capital International (MSCI) All Country World Index (ACWI).
The Fund’s sector and country allocations had a modest impact on performance, as relative returns were mostly driven by stock selection. An underweight position in Information Technology detracted from performance, while a net short position in Energy contributed positively. In terms of country weights, a net short position in the United Kingdom added to performance while an underweight position in China detracted.
As we look ahead, continued corporate earnings growth should lead to positive stock market returns. Any tax reform and infrastructure spending could further support economic growth, although with more uncertainty around these drivers. However, markets could react negatively with a slowdown in corporate earnings, or fiscal or monetary policy falls short of expectations. We also recognize the seeming disconnect between the equity and bond market that we continue to monitor. Accordingly, we have positioned your portfolio to participate in up markets while managing downside risks.
Fund Managers; Investment Experience
Jay Kaufman, CFA; since 2006
Ernesto Ramos, Ph.D.; since 1988
David Rosenblatt, CFA; since 2006
| | | | | | | | | | | | | | | | | | | | |
| | | | | | | | | Inception date | | | Expenses (%) | |
| Share class | | Ticker | | | Cusip | | | | Gross | | | Net | |
| Advisor (A) | | | BGAQX | | | | 09658W626 | | | | 9/17/2015 | | | | 9.50 | | | | 2.40 | |
| Institutional (I) | | | BGIQX | | | | 09658W618 | | | | 9/17/2015 | | | | 9.25 | | | | 2.15 | |
The net expense ratio shown reflects contractual expense limitations made by the Adviser, currently through December 31, 2017. The Adviser has committed to continue this arrangement through December 31, 2018. The Fund’s return would have been lower without these contractual expense limitations.
| | | | | | | | |
Portfolio sector allocation | |
| Sector | | Fund (%) | |
| | | Short | | | Long | |
| Common Stocks Sold Short or Purchased Long | | | | | | | | |
Consumer Discretionary | | | (5.1 | ) | | | 9.9 | |
Consumer Staples | | | (1.6 | ) | | | 9.4 | |
Energy | | | (0.2 | ) | | | — | |
Financials | | | (2.8 | ) | | | 11.7 | |
Healthcare | | | (1.6 | ) | | | 19.9 | |
Industrials | | | (8.0 | ) | | | 18.3 | |
Information Technology | | | (7.5 | ) | | | 11.2 | |
Materials | | | (3.3 | ) | | | 5.1 | |
Real Estate | | | (4.9 | ) | | | 5.4 | |
Telecommunication Services | | | (0.6 | ) | | | 2.2 | |
Utilities | | | — | | | | 5.7 | |
| | | | |
| Total Common Stocks | | | (35.6 | ) | | | 98.8 | |
| Total Common Stocks Sold Short | | | | | | | (35.6 | ) |
| | | | | | | | |
| Total Net Sold Short and Purchased Long Common Stocks | | | | | | | 63.2 | |
| Short-Term Investments | | | | | | | 40.1 | |
| Other Assets & Liabilities | | | | | | | (3.3 | ) |
| Total | | | | | | | 100.0 | |
Portfolio composition will change due to the ongoing management of the Fund. The percentages are based on net assets as of August 31, 2017 and may not necessarily reflect adjustments that are routinely made when presenting net assets for formal financial statement processes.
Growth of an assumed $10,000 investment
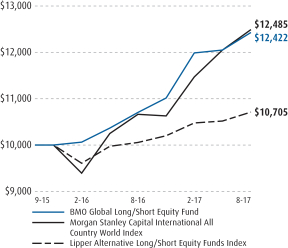
See Explanation of the Indices and Notes in the Commentary for additional information. The above graph relates to the Institutional Class shares of the Fund. Performance for the Advisor Class shares will vary from the performance of the Institutional Class shares shown above due to differences in charges and expenses. This graph illustrates the hypothetical investment of $10,000 in the Institutional Class shares of the Fund from the lesser of the Fund’s inception date or August 31, 2007 to August 31, 2017.
17
| | |
| Annual Report | | BMO Ultra Short Tax-Free Fund |
| | | | | | | | | | | | |
Average annual total returns (%) | |
| | | 1-year | | | 5-year | | | Since
inception* | |
| Advisor Class (A) NAV | | | 0.80 | | | | — | | | | 0.51 | |
| Advisor Class (A) OFFER | | | (1.26 | ) | | | — | | | | (0.12 | ) |
| Institutional Class (I) | | | 1.15 | | | | 0.83 | | | | 1.19 | |
| Blended Index (50% Bloomberg Barclays 1 Year Municipal Bond Index and 50% iMoneyNet, Inc. Money Market Fund Tax-Free National Retail Index) | | | 0.66 | | | | 0.43 | | | | 0.52 | |
| Lipper Short Municipal Debt Funds Index | | | 0.77 | | | | 0.78 | | | | 1.18 | |
| * | Benchmarks since inception reflect the inception date of the Institutional Class. |
The performance data quoted represents past performance which is no guarantee of future results. Investment return and principal value will fluctuate so that an investor’s shares, when redeemed, may be worth more or less than their original costs. Mutual fund performance changes over time and current performance may be lower or higher than what is stated. To receive current performance to the most recent month-end, please call 1-800-236-3863 or visit www.bmofunds.com.
Commentary
Looking back over the past year, interest rates increased dramatically following the election of President Trump—the “reflation” trade—before rallying back towards pre-election levels. Fixed income yields moved higher with forecasted increases in Gross Domestic Product and inflation due to aggressive fiscal policies proposed by the new Trump Administration. Ultimately, this put some pressure on the Federal Reserve (the Fed) to move interest rates higher. However, hurdles to enacting looser fiscal policy, as well as choppy economic data and lower inflation, limited the Fed’s actions over the past year. As of August 31, only four interest rate hikes have been made by the Fed in the current tightening cycle. Since December 2015, the Federal Open Market Committee (FOMC) has increased the Fed Funds target rate by 100 basis points from 0.25% to the current 1.25%. The probability for a widely anticipated rate hike in the fourth quarter of 2017 has fallen as inflation has drifted lower over the year and global political tensions have risen.
Municipal yields increased across the curve for the year. The long end experienced the largest increase with the thirty-year yield higher by about 60 basis points from August 2016. On the short end of the curve, one- and five-year yields increased by 25 basis points, and the ten-year yield increased by 45 basis points. Despite higher yields, returns were positive for all spots along the municipal yield curve, albeit with a wide range of outcomes. According to the Bloomberg Barclays Municipal Bond Index, the long bond index returned 0.42%, the ten-year bond index returned 1.06% the five-year bond index returned 1.44%, and the one year bond index returned 1.04%.
The Fund outperformed its blended benchmark and peer group over the period. Performance was helped by an overweight of lower quality bonds as spreads tightened with investors stretching for yield in the low interest rate environment. Additionally, the Fund had an overweight of municipal floating rate notes which performed well in the rising interest rate environment. The Fund’s performance was hindered by its selection of bonds within the lower quality rating sectors.
Fund Managers; Investment Experience
Thomas Byron; since 1981
Brian Sipich, CFA; since 1998
Robert Wimmel; since 1992
| | | | | | | | | | | | | | | | | | | | |
| | | | | | | | | Inception date | | | Expenses (%) | |
| Share class | | Ticker | | | Cusip | | | | Gross | | | Net | |
| Advisor (A) | | | BAUSX | | | | 09658W790 | | | | 5/27/2014 | | | | 0.64 | | | | 0.55 | |
| Institutional (I) | | | MUISX | | | | 09658L539 | | | | 9/30/2009 | | | | 0.39 | | | | 0.30 | |
The net expense ratio shown reflects contractual expense limitations made by the Adviser, currently through December 31, 2017. The Adviser has committed to continue this arrangement through December 31, 2018. The Fund’s return would have been lower without these contractual expense limitations.
| | | | |
Municipal Issuance/Industry Type | |
| Issuance/Industry | | Fund (%) | |
| General Obligation — 14.1% | | | | |
School District | | | 5.4 | |
State or Local | | | 8.7 | |
| Revenue Bonds — 89.2% | | | | |
Appropriation | | | 16.8 | |
Education | | | 6.4 | |
General Revenue | | | 1.2 | |
Healthcare | | | 23.2 | |
Housing | | | 7.8 | |
Industrial Revenue | | | 8.1 | |
Power | | | 2.9 | |
Special Tax | | | 3.4 | |
Tobacco | | | 0.8 | |
Transportation | | | 9.4 | |
Water & Sewer | | | 9.2 | |
| Other Assets & Liabilities, Net | | | (3.3 | ) |
| Total | | | 100.0 | |
Portfolio composition will change due to the ongoing management of the Fund. The percentages are based on net assets as of August 31, 2017 and may not necessarily reflect adjustments that are routinely made when presenting net assets for formal financial statement processes.
Growth of an assumed $10,000 investment
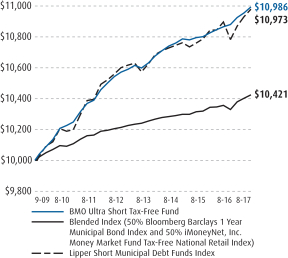
See Explanation of the Indices and Notes in the Commentary for additional information. The above graph relates to the Institutional Class shares of the Fund. Performance for the Advisor Class shares will vary from the performance of the Institutional Class shares shown above due to differences in charges and expenses. This graph illustrates the hypothetical investment of $10,000 in the Institutional Class shares of the Fund from the lesser of the Fund’s inception date or August 31, 2007 to August 31, 2017.
18
| | |
| Annual Report | | BMO Short Tax-Free Fund |
| | | | | | | | |
Average annual total returns (%) | |
| | | 1-year | | | Since
inception* | |
| Advisor Class (A) NAV | | | 1.08 | | | | 1.42 | |
| Advisor Class (A) OFFER | | | (0.95 | ) | | | 0.78 | |
| Institutional Class (I) | | | 1.14 | | | | 1.87 | |
| Bloomberg Barclays Short (1-5 Year) Municipal Index | | | 1.13 | | | | 1.29 | |
| Lipper Short Municipal Debt Funds Index | | | 0.77 | | | | 0.74 | |
| * | Benchmarks since inception reflect the inception date of the Institutional Class. |
The performance data quoted represents past performance which is no guarantee of future results. Investment return and principal value will fluctuate so that an investor’s shares, when redeemed, may be worth more or less than their original costs. Mutual fund performance changes over time and current performance may be lower or higher than what is stated. To receive current performance to the most recent month-end, please call 1-800-236-3863 or visit www.bmofunds.com.
Commentary
Looking back over the past year, interest rates increased dramatically following the election of President Trump—the “reflation” trade—before rallying back towards pre-election levels. Fixed income yields moved higher with forecasted increases in Gross Domestic Product and inflation due to aggressive fiscal policies proposed by the new Trump Administration. Ultimately, this put some pressure on the Federal Reserve (the Fed) to move interest rates higher. However, hurdles to enacting looser fiscal policy, as well as choppy economic data and lower inflation, limited the Fed’s actions over the past year. As of August 31, only four interest rate hikes have been made by the Fed in the current tightening cycle. Since December 2015, the Federal Open Market Committee (FOMC) has increased the Fed Funds target rate by 100 basis points from 0.25% to the current 1.25%. The probability for a widely anticipated rate hike in the fourth quarter of 2017 has fallen as inflation has drifted lower over the year and global political tensions have risen.
Municipal yields increased across the curve for the year. The long end experienced the largest increase with the thirty-year yield higher by about 60 basis points from August 2016. On the short end of the curve, one- and five-year yields increased by 25 basis points, and the ten-year yield increased by 45 basis points. Despite higher yields, returns were positive for all spots along the municipal yield curve, albeit with a wide range of outcomes. According to the Bloomberg Barclays Municipal Bond Index, the long bond index returned 0.42%, the ten-year bond index returned 1.06% the five-year bond index returned 1.44%, and the one year bond index returned 1.04%.
The Fund performed in line with the benchmark and outperformed the peer group over the period. Performance was helped by an overweight of lower quality bonds as spreads tightened with investors stretching for yield in the low interest rate environment. The Fund’s barbell structure also was additive as the yield curve rose. The Fund’s performance was hindered by its selection of bonds within the lower quality rating sectors.
Fund Managers; Investment Experience
Thomas Byron; since 1981
Brian Sipich, CFA; since 1998
Robert Wimmel; since 1992
| | | | | | | | | | | | | | | | | | | | |
| | | | | | | | | Inception date | | | Expenses (%) | |
| Share class | | Ticker | | | Cusip | | | | Gross | | | Net | |
| Advisor (A) | | | BASFX | | | | 09658W782 | | | | 5/27/2014 | | | | 0.78 | | | | 0.56 | |
| Institutional (I) | | | MTFIX | | | | 09658L646 | | | | 11/29/2012 | | | | 0.53 | | | | 0.41 | |
The net expense ratio shown reflects contractual expense limitations made by the Adviser, currently through December 31, 2017. The Adviser has committed to continue this arrangement through December 31, 2018. The Fund’s return would have been lower without these contractual expense limitations.
| | | | |
Municipal Issuance/Industry Type | |
| Issuance/Industry | | Fund (%) | |
| General Obligation — 19.0% | | | | |
School District | | | 7.2 | |
State or Local | | | 11.8 | |
| Revenue Bonds — 76.3% | | | | |
Appropriation | | | 14.2 | |
Education | | | 12.3 | |
General Revenue | | | 1.5 | |
Healthcare | | | 22.3 | |
Housing | | | 3.4 | |
Industrial Revenue | | | 3.2 | |
Power | | | 2.9 | |
Special Tax | | | 2.3 | |
Student Loan | | | 0.3 | |
Tobacco | | | 2.0 | |
Transportation | | | 7.8 | |
Water & Sewer | | | 4.1 | |
| Other Assets & Liabilities, Net | | | 4.7 | |
| Total | | | 100.0 | |
Portfolio composition will change due to the ongoing management of the Fund. The percentages are based on net assets as of August 31, 2017 and may not necessarily reflect adjustments that are routinely made when presenting net assets for formal financial statement processes.
Growth of an assumed $10,000 investment
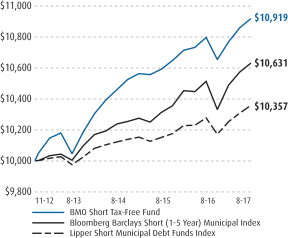
See Explanation of the Indices and Notes in the Commentary for additional information. The above graph relates to the Institutional Class shares of the Fund. Performance for the Advisor Class shares will vary from the performance of the Institutional Class shares shown above due to differences in charges and expenses. This graph illustrates the hypothetical investment of $10,000 in the Institutional Class shares of the Fund from the lesser of the Fund’s inception date or August 31, 2007 to August 31, 2017.
19
| | |
| Annual Report | | BMO Short-Term Income Fund |
| | | | | | | | | | | | | | | | |
Average annual total returns (%) | |
| | | 1-year | | | 5-year | | | 10-year | | | Since
inception | |
| Advisor Class (A) NAV | | | 1.46 | | | | — | | | | — | | | | 1.18 | |
| Advisor Class (A) OFFER | | | (0.55 | ) | | | — | | | | — | | | | 0.57 | |
| Institutional Class (I) | | | 1.60 | | | | 1.43 | | | | 2.93 | | | | — | |
| Bank of America Merrill Lynch 1-3 Year U.S. Government/Corporate Index | | | 0.88 | | | | 0.98 | | | | 2.18 | | | | — | |
| Lipper Short Investment-Grade Debt Funds Index | | | 1.60 | | | | 1.36 | | | | 2.30 | | | | — | |
The performance data quoted represents past performance which is no guarantee of future results. Investment return and principal value will fluctuate so that an investor’s shares, when redeemed, may be worth more or less than their original costs. Mutual fund performance changes over time and current performance may be lower or higher than what is stated. To receive current performance to the most recent month-end, please call 1-800-236-3863 or visit www.bmofunds.com.
Commentary
The Federal Open Market Committee (FOMC) and the surprise election of Donald Trump were significant factors in the bond market’s significant volatility over the past year. While three interest rate increases by the FOMC since December 2016 spurred yields dramatically higher, the Presidential election ignited market participants’ hopes for deregulation and tax reform. These beliefs reinforced a “risk-on” mentality in the marketplace, which drove sales of Treasury bonds and increased the buying of credit bonds. While interest rates climbed all across the yield curve, the most dramatic increases were seen in maturities of 1 year and shorter.
An overweight in percentage and duration exposure to the Corporate, Asset-Backed Securities (ABS) and Commercial Mortgage Securities (CMS) sectors, as compared to the benchmark index, benefited performance, as they were the top performers for the year. Conversely, exposure to longer-dated U.S. Government securities detracted from performance, as interest rates rose dramatically all across the yield curve. A barbell term structure was beneficial as the yield curve flattened in maturities greater than one year. Thanks in large part to the anticipation of regulatory and tax reform, the security selection of financial versus industrial corporate issues also proved to be additive to performance.
After a rebound in growth for the second quarter of 2017, economists anticipate that the economy will finish the year at 2% to 2.5% Gross Domestic Product. The U.S. Federal Reserve continues to be concerned with inflation persisting well below its targeted level of 2%; however, the employment data remains strong and has shown resilience in the face of economic uncertainty. As of August 31, 2017 the futures market reflected only a 33% chance of a policy tightening occurring by the end of 2017.
The trends of rising rates out to five years and a flatter yield curve beyond six months are likely to remain in place. As the fiscal year drew to a close, and as efforts to swiftly implement agenda items have reached an impasse, Congress and the new administration will remain significant wildcards in the marketplace. A few items of focus in the near-term include raising the debt ceiling, passing a budget and any potential tax or regulatory reform. Exogenous items that affect market confidence, like weather-related emergencies and/or increasing tension in Asia will also bear watching.
Fund Managers; Investment Experience
Peter J. Arts; since 1992
Boyd R. Eager; since 1997
| | | | | | | | | | | | | | | | | | | | |
| | | | | | | | | Inception date | | | Expenses (%) | |
| Share class | | Ticker | | | Cusip | | | | Gross | | | Net | |
| Advisor (A) | | | BTMAX | | | | 09658W774 | | | | 5/27/2014 | | | | 0.72 | | | | 0.62 | |
| Institutional (I) | | | MSIFX | | | | 09658L570 | | | | 5/31/2007 | | | | 0.47 | | | | 0.37 | |
The net expense ratio shown reflects contractual expense limitations made by the Adviser, currently through December 31, 2017. The Adviser has committed to continue this arrangement through December 31, 2018. The Fund’s return would have been lower without these contractual expense limitations.
| | | | |
Portfolio sector allocation | |
| Sector | | Fund (%) | |
| Asset-Backed Securities | | | 21.6 | |
| Collateralized Mortgage Obligations | | | 3.0 | |
| Commercial Mortgage Securities | | | 7.0 | |
| Corporate Bonds & Notes | | | 41.7 | |
| Mutual Funds | | | 1.9 | |
| U.S. Government & U.S. Government Agency Obligations | | | 15.9 | |
| U.S. Government Agency—Mortgage Securities | | | 0.5 | |
| Other Assets & Liabilities, Net | | | 8.4 | |
| Total | | | 100.0 | |
Portfolio composition will change due to the ongoing management of the Fund. The percentages are based on net assets as of August 31, 2017 and may not necessarily reflect adjustments that are routinely made when presenting net assets for formal financial statement processes.
Growth of an assumed $10,000 investment
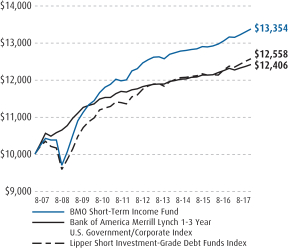
See Explanation of the Indices and Notes in the Commentary for additional information. The above graph relates to the Institutional Class shares of the Fund. Performance for the Advisor Class shares will vary from the performance of the Institutional Class shares shown above due to differences in charges and expenses. This graph illustrates the hypothetical investment of $10,000 in the Institutional Class shares of the Fund from the lesser of the Fund’s inception date or August 31, 2007 to August 31, 2017.
20
| | |
| Annual Report | | BMO Intermediate Tax-Free Fund |
| | | | | | | | | | | | | | | | |
Average annual total returns (%) | |
| | | 1-year | | | 5-year | | | 10-year | | | Since
inception | |
| Investor Class (Y) | | | 0.78 | | | | 2.79 | | | | 4.75 | | | | — | |
| Advisor Class (A) NAV | | | 0.79 | | | | — | | | | — | | | | 3.10 | |
| Advisor Class (A) OFFER | | | (2.73 | ) | | | — | | | | — | | | | 2.00 | |
| Institutional Class (I) | | | 1.11 | | | | 3.04 | | | | — | | | | 4.44 | |
| Bloomberg Barclays 1-15 Year Blend Municipal Bond Index | | | 1.07 | | | | 2.73 | | | | 4.32 | | | | — | |
| Lipper Intermediate Municipal Debt Funds Index | | | 0.63 | | | | 2.48 | | | | 3.87 | | | | — | |
The performance data quoted represents past performance which is no guarantee of future results. Investment return and principal value will fluctuate so that an investor’s shares, when redeemed, may be worth more or less than their original costs. Mutual fund performance changes over time and current performance may be lower or higher than what is stated. To receive current performance to the most recent month-end, please call 1-800-236-3863 or visit www.bmofunds.com.
Commentary
Looking back over the past year, interest rates increased dramatically following the election of President Trump—the “reflation” trade—before rallying back towards pre-election levels. Fixed income yields moved higher with forecasted increases in Gross Domestic Product and inflation due to aggressive fiscal policies proposed by the new Trump Administration. Ultimately, this put some pressure on the Federal Reserve (the Fed) to move interest rates higher. However, hurdles to enacting looser fiscal policy, as well as choppy economic data and lower inflation, limited the Fed’s actions over the past year. As of August 31, only four interest rate hikes have been made by the Fed in the current tightening cycle. Since December 2015, the Federal Open Market Committee (FOMC) has increased the Fed Funds target rate by 100 basis points from 0.25% to the current 1.25%. The probability for a widely anticipated rate hike in the fourth quarter of 2017 has fallen as inflation has drifted lower over the year and global political tensions have risen.
Municipal yields increased across the curve for the year. The long end experienced the largest increase with the thirty-year yield higher by about 60 basis points from August 2016. On the short end of the curve, one- and five-year yields increased by 25 basis points, and the ten-year yield increased by 45 basis points. Despite higher yields, returns were positive for all spots along the municipal yield curve, albeit with a wide range of outcomes. According to the Bloomberg Barclays Municipal Bond Index, the long bond index returned 0.42%, the ten-year bond index returned 1.06% the five-year bond index returned 1.44%, and the one year bond index returned 1.04%.
The Fund outperformed its benchmark and peer group over the period. Performance was helped by an overweight of lower quality bonds as spreads tightened with investors stretching for yield in the low interest rate environment. The Fund’s barbell structure also was additive as the yield curve rose. The Fund’s performance was hindered by the selection of bonds in the 15 year portion of the yield curve.
Fund Managers; Investment Experience
Thomas Byron; since 1981
Brian Sipich, CFA; since 1998
Robert Wimmel; since 1992
| | | | | | | | | | | | | | | | | | | | |
| | | | | | | | | Inception date | | | Expenses (%) | |
| Share class | | Ticker | | | Cusip | | | | Gross | | | Net | |
| Investor (Y) | | | MITFX | | | | 09658L760 | | | | 2/1/1994 | | | | 0.58 | | | | 0.56 | |
| Advisor (A) | | | BITAX | | | | 09658W766 | | | | 5/27/2014 | | | | 0.58 | | | | 0.56 | |
| Institutional (I) | | | MIITX | | | | 09658L778 | | | | 12/27/2010 | | | | 0.33 | | | | 0.33 | |
The net expense ratio shown reflects contractual expense limitations made by the Adviser, currently through December 31, 2017. The Adviser has committed to continue this arrangement through December 31, 2018. The Fund’s return would have been lower without these contractual expense limitations.
| | | | |
Municipal Issuance/Industry Type | |
| Issuance/Industry | | Fund (%) | |
| General Obligation — 23.0% | |
School District | | | 13.2 | |
State or Local | | | 9.8 | |
| Revenue Bonds — 75.5% | | | | |
Appropriation | | | 18.7 | |
Education | | | 8.1 | |
General Revenue | | | 0.9 | |
Healthcare | | | 18.4 | |
Housing | | | 4.0 | |
Industrial Revenue | | | 0.7 | |
Power | | | 2.7 | |
Special Tax | | | 1.3 | |
Student Loan | | | 0.7 | |
Tobacco | | | 0.7 | |
Transportation | | | 11.4 | |
Water & Sewer | | | 7.9 | |
| Other Assets & Liabilities, Net | | | 1.5 | |
| Total | | | 100.0 | |
Portfolio composition will change due to the ongoing management of the Fund. The percentages are based on net assets as of August 31, 2017 and may not necessarily reflect adjustments that are routinely made when presenting net assets for formal financial statement processes.
Growth of an assumed $10,000 investment
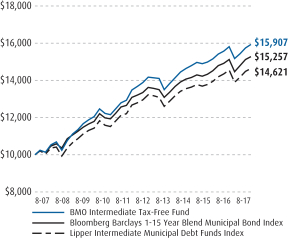
See Explanation of the Indices and Notes in the Commentary for additional information. The above graph relates to the Investor Class shares of the Fund. Performance for the Institutional Class and Advisor Class shares will vary from the performance of the Investor Class shares shown above due to differences in charges and expenses. This graph illustrates the hypothetical investment of $10,000 in the Investor Class shares of the Fund from the lesser of the Fund’s inception date or August 31, 2007 to August 31, 2017.
21
| | |
| Annual Report | | BMO Strategic Income Fund |
| | | | | | | | | | | | | | | | |
Average annual total returns (%) | |
| | | 1-year | | | 5-year | | | 10-year | | | Since
inception | |
| Investor Class (Y) | | | 3.32 | | | | 2.34 | | | | 4.31 | | | | — | |
| Advisor Class (A)NAV | | | 3.32 | | | | — | | | | — | | | | 3.27 | |
| Advisor Class (A)OFFER | | | (0.28 | ) | | | — | | | | — | | | | 2.15 | |
| Institutional Class (I) | | | 3.58 | | | | 2.59 | | | | 4.56 | | | | — | |
| Bloomberg Barclays U.S. Aggregate Bond Index* | | | 0.49 | | | | 2.19 | | | | 4.40 | | | | — | |
| Bloomberg Barclays U.S. Mortgage Backed Securities Index | | | 0.80 | | | | 2.05 | | | | 4.24 | | | | — | |
| Lipper Multi-Sector Income Funds Index | | | 5.51 | | | | 3.87 | | | | 5.61 | | | | — | |
| * | The Bloomberg Barclays U.S. Aggregate Bond Index is replacing the Bloomberg Barclays U.S. Mortgage Backed Securities Index as the Fund’s benchmark. The Fund has changed the broad-based securities market index to which it compares its performance. The Bloomberg Barclays U.S. Mortgage Back Securities Index will be excluded from this comparison in the future. |
The performance data quoted represents past performance which is no guarantee of future results. Investment return and principal value will fluctuate so that an investor’s shares, when redeemed, may be worth more or less than their original costs. Mutual fund performance changes over time and current performance may be lower or higher than what is stated. To receive current performance to the most recent month-end, please call 1-800-236-3863 or visit www.bmofunds.com.
Commentary
Since the end of May, the Fund has performed approximately in-line with its new benchmark, benefitting from the strength of security selection and the performance of non-government securities, but interest rate and yield curve impacts offset these contributions. In this timeframe, security selection within Mining and Chemicals was particularly additive, while selection within Energy names detracted from performance.
The Fund outperformed the new benchmark, but underperformed the new peer group for the full fiscal period. Relative to the benchmark, the Fund was overweight non-agency mortgages, which performed well and contributed meaningful income to the portfolio. The Fund’s outperformance was significantly benefited by a litigation settlement from a crisis-era investment received during the first quarter. Relative to the new peer group, the Fund had a significant overweight to agency mortgages in a period when agency mortgages underperformed higher yielding securities typically held in multi-sector fixed income portfolios, such as emerging market debt, credit and high yield corporates.
Looking forward, when the Federal Reserve begins its long awaited balance sheet reduction plan, the deliberate and methodical approach should ease the direct impact to Treasuries and broader fixed income, though implementation should be monitored closely. U.S. fixed income has benefited from significant international flows, a continuing support given yield differentials. Those factors notwithstanding, Treasury markets have priced in moderating economic data to a greater degree than other asset classes and sectors. Whether credit, priced near historical median levels, or Treasuries are better reflective of near term economic outcomes will help define the coming quarters for fixed income investors. As markets respond to U.S. fiscal policy and global monetary policy shifts, we see opportunities and risks across the spectrum of fixed income sectors and expect sub-sector and security selection opportunities to be important drivers of returns for the upcoming period.
Fund Managers; Investment Experience
Scott M. Kimball, CFA; since 2004
Daniela Mardarovici, CFA; since 2000
Frank J. Reda, CMT; since 2001
Janelle Woodward, CFA; since 2003
| | | | | | | | | | | | | | | | | | | | |
| | | | | | | | | Inception date | | | Expenses (%) | |
| Share class | | Ticker | | | Cusip | | | | Gross | | | Net | |
| Investor (Y) | | | MRGIX | | | | 09658L810 | | | | 12/13/1992 | | | | 0.86 | | | | 0.80 | |
| Advisor (A) | | | BMTAX | | | | 09658W758 | | | | 5/27/2014 | | | | 0.86 | | | | 0.80 | |
| Institutional (I) | | | MGIIX | | | | 09658L828 | | | | 5/31/2007 | | | | 0.61 | | | | 0.55 | |
The net expense ratio shown reflects contractual expense limitations made by the Adviser, currently through December 31, 2017. The Adviser has committed to continue this arrangement through December 31, 2018. The Fund’s return would have been lower without these contractual expense limitations.
| | | | |
Portfolio sector allocation | |
| Sector | | Fund (%) | |
| Asset-Backed Securities | | | 0.2 | |
| Collateralized Mortgage Obligations | | | 10.6 | |
| Commercial Mortgage Securities | | | 6.0 | |
| Corporate Bonds & Notes | | | 66.0 | |
| U.S. Government Agency—Mortgage Securities | | | 15.6 | |
| Other Assets & Liabilities, Net | | | 1.6 | |
| Total | | | 100.0 | |
Portfolio composition will change due to the ongoing management of the Fund. The percentages are based on net assets as of August 31, 2017 and may not necessarily reflect adjustments that are routinely made when presenting net assets for formal financial statement processes.
Growth of an assumed $10,000 investment
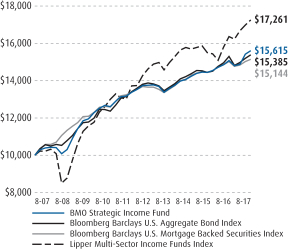
See Explanation of the Indices and Notes in the Commentary for additional information. The above graph relates to the Institutional Class shares of the Fund. Performance for the Investor Class and Advisor Class shares will vary from the performance of the Institutional Class shares shown above due to differences in charges and expenses. This graph illustrates the hypothetical investment of $10,000 in the Institutional Class shares of the Fund from the lesser of the Fund’s inception date or August 31, 2007 to August 31, 2017.
22
| | |
| Annual Report | | BMO TCH Corporate Income Fund |
| | | | | | | | | | | | |
Average annual total returns (%) | |
| | | 1-year | | | 5-year | | | Since
inception* | |
| Investor Class (Y) | | | 3.86 | | | | 4.64 | | | | 8.22 | |
| Advisor Class (A)NAV | | | 3.86 | | | | — | | | | 4.27 | |
| Advisor Class (A)OFFER | | | 0.21 | | | | — | | | | 3.14 | |
| Institutional Class (I) | | | 4.07 | | | | 4.79 | | | | 8.40 | |
| Bloomberg Barclays U.S. Credit Index | | | 1.90 | | | | 3.39 | | | | 6.61 | |
| Lipper Corporate Debt Funds BBB-Rated Index | | | 3.35 | | | | 4.45 | | | | 10.50 | |
| * | Benchmarks since inception reflect the inception date of the Institutional Class. |
The performance data quoted represents past performance which is no guarantee of future results. Investment return and principal value will fluctuate so that an investor’s shares, when redeemed, may be worth more or less than their original costs. Mutual fund performance changes over time and current performance may be lower or higher than what is stated. To receive current performance to the most recent month-end, please call 1-800-236-3863 or visit www.bmofunds.com.
Commentary
The Fund outperformed its benchmark and peer group in a period when rates rose significantly and economic expectations improved.
Interest rates on the 10 year U.S. Treasury rose from 1.58% on August 31, 2016 to 2.12% on August 31, 2017, resulting in a -0.95% return for Treasuries. The Fund had tactically reduced portfolio duration in 2016 and that positioning contributed to strong relative performance against the benchmark as yields rose sharply in the later part of 2016. Floating rate notes, also part of the yield curve positioning, benefited the portfolio as the Federal Reserve hiked rates three times (December, March, June) during the period.
Individual security selection within corporate credit was the largest driver of positive performance. In particular, names within Information Technology, Healthcare, and Metals & Mining, contributed to returns while other sectors such as Retail mildly detracted from returns.
Sector and quality selection was positive. The portfolio was overweight credit, which outperformed duration-matched Treasuries by 309 basis points as spreads tightened. Within credit, the Fund was overweight lower quality investment grade securities which outperformed higher quality securities with BBB bonds outperforming AAA equivalents by over 360 basis points of excess return. The portfolio was overweight corporate credit, which outperformed non-corporate credit by 150 basis points, adding to relative performance.
Looking forward, duration positioning has been brought closer to benchmark given the adjustment in rates and the Fund is positioning for continued flattening of the yield curve as the rate hike cycle proceeds. The Fund remains modestly constructive credit relative to government securities in light of fundamental underpinnings as the corporate backdrop remains benign, but this view is balanced against tightening credit spreads. To date, earnings and strong demand continue to be supportive of spread levels. We expect security selection and idiosyncratic opportunities to remain key drivers in the coming quarters as uncertainty regarding U.S. policy implementation (Healthcare, Financials) and Merger & Acquisition activity continue to create opportunities, while other sectors undergo secular changes (Retail, Telecommunications).
Investment Adviser:
BMO Asset Management Corp.
Sub-adviser:
Taplin, Canida & Habacht, LLC
Fund Managers; Investment Experience
Scott M. Kimball, CFA; since 2004
Daniela Mardarovici, CFA; since 2000
Frank J. Reda, CMT; since 2001
Janelle Woodward, CFA; since 2003
| | | | | | | | | | | | | | | | | | | | |
| | | | | | | | | Inception date | | | Expenses (%) | |
| Share class | | Ticker | | | Cusip | | | | Gross | | | Net | |
| Investor (Y) | | | MCIYX | | | | 09658L851 | | | | 12/22/2008 | | | | 0.73 | | | | 0.60 | |
| Advisor (A) | | | BATIX | | | | 09658W733 | | | | 5/27/2014 | | | | 0.73 | | | | 0.60 | |
| Institutional (I) | | | MCIIX | | | | 09658L869 | | | | 12/22/2008 | | | | 0.48 | | | | 0.48 | |
The net expense ratio shown reflects contractual expense limitations made by the Adviser, currently through December 31, 2017. The Adviser has committed to continue this arrangement through December 31, 2018. The Fund’s return would have been lower without these contractual expense limitations.
| | | | |
Portfolio sector allocation | |
| Sector | | Fund (%) | |
| Corporate Bonds & Notes | | | 93.7 | |
| Municipals | | | 0.2 | |
| U.S. Government & U.S. Government Agency Obligations | | | 3.3 | |
| Other Assets & Liabilities, Net | | | 2.8 | |
| Total | | | 100.0 | |
Portfolio composition will change due to the ongoing management of the Fund. The percentages are based on net assets as of August 31, 2017 and may not necessarily reflect adjustments that are routinely made when presenting net assets for formal financial statement processes.
Growth of an assumed $10,000 investment
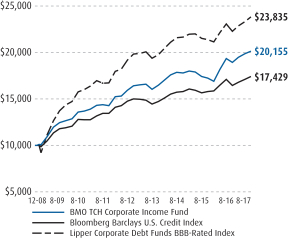
See Explanation of the Indices and Notes in the Commentary for additional information. The above graph relates to the Institutional Class shares of the Fund. Performance for the Investor Class and Advisor Class shares will vary from the performance of the Institutional Class shares shown above due to differences in charges and expenses. This graph illustrates the hypothetical investment of $10,000 in the Institutional Class shares of the Fund from the lesser of the Fund’s inception date or August 31, 2007 to August 31, 2017.
23
| | |
| Annual Report | | BMO TCH Core Plus Bond Fund |
| | | | | | | | | | | | |
Average annual total returns (%) | |
| | | 1-year | | | 5-year | | | Since
inception* | |
| Investor Class (Y) | | | 1.91 | | | | 3.22 | | | | 6.00 | |
| Advisor Class (A) NAV | | | 1.91 | | | | — | | | | 2.96 | |
| Advisor Class (A) OFFER | | | (1.65 | ) | | | — | | | | 1.84 | |
| Institutional Class (I) | | | 2.08 | | | | 3.46 | | | | 6.25 | |
| Bloomberg Barclays U.S. Aggregate Bond Index | | | 0.49 | | | | 2.19 | | | | 4.04 | |
| Lipper Core Plus Bond Funds Index | | | 1.16 | | | | 2.58 | | | | 6.03 | |
| * | Benchmarks since inception reflect the inception date of the Institutional Class. |
The performance data quoted represents past performance which is no guarantee of future results. Investment return and principal value will fluctuate so that an investor’s shares, when redeemed, may be worth more or less than their original costs. Mutual fund performance changes over time and current performance may be lower or higher than what is stated. To receive current performance to the most recent month-end, please call 1-800-236-3863 or visit www.bmofunds.com.
Commentary
The Fund outperformed its benchmark meaningfully, but modestly underperformed the peer group in a period when rates rose significantly and economic expectations improved.
Interest rates on the 10 year U.S. Treasury rose from 1.58% on August 31, 2016 to 2.12% on August 31, 2017, resulting in a -0.95% return for Treasuries. The Fund had tactically reduced portfolio duration in 2016 and that positioning contributed to strong relative performance against the benchmark as yields rose sharply in the later part of 2016. Floating rate notes, also part of the yield curve positioning, benefited the portfolio as the Federal Reserve hiked rates three times (December, March, June) during the period.
Sector and quality selection was positive. The portfolio was overweight credit, which outperformed duration-matched Treasuries by 309 basis points as spreads tightened. Within credit, the Fund was overweight lower quality investment grade securities which outperformed higher quality securities with BBB bonds outperforming AAA equivalents by over 360 basis points of excess return. The portfolio was overweight corporate credit, which outperformed non-corporate credit by 150 basis points, adding to relative performance. However, the overweight to mortgage backed securities (MBS) detracted from relative returns as that sector underperformed in the period and mortgage duration extended with the increase in Treasury yields.
Individual security selection within corporate credit contributed to performance, in particular names within Information Technology and Metals & Mining, while other sectors such as Retail mildly detracted from returns.
Looking forward, duration positioning has been brought closer to benchmark given the adjustment in rates and the Fund is positioning for continued flattening of the yield curve as the rate hike cycle proceeds. The Fund remains modestly constructive credit relative to government securities in light of fundamental underpinnings as the corporate backdrop remains benign, but this view is balanced against tightening credit spreads. To date, earnings and strong demand continue to be supportive of spread levels. We expect security selection and idiosyncratic opportunities to remain key drivers in the coming quarters as uncertainty regarding U.S. policy implementation (Healthcare, Financials) and Merger & Acquisition activity continue to create opportunities, while other sectors undergo secular changes (Retail, Telecommunications).
Investment Adviser:
BMO Asset Management Corp.
Sub-adviser:
Taplin, Canida & Habacht, LLC
Fund Managers; Investment Experience
Scott M. Kimball, CFA; since 2004
Daniela Mardarovici, CFA; since 2000
Frank J. Reda, CMT; since 2001
Janelle Woodward, CFA; since 2003
| | | | | | | | | | | | | | | | | | | | |
| | | | | | | | | Inception date | | | Expenses (%) | |
| Share class | | Ticker | | | Cusip | | | | Gross | | | Net | |
| Investor (Y) | | | MCYBX | | | | 09658L877 | | | | 12/22/2008 | | | | 0.60 | | | | 0.60 | |
| Advisor (A) | | | BATCX | | | | 09658W725 | | | | 5/27/2014 | | | | 0.60 | | | | 0.60 | |
| Institutional (I) | | | MCBIX | | | | 09658L885 | | | | 12/22/2008 | | | | 0.35 | | | | 0.35 | |
| | | | |
Portfolio sector allocation | |
| Sector | | Fund (%) | |
| Corporate Bonds & Notes | | | 46.0 | |
| U.S. Government & U.S. Government Agency Obligations | | | 12.7 | |
| U.S. Government Agency—Mortgage Securities | | | 36.2 | |
| Other Assets & Liabilities, Net | | | 5.1 | |
| Total | | | 100.0 | |
Portfolio composition will change due to the ongoing management of the Fund. The percentages are based on net assets as of August 31, 2017 and may not necessarily reflect adjustments that are routinely made when presenting net assets for formal financial statement processes.
Growth of an assumed $10,000 investment
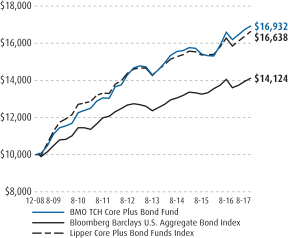
See Explanation of the Indices and Notes in the Commentary for additional information. The above graph relates to the Institutional Class shares of the Fund. Performance for the Investor Class and Advisor Class shares will vary from the performance of the Institutional Class shares shown above due to differences in charges and expenses. This graph illustrates the hypothetical investment of $10,000 in the Institutional Class shares of the Fund from the lesser of the Fund’s inception date or August 31, 2007 to August 31, 2017.
24
| | |
| Annual Report | | BMO High Yield Bond Fund |
| | | | | | | | | | | | |
Average annual total returns (%) | |
| | | 1-year | | | 5-year | | | Since
inception* | |
| Advisor Class (A) NAV | | | 6.37 | | | | — | | | | 3.13 | |
| Advisor Class (A) OFFER | | | 2.70 | | | | — | | | | 2.01 | |
| Institutional Class (I) | | | 6.53 | | | | 4.86 | | | | 5.52 | |
| Bank of America Merrill Lynch U.S. High Yield, Master II Constrained Index | | | 8.78 | | | | 6.50 | | | | 7.58 | |
| Bank of America Merrill Lynch U.S. High Yield, BB-B Rated, Constrained Index | | | 7.58 | | | | 6.26 | | | | 7.25 | |
| Lipper High Yield Bond Funds Index | | | 8.67 | | | | 5.88 | | | | 7.00 | |
| * | Benchmarks since inception reflect the inception date of the Institutional Class. |
The performance data quoted represents past performance which is no guarantee of future results. Investment return and principal value will fluctuate so that an investor’s shares, when redeemed, may be worth more or less than their original costs. Mutual fund performance changes over time and current performance may be lower or higher than what is stated. To receive current performance to the most recent month-end, please call 1-800-236-3863 or visit www.bmofunds.com.
Commentary
For the full fiscal year, lower quality high yield outperformed with CCC rated bonds producing more than double the return of B rate securities—over 14% vs. approximately 7%. This difference in returns by quality segment led the Fund to underperform given its higher quality bias. Of note, during the first six months of the fiscal year, when the Fund had more of a high quality bias, CCC rated bonds returned approximately 12% versus 3% for BB rated. However, in the second half of the fiscal year, as the benchmark changed and the Fund incorporated lower quality assets, BB rated securities outperformed CCC rated by over 1%. Since the end of March, high yield spreads have remained unchanged with rates moving modestly lower impacting overall yields.
For the second quarter of calendar year 2017, security selection within certain Energy sub-sectors, Consumer Products and niche Retail sectors detracted from performance. Companies within the Telecommunication sector were the largest positive contributors, offsetting some of the impact from Energy. Cable sector performance was due to fundamental strength and idiosyncratic company factors.
Since the end of the second quarter of calendar year 2017, security selection within the Mining and Transportation sectors were positive contributors while Telecommunications and Consumer, Non-Cyclical were the largest detractors.
We continue to expect returns for full year 2017 to be approximately 5-7%, driven primarily by interest income and continued spread compression, partially offset by rising rates. High yield continues to be an attractive asset class for investors due to its diversification benefits and short duration, which should benefit from reinvestment activity when rates increase.
Fund Managers; Investment Experience
Ronald J. Salinas, CFA; since 2000
Eduardo J. Simpson, CFA; since 1999
Janelle Woodward, CFA; since 2003
| | | | | | | | | | | | | | | | | | | | |
| | | | | | | | | Inception date | | | Expenses (%) | |
| Share class | | Ticker | | | Cusip | | | | Gross | | | Net | |
| Advisor (A) | | | BMHAX | | | | 09658W717 | | | | 5/27/2014 | | | | 1.22 | | | | 0.91 | |
| Institutional (I) | | | MHBNX | | | | 09658L406 | | | | 12/29/2011 | | | | 0.97 | | | | 0.66 | |
The net expense ratio shown reflects contractual expense limitations made by the Adviser, currently through December 31, 2017. The Adviser has committed to continue this arrangement through December 31, 2018. The Fund’s return would have been lower without these contractual expense limitations.
| | | | |
Portfolio sector allocation | |
| Sector | | Fund (%) | |
| Corporate Bonds & Notes | | | 96.0 | |
| Other Assets & Liabilities, Net | | | 4.0 | |
| Total | | | 100.0 | |
Portfolio composition will change due to the ongoing management of the Fund. The percentages are based on net assets as of August 31, 2017 and may not necessarily reflect adjustments that are routinely made when presenting net assets for formal financial statement processes.
Growth of an assumed $10,000 investment
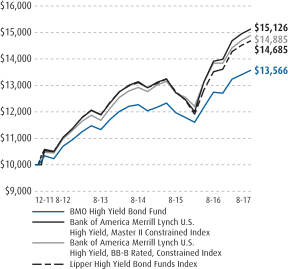
See Explanation of the Indices and Notes in the Commentary for additional information. The above graph relates to the Institutional Class shares of the Fund. Performance for the Advisor Class shares will vary from the performance of the Institutional Class shares shown above due to differences in charges and expenses. This graph illustrates the hypothetical investment of $10,000 in the Institutional Class shares of the Fund from the lesser of the Fund’s inception date or August 31, 2007 to August 31, 2017.
25
| | |
| Annual Report | | BMO Government Money Market Fund |
| | | | | | | | | | | | | | | | |
Average annual total returns (%) | |
| | | 7-day
current
yield | | | 1-year | | | 5-year | | | 10-year | |
| Investor Class (Y) | | | 0.62 | | | | 0.24 | | | | 0.06 | | | | 0.40 | |
| Premier Class | | | 0.87 | | | | 0.45 | | | | 0.12 | | | | 0.49 | |
| iMoneyNet, Inc. Government Money Market Index | | | | | | | 0.03 | | | | 0.02 | | | | 0.29 | |
| Lipper U.S. Government Money Market Funds Index | | | | | | | 0.18 | | | | 0.05 | | | | 0.35 | |
The performance data quoted represents past performance which is no guarantee of future results. Investment return and principal value will fluctuate so that an investor’s shares, when redeemed, may be worth more or less than their original costs. Mutual fund performance changes over time and current performance may be lower or higher than what is stated. To receive current performance to the most recent month-end, please call 1-800-236-3863 or visit www.bmofunds.com.
An investment in the Fund is neither insured nor guaranteed by the Federal Deposit Insurance Corporation or any other government agency. Although the Fund seeks to preserve the value of your investment at $1.00 per share, it is possible to lose money by investing in the Fund.
Commentary
The Federal Open Market Committee (FOMC) and the surprise election of Donald Trump were significant factors in the bond market’s significant volatility over the past year. While three interest rate increases, by the FOMC, since December 2016, spurred yields dramatically higher, the Presidential election ignited market participants’ hopes for deregulation and tax reform. These beliefs reinforced a “risk-on” mentality in the marketplace, which drove sales of Treasury bonds and increased the buying of credit bonds. While interest rates climbed all across the yield curve, the most dramatic increases were seen in maturities of one year and shorter.
Due to a rising interest rate environment, the Fund’s low Weighted Average Maturity and increased allocation to floating rate securities were strong contributors to performance during the fiscal year. Following the Money Market Reform implemented last October, strong demand for short-dated Government instruments has continued unabated, and as a result, short government yields remain under pressure. Nearly one year later, assets have still not begun shifting back to the Prime Funds as expected, as clients continue to rely on Government Funds for liquidity and many investors are content to keep the status quo amid uncertainty regarding fiscal policy and regulatory reform.
Thanks to the December 2016, March and June 2017 interest rate increases, yields climbed dramatically during the fiscal year, most noticeably on maturities of one year and less. Floating rate instruments remain attractive as the FOMC projects a further reduction in policy accommodation in the remainder of 2017 and 2018.
The trends of rising rates out to five years and a flatter yield curve beyond six months are likely to remain in place. As the fiscal year drew to a close, and as efforts to swiftly implement agenda items have reached an impasse, Congress and the Trump administration will remain significant wildcards in the marketplace. A few items of focus in the near-term include raising the debt ceiling, passing a budget and any potential tax or regulatory reform. Exogenous items that affect market confidence, like weather-related emergencies and/or increasing tension in Asia also will bear watching.
Fund Managers; Investment Experience
Peter J. Arts; since 1992
Boyd R. Eager; since 1997
| | | | | | | | | | | | | | | | | | | | |
| | | | | | | | | Inception date | | | Expenses (%) | |
| Share class | | Ticker | | | Cusip | | | | Gross | | | Net | |
| Investor (Y) | | | MGYXX | | | | 09658L786 | | | | 5/17/2004 | | | | 0.54 | | | | 0.46 | |
| Premier | | | MGNXX | | | | 09658L794 | | | | 5/28/2004 | | | | 0.29 | | | | 0.21 | |
The net expense ratio shown reflects contractual expense limitations made by the Adviser, currently through December 31, 2017. The Adviser has committed to continue this arrangement through December 31, 2018. The Fund’s return would have been lower without these contractual expense limitations.
| | | | |
Portfolio sector allocation | |
| Sector | | Fund (%) | |
| Mutual Funds | | | 5.5 | |
| Repurchase Agreements | | | 19.7 | |
| U.S. Government & U.S. Government Agency Obligations | | | 86.2 | |
| Other Assets & Liabilities, Net | | | (11.4 | ) |
| Total | | | 100.0 | |
Portfolio composition will change due to the ongoing management of the Fund. The percentages are based on net assets as of August 31, 2017 and may not necessarily reflect adjustments that are routinely made when presenting net assets for formal financial statement processes.
Growth of an assumed $10,000 investment
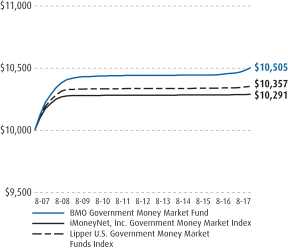
See Explanation of the Indices and Notes in the Commentary for additional information. The above graph relates to the Premier Class shares of the Fund. Performance for the Investor Class shares will vary from the performance of the Premier Class shares shown above due to differences in charges and expenses. This graph illustrates the hypothetical investment of $10,000 in the Premier Class shares of the Fund from the lesser of the Fund’s inception date or August 31, 2007 to August 31, 2017.
26
| | |
| Annual Report | | BMO Tax-Free Money Market Fund |
| | | | | | | | | | | | | | | | |
Average annual total returns (%) | |
| | | 7-day
current
yield | | | 1-year | | | 5-year | | | 10-year | |
| Investor Class (Y) | | | 0.42 | | | | 0.37 | | | | 0.10 | | | | 0.49 | |
| Premier Class | | | 0.67 | | | | 0.62 | | | | 0.19 | | | | 0.66 | |
| iMoneyNet, Inc. Fund Report/Tax-Free National Retail Index | | | | | | | 0.28 | | | | 0.07 | | | | 0.34 | |
| Lipper Tax-Exempt Money Market Funds Index | | | | | | | 0.39 | | | | 0.10 | | | | 0.35 | |
The performance data quoted represents past performance which is no guarantee of future results. Investment return and principal value will fluctuate so that an investor’s shares, when redeemed, may be worth more or less than their original costs. Mutual fund performance changes over time and current performance may be lower or higher than what is stated. To receive current performance to the most recent month-end, please call 1-800-236-3863 or visit www.bmofunds.com.
An investment in the Fund is neither insured nor guaranteed by the Federal Deposit Insurance Corporation or any other government agency. Although the Fund seeks to preserve the value of your investment at $1.00 per share, it is possible to lose money by investing in the Fund.
Commentary
Looking back over the past year, interest rates increased dramatically following the election of President Trump—the “reflation” trade—before rallying back towards pre-election levels. Fixed income yields moved higher with forecasted increases in Gross Domestic Product and inflation due to aggressive fiscal policies proposed by the new Trump Administration. Ultimately, this put some pressure on the Federal Reserve (the Fed) to move interest rates higher. However, hurdles to enacting looser fiscal policy, as well as choppy economic data and lower inflation, limited the Fed’s actions over the past year. As of August 31 only four interest rate hikes have been made by the Fed in the current tightening cycle. Since December 2015, the Federal Open Market Committee (FOMC) has increased the Fed Funds target rate by 100 basis points from 0.25% to the current 1.25%. The probability for a widely anticipated rate hike in the fourth quarter of 2017 has fallen as inflation has drifted lower over the year and global political tensions have risen.
Municipal yields increased across the curve for the year. The long end experienced the largest increase with the thirty-year yield higher by about 60 basis points from August 2016. On the short end of the curve, one- and five-year yields increased by 25 basis points, and the ten-year yield increased by 45 basis points. Despite higher yields, returns were positive for all spots along the municipal yield curve, albeit with a wide range of outcomes. According to the Bloomberg Barclays Municipal Bond Index, the long bond index returned 0.42%, the ten-year bond index returned 1.06% the five-year bond index returned 1.44%, and the one year bond index returned 1.04%.
The Fund outperformed its benchmark and peer group over the period. Duration for the Fund has stayed short with the Weighted Average Maturity fluctuating between 13 and 30 days. The Fund has a large allocation to variable rate demand bonds with daily or weekly liquidity and management made purchases in fixed rate bonds when the Fund was adequately compensated. Use of commercial paper has allowed the Fund to pick up some fixed interest rate exposure in the one to three month space as a way to diversify interest rate exposure while allowing flexibility for additional rate increases by the Fed.
Fund Managers; Investment Experience
Peter J. Arts; since 1992
Thomas Byron; since 1981
Boyd R. Eager; since 1997
Brian Sipich, CFA; since 1998
Robert Wimmel; since 1992
| | | | | | | | | | | | | | | | | | | | |
| | | | | | | | | Inception date | | | Expenses (%) | |
| Share class | | Ticker | | | Cusip | | | | Gross | | | Net | |
| Investor (Y) | | | MTFXX | | | | 09658L547 | | | | 9/22/2004 | | | | 0.54 | | | | 0.46 | |
| Premier | | | MFIXX | | | | 09658L554 | | | | 6/29/2005 | | | | 0.29 | | | | 0.21 | |
The net expense ratio shown reflects contractual expense limitations made by the Adviser, currently through December 31, 2017. The Adviser has committed to continue this arrangement through December 31, 2018. The Fund’s return would have been lower without these contractual expense limitations.
| | | | |
Municipal Issuance/Industry Type | |
| Issuance/Industry | | Fund (%) | |
| General Obligation — 15.9% | | | | |
State or Local | | | 15.9 | |
| Revenue Bonds — 85.5% | | | | |
Appropriation | | | 8.3 | |
Education | | | 8.8 | |
General Revenue | | | 2.5 | |
Healthcare | | | 16.3 | |
Housing | | | 8.7 | |
Industrial Revenue | | | 7.4 | |
Special Tax | | | 13.5 | |
Transportation | | | 8.6 | |
Water & Sewer | | | 11.4 | |
| Other Assets & Liabilities, Net | | | (1.4 | ) |
| Total | | | 100.0 | |
Portfolio composition will change due to the ongoing management of the Fund. The percentages are based on net assets as of August 31, 2017 and may not necessarily reflect adjustments that are routinely made when presenting net assets for formal financial statement processes.
Growth of an assumed $10,000 investment
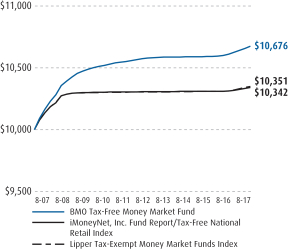
See Explanation of the Indices and Notes in the Commentary for additional information. The above graph relates to the Premier Class shares of the Fund. Performance for the Investor Class shares will vary from the performance of the Premier Class shares shown above due to differences in charges and expenses. This graph illustrates the hypothetical investment of $10,000 in the Premier Class shares of the Fund from the lesser of the Fund’s inception date or August 31, 2007 to August 31, 2017.
27
| | |
| Annual Report | | BMO Prime Money Market Fund |
| | | | | | | | | | | | | | | | |
Average annual total returns (%) | |
| | | 7-day
current
yield | | | 1-year | | | 5-year | | | 10-year | |
| Investor Class (Y) | | | 0.81 | | | | 0.42 | | | | 0.10 | | | | 0.53 | |
| Premier Class | | | 1.06 | | | | 0.67 | | | | 0.20 | | | | 0.69 | |
| iMoneyNet, Inc. Money Fund Report Averages | | | | | | | 0.14 | | | | 0.05 | | | | 0.40 | |
| Lipper Money Market Instrument Funds Index | | | | | | | 0.44 | | | | 0.11 | | | | 0.47 | |
The performance data quoted represents past performance which is no guarantee of future results. Investment return and principal value will fluctuate so that an investor’s shares, when redeemed, may be worth more or less than their original costs. Mutual fund performance changes over time and current performance may be lower or higher than what is stated. To receive current performance to the most recent month-end, please call 1-800-236-3863 or visit www.bmofunds.com.
An investment in the Fund is neither insured nor guaranteed by the Federal Deposit Insurance Corporation or any other government agency. Although the Fund seeks to preserve the value of your investment at $1.00 per share, it is possible to lose money by investing in the Fund.
Commentary
The Federal Open Market Committee (FOMC) and the surprise election of Donald Trump were significant factors in the bond market’s significant volatility over the past year. While three interest rate increases, by the FOMC, since December 2016, spurred yields dramatically higher, the Presidential election ignited market participants’ hopes for deregulation and tax reform. These beliefs reinforced a “risk-on” mentality in the marketplace, which drove sales of Treasury bonds and increased the buying of credit bonds. While interest rates climbed all across the yield curve, the most dramatic increases were seen in maturities of one year and shorter.
Due to a rising interest rate environment, the Fund’s low Weighted Average Maturity and increased allocation to floating rate securities were strong contributors to performance during the fiscal year. Higher yields on commercial paper, particularly in financial and asset-backed names, also helped performance. Following the Money Market Reform implemented last October, strong demand for short-dated Government instruments has continued unabated, and as a result, short government yields remain under pressure. Nearly one year later, assets have still not begun shifting back to the Prime Funds as expected, as clients continue to rely on Government Funds for liquidity, and many investors are content to keep the status quo amid uncertainty regarding fiscal policy and regulatory reform.
Thanks to the December 2016, March and June 2017 interest rate increases, yields climbed dramatically during the fiscal year, most noticeably on maturities of one year and less. Floating rate instruments remain attractive as the FOMC projects a further reduction in policy accommodation in the remainder of 2017 and 2018.
The trends of rising rates out to five years and a flatter yield curve beyond six months are likely to remain in place. As the fiscal year drew to a close, and as efforts to swiftly implement agenda items have reached an impasse, Congress and the Trump administration will remain significant wildcards in the marketplace. A few items of focus in the near-term include raising the debt ceiling, passing a budget and any potential tax or regulatory reform. Exogenous items that affect market confidence, like weather-related emergencies and/or increasing tension in Asia also will bear watching.
Fund Managers; Investment Experience
Peter J. Arts; since 1992
Boyd R. Eager; since 1997
| | | | | | | | | | | | | | | | | | | | |
| | | | | | | | | Inception date | | | Expenses (%) | |
| Share class | | Ticker | | | Cusip | | | | Gross | | | Net | |
| Investor (Y) | | | MARXX | | | | 09658L679 | | | | 11/23/1992 | | | | 0.46 | | | | 0.46 | |
| Premier | | | MAIXX | | | | 09658L687 | | | | 4/3/2000 | | | | 0.21 | | | | 0.21 | |
The net expense ratio shown reflects contractual expense limitations made by the Adviser, currently through December 31, 2017. The Adviser has committed to continue this arrangement through December 31, 2018. The Fund’s return would have been lower without these contractual expense limitations.
| | | | |
Portfolio sector allocation | |
| Sector | | Fund (%) | |
| Certificates of Deposit | | | 25.7 | |
| Commercial Paper | | | 57.4 | |
| Municipals | | | 4.3 | |
| Mutual Funds | | | 7.0 | |
| Repurchase Agreements | | | 5.6 | |
| Total | | | 100.0 | |
Portfolio composition will change due to the ongoing management of the Fund. The percentages are based on net assets as of August 31, 2017 and may not necessarily reflect adjustments that are routinely made when presenting net assets for formal financial statement processes.
Growth of an assumed $10,000 investment
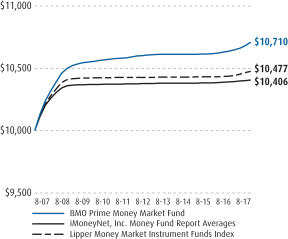
See Explanation of the Indices and Notes in the Commentary for additional information. The above graph relates to the Premier Class shares of the Fund. Performance for the Investor Class shares will vary from the performance of the Premier Class shares shown above due to differences in charges and expenses. This graph illustrates the hypothetical investment of $10,000 in the Premier Class shares of the Fund from the lesser of the Fund’s inception date or August 31, 2007 to August 31, 2017.
28
| | |
| Annual Report | | BMO Institutional Prime Money Market Fund |
| | | | | | | | | | | | |
Average annual total returns (%) | |
| | | 7-day
current
yield | | | 1-year | | | Since
inception* | |
| Investor Class (Y) | | | 0.83 | | | | 0.50 | | | | 0.43 | |
| Premier Class | | | 1.08 | | | | 0.75 | | | | 0.68 | |
| iMoneyNet, Inc. Money Fund Report Averages | | | | | | | 0.14 | | | | 0.14 | |
| Lipper Institutional Money Market Funds Index | | | | | | | 0.86 | | | | 0.69 | |
| * | Benchmarks since inception reflect the inception date of the Premier Class. |
The performance data quoted represents past performance which is no guarantee of future results. Investment return and principal value will fluctuate so that an investor’s shares, when redeemed, may be worth more or less than their original costs. Mutual fund performance changes over time and current performance may be lower or higher than what is stated. To receive current performance to the most recent month-end, please call 1-800-236-3863 or visit www.bmofunds.com.
An investment in the Fund is neither insured nor guaranteed by the Federal Deposit Insurance Corporation or any other government agency. Although the Fund seeks to preserve the value of your investment at $1.00 per share, it is possible to lose money by investing in the Fund.
Commentary
The Federal Open Market Committee (FOMC) and the surprise election of Donald Trump were significant factors in the bond market’s significant volatility over the past year. While three interest rate increases by the FOMC, since December 2016, spurred yields dramatically higher, the Presidential election ignited market participants’ hopes for deregulation and tax reform. These beliefs reinforced a “risk-on” mentality in the marketplace, which drove sales of Treasury bonds and increased the buying of credit bonds. While interest rates climbed all across the yield curve, the most dramatic increases were seen in maturities of one year and shorter.
Due to a rising interest rate environment, the Fund’s low Weighted Average Maturity and increased allocation to floating rate securities were strong contributors to performance during the fiscal year. Higher yields on commercial paper, particularly in financial and asset-backed names, also helped performance. The Fund had substantial liquidity and considerably short-weighted average maturity relative to its peers, which weighed on performance relative to the Index. Following the Money Market Reform implemented last October, strong demand for short-dated Government instruments has continued unabated, and as a result, short government yields remain under pressure. Nearly one year later, assets have still not begun shifting back to the Prime Funds as expected, as clients continue to rely on Government Funds for liquidity, and many investors are content to keep the status quo amid uncertainty regarding fiscal policy and regulatory reform.
Thanks to the December 2016, March and June 2017 interest rate increases, yields climbed dramatically during the fiscal year, most noticeably on maturities of one year and less. Floating rate instruments remain attractive as the FOMC projects a further reduction in policy accommodation in the remainder of 2017 and 2018.
The trends of rising rates out to five years and a flatter yield curve beyond six months are likely to remain in place. As the fiscal year drew to a close, and as efforts to swiftly implement agenda items have reached an impasse, Congress and the Trump administration will remain significant wildcards in the marketplace. A few items of focus in the near-term include raising the debt ceiling, passing a budget and any potential tax or regulatory reform. Exogenous items that affect market confidence, like weather-related emergencies and/or increasing tension in Asia also will bear watching.
Fund Managers; Investment Experience
Peter J. Arts; since 1992
Boyd R. Eager; since 1997
| | | | | | | | | | | | | | | | | | | | |
| | | | | | | | | Inception date | | | Expenses (%) | |
| Share class | | Ticker | | | Cusip | | | | Gross | | | Net | |
| Investor (Y) | | | BYFXX | | | | 09658V354 | | | | 6/3/2016 | | | | 0.54 | | | | 0.45 | |
| Premier | | | BPFXX | | | | 09658L347 | | | | 6/3/2016 | | | | 0.29 | | | | 0.20 | |
The net expense ratio shown reflects contractual expense limitations made by the Adviser, currently through December 31, 2017. The Adviser has committed to continue this arrangement through December 31, 2018. The Fund’s return would have been lower without these contractual expense limitations.
| | | | |
Portfolio sector allocation | |
| Sector | | Fund (%) | |
| Certificates of Deposit | | | 17.6 | |
| Commercial Paper | | | 59.1 | |
| Mutual Funds | | | 6.0 | |
| Repurchase Agreements | | | 17.4 | |
| Other Assets & Liabilities, Net | | | (0.1 | ) |
| Total | | | 100.0 | |
Portfolio composition will change due to the ongoing management of the Fund. The percentages are based on net assets as of August 31, 2017 and may not necessarily reflect adjustments that are routinely made when presenting net assets for formal financial statement processes.
Growth of an assumed $10,000 investment
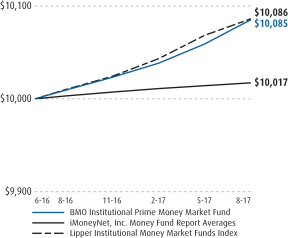
See Explanation of the Indices and Notes in the Commentary for additional information. The above graph relates to the Premier Class shares of the Fund. Performance for the Investor Class shares will vary from the performance of the Premier Class shares shown above due to differences in charges and expenses. This graph illustrates the hypothetical investment of $10,000 in the Premier Class shares of the Fund from the lesser of the Fund’s inception date or August 31, 2007 to August 31, 2017.
29
| | |
| Explanation of the Indices and Notes in the Commentary |
The views expressed in the commentary are as of August 31, 2017 and are those of the Funds’ investment adviser and/or portfolio manager(s). The views are subject to change at any time in response to changing circumstances in the market and are not intended to predict or guarantee the future performance of the Funds or any individual security, industry, market sector or the markets generally. Statements involving predictions, assessments, analyses or outlook for individual securities, industries, market sectors and/or markets involve risks and uncertainties. In addition to the general risks described for the Funds in their current Prospectuses, other factors bearing on these commentaries include the accuracy of the investment adviser’s or portfolio manager’s forecasts and predictions and the appropriateness of the investment programs designed by the investment adviser or portfolio managers to implement their strategies efficiently and effectively. Any one, or more, of these factors, as well as other risks affecting the securities markets and investment instruments generally, could cause the actual results of a Fund to differ materially as compared to benchmarks associated with that Fund. The line graphs and tables do not reflect the deduction of taxes that a shareholder would pay on Fund distributions or the redemption of Fund shares. The gross and net expense ratios are based on expenses incurred by a Fund as disclosed in the Funds’ Prospectus dated December 29, 2016. Each Fund’s performance assumes the reinvestment of all dividends and distributions. Performance returns for all benchmark comparisons assume dividends and distributions were reinvested for the entire period. All indices are unmanaged and are not available for direct investment.
| | | | |
| Fund/Benchmark Comparison per Fund | | Explanation |
| Low Volatility Equity Fund | | Russell 1000® Index | | The Russell 1000® Index consists of approximately 1,000 of the largest companies in the U.S. equity markets.(4) |
| | Lipper Multi-Cap Core Funds Index | | Lipper indices are comprised of a certain number of eligible mutual funds designated by Lipper, Inc. as falling into the respective categories indicated.(5) |
| Dividend Income Fund | | Russell 1000® Value Index | | The Russell 1000® Value Index measures the performance of those Russell 1000 companies with lower price-to-book ratios and lower forecasted growth values.(4) |
| | Standard & Poor’s 500® Index | | The S&P 500® is an unmanaged index of large-cap common stocks. |
| | Lipper Equity Income Funds Index | | Lipper indices are comprised of a certain number of eligible mutual funds designated by Lipper, Inc. as falling into the respective categories indicated.(5) |
| Large-Cap Value Fund | | Russell 1000® Value Index | | The Russell 1000® Value Index measures the performance of those Russell 1000 companies with lower price-to-book ratios and lower forecasted growth values.(4) |
| | Lipper Multi-Cap Value Funds Index | | Lipper indices are comprised of a certain number of eligible mutual funds designated by Lipper, Inc. as falling into the respective categories indicated.(5) |
| Large-Cap Growth Fund | | Russell 1000® Growth Index | | The Russell 1000® Growth Index measures the performance of those Russell 1000 companies with higher price-to-book ratios and higher forecasted growth values.(4) |
| | Lipper Multi-Cap Growth Funds Index | | Lipper indices are comprised of a certain number of eligible mutual funds designated by Lipper, Inc. as falling into the respective categories indicated.(5) |
| Mid-Cap Value Fund | | Russell Midcap® Value Index | | This index measures the performance of those Russell Midcap companies with lower price-to-book ratios and lower forecasted growth values. The stocks are also members of the Russell 1000® Value Index.(4) |
| | Lipper Mid-Cap Value Funds Index | | Lipper indices are comprised of a certain number of eligible mutual funds designated by Lipper, Inc. as falling into the respective categories indicated.(5) |
| Mid-Cap Growth Fund | | Russell Midcap® Growth Index | | This index measures the performance of those Russell Midcap companies with higher price-to-book ratios and higher forecasted growth values. The stocks are also members of the Russell 1000® Growth Index.(4) |
| | Lipper Mid-Cap Growth Funds Index | | Lipper indices are comprised of a certain number of eligible mutual funds designated by Lipper, Inc. as falling into the respective categories indicated.(5) |
| Small-Cap Value Fund(1) | | Russell 2000® Value Index | | The Russell 2000® Value Index measures the performance of those Russell 2000 companies with lower price-to-book ratios and lower forecasted growth values.(4) |
| | Lipper Small-Cap Core Funds Index | | Lipper indices are comprised of a certain number of eligible mutual funds designated by Lipper, Inc. as falling into the respective categories indicated.(5) |
| Small-Cap Core Fund(1) | | Russell 2000® Index | | The Russell 2000® Index measures the performance of the small-cap segment of the U.S. equity universe. The Russell 2000® Index is a subset of the Russell 3000® Index representing approximately 10% of the total market capitalization of that index. It includes approximately 2000 of the smallest securities based on a combination of their market cap and current index membership.(4) |
| | Lipper Small-Cap Core Funds Index | | Lipper indices are comprised of a certain number of eligible mutual funds designated by Lipper, Inc. as falling into the respective categories indicated.(5) |
30
| | |
| Explanation of the Indices and Notes in the Commentary (continued) |
| | | | |
| Fund/Benchmark Comparison per Fund | | Explanation |
| Small-Cap Growth Fund(1) | | Russell 2000® Growth Index | | The Russell 2000® Growth Index measures the performance of those Russell 2000 companies with higher price-to-book ratios and higher forecasted growth values.(4) |
| | Lipper Small-Cap Growth Funds Index | | Lipper indices are comprised of a certain number of eligible mutual funds designated by Lipper, Inc. as falling into the respective categories indicated.(5) |
| Global Low Volatility Equity Fund(3) | | Morgan Stanley Capital International All Country World Index | | The MSCI All Country World Index is a free float-adjusted market capitalization weighted index that is designed to measure the equity market performance of developed and emerging markets.(4) |
| | Lipper Global Multi-Cap Value Funds Index | | Lipper indices are comprised of a certain number of eligible mutual funds designated by Lipper, Inc. as falling into the respective categories indicated.(5) |
| Disciplined International Equity Fund(3) | | Morgan Stanley Capital International Europe, Australasia, Far East Index | | The MSCI Europe, Australasia and Far East Index is a standard unmanaged foreign securities index representing major non-U.S. stock markets, as monitored by Morgan Stanley Capital International.(4) |
| | Lipper International Multi-Cap Core Funds Index | | Lipper indices are comprised of a certain number of eligible mutual funds designated by Lipper, Inc. as falling into the respective categories indicated.(5) |
| Pyrford International Stock Fund(3) | | Morgan Stanley Capital International Europe, Australasia, Far East Index | | The MSCI Europe, Australasia and Far East Index is a standard unmanaged foreign securities index representing major non-U.S. stock markets, as monitored by Morgan Stanley Capital International.(4) |
| | Lipper International Multi-Cap Core Funds Index | | Lipper indices are comprised of a certain number of eligible mutual funds designated by Lipper, Inc. as falling into the respective categories indicated.(5) |
| LGM Emerging Markets Equity Fund(3) | | Morgan Stanley Capital International Emerging Markets Index | | The MSCI Emerging Markets Index is a market capitalization weighted index comprised of over 800 companies representative of the market structure of the emerging countries in Europe, Latin America, Africa, Middle East and Asia, as monitored by Morgan Stanley Capital International.(4) |
| | Lipper Emerging Markets Funds Index | | Lipper indices are comprised of a certain number of eligible mutual funds designated by Lipper, Inc. as falling into the respective categories indicated.(5) |
| TCH Emerging Markets Bond Fund(3)(6) | | JP Morgan Emerging Markets Bond Global Diversified Index | | The JP Morgan Emerging Markets Bond Global Diversified Index tracks total returns for traded external debt instruments (external meaning foreign currency denominated fixed income) in the emerging markets and limits the weights of those index countries with larger debt stocks by only including a specified portion of these countries eligible current face amounts of debt outstanding.(4) |
| | Lipper Emerging Markets Hard Currency Debt Funds Index | | Lipper indices are comprised of a certain number of eligible mutual funds designated by Lipper, Inc. as falling into the respective categories indicated.(5) |
| Alternative Strategies Fund(3) | | Bank of America Merrill Lynch 3-Month T-Bill Index | | Bank of America Merrill Lynch 3-Month T-Bill Index comprises a single issue purchased at the beginning of the month and held for a full month. At the end of the month that issue is sold and rolled into a newly selected issue. The issue selected at each month-end rebalancing is the outstanding Treasury Bill that matures closest to, but not beyond, three months from the rebalancing date. To qualify for selection, an issue must have settled on or before the month-end rebalancing date. While the index will often hold the Treasury Bill issued at the most recent 3-month auction, it is also possible for a seasoned 6-month Bill to be selected.(4) |
| | HFRX Global Hedge Fund Index | | HFRX Global Hedge Fund Index is designed to be representative of the overall composition of the hedge fund universe. It comprises all eligible hedge fund strategies, including but not limited to convertible arbitrage, distressed securities, equity hedge, equity market neutral, event-driven, macro, merger arbitrage, and relative value arbitrage. The strategies are asset weighted based on the distribution of assets in the hedge fund industry. |
| | Lipper Alternative Multi-Strategy Funds Index | | Lipper indices are comprised of a certain number of eligible mutual funds designated by Lipper, Inc. as falling into the respective categories indicated.(5) |
| Global Long/Short Equity Fund(3) | | Morgan Stanley Capital International All Country World Index | | The MSCI All Country World Index is a free float-adjusted market capitalization weighted index that is designed to measure the equity market performance of developed and emerging markets.(4) |
| | Lipper Alternative Long/Short Equity Funds Index | | Lipper indices are comprised of a certain number of eligible mutual funds designated by Lipper, Inc. as falling into the respective categories indicated.(5) |
| Ultra Short Tax-Free Fund(2)(6) | | Blended Index (50% Bloomberg Barclays 1 Year Municipal Bond Index and 50% iMoneyNet, Inc. Money Market Fund Tax-Free National Retail Index) | | The blended index consists of 50% Bloomberg Barclays 1 Year Municipal Bond Index and 50% iMoneyNet Money Market Fund Tax-Free National Retail Index. The Bloomberg Barclays 1 Year Municipal Bond Index is the 1 year component of the Bloomberg Barclays Capital Municipal Bond Index, which is an unmanaged index composed of long-term tax-exempt bonds with a minimum credit rating of Baa. The iMoneyNet Money Market Fund Tax-Free National Retail Index is an average of money funds with investment objectives similar to that of the Fund.(4) |
| | Lipper Short Municipal Debt Funds Index | | Lipper indices are comprised of a certain number of eligible mutual funds designated by Lipper, Inc. as falling into the respective categories indicated.(5) |
31
| | |
| Explanation of the Indices and Notes in the Commentary (continued) |
| | | | |
| Fund/Benchmark Comparison per Fund | | Explanation |
| Short Tax-Free Fund(2)(6) | | Bloomberg Barclays Short (1-5 Year) Municipal Index | | The Bloomberg Barclays Short (1-5 Year) Municipal Index includes invetment-grade tax-exempt bonds that are issued by state and local governments and have maturities of 1 to 5 years.(4) |
| | Lipper Short Municipal Debt Funds Index | | Lipper indices are comprised of a certain number of eligible mutual funds designated by Lipper, Inc. as falling into the respective categories indicated.(5) |
| Short-Term Income Fund(6) | | Bank of America Merrill Lynch 1-3 Year U.S. Government/Corporate Index | | This is an index tracking short-term U.S. government and corporate securities with maturities between 1 and 2.99 years. The index is produced by Merrill Lynch, Pierce, Fenner & Smith.(4) |
| | Lipper Short Investment-Grade Debt Funds Index | | Lipper indices are comprised of a certain number of eligible mutual funds designated by Lipper, Inc. as falling into the respective categories indicated.(5) |
| Intermediate Tax-Free Fund(2)(6) | | Bloomberg Barclays 1-15 Year Blend Municipal Bond Index | | This index is the 1-15 year Blend component of the Bloomberg Barclays Municipal Bond Index, which is an unmanaged index composed of long-term tax-exempt bonds with a minimum credit rating of Baa and a range of maturities between 1-17 years. To qualify for inclusion, a bond or security must have outstanding par value of at least $7 million, issued as part of a transaction of at least $75 million, fixed rate, dated-date after December 31, 1990 and must have at least one year from final maturity.(4) |
| | Lipper Intermediate Municipal Debt Funds Index | | Lipper indices are comprised of a certain number of eligible mutual funds designated by Lipper, Inc. as falling into the respective categories indicated.(5) |
| Strategic Income Fund(6) | | Bloomberg Barclays U.S. Aggregate Bond Index | | Bloomberg Barclays U.S. Aggregate Bond Index is an unmanaged index that covers the U.S. investment-grade fixed-rate bond market, including government and credit securities, agency mortgage pass-through securities, asset-backed securities and commercial mortgage-based securities.(4) |
| | Bloomberg Barclays U.S. Mortgage Backed Securities Index | | This index is an unmanaged index that includes 15 and 30 year fixed-rate securities backed by mortgage pools of the Government National Mortgage Association (GNMA), Federal Home Loan Mortgage Corp. (FHLMC) and the Federal National Mortgage Corporation (FNMC).(4) |
| | Lipper Multi-Sector Income Funds Index | | Lipper indices are comprised of a certain number of eligible mutual funds designated by Lipper, Inc. as falling into the respective categories indicated.(5) |
| TCH Corporate Income Fund(6) | | Bloomberg Barclays U.S. Credit Index | | Bloomberg Barclays U.S. Credit Index represents securities that are SEC registered, taxable and U.S. dollar denominated. The index covers U.S. corporate and specified foreign debentures and secured notes that meet the specified maturity, liquidity and quality requirements.(4) |
| | Lipper Corporate Debt Funds BBB-Rated Index | | Lipper indices are comprised of a certain number of eligible mutual funds designated by Lipper, Inc. as falling into the respective categories indicated.(5) |
| TCH Core Plus Bond Fund(6) | | Bloomberg Barclays U.S Aggregate Bond Index | | Bloomberg Barclays U.S. Aggregate Bond Index is an unmanaged index that covers the U.S. investment-grade fixed-rate bond market, including government and credit securities, agency mortgage pass-through securities, asset-backed securities and commercial mortgage-based securities. To qualify for inclusion, a bond or security must have at least one year to final maturity, rated investment grade Baa3 or better, dollar denominated, non-convertible, fixed rate and be publicly issued.(4) |
| | Lipper Core Plus Bond Funds Index | | Lipper indices are comprised of a certain number of eligible mutual funds designated by Lipper, Inc. as falling into the respective categories indicated.(5) |
| High Yield Bond Fund(3)(6) | | Bank of America Merrill Lynch U.S. High Yield Master II Constrained Index | | This is an Index that tracks the performance of U.S. dollar denominated below investment grade rated corporate debt publically issued in the U.S. domestic market.(4) |
| | Bank of America Merrill Lynch U.S. High Yield, BB-B Rated, Constrained Index | | This is a benchmark index for high yield corporate bonds which excludes lower-rated securities and caps exposure to any one issuer at 2% and is administrated by Merrill Lynch.(4) |
| | Lipper High Yield Bond Funds Index | | Lipper indices are comprised of a certain number of eligible mutual funds designated by Lipper, Inc. as falling into the respective categories indicated.(5) |
| Government Money Market Fund | | iMoneyNet, Inc. Government Money Market Index | | This index is an average of money funds with investment objectives similar to that of the Fund. |
| | Lipper U.S. Government Money Market Funds Index | | Lipper indices are comprised of a certain number of eligible mutual funds designated by Lipper, Inc. as falling into the respective categories indicated.(5) |
32
| | |
| Explanation of the Indices and Notes in the Commentary (continued) |
| | | | |
| Fund/Benchmark Comparison per Fund | | Explanation |
| Tax-Free Money Market Fund | | iMoneyNet, Inc. Fund Report/Tax-Free National Retail Index | | This index is an average of money funds with investment objectives similar to that of the Fund. |
| | Lipper Tax-Exempt Money Market Funds Index | | Lipper indices are comprised of a certain number of eligible mutual funds designated by Lipper, Inc. as falling into the respective categories indicated.(5) |
| Prime Money Market Fund | | iMoneyNet, Inc. Money Fund Report Averages | | This index is an average of money funds with investment objectives similar to that of the Fund. |
| | Lipper Money Market Instrument Funds Index | | Lipper indices are comprised of a certain number of eligible mutual funds designated by Lipper, Inc. as falling into the respective categories indicated.(5) |
| Institutional Prime Money Market Fund | | iMoneyNet, Inc. Money Fund Report Averages | | This index is an average of money funds with investment objectives similar to that of the Fund. |
| | Lipper Institutional Money Market Funds Index | | Lipper indices are comprised of a certain number of eligible mutual funds designated by Lipper, Inc. as falling into the respective categories indicated.(5) |
| (1) | Small-Cap stocks are less liquid and more volatile than large-cap stocks. |
| (2) | Income generated by the Fund may be subject to the federal alternative minimum tax. |
| (3) | International investing involves special risks including currency risk, political risk, increased volatility of foreign securities, and differences in auditing and other financial standards. |
| (4) | Performance returns do not reflect the deduction of sales charges, expenses, or other fees that the Securities and Exchange Commission requires to be reflected in a mutual fund’s performance. |
| (5) | Performance returns do not reflect the deduction of sales charges of component funds, or taxes, but do reflect the deduction of fund expenses. |
| (6) | Investors should be aware that in an environment of rising interest rates, they may expect to see declining bond prices. |
33
| | |
| Expense Example (Unaudited) |
For the Six Months Ended August 31, 2017
As a shareholder of the Fund, you may incur two types of costs: (1) transaction costs, which may include sales charges (loads) on purchase payments, reinvested dividends, or other distributions; redemption fees; and exchange fees; and (2) ongoing costs, including management fees; distribution and/or service (12b-1) fees; and other Fund expenses. This Example is intended to help you understand your ongoing costs (in dollars) of investing in the Funds and to compare these costs with the ongoing costs of investing in other mutual funds.
The Example is based on an investment of $1,000 invested at the beginning of the period and held for the entire six month period ended August 31, 2017 (3/1/17-8/31/17).
Actual Expenses
The first line of the table below provides information about actual account values and actual expenses. You may use the information in this line, together with the amount you invested, to estimate the expenses that you paid over the period. Simply divide your account value by $1,000 (for example, an $8,600 account value divided by $1,000 = 8.6), then multiply the result by the number in the first line under the heading entitled “Expenses Paid During Period” to estimate the expenses you paid on your account during this period.
Hypothetical Example for Comparison Purposes
The second line of the table below provides information about hypothetical account values and hypothetical expenses based on a Fund’s actual expense ratio and an assumed rate of return of 5% per year before expenses, which is not the Fund’s actual return. The hypothetical account values and expenses may not be used to estimate the actual ending account balance or expenses you paid for the period. You may use this information to compare the ongoing costs of investing in a Fund and other funds. To do so, compare this 5% hypothetical example with the 5% hypothetical examples that appear in the shareholder reports of the other funds.
Please note that the expenses shown in the table are meant to highlight your ongoing costs only and do not reflect any transaction costs, such as sales charges (loads), redemption fees, or exchange fees. Therefore, the second line of the table is useful in comparing ongoing costs only, and will not help you determine the relative total costs of owning different funds. In addition, if these transaction costs were included, your costs would have been higher.
| | | | | | | | | | | | | | | | | | | | | | | | | | | | | | | | | | | | | | | | | | | | | | | | |
| | | Investor | | | Advisor | | | Institutional | |
Fund | | Beginning
account
value
3/1/17 | | | Ending
account
value
8/31/17 | | | Annualized
Expense
Ratio(1) | | | Expenses
paid during
period
3/1/17-
8/31/17(1) | | | Beginning
account
value
3/1/17 | | | Ending
account
value
8/31/17 | | | Annualized
Expense
Ratio(1) | | | Expenses
paid during
period
3/1/17-
8/31/17(1) | | | Beginning
account
value
3/1/17 | | | Ending
account
value
8/31/17 | | | Annualized
Expense
Ratio(1) | | | Expenses
paid during
period
3/1/17-
8/31/17(1) | |
Low Volatility Equity Fund | | | | | | | | | | | | | | | | | | | | | | | | | | | | | | | | | | | | | | | | | | | | | | | | |
| Actual | | | | | | | | | | | | | | | | | | $ | 1,000.00 | | | $ | 1,015.20 | | | | 0.90 | % | | $ | 4.57 | | | $ | 1,000.00 | | | $ | 1,017.10 | | | | 0.65 | % | | $ | 3.31 | |
| Hypothetical (5% return before expenses) | | | | | | | | | | | | | | | | | | | 1,000.00 | | | | 1,020.46 | | | | 0.90 | | | | 4.58 | | | | 1,000.00 | | | | 1,021.72 | | | | 0.65 | | | | 3.31 | |
Dividend Income Fund | | | | | | | | | | | | | | | | | | | | | | | | | | | | | | | | | | | | | | | | | | | | | | | | |
| Actual | | | | | | | | | | | | | | | | | | | 1,000.00 | | | | 1,035.60 | | | | 0.90 | | | | 4.62 | | | | 1,000.00 | | | | 1,037.00 | | | | 0.65 | | | | 3.34 | |
| Hypothetical (5% return before expenses) | | | | | | | | | | | | | | | | | | | 1,000.00 | | | | 1,020.46 | | | | 0.90 | | | | 4.58 | | | | 1,000.00 | | | | 1,021.72 | | | | 0.65 | | | | 3.31 | |
Large-Cap Value Fund | | | | | | | | | | | | | | | | | | | | | | | | | | | | | | | | | | | | | | | | | | | | | | | | |
| Actual | | | | | | | | | | | | | | | | | | | 1,000.00 | | | | 1,014.40 | | | | 1.00 | | | | 5.08 | | | | 1,000.00 | | | | 1,016.40 | | | | 0.75 | | | | 3.81 | |
| Hypothetical (5% return before expenses) | | | | | | | | | | | | | | | | | | | 1,000.00 | | | | 1,019.96 | | | | 1.00 | | | | 5.09 | | | | 1,000.00 | | | | 1,021.22 | | | | 0.75 | | | | 3.82 | |
Large-Cap Growth Fund | | | | | | | | | | | | | | | | | | | | | | | | | | | | | | | | | | | | | | | | | | | | | | | | |
| Actual | | $ | 1,000.00 | | | $ | 1,093.90 | | | | 1.00 | % | | $ | 5.27 | | | | 1,000.00 | | | | 1,093.90 | | | | 1.00 | | | | 5.25 | | | | 1,000.00 | | | | 1,095.20 | | | | 0.75 | | | | 3.95 | |
| Hypothetical (5% return before expenses) | | | 1,000.00 | | | | 1,019.96 | | | | 1.00 | | | | 5.09 | | | | 1,000.00 | | | | 1,019.96 | | | | 1.00 | | | | 5.09 | | | | 1,000.00 | | | | 1,021.22 | | | | 0.75 | | | | 3.82 | |
34
| | |
| Expense Example (Unaudited) (continued) |
| | | | | | | | | | | | | | | | | | | | | | | | | | | | | | | | | | | | | | | | | | | | | | | | |
| | | Investor | | | Advisor | | | Institutional | |
Fund | | Beginning
account
value
3/1/17 | | | Ending
account
value
8/31/17 | | | Annualized
Expense
Ratio(1) | | | Expenses
paid during
period
3/1/17-
8/31/17(1) | | | Beginning
account
value
3/1/17 | | | Ending
account
value
8/31/17 | | | Annualized
Expense
Ratio(1) | | | Expenses
paid during
period
3/1/17-
8/31/17(1) | | | Beginning
account
value
3/1/17 | | | Ending
account
value
8/31/17 | | | Annualized
Expense
Ratio(1) | | | Expenses
paid during
period
3/1/17-
8/31/17(1) | |
Mid-Cap Value Fund | | | | | | | | | | | | | | | | | | | | | | | | | | | | | | | | | | | | | | | | | | | | | | | | |
| Actual | | | | | | | | | | | | | | | | | | $ | 1,000.00 | | | $ | 1,003.40 | | | | 1.24 | % | | $ | 6.26 | | | $ | 1,000.00 | | | $ | 1,004.20 | | | | 0.99 | % | | $ | 5.00 | |
| Hypothetical (5% return before expenses) | | | | | | | | | | | | | | | | | | | 1,000.00 | | | | 1,018.75 | | | | 1.24 | | | | 6.31 | | | | 1,000.00 | | | | 1,020.01 | | | | 0.99 | | | | 5.04 | |
Mid-Cap Growth Fund | | | | | | | | | | | | | | | | | | | | | | | | | | | | | | | | | | | | | | | | | | | | | | | | |
| Actual | | | | | | | | | | | | | | | | | | | 1,000.00 | | | | 1,064.80 | | | | 1.24 | | | | 6.48 | | | | 1,000.00 | | | | 1,066.50 | | | | 0.99 | | | | 5.15 | |
| Hypothetical (5% return before expenses) | | | | | | | | | | | | | | | | | | | 1,000.00 | | | | 1,018.75 | | | | 1.24 | | | | 6.31 | | | | 1,000.00 | | | | 1,020.01 | | | | 0.99 | | | | 5.04 | |
Small-Cap Value Fund | | | | | | | | | | | | | | | | | | | | | | | | | | | | | | | | | | | | | | | | | | | | | | | | |
| Actual | | | | | | | | | | | | | | | | | | | 1,000.00 | | | | 973.60 | | | | 1.24 | | | | 6.18 | | | | 1,000.00 | | | | 974.00 | | | | 0.99 | | | | 4.92 | |
| Hypothetical (5% return before expenses) | | | | | | | | | | | | | | | | | | | 1,000.00 | | | | 1,018.75 | | | | 1.24 | | | | 6.31 | | | | 1,000.00 | | | | 1,020.01 | | | | 0.99 | | | | 5.04 | |
Small-Cap Core Fund | | | | | | | | | | | | | | | | | | | | | | | | | | | | | | | | | | | | | | | | | | | | | | | | |
| Actual | | | | | | | | | | | | | | | | | | | 1,000.00 | | | | 1,004.60 | | | | 1.15 | | | | 5.80 | | | | 1,000.00 | | | | 1,006.10 | | | | 0.90 | | | | 4.56 | |
| Hypothetical (5% return before expenses) | | | | | | | | | | | | | | | | | | | 1,000.00 | | | | 1,019.20 | | | | 1.15 | | | | 5.85 | | | | 1,000.00 | | | | 1,020.46 | | | | 0.90 | | | | 4.58 | |
Small-Cap Growth Fund | | | | | | | | | | | | | | | | | | | | | | | | | | | | | | | | | | | | | | | | | | | | | | | | |
| Actual | | | | | | | | | | | | | | | | | | | 1,000.00 | | | | 1,032.60 | | | | 1.24 | (2) | | | 3.19 | (2) | | | 1,000.00 | | | | 1,057.30 | | | | 0.99 | | | | 5.16 | |
| Hypothetical (5% return before expenses) | | | | | | | | | | | | | | | | | | | 1,000.00 | | | | 1,018.72 | | | | 1.24 | (3) | | | 6.33 | (3) | | | 1,000.00 | | | | 1,020.01 | | | | 0.99 | | | | 5.04 | |
Global Low Volatility Equity Fund | | | | | | | | | | | | | | | | | | | | | | | | | | | | | | | | | | | | | | | | | | | | | | | | |
| Actual | | | | | | | | | | | | | | | | | | | 1,000.00 | | | | 1,060.40 | | | | 1.10 | | | | 5.70 | | | | 1,000.00 | | | | 1,061.90 | | | | 0.85 | | | | 4.41 | |
| Hypothetical (5% return before expenses) | | | | | | | | | | | | | | | | | | | 1,000.00 | | | | 1,019.46 | | | | 1.10 | | | | 5.60 | | | | 1,000.00 | | | | 1,020.72 | | | | 0.85 | | | | 4.33 | |
Disciplined International Equity Fund | | | | | | | | | | | | | | | | | | | | | | | | | | | | | | | | | | | | | | | | | | | | | | | | |
| Actual | | | | | | | | | | | | | | | | | | | 1,000.00 | | | | 1,124.90 | | | | 1.15 | | | | 6.15 | | | | 1,000.00 | | | | 1,126.90 | | | | 0.90 | | | | 4.81 | |
| Hypothetical (5% return before expenses) | | | | | | | | | | | | | | | | | | | 1,000.00 | | | | 1,019.20 | | | | 1.15 | | | | 5.85 | | | | 1,000.00 | | | | 1,020.46 | | | | 0.90 | | | | 4.58 | |
Pyrford International Stock Fund | | | | | | | | | | | | | | | | | | | | | | | | | | | | | | | | | | | | | | | | | | | | | | | | |
| Actual | | $ | 1,000.00 | | | $ | 1,090.30 | | | | 1.19 | % | | $ | 6.24 | | | | 1,000.00 | | | | 1,090.30 | | | | 1.19 | | | | 6.30 | | | | 1,000.00 | | | | 1,091.70 | | | | 0.94 | | | | 4.94 | |
| Hypothetical (5% return before expenses) | | | 1,000.00 | | | | 1,019.00 | | | | 1.19 | | | | 6.06 | | | | 1,000.00 | | | | 1,019.00 | | | | 1.19 | | | | 6.06 | | | | 1,000.00 | | | | 1,020.26 | | | | 0.94 | | | | 4.79 | |
LGM Emerging Markets Equity Fund | | | | | | | | | | | | | | | | | | | | | | | | | | | | | | | | | | | | | | | | | | | | | | | | |
| Actual | | | | | | | | | | | | | | | | | | | 1,000.00 | | | | 1,187.90 | | | | 1.40 | | | | 7.75 | | | | 1,000.00 | | | | 1,190.00 | | | | 1.15 | | | | 6.32 | |
| Hypothetical (5% return before expenses) | | | | | | | | | | | | | | | | | | | 1,000.00 | | | | 1,017.94 | | | | 1.40 | | | | 7.12 | | | | 1,000.00 | | | | 1,019.20 | | | | 1.15 | | | | 5.85 | |
TCH Emerging Markets Bond Fund | | | | | | | | | | | | | | | | | | | | | | | | | | | | | | | | | | | | | | | | | | | | | | | | |
| Actual | | | | | | | | | | | | | | | | | | | 1,000.00 | | | | 1,045.10 | | | | 1.00 | | | | 5.13 | | | | 1,000.00 | | | | 1,046.50 | | | | 0.85 | | | | 4.41 | |
| Hypothetical (5% return before expenses) | | | | | | | | | | | | | | | | | | | 1,000.00 | | | | 1,019.96 | | | | 1.00 | | | | 5.09 | | | | 1,000.00 | | | | 1,020.72 | | | | 0.85 | | | | 4.33 | |
Alternative Strategies Fund | | | | | | | | | | | | | | | | | | | | | | | | | | | | | | | | | | | | | | | | | | | | | | | | |
| Actual | | | | | | | | | | | | | | | | | | | 1,000.00 | | | | 1,018.00 | | | | 2.97 | | | | 15.12 | | | | 1,000.00 | | | | 1,020.80 | | | | 2.72 | | | | 13.87 | |
| Hypothetical (5% return before expenses) | | | | | | | | | | | | | | | | | | | 1,000.00 | | | | 1,010.03 | | | | 2.97 | | | | 15.05 | | | | 1,000.00 | | | | 1,011.29 | | | | 2.72 | | | | 13.79 | |
Global Long/Short Equity Fund | | | | | | | | | | | | | | | | | | | | | | | | | | | | | | | | | | | | | | | | | | | | | | | | |
| Actual | | | | | | | | | | | | | | | | | | | 1,000.00 | | | | 1,034.70 | | | | 2.49 | | | | 12.76 | | | | 1,000.00 | | | | 1,036.40 | | | | 2.24 | | | | 11.49 | |
| Hypothetical (5% return before expenses) | | | | | | | | | | | | | | | | | | | 1,000.00 | | | | 1,012.45 | | | | 2.49 | | | | 12.63 | | | | 1,000.00 | | | | 1,013.71 | | | | 2.24 | | | | 11.37 | |
Ultra Short Tax-Free Fund | | | | | | | | | | | | | | | | | | | | | | | | | | | | | | | | | | | | | | | | | | | | | | | | |
| Actual | | | | | | | | | | | | | | | | | | | 1,000.00 | | | | 1,004.70 | | | | 0.55 | | | | 2.78 | | | | 1,000.00 | | | | 1,006.00 | | | | 0.30 | | | | 1.52 | |
| Hypothetical (5% return before expenses) | | | | | | | | | | | | | | | | | | | 1,000.00 | | | | 1,022.23 | | | | 0.55 | | | | 2.80 | | | | 1,000.00 | | | | 1,023.49 | | | | 0.30 | | | | 1.53 | |
Short Tax-Free Fund | | | | | | | | | | | | | | | | | | | | | | | | | | | | | | | | | | | | | | | | | | | | | | | | |
| Actual | | | | | | | | | | | | | | | | | | | 1,000.00 | | | | 1,014.30 | | | | 0.55 | | | | 2.80 | | | | 1,000.00 | | | | 1,014.10 | | | | 0.40 | | | | 2.03 | |
| Hypothetical (5% return before expenses) | | | | | | | | | | | | | | | | | | | 1,000.00 | | | | 1,022.23 | | | | 0.55 | | | | 2.80 | | | | 1,000.00 | | | | 1,022.98 | | | | 0.40 | | | | 2.04 | |
Short-Term Income Fund | | | | | | | | | | | | | | | | | | | | | | | | | | | | | | | | | | | | | | | | | | | | | | | | |
| Actual | | | | | | | | | | | | | | | | | | | 1,000.00 | | | | 1,011.40 | | | | 0.60 | | | | 3.05 | | | | 1,000.00 | | | | 1,011.60 | | | | 0.35 | | | | 1.78 | |
| Hypothetical (5% return before expenses) | | | | | | | | | | | | | | | | | | | 1,000.00 | | | | 1,021.98 | | | | 0.60 | | | | 3.06 | | | | 1,000.00 | | | | 1,023.24 | | | | 0.35 | | | | 1.78 | |
Intermediate Tax-Free Fund | | | | | | | | | | | | | | | | | | | | | | | | | | | | | | | | | | | | | | | | | | | | | | | | |
| Actual | | | 1,000.00 | | | | 1,033.20 | | | | 0.55 | | | | 2.82 | | | | 1,000.00 | | | | 1,033.20 | | | | 0.55 | | | | 2.83 | | | | 1,000.00 | | | | 1,034.40 | | | | 0.32 | | | | 1.64 | |
| Hypothetical (5% return before expenses) | | | 1,000.00 | | | | 1,022.23 | | | | 0.55 | | | | 2.80 | | | | 1,000.00 | | | | 1,022.23 | | | | 0.55 | | | | 2.80 | | | | 1,000.00 | | | | 1,023.39 | | | | 0.32 | | | | 1.63 | |
35
| | |
| Expense Example (Unaudited) (continued) |
| | | | | | | | | | | | | | | | | | | | | | | | | | | | | | | | | | | | | | | | | | | | | | | | |
| | | Investor | | | Advisor | | | Institutional | |
Fund | | Beginning
account
value
3/1/17 | | | Ending
account
value
8/31/17 | | | Annualized
Expense
Ratio(1) | | | Expenses
paid during
period
3/1/17-
8/31/17(1) | | | Beginning
account
value
3/1/17 | | | Ending
account
value
8/31/17 | | | Annualized
Expense
Ratio(1) | | | Expenses
paid during
period
3/1/17-
8/31/17(1) | | | Beginning
account
value
3/1/17 | | | Ending
account
value
8/31/17 | | | Annualized
Expense
Ratio(1) | | | Expenses
paid during
period
3/1/17-
8/31/17(1) | |
Strategic Income Fund | | | | | | | | | | | | | | | | | | | | | | | | | | | | | | | | | | | | | | | | | | | | | | | | |
| Actual | | $ | 1,000.00 | | | $ | 1,049.10 | | | | 0.80 | % | | $ | 4.13 | | | $ | 1,000.00 | | | $ | 1,049.10 | | | | 0.80 | % | | $ | 4.13 | | | $ | 1,000.00 | | | $ | 1,050.50 | | | | 0.55 | % | | $ | 2.84 | |
| Hypothetical (5% return before expenses) | | | 1,000.00 | | | | 1,020.97 | | | | 0.80 | | | | 4.08 | | | | 1,000.00 | | | | 1,020.97 | | | | 0.80 | | | | 4.08 | | | | 1,000.00 | | | | 1,022.23 | | | | 0.55 | | | | 2.80 | |
TCH Corporate Income Fund | | | | | | | | | | | | | | | | | | | | | | | | | | | | | | | | | | | | | | | | | | | | | | | | |
| Actual | | | 1,000.00 | | | | 1,032.10 | | | | 0.59 | | | | 3.01 | | | | 1,000.00 | | | | 1,032.10 | | | | 0.59 | | | | 3.01 | | | | 1,000.00 | | | | 1,033.50 | | | | 0.46 | | | | 2.36 | |
| Hypothetical (5% return before expenses) | | | 1,000.00 | | | | 1,022.03 | | | | 0.59 | | | | 3.01 | | | | 1,000.00 | | | | 1,022.03 | | | | 0.59 | | | | 3.01 | | | | 1,000.00 | | | | 1,022.68 | | | | 0.46 | | | | 2.35 | |
TCH Core Plus Bond Fund | | | | | | | | | | | | | | | | | | | | | | | | | | | | | | | | | | | | | | | | | | | | | | | | |
| Actual | | | 1,000.00 | | | | 1,027.80 | | | | 0.59 | | | | 2.99 | | | | 1,000.00 | | | | 1,027.80 | | | | 0.59 | | | | 2.99 | | | | 1,000.00 | | | | 1,028.20 | | | | 0.34 | | | | 1.72 | |
| Hypothetical (5% return before expenses) | | | 1,000.00 | | | | 1,022.03 | | | | 0.59 | | | | 3.01 | | | | 1,000.00 | | | | 1,022.03 | | | | 0.59 | | | | 3.01 | | | | 1,000.00 | | | | 1,023.29 | | | | 0.34 | | | | 1.73 | |
High Yield Bond Fund | | | | | | | | | | | | | | | | | | | | | | | | | | | | | | | | | | | | | | | | | | | | | | | | |
| Actual | | | | | | | | | | | | | | | | | | | 1,000.00 | | | | 1,025.20 | | | | 0.90 | | | | 4.60 | | | | 1,000.00 | | | | 1,025.40 | | | | 0.65 | | | | 3.29 | |
| Hypothetical (5% return before expenses) | | | | | | | | | | | | | | | | | | | 1,000.00 | | | | 1,020.46 | | | | 0.90 | | | | 4.58 | | | | 1,000.00 | | | | 1,021.72 | | | | 0.65 | | | | 3.31 | |
| | | | | | | | | |
| | | | | | | | | | | | | | | | | | | | | | | | | | | Premier | |
Government Money Market Fund | | | | | | | | | | | | | | | | | | | | | | | | | | | | | | | | | | | | | | | | | | | | | | | | |
| Actual | | | 1,000.00 | | | | 1,002.10 | | | | 0.45 | | | | 2.27 | | | | | | | | | | | | | | | | | | | | 1,000.00 | | | | 1,003.40 | | | | 0.20 | | | | 1.01 | |
| Hypothetical (5% return before expenses) | | | 1,000.00 | | | | 1,022.73 | | | | 0.45 | | | | 2.29 | | | | | | | | | | | | | | | | | | | | 1,000.00 | | | | 1,023.99 | | | | 0.20 | | | | 1.02 | |
Tax-Free Money Market Fund | | | | | | | | | | | | | | | | | | | | | | | | | | | | | | | | | | | | | | | | | | | | | | | | |
| Actual | | | 1,000.00 | | | | 1,002.00 | | | | 0.45 | | | | 2.27 | | | | | | | | | | | | | | | | | | | | 1,000.00 | | | | 1,003.30 | | | | 0.20 | | | | 1.01 | |
| Hypothetical (5% return before expenses) | | | 1,000.00 | | | | 1,022.73 | | | | 0.45 | | | | 2.29 | | | | | | | | | | | | | | | | | | | | 1,000.00 | | | | 1,023.99 | | | | 0.20 | | | | 1.02 | |
Prime Money Market Fund | | | | | | | | | | | | | | | | | | | | | | | | | | | | | | | | | | | | | | | | | | | | | | | | |
| Actual | | | 1,000.00 | | | | 1,003.20 | | | | 0.45 | | | | 2.27 | | | | | | | | | | | | | | | | | | | | 1,000.00 | | | | 1,004.50 | | | | 0.20 | | | | 1.01 | |
| Hypothetical (5% return before expenses) | | | 1,000.00 | | | | 1,022.73 | | | | 0.45 | | | | 2.29 | | | | | | | | | | | | | | | | | | | | 1,000.00 | | | | 1,023.99 | | | | 0.20 | | | | 1.02 | |
Institutional Prime Money Market Fund | | | | | | | | | | | | | | | | | | | | | | | | | | | | | | | | | | | | | | | | | | | | | | | | |
| Actual | | | 1,000.00 | | | | 1,003.30 | | | | 0.45 | | | | 2.27 | | | | | | | | | | | | | | | | | | | | 1,000.00 | | | | 1,004.60 | | | | 0.20 | | | | 1.01 | |
| Hypothetical (5% return before expenses) | | | 1,000.00 | | | | 1,022.73 | | | | 0.45 | | | | 2.29 | | | | | | | | | | | | | | | | | | | | 1,000.00 | | | | 1,023.99 | | | | 0.20 | | | | 1.02 | |
| | | | | | |
| | | Retirement Class R-3 | | | Retirement Class R-6 | | | | | | | | | | | | | |
Fund | | Beginning
account
value
3/1/17 | | | Ending
account
value
8/31/17 | | | Annualized
Expense
Ratio(1) | | | Expenses
paid during
period
3/1/17-
8/31/17(1) | | | Beginning
account
value
3/1/17 | | | Ending
account
value
8/31/17 | | | Annualized
Expense
Ratio(1) | | | Expenses
paid during
period
3/1/17-
8/31/17(1) | | | | | | | | | | | | | |
Large-Cap Value Fund | | | | | | | | | | | | | | | | | | | | | | | | | | | | | | | | | | | | | | | | | | | | | | | | |
| Actual | | | | | | | | | | | | | | | | | | $ | 1,000.00 | | | $ | 1,016.60 | | | | 0.60 | % | | $ | 3.05 | | | | | | | | | | | | | | | | | |
| Hypothetical (5% return before expenses) | | | | | | | | | | | | | | | | | | | 1,000.00 | | | | 1,021.98 | | | | 0.60 | | | | 3.06 | | | | | | | | | | | | | | | | | |
Large-Cap Growth Fund | | | | | | | | | | | | | | | | | | | | | | | | | | | | | | | | | | | | | | | | | | | | | | | | |
| Actual | | | | | | | | | | | | | | | | | | | 1,000.00 | | | | 1,096.50 | | | | 0.60 | | | | 3.17 | | | | | | | | | | | | | | | | | |
| Hypothetical (5% return before expenses) | | | | | | | | | | | | | | | | | | | 1,000.00 | | | | 1,021.98 | | | | 0.60 | | | | 3.06 | | | | | | | | | | | | | | | | | |
Mid-Cap Value Fund | | | | | | | | | | | | | | | | | | | | | | | | | | | | | | | | | | | | | | | | | | | | | | | | |
| Actual | | $ | 1,000.00 | | | $ | 1,001.70 | | | | 1.49 | % | | $ | 7.54 | | | | 1,000.00 | | | | 1,005.10 | | | | 0.84 | | | | 4.25 | | | | | | | | | | | | | | | | | |
| Hypothetical (5% return before expenses) | | | 1,000.00 | | | | 1,017.49 | | | | 1.49 | | | | 7.58 | | | | 1,000.00 | | | | 1,020.77 | | | | 0.84 | | | | 4.28 | | | | | | | | | | | | | | | | | |
Mid-Cap Growth Fund | | | | | | | | | | | | | | | | | | | | | | | | | | | | | | | | | | | | | | | | | | | | | | | | |
| Actual | | | 1,000.00 | | | | 1,064.00 | | | | 1.49 | | | | 7.78 | | | | 1,000.00 | | | | 1,066.90 | | | | 0.84 | | | | 4.38 | | | | | | | | | | | | | | | | | |
| Hypothetical (5% return before expenses) | | | 1,000.00 | | | | 1,017.49 | | | | 1.49 | | | | 7.58 | | | | 1,000.00 | | | | 1,020.77 | | | | 0.84 | | | | 4.28 | | | | | | | | | | | | | | | | | |
Small-Cap Value Fund | | | | | | | | | | | | | | | | | | | | | | | | | | | | | | | | | | | | | | | | | | | | | | | | |
| Actual | | | 1,000.00 | | | | 971.40 | | | | 1.49 | | | | 7.40 | | | | 1,000.00 | | | | 974.80 | | | | 0.84 | | | | 4.18 | | | | | | | | | | | | | | | | | |
| Hypothetical (5% return before expenses) | | | 1,000.00 | | | | 1,017.49 | | | | 1.49 | | | | 7.58 | | | | 1,000.00 | | | | 1,020.77 | | | | 0.84 | | | | 4.28 | | | | | | | | | | | | | | | | | |
36
| | |
| Expense Example (Unaudited) (continued) |
| | | | | | | | | | | | | | | | | | | | | | | | | | | | | | | | | | | | | | | | | | | | | | | | |
| | | Retirement Class R-3 | | | Retirement Class R-6 | | | Class F-3 | |
Fund | | Beginning
account
value
3/1/17 | | | Ending
account
value
8/31/17 | | | Annualized
Expense
Ratio(1) | | | Expenses
paid during
period
3/1/17-
8/31/17(1) | | | Beginning
account
value
3/1/17 | | | Ending
account
value
8/31/17 | | | Annualized
Expense
Ratio(1) | | | Expenses
paid during
period
3/1/17-
8/31/17(1) | | | Beginning
account
value
3/1/17 | | | Ending
account
value
8/31/17 | | | Annualized
Expense
Ratio | | | Expenses
paid during
period
3/1/17-
8/31/17 | |
Pyrford International Stock Fund | | | | | | | | | | | | | | | | | | | | | | | | | | | | | | | | | | | | | | | | | | | | | | | | |
| Actual | | $ | 1,000.00 | | | $ | 1,089.30 | | | | 1.44 | % | | $ | 7.56 | | | $ | 1,000.00 | | | $ | 1,092.60 | | | | 0.79 | % | | $ | 4.15 | | | $ | 1,000.00 | | | $ | 1,000.80 | | | | 0.79 | (2)% | | $ | 2.00 | (2) |
| Hypothetical (5% return before expenses) | | | 1,000.00 | | | | 1,017.74 | | | | 1.44 | | | | 7.32 | | | | 1,000.00 | | | | 1,021.02 | | | | 0.79 | | | | 4.02 | | | | 1,000.00 | | | | 1,020.99 | | | | 0.79 | (3) | | | 4.02 | (3) |
| (1) | Expenses are equal to the Funds’ annualized expense ratios for the period March 1, 2017 through August 31, 2017, multiplied by the average account value over the period, multiplied by 184/365 (to reflect the one-half year period). These expenses and ratios are exclusive of acquired fund fees and expenses. |
| (2) | Expenses are equal to the Funds’ annualized expense ratios for the period May 31, 2017 (inception date) through August 31, 2017, multiplied by the average account value over the period, multiplied by 92/365 (to reflect the one-half year period). These expenses and ratios are exclusive of acquired fund fees and expenses. |
| (3) | Expenses are equal to the Funds’ annualized expense ratios for the period May 31, 2017 (inception date) through August 31, 2017, multiplied by the average account value over the period, multiplied by 184/365 (to reflect the one-half year period). These expenses and ratios are exclusive of acquired fund fees and expenses. |
37
August 31, 2017
Low Volatility Equity Fund
| | | | | | | | |
| Description | | Shares | | | Value | |
| Common Stocks — 98.0% | | | | | | |
|
| Consumer Discretionary — 8.4% | |
| | |
Apparel Retail — 0.2% | | | | | | | | |
Foot Locker, Inc. (1) | | | 8,836 | | | $ | 311,292 | |
|
Apparel, Accessories & Luxury Goods — 0.4% | |
Carter’s, Inc. (1) | | | 7,100 | | | | 615,641 | |
| | |
Automotive Retail — 0.3% | | | | | | | | |
AutoZone, Inc. (1)(2) | | | 802 | | | | 423,809 | |
| | |
Broadcasting — 0.4% | | | | | | | | |
AMC Networks, Inc., Class A (1)(2) | | | 11,636 | | | | 707,236 | |
| | |
Cable & Satellite — 2.0% | | | | | | | | |
Comcast Corp., Class A | | | 79,535 | | | | 3,229,916 | |
|
Computer & Electronics Retail — 0.3% | |
Best Buy Co., Inc. (1) | | | 7,875 | | | | 427,298 | |
| |
General Merchandise Stores — 0.4% | | | | | |
Target Corp. (1) | | | 11,534 | | | | 628,949 | |
|
Movies & Entertainment — 2.0% | |
Regal Entertainment Group, Class A (1) | | | 35,709 | | | | 527,422 | |
Walt Disney Co. | | | 26,555 | | | | 2,687,366 | |
| | | | | | | | |
| | | | | | | 3,214,788 | |
| | |
Publishing — 0.2% | | | | | | | | |
John Wiley & Sons, Inc., Class A (1) | | | 7,697 | | | | 415,253 | |
| | |
Restaurants — 2.2% | | | | | | | | |
Brinker International, Inc. (1) | | | 23,762 | | | | 741,849 | |
Darden Restaurants, Inc. (1) | | | 14,854 | | | | 1,219,365 | |
Dunkin’ Brands Group, Inc. (1) | | | 29,062 | | | | 1,498,437 | |
| | | | | | | | |
| | | | | | | 3,459,651 | |
| | | | | | | | |
Total Consumer Discretionary | | | | | | | 13,433,833 | |
|
| Consumer Staples — 17.9% | |
|
Agricultural Products — 1.2% | |
Bunge, Ltd. | | | 26,453 | | | | 1,974,187 | |
| | |
Drug Retail — 2.2% | | | | | | | | |
CVS Health Corp. | | | 38,537 | | | | 2,980,452 | |
Walgreens Boots Alliance, Inc. (1) | | | 6,425 | | | | 523,637 | |
| | | | | | | | |
| | | | | | | 3,504,089 | |
| | |
Food Distributors — 2.5% | | | | | | | | |
Sysco Corp. (1) | | | 30,311 | | | | 1,596,480 | |
U.S. Foods Holding Corp. (2) | | | 84,188 | | | | 2,310,961 | |
| | | | | | | | |
| | | | | | | 3,907,441 | |
| | |
Food Retail — 1.5% | | | | | | | | |
Kroger Co. (1) | | | 107,753 | | | | 2,356,558 | |
|
Household Products — 0.8% | |
Church & Dwight Co., Inc. (1) | | | 10,626 | | | | 533,106 | |
Spectrum Brands Holdings, Inc. (1) | | | 7,424 | | | | 816,343 | |
| | | | | | | | |
| | | | | | | 1,349,449 | |
|
Hypermarkets & Super Centers — 3.9% | |
Costco Wholesale Corp. (1) | | | 18,228 | | | | 2,857,057 | |
Wal-Mart Stores, Inc. (1) | | | 42,742 | | | | 3,336,868 | |
| | | | | | | | |
| | | | | | | 6,193,925 | |
|
Packaged Foods & Meats — 1.9% | |
ConAgra Brands, Inc. (1) | | | 42,582 | | | | 1,382,212 | |
Kellogg Co. (1) | | | 7,885 | | | | 516,152 | |
Pinnacle Foods, Inc. (1) | | | 19,112 | | | | 1,133,533 | |
| | | | | | | | |
| | | | | | | 3,031,897 | |
| | | | | | | | |
| Description | | Shares | | | Value | |
| Common Stocks (continued) | | | | | | |
| | |
| Consumer Staples (continued) | | | | | | |
| | |
Soft Drinks — 3.9% | | | | | | | | |
Dr. Pepper Snapple Group, Inc. (1) | | | 32,393 | | | $ | 2,949,383 | |
PepsiCo, Inc. (1) | | | 28,400 | | | | 3,286,732 | |
| | | | | | | | |
| | | | | | | 6,236,115 | |
| | | | | | | | |
Total Consumer Staples | | | | | | | 28,553,661 | |
| | |
| Energy — 2.3% | | | | | | |
| | |
Integrated Oil & Gas — 2.3% | | | | | | | | |
Chevron Corp. (1) | | | 28,610 | | | | 3,079,008 | |
Exxon Mobil Corp. (1) | | | 7,526 | | | | 574,460 | |
| | | | | | | | |
Total Energy | | | | | | | 3,653,468 | |
| | |
| Financials — 18.1% | | | | | | |
| | |
Consumer Finance — 1.6% | | | | | | | | |
American Express Co. (1) | | | 29,432 | | | | 2,534,095 | |
|
Financial Exchanges & Data — 0.8% | |
Morningstar, Inc. (1) | | | 15,179 | | | | 1,255,303 | |
|
Life & Health Insurance — 2.5% | |
Aflac, Inc. (1) | | | 42,631 | | | | 3,519,189 | |
Unum Group | | | 8,399 | | | | 404,664 | |
| | | | | | | | |
| | | | | | | 3,923,853 | |
|
Multi-Line Insurance — 0.7% | |
Hartford Financial Services Group, Inc. (1) | | | 19,714 | | | | 1,065,936 | |
|
Property & Casualty Insurance — 7.4% | |
Allstate Corp. | | | 40,214 | | | | 3,639,367 | |
Aspen Insurance Holdings, Ltd. | | | 39,893 | | | | 1,803,164 | |
Axis Capital Holdings, Ltd. | | | 52,235 | | | | 3,146,636 | |
Progressive Corp. | | | 22,201 | | | | 1,031,902 | |
Travelers Cos., Inc. | | | 18,642 | | | | 2,259,038 | |
| | | | | | | | |
| | | | | | | 11,880,107 | |
| | |
Regional Banks — 0.9% | | | | | | | | |
PNC Financial Services Group, Inc. (1) | | | 11,807 | | | | 1,480,716 | |
| | |
Reinsurance — 4.2% | | | | | | | | |
Everest Re Group, Ltd. (1) | | | 14,826 | | | | 3,743,269 | |
Validus Holdings, Ltd. (1) | | | 59,281 | | | | 2,972,942 | |
| | | | | | | | |
| | | | | | | 6,716,211 | |
| | | | | | | | |
Total Financials | | | | | | | 28,856,221 | |
| | |
| Healthcare — 18.7% | | | | | | |
| | |
Biotechnology — 0.6% | | | | | | | | |
AbbVie, Inc. (1) | | | 13,253 | | | | 997,951 | |
|
Healthcare Equipment — 5.3% | |
Baxter International, Inc. | | | 52,866 | | | | 3,279,807 | |
Becton, Dickinson and Co. (1) | | | 13,417 | | | | 2,675,887 | |
Hill-Rom Holdings, Inc. (1) | | | 7,813 | | | | 601,288 | |
Medtronic PLC | | | 12,611 | | | | 1,016,699 | |
Varian Medical Systems, Inc. (1)(2) | | | 7,700 | | | | 818,125 | |
| | | | | | | | |
| | | | | | | 8,391,806 | |
|
Healthcare Services — 2.1% | |
DaVita, Inc. (2) | | | 23,520 | | | | 1,377,331 | |
Express Scripts Holding Co. (1)(2) | | | 31,703 | | | | 1,991,583 | |
| | | | | | | | |
| | | | | | | 3,368,914 | |
| | |
Healthcare Supplies — 1.1% | | | | | | | | |
Cooper Cos., Inc. | | | 6,794 | | | | 1,704,139 | |
| |
Life Sciences Tools & Services — 0.4% | | | | | |
Bio-Rad Laboratories, Inc., Class A (1)(2) | | | 2,643 | | | | 575,698 | |
(See Notes which are an integral part of the Financial Statements)
38
Low Volatility Equity Fund (continued)
| | | | | | | | |
| Description | | Shares | | | Value | |
| Common Stocks (continued) | | | | | | |
| | |
| Healthcare (continued) | | | | | | |
|
Managed Healthcare — 1.3% | |
Anthem, Inc. (1) | | | 2,310 | | | $ | 452,852 | |
Cigna Corp. | | | 9,167 | | | | 1,668,944 | |
| | | | | | | | |
| | | | | | | 2,121,796 | |
| | |
Pharmaceuticals — 7.9% | | | | | | | | |
Bristol-Myers Squibb Co. (1) | | | 11,095 | | | | 671,026 | |
Eli Lilly & Co. (1) | | | 36,090 | | | | 2,933,756 | |
Johnson & Johnson (1) | | | 27,907 | | | | 3,694,049 | |
Merck & Co., Inc. | | | 35,208 | | | | 2,248,383 | |
Pfizer, Inc. | | | 92,526 | | | | 3,138,482 | |
| | | | | | | | |
| | | | | | | 12,685,696 | |
| | | | | | | | |
Total Healthcare | | | | | | | 29,846,000 | |
| | |
| Industrials — 7.1% | | | | | | |
|
Aerospace & Defense — 4.3% | |
Huntington Ingalls Industries, Inc. | | | 3,264 | | | | 698,365 | |
Lockheed Martin Corp. (1) | | | 10,520 | | | | 3,212,703 | |
Northrop Grumman Corp. (1) | | | 5,359 | | | | 1,458,773 | |
Raytheon Co. (1) | | | 2,693 | | | | 490,153 | |
Spirit AeroSystems Holdings, Inc., Class A (1) | | | 12,495 | | | | 930,878 | |
| | | | | | | | |
| | | | | | | 6,790,872 | |
|
Agricultural & Farm Machinery — 0.3% | |
Deere & Co. (1) | | | 4,544 | | | | 526,786 | |
|
Environmental & Facilities Services — 2.0% | |
Waste Management, Inc. (1) | | | 42,112 | | | | 3,247,256 | |
| | |
Trucking — 0.5% | | | | | | | | |
Landstar System, Inc. (1) | | | 7,709 | | | | 719,635 | |
| | | | | | | | |
Total Industrials | | | | | | | 11,284,549 | |
|
| Information Technology — 7.8% | |
|
Communications Equipment — 2.0% | |
Cisco Systems, Inc. | | | 79,751 | | | | 2,568,780 | |
Motorola Solutions, Inc. (1) | | | 6,336 | | | | 558,328 | |
| | | | | | | | |
| | | | | | | 3,127,108 | |
|
Consulting & Other Services — 1.6% | |
Amdocs, Ltd. | | | 39,312 | | | | 2,547,025 | |
|
Data Processing & Outsourced Services — 1.0% | |
Genpact, Ltd. (1) | | | 54,891 | | | | 1,561,649 | |
|
Electronic Components — 0.4% | |
Dolby Laboratories, Inc., Class A (1) | | | 13,640 | | | | 688,274 | |
| |
Internet Software & Services — 0.3% | | | | | |
eBay, Inc. (1)(2) | | | 13,025 | | | | 470,593 | |
|
Technology Hardware, Storage & Peripherals — 2.5% | |
Apple, Inc. | | | 24,427 | | | | 4,006,028 | |
| | | | | | | | |
Total Information Technology | | | | | | | 12,400,677 | |
| | |
| Real Estate — 3.2% | | | | | | |
| | |
Office REITs — 1.7% | | | | | | | | |
Piedmont Office Realty Trust, Inc., Class A (1) | | | 17,647 | | | | 357,352 | |
Equity Commonwealth (1)(2) | | | 77,486 | | | | 2,397,417 | |
| | | | | | | | |
| | | | | | | 2,754,769 | |
| | |
Residential REITs — 1.5% | | | | | | | | |
Essex Property Trust, Inc. (1) | | | 9,194 | | | | 2,445,328 | |
| | | | | | | | |
Total Real Estate | | | | | | | 5,200,097 | |
| | | | | | | | |
| Description | | Shares | | | Value | |
| Common Stocks (continued) | | | | | | |
|
| Telecommunication Services — 1.7% | |
|
Integrated Telecommunication Services — 1.7% | |
AT&T, Inc. (1) | | | 74,073 | | | $ | 2,774,775 | |
| | |
| Utilities — 12.8% | | | | | | |
| | |
Electric Utilities — 8.3% | | | | | | | | |
American Electric Power Co., Inc. (1) | | | 45,207 | | | | 3,328,591 | |
Edison International (1) | | | 38,800 | | | | 3,110,984 | |
Entergy Corp. | | | 21,403 | | | | 1,694,476 | |
Exelon Corp. | | | 31,922 | | | | 1,208,886 | |
Great Plains Energy, Inc. (1) | | | 52,804 | | | | 1,620,555 | |
Xcel Energy, Inc. (1) | | | 46,685 | | | | 2,310,907 | |
| | | | | | | | |
| | | | | | | 13,274,399 | |
| | |
Multi-Utilities — 4.5% | | | | | | | | |
Ameren Corp. (1) | | | 20,021 | | | | 1,201,060 | |
Consolidated Edison, Inc. (1) | | | 28,412 | | | | 2,394,279 | |
PG&E Corp. (1) | | | 49,552 | | | | 3,487,470 | |
| | | | | | | | |
| | | | | | | 7,082,809 | |
| | | | | | | | |
Total Utilities | | | | | | | 20,357,208 | |
| | | | | | | | |
Total Common Stocks
(identified cost $136,995,994) | | | | | | | 156,360,489 | |
| | | | | | | | |
| Short-Term Investments — 49.3% | |
|
| Collateral Pool Investments for Securities on Loan — 47.5% | |
| | |
Collateral pool allocation (3) | | | | | | | 75,732,318 | |
| | |
| Mutual Funds — 1.8% | | | | | | |
BMO Institutional Prime Money Market Fund — Premier Class, 1.080% (4) | | | 2,832,860 | | | | 2,833,143 | |
| | | | | | | | |
Total Short-Term Investments
(identified cost $78,565,461) | | | | 78,565,461 | |
| | | | | | | | |
Total Investments — 147.3%
(identified cost $215,561,455) | | | | 234,925,950 | |
| Other Assets and Liabilities — (47.3)% | | | | (75,464,782 | ) |
| | | | | | | | |
| Total Net Assets — 100.0% | | | | | | $ | 159,461,168 | |
| | | | | | | | |
Dividend Income Fund
| | | | | | | | |
| Description | | Shares | | | Value | |
| Common Stocks — 98.2% | |
|
| Consumer Discretionary — 8.3% | |
|
Automobile Manufacturers — 1.3% | |
Ford Motor Co. (1) | | | 136,632 | | | $ | 1,507,051 | |
| | |
Cable & Satellite — 0.6% | | | | | | | | |
Comcast Corp., Class A (1) | | | 15,889 | | | | 645,252 | |
| | |
Department Stores — 1.5% | | | | | | | | |
Kohl’s Corp. (1) | | | 24,864 | | | | 989,090 | |
Nordstrom, Inc. (1) | | | 17,055 | | | | 760,994 | |
| | | | | | | | |
| | | | | | | 1,750,084 | |
|
Hotels, Resorts & Cruise Lines — 2.8% | |
Carnival Corp. (1) | | | 16,315 | | | | 1,133,566 | |
Wyndham Worldwide Corp. (1) | | | 21,421 | | | | 2,135,245 | |
| | | | | | | | |
| | | | | | | 3,268,811 | |
| | |
Restaurants — 2.1% | | | | | | | | |
Darden Restaurants, Inc. (1) | | | 21,923 | | | | 1,799,659 | |
Yum! Brands, Inc. (1) | | | 7,724 | | | | 593,358 | |
| | | | | | | | |
| | | | | | | 2,393,017 | |
| | | | | | | | |
Total Consumer Discretionary | | | | 9,564,215 | |
(See Notes which are an integral part of the Financial Statements)
39
August 31, 2017
Dividend Income Fund (continued)
| | | | | | | | |
| Description | | Shares | | | Value | |
| Common Stocks (continued) | | | | | | |
| | |
| Consumer Staples — 7.7% | | | | | | |
| | |
Drug Retail — 1.4% | | | | | | | | |
CVS Health Corp. | | | 21,054 | | | $ | 1,628,317 | |
|
Food Distributors — 1.0% | |
Sysco Corp. (1) | | | 23,058 | | | | 1,214,465 | |
|
Hypermarkets & Super Centers — 2.3% | |
Wal-Mart Stores, Inc. (1) | | | 33,360 | | | | 2,604,415 | |
|
Packaged Foods & Meats — 0.4% | |
ConAgra Brands, Inc. (1) | | | 14,105 | | | | 457,848 | |
| | |
Soft Drinks — 2.0% | | | | | | | | |
Dr. Pepper Snapple Group, Inc. (1) | | | 6,213 | | | | 565,694 | |
PepsiCo, Inc. (1) | | | 14,957 | | | | 1,730,973 | |
| | | | | | | | |
| | | | | | | 2,296,667 | |
| | |
Tobacco — 0.6% | | | | | | | | |
Philip Morris International, Inc. (1) | | | 5,886 | | | | 688,250 | |
| | | | | | | | |
Total Consumer Staples | | | | 8,889,962 | |
| | |
| Energy — 6.6% | | | | | | |
|
Integrated Oil & Gas — 2.7% | |
Chevron Corp. (1) | | | 29,112 | | | | 3,133,033 | |
|
Oil & Gas-Drilling — 0.8% | |
Helmerich & Payne, Inc. (1) | | | 20,228 | | | | 856,454 | |
|
Oil & Gas-Refining & Marketing — 1.7% | |
Marathon Petroleum Corp. | | | 10,207 | | | | 535,357 | |
Valero Energy Corp. (1) | | | 21,330 | | | | 1,452,573 | |
| | | | | | | | |
| | | | | | | 1,987,930 | |
|
Oil & Gas-Storage & Transportation — 1.4% | |
Kinder Morgan, Inc. (1) | | | 28,320 | | | | 547,426 | |
Williams Cos., Inc. | | | 37,470 | | | | 1,113,983 | |
| | | | | | | | |
| | | | | | | 1,661,409 | |
| | | | | | | | |
Total Energy | | | | 7,638,826 | |
| | |
| Financials — 14.3% | | | | | | |
|
Asset Management & Custody Banks — 2.3% | |
Ameriprise Financial, Inc. | | | 19,004 | | | | 2,632,244 | |
|
Consumer Finance — 2.8% | |
Discover Financial Services (1) | | | 25,933 | | | | 1,528,750 | |
Navient Corp. (1) | | | 126,399 | | | | 1,668,467 | |
| | | | | | | | |
| | | | | | | 3,197,217 | |
|
Diversified Banks — 4.5% | |
JPMorgan Chase & Co. | | | 17,751 | | | | 1,613,389 | |
Wells Fargo & Co. | | | 70,876 | | | | 3,619,637 | |
| | | | | | | | |
| | | | | | | 5,233,026 | |
|
Life & Health Insurance — 2.8% | |
Lincoln National Corp. (1) | | | 12,443 | | | | 844,382 | |
Prudential Financial, Inc. | | | 23,089 | | | | 2,356,925 | |
| | | | | | | | |
| | | | | | | 3,201,307 | |
|
Property & Casualty Insurance — 1.0% | |
Allstate Corp. | | | 12,993 | | | | 1,175,866 | |
| | |
Regional Banks — 0.9% | | | | | | | | |
PNC Financial Services Group, Inc. (1) | | | 4,452 | | | | 558,325 | |
Regions Financial Corp. (1) | | | 38,497 | | | | 543,193 | |
| | | | | | | | |
| | | | | | | 1,101,518 | |
| | | | | | | | |
Total Financials | | | | | | | 16,541,178 | |
| | | | | | | | |
| Description | | Shares | | | Value | |
| Common Stocks (continued) | |
| | |
| Healthcare — 11.1% | | | | | | |
| | |
Biotechnology — 4.6% | | | | | | | | |
AbbVie, Inc. (1) | | | 40,781 | | | $ | 3,070,809 | |
Amgen, Inc. | | | 12,518 | | | | 2,225,325 | |
| | | | | | | | |
| | | | | | | 5,296,134 | |
| | |
Pharmaceuticals — 6.5% | | | | | | | | |
Eli Lilly & Co. (1) | | | 6,748 | | | | 548,545 | |
Johnson & Johnson (1) | | | 10,065 | | | | 1,332,304 | |
Merck & Co., Inc. | | | 38,741 | | | | 2,474,000 | |
Pfizer, Inc. | | | 93,569 | | | | 3,173,861 | |
| | | | | | | | |
| | | | | | | 7,528,710 | |
| | | | | | | | |
Total Healthcare | | | | | | | 12,824,844 | |
| | |
| Industrials — 9.1% | | | | | | |
|
Aerospace & Defense — 3.4% | |
Boeing Co. (1) | | | 13,189 | | | | 3,160,876 | |
Lockheed Martin Corp. (1) | | | 2,460 | | | | 751,259 | |
| | | | | | | | |
| | | | | | | 3,912,135 | |
| | |
Airlines — 0.9% | | | | | | | | |
Delta Air Lines, Inc. (1) | | | 21,955 | | | | 1,036,056 | |
|
Construction Machinery & Heavy Trucks — 1.5% | |
Cummins, Inc. (1) | | | 10,589 | | | | 1,687,675 | |
|
Environmental & Facilities Services — 1.0% | |
Republic Services, Inc. (1) | | | 8,761 | | | | 571,568 | |
Waste Management, Inc. (1) | | | 7,891 | | | | 608,475 | |
| | | | | | | | |
| | | | | | | 1,180,043 | |
|
Industrial Machinery — 0.9% | |
Ingersoll-Rand PLC (1) | | | 12,930 | | | | 1,104,093 | |
| | |
Railroads — 0.5% | | | | | | | | |
Union Pacific Corp. (1) | | | 5,035 | | | | 530,185 | |
| | |
Trucking — 0.9% | | | | | | | | |
Ryder System, Inc. (1) | | | 14,002 | | | | 1,086,555 | |
| | | | | | | | |
Total Industrials | | | | | | | 10,536,742 | |
|
| Information Technology — 18.2% | |
|
Communications Equipment — 4.8% | |
Cisco Systems, Inc. (1) | | | 105,645 | | | | 3,402,825 | |
Harris Corp. (1) | | | 17,749 | | | | 2,181,352 | |
| | | | | | | | |
| | | | | | | 5,584,177 | |
|
Electronic Equipment & Instruments — 0.5% | |
FLIR Systems, Inc. (1) | | | 15,699 | | | | 596,562 | |
|
Semiconductor Equipment — 2.2% | |
KLA-Tencor Corp. (1) | | | 17,051 | | | | 1,597,508 | |
Lam Research Corp. (1) | | | 5,775 | | | | 958,535 | |
| | | | | | | | |
| | | | | | | 2,556,043 | |
|
Semiconductors — 4.4% | |
Intel Corp. (1) | | | 67,514 | | | | 2,367,716 | |
Texas Instruments, Inc. (1) | | | 32,761 | | | | 2,713,266 | |
| | | | | | | | |
| | | | | | | 5,080,982 | |
|
Systems Software — 3.3% | |
Microsoft Corp. | | | 51,170 | | | | 3,825,981 | |
|
Technology Hardware, Storage & Peripherals — 3.0% | |
Apple, Inc. (1) | | | 8,055 | | | | 1,321,020 | |
HP, Inc. (1) | | | 78,982 | | | | 1,506,976 | |
Xerox Corp. | | | 17,510 | | | | 565,048 | |
| | | | | | | | |
| | | | | | | 3,393,044 | |
| | | | | | | | |
Total Information Technology | | | | 21,036,789 | |
(See Notes which are an integral part of the Financial Statements)
40
Dividend Income Fund (continued)
| | | | | | | | |
| Description | | Shares | | | Value | |
| Common Stocks (continued) | |
| | |
| Materials — 4.7% | | | | | | |
|
Commodity Chemicals — 0.5% | |
LyondellBasell Industries NV, Class A (1) | | | 6,733 | | | $ | 609,943 | |
|
Diversified Chemicals — 1.1% | |
Eastman Chemical Co. (1) | | | 14,095 | | | | 1,214,989 | |
|
Paper Packaging — 3.1% | |
Avery Dennison Corp. (1) | | | 11,602 | | | | 1,093,604 | |
WestRock Co. | | | 43,181 | | | | 2,457,431 | |
| | | | | | | | |
| | | | | | | 3,551,035 | |
| | | | | | | | |
Total Materials | | | | | | | 5,375,967 | |
| | |
| Real Estate — 5.4% | | | | | | |
|
Hotel & Resort REITs — 2.0% | |
Host Hotels & Resorts, Inc. (1) | | | 128,260 | | | | 2,324,071 | |
|
Industrial REITs — 0.6% | |
Prologis, Inc. | | | 10,753 | | | | 681,310 | |
| | |
Office REITs — 0.5% | | | | | | | | |
Alexandria Real Estate Equities, Inc. (1) | | | 4,655 | | | | 564,698 | |
|
Residential REITs — 1.7% | |
Essex Property Trust, Inc. (1) | | | 7,348 | | | | 1,954,348 | |
|
Specialized REITs — 0.6% | |
Crown Castle International Corp. (1) | | | 6,207 | | | | 673,087 | |
| | | | | | | | |
Total Real Estate | | | | 6,197,514 | |
|
| Telecommunication Services — 4.8% | |
|
Integrated Telecommunication Services — 4.8% | |
AT&T, Inc. (1) | | | 61,672 | | | | 2,310,233 | |
Verizon Communications, Inc. | | | 66,981 | | | | 3,213,079 | |
| | | | | | | | |
Total Telecommunication Services | | | | 5,523,312 | |
| | |
| Utilities — 8.0% | | | | | | |
|
Electric Utilities — 3.0% | |
American Electric Power Co., Inc. | | | 25,374 | | | | 1,868,288 | |
Exelon Corp. | | | 41,655 | | | | 1,577,475 | |
| | | | | | | | |
| | | | | | | 3,445,763 | |
|
Independent Power Producers & Energy Traders — 0.7% | |
AES Corp. (1) | | | 81,222 | | | | 896,691 | |
| | |
Multi-Utilities — 4.3% | | | | | | | | |
Ameren Corp. (1) | | | 42,225 | | | | 2,533,078 | |
CenterPoint Energy, Inc. (1) | | | 81,946 | | | | 2,427,240 | |
| | | | | | | | |
| | | | | | | 4,960,318 | |
| | | | | | | | |
Total Utilities | | | | | | | 9,302,772 | |
| | | | | | | | |
Total Common Stocks
(identified cost $90,591,714) | | | | 113,432,121 | |
| | | | | | | | |
| Short-Term Investments — 47.5% | |
|
| Collateral Pool Investments for Securities on Loan — 45.7% | |
| |
Collateral pool allocation (3) | | | | 52,860,743 | |
| | | | | | | | |
| Description | | Shares | | | Value | |
| Short-Term Investments (continued) | |
|
| Mutual Funds — 1.8% | |
BMO Institutional Prime Money Market Fund — Premier Class, 1.080% (4) | | | 2,075,197 | | | $ | 2,075,405 | |
| | | | | | | | |
Total Short-Term Investments
(identified cost $54,936,116) | | | | 54,936,148 | |
| | | | | | | | |
Total Investments — 145.7%
(identified cost $145,527,830) | | | | 168,368,269 | |
| Other Assets and Liabilities — (45.7)% | | | | (52,786,561 | ) |
| | | | | | | | |
| Total Net Assets — 100.0% | | | $ | 115,581,708 | |
| | | | | | | | |
Large-Cap Value Fund
| | | | | | | | |
| Description | | Shares | | | Value | |
| Common Stocks — 98.4% | |
|
| Consumer Discretionary — 6.4% | |
|
Apparel Retail — 0.5% | |
Gap, Inc. (1) | | | 76,114 | | | $ | 1,797,813 | |
|
Auto Parts & Equipment — 1.9% | |
Lear Corp. (1) | | | 41,541 | | | | 6,212,041 | |
|
Broadcasting — 0.3% | |
AMC Networks, Inc., Class A (1)(2) | | | 15,134 | | | | 919,844 | |
|
Cable & Satellite — 1.9% | |
Comcast Corp., Class A (1) | | | 158,123 | | | | 6,421,375 | |
|
Home Improvement Retail — 0.7% | |
Lowe’s Cos., Inc. | | | 33,824 | | | | 2,499,255 | |
|
Hotels, Resorts & Cruise Lines — 1.1% | |
Wyndham Worldwide Corp. (1) | | | 36,095 | | | | 3,597,950 | |
| | | | | | | | |
Total Consumer Discretionary | | | | 21,448,278 | |
| | |
| Consumer Staples — 9.5% | | | | | | |
|
Agricultural Products — 1.1% | |
Bunge, Ltd. | | | 47,781 | | | | 3,565,896 | |
| | |
Drug Retail — 2.3% | | | | | | | | |
CVS Health Corp. (1) | | | 100,054 | | | | 7,738,176 | |
|
Hypermarkets & Super Centers — 2.9% | |
Wal-Mart Stores, Inc. (1) | | | 122,937 | | | | 9,597,692 | |
|
Packaged Foods & Meats — 0.4% | |
ConAgra Brands, Inc. (1) | | | 38,101 | | | | 1,236,758 | |
|
Soft Drinks — 2.8% | |
Dr. Pepper Snapple Group, Inc. (1) | | | 52,580 | | | | 4,787,409 | |
PepsiCo, Inc. (1) | | | 41,275 | | | | 4,776,756 | |
| | | | | | | | |
| | | | | | | 9,564,165 | |
| | | | | | | | |
Total Consumer Staples | | | | 31,702,687 | |
|
| Energy — 9.3% | |
|
Integrated Oil & Gas — 3.9% | |
Chevron Corp. (1) | | | 79,182 | | | | 8,521,567 | |
Exxon Mobil Corp. (1) | | | 57,018 | | | | 4,352,184 | |
| | | | | | | | |
| | | | | | | 12,873,751 | |
|
Oil & Gas-Equipment & Services — 0.9% | |
National Oilwell Varco, Inc. (1) | | | 97,342 | | | | 2,985,479 | |
|
Oil & Gas-Exploration & Production — 1.4% | |
ConocoPhillips (1) | | | 105,075 | | | | 4,587,574 | |
(See Notes which are an integral part of the Financial Statements)
41
August 31, 2017
Large-Cap Value Fund (continued)
| | | | | | | | |
| Description | | Shares | | | Value | |
| Common Stocks (continued) | | | | | | |
| | |
| Energy (continued) | | | | | | |
| |
Oil & Gas-Refining & Marketing — 3.1% | | | | | |
Marathon Petroleum Corp. | | | 95,218 | | | $ | 4,994,184 | |
Valero Energy Corp. (1) | | | 80,538 | | | | 5,484,638 | |
| | | | | | | | |
| | | | | | | 10,478,822 | |
| | | | | | | | |
Total Energy | | | | | | | 30,925,626 | |
| | |
| Financials — 22.5% | | | | | | |
|
Asset Management & Custody Banks — 1.6% | |
Northern Trust Corp. (1) | | | 35,070 | | | | 3,103,695 | |
State Street Corp. (1) | | | 24,346 | | | | 2,251,762 | |
| | | | | | | | |
| | | | | | | 5,355,457 | |
| | |
Consumer Finance — 1.9% | | | | | | | | |
American Express Co. (1) | | | 12,855 | | | | 1,106,815 | |
Synchrony Financial (1) | | | 173,339 | | | | 5,337,108 | |
| | | | | | | | |
| | | | | | | 6,443,923 | |
| | |
Diversified Banks — 10.4% | | | | | | | | |
Bank of America Corp. (1) | | | 526,977 | | | | 12,589,481 | |
Citigroup, Inc. | | | 173,466 | | | | 11,800,892 | |
Wells Fargo & Co. | | | 200,002 | | | | 10,214,102 | |
| | | | | | | | |
| | | | | | | 34,604,475 | |
|
Investment Banking & Brokerage — 0.2% | |
Raymond James Financial, Inc. (1) | | | 9,999 | | | | 783,122 | |
|
Life & Health Insurance — 3.5% | |
Prudential Financial, Inc. | | | 62,444 | | | | 6,374,284 | |
Unum Group (1) | | | 106,586 | | | | 5,135,313 | |
| | | | | | | | |
| | | | | | | 11,509,597 | |
| | |
Multi-Line Insurance — 1.7% | | | | | | | | |
American International Group, Inc. (1) | | | 91,337 | | | | 5,524,062 | |
| |
Property & Casualty Insurance — 2.0% | | | | | |
Allstate Corp. (1) | | | 75,441 | | | | 6,827,410 | |
| | |
Regional Banks — 1.2% | | | | | | | | |
PNC Financial Services Group, Inc. (1) | | | 31,193 | | | | 3,911,914 | |
| | | | | | | | |
Total Financials | | | | | | | 74,959,960 | |
| | |
| Healthcare — 11.8% | | | | | | |
| | |
Biotechnology — 3.0% | | | | | | | | |
AbbVie, Inc. (1) | | | 67,982 | | | | 5,119,045 | |
Amgen, Inc. | | | 17,177 | | | | 3,053,555 | |
Celgene Corp. (1)(2) | | | 11,777 | | | | 1,636,179 | |
| | | | | | | | |
| | | | | | | 9,808,779 | |
|
Healthcare Equipment — 1.9% | |
Baxter International, Inc. (1) | | | 46,413 | | | | 2,879,462 | |
Hill-Rom Holdings, Inc. (1) | | | 11,881 | | | | 914,362 | |
Hologic, Inc. (1)(2) | | | 68,761 | | | | 2,654,175 | |
| | | | | | | | |
| | | | | | | 6,447,999 | |
| | |
Pharmaceuticals — 6.9% | | | | | | | | |
Eli Lilly & Co. (1) | | | 45,985 | | | | 3,738,121 | |
Johnson & Johnson | | | 59,150 | | | | 7,829,685 | |
Merck & Co., Inc. (1) | | | 53,540 | | | | 3,419,064 | |
Pfizer, Inc. (1) | | | 239,227 | | | | 8,114,580 | |
| | | | | | | | |
| | | | | | | 23,101,450 | |
| | | | | | | | |
Total Healthcare | | | | | | | 39,358,228 | |
| | | | | | | | |
| Description | | Shares | | | Value | |
| Common Stocks (continued) | | | | | | |
| | |
| Industrials — 11.4% | | | | | | |
|
Aerospace & Defense — 4.4% | |
Boeing Co. (1) | | | 26,227 | | | $ | 6,285,563 | |
Huntington Ingalls Industries, Inc. | | | 19,248 | | | | 4,118,302 | |
Spirit AeroSystems Holdings, Inc., Class A (1) | | | 59,345 | | | | 4,421,202 | |
| | | | | | | | |
| | | | | | | 14,825,067 | |
|
Air Freight & Logistics — 0.5% | |
FedEx Corp. | | | 7,909 | | | | 1,695,531 | |
| | |
Airlines — 2.0% | | | | | | | | |
JetBlue Airways Corp. (2) | | | 69,728 | | | | 1,381,312 | |
Southwest Airlines Co. | | | 101,427 | | | | 5,288,404 | |
| | | | | | | | |
| | | | | | | 6,669,716 | |
| | |
Building Products — 0.6% | | | | | | | | |
Owens Corning (1) | | | 25,585 | | | | 1,896,616 | |
|
Construction & Engineering — 0.4% | |
Quanta Services, Inc. (1)(2) | | | 36,388 | | | | 1,307,421 | |
|
Construction Machinery & Heavy Trucks — 2.1% | |
Allison Transmission Holdings, Inc. (1) | | | 24,639 | | | | 855,712 | |
Cummins, Inc. (1) | | | 39,362 | | | | 6,273,516 | |
| | | | | | | | |
| | | | | | | 7,129,228 | |
|
Trading Companies & Distributors — 1.4% | |
United Rentals, Inc. (1)(2) | | | 38,141 | | | | 4,502,927 | |
| | | | | | | | |
Total Industrials | | | | | | | 38,026,506 | |
|
| Information Technology — 9.3% | |
|
Application Software — 1.0% | |
Citrix Systems, Inc. (1)(2) | | | 42,571 | | | | 3,329,478 | |
|
Communications Equipment — 4.0% | |
Cisco Systems, Inc. | | | 276,406 | | | | 8,903,037 | |
F5 Networks, Inc. (1)(2) | | | 38,289 | | | | 4,570,941 | |
| | | | | | | | |
| | | | | | | 13,473,978 | |
|
Electronic Manufacturing Services — 1.0% | |
Flex, Ltd. (2) | | | 211,682 | | | | 3,444,066 | |
|
Semiconductor Equipment — 3.3% | |
Applied Materials, Inc. | | | 125,823 | | | | 5,677,134 | |
Lam Research Corp. (1) | | | 31,355 | | | | 5,204,303 | |
| | | | | | | | |
| | | | | | | 10,881,437 | |
| | | | | | | | |
Total Information Technology | | | | 31,128,959 | |
| | |
| Materials — 4.0% | | | | | | |
|
Metal & Glass Containers — 1.7% | |
Berry Global Group, Inc. (2) | | | 101,774 | | | | 5,723,770 | |
|
Paper Packaging — 1.5% | |
WestRock Co. | | | 87,422 | | | | 4,975,186 | |
|
Steel — 0.8% | |
Steel Dynamics, Inc. (1) | | | 81,321 | | | | 2,801,508 | |
| | | | | | | | |
Total Materials | | | | | | | 13,500,464 | |
|
| Real Estate — 7.7% | |
|
Hotel & Resort REITs — 0.8% | |
Host Hotels & Resorts, Inc. (1) | | | 145,837 | | | | 2,642,566 | |
| | |
Office REITs — 3.5% | | | | | | | | |
Boston Properties, Inc. (1) | | | 49,553 | | | | 5,976,092 | |
Highwoods Properties, Inc. (1) | | | 69,588 | | | | 3,634,581 | |
Kilroy Realty Corp. (1) | | | 30,099 | | | | 2,083,754 | |
| | | | | | | | |
| | | | | | | 11,694,427 | |
(See Notes which are an integral part of the Financial Statements)
42
Large-Cap Value Fund (continued)
| | | | | | | | |
| Description | | Shares | | | Value | |
| Common Stocks (continued) | | | | | | |
| | |
| Real Estate (continued) | | | | | | |
| |
Residential REITs — 1.8% | | | | | |
Essex Property Trust, Inc. (1) | | | 22,092 | | | $ | 5,875,809 | |
| |
Specialized REITs — 1.6% | | | | | |
Equinix, Inc. (1) | | | 11,385 | | | | 5,332,848 | |
| | | | | | | | |
Total Real Estate | | | | | | | 25,545,650 | |
|
| Telecommunication Services — 0.2% | |
|
Integrated Telecommunication Services — 0.2% | |
AT&T, Inc. (1) | | | 21,250 | | | | 796,025 | |
| | |
| Utilities — 6.3% | | | | | | |
| | |
Electric Utilities — 2.5% | | | | | | | | |
American Electric Power Co., Inc. (1) | | | 98,637 | | | | 7,262,642 | |
Entergy Corp. | | | 12,891 | | | | 1,020,581 | |
| | | | | | | | |
| | | | | | | 8,283,223 | |
| | |
Multi-Utilities — 3.8% | | | | | | | | |
Ameren Corp. (1) | | | 110,310 | | | | 6,617,497 | |
PG&E Corp. (1) | | | 87,307 | | | | 6,144,666 | |
| | | | | | | | |
| | | | | | | 12,762,163 | |
| | | | | | | | |
Total Utilities | | | | | | | 21,045,386 | |
| | | | | | | | |
Total Common Stocks
(identified cost $276,420,349) | | | | 328,437,769 | |
| | | | | | | | |
| Short-Term Investments — 50.1% | |
|
| Collateral Pool Investments for Securities on Loan — 48.8% | |
| |
Collateral pool allocation (3) | | | | 162,597,871 | |
| | |
| Mutual Funds — 1.3% | | | | | | |
BMO Institutional Prime Money Market Fund — Premier Class, 1.080% (4) | | | 4,410,765 | | | | 4,411,207 | |
| | | | | | | | |
Total Short-Term Investments
(identified cost $167,009,052) | | | | 167,009,078 | |
| | | | | | | | |
Total Investments — 148.5%
(identified cost $443,429,401) | | | | 495,446,847 | |
| Other Assets and Liabilities — (48.5)% | | | | (161,751,155 | ) |
| | | | | | | | |
| Total Net Assets — 100.0% | | | | | | $ | 333,695,692 | |
| | | | | | | | |
Large-Cap Growth Fund
| | | | | | | | |
| Description | | Shares | | | Value | |
| Common Stocks — 98.6% | |
|
| Consumer Discretionary — 16.2% | |
|
Apparel Retail — 0.7% | |
Burlington Stores, Inc. (1)(2) | | | 28,631 | | | $ | 2,494,619 | |
|
Broadcasting — 1.4% | |
AMC Networks, Inc., Class A (1)(2) | | | 84,822 | | | | 5,155,481 | |
|
Cable & Satellite — 5.2% | |
Comcast Corp., Class A (1) | | | 280,012 | | | | 11,371,287 | |
Sirius XM Holdings, Inc. (1) | | | 1,231,570 | | | | 7,081,528 | |
| | | | | | | | |
| | | | | | | 18,452,815 | |
|
Home Improvement Retail — 1.4% | |
Home Depot, Inc. (1) | | | 33,575 | | | | 5,031,885 | |
|
Hotels, Resorts & Cruise Lines — 1.8% | |
Wyndham Worldwide Corp. (1) | | | 65,853 | | | | 6,564,227 | |
| | | | | | | | |
| Description | | Shares | | | Value | |
| Common Stocks (continued) | |
|
| Consumer Discretionary (continued) | |
|
Internet & Direct Marketing Retail — 4.6% | |
Amazon.com, Inc. (2) | | | 16,760 | | | $ | 16,434,856 | |
|
Leisure Facilities — 1.1% | |
Vail Resorts, Inc. | | | 16,586 | | | | 3,780,779 | |
| | | | | | | | |
Total Consumer Discretionary | | | | 57,914,662 | |
|
| Consumer Staples — 4.3% | |
|
Soft Drinks — 4.3% | |
Dr. Pepper Snapple Group, Inc. (1) | | | 61,512 | | | | 5,600,668 | |
PepsiCo, Inc. (1) | | | 84,336 | | | | 9,760,205 | |
| | | | | | | | |
Total Consumer Staples | | | | | | | 15,360,873 | |
|
| Financials — 6.3% | |
|
Consumer Finance — 1.8% | |
American Express Co. (1) | | | 76,457 | | | | 6,582,947 | |
|
Diversified Banks — 1.4% | |
U.S. Bancorp (1) | | | 97,579 | | | | 5,000,924 | |
|
Financial Exchanges & Data — 1.4% | |
MSCI, Inc. (1) | | | 22,373 | | | | 2,564,169 | |
S&P Global, Inc. (1) | | | 15,014 | | | | 2,317,111 | |
| | | | | | | | |
| | | | | | | 4,881,280 | |
|
Property & Casualty Insurance — 1.7% | |
Allstate Corp. (1) | | | 67,570 | | | | 6,115,085 | |
| | | | | | | | |
Total Financials | | | | | | | 22,580,236 | |
|
| Healthcare — 16.2% | |
|
Biotechnology — 5.2% | |
AbbVie, Inc. (1) | | | 29,203 | | | | 2,198,986 | |
Amgen, Inc. | | | 38,429 | | | | 6,831,523 | |
Celgene Corp. (1)(2) | | | 69,018 | | | | 9,588,671 | |
| | | | | | | | |
| | | | | | | 18,619,180 | |
|
Healthcare Equipment — 1.9% | |
IDEXX Laboratories, Inc. (1)(2) | | | 24,085 | | | | 3,743,532 | |
Masimo Corp. (1)(2) | | | 35,164 | | | | 2,967,138 | |
| | | | | | | | |
| | | | | | | 6,710,670 | |
|
Healthcare Supplies — 2.1% | |
Align Technology, Inc. (1)(2) | | | 31,687 | | | | 5,600,360 | |
Cooper Cos., Inc. (1) | | | 8,236 | | | | 2,065,836 | |
| | | | | | | | |
| | | | | | | 7,666,196 | |
|
Healthcare Technology — 0.5% | |
Veeva Systems, Inc., Class A (1)(2) | | | 28,236 | | | | 1,680,042 | |
|
Managed Healthcare — 2.5% | |
Cigna Corp. | | | 11,884 | | | | 2,163,601 | |
UnitedHealth Group, Inc. (1) | | | 24,636 | | | | 4,900,100 | |
WellCare Health Plans, Inc. (1)(2) | | | 10,010 | | | | 1,748,547 | |
| | | | | | | | |
| | | | | | | 8,812,248 | |
|
Pharmaceuticals — 4.0% | |
Eli Lilly & Co. (1) | | | 102,822 | | | | 8,358,401 | |
Johnson & Johnson | | | 44,203 | | | | 5,851,151 | |
| | | | | | | | |
| | | | | | | 14,209,552 | |
| | | | | | | | |
Total Healthcare | | | | | | | 57,697,888 | |
|
| Industrials — 11.5% | |
|
Aerospace & Defense — 4.9% | |
Boeing Co. (1) | | | 44,154 | | | | 10,581,948 | |
Huntington Ingalls Industries, Inc. | | | 32,085 | | | | 6,864,906 | |
| | | | | | | | |
| | | | | | | 17,446,854 | |
(See Notes which are an integral part of the Financial Statements)
43
August 31, 2017
Large-Cap Growth Fund (continued)
| | | | | | | | |
| Description | | Shares | | | Value | |
| Common Stocks (continued) | |
|
| Industrials (continued) | |
|
Agricultural & Farm Machinery — 1.0% | |
Toro Co. | | | 59,479 | | | $ | 3,668,665 | |
|
Airlines — 1.7% | |
Southwest Airlines Co. | | | 114,206 | | | | 5,954,701 | |
|
Construction Machinery & Heavy Trucks — 3.3% | |
Allison Transmission Holdings, Inc. (1) | | | 110,380 | | | | 3,833,497 | |
Caterpillar, Inc. (1) | | | 68,410 | | | | 8,037,491 | |
| | | | | | | | |
| | | | | | | 11,870,988 | |
|
Electrical Components & Equipment — 0.6% | |
Rockwell Automation, Inc. (1) | | | 13,444 | | | | 2,205,623 | |
| | | | | | | | |
Total Industrials | | | | | | | 41,146,831 | |
|
| Information Technology — 35.4% | |
|
Application Software — 4.7% | |
Adobe Systems, Inc. (2) | | | 46,711 | | | | 7,247,679 | |
Cadence Design Systems, Inc. (1)(2) | | | 188,444 | | | | 7,403,965 | |
Synopsys, Inc. (1)(2) | | | 27,622 | | | | 2,221,361 | |
| | | | | | | | |
| | | | | | | 16,873,005 | |
|
Communications Equipment — 2.7% | |
Cisco Systems, Inc. (1) | | | 158,298 | | | | 5,098,778 | |
F5 Networks, Inc. (1)(2) | | | 31,042 | | | | 3,705,794 | |
Palo Alto Networks, Inc. (1)(2) | | | 6,872 | | | | 911,846 | |
| | | | | | | | |
| | | | | | | 9,716,418 | |
|
Data Processing & Outsourced Services — 4.6% | |
Alliance Data Systems Corp. (1) | | | 26,741 | | | | 6,030,096 | |
MasterCard, Inc., Class A (1) | | | 78,688 | | | | 10,489,110 | |
| | | | | | | | |
| | | | | | | 16,519,206 | |
|
Internet Software & Services — 6.5% | |
Alphabet, Inc., Class A (2) | | | 5,115 | | | | 4,886,053 | |
Alphabet, Inc., Class C (2) | | | 12,948 | | | | 12,162,445 | |
Facebook, Inc., Class A (2) | | | 35,392 | | | | 6,086,362 | |
| | | | | | | | |
| | | | | | | 23,134,860 | |
|
Semiconductor Equipment — 3.6% | |
Applied Materials, Inc. | | | 120,586 | | | | 5,440,840 | |
Lam Research Corp. (1) | | | 45,097 | | | | 7,485,200 | |
| | | | | | | | |
| | | | | | | 12,926,040 | |
|
Semiconductors — 0.7% | |
Skyworks Solutions, Inc. (1) | | | 21,589 | | | | 2,274,617 | |
|
Systems Software — 7.2% | |
Microsoft Corp. (1) | | | 206,625 | | | | 15,449,351 | |
Oracle Corp. | | | 62,345 | | | | 3,137,824 | |
Red Hat, Inc. (1)(2) | | | 64,556 | | | | 6,939,770 | |
| | | | | | | | |
| | | | | | | 25,526,945 | |
|
Technology Hardware, Storage & Peripherals — 5.4% | |
Apple, Inc. | | | 116,110 | | | | 19,042,040 | |
| | | | | | | | |
Total Information Technology | | | | 126,013,131 | |
|
| Materials — 2.4% | |
|
Metal & Glass Containers — 1.9% | |
Berry Global Group, Inc. (2) | | | 120,354 | | | | 6,768,709 | |
|
Specialty Chemicals — 0.5% | |
Axalta Coating Systems, Ltd. (1)(2) | | | 57,487 | | | | 1,697,016 | |
| | | | | | | | |
Total Materials | | | | | | | 8,465,725 | |
| | | | | | | | |
| Description | | Shares | | | Value | |
| Common Stocks (continued) | |
|
| Real Estate — 5.0% | |
|
Office REITs — 2.4% | |
Douglas Emmett, Inc. (1) | | | 104,692 | | | $ | 4,078,800 | |
Alexandria Real Estate Equities, Inc. (1) | | | 35,472 | | | | 4,303,109 | |
| | | | | | | | |
| | | | | | | 8,381,909 | |
|
Specialized REITs — 2.6% | |
EPR Properties (1) | | | 30,815 | | | | 2,146,573 | |
Equinix, Inc. (1) | | | 15,382 | | | | 7,205,082 | |
| | | | | | | | |
| | | | | | | 9,351,655 | |
| | | | | | | | |
Total Real Estate | | | | | | | 17,733,564 | |
|
| Telecommunication Services — 1.3% | |
|
Wireless Telecommunication Services — 1.3% | |
T-Mobile US, Inc. (1)(2) | | | 72,615 | | | | 4,698,917 | |
| | | | | | | | |
Total Common Stocks
(identified cost $264,960,557) | | | | 351,611,827 | |
| | | | | | | | |
| Short-Term Investments — 43.8% | |
|
| Collateral Pool Investments for Securities on Loan — 42.5% | |
| | |
Collateral pool allocation (3) | | | | | | | 151,430,406 | |
| | |
| Mutual Funds — 1.3% | | | | | | |
BMO Institutional Prime Money Market Fund — Premier Class, 1.080% (4) | | | 4,542,326 | | | | 4,542,780 | |
| | | | | | | | |
Total Short-Term Investments
(identified cost $155,973,136) | | | | 155,973,186 | |
| | | | | | | | |
Total Investments — 142.4%
(identified cost $420,933,693) | | | | 507,585,013 | |
| Other Assets and Liabilities — (42.4)% | | | | (151,129,585 | ) |
| | | | | | | | |
| Total Net Assets — 100.0% | | | | | | $ | 356,455,428 | |
| | | | | | | | |
Mid-Cap Value Fund
| | | | | | | | |
| Description | | Shares | | | Value | |
| Common Stocks — 99.0% | | | | | | |
|
| Consumer Discretionary — 9.5% | |
|
Apparel, Accessories & Luxury Goods — 1.6% | |
PVH Corp. | | | 25,913 | | | $ | 3,262,187 | |
|
Auto Parts & Equipment — 1.7% | |
Lear Corp. (1) | | | 23,177 | | | | 3,465,889 | |
| | |
Broadcasting — 2.3% | | | | | | | | |
AMC Networks, Inc., Class A (1)(2) | | | 39,992 | | | | 2,430,714 | |
Discovery Communications, Inc., Class A (1)(2) | | | 101,306 | | | | 2,250,006 | |
| | | | | | | | |
| | | | | | | 4,680,720 | |
| | |
Department Stores — 1.2% | | | | | | | | |
Kohl’s Corp. (1) | | | 65,278 | | | | 2,596,759 | |
| |
Hotels, Resorts & Cruise Lines — 1.5% | | | | | |
Royal Caribbean Cruises, Ltd. (1) | | | 24,961 | | | | 3,106,646 | |
| | |
Leisure Products — 1.2% | | | | | | | | |
Brunswick Corp. (1) | | | 49,237 | | | | 2,583,958 | |
| | | | | | | | |
Total Consumer Discretionary | | | | 19,696,159 | |
(See Notes which are an integral part of the Financial Statements)
44
Mid-Cap Value Fund (continued)
| | | | | | | | |
| Description | | Shares | | | Value | |
| Common Stocks (continued) | |
|
| Consumer Staples — 4.6% | |
|
Agricultural Products — 2.0% | |
Bunge, Ltd. | | | 28,342 | | | $ | 2,115,163 | |
Ingredion, Inc. | | | 16,746 | | | | 2,073,490 | |
| | | | | | | | |
| | | | | | | 4,188,653 | |
|
Food Distributors — 1.4% | |
Sysco Corp. (1) | | | 55,190 | | | | 2,906,857 | |
|
Packaged Foods & Meats — 1.2% | |
Pinnacle Foods, Inc. | | | 42,683 | | | | 2,531,529 | |
| | | | | | | | |
Total Consumer Staples | | | | | | | 9,627,039 | |
| | |
| Energy — 7.3% | | | | | | |
|
Oil & Gas-Equipment & Services — 1.2% | |
Oceaneering International, Inc. (1) | | | 108,587 | | | | 2,448,637 | |
|
Oil & Gas-Exploration & Production — 3.7% | |
Cimarex Energy Co. (1) | | | 28,315 | | | | 2,822,723 | |
Diamondback Energy, Inc. (1)(2) | | | 22,497 | | | | 2,042,503 | |
Noble Energy, Inc. (1) | | | 51,342 | | | | 1,220,399 | |
Parsley Energy, Inc., Class A (1)(2) | | | 62,845 | | | | 1,574,267 | |
| | | | | | | | |
| | | | | | | 7,659,892 | |
|
Oil & Gas-Refining & Marketing — 1.1% | |
Valero Energy Corp. (1) | | | 33,374 | | | | 2,272,769 | |
|
Oil & Gas-Storage & Transportation — 1.3% | |
Williams Cos., Inc. | | | 90,597 | | | | 2,693,449 | |
| | | | | | | | |
Total Energy | | | | | | | 15,074,747 | |
| | |
| Financials — 17.5% | | | | | | |
|
Asset Management & Custody Banks — 2.8% | |
Ameriprise Financial, Inc. | | | 22,933 | | | | 3,176,450 | |
Northern Trust Corp. (1) | | | 29,167 | | | | 2,581,279 | |
| | | | | | | | |
| | | | | | | 5,757,729 | |
|
Consumer Finance — 2.2% | |
Discover Financial Services (1) | | | 42,316 | | | | 2,494,528 | |
Synchrony Financial | | | 63,494 | | | | 1,954,981 | |
| | | | | | | | |
| | | | 4,449,509 | |
|
Life & Health Insurance — 2.3% | |
Lincoln National Corp. (1) | | | 29,980 | | | | 2,034,443 | |
Unum Group | | | 57,780 | | | | 2,783,840 | |
| | | | | | | | |
| | | | 4,818,283 | |
|
Multi-Line Insurance — 1.6% | |
Hartford Financial Services Group, Inc. (1) | | | 61,945 | | | | 3,349,366 | |
|
Property & Casualty Insurance — 1.2% | |
Aspen Insurance Holdings, Ltd. | | | 56,615 | | | | 2,558,998 | |
|
Regional Banks — 5.9% | |
Comerica, Inc. | | | 32,797 | | | | 2,238,395 | |
East West Bancorp, Inc. (1) | | | 37,990 | | | | 2,103,506 | |
Regions Financial Corp. (1) | | | 189,502 | | | | 2,673,873 | |
SunTrust Banks, Inc. (1) | | | 50,815 | | | | 2,799,907 | |
TCF Financial Corp. | | | 151,084 | | | | 2,346,335 | |
| | | | | | | | |
| | | | 12,162,016 | |
|
Reinsurance — 1.5% | |
Everest Re Group, Ltd. (1) | | | 11,783 | | | | 2,974,972 | |
| | | | | | | | |
Total Financials | | | | 36,070,873 | |
|
| Healthcare — 6.2% | |
|
Biotechnology — 0.9% | |
United Therapeutics Corp. (1)(2) | | | 13,838 | | | | 1,810,011 | |
| | | | | | | | |
| Description | | Shares | | | Value | |
| Common Stocks (continued) | |
|
| Healthcare (continued) | |
|
Healthcare Equipment — 3.7% | |
Hill-Rom Holdings, Inc. (1) | | | 38,319 | | | $ | 2,949,030 | |
Hologic, Inc. (1)(2) | | | 63,327 | | | | 2,444,422 | |
Zimmer Biomet Holdings, Inc. | | | 20,080 | | | | 2,294,542 | |
| | | | | | | | |
| | | | 7,687,994 | |
|
Managed Healthcare — 1.6% | |
Centene Corp. (2) | | | 36,359 | | | | 3,230,497 | |
| | | | | | | | |
Total Healthcare | | | | 12,728,502 | |
|
| Industrials — 14.5% | |
|
Aerospace & Defense — 1.9% | |
Spirit AeroSystems Holdings, Inc., Class A (1) | | | 54,292 | | | | 4,044,754 | |
|
Airlines — 2.1% | |
JetBlue Airways Corp. (1)(2) | | | 131,731 | | | | 2,609,591 | |
Spirit Airlines, Inc. (2) | | | 49,902 | | | | 1,699,163 | |
| | | | | | | | |
| | | | 4,308,754 | |
|
Building Products — 1.7% | |
Owens Corning (1) | | | 48,269 | | | | 3,578,181 | |
|
Construction Machinery & Heavy Trucks — 2.2% | |
Allison Transmission Holdings, Inc. (1) | | | 55,608 | | | | 1,931,266 | |
Cummins, Inc. | | | 15,966 | | | | 2,544,661 | |
| | | | | | | | |
| | | | 4,475,927 | |
|
Environmental & Facilities Services — 1.6% | |
Republic Services, Inc. | | | 50,596 | | | | 3,300,883 | |
|
Human Resource & Employment Services — 1.3% | |
Robert Half International, Inc. (1) | | | 60,204 | | | | 2,727,241 | |
|
Trading Companies & Distributors — 1.1% | |
United Rentals, Inc. (1)(2) | | | 18,722 | | | | 2,210,319 | |
|
Trucking — 2.6% | |
Old Dominion Freight Line, Inc. (1) | | | 23,890 | | | | 2,386,611 | |
Ryder System, Inc. | | | 38,196 | | | | 2,964,010 | |
| | | | | | | | |
| | | | 5,350,621 | |
| | | | | | | | |
Total Industrials | | | | | | | 29,996,680 | |
|
| Information Technology — 9.2% | |
|
Application Software — 1.0% | |
Citrix Systems, Inc. (1)(2) | | | 26,860 | | | | 2,100,721 | |
|
Data Processing & Outsourced Services — 0.9% | |
Alliance Data Systems Corp. (1) | | | 8,111 | | | | 1,829,030 | |
|
Electronic Equipment & Instruments — 1.4% | |
FLIR Systems, Inc. (1) | | | 75,773 | | | | 2,879,374 | |
|
Electronic Manufacturing Services — 1.6% | |
Jabil, Inc. (1) | | | 108,023 | | | | 3,386,521 | |
|
Semiconductor Equipment — 1.5% | |
Lam Research Corp. (1) | | | 18,434 | | | | 3,059,675 | |
|
Semiconductors — 1.6% | |
ON Semiconductor Corp. (1)(2) | | | 190,776 | | | | 3,258,454 | |
|
Technology Hardware, Storage & Peripherals — 1.2% | |
Western Digital Corp. | | | 27,689 | | | | 2,444,108 | |
| | | | | | | | |
Total Information Technology | | | | 18,957,883 | |
|
| Materials — 5.9% | |
|
Commodity Chemicals — 1.0% | |
Cabot Corp. (1) | | | 38,259 | | | | 2,015,484 | |
(See Notes which are an integral part of the Financial Statements)
45
August 31, 2017
Mid-Cap Value Fund (continued)
| | | | | | | | |
| Description | | Shares | | | Value | |
| Common Stocks (continued) | |
|
| Materials (continued) | |
|
Diversified Chemicals — 1.2% | |
Eastman Chemical Co. | | | 29,306 | | | $ | 2,526,177 | |
|
Paper Packaging — 2.5% | |
Avery Dennison Corp. | | | 29,105 | | | | 2,743,437 | |
WestRock Co. | | | 43,009 | | | | 2,447,642 | |
| | | | | | | | |
| | | | 5,191,079 | |
|
Steel — 1.2% | |
Nucor Corp. (1) | | | 43,141 | | | | 2,377,501 | |
| | | | | | | | |
Total Materials | | | | 12,110,241 | |
|
| Real Estate — 13.1% | |
|
Diversified REITs — 1.6% | |
Liberty Property Trust (1) | | | 76,208 | | | | 3,246,461 | |
|
Hotel & Resort REITs — 1.2% | |
Host Hotels & Resorts, Inc. (1) | | | 138,250 | | | | 2,505,090 | |
|
Industrial REITs — 1.2% | |
Prologis, Inc. | | | 38,410 | | | | 2,433,658 | |
|
Office REITs — 5.1% | |
Boston Properties, Inc. (1) | | | 23,502 | | | | 2,834,341 | |
Highwoods Properties, Inc. (1) | | | 58,807 | | | | 3,071,490 | |
Kilroy Realty Corp. (1) | | | 42,651 | | | | 2,952,729 | |
SL Green Realty Corp. (1) | | | 16,777 | | | | 1,616,967 | |
| | | | | | | | |
| | | | 10,475,527 | |
|
Residential REITs — 1.8% | |
Essex Property Trust, Inc. (1) | | | 14,397 | | | | 3,829,170 | |
|
Retail REITs — 1.0% | |
Brixmor Property Group, Inc. (1) | | | 116,913 | | | | 2,188,611 | |
|
Specialized REITs — 1.2% | |
EPR Properties (1) | | | 34,403 | | | | 2,396,513 | |
| | | | | | | | |
Total Real Estate | | | | 27,075,030 | |
|
| Utilities — 11.2% | |
|
Electric Utilities — 6.4% | |
Entergy Corp. | | | 35,810 | | | | 2,835,078 | |
Great Plains Energy, Inc. | | | 119,552 | | | | 3,669,051 | |
Pinnacle West Capital Corp. | | | 36,067 | | | | 3,244,948 | |
Xcel Energy, Inc. (1) | | | 67,573 | | | | 3,344,863 | |
| | | | | | | | |
| | | | 13,093,940 | |
|
Gas Utilities — 1.3% | |
UGI Corp. (1) | | | 55,076 | | | | 2,721,305 | |
|
Multi-Utilities — 3.5% | |
Ameren Corp. (1) | | | 61,599 | | | | 3,695,324 | |
Public Service Enterprise Group, Inc. | | | 76,674 | | | | 3,591,410 | |
| | | | | | | | |
| | | | 7,286,734 | |
| | | | | | | | |
Total Utilities | | | | 23,101,979 | |
| | | | | | | | |
Total Common Stocks
(identified cost $177,370,389) | | | | | | | 204,439,133 | |
| | | | | | | | |
| Short-Term Investments — 44.1% | |
|
| Collateral Pool Investments for Securities on Loan — 43.2% | |
| |
Collateral pool allocation (3) | | | | 89,263,621 | |
| | | | | | | | |
| Description | | Shares | | | Value | |
| Short-Term Investments (continued) | |
|
| Mutual Funds — 0.9% | |
BMO Institutional Prime Money Market Fund — Premier Class, 1.080% (4) | | | 1,880,603 | | | $ | 1,880,791 | |
| | | | | | | | |
Total Short-Term Investments
(identified cost $91,144,412) | | | | | | | 91,144,412 | |
| | | | | | | | |
Total Investments — 143.1%
(identified cost $268,514,801) | | | | | | | 295,583,545 | |
| Other Assets and Liabilities — (43.1)% | | | | (89,079,577 | ) |
| | | | | | | | |
| Total Net Assets — 100.0% | | | | | | $ | 206,503,968 | |
| | | | | | | | |
Mid-Cap Growth Fund
| | | | | | | | |
| Description | | Shares | | | Value | |
| Common Stocks — 98.3% | | | | | | |
|
| Consumer Discretionary — 15.6% | |
|
Apparel Retail — 1.6% | |
Burlington Stores, Inc. (1)(2) | | | 20,758 | | | $ | 1,808,644 | |
|
Auto Parts & Equipment — 1.5% | |
Lear Corp. (1) | | | 11,128 | | | | 1,664,081 | |
|
Casinos & Gaming — 1.4% | |
Wynn Resorts, Ltd. (1) | | | 11,681 | | | | 1,623,542 | |
|
Distributors — 1.2% | |
Pool Corp. (1) | | | 13,688 | | | | 1,364,557 | |
|
General Merchandise Stores — 1.8% | |
Dollar Tree, Inc. (1)(2) | | | 25,422 | | | | 2,024,608 | |
|
Homebuilding — 1.4% | |
D.R. Horton, Inc. | | | 45,412 | | | | 1,641,644 | |
|
Hotels, Resorts & Cruise Lines — 1.8% | |
Wyndham Worldwide Corp. (1) | | | 20,041 | | | | 1,997,687 | |
|
Internet & Direct Marketing Retail — 1.8% | |
Expedia, Inc. (1) | | | 13,974 | | | | 2,073,183 | |
|
Leisure Products — 1.4% | |
Brunswick Corp. | | | 30,484 | | | | 1,599,800 | |
|
Movies & Entertainment — 1.7% | |
Live Nation Entertainment, Inc. (1)(2) | | | 47,321 | | | | 1,890,947 | |
| | | | | | | | |
Total Consumer Discretionary | | | | 17,688,693 | |
| | |
| Consumer Staples — 2.8% | | | | | | |
|
Food Distributors — 1.4% | |
U.S. Foods Holding Corp. (2) | | | 57,300 | | | | 1,572,885 | |
|
Packaged Foods & Meats — 1.4% | |
Blue Buffalo Pet Products, Inc. (1)(2) | | | 60,247 | | | | 1,551,963 | |
| | | | | | | | |
Total Consumer Staples | | | | | | | 3,124,848 | |
| | |
| Energy — 1.7% | | | | | | |
|
Oil & Gas-Exploration & Production — 1.7% | |
Diamondback Energy, Inc. (1)(2) | | | 10,667 | | | | 968,457 | |
Newfield Exploration Co. (2) | | | 34,477 | | | | 900,884 | |
| | | | | | | | |
Total Energy | | | | | | | 1,869,341 | |
| | |
| Financials — 6.0% | | | | | | |
|
Financial Exchanges & Data — 1.5% | |
MSCI, Inc. | | | 14,451 | | | | 1,656,229 | |
|
Investment Banking & Brokerage — 1.5% | |
LPL Financial Holdings, Inc. | | | 35,518 | | | | 1,663,663 | |
|
Property & Casualty Insurance — 1.5% | |
Progressive Corp. | | | 37,928 | | | | 1,762,893 | |
(See Notes which are an integral part of the Financial Statements)
46
Mid-Cap Growth Fund (continued)
| | | | | | | | |
| Description | | Shares | | | Value | |
| Common Stocks (continued) | |
| | |
| Financials (continued) | | | | | | |
|
Regional Banks — 1.5% | |
Citizens Financial Group, Inc. (1) | | | 52,105 | | | $ | 1,726,239 | |
| | | | | | | | |
Total Financials | | | | | | | 6,809,024 | |
|
| Healthcare — 15.2% | |
|
Biotechnology — 1.1% | |
Exelixis, Inc. (1)(2) | | | 41,546 | | | | 1,214,805 | |
|
Healthcare Equipment — 4.7% | |
Hill-Rom Holdings, Inc. (1) | | | 25,050 | | | | 1,927,848 | |
Masimo Corp. (2) | | | 19,913 | | | | 1,680,259 | |
Varian Medical Systems, Inc. (1)(2) | | | 16,263 | | | | 1,727,944 | |
| | | | | | | | |
| | | | 5,336,051 | |
|
Healthcare Supplies — 1.7% | |
Align Technology, Inc. (1)(2) | | | 10,908 | | | | 1,927,880 | |
|
Life Sciences Tools & Services — 4.7% | |
Agilent Technologies, Inc. | | | 29,451 | | | | 1,906,069 | |
Bio-Rad Laboratories, Inc., Class A (1)(2) | | | 8,408 | | | | 1,831,430 | |
Waters Corp. (1)(2) | | | 8,706 | | | | 1,597,377 | |
| | | | | | | | |
| | | | 5,334,876 | |
|
Managed Healthcare — 1.8% | |
WellCare Health Plans, Inc. (2) | | | 11,449 | | | | 1,999,911 | |
|
Pharmaceuticals — 1.2% | |
Jazz Pharmaceuticals PLC (1)(2) | | | 9,479 | | | | 1,415,784 | |
| | | | | | | | |
Total Healthcare | | | | 17,229,307 | |
|
| Industrials — 16.2% | |
|
Aerospace & Defense — 1.8% | |
Huntington Ingalls Industries, Inc. | | | 9,331 | | | | 1,996,461 | |
|
Air Freight & Logistics — 1.2% | |
XPO Logistics, Inc. (1)(2) | | | 23,257 | | | | 1,423,328 | |
|
Airlines — 1.1% | |
JetBlue Airways Corp. (1)(2) | | | 64,251 | | | | 1,272,812 | |
|
Building Products — 3.1% | |
Fortune Brands Home & Security, Inc. (1) | | | 24,301 | | | | 1,519,542 | |
Masco Corp. | | | 52,920 | | | | 1,945,868 | |
| | | | | | | | |
| | | | 3,465,410 | |
|
Construction Machinery & Heavy Trucks — 1.5% | |
Cummins, Inc. | | | 11,041 | | | | 1,759,715 | |
|
Diversified Support Services — 1.5% | |
KAR Auction Services, Inc. | | | 37,058 | | | | 1,670,945 | |
|
Electrical Components & Equipment — 1.5% | |
Rockwell Automation, Inc. (1) | | | 10,092 | | | | 1,655,694 | |
|
Industrial Machinery — 2.7% | |
Ingersoll-Rand PLC | | | 19,089 | | | | 1,630,010 | |
Lincoln Electric Holdings, Inc. | | | 15,971 | | | | 1,386,921 | |
| | | | | | | | |
| | | | 3,016,931 | |
|
Trucking — 1.8% | |
Landstar System, Inc. | | | 21,802 | | | | 2,035,217 | |
| | | | | | | | |
Total Industrials | | | | 18,296,513 | |
|
| Information Technology — 28.9% | |
|
Application Software — 3.0% | |
Synopsys, Inc. (2) | | | 21,495 | | | | 1,728,628 | |
Workday, Inc., Class A (1)(2) | | | 14,676 | | | | 1,609,810 | |
| | | | | | | | |
| | | | 3,338,438 | |
| | | | | | | | |
| Description | | Shares | | | Value | |
| Common Stocks (continued) | |
|
| Information Technology (continued) | |
|
Communications Equipment — 1.5% | |
F5 Networks, Inc. (2) | | | 14,385 | | | $ | 1,717,281 | |
|
Consulting & Other Services — 1.7% | |
Gartner, Inc. (1)(2) | | | 15,450 | | | | 1,863,116 | |
|
Data Processing & Outsourced Services — 3.2% | |
Euronet Worldwide, Inc. (1)(2) | | | 19,321 | | | | 1,898,675 | |
MAXIMUS, Inc. (1) | | | 28,494 | | | | 1,731,865 | |
| | | | | | | | |
| | | | 3,630,540 | |
|
Electronic Equipment & Instruments — 1.4% | |
Zebra Technologies Corp., Class A (1)(2) | | | 15,766 | | | | 1,625,317 | |
|
Electronic Manufacturing Services — 1.5% | |
IPG Photonics Corp. (1)(2) | | | 9,794 | | | | 1,721,687 | |
|
Home Entertainment Software — 1.6% | |
Electronic Arts, Inc. (1)(2) | | | 14,889 | | | | 1,809,014 | |
|
Internet Software & Services — 2.8% | |
GoDaddy, Inc., Class A (1)(2) | | | 32,971 | | | | 1,477,760 | |
VeriSign, Inc. (1)(2) | | | 15,855 | | | | 1,644,956 | |
| | | | | | | | |
| | | | 3,122,716 | |
|
Semiconductor Equipment — 3.7% | |
Lam Research Corp. (1) | | | 12,630 | | | | 2,096,327 | |
Teradyne, Inc. (1) | | | 58,550 | | | | 2,084,966 | |
| | | | | | | | |
| | | | 4,181,293 | |
|
Semiconductors — 2.9% | |
Maxim Integrated Products, Inc. (1) | | | 31,210 | | | | 1,456,259 | |
ON Semiconductor Corp. (1)(2) | | | 109,812 | | | | 1,875,589 | |
| | | | | | | | |
| | | | 3,331,848 | |
|
Systems Software — 5.6% | |
Fortinet, Inc. (1)(2) | | | 51,388 | | | | 1,963,022 | |
Red Hat, Inc. (1)(2) | | | 21,401 | | | | 2,300,607 | |
Tableau Software, Inc., Class A (1)(2) | | | 28,510 | | | | 2,066,405 | |
| | | | | | | | |
| | | | 6,330,034 | |
| | | | | | | | |
Total Information Technology | | | | 32,671,284 | |
|
| Materials — 5.4% | |
|
Copper — 1.2% | |
Freeport-McMoRan, Inc. (2) | | | 91,683 | | | | 1,355,075 | |
|
Metal & Glass Containers — 1.6% | |
Berry Global Group, Inc. (2) | | | 31,704 | | | | 1,783,033 | |
|
Specialty Chemicals — 1.4% | |
Axalta Coating Systems, Ltd. (2) | | | 55,635 | | | | 1,642,345 | |
|
Steel — 1.2% | |
Steel Dynamics, Inc. | | | 39,739 | | | | 1,369,008 | |
| | | | | | | | |
Total Materials | | | | 6,149,461 | |
|
| Real Estate — 5.2% | |
|
Office REITs — 2.8% | |
Boston Properties, Inc. (1) | | | 13,988 | | | | 1,686,953 | |
Highwoods Properties, Inc. (1) | | | 27,047 | | | | 1,412,665 | |
| | | | | | | | |
| | | | 3,099,618 | |
|
Residential REITs — 1.1% | |
Essex Property Trust, Inc. (1) | | | 4,659 | | | | 1,239,154 | |
|
Specialized REITs — 1.3% | |
Equinix, Inc. (1) | | | 3,210 | | | | 1,503,596 | |
| | | | | | | | |
Total Real Estate | | | | 5,842,368 | |
(See Notes which are an integral part of the Financial Statements)
47
August 31, 2017
Mid-Cap Growth Fund (continued)
| | | | | | | | |
| Description | | Shares | | | Value | |
| Common Stocks (continued) | | | | | | |
|
| Telecommunication Services — 1.3% | |
|
Alternative Carriers — 1.3% | |
Zayo Group Holdings, Inc. (1)(2) | | | 42,070 | | | $ | 1,437,532 | |
| | | | | | | | |
Total Common Stocks
(identified cost $93,605,992) | | | | 111,118,371 | |
| | | | | | | | |
| Short-Term Investments — 50.8% | |
|
| Collateral Pool Investments for Securities on Loan — 49.1% | |
| | |
Collateral pool allocation (3) | | | | | | | 55,413,816 | |
|
| Mutual Funds — 1.7% | |
BMO Institutional Prime Money Market Fund — Premier Class, 1.080% (4) | | | 1,947,119 | | | | 1,947,313 | |
| | | | | | | | |
Total Short-Term Investments
(identified cost $57,361,129) | | | | | | | 57,361,129 | |
| | | | | | | | |
Total Investments — 149.1%
(identified cost $150,967,121) | | | | | | | 168,479,500 | |
| Other Assets and Liabilities — (49.1)% | | | | (55,456,983 | ) |
| | | | | | | | |
| Total Net Assets — 100.0% | | | $ | 113,022,517 | |
| | | | | | | | |
Small-Cap Value Fund
| | | | | | | | |
| Description | | Shares | | | Value | |
| Common Stocks — 99.2% | | | | | | |
| | |
| Consumer Discretionary — 7.4% | | | | | | |
| | |
Apparel Retail — 1.4% | | | | | | | | |
Children’s Place, Inc. (1) | | | 4,276 | | | $ | 453,897 | |
Express, Inc. (1)(2) | | | 42,593 | | | | 271,318 | |
Genesco, Inc. (2) | | | 6,678 | | | | 141,240 | |
| | | | | | | | |
| | | | | | | 866,455 | |
|
Auto Parts & Equipment — 2.1% | |
Cooper-Standard Holdings, Inc. (1)(2) | | | 5,902 | | | | 593,623 | |
Dana, Inc. | | | 30,989 | | | | 745,905 | |
| | | | | | | | |
| | | | | | | 1,339,528 | |
| | |
Broadcasting — 0.8% | | | | | | | | |
Gray Television, Inc. (1)(2) | | | 35,797 | | | | 511,897 | |
|
Casinos & Gaming — 0.3% | |
Penn National Gaming, Inc. (2) | | | 9,126 | | | | 202,506 | |
|
Education Services — 0.7% | |
American Public Education, Inc. (2) | | | 9,470 | | | | 174,721 | |
K12, Inc. (1)(2) | | | 16,503 | | | | 295,734 | |
| | | | | | | | |
| | | | | | | 470,455 | |
| | |
Footwear — 0.7% | | | | | | | | |
Deckers Outdoor Corp. (1)(2) | | | 7,320 | | | | 467,748 | |
| | |
Homebuilding — 0.9% | | | | | | | | |
KB Home | | | 27,522 | | | | 588,971 | |
| | |
Specialty Stores — 0.5% | | | | | | | | |
Hibbett Sports, Inc. (1)(2) | | | 23,703 | | | | 291,547 | |
| | | | | | | | |
Total Consumer Discretionary | | | | | | | 4,739,107 | |
| | |
| Consumer Staples — 1.8% | | | | | | |
| | |
Agricultural Products — 1.2% | | | | | | | | |
Darling Ingredients, Inc. (2) | | | 45,573 | | | | 792,970 | |
|
Packaged Foods & Meats — 0.6% | |
Dean Foods Co. (1) | | | 31,298 | | | | 344,278 | |
| | | | | | | | |
Total Consumer Staples | | | | | | | 1,137,248 | |
| | | | | | | | |
| Description | | Shares | | | Value | |
| Common Stocks (continued) | | | | | | |
| | |
| Energy — 4.9% | | | | | | |
| | |
Oil & Gas-Drilling — 0.4% | | | | | | | | |
Rowan Cos. PLC (1)(2) | | | 28,974 | | | $ | 282,496 | |
|
Oil & Gas-Equipment & Services — 2.2% | |
Exterran Corp. (2) | | | 15,638 | | | | 433,798 | |
McDermott International, Inc. (1)(2) | | | 81,604 | | | | 501,049 | |
Newpark Resources, Inc. (1)(2) | | | 33,598 | | | | 270,464 | |
U.S. Silica Holdings, Inc. (1) | | | 8,412 | | | | 228,890 | |
| | | | | | | | |
| | | | | | | 1,434,201 | |
|
Oil & Gas-Exploration & Production — 1.4% | |
Callon Petroleum Co. (1)(2) | | | 27,071 | | | | 280,456 | |
Carrizo Oil & Gas, Inc. (1)(2) | | | 7,844 | | | | 105,423 | |
PDC Energy, Inc. (1)(2) | | | 7,675 | | | | 301,858 | |
RSP Permian, Inc. (2) | | | 6,200 | | | | 194,556 | |
| | | | | | | | |
| | | | | | | 882,293 | |
|
Oil & Gas-Refining & Marketing — 0.9% | |
Pacific Ethanol, Inc. (2) | | | 52,976 | | | | 264,880 | |
Renewable Energy Group, Inc. (1)(2) | | | 26,049 | | | | 315,193 | |
| | | | | | | | |
| | | | 580,073 | |
| | | | | | | | |
Total Energy | | | | 3,179,063 | |
|
| Financials — 27.0% | |
|
Consumer Finance — 0.5% | |
Nelnet, Inc., Class A (1) | | | 7,039 | | | | 333,860 | |
|
Investment Banking & Brokerage — 0.4% | |
Stifel Financial Corp. (1) | | | 5,622 | | | | 268,451 | |
|
Life & Health Insurance — 2.3% | |
American Equity Investment Life Holding Co. (1) | | | 24,868 | | | | 690,335 | |
CNO Financial Group, Inc. | | | 36,225 | | | | 809,629 | |
| | | | | | | | |
| | | | 1,499,964 | |
|
Property & Casualty Insurance — 3.5% | |
Argo Group International Holdings, Ltd. | | | 9,877 | | | | 594,596 | |
Employers Holdings, Inc. | | | 13,095 | | | | 551,954 | |
HCI Group, Inc. (1) | | | 10,092 | | | | 393,487 | |
Safety Insurance Group, Inc. (1) | | | 2,396 | | | | 171,074 | |
Selective Insurance Group, Inc. | | | 10,100 | | | | 509,040 | |
| | | | | | | | |
| | | | 2,220,151 | |
|
Regional Banks — 16.6% | |
1st Source Corp. (1) | | | 7,911 | | | | 369,206 | |
BancFirst Corp. | | | 5,996 | | | | 302,198 | |
BancorpSouth, Inc. (1) | | | 23,213 | | | | 674,338 | |
Banner Corp. | | | 9,633 | | | | 530,971 | |
Cathay General Bancorp (1) | | | 19,848 | | | | 700,039 | |
Central Pacific Financial Corp. (1) | | | 18,811 | | | | 545,519 | |
City Holding Co. (1) | | | 6,404 | | | | 405,565 | |
Customers Bancorp, Inc. (1)(2) | | | 15,757 | | | | 444,032 | |
Fidelity Southern Corp. | | | 9,718 | | | | 212,436 | |
Financial Institutions, Inc. | | | 6,523 | | | | 177,426 | |
First Interstate BancSystem, Inc., Class A | | | 9,782 | | | | 344,326 | |
Great Southern Bancorp, Inc. | | | 2,762 | | | | 137,548 | |
Hanmi Financial Corp. | | | 17,811 | | | | 475,554 | |
Heartland Financial USA, Inc. | | | 10,173 | | | | 462,872 | |
Heritage Financial Corp. | | | 10,220 | | | | 267,253 | |
Hilltop Holdings, Inc. (1) | | | 25,108 | | | | 594,306 | |
Independent Bank Corp. | | | 7,686 | | | | 156,794 | |
Investors Bancorp, Inc. | | | 26,468 | | | | 346,466 | |
Peapack Gladstone Financial Corp. | | | 5,148 | | | | 156,860 | |
Peoples Bancorp, Inc. | | | 5,036 | | | | 156,418 | |
Preferred Bank (1) | | | 8,849 | | | | 476,076 | |
S&T Bancorp, Inc. | | | 4,461 | | | | 160,328 | |
(See Notes which are an integral part of the Financial Statements)
48
Small-Cap Value Fund (continued)
| | | | | | | | |
| Description | | Shares | | | Value | |
| Common Stocks (continued) | |
|
| Financials (continued) | |
|
Regional Banks (continued) | |
Sandy Spring Bancorp, Inc. | | | 7,152 | | | $ | 275,853 | |
TriCo Bancshares | | | 6,961 | | | | 247,672 | |
Umpqua Holdings Corp. (1) | | | 43,897 | | | | 768,198 | |
United Community Banks, Inc. (1) | | | 19,456 | | | | 507,996 | |
Wintrust Financial Corp. (1) | | | 10,098 | | | | 735,235 | |
| | | | | | | | |
| | | | 10,631,485 | |
|
Thrifts & Mortgage Finance — 3.7% | |
First Defiance Financial Corp. | | | 3,483 | | | | 170,528 | |
HomeStreet, Inc. (1)(2) | | | 18,616 | | | | 470,054 | |
NMI Holdings, Inc., Class A (2) | | | 16,388 | | | | 177,810 | |
TrustCo Bank Corp. | | | 33,571 | | | | 265,211 | |
Walker & Dunlop, Inc. (1)(2) | | | 12,001 | | | | 578,328 | |
Washington Federal, Inc. (1) | | | 23,061 | | | | 720,656 | |
| | | | | | | | |
| | | | 2,382,587 | |
| | | | | | | | |
Total Financials | | | | 17,336,498 | |
|
| Healthcare — 9.1% | |
|
Biotechnology — 2.1% | |
Emergent BioSolutions, Inc. (1)(2) | | | 11,040 | | | | 412,123 | |
Enanta Pharmaceuticals, Inc. (1)(2) | | | 9,006 | | | | 385,997 | |
Myriad Genetics, Inc. (1)(2) | | | 18,201 | | | | 554,949 | |
| | | | | | | | |
| | | | 1,353,069 | |
|
Healthcare Equipment — 2.4% | |
Analogic Corp. | | | 5,147 | | | | 368,268 | |
AngioDynamics, Inc. (1)(2) | | | 12,572 | | | | 214,101 | |
Integer Holdings Corp. (2) | | | 10,049 | | | | 461,752 | |
Natus Medical, Inc. (1)(2) | | | 9,584 | | | | 322,022 | |
Orthofix International NV (1)(2) | | | 4,004 | | | | 197,037 | |
| | | | | | | | |
| | | | 1,563,180 | |
|
Healthcare Supplies — 1.1% | |
Anika Therapeutics, Inc. (1)(2) | | | 4,087 | | | | 219,472 | |
Merit Medical Systems, Inc. (2) | | | 11,125 | | | | 459,462 | |
| | | | | | | | |
| | | | 678,934 | |
|
Healthcare Technology — 0.4% | |
Allscripts Healthcare Solutions, Inc. (2) | | | 20,331 | | | | 267,149 | |
|
Life Sciences Tools & Services — 0.7% | |
Luminex Corp. (1) | | | 21,943 | | | | 424,158 | |
|
Managed Healthcare — 0.8% | |
Magellan Health, Inc. (2) | | | 4,339 | | | | 351,025 | |
Triple-S Management Corp., Class B (2) | | | 7,709 | | | | 190,490 | |
| | | | | | | | |
| | | | 541,515 | |
|
Pharmaceuticals — 1.6% | |
Innoviva, Inc. (1)(2) | | | 19,579 | | | | 274,889 | |
Phibro Animal Health Corp., Class A | | | 14,643 | | | | 519,827 | |
Sucampo Pharmaceuticals, Inc., Class A (1)(2) | | | 19,663 | | | | 231,040 | |
| | | | | | | | |
| | | | 1,025,756 | |
| | | | | | | | |
Total Healthcare | | | | 5,853,761 | |
|
| Industrials — 14.6% | |
|
Aerospace & Defense — 1.4% | |
KLX, Inc. (1)(2) | | | 6,256 | | | | 299,913 | |
Moog, Inc., Class A (1)(2) | | | 8,152 | | | | 625,747 | |
| | | | | | | | |
| | | | 925,660 | |
| | | | | | | | |
| Description | | Shares | | | Value | |
| Common Stocks (continued) | |
|
| Industrials (continued) | |
|
Airlines — 0.7% | |
Hawaiian Holdings, Inc. (1)(2) | | | 9,809 | | | $ | 420,316 | |
|
Construction & Engineering — 1.0% | |
EMCOR Group, Inc. (1) | | | 9,945 | | | | 656,768 | |
|
Construction Machinery & Heavy Trucks — 1.8% | |
Greenbrier Cos., Inc. (1) | | | 14,020 | | | | 601,458 | |
Wabash National Corp. (1) | | | 26,890 | | | | 565,228 | |
| | | | | | | | |
| | | | 1,166,686 | |
|
Environmental & Facilities Services — 0.2% | |
CECO Environmental Corp. (1) | | | 16,063 | | | | 119,991 | |
|
Human Resource & Employment Services — 0.9% | |
TrueBlue, Inc. (2) | | | 27,746 | | | | 567,406 | |
|
Industrial Machinery — 2.3% | |
Chart Industries, Inc. (1)(2) | | | 10,329 | | | | 348,501 | |
Columbus McKinnon Corp. (1) | | | 7,780 | | | | 256,973 | |
EnPro Industries, Inc. | | | 5,239 | | | | 369,192 | |
Global Brass & Copper Holdings, Inc. (1) | | | 10,889 | | | | 325,037 | |
Hyster-Yale Materials Handling, Inc. | | | 2,741 | | | | 195,104 | |
| | | | | | | | |
| | | | 1,494,807 | |
|
Office Services & Supplies — 1.5% | |
ACCO Brands Corp. (2) | | | 42,071 | | | | 460,677 | |
Herman Miller, Inc. | | | 8,760 | | | | 294,774 | |
Kimball International, Inc., Class B | | | 13,534 | | | | 229,537 | |
| | | | | | | | |
| | | | 984,988 | |
|
Research & Consulting Services — 1.2% | |
Navigant Consulting, Inc. (2) | | | 13,637 | | | | 209,055 | |
RPX Corp. (2) | | | 42,316 | | | | 552,647 | |
| | | | | | | | |
| | | | 761,702 | |
|
Security & Alarm Services — 0.7% | |
Brink’s Co. (1) | | | 5,320 | | | | 417,354 | |
|
Trading Companies & Distributors — 1.8% | |
Aircastle, Ltd. (1) | | | 23,868 | | | | 535,120 | |
Rush Enterprises, Inc., Class A (2) | | | 15,217 | | | | 623,745 | |
| | | | | | | | |
| | | | 1,158,865 | |
|
Trucking — 1.1% | |
ArcBest Corp. (1) | | | 24,122 | | | | 716,423 | |
| | | | | | | | |
Total Industrials | | | | 9,390,966 | |
|
| Information Technology — 10.8% | |
|
Data Processing & Outsourced Services — 2.1% | |
Convergys Corp. (1) | | | 27,063 | | | | 635,981 | |
Travelport Worldwide, Ltd. | | | 44,294 | | | | 670,611 | |
| | | | | | | | |
| | | | 1,306,592 | |
|
Electronic Components — 1.9% | |
Rogers Corp. (2) | | | 3,878 | | | | 459,737 | |
Vishay Intertechnology, Inc. (1) | | | 43,532 | | | | 770,516 | |
| | | | | | | | |
| | | | 1,230,253 | |
|
Electronic Manufacturing Services — 1.8% | |
Benchmark Electronics, Inc. (2) | | | 20,132 | | | | 654,290 | |
TTM Technologies, Inc. (1)(2) | | | 35,840 | | | | 510,362 | |
| | | | | | | | |
| | | | 1,164,652 | |
|
Semiconductor Equipment — 2.6% | |
Cohu, Inc. (1) | | | 19,091 | | | | 358,147 | |
Entegris, Inc. (2) | | | 24,275 | | | | 617,799 | |
Photronics, Inc. (1)(2) | | | 27,364 | | | | 216,176 | |
Rudolph Technologies, Inc. (2) | | | 21,145 | | | | 469,419 | |
| | | | | | | | |
| | | | 1,661,541 | |
(See Notes which are an integral part of the Financial Statements)
49
August 31, 2017
Small-Cap Value Fund (continued)
| | | | | | | | |
| Description | | Shares | | | Value | |
| Common Stocks (continued) | | | | | | |
|
| Information Technology (continued) | |
|
Semiconductors — 1.0% | |
Diodes, Inc. (2) | | | 23,266 | | | $ | 654,705 | |
|
Systems Software — 0.8% | |
Progress Software Corp. | | | 15,784 | | | | 530,027 | |
|
Technology Distributors — 0.6% | |
ScanSource, Inc. (2) | | | 10,098 | | | | 396,346 | |
| | | | | | | | |
Total Information Technology | | | | 6,944,116 | |
|
| Materials — 7.1% | |
|
Aluminum — 0.9% | |
Kaiser Aluminum Corp. | | | 6,295 | | | | 606,334 | |
|
Commodity Chemicals — 1.4% | |
Koppers Holdings, Inc. (2) | | | 12,748 | | | | 499,722 | |
Trinseo SA (1) | | | 2,336 | | | | 156,278 | |
Tronox, Ltd., Class A | | | 11,012 | | | | 227,838 | |
| | | | | | | | |
| | | | 883,838 | |
|
Forest Products — 1.7% | |
Boise Cascade Co. (2) | | | 19,220 | | | | 576,600 | |
Louisiana-Pacific Corp. (2) | | | 20,655 | | | | 526,290 | |
| | | | | | | | |
| | | | 1,102,890 | |
|
Specialty Chemicals — 3.1% | |
A Schulman, Inc. | | | 7,777 | | | | 236,421 | |
Kraton Corp. (2) | | | 15,604 | | | | 512,279 | |
Minerals Technologies, Inc. | | | 7,954 | | | | 509,056 | |
OMNOVA Solutions, Inc. (2) | | | 16,971 | | | | 147,648 | |
Stepan Co. | | | 7,179 | | | | 555,367 | |
| | | | | | | | |
| | | | 1,960,771 | |
| | | | | | | | |
Total Materials | | | | 4,553,833 | |
|
| Real Estate — 10.2% | |
|
Diversified REITs — 1.6% | |
American Assets Trust, Inc. | | | 15,514 | | | | 630,179 | |
Select Income REIT (1) | | | 18,535 | | | | 430,197 | |
| | | | | | | | |
| | | | 1,060,376 | |
|
Hotel & Resort REITs — 2.4% | |
Ashford Hospitality Prime, Inc. (1) | | | 28,079 | | | | 270,120 | |
Chesapeake Lodging Trust (1) | | | 24,840 | | | | 635,656 | |
Xenia Hotels & Resorts, Inc. | | | 33,051 | | | | 659,698 | |
| | | | | | | | |
| | | | 1,565,474 | |
|
Industrial REITs — 2.0% | |
DCT Industrial Trust, Inc. (1) | | | 9,503 | | | | 554,500 | |
First Industrial Realty Trust, Inc. | | | 22,700 | | | | 703,246 | |
| | | | | | | | |
| | | | 1,257,746 | |
|
Office REITs — 1.3% | |
Mack-Cali Realty Corp. (1) | | | 27,717 | | | | 634,442 | |
Tier REIT, Inc. | | | 11,617 | | | | 213,869 | |
| | | | | | | | |
| | | | 848,311 | |
|
Residential REITs — 1.0% | |
Preferred Apartment Communities, Inc., Class A (1) | | | 33,885 | | | | 616,368 | |
|
Retail REITs — 0.3% | |
Saul Centers, Inc. (1) | | | 3,497 | | | | 211,918 | |
| | | | | | | | |
| Description | | Shares | | | Value | |
| Common Stocks (continued) | | | | | | |
|
| Real Estate (continued) | |
|
Specialized REITs — 1.6% | |
EPR Properties (1) | | | 4,992 | | | $ | 347,743 | |
Pebblebrook Hotel Trust (1) | | | 20,398 | | | | 685,169 | |
| | | | | | | | |
| | | | 1,032,912 | |
| | | | | | | | |
Total Real Estate | | | | 6,593,105 | |
|
| Utilities — 6.3% | |
|
Electric Utilities — 3.7% | |
El Paso Electric Co. (1) | | | 13,458 | | | | 747,592 | |
PNM Resources, Inc. (1) | | | 19,628 | | | | 832,227 | |
Portland General Electric Co. | | | 16,731 | | | | 794,890 | |
| | | | | | | | |
| | | | 2,374,709 | |
|
Gas Utilities — 1.2% | |
Southwest Gas Holdings, Inc. | | | 9,754 | | | | 775,638 | |
|
Multi-Utilities — 1.1% | |
NorthWestern Corp. (1) | | | 11,494 | | | | 693,318 | |
|
Renewable Electricity — 0.3% | |
Pattern Energy Group, Inc. | | | 7,950 | | | | 199,704 | |
| | | | | | | | |
Total Utilities | | | | 4,043,369 | |
| | | | | | | | |
Total Common Stocks
(identified cost $58,459,807) | | | | 63,771,066 | |
| | | | | | | | |
| Short-Term Investments — 24.5% | |
|
| Collateral Pool Investments for Securities on Loan — 23.6% | |
| |
Collateral pool allocation (3) | | | | 15,189,775 | |
|
| Mutual Funds — 0.9% | |
BMO Institutional Prime Money Market Fund — Premier Class, 1.080% (4) | | | 588,503 | | | | 588,562 | |
| | | | | | | | |
Total Short-Term Investments
(identified cost $15,778,337) | | | | 15,778,337 | |
| | | | | | | | |
Total Investments — 123.7%
(identified cost $74,238,144) | | | | 79,549,403 | |
| Other Assets and Liabilities — (23.7)% | | | | (15,263,871 | ) |
| | | | | | | | |
| Total Net Assets — 100.0% | | | $ | 64,285,532 | |
| | | | | | | | |
Small-Cap Core Fund
| | | | | | | | |
| Description | | Shares | | | Value | |
| Common Stocks — 98.1% | | | | | | |
| | |
| Consumer Discretionary — 9.3% | | | | | | |
| | |
Apparel Retail — 1.5% | | | | | | | | |
Children’s Place, Inc. (1) | | | 954 | | | $ | 101,267 | |
DSW, Inc., Class A (1) | | | 4,895 | | | | 90,704 | |
Express, Inc. (1)(2) | | | 8,969 | | | | 57,133 | |
Francesca’s Holdings Corp. (1)(2) | | | 5,499 | | | | 39,923 | |
| | | | | | | | |
| | | | | | | 289,027 | |
|
Apparel, Accessories & Luxury Goods — 0.5% | |
Movado Group, Inc. | | | 3,326 | | | | 92,296 | |
| | |
Auto Parts & Equipment — 2.7% | | | | | | | | |
Cooper-Standard Holdings, Inc. (1)(2) | | | 1,393 | | | | 140,108 | |
Dana, Inc. (1) | | | 8,642 | | | | 208,013 | |
Tenneco, Inc. (1) | | | 3,430 | | | | 185,906 | |
| | | | | | | | |
| | | | | | | 534,027 | |
| | |
Broadcasting — 0.7% | | | | | | | | |
Gray Television, Inc. (1)(2) | | | 9,472 | | | | 135,450 | |
(See Notes which are an integral part of the Financial Statements)
50
Small-Cap Core Fund (continued)
| | | | | | | | |
| Description | | Shares | | | Value | |
| Common Stocks (continued) | | | | | | |
|
| Consumer Discretionary (continued) | |
|
Casinos & Gaming — 0.8% | |
Penn National Gaming, Inc. (1)(2) | | | 3,363 | | | $ | 74,625 | |
Pinnacle Entertainment, Inc. (1)(2) | | | 4,442 | | | | 86,619 | |
| | | | | | | | |
| | | | | | | 161,244 | |
|
Education Services — 0.3% | |
American Public Education, Inc. (2) | | | 3,511 | | | | 64,778 | |
|
Footwear — 0.3% | |
Deckers Outdoor Corp. (1)(2) | | | 1,049 | | | | 67,031 | |
|
General Merchandise Stores — 0.3% | |
Big Lots, Inc. (1) | | | 1,330 | | | | 63,308 | |
|
Homebuilding — 0.8% | |
KB Home (1) | | | 7,635 | | | | 163,389 | |
|
Homefurnishing Retail — 0.3% | |
Haverty Furniture Cos., Inc. (1) | | | 2,434 | | | | 57,077 | |
|
Leisure Products — 0.6% | |
Malibu Boats, Inc., Class A (1)(2) | | | 4,408 | | | | 118,884 | |
|
Restaurants — 0.5% | |
BJ’s Restaurants, Inc. (2) | | | 3,010 | | | | 90,601 | |
| | | | | | | | |
Total Consumer Discretionary | | | | 1,837,112 | |
| | |
| Consumer Staples — 2.2% | | | | | | |
|
Agricultural Products — 1.1% | |
Darling Ingredients, Inc. (2) | | | 11,905 | | | | 207,147 | |
|
Food Distributors — 0.3% | |
SpartanNash Co. (1) | | | 2,559 | | | | 63,054 | |
|
Packaged Foods & Meats — 0.8% | |
Sanderson Farms, Inc. (1) | | | 1,075 | | | | 158,584 | |
| | | | | | | | |
Total Consumer Staples | | | | 428,785 | |
| | |
| Energy — 2.0% | | | | | | |
|
Oil & Gas-Drilling — 0.5% | |
Rowan Cos. PLC (1)(2) | | | 9,885 | | | | 96,379 | |
|
Oil & Gas-Equipment & Services — 1.1% | |
McDermott International, Inc. (1)(2) | | | 25,788 | | | | 158,338 | |
U.S. Silica Holdings, Inc. (1) | | | 2,145 | | | | 58,366 | |
| | | | | | | | |
| | | | 216,704 | |
|
Oil & Gas-Refining & Marketing — 0.4% | |
Renewable Energy Group, Inc. (1)(2) | | | 6,592 | | | | 79,763 | |
| | | | | | | | |
Total Energy | | | | 392,846 | |
|
| Financials — 15.6% | |
|
Consumer Finance — 0.5% | |
Nelnet, Inc., Class A | | | 2,008 | | | | 95,240 | |
|
Investment Banking & Brokerage — 0.4% | |
Evercore Inc., Class A (1) | | | 1,214 | | | | 91,596 | |
|
Life & Health Insurance — 2.7% | |
American Equity Investment Life Holding Co. (1) | | | 5,643 | | | | 156,650 | |
CNO Financial Group, Inc. | | | 8,406 | | | | 187,874 | |
Primerica, Inc. (1) | | | 2,492 | | | | 190,762 | |
| | | | | | | | |
| | | | 535,286 | |
|
Property & Casualty Insurance — 2.1% | |
Argo Group International Holdings, Ltd. (1) | | | 1,675 | | | | 100,835 | |
Employers Holdings, Inc. | | | 4,569 | | | | 192,583 | |
Selective Insurance Group, Inc. | | | 2,340 | | | | 117,936 | |
| | | | | | | | |
| | | | 411,354 | |
| | | | | | | | |
| Description | | Shares | | | Value | |
| Common Stocks (continued) | | | | | | |
|
| Financials (continued) | |
|
Regional Banks — 7.5% | |
1st Source Corp. (1) | | | 2,022 | | | $ | 94,367 | |
BancFirst Corp. (1) | | | 1,782 | | | | 89,813 | |
BancorpSouth, Inc. | | | 2,921 | | | | 84,855 | |
Bryn Mawr Bank Corp. (1) | | | 1,477 | | | | 60,483 | |
Cathay General Bancorp (1) | | | 3,531 | | | | 124,538 | |
Central Pacific Financial Corp. | | | 5,500 | | | | 159,500 | |
First Financial Corp. | | | 1,262 | | | | 54,771 | |
Hanmi Financial Corp. | | | 4,812 | | | | 128,480 | |
Heartland Financial USA, Inc. | | | 1,852 | | | | 84,266 | |
Heritage Financial Corp. | | | 3,344 | | | | 87,446 | |
Hilltop Holdings, Inc. (1) | | | 5,398 | | | | 127,771 | |
Investors Bancorp, Inc. | | | 12,550 | | | | 164,279 | |
Preferred Bank (1) | | | 2,886 | | | | 155,267 | |
TriCo Bancshares | | | 1,729 | | | | 61,518 | |
| | | | | | | | |
| | | | 1,477,354 | |
|
Thrifts & Mortgage Finance — 2.4% | |
HomeStreet, Inc. (1)(2) | | | 2,437 | | | | 61,534 | |
TrustCo Bank Corp. (1) | | | 7,208 | | | | 56,943 | |
Walker & Dunlop, Inc. (1)(2) | | | 3,814 | | | | 183,797 | |
Washington Federal, Inc. (1) | | | 5,267 | | | | 164,594 | |
| | | | | | | | |
| | | | 466,868 | |
| | | | | | | | |
Total Financials | | | | 3,077,698 | |
|
| Healthcare — 18.6% | |
|
Biotechnology — 3.3% | |
BioSpecifics Technologies Corp. (2) | | | 1,423 | | | | 67,094 | |
Cytokinetics, Inc. (1)(2) | | | 7,256 | | | | 107,752 | |
Emergent BioSolutions, Inc. (1)(2) | | | 4,044 | | | | 150,963 | |
Genomic Health, Inc. (1)(2) | | | 2,983 | | | | 94,561 | |
Ironwood Pharmaceuticals, Inc. (1)(2) | | | 2,635 | | | | 42,028 | |
Myriad Genetics, Inc. (1)(2) | | | 4,265 | | | | 130,040 | |
Versartis, Inc. (1)(2) | | | 3,223 | | | | 61,237 | |
| | | | | | | | |
| | | | 653,675 | |
|
Healthcare Equipment — 4.3% | |
Cardiovascular Systems, Inc. (1)(2) | | | 3,720 | | | | 109,256 | |
Cutera, Inc. (2) | | | 2,526 | | | | 93,841 | |
Globus Medical, Inc., Class A (1)(2) | | | 5,430 | | | | 164,149 | |
Inogen, Inc. (1)(2) | | | 1,450 | | | | 138,910 | |
Integer Holdings Corp. (1)(2) | | | 1,664 | | | | 76,461 | |
LeMaitre Vascular, Inc. (1) | | | 3,567 | | | | 129,839 | |
Masimo Corp. (2) | | | 1,541 | | | | 130,030 | |
| | | | | | | | |
| | | | 842,486 | |
|
Healthcare Supplies — 1.6% | |
Anika Therapeutics, Inc. (1)(2) | | | 2,156 | | | | 115,777 | |
OraSure Technologies, Inc. (1)(2) | | | 9,129 | | | | 186,323 | |
| | | | | | | | |
| | | | 302,100 | |
|
Healthcare Technology — 1.1% | |
HealthStream, Inc. (1)(2) | | | 3,564 | | | | 83,718 | |
Medidata Solutions, Inc. (1)(2) | | | 1,730 | | | | 129,681 | |
| | | | | | | | |
| | | | 213,399 | |
|
Life Sciences Tools & Services — 2.6% | |
Cambrex Corp. (1)(2) | | | 3,050 | | | | 158,905 | |
INC Research Holdings, Inc. (1)(2) | | | 2,537 | | | | 148,922 | |
PRA Health Sciences, Inc. (2) | | | 2,634 | | | | 203,872 | |
| | | | | | | | |
| | | | 511,699 | |
|
Managed Healthcare — 1.5% | |
Magellan Health, Inc. (2) | | | 2,637 | | | | 213,333 | |
Molina Healthcare, Inc. (1)(2) | | | 1,339 | | | | 85,696 | |
| | | | | | | | |
| | | | 299,029 | |
(See Notes which are an integral part of the Financial Statements)
51
August 31, 2017
Small-Cap Core Fund (continued)
| | | | | | | | |
| Description | | Shares | | | Value | |
| Common Stocks (continued) | | | | | | |
|
| Healthcare (continued) | |
|
Pharmaceuticals — 4.2% | |
Catalent, Inc. (2) | | | 2,603 | | | $ | 107,478 | |
Corcept Therapeutics, Inc. (1)(2) | | | 10,414 | | | | 173,601 | |
Heska Corp. (1)(2) | | | 1,236 | | | | 125,726 | |
Pacira Pharmaceuticals, Inc. (1)(2) | | | 3,451 | | | | 131,483 | |
Phibro Animal Health Corp., Class A (1) | | | 3,797 | | | | 134,793 | |
Supernus Pharmaceuticals, Inc. (1)(2) | | | 3,432 | | | | 157,186 | |
| | | | | | | | |
| | | | 830,267 | |
| | | | | | | | |
Total Healthcare | | | | 3,652,655 | |
|
| Industrials — 14.8% | |
|
Airlines — 0.9% | |
Hawaiian Holdings, Inc. (1)(2) | | | 4,220 | | | | 180,827 | |
|
Construction & Engineering — 1.8% | |
Argan, Inc. (1) | | | 2,371 | | | | 150,203 | |
EMCOR Group, Inc. | | | 2,509 | | | | 165,694 | |
MYR Group, Inc. (2) | | | 1,604 | | | | 41,399 | |
| | | | | | | | |
| | | | 357,296 | |
|
Construction Machinery & Heavy Trucks — 1.8% | |
Greenbrier Cos., Inc. (1) | | | 3,821 | | | | 163,921 | |
Wabash National Corp. (1) | | | 8,613 | | | | 181,045 | |
| | | | | | | | |
| | | | 344,966 | |
|
Environmental & Facilities Services — 0.3% | |
CECO Environmental Corp. (1) | | | 8,064 | | | | 60,238 | |
|
Human Resource & Employment Services — 0.8% | |
TrueBlue, Inc. (2) | | | 7,249 | | | | 148,242 | |
|
Industrial Machinery — 1.9% | |
Briggs & Stratton Corp. | | | 5,700 | | | | 119,358 | |
Chart Industries, Inc. (1)(2) | | | 3,196 | | | | 107,833 | |
Global Brass & Copper Holdings, Inc. | | | 2,725 | | | | 81,341 | |
Hyster-Yale Materials Handling, Inc. | | | 887 | | | | 63,137 | |
| | | | | | | | |
| | | | 371,669 | |
|
Office Services & Supplies — 1.3% | |
ACCO Brands Corp. (2) | | | 7,549 | | | | 82,662 | |
Herman Miller, Inc. (1) | | | 5,445 | | | | 183,224 | |
| | | | | | | | |
| | | | 265,886 | |
|
Research & Consulting Services — 0.8% | |
RPX Corp. (2) | | | 11,538 | | | | 150,686 | |
|
Security & Alarm Services — 1.0% | |
Brink’s Co. | | | 2,569 | | | | 201,538 | |
|
Trading Companies & Distributors — 2.3% | |
H&E Equipment Services, Inc. | | | 6,456 | | | | 151,974 | |
MRC Global, Inc. (1)(2) | | | 7,319 | | | | 115,421 | |
Rush Enterprises, Inc., Class A (1)(2) | | | 4,637 | | | | 190,071 | |
| | | | | | | | |
| | | | 457,466 | |
|
Trucking — 1.9% | |
ArcBest Corp. | | | 5,733 | | | | 170,270 | |
Saia, Inc. (1)(2) | | | 3,587 | | | | 202,845 | |
| | | | | | | | |
| | | | 373,115 | |
| | | | | | | | |
Total Industrials | | | | 2,911,929 | |
|
| Information Technology — 20.3% | |
|
Application Software — 1.5% | |
RealPage, Inc. (1)(2) | | | 3,255 | | | | 140,291 | |
Verint Systems, Inc. (2) | | | 3,695 | | | | 146,691 | |
| | | | | | | | |
| | | | 286,982 | |
| | | | | | | | |
| Description | | Shares | | | Value | |
| Common Stocks (continued) | | | | | | |
|
| Information Technology (continued) | |
|
Communications Equipment — 1.7% | |
Ciena Corp. (1)(2) | | | 6,596 | | | $ | 142,540 | |
Plantronics, Inc. (1) | | | 3,224 | | | | 137,439 | |
Silicom, Ltd. | | | 1,125 | | | | 61,537 | |
| | | | | | | | |
| | | | 341,516 | |
|
Consulting & Other Services — 0.3% | |
Hackett Group, Inc. | | | 4,104 | | | | 56,061 | |
|
Data Processing & Outsourced Services — 3.0% | |
Cardtronics PLC (2) | | | 3,417 | | | | 88,774 | |
Convergys Corp. (1) | | | 4,896 | | | | 115,056 | |
CSG Systems International, Inc. (1) | | | 3,198 | | | | 123,795 | |
Sykes Enterprises, Inc. (2) | | | 1,396 | | | | 37,217 | |
Travelport Worldwide, Ltd. | | | 14,523 | | | | 219,878 | |
| | | | | | | | |
| | | | 584,720 | |
|
Electronic Components — 1.8% | |
Rogers Corp. (2) | | | 1,576 | | | | 186,835 | |
Vishay Intertechnology, Inc. (1) | | | 9,118 | | | | 161,388 | |
| | | | | | | | |
| | | | 348,223 | |
|
Electronic Equipment & Instruments — 1.0% | |
Control4 Corp. (1)(2) | | | 2,588 | | | | 64,079 | |
Itron, Inc. (1)(2) | | | 1,955 | | | | 141,933 | |
| | | | | | | | |
| | | | 206,012 | |
|
Electronic Manufacturing Services — 3.0% | |
Benchmark Electronics, Inc. (2) | | | 5,607 | | | | 182,227 | |
Methode Electronics, Inc. | | | 3,886 | | | | 158,937 | |
Sanmina Corp. (2) | | | 3,295 | | | | 123,398 | |
TTM Technologies, Inc. (1)(2) | | | 9,032 | | | | 128,616 | |
| | | | | | | | |
| | | | 593,178 | |
|
Internet Software & Services — 0.3% | |
Blucora, Inc. (1)(2) | | | 2,167 | | | | 49,407 | |
|
Semiconductor Equipment — 4.1% | |
Amkor Technology, Inc. (1)(2) | | | 14,104 | | | | 123,833 | |
Brooks Automation, Inc. (1) | | | 3,860 | | | | 100,630 | |
Entegris, Inc. (2) | | | 8,605 | | | | 218,997 | |
MKS Instruments, Inc. | | | 967 | | | | 79,633 | |
Photronics, Inc. (1)(2) | | | 13,534 | | | | 106,919 | |
Rudolph Technologies, Inc. (1)(2) | | | 7,576 | | | | 168,187 | |
| | | | | | | | |
| | | | 798,199 | |
|
Semiconductors — 1.6% | |
Diodes, Inc. (2) | | | 2,881 | | | | 81,071 | |
Integrated Device Technology, Inc. (1)(2) | | | 6,194 | | | | 153,054 | |
Silicon Laboratories, Inc. (1)(2) | | | 1,143 | | | | 86,754 | |
| | | | | | | | |
| | | | 320,879 | |
|
Systems Software — 2.0% | |
Barracuda Networks, Inc. (1)(2) | | | 4,393 | | | | 106,355 | |
CommVault Systems, Inc. (2) | | | 1,960 | | | | 119,658 | |
Progress Software Corp. | | | 5,106 | | | | 171,459 | |
| | | | | | | | |
| | | | 397,472 | |
| | | | | | | | |
Total Information Technology | | | | 3,982,649 | |
|
| Materials — 6.0% | |
|
Commodity Chemicals — 1.7% | |
Koppers Holdings, Inc. (2) | | | 4,246 | | | | 166,443 | |
Trinseo SA (1) | | | 2,655 | | | | 177,619 | |
| | | | | | | | |
| | | | 344,062 | |
|
Forest Products — 1.9% | |
Boise Cascade Co. (1)(2) | | | 5,511 | | | | 165,330 | |
Louisiana-Pacific Corp. (2) | | | 8,052 | | | | 205,165 | |
| | | | | | | | |
| | | | 370,495 | |
(See Notes which are an integral part of the Financial Statements)
52
Small-Cap Core Fund (continued)
| | | | | | | | |
| Description | | Shares | | | Value | |
| Common Stocks (continued) | | | | | | |
|
| Materials (continued) | |
|
Metal & Glass Containers — 0.7% | |
Berry Global Group, Inc. (2) | | | 2,533 | | | $ | 142,456 | |
|
Specialty Chemicals — 1.7% | |
Kraton Corp. (1)(2) | | | 4,205 | | | | 138,050 | |
Minerals Technologies, Inc. | | | 1,617 | | | | 103,488 | |
OMNOVA Solutions, Inc. (2) | | | 9,714 | | | | 84,512 | |
| | | | | | | | |
| | | | 326,050 | |
| | | | | | | | |
Total Materials | | | | 1,183,063 | |
|
| Real Estate — 5.9% | |
|
Diversified REITs — 1.6% | |
American Assets Trust, Inc. | | | 2,754 | | | | 111,868 | |
PS Business Parks, Inc. | | | 682 | | | | 92,145 | |
Select Income REIT (1) | | | 4,982 | | | | 115,632 | |
| | | | | | | | |
| | | | 319,645 | |
|
Hotel & Resort REITs — 2.0% | |
Chesapeake Lodging Trust (1) | | | 5,295 | | | | 135,499 | |
Ashford Hospitality Prime, Inc. (1) | | | 7,399 | | | | 71,178 | |
Xenia Hotels & Resorts, Inc. | | | 8,712 | | | | 173,892 | |
| | | | | | | | |
| | | | 380,569 | |
|
Industrial REITs — 0.6% | |
First Industrial Realty Trust, Inc. | | | 3,775 | | | | 116,949 | |
|
Office REITs — 0.8% | |
Mack-Cali Realty Corp. (1) | | | 7,106 | | | | 162,656 | |
|
Residential REITs — 0.9% | |
Preferred Apartment Communities, Inc., Class A | | | 9,735 | | | | 177,080 | |
| | | | | | | | |
Total Real Estate | | | | 1,156,899 | |
|
| Telecommunication Services — 0.8% | |
|
Alternative Carriers — 0.8% | |
Cogent Communications Holdings, Inc. (1) | | | 3,398 | | | | 158,347 | |
|
| Utilities — 2.6% | |
|
Electric Utilities — 2.1% | |
El Paso Electric Co. | | | 3,511 | | | | 195,036 | |
Portland General Electric Co. | | | 4,415 | | | | 209,757 | |
| | | | | | | | |
| | | | 404,793 | |
|
Gas Utilities — 0.5% | |
Southwest Gas Holdings, Inc. | | | 1,299 | | | | 103,296 | |
| | | | | | | | |
Total Utilities | | | | 508,089 | |
| | | | | | | | |
Total Common Stocks
(identified cost $16,742,274) | | | | 19,290,072 | |
| | | | | | | | |
| Short-Term Investments — 50.7% | |
|
| Collateral Pool Investments for Securities on Loan — 48.8% | |
| |
Collateral pool allocation (3) | | | | 9,591,857 | |
|
| Mutual Funds — 1.9% | |
BMO Institutional Prime Money Market Fund — Premier Class, 1.080% (4) | | | 368,964 | | | | 369,001 | |
| | | | | | | | |
Total Short-Term Investments
(identified cost $9,960,858) | | | | 9,960,858 | |
| | | | | | | | |
Total Investments — 148.8%
(identified cost $26,703,132) | | | | 29,250,930 | |
| Other Assets and Liabilities — (48.8)% | | | | (9,589,952 | ) |
| | | | | | | | |
| Total Net Assets — 100.0% | | | $ | 19,660,978 | |
| | | | | | | | |
Small-Cap Growth Fund
| | | | | | | | |
| Description | | Shares | | | Value | |
| Common Stocks — 98.8% | |
|
| Consumer Discretionary — 10.8% | |
|
Apparel Retail — 0.4% | |
Francesca’s Holdings Corp. (1)(2) | | | 73,884 | | | $ | 536,398 | |
|
Auto Parts & Equipment — 0.8% | |
Gentherm, Inc. (1)(2) | | | 36,804 | | | | 1,146,445 | |
|
Casinos & Gaming — 1.0% | |
Pinnacle Entertainment, Inc. (2) | | | 69,446 | | | | 1,354,197 | |
|
Footwear — 1.0% | |
Steven Madden, Ltd. (2) | | | 32,460 | | | | 1,376,304 | |
|
Home Furnishings — 0.9% | |
La-Z-Boy, Inc. | | | 50,216 | | | | 1,197,651 | |
|
Homebuilding — 1.0% | |
TopBuild Corp. (2) | | | 24,708 | | | | 1,466,420 | |
|
Household Appliances — 0.8% | |
iRobot Corp. (1)(2) | | | 11,269 | | | | 1,075,288 | |
|
Internet & Direct Marketing Retail — 0.7% | |
Shutterfly, Inc. (1)(2) | | | 22,803 | | | | 1,039,361 | |
|
Restaurants — 1.4% | |
Habit Restaurants, Inc., Class A (1)(2) | | | 58,778 | | | | 764,114 | |
Texas Roadhouse, Inc. (1) | | | 24,641 | | | | 1,169,215 | |
| | | | | | | | |
| | | | | | | 1,933,329 | |
|
Specialized Consumer Services — 1.0% | |
Sotheby’s (1)(2) | | | 30,369 | | | | 1,362,657 | |
|
Specialty Stores — 1.8% | |
Five Below, Inc. (1)(2) | | | 27,502 | | | | 1,308,270 | |
MarineMax, Inc. (1)(2) | | | 71,269 | | | | 1,150,994 | |
| | | | | | | | |
| | | | | | | 2,459,264 | |
| | | | | | | | |
Total Consumer Discretionary | | | | 14,947,314 | |
|
| Consumer Staples — 2.8% | |
|
Agricultural Products — 1.0% | |
Darling Ingredients, Inc. (1)(2) | | | 77,385 | | | | 1,346,499 | |
|
Hypermarkets & Super Centers — 0.8% | |
PriceSmart, Inc. (1) | | | 14,349 | | | | 1,165,856 | |
|
Soft Drinks — 1.0% | |
Coca-Cola Bottling Co. Consolidated (1) | | | 6,671 | | | | 1,424,859 | |
| | | | | | | | |
Total Consumer Staples | | | | | | | 3,937,214 | |
|
| Energy — 1.1% | |
|
Oil & Gas-Equipment & Services — 0.7% | |
McDermott International, Inc. (1)(2) | | | 152,527 | | | | 936,516 | |
|
Oil & Gas-Exploration & Production — 0.4% | |
PDC Energy, Inc. (1)(2) | | | 13,640 | | | | 536,461 | |
| | | | | | | | |
Total Energy | | | | | | | 1,472,977 | |
|
| Financials — 4.5% | |
|
Life & Health Insurance — 0.9% | |
CNO Financial Group, Inc. | | | 57,289 | | | | 1,280,409 | |
|
Mortgage REITs — 0.9% | |
Redwood Trust, Inc. (1) | | | 74,808 | | | | 1,247,798 | |
|
Property & Casualty Insurance — 0.8% | |
Employers Holdings, Inc. | | | 27,554 | | | | 1,161,401 | |
(See Notes which are an integral part of the Financial Statements)
53
August 31, 2017
Small-Cap Growth Fund (continued)
| | | | | | | | |
| Description | | Shares | | | Value | |
| Common Stocks (continued) | |
|
| Financials (continued) | |
|
Regional Banks — 1.9% | |
Customers Bancorp, Inc. (1)(2) | | | 44,085 | | | $ | 1,242,315 | |
Great Western Bancorp, Inc. (1) | | | 36,479 | | | | 1,310,326 | |
| | | | | | | | |
| | | | | | | 2,552,641 | |
| | | | | | | | |
Total Financials | | | | | | | 6,242,249 | |
|
| Healthcare — 24.6% | |
|
Biotechnology — 7.4% | |
Akebia Therapeutics, Inc. (2) | | | 54,324 | | | | 909,384 | |
Cytokinetics, Inc. (2) | | | 74,035 | | | | 1,099,420 | |
Emergent BioSolutions, Inc. (1)(2) | | | 37,441 | | | | 1,397,672 | |
Exact Sciences Corp. (1)(2) | | | 30,434 | | | | 1,274,880 | |
Genomic Health, Inc. (1)(2) | | | 34,099 | | | | 1,080,938 | |
Ironwood Pharmaceuticals, Inc. (1)(2) | | | 54,380 | | | | 867,361 | |
MiMedx Group, Inc. (1)(2) | | | 75,410 | | | | 1,226,921 | |
Vanda Pharmaceuticals, Inc. (2) | | | 65,443 | | | | 1,125,620 | |
Versartis, Inc. (1)(2) | | | 64,653 | | | | 1,228,407 | |
| | | | | | | | |
| | | | | | | 10,210,603 | |
|
Healthcare Equipment — 4.6% | |
Analogic Corp. | | | 17,610 | | | | 1,259,995 | |
Cardiovascular Systems, Inc. (2) | | | 41,852 | | | | 1,229,193 | |
Inogen, Inc. (1)(2) | | | 14,137 | | | | 1,354,325 | |
K2M Group Holdings, Inc. (1)(2) | | | 50,725 | | | | 1,185,951 | |
Masimo Corp. (2) | | | 16,465 | | | | 1,389,317 | |
| | | | | | | | |
| | | | | | | 6,418,781 | |
|
Healthcare Services — 0.8% | |
Amedisys, Inc. (2) | | | 22,038 | | | | 1,151,265 | |
|
Healthcare Supplies — 2.3% | |
Merit Medical Systems, Inc. (1)(2) | | | 42,856 | | | | 1,769,953 | |
OraSure Technologies, Inc. (1)(2) | | | 71,826 | | | | 1,465,969 | |
| | | | | | | | |
| | | | | | | 3,235,922 | |
|
Healthcare Technology — 2.0% | |
Medidata Solutions, Inc. (1)(2) | | | 22,651 | | | | 1,697,919 | |
Vocera Communications, Inc. (1)(2) | | | 37,640 | | | | 1,048,274 | |
| | | | | | | | |
| | | | | | | 2,746,193 | |
|
Life Sciences Tools & Services — 3.1% | |
Cambrex Corp. (1)(2) | | | 26,714 | | | | 1,391,799 | |
INC Research Holdings, Inc. (1)(2) | | | 23,864 | | | | 1,400,817 | |
PRA Health Sciences, Inc. (1)(2) | | | 19,538 | | | | 1,512,241 | |
| | | | | | | | |
| | | | | | | 4,304,857 | |
|
Managed Healthcare — 0.9% | |
Magellan Health, Inc. (2) | | | 16,168 | | | | 1,307,991 | |
|
Pharmaceuticals — 3.5% | |
Innoviva, Inc. (1)(2) | | | 87,827 | | | | 1,233,091 | |
Pacira Pharmaceuticals, Inc. (1)(2) | | | 29,982 | | | | 1,142,314 | |
Phibro Animal Health Corp., Class A (1) | | | 31,199 | | | | 1,107,565 | |
Supernus Pharmaceuticals, Inc. (1)(2) | | | 29,453 | | | | 1,348,947 | |
| | | | | | | | |
| | | | | | | 4,831,917 | |
| | | | | | | | |
Total Healthcare | | | | | | | 34,207,529 | |
|
| Industrials — 17.3% | |
|
Aerospace & Defense — 0.1% | |
Cubic Corp. (1) | | | 2,709 | | | | 116,352 | |
|
Air Freight & Logistics — 0.9% | |
Hub Group, Inc., Class A (1)(2) | | | 32,040 | | | | 1,231,938 | |
| | | | | | | | |
| Description | | Shares | | | Value | |
| Common Stocks (continued) | |
|
| Industrials (continued) | |
|
Building Products — 3.7% | |
American Woodmark Corp. (2) | | | 13,725 | | | $ | 1,136,430 | |
Builders FirstSource, Inc. (1)(2) | | | 98,307 | | | | 1,600,438 | |
NCI Building Systems, Inc. (1)(2) | | | 74,059 | | | | 1,244,191 | |
Simpson Manufacturing Co., Inc. (1) | | | 25,931 | | | | 1,135,259 | |
| | | | | | | | |
| | | | | | | 5,116,318 | |
|
Construction & Engineering — 1.7% | |
Comfort Systems USA, Inc. | | | 38,435 | | | | 1,308,712 | |
MasTec, Inc. (2) | | | 25,337 | | | | 1,033,749 | |
| | | | | | | | |
| | | | | | | 2,342,461 | |
|
Construction Machinery & Heavy Trucks — 1.8% | |
Greenbrier Cos., Inc. (1) | | | 27,163 | | | | 1,165,293 | |
Wabash National Corp. (1) | | | 66,702 | | | | 1,402,076 | |
| | | | | | | | |
| | | | | | | 2,567,369 | |
|
Human Resource & Employment Services — 3.0% | |
Insperity, Inc. | | | 16,994 | | | | 1,364,618 | |
Korn/Ferry International | | | 39,805 | | | | 1,326,302 | |
TriNet Group, Inc. (2) | | | 42,468 | | | | 1,517,382 | |
| | | | | | | | |
| | | | | | | 4,208,302 | |
|
Industrial Machinery — 3.2% | |
Chart Industries, Inc. (1)(2) | | | 32,821 | | | | 1,107,381 | |
Proto Labs, Inc. (1)(2) | | | 18,551 | | | | 1,331,962 | |
SPX FLOW Inc. (2) | | | 21,404 | | | | 716,392 | |
Watts Water Technologies, Inc., Class A | | | 21,925 | | | | 1,352,772 | |
| | | | | | | | |
| | | | | | | 4,508,507 | |
|
Office Services & Supplies — 1.0% | |
Herman Miller, Inc. (1) | | | 40,352 | | | | 1,357,845 | |
|
Research & Consulting Services — 0.9% | |
ICF International, Inc. (1)(2) | | | 26,565 | | | | 1,276,448 | |
|
Trucking — 1.0% | |
Werner Enterprises, Inc. | | | 40,620 | | | | 1,344,522 | |
| | | | | | | | |
Total Industrials | | | | | | | 24,070,062 | |
|
| Information Technology — 27.0% | |
|
Application Software — 2.9% | |
Callidus Software, Inc. (1)(2) | | | 57,138 | | | | 1,471,304 | |
RealPage, Inc. (2) | | | 29,159 | | | | 1,256,753 | |
Verint Systems, Inc. (2) | | | 31,230 | | | | 1,239,831 | |
| | | | | | | | |
| | | | | | | 3,967,888 | |
|
Communications Equipment — 1.9% | |
Ciena Corp. (1)(2) | | | 59,249 | | | | 1,280,371 | |
Extreme Networks, Inc. (2) | | | 122,120 | | | | 1,395,832 | |
| | | | | | | | |
| | | | | | | 2,676,203 | |
|
Data Processing & Outsourced Services — 2.0% | |
Blackhawk Network Holdings, Inc. (2) | | | 31,383 | | | | 1,405,959 | |
Travelport Worldwide, Ltd. (1) | | | 95,052 | | | | 1,439,087 | |
| | | | | | | | |
| | | | | | | 2,845,046 | |
|
Electronic Components — 2.0% | |
II-VI, Inc. (1)(2) | | | 31,181 | | | | 1,117,839 | |
Rogers Corp. (2) | | | 14,137 | | | | 1,675,941 | |
| | | | | | | | |
| | | | | | | 2,793,780 | |
|
Electronic Equipment & Instruments — 1.2% | |
Itron, Inc. (2) | | | 22,097 | | | | 1,604,242 | |
|
Electronic Manufacturing Services — 0.9% | |
Methode Electronics, Inc. | | | 30,097 | | | | 1,230,967 | |
(See Notes which are an integral part of the Financial Statements)
54
Small-Cap Growth Fund (continued)
| | | | | | | | |
| Description | | Shares | | | Value | |
| Common Stocks (continued) | |
|
| Information Technology (continued) | |
|
Internet Software & Services — 3.3% | |
Carbonite, Inc. (2) | | | 57,508 | | | $ | 1,150,160 | |
Cornerstone OnDemand, Inc. (1)(2) | | | 32,169 | | | | 1,125,272 | |
Shutterstock, Inc. (1)(2) | | | 23,654 | | | | 794,301 | |
Yelp, Inc. (1)(2) | | | 35,093 | | | | 1,494,962 | |
| | | | | | | | |
| | | | | | | 4,564,695 | |
|
Semiconductor Equipment — 5.0% | |
Brooks Automation, Inc. (1) | | | 56,268 | | | | 1,466,907 | |
Entegris, Inc. (1)(2) | | | 76,087 | | | | 1,936,414 | |
FormFactor, Inc. (1)(2) | | | 75,916 | | | | 1,146,332 | |
Nanometrics, Inc. (2) | | | 45,387 | | | | 1,170,531 | |
Rudolph Technologies, Inc. (1)(2) | | | 54,743 | | | | 1,215,294 | |
| | | | | | | | |
| | | | | | | 6,935,478 | |
|
Semiconductors — 2.2% | |
Semtech Corp. (1)(2) | | | 41,493 | | | | 1,560,137 | |
Silicon Laboratories, Inc. (1)(2) | | | 19,964 | | | | 1,515,267 | |
| | | | | | | | |
| | | | | | | 3,075,404 | |
|
Systems Software — 5.6% | |
Barracuda Networks, Inc. (1)(2) | | | 56,834 | | | | 1,375,951 | |
CommVault Systems, Inc. (1)(2) | | | 24,487 | | | | 1,494,931 | |
Gigamon, Inc. (1)(2) | | | 37,933 | | | | 1,629,222 | |
Qualys, Inc. (1)(2) | | | 29,841 | | | | 1,417,448 | |
Rapid7, Inc. (1)(2) | | | 41,926 | | | | 706,872 | |
Varonis Systems, Inc. (1)(2) | | | 30,152 | | | | 1,169,898 | |
| | | | | | | | |
| | | | | | | 7,794,322 | |
| | | | | | | | |
Total Information Technology | | | | 37,488,025 | |
|
| Materials — 6.2% | |
|
Commodity Chemicals — 1.1% | |
Trinseo SA (1) | | | 23,341 | | | | 1,561,513 | |
|
Forest Products — 2.2% | |
Boise Cascade Co. (2) | | | 50,015 | | | | 1,500,450 | |
Louisiana-Pacific Corp. (2) | | | 59,786 | | | | 1,523,347 | |
| | | | | | | | |
| | | | | | | 3,023,797 | |
|
Specialty Chemicals — 1.9% | |
Ferro Corp. (1)(2) | | | 71,826 | | | | 1,384,087 | |
Kraton Corp. (1)(2) | | | 38,933 | | | | 1,278,170 | |
| | | | | | | | |
| | | | | | | 2,662,257 | |
|
Steel — 1.0% | |
Commercial Metals Co. (1) | | | 73,875 | | | | 1,395,499 | |
| | | | | | | | |
Total Materials | | | | | | | 8,643,066 | |
|
| Real Estate — 2.5% | |
|
Diversified REITs — 0.8% | |
American Assets Trust, Inc. | | | 29,340 | | | | 1,191,791 | |
|
Hotel & Resort REITs — 0.8% | |
Hersha Hospitality Trust (1) | | | 58,278 | | | | 1,080,474 | |
|
Specialized REITs — 0.9% | |
DiamondRock Hospitality Co. | | | 112,805 | | | | 1,239,727 | |
| | | | | | | | |
Total Real Estate | | | | | | | 3,511,992 | |
|
| Telecommunication Services — 1.0% | |
|
Alternative Carriers — 1.0% | |
Cogent Communications Holdings, Inc. (1) | | | 30,206 | | | | 1,407,600 | |
| | | | | | | | |
| Description | | Shares | | | Value | |
| Common Stocks (continued) | |
|
| Utilities — 1.0% | |
|
Gas Utilities — 1.0% | |
Southwest Gas Holdings, Inc. | | | 16,842 | | | $ | 1,339,276 | |
| | | | | | | | |
Total Common Stocks
(identified cost $122,328,148) | | | | | | | 137,267,304 | |
| | | | | | | | |
| Short-Term Investments — 30.2% | |
|
| Collateral Pool Investments for Securities on Loan —29.1% | |
| | |
Collateral pool allocation (3) | | | | | | | 40,411,406 | |
| | |
| Mutual Funds — 1.1% | | | | | | |
BMO Institutional Prime Money Market Fund — Premier Class, 1.080% (4) | | | 1,560,337 | | | | 1,560,493 | |
| | | | | | | | |
Total Short-Term Investments
(identified cost $41,971,899) | | | | | | | 41,971,899 | |
| | | | | | | | |
Total Investments — 129.0%
(identified cost $164,300,047) | | | | | | | 179,239,203 | |
| Other Assets and Liabilities — (29.0)% | | | | (40,243,373 | ) |
| | | | | | | | |
| Total Net Assets — 100.0% | | | | | | $ | 138,995,830 | |
| | | | | | | | |
Global Low Volatility Equity Fund
| | | | | | | | |
| Description | | Shares | | | Value | |
| Common Stocks — 98.1% | | | | | | |
| | |
Austria — 0.9% | | | | | | | | |
Flughafen Wien AG | | | 10,782 | | | $ | 423,924 | |
| | |
Belgium — 0.3% | | | | | | | | |
bpost SA | | | 5,983 | | | | 167,104 | |
| | |
Bermuda — 3.7% | | | | | | | | |
Argo Group International Holdings, Ltd. | | | 2,975 | | | | 179,095 | |
Dairy Farm International Holdings, Ltd. | | | 16,800 | | | | 136,197 | |
Enstar Group, Ltd. (2) | | | 1,470 | | | | 305,099 | |
Everest Re Group, Ltd. | | | 4,317 | | | | 1,089,956 | |
Giordano International, Ltd. | | | 164,000 | | | | 97,242 | |
| | | | | | | | |
| | | | | | | 1,807,589 | |
| | |
Canada — 3.9% | | | | | | | | |
BCE, Inc. | | | 12,132 | | | | 577,478 | |
First Capital Realty, Inc. (1) | | | 7,354 | | | | 119,489 | |
George Weston, Ltd. | | | 1,403 | | | | 121,936 | |
Granite Real Estate Investment Trust | | | 5,343 | | | | 217,571 | |
Laurentian Bank of Canada | | | 6,001 | | | | 269,931 | |
Loblaw Cos., Ltd. | | | 7,094 | | | | 384,766 | |
Metro, Inc. | | | 2,310 | | | | 76,251 | |
Pure Industrial Real Estate Trust | | | 26,202 | | | | 138,905 | |
| | | | | | | | |
| | | | | | | 1,906,327 | |
| | |
Cayman Islands — 2.4% | | | | | | | | |
361 Degrees International, Ltd. | | | 292,000 | | | | 126,052 | |
Dali Foods Group Co., Ltd. | | | 349,000 | | | | 232,396 | |
Fresh Del Monte Produce, Inc. | | | 2,304 | | | | 108,265 | |
Melco Resorts & Entertainment, Ltd., ADR | | | 11,859 | | | | 260,305 | |
Uni-President China Holdings, Ltd. | | | 91,000 | | | | 78,033 | |
WH Group, Ltd. | | | 347,000 | | | | 362,829 | |
| | | | | | | | |
| | | | | | | 1,167,880 | |
(See Notes which are an integral part of the Financial Statements)
55
August 31, 2017
Global Low Volatility Equity Fund (continued)
| | | | | | | | |
| Description | | Shares | | | Value | |
| Common Stocks (continued) | | | | | | |
| | |
China — 3.3% | | | | | | | | |
Agricultural Bank of China, Ltd., Class H | | | 613,000 | | | $ | 289,282 | |
China Minsheng Banking Corp., Ltd., Class H | | | 204,000 | | | | 203,680 | |
China Telecom Corp., Ltd., Class H | | | 172,000 | | | | 88,690 | |
Industrial & Commercial Bank of China, Ltd., Class H | | | 705,000 | | | | 530,260 | |
Livzon Pharmaceutical Group, Inc., Class H | | | 23,210 | | | | 126,803 | |
Tsingtao Brewery Co., Ltd., Class H | | | 94,000 | | | | 389,923 | |
| | | | | | | | |
| | | | | | | 1,628,638 | |
| | |
Czech Republic — 0.7% | | | | | | | | |
CEZ AS | | | 17,990 | | | | 341,272 | |
| | |
Denmark — 0.4% | | | | | | | | |
Dfds A/S | | | 3,659 | | | | 211,022 | |
| | |
France — 0.1% | | | | | | | | |
Boiron SA | | | 743 | | | | 70,198 | |
| | |
Germany — 0.7% | | | | | | | | |
RHOEN-KLINIKUM AG | | | 9,827 | | | | 326,729 | |
| | |
Guernsey — 2.0% | | | | | | | | |
Amdocs, Ltd. | | | 15,264 | | | | 988,955 | |
| | |
Hong Kong — 7.9% | | | | | | | | |
China Unicom Hong Kong, Ltd. (2) | | | 62,000 | | | | 89,932 | |
CLP Holdings, Ltd. | | | 100,500 | | | | 1,063,216 | |
Dah Sing Financial Holdings, Ltd. | | | 29,600 | | | | 215,117 | |
Hang Seng Bank, Ltd. | | | 23,300 | | | | 537,273 | |
HK Electric Investments & HK Electric Investments, Ltd. (1) | | | 800,500 | | | | 736,326 | |
Hysan Development Co., Ltd. | | | 52,000 | | | | 240,640 | |
PCCW, Ltd. | | | 805,000 | | | | 449,129 | |
VTech Holdings, Ltd. | | | 21,800 | | | | 306,496 | |
Yuexiu Real Estate Investment Trust | | | 409,000 | | | | 269,674 | |
| | | | | | | | |
| | | | | | | 3,907,803 | |
| | |
Hungary — 0.6% | | | | | | | | |
Magyar Telekom Telecommunications PLC | | | 102,609 | | | | 194,971 | |
Richter Gedeon Nyrt | | | 4,313 | | | | 112,232 | |
| | | | | | | | |
| | | | | | | 307,203 | |
| | |
Ireland — 0.2% | | | | | | | | |
ICON PLC (2) | | | 1,027 | | | | 116,452 | |
| | |
Israel — 1.3% | | | | | | | | |
Bank Leumi Le-Israel BM | | | 67,867 | | | | 355,678 | |
Bezeq — The Israeli Telecommunication Corp., Ltd. | | | 204,161 | | | | 300,842 | |
| | | | | | | | |
| | | | | | | 656,520 | |
| | |
Italy — 0.6% | | | | | | | | |
Amplifon SpA | | | 19,236 | | | | 278,341 | |
| | |
Japan — 8.9% | | | | | | | | |
Bridgestone Corp. | | | 2,700 | | | | 116,090 | |
Daiichi Sankyo Co., Ltd. | | | 5,700 | | | | 134,933 | |
Duskin Co., Ltd. | | | 17,700 | | | | 511,844 | |
Hogy Medical Co., Ltd. | | | 1,400 | | | | 99,176 | |
Kissei Pharmaceutical Co., Ltd. | | | 7,100 | | | | 180,686 | |
KYORIN Holdings, Inc. | | | 18,300 | | | | 385,309 | |
Mitsui Sugar Co., Ltd. | | | 5,700 | | | | 194,359 | |
Morinaga Milk Industry Co., Ltd. | | | 14,000 | | | | 110,567 | |
Nippon Telegraph & Telephone Corp. | | | 10,100 | | | | 503,106 | |
Nisshin Oillio Group, Ltd. | | | 47,000 | | | | 337,652 | |
Noevir Holdings Co., Ltd. | | | 2,600 | | | | 155,848 | |
| | | | | | | | |
| Description | | Shares | | | Value | |
| Common Stocks (continued) | | | | | | |
| | |
Japan (continued) | | | | | | | | |
Prima Meat Packers, Ltd. | | | 28,000 | | | $ | 174,168 | |
Shimachu Co., Ltd. (1) | | | 7,200 | | | | 186,222 | |
Suzuken Co., Ltd. | | | 7,900 | | | | 288,185 | |
Takeda Pharmaceutical Co., Ltd. | | | 5,000 | | | | 277,174 | |
Towa Pharmaceutical Co., Ltd. | | | 2,400 | | | | 114,555 | |
Tsumura & Co. | | | 9,600 | | | | 363,010 | |
Vital KSK Holdings, Inc. (1) | | | 11,900 | | | | 97,443 | |
Xebio Holdings Co., Ltd. | | | 7,500 | | | | 148,204 | |
| | | | | | | | |
| | | | | | | 4,378,531 | |
| | |
Malaysia — 4.4% | | | | | | | | |
Malayan Banking Bhd | | | 198,500 | | | | 440,068 | |
Public Bank Bhd | | | 154,100 | | | | 744,197 | |
Tenaga Nasional Bhd | | | 285,900 | | | | 956,262 | |
| | | | | | | | |
| | | | | | | 2,140,527 | |
| | |
Netherlands — 0.1% | | | | | | | | |
Sligro Food Group NV | | | 1,358 | | | | 59,856 | |
| | |
New Zealand — 3.0% | | | | | | | | |
Argosy Property, Ltd. | | | 199,824 | | | | 151,486 | |
Chorus, Ltd. | | | 36,168 | | | | 104,005 | |
Fisher & Paykel Healthcare Corp., Ltd. | | | 40,960 | | | | 346,661 | |
Infratil, Ltd. | | | 76,744 | | | | 173,631 | |
Metlifecare, Ltd. | | | 40,331 | | | | 177,238 | |
Ryman Healthcare, Ltd. | | | 45,465 | | | | 297,152 | |
Summerset Group Holdings, Ltd. | | | 61,146 | | | | 224,774 | |
| | | | | | | | |
| | | | | | | 1,474,947 | |
| | |
Philippines — 0.9% | | | | | | | | |
First Philippine Holdings Corp. | | | 60,540 | | | | 79,266 | |
Manila Electric Co. | | | 64,300 | | | | 340,348 | |
| | | | | | | | |
| | | | | | | 419,614 | |
| | |
Singapore — 5.3% | | | | | | | | |
Ascott Residence Trust | | | 83,200 | | | | 72,133 | |
Cache Logistics Trust | | | 174,300 | | | | 112,441 | |
CDL Hospitality Trusts | | | 72,400 | | | | 87,008 | |
Frasers Centrepoint Trust | | | 191,700 | | | | 298,438 | |
Mapletree Industrial Trust | | | 73,300 | | | | 100,291 | |
Mapletree Logistics Trust | | | 474,200 | | | | 430,255 | |
RHT Health Trust | | | 210,000 | | | | 133,344 | |
SATS, Ltd. | | | 128,800 | | | | 459,257 | |
Sheng Siong Group, Ltd. (1) | | | 126,800 | | | | 86,113 | |
Singapore Airlines, Ltd. | | | 29,800 | | | | 226,752 | |
Venture Corp., Ltd. | | | 50,100 | | | | 584,456 | |
| | | | | | | | |
| | | | | | | 2,590,488 | |
| | |
South Korea — 0.7% | | | | | | | | |
GS Home Shopping, Inc. | | | 824 | | | | 161,127 | |
Kia Motors Corp. | | | 6,127 | | | | 192,551 | |
| | | | | | | | |
| | | | | | | 353,678 | |
| | |
Switzerland — 4.0% | | | | | | | | |
ALSO Holding AG (2) | | | 1,695 | | | | 220,435 | |
Cembra Money Bank AG | | | 6,384 | | | | 556,090 | |
Novartis AG | | | 6,219 | | | | 524,511 | |
Roche Holding AG | | | 280 | | | | 71,367 | |
Sonova Holding AG | | | 1,640 | | | | 277,313 | |
Valora Holding AG | | | 991 | | | | 299,007 | |
| | | | | | | | |
| | | | | | | 1,948,723 | |
| | |
Taiwan — 2.2% | | | | | | | | |
Far EasTone Telecommunications Co., Ltd. | | | 324,000 | | | | 785,990 | |
Taichung Commercial Bank Co., Ltd. | | | 503,100 | | | | 159,281 | |
Taiwan Secom Co., Ltd. | | | 41,075 | | | | 121,410 | |
| | | | | | | | |
| | | | | | | 1,066,681 | |
(See Notes which are an integral part of the Financial Statements)
56
Global Low Volatility Equity Fund (continued)
| | | | | | | | |
| Description | | Shares | | | Value | |
| Common Stocks (continued) | | | | | | |
| | |
Thailand — 1.1% | | | | | | | | |
Thai Beverage PCL | | | 803,400 | | | $ | 551,464 | |
| | |
United States — 38.5% | | | | | | | | |
Abaxis, Inc. (1) | | | 4,934 | | | | 228,049 | |
Allstate Corp. | | | 10,576 | | | | 957,128 | |
American Electric Power Co., Inc. | | | 4,657 | | | | 342,895 | |
American Express Co. | | | 1,671 | | | | 143,873 | |
Atrion Corp. | | | 358 | | | | 222,730 | |
Avista Corp. (1) | | | 2,585 | | | | 132,869 | |
Bryn Mawr Bank Corp. | | | 4,409 | | | | 180,549 | |
Carter’s, Inc. | | | 815 | | | | 70,669 | |
Chemed Corp. | | | 3,708 | | | | 731,551 | |
Children’s Place, Inc. (1) | | | 1,081 | | | | 114,748 | |
Cisco Systems, Inc. | | | 11,502 | | | | 370,479 | |
Consolidated Edison, Inc. | | | 10,993 | | | | 926,380 | |
CVS Health Corp. | | | 3,360 | | | | 259,862 | |
Darden Restaurants, Inc. | | | 4,325 | | | | 355,039 | |
Discover Financial Services | | | 12,344 | | | | 727,679 | |
Dr. Pepper Snapple Group, Inc. | | | 10,225 | | | | 930,986 | |
Edison International | | | 2,750 | | | | 220,495 | |
Equity Commonwealth (2) | | | 3,658 | | | | 113,179 | |
Essex Property Trust, Inc. | | | 1,966 | | | | 522,897 | |
Fiserv, Inc. (2) | | | 1,999 | | | | 247,296 | |
Foot Locker, Inc. | | | 1,744 | | | | 61,441 | |
Forrester Research, Inc. | | | 2,074 | | | | 84,515 | |
Getty Realty Corp. | | | 10,678 | | | | 294,286 | |
Harris Corp. | | | 3,502 | | | | 430,396 | |
Huntington Ingalls Industries, Inc. | | | 1,102 | | | | 235,784 | |
ICU Medical, Inc. (2) | | | 1,336 | | | | 232,932 | |
Jack Henry & Associates, Inc. | | | 1,873 | | | | 193,050 | |
Johnson & Johnson | | | 7,707 | | | | 1,020,176 | |
Kroger Co. | | | 15,693 | | | | 343,206 | |
Masimo Corp. (2) | | | 1,851 | | | | 156,187 | |
Merck & Co., Inc. | | | 14,340 | | | | 915,752 | |
Meridian Bancorp, Inc. | | | 28,052 | | | | 493,715 | |
Navigators Group, Inc. | | | 3,103 | | | | 173,147 | |
Owens & Minor, Inc. | | | 21,184 | | | | 591,881 | |
PepsiCo, Inc. | | | 6,404 | | | | 741,135 | |
Pfizer, Inc. | | | 26,815 | | | | 909,565 | |
Pinnacle West Capital Corp. | | | 1,145 | | | | 103,016 | |
Portland General Electric Co. | | | 8,462 | | | | 402,030 | |
Progressive Corp. | | | 2,610 | | | | 121,313 | |
Prudential Financial, Inc. | | | 4,670 | | | | 476,714 | |
Quidel Corp. (2) | | | 5,105 | | | | 178,369 | |
Safety Insurance Group, Inc. | | | 3,537 | | | | 252,542 | |
Spirit AeroSystems Holdings, Inc., Class A | | | 2,977 | | | | 221,786 | |
Sysco Corp. | | | 11,941 | | | | 628,932 | |
U.S. Physical Therapy, Inc. | | | 2,798 | | | | 167,600 | |
Unum Group | | | 8,711 | | | | 419,696 | |
Wal-Mart Stores, Inc. | | | 12,869 | | | | 1,004,683 | |
WebMD Health Corp. (2) | | | 2,170 | | | | 144,175 | |
WellCare Health Plans, Inc. (2) | | | 932 | | | | 162,802 | |
| | | | | | | | |
| | | | | | | 18,960,179 | |
| | | | | | | | |
Total Common Stocks
(identified cost $41,729,321) | | | | | | | 48,250,645 | |
| | | | | | | | |
| Short-Term Investments — 4.1% | |
|
| Collateral Investment for Securities on Loan — 2.4% | |
| | |
State Street Navigator Securities Lending Government Money Market Portfolio, 0.994% (3) | | | 1,201,607 | | | | 1,201,607 | |
| | | | | | | | |
| Description | | Shares | | | Value | |
| Short-Term Investments (continued) | |
| | |
| Mutual Funds — 1.7% | | | | | | |
State Street Institutional Liquid Reserves Fund — Premier Class, 1.150% | | | 825,968 | | | $ | 825,968 | |
| | | | | | | | |
Total Short-Term Investments
(identified cost $2,027,649) | | | | | | | 2,027,575 | |
| | | | | | | | |
Total Investments — 102.2%
(identified cost $43,756,970) | | | | | | | 50,278,220 | |
| Other Assets and Liabilities — (2.2)% | | | | (1,060,037 | ) |
| | | | | | | | |
| Total Net Assets — 100.0% | | | | | | $ | 49,218,183 | |
| | | | | | | | |
| | | | | | | | |
| Industry Allocation | |
| Industry | | Value | | | % of
Total
Net Assets | |
Aerospace/Defense | | $ | 652,182 | | | | 1.3 | % |
Airlines | | | 226,752 | | | | 0.5 | |
Apparel | | | 70,669 | | | | 0.2 | |
Auto Manufacturers | | | 192,551 | | | | 0.4 | |
Auto Parts & Equipment | | | 116,090 | | | | 0.2 | |
Banks | | | 3,925,316 | | | | 8.0 | |
Beverages | | | 2,613,509 | | | | 5.3 | |
Commercial Services | | | 717,770 | | | | 1.5 | |
Computers | | | 988,954 | | | | 2.0 | |
Cosmetics/Personal Care | | | 155,848 | | | | 0.3 | |
Diversified Financial Services | | | 1,427,642 | | | | 2.9 | |
Electric | | | 5,818,006 | | | | 11.8 | |
Electronics | | | 804,891 | | | | 1.6 | |
Engineering & Construction | | | 883,182 | | | | 1.8 | |
Food | | | 3,349,414 | | | | 6.8 | |
Healthcare-Products | | | 1,741,417 | | | | 3.5 | |
Healthcare-Services | | | 2,204,298 | | | | 4.5 | |
Insurance | | | 3,974,689 | | | | 8.1 | |
Internet | | | 144,175 | | | | 0.3 | |
Lodging | | | 260,305 | | | | 0.5 | |
Pharmaceuticals | | | 6,462,119 | | | | 13.1 | |
Real Estate | | | 644,960 | | | | 1.3 | |
Real Estate Investment Trusts | | | 2,657,076 | | | | 5.4 | |
Retail | | | 2,899,741 | | | | 5.9 | |
Savings & Loans | | | 493,715 | | | | 1.0 | |
Shipbuilding | | | 235,784 | | | | 0.5 | |
Software | | | 440,346 | | | | 0.9 | |
Telecommunications | | | 3,771,118 | | | | 7.7 | |
Transportation | | | 378,126 | | | | 0.8 | |
| | | | | | | | |
Total Common Stocks | | | 48,250,645 | | | | 98.1 | |
Collateral Investment for Securities on Loan | | | 1,201,607 | | | | 2.4 | |
Mutual Funds | | | 825,968 | | | | 1.7 | |
| | | | | | | | |
Total Investments | | | 50,278,220 | | | | 102.2 | |
Other Assets and Liabilities | | | (1,060,037 | ) | | | (2.2 | ) |
| | | | | | | | |
Total Net Assets | | $ | 49,218,183 | | | | 100.0 | % |
| | | | | | | | |
Disciplined International Equity Fund
| | | | | | | | |
| Description | | Shares | | | Value | |
| Common Stocks — 98.7% | | | | | | |
| | |
Australia — 6.3% | | | | | | | | |
Australia & New Zealand Banking Group, Ltd. | | | 26,165 | | | $ | 614,731 | |
BHP Billiton, Ltd. | | | 33,203 | | | | 722,401 | |
CSL, Ltd. | | | 1,696 | | | | 173,465 | |
Fortescue Metals Group, Ltd. (1) | | | 279,478 | | | | 1,337,576 | |
(See Notes which are an integral part of the Financial Statements)
57
August 31, 2017
Disciplined International Equity Fund (continued)
| | | | | | | | |
| Description | | Shares | | | Value | |
| Common Stocks (continued) | | | | | | |
| | |
Australia (continued) | | | | | | | | |
Ramsay Health Care, Ltd. | | | 5,373 | | | $ | 292,265 | |
Telstra Corp., Ltd. (1) | | | 135,851 | | | | 396,666 | |
Woodside Petroleum, Ltd. (1) | | | 45,188 | | | | 1,040,579 | |
| | | | | | | | |
| | | | | | | 4,577,683 | |
| | |
Belgium — 0.2% | | | | | | | | |
bpost SA | | | 3,900 | | | | 108,926 | |
| | |
Bermuda — 0.2% | | | | | | | | |
Fly Leasing, Ltd. (2) | | | 9,729 | | | | 132,606 | |
| | |
Cayman Islands — 0.6% | | | | | | | | |
Cheung Kong Property Holdings, Ltd. | | | 23,000 | | | | 202,492 | |
WH Group, Ltd. | | | 186,000 | | | | 194,485 | |
| | | | | | | | |
| | | | | | | 396,977 | |
| | |
Denmark — 3.1% | | | | | | | | |
Danske Bank A/S | | | 15,874 | | | | 617,224 | |
Novo Nordisk A/S | | | 23,888 | | | | 1,140,453 | |
Vestas Wind Systems A/S | | | 5,359 | | | | 488,217 | |
| | | | | | | | |
| | | | | | | 2,245,894 | |
| | |
Finland — 2.7% | | | | | | | | |
Nokian Renkaat OYJ | | | 4,175 | | | | 176,581 | |
Orion OYJ | | | 3,778 | | | | 178,970 | |
UPM-Kymmene OYJ | | | 62,567 | | | | 1,628,912 | |
| | | | | | | | |
| | | | | | | 1,984,463 | |
| | |
France — 13.3% | | | | | | | | |
Arkema SA | | | 7,651 | | | | 832,537 | |
Bouygues SA | | | 4,109 | | | | 186,473 | |
Capgemini SE | | | 1,918 | | | | 212,900 | |
CNP Assurances | | | 38,305 | | | | 889,885 | |
Credit Agricole SA | | | 46,045 | | | | 812,535 | |
Eiffage SA | | | 2,637 | | | | 272,770 | |
Peugeot SA | | | 82,510 | | | | 1,744,204 | |
Sanofi | | | 15,542 | | | | 1,517,506 | |
Societe Generale SA | | | 20,670 | | | | 1,158,396 | |
TOTAL SA | | | 3,288 | | | | 170,125 | |
Valeo SA | | | 12,858 | | | | 860,911 | |
Vinci SA | | | 10,725 | | | | 988,440 | |
| | | | | | | | |
| | | | | | | 9,646,682 | |
| | |
Germany — 7.5% | | | | | | | | |
Allianz SE | | | 9,431 | | | | 2,018,074 | |
Bayer AG | | | 4,375 | | | | 560,317 | |
Continental AG | | | 773 | | | | 174,413 | |
Fresenius Medical Care AG & Co. KGaA | | | 1,941 | | | | 181,532 | |
Fresenius SE & Co. KGaA | | | 18,295 | | | | 1,548,597 | |
Merck KGaA | | | 3,690 | | | | 405,603 | |
Siemens AG | | | 2,547 | | | | 333,031 | |
Talanx AG | | | 4,760 | | | | 196,996 | |
| | | | | | | | |
| | | | | | | 5,418,563 | |
| | |
Hong Kong — 0.8% | | | | | | | | |
BOC Hong Kong Holdings, Ltd. | | | 39,000 | | | | 199,225 | |
I-CABLE Communications, Ltd. (2) | | | 10,272 | | | | 362 | |
Sun Hung Kai Properties, Ltd. | | | 12,000 | | | | 200,377 | |
Wharf Holdings, Ltd. | | | 21,000 | | | | 200,592 | |
| | | | | | | | |
| | | | | | | 600,556 | |
| | |
Ireland — 1.2% | | | | | | | | |
Seagate Technology PLC (1) | | | 27,664 | | | | 872,246 | |
| | |
Israel — 0.3% | | | | | | | | |
Check Point Software Technologies, Ltd. (2) | | | 1,755 | | | | 196,332 | |
| | | | | | | | |
| Description | | Shares | | | Value | |
| Common Stocks (continued) | | | | | | |
| | |
Italy — 0.5% | | | | | | | | |
Atlantia SpA | | | 6,897 | | | $ | 222,176 | |
GEDI Gruppo Editoriale SpA (2) | | | 4,099 | | | | 3,506 | |
Recordati SpA | | | 3,934 | | | | 168,629 | |
| | | | | | | | |
| | | | | | | 394,311 | |
| | |
Japan — 23.8% | | | | | | | | |
Aoyama Trading Co., Ltd. | | | 14,100 | | | | 518,002 | |
Asahi Glass Co., Ltd. | | | 12,100 | | | | 474,224 | |
Bridgestone Corp. | | | 5,100 | | | | 219,282 | |
Chubu Electric Power Co., Inc. | | | 39,500 | | | | 517,310 | |
Dai Nippon Printing Co., Ltd. | | | 73,000 | | | | 863,757 | |
Daiwa Securities Group, Inc. | | | 113,000 | | | | 619,888 | |
Fujikura, Ltd. | | | 141,000 | | | | 1,149,595 | |
Fujitsu, Ltd. | | | 51,000 | | | | 380,858 | |
Heiwado Co., Ltd. | | | 15,000 | | | | 350,704 | |
Hitachi Maxell, Ltd. | | | 10,300 | | | | 246,633 | |
Hitachi, Ltd. | | | 142,000 | | | | 979,693 | |
Ibiden Co., Ltd. (1) | | | 46,600 | | | | 773,864 | |
Kansai Electric Power Co., Inc. | | | 53,500 | | | | 750,385 | |
Kawasaki Kisen Kaisha, Ltd. (1)(2) | | | 185,000 | | | | 502,929 | |
Kirin Holdings Co., Ltd. | | | 82,300 | | | | 1,872,456 | |
Konica Minolta, Inc. (1) | | | 79,100 | | | | 633,145 | |
Mitsubishi Chemical Holdings Corp. | | | 99,000 | | | | 923,754 | |
Mitsubishi UFJ Financial Group, Inc. | | | 20,900 | | | | 127,376 | |
Monex Group, Inc. (1) | | | 110,400 | | | | 291,920 | |
Morinaga Milk Industry Co., Ltd. | | | 34,000 | | | | 268,520 | |
NEC Corp. | | | 106,000 | | | | 281,227 | |
Nippon Telegraph & Telephone Corp. | | | 40,200 | | | | 2,002,460 | |
Nissan Motor Co., Ltd. | | | 10,500 | | | | 104,594 | |
Nisshin Oillio Group, Ltd. | | | 51,000 | | | | 366,388 | |
Nisshinbo Holdings, Inc. | | | 53,200 | | | | 565,231 | |
NTT DoCoMo, Inc. | | | 11,600 | | | | 269,760 | |
Sumitomo Electric Industries, Ltd. | | | 11,000 | | | | 173,087 | |
Sumitomo Riko Co., Ltd. (1) | | | 11,100 | | | | 106,759 | |
Toho Holdings Co., Ltd. | | | 6,200 | | | | 121,668 | |
Toppan Printing Co., Ltd. | | | 59,000 | | | | 591,714 | |
Warabeya Nichiyo Holdings Co., Ltd. | | | 6,200 | | | | 155,971 | |
| | | | | | | | |
| | | | | | | 17,203,154 | |
| | |
Jersey — 2.4% | | | | | | | | |
Centamin PLC | | | 140,140 | | | | 275,094 | |
Delphi Automotive PLC | | | 15,140 | | | | 1,459,496 | |
| | | | | | | | |
| | | | | | | 1,734,590 | |
| | |
Luxembourg — 1.0% | | | | | | | | |
Subsea 7 SA | | | 24,812 | | | | 357,096 | |
Ternium SA | | | 12,813 | | | | 389,900 | |
| | | | | | | | |
| | | | | | | 746,996 | |
| | |
Marshall Islands — 0.1% | | | | | | | | |
Seaspan Corp. (1) | | | 13,901 | | | | 99,253 | |
| | |
Netherlands — 4.2% | | | | | | | | |
AerCap Holdings NV (2) | | | 9,151 | | | | 460,295 | |
Boskalis Westminster | | | 14,727 | | | | 481,596 | |
Fiat Chrysler Automobiles NV (2) | | | 83,348 | | | | 1,258,626 | |
ING Groep NV | | | 48,497 | | | | 861,597 | |
| | | | | | | | |
| | | | | | | 3,062,114 | |
| | |
New Zealand — 0.6% | | | | | | | | |
Air New Zealand, Ltd. | | | 155,551 | | | | 399,560 | |
| | |
Norway — 1.1% | | | | | | | | |
Marine Harvest ASA | | | 9,952 | | | | 197,699 | |
Salmar ASA | | | 14,532 | | | | 421,542 | |
Yara International ASA | | | 3,939 | | | | 161,134 | |
| | | | | | | | |
| | | | | | | 780,375 | |
(See Notes which are an integral part of the Financial Statements)
58
Disciplined International Equity Fund (continued)
| | | | | | | | |
| Description | | Shares | | | Value | |
| Common Stocks (continued) | | | | | | |
| | |
Portugal — 1.1% | | | | | | | | |
EDP — Energias de Portugal SA | | | 202,082 | | | $ | 775,991 | |
| | |
Singapore — 2.3% | | | | | | | | |
DBS Group Holdings, Ltd. | | | 24,400 | | | | 371,737 | |
Japfa, Ltd. (1) | | | 219,800 | | | | 89,301 | |
Mapletree Industrial Trust | | | 239,000 | | | | 327,006 | |
Oversea-Chinese Banking Corp., Ltd. | | | 24,000 | | | | 198,018 | |
SATS, Ltd. | | | 79,000 | | | | 281,688 | |
Singapore Airlines, Ltd. | | | 28,200 | | | | 214,578 | |
Yanlord Land Group, Ltd. | | | 168,100 | | | | 214,655 | |
| | | | | | | | |
| | | | | | | 1,696,983 | |
| | |
Spain — 1.1% | | | | | | | | |
Banco Bilbao Vizcaya Argentaria SA | | | 36,947 | | | | 326,906 | |
Distribuidora Internacional de Alimentacion SA (1) | | | 28,883 | | | | 182,835 | |
Repsol SA | | | 16,775 | | | | 288,260 | |
| | | | | | | | |
| | | | | | | 798,001 | |
| | |
Sweden — 2.6% | | | | | | | | |
Nordea Bank AB | | | 113,466 | | | | 1,527,533 | |
Skandinaviska Enskilda Banken AB, Class A | | | 27,835 | | | | 362,450 | |
| | | | | | | | |
| | | | | | | 1,889,983 | |
| | |
Switzerland — 6.2% | | | | | | | | |
Lonza Group AG | | | 4,362 | | | | 1,105,501 | |
Novartis AG | | | 6,054 | | | | 510,594 | |
Roche Holding AG | | | 3,722 | | | | 948,669 | |
Swiss Re AG | | | 4,760 | | | | 431,359 | |
TE Connectivity, Ltd. | | | 14,760 | | | | 1,174,896 | |
Zurich Insurance Group AG | | | 1,051 | | | | 314,653 | |
| | | | | | | | |
| | | | | | | 4,485,672 | |
| | |
United Kingdom — 15.5% | | | | | | | | |
Admiral Group PLC | | | 12,936 | | | | 323,146 | |
British American Tobacco PLC | | | 15,932 | | | | 993,465 | |
Compass Group PLC | | | 19,139 | | | | 408,618 | |
GlaxoSmithKline PLC | | | 90,129 | | | | 1,787,858 | |
Go-Ahead Group PLC | | | 15,231 | | | | 354,757 | |
Imperial Brands PLC | | | 29,784 | | | | 1,231,768 | |
Jupiter Fund Management PLC | | | 28,641 | | | | 198,805 | |
Legal & General Group PLC | | | 418,713 | | | | 1,408,305 | |
Paragon Group of Cos. PLC | | | 30,311 | | | | 160,600 | |
QinetiQ Group PLC | | | 156,450 | | | | 465,260 | |
Reckitt Benckiser Group PLC | | | 12,401 | | | | 1,176,390 | |
RELX PLC | | | 50,962 | | | | 1,114,868 | |
Rio Tinto PLC | | | 11,214 | | | | 542,785 | |
Royal Mail PLC | | | 83,570 | | | | 426,113 | |
Unilever PLC | | | 7,447 | | | | 435,420 | |
WH Smith PLC | | | 7,957 | | | | 190,161 | |
| | | | | | | | |
| | | | | | | 11,218,319 | |
| | | | | | | | |
Total Common Stocks
(identified cost $60,570,265) | | | | | | | 71,466,230 | |
| | | | | | | | |
| Short-Term Investments — 6.8% | |
|
| Collateral Investment for Securities on Loan — 6.1% | |
| | |
State Street Navigator Securities Lending Government Money Market Portfolio, 0.994% (3) | | | 4,416,726 | | | | 4,416,726 | |
| | | | | | | | |
| Description | | Shares | | | Value | |
| Short-Term Investments (continued) | | | | | | |
| | |
| Mutual Funds — 0.7% | | | | | | |
State Street Institutional Liquid Reserves Fund — Premier Class, 1.150% | | | 521,362 | | | $ | 521,362 | |
| | | | | | | | |
Total Short-Term Investments
(identified cost $4,938,129) | | | | | | | 4,938,088 | |
| | | | | | | | |
Total Investments — 105.5%
(identified cost $65,508,394) | | | | | | | 76,404,318 | |
| Other Assets and Liabilities — (5.5)% | | | | (4,016,276 | ) |
| | | | | | | | |
| Total Net Assets — 100.0% | | | | | | $ | 72,388,042 | |
| | | | | | | | |
| | | | | | | | |
| Industry Allocation | |
| Industry | | Value | | | % of
Total
Net Assets | |
Agriculture | | $ | 2,314,534 | | | | 3.2 | % |
Airlines | | | 614,138 | | | | 0.8 | |
Auto Manufacturers | | | 3,107,424 | | | | 4.3 | |
Auto Parts & Equipment | | | 3,170,530 | | | | 4.4 | |
Banks | | | 7,177,730 | | | | 9.9 | |
Beverages | | | 1,872,456 | | | | 2.6 | |
Biotechnology | | | 173,465 | | | | 0.2 | |
Building Materials | | | 474,224 | | | | 0.7 | |
Chemicals | | | 1,917,425 | | | | 2.6 | |
Commercial Services | | | 3,718,071 | | | | 5.1 | |
Computers | | | 1,662,336 | | | | 2.3 | |
Cosmetics/Personal Care | | | 435,419 | | | | 0.6 | |
Diversified Financial Services | | | 1,111,900 | | | | 1.5 | |
Electric | | | 2,043,686 | | | | 2.8 | |
Electrical Components & Equipment | | | 1,149,595 | | | | 1.6 | |
Electronics | | | 2,476,620 | | | | 3.4 | |
Energy-Alternate Sources | | | 488,217 | | | | 0.7 | |
Engineering & Construction | | | 2,210,965 | | | | 3.1 | |
Food | | | 2,138,143 | | | | 3.0 | |
Food Service | | | 408,618 | | | | 0.6 | |
Forest Products & Paper | | | 1,628,911 | | | | 2.2 | |
Healthcare-Products | | | 1,105,501 | | | | 1.5 | |
Healthcare-Services | | | 2,022,393 | | | | 2.8 | |
Holding Companies-Diversified | | | 200,592 | | | | 0.3 | |
Household Products/Wares | | | 1,176,390 | | | | 1.6 | |
Insurance | | | 5,582,419 | | | | 7.7 | |
Internet | | | 291,920 | | | | 0.4 | |
Iron/Steel | | | 1,727,476 | | | | 2.4 | |
Machinery-Construction & Mining | | | 979,693 | | | | 1.4 | |
Media | | | 3,868 | | | | 0.0 | |
Mining | | | 1,540,280 | | | | 2.1 | |
Miscellaneous Manufacturing | | | 966,176 | | | | 1.3 | |
Oil & Gas | | | 1,498,963 | | | | 2.1 | |
Oil & Gas Services | | | 357,096 | | | | 0.5 | |
Pharmaceuticals | | | 7,340,267 | | | | 10.1 | |
Real Estate | | | 617,524 | | | | 0.9 | |
Real Estate Investment Trusts | | | 327,006 | | | | 0.4 | |
Retail | | | 708,163 | | | | 1.0 | |
Telecommunications | | | 3,234,117 | | | | 4.5 | |
Transportation | | | 1,491,979 | | | | 2.1 | |
| | | | | | | | |
Total Common Stocks | | | 71,466,230 | | | | 98.7 | |
Collateral Investment for Securities on Loan | | | 4,416,726 | | | | 6.1 | |
Mutual Funds | | | 521,362 | | | | 0.7 | |
| | | | | | | | |
Total Investments | | | 76,404,318 | | | | 105.5 | |
Other Assets and Liabilities | | | (4,016,276 | ) | | | (5.5 | ) |
| | | | | | | | |
Total Net Assets | | $ | 72,388,042 | | | | 100.0 | % |
| | | | | | | | |
(See Notes which are an integral part of the Financial Statements)
59
August 31, 2017
Pyrford International Stock Fund
| | | | | | | | |
| Description | | Shares | | | Value | |
| Common Stocks — 90.2% | |
|
Australia — 10.6% | |
Brambles, Ltd. | | | 1,810,183 | | | $ | 13,450,842 | |
Computershare, Ltd. | | | 944,925 | | | | 10,573,888 | |
Newcrest Mining, Ltd. | | | 329,017 | | | | 5,992,086 | |
QBE Insurance Group, Ltd. | | | 1,044,434 | | | | 8,726,581 | �� |
Rio Tinto, Ltd. (1) | | | 119,946 | | | | 6,479,153 | |
Woodside Petroleum, Ltd. | | | 485,185 | | | | 11,172,729 | |
Woolworths, Ltd. | | | 603,957 | | | | 12,496,098 | |
| | | | | | | | |
| | | | | | | 68,891,377 | |
|
Belgium — 1.2% | |
Proximus SADP | | | 208,917 | | | | 7,362,780 | |
|
Finland — 1.9% | |
Kone OYJ, Class B (1) | | | 117,273 | | | | 6,365,070 | |
Sampo OYJ, A Shares | | | 109,064 | | | | 5,759,229 | |
| | | | | | | | |
| | | | | | | 12,124,299 | |
|
France — 7.7% | |
Air Liquide SA | | | 80,993 | | | | 9,901,516 | |
Bureau Veritas SA | | | 291,566 | | | | 6,941,936 | |
Legrand SA | | | 101,747 | | | | 7,134,188 | |
Rubis SCA | | | 88,590 | | | | 5,765,686 | |
Sanofi | | | 115,639 | | | | 11,290,884 | |
TOTAL SA | | | 175,124 | | | | 9,061,101 | |
| | | | | | | | |
| | | | | | | 50,095,311 | |
|
Germany — 4.6% | |
Brenntag AG | | | 144,483 | | | | 7,669,507 | |
Deutsche Post AG | | | 189,282 | | | | 7,852,871 | |
GEA Group AG (1) | | | 127,857 | | | | 5,636,305 | |
SAP AG | | | 79,376 | | | | 8,325,610 | |
| | | | | | | | |
| | | | | | | 29,484,293 | |
|
Hong Kong — 5.5% | |
AIA Group, Ltd. | | | 814,400 | | | | 6,254,055 | |
ASM Pacific Technology, Ltd. | | | 70,500 | | | | 880,039 | |
China Mobile, Ltd. | | | 997,500 | | | | 10,576,556 | |
CNOOC, Ltd. | | | 5,417,000 | | | | 6,541,034 | |
Power Assets Holdings, Ltd. | | | 629,500 | | | | 5,564,695 | |
VTech Holdings, Ltd. | | | 431,900 | | | | 6,072,264 | |
| | | | | | | | |
| | | | | | | 35,888,643 | |
|
Israel — 1.4% | |
Bezeq — The Israeli Telecommunication Corp., Ltd. | | | 6,252,554 | | | | 9,213,470 | |
|
Japan — 8.2% | |
ABC-Mart, Inc. (1) | | | 71,600 | | | | 3,683,914 | |
Japan Tobacco, Inc. | | | 306,868 | | | | 10,523,263 | |
KDDI Corp. | | | 364,700 | | | | 9,854,591 | |
Mitsubishi Electric Corp. | | | 644,000 | | | | 9,557,826 | |
Nihon Kohden Corp. | | | 330,500 | | | | 7,678,088 | |
Sumitomo Rubber Industries, Ltd. | | | 431,100 | | | | 7,165,584 | |
Toyota Tsusho Corp. | | | 159,700 | | | | 4,929,780 | |
| | | | | | | | |
| | | | | | | 53,393,046 | |
|
Malaysia — 2.8% | |
Axiata Group Bhd | | | 8,159,163 | | | | 9,434,058 | |
Malayan Banking Bhd | | | 4,044,591 | | | | 8,966,725 | |
| | | | | | | | |
| | | | | | | 18,400,783 | |
|
Netherlands — 4.1% | |
Koninklijke Vopak NV (1) | | | 175,847 | | | | 7,451,751 | |
RELX NV | | | 344,272 | | | | 7,238,031 | |
Unilever NV | | | 202,659 | | | | 12,073,104 | |
| | | | | | | | |
| | | | | | | 26,762,886 | |
| | | | | | | | |
| Description | | Shares | | | Value | |
| Common Stocks (continued) | |
|
Norway — 1.9% | |
Telenor ASA | | | 601,663 | | | $ | 12,186,717 | |
|
Singapore — 4.6% | |
ComfortDelGro Corp., Ltd. | | | 5,304,900 | | | | 8,977,873 | |
Sembcorp Industries, Ltd. | | | 2,273,000 | | | | 5,000,729 | |
Singapore Technologies Engineering, Ltd. | | | 2,768,400 | | | | 7,465,458 | |
United Overseas Bank, Ltd. | | | 468,702 | | | | 8,321,553 | |
| | | | | | | | |
| | | | | | | 29,765,613 | |
|
Sweden — 4.2% | |
Assa Abloy AB, Class B | | | 230,871 | | | | 4,994,396 | |
Atlas Copco AB, A Shares | | | 290,455 | | | | 11,394,923 | |
Essity AB, Class B (2) | | | 388,950 | | | | 10,805,748 | |
| | | | | | | | |
| | | | | | | 27,195,067 | |
|
Switzerland — 12.8% | |
Givaudan SA | | | 2,031 | | | | 4,152,294 | |
Nestle SA | | | 247,323 | | | | 20,988,864 | |
Novartis AG | | | 208,655 | | | | 17,597,961 | |
Panalpina Welttransport Holding AG (1) | | | 36,698 | | | | 4,836,833 | |
Roche Holding AG | | | 73,846 | | | | 18,821,988 | |
Schindler Holding AG | | | 19,288 | | | | 4,133,202 | |
SGS SA | | | 1,731 | | | | 3,869,763 | |
Zurich Insurance Group AG | | | 29,953 | | | | 8,967,447 | |
| | | | | | | | |
| | | | | | | 83,368,352 | |
|
Taiwan — 3.7% | |
Advantech Co., Ltd. | | | 735,118 | | | | 5,436,616 | |
Chunghwa Telecom Co., Ltd. | | | 2,287,000 | | | | 7,952,519 | |
Merida Industry Co., Ltd. | | | 435,000 | | | | 1,916,742 | |
Taiwan Semiconductor Manufacturing Co., Ltd. | | | 1,236,000 | | | | 8,897,733 | |
| | | | | | | | |
| | | | | | | 24,203,610 | |
|
United Kingdom — 15.0% | |
BP PLC | | | 893,351 | | | | 5,159,387 | |
British American Tobacco PLC | | | 177,810 | | | | 11,087,620 | |
GlaxoSmithKline PLC | | | 469,365 | | | | 9,310,633 | |
Imperial Brands PLC | | | 153,279 | | | | 6,339,116 | |
Legal & General Group PLC | | | 2,963,333 | | | | 9,966,913 | |
National Grid PLC | | | 1,057,267 | | | | 13,317,494 | |
Royal Dutch Shell PLC, A Shares | | | 299,726 | | | | 8,261,590 | |
Royal Dutch Shell PLC, B Shares | | | 221,646 | | | | 6,194,543 | |
SSE PLC | | | 426,361 | | | | 7,854,000 | |
United Utilities Group PLC | | | 814,394 | | | | 9,578,885 | |
Vodafone Group PLC | | | 3,662,383 | | | | 10,476,087 | |
| | | | | | | | |
| | | | | | | 97,546,268 | |
| | | | | | | | |
Total Common Stocks
(identified cost $522,880,624) | | | | 585,882,515 | |
| | | | | | | | |
| Preferred Stocks — 1.6% | |
|
Germany — 1.6% | |
Fuchs Petrolub SE (1) | | | 182,577 | | | | 10,159,146 | |
| | | | | | | | |
Total Preferred Stocks
(identified cost $6,602,641) | | | | 10,159,146 | |
| | | | | | | | |
| Short-Term Investments — 6.9% | |
|
| Collateral Investment for Securities on Loan — 2.8% | |
| | |
State Street Navigator Securities Lending Government Money Market Portfolio, 0.994% (3) | | | 18,127,685 | | | | 18,127,685 | |
(See Notes which are an integral part of the Financial Statements)
60
Pyrford International Stock Fund (continued)
| | | | | | | | |
| Description | | Shares | | | Value | |
| Short-Term Investments (continued) | |
|
| Mutual Funds — 4.1% | |
State Street Institutional Liquid Reserves Fund — Premier Class, 1.150% | | | 26,855,802 | | | $ | 26,855,802 | |
| | | | | | | | |
Total Short-Term Investments
(identified cost $44,985,600) | | | | 44,983,487 | |
| | | | | | | | |
Total Investments — 98.7%
(identified cost $574,468,865) | | | | 641,025,148 | |
| Other Assets and Liabilities — 1.3% | | | | 8,714,437 | |
| | | | | | | | |
| Total Net Assets — 100.0% | | | $ | 649,739,585 | |
| | | | | | | | |
| | | | | | | | |
| Industry Allocation | |
| Industry | | Value | | | % of Total
Net Assets | |
Agriculture | | $ | 27,949,999 | | | | 4.3 | % |
Auto Parts & Equipment | | | 7,165,584 | | | | 1.1 | |
Banks | | | 17,288,278 | | | | 2.7 | |
Chemicals | | | 21,723,318 | | | | 3.3 | |
Commercial Services | | | 31,500,572 | | | | 4.8 | |
Computers | | | 16,010,504 | | | | 2.5 | |
Cosmetics/Personal Care | | | 22,878,852 | | | | 3.5 | |
Distribution/Wholesale | | | 4,929,780 | | | | 0.8 | |
Electric | | | 13,418,695 | | | | 2.1 | |
Electrical Components & Equipment | | | 7,134,188 | | | | 1.1 | |
Electronics | | | 4,994,396 | | | | 0.8 | |
Engineering & Construction | | | 7,465,458 | | | | 1.2 | |
Food | | | 33,484,962 | | | | 5.2 | |
Gas | | | 19,083,180 | | | | 2.9 | |
Hand/Machine Tools | | | 4,133,202 | | | | 0.6 | |
Healthcare-Products | | | 7,678,088 | | | | 1.2 | |
Insurance | | | 39,674,225 | | | | 6.1 | |
Leisure Time | | | 1,916,741 | | | | 0.3 | |
Machinery-Construction & Mining | | | 20,952,749 | | | | 3.2 | |
Machinery-Diversified | | | 12,001,375 | | | | 1.8 | |
Mining | | | 12,471,239 | | | | 1.9 | |
Oil & Gas | | | 46,390,384 | | | | 7.1 | |
Pharmaceuticals | | | 57,021,465 | | | | 8.8 | |
Pipelines | | | 7,451,751 | | | | 1.1 | |
Retail | | | 3,683,914 | | | | 0.6 | |
Semiconductors | | | 9,777,772 | | | | 1.5 | |
Shipbuilding | | | 5,000,729 | | | | 0.8 | |
Software | | | 8,325,610 | | | | 1.3 | |
Telecommunications | | | 83,129,043 | | | | 12.8 | |
Transportation | | | 21,667,577 | | | | 3.3 | |
Water | | | 9,578,885 | | | | 1.5 | |
| | | | | | | | |
Total Common Stocks | | | 585,882,515 | | | | 90.2 | |
Preferred Stocks | | | 10,159,146 | | | | 1.6 | |
Collateral Investment for Securities on Loan | | | 18,127,685 | | | | 2.8 | |
Mutual Funds | | | 26,855,802 | | | | 4.1 | |
| | | | | | | | |
Total Investments | | | 641,025,148 | | | | 98.7 | |
Other Assets and Liabilities | | | 8,714,437 | | | | 1.3 | |
| | | | | | | | |
Total Net Assets | | $ | 649,739,585 | | | | 100.0 | % |
| | | | | | | | |
LGM Emerging Markets Equity Fund
| | | | | | | | |
| Description | | Shares | | | Value | |
| Common Stocks — 91.1% | | | | | | |
| | |
Bermuda — 3.9% | | | | | | | | |
Credicorp, Ltd. | | | 11,938 | | | $ | 2,421,504 | |
Dairy Farm International Holdings, Ltd. | | | 483,415 | | | | 3,919,033 | |
| | | | | | | | |
| | | | | | | 6,340,537 | |
| | |
Brazil — 1.0% | | | | | | | | |
CCR SA | | | 298,400 | | | | 1,655,118 | |
| | |
Cayman Islands — 2.0% | | | | | | | | |
Sands China, Ltd. | | | 725,200 | | | | 3,249,913 | |
| | |
Chile — 1.7% | | | | | | | | |
Aguas Andinas SA, Class A | | | 4,263,203 | | | | 2,738,855 | |
| | |
China — 2.2% | | | | | | | | |
Foshan Haitian Flavouring & Food Co., Ltd., Class A | | | 587,000 | | | | 3,609,517 | |
| | |
Egypt — 4.0% | | | | | | | | |
Commercial International Bank Egypt SAE GDR | | | 1,265,531 | | | | 5,784,314 | |
Edita Food Industries SAE GDR | | | 131,694 | | | | 691,394 | |
| | | | | | | | |
| | | | | | | 6,475,708 | |
| | |
Hong Kong — 2.7% | | | | | | | | |
AIA Group, Ltd. | | | 569,400 | | | | 4,372,616 | |
| | |
India — 22.2% | | | | | | | | |
Colgate-Palmolive India, Ltd. | | | 96,303 | | | | 1,684,442 | |
Container Corp. Of India, Ltd. | | | 42,312 | | | | 873,460 | |
Emami, Ltd. | | | 269,911 | | | | 4,574,105 | |
Hindustan Unilever, Ltd. | | | 91,123 | | | | 1,733,562 | |
Housing Development Finance Corp., Ltd. | | | 177,246 | | | | 4,932,117 | |
ICICI Bank, Ltd. | | | 1,150,310 | | | | 5,391,605 | |
ITC, Ltd. | | | 1,177,734 | | | | 5,200,175 | |
Nestle India, Ltd. | | | 21,848 | | | | 2,428,500 | |
Pidilite Industries, Ltd. | | | 129,835 | | | | 1,706,765 | |
Titan Co., Ltd. | | | 212,221 | | | | 2,054,899 | |
Yes Bank, Ltd. | | | 197,638 | | | | 5,405,933 | |
| | | | | | | | |
| | | | | | | 35,985,563 | |
| | |
Indonesia — 11.3% | | | | | | | | |
Bank Mandiri Persero Tbk PT | | | 7,009,304 | | | | 6,894,865 | |
Bank Rakyat Indonesia Persero Tbk PT | | | 5,516,100 | | | | 6,264,824 | |
Hanjaya Mandala Sampoerna Tbk PT | | | 5,174,800 | | | | 1,410,397 | |
Kalbe Farma Tbk PT | | | 18,977,100 | | | | 2,432,436 | |
Unilever Indonesia Tbk PT | | | 352,100 | | | | 1,333,545 | |
| | | | | | | | |
| | | | | | | 18,336,067 | |
| | |
Kenya — 0.5% | | | | | | | | |
East African Breweries, Ltd. | | | 317,471 | | | | 802,539 | |
| | |
Malaysia — 3.7% | | | | | | | | |
British American Tobacco Malaysia Bhd | | | 445,200 | | | | 4,606,137 | |
Public Bank Bhd | | | 277,300 | | | | 1,339,169 | |
| | | | | | | | |
| | | | | | | 5,945,306 | |
| | |
Mexico — 10.1% | | | | | | | | |
Bolsa Mexicana de Valores SAB de C.V. (1) | | | 1,817,373 | | | | 3,134,795 | |
Grupo Financiero Banorte SAB de C.V., Class O | | | 572,875 | | | | 3,909,043 | |
Grupo Herdez SAB de C.V. (1) | | | 555,373 | | | | 1,360,534 | |
Wal-Mart de Mexico SAB de C.V. | | | 3,287,211 | | | | 7,997,745 | |
| | | | | | | | |
| | | | | | | 16,402,117 | |
(See Notes which are an integral part of the Financial Statements)
61
August 31, 2017
LGM Emerging Markets Equity Fund (continued)
| | | | | | | | |
| Description | | Shares or
Units | | | Value | |
| Common Stocks (continued) | | | | | | |
| | |
Nigeria — 1.0% | | | | | | | | |
Guaranty Trust Bank PLC | | | 15,198,387 | | | $ | 1,658,823 | |
| | |
Philippines — 3.6% | | | | | | | | |
Universal Robina Corp. | | | 2,046,650 | | | | 5,843,654 | |
| | |
South Africa — 6.4% | | | | | | | | |
Clicks Group, Ltd. | | | 253,311 | | | | 2,898,622 | |
Famous Brands, Ltd. | | | 109,124 | | | | 991,371 | |
Mr Price Group, Ltd. | | | 461,564 | | | | 6,432,264 | |
| | | | | | | | |
| | | | | | | 10,322,257 | |
| | |
Taiwan — 2.1% | | | | | | | | |
President Chain Store Corp. | | | 416,000 | | | | 3,488,268 | |
| | |
Thailand — 0.9% | | | | | | | | |
Kasikornbank PCL | | | 255,869 | | | | 1,548,853 | |
| | |
Turkey — 3.5% | | | | | | | | |
BIM Birlesik Magazalar AS | | | 259,893 | | | | 5,760,591 | |
| | |
United States — 7.3% | | | | | | | | |
PriceSmart, Inc. | | | 29,900 | | | | 2,429,375 | |
Western Union Co. | | | 164,589 | | | | 3,114,024 | |
Yum China Holdings, Inc. (2) | | | 178,293 | | | | 6,304,440 | |
| | | | | | | | |
| | | | | | | 11,847,839 | |
| | |
Vietnam — 1.0% | | | | | | | | |
Vietnam Dairy Products JSC | | | 248,570 | | | | 1,622,909 | |
| | | | | | | | |
Total Common Stocks
(identified cost $111,114,602) | | | | | | | 148,007,050 | |
| | | | | | | | |
| Common Stock Units — 2.4% | | | | | | |
| | |
Mexico — 2.4% | | | | | | | | |
Fomento Economico Mexicano SAB de C.V. | | | 383,200 | | | | 3,837,734 | |
| | | | | | | | |
Total Common Stock Units
(identified cost $3,169,741) | | | | | | | 3,837,734 | |
| | |
| Participation Notes — 2.6% | | | | | | |
| | |
United States — 2.6% | | | | | | | | |
Vietnam Dairy Products JSC, Issued by Citigroup Global Markets Holding, Maturity Date 2/8/2018 (5) | | | 641,463 | | | | 4,187,718 | |
| | | | | | | | |
Total Participation Notes
(identified cost $2,536,119) | | | | | | | 4,187,718 | |
| | | | | | | | |
| Short-Term Investments — 4.2% | | | | |
|
| Collateral Investment for Securities on Loan — 0.3% | |
State Street Navigator Securities Lending Government Money Market Portfolio, 0.994% (3) | | | 512,972 | | | | 512,972 | |
| | |
| Mutual Funds — 3.9% | | | | | | |
State Street Institutional Liquid Reserves Fund — Premier Class, 1.150% | | | 6,268,485 | | | | 6,268,485 | |
| | | | | | | | |
Total Short-Term Investments
(identified cost $6,781,960) | | | | | | | 6,781,457 | |
| | | | | | | | |
Total Investments — 100.3%
(identified cost $123,602,422) | | | | | | | 162,813,959 | |
| Other Assets and Liabilities — (0.3)% | | | | (457,148 | ) |
| | | | | | | | |
| Total Net Assets — 100.0% | | | | | | $ | 162,356,811 | |
| | | | | | | | |
| | | | | | | | |
| Industry Allocation | |
| Industry | | Value | | | % of
Total
Net Assets | |
Agriculture | | $ | 11,216,709 | | | | 6.9 | % |
Banks | | | 40,618,933 | | | | 25.0 | |
Beverages | | | 802,539 | | | | 0.5 | |
Commercial Services | | | 4,769,142 | | | | 2.9 | |
Cosmetics/Personal Care | | | 1,684,442 | | | | 1.0 | |
Diversified Financial Services | | | 8,066,912 | | | | 5.0 | |
Food | | | 25,236,131 | | | | 15.5 | |
Household Products/Wares | | | 3,067,107 | | | | 1.9 | |
Insurance | | | 4,372,617 | | | | 2.7 | |
Lodging | | | 3,249,913 | | | | 2.0 | |
Miscellaneous Manufacturing | | | 1,706,765 | | | | 1.1 | |
Pharmaceuticals | | | 7,006,541 | | | | 4.3 | |
Retail | | | 32,596,984 | | | | 20.1 | |
Transportation | | | 873,460 | | | | 0.5 | |
Water | | | 2,738,855 | | | | 1.7 | |
| | | | | | | | |
Total Common Stocks | | | 148,007,050 | | | | 91.1 | |
Common Stock Units | | | 3,837,734 | | | | 2.4 | |
Participation Notes | | | 4,187,718 | | | | 2.6 | |
Collateral Investment for Securities on Loan | | | 512,972 | | | | 0.3 | |
Mutual Funds | | | 6,268,485 | | | | 3.9 | |
| | | | | | | | |
Total Investments | | | 162,813,959 | | | | 100.3 | |
Other Assets and Liabilities | | | (457,148 | ) | | | (0.3 | ) |
| | | | | | | | |
Total Net Assets | | $ | 162,356,811 | | | | 100.0 | % |
| | | | | | | | |
TCH Emerging Markets Bond Fund
| | | | | | | | |
| Description | | Principal Amount | | | Value | |
| Corporate Bonds & Notes — 55.0% | | | | | | |
| | |
Austria — 1.8% | | | | | | | | |
Suzano Austria GmbH, 5.750%, 7/14/2026 (1)(6) | | $ | 200,000 | | | $ | 217,000 | |
| | |
British Virgin Islands — 3.2% | | | | | | | | |
China Cinda Finance 2014, Ltd., 5.625%, 5/14/2024 (6) | | | 200,000 | | | | 223,634 | |
GTL Trade Finance, Inc., 5.893%, 4/29/2024 (6) | | | 150,000 | | | | 159,750 | |
| | | | | | | | |
| | | | | | | 383,384 | |
| | |
Canada — 1.8% | | | | | | | | |
Kinross Gold Corp.: | | | | | | | | |
5.125%, 9/1/2021 (1) | | | 50,000 | | | | 53,380 | |
6.875%, 9/1/2041 | | | 150,000 | | | | 161,625 | |
| | | | | | | | |
| | | | | | | 215,005 | |
| | |
Cayman Islands — 4.2% | | | | | | | | |
Batelco International Finance No. 1, Ltd., 4.250%, 5/1/2020 | | | 200,000 | | | | 201,236 | |
Odebrecht Finance, Ltd., 7.125%, 6/26/2042 (6) | | | 200,000 | | | | 82,000 | |
Vale Overseas, Ltd., 4.375%, 1/11/2022 | | | 200,000 | | | | 211,250 | |
| | | | | | | | |
| | | | | | | 494,486 | |
| | |
Chile — 1.8% | | | | | | | | |
Empresa de Transporte de Pasajeros Metro SA, 5.000%, 1/25/2047 (6) | | | 200,000 | | | | 219,578 | |
(See Notes which are an integral part of the Financial Statements)
62
TCH Emerging Markets Bond Fund (continued)
| | | | | | | | |
| Description | | Principal Amount | | | Value | |
| Corporate Bonds & Notes (continued) | | | | |
| | |
Colombia — 3.4% | | | | | | | | |
Colombia Telecomunicaciones SA ESP, 5.375%, 9/27/2022 | | $ | 200,000 | | | $ | 206,000 | |
Ecopetrol SA, 5.875%, 5/28/2045 | | | 200,000 | | | | 195,370 | |
| | | | | | | | |
| | | | | | | 401,370 | |
| | |
Costa Rica — 1.8% | | | | | | | | |
Banco Nacional de Costa Rica, 6.250%, 11/1/2023 | | | 200,000 | | | | 210,040 | |
| | |
Georgia — 2.3% | | | | | | | | |
Georgian Railway JSC, 7.750%, 7/11/2022 (6) | | | 250,000 | | | | 276,310 | |
| | |
Hungary — 1.7% | | | | | | | | |
Magyar Export-Import Bank Zrt, 4.000%, 1/30/2020 (6) | | | 200,000 | | | | 207,522 | |
| | |
Indonesia — 1.7% | | | | | | | | |
Pelabuhan Indonesia II PT, 4.250%, 5/5/2025 (1)(6) | | | 200,000 | | | | 205,680 | |
| | |
Kazakstan — 3.5% | | | | | | | | |
Eurasian Development Bank, 4.767%, 9/20/2022 (6) | | | 200,000 | | | | 208,845 | |
KazMunayGas National Co. JSC, 3.875%, 4/19/2022 (6) | | | 200,000 | | | | 204,300 | |
| | | | | | | | |
| | | | | | | 413,145 | |
| | |
Luxembourg — 3.5% | | | | | | | | |
Gazprom Neft OAO Via GPN Capital SA, 6.000%, 11/27/2023 (6) | | | 200,000 | | | | 219,557 | |
Minerva Luxembourg SA, 6.500%, 9/20/2026 (6) | | | 200,000 | | | | 201,360 | |
| | | | | | | | |
| | | | | | | 420,917 | |
| | |
Mexico — 9.2% | | | | | | | | |
Alfa SAB de CV, 6.875%, 3/25/2044 (6) | | | 200,000 | | | | 223,750 | |
Comision Federal de Electricidad, 4.750%, 2/23/2027 (6) | | | 300,000 | | | | 312,000 | |
Nemak SAB de CV, 5.500%, 2/28/2023 (6) | | | 250,000 | | | | 257,500 | |
Petroleos Mexicanos: | | | | | | | | |
6.375%, 2/4/2021 | | | 100,000 | | | | 110,600 | |
5.625%, 1/23/2046 | | | 200,000 | | | | 188,800 | |
| | | | | | | | |
| | | | | | | 1,092,650 | |
| | |
Morocco — 1.9% | | | | | | | | |
OCP SA, 6.875%, 4/25/2044 (6) | | | 200,000 | | | | 226,608 | |
|
Netherlands — 1.9% | |
Kazakhstan Temir Zholy Finance BV, 6.950%, 7/10/2042 (6) | | | 200,000 | | | | 223,708 | |
|
Peru — 1.8% | |
Corp Financiera de Desarrollo SA, 4.750%, 7/15/2025 (6) | | | 200,000 | | | | 216,750 | |
|
South Africa — 2.1% | |
Transnet SOC, Ltd., 4.000%, 7/26/2022 (6) | | | 250,000 | | | | 247,026 | |
| | |
Turkey — 5.2% | | | | | | | | |
Coca-Cola Icecek AS, 4.750%, 10/1/2018 (6) | | | 200,000 | | | | 205,111 | |
| | | | | | | | |
| Description | | Principal Amount | | | Value | |
| Corporate Bonds & Notes (continued) | | | | |
| | |
Turkey (continued) | | | | | | | | |
TC Ziraat Bankasi AS, 4.250%, 7/3/2019 (6) | | $ | 200,000 | | | $ | 202,600 | |
Turk Telekomunikasyon AS, 4.875%, 6/19/2024 (6) | | | 200,000 | | | | 205,092 | |
| | | | | | | | |
| | | | | | | 612,803 | |
|
United Kingdom — 2.2% | |
Standard Chartered PLC, 3.950%, 1/11/2023 (6) | | | 250,000 | | | | 256,524 | |
| | | | | | | | |
Total Corporate Bonds & Notes
(identified cost $6,314,604) | | | | 6,540,506 | |
|
| International Bonds — 41.5% | |
|
Argentina — 3.6% | |
Argentine Republic Government International Bond: | | | | | | | | |
5.625%, 1/26/2022 | | | 200,000 | | | | 209,700 | |
6.875%, 1/26/2027 (1) | | | 200,000 | | | | 215,800 | |
| | | | | | | | |
| | | | | | | 425,500 | |
|
Armenia — 3.2% | |
Republic of Armenia, 6.000%, 9/30/2020 (1)(6) | | | 362,000 | | | | 385,092 | |
|
Bahamas — 1.8% | |
Bahamas Government International Bond, 5.750%, 1/16/2024 | | | 200,000 | | | | 211,500 | |
|
Bahrain — 1.5% | |
Bahrain Government International Bond, 6.000%, 9/19/2044 (1)(6) | | | 200,000 | | | | 175,192 | |
|
Bolivia — 2.1% | |
Bolivian Government International Bond, 4.500%, 3/20/2028 (6) | | | 250,000 | | | | 246,562 | |
|
Brazil — 1.9% | |
Brazilian Government International Bond, 6.000%, 4/7/2026 | | | 200,000 | | | | 222,300 | |
|
Costa Rica — 1.5% | |
Costa Rica Government International Bond, 5.625%, 4/30/2043 (6) | | | 200,000 | | | | 182,750 | |
|
Cote d’Ivoire — 2.1% | |
Ivory Coast Government International Bond, 6.125%, 6/15/2033 | | | 250,000 | | | | 250,000 | |
|
Croatia — 1.9% | |
Croatia Government International Bond, 5.500%, 4/4/2023 (6) | | | 200,000 | | | | 222,493 | |
|
Dominican Republic — 2.3% | |
Dominican Republic International Bond: | | | | | | | | |
5.875%, 4/18/2024 (6) | | | 100,000 | | | | 108,750 | |
5.950%, 1/25/2027 (6) | | | 150,000 | | | | 163,125 | |
| | | | | | | | |
| | | | | | | 271,875 | |
|
Ethiopia — 1.7% | |
Federal Democratic Republic of Ethiopia, 6.625%, 12/11/2024 (6) | | | 200,000 | | | | 205,071 | |
|
Indonesia — 2.1% | |
Perusahaan Penerbit SBSN Indonesia III, 3.300%, 11/21/2022 | | | 250,000 | | | | 255,312 | |
(See Notes which are an integral part of the Financial Statements)
63
August 31, 2017
TCH Emerging Markets Bond Fund (continued)
| | | | | | | | |
| Description | | Shares or Principal Amount | | | Value | |
|
| International Bonds (continued) | |
|
Namibia — 1.7% | |
Namibia International Bonds, 5.250%, 10/29/2025 (6) | | $ | 200,000 | | | $ | 205,430 | |
|
Oman — 1.7% | |
Oman Government International Bond, 4.750%, 6/15/2026 (1)(6) | | | 200,000 | | | | 200,050 | |
|
Paraguay — 1.8% | |
Paraguay Government International Bond, 4.625%, 1/25/2023 (6) | | | 200,000 | | | | 212,000 | |
|
Rwanda — 1.8% | |
Rwanda International Government Bond, 6.625%, 5/2/2023 (6) | | | 200,000 | | | | 209,492 | |
|
Saudi Arabia — 1.7% | |
Saudi Government International Bond, 4.500%, 10/26/2046 (6) | | | 200,000 | | | | 205,935 | |
|
Sri Lanka — 1.7% | |
Sri Lanka Government International Bond, 6.000%, 1/14/2019 (6) | | | 200,000 | | | | 207,614 | |
|
Turkey — 3.6% | |
Export Credit Bank of Turkey, 5.000%, 9/23/2021 (6) | | | 200,000 | | | | 206,279 | |
Turkey Government International Bond, 6.000%, 3/25/2027 | | | 200,000 | | | | 219,490 | |
| | | | | | | | |
| | | | | | | 425,769 | |
|
Vietnam — 1.8% | |
Vietnam Government International Bond, 4.800%, 11/19/2024 (6) | | | 200,000 | | | | 212,781 | |
| | | | | | | | |
Total International Bonds
(identified cost $4,769,923) | | | | 4,932,718 | |
| | | | | | | | |
| Short-Term Investments — 9.9% | |
|
| Collateral Investment for Securities on Loan — 8.6% | |
State Street Navigator Securities Lending Government Money Market Portfolio, 0.994% (3) | | | 1,016,625 | | | | 1,016,625 | |
|
| Mutual Funds — 1.3% | |
State Street Institutional Liquid Reserves Fund — Premier Class, 1.150% | | | 153,700 | | | | 153,701 | |
| | | | | | | | |
Total Short-Term Investments
(identified cost $1,170,330) | | | | 1,170,326 | |
| | | | | | | | |
Total Investments — 106.4%
(identified cost $12,254,857) | | | | 12,643,550 | |
| Other Assets and Liabilities — (6.4)% | | | | (760,017 | ) |
| | | | | | | | |
| Total Net Assets — 100.0% | | | $ | 11,883,533 | |
| | | | | | | | |
| | | | | | | | |
| Industry Allocation | |
| Industry | | Value | | | % of
Total
Net Assets | |
Auto Parts & Equipment | | $ | 257,500 | | | | 2.2 | % |
Banks | | | 885,914 | | | | 7.5 | |
Beverages | | | 205,111 | | | | 1.7 | |
Chemicals | | | 226,608 | | | | 1.9 | |
Diversified Financial Services | | | 223,634 | | | | 1.9 | |
Electric | | | 312,000 | | | | 2.6 | |
Engineering & Construction | | | 82,000 | | | | 0.7 | |
Food | | | 201,360 | | | | 1.7 | |
Forest Products & Paper | | | 217,000 | | | | 1.8 | |
Holding Companies-Diversified | | | 223,750 | | | | 1.9 | |
Iron/Steel | | | 371,000 | | | | 3.1 | |
Mining | | | 215,005 | | | | 1.8 | |
Multi-National | | | 208,845 | | | | 1.8 | |
Oil & Gas | | | 918,627 | | | | 7.7 | |
Sovereign | | | 207,522 | | | | 1.7 | |
Telecommunications | | | 612,328 | | | | 5.1 | |
Transportation | | | 1,172,302 | | | | 9.9 | |
| | | | | | | | |
Total Corporate Bonds & Notes | | | 6,540,506 | | | | 55.0 | |
International Bonds | | | 4,932,718 | | | | 41.5 | |
Collateral Investment for Securities on Loan | | | 1,016,625 | | | | 8.6 | |
Mutual Funds | | | 153,701 | | | | 1.3 | |
| | | | | | | | |
Total Investments | | | 12,643,550 | | | | 106.4 | |
Other Assets and Liabilities | | | (760,017 | ) | | | (6.4 | ) |
| | | | | | | | |
Total Net Assets | | $ | 11,883,533 | | | | 100.0 | % |
| | | | | | | | |
Alternative Strategies Fund
| | | | | | | | |
| Description | | Principal
Amount | | | Value | |
| Bank Loans Purchased Long — 4.7% | |
|
Canada — 0.3% | |
Valeant Pharmaceuticals International, Inc., 5.990%
(US LIBOR+475 basis points), 4/1/2022 (7) | | $ | 228,279 | | | $ | 232,429 | |
|
Jersey — 0.0% | |
Cyan Blue Holdco 3, Ltd.,
4.818% (US LIBOR+350 basis points), 7/26/2024 (7)(8) | | | 11,000 | | | | 11,086 | |
|
Netherlands — 0.0% | |
Diamond (BC) B.V., 4.818%
(US LIBOR+350 basis points), 7/12/2024 (7)(8) | | | 25,000 | | | | 24,883 | |
|
United States — 4.4% | |
21st Century Oncology Holdings, Inc., 7.425% (US LIBOR+613 basis points), 4/30/2022 (7)(9) | | | 185,171 | | | | 175,449 | |
Air Newco LLC, 6.816%
(US LIBOR+550 basis points), 3/18/2022 (7) | | | 193,882 | | | | 191,943 | |
Almonde, Inc., 8.567%
(US LIBOR+725 basis points), 6/13/2025 (7) | | | 30,000 | | | | 30,637 | |
American Bath Group LLC, 6.546% (US LIBOR+525 basis points), 9/30/2023 (7) | | | 130,343 | | | | 130,180 | |
AP Exhaust Acquisition LLC, 6.309% (US LIBOR+500 basis points), 5/10/2024 (7) | | | 14,963 | | | | 14,738 | |
(See Notes which are an integral part of the Financial Statements)
64
Alternative Strategies Fund (continued)
| | | | | | | | |
| Description | | Principal
Amount | | | Value | |
| Bank Loans Purchased Long (continued) | |
|
United States (continued) | |
Centurylink, Inc., 6.318%
(US LIBOR+500 basis points), 2/17/2018 (7)(8) | | $ | 300,000 | | | $ | 300,000 | |
Chief Power Finance LLC, 5.990% (US LIBOR+475 basis points), 12/31/2020 (7) | | | 52,730 | | | | 34,472 | |
Confie Seguros Holding II Co.: | | | | | | | | |
6.739% (US LIBOR+550 basis points), 4/19/2022 (7) | | | 176,115 | | | | 174,618 | |
11.046% (US LIBOR+975 basis points), 5/8/2019 (7) | | | 126,000 | | | | 124,425 | |
CPI International, Inc., 4.734%
(US LIBOR+350 basis points), 7/26/2024 (7) | | | 49,000 | | | | 48,980 | |
Del Monte Foods, Inc., 4.570%
(US LIBOR+325 basis points), 2/18/2021 (7) | | | 15,877 | | | | 13,059 | |
Duff & Phelps Corp., 9.796%
(US LIBOR+850 basis points), 4/23/2021 (7) | | | 51,750 | | | | 52,267 | |
Duravant LLC: | | | | | | | | |
4.485% (US LIBOR+325 basis points), 7/19/2024 (7) | | | 5,522 | | | | 5,527 | |
4.556% (US LIBOR+325 basis points), 7/19/2024 (7)(8) | | | 103,478 | | | | 103,575 | |
8.556% (US LIBOR+725 basis points), 7/18/2025 (7)(8) | | | 30,000 | | | | 30,263 | |
GenOn Energy, Inc., 11.458%
(US LIBOR+1,014 basis points), 6/12/2018 (7)(8) | | | 662,000 | | | | 662,000 | |
Global Tel*Link Corp.: | | | | | | | | |
5.296% (US LIBOR+400 basis points), 5/23/2020 (7) | | | 17,000 | | | | 17,162 | |
9.046% (US LIBOR+775 basis points), 11/23/2020 (7) | | | 71,000 | | | | 70,882 | |
Harland Clarke Holdings Corp., 6.796% (US LIBOR+550 basis points), 2/9/2022 (7) | | | 95,396 | | | | 95,973 | |
HD Supply Waterworks, Ltd., 4.455% (US LIBOR+300 basis points), 8/1/2024 (7) | | | 65,000 | | | | 65,244 | |
Highland Acquisitions Holdings LLC, 6.739% (US LIBOR+550 basis points), 11/30/2022 (7) | | | 189,101 | | | | 190,835 | |
Invenergy Thermal Operating I LLC, 6.796% (US LIBOR+550 basis points), 10/19/2022 (7) | | | 17,307 | | | | 16,614 | |
Ocwen Loan Servicing LLC, 6.231% (US LIBOR+500 basis points), 12/5/2020 (7) | | | 156,987 | | | | 156,536 | |
Proampac PG Borrower LLC, 9.816% (US LIBOR+850 basis points), 11/18/2024 (7) | | | 122,000 | | | | 124,478 | |
Quorum Health Corp., 8.067%
(US LIBOR+675 basis points), 4/29/2022 (7) | | | 175,974 | | | | 177,790 | |
Securus Technologies Holdings, Inc., 9.000% (US LIBOR+775 basis points), 4/30/2021 (7) | | | 70,000 | | | | 70,379 | |
Southcross Energy Partners LP, 5.546% (US LIBOR+425 basis points), 8/4/2021 (7) | | | 87,786 | | | | 77,636 | |
| | | | | | | | |
| Description | | Shares or
Principal
Amount | | | Value | |
| Bank Loans Purchased Long (continued) | |
|
United States (continued) | |
StandardAero Aviation Holdings, Inc., 5.068% (US LIBOR+375 basis points), 7/7/2022 (7)(8) | | $ | 22,000 | | | $ | 22,103 | |
SunEdison, Inc.: | | | | | | | | |
8.739% (US LIBOR+750 basis points), 5/2/2018 (7) | | | 559,696 | | | | 560,255 | |
11.318% (US LIBOR+1,000 basis points), 7/2/2018 (7)(9) | | | 40,059 | | | | 4,574 | |
13.318% (US LIBOR+1,200 basis points), 5/2/2018 (7)(8) | | | 161,888 | | | | 162,293 | |
TKC Holdings, Inc., 9.239%
(US LIBOR+800 basis points), 2/1/2024 (7) | | | 21,000 | | | | 21,095 | |
Walter Investment Management Corp., 4.989% (US LIBOR+375 basis points), 12/18/2020 (7) | | | 338,031 | | | | 314,001 | |
| | | | | | | | |
| | | | | | | 4,239,983 | |
| | | | | | | | |
Total Bank Loans Purchased Long
(identified cost $4,463,636) | | | | | | | 4,508,381 | |
| | | | | | | | |
| Common Stocks Purchased Long — 42.4% | |
|
Australia — 0.1% | |
Regis Resources, Ltd. | | | 24,998 | | | | 82,605 | |
|
Bermuda — 0.3% | |
Argo Group International Holdings, Ltd. | | | 1,667 | | | | 100,354 | |
Aspen Insurance Holdings, Ltd. | | | 3,105 | | | | 140,346 | |
Everest Re Group, Ltd. | | | 188 | | | | 47,466 | |
Syncora Holdings, Ltd. (2) | | | 5,417 | | | | 12,838 | |
| | | | | | | | |
| | | | | | | 301,004 | |
|
Canada — 0.7% | |
Air Canada (2) | | | 480 | | | | 8,972 | |
BlackBerry, Ltd. (2) | | | 35,570 | | | | 329,734 | |
Celestica, Inc. (2) | | | 3,022 | | | | 34,679 | |
George Weston, Ltd. | | | 1,762 | | | | 153,137 | |
Just Energy Group, Inc. | | | 3,322 | | | | 19,180 | |
Pure Industrial Real Estate Trust | | | 9,001 | | | | 47,717 | |
Transcontinental, Inc. | | | 1,719 | | | | 33,451 | |
| | | | | | | | |
| | | | | | | 626,870 | |
|
Cayman Islands — 0.0% | |
China Dongxiang Group Co., Ltd. | | | 159,000 | | | | 28,448 | |
|
China — 0.1% | |
Agricultural Bank of China, Ltd., Class H | | | 48,000 | | | | 22,652 | |
China Machinery Engineering Corp., Class H | | | 55,000 | | | | 36,147 | |
| | | | | | | | |
| | | | | | | 58,799 | |
|
Denmark — 0.0% | |
Novo Nordisk A/S | | | 636 | | | | 30,364 | |
|
France — 0.2% | |
Boiron SA | | | 398 | | | | 37,603 | |
IPSOS | | | 987 | | | | 30,856 | |
Peugeot SA | | | 2,188 | | | | 46,253 | |
Sanofi | | | 356 | | | | 34,759 | |
| | | | | | | | |
| | | | | | | 149,471 | |
|
Germany — 0.1% | |
Hamburger Hafen und Logistik AG | | | 540 | | | | 17,204 | |
Software AG | | | 2,444 | | | | 107,408 | |
| | | | | | | | |
| | | | | | | 124,612 | |
|
Hungary — 0.1% | |
Richter Gedeon Nyrt | | | 3,288 | | | | 85,559 | |
(See Notes which are an integral part of the Financial Statements)
65
August 31, 2017
Alternative Strategies Fund (continued)
| | | | | | | | |
Description | | Shares | | | Value | |
| Common Stocks Purchased Long (continued) | |
|
Ireland — 2.3% | |
Adient PLC | | | 4,370 | | | $ | 308,872 | |
Allergan PLC (10) | | | 3,753 | | | | 861,238 | |
Johnson Controls International PLC (10) | | | 26,290 | | | | 1,040,821 | |
Seagate Technology PLC | | | 1,025 | | | | 32,318 | |
| | | | | | | | |
| | | | | | | 2,243,249 | |
|
Italy — 0.1% | |
Amplifon SpA | | | 4,951 | | | | 71,640 | |
ASTM SpA | | | 895 | | | | 22,574 | |
Societa Iniziative Autostradali e Servizi SpA | | | 1,940 | | | | 28,993 | |
| | | | | | | | |
| | | | | | | 123,207 | |
|
Japan — 1.2% | |
Fujibo Holdings, Inc. | | | 800 | | | | 24,481 | |
Futaba Corp. | | | 2,000 | | | | 37,059 | |
Heiwado Co., Ltd. | | | 4,700 | | | | 109,887 | |
Kato Sangyo Co., Ltd. | | | 600 | | | | 17,706 | |
Keihin Corp. | | | 3,100 | | | | 51,189 | |
Mitsui Sugar Co., Ltd. | | | 1,000 | | | | 34,098 | |
Nippon Road Co., Ltd. | | | 2,000 | | | | 11,150 | |
Nippon Telegraph & Telephone Corp. (10) | | | 3,900 | | | | 194,269 | |
Nipro Corp. | | | 6,200 | | | | 82,213 | |
Nissan Motor Co., Ltd. | | | 7,000 | | | | 69,729 | |
Okinawa Electric Power Co., Inc. | | | 800 | | | | 17,888 | |
Paramount Bed Holdings Co., Ltd. | | | 2,400 | | | | 106,548 | |
Press Kogyo Co., Ltd. | | | 5,800 | | | | 30,514 | |
Sapporo Holdings, Ltd. (10) | | | 6,600 | | | | 192,035 | |
Shimachu Co., Ltd. | | | 2,100 | | | | 54,315 | |
Wakita & Co., Ltd. | | | 2,900 | | | | 33,758 | |
Warabeya Nichiyo Holdings Co., Ltd. | | | 1,400 | | | | 35,219 | |
Yorozu Corp. | | | 1,200 | | | | 23,758 | |
| | | | | | | | |
| | | | | | | 1,125,816 | |
|
Jersey — 0.6% | |
Delphi Automotive PLC (10) | | | 5,495 | | | | 529,718 | |
Wizz Air Holdings PLC (2)(6) | | | 860 | | | | 32,783 | |
| | | | | | | | |
| | | | | | | 562,501 | |
|
Luxembourg — 0.2% | |
Orion Engineered Carbons SA | | | 1,537 | | | | 33,046 | |
Ternium SA | | | 2,414 | | | | 73,458 | |
Trinseo SA | | | 1,589 | | | | 106,304 | |
| | | | | | | | |
| | | | | | | 212,808 | |
|
Netherlands — 0.6% | |
BE Semiconductor Industries NV (10) | | | 2,449 | | | | 158,967 | |
Boskalis Westminster | | | 2,986 | | | | 97,647 | |
Playa Hotels & Resorts NV (2) | | | 31,740 | | | | 329,144 | |
| | | | | | | | |
| | | | | | | 585,758 | |
|
New Zealand — 0.1% | |
Air New Zealand, Ltd. | | | 43,483 | | | | 111,694 | |
|
Norway — 0.0% | |
Austevoll Seafood ASA | | | 3,803 | | | | 39,344 | |
|
Panama — 0.1% | |
Copa Holdings SA, Class A | | | 506 | | | | 62,779 | |
|
Singapore — 0.7% | |
Broadcom, Ltd. | | | 1,769 | | | | 445,912 | |
Flex, Ltd. (2) | | | 10,525 | | | | 171,242 | |
Yanlord Land Group, Ltd. | | | 21,100 | | | | 26,943 | |
| | | | | | | | |
| | | | | | | 644,097 | |
| | | | | | | | |
Description | | Shares | | | Value | |
| Common Stocks Purchased Long (continued) | |
|
Sweden — 0.0% | |
Mycronic AB | | | 3,697 | | | $ | 34,787 | |
|
United Kingdom — 0.4% | |
Debenhams PLC | | | 30,024 | | | | 15,622 | |
DFS Furniture PLC | | | 5,073 | | | | 15,646 | |
Go-Ahead Group PLC | | | 1,369 | | | | 31,887 | |
Greggs PLC | | | 2,858 | | | | 44,492 | |
Imperial Brands PLC | | | 2,002 | | | | 82,796 | |
QinetiQ Group PLC | | | 14,895 | | | | 44,296 | |
WH Smith PLC | | | 4,118 | | | | 98,414 | |
| | | | | | | | |
| | | | | | | 333,153 | |
|
United States — 34.5% | |
Aetna, Inc. | | | 1,825 | | | | 287,802 | |
Air Products & Chemicals, Inc. | | | 2,305 | | | | 335,078 | |
Allegheny Technologies, Inc. | | | 11,795 | | | | 245,690 | |
Allscripts Healthcare Solutions, Inc. (2) | | | 12,600 | | | | 165,564 | |
American International Group, Inc. | | | 3,935 | | | | 237,989 | |
Amkor Technology, Inc. (2) | | | 4,430 | | | | 38,895 | |
ArcBest Corp. (10) | | | 6,126 | | | | 181,942 | |
Armstrong World Industries, Inc. (2) | | | 8,215 | | | | 390,212 | |
Artec Group, Inc. | | | 3,308 | | | | 67,814 | |
Atmos Energy Corp. | | | 3,805 | | | | 334,992 | |
AutoZone, Inc. (2)(10) | | | 1,994 | | | | 1,053,709 | |
Ball Corp. | | | 10,229 | | | | 409,058 | |
Bank of America Corp. | | | 13,785 | | | | 329,324 | |
Best Buy Co., Inc. | | | 1,505 | | | | 81,661 | |
Bio-Rad Laboratories, Inc., Class A (2)(10) | | | 2,370 | | | | 516,233 | |
Boston Properties, Inc. (10) | | | 1,376 | | | | 165,946 | |
Cabot Corp. | | | 2,892 | | | | 152,351 | |
Casey’s General Stores, Inc. | | | 2,370 | | | | 249,845 | |
Chemed Corp. | | | 464 | | | | 91,543 | |
CNO Financial Group, Inc. (10) | | | 8,437 | | | | 188,567 | |
Cooper-Standard Holdings, Inc. (2) | | | 707 | | | | 71,110 | |
CSX Corp. | | | 7,980 | | | | 400,596 | |
Cutera, Inc. (2) | | | 1,463 | | | | 54,350 | |
Danaher Corp. (10) | | | 9,340 | | | | 779,143 | |
Delta Air Lines, Inc. | | | 2,670 | | | | 125,997 | |
Discover Financial Services | | | 1,505 | | | | 88,720 | |
Dover Corp. (10) | | | 9,420 | | | | 799,570 | |
Dun & Bradstreet Corp. (10) | | | 7,595 | | | | 846,387 | |
Eagle Pharmaceuticals, Inc. (2)(10) | | | 6,830 | | | | 372,645 | |
Edgewell Personal Care Co. (2)(10) | | | 7,040 | | | | 534,618 | |
Emergent BioSolutions, Inc. (2) | | | 2,847 | | | | 106,278 | |
Employers Holdings, Inc. | | | 1,299 | | | | 54,753 | |
Ennis, Inc. | | | 2,358 | | | | 45,038 | |
Equinix, Inc. (10) | | | 403 | | | | 188,769 | |
F5 Networks, Inc. (2) | | | 310 | | | | 37,008 | |
FedEx Corp. | | | 2,380 | | | | 510,224 | |
FLIR Systems, Inc. | | | 10,285 | | | | 390,830 | |
GameStop Corp., Class A | | | 1,612 | | | | 29,822 | |
GCP Applied Technologies, Inc. (2)(10) | | | 13,220 | | | | 373,465 | |
General Dynamics Corp. (10) | | | 2,620 | | | | 527,537 | |
Halozyme Therapeutics, Inc. (2)(10) | | | 26,798 | | | | 348,642 | |
HD Supply Holdings, Inc. (2) | | | 14,028 | | | | 467,132 | |
Highwoods Properties, Inc. | | | 1,310 | | | | 68,421 | |
HP, Inc. | | | 13,940 | | | | 265,975 | |
Huntington Ingalls Industries, Inc. | | | 627 | | | | 134,153 | |
INC Research Holdings, Inc. (2) | | | 1,104 | | | | 64,805 | |
Inogen, Inc. (2) | | | 711 | | | | 68,114 | |
Intercontinental Exchange, Inc. | | | 5,015 | | | | 324,320 | |
International Paper Co. | | | 5,280 | | | | 284,434 | |
Intersect ENT, Inc. (2) | | | 268 | | | | 8,281 | |
Intrexon Corp. (2) | | | 9,025 | | | | 178,063 | |
KLX, Inc. (2) | | | 6,165 | | | | 295,550 | |
Kraft Heinz Co. | | | 2,005 | | | | 161,904 | |
La Quinta Holdings, Inc. (2)(10) | | | 34,075 | | | | 538,385 | |
(See Notes which are an integral part of the Financial Statements)
66
Alternative Strategies Fund (continued)
| | | | | | | | |
Description | | Shares | | | Value | |
| Common Stocks Purchased Long (continued) | |
|
United States (continued) | |
Lantheus Holdings, Inc. (2) | | | 1,949 | | | $ | 34,107 | |
Lear Corp. (10) | | | 1,228 | | | | 183,635 | |
LeMaitre Vascular, Inc. | | | 1,486 | | | | 54,090 | |
Louisiana-Pacific Corp. (2) | | | 10,765 | | | | 274,292 | |
Lumentum Holdings, Inc. (2) | | | 7,775 | | | | 442,009 | |
Magellan Health, Inc. (2) | | | 1,134 | | | | 91,741 | |
Marathon Petroleum Corp. (10) | | | 12,415 | | | | 651,167 | |
Martin Marietta Materials, Inc. | | | 2,336 | | | | 495,209 | |
Masimo Corp. (2)(10) | | | 2,094 | | | | 176,692 | |
MBIA, Inc. (2) | | | 7,740 | | | | 77,864 | |
Medicines Co. (2) | | | 4,800 | | | | 176,112 | |
Merit Medical Systems, Inc. (2)(10) | | | 3,790 | | | | 156,527 | |
MGM Resorts International (10) | | | 13,045 | | | | 429,963 | |
Microchip Technology, Inc. | | | 4,515 | | | | 391,902 | |
Mohawk Industries, Inc. (2) | | | 1,415 | | | | 358,165 | |
Molina Healthcare, Inc. (2) | | | 1,736 | | | | 111,104 | |
Mondelez International, Inc. | | | 8,460 | | | | 343,984 | |
Murphy USA, Inc. (2) | | | 4,082 | | | | 263,126 | |
Natus Medical, Inc. (2) | | | 1,119 | | | | 37,598 | |
NCR Corp. (2) | | | 2,150 | | | | 78,539 | |
NextEra Energy, Inc. | | | 2,265 | | | | 340,905 | |
Norfolk Southern Corp. (10) | | | 4,830 | | | | 582,112 | |
Olin Corp. (10) | | | 13,185 | | | | 424,953 | |
OraSure Technologies, Inc. (2) | | | 4,212 | | | | 85,967 | |
Orbital ATK, Inc. | | | 2,970 | | | | 331,393 | |
Owens Corning | | | 5,971 | | | | 442,630 | |
PennyMac Financial Services, Inc., Class A (2) | | | 2,121 | | | | 36,057 | |
PG&E Corp. (10) | | | 2,391 | | | | 168,279 | |
Photronics, Inc. (2) | | | 3,286 | | | | 25,959 | |
PNM Resources, Inc. | | | 3,219 | | | | 136,486 | |
Portland General Electric Co. (10) | | | 3,780 | | | | 179,588 | |
Post Holdings, Inc. (2) | | | 3,900 | | | | 332,007 | |
PPG Industries, Inc. | | | 2,980 | | | | 310,874 | |
PTC, Inc. (2) | | | 4,890 | | | | 273,840 | |
PVH Corp. (10) | | | 4,365 | | | | 549,510 | |
Quanta Services, Inc. (2) | | | 2,094 | | | | 75,237 | |
Raymond James Financial, Inc. | | | 1,226 | | | | 96,020 | |
Rogers Corp. (2) | | | 577 | | | | 68,403 | |
Rush Enterprises, Inc., Class A (2) | | | 1,791 | | | | 73,413 | |
S&P Global, Inc. | | | 2,135 | | | | 329,495 | |
Sanmina Corp. (2) | | | 300 | | | | 11,235 | |
SBA Communications Corp., Class A (2)(10) | | | 4,410 | | | | 677,155 | |
Sealed Air Corp. (10) | | | 7,670 | | | | 340,395 | |
Selective Insurance Group, Inc. | | | 2,377 | | | | 119,801 | |
Six Flags Entertainment Corp. | | | 7,955 | | | | 434,104 | |
Steel Dynamics, Inc. | | | 644 | | | | 22,186 | |
Supernus Pharmaceuticals, Inc. (2) | | | 1,872 | | | | 85,738 | |
Sykes Enterprises, Inc. (2) | | | 2,146 | | | | 57,212 | |
Sysco Corp. | | | 1,470 | | | | 77,425 | |
Tiffany & Co. (10) | | | 5,575 | | | | 509,555 | |
Total System Services, Inc. (10) | | | 10,080 | | | | 696,730 | |
TriCo Bancshares | | | 888 | | | | 31,595 | |
Tyson Foods, Inc., Class A | | | 818 | | | | 51,779 | |
United Rentals, Inc. (2) | | | 1,354 | | | | 159,853 | |
Univar, Inc. (2)(10) | | | 16,275 | | | | 459,118 | |
Unum Group | | | 3,017 | | | | 145,359 | |
Vail Resorts, Inc. | | | 1,400 | | | | 319,130 | |
Versum Materials, Inc. | | | 4,800 | | | | 177,264 | |
Vishay Intertechnology, Inc. | | | 6,305 | | | | 111,598 | |
Visteon Corp. (2)(10) | | | 4,060 | | | | 468,686 | |
Wabash National Corp. | | | 5,881 | | | | 123,619 | |
WellCare Health Plans, Inc. (2) | | | 688 | | | | 120,180 | |
Wells Fargo & Co. | | | 6,830 | | | | 348,808 | |
| | | | | | | | |
| Description | | Shares,
Contracts,
Principal
Amount,
or Units | | | Value | |
| Common Stocks Purchased Long (continued) | |
|
United States (continued) | |
Western Digital Corp. (10) | | | 10,595 | | | $ | 935,221 | |
WR Grace & Co. | | | 10,850 | | | | 775,558 | |
Wyndham Worldwide Corp. | | | 3,425 | | | | 341,404 | |
Yum China Holdings, Inc. (2) | | | 5,364 | | | | 189,671 | |
Zimmer Biomet Holdings, Inc. | | | 3,760 | | | | 429,655 | |
| | | | | | | | |
| | | | | | | 32,980,242 | |
| | | | | | | | |
Total Common Stocks Purchased Long
(identified cost $37,597,559) | | | | 40,547,167 | |
| | | | | | | | |
| Convertible Bonds Purchased Long — 0.1% | |
|
United States — 0.1% | |
Ascent Capital Group, Inc., 4.000%, 7/15/2020 | | $ | 158,000 | | | | 124,820 | |
| | | | | | | | |
Total Convertible Bonds Purchased Long
(identified cost $113,677) | | | | 124,820 | |
| | | | | | | | |
| Corporate Bonds & Notes Purchased Long — 0.6% | |
| | |
Luxembourg — 0.2% | | | | | | | | |
ABG Orphan Holdco SARL, 14.000%, 2/28/2021 | | | 181,000 | | | | 192,765 | |
| | |
United States — 0.4% | | | | | | | | |
ASP AMC Merger Sub, Inc., 8.000%, 5/15/2025 (6) | | | 136,000 | | | | 129,880 | |
CEDC Finance Corp. International, Inc., 10.000%, 12/31/2022 (6) | | | 263,959 | | | | 253,401 | |
Midstates Petroleum Co., Inc., 10.000%, 6/1/2020 (9) | | | 72,000 | | | | 0 | |
| | | | | | | | |
| | | | | | | 383,281 | |
| | | | | | | | |
Total Corporate Bonds & Notes Purchased Long
(identified cost $585,137) | | | | 576,046 | |
|
| Limited Partnership Units Purchased Long — 0.7% | |
| | |
United States — 0.7% | | | | | | | | |
CrossAmerica Partners LP | | | 19,755 | | | | 529,434 | |
DCP Midstream LP, Class A | | | 2,962 | | | | 95,110 | |
| | | | | | | | |
Total Limited Partnership Units Purchased Long
(identified cost $586,016) | | | | 624,544 | |
| | | | | | | | |
| Mutual Funds Purchased Long — 0.9% | |
|
United States — 0.9% | |
Altaba, Inc. (2) | | | 13,270 | | | | 850,342 | |
| | | | | | | | |
Total Mutual Funds Purchased Long
(identified cost $523,651) | | | | 850,342 | |
| | | | | | | | |
| Purchased Call Options — 0.6% | |
|
United States — 0.6% | |
MBIA, Inc., Exercise Price: $9.00, Notional: $162,000, 1/19/2018 (2) | | | 180 | | | | 29,070 | |
Perrigo Co. PLC, Exercise Price: $50.00, Notional: $205,000, 1/19/2018 (2) | | | 41 | | | | 118,490 | |
S&P 500 Index: | | | | | | | | |
Exercise Price: $2,445.00, Notional: $6,846,000, 9/15/2017 (2) | | | 28 | | | | 99,400 | |
Exercise Price: $2,470.00, Notional: $11,856,000, 9/15/2017 (2) | | | 48 | | | | 67,200 | |
Exercise Price: $2,450.00,
Notional: $980,000, 9/15/2017 (2) | | | 4 | | | | 11,200 | |
(See Notes which are an integral part of the Financial Statements)
67
August 31, 2017
Alternative Strategies Fund (continued)
| | | | | | | | |
| Description | | Shares,
Contracts, or
Principal
Amount
| | | Value | |
| Purchased Call Options (continued) | |
|
United States (continued) | |
Exercise Price: $2,430.00, Notional: $11,178,000, 9/15/2017 (2) | | | 46 | | | $ | 204,700 | |
Exercise Price: $2,425.00, Notional: $2,182,500, 9/15/2017 (2) | | | 9 | | | | 44,055 | |
| | | | | | | | |
Total Purchased Call Options
(identified cost $636,934) | | | | 574,115 | |
| | | | | | | | |
| Purchased Put Options — 0.3% | |
|
United States — 0.3% | |
General Dynamics Corp., Exercise Price: $195.00, Notional: $175,500, 9/15/2017 (2) | | | 9 | | | | 513 | |
iShares Russell 2000 ETF, Exercise Price: $130.00, Notional: $2,353,000, 9/29/2017 (2) | | | 181 | | | | 5,792 | |
Medicines Co., Exercise Price: $38.00, Notional: $182,400, 9/15/2017 (2) | | | 48 | | | | 11,040 | |
S&P 500 Index: | | | | | | | | |
Exercise Price: $2,465.00, Notional: $5,176,500, 9/15/2017 (2) | | | 21 | | | | 25,200 | |
Exercise Price: $2,475.00, Notional: $29,205,000, 9/15/2017 (2) | | | 118 | | | | 194,700 | |
Exercise Price: $2,455.00, Notional: $7,856,000, 9/15/2017 (2) | | | 32 | | | | 30,720 | |
Exercise Price: $2,420.00, Notional: $9,680,000, 9/15/2017 (2) | | | 40 | | | | 17,000 | |
| | | | | | | | |
Total Purchased Put Options
(identified cost $809,054) | | | | 284,965 | |
| | | | | | | | |
| Short-Term Investments — 51.9% | |
|
| Mutual Funds — 38.8% | |
State Street Institutional Liquid Reserves Fund — Premier Class, 1.150% | | | 37,183,212 | | | | 37,183,212 | |
| | | | | | | | |
| U.S. Treasury Bills — 13.1% | |
United States Treasury Bill, 0.985%, 9/21/2017 (11) | | $ | 12,500,000 | | | | 12,493,827 | |
| | | | | | | | |
Total Short-Term Investments
(identified cost $49,677,675) | | | | 49,677,039 | |
| | | | | | | | |
Total Investments — 102.2%
(identified cost $94,993,340) | | | | 97,767,419 | |
| Other Assets and Liabilities — 17.5% | | | | 16,762,897 | |
| Securities Sold Short and Written Options (see summary below) — (19.7)% | | | | (18,790,135 | ) |
| | | | | | | | |
| Total Net Assets — 100.0% | | | $ | 95,740,181 | |
| | | | | | | | |
| | | | | | | | |
| Securities Sold Short & Written Options — (19.7)% | |
|
| Common Stocks Sold Short — (13.6)% | |
| | |
Australia — (0.1)% | | | | | | | | |
Aconex, Ltd. (2) | | | (6,190 | ) | | $ | (20,093 | ) |
Mayne Pharma Group, Ltd. (2) | | | (80,611 | ) | | | (43,016 | ) |
| | | | | | | | |
Description | | Shares | | | Value | |
| Securities Sold Short & Written Options (continued) | |
|
| Common Stocks Sold Short (continued) | |
| | |
Australia (continued) | | | | | | | | |
Nanosonics, Ltd. (2) | | | (10,765 | ) | | $ | (22,376 | ) |
| | | | | | | | |
| | | | | | | (85,485 | ) |
| | |
Belgium — (0.0)% | | | | | | | | |
Tessenderlo Group SA (2) | | | (386 | ) | | | (16,922 | ) |
| | |
Bermuda — (0.0)% | | | | | | | | |
Esprit Holdings, Ltd. (2) | | | (28,500 | ) | | | (16,500 | ) |
| | |
Canada — (0.8)% | | | | | | | | |
Canadian Tire Corp. Ltd., Class A | | | (750 | ) | | | (88,769 | ) |
Canadian Western Bank | | | (5,660 | ) | | | (131,443 | ) |
Genworth MI Canada, Inc. | | | (4,520 | ) | | | (130,198 | ) |
Magna International, Inc. | | | (5,325 | ) | | | (256,133 | ) |
National Bank of Canada | | | (2,700 | ) | | | (124,281 | ) |
| | | | | | | | |
| | | | | | | (730,824 | ) |
| | |
Cayman Islands — (0.0)% | | | | | | | | |
JD.com, Inc. (2) | | | (1,112 | ) | | | (46,604 | ) |
| | |
Finland — (0.0)% | | | | | | | | |
Caverion Corp. (2) | | | (2,098 | ) | | | (18,838 | ) |
| | |
Germany — (0.2)% | | | | | | | | |
Deutsche Lufthansa AG | | | (3,870 | ) | | | (97,144 | ) |
Zalando SE (2)(6) | | | (1,850 | ) | | | (87,672 | ) |
zooplus AG (2) | | | (127 | ) | | | (22,219 | ) |
| | | | | | | | |
| | | | | | | (207,035 | ) |
| | |
Ireland — (0.3)% | | | | | | | | |
Eaton Corp. PLC | | | (2,350 | ) | | | (168,636 | ) |
Ingersoll-Rand PLC | | | (2,015 | ) | | | (172,061 | ) |
| | | | | | | | |
| | | | | | | (340,697 | ) |
| | |
Japan — (0.5)% | | | | | | | | |
ABC-Mart, Inc. | | | (200 | ) | | | (10,290 | ) |
Acom Co., Ltd. (2) | | | (5,100 | ) | | | (20,912 | ) |
Don Quijote Holdings Co., Ltd. | | | (800 | ) | | | (30,441 | ) |
Fuji Seal International, Inc. | | | (1,700 | ) | | | (51,707 | ) |
Hoshizaki Corp. | | | (900 | ) | | | (78,458 | ) |
Kose Corp. | | | (300 | ) | | | (37,714 | ) |
Kura Corp. | | | (500 | ) | | | (27,474 | ) |
M3, Inc. | | | (1,200 | ) | | | (31,342 | ) |
MISUMI Group, Inc. | | | (3,100 | ) | | | (79,879 | ) |
Nippon Paint Holdings Co., Ltd. | | | (500 | ) | | | (17,101 | ) |
Pilot Corp. | | | (1,000 | ) | | | (43,958 | ) |
Prestige International, Inc. | | | (2,800 | ) | | | (30,092 | ) |
SMS Co., Ltd. | | | (1,600 | ) | | | (51,836 | ) |
| | | | | | | | |
| | | | | | | (511,204 | ) |
|
Netherlands — (0.1)% | |
TomTom NV (2) | | | (7,107 | ) | | | (74,219 | ) |
|
New Zealand — (0.1)% | |
Xero, Ltd. (2) | | | (2,830 | ) | | | (53,530 | ) |
| | |
Norway — (0.1)% | | | | | | | | |
Schibsted ASA | | | (2,196 | ) | | | (53,367 | ) |
XXL ASA (6) | | | (2,116 | ) | | | (21,206 | ) |
| | | | | | | | |
| | | | | | | (74,573 | ) |
| | |
Spain — (0.1)% | | | | | | | | |
Cellnex Telecom SA (6) | | | (2,463 | ) | | | (55,030 | ) |
Inmobiliaria Colonial SA | | | (1,463 | ) | | | (14,302 | ) |
| | | | | | | | |
| | | | | | | (69,332 | ) |
| | |
Sweden — (0.2)% | | | | | | | | |
AAK AB | | | (467 | ) | | | (34,306 | ) |
SKF AB | | | (8,205 | ) | | | (164,108 | ) |
Wallenstam AB | | | (3,705 | ) | | | (37,748 | ) |
| | | | | | | | |
| | | | | | | (236,162 | ) |
(See Notes which are an integral part of the Financial Statements)
68
Alternative Strategies Fund (continued)
| | | | | | | | |
Description | | Shares | | | Value | |
| Securities Sold Short & Written Options (continued) | |
|
| Common Stocks Sold Short (continued) | |
|
Switzerland — (0.3)% | |
Arbonia AG (2) | | | (1,707 | ) | | $ | (30,538 | ) |
Roche Holding AG | | | (855 | ) | | | (217,924 | ) |
| | | | | | | | |
| | | | | | | (248,462 | ) |
|
United Kingdom — (0.6)% | |
Balfour Beatty PLC | | | (9,279 | ) | | | (32,243 | ) |
Capital & Counties Properties PLC | | | (7,981 | ) | | | (27,999 | ) |
Cobham PLC | | | (50,275 | ) | | | (89,290 | ) |
Just Eat PLC (2) | | | (8,883 | ) | | | (76,609 | ) |
LivaNova PLC (2) | | | (3,175 | ) | | | (198,691 | ) |
Serco Group PLC (2) | | | (28,423 | ) | | | (43,278 | ) |
Sophos Group PLC (6) | | | (10,092 | ) | | | (65,760 | ) |
| | | | | | | | |
| | | | | | | (533,870 | ) |
|
United States — (10.2)% | |
Abiomed, Inc. (2) | | | (1,150 | ) | | | (173,420 | ) |
Acuity Brands, Inc. | | | (925 | ) | | | (163,531 | ) |
Advanced Micro Devices, Inc. (2) | | | (6,696 | ) | | | (87,048 | ) |
Aerovironment, Inc. (2) | | | (1,529 | ) | | | (74,952 | ) |
Albemarle Corp. | | | (1,415 | ) | | | (164,508 | ) |
Allegheny Technologies, Inc. | | | (2,437 | ) | | | (50,763 | ) |
Apartment Investment & Management Co., Class A | | | (829 | ) | | | (37,579 | ) |
Aspen Technology, Inc. (2) | | | (2,960 | ) | | | (187,220 | ) |
Autoliv, Inc. | | | (1,240 | ) | | | (134,689 | ) |
Automatic Data Processing, Inc. | | | (1,525 | ) | | | (162,367 | ) |
B&G Foods, Inc. | | | (4,615 | ) | | | (140,758 | ) |
Bancorp, Inc. (2) | | | (4,588 | ) | | | (36,016 | ) |
Benefitfocus, Inc. (2) | | | (1,554 | ) | | | (47,941 | ) |
Big Lots, Inc. | | | (2,550 | ) | | | (121,380 | ) |
BioScrip, Inc. (2) | | | (16,177 | ) | | | (49,016 | ) |
Brown-Forman Corp., Class B | | | (1,283 | ) | | | (68,050 | ) |
C.H. Robinson Worldwide, Inc. | | | (2,210 | ) | | | (156,092 | ) |
Chesapeake Energy Corp. (2) | | | (4,022 | ) | | | (14,640 | ) |
Children’s Place, Inc. | | | (1,635 | ) | | | (173,555 | ) |
Church & Dwight Co., Inc. | | | (3,880 | ) | | | (194,660 | ) |
Coeur Mining, Inc. (2) | | | (3,588 | ) | | | (31,395 | ) |
Consolidated Edison, Inc. | | | (2,005 | ) | | | (168,961 | ) |
Costco Wholesale Corp. | | | (1,595 | ) | | | (250,000 | ) |
CubeSmart | | | (8,795 | ) | | | (216,797 | ) |
Deltic Timber Corp. | | | (546 | ) | | | (42,610 | ) |
Dominion Energy, Inc. | | | (2,115 | ) | | | (166,599 | ) |
Duke Energy Corp. | | | (1,940 | ) | | | (169,362 | ) |
Duke Realty Corp. | | | (2,785 | ) | | | (82,770 | ) |
Dunkin’ Brands Group, Inc. | | | (3,170 | ) | | | (163,445 | ) |
Education Realty Trust, Inc. | | | (1,510 | ) | | | (58,346 | ) |
Financial Engines, Inc. | | | (798 | ) | | | (26,374 | ) |
Five Below, Inc. (2) | | | (2,550 | ) | | | (121,303 | ) |
Ford Motor Co. | | | (18,070 | ) | | | (199,312 | ) |
GATX Corp. | | | (1,285 | ) | | | (77,845 | ) |
General Mills, Inc. | | | (4,820 | ) | | | (256,713 | ) |
Genuine Parts Co. | | | (2,040 | ) | | | (168,973 | ) |
Guidewire Software, Inc. (2) | | | (776 | ) | | | (58,751 | ) |
H&R Block, Inc. | | | (2,790 | ) | | | (74,605 | ) |
Harmonic, Inc. (2) | | | (11,984 | ) | | | (38,948 | ) |
Hasbro, Inc. | | | (1,695 | ) | | | (166,534 | ) |
Hawaiian Electric Industries, Inc. | | | (5,045 | ) | | | (168,604 | ) |
Hologic, Inc. (2) | | | (3,170 | ) | | | (122,362 | ) |
Hormel Foods Corp. | | | (5,370 | ) | | | (165,074 | ) |
Host Hotels & Resorts, Inc. | | | (6,970 | ) | | | (126,296 | ) |
Instructure, Inc. (2) | | | (1,697 | ) | | | (50,231 | ) |
Intel Corp. | | | (4,900 | ) | | | (171,843 | ) |
Interactive Brokers Group, Inc. | | | (2,200 | ) | | | (92,246 | ) |
| | | | | | | | |
| Description | | Shares or
Principal
Amount | | | Value | |
| Securities Sold Short & Written Options (continued) | |
|
| Common Stocks Sold Short (continued) | |
|
United States (continued) | |
Kansas City Southern | | | (1,650 | ) | | $ | (170,660 | ) |
Kopin Corp. (2) | | | (7,526 | ) | | | (30,255 | ) |
Leggett & Platt, Inc. | | | (3,705 | ) | | | (170,319 | ) |
LSB Industries, Inc. (2) | | | (3,881 | ) | | | (23,674 | ) |
Macerich Co. | | | (732 | ) | | | (38,628 | ) |
Macquarie Infrastructure Corp. | | | (1,048 | ) | | | (78,055 | ) |
McCormick & Co., Inc. | | | (1,780 | ) | | | (169,331 | ) |
NetApp, Inc. | | | (4,135 | ) | | | (159,859 | ) |
Netflix, Inc. (2) | | | (295 | ) | | | (51,539 | ) |
Park Hotels & Resorts, Inc. | | | (6,655 | ) | | | (177,622 | ) |
Patterson Cos., Inc. | | | (4,450 | ) | | | (171,325 | ) |
PHH Corp. (2) | | | (5,688 | ) | | | (80,770 | ) |
Praxair, Inc. | | | (1,255 | ) | | | (165,083 | ) |
PROS Holdings, Inc. (2) | | | (2,176 | ) | | | (57,316 | ) |
Rayonier, Inc. | | | (2,517 | ) | | | (73,018 | ) |
Regal Beloit Corp. | | | (1,500 | ) | | | (113,100 | ) |
Ross Stores, Inc. | | | (4,615 | ) | | | (269,747 | ) |
Scotts Miracle-Gro Co. | | | (1,780 | ) | | | (170,150 | ) |
Senior Housing Properties Trust | | | (1,923 | ) | | | (37,922 | ) |
Sonic Corp. | | | (6,825 | ) | | | (159,773 | ) |
Splunk, Inc. (2) | | | (566 | ) | | | (37,973 | ) |
Symantec Corp. | | | (9,050 | ) | | | (271,319 | ) |
Synaptics, Inc. (2) | | | (1,900 | ) | | | (78,983 | ) |
Target Corp. | | | (3,775 | ) | | | (205,851 | ) |
Tenneco, Inc. | | | (2,810 | ) | | | (152,302 | ) |
TimkenSteel Corp. (2) | | | (1,892 | ) | | | (28,058 | ) |
Titan International, Inc. | | | (2,874 | ) | | | (24,659 | ) |
Tractor Supply Co. | | | (1,530 | ) | | | (91,050 | ) |
United Therapeutics Corp. (2) | | | (1,360 | ) | | | (177,888 | ) |
Verso Corp., Class A (2) | | | (5,495 | ) | | | (29,233 | ) |
Wabtec Corp. | | | (1,216 | ) | | | (85,813 | ) |
WageWorks, Inc. (2) | | | (2,190 | ) | | | (129,100 | ) |
Walt Disney Co. | | | (1,190 | ) | | | (120,428 | ) |
Weyerhaeuser Co. | | | (1,270 | ) | | | (41,415 | ) |
Whirlpool Corp. | | | (1,370 | ) | | | (235,119 | ) |
| | | | | | | | |
| | | | | | | (9,751,821 | ) |
| | | | | | | | |
Total Common Stocks Sold Short
(proceeds $(13,033,260)) | | | | (13,016,078 | ) |
| | | | | | | | |
| Corporate Bonds & Notes Sold Short — (0.2)% | |
| | |
United States — (0.2)% | | | | | | | | |
Flowers Foods, Inc., 4.375%, 4/1/2022 | | $ | (135,000 | ) | | | (144,972 | ) |
| | | | | | | | |
Total Corporate Bonds & Notes Sold Short
(proceeds $(142,621)) | | | | (144,972 | ) |
| | | | | | | | |
| Exchange Traded Funds Sold Short — (4.8)% | |
| | |
United States — (4.8)% | | | | | | | | |
Energy Select Sector SPDR | | | (4,795 | ) | | | (301,941 | ) |
Industrial Select Sector SPDR | | | (2,870 | ) | | | (196,480 | ) |
iShares Russell 2000 | | | (9,365 | ) | | | (1,308,571 | ) |
iShares Russell 2000 Growth | | | (3,485 | ) | | | (592,311 | ) |
iShares Russell 2000 Value | | | (3,195 | ) | | | (371,195 | ) |
iShares Russell Mid-Cap | | | (1,635 | ) | | | (315,048 | ) |
iShares Russell Mid-Cap Growth | | | (3,205 | ) | | | (353,640 | ) |
iShares Russell Mid-Cap Value | | | (1,162 | ) | | | (96,620 | ) |
PowerShares QQQ Trust Series 1 | | | (2,975 | ) | | | (434,945 | ) |
SPDR S&P 500 Trust | | | (2,438 | ) | | | (603,381 | ) |
| | | | | | | | |
Total Exchange Traded Funds Sold Short
(proceeds $(4,323,651)) | | | | (4,574,132 | ) |
| | | | | | | | |
(See Notes which are an integral part of the Financial Statements)
69
August 31, 2017
Alternative Strategies Fund (continued)
| | | | | | | | |
Description | | Contracts | | | Value | |
| Securities Sold Short & Written Options (continued) | |
|
| Written Call Options — (0.9)% | |
| | |
United States — (0.9)% | | | | | | | | |
Allergan PLC, Exercise Price: $230.00, Notional: $(23,000), 11/17/2017 (2) | | | (1 | ) | | $ | (1,050 | ) |
Altaba, Inc.: | | | | | | | | |
Exercise Price: $62.50, Notional: $(93,750), 9/15/2017 (2) | | | (15 | ) | | | (3,210 | ) |
Exercise Price: $60.00, Notional: $(54,000), 9/15/2017 (2) | | | (9 | ) | | | (3,870 | ) |
Exercise Price: $57.50, Notional: $(57,500), 9/15/2017 (2) | | | (10 | ) | | | (6,600 | ) |
Exercise Price: $55.00, Notional: $(22,000), 9/15/2017 (2) | | | (4 | ) | | | (3,660 | ) |
Exercise Price: $65.00, Notional: $(78,000), 10/20/2017 (2) | | | (12 | ) | | | (2,460 | ) |
Exercise Price: $62.50, Notional: $(37,500), 10/20/2017 (2) | | | (6 | ) | | | (2,010 | ) |
BlackBerry Ltd.: | | | | | | | | |
Exercise Price: $11.00, Notional: $(5,500), 9/15/2017 (2) | | | (5 | ) | | | (5 | ) |
Exercise Price: $10.00, Notional: $(5,000), 9/15/2017 (2) | | | (5 | ) | | | (30 | ) |
Exercise Price: $9.00, Notional: $(9,900), 12/15/2017 (2) | | | (11 | ) | | | (1,056 | ) |
Eagle Pharmaceuticals, Inc.: | | | | | | | | |
Exercise Price: $55.00, Notional: $(104,500), 9/15/2017 (2) | | | (19 | ) | | | (4,465 | ) |
Exercise Price: $50.00, Notional: $(65,000), 9/15/2017 (2) | | | (13 | ) | | | (6,630 | ) |
Exercise Price: $95.00, Notional: $(209,000), 9/15/2017 (2) | | | (22 | ) | | | (198 | ) |
General Dynamics Corp., Exercise Price: $200.00, Notional: $(180,000), 9/15/2017 (2) | | | (9 | ) | | | (3,060 | ) |
Halozyme Therapeutics, Inc.: | | | | | | | | |
Exercise Price: $12.00, Notional: $(15,600), 9/15/2017 (2) | | | (13 | ) | | | (1,287 | ) |
Exercise Price: $11.00, Notional: $(14,300), 9/15/2017 (2) | | | (13 | ) | | | (2,600 | ) |
Exercise Price: $14.00, Notional: $(25,200), 9/15/2017 (2) | | | (18 | ) | | | (144 | ) |
Exercise Price: $13.00, Notional: $(81,900), 12/15/2017 (2) | | | (63 | ) | | | (6,300 | ) |
Intrexon Corp.: | | | | | | | | |
Exercise Price: $19.00, Notional: $(34,200), 9/15/2017 (2) | | | (18 | ) | | | (2,250 | ) |
Exercise Price: $18.00, Notional: $(32,400), 9/15/2017 (2) | | | (18 | ) | | | (3,582 | ) |
Exercise Price: $24.00, Notional: $(12,000), 9/15/2017 (2) | | | (5 | ) | | | (5 | ) |
iShares Russell 2000 ETF, Exercise Price: $135.00, Notional: $(148,500), 9/15/2017 (2) | | | (11 | ) | | | (5,588 | ) |
KLX, Inc., Exercise Price: $50.00, Notional: $(30,000), 9/15/2017 (2) | | | (6 | ) | | | (222 | ) |
La Quinta Holdings, Inc., Exercise Price: $15.00, Notional: $(16,500), 9/15/2017 (2) | | | (11 | ) | | | (990 | ) |
Martin Marietta Materials, Inc.: | | | | | | | | |
Exercise Price: $220.00, Notional: $(22,000), 9/15/2017 (2) | | | (1 | ) | | | (123 | ) |
Exercise Price: $210.00, Notional: $(42,000), 9/15/2017 (2) | | | (2 | ) | | | (946 | ) |
Exercise Price: $220.00, Notional: $(22,000), 10/20/2017 (2) | | | (1 | ) | | | (410 | ) |
| | | | | | | | |
Description | | Contracts | | | Value | |
| Securities Sold Short & Written Options (continued) | |
|
| Written Call Options (continued) | |
| | |
United States (continued) | | | | | | | | |
Exercise Price: $210.00, Notional: $(21,000), 10/20/2017 (2) | | | (1 | ) | | $ | (830 | ) |
Exercise Price: $200.00, Notional: $(20,000), 10/20/2017 (2) | | | (1 | ) | | | (1,467 | ) |
Medicines Co., Exercise Price: $38.00, Notional: $(182,400), 9/15/2017 (2) | | | (48 | ) | | | (3,600 | ) |
MGM Resorts International, Exercise Price: $32.00, Notional: $(54,400), 12/15/2017 (2) | | | (17 | ) | | | (4,114 | ) |
Murphy USA, Inc.: | | | | | | | | |
Exercise Price: $80.00, Notional: $(32,000), 9/15/2017 (2) | | | (4 | ) | | | (70 | ) |
Exercise Price: $75.00, Notional: $(30,000), 9/15/2017 (2) | | | (4 | ) | | | (120 | ) |
Olin Corp., Exercise Price: $30.00, Notional: $(27,000), 9/15/2017 (2) | | | (9 | ) | | | (2,138 | ) |
S&P 500 Index: | | | | | | | | |
Exercise Price: $2,465.00, Notional: $(32,538,000), 9/15/2017 (2) | | | (132 | ) | | | (223,080 | ) |
Exercise Price: $2,475.00, Notional: $(29,205,000), 9/15/2017 (2) | | | (118 | ) | | | (135,700 | ) |
Exercise Price: $2,455.00, Notional: $(7,856,000), 9/15/2017 (2) | | | (32 | )�� | | | (78,400 | ) |
Exercise Price: $2,420.00, Notional: $(9,680,000), 9/15/2017 (2) | | | (40 | ) | | | (230,000 | ) |
SPDR S&P 500 ETF Trust: | | | | | | | | |
Exercise Price: $225.00, Notional: $(697,500), 9/15/2017 (2) | | | (31 | ) | | | (70,804 | ) |
Exercise Price: $230.00, Notional: $(713,000), 10/20/2017 (2) | | | (31 | ) | | | (54,684 | ) |
Western Digital Corp., Exercise Price: $95.00, Notional: $(38,000), 9/15/2017 (2) | | | (4 | ) | | | (116 | ) |
Wyndham Worldwide Corp.: | | | | | | | | |
Exercise Price: $97.50, Notional: $(19,500), 11/17/2017 (2) | | | (2 | ) | | | (1,092 | ) |
Exercise Price: $100.00, Notional: $(20,000), 11/17/2017 (2) | | | (2 | ) | | | (826 | ) |
| | | | | | | | |
Total Written Call Options
(proceeds $(1,027,388)) | | | | | | | (869,792 | ) |
| | | | | | | | |
| Written Put Options — (0.2)% | | | | | | |
| | |
United States — (0.2)% | | | | | | | | |
iShares Russell 2000 ETF, Exercise Price: $115.00, Notional: $(2,081,500), 9/29/2017 (2) | | | (181 | ) | | | (905 | ) |
S&P 500 Index: | | | | | | | | |
Exercise Price: $2,445.00, Notional: $(6,846,000), 9/15/2017 (2) | | | (28 | ) | | | (20,160 | ) |
Exercise Price: $2,470.00, Notional: $(11,856,000), 9/15/2017 (2) | | | (48 | ) | | | (67,200 | ) |
Exercise Price: $2,450.00, Notional: $(980,000), 9/15/2017 (2) | | | (4 | ) | | | (3,200 | ) |
Exercise Price: $2,430.00, Notional: $(11,178,000), 9/15/2017 (2) | | | (46 | ) | | | (24,242 | ) |
Exercise Price: $2,425.00, Notional: $(37,345,000), 9/15/2017 (2) | | | (154 | ) | | | (69,454 | ) |
| | | | | | | | |
Total Written Put Options
(proceeds $(712,113)) | | | | | | | (185,161 | ) |
| | | | | | | | |
Total Securities Sold Short & Written Options
(proceeds $(19,239,033)) | | | $ | (18,790,135 | ) |
| | | | | | | | |
(See Notes which are an integral part of the Financial Statements)
70
Alternative Strategies Fund (continued)
| | | | | | | | |
| Industry Allocation | |
| Industry | | Value | | | % of
Total
Net Assets | |
Common Stocks Purchased Long | | | | | | | | |
Advertising | | $ | 30,856 | | | | 0.0 | % |
Aerospace/Defense | | | 1,154,480 | | | | 1.2 | |
Agriculture | | | 82,796 | | | | 0.1 | |
Airlines | | | 342,225 | | | | 0.4 | |
Auto Manufacturers | | | 239,601 | | | | 0.2 | |
Auto Parts & Equipment | | | 1,667,482 | | | | 1.7 | |
Banks | | | 732,378 | | | | 0.8 | |
Beverages | | | 192,035 | | | | 0.2 | |
Biotechnology | | | 1,325,329 | | | | 1.4 | |
Building Materials | | | 2,643,165 | | | | 2.8 | |
Chemicals | | | 3,041,705 | | | | 3.2 | |
Commercial Services | | | 1,517,675 | | | | 1.6 | |
Computers | | | 2,141,009 | | | | 2.2 | |
Cosmetics/Personal Care | | | 534,617 | | | | 0.6 | |
Distribution/Wholesale | | | 500,890 | | | | 0.5 | |
Diversified Financial Services | | | 612,931 | | | | 0.6 | |
Electric | | | 843,145 | | | | 0.9 | |
Electronics | | | 859,834 | | | | 0.9 | |
Engineering & Construction | | | 144,944 | | | | 0.1 | |
Entertainment | | | 753,234 | | | | 0.8 | |
Food | | | 1,400,983 | | | | 1.5 | |
Forest Products & Paper | | | 284,434 | | | | 0.3 | |
Gas | | | 354,173 | | | | 0.4 | |
Healthcare-Products | | | 2,073,286 | | | | 2.2 | |
Healthcare-Services | | | 702,369 | | | | 0.7 | |
Insurance | | | 1,125,337 | | | | 1.2 | |
Internet | | | 37,008 | | | | 0.0 | |
Iron/Steel | | | 341,334 | | | | 0.4 | |
Lodging | | | 1,638,896 | | | | 1.7 | |
Mining | | | 82,605 | | | | 0.1 | |
Miscellaneous Manufacturing | | | 905,874 | | | | 0.9 | |
Oil & Gas | | | 914,292 | | | | 1.0 | |
Packaging & Containers | | | 749,452 | | | | 0.8 | |
Pharmaceuticals | | | 1,579,546 | | | | 1.6 | |
Real Estate | | | 26,944 | | | | 0.0 | |
Real Estate Investment Trusts | | | 1,148,009 | | | | 1.2 | |
Retail | | | 2,949,632 | | | | 3.1 | |
Semiconductors | | | 1,061,636 | | | | 1.1 | |
Shipbuilding | | | 134,153 | | | | 0.1 | |
Software | | | 1,393,199 | | | | 1.5 | |
Telecommunications | | | 194,268 | | | | 0.2 | |
Textiles | | | 382,645 | | | | 0.4 | |
Transportation | | | 1,706,761 | | | | 1.8 | |
| | | | | | | | |
Total Common Stocks Purchased Long | | | 40,547,167 | | | | 42.4 | |
Bank Loans Purchased Long | | | 4,508,381 | | | | 4.7 | |
Convertible Bonds Purchased Long | | | 124,820 | | | | 0.1 | |
Corporate Bonds & Notes Purchased Long | | | | | | | | |
Beverages | | | 253,401 | | | | 0.3 | |
Diversified Financial Services | | | 129,880 | | | | 0.1 | |
Engineering & Construction | | | 192,765 | | | | 0.2 | |
| | | | | | | | |
Total Corporate Bonds & Notes Purchased Long | | | 576,046 | | | | 0.6 | |
Limited Partnership Units Purchased Long | | | 624,544 | | | | 0.7 | |
Mutual Funds Purchased Long | | | 850,342 | | | | 0.9 | |
Purchased Call Options | | | 574,115 | | | | 0.6 | |
Purchased Put Options | | | 284,965 | | | | 0.3 | |
Short-Term Investments | | | 49,677,039 | | | | 51.9 | |
| | | | | | | | |
Total Investments | | | 97,767,419 | | | | 102.2 | |
| | | | | | | | |
| Industry Allocation (continued) | |
| Industry | | Value | | | % of
Total
Net Assets | |
Other Assets and Liabilities | | $ | 16,762,897 | | | | 17.5 | % |
Securities Sold Short & Written Options (see below) | | | (18,790,135 | ) | | | (19.7 | ) |
| | | | | | | | |
Total Net Assets | | $ | 95,740,181 | | | | 100.0 | % |
| | | | | | | | |
Securities Sold Short & Written Options | | | | | | | | |
Common Stocks Sold Short | | | | | | | | |
Aerospace/Defense | | $ | (164,241 | ) | | | (0.2 | )% |
Airlines | | | (97,144 | ) | | | (0.1 | ) |
Auto Manufacturers | | | (199,312 | ) | | | (0.2 | ) |
Auto Parts & Equipment | | | (567,782 | ) | | | (0.6 | ) |
Banks | | | (291,740 | ) | | | (0.3 | ) |
Beverages | | | (68,050 | ) | | | (0.1 | ) |
Biotechnology | | | (177,888 | ) | | | (0.2 | ) |
Building Materials | | | (30,539 | ) | | | (0.0 | ) |
Chemicals | | | (363,614 | ) | | | (0.4 | ) |
Commercial Services | | | (363,956 | ) | | | (0.4 | ) |
Computers | | | (268,897 | ) | | | (0.3 | ) |
Cosmetics/Personal Care | | | (37,714 | ) | | | (0.0 | ) |
Diversified Financial Services | | | (349,402 | ) | | | (0.3 | ) |
Electric | | | (673,526 | ) | | | (0.7 | ) |
Electrical Components & Equipment | | | (163,531 | ) | | | (0.2 | ) |
Engineering & Construction | | �� | (32,243 | ) | | | (0.0 | ) |
Food | | | (766,182 | ) | | | (0.8 | ) |
Forest Products & Paper | | | (71,843 | ) | | | (0.1 | ) |
Hand/Machine Tools | | | (113,100 | ) | | | (0.1 | ) |
Healthcare-Products | | | (688,175 | ) | | | (0.7 | ) |
Home Furnishings | | | (483,897 | ) | | | (0.5 | ) |
Household Products/Wares | | | (238,618 | ) | | | (0.2 | ) |
Housewares | | | (170,150 | ) | | | (0.2 | ) |
Insurance | | | (130,198 | ) | | | (0.1 | ) |
Internet | | | (551,468 | ) | | | (0.6 | ) |
Iron/Steel | | | (50,763 | ) | | | (0.1 | ) |
Machinery-Diversified | | | (85,813 | ) | | | (0.1 | ) |
Media | | | (173,795 | ) | | | (0.2 | ) |
Metal Fabricate/Hardware | | | (272,045 | ) | | | (0.3 | ) |
Mining | | | (31,395 | ) | | | (0.0 | ) |
Miscellaneous Manufacturing | | | (364,371 | ) | | | (0.4 | ) |
Oil & Gas | | | (14,640 | ) | | | (0.0 | ) |
Packaging & Containers | | | (51,707 | ) | | | (0.1 | ) |
Pharmaceuticals | | | (309,956 | ) | | | (0.3 | ) |
Real Estate | | | (65,747 | ) | | | (0.1 | ) |
Real Estate Investment Trusts | | | (904,694 | ) | | | (0.9 | ) |
Retail | | | (2,007,431 | ) | | | (2.1 | ) |
Semiconductors | | | (368,128 | ) | | | (0.4 | ) |
Software | | | (587,274 | ) | | | (0.6 | ) |
Telecommunications | | | (93,978 | ) | | | (0.1 | ) |
Toys/Games/Hobbies | | | (166,534 | ) | | | (0.2 | ) |
Transportation | | | (326,752 | ) | | | (0.3 | ) |
Trucking & Leasing | | | (77,845 | ) | | | (0.1 | ) |
| | | | | | | | |
Total Common Stocks Sold Short | | | (13,016,078 | ) | | | (13.6 | ) |
Corporate Bonds & Notes Sold Short Food | | | (144,972 | ) | | | (0.2 | ) |
Exchange Traded Funds Sold Short | | | (4,574,132 | ) | | | (4.8 | ) |
Written Call Options | | | (869,792 | ) | | | (0.9 | ) |
Written Put Options | | | (185,161 | ) | | | (0.2 | ) |
| | | | | | | | |
Total Securities Sold Short & Written Options | | $ | (18,790,135 | ) | | | (19.7 | )% |
| | | | | | | | |
(See Notes which are an integral part of the Financial Statements)
71
August 31, 2017
At August 31, 2017, the Alternative Strategies Fund had outstanding futures contracts as set forth below:
| | | | | | | | | | | | | | |
Expiration Date | | Number of
Contracts | | Description | | | Notional
Amount | | Value at
August 31,
2017 | | Unrealized
Appreciation
(Depreciation) | |
Long Futures | | | | | | | | | | | | | | |
Bond Futures | | | | | | | | | | | | | | |
September 2017 | | 21 | | | SFE 10-Year Australian Bond | | | $2,160,673 | | $2,147,681 | | $ | (12,992) | |
December 2017 | | 29 | | | CBOT U.S. Long Bond | | | 4,502,906 | | 4,526,719 | | | 23,813 | |
December 2017 | | 20 | | | Eurex 10-Year Euro BUND | | | 3,864,084 | | 3,862,060 | | | (2,024) | |
December 2017 | | 14 | | | LIFFE Long Gilt Government Bond | | | 2,299,416 | | 2,304,564 | | | 5,148 | |
December 2017 | | 13 | | | CBOT 10-Year U.S. Treasury Note | | | 1,646,359 | | 1,650,797 | | | 4,438 | |
Index Futures | | | | | | | | | | | | | | |
September 2017 | | 228 | | | CME E-Mini S&P 500® Index | | | 28,030,502 | | 28,159,140 | | | 128,638 | |
September 2017 | | 30 | | | Eurex Euro STOXX 50 Index | | | 1,235,580 | | 1,222,831 | | | (12,749) | |
September 2017 | | 22 | | | CBOT E-Mini DJIA Index | | | 2,361,517 | | 2,414,500 | | | 52,983 | |
September 2017 | | 17 | | | LIFFE FTSE 100 Index | | | 1,625,619 | | 1,633,865 | | | 8,246 | |
September 2017 | | 15 | | | CME E-Mini S&P 500® Index | | | 1,841,967 | | 1,852,575 | | | 10,608 | |
September 2017 | | 13 | | | TSE TOPIX Index | | | 1,907,156 | | 1,916,860 | | | 9,704 | |
September 2017 | | 6 | | | CAC 40 10 Euro | | | 370,135 | | 363,171 | | | (6,964) | |
September 2017 | | 5 | | | OSE Nikkei 225 Index | | | 911,568 | | 895,529 | | | (16,039) | |
September 2017 | | 5 | | | CME E-Mini NASDAQ 100 Index | | | 588,794 | | 599,075 | | | 10,281 | |
September 2017 | | 3 | | | Eurex DAX Index | | | 1,107,066 | | 1,077,298 | | | (29,768) | |
September 2017 | | 2 | | | Russell 2000 Mini Index | | | 137,755 | | 140,440 | | | 2,685 | |
September 2017 | | 2 | | | HKG Hang Seng Index | | | 353,019 | | 356,988 | | | 3,969 | |
Interest Rate Futures | | | | | | | | | | | | | | |
December 2018 | | 231 | | | CME 3-Month Eurodollar | | | 56,755,033 | | 56,814,450 | | | 59,417 | |
December 2018 | | 173 | | | LIFFE 90-Day Sterling | | | 27,810,209 | | 27,815,096 | | | 4,887 | |
Short Futures | | | | | | | | | | | | | | |
Bond Futures | | | | | | | | | | | | | | |
December 2017 | | 10 | | | MSE 10-Year Canadian Bond | | | (1,101,477) | | (1,107,107) | | | (5,630) | |
Interest Rate Futures | | | | | | | | | | | | | | |
December 2018 | | 51 | | | LIFFE 3-Month Euro Euribor | | | (15,201,082) | | (15,210,879) | | | (9,797) | |
| | | | | | | | | | | | | | |
Total Futures Contracts | | | | | | | | $123,206,799 | | $123,435,653 | | $ | 228,854 | |
| | | | | | | | | | | | | | |
At August 31, 2017, the Alternative Strategies Fund had outstanding forward foreign currency exchange contracts as set forth below:
| | | | | | | | | | | | | | | | | | | | |
| | | | | Contract Amount | | | | | | Unrealized
Appreciation
(Depreciation) | | | |
Settlement Date | | Currency | | Buy | | | Sell | | | Value | | | | Counterparty |
September 22, 2017 | | Australian Dollar | | AUD | 8,901,000 | | | $ | 6,783,812 | | | $ | 7,074,424 | | | $ | 290,612 | | | Bank of America |
September 22, 2017 | | Australian Dollar | | $ | 3,860,353 | | | AUD | 5,076,000 | | | | 4,034,353 | | | | (174,000 | ) | | Bank of America |
September 22, 2017 | | Canadian Dollar | | CAD | 8,903,000 | | | $ | 6,895,459 | | | | 7,131,028 | | | | 235,569 | | | Bank of America |
September 22, 2017 | | Canadian Dollar | | $ | 3,524,370 | | | CAD | 4,711,000 | | | | 3,773,366 | | | | (248,996 | ) | | Bank of America |
September 22, 2017 | | Euro Currency | | EUR | 5,618,000 | | | $ | 6,390,662 | | | | 6,693,989 | | | | 303,327 | | | Bank of America |
September 22, 2017 | | Euro Currency | | $ | 3,755,043 | | | EUR | 3,196,000 | | | | 3,808,116 | | | | (53,073 | ) | | Bank of America |
September 22, 2017 | | Japanese Yen | | JPY | 1,241,791,000 | | | $ | 11,366,941 | | | | 11,304,479 | | | | (62,462 | ) | | Bank of America |
September 22, 2017 | | Japanese Yen | | $ | 10,410,796 | | | JPY | 1,152,394 | | | | 10,490,666 | | | | (79,870 | ) | | Bank of America |
September 22, 2017 | | Mexican Peso | | MXN | 23,992,000 | | | $ | 1,303,724 | | | | 1,338,209 | | | | 34,485 | | | Bank of America |
September 22, 2017 | | Mexican Peso | | $ | 474,234 | | | MXN | 8,495,000 | | | | 473,828 | | | | 406 | | | Bank of America |
September 22, 2017 | | New Zealand Dollar | | NZD | 2,571,000 | | | $ | 1,855,947 | | | | 1,845,385 | | | | (10,562 | ) | | Bank of America |
September 22, 2017 | | New Zealand Dollar | | $ | 522,595 | | | NZD | 717,000 | | | | 514,641 | | | | 7,954 | | | Bank of America |
September 22, 2017 | | Pound Sterling | | GBP | 4,622,000 | | | $ | 6,011,775 | | | | 5,980,195 | | | | (31,580 | ) | | Bank of America |
September 22, 2017 | | Pound Sterling | | $ | 6,115,884 | | | GBP | 4,735,000 | | | | 6,126,401 | | | | (10,517 | ) | | Bank of America |
September 22, 2017 | | Swiss Franc | | CHF | 2,720,000 | | | $ | 2,835,896 | | | | 2,839,611 | | | | 3,715 | | | Bank of America |
September 22, 2017 | | Swiss Franc | | $ | 642,653 | | | CHF | 620,000 | | | | 647,264 | | | | (4,611 | ) | | Bank of America |
| | | | | | | | | | | | | | | | | | | | |
| | | | | | | | | | | | | | | | $ | 200,397 | | | |
| | | | | | | | | | | | | | | | | | | | |
72
Global Long/Short Equity Fund
| | | | | | | | |
| Description | | Shares | | | Value | |
| Common Stocks Purchased Long — 98.8% | |
|
Australia — 0.9% | |
Regis Resources, Ltd. | | | 26,491 | | | $ | 87,539 | |
| | |
Bermuda — 3.2% | | | | | | | | |
Argo Group International Holdings, Ltd. | | | 1,768 | | | | 106,434 | |
Aspen Insurance Holdings, Ltd. (10) | | | 3,291 | | | | 148,753 | |
Everest Re Group, Ltd. | | | 200 | | | | 50,496 | |
| | | | | | | | |
| | | | | | | 305,683 | |
| | |
Canada — 3.3% | | | | | | | | |
Air Canada (2) | | | 525 | | | | 9,813 | |
Celestica, Inc. (2) | | | 3,204 | | | | 36,767 | |
George Weston, Ltd. (10) | | | 1,869 | | | | 162,437 | |
Just Energy Group, Inc. | | | 3,521 | | | | 20,330 | |
Pure Industrial Real Estate Trust | | | 9,540 | | | | 50,574 | |
Transcontinental, Inc. | | | 1,822 | | | | 35,455 | |
| | | | | | | | |
| | | | | | | 315,376 | |
| | |
Cayman Islands — 0.3% | | | | | | | | |
China Dongxiang Group Co., Ltd. | | | 170,000 | | | | 30,416 | |
| | |
China — 0.7% | | | | | | | | |
Agricultural Bank of China, Ltd., Class H | | | 52,000 | | | | 24,540 | |
China Machinery Engineering Corp., Class H | | | 59,000 | | | | 38,776 | |
| | | | | | | | |
| | | | | | | 63,316 | |
| | |
Denmark — 0.3% | | | | | | | | |
Novo Nordisk A/S | | | 695 | | | | 33,180 | |
| | |
France — 1.6% | | | | | | | | |
Boiron SA | | | 423 | | | | 39,965 | |
IPSOS | | | 1,048 | | | | 32,763 | |
Peugeot SA | | | 2,320 | | | | 49,043 | |
Sanofi | | | 378 | | | | 36,907 | |
| | | | | | | | |
| | | | | | | 158,678 | |
| | |
Germany — 1.4% | | | | | | | | |
Hamburger Hafen und Logistik AG | | | 574 | | | | 18,287 | |
Software AG (1) | | | 2,591 | | | | 113,869 | |
| | | | | | | | |
| | | | | | | 132,156 | |
| | |
Greece — 0.5% | | | | | | | | |
JUMBO SA | | | 2,682 | | | | 44,718 | |
| | |
Hungary — 0.9% | | | | | | | | |
Richter Gedeon Nyrt | | | 3,485 | | | | 90,685 | |
| | |
Ireland — 0.4% | | | | | | | | |
Seagate Technology PLC (1) | | | 1,088 | | | | 34,305 | |
| | |
Italy — 1.3% | | | | | | | | |
Amplifon SpA | | | 5,248 | | | | 75,937 | |
ASTM SpA | | | 949 | | | | 23,936 | |
Societa Iniziative Autostradali e Servizi SpA | | | 2,057 | | | | 30,742 | |
| | | | | | | | |
| | | | | | | 130,615 | |
| | |
Japan — 12.8% | | | | | | | | |
Fujibo Holdings, Inc. | | | 900 | | | | 27,541 | |
Futaba Corp. (1) | | | 2,200 | | | | 40,765 | |
Heiwado Co., Ltd. (10) | | | 5,100 | | | | 119,239 | |
Kato Sangyo Co., Ltd. | | | 800 | | | | 23,608 | |
Keihin Corp. | | | 3,400 | | | | 56,143 | |
Mitsui Sugar Co., Ltd. | | | 1,200 | | | | 40,918 | |
Nippon Road Co., Ltd. (10) | | | 4,000 | | | | 22,299 | |
Nippon Telegraph & Telephone Corp. (10) | | | 4,200 | | | | 209,212 | |
| | | | | | | | |
| Description | | Shares | | | Value | |
| Common Stocks Purchased Long (continued) | |
| | |
Japan (continued) | | | | | | | | |
Nipro Corp. | | | 6,700 | | | $ | 88,843 | |
Nissan Motor Co., Ltd. | | | 7,500 | | | | 74,710 | |
Okinawa Electric Power Co., Inc. (1) | | | 880 | | | | 19,677 | |
Paramount Bed Holdings Co., Ltd. (10) | | | 2,600 | | | | 115,427 | |
Press Kogyo Co., Ltd. | | | 6,300 | | | | 33,145 | |
Sapporo Holdings, Ltd. (10) | | | 7,100 | | | | 206,583 | |
Shimachu Co., Ltd. (1) | | | 2,400 | | | | 62,074 | |
Wakita & Co., Ltd. | | | 3,200 | | | | 37,250 | |
Warabeya Nichiyo Holdings Co., Ltd. | | | 1,600 | | | | 40,251 | |
Yorozu Corp. | | | 1,400 | | | | 27,718 | |
| | | | | | | | |
| | | | | | | 1,245,403 | |
| | |
Jersey — 0.4% | | | | | | | | |
Wizz Air Holdings PLC (2)(6) | | | 912 | | | | 34,765 | |
| | |
Luxembourg — 2.3% | | | | | | | | |
Orion Engineered Carbons SA | | | 1,630 | | | | 35,045 | |
Ternium SA | | | 2,559 | | | | 77,870 | |
Trinseo SA | | | 1,685 | | | | 112,727 | |
| | | | | | | | |
| | | | | | | 225,642 | |
| | |
Netherlands — 2.8% | | | | | | | | |
BE Semiconductor Industries NV (10) | | | 2,597 | | | | 168,574 | |
Boskalis Westminster | | | 3,165 | | | | 103,501 | |
| | | | | | | | |
| | | | | | | 272,075 | |
| | |
New Zealand — 1.2% | | | | | | | | |
Air New Zealand, Ltd. | | | 46,079 | | | | 118,362 | |
| | |
Norway — 0.4% | | | | | | | | |
Austevoll Seafood ASA | | | 4,031 | | | | 41,702 | |
| | |
Panama — 0.7% | | | | | | | | |
Copa Holdings SA, Class A | | | 538 | | | | 66,750 | |
| | |
Poland — 0.5% | | | | | | | | |
Asseco Poland SA | | | 4,073 | | | | 51,742 | |
| | |
Singapore — 0.3% | | | | | | | | |
Yanlord Land Group, Ltd. | | | 22,400 | | | | 28,604 | |
| | |
South Korea — 1.4% | | | | | | | | |
Samsung Electronics Co., Ltd. | | | 67 | | | | 138,352 | |
| | |
Sweden — 0.4% | | | | | | | | |
Mycronic AB (1) | | | 3,918 | | | | 36,867 | |
| | |
Taiwan — 0.5% | | | | | | | | |
HannStar Display Corp. | | | 115,000 | | | | 46,893 | |
| | |
United Kingdom — 3.6% | | | | | | | | |
Debenhams PLC | | | 31,817 | | | | 16,555 | |
DFS Furniture PLC (1) | | | 5,378 | | | | 16,586 | |
Go-Ahead Group PLC | | | 1,452 | | | | 33,820 | |
Greggs PLC | | | 3,030 | | | | 47,170 | |
Imperial Brands PLC | | | 2,122 | | | | 87,759 | |
QinetiQ Group PLC | | | 15,784 | | | | 46,939 | |
WH Smith PLC (10) | | | 4,365 | | | | 104,317 | |
| | | | | | | | |
| | | | | | | 353,146 | |
| | |
United States — 56.7% | | | | | | | | |
Amkor Technology, Inc. (2) | | | 4,696 | | | | 41,231 | |
ArcBest Corp. (10) | | | 6,699 | | | | 198,960 | |
Best Buy Co., Inc. | | | 1,596 | | | | 86,599 | |
Boston Properties, Inc. (10) | | | 1,460 | | | | 176,076 | |
Cabot Corp. (10) | | | 3,066 | | | | 161,517 | |
Chemed Corp. | | | 507 | | | | 100,026 | |
CNO Financial Group, Inc. (10) | | | 8,942 | | | | 199,854 | |
Cooper-Standard Holdings, Inc. (2) | | | 750 | | | | 75,435 | |
Cutera, Inc. (2) | | | 1,600 | | | | 59,440 | |
Delta Air Lines, Inc. (10) | | | 2,830 | | | | 133,548 | |
(See Notes which are an integral part of the Financial Statements)
73
August 31, 2017
Global Long/Short Equity Fund (continued)
| | | | | | | | |
| Description | | Shares | | | Value | |
| Common Stocks Purchased Long (continued) | |
| | |
United States (continued) | | | | | | | | |
Discover Financial Services | | | 1,596 | | | $ | 94,084 | |
Emergent BioSolutions, Inc. (2)(10) | | | 3,114 | | | | 116,246 | |
Employers Holdings, Inc. | | | 1,377 | | | | 58,041 | |
Ennis, Inc. | | | 2,500 | | | | 47,750 | |
Equinix, Inc. (10) | | | 428 | | | | 200,479 | |
F5 Networks, Inc. (2) | | | 330 | | | | 39,395 | |
GameStop Corp., Class A (1) | | | 1,709 | | | | 31,616 | |
Highwoods Properties, Inc. | | | 1,389 | | | | 72,547 | |
Huntington Ingalls Industries, Inc. (10) | | | 665 | | | | 142,283 | |
INC Research Holdings, Inc. (2) | | | 1,171 | | | | 68,738 | |
Inogen, Inc. (2) | | | 778 | | | | 74,532 | |
Intersect ENT, Inc. (2) | | | 293 | | | | 9,054 | |
Lantheus Holdings, Inc. (2) | | | 2,132 | | | | 37,310 | |
Lear Corp. (10) | | | 1,303 | | | | 194,851 | |
LeMaitre Vascular, Inc. | | | 1,625 | | | | 59,150 | |
Magellan Health, Inc. (2) | | | 1,203 | | | | 97,323 | |
Masimo Corp. (2)(10) | | | 2,221 | | | | 187,408 | |
Merit Medical Systems, Inc. (2)(10) | | | 4,018 | | | | 165,943 | |
Molina Healthcare, Inc. (2)(10) | | | 1,841 | | | | 117,824 | |
Natus Medical, Inc. (2) | | | 1,187 | | | | 39,883 | |
NCR Corp. (2) | | | 2,279 | | | | 83,252 | |
OraSure Technologies, Inc. (2) | | | 4,464 | | | | 91,110 | |
Owens Corning (10) | | | 1,703 | | | | 126,243 | |
PennyMac Financial Services, Inc., Class A (2) | | | 2,249 | | | | 38,233 | |
PG&E Corp. (10) | | | 2,534 | | | | 178,343 | |
Photronics, Inc. (2) | | | 3,483 | | | | 27,516 | |
PNM Resources, Inc. (10) | | | 3,412 | | | | 144,669 | |
Portland General Electric Co. (10) | | | 4,007 | | | | 190,373 | |
Quanta Services, Inc. (2) | | | 2,221 | | | | 79,801 | |
Raymond James Financial, Inc. | | | 1,300 | | | | 101,816 | |
Rogers Corp. (2) | | | 613 | | | | 72,671 | |
Rush Enterprises, Inc., Class A (2) | | | 1,898 | | | | 77,799 | |
Sanmina Corp. (2) | | | 319 | | | | 11,947 | |
Selective Insurance Group, Inc. (10) | | | 2,520 | | | | 127,008 | |
Steel Dynamics, Inc. | | | 704 | | | | 24,253 | |
Supernus Pharmaceuticals, Inc. (2) | | | 2,047 | | | | 93,753 | |
Sykes Enterprises, Inc. (2) | | | 2,275 | | | | 60,651 | |
Sysco Corp. | | | 1,559 | | | | 82,112 | |
TriCo Bancshares | | | 943 | | | | 33,552 | |
Tyson Foods, Inc., Class A | | | 868 | | | | 54,944 | |
United Rentals, Inc. (2)(10) | | | 1,481 | | | | 174,847 | |
Unum Group (10) | | | 3,198 | | | | 154,080 | |
Vishay Intertechnology, Inc. (10) | | | 6,895 | | | | 122,041 | |
Wabash National Corp. (1) | | | 6,233 | | | | 131,018 | |
WellCare Health Plans, Inc. (2)(10) | | | 730 | | | | 127,516 | |
| | | | | | | | |
| | | | | | | 5,496,691 | |
| | | | | | | | |
Total Common Stocks Purchased Long
(identified cost $8,355,746) | | | | 9,583,661 | |
| | | | | | | | |
| Short-Term Investments — 40.1% | |
|
| Collateral Investment for Securities on Loan — 3.2% | |
State Street Navigator Securities Lending Government Money Market Portfolio, 0.994% (3) | | | 310,539 | | | | 310,539 | |
| | | | | | | | |
| Description | | Shares | | | Value | |
| Short-Term Investments (continued) | |
| | |
| Mutual Funds — 36.9% | | | | | | |
State Street Institutional Liquid Reserves Fund — Premier Class, 1.150% | | | 3,573,943 | | | $ | 3,573,943 | |
| | | | | | | | |
Total Short-Term Investments
(identified cost $3,884,700) | | | | 3,884,482 | |
| | | | | | | | |
Total Investments — 138.9%
(identified cost $12,240,446) | | | | 13,468,143 | |
| Other Assets and Liabilities — (3.3)% | | | | (316,834 | ) |
| Securities Sold Short (see below) — (35.6)% | | | | (3,454,239 | ) |
| | | | | | | | |
| Total Net Assets — 100.0% | | | | | | $ | 9,697,070 | |
| | | | | | | | |
|
| Securities Sold Short — (35.6)% | |
|
| Common Stocks Sold Short — (35.6)% | |
| | |
Australia — (0.9)% | | | | | | | | |
Aconex, Ltd. (2) | | | (6,560 | ) | | $ | (21,294 | ) |
Mayne Pharma Group, Ltd. (2) | | | (85,423 | ) | | | (45,583 | ) |
Nanosonics, Ltd. (2) | | | (11,409 | ) | | | (23,715 | ) |
| | | | | | | | |
| | | | | | | (90,592 | ) |
| | |
Belgium — (0.2)% | | | | | | | | |
Tessenderlo Group SA (2) | | | (422 | ) | | | (18,501 | ) |
| | |
Bermuda — (0.2)% | | | | | | | | |
Esprit Holdings, Ltd. (2) | | | (30,300 | ) | | | (17,542 | ) |
| | |
Cayman Islands — (0.5)% | | | | | | | | |
JD.com, Inc. (2) | | | (1,179 | ) | | | (49,412 | ) |
| | |
Finland — (0.2)% | | | | | | | | |
Caverion Corp. (2) | | | (2,225 | ) | | | (19,978 | ) |
| | |
Germany — (1.2)% | | | | | | | | |
Zalando SE (2)(6) | | | (2,026 | ) | | | (96,012 | ) |
zooplus AG (2) | | | (135 | ) | | | (23,619 | ) |
| | | | | | | | |
| | | | | | | (119,631 | ) |
| | |
Japan — (6.2)% | | | | | | | | |
ABC-Mart, Inc. | | | (400 | ) | | | (20,580 | ) |
Acom Co., Ltd. (2) | | | (5,600 | ) | | | (22,962 | ) |
Don Quijote Holdings Co., Ltd. | | | (1,000 | ) | | | (38,051 | ) |
Fuji Seal International, Inc. | | | (2,000 | ) | | | (60,832 | ) |
Hoshizaki Corp. | | | (1,100 | ) | | | (95,894 | ) |
Kose Corp. | | | (400 | ) | | | (50,286 | ) |
Kura Corp. | | | (600 | ) | | | (32,969 | ) |
M3, Inc. | | | (1,400 | ) | | | (36,566 | ) |
MISUMI Group, Inc. | | | (3,400 | ) | | | (87,609 | ) |
Nippon Paint Holdings Co., Ltd. | | | (500 | ) | | | (17,101 | ) |
Pilot Corp. | | | (1,200 | ) | | | (52,750 | ) |
Prestige International, Inc. | | | (3,000 | ) | | | (32,241 | ) |
SMS Co., Ltd. | | | (1,800 | ) | | | (58,315 | ) |
| | | | | | | | |
| | | | | | | (606,156 | ) |
| | |
Netherlands — (0.8)% | | | | | | | | |
TomTom NV (2) | | | (7,532 | ) | | | (78,657 | ) |
| | |
New Zealand — (0.6)% | | | | | | | | |
Xero, Ltd. (2) | | | (3,000 | ) | | | (56,746 | ) |
| | |
Norway — (0.8)% | | | | | | | | |
Schibsted ASA | | | (2,328 | ) | | | (56,575 | ) |
XXL ASA (6) | | | (2,243 | ) | | | (22,479 | ) |
| | | | | | | | |
| | | | | | | (79,054 | ) |
| | |
Spain — (0.8)% | | | | | | | | |
Cellnex Telecom SA (6) | | | (2,611 | ) | | | (58,336 | ) |
Inmobiliaria Colonial SA | | | (1,551 | ) | | | (15,162 | ) |
| | | | | | | | |
| | | | | | | (73,498 | ) |
(See Notes which are an integral part of the Financial Statements)
74
Global Long/Short Equity Fund (continued)
| | | | | | | | |
| Description | | Shares | | | Value | |
|
| Securities Sold Short (continued) | |
|
| Common Stocks Sold Short (continued) | |
Sweden — (0.8)% | | | | | | | | |
AAK AB | | | (496 | ) | | $ | (36,437 | ) |
Wallenstam AB | | | (3,928 | ) | | | (40,020 | ) |
| | | | | | | | |
| | | | | | | (76,457 | ) |
| | |
Switzerland — (0.3)% | | | | | | | | |
Arbonia AG (2) | | | (1,810 | ) | | | (32,381 | ) |
| | |
United Kingdom — (3.7)% | | | | | | | | |
Balfour Beatty PLC | | | (9,834 | ) | | | (34,171 | ) |
Capital & Counties Properties PLC | | | (8,458 | ) | | | (29,672 | ) |
Cobham PLC | | | (53,277 | ) | | | (94,621 | ) |
Just Eat PLC (2) | | | (9,415 | ) | | | (81,197 | ) |
Serco Group PLC (2) | | | (30,120 | ) | | | (45,862 | ) |
Sophos Group PLC (6) | | | (10,695 | ) | | | (69,690 | ) |
| | | | | | | | |
| | | | | | | (355,213 | ) |
| | |
United States — (18.4)% | | | | | | | | |
Advanced Micro Devices, Inc. (2) | | | (7,323 | ) | | | (95,199 | ) |
Aerovironment, Inc. (2) | | | (1,622 | ) | | | (79,511 | ) |
Allegheny Technologies, Inc. | | | (2,584 | ) | | | (53,825 | ) |
Apartment Investment & Management Co., Class A | | | (906 | ) | | | (41,069 | ) |
Bancorp, Inc. (2) | | | (4,863 | ) | | | (38,175 | ) |
Benefitfocus, Inc. (2) | | | (1,648 | ) | | | (50,841 | ) |
BioScrip, Inc. (2) | | | (17,690 | ) | | | (53,601 | ) |
Brown-Forman Corp., Class B | | | (1,361 | ) | | | (72,188 | ) |
Chesapeake Energy Corp. (2) | | | (4,263 | ) | | | (15,517 | ) |
Coeur Mining, Inc. (2) | | | (3,804 | ) | | | (33,285 | ) |
Deltic Timber Corp. | | | (580 | ) | | | (45,263 | ) |
Duke Realty Corp. | | | (2,953 | ) | | | (87,763 | ) |
Education Realty Trust, Inc. | | | (1,602 | ) | | | (61,901 | ) |
Financial Engines, Inc. | | | (846 | ) | | | (27,960 | ) |
Guidewire Software, Inc. (2) | | | (823 | ) | | | (62,309 | ) |
Harmonic, Inc. (2) | | | (13,105 | ) | | | (42,591 | ) |
Instructure, Inc. (2) | | | (1,800 | ) | | | (53,280 | ) |
Interactive Brokers Group, Inc. | | | (2,332 | ) | | | (97,781 | ) |
Kopin Corp. (2) | | | (7,976 | ) | | | (32,064 | ) |
LSB Industries, Inc. (2) | | | (4,114 | ) | | | (25,095 | ) |
Macerich Co. | | | (777 | ) | | | (41,002 | ) |
Macquarie Infrastructure Corp. | | | (1,112 | ) | | | (82,822 | ) |
Netflix, Inc. (2) | | | (313 | ) | | | (54,684 | ) |
PHH Corp. (2) | | | (6,029 | ) | | | (85,612 | ) |
PROS Holdings, Inc. (2) | | | (2,379 | ) | | | (62,663 | ) |
Rayonier, Inc. | | | (2,668 | ) | | | (77,399 | ) |
Senior Housing Properties Trust | | | (2,039 | ) | | | (40,209 | ) |
Splunk, Inc. (2) | | | (601 | ) | | | (40,321 | ) |
TimkenSteel Corp. (2) | | | (2,006 | ) | | | (29,749 | ) |
Titan International, Inc. | | | (3,142 | ) | | | (26,958 | ) |
Verso Corp., Class A (2) | | | (6,009 | ) | | | (31,968 | ) |
Wabtec Corp. | | | (1,330 | ) | | | (93,858 | ) |
Weyerhaeuser Co. | | | (1,348 | ) | | | (43,958 | ) |
| | | | | | | | |
| | | | | | | (1,780,421 | ) |
| | | | | | | | |
Total Securities Sold Short
(proceeds $(3,171,194)) | | | $ | (3,454,239 | ) |
| | | | | | | | |
| | | | | | | | |
| Industry Allocation | |
| Industry | | Value | | | % of
Total
Net Assets | |
Common Stocks Purchased Long | | | | | | | | |
Advertising | | $ | 32,763 | | | | 0.3 | % |
Agriculture | | | 87,759 | | | | 0.9 | |
Airlines | | | 363,237 | | | | 3.7 | |
Auto Manufacturers | | | 254,771 | | | | 2.6 | |
Auto Parts & Equipment | | | 387,291 | | | | 4.0 | |
Banks | | | 58,091 | | | | 0.6 | |
Beverages | | | 206,583 | | | | 2.1 | |
Biotechnology | | | 116,246 | | | | 1.2 | |
Building Materials | | | 126,243 | | | | 1.3 | |
Chemicals | | | 196,562 | | | | 2.0 | |
Commercial Services | | | 526,494 | | | | 5.4 | |
Computers | | | 229,950 | | | | 2.4 | |
Distribution/Wholesale | | | 37,250 | | | | 0.4 | |
Diversified Financial Services | | | 234,133 | | | | 2.4 | |
Electric | | | 533,061 | | | | 5.5 | |
Electronics | | | 367,952 | | | | 3.8 | |
Engineering & Construction | | | 164,576 | | | | 1.7 | |
Food | | | 612,382 | | | | 6.3 | |
Gas | | | 20,329 | | | | 0.2 | |
Healthcare-Products | | | 928,101 | | | | 9.6 | |
Healthcare-Services | | | 442,689 | | | | 4.6 | |
Insurance | | | 844,665 | | | | 8.7 | |
Internet | | | 39,395 | | | | 0.4 | |
Iron/Steel | | | 102,123 | | | | 1.0 | |
Mining | | | 87,539 | | | | 0.9 | |
Miscellaneous Manufacturing | | | 112,727 | | | | 1.2 | |
Pharmaceuticals | | | 370,429 | | | | 3.8 | |
Real Estate | | | 28,604 | | | | 0.3 | |
Real Estate Investment Trusts | | | 499,677 | | | | 5.1 | |
Retail | | | 470,681 | | | | 4.9 | |
Semiconductors | | | 375,673 | | | | 3.9 | |
Shipbuilding | | | 142,283 | | | | 1.5 | |
Software | | | 113,869 | | | | 1.2 | |
Telecommunications | | | 209,212 | | | | 2.2 | |
Textiles | | | 27,541 | | | | 0.3 | |
Transportation | | | 232,780 | | | | 2.4 | |
| | | | | | | | |
Total Common Stocks Purchased Long | | | 9,583,661 | | | | 98.8 | |
Collateral Investment for Securities on Loan | | | 310,539 | | | | 3.2 | |
Mutual Funds | | | 3,573,943 | | | | 36.9 | |
| | | | | | | | |
Total Investments | | | 13,468,143 | | | | 138.9 | |
Other Assets and Liabilities | | | (316,834 | ) | | | (3.3 | ) |
Securities Sold Short (see below) | | | (3,454,239 | ) | | | (35.6 | ) |
| | | | | | | | |
Total Net Assets | | $ | 9,697,070 | | | | 100.0 | % |
| | | | | | | | |
Securities Sold Short | | | | | | | | |
Aerospace/Defense | | $ | (174,132 | ) | | | (1.8 | )% |
Auto Parts & Equipment | | | (26,958 | ) | | | (0.3 | ) |
Banks | | | (38,175 | ) | | | (0.4 | ) |
Beverages | | | (72,187 | ) | | | (0.7 | ) |
Building Materials | | | (32,381 | ) | | | (0.3 | ) |
Chemicals | | | (35,601 | ) | | | (0.4 | ) |
Commercial Services | | | (135,041 | ) | | | (1.4 | ) |
Computers | | | (115,552 | ) | | | (1.2 | ) |
Cosmetics/Personal Care | | | (50,286 | ) | | | (0.5 | ) |
Diversified Financial Services | | | (234,315 | ) | | | (2.4 | ) |
Engineering & Construction | | | (34,171 | ) | | | (0.4 | ) |
Food | | | (36,437 | ) | | | (0.4 | ) |
Forest Products & Paper | | | (77,231 | ) | | | (0.8 | ) |
Healthcare-Products | | | (23,715 | ) | | | (0.2 | ) |
Home Furnishings | | | (95,894 | ) | | | (1.0 | ) |
Household Products/Wares | | | (52,750 | ) | | | (0.5 | ) |
Internet | | | (303,793 | ) | | | (3.1 | ) |
Iron/Steel | | | (53,825 | ) | | | (0.6 | ) |
(See Notes which are an integral part of the Financial Statements)
75
August 31, 2017
Global Long/Short Equity Fund (continued)
| | | | | | | | |
| Industry Allocation (continued) | |
| Industry | | Value | | | % of
Total
Net Assets | |
Machinery-Diversified | | $ | (93,858 | ) | | | (1.0 | ) % |
Media | | | (56,575 | ) | | | (0.6 | ) |
Metal Fabricate/Hardware | | | (117,358 | ) | | | (1.2 | ) |
Mining | | | (33,285 | ) | | | (0.3 | ) |
Miscellaneous Manufacturing | | | (25,095 | ) | | | (0.3 | ) |
Oil & Gas | | | (15,517 | ) | | | (0.2 | ) |
Packaging & Containers | | | (60,832 | ) | | | (0.6 | ) |
Pharmaceuticals | | | (99,184 | ) | | | (1.0 | ) |
Real Estate | | | (69,692 | ) | | | (0.7 | ) |
Real Estate Investment Trusts | | | (408,464 | ) | | | (4.2 | ) |
Retail | | | (227,634 | ) | | | (2.4 | ) |
Semiconductors | | | (127,262 | ) | | | (1.3 | ) |
Software | | | (426,111 | ) | | | (4.4 | ) |
Telecommunications | | | (100,928 | ) | | | (1.0 | ) |
| | | | | | | | |
Total Securities Sold Short | | $ | (3,454,239 | ) | | | (35.6 | )% |
| | | | | | | | |
Ultra Short Tax-Free Fund*
| | | | | | | | |
| Description | | Principal
Amount | | | Value | |
| Municipals — 96.1% | |
|
Alabama — 4.9% | |
Health Care Authority for Baptist Health, 1.150%, 11/1/2042 (12) | | $ | 14,125,000 | | | $ | 14,125,000 | |
Mobile Industrial Development Board: | | | | | | | | |
0.930%, 6/1/2034, Call 9/1/2017 (12) | | | 250,000 | | | | 250,000 | |
1.000%, 6/1/2034, Call 9/1/2017 (12) | | | 4,000,000 | | | | 4,000,000 | |
Tender Option Bond Trust Receipts/Certificates, 1.040%, 12/1/2030 (6)(12) | | | 7,060,000 | | | | 7,060,000 | |
Other securities | | | | | | | 6,863,635 | |
| | | | | | | | |
| | | | | | | 32,298,635 | |
|
Arizona — 1.8% | |
Arizona Health Facilities Authority: | | | | | | | | |
0.800%, 1/1/2029, Call 9/1/2017 (12) | | | 6,000,000 | | | | 6,000,000 | |
2.640% (SIFMA Municipal Swap Index Yield+185 basis points), 2/5/2020, Call 8/9/2019 (7) | | | 3,250,000 | | | | 3,299,497 | |
2.640% (SIFMA Municipal Swap Index Yield+185 basis points), 2/5/2020, Call 8/9/2019 (7) | | | 750,000 | | | | 761,423 | |
Other securities | | | | | | | 1,570,519 | |
| | | | | | | | |
| | | | | | | 11,631,439 | |
|
Arkansas — 2.6% | |
Arkansas Development Finance Authority: | | | | | | | | |
1.200%, 9/1/2044, Call 9/1/2017 (12) | | | 10,400,000 | | | | 10,400,000 | |
1.890% (SIFMA Municipal Swap Index Yield+110 basis points), 9/1/2019, Call 3/1/2019 (7) | | | 3,000,000 | | | | 3,005,220 | |
| | | | | | | | |
| Description | | Principal
Amount | | | Value | |
| Municipals (continued) | |
|
Arkansas (continued) | |
Other securities | | | | | | $ | 3,658,102 | |
| | | | | | | | |
| | | | | | | 17,063,322 | |
|
California — 7.6% | |
Golden Empire Schools Financing Authority, 4.000%, 5/1/2018 | | $ | 4,000,000 | | | | 4,085,520 | |
Golden State Tobacco Securitization Corp., 4.000%, 6/1/2018 | | | 5,000,000 | | | | 5,114,900 | |
Northern California Gas Authority No. 1, 1.500% (LIBOR 3 Month+63 basis points), 7/1/2019 (7) | | | 7,500,000 | | | | 7,494,975 | |
Rib Floater Trust Various States, 0.970%, 8/15/2051 (6)(12) | | | 3,000,000 | | | | 3,000,000 | |
State of California, FSA, 1.000%, 8/1/2027 (6)(12) | | | 5,500,000 | | | | 5,500,000 | |
Tender Option Bond Trust Receipts/Certificates: | | | | | | | | |
0.860%, 11/1/2023 (6)(12) | | | 8,000,000 | | | | 8,000,000 | |
0.910%, 5/1/2022 (6)(12) | | | 3,000,000 | | | | 3,000,000 | |
Other securities | | | | | | | 14,358,466 | |
| | | | | | | | |
| | | | | | | 50,553,861 | |
|
Colorado — 1.8% | |
Colorado Health Facilities Authority: | |
1.450%, 7/1/2034, Call 7/1/2019 (6)(12) | | | 4,300,000 | | | | 4,300,000 | |
4.000%, 2/1/2018 | | | 175,000 | | | | 176,628 | |
Other securities | | | | | | | 7,553,614 | |
| | | | | | | | |
| | | | | | | 12,030,242 | |
|
Connecticut — 0.3% | |
Other securities | | | | | | | 2,204,994 | |
|
District of Columbia — 0.1% | |
Other securities | | | | | | | 391,209 | |
|
Florida — 6.2% | |
County of Escambia, 0.870%, 4/1/2039, Call 9/1/2017 (12) | | | 6,100,000 | | | | 6,100,000 | |
County of Manatee, 0.870%, 9/1/2024, Call 9/1/2017 (12) | | | 4,300,000 | | | | 4,300,000 | |
Miami-Dade County Industrial Development Authority, 0.870%, 6/1/2021, Call 9/1/2017 (12) | | | 8,100,000 | | | | 8,100,000 | |
School Board of Miami-Dade County, FGIC, 1.020%, 9/7/2017, Call 9/1/2017 (6)(12) | | | 8,000,000 | | | | 8,000,000 | |
Other securities | | | | | | | 14,305,927 | |
| | | | | | | | |
| | | | | | | 40,805,927 | |
|
Georgia — 0.9% | |
Other securities | | | | | | | 5,749,219 | |
|
Guam — 0.1% | |
Other securities | | | | | | | 763,538 | |
|
Idaho — 1.4% | |
American Falls Reservoir District, 0.980%, 2/1/2025, Call 9/1/2017 (12) | | | 4,885,000 | | | | 4,885,000 | |
Idaho Housing & Finance Association, 0.870%, 1/1/2038, Call 9/1/2017 (12) | | | 4,600,000 | | | | 4,600,000 | |
| | | | | | | | |
| | | | | | | 9,485,000 | |
(See Notes which are an integral part of the Financial Statements)
76
Ultra Short Tax-Free Fund* (continued)
| | | | | | | | |
| Description | | Principal
Amount | | | Value | |
| Municipals (continued) | |
|
Illinois — 5.6% | |
City of Chicago: | | | | | | | | |
2.000%, 11/1/2017 | | $ | 2,000,000 | | | $ | 2,003,160 | |
5.000%, 11/1/2018 | | | 1,000,000 | | | | 1,045,360 | |
5.000%, 11/1/2018 | | | 1,155,000 | | | | 1,207,391 | |
City of Chicago, AGM, 4.250%, 11/1/2018 | | | 150,000 | | | | 155,519 | |
Rib Floater Trust Various States, 1.040%, 4/1/2036, Call 4/1/2027 (6)(12) | | | 4,250,000 | | | | 4,250,000 | |
Tender Option Bond Trust Receipts/Certificates, 0.990%, 6/15/2032, Call 6/15/2026 (6)(12) | | | 4,655,000 | | | | 4,655,000 | |
Other securities | | | | | | | 23,412,177 | |
| | | | | | | | |
| | | | | | | 36,728,607 | |
|
Indiana — 2.8% | |
Indiana Housing & Community Development Authority, GNMA FNMA FHLMC COLL, 0.890%, 7/1/2039, Call 10/2/2017 (12) | | | 8,200,000 | | | | 8,200,000 | |
Tender Option Bond Trust Receipts/Certificates, 1.140%, 4/15/2019 (6)(12) | | | 8,500,000 | | | | 8,500,000 | |
Other securities | | | | | | | 2,086,160 | |
| | | | | | | | |
| | | | | | | 18,786,160 | |
|
Iowa — 1.9% | |
Iowa Finance Authority, 0.810%, 6/1/2039, Call 9/1/2017 (12) | | | 4,900,000 | | | | 4,900,000 | |
Iowa Higher Education Loan Authority: | | | | | | | | |
1.000%, 9/1/2018, Call 3/1/2018 | | | 3,000,000 | | | | 3,000,300 | |
2.000%, 12/1/2018, Call 6/1/2018 | | | 3,500,000 | | | | 3,519,670 | |
Other securities | | | | | | | 979,065 | |
| | | | | | | | |
| | | | | | | 12,399,035 | |
|
Kansas — 0.3% | |
Other securities | | | | | | | 1,745,000 | |
|
Kentucky — 1.4% | |
Other securities | | | | | | | 9,044,749 | |
|
Louisiana — 3.1% | |
East Baton Rouge Sewerage Commission, 1.362% (LIBOR 1 Month+50 basis points), 8/1/2018, Call 2/1/2018 (7) | | | 6,090,000 | | | | 6,094,019 | |
Louisiana Offshore Terminal Authority, 0.800%, 9/1/2033, Call 9/1/2017 (12) | | | 5,000,000 | | | | 5,000,000 | |
Other securities | | | | | | | 9,716,280 | |
| | | | | | | | |
| | | | | | | 20,810,299 | |
|
Maine — 0.1% | |
Other securities | | | | | | | 608,000 | |
|
Maryland — 0.1% | |
Other securities | | | | | | | 622,519 | |
|
Massachusetts — 0.3% | |
Other securities | | | | | | | 1,783,501 | |
| | | | | | | | |
| Description | | Principal
Amount | | | Value | |
| Municipals (continued) | |
|
Michigan — 1.6% | |
Michigan Finance Authority, 0.850%, 12/1/2017 (8)(12) | | $ | 5,000,000 | | | $ | 5,000,000 | |
Other securities | | | | | | | 5,371,942 | |
| | | | | | | | |
| | | | | | | 10,371,942 | |
|
Minnesota — 1.4% | |
Minnesota Rural Water Finance Authority, Inc.: | | | | | | | | |
1.050%, 3/1/2019 (8) | | | 1,350,000 | | | | 1,350,203 | |
2.000%, 10/1/2017 | | | 3,000,000 | | | | 3,002,490 | |
Other securities | | | | | | | 4,666,399 | |
| | | | | | | | |
| | | | | | | 9,019,092 | |
|
Mississippi — 1.7% | |
Mississippi Business Finance Corp., 1.150%, 5/1/2037, Call 11/1/2017 (12) | | | 6,662,000 | | | | 6,662,666 | |
Other securities | | | | | | | 4,431,621 | |
| | | | | | | | |
| | | | | | | 11,094,287 | |
|
Missouri — 1.3% | |
City of Kansas City, 0.810%, 4/15/2034, Call 9/1/2017 (12) | | | 5,000,000 | | | | 5,000,000 | |
Other securities | | | | | | | 3,588,420 | |
| | | | | | | | |
| | | | | | | 8,588,420 | |
|
Nebraska — 0.4% | |
Other securities | | | | | | | 2,558,245 | |
|
Nevada — 0.1% | |
Other securities | | | | | | | 555,616 | |
|
New Jersey — 5.2% | |
New Jersey Economic Development Authority: | | | | | | | | |
1.080%, 11/1/2040, Call 9/1/2017 (12) | | | 5,770,000 | | | | 5,770,000 | |
1.080%, 11/1/2040, Call 9/1/2017 (12) | | | 4,700,000 | | | | 4,700,000 | |
1.090%, 11/1/2031, Call 9/1/2017 (12) | | | 5,395,000 | | | | 5,395,000 | |
New Jersey Transportation Trust Fund Authority: | | | | | | | | |
1.790% (SIFMA Municipal Swap Index Yield+100 basis points), 12/15/2019, Call 6/15/2019 (7) | | | 5,000,000 | | | | 4,940,650 | |
5.000%, 12/15/2017 | | | 1,200,000 | | | | 1,213,368 | |
5.000%, 6/15/2019 | | | 1,500,000 | | | | 1,576,425 | |
Tender Option Bond Trust Receipts/Certificates, 0.850%, 1/1/2043, Call 7/1/2022 (6)(12) | | | 5,000,000 | | | | 5,000,000 | |
Other securities | | | | | | | 5,756,867 | |
| | | | | | | | |
| | | | | | | 34,352,310 | |
|
New Mexico — 1.2% | |
New Mexico Municipal Energy Acquisition Authority, 1.575% (LIBOR 1 Month+75 basis points), 8/1/2019, Call 2/1/2019 (7) | | | 5,500,000 | | | | 5,500,825 | |
Other securities | | | | | | | 2,789,486 | |
| | | | | | | | |
| | | | | | | 8,290,311 | |
(See Notes which are an integral part of the Financial Statements)
77
August 31, 2017
Ultra Short Tax-Free Fund* (continued)
| | | | | | | | |
| Description | | Principal
Amount | | | Value | |
| Municipals (continued) | |
|
New York — 8.6% | |
Metropolitan Transportation Authority, AGM, 1.450% (LIBOR 1 Month+60 basis points), 5/15/2018, Call 11/15/2017 (7) | | $ | 4,650,000 | | | $ | 4,653,023 | |
New York City Transitional Finance Authority: | | | | | | | | |
0.920%, 8/1/2022, Call 9/1/2017 (12) | | | 4,320,000 | | | | 4,320,000 | |
0.920%, 8/1/2023, Call 9/1/2017 (12) | | | 6,550,000 | | | | 6,550,000 | |
New York State Energy Research & Development Authority, NATL-RE, 1.365%, 12/1/2020,
Call 9/6/2017 (12)(13) | | | 7,350,000 | | | | 7,101,791 | |
Triborough Bridge & Tunnel Authority: | | | | | | | | |
0.860%, 11/1/2032, Call 9/1/2017 (12) | | | 150,000 | | | | 150,000 | |
1.525% (LIBOR 1 Month+70 basis points), 2/1/2021 (7) | | | 5,000,000 | | | | 5,050,600 | |
Other securities | | | | | | | 29,120,629 | |
| | | | | | | | |
| | | | | | | 56,946,043 | |
|
North Carolina — 0.3% | |
Other securities | | | | | | | 1,925,194 | |
|
North Dakota — 0.5% | |
Other securities | | | | | | | 3,141,068 | |
|
Ohio — 5.9% | |
County of Allen, 0.800%, 5/1/2036, Call 9/1/2017 (12) | | | 6,000,000 | | | | 6,000,000 | |
County of Crawford, 1.430%, 11/1/2017, Call 10/2/2017 | | | 5,000,000 | | | | 5,001,850 | |
Lancaster Port Authority, 1.545% (LIBOR 1 Month+72 basis points), 8/1/2019, Call 2/1/2019 (7) | | | 5,000,000 | | | | 5,003,050 | |
Rib Floater Trust Various States, 0.970%, 1/15/2046, Call 10/2/2017 (6)(12) | | | 4,000,000 | | | | 4,000,000 | |
State of Ohio: | | | | | | | | |
0.870%, 1/15/2045, Call 9/1/2017 (12) | | | 5,500,000 | | | | 5,500,000 | |
0.950%, 1/15/2045, Call 9/1/2017 (12) | | | 5,000,000 | | | | 5,000,000 | |
Other securities | | | | | | | 8,618,924 | |
| | | | | | | | |
| | | | | | | 39,123,824 | |
|
Oklahoma — 0.2% | |
Other securities | | | | | | | 1,150,076 | |
|
Oregon — 0.6% | |
Other securities | | | | | | | 4,215,730 | |
| | | | | | | | |
| Description | | Principal
Amount | | | Value | |
| Municipals (continued) | |
|
Pennsylvania — 4.6% | |
Pennsylvania Turnpike Commission: | | | | | | | | |
1.390% (SIFMA Municipal Swap Index Yield+60 basis points), 12/1/2017, Call 10/2/2017 (7) | | $ | 100,000 | | | $ | 100,034 | |
1.470% (SIFMA Municipal Swap Index Yield+68 basis points), 12/1/2018, Call 6/1/2018 (7) | | | 6,000,000 | | | | 6,012,840 | |
1.940% (SIFMA Municipal Swap Index Yield+115 basis points), 12/1/2019, Call 6/1/2019 (7) | | | 2,225,000 | | | | 2,248,118 | |
Other securities | | | | | | | 21,975,720 | |
| | | | | | | | |
| | | | | | | 30,336,712 | |
|
Rhode Island — 0.1% | |
Other securities | | | | | | | 1,023,340 | |
|
South Carolina — 0.8% | |
Other securities | | | | | | | 5,057,640 | |
|
Tennessee — 2.2% | |
Tender Option Bond Trust Receipts/Certificates, 0.940%, 7/1/2046, Call 7/1/2026 (6)(12) | | | 5,000,000 | | | | 5,000,000 | |
Other securities | | | | | | | 9,852,067 | |
| | | | | | | | |
| | | | | | | 14,852,067 | |
|
Texas — 8.8% | |
Alamito Public Facility Corp., 1.000%, 10/1/2017, Call 9/21/2017 (12) | | | 5,590,000 | | | | 5,589,609 | |
Harris County Cultural Education Facilities Finance Corp., 0.880%, 12/1/2024, Call 9/1/2017 (12) | | | 8,000,000 | | | | 8,000,000 | |
Spring Branch Independent School District, PSF, 3.000%, 6/18/2019 (12) | | | 4,000,000 | | | | 4,138,120 | |
Tender Option Bond Trust Receipts/Certificates, 0.990%, 7/1/2021 (6)(12) | | | 11,950,000 | | | | 11,950,000 | |
Other securities | | | | | | | 28,173,631 | |
| | | | | | | | |
| | | | | | | 57,851,360 | |
|
Utah — 0.4% | |
Tender Option Bond Trust Receipts/Certificates, 0.990%, 1/1/2025 (6)(12) | | | 2,500,000 | | | | 2,500,000 | |
|
Virginia — 0.9% | |
Other securities | | | | | | | 5,719,651 | |
|
Washington — 2.9% | |
Tender Option Bond Trust Receipts/Certificates: | | | | | | | | |
0.940%, 6/15/2033, Call 6/1/2019 (6)(12) | | | 5,050,000 | | | | 5,050,000 | |
0.960%, 1/1/2035 (6)(12) | | | 5,000,000 | | | | 5,000,000 | |
Washington State Housing Finance Commission, 0.810%, 9/1/2049, Call 9/1/2017 (12) | | | 5,000,000 | | | | 5,000,000 | |
Other securities | | | | | | | 4,022,633 | |
| | | | | | | | |
| | | | | | | 19,072,633 | |
(See Notes which are an integral part of the Financial Statements)
78
Ultra Short Tax-Free Fund* (continued)
| | | | | | | | |
| Description | | Principal
Amount | | | Value | |
| Municipals (continued) | |
|
West Virginia — 0.0% | |
Other securities | | | | | | $ | 50,000 | |
|
Wisconsin — 2.4% | |
Wisconsin Housing & Economic Development Authority, 0.800%, 5/1/2055, Call 9/1/2017 (12) | | $ | 5,000,000 | | | | 5,000,000 | |
Other securities | | | | | | | 11,161,871 | |
| | | | | | | | |
| | | | | | | 16,161,871 | |
|
Wyoming — 0.7% | |
County of Converse, 0.880%, 12/1/2020, Call 9/1/2017 (12) | | | 5,000,000 | | | | 5,000,000 | |
| | | | | | | | |
Total Municipals
(identified cost $633,869,349) | | | | 634,462,688 | |
| | | | | | | | |
| Short-Term Investments — 7.2% | |
|
| Mutual Funds — 0.0% | |
Other securities (4) | | | | | | | 80,322 | |
| | | | | | | | |
| Short-Term Municipals — 7.2% | |
|
California — 0.2% | |
Other securities | | | | | | | 1,121,333 | |
|
Colorado — 0.1% | |
Other securities | | | | | | | 512,740 | |
|
Connecticut — 1.2% | |
Other securities | | | | | | | 7,936,090 | |
|
Florida — 0.6% | |
Other securities | | | | | | | 4,000,000 | |
|
Georgia — 0.2% | |
Other securities | | | | | | | 1,030,900 | |
|
Illinois — 0.0% | |
Other securities | | | | | | | 176,048 | |
|
Minnesota — 0.1% | |
Other securities | | | | | | | 657,833 | |
|
New Jersey — 0.3% | |
Other securities | | | | | | | 2,015,140 | |
|
New York — 0.6% | |
Other securities | | | | | | | 4,000,760 | |
|
Ohio — 1.9% | |
Other securities | | | | | | | 12,609,376 | |
|
Texas — 2.0% | |
State of Texas, 4.000%, 8/30/2018 (8) | | | 10,000,000 | | | | 10,305,000 | |
Other securities | | | | | | | 3,202,458 | |
| | | | | | | | |
| | | | | | | 13,507,458 | |
| | | | | | | | |
Total Short-Term Municipals | | | | 47,567,678 | |
| | | | | | | | |
Total Short-Term Investments
(identified cost $47,633,316) | | | | 47,648,000 | |
| | | | | | | | |
Total Investments — 103.3%
(identified cost $681,502,665) | | | | 682,110,688 | |
| Other Assets and Liabilities — (3.3)% | | | | (21,723,398 | ) |
| | | | | | | | |
| Total Net Assets — 100.0% | | | $ | 660,387,290 | |
| | | | | | | | |
Short Tax-Free Fund*
| | | | | | | | |
| Description | | Principal
Amount | | | Value | |
| Municipals — 94.4% | | | | | | |
|
Alabama — 2.8% | |
Alabama Federal Aid Highway Finance Authority, 5.000%, 9/1/2018 | | $ | 1,000,000 | | | $ | 1,034,430 | |
Black Belt Energy Gas District, 4.000%, 6/1/2021, Call 3/1/2021 (12) | | | 1,000,000 | | | | 1,085,910 | |
County of Jefferson, 5.000%, 9/15/2021 | | | 1,000,000 | | | | 1,139,990 | |
Other securities | | | | | | | 1,896,799 | |
| | | | | | | | |
| | | | | | | 5,157,129 | |
|
Alaska — 0.4% | |
Other securities | | | | | | | 660,611 | |
|
Arizona — 2.3% | |
Other securities | | | | | | | 4,292,562 | |
|
Arkansas — 0.7% | |
Other securities | | | | | | | 1,312,872 | |
|
California — 10.1% | |
California Municipal Finance Authority, 5.000%, 2/1/2022 | | | 1,000,000 | | | | 1,144,430 | |
California Statewide Communities Development Authority: | | | | | | | | |
3.500%, 11/1/2018 | | | 100,000 | | | | 100,634 | |
5.000%, 12/1/2025 (6) | | | 200,000 | | | | 234,080 | |
California Statewide Communities Development Authority, AGM, 3.000%, 10/1/2017 | | | 200,000 | | | | 200,226 | |
California Statewide Communities Development Authority, CMI, 3.500%, 11/1/2021, Call 11/1/2019 | | | 750,000 | | | | 782,790 | |
Golden State Tobacco Securitization Corp., 5.000%, 6/1/2022 | | | 1,000,000 | | | | 1,161,400 | |
Northern California Gas Authority No. 1, 1.500% (LIBOR 3 Month+63 basis points), 7/1/2019 (7) | | | 1,040,000 | | | | 1,039,303 | |
Tender Option Bond Trust, 0.940%, 8/1/2022 (6)(12) | | | 2,000,000 | | | | 2,000,000 | |
Other securities | | | | | | | 11,696,058 | |
| | | | | | | | |
| | | | | | | 18,358,921 | |
| | |
Colorado — 5.0% | | | | | | | | |
Colorado Educational & Cultural Facilities Authority: | | | | | | | | |
2.500%, 12/15/2019 (6) | | | 590,000 | | | | 591,811 | |
3.000%, 10/1/2017 | | | 380,000 | | | | 380,608 | |
3.000%, 11/15/2017 | | | 200,000 | | | | 200,972 | |
5.000%, 10/1/2021 | | | 1,000,000 | | | | 1,129,210 | |
Colorado Health Facilities Authority: | | | | | | | | |
1.450%, 7/1/2034, Call 7/1/2019 (6)(12) | | | 1,000,000 | | | | 1,000,000 | |
4.000%, 12/1/2018 | | | 250,000 | | | | 257,870 | |
4.500%, 2/1/2019 | | | 250,000 | | | | 258,988 | |
5.000%, 5/15/2021 | | | 325,000 | | | | 356,843 | |
5.000%, 6/1/2021 (8) | | | 250,000 | | | | 279,605 | |
5.000%, 5/15/2022 | | | 250,000 | | | | 277,965 | |
5.000%, 6/1/2022 (8) | | | 250,000 | | | | 285,245 | |
El Paso County School District No. 20 Academy, SAW, 5.000%, 12/15/2022 | | | 1,000,000 | | | | 1,191,960 | |
Other securities | | | | | | | 2,989,442 | |
| | | | | | | | |
| | | | | | | 9,200,519 | |
(See Notes which are an integral part of the Financial Statements)
79
August 31, 2017
Short Tax-Free Fund* (continued)
| | | | | | | | |
| Description | | Principal
Amount | | | Value | |
| Municipals (continued) | | | | | | |
| | |
Connecticut — 0.7% | | | | | | | | |
State of Connecticut: | | | | | | | | |
1.670% (SIFMA Municipal Swap Index Yield+88 basis points), 8/15/2018 (7) | | $ | 250,000 | | | $ | 250,890 | |
1.710% (SIFMA Municipal Swap Index Yield+92 basis points), 5/15/2018 (7) | | | 150,000 | | | | 150,710 | |
1.710% (SIFMA Municipal Swap Index Yield+92 basis points), 9/15/2019 (7) | | | 115,000 | | | | 115,619 | |
5.000%, 3/15/2021 | | | 500,000 | | | | 556,585 | |
Other securities | | | | | | | 250,052 | |
| | | | | | | | |
| | | | | | | 1,323,856 | |
| | |
Delaware — 0.1% | | | | | | | | |
Other securities | | | | | | | 106,335 | |
|
Florida — 5.8% | |
Columbia County School Board: | | | | | | | | |
5.000%, 7/1/2019 | | | 920,000 | | | | 983,922 | |
5.000%, 7/1/2021 | | | 400,000 | | | | 448,920 | |
Miami-Dade County School Board Foundation, Inc.: | | | | | | | | |
5.000%, 5/1/2018 | | | 300,000 | | | | 308,025 | |
5.000%, 5/1/2019 | | | 225,000 | | | | 239,674 | |
Miami-Dade County School Board Foundation, Inc., AMBAC, 5.000%, 8/1/2023, Call 8/1/2018 | | | 100,000 | | | | 103,493 | |
School Board of Miami-Dade County, 1.020%, 9/7/2017 (6)(12) | | | 650,000 | | | | 650,000 | |
School District of Broward County, 5.000%, 7/1/2019 | | | 1,000,000 | | | | 1,073,250 | |
Other securities | | | | | | | 6,841,601 | |
| | | | | | | | |
| | | | | | | 10,648,885 | |
|
Georgia — 3.6% | |
City of Atlanta: | | | | | | | | |
5.000%, 1/1/2021 | | | 250,000 | | | | 279,088 | |
5.000%, 1/1/2022 | | | 700,000 | | | | 801,136 | |
Gainesville & Hall County Hospital Authority: | | | | | | | | |
1.740% (SIFMA Municipal Swap Index Yield+95 basis points), 2/18/2020, Call 8/22/2019 (7) | | | 350,000 | | | | 348,988 | |
5.000%, 2/15/2021 | | | 700,000 | | | | 784,378 | |
Georgia State Road & Tollway Authority, 5.000%, 6/1/2021 | | | 1,250,000 | | | | 1,424,487 | |
Main Street Natural Gas, Inc.: | | | | | | | | |
5.000%, 3/15/2019 | | | 1,000,000 | | | | 1,053,660 | |
5.250%, 9/15/2018 | | | 100,000 | | | | 103,988 | |
Other securities | | | | | | | 1,742,102 | |
| | | | | | | | |
| | | | | | | 6,537,827 | |
|
Guam — 0.3% | |
Other securities | | | | | | | 574,580 | |
|
Idaho — 0.1% | |
Other securities | | | | | | | 239,647 | |
| | | | | | | | |
| Description | | Principal
Amount | | | Value | |
| Municipals (continued) | | | | | | |
| | |
Illinois — 13.1% | | | | | | | | |
City of Chicago: | | | | | | | | |
5.000%, 1/1/2021 | | $ | 840,000 | | | $ | 929,082 | |
5.000%, 11/1/2021 | | | 1,000,000 | | | | 1,127,900 | |
5.000%, 1/1/2022 | | | 500,000 | | | | 565,080 | |
Cook Kane Lake & McHenry Counties Community College District No. 512, 5.000%, 12/1/2019 | | | 1,000,000 | | | | 1,085,660 | |
County of Cook: | | | | | | | | |
5.000%, 11/15/2020, Call 11/15/2019 | | | 250,000 | | | | 266,385 | |
5.000%, 11/15/2021 | | | 720,000 | | | | 805,795 | |
Illinois Finance Authority: | | | | | | | | |
2.212% (LIBOR 1 Month+135 basis points), 5/1/2021, Call 11/1/2020 (7) | | | 1,000,000 | | | | 1,007,440 | |
2.500%, 5/15/2018 | | | 150,000 | | | | 150,664 | |
4.000%, 10/1/2018 | | | 275,000 | | | | 281,229 | |
5.000%, 1/1/2021 | | | 200,000 | | | | 219,916 | |
5.000%, 11/15/2021 | | | 400,000 | | | | 455,788 | |
5.000%, 1/1/2022 | | | 150,000 | | | | 168,396 | |
5.000%, 11/15/2022 | | | 555,000 | | | | 646,231 | |
5.000%, 11/15/2022 | | | 500,000 | | | | 582,190 | |
Kane McHenry Cook & De Kalb Counties Unit School District No. 300, 5.000%, 1/1/2023 | | | 1,000,000 | | | | 1,169,360 | |
Rib Floater Trust Various States, 1.040%, 4/1/2036, Call 4/1/2027 (6)(12) | | | 1,710,000 | | | | 1,710,000 | |
State of Illinois: | | | | | | | | |
5.000%, 1/1/2018 | | | 1,000,000 | | | | 1,010,270 | |
5.000%, 4/1/2020 | | | 100,000 | | | | 106,208 | |
5.000%, 2/1/2021 | | | 240,000 | | | | 258,554 | |
Will & Kankakee Counties School District No. 255, 4.000%, 6/1/2019 | | | 1,110,000 | | | | 1,163,613 | |
Other securities | | | | | | | 10,288,780 | |
| | | | | | | | |
| | | | | | | 23,998,541 | |
|
Indiana — 2.3% | |
Other securities | | | | | | | 4,160,934 | |
|
Iowa — 1.1% | |
Other securities | | | | | | | 2,003,660 | |
|
Kansas — 0.4% | |
Other securities | | | | | | | 775,814 | |
|
Kentucky — 1.1% | |
Other securities | | | | | | | 2,034,131 | |
|
Louisiana — 0.6% | |
Other securities | | | | | | | 1,083,273 | |
|
Maine — 0.1% | |
Other securities | | | | | | | 253,494 | |
|
Maryland — 0.5% | |
Other securities | | | | | | | 914,220 | |
|
Massachusetts — 1.2% | |
Massachusetts Development Finance Agency: | | | | | | | | |
4.000%, 4/15/2020 | | | 330,000 | | | | 348,325 | |
5.000%, 7/1/2021 | | | 280,000 | | | | 315,241 | |
5.000%, 7/1/2022 | | | 315,000 | | | | 362,426 | |
Other securities | | | | | | | 1,099,349 | |
| | | | | | | | |
| | | | | | | 2,125,341 | |
(See Notes which are an integral part of the Financial Statements)
80
Short Tax-Free Fund* (continued)
| | | | | | | | |
| Description | | Principal
Amount | | | Value | |
| Municipals (continued) | | | | | | |
| | |
Michigan — 2.1% | | | | | | | | |
Other securities | | | | | | $ | 3,925,008 | |
|
Minnesota — 0.7% | |
St. Paul Housing & Redevelopment Authority: | | | | | | | | |
5.000%, 11/15/2021 | | $ | 500,000 | | | | 574,780 | |
5.000%, 11/15/2022 | | | 500,000 | | | | 587,355 | |
St. Paul Housing & Redevelopment Authority, NATL-RE, 5.000%, 11/15/2021, Call 11/15/2017 | | | 50,000 | | | | 50,401 | |
Other securities | | | | | | | 110,616 | |
| | | | | | | | |
| | | | | | | 1,323,152 | |
|
Mississippi — 0.2% | |
Other securities | | | | | | | 441,808 | |
|
Missouri — 2.8% | |
Southeast Missouri State University, 5.000%, 4/1/2019 | | | 1,000,000 | | | | 1,060,830 | |
Other securities | | | | | | | 4,007,769 | |
| | | | | | | | |
| | | | | | | 5,068,599 | |
|
Nebraska — 0.1% | |
Other securities | | | | | | | 159,886 | |
|
Nevada — 0.1% | |
Other securities | | | | | | | 165,198 | |
|
New Hampshire — 0.1% | |
Other securities | | | | | | | 250,795 | |
|
New Jersey — 3.1% | |
New Jersey Health Care Facilities Financing Authority: | | | | | | | | |
5.000%, 7/1/2022 | | | 790,000 | | | | 920,073 | |
5.125%, 7/1/2019, Call 7/1/2018 | | | 130,000 | | | | 134,462 | |
Other securities | | | | | | | 4,653,667 | |
| | | | | | | | |
| | | | | | | 5,708,202 | |
|
New Mexico — 1.6% | |
City of Farmington, 1.875%, 4/1/2020 (12) | | | 1,000,000 | | | | 1,016,260 | |
Other securities | | | | | | | 1,831,119 | |
| | | | | | | | |
| | | | | | | 2,847,379 | |
|
New York — 9.2% | |
County of Nassau, 5.000%, 10/1/2018 | | | 1,000,000 | | | | 1,044,190 | |
New York City Transitional Finance Authority: | | | | | | | | |
0.850%, 11/1/2029, Call 9/1/2017 (12) | | | 1,200,000 | | | | 1,200,000 | |
0.920%, 8/1/2022, Call 9/1/2017 (12) | | | 1,250,000 | | | | 1,250,000 | |
New York State Dormitory Authority, 5.000%, 7/1/2018 | | | 1,000,000 | | | | 1,034,140 | |
New York State Thruway Authority, 5.000%, 5/1/2019 | | | 1,000,000 | | | | 1,066,420 | |
TSASC, Inc., 5.000%, 6/1/2021 | | | 1,000,000 | | | | 1,118,170 | |
Westchester Tobacco Asset Securitization, 5.000%, 6/1/2020 | | | 1,155,000 | | | | 1,260,013 | |
Other securities | | | | | | | 8,841,208 | |
| | | | | | | | |
| | | | | | | 16,814,141 | |
| | | | | | | | |
| Description | | Principal
Amount | | | Value | |
| Municipals (continued) | | | | | | |
| | |
North Carolina — 0.6% | | | | | | | | |
Other securities | | | | | | $ | 1,123,703 | |
| | |
North Dakota — 0.2% | | | | | | | | |
Other securities | | | | | | | 385,692 | |
|
Ohio — 2.8% | |
Rib Floater Trust Various States, 0.970%, 1/15/2046, Call 10/2/2017 (6)(12) | | $ | 1,000,000 | | | | 1,000,000 | |
Other securities | | | | | | | 4,102,924 | |
| | | | | | | | |
| | | | | | | 5,102,924 | |
|
Oklahoma — 0.1% | |
Other securities | | | | | | | 135,100 | |
|
Oregon — 0.5% | |
Other securities | | | | | | | 1,000,000 | |
|
Pennsylvania — 3.8% | |
Other securities | | | | | | | 6,924,022 | |
|
Rhode Island — 0.5% | |
Other securities | | | | | | | 848,875 | |
|
South Carolina — 0.6% | |
Newberry Investing in Children’s Education, 5.000%, 12/1/2019 | | | 1,000,000 | | | | 1,083,340 | |
|
Tennessee — 0.3% | |
Other securities | | | | | | | 484,975 | |
|
Texas — 6.5% | |
Lower Colorado River Authority, 5.000%, 5/15/2019 | | | 1,000,000 | | | | 1,068,490 | |
New Hope Cultural Education Facilities Finance Corp.: | | | | | | | | |
4.000%, 11/15/2021 | | | 615,000 | | | | 644,059 | |
5.000%, 11/1/2022 | | | 500,000 | | | | 578,390 | |
Tarrant County Cultural Education Facilities Finance Corp.: | | | | | | | | |
5.000%, 5/15/2021 | | | 500,000 | | | | 542,880 | |
5.000%, 11/15/2022 | | | 1,000,000 | | | | 1,164,380 | |
Other securities | | | | | | | 7,857,990 | |
| | | | | | | | |
| | | | | | | 11,856,189 | |
|
Utah — 0.3% | |
Other securities | | | | | | | 493,082 | |
|
Vermont — 0.2% | |
Other securities | | | | | | | 364,823 | |
|
Virgin Islands — 0.1% | |
Other securities | | | | | | | 98,775 | |
|
Virginia — 0.7% | |
Henrico County Economic Development Authority, AGM, 2.156%, 8/23/2027, Call 9/1/2017 (12)(13) | | | 1,250,000 | | | | 1,192,784 | |
|
Washington — 1.2% | |
State of Washington, 5.000%, 2/1/2022 | | | 1,000,000 | | | | 1,166,220 | |
Other securities | | | | | | | 937,309 | |
| | | | | | | | |
| | | | | | | 2,103,529 | |
|
West Virginia — 0.7% | |
West Virginia Commissioner, 5.000%, 9/1/2018 | | | 1,250,000 | | | | 1,298,312 | |
(See Notes which are an integral part of the Financial Statements)
81
August 31, 2017
Short Tax-Free Fund* (continued)
| | | | | | | | |
| Description | | Principal
Amount | | | Value | |
| Municipals (continued) | | | | | | |
| | |
Wisconsin — 3.0% | | | | | | | | |
Public Finance Authority: | | | | | | | | |
5.000%, 11/15/2021 (8) | | $ | 610,000 | | | $ | 692,948 | |
5.000%, 11/15/2022 (8) | | | 500,000 | | | | 579,490 | |
Other securities | | | | | | | 4,254,354 | |
| | | | | | | | |
| | | | | | | 5,526,792 | |
| | | | | | | | |
Total Municipals
(identified cost $170,882,303) | | | | 172,490,237 | |
| | | | | | | | |
| Mutual Funds — 0.5% | |
Other securities (4) | | | | | | | 866,132 | |
| | | | | | | | |
Total Mutual Funds
(identified cost $866,956) | | | | | | | 866,132 | |
|
| Short-Term Investments — 1.0% | |
|
| Mutual Funds — 0.1% | |
Other securities (4) | | | | | | | 115,488 | |
|
| Short-Term Municipals — 0.9% | |
|
Connecticut — 0.4% | |
Other securities | | | | | | | 705,810 | |
|
Ohio — 0.5% | |
Other securities | | | | | | | 1,002,240 | |
| | | | | | | | |
Total Short-Term Municipals | | | | 1,708,050 | |
| | | | | | | | |
Total Short-Term Investments
(identified cost $1,823,132) | | | | 1,823,538 | |
| | | | | | | | |
Total Investments — 95.9%
(identified cost $173,572,391) | | | | 175,179,907 | |
| Other Assets and Liabilities — 4.1% | | | | 7,440,509 | |
| | | | | | | | |
| Total Net Assets — 100.0% | | | $ | 182,620,416 | |
| | | | | | | | |
Short-Term Income Fund
| | | | | | | | |
| Description | | Principal
Amount | | | Value | |
| Asset-Backed Securities — 21.6% | |
| | |
Automobiles — 6.0% | | | | | | | | |
AmeriCredit Auto Receivables Trust, Class B, (Series 2014-4), 1.870%, 12/9/2019 | | $ | 500,000 | | | $ | 500,463 | |
CarMax Auto Owner Trust: | | | | | | | | |
Class A3, (Series 2015-4), 1.560%, 11/16/2020 | | | 650,000 | | | | 650,053 | |
Class A3, (Series 2016-2), 1.520%, 2/16/2021 | | | 420,000 | | | | 419,451 | |
CPS Auto Receivables Trust, Class A, (Series 2013-A), 1.310%, 6/15/2020 (6) | | | 206,429 | | | | 206,022 | |
GM Financial Automobile Leasing Trust, Class A3, (Series 2017-2), 2.020%, 9/21/2020 | | | 1,000,000 | | | | 1,004,685 | |
GM Financial Consumer Automobile, Class C, (Series 2017-1A), 2.450%, 7/17/2023 (6) | | | 1,000,000 | | | | 1,006,093 | |
GM Financial Leasing Trust, Class A3, (Series 2017-1), 2.060%, 5/20/2020 | | | 1,000,000 | | | | 1,005,566 | |
Mercedes-Benz Auto Lease Trust, Class A3, (Series 2017-A), 1.790%, 4/15/2020 | | | 2,400,000 | | | | 2,404,644 | |
| | | | | | | | |
| Description | | Principal
Amount | | | Value | |
| Asset-Backed Securities (continued) | |
| | |
Automobiles (continued) | | | | | | | | |
Nissan Auto Receivables Owner Trust, Class A3, (Series 2017-B), 1.750%, 10/15/2021 | | $ | 2,000,000 | | | $ | 2,004,248 | |
Santander Drive Auto Receivables Trust: | | | | | | | | |
Class C, (Series 2013-A), 3.120%, 10/15/2019 (6) | | | 237,799 | | | | 238,294 | |
Class D, (Series 2014-1), 2.910%, 4/15/2020 | | | 1,431,000 | | | | 1,442,976 | |
Class D, (Series 2015-2), 3.020%, 4/15/2021 | | | 760,000 | | | | 769,764 | |
Toyota Auto Receivables, Class A3, (Series 2016-C), 1.140%, 8/17/2020 | | | 880,000 | | | | 875,860 | |
World Omni Auto Receivables Trust: | | | | | | | | |
Class A3, (Series 2015-B), 1.490%, 12/15/2020 | | | 1,603,000 | | | | 1,602,692 | |
Class A3, (Series 2017-B), 1.950%, 2/15/2023 | | | 450,000 | | | | 451,910 | |
| | | | | | | | |
| | | | | | | 14,582,721 | |
|
Credit Cards — 5.8% | |
Cabela’s Credit Card Master Trust: | | | | | | | | |
Class A, (Series 2014-2), 1.677% (LIBOR 1 Month+45 basis points), 7/15/2022 (7) | | | 1,000,000 | | | | 1,004,504 | |
Class A1, (Series 2015-1A), 2.260%, 3/15/2023 | | | 1,000,000 | | | | 1,009,578 | |
Class A1, (Series 2015-2), 2.250%, 7/17/2023 | | | 2,208,000 | | | | 2,231,286 | |
Chase Issuance Trust: | | | | | | | | |
Class A4, (Series 2016-A4), 1.490%, 7/15/2022 | | | 2,500,000 | | | | 2,482,202 | |
Class A5, (Series 2016-A5), 1.270%, 7/15/2021 | | | 2,000,000 | | | | 1,989,188 | |
Discover Card Execution Note Trust, Class A1, (Series 2016-A1), 1.640%, 7/15/2021 | | | 1,725,000 | | | | 1,727,881 | |
Synchrony Credit Card Master Trust, Class B, (Series 2012-7), 2.210%, 9/15/2022 | | | 1,285,000 | | | | 1,290,382 | |
World Financial Network Credit Card Master Trust: | | | | | | | | |
Class A, (Series 2015-B), 2.550%, 6/17/2024 | | | 365,000 | | | | 370,580 | |
Class A, (Series 2016-A), 2.030%, 4/15/2025 | | | 2,000,000 | | | | 1,995,120 | |
| | | | | | | | |
| | | | | | | 14,100,721 | |
|
Other Financial — 9.1% | |
Ally Master Owner Trust, Class A, (Series 2012-5), 1.540%, 9/15/2019 | | | 1,000,000 | | | | 999,964 | |
Colony American Homes, Class A, (Series 2014-2A), 2.177% (LIBOR 1 Month+95 basis points), 7/17/2031 (6)(7) | | | 1,517,577 | | | | 1,520,927 | |
Consumers Securitization Funding LLC, Class A1, (Series 2014-A), 1.334%, 11/1/2020 | | | 1,564,218 | | | | 1,559,015 | |
Dell Equipment Finance Trust, Class A3, (Series 2017-1), 2.140%, 4/22/2022 (6) | | | 1,300,000 | | | | 1,307,250 | |
(See Notes which are an integral part of the Financial Statements)
82
Short-Term Income Fund (continued)
| | | | | | | | |
| Description | | Principal
Amount | | | Value | |
| Asset-Backed Securities (continued) | |
|
Other Financial (continued) | |
Ford Credit Floorplan Master Owner Trust: | | | | | | | | |
Class A1, (Series 2016-3), 1.550%, 7/15/2021 | | $ | 2,000,000 | | | $ | 1,995,080 | |
Class A1, (Series 2016-5), 1.950%, 11/15/2021 | | | 1,000,000 | | | | 1,004,800 | |
GMF Floorplan Owner Revolving Trust: | | | | | | | | |
Class��A1, (Series 2015-1), 1.650%, 5/15/2020 (6) | | | 1,000,000 | | | | 1,000,653 | |
Class C, (Series 2015-1), 2.220%, 5/15/2020 (6) | | | 1,170,000 | | | | 1,171,012 | |
Hilton Grand Vacations Trust, Class A, (Series 2014-AA), 1.770%, 11/25/2026 (6) | | | 725,753 | | | | 719,308 | |
Sierra Receivables Funding Co. LLC, Class B, (Series 2017-1A), 3.200%, 3/20/2034 (6) | | | 2,007,904 | | | | 2,032,860 | |
SLM Student Loan Trust, Class A5, (Series 2004-5A), 1.914% (LIBOR 3 Month+60 basis points), 10/25/2023 (6)(7) | | | 379,847 | | | | 380,491 | |
Trafigura Securitisation Finance PLC, Class A1, (Series 2017-1A), 2.077% (LIBOR 1 Month+85 basis points), 12/15/2020 (6)(7) | | | 3,000,000 | | | | 3,012,783 | |
Verizon Owner Trust, Class A, (Series 2016-1A), 1.420%, 1/20/2021 (6) | | | 1,250,000 | | | | 1,247,685 | |
Westgate Resorts LLC: | | | | | | | | |
Class A, (Series 2015-2A), 3.200%, 7/20/2028 (6) | | | 2,900,716 | | | | 2,919,237 | |
Class B, (Series 2014-1A), 3.250%, 12/20/2026 (6) | | | 1,213,823 | | | | 1,217,796 | |
| | | | | | | | |
| | | | | | | 22,088,861 | |
|
Private Sponsor — 0.7% | |
JP Morgan Mortgage Trust, Class 1A5, (Series 2017-3), 3.500%, 8/25/2047 (6)(12) | | | 1,500,000 | | | | 1,546,369 | |
| | | | | | | | |
Total Asset-Backed Securities
(identified cost $52,183,886) | | | | 52,318,672 | |
| | | | | | | | |
| Collateralized Mortgage Obligations — 3.0% | |
|
Federal National Mortgage Association — 1.6% | |
3.000%, 6/25/2033, (Series 2014-20) | | | 2,115,093 | | | | 2,172,391 | |
3.000%, 8/25/2040, (Series 2015-15) | | | 1,668,827 | | | | 1,714,088 | |
| | | | | | | | |
| | | | | | | 3,886,479 | |
|
Federal Home Loan Mortgage Corporation — 0.6% | |
3.000%, 2/15/2031, (Series 4013) | | | 1,431,617 | | | | 1,491,809 | |
| | |
Private Sponsor — 0.8% | | | | | | | | |
Banc of America Funding Trust: | | | | | | | | |
Class 1A3, (Series 2007-C), 3.192%, 5/20/2036 (12) | | | 210,313 | | | | 193,593 | |
Class 2A1, (Series 2005-5), 5.500%, 9/25/2035 | | | 267,460 | | | | 283,226 | |
| | | | | | | | |
| Description | | Principal
Amount | | | Value | |
| Collateralized Mortgage Obligations (continued) | |
| | |
Private Sponsor (continued) | | | | | | | | |
Chase Mortgage Finance Trust: | | | | | | | | |
Class A1, (Series 2005-S2), 5.500%, 10/25/2035 | | $ | 202,200 | | | $ | 209,754 | |
Class A3, (Series 2006-S4), 6.000%, 12/25/2036 | | | 233,695 | | | | 202,549 | |
JP Morgan Mortgage Trust: | | | | | | | | |
Class 2A2, (Series 2005-S3), 5.500%, 1/25/2021 | | | 133,318 | | | | 131,618 | |
Class 3A1, (Series 2007-A2), 3.139%, 4/25/2037 (12) | | | 19,070 | | | | 16,721 | |
Morgan Stanley Mortgage Loan Trust, Class 2A2, (Series 2004-10AR), 3.385%, 11/25/2034 (12) | | | 388,528 | | | | 396,351 | |
Wells Fargo Mortgage Backed Securities Trust: | | | | | | | | |
Class 2A4, (Series 2006-AR7), 3.329%, 5/25/2036 (12) | | | 159,881 | | | | 154,383 | |
Class 2A4, (Series 2006-AR8), 3.340%, 4/25/2036 (12) | | | 54,471 | | | | 55,106 | |
Class A1, (Series 2006-AR19), 3.081%, 12/25/2036 (12) | | | 314,663 | | | | 292,901 | |
| | | | | | | | |
| | | | | | | 1,936,202 | |
| | | | | | | | |
Total Collateralized Mortgage Obligations
(identified cost $7,314,441) | | | | 7,314,490 | |
| | | | | | | | |
| Commercial Mortgage Securities — 7.0% | |
|
Federal Home Loan Mortgage Corporation — 1.2% | |
3.274%, 4/25/2046, (Series 2013-K713) (6)(12) | | | 1,010,000 | | | | 1,031,007 | |
3.942%, 6/25/2047, (Series 2012-K710) (6)(12) | | | 475,000 | | | | 487,085 | |
4.301%, 9/25/2044, (Series 2012-K705) (6)(12) | | | 217,211 | | | | 221,502 | |
5.045%, 7/25/2044, (Series 2011-K703) (6)(12) | | | 1,200,000 | | | | 1,221,730 | |
| | | | | | | | |
| | | | | | | 2,961,324 | |
|
Government National Mortgage Association — 1.8% | |
1.600%, 12/16/2042, (Series 2013-2) | | | 685,932 | | | | 680,962 | |
1.800%, 7/16/2037, (Series 2013-179) | | | 1,058,557 | | | | 1,054,480 | |
2.205%, 1/16/2044, (Series 2014-61) | | | 865,888 | | | | 867,754 | |
2.650%, 2/16/2045, (Series 2015-33) | | | 1,696,135 | | | | 1,705,291 | |
| | | | | | | | |
| | | | | | | 4,308,487 | |
|
Private Sponsor — 4.0% | |
Assurant Commercial Mortgage Trust, Class A1, (Series 2016-1A), 1.362%, 5/15/2049 (6) | | | 2,146,677 | | | | 2,130,950 | |
Citigroup Commercial Mortgage Trust, Class A1, (Series 2017-P7), 2.008%, 4/14/2050 | | | 957,044 | | | | 962,086 | |
GS Mortgage Securities Trust, Class A1, (Series 2014-GC22), 1.290%, 6/10/2047 | | | 504,395 | | | | 503,026 | |
JPMBB Commercial Mortgage Securities Trust, Class A2, (Series 2013-C14), 3.019%, 8/15/2046 | | | 1,138,954 | | | | 1,155,997 | |
Morgan Stanley BAML Trust, Class A1, (Series 2016-C30), 1.389%, 9/15/2049 | | | 1,771,042 | | | | 1,754,965 | |
(See Notes which are an integral part of the Financial Statements)
83
August 31, 2017
Short-Term Income Fund (continued)
| | | | | | | | |
| Description | | Principal
Amount | | | Value | |
| Commercial Mortgage Securities (continued) | |
|
Private Sponsor (continued) | |
RAIT Trust, Class A, (Series 2017-FL7), 2.177% (LIBOR 1 Month+95 basis points), 6/15/2037 (6)(7) | | $ | 1,499,931 | | | $ | 1,501,104 | |
UBS Commercial Mortgage Trust, Class A1, (Series 2017-C3), 1.935%, 8/15/2050 | | | 1,850,000 | | | | 1,849,960 | |
| | | | | | | | |
| | | | | | | 9,858,088 | |
| | | | | | | | |
Total Commercial Mortgage Securities
(identified cost $17,188,135) | | | | 17,127,899 | |
| | | | | | | | |
| Corporate Bonds & Notes — 41.7% | |
|
Auto Manufacturers — 3.1% | |
Ford Motor Credit Co. LLC: | | | | | | | | |
2.021%, 5/3/2019 | | | 500,000 | | | | 500,002 | |
2.551%, 10/5/2018 (1) | | | 500,000 | | | | 503,529 | |
2.565% (LIBOR 3 Month+127 basis points), 3/28/2022 (7) | | | 1,000,000 | | | | 1,008,547 | |
2.943%, 1/8/2019 | | | 1,500,000 | | | | 1,519,935 | |
General Motors Financial Co., Inc.: | | | | | | | | |
2.400%, 5/9/2019 | | | 1,000,000 | | | | 1,005,110 | |
3.100%, 1/15/2019 (1) | | | 2,000,000 | | | | 2,029,154 | |
Toyota Motor Credit Corp., 1.200%, 4/6/2018 | | | 1,000,000 | | | | 998,784 | |
| | | | | | | | |
| | | | | | | 7,565,061 | |
| | |
Banks — 23.6% | | | | | | | | |
Bank of America Corp.: | | | | | | | | |
2.250%, 4/21/2020 (1) | | | 1,000,000 | | | | 1,005,876 | |
2.313% (LIBOR 3 Month+100 basis points), 4/24/2023 (1)(7) | | | 2,000,000 | | | | 2,008,400 | |
2.625%, 10/19/2020 | | | 1,000,000 | | | | 1,014,663 | |
Bank of America NA, 1.650%, 3/26/2018 (1) | | | 1,000,000 | | | | 1,000,678 | |
Bank of Nova Scotia, 1.950%, 1/15/2019 (1) | | | 2,000,000 | | | | 2,009,500 | |
Bank of the Ozarks, Inc., 5.500%, 7/1/2026 (12) | | | 1,225,000 | | | | 1,284,985 | |
Branch Banking & Trust Co., 2.100%, 1/15/2020 | | | 1,200,000 | | | | 1,209,040 | |
Canadian Imperial Bank of Commerce: | | | | | | | | |
1.492% (LIBOR 3 Month+18 basis points), 11/5/2018 (7) | | | 1,250,000 | | | | 1,249,925 | |
1.672% (LIBOR 3 Month+36 basis points), 8/8/2018 (7) | | | 1,350,000 | | | | 1,349,935 | |
1.694% (LIBOR 3 Month+39 basis points), 7/13/2018 (7) | | | 1,250,000 | | | | 1,249,944 | |
Capital One Financial Corp.: | | | | | | | | |
2.500%, 5/12/2020 | | | 900,000 | | | | 908,798 | |
3.050%, 3/9/2022 | | | 1,000,000 | | | | 1,017,721 | |
Citigroup, Inc.: | | | | | | | | |
2.274% (LIBOR 3 Month+96 basis points), 4/25/2022 (7) | | | 1,500,000 | | | | 1,511,881 | |
2.350%, 8/2/2021 (1) | | | 520,000 | | | | 519,751 | |
Customers Bancorp, Inc., 3.950%, 6/30/2022 | | | 2,000,000 | | | | 2,022,500 | |
Discover Bank, 2.600%, 11/13/2018 | | | 1,000,000 | | | | 1,008,355 | |
Eagle Bancorp, Inc., 5.000%, 8/1/2026 (12) | | | 1,900,000 | | | | 1,962,312 | |
| | | | | | | | |
| Description | | Principal
Amount | | | Value | |
| Corporate Bonds & Notes (continued) | |
| | |
Banks (continued) | | | | | | | | |
Goldman Sachs Group, Inc.: | | | | | | | | |
2.000%, 4/25/2019 (1) | | $ | 1,000,000 | | | $ | 1,001,929 | |
2.511% (LIBOR 3 Month+120 basis points), 4/30/2018 (7) | | | 1,650,000 | | | | 1,660,479 | |
2.550%, 10/23/2019 (1) | | | 1,500,000 | | | | 1,518,639 | |
Hanmi Financial Corp., 5.450%, 3/30/2027 (12) | | | 2,000,000 | | | | 2,064,574 | |
Home BancShares, Inc., 5.625%, 4/15/2027 (12) | | | 2,000,000 | | | | 2,095,000 | |
HSBC USA, Inc., 2.000%, 8/7/2018 (1) | | | 1,000,000 | | | | 1,003,836 | |
Huntington Bancshares, Inc.: | | | | | | | | |
2.300%, 1/14/2022 (1) | | | 700,000 | | | | 695,567 | |
3.150%, 3/14/2021 (1) | | | 1,000,000 | | | | 1,030,042 | |
Independent Bank Group, Inc., 5.875%, 8/1/2024 | | | 1,745,000 | | | | 1,782,029 | |
KeyCorp, 2.900%, 9/15/2020 | | | 1,000,000 | | | | 1,024,481 | |
Mizuho Bank, Ltd., 1.796% (LIBOR 3 Month+50 basis points), 9/24/2018 (7) | | | 875,000 | | | | 874,953 | |
Morgan Stanley: | | | | | | | | |
2.163% (LIBOR 3 Month+85 basis points), 1/24/2019 (7) | | | 500,000 | | | | 503,463 | |
2.487% (LIBOR 3 Month+118 basis points), 1/20/2022 (1)(7) | | | 645,000 | | | | 653,377 | |
2.500%, 1/24/2019 (1) | | | 900,000 | | | | 908,775 | |
Peapack Gladstone Financial Corp., 6.000%, 6/30/2026 (12) | | | 1,525,000 | | | | 1,581,969 | |
PNC Bank NA, 1.950%, 3/4/2019 | | | 1,000,000 | | | | 1,003,363 | |
PNC Financial Services Group, Inc., 1.562% (LIBOR 3 Month+25 basis points), 8/7/2018 (7) | | | 1,350,000 | | | | 1,352,654 | |
Renasant Corp., 5.000%, 9/1/2026 (12) | | | 1,125,000 | | | | 1,157,161 | |
Royal Bank of Canada: | | | | | | | | |
2.000%, 12/10/2018 (1) | | | 1,000,000 | | | | 1,004,365 | |
2.125%, 3/2/2020 (1) | | | 1,400,000 | | | | 1,410,021 | |
Sumitomo Mitsui Banking Corp.: | | | | | | | | |
1.691% (LIBOR 3 Month+38 basis points), 8/2/2019 (7) | | | 1,000,000 | | | | 999,905 | |
1.775% (LIBOR 3 Month+46 basis points), 5/15/2019 (7) | | | 1,300,000 | | | | 1,299,889 | |
2.053% (LIBOR 3 Month+74 basis points), 7/23/2018 (7) | | | 1,000,000 | | | | 1,005,126 | |
SunTrust Bank, 2.250%, 1/31/2020 (1) | | | 1,000,000 | | | | 1,007,136 | |
Toronto-Dominion Bank, 1.750%, 7/23/2018 (1) | | | 500,000 | | | | 500,964 | |
Towne Bank, 4.500%, 7/30/2027 (12) | | | 2,000,000 | | | | 2,057,500 | |
U.S. Bank NA, 1.467% (LIBOR 3 Month+15 basis points), 5/24/2019 (7) | | | 1,500,000 | | | | 1,500,883 | |
Wells Fargo Bank NA, 1.750%, 5/24/2019 | | | 700,000 | | | | 700,643 | |
Westpac Banking Corp.: | | | | | | | | |
1.650%, 5/13/2019 | | | 500,000 | | | | 498,687 | |
2.800%, 1/11/2022 (1) | | | 1,000,000 | | | | 1,024,787 | |
| | | | | | | | |
| | | | | | | 57,256,461 | |
|
Beverages — 0.6% | |
Anheuser-Busch InBev Finance, Inc., 1.900%, 2/1/2019 | | | 1,405,000 | | | | 1,408,907 | |
|
Biotechnology — 0.6% | |
Amgen, Inc., 2.200%, 5/22/2019 | | | 1,450,000 | | | | 1,458,839 | |
(See Notes which are an integral part of the Financial Statements)
84
Short-Term Income Fund (continued)
| | | | | | | | |
| Description | | Principal
Amount | | | Value | |
| Corporate Bonds & Notes (continued) | |
|
Chemicals — 0.3% | |
Rohm & Haas Co., 6.000%, 9/15/2017 | | $ | 588,000 | | | $ | 588,667 | |
|
Computers — 0.5% | |
Dell International LLC, 4.420%, 6/15/2021 (6) | | | 1,000,000 | | | | 1,054,626 | |
|
Cosmetics/Personal Care — 0.3% | |
Procter & Gamble Co., 2.150%, 8/11/2022 | | | 775,000 | | | | 781,459 | |
|
Diversified Financial Services — 2.2% | |
Ally Financial, Inc.: | | | | | | | | |
3.250%, 9/29/2017 | | | 500,000 | | | | 500,525 | |
3.250%, 2/13/2018 (1) | | | 1,000,000 | | | | 1,005,000 | |
American Express Credit Corp.: | | | | | | | | |
2.375%, 5/26/2020 (1) | | | 1,000,000 | | | | 1,012,415 | |
2.700%, 3/3/2022 (1) | | | 1,500,000 | | | | 1,529,946 | |
National Rural Utilities Cooperative Finance Corp., 1.500%, 11/1/2019 | | | 1,285,000 | | | | 1,278,061 | |
| | | | | | | | |
| | | | | | | 5,325,947 | |
|
Electric — 0.8% | |
Duke Energy Corp., 2.100%, 6/15/2018 (1) | | | 1,500,000 | | | | 1,504,366 | |
NextEra Energy Capital Holdings, Inc., 2.300%, 4/1/2019 | | | 500,000 | | | | 504,228 | |
| | | | | | | | |
| | | | | | | 2,008,594 | |
|
Insurance — 0.4% | |
QBE Insurance Group, Ltd., 2.400%, 5/1/2018 (6) | | | 1,000,000 | | | | 1,001,143 | |
|
Machinery-Construction & Mining — 0.4% | |
Caterpillar Financial Services Corp., 1.700%, 6/16/2018 (1) | | | 1,000,000 | | | | 1,000,570 | |
|
Machinery-Diversified — 0.7% | |
John Deere Capital Corp., 1.250%, 10/9/2019 (1) | | | 775,000 | | | | 768,816 | |
Roper Technologies, Inc., 2.050%, 10/1/2018 | | | 1,000,000 | | | | 1,002,637 | |
| | | | | | | | |
| | | | | | | 1,771,453 | |
|
Media — 0.2% | |
Walt Disney Co., 1.950%, 3/4/2020 (1) | | | 500,000 | | | | 504,116 | |
|
Miscellaneous Manufacturing — 0.4% | |
Ingersoll-Rand Global Holding Co., Ltd., 2.875%, 1/15/2019 | | | 1,000,000 | | | | 1,013,507 | |
|
Oil & Gas — 2.4% | |
BP Capital Markets PLC: | | | | | | | | |
2.237%, 5/10/2019 | | | 1,000,000 | | | | 1,008,976 | |
2.315%, 2/13/2020 (1) | | | 610,000 | | | | 617,195 | |
Chevron Corp., 1.961%, 3/3/2020 (1) | | | 1,000,000 | | | | 1,007,097 | |
Exxon Mobil Corp.: | | | | | | | | |
1.708%, 3/1/2019 (1) | | | 1,000,000 | | | | 1,002,457 | |
1.912%, 3/6/2020 (1) | | | 1,200,000 | | | | 1,207,919 | |
Shell International Finance BV, 1.625%, 11/10/2018 | | | 1,039,000 | | | | 1,040,429 | |
| | | | | | | | |
| | | | | | | 5,884,073 | |
| | | | | | | | |
| Description | | Shares or
Principal
Amount | | | Value | |
| Corporate Bonds & Notes (continued) | |
|
Pharmaceuticals — 1.0% | |
Cardinal Health, Inc., 1.950%, 6/15/2018 (1) | | $ | 400,000 | | | $ | 401,139 | |
Express Scripts Holding Co., 2.250%, 6/15/2019 (1) | | | 1,000,000 | | | | 1,004,934 | |
Novartis Capital Corp., 1.800%, 2/14/2020 | | | 1,000,000 | | | | 1,005,724 | |
| | | | | | | | |
| | | | | | | 2,411,797 | |
|
Real Estate Investment Trusts — 0.4% | |
Welltower, Inc., 2.250%, 3/15/2018 | | | 1,000,000 | | | | 1,001,835 | |
|
Savings & Loans — 0.9% | |
Flagstar Bancorp, Inc., 6.125%, 7/15/2021 | | | 2,000,000 | | | | 2,143,666 | |
|
Semiconductors — 0.7% | |
Intel Corp., 2.450%, 7/29/2020 (1) | | | 1,000,000 | | | | 1,022,651 | |
QUALCOMM, Inc., 2.100%, 5/20/2020 | | | 600,000 | | | | 604,681 | |
| | | | | | | | |
| | | | | | | 1,627,332 | |
|
Software — 0.4% | |
Microsoft Corp., 1.850%, 2/6/2020 (1) | | | 1,000,000 | | | | 1,006,467 | |
|
Telecommunications — 1.8% | |
AT&T, Inc., 2.450%, 6/30/2020 (1) | | | 500,000 | | | | 504,604 | |
Cisco Systems, Inc.: | | | | | | | | |
1.400%, 9/20/2019 (1) | | | 500,000 | | | | 498,421 | |
2.125%, 3/1/2019 (1) | | | 1,500,000 | | | | 1,512,570 | |
Verizon Communications, Inc.: | | | | | | | | |
2.250% (LIBOR 3 Month+100 basis points), 3/16/2022 (7) | | | 750,000 | | | | 759,861 | |
2.625%, 2/21/2020 (1) | | | 500,000 | | | | 510,510 | |
3.450%, 3/15/2021 (1) | | | 500,000 | | | | 520,049 | |
| | | | | | | | |
| | | | | | | 4,306,015 | |
| | | | | | | | |
Total Corporate Bonds & Notes
(identified cost $100,071,757) | | | | 101,120,535 | |
| | | | | | | | |
| Mutual Funds — 1.9% | |
Eaton Vance Institutional Senior Loan Fund, Open-end Cayman Islands Exempted Co. (14) | | | 110,732 | | | | 999,914 | |
Fidelity Floating Rate High Income Fund | | | 381,700 | | | | 3,675,768 | |
| | | | | | | | |
Total Mutual Funds
(identified cost $4,506,884) | | | | | | | 4,675,682 | |
| | | | | | | | |
| U.S. Government & U.S. Government Agency Obligations — 15.9% | |
|
Federal Home Loan Mortgage Corporation — 0.8% | |
1.750%, 5/30/2019 (1) | | $ | 2,000,000 | | | | 2,014,308 | |
|
Federal National Mortgage Association — 2.0% | |
1.000%, 2/26/2019 | | | 2,000,000 | | | | 1,990,390 | |
1.500%, 6/22/2020 (1) | | | 1,000,000 | | | | 1,001,900 | |
1.750%, 11/26/2019 | | | 1,750,000 | | | | 1,763,482 | |
| | | | | | | | |
| | | | | | | 4,755,772 | |
|
U.S. Treasury Bonds & Notes — 13.1% | |
0.875%, 7/31/2019 (1) | | | 1,000,000 | | | | 991,758 | |
1.000%, 5/15/2018 (1) | | | 1,500,000 | | | | 1,497,878 | |
1.000%, 5/31/2018 (1) | | | 1,000,000 | | | | 998,359 | |
1.000%, 8/31/2019 (1) | | | 1,500,000 | | | | 1,490,537 | |
1.000%, 9/30/2019 (1) | | | 1,500,000 | | | | 1,490,097 | |
1.250%, 10/31/2018 (1) | | | 2,000,000 | | | | 1,999,844 | |
1.250%, 11/15/2018 (1) | | | 1,500,000 | | | | 1,499,941 | |
(See Notes which are an integral part of the Financial Statements)
85
August 31, 2017
Short-Term Income Fund (continued)
| | | | | | | | |
| Description | | Principal
Amount | | | Value | |
U.S. Government & U.S. Government Agency Obligations
(continued) | |
|
| U.S. Treasury Bonds & Notes (continued) | |
1.250%, 11/30/2018 (1) | | $ | 1,500,000 | | | $ | 1,499,649 | |
1.250%, 1/31/2019 (1) | | | 1,000,000 | | | | 999,570 | |
1.250%, 1/31/2020 (1) | | | 1,000,000 | | | | 997,363 | |
1.375%, 9/30/2018 (1) | | | 1,500,000 | | | | 1,501,905 | |
1.375%, 1/31/2020 (1) | | | 1,000,000 | | | | 1,000,293 | |
1.375%, 10/31/2020 (1) | | | 2,000,000 | | | | 1,993,790 | |
1.375%, 1/31/2021 (1) | | | 1,000,000 | | | | 995,449 | |
1.500%, 2/28/2019 (1) | | | 1,500,000 | | | | 1,504,453 | |
1.500%, 10/31/2019 (1) | | | 2,000,000 | | | | 2,006,484 | |
1.500%, 4/15/2020 (1) | | | 2,000,000 | | | | 2,005,860 | |
1.625%, 8/31/2019 (1) | | | 1,750,000 | | | | 1,760,083 | |
1.750%, 9/30/2019 (1) | | | 1,500,000 | | | | 1,512,597 | |
2.000%, 8/31/2021 | | | 4,000,000 | | | | 4,060,780 | |
| | | | | | | | |
| | | | | | | 31,806,690 | |
| | | | | | | | |
Total U.S. Government & U.S. Government
Agency Obligations
(identified cost $38,588,058) | | | | 38,576,770 | |
| | | | | | | | |
| U.S. Government Agency-Mortgage Securities — 0.5% | |
|
Federal National Mortgage Association — 0.5% | |
3.500%, 4/1/2026 | | | 123,578 | | | | 129,047 | |
4.000%, 11/1/2031 | | | 485,713 | | | | 518,806 | |
5.500%, 11/1/2033 | | | 138,105 | | | | 154,683 | |
5.500%, 2/1/2034 | | | 104,530 | | | | 117,212 | |
5.500%, 8/1/2037 | | | 241,340 | | | | 270,658 | |
9.500%, 12/1/2024 | | | 2,321 | | | | 2,336 | |
9.500%, 1/1/2025 | | | 4,888 | | | | 4,927 | |
9.500%, 1/1/2025 | | | 2,717 | | | | 2,732 | |
10.000%, 7/1/2020 | | | 10,516 | | | | 10,708 | |
| | | | | | | | |
| | | | | | | 1,211,109 | |
|
Government National Mortgage Association — 0.0% | |
7.500%, 8/15/2037 | | | 13,243 | | | | 13,544 | |
9.000%, 12/15/2019 | | | 4,048 | | | | 4,235 | |
| | | | | | | | |
| | | | | | | 17,779 | |
| | | | | | | | |
Total U.S. Government Agency-Mortgage Securities
(identified cost $1,195,608) | | | | 1,228,888 | |
| | | | | | | | |
| Short-Term Investments — 28.6% | |
|
| Collateral Pool Investments for Securities on Loan — 21.0% | |
| | |
Collateral pool allocation (3) | | | | | | | 50,854,186 | |
| | |
| Commercial Paper — 5.8% | | | | | | |
Atlantic Asset Securitization LLC, 1.552%, (LIBOR + 32 basis points) 1/2/2018 (7) | | | 1,400,000 | | | | 1,400,022 | |
Duke Energy Corp., 1.319%, 9/6/2017 (11) | | | 2,000,000 | | | | 1,999,524 | |
Hyundai Captial America, 1.400%, 9/7/2017 (11) | | | 2,500,000 | | | | 2,499,303 | |
Mondelez International, Inc., 1.490%, 11/9/2017 (11) | | | 1,000,000 | | | | 997,060 | |
NextEra Energy Capital Holdings, Inc., 2.100%, 9/27/2017 (11) | | | 1,500,000 | | | | 1,498,334 | |
Omnicom Capital, Inc., 3.082%, 9/18/2017 (11) | | | 1,120,000 | | | | 1,119,178 | |
Potash Corp., 1.400%, 9/5/2017 (11) | | | 2,000,000 | | | | 1,999,604 | |
Sysco Corp., 1.331%, 9/1/2017 (11) | | | 2,500,000 | | | | 2,499,902 | |
| | | | | | | | |
| | | | | | | 14,012,927 | |
| | | | | | | | |
| Description | | Shares | | | Value | |
| Short-Term Investments (continued) | |
|
| Mutual Funds — 1.8% | |
BMO Institutional Prime Money Market Fund — Premier Class, 1.080% (4) | | | 4,463,655 | | | $ | 4,464,102 | |
| | | | | | | | |
Total Short-Term Investments
(identified cost $69,331,800) | | | | | | | 69,331,215 | |
| | | | | | | | |
Total Investments — 120.2%
(identified cost $290,380,569) | | | | 291,694,151 | |
| Other Assets and Liabilities — (20.2)% | | | | (49,105,043 | ) |
| | | | | | | | |
| Total Net Assets — 100.0% | | | | | | $ | 242,589,108 | |
| | | | | | | | |
Intermediate Tax-Free Fund*
| | | | | | | | |
| Description | | Principal
Amount | | | Value | |
| Municipals — 98.4% | | | | | | |
| | |
Alabama — 1.8% | | | | | | | | |
UAB Medicine Finance Authority: | | | | | | | | |
5.000%, 9/1/2036, Call 3/1/2027 | | $ | 2,340,000 | | | $ | 2,751,325 | |
5.000%, 9/1/2037, Call 3/1/2027 | | | 2,030,000 | | | | 2,381,312 | |
5.000%, 9/1/2041, Call 3/1/2027 | | | 2,020,000 | | | | 2,345,947 | |
Other securities | | | | | | | 21,275,515 | |
| | | | | | | | |
| | | | | | | 28,754,099 | |
| | |
Alaska — 0.6% | | | | | | | | |
Other securities | | | | | | | 9,493,845 | |
| | |
Arizona — 2.7% | | | | | | | | |
State of Arizona, AGM: | | | | | | | | |
5.000%, 10/1/2023, Call 4/1/2020 | | | 1,000,000 | | | | 1,100,140 | |
5.250%, 10/1/2024, Call 10/1/2019 | | | 5,000,000 | | | | 5,433,050 | |
Other securities | | | | | | | 37,885,117 | |
| | | | | | | | |
| | | | | | | 44,418,307 | |
| | |
Arkansas — 1.4% | | | | | | | | |
Other securities | | | | | | | 23,380,386 | |
| | |
California — 7.2% | | | | | | | | |
Other securities | | | | | | | 116,521,938 | |
| | |
Colorado — 2.4% | | | | | | | | |
Colorado Health Facilities Authority: | | | | | | | | |
1.450%, 7/1/2034, Call 7/1/2019 (6)(12) | | | 3,325,000 | | | | 3,325,000 | |
4.500%, 2/1/2020 | | | 455,000 | | | | 480,667 | |
5.000%, 9/1/2018 | | | 530,000 | | | | 550,802 | |
5.000%, 9/1/2019 | | | 560,000 | | | | 598,438 | |
5.000%, 2/1/2021 | | | 475,000 | | | | 517,550 | |
5.000%, 9/1/2022 | | | 750,000 | | | | 867,450 | |
5.000%, 12/1/2023 | | | 215,000 | | | | 247,325 | |
5.000%, 2/1/2024 | | | 420,000 | | | | 473,281 | |
5.250%, 1/1/2025, Call 1/1/2020 | | | 460,000 | | | | 500,931 | |
Other securities | | | | | | | 30,388,452 | |
| | | | | | | | |
| | | | | | | 37,949,896 | |
(See Notes which are an integral part of the Financial Statements)
86
Intermediate Tax-Free Fund* (continued)
| | | | | | | | |
| Description | | Principal
Amount | | | Value | |
| Municipals (continued) | | | | | | |
| | |
Connecticut — 1.1% | | | | | | | | |
University of Connecticut: | | | | | | | | |
5.000%, 3/15/2032, Call 3/15/2026 | | $ | 2,000,000 | | | $ | 2,308,660 | |
5.000%, 1/15/2033, Call 1/15/2027 | | | 4,000,000 | | | | 4,620,160 | |
Other securities | | | | | | | 10,186,741 | |
| | | | | | | | |
| | | | | | | 17,115,561 | |
| | |
Delaware — 0.6% | | | | | | | | |
Other securities | | | | | | | 8,944,305 | |
|
District of Columbia — 0.3% | |
Other securities | | | | | | | 5,412,044 | |
| | |
Florida — 5.2% | | | | | | | | |
County of Orange, 5.000%, 1/1/2027, Call 1/1/2022 | | | 5,810,000 | | | | 6,688,879 | |
Other securities | | | | | | | 77,799,357 | |
| | | | | | | | |
| | | | | | | 84,488,236 | |
| | |
Georgia — 2.7% | | | | | | | | |
City of Atlanta Department of Aviation: | | | | | | | | |
5.000%, 1/1/2031, Call 1/1/2024 | | | 1,000,000 | | | | 1,181,790 | |
5.000%, 1/1/2032, Call 1/1/2024 | | | 2,500,000 | | | | 2,949,600 | |
5.000%, 1/1/2033, Call 1/1/2024 | | | 1,000,000 | | | | 1,175,290 | |
5.000%, 1/1/2034, Call 1/1/2024 | | | 1,000,000 | | | | 1,170,110 | |
Gainesville & Hall County Hospital Authority: | | | | | | | | |
5.000%, 2/15/2036, Call 2/15/2027 | | | 1,500,000 | | | | 1,733,040 | |
5.000%, 2/15/2037, Call 2/15/2027 | | | 2,000,000 | | | | 2,305,420 | |
5.000%, 2/15/2042, Call 2/15/2027 | | | 3,000,000 | | | | 3,418,620 | |
Other securities | | | | | | | 29,068,953 | |
| | | | | | | | |
| | | | | | | 43,002,823 | |
|
Guam — 0.1% | |
Other securities | | | | | | | 2,285,780 | |
|
Hawaii — 0.1% | |
Other securities | | | | | | | 1,199,125 | |
|
Idaho — 0.3% | |
Other securities | | | | | | | 5,395,609 | |
|
Illinois — 15.5% | |
Chicago Park District: | | | | | | | | |
5.000%, 1/1/2023, Call 1/1/2022 | | | 1,060,000 | | | | 1,194,217 | |
5.000%, 1/1/2025, Call 7/1/2020 | | | 230,000 | | | | 247,048 | |
5.000%, 1/1/2026, Call 1/1/2021 | | | 730,000 | | | | 789,699 | |
5.000%, 1/1/2028, Call 1/1/2024 | | | 2,500,000 | | | | 2,821,075 | |
5.000%, 11/15/2029, Call 11/15/2018 | | | 130,000 | | | | 136,413 | |
5.000%, 1/1/2031, Call 1/1/2026 | | | 1,790,000 | | | | 2,018,046 | |
| | | | | | | | |
| Description | | Principal
Amount | | | Value | |
| Municipals (continued) | | | | | | |
|
Illinois (continued) | |
5.000%, 1/1/2040, Call 1/1/2026 | | $ | 1,000,000 | | | $ | 1,099,070 | |
City of Chicago: | | | | | | | | |
5.000%, 11/1/2025 | | | 2,000,000 | | | | 2,358,580 | |
5.000%, 11/1/2027, Call 11/1/2026 | | | 2,500,000 | | | | 2,954,550 | |
5.000%, 11/1/2027, Call 11/1/2026 | | | 1,000,000 | | | | 1,181,820 | |
5.000%, 11/1/2028, Call 11/1/2026 | | | 1,000,000 | | | | 1,174,750 | |
5.000%, 11/1/2029, Call 11/1/2026 | | | 1,000,000 | | | | 1,165,970 | |
5.000%, 1/1/2031, Call 1/1/2025 | | | 3,715,000 | | | | 4,163,549 | |
5.000%, 1/1/2032, Call 1/1/2027 | | | 2,000,000 | | | | 2,279,380 | |
5.000%, 1/1/2033, Call 1/1/2027 | | | 3,000,000 | | | | 3,401,010 | |
5.000%, 1/1/2039, Call 1/1/2025 | | | 500,000 | | | | 548,375 | |
6.000%, 1/1/2038, Call 1/1/2027 | | | 10,000,000 | | | | 11,567,800 | |
City of Chicago, AGM: | | | | | | | | |
5.000%, 11/1/2027, Call 11/1/2018 | | | 140,000 | | | | 146,682 | |
5.000%, 11/1/2027, Call 11/1/2018 | | | 60,000 | | | | 62,587 | |
Cook County Township High School District No. 220 Reavis: | | | | | | | | |
6.000%, 12/1/2030, Call 12/1/2023 | | | 1,000,000 | | | | 1,191,350 | |
6.000%, 12/1/2031, Call 12/1/2023 | | | 2,035,000 | | | | 2,424,397 | |
6.000%, 12/1/2032, Call 12/1/2023 | | | 2,160,000 | | | | 2,574,677 | |
6.000%, 6/1/2033, Call 12/1/2023 | | | 2,235,000 | | | | 2,657,013 | |
County of Cook: | | | | | | | | |
5.000%, 11/15/2029, Call 11/15/2026 | | | 3,270,000 | | | | 3,749,382 | |
5.000%, 11/15/2031, Call 11/15/2026 | | | 2,000,000 | | | | 2,276,080 | |
5.250%, 11/15/2023, Call 11/15/2020 | | | 350,000 | | | | 383,512 | |
County of Cook, BAM, 5.000%, 11/15/2023 | | | 1,000,000 | | | | 1,160,590 | |
Illinois Finance Authority: | | | | | | | | |
2.500%, 5/15/2018 | | | 170,000 | | | | 170,753 | |
5.000%, 11/15/2023, Call 11/15/2022 | | | 215,000 | | | | 248,948 | |
5.000%, 8/15/2024 | | | 250,000 | | | | 290,465 | |
5.000%, 5/15/2025 | | | 1,000,000 | | | | 1,109,590 | |
5.000%, 11/15/2026, Call 11/15/2025 | | | 1,000,000 | | | | 1,184,110 | |
5.000%, 11/15/2027, Call 11/15/2025 | | | 500,000 | | | | 585,995 | |
5.000%, 11/1/2029, Call 11/1/2026 | | | 2,000,000 | | | | 2,328,440 | |
5.000%, 5/15/2030, Call 5/15/2025 | | | 1,000,000 | | | | 1,064,230 | |
5.000%, 11/1/2030, Call 11/1/2026 | | | 1,200,000 | | | | 1,388,724 | |
5.000%, 1/1/2036, Call 1/1/2027 | | | 2,000,000 | | | | 2,235,040 | |
(See Notes which are an integral part of the Financial Statements)
87
August 31, 2017
Intermediate Tax-Free Fund* (continued)
| | | | | | | | |
| Description | | Principal
Amount | | | Value | |
| Municipals (continued) | | | | | | |
|
Illinois (continued) | |
5.000%, 8/1/2042, Call 8/1/2027 | | $ | 580,000 | | | $ | 634,468 | |
5.000%, 8/1/2046, Call 8/1/2027 | | | 515,000 | | | | 562,035 | |
5.000%, 8/1/2047, Call 8/1/2027 | | | 750,000 | | | | 816,555 | |
6.000%, 8/15/2041, Call 8/15/2021 | | | 2,665,000 | | | | 3,031,251 | |
Illinois State Toll Highway Authority: | | | | | | | | |
5.000%, 1/1/2028, Call 1/1/2023 | | | 1,000,000 | | | | 1,146,840 | |
5.000%, 1/1/2029, Call 1/1/2023 | | | 1,000,000 | | | | 1,141,420 | |
5.000%, 1/1/2030, Call 1/1/2026 | | | 1,000,000 | | | | 1,181,760 | |
5.000%, 12/1/2032, Call 1/1/2026 | | | 7,790,000 | | | | 9,097,785 | |
5.500%, 1/1/2033, Call 1/1/2018 | | | 490,000 | | | | 497,374 | |
Kane McHenry Cook & De Kalb Counties Unit School District No. 300: | | | | | | | | |
5.000%, 1/1/2023 | | | 1,000,000 | | | | 1,169,360 | |
5.000%, 1/1/2024 | | | 1,000,000 | | | | 1,186,370 | |
5.000%, 1/1/2026, Call 1/1/2025 | | | 4,000,000 | | | | 4,723,600 | |
5.250%, 1/1/2033, Call 1/1/2023 | | | 900,000 | | | | 1,013,922 | |
State of Illinois: | | | | | | | | |
5.000%, 3/1/2020 | | | 500,000 | | | | 530,195 | |
5.000%, 4/1/2024, Call 4/1/2023 | | | 500,000 | | | | 550,120 | |
5.000%, 11/1/2025 | | | 7,000,000 | | | | 7,828,380 | |
5.000%, 2/1/2027 | | | 1,000,000 | | | | 1,119,270 | |
5.000%, 2/1/2029, Call 2/1/2027 | | | 1,000,000 | | | | 1,095,750 | |
5.000%, 11/1/2033, Call 11/1/2026 | | | 8,000,000 | | | | 8,506,800 | |
State of Illinois, AGM, 5.000%, 4/1/2028, Call 4/1/2023 | | | 3,205,000 | | | | 3,497,104 | |
Other securities | | | | | | | 134,809,236 | |
| | | | | | | | |
| | | | | | | 250,473,512 | |
|
Indiana — 2.3% | |
Indiana Finance Authority: | | | | | | | | |
3.000%, 7/1/2019 | | | 250,000 | | | | 258,623 | |
5.000%, 8/15/2020 | | | 700,000 | | | | 753,914 | |
5.000%, 10/1/2022 | | | 300,000 | | | | 343,491 | |
5.000%, 10/1/2023 | | | 400,000 | | | | 464,288 | |
5.000%, 10/1/2024, Call 10/1/2023 | | | 275,000 | | | | 318,013 | |
5.000%, 5/1/2029, Call 5/1/2022 | | | 4,070,000 | | | | 4,536,910 | |
5.500%, 5/1/2024, Call 5/1/2019 | | | 1,000,000 | | | | 1,070,140 | |
Other securities | | | | | | | 29,858,912 | |
| | | | | | | | |
| | | | | | | 37,604,291 | |
|
Iowa — 0.4% | |
Other securities | | | | | | | 6,188,032 | |
| | | | | | | | |
| Description | | Principal
Amount | | | Value | |
| Municipals (continued) | | | | | | |
|
Kansas — 0.2% | |
Other securities | | | | | | $ | 3,586,716 | |
|
Kentucky — 1.1% | |
Paducah Electric Plant Board, AGC, 5.000%, 10/1/2023, Call 4/1/2019 | | $ | 100,000 | | | | 106,358 | |
Paducah Electric Plant Board, AGM: | | | | | | | | |
5.000%, 10/1/2027, Call 10/1/2026 | | | 2,000,000 | | | | 2,380,220 | |
5.000%, 10/1/2028, Call 10/1/2026 | | | 1,850,000 | | | | 2,185,331 | |
5.000%, 10/1/2030, Call 10/1/2026 | | | 1,500,000 | | | | 1,748,295 | |
Other securities | | | | | | | 12,002,895 | |
| | | | | | | | |
| | | | | | | 18,423,099 | |
|
Louisiana — 2.4% | |
Parish of St. Bernard: | | | | | | | | |
4.000%, 3/1/2020 | | | 3,470,000 | | | | 3,678,304 | |
4.000%, 3/1/2021 | | | 3,585,000 | | | | 3,868,000 | |
State of Louisiana, 1.332% (LIBOR 1 Month+47 basis points), 5/1/2018, Call 11/1/2017 (7) | | | 7,000,000 | | | | 7,001,820 | |
Other securities | | | | | | | 24,144,303 | |
| | | | | | | | |
| | | | | | | 38,692,427 | |
|
Maine — 0.6% | |
Maine State Housing Authority, 3.850%, 11/15/2029, Call 11/15/2021 | | | 7,500,000 | | | | 7,880,475 | |
Other securities | | | | | | | 2,079,198 | |
| | | | | | | | |
| | | | | | | 9,959,673 | |
|
Maryland — 1.0% | |
Maryland Health & Higher Educational Facilities Authority: | | | | | | | | |
5.000%, 5/15/2042, Call 5/15/2027 | | | 4,750,000 | | | | 5,436,138 | |
5.750%, 7/1/2034, Call 7/1/2021 | | | 775,000 | | | | 910,369 | |
Other securities | | | | | | | 9,797,919 | |
| | | | | | | | |
| | | | | | | 16,144,426 | |
|
Massachusetts — 1.1% | |
Commonwealth of Massachusetts, NATL-RE FGIC: | | | | | | | | |
1.620%, 12/1/2030, Call 9/5/2017 (12)(13) | | | 1,450,000 | | | | 1,338,347 | |
1.635%, 12/1/2030, Call 9/7/2017 (12)(13) | | | 7,375,000 | | | | 6,807,051 | |
Other securities | | | | | | | 9,858,191 | |
| | | | | | | | |
| | | | | | | 18,003,589 | |
|
Michigan — 4.0% | |
Other securities | | | | | | | 65,028,317 | |
|
Minnesota — 0.5% | |
Other securities | | | | | | | 7,535,094 | |
|
Mississippi — 0.3% | |
Other securities | | | | | | | 5,119,717 | |
|
Missouri — 2.1% | |
Other securities | | | | | | | 33,511,469 | |
(See Notes which are an integral part of the Financial Statements)
88
Intermediate Tax-Free Fund* (continued)
| | | | | | | | |
| Description | | Principal
Amount | | | Value | |
| Municipals (continued) | | | | | | |
|
Nebraska — 0.4% | |
Other securities | | | | | | $ | 7,099,821 | |
|
Nevada — 1.3% | |
County of Clark Department of Aviation: | | | | | | | | |
5.000%, 7/1/2029, Call 7/1/2024 | | $ | 1,200,000 | | | | 1,412,484 | |
5.000%, 7/1/2030, Call 7/1/2024 | | | 1,000,000 | | | | 1,172,240 | |
5.000%, 7/1/2040, Call 7/1/2027 | | | 4,000,000 | | | | 4,679,600 | |
Other securities | | | | | | | 13,490,247 | |
| | | | | | | | |
| | | | | | | 20,754,571 | |
|
New Hampshire — 0.1% | |
Other securities | | | | | | | 1,387,119 | |
|
New Jersey — 3.7% | |
New Jersey Economic Development Authority: | | | | | | | | |
5.000%, 11/1/2021 | | | 4,600,000 | | | | 5,091,004 | |
5.500%, 6/15/2030, Call 12/15/2026 | | | 2,500,000 | | | | 2,910,175 | |
New Jersey Higher Education Student Assistance Authority, 4.875%, 12/1/2024, Call 12/1/2019 | | | 6,520,000 | | | | 6,905,658 | |
New Jersey State Turnpike Authority: | | | | | | | | |
5.000%, 1/1/2032, Call 7/1/2022 | | | 3,440,000 | | | | 3,928,824 | |
5.000%, 1/1/2035, Call 1/1/2022 | | | 1,685,000 | | | | 1,895,372 | |
New Jersey State Turnpike Authority, NATL-RE: | | | | | | | | |
1.365%, 1/1/2030, Call 9/5/2017 (12)(13) | | | 350,000 | | | | 316,493 | |
1.365%, 1/1/2030, Call 9/7/2017 (12)(13) | | | 475,000 | | | | 429,522 | |
1.367%, 1/1/2030, Call 9/1/2017 (12)(13) | | | 1,900,000 | | | | 1,718,138 | |
1.418%, 1/1/2030, Call 9/1/2017 (12)(13) | | | 500,000 | | | | 452,142 | |
New Jersey Transportation Trust Fund Authority: | | | | | | | | |
1.790% (SIFMA Municipal Swap Index Yield+100 basis points), 12/15/2019, Call 6/15/2019 (7) | | | 5,000,000 | | | | 4,940,650 | |
5.000%, 6/15/2022 | | | 500,000 | | | | 560,700 | |
5.000%, 6/15/2032, Call 12/15/2024 | | | 5,000,000 | | | | 5,471,050 | |
5.250%, 12/15/2023, Call 12/15/2018 | | | 1,355,000 | | | | 1,421,720 | |
5.250%, 12/15/2023 | | | 240,000 | | | | 278,554 | |
New Jersey Transportation Trust Fund Authority, BAM: | | | | | | | | |
5.000%, 6/15/2028, Call 6/15/2022 | | | 5,000,000 | | | | 5,462,500 | |
5.000%, 6/15/2033, Call 6/15/2022 | | | 3,000,000 | | | | 3,226,200 | |
5.250%, 6/15/2033, Call 6/15/2023 | | | 5,635,000 | | | | 6,214,391 | |
| | | | | | | | |
| Description | | Principal
Amount | | | Value | |
| Municipals (continued) | | | | | | |
|
New Jersey (continued) | |
New Jersey Transportation Trust Fund Authority, BHAC, 0.000%, 12/15/2024 | | $ | 440,000 | | | $ | 374,444 | |
New Jersey Turnpike Authority: | | | | | | | | |
5.000%, 1/1/2031, Call 1/1/2025 | | | 500,000 | | | | 587,505 | |
5.000%, 1/1/2040, Call 1/1/2028 | | | 1,000,000 | | | | 1,182,180 | |
Other securities | | | | | | | 6,863,130 | |
| | | | | | | | |
| | | | | | | 60,230,352 | |
|
New Mexico — 1.3% | |
New Mexico Municipal Energy Acquisition Authority, 1.575% (LIBOR 1 Month+75 basis points), 8/1/2019, Call 2/1/2019 (7) | | | 10,000,000 | | | | 10,001,500 | |
Other securities | | | | | | | 10,166,732 | |
| | | | | | | | |
| | | | | | | 20,168,232 | |
|
New York — 6.1% | |
City of New York, AGM, 0.920%, 11/1/2026 (12) | | | 7,800,000 | | | | 7,800,000 | |
Metropolitan Transportation Authority, 1.175% (LIBOR 1 Month+35 basis points), 11/1/2017, Call 10/2/2017 (7) | | | 2,800,000 | | | | 2,800,112 | |
Metropolitan Transportation Authority, AGM, 1.450% (LIBOR 1 Month+60 basis points), 5/15/2018, Call 11/15/2017 (7) | | | 3,950,000 | | | | 3,952,568 | |
New York City Transitional Finance Authority: | | | | | | | | |
0.920%, 8/1/2022, Call 9/1/2017 (12) | | | 5,855,000 | | | | 5,855,000 | |
0.920%, 8/1/2023, Call 9/1/2017 (12) | | | 4,600,000 | | | | 4,600,000 | |
5.000%, 11/1/2024, Call 11/1/2022 | | | 5,715,000 | | | | 6,765,474 | |
5.000%, 11/1/2026, Call 5/1/2025 | | | 1,000,000 | | | | 1,222,990 | |
5.000%, 11/1/2026, Call 5/1/2025 | | | 2,000,000 | | | | 2,445,980 | |
5.000%, 2/1/2038, Call 2/1/2027 | | | 4,000,000 | | | | 4,733,840 | |
5.000%, 2/1/2039, Call 2/1/2027 | | | 4,000,000 | | | | 4,722,960 | |
New York State Dormitory Authority, 5.000%, 3/15/2027, Call 3/15/2022 | | | 7,555,000 | | | | 8,765,084 | |
Other securities | | | | | | | 44,788,890 | |
| | | | | | | | |
| | | | | | | 98,452,898 | |
|
North Carolina — 0.8% | |
Other securities | | | | | | | 12,223,494 | |
|
North Dakota — 1.3% | |
North Dakota Public Finance Authority: | | | | | | | | |
4.000%, 6/1/2023 | | | 2,440,000 | | | | 2,761,104 | |
4.000%, 6/1/2024, Call 6/1/2023 | | | 2,190,000 | | | | 2,452,690 | |
4.000%, 6/1/2025, Call 6/1/2023 | | | 1,145,000 | | | | 1,265,878 | |
Other securities | | | | | | | 15,009,581 | |
| | | | | | | | |
| | | | | | | 21,489,253 | |
(See Notes which are an integral part of the Financial Statements)
89
August 31, 2017
Intermediate Tax-Free Fund* (continued)
| | | | | | | | |
| Description | | Principal
Amount | | | Value | |
| Municipals (continued) | | | | | | |
|
Ohio — 4.0% | |
City of Cleveland: | | | | | | | | |
5.000%, 1/1/2022, Call 1/1/2021 | | $ | 2,320,000 | | | $ | 2,574,759 | |
5.000%, 1/1/2031, Call 1/1/2022 | | | 1,270,000 | | | | 1,411,287 | |
City of Cleveland, AGM: | | | | | | | | |
5.000%, 1/1/2030, Call 1/1/2022 | | | 3,900,000 | | | | 4,374,864 | |
5.000%, 1/1/2031, Call 1/1/2022 | | | 1,000,000 | | | | 1,120,440 | |
Other securities | | | | | | | 55,139,319 | |
| | | | | | | | |
| | | | | | | 64,620,669 | |
|
Oklahoma — 0.9% | |
Other securities | | | | | | | 13,977,900 | |
|
Oregon — 0.8% | |
Other securities | | | | | | | 12,128,205 | |
|
Pennsylvania — 2.3% | |
Pennsylvania Turnpike Commission: | | | | | | | | |
1.770% (SIFMA Municipal Swap Index Yield+98 basis points), 12/1/2021, Call 6/1/2021 (7) | | | 5,000,000 | | | | 5,075,000 | |
5.000%, 12/1/2030, Call 12/1/2020 (15) | | | 215,000 | | | | 242,314 | |
5.000%, 12/1/2030, Call 12/1/2020 (15) | | | 120,000 | | | | 135,245 | |
5.000%, 12/1/2030, Call 12/1/2020 (15) | | | 250,000 | | | | 276,530 | |
5.500%, 12/1/2042, Call 12/1/2026 | | | 3,000,000 | | | | 3,574,290 | |
6.000%, 12/1/2034, Call 12/1/2020 (15) | | | 55,000 | | | | 63,734 | |
6.000%, 12/1/2034, Call 12/1/2020 (15) | | | 70,000 | | | | 81,117 | |
6.000%, 12/1/2034, Call 12/1/2020 (15) | | | 270,000 | | | | 312,879 | |
Other securities | | | | | | | 28,104,426 | |
| | | | | | | | |
| | | | | | | 37,865,535 | |
|
Rhode Island — 0.7% | |
Rhode Island Student Loan Authority: | | | | | | | | |
3.375%, 12/1/2023, Call 12/1/2020 (16) | | | 300,000 | | | | 308,010 | |
3.950%, 12/1/2017 | | | 250,000 | | | | 251,592 | |
4.000%, 12/1/2022, Call 12/1/2021 (16) | | | 2,885,000 | | | | 3,082,997 | |
4.200%, 12/1/2018, Call 12/1/2017 | | | 600,000 | | | | 605,052 | |
4.250%, 12/1/2020, Call 12/1/2017 | | | 500,000 | | | | 503,010 | |
4.250%, 12/1/2025, Call 12/1/2021 (16) | | | 2,205,000 | | | | 2,313,795 | |
4.500%, 12/1/2021, Call 12/1/2017 | | | 1,000,000 | | | | 1,006,420 | |
4.750%, 12/1/2028, Call 12/1/2021 (16) | | | 1,000,000 | | | | 1,050,380 | |
4.750%, 12/1/2029, Call 12/1/2021 (16) | | | 275,000 | | | | 288,412 | |
Other securities | | | | | | | 2,222,236 | |
| | | | | | | | |
| | | | | | | 11,631,904 | |
| | | | | | | | |
| Description | | Principal
Amount | | | Value | |
| Municipals (continued) | | | | | | |
|
South Carolina — 1.0% | |
Other securities | | | | | | $ | 16,806,643 | |
|
South Dakota — 1.0% | |
South Dakota Health & Educational Facilities Authority: | | | | | | | | |
4.000%, 11/1/2021 | | $ | 500,000 | | | | 552,475 | |
4.250%, 9/1/2023 | | | 740,000 | | | | 842,897 | |
4.500%, 9/1/2018 | | | 500,000 | | | | 518,540 | |
4.500%, 9/1/2020 | | | 900,000 | | | | 987,417 | |
4.500%, 9/1/2021, Call 9/1/2020 | | | 1,080,000 | | | | 1,175,926 | |
4.500%, 9/1/2022, Call 9/1/2020 | | | 1,005,000 | | | | 1,090,264 | |
5.000%, 9/1/2019 | | | 200,000 | | | | 215,652 | |
5.000%, 11/1/2022 | | | 715,000 | | | | 837,472 | |
5.000%, 8/1/2023 | | | 375,000 | | | | 443,985 | |
5.000%, 11/1/2023 | | | 625,000 | | | | 744,588 | |
5.000%, 8/1/2024 | | | 195,000 | | | | 234,211 | |
5.000%, 11/1/2024, Call 11/1/2019 | | | 1,000,000 | | | | 1,081,620 | |
5.000%, 11/1/2024 | | | 650,000 | | | | 783,673 | |
5.000%, 11/1/2025, Call 11/1/2024 | | | 600,000 | | | | 714,984 | |
5.000%, 9/1/2027, Call 9/1/2024 | | | 720,000 | | | | 834,221 | |
Other securities | | | | | | | 4,275,304 | |
| | | | | | | | |
| | | | | | | 15,333,229 | |
|
Tennessee — 1.4% | |
Knox County Health Educational & Housing Facility Board, 5.000%, 1/1/2042, Call 1/1/2027 | | | 5,815,000 | | | | 6,537,688 | |
Tennessee Energy Acquisition Corp.: | | | | | | | | |
5.000%, 2/1/2023 | | | 5,310,000 | | | | 6,121,846 | |
5.250%, 9/1/2021 | | | 3,810,000 | | | | 4,346,524 | |
5.250%, 9/1/2022 | | | 250,000 | | | | 291,605 | |
Other securities | | | | | | | 5,433,049 | |
| | | | | | | | |
| | | | | | | 22,730,712 | |
|
Texas — 6.6% | |
City of Houston Combined Utility System: | | | | | | | | |
5.000%, 11/15/2028, Call 11/15/2025 | | | 3,540,000 | | | | 4,302,870 | |
5.000%, 11/15/2028, Call 11/15/2027 | | | 3,000,000 | | | | 3,772,440 | |
Dallas/Fort Worth International Airport: | | | | | | | | |
5.000%, 11/1/2024, Call 11/1/2022 | | | 1,000,000 | | | | 1,178,890 | |
5.000%, 11/1/2032, Call 11/1/2020 | | | 5,000,000 | | | | 5,564,650 | |
5.000%, 11/1/2033, Call 11/1/2023 | | | 2,000,000 | | | | 2,324,300 | |
5.250%, 11/1/2033, Call 11/1/2023 | | | 1,200,000 | | | | 1,420,884 | |
North Texas Tollway Authority: | | | | | | | | |
1.590% (SIFMA Municipal Swap Index Yield+80 basis points), 1/1/2019, Call 7/1/2018 (7) | | | 1,750,000 | | | | 1,756,248 | |
5.000%, 1/1/2027, Call 1/1/2025 | | | 2,090,000 | | | | 2,508,585 | |
(See Notes which are an integral part of the Financial Statements)
90
Intermediate Tax-Free Fund* (continued)
| | | | | | | | |
| Description | | Principal
Amount | | | Value | |
| Municipals (continued) | | | | | | |
|
Texas (continued) | |
North Texas Tollway Authority, AGC, 5.750%, 1/1/2038, Call 1/1/2019 | | $ | 1,725,000 | | | $ | 1,835,883 | |
North Texas Tollway Authority, BHAC: | | | | | | | | |
5.125%, 1/1/2028, Call 1/1/2018 | | | 435,000 | | | | 441,029 | |
5.125%, 1/1/2028, Call 1/1/2018 | | | 65,000 | | | | 65,829 | |
Tarrant County Cultural Education Facilities Finance Corp.: | | | | | | | | |
5.000%, 5/15/2037, Call 5/15/2024 | | | 5,145,000 | | | | 5,461,057 | |
5.000%, 11/15/2037, Call 11/15/2027 | | | 2,175,000 | | | | 2,500,837 | |
Other securities | | | | | | | 73,197,595 | |
| | | | | | | | |
| | | | | | | 106,331,097 | |
|
Utah — 0.8% | |
Other securities | | | | | | | 13,408,956 | |
|
Vermont — 0.1% | |
Other securities | | | | | | | 1,461,121 | |
|
Virgin Islands — 0.2% | |
Other securities | | | | | | | 3,618,568 | |
|
Virginia — 0.4% | |
Other securities | | | | | | | 6,419,505 | |
|
Washington — 1.2% | |
Other securities | | | | | | | 19,852,572 | |
|
West Virginia — 0.2% | |
Other securities | | | | | | | 2,658,975 | |
|
Wisconsin — 3.7% | |
Wisconsin Center District: | | | | | | | | |
0.000%, 12/15/2033, Call 6/15/2026 | | | 2,200,000 | | | | 1,227,006 | |
0.000%, 12/15/2034, Call 6/15/2026 | | | 6,665,000 | | | | 3,549,912 | |
Wisconsin Center District, AGM: | | | | | | | | |
5.250%, 12/15/2023 | | | 520,000 | | | | 604,162 | |
5.250%, 12/15/2027 | | | 1,930,000 | | | | 2,324,724 | |
Wisconsin Health & Educational Facilities Authority: | | | | | | | | |
4.500%, 10/15/2026, Call 10/15/2021 | | | 20,000 | | | | 21,797 | |
4.750%, 10/15/2029, Call 10/15/2021 | | | 605,000 | | | | 657,078 | |
5.000%, 8/15/2018 | | | 1,000,000 | | | | 1,037,680 | |
5.000%, 6/1/2019 | | | 205,000 | | | | 214,225 | |
5.000%, 7/1/2019 | | | 990,000 | | | | 1,056,380 | |
5.000%, 8/15/2019 | | | 250,000 | | | | 268,428 | |
5.000%, 8/15/2019 | | | 955,000 | | | | 1,027,313 | |
5.000%, 8/15/2020 | | | 1,060,000 | | | | 1,178,031 | |
5.000%, 8/15/2021 | | | 1,160,000 | | | | 1,327,748 | |
5.000%, 10/1/2022 | | | 750,000 | | | | 878,070 | |
5.000%, 6/1/2026, Call 6/1/2020 | | | 135,000 | | | | 149,653 | |
5.000%, 8/15/2027, Call 8/15/2022 | | | 500,000 | | | | 587,480 | |
| | | | | | | | |
| Description | | Principal
Amount | | | Value | |
| Municipals (continued) | | | | | | |
|
Wisconsin (continued) | |
5.000%, 8/15/2029, Call 8/15/2022 | | $ | 1,700,000 | | | $ | 2,015,316 | |
5.000%, 4/1/2032, Call 10/1/2022 | | | 4,560,000 | | | | 5,081,162 | |
5.000%, 6/1/2032, Call 6/1/2022 | | | 1,000,000 | | | | 1,083,970 | |
5.000%, 8/15/2032, Call 8/15/2022 | | | 5,000,000 | | | | 5,927,400 | |
5.250%, 6/1/2034, Call 6/1/2020 | | | 300,000 | | | | 328,035 | |
5.375%, 8/15/2024, Call 2/15/2020 | | | 1,625,000 | | | | 1,781,569 | |
Wisconsin Health & Educational Facilities Authority, AGM,
5.000%, 7/15/2027, Call 7/15/2021 | | | 3,655,000 | | | | 4,054,382 | |
Other securities | | | | | | | 24,191,169 | |
| | | | | | | | |
| | | | | | | 60,572,690 | |
|
Wyoming — 0.1% | |
Other securities | | | | | | | 1,614,905 | |
| | | | | | | | |
Total Municipals
(identified cost $1,519,664,582) | | | | 1,591,471,242 | |
|
| Mutual Funds — 1.0% | |
Other securities (4) | | | | | | | 16,625,697 | |
| | | | | | | | |
Total Mutual Funds
(identified cost $15,715,415) | | | | 16,625,697 | |
|
| Short-Term Investments — 0.1% | |
| | |
| Mutual Funds — 0.0% | | | | | | |
Other securities (4) | | | | | | | 79,783 | |
| |
| Short-Term Municipals — 0.1% | | | | |
| | |
New York — 0.1% | | | | | | | | |
Other securities | | | | | | | 2,008,460 | |
| | | | | | | | |
Total Short-Term Investments
(identified cost $2,087,745) | | | | 2,088,243 | |
| | | | | | | | |
Total Investments — 99.5%
(identified cost $1,537,467,742) | | | | 1,610,185,182 | |
| Other Assets and Liabilities — 0.5% | | | | 7,978,573 | |
| | | | | | | | |
| Total Net Assets — 100.0% | | | $ | 1,618,163,755 | |
| | | | | | | | |
Strategic Income Fund
| | | | | | | | |
| Description | | Principal
Amount | | | Value | |
| Asset-Backed Security — 0.2% | |
|
Federal Home Loan Mortgage Corporation — 0.2% | |
1.494% (LIBOR 1 Month+26 basis points), 8/25/2031, (Series T-32) (7) | | $ | 257,659 | | | $ | 252,973 | |
| | | | | | | | |
Total Asset-Backed Securities
(identified cost $257,659) | | | | 252,973 | |
| | | | | | | | |
| Collateralized Mortgage Obligations — 10.6% | |
|
Federal National Mortgage Association — 0.5% | |
1.634% (LIBOR 1 Month+40 basis points), 4/25/2034, (Series 2004-25) (7) | | | 208,668 | | | | 210,001 | |
4.000%, 3/25/2041, (Series 2012-21) | | | 327,805 | | | | 344,225 | |
| | | | | | | | |
| | | | | | | 554,226 | |
(See Notes which are an integral part of the Financial Statements)
91
August 31, 2017
Strategic Income Fund (continued)
| | | | | | | | |
| Description | | Principal
Amount | | | Value | |
| Collateralized Mortgage Obligations (continued) | |
| |
Private Sponsor — 10.1% | | | | | |
Alternative Loan Trust, Class 1A1, (Series 2004-24CB), 6.000%, 11/25/2034 | | $ | 864,630 | | | $ | 873,309 | |
Banc of America Funding Trust, Class 2A1, (Series 2005-5), 5.500%, 9/25/2035 | | | 267,460 | | | | 283,226 | |
Chase Mortgage Finance Trust: | | | | | | | | |
Class 7A1, (Series 2007-A2), 3.123%, 7/25/2037 (12) | | | 498,714 | | | | 458,236 | |
Class A1, (Series 2005-S2), 5.500%, 10/25/2035 | | | 606,599 | | | | 629,261 | |
ChaseFlex Trust, Class 4A3, (Series 2005-2), 6.000%, 5/25/2020 | | | 127,291 | | | | 112,015 | |
GSR Mortgage Loan Trust, Class 2A4, (Series 2007-1F), 5.500%, 1/25/2037 | | | 158,685 | | | | 157,885 | |
Morgan Stanley Mortgage Loan Trust, Class 2A2, (Series 2004-10AR), 3.385%, 11/25/2034 (12) | | | 716,826 | | | | 731,259 | |
Residential Asset Securitization Trust, Class A4, (Series 2005-A8CB), 5.500%, 7/25/2035 | | | 776,071 | | | | 694,183 | |
RFMSI Series Trust, Class A2, (Series 2006-S4), 6.000%, 4/25/2036 | | | 676,491 | | | | 655,342 | |
Structured Adjustable Rate Mortgage Loan Trust, Class 1A2, (Series 2004-18), 3.326%, 12/25/2034 (12) | | | 627,380 | | | | 606,798 | |
Wells Fargo Mortgage Backed Securities Trust: | | | | | | | | |
Class 1A2, (Series 2006-6), 5.750%, 5/25/2036 | | | 385,302 | | | | 387,013 | |
Class 1A9, (Series 2007-8), 6.000%, 7/25/2037 | | | 3,388,756 | | | | 3,416,130 | |
Class A1, (Series 2006-AR19), 3.081%, 12/25/2036 (12) | | | 831,968 | | | | 774,430 | |
Class A1, (Series 2007-15), 6.000%, 11/25/2037 | | | 722,127 | | | | 719,147 | |
Class A6, (Series 2007-7), 6.000%, 6/25/2037 | | | 443,278 | | | | 446,955 | |
Class A8, (Series 2007-11), 6.000%, 8/25/2037 | | | 524,313 | | | | 525,872 | |
| | | | | | | | |
| | | | | | | 11,471,061 | |
| | | | | | | | |
Total Collateralized Mortgage Obligations
(identified cost $11,923,992) | | | | 12,025,287 | |
| | | | | | | | |
| Commercial Mortgage Securities — 6.0% | |
|
Private Sponsor — 6.0% | |
Citigroup Commercial Mortgage Trust, Class B, (Series 2014-GC23), 4.175%, 7/10/2047 (12) | | | 1,000,000 | | | | 1,043,796 | |
FREMF Mortgage Trust, Class C, (Series 2012-K21), 4.071%, 7/25/2045 (6)(12) | | | 1,500,000 | | | | 1,541,655 | |
| | | | | | | | |
| Description | | Principal
Amount | | | Value | |
| Commercial Mortgage Securities (continued) | |
|
Private Sponsor (continued) | |
JP Morgan Chase Commercial Mortgage Securities Trust, Class B, (Series 2014-C20), 4.399%, 7/15/2047 (12) | | $ | 2,000,000 | | | $ | 2,100,898 | |
UBS-Barclays Commercial Mortgage Trust, Class B,
(Series 2013-C6), 3.875%, 4/10/2046 (6)(12) | | | 2,000,000 | | | | 2,074,290 | |
| | | | | | | | |
Total Commercial Mortgage Securities
(identified cost $6,568,258) | | | | 6,760,639 | |
| | | | | | | | |
| Corporate Bonds & Notes — 66.0% | |
|
Auto Manufacturers — 1.9% | |
Daimler Finance North America LLC, 2.000%, 7/6/2021 (6) | | | 700,000 | | | | 691,882 | |
Ford Motor Credit Co. LLC,
2.565% (LIBOR 3 Month+127 basis points), 3/28/2022 (7) | | | 1,000,000 | | | | 1,008,547 | |
General Motors Financial Co., Inc., 3.700%, 5/9/2023 (1) | | | 500,000 | | | | 510,416 | |
| | | | | | | | |
| | | | | | | 2,210,845 | |
|
Auto Parts & Equipment — 0.7% | |
American Axle & Manufacturing, Inc., 6.625%, 10/15/2022 (1) | | | 750,000 | | | | 777,187 | |
|
Banks — 7.7% | |
Australia & New Zealand Banking Group, Ltd., 4.500%, 3/19/2024 (6) | | | 500,000 | | | | 530,249 | |
Banco Nacional de Costa Rica, 6.250%, 11/1/2023 (6) | | | 1,000,000 | | | | 1,050,200 | |
Canadian Imperial Bank of Commerce, 1.743% (LIBOR 3 Month+52 basis points), 9/6/2019 (7) | | | 800,000 | | | | 803,790 | |
Capital One Financial Corp.: | | | | | | | | |
2.069% (LIBOR 3 Month+76 basis points), 5/12/2020 (7) | | | 750,000 | | | | 753,187 | |
4.200%, 10/29/2025 (1) | | | 750,000 | | | | 774,988 | |
Goldman Sachs Group, Inc.: | | | | | | | | |
2.511% (LIBOR 3 Month+120 basis points), 4/30/2018 (7) | | | 500,000 | | | | 503,176 | |
2.424% (LIBOR 3 Month+111 basis points), 4/26/2022 (7) | | | 1,000,000 | | | | 1,010,889 | |
HSBC Holdings PLC,
4.250%, 3/14/2024 | | | 1,000,000 | | | | 1,054,200 | |
Morgan Stanley: | | | | | | | | |
2.041% (LIBOR 3 Month+74 basis points), 1/5/2018 (1)(7) | | | 1,000,000 | | | | 1,002,027 | |
2.053% (LIBOR 3 Month+74 basis points), 7/23/2019 (7) | | | 500,000 | | | | 503,616 | |
Westpac Banking Corp.,
1.876% (LIBOR 3 Month+56 basis points), 8/19/2019 (7) | | | 750,000 | | | | 753,939 | |
| | | | | | | | |
| | | | | | | 8,740,261 | |
|
Chemicals — 1.3% | |
CF Industries, Inc., 3.450%, 6/1/2023 (1) | | | 1,550,000 | | | | 1,511,250 | |
|
Commercial Services — 2.6% | |
ADT Corp., 4.875%, 7/15/2032 (1)(6) | | | 1,000,000 | | | | 931,250 | |
Avis Budget Car Rental LLC, 5.125%, 6/1/2022 (1)(6) | | | 750,000 | | | | 754,687 | |
(See Notes which are an integral part of the Financial Statements)
92
Strategic Income Fund (continued)
| | | | | | | | |
| Description | | Principal
Amount | | | Value | |
| Corporate Bonds & Notes (continued) | |
|
Commercial Services (continued) | |
Hertz Corp.,
5.875%, 10/15/2020 (1) | | $ | 500,000 | | | $ | 482,500 | |
United Rentals North America, Inc., 5.500%, 5/15/2027 (1) | | | 750,000 | | | | 796,875 | |
| | | | | | | | |
| | | | | | | 2,965,312 | |
|
Computers — 1.3% | |
Dell International LLC, 5.450%, 6/15/2023 (6) | | | 750,000 | | | | 822,622 | |
Seagate HDD Cayman, 4.875%, 6/1/2027 (1) | | | 750,000 | | | | 709,324 | |
| | | | | | | | |
| | | | | | | 1,531,946 | |
|
Diversified Financial Services — 3.5% | |
Ally Financial, Inc., 5.750%, 11/20/2025 | | | 1,250,000 | | | | 1,354,312 | |
American Express Credit Corp., 1.805% (LIBOR 3 Month+49 basis points), 8/15/2019 (7) | | | 500,000 | | | | 502,450 | |
Discover Financial Services, 4.100%, 2/9/2027 | | | 500,000 | | | | 513,165 | |
Fly Leasing, Ltd., 6.375%, 10/15/2021 (1) | | | 750,000 | | | | 788,438 | |
Jefferies Finance LLC, 7.500%, 4/15/2021 (1)(6) | | | 750,000 | | | | 776,250 | |
| | | | | | | | |
| | | | | | | 3,934,615 | |
|
Electric — 0.7% | |
Dynegy, Inc.,
7.375%, 11/1/2022 (1) | | | 750,000 | | | | 778,125 | |
|
Electrical Components & Equipment — 0.5% | |
Belden, Inc.,
5.250%, 7/15/2024 (6) | | | 500,000 | | | | 517,500 | |
|
Electronics — 0.7% | |
Ingram Micro, Inc., 5.450%, 12/15/2024 (1) | | | 750,000 | | | | 764,329 | |
|
Entertainment — 0.6% | |
AMC Entertainment Holdings, Inc., 5.750%, 6/15/2025 | | | 750,000 | | | | 716,250 | |
|
Food — 3.5% | |
Kellogg Co., 2.650%, 12/1/2023 | | | 750,000 | | | | 752,498 | |
Kroger Co., 4.450%, 2/1/2047 (1) | | | 1,200,000 | | | | 1,161,275 | |
Minerva Luxembourg SA, 6.500%, 9/20/2026 (6) | | | 750,000 | | | | 755,100 | |
Mondelez International Holdings Netherlands BV, 1.924% (LIBOR 3 Month+61 basis points), 10/28/2019 (6)(7) | | | 750,000 | | | | 753,156 | |
Post Holdings, Inc., 5.000%, 8/15/2026 (1)(6) | | | 500,000 | | | | 501,250 | |
| | | | | | | | |
| | | | | | | 3,923,279 | |
|
Forest Products & Paper — 0.7% | |
Suzano Austria GmbH,
7.000%, 3/16/2047 (1)(6) | | | 750,000 | | | | 815,625 | |
|
Healthcare-Products — 0.7% | |
Zimmer Biomet Holdings, Inc., 3.550%, 4/1/2025 (1) | | | 750,000 | | | | 763,271 | |
|
Healthcare-Services — 0.4% | |
CHS/Community Health Systems, Inc., 8.000%, 11/15/2019 (1) | | | 500,000 | | | | 497,500 | |
| | | | | | | | |
| Description | | Principal
Amount | | | Value | |
| Corporate Bonds & Notes (continued) | |
|
Holding Companies-Diversified — 0.5% | |
Leucadia National Corp., 5.500%, 10/18/2023 | | $ | 500,000 | | | $ | 538,614 | |
|
Home Builders — 1.1% | |
CalAtlantic Group, Inc., 5.000%, 6/15/2027 | | | 750,000 | | | | 753,750 | |
K Hovnanian Enterprises, Inc., 10.000%, 7/15/2022 (6) | | | 500,000 | | | | 515,000 | |
| | | | | | | | |
| | | | | | | 1,268,750 | |
|
Household Products/Wares — 0.5% | |
ACCO Brands Corp., 5.250%, 12/15/2024 (6) | | | 500,000 | | | | 516,250 | |
|
Insurance — 0.7% | |
Voya Financial, Inc., 3.650%, 6/15/2026 | | | 750,000 | | | | 762,686 | |
|
Internet — 0.4% | |
eBay, Inc., 2.181% (LIBOR 3 Month+87 basis points), 1/30/2023 (7) | | | 500,000 | | | | 503,005 | |
|
Iron/Steel — 1.8% | |
GTL Trade Finance, Inc., 5.893%, 4/29/2024 (6) | | | 1,000,000 | | | | 1,065,000 | |
Vale SA, 5.625%, 9/11/2042 (1) | | | 1,000,000 | | | | 1,022,500 | |
| | | | | | | | |
| | | | | | | 2,087,500 | |
| | |
Media — 3.4% | | | | | | | | |
Altice Finco SA, 7.625%, 2/15/2025 (1)(6) | | | 800,000 | | | | 848,000 | |
Cablevision Systems Corp., 5.875%, 9/15/2022 (1) | | | 750,000 | | | | 785,625 | |
SFR Group SA, 6.000%, 5/15/2022 (1)(6) | | | 500,000 | | | | 527,490 | |
Sirius XM Radio, Inc., 5.375%, 7/15/2026 (6) | | | 750,000 | | | | 789,375 | |
Time Warner Cable LLC, 4.500%, 9/15/2042 | | | 1,000,000 | | | | 927,157 | |
| | | | | | | | |
| | | | | | | 3,877,647 | |
| | |
Mining — 3.2% | | | | | | | | |
Anglo American Capital PLC, 4.875%, 5/14/2025 (1)(6) | | | 1,000,000 | | | | 1,066,200 | |
Glencore Funding LLC, 4.625%, 4/29/2024 (6) | | | 500,000 | | | | 532,308 | |
HudBay Minerals, Inc., 7.250%, 1/15/2023 (1)(6) | | | 750,000 | | | | 810,000 | |
Kinross Gold Corp.: | | | | | | | | |
4.500%, 7/15/2027 (6) | | | 25,000 | | | | 25,063 | |
6.875%, 9/1/2041 | | | 750,000 | | | | 808,125 | |
Teck Resources, Ltd., 3.750%, 2/1/2023 (1) | | | 350,000 | | | | 353,745 | |
| | | | | | | | |
| | | | | | | 3,595,441 | |
|
Miscellaneous Manufacturing — 1.4% | |
Trinity Industries, Inc.,
4.550%, 10/1/2024 | | | 1,550,000 | | | | 1,572,463 | |
| |
Oil & Gas — 6.0% | | | | | |
Ecopetrol SA, 5.875%, 5/28/2045 | | | 750,000 | | | | 732,638 | |
Ensco PLC: | | | | | | | | |
4.500%, 10/1/2024 (1) | | | 1,000,000 | | | | 735,000 | |
5.200%, 3/15/2025 (1) | | | 1,000,000 | | | | 750,000 | |
PBF Holding Co. LLC, 7.250%, 6/15/2025 (1)(6) | | | 750,000 | | | | 744,375 | |
Petrobras Global Finance BV, 5.750%, 1/20/2020 | | | 1,000,000 | | | | 1,054,000 | |
(See Notes which are an integral part of the Financial Statements)
93
August 31, 2017
Strategic Income Fund (continued)
| | | | | | | | |
| Description | | Principal
Amount | | | Value | |
| Corporate Bonds & Notes (continued) | |
|
Oil & Gas (continued) | |
Petroleos Mexicanos: | | | | | | | | |
5.375%, 3/13/2022 (6) | | $ | 750,000 | | | $ | 805,687 | |
5.500%, 6/27/2044 | | | 1,000,000 | | | | 943,500 | |
Rowan Cos., Inc.: | | | | | | | | |
4.875%, 6/1/2022 (1) | | | 250,000 | | | | 228,125 | |
4.750%, 1/15/2024 (1) | | | 1,000,000 | | | | 810,000 | |
| | | | | | | | |
| | | | | | | 6,803,325 | |
|
Pharmaceuticals — 1.1% | |
Endo Finance LLC, 5.750%, 1/15/2022 (6) | | | 500,000 | | | | 450,000 | |
Teva Pharmaceutical Finance Netherlands III BV, 4.100%, 10/1/2046 (1) | | | 1,000,000 | | | | 846,092 | |
| | | | | | | | |
| | | | | | | 1,296,092 | |
| | |
Pipelines — 1.6% | | | | | | | | |
Cheniere Corpus Christi Holdings LLC, 5.125%, 6/30/2027 (1)(6) | | | 750,000 | | | | 778,125 | |
Energy Transfer LP, 4.900%, 3/15/2035 | | | 1,000,000 | | | | 993,809 | |
| | | | | | | | |
| | | | | | | 1,771,934 | |
|
Real Estate Investment Trusts — 4.1% | |
EPR Properties: | | | | | | | | |
5.250%, 7/15/2023 | | | 1,250,000 | | | | 1,351,152 | |
4.500%, 6/1/2027 (1) | | | 750,000 | | | | 763,495 | |
GEO Group, Inc.,
5.125%, 4/1/2023 | | | 1,000,000 | | | | 1,008,750 | |
SBA Communications Corp., 4.875%, 9/1/2024 (1) | | | 500,000 | | | | 517,500 | |
Senior Housing Properties Trust, 4.750%, 5/1/2024 | | | 1,000,000 | | | | 1,057,369 | |
| | | | | | | | |
| | | | | | | 4,698,266 | |
|
Retail — 3.0% | |
JC Penney Corp., Inc., 5.650%, 6/1/2020 (1) | | | 750,000 | | | | 744,975 | |
L Brands, Inc.: | | | | | | | | |
6.950%, 3/1/2033 | | | 1,000,000 | | | | 967,500 | |
7.600%, 7/15/2037 | | | 500,000 | | | | 495,000 | |
New Red Finance, Inc., 4.250%, 5/15/2024 (1)(6) | | | 650,000 | | | | 659,750 | |
Party City Holdings, Inc., 6.125%, 8/15/2023 (1)(6) | | | 500,000 | | | | 525,000 | |
| | | | | | | | |
| | | | | | | 3,392,225 | |
|
Software — 0.7% | |
VMware, Inc., 3.900%, 8/21/2027 | | | 750,000 | | | | 757,897 | |
| | |
Sovereign — 3.3% | | | | | | | | |
Costa Rica Government International Bond, 5.625%, 4/30/2043 (6) | | | 800,000 | | | | 731,000 | |
Export Credit Bank of Turkey, 5.000%, 9/23/2021 (6) | | | 750,000 | | | | 773,548 | |
Ivory Coast Government International Bond, 6.125%, 6/15/2033 (6) | | | 750,000 | | | | 750,000 | |
Oman Sovereign Sukuk SAOC, 4.397%, 6/1/2024 (6) | | | 500,000 | | | | 501,886 | |
Sri Lanka Government International Bond,
6.000%, 1/14/2019 (6) | | | 1,000,000 | | | | 1,038,068 | |
| | | | | | | | |
| | | | | | | 3,794,502 | |
| | | | | | | | |
| Description | | Principal
Amount | | | Value | |
| Corporate Bonds & Notes (continued) | |
|
Telecommunications — 4.1% | |
CenturyLink, Inc., 5.625%, 4/1/2025 (1) | | $ | 750,000 | | | $ | 716,250 | |
Colombia Telecomunicaciones SA ESP, 5.375%, 9/27/2022 (6) | | | 1,000,000 | | | | 1,030,000 | |
CommScope, Inc., 5.500%, 6/15/2024 (6) | | | 1,000,000 | | | | 1,046,250 | |
Motorola Solutions, Inc., 4.000%, 9/1/2024 (1) | | | 500,000 | | | | 514,018 | |
Sprint Communications, Inc., 6.000%, 11/15/2022 (1) | | | 500,000 | | | | 533,125 | |
Turk Telekomunikasyon AS, 4.875%, 6/19/2024 (6) | | | 750,000 | | | | 769,093 | |
| | | | | | | | |
| | | | | | | 4,608,736 | |
| | |
Textiles — 0.7% | | | | | | | | |
Cintas Corp. No. 2, 2.900%, 4/1/2022 | | | 750,000 | | | | 770,216 | |
| |
Transportation — 0.9% | | | | | |
Asciano Finance, Ltd., 4.625%, 9/23/2020 (6) | | | 1,000,000 | | | | 1,044,937 | |
| |
Venture Capital — 0.7% | | | | | |
Icahn Enterprises LP, 5.875%, 2/1/2022 (1) | | | 750,000 | | | | 775,087 | |
| | | | | | | | |
Total Corporate Bonds & Notes
(identified cost $73,694,027) | | | | 74,882,868 | |
| | | | | | | | |
| U.S. Government Agency-Mortgage Securities — 15.6% | |
|
Federal Home Loan Mortgage Corporation — 4.8% | |
3.500%, 4/1/2042 | | | 82,937 | | | | 86,591 | |
4.000%, 10/1/2031 | | | 1,390,930 | | | | 1,485,591 | |
4.000%, 12/1/2040 | | | 399,338 | | | | 425,980 | |
4.500%, 9/1/2031 | | | 411,981 | | | | 445,161 | |
4.500%, 7/1/2040 | | | 30,489 | | | | 33,218 | |
4.500%, 11/1/2040 | | | 854,308 | | | | 928,254 | |
4.500%, 2/1/2041 | | | 1,197,903 | | | | 1,292,551 | |
5.000%, 12/1/2022 | | | 113,589 | | | | 119,739 | |
5.000%, 1/1/2040 | | | 257,520 | | | | 283,925 | |
5.500%, 11/1/2018 | | | 25,867 | | | | 26,074 | |
5.500%, 10/1/2021 | | | 114,830 | | | | 120,487 | |
5.500%, 7/1/2035 | | | 49,913 | | | | 55,667 | |
6.000%, 12/1/2036 | | | 26,374 | | | | 29,862 | |
6.000%, 12/1/2037 | | | 10,341 | | | | 11,610 | |
7.500%, 4/1/2024 | | | 34,027 | | | | 37,960 | |
7.500%, 4/1/2027 | | | 19,325 | | | | 22,328 | |
8.000%, 8/1/2030 | | | 19,829 | | | | 23,495 | |
8.500%, 9/1/2024 | | | 18,152 | | | | 20,253 | |
9.000%, 6/1/2019 | | | 1,382 | | | | 1,390 | |
9.500%, 2/1/2025 | | | 6,286 | | | | 6,354 | |
| | | | | | | | |
| | | | | | | 5,456,490 | |
|
Federal National Mortgage Association — 9.1% | |
3.000%, 8/1/2032 | | | 223,669 | | | | 231,622 | |
3.500%, 7/1/2032 | | | 437,616 | | | | 459,773 | |
4.000%, 11/1/2031 | | | 809,521 | | | | 864,677 | |
4.000%, 3/1/2041 | | | 284,386 | | | | 303,862 | |
4.000%, 9/1/2043 | | | 1,128,205 | | | | 1,205,934 | |
4.500%, 4/1/2041 | | | 2,281,733 | | | | 2,475,915 | |
4.500%, 6/1/2042 | | | 992,064 | | | | 1,083,173 | |
5.000%, 5/1/2018 | | | 29,071 | | | | 29,776 | |
5.500%, 1/1/2023 | | | 131,734 | | | | 145,639 | |
5.500%, 10/1/2024 | | | 220,435 | | | | 243,703 | |
5.500%, 2/1/2036 | | | 170,427 | | | | 191,114 | |
5.500%, 7/1/2036 | | | 352,317 | | | | 394,803 | |
(See Notes which are an integral part of the Financial Statements)
94
Strategic Income Fund (continued)
| | | | | | | | |
| Description | | Shares or
Principal
Amount | | | Value | |
| U.S. Government Agency-Mortgage Securities (continued) | |
|
Federal National Mortgage Association (continued) | |
5.500%, 8/1/2037 | | $ | 644,079 | | | $ | 722,321 | |
6.000%, 9/1/2021 | | | 163,931 | | | | 172,583 | |
6.000%, 5/1/2039 | | | 599,402 | | | | 681,864 | |
6.500%, 8/1/2030 | | | 365,735 | | | | 411,311 | |
6.500%, 12/1/2031 | | | 21,247 | | | | 24,415 | |
6.500%, 11/1/2037 | | | 71,879 | | | | 80,548 | |
7.000%, 3/1/2029 | | | 48,433 | | | | 56,631 | |
7.000%, 7/1/2029 | | | 138,060 | | | | 156,811 | |
7.000%, 2/1/2030 | | | 93,596 | | | | 104,729 | |
7.500%, 10/1/2030 | | | 21,744 | | | | 24,442 | |
8.000%, 10/1/2028 | | | 165,171 | | | | 184,758 | |
8.000%, 4/1/2030 | | | 38,740 | | | | 46,943 | |
| | | | | | | | |
| | | | | | | 10,297,347 | |
|
Government National Mortgage Association — 1.7% | |
5.000%, 4/15/2034 | | | 279,397 | | | | 307,068 | |
5.500%, 9/15/2033 | | | 666,167 | | | | 748,582 | |
6.000%, 12/20/2033 | | | 697,823 | | | | 801,916 | |
7.000%, 8/15/2031 | | | 38,368 | | | | 44,234 | |
9.500%, 10/15/2024 | | | 4,618 | | | | 4,637 | |
| | | | | | | | |
| | | | | | | 1,906,437 | |
| | | | | | | | |
Total U.S. Government Agency-Mortgage Securities | |
(identified cost $16,947,014) | | | | 17,660,274 | |
| | | | | | | | |
| Short-Term Investments — 22.1% | |
|
| Collateral Pool Investments for Securities on Loan — 21.3% | |
| | |
Collateral pool allocation (3) | | | | | | | 24,164,624 | |
| | |
| Mutual Funds — 0.8% | | | | | | |
BMO Institutional Prime Money Market Fund — Premier Class, 1.080% (4) | | | 937,935 | | | | 938,029 | |
| | | | | | | | |
Total Short-Term Investments
(identified cost $25,102,653) | | | | 25,102,653 | |
| | | | | | | | |
Total Investments — 120.5%
(identified cost $134,493,603) | | | | 136,684,694 | |
| Other Assets and Liabilities — (20.5)% | | | | (23,292,207 | ) |
| | | | | | | | |
| Total Net Assets — 100.0% | | | | | | $ | 113,392,487 | |
| | | | | | | | |
TCH Corporate Income Fund
| | | | | | | | |
| Description | | Principal
Amount | | | Value | |
| Corporate Bonds & Notes — 93.7% | |
|
Aerospace/Defense — 1.0% | |
Lockheed Martin Corp., 2.500%, 11/23/2020 (1) | | $ | 2,500,000 | | | $ | 2,545,245 | |
|
Agriculture — 1.8% | |
Philip Morris International, Inc.: | | | | | | | | |
2.000%, 2/21/2020 (1) | | | 2,000,000 | | | | 2,007,190 | |
2.900%, 11/15/2021 | | | 1,000,000 | | | | 1,027,082 | |
Reynolds American, Inc., 2.300%, 6/12/2018 (1) | | | 1,500,000 | | | | 1,506,213 | |
| | | | | | | | |
| | | | | | | 4,540,485 | |
|
Apparel — 0.8% | |
Ralph Lauren Corp., 2.125%, 9/26/2018 | | | 2,000,000 | | | | 2,010,218 | |
| | | | | | | | |
| Description | | Principal
Amount | | | Value | |
| Corporate Bonds & Notes (continued) | |
|
Auto Manufacturers — 3.0% | |
Daimler Finance North America LLC, 2.000%, 7/6/2021 (6) | | $ | 2,500,000 | | | $ | 2,471,007 | |
Ford Motor Co., 5.291%, 12/8/2046 (1) | | | 2,000,000 | | | | 2,061,008 | |
Ford Motor Credit Co. LLC, 2.243% (LIBOR 3 Month+93 basis points), 11/4/2019 (7) | | | 1,500,000 | | | | 1,510,511 | |
General Motors Financial Co., Inc.: | | | | | | | | |
4.000%, 1/15/2025 | | | 1,000,000 | | | | 1,014,519 | |
4.350%, 1/17/2027 | | | 500,000 | | | | 514,431 | |
| | | | | | | | |
| | | | | | | 7,571,476 | |
|
Banks — 9.5% | |
Banco Santander SA, 2.865% (LIBOR 3 Month+156 basis points), 4/11/2022 (7) | | | 2,000,000 | | | | 2,066,056 | |
Bank of America Corp.: | | | | | | | | |
2.169% (LIBOR 3 Month+87 basis points), 4/1/2019 (1)(7) | | | 1,000,000 | | | | 1,009,558 | |
2.344% (LIBOR 3 Month+104 basis points), 1/15/2019 (7) | | | 2,000,000 | | | | 2,021,228 | |
Canadian Imperial Bank of Commerce, 1.743% (LIBOR 3 Month+52 basis points), 9/6/2019 (7) | | | 2,000,000 | | | | 2,009,474 | |
Capital One Financial Corp., 2.171% (LIBOR 3 Month+95 basis points), 3/9/2022 (7) | | | 1,000,000 | | | | 1,000,611 | |
Citigroup, Inc., 2.632% (LIBOR 3 Month+143 basis points), 9/1/2023 (1)(7) | | | 2,000,000 | | | | 2,042,894 | |
Goldman Sachs Group, Inc.: | | | | | | | | |
2.415% (LIBOR 3 Month+110 basis points), 11/15/2018 (7) | | | 1,000,000 | | | | 1,009,340 | |
2.424% (LIBOR 3 Month+111 basis points), 4/26/2022 (7) | | | 1,000,000 | | | | 1,010,889 | |
HSBC Holdings PLC, 2.977% (LIBOR 3 Month+166 basis points), 5/25/2021 (7) | | | 1,500,000 | | | | 1,552,728 | |
JPMorgan Chase & Co., 2.127% (LIBOR 3 Month+84 basis points), 3/22/2019 (7) | | | 2,000,000 | | | | 2,017,124 | |
Mizuho Financial Group, Inc., 2.953%, 2/28/2022 | | | 1,500,000 | | | | 1,526,213 | |
Morgan Stanley, 2.053% (LIBOR 3 Month+74 basis points), 7/23/2019 (7) | | | 1,500,000 | | | | 1,510,848 | |
Toronto-Dominion Bank, 2.303% (LIBOR 3 Month+100 basis points), 4/7/2021 (7) | | | 2,000,000 | | | | 2,042,796 | |
U.S. Bank NA, 1.633% (LIBOR 3 Month+32 basis points), 1/24/2020 (7) | | | 1,500,000 | | | | 1,504,584 | |
Wells Fargo Bank NA, 1.917% (LIBOR 3 Month+60 basis points), 5/24/2019 (7) | | | 1,000,000 | | | | 1,007,212 | |
Westpac Banking Corp., 1.876% (LIBOR 3 Month+56 basis points), 8/19/2019 (7) | | | 1,000,000 | | | | 1,005,252 | |
| | | | | | | | |
| | | | | | | 24,336,807 | |
(See Notes which are an integral part of the Financial Statements)
95
August 31, 2017
TCH Corporate Income Fund (continued)
| | | | | | | | |
| Description | | Principal
Amount | | | Value | |
| Corporate Bonds & Notes (continued) | |
| | |
Beverages — 2.5% | | | | | | | | |
Anheuser-Busch InBev Finance, Inc.: | | | | | | | | |
2.571% (LIBOR 3 Month+126 basis points), 2/1/2021 (7) | | $ | 1,250,000 | | | $ | 1,290,910 | |
2.650%, 2/1/2021 (1) | | | 1,500,000 | | | | 1,531,689 | |
Molson Coors Brewing Co., 2.250%, 3/15/2020 (1)(6) | | | 1,500,000 | | | | 1,507,139 | |
PepsiCo, Inc., 1.481% (LIBOR 3 Month+17 basis points), 4/30/2018 (7) | | | 2,000,000 | | | | 2,002,418 | |
| | | | | | | | |
| | | | | | | 6,332,156 | |
|
Biotechnology — 0.5% | |
Amgen, Inc., 2.200%, 5/22/2019 | | | 1,300,000 | | | | 1,307,925 | |
|
Chemicals — 2.6% | |
Braskem America Finance Co., 7.125%, 7/22/2041 (6) | | | 1,000,000 | | | | 1,133,750 | |
CF Industries, Inc., 5.375%, 3/15/2044 (1) | | | 2,000,000 | | | | 1,832,500 | |
EI du Pont de Nemours & Co., 1.841% (LIBOR 3 Month+53 basis points), 5/1/2020 (7) | | | 1,500,000 | | | | 1,513,839 | |
Mexichem SAB de C.V.: | | | | | | | | |
5.875%, 9/17/2044 (6) | | | 500,000 | | | | 513,750 | |
6.750%, 9/19/2042 (6) | | | 1,500,000 | | | | 1,693,500 | |
| | | | | | | | |
| | | | | | | 6,687,339 | |
|
Commercial Services — 0.7% | |
ADT Corp.: | | | | | | | | |
4.125%, 6/15/2023 | | | 500,000 | | | | 507,500 | |
4.875%, 7/15/2032 (6) | | | 250,000 | | | | 232,813 | |
Hertz Corp., 6.750%, 4/15/2019 | | | 1,000,000 | | | | 996,875 | |
| | | | | | | | |
| | | | | | | 1,737,188 | |
|
Computers — 4.1% | |
Apple, Inc., 2.250%, 2/23/2021 | | | 2,000,000 | | | | 2,023,492 | |
Dell International LLC, 8.350%, 7/15/2046 (1)(6) | | | 2,000,000 | | | | 2,588,426 | |
Hewlett Packard Enterprise Co., 4.900%, 10/15/2025 (1) | | | 1,000,000 | | | | 1,063,235 | |
International Business Machines Corp., 1.547% (LIBOR 3 Month+23 basis points), 1/27/2020 (7) | | | 2,500,000 | | | | 2,508,680 | |
Seagate HDD Cayman, 5.750%, 12/1/2034 | | | 2,500,000 | | | | 2,334,692 | |
| | | | | | | | |
| | | | | | | 10,518,525 | |
|
Diversified Financial Services — 3.9% | |
AerCap Ireland Capital DAC, 3.950%, 2/1/2022 (1) | | | 2,000,000 | | | | 2,088,292 | |
American Express Credit Corp., 1.817% (LIBOR 3 Month+55 basis points), 3/18/2019 (7) | | | 1,500,000 | | | | 1,509,009 | |
Capital One Bank USA NA, 2.250%, 2/13/2019 (1) | | | 1,200,000 | | | | 1,204,883 | |
Discover Financial Services, 4.100%, 2/9/2027 (1) | | | 2,000,000 | | | | 2,052,660 | |
E*TRADE Financial Corp., 3.800%, 8/24/2027 | | | 1,000,000 | | | | 1,020,522 | |
Jefferies Group, LLC, 6.500%, 1/20/2043 | | | 500,000 | | | | 571,914 | |
| | | | | | | | |
| Description | | Principal
Amount | | | Value | |
| Corporate Bonds & Notes (continued) | |
|
Diversified Financial Services (continued) | |
Legg Mason, Inc., 4.750%, 3/15/2026 | | $ | 500,000 | | | $ | 540,051 | |
Mastercard, Inc., 2.000%, 11/21/2021 (1) | | | 1,000,000 | | | | 999,919 | |
| | | | | | | | |
| | | | | | | 9,987,250 | |
|
Electric — 0.8% | |
Comision Federal de Electricidad, 4.750%, 2/23/2027 (6) | | | 2,000,000 | | | | 2,080,000 | |
|
Food — 3.0% | |
Kraft Heinz Foods Co.: | | | | | | | | |
2.800%, 7/2/2020 | | | 1,500,000 | | | | 1,528,319 | |
3.000%, 6/1/2026 | | | 2,000,000 | | | | 1,930,392 | |
Kroger Co., 4.450%, 2/1/2047 (1) | | | 2,250,000 | | | | 2,177,390 | |
Mondelez International, Inc., 1.831% (LIBOR 3 Month+52 basis points), 2/1/2019 (7) | | | 2,000,000 | | | | 2,005,014 | |
| | | | | | | | |
| | | | | | | 7,641,115 | |
|
Forest Products & Paper — 0.8% | |
International Paper Co., 3.000%, 2/15/2027 (1) | | | 2,000,000 | | | | 1,946,312 | |
|
Healthcare-Products — 4.7% | |
Abbott Laboratories: | | | | | | | | |
4.750%, 11/30/2036 | | | 1,500,000 | | | | 1,649,628 | |
4.900%, 11/30/2046 (1) | | | 2,000,000 | | | | 2,244,776 | |
Becton, Dickinson and Co.: | | | | | | | | |
2.675%, 12/15/2019 (1) | | | 1,500,000 | | | | 1,522,327 | |
4.685%, 12/15/2044 (1) | | | 2,000,000 | | | | 2,109,318 | |
Medtronic, Inc., 2.046% (LIBOR 3 Month+80 basis points), 3/15/2020 (7) | | | 2,000,000 | | | | 2,031,718 | |
Thermo Fisher Scientific, Inc., 3.000%, 4/15/2023 (1) | | | 1,000,000 | | | | 1,022,034 | |
Zimmer Biomet Holdings, Inc., 2.700%, 4/1/2020 | | | 1,500,000 | | | | 1,518,837 | |
| | | | | | | | |
| | | | | | | 12,098,638 | |
|
Healthcare-Services — 0.8% | |
Laboratory Corp. of America Holdings, 3.250%, 9/1/2024 | | | 2,000,000 | | | | 2,028,836 | |
|
Holding Companies-Diversified — 0.2% | |
Leucadia National Corp., 6.625%, 10/23/2043 (1) | | | 500,000 | | | | 544,478 | |
|
Insurance — 3.6% | |
Berkshire Hathaway Finance Corp.: | | | | | | | | |
1.555% (LIBOR 3 Month+25 basis points), 1/11/2019 (7) | | | 1,000,000 | | | | 1,003,336 | |
1.770% (LIBOR 3 Month+55 basis points), 3/7/2018 (7) | | | 2,000,000 | | | | 2,006,104 | |
Lincoln National Corp., 3.625%, 12/12/2026 | | | 2,000,000 | | | | 2,051,056 | |
Metropolitan Life Global Funding I, 1.697% (LIBOR 3 Month+43 basis points), 12/19/2018 (6)(7) | | | 2,000,000 | | | | 2,008,124 | |
Unum Group, 4.000%, 3/15/2024 | | | 2,000,000 | | | | 2,115,460 | |
| | | | | | | | |
| | | | | | | 9,184,080 | |
(See Notes which are an integral part of the Financial Statements)
96
TCH Corporate Income Fund (continued)
| | | | | | | | |
| Description | | Principal
Amount | | | Value | |
| Corporate Bonds & Notes (continued) | |
|
Internet — 3.7% | |
Amazon.com, Inc.: | | | | | | | | |
2.500%, 11/29/2022 (1) | | $ | 2,500,000 | | | $ | 2,533,237 | |
2.800%, 8/22/2024 (6) | | | 1,500,000 | | | | 1,524,608 | |
4.050%, 8/22/2047 (6) | | | 1,500,000 | | | | 1,549,697 | |
eBay, Inc.: | | | | | | | | |
2.181% (LIBOR 3 Month+87 basis points), 1/30/2023 (7) | | | 2,500,000 | | | | 2,515,022 | |
4.000%, 7/15/2042 | | | 1,500,000 | | | | 1,368,210 | |
| | | | | | | | |
| | | | | | | 9,490,774 | |
|
Iron/Steel — 1.5% | |
GTL Trade Finance, Inc., 7.250%, 4/16/2044 (6) | | | 2,500,000 | | | | 2,607,500 | |
Vale Overseas, Ltd., 8.250%, 1/17/2034 | | | 1,000,000 | | | | 1,262,500 | |
| | | | | | | | |
| | | | | | | 3,870,000 | |
|
Lodging — 1.2% | |
Hyatt Hotels Corp., 5.375%, 8/15/2021 | | | 1,000,000 | | | | 1,097,409 | |
Wyndham Worldwide Corp., 4.500%, 4/1/2027 | | | 2,000,000 | | | | 2,038,448 | |
| | | | | | | | |
| | | | | | | 3,135,857 | |
|
Media — 2.8% | |
Charter Communications Operating LLC, 6.484%, 10/23/2045 (1) | | | 2,500,000 | | | | 2,881,990 | |
Cox Communications, Inc., 4.600%, 8/15/2047 (6) | | | 1,500,000 | | | | 1,527,577 | |
Scripps Networks Interactive, Inc., 2.750%, 11/15/2019 | | | 1,000,000 | | | | 1,011,976 | |
Viacom, Inc.: | | | | | | | | |
4.375%, 3/15/2043 (1) | | | 1,050,000 | | | | 905,267 | |
4.850%, 12/15/2034 (1) | | | 1,000,000 | | | | 966,778 | |
| | | | | | | | |
| | | | | | | 7,293,588 | |
|
Mining — 0.4% | |
Glencore Funding LLC, 4.625%, 4/29/2024 (6) | | | 1,000,000 | | | | 1,064,617 | |
|
Miscellaneous Manufacturing — 0.4% | |
Siemens Financieringsmaatschappij NV, 1.590% (LIBOR 3 Month+34 basis points), 3/16/2020 (6)(7) | | | 1,000,000 | | | | 1,001,933 | |
|
Oil & Gas — 6.7% | |
BP Capital Markets PLC, 2.120% (LIBOR 3 Month+87 basis points), 9/16/2021 (7) | | | 2,000,000 | | | | 2,035,914 | |
Chevron Corp., 1.428% (LIBOR 3 Month+21 basis points), 3/3/2020 (7) | | | 3,000,000 | | | | 3,010,077 | |
Ecopetrol SA: | | | | | | | | |
5.375%, 6/26/2026 (1) | | | 1,000,000 | | | | 1,066,500 | |
7.375%, 9/18/2043 (1) | | | 1,500,000 | | | | 1,692,750 | |
Ensco PLC: | | | | | | | | |
4.500%, 10/1/2024 | | | 1,000,000 | | | | 735,000 | |
5.200%, 3/15/2025 (1) | | | 1,000,000 | | | | 750,000 | |
Exxon Mobil Corp., 1.917% (LIBOR 3 Month+60 basis points), 2/28/2018 (1)(7) | | | 2,000,000 | | | | 2,006,386 | |
| | | | | | | | |
| Description | | Principal
Amount | | | Value | |
| Corporate Bonds & Notes (continued) | |
|
Oil & Gas (continued) | |
Petroleos Mexicanos, 5.625%, 1/23/2046 | | $ | 2,000,000 | | | $ | 1,888,000 | |
Phillips 66, 1.954% (LIBOR 3 Month+65 basis points), 4/15/2019 (6)(7) | | | 2,000,000 | | | | 2,002,016 | |
Shell International Finance BV, 3.750%, 9/12/2046 | | | 1,000,000 | | | | 976,250 | |
Transocean, Inc., 9.350%, 12/15/2041 | | | 1,000,000 | | | | 922,500 | |
| | | | | | | | |
| | | | | | | 17,085,393 | |
| | |
Pharmaceuticals — 7.4% | | | | | | | | |
Allergan Funding SCS: | | | | | | | | |
4.550%, 3/15/2035 | | | 500,000 | | | | 539,382 | |
4.850%, 6/15/2044 | | | 1,500,000 | | | | 1,658,541 | |
Bristol-Myers Squibb Co., 2.000%, 8/1/2022 (1) | | | 2,500,000 | | | | 2,490,647 | |
Express Scripts Holding Co., 4.800%, 7/15/2046 (1) | | | 1,500,000 | | | | 1,584,810 | |
Johnson & Johnson,
1.472% (LIBOR 3 Month+27 basis points), 3/1/2019 (7) | | | 2,000,000 | | | | 2,007,748 | |
Merck & Co., Inc., 2.350%, 2/10/2022 (1) | | | 2,500,000 | | | | 2,542,292 | |
Novartis Capital Corp., 2.400%, 5/17/2022 (1) | | | 1,000,000 | | | | 1,013,981 | |
Perrigo Finance Unlimited Co., 3.500%, 3/15/2021 | | | 1,500,000 | | | | 1,548,684 | |
Shire Acquisitions Investments Ireland DAC: | | | | | | | | |
2.400%, 9/23/2021 (1) | | | 1,000,000 | | | | 993,747 | |
2.875%, 9/23/2023 | | | 2,000,000 | | | | 1,992,258 | |
Teva Pharmaceutical Finance Netherlands III BV, 4.100%, 10/1/2046 (1) | | | 2,000,000 | | | | 1,692,184 | |
Zoetis, Inc.,
3.250%, 2/1/2023 (1) | | | 1,000,000 | | | | 1,035,737 | |
| | | | | | | | |
| | | | | | | 19,100,011 | |
|
Pipelines — 2.8% | |
Energy Transfer LP: | | | | | | | | |
5.150%, 3/15/2045 | | | 2,000,000 | | | | 1,943,590 | |
6.500%, 2/1/2042 | | | 1,500,000 | | | | 1,688,121 | |
Kinder Morgan Energy Partners LP, 7.500%, 11/15/2040 | | | 250,000 | | | | 311,730 | |
Kinder Morgan, Inc., 5.300%, 12/1/2034 (1) | | | 3,000,000 | | | | 3,126,819 | |
| | | | | | | | |
| | | | | | | 7,070,260 | |
|
Real Estate Investment Trusts — 2.3% | |
EPR Properties: | | | | | | | | |
4.500%, 6/1/2027 (1) | | | 1,500,000 | | | | 1,526,990 | |
5.250%, 7/15/2023 | | | 1,000,000 | | | | 1,080,922 | |
Hospitality Properties Trust: | | | | | | | | |
4.500%, 6/15/2023 (1) | | | 500,000 | | | | 530,738 | |
4.500%, 3/15/2025 | | | 1,500,000 | | | | 1,557,807 | |
Kimco Realty Corp., 3.300%, 2/1/2025 | | | 1,250,000 | | | | 1,261,191 | |
| | | | | | | | |
| | | | | | | 5,957,648 | |
|
Retail — 6.4% | |
Bed Bath & Beyond, Inc., 5.165%, 8/1/2044 | | | 1,000,000 | | | | 911,306 | |
Coach, Inc., 4.125%, 7/15/2027 | | | 2,500,000 | | | | 2,519,977 | |
(See Notes which are an integral part of the Financial Statements)
97
August 31, 2017
TCH Corporate Income Fund (continued)
| | | | | | | | |
| Description | | Principal
Amount | | | Value | |
| Corporate Bonds & Notes (continued) | |
|
Retail (continued) | |
CVS Health Corp.: | | | | | | | | |
2.125%, 6/1/2021 (1) | | $ | 2,000,000 | | | $ | 1,995,072 | |
2.250%, 12/5/2018 (1) | | | 1,250,000 | | | | 1,258,450 | |
L Brands, Inc.: | | | | | | | | |
6.950%, 3/1/2033 | | | 600,000 | | | | 580,500 | |
7.600%, 7/15/2037 | | | 500,000 | | | | 495,000 | |
Lowe’s Cos., Inc., 1.842% (LIBOR 3 Month+60 basis points), 9/14/2018 (7) | | | 2,000,000 | | | | 2,011,566 | |
McDonald’s Corp.: | | | | | | | | |
2.100%, 12/7/2018 | | | 750,000 | | | | 755,092 | |
2.750%, 12/9/2020 (1) | | | 1,500,000 | | | | 1,537,637 | |
O’Reilly Automotive, Inc., 3.600%, 9/1/2027 | | | 2,000,000 | | | | 2,011,724 | |
Target Corp., 3.625%, 4/15/2046 | | | 2,500,000 | | | | 2,355,627 | |
| | | | | | | | |
| | | | | | | 16,431,951 | |
|
Semiconductors — 1.6% | |
QUALCOMM, Inc.: | | | | | | | | |
1.676% (LIBOR 3 Month+36 basis points), 5/20/2019 (7) | | | 2,500,000 | | | | 2,509,880 | |
4.800%, 5/20/2045 (1) | | | 1,500,000 | | | | 1,658,007 | |
| | | | | | | | |
| | | | | | | 4,167,887 | |
|
Software — 4.7% | |
Activision Blizzard, Inc., 4.500%, 6/15/2047 (1) | | | 2,000,000 | | | | 2,086,284 | |
CA, Inc., 4.700%, 3/15/2027 (1) | | | 2,500,000 | | | | 2,662,880 | |
Microsoft Corp.: | | | | | | | | |
2.000%, 8/8/2023 (1) | | | 1,750,000 | | | | 1,729,558 | |
2.875%, 2/6/2024 | | | 500,000 | | | | 514,616 | |
Oracle Corp.: | | | | | | | | |
1.814% (LIBOR 3 Month+51 basis points), 10/8/2019 (7) | | | 2,000,000 | | | | 2,018,540 | |
2.400%, 9/15/2023 (1) | | | 1,000,000 | | | | 1,002,944 | |
VMware, Inc.,
3.900%, 8/21/2027 | | | 2,000,000 | | | | 2,021,058 | |
| | | | | | | | |
| | | | | | | 12,035,880 | |
|
Sovereign — 0.8% | |
Costa Rica Government International Bond, 7.158%, 3/12/2045 (6) | | | 2,000,000 | | | | 2,145,000 | |
|
Telecommunications — 4.9% | |
AT&T, Inc.: | | | | | | | | |
2.227% (LIBOR 3 Month+91 basis points), 11/27/2018 (7) | | | 1,235,000 | | | | 1,245,065 | |
5.150%, 3/15/2042 | | | 2,000,000 | | | | 2,049,052 | |
CenturyLink, Inc.: | | | | | | | | |
7.600%, 9/15/2039 | | | 550,000 | | | | 488,125 | |
7.650%, 3/15/2042 | | | 1,000,000 | | | | 885,000 | |
Cisco Systems, Inc.,
1.614% (LIBOR 3 Month+34 basis points), 9/20/2019 (7) | | | 2,000,000 | | | | 2,011,672 | |
Colombia Telecomunicaciones SA ESP, 5.375%, 9/27/2022 | | | 800,000 | | | | 824,000 | |
Motorola Solutions, Inc., 5.500%, 9/1/2044 | | | 1,000,000 | | | | 1,029,305 | |
| | | | | | | | |
| Description | | Shares or
Principal
Amount | | | Value | |
| Corporate Bonds & Notes (continued) | |
|
Telecommunications (continued) | |
Telecom Italia Capital SA, 7.200%, 7/18/2036 (1) | | $ | 1,500,000 | | | $ | 1,875,000 | |
Telefonica Emisiones SAU, 5.213%, 3/8/2047 (1) | | | 2,000,000 | | | | 2,234,026 | |
| | | | | | | | |
| | | | | | | 12,641,245 | |
|
Toys/Games/Hobbies — 0.8% | |
Mattel, Inc., 2.350%, 8/15/2021 (1) | | | 2,000,000 | | | | 1,969,936 | |
|
Transportation — 0.2% | |
Kazakhstan Temir Zholy Finance BV,
6.950%, 7/10/2042 (6) | | | 500,000 | | | | 559,270 | |
|
Trucking & Leasing — 0.8% | |
Penske Truck Leasing Co. Lp, 3.300%, 4/1/2021 (6) | | | 2,000,000 | | | | 2,067,716 | |
| | | | | | | | |
Total Corporate Bonds & Notes
(identified cost $233,998,045) | | | | 240,187,039 | |
| | | | | | | | |
| | |
| Municipals — 0.2% | | | | | | |
|
California — 0.2% | |
Metropolitan Water District of Southern California,
6.947%, 7/1/2040, Call 7/1/2020 | | | 500,000 | | | | 565,325 | |
| | | | | | | | |
Total Municipals
(identified cost $500,000) | | | | | | | 565,325 | |
| | | | | | | | |
|
| U.S. Government & U.S. Government Agency Obligations — 3.3% | |
|
U.S. Treasury Bonds & Notes — 3.3% | |
2.000%, 11/30/2022 (1) | | | 3,000,000 | | | | 3,036,681 | |
2.000%, 8/15/2025 (1) | | | 2,500,000 | | | | 2,494,775 | |
3.500%, 2/15/2018 (1) | | | 3,000,000 | | | | 3,032,076 | |
| | | | | | | | |
Total U.S. Government & U.S. Government Agency Obligations
(identified cost $8,598,271) | | | | 8,563,532 | |
| | | | | | | | |
| Short-Term Investments — 25.0% | |
|
| Collateral Pool Investments for Securities on Loan — 23.3% | |
| | |
Collateral pool allocation (3) | | | | | | | 59,729,711 | |
|
| Mutual Funds — 1.7% | |
BMO Institutional Prime Money Market Fund — Premier Class, 1.080% (4) | | | 4,410,395 | | | | 4,410,836 | |
| | | | | | | | |
Total Short-Term Investments
(identified cost $64,140,547) | | | | 64,140,547 | |
| | | | | | | | |
Total Investments — 122.2%
(identified cost $307,236,863) | | | | 313,456,443 | |
| Other Assets and Liabilities — (22.2)% | | | | (57,034,214 | ) |
| | | | | | | | |
| Total Net Assets — 100.0% | | | $ | 256,422,229 | |
| | | | | | | | |
(See Notes which are an integral part of the Financial Statements)
98
TCH Core Plus Bond Fund
| | | | | | | | |
| Description | | Principal
Amount | | | Value | |
| Corporate Bonds & Notes — 46.0% | |
|
Apparel — 0.4% | |
Ralph Lauren Corp., 2.125%, 9/26/2018 | | $ | 4,000,000 | | | $ | 4,020,436 | |
|
Auto Manufacturers — 2.6% | |
Daimler Finance North America LLC, 1.932% (LIBOR 3 Month+63 basis points), 1/6/2020 (6)(7) | | | 10,000,000 | | | | 10,061,400 | |
Ford Motor Co., 5.291%, 12/8/2046 (1) | | | 1,500,000 | | | | 1,545,756 | |
Ford Motor Credit Co. LLC: | | | | | | | | |
2.243% (LIBOR 3 Month+93 basis points), 11/4/2019 (7) | | | 4,000,000 | | | | 4,028,028 | |
2.244% (LIBOR 3 Month+94 basis points), 1/9/2018 (7) | | | 7,000,000 | | | | 7,016,275 | |
General Motors Financial Co., Inc., 4.000%, 1/15/2025 (1) | | | 5,000,000 | | | | 5,072,595 | |
| | | | | | | | |
| | | | | | | 27,724,054 | |
|
Banks — 7.6% | |
Banco Santander SA,
2.865% (LIBOR 3 Month+156 basis points), 4/11/2022 (7) | | | 4,000,000 | | | | 4,132,112 | |
BB&T Corp., 1.816% (LIBOR 3 Month+57 basis points), 6/15/2020 (7) | | | 3,000,000 | | | | 3,017,916 | |
Canadian Imperial Bank of Commerce, 1.743% (LIBOR 3 Month+52 basis points), 9/6/2019 (1)(7) | | | 5,000,000 | | | | 5,023,685 | |
Capital One Financial Corp., 2.171% (LIBOR 3 Month+95 basis points), 3/9/2022 (7) | | | 1,500,000 | | | | 1,500,917 | |
Citigroup, Inc.: | | | | | | | | |
2.150% (LIBOR 3 Month+93 basis points), 6/7/2019 (1)(7) | | | 4,500,000 | | | | 4,543,321 | |
2.289% (LIBOR 3 Month+107 basis points), 12/8/2021 (1)(7) | | | 1,250,000 | | | | 1,265,331 | |
2.632% (LIBOR 3 Month+143 basis points), 9/1/2023 (1)(7) | | | 5,000,000 | | | | 5,107,235 | |
Goldman Sachs Group, Inc.: | | | | | | | | |
2.415% (LIBOR 3 Month+110 basis points), 11/15/2018 (7) | | | 5,000,000 | | | | 5,046,700 | |
2.424% (LIBOR 3 Month+111 basis points), 4/26/2022 (7) | | | 5,000,000 | | | | 5,054,445 | |
2.473% (LIBOR 3 Month+116 basis points), 4/23/2020 (7) | | | 8,000,000 | | | | 8,132,040 | |
HSBC Holdings PLC,
2.977% (LIBOR 3 Month+166 basis points), 5/25/2021 (7) | | | 5,000,000 | | | | 5,175,760 | |
JPMorgan Chase & Co.: | | | | | | | | |
2.127% (LIBOR 3 Month+84 basis points), 3/22/2019 (7) | | | 3,500,000 | | | | 3,529,967 | |
2.320% (LIBOR 3 Month+110 basis points), 6/7/2021 (7) | | | 5,000,000 | | | | 5,089,425 | |
2.516% (LIBOR 3 Month+121 basis points), 10/29/2020 (7) | | | 4,000,000 | | | | 4,093,564 | |
| | | | | | | | |
| Description | | Principal
Amount | | | Value | |
| Corporate Bonds & Notes (continued) | |
|
Banks (continued) | |
Morgan Stanley, 2.041% (LIBOR 3 Month+74 basis points), 1/5/2018 (7) | | $ | 3,000,000 | | | $ | 3,006,081 | |
Toronto-Dominion Bank, 2.303% (LIBOR 3 Month+100 basis points), 4/7/2021 (7) | | | 4,500,000 | | | | 4,596,291 | |
U.S. Bank NA, 1.633% (LIBOR 3 Month+32 basis points), 1/24/2020 (7) | | | 4,000,000 | | | | 4,012,224 | |
Wells Fargo Bank NA,
1.917% (LIBOR 3 Month+60 basis points), 5/24/2019 (7) | | | 3,000,000 | | | | 3,021,636 | |
Westpac Banking Corp.,
1.876% (LIBOR 3 Month+56 basis points), 8/19/2019 (7) | | | 4,000,000 | | | | 4,021,008 | |
| | | | | | | | |
| | | | | | | 79,369,658 | |
|
Beverages — 0.8% | |
Anheuser-Busch InBev Finance, Inc., 2.571% (LIBOR 3 Month+126 basis points), 2/1/2021 (7) | | | 3,000,000 | | | | 3,098,184 | |
PepsiCo, Inc., 1.481% (LIBOR 3 Month+17 basis points), 4/30/2018 (7) | | | 5,000,000 | | | | 5,006,045 | |
| | | | | | | | |
| | | | | | | 8,104,229 | |
|
Chemicals — 1.6% | |
Braskem America Finance Co., 7.125%, 7/22/2041 (1)(6) | | | 1,000,000 | | | | 1,133,750 | |
CF Industries, Inc., 5.150%, 3/15/2034 (1) | | | 6,500,000 | | | | 6,166,875 | |
Mexichem SAB de C.V.: | | | | | | | | |
5.875%, 9/17/2044 (1)(6) | | | 2,000,000 | | | | 2,055,000 | |
6.750%, 9/19/2042 (1)(6) | | | 6,400,000 | | | | 7,225,600 | |
| | | | | | | | |
| | | | | | | 16,581,225 | |
|
Commercial Services — 0.4% | |
Hertz Corp., 6.750%, 4/15/2019 | | | 4,250,000 | | | | 4,236,719 | |
|
Computers — 2.6% | |
Apple, Inc., 2.250%, 2/23/2021 | | | 1,500,000 | | | | 1,517,619 | |
Dell International LLC,
8.350%, 7/15/2046 (1)(6) | | | 5,500,000 | | | | 7,118,171 | |
Hewlett Packard Enterprise Co., 4.900%, 10/15/2025 (1) | | | 2,000,000 | | | | 2,126,470 | |
International Business Machines Corp., 1.547% (LIBOR 3 Month+23 basis points), 1/27/2020 (7) | | | 11,000,000 | | | | 11,038,192 | |
Seagate HDD Cayman: | | | | | | | | |
4.875%, 6/1/2027 (1) | | | 2,000,000 | | | | 1,891,530 | |
5.750%, 12/1/2034 (1) | | | 3,500,000 | | | | 3,268,570 | |
| | | | | | | | |
| | | | | | | 26,960,552 | |
|
Diversified Financial Services — 1.6% | |
American Express Credit Corp.: | | | | | | | | |
1.921% (LIBOR 3 Month+61 basis points), 7/31/2018 (1)(7) | | | 3,000,000 | | | | 3,012,102 | |
2.092% (LIBOR 3 Month+78 basis points), 11/5/2018 (7) | | | 5,000,000 | | | | 5,037,655 | |
Discover Financial Services, 4.100%, 2/9/2027 | | | 5,000,000 | | | | 5,131,650 | |
(See Notes which are an integral part of the Financial Statements)
99
August 31, 2017
TCH Core Plus Bond Fund (continued)
| | | | | | | | |
| Description | | Principal
Amount | | | Value | |
| Corporate Bonds & Notes (continued) | |
|
Diversified Financial Services (continued) | |
Jefferies Group, LLC, 6.500%, 1/20/2043 (1) | | $ | 1,000,000 | | | $ | 1,143,828 | |
Legg Mason, Inc., 4.750%, 3/15/2026 | | | 1,950,000 | | | | 2,106,201 | |
| | | | | | | | |
| | | | | | | 16,431,436 | |
|
Electric — 0.4% | |
Comision Federal de Electricidad,
4.750%, 2/23/2027 (6) | | | 4,000,000 | | | | 4,160,000 | |
|
Food — 1.9% | |
Kraft Heinz Foods Co., 3.000%, 6/1/2026 (1) | | | 8,000,000 | | | | 7,721,568 | |
Kroger Co.,
4.450%, 2/1/2047 (1) | | | 5,000,000 | | | | 4,838,645 | |
Mondelez International Holdings Netherlands BV, 1.924% (LIBOR 3 Month+61 basis points), 10/28/2019 (6)(7) | | | 7,000,000 | | | | 7,029,456 | |
| | | | | | | | |
| | | | | | | 19,589,669 | |
|
Healthcare-Products — 3.0% | |
Abbott Laboratories: | | | | | | | | |
2.350%, 11/22/2019 (1) | | | 10,000,000 | | | | 10,093,470 | |
4.750%, 11/30/2036 | | | 6,500,000 | | | | 7,148,388 | |
Becton, Dickinson and Co., 4.685%, 12/15/2044 (1) | | | 7,000,000 | | | | 7,382,613 | |
Medtronic, Inc., 2.046% (LIBOR 3 Month+80 basis points), 3/15/2020 (7) | | | 7,000,000 | | | | 7,111,013 | |
| | | | | | | | |
| | | | | | | 31,735,484 | |
|
Holding Companies-Diversified — 0.1% | |
Leucadia National Corp., 6.625%, 10/23/2043 | | | 500,000 | | | | 544,478 | |
|
Insurance — 1.1% | |
Berkshire Hathaway, Inc., 3.125%, 3/15/2026 | | | 2,000,000 | | | | 2,049,654 | |
Lincoln National Corp., 3.625%, 12/12/2026 | | | 4,500,000 | | | | 4,614,876 | |
Metropolitan Life Global Funding I, 1.697% (LIBOR 3 Month+43 basis points), 12/19/2018 (6)(7) | | | 5,000,000 | | | | 5,020,310 | |
| | | | | | | | |
| | | | | | | 11,684,840 | |
|
Internet — 1.1% | |
eBay, Inc.: | | | | | | | | |
2.181% (LIBOR 3 Month+87 basis points), 1/30/2023 (7) | | | 7,500,000 | | | | 7,545,068 | |
4.000%, 7/15/2042 | | | 4,000,000 | | | | 3,648,560 | |
| | | | | | | | |
| | | | | | | 11,193,628 | |
|
Iron/Steel — 1.1% | |
GTL Trade Finance, Inc., 7.250%, 4/16/2044 (6) | | | 6,500,000 | | | | 6,779,500 | |
Vale Overseas, Ltd.: | | | | | | | | |
6.875%, 11/21/2036 (1) | | | 3,000,000 | | | | 3,445,500 | |
8.250%, 1/17/2034 (1) | | | 1,500,000 | | | | 1,893,750 | |
| | | | | | | | |
| | | | | | | 12,118,750 | |
| | | | | | | | |
| Description | | Principal
Amount | | | Value | |
| Corporate Bonds & Notes (continued) | |
|
Lodging — 0.3% | |
Wyndham Worldwide Corp., 4.150%, 4/1/2024 (1) | | $ | 3,000,000 | | | $ | 3,061,311 | |
|
Media — 1.3% | |
Charter Communications Operating LLC,
4.464%, 7/23/2022 | | | 1,000,000 | | | | 1,058,843 | |
Cox Communications, Inc., 4.600%, 8/15/2047 (6) | | | 5,650,000 | | | | 5,753,875 | |
Viacom, Inc., 4.375%, 3/15/2043 | | | 6,500,000 | | | | 5,604,034 | |
Walt Disney Co., 1.628% (LIBOR 3 Month+31 basis points), 5/30/2019 (7) | | | 1,000,000 | | | | 1,004,837 | |
| | | | | | | | |
| | | | | | | 13,421,589 | |
|
Mining — 0.1% | |
Glencore Funding LLC, 4.625%, 4/29/2024 (6) | | | 1,000,000 | | | | 1,064,617 | |
|
Oil & Gas — 3.8% | |
BP Capital Markets PLC, 2.120% (LIBOR 3 Month+87 basis points), 9/16/2021 (7) | | | 7,000,000 | | | | 7,125,699 | |
Chevron Corp., 1.428% (LIBOR 3 Month+21 basis points), 3/3/2020 (7) | | | 5,000,000 | | | | 5,016,795 | |
Ecopetrol SA: | | | | | | | | |
5.375%, 6/26/2026 (1) | | | 1,000,000 | | | | 1,066,500 | |
7.375%, 9/18/2043 (1) | | | 6,000,000 | | | | 6,771,000 | |
Ensco PLC: | | | | | | | | |
5.200%, 3/15/2025 (1) | | | 4,500,000 | | | | 3,375,000 | |
5.750%, 10/1/2044 | | | 2,168,000 | | | | 1,403,780 | |
Exxon Mobil Corp.,
1.917% (LIBOR 3 Month+60 basis points), 2/28/2018 (7) | | | 2,500,000 | | | | 2,507,982 | |
Petroleos Mexicanos: | | | | | | | | |
5.625%, 1/23/2046 | | | 3,000,000 | | | | 2,832,000 | |
6.375%, 1/23/2045 (1) | | | 2,500,000 | | | | 2,583,750 | |
Phillips 66, 1.954% (LIBOR 3 Month+65 basis points), 4/15/2019 (6)(7) | | | 2,000,000 | | | | 2,002,016 | |
Shell International Finance BV, 3.750%, 9/12/2046 (1) | | | 4,500,000 | | | | 4,393,125 | |
Transocean, Inc., 9.350%, 12/15/2041 | | | 1,500,000 | | | | 1,383,750 | |
| | | | | | | | |
| | | | | | | 40,461,397 | |
|
Pharmaceuticals — 2.4% | |
Allergan Funding SCS: | | | | | | | | |
4.550%, 3/15/2035 (1) | | | 1,500,000 | | | | 1,618,145 | |
4.850%, 6/15/2044 | | | 1,500,000 | | | | 1,658,541 | |
Bristol-Myers Squibb Co., 2.000%, 8/1/2022 | | | 2,500,000 | | | | 2,490,647 | |
Express Scripts Holding Co., 4.800%, 7/15/2046 (1) | | | 5,000,000 | | | | 5,282,700 | |
Shire Acquisitions Investments Ireland DAC,
2.875%, 9/23/2023 (1) | | | 7,000,000 | | | | 6,972,903 | |
Teva Pharmaceutical Finance Netherlands III BV,
4.100%, 10/1/2046 (1) | | | 5,000,000 | | | | 4,230,460 | |
Zoetis, Inc.,
3.250%, 2/1/2023 (1) | | | 2,500,000 | | | | 2,589,342 | |
| | | | | | | | |
| | | | | | | 24,842,738 | |
(See Notes which are an integral part of the Financial Statements)
100
TCH Core Plus Bond Fund (continued)
| | | | | | | | |
| Description | | Principal
Amount | | | Value | |
| Corporate Bonds & Notes (continued) | |
|
Pipelines — 0.9% | |
Energy Transfer LP: | | | | | | | | |
5.150%, 3/15/2045 (1) | | $ | 4,000,000 | | | $ | 3,887,180 | |
6.500%, 2/1/2042 | | | 1,000,000 | | | | 1,125,414 | |
Kinder Morgan Energy Partners LP, 5.000%, 3/1/2043 | | | 5,000,000 | | | | 4,938,845 | |
| | | | | | | | |
| | | | | | | 9,951,439 | |
|
Real Estate Investment Trusts — 1.7% | |
EPR Properties: | | | | | | | | |
4.500%, 6/1/2027 (1) | | | 1,000,000 | | | | 1,017,993 | |
5.250%, 7/15/2023 (1) | | | 5,000,000 | | | | 5,404,610 | |
Hospitality Properties Trust: | | | | | | | | |
4.500%, 6/15/2023 (1) | | | 1,000,000 | | | | 1,061,476 | |
4.500%, 3/15/2025 | | | 2,500,000 | | | | 2,596,345 | |
Kimco Realty Corp., 4.450%, 9/1/2047 | | | 5,000,000 | | | | 5,077,255 | |
Wellltower, Inc., 4.500%, 1/15/2024 | | | 2,500,000 | | | | 2,726,095 | |
| | | | | | | | |
| | | | | | | 17,883,774 | |
|
Retail — 2.8% | |
Bed Bath & Beyond, Inc., 5.165%, 8/1/2044 | | | 4,900,000 | | | | 4,465,399 | |
Coach, Inc., 4.125%, 7/15/2027 | | | 7,500,000 | | | | 7,559,933 | |
CVS Health Corp., 2.250%, 12/5/2018 | | | 1,500,000 | | | | 1,510,140 | |
L Brands, Inc.: | | | | | | | | |
6.950%, 3/1/2033 (1) | | | 2,500,000 | | | | 2,418,750 | |
7.600%, 7/15/2037 | | | 1,500,000 | | | | 1,485,000 | |
McDonald’s Corp., 2.100%, 12/7/2018 (1) | | | 2,000,000 | | | | 2,013,578 | |
O’Reilly Automotive, Inc., 3.600%, 9/1/2027 | | | 5,000,000 | | | | 5,029,310 | |
Target Corp., 3.625%, 4/15/2046 | | | 5,000,000 | | | | 4,711,255 | |
| | | | | | | | |
| | | | | | | 29,193,365 | |
|
Semiconductors — 0.9% | |
QUALCOMM, Inc.: | | | | | | | | |
1.766% (LIBOR 3 Month+45 basis points), 5/20/2020 (7) | | | 5,000,000 | | | | 5,029,055 | |
4.800%, 5/20/2045 (1) | | | 4,000,000 | | | | 4,421,352 | |
| | | | | | | | |
| | | | | | | 9,450,407 | |
| | |
Software — 1.9% | | | | | | | | |
Activision Blizzard, Inc., 4.500%, 6/15/2047 | | | 8,000,000 | | | | 8,345,136 | |
CA, Inc., 4.700%, 3/15/2027 | | | 4,000,000 | | | | 4,260,608 | |
Oracle Corp.: | | | | | | | | |
1.814% (LIBOR 3 Month+51 basis points), 10/8/2019 (1)(7) | | | 3,600,000 | | | | 3,633,372 | |
2.400%, 9/15/2023 (1) | | | 4,000,000 | | | | 4,011,776 | |
| | | | | | | | |
| | | | | | | 20,250,892 | |
| | |
Sovereign — 0.6% | | | | | | | | |
Costa Rica Government International Bond: | | | | | | | | |
5.625%, 4/30/2043 (6) | | | 5,000,000 | | | | 4,568,750 | |
7.000%, 4/4/2044 (6) | | | 2,000,000 | | | | 2,110,000 | |
| | | | | | | | |
| | | | | | | 6,678,750 | |
| | | | | | | | |
| Description | | Principal
Amount | | | Value | |
| Corporate Bonds & Notes (continued) | |
|
Telecommunications — 2.9% | |
AT&T, Inc., 5.150%, 3/15/2042 | | $ | 4,000,000 | | | $ | 4,098,104 | |
CenturyLink, Inc.: | | | | | | | | |
7.600%, 9/15/2039 | | | 4,000,000 | | | | 3,550,000 | |
7.650%, 3/15/2042 | | | 4,800,000 | | | | 4,248,000 | |
Cisco Systems, Inc.: | | | | | | | | |
1.556% (LIBOR 3 Month+31 basis points), 6/15/2018 (7) | | | 5,000,000 | | | | 5,013,120 | |
1.614% (LIBOR 3 Month+34 basis points), 9/20/2019 (1)(7) | | | 5,000,000 | | | | 5,029,180 | |
Motorola Solutions, Inc., 5.500%, 9/1/2044 | | | 3,000,000 | | | | 3,087,915 | |
Telefonica Emisiones SAU, 5.213%, 3/8/2047 (1) | | | 5,000,000 | | | | 5,585,065 | |
| | | | | | | | |
| | | | | | | 30,611,384 | |
| | |
Transportation — 0.1% | | | | | | | | |
Kazakhstan Temir Zholy Finance BV, 6.950%, 7/10/2042 (6) | | | 500,000 | | | | 559,270 | |
| | | | | | | | |
Total Corporate Bonds & Notes
(identified cost $468,089,616) | | | | 481,886,091 | |
| | | | | | | | |
| Municipals — 0.0% | | | | | | |
| | |
California — 0.0% | | | | | | | | |
Metropolitan Water District of Southern California, 6.947%, 7/1/2040, Call 7/1/2020 | | | 300,000 | | | | 339,195 | |
| | | | | | | | |
Total Municipals
(identified cost $300,000) | | | | | | | 339,195 | |
| | | | | | | | |
| U.S. Government & U.S. Government Agency Obligations — 12.7% | |
|
U.S. Treasury Bonds & Notes — 12.7% | |
1.375%, 7/15/2018 (1) | | | 2,839,775 | | | | 2,883,814 | |
1.750%, 1/15/2028 (1) | | | 1,753,830 | | | | 1,987,875 | |
1.875%, 7/15/2019 (1) | | | 5,736,000 | | | | 5,974,887 | |
2.000%, 7/31/2020 (1) | | | 15,000,000 | | | | 15,246,390 | |
2.000%, 9/30/2020 (1) | | | 5,000,000 | | | | 5,081,250 | |
2.000%, 11/30/2020 (1) | | | 5,000,000 | | | | 5,080,860 | |
2.000%, 11/15/2021 (1) | | | 10,000,000 | | | | 10,155,860 | |
2.000%, 2/15/2023 (1) | | | 15,000,000 | | | | 15,168,450 | |
2.000%, 2/15/2025 (1) | | | 5,000,000 | | | | 5,002,540 | |
2.000%, 8/15/2025 (1) | | | 5,000,000 | | | | 4,989,550 | |
2.125%, 1/15/2019 (1) | | | 5,134,005 | | | | 5,293,308 | |
2.125%, 8/15/2021 (1) | | | 12,500,000 | | | | 12,755,613 | |
2.250%, 7/31/2018 (1) | | | 10,000,000 | | | | 10,090,040 | |
2.375%, 5/31/2018 (1) | | | 7,500,000 | | | | 7,563,285 | |
2.500%, 5/15/2024 (1) | | | 5,000,000 | | | | 5,182,715 | |
2.500%, 2/15/2045 (1) | | | 2,500,000 | | | | 2,394,483 | |
3.500%, 2/15/2018 (1) | | | 17,500,000 | | | | 17,687,110 | |
| | | | | | | | |
Total U.S. Government & U.S. Government Agency Obligations
(identified cost $131,595,017) | | | | 132,538,030 | |
| | | | | | | | |
| U.S. Government Agency-Mortgage Securities — 36.2% | |
|
Federal Home Loan Mortgage Corporation — 15.8% | |
3.000%, 11/1/2042 | | | 1,297,138 | | | | 1,319,590 | |
3.000%, 4/1/2043 | | | 5,278,039 | | | | 5,369,301 | |
3.000%, 4/1/2043 | | | 1,537,454 | | | | 1,564,918 | |
3.000%, 4/1/2043 | | | 2,311,388 | | | | 2,351,444 | |
3.000%, 5/1/2043 | | | 2,673,089 | | | | 2,717,363 | |
3.000%, 7/1/2043 | | | 10,510,808 | | | | 10,680,746 | |
3.000%, 9/1/2043 | | | 10,604,982 | | | | 10,767,684 | |
(See Notes which are an integral part of the Financial Statements)
101
August 31, 2017
TCH Core Plus Bond Fund (continued)
| | | | | | | | |
| Description | | Principal
Amount | | | Value | |
| U.S. Government Agency-Mortgage Securities (continued) | |
|
Federal Home Loan Mortgage Corporation (continued) | |
3.000%, 4/1/2045 | | $ | 9,483,127 | | | $ | 9,597,076 | |
3.000%, 5/1/2045 | | | 5,220,687 | | | | 5,283,419 | |
3.000%, 9/1/2045 | | | 16,465,826 | | | | 16,666,051 | |
3.000%, 1/1/2046 | | | 17,044,763 | | | | 17,254,857 | |
3.000%, 4/1/2046 | | | 17,467,098 | | | | 17,682,432 | |
3.500%, 12/1/2040 | | | 883,786 | | | | 922,737 | |
3.500%, 12/1/2041 | | | 840,426 | | | | 877,443 | |
3.500%, 3/1/2042 | | | 314,906 | | | | 328,799 | |
3.500%, 12/1/2042 | | | 713,047 | | | | 742,770 | |
3.500%, 7/1/2043 | | | 4,649,183 | | | | 4,843,151 | |
3.500%, 9/1/2043 | | | 9,168,230 | | | | 9,550,353 | |
3.500%, 11/1/2043 | | | 7,260,269 | | | | 7,562,456 | |
3.500%, 1/1/2044 | | | 7,460,258 | | | | 7,770,463 | |
3.500%, 2/1/2044 | | | 7,877,871 | | | | 8,205,819 | |
3.500%, 11/1/2044 | | | 5,688,272 | | | | 5,904,569 | |
4.000%, 4/1/2026 | | | 437,116 | | | | 458,699 | |
4.000%, 10/1/2031 | | | 695,465 | | | | 742,795 | |
4.000%, 12/1/2039 | | | 603,580 | | | | 640,518 | |
4.000%, 12/1/2040 | | | 263,603 | | | | 281,189 | |
4.000%, 12/1/2040 | | | 3,210,053 | | | | 3,406,614 | |
4.000%, 3/1/2041 | | | 267,181 | | | | 283,534 | |
4.000%, 4/1/2041 | | | 6,675,751 | | | | 7,151,131 | |
4.000%, 8/1/2041 | | | 180,649 | | | | 191,748 | |
4.000%, 11/1/2041 | | | 699,113 | | | | 742,064 | |
4.500%, 9/1/2031 | | | 323,699 | | | | 349,769 | |
4.500%, 3/1/2039 | | | 139,937 | | | | 151,341 | |
4.500%, 5/1/2039 | | | 533,548 | | | | 578,790 | |
4.500%, 2/1/2040 | | | 139,032 | | | | 149,975 | |
4.500%, 11/1/2040 | | | 512,585 | | | | 556,953 | |
4.500%, 2/1/2041 | | | 1,048,165 | | | | 1,130,982 | |
5.000%, 12/1/2035 | | | 65,464 | | | | 71,418 | |
5.000%, 1/1/2038 | | | 35,022 | | | | 38,340 | |
5.000%, 3/1/2038 | | | 118,450 | | | | 129,859 | |
5.000%, 3/1/2038 | | | 38,423 | | | | 42,077 | |
5.000%, 2/1/2039 | | | 170,507 | | | | 185,203 | |
5.000%, 1/1/2040 | | | 184,743 | | | | 203,685 | |
6.000%, 6/1/2037 | | | 81,078 | | | | 91,589 | |
6.000%, 1/1/2038 | | | 82,712 | | | | 92,867 | |
| | | | | | | | |
| | | | | | | 165,634,581 | |
|
Federal National Mortgage Association — 20.2% | |
3.000%, 3/1/2043 | | | 2,968,636 | | | | 3,019,575 | |
3.000%, 7/1/2043 | | | 6,998,989 | | | | 7,117,356 | |
3.000%, 7/1/2043 | | | 13,862,980 | | | | 14,098,665 | |
3.000%, 8/1/2043 | | | 10,852,089 | | | | 11,035,587 | |
3.000%, 9/1/2044 | | | 9,005,382 | | | | 9,145,839 | |
3.000%, 1/1/2045 | | | 9,894,301 | | | | 10,034,889 | |
3.000%, 2/1/2045 | | | 13,909,503 | | | | 14,097,240 | |
3.000%, 6/1/2045 | | | 8,094,099 | | | | 8,199,379 | |
3.000%, 3/1/2046 | | | 16,076,809 | | | | 16,276,258 | |
3.000%, 7/1/2046 | | | 18,454,119 | | | | 18,683,061 | |
3.000%, 10/1/2046 | | | 18,992,182 | | | | 19,227,799 | |
3.000%, 12/1/2046 | | | 24,152,155 | | | | 24,451,787 | |
3.000%, 1/1/2047 | | | 24,230,501 | | | | 24,531,105 | |
3.500%, 7/1/2032 | | | 437,616 | | | | 459,773 | |
3.500%, 5/1/2042 | | | 1,141,960 | | | | 1,191,055 | |
3.500%, 10/1/2042 | | | 873,714 | | | | 911,650 | |
3.500%, 10/1/2042 | | | 971,169 | | | | 1,010,351 | |
3.500%, 10/1/2042 | | | 1,258,372 | | | | 1,308,750 | |
3.500%, 11/1/2042 | | | 564,528 | | | | 587,909 | |
3.500%, 12/1/2042 | | | 1,043,284 | | | | 1,085,249 | |
| | | | | | | | |
| Description | | Shares or
Principal
Amount | | | Value | |
| U.S. Government Agency-Mortgage Securities (continued) | |
|
Federal National Mortgage Association (continued) | |
3.500%, 1/1/2043 | | $ | 3,411,081 | | | $ | 3,571,685 | |
3.500%, 5/1/2043 | | | 11,658,957 | | | | 12,113,866 | |
4.000%, 11/1/2040 | | | 342,982 | | | | 364,155 | |
4.000%, 1/1/2041 | | | 514,753 | | | | 546,256 | |
4.000%, 2/1/2041 | | | 466,894 | | | | 495,507 | |
4.000%, 2/1/2041 | | | 2,596,188 | | | | 2,757,424 | |
4.000%, 3/1/2041 | | | 196,583 | | | | 210,046 | |
4.000%, 11/1/2041 | | | 445,350 | | | | 472,637 | |
4.500%, 6/1/2039 | | | 759,699 | | | | 829,032 | |
4.500%, 8/1/2041 | | | 492,010 | | | | 533,156 | |
5.000%, 7/1/2022 | | | 232,366 | | | | 243,743 | |
5.000%, 3/1/2035 | | | 282,179 | | | | 311,639 | |
5.000%, 5/1/2042 | | | 725,000 | | | | 793,705 | |
5.500%, 2/1/2034 | | | 47,873 | | | | 53,681 | |
5.500%, 7/1/2036 | | | 253,820 | | | | 284,428 | |
5.500%, 8/1/2037 | | | 492,531 | | | | 552,363 | |
5.500%, 6/1/2038 | | | 66,433 | | | | 74,206 | |
6.000%, 12/1/2038 | | | 25,519 | | | | 28,692 | |
6.000%, 5/1/2039 | | | 191,434 | | | | 217,770 | |
6.500%, 10/1/2037 | | | 51,105 | | | | 59,252 | |
6.500%, 11/1/2037 | | | 35,940 | | | | 40,274 | |
| | | | | | | | |
| | | | | | | 211,026,794 | |
|
Government National Mortgage Association — 0.2% | |
4.000%, 10/15/2040 | | | 492,117 | | | | 521,282 | |
4.000%, 12/15/2040 | | | 599,430 | | | | 634,619 | |
4.000%, 4/15/2041 | | | 571,840 | | | | 605,697 | |
5.500%, 8/20/2038 | | | 89,237 | | | | 93,625 | |
5.500%, 2/15/2039 | | | 46,336 | | | | 51,594 | |
6.000%, 12/15/2038 | | | 61,448 | | | | 69,513 | |
6.000%, 1/15/2039 | | | 33,041 | | | | 37,378 | |
| | | | | | | | |
| | | | | | | 2,013,708 | |
| | | | | | | | |
Total U.S. Government Agency-Mortgage Securities | |
(identified cost $373,731,220) | | | | 378,675,083 | |
| | | | | | | | |
| Short-Term Investments — 24.5% | |
|
| Collateral Pool Investments for Securities on Loan — 20.1% | |
| |
Collateral pool allocation (3) | | | | 210,537,373 | |
|
| Mutual Funds — 4.4% | |
BMO Institutional Prime Money Market Fund —Premier Class, 1.080% (4) | | | 46,555,400 | | | | 46,560,055 | |
| | | | | | | | |
Total Short-Term Investments
(identified cost $257,096,536) | | | | 257,097,428 | |
| | | | | | | | |
Total Investments — 119.4%
(identified cost $1,230,812,389) | | | | 1,250,535,827 | |
| Other Assets and Liabilities — (19.4)% | | | | (203,201,539 | ) |
| | | | | | | | |
| Total Net Assets — 100.0% | | | $ | 1,047,334,288 | |
| | | | | | | | |
(See Notes which are an integral part of the Financial Statements)
102
High Yield Bond Fund
| | | | | | | | |
| Description | | Principal
Amount | | | Value | |
| Corporate Bonds & Notes — 96.0% | |
|
Aerospace/Defense — 1.3% | |
KLX, Inc., 5.875%, 12/1/2022 (6) | | $ | 52,000 | | | $ | 54,730 | |
TransDigm, Inc., 6.500%, 7/15/2024 | | | 115,000 | | | | 119,744 | |
| | | | | | | | |
| | | | 174,474 | |
|
Agriculture — 1.4% | |
Vector Group, Ltd., 6.125%, 2/1/2025 (6) | | | 188,000 | | | | 193,170 | |
|
Airlines — 1.2% | |
United Continental Holdings, Inc., 6.000%, 12/1/2020 | | | 150,000 | | | | 163,125 | |
|
Auto Parts & Equipment — 3.1% | |
American Axle & Manufacturing, Inc., 6.625%, 10/15/2022 | | | 100,000 | | | | 103,625 | |
Goodyear Tire & Rubber Co., 5.000%, 5/31/2026 | | | 150,000 | | | | 157,125 | |
Tenneco, Inc., 5.000%, 7/15/2026 | | | 150,000 | | | | 151,875 | |
| | | | | | | | |
| | | | 412,625 | |
|
Banks — 1.0% | |
CIT Group, Inc., 5.000%, 8/15/2022 | | | 125,000 | | | | 135,613 | |
|
Building Materials — 3.2% | |
Builders FirstSource, Inc., 5.625%, 9/1/2024 (6) | | | 150,000 | | | | 157,312 | |
Norbord, Inc., 6.250%, 4/15/2023 (6) | | | 45,000 | | | | 48,600 | |
U.S. Concrete, Inc., 6.375%, 6/1/2024 | | | 200,000 | | | | 217,000 | |
| | | | | | | | |
| | | | 422,912 | |
|
Chemicals — 1.1% | |
CF Industries, Inc., 3.450%, 6/1/2023 | | | 50,000 | | | | 48,750 | |
Trinseo Materials Finance, Inc., 5.375%, 9/1/2025 (6) | | | 50,000 | | | | 51,250 | |
Valvoline, Inc., 4.375%, 8/15/2025 (6) | | | 50,000 | | | | 50,500 | |
| | | | | | | | |
| | | | | | | 150,500 | |
|
Commercial Services — 5.1% | |
Avis Budget Finance Inc., 5.250%, 3/15/2025 (6) | | | 150,000 | | | | 147,141 | |
Herc Rentals, Inc., 7.500%, 6/1/2022 (6) | | | 169,000 | | | | 185,900 | |
Hertz Corp., 5.875%, 10/15/2020 | | | 100,000 | | | | 96,500 | |
Live Nation Entertainment, Inc., 4.875%, 11/1/2024 (6) | | | 136,000 | | | | 139,060 | |
Prime Security Services Borrower LLC, 9.250%, 5/15/2023 (6) | | | 100,000 | | | | 110,750 | |
| | | | | | | | |
| | | | | | | 679,351 | |
|
Computers — 3.1% | |
Dell, Inc., 6.500%, 4/15/2038 | | | 125,000 | | | | 127,500 | |
Seagate HDD Cayman: | | | | | | | | |
4.750%, 1/1/2025 | | | 25,000 | | | | 24,374 | |
4.875%, 6/1/2027 | | | 50,000 | | | | 47,288 | |
Western Digital Corp., 10.500%, 4/1/2024 | | | 175,000 | | | | 208,250 | |
| | | | | | | | |
| | | | | | | 407,412 | |
|
Cosmetics/Personal Care — 0.6% | |
Revlon Consumer Products Corp., 6.250%, 8/1/2024 | | | 100,000 | | | | 81,243 | |
|
Diversified Financial Services — 1.4% | |
Ally Financial, Inc., 8.000%, 11/1/2031 | | | 140,000 | | | | 180,950 | |
| | | | | | | | |
| Description | | Principal
Amount | | | Value | |
| Corporate Bonds & Notes (continued) | |
|
Electric — 1.8% | |
Dynegy, Inc., 7.375%, 11/1/2022 | | $ | 100,000 | | | $ | 103,750 | |
NRG Energy, Inc., 6.625%, 3/15/2023 | | | 125,000 | | | | 129,687 | |
| | | | | | | | |
| | | | | | | 233,437 | |
|
Electrical Components & Equipment — 0.8% | |
Belden, Inc., 5.250%, 7/15/2024 (6) | | | 100,000 | | | | 103,500 | |
|
Electronics — 0.8% | |
Ingram Micro, Inc., 5.450%, 12/15/2024 | | | 100,000 | | | | 101,911 | |
| | |
Entertainment — 1.2% | | | | | | | | |
AMC Entertainment Holdings, Inc., 5.875%, 2/15/2022 | | | 100,000 | | | | 101,000 | |
Cinemark USA, Inc., 4.875%, 6/1/2023 | | | 60,000 | | | | 60,150 | |
| | | | | | | | |
| | | | 161,150 | |
|
Food — 1.3% | |
Minerva Luxembourg SA, 6.500%, 9/20/2026 (6) | | | 75,000 | | | | 75,510 | |
Post Holdings, Inc., 5.000%, 8/15/2026 (6) | | | 100,000 | | | | 100,250 | |
| | | | | | | | |
| | | | 175,760 | |
|
Forest Products & Paper — 1.0% | |
Mercer International, Inc., 6.500%, 2/1/2024 (6) | | | 125,000 | | | | 130,625 | |
|
Healthcare-Services — 6.8% | |
CHS/Community Health Systems, Inc., 7.125%, 7/15/2020 | | | 125,000 | | | | 118,047 | |
DaVita, Inc., 5.000%, 5/1/2025 | | | 212,000 | | | | 215,456 | |
Envision Healthcare Corp., 5.625%, 7/15/2022 | | | 150,000 | | | | 156,094 | |
HCA, Inc., 5.875%, 5/1/2023 | | | 90,000 | | | | 98,685 | |
LifePoint Health, Inc., 5.375%, 5/1/2024 | | | 159,000 | | | | 164,962 | |
Select Medical Corp., 6.375%, 6/1/2021 | | | 150,000 | | | | 155,019 | |
| | | | | | | | |
| | | | | | | 908,263 | |
|
Home Builders — 4.8% | |
Brookfield Residential Properties, Inc., 6.125%, 7/1/2022 (6) | | | 150,000 | | | | 157,125 | |
CalAtlantic Group, Inc., 5.000%, 6/15/2027 | | | 100,000 | | | | 100,500 | |
TRI Pointe Group, Inc., 5.875%, 6/15/2024 | | | 176,000 | | | | 187,880 | |
William Lyon Homes, Inc., 5.875%, 1/31/2025 | | | 188,000 | | | | 193,640 | |
| | | | | | | | |
| | | | 639,145 | |
|
Home Furnishings — 1.2% | |
Tempur Sealy International, Inc., 5.625%, 10/15/2023 | | | 150,000 | | | | 156,938 | |
|
Household Products/Wares — 0.6% | |
ACCO Brands Corp., 5.250%, 12/15/2024 (6) | | | 75,000 | | | | 77,438 | |
|
Iron/Steel — 1.0% | |
United States Steel Corp.: | | | | | | | | |
6.875%, 8/15/2025 | | | 50,000 | | | | 51,000 | |
8.375%, 7/1/2021(6) | | | 75,000 | | | | 83,063 | |
| | | | | | | | |
| | | | 134,063 | |
|
Lodging — 1.3% | |
MGM Resorts International, 4.625%, 9/1/2026 | | | 175,000 | | | | 178,936 | |
(See Notes which are an integral part of the Financial Statements)
103
August 31, 2017
High Yield Bond Fund (continued)
| | | | | | | | |
| Description | | Principal
Amount | | | Value | |
| Corporate Bonds & Notes (continued) | |
|
Media — 9.2% | |
Altice Finco SA, 7.625%, 2/15/2025 (6) | | $ | 200,000 | | | $ | 212,000 | |
CCO Holdings LLC, 5.500%, 5/1/2026 (6) | | | 200,000 | | | | 209,250 | |
Clear Channel Worldwide Holdings, Inc., 7.625%, 3/15/2020 | | | 75,000 | | | | 75,000 | |
Nexstar Broadcasting, Inc., 6.125%, 2/15/2022 (6) | | | 75,000 | | | | 78,562 | |
SFR Group SA, 7.375%, 5/1/2026 (6) | | | 100,000 | | | | 108,377 | |
Sirius XM Radio, Inc., 5.375%, 7/15/2026 (6) | | | 100,000 | | | | 105,250 | |
UPCB Finance IV, Ltd., 5.375%, 1/15/2025 (6) | | | 200,000 | | | | 208,500 | |
Virgin Media Finance PLC, 6.375%, 4/15/2023 (6) | | | 220,000 | | | | 231,550 | |
| | | | | | | | |
| | | | 1,228,489 | |
|
Mining — 5.0% | |
Aleris International, Inc., 9.500%, 4/1/2021 (6) | | | 75,000 | | | | 80,062 | |
Freeport-McMoRan, Inc., 3.550%, 3/1/2022 | | | 150,000 | | | | 147,937 | |
HudBay Minerals, Inc., 7.250%, 1/15/2023 (6) | | | 75,000 | | | | 81,000 | |
Kaiser Aluminum Corp., 5.875%, 5/15/2024 | | | 100,000 | | | | 107,250 | |
Kinross Gold Corp.: | | | | | | | | |
4.500%, 7/15/2027(6) | | | 75,000 | | | | 75,188 | |
6.875%, 9/1/2041 | | | 50,000 | | | | 53,875 | |
Teck Resources, Ltd., 4.750%, 1/15/2022 | | | 116,000 | | | | 122,090 | |
| | | | | | | | |
| | | | 667,402 | |
| |
Oil & Gas — 9.6% | | | | | |
Ensco PLC, 4.500%, 10/1/2024 | | | 100,000 | | | | 73,500 | |
EP Energy LLC, 9.375%, 5/1/2020 | | | 100,000 | | | | 74,125 | |
Gulfport Energy Corp., 6.625%, 5/1/2023 | | | 100,000 | | | | 100,000 | |
Halcon Resources Corp., 6.750%, 2/15/2025 (6) | | | 125,000 | | | | 126,250 | |
MEG Energy Corp., 7.000%, 3/31/2024 (6) | | | 150,000 | | | | 120,000 | |
Noble Holding International, Ltd., 7.750%, 1/15/2024 | | | 130,000 | | | | 101,072 | |
Oasis Petroleum, Inc., 6.875%, 3/15/2022 | | | 75,000 | | | | 73,313 | |
PBF Holding Co. LLC, 7.250%, 6/15/2025 (6) | | | 100,000 | | | | 99,250 | |
QEP Resources, Inc., 5.250%, 5/1/2023 | | | 150,000 | | | | 143,250 | |
Rowan Cos., Inc., 7.375%, 6/15/2025 | | | 124,000 | | | | 112,840 | |
Transocean, Inc., 9.000%, 7/15/2023 (6) | | | 150,000 | | | | 160,125 | |
Whiting Petroleum Corp., 5.750%, 3/15/2021 | | | 100,000 | | | | 94,250 | |
| | | | | | | | |
| | | | 1,277,975 | |
| | |
Oil & Gas Services — 1.0% | | | | | | | | |
Weatherford International, Ltd., 7.750%, 6/15/2021 | | | 128,000 | | | | 128,480 | |
| | |
Pharmaceuticals — 0.5% | | | | | | | | |
Endo Finance LLC, 5.750%, 1/15/2022 (6) | | | 75,000 | | | | 67,500 | |
| | | | | | | | |
| Description | | Principal
Amount | | | Value | |
| Corporate Bonds & Notes (continued) | |
| | |
Pipelines — 3.7% | | | | | | | | |
Antero Midstream Partners LP, 5.375%, 9/15/2024 | | $ | 100,000 | | | $ | 102,500 | |
Cheniere Corpus Christi Holdings LLC: | | | | | | | | |
5.125%, 6/30/2027 (6) | | | 150,000 | | | | 155,625 | |
7.000%, 6/30/2024 | | | 75,000 | | | | 85,687 | |
Genesis Energy LP, 6.750%, 8/1/2022 | | | 150,000 | | | | 152,625 | |
| | | | | | | | |
| | | | 496,437 | |
|
Real Estate Investment Trusts — 2.2% | |
GEO Group, Inc., 5.875%, 10/15/2024 | | | 138,000 | | | | 143,520 | |
Iron Mountain, Inc., 5.750%, 8/15/2024 | | | 100,000 | | | | 102,505 | |
SBA Communications Corp., 4.875%, 9/1/2024 | | | 50,000 | | | | 51,750 | |
| | | | | | | | |
| | | | 297,775 | |
| | |
Retail — 3.4% | | | | | | | | |
Asbury Automotive Group, Inc., 6.000%, 12/15/2024 | | | 100,000 | | | | 103,500 | |
JC Penney Corp., Inc., 5.650%, 6/1/2020 | | | 75,000 | | | | 74,497 | |
L Brands, Inc., 5.625%, 10/15/2023 | | | 117,000 | | | | 123,435 | |
New Red Finance, Inc., 4.250%, 5/15/2024 (6) | | | 150,000 | | | | 152,250 | |
| | | | | | | | |
| | | | | | | 453,682 | |
| | |
Semiconductors — 1.6% | | | | | | | | |
Amkor Technology, Inc., 6.375%, 10/1/2022 | | | 100,000 | | | | 103,625 | |
Micron Technology, Inc., 5.250%, 8/1/2023 (6) | | | 100,000 | | | | 104,625 | |
| | | | | | | | |
| | | | | | | 208,250 | |
| | |
Software — 1.6% | | | | | | | | |
Donnelley Financial Solutions, Inc., 8.250%, 10/15/2024 | | | 74,000 | | | | 79,735 | |
Rackspace Hosting, Inc., 8.625%, 11/15/2024 (6) | | | 122,000 | | | | 129,778 | |
| | | | | | | | |
| | | | | | | 209,513 | |
| | |
Telecommunications — 11.7% | | | | | | | | |
CenturyLink, Inc., 5.800%, 3/15/2022 | | | 200,000 | | | | 199,500 | |
Cincinnati Bell, Inc., 7.000%, 7/15/2024 (6) | | | 150,000 | | | | 148,875 | |
CommScope, Inc., 5.500%, 6/15/2024 (6) | | | 158,000 | | | | 165,307 | |
Frontier Communications Corp., 8.750%, 4/15/2022 | | | 125,000 | | | | 106,250 | |
GCI, Inc., 6.750%, 6/1/2021 | | | 119,000 | | | | 122,124 | �� |
Hughes Satellite Systems Corp., 7.625%, 6/15/2021 | | | 100,000 | | | | 114,250 | |
Inmarsat Finance PLC, 4.875%, 5/15/2022 (6) | | | 150,000 | | | | 153,375 | |
Sprint Communications, Inc., 6.000%, 11/15/2022 | | | 100,000 | | | | 106,625 | |
Sprint Corp., 7.125%, 6/15/2024 | | | 110,000 | | | | 121,275 | |
Telecom Italia Capital SA, 6.000%, 9/30/2034 | | | 200,000 | | | | 222,000 | |
Telesat Canada, 8.875%, 11/15/2024 (6) | | | 82,000 | | | | 92,045 | |
| | | | | | | | |
| | | | | | | 1,551,626 | |
(See Notes which are an integral part of the Financial Statements)
104
High Yield Bond Fund (continued)
| | | | | | | | |
| Description | | Shares or
Principal
Amount | | | Value | |
| Corporate Bonds & Notes (continued) | |
| | |
Transportation — 1.4% | | | | | | | | |
XPO Logistics, Inc., 6.500%, 6/15/2022 (6) | | $ | 175,000 | | | $ | 184,774 | |
| | | | | | | | |
Total Corporate Bonds & Notes
(identified cost $12,275,868) | | | | | | | 12,774,444 | |
| | | | | | | | |
| Short-Term Investments — 2.7% | | | | | | |
| | |
| Mutual Funds — 2.7% | | | | | | |
BMO Institutional Prime Money Market Fund — Premier Class, 1.080% (4) | | | 360,009 | | | | 360,045 | |
| | | | | | | | |
Total Short-Term Investments
(identified cost $360,045) | | | | | | | 360,045 | |
| | | | | | | | |
Total Investments — 98.7%
(identified cost $12,635,913) | | | | | | | 13,134,489 | |
| Other Assets and Liabilities — 1.3% | | | | 178,860 | |
| | | | | | | | |
| Total Net Assets — 100.0% | | | | | | $ | 13,313,349 | |
| | | | | | | | |
Government Money Market Fund
| | | | | | | | |
| Description | | Shares or
Principal
Amount | | | Value | |
| Mutual Funds — 5.5% | | | | | | |
BlackRock Liquidity Funds T-Fund Portfolio — Institutional Class, 0.890% | | | 25,000,000 | | | $ | 25,000,000 | |
Invesco Government & Agency Portfolio — Institutional Class, 0.930% | | | 145,000,000 | | | | 145,000,000 | |
| | | | | | | | |
| Total Mutual Funds | | | | | | | 170,000,000 | |
| | | | | | | | |
| Repurchase Agreements — 19.7% | |
Agreement with Fixed Income Clearing Corp., 0.120%, dated 8/31/2017, to be repurchased at $13,302,580 on 9/1/2017, collateralized by a U.S. Government Treasury Obligation with a maturity of 11/30/2023, with a market value of $13,572,393 | | $ | 13,302,536 | | | | 13,302,536 | |
Agreement with Goldman Sachs Group, Inc., 1.040%, dated 8/31/2017, to be repurchased at $430,012,422 on 9/1/2017, collateralized by U.S. Government Agency Obligations with various maturities to 8/1/2047, with a market value of $437,308,940 | | | 430,000,000 | | | | 430,000,000 | |
| | | | | | | | |
| Description | | Principal
Amount | | | Value | |
| Repurchase Agreements (continued) | |
Agreement with Merrill Lynch, Pierce, Fenner & Smith, Inc., 1.080%, dated 8/31/2017, to be repurchased at $65,001,950 on 9/1/2017, collateralized by U.S. Government Agency Obligations with various maturities to 9/1/2047, with a market value of $66,120,013 | | $ | 65,000,000 | | | $ | 65,000,000 | |
Agreement with Toronto Dominion Bank, 1.070%, dated 8/31/2017, to be repurchased at $100,002,972 on 9/1/2017, collateralized by U.S. Government Agency Obligations with various maturities to 3/1/2047, with a market value of $101,715,362 | | | 100,000,000 | | | | 100,000,000 | |
| | | | | | | | |
| Total Repurchase Agreements | | | | | | | 608,302,536 | |
| | | | | | | | |
| U.S. Government & U.S. Government Agency Obligations — 86.2% | |
|
Federal Farm Credit Bank — 17.0% | |
0.990%, 9/6/2017 (11) | | | 20,000,000 | | | | 19,997,250 | |
0.990%, 9/8/2017 (11) | | | 23,000,000 | | | | 22,995,572 | |
1.000%, 10/13/2017 (11) | | | 20,000,000 | | | | 19,976,667 | |
1.035% (LIBOR 3 Month-26 basis points), 9/28/2018 (7) | | | 18,000,000 | | | | 18,001,741 | |
1.073% (U.S. Treasury 3 Month Bill Money Market Yield+5 basis points), 12/5/2018 (7) | | | 11,000,000 | | | | 10,999,297 | |
1.129% (LIBOR 1 Month-10 basis points), 8/8/2018 (7) | | | 15,000,000 | | | | 15,000,000 | |
1.135% (U.S. Federal Funds Effective Rate (continuous series)-3 basis points), 4/25/2019 (7) | | | 18,000,000 | | | | 17,998,509 | |
1.137% (LIBOR 1 Month-10 basis points), 12/3/2018 (7) | | | 15,000,000 | | | | 15,000,000 | |
1.145% (FCPR DLY-311 basis points), 4/10/2019 (7) | | | 14,000,000 | | | | 13,998,867 | |
1.149% (LIBOR 1 Month-8 basis points), 11/9/2018 (7) | | | 10,000,000 | | | | 9,999,422 | |
1.160% (U.S. Federal Funds Effective Rate (continuous series)+0 basis points), 4/15/2019 (7) | | | 16,000,000 | | | | 15,997,388 | |
1.166% (LIBOR 1 Month-7 basis points), 7/20/2018 (7) | | | 18,000,000 | | | | 18,012,205 | |
1.170% (U.S. Federal Funds Effective Rate (continuous series)+1 basis points), 4/24/2019 (7) | | | 15,000,000 | | | | 14,997,525 | |
1.170% (FCPR DLY-308 basis points), 6/27/2019 (7) | | | 25,000,000 | | | | 24,999,532 | |
(See Notes which are an integral part of the Financial Statements)
105
August 31, 2017
Government Money Market Fund (continued)
| | | | | | | | |
| Description | | Principal
Amount | | | Value | |
U.S. Government & U.S. Government Agency Obligations
(continued) | |
|
Federal Farm Credit Bank (continued) | |
1.176% (LIBOR 1 Month-6 basis points), 12/20/2018 (7) | | $ | 15,500,000 | | | $ | 15,499,470 | |
1.180% (LIBOR 3 Month-3 basis points), 3/2/2018 (7) | | | 25,950,000 | | | | 25,978,771 | |
1.186% (LIBOR 1 Month-5 basis points), 1/23/2019 (7) | | | 10,000,000 | | | | 10,000,785 | |
1.190% (FCPR DLY-306 basis points), 4/25/2019 (7) | | | 10,000,000 | | | | 9,998,339 | |
1.204% (LIBOR 1 Month-3 basis points), 10/25/2017 (7) | | | 15,000,000 | | | | 15,000,000 | |
1.244% (LIBOR 1 Month+1 basis points), 11/27/2017 (7) | | | 8,415,000 | | | | 8,414,593 | |
1.248% (LIBOR 1 Month+2 basis points), 5/17/2018 (7) | | | 12,900,000 | | | | 12,914,868 | |
1.249% (LIBOR 1 Month+2 basis points), 1/8/2018 (7) | | | 13,690,000 | | | | 13,697,689 | |
1.258% (LIBOR 1 Month+3 basis points), 1/17/2018 (7) | | | 7,995,000 | | | | 7,996,780 | |
1.260% (U.S. Federal Funds Effective Rate (continuous series)+10 basis points), 9/1/2017 (7) | | | 15,000,000 | | | | 15,000,000 | |
1.264% (LIBOR 1 Month+4 basis points), 12/8/2017 (7) | | | 8,000,000 | | | | 8,002,361 | |
1.265% (LIBOR 1 Month+3 basis points), 11/22/2017 (7) | | | 5,000,000 | | | | 5,002,384 | |
1.265% (LIBOR 1 Month+3 basis points), 3/22/2018 (7) | | | 2,945,000 | | | | 2,947,472 | |
1.267% (LIBOR 1 Month+4 basis points), 9/15/2017 (7) | | | 8,100,000 | | | | 8,100,472 | |
1.270% (U.S. Federal Funds Effective Rate (continuous series)+11 basis points), 1/22/2018 (7) | | | 20,000,000 | | | | 20,013,368 | |
1.274% (LIBOR 1 Month+5 basis points), 4/9/2018 (7) | | | 27,350,000 | | | | 27,362,513 | |
1.278% (LIBOR 1 Month+5 basis points), 4/16/2018 (7) | | | 21,075,000 | | | | 21,084,232 | |
1.284% (LIBOR 3 Month-3 basis points), 1/26/2018 (7) | | | 12,500,000 | | | | 12,509,168 | |
1.304% (LIBOR 1 Month+7 basis points), 9/28/2017 (7) | | | 6,500,000 | | | | 6,501,359 | |
1.327% (LIBOR 1 Month+10 basis points), 10/3/2018 (7) | | | 15,050,000 | | | | 15,054,788 | |
1.349% (LIBOR 1 Month+12 basis points), 11/13/2017 (7) | | | 5,000,000 | | | | 5,000,000 | |
1.354% (LIBOR 1 Month+13 basis points), 9/14/2017 (7) | | | 5,000,000 | | | | 5,000,259 | |
1.361% (LIBOR 1 Month+13 basis points), 10/6/2017 (7) | | | 5,300,000 | | | | 5,301,719 | |
1.374% (LIBOR 1 Month+14 basis points), 1/25/2018 (7) | | | 3,500,000 | | | | 3,500,294 | |
1.394% (LIBOR 1 Month+16 basis points), 3/26/2018 (7) | | | 5,235,000 | | | | 5,239,923 | |
| | | | | | | | |
| | | | | | | 523,095,582 | |
| | | | | | | | |
| Description | | Principal
Amount | | | Value | |
U.S. Government & U.S. Government Agency Obligations
(continued) | |
| |
Federal Home Loan Bank — 30.0% | | | | | |
0.937% (LIBOR 3 Month-35 basis points), 9/22/2017 (7) | | $ | 24,000,000 | | | $ | 24,000,000 | |
0.960%, 9/5/2017 (11) | | | 6,500,000 | | | | 6,499,307 | |
0.960% (LIBOR 3 Month-26 basis points), 9/7/2017 (7) | | | 10,000,000 | | | | 10,000,001 | |
0.997%, 9/6/2017 (11) | | | 95,683,000 | | | | 95,669,757 | |
1.000%, 9/14/2017 (11) | | | 15,000,000 | | | | 14,994,583 | |
1.005%, 9/8/2017 (11) | | | 15,000,000 | | | | 14,997,069 | |
1.019% (LIBOR 3 Month-30 basis points), 10/25/2017 (7) | | | 14,000,000 | | | | 13,999,895 | |
1.037%, 11/22/2017 (11) | | | 15,000,000 | | | | 14,964,569 | |
1.039% (LIBOR 3 Month-16 basis points), 3/1/2018 (7) | | | 10,000,000 | | | | 10,002,592 | |
1.041% (LIBOR 1 Month-19 basis points), 10/20/2017 (7) | | | 16,000,000 | | | | 16,000,000 | |
1.048% (LIBOR 1 Month-18 basis points), 1/18/2018 (7) | | | 15,000,000 | | | | 15,000,000 | |
1.049% (LIBOR 1 Month-19 basis points), 9/26/2017 (7) | | | 20,000,000 | | | | 20,000,000 | |
1.052% (LIBOR 1 Month-18 basis points), 2/2/2018 (7) | | | 12,000,000 | | | | 11,997,446 | |
1.062% (LIBOR 1 Month-17 basis points), 1/2/2018 (7) | | | 10,000,000 | | | | 10,000,000 | |
1.064% (LIBOR 1 Month-17 basis points), 1/26/2018 (7) | | | 12,500,000 | | | | 12,500,000 | |
1.064% (LIBOR 1 Month-17 basis points), 1/26/2018 (7) | | | 15,000,000 | | | | 15,000,000 | |
1.069% (LIBOR 1 Month-17 basis points), 1/25/2018 (7) | | | 30,000,000 | | | | 29,998,896 | |
1.069% (LIBOR 1 Month-17 basis points), 1/26/2018 (7) | | | 10,000,000 | | | | 9,999,422 | |
1.071% (LIBOR 1 Month-17 basis points), 1/23/2018 (7) | | | 9,000,000 | | | | 8,999,684 | |
1.073% (LIBOR 1 Month-16 basis points), 1/17/2018 (7) | | | 20,000,000 | | | | 20,000,000 | |
1.074% (LIBOR 1 Month-16 basis points), 2/12/2018 (7) | | | 14,000,000 | | | | 14,000,000 | |
1.076% (LIBOR 3 Month-22 basis points), 3/26/2018 (7) | | | 18,500,000 | | | | 18,500,000 | |
1.079% (LIBOR 1 Month-16 basis points), 1/25/2018 (7) | | | 15,000,000 | | | | 14,999,786 | |
1.081% (LIBOR 1 Month-15 basis points), 2/2/2018 (7) | | | 15,000,000 | | | | 14,999,916 | |
1.088% (LIBOR 1 Month-14 basis points), 5/18/2018 (7) | | | 20,000,000 | | | | 20,000,000 | |
1.089% (LIBOR 1 Month-15 basis points), 4/25/2018 (7) | | | 13,500,000 | | | | 13,499,542 | |
1.089% (LIBOR 1 Month-15 basis points), 4/26/2018 (7) | | | 15,000,000 | | | | 14,999,586 | |
1.091% (LIBOR 1 Month-14 basis points), 4/6/2018 (7) | | | 15,000,000 | | | | 15,000,000 | |
1.104% (LIBOR 1 Month-13 basis points), 7/25/2018 (7) | | | 15,000,000 | | | | 15,000,000 | |
1.113% (LIBOR 1 Month-12 basis points), 8/23/2018 (7) | | | 15,000,000 | | | | 15,000,000 | |
1.129% (LIBOR 3 Month-18 basis points), 11/13/2017 (7) | | | 12,500,000 | | | | 12,500,128 | |
1.129%, 12/22/2017 (11) | | | 17,500,000 | | | | 17,438,532 | |
1.130%, 12/27/2017 (11) | | | 4,000,000 | | | | 3,985,310 | |
1.131% (LIBOR 1 Month-10 basis points), 12/21/2018 (7) | | | 17,500,000 | | | | 17,500,000 | |
1.139% (LIBOR 1 Month-9 basis points), 11/8/2018 (7) | | | 15,000,000 | | | | 15,000,000 | |
(See Notes which are an integral part of the Financial Statements)
106
Government Money Market Fund (continued)
| | | | | | | | |
| Description | | Principal
Amount | | | Value | |
U.S. Government & U.S. Government Agency Obligations
(continued) | |
| |
Federal Home Loan Bank (continued) | | | | | |
1.139% (LIBOR 1 Month-9 basis points), 1/11/2019 (7) | | $ | 13,500,000 | | | $ | 13,500,000 | |
1.140%, 2/9/2018 (11) | | | 10,000,000 | | | | 9,949,017 | |
1.145% (LIBOR 1 Month-9 basis points), 1/22/2019 (7) | | | 15,000,000 | | | | 15,000,000 | |
1.151% (LIBOR 1 Month-8 basis points), 2/4/2019 (7) | | | 10,000,000 | | | | 10,000,000 | |
1.156% (LIBOR 1 Month-8 basis points), 7/23/2018 (7) | | | 10,000,000 | | | | 10,000,000 | |
1.156% (LIBOR 1 Month-8 basis points), 11/23/2018 (7) | | | 14,500,000 | | | | 14,500,000 | |
1.165% (LIBOR 1 Month-7 basis points), 11/22/2017 (7) | | | 18,800,000 | | | | 18,799,537 | |
1.176% (LIBOR 1 Month-6 basis points), 8/28/2019 (7) | | | 10,000,000 | | | | 10,000,000 | |
1.181% (LIBOR 1 Month-5 basis points), 10/10/2017 (7) | | | 23,000,000 | | | | 23,000,000 | |
1.187% (LIBOR 1 Month-5 basis points), 2/1/2019 (7) | | | 10,000,000 | | | | 10,000,052 | |
1.196% (LIBOR 1 Month-4 basis points), 10/6/2017 (7) | | | 5,000,000 | | | | 5,000,725 | |
1.197% (LIBOR 1 Month-3 basis points), 9/15/2017 (7) | | | 17,500,000 | | | | 17,500,000 | |
1.213% (LIBOR 3 Month-2 basis points), 9/11/2017 (7) | | | 7,500,000 | | | | 7,499,438 | |
1.222% (LIBOR 3 Month-9 basis points), 11/6/2017 (7) | | | 4,600,000 | | | | 4,601,327 | |
1.244% (LIBOR 1 Month+2 basis points), 12/8/2017 (7) | | | 10,000,000 | | | | 9,999,865 | |
1.249% (LIBOR 1 Month+2 basis points), 11/28/2017 (7) | | | 20,725,000 | | | | 20,724,931 | |
1.253% (LIBOR 1 Month+3 basis points), 5/17/2018 (7) | | | 5,000,000 | | | | 5,004,346 | |
1.256% (LIBOR 1 Month+2 basis points), 3/23/2018 (7) | | | 25,000,000 | | | | 25,000,091 | |
1.271% (LIBOR 1 Month+4 basis points), 9/5/2017 (7) | | | 25,390,000 | | | | 25,390,377 | |
1.283% (LIBOR 1 Month+6 basis points), 11/17/2017 (7) | | | 12,500,000 | | | | 12,500,000 | |
1.301% (LIBOR 1 Month+7 basis points), 12/5/2017 (7) | | | 25,530,000 | | | | 25,534,279 | |
1.301% (LIBOR 1 Month+7 basis points), 12/7/2017 (7) | | | 17,535,000 | | | | 17,540,053 | |
1.307% (LIBOR 1 Month+8 basis points), 11/3/2017 (7) | | | 10,000,000 | | | | 10,000,000 | |
1.308% (LIBOR 1 Month+8 basis points), 10/18/2017 (7) | | | 5,000,000 | | | | 5,000,000 | |
1.331% (LIBOR 1 Month+10 basis points), 2/5/2018 (7) | | | 1,700,000 | | | | 1,701,675 | |
| | | | | | | | |
| | | | | | | 924,791,734 | |
|
Federal Home Loan Mortgage Corporation — 6.1% | |
0.800%, 9/28/2017 | | | 6,400,000 | | | | 6,400,000 | |
0.924% (LIBOR 3 Month-38 basis points), 10/12/2017 (7) | | | 15,000,000 | | | | 15,000,000 | |
0.950%, 9/1/2017 (11) | | | 50,000,000 | | | | 50,000,000 | |
0.995%, 9/5/2017 (11) | | | 10,000,000 | | | | 9,998,895 | |
| | | | | | | | |
| Description | | Principal
Amount | | | Value | |
U.S. Government & U.S. Government Agency Obligations
(continued) | |
|
Federal Home Loan Mortgage Corporation (continued) | |
1.005%, 9/14/2017 (11) | | $ | 25,000,000 | | | $ | 24,990,927 | |
1.029% (LIBOR 3 Month-28 basis points), 8/10/2018 (7) | | | 15,000,000 | | | | 15,000,000 | |
1.054% (LIBOR 3 Month-25 basis points), 10/10/2018 (7) | | | 20,000,000 | | | | 20,000,000 | |
1.064% (LIBOR 3 Month-25 basis points), 7/25/2018 (7) | | | 10,000,000 | | | | 10,000,000 | |
1.269% (LIBOR 1 Month+4 basis points), 11/13/2017 (7) | | | 36,935,000 | | | | 36,943,161 | |
| | | | | | | | |
| | | | 188,332,983 | |
|
Federal National Mortgage Association — 28.9% | |
0.900%, 9/5/2017 (11) | | | 350,000,000 | | | | 349,965,000 | |
0.950%, 9/1/2017 (11) | | | 475,000,000 | | | | 475,000,000 | |
1.000%, 9/11/2017 (11) | | | 11,950,000 | | | | 11,946,680 | |
1.140%, 1/3/2018 (11) | | | 13,414,000 | | | | 13,361,328 | |
1.239% (LIBOR 1 Month+1 basis points), 9/8/2017 (7) | | | 3,000,000 | | | | 2,994,450 | |
1.241% (LIBOR 1 Month+1 basis points), 10/5/2017 (7) | | | 29,555,000 | | | | 29,558,246 | |
1.275% (LIBOR 3 Month-3 basis points), 1/11/2018 (7) | | | 7,500,000 | | | | 7,500,000 | |
| | | | | | | | |
| | | | 890,325,704 | |
|
U.S. Treasury Bonds & Notes — 4.2% | |
0.875%, 10/15/2017 | | | 15,000,000 | | | | 14,995,488 | |
0.965%, 9/7/2017 (11) | | | 50,000,000 | | | | 49,991,958 | |
1.071%, 10/5/2017 (11) | | | 15,000,000 | | | | 14,984,827 | |
1.122%, 10/19/2017 (11) | | | 30,000,000 | | | | 29,955,127 | |
1.145%, 10/12/2017 (11) | | | 10,000,000 | | | | 9,986,960 | |
1.175%, 10/26/2017 (11) | | | 10,000,000 | | | | 9,982,049 | |
| | | | | | | | |
| | | | 129,896,409 | |
| | | | | | | | |
Total U.S. Government & U.S. Government Agency Obligations | | | | 2,656,442,412 | |
| | | | | | | | |
Total Investments — 111.4%
(at amortized cost) | | | | 3,434,744,948 | |
| Other Assets and Liabilities — (11.4)% | | | | (351,141,574 | ) |
| | | | | | | | |
| Total Net Assets — 100.0% | | | $ | 3,083,603,374 | |
| | | | | | | | |
Tax-Free Money Market Fund
| | | | | | | | |
| Description | | Principal
Amount | | | Value | |
| Municipals — 101.4% | | | | | | |
| | |
Alabama — 9.0% | | | | | | | | |
Chatom Industrial Development Board, 1.300%, 8/1/2037 (12) | | $ | 5,500,000 | | | $ | 5,500,000 | |
City of Oxford, 0.940%, 9/1/2041 (12) | | | 12,745,000 | | | | 12,745,000 | |
Mobile Industrial Development Board, 1.000%, 6/1/2034 (12) | | | 10,000,000 | | | | 10,000,000 | |
| | | | | | | | |
| | | | | | | 28,245,000 | |
(See Notes which are an integral part of the Financial Statements)
107
August 31, 2017
Tax-Free Money Market Fund (continued)
| | | | | | | | |
| Description | | Principal
Amount | | | Value | |
| Municipals (continued) | | | | | | |
| | |
California — 1.6% | | | | | | | | |
San Francisco City & County Public Utilities Commission, 0.840%, 10/18/2017 | | $ | 5,000,000 | | | $ | 5,000,000 | |
| | |
Colorado — 3.1% | | | | | | | | |
Colorado Health Facilities Authority, 0.850%, 1/1/2035 (12) | | | 9,900,000 | | | | 9,900,000 | |
| | |
Connecticut — 4.0% | | | | | | | | |
State of Connecticut, 0.900%, 5/15/2034 (12) | | | 12,700,000 | | | | 12,700,000 | |
| | |
Delaware — 2.2% | | | | | | | | |
Delaware State Health Facilities Authority, 0.880%, 10/1/2038 (12) | | | 7,000,000 | | | | 7,000,000 | |
| | |
Florida — 6.3% | | | | | | | | |
County of Brevard, 0.940%, 10/1/2019 (12) | | | 800,000 | | | | 800,000 | |
Jacksonville Pollution Control, 0.870%, 9/18/2017 | | | 13,300,000 | | | | 13,300,000 | |
Tender Option Bond Trust Receipts/Certificates, 0.860%, 11/1/2027 (6)(12) | | | 5,695,000 | | | | 5,695,000 | |
| | | | | | | | |
| | | | | | | 19,795,000 | |
| | |
Georgia — 0.1% | | | | | | | | |
Columbia County Development Authority, 0.890%, 8/1/2018 (12) | | | 400,000 | | | | 400,000 | |
| | |
Illinois — 3.3% | | | | | | | | |
Jackson-Union Counties Regional Port District, 0.840%, 4/1/2024 (12) | | | 2,400,000 | | | | 2,400,000 | |
Phoenix Realty Special Account-U LP, 0.810%, 4/1/2020 (12) | | | 8,075,000 | | | | 8,075,000 | |
| | | | | | | | |
| | | | | | | 10,475,000 | |
| | |
Indiana — 2.5% | | | | | | | | |
Tender Option Bond Trust Receipts/Certificates, 0.940%, 5/14/2026 (6)(12) | | | 7,770,000 | | | | 7,770,000 | |
| | |
Iowa — 4.5% | | | | | | | | |
Iowa Finance Authority: | | | | | | | | |
0.810%, 6/1/2039 (12) | | | 9,800,000 | | | | 9,800,000 | |
0.830%, 9/1/2036 (12) | | | 3,200,000 | | | | 3,200,000 | |
0.870%, 3/1/2022 (12) | | | 1,175,000 | | | | 1,175,000 | |
| | | | | | | | |
| | | | | | | 14,175,000 | |
| | |
Maryland — 3.2% | | | | | | | | |
City of Montgomery, 0.960%, 9/14/2017 | | | 10,000,000 | | | | 10,000,000 | |
| | |
Massachusetts — 1.6% | | | | | | | | |
Massachusetts Bay Trust, 0.870%, 10/17/2017 | | | 5,000,000 | | | | 5,000,000 | |
| | |
Michigan — 0.4% | | | | | | | | |
Michigan Strategic Fund, 0.890%, 6/1/2039 (12) | | | 1,175,000 | | | | 1,175,000 | |
| | | | | | | | |
| Description | | Principal
Amount | | | Value | |
| Municipals (continued) | | | | | | |
| | |
Minnesota — 2.3% | | | | | | | | |
City of Ramsey, 0.980%, 12/1/2023 (12) | | $ | 2,090,000 | | | $ | 2,090,000 | |
Minnesota Higher Education Facilities Authority: | | | | | | | | |
0.860%, 3/1/2024 (12) | | | 2,000,000 | | | | 2,000,000 | |
0.860%, 3/1/2033 (12) | | | 3,215,000 | | | | 3,215,000 | |
| | | | | | | | |
| | | | | | | 7,305,000 | |
| | |
Mississippi — 4.7% | | | | | | | | |
Mississippi Business Finance Corp.: | | | | | | | | |
0.840%, 12/1/2030 (12) | | | 7,000,000 | | | | 7,000,000 | |
0.840%, 11/1/2035 (12) | | | 3,520,000 | | | | 3,520,000 | |
0.840%, 11/1/2035 (12) | | | 1,400,000 | | | | 1,400,000 | |
1.150%, 5/1/2037 (12) | | | 2,823,000 | | | | 2,823,000 | |
| | | | | | | | |
| | | | | | | 14,743,000 | |
| | |
Missouri — 0.3% | | | | | | | | |
Greene County Industrial Development Authority, 0.910%, 5/1/2039 (12) | | | 1,025,000 | | | | 1,025,000 | |
| | |
Nebraska — 0.2% | | | | | | | | |
Nebraska Investment Finance Authority, 1.000%, 9/1/2031 (12) | | | 600,000 | | | | 600,000 | |
| | |
New Jersey — 3.1% | | | | | | | | |
New Jersey Housing & Mortgage Finance Agency, 0.850%, 10/1/2017 (12) | | | 4,780,000 | | | | 4,780,000 | |
RBC Municipal Products, Inc. Trust, 0.820%, 6/28/2018 (6)(12) | | | 5,000,000 | | | | 5,000,000 | |
| | | | | | | | |
| | | | | | | 9,780,000 | |
| | |
New York — 16.6% | | | | | | | | |
City of New York: | | | | | | | | |
0.850%, 4/1/2036 (12) | | | 2,600,000 | | | | 2,600,000 | |
0.860%, 8/1/2024 (12) | | | 6,205,000 | | | | 6,205,000 | |
0.860%, 8/1/2044 (12) | | | 2,615,000 | | | | 2,615,000 | |
Metropolitan Transportation Authority, 0.800%, 11/1/2032 (12) | | | 10,000,000 | | | | 10,000,000 | |
New York City Transitional Finance Authority, 0.850%, 8/1/2043 (12) | | | 6,715,000 | | | | 6,715,000 | |
New York City Water & Sewer System: | | | | | | | | |
0.830%, 6/15/2049 (12) | | | 2,520,000 | | | | 2,520,000 | |
0.840%, 6/15/2039 (12) | | | 5,500,000 | | | | 5,500,000 | |
0.860%, 6/15/2044 (12) | | | 3,950,000 | | | | 3,950,000 | |
Tender Option Bond Trust Receipts/Certificates, 0.840%, 1/1/2024 (6)(12) | | | 2,000,000 | | | | 2,000,000 | |
Triborough Bridge & Tunnel Authority: | | | | | | | | |
0.800%, 1/1/2032 (12) | | | 1,750,000 | | | | 1,750,000 | |
0.860%, 11/1/2032 (12) | | | 8,330,000 | | | | 8,330,000 | |
| | | | | | | | |
| | | | | | | 52,185,000 | |
| | |
Ohio — 4.5% | | | | | | | | |
County of Franklin, 0.950%, 12/1/2017 (12) | | | 9,000,000 | | | | 9,000,000 | |
County of Licking, 2.000%, 5/23/2018 | | | 1,200,000 | | | | 1,206,857 | |
(See Notes which are an integral part of the Financial Statements)
108
Tax-Free Money Market Fund (continued)
| | | | | | | | |
| Description | | Principal
Amount | | | Value | |
| Municipals (continued) | | | | | | |
| | |
Ohio (continued) | | | | | | | | |
Port of Greater Cincinnati Development Authority: | | | | | | | | |
0.930%, 11/1/2023 (12) | | $ | 1,675,000 | | | $ | 1,675,000 | |
0.930%, 11/1/2025 (12) | | | 315,000 | | | | 315,000 | |
Village of Cuyahoga Heights, 1.625%, 6/20/2018 | | | 2,000,000 | | | | 2,008,304 | |
| | | | | | | | |
| | | | | | | 14,205,161 | |
| | |
South Carolina — 2.7% | | | | | | | | |
South Carolina Educational Facilities Authority, 0.830%, 10/1/2039 (12) | | | 8,340,000 | | | | 8,340,000 | |
| | |
South Dakota — 4.1% | | | | | | | | |
South Dakota Housing Development Authority: | | | | | | | | |
0.940%, 5/1/2048 (12) | | | 6,685,000 | | | | 6,685,000 | |
0.950%, 11/1/2048 (12) | | | 6,255,000 | | | | 6,255,000 | |
| | | | | | | | |
| | | | | | | 12,940,000 | |
| | |
Texas — 9.2% | | | | | | | | |
Harris County Cultural Education Facilities Finance Corp., 0.880%, 12/1/2027 (12) | | | 6,985,000 | | | | 6,985,000 | |
Harris County Health Facilities Development Corp.: | | | | | | | | |
0.880%, 12/1/2041(12) | | | 3,000,000 | | | | 3,000,000 | |
0.880%, 12/1/2041(12) | | | 3,100,000 | | | | 3,100,000 | |
Mission Economic Development Corp., 0.840%, 4/1/2022 (12) | | | 11,000,000 | | | | 11,000,000 | |
Texas Municipal Power, 0.850%, 9/13/2017 | | | 5,000,000 | | | | 5,000,000 | |
| | | | | | | | |
| | | | | | | 29,085,000 | |
| | |
Utah — 2.5% | | | | | | | | |
City of Murray, 0.790%, 5/15/2036 (12) | | | 8,000,000 | | | | 8,000,000 | |
| | |
Washington — 4.8% | | | | | | | | |
Seattle Housing Authority, 0.940%, 6/1/2040 (12) | | | 1,000,000 | | | | 1,000,000 | |
Tender Option Bond Trust Receipts/Certificates, 0.940%, 6/15/2029 (6)(12) | | | 11,320,000 | | | | 11,320,000 | |
Washington State Housing Finance Commission, 0.890%, 7/1/2028 (12) | | | 2,720,000 | | | | 2,720,000 | |
| | | | | | | | |
| | | | | | | 15,040,000 | |
| | |
Wisconsin — 4.6% | | | | | | | | |
Burlington Area School District, 1.000%, 9/20/2017 | | | 2,000,000 | | | | 2,000,103 | |
Pewaukee School District, 1.000%, 9/27/2017 | | | 2,400,000 | | | | 2,400,254 | |
PMA, 2.000%, 10/20/2017 | | | 5,800,000 | | | | 5,807,865 | |
Tender Option Bond Trust Receipts/Certificates, 0.840%, 7/1/2047 (6)(12) | | | 2,385,000 | | | | 2,385,000 | |
| | | | | | | | |
| Description | | Shares or
Principal
Amount | | | Value | |
| Municipals (continued) | | | | | | |
| | |
Wisconsin (continued) | | | | | | | | |
Wisconsin Health & Educational Facilities Authority, 0.830%, 5/1/2030 (12) | | $ | 1,805,000 | | | $ | 1,805,000 | |
| | | | | | | | |
| | | | | | | 14,398,222 | |
| | | | | | | | |
| Total Municipals | | | | | | | 319,281,383 | |
| | |
| Mutual Funds — 0.1% | | | | | | |
BlackRock Liquidity Funds T-Fund Portfolio — Institutional Class, 0.890% | | | 83,175 | | | | 83,175 | |
Federated Institutional Tax-Free Cash Trust — Institutional Class, 0.660% | | | 118,311 | | | | 118,311 | |
| | | | | | | | |
| Total Mutual Funds | | | | | | | 201,486 | |
| | | | | | | | |
Total Investments — 101.5%
(at amortized cost) | | | | 319,482,869 | |
| Other Assets and Liabilities — (1.5)% | | | | (4,681,456 | ) |
| | | | | | | | |
| Total Net Assets — 100.0% | | | $ | 314,801,413 | |
| | | | | | | | |
Prime Money Market Fund
| | | | | | | | |
| Description | | Principal
Amount | | | Value | |
| Certificates of Deposit — 25.7% | |
| | |
Banks — 18.1% | | | | | | | | |
Bank of Nova Scotia/Houston, 1.408% (LIBOR 1 Month+18 basis points), 5/18/2018 (7) | | $ | 2,000,000 | | | $ | 2,000,000 | |
Commonwealth Bank of Australia/New York, 1.571% (LIBOR 3 Month+26 basis points), 2/2/2018 (7) | | | 2,000,000 | | | | 2,000,337 | |
HSBC Bank USA NA: | | | | | | | | |
1.561% (LIBOR 1 Month+33 basis points), 3/20/2018 (7) | | | 2,500,000 | | | | 2,500,000 | |
1.709% (LIBOR 1 Month+48 basis points), 10/13/2017 (7) | | | 2,500,000 | | | | 2,500,000 | |
Mitsubishi UFJ Trust & Banking Corp.: | | | | | | | | |
1.399% (LIBOR 1 Month+17 basis points), 12/11/2017 (7) | | | 2,650,000 | | | | 2,649,784 | |
1.411% (LIBOR 1 Month+18 basis points), 2/9/2018 (7) | | | 2,500,000 | | | | 2,500,023 | |
1.462% (LIBOR 1 Month+23 basis points), 11/1/2017 (7) | | | 1,500,000 | | | | 1,500,235 | |
Mizuho Bank, Ltd.: | | | | | | | | |
1.411% (LIBOR 1 Month+18 basis points), 11/10/2017 (7) | | | 2,000,000 | | | | 2,000,160 | |
1.512% (LIBOR 1 Month+28 basis points), 12/1/2017 (7) | | | 2,500,000 | | | | 2,500,583 | |
1.632% (LIBOR 1 Month+40 basis points), 9/1/2017 (7) | | | 2,500,000 | | | | 2,500,000 | |
Skandinaviska Enskilda Banken AB, 1.531% (LIBOR 1 Month+30 basis points), 9/21/2017 (7) | | | 2,500,000 | | | | 2,500,000 | |
Sumitomo Mitsui Banking Corp./New York, 1.358% (LIBOR 1 Month+13 basis points), 9/18/2017 (7) | | | 2,500,000 | | | | 2,500,014 | |
(See Notes which are an integral part of the Financial Statements)
109
August 31, 2017
Prime Money Market Fund (continued)
| | | | | | | | |
| Description | | Principal
Amount | | | Value | |
| Certificates of Deposit (continued) | |
| | |
Banks (continued) | | | | | | | | |
Swedbank (New York): | | | | | | | | |
1.150%, 9/7/2017 | | $ | 7,000,000 | | | $ | 7,000,000 | |
1.160%, 9/6/2017 | | | 7,500,000 | | | | 7,500,000 | |
Toronto Dominion Bank: | | | | | | | | |
1.431% (LIBOR 1 Month+20 basis points), 8/10/2018 (7) | | | 2,375,000 | | | | 2,375,000 | |
1.569% (LIBOR 1 Month+34 basis points), 3/13/2018 (7) | | | 2,500,000 | | | | 2,500,000 | |
1.672% (LIBOR 1 Month+44 basis points), 11/1/2017 (7) | | | 2,500,000 | | | | 2,500,000 | |
1.748% (LIBOR 1 Month+52 basis points), 11/20/2017 (7) | | | 2,000,000 | | | | 2,000,000 | |
1.751% (LIBOR 1 Month+52 basis points), 1/10/2018 (7) | | | 2,750,000 | | | | 2,750,000 | |
Wells Fargo Bank NA: | | | | | | | | |
1.366% (LIBOR 1 Month+13 basis points), 12/19/2017 (7) | | | 3,000,000 | | | | 3,000,000 | |
1.401% (LIBOR 1 Month+17 basis points), 4/20/2018 (7) | | | 2,500,000 | | | | 2,500,000 | |
1.664% (LIBOR 3 Month+35 basis points), 11/16/2017 (7) | | | 1,850,000 | | | | 1,850,000 | |
1.669% (LIBOR 1 Month+44 basis points), 2/14/2018 (7) | | | 2,500,000 | | | | 2,500,000 | |
1.699% (LIBOR 1 Month+47 basis points), 10/11/2017 (7) | | | 2,500,000 | | | | 2,500,000 | |
| | | | | | | | |
| | | | | | | 66,626,136 | |
|
European Time Deposit — 7.6% | |
DNB NOR Bank ASA Cayman, 1.060%, 9/1/2017 | | | 14,000,000 | | | | 14,000,000 | |
Svenska Handelsbanken, Inc., 1.060%, 9/1/2017 | | | 14,000,000 | | | | 14,000,000 | |
| | | | | | | | |
| | | | 28,000,000 | |
| | | | | | | | |
| Total Certificates of Deposit | | | | | | | 94,626,136 | |
| | | | | | | | |
| Commercial Paper — 57.4% | |
|
Asset-Backed Securities — 33.8% | |
Atlantic Asset Securitization LLC: | | | | | | | | |
1.060%, 9/1/2017 (6)(11) | | | 7,000,000 | | | | 7,000,000 | |
1.440%, 9/21/2017 (6)(11) | | | 2,500,000 | | | | 2,498,000 | |
1.552% (LIBOR 1 Month+32 basis points), 1/2/2018 (6)(7) | | | 2,500,000 | | | | 2,500,000 | |
1.567% (LIBOR 1 Month+34 basis points), 12/15/2017 (7) | | | 2,500,000 | | | | 2,500,000 | |
Bedford Row Funding Corp.: | | | | | | | | |
1.372% (LIBOR 1 Month+14 basis points), 3/1/2018 (6)(7) | | | 2,500,000 | | | | 2,500,000 | |
1.449% (LIBOR 1 Month+22 basis points), 6/11/2018 (6)(7) | | | 3,000,000 | | | | 3,000,000 | |
1.451% (LIBOR 1 Month+22 basis points), 2/21/2018 (6)(7) | | | 2,250,000 | | | | 2,250,000 | |
1.455% (LIBOR 1 Month+22 basis points), 8/17/2018 (6)(7) | | | 2,000,000 | | | | 2,000,000 | |
1.498% (LIBOR 1 Month+27 basis points), 12/18/2017 (6)(7) | | | 2,500,000 | | | | 2,500,000 | |
1.712% (LIBOR 3 Month+41 basis points), 10/6/2017 (6)(7) | | | 2,500,000 | | | | 2,500,753 | |
| | | | | | | | |
| Description | | Principal
Amount | | | Value | |
| Commercial Paper (continued) | |
|
Asset-Backed Securities (continued) | |
Chesham Finance Ltd., 1.180%, 9/1/2017 (6)(11) | | $ | 14,500,000 | | | $ | 14,500,000 | |
Crown Point Capital Co. LLC: | | | | | | | | |
1.310%, 10/31/2017 (6)(11) | | | 2,500,000 | | | | 2,494,542 | |
1.320%, 10/17/2017 (6)(11) | | | 3,500,000 | | | | 3,494,097 | |
Gotham Funding Corp., 1.320%, 10/2/2017 (6)(11) | | | 3,500,000 | | | | 3,496,022 | |
Liberty Street Funding LLC: | | | | | | | | |
1.290%, 9/25/2017 (6)(11) | | | 3,000,000 | | | | 2,997,420 | |
1.310%, 10/17/2017 (6)(11) | | | 3,000,000 | | | | 2,994,978 | |
1.310%, 10/25/2017 (6)(11) | | | 3,000,000 | | | | 2,994,105 | |
Manhattan Asset Funding Co.: | | | | | | | | |
1.220%, 9/19/2017 (6)(11) | | | 2,000,000 | | | | 1,998,780 | |
1.371% (LIBOR 1 Month+14 basis points), 12/5/2017 (6)(7) | | | 3,000,000 | | | | 3,000,000 | |
1.389% (LIBOR 1 Month+16 basis points), 2/8/2018 (6)(7) | | | 2,500,000 | | | | 2,500,000 | |
1.399% (LIBOR 1 Month+16 basis points), 1/31/2018 (6)(7) | | | 2,500,000 | | | | 2,500,000 | |
1.534% (LIBOR 1 Month+30 basis points), 9/28/2017 (6)(7) | | | 2,500,000 | | | | 2,500,000 | |
Old Line Funding LLC: | | | | | | | | |
1.351% (LIBOR 1 Month+12 basis points), 12/4/2017 (6)(7) | | | 3,500,000 | | | | 3,500,000 | |
1.351% (LIBOR 1 Month+12 basis points), 1/19/2018 (6)(7) | | | 2,500,000 | | | | 2,500,000 | |
1.369% (LIBOR 1 Month+14 basis points), 11/8/2017 (6)(7) | | | 3,000,000 | | | | 3,000,000 | |
Regency Markets No. 1 LLC: | | | | | | | | |
1.210%, 9/7/2017 (6)(11) | | | 8,000,000 | | | | 7,998,382 | |
1.230%, 9/15/2017 (6)(11) | | | 4,000,000 | | | | 3,998,087 | |
1.230%, 9/26/2017 (6)(11) | | | 2,500,000 | | | | 2,497,865 | |
Ridgefield Funding Co. LLC: | | | | | | | | |
1.300%, 9/18/2017 (6)(11) | | | 4,650,000 | | | | 4,647,145 | |
1.388% (LIBOR 1 Month+16 basis points), 12/18/2017 (6)(7) | | | 3,500,000 | | | | 3,500,000 | |
1.409% (LIBOR 1 Month+18 basis points), 1/11/2018 (6)(7) | | | 2,500,000 | | | | 2,500,000 | |
Starbird Funding Corp., 1.280%, 9/12/2017 (6)(11) | | | 3,750,000 | | | | 3,748,533 | |
Thunder Bay Funding LLC: | | | | | | | | |
1.349% (LIBOR 1 Month+12 basis points), 12/8/2017 (6)(7) | | | 3,000,000 | | | | 3,000,000 | |
1.349% (LIBOR 1 Month+12 basis points), 1/12/2018 (6)(7) | | | 3,000,000 | | | | 3,000,000 | |
1.465% (LIBOR 1 Month+23 basis points), 6/22/2018 (6)(7) | | | 2,500,000 | | | | 2,500,000 | |
Victory Receivables Corp., 1.260%, 9/8/2017 (6)(11) | | | 3,500,000 | | | | 3,499,143 | |
| | | | | | | | |
| | | | | | | 124,607,852 | |
(See Notes which are an integral part of the Financial Statements)
110
Prime Money Market Fund (continued)
| | | | | | | | |
| Description | | Principal
Amount | | | Value | |
| Commercial Paper (continued) | |
| | |
Automobiles — 2.6% | | | | | | | | |
Toyota Motor Credit Corp.: | | | | | | | | |
1.401% (LIBOR 1 Month+17 basis points), 3/12/2018 (7) | | $ | 4,000,000 | | | $ | 4,000,000 | |
1.412% (LIBOR 1 Month+18 basis points), 4/27/2018 (7) | | | 3,000,000 | | | | 3,000,000 | |
1.418% (LIBOR 1 Month+19 basis points), 5/10/2018 (7) | | | 2,500,000 | | | | 2,500,000 | |
| | | | | | | | |
| | | | | | | 9,500,000 | |
|
Diversified Financial Services — 6.2% | |
Collateralized Commercial Paper Co. LLC: | | | | | | | | |
1.536% (LIBOR 1 Month+30 basis points), 10/23/2017 (7) | | | 2,500,000 | | | | 2,500,000 | |
1.584% (LIBOR 1 Month+35 basis points), 11/28/2017 (7) | | | 2,500,000 | | | | 2,501,206 | |
JP Morgan Securities LLC: | | | | | | | | |
1.385% (LIBOR 1 Month+15 basis points), 12/22/2017 (7) | | | 3,000,000 | | | | 3,000,000 | |
1.431% (LIBOR 1 Month+20 basis points), 4/6/2018 (7) | | | 2,500,000 | | | | 2,500,000 | |
1.481% (LIBOR 1 Month+25 basis points), 9/5/2017 (7) | | | 2,500,000 | | | | 2,500,000 | |
National Rural Utilities: | | | | | | | | |
1.080%, 9/1/2017 (11) | | | 3,250,000 | | | | 3,250,000 | |
1.140%, 9/18/2017 (11) | | | 5,000,000 | | | | 4,997,309 | |
1.160%, 9/6/2017 (11) | | | 1,557,000 | | | | 1,556,749 | |
| | | | | | | | |
| | | | | | | 22,805,264 | |
|
Foreign Banks — 7.9% | |
Commonwealth Bank of Australia, 1.429% (LIBOR 1 Month+20 basis points), 5/11/2018 (6)(7) | | | 2,500,000 | | | | 2,500,000 | |
HSBC Bank PLC, 1.568% (LIBOR 1 Month+34 basis points), 9/15/2017 (6)(7) | | | 3,250,000 | | | | 3,250,000 | |
National Australia Bank, Ltd., 1.581% (LIBOR 1 Month+35 basis points), 3/6/2018 (6)(7) | | | 2,000,000 | | | | 2,000,000 | |
Natixis, NY Branch, 1.070%, 9/1/2017 (11) | | | 14,000,000 | | | | 14,000,000 | |
Suncorp Metway, Ltd.: | | | | | | | | |
1.350%, 11/14/2017 (6)(11) | | | 2,000,000 | | | | 1,994,450 | |
1.460%, 2/5/2018 (6)(11) | | | 3,000,000 | | | | 2,980,898 | |
Westpac Banking Corp., 1.657% (LIBOR 3 Month+35 basis points), 10/20/2017 (6)(7) | | | 2,500,000 | | | | 2,500,000 | |
| | | | | | | | |
| | | | | | | 29,225,348 | |
|
Machinery Manufacturing — 0.7% | |
John Deere Capital Corp., 1.150%, 9/5/2017 (6)(11) | | | 2,500,000 | | | | 2,499,681 | |
|
Pharmaceuticals — 2.7% | |
Novartis Finance Corp., 1.100%, 9/6/2017 (6)(11) | | | 10,000,000 | | | | 9,998,472 | |
| | | | | | | | |
| Description | | Shares or
Principal
Amount | | | Value | |
| Commercial Paper (continued) | |
|
Winding Up Agencies — 3.5% | |
Erste Abwicklungsanstalt: | | | | | | | | |
1.160%, 9/1/2017(6)(11) | | $ | 5,000,000 | | | $ | 5,000,000 | |
1.280%, 9/28/2017(6)(11) | | | 3,000,000 | | | | 2,997,142 | |
1.300%, 10/18/2017(6)(11) | | | 2,500,000 | | | | 2,495,757 | |
1.451% (LIBOR 1 Month+22 basis points), 9/7/2017 (6)(7) | | | 2,500,000 | | | | 2,500,000 | |
| | | | | | | | |
| | | | | | | 12,992,899 | |
| | | | | | | | |
| Total Commercial Paper | | | | 211,629,516 | |
| | | | | | | | |
| Municipals — 4.3% | | | | | | |
| | |
Colorado — 1.3% | | | | | | | | |
Colorado Housing & Finance Authority, 1.190%, 10/1/2036 (12) | | | 4,800,000 | | | | 4,800,000 | |
| | |
Tennessee — 3.0% | | | | | | | | |
Johnson City Health & Educational Facilities Board, 1.180%, 8/15/2043 (12) | | | 11,075,000 | | | | 11,075,000 | |
| | | | | | | | |
| Total Municipals | | | | | | | 15,875,000 | |
| | |
| Mutual Funds — 7.0% | | | | | | |
BlackRock Liquidity Funds T-Fund Portfolio —
Institutional Class, 0.890% | | | 10,000,000 | | | | 10,000,000 | |
Invesco Government &
Agency Portfolio —
Institutional Class, 0.930% | | | 16,000,000 | | | | 16,000,000 | |
| | | | | | | | |
| Total Mutual Funds | | | | | | | 26,000,000 | |
| | | | | | | | |
| Repurchase Agreements — 5.6% | |
Agreement with Fixed Income Clearing Corp., 0.120%, dated 8/31/2017, to be repurchased at $10,618,336 on 9/1/2017, collateralized by U.S. Government Treasury Obligations with various maturities to 1/15/2024, with a market value of $10,835,417 | | $ | 10,618,301 | | | | 10,618,301 | |
Agreement with Goldman Sachs Group, Inc., 1.040%, dated 8/31/2017, to be repurchased at $10,000,289 on 9/1/2017, collateralized by a U.S. Government Treasury Obligation with a maturity of 5/15/2024, with a market value of $10,200,000 | | | 10,000,000 | | | | 10,000,000 | |
| | | | | | | | |
| Total Repurchase Agreements | | | | 20,618,301 | |
| | | | | | | | |
Total Investments — 100.0%
(at amortized cost) | | | | 368,748,953 | |
| Other Assets and Liabilities — 0.0% | | | | (160,186 | ) |
| | | | | | | | |
| Total Net Assets — 100.0% | | | $ | 368,588,767 | |
| | | | | | | | |
(See Notes which are an integral part of the Financial Statements)
111
August 31, 2017
Institutional Prime Money Market Fund
| | | | | | | | |
| Description | | Principal
Amount | | | Value | |
| Certificates of Deposit — 17.6% | |
| | |
Banks — 17.6% | | | | | | | | |
Bank of Nova Scotia/Houston, 1.408% (LIBOR 1 Month+18 basis points), 5/18/2018 (7) | | $ | 2,000,000 | | | $ | 2,000,035 | |
Commonwealth Bank of Australia/New York: | | | | | | | | |
1.397% (LIBOR 1 Month+17 basis points), 8/15/2018 (7) | | | 2,500,000 | | | | 2,499,818 | |
1.571% (LIBOR 3 Month+26 basis points), 2/2/2018 (7) | | | 2,000,000 | | | | 2,002,207 | |
HSBC Bank USA NA: | | | | | | | | |
1.561% (LIBOR 1 Month+33 basis points), 3/20/2018 (7) | | | 2,500,000 | | | | 2,503,120 | |
1.709% (LIBOR 1 Month+48 basis points), 10/13/2017 (7) | | | 2,500,000 | | | | 2,501,496 | |
Mitsubishi UFJ Trust & Banking Corp.: | | | | | | | | |
1.399% (LIBOR 1 Month+17 basis points), 12/11/2017 (7) | | | 2,650,000 | | | | 2,650,474 | |
1.411% (LIBOR 1 Month+18 basis points), 2/9/2018 (7) | | | 2,500,000 | | | | 2,500,266 | |
1.462% (LIBOR 1 Month+23 basis points), 11/1/2017 (7) | | | 1,500,000 | | | | 1,500,576 | |
Mizuho Bank, Ltd.: | | | | | | | | |
1.411% (LIBOR 1 Month+18 basis points), 11/10/2017 (7) | | | 2,000,000 | | | | 2,000,647 | |
1.512% (LIBOR 1 Month+28 basis points), 12/1/2017 (7) | | | 2,500,000 | | | | 2,501,454 | |
1.632% (LIBOR 1 Month+40 basis points), 9/1/2017 (7) | | | 2,500,000 | | | | 2,500,034 | |
Skandinaviska Enskilda Banken AB, 1.531% (LIBOR 1 Month+30 basis points), 9/21/2017 (7) | | | 2,500,000 | | | | 2,500,516 | |
Sumitomo Mitsui Banking Corp./New York, 1.358% (LIBOR 1 Month+13 basis points), 9/18/2017 (7) | | | 2,500,000 | | | | 2,500,170 | |
Svenska Handelsbanken, Inc., 1.527% (LIBOR 1 Month+30 basis points), 9/15/2017 (7) | | | 2,500,000 | | | | 2,500,374 | |
Swedbank (New York): | | | | | | | | |
1.150%, 9/7/2017 | | | 7,500,000 | | | | 7,500,012 | |
1.160%, 9/6/2017 | | | 7,500,000 | | | | 7,500,024 | |
Toronto Dominion Bank: | | | | | | | | |
1.431% (LIBOR 1 Month+20 basis points), 8/10/2018 (7) | | | 2,375,000 | | | | 2,375,577 | |
1.569% (LIBOR 1 Month+34 basis points), 3/13/2018 (7) | | | 2,500,000 | | | | 2,503,159 | |
1.672% (LIBOR 1 Month+44 basis points), 11/1/2017 (7) | | | 2,000,000 | | | | 2,001,501 | |
1.748% (LIBOR 1 Month+52 basis points), 11/20/2017 (7) | | | 2,000,000 | | | | 2,002,177 | |
1.751% (LIBOR 1 Month+52 basis points), 1/10/2018 (7) | | | 2,250,000 | | | | 2,253,590 | |
Wells Fargo Bank NA: | | | | | | | | |
1.366% (LIBOR 1 Month+13 basis points), 12/19/2017 (7) | | | 3,000,000 | | | | 3,000,480 | |
1.401% (LIBOR 1 Month+17 basis points), 4/20/2018 (7) | | | 2,500,000 | | | | 2,500,377 | |
1.664% (LIBOR 3 Month+35 basis points), 11/16/2017 (7) | | | 1,850,000 | | | | 1,851,593 | |
1.669% (LIBOR 1 Month+44 basis points), 2/14/2018 (7) | | | 2,500,000 | | | | 2,503,759 | |
1.699% (LIBOR 1 Month+47 basis points), 10/11/2017 (7) | | | 2,000,000 | | | | 2,001,126 | |
| | | | | | | | |
Total Certificates of Deposit
(identified cost $70,625,926) | | | | 70,654,562 | |
| | | | | | | | |
| | | | | | | | |
| Description | | Principal
Amount | | | Value | |
| Commercial Paper — 59.1% | |
| |
Asset-Backed Securities — 33.1% | | | | | |
Atlantic Asset Securitization LLC: | | | | | | | | |
1.060%, 9/1/2017 (6)(11) | | $ | 8,000,000 | | | $ | 7,999,730 | |
1.440%, 9/21/2017 (6)(11) | | | 2,500,000 | | | | 2,498,182 | |
1.552% (LIBOR 1 Month+32 basis points), 1/2/2018 (6)(7) | | | 2,500,000 | | | | 2,500,040 | |
1.567% (LIBOR 1 Month+34 basis points), 12/15/2017 (7) | | | 2,500,000 | | | | 2,500,034 | |
Bedford Row Funding Corp.: | | | | | | | | |
1.372% (LIBOR 1 Month+14 basis points), 3/1/2018 (6)(7) | | | 2,500,000 | | | | 2,500,070 | |
1.449% (LIBOR 1 Month+22 basis points), 6/11/2018 (6)(7) | | | 3,000,000 | | | | 3,000,718 | |
1.451% (LIBOR 1 Month+22 basis points), 2/21/2018 (6)(7) | | | 2,250,000 | | | | 2,250,915 | |
1.455% (LIBOR 1 Month+22 basis points), 8/17/2018 (6)(7) | | | 2,500,000 | | | | 2,499,923 | |
1.498% (LIBOR 1 Month+27 basis points), 12/18/2017 (6)(7) | | | 2,500,000 | | | | 2,501,261 | |
1.712% (LIBOR 3 Month+41 basis points), 10/6/2017 (6)(7) | | | 2,500,000 | | | | 2,501,276 | |
Chesham Finance Ltd., 1.180%, 9/1/2017 (6)(11) | | | 15,500,000 | | | | 15,499,492 | |
Crown Point Capital Co. LLC: | | | | | | | | |
1.310%, 10/31/2017 (6)(11) | | | 2,500,000 | | | | 2,494,464 | |
1.320%, 10/17/2017 (6)(11) | | | 3,500,000 | | | | 3,494,137 | |
Gotham Funding Corp., 1.320%, 10/2/2017 (6)(11) | | | 3,500,000 | | | | 3,496,117 | |
Kells Funding LLC, 1.210%, 9/13/2017 (6)(11) | | | 5,000,000 | | | | 4,997,846 | |
Liberty Street Funding LLC: | | | | | | | | |
1.290%, 9/25/2017 (6)(11) | | | 3,000,000 | | | | 2,997,406 | |
1.310%, 10/17/2017 (6)(11) | | | 3,000,000 | | | | 2,995,018 | |
1.310%, 10/25/2017 (6)(11) | | | 3,000,000 | | | | 2,994,133 | |
Manhattan Asset Funding Co.: | | | | | | | | |
1.220%, 9/19/2017 (6)(11) | | | 2,000,000 | | | | 1,998,699 | |
1.371% (LIBOR 1 Month+14 basis points), 12/5/2017 (6)(7) | | | 3,000,000 | | | | 2,999,933 | |
1.389% (LIBOR 1 Month+16 basis points), 2/8/2018 (6)(7) | | | 2,500,000 | | | | 2,499,994 | |
1.399% (LIBOR 1 Month+16 basis points), 1/31/2018 (6)(7) | | | 2,500,000 | | | | 2,500,064 | |
1.534% (LIBOR 1 Month+30 basis points), 9/28/2017 (6)(7) | | | 2,500,000 | | | | 2,500,674 | |
Old Line Funding LLC: | | | | | | | | |
1.351% (LIBOR 1 MonthLIBOR 1 Month+12 basis points), 12/4/2017 (6)(7) | | | 3,500,000 | | | | 3,500,043 | |
1.351% (LIBOR 1 Month+12 basis points), 1/19/2018 (6)(7) | | | 2,500,000 | | | | 2,500,046 | |
1.369% (LIBOR 1 Month+14 basis points), 11/8/2017 (6)(7) | | | 3,000,000 | | | | 3,000,056 | |
Regency Markets No. 1 LLC: | | | | | | | | |
1.210%, 9/7/2017 (6)(11) | | | 9,000,000 | | | | 8,997,874 | |
1.230%, 9/15/2017 (6)(11) | | | 3,500,000 | | | | 3,498,214 | |
1.230%, 9/26/2017 (6)(11) | | | 3,000,000 | | | | 2,997,298 | |
Ridgefield Funding Co. LLC: | | | | | | | | |
1.300%, 9/18/2017 (6)(11) | | | 4,660,000 | | | | 4,657,132 | |
1.388% (LIBOR 1 Month+16 basis points), 12/18/2017 (6)(7) | | | 3,500,000 | | | | 3,500,540 | |
1.409% (LIBOR 1 Month+18 basis points), 1/11/2018 (6)(7) | | | 2,500,000 | | | | 2,500,132 | |
Starbird Funding Corp., 1.280%, 9/12/2017 (6)(11) | | | 3,750,000 | | | | 3,748,474 | |
(See Notes which are an integral part of the Financial Statements)
112
Institutional Prime Money Market Fund (continued)
| | | | | | | | |
| Description | | Principal
Amount | | | Value | |
| Commercial Paper (continued) | |
| |
Asset-Backed Securities (continued) | | | | | |
Thunder Bay Funding LLC: | | | | | | | | |
1.349% (LIBOR 1 Month+12 basis points), 12/8/2017 (6)(7) | | $ | 3,000,000 | | | $ | 3,000,038 | |
1.349% (LIBOR 1 Month+12 basis points), 1/12/2018 (6)(7) | | | 3,000,000 | | | | 3,000,052 | |
1.465% (LIBOR 1 Month+23 basis points), 6/22/2018 (6)(7) | | | 2,500,000 | | | | 2,500,098 | |
Victory Receivables Corp., 1.260%, 9/8/2017 (6)(11) | | | 3,500,000 | | | | 3,499,068 | |
| | | | | | | | |
| | | | | | | 133,119,191 | |
| | |
Automobiles — 2.4% | | | | | | | | |
Toyota Motor Credit Corp.: | | | | | | | | |
1.401% (LIBOR 1 Month+17 basis points), 3/12/2018 (7) | | | 4,000,000 | | | | 4,000,866 | |
1.412% (LIBOR 1 Month+18 basis points), 4/27/2018 (7) | | | 3,000,000 | | | | 3,000,013 | |
1.418% (LIBOR 1 Month+19 basis points), 5/10/2018 (7) | | | 2,500,000 | | | | 2,499,938 | |
| | | | | | | | |
| | | | | | | 9,500,817 | |
| |
Diversified Financial Services — 5.3% | | | | | |
Collateralized Commercial Paper Co. LLC: | | | | | | | | |
1.536% (LIBOR 1 Month+30 basis points), 10/23/2017 (7) | | | 2,500,000 | | | | 2,501,137 | |
1.584% (LIBOR 1 Month+35 basis points), 11/28/2017 (7) | | | 2,500,000 | | | | 2,501,877 | |
JP Morgan Securities LLC: | | | | | | | | |
1.385% (LIBOR 1 Month+15 basis points), 12/22/2017 (7) | | | 3,000,000 | | | | 3,000,674 | |
1.431% (LIBOR 1 Month+20 basis points), 4/6/2018 (7) | | | 2,500,000 | | | | 2,501,130 | |
1.481% (LIBOR 1 Month+25 basis points), 9/5/2017 (7) | | | 2,500,000 | | | | 2,500,114 | |
National Rural Utilities: | | | | | | | | |
1.080%, 9/1/2017 (11) | | | 3,250,000 | | | | 3,249,895 | |
1.140%, 9/18/2017 (11) | | | 5,000,000 | | | | 4,997,027 | |
| | | | | | | | |
| | | | | | | 21,251,854 | |
|
Foreign Banks — 10.0% | |
Commonwealth Bank of Australia, 1.429% (LIBOR 1 Month+20 basis points), 5/11/2018 (6)(7) | | | 2,500,000 | | | | 2,501,552 | |
DNB Bank ASA, 1.160%, 9/5/2017 (6)(11) | | | 10,000,000 | | | | 9,998,401 | |
HSBC Bank PLC, 1.568% (LIBOR 1 Month+34 basis points), 9/15/2017 (6)(7) | | | 3,250,000 | | | | 3,250,543 | |
National Australia Bank, Ltd., 1.581% (LIBOR 1 Month+35 basis points), 3/6/2018 (6)(7) | | | 2,000,000 | | | | 2,002,390 | |
Natixis, NY Branch, 1.070%, 9/1/2017 (11) | | | 15,000,000 | | | | 14,999,515 | |
Suncorp Metway, Ltd.: | | | | | | | | |
1.350%, 11/14/2017 (6)(11) | | | 2,000,000 | | | | 1,994,396 | |
1.460%, 2/5/2018 (6)(11) | | | 3,000,000 | | | | 2,980,698 | |
| | | | | | | | |
| Description | | Shares or
Principal
Amount | | | Value | |
| Commercial Paper (continued) | |
|
Foreign Banks (continued) | |
Westpac Banking Corp., 1.657% (LIBOR 3 Month+35 basis points), 10/20/2017 (6)(7) | | $ | 2,500,000 | | | $ | 2,501,509 | |
| | | | | | | | |
| | | | | | | 40,229,004 | |
|
Machinery Manufacturing — 1.9% | |
Illinois Tool Works, Inc., 1.100%, 9/5/2017 (6)(11) | | | 5,000,000 | | | | 4,999,185 | |
John Deere Capital Corp., 1.150%, 9/5/2017 (6)(11) | | | 2,500,000 | | | | 2,499,614 | |
| | | | | | | | |
| | | | | | | 7,498,799 | |
|
Pharmaceuticals — 2.5% | |
Novartis Finance Corp., 1.100%, 9/6/2017 (6)(11) | | | 10,000,000 | | | | 9,998,193 | |
|
Winding Up Agencies — 3.9% | |
Erste Abwicklungsanstalt: | | | | | | | | |
1.160%, 9/1/2017 (6)(11) | | | 5,000,000 | | | | 4,999,842 | |
1.280%, 9/28/2017 (6)(11) | | | 3,000,000 | | | | 2,997,265 | |
1.300%, 10/18/2017 (6)(11) | | | 2,500,000 | | | | 2,496,010 | |
1.320%, 12/13/2017 (6)(11) | | | 2,500,000 | | | | 2,490,662 | |
1.451% (LIBOR 1 MonthLIBOR 1 Month+22 basis points), 9/7/2017 (6)(7) | | | 2,500,000 | | | | 2,500,143 | |
| | | | | | | | |
| | | | | | | 15,483,922 | |
| | | | | | | | |
Total Commercial Paper
(identified cost $237,069,014) | | | | 237,081,780 | |
| | |
| Mutual Funds — 6.0% | | | | | | |
BlackRock Liquidity Funds T-Fund Portfolio —
Institutional Class, 0.890% | | | 8,201,139 | | | | 8,201,139 | |
Invesco Government & Agency Portfolio —
Institutional Class, 0.930% | | | 16,000,000 | | | | 16,000,000 | |
| | | | | | | | |
Total Mutual Funds
(identified cost $24,201,139) | | | | 24,201,139 | |
| | | | | | | | |
|
| Repurchase Agreements — 17.4% | |
Agreement with Goldman Sachs Group, Inc., 1.040%, dated 8/31/2017, to be repurchased at $35,001,011 on 9/1/2017, collateralized by U.S. Government Agency Obligations with various maturities to 7/1/2047, with a market value of $35,610,746 | | $ | 35,000,000 | | | | 35,000,000 | |
Agreement with Merrill Lynch, Pierce, Fenner & Smith, Inc., 1.080%, dated 8/31/2017, to be repurchased at $35,001,050 on 9/1/2017, collateralized by a U.S. Government Agency Obligation with a maturity of 3/1/2042, with a market value of $35,588,647 | | | 35,000,000 | | | | 35,000,000 | |
| | | | | | | | |
Total Repurchase Agreements
(identified cost $70,000,000) | | | | 70,000,000 | |
| | | | | | | | |
Total Investments — 100.1%
(identified cost $401,896,079) | | | | 401,937,481 | |
| Other Assets and Liabilities — (0.1)% | | | | (313,521 | ) |
| | | | | | | | |
| Total Net Assets — 100.0% | | | $ | 401,623,960 | |
| | | | | | | | |
(See Notes which are an integral part of the Financial Statements)
113
| | |
| Notes to Schedules of Investments | | |
The categories of investments are shown as a percentage of total net assets for each Fund as of August 31, 2017. Call dates contained within the Schedules of Investments represent the next possible date the security can be redeemed, at the option of the issuer, determined as of August 31, 2017. Maturity dates contained within the Schedules of Investments represent the stated legal maturity date or mandatory put date. Certain securities may be subject to demand features which allow the security to be redeemed prior to final maturity date. In accordance with Rule 2a-7, securities held in the money market funds provide for the return of principal and interest within 397 days due to a scheduled final maturity date or through specific demand features. Demand features entitle a Fund to receive the principal amount of the instrument from the issuer or a third party (1) on no more than 30 calendar days’ notice or (2) at specified intervals not exceeding 397 calendar days.
| * | A Summary Schedule of Investments is presented for this portfolio. A complete Schedule of Investments is available by accessing the SEC’s website, www.sec.gov. For all items listed as “Other securities” in this summary Schedule of Investments, this represents issues not identified as top-fifty unaffiliated holdings in terms of value and issues or issuers not exceeding one percent individually or in aggregate, respectively, as of August 31, 2017. In certain instances, securities for which footnotes listed below may otherwise apply are included in the “Other securities” caption. |
| (1) | Certain shares or principal amounts are temporarily on loan to unaffiliated brokers-dealers. |
| (3) | Please refer to Note 2, subsection Securities Lending, in the Notes to Financial Statements. |
| (4) | Denotes an investment in an affiliated entity. Please refer to Note 6, subsection Investments in Affiliated Issuers, in the Notes to Financial Statements. |
| (5) | Participation notes are issued by banks or broker-dealers and are designed to offer a return linked to the performance of a particular underlying equity security or market. |
| (6) | Denotes a restricted security which is subject to restrictions on resale under federal securities laws. These securities have been deemed liquid based on criteria approved by the Board of Directors of the BMO Funds. At August 31, 2017 these securities amounted to: |
| | | | | | | | |
| Fund | | Amount | | | % of Total
Net Assets | |
Disciplined International Equity Fund | | $ | 194,485 | | | | 0.27 | % |
TCH Emerging Markets Bond Fund | | | 8,350,821 | | | | 70.27 | |
Alternative Strategies Fund | | | | | | | | |
Long | | | 416,064 | | | | 0.43 | |
Short | | | 229,668 | | | | 0.24 | |
Global Long/Short Equity Fund | | | | | | | | |
Long | | | 34,765 | | | | 0.36 | |
Short | | | 246,517 | | | | 2.54 | |
Ultra Short Tax-Free Fund | | | 106,814,893 | | | | 16.17 | |
Short Tax-Free Fund | | | 12,985,103 | | | | 7.11 | |
| | | | | | | | |
| Fund | | Amount | | | % of Total
Net Assets | |
Short-Term Income Fund | | $ | 28,175,927 | | | | 11.61 | % |
Intermediate Tax-Free Fund | | | 35,866,226 | | | | 2.22 | |
Strategic Income Fund | | | 30,858,121 | | | | 27.21 | |
TCH Corporate Income Fund | | | 30,278,443 | | | | 11.81 | |
TCH Core Plus Bond Fund | | | 66,641,715 | | | | 6.36 | |
High Yield Bond Fund | | | 5,115,442 | | | | 38.42 | |
Tax-Free Money Market Fund | | | 34,170,000 | | | | 10.85 | |
Prime Money Market Fund | | | 162,824,252 | | | | 44.18 | |
Institutional Prime Money Market Fund | | | 188,829,560 | | | | 47.02 | |
| (7) | Denotes a floating rate security. Floating rate securities are securities whose yields vary with a designated market index or market rate. These securities are shown at their current rates as of August 31, 2017. |
| (8) | Purchased on a when-issued or delayed delivery basis. |
| (9) | Issue is in default or bankruptcy. |
| (10) | All or a portion of this security is segregated as collateral for securities sold short. |
| (11) | Each issue shows the rate of the discount at the time of purchase. |
| (12) | Denotes a variable rate security. |
| (13) | Issue represents an Auction Rate Security. An Auction Rate Security is a corporate or municipal bond debt instrument with a long nominal maturity for which the interest rate is regularly reset through a Dutch auction. The rate presented is either the rate set through the auction or the maximum interest rate provided for in the security issuance provision. |
| (14) | Securities have redemption features that may delay redemption beyond seven days. |
| (15) | Issue represents a convertible capital appreciation bond. These securities are tax-exempt bonds that originate as capital appreciation bonds with zero coupon features at time of issuance and convert to an interest paying bond at a pre-specified rate determined at time of issuance. |
| (16) | Securities that are subject to alternative minimum tax of the Intermediate Tax-Free Fund portfolio represents 2.34%, as calculated based upon total portfolio market value. |
The following acronyms may be referenced throughout this report:
| | |
ACA — American Capital Access Corporation ADED — Arkansas Department of Economic Development ADR — American Depository Receipt AGC — Assured Guaranty Corporation AGM — Assured Guaranty Municipal AMBAC — American Municipal Bond Assurance Corporation AMT — Alternative Minimum Tax BAM — Build America Mutual Assurance Company BHAC — Berkshire Hathaway Assurance Corporation BMA — Bond Market Association CFC — Cooperative Finance Corporation CIFG — CDC IXIS Financial Guaranty CMI — California Mortgage Insurance COLL — Collateralized ETF — Exchange Traded Fund FDIC — Federal Depository Insurance Corporation FGIC — Financial Guaranty Insurance Corporation FHA — Federal Housing Administration FHLB — Federal Home Loan Bank FHLMC — Federal Home Loan Mortgage Corporation FNMA — Federal National Mortgage Association FRN — Floating Rate Note FSA — Financial Security Assurance Corporation GDR — Global Depository Receipt GNMA — Government National Mortgage Association GO — Government Obligation HFDC — Health Facility Development Corporation HUD — Department of Housing and Urban Development IDC — Industrial Development Corporation IMI — Investors Mortgage Insurance Company | | INS — Insured LIBOR — London Interbank Offered Rate LIQ — Liquidity Agreement LLC — Limited Liability Corporation LOC — Letter of Credit LP — Limited Partnership LT — Limited Tax MAC — Municipal Assurance Corporation MBIA — Municipal Bond Insurance Association MHF — Maryland Housing Fund MTN — Medium Term Note NATL-RE — National Rural Utilities Cooperative Finance Corporation Reinsurance PCA — Pollution Control Authority PLC — Public Limited Company PSF — Permanent School Fund Guaranteed PUFG — Permanent University Fund Guarantee Q-SBLF — Qualified School Bond Loan Fund RADIAN — Radian Asset Assurance REITs — Real Estate Investment Trusts REMIC — Real Estate Mortgage Investment Conduit SAW — State Aid Withholding SIFMA — Securities Industry and Financial Markets Association TCRs — Transferable Custody Receipts TLGP — Temporary Liquidity Guarantee Program TRANs — Tax and Revenue Anticipation Notes UT — Unlimited Tax VRNs — Variable Rate Notes XLCA — XL Capital Assurance |
114
August 31, 2017
| | |
| Statements of Assets and Liabilities | | BMO Funds |
| | | | | | | | | | | | | | | | | | | | |
| | | | | | | | | | | | | | | | |
| | | Low Volatility
Equity Fund | | | Dividend
Income Fund | | | Large-Cap
Value Fund | | | Large-Cap
Growth Fund | | | Mid-Cap
Value Fund | |
Assets: | |
Investments in unaffiliated issuers, at value | | $ | 232,092,807 | (1) | | $ | 166,292,864 | (1) | | $ | 491,035,640 | (1) | | $ | 503,042,233 | (1) | | $ | 293,702,754 | (1) |
Cash sweep investments in affiliated issuers, at value | | | 2,833,143 | | | | 2,075,405 | | | | 4,411,207 | | | | 4,542,780 | | | | 1,880,791 | |
Dividends and interest receivable | | | 410,003 | | | | 427,427 | | | | 1,062,397 | | | | 560,103 | | | | 383,379 | |
Receivable for capital stock sold | | | 192,719 | | | | 95,260 | | | | 272,314 | | | | 383,251 | | | | 105,659 | |
Prepaid expenses and other receivables | | | 13,917 | | | | 13,525 | | | | 20,049 | | | | 21,507 | | | | 27,036 | |
| | | | | | | | | | | | | | | | | | | | |
Total assets | | | 235,542,589 | | | | 168,904,481 | | | | 496,801,607 | | | | 508,549,874 | | | | 296,099,619 | |
|
Liabilities: | |
Payable for return of securities lending collateral | | | 75,732,318 | | | | 52,860,743 | | | | 162,597,871 | | | | 151,430,406 | | | | 89,263,621 | |
Payable for capital stock redeemed | | | 248,024 | | | | 372,498 | | | | 258,996 | | | | 385,350 | | | | 113,515 | |
Payable to affiliates, net (Note 6) | | | 60,749 | | | | 43,507 | | | | 176,390 | | | | 199,671 | | | | 142,679 | |
Other liabilities | | | 40,330 | | | | 46,025 | | | | 72,658 | | | | 79,019 | | | | 75,836 | |
| | | | | | | | | | | | | | | | | | | | |
Total liabilities | | | 76,081,421 | | | | 53,322,773 | | | | 163,105,915 | | | | 152,094,446 | | | | 89,595,651 | |
| | | | | | | | | | | | | | | | | | | | |
Total net assets | | $ | 159,461,168 | | | $ | 115,581,708 | | | $ | 333,695,692 | | | $ | 356,455,428 | | | $ | 206,503,968 | |
| | | | | | | | | | | | | | | | | | | | |
Net assets consist of: | |
Paid-in capital | | $ | 136,485,151 | | | $ | 81,556,123 | | | $ | 257,602,366 | | | $ | 253,582,557 | | | $ | 170,180,285 | |
Net unrealized appreciation on investments | | | 19,364,495 | | | | 22,840,439 | | | | 52,017,446 | | | | 86,651,320 | | | | 27,068,744 | |
Accumulated net realized gain on investments | | | 3,151,309 | | | | 10,661,810 | | | | 23,173,582 | | | | 15,876,085 | | | | 8,236,155 | |
Undistributed net investment income | | | 460,213 | | | | 523,336 | | | | 902,298 | | | | 345,466 | | | | 1,018,784 | |
| | | | | | | | | | | | | | | | | | | | |
Total net assets | | $ | 159,461,168 | | | $ | 115,581,708 | | | $ | 333,695,692 | | | $ | 356,455,428 | | | $ | 206,503,968 | |
| | | | | | | | | | | | | | | | | | | | |
Net asset value, offering price and redemption proceeds per share (unlimited shares authorized, no par value) | | | | | | | | | | | | | | | | | | | | |
Investor class of shares: | | | | | | | | | | | | | | | | | | | | |
Net asset value, offering price and redemption proceeds per share | | $ | — | | | $ | — | | | $ | — | | | $ | 17.46 | | | $ | — | |
Advisor class of shares: | | | | | | | | | | | | | | | | | | | | |
Net asset value and redemption proceeds per share | | | 14.36 | | | | 14.51 | | | | 15.85 | | | | 17.46 | | | | 11.91 | |
Offering price per share(2) | | | 15.12 | | | | 15.27 | | | | 16.68 | | | | 18.38 | | | | 12.54 | |
Institutional class of shares: | | | | | | | | | | | | | | | | | | | | |
Net asset value, offering price and redemption proceeds per share | | | 14.42 | | | | 14.47 | | | | 15.88 | | | | 17.60 | | | | 11.89 | |
Retirement class R-3 of shares: | | | | | | | | | | | | | | | | | | | | |
Net asset value, offering price and redemption proceeds per share | | | — | | | | — | | | | — | | | | — | | | | 11.84 | |
Retirement class R-6 of shares: | | | | | | | | | | | | | | | | | | | | |
Net asset value, offering price and redemption proceeds per share | | | — | | | | — | | | | 15.88 | | | | 17.62 | | | | 11.90 | |
| | | | | |
Net assets: | | | | | | | | | | | | | | | | | | | | |
Investor class of shares | | $ | — | | | $ | — | | | $ | — | | | $ | 74,358,963 | | | $ | — | |
Advisor class of shares | | | 31,623,915 | | | | 3,204,469 | | | | 25,060,949 | | | | 808,481 | | | | 64,462,116 | |
Institutional class of shares | | | 127,837,253 | | | | 112,377,239 | | | | 307,156,339 | | | | 278,435,992 | | | | 127,304,443 | |
Retirement class R-3 of shares | | | — | | | | — | | | | — | | | | — | | | | 23,954 | |
Retirement class R-6 of shares | | | — | | | | — | | | | 1,478,404 | | | | 2,851,992 | | | | 14,713,455 | |
| | | | | | | | | | | | | | | | | | | | |
Total net assets | | $ | 159,461,168 | | | $ | 115,581,708 | | | $ | 333,695,692 | | | $ | 356,455,428 | | | $ | 206,503,968 | |
| | | | | | | | | | | | | | | | | | | | |
Shares outstanding: | | | | | | | | | | | | | | | | | | | | |
Investor class of shares | | | — | | | | — | | | | — | | | | 4,259,918 | | | | — | |
Advisor class of shares | | | 2,201,464 | | | | 220,776 | | | | 1,580,963 | | | | 46,318 | | | | 5,411,834 | |
Institutional class of shares | | | 8,867,909 | | | | 7,764,222 | | | | 19,347,639 | | | | 15,818,210 | | | | 10,704,247 | |
Retirement class R-3 of shares | | | — | | | | — | | | | — | | | | — | | | | 2,023 | |
Retirement class R-6 of shares | | | — | | | | — | | | | 93,093 | | | | 161,877 | | | | 1,235,973 | |
| | | | | | | | | | | | | | | | | | | | |
Total shares outstanding | | | 11,069,373 | | | | 7,984,998 | | | | 21,021,695 | | | | 20,286,323 | | | | 17,354,077 | |
| | | | | | | | | | | | | | | | | | | | |
Investments, at cost: | | | | | | | | | | | | | | | | | | | | |
Investments in unaffiliated issuers | | $ | 212,728,312 | | | $ | 143,452,457 | | | $ | 439,018,220 | | | $ | 416,390,963 | | | $ | 266,634,010 | |
Cash sweep investments in affiliated issuers | | | 2,833,143 | | | | 2,075,373 | | | | 4,411,181 | | | | 4,542,730 | | | | 1,880,791 | |
| | | | | | | | | | | | | | | | | | | | |
Total investments, at cost | | $ | 215,561,455 | | | $ | 145,527,830 | | | $ | 443,429,401 | | | $ | 420,933,693 | | | $ | 268,514,801 | |
| | | | | | | | | | | | | | | | | | | | |
| (1) | Including $74,313,568, $51,870,464, $159,551,804, $148,593,547 and $87,591,380, respectively, of securities on loan. A security on loan value represents both market value and accrued interest. |
| (2) | Computation of offering price per share 100/95 of net asset value. |
(See Notes which are an integral part of the Financial Statements)
115
August 31, 2017
| | |
| Statements of Assets and Liabilities | | BMO Funds |
| | | | | | | | | | | | | | | | | | | | |
| | | | | | | | | | | | | | | | |
| | | Mid-Cap
Growth Fund | | | Small-Cap
Value Fund | | | Small-Cap
Core Fund | | | Small-Cap
Growth Fund | | | Global Low
Volatility
Equity Fund | |
Assets: | |
Investments in unaffiliated issuers, at value | | $ | 166,532,187 | (1) | | $ | 78,960,841 | (1) | | $ | 28,881,929 | (1) | | $ | 177,678,710 | (1) | | $ | 50,278,220 | (1) |
Cash sweep investments in affiliated issuers, at value | | | 1,947,313 | | | | 588,562 | | | | 369,001 | | | | 1,560,493 | | | | — | |
Cash denominated in foreign currencies | | | — | | | | — | | | | — | | | | — | | | | 105,909 | (2) |
Dividends and interest receivable | | | 88,001 | | | | 46,173 | | | | 14,315 | | | | 37,388 | | | | 128,023 | |
Receivable for investments sold | | | — | | | | — | | | | — | | | | 5,828,724 | | | | 4,984,432 | |
Receivable for capital stock sold | | | 70,128 | | | | 28,317 | | | | 6,000 | | | | 583,703 | | | | — | |
Receivable from affiliates, net (Note 6) | | | — | | | | — | | | | 348 | | | | — | | | | — | |
Prepaid expenses and other receivables | | | 28,821 | | | | 27,156 | | | | 12,178 | | | | 25,479 | | | | 10,566 | |
| | | | | | | | | | | | | | | | | | | | |
Total assets | | | 168,666,450 | | | | 79,651,049 | | | | 29,283,771 | | | | 185,714,497 | | | | 55,507,150 | |
|
Liabilities: | |
Payable for return of securities lending collateral | | | 55,413,816 | | | | 15,189,775 | | | | 9,591,857 | | | | 40,411,406 | | | | 1,201,607 | |
Payable for investments purchased | | | — | | | | — | | | | — | | | | 5,989,230 | | | | — | |
Payable for capital stock redeemed | | | 90,778 | | | | 96,068 | | | | — | | | | 98,559 | | | | 5,000,000 | |
Payable for foreign tax expense | | | — | | | | — | | | | — | | | | — | | | | 7,170 | |
Payable to affiliates, net (Note 6) | | | 72,617 | | | | 18,448 | | | | — | | | | 151,420 | | | | 24,541 | |
Other liabilities | | | 66,722 | | | | 61,226 | | | | 30,936 | | | | 68,052 | | | | 55,649 | |
| | | | | | | | | | | | | | | | | | | | |
Total liabilities | | | 55,643,933 | | | | 15,365,517 | | | | 9,622,793 | | | | 46,718,667 | | | | 6,288,967 | |
| | | | | | | | | | | | | | | | | | | | |
Total net assets | | $ | 113,022,517 | | | $ | 64,285,532 | | | $ | 19,660,978 | | | $ | 138,995,830 | | | $ | 49,218,183 | |
| | | | | | | | | | | | | | | | | | | | |
Net assets consist of: | |
Paid-in capital | | $ | 91,133,909 | | | $ | 54,828,650 | | | $ | 16,329,751 | | | $ | 111,119,631 | | | $ | 42,050,010 | |
Net unrealized appreciation on investments and foreign currency translation | | | 17,512,379 | | | | 5,311,259 | | | | 2,547,798 | | | | 14,939,156 | | | | 6,531,140 | |
Accumulated net realized gain (loss) on investments | | | 4,376,229 | | | | 4,117,399 | | | | 782,831 | | | | 13,424,119 | | | | (39,336 | ) |
Undistributed net investment income (distributions in excess of net investment income) | | | — | | | | 28,224 | | | | 598 | | | | (487,076 | ) | | | 676,369 | |
| | | | | | | | | | | | | | | | | | | | |
Total net assets | | $ | 113,022,517 | | | $ | 64,285,532 | | | $ | 19,660,978 | | | $ | 138,995,830 | | | $ | 49,218,183 | |
| | | | | | | | | | | | | | | | | | | | |
Net asset value, offering price and redemption proceeds per share (unlimited shares authorized, no par value) | | | | | | | | | | | | | | | | | | | | |
Advisor class of shares: | | | | | | | | | | | | | | | | | | | | |
Net asset value and redemption proceeds per share | | $ | 14.79 | | | $ | 13.30 | | | $ | 13.22 | | | $ | 18.37 | | | $ | 13.16 | |
Offering price per share(3) | | | 15.57 | | | | 14.00 | | | | 13.92 | | | | 19.34 | | | | 13.85 | |
Institutional class of shares: | | | | | | | | | | | | | | | | | | | | |
Net asset value, offering price and redemption proceeds per share | | | 15.39 | | | | 13.47 | | | | 13.30 | | | | 19.00 | | | | 13.20 | |
Retirement class R-3 of shares: | | | | | | | | | | | | | | | | | | | | |
Net asset value, offering price and redemption proceeds per share | | | 15.12 | | | | 13.27 | | | | — | | | | — | | | | — | |
Retirement class R-6 of shares: | | | | | | | | | | | | | | | | | | | | |
Net asset value, offering price and redemption proceeds per share | | | 15.46 | | | | 13.53 | | | | — | | | | — | | | | — | |
| | | | | |
Net assets: | | | | | | | | | | | | | | | | | | | | |
Advisor class of shares | | $ | 17,944,744 | | | $ | 4,930,535 | | | $ | 2,612,070 | | | $ | 57,736,691 | | | $ | 997,288 | |
Institutional class of shares | | | 94,464,000 | | | | 56,584,762 | | | | 17,048,908 | | | | 81,259,139 | | | | 48,220,895 | |
Retirement class R-3 of shares | | | 22,078 | | | | 116,804 | | | | — | | | | — | | | | — | |
Retirement class R-6 of shares | | | 591,695 | | | | 2,653,431 | | | | — | | | | — | | | | — | |
| | | | | | | | | | | | | | | | | | | | |
Total net assets | | $ | 113,022,517 | | | $ | 64,285,532 | | | $ | 19,660,978 | | | $ | 138,995,830 | | | $ | 49,218,183 | |
| | | | | | | | | | | | | | | | | | | | |
Shares outstanding: | | | | | | | | | | | | | | | | | | | | |
Advisor class of shares | | | 1,213,597 | | | | 370,843 | | | | 197,512 | | | | 3,142,568 | | | | 75,799 | |
Institutional class of shares | | | 6,138,097 | | | | 4,199,919 | | | | 1,281,617 | | | | 4,276,477 | | | | 3,653,718 | |
Retirement class R-3 of shares | | | 1,460 | | | | 8,801 | | | | — | | | | — | | | | — | |
Retirement class R-6 of shares | | | 38,263 | | | | 196,050 | | | | — | | | | — | | | | — | |
| | | | | | | | | | | | | | | | | | | | |
Total shares outstanding | | | 7,391,417 | | | | 4,775,613 | | | | 1,479,129 | | | | 7,419,045 | | | | 3,729,517 | |
| | | | | | | | | | | | | | | | | | | | |
Investments, at cost: | | | | | | | | | | | | | | | | | | | | |
Investments in unaffiliated issuers | | $ | 149,019,808 | | | $ | 73,649,582 | | | $ | 26,334,131 | | | $ | 162,739,554 | | | $ | 43,756,970 | |
Cash sweep investments in affiliated issuers | | | 1,947,313 | | | | 588,562 | | | | 369,001 | | | | 1,560,493 | | | | — | |
| | | | | | | | | | | | | | | | | | | | |
Total investments, at cost | | $ | 150,967,121 | | | $ | 74,238,144 | | | $ | 26,703,132 | | | $ | 164,300,047 | | | $ | 43,756,970 | |
| | | | | | | | | | | | | | | | | | | | |
| (1) | Including $54,375,708, $14,905,213, $9,412,165, $39,654,349 and $1,149,975, respectively, of securities on loan. A security on loan value represents both market value and accrued interest. |
| (2) | Identified cost of cash denominated in foreign currencies is $99,730. |
| (3) | Computation of offering price per share 100/95 of net asset value. |
(See Notes which are an integral part of the Financial Statements)
116
August 31, 2017
| | |
| Statements of Assets and Liabilities | | BMO Funds |
| | | | | | | | | | | | | | | | | | | | |
| | | | | | | | | | | | | | | | |
| | | Disciplined
International
Equity Fund | | | Pyrford
International
Stock Fund | | | LGM
Emerging
Markets
Equity Fund | | | TCH
Emerging
Markets
Bond Fund | | | Alternative
Strategies
Fund | |
Assets: | |
Investments in unaffiliated issuers, at value | | $ | 76,404,318 | (1) | | $ | 641,025,148 | (1) | | $ | 162,813,959 | (1) | | $ | 12,643,550 | (1) | | $ | 96,908,339 | |
Purchased options, at value | | | — | | | | — | | | | — | | | | — | | | | 859,080 | |
Cash | | | — | | | | — | | | | — | | | | 20,000 | | | | 4,955 | |
Deposits held at broker for: | | | | | | | | | | | | | | | | | | | | |
Securities sold short | | | — | | | | — | | | | — | | | | — | | | | 13,032,430 | |
Options | | | — | | | | — | | | | — | | | | — | | | | 1,739,487 | |
Futures contracts | | | — | | | | — | | | | — | | | | — | | | | 1,848,200 | |
Forward foreign currency contracts | | | — | | | | — | | | | — | | | | — | | | | 243,900 | |
Cash denominated in foreign currencies | | | 103,367 | (2) | | | 704,326 | (2) | | | 438,602 | (2) | | | — | | | | 3,738 | (2) |
Dividends and interest receivable | | | 307,025 | | | | 4,483,555 | | | | 244,888 | | | | 159,889 | | | | 160,393 | |
Receivable for investments sold | | | — | | | | 203,264 | | | | 316,883 | | | | 108,032 | | | | 2,447,275 | |
Receivable for capital stock sold | | | 69,298 | | | | 25,860,609 | | | | 167,547 | | | | — | | | | 54,931 | |
Receivable for daily variation margin on futures contracts | | | — | | | | — | | | | — | | | | — | | | | 324,817 | |
Receivable for forward foreign currency contracts | | | — | | | | — | | | | — | | | | — | | | | 876,068 | |
Receivable from affiliates, net (Note 6) | | | — | | | | — | | | | — | | | | 7,247 | | | | — | |
Prepaid expenses and other receivables | | | 8,214 | | | | 50,715 | | | | 13,210 | | | | 9,843 | | | | 8,043 | |
| | | | | | | | | | | | | | | | | | | | |
Total assets | | | 76,892,222 | | | | 672,327,617 | | | | 163,995,089 | | | | 12,948,561 | | | | 118,511,656 | |
|
Liabilities: | |
Securities sold short, at value (proceeds $17,499,532) | | | — | | | | — | | | | — | | | | — | | | | 17,735,182 | |
Options written, at value (proceeds $1,739,501) | | | — | | | | — | | | | — | | | | — | | | | 1,054,953 | |
Payable for dividends and interest on securities sold short | | | — | | | | — | | | | — | | | | — | | | | 30,722 | |
Payable for return of securities lending collateral | | | 4,416,726 | | | | 18,127,685 | | | | 512,972 | | | | 1,016,625 | | | | — | |
Payable for investments purchased | | | 394 | | | | 1,747,036 | | | | 39,149 | | | | — | | | | 2,901,902 | |
Payable for capital stock redeemed | | | — | | | | 1,904,065 | | | | 118,993 | | | | 10,733 | | | | 22,235 | |
Payable for daily variation margin on futures contracts | | | — | | | | — | | | | — | | | | — | | | | 95,963 | |
Payable for forward foreign currency contracts | | | — | | | | — | | | | — | | | | — | | | | 675,671 | |
Payable for foreign tax expense | | | 2,803 | | | | 140,362 | | | | 751,865 | | | | 201 | | | | 211 | |
Payable to affiliates, net (Note 6) | | | 31,200 | | | | 415,246 | | | | 121,850 | | | | — | | | | 75,658 | |
Other liabilities | | | 53,057 | | | | 253,638 | | | | 93,449 | | | | 37,469 | | | | 178,978 | |
| | | | | | | | | | | | | | | | | | | | |
Total liabilities | | | 4,504,180 | | | | 22,588,032 | | | | 1,638,278 | | | | 1,065,028 | | | | 22,771,475 | |
| | | | | | | | | | | | | | | | | | | | |
Total net assets | | $ | 72,388,042 | | | $ | 649,739,585 | | | $ | 162,356,811 | | | $ | 11,883,533 | | | $ | 95,740,181 | |
| | | | | | | | | | | | | | | | | | | | |
Net assets consist of: | |
Paid-in capital | | $ | 65,449,080 | | | $ | 607,200,745 | | | $ | 128,661,783 | | | $ | 11,520,733 | | | $ | 89,777,534 | |
Net unrealized appreciation on investments, options, futures contracts and foreign currency translation | | | 10,902,421 | | | | 66,591,524 | | | | 39,190,730 | | | | 387,866 | | | | 3,652,728 | |
Accumulated net realized gain (loss) on investments, options, futures contracts and foreign currency transactions | | | (4,932,303 | ) | | | (38,807,772 | ) | | | (6,740,776 | ) | | | (338,585 | ) | | | 2,513,096 | |
Undistributed net investment income (distributions in excess of net investment income) | | | 968,844 | | | | 14,755,088 | | | | 1,245,074 | | | | 313,519 | | | | (203,177 | ) |
| | | | | | | | | | | | | | | | | | | | |
Total net assets | | $ | 72,388,042 | | | $ | 649,739,585 | | | $ | 162,356,811 | | | $ | 11,883,533 | | | $ | 95,740,181 | |
| | | | | | | | | | | | | | | | | | | | |
Net asset value, offering price and redemption proceeds per share (unlimited shares authorized, no par value) | | | | | | | | | | | | | | | | | | | | |
Investor class of shares: | | | | | | | | | | | | | | | | | | | | |
Net asset value, offering price and redemption proceeds per share | | $ | — | | | $ | 13.16 | | | $ | — | | | $ | — | | | $ | — | |
Advisor class of shares: | | | | | | | | | | | | | | | | | | | | |
Net asset value and redemption proceeds per share | | | 11.17 | | | | 13.16 | | | | 15.93 | | | | 10.66 | | | | 10.74 | |
Offering price per share | | | 11.76 | (3) | | | 13.85 | (3) | | | 16.77 | (3) | | | 11.05 | (4) | | | 11.31 | (3) |
Institutional class of shares: | | | | | | | | | | | | | | | | | | | | |
Net asset value, offering price and redemption proceeds per share | | | 11.19 | | | | 13.21 | | | | 15.97 | | | | 10.35 | | | | 10.81 | |
Retirement class R-3 of shares: | | | | | | | | | | | | | | | | | | | | |
Net asset value, offering price and redemption proceeds per share | | | — | | | | 13.17 | | | | — | | | | — | | | | — | |
Retirement class R-6 of shares: | | | | | | | | | | | | | | | | | | | | |
Net asset value, offering price and redemption proceeds per share | | | — | | | | 13.22 | | | | — | | | | — | | | | — | |
Class F-3 of shares: | | | | | | | | | | | | | | | | | | | | |
Net asset value, offering price and redemption proceeds per share | | | — | | | | 13.22 | | | | — | | | | — | | | | — | |
| | | | | |
Net assets: | | | | | | | | | | | | | | | | | | | | |
Investor class of shares | | $ | — | | | $ | 6,162,257 | | | $ | — | | | $ | — | | | $ | — | |
Advisor class of shares | | | 149,401 | | | | 890,491 | | | | 4,775,653 | | | | 119,018 | | | | 156,860 | |
Institutional class of shares | | | 72,238,641 | | | | 593,746,432 | | | | 157,581,158 | | | | 11,764,515 | | | | 95,583,321 | |
Retirement class R-3 of shares | | | — | | | | 25,623 | | | | — | | | | — | | | | — | |
Retirement class R-6 of shares | | | — | | | | 48,888,994 | | | | — | | | | — | | | | — | |
Class F-3 of shares | | | — | | | | 25,788 | | | | — | | | | — | | | | — | |
| | | | | | | | | | | | | | | | | | | | |
Total net assets | | $ | 72,388,042 | | | $ | 649,739,585 | | | $ | 162,356,811 | | | $ | 11,883,533 | | | $ | 95,740,181 | |
| | | | | | | | | | | | | | | | | | | | |
(Continued on next page)
(See Notes which are an integral part of the Financial Statements)
117
August 31, 2017
| | |
| Statements of Assets and Liabilities | | BMO Funds |
| | | | | | | | | | | | | | | | | | | | |
| | | | | | | | | | | | | | | | |
| | | Disciplined
International
Equity Fund | | | Pyrford
International
Stock Fund | | | LGM
Emerging
Markets
Equity Fund | | | TCH
Emerging
Markets
Bond Fund | | | Alternative
Strategies
Fund | |
Shares outstanding: | | | | | | | | | | | | | | | | | | | | |
Investor class of shares | | | — | | | | 468,390 | | | | — | | | | — | | | | — | |
Advisor class of shares | | | 13,375 | | | | 67,686 | | | | 299,807 | | | | 11,168 | | | | 14,601 | |
Institutional class of shares | | | 6,455,738 | | | | 44,948,939 | | | | 9,867,658 | | | | 1,137,182 | | | | 8,845,309 | |
Retirement class R-3 of shares | | | — | | | | 1,946 | | | | — | | | | — | | | | — | |
Retirement class R-6 of shares | | | — | | | | 3,696,876 | | | | — | | | | — | | | | — | |
Class F-3 of shares | | | — | | | | 1,950 | | | | — | | | | — | | | | — | |
| | | | | | | | | | | | | | | | | | | | |
Total shares outstanding | | | 6,469,113 | | | | 49,185,787 | | | | 10,167,465 | | | | 1,148,350 | | | | 8,859,910 | |
| | | | | | | | | | | | | | | | | | | | |
Investments, at cost: | | | | | | | | | | | | | | | | | | | | |
Investments in unaffiliated issuers | | $ | 65,508,394 | | | $ | 574,468,865 | | | $ | 123,602,422 | | | $ | 12,254,857 | | | $ | 93,547,352 | |
Purchased options | | | — | | | | — | | | | — | | | | — | | | | 1,445,988 | |
| | | | | | | | | | | | | | | | | | | | |
Total investments, at cost | | $ | 65,508,394 | | | $ | 574,468,865 | | | $ | 123,602,422 | | | $ | 12,254,857 | | | $ | 94,993,340 | |
| | | | | | | | | | | | | | | | | | | | |
| (1) | Including $4,228,706, $17,373,890, $491,205 and $995,570, respectively, of securities on loan. A security on loan value represents both market value and accrued interest. |
| (2) | Identified cost of cash denominated in foreign currencies are $102,904, $701,572, $460,906 and $8,017, respectively. |
| (3) | Computation of offering price per share 100/95 of net asset value. |
| (4) | Computation of offering price per share 100/96.5 of net asset value. |
(See Notes which are an integral part of the Financial Statements)
118
August 31, 2017
| | |
| Statements of Assets and Liabilities | | BMO Funds |
| | | | | | | | | | | | | | | | | | | | |
| | | | | | | | | | | | | | | | |
| | | Global
Long/Short
Equity Fund | | | Ultra Short
Tax-Free Fund | | | Short
Tax-Free Fund | | | Short-Term
Income Fund | | | Intermediate
Tax-Free Fund | |
Assets: | |
Investments in unaffiliated issuers, at value | | $ | 13,468,143 | (1) | | $ | 682,030,366 | | | $ | 174,198,287 | | | $ | 287,230,049 | (1) | | $ | 1,604,996,902 | |
Cash sweep investments in affiliated issuers, at value | | | — | | | | 80,322 | | | | 115,488 | | | | 4,464,102 | | | | 79,783 | |
Investments in other affiliated issuers, at value | | | — | | | | — | | | | 866,132 | | | | — | | | | 5,108,497 | |
Cash | | | — | | | | 1,000 | | | | 1,000 | | | | — | | | | 1,000 | |
Cash denominated in foreign currencies | | | 1,386 | (2) | | | — | | | | — | | | | — | | | | — | |
Dividends and interest receivable | | | 27,556 | | | | 2,429,893 | | | | 1,428,365 | | | | 907,764 | | | | 15,905,509 | |
Receivable for investments sold | | | — | | | | 8,200,888 | | | | 8,940,507 | | | | — | | | | — | |
Receivable for capital stock sold | | | — | | | | 1,141,445 | | | | 156,530 | | | | 3,284,807 | | | | 1,424,821 | |
Receivable from affiliates, net (Note 6) | | | 9,153 | | | | — | | | | — | | | | — | | | | — | |
Prepaid expenses and other receivables | | | 7,284 | | | | 15,756 | | | | 11,471 | | | | 20,228 | | | | 26,011 | |
| | | | | | | | | | | | | | | | | | | | |
Total assets | | | 13,513,522 | | | | 693,899,670 | | | | 185,717,780 | | | | 295,906,950 | | | | 1,627,542,523 | |
|
Liabilities: | |
Securities sold short, at value (proceeds $3,171,194) | | | 3,454,239 | | | | — | | | | — | | | | — | | | | — | |
Payable for dividends and interest on securities sold short | | | 1,807 | | | | — | | | | — | | | | — | | | | — | |
Payable for return of securities lending collateral | | | 310,539 | | | | — | | | | — | | | | 50,854,186 | | | | — | |
Payable for investments purchased | | | — | | | | 29,292,677 | | | | 1,829,914 | | | | — | | | | 6,497,588 | |
Payable for capital stock redeemed | | | — | | | | 3,673,351 | | | | 1,022,427 | | | | 2,197,710 | | | | 1,518,048 | |
Payable for foreign tax expense | | | 789 | | | | — | | | | — | | | | — | | | | — | |
Payable to affiliates, net (Note 6) | | | — | | | | 132,945 | | | | 47,496 | | | | 55,633 | | | | 566,067 | |
Payable for income distribution | | | — | | | | 338,757 | | | | 141,018 | | | | 148,910 | | | | 658,172 | |
Other liabilities | | | 49,078 | | | | 74,650 | | | | 56,509 | | | | 61,403 | | | | 138,893 | |
| | | | | | | | | | | | | | | | | | | | |
Total liabilities | | | 3,816,452 | | | | 33,512,380 | | | | 3,097,364 | | | | 53,317,842 | | | | 9,378,768 | |
| | | | | | | | | | | | | | | | | | | | |
Total net assets | | $ | 9,697,070 | | | $ | 660,387,290 | | | $ | 182,620,416 | | | $ | 242,589,108 | | | $ | 1,618,163,755 | |
| | | | | | | | | | | | | | | | | | | | |
Net assets consist of: | |
Paid-in capital | | $ | 8,520,769 | | | $ | 659,590,565 | | | $ | 181,253,435 | | | $ | 242,931,457 | | | $ | 1,558,090,752 | |
Net unrealized appreciation on investments and foreign currency translation | | | 944,614 | | | | 608,023 | | | | 1,607,516 | | | | 1,313,582 | | | | 72,717,440 | |
Accumulated net realized gain (loss) on investments and foreign currency transactions | | | 224,365 | | | | 204,338 | | | | (240,070 | ) | | | (1,657,291 | ) | | | (12,860,202 | ) |
Undistributed net investment income (distributions in excess of net investment income) | | | 7,322 | | | | (15,636 | ) | | | (465 | ) | | | 1,360 | | | | 215,765 | |
| | | | | | | | | | | | | | | | | | | | |
Total net assets | | $ | 9,697,070 | | | $ | 660,387,290 | | | $ | 182,620,416 | | | $ | 242,589,108 | | | $ | 1,618,163,755 | |
| | | | | | | | | | | | | | | | | | | | |
Net asset value, offering price and redemption proceeds per share (unlimited shares authorized, no par value) | | | | | | | | | | | | | | | | | | | | |
Investor class of shares: | |
Net asset value, offering price and redemption proceeds per share | | $ | — | | | $ | — | | | $ | — | | | $ | — | | | $ | 11.37 | |
Advisor class of shares: | |
Net asset value and redemption proceeds per share | | | 12.22 | | | | 10.08 | | | | 10.22 | | | | 9.39 | | | | 11.37 | |
Offering price per share | | | 12.86 | (3) | | | 10.29 | (4) | | | 10.43 | (4) | | | 9.58 | (4) | | | 11.78 | (5) |
Institutional class of shares: | |
Net asset value, offering price and redemption proceeds per share | | | 12.25 | | | | 10.08 | | | | 10.22 | | | | 9.40 | | | | 11.37 | |
|
Net assets: | |
Investor class of shares | | $ | — | | | $ | — | | | $ | — | | | $ | — | | | $ | 975,663,588 | |
Advisor class of shares | | | 729,758 | | | | 34,696,297 | | | | 7,165,834 | | | | 33,311,368 | | | | 10,841,713 | |
Institutional class of shares | | | 8,967,312 | | | | 625,690,993 | | | | 175,454,582 | | | | 209,277,740 | | | | 631,658,454 | |
| | | | | | | | | | | | | | | | | | | | |
Total net assets | | $ | 9,697,070 | | | $ | 660,387,290 | | | $ | 182,620,416 | | | $ | 242,589,108 | | | $ | 1,618,163,755 | |
| | | | | | | | | | | | | | | | | | | | |
Shares outstanding: | |
Investor class of shares | | | — | | | | — | | | | — | | | | — | | | | 85,781,846 | |
Advisor class of shares | | | 59,730 | | | | 3,440,971 | | | | 701,432 | | | | 3,549,415 | | | | 953,217 | |
Institutional class of shares | | | 731,994 | | | | 62,090,069 | | | | 17,163,320 | | | | 22,256,627 | | | | 55,550,449 | |
| | | | | | | | | | | | | | | | | | | | |
Total shares outstanding | | | 791,724 | | | | 65,531,040 | | | | 17,864,752 | | | | 25,806,042 | | | | 142,285,512 | |
| | | | | | | | | | | | | | | | | | | | |
Investments, at cost: | |
Investments in unaffiliated issuers | | $ | 12,240,446 | | | $ | 681,422,343 | | | $ | 172,589,947 | | | $ | 285,916,555 | | | $ | 1,532,274,601 | |
Cash sweep investments in affiliated issuers | | | — | | | | 80,322 | | | | 115,488 | | | | 4,464,014 | | | | 79,783 | |
Investments in other affiliated issuers | | | — | | | | — | | | | 866,956 | | | | — | | | | 5,113,358 | |
| | | | | | | | | | | | | | | | | | | | |
Total investments, at cost | | $ | 12,240,446 | | | $ | 681,502,665 | | | $ | 173,572,391 | | | $ | 290,380,569 | | | $ | 1,537,467,742 | |
| | | | | | | | | | | | | | | | | | | | |
| (1) | Including $302,768 and $49,901,497, respectively, of securities on loan. A security on loan value represents both market value and accrued interest. |
| (2) | Identified cost of cash denominated in foreign currencies is $1,424. |
| (3) | Computation of offering price per share 100/95 of net asset value. |
| (4) | Computation of offering price per share 100/98 of net asset value. |
| (5) | Computation of offering price per share 100/96.5 of net asset value. |
(See Notes which are an integral part of the Financial Statements)
119
August 31, 2017
| | |
| Statements of Assets and Liabilities | | BMO Funds |
| | | | | | | | | | | | | | | | |
| | | | | | | | | | | | | |
| | | Strategic
Income Fund | | | TCH
Corporate
Income Fund | | | TCH
Core Plus
Bond Fund | | | High Yield
Bond Fund | |
Assets: | |
Investments in unaffiliated issuers, at value | | $ | 135,746,665 | (1) | | $ | 309,045,607 | (1) | | $ | 1,203,975,772 | (1) | | $ | 12,774,444 | |
Cash sweep investments in affiliated issuers, at value | | | 938,029 | | | | 4,410,836 | | | | 46,560,055 | | | | 360,045 | |
Deposit held at broker | | | 100,000 | | | | 250,000 | | | | 250,000 | | | | — | |
Dividends and interest receivable | | | 1,183,527 | | | | 2,092,348 | | | | 6,113,300 | | | | 207,397 | |
Receivable for investments sold | | | 695,816 | | | | — | | | | — | | | | — | |
Receivable for capital stock sold | | | 19,704 | | | | 829,177 | | | | 2,484,534 | | | | 569 | |
Receivable from affiliates, net (Note 6) | | | — | | | | — | | | | — | | | | 16,209 | |
Prepaid expenses and other receivables | | | 24,785 | | | | 21,087 | | | | 22,898 | | | | 16,290 | |
| | | | | | | | | | | | | | | | |
Total assets | | | 138,708,526 | | | | 316,649,055 | | | | 1,259,406,559 | | | | 13,374,954 | |
|
Liabilities: | |
Payable for return of securities lending collateral | | | 24,164,624 | | | | 59,729,711 | | | | 210,537,373 | | | | — | |
Payable for investments purchased | | | 973,144 | | | | — | | | | — | | | | — | |
Payable for capital stock redeemed | | | 38,635 | | | | 123,528 | | | | 946,357 | | | | 1,271 | |
Payable to affiliates, net (Note 6) | | | 45,468 | | | | 88,382 | | | | 261,772 | | | | — | |
Payable for income distribution | | | 28,279 | | | | 225,152 | | | | 232,139 | | | | 10,281 | |
Other liabilities | | | 65,889 | | | | 60,053 | | | | 94,630 | | | | 50,053 | |
| | | | | | | | | | | | | | | | |
Total liabilities | | | 25,316,039 | | | | 60,226,826 | | | | 212,072,271 | | | | 61,605 | |
| | | | | | | | | | | | | | | | |
Total net assets | | $ | 113,392,487 | | | $ | 256,422,229 | | | $ | 1,047,334,288 | | | $ | 13,313,349 | |
| | | | | | | | | | | | | | | | |
Net assets consist of: | |
Paid-in capital | | $ | 115,228,862 | | | $ | 249,924,716 | | | $ | 1,029,220,474 | | | $ | 16,059,593 | |
Net unrealized appreciation on investments | | | 2,191,091 | | | | 6,219,580 | | | | 19,723,438 | | | | 498,576 | |
Accumulated net realized gain (loss) on investments | | | (4,012,540 | ) | | | 280,631 | | | | (1,596,519 | ) | | | (3,235,433 | ) |
Distributions in excess of net investment income | | | (14,926 | ) | | | (2,698 | ) | | | (13,105 | ) | | | (9,387 | ) |
| | | | | | | | | | | | | | | | |
Total net assets | | $ | 113,392,487 | | | $ | 256,422,229 | | | $ | 1,047,334,288 | | | $ | 13,313,349 | |
| | | | | | | | | | | | | | | | |
Net asset value, offering price and redemption proceeds per share (unlimited shares authorized, no par value) | | | | | | | | | | | | | | | | |
Investor class of shares: | |
Net asset value, offering price and redemption proceeds per share | | $ | 9.45 | | | $ | 13.20 | | | $ | 11.79 | | | $ | — | |
Advisor class of shares: | |
Net asset value and redemption proceeds per share | | | 9.45 | | | | 13.20 | | | | 11.79 | | | | 9.58 | |
Offering price per share(2) | | | 9.79 | | | | 13.68 | | | | 12.22 | | | | 9.93 | |
Institutional class of shares: | |
Net asset value, offering price and redemption proceeds per share | | | 9.44 | | | | 13.19 | | | | 11.78 | | | | 9.57 | |
|
Net assets: | |
Investor class of shares | | $ | 73,488,107 | | | $ | 120,745,358 | | | $ | 68,946,379 | | | $ | — | |
Advisor class of shares | | | 18,353,839 | | | | 1,384,266 | | | | 3,336,844 | | | | 1,010,341 | |
Institutional class of shares | | | 21,550,541 | | | | 134,292,605 | | | | 975,051,065 | | | | 12,303,008 | |
| | | | | | | | | | | | | | | | |
Total net assets | | $ | 113,392,487 | | | $ | 256,422,229 | | | $ | 1,047,334,288 | | | $ | 13,313,349 | |
| | | | | | | | | | | | | | | | |
Shares outstanding: | |
Investor class of shares | | | 7,778,142 | | | | 9,145,304 | | | | 5,849,353 | | | | — | |
Advisor class of shares | | | 1,942,612 | | | | 104,846 | | | | 283,095 | | | | 105,492 | |
Institutional class of shares | | | 2,282,544 | | | | 10,183,020 | | | | 82,745,549 | | | | 1,285,869 | |
| | | | | | | | | | | | | | | | |
Total shares outstanding | | | 12,003,298 | | | | 19,433,170 | | | | 88,877,997 | | | | 1,391,361 | |
| | | | | | | | | | | | | | | | |
Investments, at cost: | |
Investments in unaffiliated issuers | | $ | 133,555,574 | | | $ | 302,826,027 | | | $ | 1,184,253,226 | | | $ | 12,275,868 | |
Cash sweep investments in affiliated issuers | | | 938,029 | | | | 4,410,836 | | | | 46,559,163 | | | | 360,045 | |
| | | | | | | | | | | | | | | | |
Total investments, at cost | | $ | 134,493,603 | | | $ | 307,236,863 | | | $ | 1,230,812,389 | | | $ | 12,635,913 | |
| | | | | | | | | | | | | | | | |
| (1) | Including $23,711,930, $58,610,750 and $206,593,220, respectively, of securities on loan. A security on loan value represents both market value and accrued interest. |
| (2) | Computation of offering price per share 100/96.5 of net asset value. |
(See Notes which are an integral part of the Financial Statements)
120
August 31, 2017
| | |
| Statements of Assets and Liabilities | | BMO Funds |
| | | | | | | | | | | | | | | | |
| | | | | | | | | | | | | |
| | | Government
Money
Market Fund | | | Tax-Free
Money
Market Fund | | | Prime
Money
Market Fund | | | Institutional
Prime Money
Market Fund | |
Assets: | | | | | | | | | | | | | | | | |
Investments in unaffiliated issuers, at value | | $ | 2,826,442,412 | | | $ | 319,482,869 | | | $ | 348,130,652 | | | $ | 331,937,481 | |
Investments in repurchase agreements | | | 608,302,536 | | | | — | | | | 20,618,301 | | | | 70,000,000 | |
Cash | | | — | | | | 1,000 | | | | — | | | | 3,000 | |
Dividends and interest receivable | | | 1,410,588 | | | | 512,113 | | | | 166,259 | | | | 137,127 | |
Receivable for capital stock sold | | | 60,406 | | | | — | | | | — | | | | — | |
Prepaid expenses and other receivables | | | 15,874 | | | | 19,697 | | | | 18,276 | | | | 19,547 | |
| | | | | | | | | | | | | | | | |
Total assets | | | 3,436,231,816 | | | | 320,015,679 | | | | 368,933,488 | | | | 402,097,155 | |
Liabilities: | | | | | | | | | | | | | | | | |
Payable for investments purchased | | | 349,965,000 | | | | 5,000,000 | | | | — | | | | — | |
Payable to affiliates, net (Note 6) | | | 638,439 | | | | 34,194 | | | | 86,578 | | | | 11,974 | |
Payable for income distribution | | | 1,938,044 | | | | 135,746 | | | | 181,345 | | | | 360,165 | |
Other liabilities | | | 86,959 | | | | 44,326 | | | | 76,798 | | | | 101,056 | |
| | | | | | | | | | | | | | | | |
Total liabilities | | | 352,628,442 | | | | 5,214,266 | | | | 344,721 | | | | 473,195 | |
| | | | | | | | | | | | | | | | |
Total net assets | | $ | 3,083,603,374 | | | $ | 314,801,413 | | | $ | 368,588,767 | | | $ | 401,623,960 | |
| | | | | | | | | | | | | | | | |
Net assets consist of: | | | | | | | | | | | | | | | | |
Paid-in capital | | $ | 3,083,603,515 | | | $ | 314,801,359 | | | $ | 368,612,742 | | | $ | 401,566,073 | |
Net unrealized appreciation on investments | | | — | | | | — | | | | — | | | | 41,402 | |
Accumulated net realized gain on investments | | | 900 | | | | 24,255 | | | | 87 | | | | 33 | |
Undistributed net investment income
(distributions in excess of net investment income) | | | (1,041 | ) | | | (24,201 | ) | | | (24,062 | ) | | | 16,452 | |
| | | | | | | | | | | | | | | | |
Total net assets | | $ | 3,083,603,374 | | | $ | 314,801,413 | | | $ | 368,588,767 | | | $ | 401,623,960 | |
| | | | | | | | | | | | | | | | |
Net asset value, offering price and redemption proceeds per share (unlimited shares authorized, no par value) | | | | | | | | | | | | | | | | |
Investor class of shares: | | | | | | | | | | | | | | | | |
Net asset value, offering price and redemption proceeds per share | | $ | 1.00 | | | $ | 1.00 | | | $ | 1.00 | | | $ | 1.0001 | |
Premier class of shares: | | | | | | | | | | | | | | | | |
Net asset value, offering price and redemption proceeds per share | | | 1.00 | | | | 1.00 | | | | 1.00 | | | | 1.0001 | |
| | | | |
Net assets: | | | | | | | | | | | | | | | | |
Investor class of shares | | $ | 814,242,090 | | | $ | 76,029,311 | | | $ | 202,251,252 | | | $ | 1,421,404 | |
Premier class of shares | | | 2,269,361,284 | | | | 238,772,102 | | | | 166,337,515 | | | | 400,202,556 | |
| | | | | | | | | | | | | | | | |
Total net assets | | $ | 3,083,603,374 | | | $ | 314,801,413 | | | $ | 368,588,767 | | | $ | 401,623,960 | |
| | | | | | | | | | | | | | | | |
Shares outstanding: | | | | | | | | | | | | | | | | |
Investor class of shares | | | 814,243,487 | | | | 76,026,926 | | | | 202,313,238 | | | | 1,421,281 | |
Premier class of shares | | | 2,269,360,028 | | | | 238,802,101 | | | | 166,299,555 | | | | 400,167,550 | |
| | | | | | | | | | | | | | | | |
Total shares outstanding | | | 3,083,603,515 | | | | 314,829,027 | | | | 368,612,793 | | | | 401,588,831 | |
| | | | | | | | | | | | | | | | |
Investments, at cost: | | | | | | | | | | | | | | | | |
Investments in unaffiliated issuers | | $ | 3,434,744,948 | | | $ | 319,482,869 | | | $ | 368,748,953 | | | $ | 401,896,079 | |
| | | | | | | | | | | | | | | | |
Total investments, at cost | | $ | 3,434,744,948 | | | $ | 319,482,869 | | | $ | 368,748,953 | | | $ | 401,896,079 | |
| | | | | | | | | | | | | | | | |
(See Notes which are an integral part of the Financial Statements)
121
Year Ended August 31, 2017
| | |
| Statements of Operations | | BMO Funds |
| | | | | | | | | | | | | | | | | | | | |
| | | | | | | | | | | | | | | | |
| | | Low Volatility
Equity Fund | | | Dividend
Income Fund | | | Large-Cap
Value Fund | | | Large-Cap
Growth Fund | | | Mid-Cap
Value Fund | |
Investment income: | | | | | | | | | | | | | | | | | | | | |
Dividend income from: | | | | | | | | | | | | | | | | | | | | |
Unaffiliated issuers | | $ | 3,620,907 | (1) | | $ | 3,392,440 | | | $ | 6,699,101 | | | $ | 3,879,281 | | | $ | 3,993,078 | |
Affiliated issuers | | | 21,760 | | | | 15,692 | | | | 38,584 | | | | 43,549 | | | | 28,896 | |
Net securities lending income (Note 6) | | | 105,900 | | | | 83,857 | | | | 217,322 | | | | 229,074 | | | | 146,626 | |
| | | | | | | | | | | | | | | | | | | | |
Total income | | | 3,748,567 | | | | 3,491,989 | | | | 6,955,007 | | | | 4,151,904 | | | | 4,168,600 | |
| | | | | |
Expenses: | | | | | | | | | | | | | | | | | | | | |
Investment advisory fees (Note 6) | | | 798,321 | | | | 584,597 | | | | 1,630,918 | | | | 1,518,543 | | | | 1,511,577 | |
Shareholder servicing fees (Note 6) | | | — | | | | — | | | | 337,030 | | | | 403,832 | | | | 271,592 | |
Administration fees (Note 6) | | | 239,496 | | | | 175,379 | | | | 487,801 | | | | 454,021 | | | | 311,151 | |
Portfolio accounting fees | | | 73,806 | | | | 60,608 | | | | 135,649 | | | | 131,733 | | | | 117,799 | |
Recordkeeping fees | | | 34,079 | | | | 27,776 | | | | 79,379 | | | | 96,492 | | | | 90,086 | |
Custodian fees (Note 6) | | | 7,423 | | | | 5,434 | | | | 15,164 | | | | 14,133 | | | | 10,252 | |
Registration fees | | | 35,424 | | | | 33,738 | | | | 70,165 | | | | 68,300 | | | | 66,093 | |
Professional fees | | | 23,610 | | | | 23,610 | | | | 23,990 | | | | 23,990 | | | | 23,990 | |
Printing and postage | | | 20,904 | | | | 38,185 | | | | 44,175 | | | | 40,601 | | | | 54,073 | |
Directors’ fees | | | 13,333 | | | | 13,333 | | | | 13,333 | | | | 13,333 | | | | 13,333 | |
Distribution services fees (Note 6): | | | | | | | | | | | | | | | | | | | | |
Advisor class | | | 67,829 | | | | 164,465 | | | | 40,851 | | | | 1,349 | | | | 50,699 | |
Retirement class R-3 | | | — | | | | — | | | | �� | | | | — | | | | 116 | |
Miscellaneous | | | 6,669 | | | | 5,311 | | | | 11,337 | | | | 10,123 | | | | 10,287 | |
| | | | | | | | | | | | | | | | | | | | |
Total expenses | | | 1,320,894 | | | | 1,132,436 | | | | 2,889,792 | | | | 2,776,450 | | | | 2,531,048 | |
| | | | | |
Deduct: | | | | | | | | | | | | | | | | | | | | |
Expense waivers (Note 6) | | | (214,704 | ) | | | (207,995 | ) | | | (67,008 | ) | | | (94,996 | ) | | | (43,876 | ) |
| | | | | | | | | | | | | | | | | | | | |
Net expenses | | | 1,106,190 | | | | 924,441 | | | | 2,822,784 | | | | 2,681,454 | | | | 2,487,172 | |
| | | | | | | | | | | | | | | | | | | | |
Net investment income | | | 2,642,377 | | | | 2,567,548 | | | | 4,132,223 | | | | 1,470,450 | | | | 1,681,428 | |
| | | | | |
Net realized and unrealized gain (loss) on investments: | | | | | | | | | | | | | | | | | | | | |
Net realized gain on transactions from: | |
Investments in unaffiliated issuers | | | 3,957,705 | | | | 11,549,944 | | | | 26,065,495 | | | | 18,479,605 | | | | 46,313,287 | |
Investments in affiliated issuers | | | 299 | | | | 73 | | | | 1,358 | | | | 1,391 | | | | 1,383 | |
| | | | | | | | | | | | | | | | | | | | |
Total net realized gain | | | 3,958,004 | | | | 11,550,017 | | | | 26,066,853 | | | | 18,480,996 | | | | 46,314,670 | |
Net change in unrealized appreciation (depreciation) on: | | | | | | | | | | | | | | | | | | | | |
Investments in unaffiliated issuers | | | 4,847,208 | | | | 2,280,340 | | | | 14,277,360 | | | | 39,702,441 | | | | (20,600,805 | ) |
Investments in affiliated issuers | | | — | | | | 32 | | | | 26 | | | | 50 | | | | — | |
| | | | | | | | | | | | | | | | | | | | |
Total net change in unrealized appreciation (depreciation) | | | 4,847,208 | | | | 2,280,372 | | | | 14,277,386 | | | | 39,702,491 | | | | (20,600,805 | ) |
| | | | | | | | | | | | | | | | | | | | |
Net realized and unrealized gain on investments | | | 8,805,212 | | | | 13,830,389 | | | | 40,344,239 | | | | 58,183,487 | | | | 25,713,865 | |
| | | | | | | | | | | | | | | | | | | | |
Change in net assets resulting from operations | | $ | 11,447,589 | | | $ | 16,397,937 | | | $ | 44,476,462 | | | $ | 59,653,937 | | | $ | 27,395,293 | |
| | | | | | | | | | | | | | | | | | | | |
| (1) | Net of foreign taxes withheld of $4,561. |
(See Notes which are an integral part of the Financial Statements)
122
Year Ended August 31, 2017
| | |
| Statements of Operations | | BMO Funds |
| | | | | | | | | | | | | | | | | | | | |
| | | | | | | | | | | | | | | | |
| | | Mid-Cap
Growth Fund | | | Small-Cap
Value Fund | | | Small-Cap
Core Fund | | | Small-Cap
Growth Fund | | | Global Low
Volatility
Equity Fund | |
Investment income: | | | | | | | | | | | | | | | | | | | | |
Dividend income from: | | | | | | | | | | | | | | | | | | | | |
Unaffiliated issuers | | $ | 1,007,493 | (1) | | $ | 878,521 | (2) | | $ | 159,554 | (2) | | $ | 824,535 | | | $ | 1,420,974 | (1) |
Affiliated issuers | | | 18,016 | | | | 9,724 | | | | 2,946 | | | | 24,748 | | | | — | |
Net securities lending income (Note 6) | | | 86,241 | | | | 55,213 | | | | 15,512 | | | | 457,173 | | | | 6,805 | |
| | | | | | | | | | | | | | | | | | | | |
Total income | | | 1,111,750 | | | | 943,458 | | | | 178,012 | | | | 1,306,456 | | | | 1,427,779 | |
|
Expenses: | |
Investment advisory fees (Note 6) | | | 804,195 | | | | 462,184 | | | | 111,610 | | | | 1,471,741 | | | | 326,874 | |
Shareholder servicing fees (Note 6) | | | 163,287 | | | | — | | | | — | | | | 214,723 | | | | — | |
Administration fees (Note 6) | | | 175,873 | | | | 98,504 | | | | 25,756 | | | | 306,628 | | | | 75,432 | |
Portfolio accounting fees | | | 87,627 | | | | 67,346 | | | | 33,750 | | | | 86,715 | | | | 55,605 | |
Recordkeeping fees | | | 81,631 | | | | 50,244 | | | | 23,131 | | | | 55,821 | | | | 23,177 | |
Custodian fees (Note 6) | | | 5,455 | | | | 3,135 | | | | 799 | | | | 9,471 | | | | 71,660 | |
Registration fees | | | 66,077 | | | | 53,696 | | | | 30,315 | | | | 42,756 | | | | 30,634 | |
Professional fees | | | 23,990 | | | | 23,610 | | | | 23,610 | | | | 23,990 | | | | 23,915 | |
Printing and postage | | | 44,033 | | | | 54,655 | | | | 6,886 | | | | 56,838 | | | | 6,657 | |
Directors’ fees | | | 13,333 | | | | 13,333 | | | | 13,333 | | | | 13,333 | | | | 13,333 | |
Distribution services fees (Note 6): | | | | | | | | | | | | | | | | | | | | |
Advisor class | | | 29,588 | | | | 95,691 | | | | 3,434 | | | | 46,513 | | | | 1,419 | |
Retirement class R-3 | | | 105 | | | | 519 | | | | — | | | | — | | | | — | |
Miscellaneous | | | 8,120 | | | | 5,518 | | | | 2,795 | | | | 15,430 | | | | 12,632 | |
| | | | | | | | | | | | | | | | | | | | |
Total expenses | | | 1,503,314 | | | | 928,435 | | | | 275,419 | | | | 2,343,959 | | | | 641,338 | |
| | | | | |
Deduct: | | | | | | | | | | | | | | | | | | | | |
Expense waivers (Note 6) | | | (148,063 | ) | | | (166,953 | ) | | | (117,281 | ) | | | (5,110 | ) | | | (211,613 | ) |
| | | | | | | | | | | | | | | | | | | | |
Net expenses | | | 1,355,251 | | | | 761,482 | | | | 158,138 | | | | 2,338,849 | | | | 429,725 | |
| | | | | | | | | | | | | | | | | | | | |
Net investment income (loss) | | | (243,501 | ) | | | 181,976 | | | | 19,874 | | | | (1,032,393 | ) | | | 998,054 | |
| | | | | |
Net realized and unrealized gain (loss) on investments and foreign currency: | | | | | | | | | | | | | | | | | | | | |
Net realized gain on transactions from: | |
Investments in unaffiliated issuers | | | 30,467,203 | | | | 9,972,454 | | | | 952,281 | | | | 81,423,920 | | | | 307,488 | |
Investments in affiliated issuers | | | 689 | | | | 216 | | | | 95 | | | | 1,531 | | | | — | |
Foreign currency transactions | | | — | | | | — | | | | — | | | | — | | | | (23,988 | ) |
| | | | | | | | | | | | | | | | | | | | |
Total net realized gain | | | 30,467,892 | | | | 9,972,670 | | | | 952,376 | | | | 81,425,451 | | | | 283,500 | |
Net change in unrealized appreciation (depreciation) on: | | | | | | | | | | | | | | | | | | | | |
Investments in unaffiliated issuers | | | (11,980,712 | ) | | | (2,759,597 | ) | | | 1,428,444 | | | | (53,783,096 | ) | | | 2,417,478 | |
Foreign currency translations | | | — | | | | — | | | | — | | | | — | | | | 10,749 | |
| | | | | | | | | | | | | | | | | | | | |
Total net change in unrealized appreciation (depreciation) | | | (11,980,712 | ) | | | (2,759,597 | ) | | | 1,428,444 | | | | (53,783,096 | ) | | | 2,428,227 | |
| | | | | | | | | | | | | | | | | | | | |
Net realized and unrealized gain on investments and foreign currency | | | 18,487,180 | | | | 7,213,073 | | | | 2,380,820 | | | | 27,642,355 | | | | 2,711,727 | |
| | | | | | | | | | | | | | | | | | | | |
Change in net assets resulting from operations | | $ | 18,243,679 | | | $ | 7,395,049 | | | $ | 2,400,694 | | | $ | 26,609,962 | | | $ | 3,709,781 | |
| | | | | | | | | | | | | | | | | | | | |
| (1) | Net of foreign taxes withheld of $2,530 and $87,057, respectively. |
| (2) | Non-cash dividends amounted to $147,301 and $17,755, respectively. |
(See Notes which are an integral part of the Financial Statements)
123
Year Ended August 31, 2017
| | |
| Statements of Operations | | BMO Funds |
| | | | | | | | | | | | | | | | | | | | |
| | | | | | | | | | | | | | | | |
| | | Disciplined
International
Equity Fund | | | Pyrford
International
Stock Fund | | | LGM
Emerging
Markets
Equity Fund | | | TCH
Emerging
Markets
Bond Fund | | | Alternative
Strategies
Fund | |
Investment income: | | | | | | | | | | | | | | | | | | | | |
Dividend income from: | | | | | | | | | | | | | | | | | | | | |
Unaffiliated issuers | | $ | 1,925,768 | (1) | | $ | 22,265,547 | (1) | | $ | 3,242,582 | (1) | | $ | 5,093 | | | $ | 1,129,361 | (1)(3) |
Interest income | | | — | | | | — | | | | — | | | | 625,596 | | | | 1,000,987 | (3) |
Net securities lending income (Note 6) | | | 36,575 | | | | 273,392 | | | | 4,390 | | | | 6,352 | | | | — | |
| | | | | | | | | | | | | | | | | | | | |
Total income | | | 1,962,343 | | | | 22,538,939 | | | | 3,246,972 | | | | 637,041 | | | | 2,130,348 | |
| | | | | |
Expenses: | | | | | | | | | | | | | | | | | | | | |
Investment advisory fees (Note 6) | | | 388,006 | | | | 4,616,251 | | | | 1,304,225 | | | | 73,045 | | | | 1,734,588 | |
Shareholder servicing fees (Note 6) | | | — | | | | 215,123 | | | | — | | | | — | | | | — | |
Administration fees (Note 6) | | | 97,001 | | | | 893,292 | | | | 217,371 | | | | 19,921 | | | | 157,472 | |
Portfolio accounting fees | | | 45,920 | | | | 91,397 | | | | 49,437 | | | | 50,707 | | | | 317,705 | |
Recordkeeping fees | | | 22,409 | | | | 493,295 | | | | 32,782 | | | | 21,570 | | | | 23,657 | |
Custodian fees (Note 6) | | | 75,294 | | | | 312,038 | | | | 254,200 | | | | 3,106 | | | | 370,157 | |
Registration fees | | | 53,530 | | | | 76,948 | | | | 36,082 | | | | 30,666 | | | | 34,319 | |
Professional fees | | | 23,461 | | | | 24,390 | | | | 30,215 | | | | 27,066 | | | | 59,480 | |
Printing and postage | | | 6,601 | | | | 44,185 | | | | 40,960 | | | | 7,043 | | | | 6,913 | |
Directors’ fees | | | 13,333 | | | | 13,333 | | | | 13,333 | | | | 13,333 | | | | 13,333 | |
Interest expense and dividends on securities sold short | | | — | | | | — | | | | — | | | | — | | | | 836,747 | |
Distribution services fees (Note 6): | | | | | | | | | | | | | | | | | | | | |
Advisor class | | | 334 | | | | 694 | | | | 110,747 | | | | 593 | | | | 573 | |
Retirement class R-3 | | | — | | | | 120 | | | | — | | | | — | | | | — | |
Miscellaneous | | | 14,405 | | | | 14,008 | | | | 27,318 | | | | 3,713 | | | | 11,918 | |
| | | | | | | | | | | | | | | | | | | | |
Total expenses | | | 740,294 | | | | 6,795,074 | | | | 2,116,670 | | | | 250,763 | | | | 3,566,862 | |
| | | | | |
Deduct: | | | | | | | | | | | | | | | | | | | | |
Expense waivers (Note 6) | | | (157,950 | ) | | | (560,420 | ) | | | (339,413 | ) | | | (137,519 | ) | | | (730,384 | ) |
| | | | | | | | | | | | | | | | | | | | |
Net expenses | | | 582,344 | | | | 6,234,654 | | | | 1,777,257 | | | | 113,244 | | | | 2,836,478 | |
| | | | | | | | | | | | | | | | | | | | |
Net investment income (loss) | | | 1,379,999 | | | | 16,304,285 | | | | 1,469,715 | | | | 523,797 | | | | (706,130 | ) |
| | | | | |
Net realized and unrealized gain (loss) on investments, options, futures contracts and foreign currency: | | | | | | | | | | | | | | | | | | | | |
Net realized gain (loss) on transactions from: | |
Investments in unaffiliated issuers | | | (968,406 | ) | | | (9,737,039 | ) | | | 1,815,795 | (2) | | | (111,397 | ) | | | 7,513,102 | |
Foreign currency transactions | | | 18,574 | | | | (286,543 | ) | | | (119,866 | ) | | | (3,193 | ) | | | (881,295 | ) |
Forward contracts | | | — | | | | — | | | | — | | | | — | | | | 438,847 | |
Futures contracts | | | — | | | | — | | | | — | | | | — | | | | 636,116 | |
Purchased options | | | — | | | | — | | | | — | | | | — | | | | (872,774 | ) |
Written options | | | — | | | | — | | | | — | | | | — | | | | 1,647,284 | |
Short sales | | | — | | | | — | | | | — | | | | — | | | | (2,961,988 | ) |
| | | | | | | | | | | | | | | | | | | | |
Total net realized gain (loss) | | | (949,832 | ) | | | (10,023,582 | ) | | | 1,695,929 | | | | (114,590 | ) | | | 5,519,292 | |
Net change in unrealized appreciation (depreciation) on: | | | | | | | | | | | | | | | | | | | | |
Investments in unaffiliated issuers | | | 10,636,880 | | | | 59,287,847 | | | | 17,592,021 | | | | 171,149 | | | | (909,527 | ) |
Futures contracts | | | — | | | | — | | | | — | | | | — | | | | 179,786 | |
Forward contracts | | | — | | | | — | | | | — | | | | — | | | | 189,412 | |
Purchased options | | | — | | | | — | | | | — | | | | — | | | | (331,039 | ) |
Written options | | | — | | | | — | | | | — | | | | — | | | | 336,447 | |
Short sales | | | — | | | | — | | | | — | | | | — | | | | 439,680 | |
Foreign currency translations | | | 5,586 | | | | 66,893 | | | | (22,684 | ) | | | (804 | ) | | | 118 | |
| | | | | | | | | | | | | | | | | | | | |
Total net change in unrealized appreciation (depreciation) | | | 10,642,466 | | | | 59,354,740 | | | | 17,569,337 | | | | 170,345 | | | | (95,123 | ) |
| | | | | | | | | | | | | | | | | | | | |
Net realized and unrealized gain on investments, options, futures contracts and foreign currency | | | 9,692,634 | | | | 49,331,158 | | | | 19,265,266 | | | | 55,755 | | | | 5,424,169 | |
| | | | | | | | | | | | | | | | | | | | |
Change in net assets resulting from operations | | $ | 11,072,633 | | | $ | 65,635,443 | | | $ | 20,734,981 | | | $ | 579,552 | | | $ | 4,718,039 | |
| | | | | | | | | | | | | | | | | | | | |
| (1) | Net of foreign taxes withheld of $169,082, $1,820,670, $310,644 and $422, respectively. |
| (2) | Net of foreign taxes withheld of $822,045, $717,474 of which is related to appreciated investments held at period end. |
| (3) | Non-cash dividend and Paid-in-kind interest amounted to $123,691 and $3,368, respectively. |
(See Notes which are an integral part of the Financial Statements)
124
Year Ended August 31, 2017
| | |
| Statements of Operations | | BMO Funds |
| | | | | | | | | | | | | | | | | | | | |
| | | | | | | | | | | | | | | | |
| | | Global
Long/Short
Equity Fund | | | Ultra Short
Tax-Free Fund | | | Short
Tax-Free Fund | | | Short-Term
Income Fund | | | Intermediate
Tax-Free Fund | |
Investment income: | | | | | | | | | | | | | | | | | | | | |
Dividend income from: | | | | | | | | | | | | | | | | | | | | |
Unaffiliated issuers | | $ | 175,243 | (1) | | $ | — | | | $ | — | | | $ | 178,715 | | | $ | 671,819 | |
Affiliated issuers | | | — | | | | 6,215 | | | | 9,835 | | | | 55,426 | | | | 53,517 | |
Interest income | | | — | | | | 7,579,698 | | | | 3,273,608 | | | | 5,005,838 | | | | 50,875,140 | |
Net securities lending income (Note 6) | | | 1,530 | | | | — | | | | — | | | | 92,724 | | | | — | |
| | | | | | | | | | | | | | | | | | | | |
Total income | | | 176,773 | | | | 7,585,913 | | | | 3,283,443 | | | | 5,332,703 | | | | 51,600,476 | |
| | | | | |
Expenses: | | | | | | | | | | | | | | | | | | | | |
Investment advisory fees (Note 6) | | | 72,295 | | | | 1,019,790 | | | | 358,602 | | | | 490,064 | | | | 1,954,524 | |
Shareholder servicing fees (Note 6) | | | — | | | | 89,795 | | | | 33,777 | | | | 103,883 | | | | 2,719,878 | |
Administration fees (Note 6) | | | 10,844 | | | | 914,685 | | | | 275,212 | | | | 380,459 | | | | 2,496,786 | |
Portfolio accounting fees | | | 47,146 | | | | 245,717 | | | | 153,791 | | | | 135,795 | | | | 468,796 | |
Recordkeeping fees | | | 22,816 | | | | 39,536 | | | | 37,255 | | | | 51,679 | | | | 52,170 | |
Custodian fees (Note 6) | | | 24,540 | | | | 28,348 | | | | 8,527 | | | | 11,780 | | | | 77,318 | |
Registration fees | | | 53,635 | | | | 61,835 | | | | 46,764 | | | | 49,217 | | | | 74,458 | |
Professional fees | | | 26,006 | | | | 28,320 | | | | 28,320 | | | | 28,320 | | | | 28,320 | |
Printing and postage | | | 6,907 | | | | 11,527 | | | | 10,345 | | | | 12,796 | | | | 61,122 | |
Directors’ fees | | | 13,333 | | | | 13,333 | | | | 13,333 | | | | 13,333 | | | | 13,333 | |
Interest expense and dividends on securities sold short | | | 59,502 | | | | — | | | | — | | | | — | | | | — | |
Distribution services fees (Note 6): | | | | | | | | | | | | | | | | | | | | |
Advisor class | | | 1,459 | | | | 23,562 | | | | 10,444 | | | | 23,865 | | | | 8,137 | |
Miscellaneous | | | 10,827 | | | | 19,544 | | | | 7,559 | | | | 9,592 | | | | 49,880 | |
| | | | | | | | | | | | | | | | | | | | |
Total expenses | | | 349,310 | | | | 2,495,992 | | | | 983,929 | | | | 1,310,783 | | | | 8,004,722 | |
| | | | | |
Deduct: | | | | | | | | | | | | | | | | | | | | |
Expense waivers (Note 6) | | | (190,751 | ) | | | (552,571 | ) | | | (223,371 | ) | | | (295,091 | ) | | | (182,371 | ) |
| | | | | | | | | | | | | | | | | | | | |
Net expenses | | | 158,559 | | | | 1,943,421 | | | | 760,558 | | | | 1,015,692 | | | | 7,822,351 | |
| | | | | | | | | | | | | | | | | | | | |
Net investment income | | | 18,214 | | | | 5,642,492 | | | | 2,522,885 | | | | 4,317,011 | | | | 43,778,125 | |
| | | | | |
Net realized and unrealized gain (loss) on investments and foreign currency: | | | | | | | | | | | | | | | | | | | | |
Net realized gain (loss) on transactions from: | | | | | | | | | | | | | | | | | | | | |
Investments in unaffiliated issuers | | | 294,718 | | | | 727,984 | | | | (226,841 | ) | | | 236,882 | | | | (11,059,808 | ) |
Investments in affiliated issuers | | | — | | | | — | | | | — | | | | 218 | | | | — | |
Foreign currency transactions | | | 457 | | | | — | | | | — | | | | — | | | | — | |
Short sales | | | (46,199 | ) | | | — | | | | — | | | | — | | | | — | |
Net realized gain on capital gains distributions from: | | | | | | | | | | | | | | | | | | | | |
Investments in affiliated issuers | | | — | | | | — | | | | 895 | | | | — | | | | 5,281 | |
| | | | | | | | | | | | | | | | | | | | |
Total net realized gain (loss) | | | 248,976 | | | | 727,984 | | | | (225,946 | ) | | | 237,100 | | | | (11,054,527 | ) |
Net change in unrealized appreciation (depreciation) on: | | | | | | | | | | | | | | | | | | | | |
Investments in unaffiliated issuers | | | 953,226 | | | | 208,911 | | | | (181,247 | ) | | | (716,487 | ) | | | (26,177,041 | ) |
Investments in affiliated issuers | | | — | | | | — | | | | 864 | | | | 88 | | | | 5,093 | |
Short sales | | | (240,445 | ) | | | — | | | | — | | | | — | | | | — | |
Foreign currency translations | | | (27 | ) | | | — | | | | — | | | | — | | | | — | |
| | | | | | | | | | | | | | | | | | | | |
Total net change in unrealized appreciation (depreciation) | | | 712,754 | | | | 208,911 | | | | (180,383 | ) | | | (716,399 | ) | | | (26,171,948 | ) |
| | | | | | | | | | | | | | | | | | | | |
Net realized and unrealized gain (loss) on investments and foreign currency | | | 961,730 | | | | 936,895 | | | | (406,329 | ) | | | (479,299 | ) | | | (37,226,475 | ) |
| | | | | | | | | | | | | | | | | | | | |
Change in net assets resulting from operations | | $ | 979,944 | | | $ | 6,579,387 | | | $ | 2,116,556 | | | $ | 3,837,712 | | | $ | 6,551,650 | |
| | | | | | | | | | | | | | | | | | | | |
| (1) | Net of foreign taxes withheld of $10,985. |
(See Notes which are an integral part of the Financial Statements)
125
Year Ended August 31, 2017
| | |
| Statements of Operations | | BMO Funds |
| | | | | | | | | | | | | | | | |
| | | | | | | | | | | | | |
| | | Strategic
Income Fund | | | TCH
Corporate
Income Fund | | | TCH
Core Plus
Bond Fund | | | High Yield
Bond Fund | |
Investment income: | | | | | | | | | | | | | | | | |
Dividend income from: | | | | | | | | | | | | | | | | |
Affiliated issuers | | $ | 11,067 | | | $ | 77,149 | | | $ | 268,202 | | | $ | 8,277 | |
Interest income | | | 3,176,016 | | | | 7,402,926 | | | | 28,444,864 | | | | 2,537,723 | |
Net securities lending income (Note 6) | | | 10,262 | | | | 70,178 | | | | 344,146 | | | | — | |
| | | | | | | | | | | | | | | | |
Total income | | | 3,197,345 | | | | 7,550,253 | | | | 29,057,212 | | | | 2,546,000 | |
| | | | |
Expenses: | | | | | | | | | | | | | | | | |
Investment advisory fees (Note 6) | | | 242,483 | | | | 444,534 | | | | 1,272,636 | | | | 208,206 | |
Shareholder servicing fees (Note 6) | | | 193,934 | | | | 257,330 | | | | 1,131,214 | | | | — | |
Administration fees (Note 6) | | | 146,559 | | | | 343,184 | | | | 1,473,953 | | | | 62,462 | |
Portfolio accounting fees | | | 76,443 | | | | 112,136 | | | | 268,405 | | | | 59,199 | |
Recordkeeping fees | | | 57,921 | | | | 40,014 | | | | 43,311 | | | | 26,382 | |
Custodian fees (Note 6) | | | 4,541 | | | | 10,642 | | | | 45,679 | | | | 1,922 | |
Registration fees | | | 38,727 | | | | 47,255 | | | | 74,391 | | | | 41,238 | |
Professional fees | | | 30,480 | | | | 30,480 | | | | 30,480 | | | | 29,910 | |
Printing and postage | | | 19,781 | | | | 14,505 | | | | 45,343 | | | | 38,371 | |
Directors’ fees | | | 13,333 | | | | 13,333 | | | | 13,333 | | | | 13,333 | |
Distribution services fees (Note 6): | | | | | | | | | | | | | | | | |
Advisor class | | | 8,112 | | | | 1,388 | | | | 5,387 | | | | 56,080 | |
Miscellaneous | | | 4,824 | | | | 8,521 | | | | 30,641 | | | | 3,486 | |
| | | | | | | | | | | | | | | | |
Total expenses | | | 837,138 | | | | 1,323,322 | | | | 4,434,773 | | | | 540,589 | |
| | | | |
Deduct: | | | | | | | | | | | | | | | | |
Expense waivers (Note 6) | | | (97,679 | ) | | | (130,828 | ) | | | — | | | | (215,614 | ) |
| | | | | | | | | | | | | | | | |
Net expenses | | | 739,459 | | | | 1,192,494 | | | | 4,434,773 | | | | 324,975 | |
| | | | | | | | | | | | | | | | |
Net investment income | | | 2,457,886 | | | | 6,357,759 | | | | 24,622,439 | | | | 2,221,025 | |
| | | | |
Net realized and unrealized gain (loss) on investments: | | | | | | | | | | | | | | | | |
Net realized gain on transactions from: | | | | | | | | | | | | | | | | |
Investments in unaffiliated issuers | | | 2,392,762 | | | | 1,718,848 | | | | 3,197,584 | | | | 2,635,106 | |
Investments in affiliated issuers | | | (126 | ) | | | 2,028 | | | | 1,503 | | | | 1,965 | |
| | | | | | | | | | | | | | | | |
Total net realized gain | | | 2,392,636 | | | | 1,720,876 | | | | 3,199,087 | | | | 2,637,071 | |
Net change in unrealized appreciation (depreciation) on: | | | | | | | | | | | | | | | | |
Investments in unaffiliated issuers | | | (1,889,424 | ) | | | 1,352,901 | | | | (7,557,407 | ) | | | (2,865,438 | ) |
Investments in affiliated issuers | | | — | | | | — | | | | 892 | | | | — | |
| | | | | | | | | | | | | | | | |
Total net change in unrealized appreciation (depreciation) | | | (1,889,424 | ) | | | 1,352,901 | | | | (7,556,515 | ) | | | (2,865,438 | ) |
| | | | | | | | | | | | | | | | |
Net realized and unrealized gain (loss) on investments | | | 503,212 | | | | 3,073,777 | | | | (4,357,428 | ) | | | (228,367 | ) |
| | | | | | | | | | | | | | | | |
Change in net assets resulting from operations | | $ | 2,961,098 | | | $ | 9,431,536 | | | $ | 20,265,011 | | | $ | 1,992,658 | |
| | | | | | | | | | | | | | | | |
(See Notes which are an integral part of the Financial Statements)
126
Year Ended August 31, 2017
| | |
| Statements of Operations | | BMO Funds |
| | | | | | | | | | | | | | | | |
| | | | | | | | | | | | | |
| | | Government
Money
Market Fund | | | Tax-Free
Money
Market Fund | | | Prime
Money
Market Fund | | | Institutional
Prime Money
Market Fund | |
Investment income: | | | | | | | | | | | | | | | | |
Dividend income from: | | | | | | | | | | | | | | | | |
Unaffiliated issuers | | $ | 1,233,975 | | | $ | 79,917 | | | $ | 156,301 | | | $ | 125,834 | |
Interest income | | | 20,489,776 | | | | 2,752,345 | | | | 3,935,306 | | | | 3,793,344 | |
| | | | | | | | | | | | | | | | |
Total income | | | 21,723,751 | | | | 2,832,262 | | | | 4,091,607 | | | | 3,919,178 | |
| | | | |
Expenses: | | | | | | | | | | | | | | | | |
Investment advisory fees (Note 6) | | | 6,422,550 | | | | 733,467 | | | | 763,460 | | | | 624,829 | |
Shareholder servicing fees (Note 6) | | | 2,179,124 | | | | 202,042 | | | | 640,252 | | | | 3,417 | |
Administration fees (Note 6) | | | 1,115,080 | | | | 123,526 | | | | 171,450 | | | | 140,384 | |
Portfolio accounting fees | | | 354,841 | | | | 104,845 | | | | 118,062 | | | | 146,194 | |
Recordkeeping fees | | | 29,809 | | | | 30,361 | | | | 83,418 | | | | 196,975 | |
Custodian fees (Note 6) | | | 153,833 | | | | 17,029 | | | | 23,586 | | | | 19,362 | |
Registration fees | | | 65,563 | | | | 66,330 | | | | 72,875 | | | | 45,546 | |
Professional fees | | | 27,240 | | | | 31,550 | | | | 37,055 | | | | 31,550 | |
Printing and postage | | | 35,453 | | | | 25,279 | | | | 70,012 | | | | 35,896 | |
Directors’ fees | | | 13,333 | | | | 13,333 | | | | 13,333 | | | | 13,333 | |
Miscellaneous | | | 63,913 | | | | 16,001 | | | | 46,544 | | | | 12,458 | |
| | | | | | | | | | | | | | | | |
Total expenses | | | 10,460,739 | | | | 1,363,763 | | | | 2,040,047 | | | | 1,269,944 | |
| | | | |
Deduct: | | | | | | | | | | | | | | | | |
Expense waivers (Note 6) | | | (1,927,424 | ) | | | (427,816 | ) | | | (388,578 | ) | | | (433,421 | ) |
| | | | | | | | | | | | | | | | |
Net expenses | | | 8,533,315 | | | | 935,947 | | | | 1,651,469 | | | | 836,523 | |
| | | | | | | | | | | | | | | | |
Net investment income | | | 13,190,436 | | | | 1,896,315 | | | | 2,440,138 | | | | 3,082,655 | |
| | | | |
Net realized and unrealized gain on investments: | | | | | | | | | | | | | | | | |
Net Increase from payments by affiliates (Note 6) | | | _ | | | | _ | | | | 264,566 | | | | _ | |
Net realized gain on transactions from: | | | | | | | | | | | | | | | | |
Investments in unaffiliated issuers | | | 3,240 | | | | 35,088 | | | | 1,277 | | | | 1,901 | |
Net realized gain on capital gains distributions from: | | | | | | | | | | | | | | | | |
Investments in unaffiliated issuers | | | 900 | | | | 33,710 | | | | 87 | | | | 33 | |
| | | | | | | | | | | | | | | | |
Total net realized gain | | | 4,140 | | | | 68,798 | | | | 265,930 | | | | 1,934 | |
Net change in unrealized appreciation on: | | | | | | | | | | | | | | | | |
Investments in unaffiliated issuers | | | — | | | | — | | | | — | | | | 41,402 | |
| | | | | | | | | | | | | | | | |
Net realized and unrealized gain on investments | | | 4,140 | | | | 68,798 | | | | 265,930 | | | | 43,336 | |
| | | | | | | | | | | | | | | | |
Change in net assets resulting from operations | | $ | 13,194,576 | | | $ | 1,965,113 | | | $ | 2,706,068 | | | $ | 3,125,991 | |
| | | | | | | | | | | | | | | | |
(See Notes which are an integral part of the Financial Statements)
127
| | |
| Statements of Changes in Net Assets | | |
| | | | | | | | | | | | | | | | | | | | | | | | |
| | | | | | | | | | |
| | | Low Volatility
Equity Fund | | | Dividend
Income Fund | | | Large-Cap
Value Fund | |
| | | Year Ended
August 31,
2017 | | | Year Ended
August 31,
2016 | | | Year Ended
August 31,
2017 | | | Year Ended
August 31,
2016 | | | Year Ended
August 31,
2017 | | | Year Ended
August 31,
2016 | |
Change in net assets resulting from: | | | | | | | | | | | | | | | | | | | | | | | | |
| | | | | | |
Operations: | | | | | | | | | | | | | | | | | | | | | | | | |
Net investment income (loss) | | $ | 2,642,377 | | | $ | 1,719,750 | | | $ | 2,567,548 | | | $ | 2,902,334 | | | $ | 4,132,223 | | | $ | 4,610,415 | |
Net realized gain (loss) on investments | | | 3,958,004 | | | | 1,240,148 | | | | 11,550,017 | | | | 354,810 | | | | 26,066,853 | | | | (38,852 | ) |
Net change in unrealized appreciation (depreciation) on investments | | | 4,847,208 | | | | 9,835,447 | | | | 2,280,372 | | | | 9,968,239 | | | | 14,277,386 | | | | 11,147,062 | |
| | | | | | | | | | | | | | | | | | | | | | | | |
Change in net assets resulting from operations | | | 11,447,589 | | | | 12,795,345 | | | | 16,397,937 | | | | 13,225,383 | | | | 44,476,462 | | | | 15,718,625 | |
| | | | | | |
Distributions to shareholders: | | | | | | | | | | | | | | | | | | | | | | | | |
Distributions to shareholders from net investment income: | | | | | | | | | | | | | | | | | | | | | | | | |
Investor class of shares | | | — | | | | — | | | | — | | | | — | | | | (1,604,050 | )(1) | | | (2,355,769 | ) |
Advisor class of shares | | | (369,362 | ) | | | (93,308 | ) | | | (1,243,935 | ) | | | (1,799,680 | ) | | | (525,994 | ) | | | (496 | ) |
Institutional class of shares | | | (2,199,344 | ) | | | (1,399,044 | ) | | | (1,256,597 | ) | | | (1,023,663 | ) | | | (2,082,733 | ) | | | (2,144,146 | ) |
Retirement class R-3 of shares | | | — | | | | — | | | | — | | | | — | | | | — | | | | — | |
Retirement class R-6 of shares | | | — | | | | — | | | | — | | | | — | | | | (6,226 | ) | | | (551 | ) |
Distributions to shareholders from net realized gain on investments: | | | | | | | | | | | | | | | | | | | | | | | | |
Investor class of shares | | | — | | | | — | | | | — | | | | — | | | | (1,409,302 | )(1) | | | (16,736,440 | ) |
Advisor class of shares | | | (242,749 | ) | | | (186,472 | ) | | | (664,793 | ) | | | (4,585,710 | ) | | | (310 | ) | | | (3,030 | ) |
Institutional class of shares | | | (1,697,222 | ) | | | (2,310,319 | ) | | | (294,696 | ) | | | (2,265,425 | ) | | | (1,185,002 | ) | | | (12,497,098 | ) |
Retirement class R-3 of shares | | | — | | | | — | | | | — | | | | — | | | | — | | | | — | |
Retirement class R-6 of shares | | | — | | | | — | | | | — | | | | — | | | | (429 | ) | | | — | |
| | | | | | | | | | | | | | | | | | | | | | | | |
Change in net assets resulting from distributions to shareholders | | | (4,508,677 | ) | | | (3,989,143 | ) | | | (3,460,021 | ) | | | (9,674,478 | ) | | | (6,814,046 | ) | | | (33,737,530 | ) |
| | | | | | |
Capital stock transactions: | | | | | | | | | | | | | | | | | | | | | | | | |
Proceeds from sale of shares | | | 54,505,942 | | | | 77,894,953 | | | | 94,718,963 | | | | 17,607,800 | | | | 425,435,120 | | | | 104,915,403 | |
Net asset value of shares issued to shareholders in payment of distributions declared | | | 4,155,724 | | | | 3,775,035 | | | | 3,335,815 | | | | 9,308,888 | | | | 6,683,858 | | | | 33,226,566 | |
Cost of shares redeemed | | | (56,616,611 | ) | | | (17,952,511 | ) | | | (112,660,977 | ) | | | (33,025,752 | ) | | | (443,263,199 | ) | | | (64,253,029 | ) |
| | | | | | | | | | | | | | | | | | | | | | | | |
Change in net assets resulting from capital stock transactions | | | 2,045,055 | | | | 63,717,477 | | | | (14,606,199 | ) | | | (6,109,064 | ) | | | (11,144,221 | ) | | | 73,888,940 | |
| | | | | | | | | | | | | | | | | | | | | | | | |
Change in net assets | | | 8,983,967 | | | | 72,523,679 | | | | (1,668,283 | ) | | | (2,558,159 | ) | | | 26,518,195 | | | | 55,870,035 | |
| | | | | | |
Net assets: | | | | | | | | | | | | | | | | | | | | | | | | |
Beginning of period | | | 150,477,201 | | | | 77,953,522 | | | | 117,249,991 | | | | 119,808,150 | | | | 307,177,497 | | | | 251,307,462 | |
| | | | | | | | | | | | | | | | | | | | | | | | |
End of period | | $ | 159,461,168 | | | $ | 150,477,201 | | | $ | 115,581,708 | | | $ | 117,249,991 | | | $ | 333,695,692 | | | $ | 307,177,497 | |
| | | | | | | | | | | | | | | | | | | | | | | | |
Undistributed net investment income included in net assets at end of period | | $ | 460,213 | | | $ | 386,543 | | | $ | 523,336 | | | $ | 456,320 | | | $ | 902,298 | | | $ | 989,078 | |
| | | | | | | | | | | | | | | | | | | | | | | | |
| (1) | Reflects operations for the period from September 1, 2016, to June 2, 2017 (termination of Investor class of shares). |
(See Notes which are an integral part of the Financial Statements)
128
| | | | | | | | | | | | | | | | | | | | | | | | | | | | | | |
| | | | | | | | | | |
Large-Cap
Growth Fund | | | Mid-Cap
Value Fund | | | Mid-Cap
Growth Fund | | | Small-Cap
Value Fund | |
Year Ended
August 31,
2017 | | | Year Ended
August 31,
2016 | | | Year Ended
August 31,
2017 | | | Year Ended
August 31,
2016 | | | Year Ended
August 31,
2017 | | | Year Ended
August 31,
2016 | | | Year Ended
August 31,
2017 | | | Year Ended
August 31,
2016 | |
| | | | | | | | | | | | | | | | | | | | | | | | | | | | | | |
| | | | | | | |
| | | | | | | | | | | | | | | | | | | | | | | | | | | | | | |
| $ | 1,470,450 | | | $ | 709,679 | | | $ | 1,681,428 | | | $ | 2,409,099 | | | $ | (243,501 | ) | | $ | 274,516 | | | $ | 181,976 | | | $ | 197,179 | |
| | 18,480,996 | | | | 15,242,072 | | | | 46,314,670 | | | | 26,245,163 | | | | 30,467,892 | | | | 8,811,909 | | | | 9,972,670 | | | | 2,472,186 | |
|
39,702,491 |
| | | 5,020,597 | | | | (20,600,805 | ) | | | (11,337,427 | ) | | | (11,980,712 | ) | | | (19,868,300 | ) | | | (2,759,597 | ) | | | 4,049,590 | |
| | | | | | | | | | | | | | | | | | | | | | | | | | | | | | |
|
59,653,937 |
| | | 20,972,348 | | | | 27,395,293 | | | | 17,316,835 | | | | 18,243,679 | | | | (10,781,875 | ) | | | 7,395,049 | | | | 6,718,955 | |
| | | | | | | |
| | | | | | | | | | | | | | | | | | | | | | | | | | | | | | |
| | | | | | | | | | | | | | | | | | | | | | | | | | | | | | |
| | (850,301 | ) | | | (172,029 | ) | | | (620,800 | )(1) | | | (1,451,373 | ) | | | (154,340 | )(1) | | | — | | | | — | | | | — | |
| | (3,292 | ) | | | (108 | ) | | | (141 | ) | | | (283 | ) | | | (48 | ) | | | — | | | | (127,825 | ) | | | — | |
| | (962,258 | ) | | | (227,954 | ) | | | (406,171 | ) | | | (1,036,907 | ) | | | (120,879 | ) | | | — | | | | (140,161 | ) | | | — | |
| | — | | | | — | | | | (40 | ) | | | (140 | ) | | | — | | | | — | | | | (288 | ) | | | — | |
| | (9,663 | ) | | | — | | | | (86,426 | ) | | | (132,586 | ) | | | (115 | ) | | | — | | | | (7,836 | ) | | | — | |
| | | | | | | | | | | | | | | | | | | | | | | | | | | | | | |
| | (9,731,477 | ) | | | (23,424,642 | ) | | | (37,656,722 | )(1) | | | (17,282,806 | ) | | | (18,668,185 | )(1) | | | (17,885,662 | ) | | | — | | | | — | |
| | (23,105 | ) | | | (14,660 | ) | | | (10,206 | ) | | | (2,836 | ) | | | (6,793 | ) | | | (4,458 | ) | | | (4,014,102 | ) | | | (2,966,991 | ) |
| | (5,612,118 | ) | | | (9,138,591 | ) | | | (19,251,433 | ) | | | (8,980,221 | ) | | | (7,922,531 | ) | | | (11,158,688 | ) | | | (2,247,077 | ) | | | (864,410 | ) |
| | — | | | | — | | | | (7,265 | ) | | | (2,517 | ) | | | (5,167 | ) | | | (3,577 | ) | | | (8,082 | ) | | | (1,046 | ) |
| | (3,064 | ) | | | — | | | | (3,042,303 | ) | | | (830,126 | ) | | | (5,155 | ) | | | (3,575 | ) | | | (90,268 | ) | | | (22,642 | ) |
| | | | | | | | | | | | | | | | | | | | | | | | | | | | | | |
|
(17,195,278 |
) | | | (32,977,984 | ) | | | (61,081,507 | ) | | | (29,719,795 | ) | | | (26,883,213 | ) | | | (29,055,960 | ) | | | (6,635,639 | ) | | | (3,855,089 | ) |
| | | | | | | |
| | | | | | | | | | | | | | | | | | | | | | | | | | | | | | |
| | 260,299,527 | | | | 72,780,170 | | | | 235,382,599 | | | | 32,137,269 | | | | 172,115,168 | | | | 22,934,076 | | | | 51,649,898 | | | | 23,835,358 | |
|
16,862,068 |
| | | 32,554,872 | | | | 60,113,519 | | | | 29,132,606 | | | | 26,605,786 | | | | 28,499,772 | | | | 6,551,653 | | | | 3,718,316 | |
| | (222,772,588 | ) | | | (68,634,929 | ) | | | (286,548,985 | ) | | | (104,242,115 | ) | | | (203,548,530 | ) | | | (92,972,085 | ) | | | (63,822,053 | ) | | | (53,436,591 | ) |
| | | | | | | | | | | | | | | | | | | | | | | | | | | | | | |
|
54,389,007 |
| | | 36,700,113 | | | | 8,947,133 | | | | (42,972,240 | ) | | | (4,827,576 | ) | | | (41,538,237 | ) | | | (5,620,502 | ) | | | (25,882,917 | ) |
| | | | | | | | | | | | | | | | | | | | | | | | | | | | | | |
| | 96,847,666 | | | | 24,694,477 | | | | (24,739,081 | ) | | | (55,375,200 | ) | | | (13,467,110 | ) | | | (81,376,072 | ) | | | (4,861,092 | ) | | | (23,019,051 | ) |
| | | | | | | |
| | | | | | | | | | | | | | | | | | | | | | | | | | | | | | |
| | 259,607,762 | | | | 234,913,285 | | | | 231,243,049 | | | | 286,618,249 | | | | 126,489,627 | | | | 207,865,699 | | | | 69,146,624 | | | | 92,165,675 | |
| | | | | | | | | | | | | | | | | | | | | | | | | | | | | | |
| $ | 356,455,428 | | | $ | 259,607,762 | | | $ | 206,503,968 | | | $ | 231,243,049 | | | $ | 113,022,517 | | | $ | 126,489,627 | | | $ | 64,285,532 | | | $ | 69,146,624 | |
| | | | | | | | | | | | | | | | | | | | | | | | | | | | | | |
$ | 345,466 | | | $ | 700,529 | | | $ | 1,018,784 | | | $ | 450,934 | | | $ | — | | | $ | — | | | $ | 28,224 | | | $ | 120,329 | |
| | | | | | | | | | | | | | | | | | | | | | | | | | | | | | |
129
| | |
| Statements of Changes in Net Assets | | |
| | | | | | | | | | | | | | | | | | | | | | | | |
| | | | | | | | | | |
| | | Small-Cap
Core Fund | | | Small-Cap
Growth Fund | | | Global Low Volatility
Equity Fund | |
| | | Year Ended
August 31,
2017 | | | Year Ended
August 31,
2016 | | | Year Ended
August 31,
2017 | | | Year Ended
August 31,
2016 | | | Year Ended
August 31,
2017 | | | Year Ended
August 31,
2016 | |
Change in net assets resulting from: | | | | | | | | | | | | | | | | | | | | | | | | |
| | | | | | |
Operations: | | | | | | | | | | | | | | | | | | | | | | | | |
Net investment income (loss) | | $ | 19,874 | | | $ | 35,444 | | | $ | (1,032,393 | ) | | $ | (1,545,872 | ) | | $ | 998,054 | | | $ | 770,195 | |
Net realized gain (loss) on investments and foreign currency transactions | | | 952,376 | | | | 77,182 | | | | 81,425,451 | | | | (66,588,079 | ) | | | 283,500 | | | | 77,910 | |
Net change in unrealized appreciation (depreciation) on investments and foreign currency translation | | | 1,428,444 | | | | 1,088,736 | | | | (53,783,096 | ) | | | 22,778,741 | | | | 2,428,227 | | | | 3,976,037 | |
| | | | | | | | | | | | | | | | | | | | | | | | |
Change in net assets resulting from operations | | | 2,400,694 | | | | 1,201,362 | | | | 26,609,962 | | | | (45,355,210 | ) | | | 3,709,781 | | | | 4,824,142 | |
| | | | | | |
Distributions to shareholders: | | | | | | | | | | | | | | | | | | | | | | | | |
Distributions to shareholders from net investment income: | | | | | | | | | | | | | | | | | | | | | | | | |
Investor class of shares | | | — | | | | — | | | | — | | | | — | | | | — | | | | — | |
Advisor class of shares | | | (558 | ) | | | — | | | | — | | | | — | | | | (3,979 | ) | | | (842 | ) |
Institutional class of shares | | | (45,376 | ) | | | (8,676 | ) | | | — | | | | — | | | | (903,509 | ) | | | (276,907 | ) |
Retirement class R-3 of shares | | | — | | | | — | | | | — | | | | — | | | | — | | | | — | |
Retirement class R-6 of shares | | | — | | | | — | | | | — | | | | — | | | | — | | | | — | |
Distributions to shareholders from net realized gain on investments: | | | | | | | | | | | | | | | | | | | | | | | | |
Investor class of shares | | | — | | | | — | | | | — | | | | (19,043,435 | ) | | | — | | | | — | |
Advisor class of shares | | | (10,911 | ) | | | (4,815 | ) | | | — | | | | — | | | | (1,779 | ) | | | (5 | ) |
Institutional class of shares | | | (235,448 | ) | | | (44,857 | ) | | | — | | | | (21,414,838 | ) | | | (358,652 | ) | | | (1,223 | ) |
| | | | | | | | | | | | | | | | | | | | | | | | |
Change in net assets resulting from distributions to shareholders | | | (292,293 | ) | | | (58,348 | ) | | | — | | | | (40,458,273 | ) | | | (1,267,919 | ) | | | (278,977 | ) |
| | | | | | |
Capital stock transactions: | | | | | | | | | | | | | | | | | | | | | | | | |
Proceeds from sale of shares | | | 9,920,241 | | | | 7,519,961 | | | | 164,623,919 | | | | 122,730,351 | | | | 25,974,881 | | | | 30,143,065 | |
Net asset value of shares issued to shareholders in payment of distributions declared | | | 233,520 | | | | 55,327 | | | | — | | | | 38,844,689 | | | | 1,088,741 | | | | 278,762 | |
Cost of shares redeemed | | | (4,028,666 | ) | | | (1,552,099 | ) | | | (388,067,585 | ) | | | (386,000,081 | ) | | | (19,462,032 | ) | | | (78,393 | ) |
Redemption fees | | | — | | | | — | | | | — | | | | — | | | | 50 | | | | — | |
| | | | | | | | | | | | | | | | | | | | | | | | |
Change in net assets resulting from capital stock transactions | | | 6,125,095 | | | | 6,023,189 | | | | (223,443,666 | ) | | | (224,425,041 | ) | | | 7,601,640 | | | | 30,343,434 | |
| | | | | | | | | | | | | | | | | | | | | | | | |
Change in net assets | | | 8,233,496 | | | | 7,166,203 | | | | (196,833,704 | ) | | | (310,238,524 | ) | | | 10,043,502 | | | | 34,888,599 | |
| | | | | | |
Net assets: | | | | | | | | | | | | | | | | | | | | | | | | |
Beginning of period | | | 11,427,482 | | | | 4,261,279 | | | | 335,829,534 | | | | 646,068,058 | | | | 39,174,681 | | | | 4,286,082 | |
| | | | | | | | | | | | | | | | | | | | | | | | |
End of period | | $ | 19,660,978 | | | $ | 11,427,482 | | | $ | 138,995,830 | | | $ | 335,829,534 | | | $ | 49,218,183 | | | $ | 39,174,681 | |
| | | | | | | | | | | | | | | | | | | | | | | | |
Undistributed net investment income (distributions in excess of net investment income) included in net assets at end of period | | $ | 598 | | | $ | 26,658 | | | $ | (487,076 | ) | | $ | (781,484 | ) | | $ | 676,369 | | | $ | 562,878 | |
| | | | | | | | | | | | | | | | | | | | | | | | |
| (1) | Reflects operations for the period from September 17, 2015 (inception date) to August 31, 2016. |
(See Notes which are an integral part of the Financial Statements)
130
| | | | | | | | | | | | | | | | | | | | | | | | | | | | | | |
| | | | | | | | | | |
Disciplined International
Equity Fund | | | Pyrford International
Stock Fund | | | LGM Emerging Markets
Equity Fund | | | TCH Emerging Markets
Bond Fund | |
Year Ended
August 31,
2017 | | | Period Ended
August 31,
2016(1) | | | Year Ended
August 31,
2017 | | | Year Ended
August 31,
2016 | | | Year Ended
August 31,
2017 | | | Year Ended
August 31,
2016 | | | Year Ended
August 31,
2017 | | | Year Ended
August 31,
2016 | |
| | | | | | | | | | | | | | | | | | | | | | | | | | | | | | |
| | | | | | | |
| | | | | | | | | | | | | | | | | | | | | | | | | | | | | | |
| $ | 1,379,999 | | | $ | 1,597,236 | | | $ | 16,304,285 | | | $ | 16,087,942 | | | $ | 1,469,715 | | | $ | 1,453,122 | | | $ | 523,797 | | | $ | 371,826 | |
| | (949,832 | ) | | | (4,330,485 | ) | | | (10,023,582 | ) | | | (25,932,608 | ) | |
|
1,695,929 |
| | | (5,190,819 | ) | | | (114,590 | ) | | | (285,616 | ) |
|
10,642,466 |
| | | 259,955 | | | | 59,354,740 | | | | 47,465,510 | | | | 17,569,337 | | | | 26,731,218 | | | | 170,345 | | | | 623,408 | |
| | | | | | | | | | | | | | | | | | | | | | | | | | | | | | |
|
11,072,633 |
| | | (2,473,294 | ) | | | 65,635,443 | | | | 37,620,844 | | | | 20,734,981 | | | | 22,993,521 | | | | 579,552 | | | | 709,618 | |
| | | | | | | |
| | | | | | | | | | | | | | | | | | | | | | | | | | | | | | |
| | | | | | | | | | | | | | | | | | | | | | | | | | | | | | |
| | — | | | | — | | | | (2,021,310 | ) | | | (1,934,163 | ) | | | — | | | | — | | | | — | | | | — | |
| | (3,317 | ) | | | — | | | | (2,390 | ) | | | (16,401 | ) | | | (239,982 | ) | | | (565,517 | ) | | | — | | | | (184,869 | ) |
| | (1,673,168 | ) | | | — | | | | (11,624,253 | ) | | | (13,383,043 | ) | | | (717,841 | ) | | | (891,245 | ) | | | (401,330 | ) | | | (187,204 | ) |
| | — | | | | — | | | | (421 | ) | | | (399 | ) | | | — | | | | — | | | | — | | | | — | |
| | — | | | | — | | | | (652,041 | ) | | | (314,323 | ) | | | — | | | | — | | | | — | | | | — | |
| | | | | | | | | | | | | | | | | | | | | | | | | | | | | | |
| | — | | | | — | | | | — | | | | — | | | | — | | | | — | | | | — | | | | — | |
| | — | | | | — | | | | — | | | | — | | | | — | | | | — | | | | — | | | | (35,898 | ) |
| | — | | | | — | | | | — | | | | — | | | | — | | | | — | | | | — | | | | (35,236 | ) |
| | | | | | | | | | | | | | | | | | | | | | | | | | | | | | |
| | (1,676,485 | ) | |
|
— |
| | | (14,300,415 | ) | | | (15,648,329 | ) | | | (957,823 | ) | | | (1,456,762 | ) | | | (401,330 | ) | | | (443,207 | ) |
| | | | | | | |
| | | | | | | | | | | | | | | | | | | | | | | | | | | | | | |
| | 22,343,033 | | | | 82,544,586 | | | | 396,261,133 | | | | 193,170,479 | | | | 109,773,573 | | | | 36,515,328 | | | | 17,880,925 | | | | 6,501 | |
|
1,670,654 |
| | | — | | | | 9,352,958 | | | | 7,286,600 | | | | 866,512 | | | | 1,293,611 | | | | 391,248 | | | | 443,207 | |
| | (28,580,607 | ) | | | (12,512,586 | ) | | | (409,127,462 | ) | | | (345,856,593 | ) | | | (98,790,975 | ) | | | (77,615,987 | ) | | | (14,911,038 | ) | | | (66,846 | ) |
| | — | | | | 108 | | | | 3,133 | | | | 10,295 | | | | 680 | | | | 254 | | | | 423 | | | | — | |
| | | | | | | | | | | | | | | | | | | | | | | | | | | | | | |
| | (4,566,920 | ) | |
|
70,032,108 |
| | | (3,510,238 | ) | | | (145,389,219 | ) | | | 11,849,790 | | | | (39,806,794 | ) | | | 3,361,558 | | | | 382,862 | |
| | | | | | | | | | | | | | | | | | | | | | | | | | | | | | |
| | 4,829,228 | | | | 67,558,814 | | | | 47,824,790 | | | | (123,416,704 | ) | | | 31,626,948 | | | | (18,270,035 | ) | | | 3,539,780 | | | | 649,273 | |
| | | | | | | |
| | | | | | | | | | | | | | | | | | | | | | | | | | | | | | |
| | 67,558,814 | | | | — | | | | 601,914,795 | | | | 725,331,499 | | | | 130,729,863 | | | | 148,999,898 | | | | 8,343,753 | | | | 7,694,480 | |
| | | | | | | | | | | | | | | | | | | | | | | | | | | | | | |
| $ | 72,388,042 | | | $ | 67,558,814 | | | $ | 649,739,585 | | | $ | 601,914,795 | | | $ | 162,356,811 | | | $ | 130,729,863 | | | $ | 11,883,533 | | | $ | 8,343,753 | |
| | | | | | | | | | | | | | | | | | | | | | | | | | | | | | |
$ |
968,844 |
| | $ | 1,157,071 | | | $ | 14,755,088 | | | $ | 13,037,761 | | | $ | 1,245,074 | | | $ | 957,619 | | | $ | 313,519 | | | $ | 232,485 | |
| | | | | | | | | | | | | | | | | | | | | | | | | | | | | | |
131
| | |
| Statements of Changes in Net Assets | | |
| | | | | | | | | | | | | | | | | | | | | | | | |
| | | | | | | | | | |
| | | Alternative
Strategies Fund | | | Global Long/Short
Equity Fund | | | Ultra Short
Tax-Free Fund | |
| | | Year Ended
August 31,
2017 | | | Year Ended
August 31,
2016 | | | Year Ended
August 31,
2017 | | | Period Ended
August 31,
2016 (1) | | | Year Ended
August 31,
2017 | | | Year Ended
August 31,
2016 | |
Change in net assets resulting from: | | | | | | | | | | | | | | | | | | | | | | | | |
| | | | | | |
Operations: | | | | | | | | | | | | | | | | | | | | | | | | |
Net investment income (loss) | | $ | (706,130 | ) | | $ | (691,816 | ) | | $ | 18,214 | | | $ | 15,944 | | | $ | 5,642,492 | | | $ | 4,066,409 | |
Net realized gain (loss) on investments, options, futures contracts and foreign currency transactions | | | 5,519,292 | | | | (1,592,956 | ) | | | 248,976 | | | | 5,470 | | | | 727,984 | | | | 219,331 | |
Net change in unrealized appreciation (depreciation) on investments, options, futures contracts and foreign currency translation | | | (95,123 | ) | | | 3,205,423 | | | | 712,754 | | | | 231,860 | | | | 208,911 | | | | 15,848 | |
| | | | | | | | | | | | | | | | | | | | | | | | |
Change in net assets resulting from operations | | | 4,718,039 | | | | 920,651 | | | | 979,944 | | | | 253,274 | | | | 6,579,387 | | | | 4,301,588 | |
| | | | | | |
Distributions to shareholders: | | | | | | | | | | | | | | | | | | | | | | | | |
Distributions to shareholders from net investment income: | | | | | | | | | | | | | | | | | | | | | | | | |
Investor class of shares | | | — | | | | — | | | | — | | | | — | | | | (241,956 | )(2) | | | (238,848 | ) |
Advisor class of shares | | | — | | | | — | | | | (1,759 | ) | | | — | | | | (69,829 | ) | | | (142 | ) |
Institutional class of shares | | | — | | | | (80,732 | ) | | | (23,821 | ) | | | — | | | | (5,330,707 | ) | | | (3,827,419 | ) |
Distributions to shareholders from net realized gain on investments: | | | | | | | | | | | | | | | | | | | | | | | | |
Investor class of shares | | | — | | | | — | | | | — | | | | — | | | | (49,470 | )(2) | | | (57,924 | ) |
Advisor class of shares | | | — | | | | (4,097 | ) | | | (3,694 | ) | | | — | | | | (91 | ) | | | (47 | ) |
Institutional class of shares | | | — | | | | (965,757 | ) | | | (31,174 | ) | | | — | | | | (590,147 | ) | | | (615,255 | ) |
| | | | | | | | | | | | | | | | | | | | | | | | |
Change in net assets resulting from distributions to shareholders | | | — | | | | (1,050,586 | ) | | | (60,448 | ) | | | — | | | | (6,282,200 | ) | | | (4,739,635 | ) |
| | | | | | |
Capital stock transactions: | | | | | | | | | | | | | | | | | | | | | | | | |
Proceeds from sale of shares | | | 21,309,308 | | | | 86,984,278 | | | | 4,825,632 | | | | 4,031,365 | | | | 524,112,502 | | | | 397,573,428 | |
Net asset value of shares issued to shareholders in payment of distributions declared | | | — | | | | 967,655 | | | | 27,773 | | | | — | | | | 2,303,408 | | | | 1,987,757 | |
Cost of shares redeemed | | | (39,701,160 | ) | | | (13,680,094 | ) | | | (303,296 | ) | | | (57,174 | ) | | | (468,304,972 | ) | | | (563,825,769 | ) |
| | | | | | | | | | | | | | | | | | | | | | | | |
Change in net assets resulting from capital stock transactions | | | (18,391,852 | ) | | | 74,271,839 | | | | 4,550,109 | | | | 3,974,191 | | | | 58,110,938 | | | | (164,264,584 | ) |
| | | | | | | | | | | | | | | | | | | | | | | | |
Change in net assets | | | (13,673,813 | ) | | | 74,141,904 | | | | 5,469,605 | | | | 4,227,465 | | | | 58,408,125 | | | | (164,702,631 | ) |
| | | | | | |
Net assets: | | | | | | | | | | | | | | | | | | | | | | | | |
Beginning of period | | | 109,413,994 | | | | 35,272,090 | | | | 4,227,465 | | | | — | | | | 601,979,165 | | | | 766,681,796 | |
| | | | | | | | | | | | | | | | | | | | | | | | |
End of period | | $ | 95,740,181 | | | $ | 109,413,994 | | | $ | 9,697,070 | | | $ | 4,227,465 | | | $ | 660,387,290 | | | $ | 601,979,165 | |
| | | | | | | | | | | | | | | | | | | | | | | | |
Undistributed net investment income (distributions in excess of net investment income) included in net assets at end of period | | $ | (203,177 | ) | | $ | (461,064 | ) | | $ | 7,322 | | | $ | 9,599 | | | $ | (15,636 | ) | | $ | (15,383 | ) |
| | | | | | | | | | | | | | | | | | | | | | | | |
| (1) | Reflects operations for the period from September 17, 2015 (inception date) to August 31, 2016. |
| (2) | Reflects operations for the period from September 1, 2016, to June 2, 2017 (termination of Investor class of shares). |
| (3) | Includes paid-in-capital received from a non-taxable in-kind subscription merger of the BMO TCH Intermediate Income Fund effective as of the close of business on June 29, 2017. See Note 11, Reorganization Information, in the Notes to Financial Statements for additional information. |
(See Notes which are an integral part of the Financial Statements)
132
| | | | | | | | | | | | | | | | | | | | | | | | | | | | | | |
| | | | | | | | | | |
| Short Tax-Free Fund | | | Short-Term Income Fund | | | Intermediate
Tax-Free Fund | | | Strategic Income Fund | |
Year Ended
August 31,
2017 | | | Year Ended
August 31,
2016 | | | Year Ended
August 31,
2017 | | | Year Ended
August 31,
2016 | | | Year Ended
August 31,
2017 | | | Year Ended
August 31,
2016 | | | Year Ended
August 31,
2017 | | | Year Ended
August 31,
2016 | |
| | | | | | | | | | | | | | | | | | | | | | | | | | | | | | |
| | | | | | | |
| | | | | | | | | | | | | | | | | | | | | | | | | | | | | | |
| $ | 2,522,885 | | | $ | 1,979,487 | | | $ | 4,317,011 | | | $ | 3,631,630 | | | $ | 43,778,125 | | | $ | 40,557,680 | | | $ | 2,457,886 | | | $ | 2,650,384 | |
| | (225,946 | ) | |
|
60,387 |
| | | 237,100 | | | | 290,853 | | | | (11,054,527 | ) | | | 5,539,237 | | | | 2,392,636 | | | | 654,730 | |
| | (180,383 | ) | |
|
1,077,276 |
| | | (716,399 | ) | | | 2,643,827 | | | | (26,171,948 | ) | | | 52,312,210 | | | | (1,889,424 | ) | | | 1,346,851 | |
| | | | | | | | | | | | | | | | | | | | | | | | | | | | | | |
|
2,116,556 |
| | | 3,117,150 | | | | 3,837,712 | | | | 6,566,310 | | | | 6,551,650 | | | | 98,409,127 | | | | 2,961,098 | | | | 4,651,965 | |
| | | | | | | |
| | | | | | | | | | | | | | | | | | | | | | | | | | | | | | |
| | | | | | | | | | | | | | | | | | | | | | | | | | | | | | |
| | (167,597 | )(2) | | | (185,196 | ) | | | (632,772 | )(2) | | | (675,983 | ) | | | (27,728,210 | ) | | | (27,499,998 | ) | | | (2,360,082 | ) | | | (2,520,683 | ) |
| | (52,821 | ) | | | (7,632 | ) | | | (155,425 | ) | | | (502 | ) | | | (83,767 | ) | | | (44,788 | ) | | | (121,105 | ) | | | (812 | ) |
| | (2,303,362 | ) | | | (1,786,659 | ) | | | (3,644,261 | ) | | | (3,572,053 | ) | | | (15,971,429 | ) | | | (13,012,894 | ) | | | (551,185 | ) | | | (728,392 | ) |
| | | | | | | | | | | | | | | | | | | | | | | | | | | | | | |
| | (5,100 | )(2) | | | (53,401 | ) | | | — | | | | — | | | | (3,552,901 | ) | | | (2,043,712 | ) | | | — | | | | — | |
| | (377 | ) | | | (1,269 | ) | | | — | | | | — | | | | (5,750 | ) | | | (3,906 | ) | | | — | | | | — | |
| | (51,518 | ) | | | (280,303 | ) | | | — | | | | — | | | | (1,761,746 | ) | | | (788,345 | ) | | | — | | | | — | |
| | | | | | | | | | | | | | | | | | | | | | | | | | | | | | |
|
(2,580,775 |
) | | | (2,314,460 | ) | | | (4,432,458 | ) | | | (4,248,538 | ) | | | (49,103,803 | ) | | | (43,393,643 | ) | | | (3,032,372 | ) | | | (3,249,887 | ) |
| | | | | | | |
| | | | | | | | | | | | | | | | | | | | | | | | | | | | | | |
| | 122,858,814 | | | | 134,561,550 | | | | 204,775,746 | | | | 199,061,625 | | | | 512,577,117 | | | | 569,389,446 | | | | 39,469,441 | (3) | | | 23,372,036 | |
|
852,087 |
| | | 583,082 | | | | 2,472,081 | | | | 2,617,594 | | | | 40,385,928 | | | | 35,545,708 | | | | 2,752,071 | | | | 2,729,391 | |
| | (125,930,060 | ) | | | (81,519,478 | ) | | | (257,682,881 | ) | | | (241,672,762 | ) | | | (737,200,006 | ) | | | (627,844,836 | ) | | | (36,107,475 | ) | | | (37,540,648 | ) |
| | | | | | | | | | | | | | | | | | | | | | | | | | | | | | |
| | (2,219,159 | ) | |
|
53,625,154 |
| | | (50,435,054 | ) | | | (39,993,543 | ) | | | (184,236,961 | ) | | | (22,909,682 | ) | | | 6,114,037 | | | | (11,439,221 | ) |
| | | | | | | | | | | | | | | | | | | | | | | | | | | | | | |
| | (2,683,378 | ) | | | 54,427,844 | | | | (51,029,800 | ) | | | (37,675,771 | ) | | | (226,789,114 | ) | | | 32,105,802 | | | | 6,042,763 | | | | (10,037,143 | ) |
| | | | | | | |
| | | | | | | | | | | | | | | | | | | | | | | | | | | | | | |
| | 185,303,794 | | | | 130,875,950 | | | | 293,618,908 | | | | 331,294,679 | | | | 1,844,952,869 | | | | 1,812,847,067 | | | | 107,349,724 | | | | 117,386,867 | |
| | | | | | | | | | | | | | | | | | | | | | | | | | | | | | |
| $ | 182,620,416 | | | $ | 185,303,794 | | | $ | 242,589,108 | | | $ | 293,618,908 | | | $ | 1,618,163,755 | | | $ | 1,844,952,869 | | | $ | 113,392,487 | | | $ | 107,349,724 | |
| | | | | | | | | | | | | | | | | | | | | | | | | | | | | | |
$ |
(465 |
) | | $ | 8,540 | | | $ | 1,360 | | | $ | 1,359 | | | $ | 215,765 | | | $ | 71,970 | | | $ | (14,926 | ) | | $ | (14,927 | ) |
| | | | | | | | | | | | | | | | | | | | | | | | | | | | | | |
133
| | |
| Statements of Changes in Net Assets | | |
| | | | | | | | | | | | | | | | | | | | | | | | |
| | | | | | | | | | |
| | |
TCH Corporate
Income Fund | | | TCH Core Plus
Bond Fund | | | High Yield
Bond Fund | |
| | | Year Ended
August 31,
2017 | | | Year Ended
August 31,
2016 | | | Year Ended
August 31,
2017 | | | Year Ended
August 31,
2016 | | | Year Ended
August 31,
2017 | | | Year Ended
August 31,
2016 | |
Change in net assets resulting from: | | | | | | | | | | | | | | | | | | | | | | | | |
| | | | | | |
Operations: | | | | | | | | | | | | | | | | | | | | | | | | |
Net investment income | | $ | 6,357,759 | | | $ | 8,488,508 | | | $ | 24,622,439 | | | $ | 31,078,645 | | | $ | 2,221,025 | | | $ | 3,905,456 | |
Net realized gain (loss) on investments | | | 1,720,876 | | | | 348,361 | | | | 3,199,087 | | | | (760,961 | ) | | | 2,637,071 | | | | (4,008,398 | ) |
Net change in unrealized appreciation (depreciation) on investments | | | 1,352,901 | | | | 10,485,972 | | | | (7,556,515 | ) | | | 38,114,466 | | | | (2,865,438 | ) | | | 5,004,789 | |
| | | | | | | | | | | | | | | | | | | | | | | | |
Change in net assets resulting from operations | | | 9,431,536 | | | | 19,322,841 | | | | 20,265,011 | | | | 68,432,150 | | | | 1,992,658 | | | | 4,901,847 | |
| | | | | | |
Distributions to shareholders: | | | | | | | | | | | | | | | | | | | | | | | | |
Distributions to shareholders from net investment income: | | | | | | | | | | | | | | | | | | | | | | | | |
Investor class of shares | | | (2,785,140 | ) | | | (3,428,757 | ) | | | (10,958,410 | ) | | | (16,668,242 | ) | | | — | | | | — | |
Advisor class of shares | | | (14,625 | ) | | | (2,556 | ) | | | (52,010 | ) | | | (29,941 | ) | | | (1,179,592 | ) | | | (2,343,275 | ) |
Institutional/Premier class of shares | | | (3,557,995 | ) | | | (5,057,195 | ) | | | (14,084,186 | ) | | | (14,807,318 | ) | | | (1,041,433 | ) | | | (1,562,181 | ) |
Distributions to shareholders from net realized gain on investments: | | | | | | | | | | | | | | | | | | | | | | | | |
Investor class of shares | | | (669,458 | ) | | | (418,374 | ) | | | (1,604,981 | ) | | | (197,248 | ) | | | — | | | | — | |
Advisor class of shares | | | (392 | ) | | | (93 | ) | | | (5,068 | ) | | | (295 | ) | | | — | | | | — | |
Institutional/Premier class of shares | | | (1,035,668 | ) | | | (572,757 | ) | | | (1,455,998 | ) | | | (156,189 | ) | | | — | | | | — | |
| | | | | | | | | | | | | | | | | | | | | | | | |
Change in net assets resulting from distributions to shareholders | | | (8,063,278 | ) | | | (9,479,732 | ) | | | (28,160,653 | ) | | | (31,859,233 | ) | | | (2,221,025 | ) | | | (3,905,456 | ) |
| | | | | | |
Capital stock transactions: | | | | | | | | | | | | | | | | | | | | | | | | |
Proceeds from sale of shares | | | 117,056,559 | | | | 46,517,931 | | | | 781,831,952 | | | | 215,750,635 | | | | 4,246,536 | | | | 48,801,469 | |
Net asset value of shares issued to shareholders in payment of distributions declared | | | 5,060,623 | | | | 5,815,437 | | | | 25,943,203 | | | | 29,598,956 | | | | 2,021,657 | | | | 3,593,223 | |
Cost of shares redeemed | | | (79,201,504 | ) | | | (150,156,892 | ) | | | (721,237,192 | ) | | | (388,706,092 | ) | | | (99,081,869 | ) | | | (20,052,181 | ) |
| | | | | | | | | | | | | | | | | | | | | | | | |
Change in net assets resulting from capital stock transactions | | | 42,915,678 | | | | (97,823,524 | ) | | | 86,537,963 | | | | (143,356,501 | ) | | | (92,813,676 | ) | | | 32,342,511 | |
| | | | | | | | | | | | | | | | | | | | | | | | |
Change in net assets | | | 44,283,936 | | | | (87,980,415 | ) | | | 78,642,321 | | | | (106,783,584 | ) | | | (93,042,043 | ) | | | 33,338,902 | |
| | | | | | |
Net assets: | | | | | | | | | | | | | | | | | | | | | | | | |
Beginning of period | | | 212,138,293 | | | | 300,118,708 | | | | 968,691,967 | | | | 1,075,475,551 | | | | 106,355,392 | | | | 73,016,490 | |
| | | | | | | | | | | | | | | | | | | | | | | | |
End of period | | $ | 256,422,229 | | | $ | 212,138,293 | | | $ | 1,047,334,288 | | | $ | 968,691,967 | | | $ | 13,313,349 | | | $ | 106,355,392 | |
| | | | | | | | | | | | | | | | | | | | | | | | |
Undistributed net investment income (distributions in excess of net investment income) included in net assets at end of period | | $ | (2,698 | ) | | $ | (2,698 | ) | | $ | (13,105 | ) | | $ | (13,105 | ) | | $ | (9,387 | ) | | $ | (9,387 | ) |
| | | | | | | | | | | | | | | | | | | | | | | | |
| (1) | Reflects operations for the period from June 3, 2016 (inception date) to August 31, 2016. |
(See Notes which are an integral part of the Financial Statements)
134
| | | | | | | | | | | | | | | | | | | | | | | | | | | | | | |
| | | | | | | | | | |
Government Money
Market Fund | | | Tax-Free Money
Market Fund | | | Prime Money
Market Fund | | | Institutional
Prime Money
Market Fund | |
Year Ended
August 31,
2017 | | | Year Ended
August 31,
2016 | | | Year Ended
August 31,
2017 | | | Year Ended
August 31,
2016 | | | Year Ended
August 31,
2017 | | | Year Ended
August 31, 2016 | | | Year Ended
August 31,
2017 | | | Period Ended
August 31,
2016 (1) | |
| | | | | | | | | | | | | | | | | | | | | | | | | | | | | | |
| | | | | | | |
| | | | | | | | | | | | | | | | | | | | | | | | | | | | | | |
| $ | 13,190,436 | | | $ | 733,948 | | | $ | 1,896,315 | | | $ | 707,407 | | | $ | 2,440,138 | | | $ | 5,070,691 | | | $ | 3,082,655 | | | $ | 384,445 | |
| | 4,140 | | | | 1,602 | | | | 68,798 | | | | 299,462 | | | | 265,930 | | | | 13,842 | | | | 1,934 | | | | 1,744 | |
|
— |
| | | — | | | | — | | | | — | | | | — | | | | — | | | | 41,402 | | | | — | |
| | | | | | | | | | | | | | | | | | | | | | | | | | | | | | |
|
13,194,576 |
| | | 735,550 | | | | 1,965,113 | | | | 1,006,869 | | | | 2,706,068 | | | | 5,084,533 | | | | 3,125,991 | | | | 386,189 | |
| | | | | | | |
| | | | | | | | | | | | | | | | | | | | | | | | | | | | | | |
| | | | | | | | | | | | | | | | | | | | | | | | | | | | | | |
| | (2,102,345 | ) | | | (13,465 | ) | | | (273,064 | ) | | | (39,268 | ) | | | (908,840 | ) | | | (386,549 | ) | | | (6,848 | ) | | | (24 | ) |
| | — | | | | — | | | | — | | | | — | | | | — | | | | — | | | | — | | | | — | |
| | (11,088,991 | ) | | | (720,483 | ) | | | (1,656,960 | ) | | | (669,366 | ) | | | (1,531,386 | ) | | | (4,684,142 | ) | | | (3,075,841 | ) | | | (384,421 | ) |
| | | | | | | | | | | | | | | | | | | | | | | | | | | | | | |
| | (873 | ) | | | (265 | ) | | | (20,917 | ) | | | (53,619 | ) | | | (603 | ) | | | (5,949 | ) | | | (6 | ) | | | — | |
| | — | | | | — | | | | — | | | | — | | | | — | | | | — | | | | — | | | | — | |
| | (2,367 | ) | | | (1,478 | ) | | | (76,487 | ) | | | (182,300 | ) | | | (685 | ) | | | (7,893 | ) | | | (1,894 | ) | | | (1,744 | ) |
| | | | | | | | | | | | | | | | | | | | | | | | | | | | | | |
|
(13,194,576 |
) | | | (735,691 | ) | | | (2,027,428 | ) | | | (944,553 | ) | | | (2,441,514 | ) | | | (5,084,533 | ) | | | (3,084,589 | ) | | | (386,189 | ) |
| | | | | | | |
| | | | | | | | | | | | | | | | | | | | | | | | | | | | | | |
| | 14,334,494,569 | | | | 5,808,935,538 | | | | 705,359,534 | | | | 1,842,462,751 | | | | 783,415,206 | | | | 10,819,024,804 | | | | 914,326,979 | | | | 748,116,962 | |
|
1,300,125 |
| | | 144,953 | | | | 275,718 | | | | 85,897 | | | | 780,900 | | | | 454,947 | | | | 8,930 | | | | 68 | |
| | (13,488,067,651 | ) | | | (4,142,091,449 | ) | | | (794,823,978 | ) | | | (2,095,615,919 | ) | | | (1,988,344,911 | ) | | | (13,119,885,203 | ) | | | (928,963,735 | ) | | | (331,906,646 | ) |
| | | | | | | | | | | | | | | | | | | | | | | | | | | | | | |
|
847,727,043 |
| | | 1,666,989,042 | | | | (89,188,726 | ) | | | (253,067,271 | ) | | | (1,204,148,805 | ) | | | (2,300,405,452 | ) | | | (14,627,826 | ) | | | 416,210,384 | |
| | | | | | | | | | | | | | | | | | | | | | | | | | | | | | |
| | 847,727,043 | | | | 1,666,988,901 | | | | (89,251,041 | ) | | | (253,004,955 | ) | | | (1,203,884,251 | ) | | | (2,300,405,452 | ) | | | (14,586,424 | ) | | | 416,210,384 | |
| | | | | | | |
| | | | | | | | | | | | | | | | | | | | | | | | | | | | | | |
| | 2,235,876,331 | | | | 568,887,430 | | | | 404,052,454 | | | | 657,057,409 | | | | 1,572,473,018 | | | | 3,872,878,470 | | | | 416,210,384 | | | | — | |
| | | | | | | | | | | | | | | | | | | | | | | | | | | | | | |
| $ | 3,083,603,374 | | | $ | 2,235,876,331 | | | $ | 314,801,413 | | | $ | 404,052,454 | | | $ | 368,588,767 | | | $ | 1,572,473,018 | | | $ | 401,623,960 | | | $ | 416,210,384 | |
| | | | | | | | | | | | | | | | | | | | | | | | | | | | | | |
$ |
(1,041 |
) | | $ | (141 | ) | | $ | (24,201 | ) | | $ | (8,320 | ) | | $ | (24,062 | ) | | $ | (23,963 | ) | | $ | 16,452 | | | $ | — | |
| | | | | | | | | | | | | | | | | | | | | | | | | | | | | | |
135
| | |
| Financial Highlights—Investor Class of Shares (For a share outstanding throughout each period) |
| | | | | | | | | | | | | | | | | | | | | | | | | | | | | | | | | | | | | | | | | | | | | | | | | | | | | | | | | | | | | | | | | | | | | | |
Period
Ended
August 31, | | Net asset
value,
beginning
of period | | Net
investment
income
(loss) | | Net realized
and unrealized
gain (loss) | | Total from
investment
operations | | Distributions to
shareholders
from net
investment
income | | Distributions to
shareholders
from net
realized gain | | Total
distributions | | Net asset
value, end
of period | | Total
return (1)(4) | | Ratios to Average Net Assets (5) | | Net assets,
end of period
(000 omitted) | | Portfolio
turnover
rate (4) |
| | | | | | | | | | | Gross
Expenses | | Net
Expenses (2) | | Net
investment
income
(loss) (2) | | |
Large-Cap Growth Fund | |
| 2017 | | | $ | 15.34 | | | | $ | 0.06 | | | | $ | 3.03 | | | | $ | 3.09 | | | | $ | (0.07 | ) | | | $ | (0.90 | ) | | | $ | (0.97 | ) | | | $ | 17.46 | | | | | 21.30 | % | | | | 1.03 | % | | | | 1.00 | % | | | | 0.34 | % | | | $ | 74,359 | | | | | 75 | % |
| 2016 | | | | 16.26 | | | | | 0.03 | | | | | 1.44 | | | | | 1.47 | | | | | (0.02 | ) | | | | (2.37 | ) | | | | (2.39 | ) | | | | 15.34 | | | | | 9.68 | | | | | 1.13 | | | | | 1.07 | | | | | 0.23 | | | | | 163,712 | | | | | 70 | |
| 2015 | | | | 17.94 | | | | | (0.01 | ) | | | | 0.93 | | | | | 0.92 | | | | | (0.01 | ) | | | | (2.59 | ) | | | | (2.60 | ) | | | | 16.26 | | | | | 5.58 | | | | | 1.23 | | | | | 1.21 | | | | | 0.03 | | | | | 161,918 | | | | | 94 | |
| 2014 | | | | 15.08 | | | | | 0.01 | | | | | 4.34 | | | | | 4.35 | | | | | (0.04 | ) | | | | (1.45 | ) | | | | (1.49 | ) | | | | 17.94 | | | | | 30.33 | | | | | 1.24 | | | | | 1.24 | | | | | 0.03 | | | | | 97,738 | | | | | 67 | |
| 2013(3) | | | | 14.16 | | | | | 0.06 | | | | | 1.93 | | | | | 1.99 | | | | | (0.03 | ) | | | | (1.04 | ) | | | | (1.07 | ) | | | | 15.08 | | | | | 15.07 | | | | | 1.25 | | | | | 1.24 | | | | | 0.37 | | | | | 92,037 | | | | | 100 | |
Pyrford International Stock Fund | |
| 2017(3)(7) | | | | 12.18 | | | | | 0.28 | | | | | 0.95 | | | | | 1.23 | | | | | (0.25 | ) | | | | — | | | | | (0.25 | ) | | | | 13.16 | | | | | 10.38 | | | | | 1.30 | | | | | 1.21 | | | | | 2.28 | | | | | 6,162 | | | | | 33 | |
| 2016(3) | | | | 11.74 | | | | | 0.24 | | | | | 0.44 | | | | | 0.68 | | | | | (0.24 | ) | | | | — | | | | | (0.24 | ) | | | | 12.18 | | | | | 5.96 | | | | | 1.31 | | | | | 1.24 | | | | | 2.20 | | | | | 99,916 | | | | | 12 | |
| 2015(3) | | | | 13.11 | | | | | 0.23 | | | | | (1.52 | ) | | | | (1.29 | ) | | | | (0.08 | ) | | | | — | | | | | (0.08 | ) | | | | 11.74 | | | | | (9.86 | ) | | | | 1.28 | | | | | 1.24 | | | | | 2.02 | | | | | 91,700 | | | | | 9 | |
| 2014(3) | | | | 12.07 | | | | | 0.36 | | | | | 1.27 | | | | | 1.63 | | | | | (0.56 | ) | | | | (0.03 | ) | | | | (0.59 | ) | | | | 13.11 | | | | | 13.69 | | | | | 1.27 | | | | | 1.24 | | | | | 3.12 | | | | | 81,352 | | | | | 6 | |
| 2013(3) | | | | 10.76 | | | | | 0.24 | | | | | 1.35 | | | | | 1.59 | | | | | (0.23 | ) | | | | (0.05 | ) | | | | (0.28 | ) | | | | 12.07 | | | | | 14.98 | | | | | 1.34 | | | | | 1.24 | | | | | 2.23 | | | | | 51,265 | | | | | 15 | |
Intermediate Tax-Free Fund | |
| 2017 | | | | 11.61 | | | | | 0.29 | | | | | (0.21 | ) | | | | 0.08 | | | | | (0.29 | ) | | | | (0.03 | ) | | | | (0.32 | ) | | | | 11.37 | | | | | 0.78 | | | | | 0.57 | | | | | 0.55 | | | | | 2.55 | | | | | 975,664 | | | | | 44 | |
| 2016 | | | | 11.26 | | | | | 0.25 | | | | | 0.37 | | | | | 0.62 | | | | | (0.25 | ) | | | | (0.02 | ) | | | | (0.27 | ) | | | | 11.61 | | | | | 5.56 | | | | | 0.57 | | | | | 0.55 | | | | | 2.19 | | | | | 1,241,387 | | | | | 42 | |
| 2015 | | | | 11.25 | | | | | 0.26 | | | | | 0.01 | | | | | 0.27 | | | | | (0.26 | ) | | | | — | | | | | (0.26 | ) | | | | 11.26 | | | | | 2.36 | | | | | 0.57 | | | | | 0.55 | | | | | 2.23 | | | | | 1,250,815 | | | | | 26 | |
| 2014 | | | | 10.66 | | | | | 0.28 | | | | | 0.59 | | | | | 0.87 | | | | | (0.28 | ) | | | | (0.00 | ) | | | | (0.28 | ) | | | | 11.25 | | | | | 8.29 | | | | | 0.61 | | | | | 0.55 | | | | | 2.58 | | | | | 1,003,132 | | | | | 35 | |
| 2013(3) | | | | 11.30 | | | | | 0.28 | | | | | (0.57 | ) | | | | (0.29 | ) | | | | (0.28 | ) | | | | (0.07 | ) | | | | (0.35 | ) | | | | 10.66 | | | | | (2.67 | ) | | | | 0.61 | | | | | 0.55 | | | | | 2.51 | | | | | 844,129 | | | | | 39 | |
Strategic Income Fund | |
| 2017 | | | | 9.43 | | | | | 0.23 | | | | | 0.08 | | | | | 0.31 | | | | | (0.29 | ) | | | | — | | | | | (0.29 | ) | | | | 9.45 | | | | | 3.32 | | | | | 0.90 | | | | | 0.80 | | | | | 2.46 | | | | | 73,488 | | | | | 65 | |
| 2016 | | | | 9.31 | | | | | 0.21 | | | | | 0.17 | | | | | 0.38 | | | | | (0.26 | ) | | | | — | | | | | (0.26 | ) | | | | 9.43 | | | | | 4.17 | | | | | 0.86 | | | | | 0.80 | | | | | 2.28 | | | | | 85,665 | | | | | 13 | |
| 2015 | | | | 9.36 | | | | | 0.22 | | | | | — | | | | | 0.22 | | | | | (0.27 | ) | | | | — | | | | | (0.27 | ) | | | | 9.31 | | | | | 2.34 | | | | | 0.93 | | | | | 0.80 | | | | | 2.36 | | | | | 94,380 | | | | | 44 | |
| 2014 | | | | 9.17 | | | | | 0.20 | | | | | 0.24 | | | | | 0.44 | | | | | (0.25 | ) | | | | — | | | | | (0.25 | ) | | | | 9.36 | | | | | 4.87 | | | | | 0.92 | | | | | 0.80 | | | | | 2.21 | | | | | 105,888 | | | | | 129 | |
| 2013(3) | | | | 9.77 | | | | | 0.11 | | | | | (0.38 | ) | | | | (0.27 | ) | | | | (0.22 | ) | | | | (0.11 | ) | | | | (0.33 | ) | | | | 9.17 | | | | | (2.81 | ) | | | | 0.88 | | | | | 0.80 | | | | | 1.33 | | | | | 138,914 | | | | | 307 | |
TCH Corporate Income Fund | |
| 2017 | | | | 13.17 | | | | | 0.35 | | | | | 0.14 | | | | | 0.49 | | | | | (0.35 | ) | | | | (0.11 | ) | | | | (0.46 | ) | | | | 13.20 | | | | | 3.86 | | | | | 0.71 | | | | | 0.59 | | | | | 2.70 | | | | | 120,745 | | | | | 44 | |
| 2016 | | | | 12.33 | | | | | 0.45 | | | | | 0.89 | | | | | 1.34 | | | | | (0.45 | ) | | | | (0.05 | ) | | | | (0.50 | ) | | | | 13.17 | | | | | 11.23 | | | | | 0.72 | | | | | 0.59 | | | | | 3.65 | | | | | 82,643 | | | | | 62 | |
| 2015 | | | | 13.09 | | | | | 0.36 | | | | | (0.71 | ) | | | | (0.35 | ) | | | | (0.36 | ) | | | | (0.05 | ) | | | | (0.41 | ) | | | | 12.33 | | | | | (2.73 | ) | | | | 0.70 | | | | | 0.59 | | | | | 2.83 | | | | | 137,987 | | | | | 26 | |
| 2014 | | | | 12.39 | | | | | 0.44 | | | | | 0.91 | | | | | 1.35 | | | | | (0.44 | ) | | | | (0.21 | ) | | | | (0.65 | ) | | | | 13.09 | | | | | 11.20 | | | | | 0.74 | | | | | 0.59 | | | | | 3.32 | | | | | 78,347 | | | | | 25 | |
| 2013(3) | | | | 13.05 | | | | | 0.41 | | | | | (0.34 | ) | | | | 0.07 | | | | | (0.43 | ) | | | | (0.30 | ) | | | | (0.73 | ) | | | | 12.39 | | | | | 0.40 | | | | | 0.75 | | | | | 0.65 | | | | | 3.20 | | | | | 35,860 | | | | | 123 | |
TCH Core Plus Bond Fund | |
| 2017 | | | | 11.89 | | | | | 0.24 | | | | | (0.02 | ) | | | | 0.22 | | | | | (0.28 | ) | | | | (0.04 | ) | | | | (0.32 | ) | | | | 11.79 | | | | | 1.91 | | | | | 0.59 | | | | | 0.59 | | | | | 2.37 | | | | | 68,946 | | | | | 34 | |
| 2016 | | | | 11.42 | | | | | 0.34 | | | | | 0.48 | | | | | 0.82 | | | | | (0.35 | ) | | | | (0.00 | ) | | | | (0.35 | ) | | | | 11.89 | | | | | 7.36 | | | | | 0.59 | | | | | 0.59 | | | | | 3.00 | | | | | 508,030 | | | | | 39 | |
| 2015 | | | | 11.95 | | | | | 0.32 | | | | | (0.47 | ) | | | | (0.15 | ) | | | | (0.32 | ) | | | | (0.06 | ) | | | | (0.38 | ) | | | | 11.42 | | | | | (1.28 | ) | | | | 0.58 | | | | | 0.58 | | | | | 2.69 | | | | | 602,588 | | | | | 25 | |
| 2014 | | | | 11.32 | | | | | 0.31 | | | | | 0.66 | | | | | 0.97 | | | | | (0.32 | ) | | | | (0.02 | ) | | | | (0.34 | ) | | | | 11.95 | | | | | 8.68 | | | | | 0.62 | | | | | 0.59 | | | | | 2.66 | | | | | 517,753 | | | | | 44 | |
| 2013(3) | | | | 11.90 | | | | | 0.30 | | | | | (0.30 | ) | | | | 0.00 | | | | | (0.30 | ) | | | | (0.28 | ) | | | | (0.58 | ) | | | | 11.32 | | | | | (0.18 | ) | | | | 0.68 | | | | | 0.61 | | | | | 2.26 | | | | | 463,851 | | | | | 101 | |
Government Money Market Fund | |
| 2017 | | | | 1.00 | | | | | 0.00 | | | | | 0.00 | | | | | 0.00 | | | | | (0.00 | ) | | | | (0.00 | ) | | | | (0.00 | ) | | | | 1.00 | | | | | 0.24 | | | | | 0.50 | | | | | 0.42 | | | | | 0.24 | | | | | 814,242 | | | | | — | |
| 2016 | | | | 1.00 | | | | | 0.00 | | | | | 0.00 | | | | | 0.00 | | | | | (0.00 | ) | | | | (0.00 | ) | | | | (0.00 | ) | | | | 1.00 | | | | | 0.01 | | | | | 0.53 | | | | | 0.29 | | | | | 0.01 | | | | | 268,417 | | | | | — | |
| 2015 | | | | 1.00 | | | | | 0.00 | | | | | 0.00 | | | | | 0.00 | | | | | (0.00 | ) | | | | (0.00 | ) | | | | (0.00 | ) | | | | 1.00 | | | | | 0.01 | | | | | 0.53 | | | | | 0.08 | | | | | 0.01 | | | | | 101,593 | | | | | — | |
| 2014 | | | | 1.00 | | | | | 0.00 | | | | | — | | | | | 0.00 | | | | | (0.00 | ) | | | | — | | | | | (0.00 | ) | | | | 1.00 | | | | | 0.01 | | | | | 0.54 | | | | | 0.07 | | | | | 0.01 | | | | | 105,267 | | | | | — | |
| 2013 | | | | 1.00 | | | | | 0.00 | | | | | — | | | | | 0.00 | | | | | (0.00 | ) | | | | (0.00 | ) | | | | (0.00 | ) | | | | 1.00 | | | | | 0.01 | | | | | 0.55 | | | | | 0.13 | | | | | 0.01 | | | | | 133,255 | | | | | — | |
Tax-Free Money Market Fund | |
| 2017 | | | | 1.00 | | | | | 0.00 | | | | | 0.00 | | | | | 0.00 | | | | | (0.00 | ) | | | | (0.00 | ) | | | | (0.00 | ) | | | | 1.00 | | | | | 0.37 | | | | | 0.57 | | | | | 0.45 | | | | | 0.33 | | | | | 76,029 | | | | | — | |
| 2016 | | | | 1.00 | | | | | 0.00 | | | | | 0.00 | | | | | 0.00 | | | | | (0.00 | ) | | | | (0.00 | ) | | | | (0.00 | ) | | | | 1.00 | | | | | 0.06 | | | | | 0.53 | | | | | 0.26 | | | | | 0.03 | | | | | 90,098 | | | | | — | |
| 2015 | | | | 1.00 | | | | | 0.00 | | | | | 0.00 | | | | | 0.00 | | | | | (0.00 | ) | | | | (0.00 | ) | | | | (0.00 | ) | | | | 1.00 | | | | | 0.02 | | | | | 0.53 | | | | | 0.16 | | | | | 0.01 | | | | | 142,052 | | | | | — | |
| 2014 | | | | 1.00 | | | | | 0.00 | | | | | 0.00 | | | | | 0.00 | | | | | (0.00 | ) | | | | (0.00 | ) | | | | (0.00 | ) | | | | 1.00 | | | | | 0.02 | | | | | 0.53 | | | | | 0.20 | | | | | 0.01 | | | | | 131,175 | | | | | — | |
| 2013 | | | | 1.00 | | | | | 0.00 | | | | | 0.00 | | | | | 0.00 | | | | | (0.00 | ) | | | | (0.00 | ) | | | | (0.00 | ) | | | | 1.00 | | | | | 0.02 | | | | | 0.53 | | | | | 0.30 | | | | | 0.01 | | | | | 121,613 | | | | | — | |
(See Notes which are an integral part of the Financial Statements)
136
| | |
| Financial Highlights—Investor Class of Shares (For a share outstanding throughout each period) |
| | | | | | | | | | | | | | | | | | | | | | | | | | | | | | | | | | | | | | | | | | | | | | | | | | | | | | | | | | | | | | | | | | | | | | |
Period
Ended
August 31, | | Net asset
value,
beginning
of period | | Net
investment
income
(loss) | | Net realized
and unrealized
gain (loss) | | Total from
investment
operations | | Distributions to
shareholders
from net
investment
income | | Distributions to
shareholders
from net
realized gain | | Total
distributions | | Net asset
value, end
of period | | Total
return (1)(4) | | Ratios to Average Net Assets (5) | | Net assets,
end of period
(000 omitted) | | Portfolio
turnover
rate (4) |
| | | | | | | | | | | Gross
Expenses | | Net
Expenses (2) | | Net
investment
income
(loss) (2) | | |
Prime Money Market Fund | |
| 2017 | | | $ | 1.00 | | | | $ | 0.00 | | | | $ | 0.00 | | | | $ | 0.00 | | | | $ | (0.00 | ) | | | $ | (0.00 | ) | | | $ | (0.00 | ) | | | $ | 1.00 | | | | | 0.42 | % | | | | 0.53 | % | | | | 0.45 | % | | | | 0.36 | % | | | $ | 202,251 | | | | | — | % |
| 2016 | | | | 1.00 | | | | | 0.00 | | | | | 0.00 | | | | | 0.00 | | | | | (0.00 | ) | | | | (0.00 | ) | | | | (0.00 | ) | | | | 1.00 | | | | | 0.03 | | | | | 0.45 | | | | | 0.38 | | | | | 0.03 | | | | | 903,864 | | | | | — | |
| 2015 | | | | 1.00 | | | | | 0.00 | | | | | 0.00 | | | | | 0.00 | | | | | (0.00 | ) | | | | (0.00 | ) | | | | (0.00 | ) | | | | 1.00 | | | | | 0.01 | | | | | 0.45 | | | | | 0.19 | | | | | 0.01 | | | | | 1,296,633 | | | | | — | |
| 2014 | | | | 1.00 | | | | | 0.00 | | | | | 0.00 | | | | | 0.00 | | | | | (0.00 | ) | | | | (0.00 | ) | | | | (0.00 | ) | | | | 1.00 | | | | | 0.01 | | | | | 0.45 | | | | | 0.18 | | | | | 0.01 | | | | | 1,356,875 | | | | | — | |
| 2013 | | | | 1.00 | | | | | 0.00 | | | | | 0.00 | | | | | 0.00 | | | | | (0.00 | ) | | | | (0.00 | ) | | | | (0.00 | ) | | | | 1.00 | | | | | 0.01 | | | | | 0.46 | | | | | 0.27 | | | | | 0.01 | | | | | 1,423,007 | | | | | — | |
Institutional Prime Money Market Fund | |
| 2017(8) | | | | 1.00 | | | | | 0.0049 | | | | | 0.0001 | | | | | 0.0050 | | | | | (0.0049 | ) | | | | (0.0000 | ) | | | | (0.0049 | ) | | | | 1.0001 | | | | | 0.50 | | | | | 0.55 | | | | | 0.45 | | | | | 0.50 | | | | | 1,421 | | | | | — | |
| 2016(6) | | | | 1.00 | | | | | 0.00 | | | | | 0.00 | | | | | 0.00 | | | | | (0.00 | ) | | | | (0.00 | ) | | | | (0.00 | ) | | | | 1.00 | | | | | 0.03 | | | | | 0.54 | | | | | 0.45 | | | | | 0.14 | | | | | 992 | | | | | — | |
| (1) | Based on net asset value as of end of period date. |
| (2) | The contractual and voluntary expense waivers pursuant to Note 6 of the financial statements are reflected in both the net expense and net investment income (loss) ratios. |
| (3) | Redemption fees consisted of per share amounts less than $0.01. Effective February 8, 2012, the Ultra Short Tax-Free Fund discontinued it’s redemption fee policy and effective June 14, 2013, the remaining domestic Funds discontinued their redemption fee policy. |
| (4) | Not annualized for periods less than one year. |
| (5) | Annualized for periods less than one year. |
| (6) | Reflects operations for the period from June 3, 2016 (inception date) to August 31, 2016. |
| (7) | Calculated using the average shares method. |
| (8) | Effective October 3, 2016, the BMO Institutional Money Market Fund switched the valuation method of its securities from amortized cost to reflecting changes in market values, thus allowing the Fund’s NAV to “float”. In connection with this change, the Fund’s per share NAV is now calculated to four decimals (e.g., $1.0000). |
(See Notes which are an integral part of the Financial Statements)
137
| | |
| Financial Highlights—Advisor Class of Shares (For a share outstanding throughout each period) |
| | | | | | | | | | | | | | | | | | | | | | | | | | | | | | | | | | | | | | | | | | | | | | | | | | | | | | | | | | | | | | | | | | | | | | |
Period
Ended
August 31, | | Net asset
value,
beginning
of period | | Net
investment
income
(loss) | | Net realized
and unrealized
gain (loss) | | Total from
investment
operations | | Distributions to
shareholders
from net
investment
income | | Distributions to
shareholders
from net
realized gain | | Total
distributions | | Net asset
value, end
of period | | Total
return (1)(4) | | Ratios to Average Net Assets (5) | | Net assets,
end of period
(000 omitted) | | Portfolio
turnover
rate (4) |
| | | | | | | | | | | Gross
Expenses | | Net
Expenses (2) | | Net
investment
income
(loss) (2) | | |
Low Volatility Equity Fund | |
| 2017 | | | $ | 13.79 | | | | $ | 0.20 | | | | $ | 0.74 | | | | $ | 0.94 | | | | $ | (0.20 | ) | | | $ | (0.17 | ) | | | $ | (0.37 | ) | | | $ | 14.36 | | | | | 6.94 | % | | | | 1.03 | % | | | | 0.90 | % | | | | 1.47 | % | | | $ | 31,624 | | | | | 56 | % |
| 2016 | | | | 12.81 | | | | | 0.16 | | | | | 1.35 | | | | | 1.51 | | | | | (0.17 | ) | | | | (0.36 | ) | | | | (0.53 | ) | | | | 13.79 | | | | | 12.13 | | | | | 1.05 | | | | | 0.90 | | | | | 1.40 | | | | | 15,064 | | | | | 40 | |
| 2015 | | | | 13.20 | | | | | 0.14 | | | | | 0.55 | | | | | 0.69 | | | | | (0.18 | ) | | | | (0.90 | ) | | | | (1.08 | ) | | | | 12.81 | | | | | 5.22 | | | | | 1.12 | | | | | 0.90 | | | | | 1.12 | | | | | 1,162 | | | | | 47 | |
| 2014(6) | | | | 12.74 | | | | | 0.04 | | | | | 0.47 | | | | | 0.51 | | | | | (0.05 | ) | | | | — | | | | | (0.05 | ) | | | | 13.20 | | | | | 4.03 | | | | | 1.02 | | | | | 0.90 | | | | | 1.17 | | | | | 26 | | | | | 47 | |
Dividend Income Fund | |
| 2017(11) | | | | 12.94 | | | | | 0.28 | | | | | 1.61 | | | | | 1.89 | | | | | (0.21 | ) | | | | (0.11 | ) | | | | (0.32 | ) | | | | 14.51 | | | | | 14.80 | | | | | 1.08 | | | | | 0.90 | | | | | 2.06 | | | | | 3,205 | | | | | 43 | |
| 2016 | | | | 12.59 | | | | | 0.30 | | | | | 1.11 | | | | | 1.41 | | | | | (0.30 | ) | | | | (0.76 | ) | | | | (1.06 | ) | | | | 12.94 | | | | | 11.89 | | | | | 1.08 | | | | | 0.90 | | | | | 2.44 | | | | | 78,531 | | | | | 51 | |
| 2015 | | | | 14.29 | | | | | 0.31 | | | | | (0.76 | ) | | | | (0.45 | ) | | | | (0.33 | ) | | | | (0.92 | ) | | | | (1.25 | ) | | | | 12.59 | | | | | (3.63 | ) | | | | 1.05 | | | | | 0.90 | | | | | 2.16 | | | | | 74,254 | | | | | 46 | |
| 2014(6) | | | | 13.57 | | | | | 0.08 | | | | | 0.71 | | | | | 0.79 | | | | | (0.07 | ) | | | | — | | | | | (0.07 | ) | | | | 14.29 | | | | | 5.84 | | | | | 1.08 | | | | | 0.90 | | | | | 2.09 | | | | | 26 | | | | | 45 | |
Large-Cap Value Fund | |
| 2017(11) | | | | 14.14 | | | | | 0.08 | | | | | 1.93 | | | | | 2.01 | | | | | (0.18 | ) | | | | (0.12 | ) | | | | (0.30 | ) | | | | 15.85 | | | | | 14.33 | | | | | 1.02 | | | | | 1.00 | | | | | 0.49 | | | | | 25,061 | | | | | 62 | |
| 2016 | | | | 15.23 | | | | | 0.21 | | | | | 0.53 | | | | | 0.74 | | | | | (0.22 | ) | | | | (1.61 | ) | | | | (1.83 | ) | | | | 14.14 | | | | | 5.31 | | | | | 1.10 | | | | | 1.07 | | | | | 1.61 | | | | | 37 | | | | | 60 | |
| 2015 | | | | 17.04 | | | | | 0.13 | | | | | (0.22 | ) | | | | (0.09 | ) | | | | (0.10 | ) | | | | (1.62 | ) | | | | (1.72 | ) | | | | 15.23 | | | | | (0.70 | ) | | | | 1.22 | | | | | 1.21 | | | | | 0.80 | | | | | 28 | | | | | 72 | |
| 2014(6) | | | | 16.23 | | | | | 0.04 | | | | | 0.82 | | | | | 0.86 | | | | | (0.05 | ) | | | | — | | | | | (0.05 | ) | | | | 17.04 | | | | | 5.32 | | | | | 1.23 | | | | | 1.23 | | | | | 0.83 | | | | | 27 | | | | | 68 | |
Large-Cap Growth Fund | |
| 2017 | | | | 15.34 | | | | | 0.03 | | | | | 3.06 | | | | | 3.09 | | | | | (0.07 | ) | | | | (0.90 | ) | | | | (0.97 | ) | | | | 17.46 | | | | | 21.30 | | | | | 1.03 | | | | | 1.00 | | | | | 0.39 | | | | | 808 | | | | | 75 | |
| 2016 | | | | 16.26 | | | | | 0.02 | | | | | 1.45 | | | | | 1.47 | | | | | (0.02 | ) | | | | (2.37 | ) | | | | (2.39 | ) | | | | 15.34 | | | | | 9.68 | | | | | 1.13 | | | | | 1.07 | | | | | 0.29 | | | | | 405 | | | | | 70 | |
| 2015 | | | | 17.94 | | | | | 0.00 | | | | | 0.92 | | | | | 0.92 | | | | | (0.01 | ) | | | | (2.59 | ) | | | | (2.60 | ) | | | | 16.26 | | | | | 5.58 | | | | | 1.23 | | | | | 1.21 | | | | | 0.03 | | | | | 37 | | | | | 94 | |
| 2014(6) | | | | 16.81 | | | | | 0.01 | | | | | 1.12 | | | | | 1.13 | | | | | — | | | | | — | | | | | — | | | | | 17.94 | | | | | 6.72 | | | | | 1.24 | | | | | 1.24 | | | | | 0.17 | | | | | 26 | | | | | 67 | |
Mid-Cap Value Fund | |
| 2017 | | | | 14.40 | | | | | 0.05 | | | | | 1.28 | | | | | 1.33 | | | | | (0.05 | ) | | | | (3.77 | ) | | | | (3.82 | ) | | | | 11.91 | | | | | 12.88 | | | | | 1.26 | | | | | 1.24 | | | | | 0.74 | | | | | 64,462 | | | | | 139 | |
| 2016 | | | | 15.02 | | | | | 0.11 | | | | | 0.86 | | | | | 0.97 | | | | | (0.12 | ) | | | | (1.47 | ) | | | | (1.59 | ) | | | | 14.40 | | | | | 7.27 | | | | | 1.23 | | | | | 1.23 | | | | | 0.90 | | | | | 39 | | | | | 24 | |
| 2015 | | | | 17.66 | | | | | 0.03 | | | | | (0.59 | ) | | | | (0.56 | ) | | | | (0.02 | ) | | | | (2.06 | ) | | | | (2.08 | ) | | | | 15.02 | | | | | (3.55 | ) | | | | 1.22 | | | | | 1.22 | | | | | 0.19 | | | | | 26 | | | | | 27 | |
| 2014(6) | | | | 16.61 | | | | | 0.01 | | | | | 1.04 | | | | | 1.05 | | | | | — | | | | | — | | | | | — | | | | | 17.66 | | | | | 6.32 | | | | | 1.20 | | | | | 1.20 | | | | | 0.31 | | | | | 27 | | | | | 30 | |
Mid-Cap Growth Fund | |
| 2017 | | | | 16.26 | | | | | (0.02 | ) | | | | 2.11 | | | | | 2.09 | | | | | (0.02 | ) | | | | (3.54 | ) | | | | (3.56 | ) | | | | 14.79 | | | | | 16.73 | | | | | 1.37 | | | | | 1.24 | | | | | (0.47 | ) | | | | 17,945 | | | | | 157 | |
| 2016 | | | | 20.02 | | | | | 0.03 | | | | | (0.91 | ) | | | | (0.88 | ) | | | | — | | | | | (2.88 | ) | | | | (2.88 | ) | | | | 16.26 | | | | | (4.23 | ) | | | | 1.29 | | | | | 1.24 | | | | | 0.09 | | | | | 31 | | | | | 59 | |
| 2015 | | | | 23.93 | | | | | (0.11 | ) | | | | (0.57 | ) | | | | (0.68 | ) | | | | — | | | | | (3.23 | ) | | | | (3.23 | ) | | | | 20.02 | | | | | (2.89 | ) | | | | 1.25 | | | | | 1.24 | | | | | (0.52 | ) | | | | 28 | | | | | 53 | |
| 2014(6) | | | | 22.89 | | | | | (0.04 | ) | | | | 1.08 | | | | | 1.04 | | | | | — | | | | | — | | | | | — | | | | | 23.93 | | | | | 4.54 | | | | | 1.24 | | | | | 1.24 | | | | | (0.63 | ) | | | | 26 | | | | | 57 | |
Small-Cap Value Fund | |
| 2017(11) | | | | 13.21 | | | | | 0.03 | | | | | 1.36 | | | | | 1.39 | | | | | (0.04 | ) | | | | (1.26 | ) | | | | (1.30 | ) | | | | 13.30 | | | | | 11.58 | | | | | 1.49 | | | | | 1.24 | | | | | 0.22 | | | | | 4,931 | | | | | 148 | |
| 2016 | | | | 12.72 | | | | | 0.03 | | | | | 0.98 | | | | | 1.01 | | | | | — | | | | | (0.52 | ) | | | | (0.52 | ) | | | | 13.21 | | | | | 8.23 | | | | | 1.39 | | | | | 1.24 | | | | | 0.17 | | | | | 42,615 | | | | | 39 | |
| 2015 | | | | 14.40 | | | | | (0.02 | ) | | | | (0.85 | ) | | | | (0.87 | ) | | | | — | | | | | (0.81 | ) | | | | (0.81 | ) | | | | 12.72 | | | | | (6.18 | ) | | | | 1.46 | | | | | 1.24 | | | | | (0.46 | ) | | | | 72,822 | | | | | 53 | |
| 2014(6) | | | | 13.99 | | | | | (0.01 | ) | | | | 0.42 | | | | | 0.41 | | | | | — | | | | | — | | | | | — | | | | | 14.40 | | | | | 2.93 | | | | | 1.46 | | | | | 1.24 | | | | | (0.14 | ) | | | | 26 | | | | | 43 | |
Small-Cap Core Fund | |
| 2017 | | | | 11.57 | | | | | (0.02 | ) | | | | 1.88 | | | | | 1.86 | | | | | (0.01 | ) | | | | (0.20 | ) | | | | (0.21 | ) | | | | 13.22 | | | | | 16.09 | | | | | 1.83 | | | | | 1.15 | | | | | (0.18 | ) | | | | 2,612 | | | | | 90 | |
| 2016 | | | | 10.41 | | | | | 0.02 | | | | | 1.22 | | | | | 1.24 | | | | | — | | | | | (0.08 | ) | | | | (0.08 | ) | | | | 11.57 | | | | | 11.97 | | | | | 2.54 | | | | | 1.15 | | | | | 0.19 | | | | | 647 | | | | | 70 | |
| 2015 | | | | 10.38 | | | | | (0.01 | ) | | | | 0.04 | | | | | 0.03 | | | | | — | | | | | — | | | | | — | | | | | 10.41 | | | | | 0.29 | | | | | 5.02 | | | | | 1.15 | | | | | (0.28 | ) | | | | 629 | | | | | 64 | |
| 2014(6) | | | | 10.08 | | | | | (0.01 | ) | | | | 0.31 | | | | | 0.30 | | | | | — | | | | | — | | | | | — | | | | | 10.38 | | | | | 2.98 | | | | | 4.82 | | | | | 1.15 | | | | | (0.30 | ) | | | | 26 | | | | | 43 | |
Small-Cap Growth Fund | |
| 2017(9) | | | | 17.79 | | | | | (0.06 | ) | | | | 0.64 | | | | | 0.58 | | | | | — | | | | | — | | | | | — | | | | | 18.37 | | | | | 3.26 | | | | | 1.24 | | | | | 1.24 | | | | | (0.97 | ) | | | | 57,737 | | | | | 197 | |
Global Low Volatility Equity Fund | |
| 2017(3) | | | | 12.61 | | | | | 0.14 | | | | | 0.66 | | | | | 0.80 | | | | | (0.17 | ) | | | | (0.08 | ) | | | | (0.25 | ) | | | | 13.16 | | | | | 6.59 | | | | | 1.52 | | | | | 1.10 | | | | | 1.96 | | | | | 997 | | | | | 74 | |
| 2016(3) | | | | 11.31 | | | | | 0.11 | | | | | 1.25 | | | | | 1.36 | | | | | (0.06 | ) | | | | (0.00 | ) | | | | (0.06 | ) | | | | 12.61 | | | | | 12.11 | | | | | 1.63 | | | | | 1.10 | | | | | 2.04 | | | | | 266 | | | | | 36 | |
| 2015(3) | | | | 11.47 | | | | | 0.14 | | | | | (0.17 | ) | | | | (0.03 | ) | | | | (0.08 | ) | | | | (0.05 | ) | | | | (0.13 | ) | | | | 11.31 | | | | | (0.28 | ) | | | | 5.76 | | | | | 1.10 | | | | | 2.38 | | | | | 142 | | | | | 31 | |
| 2014(3)(6) | | | | 11.12 | | | | | 0.05 | | | | | 0.30 | | | | | 0.35 | | | | | — | | | | | — | | | | | — | | | | | 11.47 | | | | | 3.15 | | | | | 11.55 | | | | | 1.10 | | | | | 1.53 | | | | | 26 | | | | | 29 | |
Disciplined International Equity Fund | |
| 2017(3) | | | | 9.56 | | | | | 0.20 | | | | | 1.66 | | | | | 1.86 | | | | | (0.25 | ) | | | | — | | | | | (0.25 | ) | | | | 11.17 | | | | | 19.97 | | | | | 1.39 | | | | | 1.15 | | | | | 1.98 | | | | | 149 | | | | | 77 | |
| 2016(3)(8) | | | | 10.00 | | | | | 0.23 | | | | | (0.67 | ) | | | | (0.44 | ) | | | | — | | | | | — | | | | | — | | | | | 9.56 | | | | | (4.40 | ) | | | | 1.45 | | | | | 1.15 | | | | | 2.53 | | | | | 125 | | | | | 64 | |
(See Notes which are an integral part of the Financial Statements)
138
| | |
| Financial Highlights—Advisor Class of Shares (For a share outstanding throughout each period) |
| | | | | | | | | | | | | | | | | | | | | | | | | | | | | | | | | | | | | | | | | | | | | | | | | | | | | | | | | | | | | | | | | | | | | | |
Period
Ended
August 31, | | Net asset
value,
beginning
of period | | Net
investment
income
(loss) | | Net realized
and unrealized
gain (loss) | | Total from
investment
operations | | Distributions to
shareholders
from net
investment
income | | Distributions to
shareholders
from net
realized gain | | Total
distributions | | Net asset
value, end
of period | | Total
return (1)(4) | | Ratios to Average Net Assets (5) | | Net assets,
end of period
(000 omitted) | | Portfolio
turnover
rate (4) |
| | | | | | | | | | | Gross
Expenses | | Net
Expenses (2) | | Net
investment
income
(loss) (2) | | |
Pyrford International Stock Fund | |
| 2017(3)(11) | | | $ | 12.18 | | | | $ | 0.40 | | | | $ | 0.83 | | | | $ | 1.23 | | | | $ | (0.25 | ) | | | $ | — | | | | $ | (0.25 | ) | | | $ | 13.16 | | | | | 10.38 | % | | | | 1.30 | % | | | | 1.21 | % | | | | 3.11 | % | | | $ | 891 | | | | | 33 | % |
| 2016(3) | | | | 11.74 | | | | | 0.33 | | | | | 0.35 | | | | | 0.68 | | | | | (0.24 | ) | | | | — | | | | | (0.24 | ) | | | | 12.18 | | | | | 5.96 | | | | | 1.31 | | | | | 1.24 | | | | | 0.92 | | | | | 88 | | | | | 12 | |
| 2015(3) | | | | 13.11 | | | | | 0.05 | | | | | (1.34 | ) | | | | (1.29 | ) | | | | (0.08 | ) | | | | — | | | | | (0.08 | ) | | | | 11.74 | | | | | (9.86 | ) | | | | 1.28 | | | | | 1.24 | | | | | 2.79 | | | | | 817 | | | | | 9 | |
| 2014(3)(6) | | | | 13.13 | | | | | 0.07 | | | | | (0.09 | ) | | | | (0.02 | ) | | | | — | | | | | — | | | | | — | | | | | 13.11 | | | | | (0.15 | ) | | | | 1.28 | | | | | 1.24 | | | | | 1.95 | | | | | 25 | | | | | 6 | |
LGM Emerging Markets Equity Fund | |
| 2017(3)(11) | | | | 14.04 | | | | | 0.13 | | | | | 1.82 | | | | | 1.95 | | | | | (0.06 | ) | | | | — | | | | | (0.06 | ) | | | | 15.93 | | | | | 14.03 | | | | | 1.63 | | | | | 1.40 | | | | | 0.96 | | | | | 4,776 | | | | | 40 | |
| 2016(3) | | | | 12.12 | | | | | 0.16 | | | | | 1.86 | | | | | 2.02 | | | | | (0.10 | ) | | | | — | | | | | (0.10 | ) | | | | 14.04 | | | | | 16.88 | | | | | 1.64 | | | | | 1.40 | | | | | 0.92 | | | | | 51,879 | | | | | 24 | |
| 2015(3) | | | | 14.30 | | | | | 0.08 | | | | | (2.09 | ) | | | | (2.01 | ) | | | | (0.17 | ) | | | | — | | | | | (0.17 | ) | | | | 12.12 | | | | | (14.18 | ) | | | | 1.59 | | | | | 1.40 | | | | | 2.01 | | | | | 63,966 | | | | | 25 | |
| 2014(3)(6) | | | | 13.69 | | | | | 0.08 | | | | | 0.53 | | | | | 0.61 | | | | | — | | | | | — | | | | | — | | | | | 14.30 | | | | | 4.46 | | | | | 1.66 | | | | | 1.40 | | | | | 2.05 | | | | | 26 | | | | | 38 | |
TCH Emerging Markets Bond Fund | |
| 2017(3)(11) | | | | 10.16 | | | | | 0.40 | | | | | 0.10 | | | | | 0.50 | | | | | — | | | | | — | | | | | — | | | | | 10.66 | | | | | 4.92 | | | | | 2.14 | | | | | 1.00 | | | | | 3.95 | | | | | 119 | | | | | 74 | |
| 2016(3) | | | | 9.89 | | | | | 0.45 | | | | | 0.38 | | | | | 0.83 | | | | | (0.47 | ) | | | | (0.09 | ) | | | | (0.56 | ) | | | | 10.16 | | | | | 9.20 | | | | | 2.84 | | | | | 1.00 | | | | | 4.76 | | | | | 4,168 | | | | | 44 | |
| 2015(3) | | | | 11.14 | | | | | 0.34 | | | | | (0.79 | ) | | | | (0.45 | ) | | | | (0.48 | ) | | | | (0.32 | ) | | | | (0.80 | ) | | | | 9.89 | | | | | (4.11 | ) | | | | 3.21 | | | | | 1.00 | | | | | 4.94 | | | | | 3,882 | | | | | 60 | |
| 2014(3)(6) | | | | 10.80 | | | | | 0.12 | | | | | 0.22 | | | | | 0.34 | | | | | — | | | | | — | | | | | — | | | | | 11.14 | | | | | 3.15 | | | | | 2.42 | | | | | 1.00 | | | | | 4.26 | | | | | 26 | | | | | 72 | |
Alternative Strategies Fund | |
| 2017(3) | | | | 10.30 | | | | | (0.18 | ) | | | | 0.62 | | | | | 0.44 | | | | | — | | | | | — | | | | | — | | | | | 10.74 | | | | | 4.27 | | | | | 3.65 | (10) | | | | 2.95 | (10) | | | | (0.93 | ) | | | | 157 | | | | | 251 | |
| 2016(3) | | | | 10.40 | | | | | (0.23 | ) | | | | 0.23 | | | | | 0.00 | | | | | — | | | | | (0.10 | ) | | | | (0.10 | ) | | | | 10.30 | | | | | (0.02 | ) | | | | 3.88 | (10) | | | | 3.07 | (10) | | | | 1.11 | | | | | 286 | | | | | 279 | |
| 2015(3)(7) | | | | 10.00 | | | | | (0.06 | ) | | | | 0.46 | | | | | 0.40 | | | | | — | | | | | — | | | | | — | | | | | 10.40 | | | | | 4.00 | | | | | 4.94 | (10) | | | | 2.72 | (10) | | | | (1.07 | ) | | | | 1,011 | | | | | 119 | |
Global Long/Short Equity Fund | |
| 2017(3) | | | | 10.68 | | | | | 0.01 | | | | | 1.66 | | | | | 1.67 | | | | | (0.04 | ) | | | | (0.09 | ) | | | | (0.13 | ) | | | | 12.22 | | | | | 15.77 | | | | | 5.05 | (10) | | | | 2.42 | (10) | | | | 0.03 | | | | | 730 | | | | | 42 | |
| 2016(3)(8) | | | | 10.00 | | | | | 0.03 | | | | | 0.65 | | | | | 0.68 | | | | | — | | | | | — | | | | | — | | | | | 10.68 | | | | | 6.80 | | | | | 9.46 | (10) | | | | 2.36 | (10) | | | | 0.46 | | | | | 510 | | | | | 45 | |
Ultra Short Tax-Free Fund | |
| 2017 | | | | 10.08 | | | | | 0.07 | | | | | 0.01 | | | | | 0.08 | | | | | (0.07 | ) | | | | (0.01 | ) | | | | (0.08 | ) | | | | 10.08 | | | | | 0.80 | | | | | 0.64 | | | | | 0.55 | | | | | 0.74 | | | | | 34,696 | | | | | 126 | |
| 2016 | | | | 10.08 | | | | | 0.04 | | | | | 0.01 | | | | | 0.05 | | | | | (0.04 | ) | | | | (0.01 | ) | | | | (0.05 | ) | | | | 10.08 | | | | | 0.50 | | | | | 0.64 | | | | | 0.55 | | | | | 0.39 | | | | | 25 | | | | | 56 | |
| 2015 | | | | 10.09 | | | | | 0.04 | | | | | (0.01 | ) | | | | 0.03 | | | | | (0.04 | ) | | | | — | | | | | (0.04 | ) | | | | 10.08 | | | | | 0.25 | | | | | 0.60 | | | | | 0.55 | | | | | 0.34 | | | | | 25 | | | | | 57 | |
| 2014(6) | | | | 10.09 | | | | | 0.01 | | | | | 0.00 | | | | | 0.01 | | | | | (0.01 | ) | | | | — | | | | | (0.01 | ) | | | | 10.09 | | | | | 0.13 | | | | | 0.59 | | | | | 0.55 | | | | | 0.50 | | | | | 25 | | | | | 86 | |
Short Tax-Free Fund | |
| 2017 | | | | 10.24 | | | | | 0.13 | | | | | (0.02 | ) | | | | 0.11 | | | | | (0.13 | ) | | | | (0.00 | ) | | | | (0.13 | ) | | | | 10.22 | | | | | 1.08 | | | | | 0.76 | | | | | 0.55 | | | | | 1.27 | | | | | 7,166 | | | | | 93 | |
| 2016 | | | | 10.20 | | | | | 0.11 | | | | | 0.06 | | | | | 0.17 | | | | | (0.11 | ) | | | | (0.02 | ) | | | | (0.13 | ) | | | | 10.24 | | | | | 1.69 | | | | | 0.77 | | | | | 0.55 | | | | | 1.04 | | | | | 1,151 | | | | | 39 | |
| 2015 | | | | 10.20 | | | | | 0.12 | | | | | (0.00 | ) | | | | 0.12 | | | | | (0.12 | ) | | | | — | | | | | (0.12 | ) | | | | 10.20 | | | | | 1.21 | | | | | 0.83 | | | | | 0.55 | | | | | 1.15 | | | | | 453 | | | | | 50 | |
| 2014(6) | | | | 10.17 | | | | | 0.03 | | | | | 0.03 | | | | | 0.06 | | | | | (0.03 | ) | | | | — | | | | | (0.03 | ) | | | | 10.20 | | | | | 0.64 | | | | | 0.83 | | | | | 0.55 | | | | | 1.29 | | | | | 25 | | | | | 69 | |
Short-Term Income Fund | |
| 2017 | | | | 9.40 | | | | | 0.15 | | | | | (0.01 | ) | | | | 0.14 | | | | | (0.15 | ) | | | | — | | | | | (0.15 | ) | | | | 9.39 | | | | | 1.46 | | | | | 0.72 | | | | | 0.60 | | | | | 1.61 | | | | | 33,311 | | | | | 53 | |
| 2016 | | | | 9.33 | | | | | 0.10 | | | | | 0.07 | | | | | 0.17 | | | | | (0.10 | ) | | | | — | | | | | (0.10 | ) | | | | 9.40 | | | | | 1.87 | | | | | 0.70 | | | | | 0.60 | | | | | 0.98 | | | | | 157 | | | | | 64 | |
| 2015 | | | | 9.40 | | | | | 0.09 | | | | | (0.05 | ) | | | | 0.04 | | | | | (0.11 | ) | | | | — | | | | | (0.11 | ) | | | | 9.33 | | | | | 0.43 | | | | | 0.69 | | | | | 0.60 | | | | | 1.02 | | | | | 25 | | | | | 29 | |
| 2014(6) | | | | 9.42 | | | | | 0.02 | | | | | (0.01 | ) | | | | 0.01 | | | | | (0.03 | ) | | | | — | | | | | (0.03 | ) | | | | 9.40 | | | | | 0.10 | | | | | 0.71 | | | | | 0.60 | | | | | 1.10 | | | | | 25 | | | | | 43 | |
Intermediate Tax-Free Fund | |
| 2017 | | | | 11.61 | | | | | 0.29 | | | | | (0.21 | ) | | | | 0.08 | | | | | (0.29 | ) | | | | (0.03 | ) | | | | (0.32 | ) | | | | 11.37 | | | | | 0.79 | | | | | 0.57 | | | | | 0.55 | | | | | 2.57 | | | | | 10,842 | | | | | 44 | |
| 2016 | | | | 11.26 | | | | | 0.25 | | | | | 0.37 | | | | | 0.62 | | | | | (0.25 | ) | | | | (0.02 | ) | | | | (0.27 | ) | | | | 11.61 | | | | | 5.56 | | | | | 0.57 | | | | | 0.55 | | | | | 2.18 | | | | | 1,693 | | | | | 42 | |
| 2015 | | | | 11.25 | | | | | 0.26 | | | | | 0.01 | | | | | 0.27 | | | | | (0.26 | ) | | | | — | | | | | (0.26 | ) | | | | 11.26 | | | | | 2.36 | | | | | 0.57 | | | | | 0.55 | | | | | 2.24 | | | | | 2,095 | | | | | 26 | |
| 2014(6) | | | | 11.16 | | | | | 0.07 | | | | | 0.09 | | | | | 0.16 | | | | | (0.07 | ) | | | | — | | | | | (0.07 | ) | | | | 11.25 | | | | | 1.46 | | | | | 0.60 | | | | | 0.55 | | | | | 2.41 | | | | | 2,044 | | | | | 35 | |
Strategic Income Fund | |
| 2017 | | | | 9.43 | | | | | 0.28 | | | | | 0.03 | | | | | 0.31 | | | | | (0.29 | ) | | | | — | | | | | (0.29 | ) | | | | 9.45 | | | | | 3.32 | | | | | 0.90 | | | | | 0.80 | | | | | 3.14 | | | | | 18,354 | | | | | 65 | |
| 2016 | | | | 9.31 | | | | | 0.22 | | | | | 0.16 | | | | | 0.38 | | | | | (0.26 | ) | | | | — | | | | | (0.26 | ) | | | | 9.43 | | | | | 4.17 | | | | | 0.86 | | | | | 0.80 | | | | | 2.27 | | | | | 32 | | | | | 13 | |
| 2015 | | | | 9.36 | | | | | 0.22 | | | | | 0.00 | | | | | 0.22 | | | | | (0.27 | ) | | | | — | | | | | (0.27 | ) | | | | 9.31 | | | | | 2.34 | | | | | 0.93 | | | | | 0.80 | | | | | 2.36 | | | | | 26 | | | | | 44 | |
| 2014(6) | | | | 9.35 | | | | | 0.03 | | | | | 0.05 | | | | | 0.08 | | | | | (0.07 | ) | | | | — | | | | | (0.07 | ) | | | | 9.36 | | | | | 0.86 | | | | | 0.94 | | | | | 0.80 | | | | | 2.38 | | | | | 25 | | | | | 129 | |
(See Notes which are an integral part of the Financial Statements)
139
| | |
| Financial Highlights—Advisor Class of Shares (For a share outstanding throughout each period) |
| | | | | | | | | | | | | | | | | | | | | | | | | | | | | | | | | | | | | | | | | | | | | | | | | | | | | | | | | | | | | | | | | | | | | | |
Period
Ended
August 31, | | Net asset
value,
beginning
of period | | Net
investment
income
(loss) | | Net realized
and unrealized
gain (loss) | | Total from
investment
operations | | Distributions to
shareholders
from net
investment
income | | Distributions to
shareholders
from net
realized gain | | Total
distributions | | Net asset
value, end
of period | | Total
return (1)(4) | | Ratios to Average Net Assets (5) | | Net assets,
end of period
(000 omitted) | | Portfolio
turnover
rate (4) |
| | | | | | | | | | | Gross
Expenses | | Net
Expenses (2) | | Net
investment
income
(loss) (2) | | |
TCH Corporate Income Fund | |
| 2017 | | | $ | 13.17 | | | | $ | 0.35 | | | | $ | 0.14 | | | | $ | 0.49 | | | | $ | (0.35 | ) | | | $ | (0.11 | ) | | | $ | (0.46 | ) | | | $ | 13.20 | | | | | 3.86 | % | | | | 0.71 | % | | | | 0.59 | % | | | | 2.63 | % | | | $ | 1,384 | | | | | 44 | % |
| 2016 | | | | 12.33 | | | | | 0.45 | | | | | 0.89 | | | | | 1.34 | | | | | (0.45 | ) | | | | (0.05 | ) | | | | (0.50 | ) | | | | 13.17 | | | | | 11.23 | | | | | 0.72 | | | | | 0.59 | | | | | 3.77 | | | | | 66 | | | | | 62 | |
| 2015 | | | | 13.09 | | | | | 0.36 | | | | | (0.71 | ) | | | | (0.35 | ) | | | | (0.36 | ) | | | | (0.05 | ) | | | | (0.41 | ) | | | | 12.33 | | | | | (2.73 | ) | | | | 0.70 | | | | | 0.59 | | | | | 2.83 | | | | | 25 | | | | | 26 | |
| 2014(6) | | | | 12.93 | | | | | 0.09 | | | | | 0.17 | | | | | 0.26 | | | | | (0.10 | ) | | | | — | | | | | (0.10 | ) | | | | 13.09 | | | | | 2.02 | | | | | 0.72 | | | | | 0.59 | | | | | 2.92 | | | | | 25 | | | | | 25 | |
TCH Core Plus Bond Fund | |
| 2017 | | | | 11.89 | | | | | 0.28 | | | | | (0.06 | ) | | | | 0.22 | | | | | (0.28 | ) | | | | (0.04 | ) | | | | (0.32 | ) | | | | 11.79 | | | | | 1.91 | | | | | 0.59 | | | | | 0.59 | | | | | 2.36 | | | | | 3,337 | | | | | 34 | |
| 2016 | | | | 11.42 | | | | | 0.34 | | | | | 0.48 | | | | | 0.82 | | | | | (0.35 | ) | | | | (0.00 | ) | | | | (0.35 | ) | | | | 11.89 | | | | | 7.36 | | | | | 0.59 | | | | | 0.59 | | | | | 2.99 | | | | | 1,434 | | | | | 39 | |
| 2015 | | | | 11.95 | | | | | 0.32 | | | | | (0.47 | ) | | | | (0.15 | ) | | | | (0.32 | ) | | | | (0.06 | ) | | | | (0.38 | ) | | | | 11.42 | | | | | (1.28 | ) | | | | 0.58 | | | | | 0.58 | | | | | 2.71 | | | | | 312 | | | | | 25 | |
| 2014(6) | | | | 11.82 | | | | | 0.08 | | | | | 0.14 | | | | | 0.22 | | | | | (0.09 | ) | | | | — | | | | | (0.09 | ) | | | | 11.95 | | | | | 1.85 | | | | | 0.60 | | | | | 0.59 | | | | | 2.74 | | | | | 25 | | | | | 44 | |
High Yield Bond Fund | |
| 2017 | | | | 9.49 | | | | | 0.44 | | | | | 0.15 | | | | | 0.59 | | | | | (0.50 | ) | | | | — | | | | | (0.50 | ) | | | | 9.58 | | | | | 6.37 | | | | | 1.42 | | | | | 0.90 | | | | | 5.26 | | | | | 1,010 | | | | | 47 | |
| 2016 | | | | 9.41 | | | | | 0.48 | | | | | 0.08 | | | | | 0.56 | | | | | (0.48 | ) | | | | — | | | | | (0.48 | ) | | | | 9.49 | | | | | 6.22 | | | | | 1.21 | | | | | 0.90 | | | | | 5.15 | | | | | 72,010 | | | | | 51 | |
| 2015 | | | | 10.44 | | | | | 0.51 | | | | | (0.79 | ) | | | | (0.28 | ) | | | | (0.51 | ) | | | | (0.24 | ) | | | | (0.75 | ) | | | | 9.41 | | | | | (2.70 | ) | | | | 1.21 | | | | | 0.90 | | | | | 5.13 | | | | | 42,843 | | | | | 46 | |
| 2014(6) | | | | 10.52 | | | | | 0.14 | | | | | (0.08 | ) | | | | 0.06 | | | | | (0.14 | ) | | | | — | | | | | (0.14 | ) | | | | 10.44 | | | | | 0.58 | | | | | 1.17 | | | | | 0.90 | | | | | 5.09 | | | | | 25 | | | | | 42 | |
| (1) | Based on net asset value as of end of period date. |
| (2) | The contractual and voluntary expense waivers pursuant to Note 6 of the financial statements are reflected in both the net expense and net investment income (loss) ratios. |
| (3) | Redemption fees consisted of per share amounts less than $0.01. |
| (4) | Not annualized for periods less than one year. |
| (5) | Annualized for periods less than one year. |
| (6) | Reflects operations for the period from May 27, 2014 (inception date) to August 31, 2014. |
| (7) | Reflects operations for the period from December 16, 2014 (inception date) to August 31, 2015. |
| (8) | Reflects operations for the period from September 17, 2015 (inception date) to August 31, 2016. |
| (9) | Reflects operations for the period from May 31, 2017 (inception date) to August 31, 2017 |
| (10) | Percentages shown include interest expense and dividends on securities sold short. Gross and net expense ratios, respectively, excluding interest expense and dividends on securities sold short are as follows: |
| | | | | | | | | | | | | | | | | | | | | | |
Alternatives Strategies Fund | | | | | | Global Long/Short Equity Fund | |
| | | Gross | | | Net | | | | | | | | Gross | | | Net | |
| 2017 | | | 2.85 | % | | | 2.15 | % | | | | | | 2017 | | | 4.23 | % | | | 1.60 | % |
| 2016 | | | 3.05 | | | | 2.20 | | | | | | | 2016 | | | 8.70 | | | | 1.60 | |
| 2015 | | | 4.42 | | | | 2.20 | | | | | | | | | | | | | | | |
| (11) | Calculated using the average shares method. |
(See Notes which are an integral part of the Financial Statements)
140
| | |
| Financial Highlights—Institutional Class of Shares (For a share outstanding throughout each period) |
| | | | | | | | | | | | | | | | | | | | | | | | | | | | | | | | | | | | | | | | | | | | | | | | | | | | | | | | | | | | | | | | | | | | | | |
Period
Ended
August 31, | | Net asset
value,
beginning
of period | | Net
investment
income
(loss) | | Net realized
and unrealized
gain (loss) | | Total from
investment
operations | | Distributions to
shareholders
from net
investment
income | | Distributions to
shareholders
from net
realized gain | | Total
distributions | | Net asset
value, end
of period | | Total
return (1)(4) | | Ratios to Average Net Assets (5) | | Net assets,
end of period
(000 omitted) | | Portfolio
turnover
rate (4) |
| | | | | | | | | | | Gross
Expenses | | Net
Expenses (2) | | Net
investment
income
(loss) (2) | | |
Low Volatility Equity Fund | | | | | | | | | | | | | | | | | | | | | | | | | | | | | | | | | | | | | | | | | | | | | | | | | | | | | | | | | | | | | |
| 2017 | | | $ | 13.84 | | | | $ | 0.24 | | | | $ | 0.74 | | | | $ | 0.98 | | | | $ | (0.23 | ) | | | $ | (0.17 | ) | | | $ | (0.40 | ) | | | $ | 14.42 | | | | | 7.24 | % | | | | 0.78 | % | | | | 0.65 | % | | | | 1.69 | % | | | $ | 127,837 | | | | | 56 | % |
| 2016 | | | | 12.84 | | | | | 0.20 | | | | | 1.35 | | | | | 1.55 | | | | | (0.19 | ) | | | | (0.36 | ) | | | | (0.55 | ) | | | | 13.84 | | | | | 12.47 | | | | | 0.80 | | | | | 0.65 | | | | | 1.62 | | | | | 135,413 | | | | | 40 | |
| 2015 | | | | 13.22 | | | | | 0.20 | | | | | 0.53 | | | | | 0.73 | | | | | (0.21 | ) | | | | (0.90 | ) | | | | (1.11 | ) | | | | 12.84 | | | | | 5.56 | | | | | 0.87 | | | | | 0.65 | | | | | 1.52 | | | | | 76,792 | | | | | 47 | |
| 2014 | | | | 11.28 | | | | | 0.18 | | | | | 2.05 | | | | | 2.23 | | | | | (0.18 | ) | | | | (0.11 | ) | | | | (0.29 | ) | | | | 13.22 | | | | | 19.97 | | | | | 0.89 | | | | | 0.65 | | | | | 1.49 | | | | | 57,421 | | | | | 47 | |
| 2013(3)(6) | | | | 10.00 | | | | | 0.10 | | | | | 1.25 | | | | | 1.35 | | | | | (0.07 | ) | | | | — | | | | | (0.07 | ) | | | | 11.28 | | | | | 13.47 | | | | | 1.28 | | | | | 0.65 | | | | | 1.79 | | | | | 41,009 | | | | | 101 | |
Dividend Income Fund | | | | | | | | | | | | | | | | | | | | | | | | | | | | | | | | | | | | | | | | | | | | | | | | | | | | | | | | | | | | | |
| 2017(13) | | | | 12.96 | | | | | 0.33 | | | | | 1.60 | | | | | 1.93 | | | | | (0.31 | ) | | | | (0.11 | ) | | | | (0.42 | ) | | | | 14.47 | | | | | 15.15 | | | | | 0.83 | | | | | 0.65 | | | | | 2.37 | | | | | 112,377 | | | | | 43 | |
| 2016 | | | | 12.62 | | | | | 0.35 | | | | | 1.08 | | | | | 1.43 | | | | | (0.33 | ) | | | | (0.76 | ) | | | | (1.09 | ) | | | | 12.96 | | | | | 12.07 | | | | | 0.83 | | | | | 0.65 | | | | | 2.68 | | | | | 38,719 | | | | | 51 | |
| 2015 | | | | 14.32 | | | | | 0.35 | | | | | (0.77 | ) | | | | (0.42 | ) | | | | (0.36 | ) | | | | (0.92 | ) | | | | (1.28 | ) | | | | 12.62 | | | | | (3.38 | ) | | | | 0.80 | | | | | 0.65 | | | | | 2.50 | | | | | 45,554 | | | | | 46 | |
| 2014 | | | | 12.27 | | | | | 0.32 | | | | | 2.51 | | | | | 2.83 | | | | | (0.31 | ) | | | | (0.47 | ) | | | | (0.78 | ) | | | | 14.32 | | | | | 23.87 | | | | | 0.80 | | | | | 0.65 | | | | | 2.43 | | | | | 55,387 | | | | | 45 | |
| 2013(3) | | | | 10.80 | | | | | 0.33 | | | | | 1.46 | | | | | 1.79 | | | | | (0.32 | ) | | | | — | | | | | (0.32 | ) | | | | 12.27 | | | | | 16.78 | | | | | 0.81 | | | | | 0.65 | | | | | 2.79 | | | | | 50,393 | | | | | 25 | |
Large-Cap Value Fund | | | | | | | | | | | | | | | | | | | | | | | | | | | | | | | | | | | | | | | | | | | | | | | | | | | | | | | | | | | | | |
| 2017(13) | | | | 14.16 | | | | | 0.22 | | | | | 1.83 | | | | | 2.05 | | | | | (0.21 | ) | | | | (0.12 | ) | | | | (0.33 | ) | | | | 15.88 | | | | | 14.66 | | | | | 0.77 | | | | | 0.75 | | | | | 1.47 | | | | | 307,156 | | | | | 62 | |
| 2016 | | | | 15.26 | | | | | 0.24 | | | | | 0.53 | | | | | 0.77 | | | | | (0.26 | ) | | | | (1.61 | ) | | | | (1.87 | ) | | | | 14.16 | | | | | 5.57 | | | | | 0.85 | | | | | 0.82 | | | | | 1.83 | | | | | 136,813 | | | | | 60 | |
| 2015 | | | | 17.06 | | | | | 0.18 | | | | | (0.23 | ) | | | | (0.05 | ) | | | | (0.13 | ) | | | | (1.62 | ) | | | | (1.75 | ) | | | | 15.26 | | | | | (0.45 | ) | | | | 0.97 | | | | | 0.96 | | | | | 1.04 | | | | | 94,439 | | | | | 72 | |
| 2014 | | | | 14.56 | | | | | 0.16 | | | | | 3.56 | | | | | 3.72 | | | | | (0.16 | ) | | | | (1.06 | ) | | | | (1.22 | ) | | | | 17.06 | | | | | 26.74 | | | | | 0.98 | | | | | 0.98 | | | | | 0.95 | | | | | 119,263 | | | | | 68 | |
| 2013(3) | | | | 12.24 | | | | | 0.17 | | | | | 2.37 | | | | | 2.54 | | | | | (0.22 | ) | | | | — | | | | | (0.22 | ) | | | | 14.56 | | | | | 20.95 | | | | | 1.02 | | | | | 0.99 | | | | | 1.24 | | | | | 101,834 | | | | | 71 | |
Large-Cap Growth Fund | | | | | | | | | | | | | | | | | | | | | | | | | | | | | | | | | | | | | | | | | | | | | | | | | | | | | | | | | | | | | |
| 2017 | | | | 15.47 | | | | | 0.10 | | | | | 3.06 | | | | | 3.16 | | | | | (0.13 | ) | | | | (0.90 | ) | | | | (1.03 | ) | | | | 17.60 | | | | | 21.63 | | | | | 0.78 | | | | | 0.75 | | | | | 0.65 | | | | | 278,436 | | | | | 75 | |
| 2016 | | | | 16.39 | | | | | 0.07 | | | | | 1.44 | | | | | 1.51 | | | | | (0.06 | ) | | | | (2.37 | ) | | | | (2.43 | ) | | | | 15.47 | | | | | 9.88 | | | | | 0.88 | | | | | 0.82 | | | | | 0.50 | | | | | 95,438 | | | | | 70 | |
| 2015 | | | | 18.06 | | | | | 0.07 | | | | | 0.90 | | | | | 0.97 | | | | | (0.04 | ) | | | | (2.60 | ) | | | | (2.64 | ) | | | | 16.39 | | | | | 5.85 | | | | | 0.98 | | | | | 0.96 | | | | | 0.29 | | | | | 72,958 | | | | | 94 | |
| 2014 | | | | 15.18 | | | | | 0.06 | | | | | 4.36 | | | | | 4.42 | | | | | (0.09 | ) | | | | (1.45 | ) | | | | (1.54 | ) | | | | 18.06 | | | | | 30.63 | | | | | 0.99 | | | | | 0.99 | | | | | 0.28 | | | | | 130,948 | | | | | 67 | |
| 2013(3) | | | | 14.24 | | | | | 0.08 | | | | | 1.96 | | | | | 2.04 | | | | | (0.06 | ) | | | | (1.04 | ) | | | | (1.10 | ) | | | | 15.18 | | | | | 15.46 | | | | | 1.00 | | | | | 0.99 | | | | | 0.58 | | | | | 122,689 | | | | | 100 | |
Mid-Cap Value Fund | | | | | | | | | | | | | | | | | | | | | | | | | | | | | | | | | | | | | | | | | | | | | | | | | | | | | | | | | | | | | |
| 2017 | | | | 14.38 | | | | | 0.08 | | | | | 1.27 | | | | | 1.35 | | | | | (0.07 | ) | | | | (3.77 | ) | | | | (3.84 | ) | | | | 11.89 | | | | | 13.10 | | | | | 1.01 | | | | | 0.99 | | | | | 0.91 | | | | | 127,304 | | | | | 139 | |
| 2016 | | | | 15.01 | | | | | 0.16 | | | | | 0.85 | | | | | 1.01 | | | | | (0.17 | ) | | | | (1.47 | ) | | | | (1.64 | ) | | | | 14.38 | | | | | 7.55 | | | | | 0.98 | | | | | 0.98 | | | | | 1.09 | | | | | 75,608 | | | | | 24 | |
| 2015 | | | | 17.63 | | | | | 0.08 | | | | | (0.60 | ) | | | | (0.52 | ) | | | | (0.04 | ) | | | | (2.06 | ) | | | | (2.10 | ) | | | | 15.01 | | | | | (3.29 | ) | | | | 0.97 | | | | | 0.97 | | | | | 0.43 | | | | | 99,160 | | | | | 27 | |
| 2014 | | | | 16.23 | | | | | 0.08 | | | | | 3.64 | | | | | 3.72 | | | | | (0.12 | ) | | | | (2.20 | ) | | | | (2.32 | ) | | �� | | 17.63 | | | | | 24.96 | | | | | 0.95 | | | | | 0.95 | | | | | 0.49 | | | | | 145,606 | | | | | 30 | |
| 2013(3) | | | | 13.23 | | | | | 0.12 | | | | | 3.61 | | | | | 3.73 | | | | | (0.11 | ) | | | | (0.62 | ) | | | | (0.73 | ) | | | | 16.23 | | | | | 29.58 | | | | | 0.97 | | | | | 0.97 | | | | | 0.77 | | | | | 122,818 | | | | | 48 | |
Mid-Cap Growth Fund | | | | | | | | | | | | | | | | | | | | | | | | | | | | | | | | | | | | | | | | | | | | | | | | | | | | | | | | | | | | | |
| 2017 | | | | 16.76 | | | | | 0.03 | | | | | 2.19 | | | | | 2.22 | | | | | (0.05 | ) | | | | (3.54 | ) | | | | (3.59 | ) | | | | 15.39 | | | | | 17.07 | | | | | 1.12 | | | | | 0.99 | | | | | (0.07 | ) | | | | 94,464 | | | | | 157 | |
| 2016 | | | | 20.51 | | | | | 0.04 | | | | | (0.91 | ) | | | | (0.87 | ) | | | | — | | | | | (2.88 | ) | | | | (2.88 | ) | | | | 16.76 | | | | | (4.06 | ) | | | | 1.04 | | | | | 0.99 | | | | | 0.33 | | | | | 39,569 | | | | | 59 | |
| 2015 | | | | 24.37 | | | | | (0.08 | ) | | | | (0.55 | ) | | | | (0.63 | ) | | | | — | | | | | (3.23 | ) | | | | (3.23 | ) | | | | 20.51 | | | | | (2.61 | ) | | | | 1.00 | | | | | 0.99 | | | | | (0.26 | ) | | | | 82,768 | | | | | 53 | |
| 2014 | | | | 23.26 | | | | | (0.09 | ) | | | | 4.26 | | | | | 4.17 | | | | | — | | | | | (3.06 | ) | | | | (3.06 | ) | | | | 24.37 | | | | | 19.43 | | | | | 0.97 | | | | | 0.97 | | | | | (0.36 | ) | | | | 144,807 | | | | | 57 | |
| 2013(3) | | | | 20.32 | | | | | (0.05 | ) | | | | 4.26 | | | | | 4.21 | | | | | — | | | | | (1.27 | ) | | | | (1.27 | ) | | | | 23.26 | | | | | 21.74 | | | | | 0.97 | | | | | 0.97 | | | | | (0.24 | ) | | | | 142,302 | | | | | 58 | |
Small-Cap Value Fund | | | | | | | | | | | | | | | | | | | | | | | | | | | | | | | | | | | | | | | | | | | | | | | | | | | | | | | | | | | | | |
| 2017(13) | | | | 13.37 | | | | | 0.04 | | | | | 1.41 | | | | | 1.45 | | | | | (0.09 | ) | | | | (1.26 | ) | | | | (1.35 | ) | | | | 13.47 | | | | | 11.87 | | | | | 1.24 | | | | | 0.99 | | | | | 0.33 | | | | | 56,585 | | | | | 148 | |
| 2016 | | | | 12.84 | | | | | 0.05 | | | | | 1.00 | | | | | 1.05 | | | | | — | | | | | (0.52 | ) | | | | (0.52 | ) | | | | 13.37 | | | | | 8.47 | | | | | 1.14 | | | | | 0.99 | | | | | 0.40 | | | | | 25,522 | | | | | 39 | |
| 2015 | | | | 14.50 | | | | | (0.01 | ) | | | | (0.84 | ) | | | | (0.85 | ) | | | | — | | | | | (0.81 | ) | | | | (0.81 | ) | | | | 12.84 | | | | | (5.99 | ) | | | | 1.21 | | | | | 0.99 | | | | | (0.14 | ) | | | | 19,186 | | | | | 53 | |
| 2014 | | | | 13.62 | | | | | 0.01 | | | | | 2.25 | | | | | 2.26 | | | | | — | | | | | (1.38 | ) | | | | (1.38 | ) | | | | 14.50 | | | | | 17.68 | | | | | 1.15 | | | | | 0.99 | | | | | 0.04 | | | | | 16,369 | | | | | 43 | |
| 2013(3) | | | | 10.51 | | | | | 0.09 | | | | | 3.35 | | | | | 3.44 | | | | | (0.09 | ) | | | | (0.24 | ) | | | | (0.33 | ) | | | | 13.62 | | | | | 33.49 | | | | | 1.26 | | | | | 0.99 | | | | | 0.48 | | | | | 13,404 | | | | | 74 | |
Small-Cap Core Fund | | | | | | | | | | | | | | | | | | | | | | | | | | | | | | | | | | | | | | | | | | | | | | | | | | | | | | | | | | | | | |
| 2017 | | | | 11.64 | | | | | 0.01 | | | | | 1.89 | | | | | 1.90 | | | | | (0.04 | ) | | | | (0.20 | ) | | | | (0.24 | ) | | | | 13.30 | | | | | 16.33 | | | | | 1.58 | | | | | 0.90 | | | | | 0.14 | | | | | 17,049 | | | | | 90 | |
| 2016 | | | | 10.45 | | | | | 0.03 | | | | | 1.25 | | | | | 1.28 | | | | | (0.01 | ) | | | | (0.08 | ) | | | | (0.09 | ) | | | | 11.64 | | | | | 12.37 | | | | | 2.29 | | | | | 0.90 | | | | | 0.44 | | | | | 10,780 | | | | | 70 | |
| 2015 | | | | 10.40 | | | | | 0.02 | | | | | 0.03 | | | | | 0.05 | | | | | — | | | | | — | | | | | — | | | | | 10.45 | | | | | 0.48 | | | | | 4.77 | | | | | 0.90 | | | | | 0.17 | | | | | 3,632 | | | | | 64 | |
| 2014(9) | | | | 10.00 | | | | | 0.00 | | | | | 0.40 | | | | | 0.40 | | | | | — | | | | | — | | | | | — | | | | | 10.40 | | | | | 4.00 | | | | | 6.75 | | | | | 0.90 | | | | | (0.03 | ) | | | | 3,030 | | | | | 43 | |
(See Notes which are an integral part of the Financial Statements)
141
| | |
| Financial Highlights—Institutional Class of Shares (For a share outstanding throughout each period) |
| | | | | | | | | | | | | | | | | | | | | | | | | | | | | | | | | | | | | | | | | | | | | | | | | | | | | | | | | | | | | | | | | | | | | | |
Period
Ended
August 31, | | Net asset
value,
beginning
of period | | Net
investment
income
(loss) | | Net realized
and unrealized
gain (loss) | | Total from
investment
operations | | Distributions to
shareholders
from net
investment
income | | Distributions to
shareholders
from net
realized gain | | Total
distributions | | Net asset
value, end
of period | | Total
return (1)(4) | | Ratios to Average Net Assets (5) | | Net assets,
end of period
(000 omitted) | | Portfolio
turnover
rate (4) |
| | | | | | | | | | | Gross
Expenses | | Net
Expenses (2) | | Net
investment
income
(loss) (2) | | |
Small-Cap Growth Fund | | | | | | | | | | | | | | | | | | | | | | | | | | | | | | | | | | | | | | | | | | | | | | | | | | | | | | | | | | | | | |
| 2017 | | | $ | 16.62 | | | | $ | (0.14 | ) | | | $ | 2.52 | | | | $ | 2.38 | | | | $ | — | | | | $ | — | | | | $ | — | | | | $ | 19.00 | | | | | 14.32 | % | | | | 1.02 | % | | | | 1.02 | % | | | | (0.37 | )% | | | $ | 81,259 | | | | | 197 | % |
| 2016 | | | | 18.60 | | | | | (0.10 | ) | | | | (0.64 | ) | | | | (0.74 | ) | | | | — | | | | | (1.24 | ) | | | | (1.24 | ) | | | | 16.62 | | | | | (3.72 | ) | | | | 1.18 | | | | | 1.18 | | | | | (0.21 | ) | | | | 179,726 | | | | | 63 | |
| 2015 | | | | 22.75 | | | | | (0.07 | ) | | | | (0.29 | ) | | | | (0.36 | ) | | | | — | | | | | (3.79 | ) | | | | (3.79 | ) | | | | 18.60 | | | | | (1.27 | ) | | | | 1.15 | | | | | 1.15 | | | | | (0.35 | ) | | | | 339,016 | | | | | 59 | |
| 2014 | | | | 22.55 | | | | | (0.02 | ) | | | | 3.16 | | | | | 3.14 | | | | | — | | | | | (2.94 | ) | | | | (2.94 | ) | | | | 22.75 | | | | | 14.69 | | | | | 1.15 | | | | | 1.15 | | | | | (0.09 | ) | | | | 363,988 | | | | | 82 | |
| 2013(3) | | | | 18.33 | | | | | (0.12 | ) | | | | 5.67 | | | | | 5.55 | | | | | — | | | | | (1.33 | ) | | | | (1.33 | ) | | | | 22.55 | | | | | 32.26 | | | | | 1.16 | | | | | 1.16 | | | | | (0.62 | ) | | | | 297,065 | | | | | 76 | |
Global Low Volatility Equity Fund | | | | | | | | | | | | | | | | | | | | | | | | | | | | | | | | | | | | | | | | | | | | | | | | | | | | | | | | | | | | | |
| 2017(3) | | | | 12.65 | | | | | 0.19 | | | | | 0.64 | | | | | 0.83 | | | | | (0.20 | ) | | | | (0.08 | ) | | | | (0.28 | ) | | | | 13.20 | | | | | 6.76 | | | | | 1.27 | | | | | 0.85 | | | | | 1.98 | | | | | 48,221 | | | | | 74 | |
| 2016(3) | | | | 11.34 | | | | | 0.07 | | | | | 1.33 | | | | | 1.40 | | | | | (0.09 | ) | | | | (0.00 | ) | | | | (0.09 | ) | | | | 12.65 | | | | | 12.44 | | | | | 1.38 | | | | | 0.85 | | | | | 2.26 | | | | | 38,909 | | | | | 36 | |
| 2015(3) | | | | 11.50 | | | | | 0.25 | | | | | (0.26 | ) | | | | (0.01 | ) | | | | (0.10 | ) | | | | (0.05 | ) | | | | (0.15 | ) | | | | 11.34 | | | | | (0.08 | ) | | | | 5.51 | | | | | 0.85 | | | | | 2.16 | | | | | 4,144 | | | | | 31 | |
| 2014(3)(8) | | | | 10.00 | | | | | 0.07 | | | | | 1.43 | | | | | 1.50 | | | | | — | | | | | — | | | | | — | | | | | 11.50 | | | | | 15.00 | | | | | 13.27 | | | | | 0.85 | | | | | 1.76 | | | | | 3,947 | | | | | 29 | |
Discipline International Equity Fund | | | | | | | | | | | | | | | | | | | | | | | | | | | | | | | | | | | | | | | | | | | | | | | | | | | | | | | | | | | | | |
| 2017(3) | | | | 9.58 | | | | | 0.25 | | | | | 1.64 | | | | | 1.89 | | | | | (0.28 | ) | | | | — | | | | | (0.28 | ) | | | | 11.19 | | | | | 20.30 | | | | | 1.14 | | | | | 0.90 | | | | | 2.13 | | | | | 72,239 | | | | | 77 | |
| 2016(3)(11) | | | | 10.00 | | | | | 0.23 | | | | | (0.65 | ) | | | | (0.42 | ) | | | | — | | | | | — | | | | | — | | | | | 9.58 | | | | | (4.20 | ) | | | | 1.20 | | | | | 0.90 | | | | | 2.51 | | | | | 67,434 | | | | | 64 | |
Pyrford International Stock Fund | | | | | | | | | | | | | | | | | | | | | | | | | | | | | | | | | | | | | | | | | | | | | | | | | | | | | | | | | | | | | |
| 2017(3)(13) | | | | 12.22 | | | | | 0.32 | | | | | 0.94 | | | | | 1.26 | | | | | (0.27 | ) | | | | — | | | | | (0.27 | ) | | | | 13.21 | | | | | 10.68 | | | | | 1.05 | | | | | 0.96 | | | | | 2.59 | | | | | 593,746 | | | | | 33 | |
| 2016(3) | | | | 11.78 | | | | | 0.35 | | | | | 0.36 | | | | | 0.71 | | | | | (0.27 | ) | | | | — | | | | | (0.27 | ) | | | | 12.22 | | | | | 6.21 | | | | | 1.06 | | | | | 0.99 | | | | | 2.44 | | | | | 485,787 | | | | | 12 | |
| 2015(3) | | | | 13.14 | | | | | 0.22 | | | | | (1.48 | ) | | | | (1.26 | ) | | | | (0.10 | ) | | | | — | | | | | (0.10 | ) | | | | 11.78 | | | | | (9.63 | ) | | | | 1.03 | | | | | 0.99 | | | | | 2.52 | | | | | 626,232 | | | | | 9 | |
| 2014(3) | | | | 12.10 | | | | | 0.39 | | | | | 1.27 | | | | | 1.66 | | | | | (0.59 | ) | | | | (0.03 | ) | | | | (0.62 | ) | | | | 13.14 | | | | | 14.00 | | | | | 1.02 | | | | | 0.99 | | | | | 3.32 | | | | | 272,486 | | | | | 6 | |
| 2013(3) | | | | 10.78 | | | | | 0.22 | | | | | 1.40 | | | | | 1.62 | | | | | (0.25 | ) | | | | (0.05 | ) | | | | (0.30 | ) | | | | 12.10 | | | | | 15.29 | | | | | 1.09 | | | | | 0.99 | | | | | 2.63 | | | | | 159,985 | | | | | 15 | |
LGM Emerging Markets Equity Fund | | | | | | | | | | | | | | | | | | | | | | | | | | | | | | | | | | | | | | | | | | | | | | | | | | | | | | | | | | | | | |
| 2017(3)(13) | | | | 14.08 | | | | | 0.15 | | | | | 1.84 | | | | | 1.99 | | | | | (0.10 | ) | | | | — | | | | | (0.10 | ) | | | | 15.97 | | | | | 14.36 | | | | | 1.38 | | | | | 1.15 | | | | | 1.04 | | | | | 157,581 | | | | | 40 | |
| 2016(3) | | | | 12.16 | | | | | 0.15 | | | | | 1.90 | | | | | 2.05 | | | | | (0.13 | ) | | | | — | | | | | (0.13 | ) | | | | 14.08 | | | | | 17.12 | | | | | 1.39 | | | | | 1.15 | | | | | 1.07 | | | | | 78,851 | | | | | 24 | |
| 2015(3) | | | | 14.33 | | | | | 0.16 | | | | | (2.13 | ) | | | | (1.97 | ) | | | | (0.20 | ) | | | | — | | | | | (0.20 | ) | | | | 12.16 | | | | | (13.88 | ) | | | | 1.34 | | | | | 1.15 | | | | | 1.15 | | | | | 85,034 | | | | | 25 | |
| 2014(3) | | | | 12.61 | | | | | 0.23 | | | | | 1.71 | | | | | 1.94 | | | | | (0.22 | ) | | | | — | | | | | (0.22 | ) | | | | 14.33 | | | | | 15.57 | | | | | 1.30 | | | | | 1.15 | | | | | 1.89 | | | | | 111,807 | | | | | 38 | |
| 2013(3) | | | | 13.69 | | | | | 0.26 | | | | | (0.34 | ) | | | | (0.08 | ) | | | | (0.20 | ) | | | | (0.80 | ) | | | | (1.00 | ) | | | | 12.61 | | | | | (1.00 | ) | | | | 1.40 | | | | | 1.15 | | | | | 2.41 | | | | | 84,760 | | | | | 29 | |
TCH Emerging Markets Bond Fund | | | | | | | | | | | | | | | | | | | | | | | | | | | | | | | | | | | | | | | | | | | | | | | | | | | | | | | | | | | | | |
| 2017(3)(13) | | | | 10.17 | | | | | 0.40 | | | | | 0.09 | | | | | 0.49 | | | | | (0.31 | ) | | | | — | | | | | (0.31 | ) | | | | 10.35 | | | | | 5.07 | | | | | 1.89 | | | | | 0.85 | | | | | 3.96 | | | | | 11,765 | | | | | 74 | |
| 2016(3) | | | | 9.90 | | | | | 0.47 | | | | | 0.38 | | | | | 0.85 | | | | | (0.49 | ) | | | | (0.09 | ) | | | | (0.58 | ) | | | | 10.17 | | | | | 9.36 | | | | | 2.59 | | | | | 0.85 | | | | | 4.91 | | | | | 4,176 | | | | | 44 | |
| 2015(3) | | | | 11.16 | | | | | 0.51 | | | | | (0.96 | ) | | | | (0.45 | ) | | | | (0.49 | ) | | | | (0.32 | ) | | | | (0.81 | ) | | | | 9.90 | | | | | (4.04 | ) | | | | 2.96 | | | | | 0.85 | | | | | 4.96 | | | | | 3,812 | | | | | 60 | |
| 2014(3)(8) | | | | 10.00 | | | | | 0.44 | | | | | 0.84 | | | | | 1.28 | | | | | (0.12 | ) | | | | — | | | | | (0.12 | ) | | | | 11.16 | | | | | 12.89 | | | | | 2.85 | | | | | 0.85 | | | | | 4.52 | | | | | 3,961 | | | | | 72 | |
Alternative Strategies Fund | | | | | | | | | | | | | | | | | | | | | | | | | | | | | | | | | | | | | | | | | | | | | | | | | | | | | | | | | | | | | |
| 2017(3) | | | | 10.33 | | | | | (0.09 | ) | | | | 0.57 | | | | | 0.48 | | | | | — | | | | | — | | | | | — | | | | | 10.81 | | | | | 4.65 | | | | | 3.40 | (12) | | | | 2.70 | (12) | | | | (0.67 | ) | | | | 95,583 | | | | | 251 | |
| 2016(3) | | | | 10.42 | | | | | (0.05 | ) | | | | 0.07 | | | | | 0.02 | | | | | (0.01 | ) | | | | (0.10 | ) | | | | (0.11 | ) | | | | 10.33 | | | | | 0.16 | | | | | 3.63 | (12) | | | | 2.82 | (12) | | | | (0.75 | ) | | | | 109,128 | | | | | 279 | |
| 2015(3)(10) | | | | 10.00 | | | | | (0.08 | ) | | | | 0.50 | | | | | 0.42 | | | | | — | | | | | — | | | | | — | | | | | 10.42 | | | | | 4.20 | | | | | 4.69 | (12) | | | | 2.47 | (12) | | | | (1.11 | ) | | | | 34,261 | | | | | 119 | |
Global Long/Short Equity Fund | | | | | | | | | | | | | | | | | | | | | | | | | | | | | | | | | | | | | | | | | | | | | | | | | | | | | | | | | | | | | |
| 2017(3) | | | | 10.70 | | | | | 0.05 | | | | | 1.66 | | | | | 1.71 | | | | | (0.07 | ) | | | | (0.09 | ) | | | | (0.16 | ) | | | | 12.25 | | | | | 16.10 | | | | | 4.80 | (12) | | | | 2.17 | (12) | | | | 0.27 | | | | | 8,967 | | | | | 42 | |
| 2016(3)(11) | | | | 10.00 | | | | | 0.04 | | | | | 0.66 | | | | | 0.70 | | | | | — | | | | | — | | | | | — | | | | | 10.70 | | | | | 7.00 | | | | | 9.21 | (12) | | | | 2.11 | (12) | | | | 0.50 | | | | | 3,717 | | | | | 45 | |
Ultra Short Tax-Free Fund | | | | | | | | | | | | | | | | | | | | | | | | | | | | | | | | | | | | | | | | | | | | | | | | | | | | | | | | | | | | | |
| 2017 | | | | 10.07 | | | | | 0.10 | | | | | 0.02 | | | | | 0.12 | | | | | (0.10 | ) | | | | (0.01 | ) | | | | (0.11 | ) | | | | 10.08 | | | | | 1.15 | | | | | 0.39 | | | | | 0.30 | | | | | 0.94 | | | | | 625,691 | | | | | 126 | |
| 2016 | | | | 10.08 | | | | | 0.07 | | | | | 0.00 | | | | | 0.07 | | | | | (0.07 | ) | | | | (0.01 | ) | | | | (0.08 | ) | | | | 10.07 | | | | | 0.65 | | | | | 0.39 | | | | | 0.30 | | | | | 0.65 | | | | | 548,641 | | | | | 56 | |
| 2015 | | | | 10.09 | | | | | 0.06 | | | | | (0.01 | ) | | | | 0.05 | | | | | (0.06 | ) | | | | — | | | | | (0.06 | ) | | | | 10.08 | | | | | 0.50 | | | | | 0.35 | | | | | 0.30 | | | | | 0.59 | | | | | 702,324 | | | | | 57 | |
| 2014 | | | | 10.04 | | | | | 0.09 | | | | | 0.05 | | | | | 0.14 | | | | | (0.09 | ) | | | | (0.00 | ) | | | | (0.09 | ) | | | | 10.09 | | | | | 1.35 | | | | | 0.34 | | | | | 0.30 | | | | | 0.82 | | | | | 663,538 | | | | | 86 | |
| 2013 | | | | 10.09 | | | | | 0.10 | | | | | (0.05 | ) | | | | 0.05 | | | | | (0.10 | ) | | | | (0.00 | ) | | | | (0.10 | ) | | | | 10.04 | | | | | 0.51 | | | | | 0.32 | | | | | 0.30 | | | | | 0.97 | | | | | 739,246 | | | | | 71 | |
Short Tax-Free Fund | | | | | | | | | | | | | | | | | | | | | | | | | | | | | | | | | | | | | | | | | | | | | | | | | | | | | | | | | | | | | |
| 2017 | | | | 10.25 | | | | | 0.14 | | | | | (0.03 | ) | | | | 0.11 | | | | | (0.14 | ) | | | | (0.00 | ) | | | | (0.14 | ) | | | | 10.22 | | | | | 1.14 | | | | | 0.51 | | | | | 0.40 | | | | | 1.39 | | | | | 175,454 | | | | | 93 | |
| 2016 | | | | 10.20 | | | | | 0.13 | | | | | 0.07 | | | | | 0.20 | | | | | (0.13 | ) | | | | (0.02 | ) | | | | (0.15 | ) | | | | 10.25 | | | | | 1.94 | | | | | 0.52 | | | | | 0.40 | | | | | 1.18 | | | | | 168,592 | | | | | 39 | |
| 2015 | | | | 10.21 | | | | | 0.14 | | | | | (0.01 | ) | | | | 0.13 | | | | | (0.14 | ) | | | | — | | | | | (0.14 | ) | | | | 10.20 | | | | | 1.26 | | | | | 0.58 | | | | | 0.40 | | | | | 1.32 | | | | | 105,734 | | | | | 50 | |
| 2014 | | | | 9.95 | | | | | 0.15 | | | | | 0.26 | | | | | 0.41 | | | | | (0.15 | ) | | | | — | | | | | (0.15 | ) | | | | 10.21 | | | | | 4.12 | | | | | 0.62 | | | | | 0.40 | | | | | 1.45 | | | | | 78,050 | | | | | 69 | |
| 2013(3)(7) | | | | 10.00 | | | | | 0.10 | | | | | (0.05 | ) | | | | (0.05 | ) | | | | 0.10 | | | | | — | | | | | (0.10 | ) | | | | 9.95 | | | | | 0.45 | | | | | 0.81 | | | | | 0.40 | | | | | 1.33 | | | | | 34,138 | | | | | 74 | |
(See Notes which are an integral part of the Financial Statements)
142
| | |
| Financial Highlights—Institutional Class of Shares (For a share outstanding throughout each period) |
| | | | | | | | | | | | | | | | | | | | | | | | | | | | | | | | | | | | | | | | | | | | | | | | | | | | | | | | | | | | | | | | | | | | | | |
Period
Ended
August 31, | | Net asset
value,
beginning
of period | | Net
investment
income
(loss) | | Net realized
and unrealized
gain (loss) | | Total from
investment
operations | | Distributions to
shareholders
from net
investment
income | | Distributions to
shareholders
from net
realized gain | | Total
distributions | | Net asset
value, end
of period | | Total
return (1)(4) | | Ratios to Average Net Assets (5) | | Net assets,
end of period
(000 omitted) | | Portfolio
turnover
rate (4) |
| | | | | | | | | | | Gross
Expenses | | Net
Expenses (2) | | Net
investment
income
(loss) (2) | | |
Short-Term Income Fund | | | | | | | | | | | | | | | | | | | | | | | | | | | | | | | | | | | | | | | | | | | | | | | | | | | | | | | | | | | | | |
| 2017 | | | $ | 9.42 | | | | $ | 0.17 | | | | $ | (0.02 | ) | | | $ | 0.15 | | | | $ | (0.17 | ) | | | $ | — | | | | $ | (0.17 | ) | | | $ | 9.40 | | | | | 1.60 | % | | | | 0.47 | % | | | | 0.35 | % | | | | 1.76 | % | | | $ | 209,278 | | | | | 53 | % |
| 2016 | | | | 9.35 | | | | | 0.11 | | | | | 0.09 | | | | | 0.20 | | | | | (0.13 | ) | | | | — | | | | | (0.13 | ) | | | | 9.42 | | | | | 2.12 | | | | | 0.45 | | | | | 0.35 | | | | | 1.16 | | | | | 234,507 | | | | | 64 | |
| 2015 | | | | 9.42 | | | | | 0.12 | | | | | (0.06 | ) | | | | 0.06 | | | | | (0.13 | ) | | | | — | | | | | (0.13 | ) | | | | 9.35 | | | | | 0.69 | | | | | 0.44 | | | | | 0.35 | | | | | 1.24 | | | | | 263,894 | | | | | 29 | |
| 2014 | | | | 9.39 | | | | | 0.13 | | | | | 0.04 | | | | | 0.17 | | | | | (0.14 | ) | | | | — | | | | | (0.14 | ) | | | | 9.42 | | | | | 1.80 | | | | | 0.43 | | | | | 0.35 | | | | | 1.35 | | | | | 142,526 | | | | | 43 | |
| 2013(3) | | | | 9.48 | | | | | 0.16 | | | | | (0.07 | ) | | | | 0.09 | | | | | (0.18 | ) | | | | — | | | | | (0.18 | ) | | | | 9.39 | | | | | 0.91 | | | | | 0.43 | | | | | 0.35 | | | | | 1.70 | | | | | 117,378 | | | | | 51 | |
Intermediate Tax-Free Fund | | | | | | | | | | | | | | | | | | | | | | | | | | | | | | | | | | | | | | | | | | | | | | | | | | | | | | | | | | | | | |
| 2017 | | | | 11.60 | | | | | 0.31 | | | | | (0.20 | ) | | | | 0.11 | | | | | (0.31 | ) | | | | (0.03 | ) | | | | (0.34 | ) | | | | 11.37 | | | | | 1.11 | | | | | 0.32 | | | | | 0.32 | | | | | 2.79 | | | | | 631,658 | | | | | 44 | |
| 2016 | | | | 11.26 | | | | | 0.28 | | | | | 0.36 | | | | | 0.64 | | | | | (0.28 | ) | | | | (0.02 | ) | | | | (0.30 | ) | | | | 11.60 | | | | | 5.71 | | | | | 0.32 | | | | | 0.32 | | | | | 2.43 | | | | | 601,873 | | | | | 42 | |
| 2015 | | | | 11.25 | | | | | 0.28 | | | | | 0.01 | | | | | 0.29 | | | | | (0.28 | ) | | | | — | | | | | (0.28 | ) | | | | 11.26 | | | | | 2.60 | | | | | 0.32 | | | | | 0.32 | | | | | 2.46 | | | | | 559,937 | | | | | 26 | |
| 2014 | | | | 10.66 | | | | | 0.31 | | | | | 0.59 | | | | | 0.90 | | | | | (0.31 | ) | | | | (0.00 | ) | | | | (0.31 | ) | | | | 11.25 | | | | | 8.50 | | | | | 0.36 | | | | | 0.36 | | | | | 2.77 | | | | | 396,291 | | | | | 35 | |
| 2013(3) | | | | 11.29 | | | | | 0.30 | | | | | (0.56 | ) | | | | (0.26 | ) | | | | (0.30 | ) | | | | (0.07 | ) | | | | (0.37 | ) | | | | 10.66 | | | | | (2.40 | ) | | | | 0.36 | | | | | 0.36 | | | | | 2.70 | | | | | 352,883 | | | | | 39 | |
Strategic Income Fund | | | | | | | | | | | | | | | | | | | | | | | | | | | | | | | | | | | | | | | | | | | | | | | | | | | | | | | | | | | | | |
| 2017 | | | | 9.42 | | | | | 0.27 | | | | | 0.06 | | | | | 0.33 | | | | | (0.31 | ) | | | | — | | | | | (0.31 | ) | | | | 9.44 | | | | | 3.58 | | | | | 0.65 | | | | | 0.55 | | | | | 2.68 | | | | | 21,550 | | | | | 65 | |
| 2016 | | | | 9.31 | | | | | 0.23 | | | | | 0.17 | | | | | 0.40 | | | | | (0.29 | ) | | | | — | | | | | (0.29 | ) | | | | 9.42 | | | | | 4.32 | | | | | 0.61 | | | | | 0.55 | | | | | 2.53 | | | | | 21,663 | | | | | 13 | |
| 2015 | | | | 9.35 | | | | | 0.24 | | | | | 0.01 | | | | | 0.25 | | | | | (0.29 | ) | | | | — | | | | | (0.29 | ) | | | | 9.31 | | | | | 2.70 | | | | | 0.68 | | | | | 0.55 | | | | | 2.61 | | | | | 22,981 | | | | | 44 | |
| 2014 | | | | 9.16 | | | | | 0.23 | | | | | 0.23 | | | | | 0.46 | | | | | (0.27 | ) | | | | — | | | | | (0.27 | ) | | | | 9.35 | | | | | 5.13 | | | | | 0.67 | | | | | 0.55 | | | | | 2.45 | | | | | 28,473 | | | | | 129 | |
| 2013(3) | | | | 9.76 | | | | | 0.15 | | | | | (0.39 | ) | | | | (0.24 | ) | | | | (0.25 | ) | | | | (0.11 | ) | | | | (0.36 | ) | | | | 9.16 | | | | | (2.57 | ) | | | | 0.63 | | | | | 0.55 | | | | | 1.57 | | | | | 35,880 | | | | | 307 | |
TCH Corporate Income Fund | | | | | | | | | | | | | | | | | | | | | | | | | | | | | | | | | | | | | | | | | | | | | | | | | | | | | | | | | | | | | |
| 2017 | | | | 13.15 | | | | | 0.37 | | | | | 0.15 | | | | | 0.52 | | | | | (0.37 | ) | | | | (0.11 | ) | | | | (0.48 | ) | | | | 13.19 | | | | | 4.07 | | | | | 0.46 | | | | | 0.46 | | | | | 2.84 | | | | | 134,293 | | | | | 44 | |
| 2016 | | | | 12.32 | | | | | 0.46 | | | | | 0.88 | | | | | 1.34 | | | | | (0.46 | ) | | | | (0.05 | ) | | | | (0.51 | ) | | | | 13.15 | | | | | 11.28 | | | | | 0.47 | | | | | 0.47 | | | | | 3.77 | | | | | 129,429 | | | | | 62 | |
| 2015 | | | | 13.07 | | | | | 0.38 | | | | | (0.70 | ) | | | | (0.32 | ) | | | | (0.38 | ) | | | | (0.05 | ) | | | | (0.43 | ) | | | | 12.32 | | | | | (2.53 | ) | | | | 0.45 | | | | | 0.45 | | | | | 2.97 | | | | | 162,107 | | | | | 26 | |
| 2014 | | | | 12.37 | | | | | 0.45 | | | | | 0.91 | | | | | 1.36 | | | | | (0.45 | ) | | | | (0.21 | ) | | | | (0.66 | ) | | | | 13.07 | | | | | 11.32 | | | | | 0.49 | | | | | 0.49 | | | | | 3.50 | | | | | 121,773 | | | | | 25 | |
| 2013(3) | | | | 13.03 | | | | | 0.44 | | | | | (0.35 | ) | | | | 0.09 | | | | | (0.45 | ) | | | | (0.30 | ) | | | | (0.75 | ) | | | | 12.37 | | | | | 0.54 | | | | | 0.50 | | | | | 0.50 | | | | | 3.36 | | | | | 93,490 | | | | | 123 | |
TCH Core Plus Bond Fund | | | | | | | | | | | | | | | | | | | | | | | | | | | | | | | | | | | | | | | | | | | | | | | | | | | | | | | | | | | | | |
| 2017 | | | | 11.89 | | | | | 0.31 | | | | | (0.07 | ) | | | | 0.24 | | | | | (0.31 | ) | | | | (0.04 | ) | | | | (0.35 | ) | | | | 11.78 | | | | | 2.08 | | | | | 0.34 | | | | | 0.34 | | | | | 2.62 | | | | | 975,051 | | | | | 34 | |
| 2016 | | | | 11.42 | | | | | 0.37 | | | | | 0.48 | | | | | 0.85 | | | | | (0.38 | ) | | | | (0.00 | ) | | | | (0.38 | ) | | | | 11.89 | | | | | 7.63 | | | | | 0.34 | | | | | 0.34 | | | | | 3.25 | | | | | 459,228 | | | | | 39 | |
| 2015 | | | | 11.94 | | | | | 0.34 | | | | | (0.45 | ) | | | | (0.11 | ) | | | | (0.35 | ) | | | | (0.06 | ) | | | | (0.41 | ) | | | | 11.42 | | | | | (0.96 | ) | | | | 0.33 | | | | | 0.33 | | | | | 2.94 | | | | | 472,576 | | | | | 25 | |
| 2014 | | | | 11.32 | | | | | 0.33 | | | | | 0.65 | | | | | 0.98 | | | | | (0.34 | ) | | | | (0.02 | ) | | | | (0.36 | ) | | | | 11.94 | | | | | 8.82 | | | | | 0.37 | | | | | 0.37 | | | | | 2.89 | | | | | 422,941 | | | | | 44 | |
| 2013(3) | | | | 11.90 | | | | | 0.32 | | | | | (0.29 | ) | | | | 0.03 | | | | | (0.33 | ) | | | | (0.28 | ) | | | | (0.61 | ) | | | | 11.32 | | | | | 0.09 | | | | | 0.43 | | | | | 0.43 | | | | | 2.44 | | | | | 321,051 | | | | | 101 | |
High Yield Bond Fund | | | | | | | | | | | | | | | | | | | | | | | | | | | | | | | | | | | | | | | | | | | | | | | | | | | | | | | | | | | | | |
| 2017 | | | | 9.49 | | | | | 0.52 | | | | | 0.08 | | | | | 0.60 | | | | | (0.52 | ) | | | | — | | | | | (0.52 | ) | | | | 9.57 | | | | | 6.53 | | | | | 1.17 | | | | | 0.65 | | | | | 5.50 | | | | | 12,303 | | | | | 47 | |
| 2016 | | | | 9.41 | | | | | 0.50 | | | | | 0.08 | | | | | 0.58 | | | | | (0.50 | ) | | | | — | | | | | (0.50 | ) | | | | 9.49 | | | | | 6.47 | | | | | 0.96 | | | | | 0.65 | | | | | 5.43 | | | | | 34,345 | | | | | 51 | |
| 2015 | | | | 10.44 | | | | | 0.54 | | | | | (0.79 | ) | | | | (0.25 | ) | | | | (0.54 | ) | | | | (0.24 | ) | | | | (0.78 | ) | | | | 9.41 | | | | | (2.46 | ) | | | | 0.96 | | | | | 0.65 | | | | | 5.46 | | | | | 30,173 | | | | | 46 | |
| 2014 | | | | 10.32 | | | | | 0.58 | | | | | 0.26 | | | | | 0.84 | | | | | (0.58 | ) | | | | (0.14 | ) | | | | (0.72 | ) | | | | 10.44 | | | | | 8.32 | | | | | 0.85 | | | | | 0.65 | | | | | 5.53 | | | | | 37,307 | | | | | 42 | |
| 2013(3) | | | | 10.32 | | | | | 0.59 | | | | | 0.00 | | | | | 0.59 | | | | | (0.59 | ) | | | | (0.00 | ) | | | | (0.59 | ) | | | | 10.32 | | | | | 5.80 | | | | | 0.83 | | | | | 0.65 | | | | | 5.61 | | | | | 49,722 | | | | | 34 | |
| (1) | Based on net asset value as of end of period date. |
| (2) | The contractual and voluntary expense waivers pursuant to Note 6 of the financial statements are reflected in both the net expense and net investment income (loss) ratios. |
| (3) | Redemption fees consisted of per share amounts less than $0.01. Effective February 8, 2012, the Ultra Short Tax-Free Fund discontinued it’s redemption fee policy and effective June 14, 2013, the remaining domestic Funds discontinued their redemption fee policy. |
| (4) | Not annualized for periods less than one year. |
| (5) | Annualized for periods less than one year. |
| (6) | Reflects operations for the period from September 28, 2012 (inception date) to August 31, 2013. |
| (7) | Reflects operations for the period from November 29, 2012 (inception date) to August 31, 2013. |
| (8) | Reflects operations for the period from September 30, 2013 (inception date) to August 31, 2014. |
| (9) | Reflects operations for the period from December 27, 2013 (inception date) to August 31, 2014. |
| (10) | Reflects operations for the period from December 16, 2014 (inception date) to August 31, 2015. |
| (11) | Reflects operations for the period from September 17, 2015 (inception date) to August 31, 2016. |
(See Notes which are an integral part of the Financial Statements)
143
| | |
| Financial Highlights—Institutional Class of Shares (For a share outstanding throughout each period) |
| (12) | Percentages shown include interest expense and dividends on securities sold short. Gross and net expense ratios, respectively, excluding interest expense and dividends on securities sold short are as follows: |
| | | | | | | | | | | | | | | | | | | | | | |
Alternatives Strategies Fund | | | | | | Global Long/Short Equity Fund | |
| | | Gross | | | Net | | | | | | | | Gross | | | Net | |
| 2017 | | | 2.60 | % | | | 1.90 | % | | | | | | 2017 | | | 3.98 | % | | | 1.35 | % |
| 2016 | | | 2.76 | | | | 1.95 | | | | | | | 2016 | | | 8.45 | | | | 1.35 | |
| 2015 | | | 4.17 | | | | 1.95 | | | | | | | | | | | | | | | |
| (13) | Calculated using the average shares method. |
Financial Highlights—Premier Class of Shares (For a share outstanding throughout each period)
| | | | | | | | | | | | | | | | | | | | | | | | | | | | | | | | | | | | | | | | | | | | | | | | | | | | | | | | | | | | | | | | | | | | | | |
Period
Ended
August 31, | | Net asset
value,
beginning
of period | | Net
investment
income
(loss) | | Net realized
and unrealized
gain (loss) | | Total from
investment
operations | | Distributions to
shareholders
from net
investment
income | | Distributions to
shareholders
from net
realized gain | | Total
distributions | | Net asset
value, end
of period | | Total
return (1)(3) | | Ratios to Average Net Assets (4) | | Net assets,
end of period
(000 omitted) | | Portfolio
turnover
rate (3) |
| | | | | | | | | | | Gross
Expenses | | Net
Expenses (2) | | Net
investment
income
(loss) (2) | | |
Government Money Market Fund | | | | | | | | | | | | | | | | | | | | | | | | | | | | | | | | | | | | | | | | | | | | | | | | | | | | | | | | | | | | | |
| 2017 | | | $ | 1.00 | | | | $ | 0.00 | | | | $ | 0.00 | | | | $ | 0.00 | | | | $ | 0.00 | | | | $ | 0.00 | | | | $ | 0.00 | | | | $ | 1.00 | | | | | 0.45 | % | | | | 0.25 | % | | | | 0.20 | % | | | | 0.45 | % | | | $ | 2,269,361 | | | | | — | % |
| 2016 | | | | 1.00 | | | | | 0.00 | | | | | 0.00 | | | | | 0.00 | | | | | (0.00 | ) | | | | (0.00 | ) | | | | (0.00 | ) | | | | 1.00 | | | | | 0.11 | | | | | 0.28 | | | | | 0.18 | | | | | 0.12 | | | | | 1,967,459 | | | | | — | |
| 2015 | | | | 1.00 | | | | | 0.00 | | | | | 0.00 | | | | | 0.00 | | | | | (0.00 | ) | | | | (0.00 | ) | | | | (0.00 | ) | | | | 1.00 | | | | | 0.01 | | | | | 0.28 | | | | | 0.08 | | | | | 0.01 | | | | | 467,294 | | | | | — | |
| 2014 | | | | 1.00 | | | | | 0.00 | | | | | — | | | | | 0.00 | | | | | (0.00 | ) | | | | — | | | | | (0.00 | ) | | | | 1.00 | | | | | 0.01 | | | | | 0.29 | | | | | 0.07 | | | | | 0.01 | | | | | 427,913 | | | | | — | |
| 2013 | | | | 1.00 | | | | | 0.00 | | | | | — | | | | | 0.00 | | | | | (0.00 | ) | | | | (0.00 | ) | | | | (0.00 | ) | | | | 1.00 | | | | | 0.01 | | | | | 0.30 | | | | | 0.13 | | | | | 0.01 | | | | | 431,677 | | | | | — | |
Tax-Free Money Market Fund | | | | | | | | | | | | | | | | | | | | | | | | | | | | | | | | | | | | | | | | | | | | | | | | | | | | | | | | | | | | | |
| 2017 | | | | 1.00 | | | | | 0.01 | | | | | 0.00 | | | | | 0.01 | | | | | (0.01 | ) | | | | (0.00 | ) | | | | (0.01 | ) | | | | 1.00 | | | | | 0.62 | | | | | 0.32 | | | | | 0.20 | | | | | 0.57 | | | | | 238,772 | | | | | — | |
| 2016 | | | | 1.00 | | | | | 0.00 | | | | | 0.00 | | | | | 0.00 | | | | | (0.00 | ) | | | | (0.00 | ) | | | | (0.00 | ) | | | | 1.00 | | | | | 0.17 | | | | | 0.28 | | | | | 0.16 | | | | | 0.13 | | | | | 313,954 | | | | | — | |
| 2015 | | | | 1.00 | | | | | 0.00 | | | | | 0.00 | | | | | 0.00 | | | | | (0.00 | ) | | | | (0.00 | ) | | | | (0.00 | ) | | | | 1.00 | | | | | 0.02 | | | | | 0.28 | | | | | 0.16 | | | | | 0.01 | | | | | 515,005 | | | | | — | |
| 2014 | | | | 1.00 | | | | | 0.00 | | | | | 0.00 | | | | | 0.00 | | | | | (0.00 | ) | | | | (0.00 | ) | | | | (0.00 | ) | | | | 1.00 | | | | | 0.03 | | | | | 0.28 | | | | | 0.19 | | | | | 0.02 | | | | | 453,901 | | | | | — | |
| 2013 | | | | 1.00 | | | | | 0.00 | | | | | 0.00 | | | | | 0.00 | | | | | (0.00 | ) | | | | (0.00 | ) | | | | (0.00 | ) | | | | 1.00 | | | | | 0.13 | | | | | 0.28 | | | | | 0.20 | | | | | 0.11 | | | | | 696,785 | | | | | — | |
Prime Money Market Fund | | | | | | | | | | | | | | | | | | | | | | | | | | | | | | | | | | | | | | | | | | | | | | | | | | | | | | | | | | | | | |
| 2017 | | | | 1.00 | | | | | 0.01 | | | | | 0.00 | | | | | 0.01 | | | | | (0.01 | ) | | | | (0.00 | ) | | | | (0.01 | ) | | | | 1.00 | | | | | 0.67 | | | | | 0.28 | | | | | 0.20 | | | | | 0.61 | | | | | 166,338 | | | | | — | |
| 2016 | | | | 1.00 | | | | | 0.00 | | | | | 0.00 | | | | | 0.00 | | | | | (0.00 | ) | | | | (0.00 | ) | | | | (0.00 | ) | | | | 1.00 | | | | | 0.22 | | | | | 0.20 | | | | | 0.20 | | | | | 0.21 | | | | | 668,609 | | | | | — | |
| 2015 | | | | 1.00 | | | | | 0.00 | | | | | 0.00 | | | | | 0.00 | | | | | (0.00 | ) | | | | (0.00 | ) | | | | (0.00 | ) | | | | 1.00 | | | | | 0.02 | | | | | 0.20 | | | | | 0.18 | | | | | 0.01 | | | | | 2,576,245 | | | | | — | |
| 2014 | | | | 1.00 | | | | | 0.00 | | | | | 0.00 | | | | | 0.00 | | | | | (0.00 | ) | | | | (0.00 | ) | | | | (0.00 | ) | | | | 1.00 | | | | | 0.01 | | | | | 0.20 | | | | | 0.18 | | | | | 0.01 | | | | | 1,968,436 | | | | | — | |
| 2013 | | | | 1.00 | | | | | 0.00 | | | | | 0.00 | | | | | 0.00 | | | | | (0.00 | ) | | | | (0.00 | ) | | | | (0.00 | ) | | | | 1.00 | | | | | 0.08 | | | | | 0.21 | | | | | 0.20 | | | | | 0.08 | | | | | 2,590,312 | | | | | — | |
Institutional Prime Money Market Fund | | | | | | | | | | | | | | | | | | | | | | | | | | | | | | | | | | | | | | | | | | | | | | | | | | | | | | | | |
| 2017(6) | | | | 1.00 | | | | | 0.0074 | | | | | 0.0001 | | | | | 0.0075 | | | | | (0.0074 | ) | | | | (0.0000 | ) | | | | (0.0074 | ) | | | | 1.0001 | | | | | 0.75 | | | | | 0.30 | | | | | 0.20 | | | | | 0.74 | | | | | 400,203 | | | | | — | |
| 2016(5) | | | | 1.00 | | | | | 0.00 | | | | | 0.00 | | | | | 0.00 | | | | | (0.00 | ) | | | | (0.00 | ) | | | | (0.00 | ) | | | | 1.00 | | | | | 0.00 | | | | | 0.29 | | | | | 0.20 | | | | | 0.37 | | | | | 415,218 | | | | | — | |
| (1) | Based on net asset value as of end of period date. |
| (2) | The contractual and voluntary expense waivers pursuant to Note 6 of the financial statements are reflected in both the net expense and net investment income (loss) ratios. |
| (3) | Not annualized for periods less than one year. |
| (4) | Annualized for periods less than one year. |
| (5) | Reflects operations for the period from June 3, 2016 (inception date) to August 31, 2016. |
| (6) | Effective October 3, 2016, the BMO Institutional Money Market Fund switched the valuation method of its securities from amortized cost to reflecting changes in market values, thus allowing the Fund’s NAV to “float”. In connection with this change, the Fund’s per share NAV is now calculated to four decimals (e.g., $1.0000). |
(See Notes which are an integral part of the Financial Statements)
144
| | |
| Financial Highlights—Retirement Class R-3 of Shares (For a share outstanding throughout each period) |
| | | | | | | | | | | | | | | | | | | | | | | | | | | | | | | | | | | | | | | | | | | | | | | | | | | | | | | | | | | | | | | | | | | | | | |
Period
Ended
August 31, | | Net asset
value,
beginning
of period | | Net
investment
income
(loss) | | Net realized
and unrealized
gain (loss) | | Total from
investment
operations | | Distributions to
shareholders
from net
investment
income | | Distributions to
shareholders
from net
realized gain | | Total
distributions | | Net asset
value, end
of period | | Total
return (1)(4) | | Ratios to Average Net Assets (5) | | Net assets,
end of period
(000 omitted) | | Portfolio
turnover
rate (4) |
| | | | | | | | | | | Gross
Expenses | | Net
Expenses (2) | | Net
investment
income
(loss) (2) | | |
Mid-Cap Value Fund | | | | | | | | | | | | | | | | | | | | | | | | | | | | | | | | | | | | | | | | | | | | | | | | | | | | | | | | |
| 2017 | | | $ | 14.34 | | | | $ | 0.04 | | | | $ | 1.25 | | | | $ | 1.29 | | | | $ | (0.02 | ) | | | $ | (3.77 | ) | | | $ | (3.79 | ) | | | $ | 11.84 | | | | | 12.60 | % | | | | 1.51 | % | | | | 1.49 | % | | | | 0.40 | % | | | $ | 24 | | | | | 139 | % |
| 2016 | | | | 14.96 | | | | | 0.07 | | | | | 0.86 | | | | | 0.93 | | | | | (0.08 | ) | | | | (1.47 | ) | | | | (1.55 | ) | | | | 14.34 | | | | | 6.95 | | | | | 1.48 | | | | | 1.48 | | | | | 0.56 | | | | | 28 | | | | | 24 | |
| 2015 | | | | 17.62 | | | | | (0.01 | ) | | | | (0.59 | ) | | | | (0.60 | ) | | | | — | | | | | (2.06 | ) | | | | (2.06 | ) | | | | 14.96 | | | | | (3.80 | ) | | | | 1.47 | | | | | 1.47 | | | | | (0.06 | ) | | | | 25 | | | | | 27 | |
| 2014(6) | | | | 16.58 | | | | | 0.00 | | | | | 1.04 | | | | | 1.04 | | | | | — | | | | | — | | | | | — | | | | | 17.62 | | | | | 6.27 | | | | | 1.45 | | | | | 1.45 | | | | | 0.07 | | | | | 26 | | | | | 30 | |
Mid-Cap Growth Fund | | | | | | | | | | | | | | | | | | | | | | | | | | | | | | | | | | | | | | | | | | | | | | | | | | | | | | | | | | | | | |
| 2017 | | | | 16.55 | | | | | (0.08 | ) | | | | 2.19 | | | | | 2.11 | | | | | — | | | | | (3.54 | ) | | | | (3.54 | ) | | | | 15.12 | | | | | 16.47 | | | | | 1.62 | | | | | 1.49 | | | | | (0.55 | ) | | | | 22 | | | | | 157 | |
| 2016 | | | | 20.37 | | | | | (0.01 | ) | | | | (0.93 | ) | | | | (0.94 | ) | | | | — | | | | | (2.88 | ) | | | | (2.88 | ) | | | | 16.55 | | | | | (4.48 | ) | | | | 1.54 | | | | | 1.49 | | | | | (0.16 | ) | | | | 24 | | | | | 59 | |
| 2015 | | | | 24.34 | | | | | (0.16 | ) | | | | (0.58 | ) | | | | (0.74 | ) | | | | — | | | | | (3.23 | ) | | | | (3.23 | ) | | | | 20.37 | | | | | (3.11 | ) | | | | 1.50 | | | | | 1.49 | | | | | (0.77 | ) | | | | 25 | | | | | 53 | |
| 2014(6) | | | | 23.30 | | | | | (0.06 | ) | | | | 1.10 | | | | | 1.04 | | | | | — | | | | | — | | | | | — | | | | | 24.34 | | | | | 4.46 | | | | | 1.49 | | | | | 1.49 | | | | | (0.89 | ) | | | | 26 | | | | | 57 | |
Small-Cap Value Fund | | | | | | | | | | | | | | | | | | | | | | | | | | | | | | | | | | | | | | | | | | | | | | | | | | | | | | | | |
| 2017(7) | | | | 13.21 | | | | | (0.02 | ) | | | | 1.38 | | | | | 1.36 | | | | | (0.04 | ) | | | | (1.26 | ) | | | | (1.30 | ) | | | | 13.27 | | | | | 11.32 | | | | | 1.74 | | | | | 1.49 | | | | | (0.15 | ) | | | | 117 | | | | | 148 | |
| 2016 | | | | 12.76 | | | | | 0.00 | | | | | 0.97 | | | | | 0.97 | | | | | — | | | | | (0.52 | ) | | | | (0.52 | ) | | | | 13.21 | | | | | 7.88 | | | | | 1.64 | | | | | 1.49 | | | | | (0.07 | ) | | | | 84 | | | | | 39 | |
| 2015 | | | | 14.48 | | | | | (0.08 | ) | | | | (0.83 | ) | | | | (0.91 | ) | | | | — | | | | | (0.81 | ) | | | | (0.81 | ) | | | | 12.76 | | | | | (6.43 | ) | | | | 1.71 | | | | | 1.49 | | | | | (0.62 | ) | | | | 24 | | | | | 53 | |
| 2014(6) | | | | 14.07 | | | | | (0.01 | ) | | | | 0.42 | | | | | 0.41 | | | | | — | | | | | — | | | | | — | | | | | 14.48 | | | | | 2.91 | | | | | 1.71 | | | | | 1.49 | | | | | (0.39 | ) | | | | 26 | | | | | 43 | |
Pyrford International Stock Fund | | | | | | | | | | | | | | | | | | | | | | | | | | | | | | | | | | | | | | | | | | | | | | | | | | | | | | | | |
| 2017(3)(7) | | | | 12.18 | | | | | 0.27 | | | | | 0.94 | | | | | 1.21 | | | | | (0.22 | ) | | | | — | | | | | (0.22 | ) | | | | 13.17 | | | | | 10.17 | | | | | 1.55 | | | | | 1.46 | | | | | 2.18 | | | | | 26 | | | | | 33 | |
| 2016(3) | | | | 11.74 | | | | | 0.23 | | | | | 0.42 | | | | | 0.65 | | | | | (0.21 | ) | | | | — | | | | | (0.21 | ) | | | | 12.18 | | | | | 5.63 | | | | | 1.56 | | | | | 1.49 | | | | | 1.98 | | | | | 24 | | | | | 12 | |
| 2015(3) | | | | 13.12 | | | | | 0.22 | | | | | (1.54 | ) | | | | (1.32 | ) | | | | (0.06 | ) | | | | — | | | | | (0.06 | ) | | | | 11.74 | | | | | (10.06 | ) | | | | 1.53 | | | | | 1.49 | | | | | 1.71 | | | | | 22 | | | | | 9 | |
| 2014(3)(6) | | | | 13.15 | | | | | 0.06 | | | | | (0.09 | ) | | | | (0.03 | ) | | | | — | | | | | — | | | | | — | | | | | 13.12 | | | | | (0.23 | ) | | | | 1.53 | | | | | 1.49 | | | | | 1.70 | | | | | 25 | | | | | 6 | |
| (1) | Based on net asset value as of end of period date. |
| (2) | The contractual and voluntary expense waivers pursuant to Note 6 of the financial statements are reflected in both the net expense and net investment income (loss) ratios. |
| (3) | Redemption fees consisted of per share amounts less than $0.01. |
| (4) | Not annualized for periods less than one year. |
| (5) | Annualized for periods less than one year. |
| (6) | Reflects operations for the period from May 27, 2014 (inception date) to August 31, 2014. |
| (7) | Calculated using the average shares method. |
(See Notes which are an integral part of the Financial Statements)
145
| | |
| Financial Highlights—Retirement Class R-6 of Shares (For a share outstanding throughout each period) |
| | | | | | | | | | | | | | | | | | | | | | | | | | | | | | | | | | | | | | | | | | | | | | | | | | | | | | | | | | | | | | | | | | | | | | |
Period
Ended
August 31, | | Net asset
value,
beginning
of period | | Net
investment
income
(loss) | | Net realized
and unrealized
gain (loss) | | Total from
investment
operations | | Distributions to
shareholders
from net
investment
income | | Distributions to
shareholders
from net
realized gain | | Total
distributions | | Net asset
value, end
of period | | Total
return (1)(4) | | Ratios to Average Net Assets (5) | | Net assets,
end of period
(000 omitted) | | Portfolio
turnover
rate (4) |
| | | | | | | | | | | Gross
Expenses | | Net
Expenses (2) | | Net
investment
income
(loss) (2) | | |
Large-Cap Value Fund | | | | | | | | | | | | | | | | | | | | | | | | | | | | | | | | | | | | | | | | | | | | | | | | | | | | | | | | | | | | | |
| 2017(9) | | | $ | 14.17 | | | | $ | 0.26 | | | | $ | 1.81 | | | | $ | 2.07 | | | | $ | (0.24 | ) | | | $ | (0.12 | ) | | | $ | (0.36 | ) | | | $ | 15.88 | | | | | 14.75 | % | | | | 0.62 | % | | | | 0.60 | % | | | | 1.64 | % | | | $ | 1,479 | | | | | 62 | % |
| 2016(7) | | | | 13.81 | | | | | 0.21 | | | | | 0.30 | | | | | 0.51 | | | | | (0.15 | ) | | | | — | | | | | (0.15 | ) | | | | 14.17 | | | | | 3.77 | | | | | 0.63 | | | | | 0.60 | | | | | 2.27 | | | | | 52 | | | | | 60 | |
Large-Cap Growth Fund | | | | | | | | | | | | | | | | | | | | | | | | | | | | | | | | | | | | | | | | | | | | | | | | | | | | | | | | | | | | | |
| 2017 | | | | 15.49 | | | | | 0.09 | | | | | 3.10 | | | | | 3.19 | | | | | (0.16 | ) | | | | (0.90 | ) | | | | (1.06 | ) | | | | 17.62 | | | | | 21.83 | | | | | 0.63 | | | | | 0.60 | | | | | 0.75 | | | | | 2,852 | | | | | 75 | |
| 2016(7) | | | | 14.75 | | | | | 0.07 | | | | | 0.67 | | | | | 0.74 | | | | | — | | | | | — | | | | | — | | | | | 15.49 | | | | | 5.02 | | | | | 0.66 | | | | | 0.60 | | | | | 0.72 | | | | | 53 | | | | | 70 | |
Mid-Cap Value Fund | | | | | | | | | | | | | | | | | | | | | | | | | | | | | | | | | | | | | | | | | | | | | | | | | | | | | | | | | | | | | |
| 2017 | | | | 14.38 | | | | | 0.11 | | | | | 1.26 | | | | | 1.37 | | | | | (0.08 | ) | | | | (3.77 | ) | | | | (3.85 | ) | | | | 11.90 | | | | | 13.31 | | | | | 0.86 | | | | | 0.84 | | | | | 1.05 | | | | | 14,714 | | | | | 139 | |
| 2016 | | | | 15.03 | | | | | 0.18 | | | | | 0.84 | | | | | 1.02 | | | | | (0.20 | ) | | | | (1.47 | ) | | | | (1.67 | ) | | | | 14.38 | | | | | 7.65 | | | | | 0.83 | | | | | 0.83 | | | | | 1.28 | | | | | 11,332 | | | | | 24 | |
| 2015 | | | | 17.65 | | | | | 0.11 | | | | | (0.62 | ) | | | | (0.51 | ) | | | | (0.05 | ) | | | | (2.06 | ) | | | | (2.11 | ) | | | | 15.03 | | | | | (3.19 | ) | | | | 0.82 | | | | | 0.82 | | | | | 0.64 | | | | | 8,776 | | | | | 27 | |
| 2014(6) | | | | 16.58 | | | | | 0.03 | | | | | 1.04 | | | | | 1.07 | | | | | — | | | | | — | | | | | — | | | | | 17.65 | | | | | 6.45 | | | | | 0.80 | | | | | 0.80 | | | | | 0.71 | | | | | 27 | | | | | 30 | |
Mid-Cap Growth Fund | | | | | | | | | | | | | | | | | | | | | | | | | | | | | | | | | | | | | | | | | | | | | | | | | | | | | | | | | | | | | |
| 2017 | | | | 16.83 | | | | | 0.07 | | | | | 2.18 | | | | | 2.25 | | | | | (0.08 | ) | | | | (3.54 | ) | | | | (3.62 | ) | | | | 15.46 | | | | | 17.22 | | | | | 0.97 | | | | | 0.84 | | | | | (0.13 | ) | | | | 592 | | | | | 157 | |
| 2016 | | | | 20.55 | | | | | 0.09 | | | | | (0.93 | ) | | | | (0.84 | ) | | | | — | | | | | (2.88 | ) | | | | (2.88 | ) | | | | 16.83 | | | | | (3.89 | ) | | | | 0.89 | | | | | 0.84 | | | | | 0.49 | | | | | 25 | | | | | 59 | |
| 2015 | | | | 24.38 | | | | | (0.03 | ) | | | | (0.57 | ) | | | | (0.60 | ) | | | | — | | | | | (3.23 | ) | | | | (3.23 | ) | | | | 20.55 | | | | | (2.47 | ) | | | | 0.85 | | | | | 0.84 | | | | | (0.12 | ) | | | | 26 | | | | | 53 | |
| 2014(6) | | | | 23.30 | | | | | (0.02 | ) | | | | 1.10 | | | | | 1.08 | | | | | — | | | | | — | | | | | — | | | | | 24.38 | | | | | 4.64 | | | | | 0.84 | | | | | 0.84 | | | | | (0.24 | ) | | | | 26 | | | | | 57 | |
Small-Cap Value Fund | | | | | | | | | | | | | | | | | | | | | | | | | | | | | | | | | | | | | | | | | | | | | | | | | | | | | | | | | | | | | |
| 2017(9) | | | | 13.42 | | | | | 0.05 | | | | | 1.42 | | | | | 1.47 | | | | | (0.10 | ) | | | | (1.26 | ) | | | | (1.36 | ) | | | | 13.53 | | | | | 12.05 | | | | | 1.09 | | | | | 0.84 | | | | | 0.37 | | | | | 2,653 | | | | | 148 | |
| 2016 | | | | 12.87 | | | | | 0.07 | | | | | 1.00 | | | | | 1.07 | | | | | — | | | | | (0.52 | ) | | | | (0.52 | ) | | | | 13.42 | | | | | 8.61 | | | | | 0.99 | | | | | 0.84 | | | | | 0.60 | | | | | 926 | | | | | 39 | |
| 2015 | | | | 14.50 | | | | | (0.00 | ) | | | | (0.82 | ) | | | | (0.82 | ) | | | | — | | | | | (0.81 | ) | | | | (0.81 | ) | | | | 12.87 | | | | | (5.78 | ) | | | | 1.06 | | | | | 0.84 | | | | | 0.01 | | | | | 134 | | | | | 53 | |
| 2014(6) | | | | 14.07 | | | | | 0.01 | | | | | 0.42 | | | | | 0.43 | | | | | — | | | | | — | | | | | — | | | | | 14.50 | | | | | 3.06 | | | | | 1.06 | | | | | 0.84 | | | | | 0.25 | | | | | 26 | | | | | 43 | |
Pyrford International Stock Fund | | | | | | | | | | | | | | | | | | | | | | | | | | | | | | | | | | | | | | | | | | | | | | | | | | | | | | | | | | | | | |
| 2017(3)(9) | | | | 12.23 | | | | | 0.40 | | | | | 0.88 | | | | | 1.28 | | | | | (0.29 | ) | | | | — | | | | | (0.29 | ) | | | | 13.22 | | | | | 10.85 | | | | | 0.90 | | | | | 0.81 | | | | | 3.21 | | | | | 48,889 | | | | | 33 | |
| 2016(3) | | | | 11.79 | | | | | 0.20 | | | | | 0.53 | | | | | 0.73 | | | | | (0.29 | ) | | | | — | | | | | (0.29 | ) | | | | 12.23 | | | | | 6.35 | | | | | 0.91 | | | | | 0.84 | | | | | 2.85 | | | | | 16,100 | | | | | 12 | |
| 2015(3) | | | | 13.15 | | | | | 0.20 | | | | | (1.45 | ) | | | | (1.25 | ) | | | | (0.11 | ) | | | | — | | | | | (0.11 | ) | | | | 11.79 | | | | | (9.56 | ) | | | | 0.88 | | | | | 0.84 | | | | | 3.42 | | | | | 6,560 | | | | | 9 | |
2014(3)(6) | | | | 13.15 | | | | | 0.08 | | | | | (0.08 | ) | | | | 0.00 | | | | | — | | | | | — | | | | | — | | | | | 13.15 | | | | | 0.00 | | | | | 0.88 | | | | | 0.84 | | | | | 2.36 | | | | | 25 | | | | | 6 | |
| Financial Highlights—Class F-3 of Shares (For a share outstanding throughout each period) | |
| | | | | | | | | | | | |
Period
Ended
August 31, | | Net asset
value,
beginning
of period | | Net
investment
income
(loss) | | Net realized
and unrealized
gain (loss) | | Total from
investment
operations | | Distributions to
shareholders
from net
investment
income | | Distributions to
shareholders
from net
realized gain | | Total
distributions | | Net asset
value, end
of period | | Total
return (1)(4) | | Ratios to Average Net Assets (5) | | Net assets,
end of period
(000 omitted) | | Portfolio
turnover
rate (4) |
| | | | | | | | | | | Gross
Expenses | | Net
Expenses (2) | | Net
investment
income
(loss) (2) | | |
Pyrford International Stock Fund | | | | | | | | | | | | | | | | | | | | | | | | | | | | | | | | | | | | | | | | | | | | | | | | | | | | | | | | | | | | | |
| 2017(3)(8)(9) | | | $ | 13.21 | | | | $ | 0.12 | | | | $ | (0.11 | ) | | | $ | 0.01 | | | | $ | — | | | | $ | — | | | | $ | — | | | | $ | 13.22 | | | | | 0.08 | % | | | | 0.88 | % | | | | 0.79 | % | | | | 3.52 | % | | | $ | 26 | | | | | 33 | % |
| (1) | Based on net asset value as of end of period date. |
| (2) | The contractual and voluntary expense waivers pursuant to Note 6 of the financial statements are reflected in both the net expense and net investment income (loss) ratios. |
| (3) | Redemption fees consisted of per share amounts less than $0.01. |
| (4) | Not annualized for periods less than one year. |
| (5) | Annualized for periods less than one year. |
| (6) | Reflects operations for the period from May 27, 2014 (inception date) to August 31, 2014. |
| (7) | Reflects operations for the period from December 28, 2015 (inception date) to August 31, 2016. |
| (8) | Reflects operations for the period from May 31, 2017 (inception date) to August 31, 2017. |
| (9) | Calculated using the average shares method. |
(See Notes which are an integral part of the Financial Statements)
146
August 31, 2017
| | |
| Notes to Financial Statements | | |
BMO Funds, Inc. (the “Corporation”) is registered under the Investment Company Act of 1940, as amended (the “Act”), as an open-end management investment company. As of August 31, 2017, the Corporation consisted of 43 portfolios, including 28 diversified portfolios within this annual report (individually referred to as the “Fund,” or collectively as the “Funds”) each with differing share class offerings, as well as 10 target retirement and 5 target risk portfolios whose annual report is available under a separate cover. BMO Asset Management Corp. serves as the Funds’ investment adviser (the “Adviser”), a Delaware corporation headquartered in Chicago, Illinois that is a wholly-owned subsidiary of BMO Financial Corp.
| | | | |
BMO Fund names as displayed throughout this report | | Fund Inception Date | | Investment Objective |
Low Volatility Equity Fund | | September 28, 2012 | | To provide capital appreciation. |
Dividend Income Fund | | December 29, 2011 | | To provide capital appreciation and current income. |
Large-Cap Value Fund | | September 30, 1993 | | To provide capital appreciation. |
Large-Cap Growth Fund | | November 20, 1992 | | To provide capital appreciation. |
Mid-Cap Value Fund | | September 30, 1993 | | To provide capital appreciation. |
Mid-Cap Growth Fund | | September 30, 1993 | | To provide capital appreciation. |
Small-Cap Value Fund | | February 28, 2011 | | To provide capital appreciation. |
Small-Cap Core Fund | | December 27, 2013 | | To provide capital appreciation. |
Small-Cap Growth Fund | | October 31, 1995 | | To provide capital appreciation. |
Global Low Volatility Equity Fund(1) | | September 30, 2013 | | To provide capital appreciation. |
Disciplined International Equity Fund(1) | | September 17, 2015 | | To provide capital appreciation. |
Pyrford International Stock Fund(1) | | December 29, 2011 | | To provide capital appreciation. |
LGM Emerging Markets Equity Fund(1) | | December 22, 2008 | | To provide capital appreciation. |
TCH Emerging Markets Bond Fund(1) | | September 30, 2013 | | To maximize total return consistent with current income. |
Alternative Strategies Fund(1) | | December 16, 2014 | | To provide capital appreciation with an emphasis on absolute returns. |
Global Long/Short Equity Fund(1) | | September 17, 2015 | | To provide capital appreciation. |
Ultra Short Tax-Free Fund | | September 30, 2009 | | To provide current income exempt from federal income tax consistent with preservation of capital. |
Short Tax-Free Fund | | November 29, 2012 | | To provide current income exempt from federal income tax consistent with preservation of capital. |
Short-Term Income Fund | | November 1, 1992 | | To maximize total return consistent with current income. |
Intermediate Tax-Free Fund | | February 1, 1994 | | To provide a high level of current income exempt from federal income tax consistent with preservation of capital. |
Strategic Income Fund(2) | | December 13, 1992 | | To maximize total return consistent with current income. |
TCH Corporate Income Fund | | December 22, 2008 | | To maximize total return consistent with current income. |
TCH Core Plus Bond Fund | | December 22, 2008 | | To maximize total return consistent with current income. |
High Yield Bond Fund(2) | | December 29, 2011 | | To maximize total return consistent with current income. |
Government Money Market Fund | | May 17, 2004 | | To provide current income consistent with stability of principal. |
Tax-Free Money Market Fund | | September 22, 2004 | | To provide current income that is exempt from federal income tax and is consistent with stability of principal. |
Prime Money Market Fund | | November 23, 1992 | | To provide current income consistent with stability of principal. |
Institutional Prime Money Market Fund | | June 3, 2016 | | To provide current income consistent with preservation of capital. |
| (1) | Collectively referred to as the “International Funds”. |
| (2) | Effective March 7, 2017, the BMO Monegy High Yield Bond Fund changed its name to the BMO High Yield Bond Fund. Effective May 8, 2017, the BMO Mortgage Income Fund changed its name to the BMO Strategic Income Fund. Effective as of the close of business June 29, 2017, the BMO TCH Intermediate Income Fund merged into the BMO Strategic Income Fund. |
| 2. | | Significant Accounting Policies |
The Funds are investment companies and follow the accounting and reporting guidance under Financial Accounting Standards Board (“FASB”) Accounting Standards Codification (“ASC”) Topic 946, Financial Services—Investment Companies. The following is a summary of significant accounting policies consistently followed by the Funds in the preparation of their financial statements.
Use of Estimates—The preparation of financial statements in conformity with accounting principles generally accepted in the United States of America (“GAAP”) requires management to make estimates and assumptions that affect the reported amounts of assets and liabilities at the date of the financial statements and the reported amounts of increases and decreases in net assets from operations during the reporting period. Actual results may differ from those estimates.
147
| | |
| Notes to Financial Statements (continued) | | |
Investment Valuations—Listed equity securities are valued each trading day at the last sale price or official closing price reported on a national securities exchange. Securities listed on a foreign exchange are valued each trading day at the last closing price on the principal exchange on which they are traded immediately prior to the time for determination of Net Asset Value (“NAV”) or at fair value as discussed below. Equity securities without a reported trade, U.S. government securities, listed corporate bonds, other fixed income and asset-backed securities with maturities of 60 days or more, unlisted securities, and private placement securities are generally valued at the mean of the latest bid and asked price as furnished by an independent pricing service. Fixed income securities that are not exchange traded are valued by an independent pricing service, taking into consideration yield, liquidity, risk, credit quality, coupon, maturity, type of issue, and any other factors or market data the pricing service deems relevant. Fixed income securities with remaining maturities of 60 days or less at the time of purchase, and of sufficient credit quality, are valued at amortized cost, which approximates fair value. Investments in other open-end registered investment companies are valued at net asset value. The money market funds use the amortized cost method to value portfolio securities in accordance with Rule 2a-7 under the Act.
Securities or other assets for which market valuations are not readily available, or are deemed to be inaccurate, are valued at fair value as determined in good faith using methods approved by the Board of Directors (the “Directors”). The Directors have established a Pricing Committee, which is responsible for determinations of fair value, subject to the supervision of the Directors. In determining fair value, the Pricing Committee takes into account all information available and any factors it deems appropriate. Consequently, the price of securities used by a Fund to calculate its NAV may differ from quoted or published prices for the same securities. Fair value pricing involves subjective judgments; it is possible that the fair value determined for a security is materially different than the value that would be realized upon the sale of that security and the differences may be material to the NAV of the respective Fund or the financial statements presented.
Securities held in certain funds may be listed on foreign exchanges that do not value their listed securities at the same time each Fund calculates its NAV. Most foreign markets close well before each Fund values its securities, generally 3:00 p.m. (Central Time). The earlier close of these foreign markets gives rise to the possibility that significant events, including broad market moves, may have occurred in the interim.
The Pricing Committee may determine that a security needs to be fair valued if, among other things, it believes the value of the security might have been materially affected by events occurring after the close of the market in which the security was principally traded, but before the time for determination of the NAV (“a subsequent event”). A subsequent event might include a company-specific development (for example, announcement of a merger that is made after the close of the foreign market), a development that might affect an entire market or region (for example, weather related events) or a potentially global development (such as a terrorist attack that may be expected to have an effect on investor expectations worldwide). The Funds have retained an independent fair value pricing service to assist in fair valuing foreign securities. The service utilizes statistical data based on historical performance of securities, markets, and other data in developing factors used to estimate a fair value.
Repurchase Agreements—The Funds’ policy requires the custodian bank to take possession, to have legally segregated in the Federal Reserve Book Entry System, or to have segregated within the custodian bank’s vault, all securities held as collateral under repurchase agreement transactions. Additionally, procedures have been established by the Funds to monitor, on a daily basis, the market value of each repurchase agreement’s collateral to ensure that the value of collateral at least equals the repurchase price to be paid under the repurchase agreement, including accrued interest.
The Funds will enter into repurchase agreements only with banks and other recognized financial institutions, such as broker-dealers, which are deemed by the Adviser (or sub-advisers, as applicable) to be creditworthy pursuant to the guidelines and/or standards reviewed or established by the Directors. Risks may arise from the potential inability of counterparties to honor the terms of the repurchase agreement. Accordingly, the Funds could receive less than the repurchase price on the sale of collateral securities.
Investment Income, Expenses, and Distributions—Interest income and expenses are accrued daily. Dividend income, realized gain distributions from underlying funds, and distributions to shareholders are recorded on the ex-dividend date. Non-cash dividends included in dividend income, if any, are recorded at fair market value. Paid-in-kind interest included in interest income, if any, is accrued daily.
The Funds offer multiple classes of shares which differ in their respective distribution, administration, and service fees. All shareholders bear the common expenses of the Funds. Dividends are declared separately for each class. No class has preferential dividend rights; differences in per share dividend rates are generally due to differences in class-specific expenses. Income, non-class specific expenses, and realized and unrealized gains and losses are allocated daily to each class of shares based on the value of total shares outstanding of each class without distinction between share classes.
Expenses attributable to a particular class of shares, such as shareholder servicing fees, are allocated directly to that class.
Premium and Discount Amortization/Paydown Gains and Losses—Premiums and discounts on fixed income securities are amortized/accreted for tax and financial statement purposes. Gains and losses realized on principal payments of mortgage-backed and asset-backed securities (paydown gains and losses) are classified as part of interest income.
Federal Income Taxes—The policies and procedures of the Funds require compliance with Subchapter M of the Internal Revenue Code of 1986, as amended (the “Code”), and distribution to shareholders each year substantially all of their income. Accordingly, no provisions for federal tax are necessary. Withholding taxes on foreign dividends and unrealized appreciation on investments have been provided for in accordance with the applicable country’s tax rules and rates.
148
When-Issued and Delayed Delivery Transactions—The Funds may engage in when-issued or delayed delivery transactions. The Funds record when-issued securities on the trade date and maintain security positions such that sufficient liquid assets will be available to make payment for the commitment to purchase securities. Securities purchased on a when-issued or delayed delivery basis are marked-to-market daily and begin earning interest on the settlement date. Losses may occur on these transactions due to changes in market conditions or the failure of counterparties to perform under the contract.
Short Sales—Certain Funds may sell a security they do not own in anticipation that the price of the security will decline. To complete such a transaction, the Fund must borrow the security to make delivery to the buyer. The Fund closes the short sale by purchasing the security at the market price at the time of closure. The price at such time may be more or less than the price at which the security was sold by the Fund. Until the transaction is closed, the Fund is required to pay the lender amounts equal to dividend or interest that accrue during the period of the loan which is recorded as an expense. To borrow the security, the Fund also may be required to pay a premium or an interest fee, which are recorded as interest expense. The proceeds of the short sale will be retained by the broker, to the extent necessary to meet margin requirements, until the short position is closed out. A gain, limited to the price at which the Fund sells the security short, or a loss, potentially unlimited in size, will be recognized upon the closing of a short sale. The Fund may not always be able to borrow a security or to close out a short position at a particular time or at an acceptable price. If the price of the borrowed security increases between the date of the short sale and the date on which the Fund closes the short sale, the Fund will experience a loss. The Fund’s loss on a short sale is the maximum attainable price of the security (which could be limitless) less the price the Fund paid for the security at the time it was borrowed.
Futures Contracts—Certain Funds may purchase futures contracts to manage cash flows, enhance yield, or to potentially reduce transaction costs. Upon entering into a futures contract with a broker, the Fund is required to deposit in a segregated account a specified amount of cash or U.S. government securities. Futures contracts are valued daily and unrealized gains or losses are recorded in a “variation margin” account. Daily, the Fund receives from, or pays to, the broker a specified amount of cash based upon changes in the variation margin account. When a contract is closed, the Fund recognizes a realized gain or loss. Futures contracts have market risks, including the risk that the change in the value of the contract may not correlate with changes in the value of the underlying securities.
Options Contracts—Certain Funds may write covered call and put options on futures, swaps, securities, or currencies a Fund owns, or in which it may invest to create investment exposure consistent with their investment objectives. Writing put options tends to increase a Fund’s exposure to the underlying instrument. Writing call options tends to decrease a Fund’s exposure to the underlying instrument. When a Fund writes a call or put option, an amount equal to the premium received is recorded as a liability and subsequently marked-to-market to reflect the current value of the option written. These liabilities are reflected as written options outstanding in the Statements of Assets and Liabilities. Payments received, or made, from writing options with premiums to be determined on a future date are reflected as such on the Statements of Assets and Liabilities. Premiums received from writing options that expire are treated as realized gains. Premiums received from writing options which are exercised or closed are added to the proceeds or offset against amounts paid on the underlying future, swap, security, or currency transaction to determine the realized gain or loss. A Fund, as a writer of an option, has no control over whether the underlying future, swap, security, or currency may be sold (called) or purchased (put) and, as a result, bears the market risk of an unfavorable change in the price of the future, swap, security, or currency underlying the written option. The risk exists that a Fund may not be able to enter into a closing transaction because of an illiquid market.
Certain Funds also may purchase put and call options. Purchasing call options tends to increase a Fund’s exposure to the underlying instrument. Purchasing put options tends to decrease a Fund’s exposure to the underlying instrument. A Fund pays a premium, which is included in a Fund’s Statement of Assets and Liabilities as an investment and subsequently marked- to-market to reflect the current value of the option. Premiums paid for purchasing options that expire are treated as realized losses. The risk associated with purchasing put and call options is limited to the premium paid. Premiums paid for purchasing options which are exercised or closed are added to the amounts paid or offset against the proceeds on the underlying future, swap, security, or currency transaction to determine the realized gain or loss.
Foreign Exchange Contracts—Certain Funds may enter into foreign currency exchange contracts as a way of managing foreign exchange rate risk. Certain Funds may enter into these contracts for the purchase or sale of a specific foreign currency at a fixed price on a future date as a hedge or cross hedge against either specific transactions or portfolio positions. The objective of foreign currency hedging transactions is to reduce the risk that the U.S. dollar value of these Funds’ foreign currency denominated securities will decline in value due to changes in foreign currency exchange rates. All foreign currency exchange contracts are marked-to-market daily at the applicable translation rates resulting in unrealized gains or losses. Realized gains or losses are recorded at the time the foreign currency exchange contract is offset by entering into a closing transaction or by the delivery or receipt of the currency. Risk may arise upon entering into these contracts from the potential inability of counterparties to meet the terms of their contracts and from unanticipated movements in the value of a foreign currency relative to the U.S. dollar.
Foreign Currency Translation—The accounting records of the Funds are maintained in U.S. dollars. All assets and liabilities denominated in foreign currencies are translated into U.S. dollars based on the rate of exchange of such currencies against U.S. dollars on the date of valuation. Purchases and sales of securities, income, and expenses are translated at the rate of exchange quoted on the respective date that such transactions are recorded. The Funds do not isolate that portion of the results of operations resulting from changes in foreign exchange rates on investments from the fluctuations arising from changes in market prices of securities held. Such fluctuations are included with the net realized and unrealized gain or loss from investments.
149
| | |
| Notes to Financial Statements (continued) | | |
Reported net realized foreign exchange gains or losses arise from sales of portfolio securities, sales and maturities of short-term securities, sales of foreign currencies, currency gains or losses realized between the trade and settlement dates on securities transactions, and the difference between the amounts of dividends, interest, and foreign withholding taxes recorded on the Funds’ books and the U.S. dollar equivalent of the amounts actually received or paid. Net unrealized foreign exchange gains and losses arise from changes in the value of assets and liabilities other than investments in securities at each reporting period, resulting from changes in the exchange rate.
Restricted Securities—Restricted securities are securities that may be resold only upon registration under federal securities laws or in transactions exempt from such registration. In some cases, the issuer of restricted securities has agreed to register such securities for resale at the issuer’s expense either upon demand by the Funds or in connection with another registered offering of the securities. Many restricted securities may be resold in the secondary market in transactions exempt from registration. Such restricted securities may be determined to be liquid under criteria established by the Directors.
Redemption Fees—The International Funds impose a 2% redemption fee to shareholders who redeem shares held for 30 days or less. All redemption fees are recorded by the International Funds as paid-in-capital.
Securities Lending—Certain Funds participate in one of two securities lending programs, providing for the lending of corporate bonds, equity, and government securities to qualified brokers, in exchange for the opportunity to earn additional income for participating. State Street Bank & Trust Company and BMO Harris Bank N.A. serve as the securities lending agents for the International Funds and non-International Funds participating in the programs, respectively. The Funds receive cash as collateral in return for the securities and record a corresponding payable for collateral due to the respective broker. The amount of cash collateral received is maintained at a minimum level of 100% of the prior day’s market value on securities and accrued interest loaned. Collateral is reinvested in short-term securities including overnight repurchase agreements, commercial paper, master notes, floating rate corporate notes (with at least quarterly reset rates), and money market funds. The valuation of these collateral securities is discussed in “Investment Valuations” above. When a Fund lends its portfolio securities, it is subject to the risk that it may not be able to get the portfolio securities back from the borrower on a timely basis, in which case the Fund may lose certain investment opportunities. A Fund also is subject to the risks associated with the investments of cash collateral received from the borrower.
Cash collateral received as part of the International Funds securities lending program was invested in the following security as of August 31, 2017:
| | | | |
Description | | Value | |
State Street Navigator Securities Lending Government Money Market Portfolio, 0.994% | | $ | 25,586,154 | |
Cash collateral received as part of the non-International Funds securities lending program was jointly pooled and invested in the following securities as of August 31, 2017 (1):
| | | | |
Description | | Value | |
Atlantic Asset Securitization LLC, 1.100%, 9/1/2017(3) | | $ | 10,000,000 | |
Atlantic Asset Securitization LLC, 1.300%, 11/1/2017(3) | | | 4,988,901 | |
Atlantic Asset Securitization LLC, 1.400%, 9/21/2017(3) | | | 5,995,200 | |
Atlantic Asset Securitization LLC, 1.600%
(LIBOR 1 Month+32 basis points), 1/2/2018(2) | | | 12,500,000 | |
Atlantic Asset Securitization LLC, 1.600%
(LIBOR 1 Month+34 basis points), 12/15/2017(2) | | | 7,500,000 | |
Bank of Nova Scotia/Houston, 1.400%
(LIBOR 1 Month+18 basis points), 5/18/2018(2) | | | 4,999,905 | |
Bank of Nova Scotia/Houston, 1.700%
(LIBOR 1 Month+48 basis points), 2/2/2018(2) | | | 4,005,983 | |
Bedford Row Funding Corp., 1.400%
(LIBOR 1 Month+14 basis points), 3/1/2018(2) | | | 7,850,000 | |
Bedford Row Funding Corp., 1.400%
(LIBOR 1 Month+22 basis points), 6/11/2018(2) | | | 7,500,000 | |
Bedford Row Funding Corp., 1.500%
(LIBOR 1 Month+22 basis points), 2/21/2018(2) | | | 5,000,000 | |
Bedford Row Funding Corp., 1.500%
(LIBOR 1 Month+22 basis points), 8/17/2018(2) | | | 6,500,000 | |
Bedford Row Funding Corp., 1.500%
(LIBOR 1 Month+27 basis points), 12/18/2017(2) | | | 5,000,000 | |
BlackRock Liquidity Funds FedFund
Portfolio, 1.000% | | | 7,279,367 | |
BMO Government Money Market Fund, 0.870%(4) | | | 55,000,000 | |
| | | | |
Description | | Value | |
BMO Institutional Prime Money Market
Fund, 1.080%(4) | | $ | 310,031,000 | |
Collateralized Commercial Paper Co. LLC, 1.500%
(LIBOR 1 Month+30 basis points), 10/23/2017(2) | | | 5,800,000 | |
Commonwealth Bank of Australia, 1.400%
(LIBOR 1 Month+20 basis points), 5/11/2018(2) | | | 6,000,000 | |
Commonwealth Bank of Australia,
1.400%, 8/15/2018 | | | 4,999,395 | |
Crown Point Capital Co. LLC, 1.300%, 10/17/2017(3) | | | 4,991,567 | |
Crown Point Capital Co. LLC, 1.300%, 10/31/2017(3) | | | 4,989,083 | |
Erste Abwicklungsanstalt, 1.200%, 9/6/2017(3) | | | 7,498,802 | |
Erste Abwicklungsanstalt, 1.300%, 10/18/2017(3) | | | 7,487,271 | |
Erste Abwicklungsanstalt, 1.300%, 12/13/2017(3) | | | 7,471,675 | |
Erste Abwicklungsanstalt, 1.400% , 1/19/2018(3) | | | 7,460,625 | |
Erste Abwicklungsanstalt, 1.500% (LIBOR 1 Month+22 basis points), 9/7/2017(2) | | | 6,500,000 | |
HSBC Bank USA NA, 1.600% (LIBOR 1 Month+33 basis points), 3/20/2018(2) | | | 5,006,100 | |
HSBC Bank USA NA, 1.700% (LIBOR 1 Month+48 basis points), 10/13/2017(2) | | | 6,503,855 | |
HSBC Bank, PLC, 1.600% (LIBOR 1 Month+34 basis points), 9/15/2017(2) | | | 7,500,000 | |
Illinois Tool Works, Inc., 1.100% , 9/6/2017(3) | | | 3,999,378 | |
Illinois Tool Works, Inc., 1.100% , 9/8/2017(3) | | | 7,498,352 | |
John Deere Capital Corp., 1.200% , 9/5/2017(3) | | | 4,999,361 | |
JP Morgan Securities LLC, 1.400% (LIBOR 1 Month+15 basis points), 12/22/2017(2) | | | 5,750,000 | |
150
| | | | |
Description | | Value | |
JP Morgan Securities LLC, 1.400% (LIBOR 1 Month+20 basis points), 4/6/2018(2) | | $ | 7,500,000 | |
JP Morgan Securities LLC, 1.500% (LIBOR 1 Month+25 basis points), 9/5/2017(2) | | | 7,100,000 | |
Liberty Street Funding LLC, 1.300%, 10/17/2017(3) | | | 6,838,534 | |
Liberty Street Funding LLC, 1.300%, 9/25/2017(3) | | | 8,992,260 | |
Liberty Street Funding LLC, 1.400%, 12/13/2017(3) | | | 7,969,100 | |
Manhattan Asset Funding Co., 1.400% (LIBOR 1 Month+14 basis points), 12/5/2017(2) | | | 5,000,000 | |
Manhattan Asset Funding Co., 1.400% (LIBOR 1 Month+16 basis points), 1/31/2018(2) | | | 5,000,000 | |
Manhattan Asset Funding Co., 1.400% (LIBOR 1 Month+16 basis points), 2/8/2018(2) | | | 7,500,000 | |
Manhattan Asset Funding Co., 1.500% (LIBOR 1 Month+30 basis points), 9/28/2017(2) | | | 7,500,000 | |
Mitsubishi UFJ Trust & Banking Corp., 1.400%, 2/9/2018 | | | 7,500,630 | |
Mizuho Bank, Ltd., 1.400% (LIBOR 1 Month+28 basis points), 12/1/2017(2) | | | 5,002,845 | |
Mizuho Bank, Ltd., 1.600% (LIBOR 1 Month+40 basis points), 9/1/2017(2) | | | 6,500,085 | |
National Australia Bank Ltd., 1.600% (LIBOR 1 Month+35 basis points), 3/6/2018(2) | | | 5,000,000 | |
National Rural Utilities Co., 1.100%, 9/1/2017(3) | | | 5,000,000 | |
National Rural Utilities Co., 1.100%, 9/6/2017(3) | | | 8,748,615 | |
National Rural Utilities Co., 1.200%, 9/11/2017(3) | | | 16,144,841 | |
Natixis, NY Branch, 1.200% , 9/7/2017(3) | | | 9,998,067 | |
Novartis Finance Corp., 1.100% , 9/1/2017(3) | | | 5,000,000 | |
Old Line Funding LLC, 1.400% (LIBOR 1 Month+12 basis points), 1/19/2018(2) | | | 5,000,000 | |
Old Line Funding LLC, 1.400% (LIBOR 1 Month+12 basis points), 12/4/2017(2) | | | 7,500,000 | |
Old Line Funding LLC, 1.400% (LIBOR 1 Month+14 basis points), 11/8/2017(2) | | | 14,900,000 | |
Paccar Financial Corp., 1.100%, 9/7/2017(3) | | | 4,999,108 | |
Regency Markets No.1 LLC, 1.200%, 9/15/2017(3) | | | 12,494,021 | |
Regency Markets No.1 LLC, 1.200%, 9/26/2017(3) | | | 5,495,302 | |
Regency Markets No.1 LLC, 1.200%, 9/7/2017(3) | | | 15,196,923 | |
Regency Markets No.1 LLC, 1.200%, 9/8/2017(3) | | | 9,997,608 | |
Ridgefield Funding Co. LLC, 1.400% (LIBOR 1 Month+16 basis points), 12/18/2017(2) | | | 10,000,000 | |
Ridgefield Funding Co. LLC, 1.400% (LIBOR 1 Month+18 basis points), 1/11/2018(2) | | | 8,750,000 | |
Ridgefield Funding Co. LLC, 1.400%, 11/14/2017(3) | | | 6,481,963 | |
Skandinaviska Enskilda Banken AB, 1.500% (LIBOR 1 Month+30 basis points), 9/21/2017(2) | | | 7,226,474 | |
Sumitomo Mitsui Banking Corp., 1.300% (LIBOR 1 Month+13 basis points), 9/18/2017(2) | | | 7,500,488 | |
Suncorp Metway Ltd., 1.400%, 11/13/2017(3) | | | 7,479,165 | |
Suncorp Metway Ltd., 1.400%, 11/14/2017(3) | | | 4,986,125 | |
| | | | |
Description | | Value | |
Suncorp Metway Ltd., 1.500%, 2/5/2018(3) | | $ | 7,452,246 | |
Svenska Handelsbaken, Inc., 1.500% (LIBOR 1 Month+30 basis points), 9/15/2017(2) | | | 7,001,029 | |
Swedbank Foreningsspar, 1.100%, 9/7/2017 | | | 10,000,000 | |
Swedbank Foreningsspar, 1.200%, 9/6/2017 | | | 10,000,020 | |
Swedbank, 1.300% , 12/14/2017(3) | | | 7,471,400 | |
Swedish Export Credit Corp., 1.400%, 11/28/2017(3) | | | 9,967,000 | |
Thunder Bay Funding LLC, 1.300% (LIBOR 1 Month+12 basis points), 12/8/2017(2) | | | 8,500,000 | |
Thunder Bay Funding LLC, 1.400% (LIBOR 1 Month+12 basis points), 1/12/2018(2) | | | 7,500,000 | |
Thunder Bay Funding LLC, 1.500% (LIBOR 1 Month+23 basis points), 6/22/2018(2) | | | 5,000,000 | |
Toronto- Dominion Bank, 1.400% (LIBOR 1 Month+20 basis points), 8/10/2018(2) | | | 5,000,975 | |
Toronto- Dominion Bank, 1.600% (LIBOR 1 Month+34 basis points), 3/13/2018(2) | | | 5,506,804 | |
Toronto- Dominion Bank, 1.700% (LIBOR 1 Month+44 basis points), 11/1/2017(2) | | | 8,005,936 | |
Toronto- Dominion Bank, 1.700% (LIBOR 1 Month+52 basis points), 11/20/2017(2) | | | 5,005,385 | |
Toronto- Dominion Bank, 1.700% (LIBOR 3 Month+40 basis points), 10/17/2017(2) | | | 5,003,140 | |
Toronto- Dominion Bank, 1.800% (LIBOR 1 Month+52 basis points), 1/10/2018(2) | | | 6,510,257 | |
Toyota Motor Credit Corp., 1.400% (LIBOR 1 Month+17 basis points), 3/12/2018(2) | | | 5,000,000 | |
Toyota Motor Credit Corp., 1.400% (LIBOR 1 Month+18 basis points), 4/27/2018(2) | | | 7,450,000 | |
Toyota Motor Credit Corp., 1.400% (LIBOR 1 Month+19 basis points), 5/10/2018(2) | | | 7,500,000 | |
Victory Receivables Corp., 1.300%, 9/25/2017(3) | | | 7,493,500 | |
Victory Receivables Corp., 1.300%, 9/6/2017(3) | | | 4,399,224 | |
Wal-Mart Stores, Inc., 1.100%, 9/5/2017(3) | | | 7,499,058 | |
Wells Fargo Bank NA, 1.400% (LIBOR 1 Month+13 basis points), 12/19/2017(2) | | | 5,650,816 | |
Wells Fargo Bank NA, 1.400% (LIBOR 1 Month+17 basis points), 4/20/2018(2) | | | 5,000,595 | |
Wells Fargo Bank NA, 1.700% (LIBOR 1 Month+44 basis points), 2/14/2018(2) | | | 5,007,405 | |
Wells Fargo Bank NA, 1.700% (LIBOR 1 Month+47 basis points), 10/11/2017(2) | | | 5,002,785 | |
Wells Fargo Bank NA, 1.700% (LIBOR 3 Month+35 basis points), 11/16/2017(2) | | | 5,004,250 | |
Westpac Banking Corp., 1.700% (LIBOR 3 Month+35 basis points), 10/20/2017(2) | | | 6,000,000 | |
Other | | | (62,092 | ) |
| | | | |
Total | | $ | 997,777,707 | |
| | | | |
| | (1) | The collateral pool is managed by the fixed income group within the Adviser. Each Fund owns a pro-rata interest in the collateral pool determined by the value of securities on loan for such Fund. |
| | (2) | Floating rate securities are securities whose yields vary with a designated market index or market rate. These securities are shown at their current rates as of August 31, 2017. |
| | (3) | Each issue shows the rate of discount at the time of purchase. |
| | (4) | Denotes an investment in an affiliated entity. |
Commitments and Contingencies—In the normal course of business, the Corporation enters into contracts that provide general indemnifications to other parties. The Corporation’s maximum exposure under these arrangements is unknown as this would involve future claims that may be made against the Corporation that have not yet occurred. However, the Corporation has not had prior claims or losses pursuant to these contracts and expects the risk of loss to be remote.
Other—Investment transactions are accounted for on a trade date basis. Net realized gains and losses on securities are computed on the basis of specific security lot identification.
151
| | |
| Notes to Financial Statements (continued) | | |
| 3. | | Fair Value Measurement |
Fair Valuation Measurement defines fair value, establishes a framework for measuring fair value in accordance with GAAP, and requires disclosure about fair value measurements. It establishes a fair value hierarchy that distinguishes between (1) market participant assumptions developed based on market data obtained from sources independent of the reporting issuer (observable inputs), and (2) the reporting issuer’s own assumptions about market participant assumptions developed based on the best information available in the circumstances (unobservable inputs). It also provides guidance on determining when there has been a significant decrease in the volume and level of activity for an asset or liability, when a transaction is not orderly, and how that information must be incorporated into fair value measurement.
Various inputs are used in determining the value of the Funds’ investments. The inputs or methodology used for valuing securities are not necessarily an indication of the risk associated with investing in those securities. These inputs are summarized in the three broad levels listed below:
Level 1—quoted prices in active markets for identical securities. An active market for the security is a market in which transactions occur with sufficient frequency and volume to provide pricing information on an ongoing basis. Common and preferred stocks, options and futures contracts, and U.S. registered mutual funds are generally categorized as Level 1.
Level 2—other significant observable inputs (including quoted prices for similar securities, interest rates, prepayment speeds, credit risk, etc.). Fixed income securities, repurchase agreements, cash collateral received as part of the securities lending program, and securities valued by an independent fair value pricing service are generally categorized as Level 2.
Level 3—significant unobservable inputs, including management’s own assumptions in determining the fair value of investments.
In May 2015, the Financial Accounting Standards Board (the “FASB”) issued Accounting Standard Update (“ASU”) 2015-07, Disclosures for Investments in Certain Entities That Calculate Net Asset Value per Unit (or Its Equivalent), modifying ASC 820. Under the modifications, investments in private investment funds valued at net asset value are no longer included in the fair value hierarchy. The Funds did not hold any Level 3 securities as of August 31, 2017.
The following is a summary of the inputs used, as of August 31, 2017, in valuing the Funds’ assets:
| | | | | | | | | | | | | | | | |
| | | Low Volatility Equity Fund | | | | |
| | | Level 1 | | | Level 2 | | | Level 3 | | | Total | |
Common Stocks(1) | | $ | 156,360,489 | | | $ | — | | | $ | — | | | $ | 156,360,489 | |
Short-Term Investments | | | 2,833,143 | | | | 75,732,318 | | | | — | | | | 78,565,461 | |
| | | | | | | | | | | | | | | | |
Total | | $ | 159,193,632 | | | $ | 75,732,318 | | | $ | — | | | $ | 234,925,950 | |
| | | | | | | | | | | | | | | | |
| | |
| | | Dividend Income Fund | | | | |
| | | Level 1 | | | Level 2 | | | Level 3 | | | Total | |
Common Stocks(1) | | $ | 113,432,121 | | | $ | — | | | $ | — | | | $ | 113,432,121 | |
Short-Term Investments | | | 2,075,405 | | | | 52,860,743 | | | | — | | | | 54,936,148 | |
| | | | | | | | | | | | | | | | |
Total | | $ | 115,507,526 | | | $ | 52,860,743 | | | $ | — | | | $ | 168,368,269 | |
| | | | | | | | | | | | | | | | |
| | |
| | | Large-Cap Value Fund | | | | |
| | | Level 1 | | | Level 2 | | | Level 3 | | | Total | |
Common Stocks(1) | | $ | 328,437,769 | | | $ | — | | | $ | — | | | $ | 328,437,769 | |
Short-Term Investments | | | 4,411,207 | | | | 162,597,871 | | | | — | | | | 167,009,078 | |
| | | | | | | | | | | | | | | | |
Total | | $ | 332,848,976 | | | $ | 162,597,871 | | | $ | — | | | $ | 495,446,847 | |
| | | | | | | | | | | | | | | | |
| | |
| | | Large-Cap Growth Fund | | | | |
| | | Level 1 | | | Level 2 | | | Level 3 | | | Total | |
Common Stocks(1) | | $ | 351,611,827 | | | $ | — | | | $ | — | | | $ | 351,611,827 | |
Short-Term Investments | | | 4,542,780 | | | | 151,430,406 | | | | — | | | | 155,973,186 | |
| | | | | | | | | | | | | | | | |
Total | | $ | 356,154,607 | | | $ | 151,430,406 | | | $ | — | | | $ | 507,585,013 | |
| | | | | | | | | | | | | | | | |
| | |
| | | Mid-Cap Value Fund | | | | |
| | | Level 1 | | | Level 2 | | | Level 3 | | | Total | |
Common Stocks(1) | | $ | 204,439,133 | | | $ | — | | | $ | — | | | $ | 204,439,133 | |
Short-Term Investments | | | 1,880,791 | | | | 89,263,621 | | | | — | | | | 91,144,412 | |
| | | | | | | | | | | | | | | | |
Total | | $ | 206,319,924 | | | $ | 89,263,621 | | | $ | — | | | $ | 295,583,545 | |
| | | | | | | | | | | | | | | | |
| | | | | | | | | | | | | | | | |
| | | Mid-Cap Growth Fund | | | | |
| | | Level 1 | | | Level 2 | | | Level 3 | | | Total | |
Common Stocks(1) | | $ | 111,118,371 | | | $ | — | | | $ | — | | | $ | 111,118,371 | |
Short-Term Investments | | | 1,947,313 | | | | 55,413,816 | | | | — | | | | 57,361,129 | |
| | | | | | | | | | | | | | | | |
Total | | $ | 113,065,684 | | | $ | 55,413,816 | | | $ | — | | | $ | 168,479,500 | |
| | | | | | | | | | | | | | | | |
| | |
| | | Small-Cap Value Fund | | | | |
| | | Level 1 | | | Level 2 | | | Level 3 | | | Total | |
Common Stocks(1) | | $ | 63,771,066 | | | $ | — | | | $ | — | | | $ | 63,771,066 | |
Short-Term Investments | | | 588,562 | | | | 15,189,775 | | | | — | | | | 15,778,337 | |
| | | | | | | | | | | | | | | | |
Total | | $ | 64,359,628 | | | $ | 15,189,775 | | | $ | — | | | $ | 79,549,403 | |
| | | | | | | | | | | | | | | | |
| | |
| | | Small-Cap Core Fund | | | | |
| | | Level 1 | | | Level 2 | | | Level 3 | | | Total | |
Common Stocks(1) | | $ | 19,290,072 | | | $ | — | | | $ | — | | | $ | 19,290,072 | |
Short-Term Investments | | | 369,001 | | | | 9,591,857 | | | | — | | | | 9,960,858 | |
| | | | | | | | | | | | | | | | |
Total | | $ | 19,659,073 | | | $ | 9,591,857 | | | $ | — | | | $ | 29,250,930 | |
| | | | | | | | | | | | | | | | |
| | |
| | | Small-Cap Growth Fund | | | | |
| | | Level 1 | | | Level 2 | | | Level 3 | | | Total | |
Common Stocks(1) | | $ | 137,267,304 | | | $ | — | | | $ | — | | | $ | 137,267,304 | |
Short-Term Investments | | | 1,560,493 | | | | 40,411,406 | | | | — | | | | 41,971,899 | |
| | | | | | | | | | | | | | | | |
Total | | $ | 138,827,797 | | | $ | 40,411,406 | | | $ | — | | | $ | 179,239,203 | |
| | | | | | | | | | | | | | | | |
152
| | | | | | | | | | | | | | | | |
| | | Global Low Volatility Equity Fund | | | | |
| | | Level 1 | | | Level 2 | | | Level 3 | | | Total | |
Common Stocks | | | | | | | | | | | | | | | | |
Austria | | $ | — | | | $ | 423,924 | | | $ | — | | | $ | 423,924 | |
Belgium | | | — | | | | 167,104 | | | | — | | | | 167,104 | |
Bermuda | | | 1,574,150 | | | | 233,439 | | | | — | | | | 1,807,589 | |
Canada | | | 1,906,327 | | | | — | | | | — | | | | 1,906,327 | |
Cayman Islands | | | 368,570 | | | | 799,310 | | | | — | | | | 1,167,880 | |
China | | | — | | | | 1,628,638 | | | | — | | | | 1,628,638 | |
Czech Republic | | | — | | | | 341,272 | | | | — | | | | 341,272 | |
Denmark | | | — | | | | 211,022 | | | | — | | | | 211,022 | |
France | | | — | | | | 70,198 | | | | — | | | | 70,198 | |
Germany | | | — | | | | 326,729 | | | | — | | | | 326,729 | |
Guernsey | | | 988,955 | | | | — | | | | — | | | | 988,955 | |
Hong Kong | | | — | | | | 3,907,803 | | | | — | | | | 3,907,803 | |
Hungary | | | — | | | | 307,203 | | | | — | | | | 307,203 | |
Ireland | | | 116,452 | | | | — | | | | — | | | | 116,452 | |
Israel | | | — | | | | 656,520 | | | | — | | | | 656,520 | |
Italy | | | — | | | | 278,341 | | | | — | | | | 278,341 | |
Japan | | | — | | | | 4,378,531 | | | | — | | | | 4,378,531 | |
Malaysia | | | — | | | | 2,140,527 | | | | — | | | | 2,140,527 | |
Netherlands | | | — | | | | 59,856 | | | | — | | | | 59,856 | |
New Zealand | | | — | | | | 1,474,947 | | | | — | | | | 1,474,947 | |
Philippines | | | — | | | | 419,614 | | | | — | | | | 419,614 | |
Singapore | | | — | | | | 2,590,488 | | | | — | | | | 2,590,488 | |
South Korea | | | — | | | | 353,678 | | | | — | | | | 353,678 | |
Switzerland | | | — | | | | 1,948,723 | | | | — | | | | 1,948,723 | |
Taiwan | | | — | | | | 1,066,681 | | | | — | | | | 1,066,681 | |
Thailand | | | — | | | | 551,464 | | | | — | | | | 551,464 | |
United States | | | 18,960,179 | | | | — | | | | — | | | | 18,960,179 | |
Short-Term Investments | | | 2,027,575 | | | | — | | | | — | | | | 2,027,575 | |
| | | | | | | | | | | | | | | | |
Total | | $ | 25,942,208 | | | $ | 24,336,012 | | | $ | — | | | $ | 50,278,220 | |
| | | | | | | | | | | | | | | | |
| | |
| | | Disciplined International Equity Fund | | | | |
| | | Level 1 | | | Level 2 | | | Level 3 | | | Total | |
Common Stocks | | | | | | | | | | | | | | | | |
Australia | | $ | — | | | $ | 4,577,683 | | | $ | — | | | $ | 4,577,683 | |
Belgium | | | — | | | | 108,926 | | | | — | | | | 108,926 | |
Bermuda | | | 132,606 | | | | — | | | | — | | | | 132,606 | |
Cayman Islands | | | — | | | | 396,977 | | | | — | | | | 396,977 | |
Denmark | | | — | | | | 2,245,894 | | | | — | | | | 2,245,894 | |
Finland | | | — | | | | 1,984,463 | | | | — | | | | 1,984,463 | |
France | | | — | | | | 9,646,682 | | | | — | | | | 9,646,682 | |
Germany | | | — | | | | 5,418,563 | | | | — | | | | 5,418,563 | |
Hong Kong | | | — | | | | 600,556 | | | | — | | | | 600,556 | |
Ireland | | | 872,246 | | | | — | | | | — | | | | 872,246 | |
Israel | | | 196,332 | | | | | | | | — | | | | 196,332 | |
Italy | | | — | | | | 394,311 | | | | — | | | | 394,311 | |
Japan | | | — | | | | 17,203,154 | | | | — | | | | 17,203,154 | |
Jersey | | | 1,459,496 | | | | 275,094 | | | | — | | | | 1,734,590 | |
Luxembourg | | | 389,900 | | | | 357,096 | | | | — | | | | 746,996 | |
Marshall Islands | | | 99,253 | | | | — | | | | — | | | | 99,253 | |
Netherlands | | | 460,295 | | | | 2,601,819 | | | | — | | | | 3,062,114 | |
New Zealand | | | — | | | | 399,560 | | | | — | | | | 399,560 | |
Norway | | | — | | | | 780,375 | | | | — | | | | 780,375 | |
Portugal | | | — | | | | 775,991 | | | | — | | | | 775,991 | |
Singapore | | | — | | | | 1,696,983 | | | | — | | | | 1,696,983 | |
Spain | | | — | | | | 798,001 | | | | — | | | | 798,001 | |
Sweden | | | — | | | | 1,889,983 | | | | — | | | | 1,889,983 | |
Switzerland | | | 1,174,896 | | | | 3,310,776 | | | | — | | | | 4,485,672 | |
United Kingdom | | | — | | | | 11,218,319 | | | | — | | | | 11,218,319 | |
Short-Term Investments | | | 4,938,088 | | | | — | | | | — | | | | 4,938,088 | |
| | | | | | | | | | | | | | | | |
Total | | $ | 9,723,112 | | | $ | 66,681,206 | | | $ | — | | | $ | 76,404,318 | |
| | | | | | | | | | | | | | | | |
| | |
| | | Pyrford International Stock Fund | | | | |
| | | Level 1 | | | Level 2 | | | Level 3 | | | Total | |
Common Stocks(1) | | $ | — | | | $ | 585,882,515 | | | $ | — | | | $ | 585,882,515 | |
Preferred Stocks(1) | | | — | | | | 10,159,146 | | | | — | | | | 10,159,146 | |
Short-Term Investments | | | 44,983,487 | | | | — | | | | — | | | | 44,983,487 | |
| | | | | | | | | | | | | | | | |
Total | | $ | 44,983,487 | | | $ | 596,041,661 | | | $ | — | | | $ | 641,025,148 | |
| | | | | | | | | | | | | | | | |
| | | | | | | | | | | | | | | | |
| | | LGM Emerging Markets Equity Fund | | | | |
| | | Level 1 | | | Level 2 | | | Level 3 | | | Total | |
Common Stocks | | | | | | | | | | | | | | | | |
Bermuda | | $ | 2,421,504 | | | $ | 3,919,033 | | | $ | — | | | $ | 6,340,537 | |
Brazil | | | 1,655,118 | | | | — | | | | — | | | | 1,655,118 | |
Cayman Islands | | | — | | | | 3,249,913 | | | | — | | | | 3,249,913 | |
Chile | | | 2,738,855 | | | | — | | | | — | | | | 2,738,855 | |
China | | | — | | | | 3,609,517 | | | | — | | | | 3,609,517 | |
Egypt | | | 691,394 | | | | 5,784,314 | | | | — | | | | 6,475,708 | |
Hong Kong | | | — | | | | 4,372,616 | | | | — | | | | 4,372,616 | |
India | | | — | | | | 35,985,563 | | | | — | | | | 35,985,563 | |
Indonesia | | | — | | | | 18,336,067 | | | | — | | | | 18,336,067 | |
Kenya | | | — | | | | 802,539 | | | | — | | | | 802,539 | |
Malaysia | | | — | | | | 5,945,306 | | | | — | | | | 5,945,306 | |
Mexico | | | 16,402,117 | | | | — | | | | — | | | | 16,402,117 | |
Nigeria | | | — | | | | 1,658,823 | | | | — | | | | 1,658,823 | |
Philippines | | | — | | | | 5,843,654 | | | | — | | | | 5,843,654 | |
South Africa | | | — | | | | 10,322,257 | | | | — | | | | 10,322,257 | |
Taiwan | | | — | | | | 3,488,268 | | | | — | | | | 3,488,268 | |
Thailand | | | 1,548,853 | | | | — | | | | — | | | | 1,548,853 | |
Turkey | | | — | | | | 5,760,591 | | | | — | | | | 5,760,591 | |
United States | | | 11,847,839 | | | | — | | | | — | | | | 11,847,839 | |
Vietnam | | | — | | | | 1,622,909 | | | | — | | | | 1,622,909 | |
Common Stock Units | | | 3,837,734 | | | | — | | | | — | | | | 3,837,734 | |
Participation Notes | | | — | | | | 4,187,718 | | | | — | | | | 4,187,718 | |
Short-Term Investments | | | 6,781,457 | | | | — | | | | — | | | | 6,781,457 | |
| | | | | | | | | | | | | | | | |
Total | | $ | 47,924,871 | | | $ | 114,889,088 | | | $ | — | | | $ | 162,813,959 | |
| | | | | | | | | | | | | | | | |
| | |
| | | TCH Emerging Markets Bond Fund | | | | |
| | | Level 1 | | | Level 2 | | | Level 3 | | | Total | |
Corporate Bonds & Notes | | $ | — | | | $ | 6,540,506 | | | $ | — | | | $ | 6,540,506 | |
International Bonds | | | — | | | | 4,932,718 | | | | — | | | | 4,932,718 | |
Short-Term Investments | | | 1,170,326 | | | | — | | | | — | | | | 1,170,326 | |
| | | | | | | | | | | | | | | | |
Total | | $ | 1,170,326 | | | $ | 11,473,224 | | | $ | — | | | $ | 12,643,550 | |
| | | | | | | | | | | | | | | | |
153
| | |
| Notes to Financial Statements (continued) | | |
| | | | | | | | | | | | | | | | |
| | | Alternative Strategies Fund(2) | | | | |
| | | Level 1 | | | Level 2 | | | Level 3 | | | Total | |
| Assets-Long | | | | | | | | | | | | | | | | |
Bank Loans | | $ | — | | | $ | 4,508,381 | | | $ | — | | | $ | 4,508,381 | |
Common Stocks | | | | | | | | | | | | | | | | |
Australia | | | — | | | | 82,605 | | | | — | | | | 82,605 | |
Bermuda | | | 301,004 | | | | — | | | | — | | | | 301,004 | |
Canada | | | 626,870 | | | | — | | | | — | | | | 626,870 | |
Cayman Islands | | | — | | | | 28,448 | | | | — | | | | 28,448 | |
China | | | — | | | | 58,799 | | | | — | | | | 58,799 | |
Denmark | | | — | | | | 30,364 | | | | — | | | | 30,364 | |
France | | | — | | | | 149,471 | | | | — | | | | 149,471 | |
Germany | | | — | | | | 124,612 | | | | — | | | | 124,612 | |
Hungary | | | — | | | | 85,559 | | | | — | | | | 85,559 | |
Ireland | | | 2,243,249 | | | | — | | | | — | | | | 2,243,249 | |
Italy | | | — | | | | 123,207 | | | | — | | | | 123,207 | |
Japan | | | — | | | | 1,125,816 | | | | — | | | | 1,125,816 | |
Jersey | | | 529,718 | | | | 32,783 | | | | — | | | | 562,501 | |
Luxembourg | | | 212,808 | | | | — | | | | — | | | | 212,808 | |
Netherlands | | | 329,144 | | | | 256,614 | | | | — | | | | 585,758 | |
New Zealand | | | — | | | | 111,694 | | | | — | | | | 111,694 | |
Norway | | | — | | | | 39,344 | | | | — | | | | 39,344 | |
Panama | | | 62,779 | | | | — | | | | — | | | | 62,779 | |
Singapore | | | 617,154 | | | | 26,943 | | | | — | | | | 644,097 | |
Sweden | | | — | | | | 34,787 | | | | — | | | | 34,787 | |
United Kingdom | | | — | | | | 333,153 | | | | — | | | | 333,153 | |
United States | | | 32,980,242 | | | | — | | | | — | | | | 32,980,242 | |
Convertible Bonds | | | — | | | | 124,820 | | | | — | | | | 124,820 | |
Corporate Bonds & Notes | | | — | | | | 576,046 | | | | — | | | | 576,046 | |
Limited Partnership Units | | | 624,544 | | | | — | | | | — | | | | 624,544 | |
Mutual Funds | | | 850,342 | | | | — | | | | — | | | | 850,342 | |
Purchased Options | | | 859,080 | | | | — | | | | — | | | | 859,080 | |
Short-Term Investments | | | 37,183,212 | | | | 12,493,827 | | | | — | | | | 49,677,039 | |
| | | | | | | | | | | | | | | | |
Total | | $ | 77,420,146 | | | $ | 20,347,273 | | | $ | — | | | $ | 97,767,419 | |
| | | | | | | | | | | | | | | | |
Liabilities-Short | | | | | | | | | | | | | | | | |
Common Stocks | | | | | | | | | | | | | | | | |
Australia | | $ | — | | | $ | 85,485 | | | $ | — | | | $ | 85,485 | |
Belgium | | | — | | | | 16,922 | | | | — | | | | 16,922 | |
Bermuda | | | — | | | | 16,500 | | | | — | | | | 16,500 | |
Canada | | | 730,824 | | | | — | | | | — | | | | 730,824 | |
Cayman Islands | | | 46,604 | | | | — | | | | — | | | | 46,604 | |
Finland | | | — | | | | 18,838 | | | | — | | | | 18,838 | |
Germany | | | — | | | | 207,035 | | | | — | | | | 207,035 | |
Ireland | | | 340,697 | | | | — | | | | — | | | | 340,697 | |
Japan | | | — | | | | 511,204 | | | | — | | | | 511,204 | |
Netherlands | | | — | | | | 74,219 | | | | — | | | | 74,219 | |
New Zealand | | | — | | | | 53,530 | | | | — | | | | 53,530 | |
Norway | | | — | | | | 74,573 | | | | — | | | | 74,573 | |
Spain | | | — | | | | 69,332 | | | | — | | | | 69,332 | |
Sweden | | | — | | | | 236,162 | | | | — | | | | 236,162 | |
Switzerland | | | — | | | | 248,462 | | | | — | | | | 248,462 | |
United Kingdom | | | 198,691 | | | | 335,179 | | | | — | | | | 533,870 | |
United States | | | 9,751,821 | | | | — | | | | — | | | | 9,751,821 | |
Corporate Bonds & Notes | | | — | | | | 144,972 | | | | — | | | | 144,972 | |
Exchange Traded Funds | | | 4,574,132 | | | | — | | | | — | | | | 4,574,132 | |
Written Options | | | 1,054,953 | | | | — | | | | — | | | | 1,054,953 | |
| | | | | | | | | | | | | | | | |
Total | | $ | 16,697,722 | | | $ | 2,092,413 | | | $ | — | | | $ | 18,790,135 | |
| | | | | | | | | | | | | | | | |
| | | | | | | | | | | | | | | | |
| | | Global Long/Short Equity Fund | | | | |
| | | Level 1 | | | Level 2 | | | Level 3 | | | Total | |
Assets-Long | | | | | | | | | | | | | | | | |
Common Stocks | | | | | | | | | | | | | | | | |
Australia | | $ | — | | | $ | 87,539 | | | $ | — | | | $ | 87,539 | |
Bermuda | | | 305,683 | | | | — | | | | — | | | | 305,683 | |
Canada | | | 315,376 | | | | — | | | | — | | | | 315,376 | |
Cayman Islands | | | — | | | | 30,416 | | | | — | | | | 30,416 | |
China | | | — | | | | 63,316 | | | | — | | | | 63,316 | |
Denmark | | | — | | | | 33,180 | | | | — | | | | 33,180 | |
France | | | — | | | | 158,678 | | | | — | | | | 158,678 | |
Germany | | | — | | | | 132,156 | | | | — | | | | 132,156 | |
Greece | | | — | | | | 44,718 | | | | — | | | | 44,718 | |
Hungary | | | — | | | | 90,685 | | | | — | | | | 90,685 | |
Ireland | | | 34,305 | | | | — | | | | — | | | | 34,305 | |
Italy | | | — | | | | 130,615 | | | | — | | | | 130,615 | |
Japan | | | — | | | | 1,245,403 | | | | — | | | | 1,245,403 | |
Jersey | | | — | | | | 34,765 | | | | — | | | | 34,765 | |
Luxembourg | | | 225,642 | | | | — | | | | — | | | | 225,642 | |
Netherlands | | | — | | | | 272,075 | | | | — | | | | 272,075 | |
New Zealand | | | — | | | | 118,362 | | | | — | | | | 118,362 | |
Norway | | | — | | | | 41,702 | | | | — | | | | 41,702 | |
Panama | | | 66,750 | | | | — | | | | — | | | | 66,750 | |
Poland | | | — | | | | 51,742 | | | | — | | | | 51,742 | |
Singapore | | | — | | | | 28,604 | | | | — | | | | 28,604 | |
South Korea | | | — | | | | 138,352 | | | | — | | | | 138,352 | |
Sweden | | | — | | | | 36,867 | | | | — | | | | 36,867 | |
Taiwan | | | — | | | | 46,893 | | | | — | | | | 46,893 | |
United Kingdom | | | — | | | | 353,146 | | | | — | | | | 353,146 | |
United States | | | 5,496,691 | | | | — | | | | — | | | | 5,496,691 | |
Short-Term Investments | | | 3,884,482 | | | | — | | | | — | | | | 3,884,482 | |
| | | | | | | | | | | | | | | | |
Total | | $ | 10,328,929 | | | $ | 3,139,214 | | | $ | — | | | $ | 13,468,143 | |
| | | | | | | | | | | | | | | | |
Liabilities-Short | | | | | | | | | | | | | | | | |
Common Stocks | | | | | | | | | | | | | | | | |
Australia | | $ | — | | | $ | 90,592 | | | $ | — | | | $ | 90,592 | |
Belgium | | | — | | | | 18,501 | | | | — | | | | 18,501 | |
Bermuda | | | — | | | | 17,542 | | | | — | | | | 17,542 | |
Cayman Islands | | | 49,412 | | | | — | | | | — | | | | 49,412 | |
Finland | | | — | | | | 19,978 | | | | — | | | | 19,978 | |
Germany | | | — | | | | 119,631 | | | | — | | | | 119,631 | |
Japan | | | — | | | | 606,156 | | | | — | | | | 606,156 | |
Netherlands | | | — | | | | 78,657 | | | | — | | | | 78,657 | |
New Zealand | | | — | | | | 56,746 | | | | — | | | | 56,746 | |
Norway | | | — | | | | 79,054 | | | | — | | | | 79,054 | |
Spain | | | — | | | | 73,498 | | | | — | | | | 73,498 | |
Sweden | | | — | | | | 76,457 | | | | — | | | | 76,457 | |
Switzerland | | | — | | | | 32,381 | | | | — | | | | 32,381 | |
United Kingdom | | | — | | | | 355,213 | | | | — | | | | 355,213 | |
United States | | | 1,780,421 | | | | — | | | | — | | | | 1,780,421 | |
| | | | | | | | | | | | | | | | |
Total | | $ | 1,829,833 | | | $ | 1,624,406 | | | $ | — | | | $ | 3,454,239 | |
| | | | | | | | | | | | | | | | |
| | |
| | | Ultra Short Tax-Free Fund | | | | |
| | | Level 1 | | | Level 2 | | | Level 3 | | | Total | |
Municipals | | $ | — | | | $ | 634,462,688 | | | $ | — | | | $ | 634,462,688 | |
Short-Term Investments | | | 80,322 | | | | 47,567,678 | | | | — | | | | 47,648,000 | |
| | | | | | | | | | | | | | | | |
Total | | $ | 80,322 | | | $ | 682,030,366 | | | $ | — | | | $ | 682,110,688 | |
| | | | | | | | | | | | | | | | |
| | |
| | | Short Tax-Free Fund | | | | |
| | | Level 1 | | | Level 2 | | | Level 3 | | | Total | |
Municipals | | $ | — | | | $ | 172,490,237 | | | $ | — | | | $ | 172,490,237 | |
Mutual Funds | | | 866,132 | | | | — | | | | — | | | | 866,132 | |
Short-Term Investments | | | 115,488 | | | | 1,708,050 | | | | — | | | | 1,823,538 | |
| | | | | | | | | | | | | | | | |
Total | | $ | 981,620 | | | $ | 174,198,287 | | | $ | — | | | $ | 175,179,907 | |
| | | | | | | | | | | | | | | | |
154
| | | | | | | | | | | | | | | | |
| | | Short-Term Income Fund | | | | |
| | | Level 1 | | | Level 2 | | | Level 3 | | | Total | |
Asset-Backed Securities | | $ | — | | | $ | 52,318,672 | | | $ | — | | | $ | 52,318,672 | |
Collateralized Mortgage Obligations | | | — | | | | 7,314,490 | | | | — | | | | 7,314,490 | |
Commercial Mortgage Securities | | | — | | | | 17,127,899 | | | | — | | | | 17,127,899 | |
Corporate Bonds & Notes | | | — | | | | 101,120,535 | | | | — | | | | 101,120,535 | |
Mutual Funds | | | 3,675,768 | | | | — | | | | — | | | | 4,675,682 | * |
U.S. Government & U.S. Government Agency Obligations | | | — | | | | 38,576,770 | | | | — | | | | 38,576,770 | |
U.S. Government Agency-Mortgage Securities | | | — | | | | 1,228,888 | | | | — | | | | 1,228,888 | |
Short-Term Investments | | | 4,464,102 | | | | 64,867,113 | | | | — | | | | 69,331,215 | |
| | | | | | | | | | | | | | | | |
Total | | $ | 8,139,870 | | | $ | 282,554,367 | | | $ | — | | | $ | 291,694,151 | |
| | | | | | | | | | | | | | | | |
| * | Total includes a $999,914 private placement senior loan fund holding valued using practical expedient. |
| | | | | | | | | | | | | | | | |
| | |
| | | Intermediate Tax-Free Fund | | | | |
| | | Level 1 | | | Level 2 | | | Level 3 | | | Total | |
Municipals | | $ | — | | | $ | 1,591,471,242 | | | $ | — | | | $ | 1,591,471,242 | |
Mutual Funds | | | 16,625,697 | | | | — | | | | — | | | | 16,625,697 | |
Short-Term Investments | | | 79,783 | | | | 2,008,460 | | | | — | | | | 2,088,243 | |
| | | | | | | | | | | | | | | | |
Total | | $ | 16,705,480 | | | $ | 1,593,479,702 | | | $ | — | | | $ | 1,610,185,182 | |
| | | | | | | | | | | | | | | | |
| | |
| | | Strategic Income Fund | | | | |
| | | Level 1 | | | Level 2 | | | Level 3 | | | Total | |
Asset-Backed Securities | | $ | — | | | $ | 252,973 | | | $ | — | | | $ | 252,973 | |
Collateralized Mortgage Obligations | | | — | | | | 12,025,287 | | | | — | | | | 12,025,287 | |
Commercial Mortgage Securities | | | — | | | | 6,760,639 | | | | — | | | | 6,760,639 | |
Corporate Bonds & Notes | | | — | | | | 74,882,868 | | | | — | | | | 74,882,868 | |
U.S. Government Agency-Mortgage Securities | | | — | | | | 17,660,274 | | | | — | | | | 17,660,274 | |
Short-Term Investments | | | 938,029 | | | | 24,164,624 | | | | — | | | | 25,102,653 | |
| | | | | | | | | | | | | | | | |
Total | | $ | 938,029 | | | $ | 135,746,665 | | | $ | — | | | $ | 136,684,694 | |
| | | | | | | | | | | | | | | | |
| | |
| | | TCH Corporate Income Fund | | | | |
| | | Level 1 | | | Level 2 | | | Level 3 | | | Total | |
Corporate Bonds & Notes | | $ | — | | | $ | 240,187,039 | | | $ | — | | | $ | 240,187,039 | |
Municipals | | | — | | | | 565,325 | | | | — | | | | 565,325 | |
U.S. Government & U.S. Government Agency Obligations | | | — | | | | 8,563,532 | | | | — | | | | 8,563,532 | |
Short-Term Investments | | | 4,410,836 | | | | 59,729,711 | | | | — | | | | 64,140,547 | |
| | | | | | | | | | | | | | | | |
Total | | $ | 4,410,836 | | | $ | 309,045,607 | | | $ | — | | | $ | 313,456,443 | |
| | | | | | | | | | | | | | | | |
| | | | | | | | | | | | | | | | |
| | | TCH Core Plus Bond Fund | | | | |
| | | Level 1 | | | Level 2 | | | Level 3 | | | Total | |
Corporate Bonds & Notes | | $ | — | | | $ | 481,886,091 | | | $ | — | | | $ | 481,886,091 | |
Municipals | | | — | | | | 339,195 | | | | — | | | | 339,195 | |
U.S. Government & U.S. Government Agency Obligations | | | — | | | | 132,538,030 | | | | — | | | | 132,538,030 | |
U.S. Government Agency-Mortgage Securities | | | — | | | | 378,675,083 | | | | — | | | | 378,675,083 | |
Short-Term Investments | | | 46,560,055 | | | | 210,537,373 | | | | — | | | | 257,097,428 | |
| | | | | | | | | | | | | | | | |
Total | | $ | 46,560,055 | | | $ | 1,203,975,772 | | | $ | — | | | $ | 1,250,535,827 | |
| | | | | | | | | | | | | | | | |
| | |
| | | High Yield Bond Fund | | | | |
| | | Level 1 | | | Level 2 | | | Level 3 | | | Total | |
Corporate Bonds & Notes | | $ | — | | | $ | 12,774,444 | | | $ | — | | | $ | 12,774,444 | |
Short-Term Investments | | | 360,045 | | | | — | | | | — | | | | 360,045 | |
| | | | | | | | | | | | | | | | |
Total | | $ | 360,045 | | | $ | 12,774,444 | | | $ | — | | | $ | 13,134,489 | |
| | | | | | | | | | | | | | | | |
| | |
| | | Government Money Market Fund | | | | |
| | | Level 1 | | | Level 2 | | | Level 3 | | | Total | |
Mutual Funds | | $ | 170,000,000 | | | $ | — | | | $ | — | | | $ | 170,000,000 | |
Repurchase Agreements | | | — | | | | 608,302,536 | | | | — | | | | 608,302,536 | |
U.S. Government & U.S. Government Agency Obligations | | | — | | | | 2,656,442,412 | | | | — | | | | 2,656,442,412 | |
| | | | | | | | | | | | | | | | |
Total | | $ | 170,000,000 | | | $ | 3,264,744,948 | | | $ | — | | | $ | 3,434,744,948 | |
| | | | | | | | | | | | | | | | |
| | |
| | | Tax-Free Money Market Fund | | | | |
| | | Level 1 | | | Level 2 | | | Level 3 | | | Total | |
Municipals | | $ | — | | | $ | 319,281,383 | | | $ | — | | | $ | 319,281,383 | |
Mutual Funds | | | 201,486 | | | | — | | | | — | | | | 201,486 | |
| | | | | | | | | | | | | | | | |
Total | | $ | 201,486 | | | $ | 319,281,383 | | | $ | — | | | $ | 319,482,869 | |
| | | | | | | | | | | | | | | | |
| | |
| | | Prime Money Market Fund | | | | |
| | | Level 1 | | | Level 2 | | | Level 3 | | | Total | |
Certificates of Deposit | | $ | — | | | $ | 94,626,136 | | | $ | — | | | $ | 94,626,136 | |
Commercial Paper | | | — | | | | 211,629,516 | | | | — | | | | 211,629,516 | |
Municipals | | | — | | | | 15,875,000 | | | | — | | | | 15,875,000 | |
Mutual Funds | | | 26,000,000 | | | | — | | | | — | | | | 26,000,000 | |
Repurchase Agreements | | | — | | | | 20,618,301 | | | | — | | | | 20,618,301 | |
| | | | | | | | | | | | | | | | |
Total | | $ | 26,000,000 | | | $ | 342,748,953 | | | $ | — | | | $ | 368,748,953 | |
| | | | | | | | | | | | | | | | |
| | |
| | | Institutional Prime Money Market Fund | | | | |
| | | Level 1 | | | Level 2 | | | Level 3 | | | Total | |
Certificates of Deposit | | $ | — | | | $ | 70,654,562 | | | $ | — | | | $ | 70,654,562 | |
Commercial Paper | | | — | | | | 237,081,780 | | | | — | | | | 237,081,780 | |
Mutual Funds | | | 24,201,139 | | | | — | | | | — | | | | 24,201,139 | |
Repurchase Agreements | | | — | | | | 70,000,000 | | | | — | | | | 70,000,000 | |
| | | | | | | | | | | | | | | | |
Total | | $ | 24,201,139 | | | $ | 377,736,342 | | | $ | — | | | $ | 401,937,481 | |
| | | | | | | | | | | | | | | | |
| (1) | All sub-categories within Common Stocks and Preferred Stocks represent either entire Level 1 or Level 2 evaluation status. |
| (2) | The following is a summary of other financial instruments that are derivative instruments not reflected in the Schedules of Investments, such as futures and forward contracts. Amounts below are the unrealized appreciation/(depreciation) on the investment. |
155
| | |
| Notes to Financial Statements (continued) | | |
| | | | | | | | | | | | | | | | |
| | | Unrealized Appreciation/(Depreciation) On
Other Financial Instruments | |
Fund | | Level 1 | | | Level 2 | | | Level 3 | | | Total | |
Alternative Strategies Fund | | | | | | | | | | | | | | | | |
Long Forward Contracts | | $ | — | | | $ | 763,104 | | | $ | — | | | $ | 763,104 | |
Short Forward Contracts | | | — | | | | (562,707 | ) | | | — | | | | (562,707 | ) |
| | | | | | | | | | | | | | | | |
Total Forwards | | $ | — | | | $ | 200,397 | | | $ | — | | | $ | 200,397 | |
| | | | | | | | | | | | | | | | |
Long Futures Contracts | | $ | 244,281 | | | $ | — | | | $ | — | | | $ | 244,281 | |
Short Futures Contracts | | | (15,427 | ) | | | — | | | | — | | | | (15,427 | ) |
| | | | | | | | | | | | | | | | |
Total Futures | | $ | 228,854 | | | $ | — | | | $ | — | | | $ | 228,854 | |
| | | | | | | | | | | | | | | | |
It is the Funds’ policy to recognize transfers between category levels at the end of the period. As described in Note 2, the Funds’ have retained an independent pricing service to fair value foreign equity securities for events occurring after the close of the market in which the security is principally traded. These valuations occurred on August 31, 2017, but not on August 31, 2016, resulting in transfers between categorization levels.
The following is a reconciliation of transfers between category levels from August 31, 2016 to August 31, 2017:
| | | | | | | | | | | | | | | | | | | | | | | | | | | | |
| | | Global Low
Volatility
Equity Fund | | | Disciplined
International
Equity Fund | | | Pyrford
International
Stock Fund | | | LGM
Emerging
Markets
Equity Fund | | | Alternative
Strategies Fund
- Short
Transfers | | | Global
Long/Short
Equity Fund
- Long
Transfers | | | Global
Long/Short
Equity Fund
- Short
Transfers | |
Transfers into Level 1 | | $ | — | | | $ | — | | | $ | — | | | $ | — | | | $ | — | | | $ | — | | | $ | — | |
Transfers out of Level 1 | | | (19,038,852 | ) | | | (46,764,286 | ) | | | (528,090,901 | ) | | | (87,271,461 | ) | | | (315,068 | ) | | | (2,275,656 | ) | | | (874,778 | ) |
| | | | | | | | | | | | | | | | | | | | | | | | | | | | |
Net Transfers out of Level 1 | | $ | (19,038,852 | ) | | $ | (46,764,286 | ) | | $ | (528,090,901 | ) | | $ | (87,271,461 | ) | | $ | (315,068 | ) | | $ | (2,275,656 | ) | | $ | (874,778 | ) |
| | | | | | | | | | | | | | | | | | | | | | | | | | | | |
Transfers into Level 2 | | $ | 19,038,852 | | | $ | 46,764,286 | | | | 528,090,901 | | | $ | 87,271,461 | | | $ | 315,068 | | | $ | 2,275,656 | | | $ | 874,778 | |
Transfers out of Level 2 | | | — | | | | — | | | | — | | | | — | | | | — | | | | — | | | | — | |
| | | | | | | | | | | | | | | | | | | | | | | | | | | | |
Net Transfers into Level 2 | | $ | 19,038,852 | | | $ | 46,764,286 | | | $ | 528,090,901 | | | $ | 87,271,461 | | | $ | 315,068 | | | $ | 2,275,656 | | | $ | 874,778 | |
| | | | | | | | | | | | | | | | | | | | | | | | | | | | |
| 4. | | Derivative Holdings and Activity Detail |
Derivatives and Hedging Disclosures—Derivatives and hedging require enhanced disclosures about the Funds’ derivative and hedging activities, including how such activities are accounted for and their effects on the Funds’ financial positions, performance and cash flows. For the year ended August 31, 2017, the Alternative Strategies Fund utilized all derivatives for the purposes of generating and enhancing total return.
During the year ended August 31, 2017, the Alternative Strategies Fund had average quarterly contracts or notional values outstanding:
| | | | | | | | | | |
Average Quarterly Contracts | | Average Quarterly Notional Values |
Long Futures | | Short Futures | | Purchased Options | | Written Options | | Long Forwards | | Short Forwards |
| 618 | | 121 | | 618 | | 1,177 | | $33,189,114 | | $29,582,452 |
156
The effects of these derivative instruments on the Fund’s financial positions and financial performance are reflected in the Statements of Assets and Liabilities and Statements of Operations, and are presented in the table below. The values of derivative instruments as of August 31, 2017 by risk category are as follows:
| | | | | | | | | | | | |
| | | Statement of
Asset and Liabilities | | | Statement of Operations | |
Fund/Financial Instrument Type | | Amount | | | Realized
Gain/(Loss) | | | Net Change in
Unrealized
Appreciation/
(Depreciation) | |
Alternative Strategies Fund | | | | | | | | | | | | |
Interest rate futures contracts: | | | | | | | | | | | | |
Receivables for daily variation margin | | $ | 97,703 | | | | | | | | | |
Payables for daily variation margin | | | (30,443 | ) | | | | | | | | |
| | | | | | | | | | | | |
Net | | | 67,260 | | | $ | (334,572 | ) | | $ | 46,875 | |
| | | |
Equity futures contracts: | | | | | | | | | | | | |
Receivables for daily variation margin | | | 227,114 | | | | | | | | | |
Payables for daily variation margin | | | (65,520 | ) | | | | | | | | |
| | | | | | | | | | | | |
Net | | | 161,594 | | | | 970,688 | | | | 132,911 | |
| | | |
Total receivables for interest rate and equity futures contracts | | | 324,817 | | | | | | | | | |
Total payables for interest rate and equity futures contracts | | | (95,963 | ) | | | | | | | | |
| | | | | | | | | | | | |
Net | | $ | 228,854 | | | $ | 636,116 | | | $ | 179,786 | |
| | | | | | | | | | | | |
Forward foreign exchange contracts: | | | | | | | | | | | | |
Receivables for forward foreign exchange contracts | | $ | 876,068 | | | | | | | | | |
Payables for forward foreign exchange contracts | | | (675,671 | ) | | | | | | | | |
| | | | | | | | | | | | |
Net | | $ | 200,397 | | | $ | 438,847 | | | $ | 189,412 | |
| | | | | | | | | | | | |
Equity option contracts: | | | | | | | | | | | | |
Purchased options | | $ | 859,080 | | | $ | (872,774 | ) | | $ | (331,039 | ) |
| | | | | | | | | | | | |
Written options | | $ | (1,054,953 | ) | | $ | 1,647,284 | | | $ | 336,447 | |
| | | | | | | | | | | | |
Offsetting of Assets and Liabilities—Disclosures about offsetting assets and liabilities require an entity to disclose information about offsetting and related arrangements to enable users of its financial statements to understand the effect of those arrangements on its financial position. The guidance requires retrospective application for all comparative periods presented. As of August 31, 2017, no master netting arrangements exist related to the Funds. The Funds’ Statements of Assets and Liabilities (“SAL”) presents derivative instruments on a gross basis, therefore, no net amounts and no offset amounts exist within the SAL to present below. Gross amounts of the derivative instruments, amounts related to financial instruments/cash collateral not offset in the SAL and net amounts are presented below:
| | | | | | | | | | | | | | | | | | | | | | | | | | | | | | | | | | | | |
| | | Derivative Assets | | | Derivative Liabilities | | | Net
Derivative
Assets
(Liabilities) | | | Collateral Pledged
(Received) (1) | | | | |
Fund/Counterparty | | Forward
Currency
Contracts | | | Futures
Contracts | | | Forward
Currency
Contracts | | | Futures
Contracts | | | Written
Options | | | | Financial
Instruments | | | Cash | | | Net
Amount | |
Alternative Strategies Fund | | | | | | | | | | | | | | | | | | | | | | | | | | | | | | | | | | | | |
Bank of America Merrill Lynch (Over the Counter) | | $ | 876,068 | | | $ | — | | | $ | (675,671 | ) | | $ | — | | | $ | — | | | $ | 200,397 | | | $ | — | | | $ | — | | | $ | 200,397 | |
Exchange Traded Futures Contracts | | | — | | | | 324,817 | | | | — | | | | (95,963 | ) | | | — | | | | 228,854 | | | | — | | | | — | | | | 228,854 | |
Exchange Traded Options Contracts | | | — | | | | — | | | | — | | | | — | | | | (1,054,953 | ) | | | (1,054,953 | ) | | | — | | | | 1,054,953 | | | | — | |
| (1) | Collateral pledged exceeds amount of liability balance. |
At period end, certain Funds covered in this report had investments in repurchase agreements. The gross value and related collateral received for these investments are presented in each applicable Fund’s Schedule of Investments and the value of these investments is also presented in the Statements of Assets and Liabilities. The value of the related collateral received exceeded the value of the repurchase agreements as of August 31, 2017.
157
| | |
| Notes to Financial Statements (continued) | | |
The Articles of Incorporation permit the Directors to issue an indefinite number of full and fractional shares of common stock, par value $0.0001 per share. Transactions in capital stock were as follows:
| | | | | | | | | | | | | | | | | | | | | | | | |
| | | | | | | | | | |
| | | Low Volatility
Equity Fund | | | Dividend
Income Fund | | | Large-Cap
Value Fund | |
| | | Year Ended
August 31,
2017
| | | Year Ended
August 31,
2016
| | | Year Ended
August 31,
2017
| | | Year Ended
August 31,
2016
| | | Year Ended
August 31,
2017
| | | Year Ended
August 31,
2016
| |
Capital stock transactions in dollars: | | | | | | | | | | | | | | | | | | | | | | | | |
Proceeds from sale of shares: | | | | | | | | | | | | | | | | | | | | | | | | |
Investor class of shares | | $ | — | | | $ | — | | | $ | — | | | $ | — | | | $ | 25,782,143 | (1) | | $ | 41,929,434 | |
Advisor class of shares | | | 30,709,923 | | | | 20,450,099 | | | | 9,963,731 | | | | 12,240,448 | | | | 2,132,939 | | | | 6,500 | |
Institutional class of shares | | | 23,796,019 | | | | 57,444,854 | | | | 84,755,232 | | | | 5,367,352 | | | | 209,105,302 | | | | 62,929,469 | |
Retirement class R-3 of shares | | | — | | | | — | | | | — | | | | — | | | | — | | | | — | |
Retirement class R-6 of shares | | | — | | | | — | | | | — | | | | — | | | | 1,523,544 | | | | 50,000 | (2) |
Advisor class transfers from termination of Investor class | | | — | | | | — | | | | — | | | | — | | | | 186,891,192 | | | | — | |
| | | | | | | | | | | | | | | | | | | | | | | | |
Net proceeds from sale of shares | | | 54,505,942 | | | | 77,894,953 | | | | 94,718,963 | | | | 17,607,800 | | | | 425,435,120 | | | | 104,915,403 | |
Net asset value of shares issued to shareholders in payment of distributions declared: | | | | | | | | | | | | | | | | | | | | | | | | |
Investor class of shares | | | — | | | | — | | | | — | | | | — | | | | 3,003,799 | (1) | | | 19,028,638 | |
Advisor class of shares | | | 600,108 | | | | 271,512 | | | | 1,904,772 | | | | 6,370,133 | | | | 523,217 | | | | 3,421 | |
Institutional class of shares | | | 3,555,616 | | | | 3,503,523 | | | | 1,431,043 | | | | 2,938,755 | | | | 3,151,481 | | | | 14,194,204 | |
Retirement class R-3 of shares | | | — | | | | — | | | | — | | | | — | | | | — | | | | — | |
Retirement class R-6 of shares | | | — | | | | — | | | | — | | | | — | | | | 5,361 | | | | 303 | (2) |
| | | | | | | | | | | | | | | | | | | | | | | | |
Net proceeds from shares issued | | | 4,155,724 | | | | 3,775,035 | | | | 3,335,815 | | | | 9,308,888 | | | | 6,683,858 | | | | 33,226,566 | |
Cost of shares redeemed: | | | | | | | | | | | | | | | | | | | | | | | | |
Investor class of shares | | | — | | | | — | | | | — | | | | — | | | | (29,944,864 | )(1) | | | (36,548,453 | ) |
Advisor class of shares | | | (16,253,010 | ) | | | (7,296,072 | ) | | | (95,290,255 | ) | | | (16,513,415 | ) | | | (163,849,415 | ) | | | — | |
Institutional class of shares | | | (40,363,601 | ) | | | (10,656,439 | ) | | | (17,370,722 | ) | | | (16,512,337 | ) | | | (62,434,365 | ) | | | (27,704,576 | ) |
Retirement class R-3 of shares | | | — | | | | — | | | | — | | | | — | | | | — | | | | — | |
Retirement class R-6 of shares | | | — | | | | — | | | | — | | | | — | | | | (143,363 | ) | | | — | |
Advisor class transfers from termination of Investor class | | | — | | | | — | | | | — | | | | — | | | | (186,891,192 | ) | | | — | |
| | | | | | | | | | | | | | | | | | | | | | | | |
Net cost of shares redeemed | | | (56,616,611 | ) | | | (17,952,511 | ) | | | (112,660,977 | ) | | | (33,025,752 | ) | | | (443,263,199 | ) | | | (64,253,029 | ) |
| | | | | | | | | | | | | | | | | | | | | | | | |
Net change resulting from fund share transactions in dollars | | $ | 2,045,055 | | | $ | 63,717,477 | | | $ | (14,606,199 | ) | | $ | (6,109,064 | ) | | $ | (11,144,221 | ) | | $ | 73,888,940 | |
| | | | | | | | | | | | | | | | | | | | | | | | |
| | | | | | |
Capital stock transactions in shares: | | | | | | | | | | | | | | | | | | | | | | | | |
Sale of shares: | | | | | | | | | | | | | | | | | | | | | | | | |
Investor class of shares | | | — | | | | — | | | | — | | | | — | | | | 1,721,277 | (1) | | | 2,992,053 | |
Advisor class of shares | | | 2,223,381 | | | | 1,557,280 | | | | 734,704 | | | | 986,639 | | | | 136,008 | | | | 518 | |
Institutional class of shares | | | 1,717,254 | | | | 4,341,968 | | | | 5,932,931 | | | | 450,270 | | | | 13,571,425 | | | | 4,406,925 | |
Retirement class R-3 of shares | | | — | | | | — | | | | — | | | | — | | | | — | | | | — | |
Retirement class R-6 of shares | | | — | | | | — | | | | — | | | | — | | | | 98,226 | | | | 3,621 | (2) |
Advisor class transfers from termination of Investor class | | | — | | | | — | | | | — | | | | — | | | | 11,959,735 | | | | — | |
| | | | | | | | | | | | | | | | | | | | | | | | |
Net sale of shares | | | 3,940,635 | | | | 5,899,248 | | | | 6,667,635 | | | | 1,436,909 | | | | 27,486,671 | | | | 7,403,117 | |
Shares issued to shareholders in payment of distributions declared: | | | | | | | | | | | | | | | | | | | | | | | | |
Investor class of shares | | | — | | | | — | | | | — | | | | — | | | | 202,894 | (1) | | | 1,381,134 | |
Advisor class of shares | | | 43,466 | | | | 21,225 | | | | 142,063 | | | | 526,209 | | | | 33,497 | | | | 248 | |
Institutional class of shares | | | 258,635 | | | | 273,483 | | | | 104,269 | | | | 242,483 | | | | 210,885 | | | | 1,029,042 | |
Retirement class R-3 of shares | | | — | | | | — | | | | — | | | | — | | | | — | | | | — | |
Retirement class R-6 of shares | | | — | | | | — | | | | — | | | | — | | | | 343 | | | | 22 | (2) |
| | | | | | | | | | | | | | | | | | | | | | | | |
Net shares issued | | | 302,101 | | | | 294,708 | | | | 246,332 | | | | 768,692 | | | | 447,619 | | | | 2,410,446 | |
Shares redeemed: | | | | | | | | | | | | | | | | | | | | | | | | |
Investor class of shares | | | — | | | | — | | | | — | | | | — | | | | (2,003,359 | )(1) | | | (2,635,055 | ) |
Advisor class of shares | | | (1,157,535 | ) | | | (577,073 | ) | | | (6,726,795 | ) | | | (1,338,905 | ) | | | (10,550,915 | ) | | | — | |
Institutional class of shares | | | (2,894,759 | ) | | | (809,930 | ) | | | (1,260,014 | ) | | | (1,316,263 | ) | | | (4,093,910 | ) | | | (1,966,849 | ) |
Retirement class R-3 of shares | | | — | | | | — | | | | — | | | | — | | | | — | | | | — | |
Retirement class R-6 of shares | | | — | | | | — | | | | — | | | | — | | | | (9,119 | ) | | | — | |
Advisor class transfers from termination of Investor class | | | — | | | | — | | | | — | | | | — | | | | (11,959,735 | ) | | | — | |
| | | | | | | | | | | | | | | | | | | | | | | | |
Net shares redeemed | | | (4,052,294 | ) | | | (1,387,003 | ) | | | (7,986,809 | ) | | | (2,655,168 | ) | | | (28,617,038 | ) | | | (4,601,904 | ) |
| | | | | | | | | | | | | | | | | | | | | | | | |
Net change resulting from fund share transactions in shares | | | 190,442 | | | | 4,806,953 | | | | (1,072,842 | ) | | | (449,567 | ) | | | (682,748 | ) | | | 5,211,659 | |
| | | | | | | | | | | | | | | | | | | | | | | | |
| (1) | Reflects operations for the period from September 1, 2016, to June 2, 2017 (termination of Investor class of shares). |
| (2) | Reflects operations for the period from December 28, 2015 (inception date) to August 31, 2016. |
158
| | | | | | | | | | | | | | | | | | | | | | | | | | | | | | |
| | | | | | | | | | |
Large-Cap
Growth Fund | | | Mid-Cap
Value Fund | | | Mid-Cap
Growth Fund | | | Small-Cap
Value Fund | |
Year Ended
August 31,
2017 | | | Year Ended
August 31,
2016 | | | Year Ended
August 31,
2017 | | | Year Ended
August 31,
2016 | | | Year Ended
August 31,
2017 | | | Year Ended
August 31,
2016 | | | Year Ended
August 31,
2017 | | | Year Ended
August 31,
2016 | |
| | | | | | | | | | | | | | | | | | | | | | | | | | | | | | |
| | | | | | | | | | | | | | | | | | | | | | | | | | | | | | |
| $ | 47,552,629 | | | $ | 36,107,215 | | | $ | 12,630,560 | (1) | | $ | 17,762,637 | | | $ | 8,328,558 | (1) | | $ | 16,444,621 | | | $ | — | | | $ | — | |
| | 989,079 | | | | 375,678 | | | | 3,288,541 | | | | 9,778 | | | | 3,531,002 | | | | 4,540 | | | | 4,344,594 | | | | 11,310,749 | |
| | 208,981,585 | | | | 36,247,277 | | | | 80,906,095 | | | | 10,810,827 | | | | 73,932,023 | | | | 6,484,915 | | | | 45,025,931 | | | | 11,641,400 | |
| | — | | | | — | | | | 1,057 | | | | 253 | | | | — | | | | — | | | | 30,591 | | | | 88,324 | |
| | 2,776,234 | | | | 50,000 | (2) | | | 3,976,868 | | | | 3,553,774 | | | | 563,173 | | | | — | | | | 2,248,782 | | | | 794,885 | |
|
— |
| | | — | | | | 134,579,478 | | | | — | | | | 85,760,412 | | | | — | | | | — | | | | — | |
| | | | | | | | | | | | | | | | | | | | | | | | | | | | | | |
| 260,299,527 | | | | 72,780,170 | | | | 235,382,599 | | | | 32,137,269 | | | | 172,115,168 | | | | 22,934,076 | | | | 51,649,898 | | | | 23,835,358 | |
| | | | | | | |
| | 10,511,010 | | | | 23,452,821 | | | | 37,960,691 | (1) | | | 18,609,651 | | | | 18,801,115 | (1) | | | 17,851,037 | | | | — | | | | — | |
| | 23,490 | | | | 14,768 | | | | 3,053 | | | | 3,119 | | | | 1,518 | | | | 4,458 | | | | 4,111,818 | | | | 2,832,915 | |
| | 6,318,459 | | | | 9,087,283 | | | | 19,028,243 | | | | 9,554,467 | | | | 7,803,153 | | | | 10,637,125 | | | | 2,338,598 | | | | 861,712 | |
| | — | | | | — | | | | 76 | | | | 2,657 | | | | — | | | | 3,577 | | | | 5,814 | | | | 1,046 | |
| | 9,109 | | | | — | | | | 3,121,456 | | | | 962,712 | | | | — | | | | 3,575 | | | | 95,423 | | | | 22,643 | |
| | | | | | | | | | | | | | | | | | | | | | | | | | | | | | |
| 16,862,068 | | | | 32,554,872 | | | | 60,113,519 | | | | 29,132,606 | | | | 26,605,786 | | | | 28,499,772 | | | | 6,551,653 | | | | 3,718,316 | |
| | | | | | | | | | | | | | | | | | | | | | | | | | | | | | |
| | (167,909,613 | ) | | | (48,455,232 | ) | | | (37,912,274 | )(1) | | | (62,652,705 | ) | | | (21,939,370 | )(1) | | | (48,774,799 | ) | | | — | | | | — | |
| | (684,033 | ) | | | (36,501 | ) | | | (74,055,945 | ) | | | — | | | | (71,617,531 | ) | | | — | | | | (47,396,459 | ) | | | (46,161,907 | ) |
| | (54,111,950 | ) | | | (20,143,196 | ) | | | (37,859,484 | ) | | | (39,711,399 | ) | | | (24,230,419 | ) | | | (44,197,286 | ) | | | (15,809,625 | ) | | | (7,171,229 | ) |
| | — | | | | — | | | | (9 | ) | | | — | | | | — | | | | — | | | | (4,887 | ) | | | (35,255 | ) |
| | (66,992 | ) | | | — | | | | (2,141,795 | ) | | | (1,878,011 | ) | | | (798 | ) | | | — | | | | (611,082 | ) | | | (68,200 | ) |
| | | | | | | |
| | — | | | | — | | | | (134,579,478 | ) | | | — | | | | (85,760,412 | ) | | | — | | | | — | | | | — | |
| | | | | | | | | | | | | | | | | | | | | | | | | | | | | | |
| | (222,772,588 | ) | | | (68,634,929 | ) | | | (286,548,985 | ) | | | (104,242,115 | ) | | | (203,548,530 | ) | | | (92,972,085 | ) | | | (63,822,053 | ) | | | (53,436,591 | ) |
| | | | | | | | | | | | | | | | | | | | | | | | | | | | | | |
| | | | | | | |
| $ | 54,389,007 | | | $ | 36,700,113 | | | $ | 8,947,133 | | | $ | (42,972,240 | ) | | $ | (4,827,576 | ) | | $ | (41,538,237 | ) | | $ | (5,620,502 | ) | | $ | (25,882,917 | ) |
| | | | | | | | | | | | | | | | | | | | | | | | | | | | | | |
| | | | | | | |
| | | | | | | | | | | | | | | | | | | | | | | | | | | | | | |
| | | | | | | | | | | | | | | | | | | | | | | | | | | | | | |
| | 2,983,477 | | | | 2,388,038 | | | | 1,079,783 | (1) | | | 1,290,770 | | | | 603,003 | (1) | | | 1,010,464 | | | | — | | | | — | |
| | 60,502 | | | | 25,578 | | | | 277,019 | | | | 767 | | | | 245,836 | | | | 254 | | | | 327,444 | | | | 917,999 | |
| | 12,557,523 | | | | 2,381,183 | | | | 6,898,100 | | | | 791,413 | | | | 4,865,381 | | | | 395,131 | | | | 3,311,166 | | | | 916,465 | |
| | — | | | | — | | | | 92 | | | | 19 | | | | (1 | ) | | | — | | | | 2,331 | | | | 7,056 | |
| | 161,842 | | | | 3,390 | (2) | | | 337,095 | | | | 267,325 | | | | 36,858 | | | | — | | | | 165,453 | | | | 62,124 | |
| | | | | | | |
| | — | | | | — | | | | 11,426,538 | | | | — | | | | 5,852,195 | | | | — | | | | — | | | | — | |
| | | | | | | | | | | | | | | | | | | | | | | | | | | | | | |
| | 15,763,344 | | | | 4,798,189 | | | | 20,018,627 | | | | 2,350,294 | | | | 11,603,272 | | | | 1,405,849 | | | | 3,806,394 | | | | 1,903,644 | |
| | | | | | | |
| | | | | | | | | | | | | | | | | | | | | | | | | | | | | | |
| | 704,400 | | | | 1,597,604 | | | | 3,609,940 | (1) | | | 1,381,140 | | | | 1,480,172 | (1) | | | 1,110,830 | | | | — | | | | — | |
| | 1,564 | | | | 1,006 | | | | 290 | | | | 232 | | | | 120 | | | | 277 | | | | 340,483 | | | | 231,258 | |
| | 419,303 | | | | 614,421 | | | | 1,812,569 | | | | 711,232 | | | | 591,039 | | | | 643,115 | | | | 190,485 | | | | 69,605 | |
| | — | | | | — | | | | 7 | | | | 198 | | | | — | | | | 219 | | | | 481 | | | | 85 | |
| | 531 | | | | — | | | | 296,837 | | | | 71,713 | | | | — | | | | 215 | | | | 7,719 | | | | 1,823 | |
| | | | | | | | | | | | | | | | | | | | | | | | | | | | | | |
| | 1,125,798 | | | | 2,213,031 | | | | 5,719,643 | | | | 2,164,515 | | | | 2,071,331 | | | | 1,754,656 | | | | 539,168 | | | | 302,771 | |
| | | | | | | | | | | | | | | | | | | | | | | | | | | | | | |
| | (10,102,414 | ) | | | (3,267,889 | ) | | | (3,280,928 | )(1) | | | (4,544,016 | ) | | | (1,572,244 | )(1) | | | (3,023,971 | ) | | | — | | | | — | |
| | (42,166 | ) | | | (2,427 | ) | | | (6,294,719 | ) | | | — | | | | (4,886,470 | ) | | | — | | | | (3,524,240 | ) | | | (3,645,999 | ) |
| | (3,325,891 | ) | | | (1,279,184 | ) | | | (3,265,545 | ) | | | (2,848,865 | ) | | | (1,678,679 | ) | | | (2,714,350 | ) | | | (1,210,294 | ) | | | (571,338 | ) |
| | — | | | | — | | | | (1 | ) | | | — | | | | — | | | | — | | | | (367 | ) | | | (2,687 | ) |
| | (3,886 | ) | | | — | | | | (185,873 | ) | | | (134,934 | ) | | | (52 | ) | | | — | | | | (46,103 | ) | | | (5,340 | ) |
| | | | | | | |
| | — | | | | — | | | | (11,426,538 | ) | | | — | | | | (5,852,195 | ) | | | — | | | | — | | | | — | |
| | | | | | | | | | | | | | | | | | | | | | | | | | | | | | |
| | (13,474,357 | ) | | | (4,549,500 | ) | | | (24,453,604 | ) | | | (7,527,815 | ) | | | (13,989,640 | ) | | | (5,738,321 | ) | | | (4,781,004 | ) | | | (4,225,364 | ) |
| | | | | | | | | | | | | | | | | | | | | | | | | | | | | | |
| | | | | | | |
| | 3,414,785 | | | | 2,461,720 | | | | 1,284,666 | | | | (3,013,006 | ) | | | (315,037 | ) | | | (2,577,816 | ) | | | (435,442 | ) | | | (2,018,949 | ) |
| | | | | | | | | | | | | | | | | | | | | | | | | | | | | | |
159
| | |
| Notes to Financial Statements (continued) | | |
| | | | | | | | | | | | | | | | | | | | | | | | |
| | | | | | | | | | |
| | | Small-Cap
Core Fund | | | Small-Cap
Growth Fund | | | Global Low Volatility
Equity Fund | |
| | | Year Ended
August 31,
2017 | | | Year Ended
August 31,
2016 | | | Year Ended
August 31,
2017 | | | Year Ended
August 31,
2016 | | | Year Ended
August 31,
2017 | | | Year Ended
August 31,
2016 | |
Capital stock transactions in dollars: | | | | | | | | | | | | | | | | | | | | | | | | |
Proceeds from sale of shares: | | | | | | | | | | | | | | | | | | | | | | | | |
Investor class of shares | | $ | — | | | $ | — | | | $ | 8,270,106 | (1) | | $ | 24,197,134 | | | $ | — | | | $ | — | |
Advisor class of shares | | | 2,075,979 | | | | 7,593 | | | | 8,904,983 | (2) | | | — | | | | 795,975 | | | | 110,308 | |
Institutional class of shares | | | 7,844,262 | | | | 7,512,368 | | | | 54,817,595 | | | | 98,533,217 | | | | 25,178,906 | | | | 30,032,757 | |
Retirement class R-6 of shares | | | — | | | | — | | | | — | | | | — | | | | — | | | | — | |
Class F-3 of shares | | | — | | | | — | | | | — | | | | — | | | | — | | | | — | |
Advisor class transfers from termination of Investor class | | | — | | | | — | | | | 92,631,103 | | | | — | | | | — | | | | — | |
| | | | | | | | | | | | | | | | | | | | | | | | |
Net proceeds from sale of shares | | | 9,920,241 | | | | 7,519,961 | | | | 164,623,787 | | | | 122,730,351 | | | | 25,974,881 | | | | 30,143,065 | |
Net asset value of shares issued to shareholders in payment of distributions declared: | | | | | | | | | | | | | | | | | | | | | | | | |
Investor class of shares | | | — | | | | — | | | | — | | | | 18,971,056 | | | | — | | | | — | |
Advisor class of shares | | | 627 | | | | 4,815 | | | | — | | | | — | | | | 2,983 | | | | 723 | |
Institutional class of shares | | | 232,893 | | | | 50,512 | | | | — | | | | 19,873,633 | | | | 1,085,758 | | | | 278,039 | |
Retirement class R-3 of shares | | | — | | | | — | | | | — | | | | — | | | | — | | | | — | |
Retirement class R-6 of shares | | | — | | | | — | | | | — | | | | — | | | | — | | | | — | |
| | | | | | | | | | | | | | | | | | | | | | | | |
Net proceeds from shares issued | | | 233,520 | | | | 55,327 | | | | — | | | | 38,844,689 | | | | 1,088,741 | | | | 278,762 | |
Cost of shares redeemed: | |
Investor class of shares | | | — | | | | — | | | | (85,059,894 | )(1) | | | (153,670,290 | ) | | | — | | | | — | |
Advisor class of shares | | | (211,102 | ) | | | (54,259 | ) | | | (45,090,880 | )(2) | | | — | | | | (115,806 | ) | | | (5,598 | ) |
Institutional class of shares | | | (3,817,564 | ) | | | (1,497,840 | ) | | | (165,285,708 | ) | | | (232,329,791 | ) | | | (19,346,226 | ) | | | (72,795 | ) |
Retirement class R-6 of shares | | | — | | | | — | | | | — | | | | — | | | | — | | | | — | |
Advisor class transfers from termination of Investor class | | | — | | | | — | | | | (92,631,103 | ) | | | — | | | | — | | | | — | |
| | | | | | | | | | | | | | | | | | | | | | | | |
Net cost of shares redeemed | | | (4,028,666 | ) | | | (1,552,099 | ) | | | (388,067,585 | ) | | | (386,000,081 | ) | | | (19,462,032 | ) | | | (78,393 | ) |
Redemption fees | | | — | | | | — | | | | 132 | | | | — | | | | 50 | | | | — | |
| | | | | | | | | | | | | | | | | | | | | | | | |
Net change resulting from fund share transactions in dollars | | $ | 6,125,095 | | | $ | 6,023,189 | | | $ | (223,443,666 | ) | | $ | (224,425,041 | ) | | $ | 7,601,640 | | | $ | 30,343,434 | |
| | | | | | | | | | | | | | | | | | | | | | | | |
| | | | | | |
Capital stock transactions in shares: | | | | | | | | | | | | | | | | | | | | | | | | |
Sale of shares: | | | | | | | | | | | | | | | | | | | | | | | | |
Investor class of shares | | | — | | | | — | | | | 494,669 | (1) | | | 1,560,531 | | | | — | | | | — | |
Advisor class of shares | | | 157,501 | | | | 729 | | | | 498,846 | (2) | | | — | | | | 63,712 | | | | 8,876 | |
Institutional class of shares | | | 629,056 | | | | 714,579 | | | | 2,932,428 | | | | 6,166,782 | | | | 2,042,381 | | | | 2,693,452 | |
Retirement class R-6 of shares | | | — | | | | — | | | | — | | | | — | | | | — | | | | — | |
Class F-3 of shares | | | — | | | | — | | | | — | | | | — | | | | — | | | | — | |
Advisor class transfers from termination of Investor class | | | — | | | | — | | | | 5,076,122 | | | | — | | | | — | | | | — | |
| | | | | | | | | | | | | | | | | | | | | | | | |
Net sale of shares | | | 786,557 | | | | 715,308 | | | | 9,002,065 | | | | 7,727,313 | | | | 2,106,093 | | | | 2,702,328 | |
Shares issued to shareholders in payment of distributions declared: | | | | | | | | | | | | | | | | | | | | | | | | |
Investor class of shares | | | — | | | | — | | | | — | | | | 1,220,789 | | | | — | | | | — | |
Advisor class of shares | | | 49 | | | | 451 | | | | — | | | | — | | | | 251 | | | | 63 | |
Institutional class of shares | | | 18,110 | | | | 4,712 | | | | — | | | | 1,242,102 | | | | 91,317 | | | | 24,262 | |
Retirement class R-3 of shares | | | — | | | | — | | | | — | | | | — | | | | — | | | | — | |
Retirement class R-6 of shares | | | — | | | | — | | | | — | | | | — | | | | — | | | | — | |
| | | | | | | | | | | | | | | | | | | | | | | | |
Net shares issued | | | 18,159 | | | | 5,163 | | | | — | | | | 2,462,891 | | | | 91,568 | | | | 24,325 | |
Shares redeemed: | | | | | | | | | | | | | | | | | | | | | | | | |
Investor class of shares | | | — | | | | — | | | | (5,106,058 | )(1) | | | (10,045,724 | ) | | | — | | | | — | |
Advisor class of shares | | | (15,970 | ) | | | (5,681 | ) | | | (2,432,400 | )(2) | | | — | | | | (9,239 | ) | | | (444 | ) |
Institutional class of shares | | | (291,933 | ) | | | (140,397 | ) | | | (9,469,711 | ) | | | (14,824,948 | ) | | | (1,556,987 | ) | | | (6,055 | ) |
Retirement class R-6 of shares | | | — | | | | — | | | | — | | | | — | | | | — | | | | — | |
Advisor class transfers from termination of Investor class | | | — | | | | — | | | | (5,076,122 | ) | | | — | | | | — | | | | — | |
| | | | | | | | | | | | | | | | | | | | | | | | |
Net shares redeemed | | | (307,903 | ) | | | (146,078 | ) | | | (22,084,291 | ) | | | (24,870,672 | ) | | | (1,566,226 | ) | | | (6,499 | ) |
| | | | | | | | | | | | | | | | | | | | | | | | |
Net change resulting from fund share transactions in shares | | | 496,813 | | | | 574,393 | | | | (13,082,226 | ) | | | (14,680,468 | ) | | | 631,435 | | | | 2,720,154 | |
| | | | | | | | | | | | | | | | | | | | | | | | |
| (1) | Reflects operations for the period from September 1, 2016, to June 2, 2017 (termination of Investor class of shares). |
| (2) | Reflects operations for the period from May 31, 2017 (inception date) to August 31, 2017. |
| (3) | Reflects operations for the period from September 17, 2015 (inception date) to August 31, 2016. |
160
| | | | | | | | | | | | | | | | | | | | | | | | | | | | | | |
| | | | | | | | | | |
Disciplined International
Equity Fund | | | Pyrford International
Stock Fund | | | LGM Emerging Markets
Equity Fund | | | TCH Emerging Markets
Bond Fund | |
Year Ended
August 31,
2017 | | | Period Ended
August 31,
2016(3) | | | Year Ended
August 31,
2017 | | | Year Ended
August 31,
2016 | | | Year Ended
August 31,
2017 | | | Year Ended
August 31,
2016 | | | Year Ended
August 31,
2017 | | | Year Ended
August 31,
2016 | |
| | | | | | | | | | | | | | | | | | | | | | | | | | | | | | |
| | | | | | | | | | | | | | | | | | | | | | | | | | | | | | |
| $ | — | | | $ | — | | | $ | 13,163,350 | | | $ | 24,600,796 | | | $ | — | | | $ | — | | | $ | — | | | $ | — | |
| | 2,000 | | | | 183,392 | | | | 822,444 | | | | 125,044 | | | | 8,777,557 | | | | 12,304,331 | | | | 6,915 | | | | 2,240 | |
| | 22,341,033 | | | | 82,361,194 | | | | 350,747,663 | | | | 157,265,153 | | | | 100,996,016 | | | | 24,210,997 | | | | 17,874,010 | | | | 4,261 | |
| | — | | | | — | | | | 31,501,915 | | | | 11,179,486 | | | | — | | | | — | | | | — | | | | — | |
| | — | | | | — | | | | 25,761 | (2) | | | — | | | | — | | | | — | | | | — | | | | — | |
| — | | | | — | | | | — | | | | — | | | | — | | | | — | | | | — | | | | — | |
| | | | | | | | | | | | | | | | | | | | | | | | | | | | | | |
| | 22,343,033 | | | | 82,544,586 | | | | 396,261,133 | | | | 193,170,479 | | | | 109,773,573 | | | | 36,515,328 | | | | 17,880,925 | | | | 6,501 | |
| | | | | | | | | | | | | | | | | | | | | | | | | | | | | | |
| | — | | | | — | | | | 1,999,666 | | | | 1,910,079 | | | | — | | | | — | | | | — | | | | — | |
| | 787 | | | | — | | | | 1,905 | | | | 16,401 | | | | 235,064 | | | | 562,607 | | | | — | | | | 220,767 | |
| | 1,669,867 | | | | — | | | | 6,699,345 | | | | 5,045,398 | | | | 631,448 | | | | 731,004 | | | | 391,248 | | | | 222,440 | |
| | — | | | | — | | | | — | | | | 399 | | | | — | | | | — | | | | — | | | | — | |
| | — | | | | — | | | | 652,042 | | | | 314,323 | | | | — | | | | — | | | | — | | | | — | |
| | | | | | | | | | | | | | | | | | | | | | | | | | | | | | |
| | 1,670,654 | | | | — | | | | 9,352,958 | | | | 7,286,600 | | | | 866,512 | | | | 1,293,611 | | | | 391,248 | | | | 443,207 | |
| | | | | | | | | | | | | | | | | | | | | | | | | | | | | | |
| | — | | | | — | | | | (115,429,633 | ) | | | (21,379,221 | ) | | | — | | | | — | | | | — | | | | — | |
| | — | | | | (60,715 | ) | | | (43,970 | ) | | | (831,920 | ) | | | (61,462,014 | ) | | | (34,906,050 | ) | | | (4,087,474 | ) | | | (66,846 | ) |
| | (28,580,607 | ) | | | (12,451,871 | ) | | | (290,612,247 | ) | | | (321,169,468 | ) | | | (37,328,961 | ) | | | (42,709,937 | ) | | | (10,823,564 | ) | | | — | |
| | — | | | | — | | | | (3,041,612 | ) | | | (2,475,984 | ) | | | — | | | | — | | | | — | | | | — | |
| | | | | | | |
| | — | | | | — | | | | — | | | | — | | | | — | | | | — | | | | — | | | | — | |
| | | | | | | | | | | | | | | | | | | | | | | | | | | | | | |
| | (28,580,607 | ) | | | (12,512,586 | ) | | | (409,127,462 | ) | | | (345,856,593 | ) | | | (98,790,975 | ) | | | (77,615,987 | ) | | | (14,911,038 | ) | | | (66,846 | ) |
| | — | | | | 108 | | | | 3,133 | | | | 10,295 | | | | 680 | | | | 254 | | | | 423 | | | | — | |
| | | | | | | | | | | | | | | | | | | | | | | | | | | | | | |
| | | | | | | |
| $ | (4,566,920 | ) | | $ | 70,032,108 | | | $ | (3,510,238 | ) | | $ | (145,389,219 | ) | | $ | 11,849,790 | | | $ | (39,806,794 | ) | | $ | 3,361,558 | | | $ | 382,862 | |
| | | | | | | | | | | | | | | | | | | | | | | | | | | | | | |
| | | | | | | |
| | | | | | | | | | | | | | | | | | | | | | | | | | | | | | |
| | | | | | | | | | | | | | | | | | | | | | | | | | | | | | |
| | — | | | | — | | | | 1,073,748 | | | | 2,068,034 | | | | — | | | | — | | | | — | | | | — | |
| | 180 | | | | 19,419 | | | | 63,670 | | | | 10,726 | | | | 629,812 | | | | 995,220 | | | | 683 | | | | 243 | |
| | 2,090,763 | | | | 8,345,169 | | | | 27,977,151 | | | | 13,350,667 | | | | 6,844,430 | | | | 1,921,645 | | | | 1,759,695 | | | | 429 | |
| | — | | | | — | | | | 2,563,451 | | | | 939,422 | | | | — | | | | — | | | | — | | | | — | |
| | — | | | | — | | | | 1,950 | (2) | | | — | | | | — | | | | — | | | | — | | | | — | |
| | | | | | | |
| | — | | | | — | | | | — | | | | — | | | | — | | | | — | | | | — | | | | — | |
| | | | | | | | | | | | | | | | | | | | | | | | | | | | | | |
| | 2,090,943 | | | | 8,364,588 | | | | 31,679,970 | | | | 16,368,849 | | | | 7,474,242 | | | | 2,916,865 | | | | 1,760,378 | | | | 672 | |
| | | | | | | | | | | | | | | | | | | | | | | | | | | | | | |
| | — | | | | — | | | | 174,491 | | | | 166,673 | | | | — | | | | — | | | | — | | | | — | |
| | 84 | | | | — | | | | 166 | | | | 1,431 | | | | 18,509 | | | | 48,375 | | | | — | | | | 24,722 | |
| | 176,893 | | | | — | | | | 583,567 | | | | 439,495 | | | | 49,681 | | | | 62,747 | | | | 40,883 | | | | 24,909 | |
| | — | | | | — | | | | — | | | | 35 | | | | — | | | | — | | | | — | | | | — | |
| | — | | | | — | | | | 56,798 | | | | 27,380 | | | | — | | | | — | | | | — | | | | — | |
| | | | | | | | | | | | | | | | | | | | | | | | | | | | | | |
| | 176,977 | | | | — | | | | 815,022 | | | | 635,014 | | | | 68,190 | | | | 111,122 | | | | 40,883 | | | | 49,631 | |
| | | | | | | | | | | | | | | | | | | | | | | | | | | | | | |
| | — | | | | — | | | | (8,986,498 | ) | | | (1,839,808 | ) | | | — | | | | — | | | | — | | | | — | |
| | — | | | | (6,308 | ) | | | (3,359 | ) | | | (74,548 | ) | | | (4,044,334 | ) | | | (2,626,422 | ) | | | (399,562 | ) | | | (7,570 | ) |
| | (2,848,966 | ) | | | (1,308,121 | ) | | | (23,381,161 | ) | | | (27,191,302 | ) | | | (2,627,477 | ) | | | (3,377,266 | ) | | | (1,073,815 | ) | | | — | |
| | — | | | | — | | | | (239,843 | ) | | | (206,714 | ) | | | — | | | | — | | | | — | | | | — | |
| | | | | | | |
| | — | | | | — | | | | — | | | | — | | | | — | | | | — | | | | — | | | | — | |
| | | | | | | | | | | | | | | | | | | | | | | | | | | | | | |
| | (2,848,966 | ) | | | (1,314,429 | ) | | | (32,610,861 | ) | | | (29,312,372 | ) | | | (6,671,811 | ) | | | (6,003,688 | ) | | | (1,473,377 | ) | | | (7,570 | ) |
| | | | | | | | | | | | | | | | | | | | | | | | | | | | | | |
| | | | | | | |
| | (581,046 | ) | | | 7,050,159 | | | | (115,869 | ) | | | (12,308,509 | ) | | | 870,621 | | | | (2,975,701 | ) | | | 327,884 | | | | 42,733 | |
| | | | | | | | | | | | | | | | | | | | | | | | | | | | | | |
161
| | |
| Notes to Financial Statements (continued) | | |
| | | | | | | | | | | | | | | | | | | | | | | | |
| | | | | | | | | | |
| | | Alternative
Strategies Fund | | | Global Long/Short
Equity Fund | | | Ultra Short
Tax-Free Fund | |
| | | Year Ended
August 31,
2017 | | | Year Ended
August 31,
2016 | | | Year Ended
August 31,
2017 | | | Period Ended
August 31,
2016(1) | | | Year Ended
August 31,
2017 | | | Year Ended
August 31,
2016 | |
Capital stock transactions in dollars: | | | | | | | | | | | | | | | | | | | | | | | | |
Proceeds from sale of shares: | | | | | | | | | | | | | | | | | | | | | | | | |
Investor class of shares | | $ | — | | | $ | — | | | $ | — | | | $ | — | | | $ | 6,104,616 | (2) | | $ | 10,594,870 | |
Advisor class of shares | | | 27,169 | | | | 176,496 | | | | 269,383 | | | | 483,490 | | | | 6,200,069 | | | | 55,513 | |
Institutional class of shares | | | 21,282,139 | | | | 86,807,782 | | | | 4,556,249 | | | | 3,547,875 | | | | 466,456,337 | | | | 386,923,045 | |
Advisor class transfers from termination of Investor class | | | — | | | | — | | | | — | | | | — | | | | 45,351,480 | | | | — | |
| | | | | | | | | | | | | | | | | | | | | | | | |
Net proceeds from sale of shares | | | 21,309,308 | | | | 86,984,278 | | | | 4,825,632 | | | | 4,031,365 | | | | 524,112,502 | | | | 397,573,428 | |
Net asset value of shares issued to shareholders in payment of distributions declared: | | | | | | | | | | | | | | | | | | | | | | | | |
Investor class of shares | | | — | | | | — | | | | — | | | | — | | | | 286,536 | (2) | | | 295,588 | |
Advisor class of shares | | | — | | | | 2,839 | | | | 4,145 | | | | — | | | | 71,269 | | | | 132 | |
Institutional class of shares | | | — | | | | 964,816 | | | | 23,628 | | | | — | | | | 1,945,603 | | | | 1,692,037 | |
| | | | | | | | | | | | | | | | | | | | | | | | |
Net proceeds from shares issued | | | — | | | | 967,655 | | | | 27,773 | | | | — | | | | 2,303,408 | | | | 1,987,757 | |
Cost of shares redeemed: | | | | | | | | | | | | | | | | | | | | | | | | |
Investor class of shares | | | — | | | | — | | | | — | | | | — | | | | (14,358,125 | )(2) | | | (21,875,452 | ) |
Advisor class of shares | | | (165,974 | ) | | | (887,690 | ) | | | (128,015 | ) | | | (7,748 | ) | | | (16,963,463 | ) | | | (55,553 | ) |
Institutional class of shares | | | (39,535,186 | ) | | | (12,792,404 | ) | | | (175,281 | ) | | | (49,426 | ) | | | (391,631,904 | ) | | | (541,894,764 | ) |
Advisor class transfers from termination of Investor class | | | — | | | | — | | | | — | | | | — | | | | (45,351,480 | ) | | | — | |
| | | | | | | | | | | | | | | | | | | | | | | | |
Net cost of shares redeemed | | | (39,701,160 | ) | | | (13,680,094 | ) | | | (303,296 | ) | | | (57,174 | ) | | | (468,304,972 | ) | | | (563,825,769 | ) |
| | | | | | | | | | | | | | | | | | | | | | | | |
Net change resulting from fund share transactions in dollars | | $ | (18,391,852 | ) | | $ | 74,271,839 | | | $ | 4,550,109 | | | $ | 3,974,191 | | | $ | 58,110,938 | | | $ | (164,264,584 | ) |
| | | | | | | | | | | | | | | | | | | | | | | | |
| | | | | | |
Capital stock transactions in shares: | | | | | | | | | | | | | | | | | | | | | | | | |
Sale of shares: | | | | | | | | | | | | | | | | | | | | | | | | |
Investor class of shares | | | — | | | | — | | | | — | | | | — | | | | 606,227 | (2) | | | 1,051,519 | |
Advisor class of shares | | | 2,572 | | | | 17,279 | | | | 22,951 | | | | 48,577 | | | | 615,178 | | | | 5,509 | |
Institutional class of shares | | | 2,009,145 | | | | 8,459,347 | | | | 397,699 | | | | 351,888 | | | | 46,336,954 | | | | 38,417,809 | |
Advisor class transfers from termination of Investor class | | | — | | | | — | | | | — | | | | — | | | | 4,499,110 | | | | — | |
| | | | | | | | | | | | | | | | | | | | | | | | |
Net sale of shares | | | 2,011,717 | | | | 8,476,626 | | | | 420,650 | | | | 400,465 | | | | 52,057,469 | | | | 39,474,837 | |
Shares issued to shareholders in payment of distributions declared: | | | | | | | | | | | | | | | | | | | | | | | | |
Investor class of shares | | | — | | | | — | | | | — | | | | — | | | | 28,463 | (2) | | | 29,340 | |
Advisor class of shares | | | — | | | | 282 | | | | 374 | | | | — | | | | 7,071 | | | | 13 | |
Institutional class of shares | | | — | | | | 95,621 | | | | 2,129 | | | | — | | | | 193,296 | | | | 168,066 | |
| | | | | | | | | | | | | | | | | | | | | | | | |
Net shares issued | | | — | | | | 95,903 | | | | 2,503 | | | | — | | | | 228,830 | | | | 197,419 | |
Shares redeemed: | | | | | | | | | | | | | | | | | | | | | | | | |
Investor class of shares | | | — | | | | — | | | | — | | | | — | | | | (1,426,090 | )(2) | | | (2,171,241 | ) |
Advisor class of shares | | | (15,772 | ) | | | (86,934 | ) | | | (11,422 | ) | | | (750 | ) | | | (1,682,885 | ) | | | (5,515 | ) |
Institutional class of shares | | | (3,732,936 | ) | | | (1,273,394 | ) | | | (15,094 | ) | | | (4,628 | ) | | | (38,912,011 | ) | | | (53,812,434 | ) |
Advisor class transfers from termination of Investor class | | | — | | | | — | | | | — | | | | — | | | | (4,499,110 | ) | | | — | |
| | | | | | | | | | | | | | | | | | | | | | | | |
Net shares redeemed | | | (3,748,708 | ) | | | (1,360,328 | ) | | | (26,516 | ) | | | (5,378 | ) | | | (46,520,096 | ) | | | (55,989,190 | ) |
| | | | | | | | | | | | | | | | | | | | | | | | |
Net change resulting from fund share transactions in shares | | | (1,736,991 | ) | | | 7,212,201 | | | | 396,637 | | | | 395,087 | | | | 5,766,203 | | | | (16,316,934 | ) |
| | | | | | | | | | | | | | | | | | | | | | | | |
| (1) | Reflects operations for the period from September 17, 2015 (inception date) to August 31, 2016. |
| (2) | Reflects operations for the period from September 1, 2016, to June 2, 2017 (termination of Investor class of shares). |
| (3) | Includes paid-in-capital and shares received from a non-taxable in-kind subscription merger of the BMO TCH Intermediate Income Fund effective as of the close of business on June 29, 2017. See Note 11, Reorganization Information, in the Notes to Financial Statements for additional information. |
162
| | | | | | | | | | | | | | | | | | | | | | | | | | | | | | |
| | | | | | | | | | |
Short Tax-Free Fund | | | Short-Term Income Fund | | | Intermediate
Tax-Free Fund | | | Strategic Income Fund | |
Year Ended
August 31,
2017 | | | Year Ended
August 31,
2016 | | | Year Ended
August 31,
2017 | | | Year Ended
August 31,
2016 | | | Year Ended
August 31,
2017 | | | Year Ended
August 31,
2016 | | | Year Ended
August 31,
2017 | | | Year Ended
August 31,
2016 | |
| | | | | | | | | | | | | | | | | | | | | | | | | | | | | | |
| | | | | | | | | | | | | | | | | | | | | | | | | | | | | | |
| $ | 10,895,505 | (2) | | $ | 8,254,754 | | | $ | 11,653,364 | (2) | | $ | 21,538,961 | | | $ | 213,547,673 | | | $ | 303,551,800 | | | $ | 2,074,321 | | | $ | 8,893,429 | |
| | 1,819,564 | | | | 726,443 | | | | 10,184,761 | | | | 138,520 | | | | 9,967,233 | | | | 1,694,228 | | | | 18,617,076 | (3) | | | 5,481 | |
| | 88,094,396 | | | | 125,580,353 | | | | 132,998,094 | | | | 177,384,144 | | | | 289,062,211 | | | | 264,143,418 | | | | 18,778,044 | (3) | | | 14,473,126 | |
| 22,049,349 | | | | — | | | | 49,939,527 | | | | — | | | | — | | | | — | | | | — | | | | — | |
| | | | | | | | | | | | | | | | | | | | | | | | | | | | | | |
| | 122,858,814 | | | | 134,561,550 | | | | 204,775,746 | | | | 199,061,625 | | | | 512,577,117 | | | | 569,389,446 | | | | 39,469,441 | | | | 23,372,036 | |
| | | | | | | |
| | | | | | | | | | | | | | | | | | | | | | | | | | | | | | |
| | 169,287 | (2) | | | 237,387 | | | | 618,739 | (2) | | | 668,656 | | | | 30,885,014 | | | | 29,129,421 | | | | 2,325,868 | | | | 2,478,073 | |
| | 46,057 | | | | 3,317 | | | | 143,243 | | | | 370 | | | | 83,901 | | | | 45,391 | | | | 148,215 | | | | 508 | |
| | 636,743 | | | | 342,378 | | | | 1,710,099 | | | | 1,948,568 | | | | 9,417,013 | | | | 6,370,896 | | | | 277,988 | | | | 250,810 | |
| | | | | | | | | | | | | | | | | | | | | | | | | | | | | | |
| | 852,087 | | | | 583,082 | | | | 2,472,081 | | | | 2,617,594 | | | | 40,385,928 | | | | 35,545,708 | | | | 2,752,071 | | | | 2,729,391 | |
| | | | | | | | | | | | | | | | | | | | | | | | | | | | | | |
| | (4,549,287 | )(2) | | | (17,676,600 | ) | | | (21,089,307 | )(2) | | | (31,041,668 | ) | | | (480,822,580 | ) | | | (380,922,084 | ) | | | (16,498,767 | ) | | | (21,179,966 | ) |
| | (17,897,661 | ) | | | (35,665 | ) | | | (27,139,404 | ) | | | (7,758 | ) | | | (930,368 | ) | | | (2,217,585 | ) | | | (531,749 | ) | | | — | |
| | (81,433,763 | ) | | | (63,807,213 | ) | | | (159,514,643 | ) | | | (210,623,336 | ) | | | (255,447,058 | ) | | | (244,705,167 | ) | | | (19,076,959 | ) | | | (16,360,682 | ) |
| (22,049,349 | ) | | | — | | | | (49,939,527 | ) | | | — | | | | — | | | | — | | | | — | | | | — | |
| | | | | | | | | | | | | | | | | | | | | | | | | | | | | | |
| | (125,930,060 | ) | | | (81,519,478 | ) | | | (257,682,881 | ) | | | (241,672,762 | ) | | | (737,200,006 | ) | | | (627,844,836 | ) | | | (36,107,475 | ) | | | (37,540,648 | ) |
| | | | | | | | | | | | | | | | | | | | | | | | | | | | | | |
| | | | | | | |
| $ | (2,219,159 | ) | | $ | 53,625,154 | | | $ | (50,435,054 | ) | | $ | (39,993,543 | ) | | $ | (184,236,961 | ) | | $ | (22,909,682 | ) | | $ | 6,114,037 | | | $ | (11,439,221 | ) |
| | | | | | | | | | | | | | | | | | | | | | | | | | | | | | |
| | | | | | | |
| | | | | | | | | | | | | | | | | | | | | | | | | | | | | | |
| | | | | | | | | | | | | | | | | | | | | | | | | | | | | | |
| | 1,076,290 | (2) | | | 807,524 | | | | 1,243,973 | (2) | | | 2,303,957 | | | | 19,005,661 | | | | 26,553,160 | | | | 221,723 | | | | 951,599 | |
| | 179,645 | | | | 71,053 | | | | 1,087,006 | | | | 14,746 | | | | 883,384 | | | | 148,986 | | | | 1,979,944 | (3) | | | 587 | |
| | 8,670,982 | | | | 12,284,978 | | | | 14,175,534 | | | | 18,916,667 | | | | 25,701,510 | | | | 23,113,614 | | | | 2,000,814 | (3) | | | 1,545,784 | |
| 2,162,888 | | | | — | | | | 5,326,826 | | | | — | | | | — | | | | — | | | | — | | | | — | |
| | | | | | | | | | | | | | | | | | | | | | | | | | | | | | |
| | 12,089,805 | | | | 13,163,555 | | | | 21,833,339 | | | | 21,235,370 | | | | 45,590,555 | | | | 49,815,760 | | | | 4,202,481 | | | | 2,497,970 | |
| | | | | | | |
| | | | | | | | | | | | | | | | | | | | | | | | | | | | | | |
| | 16,686 | (2) | | | 23,243 | | | | 66,052 | (2) | | | 71,445 | | | | 2,750,131 | | | | 2,544,022 | | | | 249,197 | | | | 264,677 | |
| | 4,523 | | | | 324 | | | | 15,277 | | | | 39 | | | | 7,446 | | | | 3,970 | | | | 15,702 | | | | 54 | |
| | 62,642 | | | | 33,492 | | | | 182,198 | | | | 207,919 | | | | 838,538 | | | | 556,153 | | | | 29,730 | | | | 26,811 | |
| | | | | | | | | | | | | | | | | | | | | | | | | | | | | | |
| | 83,851 | | | | 57,059 | | | | 263,527 | | | | 279,403 | | | | 3,596,115 | | | | 3,104,145 | | | | 294,629 | | | | 291,542 | |
| | | | | | | | | | | | | | | | | | | | | | | | | | | | | | |
| | (449,187 | )(2) | | | (1,732,485 | ) | | | (2,253,283 | )(2) | | | (3,324,720 | ) | | | (42,913,006 | ) | | | (33,248,095 | ) | | | (1,775,161 | ) | | | (2,268,782 | ) |
| | (1,757,934 | ) | | | (3,492 | ) | | | (2,896,344 | ) | | | (829 | ) | | | (83,471 | ) | | | (193,161 | ) | | | (56,447 | ) | | | — | |
| | (8,016,682 | ) | | | (6,234,376 | ) | | | (16,993,915 | ) | | | (22,453,676 | ) | | | (22,853,490 | ) | | | (21,551,776 | ) | | | (2,046,850 | ) | | | (1,743,421 | ) |
| (2,162,888 | ) | | | — | | | | (5,326,826 | ) | | | — | | | | — | | | | — | | | | — | | | | — | |
| | | | | | | | | | | | | | | | | | | | | | | | | | | | | | |
| | (12,386,691 | ) | | | (7,970,353 | ) | | | (27,470,368 | ) | | | (25,779,225 | ) | | | (65,849,967 | ) | | | (54,993,032 | ) | | | (3,878,458 | ) | | | (4,012,203 | ) |
| | | | | | | | | | | | | | | | | | | | | | | | | | | | | | |
| | | | | | | |
| | (213,035 | ) | | | 5,250,261 | | | | (5,373,502 | ) | | | (4,264,452 | ) | | | (16,663,297 | ) | | | (2,073,127 | ) | | | 618,652 | | | | (1,222,691 | ) |
| | | | | | | | | | | | | | | | | | | | | | | | | | | | | | |
163
| | |
| Notes to Financial Statements (continued) | | |
| | | | | | | | | | | | | | | | | | | | | | | | |
| | | | | | | | | | |
| | | TCH Corporate
Income Fund | | | TCH Core Plus
Bond Fund | | | High Yield
Bond Fund | |
| | | Year Ended
August 31,
2017 | | | Year Ended
August 31,
2016 | | | Year Ended
August 31,
2017 | | | Year Ended
August 31,
2016 | | | Year Ended
August 31,
2017 | | | Year Ended
August 31,
2016 | |
Capital stock transactions in dollars: | | | | | | | | | | | | | | | | | | | | | | | | |
Proceeds from sale of shares: | | | | | | | | | | | | | | | | | | | | | | | | |
Investor class of shares | | $ | 85,092,119 | | | $ | 15,889,907 | | | $ | 114,719,160 | | | $ | 114,431,708 | | | $ | — | | | $ | — | |
Advisor class of shares | | | 1,376,817 | | | | 65,129 | | | | 1,956,570 | | | | 1,140,601 | | | | 2,426,855 | | | | 36,554,073 | |
Institutional/Premier class of shares | | | 30,587,623 | | | | 30,562,895 | | | | 665,156,222 | | | | 100,178,326 | | | | 1,819,681 | | | | 12,247,396 | |
| | | | | | | | | | | | | | | | | | | | | | | | |
Net proceeds from sale of shares | | | 117,056,559 | | | | 46,517,931 | | | | 781,831,952 | | | | 215,750,635 | | | | 4,246,536 | | | | 48,801,469 | |
Net asset value of shares issued to shareholders in payment of distributions declared: | | | | | | | | | | | | | | | | | | | | | | | | |
Investor class of shares | | | 3,445,037 | | | | 3,841,197 | | | | 12,537,390 | | | | 16,828,416 | | | | — | | | | — | |
Advisor class of shares | | | 13,619 | | | | 717 | | | | 55,571 | | | | 29,476 | | | | 1,174,457 | | | | 2,338,389 | |
Institutional/Premier class of shares | | | 1,601,967 | | | | 1,973,523 | | | | 13,350,242 | | | | 12,741,064 | | | | 847,200 | | | | 1,254,834 | |
| | | | | | | | | | | | | | | | | | | | | | | | |
Net proceeds from shares issued | | | 5,060,623 | | | | 5,815,437 | | | | 25,943,203 | | | | 29,598,956 | | | | 2,021,657 | | | | 3,593,223 | |
Cost of shares redeemed: | | | | | | | | | | | | | | | | | | | | | | | | |
Investor class of shares | | | (51,507,090 | ) | | | (78,466,864 | ) | | | (559,991,083 | ) | | | (245,175,384 | ) | | | — | | | | — | |
Advisor class of shares | | | (94,009 | ) | | | (33,000 | ) | | | (118,015 | ) | | | (108,607 | ) | | | (74,352,589 | ) | | | (10,463,414 | ) |
Institutional/Premier class of shares | | | (27,600,405 | ) | | | (71,657,028 | ) | | | (161,128,094 | ) | | | (143,422,101 | ) | | | (24,729,280 | ) | | | (9,588,767 | ) |
| | | | | | | | | | | | | | | | | | | | | | | | |
Net cost of shares redeemed | | | (79,201,504 | ) | | | (150,156,892 | ) | | | (721,237,192 | ) | | | (388,706,092 | ) | | | (99,081,869 | ) | | | (20,052,181 | ) |
| | | | | | | | | | | | | | | | | | | | | | | | |
Net change resulting from fund share transactions in dollars | | $ | 42,915,678 | | | $ | (97,823,524 | ) | | $ | 86,537,963 | | | $ | (143,356,501 | ) | | $ | (92,813,676 | ) | | $ | 32,342,511 | |
| | | | | | | | | | | | | | | | | | | | | | | | |
| | | | | | |
Capital stock transactions in shares: | | | | | | | | | | | | | | | | | | | | | | | | |
Sale of shares: | | | | | | | | | | | | | | | | | | | | | | | | |
Investor class of shares | | | 6,571,426 | | | | 1,256,150 | | | | 9,850,492 | | | | 9,982,746 | | | | — | | | | — | |
Advisor class of shares | | | 105,997 | | | | 5,514 | | | | 167,833 | | | | 100,260 | | | | 256,453 | | | | 3,920,938 | |
Institutional/Premier class of shares | | | 2,352,481 | | | | 2,492,220 | | | | 56,847,089 | | | | 8,781,394 | | | | 191,620 | | | | 1,331,768 | |
| | | | | | | | | | | | | | | | | | | | | | | | |
Net sale of shares | | | 9,029,904 | | | | 3,753,884 | | | | 66,865,414 | | | | 18,864,400 | | | | 448,073 | | | | 5,252,706 | |
Shares issued to shareholders in payment of distributions declared: | | | | | | | | | | | | | | | | | | | | | | | | |
Investor class of shares | | | 265,827 | | | | 314,467 | | | | 1,076,725 | | | | 1,474,824 | | | | — | | | | — | |
Advisor class of shares | | | 1,039 | | | | 60 | | | | 4,763 | | | | 2,571 | | | | 123,996 | | | | 254,964 | |
Institutional/Premier class of shares | | | 124,238 | | | | 161,853 | | | | 1,144,537 | | | | 1,116,150 | | | | 89,193 | | | | 136,962 | |
| | | | | | | | | | | | | | | | | | | | | | | | |
Net shares issued | | | 391,104 | | | | 476,380 | | | | 2,226,025 | | | | 2,593,545 | | | | 213,189 | | | | 391,926 | |
Shares redeemed: | | | | | | | | | | | | | | | | | | | | | | | | |
Investor class of shares | | | (3,968,342 | ) | | | (6,486,382 | ) | | | (47,799,589 | ) | | | (21,481,672 | ) | | | — | | | | — | |
Advisor class of shares | | | (7,234 | ) | | | (2,542 | ) | | | (10,119 | ) | | | (9,517 | ) | | | (7,860,812 | ) | | | (1,141,300 | ) |
Institutional/Premier class of shares | | | (2,134,030 | ) | | | (5,976,747 | ) | | | (13,875,014 | ) | | | (12,645,049 | ) | | | (2,615,394 | ) | | | (1,055,620 | ) |
| | | | | | | | | | | | | | | | | | | | | | | | |
Net shares redeemed | | | (6,109,606 | ) | | | (12,465,671 | ) | | | (61,684,722 | ) | | | (34,136,238 | ) | | | (10,476,206 | ) | | | (2,196,920 | ) |
| | | | | | | | | | | | | | | | | | | | | | | | |
Net change resulting from fund share transactions in shares | | | 3,311,402 | | | | (8,235,407 | ) | | | 7,406,717 | | | | (12,678,293 | ) | | | (9,814,944 | ) | | | 3,447,712 | |
| | | | | | | | | | | | | | | | | | | | | | | | |
| (1) | Reflects operations for the period from June 3, 2016 (inception date) to August 31, 2016. |
164
| | | | | | | | | | | | | | | | | | | | | | | | | | | | | | |
| | | | | | | | | | |
Government Money
Market Fund | | | Tax-Free Money
Market Fund | | | Prime Money
Market Fund | | | Institutional Prime
Money Market Fund | |
Year Ended
August 31,
2017 | | | Year Ended
August 31,
2016 | | | Year Ended
August 31,
2017 | | | Year Ended
August 31,
2016 | | | Year Ended
August 31,
2017 | | | Year Ended
August 31,
2016 | | | Year Ended
August 31,
2017 | | | Period Ended
August 31,
2016(1) | |
| | | | | | | | | | | | | | | | | | | | | | | | | | | | | | |
| | | | | | | | | | | | | | | | | | | | | | | | | | | | | | |
| $ | 4,367,701,056 | | | $ | 946,889,691 | | | $ | 89,068,383 | | | $ | 330,536,933 | | | $ | 382,077,941 | | | $ | 3,365,952,862 | | | $ | 440,297 | | | $ | 992,287 | |
| | — | | | | — | | | | — | | | | — | | | | — | | | | — | | | | — | | | | — | |
| | 9,966,793,513 | | | | 4,862,045,847 | | | | 616,291,151 | | | | 1,511,925,818 | | | | 401,337,265 | | | | 7,453,071,942 | | | | 913,886,682 | | | | 747,124,675 | |
| | | | | | | | | | | | | | | | | | | | | | | | | | | | | | |
| | 14,334,494,569 | | | | 5,808,935,538 | | | | 705,359,534 | | | | 1,842,462,751 | | | | 783,415,206 | | | | 10,819,024,804 | | | | 914,326,979 | | | | 748,116,962 | |
| | | | | | | | | | | | | | | | | | | | | | | | | | | | | | |
| | 329,721 | | | | 5,370 | | | | 274,041 | | | | 67,804 | | | | 644,425 | | | | 108,168 | | | | 6,606 | | | | 24 | |
| | — | | | | — | | | | — | | | | — | | | | — | | | | — | | | | — | | | | — | |
| | 970,404 | | | | 139,583 | | | | 1,677 | | | | 18,093 | | | | 136,475 | | | | 346,779 | | | | 2,324 | | | | 44 | |
| | | | | | | | | | | | | | | | | | | | | | | | | | | | | | |
| | 1,300,125 | | | | 144,953 | | | | 275,718 | | | | 85,897 | | | | 780,900 | | | | 454,947 | | | | 8,930 | | | | 68 | |
| | | | | | | | | | | | | | | | | | | | | | | | | | | | | | |
| | (3,822,205,017 | ) | | | (780,070,665 | ) | | | (103,397,551 | ) | | | (382,571,875 | ) | | | (1,084,487,321 | ) | | | (3,758,829,326 | ) | | | (17,918 | ) | | | — | |
| | — | | | | — | | | | — | | | | — | | | | — | | | | — | | | | — | | | | — | |
| | (9,665,862,634 | ) | | | (3,362,020,784 | ) | | | (691,426,427 | ) | | | (1,713,044,044 | ) | | | (903,857,590 | ) | | | (9,361,055,877 | ) | | | (928,945,817 | ) | | | (331,906,646 | ) |
| | | | | | | | | | | | | | | | | | | | | | | | | | | | | | |
| | (13,488,067,651 | ) | | | (4,142,091,449 | ) | | | (794,823,978 | ) | | | (2,095,615,919 | ) | | | (1,988,344,911 | ) | | | (13,119,885,203 | ) | | | (928,963,735 | ) | | | (331,906,646 | ) |
| | | | | | | | | | | | | | | | | | | | | | | | | | | | | | |
$ | 847,727,043 | | | $ | 1,666,989,042 | | | $ | (89,188,726 | ) | | $ | (253,067,271 | ) | | $ | (1,204,148,805 | ) | | $ | (2,300,405,452 | ) | | $ | (14,627,826 | ) | | $ | 416,210,384 | |
| | | | | | | | | | | | | | | | | | | | | | | | | | | | | | |
| | | | | | | |
| | | | | | | | | | | | | | | | | | | | | | | | | | | | | | |
| | | | | | | | | | | | | | | | | | | | | | | | | | | | | | |
| | 4,367,701,056 | | | | 946,889,691 | | | | 89,068,383 | | | | 330,536,933 | | | | 382,077,940 | | | | 3,365,952,862 | | | | 440,281 | | | | 992,287 | |
| | — | | | | — | | | | — | | | | — | | | | — | | | | — | | | | — | | | | — | |
| | 9,966,793,513 | | | | 4,862,045,847 | | | | 616,291,151 | | | | 1,511,925,818 | | | | 401,337,265 | | | | 7,453,071,942 | | | | 913,743,656 | | | | 747,124,675 | |
| | | | | | | | | | | | | | | | | | | | | | | | | | | | | | |
| | 14,334,494,569 | | | | 5,808,935,538 | | | | 705,359,534 | | | | 1,842,462,751 | | | | 783,415,205 | | | | 10,819,024,804 | | | | 914,183,937 | | | | 748,116,962 | |
| | | | | | | | | | | | | | | | | | | | | | | | | | | | | | |
| | 329,721 | | | | 5,370 | | | | 274,041 | | | | 67,804 | | | | 644,425 | | | | 108,168 | | | | 6,605 | | | | 24 | |
| | — | | | | — | | | | — | | | | — | | | | — | | | | — | | | | — | | | | — | |
| | 970,404 | | | | 139,583 | | | | 1,677 | | | | 18,093 | | | | 136,475 | | | | 346,779 | | | | 2,324 | | | | 44 | |
| | | | | | | | | | | | | | | | | | | | | | | | | | | | | | |
| | 1,300,125 | | | | 144,953 | | | | 275,718 | | | | 85,897 | | | | 780,900 | | | | 454,947 | | | | 8,929 | | | | 68 | |
| | | | | | | | | | | | | | | | | | | | | | | | | | | | | | |
| | (3,822,205,017 | ) | | | (780,070,665 | ) | | | (103,397,551 | ) | | | (382,571,875 | ) | | | (1,084,487,321 | ) | | | (3,758,829,326 | ) | | | (17,916 | ) | | | — | |
| | — | | | | — | | | | — | | | | — | | | | — | | | | — | | | | — | | | | — | |
| | (9,665,862,634 | ) | | | (3,362,020,784 | ) | | | (691,426,427 | ) | | | (1,713,044,044 | ) | | | (903,857,590 | ) | | | (9,361,055,877 | ) | | | (928,796,503 | ) | | | (331,906,646 | ) |
| | | | | | | | | | | | | | | | | | | | | | | | | | | | | | |
| | (13,488,067,651 | ) | | | (4,142,091,449 | ) | | | (794,823,978 | ) | | | (2,095,615,919 | ) | | | (1,988,344,911 | ) | | | (13,119,885,203 | ) | | | (928,814,419 | ) | | | (331,906,646 | ) |
| | | | | | | | | | | | | | | | | | | | | | | | | | | | | | |
| 847,727,043 | | | | 1,666,989,042 | | | | (89,188,726 | ) | | | (253,067,271 | ) | | | (1,204,148,806 | ) | | | (2,300,405,452 | ) | | | (14,621,553 | ) | | | 416,210,384 | |
| | | | | | | | | | | | | | | | | | | | | | | | | | | | | | |
165
| | |
| Notes to Financial Statements (continued) | | |
| 6. | | Investment Adviser Fee and Other Transactions with Affiliates |
Investment Advisory Fees—The Adviser receives for its services an investment adviser fee based on a percentage of each Fund’s average daily net assets (“ADNA”) as listed below.
| | | | | | | | | | | | | | | | | | | | |
| | | Fund’s ADNA | | | | |
Fund | | on the
first
$500
million | | | on the
next
$200
million | | | on the
next
$100
million | | | in excess
of $800
million | | | | |
Low Volatility Equity Fund | | | 0.500 | % | | | 0.490 | % | | | 0.450 | % | | | 0.400 | % | | | | |
Dividend Income Fund | | | 0.500 | | | | 0.490 | | | | 0.450 | | | | 0.400 | | | | | |
Mid-Cap Value Fund | | | 0.685 | | | | 0.670 | | | | 0.570 | | | | 0.510 | | | | | |
Mid-Cap Growth Fund | | | 0.685 | | | | 0.670 | | | | 0.570 | | | | 0.510 | | | | | |
Small-Cap Value Fund | | | 0.685 | | | | 0.680 | | | | 0.620 | | | | 0.610 | | | | | |
Small-Cap Growth Fund(1) | | | 0.685 | | | | 0.680 | | | | 0.620 | | | | 0.610 | | | | | |
Global Low Volatility Equity Fund | | | 0.650 | | | | 0.640 | | | | 0.600 | | | | 0.550 | | | | | |
Pyrford International Stock Fund | | | 0.735 | | | | 0.720 | | | | 0.620 | | | | 0.560 | | | | | |
LGM Emerging Markets Equity Fund | | | 0.900 | | | | 0.890 | | | | 0.850 | | | | 0.800 | | | | | |
| | |
| | | Fund’s ADNA | | | | |
Fund | | on the
first
$100
million | | | on the
next
$150
million | | | on the
next
$250
million | | | in excess
of $500
million | | | | |
TCH Emerging Markets Bond Fund | | | 0.550 | % | | | 0.550 | % | | | 0.550 | % | | | 0.550 | % | | | | |
Ultra Short Tax-Free Fund | | | 0.200 | | | | 0.190 | | | | 0.170 | | | | 0.100 | | | | | |
Short Tax-Free Fund | | | 0.200 | | | | 0.190 | | | | 0.170 | | | | 0.150 | | | | | |
Short-Term Income Fund | | | 0.200 | | | | 0.190 | | | | 0.170 | | | | 0.100 | | | | | |
Intermediate Tax-Free Fund | | | 0.250 | | | | 0.160 | | | | 0.120 | | | | 0.100 | | | | | |
Strategic Income Fund | | | 0.250 | | | | 0.200 | | | | 0.200 | | | | 0.200 | | | | | |
TCH Corporate Income Fund | | | 0.200 | | | | 0.190 | | | | 0.150 | | | | 0.100 | | | | | |
TCH Core Plus Bond Fund | | | 0.250 | | | | 0.160 | | | | 0.120 | | | | 0.100 | | | | | |
High Yield Bond Fund | | | 0.500 | | | | 0.500 | | | | 0.500 | | | | 0.500 | | | | | |
| | | |
| | | Fund’s ADNA | | | | | | | |
Fund | | on the
first
$1
billion | | | on the
next
$1
billion | | | in excess
of $2
billion | | | | | | | |
Large-Cap Value Fund | | | 0.500 | % | | | 0.475 | % | | | 0.450 | % | | | | | | | | |
Large-Cap Growth Fund | | | 0.500 | | | | 0.475 | | | | 0.450 | | | | | | | | | |
Small-Cap Core Fund | | | 0.650 | | | | 0.625 | | | | 0.600 | | | | | | | | | |
Disciplined International Equity Fund | | | 0.600 | | | | 0.575 | | | | 0.550 | | | | | | | | | |
Alternative Strategies Fund(2) | | | 1.500 | | | | 1.475 | | | | 1.450 | | | | | | | | | |
Global Long/Short Equity Fund | | | 1.000 | | | | 0.975 | | | | 0.950 | | | | | | | | | |
| |
| | | Fund’s ADNA | |
Fund | | on the
first
$2
billion | | | on the
next
$2
billion | | | on the
next
$2
billion | | | on the
next
$2
billion | | | in excess
of $8
billion | |
Government Money Market Fund | | | 0.200 | % | | | 0.185 | % | | | 0.170 | % | | | 0.155 | % | | | 0.140 | % |
Tax-Free Money Market Fund | | | 0.200 | | | | 0.185 | | | | 0.170 | | | | 0.155 | | | | 0.140 | |
Prime Money Market Fund | | | 0.150 | | | | 0.135 | | | | 0.120 | | | | 0.105 | | | | 0.090 | |
Institutional Prime Money Market Fund | | | 0.150 | | | | 0.135 | | | | 0.120 | | | | 0.105 | | | | 0.090 | |
| | (1) | Effective October 5, 2016 the investment adviser fees and breakpoint tiers were reduced for this BMO Fund. Prior to October 5, 2016, the fees charged based on the Fund’s ADNA were as follows: 0.95% on the first $500 million, 0.90% on the next $200 million, 0.90% on the next $100 million and 0.90% in excess of $800 million. |
| | (2) | Effective June 1, 2017 the investment adviser fees and breakpoint tiers were reduced for this BMO Fund. Prior to June 1, 2017, the fees charged based on the Fund’s ADNA were as follows: 1.700% on the first $1 billion, 1.675% on the next $1 billion and 1.650% in excess of $2 billion. |
166
The Pyrford International Stock Fund’s sub-adviser is Pyrford International Ltd., an affiliate of the Adviser. The LGM Emerging Markets Equity Fund’s sub-adviser is LGM Investments Limited, an affiliate of the Adviser. The TCH Emerging Markets Bond Fund, TCH Corporate Income Fund and TCH Core Plus Bond Fund’s sub-adviser is Taplin, Canida & Habacht, LLC, an affiliate of the Adviser. One of the sub-advisers of the Alternative Strategies Fund is CTC myCFO, LLC, an affiliate of the Adviser. The Adviser compensates each sub-adviser based on the level of average daily net assets of each respective Fund managed by each sub-adviser.
Contractual Expense Limitation—The Adviser has agreed to waive or reduce its investment advisory fee or reimburse expenses to the extent necessary to prevent class specific total annual operating expenses (excluding taxes, dividend and interest expense, brokerage commissions, other investment related costs, Acquired Fund Fees and Expenses and extraordinary expenses, such as litigation and other expenses not incurred in the ordinary course of a Fund’s business) from exceeding the amounts for the periods set forth below. The Adviser may not terminate this arrangement prior to December 31, 2018, without the consent of the Directors, unless the investment advisory agreement is terminated. The Adviser may voluntarily choose to waive any portion of its fee beyond its contractual agreement. The Adviser can modify or terminate this voluntary waiver at any time at its sole discretion. Additionally, the agreement does not provide for recoupment by the Adviser of waived fees or reimbursed expenses.
| | | | | | | | | | | | | | | | | | | | | | | | | | | | |
| | | Annualized Contractual Expense Limitation | |
Fund | | Investor
Class | | | Advisor
Class | | | Institutional
Class | | | Premier
Class | | | Retirement
Class R-3 | | | Retirement
Class R-6 | | | Class F-3 | |
Low Volatility Equity Fund | | | | | | | 0.90 | % | | | 0.65 | % | | | | | | | | | | | | | | | | |
Dividend Income Fund | | | | | | | 0.90 | | | | 0.65 | | | | | | | | | | | | | | | | | |
Large-Cap Value Fund | | | 1.00 | %(1) | | | 1.00 | | | | 0.75 | | | | | | | | | | | | 0.60 | % | | | | |
Large-Cap Growth Fund | | | 1.00 | | | | 1.00 | | | | 0.75 | | | | | | | | | | | | 0.60 | | | | | |
Mid-Cap Value Fund | | | 1.24 | (1) | | | 1.24 | | | | 0.99 | | | | | | | | 1.49 | % | | | 0.84 | | | | | |
Mid-Cap Growth Fund | | | 1.24 | (1) | | | 1.24 | (4) | | | 0.99 | | | | | | | | 1.49 | | | | 0.84 | | | | | |
Small-Cap Value Fund | | | | | | | 1.24 | | | | 0.99 | | | | | | | | 1.49 | | | | 0.84 | | | | | |
Small-Cap Core Fund | | | | | | | 1.15 | | | | 0.90 | | | | | | | | | | | | | | | | | |
Small-Cap Growth Fund | | | 1.24 | (1)(2) | | | 1.24 | (5) | | | 0.99 | (2) | | | | | | | | | | | | | | | | |
Global Low Volatility Equity Fund | | | | | | | 1.10 | | | | 0.85 | | | | | | | | | | | | | | | | | |
Disciplined International Equity Fund | | | | | | | 1.15 | | | | 0.90 | | | | | | | | | | | | | | | | | |
Pyrford International Stock Fund | | | 1.19 | (3) | | | 1.19 | (3) | | | 0.94 | (3) | | | | | | | 1.44 | (3) | | | 0.79 | (3) | | | 0.79 | %(5) |
LGM Emerging Markets Equity Fund | | | | | | | 1.40 | | | | 1.15 | | | | | | | | | | | | | | | | | |
TCH Emerging Markets Bond Fund | | | | | | | 1.00 | | | | 0.85 | | | | | | | | | | | | | | | | | |
Alternative Strategies Fund | | | | | | | 2.00 | (4) | | | 1.75 | (4) | | | | | | | | | | | | | | | | |
Global Long/Short Equity Fund | | | | | | | 1.60 | | | | 1.35 | | | | | | | | | | | | | | | | | |
Ultra Short Tax-Free Fund | | | 0.55 | (1) | | | 0.55 | | | | 0.30 | | | | | | | | | | | | | | | | | |
Short Tax-Free Fund | | | 0.55 | (1) | | | 0.55 | | | | 0.40 | | | | | | | | | | | | | | | | | |
Short-Term Income Fund | | | 0.60 | (1) | | | 0.60 | | | | 0.35 | | | | | | | | | | | | | | | | | |
Intermediate Tax-Free Fund | | | 0.55 | | | | 0.55 | | | | 0.50 | | | | | | | | | | | | | | | | | |
Strategic Income Fund | | | 0.80 | | | | 0.80 | | | | 0.55 | | | | | | | | | | | | | | | | | |
TCH Corporate Income Fund | | | 0.59 | | | | 0.59 | | | | 0.55 | | | | | | | | | | | | | | | | | |
TCH Core Plus Bond Fund | | | 0.59 | | | | 0.59 | | | | 0.55 | | | | | | | | | | | | | | | | | |
High Yield Bond Fund | | | | | | | 0.90 | | | | 0.65 | | | | | | | | | | | | | | | | | |
Government Money Market Fund | | | 0.45 | | | | | | | | | | | | 0.20 | % | | | | | | | | | | | | |
Tax-Free Money Market Fund | | | 0.45 | | | | | | | | | | | | 0.20 | | | | | | | | | | | | | |
Prime Money Market Fund | | | 0.45 | | | | | | | | | | | | 0.20 | | | | | | | | | | | | | |
Institutional Prime Money Market Fund | | | 0.45 | | | | | | | | | | | | 0.20 | | | | | | | | | | | | | |
| | (1) | Effective through June 2, 2017 (termination of Investor class of shares). |
| | (2) | Effective October 5, 2016. Prior to October 5, 2016, the annual rates were 1.44% and 1.19%, respectively. |
| | (3) | Effective March 1, 2017. Prior to March 1, 2017, the annual rates were 1.24%, 1.24%, 0.99%, 1.49%, and 0.84%, respectively. |
| | (4) | Effective June 1, 2017. Prior to June 1, 2017, the annual rates were 2.20% and 1.95%, respectively. |
| | (5) | Class inception date is May 31, 2017. |
For the year ended August 31, 2017, the Adviser chose to voluntarily waive beyond its contractual expense limitations for the Government Money Market Fund and the Prime Money Market Fund in the amounts of $264,781 and $5,970, respectively, to ensure shareholders earned at least 0.01% return on their investment. The Adviser also chose to voluntarily make a capital contribution to the Prime Money Market Fund in the amount of $264,566 with the implementation of the new money market fund rules during the period.
Shareholder Servicing Fees—Under the terms of a Shareholder Services Agreement with the Adviser, certain Funds pay the Adviser at the annual rate of 0.25% of average daily net assets of the Fund’s Investor Class shares for the period. The fee paid to the Adviser is used to finance certain services for shareholders and to maintain shareholder accounts.
Distribution Services Fees—Certain Funds are subject to a Distribution Plan (the “Plan”) pursuant to Rule 12b-1 under the Act. The Plan authorizes payments by the Fund to finance activities intended to result in the sale of its Advisor Class and
167
| | |
| Notes to Financial Statements (continued) | | |
Retirement Class R-3 shares. The Plan provides that the Fund may incur distribution expenses of 0.25% and 0.50% of the average daily net assets of the Fund’s Advisor Class and Retirement Class R-3 shares, respectively.
Administration Fees—The fee paid to the Adviser is based on each Fund’s average daily net assets with respect to Administration Fee Schedule A and the aggregate average daily net assets of all Funds representing Administration Fee Schedule B as listed below.
| | | | | | | | | | |
| Administration Fee Schedule A | | | | Administration Fee Schedule B |
Annual Rate | | | | | | | | Annual Rate | | ADNA |
| 0.1500% | | | | | | | | 0.0400% | | on the first $2 billion |
| | | | | | | | 0.0300 | | on the next $2 billion |
| | | | | | | | 0.0250 | | on the next $2 billion |
| | | | | | | | 0.0200 | | on the next $2 billion |
| | | | | | | | 0.0100 | | in excess of $8 billion |
| | | | | | | | | | |
| | |
| Fund | | | | Fund |
| Low Volatility Equity Fund | | TCH Emerging Markets Bond Fund | | | | Government Money Market Fund |
| Dividend Income Fund | | Alternative Strategies Fund | | | | Tax-Free Money Market Fund |
| Large-Cap Value Fund(1) | | Global Long/Short Equity Fund | | | | Prime Money Market Fund |
| Large-Cap Growth Fund(1) | | Ultra Short Tax-Free Fund | | | | Institutional Prime Money Market Fund |
| Mid-Cap Value Fund(1) | | Short Tax-Free Fund | | | | |
| Mid-Cap Growth Fund(1) | | Short-Term Income Fund | | | | |
| Small-Cap Value Fund(1) | | Intermediate Tax-Free Fund | | | | |
| Small-Cap Core Fund | | Strategic Income Fund | | | | |
| Small-Cap Growth Fund | | TCH Corporate Income Fund | | | | |
| Global Low Volatility Equity Fund | | TCH Core Plus Bond Fund | | | | |
| Disciplined International Equity Fund | | High Yield Bond Fund | | | | |
| Pyrford International Stock Fund(1) | | | | | | |
| LGM Emerging Markets Equity Fund | | | | | | |
| | (1) | For the year ended August 31, 2017, the Funds with class-specific Administration Fees were as follows: |
| | | | | | | | | | | | | | | | | | | | | | | | |
Fund | | Investor
Class | | | Advisor
Class | | | Institutional
Class | | | Retirement
Class R-3 | | | Retirement
Class R-6(a) | | | Class F-3(a) | |
Large-Cap Value Fund | | $ | 202,218 | (b) | | $ | 24,511 | | | $ | 261,072 | | | $ | — | | | $ | — | | | $ | — | |
Large-Cap Growth Fund | | | 242,299 | | | | 809 | | | | 210,913 | | | | — | | | | — | | | | — | |
Mid-Cap Value Fund | | | 162,955 | (b) | | | 30,420 | | | | 117,741 | | | | 35 | | | | — | | | | — | |
Mid-Cap Growth Fund | | | 97,972 | (b) | | | 17,753 | | | | 60,116 | | | | 32 | | | | — | | | | — | |
Small-Cap Value Fund | | | — | | | | 57,415 | | | | 40,934 | | | | 156 | | | | — | | | | — | |
Pyrford International Stock Fund | | | 129,074 | | | | 417 | | | | 763,765 | | | | 36 | | | | — | | | | — | |
| | (a) | Retirement Class R-6 and Class F-3 do not pay an Administrative Fee. |
| | (b) | Reflects operations for the period from September 1, 2016 to June 2, 2017 (termination of Investor Class Shares) |
Custodian Fees—BMO Harris is the Funds’ custodian, except for the International Funds, for which State Street Bank & Trust Company maintains custody. BMO Harris receives fees consisting of 0.005% on the first $10 billion average daily net assets, based on the collective net assets of the Corporation custodied by BMO Harris, and 0.0025% on all assets in excess of $10 billion.
168
Securities Lending—The Funds pay a fee to BMO Harris for its services as the securities lending agent. The securities lending income as shown in the Statements of Operations is net of these fees. The following amounts were paid for the year ended August 31, 2017:
| | | | |
Fund | | Fees Paid | |
Low Volatility Equity Fund | | $ | 36,124 | |
Dividend Income Fund | | | 27,923 | |
Large-Cap Value Fund | | | 72,303 | |
Large-Cap Growth Fund | | | 84,623 | |
Mid-Cap Value Fund | | | 49,788 | |
Mid-Cap Growth Fund | | | 28,555 | |
Small-Cap Value Fund | | | 19,349 | |
| | | | |
Fund | | Fees Paid | |
Small-Cap Core Fund | | $ | 5,213 | |
Small-Cap Growth Fund | | | 130,092 | |
Short-Term Income Fund | | | 31,541 | |
Strategic Income Fund | | | 6,790 | |
TCH Corporate Income Fund | | | 25,492 | |
TCH Core Plus Bond Fund | | | 127,382 | |
Investments in Affiliated Issuers—An affiliated issuer is an entity in which the Fund has ownership of at least 5% of the voting securities or any investment in a BMO Fund. Issuers that are affiliates of the Fund at period-end are noted in the Fund’s Schedule of Investments. Additional security purchases and the reduction of certain securities shares outstanding of existing portfolio holdings that were not considered affiliated in prior periods may result in the Funds owning in excess of 5% of the outstanding shares at period-end. The table below reflects transactions during the period with entities that are affiliates as of August 31, 2017 and may include acquisitions of new investments, prior period holdings that became affiliated during the period and prior period affiliated holdings that are no longer affiliated as of period-end.
| | | | | | | | | | | | | | | | | | | | | | | | | | | | | | | | |
Security/Fund Description | | Value,
Beginning
of Period | | | Purchases | | | Sales
Proceeds | | | Change in
Unrealized
Appreciation | | | Net
Realized
Gain (Loss) | | | Value,
End
of Period | | | Dividends
Credited
to
Income | | | Net Realized
Gain on
Capital Gain
Distributions | |
Cash Sweep Investments in BMO Government Money Market Fund, Premier Class, 0.870% | | | | | |
Ultra Short Tax-Free Fund | | $ | — | | | $ | 195,146,627 | | | $ | 195,066,305 | | | $ | — | | | $ | — | | | $ | 80,322 | | | $ | 2,674 | | | $ | — | |
Short Tax-Free Fund | | | — | | | | 68,021,412 | | | | 67,905,924 | | | | — | | | | — | | | | 115,488 | | | | 1,140 | | | | — | |
Intermediate Tax-Free Fund | | | — | | | | 219,410,213 | | | | 219,330,430 | | | | — | | | | — | | | | 79,783 | | | | 3,140 | | | | — | |
Strategic Income Fund | | | 4,706,289 | | | | 45,001,736 | | | | 49,708,025 | | | | — | | | | — | | | | — | | | | 6,502 | | | | — | |
| |
| Cash Sweep Investments in BMO Tax-Free Money Market Fund, Premier Class, 0.670% | | | | | |
Ultra Short Tax-Free Fund | | | 568,942 | | | | 20,011,105 | | | | 20,580,047 | | | | — | | | | — | | | | — | | | | 3,541 | | | | — | |
Short Tax-Free Fund | | | 504,804 | | | | 4,391,807 | | | | 4,896,611 | | | | — | | | | — | | | | — | | | | 577 | | | | — | |
Intermediate Tax-Free Fund | | | 3,592,622 | | | | 17,814,943 | | | | 21,407,565 | | | | — | | | | — | | | | — | | | | 2,497 | | | | — | |
| |
Cash Sweep Investments in BMO Institutional Prime Money Market Fund, Premier Class, 1.080% | | | | | |
Low Volatility Equity Fund | | | 3,827,898 | | | | 42,870,761 | | | | 43,865,815 | | | | — | | | | 299 | | | | 2,833,143 | | | | 21,760 | | | | — | |
Dividend Income Fund | | | 1,722,615 | | | | 19,964,291 | | | | 19,611,606 | | | | 32 | | | | 73 | | | | 2,075,405 | | | | 15,692 | | | | — | |
Large-Cap Value Fund | | | 5,318,313 | | | | 78,255,738 | | | | 79,164,228 | | | | 26 | | | | 1,358 | | | | 4,411,207 | | | | 38,584 | | | | — | |
Large-Cap Growth Fund | | | 5,069,310 | | | | 90,979,481 | | | | 91,507,452 | | | | 50 | | | | 1,391 | | | | 4,542,780 | | | | 43,549 | | | | — | |
Mid-Cap Value Fund | | | 3,580,179 | | | | 59,778,509 | | | | 61,479,280 | | | | — | | | | 1,383 | | | | 1,880,791 | | | | 28,896 | | | | — | |
Mid-Cap Growth Fund | | | 3,799,114 | | | | 29,984,209 | | | | 31,836,699 | | | | — | | | | 689 | | | | 1,947,313 | | | | 18,016 | | | | — | |
Small-Cap Value Fund | | | 3,291,960 | | | | 20,487,000 | | | | 23,190,614 | | | | — | | | | 216 | | | | 588,562 | | | | 9,724 | | | | — | |
Small-Cap Core Fund | | | 183,137 | | | | 10,070,342 | | | | 9,884,573 | | | | — | | | | 95 | | | | 369,001 | | | | 2,946 | | | | — | |
Small-Cap Growth Fund | | | 14,167,565 | | | | 112,821,039 | | | | 125,429,642 | | | | — | | | | 1,531 | | | | 1,560,493 | | | | 24,748 | | | | — | |
Short-Term Income Fund | | | 6,777,627 | | | | 207,921,447 | | | | 210,235,278 | | | | 88 | | | | 218 | | | | 4,464,102 | | | | 55,426 | | | | — | |
Strategic Income Fund | | | — | | | | 16,891,633 | * | | | 15,953,478 | | | | — | | | | (126 | ) | | | 938,029 | | | | 4,565 | | | | — | |
TCH Corporate Income Fund | | | 8,154,777 | | | | 145,105,123 | | | | 148,851,092 | | | | — | | | | 2,028 | | | | 4,410,836 | | | | 77,149 | | | | — | |
TCH Core Plus Bond Fund | | | 29,910,619 | | | | 494,822,451 | | | | 478,175,410 | | | | 892 | | | | 1,503 | | | | 46,560,055 | | | | 268,202 | | | | — | |
High Yield Bond Fund | | | 3,392,910 | | | | 82,864,760 | | | | 85,899,590 | | | | — | | | | 1,965 | | | | 360,045 | | | | 8,277 | | | | — | |
| | | | | | | |
Investments in Other Affiliates | | | | | | | | | | | | | | | | | | | | | | |
Fund/Security Description | | | | | | | | | | | | | | | | | | | | | | | | | | | | | | | | |
Short Tax-Free Fund | | | | | | | | | | | | | | | | | | | | | | | | | | | | | | | | |
Ultra Short Tax-Free Fund | | | 856,408 | | | | 8,860 | | | | — | | | | 864 | | | | — | | | | 866,132 | | | | 8,118 | | | | 896 | |
| | | | | | | | |
Intermediate Tax-Free Fund | | | | | | | | | | | | | | | | | | | | | | | | | | | | | | | | |
Ultra Short Tax-Free Fund | | | 5,051,144 | | | | 52,260 | | | | — | | | | 5,093 | | | | — | | | | 5,108,497 | | | | 47,880 | | | | 5,281 | |
| * | Included in Purchases are $3,561,824 of BMO Institutional Prime Money Market Fund received as part of a non-taxable in-kind subscription merger, as of close of business June 29, 2017. See Note 11, Reorganization Information, in the Notes to Financial Statements for additional information. |
Interfund Borrowing and Lending—The Funds participate in an interfund lending program. This program allows the Funds to lend cash to and/or borrow cash from other Funds for temporary purposes, although the Money Market Funds cannot participate as borrowers. The program is subject to a number of conditions, including the requirement that the interfund loan rate to be charged to the Funds under the program is (i) more favorable to the lending Fund than the rate it could otherwise obtain from investing cash in repurchase agreements or purchasing shares of a Money Market Fund and (ii) more favorable
169
| | |
| Notes to Financial Statements (continued) | | |
to the borrowing Fund than the lowest interest rate at which bank short-term loans would be available to the Funds. In addition, a Fund may participate in the program only if its participation is consistent with the Fund’s investment policies and limitations. The Directors are responsible for the oversight of the interfund lending program. No interfund borrowing or lending balances existed as of August 31, 2017.
Funds utilizing the Interfund lending program, borrowing from either the BMO Government Money Market Fund or the BMO Prime Money Market Fund during the year ended August 31, 2017, were as follows:
| | | | | | | | |
Fund | | Average Daily
Loan Balance
Outstanding | | | Weighted Average
Interest Rate | |
Low Volatility Equity Fund | | $ | 52,885 | | | | 1.013 | % |
Dividend Income Fund | | | 55 | | | | 0.895 | |
Mid-Cap Value Fund | | | 114 | | | | 1.129 | |
Mid-Cap Growth Fund | | | 20,115 | | | | 1.135 | |
Small-Cap Core Fund | | | 14,554 | | | | 1.131 | |
Small-Cap Growth Fund | | | 361,198 | | | | 0.962 | |
Pyrford International Stock Fund | | | 15,834 | | | | 1.124 | |
| | | | | | | | |
Fund | | Average Daily
Loan Balance
Outstanding | | | Weighted Average
Interest Rate | |
Ultra Short Tax-Free Fund | | $ | 60,839 | | | | 1.126 | % |
Short Tax-Free Fund | | | 8,643 | | | | 1.025 | |
Short-Term Income Fund | | | 20,547 | | | | 0.975 | |
Intermediate Tax-Free Fund | | | 87,379 | | | | 1.114 | |
TCH Corporate Income Fund | | | 32,948 | | | | 0.934 | |
TCH Core Plus Bond Fund | | | 139,772 | | | | 0.964 | |
High Yield Bond Fund | | | 12,240 | | | | 1.101 | |
General—Certain of the Officers and Directors of the Corporation are also Officers and Directors/Trustees of one or more of the above companies, which are affiliates of the Corporation. None of the Fund Officers or interested Directors receives any compensation from the Funds.
The Corporation, on behalf of the respective Funds, participated in a $25 million unsecured, committed revolving line of credit (“LOC”) agreement with UMB Bank, n.a. The LOC was made available for extraordinary or emergency purposes, primarily for financing redemption payments. Borrowings are charged interest at a rate of the London Interbank Offering Rate (“LIBOR”) plus 1.25% and a commitment fee of 0.20% per annum on the daily unused portion with no administrative fee. The Tax-Free Money Market Fund utilized this LOC as borrower during the year ended August 31, 2017. No borrowings were outstanding under the LOC at August 31, 2017. For the year ended August 31, 2017, the average daily loan balance outstanding was $24,250 and the weighted average interest rate was 1.78%.
| 8. | | Investment Transactions |
Purchases and sales of investments, excluding short-term U.S. government securities, short-term obligations, and in-kind contributions, for the year ended August 31, 2017 were as follows:
| | | | | | | | | | | | | | | | |
| | | Other than
U.S Government
Securities | | | U.S. Government
Securities | |
Fund | | Purchases | | | Sales | | | Purchases | | | Sales | |
Low Volatility Equity Fund | | $ | 89,510,366 | | | $ | 89,672,119 | | | $ | — | | | $ | — | |
Dividend Income Fund | | | 50,172,314 | | | | 65,023,031 | | | | — | | | | — | |
Large-Cap Value Fund | | | 199,767,858 | | | | 211,992,099 | | | | — | | | | — | |
Large-Cap Growth Fund | | | 265,386,390 | | | | 226,004,260 | | | | — | | | | — | |
Mid-Cap Value Fund | | | 305,481,882 | | | | 352,242,637 | | | | — | | | | — | |
Mid-Cap Growth Fund | | | 184,774,369 | | | | 213,603,800 | | | | — | | | | — | |
Small-Cap Value Fund | | | 99,621,702 | | | | 108,786,430 | | | | — | | | | — | |
Small-Cap Core Fund | | | 20,976,527 | | | | 15,280,985 | | | | — | | | | — | |
Small-Cap Growth Fund | | | 410,457,331 | | | | 622,666,055 | | | | — | | | | — | |
Global Low Volatility Equity Fund | | | 43,605,452 | | | | 36,492,432 | | | | — | | | | — | |
Disciplined International Equity Fund | | | 48,825,365 | | | | 53,542,510 | | | | — | | | | — | |
Pyrford International Stock Fund | | | 199,960,811 | | | | 231,916,934 | | | | — | | | | — | |
LGM Emerging Markets Equity Fund | | | 67,298,841 | | | | 56,523,328 | | | | — | | | | — | |
TCH Emerging Markets Bond Fund | | | 12,479,287 | | | | 8,901,098 | | | | — | | | | — | |
Alternative Strategies Fund | | | 158,981,211 | | | | 181,185,532 | | | | 514,458 | | | | 529,216 | |
Global Long/Short Equity Fund | | | 7,152,887 | | | | 2,972,079 | | | | — | | | | — | |
Ultra Short Tax-Free Fund | | | 808,200,289 | | | | 768,496,103 | | | | — | | | | — | |
Short Tax-Free Fund | | | 171,600,558 | | | | 181,119,606 | | | | — | | | | — | |
Short-Term Income Fund | | | 99,394,099 | | | | 126,414,877 | | | | 32,591,174 | | | | 51,886,180 | |
Intermediate Tax-Free Fund | | | 738,267,040 | | | | 910,639,631 | | | | — | | | | — | |
Strategic Income Fund | | | 52,725,617 | | | | 5,617,793 | | | | 6,594,751 | | | | 70,977,406 | |
TCH Corporate Income Fund | | | 133,821,161 | | | | 86,807,281 | | | | 11,110,967 | | | | 15,089,817 | |
TCH Core Plus Bond Fund | | | 284,218,767 | | | | 237,875,871 | | | | 114,793,387 | | | | 97,517,991 | |
High Yield Bond Fund | | | 20,154,649 | | | | 109,549,741 | | | | — | | | | — | |
170
| 9. | | Federal Tax Information |
The timing and character of income and capital gain distributions are determined in accordance with income tax regulations, which may differ from GAAP. These differences are due in part to differing treatment of net operating loss, foreign currency transactions, paydown gain or loss, market discount accretion, premium amortization, and expiring capital loss carryforwards.
To the extent that differences arise that are permanent in nature, such amounts are reclassified within the capital accounts, on the Statements of Assets and Liabilities, based on their Federal tax basis treatment; temporary differences do not require reclassification and had no impact on the NAV of the Funds.
The Funds complied with the FASB interpretation Accounting for Uncertainty in Income Taxes, which provides guidance for how uncertain tax provisions should be recognized, measured, presented, and disclosed in the financial statements. Accounting for Uncertainty in Income Taxes requires the affirmative evaluation of tax positions taken or expected to be taken in the course of preparing the Funds’ tax returns to determine whether it is “more-likely-than-not,” (i.e., greater than 50 percent) of being sustained by the applicable tax authority. Tax positions not deemed to meet the more-likely-than-not threshold may result in a tax benefit or expense in the current year.
Accounting for Uncertainty in Income Taxes requires management of the Funds to analyze all open tax years, as defined by the statutes of limitations, for all major jurisdictions, which includes federal and certain states. Open tax years are those that are open for exam by the taxing authorities (i.e., the last four tax years and the interim tax period since then). The Funds have no examinations in progress. For all open tax years and all major taxing jurisdictions through the end of the reporting period, management of the Funds reviewed all tax positions taken or expected to be taken in the preparation of the Funds’ tax returns and concluded that Accounting for Uncertainty in Income Taxes resulted in no effect on the Funds’ reported net assets or results of operations as of and during the period ended August 31, 2017. Management of the Funds also is not aware of any tax positions for which it is reasonably possible that the total amounts of recognized tax benefits will significantly change in the next twelve months.
The difference between book basis and tax basis unrealized appreciation/depreciation is attributable in part to the tax deferral of losses on wash sales, the realization for tax purposes of unrealized gains on investments in passive foreign investment companies, derivatives, foreign unrealized capital gains tax, foreign currency, and the discount accretion/premium amortization of debt securities.
| | | | | | | | | | | | | | | | |
Fund | | Cost of
Investments
for Federal
Tax Purposes | | | Gross
Unrealized
Appreciation
for Federal
Tax Purposes | | | Gross
Unrealized
(Depreciation)
for Federal
Tax Purposes | | | Net
Unrealized
Appreciation
for Federal
Tax Purposes | |
Low Volatility Equity Fund | | $ | 216,269,771 | | | $ | 22,926,956 | | | $ | (4,270,777 | ) | | $ | 18,656,179 | |
Dividend Income Fund | | | 145,874,005 | | | | 24,659,017 | | | | (2,164,753 | ) | | | 22,494,264 | |
Large-Cap Value Fund | | | 444,136,668 | | | | 56,418,186 | | | | (5,108,007 | ) | | | 51,310,179 | |
Large-Cap Growth Fund | | | 421,209,539 | | | | 89,487,324 | | | | (3,111,850 | ) | | | 86,375,474 | |
Mid-Cap Value Fund | | | 268,603,855 | | | | 32,216,420 | | | | (5,236,730 | ) | | | 26,979,690 | |
Mid-Cap Growth Fund | | | 151,092,854 | | | | 18,660,410 | | | | (1,273,764 | ) | | | 17,386,646 | |
Small-Cap Value Fund | | | 74,439,541 | | | | 8,213,201 | | | | (3,103,389 | ) | | | 5,109,812 | |
Small-Cap Core Fund | | | 26,811,577 | | | | 3,212,100 | | | | (772,746 | ) | | | 2,439,354 | |
Small-Cap Growth Fund | | | 165,000,886 | | | | 18,610,025 | | | | (4,371,708 | ) | | | 14,238,317 | |
Global Low Volatility Equity Fund | | | 44,387,020 | | | | 6,902,085 | | | | (1,010,885 | ) | | | 5,891,200 | |
Disciplined International Equity Fund | | | 66,129,208 | | | | 11,872,269 | | | | (1,597,159 | ) | | | 10,275,110 | |
Pyrford International Stock Fund | | | 587,273,973 | | | | 84,782,560 | | | | (31,031,385 | ) | | | 53,751,175 | |
LGM Emerging Markets Equity Fund | | | 124,802,998 | | | | 41,673,216 | | | | (3,662,255 | ) | | | 38,010,961 | |
TCH Emerging Markets Bond Fund | | | 12,254,902 | | | | 491,534 | | | | (102,886 | ) | | | 388,648 | |
Alternative Strategies Fund | | | 77,326,725 | | | | 3,706,295 | | | | (2,055,736 | ) | | | 1,650,559 | |
Global Long/Short Equity Fund | | | 9,094,948 | | | | 1,585,300 | | | | (666,344 | ) | | | 918,956 | |
Ultra Short Tax-Free Fund | | | 681,502,665 | | | | 797,322 | | | | (189,299 | ) | | | 608,023 | |
Short Tax-Free Fund | | | 173,577,339 | | | | 1,722,829 | | | | (120,261 | ) | | | 1,602,568 | |
Short-Term Income Fund | | | 290,399,850 | | | | 1,624,133 | | | | (329,832 | ) | | | 1,294,301 | |
Intermediate Tax-Free Fund | | | 1,538,757,506 | | | | 73,539,670 | | | | (2,111,994 | ) | | | 71,427,676 | |
Strategic Income Fund | | | 134,496,320 | | | | 2,986,518 | | | | (798,144 | ) | | | 2,188,374 | |
TCH Corporate Income Fund | | | 307,236,863 | | | | 7,526,848 | | | | (1,307,268 | ) | | | 6,219,580 | |
TCH Core Plus Bond Fund | | | 1,230,812,389 | | | | 24,480,598 | | | | (4,760,429 | ) | | | 19,720,169 | |
High Yield Bond Fund | | | 12,644,526 | | | | 626,990 | | | | (137,027 | ) | | | 489,963 | |
Government Money Market Fund | | | 3,434,744,948 | * | | | — | | | | — | | | | — | |
Tax-Free Money Market Fund | | | 319,482,969 | * | | | — | | | | — | | | | — | |
Prime Money Market Fund | | | 368,748,953 | * | | | — | | | | — | | | | — | |
Institutional Prime Money Market Fund | | | 401,896,079 | | | | 45,548 | | | | (4,146 | ) | | | 41,402 | |
171
| | |
| Notes to Financial Statements (continued) | | |
The tax character of distributions reported on the Statement of Changes in Net Assets for the years ended August 31, 2017 and 2016 was as follows:
| | | | | | | | | | | | | | | | | | | | | | | | |
| | | 2017 | | | 2016 | |
Fund | | Ordinary
Income(1) | | | Tax-Exempt
Income | | | Long-Term
Capital Gains | | | Ordinary
Income(1) | | | Tax-Exempt
Income | | | Long-Term
Capital Gains | |
Low Volatility Equity Fund | | $ | 2,603,123 | | | $ | — | | | $ | 1,905,554 | | | $ | 1,746,043 | | | $ | — | | | $ | 2,243,100 | |
Dividend Income Fund | | | 2,500,532 | | | | — | | | | 959,489 | | | | 2,805,501 | | | | — | | | | 6,868,977 | |
Large-Cap Value Fund | | | 4,510,036 | | | | — | | | | 2,304,010 | | | | 9,598,945 | | | | — | | | | 24,138,585 | |
Large-Cap Growth Fund | | | 1,825,514 | | | | — | | | | 15,369,764 | | | | 6,033,858 | | | | — | | | | 26,944,126 | |
Mid-Cap Value Fund | | | 4,684,525 | | | | — | | | | 56,396,982 | | | | 2,621,289 | | | | — | | | | 27,098,506 | |
Mid-Cap Growth Fund | | | 5,370,941 | | | | — | | | | 21,512,271 | | | | — | | | | — | | | | 29,057,778 | |
Small-Cap Value Fund | | | 3,050,561 | | | | — | | | | 3,585,078 | | | | 261,828 | | | | — | | | | 3,593,261 | |
Small-Cap Core Fund | | | 168,167 | | | | — | | | | 124,126 | | | | 8,676 | | | | — | | | | 49,672 | |
Small-Cap Growth Fund | | | — | | | | — | | | | — | | | | — | | | | — | | | | 40,427,824 | |
Global Low Volatility Equity Fund | | | 1,170,206 | | | | — | | | | 97,713 | | | | 277,838 | | | | — | | | | 1,139 | |
Disciplined International Equity Fund | | | 1,676,485 | | | | — | | | | — | | | | — | | | | — | | | | — | |
Pyrford International Stock Fund | | | 14,300,415 | | | | — | | | | — | | | | 15,648,329 | | | | — | | | | — | |
LGM Emerging Markets Equity Fund | | | 957,823 | | | | — | | | | — | | | | 1,456,762 | | | | — | | | | — | |
TCH Emerging Markets Bond Fund | | | 401,330 | | | | — | | | | — | | | | 393,245 | | | | — | | | | 49,962 | |
Alternative Strategies Fund | | | — | | | | — | | | | — | | | | 1,041,789 | | | | — | | | | — | |
Global Long/Short Equity Fund | | | 56,198 | | | | — | | | | 4,250 | | | | — | | | | — | | | | — | |
Ultra Short Tax-Free Fund | | | 2,011 | | | | 5,640,480 | | | | 639,708 | | | | 62,033 | | | | 4,069,527 | | | | 608,075 | |
Short Tax-Free Fund | | | 11,645 | | | | 2,531,009 | | | | 38,121 | | | | 187,219 | | | | 1,978,212 | | | | 149,029 | |
Short-Term Income Fund | | | 4,432,458 | | | | — | | | | — | | | | 4,248,538 | | | | — | | | | — | |
Intermediate Tax-Free Fund | | | 2,084,903 | | | | 43,607,907 | | | | 3,410,963 | | | | 32,028 | | | | 40,541,321 | | | | 2,820,294 | |
Strategic Income Fund | | | 3,032,372 | | | | — | | | | — | | | | 3,249,887 | | | | — | | | | — | |
TCH Corporate Income Fund | | | 7,493,830 | | | | — | | | | 569,448 | | | | 8,488,508 | | | | — | | | | 991,224 | |
TCH Core Plus Bond Fund | | | 28,160,653 | | | | — | | | | — | | | | 31,505,501 | | | | — | | | | 353,732 | |
High Yield Bond Fund | | | 2,221,025 | | | | — | | | | — | | | | 3,905,456 | | | | — | | | | — | |
Government Money Market Fund | | | 13,191,339 | | | | — | | | | 3,237 | | | | 733,949 | | | | — | | | | — | |
Tax-Free Money Market Fund | | | 20,120 | | | | 1,920,845 | | | | 86,463 | | | | 50,489 | | | | 708,010 | | | | 186,054 | |
Prime Money Market Fund | | | 2,441,514 | | | | — | | | | — | | | | 5,070,691 | | | | — | | | | — | |
Institutional Prime Money Market Fund | | | 3,084,589 | | | | — | | | | — | | | | 386,189 | | | | — | | | | — | |
| | (1) | For tax purposes, short-term capital gain distributions are considered ordinary income. |
As of August 31, 2017, the components of distributable earnings on a tax basis are as follows:
| | | | | | | | | | | | | | | | | | | | | | | | |
Fund | | Undistributed
Ordinary
Income | | | Undistributed
Tax-Exempt
Income | | | Undistributed
Long-Term
Capital Gains | | | Accumulated
Capital and
Other Losses | | | Foreign
Currency, Futures
Dividend Payable,
and Other
Adjustments | | | Unrealized
Appreciation | |
Low Volatility Equity Fund | | $ | 1,376,718 | | | $ | — | | | $ | 2,943,120 | | | $ | — | | | $ | — | | | $ | 18,656,179 | |
Dividend Income Fund | | | 2,144,038 | | | | — | | | | 9,387,284 | | | | — | | | | (1 | ) | | | 22,494,264 | |
Large-Cap Value Fund | | | 6,866,525 | | | | — | | | | 17,916,622 | | | | — | | | | — | | | | 51,310,179 | |
Large-Cap Growth Fund | | | 4,266,980 | | | | — | | | | 12,230,417 | | | | — | | | | — | | | | 86,375,474 | |
Mid-Cap Value Fund | | | 4,757,592 | | | | — | | | | 4,586,401 | | | | — | | | | — | | | | 26,979,690 | |
Mid-Cap Growth Fund | | | 2,766,026 | | | | — | | | | 1,735,936 | | | | — | | | | — | | | | 17,386,646 | |
Small-Cap Value Fund | | | 2,621,737 | | | | — | | | | 1,725,333 | | | | — | | | | — | | | | 5,109,812 | |
Small-Cap Core Fund | | | 413,700 | | | | — | | | | 478,174 | | | | — | | | | (1 | ) | | | 2,439,354 | |
Small-Cap Growth Fund | | | — | | | | — | | | | 14,124,958 | | | | (505,948 | ) | | | — | | | | 14,238,317 | |
Global Low Volatility Equity Fund | | | 1,177,231 | | | | — | | | | 325,785 | | | | (235,933 | ) | | | 9,890 | | | | 5,891,200 | |
Disciplined International Equity Fund | | | 1,077,069 | | | | — | | | | — | | | | (4,419,714 | ) | | | 6,497 | | | | 10,275,110 | |
Pyrford International Stock Fund | | | 14,755,088 | | | | — | | | | — | | | | (26,002,664 | ) | | | 35,241 | | | | 53,751,175 | |
LGM Emerging Markets Equity Fund | | | 1,245,074 | | | | — | | | | — | | | | (5,540,201 | ) | | | (20,806 | ) | | | 38,010,961 | |
TCH Emerging Markets Bond Fund | | | 313,519 | | | | — | | | | — | | | | (338,540 | ) | | | (827 | ) | | | 388,648 | |
Alternative Strategies Fund | | | 40,915 | | | | — | | | | 4,034,633 | | | | — | | | | 236,540 | | | | 1,650,559 | |
Global Long/Short Equity Fund | | | 100,157 | | | | — | | | | 157,226 | | | | — | | | | (38 | ) | | | 918,956 | |
Ultra Short Tax-Free Fund | | | 94,095 | | | | 323,121 | | | | 110,243 | | | | — | | | | (338,757 | ) | | | 608,023 | |
Short Tax-Free Fund | | | — | | | | 140,553 | | | | — | | | | (235,122 | ) | | | (141,018 | ) | | | 1,602,568 | |
Short-Term Income Fund | | | 169,236 | | | | — | | | | — | | | | (1,656,976 | ) | | | (148,910 | ) | | | 1,294,301 | |
Intermediate Tax-Free Fund | | | 831,679 | | | | — | | | | — | | | | (11,528,180 | ) | | | (658,172 | ) | | | 71,427,676 | |
172
| | | | | | | | | | | | | | | | | | | | | | | | |
Fund | | Undistributed
Ordinary
Income | | | Undistributed
Tax-Exempt
Income | | | Undistributed
Long-Term
Capital Gains | | | Accumulated
Capital and
Other Losses | | | Foreign
Currency, Futures
Dividend Payable,
and Other
Adjustments | | | Unrealized
Appreciation | |
Strategic Income Fund | | $ | 13,353 | | | $ | — | | | $ | — | | | $ | (4,009,823 | ) | | $ | (28,279 | ) | | $ | 2,188,374 | |
TCH Corporate Income Fund | | | 526,739 | | | | — | | | | — | | | | (23,654 | ) | | | (225,152 | ) | | | 6,219,580 | |
TCH Core Plus Bond Fund | | | 1,180,703 | | | | — | | | | — | | | | (2,554,919 | ) | | | (232,139 | ) | | | 19,720,169 | |
High Yield Bond Fund | | | 894 | | | | — | | | | — | | | | (3,226,820 | ) | | | (10,281 | ) | | | 489,963 | |
Government Money Market Fund | | | 1,937,003 | | | | — | | | | 900 | | | | — | | | | (1,938,044 | ) | | | — | |
Tax-Free Money Market Fund | | | 24,255 | | | | 111,545 | | | | — | | | | — | | | | (135,746 | ) | | | — | |
Prime Money Market Fund | | | 157,283 | | | | — | | | | 87 | | | | — | | | | (181,345 | ) | | | — | |
Institutional Prime Money Market Fund | | | 376,617 | | | | — | | | | 33 | | | | — | | | | (360,165 | ) | | | 41,402 | |
At August 31, 2017, certain Funds had capital loss carryforwards, which may reduce taxable income arising from future net realized gains on investments, if any, to the extent permitted by the Code and thus will reduce the amount of distributions to shareholders that would otherwise be necessary to relieve the Funds of any liability for federal tax. Pursuant to the Code, such capital loss carryforward information is as follows:
| | | | | | | | | | | | | | | | | | | | | | | | |
| | | Utilized in
2017 | | | Expired in
2017 | | | Expiring in
2018 | | | Not Subject
to Expiration | | | | |
Fund | | | | | ST | | | LT | | | Total | |
Disciplined International Equity Fund | | $ | — | | | $ | — | | | $ | — | | | $ | 3,616,441 | | | $ | 803,273 | | | $ | 4,419,714 | |
Pyrford International Stock Fund | | | — | | | | — | | | | — | | | | 3,097,943 | | | | 19,555,037 | | | | 22,652,980 | |
LGM Emerging Markets Equity Fund | | | — | | | | — | | | | — | | | | — | | | | 5,540,201 | | | | 5,540,201 | |
TCH Emerging Markets Bond Fund | | | — | | | | — | | | | — | | | | 15,406 | | | | 323,134 | | | | 338,540 | |
Short Tax-Free Fund | | | — | | | | — | | | | — | | | | 235,122 | | | | — | | | | 235,122 | |
Short-Term Income Fund | | | — | | | | — | | | | — | | | | 444,399 | | | | 1,212,577 | | | | 1,656,976 | |
Intermediate Tax-Free Fund | | | — | | | | — | | | | — | | | | 766,136 | | | | 145,585 | | | | 911,721 | |
Strategic Income Fund | | | 1,632,086 | | | | 19,777,257 | | | | 796,694 | | | | — | | | | 3,213,129 | | | | 4,009,823 | |
High Yield Bond Fund | | | — | | | | — | | | | — | | | | 1,098,121 | | | | 2,128,699 | | | | 3,226,820 | |
As of August 31, 2017, the following Funds had post-October losses, which are deferred until fiscal year 2018 for tax purposes, of:
| | | | | | | | |
| | | Post-October Losses | |
Fund | | Short-Term | | | Long-Term | |
Global Low Volatility Equity Fund | | $ | 235,933 | | | $ | — | |
Pyrford International Stock Fund | | | — | | | | 3,349,684 | |
Intermediate Tax-Free Fund | | | 9,467,942 | | | | 1,148,517 | |
TCH Corporate Income Fund | | | — | | | | 23,654 | |
TCH Core Plus Bond Fund | | | — | | | | 2,554,919 | |
Net capital losses incurred after October 31, and within the taxable year, are deemed to arise on the first day of the Fund’s next taxable year.
As of August 31, 2017, the Small-Cap Growth Fund had qualified late-year ordinary losses of $487,076, which are deferred until fiscal year 2018 for tax purposes. Net late-year losses incurred after December 31, and within the taxable year, are deemed to arise on the first day of the Fund’s next taxable year.
173
| | |
| Notes to Financial Statements (continued) | | |
| 10. | | Shareholder Tax Information (Unaudited) |
Of the ordinary income (including short-term capital gain) distributions made by the Funds during the year ended August 31, 2017, the percentages that qualify for the dividend received deduction available to corporate shareholders were as follows:
| | | | |
Low Volatility Equity Fund | | | 87.01 | % |
Dividend Income Fund | | | 80.03 | |
Large-Cap Value Fund | | | 68.93 | |
Large-Cap Growth Fund | | | 79.74 | |
Mid-Cap Value Fund | | | 41.12 | |
Mid-Cap Growth Fund | | | 9.35 | |
| | | | |
Small-Cap Value Fund | | | 33.01 | % |
Small-Cap Core Fund | | | 43.98 | |
Global Low Volatility Equity Fund | | | 12.71 | |
LGM Emerging Markets Equity Fund | | | 16.20 | |
Alternative Strategies Fund | | | 100.00 | |
Global Long/Short Equity Fund | | | 37.83 | |
Of the ordinary income (including short-term capital gain) distributions made by the Funds during the year ended August 31, 2017, the percentages that are designated as qualified dividend income were as follows:
| | | | |
Low Volatility Equity Fund | | | 97.19 | % |
Dividend Income Fund | | | 82.10 | |
Large-Cap Value Fund | | | 69.26 | |
Large-Cap Growth Fund | | | 80.31 | |
Mid-Cap Value Fund | | | 43.87 | |
Mid-Cap Growth Fund | | | 9.96 | |
Small-Cap Value Fund | | | 33.93 | |
| | | | |
Small-Cap Core Fund | | | 46.81 | % |
Global Low Volatility Equity Fund | | | 48.22 | |
Disciplined International Equity Fund | | | 96.54 | |
Pyrford International Stock Fund | | | 71.12 | |
LGM Emerging Markets Equity Fund | | | 100.00 | |
Alternative Strategies Fund | | | 100.00 | |
Global Long/Short Equity Fund | | | 97.73 | |
For Federal tax purposes, for the year ended August 31, 2017, the following Funds designate long-term capital gains, or the amounts determined to be necessary, of:
| | | | |
Low Volatility Equity Fund | | $ | 1,905,554 | |
Dividend Income Fund | | | 9,387,284 | |
Large-Cap Value Fund | | | 2,304,010 | |
Large-Cap Growth Fund | | | 15,369,764 | |
Mid-Cap Value Fund | | | 56,396,982 | |
Mid-Cap Growth Fund | | | 21,512,271 | |
Small-Cap Value Fund | | | 3,585,078 | |
Small-Cap Core Fund | | | 124,126 | |
| | | | |
Global Low Volatility Equity Fund | | $ | 97,713 | |
Global Long/Short Equity Fund | | | 4,250 | |
Ultra Short Tax-Free Fund | | | 639,708 | |
Short Tax-Free Fund | | | 38,121 | |
Intermediate Tax-Free Fund | | | 3,407,707 | |
TCH Corporate Income Fund | | | 569,448 | |
Government Money Market Fund | | | 3,237 | |
Tax-Free Money Market Fund | | | 86,463 | |
For Federal tax purposes, for the year ended August 31, 2017, the following Funds designate qualified short-term capital gains, or the amounts determined to be necessary, of:
| | | | |
Low Volatility Equity Fund | | $ | 34,417 | |
Large-Cap Value Fund | | | 291,033 | |
Mid-Cap Value Fund | | | 3,570,947 | |
Mid-Cap Growth Fund | | | 5,370,941 | |
Small-Cap Value Fund | | | 3,585,078 | |
Small-Cap Core Fund | | | 122,232 | |
Global Low Volatility Equity Fund | | | 262,457 | |
Global Long/Short Equity Fund | | | 30,618 | |
| | | | |
Short Tax-Free Fund | | $ | 10,806 | |
Intermediate Tax-Free Fund | | | 1,908,255 | |
TCH Core Plus Bond Fund | | | 3,066,047 | |
Government Money Market Fund | | | 13,191,339 | |
Tax-Free Money Market Fund | | | 10,941 | |
Prime Money Market Fund | | | 1,277 | |
Institutional Prime Money Market Fund | | | 1,901 | |
For Federal tax purposes, for the year ended August 31, 2017, the following Funds designate qualified tax-exempt dividends, or the amounts determined to be necessary, of:
| | | | |
Ultra Short Tax-Free Fund | | $ | 7,583,649 | |
Short Tax-Free Fund | | | 3,282,561 | |
Intermediate Tax-Free Fund | | | 51,565,468 | |
Tax-Free Money Market Fund | | | 2,836,713 | |
For the year ended August 31, 2017, Pursuant to Section 853 of the Code, the following Funds designate income derived from foreign sources and foreign taxes paid, or the amounts determined to be necessary, of:
| | | | | | | | |
Fund | | Income
Derived from
Foreign Sources | | | Foreign Taxes
Paid | |
Global Low Volatility Equity Fund | | $ | 998,838 | | | $ | 67,852 | |
Disciplined International Equity Fund | | | 2,086,967 | | | | 106,581 | |
Pyrford International Stock Fund | | | 23,899,215 | | | | 953,010 | |
LGM Emerging Markets Equity Fund | | | 3,262,283 | | | | 281,058 | |
174
Of the ordinary income (including short-term capital gain) distributions made during the year ended August 31, 2017, the proportionate share of income derived from foreign sources and foreign taxes paid attributable to one share of stock are:
| | | | | | | | |
| | | Foreign
Source Income | | | Foreign
Taxes Paid | |
Global Low Volatility Equity Fund | | $ | 0.2678 | | | $ | 0.0182 | |
Disciplined International Equity Fund | | | 0.3226 | | | | 0.0165 | |
Pyrford International Stock Fund | | | 0.4859 | | | | 0.0194 | |
LGM Emerging Markets Equity Fund | | | 0.3209 | | | | 0.0276 | |
| 11. | | Reorganization Information |
On February 8, 2017, the Directors considered and approved the proposed Agreement and Plan of Reorganization that provided for the reorganization of the BMO TCH Intermediate Income Fund into the BMO Strategic Income Fund (the “Reorganization”) as detailed below. On June 20, 2017, beneficial owners of the BMO TCH Intermediate Income Fund approved the proposed Reorganization. This tax-free reorganization was accomplished after the close of business on June 29, 2017 (the “Closing Date”), by exchanging the assets and liabilities of the BMO TCH Intermediate Income Fund for shares of the BMO Strategic Income Fund. Shareholders holding Advisor and Institutional Class shares of the BMO TCH Intermediate Income Fund (1,514,424 shares and 1,489,081 shares, respectively) received corresponding Advisor and Institutional Class shares of the BMO Strategic Income Fund (1,748,491 shares and 1,718,187 shares, respectively) in the Reorganization. The BMO TCH Intermediate Income Fund’s net assets at that date of $32,584,449 included the following:
| | | | |
Assets: | | | | |
Investments cost | | $ | 31,747,731 | |
Net unrealized appreciation on investments | | | 580,466 | |
Deposit held at broker | | | 100,000 | |
Dividends & interest receivable | | | 267,709 | |
| | | | |
Total assets | | | 32,695,906 | |
| |
Liabilities: | | | | |
Payable to affiliates | | | 16,595 | |
Payable for income distribution | | | 67,250 | |
Other liabilities | | | 27,612 | |
| | | | |
Total liabilities | | | 111,457 | |
| | | | |
Total Net Assets: | | $ | 32,584,449 | |
| | | | |
The net assets of the BMO TCH Intermediate Income Fund and BMO Strategic Income Fund immediately prior to the Reorganization were $32,584,449 and $82,457,749, respectively. The aggregate net assets of the BMO Strategic Income Fund immediately after the Reorganization was $115,042,198.
The Reorganization was considered and approved primarily to streamline the BMO Funds portfolio offerings to be more consistent with industry practice. The Reorganization also was considered and approved because the potential exists to achieve economies of scale due to the combined larger asset base of the Funds, and the Funds have the same investment objectives and substantially similar policies, strategies, and restrictions. The BMO Strategic Income Fund is the accounting survivor for financial statement and performance reporting purposes.
Assuming the Reorganization had been completed on March 1, 2016, the beginning of a twelve month period of the BMO Strategic Income Fund, the BMO TCH Intermediate Income Fund’s pro forma of operations (unaudited) for the period ended February 28, 2017, are as follows:
| | | | |
Net investment income | | $ | 4,057,835 | |
Net realized gain on investments | | | 54,565 | |
Change in net unrealized appreciation on investments | | | 2,733,039 | |
| | | | |
Net increase in net assets resulting from operations | | $ | 6,845,439 | |
| | | | |
| 12. | | Recently Issued Accounting Pronouncement |
In October 2016, the Securities and Exchange Commission released its Final Rules on Investment Company Reporting Modernization (the “Rules”). The Rules introduce new regulatory reporting forms for investment companies; Form N-PORT and Form N-CEN. The compliance date for Form N-PORT and Form N-CEN is June 1, 2018 and compliance should be based on the reporting period-end date.
Management of the Funds have evaluated the impact of all subsequent events on the Funds through the date the financial statements were issued, and has determined that no subsequent events exist requiring recognition or disclosure in the financial statements.
175
| | |
| Results of the Special Meetings of Shareholders (Unaudited) |
The special meeting of the shareholders of the BMO TCH Intermediate Income Fund was held on June 20, 2017. The matters voted on by the shareholders of record as of April 13, 2017 and the results of the vote at the shareholder meetings held June 20, 2017 are as follows:
| | | | To approve an Agreement and Plan of Reorganization pursuant to which the BMO TCH Intermediate Income Fund (The “Acquired Fund”) will be reorganized with and into the BMO Strategic Income Fund, including approval of an amendment to the Articles of Incorporation of BMO Funds, Inc., to dissolve and terminate the Acquired Fund, and the transactions it contemplates. |
| | | | | | | | | | | | |
| | | Affirmative | | | Against | | | Abstain | |
BMO TCH Intermediate Income Fund | | | 4,809,294 | | | | 12,504 | | | | 10,364 | |
The special meeting of the shareholders of seven investment portfolios of BMO Funds, Inc. was held on May 23, 2017. The matters voted on by the shareholders of record as of March 14, 2017 and the results of the vote at the shareholder meetings held May 23, 2017 are as follows:
| | | | To approve an amendment to the Articles of Incorporation, as amended, of BMO Funds, Inc. (The “Corporation”) to redesignate and convert the Class Y shares of each Fund into Class A shares of the Fund and to terminate the Class Y shares of the Funds, as described in a plan of redesignation and conversion. |
| | | | | | | | | | | | |
| | | Affirmative | | | Against | | | Abstain | |
BMO Large-Cap Value Fund | | | 10,752,014 | | | | 12,719 | | | | 16,308 | |
BMO Mid-Cap Value Fund | | | 7,698,521 | | | | 83,109 | | | | 77,007 | |
BMO Mid-Cap Growth Fund | | | 5,673,706 | | | | 9,483 | | | | 8,834 | |
BMO Small-Cap Growth Fund | | | 3,195,518 | | | | 101,261 | | | | 14,885 | |
BMO Ultra Short Tax-Free Fund | | | 2,234,612 | | | | 21,114 | | | | 9,303 | |
BMO Short-Term Income Fund | | | 3,330,551 | | | | 45,068 | | | | 47,437 | |
BMO Short Tax-Free Fund | | | 997,612 | | | | 12,860 | | | | 593 | |
176
| | | | |
| Report of Independent Registered Public Accounting Firm | | | | |
The Board of Directors and Shareholders
BMO Funds, Inc.:
We have audited the accompanying statements of assets and liabilities of BMO Low Volatility Equity Fund, BMO Dividend Income Fund, BMO Large-Cap Value Fund, BMO Large-Cap Growth Fund, BMO Mid-Cap Value Fund, BMO Mid-Cap Growth Fund, BMO Small-Cap Value Fund, BMO Small-Cap Core Fund, BMO Small-Cap Growth Fund, BMO Global Low Volatility Equity Fund, BMO Disciplined International Equity Fund, BMO Pyrford International Stock Fund, BMO LGM Emerging Markets Equity Fund, BMO TCH Emerging Markets Bond Fund, BMO Alternative Strategies Fund, BMO Global Long/Short Equity Fund, BMO Ultra Short Tax-Free Fund, BMO Short Tax-Free Fund, BMO Short-Term Income Fund, BMO Intermediate Tax-Free Fund, BMO Strategic Income Fund, BMO TCH Corporate Income Fund, BMO TCH Core Plus Bond Fund, BMO High Yield Bond Fund, BMO Government Money Market Fund, BMO Tax-Free Money Market Fund, BMO Prime Money Market Fund, and BMO Institutional Prime Money Market Fund (each a series of BMO Funds, Inc., collectively the Funds), including the schedules of investments, as of August 31, 2017, and the related statements of operations for the year then ended, the statements of changes in net assets for each of the years or periods in the two-year period then ended, and the financial highlights for each of the years or periods in the five-year period then ended. These financial statements and financial highlights are the responsibility of the Funds’ management. Our responsibility is to express an opinion on these financial statements and financial highlights based on our audits.
We conducted our audits in accordance with the standards of the Public Company Accounting Oversight Board (United States). Those standards require that we plan and perform the audit to obtain reasonable assurance about whether the financial statements and financial highlights are free of material misstatement. An audit includes examining, on a test basis, evidence supporting the amounts and disclosures in the financial statements. Our procedures included confirmation of securities owned as of August 31, 2017, by correspondence with custodians and brokers or by other appropriate auditing procedures. An audit also includes assessing the accounting principles used and significant estimates made by management, as well as evaluating the overall financial statement presentation. We believe that our audits provide a reasonable basis for our opinion.
In our opinion, the financial statements and financial highlights referred to above present fairly, in all material respects, the financial position of the Funds as of August 31, 2017, the results of their operations, the changes in their net assets, and the financial highlights for the periods specified in the first paragraph, in conformity with U.S. generally accepted accounting principles.
/s/ KPMG LLP
Milwaukee, Wisconsin
October 24, 2017
177
| | |
| Directors and Officers of the Funds (Unaudited) |
The following tables provide information about each Director and Officer of the Funds as of September 1, 2017. The address of each Director is c/o BMO Funds, 111 East Kilbourn Avenue, Suite 200, Milwaukee, Wisconsin 53202. There are currently 44 separate portfolios or funds in the BMO Funds complex, of which 43 are registered as BMO Funds, Inc. and one is registered as BMO LGM Frontier Markets Equity Fund with the Securities and Exchange Commission. The Funds’ Statement of Additional Information includes additional information about the Directors and is available, without charge and upon request, by calling 1-800-236-FUND (3863).
| | | | | | | | | | |
| INDEPENDENT DIRECTORS | | | | | | |
| Name and Age | | Position(s) Held
with the Corporation | | Term of
Office and
Length of
Time Served* | | Principal Occupation(s) During Past 5 Years | | Number of
Portfolios in
Fund
Complex
Overseen by
Director | | Other
Directorships
Held by
Director |
Ridge A. Braunschweig Age: 64 | | Independent Director | | Since
October
2009 | | President and Chief Executive Officer, CPL Industries, Inc. (a manufacturing holding company prior to May 2009 and a family office since May 2009), since January 2012; Executive Vice President and Chief Financial Officer, CPL Industries, Inc., from 2000 to 2012. | | 44 | | None |
Benjamin M. Cutler Age: 72 | | Independent Director | | Since July
2004 | | Chairman, USHEALTH Group, Inc. (a health insurance company), since 2004; CEO and President, USHEALTH Group, Inc., from 2004 to 2016; Director, Freedom from Hunger (a non-profit organization), since 2016. | | 44 | | None |
John A. Lubs Age: 69 | | Independent Director | | Since July
2004 | | Retired; formerly, Vice Chairman, Mason Companies, Inc. (a footwear distributor), from 2004 to 2010 and Chief Operating Officer, from 2003 to 2010. | | 44 | | None |
Vincent P. Lyles Age: 56 | | Independent Director | | Since
September
2017 | | President and Chief Executive Officer, Boys & Girls Clubs of Greater Milwaukee, since 2012. | | 44 | | None |
James Mitchell Age: 70 | | Independent Director | | Since
March
1999 | | Chairman, Ayrshire Precision Engineering (a precision machining company), since 1992; Chief Executive Officer, NOG, Inc. (a metal processing and consulting company), from 1999 to 2015. | | 44 | | None |
Barbara J. Pope Age: 69 | | Independent Director | | Since
March
1999 | | Retired; formerly, President of Barbara J. Pope, P.C. (a financial consulting firm), 1992-2015; President of Sedgwick Street Fund LLC (a private investment partnership), 1996-2015; Tax Partner, Price Waterhouse. | | 44 | | None |
* Each Director serves an indefinite term until he or she retires or otherwise resigns, is removed, dies, or until his or her successor is duly elected.
Retirement for a Director occurs no later than August 31 following his or her 75th birthday. |
178
| | |
| Directors and Officers of the Funds (Unaudited) (continued) |
| | | | | | | | | | |
| INTERESTED DIRECTORS |
| Name and Age | | Position(s) Held with
the Corporation | | Term of
Office and
Length of
Time Served* | | Principal Occupation(s)
During Past 5 Years | | Number of
Portfolios in
Fund
Complex
Overseen by
Director | | Other
Directorships
Held by
Director |
John M. Blaser** Age: 60 | | Director and President | | Since
May
1999 | | Managing Director of the Adviser, since June 2012. | | 44 | | None |
Christopher B. Begy** Age: 63 | | Director | | Since
August
2013 | | U.S. Country Head, CEO, and a Director of BMO Financial Corp., since August 2013; Chair, BMO Harris Bank N.A., since August 2013; Director of the Adviser, since August 2013; Chief Auditor of BMO Financial Group, from 2001 to 2013. | | 44 | | None |
* Each Director serves an indefinite term until he or she retires or otherwise resigns, is removed, dies or until his or her successor is duly elected. Retirement
for a Director occurs no later than August 31 following his or her 75th birthday. |
** Mr. Blaser is an “interested person” of the Corporation (as defined in the 1940 Act) due to the positions that he holds with the Corporation, and the
Adviser. Mr. Begy is an “interested person” of the Corporation due to the positions that he holds with the Adviser and BMO. |
| | | | | | |
| PRINCIPAL OFFICERS |
| Name and Age | | Position(s) Held with
the Corporation | | Term of Office and Length of
Time Served | | Principal Occupation(s) During Past 5
Years |
Timothy M. Bonin Age: 44 | | Vice President, Chief Financial Officer and Treasurer | | Elected by the Board annually; since February 2006 | | Vice President of the Adviser, since February 2006. |
Stephen R. Oliver Age: 66 | | Chief Compliance Officer and Anti-Money Laundering Compliance Officer | | Elected by the Board annually; Chief Compliance Officer, since July 2008; and Anti-Money Laundering Officer, since January 2009 | | Vice President of BMO Harris Bank N.A., since March 2006, Vice President of BMO Investment Distributors, LLC (formerly M&I Distributors, LLC), 2007 to 2014. |
Michael J. Murphy Age: 38 | | Secretary | | Elected by the Board annually; since May 2016 | | Senior Counsel and Vice President of BMO Harris Bank N.A., since 2014; Associate, Vedder Price P.C., 2010 to 2014. |
179
| | |
Shareholder Report Disclosure of Directors’ Approval of
Continuation of Contracts (Unaudited) |
Approval of Continuation of Advisory and Subadvisory Agreements
During the reporting period, the Board of Directors (the “Board”) of BMO Funds, Inc. (the “Corporation”), including the Directors who are not “interested persons” of the Corporation as defined in the Investment Company Act of 1940, as amended (the “Independent Directors”), approved the continuation of the following agreements, all for an additional year ending August 31, 2018: (1) the investment advisory agreement (the “Advisory Agreement”) between the Corporation and BMO Asset Management Corp. (the “Adviser”) on behalf of each portfolio of the Corporation (each, a “Fund” and collectively, the “Funds”); (2) an investment subadvisory agreement with each of the following subadvisers that are affiliates of the Adviser: (i) Taplin, Canida & Habacht, LLC on behalf of BMO TCH Emerging Markets Bond Fund, BMO TCH Corporate Income Fund and BMO TCH Core Plus Bond Fund; (ii) LGM Investments Limited on behalf of BMO LGM Emerging Markets Equity Fund; (iii) Pyrford International Ltd. on behalf of BMO Pyrford International Stock Fund; and (iv) CTC myCFO, LLC (“CTC”) on behalf of BMO Alternative Strategies Fund; and (3) an investment subadvisory agreement on behalf of BMO Alternative Strategies Fund with each of the following subadvisers that are not affiliated with the Adviser: (i) Capstone Investment Advisors, LLC; (ii) Cramer Rosenthal McGlynn, LLC; (iii) Graham Capital Management L.P.; (iv) Iridian Asset Management LLC; and (v) Sound Point Capital Management, L.P. The subadvisers listed above are referred to herein each as a “Subadviser” and collectively as the “Subadvisers.” The subadvisory agreements listed above are referred to herein each as a “Subadvisory Agreement” and collectively as the “Subadvisory Agreements.”
At Board meetings held on July 12, 2017 (“July Meeting”) and August 8-9, 2017 (“August Meeting”), the Board met with management of the Adviser regarding the annual approval of the continuation of the Funds’ Advisory and Subadvisory Agreements. In connection with its consideration of the Advisory and Subadvisory Agreements, the Board considered the information furnished and discussed throughout the year at regularly scheduled Board and Committee meetings, as applicable, and the information provided specifically in relation to the annual consideration of the approval of the Advisory Agreement and Subadvisory Agreements in response to requests of the Independent Directors and their independent legal counsel. Information furnished in connection with Board or Committee meetings throughout the year included, among other things, presentations given by the portfolio managers of the Funds on each Fund’s investment strategies, risks and performance, comparative performance of each Fund against its benchmark indices; reports regarding each Fund’s asset levels including sales and redemption activities; and various reports on the monitoring of the Funds’ compliance with the securities laws, regulations, policies and procedures. In preparation for the Board’s annual consideration of the approval of the Advisory and Subadvisory Agreements, the Directors requested and received a wide variety of information and reports concerning the Adviser (and its affiliates) and the Subadvisers, including information on: (1) the nature, extent and quality of services provided to each Fund by the Adviser (and its affiliates) and the Subadvisers, as applicable; (2) the investment performance of each Fund as compared to a group of comparable funds; (3) the level of the advisory and subadvisory fees charged to each Fund as compared to: (a) other clients of the Adviser and the Subadvisers and (b) a group of comparable funds; (4) the expense ratios of each Fund as compared to a group of comparable funds; (5) the profitability of the Adviser and, to the extent made available, profitability of the Subadvisers; and (6) the Adviser’s and each Subadviser’s compliance program. The Board also considered information related to potential “fall out” or ancillary benefits enjoyed by the Adviser (and its affiliates) and each Subadviser as a result of their relationships with the Funds. In addition to evaluating, among other things, the written information provided by the Adviser, the Board also considered the answers to questions posed by the Board to representatives of the Adviser at various meetings.
In evaluating the Advisory and Subadvisory Agreements, the Board members took into account their accumulated experience in working with the Adviser on matters related to the Funds. The Independent Directors also met separately in executive sessions with their independent legal counsel to review and consider the information provided regarding the Advisory Agreement and the Subadvisory Agreements.
Based on their review, the Independent Directors and the full Board concluded that it was in the best interests of each Fund to approve the continuation of each Advisory and Subadvisory Agreement, as applicable. Although the Advisory Agreement and Subadvisory Agreements for all of the Funds were considered at the same Board meeting, the Directors considered each Fund separately. In their deliberations, the Board did not identify any single factor or group of factors as all-important or controlling, but considered all factors together. The material factors and conclusions that formed the basis for the Board’s determinations are discussed below.
Nature, Extent and Quality of Services
In evaluating the nature, extent and quality of the services provided by the Adviser and each Subadviser to the Funds, the Board reviewed information describing the financial strength, experience, resources and key personnel of the Adviser and each Subadviser, including the personnel who provide investment management services to the Funds. With respect to the Adviser, the Board considered the administrative services that are provided to each Fund, as well as other services performed by the Adviser, including the selection and monitoring of the Subadvisers, as applicable; monitoring of the execution of portfolio transactions; monitoring adherence to the Funds’ investment restrictions; monitoring the Funds’ compliance with their compliance policies and procedures and with applicable securities laws and regulations; producing shareholder reports; providing support services for the Board and Board committees; communicating with shareholders; and overseeing the activities of other service providers. The Board also considered the Adviser’s experience in providing investment advisory services to funds and the differentiation of the advisory services provided by the management team versus the portfolio management services provided by the Subadvisers, as applicable. With respect to each Subadviser, the Board noted each Subadviser’s experience in managing the strategies of its respective Fund and each Subadviser’s
180
compliance program as it relates to the Fund. The Board considered the other services provided by the Subadvisers under the Subadvisory Agreements, including selecting broker-dealers for execution of portfolio transactions; monitoring adherence to the Fund’s investment restrictions; and assisting with portfolio compliance with securities laws, regulations, policies and procedures. With respect to CTC, the Board noted CTC’s experience in the alternative strategies space, its Subadviser selection process and its responsibility for assisting the Adviser in the selection of the Subadvisers and related asset allocation.
Review of Fund Performance
The Board reviewed the investment performance of each of the Funds. While consideration was given to performance reports provided in connection with, and discussions held at, regular Board meetings throughout the year, particular attention was given to the performance reports provided specifically in connection with the July and August Meetings. In particular, the Directors noted the performance of each Fund relative to its Lipper Inc. (“Lipper”) peer universe. The Directors also considered updated performance information for each Fund relative to its benchmark and, if applicable, its Morningstar, Inc. (“Morningstar”) ratings.
With respect to each Fund’s performance as compared to its Lipper peer universe (“peer group”), the Board reviewed each Fund’s performance percentile rankings over the year-to-date and one-, three-, five- and ten-year trailing periods (if applicable) through May 31, 2017, as provided by the Adviser. The Board considered that each Fund ranked in one of the top two quartiles for performance as compared to its peer group in at least half of the periods reviewed, except for the following Funds: BMO Low Volatility Equity Fund, BMO Global Low Volatility Equity Fund, BMO Small-Cap Value Fund, BMO Small-Cap Growth Fund, BMO Mid-Cap Growth Fund, BMO Pyrford International Stock Fund, BMO TCH Emerging Markets Bond Fund, and BMO High Yield Bond Fund.
With respect to the BMO Low Volatility Equity Fund and the BMO Global Low Volatility Equity Fund, the Board considered that the Funds were rated five and four stars, respectively, by Morningstar and that each Fund’s three-year performance was in the first quartile of its peer groups, while its year-to-date and one-year performance were in the third and fourth quartiles, respectively. The Board noted the Adviser’s explanation for the recent underperformance of each Fund. In addition, the Board considered that, in the current market, the portfolio management team expected the low volatility strategy to underperform and that performance of each Fund was overall in-line with expectations given the market environment. The Board also considered the Adviser’s statement that each Fund’s low volatility strategy continues to effectively reduce risk and compare favorably to peers on realized risk metrics. With respect to the BMO Global Low Volatility Equity Fund, the Board also noted that the Adviser replaced one portfolio manager of the Fund in December 2016 with a member of the disciplined equity team.
With respect to the BMO Small-Cap Value Fund, the Board considered that Class A and Class R6 of the Fund were ranked three stars and Class I of the Fund was ranked four stars by Morningstar and that its five-year performance was in the first quartile of its peer group, while its year-to-date, one-year and three-year performance were in the fourth quartile. The Board noted that two members of the disciplined equity team took over management of the Fund in October 2016. The Board also considered the Adviser’s explanations for the Fund’s underperformance before and after the manager transition, and the Adviser’s statement that Fund performance has stabilized after the manager transition.
With respect to the BMO Small-Cap Growth Fund, the Board considered that its year-to-date performance was in the third quartile of its peer group, and its one-year, three-year and five-year performance were in the fourth quartile. The Board noted that two members of the disciplined equity team took over management of the Fund in October 2016. The Board also considered the Adviser’s explanations for the Fund’s underperformance before the manager transition, and the Adviser’s statement that Fund performance has stabilized after the manager transition.
With respect to the BMO Mid-Cap Growth Fund, the Board considered that its one-year performance was in the second quartile of its peer group, while its year-to-date performance was in the third quartile and its three-year and five-year performance were in the fourth quartile. With respect to year-to-date performance, the Fund’s rank was just below the majority of the funds in its peer group. The Board noted that two members of the disciplined equity team took over management of each Fund in October 2016. The Board noted the Adviser’s statement that the BMO Mid-Cap Growth Fund had fairly neutral performance prior to the manager transition, but had outperformed significantly following the manager transition.
With respect to the BMO Pyrford International Stock Fund, the Board considered that the Fund was ranked three stars by Morningstar (except for Class R6 of the Fund which was ranked four stars) and that its three-year performance was in the second quartile of its peer group, while its year-to-date and five-year performance were in the third quartile and its one-year performance was in the fourth quarter. The Board considered the information provided by the Adviser about the specific contributors to the Fund’s underperformance, despite positive country allocation, including the Fund’s positioning across sectors and geographic regions.
With respect to the BMO TCH Emerging Markets Bond Fund, the Board considered that the Fund was ranked three stars by Morningstar, while its one- and three-year performance was in the third quartile of its peer group and its year-to-date performance was in the fourth quartile. With respect to the Fund’s three-year performance, the Fund’s rank was only slightly below the majority of the funds in its peer group. The Board noted the Adviser’s statement that the Fund outperformed its benchmark for the one-year period. The Board also considered the information provided by the Adviser about the specific contributors to the Fund’s underperformance relative to its peer group.
With respect to the BMO High Yield Bond Fund, the Board considered that Class A shares of the Fund were ranked three stars by Morningstar, and that its year-to-date and one-, three- and five-year performance were in the third quartile of its peer
181
| | |
Shareholder Report Disclosure of Directors’ Approval of
Continuation of Contracts (Unaudited) (continued) |
group. The Board noted that three new portfolio managers took over management of the Fund in March 2017. The Board also considered the Adviser’s explanations that a significant decline in assets during the manager transition affected the repositioning, and that the Adviser expects that the investment approach of the new portfolio management team will position the Fund to be more competitive with the peer group.
The Board determined that it was generally satisfied with each Fund’s performance and would continue to monitor each Fund’s performance results.
Costs of Services Provided and Profits Realized by the Adviser and Subadvisers
The Board considered the fees payable by each Fund under the Advisory Agreement and each Subadvisory Agreement. The Board first reviewed the management fees charged to comparable accounts managed by the Adviser and the Subadvisers of each Fund, if any, taking into consideration differences in style, size and services provided to such other accounts. The Board noted that, in some cases, the fees for certain accounts or average fees for certain investment strategies were lower than the fees charged to certain Funds with similar investment strategies. The Board considered the Adviser’s explanation that registered investment companies generally require additional advisory and administrative services than other clients due to the enhanced regulatory structure and legal requirements with which investment companies must comply. With respect to the Subadvisers, the Board also considered the affiliation of each Subadviser (if any) with the Adviser.
The Board next reviewed information provided by the Adviser comparing each Fund’s contractual advisory fee to the median fee of its Morningstar peer category (“Morningstar peers”) or Strategic Insight’s Simfund peer category (“Simfund peers”). In addition, the Board reviewed information provided by the Adviser comparing each Fund’s net expense ratio to the median net expense ratio of the comparable Lipper peer group (“Lipper peers”). With respect to the Subadvisers, the Board considered the fees payable under the Subadvisory Agreements, noting that the fees would be paid by the Adviser (not the Fund).
The Board considered that substantially all of the Funds’ contractual advisory fees were lower than or within a few basis points of their Morningstar or Simfund peers. The Board noted that the contractual advisory fees for certain classes of the BMO Large Cap Growth, BMO Large Cap Value and BMO Small Cap Value Funds were in the third quartile of their respective Morningstar peers, but that the net expense ratio for the BMO Large-Cap Value and BMO Large-Cap Growth Funds were below their Lipper peers. The Board considered that the net expense ratio for the BMO Small-Cap Value Fund was within a few basis points of the average net expense ratio of its comparable Lipper peer group. With respect to the BMO Alternative Strategies Fund, the Board considered that, although its contractual investment advisory fees were higher (worse) than its Morningstar peers, its net expense ratio was below its Lipper peers. The Board also considered that the Adviser has agreed to contractual expense limitations for the Funds (the “Expense Limitations”), and that the net expense ratios for the Funds take into account the effect of the Expense Limitations. The Board noted that the Adviser had lowered expense caps during the period for the BMO Small-Cap Growth and BMO Alternative Strategies Funds.
The Board considered the methodology used by the Adviser and each Subadviser in determining compensation payable to its portfolio managers and the competitive environment for investment management talent. The Board also considered the financial condition of the Adviser and certain of its affiliates and each Subadviser, and particularly focused on the financial strength of the ultimate parent company of the Adviser, and the parent company’s commitment, financial and otherwise, to the global asset management business and the Funds.
The Board reviewed profitability information it received from the Adviser in connection with the services provided to each Fund and the Corporation as a whole. The materials provided in this regard showed, and the Directors acknowledged, that the Adviser experienced positive net margins with respect to certain Funds and did not experience positive net margins with respect to other Funds. The Board also reviewed and considered profitability information it received from each Subadviser, if provided, in connection with the services provided to each Fund.
Economies of Scale
The Board considered the extent to which economies of scale would be realized as the Funds grow and whether the Funds’ fee levels reflect these economies of scale for the benefit of Fund shareholders. The Board considered each Fund’s fee structure, asset size and net expense ratio giving effect to each Fund’s Expense Limitation. The Board also considered the Adviser’s commitment to continue to evaluate advisory fee breakpoints in the future.
Other Benefits to the Adviser and Subadvisers
The Board considered benefits that accrue to the Adviser and its affiliates from their relationships with the Funds, including revenue in the form of administration fees, custody fees, shareholder service fees and securities lending revenue. In addition, the Board considered information relating to any soft dollar arrangements in connection with equity security brokerage transactions for the Funds and/or other clients. The Board noted that, other than the services provided by the Adviser and Subadvisers pursuant to the Advisory and Subadvisory Agreements and the related fees to be paid by each Fund, the Adviser and Subadvisers may potentially benefit from their relationship with each other in other ways. The Board also considered that the success of any Fund could attract other business to the Adviser and that the success of the Adviser could enhance the Adviser’s ability to serve the Funds.
182
The Board concluded that, taking into account all of the information reviewed, each Fund’s advisory and subadvisory fee was reasonable.
Overall Conclusions
Based on all of the information considered and the conclusions reached, the Board determined that the terms of the Advisory and Subadvisory Agreements are fair and reasonable and that the approval of the continuation of the Advisory Agreement and each Subadvisory Agreement is in the best interests of each applicable Fund.
183
184
This report is authorized for distribution to prospective investors only when preceded or accompanied by the Funds’ prospectuses, which contain facts concerning each Fund’s objective and policies, management fees, expenses, and other information.
Proxy Voting
A description of the policies and procedures that the Funds use to determine how to vote proxies relating to portfolio securities is available without charge, upon request, by calling toll free, 1-800-236-FUND (3863) and by accessing the Funds’ Statement of Additional Information, which is available on the Funds’ website at http://www.bmofunds.com and on the SEC’s website at http://www.sec.gov.
Each Fund’s proxy voting record for the most recent 12-month period ended June 30 is available without charge, upon request, by calling toll free, 1-800-236-FUND (3863) and by accessing the SEC’s website at http://www.sec.gov.
Disclosure of Portfolio Holdings
The Funds file their complete schedules of portfolio holdings with the SEC for the first and third quarters of each fiscal year on Form N-Q. Each Fund’s Form N-Q is available on the SEC’s website at http://www.sec.gov and may be reviewed and copied at the SEC’s Public Reference Room in Washington, D.C. Information on the operation of the Public Reference Room may be obtained by calling 1-800-SEC-0330.
Shares of the BMO Funds are not bank deposits or other obligations of, or issued, endorsed or guaranteed by, BMO Harris Bank, NA, or any of its affiliates. Shares of the BMO Funds, like shares of all mutual funds, are not insured or guaranteed by the U.S. government, the Federal Deposit Insurance Corporation, the Federal Reserve Board, or any other government agency. Investment in mutual funds involves investment risk, including the possible loss of principal.
| | |
| | PRSRT STD U.S. POSTAGE PAID LANCASTER, PA PERMIT NO. 1793 |
| | |
 | | BMO Funds U.S. Services P.O. Box 55931 Boston, MA 02205-5931 |
| | |
 | | Contact us 1-800-236-FUND (3863) 414-287-8555 |
| | |
 | | Learn more bmofunds.com |
BMO Investment Distributors, LLC, Distributor
BMO Asset Management Corp., Investment Adviser
Investment products are: NOT FDIC INSURED — NO BANK GUARANTEE — MAY LOSE VALUE.
© 2017 BMO Financial Corp. (9/17)
Annual report
Target Retirement Funds
Target Risk Funds

Table of Contents
| | | | |
Not FDIC Insured | | No Bank Guarantee | | May Lose Value |
| | |
| Annual Report — Commentary | | BMO Target Retirement Funds |
Fund Managers; Investment Experience
Jon Adams, CFA; since 2002
Mike Dowdall, CFA; since 2007
Irina Pacheco, CFA; since 2003
Fiscal year 2017 saw the tentative re-emergence of the reflation trade. Synchronized global growth, rising corporate earnings and higher inflation expectations led to higher treasury yields, a narrowing of corporate bond spreads and strong equity returns. The reflation trade reversed in the summer due in part to declining U.S. policy expectations, but volatility in equity markets remained low and returns high. Emerging market equities were the winner, returning 25.0% as low rates, a weak dollar and receding fears of a Chinese slowdown providing a positive backdrop. The Standard & Poor’s 500® Index (S&P 500) returned 16.2%, with all sectors of the S&P 500 positive with the exception of Energy. International developed equities returned 18.3%, benefitting from an improving European and Japanese economy. Major populist political risks receded in Europe after the election of new French President Emmanuel Macron and the lack of negative short-term consequences from Brexit. The risk-on theme translated into the fixed income market where the Bloomberg Barclays High Yield Index’s return of 8.6% easily outpaced the Bloomberg Barclays U.S. Aggregate Bond Index’s return of 0.5%.
The BMO Target Retirement Funds performance was strong, with all 10 funds outperforming their Morningstar peer group median. The return range was 6.5% for the BMO In-Retirement Fund — Investor Class to 14.7% for the BMO Target Date 2050 Fund — Investor Class. This was reflective of the disparity between stocks and bonds during the one year period, with stocks outperforming bonds.
Fixed income managers had mixed results for the year. BMO TCH Core Plus Bond and Metropolitan West Total Return Bond outperformed their core bond benchmark due to the managers’ positive tilt towards credit. BMO TCH Emerging Markets Bond performed in line with its benchmark. Corporate high yield funds BMO High Yield Bond, Federated High Yield and Fidelity Floating Rate all underperformed their benchmarks mainly due to their bias towards higher quality bonds. The alternatives allocation added value during the year as BMO Alternative Strategies outperformed the Bloomberg Barclays U.S. Aggregate Bond Index’s return.
Domestic equity strategies performed in line with benchmark. Small-cap managers struggled, as Goldman Sachs Small Cap Value and BMO Small-Cap Growth were notable underperformers. Large- and mid-cap managers outperformed benchmarks with T. Rowe Price Growth Stock, BMO Large-Cap Value and Harbor Capital Appreciation performing exceptionally well. BMO Low Volatility Equity was unable to keep pace with the benchmark due to the lower risk of its holdings.
International equity fund performance was mixed, with managers detracting more than contributing to fund performance. Dodge & Cox International added the most value, while BMO Disciplined International Equity and DFA International Small Company slightly outperformed their benchmark as well. MFS International Value and Harbor International were the main laggards. On the emerging markets side, BMO LGM Emerging Markets Equity underperformed the benchmark.
Whereas political risk closed the period quietly, both home and abroad, we did see an uptick in risk around central bank policy. A recent downturn in U.S. inflation has made the Federal Reserve’s job more difficult, as they decide whether to continue hiking rates into the end of 2017 despite few signs of an overheating economy. The European Central Bank faces a similar quandary: should it normalize policy even though inflation remains below its target level. Global economic growth has proved resilient but remains vulnerable to any potential policy misstep.
We currently favor U.S. large cap equities and international developed equities with a commensurate underweight to core bonds. We believe the recent global growth momentum should buoy corporate earnings, a positive for our equity holdings. However, additional policy uncertainty tempers our view and prevents us from becoming too bullish on the equity markets.
2
| | |
| Annual Report | | BMO Target Retirement Funds |
| | | | | | | | | | | | | | | | | | | | | | | | |
| BMO In-Retirement Fund | |
Average annual total returns (%) | | | | | Ticker | | Cusip | | Inception
date | | Expenses (%)* | |
| | | 1-year | | | Since
inception | | | | | | | |
| | | | | | | | | | Gross | | | Net | |
| Investor Class (Y) | | | 6.52 | | | | 5.39 | | | | | BTRYX | | 09658L125 | | 8/30/2013 | | | 1.88 | | | | 0.96 | |
| Retirement Class (R-3) | | | 6.39 | | | | 5.15 | | | | | BTRRX | | 09658L141 | | 8/30/2013 | | | 2.13 | | | | 1.21 | |
| Retirement Class (R-6) | | | 7.04 | | | | 5.83 | | | | | BTRTX | | 09658L133 | | 8/30/2013 | | | 1.48 | | | | 0.56 | |
| Standard & Poor’s Target Date 2010 Index | | | 6.36 | | | | 5.71 | | | | | | | | | | | | | | | | | |
| Lipper Mixed-Asset Target 2010 Funds Index | | | 7.10 | | | | 5.53 | | | | | | | | | | | | | | | | | |
| | | | | | | | |
| | | | | | | | | | | | | | | | | | | | | | | | |
| Growth of an assumed $10,000 investment | | | | | Portfolio sector allocation** | |
| | | | | | Sector | | | | | Fund (%) | |
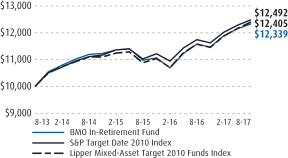 | | | | | Large-Cap Funds | | | | | | | 18.1 | |
| | | | Mid-Cap Funds | | | | | | | 3.1 | |
| | | | Small-Cap Funds | | | | | | | 1.2 | |
| | | | International Funds | | | | | | | 11.4 | |
| | | | Fixed Income Funds | | | | | | | 54.9 | |
| | | | Alternative Funds | | | | | | | 10.0 | |
| | | | Other Assets & Liabilities, Net | | | | | | | 1.3 | |
| | | | Total | | | | | | | 100.0 | |
| | | | | | | | | | | | | | | | |
| | | | | | | | | | | | | | | | |
| | | | | | | | | | | | | | | | |
| | | | | | | | | | | | | | | | |
| | | | | | | | |
| | | | | | | | | | | | | | | | | | | | | | | | |
| BMO Target Retirement 2015 Fund | |
Average annual total returns (%) | | | | | Ticker | | Cusip | | Inception
date | | Expenses (%)* | |
| | | | | | Since
inception | | | | | | | |
| | | 1-year | | | | | | | | | Gross | | | Net | |
| Investor Class (Y) | | | 8.33 | | | | 5.14 | | | | | BRTAX | | 09658V750 | | 12/27/2013 | | | 4.74 | | | | 1.00 | |
| Retirement Class (R-3) | | | 8.07 | | | | 4.90 | | | | | BRTCX | | 09658V735 | | 12/27/2013 | | | 4.99 | | | | 1.25 | |
| Retirement Class (R-6) | | | 8.80 | | | | 5.60 | | | | | BRTDX | | 09658V727 | | 12/27/2013 | | | 4.34 | | | | 0.60 | |
| Standard & Poor’s Target Date 2015 Index | | | 7.65 | | | | 5.23 | | | | | | | | | | | | | | | | | |
| Lipper Mixed-Asset Target 2015 Funds Index | | | 7.76 | | | | 4.86 | | | | | | | | | | | | | | | | | |
| | | | | | | | |
| | | | | | | | | | | | | | | | | | | | | | | | |
| Growth of an assumed $10,000 investment | | | | | Portfolio sector allocation** | |
| | | | | | Sector | | | | | Fund (%) | |
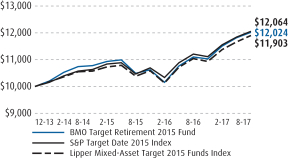 | | | | | Large-Cap Funds | | | | | | | 24.4 | |
| | | | Mid-Cap Funds | | | | | | | 4.8 | |
| | | | Small-Cap Funds | | | | | | | 2.0 | |
| | | | International Funds | | | | | | | 15.9 | |
| | | | Fixed Income Funds | | | | | | | 42.3 | |
| | | | Alternative Funds | | | | | | | 9.5 | |
| | | | Other Assets & Liabilities, Net | | | | | | | 1.1 | |
| | | | Total | | | | | | | 100.0 | |
| | | | | | | | | | | | | | | | |
| | | | | | | | | | | | | | | | |
| | | | | | | | | | | | | | | | |
| | | | | | | | | | | | | | | | |
The above graphs relate to the Investor Class shares of the Fund. Performance for the Retirement R-3 and Retirement R-6 will vary from the performance of the Investor Class shares shown above due to differences in charges and expenses. These graphs illustrate the hypothetical investment of $10,000 in the Investor Class shares of the Fund from each Fund’s inception date to August 31, 2017.
The performance data quoted represents past performance which is no guarantee of future results. Investment return and principal value will fluctuate so that an investor’s shares, when redeemed, may be worth more or less than their original costs. Mutual fund performance changes over time and current performance may be lower or higher than what is stated. To receive current performance to the most recent month-end, please call 1-800-236-3863 or visit www.bmofunds.com.
| * | The above expense ratios are from the Funds’ Prospectus dated December 29, 2016, and are inclusive of Acquired Fund Fees and Expenses. See Note 5, subsection Contractual Expense Limitation, in the Notes to Financial Statements for additional information. Net expense ratios reflect contractual fee waivers and/or expense reimbursements if applicable, made by BMO Asset Management Corp., the investment adviser (Adviser). The Adviser may not terminate these fee waivers and/or expense reimbursements prior to December 31, 2018 without the consent of the Board of Directors, unless the investment advisory agreement is terminated. Without these contractual waivers, the Fund’s returns would have been lower. |
| ** | Portfolio composition will change due to ongoing management of the Fund. The percentages are based on net assets as of August 31, 2017 and may not necessarily reflect adjustments that are routinely made when presenting net assets for formal financial statement processes. |
The Standard & Poor’s Target Date Indices are designed to measure the performance of an asset allocation strategy that meets the objectives of investors with an approximate corresponding retirement date horizon.
Lipper indices measure the performance of the 30 largest mutual funds in each respective fund category.
3
| | |
| Annual Report | | BMO Target Retirement Funds |
| | | | | | | | | | | | | | | | | | | | | | | | |
| BMO Target Retirement 2020 Fund | |
Average annual total returns (%) | | | | | Ticker | | Cusip | | Inception
date | | Expenses (%)* | |
| | | 1-year | | | Since
inception | | | | | | | |
| | | | | | | | | | Gross | | | Net | |
| Investor Class (Y) | | | 10.17 | | | | 7.03 | | | | | BTRDX | | 09658V404 | | 8/30/2013 | | | 1.33 | | | | 1.03 | |
| Retirement Class (R-3) | | | 9.87 | | | | 6.78 | | | | | BTRFX | | 09658V206 | | 8/30/2013 | | | 1.58 | | | | 1.28 | |
| Retirement Class (R-6) | | | 10.66 | | | | 7.47 | | | | | BTRGX | | 09658V305 | | 8/30/2013 | | | 0.93 | | | | 0.63 | |
| Standard & Poor’s Target Date 2020 Index | | | 8.89 | | | | 7.21 | | | | | | | | | | | | | | | | | |
| Lipper Mixed-Asset Target 2020 Funds Index | | | 8.62 | | | | 6.55 | | | | | | | | | | | | | | | | | |
| | | | | | | | |
| | | | | | | | | | | | | | | | | | | | | | | | |
| Growth of an assumed $10,000 investment | | | | | Portfolio sector allocation** | |
| | | | | | Sector | | | | | Fund (%) | |
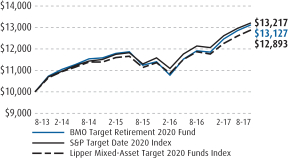 | | | | | Large-Cap Funds | | | | | | | 30.1 | |
| | | | Mid-Cap Funds | | | | | | | 6.9 | |
| | | | Small-Cap Funds | | | | | | | 2.6 | |
| | | | International Funds | | | | | | | 20.3 | |
| | | | Fixed Income Funds | | | | | | | 30.0 | |
| | | | Alternative Funds | | | | | | | 9.0 | |
| | | | Other Assets & Liabilities, Net | | | | | | | 1.1 | |
| | | | Total | | | | | | | 100.0 | |
| | | | | | | | | | | | | | | | |
| | | | | | | | | | | | | | | | |
| | | | | | | | | | | | | | | | |
| | | | | | | | | | | | | | | | |
| | | | | | | | |
| | | | | | | | | | | | | | | | | | | | | | | | |
| BMO Target Retirement 2025 Fund | |
Average annual total returns (%) | | | | | Ticker | | Cusip | | Inception
date | | Expenses (%)* | |
| | | | | | Since
inception | | | | | | | |
| | | 1-year | | | | | | | | | Gross | | | Net | |
| Investor Class (Y) | | | 11.76 | | | | 5.97 | | | | | BRTEX | | 09658V719 | | 12/27/2013 | | | 1.71 | | | | 1.03 | |
| Retirement Class (R-3) | | | 11.66 | | | | 5.76 | | | | | BRTGX | | 09658V685 | | 12/27/2013 | | | 1.96 | | | | 1.28 | |
| Retirement Class (R-6) | | | 12.20 | | | | 6.39 | | | | | BRTHX | | 09658V677 | | 12/27/2013 | | | 1.31 | | | | 0.63 | |
| Standard & Poor’s Target Date 2025 Index | | | 10.15 | | | | 6.02 | | | | | | | | | | | | | | | | | |
| Lipper Mixed-Asset Target 2025 Funds Index | | | 10.29 | | | | 5.77 | | | | | | | | | | | | | | | | | |
| | | | | | | | |
| | | | | | | | | | | | | | | | | | | | | | | | |
| Growth of an assumed $10,000 investment | | | | | Portfolio sector allocation** | |
| | | | | | Sector | | | | | Fund (%) | |
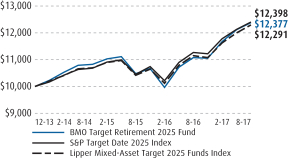 | | | | | Large-Cap Funds | | | | | | | 32.4 | |
| | | | Mid-Cap Funds | | | | | | | 9.0 | |
| | | | Small-Cap Funds | | | | | | | 3.8 | |
| | | | International Funds | | | | | | | 23.3 | |
| | | | Fixed Income Funds | | | | | | | 21.7 | |
| | | | Alternative Funds | | | | | | | 8.0 | |
| | | | Other Assets & Liabilities, Net | | | | | | | 1.8 | |
| | | | Total | | | | | | | 100.0 | |
| | | | | | | | | | | | | | | | |
| | | | | | | | | | | | | | | | |
| | | | | | | | | | | | | | | | |
| | | | | | | | | | | | | | | | |
The above graphs relate to the Investor Class shares of the Fund. Performance for the Retirement R-3 and Retirement R-6 will vary from the performance of the Investor Class shares shown above due to differences in charges and expenses. These graphs illustrate the hypothetical investment of $10,000 in the Investor Class shares of the Fund from each Fund’s inception date to August 31, 2017.
The performance data quoted represents past performance which is no guarantee of future results. Investment return and principal value will fluctuate so that an investor’s shares, when redeemed, may be worth more or less than their original costs. Mutual fund performance changes over time and current performance may be lower or higher than what is stated. To receive current performance to the most recent month-end, please call 1-800-236-3863 or visit www.bmofunds.com.
| * | The above expense ratios are from the Funds’ Prospectus dated December 29, 2016, and are inclusive of Acquired Fund Fees and Expenses. See Note 5, subsection Contractual Expense Limitation, in the Notes to Financial Statements for additional information. Net expense ratios reflect contractual fee waivers and/or expense reimbursements if applicable, made by BMO Asset Management Corp., the investment adviser (Adviser). The Adviser may not terminate these fee waivers and/or expense reimbursements prior to December 31, 2018 without the consent of the Board of Directors, unless the investment advisory agreement is terminated. Without these contractual waivers, the Fund’s returns would have been lower. |
| ** | Portfolio composition will change due to ongoing management of the Fund. The percentages are based on net assets as of August 31, 2017 and may not necessarily reflect adjustments that are routinely made when presenting net assets for formal financial statement processes. |
The Standard & Poor’s Target Date Indices are designed to measure the performance of an asset allocation strategy that meets the objectives of investors with an approximate corresponding retirement date horizon.
Lipper indices measure the performance of the 30 largest mutual funds in each respective fund category.
4
| | |
| Annual Report | | BMO Target Retirement Funds |
| | | | | | | | | | | | | | | | | | | | | | | | |
| BMO Target Retirement 2030 Fund | |
Average annual total returns (%) | | | | | Ticker | | Cusip | | Inception
date | | Expenses (%)* | |
| | | 1-year | | | Since
inception | | | | | | | |
| | | | | | | | | | Gross | | | Net | |
| Investor Class (Y) | | | 12.89 | | | | 8.15 | | | | | BTRHX | | 09658V800 | | 8/30/2013 | | | 1.33 | | | | 1.09 | |
| Retirement Class (R-3) | | | 12.70 | | | | 7.90 | | | | | BTRKX | | 09658V602 | | 8/30/2013 | | | 1.58 | | | | 1.34 | |
| Retirement Class (R-6) | | | 13.38 | | | | 8.59 | | | | | BTRLX | | 09658V701 | | 8/30/2013 | | | 0.93 | | | | 0.69 | |
| Standard & Poor’s Target Date 2030 Index | | | 11.26 | | | | 8.28 | | | | | | | | | | | | | | | | | |
| Lipper Mixed-Asset Target 2030 Funds Index | | | 12.19 | | | | 8.10 | | | | | | | | | | | | | | | | | |
| | | | | | | | |
| | | | | | | | | | | | | | | | | | | | | | | | |
| Growth of an assumed $10,000 investment | | | | | Portfolio sector allocation** | |
| | | | | | Sector | | | | | Fund (%) | |
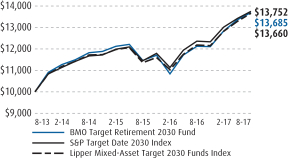 | | | | | Large-Cap Funds | | | | | | | 36.4 | |
| | | | Mid-Cap Funds | | | | | | | 10.3 | |
| | | | Small-Cap Funds | | | | | | | 4.2 | |
| | | | International Funds | | | | | | | 26.0 | |
| | | | Fixed Income Funds | | | | | | | 14.3 | |
| | | | Alternative Funds | | | | | | | 7.5 | |
| | | | Other Assets & Liabilities, Net | | | | | | | 1.3 | |
| | | | Total | | | | | | | 100.0 | |
| | | | | | | | | | | | | | | | |
| | | | | | | | | | | | | | | | |
| | | | | | | | | | | | | | | | |
| | | | | | | | | | | | | | | | |
| | | | | | | | |
| | | | | | | | | | | | | | | | | | | | | | | | |
| BMO Target Retirement 2035 Fund | |
Average annual total returns (%) | | | | | Ticker | | Cusip | | Inception
date | | Expenses (%)* | |
| | | | | | Since
inception | | | | | | | |
| | | 1-year | | | | | | | | | Gross | | | Net | |
| Investor Class (Y) | | | 13.85 | | | | 6.17 | | | | | BRTIX | | 09658V669 | | 12/27/2013 | | | 1.71 | | | | 1.06 | |
| Retirement Class (R-3) | | | 13.59 | | | | 5.88 | | | | | BRTKX | | 09658V644 | | 12/27/2013 | | | 1.96 | | | | 1.31 | |
| Retirement Class (R-6) | | | 14.31 | | | | 6.58 | | | | | BRTLX | | 09658V636 | | 12/27/2013 | | | 1.31 | | | | 0.66 | |
| Standard & Poor’s Target Date 2035 Index | | | 12.38 | | | | 6.70 | | | | | | | | | | | | | | | | | |
| Lipper Mixed-Asset Target 2035 Funds Index | | | 13.91 | | | | 6.75 | | | | | | | | | | | | | | | | | |
| | | | | | | | |
| | | | | | | | | | | | | | | | | | | | | | | | |
| Growth of an assumed $10,000 investment | | | | | Portfolio sector allocation** | |
| | | | | | Sector | | | | | Fund (%) | |
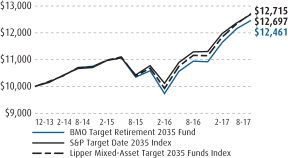 | | | | | Large-Cap Funds | | | | | | | 39.7 | |
| | | | Mid-Cap Funds | | | | | | | 11.1 | |
| | | | Small-Cap Funds | | | | | | | 4.6 | |
| | | | International Funds | | | | | | | 28.6 | |
| | | | Fixed Income Funds | | | | | | | 8.4 | |
| | | | Alternative Funds | | | | | | | 6.5 | |
| | | | Other Assets & Liabilities, Net | | | | | | | 1.1 | |
| | | | Total | | | | | | | 100.0 | |
| | | | | | | | | | | | | | | | |
| | | | | | | | | | | | | | | | |
| | | | | | | | | | | | | | | | |
| | | | | | | | | | | | | | | | |
The above graphs relate to the Investor Class shares of the Fund. Performance for the Retirement R-3 and Retirement R-6 will vary from the performance of the Investor Class shares shown above due to differences in charges and expenses. These graphs illustrate the hypothetical investment of $10,000 in the Investor Class shares of the Fund from each Fund’s inception date to August 31, 2017.
The performance data quoted represents past performance which is no guarantee of future results. Investment return and principal value will fluctuate so that an investor’s shares, when redeemed, may be worth more or less than their original costs. Mutual fund performance changes over time and current performance may be lower or higher than what is stated. To receive current performance to the most recent month-end, please call 1-800-236-3863 or visit www.bmofunds.com.
| * | The above expense ratios are from the Funds’ Prospectus dated December 29, 2016, and are inclusive of Acquired Fund Fees and Expenses. See Note 5, subsection Contractual Expense Limitation, in the Notes to Financial Statements for additional information. Net expense ratios reflect contractual fee waivers and/or expense reimbursements if applicable, made by BMO Asset Management Corp., the investment adviser (Adviser). The Adviser may not terminate these fee waivers and/or expense reimbursements prior to December 31, 2018 without the consent of the Board of Directors, unless the investment advisory agreement is terminated. Without these contractual waivers, the Fund’s returns would have been lower. |
| ** | Portfolio composition will change due to ongoing management of the Fund. The percentages are based on net assets as of August 31, 2017 and may not necessarily reflect adjustments that are routinely made when presenting net assets for formal financial statement processes. |
The Standard & Poor’s Target Date Indices are designed to measure the performance of an asset allocation strategy that meets the objectives of investors with an approximate corresponding retirement date horizon.
Lipper indices measure the performance of the 30 largest mutual funds in each respective fund category.
5
| | |
| Annual Report | | BMO Target Retirement Funds |
| | | | | | | | | | | | | | | | | | | | | | | | |
| BMO Target Retirement 2040 Fund | |
Average annual total returns (%) | | | | | Ticker | | Cusip | | Inception
date | | Expenses (%)* | |
| | | 1-year | | | Since
inception | | | | | | | |
| | | | | | | | | | Gross | | | Net | |
| Investor Class (Y) | | | 14.59 | | | | 8.80 | | | | | BTRMX | | 09658V859 | | 8/30/2013 | | | 1.43 | | | | 1.08 | |
| Retirement Class (R-3) | | | 14.17 | | | | 8.51 | | | | | BTRPX | | 09658V875 | | 8/30/2013 | | | 1.68 | | | | 1.33 | |
| Retirement Class (R-6) | | | 14.98 | | | | 9.24 | | | | | BTRQX | | 09658V867 | | 8/30/2013 | | | 1.03 | | | | 0.68 | |
| Standard & Poor’s Target Date 2040 Index | | | 13.17 | | | | 9.12 | | | | | | | | | | | | | | | | | |
| Lipper Mixed-Asset Target 2040 Funds Index | | | 14.51 | | | | 8.86 | | | | | | | | | | | | | | | | | |
| | | | | | | | |
| | | | | | | | | | | | | | | | | | | | | | | | |
| Growth of an assumed $10,000 investment | | | | | Portfolio sector allocation** | |
| | | | | | Sector | | | | | Fund (%) | |
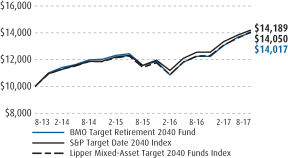 | | | | | Large-Cap Funds | | | | | | | 41.7 | |
| | | | Mid-Cap Funds | | | | | | | 11.7 | |
| | | | Small-Cap Funds | | | | | | | 4.8 | |
| | | | International Funds | | | | | | | 29.7 | |
| | | | Fixed Income Funds | | | | | | | 4.9 | |
| | | | Alternative Funds | | | | | | | 6.0 | |
| | | | Other Assets & Liabilities, Net | | | | | | | 1.2 | |
| | | | Total | | | | | | | 100.0 | |
| | | | | | | | | | | | | | | | |
| | | | | | | | | | | | | | | | |
| | | | | | | | | | | | | | | | |
| | | | | | | | | | | | | | | | |
| | | | | | | | |
| | | | | | | | | | | | | | | | | | | | | | | | |
| BMO Target Retirement 2045 Fund | |
Average annual total returns (%) | | | | | Ticker | | Cusip | | Inception
date | | Expenses (%)* | |
| | | | | | Since
inception | | | | | | | |
| | | 1-year | | | | | | | | | Gross | | | Net | |
| Investor Class (Y) | | | 14.58 | | | | 6.80 | | | | | BRTMX | | 09658V453 | | 12/27/2013 | | | 2.22 | | | | 1.05 | |
| Retirement Class (R-3) | | | 14.35 | | | | 6.54 | | | | | BRTPX | | 09658V610 | | 12/27/2013 | | | 2.47 | | | | 1.30 | |
| Retirement Class (R-6) | | | 15.08 | | | | 7.22 | | | | | BRTQX | | 09658V594 | | 12/27/2013 | | | 1.82 | | | | 0.65 | |
| Standard & Poor’s Target Date 2045 Index | | | 13.80 | | | | 7.09 | | | | | | | | | | | | | | | | | |
| Lipper Mixed-Asset Target 2045 Funds Index | | | 15.11 | | | | 7.07 | | | | | | | | | | | | | | | | | |
| | | | | | | | |
| | | | | | | | | | | | | | | | | | | | | | | | |
| Growth of an assumed $10,000 investment | | | | | Portfolio sector allocation** | |
| | | | | | Sector | | | | | Fund (%) | |
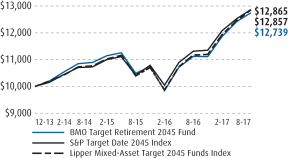 | | | | | Large-Cap Funds | | | | | | | 42.1 | |
| | | | Mid-Cap Funds | | | | | | | 11.7 | |
| | | | Small-Cap Funds | | | | | | | 5.0 | |
| | | | International Funds | | | | | | | 30.0 | |
| | | | Fixed Income Funds | | | | | | | 4.9 | |
| | | | Alternative Funds | | | | | | | 5.0 | |
| | | | Other Assets & Liabilities, Net | | | | | | | 1.3 | |
| | | | Total | | | | | | | 100.0 | |
| | | | | | | | | | | | | | | | |
| | | | | | | | | | | | | | | | |
| | | | | | | | | | | | | | | | |
| | | | | | | | | | | | | | | | |
The above graphs relate to the Investor Class shares of the Fund. Performance for the Retirement R-3 and Retirement R-6 will vary from the performance of the Investor Class shares shown above due to differences in charges and expenses. These graphs illustrate the hypothetical investment of $10,000 in the Investor Class shares of the Fund from each Fund’s inception date to August 31, 2017.
The performance data quoted represents past performance which is no guarantee of future results. Investment return and principal value will fluctuate so that an investor’s shares, when redeemed, may be worth more or less than their original costs. Mutual fund performance changes over time and current performance may be lower or higher than what is stated. To receive current performance to the most recent month-end, please call 1-800-236-3863 or visit www.bmofunds.com.
| * | The above expense ratios are from the Funds’ Prospectus dated December 29, 2016, and are inclusive of Acquired Fund Fees and Expenses. See Note 5, subsection Contractual Expense Limitation, in the Notes to Financial Statements for additional information. Net expense ratios reflect contractual fee waivers and/or expense reimbursements if applicable, made by BMO Asset Management Corp., the investment adviser (Adviser). The Adviser may not terminate these fee waivers and/or expense reimbursements prior to December 31, 2018 without the consent of the Board of Directors, unless the investment advisory agreement is terminated. Without these contractual waivers, the Fund’s returns would have been lower. |
| ** | Portfolio composition will change due to ongoing management of the Fund. The percentages are based on net assets as of August 31, 2017 and may not necessarily reflect adjustments that are routinely made when presenting net assets for formal financial statement processes. |
The Standard & Poor’s Target Date Indices are designed to measure the performance of an asset allocation strategy that meets the objectives of investors with an approximate corresponding retirement date horizon.
Lipper indices measure the performance of the 30 largest mutual funds in each respective fund category.
6
| | |
| Annual Report | | BMO Target Retirement Funds |
| | | | | | | | | | | | | | | | | | | | | | | | |
| BMO Target Retirement 2050 Fund | |
Average annual total returns (%) | | | | | Ticker | | Cusip | | Inception
date | | Expenses (%)* | |
| | | 1-year | | | Since
inception | | | | | | | |
| | | | | | | | | | Gross | | | Net | |
| Investor Class (Y) | | | 14.67 | | | | 8.88 | | | | | BTRUX | | 09658V818 | | 8/30/2013 | | | 1.58 | | | | 1.08 | |
| Retirement Class (R-3) | | | 14.38 | | | | 8.60 | | | | | BTRWX | | 09658V834 | | 8/30/2013 | | | 1.83 | | | | 1.33 | |
| Retirement Class (R-6) | | | 15.09 | | | | 9.31 | | | | | BTRZX | | 09658V826 | | 8/30/2013 | | | 1.18 | | | | 0.68 | |
| Russell 3000® Index | | | 16.06 | | | | 12.65 | | | | | | | | | | | | | | | | | |
| Lipper Mixed-Asset Target 2050+ Funds Index | | | 15.22 | | | | 8.80 | | | | | | | | | | | | | | | | | |
| | | | | | | | |
| | | | | | | | | | | | | | | | | | | | | | | | |
| Growth of an assumed $10,000 investment | | | | | Portfolio sector allocation** | |
| | | | | | Sector | | | | | Fund (%) | |
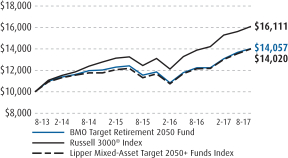 | | | | | Large-Cap Funds | | | | | | | 42.0 | |
| | | | Mid-Cap Funds | | | | | | | 11.7 | |
| | | | Small-Cap Funds | | | | | | | 5.0 | |
| | | | International Funds | | | | | | | 30.0 | |
| | | | Fixed Income Funds | | | | | | | 4.9 | |
| | | | Alternative Funds | | | | | | | 5.0 | |
| | | | Other Assets & Liabilities, Net | | | | | | | 1.4 | |
| | | | Total | | | | | | | 100.0 | |
| | | | | | | | | | | | | | | | |
| | | | | | | | | | | | | | | | |
| | | | | | | | | | | | | | | | |
| | | | | | | | | | | | | | | | |
| | | | | | | | |
| | | | | | | | | | | | | | | | | | | | | | | | |
| BMO Target Retirement 2055 Fund | |
Average annual total returns (%) | | | | | Ticker | | Cusip | | Inception
date | | Expenses (%)* | |
| | | | | | Since
inception | | | | | | | |
| | | 1-year | | | | | | | | | Gross | | | Net | |
| Investor Class (Y) | | | 14.39 | | | | 6.80 | | | | | BRTRX | | 09658V586 | | 12/27/2013 | | | 4.03 | | | | 1.07 | |
| Retirement Class (R-3) | | | 14.22 | | | | 6.55 | | | | | BRTTX | | 09658V560 | | 12/27/2013 | | | 4.28 | | | | 1.32 | |
| Retirement Class (R-6) | | | 14.93 | | | | 7.23 | | | | | BRTUX | | 09658V552 | | 12/27/2013 | | | 3.63 | | | | 0.67 | |
| Russell 3000® Index | | | 16.06 | | | | 10.07 | | | | | | | | | | | | | | | | | |
| Lipper Mixed-Asset Target 2055+ Funds Index | | | 15.73 | | | | 7.21 | | | | | | | | | | | | | | | | | |
| | | | | | | | |
| | | | | | | | | | | | | | | | | | | | | | | | |
| Growth of an assumed $10,000 investment | | | | | Portfolio sector allocation** | |
| | | | | | Sector | | | | | Fund (%) | |
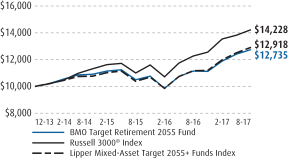 | | | | | Large-Cap Funds | | | | | | | 41.9 | |
| | | | Mid-Cap Funds | | | | | | | 11.7 | |
| | | | Small-Cap Funds | | | | | | | 5.0 | |
| | | | International Funds | | | | | | | 29.9 | |
| | | | Fixed Income Funds | | | | | | | 4.9 | |
| | | | Alternative Funds | | | | | | | 4.9 | |
| | | | Other Assets & Liabilities, Net | | | | | | | 1.7 | |
| | | | Total | | | | | | | 100.0 | |
| | | | | | | | | | | | | | | | |
| | | | | | | | | | | | | | | | |
| | | | | | | | | | | | | | | | |
| | | | | | | | | | | | | | | | |
The above graphs relate to the Investor Class shares of the Fund. Performance for the Retirement R-3 and Retirement R-6 will vary from the performance of the Investor Class shares shown above due to differences in charges and expenses. These graphs illustrate the hypothetical investment of $10,000 in the Investor Class shares of the Fund from each Fund’s inception date to August 31, 2017.
The performance data quoted represents past performance which is no guarantee of future results. Investment return and principal value will fluctuate so that an investor’s shares, when redeemed, may be worth more or less than their original costs. Mutual fund performance changes over time and current performance may be lower or higher than what is stated. To receive current performance to the most recent month-end, please call 1-800-236-3863 or visit www.bmofunds.com.
| * | The above expense ratios are from the Funds’ Prospectus dated December 29, 2016, and are inclusive of Acquired Fund Fees and Expenses. See Note 5, subsection Contractual Expense Limitation, in the Notes to Financial Statements for additional information. Net expense ratios reflect contractual fee waivers and/or expense reimbursements if applicable, made by BMO Asset Management Corp., the investment adviser (Adviser). The Adviser may not terminate these fee waivers and/or expense reimbursements prior to December 31, 2018 without the consent of the Board of Directors, unless the investment advisory agreement is terminated. Without these contractual waivers, the Fund’s returns would have been lower. |
| ** | Portfolio composition will change due to ongoing management of the Fund. The percentages are based on net assets as of August 31, 2017 and may not necessarily reflect adjustments that are routinely made when presenting net assets for formal financial statement processes. |
The Russell 3000® Index measures the performance of the largest 3000 U.S. companies representing approximately 98% of the investable U.S. equity market.
Lipper indices measure the performance of the 30 largest mutual funds in each respective fund category.
7
| | |
| Annual Report — Commentary | | BMO Target Risk Funds |
Fund Managers; Investment Experience
Jon Adams, CFA; since 2002
Mike Dowdall, CFA; since 2007
Irina Pacheco, CFA; since 2003
Fiscal year 2017 saw the tentative re-emergence of the reflation trade. Synchronized global growth, rising corporate earnings and higher inflation expectations led to higher treasury yields, a narrowing of corporate bond spreads and strong equity returns. The reflation trade reversed in the summer due in part to declining U.S. policy expectations, but volatility in equity markets remained low and returns high. Emerging market equities were the winner, returning 25.0% as low rates, a weak dollar and receding fears of a Chinese slowdown providing a positive backdrop. The Standard & Poor’s 500® (S&P 500) returned 16.2%, with all sectors of the S&P 500 positive with the exception of Energy. International developed equities returned 18.3%, benefitting from an improving European and Japanese economy. Major populist political risks receded in Europe after the election of new French President Emmanuel Macron and the lack of negative short-term consequences from Brexit. The risk-on theme translated into the fixed income market where the Bloomberg Barclays High Yield Index’s return of 8.6% easily outpaced the Bloomberg Barclays U.S. Aggregate Bond Index’s return of 0.5%.
The BMO Target Risk Funds all outperformed their peer group medians for the one-year period. The return range was 5.1% for the Conservative Allocation Fund — Institutional Class to 15.8% for the Aggressive Allocation Fund — Institutional Class. The disparity in relative performance was reflective of the divergence between stocks and bonds during the year, with stocks outperforming core bonds.
Fixed income managers had mixed results for the year. BMO TCH Core Plus Bond and Metropolitan West Total Return Bond outperformed their core bond benchmark due to the managers’ positive tilt towards credit. BMO TCH Emerging Markets Bond performed in line with its benchmark. The alternatives allocation added value during the year as BMO Alternative Strategies outperformed the Bloomberg Barclays U.S. Aggregate Bond Index’s return.
Domestic equity strategies performed in line with their benchmark. Small-cap managers struggled, as Goldman Sachs Small-Cap Value and BMO Small-Cap Growth were notable underperformers. Large- and mid-cap managers outperformed benchmarks with T. Rowe Price Growth Stock, BMO Large-Cap Value and Harbor Capital Appreciation performing exceptionally well. BMO Low Volatility Equity was unable to keep pace with the benchmark due to the lower risk of its holdings.
International equity fund performance was mixed, with managers detracting more than contributing to fund performance. Dodge and Cox International added the most value, while BMO Disciplined International Equity and DFA International Small Company slightly outperformed their benchmark as well. MFS International and Harbor International were the main laggards. On the emerging markets side, BMO LGM Emerging Markets Equity underperformed the benchmark.
Whereas political risk closed the period quietly, both home and abroad, we did see an uptick in risk around central bank policy. A recent downturn in U.S. inflation has made the Federal Reserve’s job more difficult, as they decide whether to continue hiking rates into the end of 2017 despite few signs of an overheating economy. The European Central Bank faces a similar quandary: should it normalize policy even though inflation remains below its target level. Global economic growth has proved resilient but remains vulnerable to any potential policy misstep.
Our portfolios are positioned slightly positive risk with overweights in U.S. large cap equities and international developed equities and a commensurate underweight to core bonds. We believe the recent global growth momentum should buoy corporate earnings, a positive for our equity holdings. However, additional policy uncertainty tempers our view and prevents us from taking additional risk within the portfolios.
8
| | |
| Annual Report | | BMO Target Risk Funds |
| | | | | | | | | | | | | | | | | | | | | | | | |
| BMO Conservative Allocation Fund | |
Average annual total returns (%) | | | | | Ticker | | Cusip | | Inception
date | | Expenses (%)* | |
| | | 1-year | | | Since
inception | | | | | | | |
| | | | | | | | | | Gross | | | Net | |
| Investor Class (Y) | | | 4.83 | | | | 2.99 | | | | | BDVYX | | 09658L299 | | 5/30/2014 | | | 1.25 | | | | 1.02 | |
| Institutional Class (I) | | | 5.07 | | | | 3.23 | | | | | BDVIX | | 09658L331 | | 5/30/2014 | | | 1.00 | | | | 0.77 | |
| Retirement Class (R-3) | | | 4.52 | | | | 2.74 | | | | | BDVRX | | 09658L323 | | 5/30/2014 | | | 1.50 | | | | 1.27 | |
| Retirement Class (R-6) | | | 5.22 | | | | 3.39 | | | | | BDVSX | | 09658L315 | | 5/30/2014 | | | 0.85 | | | | 0.62 | |
| Bloomberg Barclays U.S. Aggregate Bond Index | | | 0.49 | | | | 2.72 | | | | | | | | | | | | | | | | | |
| Lipper Mixed-Asset Target Allocation Conservative Funds Index | | | 5.71 | | | | 3.37 | | | | | | | | | | | | | | | | | |
| | | | | | | | |
| | | | | | | | | | | | | | | | | | | | | | | | |
| Growth of an assumed $10,000 investment | | | | | Portfolio sector allocation** | |
| | | | | | Sector | | | | | Fund (%) | |
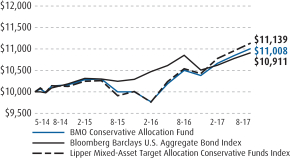 | | | | | Large-Cap Funds | | | | | | | 11.5 | |
| | | | Mid-Cap Funds | | | | | | | 1.7 | |
| | | | Small-Cap Funds | | | | | | | 1.1 | |
| | | | International Funds | | | | | | | 5.7 | |
| | | | Fixed Income Funds | | | | | | | 63.7 | |
| | | | Alternative Funds | | | | | | | 15.0 | |
| | | | Other Assets & Liabilities, Net | | | | | | | 1.3 | |
| | | | Total | | | | | | | 100.0 | |
| | | | | | | | | | | | | | | | |
| | | | | | | | | | | | | | | | |
| | | | | | | | | | | | | | | | |
| | | | | | | | | | | | | | | | |
| | | | | | | | | | | | | | | | | | | | | | | | |
| BMO Moderate Allocation Fund | |
Average annual total returns (%) | | | | | Ticker | | Cusip | | Inception
date | | Expenses (%)* | |
| | | | | | Since
inception | | | | | | | |
| | | 1-year | | | | | | | | | Gross | | | Net | |
| Investor Class (Y) | | | 7.59 | | | | 3.88 | | | | | BMBYX | | 09658L166 | | 5/30/2014 | | | 1.28 | | | | 1.02 | |
| Institutional Class (I) | | | 7.82 | | | | 4.14 | | | | | BMBHX | | 09658L190 | | 5/30/2014 | | | 1.03 | | | | 0.77 | |
| Retirement Class (R-3) | | | 7.37 | | | | 3.64 | | | | | BMBQX | | 09658L182 | | 5/30/2014 | | | 1.53 | | | | 1.27 | |
| Retirement Class (R-6) | | | 8.02 | | | | 4.31 | | | | | BMBTX | | 09658L174 | | 5/30/2014 | | | 0.88 | | | | 0.62 | |
| Bloomberg Barclays U.S. Aggregate Bond Index | | | 0.49 | | | | 2.72 | | | | | | | | | | | | | | | | | |
| Lipper Mixed-Asset Target Allocation Moderate Funds Index | | | 9.49 | | | | 4.93 | | | | | | | | | | | | | | | | | |
| | | | | | | | |
| | | | | | | | | | | | | | | | | | | | | | | | |
| Growth of an assumed $10,000 investment | | | | | Portfolio sector allocation** | |
| | | | | | Sector | | | | | Fund (%) | |
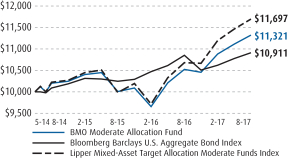 | | | | | Large-Cap Funds | | | | | | | 23.3 | |
| | | | Mid-Cap Funds | | | | | | | 3.4 | |
| | | | Small-Cap Funds | | | | | | | 2.1 | |
| | | | International Funds | | | | | | | 11.3 | |
| | | | Fixed Income Funds | | | | | | | 46.8 | |
| | | | Alternative Funds | | | | | | | 12.0 | |
| | | | Other Assets & Liabilities, Net | | | | | | | 1.1 | |
| | | | Total | | | | | | | 100.0 | |
| | | | | | | | | | | | | | | | |
| | | | | | | | | | | | | | | | |
| | | | | | | | | | | | | | | | |
| | | | | | | | | | | | | | | | |
The above graphs relate to the Investor Class shares of the Fund. Performance for the Institutional, Retirement R-3 and Retirement R-6 will vary from the performance of the Investor Class shares shown above due to differences in charges and expenses. These graphs illustrate the hypothetical investment of $10,000 in the Investor Class shares of the Fund from each Fund’s inception date to August 31, 2017.
The performance data quoted represents past performance which is no guarantee of future results. Investment return and principal value will fluctuate so that an investor’s shares, when redeemed, may be worth more or less than their original costs. Mutual fund performance changes over time and current performance may be lower or higher than what is stated. To receive current performance to the most recent month-end, please call 1-800-236-3863 or visit www.bmofunds.com.
| * | The above expense ratios are from the Funds’ Prospectus dated December 29, 2016, and are inclusive of Acquired Fund Fees and Expenses. See Note 5, subsection Contractual Expense Limitation, in the Notes to Financial Statements for additional information. Net expense ratios reflect contractual fee waivers and/or expense reimbursements if applicable, made by BMO Asset Management Corp., the investment adviser (Adviser). The Adviser may not terminate these fee waivers and/or expense reimbursements prior to December 31, 2018 without the consent of the Board of Directors, unless the investment advisory agreement is terminated. Without these contractual waivers, the Fund’s returns would have been lower. |
| ** | Portfolio composition will change due to ongoing management of the Fund. The percentages are based on net assets as of August 31, 2017 and may not necessarily reflect adjustments that are routinely made when presenting net assets for formal financial statement processes. |
Bloomberg Barclays U.S. Aggregate Bond Index is an unmanaged index that covers the U.S. investment-grade fixed-rate bond market, including government and credit securities, agency mortgage pass-through securities, asset-backed securities and commercial mortgage-based securities.
Lipper indices measure the performance of the 30 largest mutual funds in each respective fund category.
9
| | |
| Annual Report | | BMO Target Risk Funds |
| | | | | | | | | | | | | | | | | | | | | | | | |
| BMO Balanced Allocation Fund | |
Average annual total returns (%) | | | | | Ticker | | Cusip | | Inception
date | | Expenses (%)* | |
| | | 1-year | | | Since
inception | | | | | | | |
| | | | | | | | | | Gross | | | Net | |
| Investor Class (Y) | | | 10.33 | | | | 4.73 | | | | | BGRYX | | 09658L216 | | 5/30/2014 | | | 1.22 | | | | 1.08 | |
| Institutional Class (I) | | | 10.67 | | | | 5.01 | | | | | BGRHX | | 09658L240 | | 5/30/2014 | | | 0.97 | | | | 0.83 | |
| Retirement Class (R-3) | | | 10.11 | | | | 4.47 | | | | | BGRRX | | 09658L232 | | 5/30/2014 | | | 1.47 | | | | 1.33 | |
| Retirement Class (R-6) | | | 10.73 | | | | 5.14 | | | | | BGRQX | | 09658L224 | | 5/30/2014 | | | 0.82 | | | | 0.68 | |
| Standard & Poor’s 500 Index | | | 16.23 | | | | 10.30 | | | | | | | | | | | | | | | | | |
| Lipper Mixed-Asset Target Allocation Growth Funds Index | | | 12.07 | | | | 6.24 | | | | | | | | | | | | | | | | | |
| | | | | | | | |
| | | | | | | | | | | | | | | | | | | | | | | | |
| Growth of an assumed $10,000 investment | | | | | Portfolio sector allocation** | |
| | | | | | Sector | | | | | Fund (%) | |
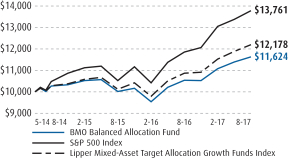 | | | | | Large-Cap Funds | | | | | | | 34.6 | |
| | | | Mid-Cap Funds | | | | | | | 5.0 | |
| | | | Small-Cap Funds | | | | | | | 3.2 | |
| | | | International Funds | | | | | | | 17.1 | |
| | | | Fixed Income Funds | | | | | | | 28.8 | |
| | | | Alternative Funds | | | | | | | 10.0 | |
| | | | Other Assets & Liabilities, Net | | | | | | | 1.3 | |
| | | | Total | | | | | | | 100.0 | |
| | | | | | | | | | | | | | | | |
| | | | | | | | | | | | | | | | |
| | | | | | | | | | | | | | | | |
| | | | | | | | | | | | | | | | |
| | | | | | | | | | | | | | | | | | | | | | | | |
| BMO Growth Allocation Fund | |
Average annual total returns (%) | | | | | Ticker | | Cusip | | Inception
date | | Expenses (%)* | |
| | | | | | Since
inception | | | | | | | |
| | | 1-year | | | | | | | | | Gross | | | Net | |
| Investor Class (Y) | | | 13.27 | | | | 5.58 | | | | | BABYX | | 09658L380 | | 5/30/2014 | | | 1.34 | | | | 1.08 | |
| Institutional Class (I) | | | 13.51 | | | | 5.82 | | | | | BABHX | | 09658L422 | | 5/30/2014 | | | 1.09 | | | | 0.83 | |
| Retirement Class (R-3) | | | 12.96 | | | | 5.30 | | | | | BABRX | | 09658L414 | | 5/30/2014 | | | 1.59 | | | | 1.33 | |
| Retirement Class (R-6) | | | 13.69 | | | | 5.99 | | | | | BABQX | | 09658L398 | | 5/30/2014 | | | 0.94 | | | | 0.68 | |
| Standard & Poor’s 500 Index | | | 16.23 | | | | 10.30 | | | | | | | | | | | | | | | | | |
| Lipper Mixed-Asset Target Allocation Aggressive Growth Funds Index | | | 14.73 | | | | 6.22 | | | | | | | | | | | | | | | | | |
| | | | | | | | |
| | | | | | | | | | | | | | | | | | | | | | | | |
| Growth of an assumed $10,000 investment | | | | | Portfolio sector allocation** | |
| | | | | | Sector | | | | | Fund (%) | |
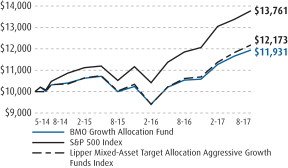 | | | | | Large-Cap Funds | | | | | | | 46.4 | |
| | | | Mid-Cap Funds | | | | | | | 6.7 | |
| | | | Small-Cap Funds | | | | | | | 4.3 | |
| | | | International Funds | | | | | | | 22.7 | |
| | | | Fixed Income Funds | | | | | | | 10.9 | |
| | | | Alternative Funds | | | | | | | 8.0 | |
| | | | Other Assets & Liabilities, Net | | | | | | | 1.0 | |
| | | | Total | | | | | | | 100.0 | |
| | | | | | | | | | | | | | | | |
| | | | | | | | | | | | | | | | |
| | | | | | | | | | | | | | | | |
| | | | | | | | | | | | | | | | |
| | | | | | | | | | | | | | | | |
The above graphs relate to the Investor Class shares of the Fund. Performance for the Institutional, Retirement R-3 and Retirement R-6 will vary from the performance of the Investor Class shares shown above due to differences in charges and expenses. These graphs illustrate the hypothetical investment of $10,000 in the Investor Class shares of the Fund from each Fund’s inception date to August 31, 2017.
The performance data quoted represents past performance which is no guarantee of future results. Investment return and principal value will fluctuate so that an investor’s shares, when redeemed, may be worth more or less than their original costs. Mutual fund performance changes over time and current performance may be lower or higher than what is stated. To receive current performance to the most recent month-end, please call 1-800-236-3863 or visit www.bmofunds.com.
| * | The above expense ratios are from the Funds’ Prospectus dated December 29, 2016, and are inclusive of Acquired Fund Fees and Expenses. See Note 5, subsection Contractual Expense Limitation, in the Notes to Financial Statements for additional information. Net expense ratios reflect contractual fee waivers and/or expense reimbursements if applicable, made by BMO Asset Management Corp., the investment adviser (Adviser). The Adviser may not terminate these fee waivers and/or expense reimbursements prior to December 31, 2018 without the consent of the Board of Directors, unless the investment advisory agreement is terminated. Without these contractual waivers, the Fund’s returns would have been lower. |
| ** | Portfolio composition will change due to ongoing management of the Fund. The percentages are based on net assets as of August 31, 2017 and may not necessarily reflect adjustments that are routinely made when presenting net assets for formal financial statement processes. |
The Standard & Poor’s 500 Index is an unmanaged index of large-cap common stocks.
Lipper indices measure the performance of the 30 largest mutual funds in each respective fund category.
10
| | |
| Annual Report | | BMO Target Risk Funds |
| | | | | | | | | | | | | | | | | | | | | | | | |
| BMO Aggressive Allocation Fund | |
Average annual total returns (%) | | | | | Ticker | | Cusip | | Inception
date | | Expenses (%)* | |
| | | 1-year | | | Since
inception | | | | | | | |
| | | | | | | | | | Gross | | | Net | |
| Investor Class (Y) | | | 15.60 | | | | 6.41 | | | | | BDSYX | | 09658L257 | | 5/30/2014 | | | 1.20 | | | | 1.01 | |
| Institutional Class (I) | | | 15.79 | | | | 6.66 | | | | | BDSHX | | 09658L281 | | 5/30/2014 | | | 0.95 | | | | 0.76 | |
| Retirement Class (R-3) | | | 15.24 | | | | 6.14 | | | | | BDSRX | | 09658L273 | | 5/30/2014 | | | 1.45 | | | | 1.26 | |
| Retirement Class (R-6) | | | 16.00 | | | | 6.83 | | | | | BDSQX | | 09658L265 | | 5/30/2014 | | | 0.80 | | | | 0.61 | |
| Standard & Poor’s 500 Index | | | 16.23 | | | | 10.30 | | | | | | | | | | | | | | | | | |
| Lipper Multi-Cap Core Funds Index | | | 14.49 | | | | 8.22 | | | | | | | | | | | | | | | | | |
| | | | | | | | |
| | | | | | | | | | | | | | | | | | | | | | | | |
| Growth of an assumed $10,000 investment | | | | | Portfolio sector allocation** | |
| | | | | | Sector | | | | | Fund (%) | |
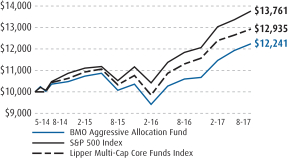 | | | | | Large-Cap Funds | | | | | | | 56.1 | |
| | | | Mid-Cap Funds | | | | | | | 8.2 | |
| | | | Small-Cap Funds | | | | | | | 5.2 | |
| | | | International Funds | | | | | | | 27.6 | |
| | | | Alternative Funds | | | | | | | 2.0 | |
| | | | Other Assets & Liabilities, Net | | | | | | | 0.9 | |
| | | | Total | | | | | | | 100.0 | |
| | | | | | | | | | | | | | | | |
| | | | | | | | | | | | | | | | |
| | | | | | | | | | | | | | | | |
| | | | | | | | | | | | | | | | |
| | | | | | | | | | | | | | | | |
| | | | | | | | | | | | | | | | |
The above graphs relate to the Investor Class shares of the Fund. Performance for the Institutional, Retirement R-3 and Retirement R-6 will vary from the performance of the Investor Class shares shown above due to differences in charges and expenses. These graphs illustrate the hypothetical investment of $10,000 in the Investor Class shares of the Fund from each Fund’s inception date to August 31, 2017.
The performance data quoted represents past performance which is no guarantee of future results. Investment return and principal value will fluctuate so that an investor’s shares, when redeemed, may be worth more or less than their original costs. Mutual fund performance changes over time and current performance may be lower or higher than what is stated. To receive current performance to the most recent month-end, please call 1-800-236-3863 or visit www.bmofunds.com.
| * | The above expense ratios are from the Funds’ Prospectus dated December 29, 2016, and are inclusive of Acquired Fund Fees and Expenses. See Note 5, subsection Contractual Expense Limitation, in the Notes to Financial Statements for additional information. Net expense ratios reflect contractual fee waivers and/or expense reimbursements if applicable, made by BMO Asset Management Corp., the investment adviser (Adviser). The Adviser may not terminate these fee waivers and/or expense reimbursements prior to December 31, 2018 without the consent of the Board of Directors, unless the investment advisory agreement is terminated. Without these contractual waivers, the Fund’s returns would have been lower. |
| ** | Portfolio composition will change due to ongoing management of the Fund. The percentages are based on net assets as of August 31, 2017 and may not necessarily reflect adjustments that are routinely made when presenting net assets for formal financial statement processes. |
The Standard & Poor’s 500 Index is an unmanaged index of large-cap common stocks.
Lipper indices measure the performance of the 30 largest mutual funds in each respective fund category.
11
| | |
| Expense Example (Unaudited) | | |
For the Six Months Ended August 31, 2017
As a shareholder of the Fund, you may incur two types of costs: (1) transaction costs, which may include sales charges (loads) on purchase payments, reinvested dividends, or other distributions; redemption fees; and exchange fees; and (2) ongoing costs, including management fees; distribution and/or service (12b-1) fees; and other Fund expenses. This Example is intended to help you understand your ongoing costs (in dollars) of investing in the Funds and to compare these costs with the ongoing costs of investing in other mutual funds.
The Example is based on an investment of $1,000 invested at the beginning of the period and held for the entire six month period ended August 31, 2017 (3/1/17-8/31/17).
Actual Expenses
The first line of the table below provides information about actual account values and actual expenses. You may use the information in this line, together with the amount you invested, to estimate the expenses that you paid over the period. Simply divide your account value by $1,000 (for example, an $8,600 account value divided by $1,000 = 8.6), then multiply the result by the number in the first line under the heading entitled “Expenses Paid During Period” to estimate the expenses you paid on your account during this period.
Hypothetical Example for Comparison Purposes
The second line of the table below provides information about hypothetical account values and hypothetical expenses based on a Fund’s actual expense ratio and an assumed rate of return of 5% per year before expenses, which is not the Fund’s actual return. The hypothetical account values and expenses may not be used to estimate the actual ending account balance or expenses you paid for the period. You may use this information to compare the ongoing costs of investing in a Fund and other funds. To do so, compare this 5% hypothetical example with the 5% hypothetical examples that appear in the shareholder reports of the other funds.
Please note that the expenses shown in the table are meant to highlight your ongoing costs only and do not reflect any transaction costs, such as sales charges (loads), redemption fees, or exchange fees. Therefore, the second line of the table is useful in comparing ongoing costs only, and will not help you determine the relative total costs of owning different funds. In addition, if these transaction costs were included, your costs would have been higher.
| | | | | | | | | | | | | | | | | | | | | | | | | | | | | | | | |
| | | Investor | | | | | | | | | | | | | |
Fund | | Beginning
account
value
3/1/17 | | | Ending
account
value
8/31/17 | | | Annualized
Expense
Ratio(1) | | | Expenses
paid during
period
3/1/17-
8/31/17(1) | | | | | | | | | | | | | |
In-Retirement Fund | | | | | | | | | | | | | | | | | | | | | | | | | | | | | | | | |
| Actual | | $ | 1,000.00 | | | $ | 1,037.60 | | | | 0.33 | % | | $ | 1.69 | | | | | | | | | | | | | | | | | |
| Hypothetical (5% return before expenses) | | | 1,000.00 | | | | 1,023.34 | | | | 0.33 | | | | 1.68 | | | | | | | | | | | | | | | | | |
2015 Fund | | | | | | | | | | | | | | | | | | | | | | | | | | | | | | | | |
| Actual | | | 1,000.00 | | | | 1,045.20 | | | | 0.33 | | | | 1.73 | | | | | | | | | | | | | | | | | |
| Hypothetical (5% return before expenses) | | | 1,000.00 | | | | 1,023.34 | | | | 0.33 | | | | 1.68 | | | | | | | | | | | | | | | | | |
2020 Fund | | | | | | | | | | | | | | | | | | | | | | | | | | | | | | | | |
| Actual | | | 1,000.00 | | | | 1,053.10 | | | | 0.33 | | | | 1.71 | | | | | | | | | | | | | | | | | |
| Hypothetical (5% return before expenses) | | | 1,000.00 | | | | 1,023.34 | | | | 0.33 | | | | 1.68 | | | | | | | | | | | | | | | | | |
2025 Fund | | | | | | | | | | | | | | | | | | | | | | | | | | | | | | | | |
| Actual | | | 1,000.00 | | | | 1,061.20 | | | | 0.33 | | | | 1.71 | | | | | | | | | | | | | | | | | |
| Hypothetical (5% return before expenses) | | | 1,000.00 | | | | 1,023.34 | | | | 0.33 | | | | 1.68 | | | | | | | | | | | | | | | | | |
2030 Fund | | | | | | | | | | | | | | | | | | | | | | | | | | | | | | | | |
| Actual | | | 1,000.00 | | | | 1,066.50 | | | | 0.37 | | | | 1.93 | | | | | | | | | | | | | | | | | |
| Hypothetical (5% return before expenses) | | | 1,000.00 | | | | 1,023.14 | | | | 0.37 | | | | 1.89 | | | | | | | | | | | | | | | | | |
2035 Fund | | | | | | | | | | | | | | | | | | | | | | | | | | | | | | | | |
| Actual | | | 1,000.00 | | | | 1,070.40 | | | | 0.37 | | | | 1.94 | | | | | | | | | | | | | | | | | |
| Hypothetical (5% return before expenses) | | | 1,000.00 | | | | 1,023.14 | | | | 0.37 | | | | 1.89 | | | | | | | | | | | | | | | | | |
2040 Fund | | | | | | | | | | | | | | | | | | | | | | | | | | | | | | | | |
| Actual | | | 1,000.00 | | | | 1,073.40 | | | | 0.36 | | | | 1.88 | | | | | | | | | | | | | | | | | |
| Hypothetical (5% return before expenses) | | | 1,000.00 | | | | 1,023.19 | | | | 0.36 | | | | 1.84 | | | | | | | | | | | | | | | | | |
2045 Fund | | | | | | | | | | | | | | | | | | | | | | | | | | | | | | | | |
| Actual | | | 1,000.00 | | | | 1,073.80 | | | | 0.36 | | | | 1.89 | | | | | | | | | | | | | | | | | |
| Hypothetical (5% return before expenses) | | | 1,000.00 | | | | 1,023.19 | | | | 0.36 | | | | 1.84 | | | | | | | | | | | | | | | | | |
2050 Fund | | | | | | | | | | | | | | | | | | | | | | | | | | | | | | | | |
| Actual | | | 1,000.00 | | | | 1,074.40 | | | | 0.36 | | | | 1.88 | | | | | | | | | | | | | | | | | |
| Hypothetical (5% return before expenses) | | | 1,000.00 | | | | 1,023.19 | | | | 0.36 | | | | 1.84 | | | | | | | | | | | | | | | | | |
2055 Fund | | | | | | | | | | | | | | | | | | | | | | | | | | | | | | | | |
| Actual | | | 1,000.00 | | | | 1,072.10 | | | | 0.36 | | | | 1.90 | | | | | | | | | | | | | | | | | |
| Hypothetical (5% return before expenses) | | | 1,000.00 | | | | 1,023.19 | | | | 0.36 | | | | 1.84 | | | | | | | | | | | | | | | | | |
12
| | |
| | | Expense Example (Unaudited) (continued) |
| | | | | | | | | | | | | | | | | | | | | | | | | | | | | | | | |
| | | Investor | | | Institutional | |
Fund | | Beginning
account
value
3/1/17 | | | Ending
account
value
8/31/17 | | | Annualized
Expense
Ratio(1) | | | Expenses
paid during
period
3/1/17-
8/31/17(1) | | | Beginning
account
value
3/1/17 | | | Ending
account
value
8/31/17 | | | Annualized
Expense
Ratio(1) | | | Expenses
paid during
period
3/1/17-
8/31/17(1) | |
Conservative Allocation Fund | | | | | | | | | | | | | | | | | | | | | | | | | | | | | | | | |
| Actual | | $ | 1,000.00 | | | $ | 1,031.90 | | | | 0.33 | % | | $ | 1.69 | | | $ | 1,000.00 | | | $ | 1,033.00 | | | | 0.08 | % | | $ | 0.41 | |
| Hypothetical (5% return before expenses) | | | 1,000.00 | | | | 1,023.34 | | | | 0.33 | | | | 1.68 | | | | 1,000.00 | | | | 1,024.60 | | | | 0.08 | | | | 0.41 | |
Moderate Allocation Fund | | | | | | | | | | | | | | | | | | | | | | | | | | | | | | | | |
| Actual | | | 1,000.00 | | | | 1,040.20 | | | | 0.30 | | | | 1.55 | | | | 1,000.00 | | | | 1,041.30 | | | | 0.05 | | | | 0.26 | |
| Hypothetical (5% return before expenses) | | | 1,000.00 | | | | 1,023.49 | | | | 0.30 | | | | 1.53 | | | | 1,000.00 | | | | 1,024.75 | | | | 0.05 | | | | 0.26 | |
Balanced Allocation Fund | | | | | | | | | | | | | | | | | | | | | | | | | | | | | | | | |
| Actual | | | 1,000.00 | | | | 1,050.10 | | | | 0.33 | | | | 1.70 | | | | 1,000.00 | | | | 1,051.10 | | | | 0.08 | | | | 0.42 | |
| Hypothetical (5% return before expenses) | | | 1,000.00 | | | | 1,023.34 | | | | 0.33 | | | | 1.68 | | | | 1,000.00 | | | | 1,024.60 | | | | 0.08 | | | | 0.41 | |
Growth Allocation Fund | | | | | | | | | | | | | | | | | | | | | | | | | | | | | | | | |
| Actual | | | 1,000.00 | | | | 1,059.00 | | | | 0.30 | | | | 1.56 | | | | 1,000.00 | | | | 1,060.10 | | | | 0.05 | | | | 0.26 | |
| Hypothetical (5% return before expenses) | | | 1,000.00 | | | | 1,023.49 | | | | 0.30 | | | | 1.53 | | | | 1,000.00 | | | | 1,024.75 | | | | 0.05 | | | | 0.26 | |
Aggressive Allocation Fund | | | | | | | | | | | | | | | | | | | | | | | | | | | | | | | | |
| Actual | | | 1,000.00 | | | | 1,067.20 | | | | 0.33 | | | | 1.72 | | | | 1,000.00 | | | | 1,068.40 | | | | 0.08 | | | | 0.42 | |
| Hypothetical (5% return before expenses) | | | 1,000.00 | | | | 1,023.34 | | | | 0.33 | | | | 1.68 | | | | 1,000.00 | | | | 1,024.60 | | | | 0.08 | | | | 0.41 | |
| (1) | Expenses are equal to the Funds’ annualized expense ratios for the period March 1, 2017 through August 31, 2017, multiplied by the average account value over the period, multiplied by 184/365 (to reflect the one-half year period). These expenses and ratios are exclusive of acquired fund fees and expenses. |
| | | | | | | | | | | | | | | | | | | | | | | | | | | | | | | | |
| | | Retirement Class R-3 | | | Retirement Class R-6 | |
Fund | | Beginning
account
value
3/1/17 | | | Ending
account
value
8/31/17 | | | Annualized
Expense
Ratio(1) | | | Expenses
paid during
period
3/1/17-
8/31/17(1) | | | Beginning
account
value
3/1/17 | | | Ending
account
value
8/31/17 | | | Annualized
Expense
Ratio(1) | | | Expenses
paid during
period
3/1/17-
8/31/17(1) | |
In-Retirement Fund | | | | | | | | | | | | | | | | | | | | | | | | | | | | | | | | |
| Actual | | $ | 1,000.00 | | | $ | 1,036.30 | | | | 0.58 | % | | $ | 3.00 | | | $ | 1,000.00 | | | $ | 1,039.80 | | | | 0.00 | % | | $ | 0.00 | |
| Hypothetical (5% return before expenses) | | | 1,000.00 | | | | 1,022.08 | | | | 0.58 | | | | 2.96 | | | | 1,000.00 | | | | 1,025.00 | | | | 0.00 | | | | 0.00 | |
2015 Fund | | | | | | | | | | | | | | | | | | | | | | | | | | | | | | | | |
| Actual | | | 1,000.00 | | | | 1,044.40 | | | | 0.58 | | | | 3.01 | | | | 1,000.00 | | | | 1,046.90 | | | | 0.00 | | | | 0.00 | |
| Hypothetical (5% return before expenses) | | | 1,000.00 | | | | 1,022.08 | | | | 0.58 | | | | 2.96 | | | | 1,000.00 | | | | 1,025.00 | | | | 0.00 | | | | 0.00 | |
2020 Fund | | | | | | | | | | | | | | | | | | | | | | | | | | | | | | | | |
| Actual | | | 1,000.00 | | | | 1,051.90 | | | | 0.58 | | | | 3.01 | | | | 1,000.00 | | | | 1,055.10 | | | | 0.00 | | | | 0.00 | |
| Hypothetical (5% return before expenses) | | | 1,000.00 | | | | 1,022.08 | | | | 0.58 | | | | 2.96 | | | | 1,000.00 | | | | 1,025.00 | | | | 0.00 | | | | 0.00 | |
2025 Fund | | | | | | | | | | | | | | | | | | | | | | | | | | | | | | | | |
| Actual | | | 1,000.00 | | | | 1,061.50 | | | | 0.58 | | | | 3.04 | | | | 1,000.00 | | | | 1,062.80 | | | | 0.00 | | | | 0.00 | |
| Hypothetical (5% return before expenses) | | | 1,000.00 | | | | 1,022.08 | | | | 0.58 | | | | 2.96 | | | | 1,000.00 | | | | 1,025.00 | �� | | | 0.00 | | | | 0.00 | |
2030 Fund | | | | | | | | | | | | | | | | | | | | | | | | | | | | | | | | |
| Actual | | | 1,000.00 | | | | 1,065.50 | | | | 0.62 | | | | 3.23 | | | | 1,000.00 | | | | 1,068.30 | | | | 0.00 | | | | 0.00 | |
| Hypothetical (5% return before expenses) | | | 1,000.00 | | | | 1,021.88 | | | | 0.62 | | | | 3.16 | | | | 1,000.00 | | | | 1,025.00 | | | | 0.00 | | | | 0.00 | |
2035 Fund | | | | | | | | | | | | | | | | | | | | | | | | | | | | | | | | |
| Actual | | | 1,000.00 | | | | 1,068.90 | | | | 0.62 | | | | 3.26 | | | | 1,000.00 | | | | 1,072.90 | | | | 0.00 | | | | 0.00 | |
| Hypothetical (5% return before expenses) | | | 1,000.00 | | | | 1,021.88 | | | | 0.62 | | | | 3.16 | | | | 1,000.00 | | | | 1,025.00 | | | | 0.00 | | | | 0.00 | |
2040 Fund | | | | | | | | | | | | | | | | | | | | | | | | | | | | | | | | |
| Actual | | | 1,000.00 | | | | 1,071.30 | | | | 0.61 | | | | 3.19 | | | | 1,000.00 | | | | 1,076.20 | | | | 0.00 | | | | 0.00 | |
| Hypothetical (5% return before expenses) | | | 1,000.00 | | | | 1,021.93 | | | | 0.61 | | | | 3.11 | | | | 1,000.00 | | | | 1,025.00 | | | | 0.00 | | | | 0.00 | |
2045 Fund | | | | | | | | | | | | | | | | | | | | | | | | | | | | | | | | |
| Actual | | | 1,000.00 | | | | 1,072.30 | | | | 0.61 | | | | 3.21 | | | | 1,000.00 | | | | 1,075.30 | | | | 0.00 | | | | 0.00 | |
| Hypothetical (5% return before expenses) | | | 1,000.00 | | | | 1,021.93 | | | | 0.61 | | | | 3.11 | | | | 1,000.00 | | | | 1,025.00 | | | | 0.00 | | | | 0.00 | |
2050 Fund | | | | | | | | | | | | | | | | | | | | | | | | | | | | | | | | |
| Actual | | | 1,000.00 | | | | 1,073.50 | | | | 0.61 | | | | 3.19 | | | | 1,000.00 | | | | 1,076.20 | | | | 0.00 | | | | 0.00 | |
| Hypothetical (5% return before expenses) | | | 1,000.00 | | | | 1,021.93 | | | | 0.61 | | | | 3.11 | | | | 1,000.00 | | | | 1,025.00 | | | | 0.00 | | | | 0.00 | |
2055 Fund | | | | | | | | | | | | | | | | | | | | | | | | | | | | | | | | |
| Actual | | | 1,000.00 | | | | 1,071.60 | | | | 0.61 | | | | 3.21 | | | | 1,000.00 | | | | 1,074.50 | | | | 0.00 | | | | 0.00 | |
| Hypothetical (5% return before expenses) | | | 1,000.00 | | | | 1,021.93 | | | | 0.61 | | | | 3.11 | | | | 1,000.00 | | | | 1,025.00 | | | | 0.00 | | | | 0.00 | |
Conservative Allocation Fund | | | | | | | | | | | | | | | | | | | | | | | | | | | | | | | | |
| Actual | | | 1,000.00 | | | | 1,030.90 | | | | 0.58 | | | | 2.97 | | | | 1,000.00 | | | | 1,033.00 | | | | 0.00 | | | | 0.00 | |
| Hypothetical (5% return before expenses) | | | 1,000.00 | | | | 1,022.08 | | | | 0.58 | | | | 2.96 | | | | 1,000.00 | | | | 1,025.00 | | | | 0.00 | | | | 0.00 | |
Moderate Allocation Fund | | | | | | | | | | | | | | | | | | | | | | | | | | | | | | | | |
| Actual | | | 1,000.00 | | | | 1,040.20 | | | | 0.55 | | | | 2.83 | | | | 1,000.00 | | | | 1,043.40 | | | | 0.00 | | | | 0.00 | |
| Hypothetical (5% return before expenses) | | | 1,000.00 | | | | 1,022.23 | | | | 0.55 | | | | 2.80 | | | | 1,000.00 | | | | 1,025.00 | | | | 0.00 | | | | 0.00 | |
Balanced Allocation Fund | | | | | | | | | | | | | | | | | | | | | | | | | | | | | | | | |
| Actual | | | 1,000.00 | | | | 1,047.80 | | | | 0.58 | | | | 3.00 | | | | 1,000.00 | | | | 1,051.10 | | | | 0.00 | | | | 0.00 | |
| Hypothetical (5% return before expenses) | | | 1,000.00 | | | | 1,022.08 | | | | 0.58 | | | | 2.96 | | | | 1,000.00 | | | | 1,025.00 | | | | 0.00 | | | | 0.00 | |
Growth Allocation Fund | | | | | | | | | | | | | | | | | | | | | | | | | | | | | | | | |
| Actual | | | 1,000.00 | | | | 1,056.90 | | | | 0.55 | | | | 2.85 | | | | 1,000.00 | | | | 1,061.10 | | | | 0.00 | | | | 0.00 | |
| Hypothetical (5% return before expenses) | | | 1,000.00 | | | | 1,022.23 | | | | 0.55 | | | | 2.80 | | | | 1,000.00 | | | | 1,025.00 | | | | 0.00 | | | | 0.00 | |
13
| | |
| Expense Example (Unaudited) (continued) | | |
| | | | | | | | | | | | | | | | | | | | | | | | | | | | | | | | |
| | | Retirement Class R-3 | | | Retirement Class R-6 | |
Fund | | Beginning
account
value
3/1/17 | | | Ending
account
value
8/31/17 | | | Annualized
Expense
Ratio(1) | | | Expenses
paid during
period
3/1/17-
8/31/17(1) | | | Beginning
account
value
3/1/17 | | | Ending
account
value
8/31/17 | | | Annualized
Expense
Ratio(1) | | | Expenses
paid during
period
3/1/17-
8/31/17(1) | |
Aggressive Allocation Fund | | | | | | | | | | | | | | | | | | | | | | | | | | | | | | | | |
| Actual | | $ | 1,000.00 | | | $ | 1,066.20 | | | | 0.58 | % | | $ | 3.02 | | | $ | 1,000.00 | | | $ | 1,069.40 | | | | 0.00 | % | | $ | 0.00 | |
| Hypothetical (5% return before expenses) | | | 1,000.00 | | | | 1,022.08 | | | | 0.58 | | | | 2.96 | | | | 1,000.00 | | | | 1,025.00 | | | | 0.00 | | | | 0.00 | |
| (1) | Expenses are equal to the Funds’ annualized expense ratios for the period March 1, 2017 through August 31, 2017, multiplied by the average account value over the period, multiplied by 184/365 (to reflect the one-half year period). These expenses and ratios are exclusive of acquired fund fees and expenses. |
14
As of August 31, 2017
| | |
| Schedules of Investments | | BMO Funds |
In-Retirement Fund
| | | | | | | | |
| Description | | Shares | | | Value | |
| Mutual Funds — 98.7% | |
|
| Large-Cap Funds — 18.1% | |
BMO Dividend Income Fund — Institutional Class (1) | | | 19,675 | | | $ | 284,696 | |
BMO Large-Cap Growth Fund — Institutional Class (1) | | | 10,344 | | | | 182,061 | |
BMO Large-Cap Value Fund — Institutional Class (1) | | | 26,503 | | | | 420,871 | |
BMO Low Volatility Equity Fund — Institutional Class (1) | | | 27,921 | | | | 402,614 | |
Harbor Capital Appreciation Fund — Institutional Class | | | 2,550 | | | | 182,648 | |
T Rowe Price Growth Stock Fund — Institutional Class | | | 2,710 | | | | 181,694 | |
Vanguard Equity Income Fund — Institutional Class | | | 4,717 | | | | 344,276 | |
Vanguard Institutional Index Fund — Institutional Class | | | 3,130 | | | | 707,407 | |
| | | | | | | | |
Total Large-Cap Funds | | | | | | | 2,706,267 | |
|
| Mid-Cap Funds — 3.1% | |
BMO Mid-Cap Growth Fund — Institutional Class (1) | | | 4,924 | | | | 75,778 | |
BMO Mid-Cap Value Fund — Institutional Class (1) | | | 15,122 | | | | 179,801 | |
Vanguard Mid-Cap Index Fund — Institutional Class | | | 5,328 | | | | 210,313 | |
| | | | | | | | |
Total Mid-Cap Funds | | | | | | | 465,892 | |
|
| Small-Cap Funds — 1.2% | |
BMO Small-Cap Growth Fund — Institutional Class (1)(2) | | | 2,402 | | | | 45,640 | |
Goldman Sachs Small Cap Value Fund — Institutional Class | | | 2,230 | | | | 135,527 | |
| | | | | | | | |
Total Small-Cap Funds | | | | | | | 181,167 | |
|
| International Funds — 11.4% | |
BMO Disciplined International Equity Fund — Institutional Class (1) | | | 26,673 | | | | 298,473 | |
BMO LGM Emerging Markets Equity Fund — Institutional Class (1) | | | 14,861 | | | | 237,323 | |
BMO Pyrford International Stock Fund — Institutional Class (1) | | | 30,416 | | | | 401,797 | |
DFA International Small Company Portfolio — Institutional Class | | | 2,161 | | | | 44,936 | |
Dodge & Cox International Stock Fund — Retail Class | | | 4,593 | | | | 207,251 | |
Harbor International Fund — Institutional Class | | | 3,044 | | | | 208,786 | |
MFS International Value Fund — Institutional Class | | | 7,247 | | | | 313,870 | |
| | | | | | | | |
Total International Funds | | | | | | | 1,712,436 | |
|
| Fixed Income Funds — 54.9% | |
BMO High Yield Bond Fund — Institutional Class (1) | | | 28,057 | | | | 268,504 | |
BMO TCH Core Plus Bond Fund — Institutional Class (1) | | | 235,190 | | | | 2,770,542 | |
BMO TCH Emerging Markets Bond Fund — Institutional Class (1) | | | 43,311 | | | | 448,273 | |
Federated Institutional High-Yield Bond Fund — Institutional Class | | | 42,824 | | | | 432,089 | |
Fidelity Advisor Floating Rate High Income Fund — Institutional Class | | | 46,324 | | | | 445,640 | |
Metropolitan West Total Return Bond Fund — Institutional Class | | | 258,007 | | | | 2,773,578 | |
| | | | | | | | |
| Description | | Shares | | | Value | |
| Mutual Funds (continued) | |
|
| Fixed Income Funds (continued) | |
Vanguard Short-Term Inflation-Protected Securities Index Fund — Institutional Class | | | 31,805 | | | $ | 790,027 | |
Vanguard Short-Term Investment Grade Fund — Institutional Class | | | 27,769 | | | | 297,681 | |
| | | | | | | | |
Total Fixed Income Funds | | | | | | | 8,226,334 | |
|
| Alternative Funds — 10.0% | |
BMO Alternative Strategies Fund — Institutional Class (1)(2) | | | 96,829 | | | | 1,046,726 | |
Credit Suisse Commodity Return Strategy Fund — Institutional Class (2) | | | 91,604 | | | | 453,438 | |
| | | | | | | | |
Total Alternative Funds | | | | | | | 1,500,164 | |
| | | | | | | | |
Total Mutual Funds
(identified cost $12,444,312) | | | | | | | 14,792,260 | |
|
| Short-Term Investments — 1.0% | |
| | |
| Mutual Funds — 1.0% | | | | | | |
BMO Institutional Prime Money Market Fund — Premier Class, 1.080% (1) | | | 144,462 | | | | 144,477 | |
| | | | | | | | |
Total Short-Term Investments (identified cost $144,477) | | | | | | | 144,477 | |
| | | | | | | | |
Total Investments — 99.7% (identified cost $12,588,789) | | | | | | | 14,936,737 | |
| Other Assets and Liabilities — 0.3% | | | | | | | 43,066 | |
| | | | | | | | |
| Total Net Assets — 100.0% | | | | | | $ | 14,979,803 | |
| | | | | | | | |
2015 Fund
| | | | | | | | |
| Description | | Shares | | | Value | |
| Mutual Funds — 98.9% | |
|
| Large-Cap Funds — 24.4% | |
BMO Dividend Income Fund — Institutional Class (1) | | | 5,142 | | | $ | 74,412 | |
BMO Large-Cap Growth Fund — Institutional Class (1) | | | 4,506 | | | | 79,310 | |
BMO Large-Cap Value Fund — Institutional Class (1) | | | 9,401 | | | | 149,289 | |
BMO Low Volatility Equity Fund — Institutional Class (1) | | | 9,730 | | | | 140,307 | |
Harbor Capital Appreciation Fund — Institutional Class | | | 1,111 | | | | 79,565 | |
T Rowe Price Growth Stock Fund — Institutional Class | | | 1,180 | | | | 79,150 | |
Vanguard Equity Income Fund — Institutional Class | | | 1,447 | | | | 105,634 | |
Vanguard Institutional Index Fund — Institutional Class | | | 1,097 | | | | 247,841 | |
| | | | | | | | |
Total Large-Cap Funds | | | | | | | 955,508 | |
|
| Mid-Cap Funds — 4.8% | |
BMO Mid-Cap Growth Fund — Institutional Class (1) | | | 1,802 | | | | 27,729 | |
BMO Mid-Cap Value Fund — Institutional Class (1) | | | 6,258 | | | | 74,407 | |
Vanguard Mid-Cap Index Fund — Institutional Class | | | 2,189 | | | | 86,380 | |
| | | | | | | | |
Total Mid-Cap Funds | | | | | | | 188,516 | |
(See Notes which are an integral part of the Financial Statements)
15
As of August 31, 2017
2015 Fund (continued)
| | | | | | | | |
| Description | | Shares | | | Value | |
| Mutual Funds (continued) | |
|
| Small-Cap Funds — 2.0% | |
BMO Small-Cap Growth Fund — Institutional Class (1)(2) | | | 1,256 | | | $ | 23,860 | |
Goldman Sachs Small Cap Value Fund — Institutional Class | | | 842 | | | | 51,165 | |
| | | | | | | | |
Total Small-Cap Funds | | | | | | | 75,025 | |
|
| International Funds — 15.9% | |
BMO Disciplined International Equity Fund — Institutional Class (1) | | | 9,412 | | | | 105,317 | |
BMO LGM Emerging Markets Equity Fund — Institutional Class (1) | | | 5,826 | | | | 93,045 | |
BMO Pyrford International Stock Fund — Institutional Class (1) | | | 10,305 | | | | 136,135 | |
DFA International Small Company Portfolio — Institutional Class | | | 753 | | | | 15,660 | |
Dodge & Cox International Stock Fund — Retail Class | | | 1,801 | | | | 81,256 | |
Harbor International Fund — Institutional Class | | | 1,364 | | | | 93,551 | |
MFS International Value Fund — Institutional Class | | | 2,255 | | | | 97,662 | |
| | | | | | | | |
Total International Funds | | | | | | | 622,626 | |
|
| Fixed Income Funds — 42.3% | |
BMO High Yield Bond Fund — Institutional Class (1) | | | 5,296 | | | | 50,685 | |
BMO TCH Core Plus Bond Fund — Institutional Class (1) | | | 49,244 | | | | 580,093 | |
BMO TCH Emerging Markets Bond Fund — Institutional Class (1) | | | 9,434 | | | | 97,638 | |
Federated Institutional High-Yield Bond Fund — Institutional Class | | | 8,877 | | | | 89,570 | |
Fidelity Advisor Floating Rate High Income Fund — Institutional Class | | | 9,686 | | | | 93,182 | |
Metropolitan West Total Return Bond Fund — Institutional Class | | | 54,021 | | | | 580,728 | |
Vanguard Short-Term Inflation-Protected Securities Index Fund — Institutional Class | | | 6,587 | | | | 163,633 | |
| | | | | | | | |
Total Fixed Income Funds | | | | | | | 1,655,529 | |
|
| Alternative Funds — 9.5% | |
BMO Alternative Strategies Fund — Institutional Class (1)(2) | | | 24,224 | | | | 261,859 | |
Credit Suisse Commodity Return Strategy Fund — Institutional Class (2) | | | 22,346 | | | | 110,613 | |
| | | | | | | | |
Total Alternative Funds | | | | | | | 372,472 | |
| | | | | | | | |
Total Mutual Funds
(identified cost $3,554,268) | | | | | | | 3,869,676 | |
|
| Short-Term Investments — 1.0% | |
| | |
| Mutual Funds — 1.0% | | | | | | |
BMO Institutional Prime Money Market Fund — Premier Class, 1.080% (1) | | | 39,794 | | | | 39,798 | |
| | | | | | | | |
Total Short-Term Investments
(identified cost $39,798) | | | | | | | 39,798 | |
| | | | | | | | |
Total Investments — 99.9%
(identified cost $3,594,066) | | | | | | | 3,909,474 | |
| Other Assets and Liabilities — 0.1% | | | | 5,219 | |
| | | | | | | | |
| Total Net Assets — 100.0% | | | | | | $ | 3,914,693 | |
| | | | | | | | |
2020 Fund
| | | | | | | | |
| Description | | Shares | | | Value | |
| Mutual Funds — 98.9% | |
|
| Large-Cap Funds — 30.1% | |
BMO Dividend Income Fund — Institutional Class (1) | | | 100,483 | | | $ | 1,453,988 | |
BMO Large-Cap Growth Fund — Institutional Class (1) | | | 120,259 | | | | 2,116,554 | |
BMO Large-Cap Value Fund — Institutional Class (1) | | | 223,647 | | | | 3,551,516 | |
BMO Low Volatility Equity Fund — Institutional Class (1) | | | 233,330 | | | | 3,364,618 | |
Harbor Capital Appreciation Fund — Institutional Class | | | 29,542 | | | | 2,116,418 | |
T Rowe Price Growth Stock Fund — Institutional Class | | | 31,490 | | | | 2,111,430 | |
Vanguard Equity Income Fund — Institutional Class | | | 30,953 | | | | 2,259,254 | |
Vanguard Institutional Index Fund — Institutional Class | | | 32,242 | | | | 7,286,661 | |
| | | | | | | | |
Total Large-Cap Funds | | | | | | | 24,260,439 | |
|
| Mid-Cap Funds — 6.9% | |
BMO Mid-Cap Growth Fund — Institutional Class (1) | | | 95,839 | | | | 1,474,968 | |
BMO Mid-Cap Value Fund — Institutional Class (1) | | | 163,649 | | | | 1,945,785 | |
Vanguard Mid-Cap Index Fund — Institutional Class | | | 55,518 | | | | 2,191,304 | |
| | | | | | | | |
Total Mid-Cap Funds | | | | | | | 5,612,057 | |
|
| Small-Cap Funds — 2.6% | |
BMO Small-Cap Growth Fund — Institutional Class (1)(2) | | | 42,477 | | | | 807,054 | |
Goldman Sachs Small Cap Value
Fund — Institutional Class | | | 21,270 | | | | 1,292,794 | |
| | | | | | | | |
Total Small-Cap Funds | | | | | | | 2,099,848 | |
|
| International Funds — 20.3% | |
BMO Disciplined International Equity Fund — Institutional Class (1) | | | 231,976 | | | | 2,595,810 | |
BMO LGM Emerging Markets Equity Fund — Institutional Class (1) | | | 170,641 | | | | 2,725,130 | |
BMO Pyrford International Stock
Fund — Institutional Class (1) | | | 273,885 | | | | 3,618,021 | |
DFA International Small Company Portfolio — Institutional Class | | | 19,704 | | | | 409,644 | |
Dodge & Cox International Stock
Fund — Retail Class | | | 48,023 | | | | 2,166,775 | |
Harbor International Fund — Institutional Class | | | 34,120 | | | | 2,340,641 | |
MFS International Value Fund — Institutional Class | | | 57,679 | | | | 2,498,059 | |
| | | | | | | | |
Total International Funds | | | | | | | 16,354,080 | |
|
| Fixed Income Funds — 30.0% | |
BMO High Yield Bond Fund — Institutional Class (1) | | | 76,179 | | | | 729,037 | |
BMO TCH Core Plus Bond Fund — Institutional Class (1) | | | 725,441 | | | | 8,545,697 | |
BMO TCH Emerging Markets Bond Fund — Institutional Class (1) | | | 116,254 | | | | 1,203,232 | |
Federated Institutional High-Yield Bond Fund — Institutional Class | | | 136,314 | | | | 1,375,403 | |
Fidelity Advisor Floating Rate High Income Fund — Institutional Class | | | 150,464 | | | | 1,447,465 | |
Metropolitan West Total Return Bond Fund — Institutional Class | | | 787,777 | | | | 8,468,606 | |
(See Notes which are an integral part of the Financial Statements)
16
2020 Fund (continued)
| | | | | | | | |
| Description | | Shares | | | Value | |
| Mutual Funds (continued) | |
|
| Fixed Income Funds (continued) | |
Vanguard Short-Term Inflation-Protected Securities Index Fund — Institutional Class | | | 96,361 | | | $ | 2,393,607 | |
| | | | | | | | |
Total Fixed Income Funds | | | | | | | 24,163,047 | |
|
| Alternative Funds — 9.0% | |
BMO Alternative Strategies Fund — Institutional Class (1)(2) | | | 469,966 | | | | 5,080,327 | |
Credit Suisse Commodity Return Strategy Fund — Institutional
Class (2) | | | 442,177 | | | | 2,188,778 | |
| | | | | | | | |
Total Alternative Funds | | | | | | | 7,269,105 | |
| | | | | | | | |
Total Mutual Funds
(identified cost $60,281,207) | | | | | | | 79,758,576 | |
|
| Short-Term Investments — 0.9% | |
| | |
| Mutual Funds — 0.9% | | | | | | |
BMO Institutional Prime Money Market Fund — Premier
Class, 1.080% (1) | | | 720,783 | | | | 720,855 | |
| | | | | | | | |
Total Short-Term Investments
(identified cost $720,855) | | | | | | | 720,855 | |
| | | | | | | | |
Total Investments — 99.8%
(identified cost $61,002,062) | | | | | | | 80,479,431 | |
| Other Assets and Liabilities — 0.2% | | | | | | | 167,953 | |
| | | | | | | | |
| Total Net Assets — 100.0% | | | | | | $ | 80,647,384 | |
| | | | | | | | |
2025 Fund
| | | | | | | | |
| Description | | Shares | | | Value | |
| Mutual Funds — 98.2% | |
|
| Large-Cap Funds — 32.4% | |
BMO Dividend Income Fund — Institutional Class (1) | | | 19,173 | | | $ | 277,430 | |
BMO Large-Cap Growth Fund — Institutional Class (1) | | | 31,689 | | | | 557,727 | |
BMO Large-Cap Value Fund — Institutional Class (1) | | | 64,569 | | | | 1,025,354 | |
BMO Low Volatility Equity Fund — Institutional Class (1) | | | 45,910 | | | | 662,025 | |
Harbor Capital Appreciation Fund — Institutional Class | | | 12,280 | | | | 879,762 | |
T Rowe Price Growth Stock Fund — Institutional Class | | | 13,109 | | | | 878,928 | |
Vanguard Equity Income Fund — Institutional Class | | | 5,270 | | | | 384,647 | |
Vanguard Institutional Index Fund — Institutional Class | | | 10,221 | | | | 2,310,050 | |
| | | | | | | | |
Total Large-Cap Funds | | | | | | | 6,975,923 | |
|
| Mid-Cap Funds — 9.0% | |
BMO Mid-Cap Growth Fund — Institutional Class (1) | | | 39,076 | | | | 601,374 | |
BMO Mid-Cap Value Fund — Institutional Class (1) | | | 52,134 | | | | 619,875 | |
Vanguard Mid-Cap Index Fund — Institutional Class | | | 18,451 | | | | 728,247 | |
| | | | | | | | |
Total Mid-Cap Funds | | | | | | | 1,949,496 | |
| | | | | | | | |
| Description | | Shares | | | Value | |
| Mutual Funds (continued) | |
|
| Small-Cap Funds — 3.8% | |
BMO Small-Cap Growth Fund — Institutional Class (1)(2) | | | 20,309 | | | $ | 385,873 | |
Goldman Sachs Small Cap Value
Fund — Institutional Class | | | 7,055 | | | | 428,807 | |
| | | | | | | | |
Total Small-Cap Funds | | | | | | | 814,680 | |
|
| International Funds — 23.3% | |
BMO Disciplined International Equity Fund — Institutional Class (1) | | | 51,864 | | | | 580,360 | |
BMO LGM Emerging Markets Equity Fund — Institutional Class (1) | | | 58,631 | | | | 936,330 | |
BMO Pyrford International Stock
Fund — Institutional Class (1) | | | 77,976 | | | | 1,030,062 | |
DFA International Small Company Portfolio — Institutional Class | | | 7,237 | | | | 150,447 | |
Dodge & Cox International Stock
Fund — Retail Class | | | 18,002 | | | | 812,248 | |
Harbor International Fund — Institutional Class | | | 13,133 | | | | 900,901 | |
MFS International Value Fund — Institutional Class | | | 14,355 | | | | 621,726 | |
| | | | | | | | |
Total International Funds | | | | | | | 5,032,074 | |
|
| Fixed Income Funds — 21.7% | |
BMO High Yield Bond Fund — Institutional Class (1) | | | 15,588 | | | | 149,180 | |
BMO TCH Core Plus Bond Fund — Institutional Class (1) | | | 139,130 | | | | 1,638,946 | |
BMO TCH Emerging Markets Bond
Fund — Institutional Class (1) | | | 22,646 | | | | 234,389 | |
Federated Institutional High-Yield Bond Fund — Institutional Class | | | 27,455 | | | | 277,018 | |
Fidelity Advisor Floating Rate High Income Fund — Institutional Class | | | 30,950 | | | | 297,738 | |
Metropolitan West Total Return Bond Fund — Institutional Class | | | 152,614 | | | | 1,640,599 | |
Vanguard Short-Term Inflation- Protected Securities Index Fund — Institutional Class | | | 18,001 | | | | 447,145 | |
| | | | | | | | |
Total Fixed Income Funds | | | | | | | 4,685,015 | |
|
| Alternative Funds — 8.0% | |
BMO Alternative Strategies Fund —Institutional Class (1)(2) | | | 110,579 | | | | 1,195,363 | |
Credit Suisse Commodity Return Strategy Fund — Institutional Class (2) | | | 105,008 | | | | 519,787 | |
| | | | | | | | |
Total Alternative Funds | | | | | | | 1,715,150 | |
| | | | | | | | |
Total Mutual Funds
(identified cost $18,910,381) | | | | | | | 21,172,338 | |
|
| Short-Term Investments — 1.2% | |
| | |
| Mutual Funds — 1.2% | | | | | | |
BMO Institutional Prime Money Market Fund — Premier Class, 1.080% (1) | | | 246,876 | | | | 246,901 | |
| | | | | | | | |
Total Short-Term Investments
(identified cost $246,901) | | | | | | | 246,901 | |
| | | | | | | | |
Total Investments — 99.4%
(identified cost $19,157,282) | | | | | | | 21,419,239 | |
| Other Assets and Liabilities — 0.6% | | | | | | | 136,429 | |
| | | | | | | | |
| Total Net Assets — 100.0% | | | | | | $ | 21,555,668 | |
| | | | | | | | |
(See Notes which are an integral part of the Financial Statements)
17
As of August 31, 2017
2030 Fund
| | | | | | | | |
| Description | | Shares | | | Value | |
| Mutual Funds — 98.7% | |
|
| Large-Cap Funds — 36.4% | |
BMO Dividend Income Fund — Institutional Class (1) | | | 89,862 | | | $ | 1,300,301 | |
BMO Large-Cap Growth Fund — Institutional Class (1) | | | 142,998 | | | | 2,516,757 | |
BMO Large-Cap Value Fund — Institutional Class (1) | | | 321,004 | | | | 5,097,536 | |
BMO Low Volatility Equity Fund — Institutional Class (1) | | | 222,309 | | | | 3,205,702 | |
Harbor Capital Appreciation Fund — Institutional Class | | | 60,387 | | | | 4,326,147 | |
T Rowe Price Growth Stock Fund — Institutional Class | | | 64,145 | | | | 4,300,936 | |
Vanguard Equity Income Fund — Institutional Class | | | 26,640 | | | | 1,944,460 | |
Vanguard Institutional Index Fund — Institutional Class | | | 49,268 | | | | 11,134,501 | |
| | | | | | | | |
Total Large-Cap Funds | | | | | | | 33,826,340 | |
|
| Mid-Cap Funds — 10.3% | |
BMO Mid-Cap Growth Fund — Institutional Class (1) | | | 195,636 | | | | 3,010,833 | |
BMO Mid-Cap Value Fund — Institutional Class (1) | | | 249,923 | | | | 2,971,588 | |
Vanguard Mid-Cap Index Fund — Institutional Class | | | 89,574 | | | | 3,535,504 | |
| | | | | | | | |
Total Mid-Cap Funds | | | | | | | 9,517,925 | |
|
| Small-Cap Funds — 4.2% | |
BMO Small-Cap Growth Fund — Institutional Class (1)(2) | | | 103,345 | | | | 1,963,556 | |
Goldman Sachs Small Cap Value Fund — Institutional Class | | | 32,395 | | | | 1,968,941 | |
| | | | | | | | |
Total Small-Cap Funds | | | | | | | 3,932,497 | |
|
| International Funds — 26.0% | |
BMO Disciplined International Equity Fund — Institutional Class (1) | | | 240,319 | | | | 2,689,172 | |
BMO LGM Emerging Markets Equity Fund — Institutional Class (1) | | | 281,126 | | | | 4,489,577 | |
BMO Pyrford International Stock Fund — Institutional Class (1) | | | 376,213 | | | | 4,969,772 | |
DFA International Small Company Portfolio — Institutional Class | | | 40,236 | | | | 836,514 | |
Dodge & Cox International Stock Fund — Retail Class | | | 87,428 | | | | 3,944,733 | |
Harbor International Fund — Institutional Class | | | 63,214 | | | | 4,336,473 | |
MFS International Value Fund — Institutional Class | | | 65,933 | | | | 2,855,580 | |
| | | | | | | | |
Total International Funds | | | | | | | 24,121,821 | |
|
| Fixed Income Funds — 14.3% | |
BMO High Yield Bond Fund — Institutional Class (1) | | | 47,970 | | | | 459,077 | |
BMO TCH Core Plus Bond Fund — Institutional Class (1) | | | 395,260 | | | | 4,656,159 | |
BMO TCH Emerging Markets Bond Fund — Institutional Class (1) | | | 62,316 | | | | 644,966 | |
Federated Institutional High-Yield Bond Fund — Institutional Class | | | 72,632 | | | | 732,860 | |
Fidelity Advisor Floating Rate High Income Fund — Institutional Class | | | 94,747 | | | | 911,461 | |
Metropolitan West Total Return Bond Fund — Institutional Class | | | 433,276 | | | | 4,657,721 | |
| | | | | | | | |
| Description | | Shares | | | Value | |
| Mutual Funds (continued) | |
|
| Fixed Income Funds (continued) | |
Vanguard Short-Term Inflation-Protected Securities Index Fund — Institutional Class | | | 47,916 | | | $ | 1,190,245 | |
| | | | | | | | |
Total Fixed Income Funds | | | | | | | 13,252,489 | |
|
| Alternative Funds — 7.5% | |
BMO Alternative Strategies Fund — Institutional Class (1)(2) | | | 443,432 | | | | 4,793,501 | |
Credit Suisse Commodity Return Strategy Fund — Institutional Class (2) | | | 430,613 | | | | 2,131,533 | |
| | | | | | | | |
Total Alternative Funds | | | | | | | 6,925,034 | |
| | | | | | | | |
Total Mutual Funds
(identified cost $65,484,763) | | | | | | | 91,576,106 | |
|
| Short-Term Investments — 1.1% | |
| | |
| Mutual Funds — 1.1% | | | | | | |
BMO Institutional Prime Money Market Fund — Premier Class, 1.080% (1) | | | 1,008,552 | | | | 1,008,652 | |
| | | | | | | | |
Total Short-Term Investments
(identified cost $1,008,650) | | | | | | | 1,008,652 | |
| | | | | | | | |
Total Investments — 99.8%
(identified cost $66,493,413) | | | | | | | 92,584,758 | |
| Other Assets and Liabilities — 0.2% | | | | 224,624 | |
| | | | | | | | |
| Total Net Assets — 100.0% | | | | | | $ | 92,809,382 | |
| | | | | | | | |
2035 Fund
| | | | | | | | |
| Description | | Shares | | | Value | |
| Mutual Funds — 98.9% | |
|
| Large-Cap Funds — 39.7% | |
BMO Dividend Income Fund — Institutional Class (1) | | | 13,498 | | | $ | 195,316 | |
BMO Large-Cap Growth Fund — Institutional Class (1) | | | 21,567 | | | | 379,575 | |
BMO Large-Cap Value Fund — Institutional Class (1) | | | 48,425 | | | | 768,994 | |
BMO Low Volatility Equity Fund — Institutional Class (1) | | | 34,338 | | | | 495,147 | |
Harbor Capital Appreciation Fund — Institutional Class | | | 9,321 | | | | 667,733 | |
T Rowe Price Growth Stock Fund — Institutional Class | | | 9,949 | | | | 667,096 | |
Vanguard Equity Income Fund — Institutional Class | | | 4,109 | | | | 299,887 | |
Vanguard Institutional Index Fund — Institutional Class | | | 7,565 | | | | 1,709,667 | |
| | | | | | | | |
Total Large-Cap Funds | | | | | | | 5,183,415 | |
|
| Mid-Cap Funds — 11.1% | |
BMO Mid-Cap Growth Fund — Institutional Class (1) | | | 29,804 | | | | 458,679 | |
BMO Mid-Cap Value Fund — Institutional Class (1) | | | 39,488 | | | | 469,515 | |
Vanguard Mid-Cap Index Fund — Institutional Class | | | 13,245 | | | | 522,764 | |
| | | | | | | | |
Total Mid-Cap Funds | | | | | | | 1,450,958 | |
|
| Small-Cap Funds — 4.6% | |
BMO Small-Cap Growth Fund — Institutional Class (1)(2) | | | 15,834 | | | | 300,849 | |
Goldman Sachs Small Cap Value Fund — Institutional Class | | | 4,950 | | | | 300,891 | |
| | | | | | | | |
Total Small-Cap Funds | | | | | | | 601,740 | |
(See Notes which are an integral part of the Financial Statements)
18
2035 Fund (continued)
| | | | | | | | |
| Description | | Shares | | | Value | |
| Mutual Funds (continued) | |
|
| International Funds — 28.6% | |
BMO Disciplined International Equity Fund — Institutional Class (1) | | | 36,335 | | | $ | 406,586 | |
BMO LGM Emerging Markets Equity Fund — Institutional Class (1) | | | 43,903 | | | | 701,128 | |
BMO Pyrford International Stock Fund — Institutional Class (1) | | | 58,482 | | | | 772,549 | |
DFA International Small Company Portfolio — Institutional Class | | | 6,308 | | | | 131,142 | |
Dodge & Cox International Stock Fund — Retail Class | | | 13,585 | | | | 612,976 | |
Harbor International Fund — Institutional Class | | | 9,921 | | | | 680,584 | |
MFS International Value Fund — Institutional Class | | | 9,967 | | | | 431,682 | |
| | | | | | | | |
Total International Funds | | | | | | | 3,736,647 | |
|
| Fixed Income Funds — 8.4% | |
BMO High Yield Bond Fund — Institutional Class (1) | | | 4,076 | | | | 39,009 | |
BMO TCH Core Plus Bond Fund — Institutional Class (1) | | | 34,176 | | | | 402,590 | |
BMO TCH Emerging Markets Bond Fund — Institutional Class (1) | | | 5,025 | | | | 52,004 | |
Federated Institutional High-Yield Bond Fund — Institutional Class | | | 5,154 | | | | 52,006 | |
Fidelity Advisor Floating Rate High Income Fund — Institutional Class | | | 6,744 | | | | 64,879 | |
Metropolitan West Total Return Bond Fund — Institutional Class | | | 37,488 | | | | 403,000 | |
Vanguard Short-Term Inflation-Protected Securities Index Fund — Institutional Class | | | 3,661 | | | | 90,940 | |
| | | | | | | | |
Total Fixed Income Funds | | | | | | | 1,104,428 | |
|
| Alternative Funds — 6.5% | |
BMO Alternative Strategies Fund — Institutional Class (1)(2) | | | 55,422 | | | | 599,109 | |
Credit Suisse Commodity Return Strategy Fund — Institutional Class (2) | | | 50,727 | | | | 251,100 | |
| | | | | | | | |
Total Alternative Funds | | | | | | | 850,209 | |
| | | | | | | | |
Total Mutual Funds
(identified cost $11,041,745) | | | | | | | 12,927,397 | |
|
| Short-Term Investments — 0.5% | |
| | |
| Mutual Funds — 0.5% | | | | | | |
BMO Institutional Prime Money Market Fund — Premier Class, 1.080% (1) | | | 58,665 | | | | 58,671 | |
| | | | | | | | |
Total Short-Term Investments
(identified cost $58,671) | | | | | | | 58,671 | |
| | | | | | | | |
Total Investments — 99.4%
(identified cost $11,100,416) | | | | | | | 12,986,068 | |
| Other Assets and Liabilities — 0.6% | | | | | | | 84,340 | |
| | | | | | | | |
| Total Net Assets — 100.0% | | | | | | $ | 13,070,408 | |
| | | | | | | | |
2040 Fund
| | | | | | | | |
| Description | | Shares | | | Value | |
| Mutual Funds — 98.8% | |
|
| Large-Cap Funds — 41.7% | |
BMO Dividend Income Fund — Institutional Class (1) | | | 50,803 | | | $ | 735,126 | |
BMO Large-Cap Growth Fund — Institutional Class (1) | | | 93,067 | | | | 1,637,988 | |
BMO Large-Cap Value Fund — Institutional Class (1) | | | 204,836 | | | | 3,252,794 | |
BMO Low Volatility Equity Fund — Institutional Class (1) | | | 143,635 | | | | 2,071,223 | |
Harbor Capital Appreciation Fund — Institutional Class | | | 40,164 | | | | 2,877,319 | |
T Rowe Price Growth Stock Fund — Institutional Class | | | 42,695 | | | | 2,862,716 | |
Vanguard Equity Income Fund — Institutional Class | | | 17,213 | | | | 1,256,345 | |
Vanguard Institutional Index Fund — Institutional Class | | | 32,096 | | | | 7,253,754 | |
| | | | | | | | |
Total Large-Cap Funds | | | | | | | 21,947,265 | |
|
| Mid-Cap Funds — 11.7% | |
BMO Mid-Cap Growth Fund — Institutional Class (1) | | | 120,972 | | | | 1,861,764 | |
BMO Mid-Cap Value Fund — Institutional Class (1) | | | 159,567 | | | | 1,897,246 | |
Vanguard Mid-Cap Index Fund — Institutional Class | | | 60,091 | | | | 2,371,804 | |
| | | | | | | | |
Total Mid-Cap Funds | | | | | | | 6,130,814 | |
|
| Small-Cap Funds — 4.8% | |
BMO Small-Cap Growth Fund — Institutional Class (1)(2) | | | 66,773 | | | | 1,268,690 | |
Goldman Sachs Small Cap Value Fund — Institutional Class | | | 20,931 | | | | 1,272,190 | |
| | | | | | | | |
Total Small-Cap Funds | | | | | | | 2,540,880 | |
|
| International Funds — 29.7% | |
BMO Disciplined International Equity Fund — Institutional Class (1) | | | 150,629 | | | | 1,685,537 | |
BMO LGM Emerging Markets Equity Fund — Institutional Class (1) | | | 185,289 | | | | 2,959,059 | |
BMO Pyrford International Stock Fund — Institutional Class (1) | | | 241,002 | | | | 3,183,635 | |
DFA International Small Company Portfolio — Institutional Class | | | 27,803 | | | | 578,021 | |
Dodge & Cox International Stock Fund — Retail Class | | | 56,443 | | | | 2,546,709 | |
Harbor International Fund — Institutional Class | | | 41,911 | | | | 2,875,088 | |
MFS International Value Fund — Institutional Class | | | 41,020 | | | | 1,776,592 | |
| | | | | | | | |
Total International Funds | | | | | | | 15,604,641 | |
|
| Fixed Income Funds — 4.9% | |
BMO High Yield Bond Fund — Institutional Class (1) | | | 10,848 | | | | 103,817 | |
BMO TCH Core Plus Bond Fund — Institutional Class (1) | | | 74,708 | | | | 880,066 | |
BMO TCH Emerging Markets Bond Fund — Institutional Class (1) | | | 15,099 | | | | 156,274 | |
Federated Institutional High-Yield Bond Fund — Institutional Class | | | 20,531 | | | | 207,162 | |
Fidelity Advisor Floating Rate High Income Fund — Institutional Class | | | 21,426 | | | | 206,119 | |
Metropolitan West Total Return Bond Fund — Institutional Class | | | 77,143 | | | | 829,286 | |
(See Notes which are an integral part of the Financial Statements)
19
As of August 31, 2017
2040 Fund (continued)
| | | | | | | | |
| Description | | Shares | | | Value | |
| Mutual Funds (continued) | |
|
| Fixed Income Funds (continued) | |
Vanguard Short-Term Inflation-Protected Securities Index Fund — Institutional Class | | | 8,335 | | | $ | 207,050 | |
| | | | | | | | |
Total Fixed Income Funds | | | | | | | 2,589,774 | |
|
| Alternative Funds — 6.0% | |
BMO Alternative Strategies Fund — Institutional Class (1)(2) | | | 202,921 | | | | 2,193,574 | |
Credit Suisse Commodity Return Strategy Fund — Institutional Class (2) | | | 190,922 | | | | 945,062 | |
| | | | | | | | |
Total Alternative Funds | | | | | | | 3,138,636 | |
| | | | | | | | |
Total Mutual Funds
(identified cost $34,698,469) | | | | | | | 51,952,010 | |
|
| Short-Term Investments — 1.0% | |
|
| Mutual Funds — 1.0% | |
BMO Institutional Prime Money Market Fund — Premier Class, 1.080% (1) | | | 533,220 | | | | 533,274 | |
| | | | | | | | |
Total Short-Term Investments
(identified cost $533,274) | | | | | | | 533,274 | |
| | | | | | | | |
Total Investments — 99.8%
(identified cost $35,231,743) | | | | | | | 52,485,284 | |
| Other Assets and Liabilities — 0.2% | | | | 112,202 | |
| | | | | | | | |
| Total Net Assets — 100.0% | | | | | | $ | 52,597,486 | |
| | | | | | | | |
2045 Fund
| | | | | | | | |
| Description | | Shares | | | Value | |
| Mutual Funds — 98.7% | |
|
| Large-Cap Funds — 42.1% | |
BMO Dividend Income Fund — Institutional Class (1) | | | 7,627 | | | $ | 110,360 | |
BMO Large-Cap Growth Fund — Institutional Class (1) | | | 14,019 | | | | 246,732 | |
BMO Large-Cap Value Fund — Institutional Class (1) | | | 31,412 | | | | 498,822 | |
BMO Low Volatility Equity Fund — Institutional Class (1) | | | 21,837 | | | | 314,892 | |
Harbor Capital Appreciation Fund — Institutional Class | | | 6,130 | | | | 439,168 | |
T Rowe Price Growth Stock Fund — Institutional Class | | | 6,516 | | | | 436,869 | |
Vanguard Equity Income Fund — Institutional Class | | | 2,592 | | | | 189,182 | |
Vanguard Institutional Index Fund — Institutional Class | | | 4,866 | | | | 1,099,712 | |
| | | | | | | | |
Total Large-Cap Funds | | | | | | | 3,335,737 | |
|
| Mid-Cap Funds — 11.7% | |
BMO Mid-Cap Growth Fund — Institutional Class (1) | | | 18,675 | | | | 287,401 | |
BMO Mid-Cap Value Fund — Institutional Class (1) | | | 23,944 | | | | 284,690 | |
Vanguard Mid-Cap Index Fund — Institutional Class | | | 9,042 | | | | 356,881 | |
| | | | | | | | |
Total Mid-Cap Funds | | | | | | | 928,972 | |
| | | | | | | | |
| Description | | Shares | | | Value | |
| Mutual Funds (continued) | |
|
| Small-Cap Funds — 5.0% | |
BMO Small-Cap Growth Fund — Institutional Class (1)(2) | | | 10,471 | | | $ | 198,946 | |
Goldman Sachs Small Cap Value
Fund — Institutional Class | | | 3,267 | | | | 198,545 | |
| | | | | | | | |
Total Small-Cap Funds | | | | | | | 397,491 | |
|
| International Funds — 30.0% | |
BMO Disciplined International Equity Fund — Institutional Class (1) | | | 22,609 | | | | 253,000 | |
BMO LGM Emerging Markets Equity Fund — Institutional Class (1) | | | 29,029 | | | | 463,592 | |
BMO Pyrford International Stock
Fund — Institutional Class (1) | | | 37,053 | | | | 489,469 | |
DFA International Small Company Portfolio — Institutional Class | | | 4,565 | | | | 94,901 | |
Dodge & Cox International Stock
Fund — Retail Class | | | 8,707 | | | | 392,844 | |
Harbor International Fund — Institutional Class | | | 6,325 | | | | 433,881 | |
MFS International Value Fund — Institutional Class | | | 5,834 | | | | 252,679 | |
| | | | | | | | |
Total International Funds | | | | | | | 2,380,366 | |
|
| Fixed Income Funds — 4.9% | |
BMO High Yield Bond Fund — Institutional Class (1) | | | 1,641 | | | | 15,707 | |
BMO TCH Core Plus Bond Fund — Institutional Class (1) | | | 11,973 | | | | 141,038 | |
BMO TCH Emerging Markets Bond
Fund — Institutional Class (1) | | | 1,519 | | | | 15,718 | |
Federated Institutional High-Yield
Bond Fund — Institutional Class | | | 2,332 | | | | 23,533 | |
Fidelity Advisor Floating Rate High Income Fund — Institutional Class | | | 2,441 | | | | 23,486 | |
Metropolitan West Total Return Bond Fund — Institutional Class | | | 13,121 | | | | 141,051 | |
Vanguard Short-Term Inflation-Protected Securities Index Fund — Institutional Class | | | 1,262 | | | | 31,353 | |
| | | | | | | | |
Total Fixed Income Funds | | | | | | | 391,886 | |
|
| Alternative Funds — 5.0% | |
BMO Alternative Strategies Fund — Institutional Class (1)(2) | | | 25,465 | | | | 275,277 | |
Credit Suisse Commodity Return Strategy Fund — Institutional Class (2) | | | 24,065 | | | | 119,123 | |
| | | | | | | | |
Total Alternative Funds | | | | | | | 394,400 | |
| | | | | | | | |
Total Mutual Funds
(identified cost $6,718,284) | | | | | | | 7,828,852 | |
|
| Short-Term Investments — 1.0% | |
|
| Mutual Funds — 1.0% | |
BMO Institutional Prime Money Market Fund — Premier Class, 1.080% (1) | | | 78,280 | | | | 78,288 | |
| | | | | | | | |
Total Short-Term Investments
(identified cost $78,288) | | | | | | | 78,288 | |
| | | | | | | | |
Total Investments — 99.7%
(identified cost $6,796,572) | | | | | | | 7,907,140 | |
| Other Assets and Liabilities — 0.3% | | | | 20,821 | |
| | | | | | | | |
| Total Net Assets — 100.0% | | | | | | $ | 7,927,961 | |
| | | | | | | | |
(See Notes which are an integral part of the Financial Statements)
20
2050 Fund
| | | | | | | | |
| Description | | Shares | | | Value | |
| Mutual Funds — 98.6% | |
|
| Large-Cap Funds — 42.0% | |
BMO Dividend Income Fund — Institutional Class (1) | | | 38,123 | | | $ | 551,643 | |
BMO Large-Cap Growth Fund — Institutional Class (1) | | | 70,078 | | | | 1,233,372 | |
BMO Large-Cap Value Fund — Institutional Class (1) | | | 157,023 | | | | 2,493,529 | |
BMO Low Volatility Equity Fund — Institutional Class (1) | | | 109,149 | | | | 1,573,932 | |
Harbor Capital Appreciation Fund — Institutional Class | | | 30,644 | | | | 2,195,369 | |
T Rowe Price Growth Stock Fund — Institutional Class | | | 32,569 | | | | 2,183,775 | |
Vanguard Equity Income Fund — Institutional Class | | | 12,955 | | | | 945,604 | |
Vanguard Institutional Index
Fund — Institutional Class | | | 24,323 | | | | 5,497,038 | |
| | | | | | | | |
Total Large-Cap Funds | | | | | | | 16,674,262 | |
|
| Mid-Cap Funds — 11.7% | |
BMO Mid-Cap Growth Fund — Institutional Class (1) | | | 93,354 | | | | 1,436,717 | |
BMO Mid-Cap Value Fund — Institutional Class (1) | | | 119,688 | | | | 1,423,085 | |
Vanguard Mid-Cap Index Fund — Institutional Class | | | 45,198 | | | | 1,783,970 | |
| | | | | | | | |
Total Mid-Cap Funds | | | | | | | 4,643,772 | |
|
| Small-Cap Funds — 5.0% | |
BMO Small-Cap Growth Fund — Institutional Class (1) (2) | | | 52,342 | | | | 994,497 | |
Goldman Sachs Small Cap Value Fund — Institutional Class | | | 16,329 | | | | 992,503 | |
| | | | | | | | |
Total Small-Cap Funds | | | | | | | 1,987,000 | |
|
| International Funds — 30.0% | |
BMO Disciplined International Equity Fund — Institutional Class (1) | | | 113,011 | | | | 1,264,588 | |
BMO LGM Emerging Markets Equity Fund — Institutional Class (1) | | | 145,107 | | | | 2,317,358 | |
BMO Pyrford International Stock Fund — Institutional Class (1) | | | 185,196 | | | | 2,446,437 | |
DFA International Small Company Portfolio — Institutional Class | | | 22,816 | | | | 474,352 | |
Dodge & Cox International Stock Fund — Retail Class | | | 43,517 | | | | 1,963,468 | |
Harbor International Fund — Institutional Class | | | 31,612 | | | | 2,168,588 | |
MFS International Value Fund — Institutional Class | | | 29,161 | | | | 1,262,952 | |
| | | | | | | | |
Total International Funds | | | | | | | 11,897,743 | |
|
| Fixed Income Funds — 4.9% | |
BMO High Yield Bond Fund — Institutional Class (1) | | | 8,203 | | | | 78,506 | |
BMO TCH Core Plus Bond Fund — Institutional Class (1) | | | 59,842 | | | | 704,940 | |
BMO TCH Emerging Markets Bond Fund — Institutional Class (1) | | | 7,591 | | | | 78,564 | |
Federated Institutional High-Yield Bond Fund — Institutional Class | | | 11,657 | | | | 117,623 | |
Fidelity Advisor Floating Rate High Income Fund — Institutional Class | | | 12,203 | | | | 117,390 | |
Metropolitan West Total Return Bond Fund — Institutional Class | | | 65,581 | | | | 704,999 | |
| | | | | | | | |
| Description | | Shares | | | Value | |
| Mutual Funds (continued) | |
|
| Fixed Income Funds (continued) | |
Vanguard Short-Term Inflation-Protected Securities Index Fund — Institutional Class | | | 6,309 | | | $ | 156,710 | |
| | | | | | | | |
Total Fixed Income Funds | | | | | | | 1,958,732 | |
|
| Alternative Funds — 5.0% | |
BMO Alternative Strategies Fund — Institutional Class (1)(2) | | | 127,283 | | | | 1,375,925 | |
Credit Suisse Commodity Return Strategy Fund — Institutional
Class (2) | | | 120,274 | | | | 595,357 | |
| | | | | | | | |
Total Alternative Funds | | | | | | | 1,971,282 | |
| | | | | | | | |
Total Mutual Funds
(identified cost $27,412,867) | | | | | | | 39,132,791 | |
|
| Short-Term Investments — 1.0% | |
| | |
| Mutual Funds — 1.0% | | | | | | |
BMO Institutional Prime Money Market Fund — Premier Class, 1.080% (1) | | | 391,262 | | | | 391,301 | |
| | | | | | | | |
Total Short-Term Investments
(identified cost $391,301) | | | | | | | 391,301 | |
| | | | | | | | |
Total Investments — 99.6%
(identified cost $27,804,168) | | | | | | | 39,524,092 | |
| Other Assets and Liabilities — 0.4% | | | | 164,119 | |
| | | | | | | | |
| Total Net Assets — 100.0% | | | | | | $ | 39,688,211 | |
| | | | | | | | |
2055 Fund
| | | | | | | | |
| Description | | Shares | | | Value | |
| Mutual Funds — 98.3% | |
|
| Large-Cap Funds — 41.9% | |
BMO Dividend Income Fund — Institutional Class (1) | | | 6,901 | | | $ | 99,854 | |
BMO Large-Cap Growth Fund — Institutional Class (1) | | | 12,685 | | | | 223,263 | |
BMO Large-Cap Value Fund — Institutional Class (1) | | | 28,423 | | | | 451,359 | |
BMO Low Volatility Equity Fund — Institutional Class (1) | | | 19,757 | | | | 284,902 | |
Harbor Capital Appreciation Fund — Institutional Class | | | 5,547 | | | | 397,415 | |
T Rowe Price Growth Stock Fund — Institutional Class | | | 5,896 | | | | 395,299 | |
Vanguard Equity Income Fund — Institutional Class | | | 2,345 | | | | 171,166 | |
Vanguard Institutional Index Fund — Institutional Class | | | 4,403 | | | | 995,039 | |
| | | | | | | | |
Total Large-Cap Funds | | | | | | | 3,018,297 | |
|
| Mid-Cap Funds — 11.7% | |
BMO Mid-Cap Growth Fund — Institutional Class (1) | | | 16,899 | | | | 260,068 | |
BMO Mid-Cap Value Fund — Institutional Class (1) | | | 21,665 | | | | 257,593 | |
Vanguard Mid-Cap Index Fund — Institutional Class | | | 8,181 | | | | 322,913 | |
| | | | | | | | |
Total Mid-Cap Funds | | | | | | | 840,574 | |
|
| Small-Cap Funds — 5.0% | |
BMO Small-Cap Growth Fund — Institutional Class (1)(2) | | | 9,475 | | | | 180,023 | |
Goldman Sachs Small Cap Value Fund — Institutional Class | | | 2,956 | | | | 179,651 | |
| | | | | | | | |
Total Small-Cap Funds | | | | | | | 359,674 | |
(See Notes which are an integral part of the Financial Statements)
21
As of August 31, 2017
2055 Fund (continued)
| | | | | | | | |
| Description | | Shares | | | Value | |
| Mutual Funds (continued) | |
|
| International Funds — 29.9% | |
BMO Disciplined International Equity Fund — Institutional Class (1) | | | 20,456 | | | $ | 228,907 | |
BMO LGM Emerging Markets Equity Fund — Institutional Class (1) | | | 26,266 | | | | 419,475 | |
BMO Pyrford International Stock Fund — Institutional Class (1) | | | 33,523 | | | | 442,839 | |
DFA International Small Company Portfolio — Institutional Class | | | 4,130 | | | | 85,863 | |
Dodge & Cox International Stock Fund — Retail Class | | | 7,877 | | | | 355,418 | |
Harbor International Fund — Institutional Class | | | 5,722 | | | | 392,544 | |
MFS International Value Fund — Institutional Class | | | 5,278 | | | | 228,608 | |
| | | | | | | | |
Total International Funds | | | | | | | 2,153,654 | |
|
| Fixed Income Funds — 4.9% | |
BMO High Yield Bond Fund — Institutional Class (1) | | | 1,485 | | | | 14,211 | |
BMO TCH Core Plus Bond Fund — Institutional Class (1) | | | 10,832 | | | | 127,602 | |
BMO TCH Emerging Markets Bond Fund — Institutional Class (1) | | | 1,374 | | | | 14,221 | |
Federated Institutional High-Yield Bond Fund — Institutional Class | | | 2,110 | | | | 21,291 | |
Fidelity Advisor Floating Rate High Income Fund — Institutional Class | | | 2,209 | | | | 21,249 | |
Metropolitan West Total Return Bond Fund — Institutional Class | | | 11,871 | | | | 127,612 | |
Vanguard Short-Term Inflation-Protected Securities Index Fund — Institutional Class | | | 1,142 | | | | 28,366 | |
| | | | | | | | |
Total Fixed Income Funds | | | | | | | 354,552 | |
|
| Alternative Funds — 4.9% | |
BMO Alternative Strategies Fund — Institutional Class (1)(2) | | | 23,040 | | | | 249,058 | |
Credit Suisse Commodity Return Strategy Fund — Institutional Class (2) | | | 21,771 | | | | 107,767 | |
| | | | | | | | |
Total Alternative Funds | | | | | | | 356,825 | |
| | | | | | | | |
Total Mutual Funds
(identified cost $6,066,262) | | | | | | | 7,083,576 | |
|
| Short-Term Investments — 1.0% | |
|
| Mutual Funds — 1.0% | |
BMO Institutional Prime Money Market Fund — Premier Class, 1.080% (1) | | | 70,823 | | | | 70,830 | |
| | | | | | | | |
Total Short-Term Investments
(identified cost $70,830) | | | | | | | 70,830 | |
| | | | | | | | |
Total Investments — 99.3%
(identified cost $6,137,092) | | | | | | | 7,154,406 | |
| Other Assets and Liabilities — 0.7% | | | | | | | 51,673 | |
| | | | | | | | |
| Total Net Assets — 100.0% | | | | | | $ | 7,206,079 | |
| | | | | | | | |
Conservative Allocation Fund
| | | | | | | | |
| Description | | Shares | | | Value | |
| Mutual Funds — 98.7% | |
|
| Large-Cap Funds — 11.5% | |
BMO Dividend Income Fund — Institutional Class (1) | | | 33,113 | | | $ | 479,141 | |
| | | | | | | | |
| Description | | Shares | | | Value | |
| Mutual Funds (continued) | |
|
| Large-Cap Funds (continued) | |
BMO Large-Cap Growth Fund — Institutional Class (1) | | | 71,992 | | | $ | 1,267,061 | |
BMO Large-Cap Value Fund — Institutional Class (1) | | | 100,828 | | | | 1,601,147 | |
BMO Low Volatility Equity Fund — Institutional Class (1) | | | 61,385 | | | | 885,177 | |
Dodge & Cox Stock Fund — Retail Class | | | 3,162 | | | | 613,821 | |
Harbor Capital Appreciation Fund — Institutional Class | | | 8,587 | | | | 615,193 | |
T Rowe Price Growth Stock Fund — Institutional Class | | | 7,399 | | | | 496,132 | |
Vanguard Institutional Index Fund — Institutional Class | | | 11,442 | | | | 2,585,895 | |
| | | | | | | | |
Total Large-Cap Funds | | | | | | | 8,543,567 | |
|
| Mid-Cap Funds — 1.7% | |
BMO Mid-Cap Growth Fund — Institutional Class (1) | | | 21,692 | | | | 333,847 | |
BMO Mid-Cap Value Fund — Institutional Class (1) | | | 27,943 | | | | 332,243 | |
Vanguard Mid-Cap Index Fund — Institutional Class | | | 14,621 | | | | 577,081 | |
| | | | | | | | |
Total Mid-Cap Funds | | | | | | | 1,243,171 | |
|
| Small-Cap Funds — 1.1% | |
BMO Small-Cap Growth Fund — Institutional Class (1)(2) | | | 20,267 | | | | 385,069 | |
BMO Small-Cap Value Fund — Institutional Class (1) | | | 15,934 | | | | 214,629 | |
Goldman Sachs Small Cap Value Fund — Institutional Class | | | 3,046 | | | | 185,145 | |
| | | | | | | | |
Total Small-Cap Funds | | | | | | | 784,843 | |
|
| International Funds — 5.7% | |
BMO Disciplined International Equity Fund — Institutional Class (1) | | | 75,642 | | | | 846,439 | |
BMO LGM Emerging Markets Equity Fund — Institutional Class (1) | | | 32,218 | | | | 514,528 | |
BMO Pyrford International Stock Fund — Institutional Class (1) | | | 62,847 | | | | 830,213 | |
Dodge & Cox International Stock Fund — Retail Class | | | 14,236 | | | | 642,330 | |
Harbor International Fund — Institutional Class | | | 9,397 | | | | 644,600 | |
MFS International Value Fund — Institutional Class | | | 17,099 | | | | 740,550 | |
| | | | | | | | |
Total International Funds | | | | | | | 4,218,660 | |
|
| Fixed Income Funds — 63.7% | |
BMO TCH Core Plus Bond Fund — Institutional Class (1) | | | 1,515,349 | | | | 17,850,814 | |
BMO TCH Emerging Markets Bond Fund — Institutional Class (1) | | | 172,802 | | | | 1,788,501 | |
Metropolitan West Total Return Bond Fund — Institutional Class (3) | | | 1,812,839 | | | | 19,488,024 | |
Vanguard Total Bond Market Index Fund, Institutional Class | | | 731,874 | | | | 7,948,156 | |
| | | | | | | | |
Total Fixed Income Funds | | | | | | | 47,075,495 | |
|
| Alternative Funds — 15.0% | |
BMO Alternative Strategies Fund — Institutional Class (1)(2) | | | 716,172 | | | | 7,741,816 | |
(See Notes which are an integral part of the Financial Statements)
22
Conservative Allocation Fund (continued)
| | | | | | | | |
| Description | | Shares | | | Value | |
| Mutual Funds (continued) | |
|
| Alternative Funds (continued) | |
Credit Suisse Commodity Return Strategy Fund — Institutional Class (2) | | | 680,147 | | | $ | 3,366,726 | |
| | | | | | | | |
Total Alternative Funds | | | | | | | 11,108,542 | |
| | | | | | | | |
Total Mutual Funds
(identified cost $63,367,553) | | | | | | | 72,974,278 | |
|
| Short-Term Investments — 0.8% | |
|
| Mutual Funds — 0.8% | |
BMO Institutional Prime Money Market Fund — Premier Class, 1.080% (1) | | | 615,479 | | | | 615,540 | |
| | | | | | | | |
Total Short-Term Investments
(identified cost $615,540) | | | | | | | 615,540 | |
| | | | | | | | |
Total Investments — 99.5%
(identified cost $63,983,093) | | | | | | | 73,589,818 | |
| Other Assets and Liabilities — 0.5% | | | | 344,571 | |
| | | | | | | | |
| Total Net Assets — 100.0% | | | | | | $ | 73,934,389 | |
| | | | | | | | |
Moderate Allocation Fund
| | | | | | | | |
| Description | | Shares | | | Value | |
| Mutual Funds — 98.9% | |
|
| Large-Cap Funds — 23.3% | |
BMO Dividend Income Fund — Institutional Class (1) | | | 99,965 | | | $ | 1,446,493 | |
BMO Large-Cap Growth Fund — Institutional Class (1) | | | 218,666 | | | | 3,848,515 | |
BMO Large-Cap Value Fund — Institutional Class (1) | | | 304,735 | | | | 4,839,198 | |
BMO Low Volatility Equity Fund — Institutional Class (1) | | | 184,809 | | | | 2,664,948 | |
Dodge & Cox Stock Fund — Retail Class | | | 9,483 | | | | 1,840,585 | |
Harbor Capital Appreciation Fund — Institutional Class | | | 26,328 | | | | 1,886,168 | |
T Rowe Price Growth Stock Fund — Institutional Class | | | 22,265 | | | | 1,492,886 | |
Vanguard Institutional Index
Fund — Institutional Class | | | 34,847 | | | | 7,875,380 | |
| | | | | | | | |
Total Large-Cap Funds | | | | | | | 25,894,173 | |
|
| Mid-Cap Funds — 3.4% | |
BMO Mid-Cap Growth Fund — Institutional Class (1) | | | 65,859 | | | | 1,013,569 | |
BMO Mid-Cap Value Fund — Institutional Class (1) | | | 84,436 | | | | 1,003,944 | |
Vanguard Mid-Cap Index Fund — Institutional Class | | | 44,419 | | | | 1,753,215 | |
| | | | | | | | |
Total Mid-Cap Funds | | | | | | | 3,770,728 | |
|
| Small-Cap Funds — 2.1% | |
BMO Small-Cap Growth Fund — Institutional Class (1)(2) | | | 60,983 | | | | 1,158,671 | |
BMO Small-Cap Value Fund — Institutional Class (1) | | | 48,191 | | | | 649,128 | |
Goldman Sachs Small Cap Value Fund — Institutional Class | | | 9,033 | | | | 549,023 | |
| | | | | | | | |
Total Small-Cap Funds | | | | | | | 2,356,822 | |
| | | | | | | | |
| Description | | Shares | | | Value | |
| Mutual Funds (continued) | |
|
| International Funds — 11.3% | |
BMO Disciplined International Equity Fund — Institutional
Class (1) | | | 226,580 | | | $ | 2,535,429 | |
BMO LGM Emerging Markets Equity Fund — Institutional Class (1) | | | 96,616 | | | | 1,542,955 | |
BMO Pyrford International Stock Fund — Institutional Class (1) | | | 186,551 | | | | 2,464,340 | |
Dodge & Cox International Stock Fund — Retail Class | | | 42,311 | | | | 1,909,081 | |
Harbor International Fund — Institutional Class | | | 27,966 | | | | 1,918,441 | |
MFS International Value Fund — Institutional Class | | | 51,170 | | | | 2,216,174 | |
| | | | | | | | |
Total International Funds | | | | | | | 12,586,420 | |
|
| Fixed Income Funds — 46.8% | |
BMO TCH Core Plus Bond Fund — Institutional Class (1) | | | 1,674,194 | | | | 19,722,005 | |
BMO TCH Emerging Markets Bond Fund — Institutional Class (1) | | | 190,644 | | | | 1,973,164 | |
Metropolitan West Total Return Bond Fund — Institutional Class | | | 2,001,622 | | | | 21,517,438 | |
Vanguard Total Bond Market Index Fund, Institutional Class | | | 808,824 | | | | 8,783,832 | |
| | | | | | | | |
Total Fixed Income Funds | | | | | | | 51,996,439 | |
|
| Alternative Funds — 12.0% | |
BMO Alternative Strategies Fund — Institutional Class (1)(2) | | | 862,042 | | | | 9,318,675 | |
Credit Suisse Commodity Return Strategy Fund — Institutional Class (2) | | | 814,599 | | | | 4,032,267 | |
| | | | | | | | |
Total Alternative Funds | | | | | | | 13,350,942 | |
| | | | | | | | |
Total Mutual Funds
(identified cost $90,428,941) | | | | | | | 109,955,524 | |
|
| Short-Term Investments — 0.9% | |
|
| Mutual Funds — 0.9% | |
BMO Institutional Prime Money Market Fund — Premier Class, 1.080% (1) | | | 1,029,976 | | | | 1,030,079 | |
| | | | | | | | |
Total Short-Term Investments
(identified cost $1,030,079) | | | | | | | 1,030,079 | |
| | | | | | | | |
Total Investments — 99.8%
(identified cost $91,459,020) | | | | | | | 110,985,603 | |
| Other Assets and Liabilities — 0.2% | | | | 174,513 | |
| | | | | | | | |
| Total Net Assets — 100.0% | | | | | | $ | 111,160,116 | |
| | | | | | | | |
Balanced Allocation Fund
| | | | | | | | |
| Description | | Shares | | | Value | |
| Mutual Funds — 98.7% | |
|
| Large-Cap Funds — 34.6% | |
BMO Dividend Income Fund — Institutional Class (1) | | | 498,493 | | | $ | 7,213,194 | |
BMO Large-Cap Growth Fund — Institutional Class (1) | | | 1,083,716 | | | | 19,073,398 | |
BMO Large-Cap Value Fund — Institutional Class (1) | | | 1,515,577 | | | | 24,067,367 | |
BMO Low Volatility Equity Fund — Institutional Class (1) | | | 924,138 | | | | 13,326,064 | |
Dodge & Cox Stock Fund — Retail Class | | | 47,417 | | | | 9,203,547 | |
(See Notes which are an integral part of the Financial Statements)
23
As of August 31, 2017
Balanced Allocation Fund (continued)
| | | | | | | | |
| Description | | Shares | | | Value | |
| Mutual Funds (continued) | |
|
| Large-Cap Funds (continued) | |
Harbor Capital Appreciation Fund — Institutional Class | | | 129,798 | | | $ | 9,298,735 | |
T Rowe Price Growth Stock Fund — Institutional Class | | | 110,839 | | | | 7,431,773 | |
Vanguard Institutional Index Fund — Institutional Class | | | 173,070 | | | | 39,113,817 | |
| | | | | | | | |
Total Large-Cap Funds | | | | | | | 128,727,895 | |
|
| Mid-Cap Funds — 5.0% | |
BMO Mid-Cap Growth Fund — Institutional Class (1) | | | 326,574 | | | | 5,025,977 | |
BMO Mid-Cap Value Fund — Institutional Class (1) | | | 420,669 | | | | 5,001,760 | |
Vanguard Mid-Cap Index Fund — Institutional Class | | | 221,052 | | | | 8,724,908 | |
| | | | | | | | |
Total Mid-Cap Funds | | | | | | | 18,752,645 | |
|
| Small-Cap Funds — 3.2% | |
BMO Small-Cap Growth Fund — Institutional Class (1)(2) | | | 303,113 | | | | 5,759,143 | |
BMO Small-Cap Value Fund — Institutional Class (1) | | | 239,877 | | | | 3,231,150 | |
Goldman Sachs Small Cap Value Fund — Institutional Class | | | 45,246 | | | | 2,750,065 | |
| | | | | | | | |
Total Small-Cap Funds | | | | | | | 11,740,358 | |
|
| International Funds — 17.1% | |
BMO Disciplined International Equity Fund — Institutional Class (1) | | | 1,142,177 | | | | 12,780,966 | |
BMO LGM Emerging Markets Equity Fund — Institutional Class (1) | | | 485,034 | | | | 7,746,000 | |
BMO Pyrford International Stock Fund — Institutional Class (1) | | | 943,395 | | | | 12,462,254 | |
Dodge & Cox International Stock Fund — Retail Class | | | 213,507 | | | | 9,633,416 | |
Harbor International Fund — Institutional Class | | | 140,925 | | | | 9,667,436 | |
MFS International Value Fund — Institutional Class | | | 257,425 | | | | 11,149,068 | |
| | | | | | | | |
Total International Funds | | | | | | | 63,439,140 | |
|
| Fixed Income Funds — 28.8% | |
BMO TCH Core Plus Bond Fund — Institutional Class (1) | | | 3,445,165 | | | | 40,584,040 | |
BMO TCH Emerging Markets Bond Fund — Institutional Class (1) | | | 392,548 | | | | 4,062,873 | |
Metropolitan West Total Return Bond Fund — Institutional Class | | | 4,122,623 | | | | 44,318,196 | |
Vanguard Total Bond Market Index Fund, Institutional Class | | | 1,664,782 | | | | 18,079,528 | |
| | | | | | | | |
Total Fixed Income Funds | | | | | | | 107,044,637 | |
|
| Alternative Funds — 10.0% | |
BMO Alternative Strategies Fund — Institutional Class (1)(2) | | | 2,395,948 | | | | 25,900,196 | |
Credit Suisse Commodity Return Strategy Fund — Institutional Class (2) | | | 2,275,267 | | | | 11,262,573 | |
| | | | | | | | |
Total Alternative Funds | | | | | | | 37,162,769 | |
| | | | | | | | |
Total Mutual Funds
(identified cost $270,249,107) | | | | | | | 366,867,444 | |
| | | | | | | | |
| Description | | Shares | | | Value | |
|
| Short-Term Investments — 0.8% | |
| | |
| Mutual Funds — 0.8% | | | | | | |
BMO Institutional Prime Money Market Fund — Premier Class, 1.080% (1) | | | 3,074,610 | | | $ | 3,074,917 | |
| | | | | | | | |
Total Short-Term Investments
(identified cost $3,074,917) | | | | | | | 3,074,917 | |
| | | | | | | | |
Total Investments — 99.5%
(identified cost $273,324,024) | | | | | | | 369,942,361 | |
| Other Assets and Liabilities — 0.5% | | | | 1,734,511 | |
| | | | | | | | |
| Total Net Assets — 100.0% | | | | | | $ | 371,676,872 | |
| | | | | | | | |
Growth Allocation Fund
| | | | | | | | |
| Description | | Shares | | | Value | |
| Mutual Funds — 99.0% | | | | | | |
| | |
| Large-Cap Funds — 46.4% | | | | | | |
BMO Dividend Income Fund — Institutional Class (1) | | | 231,185 | | | $ | 3,345,242 | |
BMO Large-Cap Growth Fund — Institutional Class (1) | | | 504,908 | | | | 8,886,380 | |
BMO Large-Cap Value Fund — Institutional Class (1) | | | 705,616 | | | | 11,205,176 | |
BMO Low Volatility Equity Fund — Institutional Class (1) | | | 427,691 | | | | 6,167,311 | |
Dodge & Cox Stock Fund — Retail Class | | | 22,023 | | | | 4,274,683 | |
Harbor Capital Appreciation Fund — Institutional Class | | | 60,588 | | | | 4,340,548 | |
T Rowe Price Growth Stock Fund — Institutional Class | | | 51,629 | | | | 3,461,718 | |
Vanguard Institutional Index Fund — Institutional Class | | | 80,395 | | | | 18,169,272 | |
| | | | | | | | |
Total Large-Cap Funds | | | | | | | 59,850,330 | |
| | |
| Mid-Cap Funds — 6.7% | | | | | | |
BMO Mid-Cap Growth Fund — Institutional Class (1) | | | 152,418 | | | | 2,345,710 | |
BMO Mid-Cap Value Fund — Institutional Class (1) | | | 195,407 | | | | 2,323,392 | |
Vanguard Mid-Cap Index Fund — Institutional Class | | | 101,996 | | | | 4,025,789 | |
| | | | | | | | |
Total Mid-Cap Funds | | | | | | | 8,694,891 | |
| | |
| Small-Cap Funds — 4.3% | | | | | | |
BMO Small-Cap Growth Fund — Institutional Class (1)(2) | | | 141,519 | | | | 2,688,854 | |
BMO Small-Cap Value Fund — Institutional Class (1) | | | 111,443 | | | | 1,501,140 | |
Goldman Sachs Small Cap Value Fund — Institutional Class | | | 21,115 | | | | 1,283,346 | |
| | | | | | | | |
Total Small-Cap Funds | | | | | | | 5,473,340 | |
|
| International Funds — 22.7% | |
BMO Disciplined International Equity Fund — Institutional Class (1) | | | 526,980 | | | | 5,896,903 | |
BMO LGM Emerging Markets Equity Fund — Institutional Class (1) | | | 224,857 | | | | 3,590,962 | |
BMO Pyrford International Stock Fund — Institutional Class (1) | | | 435,990 | | | | 5,759,429 | |
Dodge & Cox International Stock Fund — Retail Class | | | 98,613 | | | | 4,449,422 | |
Harbor International Fund — Institutional Class | | | 65,125 | | | | 4,467,559 | |
(See Notes which are an integral part of the Financial Statements)
24
Growth Allocation Fund (continued)
| | | | | | | | |
| Description | | Shares | | | Value | |
| Mutual Funds (continued) | | | | | | |
|
| International Funds (continued) | |
MFS International Value Fund — Institutional Class | | | 119,025 | | | $ | 5,154,985 | |
| | | | | | | | |
Total International Funds | | | | | | | 29,319,260 | |
| | |
| Fixed Income Funds — 10.9% | | | | | | |
BMO TCH Core Plus Bond Fund — Institutional Class (1) | | | 452,681 | | | | 5,332,581 | |
BMO TCH Emerging Markets Bond Fund — Institutional Class (1) | | | 52,051 | | | | 538,729 | |
Metropolitan West Total Return Bond Fund — Institutional Class | | | 541,300 | | | | 5,818,972 | |
Vanguard Total Bond Market Index Fund, Institutional Class | | | 218,831 | | | | 2,376,507 | |
| | | | | | | | |
Total Fixed Income Funds | | | | | | | 14,066,789 | |
| | |
| Alternative Funds — 8.0% | | | | | | |
BMO Alternative Strategies Fund — Institutional Class (1)(2) | | | 664,988 | | | | 7,188,515 | |
Credit Suisse Commodity Return Strategy Fund — Institutional Class (2) | | | 628,378 | | | | 3,110,471 | |
| | | | | | | | |
Total Alternative Funds | | | | | | | 10,298,986 | |
| | | | | | | | |
Total Mutual Funds
(identified cost $88,722,454) | | | | | | | 127,703,596 | |
|
| Short-Term Investments — 1.0% | |
|
| Mutual Funds — 1.0% | |
BMO Institutional Prime Money Market Fund — Premier Class, 1.080% (1) | | | 1,222,736 | | | | 1,222,859 | |
| | | | | | | | |
Total Short-Term Investments
(identified cost $1,222,859) | | | | | | | 1,222,859 | |
| | | | | | | | |
Total Investments — 100.0%
(identified cost $89,945,313) | | | | | | | 128,926,455 | |
| Other Assets and Liabilities — 0.0% | | | | 63,208 | |
| | | | | | | | |
| Total Net Assets — 100.0% | | | | | | $ | 128,989,663 | |
| | | | | | | | |
Aggressive Allocation Fund
| | | | | | | | |
| Description | | Shares | | | Value | |
| Mutual Funds — 99.1% | |
|
| Large-Cap Funds — 56.1% | |
BMO Dividend Income Fund — Institutional Class (1) | | | 381,946 | | | $ | 5,526,761 | |
BMO Large-Cap Growth Fund — Institutional Class (1) | | | 827,974 | | | | 14,572,342 | |
BMO Large-Cap Value Fund — Institutional Class (1) | | | 1,162,574 | | | | 18,461,681 | |
BMO Low Volatility Equity Fund — Institutional Class (1) | | | 700,308 | | | | 10,098,441 | |
Dodge & Cox Stock Fund — Retail Class | | | 36,207 | | | | 7,027,694 | |
Harbor Capital Appreciation Fund — Institutional Class | | | 99,750 | | | | 7,146,069 | |
T Rowe Price Growth Stock Fund — Institutional Class | | | 84,815 | | | | 5,686,874 | |
| | | | | | | | |
| Description | | Shares | | | Value | |
| Mutual Funds (continued) | |
|
| Large-Cap Funds (continued) | |
Vanguard Institutional Index Fund — Institutional Class | | | 132,457 | | | $ | 29,935,230 | |
| | | | | | | | |
Total Large-Cap Funds | | | | | | | 98,455,092 | |
|
| Mid-Cap Funds — 8.2% | |
BMO Mid-Cap Growth Fund — Institutional Class (1) | | | 250,695 | | | | 3,858,204 | |
BMO Mid-Cap Value Fund — Institutional Class (1) | | | 322,823 | | | | 3,838,366 | |
Vanguard Mid-Cap Index Fund — Institutional Class | | | 169,003 | | | | 6,670,556 | |
| | | | | | | | |
Total Mid-Cap Funds | | | | | | | 14,367,126 | |
|
| Small-Cap Funds — 5.2% | |
BMO Small-Cap Growth Fund — Institutional Class (1)(2) | | | 233,430 | | | | 4,435,179 | |
BMO Small-Cap Value Fund — Institutional Class (1) | | | 185,580 | | | | 2,499,768 | |
Goldman Sachs Small Cap Value Fund — Institutional Class | | | 34,940 | | | | 2,123,667 | |
| | | | | | | | |
Total Small-Cap Funds | | | | | | | 9,058,614 | |
|
| International Funds — 27.6% | |
BMO Disciplined International Equity Fund — Institutional Class (1) | | | 871,573 | | | | 9,752,897 | |
BMO LGM Emerging Markets Equity Fund — Institutional Class (1) | | | 369,977 | | | | 5,908,535 | |
BMO Pyrford International Stock Fund — Institutional Class (1) | | | 717,693 | | | | 9,480,721 | |
Dodge & Cox International Stock Fund — Retail Class | | | 162,469 | | | | 7,330,612 | |
Harbor International Fund — Institutional Class | | | 107,200 | | | | 7,353,929 | |
MFS International Value Fund — Institutional Class | | | 196,482 | | | | 8,509,641 | |
| | | | | | | | |
Total International Funds | | | | | | | 48,336,335 | |
|
| Alternative Funds — 2.0% | |
BMO Alternative Strategies Fund — Institutional Class (1)(2) | | | 229,967 | | | | 2,485,944 | |
Credit Suisse Commodity Return Strategy Fund — Institutional Class (2) | | | 215,378 | | | | 1,066,121 | |
| | | | | | | | |
Total Alternative Funds | | | | | | | 3,552,065 | |
| | | | | | | | |
Total Mutual Funds
(identified cost $106,862,059) | | | | 173,769,232 | |
|
| Short-Term Investments — 0.2% | |
|
| Mutual Funds — 0.2% | |
BMO Institutional Prime Money Market Fund — Premier Class, 1.080% (1) | | | 444,912 | | | | 444,956 | |
| | | | | | | | |
Total Short-Term Investments
(identified cost $444,956) | | | | | | | 444,956 | |
| | | | | | | | |
Total Investments — 99.3%
(identified cost $107,307,015) | | | | | | | 174,214,188 | |
| Other Assets and Liabilities — 0.7% | | | | 1,179,745 | |
| | | | | | | | |
| Total Net Assets — 100.0% | | | | | | $ | 175,393,933 | |
| | | | | | | | |
(See Notes which are an integral part of the Financial Statements)
25
As of August 31, 2017
| | |
| Notes to Schedules of Investments | | |
The categories of investments are shown as a percentage of total net assets for each Fund as of August 31, 2017.
| (1) | Denotes an investment in an affiliated entity. Please refer to Note 5, subsection Investments in Affiliated Issuers, in the Notes to Financial Statements. |
| (3) | Holding is greater than 25% of portfolio value. Additional information regarding the underlying Fund’s holdings and financial statements may be found at https://www.sec.gov. |
(See Notes which are an integral part of the Financial Statements)
26
August 31, 2017
| | |
| Statements of Assets and Liabilities | | BMO Funds |
| | | | | | | | | | | | | | | | | | | | |
| | | | | | | | | | | | | | | | |
| | | In-Retirement
Fund | | | 2015 Fund | | | 2020 Fund | | | 2025 Fund | | | 2030 Fund | |
Assets: | | | | | | | | | | | | | | | | | | | | |
Investments in unaffiliated issuers, at value | | $ | 7,729,161 | | | $ | 1,975,590 | | | $ | 40,546,839 | | | $ | 11,278,050 | | | $ | 48,807,609 | |
Cash sweep investments in affiliated issuers, at value | | | 144,477 | | | | 39,798 | | | | 720,855 | | | | 246,901 | | | | 1,008,652 | |
Investments in other affiliated issuers, at value | | | 7,063,099 | | | | 1,894,086 | | | | 39,211,737 | | | | 9,894,288 | | | | 42,768,497 | |
Dividends and interest receivable | | | 16,870 | | | | 3,355 | | | | 50,381 | | | | 9,953 | | | | 28,598 | |
Receivable for investments sold | | | — | | | | — | | | | — | | | | 35,427 | | | | — | |
Receivable for capital stock sold | | | 13,907 | | | | 2,048 | | | | 110,777 | | | | 159,948 | | | | 206,007 | |
Receivable from affiliates, net (Note 5) | | | 16,428 | | | | 18,037 | | | | 14,324 | | | | 20,180 | | | | 12,654 | |
Prepaid expenses and other receivables | | | 27,544 | | | | 12,544 | | | | 27,354 | | | | 12,646 | | | | 27,840 | |
| | | | | | | | | | | | | | | | | | | | |
Total assets | | | 15,011,486 | | | | 3,945,458 | | | | 80,682,267 | | | | 21,657,393 | | | | 92,859,857 | |
| | | | | |
Liabilities: | | | | | | | | | | | | | | | | | | | | |
Payable for investments purchased | | | — | | | | — | | | | — | | | | 69,658 | | | | — | |
Payable for capital stock redeemed | | | — | | | | — | | | | — | | | | — | | | | 14,138 | |
Other liabilities | | | 31,683 | | | | 30,765 | | | | 34,883 | | | | 32,067 | | | | 36,337 | |
| | | | | | | | | | | | | | | | | | | | |
Total liabilities | | | 31,683 | | | | 30,765 | | | | 34,883 | | | | 101,725 | | | | 50,475 | |
| | | | | | | | | | | | | | | | | | | | |
Total net assets | | $ | 14,979,803 | | | $ | 3,914,693 | | | $ | 80,647,384 | | | $ | 21,555,668 | | | $ | 92,809,382 | |
| | | | | | | | | | | | | | | | | | | | |
| | | | | |
Net assets consist of: | | | | | | | | | | | | | | | | | | | | |
Paid-in capital | | $ | 11,909,602 | | | $ | 3,700,439 | | | $ | 58,164,982 | | | $ | 19,536,933 | | | $ | 64,507,054 | |
Net unrealized appreciation on investments | | | 2,347,948 | | | | 315,408 | | | | 19,477,369 | | | | 2,261,957 | | | | 26,091,345 | |
Accumulated net realized gain (loss) on investments | | | 553,347 | | | | (138,248 | ) | | | 2,367,333 | | | | (422,022 | ) | | | 1,690,854 | |
Undistributed net investment income | | | 168,906 | | | | 37,094 | | | | 637,700 | | | | 178,800 | | | | 520,129 | |
| | | | | | | | | | | | | | | | | | | | |
Total net assets | | $ | 14,979,803 | | | $ | 3,914,693 | | | $ | 80,647,384 | | | $ | 21,555,668 | | | $ | 92,809,382 | |
| | | | | | | | | | | | | | | | | | | | |
| | | | | |
Net asset value, offering price and redemption proceeds per share (unlimited shares authorized, no par value) | | | | | | | | | | | | | | | | | | | | |
Investor class of shares | | $ | 9.39 | | | $ | 11.32 | | | $ | 10.52 | | | $ | 11.61 | | | $ | 11.55 | |
Retirement class R-3 of shares | | | 9.42 | | | | 11.30 | | | | 10.53 | | | | 11.56 | | | | 11.55 | |
Retirement class R-6 of shares | | | 9.40 | | | | 11.39 | | | | 10.54 | | | | 11.68 | | | | 11.57 | |
| | | | | |
Net assets: | | | | | | | | | | | | | | | | | | | | |
Investor class of shares | | $ | 3,461,098 | | | $ | 410,302 | | | $ | 17,810,623 | | | $ | 933,298 | | | $ | 19,498,362 | |
Retirement class R-3 of shares | | | 634,114 | | | | 114,171 | | | | 6,813,096 | | | | 150,046 | | | | 6,315,525 | |
Retirement class R-6 of shares | | | 10,884,591 | | | | 3,390,220 | | | | 56,023,665 | | | | 20,472,324 | | | | 66,995,495 | |
| | | | | | | | | | | | | | | | | | | | |
Total net assets | | $ | 14,979,803 | | | $ | 3,914,693 | | | $ | 80,647,384 | | | $ | 21,555,668 | | | $ | 92,809,382 | |
| | | | | | | | | | | | | | | | | | | | |
| | | | | |
Shares outstanding: | | | | | | | | | | | | | | | | | | | | |
Investor class of shares | | | 368,455 | | | | 36,250 | | | | 1,692,699 | | | | 80,353 | | | | 1,687,853 | |
Retirement class R-3 of shares | | | 67,343 | | | | 10,108 | | | | 647,043 | | | | 12,983 | | | | 546,967 | |
Retirement class R-6 of shares | | | 1,158,368 | | | | 297,691 | | | | 5,314,840 | | | | 1,752,441 | | | | 5,790,802 | |
| | | | | | | | | | | | | | | | | | | | |
Total shares outstanding | | | 1,594,166 | | | | 344,049 | | | | 7,654,582 | | | | 1,845,777 | | | | 8,025,622 | |
| | | | | | | | | | | | | | | | | | | | |
| | | | | |
Investments, at cost: | | | | | | | | | | | | | | | | | | | | |
Investments in unaffiliated issuers | | $ | 6,209,467 | | | $ | 1,799,065 | | | $ | 26,990,223 | | | $ | 9,814,111 | | | $ | 29,321,426 | |
Cash sweep investments in affiliated issuers | | | 144,477 | | | | 39,798 | | | | 720,855 | | | | 246,901 | | | | 1,008,650 | |
Investments in other affiliated issuers | | | 6,234,845 | | | | 1,755,203 | | | | 33,290,984 | | | | 9,096,270 | | | | 36,163,337 | |
| | | | | | | | | | | | | | | | | | | | |
Total investments, at cost | | $ | 12,588,789 | | | $ | 3,594,066 | | | $ | 61,002,062 | | | $ | 19,157,282 | | | $ | 66,493,413 | |
| | | | | | | | | | | | | | | | | | | | |
(See Notes which are an integral part of the Financial Statements)
27
August 31, 2017
| | |
| Statements of Assets and Liabilities | | BMO Funds |
| | | | | | | | | | | | | | | | | | | | |
| | | | | | | | | | | | | | | | |
| | | 2035 Fund | | | 2040 Fund | | | 2045 Fund | | | 2050 Fund | | | 2055 Fund | |
Assets: | | | | | | | | | | | | | | | | | | | | |
Investments in unaffiliated issuers, at value | | $ | 6,886,347 | | | $ | 28,065,217 | | | $ | 4,233,208 | | | $ | 21,159,698 | | | $ | 3,830,201 | |
Cash sweep investments in affiliated issuers, at value | | | 58,671 | | | | 533,274 | | | | 78,288 | | | | 391,301 | | | | 70,830 | |
Investments in other affiliated issuers, at value | | | 6,041,050 | | | | 23,886,793 | | | | 3,595,644 | | | | 17,973,093 | | | | 3,253,375 | |
Dividends and interest receivable | | | 2,435 | | | | 6,167 | | | | 898 | | | | 4,561 | | | | 820 | |
Receivable for investments sold | | | 80,738 | | | | — | | | | — | | | | — | | | | — | |
Receivable for capital stock sold | | | 10,326 | | | | 115,579 | | | | 19,630 | | | | 152,696 | | | | 50,616 | |
Receivable from affiliates, net (Note 5) | | | 19,103 | | | | 15,582 | | | | 18,627 | | | | 15,373 | | | | 18,452 | |
Prepaid expenses and other receivables | | | 12,647 | | | | 27,338 | | | | 12,546 | | | | 27,339 | | | | 12,544 | |
| | | | | | | | | | | | | | | | | | | | |
Total assets | | | 13,111,317 | | | | 52,649,950 | | | | 7,958,841 | | | | 39,724,061 | | | | 7,236,838 | |
| | | | | |
Liabilities: | | | | | | | | | | | | | | | | | | | | |
Payable for investments purchased | | | 9,651 | | | | — | | | | — | | | | — | | | | — | |
Payable for capital stock redeemed | | | — | | | | 18,530 | | | | — | | | | 2,663 | | | | — | |
Other liabilities | | | 31,258 | | | | 33,934 | | | | 30,880 | | | | 33,187 | | | | 30,759 | |
| | | | | | | | | | | | | | | | | | | | |
Total liabilities | | | 40,909 | | | | 52,464 | | | | 30,880 | | | | 35,850 | | | | 30,759 | |
| | | | | | | | | | | | | | | | | | | | |
Total net assets | | $ | 13,070,408 | | | $ | 52,597,486 | | | $ | 7,927,961 | | | $ | 39,688,211 | | | $ | 7,206,079 | |
| | | | | | | | | | | | | | | | | | | | |
| | | | | |
Net assets consist of: | | | | | | | | | | | | | | | | | | | | |
Paid-in capital | | $ | 11,081,861 | | | $ | 32,006,321 | | | $ | 6,790,789 | | | $ | 27,832,866 | | | $ | 6,289,605 | |
Net unrealized appreciation on investments | | | 1,885,652 | | | | 17,253,541 | | | | 1,110,568 | | | | 11,719,924 | | | | 1,017,314 | |
Accumulated net realized gain (loss) on investments | | | (3,017 | ) | | | 3,081,367 | | | | (25,606 | ) | | | (47,764 | ) | | | (137,673 | ) |
Undistributed net investment income | | | 105,912 | | | | 256,257 | | | | 52,210 | | | | 183,185 | | | | 36,833 | |
| | | | | | | | | | | | | | | | | | | | |
Total net assets | | $ | 13,070,408 | | | $ | 52,597,486 | | | $ | 7,927,961 | | | $ | 39,688,211 | | | $ | 7,206,079 | |
| | | | | | | | | | | | | | | | | | | | |
| | | | | |
Net asset value, offering price and redemption proceeds per share (unlimited shares authorized, no par value) | | | | | | | | | | | | | | | | | | | | |
Investor class of shares | | $ | 11.70 | | | $ | 11.56 | | | $ | 11.93 | | | $ | 11.99 | | | $ | 11.90 | |
Retirement class R-3 of shares | | | 11.63 | | | | 11.57 | | | | 11.87 | | | | 11.97 | | | | 11.83 | |
Retirement class R-6 of shares | | | 11.77 | | | | 11.58 | | | | 12.00 | | | | 12.00 | | | | 11.97 | |
| | | | | |
Net assets: | | | | | | | | | | | | | | | | | | | | |
Investor class of shares | | $ | 733,879 | | | $ | 11,098,157 | | | $ | 911,346 | | | $ | 8,400,138 | | | $ | 550,818 | |
Retirement class R-3 of shares | | | 120,189 | | | | 2,555,055 | | | | 52,887 | | | | 3,115,090 | | | | 93,724 | |
Retirement class R-6 of shares | | | 12,216,340 | | | | 38,944,274 | | | | 6,963,728 | | | | 28,172,983 | | | | 6,561,537 | |
| | | | | | | | | | | | | | | | | | | | |
Total net assets | | $ | 13,070,408 | | | $ | 52,597,486 | | | $ | 7,927,961 | | | $ | 39,688,211 | | | $ | 7,206,079 | |
| | | | | | | | | | | | | | | | | | | | |
| | | | | |
Shares outstanding: | | | | | | | | | | | | | | | | | | | | |
Investor class of shares | | | 62,735 | | | | 960,321 | | | | 76,394 | | | | 700,858 | | | | 46,275 | |
Retirement class R-3 of shares | | | 10,331 | | | | 220,748 | | | | 4,457 | | | | 260,341 | | | | 7,921 | |
Retirement class R-6 of shares | | | 1,037,674 | | | | 3,364,068 | | | | 580,174 | | | | 2,348,010 | | | | 547,978 | |
| | | | | | | | | | | | | | | | | | | | |
Total shares outstanding | | | 1,110,740 | | | | 4,545,137 | | | | 661,025 | | | | 3,309,209 | | | | 602,174 | |
| | | | | | | | | | | | | | | | | | | | |
| | | | | |
Investments, at cost: | | | | | | | | | | | | | | | | | | | | |
Investments in unaffiliated issuers | | $ | 5,740,063 | | | $ | 15,209,677 | | | $ | 3,534,313 | | | $ | 12,423,418 | | | $ | 3,190,990 | |
Cash sweep investments in affiliated issuers | | | 58,671 | | | | 533,274 | | | | 78,288 | | | | 391,301 | | | | 70,830 | |
Investments in other affiliated issuers | | | 5,301,682 | | | | 19,488,792 | | | | 3,183,971 | | | | 14,989,449 | | | | 2,875,272 | |
| | | | | | | | | | | | | | | | | | | | |
Total investments, at cost | | $ | 11,100,416 | | | $ | 35,231,743 | | | $ | 6,796,572 | | | $ | 27,804,168 | | | $ | 6,137,092 | |
| | | | | | | | | | | | | | | | | | | | |
(See Notes which are an integral part of the Financial Statements)
28
August 31, 2017
| | |
| Statements of Assets and Liabilities | | BMO Funds |
| | | | | | | | | | | | | | | | | | | | |
| | | | | | | | | | | | | | | | |
| | | Conservative
Allocation
Fund | | | Moderate
Allocation
Fund | | | Balanced
Allocation
Fund | | | Growth
Allocation
Fund | | | Aggressive
Allocation
Fund | |
Assets: | | | | | | | | | | | | | | | | | | | | |
Investments in unaffiliated issuers, at value | | $ | 37,903,653 | | | $ | 55,774,490 | | | $ | 180,633,062 | | | $ | 60,933,272 | | | $ | 82,850,393 | |
Cash sweep investments in affiliated issuers, at value | | | 615,540 | | | | 1,030,079 | | | | 3,074,917 | | | | 1,222,859 | | | | 444,956 | |
Investments in other affiliated issuers, at value | | | 35,070,625 | | | | 54,181,034 | | | | 186,234,382 | | | | 66,770,324 | | | | 90,918,839 | |
Dividends and interest receivable | | | 93,474 | | | | 103,600 | | | | 215,465 | | | | 28,946 | | | | 1,555 | |
Receivable for investments sold | | | 150,893 | | | | — | | | | 871,326 | | | | — | | | | — | |
Receivable for capital stock sold | | | 130,196 | | | | 71,594 | | | | 1,192,232 | | | | 38,637 | | | | 1,345,424 | |
Receivable from affiliates, net (Note 5) | | | 13,766 | | | | 15,618 | | | | 1,181 | | | | 15,625 | | | | 9,159 | |
Prepaid expenses and other receivables | | | 30,238 | | | | 30,238 | | | | 30,956 | | | | 30,240 | | | | 30,244 | |
| | | | | | | | | | | | | | | | | | | | |
Total assets | | | 74,008,385 | | | | 111,206,653 | | | | 372,253,521 | | | | 129,039,903 | | | | 175,600,570 | |
| | | | | |
Liabilities: | | | | | | | | | | | | | | | | | | | | |
Payable for investments purchased | | | 31,851 | | | | — | | | | 259,915 | | | | — | | | | — | |
Payable for capital stock redeemed | | | 4,649 | | | | 6,921 | | | | 261,600 | | | | 10,272 | | | | 162,353 | |
Other liabilities | | | 37,496 | | | | 39,616 | | | | 55,134 | | | | 39,968 | | | | 44,284 | |
| | | | | | | | | | | | | | | | | | | | |
Total liabilities | | | 73,996 | | | | 46,537 | | | | 576,649 | | | | 50,240 | | | | 206,637 | |
| | | | | | | | | | | | | | | | | | | | |
Total net assets | | $ | 73,934,389 | | | $ | 111,160,116 | | | $ | 371,676,872 | | | $ | 128,989,663 | | | $ | 175,393,933 | |
| | | | | | | | | | | | | | | | | | | | |
| | | | | |
Net assets consist of: | | | | | | | | | | | | | | | | | | | | |
Paid-in capital | | $ | 58,384,099 | | | $ | 86,784,428 | | | $ | 247,651,911 | | | $ | 83,798,759 | | | $ | 89,687,096 | |
Net unrealized appreciation on investments | | | 9,606,725 | | | | 19,526,583 | | | | 96,618,337 | | | | 38,981,142 | | | | 66,907,173 | |
Accumulated net realized gain on investments | | | 4,605,934 | | | | 3,713,298 | | | | 24,524,312 | | | | 5,434,734 | | | | 17,878,063 | |
Undistributed net investment income | | | 1,337,631 | | | | 1,135,807 | | | | 2,882,312 | | | | 775,028 | | | | 921,601 | |
| | | | | | | | | | | | | | | | | | | | |
Total net assets | | $ | 73,934,389 | | | $ | 111,160,116 | | | $ | 371,676,872 | | | $ | 128,989,663 | | | $ | 175,393,933 | |
| | | | | | | | | | | | | | | | | | | | |
| | | | | |
Net asset value, offering price and redemption proceeds per share (unlimited shares authorized, no par value) | | | | | | | | | | | | | | | | | | | | |
Investor class of shares | | $ | 10.02 | | | $ | 10.08 | | | $ | 9.65 | | | $ | 10.23 | | | $ | 10.01 | |
Institutional class of shares | | | 10.02 | | | | 10.08 | | | | 9.66 | | | | 10.23 | | | | 10.00 | |
Retirement class R-3 of shares | | | 10.01 | | | | 10.08 | | | | 9.64 | | | | 10.22 | | | | 9.98 | |
Retirement class R-6 of shares | | | 10.03 | | | | 10.09 | | | | 9.66 | | | | 10.24 | | | | 10.01 | |
| | | | | |
Net assets: | | | | | | | | | | | | | | | | | | | | |
Investor class of shares | | $ | 15,530,690 | | | $ | 7,776,969 | | | $ | 101,516,796 | | | $ | 16,758,335 | | | $ | 37,632,081 | |
Institutional class of shares | | | 26,464,684 | | | | 9,375,274 | | | | 52,820,533 | | | | 8,968,719 | | | | 14,684,460 | |
Retirement class R-3 of shares | | | 3,012,031 | | | | 13,725,407 | | | | 23,649,468 | | | | 18,845,420 | | | | 17,152,120 | |
Retirement class R-6 of shares | | | 28,926,984 | | | | 80,282,466 | | | | 193,690,075 | | | | 84,417,189 | | | | 105,925,272 | |
| | | | | | | | | | | | | | | | | | | | |
Total net assets | | $ | 73,934,389 | | | $ | 111,160,116 | | | $ | 371,676,872 | | | $ | 128,989,663 | | | $ | 175,393,933 | |
| | | | | | | | | | | | | | | | | | | | |
| | | | | |
Shares outstanding: | | | | | | | | | | | | | | | | | | | | |
Investor class of shares | | | 1,550,554 | | | | 771,549 | | | | 10,519,426 | | | | 1,638,627 | | | | 3,760,830 | |
Institutional class of shares | | | 2,641,526 | | | | 929,783 | | | | 5,468,892 | | | | 876,327 | | | | 1,468,206 | |
Retirement class R-3 of shares | | | 301,050 | | | | 1,362,319 | | | | 2,453,136 | | | | 1,843,727 | | | | 1,718,813 | |
Retirement class R-6 of shares | | | 2,884,152 | | | | 7,958,697 | | | | 20,040,445 | | | | 8,243,792 | | | | 10,580,148 | |
| | | | | | | | | | | | | | | | | | | | |
Total shares outstanding | | | 7,377,282 | | | | 11,022,348 | | | | 38,481,899 | | | | 12,602,473 | | | | 17,527,997 | |
| | | | | | | | | | | | | | | | | | | | |
| | | | | |
Investments, at cost: | | | | | | | | | | | | | | | | | | | | |
Investments in unaffiliated issuers | | $ | 33,316,245 | | | $ | 44,186,389 | | | $ | 119,720,054 | | | $ | 34,552,912 | | | $ | 37,633,462 | |
Cash sweep investments in affiliated issuers | | | 615,540 | | | | 1,030,079 | | | | 3,074,917 | | | | 1,222,859 | | | | 444,956 | |
Investments in other affiliated issuers | | | 30,051,308 | | | | 46,242,552 | | | | 150,529,053 | | | | 54,169,542 | | | | 69,228,597 | |
| | | | | | | | | | | | | | | | | | | | |
Total investments, at cost | | $ | 63,983,093 | | | $ | 91,459,020 | | | $ | 273,324,024 | | | $ | 89,945,313 | | | $ | 107,307,015 | |
| | | | | | | | | | | | | | | | | | | | |
(See Notes which are an integral part of the Financial Statements)
29
Year Ended August 31, 2017
| | |
| Statements of Operations | | BMO Funds |
| | | | | | | | | | | | | | | | | | | | |
| | | | | | | | | | | | | | | | |
| | | In-Retirement
Fund | | | 2015 Fund | | | 2020 Fund | | | 2025 Fund | | | 2030 Fund | |
Investment income: | | | | | | | | | | | | | | | | | | | | |
Dividend income from: | | | | | | | | | | | | | | | | | | | | |
Unaffiliated issuers | | $ | 177,847 | | | $ | 39,908 | | | $ | 773,548 | | | $ | 248,729 | | | $ | 815,465 | |
Affiliated issuers | | | 172,870 | | | | 39,757 | | | | 717,216 | | | | 205,405 | | | | 650,345 | |
Excess expense reimbursement from investment adviser (Note 5) | | | 8,930 | | | | 2,283 | | | | 41,383 | | | | 17,846 | | | | 21,137 | |
| | | | | | | | | | | | | | | | | | | | |
Total income | | | 359,647 | | | | 81,948 | | | | 1,532,147 | | | | 471,980 | | | | 1,486,947 | |
| | | | | |
Expenses: | | | | | | | | | | | | | | | | | | | | |
Shareholder servicing fees (Note 5) | | | 8,171 | | | | 1,874 | | | | 44,290 | | | | 2,097 | | | | 46,864 | |
Administration fees (Note 5) | | | 6,534 | | | | 1,313 | | | | 40,396 | | | | 2,437 | | | | 40,151 | |
Portfolio accounting fees | | | 37,921 | | | | 33,977 | | | | 58,509 | | | | 40,851 | | | | 61,871 | |
Recordkeeping fees | | | 38,638 | | | | 40,552 | | | | 38,157 | | | | 41,254 | | | | 40,455 | |
Custodian fees (Note 5) | | | 800 | | | | 197 | | | | 3,998 | | | | 1,262 | | | | 4,517 | |
Registration fees | | | 52,846 | | | | 45,565 | | | | 51,984 | | | | 45,915 | | | | 52,002 | |
Professional fees | | | 18,795 | | | | 18,795 | | | | 18,795 | | | | 18,795 | | | | 18,795 | |
Printing and postage | | | 10,594 | | | | 9,262 | | | | 11,558 | | | | 9,605 | | | | 11,373 | |
Directors’ fees | | | 13,333 | | | | 13,333 | | | | 13,333 | | | | 13,333 | | | | 13,333 | |
Distribution services fees (Note 5) | | | 5,438 | | | | 629 | | | | 46,072 | | | | 3,929 | | | | 40,110 | |
Miscellaneous | | | 3,100 | | | | 2,836 | | | | 4,835 | | | | 3,818 | | | | 5,493 | |
| | | | | | | | | | | | | | | | | | | | |
Total expenses | | | 196,170 | | | | 168,333 | | | | 331,927 | | | | 183,296 | | | | 334,964 | |
| | | | | |
Deduct: | | | | | | | | | | | | | | | | | | | | |
Expense waivers (Note 5) | | | (179,052 | ) | | | (165,110 | ) | | | (220,015 | ) | | | (175,958 | ) | | | (215,870 | ) |
| | | | | | | | | | | | | | | | | | | | |
Net expenses | | | 17,118 | | | | 3,223 | | | | 111,912 | | | | 7,338 | | | | 119,094 | |
| | | | | | | | | | | | | | | | | | | | |
Net investment income | | | 342,529 | | | | 78,725 | | | | 1,420,235 | | | | 464,642 | | | | 1,367,853 | |
| | | | | |
Net realized and unrealized gain (loss) on investments: | | | | | | | | | | | | | | | | | | | | |
Net realized gain (loss) on transactions from: | | | | | | | | | | | | | | | | | | | | |
Investments in unaffiliated issuers | | | 654,842 | | | | 15,887 | | | | 2,342,331 | | | | 240,245 | | | | 2,342,972 | |
Investments in affiliated issuers | | | 185,299 | | | | (32,756 | ) | | | 422,126 | | | | (465,701 | ) | | | (72,427 | ) |
Net realized gain on capital gains distributions from: | | | | | | | | | | | | | | | | | | | | |
Investments in unaffiliated issuers | | | 82,452 | | | | 21,820 | | | | 437,872 | | | | 195,976 | | | | 624,904 | |
Investments in affiliated issuers | | | 120,171 | | | | 40,562 | | | | 1,170,158 | | | | 519,801 | | | | 1,795,549 | |
| | | | | | | | | | | | | | | | | | | | |
Total net realized gain | | | 1,042,764 | | | | 45,513 | | | | 4,372,487 | | | | 490,321 | | | | 4,690,998 | |
Net change in unrealized appreciation (depreciation) on: | | | | | | | | | | | | | | | | | | | | |
Investments in unaffiliated issuers | | | (345,440 | ) | | | 105,364 | | | | 1,073,422 | | | | 1,142,396 | | | | 3,420,166 | |
Investments in affiliated issuers | | | 36,159 | | | | 114,313 | | | | 1,598,125 | | | | 1,042,836 | | | | 2,645,724 | |
| | | | | | | | | | | | | | | | | | | | |
Total net change in unrealized appreciation (depreciation) | | | (309,281 | ) | | | 219,677 | | | | 2,671,547 | | | | 2,185,232 | | | | 6,065,890 | |
| | | | | | | | | | | | | | | | | | | | |
Net realized and unrealized gain on investments | | | 733,483 | | | | 265,190 | | | | 7,044,034 | | | | 2,675,553 | | | | 10,756,888 | |
| | | | | | | | | | | | | | | | | | | | |
Change in net assets resulting from operations | | $ | 1,076,012 | | | $ | 343,915 | | | $ | 8,464,269 | | | $ | 3,140,195 | | | $ | 12,124,741 | |
| | | | | | | | | | | | | | | | | | | | |
(See Notes which are an integral part of the Financial Statements)
30
Year Ended August 31, 2017
| | |
| Statements of Operations | | BMO Funds |
| | | | | | | | | | | | | | | | | | | | |
| | | | | | | | | | | | | | | | |
| | | 2035 Fund | | | 2040 Fund | | | 2045 Fund | | | 2050 Fund | | | 2055 Fund | |
Investment income: | | | | | | | | | | | | | | | | | | | | |
Dividend income from: | | | | | | | | | | | | | | | | | | | | |
Unaffiliated issuers | | $ | 216,286 | | | $ | 495,102 | | | $ | 117,834 | | | $ | 338,665 | | | $ | 64,505 | |
Affiliated issuers | | | 173,992 | | | | 370,144 | | | | 91,774 | | | | 251,962 | | | | 49,578 | |
Excess expense reimbursement from investment adviser (Note 5) | | | 6,704 | | | | 17,683 | | | | 4,579 | | | | 11,875 | | | | 2,652 | |
| | | | | | | | | | | | | | | | | | | | |
Total income | | | 396,982 | | | | 882,929 | | | | 214,187 | | | | 602,502 | | | | 116,735 | |
| | | | | |
Expenses: | | | | | | | | | | | | | | | | | | | | |
Shareholder servicing fees (Note 5) | | | 1,982 | | | | 28,973 | | | | 2,267 | | | | 21,008 | | | | 1,386 | |
Administration fees (Note 5) | | | 1,764 | | | | 23,011 | | | | 1,834 | | | | 18,024 | | | | 1,409 | |
Portfolio accounting fees | | | 39,786 | | | | 50,615 | | | | 35,766 | | | | 45,253 | | | | 35,017 | |
Recordkeeping fees | | | 40,639 | | | | 40,406 | | | | 40,917 | | | | 40,095 | | | | 39,793 | |
Custodian fees (Note 5) | | | 1,093 | | | | 2,770 | | | | 592 | | | | 1,941 | | | | 356 | |
Registration fees | | | 45,915 | | | | 52,020 | | | | 45,566 | | | | 52,020 | | | | 45,566 | |
Professional fees | | | 18,795 | | | | 18,795 | | | | 18,795 | | | | 18,795 | | | | 18,795 | |
Printing and postage | | | 9,627 | | | | 11,659 | | | | 9,739 | | | | 11,561 | | | | 9,610 | |
Directors’ fees | | | 13,333 | | | | 13,333 | | | | 13,333 | | | | 13,333 | | | | 13,333 | |
Distribution services fees (Note 5) | | | 1,913 | | | | 18,757 | | | | 1,580 | | | | 18,063 | | | | 1,924 | |
Miscellaneous | | | 3,823 | | | | 4,464 | | | | 3,270 | | | | 4,017 | | | | 3,020 | |
| | | | | | | | | | | | | | | | | | | | |
Total expenses | | | 178,670 | | | | 264,803 | | | | 173,659 | | | | 244,110 | | | | 170,209 | |
| | | | | |
Deduct: | | | | | | | | | | | | | | | | | | | | |
Expense waivers (Note 5) | | | (173,364 | ) | | | (200,184 | ) | | | (168,463 | ) | | | (191,807 | ) | | | (165,860 | ) |
| | | | | | | | | | | | | | | | | | | | |
Net expenses | | | 5,306 | | | | 64,619 | | | | 5,196 | | | | 52,303 | | | | 4,349 | |
| | | | | | | | | | | | | | | | | | | | |
Net investment income | | | 391,676 | | | | 818,310 | | | | 208,991 | | | | 550,199 | | | | 112,386 | |
| | | | | |
Net realized and unrealized gain (loss) on investments: | | | | | | | | | | | | | | | | | | | | |
Net realized gain (loss) on transactions from: | | | | | | | | | | | | | | | | | | | | |
Investments in unaffiliated issuers | | | 627,677 | | | | 3,026,839 | | | | 352,418 | | | | 688,382 | | | | 65,383 | |
Investments in affiliated issuers | | | (479,901 | ) | | | 170,318 | | | | (245,220 | ) | | | (305,205 | ) | | | (98,727 | ) |
Net realized gain on capital gains distributions from: | | | | | | | | | | | | | | | | | | | | |
Investments in unaffiliated issuers | | | 213,405 | | | | 425,606 | | | | 120,587 | | | | 290,510 | | | | 59,351 | |
Investments in affiliated issuers | | | 629,208 | | | | 1,281,120 | | | | 343,596 | | | | 888,524 | | | | 160,910 | |
| | | | | | | | | | | | | | | | | | | | |
Total net realized gain | | | 990,389 | | | | 4,903,883 | | | | 571,381 | | | | 1,562,211 | | | | 186,917 | |
Net change in unrealized appreciation on: | | | | | | | | | | | | | | | | | | | | |
Investments in unaffiliated issuers | | | 830,818 | | | | 1,046,834 | | | | 490,228 | | | | 2,162,185 | | | | 467,437 | |
Investments in affiliated issuers | | | 1,001,470 | | | | 1,530,097 | | | | 543,619 | | | | 1,477,004 | | | | 329,585 | |
| | | | | | | | | | | | | | | | | | | | |
Total net change in unrealized appreciation | | | 1,832,288 | | | | 2,576,931 | | | | 1,033,847 | | | | 3,639,189 | | | | 797,022 | |
| | | | | | | | | | | | | | | | | | | | |
Net realized and unrealized gain on investments | | | 2,822,677 | | | | 7,480,814 | | | | 1,605,228 | | | | 5,201,400 | | | | 983,939 | |
| | | | | | | | | | | | | | | | | | | | |
Change in net assets resulting from operations | | $ | 3,214,353 | | | $ | 8,299,124 | | | $ | 1,814,219 | | | $ | 5,751,599 | | | $ | 1,096,325 | |
| | | | | | | | | | | | | | | | | | | | |
(See Notes which are an integral part of the Financial Statements)
31
Year Ended August 31, 2017
| | |
| Statements of Operations | | BMO Funds |
| | | | | | | | | | | | | | | | | | | | |
| | | | | | | | | | | | | | | | |
| | | Conservative
Allocation
Fund | | | Moderate
Allocation
Fund | | | Balanced
Allocation
Fund | | | Growth
Allocation
Fund | | | Aggressive
Allocation
Fund | |
Investment income: | | | | | | | | | | | | | | | | | | | | |
Dividend income from: | | | | | | | | | | | | | | | | | | | | |
Unaffiliated issuers | | $ | 1,051,020 | | | $ | 966,762 | | | $ | 3,010,947 | | | $ | 898,056 | | | $ | 1,350,022 | |
Affiliated issuers | | | 1,399,695 | | | | 1,200,659 | | | | 3,548,832 | | | | 965,301 | | | | 1,360,867 | |
Excess expense reimbursement from investment adviser (Note 5) | | | 55,640 | | | | 91,256 | | | | 157,935 | | | | 84,597 | | | | 83,047 | |
| | | | | | | | | | | | | | | | | | | | |
Total income | | | 2,506,355 | | | | 2,258,677 | | | | 6,717,714 | | | | 1,947,954 | | | | 2,793,936 | |
| | | | | |
Expenses: | | | | | | | | | | | | | | | | | | | | |
Shareholder servicing fees (Note 5) | | | 41,416 | | | | 27,281 | | | | 256,776 | | | | 52,504 | | | | 106,229 | |
Administration fees (Note 5) | | | 76,019 | | | | 52,449 | | | | 293,147 | | | | 76,102 | | | | 124,322 | |
Portfolio accounting fees | | | 81,230 | | | | 80,029 | | | | 158,703 | | | | 82,776 | | | | 102,193 | |
Recordkeeping fees | | | 41,755 | | | | 42,877 | | | | 46,736 | | | | 42,054 | | | | 43,757 | |
Custodian fees (Note 5) | | | 6,045 | | | | 5,863 | | | | 19,572 | | | | 6,292 | | | | 9,362 | |
Registration fees | | | 51,128 | | | | 51,128 | | | | 52,128 | | | | 51,128 | | | | 51,484 | |
Professional fees | | | 18,795 | | | | 18,795 | | | | 18,795 | | | | 18,795 | | | | 18,795 | |
Printing and postage | | | 11,950 | | | | 14,132 | | | | 21,016 | | | | 13,468 | | | | 16,449 | |
Directors’ fees | | | 13,333 | | | | 13,333 | | | | 13,333 | | | | 13,333 | | | | 13,333 | |
Distribution services fees (Note 5) | | | 25,179 | | | | 65,696 | | | | 131,432 | | | | 98,822 | | | | 93,520 | |
Miscellaneous | | | 6,811 | | | | 6,548 | | | | 15,134 | | | | 6,902 | | | | 8,713 | |
| | | | | | | | | | | | | | | | | | | | |
Total expenses | | | 373,661 | | | | 378,131 | | | | 1,026,772 | | | | 462,176 | | | | 588,157 | |
| | | | | |
Deduct: | | | | | | | | | | | | | | | | | | | | |
Expense waivers (Note 5) | | | (266,557 | ) | | | (267,668 | ) | | | (481,881 | ) | | | (285,379 | ) | | | (322,029 | ) |
| | | | | | | | | | | | | | | | | | | | |
Net expenses | | | 107,104 | | | | 110,463 | | | | 544,891 | | | | 176,797 | | | | 266,128 | |
| | | | | | | | | | | | | | | | | | | | |
Net investment income | | | 2,399,251 | | | | 2,148,214 | | | | 6,172,823 | | | | 1,771,157 | | | | 2,527,808 | |
| | | | | |
Net realized and unrealized gain on investments: | | | | | | | | | | | | | | | | | | | | |
Net realized gain on transactions from: | | | | | | | | | | | | | | | | | | | | |
Investments in unaffiliated issuers | | | 2,714,118 | | | | 2,813,591 | | | | 19,553,896 | | | | 4,380,509 | | | | 13,353,176 | |
Investments in affiliated issuers | | | 1,814,868 | | | | 587,533 | | | | 4,088,022 | | | | 708,787 | | | | 3,252,027 | |
Net realized gain on capital gains distributions from: | | | | | | | | | | | | | | | | | | | | |
Investments in unaffiliated issuers | | | 715,172 | | | | 714,677 | | | | 2,588,203 | | | | 895,924 | | | | 1,463,032 | |
Investments in affiliated issuers | | | 723,634 | | | | 1,200,353 | | | | 5,825,407 | | | | 2,231,773 | | | | 4,216,793 | |
| | | | | | | | | | | | | | | | | | | | |
Total net realized gain | | | 5,967,792 | | | | 5,316,154 | | | | 32,055,528 | | | | 8,216,993 | | | | 22,285,028 | |
Net change in unrealized appreciation (depreciation) on: | | | | | | | | | | | | | | | | | | | | |
Investments in unaffiliated issuers | | | (1,444,419 | ) | | | 338,321 | | | | (3,276,600 | ) | | | 2,879,840 | | | | (667,265 | ) |
Investments in affiliated issuers | | | (1,035,698 | ) | | | 1,432,819 | | | | 6,554,401 | | | | 4,456,591 | | | | 5,144,608 | |
| | | | | | | | | | | | | | | | | | | | |
Total net change in unrealized appreciation (depreciation) | | | (2,480,117 | ) | | | 1,771,140 | | | | 3,277,801 | | | | 7,336,431 | | | | 4,477,343 | |
| | | | | | | | | | | | | | | | | | | | |
Net realized and unrealized gain on investments | | | 3,487,675 | | | | 7,087,294 | | | | 35,333,329 | | | | 15,553,424 | | | | 26,762,371 | |
| | | | | | | | | | | | | | | | | | | | |
Change in net assets resulting from operations | | $ | 5,886,926 | | | $ | 9,235,508 | | | $ | 41,506,152 | | | $ | 17,324,581 | | | $ | 29,290,179 | |
| | | | | | | | | | | | | | | | | | | | |
(See Notes which are an integral part of the Financial Statements)
32
| | |
| Statements of Changes in Net Assets | | BMO Funds |
| | | | | | | | | | | | | | | | | | | | | | | | |
| | | | | | | | | | |
| | | In-Retirement Fund | | | 2015 Fund | | | 2020 Fund | |
| | | Year Ended
August 31,
2017
| | | Year Ended
August 31,
2016
| | | Year Ended
August 31,
2017
| | | Year Ended
August 31,
2016
| | | Year Ended
August 31,
2017
| | | Year Ended
August 31,
2016
| |
Change in net assets resulting from: | | | | | | | | | | | | | | | | | | | | | | | | |
| | | | | | |
Operations: | | | | | | | | | | | | | | | | | | | | | | | | |
Net investment income | | $ | 342,529 | | | $ | 481,026 | | | $ | 78,725 | | | $ | 99,552 | | | $ | 1,420,235 | | | $ | 1,695,410 | |
Net realized gain (loss) on investments | | | 1,042,764 | | | | 826,785 | | | | 45,513 | | | | (117,638 | ) | | | 4,372,487 | | | | 3,166,993 | |
Net change in unrealized appreciation (depreciation) on investments | | | (309,281 | ) | | | (168,515 | ) | | | 219,677 | | | | 262,746 | | | | 2,671,547 | | | | 623,410 | |
| | | | | | | | | | | | | | | | | | | | | | | | |
Change in net assets resulting from operations | | | 1,076,012 | | | | 1,139,296 | | | | 343,915 | | | | 244,660 | | | | 8,464,269 | | | | 5,485,813 | |
| | | | | | |
Distributions to shareholders: | | | | | | | | | | | | | | | | | | | | | | | | |
Distributions to shareholders from net investment income: | | | | | | | | | | | | | | | | | | | | | | | | |
Investor class of shares | | | (72,794 | ) | | | (103,894 | ) | | | (9,699 | ) | | | (13,918 | ) | | | (297,735 | ) | | | (451,096 | ) |
Institutional class of shares | | | — | | | | (7,826 | )(1) | | | — | | | | (2,846 | )(1) | | | — | | | | (98,138 | )(1) |
Retirement class R-3 of shares | | | (21,844 | ) | | | (36,938 | ) | | | (2,517 | ) | | | (3,317 | ) | | | (163,083 | ) | | | (219,576 | ) |
Retirement class R-6 of shares | | | (403,463 | ) | | | (434,975 | ) | | | (92,325 | ) | | | (106,160 | ) | | | (1,330,828 | ) | | | (1,343,153 | ) |
Distributions to shareholders from net realized gain on investments: | | | | | | | | | | | | | | | | | | | | | | | | |
Investor class of shares | | | (156,448 | ) | | | (311,898 | ) | | | — | | | | (6,126 | ) | | | (782,933 | ) | | | (1,326,705 | ) |
Institutional class of shares | | | — | | | | (20,244 | )(1) | | | — | | | | (1,148 | )(1) | | | — | | | | (249,266 | )(1) |
Retirement class R-3 of shares | | | (56,331 | ) | | | (128,069 | ) | | | — | | | | (1,728 | ) | | | (498,648 | ) | | | (792,457 | ) |
Retirement class R-6 of shares | | | (725,970 | ) | | | (1,061,036 | ) | | | — | | | | (40,512 | ) | | | (2,797,230 | ) | | | (3,175,449 | ) |
| | | | | | | | | | | | | | | | | | | | | | | | |
Change in net assets resulting from distributions to shareholders | | | (1,436,850 | ) | | | (2,104,880 | ) | | | (104,541 | ) | | | (175,755 | ) | | | (5,870,457 | ) | | | (7,655,840 | ) |
| | | | | | |
Capital stock transactions: | | | | | | | | | | | | | | | | | | | | | | | | |
Proceeds from sale of shares | | | 3,042,445 | | | | 5,793,776 | | | | 2,210,195 | | | | 978,988 | | | | 12,088,658 | | | | 21,076,186 | |
Net asset value of shares issued to shareholders in payment of distributions declared | | | 1,436,850 | | | | 2,104,880 | | | | 100,435 | | | | 175,755 | | | | 5,870,457 | | | | 7,655,840 | |
Cost of shares redeemed | | | (10,733,974 | ) | | | (9,176,817 | ) | | | (3,204,289 | ) | | | (1,849,421 | ) | | | (33,161,526 | ) | | | (28,163,105 | ) |
| | | | | | | | | | | | | | | | | | | | | | | | |
Change in net assets resulting from capital stock transactions | | | (6,254,679 | ) | | | (1,278,161 | ) | | | (893,659 | ) | | | (694,678 | ) | | | (15,202,411 | ) | | | 568,921 | |
| | | | | | | | | | | | | | | | | | | | | | | | |
Change in net assets | | | (6,615,517 | ) | | | (2,243,745 | ) | | | (654,285 | ) | | | (625,773 | ) | | | (12,608,599 | ) | | | (1,601,106 | ) |
| | | | | | |
Net assets: | | | | | | | | | | | | | | | | | | | | | | | | |
Beginning of period | | | 21,595,320 | | | | 23,839,065 | | | | 4,568,978 | | | | 5,194,751 | | | | 93,255,983 | | | | 94,857,089 | |
| | | | | | | | | | | | | | | | | | | | | | | | |
End of period | | $ | 14,979,803 | | | $ | 21,595,320 | | | $ | 3,914,693 | | | $ | 4,568,978 | | | $ | 80,647,384 | | | $ | 93,255,983 | |
| | | | | | | | | | | | | | | | | | | | | | | | |
Undistributed net investment income included in net assets at end of period | | $ | 168,906 | | | $ | 262,415 | | | $ | 37,094 | | | $ | 49,563 | | | $ | 637,700 | | | $ | 756,695 | |
| | | | | | | | | | | | | | | | | | | | | | | | |
| (1) | Reflects operations for the period from September 1, 2015, to August 1, 2016 (termination of Institutional class of shares). |
(See Notes which are an integral part of the Financial Statements)
33
| | |
| Statements of Changes in Net Assets | | BMO Funds |
| | | | | | | | | | | | | | | | | | | | | | | | |
| | | | | | | | | | |
| | | 2025 Fund | | | 2030 Fund | | | 2035 Fund | |
| | | Year Ended
August 31,
2017 | | | Year Ended
August 31,
2016 | | | Year Ended
August 31,
2017 | | | Year Ended
August 31,
2016 | | | Year Ended
August 31,
2017 | | | Year Ended
August 31,
2016 | |
Change in net assets resulting from: | | | | | | | | | | | | | | | | | | | | | | | | |
| | | | | | |
Operations: | | | | | | | | | | | | | | | | | | | | | | | | |
Net investment income | | $ | 464,642 | | | $ | 538,414 | | | $ | 1,367,853 | | | $ | 1,520,893 | | | $ | 391,676 | | | $ | 459,775 | |
Net realized gain (loss) on investments | | | 490,321 | | | | (105,860 | ) | | | 4,690,998 | | | | 1,870,789 | | | | 990,389 | | | | 215,954 | |
Net change in unrealized appreciation (depreciation) on investments | | | 2,185,232 | | | | 1,345,697 | | | | 6,065,890 | | | | 2,426,398 | | | | 1,832,288 | | | | 1,176,846 | |
| | | | | | | | | | | | | | | | | | | | | | | | |
Change in net assets resulting from operations | | | 3,140,195 | | | | 1,778,251 | | | | 12,124,741 | | | | 5,818,080 | | | | 3,214,353 | | | | 1,852,575 | |
| | | | | | |
Distributions to shareholders: | | | | | | | | | | | | | | | | | | | | | | | | |
Distributions to shareholders from net investment income: | | | | | | | | | | | | | | | | | | | | | | | | |
Investor class of shares | | | (10,858 | ) | | | (30,647 | ) | | | (243,224 | ) | | | (377,127 | ) | | | (9,873 | ) | | | (15,846 | ) |
Institutional class of shares | | | — | | | | (11,812 | )(1) | | | — | | | | (58,803 | )(1) | | | — | | | | (1,325 | )(1) |
Retirement class R-3 of shares | | | (15,122 | ) | | | (19,884 | ) | | | (101,706 | ) | | | (165,352 | ) | | | (5,872 | ) | | | (7,371 | ) |
Retirement class R-6 of shares | | | (591,903 | ) | | | (528,417 | ) | | | (1,339,900 | ) | | | (1,288,776 | ) | | | (518,267 | ) | | | (501,371 | ) |
Distributions to shareholders from net realized gain on investments: | | | | | | | | | | | | | | | | | | | | | | | | |
Investor class of shares | | | (12,985 | ) | | | (14,765 | ) | | | (668,223 | ) | | | (985,760 | ) | | | (22,302 | ) | | | (3,660 | ) |
Institutional class of shares | | | — | | | | (5,183 | )(1) | | | — | | | | (126,881 | )(1) | | | — | | | | (268 | )(1) |
Retirement class R-3 of shares | | | (19,978 | ) | | | (10,790 | ) | | | (340,715 | ) | | | (527,693 | ) | | | (15,697 | ) | | | (2,131 | ) |
Retirement class R-6 of shares | | | (543,487 | ) | | | (217,966 | ) | | | (2,785,759 | ) | | | (2,558,242 | ) | | | (903,500 | ) | | | (95,399 | ) |
| | | | | | | | | | | | | | | | | | | | | | | | |
Change in net assets resulting from distributions to shareholders | | | (1,194,333 | ) | | | (839,464 | ) | | | (5,479,527 | ) | | | (6,088,634 | ) | | | (1,475,511 | ) | | | (627,371 | ) |
| | | | | | |
Capital stock transactions: | | | | | | | | | | | | | | | | | | | | | | | | |
Proceeds from sale of shares | | | 5,604,471 | | | | 5,336,257 | | | | 16,918,635 | | | | 25,468,395 | | | | 3,951,792 | | | | 5,113,376 | |
Net asset value of shares issued to shareholders in payment of distributions declared | | | 1,194,333 | | | | 839,464 | | | | 5,479,527 | | | | 6,088,634 | | | | 1,475,511 | | | | 627,371 | |
Cost of shares redeemed | | | (17,820,626 | ) | | | (6,199,760 | ) | | | (39,617,757 | ) | | | (27,216,023 | ) | | | (25,378,614 | ) | | | (4,966,590 | ) |
| | | | | | | | | | | | | | | | | | | | | | | | |
Change in net assets resulting from capital stock transactions | | | (11,021,822 | ) | | | (24,039 | ) | | | (17,219,595 | ) | | | 4,341,006 | | | | (19,951,311 | ) | | | 774,157 | |
| | | | | | | | | | | | | | | | | | | | | | | | |
Change in net assets | | | (9,075,960 | ) | | | 914,748 | | | | (10,574,381 | ) | | | 4,070,452 | | | | (18,212,469 | ) | | | 1,999,361 | |
| | | | | | |
Net assets: | | | | | | | | | | | | | | | | | | | | | | | | |
Beginning of period | | | 30,631,628 | | | | 29,716,880 | | | | 103,383,763 | | | | 99,313,311 | | | | 31,282,877 | | | | 29,283,516 | |
| | | | | | | | | | | | | | | | | | | | | | | | |
End of period | | $ | 21,555,668 | | | $ | 30,631,628 | | | $ | 92,809,382 | | | $ | 103,383,763 | | | $ | 13,070,408 | | | $ | 31,282,877 | |
| | | | | | | | | | | | | | | | | | | | | | | | |
Undistributed net investment income included in net assets at end of period | | $ | 178,800 | | | $ | 238,835 | | | $ | 520,129 | | | $ | 562,149 | | | $ | 105,912 | | | $ | 163,275 | |
| | | | | | | | | | | | | | | | | | | | | | | | |
| (1) | Reflects operations for the period from September 1, 2015, to August 1, 2016 (termination of Institutional class of shares). |
(See Notes which are an integral part of the Financial Statements)
34
| | |
| Statements of Changes in Net Assets | | BMO Funds |
| | | | | | | | | | | | | | | | | | | | | | | | |
| | | | | | | | | | |
| | | 2040 Fund | | | 2045 Fund | | | 2050 Fund | |
| | | Year Ended
August 31,
2017 | | | Year Ended
August 31,
2016 | | | Year Ended
August 31,
2017 | | | Year Ended
August 31,
2016 | | | Year Ended
August 31,
2017 | | | Year Ended
August 31,
2016 | |
Change in net assets resulting from: | | | | | | | | | | | | | | | | | | | | | | | | |
| | | | | | |
Operations: | | | | | | | | | | | | | | | | | | | | | | | | |
Net investment income | | $ | 818,310 | | | $ | 889,329 | | | $ | 208,991 | | | $ | 228,529 | | | $ | 550,199 | | | $ | 559,753 | |
Net realized gain on investments | | | 4,903,883 | | | | 1,592,103 | | | | 571,381 | | | | 124,069 | | | | 1,562,211 | | | | 671,264 | |
Net change in unrealized appreciation (depreciation) on investments | | | 2,576,931 | | | | 1,374,135 | | | | 1,033,847 | | | | 670,024 | | | | 3,639,189 | | | | 1,511,768 | |
| | | | | | | | | | | | | | | | | | | | | | | | |
Change in net assets resulting from operations | | | 8,299,124 | | | | 3,855,567 | | | | 1,814,219 | | | | 1,022,622 | | | | 5,751,599 | | | | 2,742,785 | |
| | | | | | |
Distributions to shareholders: | | | | | | | | | | | | | | | | | | | | | | | | |
Distributions to shareholders from net investment income: | | | | | | | | | | | | | | | | | | | | | | | | |
Investor class of shares | | | (138,602 | ) | | | (203,534 | ) | | | (10,889 | ) | | | (20,716 | ) | | | (80,320 | ) | | | (146,769 | ) |
Institutional class of shares | | | — | | | | (44,537 | )(1) | | | — | | | | (2,048 | )(1) | | | — | | | | (35,895 | )(1) |
Retirement class R-3 of shares | | | (36,355 | ) | | | (73,664 | ) | | | (4,652 | ) | | | (6,178 | ) | | | (37,443 | ) | | | (60,323 | ) |
Retirement class R-6 of shares | | | (798,006 | ) | | | (791,125 | ) | | | (255,018 | ) | | | (231,014 | ) | | | (520,286 | ) | | | (428,840 | ) |
Distributions to shareholders from net realized gain on investments: | | | | | | | | | | | | | | | | | | | | | | | | |
Investor class of shares | | | (490,108 | ) | | | (830,743 | ) | | | (31,552 | ) | | | (3,806 | ) | | | (299,678 | ) | | | (350,073 | ) |
Institutional class of shares | | | — | | | | (150,868 | )(1) | | | — | | | | (337 | )(1) | | | — | | | | (72,362 | )(1) |
Retirement class R-3 of shares | | | (177,916 | ) | | | (416,388 | ) | | | (15,798 | ) | | | (1,532 | ) | | | (165,597 | ) | | | (181,590 | ) |
Retirement class R-6 of shares | | | (2,068,921 | ) | | | (2,427,746 | ) | | | (549,139 | ) | | | (35,560 | ) | | | (1,315,743 | ) | | | (776,404 | ) |
| | | | | | | | | | | | | | | | | | | | | | | | |
Change in net assets resulting from distributions to shareholders | | | (3,709,908 | ) | | | (4,938,605 | ) | | | (867,048 | ) | | | (301,191 | ) | | | (2,419,067 | ) | | | (2,052,256 | ) |
| | | | | | |
Capital stock transactions: | | | | | | | | | | | | | | | | | | | | | | | | |
Proceeds from sale of shares | | | 10,171,530 | | | | 17,210,809 | | | | 2,830,751 | | | | 4,959,205 | | | | 10,184,433 | | | | 14,385,642 | |
Net asset value of shares issued to shareholders in payment of distributions declared | | | 3,709,908 | | | | 4,938,605 | | | | 867,048 | | | | 301,191 | | | | 2,419,067 | | | | 2,052,256 | |
Cost of shares redeemed | | | (32,453,631 | ) | | | (17,723,164 | ) | | | (13,887,877 | ) | | | (3,856,826 | ) | | | (21,461,622 | ) | | | (11,656,291 | ) |
| | | | | | | | | | | | | | | | | | | | | | | | |
Change in net assets resulting from capital stock transactions | | | (18,572,193 | ) | | | 4,426,250 | | | | (10,190,078 | ) | | | 1,403,570 | | | | (8,858,122 | ) | | | 4,781,607 | |
| | | | | | | | | | | | | | | | | | | | | | | | |
Change in net assets | | | (13,982,977 | ) | | | 3,343,212 | | | | (9,242,907 | ) | | | 2,125,001 | | | | (5,525,590 | ) | | | 5,472,136 | |
| | | | | | |
Net assets: | | | | | | | | | | | | | | | | | | | | | | | | |
Beginning of period | | | 66,580,463 | | | | 63,237,251 | | | | 17,170,868 | | | | 15,045,867 | | | | 45,213,801 | | | | 39,741,665 | |
| | | | | | | | | | | | | | | | | | | | | | | | |
End of period | | $ | 52,597,486 | | | $ | 66,580,463 | | | $ | 7,927,961 | | | $ | 17,170,868 | | | $ | 39,688,211 | | | $ | 45,213,801 | |
| | | | | | | | | | | | | | | | | | | | | | | | |
Undistributed net investment income included in net assets at end of period | | $ | 256,257 | | | $ | 258,534 | | | $ | 52,210 | | | $ | 71,911 | | | $ | 183,185 | | | $ | 163,919 | |
| | | | | | | | | | | | | | | | | | | | | | | | |
| (1) | Reflects operations for the period from September 1, 2015, to August 1, 2016 (termination of Institutional class of shares). |
(See Notes which are an integral part of the Financial Statements)
35
| | |
| Statements of Changes in Net Assets | | BMO Funds |
| | | | | | | | | | | | | | | | | | | | | | | | |
| | | | | | | | | | |
| | | 2055 Fund | | | Conservative
Allocation Fund | | | Moderate
Allocation Fund | |
| | | Year Ended
August 31,
2017
| | | Year Ended
August 31,
2016
| | | Year Ended
August 31,
2017
| | | Year Ended
August 31,
2016
| | | Year Ended
August 31,
2017
| | | Year Ended
August 31,
2016
| |
Change in net assets resulting from: | | | | | | | | | | | | | | | | | | | | | | | | |
| | | | | | |
Operations: | | | | | | | | | | | | | | | | | | | | | | | | |
Net investment income | | $ | 112,386 | | | $ | 76,177 | | | $ | 2,399,251 | | | $ | 3,533,339 | | | $ | 2,148,214 | | | $ | 3,109,459 | |
Net realized gain (loss) on investments | | | 186,917 | | | | (2,889 | ) | | | 5,967,792 | | | | 13,546 | | | | 5,316,154 | | | | 1,358,330 | |
Net change in unrealized appreciation (depreciation) on investments | | | 797,022 | | | | 409,023 | | | | (2,480,117 | ) | | | 3,687,614 | | | | 1,771,140 | | | | 2,959,296 | |
| | | | | | | | | | | | | | | | | | | | | | | | |
Change in net assets resulting from operations | | | 1,096,325 | | | | 482,311 | | | | 5,886,926 | | | | 7,234,499 | | | | 9,235,508 | | | | 7,427,085 | |
| | | | | | |
Distributions to shareholders: | | | | | | | | | | | | | | | | | | | | | | | | |
Distributions to shareholders from net investment income: | | | | | | | | | | | | | | | | | | | | | | | | |
Investor class of shares | | | (5,113 | ) | | | (15,495 | ) | | | (392,079 | ) | | | (507,382 | ) | | | (261,497 | ) | | | (392,348 | ) |
Institutional class of shares | | | — | | | | (2,838 | )(1) | | | (813,572 | ) | | | (759,470 | ) | | | (289,008 | ) | | | (383,423 | ) |
Retirement class R-3 of shares | | | (5,867 | ) | | | (3,993 | ) | | | (152,724 | ) | | | (146,369 | ) | | | (256,521 | ) | | | (253,918 | ) |
Retirement class R-6 of shares | | | (110,946 | ) | | | (51,903 | ) | | | (2,551,270 | ) | | | (2,356,604 | ) | | | (2,444,589 | ) | | | (2,429,323 | ) |
Distributions to shareholders from net realized gain on investments: | | | | | | | | | | | | | | | | | | | | | | | | |
Investor class of shares | | | (15,407 | ) | | | (6,757 | ) | | | (3,300 | ) | | | (428,827 | ) | | | (162,234 | ) | | | (636,841 | ) |
Institutional class of shares | | | — | | | | (1,095 | )(1) | | | (6,026 | ) | | | (572,126 | ) | | | (157,323 | ) | | | (533,972 | ) |
Retirement class R-3 of shares | | | (18,291 | ) | | | (2,123 | ) | | | (1,394 | ) | | | (145,688 | ) | | | (175,521 | ) | | | (513,289 | ) |
Retirement class R-6 of shares | | | (231,583 | ) | | | (18,378 | ) | | | (17,954 | ) | | | (1,676,948 | ) | | | (1,241,608 | ) | | | (3,181,486 | ) |
| | | | | | | | | | | | | | | | | | | | | | | | |
Change in net assets resulting from distributions to shareholders | | | (387,207 | ) | | | (102,582 | ) | | | (3,938,319 | ) | | | (6,593,414 | ) | | | (4,988,301 | ) | | | (8,324,600 | ) |
| | | | | | |
Capital stock transactions: | | | | | | | | | | | | | | | | | | | | | | | | |
Proceeds from sale of shares | | | 3,302,459 | | | | 6,158,439 | | | | 16,844,101 | | | | 14,963,101 | | | | 21,818,957 | | | | 30,045,053 | |
Net asset value of shares issued to shareholders in payment of distributions declared | | | 384,898 | | | | 102,582 | | | | 3,938,319 | | | | 6,593,414 | | | | 4,988,301 | | | | 8,324,600 | |
Cost of shares redeemed | | | (4,943,591 | ) | | | (3,331,016 | ) | | | (91,814,964 | ) | | | (26,142,752 | ) | | | (59,025,227 | ) | | | (52,533,067 | ) |
| | | | | | | | | | | | | | | | | | | | | | | | |
Change in net assets resulting from capital stock transactions | | | (1,256,234 | ) | | | 2,930,005 | | | | (71,032,544 | ) | | | (4,586,237 | ) | | | (32,217,969 | ) | | | (14,163,414 | ) |
| | | | | | | | | | | | | | | | | | | | | | | | |
Change in net assets | | | (547,116 | ) | | | 3,309,734 | | | | (69,083,937 | ) | | | (3,945,152 | ) | | | (27,970,762 | ) | | | (15,060,929 | ) |
| | | | | | |
Net assets: | | | | | | | | | | | | | | | | | | | | | | | | |
Beginning of period | | | 7,753,195 | | | | 4,443,461 | | | | 143,018,326 | | | | 146,963,478 | | | | 139,130,878 | | | | 154,191,807 | |
| | | | | | | | | | | | | | | | | | | | | | | | |
End of period | | $ | 7,206,079 | | | $ | 7,753,195 | | | $ | 73,934,389 | | | $ | 143,018,326 | | | $ | 111,160,116 | | | $ | 139,130,878 | |
| | | | | | | | | | | | | | | | | | | | | | | | |
Undistributed net investment income included in net assets at end of period | | $ | 36,833 | | | $ | 26,603 | | | $ | 1,337,631 | | | $ | 2,221,712 | | | $ | 1,135,807 | | | $ | 1,741,198 | |
| | | | | | | | | | | | | | | | | | | | | | | | |
(1) Reflects operations for the period from September 1, 2015, to August 1, 2016 (termination of Institutional class of shares).
(See Notes which are an integral part of the Financial Statements)
36
| | |
| Statements of Changes in Net Assets | | BMO Funds |
| | | | | | | | | | | | | | | | | | | | | | | | |
| | | | | | | | | | |
| | | Balanced
Allocation Fund | | | Growth
Allocation Fund | | | Aggressive
Allocation Fund | |
| | | Year Ended
August 31,
2017 | | | Year Ended
August 31,
2016 | | | Year Ended
August 31,
2017 | | | Year Ended
August 31,
2016 | | | Year Ended
August 31,
2017 | | | Year Ended
August 31,
2016 | |
Change in net assets resulting from: | | | | | | | | | | | | | | | | | | | | | | | | |
| | | | | | |
Operations: | | | | | | | | | | | | | | | | | | | | | | | | |
Net investment income | | $ | 6,172,823 | | | $ | 8,458,691 | | | $ | 1,771,157 | | | $ | 1,940,498 | | | $ | 2,527,808 | | | $ | 2,825,928 | |
Net realized gain on investments | | | 32,055,528 | | | | 22,380,911 | | | | 8,216,993 | | | | 4,507,622 | | | | 22,285,028 | | | | 14,730,732 | |
Net change in unrealized appreciation (depreciation) on investments | | | 3,277,801 | | | | (5,627,353 | ) | | | 7,336,431 | | | | 864,287 | | | | 4,477,343 | | | | (5,891,402 | ) |
| | | | | | | | | | | | | | | | | | | | | | | | |
Change in net assets resulting from operations | | | 41,506,152 | | | | 25,212,249 | | | | 17,324,581 | | | | 7,312,407 | | | | 29,290,179 | | | | 11,665,258 | |
| | | | | | |
Distributions to shareholders: | | | | | | | | | | | | | | | | | | | | | | | | |
Distributions to shareholders from net investment income: | | | | | | | | | | | | | | | | | | | | | | | | |
Investor class of shares | | | (1,887,442 | ) | | | (2,670,667 | ) | | | (293,423 | ) | | | (594,557 | ) | | | (444,228 | ) | | | (947,452 | ) |
Institutional class of shares | | | (1,543,662 | ) | | | (1,639,131 | ) | | | (170,199 | ) | | | (281,588 | ) | | | (306,784 | ) | | | (528,389 | ) |
Retirement class R-3 of shares | | | (417,940 | ) | | | (571,392 | ) | | | (160,972 | ) | | | (392,670 | ) | | | (181,480 | ) | | | (232,515 | ) |
Retirement class R-6 of shares | | | (4,927,720 | ) | | | (5,290,678 | ) | | | (1,340,617 | ) | | | (1,388,142 | ) | | | (1,802,775 | ) | | | (2,050,840 | ) |
Distributions to shareholders from net realized gain on investments: | | | | | | | | | | | | | | | | | | | | | | | | |
Investor class of shares | | | (5,403,978 | ) | | | (10,179,207 | ) | | | (1,064,644 | ) | | | (2,245,206 | ) | | | (3,575,428 | ) | | | (4,638,293 | ) |
Institutional class of shares | | | (3,791,371 | ) | | | (5,371,935 | ) | | | (491,722 | ) | | | (889,202 | ) | | | (1,848,747 | ) | | | (2,052,379 | ) |
Retirement class R-3 of shares | | | (1,439,192 | ) | | | (2,566,382 | ) | | | (844,909 | ) | | | (1,711,464 | ) | | | (1,664,710 | ) | | | (1,422,315 | ) |
Retirement class R-6 of shares | | | (11,266,539 | ) | | | (16,132,271 | ) | | | (3,505,544 | ) | | | (4,043,597 | ) | | | (9,629,541 | ) | | | (7,266,289 | ) |
| | | | | | | | | | | | | | | | | | | | | | | | |
Change in net assets resulting from distributions to shareholders | | | (30,677,844 | ) | | | (44,421,663 | ) | | | (7,872,030 | ) | | | (11,546,426 | ) | | | (19,453,693 | ) | | | (19,138,472 | ) |
| | | | | | |
Capital stock transactions: | | | | | | | | | | | | | | | | | | | | | | | | |
Proceeds from sale of shares | | | 65,025,586 | | | | 75,534,959 | | | | 30,658,746 | | | | 28,369,925 | | | | 35,561,036 | | | | 37,575,365 | |
Net asset value of shares issued to shareholders in payment of distributions declared | | | 30,301,890 | | | | 44,421,663 | | | | 7,872,030 | | | | 11,546,426 | | | | 19,453,693 | | | | 19,138,472 | |
Cost of shares redeemed | | | (201,885,039 | ) | | | (158,195,784 | ) | | | (59,108,452 | ) | | | (50,472,757 | ) | | | (108,341,684 | ) | | | (81,701,480 | ) |
| | | | | | | | | | | | | | | | | | | | | | | | |
Change in net assets resulting from capital stock transactions | | | (106,557,563 | ) | | | (38,239,162 | ) | | | (20,577,676 | ) | | | (10,556,406 | ) | | | (53,326,955 | ) | | | (24,987,643 | ) |
| | | | | | | | | | | | | | | | | | | | | | | | |
Change in net assets | | | (95,729,255 | ) | | | (57,448,576 | ) | | | (11,125,125 | ) | | | (14,790,425 | ) | | | (43,490,469 | ) | | | (32,460,857 | ) |
| | | | | | |
Net assets: | | | | | | | | | | | | | | | | | | | | | | | | |
Beginning of period | | | 467,406,127 | | | | 524,854,703 | | | | 140,114,788 | | | | 154,905,213 | | | | 218,884,402 | | | | 251,345,259 | |
| | | | | | | | | | | | | | | | | | | | | | | | |
End of period | | $ | 371,676,872 | | | $ | 467,406,127 | | | $ | 128,989,663 | | | $ | 140,114,788 | | | $ | 175,393,933 | | | $ | 218,884,402 | |
| | | | | | | | | | | | | | | | | | | | | | | | |
Undistributed net investment income included in net assets at end of period | | $ | 2,882,312 | | | $ | 4,060,170 | | | $ | 775,028 | | | $ | 622,699 | | | $ | 921,601 | | | $ | 667,893 | |
| | | | | | | | | | | | | | | | | | | | | | | | |
(See Notes which are an integral part of the Financial Statements)
37
| | |
| Financial Highlights—Investor Class of Shares (For a share outstanding throughout each period) |
| | | | | | | | | | | | | | | | | | | | | | | | | | | | | | | | | | | | | | | | | | | | | | | | | | | | | | | | | | | | | | | | | | | | | | |
| | | | | | | | | | | | |
Period
Ended
August 31, | | Net asset
value,
beginning
of period | | Net
investment
income
(loss) | | Net realized
and unrealized
gain (loss) | | Total from
investment
operations | | Distributions to
shareholders
from net
investment
income | | Distributions to
shareholders
from net
realized gain | | Total
distributions | | Net asset
value, end
of period | | Total
return (1)(3) | | Ratios to Average Net Assets (4) | | Net assets,
end of period
(000 omitted) | | Portfolio
turnover
rate (3) |
| | | | | | | | | | | Gross
Expenses | | Net
Expenses (2) | | Net
investment
income (2) | | |
In-Retirement Fund | |
| 2017 | | | $ | 9.54 | | | | $ | 0.18 | | | | $ | 0.39 | | | | $ | 0.57 | | | | $ | (0.23 | ) | | | $ | (0.49 | ) | | | $ | (0.72 | ) | | | $ | 9.39 | | | | | 6.52 | % | | | | 1.42 | % | | | | 0.33 | % | | | | 1.65 | % | | | $ | 3,461 | | | | | 26 | % |
| 2016 | | | | 10.02 | | | | | 0.22 | | | | | 0.27 | | | | | 0.49 | | | | | (0.24 | ) | | | | (0.73 | ) | | | | (0.97 | ) | | | | 9.54 | | | | | 5.45 | | | | | 1.25 | | | | | 0.33 | | | | | 2.02 | | | | | 3,469 | | | | | 44 | |
| 2015 | | | | 11.05 | | | | | 0.24 | | | | | (0.44 | ) | | | | (0.20 | ) | | | | (0.29 | ) | | | | (0.54 | ) | | | | (0.83 | ) | | | | 10.02 | | | | | (1.94 | ) | | | | 1.03 | | | | | 0.33 | | | | | 1.96 | | | | | 4,804 | | | | | 53 | |
| 2014 | | | | 10.00 | | | | | 0.20 | | | | | 0.99 | | | | | 1.19 | | | | | (0.12 | ) | | | | (0.02 | ) | | | | (0.14 | ) | | | | 11.05 | | | | | 12.03 | | | | | 1.08 | | | | | 0.33 | | | | | 1.92 | | | | | 7,120 | | | | | 45 | |
2015 Fund | | | | | | | | | | | | | | | | | | | | | | | | | | | | | | | | | | | | | | | | | | | | | | | | | | | | | | | | | | | | | | | | | | | | | | |
| 2017 | | | | 10.66 | | | | | 0.34 | | | | | 0.53 | | | | | 0.87 | | | | | (0.21 | ) | | | | — | | | | | (0.21 | ) | | | | 11.32 | | | | | 8.33 | | | | | 4.29 | | | | | 0.33 | | | | | 1.47 | | | | | 411 | | | | | 72 | |
| 2016 | | | | 10.44 | | | | | 0.19 | | | | | 0.39 | | | | | 0.58 | | | | | (0.25 | ) | | | | (0.11 | ) | | | | (0.36 | ) | | | | 10.66 | | | | | 5.76 | | | | | 4.07 | | | | | 0.33 | | | | | 1.80 | | | | | 689 | | | | | 49 | |
| 2015 | | | | 10.74 | | | | | 0.11 | | | | | (0.35 | ) | | | | (0.24 | ) | | | | (0.06 | ) | | | | — | | | | | (0.06 | ) | | | | 10.44 | | | | | (2.27 | ) | | | | 4.21 | | | | | 0.33 | | | | | 1.54 | | | | | 632 | | | | | 83 | |
| 2014(5) | | | | 10.00 | | | | | 0.02 | | | | | 0.72 | | | | | 0.74 | | | | | — | | | | | — | | | | | — | | | | | 10.74 | | | | | 7.40 | | | | | 73.54 | | | | | 0.33 | | | | | 1.23 | | | | | 229 | | | | | 29 | |
2020 Fund | | | | | | | | | | | | | | | | | | | | | | | | | | | | | | | | | | | | | | | | | | | | | | | | | | | | | | | | | | | | | | | | | | | | | | |
| 2017 | | | | 10.21 | | | | | 0.17 | | | | | 0.81 | | | | | 0.98 | | | | | (0.19 | ) | | | | (0.48 | ) | | | | (0.67 | ) | | | | 10.52 | | | | | 10.17 | | | | | 0.63 | | | | | 0.33 | | | | | 1.45 | | | | | 17,810 | | | | | 23 | |
| 2016 | | | | 10.49 | | | | | 0.17 | | | | | 0.41 | | | | | 0.58 | | | | | (0.22 | ) | | | | (0.64 | ) | | | | (0.86 | ) | | | | 10.21 | | | | | 5.96 | | | | | 0.63 | | | | | 0.33 | | | | | 1.67 | | | | | 18,913 | | | | | 39 | |
| 2015 | | | | 11.34 | | | | | 0.18 | | | | | (0.46 | ) | | | | (0.28 | ) | | | | (0.25 | ) | | | | (0.32 | ) | | | | (0.57 | ) | | | | 10.49 | | | | | (2.58 | ) | | | | 0.59 | | | | | 0.33 | | | | | 1.64 | | | | | 21,331 | | | | | 37 | |
| 2014 | | | | 10.00 | | | | | 0.18 | | | | | 1.35 | | | | | 1.53 | | | | | (0.15 | ) | | | | (0.04 | ) | | | | (0.19 | ) | | | | 11.34 | | | | | 15.43 | | | | | 0.63 | | | | | 0.33 | | | | | 1.72 | | | | | 32,064 | | | | | 35 | |
2025 Fund | | | | | | | | | | | | | | | | | | | | | | | | | | | | | | | | | | | | | | | | | | | | | | | | | | | | | | | | | | | | | | | | | | | | | | |
| 2017 | | | | 10.74 | | | | | 0.12 | | | | | 1.10 | | | | | 1.22 | | | | | (0.16 | ) | | | | (0.19 | ) | | | | (0.35 | ) | | | | 11.61 | | | | | 11.76 | | | | | 1.04 | | | | | 0.33 | | | | | 1.12 | | | | | 933 | | | | | 31 | |
| 2016 | | | | 10.42 | | | | | 0.15 | | | | | 0.44 | | | | | 0.59 | | | | | (0.18 | ) | | | | (0.09 | ) | | | | (0.27 | ) | | | | 10.74 | | | | | 5.78 | | | | | 1.01 | | | | | 0.33 | | | | | 1.78 | | | | | 674 | | | | | 33 | |
| 2015 | | | | 10.78 | | | | | 0.06 | | | | | (0.37 | ) | | | | (0.31 | ) | | | | (0.05 | ) | | | | — | | | | | (0.05 | ) | | | | 10.42 | | | | | (2.89 | ) | | | | 1.26 | | | | | 0.33 | | | | | 1.04 | | | | | 1,676 | | | | | 53 | |
| 2014(5) | | | | 10.00 | | | | | 0.01 | | | | | 0.77 | | | | | 0.78 | | | | | — | | | | | — | | | | | — | | | | | 10.78 | | | | | 7.80 | | | | | 24.60 | | | | | 0.33 | | | | | 0.56 | | | | | 289 | | | | | 22 | |
2030 Fund | | | | | | | | | | | | | | | | | | | | | | | | | | | | | | | | | | | | | | | | | | | | | | | | | | | | | | | | | | | | | | | | | | | | | | |
| 2017 | | | | 10.79 | | | | | 0.15 | | | | | 1.18 | | | | | 1.33 | | | | | (0.15 | ) | | | | (0.42 | ) | | | | (0.57 | ) | | | | 11.55 | | | | | 12.89 | | | | | 0.61 | | | | | 0.37 | | | | | 1.25 | | | | | 19,498 | | | | | 25 | |
| 2016 | | | | 10.84 | | | | | 0.14 | | | | | 0.45 | | | | | 0.59 | | | | | (0.18 | ) | | | | (0.46 | ) | | | | (0.64 | ) | | | | 10.79 | | | | | 5.75 | | | | | 0.61 | | | | | 0.37 | | | | | 1.37 | | | | | 19,681 | | | | | 33 | |
| 2015 | | | | 11.61 | | | | | 0.15 | | | | | (0.49 | ) | | | | (0.34 | ) | | | | (0.18 | ) | | | | (0.25 | ) | | | | (0.43 | ) | | | | 10.84 | | | | | (3.07 | ) | | | | 0.59 | | | | | 0.37 | | | | | 1.30 | | | | | 23,332 | | | | | 45 | |
| 2014 | | | | 10.00 | | | | | 0.15 | | | | | 1.66 | | | | | 1.81 | | | | | (0.18 | ) | | | | (0.02 | ) | | | | (0.20 | ) | | | | 11.61 | | | | | 18.26 | | | | | 0.66 | | | | | 0.37 | | | | | 1.40 | | | | | 33,059 | | | | | 29 | |
2035 Fund | | | | | | | | | | | | | | | | | | | | | | | | | | | | | | | | | | | | | | | | | | | | | | | | | | | | | | | | | | | | | | | | | | | | | | |
| 2017 | | | | 10.73 | | | | | 0.10 | | | | | 1.33 | | | | | 1.43 | | | | | (0.14 | ) | | | | (0.32 | ) | | | | (0.46 | ) | | | | 11.70 | | | | | 13.85 | | | | | 1.13 | | | | | 0.37 | | | | | 0.91 | | | | | 734 | | | | | 32 | |
| 2016 | | | | 10.33 | | | | | 0.10 | | | | | 0.49 | | | | | 0.59 | | | | | (0.15 | ) | | | | (0.04 | ) | | | | (0.19 | ) | | | | 10.73 | | | | | 5.84 | | | | | 1.02 | | | | | 0.37 | | | | | 1.35 | | | | | 659 | | | | | 29 | |
| 2015 | | | | 10.71 | | | | | 0.01 | | | | | (0.38 | ) | | | | (0.37 | ) | | | | (0.01 | ) | | | | — | | | | | (0.01 | ) | | | | 10.33 | | | | | (3.43 | ) | | | | 1.29 | | | | | 0.37 | | | | | 0.26 | | | | | 870 | | | | | 96 | |
| 2014(5) | | | | 10.00 | | | | | 0.00 | | | | | 0.71 | | | | | 0.71 | | | | | — | | | | | — | | | | | — | | | | | 10.71 | | | | | 7.10 | | | | | 23.63 | | | | | 0.37 | | | | | 0.16 | | | | | 348 | | | | | 29 | |
2040 Fund | | | | | | | | | | | | | | | | | | | | | | | | | | | | | | | | | | | | | | | | | | | | | | | | | | | | | | | | | | | | | | | | | | | | | | |
| 2017 | | | | 10.68 | | | | | 0.16 | | | | | 1.32 | | | | | 1.48 | | | | | (0.13 | ) | | | | (0.47 | ) | | | | (0.60 | ) | | | | 11.56 | | | | | 14.59 | | | | | 0.73 | | | | | 0.36 | | | | | 1.30 | | | | | 11,098 | | | | | 24 | |
| 2016 | | | | 10.92 | | | | | 0.12 | | | | | 0.47 | | | | | 0.59 | | | | | (0.16 | ) | | | | (0.67 | ) | | | | (0.83 | ) | | | | 10.68 | | | | | 5.74 | | | | | 0.71 | | | | | 0.36 | | | | | 1.18 | | | | | 13,370 | | | | | 31 | |
| 2015 | | | | 11.75 | | | | | 0.12 | | | | | (0.51 | ) | | | | (0.39 | ) | | | | (0.20 | ) | | | | (0.24 | ) | | | | (0.44 | ) | | | | 10.92 | | | | | (3.46 | ) | | | | 0.67 | | | | | 0.36 | | | | | 1.14 | | | | | 12,852 | | | | | 36 | |
| 2014 | | | | 10.00 | | | | | 0.14 | | | | | 1.82 | | | | | 1.96 | | | | | (0.19 | ) | | | | (0.02 | ) | | | | (0.21 | ) | | | | 11.75 | | | | | 19.81 | | | | | 0.76 | | | | | 0.36 | | | | | 1.45 | | | | | 18,090 | | | | | 22 | |
2045 Fund | | | | | | | | | | | | | | | | | | | | | | | | | | | | | | | | | | | | | | | | | | | | | | | | | | | | | | | | | | | | | | | | | | | | | | |
| 2017(7) | | | | 10.92 | | | | | 0.11 | | | | | 1.41 | | | | | 1.52 | | | | | (0.13 | ) | | | | (0.38 | ) | | | | (0.51 | ) | | | | 11.93 | | | | | 14.58 | | | | | 1.72 | | | | | 0.36 | | | | | 1.03 | | | | | 911 | | | | | 31 | |
| 2016 | | | | 10.48 | | | | | 0.09 | | | | | 0.53 | | | | | 0.62 | | | | | (0.15 | ) | | | | (0.03 | ) | | | | (0.18 | ) | | | | 10.92 | | | | | 6.02 | | | | | 1.53 | | | | | 0.36 | | | | | 1.33 | | | | | 868 | | | | | 32 | |
| 2015 | | | | 10.84 | | | | | (0.01 | ) | | | | (0.34 | ) | | | | (0.35 | ) | | | | (0.01 | ) | | | | — | | | | | (0.01 | ) | | | | 10.48 | | | | | (3.27 | ) | | | | 2.14 | | | | | 0.36 | | | | | 0.26 | | | | | 1,142 | | | | | 95 | |
| 2014(5) | | | | 10.00 | | | | | 0.00 | | | | | 0.84 | | | | | 0.84 | | | | | — | | | | | — | | | | | — | | | | | 10.84 | | | | | 8.40 | | | | | 33.37 | | | | | 0.36 | | | | | 0.04 | | | | | 154 | | | | | 35 | |
2050 Fund | | | | | | | | | | | | | | | | | | | | | | | | | | | | | | | | | | | | | | | | | | | | | | | | | | | | | | | | | | | | | | | | | | | | | | |
| 2017 | | | | 11.05 | | | | | 0.21 | | | | | 1.34 | | | | | 1.55 | | | | | (0.13 | ) | | | | (0.48 | ) | | | | (0.61 | ) | | | | 11.99 | | | | | 14.67 | | | | | 0.85 | | | | | 0.36 | | | | | 1.55 | | | | | 8,400 | | | | | 27 | |
| 2016 | | | | 10.96 | | | | | 0.13 | | | | | 0.50 | | | | | 0.63 | | | | | (0.16 | ) | | | | (0.38 | ) | | | | (0.54 | ) | | | | 11.05 | | | | | 5.98 | | | | | 0.86 | | | | | 0.36 | | | | | 1.15 | | | | | 10,382 | | | | | 29 | |
| 2015 | | | | 11.76 | | | | | 0.12 | | | | | (0.50 | ) | | | | (0.38 | ) | | | | (0.19 | ) | | | | (0.23 | ) | | | | (0.42 | ) | | | | 10.96 | | | | | (3.37 | ) | | | | 0.84 | | | | | 0.36 | | | | | 1.06 | | | | | 10,275 | | | | | 39 | |
| 2014 | | | | 10.00 | | | | | 0.14 | | | | | 1.81 | | | | | 1.95 | | | | | (0.17 | ) | | | | (0.02 | ) | | | | (0.19 | ) | | | | 11.76 | | | | | 19.69 | | | | | 1.08 | | | | | 0.36 | | | | | 1.36 | | | | | 11,231 | | | | | 28 | |
2055 Fund | | | | | | | | | | | | | | | | | | | | | | | | | | | | | | | | | | | | | | | | | | | | | | | | | | | | | | | | | | | | | | | | | | | | | | |
| 2017 | | | | 10.85 | | | | | 0.11 | | | | | 1.40 | | | | | 1.51 | | | | | (0.12 | ) | | | | (0.34 | ) | | | | (0.46 | ) | | | | 11.90 | | | | | 14.39 | | | | | 2.56 | | | | | 0.36 | | | | | 0.91 | | | | | 551 | | | | | 56 | |
| 2016 | | | | 10.41 | | | | | 0.09 | | | | | 0.54 | | | | | 0.63 | | | | | (0.13 | ) | | | | (0.06 | ) | | | | (0.19 | ) | | | | 10.85 | | | | | 6.15 | | | | | 3.32 | | | | | 0.36 | | | | | 1.46 | | | | | 410 | | | | | 38 | |
| 2015 | | | | 10.85 | | | | | 0.06 | | | | | (0.42 | ) | | | | (0.36 | ) | | | | (0.06 | ) | | | | (0.02 | ) | | | | (0.08 | ) | | | | 10.41 | | | | | (3.33 | ) | | | | 6.91 | | | | | 0.36 | | | | | 0.57 | | | | | 1,049 | | | | | 61 | |
| 2014(5) | | | | 10.00 | | | | | 0.00 | | | | | 0.85 | | | | | 0.85 | | | | | — | | | | | — | | | | | — | | | | | 10.85 | | | | | 8.50 | | | | | 50.05 | | | | | 0.36 | | | | | 0.07 | | | | | 143 | | | | | 123 | |
(See Notes which are an integral part of the Financial Statements)
38
| | |
| Financial Highlights—Investor Class of Shares (For a share outstanding throughout each period) |
| | | | | | | | | | | | | | | | | | | | | | | | | | | | | | | | | | | | | | | | | | | | | | | | | | | | | | | | | | | | | | | | | | | | | | |
| | | | | | | | | | | | |
Period
Ended
August 31, | | Net asset
value,
beginning
of period | | Net
investment
income
(loss) | | Net realized
and unrealized
gain (loss) | | Total from
investment
operations | | Distributions to
shareholders
from net
investment
income | | Distributions to
shareholders
from net
realized gain | | Total
distributions | | Net asset
value, end
of period | | Total
return (1)(3) | | Ratios to Average Net Assets (4) | | Net assets,
end of period
(000 omitted) | | Portfolio
turnover
rate (3) |
| | | | | | | | | | | Gross
Expenses | | Net
Expenses (2) | | Net
investment
income (2) | | |
Conservative Allocation Fund | |
| 2017 | | | $ | 9.80 | | | | $ | 0.18 | | | | $ | 0.28 | | | | $ | 0.46 | | | | $ | (0.24 | ) | | | $ | (0.00 | ) | | | $ | (0.24 | ) | | | $ | 10.02 | | | | | 4.83 | % | | | | 0.58 | % | | | | 0.33 | % | | | | 1.55 | % | | | $ | 15,531 | | | | | 40 | % |
| 2016 | | | | 9.76 | | | | | 0.25 | | | | | 0.21 | | | | | 0.46 | | | | | (0.23 | ) | | | | (0.19 | ) | | | | (0.42 | ) | | | | 9.80 | | | | | 4.98 | | | | | 0.56 | | | | | 0.33 | | | | | 2.23 | | | | | 17,919 | | | | | 31 | |
| 2015 | | | | 10.14 | | | | | 0.20 | | | | | (0.34 | ) | | | | (0.14 | ) | | | | (0.16 | ) | | | | (0.08 | ) | | | | (0.24 | ) | | | | 9.76 | | | | | (1.37 | ) | | | | 0.57 | | | | | 0.33 | | | | | 1.97 | | | | | 23,598 | | | | | 39 | |
| 2014(6) | | | | 10.00 | | | | | 0.03 | | | | | 0.11 | | | | | 0.14 | | | | | — | | | | | — | | | | | — | | | | | 10.14 | | | | | 1.40 | | | | | 0.60 | | | | | 0.33 | | | | | 1.17 | | | | | 25,931 | | | | | 10 | |
Moderate Allocation Fund | |
| 2017 | | | | 9.72 | | | | | 0.17 | | | | | 0.55 | | | | | 0.72 | | | | | (0.22 | ) | | | | (0.14 | ) | | | | (0.36 | ) | | | | 10.08 | | | | | 7.59 | | | | | 0.58 | | | | | 0.30 | | | | | 1.43 | | | | | 7,777 | | | | | 39 | |
| 2016 | | | | 9.78 | | | | | 0.24 | | | | | 0.23 | | | | | 0.47 | | | | | (0.20 | ) | | | | (0.33 | ) | | | | (0.53 | ) | | | | 9.72 | | | | | 5.13 | | | | | 0.56 | | | | | 0.30 | | | | | 1.92 | | | | | 13,119 | | | | | 38 | |
| 2015 | | | | 10.20 | | | | | 0.17 | | | | | (0.36 | ) | | | | (0.19 | ) | | | | (0.17 | ) | | | | (0.06 | ) | | | | (0.23 | ) | | | | 9.78 | | | | | (1.89 | ) | | | | 0.57 | | | | | 0.30 | | | | | 1.72 | | | | | 22,595 | | | | | 30 | |
| 2014(6) | | | | 10.00 | | | | | 0.04 | | | | | 0.16 | | | | | 0.20 | | | | | — | | | | | — | | | | | — | | | | | 10.20 | | | | | 2.00 | | | | | 0.60 | | | | | 0.30 | | | | | 1.60 | | | | | 24,928 | | | | | 8 | |
Balanced Allocation Fund | |
| 2017 | | | | 9.42 | | | | | 0.13 | | | | | 0.79 | | | | | 0.92 | | | | | (0.18 | ) | | | | (0.51 | ) | | | | (0.69 | ) | | | | 9.65 | | | | | 10.33 | | | | | 0.48 | | | | | 0.33 | | | | | 1.19 | | | | | 101,517 | | | | | 35 | |
| 2016 | | | | 9.78 | | | | | 0.15 | | | | | 0.32 | | | | | 0.47 | | | | | (0.17 | ) | | | | (0.66 | ) | | | | (0.83 | ) | | | | 9.42 | | | | | 5.23 | | | | | 0.47 | | | | | 0.33 | | | | | 1.54 | | | | | 110,814 | | | | | 33 | |
| 2015 | | | | 10.26 | | | | | 0.15 | | | | | (0.39 | ) | | | | (0.24 | ) | | | | (0.17 | ) | | | | (0.07 | ) | | | | (0.24 | ) | | | | 9.78 | | | | | (2.41 | ) | | | | 0.47 | | | | | 0.33 | | | | | 1.38 | | | | | 157,207 | | | | | 29 | |
| 2014(6) | | | | 10.00 | | | | | 0.03 | | | | | 0.23 | | | | | 0.26 | | | | | — | | | | | — | | | | | — | | | | | 10.26 | | | | | 2.60 | | | | | 0.47 | | | | | 0.33 | | | | | 1.14 | | | | | 184,860 | | | | | 6 | |
Growth Allocation Fund | |
| 2017 | | | | 9.57 | | | | | 0.10 | | | | | 1.11 | | | | | 1.21 | | | | | (0.12 | ) | | | | (0.43 | ) | | | | (0.55 | ) | | | | 10.23 | | | | | 13.27 | | | | | 0.57 | | | | | 0.30 | | | | | 1.10 | | | | | 16,758 | | | | | 42 | |
| 2016 | | | | 9.82 | | | | | 0.12 | | | | | 0.37 | | | | | 0.49 | | | | | (0.16 | ) | | | | (0.58 | ) | | | | (0.74 | ) | | | | 9.57 | | | | | 5.28 | | | | | 0.56 | | | | | 0.30 | | | | | 1.22 | | | | | 24,691 | | | | | 38 | |
| 2015 | | | | 10.31 | | | | | 0.11 | | | | | (0.41 | ) | | | | (0.30 | ) | | | | (0.16 | ) | | | | (0.03 | ) | | | | (0.19 | ) | | | | 9.82 | | | | | (2.95 | ) | | | | 0.57 | | | | | 0.30 | | | | | 1.10 | | | | | 43,023 | | | | | 20 | |
| 2014(6) | | | | 10.00 | | | | | 0.02 | | | | | 0.29 | | | | | 0.31 | | | | | — | | | | | — | | | | | — | | | | | 10.31 | | | | | 3.10 | | | | | 0.60 | | | | | 0.30 | | | | | 0.73 | | | | | 46,520 | | | | | 6 | |
Aggressive Allocation Fund | |
| 2017 | | | | 9.56 | | | | | 0.11 | | | | | 1.27 | | | | | 1.38 | | | | | (0.10 | ) | | | | (0.83 | ) | | | | (0.93 | ) | | | | 10.01 | | | | | 15.60 | | | | | 0.53 | | | | | 0.33 | | | | | 1.03 | | | | | 37,632 | | | | | 33 | |
| 2016 | | | | 9.85 | | | | | 0.10 | | | | | 0.38 | | | | | 0.48 | | | | | (0.13 | ) | | | | (0.64 | ) | | | | (0.77 | ) | | | | 9.56 | | | | | 5.14 | | | | | 0.52 | | | | | 0.33 | | | | | 1.04 | | | | | 52,260 | | | | | 33 | |
| 2015 | | | | 10.36 | | | | | 0.12 | | | | | (0.41 | ) | | | | (0.29 | ) | | | | (0.18 | ) | | | | (0.04 | ) | | | | (0.22 | ) | | | | 9.85 | | | | | (2.79 | ) | | | | 0.53 | | | | | 0.34 | | | | | 0.73 | | | | | 83,064 | | | | | 44 | |
| 2014(6) | | | | 10.00 | | | | | 0.01 | | | | | 0.35 | | | | | 0.36 | | | | | — | | | | | — | | | | | — | | | | | 10.36 | | | | | 3.60 | | | | | 0.58 | | | | | 0.36 | | | | | 0.42 | | | | | 63,049 | | | | | 3 | |
| (1) | Based on net asset value as of end of period date. |
| (2) | The contractual and voluntary expense waivers pursuant to Note 5 of the financial statements are reflected in both the net expense and net investment income ratios. |
| (3) | Not annualized for periods less than one year. |
| (4) | Annualized for periods less than one year. Excludes acquired fund fees and expenses of underlying funds. |
| (5) | Reflects operations for the period from December 27, 2013 (inception date) to August 31, 2014. |
| (6) | Reflects operations for the period from May 30, 2014 (inception date) to August 31, 2014. |
| (7) | Calculated using the average shares method. |
(See Notes which are an integral part of the Financial Statements)
39
| | |
| Financial Highlights—Institutional Class of Shares (For a share outstanding throughout each period) |
| | | | | | | | | | | | | | | | | | | | | | | | | | | | | | | | | | | | | | | | | | | | | | | | | | | | | | | | | | | | | | | | | | | | | | |
| | | | | | | | | | | | |
Period
Ended
August 31, | | Net asset
value,
beginning
of period | | Net
investment
income | | Net realized
and unrealized
gain (loss) | | Total from
investment
operations | | Distributions to
shareholders
from net
investment
income | | Distributions to
shareholders
from net
realized gain | | Total
distributions | | Net asset
value, end
of period | | Total
return (1)(3) | | Ratios to Average Net Assets (4) | | Net assets,
end of period
(000 omitted) | | Portfolio
turnover
rate (3) |
| | | | | | | | | | | Gross
Expenses | | Net
Expenses (2) | | Net
investment
income (2) | | |
Conservative Allocation Fund | | | | | | | | | | | | | | | | | | | | | | | | | | | | | | | | | | | | | | | | | | | | | | | | | | | | | | | | |
| 2017 | | | $ | 9.81 | | | | $ | 0.18 | | | | $ | 0.30 | | | | $ | 0.48 | | | | $ | (0.27 | ) | | | $ | (0.00 | ) | | | $ | (0.27 | ) | | | $ | 10.02 | | | | | 5.07 | % | | | | 0.33 | % | | | | 0.08 | % | | | | 1.78 | % | | | $ | 26,464 | | | | | 40 | % |
| 2016 | | | | 9.77 | | | | | 0.24 | | | | | 0.25 | | | | | 0.49 | | | | | (0.26 | ) | | | | (0.19 | ) | | | | (0.45 | ) | | | | 9.81 | | | | | 5.29 | | | | | 0.31 | | | | | 0.08 | | | | | 2.46 | | | | | 29,479 | | | | | 31 | |
| 2015 | | | | 10.15 | | | | | 0.23 | | | | | (0.35 | ) | | | | (0.12 | ) | | | | (0.17 | ) | | | | (0.09 | ) | | | | (0.26 | ) | | | | 9.77 | | | | | (1.22 | ) | | | | 0.32 | | | | | 0.08 | | | | | 2.23 | | | | | 29,104 | | | | | 39 | |
| 2014(5) | | | | 10.00 | | | | | 0.04 | | | | | 0.11 | | | | | 0.15 | | | | | — | | | | | — | | | | | — | | | | | 10.15 | | | | | 1.50 | | | | | 0.35 | | | | | 0.08 | | | | | 1.41 | | | | | 29,082 | | | | | 10 | |
Moderate Allocation Fund | | | | | | | | | | | | | | | | | | | | | | | | | | | | | | | | | | | | | | | | | | | | | | | | | | | | | | | | |
| 2017 | | | | 9.73 | | | | | 0.17 | | | | | 0.57 | | | | | 0.74 | | | | | (0.25 | ) | | | | (0.14 | ) | | | | (0.39 | ) | | | | 10.08 | | | | | 7.82 | | | | | 0.33 | | | | | 0.05 | | | | | 1.66 | | | | | 9,375 | | | | | 39 | |
| 2016 | | | | 9.79 | | | | | 0.23 | | | | | 0.28 | | | | | 0.51 | | | | | (0.24 | ) | | | | (0.33 | ) | | | | (0.57 | ) | | | | 9.73 | | | | | 5.50 | | | | | 0.31 | | | | | 0.05 | | | | | 2.15 | | | | | 11,990 | | | | | 38 | |
| 2015 | | | | 10.21 | | | | | 0.21 | | | | | (0.38 | ) | | | | (0.17 | ) | | | | (0.18 | ) | | | | (0.07 | ) | | | | (0.25 | ) | | | | 9.79 | | | | | (1.75 | ) | | | | 0.32 | | | | | 0.05 | | | | | 1.95 | | | | | 16,112 | | | | | 30 | |
| 2014(5) | | | | 10.00 | | | | | 0.05 | | | | | 0.16 | | | | | 0.21 | | | | | — | | | | | — | | | | | — | | | | | 10.21 | | | | | 2.10 | | | | | 0.35 | | | | | 0.05 | | | | | 1.82 | | | | | 17,704 | | | | | 8 | |
Balanced Allocation Fund | | | | | | | | | | | | | | | | | | | | | | | | | | | | | | | | | | | | | | | | | | | | | | | | | | | | | | | | |
| 2017 | | | | 9.43 | | | | | 0.13 | | | | | 0.81 | | | | | 0.94 | | | | | (0.20 | ) | | | | (0.51 | ) | | | | (0.71 | ) | | | | 9.66 | | | | | 10.67 | | | | | 0.23 | | | | | 0.08 | | | | | 1.42 | | | | | 52,821 | | | | | 35 | |
| 2016 | | | | 9.79 | | | | | 0.17 | | | | | 0.33 | | | | | 0.50 | | | | | (0.20 | ) | | | | (0.66 | ) | | | | (0.86 | ) | | | | 9.43 | | | | | 5.54 | | | | | 0.22 | | | | | 0.08 | | | | | 1.73 | | | | | 74,515 | | | | | 33 | |
| 2015 | | | | 10.26 | | | | | 0.17 | | | | | (0.39 | ) | | | | (0.22 | ) | | | | (0.19 | ) | | | | (0.06 | ) | | | | (0.25 | ) | | | | 9.79 | | | | | (2.17 | ) | | | | 0.22 | | | | | 0.08 | | | | | 1.59 | | | | | 81,475 | | | | | 29 | |
| 2014(5) | | | | 10.00 | | | | | 0.04 | | | | | 0.22 | | | | | 0.26 | | | | | — | | | | | — | | | | | — | | | | | 10.26 | | | | | 2.60 | | | | | 0.22 | | | | | 0.08 | | | | | 1.39 | | | | | 79,584 | | | | | 6 | |
Growth Allocation Fund | | | | | | | | | | | | | | | | | | | | | | | | | | | | | | | | | | | | | | | | | | | | | | | | | | | | | | | | |
| 2017 | | | | 9.58 | | | | | 0.09 | | | | | 1.14 | | | | | 1.23 | | | | | (0.15 | ) | | | | (0.43 | ) | | | | (0.58 | ) | | | | 10.23 | | | | | 13.51 | | | | | 0.32 | | | | | 0.05 | | | | | 1.15 | | | | | 8,969 | | | | | 42 | |
| 2016 | | | | 9.84 | | | | | 0.14 | | | | | 0.37 | | | | | 0.51 | | | | | (0.19 | ) | | | | (0.58 | ) | | | | (0.77 | ) | | | | 9.58 | | | | | 5.50 | | | | | 0.31 | | | | | 0.05 | | | | | 1.48 | | | | | 9,696 | | | | | 38 | |
| 2015 | | | | 10.32 | | | | | 0.15 | | | | | (0.42 | ) | | | | (0.27 | ) | | | | (0.18 | ) | | | | (0.03 | ) | | | | (0.21 | ) | | | | 9.84 | | | | | (2.72 | ) | | | | 0.32 | | | | | 0.05 | | | | | 1.32 | | | | | 15,252 | | | | | 20 | |
| 2014(5) | | | | 10.00 | | | | | 0.02 | | | | | 0.30 | | | | | 0.32 | | | | | — | | | | | — | | | | | — | | | | | 10.32 | | | | | 3.20 | | | | | 0.35 | | | | | 0.05 | | | | | 0.96 | | | | | 18,598 | | | | | 6 | |
Aggressive Allocation Fund | | | | | | | | | | | | | | | | | | | | | | | | | | | | | | | | | | | | | | | | | | | | | | | | | | | | | | | | |
| 2017 | | | | 9.57 | | | | | 0.14 | | | | | 1.25 | | | | | 1.39 | | | | | (0.13 | ) | | | | (0.83 | ) | | | | (0.96 | ) | | | | 10.00 | | | | | 15.79 | | | | | 0.28 | | | | | 0.08 | | | | | 1.29 | | | | | 14,685 | | | | | 33 | |
| 2016 | | | | 9.87 | | | | | 0.11 | | | | | 0.39 | | | | | 0.50 | | | | | (0.16 | ) | | | | (0.64 | ) | | | | (0.80 | ) | | | | 9.57 | | | | | 5.41 | | | | | 0.27 | | | | | 0.08 | | | | | 1.31 | | | | | 24,026 | | | | | 33 | |
| 2015 | | | | 10.37 | | | | | 0.14 | | | | | (0.40 | ) | | | | (0.26 | ) | | | | (0.19 | ) | | | | (0.05 | ) | | | | (0.24 | ) | | | | 9.87 | | | | | (2.55 | ) | | | | 0.28 | | | | | 0.09 | | | | | 1.06 | | | | | 31,770 | | | | | 44 | |
| 2014(5) | | | | 10.00 | | | | | 0.02 | | | | | 0.35 | | | | | 0.37 | | | | | — | | | | | — | | | | | — | | | | | 10.37 | | | | | 3.70 | | | | | 0.33 | | | | | 0.11 | | | | | 0.66 | | | | | 27,401 | | | | | 3 | |
| (1) | Based on net asset value as of end of period date. |
| (2) | The contractual and voluntary expense waivers pursuant to Note 5 of the financial statements are reflected in both the net expense and net investment income ratios. |
| (3) | Not annualized for periods less than one year. |
| (4) | Annualized for periods less than one year. Excludes acquired fund fees and expenses of underlying funds. |
| (5) | Reflects operations for the period from May 30, 2014 (inception date) to August 31, 2014. |
(See Notes which are an integral part of the Financial Statements)
40
| | |
| Financial Highlights—Retirement Class R-3 of Shares (For a share outstanding throughout each period) |
| | | | | | | | | | | | | | | | | | | | | | | | | | | | | | | | | | | | | | | | | | | | | | | | | | | | | | | | | | | | | | | | | | | | | | |
| | | | | | | | | | | | |
Period
Ended
August 31, | | Net asset
value,
beginning
of period | | Net
investment
income
(loss) | | Net realized
and unrealized
gain (loss) | | Total from
investment
operations | | Distributions to
shareholders
from net
investment
income | | Distributions to
shareholders
from net
realized gain | | Total
distributions | | Net asset
value, end
of period | | Total
return (1)(3) | | Ratios to Average Net Assets (4) | | Net assets,
end of period
(000 omitted) | | Portfolio
turnover
rate (3) |
| | | | | | | | | | | Gross
Expenses | | Net
Expenses (2) | | Net
investment
income
(loss) (2) | | |
In-Retirement Fund | | | | | | | | | | | | | | | | | | | | | | | | | | | | | | | | | | | | | | | | | | | | | | | | | | | | | | | | |
| 2017 | | | $ | 9.54 | | | | $ | 0.32 | | | | $ | 0.25 | | | | $ | 0.57 | | | | $ | (0.20 | ) | | | $ | (0.49 | ) | | | $ | (0.69 | ) | | | $ | 9.42 | | | | | 6.39 | % | | | | 1.67 | % | | | | 0.58 | % | | | | 1.57 | % | | | $ | 634 | | | | | 26 | % |
| 2016 | | | | 10.01 | | | | | 0.19 | | | | | 0.28 | | | | | 0.47 | | | | | (0.21 | ) | | | | (0.73 | ) | | | | (0.94 | ) | | | | 9.54 | | | | | 5.19 | | | | | 1.50 | | | | | 0.58 | | | | | 1.77 | | | | | 1,720 | | | | | 44 | |
| 2015 | | | | 11.03 | | | | | 0.19 | | | | | (0.42 | ) | | | | (0.23 | ) | | | | (0.26 | ) | | | | (0.53 | ) | | | | (0.79 | ) | | | | 10.01 | | | | | (2.24 | ) | | | | 1.28 | | | | | 0.58 | | | | | 1.76 | | | | | 2,149 | | | | | 53 | |
| 2014 | | | | 10.00 | | | | | 0.19 | | | | | 0.98 | | | | | 1.17 | | | | | (0.12 | ) | | | | (0.02 | ) | | | | (0.14 | ) | | | | 11.03 | | | | | 11.74 | | | | | 1.33 | | | | | 0.58 | | | | | 1.64 | | | | | 4,283 | | | | | 45 | |
2015 Fund | | | | | | | | | | | | | | | | | | | | | | | | | | | | | | | | | | | | | | | | | | | | | | | | | | | | | | | | |
| 2017 | | | | 10.65 | | | | | 0.14 | | | | | 0.70 | | | | | 0.84 | | | | | (0.19 | ) | | | | — | | | | | (0.19 | ) | | | | 11.30 | | | | | 8.07 | | | | | 4.54 | | | | | 0.58 | | | | | 1.31 | | | | | 114 | | | | | 72 | |
| 2016 | | | | 10.41 | | | | | 0.26 | | | | | 0.30 | | | | | 0.56 | | | | | (0.21 | ) | | | | (0.11 | ) | | | | (0.32 | ) | | | | 10.65 | | | | | 5.57 | | | | | 4.32 | | | | | 0.58 | | | | | 1.75 | | | | | 136 | | | | | 49 | |
| 2015 | | | | 10.72 | | | | | 0.09 | | | | | (0.36 | ) | | | | (0.27 | ) | | | | (0.04 | ) | | | | — | | | | | (0.04 | ) | | | | 10.41 | | | | | (2.50 | ) | | | | 4.46 | | | | | 0.58 | | | | | 1.33 | | | | | 221 | | | | | 83 | |
| 2014(5) | | | | 10.00 | | | | | 0.03 | | | | | 0.69 | | | | | 0.72 | | | | | — | | | | | — | | | | | — | | | | | 10.72 | | | | | 7.20 | | | | | 73.79 | | | | | 0.58 | | | | | 1.18 | | | | | 105 | | | | | 29 | |
2020 Fund | | | | | | | | | | | | | | | | | | | | | | | | | | | | | | | | | | | | | | | | | | | | | | | | | | | | | | | | |
| 2017 | | | | 10.22 | | | | | 0.16 | | | | | 0.79 | | | | | 0.95 | | | | | (0.16 | ) | | | | (0.48 | ) | | | | (0.64 | ) | | | | 10.53 | | | | | 9.87 | | | | | 0.88 | | | | | 0.58 | | | | | 1.32 | | | | | 6,813 | | | | | 23 | |
| 2016 | | | | 10.48 | | | | | 0.17 | | | | | 0.39 | | | | | 0.56 | | | | | (0.18 | ) | | | | (0.64 | ) | | | | (0.82 | ) | | | | 10.22 | | | | | 5.74 | | | | | 0.88 | | | | | 0.58 | | | | | 1.44 | | | | | 11,985 | | | | | 39 | |
| 2015 | | | | 11.33 | | | | | 0.17 | | | | | (0.48 | ) | | | | (0.31 | ) | | | | (0.22 | ) | | | | (0.32 | ) | | | | (0.54 | ) | | | | 10.48 | | | | | (2.88 | ) | | | | 0.84 | | | | | 0.58 | | | | | 1.39 | | | | | 15,177 | | | | | 37 | |
| 2014 | | | | 10.00 | | | | | 0.15 | | | | | 1.36 | | | | | 1.51 | | | | | (0.14 | ) | | | | (0.04 | ) | | | | (0.18 | ) | | | | 11.33 | | | | | 15.23 | | | | | 0.88 | | | | | 0.58 | | | | | 1.28 | | | | | 23,025 | | | | | 35 | |
2025 Fund | | | | | | | | | | | | | | | | | | | | | | | | | | | | | | | | | | | | | | | | | | | | | | | | | | | | | | | | |
| 2017 | | | | 10.69 | | | | | 0.24 | | | | | 0.97 | | | | | 1.21 | | | | | (0.15 | ) | | | | (0.19 | ) | | | | (0.34 | ) | | | | 11.56 | | | | | 11.66 | | | | | 1.29 | | | | | 0.58 | | | | | 1.17 | | | | | 150 | | | | | 31 | |
| 2016 | | | | 10.38 | | | | | 0.14 | | | | | 0.42 | | | | | 0.56 | | | | | (0.16 | ) | | | | (0.09 | ) | | | | (0.25 | ) | | | | 10.69 | | | | | 5.49 | | | | | 1.26 | | | | | 0.58 | | | | | 1.30 | | | | | 1,053 | | | | | 33 | |
| 2015 | | | | 10.76 | | | | | 0.03 | | | | | (0.36 | ) | | | | (0.33 | ) | | | | (0.05 | ) | | | | — | | | | | (0.05 | ) | | | | 10.38 | | | | | (3.06 | ) | | | | 1.51 | | | | | 0.58 | | | | | 0.74 | | | | | 1,388 | | | | | 53 | |
| 2014(5) | | | | 10.00 | | | | | 0.04 | | | | | 0.72 | | | | | 0.76 | | | | | — | | | | | — | | | | | — | | | | | 10.76 | | | | | 7.60 | | | | | 24.85 | | | | | 0.58 | | | | | 0.59 | | | | | 2 | | | | | 22 | |
2030 Fund | | | | | | | | | | | | | | | | | | | | | | | | | | | | | | | | | | | | | | | | | | | | | | | | | | | | | | | | |
| 2017 | | | | 10.78 | | | | | 0.14 | | | | | 1.17 | | | | | 1.31 | | | | | (0.12 | ) | | | | (0.42 | ) | | | | (0.54 | ) | | | | 11.55 | | | | | 12.70 | | | | | 0.86 | | | | | 0.62 | | | | | 1.13 | | | | | 6,316 | | | | | 25 | |
| 2016 | | | | 10.82 | | | | | 0.12 | | | | | 0.45 | | | | | 0.57 | | | | | (0.15 | ) | | | | (0.46 | ) | | | | (0.61 | ) | | | | 10.78 | | | | | 5.53 | | | | | 0.86 | | | | | 0.62 | | | | | 1.15 | | | | | 9,875 | | | | | 33 | |
| 2015 | | | | 11.59 | | | | | 0.13 | | | | | (0.51 | ) | | | | (0.38 | ) | | | | (0.14 | ) | | | | (0.25 | ) | | | | (0.39 | ) | | | | 10.82 | | | | | (3.39 | ) | | | | 0.84 | | | | | 0.62 | | | | | 1.09 | | | | | 12,812 | | | | | 45 | |
| 2014 | | | | 10.00 | | | | | 0.13 | | | | | 1.65 | | | | | 1.78 | | | | | (0.17 | ) | | | | (0.02 | ) | | | | (0.19 | ) | | | | 11.59 | | | | | 17.98 | | | | | 0.91 | | | | | 0.62 | | | | | 1.21 | | | | | 20,329 | | | | | 29 | |
2035 Fund | | | | | | | | | | | | | | | | | | | | | | | | | | | | | | | | | | | | | | | | | | | | | | | | | | | | | | | | |
| 2017 | | | | 10.67 | | | | | 0.11 | | | | | 1.29 | | | | | 1.40 | | | | | (0.12 | ) | | | | (0.32 | ) | | | | (0.44 | ) | | | | 11.63 | | | | | 13.59 | | | | | 1.38 | | | | | 0.62 | | | | | 0.99 | | | | | 120 | | | | | 32 | |
| 2016 | | | | 10.27 | | | | | 0.12 | | | | | 0.44 | | | | | 0.56 | | | | | (0.12 | ) | | | | (0.04 | ) | | | | (0.16 | ) | | | | 10.67 | | | | | 5.55 | | | | | 1.27 | | | | | 0.62 | | | | | 1.06 | | | | | 492 | | | | | 29 | |
| 2015 | | | | 10.68 | | | | | (0.03 | ) | | | | (0.36 | ) | | | | (0.39 | ) | | | | (0.02 | ) | | | | — | | | | | (0.02 | ) | | | | 10.27 | | | | | (3.65 | ) | | | | 1.54 | | | | | 0.62 | | | | | (0.13 | ) | | | | 734 | | | | | 96 | |
| 2014(5) | | | | 10.00 | | | | | 0.01 | | | | | 0.67 | | | | | 0.68 | | | | | — | | | | | — | | | | | — | | | | | 10.68 | | | | | 6.80 | | | | | 23.88 | | | | | 0.62 | | | | | 0.19 | | | | | 3 | | | | | 29 | |
2040 Fund | | | | | | | | | | | | | | | | | | | | | | | | | | | | | | | | | | | | | | | | | | | | | | | | | | | | | | | | |
| 2017 | | | | 10.69 | | | | | 0.19 | | | | | 1.26 | | | | | 1.45 | | | | | (0.10 | ) | | | | (0.47 | ) | | | | (0.57 | ) | | | | 11.57 | | | | | 14.17 | | | | | 0.98 | | | | | 0.61 | | | | | 1.22 | | | | | 2,555 | | | | | 24 | |
| 2016 | | | | 10.91 | | | | | 0.12 | | | | | 0.44 | | | | | 0.56 | | | | | (0.11 | ) | | | | (0.67 | ) | | | | (0.78 | ) | | | | 10.69 | | | | | 5.48 | | | | | 0.96 | | | | | 0.61 | | | | | 1.06 | | | | | 4,991 | | | | | 31 | |
| 2015 | | | | 11.72 | | | | | 0.10 | | | | | (0.50 | ) | | | | (0.40 | ) | | | | (0.17 | ) | | | | (0.24 | ) | | | | (0.41 | ) | | | | 10.91 | | | | | (3.57 | ) | | | | 0.92 | | | | | 0.61 | | | | | 0.92 | | | | | 7,748 | | | | | 36 | |
| 2014 | | | | 10.00 | | | | | 0.11 | | | | | 1.82 | | | | | 1.93 | | | | | (0.19 | ) | | | | (0.02 | ) | | | | (0.21 | ) | | | | 11.72 | | | | | 19.42 | | | | | 1.01 | | | | | 0.61 | | | | | 0.97 | | | | | 11,429 | | | | | 22 | |
2045 Fund | | | | | | | | | | | | | | | | | | | | | | | | | | | | | | | | | | | | | | | | | | | | | | | | | | | | | | | | |
| 2017(7) | | | | 10.87 | | | | | 0.09 | | | | | 1.41 | | | | | 1.50 | | | | | (0.12 | ) | | | | (0.38 | ) | | | | (0.50 | ) | | | | 11.87 | | | | | 14.35 | | | | | 1.97 | | | | | 0.61 | | | | | 0.80 | | | | | 53 | | | | | 31 | |
| 2016 | | | | 10.42 | | | | | 0.13 | | | | | 0.46 | | | | | 0.59 | | | | | (0.11 | ) | | | | (0.03 | ) | | | | (0.14 | ) | | | | 10.87 | | | | | 5.74 | | | | | 1.78 | | | | | 0.61 | | | | | 1.02 | | | | | 426 | | | | | 32 | |
| 2015 | | | | 10.82 | | | | | (0.07 | ) | | | | (0.31 | ) | | | | (0.38 | ) | | | | (0.02 | ) | | | | — | | | | | (0.02 | ) | | | | 10.42 | | | | | (3.53 | ) | | | | 2.39 | | | | | 0.61 | | | | | (0.90 | ) | | | | 746 | | | | | 95 | |
| 2014(5) | | | | 10.00 | | | | | 0.00 | | | | | 0.82 | | | | | 0.82 | | | | | — | | | | | — | | | | | — | | | | | 10.82 | | | | | 8.20 | | | | | 33.62 | | | | | 0.61 | | | | | 0.01 | | | | | 3 | | | | | 35 | |
2050 Fund | | | | | | | | | | | | | | | | | | | | | | | | | | | | | | | | | | | | | | | | | | | | | | | | | | | | | | | | |
| 2017 | | | | 11.04 | | | | | 0.14 | | | | | 1.38 | | | | | 1.52 | | | | | (0.11 | ) | | | | (0.48 | ) | | | | (0.59 | ) | | | | 11.97 | | | | | 14.38 | | | | | 1.10 | | | | | 0.61 | | | | | 1.07 | | | | | 3,115 | | | | | 27 | |
| 2016 | | | | 10.95 | | | | | 0.10 | | | | | 0.50 | | | | | 0.60 | | | | | (0.13 | ) | | | | (0.38 | ) | | | | (0.51 | ) | | | | 11.04 | | | | | 5.66 | | | | | 1.11 | | | | | 0.61 | | | | | 0.98 | | | | | 4,515 | | | | | 29 | |
| 2015 | | | | 11.74 | | | | | 0.09 | | | | | (0.50 | ) | | | | (0.41 | ) | | | | (0.15 | ) | | | | (0.23 | ) | | | | (0.38 | ) | | | | 10.95 | | | | | (3.57 | ) | | | | 1.09 | | | | | 0.61 | | | | | 0.81 | | | | | 5,072 | | | | | 39 | |
| 2014 | | | | 10.00 | | | | | 0.11 | | | | | 1.82 | | | | | 1.93 | | | | | (0.17 | ) | | | | (0.02 | ) | | | | (0.19 | ) | | | | 11.74 | | | | | 19.40 | | | | | 1.33 | | | | | 0.61 | | | | | 0.87 | | | | | 6,826 | | | | | 28 | |
2055 Fund | | | | | | | | | | | | | | | | | | | | | | | | | | | | | | | | | | | | | | | | | | | | | | | | | | | | | | | | |
| 2017 | | | | 10.80 | | | | | 0.07 | | | | | 1.41 | | | | | 1.48 | | | | | (0.11 | ) | | | | (0.34 | ) | | | | (0.45 | ) | | | | 11.83 | | | | | 14.22 | | | | | 2.81 | | | | | 0.61 | | | | | 1.09 | | | | | 94 | | | | | 56 | |
| 2016 | | | | 10.38 | | | | | 0.09 | | | | | 0.50 | | | | | 0.59 | | | | | (0.11 | ) | | | | (0.06 | ) | | | | (0.17 | ) | | | | 10.80 | | | | | 5.73 | | | | | 3.57 | | | | | 0.61 | | | | | 0.82 | | | | | 477 | | | | | 38 | |
| 2015 | | | | 10.84 | | | | | 0.03 | | | | | (0.41 | ) | | | | (0.38 | ) | | | | (0.06 | ) | | | | (0.02 | ) | | | | (0.08 | ) | | | | 10.38 | | | | | (3.55 | ) | | | | 7.16 | | | | | 0.61 | | | | | 0.14 | | | | | 395 | | | | | 61 | |
| 2014(5) | | | | 10.00 | | | | | 0.01 | | | | | 0.83 | | | | | 0.84 | | | | | — | | | | | — | | | | | — | | | | | 10.84 | | | | | 8.40 | | | | | 50.30 | | | | | 0.61 | | | | | 0.44 | | | | | 54 | | | | | 123 | |
(See Notes which are an integral part of the Financial Statements)
41
| | |
| Financial Highlights—Retirement Class R-3 of Shares (For a share outstanding throughout each period) |
| | | | | | | | | | | | | | | | | | | | | | | | | | | | | | | | | | | | | | | | | | | | | | | | | | | | | | | | | | | | | | | | | | | | | | |
| | | | | | | | | | | | |
Period
Ended
August 31, | | Net asset
value,
beginning
of period | | Net
investment
income
(loss) | | Net realized
and unrealized
gain (loss) | | Total from
investment
operations | | Distributions to
shareholders
from net
investment
income | | Distributions to
shareholders
from net
realized gain | | Total
distributions | | Net asset
value, end
of period | | Total
return (1)(3) | | Ratios to Average Net Assets (4) | | Net assets,
end of period
(000 omitted) | | Portfolio
turnover
rate (3) |
| | | | | | | | | | | Gross
Expenses | | Net
Expenses (2) | | Net
investment
income
(loss) (2) | | |
Conservative Allocation Fund | | | | | | | | | | | | | | | | | | | | | | | | | | | | | | | | | | | | | | | | | | | | | | | | | | | | | | | | |
| 2017 | | | $ | 9.80 | | | | $ | 0.13 | | | | $ | 0.30 | | | | $ | 0.43 | | | | $ | (0.22 | ) | | | $ | (0.00 | ) | | | $ | (0.22 | ) | | | $ | 10.01 | | | | | 4.52 | % | | | | 0.83 | % | | | | 0.58 | % | | | | 1.34 | % | | | $ | 3,012 | | | | | 40 | % |
| 2016 | | | | 9.74 | | | | | 0.21 | | | | | 0.24 | | | | | 0.45 | | | | | (0.20 | ) | | | | (0.19 | ) | | | | (0.39 | ) | | | | 9.80 | | | | | 4.82 | | | | | 0.81 | | | | | 0.58 | | | | | 1.97 | | | | | 6,802 | | | | | 31 | |
| 2015 | | | | 10.14 | | | | | 0.20 | | | | | (0.37 | ) | | | | (0.17 | ) | | | | (0.15 | ) | | | | (0.08 | ) | | | | (0.23 | ) | | | | 9.74 | | | | | (1.72 | ) | | | | 0.82 | | | | | 0.58 | | | | | 1.74 | | | | | 7,624 | | | | | 39 | |
| 2014(6) | | | | 10.00 | | | | | 0.02 | | | | | 0.12 | | | | | 0.14 | | | | | — | | | | | — | | | | | — | | | | | 10.14 | | | | | 1.40 | | | | | 0.85 | | | | | 0.58 | | | | | 0.91 | | | | | 11,583 | | | | | 10 | |
Moderate Allocation Fund | | | | | | | | | | | | | | | | | | | | | | | | | | | | | | | | | | | | | | | | | | | | | | | | | | | | | | | | |
| 2017 | | | | 9.72 | | | | | 0.11 | | | | | 0.58 | | | | | 0.69 | | | | | (0.19 | ) | | | | (0.14 | ) | | | | (0.33 | ) | | | | 10.08 | | | | | 7.37 | | | | | 0.83 | | | | | 0.55 | | | | | 1.10 | | | | | 13,725 | | | | | 39 | |
| 2016 | | | | 9.76 | | | | | 0.26 | | | | | 0.19 | | | | | 0.45 | | | | | (0.16 | ) | | | | (0.33 | ) | | | | (0.49 | ) | | | | 9.72 | | | | | 4.90 | | | | | 0.81 | | | | | 0.55 | | | | | 1.65 | | | | | 12,695 | | | | | 38 | |
| 2015 | | | | 10.20 | | | | | 0.15 | | | | | (0.37 | ) | | | | (0.22 | ) | | | | (0.16 | ) | | | | (0.06 | ) | | | | (0.22 | ) | | | | 9.76 | | | | | (2.23 | ) | | | | 0.82 | | | | | 0.55 | | | | | 1.45 | | | | | 22,279 | | | | | 30 | |
| 2014(6) | | | | 10.00 | | | | | 0.03 | | | | | 0.17 | | | | | 0.20 | | | | | — | | | | | — | | | | | — | | | | | 10.20 | | | | | 2.00 | | | | | 0.85 | | | | | 0.55 | | | | | 1.33 | | | | | 19,949 | | | | | 8 | |
Balanced Allocation Fund | | | | | | | | | | | | | | | | | | | | | | | | | | | | | | | | | | | | | | | | | | | | | | | | | | | | | | | | |
| 2017 | | | | 9.40 | | | | | 0.09 | | | | | 0.80 | | | | | 0.89 | | | | | (0.14 | ) | | | | (0.51 | ) | | | | (0.65 | ) | | | | 9.64 | | | | | 10.11 | | | | | 0.73 | | | | | 0.58 | | | | | 0.92 | | | | | 23,649 | | | | | 35 | |
| 2016 | | | | 9.76 | | | | | 0.13 | | | | | 0.31 | | | | | 0.44 | | | | | (0.14 | ) | | | | (0.66 | ) | | | | (0.80 | ) | | | | 9.40 | | | | | 4.94 | | | | | 0.72 | | | | | 0.58 | | | | | 1.28 | | | | | 29,095 | | | | | 33 | |
| 2015 | | | | 10.25 | | | | | 0.12 | | | | | (0.38 | ) | | | | (0.26 | ) | | | | (0.16 | ) | | | | (0.07 | ) | | | | (0.23 | ) | | | | 9.76 | | | | | (2.64 | ) | | | | 0.72 | | | | | 0.58 | | | | | 1.15 | | | | | 38,677 | | | | | 29 | |
| 2014(6) | | | | 10.00 | | | | | 0.02 | | | | | 0.23 | | | | | 0.25 | | | | | — | | | | | — | | | | | — | | | | | 10.25 | | | | | 2.50 | | | | | 0.72 | | | | | 0.58 | | | | | 0.89 | | | | | 44,647 | | | | | 6 | |
Growth Allocation Fund | | | | | | | | | | | | | | | | | | | | | | | | | | | | | | | | | | | | | | | | | | | | | | | | | | | | | | | | |
| 2017 | | | | 9.55 | | | | | 0.10 | | | | | 1.08 | | | | | 1.18 | | | | | (0.08 | ) | | | | (0.43 | ) | | | | (0.51 | ) | | | | 10.22 | | | | | 12.96 | | | | | 0.82 | | | | | 0.55 | | | | | 0.85 | | | | | 18,846 | | | | | 42 | |
| 2016 | | | | 9.81 | | | | | 0.09 | | | | | 0.37 | | | | | 0.46 | | | | | (0.14 | ) | | | | (0.58 | ) | | | | (0.72 | ) | | | | 9.55 | | | | | 4.95 | | | | | 0.81 | | | | | 0.55 | | | | | 0.91 | | | | | 25,876 | | | | | 38 | |
| 2015 | | | | 10.30 | | | | | 0.09 | | | | | (0.40 | ) | | | | (0.31 | ) | | | | (0.15 | ) | | | | (0.03 | ) | | | | (0.18 | ) | | | | 9.81 | | | | | (3.10 | ) | | | | 0.82 | | | | | 0.55 | | | | | 0.83 | | | | | 28,903 | | | | | 20 | |
| 2014(6) | | | | 10.00 | | | | | 0.01 | | | | | 0.29 | | | | | 0.30 | | | | | — | | | | | — | | | | | — | | | | | 10.30 | | | | | 3.00 | | | | | 0.85 | | | | | 0.55 | | | | | 0.46 | | | | | 31,065 | | | | | 6 | |
Aggressive Allocation Fund | | | | | | | | | | | | | | | | | | | | | | | | | | | | | | | | | | | | | | | | | | | | | | | | | | | | | | | | |
| 2017 | | | | 9.55 | | | | | 0.06 | | | | | 1.29 | | | | | 1.35 | | | | | (0.09 | ) | | | | (0.83 | ) | | | | (0.92 | ) | | | | 9.98 | | | | | 15.24 | | | | | 0.78 | | | | | 0.58 | | | | | 0.63 | | | | | 17,152 | | | | | 33 | |
| 2016 | | | | 9.84 | | | | | 0.07 | | | | | 0.38 | | | | | 0.45 | | | | | (0.10 | ) | | | | (0.64 | ) | | | | (0.74 | ) | | | | 9.55 | | | | | 4.87 | | | | | 0.77 | | | | | 0.58 | | | | | 0.77 | | | | | 19,395 | | | | | 33 | |
| 2015 | | | | 10.35 | | | | | 0.10 | | | | | (0.40 | ) | | | | (0.30 | ) | | | | (0.17 | ) | | | | (0.04 | ) | | | | (0.21 | ) | | | | 9.84 | | | | | (2.94 | ) | | | | 0.78 | | | | | 0.59 | | | | | 0.48 | | | | | 22,578 | | | | | 44 | |
| 2014(6) | | | | 10.00 | | | | | 0.00 | | | | | 0.35 | | | | | 0.35 | | | | | — | | | | | — | | | | | — | | | | | 10.35 | | | | | 3.50 | | | | | 0.83 | | | | | 0.61 | | | | | 0.16 | | | | | 16,200 | | | | | 3 | |
| (1) | Based on net asset value as of end of period date. |
| (2) | The contractual and voluntary expense waivers pursuant to Note 5 of the financial statements are reflected in both the net expense and net investment income (loss) ratios. |
| (3) | Not annualized for periods less than one year. |
| (4) | Annualized for periods less than one year. Excludes acquired fund fees and expenses of underlying funds. |
| (5) | Reflects operations for the period from December 27, 2013 (inception date) to August 31, 2014. |
| (6) | Reflects operations for the period from May 30, 2014 (inception date) to August 31, 2014. |
| (7) | Calculated using the average shares method. |
(See Notes which are an integral part of the Financial Statements)
42
| | |
| Financial Highlights—Retirement Class R-6 of Shares (For a share outstanding throughout each period) |
| | | | | | | | | | | | | | | | | | | | | | | | | | | | | | | | | | | | | | | | | | | | | | | | | | | | | | | | | | | | | | | | | | | | | | |
| | | | | | | | | | | | |
Period
Ended
August 31, | | Net asset
value,
beginning
of period | | Net
investment
income | | Net realized
and unrealized
gain (loss) | | Total from
investment
operations | | Distributions to
shareholders
from net
investment
income | | Distributions to
shareholders
from net
realized gain | | Total
distributions | | Net asset
value, end
of period | | Total
return (1)(3) | | Ratios to Average Net Assets (4) | | Net assets,
end of period
(000 omitted) | | Portfolio
turnover
rate (3) |
| | | | | | | | | | | Gross
Expenses | | Net
Expenses (2)(7) | | Net
investment
income (2) | | |
In-Retirement Fund | | | | | | | | | | | | | | | | | | | | | | | | | | | | | | | | | | | | | | | | | | | | | | | | | | | | | | | | |
| 2017 | | | $ | 9.55 | | | | $ | 0.22 | | | | $ | 0.40 | | | | $ | 0.62 | | | | $ | (0.28 | ) | | | $ | (0.49 | ) | | | $ | (0.77 | ) | | | $ | 9.40 | | | | | 7.04 | % | | | | 1.02 | % | | | | 0.00 | % | | | | 2.11 | % | | | $ | 10,885 | | | | | 26 | % |
| 2016 | | | | 10.05 | | | | | 0.26 | | | | | 0.27 | | | | | 0.53 | | | | | (0.30 | ) | | | | (0.73 | ) | | | | (1.03 | ) | | | | 9.55 | | | | | 5.85 | | | | | 0.85 | | | | | 0.00 | | | | | 2.37 | | | | | 16,406 | | | | | 44 | |
| 2015 | | | | 11.08 | | | | | 0.29 | | | | | (0.45 | ) | | | | (0.16 | ) | | | | (0.34 | ) | | | | (0.53 | ) | | | | (0.87 | ) | | | | 10.05 | | | | | (1.54 | ) | | | | 0.63 | | | | | 0.00 | | | | | 2.35 | | | | | 16,611 | | | | | 53 | |
| 2014 | | | | 10.00 | | | | | 0.25 | | | | | 0.99 | | | | | 1.24 | | | | | (0.14 | ) | | | | (0.02 | ) | | | | (0.16 | ) | | | | 11.08 | | | | | 12.47 | | | | | 0.68 | | | | | 0.00 | | | | | 2.31 | | | | | 20,128 | | | | | 45 | |
2015 Fund | | | | | | | | | | | | | | | | | | | | | | | | | | | | | | | | | | | | | | | | | | | | | | | | | | | | | | | | | | | | | | | | | | |
| 2017 | | | | 10.73 | | | | | 0.19 | | | | | 0.73 | | | | | 0.92 | | | | | (0.26 | ) | | | | — | | | | | (0.26 | ) | | | | 11.39 | | | | | 8.80 | | | | | 3.89 | | | | | 0.00 | | | | | 1.97 | | | | | 3,390 | | | | | 72 | |
| 2016 | | | | 10.50 | | | | | 0.25 | | | | | 0.38 | | | | | 0.63 | | | | | (0.29 | ) | | | | (0.11 | ) | | | | (0.40 | ) | | | | 10.73 | | | | | 6.22 | | | | | 3.67 | | | | | 0.00 | | | | | 2.21 | | | | | 3,744 | | | | | 49 | |
| 2015 | | | | 10.78 | | | | | 0.13 | | | | | (0.34 | ) | | | | (0.21 | ) | | | | (0.07 | ) | | | | — | | | | | (0.07 | ) | | | | 10.50 | | | | | (1.92 | ) | | | | 3.81 | | | | | 0.00 | | | | | 1.94 | | | | | 4,234 | | | | | 83 | |
| 2014(5) | | | | 10.00 | | | | | 0.08 | | | | | 0.70 | | | | | 0.78 | | | | | — | | | | | — | | | | | — | | | | | 10.78 | | | | | 7.80 | | | | | 73.14 | | | | | 0.00 | | | | | 1.75 | | | | | 174 | | | | | 29 | |
2020 Fund | | | | | | | | | | | | | | | | | | | | | | | | | | | | | | | | | | | | | | | | | | | | | | | | | | | | | | | | | | | | | | | | | | |
| 2017 | | | | 10.23 | | | | | 0.19 | | | | | 0.83 | | | | | 1.02 | | | | | (0.23 | ) | | | | (0.48 | ) | | | | (0.71 | ) | | | | 10.54 | | | | | 10.66 | | | | | 0.23 | | | | | 0.00 | | | | | 1.76 | | | | | 56,024 | | | | | 23 | |
| 2016 | | | | 10.52 | | | | | 0.21 | | | | | 0.41 | | | | | 0.62 | | | | | (0.27 | ) | | | | (0.64 | ) | | | | (0.91 | ) | | | | 10.23 | | | | | 6.39 | | | | | 0.23 | | | | | 0.00 | | | | | 2.01 | | | | | 62,358 | | | | | 39 | |
| 2015 | | | | 11.38 | | | | | 0.25 | | | | | (0.50 | ) | | | | (0.25 | ) | | | | (0.29 | ) | | | | (0.32 | ) | | | | (0.61 | ) | | | | 10.52 | | | | | (2.28 | ) | | | | 0.19 | | | | | 0.00 | | | | | 1.98 | | | | | 53,085 | | | | | 37 | |
| 2014 | | | | 10.00 | | | | | 0.22 | | | | | 1.36 | | | | | 1.58 | | | | | (0.16 | ) | | | | (0.04 | ) | | | | (0.20 | ) | | | | 11.38 | | | | | 15.98 | | | | | 0.23 | | | | | 0.00 | | | | | 1.97 | | | | | 59,502 | | | | | 35 | |
2025 Fund | | | | | | | | | | | | | | | | | | | | | | | | | | | | | | | | | | | | | | | | | | | | | | | | | | | | | | | | | | | | | | | | | | |
| 2017 | | | | 10.81 | | | | | 0.17 | | | | | 1.11 | | | | | 1.28 | | | | | (0.22 | ) | | | | (0.19 | ) | | | | (0.41 | ) | | | | 11.68 | | | | | 12.20 | | | | | 0.64 | | | | | 0.00 | | | | | 1.75 | | | | | 20,473 | | | | | 31 | |
| 2016 | | | | 10.48 | | | | | 0.19 | | | | | 0.44 | | | | | 0.63 | | | | | (0.21 | ) | | | | (0.09 | ) | | | | (0.30 | ) | | | | 10.81 | | | | | 6.15 | | | | | 0.61 | | | | | 0.00 | | | | | 1.83 | | | | | 28,905 | | | | | 33 | |
| 2015 | | | | 10.81 | | | | | 0.09 | | | | | (0.35 | ) | | | | (0.26 | ) | | | | (0.07 | ) | | | | — | | | | | (0.07 | ) | | | | 10.48 | | | | | (2.45 | ) | | | | 0.86 | | | | | 0.00 | | | | | 1.48 | | | | | 26,042 | | | | | 53 | |
| 2014(5) | | | | 10.00 | | | | | 0.05 | | | | | 0.76 | | | | | 0.81 | | | | | — | | | | | — | | | | | — | | | | | 10.81 | | | | | 8.10 | | | | | 24.20 | | | | | 0.00 | | | | | 1.39 | | | | | 1,363 | | | | | 22 | |
2030 Fund | | | | | | | | | | | | | | | | | | | | | | | | | | | | | | | | | | | | | | | | | | | | | | | | | | | | | | | | | | | | | | | | | | |
| 2017 | | | | 10.81 | | | | | 0.16 | | | | | 1.22 | | | | | 1.38 | | | | | (0.20 | ) | | | | (0.42 | ) | | | | (0.62 | ) | | | | 11.57 | | | | | 13.38 | | | | | 0.21 | | | | | 0.00 | | | | | 1.48 | | | | | 66,995 | | | | | 25 | |
| 2016 | | | | 10.87 | | | | | 0.19 | | | | | 0.45 | | | | | 0.64 | | | | | (0.24 | ) | | | | (0.46 | ) | | | | (0.70 | ) | | | | 10.81 | | | | | 6.21 | | | | | 0.21 | | | | | 0.00 | | | | | 1.66 | | | | | 73,828 | | | | | 33 | |
| 2015 | | | | 11.64 | | | | | 0.16 | | | | | (0.46 | ) | | | | (0.30 | ) | | | | (0.22 | ) | | | | (0.25 | ) | | | | (0.47 | ) | | | | 10.87 | | | | | (2.70 | ) | | | | 0.19 | | | | | 0.00 | | | | | 1.57 | | | | | 60,302 | | | | | 45 | |
| 2014 | | | | 10.00 | | | | | 0.19 | | | | | 1.66 | | | | | 1.85 | | | | | (0.19 | ) | | | | (0.02 | ) | | | | (0.21 | ) | | | | 11.64 | | | | | 18.70 | | | | | 0.26 | | | | | 0.00 | | | | | 1.50 | | | | | 48,829 | | | | | 29 | |
2035 Fund | | | | | | | | | | | | | | | | | | | | | | | | | | | | | | | | | | | | | | | | | | | | | | | | | | | | | | | | | | | | | | | | | | |
| 2017 | | | | 10.79 | | | | | 0.14 | | | | | 1.34 | | | | | 1.48 | | | | | (0.18 | ) | | | | (0.32 | ) | | | | (0.50 | ) | | | | 11.77 | | | | | 14.31 | | | | | 0.73 | | | | | 0.00 | | | | | 1.70 | | | | | 12,216 | | | | | 32 | |
| 2016 | | | | 10.38 | | | | | 0.17 | | | | | 0.47 | | | | | 0.64 | | | | | (0.19 | ) | | | | (0.04 | ) | | | | (0.23 | ) | | | | 10.79 | | | | | 6.26 | | | | | 0.62 | | | | | 0.00 | | | | | 1.57 | | | | | 30,132 | | | | | 29 | |
| 2015 | | | | 10.73 | | | | | 0.04 | | | | | (0.36 | ) | | | | (0.32 | ) | | | | (0.03 | ) | | | | — | | | | | (0.03 | ) | | | | 10.38 | | | | | (2.99 | ) | | | | 0.89 | | | | | 0.00 | | | | | 0.97 | | | | | 27,613 | | | | | 96 | |
| 2014(5) | | | | 10.00 | | | | | 0.04 | | | | | 0.69 | | | | | 0.73 | | | | | — | | | | | — | | | | | — | | | | | 10.73 | | | | | 7.30 | | | | | 23.23 | | | | | 0.00 | | | | | 1.06 | | | | | 1,201 | | | | | 29 | |
2040 Fund | | | | | | | | | | | | | | | | | | | | | | | | | | | | | | | | | | | | | | | | | | | | | | | | | | | | | | | | | | | | | | | | | | |
| 2017 | | | | 10.71 | | | | | 0.14 | | | | | 1.38 | | | | | 1.52 | | | | | (0.18 | ) | | | | (0.47 | ) | | | | (0.65 | ) | | | | 11.58 | | | | | 14.98 | | | | | 0.33 | | | | | 0.00 | | | | | 1.40 | | | | | 38,944 | | | | | 24 | |
| 2016 | | | | 10.96 | | | | | 0.17 | | | | | 0.46 | | | | | 0.63 | | | | | (0.21 | ) | | | | (0.67 | ) | | | | (0.88 | ) | | | | 10.71 | | | | | 6.17 | | | | | 0.31 | | | | | 0.00 | | | | | 1.51 | | | | | 48,219 | | | | | 31 | |
| 2015 | | | | 11.78 | | | | | 0.16 | | | | | (0.50 | ) | | | | (0.34 | ) | | | | (0.24 | ) | | | | (0.24 | ) | | | | (0.48 | ) | | | | 10.96 | | | | | (2.98 | ) | | | | 0.27 | | | | | 0.00 | | | | | 1.45 | | | | | 40,193 | | | | | 36 | |
| 2014 | | | | 10.00 | | | | | 0.18 | | | | | 1.83 | | | | | 2.01 | | | | | (0.21 | ) | | | | (0.02 | ) | | | | (0.23 | ) | | | | 11.78 | | | | | 20.26 | | | | | 0.36 | | | | | 0.00 | | | | | 1.39 | | | | | 39,760 | | | | | 22 | |
2045 Fund | | | | | | | | | | | | | | | | | | | | | | | | | | | | | | | | | | | | | | | | | | | | | | | | | | | | | | | | | | | | | | | | | | |
| 2017(8) | | | | 10.98 | | | | | 0.19 | | | | | 1.39 | | | | | 1.58 | | | | | (0.18 | ) | | | | (0.38 | ) | | | | (0.56 | ) | | | | 12.00 | | | | | 15.08 | | | | | 1.32 | | | | | 0.00 | | | | | 1.71 | | | | | 6,964 | | | | | 31 | |
| 2016 | | | | 10.53 | | | | | 0.16 | | | | | 0.50 | | | | | 0.66 | | | | | (0.18 | ) | | | | (0.03 | ) | | | | (0.21 | ) | | | | 10.98 | | | | | 6.38 | | | | | 1.13 | | | | | 0.00 | | | | | 1.48 | | | | | 15,877 | | | | | 32 | |
| 2015 | | | | 10.87 | | | | | 0.03 | | | | | (0.35 | ) | | | | (0.32 | ) | | | | (0.02 | ) | | | | — | | | | | (0.02 | ) | | | | 10.53 | | | | | (2.91 | ) | | | | 1.74 | | | | | 0.00 | | | | | 0.85 | | | | | 13,046 | | | | | 95 | |
| 2014(5) | | | | 10.00 | | | | | 0.04 | | | | | 0.83 | | | | | 0.87 | | | | | — | | | | | — | | | | | — | | | | | 10.87 | | | | | 8.70 | | | | | 32.97 | | | | | 0.00 | | | | | 0.93 | | | | | 895 | | | | | 35 | |
2050 Fund | | | | | | | | | | | | | | | | | | | | | | | | | | | | | | | | | | | | | | | | | | | | | | | | | | | | | | | | | | | | | | | | | | |
| 2017 | | | | 11.08 | | | | | 0.14 | | | | | 1.45 | | | | | 1.59 | | | | | (0.19 | ) | | | | (0.48 | ) | | | | (0.67 | ) | | | | 12.00 | | | | | 15.09 | | | | | 0.45 | | | | | 0.00 | | | | | 1.28 | | | | | 28,173 | | | | | 27 | |
| 2016 | | | | 11.00 | | | | | 0.17 | | | | | 0.50 | | | | | 0.67 | | | | | (0.21 | ) | | | | (0.38 | ) | | | | (0.59 | ) | | | | 11.08 | | | | | 6.37 | | | | | 0.46 | | | | | 0.00 | | | | | 1.48 | | | | | 30,317 | | | | | 29 | |
| 2015 | | | | 11.80 | | | | | 0.14 | | | | | (0.48 | ) | | | | (0.34 | ) | | | | (0.23 | ) | | | | (0.23 | ) | | | | (0.46 | ) | | | | 11.00 | | | | | (2.99 | ) | | | | 0.44 | | | | | 0.00 | | | | | 1.37 | | | | | 22,487 | | | | | 39 | |
| 2014 | | | | 10.00 | | | | | 0.18 | | | | | 1.83 | | | | | 2.01 | | | | | (0.19 | ) | | | | (0.02 | ) | | | | (0.21 | ) | | | | 11.80 | | | | | 20.24 | | | | | 0.68 | | | | | 0.00 | | | | | 1.39 | | | | | 17,346 | | | | | 28 | |
2055 Fund | | | | | | | | | | | | | | | | | | | | | | | | | | | | | | | | | | | | | | | | | | | | | | | | | | | | | | | | | | | | | | | | | | |
| 2017 | | | | 10.91 | | | | | 0.16 | | | | | 1.41 | | | | | 1.57 | | | | | (0.17 | ) | | | | (0.34 | ) | | | | (0.51 | ) | | | | 11.97 | | | | | 14.93 | | | | | 2.16 | | | | | 0.00 | | | | | 1.53 | | | | | 6,561 | | | | | 56 | |
| 2016 | | | | 10.47 | | | | | 0.15 | | | | | 0.51 | | | | | 0.66 | | | | | (0.16 | ) | | | | (0.06 | ) | | | | (0.22 | ) | | | | 10.91 | | | | | 6.43 | | | | | 2.92 | | | | | 0.00 | | | | | 1.30 | | | | | 6,866 | | | | | 38 | |
| 2015 | | | | 10.89 | | | | | 0.07 | | | | | (0.39 | ) | | | | (0.32 | ) | | | | (0.08 | ) | | | | (0.02 | ) | | | | (0.10 | ) | | | | 10.47 | | | | | (2.96 | ) | | | | 6.51 | | | | | 0.00 | | | | | 0.90 | | | | | 2,809 | | | | | 61 | |
| 2014(5) | | | | 10.00 | | | | | 0.03 | | | | | 0.86 | | | | | 0.89 | | | | | — | | | | | — | | | | | — | | | | | 10.89 | | | | | 8.90 | | | | | 49.65 | | | | | 0.00 | | | | | 0.84 | | | | | 477 | | | | | 123 | |
(See Notes which are an integral part of the Financial Statements)
43
| | |
| Financial Highlights—Retirement Class R-6 of Shares (For a share outstanding throughout each period) |
| | | | | | | | | | | | | | | | | | | | | | | | | | | | | | | | | | | | | | | | | | | | | | | | | | | | | | | | | | | | | | | | | | | | | | |
| | | | | | | | | | | | |
Period
Ended
August 31, | | Net asset
value,
beginning
of period | | Net
investment
income | | Net realized
and unrealized
gain (loss) | | Total from
investment
operations | | Distributions to
shareholders
from net
investment
income | | Distributions to
shareholders
from net
realized gain | | Total
distributions | | Net asset
value, end
of period | | Total
return (1)(3) | | Ratios to Average Net Assets (4) | | Net assets,
end of period
(000 omitted) | | Portfolio
turnover
rate (3) |
| | | | | | | | | | | Gross
Expenses | | Net
Expenses (2)(7) | | Net
investment
income (2) | | |
Conservative Allocation Fund | | | | | | | | | | | | | | | | | | | | | | | | | | | | | | | | | | | | | | | | | | | | | | |
| 2017 | | | $ | 9.82 | | | | $ | 0.27 | | | | $ | 0.23 | | | | $ | 0.50 | | | | $ | (0.29 | ) | | | $ | (0.00 | ) | | | $ | (0.29 | ) | | | $ | 10.03 | | | | | 5.22 | % | | | | 0.18 | % | | | | 0.00 | % | | | | 1.96 | % | | | $ | 28,927 | | | | | 40 | % |
| 2016 | | | | 9.79 | | | | | 0.25 | | | | | 0.24 | | | | | 0.49 | | | | | (0.27 | ) | | | | (0.19 | ) | | | | (0.46 | ) | | | | 9.82 | | | | | 5.34 | | | | | 0.16 | | | | | 0.00 | | | | | 2.61 | | | | | 88,818 | | | | | 31 | |
| 2015 | | | | 10.15 | | | | | 0.25 | | | | | (0.34 | ) | | | | (0.09 | ) | | | | (0.19 | ) | | | | (0.08 | ) | | | | (0.27 | ) | | | | 9.79 | | | | | (0.94 | ) | | | | 0.17 | | | | | 0.00 | | | | | 2.38 | | | | | 86,637 | | | | | 39 | |
| 2014(6) | | | | 10.00 | | | | | 0.04 | | | | | 0.11 | | | | | 0.15 | | | | | — | | | | | — | | | | | — | | | | | 10.15 | | | | | 1.50 | | | | | 0.20 | | | | | 0.00 | | | | | 1.57 | | | | | 92,207 | | | | | 10 | |
Moderate Allocation Fund | | | | | | | | | | | | | | | | | | | | | | | | | | | | | | | | | | | | | | | | | | | | | | | | | | | |
| 2017 | | | | 9.74 | | | | | 0.21 | | | | | 0.54 | | | | | 0.75 | | | | | (0.26 | ) | | | | (0.14 | ) | | | | (0.40 | ) | | | | 10.09 | | | | | 8.02 | | | | | 0.18 | | | | | 0.00 | | | | | 1.83 | | | | | 80,283 | | | | | 39 | |
| 2016 | | | | 9.80 | | | | | 0.22 | | | | | 0.30 | | | | | 0.52 | | | | | (0.25 | ) | | | | (0.33 | ) | | | | (0.58 | ) | | | | 9.74 | | | | | 5.67 | | | | | 0.16 | | | | | 0.00 | | | | | 2.27 | | | | | 101,327 | | | | | 38 | |
| 2015 | | | | 10.21 | | | | | 0.21 | | | | | (0.37 | ) | | | | (0.16 | ) | | | | (0.19 | ) | | | | (0.06 | ) | | | | (0.25 | ) | | | | 9.80 | | | | | (1.56 | ) | | | | 0.17 | | | | | 0.00 | | | | | 2.11 | | | | | 93,206 | | | | | 30 | |
| 2014(6) | | | | 10.00 | | | | | 0.05 | | | | | 0.16 | | | | | 0.21 | | | | | — | | | | | — | | | | | — | | | | | 10.21 | | | | | 2.10 | | | | | 0.20 | | | | | 0.00 | | | | | 1.99 | | | | | 95,654 | | | | | 8 | |
Balanced Allocation Fund | |
| 2017 | | | | 9.44 | | | | | 0.19 | | | | | 0.76 | | | | | 0.95 | | | | | (0.22 | ) | | | | (0.51 | ) | | | | (0.73 | ) | | | | 9.66 | | | | | 10.73 | | | | | 0.08 | | | | | 0.00 | | | | | 1.67 | | | | | 193,690 | | | | | 35 | |
| 2016 | | | | 9.80 | | | | | 0.18 | | | | | 0.33 | | | | | 0.51 | | | | | (0.21 | ) | | | | (0.66 | ) | | | | (0.87 | ) | | | | 9.44 | | | | | 5.70 | | | | | 0.07 | | | | | 0.00 | | | | | 1.87 | | | | | 252,982 | | | | | 33 | |
| 2015 | | | | 10.27 | | | | | 0.18 | | | | | (0.39 | ) | | | | (0.21 | ) | | | | (0.19 | ) | | | | (0.07 | ) | | | | (0.26 | ) | | | | 9.80 | | | | | (2.08 | ) | | | | 0.07 | | | | | 0.00 | | | | | 1.78 | | | | | 247,496 | | | | | 29 | |
| 2014(6) | | | | 10.00 | | | | | 0.04 | | | | | 0.23 | | | | | 0.27 | | | | | — | | | | | — | | | | | — | | | | | 10.27 | | | | | 2.70 | | | | | 0.07 | | | | | 0.00 | | | | | 1.54 | | | | | 284,021 | | | | | 6 | |
Growth Allocation Fund | |
| 2017 | | | | 9.59 | | | | | 0.16 | | | | | 1.09 | | | | | 1.25 | | | | | (0.17 | ) | | | | (0.43 | ) | | | | (0.60 | ) | | | | 10.24 | | | | | 13.69 | | | | | 0.17 | | | | | 0.00 | | | | | 1.49 | | | | | 84,417 | | | | | 42 | |
| 2016 | | | | 9.85 | | | | | 0.15 | | | | | 0.37 | | | | | 0.52 | | | | | (0.20 | ) | | | | (0.58 | ) | | | | (0.78 | ) | | | | 9.59 | | | | | 5.67 | | | | | 0.16 | | | | | 0.00 | | | | | 1.51 | | | | | 79,852 | | | | | 38 | |
| 2015 | | | | 10.32 | | | | | 0.16 | | | | | (0.41 | ) | | | | (0.25 | ) | | | | (0.19 | ) | | | | (0.03 | ) | | | | (0.22 | ) | | | | 9.85 | | | | | (2.52 | ) | | | | 0.17 | | | | | 0.00 | | | | | 1.47 | | | | | 67,727 | | | | | 20 | |
| 2014(6) | | | | 10.00 | | | | | 0.03 | | | | | 0.29 | | | | | 0.32 | | | | | — | | | | | — | | | | | — | | | | | 10.32 | | | | | 3.20 | | | | | 0.20 | | | | | 0.00 | | | | | 1.11 | | | | | 56,647 | | | | | 6 | |
Aggressive Allocation Fund | |
| 2017 | | | | 9.58 | | | | | 0.15 | | | | | 1.26 | | | | | 1.41 | | | | | (0.15 | ) | | | | (0.83 | ) | | | | (0.98 | ) | | | | 10.01 | | | | | 16.00 | | | | | 0.13 | | | | | 0.00 | | | | | 1.43 | | | | | 105,925 | | | | | 33 | |
| 2016 | | | | 9.88 | | | | | 0.14 | | | | | 0.38 | | | | | 0.52 | | | | | (0.18 | ) | | | | (0.64 | ) | | | | (0.82 | ) | | | | 9.58 | | | | | 5.58 | | | | | 0.12 | | | | | 0.00 | | | | | 1.38 | | | | | 123,203 | | | | | 33 | |
| 2015 | | | | 10.37 | | | | | 0.17 | | | | | (0.41 | ) | | | | (0.24 | ) | | | | (0.21 | ) | | | | (0.04 | ) | | | | (0.25 | ) | | | | 9.88 | | | | | (2.37 | ) | | | | 0.12 | | | | | 0.00 | | | | | 1.12 | | | | | 113,933 | | | | | 44 | |
| 2014(6) | | | | 10.00 | | | | | 0.02 | | | | | 0.35 | | | | | 0.37 | | | | | — | | | | | — | | | | | — | | | | | 10.37 | | | | | 3.70 | | | | | 0.18 | | | | | 0.00 | | | | | 0.82 | | | | | 73,040 | | | | | 3 | |
| (1) | Based on net asset value as of end of period date. |
| (2) | The contractual and voluntary expense waivers pursuant to Note 5 of the financial statements are reflected in both the net expense and net investment income ratios. |
| (3) | Not annualized for periods less than one year. |
| (4) | Annualized for periods less than one year. Excludes acquired fund fees and expenses of underlying funds. |
| (5) | Reflects operations for the period from December 27, 2013 (inception date) to August 31, 2014. |
| (6) | Reflects operations for the period from May 30, 2014 (inception date) to August 31, 2014. |
| (7) | Please refer to Note 5, subsection Investment Adviser Fee and Other Transactions with Affiliates, in the Notes to Financial Statements. |
| (8) | Calculated using the average shares method. |
(See Notes which are an integral part of the Financial Statements)
44
August 31, 2017
| | |
| Notes to Financial Statements | | BMO Funds |
BMO Funds, Inc. (the “Corporation”) is registered under the Investment Company Act of 1940, as amended (the “Act”), as an open-end management investment company. As of August 31, 2017, the Corporation consisted of 43 portfolios, including 10 target retirement and 5 target risk diversified portfolios within this annual report (individually referred to as the “Fund,” or collectively as the “Funds”), each with differing share class offerings as well as 28 other portfolios whose annual report is available under a separate cover. BMO Asset Management Corp. serves as the Funds’ investment adviser (the “Adviser”), a Delaware corporation headquartered in Chicago, Illinois that is a wholly-owned subsidiary of BMO Financial Corp.
| | | | |
BMO Fund names as displayed throughout this report | | Fund Inception
Date | | Investment Objective |
Target Retirement | | | | |
In-Retirement Fund | | August 30, 2013 | | The investment objective of each Target Retirement Fund is to achieve growth, income, and conservation of capital to varying degrees depending on its proximity to its target date. As the Fund approaches its target date, the Fund will reduce its emphasis on growth and increase its emphasis on income and preservation of capital. |
2015 Fund | | December 27, 2013 | |
2020 Fund | | August 30, 2013 | |
2025 Fund | | December 27, 2013 | |
2030 Fund | | August 30, 2013 | |
2035 Fund | | December 27, 2013 | |
2040 Fund | | August 30, 2013 | |
2045 Fund | | December 27, 2013 | |
2050 Fund | | August 30, 2013 | |
2055 Fund | | December 27, 2013 | |
Target Risk | | | | |
Conservative Allocation Fund | | May 30, 2014 | | To provide total return primarily from income, secondarily from appreciation. |
Moderate Allocation Fund | | May 30, 2014 | | To provide total investment return from income and appreciation. |
Balanced Allocation Fund | | May 30, 2014 | | To provide total investment return from income and appreciation. |
Growth Allocation Fund | | May 30, 2014 | | To provide total investment return from income and appreciation. |
Aggressive Allocation Fund | | May 30, 2014 | | To provide total investment return primarily from appreciation, secondarily from income. |
The target investment allocation for each of the Target Risk Funds, based on each Fund’s total assets, is set forth below.
| | | | | | | | | | | | |
Target Risk Fund | | Equity | | | Fixed Income | | | Money Market Funds | |
Conservative Allocation Fund | | | 10%–30% | | | | 70%–90% | | | | 0%–10% | |
Moderate Allocation Fund | | | 30%–50% | | | | 50%–70% | | | | 0%–10% | |
Balanced Allocation Fund | | | 50%–70% | | | | 30%–50% | | | | 0%–10% | |
Growth Allocation Fund | | | 70%–90% | | | | 10%–30% | | | | 0%–10% | |
Aggressive Allocation Fund | | | 90%–100% | | | | 0% | | | | 0%–10% | |
Each Fund seeks to achieve its investment objectives by investing in a mix (without limitation) of BMO Funds and unaffiliated mutual funds. The Funds are designed to provide investors with investment management, asset allocation, and ongoing reallocation over time. Each Fund is considered a “fund of funds” because it invests in other mutual funds. A fund of funds bears its own direct expenses in addition to bearing a proportionate share of expenses charged to the underlying funds in which it invests.
| 2. | | Significant Accounting Policies |
The Funds are investment companies and follow the accounting and reporting guidance under Financial Accounting Standards Board (“FASB”) Accounting Standards Codification (“ASC”) Topic 946, Financial Services—Investment Companies. The following is a summary of significant accounting policies consistently followed by the Funds in the preparation of their financial statements.
Use of Estimates—The preparation of financial statements in conformity with accounting principles generally accepted in the United States of America (“GAAP”) requires management to make estimates and assumptions that affect the reported amounts of assets and liabilities at the date of the financial statements and the reported amounts of increases and decreases in net assets from operations during the reporting period. Actual results may differ from those estimates.
Investment Valuations—Investments in other open-end registered investment companies are valued at net asset value.
Securities or other assets for which market valuations are not readily available, or are deemed to be inaccurate, are valued at fair value as determined in good faith using methods approved by the Board of Directors (the “Directors”). The Directors have established a Pricing Committee, which is responsible for determinations of fair value, subject to the supervision of the Directors. In determining fair value, the Pricing Committee takes into account all information available and any factors it deems appropriate. Consequently, the price of securities used by a Fund to calculate its Net Asset Value (“NAV”) may differ from quoted or published prices for the same securities. Fair value pricing involves subjective judgments and it is possible that the fair value determined for a security is materially different than the value that would be realized upon the sale of that security and the differences may be material to the NAV of the respective Fund or the financial statements presented.
45
| | |
| Notes to Financial Statements (continued) | | |
The Pricing Committee may determine that a security needs to be fair valued. In valuing underlying fund investments, the Funds use the NAVs reported by the underlying funds. An underlying fund may need to fair value one or more of its investments, which may, in turn, require a Fund to do the same because of delays in obtaining the underlying fund’s NAV.
Investment Income, Expenses, and Distributions—Investment income and expenses are accrued daily. The Funds distribute net investment income, if any, and net realized gains (net of any capital loss carryovers) annually. Dividend income, realized gain distributions from underlying funds, and distributions to shareholders are recorded on the ex-dividend date. Non-cash dividends included in dividend income, if any, are recorded at fair market value. Paid-in-kind interest included in interest income, if any, is accrued daily.
The Funds offer multiple classes of shares which differ in their respective distribution, administration, and service fees. All shareholders bear the common expenses of the Funds. Dividends are declared separately for each class. No class has preferential dividend rights; differences in per share dividend rates are generally due to differences in class-specific expenses. Income, non-class specific expenses, and realized and unrealized gains and losses are allocated daily to each class of shares based on the value of total shares outstanding of each class without distinction between share classes. Expenses attributable to a particular class of shares, such as shareholder servicing fees, are allocated directly to that class.
Federal Income Taxes—The policies and procedures of the Funds require compliance with Subchapter M of the Internal Revenue Code of 1986, as amended (the “Code”), and distribution to shareholders each year substantially all of their income. Accordingly, no provisions for federal tax are necessary. Withholding taxes on foreign dividends have been provided for in accordance with the applicable country’s tax rules and rates.
Securities of Other Investment Companies & Underlying Fund Investment Risk—The Funds may invest in the securities of other investment companies, including exchange-traded funds, within the limits prescribed by the 1940 Act and the rules promulgated thereunder. Investments in the securities of other investment companies may involve duplication of advisory fees and certain other expenses. By investing in another investment company, a Fund becomes a shareholder of that investment company. As a result, Fund shareholders indirectly will bear the Fund’s proportionate share of the fees and expenses paid by shareholders of the other investment company, in addition to the fees and expenses Fund shareholders directly bear in connection with the Fund’s own operations. The Funds also may invest in investment companies that are not organized under the laws of the United States. The Fund’s risks are directly related to the risks of the underlying funds. It is important to understand the risks associated with investing in the underlying funds.
Commitments and Contingencies—In the normal course of business, the Corporation enters into contracts that provide general indemnifications to other parties. The Corporation’s maximum exposure under these arrangements is unknown as this would involve future claims that may be made against the Corporation that have not yet occurred. However, the Corporation has not had prior claims or losses pursuant to these contracts and expects the risk of loss to be remote.
Other—Investment transactions are accounted for on a trade date basis. Net realized gains and losses on securities are computed on the basis of specific security lot identification.
| 3. | | Fair Value Measurement |
Fair Valuation Measurement defines fair value, establishes a framework for measuring fair value in accordance with GAAP, and requires disclosure about fair value measurements. It establishes a fair value hierarchy that distinguishes between (1) market participant assumptions developed based on market data obtained from sources independent of the reporting issuer (observable inputs) and (2) the reporting issuer’s own assumptions about market participant assumptions developed based on the best information available in the circumstances (unobservable inputs). It also provides guidance on determining when there has been a significant decrease in the volume and level of activity for an asset or liability, when a transaction is not orderly, and how that information must be incorporated into fair value measurement.
Various inputs are used in determining the value of the Funds’ investments. The inputs or methodology used for valuing securities are not necessarily an indication of the risk associated with investing in those securities. These inputs are summarized in the three broad levels listed below:
Level 1—quoted prices in active markets for identical securities. An active market for the security is a market in which transactions occur with sufficient frequency and volume to provide pricing information on an ongoing basis. Common and preferred stocks, options and futures contracts, and U.S. registered mutual funds are generally categorized as Level 1.
Level 2—other significant observable inputs (including quoted prices for similar securities, interest rates, prepayment speeds, credit risk, etc.). Fixed income securities, repurchase agreements, cash collateral received as part of the securities lending program, and securities valued by an independent fair value pricing service are generally categorized as Level 2.
Level 3—significant unobservable inputs, including management’s own assumptions in determining the fair value of investments.
In May 2015, the Financial Accounting Standards Board (the “FASB”) issued Accounting Standard Update (“ASU”) 2015-07, Disclosures for Investments in Certain Entities That Calculate Net Asset Value per Unit (or Its Equivalent), modifying ASC 820. Under the modifications, investments in private investment funds valued at net asset value are no longer included in the fair value hierarchy. For the year ended August 31, 2017, the Funds had no investments in private investment funds, and there were no investments excluded from the fair value hierarchy. It is the Funds’ policy to recognize transfers between category levels at the end of the period. For the year ended August 31, 2017, there were no transfers in and out of Level 1, Level 2 and Level 3. The Funds did not hold any Level 2 or Level 3 securities as of August 31, 2017.
46
The following is a summary of the inputs used, as of August 31, 2017, in valuing the Funds’ assets:
| | | | | | | | | | | | | | | | |
| | | In-Retirement Fund | | | | |
| | | Level 1 | | | Level 2 | | | Level 3 | | | Total | |
Mutual Funds | | $ | 14,792,260 | | | $ | — | | | $ | — | | | $ | 14,792,260 | |
Short-Term Investments | | | 144,477 | | | | — | | | | — | | | | 144,477 | |
| | | | | | | | | | | | | | | | |
Total | | $ | 14,936,737 | | | $ | — | | | $ | — | | | $ | 14,936,737 | |
| | | | | | | | | | | | | | | | |
| | |
| | | 2015 Fund | | | | |
| | | Level 1 | | | Level 2 | | | Level 3 | | | Total | |
Mutual Funds | | $ | 3,869,676 | | | $ | — | | | $ | — | | | $ | 3,869,676 | |
Short-Term Investments | | | 39,798 | | | | — | | | | — | | | | 39,798 | |
| | | | | | | | | | | | | | | | |
Total | | $ | 3,909,474 | | | $ | — | | | $ | — | | | $ | 3,909,474 | |
| | | | | | | | | | | | | | | | |
| | |
| | | 2020 Fund | | | | |
| | | Level 1 | | | Level 2 | | | Level 3 | | | Total | |
Mutual Funds | | $ | 79,758,576 | | | $ | — | | | $ | — | | | $ | 79,758,576 | |
Short-Term Investments | | | 720,855 | | | | — | | | | — | | | | 720,855 | |
| | | | | | | | | | | | | | | | |
Total | | $ | 80,479,431 | | | $ | — | | | $ | — | | | $ | 80,479,431 | |
| | | | | | | | | | | | | | | | |
| | |
| | | 2025 Fund | | | | |
| | | Level 1 | | | Level 2 | | | Level 3 | | | Total | |
Mutual Funds | | $ | 21,172,338 | | | $ | — | | | $ | — | | | $ | 21,172,338 | |
Short-Term Investments | | | 246,901 | | | | — | | | | — | | | | 246,901 | |
| | | | | | | | | | | | | | | | |
Total | | $ | 21,419,239 | | | $ | — | | | $ | — | | | $ | 21,419,239 | |
| | | | | | | | | | | | | | | | |
| | |
| | | 2030 Fund | | | | |
| | | Level 1 | | | Level 2 | | | Level 3 | | | Total | |
Mutual Funds | | $ | 91,576,106 | | | $ | — | | | $ | — | | | $ | 91,576,106 | |
Short-Term Investments | | | 1,008,652 | | | | — | | | | — | | | | 1,008,652 | |
| | | | | | | | | | | | | | | | |
Total | | $ | 92,584,758 | | | $ | — | | | $ | — | | | $ | 92,584,758 | |
| | | | | | | | | | | | | | | | |
| | |
| | | 2035 Fund | | | | |
| | | Level 1 | | | Level 2 | | | Level 3 | | | Total | |
Mutual Funds | | $ | 12,927,397 | | | $ | — | | | $ | — | | | $ | 12,927,397 | |
Short-Term Investments | | | 58,671 | | | | — | | | | — | | | | 58,671 | |
| | | | | | | | | | | | | | | | |
Total | | $ | 12,986,068 | | | $ | — | | | $ | — | | | $ | 12,986,068 | |
| | | | | | | | | | | | | | | | |
| | |
| | | 2040 Fund | | | | |
| | | Level 1 | | | Level 2 | | | Level 3 | | | Total | |
Mutual Funds | | $ | 51,952,010 | | | $ | — | | | $ | — | | | $ | 51,952,010 | |
Short-Term Investments | | | 533,274 | | | | — | | | | — | | | | 533,274 | |
| | | | | | | | | | | | | | | | |
Total | | $ | 52,485,284 | | | $ | — | | | $ | — | | | $ | 52,485,284 | |
| | | | | | | | | | | | | | | | |
| | |
| | | 2045 Fund | | | | |
| | | Level 1 | | | Level 2 | | | Level 3 | | | Total | |
Mutual Funds | | $ | 7,828,852 | | | $ | — | | | $ | — | | | $ | 7,828,852 | |
Short-Term Investments | | | 78,288 | | | | — | | | | — | | | | 78,288 | |
| | | | | | | | | | | | | | | | |
Total | | $ | 7,907,140 | | | $ | — | | | $ | — | | | $ | 7,907,140 | |
| | | | | | | | | | | | | | | | |
| | | | | | | | | | | | | | | | |
| | | 2050 Fund | | | | |
| | | Level 1 | | | Level 2 | | | Level 3 | | | Total | |
Mutual Funds | | $ | 39,132,791 | | | $ | — | | | $ | — | | | $ | 39,132,791 | |
Short-Term Investments | | | 391,301 | | | | — | | | | — | | | | 391,301 | |
| | | | | | | | | | | | | | | | |
Total | | $ | 39,524,092 | | | $ | — | | | $ | — | | | $ | 39,524,092 | |
| | | | | | | | | | | | | | | | |
| | |
| | | 2055 Fund | | | | |
| | | Level 1 | | | Level 2 | | | Level 3 | | | Total | |
Mutual Funds | | $ | 7,083,576 | | | $ | — | | | $ | — | | | $ | 7,083,576 | |
Short-Term Investments | | | 70,830 | | | | — | | | | — | | | | 70,830 | |
| | | | | | | | | | | | | | | | |
Total | | $ | 7,154,406 | | | $ | — | | | $ | — | | | $ | 7,154,406 | |
| | | | | | | | | | | | | | | | |
| | |
| | | Conservative Allocation Fund | | | | |
| | | Level 1 | | | Level 2 | | | Level 3 | | | Total | |
Mutual Funds | | $ | 72,974,278 | | | $ | — | | | $ | — | | | $ | 72,974,278 | |
Short-Term Investments | | | 615,540 | | | | — | | | | — | | | | 615,540 | |
| | | | | | | | | | | | | | | | |
Total | | $ | 73,589,818 | | | $ | — | | | $ | — | | | $ | 73,589,818 | |
| | | | | | | | | | | | | | | | |
| | |
| | | Moderate Allocation Fund | | | | |
| | | Level 1 | | | Level 2 | | | Level 3 | | | Total | |
Mutual Funds | | $ | 109,955,524 | | | $ | — | | | $ | — | | | $ | 109,955,524 | |
Short-Term Investments | | | 1,030,079 | | | | — | | | | — | | | | 1,030,079 | |
| | | | | | | | | | | | | | | | |
Total | | $ | 110,985,603 | | | $ | — | | | $ | — | | | $ | 110,985,603 | |
| | | | | | | | | | | | | | | | |
| | |
| | | Balanced Allocation Fund | | | | |
| | | Level 1 | | | Level 2 | | | Level 3 | | | Total | |
Mutual Funds | | $ | 366,867,444 | | | $ | — | | | $ | — | | | $ | 366,867,444 | |
Short-Term Investments | | | 3,074,917 | | | | — | | | | — | | | | 3,074,917 | |
| | | | | | | | | | | | | | | | |
Total | | $ | 369,942,361 | | | $ | — | | | $ | — | | | $ | 369,942,361 | |
| | | | | | | | | | | | | | | | |
| | |
| | | Growth Allocation Fund | | | | |
| | | Level 1 | | | Level 2 | | | Level 3 | | | Total | |
Mutual Funds | | $ | 127,703,596 | | | $ | — | | | $ | — | | | $ | 127,703,596 | |
Short-Term Investments | | | 1,222,859 | | | | — | | | | — | | | | 1,222,859 | |
| | | | | | | | | | | | | | | | |
Total | | $ | 128,926,455 | | | $ | — | | | $ | — | | | $ | 128,926,455 | |
| | | | | | | | | | | | | | | | |
| | |
| | | Aggressive Allocation Fund | | | | |
| | | Level 1 | | | Level 2 | | | Level 3 | | | Total | |
Mutual Funds | | $ | 173,769,232 | | | $ | — | | | $ | — | | | $ | 173,769,232 | |
Short-Term Investments | | | 444,956 | | | | — | | | | — | | | | 444,956 | |
| | | | | | | | | | | | | | | | |
Total | | $ | 174,214,188 | | | $ | — | | | $ | — | | | $ | 174,214,188 | |
| | | | | | | | | | | | | | | | |
47
| | |
| Notes to Financial Statements (continued) | | |
The Articles of Incorporation permit the Directors to issue an indefinite number of full and fractional shares of common stock, par value $0.0001 per share. Transactions in capital stock were as follows:
| | | | | | | | | | | | | | | | | | | | | | | | |
| | | | | | | | | | |
| | | In-Retirement Fund | | | 2015 Fund | | | 2020 Fund | |
| | | Year Ended
August 31,
2017
| | | Year Ended
August 31,
2016
| | | Year Ended
August 31,
2017
| | | Year Ended
August 31,
2016
| | | Year Ended
August 31,
2017
| | | Year Ended
August 31,
2016
| |
Capital stock transactions in dollars: | | | | | | | | | | | | | | | | | | | | | | | | |
Proceeds from sale of shares: | | | | | | | | | | | | | | | | | | | | | | | | |
Investor class of shares | | $ | 1,008,269 | | | $ | 757,262 | | | $ | 656,625 | | | $ | 322,398 | | | $ | 2,713,803 | | | $ | 3,811,445 | |
Institutional class of shares | | | — | | | | 146,670 | (1) | | | — | | | | 2,318 | (1) | | | — | | | | 384,344 | (1) |
Retirement class R-3 of shares | | | 534,506 | | | | 471,110 | | | | 3,871 | | | | 326,651 | | | | 1,696,274 | | | | 2,597,725 | |
Retirement class R-6 of shares | | | 1,499,670 | | | | 4,418,734 | | | | 1,549,699 | | | | 327,621 | | | | 7,678,581 | | | | 14,282,672 | |
| | | | | | | | | | | | | | | | | | | | | | | | |
Net proceeds from sale of shares | | | 3,042,445 | | | | 5,793,776 | | | | 2,210,195 | | | | 978,988 | | | | 12,088,658 | | | | 21,076,186 | |
Net asset value of shares issued to shareholders in payment of distributions declared: | | | | | | | | | | | | | | | | | | | | | | | | |
Investor class of shares | | | 229,242 | | | | 415,792 | | | | 7,555 | | | | 20,044 | | | | 1,080,668 | | | | 1,777,801 | |
Institutional class of shares | | | — | | | | 28,070 | (1) | | | — | | | | 3,995 | (1) | | | — | | | | 347,404 | (1) |
Retirement class R-3 of shares | | | 78,175 | | | | 165,007 | | | | 555 | | | | 5,045 | | | | 661,731 | | | | 1,012,032 | |
Retirement class R-6 of shares | | | 1,129,433 | | | | 1,496,011 | | | | 92,325 | | | | 146,671 | | | | 4,128,058 | | | | 4,518,603 | |
| | | | | | | | | | | | | | | | | | | | | | | | |
Net proceeds from shares issued | | | 1,436,850 | | | | 2,104,880 | | | | 100,435 | | | | 175,755 | | | | 5,870,457 | | | | 7,655,840 | |
Cost of shares redeemed: | | | | | | | | | | | | | | | | | | | | | | | | |
Investor class of shares | | | (1,213,231 | ) | | | (2,254,061 | ) | | | (993,165 | ) | | | (292,086 | ) | | | (5,493,344 | ) | | | (7,143,360 | ) |
Institutional class of shares | | | — | | | | (433,997 | )(1) | | | — | | | | (115,993 | )(1) | | | — | | | | (5,700,230 | )(1) |
Retirement class R-3 of shares | | | (1,675,212 | ) | | | (965,909 | ) | | | (33,078 | ) | | | (415,640 | ) | | | (7,677,610 | ) | | | (6,373,881 | ) |
Retirement class R-6 of shares | | | (7,845,531 | ) | | | (5,522,850 | ) | | | (2,178,046 | ) | | | (1,025,702 | ) | | | (19,990,572 | ) | | | (8,945,634 | ) |
| | | | | | | | | | | | | | | | | | | | | | | | |
Net cost of shares redeemed | | | (10,733,974 | ) | | | (9,176,817 | ) | | | (3,204,289 | ) | | | (1,849,421 | ) | | | (33,161,526 | ) | | | (28,163,105 | ) |
| | | | | | | | | | | | | | | | | | | | | | | | |
Net change resulting from fund share transactions in dollars | | $ | (6,254,679 | ) | | $ | (1,278,161 | ) | | $ | (893,659 | ) | | $ | (694,678 | ) | | $ | (15,202,411 | ) | | $ | 568,921 | |
| | | | | | | | | | | | | | | | | | | | | | | | |
| | | | | | |
Capital stock transactions in shares: | | | | | | | | | | | | | | | | | | | | | | | | |
Sale of shares: | | | | | | | | | | | | | | | | | | | | | | | | |
Investor class of shares | | | 108,395 | | | | 77,952 | | | | 61,847 | | | | 31,343 | | | | 268,374 | | | | 379,524 | |
Institutional class of shares | | | — | | | | 15,572 | (1) | | | — | | | | 227 | (1) | | | — | | | | 38,990 | (1) |
Retirement class R-3 of shares | | | 58,358 | | | | 49,575 | | | | 365 | | | | 31,567 | | | | 167,507 | | | | 264,638 | |
Retirement class R-6 of shares | | | 160,992 | | | | 478,376 | | | | 140,426 | | | | 32,173 | | | | 754,743 | | | | 1,474,069 | |
| | | | | | | | | | | | | | | | | | | | | | | | |
Net sale of shares | | | 327,745 | | | | 621,475 | | | | 202,638 | | | | 95,310 | | | | 1,190,624 | | | | 2,157,221 | |
Shares issued to shareholders in payment of distributions declared: | | | | | | | | | | | | | | | | | | | | | | | | |
Investor class of shares | | | 26,020 | | | | 46,097 | | | | 719 | | | | 1,987 | | | | 112,219 | | | | 184,037 | |
Institutional class of shares | | | — | | | | 3,112 | (1) | | | — | | | | 395 | (1) | | | — | | | | 35,963 | (1) |
Retirement class R-3 of shares | | | 8,833 | | | | 18,253 | | | | 53 | | | | 500 | | | | 68,502 | | | | 104,549 | |
Retirement class R-6 of shares | | | 128,491 | | | | 166,223 | | | | 8,768 | | | | 14,479 | | | | 429,112 | | | | 467,765 | |
| | | | | | | | | | | | | | | | | | | | | | | | |
Net shares issued | | | 163,344 | | | | 233,685 | | | | 9,540 | | | | 17,361 | | | | 609,833 | | | | 792,314 | |
Shares redeemed: | | | | | | | | | | | | | | | | | | | | | | | | |
Investor class of shares | | | (129,631 | ) | | | (239,842 | ) | | | (90,952 | ) | | | (29,227 | ) | | | (540,360 | ) | | | (744,875 | ) |
Institutional class of shares | | | — | | | | (46,029 | )(1) | | | — | | | | (10,928 | )(1) | | | — | | | | (575,711 | )(1) |
Retirement class R-3 of shares | | | (180,106 | ) | | | (102,190 | ) | | | (3,051 | ) | | | (40,510 | ) | | | (762,158 | ) | | | (644,421 | ) |
Retirement class R-6 of shares | | | (849,082 | ) | | | (579,689 | ) | | | (200,328 | ) | | | (101,058 | ) | | | (1,962,803 | ) | | | (892,639 | ) |
| | | | | | | | | | | | | | | | | | | | | | | | |
Net shares redeemed | | | (1,158,819 | ) | | | (967,750 | ) | | | (294,331 | ) | | | (181,723 | ) | | | (3,265,321 | ) | | | (2,857,646 | ) |
| | | | | | | | | | | | | | | | | | | | | | | | |
Net change resulting from fund share transactions in shares | | | (667,730 | ) | | | (112,590 | ) | | | (82,153 | ) | | | (69,052 | ) | | | (1,464,864 | ) | | | 91,889 | |
| | | | | | | | | | | | | | | | | | | | | | | | |
| (1) | Reflects operations for the period from September 1, 2015, to August 1, 2016 (termination of Institutional class of shares). |
48
| | | | | | | | | | | | | | | | | | | | | | | | |
| | | | | | | | | | |
| | | 2025 Fund | | | 2030 Fund | | | 2035 Fund | |
| | | Year Ended
August 31,
2017
| | | Year Ended
August 31,
2016
| | | Year Ended
August 31,
2017
| | | Year Ended
August 31,
2016
| | | Year Ended
August 31,
2017
| | | Year Ended
August 31,
2016
| |
Capital stock transactions in dollars: | | | | | | | | | | | | | | | | | | | | | | | | |
Proceeds from sale of shares: | | | | | | | | | | | | | | | | | | | | | | | | |
Investor class of shares | | $ | 298,184 | | | $ | 348,017 | | | $ | 3,090,018 | | | $ | 4,129,727 | | | $ | 510,807 | | | $ | 486,925 | |
Institutional class of shares | | | — | | | | 39,517 | (1) | | | — | | | | 432,852 | (1) | | | — | | | | 32,639 | (1) |
Retirement class R-3 of shares | | | 141,111 | | | | 213,768 | | | | 1,391,128 | | | | 2,764,321 | | | | 102,195 | | | | 128,349 | |
Retirement class R-6 of shares | | | 5,165,176 | | | | 4,734,955 | | | | 12,437,489 | | | | 18,141,495 | | | | 3,338,790 | | | | 4,465,463 | |
| | | | | | | | | | | | | | | | | | | | | | | | |
Net proceeds from sale of shares | | | 5,604,471 | | | | 5,336,257 | | | | 16,918,635 | | | | 25,468,395 | | | | 3,951,792 | | | | 5,113,376 | |
Net asset value of shares issued to shareholders in payment of distributions declared: | | | | | | | | | | | | | | | | | | | | | | | | |
Investor class of shares | | | 23,843 | | | | 45,412 | | | | 911,447 | | | | 1,362,886 | | | | 32,175 | | | | 19,506 | |
Institutional class of shares | | | — | | | | 16,995 | (1) | | | — | | | | 185,684 | (1) | | | — | | | | 1,593 | (1) |
Retirement class R-3 of shares | | | 35,100 | | | | 30,674 | | | | 442,421 | | | | 693,045 | | | | 21,569 | | | | 9,502 | |
Retirement class R-6 of shares | | | 1,135,390 | | | | 746,383 | | | | 4,125,659 | | | | 3,847,019 | | | | 1,421,767 | | | | 596,770 | |
| | | | | | | | | | | | | | | | | | | | | | | | |
Net proceeds from shares issued | | | 1,194,333 | | | | 839,464 | | | | 5,479,527 | | | | 6,088,634 | | | | 1,475,511 | | | | 627,371 | |
Cost of shares redeemed: | | | | | | | | | | | | | | | | | | | | | | | | |
Investor class of shares | | | (137,454 | ) | | | (1,339,999 | ) | | | (5,492,840 | ) | | | (8,605,351 | ) | | | (549,772 | ) | | | (702,141 | ) |
Institutional class of shares | | | — | | | | (640,270 | )(1) | | | — | | | | (3,388,679 | )(1) | | | — | | | | (97,574 | )(1) |
Retirement class R-3 of shares | | | (1,135,416 | ) | | | (585,408 | ) | | | (5,859,197 | ) | | | (6,063,527 | ) | | | (525,837 | ) | | | (391,486 | ) |
Retirement class R-6 of shares | | | (16,547,756 | ) | | | (3,634,083 | ) | | | (28,265,720 | ) | | | (9,158,466 | ) | | | (24,303,005 | ) | | | (3,775,389 | ) |
| | | | | | | | | | | | | | | | | | | | | | | | |
Net cost of shares redeemed | | | (17,820,626 | ) | | | (6,199,760 | ) | | | (39,617,757 | ) | | | (27,216,023 | ) | | | (25,378,614 | ) | | | (4,966,590 | ) |
| | | | | | | | | | | | | | | | | | | | | | | | |
Net change resulting from fund share transactions in dollars | | $ | (11,021,822 | ) | | $ | (24,039 | ) | | $ | (17,219,595 | ) | | $ | 4,341,006 | | | $ | (19,951,311 | ) | | $ | 774,157 | |
| | | | | | | | | | | | | | | | | | | | | | | | |
| | | | | | |
Capital stock transactions in shares: | | | | | | | | | | | | | | | | | | | | | | | | |
Sale of shares: | | | | | | | | | | | | | | | | | | | | | | | | |
Investor class of shares | | | 27,606 | | | | 33,809 | | | | 282,733 | | | | 396,140 | | | | 47,612 | | | | 46,783 | |
Institutional class of shares | | | — | | | | 3,846 | (1) | | | — | | | | 41,939 | (1) | | | — | | | | 3,211 | (1) |
Retirement class R-3 of shares | | | 13,162 | | | | 21,125 | | | | 127,664 | | | | 266,280 | | | | 9,520 | | | | 12,675 | |
Retirement class R-6 of shares | | | 467,516 | | | | 464,965 | | | | 1,136,600 | | | | 1,785,871 | | | | 302,467 | | | | 439,783 | |
| | | | | | | | | | | | | | | | | | | | | | | | |
Net sale of shares | | | 508,284 | | | | 523,745 | | | | 1,546,997 | | | | 2,490,230 | | | | 359,599 | | | | 502,452 | |
Shares issued to shareholders in payment of distributions declared: | | | | | | | | | | | | | | | | | | | | | | | | |
Investor class of shares | | | 2,266 | | | | 4,448 | | | | 87,808 | | | | 132,705 | | | | 3,079 | | | | 1,907 | |
Institutional class of shares | | | — | | | | 1,659 | (1) | | | — | | | | 18,080 | (1) | | | — | | | | 155 | (1) |
Retirement class R-3 of shares | | | 3,353 | | | | 3,013 | | | | 42,540 | | | | 67,417 | | | | 2,072 | | | | 932 | |
Retirement class R-6 of shares | | | 107,620 | | | | 72,818 | | | | 397,846 | | | | 374,953 | | | | 135,535 | | | | 58,165 | |
| | | | | | | | | | | | | | | | | | | | | | | | |
Net shares issued | | | 113,239 | | | | 81,938 | | | | 528,194 | | | | 593,155 | | | | 140,686 | | | | 61,159 | |
Shares redeemed: | | | | | | | | | | | | | | | | | | | | | | | | |
Investor class of shares | | | (12,259 | ) | | | (136,317 | ) | | | (506,947 | ) | | | (857,437 | ) | | | (49,406 | ) | | | (71,417 | ) |
Institutional class of shares | | | — | | | | (63,832 | )(1) | | | — | | | | (323,760 | )(1) | | | — | | | | (9,828 | )(1) |
Retirement class R-3 of shares | | | (102,055 | ) | | | (59,326 | ) | | | (539,077 | ) | | | (601,499 | ) | | | (47,373 | ) | | | (38,954 | ) |
Retirement class R-6 of shares | | | (1,496,179 | ) | | | (349,342 | ) | | | (2,573,184 | ) | | | (878,186 | ) | | | (2,193,982 | ) | | | (364,049 | ) |
| | | | | | | | | | | | | | | | | | | | | | | | |
Net shares redeemed | | | (1,610,493 | ) | | | (608,817 | ) | | | (3,619,208 | ) | | | (2,660,882 | ) | | | (2,290,761 | ) | | | (484,248 | ) |
| | | | | | | | | | | | | | | | | | | | | | | | |
Net change resulting from fund share transactions in shares | | | (988,970 | ) | | | (3,134 | ) | | | (1,544,017 | ) | | | 422,503 | | | | (1,790,476 | ) | | | 79,363 | |
| | | | | | | | | | | | | | | | | | | | | | | | |
| (1) | Reflects operations for the period from September 1, 2015, to August 1, 2016 (termination of Institutional class of shares). |
49
| | |
| Notes to Financial Statements (continued) | | |
| | | | | | | | | | | | | | | | | | | | | | | | |
| | | | | | | | | | |
| | | 2040 Fund | | | 2045 Fund | | | 2050 Fund | |
| | | Year Ended
August 31,
2017
| | | Year Ended
August 31,
2016
| | | Year Ended
August 31,
2017
| | | Year Ended
August 31,
2016
| | | Year Ended
August 31,
2017
| | | Year Ended
August 31,
2016
| |
Capital stock transactions in dollars: | | | | | | | | | | | | | | | | | | | | | | | | |
Proceeds from sale of shares: | | | | | | | | | | | | | | | | | | | | | | | | |
Investor class of shares | | $ | 1,883,014 | | | $ | 4,767,948 | | | $ | 170,177 | | | $ | 547,569 | | | $ | 2,360,706 | | | $ | 2,855,476 | |
Institutional class of shares | | | — | | | | 744,269 | (1) | | | — | | | | 35,333 | (1) | | | — | | | | 716,030 | (1) |
Retirement class R-3 of shares | | | 585,454 | | | | 1,131,384 | | | | 143,679 | | | | 242,359 | | | | 803,818 | | | | 1,230,609 | |
Retirement class R-6 of shares | | | 7,703,062 | | | | 10,567,208 | | | | 2,516,895 | | | | 4,133,944 | | | | 7,019,909 | | | | 9,583,527 | |
| | | | | | | | | | | | | | | | | | | | | | | | |
Net proceeds from sale of shares | | | 10,171,530 | | | | 17,210,809 | | | | 2,830,751 | | | | 4,959,205 | | | | 10,184,433 | | | | 14,385,642 | |
Net asset value of shares issued to shareholders in payment of distributions declared: | | | | | | | | | | | | | | | | | | | | | | | | |
Investor class of shares | | | 628,710 | | | | 1,034,277 | | | | 42,441 | | | | 24,521 | | | | 379,998 | | | | 496,842 | |
Institutional class of shares | | | — | | | | 195,405 | (1) | | | — | | | | 2,386 | (1) | | | — | | | | 108,258 | (1) |
Retirement class R-3 of shares | | | 214,271 | | | | 490,052 | | | | 20,450 | | | | 7,710 | | | | 203,040 | | | | 241,912 | |
Retirement class R-6 of shares | | | 2,866,927 | | | | 3,218,871 | | | | 804,157 | | | | 266,574 | | | | 1,836,029 | | | | 1,205,244 | |
| | | | | | | | | | | | | | | | | | | | | | | | |
Net proceeds from shares issued | | | 3,709,908 | | | | 4,938,605 | | | | 867,048 | | | | 301,191 | | | | 2,419,067 | | | | 2,052,256 | |
Cost of shares redeemed: | | | | | | | | | | | | | | | | | | | | | | | | |
Investor class of shares | | | (5,649,232 | ) | | | (4,805,583 | ) | | | (253,382 | ) | | | (819,881 | ) | | | (5,369,123 | ) | | | (3,260,413 | ) |
Institutional class of shares | | | — | | | | (3,276,061 | )(1) | | | — | | | | (143,717 | )(1) | | | — | | | | (2,738,189 | )(1) |
Retirement class R-3 of shares | | | (3,487,878 | ) | | | (4,088,250 | ) | | | (563,598 | ) | | | (589,023 | ) | | | (2,653,255 | ) | | | (1,964,479 | ) |
Retirement class R-6 of shares | | | (23,316,521 | ) | | | (5,553,270 | ) | | | (13,070,897 | ) | | | (2,304,205 | ) | | | (13,439,244 | ) | | | (3,693,210 | ) |
| | | | | | | | | | | | | | | | | | | | | | | | |
Net cost of shares redeemed | | | (32,453,631 | ) | | | (17,723,164 | ) | | | (13,887,877 | ) | | | (3,856,826 | ) | | | (21,461,622 | ) | | | (11,656,291 | ) |
| | | | | | | | | | | | | | | | | | | | | | | | |
Net change resulting from fund share transactions in dollars | | $ | (18,572,193 | ) | | $ | 4,426,250 | | | $ | (10,190,078 | ) | | $ | 1,403,570 | | | $ | (8,858,122 | ) | | $ | 4,781,607 | |
| | | | | | | | | | | | | | | | | | | | | | | | |
| | | | | | |
Capital stock transactions in shares: | | | | | | | | | | | | | | | | | | | | | | | | |
Sale of shares: | | | | | | | | | | | | | | | | | | | | | | | | |
Investor class of shares | | | 173,576 | | | | 453,460 | | | | 15,219 | | | | 51,707 | | | | 209,620 | | | | 272,211 | |
Institutional class of shares | | | — | | | | 72,663 | (1) | | | — | | | | 3,459 | (1) | | | — | | | | 68,012 | (1) |
Retirement class R-3 of shares | | | 53,880 | | | | 108,460 | | | | 13,190 | | | | 23,399 | | | | 71,209 | | | | 115,468 | |
Retirement class R-6 of shares | | | 713,031 | | | | 1,048,607 | | | | 223,749 | | | | 400,185 | | | | 622,506 | | | | 920,719 | |
| | | | | | | | | | | | | | | | | | | | | | | | |
Net sale of shares | | | 940,487 | | | | 1,683,190 | | | | 252,158 | | | | 478,750 | | | | 903,335 | | | | 1,376,410 | |
Shares issued to shareholders in payment of distributions declared: | | | | | | | | | | | | | | | | | | | | | | | | |
Investor class of shares | | | 61,158 | | | | 101,400 | | | | 4,004 | | | | 2,358 | | | | 35,681 | | | | 47,139 | |
Institutional class of shares | | | — | | | | 19,157 | (1) | | | — | | | | 229 | (1) | | | — | | | | 10,271 | (1) |
Retirement class R-3 of shares | | | 20,763 | | | | 47,903 | | | | 1,935 | | | | 743 | | | | 19,065 | | | | 22,930 | |
Retirement class R-6 of shares | | | 279,155 | | | | 315,576 | | | | 75,579 | | | | 25,534 | | | | 172,721 | | | | 114,350 | |
| | | | | | | | | | | | | | | | | | | | | | | | |
Net shares issued | | | 361,076 | | | | 484,036 | | | | 81,518 | | | | 28,864 | | | | 227,467 | | | | 194,690 | |
Shares redeemed: | | | | | | | | | | | | | | | | | | | | | | | | |
Investor class of shares | | | (525,932 | ) | | | (480,196 | ) | | | (22,375 | ) | | | (83,493 | ) | | | (484,194 | ) | | | (316,998 | ) |
Institutional class of shares | | | — | | | | (315,193 | )(1) | | | — | | | | (14,314 | )(1) | | | — | | | | (251,953 | )(1) |
Retirement class R-3 of shares | | | (320,875 | ) | | | (399,857 | ) | | | (49,820 | ) | | | (56,631 | ) | | | (238,882 | ) | | | (192,760 | ) |
Retirement class R-6 of shares | | | (2,131,353 | ) | | | (529,589 | ) | | | (1,164,696 | ) | | | (219,487 | ) | | | (1,183,799 | ) | | | (343,195 | ) |
| | | | | | | | | | | | | | | | | | | | | | | | |
Net shares redeemed | | | (2,978,160 | ) | | | (1,724,835 | ) | | | (1,236,891 | ) | | | (373,925 | ) | | | (1,906,875 | ) | | | (1,104,906 | ) |
| | | | | | | | | | | | | | | | | | | | | | | | |
Net change resulting from fund share transactions in shares | | | (1,676,597 | ) | | | 442,391 | | | | (903,215 | ) | | | 133,689 | | | | (776,073 | ) | | | 466,194 | |
| | | | | | | | | | | | | | | | | | | | | | | | |
| (1) | Reflects operations for the period from September 1, 2015, to August 1, 2016 (termination of Institutional class of shares). |
50
| | | | | | | | | | | | | | | | | | | | | | | | |
| | | | | | | | | | |
| | | 2055 Fund | | | Conservative Allocation
Fund | | | Moderate Allocation
Fund | |
| | | Year Ended
August 31,
2017
| | | Year Ended
August 31,
2016
| | | Year Ended
August 31,
2017
| | | Year Ended
August 31,
2016
| | | Year Ended
August 31,
2017
| | | Year Ended
August 31,
2016
| |
Capital stock transactions in dollars: | | | | | | | | | | | | | | | | | | | | | | | | |
Proceeds from sale of shares: | | | | | | | | | | | | | | | | | | | | | | | | |
Investor class of shares | | $ | 379,222 | | | $ | 542,181 | | | $ | 3,333,251 | | | $ | 1,811,809 | | | $ | 1,787,884 | | | $ | 3,102,719 | |
Institutional class of shares | | | — | | | | 30,152 | (1) | | | 3,199,776 | | | | 2,723,597 | | | | 2,247,337 | | | | 3,212,145 | |
Retirement class R-3 of shares | | | 235,131 | | | | 245,910 | | | | 594,944 | | | | 747,669 | | | | 3,698,491 | | | | 2,350,004 | |
Retirement class R-6 of shares | | | 2,688,106 | | | | 5,340,196 | | | | 9,716,130 | | | | 9,680,026 | | | | 14,085,245 | | | | 21,380,185 | |
| | | | | | | | | | | | | | | | | | | | | | | | |
Net proceeds from sale of shares | | | 3,302,459 | | | | 6,158,439 | | | | 16,844,101 | | | | 14,963,101 | | | | 21,818,957 | | | | 30,045,053 | |
Net asset value of shares issued to shareholders in payment of distributions declared: | | | | | | | | | | | | | | | | | | | | | | | | |
Investor class of shares | | | 20,520 | | | | 22,251 | | | | 395,379 | | | | 936,208 | | | | 423,731 | | | | 1,029,190 | |
Institutional class of shares | | | — | | | | 3,933 | (1) | | | 819,598 | | | | 1,331,596 | | | | 446,331 | | | | 917,395 | |
Retirement class R-3 of shares | | | 21,849 | | | | 6,116 | | | | 154,118 | | | | 292,057 | | | | 432,042 | | | | 767,207 | |
Retirement class R-6 of shares | | | 342,529 | | | | 70,282 | | | | 2,569,224 | | | | 4,033,553 | | | | 3,686,197 | | | | 5,610,808 | |
| | | | | | | | | | | | | | | | | | | | | | | | |
Net proceeds from shares issued | | | 384,898 | | | | 102,582 | | | | 3,938,319 | | | | 6,593,414 | | | | 4,988,301 | | | | 8,324,600 | |
Cost of shares redeemed: | | | | | | | | | | | | | | | | | | | | | | | | |
Investor class of shares | | | (320,201 | ) | | | (1,153,963 | ) | | | (6,464,521 | ) | | | (8,437,977 | ) | | | (7,901,290 | ) | | | (13,162,467 | ) |
Institutional class of shares | | | — | | | | (227,111 | )(1) | | | (7,637,483 | ) | | | (3,814,177 | ) | | | (5,677,100 | ) | | | (8,062,550 | ) |
Retirement class R-3 of shares | | | (672,795 | ) | | | (191,938 | ) | | | (4,559,252 | ) | | | (1,890,428 | ) | | | (3,601,940 | ) | | | (12,516,924 | ) |
Retirement class R-6 of shares | | | (3,950,595 | ) | | | (1,758,004 | ) | | | (73,153,708 | ) | | | (12,000,170 | ) | | | (41,844,897 | ) | | | (18,791,126 | ) |
| | | | | | | | | | | | | | | | | | | | | | | | |
Net cost of shares redeemed | | | (4,943,591 | ) | | | (3,331,016 | ) | | | (91,814,964 | ) | | | (26,142,752 | ) | | | (59,025,227 | ) | | | (52,533,067 | ) |
| | | | | | | | | | | | | | | | | | | | | | | | |
Net change resulting from fund share transactions in dollars | | $ | (1,256,234 | ) | | $ | 2,930,005 | | | $ | (71,032,544 | ) | | $ | (4,586,237 | ) | | $ | (32,217,969 | ) | | $ | (14,163,414 | ) |
| | | | | | | | | | | | | | | | | | | | | | | | |
| | | | | | |
Capital stock transactions in shares: | | | | | | | | | | | | | | | | | | | | | | | | |
Sale of shares: | | | | | | | | | | | | | | | | | | | | | | | | |
Investor class of shares | | | 34,155 | | | | 53,020 | | | | 341,654 | | | | 190,169 | | | | 184,063 | | | | 330,167 | |
Institutional class of shares | | | — | | | | 2,909 | (1) | | | 327,989 | | | | 285,432 | | | | 231,324 | | | | 347,121 | |
Retirement class R-3 of shares | | | 21,703 | | | | 24,075 | | | | 61,258 | | | | 78,292 | | | | 379,868 | | | | 249,468 | |
Retirement class R-6 of shares | | | 241,119 | | | | 519,389 | | | | 990,085 | | | | 1,002,674 | | | | 1,440,015 | | | | 2,269,691 | |
| | | | | | | | | | | | | | | | | | | | | | | | |
Net sale of shares | | | 296,977 | | | | 599,393 | | | | 1,720,986 | | | | 1,556,567 | | | | 2,235,270 | | | | 3,196,447 | |
Shares issued to shareholders in payment of distributions declared: | | | | | | | | | | | | | | | | | | | | | | | | |
Investor class of shares | | | 1,938 | | | | 2,152 | | | | 41,663 | | | | 101,321 | | | | 45,078 | | | | 111,747 | |
Institutional class of shares | | | — | | | | 379 | (1) | | | 86,455 | | | | 144,268 | | | | 47,533 | | | | 99,717 | |
Retirement class R-3 of shares | | | 2,071 | | | | 593 | | | | 16,240 | | | | 31,574 | | | | 45,913 | | | | 83,121 | |
Retirement class R-6 of shares | | | 32,223 | | | | 6,771 | | | | 271,015 | | | | 437,005 | | | | 392,985 | | | | 609,870 | |
| | | | | | | | | | | | | | | | | | | | | | | | |
Net shares issued | | | 36,232 | | | | 9,895 | | | | 415,373 | | | | 714,168 | | | | 531,509 | | | | 904,455 | |
Shares redeemed: | | | | | | | | | | | | | | | | | | | | | | | | |
Investor class of shares | | | (27,594 | ) | | | (118,249 | ) | | | (660,920 | ) | | | (881,334 | ) | | | (806,639 | ) | | | (1,403,952 | ) |
Institutional class of shares | | | — | | | | (21,471 | )(1) | | | (777,055 | ) | | | (403,086 | ) | | | (580,703 | ) | | | (860,237 | ) |
Retirement class R-3 of shares | | | (59,996 | ) | | | (18,601 | ) | | | (470,782 | ) | | | (198,052 | ) | | | (369,030 | ) | | | (1,309,680 | ) |
Retirement class R-6 of shares | | | (354,505 | ) | | | (165,362 | ) | | | (7,418,823 | ) | | | (1,251,722 | ) | | | (4,274,881 | ) | | | (1,985,895 | ) |
| | | | | | | | | | | | | | | | | | | | | | | | |
Net shares redeemed | | | (442,095 | ) | | | (323,683 | ) | | | (9,327,580 | ) | | | (2,734,194 | ) | | | (6,031,253 | ) | | | (5,559,764 | ) |
| | | | | | | | | | | | | | | | | | | | | | | | |
Net change resulting from fund share transactions in shares | | | (108,886 | ) | | | 285,605 | | | | (7,191,221 | ) | | | (463,459 | ) | | | (3,264,474 | ) | | | (1,458,862 | ) |
| | | | | | | | | | | | | | | | | | | | | | | | |
| (1) | Reflects operations for the period from September 1, 2015, to August 1, 2016 (termination of Institutional class of shares). |
51
| | |
| Notes to Financial Statements (continued) | | |
| | | | | | | | | | | | | | | | | | | | | | | | |
| | | | | | | | | | |
| | | Balanced Allocation
Fund | | | Growth Allocation
Fund | | | Aggressive Allocation
Fund | |
| | | Year Ended
August 31,
2017
| | | Year Ended
August 31,
2016
| | | Year Ended
August 31,
2017
| | | Year Ended
August 31,
2016
| | | Year Ended
August 31,
2017
| | | Year Ended
August 31,
2016
| |
Capital stock transactions in dollars: | | | | | | | | | | | | | | | | | | | | | | | | |
Proceeds from sale of shares: | | | | | | | | | | | | | | | | | | | | | | | | |
Investor class of shares | | $ | 9,596,115 | | | $ | 7,142,376 | | | $ | 1,521,150 | | | $ | 2,077,673 | | | $ | 2,549,571 | | | $ | 3,572,978 | |
Institutional class of shares | | | 18,188,630 | | | | 13,589,037 | | | | 3,782,554 | | | | 1,591,796 | | | | 3,231,792 | | | | 3,848,563 | |
Retirement class R-3 of shares | | | 3,462,896 | | | | 3,545,301 | | | | 1,995,735 | | | | 2,171,200 | | | | 1,545,438 | | | | 1,791,359 | |
Retirement class R-6 of shares | | | 33,777,945 | | | | 51,258,245 | | | | 23,359,307 | | | | 22,529,256 | | | | 28,234,235 | | | | 28,362,465 | |
| | | | | | | | | | | | | | | | | | | | | | | | |
Net proceeds from sale of shares | | | 65,025,586 | | | | 75,534,959 | | | | 30,658,746 | | | | 28,369,925 | | | | 35,561,036 | | | | 37,575,365 | |
Net asset value of shares issued to shareholders in payment of distributions declared: | | | | | | | | | | | | | | | | | | | | | | | | |
Investor class of shares | | | 7,291,420 | | | | 12,849,873 | | | | 1,358,067 | | | | 2,839,764 | | | | 4,019,656 | | | | 5,585,746 | |
Institutional class of shares | | | 4,959,081 | | | | 7,011,067 | | | | 661,921 | | | | 1,170,790 | | | | 2,155,531 | | | | 2,580,768 | |
Retirement class R-3 of shares | | | 1,857,132 | | | | 3,137,774 | | | | 1,005,881 | | | | 2,104,133 | | | | 1,846,190 | | | | 1,654,830 | |
Retirement class R-6 of shares | | | 16,194,257 | | | | 21,422,949 | | | | 4,846,161 | | | | 5,431,739 | | | | 11,432,316 | | | | 9,317,128 | |
| | | | | | | | | | | | | | | | | | | | | | | | |
Net proceeds from shares issued | | | 30,301,890 | | | | 44,421,663 | | | | 7,872,030 | | | | 11,546,426 | | | | 19,453,693 | | | | 19,138,472 | |
Cost of shares redeemed: | | | | | | | | | | | | | | | | | | | | | | | | |
Investor class of shares | | | (28,809,458 | ) | | | (58,264,348 | ) | | | (12,160,876 | ) | | | (21,431,476 | ) | | | (23,138,517 | ) | | | (36,746,238 | ) |
Institutional class of shares | | | (46,186,859 | ) | | | (24,780,559 | ) | | | (5,854,651 | ) | | | (7,575,632 | ) | | | (15,771,306 | ) | | | (12,716,568 | ) |
Retirement class R-3 of shares | | | (11,399,285 | ) | | | (14,663,873 | ) | | | (11,372,090 | ) | | | (6,500,965 | ) | | | (6,476,231 | ) | | | (5,897,696 | ) |
Retirement class R-6 of shares | | | (115,489,437 | ) | | | (60,487,004 | ) | | | (29,720,835 | ) | | | (14,964,684 | ) | | | (62,955,630 | ) | | | (26,340,978 | ) |
| | | | | | | | | | | | | | | | | | | | | | | | |
Net cost of shares redeemed | | | (201,885,039 | ) | | | (158,195,784 | ) | | | (59,108,452 | ) | | | (50,472,757 | ) | | | (108,341,684 | ) | | | (81,701,480 | ) |
| | | | | | | | | | | | | | | | | | | | | | | | |
Net change resulting from fund share transactions in dollars | | $ | (106,557,563 | ) | | $ | (38,239,162 | ) | | $ | (20,577,676 | ) | | $ | (10,556,406 | ) | | $ | (53,326,955 | ) | | $ | (24,987,643 | ) |
| | | | | | | | | | | | | | | | | | | | | | | | |
| | | | | | |
Capital stock transactions in shares: | | | | | | | | | | | | | | | | | | | | | | | | |
Sale of shares: | | | | | | | | | | | | | | | | | | | | | | | | |
Investor class of shares | | | 1,025,790 | | | | 783,352 | | | | 157,085 | | | | 225,792 | | | | 269,537 | | | | 388,583 | |
Institutional class of shares | | | 1,949,386 | | | | 1,509,315 | | | | 397,357 | | | | 171,890 | | | | 339,793 | | | | 423,612 | |
Retirement class R-3 of shares | | | 373,495 | | | | 386,455 | | | | 206,661 | | | | 238,599 | | | | 162,532 | | | | 194,889 | |
Retirement class R-6 of shares | | | 3,612,043 | | | | 5,768,354 | | | | 2,396,103 | | | | 2,474,947 | | | | 2,925,969 | | | | 3,145,394 | |
| | | | | | | | | | | | | | | | | | | | | | | | |
Net sale of shares | | | 6,960,714 | | | | 8,447,476 | | | | 3,157,206 | | | | 3,111,228 | | | | 3,697,831 | | | | 4,152,478 | |
Shares issued to shareholders in payment of distributions declared: | | | | | | | | | | | | | | | | | | | | | | | | |
Investor class of shares | | | 822,031 | | | | 1,432,539 | | | | 146,659 | | | | 309,680 | | | | 449,626 | | | | 606,487 | |
Institutional class of shares | | | 559,716 | | | | 782,485 | | | | 71,559 | | | | 127,676 | | | | 241,651 | | | | 280,518 | |
Retirement class R-3 of shares | | | 209,372 | | | | 349,807 | | | | 108,509 | | | | 229,458 | | | | 206,740 | | | | 179,678 | |
Retirement class R-6 of shares | | | 1,827,794 | | | | 2,388,289 | | | | 524,476 | | | | 592,338 | | | | 1,281,650 | | | | 1,012,731 | |
| | | | | | | | | | | | | | | | | | | | | | | | |
Net shares issued | | | 3,418,913 | | | | 4,953,120 | | | | 851,203 | | | | 1,259,152 | | | | 2,179,667 | | | | 2,079,414 | |
Shares redeemed: | | | | | | | | | | | | | | | | | | | | | | | | |
Investor class of shares | | | (3,093,692 | ) | | | (6,527,889 | ) | | | (1,245,696 | ) | | | (2,334,793 | ) | | | (2,424,144 | ) | | | (3,958,147 | ) |
Institutional class of shares | | | (4,942,672 | ) | | | (2,708,731 | ) | | | (604,772 | ) | | | (837,364 | ) | | | (1,624,360 | ) | | | (1,411,393 | ) |
Retirement class R-3 of shares | | | (1,223,751 | ) | | | (1,605,109 | ) | | | (1,181,512 | ) | | | (705,198 | ) | | | (681,868 | ) | | | (638,101 | ) |
Retirement class R-6 of shares | | | (12,198,320 | ) | | | (6,601,754 | ) | | | (3,005,372 | ) | | | (1,615,073 | ) | | | (6,486,787 | ) | | | (2,825,539 | ) |
| | | | | | | | | | | | | | | | | | | | | | | | |
Net shares redeemed | | | (21,458,435 | ) | | | (17,443,483 | ) | | | (6,037,352 | ) | | | (5,492,428 | ) | | | (11,217,159 | ) | | | (8,833,180 | ) |
| | | | | | | | | | | | | | | | | | | | | | | | |
Net change resulting from fund share transactions in shares | | | (11,078,808 | ) | | | (4,042,887 | ) | | | (2,028,943 | ) | | | (1,122,048 | ) | | | (5,339,661 | ) | | | (2,601,288 | ) |
| | | | | | | | | | | | | | | | | | | | | | | | |
| 5. | | Investment Adviser Fee and Other Transactions with Affiliates |
Investment Advisory Fees—The Adviser does not receive an investment advisory fee for the services it performs for the Funds. However, the Adviser is entitled to receive an investment advisory fee from each of the BMO Funds that serve as underlying funds.
Contractual Expense Limitation—The Adviser has contractually agreed to waive or reduce fees and reimburse expenses to the extent necessary to prevent class total annual operating expenses (excluding acquired fund fees and expenses, interest, taxes, brokerage commissions, other investment-related costs and extraordinary expenses, such as litigation and other expenses not incurred in the ordinary course of a Fund’s business) from exceeding the levels set out in the table below through December 31, 2018. This agreement may not be terminated prior to December 31, 2018 without the consent of the Funds’ Board of Directors, unless terminated due to the termination of the investment advisory agreement. Additionally, the agreement does not provide for recoupment by the Adviser of waived fees or reimbursed expenses.
52
| | | | | | | | | | | | | | | | | | | | | | | | | | | | | | | | |
| | | Annualized Contractual Expense Limitation
Exclusive of Acquired Fund Fees and Expenses | | | Annualized Contractual Expense Limitation
Inclusive of Acquired Fund Fees and Expenses per
the Funds’ Prospectus Dated December 29, 2016 | |
Fund | | Investor
Class | | | Institutional
Class | | | Retirement
Class R-3 | | | Retirement
Class R-6(1) | | | Investor
Class | | | Institutional
Class | | | Retirement
Class R-3 | | | Retirement
Class R-6(1) | |
In-Retirement Fund | | | 0.33 | % | | | | | | | 0.58 | % | | | (0.07 | )% | | | 0.96 | % | | | | | | | 1.21 | % | | | 0.56 | % |
2015 Fund | | | 0.33 | | | | | | | | 0.58 | | | | (0.07 | ) | | | 1.00 | | | | | | | | 1.25 | | | | 0.60 | |
2020 Fund | | | 0.33 | | | | | | | | 0.58 | | | | (0.07 | ) | | | 1.03 | | | | | | | | 1.28 | | | | 0.63 | |
2025 Fund | | | 0.33 | | | | | | | | 0.58 | | | | (0.07 | ) | | | 1.03 | | | | | | | | 1.28 | | | | 0.63 | |
2030 Fund | | | 0.37 | | | | | | | | 0.62 | | | | (0.03 | ) | | | 1.09 | | | | | | | | 1.34 | | | | 0.69 | |
2035 Fund | | | 0.37 | | | | | | | | 0.62 | | | | (0.03 | ) | | | 1.06 | | | | | | | | 1.31 | | | | 0.66 | |
2040 Fund | | | 0.36 | | | | | | | | 0.61 | | | | (0.04 | ) | | | 1.08 | | | | | | | | 1.33 | | | | 0.68 | |
2045 Fund | | | 0.36 | | | | | | | | 0.61 | | | | (0.04 | ) | | | 1.05 | | | | | | | | 1.30 | | | | 0.65 | |
2050 Fund | | | 0.36 | | | | | | | | 0.61 | | | | (0.04 | ) | | | 1.08 | | | | | | | | 1.33 | | | | 0.68 | |
2055 Fund | | | 0.36 | | | | | | | | 0.61 | | | | (0.04 | ) | | | 1.07 | | | | | | | | 1.32 | | | | 0.67 | |
Conservative Allocation Fund | | | 0.33 | | | | 0.08 | % | | | 0.58 | | | | (0.07 | ) | | | 1.02 | | | | 0.77 | % | | | 1.27 | | | | 0.62 | |
Moderate Allocation Fund | | | 0.30 | | | | 0.05 | | | | 0.55 | | | | (0.10 | ) | | | 1.02 | | | | 0.77 | | | | 1.27 | | | | 0.62 | |
Balanced Allocation Fund | | | 0.33 | | | | 0.08 | | | | 0.58 | | | | (0.07 | ) | | | 1.08 | | | | 0.83 | | | | 1.33 | | | | 0.68 | |
Growth Allocation Fund | | | 0.30 | | | | 0.05 | | | | 0.55 | | | | (0.10 | ) | | | 1.08 | | | | 0.83 | | | | 1.33 | | | | 0.68 | |
Aggressive Allocation Fund | | | 0.33 | | | | 0.08 | | | | 0.58 | | | | (0.07 | ) | | | 1.01 | | | | 0.76 | | | | 1.26 | | | | 0.61 | |
| | (1) | As a result of reimbursing expenses including acquired fund expenses, the Adviser reimbursed amounts in excess of the respective share classes operating expenses. The aggregate excess reimbursement is accounted for as “Excess expense reimbursement from investment adviser” included in investment income on the Statements of Operations. |
Shareholder Servicing Fees—Under the terms of a Shareholder Services Agreement with the Adviser, each Fund pays the Adviser at the annual rate of 0.25% of average daily net assets of the Fund’s Investor Class shares for the period. The fee paid to the Adviser is used to finance certain services for shareholders and to maintain shareholder accounts.
Distribution Services Fees—The Funds are subject to a Distribution Plan (the “Plan”) pursuant to Rule 12b-1 under the Act. The Plan authorizes payments by the Fund to finance activities intended to result in the sale of its Retirement Class R-3 shares. The Plan provides that the Fund may incur distribution expenses of 0.50% of the average daily net assets of the Fund’s Retirement Class R-3 shares.
Administration Fees—Each Fund pays the Adviser at the annual rate of 0.15% of average daily net assets per class (except the Retirement class R-6, which does not pay an Administration Fee).
For the year ended August 31, 2017, the Funds were charged the following Administration Fees per class:
| | | | | | | | | | | | |
Fund | | Investor
Class | | | Institutional
Class | | | Retirement
Class R-3 | |
In-Retirement Fund | | $ | 4,903 | | | | | | | $ | 1,631 | |
2015 Fund | | | 1,124 | | | | | | | | 189 | |
2020 Fund | | | 26,575 | | | | | | | | 13,821 | |
2025 Fund | | | 1,258 | | | | | | | | 1,179 | |
2030 Fund | | | 28,118 | | | | | | | | 12,033 | |
2035 Fund | | | 1,190 | | | | | | | | 574 | |
2040 Fund | | | 17,384 | | | | | | | | 5,627 | |
2045 Fund | | | 1,360 | | | | | | | | 474 | |
2050 Fund | | | 12,605 | | | | | | | | 5,419 | |
2055 Fund | | | 832 | | | | | | | | 577 | |
Conservative Allocations Fund | | | 24,849 | | | $ | 43,616 | | | | 7,554 | |
Moderate Allocation Fund | | | 16,369 | | | | 16,371 | | | | 19,709 | |
Balanced Allocation Fund | | | 154,065 | | | | 99,652 | | | | 39,430 | |
Growth Allocation Fund | | | 31,502 | | | | 14,952 | | | | 29,648 | |
Aggressive Allocation Fund | | | 63,737 | | | | 32,529 | | | | 28,056 | |
Custodian Fees—BMO Harris Bank N.A. (“BMO Harris”) is the Funds’ custodian. BMO Harris receives fees based on 0.0050% on the first $10 billion average daily net assets, based on the collective net assets of the Corporation custodied by BMO Harris, and 0.0025% on all assets in excess of $10 billion.
Investments in Affiliated Issuers—An affiliated issuer is an entity in which the Fund has ownership of at least 5% of the voting securities or any investment in the BMO Funds. Issuers that are affiliates of the Fund at period-end are noted in the Fund’s Schedule of Investments. Additional security purchases and the reduction of certain securities shares outstanding of existing portfolio holdings that were not considered affiliated in prior years may result in the Funds owning in excess of 5% of the outstanding shares at period-end. The table below reflects transactions during the year with entities that are affiliates as of August 31, 2017. All securities listed on the table present the Institutional Class, except for BMO LGM Frontier Markets Equity Fund, which has an Investor Class, and BMO Institutional Prime Money Market, which has a Premier Class.
53
| | |
| Notes to Financial Statements (continued) | | |
| | | | | | | | | | | | | | | | | | | | | | | | | | | | | | | | |
Fund/Security Description | | Value,
Beginning
of Period | | | Purchases | | | Sales
Proceeds | | | Change in
Unrealized
Appreciation
(Depreciation) | | | Net
Realized
Gain(Loss) | | | Value, End
of Period | | | Dividends
Credited
to
Income | | | Net Realized
Gain on
Capital Gain
Distributions | |
In-Retirement Fund | | | | | | | | | | | | | | | | | | | | | | | | | | | | | | | | |
BMO Low Volatility Equity Fund | | $ | 580,470 | | | $ | 98,103 | | | $ | 292,291 | | | $ | (12,277 | ) | | $ | 28,609 | | | $ | 402,614 | | | $ | 7,851 | | | $ | 6,188 | |
BMO Dividend Income Fund | | | 409,818 | | | | 55,104 | | | | 216,372 | | | | (2,932 | ) | | | 39,078 | | | | 284,696 | | | | 7,769 | | | | 2,888 | |
BMO Large-Cap Value Fund | | | 602,411 | | | | 95,897 | | | | 334,803 | | | | 14,808 | | | | 42,558 | | | | 420,871 | | | | 7,257 | | | | 4,138 | |
BMO Large-Cap Growth Fund | | | 253,944 | | | | 38,217 | | | | 135,543 | | | | 17,264 | | | | 8,179 | | | | 182,061 | | | | 1,686 | | | | 12,678 | |
BMO Mid-Cap Value Fund | | | 260,074 | | | | 97,622 | | | | 141,464 | | | | (54,348 | ) | | | 17,917 | | | | 179,801 | | | | 1,316 | | | | 62,209 | |
BMO Mid-Cap Growth Fund | | | 107,588 | | | | 32,900 | | | | 56,666 | | | | (16,557 | ) | | | 8,513 | | | | 75,778 | | | | 337 | | | | 21,104 | |
BMO Small-Cap Growth Fund | | | 64,374 | | | | 12,332 | | | | 38,380 | | | | (7,642 | ) | | | 14,956 | | | | 45,640 | | | | — | | | | — | |
BMO Disciplined International Equity Fund | | | 428,589 | | | | 53,347 | | | | 234,945 | | | | 47,142 | | | | 4,340 | | | | 298,473 | | | | 11,097 | | | | — | |
BMO Pyrford International Stock Fund | | | 571,074 | | | | 76,865 | | | | 278,019 | | | | (5,611 | ) | | | 37,488 | | | | 401,797 | | | | 11,740 | | | | — | |
BMO LGM Emerging Markets Equity Fund | | | 258,938 | | | | 124,581 | | | | 184,493 | | | | 23,749 | | | | 14,548 | | | | 237,323 | | | | 1,746 | | | | — | |
BMO TCH Emerging Markets Bond Fund | | | — | | | | 739,144 | | | | 290,866 | | | | 7,616 | | | | (7,621 | ) | | | 448,273 | | | | 17,503 | | | | — | |
BMO Alternative Strategies Fund | | | 1,504,017 | | | | 174,719 | | | | 686,167 | | | | 45,015 | | | | 9,142 | | | | 1,046,726 | | | | — | | | | — | |
BMO TCH Core Plus Bond Fund | | | 4,014,368 | | | | 697,583 | | | | 1,893,333 | | | | (42,213 | ) | | | (5,863 | ) | | | 2,770,542 | | | | 85,438 | | | | 10,966 | |
BMO High Yield Bond Fund | | | 389,865 | | | | 57,424 | | | | 180,688 | | | | 12,191 | | | | (10,288 | ) | | | 268,504 | | | | 17,038 | | | | — | |
BMO Institutional Prime Money Market Fund | | | 209,515 | | | | 7,124,489 | | | | 7,189,547 | | | | — | | | | 20 | | | | 144,477 | | | | 1,124 | | | | — | |
BMO LGM Frontier Markets Equity Fund | | | 123,684 | | | | 968 | | | | 118,329 | | | | 9,954 | | | | (16,277 | ) | | | — | | | | 968 | | | | — | |
| | | | | | | | | | | | | | | | | | | | | | | | | | | | | | | | |
Totals | | $ | 9,778,729 | | | $ | 9,479,295 | | | $ | 12,271,906 | | | $ | 36,159 | | | $ | 185,299 | | | $ | 7,207,576 | | | $ | 172,870 | | | $ | 120,171 | |
| | | | | | | | | | | | | | | | | | | | | | | | | | | | | | | | |
| | | | | | | | |
2015 Fund | | | | | | | | | | | | | | | | | | | | | | | | | | | | | | | | |
BMO Low Volatility Equity Fund | | $ | 162,273 | | | $ | 108,196 | | | $ | 136,311 | | | $ | 2,896 | | | $ | 3,253 | | | $ | 140,307 | | | $ | 2,477 | | | $ | 1,995 | |
BMO Dividend Income Fund | | | 86,958 | | | | 52,619 | | | | 74,775 | | | | 8,793 | | | | 817 | | | | 74,412 | | | | 1,810 | | | | 697 | |
BMO Large-Cap Value Fund | | | 173,384 | | | | 104,000 | | | | 148,389 | | | | 24,273 | | | | (3,979 | ) | | | 149,289 | | | | 2,286 | | | | 1,349 | |
BMO Large-Cap Growth Fund | | | 90,149 | | | | 58,444 | | | | 80,279 | | | | 7,346 | | | | 3,650 | | | | 79,310 | | | | 723 | | | | 5,165 | |
BMO Mid-Cap Value Fund | | | 86,632 | | | | 75,325 | | | | 75,373 | | | | 8,827 | | | | (21,004 | ) | | | 74,407 | | | | 502 | | | | 22,547 | |
BMO Mid-Cap Growth Fund | | | 31,775 | | | | 24,172 | | | | 26,304 | | | | 5,299 | | | | (7,213 | ) | | | 27,729 | | | | 116 | | | | 6,680 | |
BMO Small-Cap Growth Fund | | | 27,154 | | | | 16,853 | | | | 23,940 | | | | 4,408 | | | | (615 | ) | | | 23,860 | | | | — | | | | — | |
BMO Disciplined International Equity Fund | | | 123,046 | | | | 72,833 | | | | 107,743 | | | | 15,103 | | | | 2,078 | | | | 105,317 | | | | 3,592 | | | | — | |
BMO Pyrford International Stock Fund | | | 158,684 | | | | 98,403 | | | | 131,366 | | | | 13,204 | | | | (2,790 | ) | | | 136,135 | | | | 3,670 | | | | — | |
BMO LGM Emerging Markets Equity Fund | | | 87,301 | | | | 86,187 | | | | 95,762 | | | | 11,977 | | | | 3,342 | | | | 93,045 | | | | 702 | | | | — | |
BMO TCH Emerging Markets Bond Fund | | | — | | | | 186,287 | | | | 88,864 | | | | 3,628 | | | | (3,413 | ) | | | 97,638 | | | | 3,519 | | | | — | |
BMO Alternative Strategies Fund | | | 306,504 | | | | 175,409 | | | | 232,806 | | | | 9,860 | | | | 2,892 | | | | 261,859 | | | | — | | | | — | |
BMO TCH Core Plus Bond Fund | | | 677,799 | | | | 439,737 | | | | 527,846 | | | | (3,767 | ) | | | (5,830 | ) | | | 580,093 | | | | 16,701 | | | | 2,129 | |
BMO High Yield Bond Fund | | | 59,848 | | | | 36,860 | | | | 46,209 | | | | 1,122 | | | | (936 | ) | | | 50,685 | | | | 3,013 | | | | — | |
BMO Institutional Prime Money Market Fund | | | 46,224 | | | | 2,948,449 | | | | 2,954,832 | | | | — | | | | (43 | ) | | | 39,798 | | | | 398 | | | | — | |
BMO LGM Frontier Markets Equity Fund | | | 31,708 | | | | 248 | | | | 30,335 | | | | 1,344 | | | | (2,965 | ) | | | — | | | | 248 | | | | — | |
| | | | | | | | | | | | | | | | | | | | | | | | | | | | | | | | |
Totals | | $ | 2,149,439 | | | $ | 4,484,022 | | | $ | 4,781,134 | | | $ | 114,313 | | | $ | (32,756 | ) | | $ | 1,933,884 | | | $ | 39,757 | | | $ | 40,562 | |
| | | | | | | | | | | | | | | | | | | | | | | | | | | | | | | | |
| | | | | | | | |
2020 Fund | | | | | | | | | | | | | | | | | | | | | | | | | | | | | | | | |
BMO Low Volatility Equity Fund | | $ | 3,894,115 | | | $ | 514,263 | | | $ | 1,188,355 | | | $ | 142,668 | | | $ | 1,927 | | | $ | 3,364,618 | | | $ | 58,926 | | | $ | 45,003 | |
BMO Dividend Income Fund | | | 1,670,025 | | | | 211,234 | | | | 599,305 | | | | 68,491 | | | | 103,543 | | | | 1,453,988 | | | | 35,328 | | | | 12,843 | |
BMO Large-Cap Value Fund | | | 4,126,073 | | | | 704,413 | | | | 1,725,841 | | | | 354,951 | | | | 91,920 | | | | 3,551,516 | | | | 54,568 | | | | 30,516 | |
BMO Large-Cap Growth Fund | | | 2,404,456 | | | | 362,921 | | | | 944,020 | | | | 266,729 | | | | 26,468 | | | | 2,116,554 | | | | 17,979 | | | | 128,264 | |
BMO Mid-Cap Value Fund | | | 2,281,189 | | | | 894,590 | | | | 903,056 | | | | (337,953 | ) | | | 11,015 | | | | 1,945,785 | | | | 12,385 | | | | 575,626 | |
BMO Mid-Cap Growth Fund | | | 1,670,663 | | | | 552,986 | | | | 639,442 | | | | (103,898 | ) | | | (5,341 | ) | | | 1,474,968 | | | | 5,722 | | | | 348,605 | |
BMO Small-Cap Growth Fund | | | 932,505 | | | | 202,086 | | | | 447,132 | | | | 47,023 | | | | 72,572 | | | | 807,054 | | | | — | | | | — | |
BMO Disciplined International Equity Fund | | | 2,972,794 | | | | 424,749 | | | | 1,234,558 | | | | 419,932 | | | | 12,893 | | | | 2,595,810 | | | | 81,954 | | | | — | |
BMO Pyrford International Stock Fund | | | 4,125,091 | | | | 638,568 | | | | 1,447,175 | | | | 229,918 | | | | 71,619 | | | | 3,618,021 | | | | 91,283 | | | | — | |
BMO LGM Emerging Markets Equity Fund | | | 2,631,395 | | | | 1,146,071 | | | | 1,379,794 | | | | 282,568 | | | | 44,890 | | | | 2,725,130 | | | | 19,852 | | | | — | |
BMO TCH Emerging Markets Bond Fund | | | — | | | | 1,651,354 | | | | 459,137 | | | | 22,689 | | | | (11,674 | ) | | | 1,203,232 | | | | 40,777 | | | | — | |
BMO Alternative Strategies Fund | | | 5,838,880 | | | | 808,487 | | | | 1,811,395 | | | | 222,725 | | | | 21,630 | | | | 5,080,327 | | | | — | | | | — | |
BMO TCH Core Plus Bond Fund | | | 9,971,443 | | | | 2,117,830 | | | | 3,442,858 | | | | (90,251 | ) | | | (10,467 | ) | | | 8,545,697 | | | | 244,083 | | | | 29,301 | |
BMO High Yield Bond Fund | | | 852,539 | | | | 150,208 | | | | 279,289 | | | | 21,565 | | | | (15,986 | ) | | | 729,037 | | | | 42,543 | | | | — | |
BMO Institutional Prime Money Market Fund | | | 920,373 | | | | 20,875,822 | | | | 21,075,341 | | | | — | | | | 1 | | | | 720,855 | | | | 6,262 | | | | — | |
BMO LGM Frontier Markets Equity Fund | | | 709,471 | | | | 5,554 | | | | 773,109 | | | | 50,968 | | | | 7,116 | | | | — | | | | 5,554 | | | | — | |
| | | | | | | | | | | | | | | | | | | | | | | | | | | | | | | | |
Totals | | $ | 45,001,012 | | | $ | 31,261,136 | | | $ | 38,349,807 | | | $ | 1,598,125 | | | $ | 422,126 | | | $ | 39,932,592 | | | $ | 717,216 | | | $ | 1,170,158 | |
| | | | | | | | | | | | | | | | | | | | | | | | | | | | | | | | |
54
| | | | | | | | | | | | | | | | | | | | | | | | | | | | | | | | |
Fund/Security Description | | Value,
Beginning
of Period | | | Purchases | | | Sales
Proceeds | | | Change in
Unrealized
Appreciation
(Depreciation) | | | Net
Realized
Gain(Loss) | | | Value, End
of Period | | | Dividends
Credited
to
Income | | | Net Realized
Gain on
Capital Gain
Distributions | |
2025 Fund | | | | | | | | | | | | | | | | | | | | | | | | | | | | | | | | |
BMO Low Volatility Equity Fund | | $ | 945,739 | | | $ | 266,250 | | | $ | 589,380 | | | $ | 16,114 | | | $ | 23,302 | | | $ | 662,025 | | | $ | 13,253 | | | $ | 12,198 | |
BMO Dividend Income Fund | | | 399,892 | | | | 81,452 | | | | 247,672 | | | | 41,348 | | | | 2,410 | | | | 277,430 | | | | 7,769 | | | | 3,372 | |
BMO Large-Cap Value Fund | | | 1,487,538 | | | | 334,298 | | | | 969,243 | | | | 219,507 | | | | (46,746 | ) | | | 1,025,354 | | | | 18,407 | | | | 12,156 | |
BMO Large-Cap Growth Fund | | | 784,992 | | | | 177,592 | | | | 495,309 | | | | 69,128 | | | | 21,324 | | | | 557,727 | | | | 5,691 | | | | 46,972 | |
BMO Mid-Cap Value Fund | | | 888,016 | | | | 456,619 | | | | 585,298 | | | | 78,477 | | | | (217,939 | ) | | | 619,875 | | | | 5,450 | | | | 246,015 | |
BMO Mid-Cap Growth Fund | | | 854,792 | | | | 352,248 | | | | 538,597 | | | | 189,446 | | | | (256,515 | ) | | | 601,374 | | | | 3,239 | | | | 191,286 | |
BMO Small-Cap Growth Fund | | | 549,784 | | | | 136,777 | | | | 370,012 | | | | 86,374 | | | | (17,050 | ) | | | 385,873 | | | | — | | | | — | |
BMO Disciplined International Equity Fund | | | 832,761 | | | | 129,882 | | | | 491,592 | | | | 101,069 | | | | 8,240 | | | | 580,360 | | | | 25,426 | | | | — | |
BMO Pyrford International Stock Fund | | | 1,452,719 | | | | 339,786 | | | | 854,098 | | | | 104,217 | | | | (12,562 | ) | | | 1,030,062 | | | | 35,634 | | | | — | |
BMO LGM Emerging Markets Equity Fund | | | 1,114,286 | | | | 447,553 | | | | 740,161 | | | | 91,875 | | | | 22,777 | | | | 936,330 | | | | 9,413 | | | | — | |
BMO TCH Emerging Markets Bond Fund | | | — | | | | 429,700 | | | | 193,930 | | | | 5,886 | | | | (7,267 | ) | | | 234,389 | | | | 10,949 | | | | — | |
BMO Alternative Strategies Fund | | | 1,711,494 | | | | 342,282 | | | | 928,456 | | | | 49,824 | | | | 20,219 | | | | 1,195,363 | | | | — | | | | — | |
BMO TCH Core Plus Bond Fund | | | 2,369,198 | | | | 707,679 | | | | 1,400,738 | | | | (20,482 | ) | | | (16,711 | ) | | | 1,638,946 | | | | 55,779 | | | | 7,802 | |
BMO High Yield Bond Fund | | | 215,684 | | | | 58,053 | | | | 125,448 | | | | 6,947 | | | | (6,056 | ) | | | 149,180 | | | | 10,459 | | | | — | |
BMO Institutional Prime Money Market Fund | | | 307,623 | | | | 8,206,204 | | | | 8,266,822 | | | | — | | | | (104 | ) | | | 246,901 | | | | 2,016 | | | | — | |
BMO LGM Frontier Markets Equity Fund | | | 245,304 | | | | 1,920 | | | | 267,307 | | | | 3,106 | | | | 16,977 | | | | — | | | | 1,920 | | | | — | |
| | | | | | | | | | | | | | | | | | | | | | | | | | | | | | | | |
Totals | | $ | 14,159,822 | | | $ | 12,468,295 | | | $ | 17,064,063 | | | $ | 1,042,836 | | | $ | (465,701 | ) | | $ | 10,141,189 | | | $ | 205,405 | | | $ | 519,801 | |
| | | | | | | | | | | | | | | | | | | | | | | | | | | | | | | | |
| | | | | | | | |
2030 Fund | | | | | | | | | | | | | | | | | | | | | | | | | | | | | | | | |
BMO Low Volatility Equity Fund | | $ | 3,606,619 | | | $ | 736,846 | | | $ | 1,279,971 | | | $ | 98,709 | | | $ | 43,499 | | | $ | 3,205,702 | | | $ | 54,987 | | | $ | 42,375 | |
BMO Dividend Income Fund | | | 1,432,917 | | | | 213,234 | | | | 502,060 | | | | 71,811 | | | | 84,399 | | | | 1,300,301 | | | | 30,517 | | | | 11,286 | |
BMO Large-Cap Value Fund | | | 5,680,775 | | | | 1,138,051 | | | | 2,359,851 | | | | 601,828 | | | | 36,733 | | | | 5,097,536 | | | | 75,926 | | | | 42,944 | |
BMO Large-Cap Growth Fund | | | 2,764,666 | | | | 467,804 | | | | 1,063,202 | | | | 321,654 | | | | 25,835 | | | | 2,516,757 | | | | 21,007 | | | | 150,510 | |
BMO Mid-Cap Value Fund | | | 3,327,772 | | | | 1,364,347 | | | | 1,250,755 | | | | (324,643 | ) | | | (145,133 | ) | | | 2,971,588 | | | | 18,659 | | | | 847,558 | |
BMO Mid-Cap Growth Fund | | | 3,302,450 | | | | 1,165,455 | | | | 1,257,930 | | | | 146,618 | | | | (345,760 | ) | | | 3,010,833 | | | | 11,493 | | | | 684,973 | |
BMO Small-Cap Growth Fund | | | 2,172,315 | | | | 469,769 | | | | 967,174 | | | | 207,559 | | | | 81,087 | | | | 1,963,556 | | | | — | | | | — | |
BMO Disciplined International Equity Fund | | | 2,967,999 | | | | 339,897 | | | | 1,061,676 | | | | 426,554 | | | | 16,398 | | | | 2,689,172 | | | | 84,920 | | | | — | |
BMO Pyrford International Stock Fund | | | 5,515,582 | | | | 1,357,740 | | | | 2,313,836 | | | | 366,599 | | | | 43,687 | | | | 4,969,772 | | | | 124,725 | | | | — | |
BMO LGM Emerging Markets Equity Fund | | | 4,117,478 | | | | 1,658,173 | | | | 1,824,832 | | | | 471,106 | | | | 67,652 | | | | 4,489,577 | | | | 32,239 | | | | — | |
BMO TCH Emerging Markets Bond Fund | | | — | | | | 893,191 | | | | 254,733 | | | | 13,151 | | | | (6,643 | ) | | | 644,966 | | | | 21,502 | | | | — | |
BMO Alternative Strategies Fund | | | 5,342,402 | | | | 932,782 | | | | 1,711,232 | | | | 207,533 | | | | 22,016 | | | | 4,793,501 | | | | — | | | | — | |
BMO TCH Core Plus Bond Fund | | | 5,259,167 | | | | 1,873,680 | | | | 2,423,483 | | | | (44,683 | ) | | | (8,522 | ) | | | 4,656,159 | | | | 131,471 | | | | 15,903 | |
BMO High Yield Bond Fund | | | 516,256 | | | | 102,362 | | | | 162,750 | | | | 12,714 | | | | (9,505 | ) | | | 459,077 | | | | 26,645 | | | | — | |
BMO Institutional Prime Money Market Fund | | | 1,031,813 | | | | 19,127,170 | | | | 19,150,364 | | | | 2 | | | | 31 | | | | 1,008,652 | | | | 7,552 | | | | — | |
BMO LGM Frontier Markets Equity Fund | | | 1,111,642 | | | | 8,702 | | | | 1,211,355 | | | | 69,212 | | | | 21,799 | | | | — | | | | 8,702 | | | | — | |
| | | | | | | | | | | | | | | | | | | | | | | | | | | | | | | | |
Totals | | $ | 48,149,853 | | | $ | 31,849,203 | | | $ | 38,795,204 | | | $ | 2,645,724 | | | $ | (72,427 | ) | | $ | 43,777,149 | | | $ | 650,345 | | | $ | 1,795,549 | |
| | | | | | | | | | | | | | | | | | | | | | | | | | | | | | | | |
| | | | | | | | |
2035 Fund | | | | | | | | | | | | | | | | | | | | | | | | | | | | | | | | |
BMO Low Volatility Equity Fund | | $ | 1,192,092 | | | $ | 271,417 | | | $ | 1,010,713 | | | $ | (12,813 | ) | | $ | 55,164 | | | $ | 495,147 | | | $ | 13,711 | | | $ | 15,018 | |
BMO Dividend Income Fund | | | 470,318 | | | | 90,608 | | | | 412,387 | | | | 39,639 | | | | 7,138 | | | | 195,316 | | | | 7,739 | | | | 3,954 | |
BMO Large-Cap Value Fund | | | 1,844,270 | | | | 397,773 | | | | 1,678,222 | | | | 251,776 | | | | (46,603 | ) | | | 768,994 | | | | 19,521 | | | | 15,089 | |
BMO Large-Cap Growth Fund | | | 906,140 | | | | 169,339 | | | | 779,240 | | | | 35,147 | | | | 48,189 | | | | 379,575 | | | | 5,539 | | | | 52,949 | |
BMO Mid-Cap Value Fund | | | 1,125,338 | | | | 516,667 | | | | 998,081 | | | | 123,333 | | | | (297,742 | ) | | | 469,515 | | | | 6,896 | | | | 302,707 | |
BMO Mid-Cap Growth Fund | | | 1,084,788 | | | | 385,283 | | | | 915,721 | | | | 246,460 | | | | (342,131 | ) | | | 458,679 | | | | 4,106 | | | | 236,322 | |
BMO Small-Cap Growth Fund | | | 714,664 | | | | 195,981 | | | | 689,739 | | | | 89,228 | | | | (9,285 | ) | | | 300,849 | | | | — | | | | — | |
BMO Disciplined International Equity Fund | | | 972,060 | | | | 179,229 | | | | 846,264 | | | | 73,098 | | | | 28,463 | | | | 406,586 | | | | 29,422 | | | | — | |
BMO Pyrford International Stock Fund | | | 1,842,225 | | | | 464,463 | | | | 1,617,270 | | | | 97,723 | | | | (14,592 | ) | | | 772,549 | | | | 44,249 | | | | — | |
BMO LGM Emerging Markets Equity Fund | | | 1,387,337 | | | | 538,177 | | | | 1,320,087 | | | | 40,132 | | | | 55,569 | | | | 701,128 | | | | 11,428 | | | | — | |
BMO TCH Emerging Markets Bond Fund | | | — | | | | 155,416 | | | | 101,342 | | | | 1,831 | | | | (3,901 | ) | | | 52,004 | | | | 3,996 | | | | — | |
BMO Alternative Strategies Fund | | | 1,433,661 | | | | 319,274 | | | | 1,205,382 | | | | 22,913 | | | | 28,643 | | | | 599,109 | | | | — | | | | — | |
BMO TCH Core Plus Bond Fund | | | 972,714 | | | | 345,741 | | | | 896,034 | | | | (12,115 | ) | | | (7,716 | ) | | | 402,590 | | | | 19,552 | | | | 3,169 | |
BMO High Yield Bond Fund | | | 95,926 | | | | 32,692 | | | | 89,677 | | | | 2,303 | | | | (2,235 | ) | | | 39,009 | | | | 3,897 | | | | — | |
BMO Institutional Prime Money Market Fund | | | 267,166 | | | | 6,729,019 | | | | 6,937,485 | | | | — | | | | (29 | ) | | | 58,671 | | | | 1,643 | | | | — | |
BMO LGM Frontier Markets Equity Fund | | | 292,924 | | | | 2,293 | | | | 319,199 | | | | 2,815 | | | | 21,167 | | | | — | | | | 2,293 | | | | — | |
| | | | | | | | | | | | | | | | | | | | | | | | | | | | | | | | |
Totals | | $ | 14,601,623 | | | $ | 10,793,372 | | | $ | 19,816,843 | | | $ | 1,001,470 | | | $ | (479,901 | ) | | $ | 6,099,721 | | | $ | 173,992 | | | $ | 629,208 | |
| | | | | | | | | | | | | | | | | | | | | | | | | | | | | | | | |
55
| | |
| Notes to Financial Statements (continued) | | |
| | | | | | | | | | | | | | | | | | | | | | | | | | | | | | | | |
Fund/Security Description | | Value,
Beginning
of Period | | | Purchases | | | Sales
Proceeds | | | Change in
Unrealized
Appreciation
(Depreciation) | | | Net
Realized
Gain(Loss) | | | Value, End
of Period | | | Dividends
Credited
to
Income | | | Net Realized
Gain on
Capital Gain
Distributions | |
2040 Fund | | | | | | | | | | | | | | | | | | | | | | | | | | | | | | | | |
BMO Low Volatility Equity Fund | | $ | 2,647,740 | | | $ | 464,938 | | | $ | 1,143,945 | | | $ | 21,121 | | | $ | 81,369 | | | $ | 2,071,223 | | | $ | 38,409 | | | $ | 31,178 | |
BMO Dividend Income Fund | | | 925,693 | | | | 112,287 | | | | 399,822 | | | | 19,007 | | | | 77,961 | | | | 735,126 | | | | 18,834 | | | | 7,266 | |
BMO Large-Cap Value Fund | | | 4,113,828 | | | | 669,417 | | | | 1,982,235 | | | | 362,395 | | | | 89,389 | | | | 3,252,794 | | | | 52,537 | | | | 30,676 | |
BMO Large-Cap Growth Fund | | | 2,020,064 | | | | 425,708 | | | | 1,048,994 | | | | 212,315 | | | | 28,895 | | | | 1,637,988 | | | | 14,821 | | | | 111,255 | |
BMO Mid-Cap Value Fund | | | 2,418,265 | | | | 1,064,345 | | | | 1,243,078 | | | | (258,006 | ) | | | (84,280 | ) | | | 1,897,246 | | | | 13,514 | | | | 614,507 | |
BMO Mid-Cap Growth Fund | | | 2,302,051 | | | | 762,310 | | | | 1,049,815 | | | | 109,402 | | | | (262,184 | ) | | | 1,861,764 | | | | 8,093 | | | | 482,820 | |
BMO Small-Cap Growth Fund | | | 1,590,888 | | | | 358,217 | | | | 884,543 | | | | 117,637 | | | | 86,491 | | | | 1,268,690 | | | | — | | | | — | |
BMO Disciplined International Equity Fund | | | 2,115,782 | | | | 347,429 | | | | 1,071,332 | | | | 282,425 | | | | 11,233 | | | | 1,685,537 | | | | 59,621 | | | | — | |
BMO Pyrford International Stock Fund | | | 3,996,309 | | | | 941,960 | | | | 2,032,560 | | | | 219,192 | | | | 58,734 | | | | 3,183,635 | | | | 90,019 | | | | — | |
BMO LGM Emerging Markets Equity Fund | | | 3,024,209 | | | | 1,129,759 | | | | 1,548,827 | | | | 297,884 | | | | 56,034 | | | | 2,959,059 | | | | 23,723 | | | | — | |
BMO TCH Emerging Markets Bond Fund | | | — | | | | 237,746 | | | | 82,235 | | | | 3,203 | | | | (2,440 | ) | | | 156,274 | | | | 5,933 | | | | — | |
BMO Alternative Strategies Fund | | | 2,726,915 | | | | 486,181 | | | | 1,132,929 | | | | 94,738 | | | | 18,669 | | | | 2,193,574 | | | | — | | | | — | |
BMO TCH Core Plus Bond Fund | | | 1,131,499 | | | | 296,196 | | | | 534,452 | | | | (11,273 | ) | | | (1,904 | ) | | | 880,066 | | | | 26,806 | | | | 3,418 | |
BMO High Yield Bond Fund | | | 132,377 | | | | 24,277 | | | | 53,511 | | | | 3,759 | | | | (3,085 | ) | | | 103,817 | | | | 6,554 | | | | — | |
BMO Institutional Prime Money Market Fund | | | 665,511 | | | | 12,135,421 | | | | 12,267,583 | | | | — | | | | (75 | ) | | | 533,274 | | | | 4,414 | | | | — | |
BMO LGM Frontier Markets Equity Fund | | | 877,110 | | | | 6,867 | | | | 955,786 | | | | 56,298 | | | | 15,511 | | | | — | | | | 6,866 | | | | — | |
| | | | | | | | | | | | | | | | | | | | | | | | | | | | | | | | |
Totals | | $ | 30,688,241 | | | $ | 19,463,058 | | | $ | 27,431,647 | | | $ | 1,530,097 | | | $ | 170,318 | | | $ | 24,420,067 | | | $ | 370,144 | | | $ | 1,281,120 | |
| | | | | | | | | | | | | | | | | | | | | | | | | | | | | | | | |
| | | | | | | | |
2045 Fund | | | | | | | | | | | | | | | | | | | | | | | | | | | | | | | | |
BMO Low Volatility Equity Fund | | $ | 690,023 | | | $ | 126,568 | | | $ | 524,974 | | | $ | (5,915 | ) | | $ | 29,190 | | | $ | 314,892 | | | $ | 7,855 | | | $ | 8,538 | |
BMO Dividend Income Fund | | | 241,844 | | | | 36,657 | | | | 191,361 | | | | 18,311 | | | | 4,909 | | | | 110,360 | | | | 3,976 | | | | 1,990 | |
BMO Large-Cap Value Fund | | | 1,080,830 | | | | 206,239 | | | | 903,904 | | | | 142,794 | | | | (27,137 | ) | | | 498,822 | | | | 11,497 | | | | 8,704 | |
BMO Large-Cap Growth Fund | | | 532,019 | | | | 88,768 | | | | 421,228 | | | | 23,329 | | | | 23,844 | | | | 246,732 | | | | 3,201 | | | | 30,467 | |
BMO Mid-Cap Value Fund | | | 617,634 | | | | 261,359 | | | | 500,241 | | | | 59,740 | | | | (153,802 | ) | | | 284,690 | | | | 3,701 | | | | 161,883 | |
BMO Mid-Cap Growth Fund | | | 617,448 | | | | 216,415 | | | | 492,626 | | | | 119,751 | | | | (173,587 | ) | | | 287,401 | | | | 2,282 | | | | 131,023 | |
BMO Small-Cap Growth Fund | | | 427,466 | | | | 108,970 | | | | 384,958 | | | | 55,291 | | | | (7,823 | ) | | | 198,946 | | | | — | | | | — | |
BMO Disciplined International Equity Fund | | | 550,160 | | | | 93,677 | | | | 448,269 | | | | 48,844 | | | | 8,588 | | | | 253,000 | | | | 16,401 | | | | — | |
BMO Pyrford International Stock Fund | | | 1,061,005 | | | | 227,907 | | | | 846,615 | | | | 54,512 | | | | (7,340 | ) | | | 489,469 | | | | 25,056 | | | | — | |
BMO LGM Emerging Markets Equity Fund | | | 828,201 | | | | 301,155 | | | | 720,518 | | | | 22,434 | | | | 32,320 | | | | 463,592 | | | | 6,779 | | | | — | |
BMO TCH Emerging Markets Bond Fund | | | — | | | | 42,000 | | | | 25,720 | | | | 452 | | | | (1,014 | ) | | | 15,718 | | | | 1,083 | | | | — | |
BMO Alternative Strategies Fund | | | 600,880 | | | | 100,401 | | | | 447,144 | | | | 9,594 | | | | 11,546 | | | | 275,277 | | | | — | | | | — | |
BMO TCH Core Plus Bond Fund | | | 309,465 | | | | 67,247 | | | | 229,300 | | | | (3,689 | ) | | | (2,685 | ) | | | 141,038 | | | | 6,132 | | | | 991 | |
BMO High Yield Bond Fund | | | 34,385 | | | | 6,293 | | | | 25,001 | | | | 672 | | | | (642 | ) | | | 15,707 | | | | 1,407 | | | | — | |
BMO Institutional Prime Money Market Fund | | | 99,017 | | | | 3,734,366 | | | | 3,755,134 | | | | — | | | | 39 | | | | 78,288 | | | | 886 | | | | — | |
BMO LGM Frontier Markets Equity Fund | | | 193,869 | | | | 1,517 | | | | 211,259 | | | | (2,501 | ) | | | 18,374 | | | | — | | | | 1,518 | | | | — | |
| | | | | | | | | | | | | | | | | | | | | | | | | | | | | | | | |
Totals | | $ | 7,884,246 | | | $ | 5,619,539 | | | $ | 10,128,252 | | | $ | 543,619 | | | $ | (245,220 | ) | | $ | 3,673,932 | | | $ | 91,774 | | | $ | 343,596 | |
| | | | | | | | | | | | | | | | | | | | | | | | | | | | | | | | |
| | | | | | | | |
2050 Fund | | | | | | | | | | | | | | | | | | | | | | | | | | | | | | | | |
BMO Low Volatility Equity Fund | | $ | 1,811,702 | | | $ | 484,059 | | | $ | 790,684 | | | $ | 43,146 | | | $ | 25,709 | | | $ | 1,573,932 | | | $ | 26,966 | | | $ | 20,286 | |
BMO Dividend Income Fund | | | 628,092 | | | | 120,902 | | | | 262,823 | | | | 35,079 | | | | 30,393 | | | | 551,643 | | | | 13,246 | | | | 4,734 | |
BMO Large-Cap Value Fund | | | 2,858,333 | | | | 629,430 | | | | 1,309,007 | | | | 325,585 | | | | (10,812 | ) | | | 2,493,529 | | | | 37,766 | | | | 20,769 | |
BMO Large-Cap Growth Fund | | | 1,393,578 | | | | 287,696 | | | | 615,757 | | | | 156,314 | | | | 11,541 | | | | 1,233,372 | | | | 10,249 | | | | 72,680 | |
BMO Mid-Cap Value Fund | | | 1,640,813 | | | | 774,438 | | | | 749,508 | | | | (95,880 | ) | | | (146,778 | ) | | | 1,423,085 | | | | 8,834 | | | | 424,934 | |
BMO Mid-Cap Growth Fund | | | 1,628,217 | | | | 680,923 | | | | 763,277 | | | | 136,618 | | | | (245,764 | ) | | | 1,436,717 | | | | 5,474 | | | | 342,744 | |
BMO Small-Cap Growth Fund | | | 1,130,758 | | | | 279,563 | | | | 559,454 | | | | 133,705 | | | | 9,925 | | | | 994,497 | | | | — | | | | — | |
BMO Disciplined International Equity Fund | | | 1,435,322 | | | | 254,786 | | | | 630,200 | | | | 205,578 | | | | (898 | ) | | | 1,264,588 | | | | 39,100 | | | | — | |
BMO Pyrford International Stock Fund | | | 2,795,127 | | | | 679,894 | | | | 1,223,098 | | | | 206,298 | | | | (11,784 | ) | | | 2,446,437 | | | | 59,645 | | | | — | |
BMO LGM Emerging Markets Equity Fund | | | 2,185,440 | | | | 844,042 | | | | 976,893 | | | | 241,809 | | | | 22,960 | | | | 2,317,358 | | | | 16,351 | | | | — | |
BMO TCH Emerging Markets Bond Fund | | | — | | | | 111,886 | | | | 33,753 | | | | 1,729 | | | | (1,298 | ) | | | 78,564 | | | | 2,597 | | | | — | |
BMO Alternative Strategies Fund | | | 1,560,871 | | | | 310,728 | | | | 561,074 | | | | 59,582 | | | | 5,818 | | | | 1,375,925 | | | | — | | | | — | |
BMO TCH Core Plus Bond Fund | | | 814,035 | | | | 204,951 | | | | 304,596 | | | | (6,970 | ) | | | (2,480 | ) | | | 704,940 | | | | 19,958 | | | | 2,377 | |
BMO High Yield Bond Fund | | | 89,806 | | | | 19,477 | | | | 31,181 | | | | 2,449 | | | | (2,045 | ) | | | 78,506 | | | | 4,548 | | | | — | |
BMO Institutional Prime Money Market Fund | | | 452,953 | | | | 8,574,624 | | | | 8,636,351 | | | | — | | | | 75 | | | | 391,301 | | | | 3,193 | | | | — | |
BMO LGM Frontier Markets Equity Fund | | | 515,392 | | | | 4,035 | | | | 561,622 | | | | 31,962 | | | | 10,233 | | | | — | | | | 4,035 | | | | — | |
| | | | | | | | | | | | | | | | | | | | | | | | | | | | | | | | |
Totals | | $ | 20,940,439 | | | $ | 14,261,434 | | | $ | 18,009,278 | | | $ | 1,477,004 | | | $ | (305,205 | ) | | $ | 18,364,394 | | | $ | 251,962 | | | $ | 888,524 | |
| | | | | | | | | | | | | | | | | | | | | | | | | | | | | | | | |
56
| | | | | | | | | | | | | | | | | | | | | | | | | | | | | | | | |
Fund/Security Description | | Value,
Beginning
of Period | | | Purchases | | | Sales
Proceeds | | | Change in
Unrealized
Appreciation
(Depreciation) | | | Net
Realized
Gain(Loss) | | | Value, End
of Period | | | Dividends
Credited
to
Income | | | Net Realized
Gain on
Capital Gain
Distributions | |
2055 Fund | | | | | | | | | | | | | | | | | | | | | | | | | | | | | | | | |
BMO Low Volatility Equity Fund | | $ | 308,889 | | | $ | 173,561 | | | $ | 211,539 | | | $ | 9,830 | | | $ | 4,161 | | | $ | 284,902 | | | $ | 4,953 | | | $ | 4,224 | |
BMO Dividend Income Fund | | | 108,770 | | | | 54,796 | | | | 76,506 | | | | 11,235 | | | | 1,559 | | | | 99,854 | | | | 2,411 | | | | 973 | |
BMO Large-Cap Value Fund | | | 489,994 | | | | 249,332 | | | | 348,405 | | | | 67,875 | | | | (7,437 | ) | | | 451,359 | | | | 6,866 | | | | 4,246 | |
BMO Large-Cap Growth Fund | | | 237,840 | | | | 117,655 | | | | 163,194 | | | | 27,805 | | | | 3,157 | | | | 223,263 | | | | 1,961 | | | | 15,163 | |
BMO Mid-Cap Value Fund | | | 279,791 | | | | 209,860 | | | | 192,301 | | | | 13,112 | | | | (52,869 | ) | | | 257,593 | | | | 1,804 | | | | 74,669 | |
BMO Mid-Cap Growth Fund | | | 278,456 | | | | 187,850 | | | | 189,581 | | | | 38,890 | | | | (55,547 | ) | | | 260,068 | | | | 1,121 | | | | 61,149 | |
BMO Small-Cap Growth Fund | | | 192,033 | | | | 115,200 | | | | 155,156 | | | | 29,815 | | | | (1,869 | ) | | | 180,023 | | | | — | | | | — | |
BMO Disciplined International Equity Fund | | | 245,717 | | | | 114,612 | | | | 169,363 | | | | 35,383 | | | | 2,558 | | | | 228,907 | | | | 8,061 | | | | — | |
BMO Pyrford International Stock Fund | | | 476,260 | | | | 296,234 | | | | 367,349 | | | | 41,401 | | | | (3,707 | ) | | | 442,839 | | | | 12,360 | | | | — | |
BMO LGM Emerging Markets Equity Fund | | | 374,152 | | | | 304,586 | | | | 308,043 | | | | 45,502 | | | | 3,278 | | | | 419,475 | | | | 3,364 | | | | — | |
BMO TCH Emerging Markets Bond Fund | | | — | | | | 37,782 | | | | 23,365 | | | | 808 | | | | (1,004 | ) | | | 14,221 | | | | 927 | | | | — | |
BMO Alternative Strategies Fund | | | 272,392 | | | | 134,515 | | | | 169,926 | | | | 10,179 | | | | 1,898 | | | | 249,058 | | | | — | | | | — | |
BMO TCH Core Plus Bond Fund | | | 140,717 | | | | 87,914 | | | | 99,325 | | | | (609 | ) | | | (1,095 | ) | | | 127,602 | | | | 3,665 | | | | 486 | |
BMO High Yield Bond Fund | | | 15,183 | | | | 8,734 | | | | 9,799 | | | | 301 | | | | (208 | ) | | | 14,211 | | | | 837 | | | | — | |
BMO Institutional Prime Money Market Fund | | | 77,544 | | | | 3,463,025 | | | | 3,469,667 | | | | — | | | | (72 | ) | | | 70,830 | | | | 624 | | | | — | |
BMO LGM Frontier Markets Equity Fund | | | 79,727 | | | | 624 | | | | 86,879 | | | | (1,942 | ) | | | 8,470 | | | | — | | | | 624 | | | | — | |
| | | | | | | | | | | | | | | | | | | | | | | | | | | | | | | | |
Totals | | $ | 3,577,465 | | | $ | 5,556,280 | | | $ | 6,040,398 | | | $ | 329,585 | | | $ | (98,727 | ) | | $ | 3,324,205 | | | $ | 49,578 | | | $ | 160,910 | |
| | | | | | | | | | | | | | | | | | | | | | | | | | | | | | | | |
| | | | | | | | |
Conservative Allocation Fund | | | | | | | | | | | | | | | | | | | | | | | | | | | | | | | | |
BMO Low Volatility Equity Fund | | $ | 1,649,803 | | | $ | 451,443 | | | $ | 1,280,310 | | | $ | (11,897 | ) | | $ | 76,138 | | | $ | 885,177 | | | $ | 26,880 | | | $ | 20,829 | |
BMO Dividend Income Fund | | | 901,806 | | | | 229,914 | | | | 748,793 | | | | (52,596 | ) | | | 148,810 | | | | 479,141 | | | | 20,202 | | | | 7,428 | |
BMO Large-Cap Value Fund | | | 2,311,142 | | | | 1,683,642 | | | | 2,737,024 | | | | 178,163 | | | | 165,224 | | | | 1,601,147 | | | | 39,742 | | | | 24,703 | |
BMO Large-Cap Growth Fund | | | 2,283,819 | | | | 1,112,821 | | | | 2,409,761 | | | | 132,127 | | | | 148,055 | | | | 1,267,061 | | | | 20,319 | | | | 147,930 | |
BMO Mid-Cap Value Fund | | | 705,290 | | | | 318,560 | | | | 590,285 | | | | (206,170 | ) | | | 104,848 | | | | 332,243 | | | | 4,190 | | | | 185,020 | |
BMO Mid-Cap Growth Fund | | | 697,653 | | | | 268,443 | | | | 585,184 | | | | (102,555 | ) | | | 55,490 | | | | 333,847 | | | | 2,611 | | | | 148,491 | |
BMO Small-Cap Value Fund | | | 373,564 | | | | 189,254 | | | | 360,139 | | | | 24,482 | | | | (12,532 | ) | | | 214,629 | | | | 2,320 | | | | 35,295 | |
BMO Small-Cap Growth Fund | | | 715,216 | | | | 242,749 | | | | 673,589 | | | | (81,407 | ) | | | 182,100 | | | | 385,069 | | | | — | | | | — | |
BMO Disciplined International Equity Fund | | | 1,351,407 | | | | 792,226 | | | | 1,449,393 | | | | 156,130 | | | | (3,931 | ) | | | 846,439 | | | | 31,469 | | | | — | |
BMO Pyrford International Stock Fund | | | 1,377,606 | | | | 539,520 | | | | 1,175,483 | | | | (43,495 | ) | | | 132,065 | | | | 830,213 | | | | 32,108 | | | | — | |
BMO LGM Emerging Markets Equity Fund | | | 1,114,343 | | | | 282,607 | | | | 1,004,579 | | | | (7,158 | ) | | | 129,315 | | | | 514,528 | | | | 9,561 | | | | — | |
BMO TCH Emerging Markets Bond Fund | | | — | | | | 3,984,141 | | | | 2,204,921 | | | | 57,431 | | | | (48,150 | ) | | | 1,788,501 | | | | 87,647 | | | | — | |
BMO Alternative Strategies Fund | | | 14,933,112 | | | | 1,013,889 | | | | 8,804,139 | | | | 243,366 | | | | 355,588 | | | | 7,741,816 | | | | — | | | | — | |
BMO TCH Core Plus Bond Fund | | | 46,045,431 | | | | 7,328,035 | | | | 34,603,490 | | | | (1,476,793 | ) | | | 557,631 | | | | 17,850,814 | | | | 1,031,533 | | | | 153,938 | |
BMO High Yield Bond Fund | | | 5,278,673 | | | | 131,735 | | | | 5,389,076 | | | | 154,674 | | | | (176,006 | ) | | | — | | | | 81,155 | | | | — | |
BMO Institutional Prime Money Market Fund | | | 1,460,458 | | | | 23,863,207 | | | | 24,708,348 | | | | — | | | | 223 | | | | 615,540 | | | | 9,958 | | | | — | |
| | | | | | | | | | | | | | | | | | | | | | | | | | | | | | | | |
Totals | | $ | 81,199,323 | | | $ | 42,432,186 | | | $ | 88,724,514 | | | $ | (1,035,698 | ) | | $ | 1,814,868 | | | $ | 35,686,165 | | | $ | 1,399,695 | | | $ | 723,634 | |
| | | | | | | | | | | | | | | | | | | | | | | | | | | | | | | | |
| | | | | | | | |
Moderate Allocation Fund | | | | | | | | | | | | | | | | | | | | | | | | | | | | | | | | |
BMO Low Volatility Equity Fund | | $ | 3,323,441 | | | $ | 619,164 | | | $ | 1,397,193 | | | $ | 119,495 | | | $ | 41 | | | $ | 2,664,948 | | | $ | 50,105 | | | $ | 37,457 | |
BMO Dividend Income Fund | | | 1,790,411 | | | | 300,369 | | | | 826,153 | | | | 47,309 | | | | 134,557 | | | | 1,446,493 | | | | 37,814 | | | | 13,398 | |
BMO Large-Cap Value Fund | | | 4,591,399 | | | | 2,728,049 | | | | 3,113,304 | | | | 538,616 | | | | 94,438 | | | | 4,839,198 | | | | 74,135 | | | | 44,754 | |
BMO Large-Cap Growth Fund | | | 4,598,834 | | | | 1,568,218 | | | | 2,890,512 | | | | 473,517 | | | | 98,458 | | | | 3,848,515 | | | | 36,529 | | | | 264,537 | |
BMO Mid-Cap Value Fund | | | 1,400,992 | | | | 702,350 | | | | 883,609 | | | | (300,784 | ) | | | 84,995 | | | | 1,003,944 | | | | 7,581 | | | | 367,512 | |
BMO Mid-Cap Growth Fund | | | 1,410,661 | | | | 503,701 | | | | 795,144 | | | | (157,111 | ) | | | 51,462 | | | | 1,013,569 | | | | 4,700 | | | | 298,921 | |
BMO Small-Cap Value Fund | | | 763,813 | | | | 350,230 | | | | 476,013 | | | | 40,565 | | | | (29,467 | ) | | | 649,128 | | | | 4,229 | | | | 72,032 | |
BMO Small-Cap Growth Fund | | | 1,410,154 | | | | 370,097 | | | | 804,417 | | | | 61,119 | | | | 121,718 | | | | 1,158,671 | | | | — | | | | — | |
BMO Disciplined International Equity Fund | | | 2,744,262 | | | | 1,255,204 | | | | 1,775,442 | | | | 363,648 | | | | (52,243 | ) | | | 2,535,429 | | | | 56,526 | | | | — | |
BMO Pyrford International Stock Fund | | | 2,725,365 | | | | 777,902 | | | | 1,222,099 | | | | 131,699 | | | | 51,473 | | | | 2,464,340 | | | | 57,858 | | | | — | |
BMO LGM Emerging Markets Equity Fund | | | 2,237,288 | | | | 497,244 | | | | 1,430,813 | | | | 127,176 | | | | 112,060 | | | | 1,542,955 | | | | 17,227 | | | | — | |
BMO TCH Emerging Markets Bond Fund | | | — | | | | 2,857,247 | | | | 908,336 | | | | 50,495 | | | | (26,242 | ) | | | 1,973,164 | | | | 57,688 | | | | — | |
BMO Alternative Strategies Fund | | | 11,665,276 | | | | 1,174,993 | | | | 3,998,099 | | | | 397,926 | | | | 78,579 | | | | 9,318,675 | | | | — | | | | — | |
BMO TCH Core Plus Bond Fund | | | 33,000,431 | | | | 5,917,368 | | | | 18,619,041 | | | | (577,487 | ) | | | 734 | | | | 19,722,005 | | | | 730,285 | | | | 101,742 | |
BMO High Yield Bond Fund | | | 3,805,157 | | | | 123,707 | | | | 3,912,266 | | | | 116,636 | | | | (133,234 | ) | | | — | | | | 56,138 | | | | — | |
BMO Institutional Prime Money Market Fund | | | 857,039 | | | | 29,992,593 | | | | 29,819,757 | | | | — | | | | 204 | | | | 1,030,079 | | | | 9,844 | | | | — | |
| | | | | | | | | | | | | | | | | | | | | | | | | | | | | | | | |
Totals | | $ | 76,324,523 | | | $ | 49,738,436 | | | $ | 72,872,198 | | | $ | 1,432,819 | | | $ | 587,533 | | | $ | 55,211,113 | | | $ | 1,200,659 | | | $ | 1,200,353 | |
| | | | | | | | | | | | | | | | | | | | | | | | | | | | | | | | |
57
| | |
| Notes to Financial Statements (continued) | | |
| | | | | | | | | | | | | | | | | | | | | | | | | | | | | | | | |
Fund/Security Description | | Value,
Beginning
of Period | | | Purchases | | | Sales
Proceeds | | | Change in
Unrealized
Appreciation
(Depreciation) | | | Net
Realized
Gain(Loss) | | | Value, End
of Period | | | Dividends
Credited
to
Income | | | Net Realized
Gain on
Capital Gain
Distributions | |
Balanced Allocation Fund | | | | | | | | | | | | | | | | | | | | | | | | | | | | | | | | |
BMO Low Volatility Equity Fund | | $ | 16,850,514 | | | $ | 2,831,878 | | | $ | 6,946,425 | | | $ | 617,911 | | | $ | (27,814 | ) | | $ | 13,326,064 | | | $ | 254,323 | | | $ | 191,702 | |
BMO Dividend Income Fund | | | 9,203,550 | | | | 1,110,996 | | | | 4,020,142 | | | | 137,618 | | | | 781,172 | | | | 7,213,194 | | | | 191,655 | | | | 68,673 | |
BMO Large-Cap Value Fund | | | 23,587,286 | | | | 12,676,613 | | | | 15,381,051 | | | | 2,608,466 | | | | 576,053 | | | | 24,067,367 | | | | 376,273 | | | | 228,442 | |
BMO Large-Cap Growth Fund | | | 23,390,443 | | | | 6,888,514 | | | | 14,024,985 | | | | 2,346,974 | | | | 472,452 | | | | 19,073,398 | | | | 185,894 | | | | 1,368,337 | |
BMO Mid-Cap Value Fund | | | 7,207,920 | | | | 2,728,151 | | | | 3,818,996 | | | | (1,552,704 | ) | | | 437,389 | | | | 5,001,760 | | | | 38,776 | | | | 1,890,797 | |
BMO Mid-Cap Growth Fund | | | 7,137,793 | | | | 2,203,326 | | | | 3,768,473 | | | | (1,057,884 | ) | | | 511,215 | | | | 5,025,977 | | | | 24,256 | | | | 1,513,579 | |
BMO Small-Cap Value Fund | | | 3,851,980 | | | | 1,686,382 | | | | 2,384,226 | | | | 198,784 | | | | (121,770 | ) | | | 3,231,150 | | | | 21,753 | | | | 349,987 | |
BMO Small-Cap Growth Fund | | | 7,290,452 | | | | 1,509,206 | | | | 3,961,791 | | | | 158,589 | | | | 762,687 | | | | 5,759,143 | | | | — | | | | — | |
BMO Disciplined International Equity Fund | | | 13,965,369 | | | | 6,860,912 | | | | 9,607,436 | | | | 1,847,183 | | | | (285,062 | ) | | | 12,780,966 | | | | 290,070 | | | | — | |
BMO Pyrford International Stock Fund | | | 13,826,724 | | | | 4,109,258 | | | | 6,378,199 | | | | 491,297 | | | | 413,174 | | | | 12,462,254 | | | | 296,104 | | | | — | |
BMO LGM Emerging Markets Equity Fund | | | 11,356,752 | | | | 2,399,425 | | | | 7,196,705 | | | | 618,924 | | | | 567,604 | | | | 7,746,000 | | | | 88,708 | | | | — | |
BMO TCH Emerging Markets Bond Fund | | | — | | | | 6,117,768 | | | | 2,101,614 | | | | 109,223 | | | | (62,504 | ) | | | 4,062,873 | | | | 121,680 | | | | — | |
BMO Alternative Strategies Fund | | | 32,848,915 | | | | 2,757,293 | | | | 11,021,759 | | | | 1,126,534 | | | | 189,213 | | | | 25,900,196 | | | | — | | | | — | |
BMO TCH Core Plus Bond Fund | | | 69,635,028 | | | | 12,838,586 | | | | 40,696,625 | | | | (1,311,279 | ) | | | 118,330 | | | | 40,584,040 | | | | 1,510,616 | | | | 213,890 | |
BMO High Yield Bond Fund | | | 8,029,933 | | | | 274,042 | | | | 8,274,046 | | | | 214,765 | | | | (244,694 | ) | | | — | | | | 116,858 | | | | — | |
BMO Institutional Prime Money Market Fund | | | 4,664,487 | | | | 84,144,204 | | | | 85,734,351 | | | | — | | | | 577 | | | | 3,074,917 | | | | 31,866 | | | | — | |
| | | | | | | | | | | | | | | | | | | | | | | | | | | | | | | | |
Totals | | $ | 252,847,146 | | | $ | 151,136,554 | | | $ | 225,316,824 | | | $ | 6,554,401 | | | $ | 4,088,022 | | | $ | 189,309,299 | | | $ | 3,548,832 | | | $ | 5,825,407 | |
| | | | | | | | | | | | | | | | | | | | | | | | | | | | | | | | |
| | | | | | | | |
Growth Allocation Fund | | | | | | | | | | | | | | | | | | | | | | | | | | | | | | | | |
BMO Low Volatility Equity Fund | | $ | 6,734,816 | | | $ | 1,562,953 | | | $ | 2,408,295 | | | $ | 281,501 | | | $ | (3,664 | ) | | $ | 6,167,311 | | | $ | 107,800 | | | $ | 79,459 | |
BMO Dividend Income Fund | | | 3,679,363 | | | | 703,965 | | | | 1,429,840 | | | | 259,203 | | | | 132,551 | | | | 3,345,242 | | | | 81,058 | | | | 28,337 | |
BMO Large-Cap Value Fund | | | 9,456,501 | | | | 5,604,114 | | | | 5,188,194 | | | | 1,292,439 | | | | 40,316 | | | | 11,205,176 | | | | 159,690 | | | | 94,344 | |
BMO Large-Cap Growth Fund | | | 9,360,825 | | | | 3,826,179 | | | | 5,585,867 | | | | 1,144,664 | | | | 140,579 | | | | 8,886,380 | | | | 79,255 | | | | 563,563 | |
BMO Mid-Cap Value Fund | | | 2,908,515 | | | | 1,308,039 | | | | 1,491,122 | | | | (529,783 | ) | | | 127,743 | | | | 2,323,392 | | | | 15,983 | | | | 720,258 | |
BMO Mid-Cap Growth Fund | | | 2,862,348 | | | | 1,147,855 | | | | 1,499,675 | | | | (194,602 | ) | | | 29,784 | | | | 2,345,710 | | | | 9,958 | | | | 584,876 | |
BMO Small-Cap Value Fund | | | 1,521,706 | | | | 780,145 | | | | 828,553 | | | | 76,303 | | | | (48,461 | ) | | | 1,501,140 | | | | 8,851 | | | | 135,698 | |
BMO Small-Cap Growth Fund | | | 2,905,386 | | | | 922,211 | | | | 1,537,792 | | | | 263,191 | | | | 135,858 | | | | 2,688,854 | | | | — | | | | — | |
BMO Disciplined International Equity Fund | | | 5,623,815 | | | | 3,211,531 | | | | 3,651,539 | | | | 805,564 | | | | (92,468 | ) | | | 5,896,903 | | | | 119,653 | | | | — | |
BMO Pyrford International Stock Fund | | | 5,604,413 | | | | 2,146,395 | | | | 2,443,621 | | | | 445,602 | | | | 6,640 | | | | 5,759,429 | | | | 122,491 | | | | — | |
BMO LGM Emerging Markets Equity Fund | | | 4,545,433 | | | | 1,368,956 | | | | 2,915,177 | | | | 341,801 | | | | 249,949 | | | | 3,590,962 | | | | 36,584 | | | | — | |
BMO TCH Emerging Markets Bond Fund | | | — | | | | 829,157 | | | | 302,451 | | | | 17,204 | | | | (5,181 | ) | | | 538,729 | | | | 14,282 | | | | — | |
BMO Alternative Strategies Fund | | | 7,884,284 | | | | 1,366,671 | | | | 2,408,610 | | | | 316,409 | | | | 29,761 | | | | 7,188,515 | | | | — | | | | — | |
BMO TCH Core Plus Bond Fund | | | 8,307,751 | | | | 3,028,056 | | | | 5,908,759 | | | | (78,670 | ) | | | (15,797 | ) | | | 5,332,581 | | | | 185,378 | | | | 25,238 | |
BMO High Yield Bond Fund | | | 964,705 | | | | 62,207 | | | | 1,023,687 | | | | 15,765 | | | | (18,990 | ) | | | — | | | | 13,577 | | | | — | |
BMO Institutional Prime Money Market Fund | | | 1,360,992 | | | | 38,947,948 | | | | 39,086,248 | | | | — | | | | 167 | | | | 1,222,859 | | | | 10,741 | | | | — | |
| | | | | | | | | | | | | | | | | | | | | | | | | | | | | | | | |
Totals | | $ | 73,720,853 | | | $ | 66,816,382 | | | $ | 77,709,430 | | | $ | 4,456,591 | | | $ | 708,787 | | | $ | 67,993,183 | | | $ | 965,301 | | | $ | 2,231,773 | |
| | | | | | | | | | | | | | | | | | | | | | | | | | | | | | | | |
| | | | | | | | |
Aggressive Allocation Fund | | | | | | | | | | | | | | | | | | | | | | | | | | | | | | | | |
BMO Low Volatility Equity Fund | | $ | 12,740,611 | | | $ | 2,364,553 | | | $ | 5,449,756 | | | $ | 475,814 | | | $ | (32,781 | ) | | $ | 10,098,441 | | | $ | 198,341 | | | $ | 142,978 | |
BMO Dividend Income Fund | | | 6,956,287 | | | | 1,018,441 | | | | 3,136,410 | | | | 243,773 | | | | 444,670 | | | | 5,526,761 | | | | 148,929 | | | | 50,949 | |
BMO Large-Cap Value Fund | | | 17,818,284 | | | | 8,419,800 | | | | 10,168,130 | | | | 2,155,788 | | | | 235,939 | | | | 18,461,681 | | | | 292,587 | | | | 169,800 | |
BMO Large-Cap Growth Fund | | | 17,797,993 | | | | 4,803,293 | | | | 10,276,898 | | | | 1,846,736 | | | | 401,218 | | | | 14,572,342 | | | | 142,777 | | | | 1,013,866 | |
BMO Mid-Cap Value Fund | | | 5,494,346 | | | | 2,143,131 | | | | 2,945,853 | | | | (1,176,229 | ) | | | 322,971 | | | | 3,838,366 | | | | 28,718 | | | | 1,426,715 | |
BMO Mid-Cap Growth Fund | | | 5,454,392 | | | | 1,739,781 | | | | 2,932,299 | | | | (777,507 | ) | | | 373,837 | | | | 3,858,204 | | | | 17,892 | | | | 1,144,904 | |
BMO Small-Cap Value Fund | | | 2,896,681 | | | | 1,223,275 | | | | 1,659,996 | | | | 139,705 | | | | (99,897 | ) | | | 2,499,768 | | | | 15,934 | | | | 267,581 | |
BMO Small-Cap Growth Fund | | | 5,559,132 | | | | 1,202,919 | | | | 3,031,677 | | | | (198,411 | ) | | | 903,216 | | | | 4,435,179 | | | | — | | | | — | |
BMO Disciplined International Equity Fund | | | 10,633,022 | | | | 5,308,424 | | | | 7,422,312 | | | | 1,437,262 | | | | (203,499 | ) | | | 9,752,897 | | | | 215,077 | | | | — | |
BMO Pyrford International Stock Fund | | | 10,624,201 | | | | 3,344,778 | | | | 5,241,187 | | | | 470,399 | | | | 282,530 | | | | 9,480,721 | | | | 220,271 | | | | — | |
BMO LGM Emerging Markets Equity Fund | | | 8,700,946 | | | | 2,352,813 | | | | 6,150,032 | | | | 463,494 | | | | 541,314 | | | | 5,908,535 | | | | 65,868 | | | | — | |
BMO Alternative Strategies Fund | | | 4,604,710 | | | | 3,380,225 | | | | 5,644,944 | | | | 63,784 | | | | 82,169 | | | | 2,485,944 | | | | — | | | | — | |
BMO Institutional Prime Money Market Fund | | | 2,134,008 | | | | 41,346,263 | | | | 43,035,655 | | | | — | | | | 340 | | | | 444,956 | | | | 14,473 | | | | — | |
| | | | | | | | | | | | | | | | | | | | | | | | | | | | | | | | |
Totals | | $ | 111,414,613 | | | $ | 78,647,696 | | | $ | 107,095,149 | | | $ | 5,144,608 | | | $ | 3,252,027 | | | $ | 91,363,795 | | | $ | 1,360,867 | | | $ | 4,216,793 | |
| | | | | | | | | | | | | | | | | | | | | | | | | | | | | | | | |
58
Interfund Borrowing and Lending—The Funds participate in an interfund lending program. This program allows the Funds to lend cash to and/or borrow cash from other Funds for temporary purposes. The program is subject to a number of conditions, including the requirement that the interfund loan rate to be charged to the Funds under the program is (i) more favorable to the lending Fund than the rate it could otherwise obtain from investing cash in repurchase agreements or purchasing shares of BMO Prime Money Market Fund or BMO Government Money Market Fund and (ii) more favorable to the borrowing Fund than the lowest interest rate at which bank short-term loans would be available to the Funds. In addition, a Fund may participate in the program only if its participation is consistent with the Fund’s investment policies and limitations. The Directors are responsible for the oversight of the interfund lending program. No interfund borrowing or lending balances existed as of August 31, 2017.
Funds utilizing the Interfund lending program, borrowing from either the BMO Government Money Market Fund or the BMO Prime Money Market Fund during the year ended August 31, 2017, were as follows:
| | | | | | | | |
Fund | | Average Daily Loan
Balance Outstanding | | | Weighted Average
Interest Rate | |
In-Retirement Fund | | $ | 10,622 | | | | 0.973 | % |
2015 Fund | | | 7,396 | | | | 1.136 | |
2020 Fund | | | 955 | | | | 0.944 | |
2025 Fund | | | 3,703 | | | | 1.099 | |
2035 Fund | | | 1,111 | | | | 1.110 | |
2040 Fund | | | 3,574 | | | | 1.101 | |
2045 Fund | | | 2,872 | | | | 1.058 | |
2050 Fund | | | 2,690 | | | | 1.069 | |
2055 Fund | | | 2,430 | | | | 1.094 | |
Conservative Allocation Fund | | | 1,382 | | | | 1.205 | |
Moderate Allocation Fund | | | 1,323 | | | | 1.172 | |
Balanced Allocation Fund | | | 59,492 | | | | 0.974 | |
Growth Allocation Fund | | | 16,244 | | | | 0.997 | |
Aggressive Allocation Fund | | | 8,007 | | | | 1.028 | |
General—Certain of the Officers and Directors of the Corporation are also Officers and Directors/Trustees of one or more of the above companies, which are affiliates of the Corporation. None of the Fund Officers or interested Directors receives any compensation from the Funds.
The Corporation, on behalf of the respective Funds, participated in a $25 million unsecured, committed revolving line of credit (“LOC”) agreement with UMB Bank, n.a. The LOC was made available for extraordinary or emergency purposes, primarily for financing redemption payments. Borrowings are charged interest at a rate of the London Interbank Offering Rate (“LIBOR”) plus 1.25% and a commitment fee of 0.20% per annum on the daily unused portion with no administrative fee. No borrowings were outstanding under the LOC at August 31, 2017. The Funds did not utilize the LOC during the year ended August 31, 2017.
| 7. | | Investment Transactions |
Purchases and sales of investments, excluding short-term U.S. government securities, short-term obligations, and in-kind contributions, for the year ended August 31, 2017 were as follows:
| | | | | | | | | | | | | | | | |
| | | Other than
U.S Government
Securities | | | U.S. Government
Securities | |
Fund | | Purchases | | | Sales | | | Purchases | | | Sales | |
In-Retirement Fund | | $ | 4,387,297 | | | $ | 11,445,001 | | | $ | — | | | $ | — | |
2015 Fund | | | 2,985,495 | | | | 3,831,159 | | | | — | | | | — | |
2020 Fund | | | 19,571,275 | | | | 37,368,268 | | | | — | | | | — | |
2025 Fund | | | 8,202,802 | | | | 19,283,327 | | | | — | | | | — | |
2030 Fund | | | 23,840,395 | | | | 42,617,823 | | | | — | | | | — | |
2035 Fund | | | 7,517,589 | | | | 27,527,920 | | | | — | | | | — | |
2040 Fund | | | 14,123,550 | | | | 33,492,797 | | | | — | | | | — | |
2045 Fund | | | 3,918,923 | | | | 14,220,226 | | | | — | | | | — | |
2050 Fund | | | 11,224,575 | | | | 20,806,329 | | | | — | | | | — | |
2055 Fund | | | 4,289,439 | | | | 5,612,746 | | | | — | | | | — | |
Conservative Allocation Fund | | | 51,351,032 | | | | 121,790,031 | | | | — | | | | — | |
Moderate Allocation Fund | | | 49,022,053 | | | | 81,669,821 | | | | — | | | | — | |
Balanced Allocation Fund | | | 146,766,917 | | | | 270,345,536 | | | | — | | | | — | |
Growth Allocation Fund | | | 56,218,706 | | | | 79,628,072 | | | | — | | | | — | |
Aggressive Allocation Fund | | | 65,781,255 | | | | 129,527,413 | | | | — | | | | — | |
59
| | |
| Notes to Financial Statements (continued) | | |
| 8. | | Federal Tax Information |
The timing and character of income and capital gain distributions are determined in accordance with income tax regulations, which may differ from GAAP. These differences are due in part to differing treatment of wash sales.
To the extent that differences arise that are permanent in nature, such amounts are reclassified within the capital accounts, on the Statement of Assets and Liabilities, based on their Federal tax basis treatment. Temporary differences do not require reclassification and had no impact on the net asset value of the Funds.
The Funds complied with FASB interpretation Accounting for Uncertainty in Income Taxes which provides guidance for how uncertain tax provisions should be recognized, measured, presented and disclosed in the financial statements. Accounting for Uncertainty in Income Taxes requires the affirmative evaluation of tax positions taken or expected to be taken in the course of preparing the Funds’ tax returns to determine whether it is “more-likely-than-not,” (i.e., greater than 50 percent) of being sustained by the applicable tax authority. Tax positions not deemed to meet the more-likely-than-not threshold may result in a tax benefit or expense in the current year.
Accounting for Uncertainty in Income Taxes requires management of the Funds to analyze all open tax years, as defined by the statutes of limitations, for all major jurisdictions, which includes federal and certain states. Open tax years are those that are open for exam by the taxing authorities (i.e., the last four tax years and the interim tax period since then). The Funds, have no examinations in progress. For all open tax years and all major taxing jurisdictions through the end of the reporting period, management of the Funds reviewed all tax positions taken or expected to be taken in the preparation of the Funds’ tax returns and concluded that Accounting for Uncertainty in Income Taxes resulted in no effect on the Funds’ reported net assets or results of operations as of and during the period ended August 31, 2017. Management of the Funds also is not aware of any tax positions for which it is reasonably possible that the total amounts of recognized tax benefits will significantly change in the next twelve months.
| | | | | | | | | | | | | | | | |
Fund | | Cost of
Investments
for Federal
Tax Purposes | | | Gross
Unrealized
Appreciation
for Federal
Tax Purposes | | | Gross
Unrealized
(Depreciation)
for Federal
Tax Purposes | | | Net
Unrealized
Appreciation
for Federal
Tax Purposes | |
In-Retirement Fund | | $ | 12,792,730 | | | $ | 2,270,542 | | | $ | (126,535 | ) | | $ | 2,144,007 | |
2015 Fund | | | 3,706,719 | | | | 235,259 | | | | (32,504 | ) | | | 202,755 | |
2020 Fund | | | 61,861,860 | | | | 19,231,748 | | | | (614,177 | ) | | | 18,617,571 | |
2025 Fund | | | 19,750,128 | | | | 1,970,589 | | | | (301,478 | ) | | | 1,669,111 | |
2030 Fund | | | 67,847,858 | | | | 25,551,600 | | | | (814,700 | ) | | | 24,736,900 | |
2035 Fund | | | 11,582,975 | | | | 1,533,398 | | | | (130,305 | ) | | | 1,403,093 | |
2040 Fund | | | 35,886,496 | | | | 17,067,958 | | | | (469,170 | ) | | | 16,598,788 | |
2045 Fund | | | 7,104,537 | | | | 878,968 | | | | (76,365 | ) | | | 802,603 | |
2050 Fund | | | 28,704,918 | | | | 11,251,003 | | | | (431,829 | ) | | | 10,819,174 | |
2055 Fund | | | 6,398,046 | | | | 856,899 | | | | (100,539 | ) | | | 756,360 | |
Conservative Allocation Fund | | | 64,342,777 | | | | 9,574,803 | | | | (327,762 | ) | | | 9,247,041 | |
Moderate Allocation Fund | | | 92,290,778 | | | | 19,254,030 | | | | (559,205 | ) | | | 18,694,825 | |
Balanced Allocation Fund | | | 276,298,207 | | | | 96,188,372 | | | | (2,544,218 | ) | | | 93,644,154 | |
Growth Allocation Fund | | | 91,317,057 | | | | 38,590,689 | | | | (981,291 | ) | | | 37,609,398 | |
Aggressive Allocation Fund | | | 107,996,058 | | | | 66,313,030 | | | | (94,900 | ) | | | 66,218,130 | |
The difference between book basis and tax basis unrealized appreciation/depreciation is attributable in part to the tax deferral of losses on wash sales.
The tax character of distributions reported on the Statement of Changes in Net Assets for the years ended August 31, 2017 and August 31, 2016 were as follows:
| | | | | | | | | | | | | | | | |
| | | 2017 | | | 2016 | |
Fund | | Ordinary
Income (1) | | | Long-Term
Capital Gains | | | Ordinary
Income (1) | | | Long-Term
Capital Gains | |
In-Retirement Fund | | $ | 511,590 | | | $ | 925,260 | | | $ | 607,266 | | | $ | 1,497,614 | |
2015 Fund | | | 104,541 | | | | — | | | | 130,709 | | | | 45,046 | |
2020 Fund | | | 1,860,077 | | | | 4,010,380 | | | | 2,458,238 | | | | 5,197,602 | |
2025 Fund | | | 619,664 | | | | 574,669 | | | | 590,795 | | | | 248,669 | |
2030 Fund | | | 1,684,830 | | | | 3,794,697 | | | | 2,098,312 | | | | 3,990,322 | |
2035 Fund | | | 534,601 | | | | 940,910 | | | | 547,096 | | | | 80,275 | |
2040 Fund | | | 997,987 | | | | 2,711,921 | | | | 1,223,268 | | | | 3,715,337 | |
2045 Fund | | | 271,179 | | | | 595,869 | | | | 260,096 | | | | 41,095 | |
2050 Fund | | | 641,782 | | | | 1,777,285 | | | | 671,827 | | | | 1,380,429 | |
2055 Fund | | | 122,469 | | | | 264,738 | | | | 74,229 | | | | 28,353 | |
Conservative Allocation Fund | | | 3,938,319 | | | | — | | | | 3,815,950 | | | | 2,777,464 | |
Moderate Allocation Fund | | | 3,317,223 | | | | 1,671,078 | | | | 3,459,012 | | | | 4,865,588 | |
Balanced Allocation Fund | | | 8,980,113 | | | | 21,697,731 | | | | 10,349,085 | | | | 34,072,578 | |
Growth Allocation Fund | | | 2,008,915 | | | | 5,863,115 | | | | 2,750,080 | | | | 8,796,346 | |
Aggressive Allocation Fund | | | 2,739,308 | | | | 16,714,385 | | | | 4,154,898 | | | | 14,983,574 | |
| | (1) | For tax purposes, short-term capital gain distributions are considered ordinary income. |
60
As of August 31, 2017, the components of distributable earnings on a tax basis are as follows:
| | | | | | | | | | | | | | | | | | | | |
Fund | | Undistributed
Ordinary
Income | | | Undistributed
Long-Term
Capital Gains | | | Accumulated
Capital and
Other Losses | | | Other
Adjustments | | | Unrealized
Appreciation | |
In-Retirement Fund | | $ | 189,089 | | | $ | 737,105 | | | $ | — | | | $ | — | | | $ | 2,144,007 | |
2015 Fund | | | 37,094 | | | | — | | | | (25,595 | ) | | | — | | | | 202,755 | |
2020 Fund | | | 807,413 | | | | 3,057,418 | | | | — | | | | — | | | | 18,617,571 | |
2025 Fund | | | 232,708 | | | | 116,916 | | | | — | | | | — | | | | 1,669,111 | |
2030 Fund | | | 771,792 | | | | 2,793,636 | | | | — | | | | — | | | | 24,736,900 | |
2035 Fund | | | 217,922 | | | | 367,532 | | | | — | | | | — | | | | 1,403,093 | |
2040 Fund | | | 454,587 | | | | 3,537,790 | | | | — | | | | — | | | | 16,598,788 | |
2045 Fund | | | 105,768 | | | | 228,801 | | | | — | | | | — | | | | 802,603 | |
2050 Fund | | | 371,871 | | | | 664,300 | | | | — | | | | — | | | | 10,819,174 | |
2055 Fund | | | 87,771 | | | | 72,343 | | | | — | | | | — | | | | 756,360 | |
Conservative Allocation Fund | | | 1,954,319 | | | | 4,348,930 | | | | — | | | | — | | | | 9,247,041 | |
Moderate Allocation Fund | | | 1,687,810 | | | | 3,993,054 | | | | — | | | | (1 | ) | | | 18,694,825 | |
Balanced Allocation Fund | | | 5,481,516 | | | | 24,899,291 | | | | — | | | | — | | | | 93,644,154 | |
Growth Allocation Fund | | | 1,924,624 | | | | 5,656,882 | | | | — | | | | — | | | | 37,609,398 | |
Aggressive Allocation Fund | | | 2,808,028 | | | | 16,680,679 | | | | — | | | | — | | | | 66,218,130 | |
As of August 31, 2017, the following fund had non-expiring capital loss carry forwards:
| | | | | | | | |
| | | Capital Loss Carry Forward | |
Fund | | Short-Term | | | Long-Term | |
2015 Fund | | $ | 25,595 | | | $ | — | |
| 9. | | Shareholder Tax Information (Unaudited) |
Of the ordinary income (including short-term capital gain) distributions made by the Funds during the year ended August 31, 2017, the percentages that qualify for the dividend received deduction available to corporate shareholders were as follows:
| | | | | | |
In-Retirement Fund | | | 11.65 | % | | |
2015 Fund | | | 14.89 | | | |
2020 Fund | | | 19.58 | | | |
2025 Fund | | | 20.82 | | | |
2030 Fund | | | 26.96 | | | |
2035 Fund | | | 24.90 | | | |
2040 Fund | | | 31.73 | | | |
2045 Fund | | | 27.74 | | | |
| | | | | | |
2050 Fund | | | 31.29 | % | | |
2055 Fund | | | 27.80 | | | |
Conservative Allocation Fund | | | 5.31 | | | |
Moderate Allocation Fund | | | 11.20 | | | |
Balanced Allocation Fund | | | 20.15 | | | |
Growth Allocation Fund | | | 29.77 | | | |
Aggressive Allocation Fund | | | 37.61 | | | |
Of the ordinary income (including short-term capital gain) distributions made by the Funds during the year ended August 31, 2017, the percentages that are designated as qualified dividend income were as follows:
| | | | | | |
In-Retirement Fund | | | 23.36 | % | | |
2015 Fund | | | 33.11 | | | |
2020 Fund | | | 42.78 | | | |
2025 Fund | | | 47.78 | | | |
2030 Fund | | | 58.28 | | | |
2035 Fund | | | 59.44 | | | |
2040 Fund | | | 67.69 | | | |
2045 Fund | | | 61.88 | | | |
| | | | | | |
2050 Fund | | | 65.81 | % | | |
2055 Fund | | | 59.52 | | | |
Conservative Allocation Fund | | | 10.38 | | | |
Moderate Allocation Fund | | | 22.81 | | | |
Balanced Allocation Fund | | | 38.15 | | | |
Growth Allocation Fund | | | 52.78 | | | |
Aggressive Allocation Fund | | | 64.10 | | | |
For Federal tax purposes, the Funds designate long-term capital gain dividends, or the amounts determined to be necessary, for the year ended August 31 2017:
| | | | | | |
In-Retirement Fund | | $ | 925,260 | | | |
2020 Fund | | | 4,010,380 | | | |
2025 Fund | | | 574,669 | | | |
2030 Fund | | | 3,794,697 | | | |
2035 Fund | | | 940,910 | | | |
2040 Fund | | | 2,711,921 | | | |
2045 Fund | | | 595,869 | | | |
| | | | | | |
2050 Fund | | $ | 1,777,285 | | | |
2055 Fund | | | 264,738 | | | |
Moderate Allocation Fund | | | 1,671,078 | | | |
Balanced Allocation Fund | | | 21,697,731 | | | |
Growth Allocation Fund | | | 5,863,115 | | | |
Aggressive Allocation Fund | | | 16,714,385 | | | |
61
| | |
| Notes to Financial Statements (continued) | | |
For Federal tax purposes, the Funds designate qualified short-term capital gain dividends, or the amounts determined to be necessary, for the year ended August 31 2017:
| | | | | | |
In-Retirement Fund | | $ | 13,489 | | | |
2020 Fund | | | 68,431 | | | |
2025 Fund | | | 1,781 | | | |
2035 Fund | | | 590 | | | |
2040 Fund | | | 25,024 | | | |
2045 Fund | | | 620 | | | |
2050 Fund | | | 3,732 | | | |
| | | | | | |
2055 Fund | | $ | 543 | | | |
Conservative Allocation Fund | | | 28,674 | | | |
Moderate Allocation Fund | | | 65,608 | | | |
Balanced Allocation Fund | | | 203,349 | | | |
Growth Allocation Fund | | | 43,704 | | | |
Aggressive Allocation Fund | | | 4,041 | | | |
| 10. | | Recently Issued Accounting Pronouncement |
In October 2016, the Securities and Exchange Commission released its Final Rules on Investment Company Reporting Modernization (the “Rules”). The Rules introduce new regulatory reporting forms for investment companies; Form N-PORT and Form N-CEN. The compliance date for Form N-PORT and Form N-CEN is June 1, 2018 and compliance should be based on the reporting period-end date.
Management of the Funds have evaluated the impact of all subsequent events on the Funds through the date the financial statements were issued, and has determined that no subsequent events exist requiring recognition or disclosure in the financial statements.
62
| | |
| Report of Independent Registered Public Accounting Firm |
The Board of Directors and Shareholders
BMO Funds, Inc.:
We have audited the accompanying statements of assets and liabilities of BMO In-Retirement Fund, BMO Target Retirement 2015 Fund, BMO Target Retirement 2020 Fund, BMO Target Retirement 2025 Fund, BMO Target Retirement 2030 Fund, BMO Target Retirement 2035 Fund, BMO Target Retirement 2040 Fund, BMO Target Retirement 2045 Fund, BMO Target Retirement 2050 Fund, BMO Target Retirement 2055 Fund, BMO Conservative Allocation Fund, BMO Moderate Allocation Fund, BMO Balanced Allocation Fund, BMO Growth Allocation Fund, and BMO Aggressive Allocation Fund (each a series of BMO Funds, Inc., collectively the Funds), including the schedules of investments, as of August 31, 2017, and the related statements of operations for the year then ended, the statements of changes in net assets for each of the years in the two-year period then ended, and the financial highlights for each of the years or periods in the four-year period then ended. These financial statements and financial highlights are the responsibility of the Funds’ management. Our responsibility is to express an opinion on these financial statements and financial highlights based on our audits.
We conducted our audits in accordance with the standards of the Public Company Accounting Oversight Board (United States). Those standards require that we plan and perform the audit to obtain reasonable assurance about whether the financial statements and financial highlights are free of material misstatement. An audit includes examining, on a test basis, evidence supporting the amounts and disclosures in the financial statements. Our procedures included confirmation of securities owned as of August 31, 2017, by correspondence with the custodian and transfer agents or by other appropriate auditing procedures. An audit also includes assessing the accounting principles used and significant estimates made by management, as well as evaluating the overall financial statement presentation. We believe that our audits provide a reasonable basis for our opinion.
In our opinion, the financial statements and financial highlights referred to above present fairly, in all material respects, the financial position of the Funds as of August 31, 2017, the results of their operations for the year then ended, the changes in their net assets for each of the years in the two-year period then ended, and the financial highlights for each of the years or periods in the four-year period then ended, in conformity with U.S. generally accepted accounting principles.
/s/ KPMG LLP
Milwaukee, Wisconsin
October 24, 2017
63
| | |
| Directors and Officers of the Funds (Unaudited) |
The following tables provide information about each Director and Officer of the Funds as of September 1, 2017. The address of each Director is c/o BMO Funds, 111 East Kilbourn Avenue, Suite 200, Milwaukee, Wisconsin 53202. There are currently 44 separate portfolios or funds in the BMO Funds complex, of which 43 are registered as BMO Funds, Inc. and one is registered as BMO LGM Frontier Markets Equity Fund with the Securities and Exchange Commission. The Funds’ Statement of Additional Information includes additional information about the Directors and is available, without charge and upon request, by calling 1-800-236-FUND (3863).
| | | | | | | | | | |
| INDEPENDENT DIRECTORS | | | | | | | | |
| Name and Age | | Position(s) Held with
the Corporation | | Term of
Office and
Length of
Time Served* | | Principal Occupation(s)
During Past 5 Years | | Number of
Portfolios in
Fund
Complex
Overseen by
Director | | Other
Directorships
Held by
Director |
Ridge A. Braunschweig
Age: 64 | | Independent Director | | Since October 2009 | | President and Chief Executive Officer, CPL Industries, Inc. (a manufacturing holding company prior to May 2009 and a family office since May 2009), since January 2012; Executive Vice President and Chief Financial Officer, CPL Industries, Inc., from 2000 to 2012. | | 44 | | None |
Benjamin M. Cutler
Age: 72 | | Independent Director | | Since July 2004 | | Chairman, USHEALTH Group, Inc. (a health insurance company), since 2004; CEO and President, USHEALTH Group, Inc., from 2004 to 2016; Director, Freedom from Hunger (a non-profit organization), since 2016. | | 44 | | None |
John A. Lubs
Age: 69 | | Independent Director | | Since July 2004 | | Retired; formerly, Vice Chairman, Mason Companies, Inc. (a footwear distributor), from 2004 to 2010 and Chief Operating Officer, from 2003 to 2010. | | 44 | | None |
Vincent P. Lyles
Age: 56 | | Independent Director | | Since September 2017 | | President and Chief Executive Officer, Boys & Girls Clubs of Greater Milwaukee, since 2012. | | 44 | | None |
James Mitchell
Age: 70 | | Independent Director | | Since March 1999 | | Chairman, Ayrshire Precision Engineering (a precision machining company), since 1992; Chief Executive Officer, NOG, Inc. (a metal processing and consulting company), from 1999 to 2015. | | 44 | | None |
Barbara J. Pope
Age: 69 | | Independent Director | | Since March 1999 | | Retired; formerly, President of Barbara J. Pope, P.C. (a financial consulting firm), 1992-2015; President of Sedgwick Street Fund LLC (a private investment partnership), 1996-2015; Tax Partner, Price Waterhouse. | | 44 | | None |
| * Each Director serves an indefinite term until he or she retires or otherwise resigns, is removed, dies, or until his or her successor is duly elected. Retirement for a Director occurs no later than August 31 following his or her 75th birthday. |
64
| | |
| Directors and Officers of the Fund (Unaudited) (continued) |
| | | | | | | | | | |
| INTERESTED DIRECTORS | | | | | | | | |
| Name and Age | | Position(s) Held with
the Corporation | | Term of
Office and
Length of
Time Served* | | Principal Occupation(s)
During Past 5 Years | | Number of
Portfolios in
Fund
Complex
Overseen by
Director | | Other
Directorships
Held by
Director |
John M. Blaser**
Age: 60 | | Director and President | | Since May 1999 | | Managing Director of the Adviser, since June 2012. | | 44 | | None |
Christopher B. Begy**
Age: 63 | | Director | | Since August 2013 | | U.S. Country Head, CEO, and a Director of BMO Financial Corp., since August 2013; Chair, BMO Harris Bank N.A., since August 2013; Director of the Adviser, since August 2013; Chief Auditor of BMO Financial Group, from 2001 to 2013. | | 44 | | None |
| * Each Director serves an indefinite term until he or she retires or otherwise resigns, is removed, dies or until his or her successor is duly elected. Retirement for a Director occurs no later than August 31 following his or her 75th birthday. |
| ** Mr. Blaser is an “interested person” of the Corporation (as defined in the 1940 Act) due to the positions that he holds with the Corporation, and the Adviser. Mr. Begy is an “interested person” of the Corporation due to the positions that he holds with the Adviser and BMO. |
| | | | | | |
| PRINCIPAL OFFICERS | | | | |
| Name and Age | | Position(s) Held with
the Corporation | | Term of Office and Length of
Time Served | | Principal Occupation(s) During Past 5
Years |
Timothy M. Bonin
Age: 44 | | Vice President, Chief Financial Officer and Treasurer | | Elected by the Board annually; since February 2006 | | Vice President of the Adviser, since February 2006. |
Stephen R. Oliver
Age: 66 | | Chief Compliance Officer and Anti-Money Laundering Compliance Officer | | Elected by the Board annually; Chief Compliance Officer, since July 2008; and Anti-Money Laundering Officer, since January 2009 | | Vice President of BMO Harris Bank N.A., since March 2006, Vice President of BMO Investment Distributors, LLC (formerly M&I Distributors, LLC), 2007 to 2014. |
Michael J. Murphy
Age: 38 | | Secretary | | Elected by the Board annually; since May 2016 | | Senior Counsel and Vice President of BMO Harris Bank N.A., since 2014; Associate, Vedder Price P.C., 2010 to 2014. |
65
| | |
Shareholder Report Disclosure of Directors’ Approval of
Continuation of Contracts (Unaudited) |
Approval of Continuation of Advisory Agreements
During the reporting period, the Board of Directors (the “Board”) of BMO Funds, Inc. (the “Corporation”), including the Directors who are not “interested persons” of the Corporation as defined in the Investment Company Act of 1940, as amended (the “Independent Directors”), approved the continuation of the investment advisory agreement (the “Advisory Agreement”) between the Corporation and BMO Asset Management Corp. (the “Adviser”) on behalf of each portfolio of the Corporation (each, a “Fund” and collectively, the “Funds”) for an additional year ending August 31, 2018, except for the BMO In-Retirement Fund, BMO Target Retirement 2020 Fund, BMO Target Retirement 2030 Fund, BMO Target Retirement 2040 Fund and BMO Target Retirement 2050 Fund, which were approved for an additional year ending August 29, 2018.
At Board meetings held on July 12, 2017 (“July Meeting”) and August 8-9, 2017 (“August Meeting”), the Board met with management of the Adviser regarding the annual approval of the continuation of the Funds’ Advisory Agreement. In connection with its consideration of the Advisory Agreement, the Board considered the information furnished and discussed throughout the year at regularly scheduled Board and Committee meetings, as applicable, and the information provided specifically in relation to the annual consideration of the approval of the Advisory Agreement in response to requests of the Independent Directors and their independent legal counsel. Information furnished in connection with Board or Committee meetings throughout the year included, among other things, presentations given by the portfolio managers of the Funds on each Fund’s investment strategies, risks and performance, comparative performance of each Fund against its benchmark indices; reports regarding each Fund’s asset levels including sales and redemption activities; and various reports on the monitoring of the Funds’ compliance with the securities laws, regulations, policies and procedures. In preparation for the Board’s annual consideration of the approval of the Advisory Agreement, the Directors requested and received a wide variety of information and reports concerning the Adviser (and its affiliates) including information on: (1) the nature, extent and quality of services provided to each Fund by the Adviser (and its affiliates); (2) the investment performance of each Fund as compared to a group of comparable funds; (3) the expense ratios of each Fund as compared to a group of comparable funds; (4) profitability information of the Adviser; and (5) the Adviser’s compliance program. The Board also considered information related to potential “fall out” or ancillary benefits enjoyed by the Adviser (and its affiliates) as a result of their relationships with the Funds. In addition to evaluating, among other things, the written information provided by the Adviser, the Board also considered the answers to questions posed by the Board to representatives of the Adviser at various meetings.
In evaluating the Advisory Agreement, the Board members took into account their accumulated experience in working with the Adviser on matters related to the Funds. The Independent Directors also met separately in executive sessions with their independent legal counsel to review and consider the information provided regarding the Advisory Agreement.
Based on their review, the Independent Directors and the full Board concluded that it was in the best interests of each Fund to approve the continuation of the Advisory Agreement. Although the Advisory Agreement for all of the Funds were considered at the same Board meeting, the Directors considered each Fund separately. In their deliberations, the Board did not identify any single factor or group of factors as all-important or controlling but considered all factors together. The material factors and conclusions that formed the basis for the Board’s determinations are discussed below.
Nature, Extent and Quality of Services
In evaluating the nature, extent and quality of the services provided by the Adviser to the Funds, the Board reviewed information describing the financial strength, experience, resources and key personnel of the Adviser, including the personnel who provide investment management services to the Funds. The Board considered the administrative services that are provided to each Fund, as well as other services performed by the Adviser, including the selection and monitoring of the underlying funds; monitoring adherence to the Funds’ investment restrictions; monitoring the Funds’ compliance with their compliance policies and procedures and with applicable securities laws and regulations; producing shareholder reports; providing support services for the Board and Board committees; communicating with shareholders; and overseeing the activities of other service providers. The Board also considered the Adviser’s experience in providing investment advisory services to funds.
Review of Fund Performance
The Board reviewed the investment performance of each of the Funds. While consideration was given to performance reports provided in connection with, and discussions held at, regular Board meetings throughout the year, particular attention was given to the performance reports provided specifically in connection with the July and August Meetings. In particular, the Directors noted the performance of each Fund relative to its Lipper Inc. (“Lipper”) peer universe. The Directors also considered updated performance information for each Fund relative to its benchmark and, if applicable, its Morningstar, Inc. (“Morningstar”) ratings.
With respect to each Fund’s performance as compared to its Lipper peer universe (“peer group”), the Board reviewed each Fund’s performance percentile rankings over the year-to-date and one- and three-year periods through May 31, 2017, as provided by the Adviser. The Board considered that each Fund ranked in one of the top two quartiles for performance as compared to its peer group in two out of the three periods reviewed, except for the following Funds: BMO Conservative Allocation Fund, BMO Moderate Allocation Fund, BMO Balanced Allocation Fund, and BMO Growth Allocation Fund. The Board took into consideration that each Fund has a very limited performance history.
With respect to the BMO Conservative Allocation Fund, the Board considered that the Fund was rated three stars by Morningstar and that its three-year performance was in the second quartile of its peer group, while the year-to-date and
66
one-year performance were in the third quartile. With respect to the Fund’s one-year performance, the Fund’s performance ranked only slightly below the majority of the funds in its peer group. The Board also considered portfolio management changes to the Fund during the period and the Adviser’s explanation with respect to contributors to Fund performance.
With respect to the BMO Moderate Allocation Fund, the Board consider that its year-to-date, one-year and three-year performance were in the third quartile of its peer group. With respect to the Fund’s three-year performance, the Fund’s performance ranked only slightly below the majority of the funds in its peer group. The Board also considered portfolio management changes to the Fund during the period and the Adviser’s explanation with respect to contributors to Fund performance.
With respect to the BMO Balanced Allocation Fund, the Board considered that the Fund was rated three stars by Morningstar and that its year-to-date performance was in the second quartile of its peer group, while the one-year and three-year performance were in the third quartile. With respect to the Fund’s one-year performance, the Fund’s performance ranked only slightly below the majority of the funds in its peer group. The Board also considered portfolio management changes to the Fund during the period and the Adviser’s explanation with respect to contributors to Fund performance.
With respect to the BMO Growth Allocation Fund, the Board considered that its year-to-date, one-year and three-year performance was in the third quartile of its peer group. The Board also considered portfolio management changes to the Fund during the period and the Adviser’s explanation with respect to contributors to Fund performance.
The Board determined that it was generally satisfied with each Fund’s performance and would continue to monitor each Fund’s performance results.
Costs of Services Provided and Profits Realized by the Adviser
The Board considered the fees payable by each Fund under the Advisory Agreement, noting that the Funds do not pay a management fee to the Adviser. The Board review information provided by the Adviser comparing each Fund’s net expense ratio to the median net expense ratio of its Lipper peer group (“Lipper peers”). The Board considered that each Target Date Fund’s net expense ratio was higher than the median of its Lipper peers and that each Target Allocation Fund’s net expense ratio was lower than or within a few basis points of its Lipper peers (except for Investor Class shares of the BMO Conservative Allocation Fund and BMO Balanced Allocation Fund). The Board considered that the net expense ratios included the fees and expenses of the underlying funds in which the Funds invest. In addition, the Board noted that the Adviser agreed to contractual expense limitations for the Funds (the “Expense Limitations”), and that the net expense ratios for the Funds take into account the effect of the Expense Limitations. The Board also gave consideration to the fact that the Target Date and Target Allocation Funds were still relatively new and, with the exception of the BMO Balanced Fund, relatively small in size and, therefore, economies of scale with respect to other expenses may not have been realized.
The Board considered the methodology used by the Adviser in determining compensation payable to its portfolio managers and the competitive environment for investment management talent. The Board also considered the financial condition of the Adviser and certain of its affiliates, and particularly focused on the financial strength of the ultimate parent company of the Adviser, and the parent company’s commitment, financial and otherwise, to the global asset management business and the Funds.
The Board reviewed profitability information it received from the Adviser in connection with the services provided to each Fund and the Corporation as a whole. The materials provided in this regard showed, and the Directors acknowledged, that the Adviser would not have a profit with respect to these Funds because the Funds do not pay management fees to the Adviser.
Economies of Scale
The Board did not consider the extent to which economies of scale would be realized as the Funds grow because the Funds do not pay management fees to the Adviser.
Other Benefits to the Adviser
The Board considered benefits that accrue to the Adviser and its affiliates from their relationships with the Funds, including revenue in the form of administration fees and custody fees. The Board noted that the Adviser may potentially benefit from its relationship with each Fund in other ways. The Board also considered that the success of any Fund could attract other business to the Adviser and that the success of the Adviser could enhance the Adviser’s ability to serve the Funds.
The Board concluded that, taking into account all of the information reviewed, each Fund’s advisory fee was reasonable.
Overall Conclusions
Based on all of the information considered and the conclusions reached, the Board determined that the terms of the Advisory Agreement are fair and reasonable and that the approval of the continuation of the Advisory Agreement is in the best interests of each Fund.
67
68
This report is authorized for distribution to prospective investors only when preceded or accompanied by the Funds’ prospectuses, which contain facts concerning each Fund’s objective and policies, management fees, expenses, and other information.
Proxy Voting
A description of the policies and procedures that the Funds use to determine how to vote proxies relating to portfolio securities is available without charge, upon request, by calling toll free, 1-800-236-FUND (3863) and by accessing the Funds’ Statement of Additional Information, which is available on the Funds’ website at http://www.bmofunds.com and on the SEC’s website at http://www.sec.gov.
Each Fund’s proxy voting record for the most recent 12-month period ended June 30 is available without charge, upon request, by calling toll free, 1-800-236-FUND (3863) and by accessing the SEC’s website at http://www.sec.gov.
Disclosure of Portfolio Holdings
The Funds file their complete schedules of portfolio holdings with the SEC for the first and third quarters of each fiscal year on Form N-Q. Each Fund’s Form N-Q is available on the SEC’s website at http://www.sec.gov and may be reviewed and copied at the SEC’s Public Reference Room in Washington, D.C. Information on the operation of the Public Reference Room may be obtained by calling 1-800-SEC-0330.
Shares of the BMO Funds are not bank deposits or other obligations of, or issued, endorsed or guaranteed by, BMO Harris Bank, NA, or any of its affiliates. Shares of the BMO Funds, like shares of all mutual funds, are not insured or guaranteed by the U.S. government, the Federal Deposit Insurance Corporation, the Federal Reserve Board, or any other government agency. Investment in mutual funds involves investment risk, including the possible loss of principal.
| | |
| | PRSRT STD U.S. POSTAGE PAID LANCASTER, PA PERMIT NO. 1793 |
| | |
 | | BMO Funds U.S. Services P.O. Box 55931 Boston, MA 02205-5931 |
| | |
 | | Contact us 1-800-236-FUND (3863) 414-287-8555 |
| | |
 | | Learn more bmofunds.com |
BMO Investment Distributors, LLC, Distributor
BMO Asset Management Corp., Investment Adviser
Investment products are: NOT FDIC INSURED — NO BANK GUARANTEE — MAY LOSE VALUE.
© 2017 BMO Financial Corp. (9/17)
Item 2. Code of Ethics.
The Registrant has a code of ethics (the “Code”) that applies to the Registrant’s principal executive officer and principal financial officer. During the period covered by this report, there were no amendments to the provisions of the Code, nor were there any implicit or explicit waivers to the provisions of the Code. The Code is filed herewith.
Item 3. Audit Committee Financial Expert.
The Registrant’s Board of Directors has determined that the Registrant has four audit committee financial experts serving on its audit committee, each of whom is “independent” within the meaning of Form N-CSR: Ridge A. Braunschweig, Barbara J. Pope, John A. Lubs, and Benjamin M. Cutler. Under applicable securities laws, a person who is determined to be an audit committee financial expert will not be deemed an “expert” for any purpose, including without limitation for purposes of Section 11 of the Securities Act of 1933, as amended, as a result of being designated or identified as an audit committee financial expert. The designation or identification of a person as an audit committee financial expert does not impose on such person any duties, obligations, or liabilities that are greater than the duties, obligations, and liabilities imposed on such person as a member of the audit committee and Board of Directors in the absence of such designation or identification.
Item 4. Principal Accountant Fees and Services.
The aggregate fees for professional services by KPMG LLP during the fiscal year 2017 and 2016 were as follows:
(a) Audit Fees for Registrant.
| | | | | | |
| | Fiscal year ended August 31, 2017 | | $650,555 | | |
| | Fiscal year ended August 31, 2016 | | $657,205 | | |
(b) Audit-Related Fees for Registrant. These are fees by the Registrant’s independent auditors for assurance and related services that were reasonably related to the performance of the audit of the Registrant’s financial statements that are not reported under “Audit Fees”. These fees include amounts related to Form N-17f-2 filings.
| | | | | | |
| | Fiscal year ended August 31, 2017 | | $76,755 | | |
| | Fiscal year ended August 31, 2016 | | $77,940 | | |
(c) Tax Fees for Registrant. These are fees for professional services rendered by the Registrant’s independent auditors for tax compliance, tax advice, and tax planning. These fees include federal, excise and state tax reviews; performed by KPMG LLP.
| | | | | | |
| | Fiscal year ended August 31, 2017 | | $170,210 | | |
| | Fiscal year ended August 31, 2016 | | $175,460 | | |
(d) All Other Fees.
| | | | | | |
| | Fiscal year ended August 31, 2017 | | None | | |
| | Fiscal year ended August 31, 2016 | | None | | |
(e) Audit Committee’s pre-approval policies and procedures.
| | (1) | The Audit Committee has adopted pre-approval policies and procedures that require the Audit Committee to pre-approve all audit and non-audit services of the Registrant, including services provided to the Registrant’s investment adviser or any entity controlling, controlled by or under common control with the Registrant’s investment adviser that provides ongoing services to the Registrant with respect to any engagement that directly relates to the operations and financial reporting of the Registrant. |
| | (2) | None of the services described in paragraphs (b) through (d) of this Item 4 were approved by the audit committee pursuant to paragraph (c)(7)(i)(C) of Rule 2-01 of Regulation S-X. |
(f) None.
| (g) | During the last two fiscal years, other non-audit services rendered by the Registrant’s independent auditors to the Registrant, its investment adviser or any entity controlling, controlled by or under the common control with the investment adviser that provides ongoing services to the Registrant included the following: |
Statement on Standards for Attestation Engagements No. 16 (SSAE No. 16) examinations for BMO Harris Bank N.A.
| | | | | | |
| | Fiscal year ended August 31, 2017 | | $220,000 | | |
| | Fiscal year ended August 31, 2016 | | $198,000 | | |
(h) Not applicable.
Item 5. Audit Committee of Listed Registrants.
Not applicable.
Item 6. Investments.
Except as noted below, the schedules of investments are included as part of the report to shareholders filed under Item 1 of this Form. The schedules of investments for BMO Ultra Short Tax-Free Fund, BMO Short Tax-Free Fund, and BMO Intermediate Tax-Free Fund, are filed under this Item.
Ultra Short Tax-Free Fund
SCHEDULE OF INVESTMENTS – As of August 31, 2017
| | | | | | |
Description | | Shares or Principal Amount | | | | Value |
|
Municipals — 96.1% |
|
Alabama — 4.9% |
Albertville Municipal Utilities Board, AGM: | | | | | | |
2.000%, 8/15/2019 | | $ 735,000 | | | | $ 744,121 |
2.000%, 8/15/2020 | | 355,000 | | | | 359,679 |
Chatom Industrial Development Board, 1.300%, 8/1/2037, Call 2/1/2018 (12) | | 2,800,000 | | | | 2,800,000 |
City of Brundidge, AGM: | | | | | | |
2.000%, 12/1/2017 | | 380,000 | | | | 381,091 |
2.000%, 12/1/2018 | | 385,000 | | | | 389,335 |
County of Jefferson, 5.000%, 9/15/2019 | | 1,000,000 | | | | 1,076,630 |
Health Care Authority for Baptist Health, 1.150%, 11/1/2042 (12) | | 14,125,000 | | | | 14,125,000 |
Limestone County Water & Sewer Authority, BAM, 2.000%, 12/1/2019 | | 160,000 | | | | 162,779 |
Mobile Industrial Development Board: | | | | | | |
0.910%, 6/1/2034, Call 9/1/2017 (12) | | 150,000 | | | | 150,000 |
0.930%, 6/1/2034, Call 9/1/2017 (12) | | 250,000 | | | | 250,000 |
1.000%, 6/1/2034, Call 9/1/2017 (12) | | 4,000,000 | | | | 4,000,000 |
Tender Option Bond Trust Receipts/Certificates, 1.040%, 12/1/2030 (6) (12) | | 7,060,000 | | | | 7,060,000 |
Wilsonville Industrial Development Board, 0.870%, 1/1/2024, Call 9/1/2017 (12) | | 800,000 | | | | 800,000 |
| | | | 32,298,635 |
|
Arizona — 1.8% |
Arizona Health Facilities Authority: | | | | | | |
0.800%, 1/1/2029, Call 9/1/2017 (12) | | 6,000,000 | | | | 6,000,000 |
2.640% (SIFMA Municipal Swap Index Yield+185 basis points), 2/5/2020, Call 8/9/2019 (7) | | 3,250,000 | | | | 3,299,497 |
2.640% (SIFMA Municipal Swap Index Yield+185 basis points), 2/5/2020, Call 8/9/2019 (7) | | 750,000 | | | | 761,423 |
Arizona School Facilities Board, AMBAC, 5.000%, 7/1/2018 | | 300,000 | | | | 309,939 |
City of Tucson, AGM, 3.000%, 7/1/2018 | | 500,000 | | | | 508,510 |
Industrial Development Authority of the County of Pima, 5.000%, 9/1/2017 | | 250,000 | | | | 250,000 |
Maricopa County Pollution Control Corp., 1.750%, 5/30/2018 (12) | | 500,000 | | | | 502,070 |
| | | | 11,631,439 |
|
Arkansas — 2.6% |
Arkansas Development Finance Authority: | | | | | | |
1.200%, 9/1/2044, Call 9/1/2017 (12) | | 10,400,000 | | | | 10,400,000 |
1.890% (SIFMA Municipal Swap Index Yield+110 basis points), 9/1/2019, Call 3/1/2019 (7) | | 3,000,000 | | | | 3,005,220 |
City of Cabot, 2.550%, 6/1/2043, Call 6/1/2023 | | 405,000 | | | | 405,522 |
County of Crawford, AGM, 3.000%, 9/1/2017 | | 175,000 | | | | 175,000 |
Little Rock School District, SAW, 3.000%, 2/1/2019 (8) | | 3,000,000 | | | | 3,077,580 |
| | | | 17,063,322 |
|
California — 7.6% |
Bay Area Toll Authority: | | | | | | |
1.875%, 4/1/2019, Call 10/1/2018 (12) | | 525,000 | | | | 531,279 |
1.890% (SIFMA Municipal Swap Index Yield+110 basis points), 4/1/2024, Call 10/1/2023 (7) | | 1,750,000 | | | | 1,784,527 |
BB&T Municipal Trust, 1.490% (SIFMA Municipal Swap Index Yield+70 basis points), 11/15/2017 (6) (7) | | 111,277 | | | | 111,303 |
California Health Facilities Financing Authority, NATL-RE, 1.383%, 7/1/2022, Call 9/1/2017 (12) (13) | | 700,000 | | | | 679,539 |
California Infrastructure & Economic Development Bank: | | | | | | |
1.050%, 12/1/2018 | | 750,000 | | | | 751,838 |
1.070% (SIFMA Municipal Swap Index Yield+28 basis points), 4/2/2018, Call 1/2/2018 (7) | | 550,000 | | | | 550,820 |
California Municipal Finance Authority, 1.200%, 2/1/2018 (12) | | 3,750,000 | | | | 3,751,950 |
California Statewide Communities Development Authority: | | | | | | |
3.500%, 11/1/2018 | | 400,000 | | | | 402,536 |
5.250%, 12/1/2027, Call 12/1/2017 | | 1,250,000 | | | | 1,263,312 |
California Statewide Communities Development Authority, CMI, 2.500%, 8/1/2020, Call 9/1/2017 | | 455,000 | | | | 455,000 |
| | | | | | |
Carson Redevelopment Agency Successor Agency, 4.000%, 10/1/2017 | | 1,265,000 | | | | 1,267,783 |
City of Sacramento, 2.000%, 9/1/2017 | | 200,000 | | | | 200,000 |
Golden Empire Schools Financing Authority, 4.000%, 5/1/2018 | | 4,000,000 | | | | 4,085,520 |
Golden State Tobacco Securitization Corp., 4.000%, 6/1/2018 | | 5,000,000 | | | | 5,114,900 |
Northern California Gas Authority No. 1, 1.500% (LIBOR 3 Month+63 basis points), 7/1/2019 (7) | | 7,500,000 | | | | 7,494,975 |
Palomar Health: | | | | | | |
4.000%, 11/1/2018 | | 125,000 | | | | 127,963 |
4.000%, 11/1/2019 | | 505,000 | | | | 526,493 |
Rib Floater Trust Various States, 0.970%, 8/15/2051 (6) (12) | | 3,000,000 | | | | 3,000,000 |
South Placer Wastewater Authority, 1.120% (SIFMA Municipal Swap Index Yield+33 basis points), 11/1/2017, Call 9/18/2017 (7) | | 600,000 | | | | 600,000 |
State of California, 1.692% (LIBOR 1 Month+83 basis points), 12/3/2018, Call 6/1/2018 (7) | | 950,000 | | | | 954,123 |
State of California, FSA, 1.000%, 8/1/2027 (6) (12) | | 5,500,000 | | | | 5,500,000 |
Successor Agency to the Richmond County Redevelopment Agency, BAM, 4.000%, 9/1/2017 | | 400,000 | | | | 400,000 |
Tender Option Bond Trust Receipts/Certificates: | | | | | | |
0.860%, 11/1/2023 (6) (12) | | 8,000,000 | | | | 8,000,000 |
0.910%, 5/1/2022 (6) (12) | | 3,000,000 | | | | 3,000,000 |
| | | | | | 50,553,861 |
| | | |
Colorado — 1.8% | | | | | | |
City & County of Denver, AGC, 0.880%, 11/15/2025, Call 9/1/2017 (12) (13) | | 525,000 | | | | 525,000 |
City of Sheridan, 3.000%, 12/1/2017 | | 200,000 | | | | 200,982 |
Colorado Educational & Cultural Facilities Authority, 3.000%, 11/15/2017 | | 190,000 | | | | 190,923 |
Colorado Health Facilities Authority: | | | | | | |
1.450%, 7/1/2034, Call 7/1/2019 (6) (12) | | 4,300,000 | | | | 4,300,000 |
4.000%, 2/1/2018 | | 175,000 | | | | 176,628 |
5.000%, 5/15/2018 | | 200,000 | | | | 204,556 |
5.000%, 5/15/2019 | | 250,000 | | | | 263,608 |
5.000%, 6/1/2019 (8) | | 450,000 | | | | 476,402 |
County of Montrose, 4.000%, 12/1/2017 | | 385,000 | | | | 387,352 |
Denver Health & Hospital Authority: | | | | | | |
5.000%, 12/1/2019, Call 9/29/2017 | | 200,000 | | | | 200,536 |
5.000%, 12/1/2020, Call 9/29/2017 | | 1,730,000 | | | | 1,734,636 |
E-470 Public Highway Authority, 1.725% (LIBOR 1 Month+90 basis points), 9/1/2019, Call 3/1/2019 (7) | | 3,345,000 | | | | 3,369,619 |
| | | | | | 12,030,242 |
| | | |
Connecticut — 0.3% | | | | | | |
Norwalk Housing Authority, 1.250%, 6/1/2018 (12) | | 2,200,000 | | | | 2,204,994 |
| | | |
District of Columbia — 0.1% | | | | | | |
District of Columbia Housing Finance Agency, AGM, 5.000%, 7/1/2021, Call 10/2/2017 | | 390,000 | | | | 391,209 |
| | | |
Florida — 6.2% | | | | | | |
Citizens Property Insurance Corp., 5.000%, 6/1/2018, Call 12/1/2017 | | 1,975,000 | | | | 1,995,066 |
City of Cape Coral, AGM, 1.400%, 9/1/2018 | | 650,000 | | | | 652,867 |
City of Lakeland, 5.000%, 10/1/2017 | | 1,500,000 | | | | 1,504,425 |
City of Orlando, AGM: | | | | | | |
3.000%, 11/1/2019 | | 850,000 | | | | 882,784 |
4.000%, 11/1/2018 | | 650,000 | | | | 672,822 |
City of Port St. Lucie, 1.125%, 7/1/2018 | | 625,000 | | | | 624,175 |
Columbia County School Board, 5.000%, 7/1/2018 | | 880,000 | | | | 908,644 |
County of Escambia, 0.870%, 4/1/2039, Call 9/1/2017 (12) | | 6,100,000 | | | | 6,100,000 |
County of Manatee, 0.870%, 9/1/2024, Call 9/1/2017 (12) | | 4,300,000 | | | | 4,300,000 |
County of Volusia, 5.250%, 10/1/2017 | | 1,000,000 | | | | 1,003,130 |
Florida Municipal Power Agency, AMBAC: | | | | | | |
1.365%, 10/1/2021, Call 9/7/2017 (12) (13) | | 250,000 | | | | 238,154 |
1.367%, 10/1/2021 (12) (13) | | 325,000 | | | | 309,607 |
JEA Electric System Revenue, 5.000%, 10/1/2018 | | 600,000 | | | | 626,778 |
Manatee County School District, AGM, 4.000%, 10/1/2018 | | 670,000 | | | | 691,909 |
Miami-Dade County Industrial Development Authority, 0.870%, 6/1/2021, Call 9/1/2017 (12) | | 8,100,000 | | | | 8,100,000 |
North Sumter County Utility Dependent District, 5.000%, 10/1/2017 | | 225,000 | | | | 225,596 |
Putnam County Development Authority, 0.870%, 9/1/2024, Call 9/1/2017 (12) | | 2,400,000 | | | | 2,400,000 |
Sarasota County Health Facilities Authority: | | | | | | |
4.000%, 1/1/2018 | | 400,000 | | | | 403,268 |
4.000%, 1/1/2019 | | 500,000 | | | | 515,330 |
School Board of Miami-Dade County, FGIC, 1.020%, 9/7/2017, Call 9/1/2017 (6) (12) | | 8,000,000 | | | | 8,000,000 |
Sumter County Industrial Development Authority, 4.000%, 7/1/2019 620,000 | | | | | | 651,372 |
| | | | | | 40,805,927 |
| | | | | | |
Georgia — 0.9% | | | | | | |
City of Atlanta, 2.329% (LIBOR 1 Month+150 basis points), 11/1/2018, Call 5/1/2018 (7) | | 2,750,000 | | | | 2,767,545 |
Georgia State Road & Tollway Authority, 5.000%, 6/1/2019 | | 1,750,000 | | | | 1,871,100 |
Peach County Development Authority, 1.200%, 10/1/2018, Call 4/1/2018 | | 1,000,000 | | | | 1,000,390 |
Private Colleges & Universities Authority, 4.000%, 10/1/2017 | | 110,000 | | | | 110,184 |
| | | | | | 5,749,219 |
| | | |
Guam — 0.1% | | | | | | |
Territory of Guam: | | | | | | |
3.000%, 11/15/2017 | | 300,000 | | | | 300,720 |
5.000%, 12/1/2017 | | 200,000 | | | | 201,788 |
5.000%, 12/1/2018 | | 250,000 | | | | 261,030 |
| | | | | | 763,538 |
| | | |
Idaho — 1.4% | | | | | | |
American Falls Reservoir District, 0.980%, 2/1/2025, Call 9/1/2017 (12) | | 4,885,000 | | | | 4,885,000 |
Idaho Housing & Finance Association, 0.870%, 1/1/2038, Call 9/1/2017 (12) | | 4,600,000 | | | | 4,600,000 |
| | | | | | 9,485,000 |
| | | |
Illinois — 5.6% | | | | | | |
Arlington Heights Park District, 5.000%, 12/1/2017 | | 170,000 | | | | 171,674 |
Chicago Board of Education, 9.000%, 3/1/2032, Call 9/1/2018 | | 3,890,000 | | | | 3,908,789 |
City of Burbank, BAM, 3.000%, 12/1/2017 | | 1,040,000 | | | | 1,044,732 |
City of Chicago: | | | | | | |
2.000%, 11/1/2017 | | 2,000,000 | | | | 2,003,160 |
5.000%, 11/1/2018 | | 1,000,000 | | | | 1,045,360 |
5.000%, 11/1/2018 | | 1,155,000 | | | | 1,207,391 |
City of Chicago, AGM: | | | | | | |
4.250%, 11/1/2018 | | 150,000 | | | | 155,519 |
5.000%, 1/1/2019, Call 10/2/2017 | | 250,000 | | | | 254,507 |
City of Rockford, BAM, 5.000%, 12/15/2017 | | 1,600,000 | | | | 1,617,456 |
Cook County Community Consolidated School District No. 15 Palatine, NATL-RE, 0.000%, 12/1/2017 | | 250,000 | | | | 249,252 |
County of Cook, 5.000%, 11/15/2018 | | 1,300,000 | | | | 1,355,406 |
Illinois Finance Authority: | | | | | | |
0.800%, 8/15/2042, Call 9/1/2017 (12) | | 2,400,000 | | | | 2,400,000 |
1.050%, 7/30/2018 (12) | | 3,275,000 | | | | 3,277,325 |
4.000%, 11/15/2017 | | 200,000 | | | | 201,178 |
4.000%, 11/15/2018 | | 200,000 | | | | 206,894 |
5.000%, 8/15/2018 | | 200,000 | | | | 205,832 |
5.000%, 11/15/2018 | | 350,000 | | | | 365,939 |
5.000%, 11/15/2019 | | 605,000 | | | | 652,517 |
5.000%, 11/15/2019 | | 250,000 | | | | 269,805 |
Kankakee River Metropolitan Agency, AGM: | | | | | | |
2.000%, 5/1/2018 | | 100,000 | | | | 100,342 |
3.000%, 5/1/2019 | | 300,000 | | | | 307,068 |
Lake County Forest Preserve District, 1.314% (LIBOR 3 Month+48 basis points), 12/15/2020 (7) | | 450,000 | | | | 451,633 |
McHenry County Community Consolidated School District No. 47 Crystal Lake, AGM, 5.000%, 2/1/2018 | | 210,000 | | | | 213,461 |
McHenry County Community Unit School District No. 12 Johnsburg, AGM, 4.000%, 1/1/2018 | | 125,000 | | | | 126,253 |
Northern Illinois Municipal Power Agency, 5.000%, 12/1/2018 | | 500,000 | | | | 524,690 |
Northern Illinois Municipal Power Agency, NATL-RE, 5.000%, 1/1/2018 | | 1,250,000 | | | | 1,266,250 |
Ogle Lee & De Kalb Counties Township High School District No. 212 Rochelle, 4.000%, 12/1/2018 | | 925,000 | | | | 959,225 |
Rib Floater Trust Various States, 1.040%, 4/1/2036, Call 4/1/2027 (6) (12) | | 4,250,000 | | | | 4,250,000 |
Southwestern Illinois Development Authority, AGM, 5.250%, 12/1/2020, Call 12/1/2017 | | 275,000 | | | | 277,711 |
State of Illinois: | | | | | | |
5.000%, 1/1/2018 | | 2,000,000 | | | | 2,020,540 |
5.000%, 2/1/2018 | | 500,000 | | | | 506,420 |
Tender Option Bond Trust Receipts/Certificates, 0.990%, 6/15/2032, Call 6/15/2026 (6) (12) | | 4,655,000 | | | | 4,655,000 |
Village of Franklin Park, BAM, 4.000%, 10/1/2017 | | 95,000 | | | | 95,198 |
Village of Plainfield, 2.000%, 12/15/2017 | | 130,000 | | | | 130,420 |
Village of Rantoul, AGM: | | | | | | |
2.000%, 1/1/2018 | | 100,000 | | | | 100,272 |
2.000%, 1/1/2019 | | 150,000 | | | | 151,388 |
| | | | | | 36,728,607 |
| | | | | | |
Indiana — 2.8% | | | | | | |
Clark-Pleasant Community School Building Corp., SAW, 4.000%, 1/15/2018 | | 910,000 | | | | 920,328 |
Hamilton Southeastern Consolidated School Building Corp., 5.000%, 1/15/2018 | | 900,000 | | | | 913,752 |
Indiana Housing & Community Development Authority, GNMA FNMA FHLMC COLL, 0.890%, 7/1/2039, Call 10/2/2017 (12) | | 8,200,000 | | | | 8,200,000 |
Tender Option Bond Trust Receipts/Certificates, 1.140%, 4/15/2019 (6) (12) | | 8,500,000 | | | | 8,500,000 |
Whitley County Multi School Building Corp., 3.000%, 1/15/2018 | | 250,000 | | | | 252,080 |
| | | | | | 18,786,160 |
| | | |
Iowa — 1.9% | | | | | | |
City of Altoona, 3.000%, 6/1/2018 | | 220,000 | | | | 223,249 |
Iowa Finance Authority, 0.810%, 6/1/2039, Call 9/1/2017 (12) | | 4,900,000 | | | | 4,900,000 |
Iowa Higher Education Loan Authority: | | | | | | |
1.000%, 9/1/2018, Call 3/1/2018 | | 3,000,000 | | | | 3,000,300 |
2.000%, 12/1/2018, Call 6/1/2018 | | 3,500,000 | | | | 3,519,670 |
People’s Memorial Hospital of Buchanan County, 1.500%, 12/1/2018, Call 6/1/2018 | | 405,000 | | | | 404,206 |
Xenia Rural Water District: | | | | | | |
2.000%, 12/1/2017 | | 125,000 | | | | 125,213 |
2.000%, 12/1/2018 | | 225,000 | | | | 226,397 |
| | | | | | 12,399,035 |
| | | |
Kansas — 0.3% | | | | | | |
Bourbon County Unified School District No. 234-Fort Scott, 3.000%, 9/1/2017 | | 745,000 | | | | 745,000 |
Kansas Turnpike Authority, 5.000%, 9/1/2017 | | 1,000,000 | | | | 1,000,000 |
| | | | | | 1,745,000 |
| | | |
Kentucky — 1.4% | | | | | | |
Kentucky Rural Water Finance Corp., 3.000%, 11/1/2018 | | 3,000,000 | | | | 3,066,120 |
Kentucky State Property & Building Commission, 5.250%, 10/1/2017 | | 425,000 | | | | 426,309 |
Louisville/Jefferson County Metropolitan Government: | | | | | | |
1.250%, 6/3/2019 (12) | | 1,000,000 | | | | 1,001,890 |
1.250%, 6/3/2019 (12) | | 1,000,000 | | | | 1,001,890 |
4.000%, 11/15/2017 | | 1,000,000 | | | | 1,006,240 |
Northern Kentucky Water Service District, 3.000%, 4/1/2019, Call 10/1/2018 | | 2,500,000 | | | | 2,542,300 |
| | | | | | 9,044,749 |
| | | |
Louisiana — 3.1% | | | | | | |
East Baton Rouge Sewerage Commission, 1.362% (LIBOR 1 Month+50 basis points), 8/1/2018, Call 2/1/2018 (7) | | 6,090,000 | | | | 6,094,019 |
Louisiana Housing Corp., FHA, 2.500%, 12/1/2031, Call 6/1/2020 | | 525,000 | | | | 525,037 |
Louisiana Offshore Terminal Authority, 0.800%, 9/1/2033, Call 9/1/2017 (12) | | 5,000,000 | | | | 5,000,000 |
Louisiana Public Facilities Authority: | | | | | | |
0.830%, 12/1/2043, Call 9/1/2017 (12) | | 500,000 | | | | 500,000 |
1.040%, 7/1/2021, Call 9/7/2017 (12) | | 1,155,000 | | | | 1,155,000 |
4.000%, 5/15/2019 | | 225,000 | | | | 235,593 |
Parish of St. Charles, 0.870%, 10/1/2022, Call 9/1/2017 (12) | | 800,000 | | | | 800,000 |
Parish of St. James, 0.920%, 11/1/2040, Call 9/1/2017 (12) | | 4,000,000 | | | | 4,000,000 |
State of Louisiana, 1.332% (LIBOR 1 Month+47 basis points), 5/1/2018, Call 11/1/2017 (7) | | 2,500,000 | | | | 2,500,650 |
| | | | | | 20,810,299 |
| | | |
Maine — 0.1% | | | | | | |
City of Portland: | | | | | | |
5.000%, 1/1/2018 | | 285,000 | | | | 288,454 |
5.000%, 1/1/2019 | | 305,000 | | | | 319,546 |
| | | | | | 608,000 |
| | | |
Maryland — 0.1% | | | | | | |
City of Baltimore: | | | | | | |
3.000%, 9/1/2018 | | 250,000 | | | | 254,473 |
4.000%, 9/1/2019 | | 350,000 | | | | 368,046 |
| | | | | | 622,519 |
| | | |
Massachusetts — 0.3% | | | | | | |
Commonwealth of Massachusetts, 1.338% (LIBOR 3 Month+46 basis points), 11/1/2018, Call 11/1/2017 (7) | | 750,000 | | | | 750,210 |
Marthas Vineyard Land Bank, BAM, 4.000%, 5/1/2018 | | 500,000 | | | | 509,830 |
| | | | | | |
Massachusetts Development Finance Agency, 1.270% (SIFMA Municipal Swap Index Yield+48 basis points), 1/29/2020, Call 8/1/2019 (7) | | 500,000 | | | | 498,755 |
Massachusetts Municipal Wholesale Electric Co., MBIA, 1.892%, 7/1/2018, Call 9/5/2017 (12) (13) | | 25,000 | | | | 24,706 |
| | | | | | 1,783,501 |
| | | |
Michigan — 1.6% | | | | | | |
Boyne City Public School District, 1.500%, 5/1/2019 | | 1,265,000 | | | | 1,274,918 |
City of Detroit Water Supply System Revenue, BHAC FGIC, 5.750%, 7/1/2024, Call 7/1/2018 | | 100,000 | | | | 103,848 |
Michigan Finance Authority: | | | | | | |
0.850%, 12/1/2017 (8) (12) | | 5,000,000 | | | | 5,000,000 |
5.000%, 11/15/2017 | | 500,000 | | | | 503,900 |
5.000%, 11/15/2018 | | 500,000 | | | | 523,135 |
5.000%, 11/15/2019 | | 400,000 | | | | 433,140 |
Michigan State Building Authority, 5.000%, 10/15/2017 | | 30,000 | | | | 30,137 |
Michigan State Housing Development Authority, 0.850%, 12/1/2035, Call 9/1/2017 (12) | | 460,000 | | | | 460,000 |
Taylor Tax Increment Finance Authority, AGM: | | | | | | |
4.000%, 5/1/2020, Call 10/2/2017 | | 785,000 | | | | 786,609 |
4.000%, 5/1/2021, Call 10/2/2017 | | 600,000 | | | | 601,230 |
Wayne County Airport Authority, 5.000%, 12/1/2017 | | 250,000 | | | | 252,437 |
White Cloud Public Schools, Q-SBLF: | | | | | | |
4.000%, 5/1/2018 | | 215,000 | | | | 219,242 |
4.000%, 5/1/2019 | | 175,000 | | | | 183,346 |
| | | | | | 10,371,942 |
| | | |
Minnesota — 1.4% | | | | | | |
City of Minneapolis, 1.000%, 12/1/2017, Call 9/21/2017 | | 3,225,000 | | | | 3,225,806 |
Housing & Redevelopment Authority of The City of St. Paul: | | | | | | |
2.000%, 11/15/2018 | | 805,000 | | | | 815,183 |
3.000%, 11/15/2019 | | 600,000 | | | | 625,410 |
Minnesota Rural Water Finance Authority, Inc.: | | | | | | |
1.050%, 3/1/2019 (8) | | 1,350,000 | | | | 1,350,203 |
2.000%, 10/1/2017 | | 3,000,000 | | | | 3,002,490 |
| | | | | | 9,019,092 |
| | | |
Mississippi — 1.7% | | | | | | |
City of Jackson, BAM, 3.000%, 9/1/2017 | | 375,000 | | | | 375,000 |
Mississippi Business Finance Corp.: | | | | | | |
0.840%, 11/1/2035, Call 9/1/2017 (12) | | 200,000 | | | | 200,000 |
0.840%, 11/1/2035, Call 9/1/2017 (12) | | 3,550,000 | | | | 3,550,000 |
1.150%, 5/1/2037, Call 11/1/2017 (12) | | 6,662,000 | | | | 6,662,666 |
Mississippi Development Bank, 5.000%, 4/1/2018 | | 300,000 | | | | 306,621 |
| | | | | | 11,094,287 |
| | | |
Missouri — 1.3% | | | | | | |
Cape Girardeau County Industrial Development Authority, 5.000%, 3/1/2019 | | 220,000 | | | | 231,240 |
City of Kansas City, 0.810%, 4/15/2034, Call 9/1/2017 (12) | | 5,000,000 | | | | 5,000,000 |
Health & Educational Facilities Authority of the State of Missouri, 4.000%, 2/1/2018 | | 500,000 | | | | 505,665 |
Missouri Housing Development Commission, GNMA FNMA, 4.700%, 3/1/2035, Call 9/1/2019 | | 210,000 | | | | 219,047 |
Missouri State Environmental Improvement & Energy Resources Authority, NATL-RE, 1.365%, 12/1/2022, Call 9/1/2017 (12) (13) | | 1,750,000 | | | | 1,631,098 |
St. Louis County Industrial Development Authority, 2.850%, 9/1/2018, Call 3/1/2018 | | 1,000,000 | | | | 1,001,370 |
| | | | | | 8,588,420 |
| | | |
Nebraska — 0.4% | | | | | | |
Central Plains Energy Project, 5.000%, 6/1/2018 | | 2,000,000 | | | | 2,058,200 |
City of La Vista, 1.000%, 3/15/2018, Call 10/2/2017 | | 500,000 | | | | 500,045 |
| | | | | | 2,558,245 |
| | | |
Nevada — 0.1% | | | | | | |
State of Nevada, 5.000%, 12/1/2017 | | 550,000 | | | | 555,616 |
| | | |
New Jersey — 5.2% | | | | | | |
City of Margate City, 5.000%, 2/1/2018 | | 200,000 | | | | 203,386 |
City of Union City, SAW, 4.000%, 11/1/2019 (8) | | 1,000,000 | | | | 1,052,650 |
New Jersey Economic Development Authority: | | | | | | |
1.080%, 11/1/2040, Call 9/1/2017 (12) | | 5,770,000 | | | | 5,770,000 |
1.080%, 11/1/2040, Call 9/1/2017 (12) | | 4,700,000 | | | | 4,700,000 |
1.090%, 11/1/2031, Call 9/1/2017 (12) | | 5,395,000 | | | | 5,395,000 |
| | | | | | |
New Jersey Health Care Facilities Financing Authority: | | | | | | |
1.080%, 7/1/2038, Call 9/1/2017 (12) | | 3,400,000 | | | | 3,400,000 |
1.140%, 7/1/2028, Call 9/6/2017 (12) | | 300,000 | | | | 300,000 |
1.170%, 7/1/2018, Call 9/1/2017 (12) | | 100,000 | | | | 100,000 |
New Jersey Transportation Trust Fund Authority: |
1.790% (SIFMA Municipal Swap Index Yield+100 basis points), 12/15/2019, Call 6/15/2019 (7) | | 5,000,000 | | | | 4,940,650 |
5.000%, 12/15/2017 | | 1,200,000 | | | | 1,213,368 |
5.000%, 6/15/2019 | | 1,500,000 | | | | 1,576,425 |
New Jersey Transportation Trust Fund Authority, AGM, 5.500%, 12/15/2018 | | 250,000 | | | | 263,327 |
New Jersey Transportation Trust Fund Authority, FSA, 5.500%, 12/15/2017 | | 135,000 | | | | 136,688 |
New Jersey Turnpike Authority, 1.470% (SIFMA Municipal Swap Index Yield+68 basis points), 1/1/2018, Call 10/2/2017 (7) | | 200,000 | | | | 200,054 |
Newark Housing Authority, 4.000%, 12/1/2017 | | 100,000 | | | | 100,762 |
Tender Option Bond Trust Receipts/Certificates, 0.850%, 1/1/2043, Call 7/1/2022 (6) (12) | | 5,000,000 | | | | 5,000,000 |
| | | | | | 34,352,310 |
|
New Mexico — 1.2% |
County of Bernalillo, 1.400%, 3/1/2019 (12) | | 2,775,000 | | | | 2,789,486 |
New Mexico Municipal Energy Acquisition Authority, 1.575% (LIBOR 1 Month+75 basis points), 8/1/2019, Call 2/1/2019 (7) | | 5,500,000 | | | | 5,500,825 |
| | | | | | 8,290,311 |
|
New York — 8.6% |
Albany Capital Resource Corp., 3.000%, 12/1/2017 | | 115,000 | | | | 115,578 |
Albany Industrial Development Agency, 1.040%, 7/1/2032, Call 9/7/2017 (12) | | 1,240,000 | | | | 1,240,000 |
Chautauqua County Capital Resource Corp., 1.300%, 11/1/2018 (12) | | 775,000 | | | | 779,526 |
City of New York, 0.860%, 8/1/2044, Call 9/1/2017 (12) | | 1,250,000 | | | | 1,250,000 |
City of New York, AGC, 0.820%, 10/1/2021, Call 9/5/2017 (12) (13) | | 100,000 | | | | 100,000 |
City of New York, AGM, 0.920%, 11/1/2026 (12) | | 2,750,000 | | | | 2,750,000 |
Long Island Power Authority, 1.512% (LIBOR 1 Month+65 basis points), 11/1/2018, Call 5/1/2018 (7) | | 1,600,000 | | | | 1,603,584 |
Metropolitan Transportation Authority, 1.525% (LIBOR 1 Month+70 basis points), 2/1/2020 (7) | | 3,500,000 | | | | 3,521,630 |
Metropolitan Transportation Authority, AGM, 1.450% (LIBOR 1 Month+60 basis points), 5/15/2018, Call 11/15/2017 (7) | | 4,650,000 | | | | 4,653,023 |
New York City Transitional Finance Authority: |
0.850%, 8/1/2031 (12) | | 1,045,000 | | | | 1,045,000 |
0.860%, 8/1/2031 (12) | | 2,175,000 | | | | 2,175,000 |
0.920%, 8/1/2022, Call 9/1/2017 (12) | | 4,320,000 | | | | 4,320,000 |
0.920%, 8/1/2023, Call 9/1/2017 (12) | | 6,550,000 | | | | 6,550,000 |
New York City Water & Sewer System: |
0.830%, 6/15/2039, Call 9/1/2017 (12) | | 1,700,000 | | | | 1,700,000 |
0.840%, 6/15/2039, Call 9/1/2017 (12) | | 550,000 | | | | 550,000 |
0.920%, 6/15/2032, Call 9/15/2017 (12) | | 2,400,000 | | | | 2,400,000 |
New York State Dormitory Authority, 4.000%, 12/1/2018 (6) | | 1,000,000 | | | | 1,027,250 |
New York State Energy Research & Development Authority, NATL-RE, 1.365%, 12/1/2020, Call 9/6/2017 (12) (13) | | 7,350,000 | | | | 7,101,791 |
New York State Housing Finance Agency, 0.860%, 5/1/2042, Call 9/1/2017 (12) | | 1,200,000 | | | | 1,200,000 |
Nuveen New York AMT-Free Quality Municipal Income Fund, 1.030%, 5/1/2047, Call 9/1/2017 (6) (12) | | 3,000,000 | | | | 3,000,000 |
State of New York, NATL-RE FGIC: |
1.757%, 2/15/2022, Call 9/7/2017 (12) (13) | | 1,480,000 | | | | 1,439,679 |
1.757%, 2/13/2032, Call 9/7/2017 (12) (13) | | 1,345,000 | | | | 1,260,576 |
Town of Oyster Bay: |
3.500%, 2/2/2018 | | 1,380,000 | | | | 1,390,736 |
3.500%, 6/1/2018 | | 500,000 | | | | 505,925 |
Triborough Bridge & Tunnel Authority: |
0.860%, 11/1/2032, Call 9/1/2017 (12) | | 150,000 | | | | 150,000 |
1.525% (LIBOR 1 Month+70 basis points), 2/1/2021 (7) | | 5,000,000 | | | | 5,050,600 |
Upper Mohawk Valley Regional Water Finance Authority, 4.000%, 4/1/2018 | | 65,000 | | | | 66,145 |
| | | | | | 56,946,043 |
|
North Carolina — 0.3% |
North Carolina Medical Care Commission, 1.110%, 6/1/2029, Call 6/1/2020 (6) (12) | | 1,000,000 | | | | 1,000,000 |
University of North Carolina at Chapel Hill, 1.575% (LIBOR 1 Month+75 basis points), 12/1/2017, Call 9/21/2017 (7) | | 925,000 | | | | 925,194 |
| | | | | | 1,925,194 |
| | | | | | |
North Dakota — 0.5% | | | | | | |
Barnes County North Public School District Building Authority: | | | | | | |
4.000%, 5/1/2018 | | 565,000 | | | | 572,910 |
4.000%, 5/1/2019 | | 590,000 | | | | 607,907 |
City of Grand Forks, 5.000%, 12/15/2017 | | 850,000 | | | | 859,800 |
City of Williston, AGM, 2.650%, 11/1/2020, Call 10/2/2017 | | 1,100,000 | | | | 1,100,451 |
| | | | | | 3,141,068 |
| | | |
Ohio — 5.9% | | | | | | |
City of Chillicothe, 2.000%, 9/8/2017 | | 570,000 | | | | 570,091 |
City of Cuyahoga Falls, 1.750%, 8/8/2018 | | 3,220,000 | | | | 3,238,161 |
City of Middletown, 0.800%, 11/15/2039, Call 9/1/2017 (12) | | 900,000 | | | | 900,000 |
County of Allen, 0.800%, 5/1/2036, Call 9/1/2017 (12) | | 6,000,000 | | | | 6,000,000 |
County of Crawford, 1.430%, 11/1/2017, Call 10/2/2017 | | 5,000,000 | | | | 5,001,850 |
County of Hamilton, 4.000%, 1/1/2018 | | 250,000 | | | | 252,043 |
County of Lorain, 2.000%, 3/29/2018 | | 1,650,000 | | | | 1,658,629 |
Lancaster Port Authority, 1.545% (LIBOR 1 Month+72 basis points), 8/1/2019, Call 2/1/2019 (7) | | 5,000,000 | | | | 5,003,050 |
Rib Floater Trust Various States, 0.970%, 1/15/2046, Call 10/2/2017 (6) (12) | | 4,000,000 | | | | 4,000,000 |
State of Ohio: | | | | | | |
0.870%, 1/15/2045, Call 9/1/2017 (12) | | 5,500,000 | | | | 5,500,000 |
0.950%, 1/15/2045, Call 9/1/2017 (12) | | 5,000,000 | | | | 5,000,000 |
1.050%, 9/1/2017 (12) | | 2,000,000 | | | | 2,000,000 |
| | | | | | 39,123,824 |
| | | |
Oklahoma — 0.2% | | | | | | |
Oklahoma Municipal Power Authority, 1.590% (SIFMA Municipal Swap Index Yield+80 basis points), 8/1/2018, Call 2/1/2018 (7) | | 130,000 | | | | 130,096 |
Tulsa County Independent School District No. 4 Bixby, 2.000%, 7/1/2019 | | 1,000,000 | | | | 1,019,980 |
| | | | | | 1,150,076 |
| | | |
Oregon — 0.6% | | | | | | |
County of Gilliam, 1.500%, 10/1/2018 | | 1,000,000 | | | | 1,005,730 |
Port of Morrow, 0.980%, 2/1/2027, Call 9/1/2017 (12) | | 3,210,000 | | | | 3,210,000 |
| | | | | | 4,215,730 |
| | | |
Pennsylvania — 4.6% | | | | | | |
Bethlehem Area School District, SAW, 1.297% (LIBOR 1 Month+43 basis points), 1/1/2018, Call 9/21/2017 (7) | | 3,070,000 | | | | 3,070,276 |
Bethlehem Area Vocational Technical School Authority, MAC SAW, 1.500%, 9/15/2017 | | 185,000 | | | | 185,028 |
City of Philadelphia, 4.000%, 8/1/2018 | | 2,000,000 | | | | 2,053,960 |
Indiana County Industrial Development Authority, 1.550%, 4/1/2019, Call 10/1/2018 | | 1,850,000 | | | | 1,855,476 |
North Penn Water Authority, 1.325% (LIBOR 1 Month+50 basis points), 11/1/2019, Call 5/1/2019 (7) | | 2,000,000 | | | | 2,003,020 |
Old Forge School District, BAM SAW: | | | | | | |
1.180%, 5/1/2018 | | 200,000 | | | | 199,878 |
2.000%, 5/1/2019 | | 500,000 | | | | 504,225 |
Pennsylvania Higher Educational Facilities Authority: | | | | | | |
0.875%, 2/1/2018, Call 10/2/2017 | | 2,100,000 | | | | 2,100,084 |
1.200%, 11/1/2017 (12) | | 2,200,000 | | | | 2,199,450 |
Pennsylvania Turnpike Commission: | | | | | | |
1.240% (SIFMA Municipal Swap Index Yield+45 basis points), 12/1/2017, Call 10/2/2017 (7) | | 560,000 | | | | 560,129 |
1.390% (SIFMA Municipal Swap Index Yield+60 basis points), 12/1/2017, Call 10/2/2017 (7) | | 100,000 | | | | 100,034 |
1.470% (SIFMA Municipal Swap Index Yield+68 basis points), 12/1/2018, Call 6/1/2018 (7) | | 6,000,000 | | | | 6,012,840 |
1.670% (SIFMA Municipal Swap Index Yield+88 basis points), 12/1/2020, Call 6/1/2020 (7) | | 1,800,000 | | | | 1,816,740 |
1.940% (SIFMA Municipal Swap Index Yield+115 basis points), 12/1/2019, Call 6/1/2019 (7) | | 2,225,000 | | | | 2,248,118 |
Philadelphia Authority for Industrial Development, 4.000%, 10/1/2017 | | 1,250,000 | | | | 1,252,688 |
Scranton School District, SAW, 1.837% (LIBOR 1 Month+100 basis points), 4/2/2018, Call 10/2/2017 (7) | | 2,980,000 | | | | 2,979,970 |
Tunkhannock Area School District, BAM SAW, 2.000%, 1/15/2018 | | 125,000 | | | | 125,481 |
University Area Joint Authority, 1.190% (SIFMA Municipal Swap Index Yield+40 basis points), 11/1/2017, Call 9/21/2017 (7) | | 1,070,000 | | | | 1,069,315 |
| | | | | | 30,336,712 |
| | | |
Rhode Island — 0.1% | | | | | | |
Rhode Island Health & Educational Building Corp., 5.000%, 5/15/2018 | | 1,000,000 | | | | 1,023,340 |
| | | |
South Carolina — 0.8% | | | | | | |
South Carolina Educational Facilities Authority, 0.830%, 10/1/2039, Call 9/1/2017 (12) | | 1,050,000 | | | | 1,050,000 |
South Carolina Jobs-Economic Development Authority, 2.250%, 5/1/2019, Call 11/1/2018 (6) | | 3,000,000 | | | | 3,004,710 |
Town of Hilton Head Island, SAW, 4.000%, 10/5/2017 | | 1,000,000 | | | | 1,002,930 |
| | | | | | 5,057,640 |
| | | | | | |
Tennessee — 2.2% | | | | | | |
Clarksville Public Building Authority, 0.900%, 2/1/2038, Call 9/1/2017 (12) | | 3,145,000 | | | | 3,145,000 |
County of Monroe, 1.200%, 6/15/2019, Call 12/15/2018 | | 1,250,000 | | | | 1,251,387 |
Knox County Health Educational & Housing Facility Board, 1.150%, 8/1/2018 | | 1,000,000 | | | | 1,001,480 |
Metropolitan Government Nashville & Davidson County Industrial Development Board, 0.820%, 7/15/2036, Call 9/15/2017 (12) | | 500,000 | | | | 500,000 |
Montgomery County Public Building Authority, 0.900%, 4/1/2032, Call 9/1/2017 (12) | | 3,850,000 | | | | 3,850,000 |
Tender Option Bond Trust Receipts/Certificates, 0.940%, 7/1/2046, Call 7/1/2026 (6) (12) | | 5,000,000 | | | | 5,000,000 |
Tennessee Housing Development Agency, 4.500%, 7/1/2028, Call 1/1/2020 | | 100,000 | | | | 104,200 |
| | | | | | 14,852,067 |
| | | |
Texas — 8.8% | | | | | | |
Alamito Public Facility Corp., 1.000%, 10/1/2017, Call 9/21/2017 (12) | | 5,590,000 | | | | 5,589,609 |
Austin Convention Enterprises, Inc., 5.000%, 1/1/2019 | | 400,000 | | | | 419,076 |
City of Houston, 4.000%, 9/1/2017 | | 200,000 | | | | 200,000 |
City of Lewisville, AGM: | | | | | | |
2.000%, 9/1/2017 | | 335,000 | | | | 335,000 |
4.000%, 9/1/2018 | | 340,000 | | | | 350,084 |
Clear Brook City Municipal Utility District, BAM, 2.000%, 2/1/2018 | | 220,000 | | | | 220,757 |
Crane County Water District, 4.000%, 2/15/2019 | | 1,000,000 | | | | 1,041,950 |
Denton County Fresh Water Supply District No. 7, AGM: | | | | | | |
2.000%, 2/15/2018 | | 465,000 | | | | 466,939 |
2.000%, 2/15/2019 | | 240,000 | | | | 243,391 |
Fort Bend County Municipal Utility District No. 138, BAM, 2.000%, 9/1/2017 | | 200,000 | | | | 200,000 |
Fort Bend County Municipal Utility District No. 151, MAC, 2.000%, 9/1/2017 | | 180,000 | | | | 180,000 |
Fort Bend County Municipal Utility District No. 50, MAC, 2.000%, 9/1/2017 | | 340,000 | | | | 340,000 |
Goose Creek Consolidated Independent School District, PSF: | | | | | | |
1.180%, 8/15/2019 (12) | | 1,800,000 | | | | 1,800,000 |
1.350%, 8/15/2018 (12) | | 700,000 | | | | 703,339 |
Harris County Cultural Education Facilities Finance Corp., 0.880%, 12/1/2024, Call 9/1/2017 (12) | | 8,000,000 | | | | 8,000,000 |
Harris County Health Facilities Development Corp., 0.880%, 12/1/2041, Call 9/1/2017 (12) | | 2,105,000 | | | | 2,105,000 |
Harris County Municipal Utility District No. 371, BAM: | | | | | | |
2.000%, 9/1/2018 | | 290,000 | | | | 292,352 |
2.000%, 9/1/2019 | | 295,000 | | | | 298,747 |
Harris County Municipal Utility District No. 468, AGM, 2.000%, 9/1/2017 | | 100,000 | | | | 100,000 |
Houston Independent School District, 5.000%, 9/15/2017 | | 2,025,000 | | | | 2,027,167 |
Houston Independent School District, PSF, 3.000%, 6/1/2018 (12) | | 2,640,000 | | | | 2,681,923 |
Katy Independent School District, PSF, 5.000%, 2/15/2018 | | 1,000,000 | | | | 1,018,650 |
Mission Economic Development Corp., 1.050%, 10/2/2017 (12) | | 3,000,000 | | | | 3,000,180 |
New Hope Cultural Education Facilities Finance Corp., 1.000%, 2/1/2018, Call 9/21/2017 | | 2,000,000 | | | | 1,999,900 |
North Texas Tollway Authority: | | | | | | |
6.000%, 1/1/2020, Call 1/1/2018 | | 220,000 | | | | 223,626 |
6.000%, 1/1/2020, Call 1/1/2018 | | 30,000 | | | | 30,491 |
Northside Independent School District, PSF, 2.125%, 8/1/2020, Call 2/1/2018 (12) | | 1,900,000 | | | | 1,907,562 |
Spring Branch Independent School District, PSF, 3.000%, 6/18/2019 (12) | | 4,000,000 | | | | 4,138,120 |
Spring Creek Utility District of Montgomery County, BAM, 2.000%, 10/1/2017 | | 375,000 | | | | 375,233 |
Tarrant County Cultural Education Facilities Finance Corp.: | | | | | | |
2.500%, 12/1/2018, Call 9/21/2017 | | 2,525,000 | | | | 2,527,474 |
4.000%, 9/1/2017 | | 550,000 | | | | 550,000 |
5.000%, 10/1/2017 | | 1,025,000 | | | | 1,028,013 |
5.250%, 8/15/2028, Call 8/15/2018 | | 230,000 | | | | 239,425 |
Tender Option Bond Trust Receipts/Certificates, 0.990%, 7/1/2021 (6) (12) | | 11,950,000 | | | | 11,950,000 |
Texas Municipal Gas Acquisition & Supply Corp. II: | | | | | | |
1.260% (SIFMA Municipal Swap Index Yield+47 basis points), 9/15/2017 (7) | | 50,000 | | | | 50,002 |
1.535% (LIBOR 3 Month+70 basis points), 9/15/2017 (7) | | 840,000 | | | | 840,034 |
Trail of the Lakes Municipal Utility District, BAM, 5.000%, 4/1/2019 | | 120,000 | | | | 127,766 |
Travis County Water Control & Improvement District No. 17, BAM, 0.000%, 11/1/2017 | | 250,000 | | | | 249,550 |
| | | | | | 57,851,360 |
| | | |
Utah — 0.4% | | | | | | |
Tender Option Bond Trust Receipts/Certificates, 0.990%, 1/1/2025 (6) (12) | | 2,500,000 | | | | 2,500,000 |
| | | |
Virginia — 0.9% | | | | | | |
Newport News Redevelopment & Housing Authority, FHA GNMA, 1.200%, 4/1/2019 | | 3,500,000 | | | | 3,501,365 |
Peninsula Ports Authority, 1.550%, 10/1/2019 (12) | | 1,000,000 | | | | 995,340 |
Virginia Small Business Financing Authority, 5.000%, 11/1/2017 | | 1,215,000 | | | | 1,222,946 |
| | | | | | 5,719,651 |
| | | | | | |
Washington — 2.9% | | | | | | |
County of Skagit, 2.000%, 12/1/2018 | | 485,000 | | | | 492,202 |
Pierce County School District No 10 Tacoma, 5.000%, 12/1/2017 | | 2,280,000 | | | | 2,302,846 |
Tender Option Bond Trust Receipts/Certificates: | | | | | | |
0.940%, 6/15/2033, Call 6/1/2019 (6) (12) | | 5,050,000 | | | | 5,050,000 |
0.960%, 1/1/2035 (6) (12) | | 5,000,000 | | | | 5,000,000 |
Washington Biomed Research Properties 3.2, 5.000%, 1/1/2019 | | 500,000 | | | | 527,570 |
Washington Health Care Facilities Authority, 2.500%, 12/1/2017 (6) | | 100,000 | | | | 100,015 |
Washington Higher Education Facilities Authority, 0.800%, 10/1/2029, Call 9/1/2017 (12) | | 600,000 | | | | 600,000 |
Washington State Housing Finance Commission, 0.810%, 9/1/2049, Call 9/1/2017 (12) | | 5,000,000 | | | | 5,000,000 |
| | | | | | 19,072,633 |
| | | |
West Virginia — 0.0% | | | | | | |
Berkeley County Building Commission, 3.000%, 9/1/2017 | | 50,000 | | | | 50,000 |
| | | |
Wisconsin — 2.4% | | | | | | |
City of South Milwaukee, 4.000%, 9/1/2017 | | 100,000 | | | | 100,000 |
County of Langlade: | | | | | | |
2.000%, 10/1/2017 | | 365,000 | | | | 365,186 |
2.000%, 10/1/2018 | | 100,000 | | | | 100,549 |
Hilbert School District, 2.100%, 4/1/2019, Call 4/1/2018 | | 1,580,000 | | | | 1,588,137 |
Public Finance Authority: | | | | | | |
3.000%, 11/15/2022, Call 11/15/2018 (6) | | 1,500,000 | | | | 1,506,615 |
5.000%, 11/15/2018 (8) | | 565,000 | | | | 590,250 |
5.000%, 11/15/2019 (8) | | 440,000 | | | | 474,659 |
Tender Option Bond Trust Receipts/Certificates, 0.840%, 7/1/2047, Call 7/1/2027 (6) (12) | | 2,300,000 | | | | 2,300,000 |
Town of Freedom, 2.000%, 10/1/2018, Call 10/2/2017 | | 1,170,000 | | | | 1,170,749 |
Town of Salem, 1.375%, 11/1/2018, Call 11/1/2017 | | 1,690,000 | | | | 1,690,726 |
Wisconsin Center District, 3.000%, 12/15/2017 | | 635,000 | | | | 638,823 |
Wisconsin Health & Educational Facilities Authority: | | | | | | |
5.000%, 2/15/2019 (8) | | 455,000 | | | | 480,366 |
5.000%, 8/15/2021, Call 8/15/2018 | | 150,000 | | | | 155,811 |
Wisconsin Housing & Economic Development Authority, 0.800%, 5/1/2055, Call 9/1/2017 (12) | | 5,000,000 | | | | 5,000,000 |
| | | | | | 16,161,871 |
| | | |
Wyoming — 0.7% | | | | | | |
County of Converse, 0.880%, 12/1/2020, Call 9/1/2017 (12) | | 5,000,000 | | | | 5,000,000 |
| | | |
Total Municipals (identified cost $633,869,349) | | | | | | 634,462,688 |
| | | |
Short-Term Investments — 7.2% | | | | | | |
| | | |
Mutual Funds — 0.0% | | | | | | |
BMO Government Money Market Fund - Premier Class, 0.870% (4) | | 80,322 | | | | 80,322 |
| | | |
Short-Term Municipals — 7.2% | | | | | | |
| | | |
California — 0.2% | | | | | | |
California Municipal Finance Authority, 5.000%, 2/1/2018 | | $ 500,000 | | | | 507,605 |
Fresno Joint Powers Financing Authority, 5.000%, 4/1/2018 | | 600,000 | | | | 613,728 |
| | | | | | 1,121,333 |
| | | |
Colorado — 0.1% | | | | | | |
Colorado Health Facilities Authority, 5.000%, 6/1/2018 (8) | | 500,000 | | | | 512,740 |
| | | |
Connecticut — 1.2% | | | | | | |
City of Hartford, 2.500%, 10/31/2017 | | 4,000,000 | | | | 4,007,560 |
City of New Haven, 2.500%, 5/15/2018 | | 2,900,000 | | | | 2,924,070 |
Town of Manchester, 2.000%, 2/21/2018 | | 1,000,000 | | | | 1,004,460 |
| | | | | | 7,936,090 |
| | | |
Florida — 0.6% | | | | | | |
Jacksonville Pollution Control, 0.870%, 9/18/2017 | | 4,000,000 | | | | 4,000,000 |
| | | |
Georgia — 0.2% | | | | | | |
Georgia State Road & Tollway Authority, 5.000%, 6/1/2018 | | 1,000,000 | | | | 1,030,900 |
| | | | | | |
Illinois — 0.0% | | | | | | |
Chicago Transit Authority, 2.000%, 6/1/2018 | | 175,000 | | | | 176,048 |
| | | |
Minnesota — 0.1% | | | | | | |
City of Maple Grove, 3.000%, 5/1/2018 | | 650,000 | | | | 657,833 |
| | | |
New Jersey — 0.3% | | | | | | |
Hudson County Improvement Authority, County Guarantee, 2.250%, 4/5/2018 | | 2,000,000 | | | | 2,015,140 |
| | | |
New York — 0.6% | | | | | | |
Owego Apalachin Central School District, SAW, 1.300%, 2/22/2018, Call 11/15/2017 | | 4,000,000 | | | | 4,000,760 |
| | | |
Ohio — 1.9% | | | | | | |
City of Lakewood, 2.000%, 4/2/2018 | | 2,500,000 | | | | 2,514,000 |
City of Springfield, 2.000%, 3/30/2018 | | 700,000 | | | | 704,116 |
City of Tipp City, 1.750%, 2/14/2018 | | 4,000,000 | | | | 4,008,960 |
County of Union, 1.200%, 3/28/2018, Call 10/2/2017 | | 1,500,000 | | | | 1,501,320 |
Dublin City School District, 2.000%, 4/26/2018 | | 1,500,000 | | | | 1,509,360 |
Township of Union, 2.000%, 9/6/2018 (8) | | 2,350,000 | | | | 2,371,620 |
| | | | | | 12,609,376 |
| | | |
Texas — 2.0% | | | | | | |
Austin Convention Enterprises, Inc., 5.000%, 1/1/2018 | | 200,000 | | | | 202,398 |
State of Texas, 4.000%, 8/30/2018 (8) | | 10,000,000 | | | | 10,305,000 |
Texas Municipal Power, 0.850%, 9/13/2017 | | 3,000,000 | | | | 3,000,060 |
| | | | | | 13,507,458 |
Total Short-Term Municipals | | | | | | 47,567,678 |
| | | |
Total Short-Term Investments (identified cost $47,633,316) | | | | | | 47,648,000 |
| | | |
Total Investments — 103.3% (identified cost $681,502,665) | | | | | | 682,110,688 |
Other Assets and Liabilities — (3.3)% | | | | | | (21,723,398) |
| | | |
Total Net Assets — 100.0% | | | | $ | | 660,387,290 |
| | | | | | |
(4) Denotes an investment in an affiliated entity. Please refer to Note 6, subsection Investments in Affiliated Issuers, in the Notes to Financial Statements.
(6) Denotes a restricted security which is subject to restrictions on resale under federal securities law. These securities have been deemed liquid based on criteria approved by the Board of Directors of the BMO Funds. At August 31, 2017, these securities amounted to:
| | | | | | |
Fund | | Amount | | | % of Total Net Assets |
| | |
Ultra Short Tax-Free Fund | | $ | 106,814,893 | | | 16.17% |
(7) Floating Rate Security
(8) Purchased on a when-issued or delayed delivery basis.
(12) Variable Rate Security
(13) Issue represents an Auction Rate Security. An Auction Rate Security is a corporate or municipal bond debt instrument with a long nominal maturity for which the interest rate is regularly reset through a Dutch auction. The rate presented is either the rate set through the auction or the maximum interest rate provided for in the security issuance provision.
Short Tax-Free Fund
SCHEDULE OF INVESTMENTS – As of August 31, 2017
| | | | | | |
Description | | Shares or Principal Amount | | | | Value |
| | | |
Municipals — 94.4% | | | | | | |
| | | |
Alabama — 2.8% | | | | | | |
Alabama Federal Aid Highway Finance Authority, 5.000%, 9/1/2018 | | $ 1,000,000 | | | | $ 1,034,430 |
Black Belt Energy Gas District, 4.000%, 6/1/2021, Call 3/1/2021 (12) | | 1,000,000 | | | | 1,085,910 |
County of Jefferson, 5.000%, 9/15/2021 | | 1,000,000 | | | | 1,139,990 |
County of Jefferson, AGM, 2.463% (LIBOR 1 Month+0 basis points), 2/1/2042, Call 10/5/2017 (7) | | 259,832 | | | | 225,624 |
Mobile Industrial Development Board: | | | | | | |
0.910%, 6/1/2034, Call 9/1/2017 (12) | | 250,000 | | | | 250,000 |
1.000%, 6/1/2034, Call 9/1/2017 (12) | | 1,000,000 | | | | 1,000,000 |
Tuscaloosa City Board of Education: | | | | | | |
5.000%, 8/1/2020 | | 200,000 | | | | 221,616 |
5.000%, 8/1/2021 | | 175,000 | | | | 199,559 |
| | | | | | 5,157,129 |
| | | |
Alaska — 0.4% | | | | | | |
Alaska Housing Finance Corp., NATL-RE, 5.250%, 12/1/2021, Call 12/1/2017 | | 100,000 | | | | 101,056 |
City of Valdez, 5.000%, 1/1/2021 | | 500,000 | | | | 559,555 |
| | | | | | 660,611 |
| | | |
Arizona — 2.3% | | | | | | |
Arizona Health Facilities Authority: | | | | | | |
2.640% (SIFMA Municipal Swap Index Yield+185 basis points), 2/5/2020, Call 8/9/2019 (7) | | 250,000 | | | | 253,808 |
2.640% (SIFMA Municipal Swap Index Yield+185 basis points), 2/5/2020, Call 8/9/2019 (7) | | 250,000 | | | | 253,808 |
City of El Mirage, 5.000%, 7/1/2022, Call 7/1/2020 | | 465,000 | | | | 511,788 |
Coconino County Pollution Control Corp., 1.600%, 5/21/2020 (12) | | 750,000 | | | | 754,762 |
Greater Arizona Development Authority, 5.000%, 8/1/2024, Call 8/1/2018 | | 25,000 | | | | 25,938 |
Industrial Development Authority of the City of Phoenix, 3.000%, 7/1/2020 (6) | | 85,000 | | | | 85,524 |
La Paz County Industrial Development Authority, 5.000%, 2/15/2021 (6) | | 750,000 | | | | 818,707 |
Maricopa County Industrial Development Authority: | | | | | | |
2.550%, 7/1/2021 | | 430,000 | | | | 432,176 |
2.875%, 7/1/2021 (6) | | 260,000 | | | | 261,165 |
Phoenix Civic Improvement Corp., 5.500%, 7/1/2019 (15) | | 100,000 | | | | 108,338 |
Pinal County School District No. 1 Florence, BAM, 4.000%, 7/1/2020 | | 250,000 | | | | 269,853 |
State of Arizona, AGM, 5.000%, 7/1/2018 | | 500,000 | | | | 516,695 |
| | | | | | 4,292,562 |
| | | |
Arkansas — 0.7% | | | | | | |
Arkansas Development Finance Authority, 1.200%, 9/1/2044, Call 9/1/2017 (12) | | 750,000 | | | | 750,000 |
City of Cabot, 2.550%, 6/1/2043, Call 6/1/2023 | | 140,000 | | | | 140,181 |
City of Hot Springs, 5.000%, 12/1/2020 | | 245,000 | | | | 272,477 |
City of Rogers, 2.125%, 11/1/2029, Call 11/1/2021 | | 150,000 | | | | 150,214 |
| | | | | | 1,312,872 |
| | | |
California — 10.1% | | | | | | |
Abag Finance Authority for Nonprofit Corps., 5.000%, 7/1/2020 | | 500,000 | | | | 553,540 |
Bay Area Toll Authority, 1.890% (SIFMA Municipal Swap Index Yield+110 basis points), 4/1/2024, Call 10/1/2023 (7) | | 500,000 | | | | 509,865 |
BB&T Municipal Trust, 1.590% (SIFMA Municipal Swap Index Yield+80 basis points), 11/15/2019 (6) (7) | | 500,000 | | | | 501,275 |
California Health Facilities Financing Authority, NATL-RE: | | | | | | |
1.230%, 7/15/2018, Call 9/7/2017 (12) (13) | | 100,000 | | | | 98,492 |
1.383%, 7/1/2022, Call 9/1/2017 (12) (13) | | 500,000 | | | | 485,385 |
California Housing Finance Agency, AGM GO, 3.004%, 2/1/2037, Call 9/7/2017 (12) (13) | | 10,000 | | | | 9,698 |
California Municipal Finance Authority: | | | | | | |
1.200%, 2/1/2018 (12) | | 1,000,000 | | | | 1,000,520 |
5.000%, 2/1/2022 | | 1,000,000 | | | | 1,144,430 |
California Pollution Control Financing Authority, 0.950%, 11/1/2017 (6) (12) | | 1,000,000 | | | | 1,000,040 |
| | | | | | |
California Public Finance Authority: | | | | | | |
5.000%, 10/15/2021 | | 350,000 | | | | 389,743 |
5.000%, 10/15/2022 | | 300,000 | | | | 339,594 |
California School Finance Authority, 4.000%, 8/1/2018 (6) | | 300,000 | | | | 307,518 |
California State Public Works Board: | | | | | | |
5.000%, 4/1/2020 | | 320,000 | | | | 352,646 |
5.000%, 11/1/2020, Call 11/1/2019 | | 35,000 | | | | 37,802 |
5.125%, 10/1/2022, Call 10/1/2019 | | 245,000 | | | | 266,651 |
California Statewide Communities Development Authority: | | | | | | |
3.500%, 11/1/2018 | | 100,000 | | | | 100,634 |
5.000%, 12/1/2025 (6) | | 200,000 | | | | 234,080 |
California Statewide Communities Development Authority, AGM, 3.000%, 10/1/2017 | | 200,000 | | | | 200,226 |
California Statewide Communities Development Authority, CMI: | | | | | | |
2.500%, 8/1/2020, Call 9/1/2017 | | 220,000 | | | | 220,000 |
3.500%, 11/1/2021, Call 11/1/2019 | | 750,000 | | | | 782,790 |
California Statewide Communities Development Authority, NATL-RE, 3.208%, 4/1/2028 (12) (13) | | 75,000 | | | | 69,570 |
Carson Redevelopment Agency Successor Agency, AGM, 5.000%, 10/1/2020 | | 675,000 | | | | 752,935 |
Chino Redevelopment Agency, AMBAC, 4.000%, 9/1/2019, Call 10/2/2017 | | 250,000 | | | | 250,480 |
City of Redding, NATL-RE, 1.400%, 7/1/2022 (12) (13) | | 150,000 | | | | 143,291 |
County of San Joaquin, 4.000%, 4/1/2019 | | 225,000 | | | | 235,267 |
Florin Resource Conservation District, NATL-RE, 4.000%, 9/1/2018 | | 500,000 | | | | 515,585 |
Fresno Joint Powers Financing Authority, AGM, 5.000%, 4/1/2022 | | 875,000 | | | | 1,014,790 |
Golden State Tobacco Securitization Corp., 5.000%, 6/1/2022 | | 1,000,000 | | | | 1,161,400 |
Northern California Gas Authority No. 1, 1.500% (LIBOR 3 Month+63 basis points), 7/1/2019 (7) | | 1,040,000 | | | | 1,039,303 |
Palomar Health, 5.000%, 11/1/2022 | | 375,000 | | | | 424,118 |
Sacramento Redevelopment Agency Successor Agency, BAM, 5.000%, 12/1/2022 | | 385,000 | | | | 454,308 |
State of California: | | | | | | |
1.562% (LIBOR 1 Month+70 basis points), 12/1/2017, Call 10/2/2017 (7) | | 250,000 | | | | 250,085 |
1.690% (SIFMA Municipal Swap Index Yield+90 basis points), 5/1/2018, Call 11/1/2017 (7) | | 180,000 | | | | 180,171 |
1.692% (LIBOR 1 Month+83 basis points), 12/3/2018, Call 6/1/2018 (7) | | 610,000 | | | | 612,647 |
State of California, FSA, 1.000%, 8/1/2027 (6) (12) | | 500,000 | | | | 500,000 |
Tender Option Bond Trust, 0.940%, 8/1/2022 (6) (12) | | 2,000,000 | | | | 2,000,000 |
Twin Rivers Unified School District, AGM, 3.200%, 6/1/2020, Call 11/1/2017 (12) | | 220,000 | | | | 220,042 |
| | | | | | 18,358,921 |
| | | |
Colorado — 5.0% | | | | | | |
Auraria Higher Education Center: | | | | | | |
6.000%, 5/1/2018 | | 169,000 | | | | 174,538 |
6.000%, 5/1/2019 | | 178,000 | | | | 192,213 |
City of Burlington, 3.000%, 11/1/2019 | | 100,000 | | | | 103,251 |
Colorado Educational & Cultural Facilities Authority: | | | | | | |
2.500%, 12/15/2019 (6) | | 590,000 | | | | 591,811 |
3.000%, 10/1/2017 | | 380,000 | | | | 380,608 |
3.000%, 11/15/2017 | | 200,000 | | | | 200,972 |
5.000%, 10/1/2021 | | 1,000,000 | | | | 1,129,210 |
Colorado Health Facilities Authority: | | | | | | |
1.450%, 7/1/2034, Call 7/1/2019 (6) (12) | | 1,000,000 | | | | 1,000,000 |
4.000%, 12/1/2018 | | 250,000 | | | | 257,870 |
4.500%, 2/1/2019 | | 250,000 | | | | 258,988 |
5.000%, 5/15/2021 | | 325,000 | | | | 356,843 |
5.000%, 6/1/2021 (8) | | 250,000 | | | | 279,605 |
5.000%, 5/15/2022 | | 250,000 | | | | 277,965 |
5.000%, 6/1/2022 (8) | | 250,000 | | | | 285,245 |
County of Montrose: | | | | | | |
4.000%, 12/1/2018 | | 175,000 | | | | 180,357 |
4.000%, 12/1/2019 | | 200,000 | | | | 210,046 |
E-470 Public Highway Authority, 1.880% (LIBOR 1 Month+105 basis points), 9/1/2021, Call 3/1/2021 (7) | | 575,000 | | | | 584,781 |
El Paso County School District No. 20 Academy, SAW, 5.000%, 12/15/2022 | | 1,000,000 | | | | 1,191,960 |
Regional Transportation District, 5.000%, 6/1/2025, Call 6/1/2020 | | 500,000 | | | | 554,270 |
University of Colorado Hospital Authority, 5.000%, 3/1/2022, Call 9/1/2021 (12) | | 750,000 | | | | 854,947 |
Wheatlands Metropolitan District, BAM, 4.000%, 12/1/2020 | | 125,000 | | | | 135,039 |
| | | | | | 9,200,519 |
| | | | | | |
| | | |
Connecticut — 0.7% | | | | | | |
Connecticut State Health & Educational Facility Authority, 2.875%, 9/1/2020, Call 10/2/2017 (6) | | 250,000 | | | | 250,052 |
State of Connecticut: | | | | | | |
1.670% (SIFMA Municipal Swap Index Yield+88 basis points), 8/15/2018 (7) | | 250,000 | | | | 250,890 |
1.710% (SIFMA Municipal Swap Index Yield+92 basis points), 5/15/2018 (7) | | 150,000 | | | | 150,710 |
1.710% (SIFMA Municipal Swap Index Yield+92 basis points), 9/15/2019 (7) | | 115,000 | | | | 115,619 |
5.000%, 3/15/2021 | | 500,000 | | | | 556,585 |
| | | | | | 1,323,856 |
| | | |
Delaware — 0.1% | | | | | | |
Delaware State Housing Authority, 4.800%, 1/1/2023, Call 7/1/2018 | | 105,000 | | | | 106,335 |
| | | |
Florida — 5.8% | | | | | | |
Brevard County Health Facilities Authority: | | | | | | |
5.000%, 4/1/2020 | | 500,000 | | | | 546,595 |
5.000%, 4/1/2021 | | 400,000 | | | | 450,260 |
City of Orlando, AGM: | | | | | | |
4.000%, 11/1/2021 | | 460,000 | | | | 507,688 |
5.000%, 11/1/2022 | | 350,000 | | | | 408,814 |
City of Port St. Lucie, 5.000%, 7/1/2020 | | 295,000 | | | | 326,589 |
City of Tampa, 5.000%, 11/15/2020, Call 5/15/2020 | | 25,000 | | | | 27,480 |
Columbia County School Board: | | | | | | |
5.000%, 7/1/2019 | | 920,000 | | | | 983,922 |
5.000%, 7/1/2021 | | 400,000 | | | | 448,920 |
County of Broward, 5.000%, 10/1/2020 | | 100,000 | | | | 111,674 |
County of Okeechobee, 1.550%, 7/1/2021 (12) | | 800,000 | | | | 800,248 |
Emerald Coast Utilities Authority, BAM, 5.000%, 1/1/2021 | | 300,000 | | | | 335,838 |
Florida Housing Finance Corp., GNMA/FNMA/FHLMC, 4.600%, 1/1/2029, Call 1/1/2020 | | 65,000 | | | | 67,252 |
Florida Municipal Power Agency, AMBAC, 1.365%, 10/1/2027, Call 9/6/2017 (12) (13) | | 575,000 | | | | 529,439 |
Florida Municipal Power Agency, NATL-RE FGIC, 2.104%, 10/1/2027 (12) (13) | | 25,000 | | | | 22,995 |
Halifax Hospital Medical Center: | | | | | | |
5.000%, 6/1/2020 | | 325,000 | | | | 356,200 |
5.000%, 6/1/2021 | | 300,000 | | | | 337,887 |
Miami-Dade County Educational Facilities Authority, AMBAC, 5.250%, 4/1/2020 | | 40,000 | | | | 44,323 |
Miami-Dade County School Board Foundation, Inc.: | | | | | | |
5.000%, 5/1/2018 | | 300,000 | | | | 308,025 |
5.000%, 5/1/2019 | | 225,000 | | | | 239,674 |
Miami-Dade County School Board Foundation, Inc., AMBAC, 5.000%, 8/1/2023, Call 8/1/2018 | | 100,000 | | | | 103,493 |
Orlando Community Redevelopment Agency, 4.000%, 9/1/2017 | | 55,000 | | | | 55,000 |
Pinellas County Educational Facilities Authority, 5.000%, 10/1/2017 | | 300,000 | | | | 300,780 |
Pinellas County Health Facilities Authority, NATL-RE, 1.803%, 11/15/2023, Call 9/1/2017 (12) (13) | | 175,000 | | | | 166,941 |
Sarasota County Health Facilities Authority, 5.000%, 1/1/2022 | | 500,000 | | | | 558,685 |
School Board of Miami-Dade County, 1.020%, 9/7/2017 (6) (12) | | 650,000 | | | | 650,000 |
School District of Broward County, 5.000%, 7/1/2019 | | 1,000,000 | | | | 1,073,250 |
Southeast Overtown Park West Community Redevelopment Agency, 5.000%, 3/1/2019 (6) | | 250,000 | | | | 262,170 |
Sumter County Industrial Development Authority: | | | | | | |
5.000%, 7/1/2020 | | 235,000 | | | | 256,799 |
5.000%, 7/1/2020 | | 300,000 | | | | 327,828 |
Tampa Bay Water: | | | | | | |
5.000%, 10/1/2017 | | 15,000 | | | | 15,044 |
5.000%, 10/1/2017 | | 25,000 | | | | 25,072 |
| | | | | | 10,648,885 |
| | | |
Georgia — 3.6% | | | | | | |
Atlanta Development Authority, 4.000%, 9/1/2020 | | 500,000 | | | | 544,175 |
City of Atlanta: | | | | | | |
2.329% (LIBOR 1 Month+150 basis points), 11/1/2018, Call 5/1/2018 (7) | | 250,000 | | | | 251,595 |
5.000%, 1/1/2021 | | 250,000 | | | | 279,088 |
5.000%, 1/1/2022 | | 700,000 | | | | 801,136 |
6.000%, 11/1/2029, Call 11/1/2019 | | 290,000 | | | | 321,392 |
County of DeKalb, 5.000%, 10/1/2020 | | 150,000 | | | | 167,753 |
DeKalb Private Hospital Authority, 5.000%, 11/15/2021, Call 11/15/2019 | | 420,000 | | | | 457,187 |
Gainesville & Hall County Hospital Authority: | | | | | | |
1.740% (SIFMA Municipal Swap Index Yield+95 basis points), 2/18/2020, Call 8/22/2019 (7) | | 350,000 | | | | 348,988 |
5.000%, 2/15/2021 | | 700,000 | | | | 784,378 |
Georgia State Road & Tollway Authority, 5.000%, 6/1/2021 | | 1,250,000 | | | | 1,424,487 |
Main Street Natural Gas, Inc.: | | | | | | |
5.000%, 3/15/2019 | | 1,000,000 | | | | 1,053,660 |
5.250%, 9/15/2018 | | 100,000 | | | | 103,988 |
| | | | | | 6,537,827 |
| | | | | | |
Guam — 0.3% | | | | | | |
Territory of Guam, 5.000%, 12/1/2022 | | 500,000 | | | | 574,580 |
| | | |
Idaho — 0.1% | | | | | | |
Idaho Health Facilities Authority, 6.500%, 11/1/2023, Call 11/1/2018 | | 150,000 | | | | 159,555 |
Idaho Housing & Finance Association, 5.000%, 7/15/2022, Call 7/15/2019 | | 75,000 | | | | 80,092 |
| | | | | | 239,647 |
| | | |
Illinois — 13.1% | | | | | | |
Bureau & Putnam Counties High School District No. 500 Princeton Township, BAM, 2.000%, 12/1/2018 | | 400,000 | | | | 404,504 |
Chicago Board of Education, 9.000%, 3/1/2032, Call 9/1/2018 | | 955,000 | | | | 959,613 |
Chicago O’Hare International Airport: | | | | | | |
5.000%, 1/1/2019 | | 200,000 | | | | 210,648 |
5.000%, 1/1/2021, Call 1/1/2018 | | 100,000 | | | | 101,346 |
5.000%, 1/1/2022 | | 100,000 | | | | 115,628 |
5.000%, 1/1/2022 | | 200,000 | | | | 231,256 |
Chicago Park District: | | | | | | |
5.000%, 1/1/2022 | | 250,000 | | | | 282,985 |
5.000%, 1/1/2022 | | 500,000 | | | | 565,970 |
Chicago Transit Authority: | | | | | | |
5.000%, 6/1/2021 | | 750,000 | | | | 841,230 |
5.500%, 6/1/2019, Call 12/1/2018 | | 105,000 | | | | 111,017 |
City of Chicago: | | | | | | |
5.000%, 1/1/2018 | | 50,000 | | | | 50,402 |
5.000%, 1/1/2021 | | 840,000 | | | | 929,082 |
5.000%, 11/1/2021 | | 1,000,000 | | | | 1,127,900 |
5.000%, 1/1/2022 | | 500,000 | | | | 565,080 |
City of Chicago, NATL-RE, 5.000%, 1/1/2020, Call 1/1/2018 | | 175,000 | | | | 176,860 |
City of Peoria, 3.000%, 1/1/2019 | | 300,000 | | | | 306,885 |
City of Waukegan, 5.000%, 12/30/2020 | | 250,000 | | | | 275,892 |
Clyde Park District, AGM, 4.250%, 2/1/2019 | | 340,000 | | | | 347,303 |
Cook County School District No. 100 South Berwyn, BAM, 2.000%, 12/1/2017 | | 65,000 | | | | 65,152 |
Cook County Township High School District No. 201 J Sterling Morton, AMBAC: | | | | | | |
0.000%, 12/1/2018 | | 170,000 | | | | 165,808 |
0.000%, 12/1/2019 | | 100,000 | | | | 95,309 |
Cook County Township High School District No. 220 Reavis, 4.000%, 12/1/2017 | | 100,000 | | | | 100,716 |
Cook Kane Lake & McHenry Counties Community College District No. 512, 5.000%, 12/1/2019 | | 1,000,000 | | | | 1,085,660 |
County of Cook: | | | | | | |
5.000%, 11/15/2020, Call 11/15/2019 | | 250,000 | | | | 266,385 |
5.000%, 11/15/2021 | | 720,000 | | | | 805,795 |
DeKalb County Community Unit School District No. 424 Genoa-Kingston, AMBAC, 0.000%, 1/1/2018 | | 350,000 | | | | 347,921 |
Du Page & Will Counties Community School District No. 204 Indian Prairie, 2.000%, 12/30/2019, Call 12/30/2017 | | 575,000 | | | | 576,696 |
Illinois Finance Authority: | | | | | | |
2.212% (LIBOR 1 Month+135 basis points), 5/1/2021, Call 11/1/2020 (7) | | 1,000,000 | | | | 1,007,440 |
2.500%, 5/15/2018 | | 150,000 | | | | 150,664 |
4.000%, 10/1/2018 | | 275,000 | | | | 281,229 |
5.000%, 2/15/2018 | | 40,000 | | | | 40,698 |
5.000%, 1/1/2021 | | 200,000 | | | | 219,916 |
5.000%, 11/15/2021 | | 400,000 | | | | 455,788 |
5.000%, 1/1/2022 | | 150,000 | | | | 168,396 |
5.000%, 11/15/2022 | | 555,000 | | | | 646,231 |
5.000%, 11/15/2022 | | 500,000 | | | | 582,190 |
5.500%, 8/15/2018 | | 100,000 | | | | 104,100 |
Illinois Finance Authority, AGM: | | | | | | |
0.000%, 1/1/2018 | | 40,000 | | | | 39,896 |
0.000%, 1/1/2018 | | 55,000 | | | | 54,731 |
Illinois Housing Development Authority, AGM, 4.400%, 9/1/2020, Call 10/2/2017 | | 135,000 | | | | 135,315 |
Kane McHenry Cook & De Kalb Counties Unit School District No. 300, 5.000%, 1/1/2023 | | 1,000,000 | | | | 1,169,360 |
Kendall, Kane, & Will Counties Community Unit School District No. 308, NATL-RE FGIC, 4.250%, 10/1/2020, Call 10/2/2017 | | 50,000 | | | | 50,095 |
Lake County Forest Preserve District, 1.314% (LIBOR 3 Month+48 basis points), 12/15/2020 (7) | | 300,000 | | | | 301,089 |
Marion-Clinton Counties High School District No. 200-Centralia, BAM, 3.000%, 12/1/2019 | | 185,000 | | | | 190,211 |
| | | | | | |
McHenry & Lake Counties Community Consolidated School District No. 15, AGM, 0.000%, 1/1/2018 | | 100,000 | | | | 99,536 |
Metropolitan Pier & Exposition Authority, NATL-RE FGIC, 0.000%, 6/15/2020 | | 30,000 | | | | 28,186 |
Quad Cities Regional Economic Development Authority, 4.000%, 10/1/2019 | | 400,000 | | | | 416,632 |
Railsplitter Tobacco Settlement Authority, 5.000%, 6/1/2018 | | 40,000 | | | | 41,170 |
Rib Floater Trust Various States, 1.040%, 4/1/2036, Call 4/1/2027 (6) (12) | | 1,710,000 | | | | 1,710,000 |
Rock Island County Public Building Commission, 3.700%, 12/1/2018 | | 145,000 | | | | 146,388 |
State of Illinois: | | | | | | |
3.875%, 9/1/2017 | | 100,000 | | | | 100,000 |
5.000%, 1/1/2018 | | 1,000,000 | | | | 1,010,270 |
5.000%, 4/1/2020 | | 100,000 | | | | 106,208 |
5.000%, 2/1/2021 | | 240,000 | | | | 258,554 |
Town of Cicero, 5.000%, 1/1/2020 | | 500,000 | | | | 539,855 |
Village of Round Lake Beach: | | | | | | |
2.000%, 1/1/2018 | | 275,000 | | | | 275,863 |
2.000%, 1/1/2018 | | 205,000 | | | | 205,644 |
Wayne County Public School District No. 112 Fairfield, 3.000%, 12/1/2017 | | 80,000 | | | | 80,385 |
Will & Kankakee Counties School District No. 255, 4.000%, 6/1/2019 | | 1,110,000 | | | | 1,163,613 |
Will County Community High School District No. 210 Lincoln-Way, 4.000%, 1/1/2022, Call 1/1/2019 | | 1,000,000 | | | | 994,470 |
Will County School District No. 159 Mokena, 2.000%, 12/1/2018 | | 110,000 | | | | 111,375 |
| | | | | | 23,998,541 |
| | | |
Indiana — 2.3% | | | | | | |
Center Grove Community School Corp., 2.000%, 1/1/2018 | | 505,000 | | | | 506,071 |
City of Whiting, 1.850%, 10/1/2019 (12) | | 1,000,000 | | | | 1,009,760 |
Hammond Local Public Improvement Bond Bank, 5.000%, 8/1/2018, Call 2/1/2018 | | 150,000 | | | | 152,508 |
Indiana Finance Authority: | | | | | | |
4.000%, 10/1/2017 | | 250,000 | | | | 250,470 |
5.000%, 5/1/2020 | | 100,000 | | | | 110,250 |
5.000%, 8/15/2020 | | 250,000 | | | | 269,255 |
5.000%, 9/1/2022 | | 525,000 | | | | 605,047 |
5.250%, 10/1/2022, Call 10/1/2021 | | 150,000 | | | | 173,473 |
Indiana Housing & Community Development Authority, GNMA FNMA FHLMC COLL, 0.890%, 7/1/2039, Call 10/2/2017 (12) | | 700,000 | | | | 700,000 |
Indianapolis Local Public Improvement Bond Bank, 5.000%, 6/1/2020 | | 100,000 | | | | 109,855 |
Jasper Hospital Authority, 5.000%, 11/1/2020 | | 250,000 | | | | 274,245 |
| | | | | | 4,160,934 |
| | | |
Iowa — 1.1% | | | | | | |
Iowa Higher Education Loan Authority, 2.000%, 12/1/2018, Call 6/1/2018 | | 1,000,000 | | | | 1,005,620 |
People’s Memorial Hospital of Buchanan County, 1.500%, 12/1/2018, Call 6/1/2018 | | 1,000,000 | | | | 998,040 |
| | | | | | 2,003,660 |
| | | |
Kansas — 0.4% | | | | | | |
Bourbon County Unified School District No. 234 Fort Scott, 5.000%, 9/1/2020 | | 420,000 | | | | 465,238 |
Kansas Development Finance Authority, AMBAC, 0.000%, 7/1/2019 | | 100,000 | | | | 96,548 |
Kansas Development Finance Authority, BAM, 5.000%, 12/1/2019 | | 200,000 | | | | 214,028 |
| | | | | | 775,814 |
| | | |
Kentucky — 1.1% | | | | | | |
Kentucky Asset Liability Commission, 5.000%, 9/1/2023 | | 500,000 | | | | 595,415 |
Kentucky Asset Liability Commission, NATL-RE, 1.278% (LIBOR 3 Month+40 basis points), 11/1/2017 (7) | | 35,000 | | | | 34,993 |
Kentucky Interlocal School Transportation Association, 2.000%, 3/1/2019 | | 495,000 | | | | 501,767 |
Kentucky State Property & Building Commission: | | | | | | |
5.375%, 11/1/2023, Call 11/1/2018 | | 20,000 | | | | 21,029 |
5.375%, 11/1/2023, Call 11/1/2018 | | 5,000 | | | | 5,244 |
Lexington Center Corp., AGC, 4.100%, 10/1/2020, Call 10/2/2017 | | 265,000 | | | | 265,530 |
Louisville - Jefferson County Metropolitan Government, 5.000%, 10/1/2020 | | 550,000 | | | | 610,153 |
| | | | | | 2,034,131 |
| | | |
Louisiana — 0.6% | | | | | | |
Evangeline Parish Road & Drain Sales Tax District No. 1, AGM, 5.000%, 12/1/2020 | | 400,000 | | | | 445,128 |
Louisiana Housing Corp., FHA, 2.500%, 12/1/2031, Call 6/1/2020 | | 20,000 | | | | 20,001 |
Louisiana Local Government Environmental Facilities & Community Development Authority, 1.562% (LIBOR 1 Month+70 basis points), 8/1/2018, Call 2/1/2018 (7) | | 450,000 | | | | 450,553 |
Louisiana Public Facilities Authority, AMBAC, 1.400%, 9/1/2027, Call 9/26/2017 (12) (13) | | 50,000 | | | | 46,430 |
State of Louisiana, 5.000%, 11/15/2020, Call 5/15/2020 | | 110,000 | | | | 121,161 |
| | | | | | 1,083,273 |
| | | | | | |
Maine — 0.1% | | | | | | |
City of Portland: | | | | | | |
4.000%, 7/1/2019 | | 130,000 | | | | 136,073 |
4.000%, 7/1/2020 | | 110,000 | | | | 117,421 |
| | | | | | 253,494 |
| | | |
Maryland — 0.5% | | | | | | |
City of Baltimore: | | | | | | |
1.637%, 7/1/2037, Call 9/6/2017 (12) (13) | | 25,000 | | | | 20,911 |
5.000%, 9/1/2022 | | 500,000 | | | | 572,635 |
City of Baltimore, NATL-RE, 1.599%, 7/1/2020 (12) (13) | | 50,000 | | | | 49,006 |
Howard County Housing Commission, 2.040% (SIFMA Municipal Swap Index Yield+125 basis points), 7/1/2018, Call 1/1/2018 (7) | | 245,000 | | | | 245,071 |
Maryland Community Development Administration, GNMA/FNMA, 4.500%, 3/1/2027, Call 3/1/2021 | | 25,000 | | | | 26,597 |
| | | | | | 914,220 |
| | | |
Massachusetts — 1.2% | | | | | | |
Commonwealth of Massachusetts, 1.700%, 8/1/2022 (12) | | 1,000,000 | | | | 1,007,050 |
Commonwealth of Massachusetts, NATL-RE FGIC, 1.635%, 12/1/2030, Call 9/7/2017 (12) (13) | | 100,000 | | | | 92,299 |
Massachusetts Development Finance Agency: | | | | | | |
4.000%, 4/15/2020 | | 330,000 | | | | 348,325 |
5.000%, 7/1/2021 | | 280,000 | | | | 315,241 |
5.000%, 7/1/2022 | | 315,000 | | | | 362,426 |
| | | | | | 2,125,341 |
| | | |
Michigan — 2.1% | | | | | | |
Avondale School District, Q-SBLF, 5.000%, 11/1/2018 | | 300,000 | | | | 314,319 |
City of Detroit Water Supply System Revenue, BHAC FGIC, 5.750%, 7/1/2024, Call 7/1/2018 | | 200,000 | | | | 207,696 |
City of Wyandotte, BAM: | | | | | | |
5.000%, 10/1/2017 | | 100,000 | | | | 100,280 |
5.000%, 10/1/2018 | | 200,000 | | | | 207,876 |
5.000%, 10/1/2019 | | 250,000 | | | | 266,915 |
Dexter Community Schools, NATL-RE Q-SBLF, 5.100%, 5/1/2018 | | 110,000 | | | | 113,065 |
Grosse Ile Township School District, Q-SBLF, 5.000%, 5/1/2020 | | 595,000 | | | | 655,166 |
Lake St. Claire Clean Water Initiative, 5.000%, 10/1/2020 | | 150,000 | | | | 165,548 |
Lawrence Public Schools, Q-SBLF, 4.000%, 5/1/2018 | | 255,000 | | | | 259,962 |
Marquette Board of Light & Power, 5.000%, 7/1/2020 | | 150,000 | | | | 165,138 |
Michigan State Hospital Finance Authority, 5.000%, 11/15/2020, Call 11/15/2019 | | 520,000 | | | | 566,041 |
Muskegon Public Schools, Q-SBLF, 4.250%, 5/1/2021, Call 5/1/2019 | | 200,000 | | | | 209,278 |
Romulus Community Schools, AGM, 4.000%, 11/1/2017 | | 100,000 | | | | 100,431 |
State of Michigan, 5.500%, 11/1/2021, Call 5/1/2019 | | 300,000 | | | | 322,740 |
Taylor Tax Increment Finance Authority, AGM, 4.000%, 5/1/2021, Call 10/2/2017 | | 270,000 | | | | 270,553 |
| | | | | | 3,925,008 |
| | | |
Minnesota — 0.7% | | | | | | |
Minnesota Housing Finance Agency, 2.750%, 1/1/2018 | | 110,000 | | | | 110,616 |
St. Paul Housing & Redevelopment Authority: | | | | | | |
5.000%, 11/15/2021 | | 500,000 | | | | 574,780 |
5.000%, 11/15/2022 | | 500,000 | | | | 587,355 |
St. Paul Housing & Redevelopment Authority, NATL-RE, 5.000%, 11/15/2021, Call 11/15/2017 | | 50,000 | | | | 50,401 |
| | | | | | 1,323,152 |
| | | |
Mississippi — 0.2% | | | | | | |
Mississippi Development Bank, 5.000%, 8/1/2019 | | 155,000 | | | | 166,808 |
State of Mississippi, 1.320% (SIFMA Municipal Swap Index Yield+53 basis points), 9/1/2017 (7) | | 275,000 | | | | 275,000 |
| | | | | | 441,808 |
| | | |
Missouri — 2.8% | | | | | | |
Kansas City Planned Industrial Expansion Authority, 1.500%, 12/1/2018, Call 12/1/2017 | | 1,000,000 | | | | 1,001,310 |
Missouri Health & Educational Facilities Authority: | | | | | | |
4.000%, 2/1/2018 | | 255,000 | | | | 257,889 |
5.000%, 2/1/2022 | | 250,000 | | | | 282,808 |
5.000%, 2/1/2024, Call 2/1/2021 | | 250,000 | | | | 272,310 |
| | | | | | |
Missouri Health & Educational Facilities Authority, AMBAC, 1.470%, 6/1/2020, Call 9/1/2017 (12) (13) | | 50,000 | | | | 48,437 |
Missouri Housing Development Commission, GNMA FNMA, 4.700%, 3/1/2035, Call 9/1/2019 | | 225,000 | | | | 234,693 |
Missouri State Environmental Improvement & Energy Resources Authority, NATL-RE, 1.365%, 12/1/2022, Call 9/1/2017 (12) (13) | | 805,000 | | | | 750,305 |
Southeast Missouri State University, 5.000%, 4/1/2019 | | 1,000,000 | | | | 1,060,830 |
St. Louis County Industrial Development Authority, 2.850%, 9/1/2018, Call 3/1/2018 | | 600,000 | | | | 600,822 |
St. Louis Municipal Finance Corp., 5.000%, 2/15/2021 | | 500,000 | | | | 559,195 |
| | | | | | 5,068,599 |
| | | |
Nebraska — 0.1% | | | | | | |
Central Plains Energy Project, 1.305% (LIBOR 3 Month+50 basis points), 12/1/2017 (7) | | 160,000 | | | | 159,886 |
| | | |
Nevada — 0.1% | | | | | | |
Clark County School District, NATL: | | | | | | |
5.000%, 6/15/2021, Call 10/2/2017 | | 65,000 | | | | 67,112 |
5.000%, 6/15/2023, Call 10/2/2017 | | 95,000 | | | | 98,086 |
| | | | | | 165,198 |
| | | |
New Hampshire — 0.1% | | | | | | |
New Hampshire Health and Education Facilities Authority Act: | | | | | | |
5.250%, 10/1/2023, Call 10/1/2017 | | 190,000 | | | | 190,599 |
5.250%, 10/1/2023, Call 10/2/2017 | | 60,000 | | | | 60,196 |
| | | | | | 250,795 |
| | | |
New Jersey — 3.1% | | | | | | |
City of Jersey City, AGM, 4.000%, 2/15/2019 | | 620,000 | | | | 646,096 |
New Jersey Economic Development Authority, 5.000%, 11/1/2021 | | 400,000 | | | | 442,696 |
New Jersey Educational Facilities Authority, 5.000%, 7/1/2020, Call 7/1/2018 | | 20,000 | | | | 20,691 |
New Jersey Health Care Facilities Financing Authority: | | | | | | |
5.000%, 7/1/2022 | | 790,000 | | | | 920,073 |
5.125%, 7/1/2019, Call 7/1/2018 | | 130,000 | | | | 134,462 |
New Jersey Higher Education Student Assistance Authority: | | | | | | |
4.875%, 12/1/2024, Call 12/1/2019 | | 365,000 | | | | 386,590 |
5.000%, 12/1/2017 | | 370,000 | | | | 373,430 |
5.000%, 6/1/2018 | | 100,000 | | | | 102,700 |
New Jersey State Turnpike Authority, NATL-RE: | | | | | | |
1.365%, 1/1/2030, Call 9/5/2017 (12) (13) | | 25,000 | | | | 22,607 |
1.365%, 1/1/2030, Call 9/7/2017 (12) (13) | | 500,000 | | | | 452,128 |
1.367%, 1/1/2030, Call 9/1/2017 (12) (13) | | 25,000 | | | | 22,607 |
1.523%, 1/1/2030, Call 9/5/2017 (12) (13) | | 25,000 | | | | 22,607 |
1.523%, 1/1/2030, Call 9/7/2017 (12) (13) | | 100,000 | | | | 90,426 |
New Jersey Transportation Trust Fund Authority: | | | | | | |
1.790% (SIFMA Municipal Swap Index Yield+100 basis points), 12/15/2019, Call 6/15/2019 (7) | | 475,000 | | | | 469,362 |
4.000%, 12/15/2019 | | 75,000 | | | | 78,386 |
5.000%, 6/15/2019 | | 150,000 | | | | 157,642 |
New Jersey Transportation Trust Fund Authority, AGM, 5.250%, 12/15/2019 | | 250,000 | | | | 270,535 |
New Jersey Transportation Trust Fund Authority, FSA, 5.500%, 12/15/2017 | | 300,000 | | | | 303,750 |
New Jersey Transportation Trust Fund Authority, NATL-RE: | | | | | | |
5.500%, 12/15/2019 | | 135,000 | | | | 146,524 |
5.500%, 12/15/2020 | | 10,000 | | | | 11,171 |
South Jersey Port Corp.: | | | | | | |
5.000%, 1/1/2018 | | 250,000 | | | | 252,632 |
5.000%, 1/1/2019 | | 340,000 | | | | 351,087 |
Township of Lopatcong, NATL-RE, 4.000%, 9/1/2018, Call 9/1/2017 | | 30,000 | | | | 30,000 |
| | | | | | 5,708,202 |
| | | |
New Mexico — 1.6% | | | | | | |
City of Farmington, 1.875%, 4/1/2020 (12) | | 1,000,000 | | | | 1,016,260 |
County of Bernalillo, 5.750%, 10/1/2017 | | 150,000 | | | | 150,524 |
New Mexico Mortgage Finance Authority, 5.300%, 9/1/2040, Call 9/1/2019 | | 25,000 | | | | 26,268 |
New Mexico Municipal Energy Acquisition Authority, 1.575% (LIBOR 1 Month+75 basis points), 8/1/2019, Call 2/1/2019 (7) | | 650,000 | | | | 650,097 |
Town of Clayton, NATL, 4.000%, 11/1/2017 | | 1,000,000 | | | | 1,004,230 |
| | | | | | 2,847,379 |
| | | | | | |
New York — 9.2% | | | | | | |
City of Buffalo, AGM SAW, 2.375%, 11/15/2017 | | 100,000 | | | | 100,304 |
City of New York, AGM, 0.920%, 11/1/2026 (12) | | 195,000 | | | | 195,000 |
County of Nassau, 5.000%, 10/1/2018 | | 1,000,000 | | | | 1,044,190 |
Erie County Industrial Development Agency, SAW, 5.250%, 5/1/2025, Call 5/1/2019 | | 400,000 | | | | 428,888 |
Long Island Power Authority, 1.512% (LIBOR 1 Month+65 basis points), 11/1/2018, Call 5/1/2018 (7) | | 1,000,000 | | | | 1,002,240 |
Metropolitan Transportation Authority, AGM, 1.450% (LIBOR 1 Month+60 basis points), 5/15/2018, Call 11/15/2017 (7) | | 250,000 | | | | 250,162 |
New York City Transitional Finance Authority: | | | | | | |
0.850%, 11/1/2029, Call 9/1/2017 (12) | | 1,200,000 | | | | 1,200,000 |
0.920%, 8/1/2022, Call 9/1/2017 (12) | | 1,250,000 | | | | 1,250,000 |
New York Mortgage Agency, 5.000%, 10/1/2019 | | 600,000 | | | | 640,212 |
New York State Dormitory Authority: | | | | | | |
5.000%, 7/1/2018 | | 1,000,000 | | | | 1,034,140 |
5.000%, 12/15/2019 | | 495,000 | | | | 540,827 |
5.000%, 12/1/2022 (6) | | 600,000 | | | | 682,002 |
5.250%, 2/15/2024, Call 2/15/2019 | | 380,000 | | | | 404,077 |
5.250%, 2/15/2024, Call 2/15/2019 | | 20,000 | | | | 21,255 |
New York State Dormitory Authority, NATL-RE, 2.281%, 7/1/2029, Call 9/5/2017 (12) (13) | | 550,000 | | | | 500,606 |
New York State Energy Research & Development Authority, 2.000%, 5/1/2020 (12) | | 350,000 | | | | 356,181 |
New York State Energy Research & Development Authority, NATL-RE, 1.365%, 12/1/2020, Call 9/6/2017 (12) (13) | | 1,000,000 | | | | 966,230 |
New York State Housing Finance Agency, FNMA/FHLMC COLL, 0.900%, 11/1/2017 | | 705,000 | | | | 705,275 |
New York State Thruway Authority, 5.000%, 5/1/2019 | | 1,000,000 | | | | 1,066,420 |
State of New York, AGM, 1.757%, 3/15/2021, Call 9/7/2017 (12) (13) | | 25,000 | | | | 23,694 |
State of New York, NATL-RE FGIC: | | | | | | |
1.757%, 2/15/2022, Call 9/7/2017 (12) (13) | | 455,000 | | | | 442,604 |
1.757%, 2/13/2032, Call 9/7/2017 (12) (13) | | 70,000 | | | | 65,606 |
Town of Oyster Bay, 3.500%, 6/1/2018 | | 500,000 | | | | 505,925 |
Triborough Bridge & Tunnel Authority, 1.525% (LIBOR 1 Month+70 basis points), 2/1/2021 (7) | | 1,000,000 | | | | 1,010,120 |
TSASC, Inc., 5.000%, 6/1/2021 | | 1,000,000 | | | | 1,118,170 |
Westchester Tobacco Asset Securitization, 5.000%, 6/1/2020 | | 1,155,000 | | | | 1,260,013 |
| | | | | | 16,814,141 |
| | | |
North Carolina — 0.6% | | | | | | |
North Carolina Eastern Municipal Power Agency, AGC, 6.000%, 1/1/2019 | | 100,000 | | | | 104,022 |
North Carolina Eastern Municipal Power Agency, FGIC, 1.551%, 1/1/2025 (12) (13) | | 600,000 | | | | 494,571 |
University of North Carolina at Chapel Hill, 1.575% (LIBOR 1 Month+75 basis points), 12/1/2017, Call 9/21/2017 (7) | | 525,000 | | | | 525,110 |
| | | | | | 1,123,703 |
| | | |
North Dakota — 0.2% | | | | | | |
City of Williston, 5.000%, 5/1/2020 | | 240,000 | | | | 260,258 |
North Dakota Housing Finance Agency, 3.750%, 7/1/2042, Call 7/1/2022 | | 120,000 | | | | 125,434 |
| | | | | | 385,692 |
| | | |
Ohio — 2.8% | | | | | | |
Akron Bath Copley Joint Township Hospital District, 5.000%, 11/15/2021 | | 805,000 | | | | 907,146 |
Bucyrus City School District, 0.000%, 12/1/2017 | | 155,000 | | | | 154,566 |
City of Cleveland, AGM, 5.000%, 1/1/2019 | | 600,000 | | | | 629,826 |
City of Cleveland, AMBAC, 5.250%, 1/1/2018 | | 50,000 | | | | 50,657 |
City of Harrison, 2.000%, 10/1/2018 | | 120,000 | | | | 120,700 |
County of Hamilton: | | | | | | |
4.000%, 1/1/2021 | | 445,000 | | | | 473,880 |
5.000%, 1/1/2022 | | 465,000 | | | | 520,186 |
Lancaster Port Authority, 1.445% (LIBOR 1 Month+62 basis points), 8/1/2019, Call 2/1/2019 (7) | | 195,000 | | | | 194,795 |
New Lexington City School District, BAM, 1.200%, 12/1/2017 | | 55,000 | | | | 54,968 |
Ohio Housing Finance Agency, GNMA/FNMA COLL, 4.000%, 5/1/2022, Call 5/1/2021 | | 80,000 | | | | 82,642 |
Rib Floater Trust Various States, 0.970%, 1/15/2046, Call 10/2/2017 (6) (12) | | 1,000,000 | | | | 1,000,000 |
State of Ohio, 0.950%, 1/15/2045, Call 9/1/2017 (12) | | 500,000 | | | | 500,000 |
University of Toledo, 5.000%, 6/1/2020 | | 375,000 | | | | 413,558 |
| | | | | | 5,102,924 |
| | | |
Oklahoma — 0.1% | | | | | | |
Oklahoma Municipal Power Authority, 1.590% (SIFMA Municipal Swap Index Yield+80 basis points), 8/1/2018, Call 2/1/2018 (7) | | 135,000 | | | | 135,100 |
| | | |
Oregon — 0.5% | | | | | | |
Port of Morrow, 0.980%, 2/1/2027, Call 9/1/2017 (12) | | 1,000,000 | | | | 1,000,000 |
| | | | | | |
Pennsylvania — 3.8% | | | | | | |
Allegheny County Hospital Development Authority: | | | | | | |
1.598% (LIBOR 3 Month+72 basis points), 2/1/2021, Call 11/1/2017 (7) | | 105,000 | | | | 105,452 |
5.375%, 8/15/2029, Call 8/15/2019 | | 225,000 | | | | 243,245 |
Allentown City School District, 5.000%, 2/15/2020, Call 2/15/2018 | | 50,000 | | | | 50,928 |
Berks County Municipal Authority, 2.290% (SIFMA Municipal Swap Index Yield+150 basis points), 7/1/2022, Call 9/18/2017 (7) | | 350,000 | | | | 356,685 |
City of Philadelphia, 5.250%, 8/1/2018 | | 100,000 | | | | 103,818 |
City of Philadelphia, AGC: | | | | | | |
5.125%, 8/1/2025, Call 8/1/2019 | | 10,000 | | | | 10,795 |
5.125%, 8/1/2025, Call 8/1/2019 | | 90,000 | | | | 96,325 |
City of Philadelphia, AMBAC: | | | | | | |
5.000%, 10/1/2017 | | 250,000 | | | | 250,735 |
5.000%, 10/1/2023, Call 10/1/2017 | | 100,000 | | | | 100,294 |
Commonwealth of Pennsylvania, 5.000%, 4/15/2020, Call 4/15/2019 | | 600,000 | | | | 639,588 |
Delaware County Vocational & Technical School Authority, BAM, 3.000%, 11/1/2018 | | 120,000 | | | | 122,771 |
Delaware Valley Regional Financial Authority, AMBAC, 5.500%, 8/1/2018 | | 130,000 | | | | 135,339 |
Lancaster County Solid Waste Management Authority, 5.000%, 12/15/2020 | | 200,000 | | | | 223,032 |
Lancaster Industrial Development Authority, 5.000%, 5/1/2020 | | 285,000 | | | | 307,130 |
North Penn Water Authority, 1.325% (LIBOR 1 Month+50 basis points), 11/1/2019, Call 5/1/2019 (7) | | 800,000 | | | | 801,208 |
Northampton County General Purpose Authority, 2.190% (SIFMA Municipal Swap Index Yield+140 basis points), 8/15/2020, Call 2/15/2020 (7) | | 150,000 | | | | 150,630 |
Pennsylvania Economic Development Financing Authority, 5.000%, 3/1/2020 | | 200,000 | | | | 217,582 |
Pennsylvania Turnpike Commission: | | | | | | |
1.470% (SIFMA Municipal Swap Index Yield+68 basis points), 12/1/2018, Call 6/1/2018 (7) | | 90,000 | | | | 90,193 |
1.670% (SIFMA Municipal Swap Index Yield+88 basis points), 12/1/2020, Call 6/1/2020 (7) | | 325,000 | | | | 328,022 |
1.770% (SIFMA Municipal Swap Index Yield+98 basis points), 12/1/2021, Call 6/1/2021 (7) | | 80,000 | | | | 81,200 |
1.940% (SIFMA Municipal Swap Index Yield+115 basis points), 12/1/2019, Call 6/1/2019 (7) | | 600,000 | | | | 606,234 |
Pittsburgh Public Parking Authority, NATL-RE, 0.000%, 12/1/2017 | | 50,000 | | | | 49,911 |
School District of Philadelphia, 5.000%, 9/1/2018 | | 65,000 | | | | 67,238 |
Scranton School District, SAW, 1.837% (LIBOR 1 Month+100 basis points), 4/2/2018, Call 10/2/2017 (7) | | 1,000,000 | | | | 999,990 |
State Public School Building Authority, FSA, 5.375%, 10/1/2023, Call 10/1/2018 | | 160,000 | | | | 167,725 |
State Public School Building Authority, SAW, 1.625% (LIBOR 1 Month+80 basis points), 9/1/2018, Call 3/1/2018 (7) | | 615,000 | | | | 617,952 |
| | | | | | 6,924,022 |
| | | |
Rhode Island — 0.5% | | | | | | |
Rhode Island Health & Educational Building Corp., 5.000%, 5/15/2022 | | 500,000 | | | | 568,040 |
Rhode Island Turnpike & Bridge Authority, 3.000%, 10/1/2018 | | 275,000 | | | | 280,835 |
| | | | | | 848,875 |
| | | |
South Carolina — 0.6% | | | | | | |
Newberry Investing in Children’s Education, 5.000%, 12/1/2019 | | 1,000,000 | | | | 1,083,340 |
| | | |
Tennessee — 0.3% | | | | | | |
Clarksville Natural Gas Acquisition Corp., 5.000%, 12/15/2019 | | 125,000 | | | | 134,630 |
Metropolitan Government Nashville & Davidson County Health & Educational Facility Board, 5.000%, 7/1/2018 | | 220,000 | | | | 227,086 |
Public Building Authority of Sevier County, AMBAC, 1.365%, 6/1/2018 (12) (13) | | 50,000 | | | | 49,407 |
Tennessee Energy Acquisition Corp.: | | | | | | |
5.250%, 9/1/2020 | | 10,000 | | | | 11,107 |
5.250%, 9/1/2021 | | 55,000 | | | | 62,745 |
| | | | | | 484,975 |
| | | |
Texas — 6.5% | | | | | | |
Alamito Public Facility Corp., 1.000%, 10/1/2017, Call 9/21/2017 (12) | | 650,000 | | | | 649,954 |
Cinco Southwest Municipal Utility District No. 1, BAM, 2.000%, 12/1/2017 | | 310,000 | | | | 310,617 |
City of Coppell, 5.750%, 2/1/2023, Call 2/1/2018 | | 50,000 | | | | 51,007 |
City of The Colony, 6.000%, 2/15/2019 | | 795,000 | | | | 853,774 |
Clifton Higher Education Finance Corp., PSF, 5.000%, 8/15/2020 | | 160,000 | | | | 177,080 |
County of Cameron, BAM, 5.000%, 2/15/2020 | | 240,000 | | | | 263,525 |
Crane County Water District, 3.000%, 2/15/2021 | | 605,000 | | | | 640,344 |
Harris County Cultural Education Facilities Finance Corp., 1.620% (SIFMA Municipal Swap Index Yield+83 basis points), 6/1/2021 (7) | | 350,000 | | | | 353,188 |
Lower Colorado River Authority, 5.000%, 5/15/2019 | | 1,000,000 | | | | 1,068,490 |
| | | | | | |
New Hope Cultural Education Facilities Finance Corp.: | | | | | | |
3.375%, 8/15/2021 (6) | | 500,000 | | | | 501,550 |
4.000%, 4/1/2018 | | 225,000 | | | | 228,085 |
4.000%, 11/15/2021 | | 615,000 | | | | 644,059 |
5.000%, 11/1/2022 | | 500,000 | | | | 578,390 |
New Hope Cultural Education Facilities Finance Corp., AGM, 4.000%, 4/1/2020 | | 250,000 | | | | 264,912 |
North Texas Higher Education Authority, Inc., 2.199% (LIBOR 3 Month+90 basis points), 7/1/2030 (7) | | 125,000 | | | | 125,108 |
North Texas Tollway Authority: | | | | | | |
1.460% (SIFMA Municipal Swap Index Yield+67 basis points), 1/1/2020, Call 7/1/2019 (7) | | 350,000 | | | | 351,162 |
1.590% (SIFMA Municipal Swap Index Yield+80 basis points), 1/1/2019, Call 7/1/2018 (7) | | 250,000 | | | | 250,893 |
5.000%, 1/1/2022 | | 250,000 | | | | 289,182 |
Northside Independent School District, PSF, 2.125%, 8/1/2020, Call 2/1/2018 (12) | | 695,000 | | | | 697,766 |
Panhandle-Plains Higher Education Authority, Inc., 2.549% (LIBOR 3 Month+125 basis points), 4/1/2035, Call 9/1/2017 (7) | | 250,000 | | | | 252,988 |
Tarrant County Cultural Education Facilities Finance Corp.: | | | | | | |
2.500%, 12/1/2018, Call 9/21/2017 | | 700,000 | | | | 700,686 |
5.000%, 5/15/2021 | | 500,000 | | | | 542,880 |
5.000%, 11/15/2022 | | 1,000,000 | | | | 1,164,380 |
Texas Municipal Gas Acquisition & Supply Corp. I: | | | | | | |
1.385% (LIBOR 3 Month+55 basis points), 12/15/2017, Call 9/1/2017 (7) | | 10,000 | | | | 9,984 |
5.625%, 12/15/2017 | | 255,000 | | | | 256,928 |
Texas Municipal Gas Acquisition & Supply Corp. II, 1.535% (LIBOR 3 Month+70 basis points), 9/15/2017 (7) | | 220,000 | | | | 220,009 |
Texas State University System, 5.000%, 3/15/2022 | | 350,000 | | | | 409,248 |
| | | | | | 11,856,189 |
| | | |
Utah — 0.3% | | | | | | |
Salt Lake City Corp., AMBAC, 0.737%, 5/15/2020, Call 9/1/2017 (12) (13) | | 500,000 | | | | 493,082 |
| | | |
Vermont — 0.2% | | | | | | |
City of Burlington, AGM: | | | | | | |
5.000%, 7/1/2018 | | 250,000 | | | | 257,950 |
5.000%, 7/1/2019 | | 100,000 | | | | 106,873 |
| | | | | | 364,823 |
| | | |
Virgin Islands — 0.1% | | | | | | |
Virgin Islands Public Finance Authority, 2.250%, 10/1/2017 (6) | | 100,000 | | | | 98,775 |
| | | |
Virginia — 0.7% | | | | | | |
Henrico County Economic Development Authority, AGM, 2.156%, 8/23/2027, Call 9/1/2017 (12) (13) | | 1,250,000 | | | | 1,192,784 |
| | | |
Washington — 1.2% | | | | | | |
City of Tacoma, 5.750%, 12/1/2017 | | 100,000 | | | | 101,135 |
FYI Properties, 5.000%, 6/1/2020, Call 6/1/2019 | | 360,000 | | | | 384,523 |
Marysville Local Improvement District, 3.350%, 6/1/2036, Call 6/1/2024 | | 75,000 | | | | 77,262 |
State of Washington, 5.000%, 2/1/2022 | | 1,000,000 | | | | 1,166,220 |
Washington Health Care Facilities Authority, 0.000%, 12/1/2017 (6) | | 25,000 | | | | 24,952 |
Washington State Housing Finance Commission, GNMA/FNMA/FHLMC COLL, 5.000%, 10/1/2020 | | 320,000 | | | | 349,437 |
| | | | | | 2,103,529 |
| | | |
West Virginia — 0.7% | | | | | | |
West Virginia Commissioner, 5.000%, 9/1/2018 | | 1,250,000 | | | | 1,298,312 |
| | | |
Wisconsin — 3.0% | | | | | | |
City of Stanley, 2.500%, 3/1/2018, Call 10/2/2017 | | 1,000,000 | | | | 1,000,930 |
Hilbert School District, 2.100%, 4/1/2019, Call 4/1/2018 | | 1,000,000 | | | | 1,005,150 |
Public Finance Authority: | | | | | | |
3.500%, 11/15/2023, Call 5/15/2019 (6) | | 500,000 | | | | 505,480 |
5.000%, 11/15/2021 (8) | | 610,000 | | | | 692,948 |
5.000%, 11/15/2022 (8) | | 500,000 | | | | 579,490 |
State of Wisconsin: | | | | | | |
5.000%, 9/1/2020 | | 175,000 | | | | 194,777 |
5.000%, 3/1/2021 | | 300,000 | | | | 337,932 |
Wisconsin Health & Educational Facilities Authority: | | | | | | |
3.000%, 8/15/2019 | | 105,000 | | | | 109,131 |
3.250%, 5/1/2018 | | 200,000 | | | | 200,508 |
4.000%, 8/15/2018 | | 300,000 | | | | 308,355 |
5.000%, 3/1/2020 | | 200,000 | | | | 214,682 |
| | | | | | |
5.000%, 8/15/2020 | | 260,000 | | | | 289,752 |
5.500%, 12/15/2020, Call 12/15/2019 | | 80,000 | | | | 87,657 |
| | | | | | 5,526,792 |
| | | |
Total Municipals (identified cost $170,882,303) | | | | | | 172,490,237 |
| | | |
Mutual Funds — 0.5% | | | | | | |
BMO Ultra Short Tax-Free Fund - Institutional Class (4) | | 85,926 | | | | 866,132 |
| | | |
Total Mutual Funds (identified cost $866,956) | | | | | | 866,132 |
| | | |
Short-Term Investments — 1.0% | | | | | | |
| | | |
Mutual Funds — 0.1% | | | | | | |
BMO Government Money Market Fund - Premier Class, 0.870% (4) | | 115,488 | | | | 115,488 |
| | | |
Short-Term Municipals — 0.9% | | | | | | |
| | | |
Connecticut — 0.4% | | | | | | |
City of New Haven, 2.500%, 5/15/2018 | | $ 700,000 | | | | 705,810 |
| | | |
Ohio — 0.5% | | | | | | |
City of Tipp City, 1.750%, 2/14/2018 | | 1,000,000 | | | | 1,002,240 |
Total Short-Term Municipals | | | | | | 1,708,050 |
| | | |
Total Short-Term Investments (identified cost $1,823,132) | | | | | | 1,823,538 |
| | | |
Total Investments — 95.9% (identified cost $173,572,391) | | | | | | 175,179,907 |
Other Assets and Liabilities — 4.1% | | | | | | 7,440,509 |
Total Net Assets — 100.0% | | | | $ | | 182,620,416 |
| | | | | | |
(4) Denotes an investment in an affiliated entity. Please refer to Note 6, subsection Investments in Affiliated Issuers, in the Notes to Financial Statements.
(6) Denotes a restricted security which is subject to restrictions on resale under federal securities law. These securities have been deemed liquid based on criteria approved by the Board of Directors of the BMO Funds. At August 31, 2017, these securities amounted to:
| | | | | | | | |
| Fund | | Amount | | | % of Total Net Assets | |
Short Tax-Free Fund | | $ | 12,985,101 | | | | 7.11% | |
(7) Floating Rate Security
(8) Purchased on a when-issued or delayed delivery basis.
(12) Variable Rate Security
(13) Issue represents an Auction Rate Security. An Auction Rate Security is a corporate or municipal bond debt instrument with a long nominal maturity for which the interest rate is regularly reset through a Dutch auction. The rate presented is either the rate set through the auction or the maximum interest rate provided for in the security issuance provision.
(15) Issue represents a convertible capital appreciation bond. These securities are tax-exempt bonds that originate as capital appreciation bonds with zero coupon features at time of issuance and convert to an interest paying bond at a pre-specified rate determined at time of issuance.
Intermediate Tax-Free Fund
SCHEDULE OF INVESTMENTS – As of August 31, 2017
| | | | | | |
Description | | Shares or Principal Amount | | | | Value |
| | | |
Municipals — 98.4% | | | | | | |
| | | |
Alabama — 1.8% | | | | | | |
Alabama Board of Education: | | | | | | |
3.000%, 6/1/2021 | | $ 305,000 | | | | $ 320,988 |
4.000%, 7/1/2021 | | 1,895,000 | | | | 2,065,758 |
4.375%, 10/1/2017 | | 200,000 | | | | 200,488 |
5.000%, 10/1/2020, Call 10/1/2018 | | 230,000 | | | | 239,258 |
Butler County Board of Education, AGM, 4.000%, 7/1/2020 | | 585,000 | | | | 626,389 |
City of Birmingham, 4.000%, 3/1/2022 (15) | | 1,945,000 | | | | 2,117,463 |
Columbia Industrial Development Board, 0.930%, 12/1/2037, Call 9/1/2017 (12) | | 400,000 | | | | 400,000 |
County of Jefferson, AGM, 2.463% (LIBOR 1 Month+0 basis points), 2/1/2042, Call 10/5/2017 (7) | | 454,517 | | | | 394,678 |
Health Care Authority for Baptist Health, 1.150%, 11/1/2042 (12) | | 3,485,000 | | | | 3,485,000 |
Mobile County Board of School Commissioners, 5.000%, 3/1/2027, Call 3/1/2026 | | 4,015,000 | | | | 4,842,973 |
Pell City Special Care Facilities, 5.000%, 12/1/2025, Call 12/1/2021 | | 4,000,000 | | | | 4,507,520 |
UAB Medicine Finance Authority: | | | | | | |
5.000%, 9/1/2036, Call 3/1/2027 | | 2,340,000 | | | | 2,751,325 |
5.000%, 9/1/2037, Call 3/1/2027 | | 2,030,000 | | | | 2,381,312 |
5.000%, 9/1/2041, Call 3/1/2027 | | 2,020,000 | | | | 2,345,947 |
Wilsonville Industrial Development Board, 0.870%, 1/1/2024, Call 9/1/2017 (12) | | 2,075,000 | | | | 2,075,000 |
| | | | | | 28,754,099 |
| | | |
Alaska — 0.6% | | | | | | |
Alaska Housing Finance Corp.: | | | | | | |
5.000%, 12/1/2027, Call 6/1/2022 | | 1,375,000 | | | | 1,572,518 |
5.000%, 12/1/2028, Call 12/1/2024 | | 2,500,000 | | | | 2,967,650 |
5.000%, 6/1/2029, Call 12/1/2024 | | 1,000,000 | | | | 1,181,930 |
Alaska Municipal Bond Bank Authority, AMBAC: | | | | | | |
5.100%, 4/1/2033, Call 4/1/2018 | | 165,000 | | | | 169,031 |
5.100%, 4/1/2033, Call 4/1/2018 | | 35,000 | | | | 35,855 |
Borough of Matanuska-Susitna: | | | | | | |
5.000%, 11/1/2022 | | 500,000 | | | | 591,635 |
5.000%, 4/1/2031, Call 4/1/2021 | | 150,000 | | | | 170,760 |
Borough of North Slope, 5.000%, 6/30/2024, Call 6/1/2021 | | 1,020,000 | | | | 1,166,819 |
City of Anchorage, NATL-RE, 5.000%, 12/1/2024, Call 10/2/2017 | | 305,000 | | | | 305,906 |
City of Valdez, 5.000%, 1/1/2021 | | 1,190,000 | | | | 1,331,741 |
| | | | | | 9,493,845 |
| | | |
Arizona — 2.7% | | | | | | |
Arizona Department of Transportation State Highway, 5.250%, 7/1/2029, Call 7/1/2021 | | 3,000,000 | | | | 3,468,030 |
Arizona Health Facilities Authority: | | | | | | |
2.640% (SIFMA Municipal Swap Index Yield+185 basis points), 2/5/2020, Call 8/9/2019 (7) | | 4,500,000 | | | | 4,568,535 |
5.000%, 2/1/2022 | | 1,000,000 | | | | 1,134,400 |
Arizona Sports & Tourism Authority, 4.000%, 7/1/2018 | | 765,000 | | | | 781,394 |
Arizona State University, 6.250%, 7/1/2028, Call 7/1/2018 | | 1,050,000 | | | | 1,094,415 |
Arizona Transportation Board: | | | | | | |
5.000%, 7/1/2022, Call 7/1/2020 | | 1,260,000 | | | | 1,400,503 |
5.000%, 7/1/2023, Call 7/1/2020 | | 1,405,000 | | | | 1,561,672 |
City of Goodyear, 5.125%, 7/1/2025, Call 7/1/2020 | | 345,000 | | | | 379,893 |
City of Peoria, 4.000%, 7/1/2019 | | 515,000 | | | | 543,742 |
City of Tucson, AGM, 5.000%, 7/1/2020 | | 500,000 | | | | 552,805 |
County of Pima, 5.000%, 7/1/2027, Call 7/1/2022 | | 1,450,000 | | | | 1,701,299 |
Gilbert Public Facilities Municipal Property Corp., 5.500%, 7/1/2026, Call 7/1/2019 | | 825,000 | | | | 893,632 |
Glendale Industrial Development Authority, 5.000%, 5/15/2023, Call 5/15/2020 | | 500,000 | | | | 549,470 |
Greater Arizona Development Authority, NATL-RE: | | | | | | |
5.000%, 8/1/2019, Call 10/2/2017 | | 15,000 | | | | 15,041 |
5.000%, 8/1/2027, Call 10/2/2017 | | 240,000 | | | | 240,631 |
| | | | | | |
Industrial Development Authority of the City of Phoenix: | | | | | | |
3.000%, 7/1/2020 (6) | | 425,000 | | | | 427,622 |
5.000%, 7/1/2031, Call 7/1/2026 (6) | | 3,000,000 | | | | 3,161,610 |
Industrial Development Authority of the County of Pima, 4.950%, 10/1/2020 | | 2,000,000 | | | | 2,182,280 |
La Paz County Industrial Development Authority, 5.000%, 2/15/2046, Call 2/15/2026 (6) | | 1,000,000 | | | | 1,076,220 |
Maricopa County Elementary School District No. 33 Buckeye, 5.250%, 7/1/2018 | | 365,000 | | | | 377,775 |
Maricopa County Industrial Development Authority: | | | | | | |
4.000%, 1/1/2019 | | 200,000 | | | | 207,548 |
5.000%, 7/1/2036, Call 7/1/2026 | | 750,000 | | | | 818,632 |
5.000%, 7/1/2036, Call 7/1/2026 (6) | | 1,225,000 | | | | 1,290,991 |
Maricopa County Unified School District No. 60 Higley, AGM: | | | | | | |
4.000%, 7/1/2022 | | 500,000 | | | | 561,365 |
5.000%, 7/1/2023 | | 1,000,000 | | | | 1,191,250 |
5.000%, 7/1/2024 | | 575,000 | | | | 695,853 |
Phoenix Civic Improvement Corp.: | | | | | | |
5.000%, 7/1/2019 | | 615,000 | | | | 659,354 |
5.000%, 7/1/2020, Call 7/1/2018 | | 600,000 | | | | 620,736 |
5.000%, 7/1/2026, Call 7/1/2020 | | 1,050,000 | | | | 1,163,358 |
Phoenix Civic Improvement Corp., BHAC, 5.500%, 7/1/2027 (15) | | 500,000 | | | | 633,860 |
Phoenix Civic Improvement Corp., NATL-RE FGIC: | | | | | | |
5.500%, 7/1/2021 (15) | | 555,000 | | | | 633,988 |
5.500%, 7/1/2036 (15) | | 530,000 | | | | 700,421 |
Pima County Industrial Development Authority, 6.375%, 7/1/2028, Call 7/1/2018 | | 240,000 | | | | 250,781 |
Rio Nuevo Multipurpose Facilities District, AGC, 6.000%, 7/15/2020, Call 7/15/2018 | | 240,000 | | | | 250,630 |
Salt Verde Financial Corp., 5.250%, 12/1/2022 | | 110,000 | | | | 127,863 |
Scottsdale Industrial Development Authority, 5.000%, 9/1/2018 | | 250,000 | | | | 259,888 |
State of Arizona, AGM: | | | | | | |
5.000%, 10/1/2023, Call 4/1/2020 | | 1,000,000 | | | | 1,100,140 |
5.250%, 10/1/2024, Call 10/1/2019 | | 5,000,000 | | | | 5,433,050 |
Town of Marana, 5.000%, 7/1/2023 | | 450,000 | | | | 534,411 |
Tucson & Pima Counties Industrial Development Authorities, GNMA/FNMA/FHLMC, 5.400%, 6/1/2040, Call 12/1/2017 (16) | | 170,000 | | | | 171,753 |
University Medical Center Corp., 5.000%, 7/1/2021 | | 425,000 | | | | 483,913 |
University of Arizona, 5.000%, 8/1/2026, Call 8/1/2021 | | 455,000 | | | | 517,553 |
| | | | | | 44,418,307 |
| | | |
Arkansas — 1.4% | | | | | | |
Arkansas Development Finance Authority: | | | | | | |
1.200%, 9/1/2044, Call 9/1/2017 (12) | | 3,650,000 | | | | 3,650,000 |
5.000%, 2/1/2020 | | 255,000 | | | | 275,856 |
5.000%, 2/1/2021 | | 315,000 | | | | 350,548 |
5.000%, 2/1/2022 | | 150,000 | | | | 171,459 |
Arkansas Development Finance Authority, GNMA/FNMA: | | | | | | |
4.000%, 1/1/2025, Call 7/1/2021 | | 215,000 | | | | 226,352 |
4.000%, 7/1/2025, Call 7/1/2021 | | 465,000 | | | | 488,683 |
Arkansas State University: | | | | | | |
4.000%, 3/1/2021 | | 390,000 | | | | 425,498 |
4.000%, 3/1/2022 | | 1,140,000 | | | | 1,264,773 |
4.000%, 3/1/2023 | | 985,000 | | | | 1,103,190 |
City of Fayetteville, 3.300%, 11/1/2023 | | 2,985,000 | | | | 3,213,950 |
City of Maumelle, 2.600%, 3/1/2030, Call 3/1/2022 | | 910,000 | | | | 932,523 |
City of Springdale: | | | | | | |
3.000%, 11/1/2021 | | 1,000,000 | | | | 1,064,740 |
5.000%, 11/1/2028, Call 11/1/2022 | | 1,000,000 | | | | 1,165,350 |
City of Stuttgart, AGM, 3.800%, 6/1/2042, Call 6/1/2020 | | 1,325,000 | | | | 1,325,371 |
Conway Health Facilities Board, 4.250%, 8/1/2021 | | 605,000 | | | | 633,356 |
County of Greene, AGM: | | | | | | |
4.000%, 3/1/2019, Call 10/2/2017 | | 840,000 | | | | 841,688 |
4.000%, 3/1/2020, Call 10/2/2017 | | 1,430,000 | | | | 1,433,017 |
Henderson State University, BAM: | | | | | | |
5.000%, 11/1/2022 | | 905,000 | | | | 1,061,972 |
5.000%, 11/1/2023, Call 11/1/2022 | | 860,000 | | | | 995,742 |
University of Arkansas: | | | | | | |
5.000%, 12/1/2021 | | 300,000 | | | | 347,616 |
5.000%, 12/1/2022 | | 520,000 | | | | 617,947 |
5.000%, 12/1/2023, Call 12/1/2022 | | 500,000 | | | | 590,285 |
5.000%, 11/1/2030, Call 11/1/2024 | | 1,000,000 | | | | 1,200,470 |
| | | | | | 23,380,386 |
| | | | | | |
California — 7.2% | | | | | | |
Abag Finance Authority for Nonprofit Corps., 5.000%, 7/1/2020 | | 515,000 | | | | 570,146 |
Abag Finance Authority for Nonprofit Corps., CMI, 5.000%, 4/1/2020 | | 1,000,000 | | | | 1,098,530 |
ABC Unified School District, MBIA, 5.000%, 2/1/2021 | | 1,250,000 | | | | 1,403,450 |
Alvord Unified School District, AGM, 0.000%, 8/1/2046, Call 8/1/2036 (15) | | 1,150,000 | | | | 1,091,568 |
Anaheim Public Financing Authority, 5.000%, 10/1/2030, Call 4/1/2019 | | 225,000 | | | | 239,672 |
Bay Area Toll Authority, 2.040% (SIFMA Municipal Swap Index Yield+125 basis points), 4/1/2027, Call 10/1/2026 (7) | | 5,000,000 | | | | 5,081,700 |
BB&T Municipal Trust, 1.590% (SIFMA Municipal Swap Index Yield+80 basis points), 11/15/2019 (6) (7) | | 1,500,000 | | | | 1,503,825 |
Bellevue Union School District, AGM: | | | | | | |
0.000%, 8/1/2030 | | 585,000 | | | | 379,127 |
0.000%, 8/1/2031 | | 615,000 | | | | 381,724 |
Bonita Unified School District, 5.500%, 8/1/2035, Call 8/1/2021 | | 940,000 | | | | 1,100,317 |
Burbank Unified School District, 0.000%, 8/1/2031, Call 2/1/2025 (15) | | 1,325,000 | | | | 1,146,284 |
California County Tobacco Securitization Agency, 4.000%, 6/1/2029, Call 10/2/2017 | | 4,240,000 | | | | 4,245,046 |
California Health Facilities Financing Authority: | | | | | | |
5.000%, 7/1/2037, Call 7/1/2023 | | 2,000,000 | | | | 2,279,620 |
5.000%, 8/15/2042, Call 8/15/2027 | | 1,000,000 | | | | 1,136,710 |
California Health Facilities Financing Authority, NATL-RE, 1.383%, 7/1/2022, Call 9/1/2017 (12) (13) | | 1,600,000 | | | | 1,553,232 |
California Infrastructure & Economic Development Bank, 1.750%, 6/1/2022 (12) | | 1,000,000 | | | | 1,011,380 |
California Municipal Finance Authority, 5.000%, 2/1/2042, Call 2/1/2027 | | 1,500,000 | | | | 1,698,180 |
California State Public Works Board, 5.000%, 4/1/2037, Call 4/1/2022 | | 1,000,000 | | | | 1,125,710 |
California Statewide Communities Development Authority: | | | | | | |
5.000%, 12/1/2031, Call 6/1/2026 (6) | | 1,000,000 | | | | 1,129,680 |
5.000%, 12/1/2046, Call 6/1/2026 (6) | | 1,000,000 | | | | 1,089,510 |
California Statewide Communities Development Authority, NATL-RE, 5.125%, 7/1/2024, Call 7/1/2018 | | 1,500,000 | | | | 1,553,370 |
Carson Redevelopment Agency Successor Agency, AGM, 5.000%, 10/1/2021 | | 850,000 | | | | 974,984 |
City of Fairfield, XLCA, 0.000%, 4/1/2022 | | 1,205,000 | | | | 1,097,767 |
City of Madera: | | | | | | |
5.750%, 1/1/2026, Call 1/1/2020 | | 1,550,000 | | | | 1,723,662 |
6.500%, 1/1/2040, Call 1/1/2020 | | 1,280,000 | | | | 1,445,414 |
County of Los Angeles, 0.000%, 9/1/2018 | | 750,000 | | | | 742,950 |
County of Los Angeles, AMBAC, 0.000%, 9/1/2020 | | 600,000 | | | | 578,082 |
County of San Joaquin, 5.000%, 4/1/2022 | | 350,000 | | | | 407,946 |
Delhi Unified School District, AMBAC, 0.000%, 8/1/2019 | | 250,000 | | | | 225,685 |
Duarte Unified School District, 5.125%, 8/1/2026 (15) | | 585,000 | | | | 736,661 |
El Centro Financing Authority, AGM: | | | | | | |
4.000%, 10/1/2021 | | 460,000 | | | | 509,068 |
5.000%, 10/1/2022 | | 515,000 | | | | 604,595 |
5.000%, 10/1/2022 | | 580,000 | | | | 686,511 |
5.000%, 10/1/2023 | | 800,000 | | | | 956,720 |
Encinitas Union School District, 0.000%, 8/1/2035, Call 8/1/2032 (15) | | 500,000 | | | | 550,150 |
Escondido Union High School District, 0.000%, 8/1/2032, Call 8/1/2025 (15) | | 1,250,000 | | | | 1,273,237 |
Escondido Union High School District, AGC, 0.000%, 8/1/2031 | | 480,000 | | | | 310,411 |
Fresno Joint Powers Financing Authority, AGM, 5.000%, 4/1/2033, Call 4/1/2027 | | 1,000,000 | | | | 1,174,370 |
Fresno Unified School District, 0.000%, 8/1/2034, Call 8/1/2021 | | 1,045,000 | | | | 403,454 |
Fresno Unified School District, MBIA, 6.000%, 8/1/2026 | | 2,890,000 | | | | 3,550,596 |
Golden State Tobacco Securitization Corp.: | | | | | | |
5.000%, 6/1/2028, Call 6/1/2027 | | 1,000,000 | | | | 1,197,620 |
5.000%, 6/1/2029, Call 6/1/2027 | | 1,000,000 | | | | 1,188,180 |
Hacienda La Puente Unified School District, AGM: | | | | | | |
5.000%, 6/1/2022 | | 400,000 | | | | 467,760 |
5.000%, 6/1/2023 | | 400,000 | | | | 477,636 |
5.000%, 6/1/2024 | | 775,000 | | | | 939,858 |
5.000%, 6/1/2025 | | 425,000 | | | | 521,760 |
Imperial Community College District, AGC, 0.000%, 8/1/2028 | | 330,000 | | | | 235,970 |
Imperial County Local Transportation Authority, 5.000%, 6/1/2032, Call 6/1/2022 | | 2,000,000 | | | | 2,277,540 |
Jefferson School District/San Joaquin County, 0.000%, 8/1/2029, Call 8/1/2024 | | 170,000 | | | | 108,921 |
Jurupa Community Services District, 5.000%, 9/1/2029, Call 9/1/2020 | | 375,000 | | | | 415,976 |
Lakeside Union School District/San Diego County, AGC, 0.000%, 9/1/2027 | | 295,000 | | | | 221,070 |
Long Beach Bond Finance Authority: | | | | | | |
5.000%, 11/1/2025, Call 11/1/2021 | | 1,000,000 | | | | 1,152,160 |
5.000%, 11/1/2030, Call 11/1/2021 | | 1,750,000 | | | | 1,993,390 |
| | | | | | |
Lynwood Unified School District, AGM: | | | | | | |
5.000%, 8/1/2024, Call 8/1/2023 | | 620,000 | | | | 739,046 |
5.000%, 8/1/2025, Call 8/1/2023 | | 760,000 | | | | 902,158 |
McKinleyville Union School District, AGM, 0.000%, 8/1/2041, Call 8/1/2026 (15) | | 165,000 | | | | 168,473 |
McKinleyville Union School District, BAM: | | | | | | |
0.000%, 8/1/2036, Call 8/1/2021 | | 1,200,000 | | | | 517,692 |
0.000%, 8/1/2037, Call 8/1/2021 | | 1,980,000 | | | | 802,652 |
Mendocino-Lake Community College District, AGM, 5.600%, 8/1/2031, Call 8/1/2026 (15) | | 300,000 | | | | 375,168 |
Midpeninsula Regional Open Space District, 5.000%, 9/1/2029, Call 9/1/2022 | | 2,000,000 | | | | 2,360,380 |
Modesto Irrigation District, 5.000%, 7/1/2021 | | 500,000 | | | | 573,945 |
Mount Diablo Unified School District, AGM, 0.000%, 8/1/2035, Call 8/1/2025 (15) | | 2,125,000 | | | | 1,977,206 |
Murrieta Valley Unified School District Public Financing Authority, NATL-RE FGIC, 0.000%, 9/1/2020 | | 500,000 | | | | 476,765 |
Northern California Gas Authority No. 1: | | | | | | |
1.500% (LIBOR 3 Month+63 basis points), 7/1/2019 (7) | | 3,000,000 | | | | 2,997,990 |
1.590% (LIBOR 3 Month+72 basis points), 7/1/2027 (7) | | 1,915,000 | | | | 1,843,015 |
Northern California Power Agency: | | | | | | |
5.000%, 7/1/2031, Call 7/1/2022 | | 500,000 | | | | 571,295 |
5.000%, 7/1/2032, Call 7/1/2022 | | 700,000 | | | | 798,427 |
Orchard School District, NATL-RE FGIC, 0.000%, 8/1/2023 | | 590,000 | | | | 533,272 |
Pasadena Public Financing Authority, 0.000%, 3/1/2029 | | 2,000,000 | | | | 1,440,100 |
Porterville Unified School District Facilities Improvement District, AGM, 0.000%, 8/1/2034, Call 10/2/2017 | | 1,500,000 | | | | 662,940 |
Rib Floater Trust Various States, 0.970%, 8/15/2051 (6) (12) | | 2,000,000 | | | | 2,000,000 |
Roseville Joint Union High School District, 0.000%, 8/1/2022 | | 305,000 | | | | 279,618 |
Sacramento Redevelopment Agency Successor Agency, BAM: | | | | | | |
5.000%, 12/1/2027, Call 12/1/2025 | | 235,000 | | | | 283,723 |
5.000%, 12/1/2028, Call 12/1/2025 | | 425,000 | | | | 508,173 |
5.000%, 12/1/2030, Call 12/1/2025 | | 1,000,000 | | | | 1,176,060 |
5.000%, 12/1/2031, Call 12/1/2025 | | 2,000,000 | | | | 2,340,800 |
San Francisco City & County Airport Commission: | | | | | | |
5.000%, 5/1/2024, Call 5/1/2021 | | 745,000 | | | | 853,226 |
5.000%, 5/1/2024, Call 5/1/2021 | | 295,000 | | | | 336,760 |
San Jose Financing Authority, 5.000%, 6/1/2039, Call 6/1/2023 | | 1,435,000 | | | | 1,638,727 |
San Jose International Airport: | | | | | | |
5.000%, 3/1/2041, Call 3/1/2027 (16) | | 1,000,000 | | | | 1,154,230 |
5.000%, 3/1/2042, Call 3/1/2027 | | 1,665,000 | | | | 1,951,646 |
San Jose Unified School District, NATL, 0.000%, 8/1/2027 | | 1,495,000 | | | | 1,151,912 |
San Miguel Joint Union Elementary School District, AGM: | | | | | | |
0.000%, 6/15/2020 | | 415,000 | | | | 398,363 |
0.000%, 6/15/2021 | | 490,000 | | | | 460,527 |
0.000%, 6/15/2022 | | 505,000 | | | | 462,055 |
Santa Ana Unified School District, 0.000%, 8/1/2021 | | 500,000 | | | | 472,955 |
Santa Ana Unified School District, AGM, 5.500%, 8/1/2030, Call 8/1/2018 | | 930,000 | | | | 967,851 |
Santa Barbara County College Elementary School District: | | | | | | |
0.000%, 8/1/2027 | | 365,000 | | | | 277,688 |
0.000%, 8/1/2031 | | 470,000 | | | | 300,222 |
State of California: | | | | | | |
1.562% (LIBOR 1 Month+70 basis points), 12/1/2017, Call 10/2/2017 (7) | | 2,500,000 | | | | 2,500,850 |
5.250%, 9/1/2025, Call 9/1/2021 | | 2,045,000 | | | | 2,380,319 |
6.000%, 3/1/2033, Call 3/1/2020 | | 1,550,000 | | | | 1,741,053 |
Tahoe Forest Hospital District: | | | | | | |
5.500%, 8/1/2027, Call 8/1/2018 | | 1,345,000 | | | | 1,402,109 |
5.500%, 8/1/2035, Call 8/1/2018 | | 1,000,000 | | | | 1,042,460 |
Twin Rivers Unified School District, AGM, 3.200%, 6/1/2020, Call 11/1/2017 (12) | | 1,365,000 | | | | 1,365,259 |
Vallejo City Unified School District, MBIA, 5.900%, 8/1/2025 | | 1,225,000 | | | | 1,486,280 |
Walnut Creek Elementary School District Contra Costa County, 0.000%, 9/1/2023 | | 1,560,000 | | | | 1,403,828 |
Watereuse Finance Authority, BAM, 5.500%, 5/1/2036, Call 5/1/2024 | | 2,635,000 | | | | 3,214,068 |
West Contra Costa Unified School District, AGM NATL-RE FGIC, 0.000%, 8/1/2025 | | 310,000 | | | | 257,334 |
West Kern Water District, 5.000%, 6/1/2028, Call 6/1/2021 | | 2,000,000 | | | | 2,270,540 |
Westminster School District, BAM, 0.000%, 8/1/2048, Call 8/1/2023 | | 7,045,000 | | | | 1,119,662 |
Whittier Union High School District, 0.000%, 8/1/2034, Call 8/1/2019 | | 500,000 | | | | 189,875 |
Windsor Unified School District, AGM: | | | | | | |
0.000%, 8/1/2020 | | 105,000 | | | | 100,427 |
0.000%, 8/1/2023 | | 240,000 | | | | 213,276 |
0.000%, 8/1/2024, Call 8/1/2023 | | 330,000 | | | | 282,850 |
0.000%, 8/1/2025, Call 8/1/2023 | | 270,000 | | | | 217,966 |
0.000%, 8/1/2026, Call 8/1/2023 | | 330,000 | | | | 250,081 |
0.000%, 8/1/2028, Call 8/1/2023 | | 420,000 | | | | 281,908 |
Yosemite Community College District, AGM, 5.000%, 8/1/2032, Call 8/1/2018 | | 75,000 | | | | 77,848 |
| | | | | | 116,521,938 |
| | | | | | |
Colorado — 2.4% | | | | | | |
Adams & Arapahoe Joint School District 28J Aurora, SAW, 5.000%, 12/1/2031, Call 12/1/2026 | | 5,000,000 | | | | 6,084,900 |
Adams County School District No. 14, SAW: | | | | | | |
5.000%, 12/1/2024 | | 500,000 | | | | 611,125 |
5.000%, 12/1/2026, Call 12/1/2024 | | 355,000 | | | | 436,881 |
5.000%, 12/1/2027, Call 12/1/2024 | | 500,000 | | | | 613,410 |
City & County of Denver, 5.000%, 11/15/2021 | | 500,000 | | | | 579,660 |
Colorado Educational & Cultural Facilities Authority: | | | | | | |
4.000%, 12/1/2017 | | 120,000 | | | | 120,906 |
4.000%, 12/15/2025 (6) | | 535,000 | | | | 550,558 |
5.000%, 9/1/2020 (15) | | 1,060,000 | | | | 1,174,830 |
5.000%, 9/1/2021 (15) | | 865,000 | | | | 984,232 |
5.000%, 10/1/2030, Call 10/1/2025 | | 1,250,000 | | | | 1,436,662 |
Colorado Health Facilities Authority: | | | | | | |
1.450%, 7/1/2034, Call 7/1/2019 (6) (12) | | 3,325,000 | | | | 3,325,000 |
4.500%, 2/1/2020 | | 455,000 | | | | 480,667 |
5.000%, 9/1/2018 | | 530,000 | | | | 550,802 |
5.000%, 9/1/2019 | | 560,000 | | | | 598,438 |
5.000%, 2/1/2021 | | 475,000 | | | | 517,550 |
5.000%, 9/1/2022 | | 750,000 | | | | 867,450 |
5.000%, 12/1/2023 | | 215,000 | | | | 247,325 |
5.000%, 2/1/2024 | | 420,000 | | | | 473,281 |
5.000%, 6/1/2047, Call 6/1/2027 (8) | | 1,000,000 | | | | 1,106,760 |
5.250%, 1/1/2025, Call 1/1/2020 | | 460,000 | | | | 500,931 |
5.250%, 5/15/2037, Call 5/15/2027 | | 1,000,000 | | | | 1,082,000 |
Commerce City Northern Infrastructure General Improvement District, AGM: | | | | | | |
5.000%, 12/1/2020 | | 785,000 | | | | 883,125 |
5.000%, 12/1/2021 | | 725,000 | | | | 839,093 |
5.000%, 12/1/2022 | | 1,185,000 | | | | 1,406,216 |
County of Boulder: | | | | | | |
5.000%, 12/1/2023, Call 12/1/2020 | | 500,000 | | | | 559,445 |
5.000%, 12/1/2025, Call 12/1/2020 | | 475,000 | | | | 531,150 |
Denver City & County School District No. 1, SAW, 5.000%, 12/1/2032, Call 12/1/2022 | | 1,500,000 | | | | 1,760,910 |
Denver Convention Center Hotel Authority: | | | | | | |
5.000%, 12/1/2033, Call 12/1/2026 | | 1,000,000 | | | | 1,155,890 |
5.000%, 12/1/2034, Call 12/1/2026 | | 1,000,000 | | | | 1,150,670 |
Denver Health & Hospital Authority, 5.500%, 12/1/2019 | | 1,195,000 | | | | 1,274,993 |
Park Creek Metropolitan District, 5.000%, 12/1/2030, Call 12/1/2025 | | 1,895,000 | | | | 2,128,483 |
Public Authority for Colorado Energy, 5.750%, 11/15/2018 | | 345,000 | | | | 356,161 |
Rangely Hospital District, 6.000%, 11/1/2026, Call 11/1/2021 | | 2,000,000 | | | | 2,322,420 |
Weld County School District No. RE-7 Platte Valley, SAW, 4.000%, 12/1/2023, Call 12/1/2020 | | 1,140,000 | | | | 1,237,972 |
| | | | | | 37,949,896 |
| | | |
Connecticut — 1.1% | | | | | | |
City of New Haven, AGM, 5.000%, 8/1/2023 | | 2,060,000 | | | | 2,403,670 |
Connecticut Housing Finance Authority, 3.600%, 11/15/2030, Call 11/15/2024 | | 635,000 | | | | 657,403 |
Connecticut State Health & Educational Facility Authority: | | | | | | |
2.875%, 9/1/2020, Call 10/2/2017 (6) | | 450,000 | | | | 450,095 |
3.250%, 9/1/2021, Call 3/1/2018 (6) | | 700,000 | | | | 701,743 |
State of Connecticut: | | | | | | |
5.000%, 3/15/2027, Call 3/15/2026 | | 2,155,000 | | | | 2,540,960 |
5.000%, 4/15/2034, Call 4/15/2027 | | 3,000,000 | | | | 3,432,870 |
University of Connecticut: | | | | | | |
5.000%, 3/15/2032, Call 3/15/2026 | | 2,000,000 | | | | 2,308,660 |
5.000%, 1/15/2033, Call 1/15/2027 | | 4,000,000 | | | | 4,620,160 |
| | | | | | 17,115,561 |
| | | |
Delaware — 0.6% | | | | | | |
City of Wilmington, 5.000%, 10/1/2025, Call 10/1/2023 | | 3,715,000 | | | | 4,445,146 |
Delaware State Economic Development Authority, 5.000%, 6/1/2036, Call 6/1/2026 | | 1,500,000 | | | | 1,548,105 |
Delaware State Housing Authority: | | | | | | |
5.000%, 1/1/2026, Call 7/1/2019 (16) | | 215,000 | | | | 222,742 |
5.200%, 7/1/2029, Call 7/1/2018 | | 915,000 | | | | 929,119 |
Sustainable Energy Utility, Inc., 5.000%, 9/15/2034, Call 9/15/2021 | | 1,580,000 | | | | 1,799,193 |
| | | | | | 8,944,305 |
| | | | | | |
District of Columbia — 0.3% | | | | | | |
District of Columbia: | | | | | | |
5.000%, 10/1/2025, Call 10/1/2021 | | 1,865,000 | | | | 2,079,494 |
5.000%, 6/1/2036, Call 6/1/2026 | | 2,500,000 | | | | 2,760,775 |
5.000%, 12/1/2036, Call 12/1/2021 | | 500,000 | | | | 571,775 |
| | | | | | 5,412,044 |
| | | |
Florida — 5.2% | | | | | | |
Citizens Property Insurance Corp., 5.000%, 6/1/2019 | | 2,615,000 | | | | 2,795,487 |
City of Boynton Beach, AGM, 5.000%, 11/1/2027, Call 11/1/2021 | | 1,000,000 | | | | 1,146,030 |
City of Fort Pierce, AGC, 5.875%, 9/1/2028, Call 9/1/2018 | | 1,000,000 | | | | 1,046,700 |
City of Gulf Breeze, 5.000%, 12/1/2023, Call 12/1/2020 | | 2,000,000 | | | | 2,229,680 |
City of Lakeland, AGM, 5.250%, 10/1/2028 | | 1,250,000 | | | | 1,624,162 |
City of North Port, 5.000%, 7/1/2022 | | 200,000 | | | | 231,818 |
City of Orlando, AGM: | | | | | | |
5.000%, 11/1/2034, Call 11/1/2027 | | 1,000,000 | | | | 1,177,730 |
5.000%, 11/1/2035, Call 11/1/2027 | | 1,000,000 | | | | 1,171,980 |
5.000%, 11/1/2036, Call 11/1/2027 | | 1,000,000 | | | | 1,168,170 |
5.000%, 11/1/2037, Call 11/1/2027 | | 1,000,000 | | | | 1,165,320 |
5.000%, 11/1/2038, Call 11/1/2027 | | 1,000,000 | | | | 1,161,530 |
City of Port St. Lucie, AGC, 6.250%, 9/1/2027, Call 9/1/2018 | | 500,000 | | | | 526,610 |
City of Sunrise, 4.000%, 10/1/2019 | | 540,000 | | | | 571,266 |
City of Sunrise, NATL-RE: | | | | | | |
0.000%, 10/1/2019 | | 905,000 | | | | 884,502 |
0.000%, 10/1/2020 | | 975,000 | | | | 938,408 |
0.000%, 10/1/2021 | | 175,000 | | | | 165,743 |
City of Tallahassee: | | | | | | |
5.000%, 12/1/2026, Call 12/1/2025 | | 450,000 | | | | 526,316 |
5.000%, 12/1/2027, Call 12/1/2025 | | 400,000 | | | | 464,312 |
City of Tampa, 5.250%, 11/15/2026, Call 5/15/2020 | | 2,000,000 | | | | 2,206,580 |
City of Tampa, AMBAC, 0.000%, 4/1/2021 | | 460,000 | | | | 433,030 |
Columbia County School Board, 5.000%, 7/1/2026, Call 7/1/2025 | | 495,000 | | | | 586,243 |
County of Broward: | | | | | | |
5.000%, 10/1/2026, Call 10/1/2025 (16) | | 750,000 | | | | 898,965 |
5.000%, 10/1/2031, Call 10/1/2025 (16) | | 1,000,000 | | | | 1,155,550 |
County of Broward, AGM, 5.000%, 4/1/2033, Call 4/1/2023 (16) | | 740,000 | | | | 812,187 |
County of Lee, 5.000%, 10/1/2029, Call 10/1/2022 | | 2,000,000 | | | | 2,321,360 |
County of Manatee, 0.870%, 9/1/2024, Call 9/1/2017 (12) | | 4,600,000 | | | | 4,600,000 |
County of Miami-Dade: | | | | | | |
5.000%, 10/1/2025, Call 10/1/2024 | | 800,000 | | | | 966,264 |
5.000%, 10/1/2040, Call 10/1/2027 (16) | | 1,500,000 | | | | 1,743,450 |
5.250%, 10/1/2029, Call 10/1/2023 | | 100,000 | | | | 120,069 |
5.500%, 10/1/2026, Call 10/1/2020 | | 450,000 | | | | 511,056 |
5.500%, 10/1/2026, Call 10/1/2020 | | 1,450,000 | | | | 1,639,210 |
County of Miami-Dade, AGC: | | | | | | |
0.000%, 10/1/2021 | | 610,000 | | | | 564,134 |
5.000%, 10/1/2029, Call 10/1/2019 | | 400,000 | | | | 431,744 |
County of Miami-Dade, BHAC, 6.000%, 10/1/2023, Call 10/1/2018 | | 1,000,000 | | | | 1,054,920 |
County of Miami-Dade, NATL-RE BHAC, 5.000%, 10/1/2030, Call 10/1/2017 (15) | | 475,000 | | | | 476,397 |
County of Orange, 5.000%, 1/1/2027, Call 1/1/2022 | | 5,810,000 | | | | 6,688,879 |
County of St. Johns, AGM: | | | | | | |
5.000%, 10/1/2020 | | 1,625,000 | | | | 1,814,182 |
5.000%, 10/1/2021 | | 1,110,000 | | | | 1,276,078 |
Dupree Lakes Community Development District, BAM: | | | | | | |
3.000%, 5/1/2018 | | 230,000 | | | | 232,516 |
3.000%, 5/1/2019 | | 190,000 | | | | 194,539 |
Emerald Coast Utilities Authority, BAM, 5.000%, 1/1/2032, Call 1/1/2025 | | 1,445,000 | | | | 1,660,204 |
Florida HomeLoan Corp., GNMA/FHLMC/FNMA, 5.000%, 7/1/2028, Call 1/1/2020 | | 200,000 | | | | 209,080 |
Florida HomeLoan Corp., GNMA/FNMA/FHLMC, 4.450%, 1/1/2030, Call 7/1/2021 | | 355,000 | | | | 370,755 |
Florida Municipal Loan Council, AGM, 5.000%, 5/1/2021 | | 1,745,000 | | | | 1,973,909 |
Halifax Hospital Medical Center: | | | | | | |
5.000%, 6/1/2026 | | 1,525,000 | | | | 1,845,113 |
5.000%, 6/1/2027, Call 6/1/2026 | | 1,295,000 | | | | 1,529,784 |
Lee County Industrial Development Authority, 5.000%, 11/1/2025, Call 11/1/2020 | | 2,000,000 | | | | 2,242,340 |
Lee County School Board, 5.000%, 8/1/2028, Call 8/1/2024 | | 2,500,000 | | | | 2,933,725 |
| | | | | | |
Miami-Dade County Educational Facilities Authority, 5.000%, 4/1/2031, Call 4/1/2025 | | 2,000,000 | | | | 2,332,340 |
Miami-Dade County Industrial Development Authority: | | | | | | |
0.840%, 4/1/2020, Call 9/1/2017 (12) | | 400,000 | | | | 400,000 |
0.870%, 6/1/2021, Call 9/1/2017 (12) | | 3,500,000 | | | | 3,500,000 |
Orange County Health Facilities Authority, 5.250%, 10/1/2035, Call 10/1/2018 | | 440,000 | | | | 460,662 |
Polk County Housing Finance Authority, GNMA, 5.000%, 9/1/2029, Call 8/1/2020 | | 150,000 | | | | 162,218 |
Sarasota County Health Facilities Authority: | | | | | | |
5.000%, 1/1/2030, Call 1/1/2025 | | 750,000 | | | | 841,470 |
5.000%, 1/1/2031, Call 1/1/2025 | | 935,000 | | | | 1,043,198 |
School Board of Miami-Dade County, 1.020%, 9/7/2017 (6) (12) | | 3,855,000 | | | | 3,855,000 |
Southeast Overtown Park West Community Redevelopment Agency, 5.000%, 3/1/2018 (6) | | 2,405,000 | | | | 2,446,558 |
St. Lucie County School Board, AGM, 5.000%, 7/1/2022, Call 7/1/2021 | | 2,500,000 | | | | 2,804,775 |
Sumter County Industrial Development Authority: | | | | | | |
4.000%, 7/1/2019 | | 1,000,000 | | | | 1,050,600 |
5.000%, 7/1/2020 | | 500,000 | | | | 546,380 |
Town of Davie: | | | | | | |
5.000%, 4/1/2019 | | 75,000 | | | | 79,285 |
5.000%, 4/1/2021 | | 615,000 | | | | 686,580 |
5.000%, 4/1/2022 | | 830,000 | | | | 946,781 |
Volusia County Educational Facility Authority, AGM, 5.000%, 10/15/2029, Call 10/15/2021 | | 730,000 | | | | 844,362 |
| | | | | | 84,488,236 |
| | | |
Georgia — 2.7% | | | | | | |
Carroll City-County Hospital Authority, County Guarantee: | | | | | | |
5.000%, 7/1/2023, Call 7/1/2020 | | 1,185,000 | | | | 1,315,385 |
5.000%, 7/1/2023, Call 7/1/2020 | | 1,605,000 | | | | 1,774,504 |
5.000%, 7/1/2024, Call 7/1/2020 | | 695,000 | | | | 771,471 |
5.000%, 7/1/2024, Call 7/1/2020 | | 945,000 | | | | 1,041,749 |
City of Atlanta Department of Aviation: | | | | | | |
5.000%, 1/1/2031, Call 1/1/2024 | | 1,000,000 | | | | 1,181,790 |
5.000%, 1/1/2032, Call 1/1/2024 | | 2,500,000 | | | | 2,949,600 |
5.000%, 1/1/2033, Call 1/1/2024 | | 1,000,000 | | | | 1,175,290 |
5.000%, 1/1/2034, Call 1/1/2024 | | 1,000,000 | | | | 1,170,110 |
City of Atlanta, NATL-RE FGIC, 5.500%, 11/1/2022 | | 1,000,000 | | | | 1,169,330 |
Cobb County Kennestone Hospital Authority, 5.000%, 4/1/2031, Call 4/1/2021 | | 3,000,000 | | | | 3,280,320 |
Floyd County Hospital Authority, County Guarantee: | | | | | | |
5.000%, 7/1/2020 | | 1,335,000 | | | | 1,470,890 |
5.000%, 7/1/2021 | | 1,155,000 | | | | 1,309,089 |
5.000%, 7/1/2027, Call 7/1/2022 | | 1,250,000 | | | | 1,431,337 |
Fulton County Development Authority, 5.250%, 3/15/2024, Call 3/15/2019 | | 1,120,000 | | | | 1,191,154 |
Gainesville & Hall County Development Authority: | | | | | | |
5.000%, 3/1/2027 | | 400,000 | | | | 448,356 |
5.000%, 3/1/2037, Call 3/1/2027 | | 500,000 | | | | 538,010 |
5.000%, 3/1/2047, Call 3/1/2027 | | 500,000 | | | | 527,410 |
Gainesville & Hall County Hospital Authority: | | | | | | |
5.000%, 2/15/2036, Call 2/15/2027 | | 1,500,000 | | | | 1,733,040 |
5.000%, 2/15/2037, Call 2/15/2027 | | 2,000,000 | | | | 2,305,420 |
5.000%, 2/15/2042, Call 2/15/2027 | | 3,000,000 | | | | 3,418,620 |
Jefferson City School District, SAW, 5.250%, 2/1/2029, Call 2/1/2021 | | 1,350,000 | | | | 1,533,681 |
Main Street Natural Gas, Inc., 5.250%, 9/15/2018 | | 250,000 | | | | 259,970 |
Private Colleges & Universities Authority, 5.000%, 10/1/2020 | | 575,000 | | | | 622,524 |
Richmond County Hospital Authority: | | | | | | |
5.250%, 1/1/2029, Call 1/1/2019 | | 1,150,000 | | | | 1,216,389 |
5.375%, 1/1/2029, Call 1/1/2019 | | 940,000 | | | | 995,808 |
South Fulton Municipal Regional Water & Sewer Authority, BAM: | | | | | | |
5.000%, 1/1/2023 | | 800,000 | | | | 936,816 |
5.000%, 1/1/2024 | | 1,000,000 | | | | 1,184,410 |
5.000%, 1/1/2025, Call 1/1/2024 | | 700,000 | | | | 838,768 |
South Regional Joint Development Authority, 5.250%, 8/1/2023 | | 25,000 | | | | 29,640 |
Spalding County, 6.125%, 9/1/2028, Call 9/1/2018 | | 700,000 | | | | 736,393 |
Valdosta & Lowndes County Hospital Authority, County Guarantee, 5.000%, 10/1/2025, Call 10/1/2021 | | 2,940,000 | | | | 3,305,089 |
Winder-Barrow Industrial Building Authority, AGM, 5.000%, 12/1/2029, Call 12/1/2021 | | 1,000,000 | | | | 1,140,460 |
| | | | | | 43,002,823 |
| | | |
Guam — 0.1% | | | | | | |
Territory of Guam: | | | | | | |
5.000%, 12/1/2030, Call 12/1/2026 | | 1,000,000 | | | | 1,145,920 |
5.000%, 12/1/2031, Call 12/1/2026 | | 1,000,000 | | | | 1,139,860 |
| | | | | | 2,285,780 |
| | | | | | |
Hawaii — 0.1% | | | | | | |
City & County of Honolulu: | | | | | | |
5.000%, 10/1/2022 | | 500,000 | | | | 593,445 |
5.000%, 10/1/2023 | | 500,000 | | | | 605,680 |
| | | | | | 1,199,125 |
| | | |
Idaho — 0.3% | | | | | | |
Boise-Kuna Irrigation District: | | | | | | |
5.875%, 6/1/2022, Call 6/1/2018 | | 200,000 | | | | 207,432 |
7.375%, 6/1/2034, Call 6/1/2018 | | 340,000 | | | | 356,368 |
Canyon County School District No. 131 Nampa, School Bond Gty, 5.000%, 9/15/2023 | | 1,000,000 | | | | 1,206,660 |
Idaho Health Facilities Authority, 6.500%, 11/1/2023, Call 11/1/2018 | | 515,000 | | | | 547,805 |
Idaho Housing & Finance Association, AGC, 5.250%, 7/15/2026, Call 7/15/2018 | | 2,965,000 | | | | 3,077,344 |
| | | | | | 5,395,609 |
| | | |
Illinois — 15.5% | | | | | | |
Bureau County Township High School District No. 502, BAM, 6.625%, 10/1/2043, Call 12/1/2023 | | 3,400,000 | | | | 4,189,582 |
Chicago Board of Education: | | | | | | |
6.000%, 4/1/2046, Call 4/1/2027 | | 1,500,000 | | | | 1,740,420 |
9.000%, 3/1/2032, Call 9/1/2018 | | 5,855,000 | | | | 5,883,280 |
Chicago Board of Education, NATL: | | | | | | |
0.000%, 12/1/2022 | | 365,000 | | | | 312,626 |
5.250%, 12/1/2021 | | 1,000,000 | | | | 1,094,250 |
Chicago Board of Education, NATL-RE, 5.000%, 12/1/2019 | | 70,000 | | | | 73,874 |
Chicago O’Hare International Airport: | | | | | | |
5.000%, 1/1/2026, Call 1/1/2025 (16) | | 1,500,000 | | | | 1,793,670 |
5.000%, 1/1/2031, Call 1/1/2025 (16) | | 1,000,000 | | | | 1,154,670 |
5.000%, 1/1/2039, Call 1/1/2027 | | 2,000,000 | | | | 2,310,700 |
Chicago O’Hare International Airport, AGC, 5.250%, 1/1/2026, Call 1/1/2020 | | 775,000 | | | | 846,385 |
Chicago Park District: | | | | | | |
5.000%, 1/1/2023, Call 1/1/2022 | | 1,060,000 | | | | 1,194,217 |
5.000%, 1/1/2025, Call 7/1/2020 | | 230,000 | | | | 247,048 |
5.000%, 1/1/2026, Call 1/1/2021 | | 730,000 | | | | 789,699 |
5.000%, 1/1/2028, Call 1/1/2024 | | 2,500,000 | | | | 2,821,075 |
5.000%, 11/15/2029, Call 11/15/2018 | | 130,000 | | | | 136,413 |
5.000%, 1/1/2031, Call 1/1/2026 | | 1,790,000 | | | | 2,018,046 |
5.000%, 1/1/2040, Call 1/1/2026 | | 1,000,000 | | | | 1,099,070 |
Chicago Transit Authority, 5.000%, 12/1/2046, Call 12/1/2026 | | 3,000,000 | | | | 3,310,020 |
Chicago Transit Authority, AGC: | | | | | | |
5.250%, 6/1/2019, Call 6/1/2018 | | 375,000 | | | | 387,360 |
5.250%, 6/1/2022, Call 6/1/2018 | | 3,250,000 | | | | 3,357,120 |
City of Chicago: | | | | | | |
5.000%, 11/1/2025 | | 2,000,000 | | | | 2,358,580 |
5.000%, 11/1/2027, Call 11/1/2026 | | 2,500,000 | | | | 2,954,550 |
5.000%, 11/1/2027, Call 11/1/2026 | | 1,000,000 | | | | 1,181,820 |
5.000%, 11/1/2028, Call 11/1/2026 | | 1,000,000 | | | | 1,174,750 |
5.000%, 11/1/2029, Call 11/1/2026 | | 1,000,000 | | | | 1,165,970 |
5.000%, 1/1/2031, Call 1/1/2025 | | 3,715,000 | | | | 4,163,549 |
5.000%, 1/1/2032, Call 1/1/2027 | | 2,000,000 | | | | 2,279,380 |
5.000%, 1/1/2033, Call 1/1/2027 | | 3,000,000 | | | | 3,401,010 |
5.000%, 1/1/2039, Call 1/1/2025 | | 500,000 | | | | 548,375 |
6.000%, 1/1/2038, Call 1/1/2027 | | 10,000,000 | | | | 11,567,800 |
City of Chicago, AGM: | | | | | | |
5.000%, 11/1/2027, Call 11/1/2018 | | 140,000 | | | | 146,682 |
5.000%, 11/1/2027, Call 11/1/2018 | | 60,000 | | | | 62,587 |
City of Springfield: | | | | | | |
5.000%, 12/1/2022 | | 905,000 | | | | 1,034,460 |
5.000%, 3/1/2028, Call 3/1/2025 | | 1,000,000 | | | | 1,160,830 |
5.000%, 3/1/2029, Call 3/1/2025 | | 1,000,000 | | | | 1,153,480 |
Cook County Community Consolidated School District No. 65 Evanston: | | | | | | |
0.000%, 12/1/2027, Call 12/1/2024 | | 300,000 | | | | 207,774 |
0.000%, 12/1/2029, Call 12/1/2024 | | 400,000 | | | | 247,572 |
0.000%, 12/1/2030, Call 12/1/2024 | | 1,130,000 | | | | 661,943 |
0.000%, 12/1/2031, Call 12/1/2024 | | 1,500,000 | | | | 830,085 |
| | | | | | |
Cook County Community High School District No. 219-Niles Township, FSA, 5.000%, 12/1/2025, Call 12/1/2017 | | 1,405,000 | | | | 1,418,404 |
Cook County School District No. 103 Lyons, AGM, 0.000%, 12/1/2021 | | 850,000 | | | | 774,112 |
Cook County School District No. 124 Evergreen Park, BAM, 4.000%, 12/1/2020 | | 450,000 | | | | 486,882 |
Cook County School District No. 144 Prairie Hills, AGM: | | | | | | |
0.000%, 12/1/2028 | | 2,830,000 | | | | 1,845,783 |
0.000%, 12/1/2029 | | 2,580,000 | | | | 1,596,762 |
Cook County School District No. 83 Mannheim, 5.625%, 6/1/2033 | | 2,980,000 | | | | 3,523,403 |
Cook County Township High School District No. 201 J Sterling Morton, AMBAC, 0.000%, 12/1/2019 | | 675,000 | | | | 643,336 |
Cook County Township High School District No. 220 Reavis: | | | | | | |
6.000%, 12/1/2030, Call 12/1/2023 | | 1,000,000 | | | | 1,191,350 |
6.000%, 12/1/2031, Call 12/1/2023 | | 2,035,000 | | | | 2,424,397 |
6.000%, 12/1/2032, Call 12/1/2023 | | 2,160,000 | | | | 2,574,677 |
6.000%, 6/1/2033, Call 12/1/2023 | | 2,235,000 | | | | 2,657,013 |
County of Cook: | | | | | | |
5.000%, 11/15/2029, Call 11/15/2026 | | 3,270,000 | | | | 3,749,382 |
5.000%, 11/15/2031, Call 11/15/2026 | | 2,000,000 | | | | 2,276,080 |
5.250%, 11/15/2023, Call 11/15/2020 | | 350,000 | | | | 383,512 |
County of Cook, BAM, 5.000%, 11/15/2023 | | 1,000,000 | | | | 1,160,590 |
County of St. Clair: | | | | | | |
5.250%, 10/1/2024, Call 10/1/2019 | | 485,000 | | | | 527,530 |
5.250%, 10/1/2024, Call 10/1/2019 | | 215,000 | | | | 230,454 |
5.250%, 10/1/2027, Call 10/1/2019 | | 835,000 | | | | 908,221 |
5.250%, 10/1/2027, Call 10/1/2019 | | 315,000 | | | | 336,442 |
5.500%, 1/1/2038, Call 1/1/2023 | | 825,000 | | | | 933,034 |
County of Will: | | | | | | |
5.750%, 1/1/2023 | | 480,000 | | | | 480,600 |
5.750%, 1/1/2023 | | 545,000 | | | | 547,839 |
DeKalb County Community Unit School District No. 424 Genoa-Kingston, AMBAC, 0.000%, 1/1/2020 | | 600,000 | | | | 570,048 |
DeKalb County Community Unit School District No. 428 DeKalb: | | | | | | |
0.000%, 1/1/2025, Call 7/1/2020 | | 400,000 | | | | 292,448 |
0.000%, 1/1/2028, Call 7/1/2020 | | 1,000,000 | | | | 598,240 |
DeKalb, Kane & LaSalle Counties Etc Community College District No. 523 Kishwaukee, 0.000%, 2/1/2035, Call 2/1/2021 | | 470,000 | | | | 162,310 |
DuPage County School District No. 16 Queen Bee, NATL-RE FGIC, 0.000%, 11/1/2019 | | 530,000 | | | | 508,100 |
Frankfort Square Park District, AMBAC, 0.000%, 1/1/2022 | | 670,000 | | | | 580,923 |
Illinois Finance Authority: | | | | | | |
2.500%, 5/15/2018 | | 170,000 | | | | 170,753 |
5.000%, 11/15/2023, Call 11/15/2022 | | 215,000 | | | | 248,948 |
5.000%, 8/15/2024 | | 250,000 | | | | 290,465 |
5.000%, 5/15/2025 | | 1,000,000 | | | | 1,109,590 |
5.000%, 11/15/2026, Call 11/15/2025 | | 1,000,000 | | | | 1,184,110 |
5.000%, 11/15/2027, Call 11/15/2025 | | 500,000 | | | | 585,995 |
5.000%, 11/1/2029, Call 11/1/2026 | | 2,000,000 | | | | 2,328,440 |
5.000%, 5/15/2030, Call 5/15/2025 | | 1,000,000 | | | | 1,064,230 |
5.000%, 11/1/2030, Call 11/1/2026 | | 1,200,000 | | | | 1,388,724 |
5.000%, 1/1/2036, Call 1/1/2027 | | 2,000,000 | | | | 2,235,040 |
5.000%, 8/1/2042, Call 8/1/2027 | | 580,000 | | | | 634,468 |
5.000%, 8/1/2046, Call 8/1/2027 | | 515,000 | | | | 562,035 |
5.000%, 8/1/2047, Call 8/1/2027 | | 750,000 | | | | 816,555 |
5.250%, 11/15/2022, Call 11/15/2017 | | 1,450,000 | | | | 1,462,426 |
5.250%, 2/15/2030, Call 2/15/2020 | | 250,000 | | | | 269,950 |
6.000%, 10/1/2024, Call 10/1/2021 | | 1,010,000 | | | | 1,104,566 |
6.000%, 8/15/2041, Call 8/15/2021 | | 2,665,000 | | | | 3,031,251 |
6.875%, 10/1/2043, Call 10/1/2021 | | 3,000,000 | | | | 3,342,300 |
Illinois Finance Authority, AGC, 5.250%, 8/15/2019 | | 250,000 | | | | 270,885 |
Illinois Finance Authority, AGM: | | | | | | |
0.000%, 1/1/2020 | | 450,000 | | | | 439,101 |
0.000%, 1/1/2020 | | 500,000 | | | | 478,655 |
0.000%, 1/1/2021 | | 255,000 | | | | 245,315 |
5.150%, 1/1/2019 | | 420,000 | | | | 441,987 |
Illinois Finance Authority, AMBAC, 6.000%, 2/1/2022, Call 2/1/2018 | | 335,000 | | | | 342,015 |
Illinois Housing Development Authority, GNMA/FNMA COLL, 2.450%, 6/1/2043, Call 1/1/2023 | | 660,969 | | | | 659,925 |
| | | | | | |
Illinois State Toll Highway Authority: | | | | | | |
5.000%, 1/1/2028, Call 1/1/2023 | | 1,000,000 | | | | 1,146,840 |
5.000%, 1/1/2029, Call 1/1/2023 | | 1,000,000 | | | | 1,141,420 |
5.000%, 1/1/2030, Call 1/1/2026 | | 1,000,000 | | | | 1,181,760 |
5.000%, 12/1/2032, Call 1/1/2026 | | 7,790,000 | | | | 9,097,785 |
5.500%, 1/1/2033, Call 1/1/2018 | | 490,000 | | | | 497,374 |
Kane & DeKalb Counties Community Unit School District No. 302 Kaneland, NATL-RE FGIC, 0.000%, 2/1/2023 | | 5,450,000 | | | | 4,765,425 |
Kane Cook & DuPage Counties School District No. U-46 Elgin, AMBAC: | | | | | | |
0.000%, 1/1/2023 | | 350,000 | | | | 324,110 |
0.000%, 1/1/2023 | | 650,000 | | | | 566,845 |
Kane McHenry Cook & De Kalb Counties Unit School District No. 300: | | | | | | |
5.000%, 1/1/2023 | | 1,000,000 | | | | 1,169,360 |
5.000%, 1/1/2024 | | 1,000,000 | | | | 1,186,370 |
5.000%, 1/1/2026, Call 1/1/2025 | | 4,000,000 | | | | 4,723,600 |
5.250%, 1/1/2033, Call 1/1/2023 | | 900,000 | | | | 1,013,922 |
Knox & Warren Counties Community Unit School District No. 205 Galesburg, 6.125%, 1/1/2036, Call 1/1/2021 | | 1,435,000 | | | | 1,624,147 |
Lake County School District No. 33, XLCA: | | | | | | |
0.000%, 12/1/2026 | | 525,000 | | | | 345,870 |
0.000%, 12/1/2028 | | 335,000 | | | | 195,952 |
Lake County School District No. 38 Big Hollow, AMBAC, 0.000%, 2/1/2019 | | 200,000 | | | | 192,748 |
Lake County School District No. 56 Gurnee, 5.000%, 1/1/2024 | | 440,000 | | | | 516,270 |
McHenry & Kane Counties Community Consolidated School District No. 158 Huntley, AGM FGIC, 0.000%, 1/1/2024 | | 500,000 | | | | 429,490 |
McHenry & Kane Counties Community Consolidated School District No. 158 Huntley, NATL, 0.000%, 1/1/2021 | | 1,900,000 | | | | 1,789,097 |
McHenry County Community High School District No. 154 Marengo, NATL-RE FGIC, 0.000%, 1/1/2018 | | 325,000 | | | | 323,697 |
McHenry County Community Unit School District No. 12 Johnsburg, AGM: | | | | | | |
4.000%, 1/1/2019 | | 265,000 | | | | 273,512 |
5.000%, 1/1/2020 | | 550,000 | | | | 590,183 |
5.000%, 1/1/2021 | | 810,000 | | | | 889,834 |
5.000%, 1/1/2022 | | 895,000 | | | | 1,003,188 |
Metropolitan Pier & Exposition Authority, NATL-RE: | | | | | | |
0.000%, 12/15/2023 | | 855,000 | | | | 718,106 |
0.000%, 6/15/2024 | | 1,000,000 | | | | 820,040 |
5.700%, 6/15/2023 (15) | | 3,530,000 | | | | 4,188,063 |
Metropolitan Pier & Exposition Authority, NATL-RE FGIC, 0.000%, 6/15/2020 | | 440,000 | | | | 413,398 |
Metropolitan Water Reclamation District of Greater Chicago, 5.000%, 12/1/2031, Call 12/1/2026 | | 3,500,000 | | | | 4,125,835 |
Northern Illinois Municipal Power Agency, NATL-RE, 5.000%, 1/1/2020, Call 1/1/2018 | | 2,215,000 | | | | 2,244,814 |
Peoria Public Building Commission, AGC, 0.000%, 12/1/2019, Call 12/1/2018 | | 1,000,000 | | | | 939,800 |
Railsplitter Tobacco Settlement Authority, 5.250%, 6/1/2021 | | 1,120,000 | | | | 1,273,776 |
Rib Floater Trust Various States, 1.040%, 4/1/2036, Call 4/1/2027 (6) (12) | | 1,000,000 | | | | 1,000,000 |
South Suburban College Community School District No. 510, AGC, 0.000%, 12/1/2025 | | 1,000,000 | | | | 770,540 |
Southern Illinois University, BAM, 5.000%, 4/1/2026, Call 4/1/2025 | | 1,175,000 | | | | 1,317,833 |
Southwestern Illinois Development Authority: | | | | | | |
5.000%, 10/15/2029, Call 10/15/2025 | | 1,780,000 | | | | 2,023,504 |
5.000%, 10/15/2032, Call 10/15/2025 | | 1,335,000 | | | | 1,497,283 |
Southwestern Illinois Development Authority, AGC, 5.750%, 2/1/2029, Call 2/1/2019 | | 1,025,000 | | | | 1,086,705 |
St. Clair County Community Unit School District No. 187 Cahokia, AGM, 5.000%, 1/1/2020 | | 630,000 | | | | 677,968 |
St. Louis Regional Airport Authority, 6.000%, 12/1/2024, Call 12/1/2018 (16) | | 745,000 | | | | 789,685 |
State of Illinois: | | | | | | |
5.000%, 3/1/2020 | | 500,000 | | | | 530,195 |
5.000%, 4/1/2024, Call 4/1/2023 | | 500,000 | | | | 550,120 |
5.000%, 11/1/2025 | | 7,000,000 | | | | 7,828,380 |
5.000%, 2/1/2027 | | 1,000,000 | | | | 1,119,270 |
5.000%, 2/1/2029, Call 2/1/2027 | | 1,000,000 | | | | 1,095,750 |
5.000%, 11/1/2033, Call 11/1/2026 | | 8,000,000 | | | | 8,506,800 |
5.250%, 6/15/2034, Call 6/15/2019 | | 3,715,000 | | | | 4,000,238 |
6.500%, 6/15/2022 | | 300,000 | | | | 337,032 |
State of Illinois, AGM, 5.000%, 4/1/2028, Call 4/1/2023 | | 3,205,000 | | | | 3,497,104 |
Stephenson County School District No. 145 Freeport, AMBAC, 0.000%, 1/1/2018 | | 425,000 | | | | 423,134 |
Tazewell County School District No. 51 Washington Central, NATL-RE FGIC, 9.000%, 12/1/2025 | | 165,000 | | | | 241,445 |
Town of Cicero: | | | | | | |
5.000%, 1/1/2020 | | 1,000,000 | | | | 1,079,710 |
5.000%, 1/1/2021 | | 1,000,000 | | | | 1,109,810 |
Village of Bolingbrook, AGM, 5.000%, 1/1/2025, Call 1/1/2020 | | 1,425,000 | | | | 1,527,757 |
| | | | | | |
Village of Elwood, RADIAN: | | | | | | |
0.000%, 3/1/2024, Call 3/1/2018 | | 250,000 | | | | 178,418 |
0.000%, 3/1/2026, Call 3/1/2018 | | 1,280,000 | | | | 814,771 |
Village of Franklin Park, BAM: | | | | | | |
4.000%, 10/1/2018 | | 425,000 | | | | 437,928 |
4.000%, 10/1/2019 | | 420,000 | | | | 442,546 |
4.000%, 10/1/2020 | | 615,000 | | | | 661,143 |
5.000%, 10/1/2022, Call 10/1/2021 | | 730,000 | | | | 829,251 |
5.000%, 10/1/2023, Call 10/1/2021 | | 685,000 | | | | 777,263 |
5.000%, 10/1/2024, Call 10/1/2021 | | 425,000 | | | | 481,708 |
5.000%, 10/1/2025, Call 10/1/2021 | | 920,000 | | | | 1,041,201 |
Village of Justice, AMBAC, 0.000%, 1/1/2021 | | 635,000 | | | | 575,234 |
Will & Kankakee Counties School District No 255: | | | | | | |
5.000%, 6/1/2026, Call 6/1/2025 | | 500,000 | | | | 581,680 |
5.000%, 6/1/2029, Call 6/1/2025 | | 600,000 | | | | 679,176 |
Will County Community High School District No. 210 Lincoln-Way: | | | | | | |
5.000%, 1/1/2027, Call 1/1/2023 | | 1,250,000 | | | | 1,243,475 |
5.000%, 1/1/2028, Call 1/1/2023 | | 3,500,000 | | | | 3,444,385 |
5.000%, 1/1/2030, Call 1/1/2023 | | 1,500,000 | | | | 1,449,030 |
Will County Community School District No. 161 Summit Hill, NATL-RE FGIC, 0.000%, 1/1/2019 | | 695,000 | | | | 677,785 |
Will County Community Unit School District No. 201-U Crete-Monee, NATL-RE: | | | | | | |
0.000%, 11/1/2020 | | 245,000 | | | | 236,300 |
0.000%, 11/1/2020 | | 1,755,000 | | | | 1,640,574 |
0.000%, 11/1/2021 | | 55,000 | | | | 52,226 |
0.000%, 11/1/2021 | | 245,000 | | | | 222,894 |
0.000%, 11/1/2022 | | 60,000 | | | | 55,952 |
0.000%, 11/1/2022 | | 190,000 | | | | 167,595 |
Will County School District No. 114 Manhattan, NATL, 0.000%, 12/1/2017 | | 375,000 | | | | 373,387 |
Will County School District No. 114, NATL-RE FGIC: | | | | | | |
0.000%, 12/1/2020 | | 1,180,000 | | | | 1,098,285 |
0.000%, 12/1/2023 | | 1,600,000 | | | | 1,356,912 |
Will County Township High School District No. 204 Joliet, 6.250%, 1/1/2031, Call 1/1/2021 | | 500,000 | | | | 575,910 |
Will, Grundy, Etc. Counties Community College District No. 525: | | | | | | |
5.250%, 6/1/2036, Call 12/1/2023 | | 3,400,000 | | | | 3,913,366 |
5.750%, 6/1/2028, Call 6/1/2018 | | 170,000 | | | | 175,700 |
Williamson County Community Unit School District No. 5 Carterville, AGC: | | | | | | |
0.000%, 1/1/2029, Call 1/1/2019 | | 300,000 | | | | 166,359 |
0.000%, 1/1/2033, Call 1/1/2019 | | 1,000,000 | | | | 417,010 |
0.000%, 1/1/2034, Call 1/1/2019 | | 1,000,000 | | | | 386,460 |
Winnebago & Boone Counties School District No. 205 Rockford: | | | | | | |
0.000%, 2/1/2020 | | 500,000 | | | | 474,620 |
4.000%, 2/1/2027, Call 2/1/2023 | | 4,680,000 | | | | 4,971,751 |
| | | | | | 250,473,512 |
| | | |
Indiana — 2.3% | | | | | | |
Carmel Redevelopment Authority, 5.000%, 7/1/2023, Call 7/1/2020 | | 350,000 | | | | 385,935 |
City of Greenwood: | | | | | | |
4.000%, 10/1/2017 | | 115,000 | | | | 115,223 |
4.250%, 10/1/2020, Call 10/1/2018 | | 820,000 | | | | 854,858 |
4.625%, 10/1/2024, Call 10/1/2018 | | 520,000 | | | | 544,970 |
City of Rockport, 1.750%, 6/1/2018 (12) | | 1,500,000 | | | | 1,504,260 |
Concord Community Schools Building Corp., AGM, 5.000%, 7/15/2025, Call 7/15/2018 | | 1,000,000 | | | | 1,035,760 |
Damon Run Conservancy District: | | | | | | |
4.500%, 1/1/2018 | | 215,000 | | | | 216,980 |
4.500%, 7/1/2018 | | 220,000 | | | | 225,188 |
Fishers Redevelopment District: | | | | | | |
5.125%, 7/15/2026, Call 1/15/2020 | | 1,875,000 | | | | 2,061,281 |
5.250%, 7/15/2023, Call 1/15/2020 | | 1,605,000 | | | | 1,769,127 |
Frankfort High School Elementary School Building Corp., 5.000%, 7/15/2025 | | 115,000 | | | | 140,157 |
Franklin Township-Marion County Multiple School Building Corp., SAW: | | | | | | |
5.000%, 7/10/2021 | | 580,000 | | | | 657,639 |
5.000%, 7/15/2029, Call 1/15/2023 | | 2,565,000 | | | | 2,985,275 |
Gary Chicago International Airport Authority, 5.000%, 2/1/2018 (16) | | 885,000 | | | | 898,275 |
Indiana Bond Bank, 1.450% (SIFMA Municipal Swap Index Yield+66 basis points), 10/15/2022 (7) | | 1,650,000 | | | | 1,588,884 |
Indiana Finance Authority: | | | | | | |
3.000%, 7/1/2019 | | 250,000 | | | | 258,623 |
5.000%, 8/15/2020 | | 700,000 | | | | 753,914 |
| | | | | | |
5.000%, 10/1/2022 | | 300,000 | | | | 343,491 |
5.000%, 10/1/2023 | | 400,000 | | | | 464,288 |
5.000%, 10/1/2024, Call 10/1/2023 | | 275,000 | | | | 318,013 |
5.000%, 5/1/2029, Call 5/1/2022 | | 4,070,000 | | | | 4,536,910 |
5.250%, 10/1/2024, Call 10/1/2021 | | 710,000 | | | | 820,497 |
5.250%, 10/1/2031, Call 10/1/2021 | | 2,190,000 | | | | 2,521,435 |
5.250%, 11/15/2046, Call 11/15/2026 | | 2,500,000 | | | | 2,793,275 |
5.500%, 5/1/2024, Call 5/1/2019 | | 1,000,000 | | | | 1,070,140 |
Indiana Health & Educational Facilities Financing Authority, AGM, 5.250%, 11/1/2023, Call 5/1/2018 | | 500,000 | | | | 514,485 |
Indiana Health Facility Financing Authority, AMBAC, 1.890%, 5/1/2031, Call 9/5/2017 (12) (13) | | 525,000 | | | | 487,293 |
Indiana Municipal Power Agency, 5.250%, 1/1/2024, Call 1/1/2019 | | 500,000 | | | | 529,205 |
Indianapolis Local Public Improvement Bond Bank: | | | | | | |
5.000%, 1/1/2021 | | 175,000 | | | | 195,241 |
5.000%, 1/1/2022, Call 1/1/2021 | | 200,000 | | | | 222,786 |
5.750%, 1/1/2038, Call 1/1/2019 | | 345,000 | | | | 367,411 |
Indianapolis Local Public Improvement Bond Bank, NATL-RE, 5.250%, 7/1/2022 | | 500,000 | | | | 582,795 |
Lafayette Redevelopment Authority, 3.000%, 2/1/2018 | | 95,000 | | | | 95,846 |
Marion High School Building Corp.: | | | | | | |
4.000%, 7/15/2019 | | 455,000 | | | | 479,980 |
4.000%, 7/15/2020, Call 1/15/2020 | | 935,000 | | | | 996,588 |
4.000%, 7/15/2021, Call 1/15/2020 | | 375,000 | | | | 399,881 |
North Central Campus School Building Corp., AGM, 5.250%, 7/15/2022, Call 7/15/2018 | | 1,000,000 | | | | 1,037,890 |
Portage Redevelopment District: | | | | | | |
5.000%, 1/15/2023 | | 280,000 | | | | 321,401 |
5.000%, 1/15/2024 | | 215,000 | | | | 249,701 |
Porter County Jail Building Corp., AGM, 5.500%, 7/10/2021 | | 200,000 | | | | 216,586 |
Rush County Elementary School Building Corp., SAW, 5.250%, 7/15/2021, Call 1/15/2019 | | 565,000 | | | | 598,578 |
Steuben Lakes Regional Waste District, 5.000%, 9/1/2024, Call 9/1/2023 | | 1,225,000 | | | | 1,444,226 |
| | | | | | 37,604,291 |
| | | |
Iowa — 0.4% | | | | | | |
Iowa Finance Authority, 5.000%, 5/15/2036, Call 5/15/2026 | | 4,000,000 | | | | 4,513,240 |
Johnston Community School District, AGM, 5.000%, 7/1/2027, Call 7/1/2022 | | 1,455,000 | | | | 1,674,792 |
| | | | | | 6,188,032 |
| | | |
Kansas — 0.2% | | | | | | |
Kansas Development Finance Authority: | | | | | | |
5.000%, 11/15/2020, Call 11/15/2019 | | 800,000 | | | | 869,736 |
5.000%, 3/1/2031, Call 3/1/2020 | | 1,000,000 | | | | 1,071,140 |
Kansas Development Finance Authority, FSA, 5.250%, 11/1/2028, Call 11/1/2018 | | 475,000 | | | | 499,030 |
Wyandotte County-Kansas City, 5.000%, 9/1/2032, Call 9/1/2022 | | 1,000,000 | | | | 1,146,810 |
| | | | | | 3,586,716 |
| | | |
Kentucky — 1.1% | | | | | | |
Kentucky Asset Liability Commission: | | | | | | |
5.000%, 9/1/2024 | | 1,000,000 | | | | 1,208,460 |
5.000%, 9/1/2025 | | 1,250,000 | | | | 1,524,488 |
Kentucky Economic Development Finance Authority: | | | | | | |
5.000%, 8/15/2041, Call 8/15/2027 | | 1,500,000 | | | | 1,658,295 |
5.000%, 8/15/2046, Call 8/15/2027 | | 1,500,000 | | | | 1,654,380 |
Kentucky State Property & Building Commission, NATL, 5.000%, 3/1/2022, Call 10/2/2017 | | 35,000 | | | | 35,094 |
Louisville/Jefferson County Metropolitan Government: | | | | | | |
5.000%, 10/1/2030, Call 10/1/2026 | | 1,300,000 | | | | 1,534,728 |
5.000%, 10/1/2031, Call 10/1/2026 | | 3,500,000 | | | | 4,112,885 |
Paducah Electric Plant Board, AGC, 5.000%, 10/1/2023, Call 4/1/2019 | | 100,000 | | | | 106,358 |
Paducah Electric Plant Board, AGM: | | | | | | |
5.000%, 10/1/2027, Call 10/1/2026 | | 2,000,000 | | | | 2,380,220 |
5.000%, 10/1/2028, Call 10/1/2026 | | 1,850,000 | | | | 2,185,331 |
5.000%, 10/1/2030, Call 10/1/2026 | | 1,500,000 | | | | 1,748,295 |
Pulaski County Public Properties Corp., 5.500%, 12/1/2024, Call 12/1/2018 | | 260,000 | | | | 274,565 |
| | | | | | 18,423,099 |
| | | | | | |
| | | |
Louisiana — 2.4% | | | | | | |
City of Bossier, 5.000%, 10/1/2031, Call 10/1/2024 | | 1,160,000 | | | | 1,361,608 |
City of New Orleans: | | | | | | |
5.000%, 6/1/2021 | | 800,000 | | | | 906,024 |
5.000%, 12/1/2021 | | 500,000 | | | | 569,570 |
5.000%, 6/1/2022 | | 450,000 | | | | 522,855 |
5.000%, 12/1/2022 | | 725,000 | | | | 843,958 |
5.000%, 6/1/2023 | | 500,000 | | | | 591,600 |
5.000%, 12/1/2024 | | 765,000 | | | | 917,166 |
5.000%, 6/1/2026, Call 6/1/2025 | | 150,000 | | | | 181,026 |
5.000%, 12/1/2026, Call 12/1/2025 | | 240,000 | | | | 289,759 |
5.000%, 6/1/2027, Call 6/1/2025 | | 200,000 | | | | 239,158 |
5.000%, 6/1/2029, Call 6/1/2025 | | 200,000 | | | | 235,734 |
5.000%, 12/1/2029, Call 12/1/2025 | | 350,000 | | | | 413,325 |
City of Shreveport, BAM, 4.000%, 12/1/2025, Call 12/1/2024 | | 2,210,000 | | | | 2,488,880 |
Lafayette Public Trust Financing Authority, AGM: | | | | | | |
4.000%, 10/1/2020 | | 690,000 | | | | 739,190 |
4.000%, 10/1/2021 | | 675,000 | | | | 734,400 |
Louisiana Housing Corp., GNMA/FNMA/FHLMC, 4.750%, 6/1/2027, Call 6/1/2020 | | 715,000 | | | | 746,503 |
Louisiana Public Facilities Authority: | | | | | | |
3.375%, 9/1/2028, Call 3/1/2021 | | 2,440,000 | | | | 2,452,371 |
5.000%, 5/15/2042, Call 5/15/2027 | | 2,500,000 | | | | 2,830,000 |
Louisiana Stadium & Exposition District, 5.000%, 7/1/2023 | | 800,000 | | | | 944,216 |
Louisiana State Citizens Property Insurance Corp., 5.000%, 6/1/2020 | | 650,000 | | | | 717,015 |
New Orleans Aviation Board: | | | | | | |
5.000%, 1/1/2043, Call 1/1/2027 | | 1,500,000 | | | | 1,739,625 |
5.000%, 1/1/2048, Call 1/1/2027 | | 1,875,000 | | | | 2,164,631 |
Parish of St. Bernard: | | | | | | |
4.000%, 3/1/2020 | | 3,470,000 | | | | 3,678,304 |
4.000%, 3/1/2021 | | 3,585,000 | | | | 3,868,000 |
Port New Orleans Board of Commissioners, 5.000%, 4/1/2032, Call 4/1/2023 (16) | | 725,000 | | | | 786,835 |
Regional Transit Authority, NATL-RE FGIC, 0.000%, 12/1/2021 | | 240,000 | | | | 197,278 |
State of Louisiana, 1.332% (LIBOR 1 Month+47 basis points), 5/1/2018, Call 11/1/2017 (7) | | 7,000,000 | | | | 7,001,820 |
Terrebonne Parish Consolidated Government, 5.875%, 3/1/2024, Call 3/1/2019 | | 495,000 | | | | 531,576 |
| | | | | | 38,692,427 |
| | | |
Maine — 0.6% | | | | | | |
City of Portland, 5.000%, 7/1/2022 | | 300,000 | | | | 344,343 |
Maine State Housing Authority, 3.850%, 11/15/2029, Call 11/15/2021 | | 7,500,000 | | | | 7,880,475 |
Maine Turnpike Authority, 5.000%, 7/1/2029, Call 7/1/2022 | | 1,500,000 | | | | 1,734,855 |
| | | | | | 9,959,673 |
| | | |
Maryland — 1.0% | | | | | | |
City of Baltimore: | | | | | | |
5.000%, 9/1/2034, Call 9/1/2027 | | 1,000,000 | | | | 1,143,620 |
5.000%, 9/1/2035, Call 9/1/2027 | | 1,000,000 | | | | 1,140,880 |
5.000%, 9/1/2036, Call 9/1/2027 | | 1,000,000 | | | | 1,138,150 |
5.000%, 9/1/2039, Call 9/1/2027 | | 1,000,000 | | | | 1,143,620 |
5.000%, 9/1/2042, Call 9/1/2027 | | 1,000,000 | | | | 1,138,150 |
Maryland Health & Higher Educational Facilities Authority: | | | | | | |
5.000%, 5/15/2042, Call 5/15/2027 | | 4,750,000 | | | | 5,436,138 |
5.750%, 7/1/2034, Call 7/1/2021 | | 775,000 | | | | 910,369 |
Montgomery County Housing Opportunites Commission: | | | | | | |
5.000%, 7/1/2031, Call 7/1/2020 | | 655,000 | | | | 710,845 |
5.125%, 7/1/2037, Call 7/1/2020 | | 3,110,000 | | | | 3,382,654 |
| | | | | | 16,144,426 |
| | | |
Massachusetts — 1.1% | | | | | | |
Commonwealth of Massachusetts, NATL-RE FGIC: | | | | | | |
1.620%, 12/1/2030, Call 9/5/2017 (12) (13) | | 1,450,000 | | | | 1,338,347 |
1.635%, 12/1/2030, Call 9/7/2017 (12) (13) | | 7,375,000 | | | | 6,807,051 |
Massachusetts Development Finance Agency: | | | | | | |
5.000%, 7/1/2025, Call 7/1/2021 | | 1,425,000 | | | | 1,623,673 |
5.000%, 7/1/2027, Call 7/1/2025 | | 125,000 | | | | 150,213 |
Massachusetts Educational Financing Authority: | | | | | | |
5.000%, 7/1/2025, Call 7/1/2022 (16) | | 500,000 | | | | 551,625 |
5.250%, 1/1/2019 | | 445,000 | | | | 463,134 |
5.250%, 1/1/2019 (16) | | 1,150,000 | | | | 1,200,853 |
Massachusetts Health & Educational Facilities Authority, 5.000%, 7/1/2024, Call 7/1/2019 | | 3,105,000 | | | | 3,335,360 |
Massachusetts Housing Finance Agency, 3.700%, 12/1/2027, Call 6/1/2022 (16) | | 1,540,000 | | | | 1,578,300 |
Massachusetts School Building Authority, 5.000%, 8/15/2030, Call 8/15/2022 | | 815,000 | | | | 955,033 |
| | | | | | 18,003,589 |
| | | | | | |
Michigan — 4.0% | | | | | | |
Alma Public Schools, Q-SBLF, 5.000%, 5/1/2021 | | 890,000 | | | | 1,010,497 |
Bay City School District, Q-SBLF: | | | | | | |
5.000%, 11/1/2027, Call 5/1/2024 | | 645,000 | | | | 761,435 |
5.000%, 11/1/2028, Call 5/1/2024 | | 1,305,000 | | | | 1,530,843 |
Caledonia Community Schools, Q-SBLF: | | | | | | |
5.000%, 5/1/2025 | | 600,000 | | | | 725,700 |
5.000%, 5/1/2026 | | 500,000 | | | | 608,425 |
Carman-Ainsworth Community School District, BAM, 5.000%, 5/1/2020 | | 375,000 | | | | 411,473 |
Charter Township of Northville: | | | | | | |
4.000%, 4/1/2021 | | 400,000 | | | | 438,576 |
4.000%, 4/1/2022 | | 240,000 | | | | 267,751 |
Chippewa Valley Schools, Q-SBLF, 5.000%, 5/1/2027, Call 11/1/2025 | | 20,000 | | | | 23,944 |
City of Battle Creek, BAM, 5.000%, 6/1/2033, Call 6/1/2018 | | 1,000,000 | | | | 1,030,750 |
City of Detroit Sewage Disposal System Revenue, AGC NATL-RE, 5.250%, 7/1/2023, Call 10/2/2017 | | 95,000 | | | | 95,295 |
City of Detroit Sewage Disposal System Revenue, NATL, 0.000%, 7/1/2020 | | 110,000 | | | | 102,245 |
City of Detroit Water Supply System Revenue, BHAC FGIC, 5.500%, 7/1/2035, Call 7/1/2018 | | 1,035,000 | | | | 1,074,547 |
City of Wyandotte, BAM: | | | | | | |
5.000%, 10/1/2020 | | 200,000 | | | | 219,088 |
5.000%, 10/1/2021 | | 290,000 | | | | 324,197 |
5.000%, 10/1/2022 | | 290,000 | | | | 329,194 |
5.000%, 10/1/2023 | | 250,000 | | | | 286,963 |
5.000%, 10/1/2024 | | 300,000 | | | | 344,547 |
Coloma Community School District, Q-SBLF, 3.000%, 5/1/2021 | | 905,000 | | | | 963,038 |
Comstock Park Public Schools, Q-SBLF, 5.000%, 5/1/2028, Call 5/1/2021 | | 400,000 | | | | 446,096 |
Detroit City School District, AGM Q-SBLF, 5.250%, 5/1/2026 | | 300,000 | | | | 361,494 |
Dundee Community Schools, Q-SBLF: | | | | | | |
5.000%, 5/1/2022 | | 1,200,000 | | | | 1,383,960 |
5.000%, 5/1/2025 | | 1,000,000 | | | | 1,201,650 |
Fitzgerald Public School District, BAM, 4.000%, 5/1/2019 | | 2,065,000 | | | | 2,149,975 |
Forest Hills Public Schools, 5.000%, 5/1/2021 | | 1,600,000 | | | | 1,805,600 |
Fraser Public School District, Q-SBLF: | | | | | | |
5.000%, 5/1/2021 | | 1,000,000 | | | | 1,135,780 |
5.000%, 5/1/2022 | | 1,000,000 | | | | 1,165,520 |
5.000%, 5/1/2025 | | 1,700,000 | | | | 2,066,911 |
Grosse Ile Township School District, Q-SBLF: | | | | | | |
5.000%, 5/1/2026, Call 5/1/2025 | | 200,000 | | | | 240,644 |
5.000%, 5/1/2027, Call 5/1/2025 | | 230,000 | | | | 273,698 |
Hartland Consolidated Schools, AGM Q-SBLF: | | | | | | |
5.250%, 5/1/2026, Call 5/1/2021 | | 1,625,000 | | | | 1,824,745 |
5.250%, 5/1/2027, Call 5/1/2021 | | 600,000 | | | | 672,846 |
5.250%, 5/1/2028, Call 5/1/2021 | | 1,575,000 | | | | 1,765,039 |
Howell Public Schools, Q-SBLF, 4.250%, 5/1/2024, Call 5/1/2022 | | 1,000,000 | | | | 1,120,260 |
Jackson County Hospital Finance Authority, AGC, 4.500%, 6/1/2026, Call 6/1/2020 (12) | | 415,000 | | | | 453,865 |
Jenison Public Schools: | | | | | | |
5.000%, 5/1/2021 | | 500,000 | | | | 563,490 |
5.000%, 5/1/2022, Call 5/1/2021 | | 560,000 | | | | 629,406 |
Kent Hospital Finance Authority, 5.000%, 11/15/2029, Call 11/15/2021 | | 1,000,000 | | | | 1,122,590 |
Lansing Board of Water & Light, 5.000%, 7/1/2037, Call 7/1/2021 | | 1,000,000 | | | | 1,114,840 |
Lansing School District, Q-SBLF: | | | | | | |
5.000%, 5/1/2019 | | 1,000,000 | | | | 1,067,610 |
5.000%, 5/1/2020 | | 1,825,000 | | | | 2,009,544 |
Livonia Public Schools School District, BAM, 5.000%, 5/1/2021 | | 1,600,000 | | | | 1,796,480 |
Marshall Public Schools, Q-SBLF: | | | | | | |
4.000%, 11/1/2028, Call 5/1/2025 | | 1,380,000 | | | | 1,509,237 |
4.000%, 11/1/2029, Call 5/1/2025 | | 940,000 | | | | 1,017,860 |
Mattawan Consolidated School District, Q-SBLF, 5.000%, 5/1/2019 | | 215,000 | | | | 228,986 |
Michigan Finance Authority: | | | | | | |
5.000%, 11/1/2020 | | 2,000,000 | | | | 2,231,120 |
5.000%, 7/1/2026, Call 7/1/2025 | | 175,000 | | | | 203,196 |
5.000%, 7/1/2027, Call 7/1/2025 | | 600,000 | | | | 692,100 |
5.000%, 7/1/2029, Call 7/1/2025 | | 950,000 | | | | 1,095,103 |
5.000%, 7/1/2032, Call 7/1/2025 | | 1,500,000 | | | | 1,707,660 |
5.000%, 7/1/2034, Call 7/1/2025 | | 500,000 | | | | 561,805 |
5.000%, 11/15/2041, Call 11/15/2026 | | 1,000,000 | | | | 1,124,510 |
| | | | | | |
Michigan Finance Authority, AGM: | | | | | | |
5.000%, 7/1/2029, Call 7/1/2024 | | 1,500,000 | | | | 1,738,830 |
5.000%, 7/1/2030, Call 7/1/2024 | | 1,500,000 | | | | 1,730,670 |
Michigan State Housing Development Authority, 5.625%, 10/1/2031, Call 10/1/2020 | | 850,000 | | | | 920,788 |
North Branch Area Schools, Q-SBLF, 5.000%, 5/1/2024 | | 200,000 | | | | 237,882 |
Plymouth-Canton Community School District, Q-SBLF, 5.000%, 5/1/2021 | | 450,000 | | | | 512,833 |
Redford Union School District No. 1, AMBAC Q-SBLF, 5.000%, 5/1/2022 | | 250,000 | | | | 277,663 |
River Rouge School District, Q-SBLF: | | | | | | |
5.000%, 5/1/2020 | | 1,700,000 | | | | 1,874,726 |
5.000%, 5/1/2021 | | 1,155,000 | | | | 1,314,043 |
Taylor Tax Increment Finance Authority, AGM: | | | | | | |
3.000%, 5/1/2018 | | 855,000 | | | | 866,089 |
3.000%, 5/1/2019 | | 340,000 | | | | 349,190 |
3.250%, 5/1/2020 | | 90,000 | | | | 94,128 |
Wayland Union School District, AGM Q-SBLF: | | | | | | |
5.000%, 5/1/2024, Call 5/1/2018 | | 500,000 | | | | 513,675 |
5.250%, 5/1/2019, Call 5/1/2018 | | 400,000 | | | | 411,588 |
Wayne County Airport Authority: | | | | | | |
5.000%, 12/1/2026, Call 12/1/2025 (16) | | 3,000,000 | | | | 3,572,250 |
5.000%, 12/1/2030, Call 12/1/2025 | | 1,250,000 | | | | 1,481,262 |
Wayne State University, AGM: | | | | | | |
5.000%, 11/15/2025, Call 11/15/2018 | | 230,000 | | | | 241,489 |
5.000%, 11/15/2025, Call 11/15/2018 | | 285,000 | | | | 297,839 |
Western Township Utilities Authority, 4.000%, 1/1/2021 | | 1,200,000 | | | | 1,301,244 |
| | | | | | 65,028,317 |
| | | |
Minnesota — 0.5% | | | | | | |
City of Minneapolis, AGC: | | | | | | |
6.500%, 11/15/2038, Call 11/15/2018 | | 165,000 | | | | 175,966 |
6.500%, 11/15/2038, Call 11/15/2018 | | 905,000 | | | | 963,689 |
City of Minneapolis/St Paul Housing & Redevelopment Authority, 4.000%, 8/15/2019 | | 445,000 | | | | 468,398 |
City of Minneapolis/St Paul Housing & Redevelopment Authority, AGM, 5.000%, 8/15/2025, Call 8/15/2020 (12) | | 215,000 | | | | 236,313 |
City of Minneapolis/St Paul Housing & Redevelopment Authority, NATL-RE, 1.740%, 8/1/2027, Call 9/5/2017 (12) (13) | | 375,000 | | | | 350,591 |
City of Winona, 3.750%, 7/1/2021 | | 170,000 | | | | 176,370 |
Housing & Redevelopment Authority of The City of St. Paul, 4.000%, 11/15/2043, Call 11/15/2027 | | 1,500,000 | | | | 1,570,320 |
Minneapolis & St. Paul Housing & Redevelopment Authority, 5.250%, 8/15/2025, Call 8/15/2020 | | 275,000 | | | | 305,489 |
Minnesota Higher Education Facilities Authority, 5.000%, 10/1/2019 | | 400,000 | | | | 426,220 |
Minnesota Housing Finance Agency, 3.900%, 7/1/2030, Call 1/1/2022 | | 590,000 | | | | 612,556 |
Minnesota Housing Finance Agency, GNMA, 2.600%, 9/1/2042, Call 7/1/2022 | | 974,605 | | | | 983,493 |
Minnesota Housing Finance Agency, GNMA/FNMA COLL: | | | | | | |
2.250%, 12/1/2042, Call 1/1/2022 | | 602,245 | | | | 599,764 |
5.000%, 1/1/2031, Call 7/1/2021 | | 625,000 | | | | 665,925 |
| | | | | | 7,535,094 |
| | | |
Mississippi — 0.3% | | | | | | |
Mississippi Development Bank: | | | | | | |
3.125%, 10/1/2023 | | 185,000 | | | | 190,036 |
5.000%, 10/1/2023 | | 2,615,000 | | | | 2,899,172 |
5.000%, 1/1/2027, Call 1/1/2022 | | 1,200,000 | | | | 1,396,320 |
Mississippi Home Corp., GNMA/FNMA/FHLMC, 6.750%, 6/1/2039, Call 6/1/2018 | | 205,000 | | | | 218,185 |
Mississippi State University Educational Building Corp.: | | | | | | |
5.000%, 11/1/2021 | | 225,000 | | | | 257,661 |
5.000%, 11/1/2022 | | 135,000 | | | | 158,343 |
| | | | | | 5,119,717 |
| | | |
Missouri — 2.1% | | | | | | |
Bi-State Development Agency of the Missouri-Illinois Metropolitan District, 5.000%, 10/1/2033, Call 10/1/2022 | | 4,000,000 | | | | 4,666,000 |
Chesterfield Valley Transportation Development District: | | | | | | |
4.000%, 5/15/2019 | | 475,000 | | | | 497,691 |
5.000%, 5/15/2020 | | 125,000 | | | | 136,116 |
5.000%, 5/15/2021 | | 490,000 | | | | 545,561 |
City of Kansas City: | | | | | | |
5.000%, 9/1/2021, Call 9/1/2019 | | 500,000 | | | | 538,615 |
5.000%, 9/1/2023, Call 9/1/2019 | | 300,000 | | | | 322,554 |
| | | | | | |
5.000%, 10/1/2026, Call 10/1/2025 | | 120,000 | | | | 144,618 |
5.000%, 10/1/2028, Call 10/1/2025 | | 115,000 | | | | 135,155 |
5.000%, 9/1/2032, Call 9/1/2019 | | 1,000,000 | | | | 1,069,050 |
Health & Educational Facilities Authority: | | | | | | |
5.000%, 2/1/2032, Call 2/1/2026 | | 1,000,000 | | | | 1,123,060 |
5.000%, 11/15/2034, Call 5/15/2026 | | 3,000,000 | | | | 3,470,850 |
Independence School District, SAW, 5.250%, 3/1/2030, Call 3/1/2021 | | 2,000,000 | | | | 2,267,660 |
Joplin Industrial Development Authority, 5.000%, 2/15/2020 | | 330,000 | | | | 358,581 |
Lees Summit Industrial Development Authority: | | | | | | |
5.000%, 8/15/2036, Call 8/15/2024 | | 1,000,000 | | | | 1,066,010 |
5.000%, 8/15/2046, Call 8/15/2024 | | 2,000,000 | | | | 2,104,480 |
Missouri Health & Educational Facilities Authority, 5.000%, 2/1/2024, Call 2/1/2021 | | 1,050,000 | | | | 1,143,702 |
Missouri Housing Development Commission, 5.000%, 11/1/2027, Call 11/1/2019 | | 280,000 | | | | 289,094 |
Missouri Housing Development Commission, GNMA/FNMA/FHLMC: | | | | | | |
3.800%, 5/1/2025, Call 5/1/2021 | | 690,000 | | | | 728,778 |
4.000%, 5/1/2027, Call 5/1/2021 | | 680,000 | | | | 716,230 |
Missouri State Environmental Improvement & Energy Resources Authority: | | | | | | |
5.750%, 1/1/2029, Call 1/1/2019 | | 685,000 | | | | 728,559 |
5.750%, 1/1/2029, Call 1/1/2019 | | 65,000 | | | | 69,143 |
Missouri State Health & Educational Facilities Authority: | | | | | | |
3.750%, 2/15/2018 | | 950,000 | | | | 957,971 |
5.250%, 10/1/2031, Call 10/1/2021 | | 1,000,000 | | | | 1,139,420 |
St. Louis County Industrial Development Authority, 2.850%, 9/1/2018, Call 3/1/2018 | | 2,900,000 | | | | 2,903,973 |
St. Louis Regional Convention & Sports Complex Authority, 5.000%, 8/15/2020 | | 3,050,000 | | | | 3,375,588 |
Stone County Reorganized School District No. 4 Reeds Spring, SAW: | | | | | | |
5.000%, 3/1/2030, Call 3/1/2020 | | 1,000,000 | | | | 1,095,640 |
5.000%, 3/1/2031, Call 3/1/2020 | | 750,000 | | | | 821,730 |
5.000%, 3/1/2032, Call 3/1/2020 | | 1,000,000 | | | | 1,095,640 |
| | | | | | 33,511,469 |
| | | |
Nebraska — 0.4% | | | | | | |
Central Plains Energy Project, 5.000%, 12/1/2019 (12) | | 1,000,000 | | | | 1,080,340 |
Lancaster County Hospital Authority No. 1, 5.500%, 1/1/2030, Call 1/1/2020 | | 1,000,000 | | | | 1,083,420 |
Nebraska Public Power District: | | | | | | |
5.000%, 1/1/2025, Call 1/1/2018 | | 750,000 | | | | 760,215 |
5.000%, 1/1/2032, Call 1/1/2022 | | 1,000,000 | | | | 1,134,620 |
Omaha-Douglas Public Building Commission: | | | | | | |
5.000%, 5/1/2026, Call 5/1/2022 | | 825,000 | | | | 959,533 |
5.000%, 5/1/2027, Call 5/1/2022 | | 585,000 | | | | 679,822 |
5.000%, 5/1/2028, Call 5/1/2022 | | 550,000 | | | | 637,802 |
5.000%, 5/1/2029, Call 5/1/2022 | | 660,000 | | | | 764,069 |
| | | | | | 7,099,821 |
| | | |
Nevada — 1.3% | | | | | | |
County of Clark, 5.000%, 7/1/2028, Call 7/1/2019 | | 2,180,000 | | | | 2,341,320 |
County of Clark Department of Aviation: | | | | | | |
5.000%, 7/1/2029, Call 7/1/2024 | | 1,200,000 | | | | 1,412,484 |
5.000%, 7/1/2030, Call 7/1/2024 | | 1,000,000 | | | | 1,172,240 |
5.000%, 7/1/2040, Call 7/1/2027 | | 4,000,000 | | | | 4,679,600 |
County of Washoe: | | | | | | |
5.000%, 2/1/2033, Call 2/1/2019 | | 3,920,000 | | | | 4,126,545 |
5.500%, 2/1/2028, Call 2/1/2019 | | 1,000,000 | | | | 1,063,970 |
Las Vegas Valley Water District, 5.000%, 6/1/2028, Call 6/1/2022 | | 5,115,000 | | | | 5,958,412 |
| | | | | | 20,754,571 |
| | | |
New Hampshire — 0.1% | | | | | | |
New Hampshire Housing Finance Authority: | | | | | | |
4.500%, 1/1/2029, Call 7/1/2020 | | 365,000 | | | | 378,173 |
4.800%, 7/1/2028, Call 1/1/2022 | | 965,000 | | | | 1,008,946 |
| | | | | | 1,387,119 |
| | | |
New Jersey — 3.7% | | | | | | |
New Jersey Economic Development Authority: | | | | | | |
5.000%, 6/15/2019 | | 3,000,000 | | | | 3,145,350 |
5.000%, 6/15/2020 | | 1,500,000 | | | | 1,604,460 |
5.000%, 11/1/2021 | | 4,600,000 | | | | 5,091,004 |
5.500%, 6/15/2030, Call 12/15/2026 | | 2,500,000 | | | | 2,910,175 |
New Jersey Health Care Facilities Financing Authority, 5.000%, 7/1/2042, Call 7/1/2027 | | 1,500,000 | | | | 1,723,185 |
| | | | | | |
New Jersey Higher Education Student Assistance Authority, 4.875%, 12/1/2024, Call 12/1/2019 | | 6,520,000 | | | | 6,905,658 |
New Jersey Housing & Mortgage Finance Agency, 4.250%, 10/1/2032, Call 10/1/2021 | | 375,000 | | | | 390,135 |
New Jersey State Turnpike Authority: | | | | | | |
5.000%, 1/1/2032, Call 7/1/2022 | | 3,440,000 | | | | 3,928,824 |
5.000%, 1/1/2035, Call 1/1/2022 | | 1,685,000 | | | | 1,895,372 |
New Jersey State Turnpike Authority, NATL-RE: | | | | | | |
1.365%, 1/1/2030, Call 9/5/2017 (12) (13) | | 350,000 | | | | 316,493 |
1.365%, 1/1/2030, Call 9/7/2017 (12) (13) | | 475,000 | | | | 429,522 |
1.367%, 1/1/2030, Call 9/1/2017 (12) (13) | | 1,900,000 | | | | 1,718,138 |
1.418%, 1/1/2030, Call 9/1/2017 (12) (13) | | 500,000 | | | | 452,142 |
New Jersey Transportation Trust Fund Authority: | | | | | | |
1.790% (SIFMA Municipal Swap Index Yield+100 basis points), 12/15/2019, Call 6/15/2019 (7) | | 5,000,000 | | | | 4,940,650 |
5.000%, 6/15/2022 | | 500,000 | | | | 560,700 |
5.000%, 6/15/2032, Call 12/15/2024 | | 5,000,000 | | | | 5,471,050 |
5.250%, 12/15/2023, Call 12/15/2018 | | 1,355,000 | | | | 1,421,720 |
5.250%, 12/15/2023 | | 240,000 | | | | 278,554 |
New Jersey Transportation Trust Fund Authority, BAM: | | | | | | |
5.000%, 6/15/2028, Call 6/15/2022 | | 5,000,000 | | | | 5,462,500 |
5.000%, 6/15/2033, Call 6/15/2022 | | 3,000,000 | | | | 3,226,200 |
5.250%, 6/15/2033, Call 6/15/2023 | | 5,635,000 | | | | 6,214,391 |
New Jersey Transportation Trust Fund Authority, BHAC, 0.000%, 12/15/2024 | | 440,000 | | | | 374,444 |
New Jersey Turnpike Authority: | | | | | | |
5.000%, 1/1/2031, Call 1/1/2025 | | 500,000 | | | | 587,505 |
5.000%, 1/1/2040, Call 1/1/2028 | | 1,000,000 | | | | 1,182,180 |
| | | | | | 60,230,352 |
| | | |
New Mexico — 1.3% | | | | | | |
City of Farmington, 1.875%, 4/1/2020 (12) | | 2,000,000 | | | | 2,032,520 |
City of Santa Fe, 4.000%, 6/1/2025, Call 6/1/2022 | | 655,000 | | | | 727,364 |
New Mexico Finance Authority: | | | | | | |
5.000%, 6/1/2026, Call 6/1/2018 | | 2,395,000 | | | | 2,467,018 |
5.700%, 6/1/2026, Call 6/1/2018 | | 465,000 | | | | 481,577 |
5.800%, 6/1/2027, Call 6/1/2018 | | 825,000 | | | | 855,517 |
New Mexico Mortgage Finance Authority, GNMA, 2.600%, 2/1/2043, Call 1/1/2023 | | 912,683 | | | | 920,624 |
New Mexico Mortgage Finance Authority, GNMA/FNMA/FHLMC: | | | | | | |
4.500%, 9/1/2024, Call 9/1/2019 | | 195,000 | | | | 201,743 |
5.650%, 9/1/2039, Call 3/1/2019 | | 245,000 | | | | 255,995 |
New Mexico Mortgage Finance Authority, GNMA/FNMA/FHLMC COLL: | | | | | | |
4.625%, 3/1/2028, Call 9/1/2021 | | 615,000 | | | | 640,166 |
5.350%, 3/1/2030, Call 9/1/2020 | | 1,505,000 | | | | 1,584,208 |
New Mexico Municipal Energy Acquisition Authority, 1.575% (LIBOR 1 Month+75 basis points), 8/1/2019, Call 2/1/2019 (7) | | 10,000,000 | | | | 10,001,500 |
| | | | | | 20,168,232 |
| | | |
New York — 6.1% | | | | | | |
Albany Capital Resource Corp.: | | | | | | |
5.000%, 12/1/2023 | | 150,000 | | | | 174,915 |
5.000%, 12/1/2024 | | 200,000 | | | | 235,362 |
Buffalo & Erie County Industrial Land Development Corp.: | | | | | | |
5.000%, 6/1/2035, Call 6/1/2024 | | 1,000,000 | | | | 1,084,130 |
5.000%, 8/1/2037, Call 8/1/2027 | | 1,300,000 | | | | 1,375,933 |
5.000%, 8/1/2047, Call 8/1/2027 | | 1,000,000 | | | | 1,046,070 |
Byron-Bergen Central School District, AGM SAW, 3.000%, 6/15/2018 | | 1,215,000 | | | | 1,235,412 |
City of New York, 0.860%, 8/1/2024, Call 9/1/2017 (12) | | 1,000,000 | | | | 1,000,000 |
City of New York, AGC, 0.820%, 10/1/2021, Call 9/5/2017 (12) (13) | | 400,000 | | | | 400,000 |
City of New York, AGM, 0.920%, 11/1/2026 (12) | | 7,800,000 | | | | 7,800,000 |
Long Island Power Authority, 1.512% (LIBOR 1 Month+65 basis points), 11/1/2018, Call 5/1/2018 (7) | | 2,500,000 | | | | 2,505,600 |
Metropolitan Transportation Authority: | | | | | | |
1.175% (LIBOR 1 Month+35 basis points), 11/1/2017, Call 10/2/2017 (7) | | 2,800,000 | | | | 2,800,112 |
5.000%, 11/15/2036, Call 11/15/2026 | | 2,325,000 | | | | 2,741,036 |
Metropolitan Transportation Authority, AGM, 1.450% (LIBOR 1 Month+60 basis points), 5/15/2018, Call 11/15/2017 (7) | | 3,950,000 | | | | 3,952,568 |
New York City Transitional Finance Authority: | | | | | | |
0.920%, 8/1/2022, Call 9/1/2017 (12) | | 5,855,000 | | | | 5,855,000 |
0.920%, 8/1/2023, Call 9/1/2017 (12) | | 4,600,000 | | | | 4,600,000 |
5.000%, 11/1/2024, Call 11/1/2022 | | 5,715,000 | | | | 6,765,474 |
| | | | | | |
5.000%, 11/1/2026, Call 5/1/2025 | | 1,000,000 | | | | 1,222,990 |
5.000%, 11/1/2026, Call 5/1/2025 | | 2,000,000 | | | | 2,445,980 |
5.000%, 2/1/2038, Call 2/1/2027 | | 4,000,000 | | | | 4,733,840 |
5.000%, 2/1/2039, Call 2/1/2027 | | 4,000,000 | | | | 4,722,960 |
New York City Water & Sewer System: | | | | | | |
0.920%, 6/15/2032, Call 9/15/2017 (12) | | 3,400,000 | | | | 3,400,000 |
5.000%, 6/15/2028, Call 6/15/2024 | | 500,000 | | | | 604,090 |
5.000%, 6/15/2029, Call 6/15/2024 | | 600,000 | | | | 722,778 |
New York Convention Center Development Corp., 0.000%, 11/15/2032 | | 1,250,000 | | | | 754,600 |
New York Mortgage Agency, 5.000%, 10/1/2019 | | 500,000 | | | | 533,510 |
New York State Dormitory Authority: | | | | | | |
5.000%, 3/15/2027, Call 3/15/2022 | | 7,555,000 | | | | 8,765,084 |
5.000%, 3/15/2028, Call 3/15/2019 | | 625,000 | | | | 664,413 |
5.000%, 12/1/2035, Call 6/1/2027 (6) | | 500,000 | | | | 551,505 |
5.000%, 12/1/2037, Call 6/1/2027 (6) | | 500,000 | | | | 549,700 |
6.000%, 7/1/2038, Call 7/1/2020 | | 1,000,000 | | | | 1,110,260 |
New York State Dormitory Authority, NATL-RE, 2.281%, 7/1/2029, Call 9/5/2017 (12) (13) | | 2,800,000 | | | | 2,548,538 |
New York State Energy Research & Development Authority, NATL-RE, 1.365%, 12/1/2020, Call 9/6/2017 (12) (13) | | 6,450,000 | | | | 6,232,183 |
New York State Housing Finance Agency: | | | | | | |
0.860%, 5/1/2042, Call 9/1/2017 (12) | | 2,545,000 | | | | 2,545,000 |
0.860%, 5/1/2042, Call 9/1/2017 (12) | | 750,000 | | | | 750,000 |
New York State Urban Development Corp., 5.000%, 3/15/2028, Call 3/15/2023 | | 1,000,000 | | | | 1,182,000 |
New York Transportation Development Corp., 5.000%, 7/1/2034, Call 7/1/2024 (16) | | 1,250,000 | | | | 1,397,375 |
New York Transportation Development Corp., AGM, 4.000%, 7/1/2032, Call 7/1/2024 (16) | | 2,500,000 | | | | 2,648,300 |
State of New York, NATL-RE FGIC: | | | | | | |
1.757%, 2/15/2022, Call 9/7/2017 (12) (13) | | 1,045,000 | | | | 1,016,530 |
1.757%, 2/13/2032, Call 9/7/2017 (12) (13) | | 2,080,000 | | | | 1,949,440 |
Town of Oyster Bay, 3.500%, 6/1/2018 | | 1,000,000 | | | | 1,011,850 |
TSASC, Inc.: | | | | | | |
5.000%, 6/1/2036, Call 6/1/2027 | | 1,000,000 | | | | 1,136,060 |
5.000%, 6/1/2041, Call 6/1/2027 | | 1,000,000 | | | | 1,124,560 |
Westchester Tobacco Asset Securitization, 5.000%, 6/1/2021 | | 500,000 | | | | 557,740 |
| | | | | | 98,452,898 |
| | | |
North Carolina — 0.8% | | | | | | |
County of Catawba: | | | | | | |
4.000%, 10/1/2025, Call 10/1/2021 | | 585,000 | | | | 634,795 |
5.000%, 10/1/2023, Call 10/1/2021 | | 1,000,000 | | | | 1,146,610 |
5.000%, 10/1/2024, Call 10/1/2021 | | 835,000 | | | | 957,060 |
County of Cumberland, 5.125%, 12/1/2028, Call 12/1/2019 | | 250,000 | | | | 273,270 |
County of Union: | | | | | | |
5.000%, 12/1/2026, Call 6/1/2023 | | 1,390,000 | | | | 1,642,980 |
5.000%, 12/1/2027, Call 6/1/2023 | | 1,645,000 | | | | 1,942,416 |
North Carolina Eastern Municipal Power Agency, AGC, 6.000%, 1/1/2019 | | 180,000 | | | | 187,240 |
North Carolina Housing Finance Agency, 4.250%, 1/1/2028, Call 7/1/2021 | | 340,000 | | | | 356,286 |
North Carolina Medical Care Commission: | | | | | | |
4.000%, 6/1/2020 | | 470,000 | | | | 504,653 |
5.000%, 6/1/2027, Call 6/1/2022 | | 500,000 | | | | 564,305 |
North Carolina Turnpike Authority, State Appropriation, 5.000%, 7/1/2047, Call 7/1/2026 | | 750,000 | | | | 834,098 |
Orange County Public Facilities, 5.000%, 10/1/2026, Call 10/1/2022 | | 1,130,000 | | | | 1,329,603 |
Raleigh Durham Airport Authority, 5.000%, 5/1/2036, Call 5/1/2020 | | 1,690,000 | | | | 1,850,178 |
| | | | | | 12,223,494 |
| | | |
North Dakota — 1.3% | | | | | | |
Barnes County North Public School District Building Authority: | | | | | | |
4.000%, 5/1/2021 | | 635,000 | | | | 665,772 |
4.500%, 5/1/2030, Call 5/1/2021 | | 1,515,000 | | | | 1,563,844 |
4.500%, 5/1/2033, Call 5/1/2021 | | 1,850,000 | | | | 1,889,905 |
City of Dickinson, 5.000%, 10/1/2025, Call 10/1/2021 | | 2,240,000 | | | | 2,417,498 |
City of Grand Forks: | | | | | | |
4.000%, 12/1/2019 | | 535,000 | | | | 567,212 |
5.000%, 12/1/2032, Call 12/1/2021 | | 1,000,000 | | | | 1,083,520 |
City of West Fargo, 3.000%, 5/1/2023, Call 10/2/2017 | | 185,000 | | | | 185,120 |
North Dakota Public Finance Authority: | | | | | | |
4.000%, 6/1/2023 | | 2,440,000 | | | | 2,761,104 |
4.000%, 6/1/2024, Call 6/1/2023 | | 2,190,000 | | | | 2,452,690 |
4.000%, 6/1/2025, Call 6/1/2023 | | 1,145,000 | | | | 1,265,878 |
| | | | | | |
North Dakota State Housing Finance Agency, 5.250%, 1/1/2029, Call 7/1/2019 | | 500,000 | | | | 526,155 |
Williston Parks & Recreation District: | | | | | | |
4.500%, 3/1/2020 | | 1,205,000 | | | | 1,208,928 |
4.500%, 3/1/2025, Call 3/1/2021 | | 2,525,000 | | | | 2,415,011 |
4.625%, 3/1/2026, Call 3/1/2021 | | 2,620,000 | | | | 2,486,616 |
| | | | | | 21,489,253 |
| | | |
Ohio — 4.0% | | | | | | |
Akron Bath Copley Joint Township Hospital District, 5.000%, 11/15/2021 | | 1,000,000 | | | | 1,126,890 |
Brookfield Local School District, AGM, 5.000%, 1/15/2030, Call 1/15/2018 | | 400,000 | | | | 405,672 |
City of Chillicothe, 5.000%, 12/1/2037, Call 12/1/2027 | | 3,000,000 | �� | | | 3,442,620 |
City of Cleveland: | | | | | | |
5.000%, 1/1/2022, Call 1/1/2021 | | 2,320,000 | | | | 2,574,759 |
5.000%, 10/1/2024, Call 10/1/2022 | | 460,000 | | | | 537,570 |
5.000%, 10/1/2028, Call 10/1/2022 | | 1,075,000 | | | | 1,247,731 |
5.000%, 10/1/2029, Call 10/1/2022 | | 1,130,000 | | | | 1,307,998 |
5.000%, 10/1/2029, Call 10/1/2022 | | 2,290,000 | | | | 2,650,721 |
5.000%, 1/1/2031, Call 1/1/2022 | | 1,270,000 | | | | 1,411,287 |
City of Cleveland, AGM: | | | | | | |
5.000%, 1/1/2030, Call 1/1/2022 | | 3,900,000 | | | | 4,374,864 |
5.000%, 1/1/2031, Call 1/1/2022 | | 1,000,000 | | | | 1,120,440 |
City of Middleburg Heights, 5.125%, 8/1/2031, Call 8/1/2021 | | 1,000,000 | | | | 1,103,670 |
Cleveland Department of Public Utilities Division of Water: | | | | | | |
4.000%, 1/1/2028, Call 1/1/2024 | | 500,000 | | | | 553,440 |
4.000%, 1/1/2029, Call 1/1/2024 | | 1,000,000 | | | | 1,097,580 |
4.000%, 1/1/2030, Call 1/1/2024 | | 1,000,000 | | | | 1,087,150 |
Cleveland Heights & University Heights City School District: | | | | | | |
0.000%, 12/1/2024 | | 400,000 | | | | 344,128 |
0.000%, 12/1/2025 | | 600,000 | | | | 496,998 |
Cleveland-Cuyahoga County Port Authority, 5.000%, 10/1/2022, Call 10/1/2020 | | 1,000,000 | | | | 1,119,640 |
County of Franklin: | | | | | | |
5.000%, 5/15/2028, Call 5/15/2023 | | 2,000,000 | | | | 2,320,040 |
5.000%, 7/1/2029, Call 7/1/2026 | | 2,000,000 | | | | 2,227,460 |
5.000%, 5/15/2031, Call 5/15/2023 | | 405,000 | | | | 463,709 |
County of Hamilton: | | | | | | |
5.000%, 12/1/2029, Call 12/1/2021 | | 975,000 | | | | 1,106,800 |
5.000%, 1/1/2031, Call 1/1/2026 | | 1,350,000 | | | | 1,489,873 |
County of Hancock, 5.750%, 12/1/2026, Call 6/1/2021 | | 1,120,000 | | | | 1,278,256 |
County of Lorain, AMBAC: | | | | | | |
2.524%, 10/1/2030 (12) (13) | | 500,000 | | | | 477,361 |
2.534%, 10/1/2030 (12) (13) | | 4,350,000 | | | | 4,100,123 |
County of Lucas, 5.000%, 11/15/2022, Call 11/15/2021 | | 925,000 | | | | 1,060,901 |
Delaware City School District, 5.250%, 12/1/2038, Call 6/1/2023 | | 1,240,000 | | | | 1,450,738 |
Elyria City School District, School District Credit Program: | | | | | | |
4.000%, 12/1/2026, Call 12/1/2022 | | 480,000 | | | | 525,984 |
4.000%, 12/1/2027, Call 12/1/2022 | | 1,160,000 | | | | 1,263,901 |
4.000%, 12/1/2028, Call 12/1/2022 | | 1,130,000 | | | | 1,224,807 |
Johnstown-Monroe Local School District, 5.000%, 12/1/2030, Call 12/1/2021 | | 715,000 | | | | 830,094 |
Lake County Community College District: | | | | | | |
4.000%, 12/1/2022, Call 12/1/2019 | | 695,000 | | | | 737,638 |
4.000%, 12/1/2024, Call 12/1/2019 | | 835,000 | | | | 881,292 |
4.000%, 12/1/2025, Call 12/1/2019 | | 855,000 | | | | 899,494 |
Lake Local School District/Stark County, School District Credit Program: | | | | | | |
4.000%, 12/1/2023, Call 12/1/2021 | | 1,550,000 | | | | 1,715,168 |
4.000%, 12/1/2025, Call 12/1/2021 | | 1,660,000 | | | | 1,818,945 |
Liberty Local School District, AGM, 4.500%, 12/1/2018 | | 885,000 | | | | 923,285 |
New Albany Community Authority: | | | | | | |
4.000%, 10/1/2020 | | 590,000 | | | | 634,451 |
5.000%, 10/1/2022 | | 1,000,000 | | | | 1,163,320 |
5.000%, 10/1/2023, Call 10/1/2022 | | 1,105,000 | | | | 1,290,165 |
North Olmsted City School District: | | | | | | |
5.000%, 12/1/2027, Call 12/1/2023 | | 220,000 | | | | 260,207 |
5.000%, 12/1/2028, Call 12/1/2023 | | 365,000 | | | | 430,528 |
5.000%, 12/1/2029, Call 12/1/2023 | | 500,000 | | | | 589,125 |
Ohio Higher Educational Facility Commission: | | | | | | |
4.000%, 12/1/2020 | | 1,050,000 | | | | 1,125,022 |
4.000%, 12/1/2021 | | 795,000 | | | | 865,668 |
4.000%, 12/1/2022 | | 845,000 | | | | 930,810 |
| | | | | | |
Ohio Housing Finance Agency, GNMA/FNMA/FHLMC COLL, 5.200%, 9/1/2029, Call 9/1/2018 | | 1,115,000 | | | | 1,141,336 |
Ohio State Turnpike Commission, 5.250%, 2/15/2033, Call 2/15/2023 | | 1,330,000 | | | | 1,558,547 |
Ohio State Water Development Authority, 5.000%, 6/1/2022 | | 1,100,000 | | | | 1,294,645 |
Ohio University, 5.000%, 12/1/2028, Call 6/1/2022 | | 225,000 | | | | 258,755 |
University of Toledo, 5.000%, 6/1/2030, Call 6/1/2021 | | 250,000 | | | | 279,063 |
| | | | | | 64,620,669 |
| | | |
Oklahoma — 0.9% | | | | | | |
Cushing Educational Facilities Authority, 5.000%, 9/1/2022 | | 2,000,000 | | | | 2,320,460 |
Delaware County Justice Authority: | | | | | | |
3.750%, 9/1/2029, Call 10/2/2017 | | 2,365,000 | | | | 2,367,933 |
4.000%, 9/1/2018 | | 415,000 | | | | 427,687 |
4.000%, 9/1/2019 | | 740,000 | | | | 777,407 |
4.000%, 9/1/2020 | | 700,000 | | | | 749,854 |
4.000%, 9/1/2021 | | 805,000 | | | | 876,065 |
Oklahoma Housing Finance Agency, GNMA: | | | | | | |
2.500%, 3/1/2022 | | 405,000 | | | | 415,315 |
3.300%, 3/1/2031, Call 3/1/2022 | | 985,000 | | | | 1,014,422 |
Oklahoma Housing Finance Agency, GNMA/FNMA/FHLMC, 6.500%, 9/1/2038, Call 9/1/2018 | | 90,000 | | | | 92,021 |
Oklahoma Housing Finance Agency, GNMA/FNMA/FHLMC COLL, 5.250%, 9/1/2029, Call 3/1/2019 | | 5,000 | | | | 5,022 |
Tulsa Airports Improvement Trust, BAM, 5.000%, 6/1/2028, Call 6/1/2023 (16) | | 1,405,000 | | | | 1,596,389 |
Tulsa County Industrial Authority: | | | | | | |
5.250%, 11/15/2037, Call 11/15/2025 | | 1,500,000 | | | | 1,674,960 |
5.250%, 11/15/2045, Call 11/15/2025 | | 1,500,000 | | | | 1,660,365 |
| | | | | | 13,977,900 |
| | | |
Oregon — 0.8% | | | | | | |
City of Portland, 5.000%, 6/15/2027, Call 6/15/2022 | | 1,000,000 | | | | 1,130,590 |
City of Tigard, 5.000%, 8/1/2029, Call 8/1/2022 | | 690,000 | | | | 801,959 |
City of Woodburn: | | | | | | |
0.000%, 3/1/2020 | | 1,380,000 | | | | 1,323,779 |
0.000%, 3/1/2021 | | 1,215,000 | | | | 1,141,420 |
Clackamas & Washington Counties School District No. 3, NATL-RE FGIC School Bond Gty, 0.000%, 6/15/2023 | | 2,000,000 | | | | 1,816,860 |
Klamath Falls Intercommunity Hospital Authority: | | | | | | |
5.000%, 9/1/2021 | | 250,000 | | | | 283,732 |
5.000%, 9/1/2022 | | 505,000 | | | | 586,179 |
Port of Morrow: | | | | | | |
3.500%, 6/1/2020, Call 6/1/2019 | | 210,000 | | | | 217,829 |
3.750%, 6/1/2021, Call 6/1/2019 | | 220,000 | | | | 229,374 |
4.000%, 6/1/2022, Call 6/1/2019 | | 235,000 | | | | 245,937 |
Port of Portland, 5.500%, 7/1/2031, Call 7/1/2021 | | 3,000,000 | | | | 3,438,960 |
State of Oregon Housing & Community Services Department, 4.450%, 7/1/2023, Call 1/1/2020 (16) | | 870,000 | | | | 911,586 |
| | | | | | 12,128,205 |
| | | |
Pennsylvania — 2.3% | | | | | | |
Central Bradford Progress Authority, 5.375%, 12/1/2041, Call 12/1/2021 | | 500,000 | | | | 553,810 |
City of Pittsburgh, 4.000%, 9/1/2021 | | 750,000 | | | | 826,260 |
Geisinger Authority, 5.000%, 2/15/2039, Call 2/15/2027 | | 2,500,000 | | | | 2,910,650 |
Kiski Area School District, AGM SAW, 4.000%, 3/1/2021 | | 1,450,000 | | | | 1,570,103 |
Lancaster Industrial Development Authority: | | | | | | |
5.000%, 5/1/2021 | | 360,000 | | | | 395,183 |
5.000%, 5/1/2022 | | 430,000 | | | | 478,328 |
Lehigh County General Purpose Authority, 4.000%, 11/1/2019 | | 555,000 | | | | 585,608 |
Montgomery County Industrial Development Authority, 6.250%, 11/15/2029, Call 11/15/2019 | | 715,000 | | | | 796,824 |
Montgomery County Industrial Development Authority, FHA, 5.000%, 8/1/2024, Call 8/1/2020 | | 1,350,000 | | | | 1,504,521 |
Nazareth Area School District, SAW, 1.357% (LIBOR 1 Month+52 basis points), 2/1/2018, Call 9/21/2017 (7) | | 500,000 | | | | 499,605 |
Pennsylvania Economic Development Financing Authority, AGM: | | | | | | |
0.000%, 1/1/2020 | | 600,000 | | | | 569,658 |
0.000%, 1/1/2021 | | 600,000 | | | | 554,682 |
5.000%, 1/1/2022 | | 305,000 | | | | 342,405 |
Pennsylvania Housing Finance Agency, 4.200%, 10/1/2033, Call 10/1/2022 (16) | | 2,240,000 | | | | 2,352,045 |
| | | | | | |
Pennsylvania Turnpike Commission: | | | | | | |
1.470% (SIFMA Municipal Swap Index Yield+68 basis points), 12/1/2018, Call 6/1/2018 (7) | | 2,850,000 | | | | 2,856,099 |
1.770% (SIFMA Municipal Swap Index Yield+98 basis points), 12/1/2021, Call 6/1/2021 (7) | | 5,000,000 | | | | 5,075,000 |
4.000%, 12/1/2023, Call 12/1/2019 | | 105,000 | | | | 112,043 |
4.000%, 12/1/2023, Call 12/1/2019 | | 95,000 | | | | 100,180 |
5.000%, 6/1/2021, Call 6/1/2019 | | 715,000 | | | | 766,280 |
5.000%, 12/1/2030, Call 12/1/2020 (15) | | 215,000 | | | | 242,314 |
5.000%, 12/1/2030, Call 12/1/2020 (15) | | 120,000 | | | | 135,245 |
5.000%, 12/1/2030, Call 12/1/2020 (15) | | 250,000 | | | | 276,530 |
5.500%, 12/1/2042, Call 12/1/2026 | | 3,000,000 | | | | 3,574,290 |
6.000%, 12/1/2034, Call 12/1/2020 (15) | | 55,000 | | | | 63,734 |
6.000%, 12/1/2034, Call 12/1/2020 (15) | | 70,000 | | | | 81,117 |
6.000%, 12/1/2034, Call 12/1/2020 (15) | | 270,000 | | | | 312,879 |
6.000%, 12/1/2036, Call 12/1/2020 | | 975,000 | | | | 1,129,840 |
Pittsburgh Public Schools, BAM SAW, 5.000%, 9/1/2024, Call 9/1/2022 | | 1,000,000 | | | | 1,175,430 |
Pocono Mountain School District, AGM SAW, 4.000%, 6/15/2021 | | 2,785,000 | | | | 3,067,594 |
Sayre Health Care Facilities Authority, 1.585% (LIBOR 3 Month+78 basis points), 12/1/2024, Call 12/1/2017 (7) | | 225,000 | | | | 220,471 |
Scranton School District, SAW, 1.837% (LIBOR 1 Month+100 basis points), 4/2/2018, Call 10/2/2017 (7) | | 3,305,000 | | | | 3,304,967 |
State Public School Building Authority, SAW, 1.625% (LIBOR 1 Month+80 basis points), 9/1/2018, Call 3/1/2018 (7) | | 1,425,000 | | | | 1,431,840 |
| | | | | | 37,865,535 |
| | | |
Rhode Island — 0.7% | | | | | | |
Rhode Island Housing & Mortgage Finance Corp., 3.625%, 10/1/2029, Call 10/1/2021 | | 760,000 | | | | 798,745 |
Rhode Island Student Loan Authority: | | | | | | |
3.375%, 12/1/2023, Call 12/1/2020 (16) | | 300,000 | | | | 308,010 |
3.950%, 12/1/2017 | | 250,000 | | | | 251,592 |
4.000%, 12/1/2022, Call 12/1/2021 (16) | | 2,885,000 | | | | 3,082,997 |
4.200%, 12/1/2018, Call 12/1/2017 | | 600,000 | | | | 605,052 |
4.250%, 12/1/2020, Call 12/1/2017 | | 500,000 | | | | 503,010 |
4.250%, 12/1/2025, Call 12/1/2021 (16) | | 2,205,000 | | | | 2,313,795 |
4.500%, 12/1/2021, Call 12/1/2017 | | 1,000,000 | | | | 1,006,420 |
4.750%, 12/1/2028, Call 12/1/2021 (16) | | 1,000,000 | | | | 1,050,380 |
4.750%, 12/1/2029, Call 12/1/2021 (16) | | 275,000 | | | | 288,412 |
Town of Cumberland: | | | | | | |
4.000%, 3/15/2024 | | 795,000 | | | | 907,477 |
4.000%, 3/15/2026, Call 3/15/2024 | | 460,000 | | | | 516,014 |
| | | | | | 11,631,904 |
| | | |
South Carolina — 1.0% | | | | | | |
City of Rock Hill, AGM: | | | | | | |
5.250%, 1/1/2026, Call 1/1/2022 | | 730,000 | | | | 833,543 |
5.250%, 1/1/2028, Call 1/1/2022 | | 475,000 | | | | 542,374 |
County of Dorchester: | | | | | | |
5.000%, 10/1/2022 | | 480,000 | | | | 563,246 |
5.000%, 10/1/2026, Call 10/1/2022 | | 400,000 | | | | 468,944 |
County of Florence: | | | | | | |
5.000%, 11/1/2025, Call 11/1/2020 | | 2,000,000 | | | | 2,219,960 |
5.000%, 11/1/2030, Call 11/1/2020 | | 500,000 | | | | 541,610 |
5.000%, 11/1/2031, Call 11/1/2024 | | 360,000 | | | | 414,529 |
Piedmont Municipal Power Agency, AGM: | | | | | | |
5.000%, 1/1/2030, Call 7/1/2021 | | 450,000 | | | | 504,680 |
5.750%, 1/1/2034, Call 7/1/2021 | | 1,000,000 | | | | 1,153,140 |
South Carolina Jobs-Economic Development Authority, 5.000%, 7/1/2022 | | 1,735,000 | | | | 1,965,287 |
South Carolina Public Service Authority, 5.000%, 12/1/2032, Call 12/1/2026 | | 3,265,000 | | | | 3,808,296 |
South Carolina State Housing Finance & Development Authority, 5.000%, 1/1/2028, Call 7/1/2019 | | 85,000 | | | | 88,676 |
South Carolina State Public Service Authority, 5.500%, 1/1/2038, Call 1/1/2019 | | 920,000 | | | | 976,129 |
Spartanburg Sanitation Sewer District, 5.000%, 3/1/2030, Call 3/1/2023 | | 1,500,000 | | | | 1,736,940 |
St. Peters Parish-Jasper County Public Facilities Corp., AGM, 5.000%, 4/1/2031, Call 4/1/2021 | | 900,000 | | | | 989,289 |
| | | | | | 16,806,643 |
| | | |
South Dakota — 1.0% | | | | | | |
City of Rapid City: | | | | | | |
5.500%, 12/1/2022, Call 12/1/2019 | | 225,000 | | | | 240,140 |
6.750%, 12/1/2031, Call 12/1/2019 | | 500,000 | | | | 540,570 |
7.000%, 12/1/2035, Call 12/1/2019 | | 750,000 | | | | 811,485 |
| | | | | | |
South Dakota Health & Educational Facilities Authority: | | | | | | |
4.000%, 11/1/2021 | | 500,000 | | | | 552,475 |
4.250%, 9/1/2023 | | 740,000 | | | | 842,897 |
4.500%, 9/1/2018 | | 500,000 | | | | 518,540 |
4.500%, 9/1/2020 | | 900,000 | | | | 987,417 |
4.500%, 9/1/2021, Call 9/1/2020 | | 1,080,000 | | | | 1,175,926 |
4.500%, 9/1/2022, Call 9/1/2020 | | 1,005,000 | | | | 1,090,264 |
5.000%, 9/1/2019 | | 200,000 | | | | 215,652 |
5.000%, 11/1/2022 | | 715,000 | | | | 837,472 |
5.000%, 8/1/2023 | | 375,000 | | | | 443,985 |
5.000%, 11/1/2023 | | 625,000 | | | | 744,588 |
5.000%, 8/1/2024 | | 195,000 | | | | 234,211 |
5.000%, 11/1/2024, Call 11/1/2019 | | 1,000,000 | | | | 1,081,620 |
5.000%, 11/1/2024 | | 650,000 | | | | 783,673 |
5.000%, 11/1/2025, Call 11/1/2024 | | 600,000 | | | | 714,984 |
5.000%, 9/1/2027, Call 9/1/2024 | | 720,000 | | | | 834,221 |
South Dakota Housing Development Authority, 3.750%, 5/1/2018 | | 290,000 | | | | 295,469 |
South Dakota Housing Development Authority, FHLMC COLL, 3.550%, 11/1/2033, Call 11/1/2022 | | 2,355,000 | | | | 2,387,640 |
| | | | | | 15,333,229 |
| | | |
Tennessee — 1.4% | | | | | | |
Knox County Health Educational & Housing Facility Board, 5.000%, 1/1/2042, Call 1/1/2027 | | 5,815,000 | | | | 6,537,688 |
Metropolitan Government Nashville & Davidson County Health & Educational Faciilities Board, 5.000%, 7/1/2031, Call 7/1/2026 | | 1,000,000 | | | | 1,168,280 |
Metropolitan Government Nashville & Davidson County Health & Educational Facilities Board: | | | | | | |
5.000%, 11/1/2027, Call 11/1/2021 | | 500,000 | | | | 546,970 |
5.000%, 7/1/2040, Call 7/1/2026 | | 1,350,000 | | | | 1,530,940 |
Public Building Authority of Sevier County, AMBAC, 1.365%, 6/1/2018 (12) (13) | | 200,000 | | | | 197,630 |
Tennessee Energy Acquisition Corp.: | | | | | | |
5.000%, 2/1/2023 | | 5,310,000 | | | | 6,121,846 |
5.250%, 9/1/2021 | | 3,810,000 | | | | 4,346,524 |
5.250%, 9/1/2022 | | 250,000 | | | | 291,605 |
Tennessee Housing Development Agency: | | | | | | |
4.000%, 7/1/2025, Call 1/1/2021 | | 905,000 | | | | 954,024 |
4.125%, 1/1/2025, Call 1/1/2021 | | 655,000 | | | | 692,224 |
4.500%, 7/1/2028, Call 1/1/2020 | | 190,000 | | | | 197,980 |
5.000%, 1/1/2027, Call 7/1/2019 | | 140,000 | | | | 145,001 |
| | | | | | 22,730,712 |
| | | |
Texas — 6.6% | | | | | | |
Brazoria-Fort Bend County Municipal Utility District No. 1, MAC, 3.000%, 9/1/2020 | | 700,000 | | | | 731,801 |
Capital Area Cultural Education Facilities Finance Corp.: | | | | | | |
5.000%, 4/1/2019 | | 1,000,000 | | | | 1,046,430 |
5.250%, 4/1/2021, Call 4/1/2020 | | 400,000 | | | | 429,788 |
Central Texas Regional Mobility Authority, 0.000%, 1/1/2025 | | 1,000,000 | | | | 815,260 |
City of Beaumont: | | | | | | |
5.000%, 9/1/2026, Call 9/1/2025 | | 1,000,000 | | | | 1,226,200 |
5.000%, 9/1/2027, Call 9/1/2025 | | 600,000 | | | | 728,790 |
5.000%, 9/1/2030, Call 9/1/2025 | | 1,000,000 | | | | 1,191,130 |
City of Galveston, 4.625%, 2/1/2024, Call 2/1/2021 | | 1,130,000 | | | | 1,206,693 |
City of Houston, 5.000%, 9/1/2026, Call 9/1/2024 | | 250,000 | | | | 294,568 |
City of Houston Combined Utility System: | | | | | | |
5.000%, 11/15/2028, Call 11/15/2025 | | 3,540,000 | | | | 4,302,870 |
5.000%, 11/15/2028, Call 11/15/2027 | | 3,000,000 | | | | 3,772,440 |
City of Houston, AMBAC, 0.000%, 9/1/2019 | | 400,000 | | | | 385,332 |
City of Houston, XLCA, 2.474%, 7/1/2032 (12) (16) (13) | | 425,000 | | | | 407,163 |
City of Laredo International Toll Bridge, AGM: | | | | | | |
5.000%, 10/1/2026, Call 10/1/2024 | | 225,000 | | | | 266,681 |
5.000%, 10/1/2027, Call 10/1/2024 | | 240,000 | | | | 283,255 |
City of San Antonio, 1.190% (SIFMA Municipal Swap Index Yield+40 basis points), 11/1/2017 (7) | | 1,600,000 | | | | 1,600,480 |
City of San Marcos: | | | | | | |
4.500%, 11/1/2028, Call 11/1/2022 | | 600,000 | | | | 663,162 |
5.000%, 11/1/2033, Call 11/1/2022 | | 1,215,000 | | | | 1,386,837 |
Clifton Higher Education Finance Corp., PSF: | | | | | | |
5.000%, 8/15/2026, Call 8/15/2025 | | 675,000 | | | | 819,140 |
5.000%, 8/15/2027, Call 8/15/2025 | | 545,000 | | | | 655,188 |
| | | | | | |
5.000%, 8/15/2028, Call 8/15/2025 | | 835,000 | | | | 996,447 |
5.000%, 8/15/2029, Call 8/15/2025 | | 335,000 | | | | 397,102 |
5.000%, 8/15/2030, Call 8/15/2025 | | 1,250,000 | | | | 1,473,813 |
Corpus Christi Business & Job Development Corp., 5.000%, 9/1/2022 | | 1,000,000 | | | | 1,160,750 |
County of Bexar, AGM, 5.000%, 8/15/2031, Call 8/15/2024 | | 1,280,000 | | | | 1,479,219 |
County of Bowie, AGM: | | | | | | |
4.000%, 8/1/2021, Call 10/2/2017 | | 1,275,000 | | | | 1,277,703 |
4.000%, 8/1/2024, Call 10/2/2017 | | 1,315,000 | | | | 1,317,564 |
County of Wise, 8.000%, 8/15/2034, Call 8/15/2021 | | 4,000,000 | | | | 4,433,360 |
Crane County Water District: | | | | | | |
5.000%, 2/15/2026, Call 2/15/2025 | | 915,000 | | | | 1,078,968 |
5.000%, 2/15/2030, Call 2/15/2025 | | 1,000,000 | | | | 1,139,640 |
Cypress-Fairbanks Independent School District, PSF, 5.000%, 2/15/2034, Call 2/15/2021 | | 675,000 | | | | 755,399 |
Dallas/Fort Worth International Airport: | | | | | | |
5.000%, 11/1/2024, Call 11/1/2022 | | 1,000,000 | | | | 1,178,890 |
5.000%, 11/1/2032, Call 11/1/2020 | | 5,000,000 | | | | 5,564,650 |
5.000%, 11/1/2033, Call 11/1/2023 | | 2,000,000 | | | | 2,324,300 |
5.250%, 11/1/2033, Call 11/1/2023 | | 1,200,000 | | | | 1,420,884 |
Forney Independent School District, PSF, 6.000%, 8/15/2037, Call 8/15/2018 | | 1,840,000 | | | | 1,929,222 |
Georgetown Independent School District, PSF, 5.000%, 8/15/2025, Call 8/15/2020 | | 645,000 | | | | 714,641 |
Grand Parkway Transportation Corp., 0.000%, 10/1/2030, Call 10/1/2028 (15) | | 1,000,000 | | | | 966,530 |
Gulf Coast Waste Disposal Authority, AGM: | | | | | | |
5.000%, 10/1/2029, Call 10/1/2022 | | 1,430,000 | | | | 1,659,772 |
5.000%, 10/1/2030, Call 10/1/2022 | | 1,505,000 | | | | 1,744,446 |
Harris County Cultural Education Facilities Finance Corp.: | | | | | | |
1.540% (SIFMA Municipal Swap Index Yield+75 basis points), 6/1/2020 (7) | | 2,000,000 | | | | 2,012,680 |
1.620% (SIFMA Municipal Swap Index Yield+83 basis points), 6/1/2021 (7) | | 2,400,000 | | | | 2,421,864 |
5.250%, 10/1/2029, Call 10/1/2019 | | 1,550,000 | | | | 1,685,920 |
Harris County Municipal Utility District No. 165, BAM, 5.000%, 3/1/2025 | | 400,000 | | | | 479,048 |
Harris County Municipal Utility District No. 374, AGM, 5.000%, 9/1/2036, Call 9/1/2019 | | 550,000 | | | | 594,292 |
La Vernia Higher Education Finance Corp., 5.000%, 8/15/2018 | | 150,000 | | | | 155,652 |
Lancaster Independent School District, BAM, 4.000%, 2/15/2029, Call 2/15/2025 | | 3,000,000 | | | | 3,276,090 |
Lower Colorado River Authority: | | | | | | |
5.000%, 5/15/2026, Call 5/15/2025 | | 695,000 | | | | 836,349 |
5.000%, 5/15/2027, Call 5/15/2025 | | 1,355,000 | | | | 1,618,900 |
Lower Colorado River Authority, BHAC, 5.250%, 5/15/2028, Call 5/15/2018 | | 675,000 | | | | 694,616 |
Mesquite Independent School District, PSF, 0.000%, 8/15/2021 | | 635,000 | | | | 604,564 |
Nacogdoches County Hospital District, AGM: | | | | | | |
3.000%, 5/15/2018 | | 495,000 | | | | 500,975 |
3.000%, 5/15/2019 | | 510,000 | | | | 523,418 |
New Hope Cultural Education Facilities Finance Corp.: | | | | | | |
5.000%, 7/1/2030, Call 7/1/2025 | | 750,000 | | | | 838,305 |
5.000%, 11/15/2031, Call 11/15/2024 | | 850,000 | | | | 908,718 |
5.000%, 8/15/2036, Call 8/15/2021 (6) | | 1,700,000 | | | | 1,727,744 |
5.000%, 8/15/2037, Call 8/15/2021 (6) | | 1,260,000 | | | | 1,274,893 |
5.500%, 8/15/2036, Call 8/15/2021 | | 1,000,000 | | | | 1,024,110 |
New Hope Cultural Education Facilities Finance Corp., AGM, 4.000%, 4/1/2024 | | 440,000 | | | | 482,544 |
Nolan County Hospital District: | | | | | | |
5.000%, 8/15/2022 | | 310,000 | | | | 354,491 |
5.000%, 8/15/2023 | | 250,000 | | | | 290,600 |
5.000%, 8/15/2024 | | 200,000 | | | | 235,442 |
North Texas Tollway Authority: | | | | | | |
1.590% (SIFMA Municipal Swap Index Yield+80 basis points), 1/1/2019, Call 7/1/2018 (7) | | 1,750,000 | | | | 1,756,248 |
5.000%, 1/1/2027, Call 1/1/2025 | | 2,090,000 | | | | 2,508,585 |
North Texas Tollway Authority, AGC, 5.750%, 1/1/2038, Call 1/1/2019 | | 1,725,000 | | | | 1,835,883 |
North Texas Tollway Authority, BHAC: | | | | | | |
5.125%, 1/1/2028, Call 1/1/2018 | | 435,000 | | | | 441,029 |
5.125%, 1/1/2028, Call 1/1/2018 | | 65,000 | | | | 65,829 |
Northside Independent School District, PSF, 2.125%, 8/1/2020, Call 2/1/2018 (12) | | 2,085,000 | | | | 2,093,298 |
Pleasanton Independent School District, PSF, 5.000%, 8/15/2029, Call 8/15/2024 | | 1,000,000 | | | | 1,173,000 |
Sabine River Authority, MBIA, 4.950%, 3/1/2018 | | 370,000 | | | | 377,359 |
San Antonio Municipal Facilities Corp., 5.000%, 8/15/2036, Call 8/15/2021 | | 500,000 | | | | 563,665 |
Sienna Plantation Levee Improvement District, BAM, 4.000%, 9/1/2020 | | 400,000 | | | | 431,776 |
Tarrant County Cultural Education Facilities Finance Corp.: | | | | | | |
2.500%, 12/1/2018, Call 9/21/2017 | | 1,000,000 | | | | 1,000,980 |
5.000%, 10/1/2028, Call 10/1/2023 | | 2,030,000 | | | | 2,333,850 |
5.000%, 5/15/2037, Call 5/15/2024 | | 5,145,000 | | | | 5,461,057 |
5.000%, 11/15/2037, Call 11/15/2027 | | 2,175,000 | | | | 2,500,837 |
| | | | | | |
Texas Municipal Gas Acquisition & Supply Corp. III, 5.000%, 12/15/2021 | | 2,000,000 | | | | 2,293,240 |
Waco Independent School District, PSF: | | | | | | |
4.000%, 8/15/2028, Call 8/15/2024 | | 1,000,000 | | | | 1,107,810 |
4.000%, 8/15/2029, Call 8/15/2024 | | 2,380,000 | | | | 2,618,928 |
| | | | | | 106,331,097 |
| | | |
Utah — 0.8% | | | | | | |
Central Utah Water Conservancy District: | | | | | | |
5.000%, 10/1/2026, Call 10/1/2019 | | 850,000 | | | | 921,102 |
5.000%, 10/1/2028, Call 10/1/2019 | | 1,000,000 | | | | 1,083,650 |
City of Draper, 5.000%, 5/1/2032, Call 5/1/2022 | | 325,000 | | | | 375,772 |
City of Riverton: | | | | | | |
5.250%, 12/1/2034, Call 6/1/2023 | | 1,455,000 | | | | 1,721,265 |
5.250%, 12/1/2036, Call 6/1/2023 | | 2,150,000 | | | | 2,530,657 |
Jordan Valley Water Conservancy District, 5.000%, 10/1/2035, Call 4/1/2021 | | 920,000 | | | | 1,034,568 |
Uintah County Municipal Building Authority, 5.300%, 6/1/2028, Call 6/1/2018 | | 1,350,000 | | | | 1,393,456 |
Utah Infrastructure Agency, AGM: | | | | | | |
5.400%, 10/15/2036, Call 10/15/2021 | | 1,000,000 | | | | 1,142,360 |
5.500%, 10/15/2030, Call 10/15/2021 | | 1,300,000 | | | | 1,503,606 |
Utah State Board of Regents, 5.000%, 8/1/2031, Call 8/1/2020 | | 1,030,000 | | | | 1,147,894 |
Utah State Charter School Finance Authority, 5.250%, 10/15/2028, Call 10/15/2023 | | 480,000 | | | | 554,626 |
| | | | | | 13,408,956 |
| | | |
Vermont — 0.1% | | | | | | |
Vermont Housing Finance Agency, 4.000%, 11/1/2043, Call 5/1/2023 | | 1,120,000 | | | | 1,187,737 |
Vermont Student Assistance Corp.: | | | | | | |
5.000%, 6/15/2019 (16) | | 130,000 | | | | 137,608 |
5.000%, 6/15/2020 (16) | | 125,000 | | | | 135,776 |
| | | | | | 1,461,121 |
| | | |
Virgin Islands — 0.2% | | | | | | |
Virgin Islands Public Finance Authority, 5.000%, 9/1/2030, Call 9/1/2025 (6) | | 3,320,000 | | | | 3,618,568 |
| | | |
Virginia — 0.4% | | | | | | |
City of Chesapeake, 5.000%, 7/15/2022 | | 500,000 | | | | 574,605 |
Henrico County Economic Development Authority, AGM, 2.156%, 8/23/2027, Call 9/1/2017 (12) (13) | | 50,000 | | | | 47,711 |
Stafford County Economic Development Authority: | | | | | | |
5.000%, 6/15/2028, Call 6/15/2026 | | 1,000,000 | | | | 1,170,070 |
5.000%, 6/15/2030, Call 6/15/2026 | | 700,000 | | | | 805,525 |
Virginia College Building Authority: | | | | | | |
5.000%, 3/1/2023, Call 3/1/2020 | | 745,000 | | | | 817,802 |
5.000%, 3/1/2024, Call 3/1/2020 | | 1,755,000 | | | | 1,926,042 |
Virginia Small Business Financing Authority, 4.250%, 11/1/2021, Call 5/1/2020 | | 1,000,000 | | | | 1,077,750 |
| | | | | | 6,419,505 |
| | | |
Washington — 1.2% | | | | | | |
Chelan County Public Utility District No. 1, NATL-RE, 0.000%, 6/1/2024 | | 210,000 | | | | 180,860 |
King County Housing Authority: | | | | | | |
5.200%, 5/1/2028, Call 11/1/2018 | | 660,000 | | | | 681,476 |
5.500%, 12/1/2028, Call 12/1/2018 | | 1,000,000 | | | | 1,037,430 |
King County Public Hospital District No. 1, 5.000%, 12/1/2031, Call 12/1/2026 | | 4,000,000 | | | | 4,700,960 |
King County Public Hospital District No. 2, 5.250%, 12/1/2028, Call 12/1/2020 | | 200,000 | | | | 224,342 |
Marysville Local Improvement District, 3.350%, 6/1/2036, Call 6/1/2024 | | 130,000 | | | | 133,921 |
Mason & Kitsap Counties School District No. 403 North Mason, School Bond Gty, 5.000%, 12/1/2035, Call 12/1/2023 | | 2,025,000 | | | | 2,397,701 |
Port of Bellingham, 5.250%, 12/1/2022, Call 12/1/2020 | | 1,060,000 | | | | 1,189,734 |
Spokane County School District No. 81 Spokane, School Bond Gty, 5.000%, 12/1/2030, Call 12/1/2021 | | 650,000 | | | | 747,058 |
State of Washington, 4.100%, 7/1/2022, Call 1/1/2019 | | 440,000 | | | | 456,293 |
Washington Health Care Facilities Authority: | | | | | | |
0.000%, 12/1/2017 (6) | | 70,000 | | | | 69,866 |
5.000%, 10/1/2030, Call 10/1/2022 | | 750,000 | | | | 850,208 |
Washington State Housing Finance Commission, 5.000%, 1/1/2036, Call 1/1/2025 (6) | | 2,125,000 | | | | 2,287,138 |
Washington State Housing Finance Commission, GNMA/FNMA/FHLMC COLL: | | | | | | |
3.050%, 6/1/2022 (16) | | 750,000 | | | | 793,943 |
3.150%, 12/1/2023, Call 9/1/2017 (16) | | 45,000 | | | | 45,000 |
3.300%, 6/1/2024, Call 9/1/2017 (16) | | 20,000 | | | | 20,000 |
3.450%, 6/1/2025, Call 9/1/2017 (16) | | 845,000 | | | | 845,000 |
| | | | | | |
WBRP 3.2 Washington Biomed Research Properties Lease: | | | | | | |
5.000%, 1/1/2026, Call 7/1/2025 | | 750,000 | | | | 918,795 |
5.000%, 1/1/2031, Call 7/1/2025 | | 940,000 | | | | 1,122,886 |
Whidbey Island Public Hospital District: | | | | | | |
5.000%, 12/1/2021 | | 520,000 | | | | 575,900 |
5.000%, 12/1/2022 | | 510,000 | | | | 574,061 |
| | | | | | 19,852,572 |
| | | |
West Virginia — 0.2% | | | | | | |
West Virginia Hospital Finance Authority, 5.750%, 1/1/2044, Call 1/1/2019 | | 2,500,000 | | | | 2,658,975 |
| | | |
Wisconsin — 3.7% | | | | | | |
City of Oak Creek, 3.000%, 6/1/2027, Call 6/1/2025 | | 100,000 | | | | 103,352 |
Monroe Redevelopment Authority, 5.500%, 2/15/2029, Call 2/15/2019 | | 500,000 | | | | 533,240 |
Public Finance Authority: | | | | | | |
3.500%, 11/15/2023, Call 5/15/2019 (6) | | 750,000 | | | | 758,220 |
3.950%, 11/15/2024, Call 11/15/2019 (6) | | 1,000,000 | | | | 1,020,180 |
4.750%, 12/1/2035, Call 12/1/2020 | | 2,000,000 | | | | 2,099,240 |
5.000%, 11/15/2029 (8) | | 1,900,000 | | | | 2,279,088 |
State of Wisconsin: | | | | | | |
4.000%, 5/1/2027, Call 5/1/2022 | | 800,000 | | | | 880,832 |
5.000%, 3/1/2023, Call 9/1/2021 | | 2,000,000 | | | | 2,285,720 |
5.000%, 5/1/2027, Call 5/1/2022 | | 25,000 | | | | 29,286 |
5.000%, 5/1/2027, Call 5/1/2022 | | 1,580,000 | | | | 1,836,102 |
6.000%, 5/1/2036, Call 5/1/2019 | | 1,965,000 | | | | 2,131,730 |
State of Wisconsin, State Appropriation: | | | | | | |
5.750%, 5/1/2029, Call 5/1/2019 | | 105,000 | | | | 113,298 |
5.750%, 5/1/2029, Call 5/1/2019 | | 1,050,000 | | | | 1,134,976 |
6.000%, 5/1/2033, Call 5/1/2019 | | 135,000 | | | | 146,221 |
6.000%, 5/1/2033, Call 5/1/2019 | | 1,280,000 | | | | 1,388,608 |
Wisconsin Center District: | | | | | | |
0.000%, 12/15/2033, Call 6/15/2026 | | 2,200,000 | | | | 1,227,006 |
0.000%, 12/15/2034, Call 6/15/2026 | | 6,665,000 | | | | 3,549,912 |
Wisconsin Center District, AGM: | | | | | | |
5.250%, 12/15/2023 | | 520,000 | | | | 604,162 |
5.250%, 12/15/2027 | | 1,930,000 | | | | 2,324,724 |
Wisconsin Health & Educational Facilities Authority: | | | | | | |
4.000%, 2/15/2042, Call 2/15/2027 (8) | | 2,000,000 | | | | 2,023,480 |
4.500%, 10/15/2026, Call 10/15/2021 | | 20,000 | | | | 21,797 |
4.750%, 10/15/2029, Call 10/15/2021 | | 605,000 | | | | 657,078 |
5.000%, 8/15/2018 | | 1,000,000 | | | | 1,037,680 |
5.000%, 6/1/2019 | | 205,000 | | | | 214,225 |
5.000%, 7/1/2019 | | 990,000 | | | | 1,056,380 |
5.000%, 8/15/2019 | | 250,000 | | | | 268,428 |
5.000%, 8/15/2019 | | 955,000 | | | | 1,027,313 |
5.000%, 8/15/2020 | | 1,060,000 | | | | 1,178,031 |
5.000%, 3/1/2021 | | 240,000 | | | | 263,786 |
5.000%, 8/15/2021 | | 1,160,000 | | | | 1,327,748 |
5.000%, 3/1/2022 | | 205,000 | | | | 229,672 |
5.000%, 10/1/2022 | | 750,000 | | | | 878,070 |
5.000%, 12/15/2022 | | 500,000 | | | | 581,530 |
5.000%, 12/15/2023 | | 500,000 | | | | 589,970 |
5.000%, 12/15/2024 | | 500,000 | | | | 595,850 |
5.000%, 3/1/2025, Call 3/1/2024 | | 315,000 | | | | 357,242 |
5.000%, 6/1/2026, Call 6/1/2020 | | 135,000 | | | | 149,653 |
5.000%, 8/15/2027, Call 8/15/2022 | | 500,000 | | | | 587,480 |
5.000%, 12/15/2028, Call 12/15/2024 | | 100,000 | | | | 115,883 |
5.000%, 8/15/2029, Call 8/15/2022 | | 1,700,000 | | | | 2,015,316 |
5.000%, 4/1/2032, Call 10/1/2022 | | 4,560,000 | | | | 5,081,162 |
5.000%, 6/1/2032, Call 6/1/2022 | | 1,000,000 | | | | 1,083,970 |
5.000%, 8/15/2032, Call 8/15/2022 | | 5,000,000 | | | | 5,927,400 |
5.000%, 2/15/2047, Call 2/15/2027 (8) | | 1,000,000 | | | | 1,119,480 |
5.125%, 4/15/2031, Call 4/15/2023 | | 250,000 | | | | 282,600 |
5.250%, 4/1/2023, Call 4/1/2018 | | 365,000 | | | | 374,121 |
5.250%, 6/1/2034, Call 6/1/2020 | | 300,000 | | | | 328,035 |
5.375%, 8/15/2024, Call 2/15/2020 | | 1,625,000 | | | | 1,781,569 |
Wisconsin Health & Educational Facilities Authority, AGM, 5.000%, 7/15/2027, Call 7/15/2021 | | 3,655,000 | | | | 4,054,382 |
Wisconsin Housing & Economic Development Authority, 5.750%, 11/1/2025, Call 5/1/2020 (16) | | 865,000 | | | | 917,462 |
| | | | | | 60,572,690 |
| | | | | | |
Wyoming — 0.1% | | | | | | |
County of Laramie, 5.000%, 5/1/2027, Call 5/1/2021 | | 1,000,000 | | | | 1,107,380 |
Wyoming Municipal Power Agency, Inc., 5.500%, 1/1/2028, Call 1/1/2018 | | 500,000 | | | | 507,525 |
| | | | | | 1,614,905 |
| | | |
Total Municipals (identified cost $1,519,664,582) | | | | | | 1,591,471,242 |
| | | |
Mutual Funds — 1.0% | | | | | | |
BlackRock Long-Term Municipal Advantage Trust | | 121,500 | | | | 1,482,300 |
BlackRock Muni Intermediate Duration Fund, Inc. | | 110,000 | | | | 1,574,100 |
BlackRock Municipal Bond Trust | | 93,400 | | | | 1,493,466 |
BlackRock Municipal Income Quality Trust | | 107,800 | | | | 1,599,752 |
BlackRock Municipal Income Trust | | 107,000 | | | | 1,546,150 |
BlackRock MuniHoldings Quality Fund, Inc. | | 93,400 | | | | 1,296,392 |
BlackRock MuniYield Quality Fund, Inc. | | 105,000 | | | | 1,656,900 |
BMO Ultra Short Tax-Free Fund - Institutional Class (4) | | 506,795 | | | | 5,108,497 |
Eaton Vance Municipal Income Term Trust | | 42,000 | | | | 868,140 |
| | | |
Total Mutual Funds (identified cost $15,715,415) | | | | | | 16,625,697 |
| | | |
Short-Term Investments — 0.1% | | | | | | |
| | | |
Mutual Funds — 0.0% | | | | | | |
BMO Government Money Market Fund - Premier Class, 0.870% (4) | | 79,783 | | | | 79,783 |
| | | |
Short-Term Municipals — 0.1% | | | | | | |
| | | |
New York — 0.1% | | | | | | |
Town of Oyster Bay, 2.500%, 2/23/2018 | | $ 2,000,000 | | | | 2,008,460 |
| | | |
Total Short-Term Investments (identified cost $2,087,745) | | | | | | 2,088,243 |
| | | |
Total Investments — 99.5% (identified cost $1,537,467,742) | | | | | | 1,610,185,182 |
Other Assets and Liabilities — 0.5% | | | | | | 7,978,573 |
Total Net Assets — 100.0% | | | | $ | | 1,618,163,755 |
| | | | | | |
(4) Denotes an investment in an affiliated entity. Please refer to Note 6, subsection Investments in Affiliated Issuers, in the Notes to Financial Statements.
(6) Denotes a restricted security which is subject to restrictions on resale under federal securities law. These securities have been deemed liquid based on criteria approved by the Board of Directors of the BMO Funds. At August 31, 2017, these securities amounted to:
| | | | | | | | |
Fund | | Amount | | | % of Total Net Assets | |
Intermediate Tax-Free Fund | | $ | 35,866,226 | | | | 2.22% | |
(7) Floating Rate Security
(8) Purchased on a when-issued or delayed delivery basis.
(12) Variable Rate Security
(13) Issue represents an Auction Rate Security. An Auction Rate Security is a corporate or municipal bond debt instrument with a long nominal maturity for which the interest rate is regularly reset through a Dutch auction. The rate presented is either the rate set through the auction or the maximum interest rate provided for in the security issuance provision.
(15) Issue represents a convertible capital appreciation bond. These securities are tax-exempt bonds that originate as capital appreciation bonds with zero coupon features at time of issuance and convert to an interest paying bond at a pre-specified rate determined at time of issuance.
(16) Securities that are subject to alternative minimum tax represent 2.34% of the Intermediate Tax-Free Fund’s portfolio as calculated based upon total portfolio market value.
Report of Independent Registered Public Accounting Firm
The Shareholders and Board of Directors
BMO Funds, Inc.:
We have audited the accompanying statements of assets and liabilities of BMO Ultra Short Tax-Free Fund, BMO Short Tax-Free Fund, and BMO Intermediate Tax-Free Fund (each a series of BMO Funds, Inc., collectively the Funds), including the summary schedules of investments as of August 31, 2017, and the related statements of operations for the year then ended, the statements of changes in net assets for each of the years in the two-year period then ended (collectively, the financial statements), the financial highlights for each of the years or periods in the five-year period then ended (the financial statements and financial highlights are included in Item 1 of this Form N-CSR), and the schedules of investments as of August 31, 2017 (included in Item 6 of this Form N-CSR). These financial statements, financial highlights, and schedules of investments are the responsibility of the Funds’ management. Our responsibility is to express an opinion on these financial statements and financial highlights based on our audits.
We conducted our audits in accordance with the standards of the Public Company Accounting Oversight Board (United States). Those standards require that we plan and perform the audit to obtain reasonable assurance about whether the financial statements, financial highlights, and schedules of investments are free of material misstatement. An audit includes examining, on a test basis, evidence supporting the amounts and disclosures in the financial statements. Our procedures included confirmation of securities owned as of August 31, 2017, by correspondence with custodians and brokers or by other appropriate auditing procedures. An audit also includes assessing the accounting principles used and significant estimates made by management, as well as evaluating the overall financial statement presentation. We believe that our audits provide a reasonable basis for our opinion.
In our opinion, the financial statements, financial highlights, and schedules of investments referred to above present fairly, in all material respects, the financial position of the Funds as of August 31, 2017, and the results of their operations, the changes in their net assets, and the financial highlights for the periods specified in the first paragraph above, in conformity with U.S. generally accepted accounting principles.
/s/ KPMG LLP
Milwaukee, Wisconsin
October 24, 2017
Item 7. Disclosure of Proxy Voting Policies and Procedures for Closed-End Management Investment Companies.
Not applicable to open-end management investment companies.
Item 8. Portfolio Managers of Closed-End Management Investment Companies.
Not applicable to open-end management investment companies.
Item 9. Purchases of Equity Securities by Closed-End Management Investment Company and Affiliated Purchasers.
Not applicable to open-end management investment companies.
Item 10. Submission of Matters to a Vote of Security Holders.
Not applicable.
Item 11. Controls and Procedures.
| (a) | The Registrant’s principal executive officer and principal financial officer have reviewed the Registrant’s disclosure controls and procedures (as defined in Rule 30a-3(c) under the Act) as of a date within 90 days of the filing of this report, as required by Rule 30a-3(b) under the Act. Based on their review, such officers have concluded that the disclosure controls and procedures are effective in ensuring that information required to be disclosed in this report is appropriately recorded, processed, summarized and reported and made known to them by others within the Registrant and by the Registrant’s service providers. |
| (b) | There were no changes in the Registrant’s internal control over financial reporting (as defined in Rule 30a-3(d) under the Act (17 CFR 270.30a-3(d)) that occurred during the Registrant’s second fiscal quarter of the period covered by this report that materially affected, or are reasonably likely to materially affect, the Registrant’s internal control over financial reporting. |
Item 12. Disclosure of Securities Lending Activities for Closed-End Management Investment Companies.
Not applicable to open-end management investment companies.
Item 13. Exhibits.
| (a) (1) | Code of Ethics. Filed herewith. |
| (a) (2) | Certifications required pursuant to Section 302 of the Sarbanes-Oxley Act of 2002. Filed herewith. |
| (a) (3) | Any written solicitation to purchase securities under Rule 23c-1 under the Act sent or given during the period covered by the report by or on behalf of the registrant to 10 or more persons. Not applicable to open-end management investment companies. |
| (b) | Certification pursuant to Section 906 of the Sarbanes-Oxley Act of 2002. Filed herewith. |
SIGNATURES
Pursuant to the requirements of the Securities Exchange Act of 1934 and the Investment Company Act of 1940, the Registrant has duly caused this report to be signed on its behalf by the undersigned, thereunto duly authorized.
BMO Funds, Inc.
/s/ John M. Blaser
By: John M. Blaser
President
(Principal Executive Officer)
October 24, 2017
Pursuant to the requirements of the Securities Exchange Act of 1934 and the Investment Company Act of 1940, this report has been signed below by the following persons on behalf of the Registrant and in the capacities and on the dates indicated.
/s/ John M. Blaser
By: John M. Blaser
President
(Principal Executive Officer)
October 24, 2017
/s/ Timothy M. Bonin
By: Timothy M. Bonin
Treasurer
(Principal Financial Officer)
October 24, 2017