UNITED STATES
SECURITIES AND EXCHANGE COMMISSION
Washington, D.C. 20549
FORMN-CSR
CERTIFIED SHAREHOLDER REPORT OF REGISTERED MANAGEMENT
INVESTMENT COMPANIES
Investment Company Act File Number811-58433
BMO Funds, Inc.
(Exact name of registrant as specified in charter)
111 East Kilbourn Avenue, Suite 200
Milwaukee, WI 53202
(Address of principal executive offices) (Zip code)
John M. Blaser
BMO Asset Management Corp.
111 East Kilbourn Avenue, Suite 200
Milwaukee, WI 53202
(Name and address of agent for service)
Copies to:
Michael P. O’Hare, Esq.
Stradley, Ronon, Stevens & Young, LLP
2005 Market Street, Suite 2600
Philadelphia, PA 19103
Registrant’s telephone number, including area code:(800)236-3863
Date of fiscal year end:August 31
Date of reporting period:August 31, 2019
Item 1. Reports to Stockholders.
The following is a copy of the report transmitted to shareholders pursuant to Rule30e-1 under the Investment Company Act of 1940, as amended (the “Act”).
Annualreport
Equity Funds
International & Global Funds
Alternative Funds
Fixed Income Funds
Money Market Funds
Notification of electronic delivery of shareholder materials
Beginning on January 1, 2021, as permitted by regulations adopted by the Securities and Exchange Commission, paper copies of the Funds’ shareholder reports will no longer be sent by mail, unless you specifically request paper copies of the reports from the Funds or from your broker/dealer, investment professional, or financial institution. Instead, the reports will be made available online at bmofunds.com/documents, and you will be notified by mail each time a report is posted and provided with a website link to access the report.
If you already elected to receive shareholder reports electronically, you will not be affected by this change and you need not take any action. You may elect to receive shareholder reports and other communications from the Funds electronically by calling 1-800-236-FUND (3863), by sending an email request to bmofundsus.services@bmo.com, or by asking your broker/dealer, investment professional, or financial institution.
Beginning on January 1, 2019, you may elect to receive all future reports in paper free of charge. If you invest through a financial intermediary, you can contact your financial intermediary to request that you continue to receive paper copies of your shareholder reports. If you invest directly with the Funds, you can call the Funds toll-free at1-800-236-FUND (3863) or send an email request to bmofundsus.services@bmo.com. Your election to receive reports in paper will apply to all funds held in your account if you invest through your financial intermediary or all funds held with the fund complex if you invest directly with the Funds.

Table of Contents
| | | | |
Not FDIC Insured | | No Bank Guarantee | | May Lose Value |
| | |
| | |
| Annual Report | | BMO Low Volatility Equity Fund |
| | | | | | | | | | | | |
Average annual total returns (%) | |
| | | 1-Year | | | 5-Years | | | Since
Inception | |
| Advisor Class (A)NAV | | | 11.80 | | | | 9.96 | | | | 10.26 | |
| Advisor Class (A)OFFER | | | 6.20 | | | | 8.84 | | | | 9.20 | |
| Institutional Class (I) | | | 12.18 | | | | 10.26 | | | | 12.20 | |
| Russell 1000® Index | | | 2.49 | | | | 9.85 | | | | 13.08 | |
| Lipper Multi-Cap Core Funds Index | | | (0.85 | ) | | | 7.89 | | | | 11.53 | |
| * | Benchmarks since inception reflect the inception date of the Institutional Class. |
The performance data quoted represents past performance which is no guarantee of future results. Investment return and principal value will fluctuate so that an investor’s shares, when redeemed, may be worth more or less than their original costs. Mutual fund performance changes over time and current performance may be lower or higher than what is stated. To receive current performance to the most recentmonth-end, please call1-800-236-3863 or visit www.bmofunds.com.
Commentary
The BMO Low Volatility Equity Fund (the Fund) returned 12.18% for the fiscal year ended August 31, 2019 versus the Russell 1000® Index and the LipperMulti-Cap Core Funds Index, which returned 2.49% and -0.85%, respectively.
Despite multiple pullbacks and periods of elevated market volatility, global equity markets finished the trailing fiscal year in positive territory. Equities finished calendar year 2018 in negative territory, with the fourth quarter marking the single worst quarter of performance since the financial crisis, ending a nine consecutive calendar year stretch of positive returns. The fourth quarter’ssell-off was greatly influenced by instability at the macro-level, which included continued trade tensions between the U.S. and China, concerns over tightening by the U.S. Federal Reserve, Brexit, and the U.S. Government shutdown.
U.S. equities quickly recovered from 2018’s losses, despite negative returns in May and August, as concerns continued to mount over tariffs, yield curve inversion, and slowing global economic growth. Drivers of gains included the continuation of accommodative policy by central bankers and a resilient consumer. The most dominant theme during the year was the continued underperformance of more attractively valued securities in the market. While equities finished the period in positive territory, increasing market volatility, a sharp decrease in interest rates, and the influence of macroeconomic risks continued to drive the outperformance of lower risk stocks. Similarly, larger companies outperformed smaller ones, while investors continued to favor stocks with higher sales and earnings growth, with no regard to valuations.
The Fund outperformed the Russell 1000® Index in the fiscal year. Both sector allocation and stock selection were positive for the period. The Fund’s overweight positions in Utilities and Consumer Staples added to performance, while underweight positions in Information Technology and Communication Services detracted from performance. Stock selection was strongest in Consumer Discretionary and Financials. Consumer Staples was the only sector in which stock selection contributed negatively for the period. Autozone Inc. (AZO) (2.3% of the Fund, 43.7% return) and Motorola Solutions Inc. (MSI) (2.6% of the Fund, 43.2% return) added to the Fund’s performance, while Occidental Petroleum Corp. (OXY) (0.5% of the Fund, -42.8% return) and Kroger Co. (KR) (1.4% of the Fund, -23.1% return) detracted from returns.
As we look ahead, the potential for increased market volatility remains. Elevated volatility presents opportunities to add value through active stock selection and risk management. While equities continue to post record gains, markets may react negatively to a number of risks, including the threat of ongoing trade tensions between the U.S. and China, a slowdown in global economic growth, and uncertainty surrounding the expectations of accommodative policy. We focus on stock selection while using a variety of portfolio construction tools to manage these risks. In addition, valuation spreads remain historically wide, suggesting a potentially favorable environment for more attractively valued securities in the market. Similarly, mispricings in the U.S. equity market are more extreme in defensive sectors, such as Utilities, as investors position against increased volatility. The portfolio continues to trade at a discount relative to the benchmark, while owning what we believe are fundamentally strong companies with positive or improving investor sentiment.
Fund Managers; Investment Experience
David A. Corris, CFA; since 1999
Jason C. Hans, CFA; since 1999
Jay Kaufman, CFA; since 2006
Ernesto Ramos, Ph.D.; since 1988
| | | | | | | | | | | | | | | | | | | | |
| | | | | | | | | Inception
date | | | Expenses (%) | |
| Share class | | Ticker | | | Cusip | | | Gross | | | Net | |
| Advisor (A) | | | BAEGX | | | | 09658W105 | | | | 5/27/2014 | | | | 1.03 | | | | 0.90 | |
| Institutional (I) | | | MLVEX | | | | 09658L208 | | | | 9/28/2012 | | | | 0.78 | | | | 0.65 | |
The above expense ratios are from the Funds’ Prospectus dated April 1, 2019, and are inclusive of Acquired Fund Fees and Expenses. See Note 6 in the Notes to Financial Statements for additional information. Net expense ratios reflect contractual fee waivers and/or expense reimbursements if applicable, made by BMO Asset Management Corp., the investment adviser (Adviser). The Adviser may not terminate these fee waivers and/or expense reimbursements prior to December 31, 2020 without the consent of the Board of Directors, unless the investment advisory agreement is terminated. Without these contractual waivers, the Fund’s returns would have been lower.
| | | | |
Portfolio sector allocation | |
| Sector | | Fund (%) | |
| Communication Services | | | 5.1 | |
| Consumer Discretionary | | | 10.9 | |
| Consumer Staples | | | 16.5 | |
| Energy | | | 3.0 | |
| Financials | | | 13.9 | |
| Healthcare | | | 10.0 | |
| Industrials | | | 6.7 | |
| Information Technology | | | 4.6 | |
| Materials | | | 2.1 | |
| Real Estate | | | 10.2 | |
| Utilities | | | 12.8 | |
| Other Assets & Liabilities, Net | | | 4.2 | |
| Total | | | 100.0 | |
Portfolio composition will change due to the ongoing management of the Fund. The percentages are based on net assets as of August 31, 2019 and may not necessarily reflect adjustments that are routinely made when presenting net assets for formal financial statement processes.
Growth of an assumed $10,000 investment
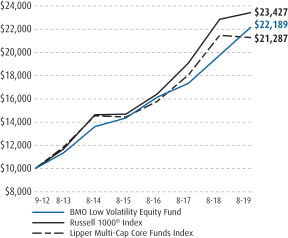
See Explanation of the Indices and Notes in the Commentary for additional information.The above graph relates to the Institutional Class shares of the Fund. Performance for the Advisor Class shares will vary from the performance of the Institutional Class shares shown above due to differences in charges and expenses. This graph illustrates the hypothetical investment of $10,000 in the Institutional Class shares of the Fund from the lesser of the Fund’s inception date or August 31, 2009 to August 31, 2019.
2
| | |
| | |
| Annual Report | | BMO Dividend Income Fund |
| | | | | | | | | | | | |
Average annual total returns (%) | |
| | | 1-Year | | | 5-Years | | | Since Inception | |
| Advisor Class (A)NAV | | | (3.51 | ) | | | 7.80 | | | | 8.56 | |
| Advisor Class (A)OFFER | | | (8.31 | ) | | | 6.71 | | | | 7.52 | |
| Institutional Class (I) | | | (3.24 | ) | | | 8.07 | | | | 11.68 | |
| Russell 1000® Value Index | | | 0.62 | | | | 6.59 | | | | 11.80 | |
| Standard & Poor’s 500® Index | | | 2.92 | | | | 10.11 | | | | 13.92 | |
| Lipper Equity Income Funds Index | | | 2.95 | | | | 7.26 | | | | 11.11 | |
| * | Benchmarks since inception reflect the inception date of the Institutional Class. |
The performance data quoted represents past performance which is no guarantee of future results. Investment return and principal value will fluctuate so that an investor’s shares, when redeemed, may be worth more or less than their original costs. Mutual fund performance changes over time and current performance may be lower or higher than what is stated. To receive current performance to the most recentmonth-end, please call1-800-236-3863 or visit www.bmofunds.com.
Commentary
The BMO Dividend Income Fund (the Fund) returned-3.24% for the fiscal year ended August 31, 2019 versus the Russell 1000® Value Index, the Standard & Poor’s 500® Index and the Lipper Equity Income Funds Index, which returned 0.62%, 2.92% and 2.95%, respectively.
Trade war escalation and volatile interest rate outlooks continued to influence the market environment during the 2019 fiscal year. Despite early optimism on a finalized trade deal with Canada and Mexico, and progress towards an agreement with China, the narrative has been negative as tariffs have increased and caused investors additional concerns. The U.S. Federal Reserve did an about face on raising interest rates early in 2019 and have now begun a rate cutting cycle. This shift has led to investors flocking to stocks with higher growth and/or lower volatility characteristics. Conversely, they have shunned cheap economically cyclical stocks.
The Fund’s performance was hampered by our active decision to rotate out of stocks that have seen their valuations become historically stretched. Our research shows that the spread between expensive and cheap stocks has now become statistically significant such that the expected future return of cheaper stocks is attractive. Unfortunately, this worked against the Fund as the global economic and trade related uncertainty led investors to continue to shun cheap value stocks with higher dividend yields. Our exposure to higher yielding, cyclical stocks in the Financials, Materials, and Energy sectors detracted from performance.
The Fund benefited from strong stock selection within the new Communication Services sector. Comcast (3.0% of the Fund, +22.2% return) benefited from healthy demand for its broadband services. Investors were attracted to telecom giants Verizon (3.0% of the Fund, +11.6% return) and AT&T (2.0% of the Fund, +17.5 return) due to their domestic focus, high dividend yields, and low risk profiles. Stock selection in the Consumer Discretionary sector detracted from Fund performance. Retailer Kohl’s (1.2% of the Fund,-37.8% return) was hurt by a combination of bad weather, poor business execution, and online competitive threats.
As we look toward fiscal year 2020, we believe several themes exist that will influence equity markets. From a policy standpoint, we believe investor sentiment will be influenced by any improvement in the trade wars and an improvement in the global economy. Investors also will assess potential outcomes of the next presidential election and their impact on financial markets. Finally, the actions of the Federal Reserve likely will play an important role in the markets over the coming year. Accordingly, we have positioned the Fund to participate in appreciating markets while managing downside risks.
Fund Managers; Investment Experience
Kenneth M. Conrad, Ph.D., CFA; since 2000
Casey J. Sambs, CFA; since 2004
| | | | | | | | | | | | | | | | | | | | |
| | | | | | | | | Inception date | | | Expenses (%) | |
| Share class | | Ticker | | | Cusip | | | Gross | | | Net | |
| Advisor (A) | | | BADIX | | | | 09658W204 | | | | 5/27/2014 | | | | 1.04 | | | | 0.90 | |
| Institutional (I) | | | MDIVX | | | | 09658L604 | | | | 12/29/2011 | | | | 0.79 | | | | 0.65 | |
The above expense ratios are from the Funds’ Prospectus dated April 1, 2019, and are inclusive of Acquired Fund Fees and Expenses. See Note 6 in the Notes to Financial Statements for additional information. Net expense ratios reflect contractual fee waivers and/or expense reimbursements if applicable, made by BMO Asset Management Corp., the investment adviser (Adviser). The Adviser may not terminate these fee waivers and/or expense reimbursements prior to December 31, 2020 without the consent of the Board of Directors, unless the investment advisory agreement is terminated. Without these contractual waivers, the Fund’s returns would have been lower.
| | | | |
Portfolio sector allocation | |
| Sector | | Fund (%) | |
| Communication Services | | | 8.0 | |
| Consumer Discretionary | | | 6.0 | |
| Consumer Staples | | | 5.7 | |
| Energy | | | 7.6 | |
| Financials | | | 15.9 | |
| Healthcare | | | 11.4 | |
| Industrials | | | 7.7 | |
| Information Technology | | | 16.4 | |
| Materials | | | 2.6 | |
| Real Estate | | | 6.5 | |
| Utilities | | | 6.7 | |
| Other Assets & Liabilities, Net | | | 5.5 | |
| Total | | | 100.0 | |
Portfolio composition will change due to the ongoing management of the Fund. The percentages are based on net assets as of August 31, 2019 and may not necessarily reflect adjustments that are routinely made when presenting net assets for formal financial statement processes.
Growth of an assumed $10,000 investment
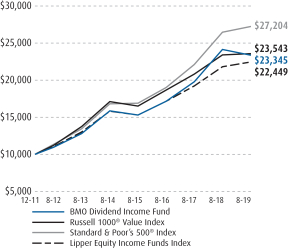
See Explanation of the Indices and Notes in the Commentary for additional information.The above graph relates to the Institutional Class shares of the Fund. Performance for the Advisor Class shares will vary from the performance of the Institutional Class shares shown above due to differences in charges and expenses. This graph illustrates the hypothetical investment of $10,000 in the Institutional Class shares of the Fund from the lesser of the Fund’s inception date or August 31, 2009 to August 31, 2019.
3
| | |
| | |
| Annual Report | | BMOLarge-Cap Value Fund |
| | | | | | | | | | | | | | | | |
Average annual total returns (%) | |
| | | 1-Year | | | 5-Years | | | 10-Years | | | Since Inception | |
| Advisor Class (A)NAV | | | (7.15 | ) | | | 5.11 | | | | — | | | | 5.89 | |
| Advisor Class (A)OFFER | | | (11.78 | ) | | | 4.03 | | | | — | | | | 4.86 | |
| Institutional Class (I) | | | (6.97 | ) | | | 5.37 | | | | 10.32 | | | | 6.12 | |
| Retirement Class (R-6) | | | (6.80 | ) | | | — | | | | — | | | | 7.13 | |
| Russell 1000® Value Index | | | 0.62 | | | | 6.59 | | | | 11.49 | | | | 11.49 | |
| Lipper Multi-Cap Value Funds Index | | | (4.31 | ) | | | 4.63 | | | | 9.90 | | | | 9.90 | |
| * | Benchmarks since inception reflect the inception date of the Institutional Class. |
The performance data quoted represents past performance which is no guarantee of future results. Investment return and principal value will fluctuate so that an investor’s shares, when redeemed, may be worth more or less than their original costs. Mutual fund performance changes over time and current performance may be lower or higher than what is stated. To receive current performance to the most recentmonth-end, please call1-800-236-3863 or visit www.bmofunds.com.
Commentary
The BMOLarge-Cap Value Fund (the Fund) returned-6.97% for the fiscal year ended August 31, 2019 versus the Russell 1000® Value Index and the LipperMulti-Cap Value Funds Index, which returned 0.62% and-4.31%, respectively.
Despite multiple pullbacks and periods of elevated market volatility, global equity markets finished the trailing fiscal year in positive territory. Equities finished calendar year 2018 in negative territory, with the fourth quarter marking the single worst quarter of performance since the financial crisis, ending a nine consecutive calendar year stretch of positive returns. The fourth quarter’ssell-off was greatly influenced by instability at the macro-level, which included continued trade tensions between the U.S. and China, concerns over tightening by the U.S. Federal Reserve, Brexit, and the U.S. Government shutdown.
U.S. equities quickly recovered from 2018’s losses, despite negative returns in May and August, as concerns continued to mount over tariffs, yield curve inversion, and slowing global economic growth. Drivers of gains included the continuation of accommodative policy by central bankers and a resilient consumer. The most dominant theme during the year was the continued underperformance of more attractively valued securities in the market. While equities finished the period in positive territory, increasing market volatility, a sharp decrease in interest rates, and the influence of macroeconomic risks continued to drive the outperformance of lower risk stocks. Similarly, larger companies outperformed smaller ones, while investors continued to favor stocks with higher sales and earnings growth, with no regard to valuations.
The Fund underperformed the Russell 1000® Value Index in the fiscal year. Sector allocation was positive for the period, while stock selection was negative. The Fund’s overweight position in Utilities and underweight position in Energy added to performance, while underweight positions in Communication Services and Consumer Staples detracted from performance. Stock selection was strongest in Utilities and Communication Services and weakest in Information Technology and Health Care. Essex Property Trust, Inc. (ESS) (2.8% of the Fund, 34.2% return) and Entergy Corporation (ETR) (3.0% of the Fund, 40.4% return) added to the portfolio’s performance, while DXC Technology, Co. (DXC) (0.2% of the Fund, -63.1% return) and Procter & Gamble Company (PG) (0.4% of the Fund, -43.2% return) detracted from returns.
As we look ahead, the potential for increased market volatility remains. Elevated volatility presents opportunities to add value through active stock selection and risk management. While equities continue to post record gains, markets may react negatively to a number of risks, including the threat of ongoing trade tensions between the U.S. and China, a slowdown in global economic growth, and uncertainty surrounding the expectations of accommodative policy. We focus on stock selection while using a variety of portfolio construction tools to manage these risks. In addition, valuation spreads remain historically wide, suggesting a potentially favorable environment for more attractively valued securities in the market. Similarly, mispricings in the U.S. equity market are more extreme in defensive sectors, such as Utilities, as investors position against increased volatility. The portfolio continues to trade at a discount relative to the benchmark, while owning what we believe are fundamentally strong companies with positive or improving investor sentiment.
Fund Managers; Investment Experience
David A. Corris, CFA; since 1999
Jason C. Hans, CFA; since 1999
Ernesto Ramos, Ph.D.; since 1988
| | | | | | | | | | | | | | | | | | | | |
| | | | | | | | | Inception date | | | Expenses (%) | |
| Share class | | Ticker | | | Cusip | | | Gross | | | Net | |
| Advisor (A) | | | BALVX | | | | 09658W303 | | | | 5/27/2014 | | | | 0.85 | | | | 0.79 | |
| Institutional (I) | | | MLVIX | | | | 09658L844 | | | | 1/31/2008 | | | | 0.61 | | | | 0.54 | |
| Retirement(R-6) | | | BLCRX | | | | 09658W568 | | | | 12/28/2015 | | | | 0.42 | | | | 0.39 | |
The above expense ratios are from the Funds’ Prospectus dated April 1, 2019, and are inclusive of Acquired Fund Fees and Expenses. See Note 6 in the Notes to Financial Statements for additional information. Net expense ratios reflect contractual fee waivers and/or expense reimbursements if applicable, made by BMO Asset Management Corp., the investment adviser (Adviser). The Adviser may not terminate these fee waivers and/or expense reimbursements prior to December 31, 2020 without the consent of the Board of Directors, unless the investment advisory agreement is terminated. Without these contractual waivers, the Fund’s returns would have been lower.
| | | | |
Portfolio sector allocation | |
| Sector | | Fund (%) | |
| Communication Services | | | 5.3 | |
| Consumer Discretionary | | | 8.1 | |
| Consumer Staples | | | 10.2 | |
| Energy | | | 6.6 | |
| Financials | | | 21.4 | |
| Healthcare | | | 12.5 | |
| Industrials | | | 8.9 | |
| Information Technology | | | 9.6 | |
| Materials | | | 1.1 | |
| Real Estate | | | 7.5 | |
| Utilities | | | 6.8 | |
| Other Assets & Liabilities, Net | | | 2.0 | |
| Total | | | 100.0 | |
Portfolio composition will change due to the ongoing management of the Fund. The percentages are based on net assets as of August 31, 2019 and may not necessarily reflect adjustments that are routinely made when presenting net assets for formal financial statement processes.
Growth of an assumed $10,000 investment
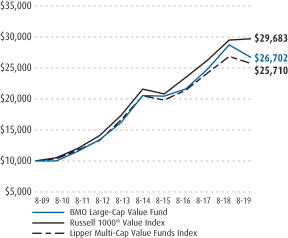
See Explanation of the Indices and Notes in the Commentary for additional information.The above graph relates to the Institutional Class shares of the Fund. Performance for the Advisor Class and RetirementR-6 shares will vary from the performance of the Institutional Class shares shown above due to differences in charges and expenses. This graph illustrates the hypothetical investment of $10,000 in the Institutional Class shares of the Fund from the lesser of the Fund’s inception date or August 31, 2009 to August 31, 2019.
4
| | |
| | |
| Annual Report | | BMOLarge-Cap Growth Fund |
| | | | | | | | | | | | | | | | |
Average annual total returns (%) | |
| | | 1-Year | | | 5-Years | | | 10-Years | | | Since Inception | |
| Investor Class (Y) | | | (0.62 | ) | | | 12.09 | | | | 14.61 | | | | 8.12 | |
| Advisor Class (A)NAV | | | (0.63 | ) | | | 12.10 | | | | — | | | | 12.83 | |
| Advisor Class (A)OFFER | | | (5.59 | ) | | | 10.96 | | | | — | | | | 11.76 | |
| Institutional Class (I) | | | (0.40 | ) | | | 12.38 | | | | 14.89 | | | | 10.70 | |
| Retirement Class (R-6) | | | (0.22 | ) | | | — | | | | — | | | | 14.14 | |
| Russell 1000® Growth Index | | | 4.27 | | | | 13.06 | | | | 15.42 | | | | 15.42 | |
| Lipper Multi-Cap Growth Funds Index | | | 2.52 | | | | 10.76 | | | | 13.89 | | | | 13.89 | |
| * | Benchmarks since inception reflect the inception date of the Institutional Class. |
The performance data quoted represents past performance which is no guarantee of future results. Investment return and principal value will fluctuate so that an investor’s shares, when redeemed, may be worth more or less than their original costs. Mutual fund performance changes over time and current performance may be lower or higher than what is stated. To receive current performance to the most recentmonth-end, please call1-800-236-3863 or visit www.bmofunds.com.
Commentary
The BMOLarge-Cap Growth Fund (the Fund) returned -0.40% for the fiscal year ended August 31, 2019 versus the Russell 1000® Growth Index and the LipperMulti-Cap Growth Funds Index, which returned 4.27% and 2.52%, respectively.
Despite multiple pullbacks and periods of elevated market volatility, global equity markets finished the trailing fiscal year in positive territory. Equities finished calendar year 2018 in negative territory, with the fourth quarter marking the single worst quarter of performance since the financial crisis, ending a nine consecutive calendar year stretch of positive returns. The fourth quarter’ssell-off was greatly influenced by instability at the macro-level, which included continued trade tensions between the U.S. and China, concerns over tightening by the U.S. Federal Reserve, Brexit, and the U.S. Government shutdown.
U.S. equities quickly recovered from 2018’s losses, despite negative returns in May and August, as concerns continued to mount over tariffs, yield curve inversion, and slowing global economic growth. Drivers of gains included the continuation of accommodative policy by central bankers and a resilient consumer. The most dominant theme during the year was the continued underperformance of more attractively valued securities in the market. While equities finished the period in positive territory, increasing market volatility, a sharp decrease in interest rates, and the influence of macroeconomic risks continued to drive the outperformance of lower risk stocks. Similarly, larger companies outperformed smaller ones, while investors continued to favor stocks with higher sales and earnings growth, with no regard to valuations.
The Fund underperformed the Russell 1000® Growth Index in the fiscal year. Both sector allocation and stock selection were negative for the period. The Fund’s overweight positions in Real Estate and Financials added to performance, while an overweight position in Energy and an underweight position in Consumer Staples detracted from performance. Stock selection was strongest in Health Care and Consumer Staples and weakest in Information Technology and Consumer Discretionary. Hershey Company (HSY) (1.8% of the Fund, 61.4% return) and Essex Property Trust, Inc. (ESS) (1.0% of the Fund, 34.2% return) (1.8% of the Fund, 61.4% return) added to the portfolio’s performance, while TripAdvisor, Inc. (TRIP) (0.7% of the Fund, -30.1% return) and ConocoPhillips, Co. (COP) (1.4% of the Fund, -27.6% return) detracted from returns.
As we look ahead, the potential for increased market volatility remains. Elevated volatility presents opportunities to add value through active stock selection and risk management. While equities continue to post record gains, markets may react negatively to a number of risks, including the threat of ongoing trade tensions between the U.S. and China, a slowdown in global economic growth, and uncertainty surrounding the expectations of accommodative policy. We focus on stock selection while using a variety of portfolio construction tools to manage these risks. In addition, valuation spreads remain historically wide, suggesting a potentially favorable environment for more attractively valued securities in the market. Similarly, mispricings in the U.S. equity market are more extreme in defensive sectors, such as Utilities, as investors position against increased volatility. The portfolio continues to trade at a discount relative to the benchmark, while owning what we believe are fundamentally strong companies with positive or improving investor sentiment.
Fund Managers; Investment Experience
David A. Corris, CFA; since 1999
Jason C. Hans, CFA; since 1999
Ernesto Ramos, Ph.D.; since 1988
| | | | | | | | | | | | | | | | | | | | |
| | | | | | | | | Inception date | | | Expenses (%) | |
| Share class | | Ticker | | | Cusip | | | Gross | | | Net | |
| Investor (Y) | | | MASTX | | | | 09658L745 | | | | 11/20/1992 | | | | 0.85 | | | | 0.79 | |
| Advisor (A) | | | BALGX | | | | 09658W402 | | | | 5/27/2014 | | | | 0.85 | | | | 0.79 | |
| Institutional (I) | | | MLCIX | | | | 09658L752 | | | | 1/31/2008 | | | | 0.60 | | | | 0.54 | |
| Retirement(R-6) | | | BLGRX | | | | 09658W576 | | | | 12/28/2015 | | | | 0.42 | | | | 0.39 | |
The above expense ratios are from the Funds’ Prospectus dated April 1, 2019, and are inclusive of Acquired Fund Fees and Expenses. See Note 6 in the Notes to Financial Statements for additional information. Net expense ratios reflect contractual fee waivers and/or expense reimbursements if applicable, made by BMO Asset Management Corp., the investment adviser (Adviser). The Adviser may not terminate these fee waivers and/or expense reimbursements prior to December 31, 2020 without the consent of the Board of Directors, unless the investment advisory agreement is terminated. Without these contractual waivers, the Fund’s returns would have been lower.
| | | | |
Portfolio sector allocation | |
| Sector | | Fund (%) | |
| Communication Services | | | 11.2 | |
| Consumer Discretionary | | | 12.5 | |
| Consumer Staples | | | 6.7 | |
| Energy | | | 1.4 | |
| Financials | | | 6.3 | |
| Healthcare | | | 13.1 | |
| Industrials | | | 9.7 | |
| Information Technology | | | 34.7 | |
| Materials | | | 1.2 | |
| Real Estate | | | 1.5 | |
| Other Assets & Liabilities, Net | | | 1.7 | |
| Total | | | 100.0 | |
Portfolio composition will change due to the ongoing management of the Fund. The percentages are based on net assets as of August 31, 2019 and may not necessarily reflect adjustments that are routinely made when presenting net assets for formal financial statement processes.
Growth of an assumed $10,000 investment
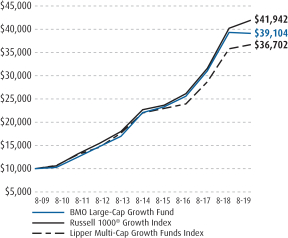
See Explanation of the Indices and Notes in the Commentary for additional information.The above graph relates to the Investor Class shares of the Fund. Performance for the Institutional Class, Advisor Class and RetirementR-6 shares will vary from the performance of the Investor Class shares shown above due to differences in charges and expenses. This graph illustrates the hypothetical investment of $10,000 in the Investor Class shares of the Fund from the lesser of the Fund’s inception date or August 31, 2009 to August 31, 2019.
5
| | |
| | |
| Annual Report | | BMOMid-Cap Value Fund |
| | | | | | | | | | | | | | | | |
Average annual total returns (%) | |
| | | 1-Year | | | 5-Years | | | 10-Years | | | Since Inception | |
| Advisor Class (A)NAV | | | (9.63 | ) | | | 3.20 | | | | — | | | | 4.24 | |
| Advisor Class (A)OFFER | | | (14.18 | ) | | | 2.14 | | | | — | | | | 3.24 | |
| Institutional Class (I) | | | (9.47 | ) | | | 3.44 | | | | 10.43 | | | | 7.18 | |
| Retirement Class (R-6) | | | (9.37 | ) | | | 3.58 | | | | — | | | | 4.64 | |
| Russell Midcap® Value Index | | | (3.13 | ) | | | 5.88 | | | | 12.46 | | | | 12.46 | |
| Lipper Mid-Cap Value Funds Index | | | (8.57 | ) | | | 3.63 | | | | 10.47 | | | | 10.47 | |
| * | Benchmarks since inception reflect the inception date of the Institutional Class. |
The performance data quoted represents past performance which is no guarantee of future results. Investment return and principal value will fluctuate so that an investor’s shares, when redeemed, may be worth more or less than their original costs. Mutual fund performance changes over time and current performance may be lower or higher than what is stated. To receive current performance to the most recentmonth-end, please call1-800-236-3863 or visit www.bmofunds.com.
Commentary
The BMOMid-Cap Value Fund (the Fund) returned-9.47% for the fiscal year ended August 31, 2019 versus the Russell Midcap® Value Index and the LipperMid-Cap Value Funds Index, which returned-3.13% and -8.57%, respectively.
Despite multiple pullbacks and periods of elevated market volatility, global equity markets finished the trailing fiscal year in positive territory. Equities finished calendar year 2018 in negative territory, with the fourth quarter marking the single worst quarter of performance since the financial crisis, ending a nine consecutive calendar year stretch of positive returns. The fourth quarter’ssell-off was greatly influenced by instability at the macro-level, which included continued trade tensions between the U.S. and China, concerns over tightening by the U.S. Federal Reserve, Brexit, and the U.S. Government shutdown.
U.S. equities quickly recovered from 2018’s losses, despite negative returns in May and August, as concerns continued to mount over tariffs, yield curve inversion, and slowing global economic growth. Drivers of gains included the continuation of accommodative policy by central bankers and a resilient consumer. The most dominant theme during the year was the continued underperformance of more attractively valued securities in the market. While equities finished the period in positive territory, increasing market volatility, a sharp decrease in interest rates, and the influence of macroeconomic risks continued to drive the outperformance of lower risk stocks. Similarly, larger companies outperformed smaller ones, while investors continued to favor stocks with higher sales and earnings growth, with no regard to valuations.
The Fund underperformed the Russell Midcap® Value Index in the fiscal year. Both sector allocation and stock selection were negative for the period. The Fund’s overweight position in Information Technology and underweight position in Energy added to performance, while an overweight position in Health Care and an underweight position in Utilities detracted from performance. Stock selection was strongest in Health Care and Energy and weakest in Information Technology and Consumer Discretionary. Hershey Company (HSY) (1.9% of the Fund, 61.4% return) and AutoZone, Inc (AZO) (1.7% of the Fund; 43.7% return) added to the portfolio’s performance, while PBF Energy, Inc. (PBF) (0.8% of the Fund, -52.4% return) and Cimarex Energy, Co. (XEC) (0.7% of the Fund, -48.7% return) detracted from returns.
As we look ahead, the potential for increased market volatility remains. Elevated volatility presents opportunities to add value through active stock selection and risk management. While equities continue to post record gains, markets may react negatively to a number of risks, including the threat of ongoing trade tensions between the U.S. and China, a slowdown in global economic growth, and uncertainty surrounding the expectations of accommodative policy. We focus on stock selection while using a variety of portfolio construction tools to manage these risks. In addition, valuation spreads remain historically wide, suggesting a potentially favorable environment for more attractively valued securities in the market. Similarly, mispricings in the U.S. equity market are more extreme in defensive sectors, such as Utilities, as investors position against increased volatility. The portfolio continues to trade at a discount relative to the benchmark, while owning what we believe are fundamentally strong companies with positive or improving investor sentiment.
Fund Managers; Investment Experience
David A. Corris, CFA; since 1999
Thomas Lettenberger, CFA; Since 1994
| | | | | | | | | | | | | | | | | | | | |
| | | | | | | | | Inception date | | | Expenses (%) | |
| Share class | | Ticker | | | Cusip | | | Gross | | | Net | |
| Advisor (A) | | | BAMCX | | | | 09658W501 | | | | 5/27/2014 | | | | 1.25 | | | | 1.24 | |
| Institutional (I) | | | MRVIX | | | | 09658L711 | | | | 1/31/2008 | | | | 1.00 | | | | 0.99 | |
| Retirement(R-6) | | | BMVGX | | | | 09658V438 | | | | 5/27/2014 | | | | 0.83 | | | | 0.83 | |
The above expense ratios are from the Funds’ Prospectus dated April 1, 2019, and are inclusive of Acquired Fund Fees and Expenses. See Note 6 in the Notes to Financial Statements for additional information. Net expense ratios reflect contractual fee waivers and/or expense reimbursements if applicable, made by BMO Asset Management Corp., the investment adviser (Adviser). The Adviser may not terminate these fee waivers and/or expense reimbursements prior to December 31, 2020 without the consent of the Board of Directors, unless the investment advisory agreement is terminated. Without these contractual waivers, the Fund’s returns would have been lower.
| | | | |
Portfolio sector allocation | |
| Sector | | Fund (%) | |
| Communication Services | | | 1.1 | |
| Consumer Discretionary | | | 6.9 | |
| Consumer Staples | | | 7.1 | |
| Energy | | | 3.8 | |
| Financials | | | 19.3 | |
| Healthcare | | | 10.2 | |
| Industrials | | | 10.5 | |
| Information Technology | | | 10.0 | |
| Materials | | | 3.7 | |
| Real Estate | | | 14.8 | |
| Utilities | | | 10.3 | |
| Other Assets & Liabilities, Net | | | 2.3 | |
| Total | | | 100.0 | |
Portfolio composition will change due to the ongoing management of the Fund. The percentages are based on net assets as of August 31, 2019 and may not necessarily reflect adjustments that are routinely made when presenting net assets for formal financial statement processes.
Growth of an assumed $10,000 investment
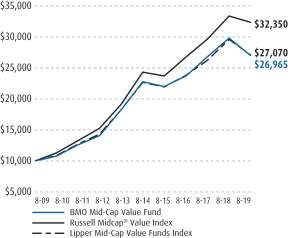
See Explanation of the Indices and Notes in the Commentary for additional information.The above graph relates to the Institutional Class shares of the Fund. Performance for the Advisor Class and RetirementR-6 shares will vary from the performance of the Institutional Class shares shown above due to differences in charges and expenses. This graph illustrates the hypothetical investment of $10,000 in the Institutional Class shares of the Fund from the lesser of the Fund’s inception date or August 31, 2009 to August 31, 2019.
6
| | |
| | |
| Annual Report | | BMOMid-Cap Growth Fund |
| | | | | | | | | | | | | | | | |
Average annual total returns (%) | |
| | | 1-Year | | | 5-Years | | | 10-Years | | | Since Inception | |
| Advisor Class (A)NAV | | | (2.95 | ) | | | 6.40 | | | | — | | | | 6.97 | |
| Advisor Class (A)OFFER | | | (7.83 | ) | | | 5.31 | | | | — | | | | 5.93 | |
| Institutional Class (I) | | | (2.75 | ) | | | 6.66 | | | | 12.41 | | | | 8.33 | |
| Retirement Class (R-6) | | | (2.54 | ) | | | 6.84 | | | | — | | | | 7.40 | |
| Russell Midcap® Growth Index | | | 5.96 | | | | 10.72 | | | | 14.85 | | | | 14.85 | |
| Lipper Mid-Cap Growth Funds Index | | | 5.03 | | | | 10.53 | | | | 13.68 | | | | 13.68 | |
| * | Benchmarks since inception reflect the inception date of the Institutional Class. |
The performance data quoted represents past performance which is no guarantee of future results. Investment return and principal value will fluctuate so that an investor’s shares, when redeemed, may be worth more or less than their original costs. Mutual fund performance changes over time and current performance may be lower or higher than what is stated. To receive current performance to the most recentmonth-end, please call1-800-236-3863 or visit www.bmofunds.com.
Commentary
The BMOMid-Cap Value Fund (the Fund) returned-2.75% for the fiscal year ended August 31, 2019 versus the Russell Midcap® Growth Index and the LipperMid-Cap Growth Funds Index, which returned 5.96% and 5.03%, respectively.
Despite multiple pullbacks and periods of elevated market volatility, global equity markets finished the trailing fiscal year in positive territory. Equities finished calendar year 2018 in negative territory, with the fourth quarter marking the single worst quarter of performance since the financial crisis, ending a nine consecutive calendar year stretch of positive returns. The fourth quarter’ssell-off was greatly influenced by instability at the macro-level, which included continued trade tensions between the U.S. and China, concerns over tightening by the U.S. Federal Reserve, Brexit, and the U.S. Government shutdown.
U.S. equities quickly recovered from 2018’s losses, despite negative returns in May and August, as concerns continued to mount over tariffs, yield curve inversion, and slowing global economic growth. Drivers of gains included the continuation of accommodative policy by central bankers and a resilient consumer. The most dominant theme during the year was the continued underperformance of more attractively valued securities in the market. While equities finished the period in positive territory, increasing market volatility, a sharp decrease in interest rates, and the influence of macroeconomic risks continued to drive the outperformance of lower risk stocks. Similarly, larger companies outperformed smaller ones, while investors continued to favor stocks with higher sales and earnings growth, with no regard to valuations.
The Fund underperformed the Russell Midcap® Growth Index in the fiscal year. Both sector allocation and stock selection were negative for the period. The Fund’s underweight position in Consumer Discretionary and overweight position in Information Technology added to performance, while an overweight position in Energy and an underweight position in Industrials detracted from performance. Health Care was the only sector in which stock selection contributed positively for the period. Stock selection was weakest in Industrials and Materials. Euronet Worldwide, Inc. (EEFT) (1.7% of the Fund, 56.6% return) and Keysight Technologies, Inc (KEYS) (2.0% of the Fund, 49.3% return) added to the portfolio’s performance, while Schneider National, Inc. (SNDR) (0.0% of the Fund; -27.3% return) and Brunswick Corporation (BC) (0.0% of the Fund; -28.6% return) detracted from returns.
As we look ahead, the potential for increased market volatility remains. Elevated volatility presents opportunities to add value through active stock selection and risk management. While equities continue to post record gains, markets may react negatively to a number of risks, including the threat of ongoing trade tensions between the U.S. and China, a slowdown in global economic growth, and uncertainty surrounding the expectations of accommodative policy. We focus on stock selection while using a variety of portfolio construction tools to manage these risks. In addition, valuation spreads remain historically wide, suggesting a potentially favorable environment for more attractively valued securities in the market. Similarly, mispricings in the U.S. equity market are more extreme in defensive sectors, such as Utilities, as investors position against increased volatility. The portfolio continues to trade at a discount relative to the benchmark, while owning what we believe are fundamentally strong companies with positive or improving investor sentiment.
Fund Managers; Investment Experience
David A. Corris, CFA; since 1999
Thomas Lettenberger, CFA; since 1994
| | | | | | | | | | | | | | | | | | | | |
| | | | | | | | | Inception date | | | Expenses (%) | |
| Share class | | Ticker | | | Cusip | | | Gross | | | Net | |
| Advisor (A) | | | BGMAX | | | | 09658W600 | | | | 5/27/2014 | | | | 1.31 | | | | 1.24 | |
| Institutional (I) | | | MRMIX | | | | 09658L737 | | | | 1/31/2008 | | | | 1.06 | | | | 0.99 | |
| Retirement(R-6) | | | BMGGX | | | | 09658V412 | | | | 5/27/2014 | | | | 0.88 | | | | 0.84 | |
The above expense ratios are from the Funds’ Prospectus dated April 1, 2019, and are inclusive of Acquired Fund Fees and Expenses. See Note 6 in the Notes to Financial Statements for additional information. Net expense ratios reflect contractual fee waivers and/or expense reimbursements if applicable, made by BMO Asset Management Corp., the investment adviser (Adviser). The Adviser may not terminate these fee waivers and/or expense reimbursements prior to December 31, 2020 without the consent of the Board of Directors, unless the investment advisory agreement is terminated. Without these contractual waivers, the Fund’s returns would have been lower.
| | | | |
Portfolio sector allocation | |
| Sector | | Fund (%) | |
| Communication Services | | | 2.6 | |
| Consumer Discretionary | | | 16.0 | |
| Consumer Staples | | | 4.0 | |
| Energy | | | 1.8 | |
| Financials | | | 4.3 | |
| Healthcare | | | 14.5 | |
| Industrials | | | 12.8 | |
| Information Technology | | | 34.6 | |
| Materials | | | 2.2 | |
| Real Estate | | | 5.5 | |
| Other Assets & Liabilities, Net | | | 1.7 | |
| Total | | | 100.0 | |
Portfolio composition will change due to the ongoing management of the Fund. The percentages are based on net assets as of August 31, 2019 and may not necessarily reflect adjustments that are routinely made when presenting net assets for formal financial statement processes.
Growth of an assumed $10,000 investment
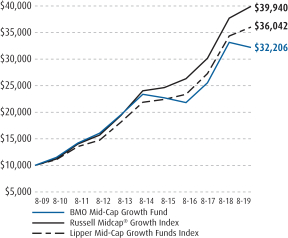
See Explanation of the Indices and Notes in the Commentary for additional information.The above graph relates to the Institutional Class shares of the Fund. Performance for the Advisor Class and RetirementR-6 shares will vary from the performance of the Institutional Class shares shown above due to differences in charges and expenses. This graph illustrates the hypothetical investment of $10,000 in the Institutional Class shares of the Fund from the lesser of the Fund’s inception date or August 31, 2009 to August 31, 2019.
7
| | |
| | |
| Annual Report | | BMOSmall-Cap Value Fund |
| | | | | | | | | | | | |
Average annual total returns (%) | |
| | | 1-Year | | | 5-Years | | | Since Inception | |
| Advisor Class (A)NAV | | | (16.19 | ) | | | 2.70 | | | | 3.13 | |
| Advisor Class (A)OFFER | | | (20.39 | ) | | | 1.65 | | | | 2.12 | |
| Institutional Class (I) | | | (15.93 | ) | | | 2.96 | | | | 7.91 | |
| Retirement Class (R-6) | | | (15.81 | ) | | | 3.14 | | | | 3.57 | |
| Russell 2000® Value Index | | | (14.89 | ) | | | 4.63 | | | | 7.35 | |
| Lipper Small-Cap Core Funds Index | | | (10.51 | ) | | | 6.34 | | | | 8.56 | |
| * | Benchmarks since inception reflect the inception date of the Institutional Class. |
The performance data quoted represents past performance which is no guarantee of future results. Investment return and principal value will fluctuate so that an investor’s shares, when redeemed, may be worth more or less than their original costs. Mutual fund performance changes over time and current performance may be lower or higher than what is stated. To receive current performance to the most recentmonth-end, please call1-800-236-3863 or visit www.bmofunds.com.
Commentary
The BMOSmall-Cap Value Fund (the Fund) returned-15.93% for the fiscal year ended August 31, 2019 versus the Russell 2000® Value Index and the LipperSmall-Cap Core Funds Index, which returned-14.89% and -10.51%, respectively.
Despite multiple pullbacks and periods of elevated market volatility, global equity markets finished the trailing fiscal year in positive territory. Equities finished calendar year 2018 in negative territory, with the fourth quarter marking the single worst quarter of performance since the financial crisis, ending a nine consecutive calendar year stretch of positive returns. The fourth quarter’ssell-off was greatly influenced by instability at the macro-level, which included continued trade tensions between the U.S. and China, concerns over tightening by the U.S. Federal Reserve, Brexit, and the U.S. Government shutdown.
U.S. equities quickly recovered from 2018’s losses, despite negative returns in May and August, as concerns continued to mount over tariffs, yield curve inversion, and slowing global economic growth. Drivers of gains included the continuation of accommodative policy by central bankers and a resilient consumer. The most dominant theme during the year was the continued underperformance of more attractively valued securities in the market. While equities finished the period in positive territory, increasing market volatility, a sharp decrease in interest rates, and the influence of macroeconomic risks continued to drive the outperformance of lower risk stocks. Similarly, larger companies outperformed smaller ones, while investors continued to favor stocks with higher sales and earnings growth, with no regard to valuations.
The Fund underperformed the Russell 2000® Value Index in the fiscal year. Sector allocation was negative for the period, while stock selection was positive. The Fund’s underweight positions in Energy and Consumer Staples added to performance, while an overweight position in Health Care and an underweight position in Utilities detracted from performance. Stock selection was strongest in Health Care and Communication Services and weakest in Consumer Discretionary and Real Estate. Sinclair Broadcast Group, Inc. (SBGI) (0.0% of the Fund, 57.1% return) and Ciena Corporation (CIEN) (0.6% of the Fund, 29.6% return) added to the portfolio’s performance, while Cooper-Standard Holdings, Inc. (CPS) (0.2% of the Fund, -73.0% return) and Realogy Holdings Corp. (RLGY) (0.2% of the Fund, -76.8% return) detracted from returns.
As we look ahead, the potential for increased market volatility remains. Elevated volatility presents opportunities to add value through active stock selection and risk management. While equities continue to post record gains, markets may react negatively to a number of risks, including the threat of ongoing trade tensions between the U.S. and China, a slowdown in global economic growth, and uncertainty surrounding the expectations of accommodative policy. We focus on stock selection while using a variety of portfolio construction tools to manage these risks. In addition, valuation spreads remain historically wide, suggesting a potentially favorable environment for more attractively valued securities in the market. Similarly, mispricings in the U.S. equity market are more extreme in defensive sectors, such as Utilities, as investors position against increased volatility. The portfolio continues to trade at a discount relative to the benchmark, while owning what we believe are fundamentally strong companies with positive or improving investor sentiment.
Fund Managers; Investment Experience
David A. Corris, CFA; since 1999
Thomas Lettenberger, CFA; Since 1994
| | | | | | | | | | | | | | | | | | | | |
| | | | | | | | | Inception date | | | Expenses (%) | |
| Share class | | Ticker | | | Cusip | | | Gross | | | Net | |
| Advisor (A) | | | BACVX | | | | 09658W709 | | | | 5/27/2014 | | | | 1.41 | | | | 1.24 | |
| Institutional (I) | | | MRSNX | | | | 09658L596 | | | | 2/28/2011 | | | | 1.16 | | | | 0.99 | |
| Retirement(R-6) | | | BSVGX | | | | 09658V388 | | | | 5/27/2014 | | | | 0.97 | | | | 0.84 | |
The above expense ratios are from the Funds’ Prospectus dated April 1, 2019, and are inclusive of Acquired Fund Fees and Expenses. See Note 6 in the Notes to Financial Statements for additional information. Net expense ratios reflect contractual fee waivers and/or expense reimbursements if applicable, made by BMO Asset Management Corp., the investment adviser (Adviser). The Adviser may not terminate these fee waivers and/or expense reimbursements prior to December 31, 2020 without the consent of the Board of Directors, unless the investment advisory agreement is terminated. Without these contractual waivers, the Fund’s returns would have been lower.
| | | | |
Portfolio sector allocation | |
| Sector | | Fund (%) | |
| Communication Services | | | 0.6 | |
| Consumer Discretionary | | | 6.8 | |
| Consumer Staples | | | 0.9 | |
| Energy | | | 5.4 | |
| Financials | | | 27.1 | |
| Healthcare | | | 7.4 | |
| Industrials | | | 15.6 | |
| Information Technology | | | 10.8 | |
| Materials | | | 5.0 | |
| Real Estate | | | 13.5 | |
| Utilities | | | 5.6 | |
| Other Assets & Liabilities, Net | | | 1.3 | |
| Total | | | 100.0 | |
Portfolio composition will change due to the ongoing management of the Fund. The percentages are based on net assets as of August 31, 2019 and may not necessarily reflect adjustments that are routinely made when presenting net assets for formal financial statement processes.
Growth of an assumed $10,000 investment
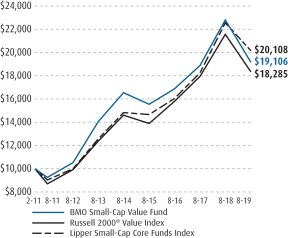
See Explanation of the Indices and Notes in the Commentary for additional information.The above graph relates to the Institutional Class shares of the Fund. Performance for the Advisor Class and RetirementR-6 shares will vary from the performance of the Institutional Class shares shown above due to differences in charges and expenses. This graph illustrates the hypothetical investment of $10,000 in the Institutional Class shares of the Fund from the lesser of the Fund’s inception date or August 31, 2009 to August 31, 2019.
8
| | |
| | |
| Annual Report | | BMOSmall-Cap Core Fund |
| | | | | | | | | | | | |
Average annual total returns (%) | |
| | | 1-Year | | | 5-Years | | | Since Inception | |
| Advisor Class (A)NAV | | | (17.39 | ) | | | 5.47 | | | | 5.78 | |
| Advisor Class (A)OFFER | | | (21.55 | ) | | | 4.39 | | | | 4.75 | |
| Institutional Class (I) | | | (17.18 | ) | | | 5.73 | | | | 5.76 | |
| Russell 2000® Index | | | (12.89 | ) | | | 6.41 | | | | 5.98 | |
| Lipper Small-Cap Core Funds Index | | | (10.51 | ) | | | 6.34 | | | | 6.04 | |
| * | Benchmarks since inception reflect the inception date of the Institutional Class. |
The performance data quoted represents past performance which is no guarantee of future results. Investment return and principal value will fluctuate so that an investor’s shares, when redeemed, may be worth more or less than their original costs. Mutual fund performance changes over time and current performance may be lower or higher than what is stated. To receive current performance to the most recentmonth-end, please call1-800-236-3863 or visit www.bmofunds.com.
Commentary
The BMOSmall-Cap Core Fund (the Fund) returned-17.18% for the fiscal year ended August 31, 2019 versus the Russell 2000® Index and the LipperSmall-Cap Core Funds Index, which returned-12.89% and-10.51%, respectively.
Despite multiple pullbacks and periods of elevated market volatility, global equity markets finished the trailing fiscal year in positive territory. Equities finished calendar year 2018 in negative territory, with the fourth quarter marking the single worst quarter of performance since the financial crisis, ending a nine consecutive calendar year stretch of positive returns. The fourth quarter’ssell-off was greatly influenced by instability at the macro-level, which included continued trade tensions between the U.S. and China, concerns over tightening by the U.S. Federal Reserve, Brexit, and the U.S. Government shutdown.
U.S. equities quickly recovered from 2018’s losses, despite negative returns in May and August, as concerns continued to mount over tariffs, yield curve inversion, and slowing global economic growth. Drivers of gains included the continuation of accommodative policy by central bankers and a resilient consumer. The most dominant theme during the year was the continued underperformance of more attractively valued securities in the market. While equities finished the period in positive territory, increasing market volatility, a sharp decrease in interest rates, and the influence of macroeconomic risks continued to drive the outperformance of lower risk stocks. Similarly, larger companies outperformed smaller ones, while investors continued to favor stocks with higher sales and earnings growth, with no regard to valuations.
The Fund underperformed the Russell 2000® Index in the fiscal year. Both sector allocation and stock selection were negative for the period. The Fund’s overweight position in Information Technology and underweight position in Energy added to performance, while an overweight position in Health Care and an underweight position in Utilities detracted from performance. Stock selection was strongest in Health Care and Energy and weakest in Information Technology and Consumer Discretionary. Novocure, Ltd. (NVCRE) (1.0% of the Fund, 101.7% return) and Performance Food Group Company (PFGC) (1.3% of the Fund, 41.4% return) added to the portfolio’s performance, while Evolent Health, Inc. (EVH) (0.4% of the Fund,-73.1% return) and Realogy Holdings Corp. (RLGY) (0.2% of the Fund; -76.8% return) detracted from returns.
As we look ahead, the potential for increased market volatility remains. Elevated volatility presents opportunities to add value through active stock selection and risk management. While equities continue to post record gains, markets may react negatively to a number of risks, including the threat of ongoing trade tensions between the U.S. and China, a slowdown in global economic growth, and uncertainty surrounding the expectations of accommodative policy. We focus on stock selection while using a variety of portfolio construction tools to manage these risks. In addition, valuation spreads remain historically wide, suggesting a potentially favorable environment for more attractively valued securities in the market. Similarly, mispricings in the U.S. equity market are more extreme in defensive sectors, such as Utilities, as investors position against increased volatility. The portfolio continues to trade at a discount relative to the benchmark, while owning what we believe are fundamentally strong companies with positive or improving investor sentiment.
Fund Managers; Investment Experience
David A. Corris, CFA; since 1999
Thomas Lettenberger, CFA; Since 1994
| | | | | | | | | | | | | | | | | | | | |
| | | | | | | | | Inception date | | | Expenses (%) | |
| Share class | | Ticker | | | Cusip | | | Gross | | | Net | |
| Advisor (A) | | | BCCAX | | | | 09658W808 | | | | 5/27/2014 | | | | 1.62 | | | | 1.15 | |
Institutional
(I) | | | BSCNX | | | | 09658V537 | | | | 12/27/2013 | | | | 1.37 | | | | 0.90 | |
The above expense ratios are from the Funds’ Prospectus dated April 1, 2019, and are inclusive of Acquired Fund Fees and Expenses. See Note 6 in the Notes to Financial Statements for additional information. Net expense ratios reflect contractual fee waivers and/or expense reimbursements if applicable, made by BMO Asset Management Corp., the investment adviser (Adviser). The Adviser may not terminate these fee waivers and/or expense reimbursements prior to December 31, 2020 without the consent of the Board of Directors, unless the investment advisory agreement is terminated. Without these contractual waivers, the Fund’s returns would have been lower.
| | | | |
Portfolio sector allocation | |
| Sector | | Fund (%) | |
| Communication Services | | | 2.8 | |
| Consumer Discretionary | | | 7.6 | |
| Consumer Staples | | | 3.7 | |
| Energy | | | 2.0 | |
| Financials | | | 15.8 | |
| Healthcare | | | 19.3 | |
| Industrials | | | 18.0 | |
| Information Technology | | | 16.2 | |
| Materials | | | 3.0 | |
| Real Estate | | | 6.6 | |
| Utilities | | | 2.9 | |
| Other Assets & Liabilities, Net | | | 2.1 | |
| Total | | | 100.0 | |
Portfolio composition will change due to the ongoing management of the Fund. The percentages are based on net assets as of August 31, 2019 and may not necessarily reflect adjustments that are routinely made when presenting net assets for formal financial statement processes.
Growth of an assumed $10,000 investment
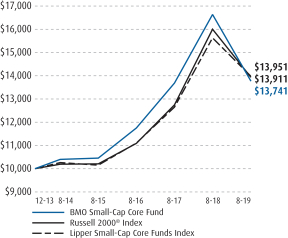
See Explanation of the Indices and Notes in the Commentary for additional information.The above graph relates to the Institutional Class shares of the Fund. Performance for the Advisor Class shares will vary from the performance of the Institutional Class shares shown above due to differences in charges and expenses. This graph illustrates the hypothetical investment of $10,000 in the Institutional Class shares of the Fund from the lesser of the Fund’s inception date or August 31, 2009 to August 31, 2019.
9
| | |
| | |
| Annual Report | | BMOSmall-Cap Growth Fund |
| | | | | | | | | | | | | | | | |
Average annual total returns (%) | |
| | | 1-Year | | | 5-Years | | | 10-Years | | | Since
Inception | |
| Advisor Class (A)NAV | | | (16.12 | ) | | | — | | | | — | | | | 5.96 | |
| Advisor Class (A)OFFER | | | (20.33 | ) | | | — | | | | — | | | | 3.57 | |
| Institutional Class (I) | | | (15.92 | ) | | | 3.79 | | | | 11.52 | | | | 7.92 | |
| Russell 2000® Growth Index | | | (11.02 | ) | | | 8.06 | | | | 13.06 | | | | 13.06 | |
| Lipper Small-Cap Growth Funds Index | | | (4.41 | ) | | | 10.09 | | | | 13.50 | | | | 13.50 | |
| * | Benchmarks since inception reflect the inception date of the Institutional Class. |
The performance data quoted represents past performance which is no guarantee of future results. Investment return and principal value will fluctuate so that an investor’s shares, when redeemed, may be worth more or less than their original costs. Mutual fund performance changes over time and current performance may be lower or higher than what is stated. To receive current performance to the most recentmonth-end, please call1-800-236-3863 or visit www.bmofunds.com.
Commentary
The BMOSmall-Cap Growth Fund (the Fund) returned-15.92% for the fiscal year ended August 31, 2019 versus the Russell 2000® Growth Index and the LipperSmall-Cap Growth Funds Index, which returned-11.02% and-4.41%, respectively.
Despite multiple pullbacks and periods of elevated market volatility, global equity markets finished the trailing fiscal year in positive territory. Equities finished calendar year 2018 in negative territory, with the fourth quarter marking the single worst quarter of performance since the financial crisis, ending a nine consecutive calendar year stretch of positive returns. The fourth quarter’ssell-off was greatly influenced by instability at the macro-level, which included continued trade tensions between the U.S. and China, concerns over tightening by the U.S. Federal Reserve, Brexit, and the U.S. Government shutdown.
U.S. equities quickly recovered from 2018’s losses, despite negative returns in May and August, as concerns continued to mount over tariffs, yield curve inversion, and slowing global economic growth. Drivers of gains included the continuation of accommodative policy by central bankers and a resilient consumer. The most dominant theme during the year was the continued underperformance of more attractively valued securities in the market. While equities finished the period in positive territory, increasing market volatility, a sharp decrease in interest rates, and the influence of macroeconomic risks continued to drive the outperformance of lower risk stocks. Similarly, larger companies outperformed smaller ones, while investors continued to favor stocks with higher sales and earnings growth, with no regard to valuations.
The Fund underperformed the Russell 2000® Growth Index in the fiscal year. Both sector allocation and stock selection were negative for the period. The Fund’s overweight positions in Information Technology and Real Estate added to performance, while an overweight position in Energy and an underweight position in Utilities detracted from performance. Stock selection was strongest in Health Care and Consumer Staples and weakest in Information Technology andConsumer Discretionary. Ciena Corporation (CIEN) (0.9% of the Fund, 29.6% return) and Genomic Health Inc. (GHDX) (1.2% of the Fund, 25.3% return) added to the portfolio’s performance, while Evolent Health, Inc. (EVH) (0.5% of the Fund; -73.1% return) and TrueCar, Inc. (TRUE) (0.4% of the Fund, -69.2% return) detracted from returns.
As we look ahead, the potential for increased market volatility remains. Elevated volatility presents opportunities to add value through active stock selection and risk management. While equities continue to post record gains, markets may react negatively to a number of risks, including the threat of ongoing trade tensions between the U.S. and China, a slowdown in global economic growth, and uncertainty surrounding the expectations of accommodative policy. We focus on stock selection while using a variety of portfolio construction tools to manage these risks. In addition, valuation spreads remain historically wide, suggesting a potentially favorable environment for more attractively valued securities in the market. Similarly, mispricings in the U.S. equity market are more extreme in defensive sectors, such as Utilities, as investors position against increased volatility. The portfolio continues to trade at a discount relative to the benchmark, while owning what we believe are fundamentally strong companies with positive or improving investor sentiment.
Fund Managers; Investment Experience
David A. Corris, CFA; since 1999
Thomas Lettenberger, CFA; Since 1994
| | | | | | | | | | | | | | | | | | | | |
| | | | | | | | | Inception date | | | Expenses (%) | |
| Share class | | Ticker | | | Cusip | | | Gross | | | Net | |
| Advisor (A) | | | BSLAX | | | | 09658V339 | | | | 5/31/2017 | | | | 1.28 | | | | 1.24 | |
Institutional
(I) | | | MSGIX | | | | 09658L620 | | | | 1/31/2008 | | | | 1.02 | | | | 0.99 | |
The above expense ratios are from the Funds’ Prospectus dated April 1, 2019, and are inclusive of Acquired Fund Fees and Expenses. See Note 6 in the Notes to Financial Statements for additional information. Net expense ratios reflect contractual fee waivers and/or expense reimbursements if applicable, made by BMO Asset Management Corp., the investment adviser (Adviser). The Adviser may not terminate these fee waivers and/or expense reimbursements prior to December 31, 2020 without the consent of the Board of Directors, unless the investment advisory agreement is terminated. Without these contractual waivers, the Fund’s returns would have been lower.
| | | | |
Portfolio sector allocation | |
| Sector | | Fund (%) | |
| Communication Services | | | 3.2 | |
| Consumer Discretionary | | | 10.2 | |
| Consumer Staples | | | 5.1 | |
| Energy | | | 1.0 | |
| Financials | | | 5.3 | |
| Healthcare | | | 28.3 | |
| Industrials | | | 19.7 | |
| Information Technology | | | 18.9 | |
| Materials | | | 2.6 | |
| Real Estate | | | 4.4 | |
| Other Assets & Liabilities, Net | | | 1.3 | |
| Total | | | 100.0 | |
Portfolio composition will change due to the ongoing management of the Fund. The percentages are based on net assets as of August 31, 2019 and may not necessarily reflect adjustments that are routinely made when presenting net assets for formal financial statement processes.
Growth of an assumed $10,000 investment
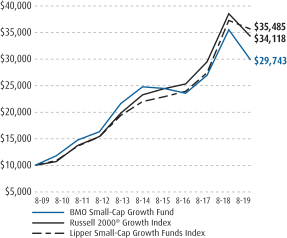
See Explanation of the Indices and Notes in the Commentary for additional information.The above graph relates to the Institutional Class shares of the Fund. Performance for the Advisor Class shares will vary from the performance of the Institutional Class shares shown above due to differences in charges and expenses. This graph illustrates the hypothetical investment of $10,000 in the Institutional Class shares of the Fund from the lesser of the Fund’s inception date or August 31, 2009 to August 31, 2019.
10
| | |
| | |
| Annual Report | | BMO Global Low Volatility Equity Fund |
| | | | | | | | | | | | |
Average annual total returns (%) | |
| | | 1-Year | | | 5-Years | | | Since
Inception | |
| Advisor Class (A)NAV | | | 2.21 | | | | 6.06 | | | | 6.38 | |
| Advisor Class (A)OFFER | | | (2.92 | ) | | | 4.99 | | | | 5.34 | |
| Institutional Class (I) | | | 2.48 | | | | 6.31 | | | | 7.82 | |
| Morgan Stanley Capital International All Country World Index | | | (0.28 | ) | | | 5.51 | | | | 7.14 | |
| Lipper Global Multi-Cap Value Funds Index | | | (6.16 | ) | | | 2.47 | | | | 4.27 | |
| * | Cumulative for periods less than one year. Benchmarks since inception reflect the inception date of the Institutional Class. |
The performance data quoted represents past performance which is no guarantee of future results. Investment return and principal value will fluctuate so that an investor’s shares, when redeemed, may be worth more or less than their original costs. Mutual fund performance changes over time and current performance may be lower or higher than what is stated. To receive current performance to the most recentmonth-end, please call1-800-236-3863 or visit www.bmofunds.com.
Commentary
The BMO Global Low Volatility Equity Fund (the Fund) returned 2.48% for the fiscal year ended August 31, 2019 versus the Morgan Stanley Capital International All Country World Index (MSCI ACW) Net and the Lipper GlobalMulti-Cap Value Funds Index, which returned -0.28% and -6.16%, respectively.
Despite multiple pullbacks and periods of elevated market volatility, global equity markets finished the trailing fiscal year in positive territory. Equities finished calendar year 2018 in negative territory, with the fourth quarter marking the single worst quarter of performance since the financial crisis, ending a nine consecutive calendar year stretch of positive returns. The fourth quarter’ssell-off was greatly influenced by instability at the macro-level, which included continued trade tensions between the U.S. and China, concerns over tightening by the U.S. Federal Reserve, Brexit, and the U.S. Government shutdown.
U.S. equities quickly recovered from 2018’s losses, despite negative returns in May and August, as concerns continued to mount over tariffs, yield curve inversion, and slowing global economic growth. Drivers of gains included the continuation of accommodative policy by central bankers and a resilient consumer. The most dominant theme during the year was the continued underperformance of more attractively valued securities in the market. While equities finished the period in positive territory, increasing market volatility, a sharp decrease in interest rates, and the influence of macroeconomic risks continued to drive the outperformance of lower risk stocks. Similarly, larger companies outperformed smaller ones, while investors continued to favor stocks with higher sales and earnings growth, with no regard to valuations.
The Fund outperformed the MSCI ACWI Index Net in the fiscal year. Sector allocation was positive while stock selection was negative for the period. The Fund’s overweight position in Utilities and underweight position in Energy added to performance, while an underweight position in Information Technology and overweight position in Financials detracted from performance. Stock selection was strongest in Materials and Real Estate and weakest in Utilities and Consumer Discretionary. Merck & Co. Inc. (2.3% of the Fund, 29.6% return) and IRB Brasil Resseguros SA (1.1% of the Fund, 88.4% return) added to the Fund’s performance, while Public Bank Bhd. (1.7% of the Fund, -17.4% return) and Hang Seng Bank Ltd. (1.2% of the Fund, -19.8% return) detracted from returns.
As we look ahead, the potential for increased market volatility remains. Elevated volatility presents opportunities to add value through active stock selection and risk management. While equities continue to post record gains, markets may react negatively to a number of risks, including the threat of ongoing trade tensions between the U.S. and China, a slowdown in global economic growth, and uncertainty surrounding the expectations of accommodative policy. We focus on stock selection while using a variety of portfolio construction tools to manage these risks. In addition, valuation spreads remain historically wide, suggesting a potentially favorable environment for more attractively valued securities in the market. Similarly, mispricings in the U.S. equity market are more extreme in defensive sectors, such as Utilities, as investors position against increased volatility. The portfolio continues to trade at a discount relative to the benchmark, while owning what we believe are fundamentally strong companies with positive or improving investor sentiment.
Fund Managers; Investment Experience
Jay Kaufman, CFA; since 2006
Ernesto Ramos, Ph.D.; since 1988
David Rosenblatt, CFA; since 2007
| | | | | | | | | | | | | | | | | | | | |
| | | | | | | | | Inception date | | | Expenses (%) | |
| Share class | | Ticker | | | Cusip | | | Gross | | | Net | |
| Advisor (A) | | | BAEGX | | | | 09658W873 | | | | 5/27/2014 | | | | 1.46 | | | | 1.10 | |
Institutional
(I) | | | BGLBX | | | | 09658V768 | | | | 9/30/2013 | | | | 1.19 | | | | 0.85 | |
The above expense ratios are from the Funds’ Prospectus dated April 1, 2019, and are inclusive of Acquired Fund Fees and Expenses. See Note 6 in the Notes to Financial Statements for additional information. Net expense ratios reflect contractual fee waivers and/or expense reimbursements if applicable, made by BMO Asset Management Corp., the investment adviser (Adviser). The Adviser may not terminate these fee waivers and/or expense reimbursements prior to December 31, 2020 without the consent of the Board of Directors, unless the investment advisory agreement is terminated. Without these contractual waivers, the Fund’s returns would have been lower.
| | | | |
Portfolio sector allocation | |
| Sector | | Fund (%) | |
| Communication Services | | | 11.0 | |
| Consumer Discretionary | | | 4.5 | |
| Consumer Staples | | | 12.7 | |
| Energy | | | 1.8 | |
| Financials | | | 17.7 | |
| Healthcare | | | 10.7 | |
| Industrials | | | 3.5 | |
| Information Technology | | | 0.3 | |
| Materials | | | 2.7 | |
| Real Estate | | | 12.3 | |
| Utilities | | | 20.4 | |
| Other Assets & Liabilities, Net | | | 2.4 | |
| Total | | | 100.0 | |
Portfolio composition will change due to the ongoing management of the Fund. The percentages are based on net assets as of August 31, 2019 and may not necessarily reflect adjustments that are routinely made when presenting net assets for formal financial statement processes.
Growth of an assumed $10,000 investment
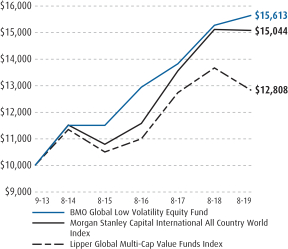
See Explanation of the Indices and Notes in the Commentary for additional information.The above graph relates to the Institutional Class shares of the Fund. Performance for the Advisor Class shares will vary from the performance of the Institutional Class shares shown above due to differences in charges and expenses. This graph illustrates the hypothetical investment of $10,000 in the Institutional Class shares of the Fund from the lesser of the Fund’s inception date or August 31, 2009 to August 31, 2019.
11
| | |
| | |
| Annual Report | | BMO Disciplined International Equity Fund |
| | | | | | | | |
Average annual total returns (%) | |
| | | 1-Year | | | Since
Inception | |
| Advisor Class (A)NAV | | | (6.91 | ) | | | 1.63 | |
| Advisor Class (A)OFFER | | | (11.60 | ) | | | 0.31 | |
| Institutional Class (I) | | | (6.64 | ) | | | 1.88 | |
| Morgan Stanley Capital International Europe, Australasia, Far East Index | | | (3.26 | ) | | | 4.74 | |
| Lipper International Multi-Cap Core Funds Index | | | (4.01 | ) | | | 9.16 | |
| * | Benchmarks since inception reflect the inception date of the Institutional Class. |
The performance data quoted represents past performance which is no guarantee of future results. Investment return and principal value will fluctuate so that an investor’s shares, when redeemed, may be worth more or less than their original costs. Mutual fund performance changes over time and current performance may be lower or higher than what is stated. To receive current performance to the most recentmonth-end, please call1-800-236-3863 or visit www.bmofunds.com.
Commentary
The BMO Disciplined International Equity Fund (the Fund) returned-6.64% for the fiscal year ended August 31, 2019 versus the Morgan Stanley Capital International Europe, Australasia, Far East Index (MSCI EAFE) and the Lipper InternationalMulti-Cap Core Funds Index, which returned-3.26% and-4.01%, respectively.
Despite multiple pullbacks and periods of elevated market volatility, global equity markets finished the trailing fiscal year in positive territory. Equities finished calendar year 2018 in negative territory, with the fourth quarter marking the single worst quarter of performance since the financial crisis, ending a nine consecutive calendar year stretch of positive returns. The fourth quarter’ssell-off was greatly influenced by instability at the macro-level, which included continued trade tensions between the U.S. and China, concerns over tightening by the U.S. Federal Reserve, Brexit, and the U.S. Government shutdown.
U.S. equities quickly recovered from 2018’s losses, despite negative returns in May and August, as concerns continued to mount over tariffs, yield curve inversion, and slowing global economic growth. Drivers of gains included the continuation of accommodative policy by central bankers and a resilient consumer. The most dominant theme during the year was the continued underperformance of more attractively valued securities in the market. While equities finished the period in positive territory, increasing market volatility, a sharp decrease in interest rates, and the influence of macroeconomic risks continued to drive the outperformance of lower risk stocks. Similarly, larger companies outperformed smaller ones, while investors continued to favor stocks with higher sales and earnings growth, with no regard to valuations.
The Fund underperformed the MSCI EAFE Index in the fiscal year. Both sector allocation and stock selection were negative for the period. The Fund’s overweight position in Health Care and underweight position in Financials added to performance, while an underweight position in Consumer Staples and overweight position in Materials detracted from performance. Stock selection was strongest in Financials and Utilities and weakest in Consumer Discretionary and Consumer Staples. Evolution Mining Ltd. (1.6% of the Fund, 85.9% return) and Enel SpA (3.0% of the Fund, 53.8% return) added to the Fund’s performance, while Covestro AG (1.8% of the Fund, -44.5% return) and Equinor ASA (1.7% of the Fund, -30.3% return) detracted from returns.
As we look ahead, the potential for increased market volatility remains. Elevated volatility presents opportunities to add value through active stock selection and risk management. While equities continue to post record gains, markets may react negatively to a number of risks, including the threat of ongoing trade tensions between the U.S. and China, a slowdown in global economic growth, and uncertainty surrounding the expectations of accommodative policy. We focus on stock selection while using a variety of portfolio construction tools to manage these risks. In addition, valuation spreads remain historically wide, suggesting a potentially favorable environment for more attractively valued securities in the market. Similarly, mispricings in the U.S. equity market are more extreme in defensive sectors, such as Utilities, as investors position against increased volatility. The portfolio continues to trade at a discount relative to the benchmark, while owning what we believe are fundamentally strong companies with positive or improving investor sentiment.
Fund Managers; Investment Experience
Jay Kaufman, CFA; since 2006
Ernesto Ramos, Ph.D.; since 1988
David Rosenblatt, CFA; since 2007
| | | | | | | | | | | | | | | | | | | | |
| | | | | | | | | Inception
date | | | Expenses (%) | |
| Share class | | Ticker | | | Cusip | | | Gross | | | Net | |
| Advisor (A) | | | BDAQX | | | | 09658W667 | | | | 9/17/2015 | | | | 1.27 | | | | 1.15 | |
Institutional
(I) | | | BDIQX | | | | 09658W659 | | | | 9/17/2015 | | | | 1.03 | | | | 0.90 | |
The above expense ratios are from the Funds’ Prospectus dated April 1, 2019, and are inclusive of Acquired Fund Fees and Expenses. See Note 6 in the Notes to Financial Statements for additional information. Net expense ratios reflect contractual fee waivers and/or expense reimbursements if applicable, made by BMO Asset Management Corp., the investment adviser (Adviser). The Adviser may not terminate these fee waivers and/or expense reimbursements prior to December 31, 2020 without the consent of the Board of Directors, unless the investment advisory agreement is terminated. Without these contractual waivers, the Fund’s returns would have been lower.
| | | | |
Portfolio sector allocation | |
| Sector | | Fund (%) | |
| Communication Services | | | 7.7 | |
| Consumer Discretionary | | | 8.7 | |
| Consumer Staples | | | 7.6 | |
| Energy | | | 7.2 | |
| Financials | | | 15.9 | |
| Healthcare | | | 13.4 | |
| Industrials | | | 10.9 | |
| Information Technology | | | 8.0 | |
| Materials | | | 10.6 | |
| Real Estate | | | 3.6 | |
| Utilities | | | 4.9 | |
| Consumer Discretionary | | | 0.2 | |
| Other Assets & Liabilities, Net | | | 1.3 | |
| Total | | | 100.0 | |
Portfolio composition will change due to the ongoing management of the Fund. The percentages are based on net assets as of August 31, 2019 and may not necessarily reflect adjustments that are routinely made when presenting net assets for formal financial statement processes.
Growth of an assumed $10,000 investment
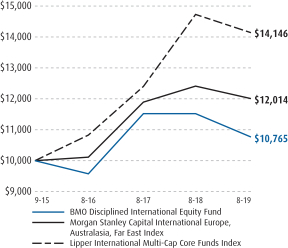
See Explanation of the Indices and Notes in the Commentary for additional information.The above graph relates to the Institutional Class shares of the Fund. Performance for the Advisor Class shares will vary from the performance of the Institutional Class shares shown above due to differences in charges and expenses. This graph illustrates the hypothetical investment of $10,000 in the Institutional Class shares of the Fund from the lesser of the Fund’s inception date or August 31, 2009 to August 31, 2019.
12
| | |
| | |
| Annual Report | | BMO Pyrford International Stock Fund |
| | | | | | | | | | | | |
Average annual total returns (%) | |
| | | 1-Year | | | 5-Years | | | Since
Inception | |
| Advisor Class (A)NAV | | | 0.04 | | | | 1.48 | | | | 1.38 | |
| Advisor Class (A)OFFER | | | (4.99 | ) | | | 0.45 | | | | 0.40 | |
| Institutional Class (I) | | | 0.25 | | | | 1.74 | | | | 5.83 | |
| Retirement Class (R-6) | | | 0.44 | | | | 1.89 | | | | 1.80 | |
| Morgan Stanley Capital International Europe, Australasia, Far East Index | | | (3.26 | ) | | | 1.89 | | | | 6.69 | |
| Lipper International Multi-Cap Core Funds Index | | | (4.01 | ) | | | 1.82 | | | | 6.55 | |
| * | Benchmarks since inception reflect the inception date of the Institutional Class. |
The performance data quoted represents past performance which is no guarantee of future results. Investment return and principal value will fluctuate so that an investor’s shares, when redeemed, may be worth more or less than their original costs. Mutual fund performance changes over time and current performance may be lower or higher than what is stated. To receive current performance to the most recentmonth-end, please call1-800-236-3863 or visit www.bmofunds.com.
Commentary
The BMO Pyrford International Stock Fund (the Fund) returned 0.25% for the fiscal year ended August 31, 2019 versus the Morgan Stanley Capital International (MSCI) Europe, Australasia, Far East Index (EAFE) and the Lipper InternationalMulti-Cap Core Funds Index, which returned -3.26% and-4.01%, respectively.
Negative market performance over the fiscal year was dominated by the selloff in Q4 2018 as concerns over quantitative tightening saw volatility return. Disappointingly, central banks coalesced and have since moved to an easing bias providing support to equity markets. Given all the political unrest throughout the world and theAmerican-led attack on the global tradestatus-quo, it is surprising that equity markets have remained relatively calm since the turn of the calendar year.
Relative performance was driven predominantly by our Asia Pacific country allocation, in particular Japan. Our underweight to Japan is based on elevated valuations, the burdensome debt level, and soft economic growth. We did give back some relative performance through being underweight the Japanese Yen which has strengthened, benefitting from the view it is a safe haven currency. Australian stock selection was positive, led by Woolworths Group, Ltd. (2.2% of the Fund, 29.0% return) that reported a steady increase in food sales and alow-cost gold producer that benefitted from the increase in gold price.
Stock selection in Europe added, led by Switzerland and Sweden. High quality companies with durable earnings led the way as Swiss Health Care names outperformed having lagged strong international equity markets in 2017. Similarly, Swedish stock selection outperformed by focusing on sustainable earnings with exposure to Industrials leading the way.
We retain a cautious outlook for economic growth and remain mindful of valuations in markets. The frantic money-printing environment of post-2008 is gradually coming to a close, but massive unwinding is now required, which will take years of the world economy hanging together with decent growth long enough for it to occur. Theup-cycle is already long in the tooth, so this may turn out to be an optimistic expectation. The primary beneficiaries of the unorthodox central bank actions have been equities and bonds, with both now expensive.
Investment Adviser:
BMO Asset Management Corp.
Sub-adviser:
Pyrford International Ltd.
Fund Managers; Investment Experience
Tony Cousins, CFA; since 1985
Daniel McDonagh, CFA; since 1997
Paul Simons, CFA; since 1996
| | | | | | | | | | | | | | | | | | | | | | | | | |
| | | | | | | Inception
date | | Expenses (%) |
| Share class | | Ticker | | Cusip | | Gross | | Net |
| Advisor (A) | | | | BPIAX | | | | | 09658W840 | | | | | 5/27/2014 | | | | | 1.22 | | | | | 1.20 | |
Institutional
(I) | | | | MISNX | | | | | 09658L513 | | | | | 12/29/2011 | | | | | 0.97 | | | | | 0.95 | |
Retirement
(R-6) | | | | BISGX | | | | | 09658V362 | | | | | 5/27/2014 | | | | | 0.82 | | | | | 0.80 | |
The above expense ratios are from the Funds’ Prospectus dated April 1, 2019, and are inclusive of Acquired Fund Fees and Expenses. See Note 6 in the Notes to Financial Statements for additional information. Net expense ratios reflect contractual fee waivers and/or expense reimbursements if applicable, made by BMO Asset Management Corp., the investment adviser (Adviser). The Adviser may not terminate these fee waivers and/or expense reimbursements prior to December 31, 2020 without the consent of the Board of Directors, unless the investment advisory agreement is terminated. Without these contractual waivers, the Fund’s returns would have been lower.
| | | | |
Portfolio sector allocation | |
| Sector | | Fund (%) | |
| Communication Services | | | 10.6 | |
| Consumer Discretionary | | | 4.2 | |
| Consumer Staples | | | 15.7 | |
| Energy | | | 7.1 | |
| Financials | | | 9.5 | |
| Healthcare | | | 10.7 | |
| Industrials | | | 20.0 | |
| Information Technology | | | 6.2 | |
| Materials | | | 4.2 | |
| Utilities | | | 5.0 | |
| Materials | | | 1.4 | |
| Other Assets & Liabilities, Net | | | 5.4 | |
| Total | | | 100.0 | |
Portfolio composition will change due to the ongoing management of the Fund. The percentages are based on net assets as of August 31, 2019 and may not necessarily reflect adjustments that are routinely made when presenting net assets for formal financial statement processes.
Growth of an assumed $10,000 investment
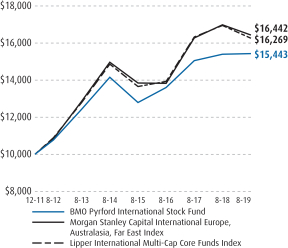
See Explanation of the Indices and Notes in the Commentary for additional information.The above graph relates to the Institutional Class��shares of the Fund. Performance for the Advisor Class and RetirementR-6 shares will vary from the performance of the Institutional Class shares shown above due to differences in charges and expenses. This graph illustrates the hypothetical investment of $10,000 in the Institutional Class shares of the Fund from the lesser of the Fund’s inception date or August 31, 2009 to August 31, 2019.
13
| | |
| | |
| Annual Report | | BMO LGM Emerging Markets Equity Fund |
| | | | | | | | | | | | | | | | |
Average annual total returns (%) | |
| | | 1-Year | | | 5-Years | | | 10-Years | | | Since
Inception | |
| Advisor Class (A)NAV | | | (3.05 | ) | | | 2.23 | | | | — | | | | 2.96 | |
| Advisor Class (A)OFFER | | | (7.88 | ) | | | 1.19 | | | | — | | | | 1.97 | |
| Institutional Class (I) | | | (2.76 | ) | | | 2.51 | | | | 4.26 | | | | 7.64 | |
| Morgan Stanley Capital International Emerging Markets Index | | | (4.36 | ) | | | 0.38 | | | | 4.07 | | | | 4.07 | |
| Lipper Emerging Markets Funds Index | | | (1.65 | ) | | | 0.76 | | | | 4.57 | | | | 4.57 | |
| * | Cumulative for periods less than one year. Benchmarks since inception reflect the inception date of the Institutional Class. |
The performance data quoted represents past performance which is no guarantee of future results. Investment return and principal value will fluctuate so that an investor’s shares, when redeemed, may be worth more or less than their original costs. Mutual fund performance changes over time and current performance may be lower or higher than what is stated. To receive current performance to the most recentmonth-end, please call1-800-236-3863 or visit www.bmofunds.com.
Commentary
The BMO LGM Emerging Markets Equity Fund (the Fund) returned -2.76% for the fiscal year ended August 31, 2019 versus the Morgan Stanley Capital International Emerging Markets Index and the Lipper Emerging Markets Funds Index, which returned -4.36% and -1.65%, respectively.
The fiscal year was a highly volatile and fragile period, primarily due to the ongoing trade conflict between the U.S. and China. 2019 got off to a very strong start in January after a very disappointing end to 2018. However, as global growth concerns grew and the impasse on trade persisted, sentiment began tosee-saw.
Contributing to performance were exposures in Hong Kong/China, Indonesia, and Mexico, while security selection in South Africa and India cost most relative performance. While Chinese equities were volatile in the period, portfolio holdings in the market delivered very strong gains. This was largely on the back of decent operating numbers, but also their more domestic orientation which gave them some protection from the trade issues. Anta sports (1.6% of the Fund, +53%) and Yum China (4.0% of the Fund, +19%) were the stand outs.
On the down side, the main detractors from performance included Yes Bank in India (0.0% of the Fund, -50%) and Emami (1.42% of the Fund,-47%). Emami has had a tough couple of months, hit both by disappointing earnings and promoter stake sales. Share pledging is endemic in India which typically occurs when a company’s founder pledges a proportion of their shares as collateral for bank loans. Nothing is intrinsically wrong with this practice, let alone illegal, but the promoter risks becoming a forced seller if collateral values fall.
Yes Bank is India’s fourth largest private sector bank and faced multiple challenges in recent months, causing a collapse in the share price. The main issue surrounded the Reserve Bank of India’s announcement that it would block the reappointment of founder and CEO Rana Kapoor (who owns approximately 10% of the bank). Subsequently, it also transpired that Mr. Kapoor had borrowed on the basis of the value of his holdings in Yes Bank. While being perfectly legal, this action should have been disclosed in our view. We reassessed the investment case for the bank on the back of this new information and we felt that we no longer had alignment with the majority shareholder and decided to exit the position.
Investment Adviser:
BMO Asset Management Corp.
Sub-adviser:
LGM Investments Limited
Fund Managers; Investment Experience
Damian Bird, CFA; since 2008
Irina Hunter; since 1994
Rishikesh Patel; since 2003
| | | | | | | | | | | | | | | | | | | | |
| | | | | | | | | Inception
date | | | Expenses (%) | |
| Share class | | Ticker | | | Cusip | | | Gross | | | Net | |
| Advisor (A) | | | BAEMX | | | | 09658W824 | | | | 5/27/2014 | | | | 1.56 | | | | 1.41 | |
Institutional
(I) | | | MIEMX | | | | 09658L489 | | | | 12/22/2008 | | | | 1.30 | | | | 1.16 | |
The above expense ratios are from the Funds’ Prospectus dated April 1, 2019, and are inclusive of Acquired Fund Fees and Expenses. See Note 6 in the Notes to Financial Statements for additional information. Net expense ratios reflect contractual fee waivers and/or expense reimbursements if applicable, made by BMO Asset Management Corp., the investment adviser (Adviser). The Adviser may not terminate these fee waivers and/or expense reimbursements prior to December 31, 2020 without the consent of the Board of Directors, unless the investment advisory agreement is terminated. Without these contractual waivers, the Fund’s returns would have been lower.
| | | | |
Portfolio sector allocation | |
| Sector | | Fund (%) | |
| Consumer Discretionary | | | 16.1 | |
| Consumer Staples | | | 39.1 | |
| Financials | | | 30.4 | |
| Healthcare | | | 1.6 | |
| Information Technology | | | 2.9 | |
| Utilities | | | 1.3 | |
| Consumer Staples | | | 3.0 | |
| Other Assets & Liabilities, Net | | | 5.6 | |
| Total | | | 100.0 | |
Portfolio composition will change due to the ongoing management of the Fund. The percentages are based on net assets as of August 31, 2019 and may not necessarily reflect adjustments that are routinely made when presenting net assets for formal financial statement processes.
Growth of an assumed $10,000 investment
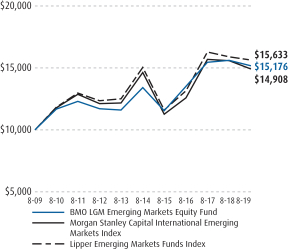
See Explanation of the Indices and Notes in the Commentary for additional information.The above graph relates to the Institutional Class shares of the Fund. Performance for the Advisor Class shares will vary from the performance of the Institutional Class shares shown above due to differences in charges and expenses. This graph illustrates the hypothetical investment of $10,000 in the Institutional Class shares of the Fund from the lesser of the Fund’s inception date or August 31, 2009 to August 31, 2019.
14
| | |
| | |
| Annual Report | | BMO Alternative Strategies Fund |
| | | | | | | | |
Average annual total returns (%) | |
| | | 1-Year | | | Since
Inception | |
| Advisor Class (A) NAV | | | (5.34 | ) | | | (0.19 | ) |
| Advisor Class (A) OFFER | | | (9.97 | ) | | | (1.28 | ) |
| Institutional Class (I) | | | (5.09 | ) | | | 0.07 | |
| Bank of America Merrill Lynch3-MonthT-Bill Index | | | 2.36 | | | | 0.98 | |
| HFRX Global Hedge Fund Index | | | (1.12 | ) | | | 1.00 | |
| Lipper Alternative Multi-Strategy Funds Index | | | 0.58 | | | | 1.24 | |
| * | Benchmarks since inception reflect the inception date of the Institutional Class. |
The performance data quoted represents past performance which is no guarantee of future results. Investment return and principal value will fluctuate so that an investor’s shares, when redeemed, may be worth more or less than their original costs. Mutual fund performance changes over time and current performance may be lower or higher than what is stated. To receive current performance to the most recentmonth-end, please call1-800-236-3863 or visit www.bmofunds.com.
Commentary
The BMO Alternative Strategies Fund returned-4.99% for the fiscal year ended August 31, 2019 versus the Bank of America Merrill Lynch3-MonthT-Bill Index and the HFRX Global Hedge Fund Index, and Lipper Alternative Multi Strategy Funds Index which returned 2.36% and-1.12%, and 0.58% respectively.
Equity long/short strategies detracted value over the fiscal year. Negative stock selection was the main culprit for the underperformance, particularly on long positions. Positioning overweight small cap stocks relative to large cap stocks also was a drag on performance as large caps significantly outperformed small caps. Net long positioning in the U.S. relative to the rest of the world helped performance.
Global macro strategy performance was mixed but overall positive on the year. The quantitative global macro strategy was a standout positive performer. The strategy benefitted from long interest rate positions, as yields fell on the back of dovish central bank guidance and slowing economic growth. The strategy also generated strong returns from long equity positions, particularly in the U.S. and Europe. The discretionary global macro strategy was slightly negative on the year. Losses were primarily from interest rate positioning, mostly short U.S. Treasuries and Eurodollar futures. The strategy generated positive returns from long positioning in equity indices, particularly in the U.S.
Relative value strategies also detracted value. Our equity style premia strategy struggled largely due to an underperformance of value stocks in the U.S. and Japan. The strategy did benefit from a tilt toward low volatility stocks, particularly in the U.S. Our alpha-based market neutral strategy also suffered from the underperformance of value versus growth in the U.S. The strategy benefitted from its overweight to quality firms particularly in the U.S. and Europe. The strategy generated factor-adjusted alpha from short positions, but negative alpha from long positions.
Looking forward, slowing global economic data and the U.S. and China trade conflict will continue to force central banks to ease monetary policy and drive swings in markets. Recession risks are rising; however, the U.S. consumer has been resilient. Going into the 2020 elections, we believe the Trump administration’s top priority will be to maintain economic momentum, which should lead to eventual easing in trade tensions. We believe the Federal Reserve is ready to continue cutting rates to offset weakness in manufacturing and to try to insulate the U.S. consumer, but the risk remains that further consumer focused tariffs are scheduled to go into effect in December.
Investment Adviser:
BMO Asset Management Corp.
Sub-advisers:
BMO Asset Management Limited
Graham Capital Management, L.P.
| | | | | | | | | | | | | | | | | | | | |
| | | | | | | | | Inception
date | | | Expenses (%) | |
| Share class | | Ticker | | | Cusip | | | Gross | | | Net | |
| Advisor (A) | | | BMATX | | | | 09658W683 | | | | 12/16/2014 | | | | 2.57 | | | | 2.02 | |
Institutional
(I) | | | BMASX | | | | 09658W675 | | | | 12/16/2014 | | | | 2.28 | | | | 1.77 | |
The above expense ratios are from the Funds’ Prospectus dated April 1, 2019, and are inclusive of Acquired Fund Fees and Expenses. See Note 6 in the Notes to Financial Statements for additional information. Net expense ratios reflect contractual fee waivers and/or expense reimbursements if applicable, made by BMO Asset Management Corp., the investment adviser (Adviser). The Adviser may not terminate these fee waivers and/or expense reimbursements prior to December 31, 2020 without the consent of the Board of Directors, unless the investment advisory agreement is terminated. Without these contractual waivers, the Fund’s returns would have been lower.
| | | | |
Portfolio sector allocation | |
| Sector | | Fund (%) | |
| Communication Services | | | 1.6 | |
| Consumer Discretionary | | | 0.8 | |
| Consumer Staples | | | 2.8 | |
| Energy | | | 0.5 | |
| Financials | | | 2.4 | |
| Healthcare | | | 4.0 | |
| Industrials | | | 2.9 | |
| Information Technology | | | 1.7 | |
| Materials | | | 1.6 | |
| Real Estate | | | 1.8 | |
| Utilities | | | 0.7 | |
| Short-Term Investments | | | 68.1 | |
| Other Assets & Liabilities | | | 11.1 | |
| Total | | | 100.0 | |
| * | See Schedules of Investments for additional detail on investment type. |
Portfolio composition will change due to the ongoing management of the Fund. The percentages are based on net assets as of August 31, 2019 and may not necessarily reflect adjustments that are routinely made when presenting net assets for formal financial statement processes.
Growth of an assumed $10,000 investment
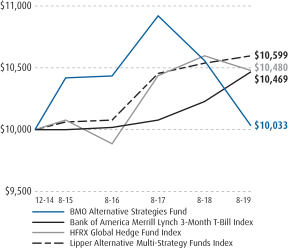
See Explanation of the Indices and Notes in the Commentary for additional information.The above graph relates to the Institutional Class shares of the Fund. Performance for the Advisor Class shares will vary from the performance of the Institutional Class shares shown above due to differences in charges and expenses. This graph illustrates the hypothetical investment of $10,000 in the Institutional Class shares of the Fund from the lesser of the Fund’s inception date or August 31, 2009 to August 31, 2019.
15
| | |
| | |
| Annual Report | | BMO Global Long/Short Equity Fund |
| | | | | | | | |
Average annual total returns (%) | |
| | | 1-Year | | | Since
Inception | |
| Advisor Class (A) NAV | | | (10.94 | ) | | | 2.88 | |
| Advisor Class (A) OFFER | | | (15.39 | ) | | | 1.54 | |
| Institutional Class (I) | | | (10.91 | ) | | | 3.09 | |
| Morgan Stanley Capital International (MSCI) All Country World Index | | | (0.28 | ) | | | 8.94 | |
| Lipper Alternative Long/Short Equity Funds Index | | | (1.34 | ) | | | 2.81 | |
| * | Benchmarks since inception reflect the inception date of the Institutional Class. |
The performance data quoted represents past performance which is no guarantee of future results. Investment return and principal value will fluctuate so that an investor’s shares, when redeemed, may be worth more or less than their original costs. Mutual fund performance changes over time and current performance may be lower or higher than what is stated. To receive current performance to the most recentmonth-end, please call1-800-236-3863 or visit www.bmofunds.com.
Commentary
The BMO Global Long/Short Equity Fund (the Fund) returned -10.91% for the fiscal year ended August 31, 2019 versus the Morgan Stanley Capital International All Country World Index and the Lipper Alternative Long/Short Equity Funds Index, which returned -0.28% and -1.34%, respectively.
Despite multiple pullbacks and periods of elevated market volatility, global equity markets finished the fiscal year in positive territory. Equities finished 2018 in negative territory, with the fourth quarter marking the single worst quarter of performance since the financial crisis, ending a nine consecutive calendar year stretch of positive returns. The fourth quarter’ssell-off was greatly influenced by instability at the macro-level, which included continued trade tensions between the U.S. and China, concerns over tightening by the U.S. Federal Reserve, Brexit, and the U.S. Government shutdown.
Global equities quickly recovered from 2018’s losses, despite negative returns in May and August as concerns continued to mount over tariffs, yield curve inversion, and slowing global economic growth. Drivers of gains included the continuation of accommodative policy by central bankers and a resilient consumer. The most dominant theme during the year was the continued underperformance of more attractively valued securities in the market. While equities finished the period in positive territory, increasing market volatility, a sharp decrease in interest rates, and the influence of macroeconomic risks continued to drive the outperformance of lower risk stocks. Similarly, larger companies outperformed smaller ones, while investors continued to favor stocks with higher sales and earnings growth, with no regard to valuations.
The Fund underperformed the MSCI All Country World Index in the fiscal year. Relating the market environment back to our process, the strategy’s long exposure to companies with attractive valuations was a significant detractor from performance as investors preferred more expensive companies with higher growth. On the other hand, the strategy’s long exposure to companies with strong fundamental characteristics added to returns as companies with higher quality and profitability held strong during a volatile month of May. However, this did not offset weak results from company valuations. While the strategy lagged for the quarter in aggregate, the portfolio continues to display the intended risk characteristics with volatility and drawdowns at a fraction of those of the MSCI ACWI.
Geographically, the Fund held meaningful weight in 24 countries during the quarter with high-level exposures largely consistent with those of last quarter. The U.S. continues to represent the largest net exposure in the portfolio, while Japan represents the portfolio’s largest net short position. Stock selection was strongest in Europe, while stock selection detracted most in North America. From a sector perspective, the portfolio’s underweight position in Energy was a contributor to performance, while an underweight position in Information Technology detracted. Stock selection was strongest in Real Estate, while selection in Health Care was a significant detractor.
As we look ahead, the potential for increased market volatility remains. Elevated volatility presents opportunities to add value through active stock selection and risk management. While equities continue to post record gains, markets may react negatively to a number of risks, including the threat of ongoing trade tensions between the U.S. and China, a slowdown in global economic growth, and uncertainty surrounding the expectations of accommodative policy. We focus on stock selection while using a variety of portfolio construction tools to manage these risks. In addition, valuation spreads remain historically wide, suggesting a potentially favorable environment for more attractively valued securities in the market. Similarly, mispricings in the U.S. equity market are more extreme in defensive sectors, such as utilities, as investors position against increased volatility. The portfolio continues to trade at a discount relative to the benchmark, while owning what we believe are fundamentally strong companies with positive or improving investor sentiment.
Fund Managers; Investment Experience
Jay Kaufman, CFA; since 2006
Ernesto Ramos, Ph.D.; since 1988
David Rosenblatt, CFA; since 2006
| | | | | | | | | | | | | | | | | | | | |
| | | | | | | | | Inception
date | | | Expenses (%) | |
| Share class | | Ticker | | | Cusip | | | Gross | | | Net | |
| Advisor (A) | | | BGAQX | | | | 09658W626 | | | | 9/17/2015 | | | | 2.89 | | | | 1.66 | |
| Institutional (I) | | | BGIQX | | | | 09658W618 | | | | 9/17/2015 | | | | 2.66 | | | | 1.41 | |
The above expense ratios are from the Funds’ Prospectus dated April 1, 2019, and are inclusive of Acquired Fund Fees and Expenses. See Note 6 in the Notes to Financial Statements for additional information. Net expense ratios reflect contractual fee waivers and/or expense reimbursements if applicable, made by BMO Asset Management Corp., the investment adviser (Adviser). The Adviser may not terminate these fee waivers and/or expense reimbursements prior to December 31, 2020 without the consent of the Board of Directors, unless the investment advisory agreement is terminated. Without these contractual waivers, the Fund’s returns would have been lower.
| | | | |
Portfolio sector allocation | |
| Sector | | Fund (%) | |
| Communication Services | | | 7.6 | |
| Consumer Discretionary | | | 4.2 | |
| Consumer Staples | | | 13.4 | |
| Energy | | | 2.4 | |
| Financials | | | 11.9 | |
| Healthcare | | | 18.6 | |
| Industrials | | | 14.0 | |
| Information Technology | | | 7.9 | |
| Materials | | | 7.7 | |
| Real Estate | | | 8.4 | |
| Utilities | | | 3.1 | |
| Short-Term Investments | | | 3.7 | |
| Other Assets & Liabilities | | | (2.9 | ) |
| Total | | | 100.0 | |
Portfolio composition will change due to the ongoing management of the Fund. The percentages are based on net assets as of August 31, 2019 and may not necessarily reflect adjustments that are routinely made when presenting net assets for formal financial statement processes.
Growth of an assumed $10,000 investment
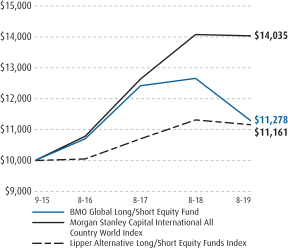
See Explanation of the Indices and Notes in the Commentary for additional information.The above graph relates to the Institutional Class shares of the Fund. Performance for the Advisor Class shares will vary from the performance of the Institutional Class shares shown above due to differences in charges and expenses. This graph illustrates the hypothetical investment of $10,000 in the Institutional Class shares of the Fund from the lesser of the Fund’s inception date or August 31, 2009 to August 31, 2019.
16
| | |
| | |
| Annual Report | | BMO Ultra ShortTax-Free Fund |
| | | | | | | | | | | | |
Average annual total returns (%) | |
| | | 1-Year | | | 5-Years | | | Since
Inception | |
| Advisor Class (A) NAV | | | 1.62 | | | | 0.82 | | | | 0.81 | |
| Advisor Class (A) OFFER | | | (0.45 | ) | | | 0.41 | | | | 0.41 | |
| Institutional Class (I) | | | 1.98 | | | | 1.08 | | | | 1.26 | |
| Blended Index (50% Bloomberg Barclays 1 Year Municipal Bond Index and 50% iMoneyNet, Inc. Money Market FundTax-Free National Retail Index) | | | 1.91 | | | | 0.79 | | | | 0.68 | |
| Lipper Short Municipal Debt Funds Index | | | 2.78 | | | | 1.12 | | | | 1.28 | |
| * | Benchmarks since inception reflect the inception date of the Institutional Class. |
The performance data quoted represents past performance which is no guarantee of future results. Investment return and principal value will fluctuate so that an investor’s shares, when redeemed, may be worth more or less than their original costs. Mutual fund performance changes over time and current performance may be lower or higher than what is stated. To receive current performance to the most recentmonth-end, please call1-800-236-3863 or visit www.bmofunds.com.
Commentary
The BMO Ultra ShortTax-Free Fund returned 1.98% for the fiscal year ended August 31, 2019 versus the blended (50% Bloomberg Barclays 1 Year Municipal Bond Index and 50% iMoneyNet, Inc. Money Market Fund Tax-Free National Retail Index) and the Lipper Short Municipal Debt Funds Index, which returned 1.91% and 2.78%, respectively.
The fiscal year began with a hawkish Federal Reserve (the Fed) intent on further tightening of short rates, which quickly evolved into the dovishness that investors have learned to love (loath?) since the start of the global financial crisis, culminating in the first Fed easing since late 2008. Why? The global economy is largely at or below stall speed and the Fed is attempting to use monetary policy to keep the U.S. from following suit. This action resulted in a sharp shift in investor sentiment over the course of the fiscal year; from fear gripping the markets in late 2018 to increased risk appetite as a result of Fed capitulation during the first half of calendar 2019. As such, and with volatility still elevated, more defensive asset classes like municipal bonds performed relatively well, with the Bloomberg Barclays Municipal Bond Index, a broad measure of the asset class, up 8.72% for the period. The current low interest rate environment continues to punish traditional savers, so thetax-advantaged income that municipals provide continues to be sought by many investors. In fact, industry mutual fund flows as the fiscal year closed remained at record levels and if the calendar year had ended on August 31, 2019, would represent the second best year on record, trailing only 2009.
The Fund was defensively positioned for much of the fiscal year, remaining up in credit quality and maintaining a slightly shorter duration relative to the benchmark. This conservative stance was a hindrance to performance prior to the Fed capitulation on rates in early 2019; the Fund has gradually increased duration relative to the benchmark since January, while continuing to maintain above average credit quality given our read on where the U.S. currently sits in the economic cycle. The Fund’s exposure to floating rate securities hindered performance, but this was largely offset by strong security selection in the3-5 year portion of the yield curve. Looking ahead, the current Administration continues its “go it alone” strategy in regards to trade and the trade war with China, despite some occasional efforts at compromise, is likely to remain a headwind to both the global and domestic economies.
Fund Managers; Investment Experience
Thomas Byron; since 1981
Brian Sipich, CFA; since 1998
Robert Wimmel; since 1992
| | | | | | | | | | | | | | | | | | | | |
| | | | | | | | | Inception
date | | | Expenses (%) | |
| Share class | | Ticker | | | Cusip | | | Gross | | | Net | |
| Advisor (A) | | | BAUSX | | | | 09658W790 | | | | 5/27/2014 | | | | 0.62 | | | | 0.55 | |
| Institutional (I) | | | MUISX | | | | 09658L539 | | | | 9/30/2009 | | | | 0.37 | | | | 0.30 | |
The above expense ratios are from the Funds’ Prospectus dated April 1, 2019, and are inclusive of Acquired Fund Fees and Expenses. See Note 6 in the Notes to Financial Statements for additional information. Net expense ratios reflect contractual fee waivers and/or expense reimbursements if applicable, made by BMO Asset Management Corp., the investment adviser (Adviser). The Adviser may not terminate these fee waivers and/or expense reimbursements prior to December 31, 2020 without the consent of the Board of Directors, unless the investment advisory agreement is terminated. Without these contractual waivers, the Fund’s returns would have been lower.
| | | | |
Municipal Issuance/ Industry Type | |
| Issuance/Industry | | Fund (%) | |
| General Obligation — 23.6% | | | | |
School District | | | 6.7 | |
State or Local | | | 16.9 | |
| Revenue Bonds — 78.2% | | | | |
Appropriation | | | 20.0 | |
Education | | | 6.1 | |
General Revenue | | | 0.6 | |
Health Care | | | 18.3 | |
Housing | | | 5.5 | |
Industrial Revenue | | | 5.3 | |
Power | | | 3.4 | |
Special Tax | | | 6.9 | |
Tobacco | | | 0.6 | |
Transportation | | | 7.6 | |
Water & Sewer | | | 3.9 | |
| Other Assets & Liabilities, Net | | | (1.8 | ) |
| Total | | | 100.0 | |
Portfolio composition will change due to the ongoing management of the Fund. The percentages are based on net assets as of August 31, 2019 and may not necessarily reflect adjustments that are routinely made when presenting net assets for formal financial statement processes.
Growth of an assumed $10,000 investment
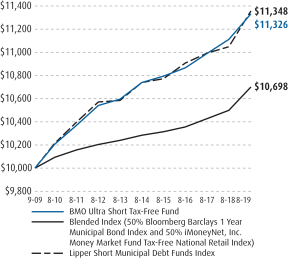
See Explanation of the Indices and Notes in the Commentary for additional information.The above graph relates to the Institutional Class shares of the Fund. Performance for the Advisor Class shares will vary from the performance of the Institutional Class shares shown above due to differences in charges and expenses. This graph illustrates the hypothetical investment of $10,000 in the Institutional Class shares of the Fund from the lesser of the Fund’s inception date or August 31, 2009 to August 31, 2019.
17
| | |
| | |
| Annual Report | | BMO ShortTax-Free Fund |
| | | | | | | | | | | | |
Average annual total returns (%) | |
| | | 1-Year | | | 5-Years | | | Since
Inception | |
| Advisor Class (A) NAV | | | 3.10 | | | | 1.54 | | | | 1.58 | |
| Advisor Class (A) OFFER | | | 1.00 | | | | 1.12 | | | | 1.19 | |
| Institutional Class (I) | | | 3.35 | | | | 1.69 | | | | 1.92 | |
| Bloomberg Barclays Short(1-5 Year) Municipal Index | | | 4.05 | | | | 1.57 | | | | 1.53 | |
| Lipper Short Municipal Debt Funds Index | | | 2.78 | | | | 1.12 | | | | 1.01 | |
| * | Benchmarks since inception reflect the inception date of the Institutional Class. |
The performance data quoted represents past performance which is no guarantee of future results. Investment return and principal value will fluctuate so that an investor’s shares, when redeemed, may be worth more or less than their original costs. Mutual fund performance changes over time and current performance may be lower or higher than what is stated. To receive current performance to the most recentmonth-end, please call1-800-236-3863 or visit www.bmofunds.com.
Commentary
The BMO ShortTax-Free Fund returned 3.35% for the fiscal year ended August 31, 2019 versus the Bloomberg Barclays Short (1-5 Year) Municipal Index and the Lipper Short Municipal Debt Funds Index, which returned 4.05% and 2.78%, respectively.
The fiscal year began with a hawkish Federal Reserve (the Fed) intent on further tightening of short rates, which quickly evolved into the dovishness that investors have learned to love (loath?) since the start of the global financial crisis, culminating in the first Fed easing since late 2008. Why? The global economy is largely at or below stall speed and the Fed is attempting to use monetary policy to keep the U.S. from following suit. This action resulted in a sharp shift in investor sentiment over the course of the fiscal year; from fear gripping the markets in late 2018 to increased risk appetite as a result of Fed capitulation during the first half of calendar 2019. As such, and with volatility still elevated, more defensive asset classes like municipal bonds performed relatively well, with the Bloomberg Barclays Municipal Bond Index, a broad measure of the asset class, up 8.72% for the period. The current low interest rate environment continues to punish traditional savers, so thetax-advantaged income that municipals provide continues to be sought by many investors. In fact, industry mutual fund flows as the fiscal year closed remained at record levels and if the calendar year had ended on August 31, 2019, would represent the second best year on record, trailing only 2009.
The Fund was defensively positioned for much of the fiscal year, remaining up in credit quality and maintaining a slightly shorter duration relative to the benchmark. This conservative stance was a hindrance to performance prior to the Fed capitulation on rates in early 2019. The Fund has gradually increased duration relative to the benchmark since January, while continuing to maintain above average credit quality given our read on where the U.S. currently sits in the economic cycle. The Fund’s exposure to floating rate securities at the front end of the yield curve hindered performance, but was somewhat offset by overweights of the A and BBB credit tiers, as well as the Hospital and IDR/PCR sectors. Looking ahead, the current Administration continues its “go it alone” strategy in regards to trade and the trade war with China, despite some occasional efforts at compromise, is likely to remain a headwind to both the global and domestic economies.
Fund Managers; Investment Experience
Thomas Byron; since 1981
Brian Sipich, CFA; since 1998
Robert Wimmel; since 1992
| | | | | | | | | | | | | | | | | | | | |
| | | | | | | | | Inception
date | | | Expenses (%) | |
| Share class | | Ticker | | | Cusip | | | Gross | | | Net | |
| Advisor (A) | | | BAUSX | | | | 09658W782 | | | | 5/27/2014 | | | | 0.67 | | | | 0.55 | |
| Institutional (I) | | | MUISX | | | | 09658L646 | | | | 11/29/2012 | | | | 0.48 | | | | 0.40 | |
The above expense ratios are from the Funds’ Prospectus dated April 1, 2019, and are inclusive of Acquired Fund Fees and Expenses. See Note 6 in the Notes to Financial Statements for additional information. Net expense ratios reflect contractual fee waivers and/or expense reimbursements if applicable, made by BMO Asset Management Corp., the investment adviser (Adviser). The Adviser may not terminate these fee waivers and/or expense reimbursements prior to December 31, 2020 without the consent of the Board of Directors, unless the investment advisory agreement is terminated. Without these contractual waivers, the Fund’s returns would have been lower.
| | | | |
Municipal Issuance/ Industry Type | |
| Issuance/Industry | | Fund (%) | |
| General Obligation — 14.2% | | | | |
School District | | | 4.9 | |
State or Local | | | 9.3 | |
| Revenue Bonds — 85.4% | | | | |
Appropriation | | | 20.1 | |
Education | | | 5.1 | |
General Revenue | | | 0.4 | |
Health Care | | | 25.8 | |
Housing | | | 4.7 | |
Industrial Revenue | | | 2.8 | |
Power | | | 3.1 | |
Special Tax | | | 5.3 | |
Student Loan | | | 0.2 | |
Tobacco | | | 4.2 | |
Transportation | | | 8.5 | |
Water & Sewer | | | 5.2 | |
| Other Assets & Liabilities, Net | | | 0.4 | |
| Total | | | 100.0 | |
Portfolio composition will change due to the ongoing management of the Fund. The percentages are based on net assets as of August 31, 2019 and may not necessarily reflect adjustments that are routinely made when presenting net assets for formal financial statement processes.
Growth of an assumed $10,000 investment
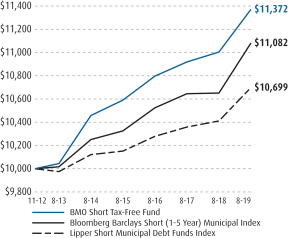
See Explanation of the Indices and Notes in the Commentary for additional information.The above graph relates to the Institutional Class shares of the Fund. Performance for the Advisor Class shares will vary from the performance of the Institutional Class shares shown above due to differences in charges and expenses. This graph illustrates the hypothetical investment of $10,000 in the Institutional Class shares of the Fund from the lesser of the Fund’s inception date or August 31, 2009 to August 31, 2019.
18
| | |
| | |
| Annual Report | | BMO Short-Term Income Fund |
| | | | | | | | | | | | | | | | |
Average annual total returns (%) | |
| | | 1-Year | | | 5-Years | | | 10-Years | | | Since
Inception | |
| Advisor Class (A) NAV | | | 4.34 | | | | 1.72 | | | | — | | | | 1.65 | |
| Advisor Class (A) OFFER | | | 2.24 | | | | 1.32 | | | | — | | | | 1.27 | |
| Institutional Class (I) | | | 4.59 | | | | 1.98 | | | | 2.61 | | | | 2.94 | |
| Bank of America Merrill Lynch1-3 Year U.S. Government/Corporate Index | | | 4.63 | | | | 1.59 | | | | 1.60 | | | | 1.60 | |
| Lipper Short Investment-Grade Debt Funds Index | | | 4.47 | | | | 1.84 | | | | 2.35 | | | | 2.35 | |
| * | Benchmarks since inception reflect the inception date of the Institutional Class. |
The performance data quoted represents past performance which is no guarantee of future results. Investment return and principal value will fluctuate so that an investor’s shares, when redeemed, may be worth more or less than their original costs. Mutual fund performance changes over time and current performance may be lower or higher than what is stated. To receive current performance to the most recentmonth-end, please call1-800-236-3863 or visit www.bmofunds.com.
Commentary
The BMO Short-Term Income Fund (the Fund) returned 4.59% for the fiscal year ended August 31, 2019 versus the Bank of America Merrill Lynch1-3 Year U.S. Government/Corporate Index and the Lipper Short Investment-Grade Debt Funds Index, which returned 4.63% and 4.47%, respectively.
The most significant episodes affecting the marketplace over the fiscal year were the interest rate policy moves by the Federal Reserve (the Fed), pressure from rising trade tariffs, and concerns over a slowing global economy. The Fed raised interest rates twice in the last 3 meetings of 2018, then kept the rate unchanged for the first 7 months of 2019, before lowering the overnight interest rate in late July 2019, for the 1st time in over 10 years. While technical factors in the domestic economy remain strong (unemployment near a historic low, growth in themid-2% area, and stubbornly low inflation), increasing trade tariffs and vitriol between the U.S. and China and a dramatically slower global economy were causes for concern and drove a significant “flight to quality”. The overall shape of the yield curve flattened dramatically. Interest rates in thefront-end of the curve declined at a slower pace than longer dated maturities, which is known as a “bull flattener”. Thanks in large part to the nearly $17 trillion in negative yielding, sovereign debt, the areas of the yield curve that saw the most buying were the 5 year and longer spaces, as investors clamored for safety and yield.
An overweight exposure to the Corporate and Asset-Backed (ABS) sectors, as compared to the benchmark index, was generally beneficial to performance as they were top performers. Conversely, ashort-to-neutral portfolio duration, especially in early 2019, detracted from performance, as interest rates fell dramatically across the yield curve. The overweight to the spread sectors proved detrimental for a couple particular months, when spreads widened during a big push into U.S. Government assets. A barbell term structure, aided by the liberal use of floating rate instruments, was additive as the yield curve flattened in maturities greater than3-months.
In the fiscal year, the Fed raised the overnight interest rate twice, only to turn around and reduce that same rate. The nearly 180 degree turn in monetary policy resulted largely from increased trade conflicts and concern about a slowing global economy. The potential for a “no deal Brexit” only has added to that concern. In the minutes from the late July 2019 Fed meeting, Fed Chair Powell referred to the rate decrease as a“mid-cycle correction”, but market participants are more cynical on the state of the economy and have built in additional rate decreases in the forward curve. According to the Fed Funds Futures market, as of August 31, 2019, 100% of market participants felt that the Fed would decrease the overnight lending rate by 0.25% at the September meeting, with approximately 83% expecting a lower overnight rate by 0.50% before the end of 2019.
The trends of lower rates and a flatter yield curve are likely to remain in place. Looking forward, tenuous geopolitics, a slowing global economy and a seemingly endless series of trade skirmishes are apt to foster near-term rate volatility across the yield curve.
Fund Managers; Investment Experience
Peter J. Arts; since 1992
Boyd R. Eager; since 1997
| | | | | | | | | | | | | | | | | | | | |
| | | | | | | | | Inception
date | | | Expenses (%) | |
| Share class | | Ticker | | | Cusip | | | Gross | | | Net | |
| Advisor (A) | | | BTMAX | | | | 09658W774 | | | | 5/27/2014 | | | | 0.72 | | | | 0.61 | |
| Institutional (I) | | | MSIFX | | | | 09658L570 | | | | 5/31/2007 | | | | 0.47 | | | | 0.36 | |
The above expense ratios are from the Funds’ Prospectus dated April 1, 2019, and are inclusive of Acquired Fund Fees and Expenses. See Note 6 in the Notes to Financial Statements for additional information. Net expense ratios reflect contractual fee waivers and/or expense reimbursements if applicable, made by BMO Asset Management Corp., the investment adviser (Adviser). The Adviser may not terminate these fee waivers and/or expense reimbursements prior to December 31, 2020 without the consent of the Board of Directors, unless the investment advisory agreement is terminated. Without these contractual waivers, the Fund’s returns would have been lower.
| | | | |
Portfolio sector allocation | |
| Sector | | Fund (%) | |
| Asset-Backed Securities | | | 20.7 | |
| Collateralized Mortgage Obligations | | | 8.1 | |
| Commercial Mortgage Securities | | | 5.5 | |
| Corporate Bonds & Notes | | | 49.5 | |
| Mutual Funds | | | 0.4 | |
| U.S. Government & U.S. Government Agency Obligations | | | 10.7 | |
| U.S. Government Agency-Mortgage Securities | | | 1.5 | |
| Other Assets & Liabilities, Net | | | 3.6 | |
| Total | | | 100.0 | |
Portfolio composition will change due to the ongoing management of the Fund. The percentages are based on net assets as of August 31, 2019 and may not necessarily reflect adjustments that are routinely made when presenting net assets for formal financial statement processes.
Growth of an assumed $10,000 investment
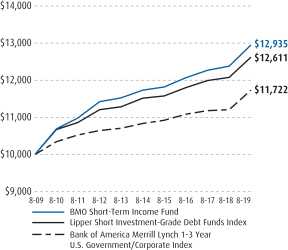
See Explanation of the Indices and Notes in the Commentary for additional information.The above graph relates to the Institutional Class shares of the Fund. Performance for the Advisor Class shares will vary from the performance of the Institutional Class shares shown above due to differences in charges and expenses. This graph illustrates the hypothetical investment of $10,000 in the Institutional Class shares of the Fund from the lesser of the Fund’s inception date or August 31, 2009 to August 31, 2019.
19
| | |
| | |
| Annual Report | | BMO IntermediateTax-Free Fund |
| | | | | | | | | | | | | | | | |
Average annual total returns (%) | |
| | | 1-Year | | | 5-Years | | | 10-Years | | | Since
Inception | |
| Investor Class (Y) | | | 7.05 | | | | 3.22 | | | | 4.20 | | | | 4.39 | |
| Advisor Class (A) NAV | | | 7.05 | | | | 3.23 | | | | — | | | | 3.35 | |
| Advisor Class (A) OFFER | | | 3.34 | | | | 2.49 | | | | — | | | | 2.66 | |
| Institutional Class (I) | | | 7.40 | | | | 3.47 | | | | — | | | | 4.34 | |
| Bloomberg Barclays1-15 Year Blend Municipal Bond Index | | | 7.67 | | | | 3.20 | | | | 3.86 | | | | 3.86 | |
| Lipper Intermediate Municipal Debt Funds Index | | | 7.45 | | | | 3.07 | | | | 3.79 | | | | 3.79 | |
| * | Benchmarks since inception reflect the inception date of the Institutional Class. |
The performance data quoted represents past performance which is no guarantee of future results. Investment return and principal value will fluctuate so that an investor’s shares, when redeemed, may be worth more or less than their original costs. Mutual fund performance changes over time and current performance may be lower or higher than what is stated. To receive current performance to the most recentmonth-end, please call1-800-236-3863 or visit www.bmofunds.com.
Commentary
The BMO IntermediateTax-Free Fund returned 7.40% for the fiscal year ended August 31, 2019 versus the Bloomberg Barclays1-15 Year Blend Municipal Bond Index and the Lipper Intermediate Municipal Debt Funds Index, which returned 7.67% and 7.45%, respectively.
The fiscal year began with a hawkish Federal Reserve (the Fed) intent on further tightening of short rates, which quickly evolved into the dovishness that investors have learned to love (loath?) since the start of the global financial crisis, culminating in the first Fed easing since late 2008. Why? The global economy is largely at or below stall speed and the Fed is attempting to use monetary policy to keep the U.S. from following suit. This action resulted in a sharp shift in investor sentiment over the course of the fiscal year; from fear gripping the markets in late 2018 to increased risk appetite as a result of Fed capitulation during the first half of calendar 2019. As such, and with volatility still elevated, more defensive asset classes like municipal bonds performed relatively well, with the Bloomberg Barclays Municipal Bond Index, a broad measure of the asset class, up 8.72% for the period. The current low interest rate environment continues to punish traditional savers, so thetax-advantaged income that municipals provide continues to be sought by many investors. In fact, industry mutual fund flows as the fiscal year closed remained at record levels, and if the calendar year had ended on August 31, 2019, would represent the second best year on record, trailing only 2009.
The Fund was defensively positioned for much of the fiscal year, remaining up in credit quality and maintaining a slightly shorter duration relative to the benchmark. This conservative stance was a hindrance to performance prior to the Fed capitulation on rates in early 2019. The Fund has gradually increased duration relative to the benchmark since January, ending the fiscal year slightly long the benchmark on this metric, while continuing to maintain above average credit quality given our read on where the U.S. currently sits in the economic cycle. The Fund’s exposure to floating rate securities at the front end of the yield curve hindered performance, but was largely offset by security selection on the long end of the yield curve. Looking ahead, the current Administration continues its “go it alone” strategy in regards to trade and the trade war with China, despite some occasional efforts at compromise, is likely to remain a headwind to both the global and domestic economies.
Fund Managers; Investment Experience
Thomas Byron; since 1981
Brian Sipich, CFA; since 1998
Robert Wimmel; since 1992
| | | | | | | | | | | | | | | | | | | | |
| | | | | | | | | Inception date | | | Expenses (%) | |
| Share class | | Ticker | | | Cusip | | | Gross | | | Net | |
| Investor (Y) | | | MITFX | | | | 09658L760 | | | | 2/1/1994 | | | | 0.55 | | | | 0.54 | |
| Advisor (A) | | | BITAX | | | | 09658W766 | | | | 5/27/2014 | | | | 0.55 | | | | 0.54 | |
| Institutional (I) | | | MIITX | | | | 09658L778 | | | | 12/27/2010 | | | | 0.30 | | | | 0.30 | |
The above expense ratios are from the Funds’ Prospectus dated April 1, 2019, and are inclusive of Acquired Fund Fees and Expenses. See Note 6 in the Notes to Financial Statements for additional information. Net expense ratios reflect contractual fee waivers and/or expense reimbursements if applicable, made by BMO Asset Management Corp., the investment adviser (Adviser). The Adviser may not terminate these fee waivers and/or expense reimbursements prior to December 31, 2020 without the consent of the Board of Directors, unless the investment advisory agreement is terminated. Without these contractual waivers, the Fund’s returns would have been lower.
| | | | |
Municipal Issuance/ Industry Type | |
| Issuance/Industry | | Fund (%) | |
| General Obligation — 20.8% | | | | |
School District | | | 10.2 | |
State or Local | | | 10.6 | |
| Revenue Bonds — 79.5% | | | | |
Appropriation | | | 21.2 | |
Education | | | 8.3 | |
General Revenue | | | 0.7 | |
Health Care | | | 19.5 | |
Housing | | | 2.5 | |
Industrial Revenue | | | 0.7 | |
Power | | | 1.6 | |
Special Tax | | | 2.3 | |
Student Loan | | | 0.3 | |
Tobacco | | | 1.5 | |
Transportation | | | 14.4 | |
Water & Sewer | | | 6.5 | |
| Other Assets & Liabilities, Net | | | (0.3 | ) |
| Total | | | 100.0 | |
Portfolio composition will change due to the ongoing management of the Fund. The percentages are based on net assets as of August 31, 2019 and may not necessarily reflect adjustments that are routinely made when presenting net assets for formal financial statement processes.
Growth of an assumed $10,000 investment
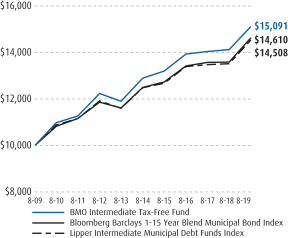
See Explanation of the Indices and Notes in the Commentary for additional information.The above graph relates to the Investor Class shares of the Fund. Performance for the Advisor Class and Institutional Class shares will vary from the performance of the Investor Class shares shown above due to differences in charges and expenses. This graph illustrates the hypothetical investment of $10,000 in the Investor Class shares of the Fund from the lesser of the Fund’s inception date or August 31, 2009 to August 31, 2019.
20
| | |
| | |
| Annual Report | | BMO Strategic Income Fund |
| | | | | | | | | | | | | | | | |
Average annual total returns (%) | |
| | | 1-Year | | | 5-Years | | | 10-Years | | | Since
Inception | |
| Investor Class (Y) | | | 9.08 | | | | 3.81 | | | | 3.92 | | | | 4.94 | |
| Advisor Class (A) NAV | | | 9.08 | | | | 3.81 | | | | — | | | | 3.79 | |
| Advisor Class (A) OFFER | | | 5.25 | | | | 3.07 | | | | — | | | | 3.09 | |
| Institutional Class (I) | | | 9.23 | | | | 4.07 | | | | 4.17 | | | | 4.65 | |
| Bloomberg Barclays U.S. Aggregate Bond Index* | | | 10.17 | | | | 3.35 | | | | 3.91 | | | | 3.91 | |
| Bloomberg Barclays U.S. Mortgage Backed Securities Index | | | 7.06 | | | | 2.75 | | | | 3.21 | | | | 3.21 | |
| Lipper Multi-Sector Funds Index | | | 6.61 | | | | 3.26 | | | | 5.72 | | | | 5.72 | |
| * | Benchmarks since inception reflect the inception date of the Institutional Class. |
The performance data quoted represents past performance which is no guarantee of future results. Investment return and principal value will fluctuate so that an investor’s shares, when redeemed, may be worth more or less than their original costs. Mutual fund performance changes over time and current performance may be lower or higher than what is stated. To receive current performance to the most recentmonth-end, please call1-800-236-3863 or visit www.bmofunds.com.
Commentary
The BMO Strategic Income Fund (the Fund) returned 9.23% for the fiscal year ended August 31, 2019 versus the Bloomberg Barclays U.S. Aggregate Bond Index, Bloomberg Barclays U.S. Mortgage Backed Securities Index and the Lipper Multi-Sector Funds Index, which returned 10.17%, 7.06% and 6.61%, respectively.
The Fund delivered strong absolute returns, significantly outperforming the peer group, but underperformed its benchmark in the period. The sharp decline in interest rates on the U.S. Treasury, which fell from 2.86% at the end of August 2018, to 1.50% at the end of August 2019, drove the higher than expected returns in the bond market. In this environment, Treasuries returned over 10% for the period. The Fund’s below benchmark duration reduced relative returns given the magnitude of decline in rates during the period.
Individual security selection within corporate credit was a negative factor for performance in the period; in particular, selection within the Energy, Food & Beverage and Pharmaceuticals sectors detracted from returns, while selection within the Media and Metals & Mining sectors contributed positively to returns.
The Fund’s significant yield advantage versus the benchmark contributed additional income during the period, increasing overall returns. Sector allocations to investment grade credit (+108 basis points of excess return) and emerging market debt (+168 bps) were additive to returns. Within investment grade, the overweight to lower quality investment grade (BBB +146 bps) was beneficial. High yield(-43 bps) underperformed investment grade, but high quality high yield (BB +190 bps) added to returns. Allocations to securitized products were additive, with positive contributions from commercial mortgage backed securities (CMBS), andnon-agency residential mortgage backed securities (RMBS), which continued to enhance portfolio income with their significant yield advantage relative to agency equivalents. In particular, lower rated CMBS tranches performed well; allocations to agency mortgages underperformed in the period.
Looking forward, our view is constructive for U.S. fixed income, particularlynon-governmental sectors, based on slowing, but resilient U.S. economic data and newly accommodative monetary policy. We expect recent U.S. monetary policy easing to continue, providing increased liquidity to markets. Possible challenges in the coming year include the ongoing tariff tensions, further slowing of U.S. data, and the upcoming presidential election. While valuations are fair in the current context, the potential exists for increased volatility from these factors. Deteriorating economic data outside of the U.S. poses risks for the U.S. economy, but to date has been positive for U.S. fixed income as relatively higher yielding U.S. assets have attracted global demand. On balance, these factors suggest a favorable outlook for the sector, but one with potential for volatility.
Fund Managers; Investment Experience
Scott M. Kimball, CFA; since 2004
Frank J. Reda, CMT; since 2001
Janelle Woodward, CFA; since 2003
| | | | | | | | | | | | | | | | | | | | |
| | | | | | | | | Inception date | | | Expenses (%) | |
| Share class | | Ticker | | | Cusip | | | Gross | | | Net | |
| Investor (Y) | | | MRGIX | | | | 09658L810 | | | | 12/13/1992 | | | | 0.91 | | | | 0.80 | |
| Advisor (A) | | | BMTAX | | | | 09658W758 | | | | 5/27/2014 | | | | 0.92 | | | | 0.80 | |
| Institutional (I) | | | MGIIX | | | | 09658L828 | | | | 5/31/2007 | | | | 0.67 | | | | 0.55 | |
The above expense ratios are from the Funds’ Prospectus dated April 1, 2019, and are inclusive of Acquired Fund Fees and Expenses. See Note 6 in the Notes to Financial Statements for additional information. Net expense ratios reflect contractual fee waivers and/or expense reimbursements if applicable, made by BMO Asset Management Corp., the investment adviser (Adviser). The Adviser may not terminate these fee waivers and/or expense reimbursements prior to December 31, 2020 without the consent of the Board of Directors, unless the investment advisory agreement is terminated. Without these contractual waivers, the Fund’s returns would have been lower.
| | | | |
Portfolio sector allocation | |
| Sector | | Fund (%) | |
| Asset-Backed Securities | | | 0.2 | |
| Collateralized Mortgage Obligations | | | 14.5 | |
| Commercial Mortgage Securities | | | 3.8 | |
| Corporate Bonds & Notes | | | 69.7 | |
| U.S. Government Agency-Mortgage Securities | | | 8.1 | |
| Other Assets & Liabilities, Net | | | 3.7 | |
| Total | | | 100.0 | |
Portfolio composition will change due to the ongoing management of the Fund. The percentages are based on net assets as of August 31, 2019 and may not necessarily reflect adjustments that are routinely made when presenting net assets for formal financial statement processes.
Growth of an assumed $10,000 investment
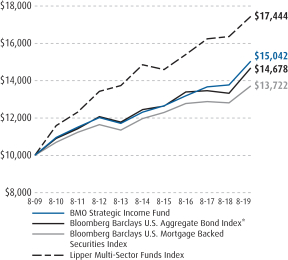
See Explanation of the Indices and Notes in the Commentary for additional information.The above graph relates to the Institutional Class shares of the Fund. Performance for the Investor Class and Advisor Class shares will vary from the performance of the Institutional Class shares shown above due to differences in charges and expenses. This graph illustrates the hypothetical investment of $10,000 in the Institutional Class shares of the Fund from the lesser of the Fund’s inception date or August 31, 2009 to August 31, 2019.
21
| | |
| | |
| Annual Report | | BMO TCH Corporate Income Fund |
| | | | | | | | | | | | | | | | |
Average annual total returns (%) | |
| | | 1-Year | | | 5-Years | | | 10-Years | | | Since
Inception | |
| Investor Class (Y) | | | 10.88 | | | | 4.51 | | | | 6.32 | | | | 7.67 | |
| Advisor Class (A) NAV | | | 10.89 | | | | 4.51 | | | | — | | | | 4.67 | |
| Advisor Class (A) OFFER | | | 7.04 | | | | 3.77 | | | | — | | | | 3.97 | |
| Institutional Class (I) | | | 11.07 | | | | 4.67 | | | | 6.49 | | | | 7.85 | |
| Bloomberg Barclays U.S. Credit Index | | | 12.99 | | | | 4.37 | | | | 5.56 | | | | 5.56 | |
| Lipper Corporate Debt FundsBBB-Rated Index | | | 13.28 | | | | 4.37 | | | | 6.03 | | | | 6.03 | |
| * | Benchmarks since inception reflect the inception date of the Institutional Class. |
The performance data quoted represents past performance which is no guarantee of future results. Investment return and principal value will fluctuate so that an investor’s shares, when redeemed, may be worth more or less than their original costs. Mutual fund performance changes over time and current performance may be lower or higher than what is stated. To receive current performance to the most recentmonth-end, please call1-800-236-3863 or visit www.bmofunds.com.
Commentary
The BMO TCH Corporate Income Fund (the Fund) returned 11.07% for the fiscal year ended August 31, 2019 versus the Bloomberg Barclays U.S. Credit Index and the Lipper Corporate Debt Funds BBB-Rated Index, which returned 12.99% and 13.28%, respectively.
The Fund delivered strong absolute returns, outperforming the peer group, but underperformed its benchmark in the period. The sharp decline in interest rates on the U.S. Treasury, which fell from 2.86% at the end of August 2018, to 1.50% at the end of August 2019, drove the higher than expected returns in the bond market. In this environment, Treasuries returned over 10% for the period.
The Fund entered the period with below benchmark duration, which reduced relative performance in the period. The Fund converged duration to benchmark levels as the period progressed, mitigating further negative impacts from the decline in rates. As part of this repositioning, the Fund reduced its exposure to investment grade corporate floating rate notes; floating rate notes delivered positive excess returns, but underperformed fixed rate credit in the period.
Individual security selection within corporate credit was a negative factor for performance in the period; in particular, selection within the Energy, Food & Beverage and Pharmaceuticals sectors detracted from returns.
Sector and quality selection was additive. Within credit, the Fund was overweight lower quality investment grade securities, which outperformed higher quality securities with BBB rated bonds outperforming overall credit by 48 basis points of excess return, though the portfolio also had an allocation to high yield, which underperformed investment grade by 151 basis points of excess returns. Over the course of the year, the Fund reduced these lower quality allocations as spreads tightened. The overweight to Financial issuers (+171 bps excess returns) and underweight to Utilities(-76 bps excess returns) contributed positively to returns.
Looking forward, our view is constructive for U.S. fixed income, particularlynon-governmental sectors, based on slowing, but resilient U.S. economic data and newly accommodative monetary policy. We expect recent U.S. monetary policy easing to continue, providing increased liquidity to markets. Possible challenges in the coming year include the ongoing tariff tensions, further slowing of U.S. data, and the upcoming presidential election. While valuations are fair in the current context, the potential exists for increased volatility from these factors. Deteriorating economic data outside of the U.S. poses risks for the U.S. economy, but to date has been positive for U.S. fixed income as relatively higher yielding U.S. assets have attracted global demand. On balance, these factors suggest a favorable outlook for the sector, but one with potential for volatility.
Investment Adviser:
BMO Asset Management Corp.
Sub-adviser:
Taplin, Canida & Habacht, LLC
Fund Managers; Investment Experience
Scott M. Kimball, CFA; since 2004
Frank J. Reda, CMT; since 2001
Janelle Woodward, CFA; since 2003
| | | | | | | | | | | | | | | | | | | | |
| | | | | | | | | Inception
date | | | Expenses (%) | |
| Share class | | Ticker | | | Cusip | | | Gross | | | Net | |
| Investor (Y) | | | MCIYX | | | | 09658L851 | | | | 12/22/2008 | | | | 0.63 | | | | 0.59 | |
| Advisor (A) | | | BATIX | | | | 09658W733 | | | | 5/27/2014 | | | | 0.63 | | | | 0.59 | |
| Institutional (I) | | | MCIIX | | | | 09658L869 | | | | 12/22/2008 | | | | 0.45 | | | | 0.45 | |
The above expense ratios are from the Funds’ Prospectus dated April 1, 2019, and are inclusive of Acquired Fund Fees and Expenses. See Note 6 in the Notes to Financial Statements for additional information. Net expense ratios reflect contractual fee waivers and/or expense reimbursements if applicable, made by BMO Asset Management Corp., the investment adviser (Adviser). The Adviser may not terminate these fee waivers and/or expense reimbursements prior to December 31, 2020 without the consent of the Board of Directors, unless the investment advisory agreement is terminated. Without these contractual waivers, the Fund’s returns would have been lower.
| | | | |
Portfolio sector allocation | |
| Sector | | Fund (%) | |
| Corporate Bonds & Notes | | | 93.4 | |
| Municipals | | | 0.1 | |
| Other Assets & Liabilities, Net | | | 6.5 | |
| Total | | | 100.0 | |
Portfolio composition will change due to the ongoing management of the Fund. The percentages are based on net assets as of August 31, 2019 and may not necessarily reflect adjustments that are routinely made when presenting net assets for formal financial statement processes.
Growth of an assumed $10,000 investment
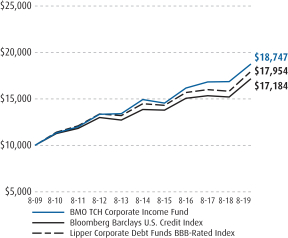
See Explanation of the Indices and Notes in the Commentary for additional information.The above graph relates to the Institutional Class shares of the Fund. Performance for the Investor Class and Advisor Class shares will vary from the performance of the Institutional Class shares shown above due to differences in charges and expenses. This graph illustrates the hypothetical investment of $10,000 in the Institutional Class shares of the Fund from the lesser of the Fund’s inception date or August 31, 2009 to August 31, 2019.
22
| | |
| | |
| Annual Report | | BMO TCH Core Plus Bond Fund |
| | | | | | | | | | | | | | | | |
Average annual total returns (%) | |
| | | 1-Year | | | 5-Years | | | 10-Years | | | Since
Inception | |
| Investor Class (Y) | | | 8.63 | | | | 3.15 | | | | 4.94 | | | | 5.62 | |
| Advisor Class (A) NAV | | | 8.63 | | | | 3.15 | | | | — | | | | 3.35 | |
| Advisor Class (A) OFFER | | | 4.86 | | | | 2.43 | | | | — | | | | 2.65 | |
| Institutional Class (I) | | | 8.99 | | | | 3.43 | | | | 5.19 | | | | 5.88 | |
| Bloomberg Barclays U.S. Aggregate Bond Index | | | 10.17 | | | | 3.35 | | | | 3.91 | | | | 3.91 | |
| Lipper Core Plus Bond Funds Index | | | 9.73 | | | | 3.48 | | | | 4.87 | | | | 4.87 | |
| * | Benchmarks since inception reflect the inception date of the Institutional Class. |
The performance data quoted represents past performance which is no guarantee of future results. Investment return and principal value will fluctuate so that an investor’s shares, when redeemed, may be worth more or less than their original costs. Mutual fund performance changes over time and current performance may be lower or higher than what is stated. To receive current performance to the most recentmonth-end, please call1-800-236-3863 or visit www.bmofunds.com.
Commentary
The BMO TCH Core Plus Bond Fund (the Fund) returned 8.99% for the fiscal year ended August 31, 2019 versus the Bloomberg Barclays U.S. Aggregate Bond Index and the Lipper Core Plus Bond Funds Index, which returned 10.17% and 9.73%, respectively.
The Fund delivered strong absolute returns, but underperformed its benchmark and peer group in the period. The sharp decline in interest rates on the U.S. Treasury, which fell from 2.86% at the end of August 2018, to 1.50% at the end of August 2019, drove the higher than expected returns in the bond market. In this environment, Treasuries returned over 10% for the period.
The Fund entered the period with below benchmark duration, which reduced relative performance in the period. The Fund converged duration to benchmark levels as the period progressed, mitigating further negative impacts from the decline in rates. As part of this repositioning, the Fund reduced its exposure to investment grade corporate floating rate notes; floating rate notes delivered positive excess returns, but underperformed fixed rate credit in the period.
Individual security selection within corporate credit was a negative factor for performance in the period; in particular, selection within the Energy, Food & Beverage and Pharmaceuticals sectors detracted from returns, while selection within securitized products, particularly commercial mortgage backed securities (CMBS) added to returns on the margin.
Sector and quality selection was positive. The portfolio was overweight credit, which outperformed duration-matched Treasuries by 108 basis points due to its yield advantage as spreads widened modestly. Within credit, the Fund was overweight lower quality investment grade securities, which outperformed higher quality securities with BBB rated bonds outperforming overall credit by 48 basis points of excess return, though the portfolio also had an allocation to high yield, which underperformed investment grade by 151 basis points of excess returns. The overweight to Financial issuers (+171 bps excess returns) was additive to returns.
Looking forward, our view is constructive for U.S. fixed income, particularlynon-governmental sectors, based on slowing, but resilient U.S. economic data and newly accommodative monetary policy. We expect recent U.S. monetary policy easing to continue, providing increased liquidity to markets. Possible challenges in the coming year include the ongoing tariff tensions, further slowing of U.S. data, and the upcoming presidential election. While valuations are fair in the current context, the potential exists for increased volatility from these factors. Deteriorating economic data outside of the U.S. poses risks for the U.S. economy, but to date has been positive for U.S. fixed income as relatively higher yielding U.S. assets have attracted global demand. On balance, these factors suggest a favorable outlook for the sector, but one with potential for volatility.
Investment Adviser:
BMO Asset Management Corp.
Sub-adviser:
Taplin, Canida & Habacht, LLC
Fund Managers; Investment Experience
Scott M. Kimball, CFA; since 2004
Frank J. Reda, CMT; since 2001
Janelle Woodward, CFA; since 2003
| | | | | | | | | | | | | | | | | | | | |
| | | | | | | | | Inception
date | | | Expenses (%) | |
| Share class | | Ticker | | | Cusip | | | Gross | | | Net | |
| Investor (Y) | | | MCYBX | | | | 09658L877 | | | | 12/22/2008 | | | | 0.59 | | | | 0.59 | |
| Advisor (A) | | | BATCX | | | | 09658W725 | | | | 5/27/2014 | | | | 0.59 | | | | 0.59 | |
| Institutional (I) | | | MCBIX | | | | 09658L885 | | | | 12/22/2008 | | | | 0.34 | | | | 0.34 | |
The above expense ratios are from the Funds’ Prospectus dated April 1, 2019, and are inclusive of Acquired Fund Fees and Expenses. See Note 6 in the Notes to Financial Statements for additional information. Net expense ratios reflect contractual fee waivers and/or expense reimbursements if applicable, made by BMO Asset Management Corp., the investment adviser (Adviser). The Adviser may not terminate these fee waivers and/or expense reimbursements prior to December 31, 2020 without the consent of the Board of Directors, unless the investment advisory agreement is terminated. Without these contractual waivers, the Fund’s returns would have been lower.
| | | | |
Portfolio sector allocation | |
| Sector | | Fund (%) | |
| Asset-Backed Securities | | | 2.3 | |
| Collateralized Mortgage Obligations | | | 2.5 | |
| Commercial Mortgage Securities | | | 3.7 | |
| Corporate Bonds & Notes | | | 36.5 | |
| Municipals | | | 0.0 | |
| U.S. Government & U.S. Government Agency Obligations | | | 20.0 | |
| U.S. Government Agency-Mortgage Securities | | | 32.1 | |
| Other Assets & Liabilities, Net | | | 2.9 | |
| Total | | | 100.0 | |
Portfolio composition will change due to the ongoing management of the Fund. The percentages are based on net assets as of August 31, 2019 and may not necessarily reflect adjustments that are routinely made when presenting net assets for formal financial statement processes.
Growth of an assumed $10,000 investment
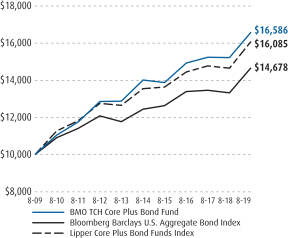
See Explanation of the Indices and Notes in the Commentary for additional information.The above graph relates to the Institutional Class shares of the Fund. Performance for the Investor Class and Advisor shares will vary from the performance of the Institutional Class shares shown above due to differences in charges and expenses. This graph illustrates the hypothetical investment of $10,000 in the Institutional Class shares of the Fund from the lesser of the Fund’s inception date or August 31, 2009 to August 31, 2019.
23
| | |
| | |
| Annual Report | | BMO High Yield Bond Fund |
| | | | | | | | | | | | |
Average annual total returns (%) | |
| | | 1-Year | | | 5-Years | | | Since
Inception | |
| Advisor Class (A) NAV | | | 5.59 | | | | 3.36 | | | | 3.30 | |
| Advisor Class (A) OFFER | | | 1.85 | | | | 2.62 | | | | 2.61 | |
| Institutional Class (I) | | | 5.84 | | | | 3.59 | | | | 5.08 | |
| Bank of America Merrill Lynch U.S. High Yield, Master II Constrained Index | | | 6.58 | | | | 4.86 | | | | 6.86 | |
| Bank of America Merrill Lynch U.S. High Yield,BB-B Rated, Constrained Index | | | 8.03 | | | | 5.02 | | | | 6.73 | |
| Lipper High Yield Bond Funds Index | | | 5.79 | | | | 4.10 | | | | 6.33 | |
| * | Benchmarks since inception reflect the inception date of the Institutional Class. |
The performance data quoted represents past performance which is no guarantee of future results. Investment return and principal value will fluctuate so that an investor’s shares, when redeemed, may be worth more or less than their original costs. Mutual fund performance changes over time and current performance may be lower or higher than what is stated. To receive current performance to the most recentmonth-end, please call1-800-236-3863 or visit www.bmofunds.com.
Commentary
The BMO High Yield Bond Fund (the Fund) returned 5.84% for the fiscal year ended August 31, 2019 versus the Bank of America Merrill Lynch U.S. High Yield Master II Constrained Index, Bank of Americal Merrill Lynch U.S. High Yield BB-B Rated Constrained Index and the Lipper High Yield Bond Funds Index, which returned 6.58%, 8.03% and 5.79%, respectively.
The Fund underperformed the benchmark, but mildly outperformed the peer group during the period. The sharp decline in interest rates on the U.S. Treasury, which fell from 2.86% at the end of August 2018, to 1.50% at the end of August 2019, drove the higher than expected returns in the bond market. In this environment, Treasuries returned over 10% for the period. High yield benchmarks, with their lower duration profile, captured the decline in rates, but to a lesser degree. The Fund’s below benchmark duration reduced relative returns given the magnitude of decline in rates during the period.
Individual security selection within corporate credit was a negative factor for performance in the period; in particular, selection within the Energy, Food & Beverage and Pharmaceuticals sectors detracted from returns, while selection within the Media and Basic Industrials sectors contributed positively to returns.
Quality selection was a positive contributor to performance. Overall, high yield delivered negative excess returns against duration matched Treasuries, but returns were sharply divided by quality. Higher quality segments delivered positive excess returns (BB +190 bps excess returns, B +48 bps) while lower quality underperformed significantly (CCC-940 bps) as defaults began to increase on the margin. The Fund’s overweight to higher quality segments and underweight to CCC bonds was beneficial for portfolio returns in this environment.
Looking forward, our view is constructive for U.S. fixed income, particularlynon-governmental sectors, based on slowing, but resilient U.S. economic data and newly accommodative monetary policy. We expect recent U.S. monetary policy easing to continue, providing increased liquidity to markets. Possible challenges in the coming year include the ongoing tariff tensions, further slowing of U.S. data, and the upcoming presidential election. While valuations are fair in the current context, the potential exists for increased volatility from these factors. Deteriorating economic data outside of the U.S. poses risks for the U.S. economy, but to date has been positive for U.S. fixed income as relatively higher yielding U.S. assets have attracted global demand. On balance, these factors suggest a favorable outlook for the sector, but one with potential for volatility.
Fund Managers; Investment Experience
Ronald J. Salinas, CFA; since 2000
Eduardo J. Simpson, CFA; since 1999
Janelle Woodward, CFA; since 2003
| | | | | | | | | | | | | | | | | | | | |
| | | | | | | | | Inception
date | | | Expenses (%) | |
| Share class | | Ticker | | | Cusip | | | Gross | | | Net | |
| Advisor (A) | | | BMHAX | | | | 09658W717 | | | | 5/27/2014 | | | | 2.01 | | | | 0.91 | |
Institutional
(I) | | | MHBNX | | | | 09658L406 | | | | 12/29/2011 | | | | 1.76 | | | | 0.66 | |
The above expense ratios are from the Funds’ Prospectus dated April 1, 2019, and are inclusive of Acquired Fund Fees and Expenses. See Note 6 in the Notes to Financial Statements for additional information. Net expense ratios reflect contractual fee waivers and/or expense reimbursements if applicable, made by BMO Asset Management Corp., the investment adviser (Adviser). The Adviser may not terminate these fee waivers and/or expense reimbursements prior to December 31, 2020 without the consent of the Board of Directors, unless the investment advisory agreement is terminated. Without these contractual waivers, the Fund’s returns would have been lower.
| | | | |
Portfolio sector allocation | |
| Sector | | Fund (%) | |
| Corporate Bonds & Notes | | | 93.5 | |
| Other Assets & Liabilities, Net | | | 6.5 | |
| Total | | | 100.0 | |
Portfolio composition will change due to the ongoing management of the Fund. The percentages are based on net assets as of August 31, 2019 and may not necessarily reflect adjustments that are routinely made when presenting net assets for formal financial statement processes.
Growth of an assumed $10,000 investment
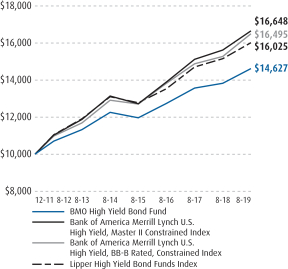
See Explanation of the Indices and Notes in the Commentary for additional information.The above graph relates to the Institutional Class shares of the Fund. Performance for the Advisor Class shares will vary from the performance of the Institutional Class shares shown above due to differences in charges and expenses. This graph illustrates the hypothetical investment of $10,000 in the Institutional Class shares of the Fund from the lesser of the Fund’s inception date or August 31, 2009 to August 31, 2019.
24
| | |
| | |
| Annual Report | | BMO Government Money Market Fund |
| | | | | | | | | | | | |
Average annual total returns (%) | |
| | | 1-Year | | | 5-Years | | | 10-Years | |
| Investor Class (Y) | | | 1.89 | | | | 0.64 | | | | 0.32 | |
| Premier Class | | | 2.14 | | | | 0.80 | | | | 0.42 | |
| iMoneyNet, Inc. Government Money Market Index | | | 1.92 | | | | 0.65 | | | | 0.33 | |
| Lipper U.S. Government Money Market Funds Index | | | 1.85 | | | | 0.61 | | | | 0.31 | |
The performance data quoted represents past performance which is no guarantee of future results. Investment return and principal value will fluctuate so that an investor’s shares, when redeemed, may be worth more or less than their original costs. Mutual fund performance changes over time and current performance may be lower or higher than what is stated. To receive current performance to the most recentmonth-end, please call1-800-236-3863 or visit www.bmofunds.com.
An investment in the Fund is neither insured nor guaranteed by the Federal Deposit Insurance Corporation or any other government agency. Although the Fund seeks to preserve the value of your investment at $1.00 per share, it is possible to lose money by investing in the Fund.
Commentary
The BMO Government Money Market Fund (the Fund) returned 2.14% for the fiscal year-ended August 31, 2019 versus the iMoneyNet, Inc. Government Money Market Index and the Lipper U.S. Government Money Market Funds Index, which returned 1.92% and 1.85%, respectively.
The most significant episodes affecting the marketplace over the fiscal year were the interest rate policy moves by the Federal Reserve (the Fed), pressure from rising trade tariffs, and concerns over a slowing global economy. The Fed raised interest rates twice in the last 3 meetings of 2018, then kept the rate unchanged for the first 7 months of 2019, before lowering the overnight interest rate in late July 2019, for the first time in over 10 years. While technical factors in the domestic economy remain strong (unemployment near a historic low, growth in themid-2% area, and stubbornly low inflation), increasing trade tariffs and vitriol between the U.S. and China and a dramatically slower global economy were causes for concern and drove a significant “flight to quality”. The overall shape of the yield curve flattened dramatically. Interest rates in thefront-end of the curve declined at a slower pace than longer dated maturities, which is known as a “bull flattener”. Thanks in large part to the nearly $17 trillion in negative yielding, sovereign debt, the areas of the yield curve that saw the most buying were the 5 year and longer spaces, as investors clamored for safety and yield.
In the first few months of the fiscal year, the Fund’s low Weighted Average Maturity (WAM) and high allocation to floating rate securities were strong contributors to performance, thanks to the two Fed rate increases during that period. Strong demand for short dated government securities persisted, as would be expected with an active Fed; however, pricing pressure abated somewhat. Floating rate instruments remained attractive as the Fed was at that time projecting a further reduction in policy accommodation for the remainder of 2018 and into 2019. However, amid uncertainty regarding global growth, the Fed reversed course at the beginning of 2019, eventually signaling that the next rate change would be a decrease. As LIBOR indices continued to show resilience to rate declines and as issuance of securities benchmarked to the new SOFR index increased, floating rate instruments were able to offer attractive yields versus fixed-rate securities. The front end of the yield curve flattened dramatically as the market priced in at least one interest rate cut to occur in the third quarter. As short term rates began pricing in rate cuts, the Fund extended its WAM through the opportunistic purchase of fixed-rate paper maturing in the three to six month space. Longer dated floaters (12 months to 2 years) also were added to maintain principal protection, which also extended the Fund’s Weighted Average Life (WAL). Defensive, high coupon, callable agency paper was purchased as a means to pick up additional yield. The Fund’s increased allocation to repo aided performance as yields on short-dated agency discount notes dropped precipitously.
In the most recent 12 months, the Fed has raised the overnight interest rate twice, only to turn around and reduce that same rate a month ago. The nearly 180 degree turn in monetary policy resulted largely from increased trade conflicts and concern about a slowing global economy. The potential for a “no deal Brexit” only has added to that concern. In the minutes from the late July 2019 Fed meeting, Fed Chair Powell referred to the rate decrease as a“mid-cycle correction”, but market participants are more cynical on the state of the economy and have built in additional rate decreases in the forward curve. According to the Fed Funds Futures market, as of August 31, 2019, 100% of market participants felt that the Fed would decrease the overnight lending rate by 0.25% at the 09/18 meeting, with ~83% expecting the Fed to lower the overnight rate by 0.50% before the end of 2019. The trends of lower rates and a flatter yield curve are likely to remain in place.
Looking forward, tenuous geopolitics, a slowing global economy, and a seemingly endless series of trade skirmishes are apt to foster near-term rate volatility across the yield curve.
Fund Managers; Investment Experience
Peter J. Arts; since 1992
Boyd R. Eager; since 1997
| | | | | | | | | | | | | | | | | | | | |
| | | | | | | | | Inception
date | | | Expenses (%) | |
| Share class | | Ticker | | | Cusip | | | Gross | | | Net | |
| Investor (Y) | | | MGYXX | | | | 09658L786 | | | | 5/17/2004 | | | | 0.51 | | | | 0.46 | |
| Premier | | | MGNXX | | | | 09658L794 | | | | 5/28/2004 | | | | 0.26 | | | | 0.21 | |
The above expense ratios are from the Funds’ Prospectus dated April 1, 2019, and are inclusive of Acquired Fund Fees and Expenses. See Note 6 in the Notes to Financial Statements for additional information. Net expense ratios reflect contractual fee waivers and/or expense reimbursements if applicable, made by BMO Asset Management Corp., the investment adviser (Adviser). The Adviser may not terminate these fee waivers and/or expense reimbursements prior to December 31, 2020 without the consent of the Board of Directors, unless the investment advisory agreement is terminated. Without these contractual waivers, the Fund’s returns would have been lower.
| | | | |
Portfolio sector allocation | |
| Sector | | Fund (%) | |
| Mutual Funds | | | 6.3 | |
| Repurchase Agreements | | | 37.9 | |
| U.S. Government & U.S. Government Agency Obligatios | | | 51.9 | |
| U.S. Treasury Bills | | | 4.0 | |
| Other Assets & Liabilities, Net | | | (0.1 | ) |
| Total | | | 100.0 | |
Portfolio composition will change due to the ongoing management of the Fund. The percentages are based on net assets as of August 31, 2019 and may not necessarily reflect adjustments that are routinely made when presenting net assets for formal financial statement processes.
Growth of an assumed $10,000 investment
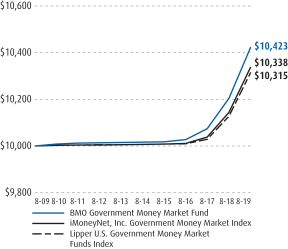
See Explanation of the Indices and Notes in the Commentary for additional information. The above graph relates to the Premier Class shares of the Fund. Performance for the Investor Class shares will vary from the performance of the Premier Class shares shown above due to differences in charges and expenses. This graph illustrates the hypothetical investment of $10,000 in the Premier Class shares of the Fund from the lesser of the Fund’s inception date or August 31, 2009 to August 31, 2019.
25
| | |
| | |
| Annual Report | | BMOTax-Free Money Market Fund |
| | | | | | | | | | | | |
Average annual total returns (%) | |
| | | 1-Year | | | 5-Years | | | 10-Years | |
| Investor Class (Y) | | | 1.20 | | | | 0.49 | | | | 0.29 | |
| Premier Class | | | 1.46 | | | | 0.66 | | | | 0.46 | |
| iMoneyNet, Inc. FundReport/Tax-Free National Retail Index | | | 1.17 | | | | 0.46 | | | | 0.24 | |
| LipperTax-Exempt Money Market Funds Index | | | 1.25 | | | | 0.51 | | | | 0.27 | |
The performance data quoted represents past performance which is no guarantee of future results. Investment return and principal value will fluctuate so that an investor’s shares, when redeemed, may be worth more or less than their original costs. Mutual fund performance changes over time and current performance may be lower or higher than what is stated. To receive current performance to the most recentmonth-end, please call1-800-236-3863 or visit www.bmofunds.com.
An investment in the Fund is neither insured nor guaranteed by the Federal Deposit Insurance Corporation or any other government agency. Although the Fund seeks to preserve the value of your investment at $1.00 per share, it is possible to lose money by investing in the Fund.
Commentary
The BMOTax-Free Money Market Fund (the Fund) returned 1.46% for the fiscal year ended August 31, 2019 versus the iMoneyNet Inc. FundReport/Tax-Free National Retail Index and the LipperTax-Exempt Money Market Funds Index, which returned 1.17% and 1.25%, respectively.
The fiscal year began with a hawkish Federal Reserve (the Fed) intent on further tightening of short rates, which quickly evolved into the dovishness that investors have learned to love (loath?) since the start of the global financial crisis, culminating in the first Fed easing since late 2008. Why? The global economy is largely at or below stall speed and the Fed is attempting to use monetary policy to keep the U.S. from following suit. This action resulted in a sharp shift in investor sentiment over the course of the fiscal year; from fear gripping the markets in late 2018 to increased risk appetite as a result of Fed capitulation during the first half of calendar 2019. As such, and with volatility still elevated, more defensive asset classes like municipal bonds performed relatively well, with the Bloomberg Barclays Municipal Bond Index, a broad measure of the asset class, up 8.72% for the period. The current low interest rate environment continues to punish traditional savers, so thetax-advantaged income that municipals provide continues to be sought by many investors. In fact, industry mutual fund flows as the fiscal year closed remained at record levels, and if the calendar year had ended on August 31, 2019, would represent the second best year on record, trailing only 2009.
The Fund stayed shorter than its peers from a duration perspective but with the Fed first signaling and then beginning an easing cycle in July, floating rate exposure was decreased over the course of the fiscal year.
Fund Managers; Investment Experience
Thomas Byron; since 1981
Brian Sipich, CFA; since 1998
Robert Wimmel; since 1992
| | | | | | | | | | | | | | | | | | | | |
| | | | | | | | | Inception date | | | Expenses (%) | |
| Share class | | Ticker | | | Cusip | | | Gross | | | Net | |
| Investor (Y) | | | MTFXX | | | | 09658L547 | | | | 9/22/2004 | | | | 0.56 | | | | 0.45 | |
| Premier | | | MFIXX | | | | 09658L554 | | | | 6/29/2005 | | | | 0.31 | | | | 0.20 | |
The above expense ratios are from the Funds’ Prospectus dated April 1, 2019, and are inclusive of Acquired Fund Fees and Expenses. See Note 6 in the Notes to Financial Statements for additional information. Net expense ratios reflect contractual fee waivers and/or expense reimbursements if applicable, made by BMO Asset Management Corp., the investment adviser (Adviser). The Adviser may not terminate these fee waivers and/or expense reimbursements prior to December 31, 2020 without the consent of the Board of Directors, unless the investment advisory agreement is terminated. Without these contractual waivers, the Fund’s returns would have been lower.
| | | | |
Municipal Issuance/ Industry Type | |
| Issuance/Industry | | Fund (%) | |
| General Obligation — 20.1% | | | | |
School District | | | 1.2 | |
State or Local | | | 18.9 | |
| Revenue Bonds — 75.5% | | | | |
Appropriation | | | 14.0 | |
Education | | | 11.1 | |
General Revenue | | | 1.9 | |
Health Care | | | 19.8 | |
Housing | | | 5.9 | |
Industrial Revenue | | | 2.9 | |
Power | | | 3.6 | |
Special Tax | | | 6.0 | |
Transportation | | | 3.7 | |
Water & Sewer | | | 6.6 | |
| Other Assets & Liabilities, Net | | | 4.4 | |
| Total | | | 100.0 | |
Portfolio composition will change due to the ongoing management of the Fund. The percentages are based on net assets as of August 31, 2019 and may not necessarily reflect adjustments that are routinely made when presenting net assets for formal financial statement processes.
Growth of an assumed $10,000 investment
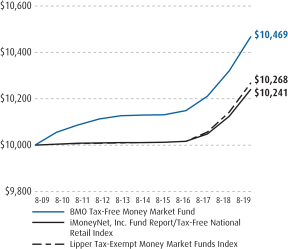
See Explanation of the Indices and Notes in the Commentary for additional information.The above graph relates to the Premier Class shares of the Fund. Performance for the Investor Class shares will vary from the performance of the Premier Class shares shown above due to differences in charges and expenses. This graph illustrates the hypothetical investment of $10,000 in the Premier Class shares of the Fund from the lesser of the Fund’s inception date or August 31, 2009 to August 31, 2019.
26
| | |
| | |
| Annual Report | | BMO Prime Money Market Fund |
| | | | | | | | | | | | |
Average annual total returns (%) | |
| | | 1-Year | | | 5-Years | | | 10-Years | |
| Investor Class (Y) | | | 2.03 | | | | 0.75 | | | | 0.38 | |
| Premier Class | | | 2.28 | | | | 0.93 | | | | 0.54 | |
| iMoneyNet, Inc. Money Market Index | | | 1.96 | | | | 0.70 | | | | 0.36 | |
| Lipper Prime Money Market Funds Index | | | 2.08 | | | | 0.77 | | | | 0.39 | |
The performance data quoted represents past performance which is no guarantee of future results. Investment return and principal value will fluctuate so that an investor’s shares, when redeemed, may be worth more or less than their original costs. Mutual fund performance changes over time and current performance may be lower or higher than what is stated. To receive current performance to the most recentmonth-end, please call1-800-236-3863 or visit www.bmofunds.com.
An investment in the Fund is neither insured nor guaranteed by the Federal Deposit Insurance Corporation or any other government agency. Although the Fund seeks to preserve the value of your investment at $1.00 per share, it is possible to lose money by investing in the Fund.
Commentary
The BMO Prime Money Market Fund (the Fund) returned 2.28% for the fiscal year-ended August 31, 2019 versus the iMoneyNet, Inc. Money Market Index and the Lipper Prime Money Market Funds Index, which returned 1.96% and 2.08%, respectively.
The most significant episodes affecting the marketplace over the fiscal year were the interest rate policy moves by the Federal Reserve (the Fed), pressure from rising trade tariffs, and concerns over a slowing global economy. The Fed raised interest rates twice in the last 3 meetings of 2018, then kept the rate unchanged for the first 7 months of 2019, before lowering the overnight interest rate in late July 2019, for the first time in over 10 years. While technical factors in the domestic economy remain strong (unemployment near a historic low, growth in themid-2% area, and stubbornly low inflation), increasing trade tariffs and vitriol between the U.S. and China and a dramatically slower global economy were causes for concern and drove a significant “flight to quality”. The overall shape of the yield curve flattened dramatically. Interest rates in thefront-end of the curve declined at a slower pace than longer dated maturities, which is known as a “bull flattener”. Thanks in large part to the nearly $17 trillion in negative yielding, sovereign debt, the areas of the yield curve that saw the most buying were the 5 year and longer spaces, as investors clamored for safety and yield.
In the first few months of the fiscal year, the Fund’s low Weighted Average Maturity (WAM) and increased allocation to floating rate securities were strong contributors to performance, due to the two Fed hikes during that period. Floating rate instruments remained attractive as the Fed was at that time projecting a further reduction in policy accommodation for the remainder of 2018 and into 2019. However, amid uncertainty regarding global growth, the Fed reversed course at the beginning of 2019, signaling that the next rate change would be a cut versus a hike. As LIBOR indices continued to show resilience to rate declines and as issuance of securities benchmarked to the new SOFR index increased, floating rate instruments were able to offer attractive yields versus fixed-rate securities. The front end of the yield curve flattened dramatically as the market priced in at least one interest rate cut to occur in the third quarter. As short term rates have priced in rate cuts, the Fund has emphasized fixed rate paper shorter than six months and longer dated floaters to maintain principal protection. The Fund also has a continued focus on asset backed commercial paper (ABCP), as it offers attractive yields relative to corporate commercial paper.
In the most recent 12 months, the Fed has raised the overnight interest rate twice, only to turn around and reduce that same rate a month ago. The nearly 180 degree turn in monetary policy resulted largely from increased trade conflicts and concern about a slowing global economy. The potential for a “no deal Brexit” only has added to that concern. In the minutes from the late July 2019 Fed meeting, Fed Chair Powell referred to the rate decrease as a“mid-cycle correction”, but market participants are more cynical on the state of the economy and have built in additional rate decreases in the forward curve. According to the Fed Funds Futures market, as of August 31, 2019, 100% of market participants felt that the Fed would decrease the overnight lending rate by 0.25% at the 09/18 meeting, with ~83% expecting the Fed to lower the overnight rate by 0.50% before the end of 2019.
The trends of lower rates and a flatter yield curve are likely to remain in place.
Looking forward, tenuous geopolitics, a slowing global economy, and a seemingly endless series of trade skirmishes are apt to foster near-term rate volatility across the yield curve.
Fund Managers; Investment Experience
Peter J. Arts; since 1992
Boyd R. Eager; since 1997
| | | | | | | | | | | | | | | | | | | | |
| | | | | | | | | Inception
date | | | Expenses (%) | |
| Share class | | Ticker | | | Cusip | | | Gross | | | Net | |
| Investor (Y) | | | BYFXX | | | | 09658V354 | | | | 11/23/1992 | | | | 0.53 | | | | 0.46 | |
| Premier | | | BPFXX | | | | 09658V347 | | | | 4/3/2000 | | | | 0.28 | | | | 0.21 | |
The above expense ratios are from the Funds’ Prospectus dated April 1, 2019, and are inclusive of Acquired Fund Fees and Expenses. See Note 6 in the Notes to Financial Statements for additional information. Net expense ratios reflect contractual fee waivers and/or expense reimbursements if applicable, made by BMO Asset Management Corp., the investment adviser (Adviser). The Adviser may not terminate these fee waivers and/or expense reimbursements prior to December 31, 2020 without the consent of the Board of Directors, unless the investment advisory agreement is terminated. Without these contractual waivers, the Fund’s returns would have been lower.
| | | | |
Portfolio sector allocation | |
| Sector | | Fund (%) | |
| Certificates of Deposit | | | 23.2 | |
| Commercial Paper | | | 50.9 | |
| Municipals | | | 0.4 | |
| Mutual Funds | | | 2.6 | |
| Repurchase Agreements | | | 22.9 | |
| Other Assets & Liabilities, Net | | | 0.0 | |
| Total | | | 100.0 | |
Portfolio composition will change due to the ongoing management of the Fund. The percentages are based on net assets as of August 31, 2019 and may not necessarily reflect adjustments that are routinely made when presenting net assets for formal financial statement processes.
Growth of an assumed $10,000 investment
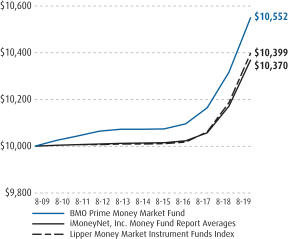
See Explanation of the Indices and Notes in the Commentary for additional information.The above graph relates to the Premier Class shares of the Fund. Performance for the Investor Class shares will vary from the performance of the Premier Class shares shown above due to differences in charges and expenses. This graph illustrates the hypothetical investment of $10,000 in the Premier Class shares of the Fund from the lesser of the Fund’s inception date or August 31, 2009 to August 31, 2019.
27
| | |
| | |
| Annual Report | | BMO Institutional Prime Money Market Fund |
| | | | | | | | |
Average annual total returns (%) | |
| | | 1-Year | | | Since
Inception | |
| Investor Class (Y) | | | 2.06 | | | | 1.19 | |
| Premier Class | | | 2.31 | | | | 1.44 | |
| iMoneyNet, Inc. Money Market Index | | | 1.96 | | | | 1.07 | |
| Lipper Institutional Money Market Funds Index | | | 2.39 | | | | 1.53 | |
The performance data quoted represents past performance which is no guarantee of future results. Investment return and principal value will fluctuate so that an investor’s shares, when redeemed, may be worth more or less than their original costs. Mutual fund performance changes over time and current performance may be lower or higher than what is stated. To receive current performance to the most recentmonth-end, please call1-800-236-3863 or visit www.bmofunds.com.
An investment in the Fund is neither insured nor guaranteed by the Federal Deposit Insurance Corporation or any other government agency. Although the Fund seeks to preserve the value of your investment at $1.00 per share, it is possible to lose money by investing in the Fund.
Commentary
The BMO Institutional Prime Money Market Fund (the Fund) returned 2.31% for the fiscal year-ended August 31, 2019 versus the iMoneyNet, Inc. Money Market Index and the Lipper Institutional Prime Money Market Funds Index, which returned 1.96% and 2.39%, respectively.
The most significant episodes affecting the marketplace over the fiscal year were the interest rate policy moves by the Federal Reserve (the Fed), pressure from rising trade tariffs, and concerns over a slowing global economy. The Fed raised interest rates twice in the last 3 meetings of 2018, then kept the rate unchanged for the first 7 months of 2019, before lowering the overnight interest rate in late July 2019, for the first time in over 10 years. While technical factors in the domestic economy remain strong (unemployment near a historic low, growth in themid-2% area, and stubbornly low inflation), increasing trade tariffs and vitriol between the U.S. and China and a dramatically slower global economy were causes for concern and drove a significant “flight to quality”. The overall shape of the yield curve flattened dramatically. Interest rates in thefront-end of the curve declined at a slower pace than longer dated maturities, which is known as a “bull flattener”. Thanks in large part to the nearly $17 trillion in negative yielding, sovereign debt, the areas of the yield curve that saw the most buying were the 5 year and longer spaces, as investors clamored for safety and yield.
In the first few months of the fiscal year, the Fund’s low Weighted Average Maturity (WAM) and high allocation to floating rate securities were strong contributors to performance, thanks to the two Fed rate increases during that period. Floating rate instruments remained attractive as the Fed was at that time projecting a further reduction in policy accommodation for the remainder of 2018 and into 2019. However, amid uncertainty regarding global growth, the Fed reversed course at the beginning of 2019, eventually signaling that the next rate change would be a decrease. As LIBOR indices continued to show resilience to rate declines and as issuance of securities benchmarked to the new SOFR index increased, floating rate instruments were able to offer attractive yields versus fixed-rate securities. The front end of the yield curve flattened dramatically as the market priced in at least one interest rate cut to occur in the third quarter. As short term rates began pricing in rate cuts, the Fund extended its WAM through the opportunistic purchase of fixed-rate paper maturing in the three to six month space. Longer dated floaters (6 months to 1 year) were also added to maintain principal protection, which also extended the Fund’s Weighted Average Life (WAL). The Fund also has maintained its focus on asset backed commercial paper (ABCP) and certificates of deposit (CD), as they offer attractive yields relative to corporate commercial paper.
In the most recent 12 months, the Fed has raised the overnight interest rate twice, only to turn around and reduce that same rate a month ago. The nearly 180 degree turn in monetary policy resulted largely from increased trade conflicts and concern about a slowing global economy. The potential for a “no deal Brexit” only has added to that concern. In the minutes from the late July 2019 Fed meeting, Fed Chair Powell referred to the rate decrease as a“mid-cycle correction”, but market participants are more cynical on the state of the economy and have built in additional rate decreases in the forward curve. According to the Fed Funds Futures market, as of August 31, 2019, 100% of market participants felt that the Fed would decrease the overnight lending rate by 0.25% at the 09/18 meeting, with ~83% expecting the Fed to lower the overnight rate by 0.50% before the end of 2019.
The trends of lower rates and a flatter yield curve are likely to remain in place.
Looking forward, tenuous geopolitics, a slowing global economy, and a seemingly endless series of trade skirmishes are apt to foster near-term rate volatility across the yield curve.
Fund Managers; Investment Experience
Peter J. Arts; since 1992
Boyd R. Eager; since 1997
| | | | | | | | | | | | | | | | | | | | |
| | | | | | | | | Inception
date | | | Expenses (%) | |
| Share class | | Ticker | | | Cusip | | | Gross | | | Net | |
| Investor (Y) | | | BYFXX | | | | 09658V354 | | | | 6/3/2016 | | | | 0.56 | | | | 0.46 | |
| Premier | | | BPFXX | | | | 09658V347 | | | | 6/3/2016 | | | | 0.30 | | | | 0.21 | |
The above expense ratios are from the Funds’ Prospectus dated April 1, 2019, and are inclusive of Acquired Fund Fees and Expenses. See Note 6 in the Notes to Financial Statements for additional information. Net expense ratios reflect contractual fee waivers and/or expense reimbursements if applicable, made by BMO Asset Management Corp., the investment adviser (Adviser). The Adviser may not terminate these fee waivers and/or expense Reimbursements prior to December 31, 2020 without the consent of the Board of Directors, unless the investment advisory agreement is terminated. Without these contractual waivers, the Fund’s returns would have been lower
| | | | |
Portfolio sector allocation | |
| Sector | | Fund (%) | |
| Certificates of Deposit | | | 23.4 | |
| Commercial Paper | | | 48.8 | |
| Mutual Funds | | | 2.9 | |
| Repurchase Agreements | | | 24.9 | |
| Other Assets & Liabilities, Net | | | 0.0 | |
| Total | | | 100.0 | |
Portfolio composition will change due to the ongoing management of the Fund. The percentages are based on net assets as of August 31, 2019 and may not necessarily reflect adjustments that are routinely made when presenting net assets for formal financial statement processes.
Growth of an assumed $10,000 investment
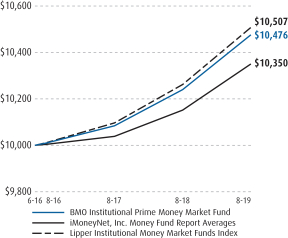
See Explanation of the Indices and Notes in the Commentary for additional information.The above graph relates to the Premier Class shares of the Fund. Performance for the Investor Class shares will vary from the performance of the Premier Class shares shown above due to differences in charges and expenses. This graph illustrates the hypothetical investment of $10,000 in the Premier Class shares of the Fund from the lesser of the Fund’s inception date or August 31, 2009 to August 31, 2019.
28
| | |
| |
| Explanation of the Indices and Notes in the Commentary |
The views expressed in the commentary are as of August 31, 2019 and are those of the Funds’ investment adviser and/or portfolio manager(s). The views are subject to change at any time in response to changing circumstances in the market and are not intended to predict or guarantee the future performance of the Funds or any individual security, industry, market sector or the markets generally. Statements involving predictions, assessments, analyses or outlook for individual securities, industries, market sectors and/or markets involve risks and uncertainties. In addition to the general risks described for the Funds in their current Prospectuses, other factors bearing on these commentaries include the accuracy of the investment adviser’s or portfolio manager’s forecasts and predictions and the appropriateness of the investment programs designed by the investment adviser or portfolio managers to implement their strategies efficiently and effectively. Any one, or more, of these factors, as well as other risks affecting the securities markets and investment instruments generally, could cause the actual results of a Fund to differ materially as compared to benchmarks associated with that Fund. The line graphs and tables do not reflect the deduction of taxes that a shareholder would pay on Fund distributions or the redemption of Fund shares. The gross and net expense ratios are based on expenses incurred by a Fund as disclosed in the Funds’ Prospectus dated April 1, 2019. Each Fund’s performance assumes the reinvestment of all dividends and distributions. Performance returns for all benchmark comparisons assume dividends and distributions were reinvested for the entire period. All indices are unmanaged and are not available for direct investment.
| | | | |
| Fund/Benchmark Comparison per Fund | | Explanation |
| Low Volatility Equity Fund | | Russell 1000® Index | | The Russell 1000® Index consists of approximately 1,000 of the largest companies in the U.S. equity markets.(4) |
| | LipperMulti-Cap Value Funds Index | | Lipper indices are comprised of a certain number of eligible mutual funds designated by Lipper, Inc. as falling into the respective categories indicated.(5) |
| Dividend Income Fund | | Russell 1000® Value Index | | The Russell 1000® Value Index measures the performance of those Russell 1000 companies with lowerprice-to-book ratios and lower forecasted growth values.(4) |
| | Standard & Poor’S 500® Index | | The S&P 500® is an unmanaged index oflarge-cap common stocks. |
| | Lipper Equity Income Funds Index | | Lipper indices are comprised of a certain number of eligible mutual funds designated by Lipper, Inc. as falling into the respective categories indicated.(5) |
| Large-Cap Value Fund | | Russell 1000® Value Index | | The Russell 1000® Value Index measures the performance of those Russell 1000 companies with lowerprice-to-book ratios and lower forecasted growth values.(4) |
| | LipperMulti-Cap Value Funds Index | | Lipper indices are comprised of a certain number of eligible mutual funds designated by Lipper, Inc. as falling into the respective categories indicated.(5) |
| Large-Cap Growth Fund | | Russell 1000® Growth Index | | The Russell 1000® Growth Index measures the performance of those Russell 1000 companies with higherprice-to-book ratios and higher forecasted growth values.(4) |
| | LipperMulti-Cap Growth Funds | | Lipper indices are comprised of a certain number of eligible mutual funds designated by Lipper, Inc. as falling into the respective categories indicated.(5) |
| Mid-Cap Value Fund | | Russell Midcap® Value Index | | This index measures the performance of those Russell Midcap companies with lowerprice-to-book ratios and lower forecasted growth values. The stocks are also members of the Russell 1000® Value Index.(4) |
| | LipperMid-Cap Value Funds Index | | Lipper indices are comprised of a certain number of eligible mutual funds designated by Lipper, Inc. as falling into the respective categories indicated.(5) |
| Mid-Cap Growth Fund | | Russell Midcap® Growth Index | | This index measures the performance of those Russell Midcap companies with higherprice-to-book ratios and higher forecasted growth values. The stocks are also members of the Russell 1000® Growth Index.(4) |
| | LipperMid-Cap Growth Funds Index | | Lipper indices are comprised of a certain number of eligible mutual funds designated by Lipper, Inc. as falling into the respective categories indicated.(5) |
| Small-Cap Value Fund(1) | | Russell 2000® Value Index | | The Russell 2000® Value Index measures the performance of those Russell 2000 companies with lowerprice-to-book ratios and lower forecasted growth values.(4) |
| | LipperSmall-Cap Core Funds Index | | Lipper indices are comprised of a certain number of eligible mutual funds designated by Lipper, Inc. as falling into the respective categories indicated.(5) |
| Small-Cap Core Fund(1) | | Russell 2000® Index | | The Russell 2000® Index measures the performance of thesmall-cap segment of the U.S. equity universe. The Russell 2000® Index is a subset of the Russell 3000® Index representing approximately 10% of the total market capitalization of that index. It includes approximately 2000 of the smallest securities based on a combination of their market cap and current index membership.(4) |
| | LipperSmall-Cap Core Funds Index | | Lipper indices are comprised of a certain number of eligible mutual funds designated by Lipper, Inc. as falling into the respective categories indicated.(5) |
29
| | |
| |
| Explanation of the Indices and Notes in the Commentary(continued) |
| | | | |
| Fund/Benchmark Comparison per Fund | | Explanation |
| Small-Cap Growth Fund(1) | | Russell 2000® Growth Index | | The Russell 2000® Growth Index measures the performance of those Russell 2000 companies with higherprice-to-book ratios and higher forecasted growth values.(4) |
| | LipperSmall-Cap Growth Funds Index | | Lipper indices are comprised of a certain number of eligible mutual funds designated by Lipper, Inc. as falling into the respective categories indicated.(5) |
| Global Low Volatility Equity Fund(1) | | Morgan Stanley Capital International All Country World Index | | The MSCI All Country World Index is a free float-adjusted market capitalization weighted index that is designed to measure the equity market performance of developed and emerging markets.(4) |
| | Lipper GlobalMulti-Cap Value Funds Index | | Lipper indices are comprised of a certain number of eligible mutual funds designated by Lipper, Inc. as falling into the respective categories indicated.(5) |
| Disciplined International Equity Fund(3) | | Morgan Stanley Capital International Europe, Australasia, Far East Index | | The MSCI Europe, Australasia and Far East Index is a standard unmanaged foreign securities index representing majornon-U.S. stock markets, as monitored by Morgan Stanley Capital International.(4) |
| | Lipper InternationalMulti-Cap Core Funds Index | | Lipper indices are comprised of a certain number of eligible mutual funds designated by Lipper, Inc. as falling into the respective categories indicated.(5) |
| Pyrford International Stock Fund(3) | | Morgan Stanley Capital International Europe, Australasia, Far East Index | | The MSCI Europe, Australasia and Far East Index is a standard unmanaged foreign securities index representing majornon-U.S. stock markets, as monitored by Morgan Stanley Capital International.(4) |
| | Lipper InternationalMulti-Cap Core Funds Index | | Lipper indices are comprised of a certain number of eligible mutual funds designated by Lipper, Inc. as falling into the respective categories indicated.(5) |
| LGM Emerging Markets Equity Fund(3) | | Morgan Stanley Capital International Emerging Markets Index | | The MSCI Emerging Markets Index is a market capitalization weighted index comprised of over 800 companies representative of the market structure of the emerging countries in Europe, Latin America, Africa, Middle East and Asia, as monitored by Morgan Stanley Capital International.(4) |
| | Lipper Emerging Markets Funds Index | | Lipper indices are comprised of a certain number of eligible mutual funds designated by Lipper, Inc. as falling into the respective categories indicated.(5) |
| Alternative Strategies Fund(3) | | Bank Of America Merrill Lynch3-MonthT-Bill Index | | Bank of America Merrill Lynch3-MonthT-Bill Index comprises a single issue purchased at the beginning of the month and held for a full month. At the end of the month that issue is sold and rolled into a newly selected issue. The issue selected at eachmonth-end rebalancing is the outstanding Treasury Bill that matures closest to, but not beyond, three months from the rebalancing date. To qualify for selection, an issue must have settled on or before themonth-end rebalancing date. While the index will often hold the Treasury Bill issued at the most recent3-month auction, it is also possible for a seasoned6-month Bill to be selected.(4) |
| | HFRX Global Hedge Fund Index | | HFRX Global Hedge Fund Index is designed to be representative of the overall composition of the hedge fund universe. It comprises all eligible hedge fund strategies, including but not limited to convertible arbitrage, distressed securities, equity hedge, equity market neutral, event-driven, macro, merger arbitrage, and relative value arbitrage. The strategies are asset weighted based on the distribution of assets in the hedge fund industry. |
| | Lipper Alternative Multi-Strategy Funds Index | | Lipper indices are comprised of a certain number of eligible mutual funds designated by Lipper, Inc. as falling into the respective categories indicated.(5) |
| Global Long/Short Equity Fund(3) | | Morgan Stanley Capital International All Country World Index | | The MSCI All Country World Index is a free float-adjusted market capitalization weighted index that is designed to measure the equity market performance of developed and emerging markets.(4) |
| | Lipper Alternative Long/Short Equity Funds Index | | Lipper indices are comprised of a certain number of eligible mutual funds designated by Lipper, Inc. as falling into the respective categories indicated.(5) |
Ultra ShortTax-Free Fund(2)(6) | | Blended Index (50% Bloomberg Barclays 1 Year Municipal Bond Index And 50% Imoneynet, Inc. Money Market FundTax-Free National Retail Index) | | The blended index consists of 50% Bloomberg Barclays 1 Year Municipal Bond Index and 50% iMoneyNet Money Market FundTax-Free National Retail Index. The Bloomberg Barclays 1 Year Municipal Bond Index is the 1 year component of the Bloomberg Barclays Capital Municipal Bond Index, which is an unmanaged index composed of longtermtax-exempt bonds with a minimum credit rating of Baa. The iMoneyNet Money Market FundTax-Free National Retail Index is an average of money funds with investment objectives similar to that of the Fund.(4) |
| | Lipper Short Municipal Debt Funds Index | | Lipper indices are comprised of a certain number of eligible mutual funds designated by Lipper, Inc. as falling into the respective categories indicated.(5) |
| ShortTax-Free Fund(2)(6) | | Bloomberg Barclays Short(1-5 Year) Municipal Index | | The Bloomberg Barclays Short(1-5 Year) Municipal Index includes invetment-gradetax-exempt bonds that are issued by state and local governments and have maturities of 1 to 5 years.(4) |
| | Lipper Short Municipal Debt Funds Index | | Lipper indices are comprised of a certain number of eligible mutual funds designated by Lipper, Inc. as falling into the respective categories indicated.(5) |
30
| | |
| |
| Explanation of the Indices and Notes in the Commentary(continued) |
| | | | |
| Fund/Benchmark Comparison per Fund | | Explanation |
Short-Term Income
Fund(6) | | Bank of America Merrill Lynch1-3 Year U.S. Government/ Corporate Index | | This is an index tracking short-term U.S. government and corporate securities with maturities between 1 and 2.99 years. The index is produced by Merrill Lynch, Pierce, Fenner & Smith.(4) |
| | Lipper Short Investment-Grade Debt Funds Index | | Lipper indices are comprised of a certain number of eligible mutual funds designated by Lipper, Inc. as falling into the respective categories indicated.(5) |
| IntermediateTax-Free Fund(2)(6) | | Bloomberg Barclays1-15 Year Blend Municipal Bond Index | | This index is the1-15 year Blend component of the Bloomberg Barclays Municipal Bond Index, which is an unmanaged index composed of long-termtax-exempt bonds with a minimum credit rating of Baa and a range of maturities between1-17 years. To qualify for inclusion, a bond or security must have outstanding par value of at least $7 million, issued as part of a transaction of at least $75 million, fixed rate, dated-date after December 31, 1990 and must have at least one year from final maturity.(4) |
| | Lipper Intermediate Municipal Debt Funds Index | | Lipper indices are comprised of a certain number of eligible mutual funds designated by Lipper, Inc. as falling into the respective categories indicated.(5) |
| Strategic Income Fund(6) | | Bloomberg Barclays U.S. Aggregate Bond Index | | Bloomberg Barclays U.S. Aggregate Bond Index is an unmanaged index that covers the U.S. investment-grade fixed-rate bond market, including government and credit securities, agency mortgage pass-through securities, asset-backed securities and commercial mortgage-based securities.(4) |
| | Lipper Multi-Sector Funds Index | | Lipper indices are comprised of a certain number of eligible mutual funds designated by Lipper, Inc. as falling into the respective categories indicated.(5) |
| TCH Corporate Income Fund(6) | | Bloomberg Barclays U.S. Credit Index | | Bloomberg Barclays U.S. Credit Index represents securities that are SEC registered, taxable and U.S. dollar denominated. The index covers U.S. corporate and specified foreign debentures and secured notes that meet the specified maturity, liquidity and quality requirements.(4) |
| | Lipper Corporate Debt FundsBBB-Rated Index | | Lipper indices are comprised of a certain number of eligible mutual funds designated by Lipper, Inc. as falling into the respective categories indicated.(5) |
TCH Core Plus Bond
Fund(6) | | Bloomberg Barclays U.S. Aggregate Bond Index | | Bloomberg Barclays U.S. Aggregate Bond Index is an unmanaged index that covers the U.S. investment-grade fixed-rate bond market, including government and credit securities, agency mortgage pass-through securities, asset-backed securities and commercial mortgage-based securities. To qualify for inclusion, a bond or security must have at least one year to final maturity, rated investment grade Baa3 or better, dollar denominated,non-convertible, fixed rate and be publicly issued.(4) |
| | Lipper Core Plus Bond Funds Index | | Lipper indices are comprised of a certain number of eligible mutual funds designated by Lipper, Inc. as falling into the respective categories indicated.(5) |
| High Yield Bond Fund(3)(6) | | Bank of America Merrill Lynch U.S. High Yield Master II Constrained Index | | This is an Index that tracks the performance of U.S. dollar denominated below investment grade rated corporate debt publically issued in the U.S. domestic market.(4) |
| | Lipper High Yield Bond Funds Index | | Lipper indices are comprised of a certain number of eligible mutual funds designated by Lipper, Inc. as falling into the respective categories indicated.(5) |
| Government Money Market Fund | | iMoneyNet, Inc. Government Money Market Index | | This index is an average of money funds with investment objectives similar to that of the Fund. |
| | Lipper U.S. Government Money Market Funds Index | | Lipper indices are comprised of a certain number of eligible mutual funds designated by Lipper, Inc. as falling into the respective categories indicated.(5) |
| Tax-Free Money Market Fund | | iMoneyNet, Inc. Fund Report/ Tax-Free National Retail Index | | This index is an average of money funds with investment objectives similar to that of the Fund. |
| | LipperTax-Exempt Money Market Funds Index | | Lipper indices are comprised of a certain number of eligible mutual funds designated by Lipper, Inc. as falling into the respective categories indicated.(5) |
| Prime Money Market Fund | | iMoneyNet, Inc. Money Fund Report Averages | | This index is an average of money funds with investment objectives similar to that of the Fund. |
| | Lipper Money Market Funds Index | | Lipper indices are comprised of a certain number of eligible mutual funds designated by Lipper, Inc. as falling into the respective categories indicated.(5) |
| Institutional Prime Money Market Fund | | iMoneyNet, Inc. Money Fund Report Averages | | This index is an average of money funds with investment objectives similar to that of the Fund. |
| | Lipper Institutional Money Market Funds Index | | Lipper indices are comprised of a certain number of eligible mutual funds designated by Lipper, Inc. as falling into the respective categories indicated.(5) |
31
| | |
| |
| Explanation of the Indices and Notes in the Commentary(continued) |
| (1) | Small-Cap stocks are less liquid and more volatile thanlarge-cap stocks. |
| (2) | Income generated by the Fund may be subject to the federal alternative minimum tax. |
| (3) | International investing involves special risks including currency risk, political risk, increased volatility of foreign securities, and differences in auditing and other financial standards. |
| (4) | Performance returns do not reflect the deduction of sales charges, expenses, or other fees that the Securities and Exchange Commission requires to be reflected in a mutual fund’s performance. |
| (5) | Performance returns do not reflect the deduction of sales charges of component funds, or taxes, but do reflect the deduction of fund expenses. |
| (6) | Investors should be aware that in an environment of rising interest rates, they may expect to see declining bond prices. |
32
| | |
| |
| Expense Example(Unaudited) |
For the Six Months Ended August 31, 2019
As a shareholder of the Fund, you may incur two types of costs: (1) transaction costs, which may include sales charges (loads) on purchase payments, reinvested dividends, or other distributions; redemption fees; and exchange fees; and (2) ongoing costs, including management fees; distribution and/or service(12b-1) fees; and other Fund expenses. This Example is intended to help you understand your ongoing costs (in dollars) of investing in the Funds and to compare these costs with the ongoing costs of investing in other mutual funds.
The Example is based on an investment of $1,000 invested at the beginning of the period and held for the entire six month period ended August 31, 2019(3/1/19-8/31/19).
Actual Expenses
The information in the table under the heading “Actual Expenses” provides information about actual account values and actual expenses. You may use the information in this line, together with the amount you invested, to estimate the expenses that you paid over the period. Simply divide your account value by $1,000 (for example, an $8,600 account value divided by $1,000 = 8.6), then multiply the result by the number in the first line under the heading entitled “Expenses Paid During Period” to estimate the expenses you paid on your account during this period.
Hypothetical Example for Comparison Purposes
The information in the table under the heading “Hypothetical Expenses” provides information about hypothetical account values and hypothetical expenses based on a Fund’s actual expense ratio and an assumed rate of return of 5% per year before expenses, which is not the Fund’s actual return. The hypothetical account values and expenses may not be used to estimate the actual ending account balance or expenses you paid for the period. You may use this information to compare the ongoing costs of investing in a Fund and other funds. To do so, compare this 5% hypothetical example with the 5% hypothetical examples that appear in the shareholder reports of the other funds.
Please note that the expenses shown in the table are meant to highlight your ongoing costs only and do not reflect any transaction costs, such as sales charges (loads), redemption fees, or exchange fees. Therefore, the information under the heading “Hypothetical Expenses” is useful in comparing ongoing costs only, and will not help you determine the relative total costs of owning different funds. In addition, if these transaction costs were included, your costs would have been higher.
| | | | | | | | | | | | | | | | | | | | | | | | |
| | | Actual Expenses | | | Hypothetical Expenses | |
Fund | | Beginning
account
value
3/1/19 | | | Ending
account
value
8/31/19 | | | Expenses
paid during
period
3/1/19-
8/31/19(1) | | | Ending
account
value
8/31/19 | | | Expenses
paid during
period
3/1/19-
8/31/19(1) | | | Annualized
Expense
Ratio(1) | |
Low Volatility Equity Fund | | | | | | | | | | | | | | | | | | | | | | | | |
| Advisor | | $ | 1,000.00 | | | $ | 1,089.40 | | | $ | 4.74 | | | $ | 1,020.67 | | | $ | 4.58 | | | | 0.90 | % |
| Institutional | | | 1,000.00 | | | | 1,091.00 | | | | 3.43 | | | | 1,021.93 | | | | 3.31 | | | | 0.65 | |
Dividend Income Fund | | | | | | | | | | | | | | | | | | | | | | | | |
| Advisor | | | 1,000.00 | | | | 988.60 | | | | 4.51 | | | | 1,020.67 | | | | 4.58 | | | | 0.90 | |
| Institutional | | | 1,000.00 | | | | 990.30 | | | | 3.26 | | | | 1,021.93 | | | | 3.31 | | | | 0.65 | |
Large-Cap Value Fund | | | | | | | | | | | | | | | | | | | | | | | | |
| Advisor | | | 1,000.00 | | | | 968.20 | | | | 3.92 | | | | 1,021.22 | | | | 4.02 | | | | 0.79 | |
| Institutional | | | 1,000.00 | | | | 968.70 | | | | 2.68 | | | | 1,022.48 | | | | 2.75 | | | | 0.54 | |
| Retirement classR-6 | | | 1,000.00 | | | | 969.80 | | | | 1.94 | | | | 1,023.24 | | | | 1.99 | | | | 0.39 | |
Large-Cap Growth Fund | | | | | | | | | | | | | | | | | | | | | | | | |
| Investor | | | 1,000.00 | | | | 1,043.60 | | | | 4.07 | | | | 1,021.22 | | | | 4.02 | | | | 0.79 | |
| Advisor | | | 1,000.00 | | | | 1,044.20 | | | | 4.07 | | | | 1,021.22 | | | | 4.02 | | | | 0.79 | |
| Institutional | | | 1,000.00 | | | | 1,044.90 | | | | 2.78 | | | | 1,022.48 | | | | 2.75 | | | | 0.54 | |
| Retirement classR-6 | | | 1,000.00 | | | | 1,046.00 | | | | 2.01 | | | | 1,023.24 | | | | 1.99 | | | | 0.39 | |
33
| | |
| |
| Expense Example(Unaudited) (continued) |
| | | | | | | | | | | | | | | | | | | | | | | | |
| | | Actual Expenses | | | Hypothetical Expenses | |
Fund | | Beginning
account
value
3/1/19 | | | Ending
account
value
8/31/19 | | | Expenses
paid during
period
3/1/19-
8/31/19(1) | | | Ending
account
value
8/31/19 | | | Expenses
paid during
period
3/1/19-
8/31/19(1) | | | Annualized
Expense
Ratio(1) | |
Mid-Cap Value Fund | | | | | | | | | | | | | | | | | | | | | | | | |
| Advisor | | $ | 1,000.00 | | | $ | 946.00 | | | $ | 6.08 | | | $ | 1,018.95 | | | $ | 6.31 | | | | 1.24 | % |
| Institutional | | | 1,000.00 | | | | 946.60 | | | | 4.86 | | | | 1,020.21 | | | | 5.04 | | | | 0.99 | |
| Retirement classR-6 | | | 1,000.00 | | | | 947.50 | | | | 4.12 | | | | 1,020.97 | | | | 4.28 | | | | 0.84 | |
Mid-Cap Growth Fund | | | | | | | | | | | | | | | | | | | | | | | | |
| Advisor | | | 1,000.00 | | | | 999.30 | | | | 6.25 | | | | 1,018.95 | | | | 6.31 | | | | 1.24 | |
| Institutional | | | 1,000.00 | | | | 1,000.00 | | | | 4.99 | | | | 1,020.21 | | | | 5.04 | | | | 0.99 | |
| Retirement classR-6 | | | 1,000.00 | | | | 1,002.00 | | | | 4.24 | | | | 1,020.97 | | | | 4.28 | | | | 0.84 | |
Small-Cap Value Fund | | | | | | | | | | | | | | | | | | | | | | | | |
| Advisor | | | 1,000.00 | | | | 924.50 | | | | 6.01 | | | | 1,018.95 | | | | 6.31 | | | | 1.24 | |
| Institutional | | | 1,000.00 | | | | 926.50 | | | | 4.81 | | | | 1,020.21 | | | | 5.04 | | | | 0.99 | |
| Retirement classR-6 | | | 1,000.00 | | | | 927.10 | | | | 4.08 | | | | 1,020.97 | | | | 4.28 | | | | 0.84 | |
Small-Cap Core Fund | | | | | | | | | | | | | | | | | | | | | | | | |
| Advisor | | | 1,000.00 | | | | 931.70 | | | | 5.65 | | | | 1,019.36 | | | | 5.90 | | | | 1.16 | |
| Institutional | | | 1,000.00 | | | | 932.50 | | | | 4.43 | | | | 1,020.62 | | | | 4.63 | | | | 0.91 | |
Small-Cap Growth Fund | | | | | | | | | | | | | | | | | | | | | | | | |
| Advisor | | | 1,000.00 | | | | 949.80 | | | | 6.09 | | | | 1,018.95 | | | | 6.31 | | | | 1.24 | |
| Institutional | | | 1,000.00 | | | | 951.00 | | | | 4.87 | | | | 1,020.21 | | | | 5.04 | | | | 0.99 | |
Global Low Volatility Equity Fund | | | | | | | | | | | | | | | | | | | | | | | | |
| Advisor | | | 1,000.00 | | | | 1,013.30 | | | | 5.58 | | | | 1,019.66 | | | | 5.60 | | | | 1.10 | |
| Institutional | | | 1,000.00 | | | | 1,014.10 | | | | 4.32 | | | | 1,020.92 | | | | 4.33 | | | | 0.85 | |
Disciplined International Equity Fund | | | | | | | | | | | | | | | | | | | | | | | | |
| Advisor | | | 1,000.00 | | | | 969.00 | | | | 5.71 | | | | 1,019.41 | | | | 5.85 | | | | 1.15 | |
| Institutional | | | 1,000.00 | | | | 970.00 | | | | 4.47 | | | | 1,020.67 | | | | 4.58 | | | | 0.90 | |
Pyrford International Stock Fund | | | | | | | | | | | | | | | | | | | | | | | | |
| Advisor | | | 1,000.00 | | | | 1,016.30 | | | | 6.05 | | | | 1,019.21 | | | | 6.06 | | | | 1.19 | |
| Institutional | | | 1,000.00 | | | | 1,016.60 | | | | 4.78 | | | | 1,020.47 | | | | 4.79 | | | | 0.94 | |
| Retirement classR-6 | | | 1,000.00 | | | | 1,018.20 | | | | 4.02 | | | | 1,021.22 | | | | 4.02 | | | | 0.79 | |
LGM Emerging Markets Equity Fund | | | | | | | | | | | | | | | | | | | | | | | | |
| Advisor | | | 1,000.00 | | | | 993.30 | | | | 7.03 | | | | 1,018.15 | | | | 7.12 | | | | 1.40 | |
| Institutional | | | 1,000.00 | | | | 994.60 | | | | 5.78 | | | | 1,019.41 | | | | 5.85 | | | | 1.15 | |
Alternative Strategies Fund | | | | | | | | | | | | | | | | | | | | | | | | |
| Advisor | | | 1,000.00 | | | | 994.60 | | | | 8.90 | | | | 1,016.28 | | | | 9.00 | | | | 1.77 | |
| Institutional | | | 1,000.00 | | | | 995.70 | | | | 7.75 | | | | 1,017.44 | | | | 7.83 | | | | 1.54 | |
Global Long/Short Equity Fund | | | | | | | | | | | | | | | | | | | | | | | | |
| Advisor | | | 1,000.00 | | | | 940.30 | | | | 7.82 | | | | 1,017.04 | | | | 8.13 | | | | 1.60 | |
| Institutional | | | 1,000.00 | | | | 939.70 | | | | 6.60 | | | | 1,018.35 | | | | 6.87 | | | | 1.35 | |
Ultra ShortTax-Free Fund | | | | | | | | | | | | | | | | | | | | | | | | |
| Advisor | | | 1,000.00 | | | | 1,008.20 | | | | 2.78 | | | | 1,022.43 | | | | 2.80 | | | | 0.55 | |
| Institutional | | | 1,000.00 | | | | 1,010.50 | | | | 1.52 | | | | 1,023.69 | | | | 1.53 | | | | 0.30 | |
ShortTax-Free Fund | | | | | | | | | | | | | | | | | | | | | | | | |
| Advisor | | | 1,000.00 | | | | 1,020.60 | | | | 2.80 | | | | 1,022.43 | | | | 2.80 | | | | 0.55 | |
| Institutional | | | 1,000.00 | | | | 1,021.30 | | | | 2.04 | | | | 1,023.19 | | | | 2.04 | | | | 0.40 | |
Short-Term Income Fund | | | | | | | | | | | | | | | | | | | | | | | | |
| Advisor | | | 1,000.00 | | | | 1,028.10 | | | | 3.07 | | | | 1,022.18 | | | | 3.06 | | | | 0.60 | |
| Institutional | | | 1,000.00 | | | | 1,030.50 | | | | 1.79 | | | | 1,023.44 | | | | 1.79 | | | | 0.35 | |
34
| | |
| |
| Expense Example(Unaudited) (continued) |
| | | | | | | | | | | | | | | | | | | | | | | | |
| | | Actual Expenses | | | Hypothetical Expenses | |
Fund | | Beginning
account
value
3/1/19 | | | Ending
account
value
8/31/19 | | | Expenses
paid during
period
3/1/19-
8/31/19(1) | | | Ending
account
value
8/31/19 | | | Expenses
paid during
period
3/1/19-
8/31/19(1) | | | Annualized
Expense
Ratio(1) | |
IntermediateTax-Free Fund | | | | | | | | | | | | | | | | | | | | | | | | |
| Investor | | $ | 1,000.00 | | | $ | 1,052.40 | | | $ | 2.85 | | | $ | 1,022.43 | | | $ | 2.80 | | | | 0.55 | % |
| Advisor | | | 1,000.00 | | | | 1,052.40 | | | | 2.85 | | | | 1,022.43 | | | | 2.80 | | | | 0.55 | |
| Institutional | | | 1,000.00 | | | | 1,053.70 | | | | 1.55 | | | | 1,023.69 | | | | 1.53 | | | | 0.30 | |
Strategic Income Fund | | | | | | | | | | | | | | | | | | | | | | | | |
| Investor | | | 1,000.00 | | | | 1,062.40 | | | | 4.16 | | | | 1,021.17 | | | | 4.08 | | | | 0.80 | |
| Advisor | | | 1,000.00 | | | | 1,062.40 | | | | 4.16 | | | | 1,021.17 | | | | 4.08 | | | | 0.80 | |
| Institutional | | | 1,000.00 | | | | 1,062.60 | | | | 2.86 | | | | 1,022.43 | | | | 2.80 | | | | 0.55 | |
TCH Corporate Income Fund | | | | | | | | | | | | | | | | | | | | | | | | |
| Investor | | | 1,000.00 | | | | 1,097.50 | | | | 3.12 | | | | 1,022.23 | | | | 3.01 | | | | 0.59 | |
| Advisor | | | 1,000.00 | | | | 1,097.60 | | | | 3.12 | | | | 1,022.23 | | | | 3.01 | | | | 0.59 | |
| Institutional | | | 1,000.00 | | | | 1,098.50 | | | | 2.22 | | | | 1,023.09 | | | | 2.14 | | | | 0.42 | |
TCH Core Plus Bond Fund | | | | | | | | | | | | | | | | | | | | | | | | |
| Investor | | | 1,000.00 | | | | 1,071.70 | | | | 3.03 | | | | 1,022.28 | | | | 2.96 | | | | 0.58 | |
| Advisor | | | 1,000.00 | | | | 1,071.70 | | | | 3.03 | | | | 1,022.28 | | | | 2.96 | | | | 0.58 | |
| Institutional | | | 1,000.00 | | | | 1,073.00 | | | | 1.72 | | | | 1,023.54 | | | | 1.68 | | | | 0.33 | |
High Yield Bond Fund | | | | | | | | | | | | | | | | | | | | | | | | |
| Advisor | | | 1,000.00 | | | | 1,034.20 | | | | 4.61 | | | | 1,020.67 | | | | 4.58 | | | | 0.90 | |
| Institutional | | | 1,000.00 | | | | 1,035.40 | | | | 3.33 | | | | 1,021.93 | | | | 3.31 | | | | 0.65 | |
Government Money Market Fund | | | | | | | | | | | | | | | | | | | | | | | | |
| Investor | | | 1,000.00 | | | | 1,009.80 | | | | 2.28 | | | | 1,022.94 | | | | 2.29 | | | | 0.45 | |
| Premier | | | 1,000.00 | | | | 1,011.10 | | | | 1.01 | | | | 1,024.20 | | | | 1.02 | | | | 0.20 | |
Tax-Free Money Market Fund | | | | | | | | | | | | | | | | | | | | | | | | |
| Investor | | | 1,000.00 | | | | 1,006.10 | | | | 2.28 | | | | 1,022.94 | | | | 2.29 | | | | 0.45 | |
| Premier | | | 1,000.00 | | | | 1,007.40 | | | | 1.01 | | | | 1,024.20 | | | | 1.02 | | | | 0.20 | |
Prime Money Market Fund | | | | | | | | | | | | | | | | | | | | | | | | |
| Investor | | | 1,000.00 | | | | 1,010.40 | | | | 2.28 | | | | 1,022.94 | | | | 2.29 | | | | 0.45 | |
| Premier | | | 1,000.00 | | | | 1,011.70 | | | | 1.01 | | | | 1,024.20 | | | | 1.02 | | | | 0.20 | |
Institutional Prime Money Market Fund | | | | | | | | | | | | | | | | | | | | | | | | |
| Investor | | | 1,000.00 | | | | 1,010.60 | | | | 2.28 | | | | 1,022.94 | | | | 2.29 | | | | 0.45 | |
| Premier | | | 1,000.00 | | | | 1,011.80 | | | | 1.01 | | | | 1,024.20 | | | | 1.02 | | | | 0.20 | |
| (1) | Expenses are equal to the Funds’ annualized expense ratios for the period March 1, 2019 through August 31, 2019, multiplied by the average account value over the period, multiplied by 184/365 (to reflect theone-half year period). These expenses and ratios are exclusive of acquired fund fees and expenses. |
35
August 31, 2019
Low Volatility Equity Fund
| | | | | | | | |
| Description | | Shares | | | Value | |
| Common Stocks — 95.8% | |
|
| Communication Services — 5.1% | |
|
Advertising — 1.1% | |
Omnicom Group, Inc. (1) | | | 31,587 | | | $ | 2,402,507 | |
|
Cable & Satellite — 0.4% | |
Sirius XM Holdings, Inc. (1) | | | 134,553 | | | | 830,192 | |
|
Integrated Telecommunication Services — 1.2% | |
Verizon Communications, Inc. | | | 44,053 | | | | 2,562,123 | |
|
Movies & Entertainment — 2.2% | |
Madison Square Garden Co., Class A (2) | | | 3,353 | | | | 846,062 | |
Walt Disney Co. (1) | | | 27,891 | | | | 3,828,319 | |
| | | | | | | | |
| | | | | | | 4,674,381 | |
|
Publishing — 0.2% | |
John Wiley & Sons, Inc., Class A (1) | | | 8,050 | | | | 358,225 | |
| | | | | | | | |
Total Communication Services | | | | | | | 10,827,428 | |
| |
| Consumer Discretionary — 10.9% | | | | |
|
Apparel Retail — 1.7% | |
TJX Cos., Inc. (1) | | | 65,002 | | | | 3,573,160 | |
|
Apparel, Accessories & Luxury Goods — 0.3% | |
Carter’s, Inc. (1) | | | 7,432 | | | | 679,879 | |
|
Automotive Retail — 2.3% | |
AutoZone, Inc. (1)(2) | | | 4,469 | | | | 4,923,453 | |
|
Computer & Electronics Retail — 0.2% | |
Best Buy Co., Inc. | | | 8,250 | | | | 525,112 | |
|
Education Services — 3.1% | |
Bright Horizons Family Solutions, Inc. (2) | | | 34,506 | | | | 5,695,215 | |
Graham Holdings Co., Class B (1) | | | 1,214 | | | | 854,729 | |
| | | | | | | | |
| | | | | | | 6,549,944 | |
|
General Merchandise Stores — 1.4% | |
Dollar General Corp. | | | 12,681 | | | | 1,979,377 | |
Target Corp. | | | 9,686 | | | | 1,036,790 | |
| | | | | | | | |
| | | | | | | 3,016,167 | |
|
Internet & Direct Marketing Retail — 0.2% | |
eBay, Inc. | | | 13,640 | | | | 549,556 | |
|
Restaurants — 1.1% | |
Brinker International, Inc. (1) | | | 9,832 | | | | 373,616 | |
Darden Restaurants, Inc. (1) | | | 15,620 | | | | 1,889,708 | |
| | | | | | | | |
| | | | | | | 2,263,324 | |
|
Specialized Consumer Services — 0.6% | |
ServiceMaster Global Holdings, Inc. (2) | | | 22,234 | | | | 1,268,227 | |
| | | | | | | | |
Total Consumer Discretionary | | | | | | | 23,348,822 | |
| |
| Consumer Staples — 16.5% | | | | |
|
Agricultural Products — 1.5% | |
Ingredion, Inc. | | | 40,210 | | | | 3,107,027 | |
|
Food Distributors — 2.9% | |
Sysco Corp. | | | 35,123 | | | | 2,610,693 | |
U.S. Foods Holding Corp. (1)(2) | | | 88,380 | | | | 3,574,971 | |
| | | | | | | | |
| | | | | | | 6,185,664 | |
|
Food Retail — 2.9% | |
Kroger Co. (1) | | | 126,657 | | | | 2,999,238 | |
Sprouts Farmers Market,
Inc. (1)(2) | | | 173,993 | | | | 3,123,174 | |
| | | | | | | | |
| | | | | | | 6,122,412 | |
| | | | | | | | |
| Description | | Shares | | | Value | |
| Common Stocks (continued) | |
| |
| Consumer Staples (continued) | | | | |
|
Household Products — 0.3% | |
Church & Dwight Co., Inc. (1) | | | 8,117 | | | $ | 647,574 | |
|
Hypermarkets & Super Centers — 4.4% | |
Costco Wholesale Corp. (1) | | | 16,911 | | | | 4,984,686 | |
Walmart, Inc. | | | 39,454 | | | | 4,508,014 | |
| | | | | | | | |
| | | | | | | 9,492,700 | |
|
Packaged Foods & Meats — 2.4% | |
Flowers Foods, Inc. (1) | | | 74,946 | | | | 1,708,769 | |
Hershey Co. (1) | | | 16,061 | | | | 2,545,347 | |
J.M. Smucker Co. (1) | | | 3,611 | | | | 379,733 | |
Kellogg Co. (1) | | | 8,250 | | | | 518,100 | |
| | | | | | | | |
| | | | | | | 5,151,949 | |
|
Soft Drinks — 2.1% | |
PepsiCo, Inc. (1) | | | 32,473 | | | | 4,440,033 | |
| | | | | | | | |
Total Consumer Staples | | | | | | | 35,147,359 | |
| | |
| Energy — 3.0% | | | | | | |
|
Integrated Oil & Gas — 2.7% | |
Chevron Corp. | | | 30,006 | | | | 3,532,307 | |
Exxon Mobil Corp. (1) | | | 15,677 | | | | 1,073,561 | |
Occidental Petroleum Corp. (1) | | | 25,321 | | | | 1,100,957 | |
| | | | | | | | |
| | | | | | | 5,706,825 | |
|
Oil &Gas-Equipment & Services — 0.2% | |
Schlumberger, Ltd. (1) | | | 12,749 | | | | 413,450 | |
|
Oil &Gas-Exploration & Production — 0.1% | |
ConocoPhillips | | | 7,113 | | | | 371,156 | |
| | | | | | | | |
Total Energy | | | | | | | 6,491,431 | |
| | |
| Financials — 13.9% | | | | | | |
|
Consumer Finance — 1.3% | |
American Express Co. (1) | | | 22,850 | | | | 2,750,454 | |
|
Financial Exchanges & Data — 1.2% | |
Morningstar, Inc. (1) | | | 15,958 | | | | 2,578,494 | |
|
Life & Health Insurance — 2.1% | |
Aflac, Inc. | | | 89,475 | | | | 4,489,855 | |
|
Property & Casualty Insurance — 4.2% | |
Allstate Corp. | | | 39,827 | | | | 4,077,887 | |
Axis Capital Holdings, Ltd. | | | 14,852 | | | | 911,764 | |
Progressive Corp. | | | 28,695 | | | | 2,175,081 | |
Travelers Cos., Inc. (1) | | | 11,526 | | | | 1,693,861 | |
| | | | | | | | |
| | | | | | | 8,858,593 | |
|
Regional Banks — 2.3% | |
Citizens Financial Group, Inc. | | | 36,444 | | | | 1,229,621 | |
PNC Financial Services Group, Inc. | | | 18,413 | | | | 2,373,988 | |
Popular, Inc. | | | 20,060 | | | | 1,054,554 | |
Regions Financial Corp. (1) | | | 22,848 | | | | 334,038 | |
| | | | | | | | |
| | | | | | | 4,992,201 | |
|
Reinsurance — 2.8% | |
Everest Re Group, Ltd. | | | 17,164 | | | | 4,048,644 | |
RenaissanceRe Holdings, Ltd. (1) | | | 11,012 | | | | 1,988,217 | |
| | | | | | | | |
| | | | | | | 6,036,861 | |
| | | | | | | | |
Total Financials | | | | | | | 29,706,458 | |
| | |
| Healthcare — 10.0% | | | | | | |
|
Healthcare Equipment — 3.0% | |
Baxter International, Inc. | | | 55,516 | | | | 4,882,632 | |
Medtronic PLC (1) | | | 13,228 | | | | 1,427,169 | |
| | | | | | | | |
| | | | | | | 6,309,801 | |
(See Notes to Schedules of Investments and Notes to Financial Statements, which are an integral part of the Financial Statements)
36
Low Volatility Equity Fund (continued)
| | | | | | | | |
| Description | | Shares | | | Value | |
| Common Stocks (continued) | |
| | |
| Healthcare (continued) | | | | | | |
|
Healthcare Facilities — 0.2% | |
Universal Health Services, Inc., Class B (1) | | | 3,698 | | | $ | 534,657 | |
|
Healthcare Services — 0.1% | |
MEDNAX, Inc. (1)(2) | | | 9,878 | | | | 208,228 | |
|
Pharmaceuticals — 6.7% | |
Bristol-Myers Squibb Co. (1) | | | 23,891 | | | | 1,148,440 | |
Eli Lilly & Co. (1) | | | 31,755 | | | | 3,587,362 | |
Johnson & Johnson | | | 22,210 | | | | 2,850,876 | |
Merck & Co., Inc. | | | 36,963 | | | | 3,196,191 | |
Pfizer, Inc. | | | 97,112 | | | | 3,452,332 | |
| | | | | | | | |
| | | | | | | 14,235,201 | |
| | | | | | | | |
Total Healthcare | | | | | | | 21,287,887 | |
| | |
| Industrials — 6.7% | | | | | | |
|
Aerospace & Defense — 2.9% | |
Lockheed Martin Corp. | | | 11,399 | | | | 4,378,470 | |
Northrop Grumman Corp. (1) | | | 4,696 | | | | 1,727,518 | |
| | | | | | | | |
| | | | | | | 6,105,988 | |
|
Environmental & Facilities Services — 3.5% | |
Republic Services, Inc. | | | 27,621 | | | | 2,465,174 | |
Waste Management, Inc. | | | 42,902 | | | | 5,120,354 | |
| | | | | | | | |
| | | | | | | 7,585,528 | |
|
Industrial Conglomerates — 0.3% | |
Carlisle Cos., Inc. | | | 3,819 | | | | 553,602 | |
| | | | | | | | |
Total Industrials | | | | | | | 14,245,118 | |
| |
| Information Technology — 4.6% | | | | |
|
Communications Equipment — 2.6% | |
Motorola Solutions, Inc. (1) | | | 30,415 | | | | 5,502,378 | |
|
Data Processing & Outsourced Services — 1.8% | |
Genpact, Ltd. | | | 94,243 | | | | 3,860,193 | |
|
Electronic Components — 0.2% | |
Dolby Laboratories, Inc., Class A (1) | | | 6,833 | | | | 420,639 | |
| | | | | | | | |
Total Information Technology | | | | 9,783,210 | |
| | |
| Materials — 2.1% | | | | | | |
|
Gold — 2.1% | |
Newmont Goldcorp Corp. (1) | | | 112,040 | | | | 4,469,276 | |
| | |
| Real Estate — 10.2% | | | | | | |
|
Hotel & Resort REIT’s — 1.2% | |
Apple Hospitality REIT, Inc. (1) | | | 159,311 | | | | 2,537,824 | |
|
Office REIT’s — 2.0% | |
Equity Commonwealth (1) | | | 117,667 | | | | 3,960,671 | |
Piedmont Office Realty Trust, Inc., Class A (1) | | | 18,549 | | | | 366,157 | |
| | | | | | | | |
| | | | | | | 4,326,828 | |
|
Residential REIT’s — 4.7% | |
Equity LifeStyle Properties, Inc. (1) | | | 14,098 | | | | 1,899,282 | |
Essex Property Trust, Inc. | | | 15,687 | | | | 5,039,606 | |
UDR, Inc. | | | 63,832 | | | | 3,075,426 | |
| | | | | | | | |
| | | | | | | 10,014,314 | |
|
Specialized REIT’s — 2.3% | |
Public Storage (1) | | | 18,002 | | | | 4,765,850 | |
| | | | | | | | |
Total Real Estate | | | | | | | 21,644,816 | |
| | | | | | | | |
| Description | | Shares | | | Value | |
| Common Stocks (continued) | |
| | |
| Utilities — 12.8% | | | | | | |
|
Electric Utilities — 10.6% | |
American Electric Power Co., Inc. | | | 52,578 | | | $ | 4,792,485 | |
Avangrid, Inc. (1) | | | 33,518 | | | | 1,694,000 | |
Duke Energy Corp. (1) | | | 40,414 | | | | 3,747,994 | |
Entergy Corp. | | | 43,946 | | | | 4,958,867 | |
Exelon Corp. | | | 94,243 | | | | 4,453,924 | |
Xcel Energy, Inc. (1) | | | 44,324 | | | | 2,846,487 | |
| | | | | | | | |
| | | | | | | 22,493,757 | |
|
Multi-Utilities — 2.2% | |
Ameren Corp. (1) | | | 37,217 | | | | 2,871,291 | |
CMS Energy Corp. (1) | | | 10,654 | | | | 671,735 | |
Public Service Enterprise Group, Inc. (1) | | | 20,401 | | | | 1,233,648 | |
| | | | | | | | |
| | | | | | | 4,776,674 | |
| | | | | | | | |
Total Utilities | | | | | | | 27,270,431 | |
| | | | | | | | |
Total Common Stocks
(identified cost $164,632,447) | | | | 204,222,236 | |
| | | | | | | | |
| Short-Term Investments — 33.2% | |
|
| Collateral Pool Investments for Securities on Loan — 30.4% | |
| | |
Collateral pool allocation (3) | | | | | | | 64,845,551 | |
| | |
| Mutual Funds — 2.8% | | | | | | |
BMO Institutional Prime Money Market Fund — Premier Class, 2.097% (4) | | | 5,839,852 | | | | 5,840,436 | |
| | | | | | | | |
Total Short-Term Investments
(identified cost $70,685,850) | | | | 70,685,987 | |
| | | | | | | | |
Total Investments — 129.0%
(identified cost $235,318,297) | | | | 274,908,223 | |
| Other Assets and Liabilities — (29.0)% | | | | (61,743,844 | ) |
| | | | | | | | |
| Total Net Assets — 100.0% | | | $ | 213,164,379 | |
| | | | | | | | |
Dividend Income Fund
| | | | | | | | |
| Description | | Shares | | | Value | |
| Common Stocks — 94.5% | |
|
| Communication Services — 8.0% | |
| | |
Broadcasting — 0.4% | | | | | | | | |
Nexstar Media Group, Inc., Class A (1) | | | 14,698 | | | $ | 1,453,485 | |
|
Cable & Satellite — 2.8% | |
Comcast Corp., Class A (1) | | | 198,710 | | | | 8,794,905 | |
|
Integrated Telecommunication Services — 4.8% | |
AT&T, Inc. (1) | | | 170,346 | | | | 6,006,400 | |
Verizon Communications, Inc. | | | 153,551 | | | | 8,930,526 | |
| | | | | | | | |
| | | | | | | 14,936,926 | |
| | | | | | | | |
Total Communication Services | | | | 25,185,316 | |
|
| Consumer Discretionary — 6.0% | |
|
Apparel, Accessories & Luxury Goods — 0.4% | |
Ralph Lauren Corp. (1) | | | 13,473 | | | | 1,190,205 | |
|
Computer & Electronics Retail — 0.9% | |
Best Buy Co., Inc. | | | 45,076 | | | | 2,869,087 | |
|
Department Stores — 1.2% | |
Kohl’s Corp. (1) | | | 75,951 | | | | 3,589,444 | |
|
Home Improvement Retail — 1.7% | |
Lowe’s Cos., Inc. | | | 48,170 | | | | 5,404,674 | |
(See Notes to Schedules of Investments and Notes to Financial Statements, which are an integral part of the Financial Statements)
37
August 31, 2019
Dividend Income Fund (continued)
| | | | | | | | |
| Description | | Shares | | | Value | |
| Common Stocks (continued) | |
|
| Consumer Discretionary (continued) | |
|
Hotels, Resorts & Cruise Lines — 0.5% | |
Wyndham Destinations, Inc. | | | 34,381 | | | $ | 1,524,454 | |
|
Restaurants — 1.3% | |
Darden Restaurants, Inc. (1) | | | 34,406 | | | | 4,162,438 | |
| | | | | | | | |
Total Consumer Discretionary | | | | 18,740,302 | |
|
| Consumer Staples — 5.7% | |
|
Food Distributors — 2.2% | |
Sysco Corp. | | | 95,720 | | | | 7,114,868 | |
|
Hypermarkets & Super Centers — 2.0% | |
Walmart, Inc. | | | 54,208 | | | | 6,193,806 | |
|
Soft Drinks — 1.5% | |
PepsiCo, Inc. (1) | | | 33,917 | | | | 4,637,471 | |
| | | | | | | | |
Total Consumer Staples | | | | 17,946,145 | |
|
| Energy — 7.6% | |
|
Integrated Oil & Gas — 2.5% | |
Chevron Corp. | | | 66,705 | | | | 7,852,513 | |
|
Oil &Gas-Exploration & Production — 1.1% | |
ConocoPhillips | | | 67,173 | | | | 3,505,087 | |
|
Oil &Gas-Refining & Marketing — 2.3% | |
Marathon Petroleum Corp. | | | 56,302 | | | | 2,770,622 | |
Valero Energy Corp. | | | 59,444 | | | | 4,474,944 | |
| | | | | | | | |
| | | | | | | 7,245,566 | |
|
Oil &Gas-Storage & Transportation — 1.7% | |
Kinder Morgan, Inc. | | | 253,165 | | | | 5,131,654 | |
| | | | | | | | |
Total Energy | | | | | | | 23,734,820 | |
|
| Financials — 15.9% | |
|
Asset Management & Custody Banks — 0.9% | |
Ameriprise Financial, Inc. (1) | | | 21,190 | | | | 2,733,086 | |
|
Consumer Finance — 3.0% | |
Discover Financial Services (1) | | | 43,543 | | | | 3,482,134 | |
Navient Corp. (1) | | | 138,076 | | | | 1,759,088 | |
Synchrony Financial (1) | | | 132,730 | | | | 4,253,997 | |
| | | | | | | | |
| | | | | | | 9,495,219 | |
|
Diversified Banks — 4.9% | |
Bank of America Corp. (1) | | | 49,752 | | | | 1,368,678 | |
Citigroup, Inc. | | | 117,547 | | | | 7,564,149 | |
Wells Fargo & Co. | | | 135,581 | | | | 6,314,007 | |
| | | | | | | | |
| | | | | | | 15,246,834 | |
|
Investment Banking & Brokerage — 1.6% | |
Morgan Stanley | | | 123,317 | | | | 5,116,422 | |
|
Life & Health Insurance — 1.2% | |
Prudential Financial, Inc. (1) | | | 45,501 | | | | 3,644,175 | |
|
Property & Casualty Insurance — 1.4% | |
Allstate Corp. | | | 42,921 | | | | 4,394,681 | |
|
Regional Banks — 1.9% | |
Citizens Financial Group, Inc. | | | 179,431 | | | | 6,054,002 | |
|
Reinsurance — 1.0% | |
Reinsurance Group of America, Inc. (1) | | | 19,579 | | | | 3,014,579 | |
| | | | | | | | |
Total Financials | | | | 49,698,998 | |
|
| Healthcare — 11.4% | |
|
Biotechnology — 2.0% | |
AbbVie, Inc. | | | 45,824 | | | | 3,012,470 | |
Amgen, Inc. (1) | | | 9,163 | | | | 1,911,585 | |
| | | | | | | | |
| Description | | Shares | | | Value | |
| Common Stocks (continued) | |
|
| Healthcare (continued) | |
| | |
Biotechnology(continued) | | | | | | | | |
Gilead Sciences, Inc. | | | 22,365 | | | $ | 1,421,072 | |
| | | | | | | | |
| | | | | | | 6,345,127 | |
|
Healthcare Services — 1.2% | |
CVS Health Corp. | | | 59,012 | | | | 3,595,011 | |
|
Pharmaceuticals — 8.2% | |
Bristol-Myers Squibb Co. (1) | | | 29,558 | | | | 1,420,853 | |
Eli Lilly & Co. | | | 45,112 | | | | 5,096,303 | |
Johnson & Johnson | | | 47,590 | | | | 6,108,652 | |
Merck & Co., Inc. | | | 70,627 | | | | 6,107,117 | |
Pfizer, Inc. | | | 195,712 | | | | 6,957,561 | |
| | | | | | | | |
| | | | | | | 25,690,486 | |
| | | | | | | | |
Total Healthcare | | | | 35,630,624 | |
|
| Industrials — 7.7% | |
|
Aerospace & Defense — 2.9% | |
Boeing Co. | | | 18,701 | | | | 6,808,847 | |
Lockheed Martin Corp. (1) | | | 5,564 | | | | 2,137,188 | |
| | | | | | | | |
| | | | | | | 8,946,035 | |
|
Airlines — 1.9% | |
Alaska Air Group, Inc. (1) | | | 41,918 | | | | 2,503,343 | |
Delta Air Lines, Inc. (1) | | | 61,516 | | | | 3,559,316 | |
| | | | | | | | |
| | | | | | | 6,062,659 | |
|
Construction Machinery & Heavy Trucks — 1.1% | |
Caterpillar, Inc. (1) | | | 29,213 | | | | 3,476,347 | |
|
Industrial Machinery — 1.1% | |
Ingersoll-Rand PLC | | | 16,787 | | | | 2,032,738 | |
Parker-Hannifin Corp. (1) | | | 8,893 | | | | 1,474,192 | |
| | | | | | | | |
| | | | | | | 3,506,930 | |
|
Railroads — 0.7% | |
Union Pacific Corp. | | | 13,911 | | | | 2,253,026 | |
| | | | | | | | |
Total Industrials | | | | 24,244,997 | |
|
| Information Technology — 16.4% | |
|
Communications Equipment — 2.9% | |
Cisco Systems, Inc. | | | 139,965 | | | | 6,551,761 | |
Motorola Solutions, Inc. (1) | | | 13,244 | | | | 2,395,972 | |
| | | | | | | | |
| | | | | | | 8,947,733 | |
|
Data Processing & Outsourced Services — 1.2% | |
Automatic Data Processing, Inc. | | | 21,633 | | | | 3,674,149 | |
|
Semiconductor Equipment — 2.1% | |
Applied Materials, Inc. | | | 35,864 | | | | 1,722,189 | |
KLA Corp. (1) | | | 22,618 | | | | 3,345,202 | |
Lam Research Corp. | | | 7,903 | | | | 1,663,661 | |
| | | | | | | | |
| | | | | | | 6,731,052 | |
|
Semiconductors — 4.8% | |
Broadcom, Inc. (1) | | | 22,108 | | | | 6,248,605 | |
Intel Corp. (1) | | | 84,548 | | | | 4,008,421 | |
Texas Instruments, Inc. (1) | | | 38,584 | | | | 4,774,770 | |
| | | | | | | | |
| | | | | | | 15,031,796 | |
|
Systems Software — 4.0% | |
Microsoft Corp. | | | 81,097 | | | | 11,180,032 | |
Oracle Corp. (1) | | | 27,111 | | | | 1,411,399 | |
| | | | | | | | |
| | | | | | | 12,591,431 | |
|
Technology Hardware, Storage & Peripherals — 1.4% | |
Apple, Inc. | | | 10,461 | | | | 2,183,629 | |
NetApp, Inc. (1) | | | 45,930 | | | | 2,207,396 | |
| | | | | | | | |
| | | | | | | 4,391,025 | |
| | | | | | | | |
Total Information Technology | | | | 51,367,186 | |
(See Notes to Schedules of Investments and Notes to Financial Statements, which are an integral part of the Financial Statements)
38
Dividend Income Fund (continued)
| | | | | | | | |
| Description | | Shares | | | Value | |
| Common Stocks (continued) | |
|
| Materials — 2.6% | |
|
Commodity Chemicals — 0.7% | |
LyondellBasell Industries NV, Class A | | | 26,628 | | | $ | 2,060,475 | |
|
Diversified Chemicals — 0.8% | |
Huntsman Corp. | | | 124,785 | | | | 2,485,717 | |
|
Fertilizers & Agricultural Chemicals — 1.1% | |
CF Industries Holdings, Inc. (1) | | | 73,301 | | | | 3,532,375 | |
| | | | | | | | |
Total Materials | | | | 8,078,567 | |
|
| Real Estate — 6.5% | |
|
Hotel & Resort REIT’s — 1.9% | |
Host Hotels & Resorts, Inc. (1) | | | 370,408 | | | | 5,941,344 | |
|
Residential REIT’s — 1.0% | |
Camden Property Trust | | | 14,718 | | | | 1,593,224 | |
Essex Property Trust, Inc. (1) | | | 5,051 | | | | 1,622,684 | |
| | | | | | | | |
| | | | | | | 3,215,908 | |
|
Retail REIT’s — 2.0% | |
National Retail Properties, Inc. | | | 28,634 | | | | 1,607,799 | |
Simon Property Group, Inc. (1) | | | 30,302 | | | | 4,513,180 | |
| | | | | | | | |
| | | | | | | 6,120,979 | |
|
Specialized REIT’s — 1.6% | |
Lamar Advertising Co., Class A (1) | | | 64,511 | | | | 4,944,768 | |
| | | | | | | | |
Total Real Estate | | | | 20,222,999 | |
|
| Utilities — 6.7% | |
|
Electric Utilities — 2.9% | |
Entergy Corp. | | | 18,498 | | | | 2,087,314 | |
Exelon Corp. (1) | | | 146,338 | | | | 6,915,934 | |
| | | | | | | | |
| | | | | | | 9,003,248 | |
|
Independent Power Producers & Energy Traders — 2.0% | |
AES Corp. | | | 418,190 | | | | 6,410,853 | |
|
Multi-Utilities — 1.8% | |
Ameren Corp. (1) | | | 22,183 | | | | 1,711,418 | |
CenterPoint Energy, Inc. | | | 141,011 | | | | 3,904,595 | |
| | | | | | | | |
| | | | | | | 5,616,013 | |
| | | | | | | | |
Total Utilities | | | | | | | 21,030,114 | |
| | | | | | | | |
Total Common Stocks
(identified cost $265,546,942) | | | | | | | 295,880,068 | |
| | | | | | | | |
|
| Short-Term Investments — 35.4% | |
|
| Collateral Pool Investments for Securities on Loan — 26.4% | |
Collateral pool allocation (3) | | | | | | | 82,546,979 | |
|
| Mutual Funds — 9.0% | |
BMO Institutional Prime Money Market Fund — Premier Class, 2.097% (4) | | | 28,261,391 | | | | 28,264,217 | |
| | | | | | | | |
Total Short-Term Investments
(identified cost $110,810,690) | | | | | | | 110,811,196 | |
| | | | | | | | |
Total Investments — 129.9%
(identified cost $376,357,632) | | | | | | | 406,691,264 | |
| Other Assets and Liabilities — (29.9)% | | | | (93,704,097 | ) |
| | | | | | | | |
| Total Net Assets — 100.0% | | | | | | $ | 312,987,167 | |
| | | | | | | | |
Large-Cap Value Fund
| | | | | | | | |
| Description | | Shares | | | Value | |
| Common Stocks — 98.0% | |
|
| Communication Services — 5.3% | |
| | |
Broadcasting — 1.7% | | | | | | | | |
Discovery, Inc., Class A (1)(2) | | | 180,821 | | | $ | 4,990,660 | |
| | |
Cable & Satellite — 2.7% | | | | | | | | |
Comcast Corp., Class A (1) | | | 184,709 | | | | 8,175,220 | |
|
Integrated Telecommunication Services — 0.9% | |
Verizon Communications, Inc. | | | 45,439 | | | | 2,642,732 | |
| | | | | | | | |
Total Communication Services | | | | | | | 15,808,612 | |
|
| Consumer Discretionary — 8.1% | |
|
Apparel, Accessories & Luxury Goods — 0.4% | |
Ralph Lauren Corp. (1) | | | 14,647 | | | | 1,293,916 | |
| | |
Auto Parts & Equipment — 0.5% | | | | | | | | |
Lear Corp. (1) | | | 12,011 | | | | 1,348,355 | |
| | |
Automotive Retail — 1.8% | | | | | | | | |
AutoZone, Inc. (1)(2) | | | 4,826 | | | | 5,316,756 | |
| | |
Department Stores — 0.5% | | | | | | | | |
Kohl’s Corp. (1) | | | 32,311 | | | | 1,527,018 | |
| | |
Footwear — 0.8% | | | | | | | | |
Deckers Outdoor Corp. (2) | | | 15,452 | | | | 2,278,397 | |
|
General Merchandise Stores — 1.3% | |
Target Corp. | | | 35,051 | | | | 3,751,859 | |
|
Home Improvement Retail — 1.5% | |
Lowe’s Cos., Inc. | | | 40,570 | | | | 4,551,954 | |
|
Internet & Direct Marketing Retail — 0.8% | |
Expedia Group, Inc. | | | 18,761 | | | | 2,440,806 | |
| | |
Specialty Stores — 0.5% | | | | | | | | |
Tractor Supply Co. (1) | | | 14,259 | | | | 1,452,707 | |
| | | | | | | | |
Total Consumer Discretionary | | | | | | | 23,961,768 | |
|
| Consumer Staples — 10.2% | |
| | |
Food Distributors — 1.3% | | | | | | | | |
Sysco Corp. | | | 12,716 | | | | 945,180 | |
U.S. Foods Holding Corp. (2) | | | 73,162 | | | | 2,959,403 | |
| | | | | | | | |
| | | | | | | 3,904,583 | |
| | |
Food Retail — 0.5% | | | | | | | | |
Kroger Co. (1) | | | 68,083 | | | | 1,612,205 | |
| | |
Household Products — 1.3% | | | | | | | | |
Kimberly-Clark Corp. | | | 26,572 | | | | 3,749,575 | |
|
Hypermarkets & Super Centers — 3.1% | |
Walmart, Inc. | | | 81,245 | | | | 9,283,054 | |
|
Packaged Foods & Meats — 3.0% | |
General Mills, Inc. (1) | | | 26,565 | | | | 1,429,197 | |
Hershey Co. (1) | | | 18,175 | | | | 2,880,374 | |
Post Holdings, Inc. (1)(2) | | | 44,543 | | | | 4,440,492 | |
| | | | | | | | |
| | | | | | | 8,750,063 | |
| | |
Soft Drinks — 1.0% | | | | | | | | |
PepsiCo, Inc. (1) | | | 22,287 | | | | 3,047,301 | |
| | | | | | | | |
Total Consumer Staples | | | | | | | 30,346,781 | |
| | |
| Energy — 6.6% | | | | | | |
| | |
Integrated Oil & Gas — 2.8% | | | | | | | | |
Chevron Corp. | | | 71,569 | | | | 8,425,103 | |
|
Oil &Gas-Equipment & Services — 0.7% | |
Schlumberger, Ltd. (1) | | | 58,847 | | | | 1,908,408 | |
(See Notes to Schedules of Investments and Notes to Financial Statements, which are an integral part of the Financial Statements)
39
August 31, 2019
Large-Cap Value Fund (continued)
| | | | | | | | |
| Description | | Shares | | | Value | |
| Common Stocks (continued) | |
| | |
| Energy (continued) | | | | | | |
|
Oil &Gas-Exploration & Production — 3.1% | |
Cabot Oil & Gas Corp. | | | 176,715 | | | $ | 3,025,361 | |
ConocoPhillips | | | 118,027 | | | | 6,158,649 | |
| | | | | | | | |
| | | | | | | 9,184,010 | |
| | | | | | | | |
Total Energy | | | | | | | 19,517,521 | |
| | |
| Financials — 21.4% | | | | | | |
|
Asset Management & Custody Banks — 0.6% | |
Ameriprise Financial, Inc. (1) | | | 13,370 | | | | 1,724,462 | |
| | |
Consumer Finance — 2.9% | | | | | | | | |
American Express Co. (1) | | | 22,501 | | | | 2,708,445 | |
Capital One Financial Corp. | | | 37,954 | | | | 3,287,576 | |
Synchrony Financial | | | 79,577 | | | | 2,550,443 | |
| | | | | | | | |
| | | | | | | 8,546,464 | |
| | |
Diversified Banks — 6.3% | | | | | | | | |
Bank of America Corp. (1) | | | 204,916 | | | | 5,637,239 | |
Citigroup, Inc. | | | 127,446 | | | | 8,201,150 | |
Wells Fargo & Co. | | | 102,259 | | | | 4,762,202 | |
| | | | | | | | |
| | | | | | | 18,600,591 | |
|
Investment Banking & Brokerage — 2.8% | |
Morgan Stanley | | | 152,017 | | | | 6,307,185 | |
Raymond James Financial, Inc. | | | 27,903 | | | | 2,190,665 | |
| | | | | | | | |
| | | | | | | 8,497,850 | |
|
Property & Casualty Insurance — 3.4% | |
Allstate Corp. | | | 62,573 | | | | 6,406,850 | |
Travelers Cos., Inc. (1) | | | 26,139 | | | | 3,841,387 | |
| | | | | | | | |
| | | | | | | 10,248,237 | |
| | |
Regional Banks — 2.3% | | | | | | | | |
Citizens Financial Group, Inc. | | | 163,562 | | | | 5,518,582 | |
Zions Bancorp NA (1) | | | 35,543 | | | | 1,460,462 | |
| | | | | | | | |
| | | | | | | 6,979,044 | |
| | |
Reinsurance — 3.1% | | | | | | | | |
Everest Re Group, Ltd. | | | 21,714 | | | | 5,121,898 | |
Reinsurance Group of America, Inc. | | | 25,966 | | | | 3,997,985 | |
| | | | | | | | |
| | | | | | | 9,119,883 | |
| | | | | | | | |
Total Financials | | | | | | | 63,716,531 | |
| | |
| Healthcare — 12.5% | | | | | | |
| | |
Biotechnology — 1.3% | | | | | | | | |
Alexion Pharmaceuticals, Inc. (2) | | | 20,127 | | | | 2,027,997 | |
Biogen, Inc. (1)(2) | | | 8,722 | | | | 1,916,659 | |
| | | | | | | | |
| | | | | | | 3,944,656 | |
|
Healthcare Equipment — 2.8% | |
Baxter International, Inc. | | | 24,819 | | | | 2,182,831 | |
Hill-Rom Holdings, Inc. (1) | | | 33,581 | | | | 3,616,002 | |
Hologic, Inc. (1)(2) | | | 50,141 | | | | 2,475,461 | |
| | | | | | | | |
| | | | | | | 8,274,294 | |
|
Healthcare Technology — 0.7% | |
Cerner Corp. (1) | | | 27,816 | | | | 1,916,801 | |
| | |
Pharmaceuticals — 7.7% | | | | | | | | |
Eli Lilly & Co. | | | 51,584 | | | | 5,827,445 | |
Johnson & Johnson | | | 13,931 | | | | 1,788,183 | |
Merck & Co., Inc. | | | 66,487 | | | | 5,749,131 | |
Pfizer, Inc. | | | 268,131 | | | | 9,532,057 | |
| | | | | | | | |
| | | | | | | 22,896,816 | |
| | | | | | | | |
Total Healthcare | | | | | | | 37,032,567 | |
| | | | | | | | |
| Description | | Shares | | | Value | |
| Common Stocks (continued) | |
| | |
| Industrials — 8.9% | | | | | | |
| | |
Aerospace & Defense — 0.9% | | | | | | | | |
Huntington Ingalls Industries, Inc. (1) | | | 13,381 | | | $ | 2,796,629 | |
|
Agricultural & Farm Machinery — 1.2% | |
AGCO Corp. (1) | | | 49,225 | | | | 3,402,432 | |
| | |
Airlines — 2.9% | | | | | | | | |
Southwest Airlines Co. (1) | | | 83,381 | | | | 4,362,494 | |
United Airlines Holdings, Inc. (2) | | | 51,057 | | | | 4,304,616 | |
| | | | | | | | |
| | | | | | | 8,667,110 | |
| | |
Building Products — 0.8% | | | | | | | | |
Masco Corp. (1) | | | 56,478 | | | | 2,300,349 | |
|
Construction Machinery & Heavy Trucks — 2.4% | |
Allison Transmission Holdings, Inc. (1) | | | 87,695 | | | | 3,896,289 | |
Cummins, Inc. (1) | | | 10,842 | | | | 1,618,385 | |
Oshkosh Corp. | | | 24,329 | | | | 1,709,599 | |
| | | | | | | | |
| | | | | | | 7,224,273 | |
| | |
Railroads — 0.3% | | | | | | | | |
Kansas City Southern (1) | | | 6,971 | | | | 876,952 | |
|
Trading Companies & Distributors — 0.4% | |
United Rentals, Inc. (1)(2) | | | 11,699 | | | | 1,316,839 | |
| | | | | | | | |
Total Industrials | | | | | | | 26,584,584 | |
|
| Information Technology — 9.6% | |
|
Communications Equipment — 2.1% | |
Cisco Systems, Inc. | | | 88,017 | | | | 4,120,076 | |
F5 Networks, Inc. (1)(2) | | | 15,548 | | | | 2,001,494 | |
| | | | | | | | |
| | | | | | | 6,121,570 | |
| |
Consulting & Other Services — 0.6% | | | | | |
DXC Technology Co. (1) | | | 52,880 | | | | 1,756,674 | |
|
Internet Services & Infrastructure — 1.0% | |
Akamai Technologies, Inc. (1)(2) | | | 32,511 | | | | 2,897,705 | |
| | |
Semiconductors — 2.1% | | | | | | | | |
Intel Corp. (1) | | | 131,993 | | | | 6,257,788 | |
| | |
Systems Software — 3.0% | | | | | | | | |
Microsoft Corp. | | | 28,194 | | | | 3,886,825 | |
Oracle Corp. (1) | | | 94,426 | | | | 4,915,817 | |
| | | | | | | | |
| | | | | | | 8,802,642 | |
|
Technology Hardware, Storage & Peripherals — 0.8% | |
NetApp, Inc. | | | 53,065 | | | | 2,550,304 | |
| | | | | | | | |
Total Information Technology | | | | | | | 28,386,683 | |
| | |
| Materials — 1.1% | | | | | | |
|
Metal & Glass Containers — 0.6% | |
Berry Global Group, Inc. (1)(2) | | | 48,189 | | | | 1,886,117 | |
| | |
Steel — 0.5% | | | | | | | | |
Steel Dynamics, Inc. (1) | | | 51,901 | | | | 1,401,327 | |
| | | | | | | | |
Total Materials | | | | | | | 3,287,444 | |
| | |
| Real Estate — 7.5% | | | | | | |
|
Hotel & Resort REIT’s — 1.7% | |
Host Hotels & Resorts, Inc. (1) | | | 312,460 | | | | 5,011,858 | |
| | |
Residential REIT’s — 3.2% | | | | | | | | |
Camden Property Trust | | | 32,978 | | | | 3,569,868 | |
Essex Property Trust, Inc. | | | 18,333 | | | | 5,889,660 | |
| | | | | | | | |
| | | | | | | 9,459,528 | |
(See Notes to Schedules of Investments and Notes to Financial Statements, which are an integral part of the Financial Statements)
40
Large-Cap Value Fund (continued)
| | | | | | | | |
| Description | | Shares | | | Value | |
| Common Stocks (continued) | |
| | |
| Real Estate (continued) | | | | | | |
| | |
Specialized REIT’s — 2.6% | | | | | | | | |
American Tower Corp. | | | 10,800 | | | $ | 2,486,052 | |
EPR Properties (1) | | | 46,328 | | | | 3,625,166 | |
Lamar Advertising Co., Class A (1) | | | 21,406 | | | | 1,640,770 | |
| | | | | | | | |
| | | | | | | 7,751,988 | |
| | | | | | | | |
Total Real Estate | | | | | | | 22,223,374 | |
| | |
| Utilities — 6.8% | | | | | | |
|
Electric Utilities — 3.9% | |
Entergy Corp. | | | 45,620 | | | | 5,147,761 | |
Exelon Corp. | | | 137,924 | | | | 6,518,288 | |
| | | | | | | | |
| | | | | | | 11,666,049 | |
|
Independent Power Producers & Energy Traders — 1.8% | |
AES Corp. | | | 358,270 | | | | 5,492,279 | |
| | |
Multi-Utilities — 1.1% | | | | | | | | |
Ameren Corp. (1) | | | 40,956 | | | | 3,159,756 | |
| | | | | | | | |
Total Utilities | | | | | | | 20,318,084 | |
| | | | | | | | |
Total Common Stocks
(identified cost $262,412,377) | | | | | | | 291,183,949 | |
| | | | | | | | |
| Short-Term Investments — 31.4% | | | | |
|
| Collateral Pool Investments for Securities on Loan — 29.4% | |
| | |
Collateral pool allocation (3) | | | | | | | 87,405,013 | |
| | |
| Mutual Funds — 2.0% | | | | | | |
BMO Institutional Prime Money Market Fund — Premier Class, 2.097% (4) | | | 5,887,606 | | | | 5,888,195 | |
| | | | | | | | |
Total Short-Term Investments
(identified cost $93,292,946) | | | | | | | 93,293,208 | |
| | | | | | | | |
Total Investments — 129.4%
(identified cost $355,705,323) | | | | | | | 384,477,157 | |
| Other Assets and Liabilities — (29.4)% | | | | (87,413,816 | ) |
| | | | | | | | |
| Total Net Assets — 100.0% | | | | | | $ | 297,063,341 | |
| | | | | | | | |
Large-Cap Growth Fund
| | | | | | | | |
| Description | | Shares | | | Value | |
| Common Stocks — 98.3% | | | | | | |
| |
| Communication Services — 11.2% | | | | |
| | |
Cable & Satellite — 2.8% | | | | | | | | |
Altice USA, Inc., Class A (1)(2) | | | 144,790 | | | $ | 4,181,535 | |
Comcast Corp., Class A (1) | | | 189,000 | | | | 8,365,140 | |
| | | | | | | | |
| | | | | | | 12,546,675 | |
| |
Interactive Media & Services — 7.7% | | | | | |
Alphabet, Inc., Class A (2) | | | 4,208 | | | | 5,009,750 | |
Alphabet, Inc., Class C (2) | | | 12,522 | | | | 14,877,388 | |
Facebook, Inc., Class A (2) | | | 48,453 | | | | 8,996,269 | |
Twitter, Inc. (2) | | | 143,810 | | | | 6,133,496 | |
| | | | | | | | |
| | | | | | | 35,016,903 | |
|
Internet & Direct Marketing Retail — 0.7% | |
TripAdvisor, Inc. (1)(2) | | | 84,433 | | | | 3,207,610 | |
| | | | | | | | |
Total Communication Services | | | | | | | 50,771,188 | |
| | | | | | | | |
| Description | | Shares | | | Value | |
| Common Stocks (continued) | | | | | | |
| |
| Consumer Discretionary — 12.5% | | | | |
| | |
Automotive Retail — 1.8% | | | | | | | | |
AutoZone, Inc. (1)(2) | | | 7,539 | | | $ | 8,305,641 | |
| | |
Footwear — 0.7% | | | | | | | | |
Deckers Outdoor Corp. (1)(2) | | | 21,147 | | | | 3,118,125 | |
|
Internet & Direct Marketing Retail — 6.8% | |
Amazon.com, Inc. (2) | | | 13,071 | | | | 23,217,886 | |
Expedia Group, Inc. (1) | | | 59,038 | | | | 7,680,844 | |
| | | | | | | | |
| | | | | | | 30,898,730 | |
| | |
Restaurants — 3.2% | | | | | | | | |
Chipotle Mexican Grill, Inc. (1)(2) | | | 4,983 | | | | 4,177,847 | |
Starbucks Corp. (1) | | | 109,553 | | | | 10,578,438 | |
| | | | | | | | |
| | | | | | | 14,756,285 | |
| | | | | | | | |
Total Consumer Discretionary | | | | | | | 57,078,781 | |
| | |
| Consumer Staples — 6.7% | | | | | | |
|
Hypermarkets & Super Centers — 1.6% | |
Walmart, Inc. | | | 63,234 | | | | 7,225,117 | |
| |
Packaged Foods & Meats — 3.3% | | | | | |
Hershey Co. (1) | | | 52,495 | | | | 8,319,408 | |
Post Holdings, Inc. (1)(2) | | | 68,335 | | | | 6,812,316 | |
| | | | | | | | |
| | | | | | | 15,131,724 | |
| | |
Personal Products — 1.8% | | | | | | | | |
Estee Lauder Cos., Inc., Class A | | | 40,754 | | | | 8,068,884 | |
| | | | | | | | |
Total Consumer Staples | | | | | | | 30,425,725 | |
| | |
| Energy — 1.4% | | | | | | |
|
Oil &Gas-Exploration & Production — 1.4% | |
ConocoPhillips | | | 120,612 | | | | 6,293,534 | |
| | |
| Financials — 6.3% | | | | | | |
|
Asset Management & Custody Banks — 0.5% | |
Ameriprise Financial, Inc. (1) | | | 15,848 | | | | 2,044,075 | |
| | |
Consumer Finance — 2.6% | | | | | | | | |
American Express Co. (1) | | | 63,098 | | | | 7,595,106 | |
Discover Financial Services (1) | | | 55,246 | | | | 4,418,023 | |
| | | | | | | | |
| | | | | | | 12,013,129 | |
|
Property & Casualty Insurance — 3.2% | |
Allstate Corp. | | | 80,528 | | | | 8,245,262 | |
Progressive Corp. | | | 85,887 | | | | 6,510,235 | |
| | | | | | | | |
| | | | | | | 14,755,497 | |
| | | | | | | | |
Total Financials | | | | | | | 28,812,701 | |
| | |
| Healthcare — 13.1% | | | | | | |
| | |
Biotechnology — 3.6% | | | | | | | | |
AbbVie, Inc. | | | 83,178 | | | | 5,468,122 | |
Amgen, Inc. (1) | | | 38,386 | | | | 8,008,087 | |
Exelixis, Inc. (2) | | | 145,725 | | | | 2,892,641 | |
| | | | | | | | |
| | | | | | | 16,368,850 | |
| |
Healthcare Equipment — 2.0% | | | | | |
Abbott Laboratories | | | 42,443 | | | | 3,621,237 | |
Edwards Lifesciences Corp. (2) | | | 14,099 | | | | 3,127,722 | |
Hologic, Inc. (1)(2) | | | 47,009 | | | | 2,320,834 | |
| | | | | | | | |
| | | | | | | 9,069,793 | |
| | |
Healthcare Supplies — 0.7% | | | | | | | | |
Cooper Cos., Inc. | | | 10,319 | | | | 3,196,310 | |
| |
Healthcare Technology — 0.6% | | | | | |
Veeva Systems, Inc., Class A (2) | | | 17,559 | | | | 2,816,113 | |
(See Notes to Schedules of Investments and Notes to Financial Statements, which are an integral part of the Financial Statements)
41
August 31, 2019
Large-Cap Growth Fund (continued)
| | | | | | | | |
| Description | | Shares | | | Value | |
| Common Stocks (continued) | | | | | | |
| | |
| Healthcare (continued) | | | | | | |
| | |
Pharmaceuticals — 6.2% | | | | | | | | |
Eli Lilly & Co. (1) | | | 84,029 | | | $ | 9,492,756 | |
Jazz Pharmaceuticals PLC (1)(2) | | | 27,737 | | | | 3,554,497 | |
Merck & Co., Inc. | | | 174,722 | | | | 15,108,211 | |
| | | | | | | | |
| | | | | | | 28,155,464 | |
| | | | | | | | |
Total Healthcare | | | | | | | 59,606,530 | |
| | |
| Industrials — 9.7% | | | | | | |
| | |
Aerospace & Defense — 0.4% | | | | | | | | |
TransDigm Group, Inc. (1) | | | 3,720 | | | | 2,002,550 | |
| | |
Airlines — 1.6% | | | | | | | | |
Southwest Airlines Co. | | | 134,531 | | | | 7,038,662 | |
| | |
Building Products — 1.6% | | | | | | | | |
Masco Corp. | | | 179,179 | | | | 7,297,961 | |
|
Construction Machinery & Heavy Trucks — 2.8% | |
Allison Transmission Holdings, Inc. | | | 140,516 | | | | 6,243,126 | |
Caterpillar, Inc. (1) | | | 33,016 | | | | 3,928,904 | |
Cummins, Inc. | | | 17,006 | | | | 2,538,486 | |
| | | | | | | | |
| | | | | | | 12,710,516 | |
| | |
Railroads — 1.4% | | | | | | | | |
Union Pacific Corp. | | | 39,139 | | | | 6,338,952 | |
|
Trading Companies & Distributors — 1.9% | |
United Rentals, Inc. (2) | | | 24,583 | | | | 2,767,062 | |
WW Grainger, Inc. (1) | | | 21,358 | | | | 5,844,617 | |
| | | | | | | | |
| | | | | | | 8,611,679 | |
| | | | | | | | |
Total Industrials | | | | | | | 44,000,320 | |
| | |
| Information Technology — 34.7% | | | | | | |
| | |
Application Software — 4.0% | | | | | | | | |
Adobe, Inc. (2) | | | 19,362 | | | | 5,508,683 | |
Cadence Design Systems, Inc. (2) | | | 89,445 | | | | 6,125,193 | |
salesforce.com, Inc. (2) | | | 42,884 | | | | 6,692,906 | |
| | | | | | | | |
| | | | | | | 18,326,782 | |
|
Communications Equipment — 1.0% | |
F5 Networks, Inc. (2) | | | 35,932 | | | | 4,625,526 | |
|
Data Processing & Outsourced Services — 7.4% | |
FleetCor Technologies, Inc. (1)(2) | | | 21,721 | | | | 6,481,546 | |
Mastercard, Inc., Class A | | | 55,658 | | | | 15,660,492 | |
Visa, Inc., Class A (1) | | | 63,774 | | | | 11,531,615 | |
| | | | | | | | |
| | | | | | | 33,673,653 | |
|
Internet Services & Infrastructure — 2.9% | |
Akamai Technologies, Inc. (1)(2) | | | 72,446 | | | | 6,457,112 | |
Palo Alto Networks, Inc. (2) | | | 33,275 | | | | 6,775,456 | |
| | | | | | | | |
| | | | | | | 13,232,568 | |
|
Semiconductor Equipment — 1.4% | |
Lam Research Corp. | | | 29,926 | | | | 6,299,722 | |
| |
Semiconductors — 1.7% | | | | | |
Broadcom, Inc. | | | 28,221 | | | | 7,976,384 | |
| |
Systems Software — 11.1% | | | | | |
Fortinet, Inc. (2) | | | 92,174 | | | | 7,298,337 | |
Microsoft Corp. | | | 209,064 | | | | 28,821,563 | |
Oracle Corp. (1) | | | 84,018 | | | | 4,373,977 | |
ServiceNow, Inc. (2) | | | 22,980 | | | | 6,017,083 | |
VMware, Inc., Class A (1) | | | 27,806 | | | | 3,932,881 | |
| | | | | | | | |
| | | | | | | 50,443,841 | |
| | | | | | | | |
| Description | | Shares | | | Value | |
| Common Stocks (continued) | | | | | | |
| |
| Information Technology (continued) | | | | |
|
Technology Hardware, Storage & Peripherals — 5.2% | |
Apple, Inc. | | | 103,865 | | | $ | 21,680,780 | |
NetApp, Inc. | | | 38,169 | | | | 1,834,402 | |
| | | | | | | | |
| | | | | | | 23,515,182 | |
| | | | | | | | |
Total Information Technology | | | | | | | 158,093,658 | |
| | |
| Materials — 1.2% | | | | | | |
|
Metal & Glass Containers — 1.2% | |
Berry Global Group, Inc. (2) | | | 136,657 | | | | 5,348,755 | |
| | |
| Real Estate — 1.5% | | | | | | |
| | |
Residential REIT’s — 1.0% | | | | | | | | |
Essex Property Trust, Inc. | | | 13,971 | | | | 4,488,324 | |
| | |
Specialized REIT’s — 0.5% | | | | | | | | |
Lamar Advertising Co., Class A (1) | | | 33,014 | | | | 2,530,523 | |
| | | | | | | | |
Total Real Estate | | | | | | | 7,018,847 | |
| | | | | | | | |
Total Common Stocks
(identified cost $344,955,470) | | | | | | | 447,450,039 | |
| | | | | | | | |
| Short-Term Investments — 24.2% | |
|
| Collateral Pool Investments for Securities on Loan — 24.2% | |
| | |
Collateral pool allocation (3) | | | | | | | 110,027,192 | |
| | |
| Mutual Funds — 0.0% | | | | | | |
BMO Institutional Prime Money Market Fund — Premier Class, 2.097% (4) | | | 6 | | | | 5 | |
| | | | | | | | |
Total Short-Term Investments
(identified cost $110,027,197) | | | | | | | 110,027,197 | |
| | | | | | | | |
Total Investments — 122.5%
(identified cost $454,982,667) | | | | | | | 557,477,236 | |
| Other Assets and Liabilities — (22.5)% | | | | (102,388,269 | ) |
| | | | | | | | |
| Total Net Assets — 100.0% | | | | | | $ | 455,088,967 | |
| | | | | | | | |
Mid-Cap Value Fund
| | | | | | | | |
| Description | | Shares | | | Value | |
| Common Stocks — 97.7% | | | | | | |
| | |
| Communication Services — 1.1% | | | | | | |
| | |
Broadcasting — 1.1% | | | | | | | | |
Discovery, Inc., Class A (1)(2) | | | 58,272 | | | $ | 1,608,307 | |
| | |
| Consumer Discretionary — 6.9% | | | | | | |
|
Apparel, Accessories & Luxury Goods — 2.1% | |
PVH Corp. | | | 19,644 | | | | 1,489,015 | |
Ralph Lauren Corp. (1) | | | 15,968 | | | | 1,410,613 | |
| | | | | | | | |
| | | | | | | 2,899,628 | |
| | |
Auto Parts & Equipment — 0.9% | | | | | | | | |
Lear Corp. (1) | | | 11,359 | | | | 1,275,161 | |
| | |
Automotive Retail — 1.7% | | | | | | | | |
AutoZone, Inc. (1)(2) | | | 2,152 | | | | 2,370,837 | |
| | |
Department Stores — 1.0% | | | | | | | | |
Kohl’s Corp. (1) | | | 30,085 | | | | 1,421,817 | |
|
Hotels, Resorts & Cruise Lines — 1.2% | |
Norwegian Cruise Line Holdings, Ltd. (2) | | | 33,302 | | | | 1,690,077 | |
| | | | | | | | |
Total Consumer Discretionary | | | | | | | 9,657,520 | |
(See Notes to Schedules of Investments and Notes to Financial Statements, which are an integral part of the Financial Statements)
42
Mid-Cap Value Fund (continued)
| | | | | | | | |
| Description | | Shares | | | Value | |
| Common Stocks (continued) | | | | | | |
| | |
| Consumer Staples — 7.1% | | | | | | |
| | |
Agricultural Products — 1.3% | | | | | | | | |
Ingredion, Inc. | | | 23,931 | | | $ | 1,849,148 | |
| | |
Brewers — 1.4% | | | | | | | | |
Molson Coors Brewing Co., Class B (1) | | | 38,292 | | | | 1,966,677 | |
| | |
Food Distributors — 1.4% | | | | | | | | |
Sysco Corp. | | | 26,696 | | | | 1,984,314 | |
| | |
Food Retail — 1.0% | | | | | | | | |
Kroger Co. (1) | | | 60,293 | | | | 1,427,738 | |
|
Packaged Foods & Meats — 2.0% | |
Hershey Co. (1) | | | 17,075 | | | | 2,706,046 | |
| | | | | | | | |
Total Consumer Staples | | | | | | | 9,933,923 | |
| | |
| Energy — 3.8% | | | | | | |
|
Oil &Gas-Exploration & Production — 3.0% | |
Cabot Oil & Gas Corp. | | | 63,454 | | | | 1,086,333 | |
Cimarex Energy Co. (1) | | | 23,008 | | | | 984,282 | |
Continental Resources, Inc. (1) | | | 31,701 | | | | 925,669 | |
Pioneer Natural Resources Co. (1) | | | 9,627 | | | | 1,188,164 | |
| | | | | | | | |
| | | | | | | 4,184,448 | |
|
Oil &Gas-Refining & Marketing — 0.8% | |
PBF Energy, Inc., Class A (1) | | | 49,339 | | | | 1,169,335 | |
| | | | | | | | |
Total Energy | | | | | | | 5,353,783 | |
| | |
| Financials — 19.3% | | | | | | |
|
Asset Management & Custody Banks — 1.5% | |
Ameriprise Financial, Inc. | | | 15,872 | | | | 2,047,171 | |
| | |
Consumer Finance — 1.6% | | | | | | | | |
Discover Financial Services (1) | | | 28,985 | | | | 2,317,930 | |
|
Investment Banking & Brokerage — 2.3% | |
E*TRADE Financial Corp. | | | 35,045 | | | | 1,462,778 | |
Raymond James Financial, Inc. | | | 22,347 | | | | 1,754,463 | |
| | | | | | | | |
| | | | | | | 3,217,241 | |
| |
Life & Health Insurance — 2.4% | | | | | |
Athene Holding, Ltd., Class A (1)(2) | | | 46,419 | | | | 1,803,842 | |
Principal Financial Group, Inc. (1) | | | 28,959 | | | | 1,541,198 | |
| | | | | | | | |
| | | | | | | 3,345,040 | |
| |
Multi-Line Insurance — 3.0% | | | | | |
American Financial Group, Inc. | | | 17,686 | | | | 1,785,756 | |
Hartford Financial Services Group, Inc. | | | 42,855 | | | | 2,497,589 | |
| | | | | | | | |
| | | | | | | 4,283,345 | |
|
Property & Casualty Insurance — 1.5% | |
Old Republic International Corp. (1) | | | 90,793 | | | | 2,120,925 | |
| | |
Regional Banks — 5.6% | | | | | | | | |
BankUnited, Inc. | | | 44,689 | | | | 1,419,323 | |
Comerica, Inc. (1) | | | 20,551 | | | | 1,266,969 | |
Regions Financial Corp. | | | 118,382 | | | | 1,730,745 | |
Signature Bank | | | 13,375 | | | | 1,560,194 | |
TCF Financial Corp. (1) | | | 50,577 | | | | 1,950,249 | |
| | | | | | | | |
| | | | | | | 7,927,480 | |
| | |
Reinsurance — 1.4% | | | | | | | | |
Reinsurance Group of America, Inc. | | | 12,825 | | | | 1,974,665 | |
| | | | | | | | |
Total Financials | | | | | | | 27,233,797 | |
| | |
| Healthcare — 10.2% | | | | | | |
| |
Healthcare Equipment — 4.4% | | | | | |
Hill-Rom Holdings, Inc. (1) | | | 17,235 | | | | 1,855,865 | |
Hologic, Inc. (1)(2) | | | 46,749 | | | | 2,307,998 | |
| | | | | | | | |
| Description | | Shares | | | Value | |
| Common Stocks (continued) | | | | | | |
| | |
| Healthcare (continued) | | | | | | |
| | |
| Healthcare Equipment(continued) | | | | | | |
Steris PLC (1) | | | 12,945 | | | $ | 1,998,708 | |
| | | | | | | | |
| | | | | | | 6,162,571 | |
| | |
Healthcare Facilities — 1.4% | | | | | | | | |
Encompass Health Corp. | | | 31,507 | | | | 1,915,310 | |
| |
Healthcare Technology — 1.6% | | | | | |
Cerner Corp. (1) | | | 32,366 | | | | 2,230,341 | |
|
Life Sciences Tools & Services — 1.5% | |
Charles River Laboratories International, Inc. (1)(2) | | | 16,111 | | | | 2,113,763 | |
| | |
Pharmaceuticals — 1.3% | | | | | | | | |
Jazz Pharmaceuticals PLC (1)(2) | | | 14,757 | | | | 1,891,110 | |
| | | | | | | | |
Total Healthcare | | | | | | | 14,313,095 | |
| | |
| Industrials — 10.5% | | | | | | |
|
Agricultural & Farm Machinery — 1.1% | |
AGCO Corp. (1) | | | 21,752 | | | | 1,503,498 | |
| | |
Airlines — 1.0% | | | | | | | | |
JetBlue Airways Corp. (1)(2) | | | 78,638 | | | | 1,362,010 | |
|
Construction Machinery & Heavy Trucks — 2.6% | |
Allison Transmission Holdings, Inc. | | | 38,140 | | | | 1,694,560 | |
Cummins, Inc. | | | 12,769 | | | | 1,906,029 | |
| | | | | | | | |
| | | | | | | 3,600,589 | |
|
Electrical Components & Equipment — 1.1% | |
Regal Beloit Corp. (1) | | | 22,725 | | | | 1,611,203 | |
|
Environmental & Facilities Services — 1.4% | |
Republic Services, Inc. | | | 22,196 | | | | 1,980,993 | |
| | |
Industrial Machinery — 1.2% | | | | | | | | |
Stanley Black & Decker, Inc. | | | 13,097 | | | | 1,740,067 | |
|
Trading Companies & Distributors — 1.1% | |
United Rentals, Inc. (2) | | | 13,628 | | | | 1,533,968 | |
| | |
Trucking — 1.0% | | | | | | | | |
Ryder System, Inc. | | | 28,916 | | | | 1,392,884 | |
| | | | | | | | |
Total Industrials | | | | | | | 14,725,212 | |
| | |
| Information Technology — 10.0% | | | | | | |
|
Communications Equipment — 1.3% | |
Juniper Networks, Inc. | | | 81,525 | | | | 1,888,119 | |
|
Consulting & Other Services — 0.6% | |
DXC Technology Co. (1) | | | 24,261 | | | | 805,950 | |
|
Data Processing & Outsourced Services — 1.2% | |
Sabre Corp. (1) | | | 69,849 | | | | 1,651,230 | |
|
Electronic Equipment & Instruments — 1.0% | |
National Instruments Corp. (1) | | | 34,900 | | | | 1,465,800 | |
|
Electronic Manufacturing Services — 1.7% | |
Jabil, Inc. | | | 80,987 | | | | 2,333,235 | |
|
Internet Services & Infrastructure — 1.5% | |
Akamai Technologies, Inc. (2) | | | 24,383 | | | | 2,173,257 | |
| | |
Semiconductors — 0.9% | | | | | | | | |
ON Semiconductor Corp. (1)(2) | | | 72,242 | | | | 1,285,908 | |
| |
Technology Distributors — 1.8% | | | | | |
CDW Corp. | | | 21,981 | | | | 2,538,806 | |
| | | | | | | | |
Total Information Technology | | | | | | | 14,142,305 | |
| | |
| Materials — 3.7% | | | | | | |
| | |
Paper Packaging — 1.0% | | | | | | | | |
WestRock Co. | | | 41,448 | | | | 1,416,693 | |
| | |
Specialty Chemicals — 1.3% | | | | | | | | |
Celanese Corp. (1) | | | 16,136 | | | | 1,829,338 | |
(See Notes to Schedules of Investments and Notes to Financial Statements, which are an integral part of the Financial Statements)
43
August 31, 2019
Mid-Cap Value Fund (continued)
| | | | | | | | |
| Description | | Shares | | | Value | |
| Common Stocks (continued) | | | | | | |
| | |
| Materials (continued) | | | | | | |
| | |
Steel — 1.4% | | | | | | | | |
Steel Dynamics, Inc. | | | 74,978 | | | $ | 2,024,406 | |
| | | | | | | | |
Total Materials | | | | | | | 5,270,437 | |
| | |
| Real Estate — 14.8% | | | | | | |
| | |
Hotel & Resort REIT’s — 1.6% | | | | | | | | |
Host Hotels & Resorts, Inc. (1) | | | 142,820 | | | | 2,290,833 | |
| | |
Office REIT’s — 1.4% | | | | | | | | |
Boston Properties, Inc. | | | 15,934 | | | | 2,046,244 | |
| | |
Residential REIT’s — 7.4% | | | | | | | | |
AvalonBay Communities, Inc. (1) | | | 11,950 | | | | 2,540,092 | |
Camden Property Trust | | | 22,951 | | | | 2,484,446 | |
Essex Property Trust, Inc. | | | 9,137 | | | | 2,935,353 | |
UDR, Inc. | | | 50,013 | | | | 2,409,626 | |
| | | | | | | | |
| | | | | | | 10,369,517 | |
| | |
Retail REIT’s — 1.4% | | | | | | | | |
Realty Income Corp. (1) | | | 26,308 | | | | 1,941,793 | |
| | |
Specialized REIT’s — 3.0% | | | | | | | | |
EPR Properties | | | 23,750 | | | | 1,858,438 | |
Lamar Advertising Co., Class A (1) | | | 31,322 | | | | 2,400,831 | |
| | | | | | | | |
| | | | | | | 4,259,269 | |
| | | | | | | | |
Total Real Estate | | | | | | | 20,907,656 | |
| | |
| Utilities — 10.3% | | | | | | |
| | |
Electric Utilities — 2.0% | | | | | | | | |
Entergy Corp. | | | 24,695 | | | | 2,786,584 | |
| | |
Gas Utilities — 1.5% | | | | | | | | |
UGI Corp. (1) | | | 44,608 | | | | 2,171,071 | |
|
Independent Power Producers & Energy Traders — 3.0% | |
AES Corp. | | | 148,573 | | | | 2,277,624 | |
NRG Energy, Inc. | | | 51,463 | | | | 1,873,253 | |
| | | | | | | | |
| | | | | | | 4,150,877 | |
| | |
Multi-Utilities — 3.8% | | | | | | | | |
Ameren Corp. | | | 36,698 | | | | 2,831,251 | |
CenterPoint Energy, Inc. | | | 92,861 | | | | 2,571,321 | |
| | | | | | | | |
| | | | | | | 5,402,572 | |
| | | | | | | | |
Total Utilities | | | | | | | 14,511,104 | |
| | | | | | | | |
Total Common Stocks
(identified cost $128,741,086) | | | | | | | 137,657,139 | |
| | | | | | | | |
| Short-Term Investments — 30.8% | | | | |
|
| Collateral Pool Investments for Securities on Loan — 29.9% | |
| | |
Collateral pool allocation (3) | | | | | | | 42,152,765 | |
| | |
| Mutual Funds — 0.9% | | | | | | |
BMO Institutional Prime Money Market Fund — Premier Class, 2.097% (4) | | | 1,258,948 | | | | 1,259,074 | |
| | | | | | | | |
Total Short-Term Investments
(identified cost $43,411,838) | | | | | | | 43,411,839 | |
| | | | | | | | |
Total Investments — 128.5%
(identified cost $172,152,924) | | | | | | | 181,068,978 | |
| Other Assets and Liabilities — (28.5)% | | | | (40,186,590 | ) |
| | | | | | | | |
| Total Net Assets — 100.0% | | | | | | $ | 140,882,388 | |
| | | | | | | | |
Mid-Cap Growth Fund
| | | | | | | | |
| Description | | Shares | | | Value | |
| Common Stocks — 98.3% | |
|
| Communication Services — 2.6% | |
|
Cable & Satellite — 1.5% | |
Altice USA, Inc., Class A (2) | | | 49,402 | | | $ | 1,426,730 | |
|
Internet & Direct Marketing Retail — 1.1% | |
TripAdvisor, Inc. (1)(2) | | | 27,989 | | | | 1,063,302 | |
| | | | | | | | |
Total Communication Services | | | | 2,490,032 | |
|
| Consumer Discretionary — 16.0% | |
|
Apparel Retail — 2.1% | |
Burlington Stores, Inc. (2) | | | 9,770 | | | | 1,978,327 | |
|
Apparel, Accessories & Luxury Goods — 2.4% | |
Columbia Sportswear Co. | | | 11,647 | | | | 1,092,372 | |
VF Corp. | | | 15,396 | | | | 1,261,702 | |
| | | | | | | | |
| | | | | | | 2,354,074 | |
| | |
Automotive Retail — 1.4% | | | | | | | | |
O’Reilly Automotive, Inc. (1)(2) | | | 3,555 | | | | 1,364,267 | |
| | |
Casinos & Gaming — 1.5% | | | | | | | | |
MGM Resorts International (1) | | | 52,674 | | | | 1,478,032 | |
| | |
Footwear — 1.3% | | | | | | | | |
Deckers Outdoor Corp. (2) | | | 8,411 | | | | 1,240,202 | |
|
General Merchandise Stores — 1.6% | |
Dollar General Corp. | | | 9,576 | | | | 1,494,718 | |
|
Hotels, Resorts & Cruise Lines — 1.3% | |
Hilton Worldwide Holdings, Inc. | | | 13,406 | | | | 1,238,312 | |
|
Internet & Direct Marketing Retail — 1.6% | |
Expedia Group, Inc. | | | 12,205 | | | | 1,587,871 | |
| | |
Specialty Stores — 2.8% | | | | | | | | |
Tractor Supply Co. | | | 16,583 | | | | 1,689,476 | |
Ulta Salon Cosmetics & Fragrance, Inc. (2) | | | 4,400 | | | | 1,046,012 | |
| | | | | | | | |
| | | | | | | 2,735,488 | |
| | | | | | | | |
Total Consumer Discretionary | | | | 15,471,291 | |
| | |
| Consumer Staples — 4.0% | | | | | | |
|
Food Distributors — 1.7% | |
U.S. Foods Holding Corp. (2) | | | 40,624 | | | | 1,643,241 | |
| | |
Food Retail — 1.0% | | | | | | | | |
Sprouts Farmers Market, Inc. (2) | | | 53,704 | | | | 963,987 | |
|
Packaged Foods & Meats — 1.3% | |
Post Holdings, Inc. (2) | | | 12,497 | | | | 1,245,826 | |
| | | | | | | | |
Total Consumer Staples | | | | | | | 3,853,054 | |
| | |
| Energy — 1.8% | | | | | | |
|
Oil &Gas-Exploration & Production — 0.8% | |
Cabot Oil & Gas Corp. | | | 45,276 | | | | 775,125 | |
|
Oil &Gas-Storage & Transportation — 1.0% | |
Cheniere Energy, Inc. (1)(2) | | | 15,771 | | | | 941,687 | |
| | | | | | | | |
Total Energy | | | | | | | 1,716,812 | |
| | |
| Financials — 4.3% | | | | | | |
|
Investment Banking & Brokerage — 2.8% | |
E*TRADE Financial Corp. | | | 25,563 | | | | 1,067,000 | |
LPL Financial Holdings, Inc. (1) | | | 21,691 | | | | 1,625,740 | |
| | | | | | | | |
| | | | | | | 2,692,740 | |
|
Reinsurance — 1.5% | |
Everest Re Group, Ltd. | | | 6,067 | | | | 1,431,084 | |
| | | | | | | | |
Total Financials | | | | | | | 4,123,824 | |
(See Notes to Schedules of Investments and Notes to Financial Statements, which are an integral part of the Financial Statements)
44
Mid-Cap Growth Fund (continued)
| | | | | | | | |
| Description | | Shares | | | Value | |
| Common Stocks (continued) | |
| | |
| Healthcare — 14.5% | | | | | | |
|
Biotechnology — 4.8% | |
Exelixis, Inc. (2) | | | 59,791 | | | $ | 1,186,851 | |
Incyte Corp. (1)(2) | | | 15,016 | | | | 1,228,609 | |
Ionis Pharmaceuticals, Inc. (1)(2) | | | 17,689 | | | | 1,118,122 | |
Neurocrine Biosciences, Inc. (2) | | | 11,254 | | | | 1,118,873 | |
| | | | | | | | |
| | | | | | | 4,652,455 | |
|
Healthcare Equipment — 4.0% | |
DexCom, Inc. (2) | | | 11,074 | | | | 1,900,409 | |
Masimo Corp. (2) | | | 13,160 | | | | 2,016,770 | |
| | | | | | | | |
| | | | | | | 3,917,179 | |
|
Healthcare Supplies — 1.5% | |
Cooper Cos., Inc. | | | 4,574 | | | | 1,416,796 | |
|
Healthcare Technology — 1.7% | |
Veeva Systems, Inc., Class A (2) | | | 10,352 | | | | 1,660,254 | |
|
Life Sciences Tools & Services — 1.5% | |
Bio-Rad Laboratories, Inc., Class A (2) | | | 4,344 | | | | 1,467,012 | |
|
Pharmaceuticals — 1.0% | |
Jazz Pharmaceuticals PLC (1)(2) | | | 7,317 | | | | 937,674 | |
| | | | | | | | |
Total Healthcare | | | | | | | 14,051,370 | |
| | |
| Industrials — 12.8% | | | | | | |
|
Building Products — 2.9% | |
Fortune Brands Home & Security, Inc. | | | 23,280 | | | | 1,188,677 | |
Masco Corp. | | | 40,508 | | | | 1,649,891 | |
| | | | | | | | |
| | | | | | | 2,838,568 | |
|
Construction Machinery & Heavy Trucks — 2.7% | |
Allison Transmission Holdings, Inc. | | | 30,419 | | | | 1,351,516 | |
Cummins, Inc. | | | 8,560 | | | | 1,277,751 | |
| | | | | | | | |
| | | | | | | 2,629,267 | |
|
Electrical Components & Equipment — 1.4% | |
Hubbell, Inc. (1) | | | 10,270 | | | | 1,346,808 | |
|
Human Resource & Employment Services — 1.3% | |
Insperity, Inc. (1) | | | 12,993 | | | | 1,287,086 | |
|
Industrial Machinery — 2.9% | |
Flowserve Corp. (1) | | | 31,701 | | | | 1,352,999 | |
ITT, Inc. | | | 25,411 | | | | 1,446,394 | |
| | | | | | | | |
| | | | | | | 2,799,393 | |
|
Research & Consulting Services — 1.6% | |
CoStar Group, Inc. (2) | | | 2,468 | | | | 1,517,499 | |
| | | | | | | | |
Total Industrials | | | | | | | 12,418,621 | |
| | |
| Information Technology — 34.6% | | | | | | |
|
Application Software — 7.9% | |
Guidewire Software, Inc. (1)(2) | | | 12,015 | | | | 1,155,603 | |
HubSpot, Inc. (1)(2) | | | 6,906 | | | | 1,378,990 | |
New Relic, Inc. (2) | | | 12,002 | | | | 688,194 | |
Paylocity Holding Corp. (2) | | | 12,573 | | | | 1,373,223 | |
Splunk, Inc. (1)(2) | | | 13,201 | | | | 1,476,136 | |
Synopsys, Inc. (2) | | | 11,406 | | | | 1,617,485 | |
| | | | | | | | |
| | | | | | | 7,689,631 | |
|
Communications Equipment — 2.4% | |
Ciena Corp. (2) | | | 27,405 | | | | 1,121,687 | |
F5 Networks, Inc. (2) | | | 9,387 | | | | 1,208,388 | |
| | | | | | | | |
| | | | | | | 2,330,075 | |
|
Consulting & Other Services — 2.1% | |
EPAM Systems, Inc. (1)(2) | | | 10,857 | | | | 2,077,270 | |
| | | | | | | | |
| Description | | Shares | | | Value | |
| Common Stocks (continued) | |
| | |
| Information Technology (continued) | | | | | | |
|
Data Processing & Outsourced Services — 4.8% | |
Euronet Worldwide, Inc. (1)(2) | | | 10,886 | | | $ | 1,667,082 | |
Genpact, Ltd. | | | 35,980 | | | | 1,473,741 | |
WEX, Inc. (2) | | | 7,382 | | | | 1,509,988 | |
| | | | | | | | |
| | | | | | | 4,650,811 | |
|
Electronic Components — 1.2% | |
Dolby Laboratories, Inc., Class A | | | 18,059 | | | | 1,111,712 | |
|
Electronic Equipment & Instruments — 2.0% | |
Keysight Technologies, Inc. (1)(2) | | | 20,265 | | | | 1,962,868 | |
|
Internet Services & Infrastructure — 3.1% | |
GoDaddy, Inc., Class A (2) | | | 23,048 | | | | 1,459,860 | |
Palo Alto Networks, Inc. (2) | | | 7,734 | | | | 1,574,797 | |
| | | | | | | | |
| | | | | | | 3,034,657 | |
|
Semiconductor Equipment — 3.6% | |
KLA Corp. | | | 12,095 | | | | 1,788,850 | |
Teradyne, Inc. | | | 31,240 | | | | 1,654,783 | |
| | | | | | | | |
| | | | | | | 3,443,633 | |
|
Semiconductors — 1.3% | |
ON Semiconductor Corp. (1)(2) | | | 70,767 | | | | 1,259,653 | |
|
Systems Software — 4.3% | |
FireEye, Inc. (1)(2) | | | 67,142 | | | | 901,717 | |
Fortinet, Inc. (2) | | | 21,812 | | | | 1,727,074 | |
Proofpoint, Inc. (1)(2) | | | 13,273 | | | | 1,507,946 | |
| | | | | | | | |
| | | | | | | 4,136,737 | |
|
Technology Hardware, Storage & Peripherals — 1.9% | |
NetApp, Inc. | | | 18,797 | | | | 903,384 | |
Pure Storage, Inc., Class A (1)(2) | | | 57,545 | | | | 936,832 | |
| | | | | | | | |
| | | | | | | 1,840,216 | |
| | | | | | | | |
Total Information Technology | | | | | | | 33,537,263 | |
| | |
| Materials — 2.2% | | | | | | |
|
Specialty Chemicals — 1.5% | |
Axalta Coating Systems, Ltd. (1)(2) | | | 50,649 | | | | 1,462,743 | |
|
Steel — 0.7% | |
Steel Dynamics, Inc. | | | 23,006 | | | | 621,162 | |
| | | | | | | | |
Total Materials | | | | | | | 2,083,905 | |
| | |
| Real Estate — 5.5% | | | | | | |
|
Office REIT’s — 1.1% | |
Boston Properties, Inc. (1) | | | 8,277 | | | | 1,062,933 | |
|
Real Estate Services — 1.5% | |
CBRE Group, Inc., Class A (1)(2) | | | 27,953 | | | | 1,461,103 | |
|
Residential REIT’s — 2.9% | |
Equity LifeStyle Properties, Inc. | | | 9,667 | | | | 1,302,338 | |
Essex Property Trust, Inc. | | | 4,784 | | | | 1,536,908 | |
| | | | | | | | |
| | | | | | | 2,839,246 | |
| | | | | | | | |
Total Real Estate | | | | | | | 5,363,282 | |
| | | | | | | | |
Total Common Stocks
(identified cost $81,911,538) | | | | | | | 95,109,454 | |
| | | | | | | | |
| Short-Term Investments — 24.0% | |
|
| Collateral Pool Investments for Securities on Loan — 23.3% | |
| |
Collateral pool allocation (3) | | | | 22,590,044 | |
(See Notes to Schedules of Investments and Notes to Financial Statements, which are an integral part of the Financial Statements)
45
August 31, 2019
Mid-Cap Growth Fund (continued)
| | | | | | | | |
| Description | | Shares | | | Value | |
| Short-Term Investments (continued) | |
|
| Mutual Funds — 0.7% | |
BMO Institutional Prime Money Market Fund — Premier Class, 2.097% (4) | | | 686,931 | | | $ | 687,000 | |
| | | | | | | | |
Total Short-Term Investments
(identified cost $23,277,041) | | | | | | | 23,277,044 | |
| | | | | | | | |
Total Investments — 122.3%
(identified cost $105,188,579) | | | | | | | 118,386,498 | |
| Other Assets and Liabilities — (22.3)% | | | | (21,602,681 | ) |
| | | | | |
| Total Net Assets — 100.0% | | | | | | $ | 96,783,817 | |
| | | | | | | | |
Small-Cap Value Fund
| | | | | | | | |
| Description | | Shares | | | Value | |
| Common Stocks — 98.7% | | | | | | |
|
| Communication Services — 0.6% | |
|
Cable & Satellite — 0.6% | |
MSG Networks, Inc., Class A (2) | | | 20,197 | | | $ | 331,231 | |
|
| Consumer Discretionary — 6.8% | |
| | |
Apparel Retail — 1.1% | | | | | | | | |
American Eagle Outfitters, Inc. (1) | | | 23,725 | | | | 399,055 | |
Genesco, Inc. (1)(2) | | | 5,684 | | | | 202,805 | |
| | | | | | | | |
| | | | | | | 601,860 | |
|
Apparel, Accessories & Luxury Goods — 0.4% | |
Vera Bradley, Inc. (1)(2) | | | 19,189 | | | | 203,211 | |
|
Auto Parts & Equipment — 1.9% | |
American Axle & Manufacturing Holdings, Inc. (1)(2) | | | 13,819 | | | | 87,612 | |
Cooper-Standard Holdings, Inc. (1)(2) | | | 3,193 | | | | 119,546 | |
Dana, Inc. (1) | | | 30,123 | | | | 383,466 | |
Stoneridge, Inc. (1)(2) | | | 14,608 | | | | 448,612 | |
| | | | | | | | |
| | | | | | | 1,039,236 | |
| | |
Footwear �� 0.7% | | | | | | | | |
Deckers Outdoor Corp. (1)(2) | | | 2,603 | | | | 383,812 | |
|
Home Furnishings — 0.5% | |
La-Z-Boy, Inc. (1) | | | 9,163 | | | | 292,025 | |
| | |
Homebuilding — 1.1% | | | | | | | | |
KB Home (1) | | | 22,336 | | | | 627,418 | |
|
Homefurnishing Retail — 0.2% | |
Bed Bath & Beyond, Inc. (1) | | | 10,891 | | | | 105,316 | |
| | |
Leisure Products — 0.3% | | | | | | | | |
Johnson Outdoors, Inc., Class A (1) | | | 3,504 | | | | 196,224 | |
|
Specialty Stores — 0.6% | |
Hibbett Sports, Inc. (1)(2) | | | 20,181 | | | | 333,794 | |
| | | | | | | | |
Total Consumer Discretionary | | | | | | | 3,782,896 | |
| | |
| Consumer Staples — 0.9% | | | | | | |
| | |
Food Distributors — 0.2% | | | | | | | | |
SpartanNash Co. | | | 9,407 | | | | 101,313 | |
|
Household Products — 0.7% | |
Central Garden & Pet Co., Class A (2) | | | 15,991 | | | | 384,744 | |
| | | | | | | | |
Total Consumer Staples | | | | | | | 486,057 | |
| | | | | | | | |
| Description | | Shares | | | Value | |
| Common Stocks (continued) | | | | | | |
| | |
| Energy — 5.4% | | | | | | |
|
Oil &Gas-Equipment & Services — 1.7% | |
FTS International, Inc. (2) | | | 54,750 | | | $ | 137,423 | |
Matrix Service Co. (1)(2) | | | 16,813 | | | | 334,074 | |
Newpark Resources, Inc. (1)(2) | | | 43,083 | | | | 284,779 | |
ProPetro Holding Corp. (1)(2) | | | 19,653 | | | | 209,304 | |
| | | | | | | | |
| | | | | | | 965,580 | |
|
Oil &Gas-Exploration & Production — 1.7% | |
Amplify Energy Corp. (1)(2) | | | 15,260 | | | | 90,950 | |
Laredo Petroleum, Inc. (1)(2) | | | 55,304 | | | | 137,154 | |
SRC Energy, Inc. (1)(2) | | | 96,712 | | | | 485,494 | |
W&T Offshore, Inc. (1)(2) | | | 46,176 | | | | 202,251 | |
| | | | | | | | |
| | | | | | | 915,849 | |
|
Oil &Gas-Refining & Marketing — 2.0% | |
Delek US Holdings, Inc. (1) | | | 16,758 | | | | 548,824 | |
World Fuel Services Corp. (1) | | | 14,712 | | | | 564,941 | |
| | | | | | | | |
| | | | | | | 1,113,765 | |
| | | | | | | | |
Total Energy | | | | | | | 2,995,194 | |
| | |
| Financials — 27.1% | | | | | | |
|
Asset Management & Custody Banks — 0.7% | |
Waddell & Reed Financial, Inc., Class A (1) | | | 24,416 | | | | 394,807 | |
| | |
Consumer Finance — 0.7% | | | | | | | | |
Nelnet, Inc., Class A (1) | | | 5,994 | | | | 401,898 | |
|
Investment Banking & Brokerage — 1.6% | |
Cowen, Inc., Class A (1)(2) | | | 15,662 | | | | 244,484 | |
Stifel Financial Corp. (1) | | | 12,301 | | | | 657,119 | |
| | | | | | | | |
| | | | | | | 901,603 | |
|
Life & Health Insurance — 0.9% | |
American Equity Investment Life Holding Co. | | | 23,177 | | | | 499,464 | |
|
Multi-Line Insurance — 0.5% | |
National General Holdings Corp. (1) | | | 11,259 | | | | 265,487 | |
|
Property & Casualty Insurance — 2.9% | |
Argo Group International Holdings, Ltd. | | | 9,018 | | | | 592,663 | |
Employers Holdings, Inc. (1) | | | 14,483 | | | | 624,652 | |
Safety Insurance Group, Inc. (1) | | | 4,132 | | | | 398,490 | |
| | | | | | | | |
| | | | | | | 1,615,805 | |
|
Regional Banks — 15.6% | |
1st Source Corp. (1) | | | 5,610 | | | | 248,916 | |
Atlantic Capital Bancshares, Inc. (2) | | | 11,685 | | | | 190,465 | |
Boston Private Financial Holdings, Inc. | | | 29,669 | | | | 315,085 | |
Cathay General Bancorp (1) | | | 19,915 | | | | 660,979 | |
Central Pacific Financial Corp. (1) | | | 16,015 | | | | 445,537 | |
Community Trust Bancorp, Inc. | | | 4,446 | | | | 172,949 | |
Enterprise Financial Services Corp. (1) | | | 7,102 | | | | 279,961 | |
Financial Institutions, Inc. | | | 5,555 | | | | 161,428 | |
First Bancorp/Southern Pines NC (1) | | | 6,531 | | | | 230,022 | |
First Commonwealth Financial Corp. | | | 29,179 | | | | 360,944 | |
Great Southern Bancorp, Inc. | | | 2,352 | | | | 132,512 | |
Great Western Bancorp, Inc. (1) | | | 19,697 | | | | 587,562 | |
Hancock Whitney Corp. (1) | | | 17,495 | | | | 614,249 | |
Hanmi Financial Corp. | | | 18,230 | | | | 326,499 | |
Hilltop Holdings, Inc. | | | 22,923 | | | | 544,421 | |
IBERIABANK Corp. (1) | | | 9,739 | | | | 671,894 | |
International Bancshares Corp. (1) | | | 16,781 | | | | 597,236 | |
Investors Bancorp, Inc. | | | 17,485 | | | | 194,083 | |
Peapack Gladstone Financial Corp. (1) | | | 6,006 | | | | 168,949 | |
Peoples Bancorp, Inc. | | | 4,287 | | | | 131,654 | |
Preferred Bank (1) | | | 5,143 | | | | 256,944 | |
Sandy Spring Bancorp, Inc. | | | 10,956 | | | | 366,807 | |
(See Notes to Schedules of Investments and Notes to Financial Statements, which are an integral part of the Financial Statements)
46
Small-Cap Value Fund (continued)
| | | | | | | | |
| Description | | Shares | | | Value | |
| Common Stocks (continued) | | | | | | |
| | |
| Financials (continued) | | | | | | |
Texas Capital Bancshares, Inc. (1)(2) | | | 5,915 | | | $ | 318,700 | |
Univest Financial Corp. (1) | | | 7,458 | | | | 188,762 | |
Wintrust Financial Corp. | | | 8,238 | | | | 517,594 | |
| | | | | | | | |
| | | | | | | 8,684,152 | |
|
Thrifts & Mortgage Finance — 4.2% | |
Axos Financial, Inc. (2) | | | 11,264 | | | | 291,850 | |
Essent Group, Ltd. (1) | | | 10,486 | | | | 508,571 | |
First Defiance Financial Corp. | | | 5,931 | | | | 155,096 | |
NMI Holdings, Inc., Class A (1)(2) | | | 17,733 | | | | 502,553 | |
TrustCo Bank Corp. (1) | | | 32,820 | | | | 251,730 | |
Walker & Dunlop, Inc. | | | 11,555 | | | | 645,462 | |
| | | | | | | | |
| | | | | | | 2,355,262 | |
| | | | | | | | |
Total Financials | | | | | | | 15,118,478 | |
| | |
| Healthcare — 7.4% | | | | | | |
| |
Biotechnology — 0.9% | | | | | |
CareDx, Inc. (1)(2) | | | 3,597 | | | | 82,084 | |
Emergent BioSolutions, Inc. (1)(2) | | | 5,757 | | | | 252,157 | |
Myriad Genetics, Inc. (1)(2) | | | 7,589 | | | | 178,569 | |
| | | | | | | | |
| | | | | | | 512,810 | |
|
Healthcare Equipment — 2.8% | |
CONMED Corp. (1) | | | 6,045 | | | | 609,154 | |
Integer Holdings Corp. (2) | | | 4,250 | | | | 307,700 | |
Natus Medical, Inc. (1)(2) | | | 8,160 | | | | 225,869 | |
Orthofix Medical, Inc. (1)(2) | | | 8,601 | | | | 437,275 | |
| | | | | | | | |
| | | | | | | 1,579,998 | |
|
Healthcare Supplies — 1.0% | |
Lantheus Holdings, Inc. (2) | | | 16,784 | | | | 365,220 | |
Meridian Bioscience, Inc. | | | 20,645 | | | | 190,553 | |
| | | | | | | | |
| | | | | | | 555,773 | |
|
Healthcare Technology — 1.4% | |
Computer Programs & Systems, Inc. | | | 10,628 | | | | 224,782 | |
HMS Holdings Corp. (1)(2) | | | 14,932 | | | | 545,466 | |
| | | | | | | | |
| | | | | | | 770,248 | |
|
Life Sciences Tools & Services — 0.7% | |
Luminex Corp. (1) | | | 17,848 | | | | 365,884 | |
| | |
Pharmaceuticals — 0.6% | | | | | | | | |
Assertio Therapeutics, Inc. (2) | | | 35,561 | | | | 51,208 | |
Phibro Animal Health Corp., Class A | | | 15,100 | | | | 311,815 | |
| | | | | | | | |
| | | | | | | 363,023 | |
| | | | | | | | |
Total Healthcare | | | | | | | 4,147,736 | |
| | |
| Industrials — 15.6% | | | | | | |
|
Air Freight & Logistics — 0.3% | |
Atlas Air Worldwide Holdings, Inc. (1)(2) | | | 6,715 | | | | 173,583 | |
| | |
Airlines — 0.6% | | | | | | | | |
Hawaiian Holdings, Inc. (1) | | | 13,993 | | | | 341,569 | |
|
Building Products — 2.2% | |
Apogee Enterprises, Inc. | | | 7,381 | | | | 272,580 | |
Builders FirstSource, Inc. (2) | | | 13,393 | | | | 260,494 | |
Masonite International Corp. (1)(2) | | | 7,670 | | | | 409,501 | |
Quanex Building Products Corp. (1) | | | 17,341 | | | | 298,612 | |
| | | | | | | | |
| | | | | | | 1,241,187 | |
|
Construction & Engineering — 0.7% | |
Great Lakes Dredge & Dock Corp. (2) | | | 35,103 | | | | 380,517 | |
| | | | | | | | |
| Description | | Shares | | | Value | |
| Common Stocks (continued) | | | | | | |
| | |
| Industrials (continued) | | | | | | |
|
Construction Machinery & Heavy Trucks — 0.3% | |
Wabash National Corp. (1) | | | 12,512 | | | $ | 170,664 | |
|
Diversified Support Services — 1.4% | |
UniFirst Corp. | | | 4,053 | | | | 794,023 | |
|
Electrical Components & Equipment — 0.3% | |
Encore Wire Corp. | | | 3,042 | | | | 164,238 | |
|
Human Resource & Employment Services — 0.5% | |
TrueBlue, Inc. (1)(2) | | | 13,608 | | | | 264,131 | |
|
Industrial Machinery — 1.0% | |
Columbus McKinnon Corp. | | | 6,625 | | | | 214,451 | |
SPX FLOW, Inc. (1)(2) | | | 10,261 | | | | 345,899 | |
| | | | | | | | |
| | | | | | | 560,350 | |
|
Office Services & Supplies — 2.6% | |
ACCO Brands Corp. (1) | | | 35,820 | | | | 332,052 | |
Herman Miller, Inc. (1) | | | 5,662 | | | | 239,389 | |
Kimball International, Inc., Class B | | | 11,524 | | | | 202,246 | |
Steelcase, Inc., Class A | | | 41,806 | | | | 649,247 | |
| | | | | | | | |
| | | | | | | 1,422,934 | |
|
Research & Consulting Services — 0.7% | |
CBIZ, Inc. (2) | | | 18,003 | | | | 402,187 | |
|
Trading Companies & Distributors — 3.5% | |
Aircastle, Ltd. (1) | | | 14,972 | | | | 327,138 | |
BMC Stock Holdings, Inc. (1)(2) | | | 16,841 | | | | 428,267 | |
Foundation Building Materials, Inc. (1)(2) | | | 12,190 | | | | 208,815 | |
Herc Holdings, Inc. (2) | | | 4,578 | | | | 188,980 | |
Rush Enterprises, Inc., Class A | | | 11,441 | | | | 413,134 | |
WESCO International, Inc. (2) | | | 9,082 | | | | 409,416 | |
| | | | | | | | |
| | | | | | | 1,975,750 | |
|
Trucking — 1.5% | |
ArcBest Corp. (1) | | | 9,779 | | | | 289,556 | |
Covenant Transportation Group, Inc., Class A (2) | | | 10,254 | | | | 147,453 | |
Ryder System, Inc. (1) | | | 8,650 | | | | 416,670 | |
| | | | | | | | |
| | | | | | | 853,679 | |
| | | | | | | | |
Total Industrials | | | | | | | 8,744,812 | |
|
| Information Technology — 10.8% | |
|
Communications Equipment — 0.8% | |
Ciena Corp. (1)(2) | | | 8,114 | | | | 332,106 | |
Comtech Telecommunications Corp. | | | 4,991 | | | | 133,509 | |
| | | | | | | | |
| | | | | | | 465,615 | |
|
Consulting & Other Services — 0.7% | |
Presidio, Inc. (1) | | | 22,801 | | | | 365,272 | |
|
Data Processing & Outsourced Services — 0.9% | |
Sykes Enterprises, Inc. (1)(2) | | | 17,513 | | | | 507,877 | |
|
Electronic Components — 1.4% | |
Belden, Inc. (1) | | | 7,120 | | | | 324,743 | |
Vishay Intertechnology, Inc. | | | 29,922 | | | | 473,665 | |
| | | | | | | | |
| | | | | | | 798,408 | |
|
Electronic Equipment & Instruments — 0.6% | |
MTS Systems Corp. | | | 5,957 | | | | 338,775 | |
|
Electronic Manufacturing Services — 1.8% | |
Benchmark Electronics, Inc. (1) | | | 12,505 | | | | 331,132 | |
CTS Corp. (1) | | | 4,694 | | | | 133,920 | |
Fabrinet (1)(2) | | | 10,187 | | | | 514,342 | |
| | | | | | | | |
| | | | | | | 979,394 | |
(See Notes to Schedules of Investments and Notes to Financial Statements, which are an integral part of the Financial Statements)
47
August 31, 2019
Small-Cap Value Fund (continued)
| | | | | | | | |
| Description | | Shares | | | Value | |
| Common Stocks (continued) | | | | | | |
|
| Information Technology (continued) | |
|
Semiconductor Equipment — 1.6% | |
Amkor Technology, Inc. (1)(2) | | | 66,310 | | | $ | 580,212 | |
Rudolph Technologies, Inc. (2) | | | 15,335 | | | | 337,217 | |
| | | | | | | | |
| | | | | | | 917,429 | |
| | |
Semiconductors — 1.1% | | | | | | | | |
Diodes, Inc. (1)(2) | | | 16,044 | | | | 586,408 | |
|
Technology Distributors — 1.9% | |
Insight Enterprises, Inc. (1)(2) | | | 11,174 | | | | 537,022 | |
Tech Data Corp. (2) | | | 5,672 | | | | 525,965 | |
| | | | | | | | |
| | | | | | | 1,062,987 | |
| | | | | | | | |
Total Information Technology | | | | | | | 6,022,165 | |
| | |
| Materials — 5.0% | | | | | | |
|
Commodity Chemicals — 0.8% | |
Trinseo SA (1) | | | 12,246 | | | | 429,712 | |
|
Forest Products — 1.7% | |
Boise Cascade Co. (1) | | | 17,697 | | | | 555,686 | |
Louisiana-Pacific Corp. (1) | | | 16,238 | | | | 390,362 | |
| | | | | | | | |
| | | | | | | 946,048 | |
|
Paper Products — 0.3% | |
Domtar Corp. | | | 5,374 | | | | 177,073 | |
|
Specialty Chemicals — 1.8% | |
Kraton Corp. (1)(2) | | | 16,540 | | | | 453,857 | |
Stepan Co. (1) | | | 6,112 | | | | 583,024 | |
| | | | | | | | |
| | | | | | | 1,036,881 | |
| | |
Steel — 0.4% | | | | | | | | |
Schnitzer Steel Industries, Inc., Class A (1) | | | 9,673 | | | | 214,160 | |
| | | | | | | | |
Total Materials | | | | | | | 2,803,874 | |
| | |
| Real Estate — 13.5% | | | | | | |
|
Diversified REIT’s — 3.6% | |
Alexander & Baldwin, Inc. (1) | | | 26,160 | | | | 598,802 | |
American Assets Trust, Inc. (1) | | | 11,368 | | | | 532,704 | |
Lexington Realty Trust (1) | | | 29,927 | | | | 310,942 | |
PS Business Parks, Inc. (1) | | | 3,096 | | | | 556,073 | |
| | | | | | | | |
| | | | | | | 1,998,521 | |
| | |
Healthcare REIT’s — 1.9% | | | | | | | | |
CareTrust REIT, Inc. (1) | | | 23,224 | | | | 552,499 | |
Physicians Realty Trust (1) | | | 27,681 | | | | 479,435 | |
| | | | | | | | |
| | | | | | | 1,031,934 | |
| | |
Hotel & Resort REIT’s — 2.4% | | | | | | | | |
Braemar Hotels & Resorts, Inc. (1) | | | 20,379 | | | | 186,876 | |
Sunstone Hotel Investors, Inc. (1) | | | 42,327 | | | | 556,177 | |
Xenia Hotels & Resorts, Inc. (1) | | | 29,816 | | | | 602,581 | |
| | | | | | | | |
| | | | | | | 1,345,634 | |
| | |
Industrial REIT’s — 1.8% | | | | | | | | |
First Industrial Realty Trust, Inc. | | | 20,568 | | | | 801,124 | |
STAG Industrial, Inc. (1) | | | 7,178 | | | | 208,736 | |
| | | | | | | | |
| | | | | | | 1,009,860 | |
| | |
Office REIT’s — 1.2% | | | | | | | | |
Piedmont Office Realty Trust, Inc., Class A (1) | | | 35,101 | | | | 692,894 | |
|
Real Estate Services — 0.2% | |
Realogy Holdings Corp. (1) | | | 23,672 | | | | 113,152 | |
| | | | | | | | |
| Description | | Shares | | | Value | |
| Common Stocks (continued) | | | | | | |
| | |
| Real Estate (continued) | | | | | | |
| | |
Residential REIT’s — 0.3% | | | | | | | | |
Preferred Apartment Communities, Inc., Class A (1) | | | 13,236 | | | $ | 178,156 | |
| | |
Retail REIT’s — 1.0% | | | | | | | | |
Getty Realty Corp. (1) | | | 10,498 | | | | 333,416 | |
Saul Centers, Inc. (1) | | | 4,073 | | | | 204,587 | |
| | | | | | | | |
| | | | | | | 538,003 | |
|
Specialized REIT’s — 1.1% | |
National Storage Affiliates Trust (1) | | | 18,272 | | | | 611,381 | |
| | | | | | | | |
Total Real Estate | | | | | | | 7,519,535 | |
| | |
| Utilities — 5.6% | | | | | | |
|
Electric Utilities — 4.3% | |
IDACORP, Inc. (1) | | | 5,607 | | | | 615,705 | |
Otter Tail Corp. | | | 4,308 | | | | 218,071 | |
PNM Resources, Inc. | | | 14,209 | | | | 724,801 | |
Portland General Electric Co. (1) | | | 15,417 | | | | 877,073 | |
| | | | | | | | |
| | | | | | | 2,435,650 | |
| | |
Multi-Utilities — 1.3% | | | | | | | | |
Black Hills Corp. (1) | | | 9,397 | | | | 720,844 | |
| | | | | | | | |
Total Utilities | | | | | | | 3,156,494 | |
| | | | | | | | |
Total Common Stocks
(identified cost $55,157,121) | | | | | | | 55,108,472 | |
| | | | | | | | |
| Short-Term Investments — 36.0% | | | | | | |
|
| Collateral Pool Investments for Securities on Loan — 35.1% | |
| | |
Collateral pool allocation (3) | | | | | | | 19,580,233 | |
| | |
| Mutual Funds — 0.9% | | | | | | |
BMO Institutional Prime Money Market Fund — Premier Class, 2.097% (4) | | | 511,778 | | | | 511,829 | |
| | | | | | | | |
Total Short-Term Investments
(identified cost $20,092,040) | | | | | | | 20,092,062 | |
| | | | | | | | |
Total Investments — 134.7%
(identified cost $75,249,161) | | | | | | | 75,200,534 | |
| Other Assets and Liabilities — (34.7)% | | | | (19,366,625 | ) |
| | | | | | | | |
| Total Net Assets — 100.0% | | | | | | $ | 55,833,909 | |
| | | | | | | | |
Small-Cap Core Fund
| | | | | | | | |
| Description | | Shares | | | Value | |
| Common Stocks — 97.9% | |
|
| Communication Services — 2.8% | |
|
Alternative Carriers — 1.9% | |
Cogent Communications Holdings, Inc. (1) | | | 2,653 | | | $ | 161,541 | |
Iridium Communications, Inc. (1)(2) | | | 4,404 | | | | 106,489 | |
| | | | | | | | |
| | | | | | | 268,030 | |
|
Movies & Entertainment — 0.9% | |
IMAX Corp. (2) | | | 5,903 | | | | 123,491 | |
| | | | | | | | |
Total Communication Services | | | | | | | 391,521 | |
|
| Consumer Discretionary — 7.6% | |
|
Apparel Retail — 1.5% | |
American Eagle Outfitters, Inc. (1) | | | 4,836 | | | | 81,342 | |
Genesco, Inc. (1)(2) | | | 2,109 | | | | 75,249 | |
Zumiez, Inc. (1)(2) | | | 2,288 | | | | 59,442 | |
| | | | | | | | |
| | | | | | | 216,033 | |
(See Notes to Schedules of Investments and Notes to Financial Statements, which are an integral part of the Financial Statements)
48
Small-Cap Core Fund (continued)
| | | | | | | | |
| Description | | Shares | | | Value | |
| Common Stocks (continued) | |
|
| Consumer Discretionary (continued) | |
|
Apparel, Accessories & Luxury Goods — 0.4% | |
Vera Bradley, Inc. (2) | | | 4,765 | | | $ | 50,461 | |
| | |
Auto Parts & Equipment — 1.5% | | | | | | | | |
American Axle & Manufacturing Holdings, Inc. (2) | | | 6,665 | | | | 42,256 | |
Dana, Inc. (1) | | | 7,604 | | | | 96,799 | |
Stoneridge, Inc. (2) | | | 2,373 | | | | 72,875 | |
| | | | | | | | |
| | | | | | | 211,930 | |
|
Casinos & Gaming — 0.6% | |
Everi Holdings, Inc. (1)(2) | | | 9,521 | | | | 85,118 | |
| | |
Education Services — 0.8% | | | | | | | | |
K12, Inc. (2) | | | 4,342 | | | | 114,412 | |
|
Footwear — 1.1% | |
Deckers Outdoor Corp. (2) | | | 999 | | | | 147,302 | |
|
Homebuilding — 1.1% | |
KB Home (1) | | | 5,484 | | | | 154,046 | |
|
Specialty Stores — 0.6% | |
Container Store Group, Inc. (1)(2) | | | 6,800 | | | | 30,464 | |
Hibbett Sports, Inc. (1)(2) | | | 3,226 | | | | 53,358 | |
| | | | | | | | |
| | | | | | | 83,822 | |
| | | | | | | | |
Total Consumer Discretionary | | | | | | | 1,063,124 | |
| | |
| Consumer Staples — 3.7% | | | | | | |
|
Food Distributors — 1.3% | |
Performance Food Group Co. (1)(2) | | | 3,827 | | | | 179,066 | |
|
Food Retail — 0.3% | |
Natural Grocers by Vitamin Cottage, Inc. (1)(2) | | | 3,375 | | | | 31,860 | |
|
Household Products — 0.8% | |
Central Garden & Pet Co., Class A (2) | | | 4,622 | | | | 111,205 | |
|
Hypermarkets & Super Centers — 0.9% | |
BJ’s Wholesale Club Holdings, Inc. (1)(2) | | | 4,855 | | | | 127,492 | |
| | |
Personal Products — 0.4% | | | | | | | | |
elf Beauty, Inc. (2) | | | 3,597 | | | | 58,703 | |
| | | | | | | | |
Total Consumer Staples | | | | | | | 508,326 | |
| | |
| Energy — 2.0% | | | | | | |
|
Oil &Gas-Equipment & Services — 1.2% | |
FTS International, Inc. (2) | | | 6,013 | | | | 15,093 | |
Helix Energy Solutions Group, Inc. (2) | | | 7,826 | | | | 56,660 | |
Matrix Service Co. (2) | | | 1,512 | | | | 30,044 | |
ProPetro Holding Corp. (1)(2) | | | 6,136 | | | | 65,348 | |
| | | | | | | | |
| | | | | | | 167,145 | |
|
Oil &Gas-Refining & Marketing — 0.8% | |
World Fuel Services Corp. (1) | | | 3,020 | | | | 115,968 | |
| | | | | | | | |
Total Energy | | | | | | | 283,113 | |
| | |
| Financials — 15.8% | | | | | | |
|
Consumer Finance — 0.4% | |
Nelnet, Inc., Class A | | | 903 | | | | 60,546 | |
|
Investment Banking & Brokerage — 0.8% | |
Evercore, Inc., Class A (1) | | | 1,497 | | | | 119,401 | |
|
Life & Health Insurance — 1.4% | |
American Equity Investment Life Holding Co. | | | 3,614 | | | | 77,882 | |
Primerica, Inc. (1) | | | 991 | | | | 118,097 | |
| | | | | | | | |
| | | | | | | 195,979 | |
| | | | | | | | |
| Description | | Shares | | | Value | |
| Common Stocks (continued) | |
| | |
| Financials (continued) | | | | | | |
|
Property & Casualty Insurance — 1.0% | |
Employers Holdings, Inc. | | | 3,158 | | | $ | 136,204 | |
|
Regional Banks — 8.3% | |
1st Source Corp. (1) | | | 1,393 | | | | 61,807 | |
Boston Private Financial Holdings, Inc. | | | 6,454 | | | | 68,542 | |
Cathay General Bancorp (1) | | | 3,662 | | | | 121,542 | |
Central Pacific Financial Corp. | | | 3,788 | | | | 105,382 | |
Community Trust Bancorp, Inc. | | | 750 | | | | 29,175 | |
First Financial Corp. | | | 870 | | | | 35,322 | |
Great Western Bancorp, Inc. | | | 3,975 | | | | 118,574 | |
Hancock Whitney Corp. (1) | | | 3,772 | | | | 132,435 | |
Hanmi Financial Corp. | | | 3,896 | | | | 69,777 | |
Hilltop Holdings, Inc. | | | 4,293 | | | | 101,959 | |
IBERIABANK Corp. | | | 1,070 | | | | 73,819 | |
Investors Bancorp, Inc. | | | 11,900 | | | | 132,090 | |
Peapack Gladstone Financial Corp. | | | 1,629 | | | | 45,824 | |
Preferred Bank | | | 1,164 | | | | 58,154 | |
| | | | | | | | |
| | | | | | | 1,154,402 | |
|
Thrifts & Mortgage Finance — 3.9% | |
Axos Financial, Inc. (2) | | | 3,034 | | | | 78,611 | |
Essent Group, Ltd. (1) | | | 2,477 | | | | 120,135 | |
NMI Holdings, Inc., Class A (2) | | | 4,530 | | | | 128,380 | |
TrustCo Bank Corp. (1) | | | 8,333 | | | | 63,914 | |
Walker & Dunlop, Inc. | | | 2,662 | | | | 148,699 | |
| | | | | | | | |
| | | | | | | 539,739 | |
| | | | | | | | |
Total Financials | | | | | | | 2,206,271 | |
| | |
| Healthcare — 19.3% | | | | | | |
|
Biotechnology — 5.0% | |
ACADIA Pharmaceuticals, Inc. (1)(2) | | | 1,188 | | | | 32,860 | |
BioSpecifics Technologies Corp. (1)(2) | | | 1,212 | | | | 66,757 | |
CareDx, Inc. (1)(2) | | | 2,267 | | | | 51,733 | |
Emergent BioSolutions, Inc. (1)(2) | | | 1,621 | | | | 71,000 | |
Halozyme Therapeutics, Inc. (1)(2) | | | 5,085 | | | | 84,004 | |
Myriad Genetics, Inc. (2) | | | 2,045 | | | | 48,119 | |
PTC Therapeutics, Inc. (2) | | | 1,190 | | | | 53,038 | |
Repligen Corp. (2) | | | 1,429 | | | | 132,626 | |
Vanda Pharmaceuticals, Inc. (2) | | | 5,278 | | | | 74,367 | |
Veracyte, Inc. (1)(2) | | | 3,006 | | | | 79,659 | |
| | | | | | | | |
| | | | | | | 694,163 | |
|
Healthcare Equipment — 5.0% | |
Cardiovascular Systems, Inc. (1)(2) | | | 2,132 | | | | 103,253 | |
CONMED Corp. | | | 1,108 | | | | 111,653 | |
Glaukos Corp. (1)(2) | | | 1,402 | | | | 90,163 | |
Globus Medical, Inc., Class A (2) | | | 1,855 | | | | 94,735 | |
Integer Holdings Corp. (2) | | | 1,474 | | | | 106,717 | |
Novocure, Ltd. (2) | | | 1,487 | | | | 135,109 | |
Tandem Diabetes Care, Inc. (2) | | | 758 | | | | 54,902 | |
| | | | | | | | |
| | | | | | | 696,532 | |
|
Healthcare Supplies — 1.8% | |
Cerus Corp. (2) | | | 10,567 | | | | 56,745 | |
Lantheus Holdings, Inc. (2) | | | 5,064 | | | | 110,193 | |
Meridian Bioscience, Inc. | | | 4,652 | | | | 42,938 | |
OraSure Technologies, Inc. (2) | | | 5,172 | | | | 34,135 | |
| | | | | | | | |
| | | | | | | 244,011 | |
|
Healthcare Technology — 3.1% | |
Evolent Health, Inc., Class A (2) | | | 7,006 | | | | 48,131 | |
HealthStream, Inc. (2) | | | 3,123 | | | | 78,918 | |
HMS Holdings Corp. (2) | | | 4,284 | | | | 156,495 | |
Omnicell, Inc. (1)(2) | | | 918 | | | | 65,912 | |
Simulations Plus, Inc. (1) | | | 2,270 | | | | 81,970 | |
| | | | | | | | |
| | | | | | | 431,426 | |
(See Notes to Schedules of Investments and Notes to Financial Statements, which are an integral part of the Financial Statements)
49
August 31, 2019
Small-Cap Core Fund (continued)
| | | | | | | | |
| Description | | Shares | | | Value | |
| Common Stocks (continued) | |
| | |
| Healthcare (continued) | | | | | | |
|
Life Sciences Tools & Services — 3.0% | |
Fluidigm Corp. (2) | | | 6,672 | | | $ | 37,230 | |
Luminex Corp. | | | 4,230 | | | | 86,715 | |
Medpace Holdings, Inc. (1)(2) | | | 2,076 | | | | 167,969 | |
NeoGenomics, Inc. (1)(2) | | | 5,074 | | | | 126,748 | |
| | | | | | | | |
| | | | | | | 418,662 | |
|
Pharmaceuticals — 1.4% | |
ANI Pharmaceuticals, Inc. (1)(2) | | | 1,071 | | | | 70,151 | |
Phibro Animal Health Corp., Class A | | | 2,613 | | | | 53,958 | |
Supernus Pharmaceuticals, Inc. (1)(2) | | | 2,749 | | | | 74,305 | |
| | | | | | | | |
| | | | | | | 198,414 | |
| | | | | | | | |
Total Healthcare | | | | | | | 2,683,208 | |
| | |
| Industrials — 18.0% | | | | | | |
|
Air Freight & Logistics — 0.8% | |
Hub Group, Inc., Class A (1)(2) | | | 2,476 | | | | 106,616 | |
|
Airlines — 0.9% | |
Hawaiian Holdings, Inc. (1) | | | 2,203 | | | | 53,775 | |
Spirit Airlines, Inc. (1)(2) | | | 1,997 | | | | 74,968 | |
| | | | | | | | |
| | | | | | | 128,743 | |
|
Building Products — 1.4% | |
Builders FirstSource, Inc. (2) | | | 3,512 | | | | 68,308 | |
Continental Building Products, Inc. (1)(2) | | | 1,380 | | | | 34,693 | |
Masonite International Corp. (1)(2) | | | 1,722 | | | | 91,938 | |
| | | | | | | | |
| | | | | | | 194,939 | |
|
Construction & Engineering — 0.7% | |
Comfort Systems USA, Inc. | | | 1,582 | | | | 61,160 | |
Great Lakes Dredge & Dock Corp. (2) | | | 3,137 | | | | 34,005 | |
| | | | | | | | |
| | | | | | | 95,165 | |
|
Construction Machinery & Heavy Trucks — 0.3% | |
Wabash National Corp. | | | 2,980 | | | | 40,647 | |
|
Diversified Support Services — 1.2% | |
UniFirst Corp. | | | 827 | | | | 162,018 | |
|
Electrical Components & Equipment — 2.1% | |
Atkore International Group, Inc. (2) | | | 5,609 | | | | 162,717 | |
Generac Holdings, Inc. (1)(2) | | | 1,680 | | | | 131,023 | |
| | | | | | | | |
| | | | | | | 293,740 | |
|
Human Resource & Employment Services — 1.5% | |
Kforce, Inc. | | | 1,931 | | | | 62,835 | |
Korn Ferry (1) | | | 1,407 | | | | 54,985 | |
TrueBlue, Inc. (2) | | | 4,812 | | | | 93,401 | |
| | | | | | | | |
| | | | | | | 211,221 | |
|
Industrial Machinery — 1.9% | |
Hillenbrand, Inc. | | | 2,496 | | | | 68,490 | |
SPX FLOW, Inc. (1)(2) | | | 2,073 | | | | 69,881 | |
Watts Water Technologies, Inc., Class A | | | 1,387 | | | | 127,091 | |
| | | | | | | | |
| | | | | | | 265,462 | |
|
Office Services & Supplies — 1.9% | |
Herman Miller, Inc. | | | 3,685 | | | | 155,802 | |
Kimball International, Inc., Class B | | | 1,673 | | | | 29,361 | |
Steelcase, Inc., Class A | | | 5,307 | | | | 82,418 | |
| | | | | | | | |
| | | | | | | 267,581 | |
|
Research & Consulting Services — 0.3% | |
CRA International, Inc. | | | 1,055 | | | | 41,029 | |
| | | | | | | | |
| Description | | Shares | | | Value | |
| Common Stocks (continued) | |
| | |
| Industrials (continued) | | | | | | |
|
Trading Companies & Distributors — 4.0% | |
BMC Stock Holdings, Inc. (2) | | | 4,930 | | | $ | 125,370 | |
DXP Enterprises, Inc. (2) | | | 1,766 | | | | 57,307 | |
Foundation Building Materials, Inc. (2) | | | 3,116 | | | | 53,377 | |
Herc Holdings, Inc. (2) | | | 3,238 | | | | 133,665 | |
Rush Enterprises, Inc., Class A | | | 3,287 | | | | 118,693 | |
WESCO International, Inc. (2) | | | 1,700 | | | | 76,636 | |
| | | | | | | | |
| | | | | | | 565,048 | |
|
Trucking — 1.0% | |
Covenant Transportation Group, Inc., Class A (2) | | | 2,873 | | | | 41,314 | |
Marten Transport, Ltd. | | | 4,684 | | | | 92,134 | |
| | | | | | | | |
| | | | | | | 133,448 | |
| | | | | | | | |
Total Industrials | | | | | | | 2,505,657 | |
| | |
| Information Technology — 16.2% | | | | | | |
|
Application Software — 3.1% | |
Bottomline Technologies DE, Inc. (2) | | | 1,978 | | | | 81,572 | |
Cornerstone OnDemand, Inc. (2) | | | 1,822 | | | | 95,054 | |
SPS Commerce, Inc. (2) | | | 3,000 | | | | 151,620 | |
Verint Systems, Inc. (1)(2) | | | 1,975 | | | | 105,248 | |
| | | | | | | | |
| | | | | | | 433,494 | |
|
Communications Equipment — 1.3% | |
Ciena Corp. (2) | | | 2,695 | | | | 110,306 | |
Extreme Networks, Inc. (2) | | | 11,305 | | | | 75,518 | |
| | | | | | | | |
| | | | | | | 185,824 | |
|
Consulting & Other Services — 0.6% | |
Virtusa Corp. (1)(2) | | | 2,417 | | | | 87,350 | |
|
Data Processing & Outsourced Services — 0.8% | |
Sykes Enterprises, Inc. (2) | | | 3,676 | | | | 106,604 | |
|
Electronic Components — 0.9% | |
AVX Corp. (1) | | | 6,004 | | | | 81,354 | |
Belden, Inc. (1) | | | 921 | | | | 42,007 | |
| | | | | | | | |
| | | | | | | 123,361 | |
|
Electronic Equipment & Instruments — 1.8% | |
FARO Technologies, Inc. (1)(2) | | | 1,723 | | | | 84,841 | |
Itron, Inc. (1)(2) | | | 1,762 | | | | 122,371 | |
Vishay Precision Group, Inc. (2) | | | 1,390 | | | | 43,437 | |
| | | | | | | | |
| | | | | | | 250,649 | |
|
Electronic Manufacturing Services — 0.8% | |
Fabrinet (1)(2) | | | 2,208 | | | | 111,482 | |
| | |
Semiconductor Equipment — 2.3% | | | | | | | | |
Amkor Technology, Inc. (2) | | | 7,429 | | | | 65,004 | |
Entegris, Inc. (1) | | | 1,468 | | | | 62,875 | |
Nanometrics, Inc. (1)(2) | | | 1,459 | | | | 39,816 | |
Photronics, Inc. (1)(2) | | | 10,163 | | | | 109,760 | |
Rudolph Technologies, Inc. (2) | | | 2,062 | | | | 45,343 | |
| | | | | | | | |
| | | | | | | 322,798 | |
|
Semiconductors — 1.3% | |
Diodes, Inc. (1)(2) | | | 1,864 | | | | 68,129 | |
Semtech Corp. (2) | | | 2,753 | | | | 115,544 | |
| | | | | | | | |
| | | | | | | 183,673 | |
|
Systems Software — 1.5% | |
CommVault Systems, Inc. (2) | | | 2,310 | | | | 100,184 | |
Progress Software Corp. | | | 3,037 | | | | 114,738 | |
| | | | | | | | |
| | | | | | | 214,922 | |
|
Technology Distributors — 1.8% | |
Insight Enterprises, Inc. (2) | | | 2,476 | | | | 118,997 | |
(See Notes to Schedules of Investments and Notes to Financial Statements, which are an integral part of the Financial Statements)
50
Small-Cap Core Fund (continued)
| | | | | | | | |
| Description | | Shares | | | Value | |
| Common Stocks (continued) | |
| |
| Information Technology (continued) | | | | |
| |
Technology Distributors(continued) | | | | | |
Tech Data Corp. (2) | | | 1,339 | | | $ | 124,165 | |
| | | | | | | | |
| | | | | | | 243,162 | |
| | | | | | | | |
Total Information Technology | | | | 2,263,319 | |
| | |
| Materials — 3.0% | | | | | | |
|
Commodity Chemicals — 0.7% | |
Trinseo SA | | | 2,938 | | | | 103,094 | |
|
Forest Products — 1.4% | |
Boise Cascade Co. | | | 3,489 | | | | 109,554 | |
Louisiana-Pacific Corp. (1) | | | 3,419 | | | | 82,193 | |
| | | | | | | | |
| | | | | | | 191,747 | |
|
Specialty Chemicals — 0.9% | |
Kraton Corp. (2) | | | 4,331 | | | | 118,843 | |
| | | | | | | | |
Total Materials | | | | | | | 413,684 | |
| | |
| Real Estate — 6.6% | | | | | | |
|
Diversified REIT’s — 3.1% | |
Alexander & Baldwin, Inc. | | | 5,626 | | | | 128,779 | |
American Assets Trust, Inc. | | | 3,244 | | | | 152,014 | |
PS Business Parks, Inc. | | | 836 | | | | 150,154 | |
| | | | | | | | |
| | | | | | | 430,947 | |
|
Healthcare REIT’s — 0.6% | |
CareTrust REIT, Inc. (1) | | | 3,608 | | | | 85,834 | |
|
Hotel & Resort REIT’s — 1.7% | |
Braemar Hotels & Resorts, Inc. | | | 5,838 | | | | 53,535 | |
Sunstone Hotel Investors, Inc. | | | 4,215 | | | | 55,385 | |
Xenia Hotels & Resorts, Inc. (1) | | | 6,591 | | | | 133,204 | |
| | | | | | | | |
| | | | | | | 242,124 | |
|
Industrial REIT’s — 1.0% | |
EastGroup Properties, Inc. | | | 1,130 | | | | 140,708 | |
|
Real Estate Services — 0.2% | |
Realogy Holdings Corp. (1) | | | 5,459 | | | | 26,094 | |
| | | | | | | | |
Total Real Estate | | | | | | | 925,707 | |
| | |
| Utilities — 2.9% | | | | | | |
|
Electric Utilities — 2.9% | |
ALLETE, Inc. | | | 716 | | | | 61,383 | |
IDACORP, Inc. | | | 499 | | | | 54,795 | |
PNM Resources, Inc. | | | 2,126 | | | | 108,447 | |
Portland General Electric Co. | | | 3,116 | | | | 177,269 | |
| | | | | | | | |
Total Utilities | | | | | | | 401,894 | |
| | | | | | | | |
Total Common Stocks
(identified cost $12,789,513) | | | | | | | 13,645,824 | |
| | | | | | | | |
| Short-Term Investments — 31.8% | |
|
| Collateral Pool Investments for Securities on Loan — 30.1% | |
| | |
Collateral pool allocation (3) | | | | | | | 4,193,876 | |
| | |
| Mutual Funds — 1.7% | | | | | | |
BMO Institutional Prime Money Market Fund — Premier Class, 2.097% (4) | | | 233,006 | | | | 233,030 | |
| | | | | | | | |
Total Short-Term Investments
(identified cost $4,426,905) | | | | 4,426,906 | |
| | | | | | | | |
Total Investments — 129.7%
(identified cost $17,216,418) | | | | | | | 18,072,730 | |
| Other Assets and Liabilities — (29.7)% | | | | (4,135,795 | ) |
| | | | | | | | |
| Total Net Assets — 100.0% | | | $ | 13,936,935 | |
| | | | | | | | |
Small-Cap Growth Fund
| | | | | | | | |
| Description | | Shares | | | Value | |
| Common Stocks — 98.7% | | | | | | |
| | |
| Communication Services — 3.2% | | | | | | |
|
Alternative Carriers — 1.2% | |
Cogent Communications Holdings, Inc. (1) | | | 19,525 | | | $ | 1,188,877 | |
|
Interactive Media & Services — 1.2% | |
TrueCar, Inc. (1)(2) | | | 96,993 | | | | 384,092 | |
Yelp, Inc. (1)(2) | | | 22,627 | | | | 758,231 | |
| | | | | | | | |
| | | | | | | 1,142,323 | |
|
Movies & Entertainment — 0.8% | |
IMAX Corp. (1)(2) | | | 40,223 | | | | 841,465 | |
| | | | | | | | |
Total Communication Services | | | | | | | 3,172,665 | |
| | |
| Consumer Discretionary — 10.2% | | | | | | |
|
Apparel Retail — 1.1% | |
Boot Barn Holdings, Inc. (1)(2) | | | 31,680 | | | | 1,085,040 | |
|
Auto Parts & Equipment — 1.4% | |
Dana, Inc. | | | 40,967 | | | | 521,510 | |
Gentherm, Inc. (1)(2) | | | 23,477 | | | | 861,606 | |
| | | | | | | | |
| | | | | | | 1,383,116 | |
|
Casinos & Gaming — 0.8% | |
Everi Holdings, Inc. (2) | | | 89,816 | | | | 802,955 | |
|
Footwear — 1.8% | |
Crocs, Inc. (1)(2) | | | 37,810 | | | | 843,163 | |
Steven Madden, Ltd. (1) | | | 28,384 | | | | 942,916 | |
| | | | | | | | |
| | | | | | | 1,786,079 | |
|
Homefurnishing Retail — 1.2% | |
Sleep Number Corp. (1)(2) | | | 28,909 | | | | 1,209,552 | |
|
Internet & Direct Marketing Retail — 1.5% | |
1-800-Flowers.com, Inc., Class A (1)(2) | | | 46,472 | | | | 684,068 | |
Shutterstock, Inc. (1)(2) | | | 22,891 | | | | 803,703 | |
| | | | | | | | |
| | | | | | | 1,487,771 | |
|
Leisure Products — 0.8% | |
Callaway Golf Co. | | | 46,504 | | | | 825,911 | |
|
Restaurants — 0.7% | |
Chuy’s Holdings, Inc. (1)(2) | | | 28,245 | | | | 716,576 | |
|
Specialty Stores — 0.9% | |
Five Below, Inc. (1)(2) | | | 7,124 | | | | 875,326 | |
| | | | | | | | |
Total Consumer Discretionary | | | | | | | 10,172,326 | |
| | |
| Consumer Staples — 5.1% | | | | | | |
|
Food Distributors — 1.3% | |
Performance Food Group Co. (1)(2) | | | 27,833 | | | | 1,302,306 | |
|
Food Retail — 0.9% | |
Sprouts Farmers Market, Inc. (1)(2) | | | 48,483 | | | | 870,270 | |
|
Household Products — 1.0% | |
Central Garden & Pet Co., Class A (2) | | | 40,417 | | | | 972,433 | |
|
Hypermarkets & Super Centers — 0.9% | |
BJ’s Wholesale Club Holdings, Inc. (1)(2) | | | 36,002 | | | | 945,413 | |
| | |
Packaged Foods & Meats — 1.0% | | | | | | | | |
Simply Good Foods Co. (2) | | | 32,635 | | | | 966,975 | |
| | | | | | | | |
Total Consumer Staples | | | | | | | 5,057,397 | |
| | |
| Energy — 1.0% | | | | | | |
|
Oil &Gas-Equipment & Services — 0.5% | |
ProPetro Holding Corp. (1)(2) | | | 45,208 | | | | 481,465 | |
(See Notes to Schedules of Investments and Notes to Financial Statements, which are an integral part of the Financial Statements)
51
August 31, 2019
Small-Cap Growth Fund (continued)
| | | | | | | | |
| Description | | Shares | | | Value | |
| Common Stocks (continued) | | | | | | |
| | |
| Energy (continued) | | | | | | |
|
Oil &Gas-Storage & Transportation — 0.5% | |
GasLog, Ltd. (1) | | | 43,923 | | | $ | 540,253 | |
| | | | | | | | |
Total Energy | | | | | | | 1,021,718 | |
| | |
| Financials — 5.3% | | | | | | |
|
Investment Banking & Brokerage — 0.9% | |
Houlihan Lokey, Inc. (1) | | | 19,619 | | | | 866,767 | |
|
Life & Health Insurance — 0.9% | |
Primerica, Inc. (1) | | | 7,791 | | | | 928,454 | |
|
Property & Casualty Insurance — 1.7% | |
AMERISAFE, Inc. (1) | | | 13,857 | | | | 951,976 | |
Employers Holdings, Inc. | | | 17,746 | | | | 765,385 | |
| | | | | | | | |
| | | | | | | 1,717,361 | |
|
Regional Banks — 0.9% | |
Great Western Bancorp, Inc. | | | 28,828 | | | | 859,939 | |
|
Thrifts & Mortgage Finance — 0.9% | |
Essent Group, Ltd. (1) | | | 18,130 | | | | 879,305 | |
| | | | | | | | |
Total Financials | | | | | | | 5,251,826 | |
| | |
| Healthcare — 28.3% | | | | | | |
|
Biotechnology — 9.8% | |
ACADIA Pharmaceuticals, Inc. (1)(2) | | | 33,440 | | | | 924,951 | |
BioSpecifics Technologies Corp. (1)(2) | | | 9,760 | | | | 537,581 | |
Blueprint Medicines Corp. (1)(2) | | | 10,514 | | | | 806,108 | |
CareDx, Inc. (1)(2) | | | 23,428 | | | | 534,627 | |
Halozyme Therapeutics, Inc. (1)(2) | | | 51,374 | | | | 848,699 | |
Natera, Inc. (2) | | | 25,073 | | | | 826,155 | |
PTC Therapeutics, Inc. (1)(2) | | | 22,560 | | | | 1,005,499 | |
Radius Health, Inc. (1)(2) | | | 38,431 | | | | 1,087,597 | |
REGENXBIO, Inc. (1)(2) | | | 13,833 | | | | 477,100 | |
Repligen Corp. (1)(2) | | | 9,139 | | | | 848,191 | |
Retrophin, Inc. (1)(2) | | | 33,265 | | | | 418,806 | |
Vanda Pharmaceuticals, Inc. (1)(2) | | | 43,992 | | | | 619,847 | |
Veracyte, Inc. (1)(2) | | | 31,895 | | | | 845,218 | |
| | | | | | | | |
| | | | | | | 9,780,379 | |
|
Healthcare Equipment — 8.0% | |
AtriCure, Inc. (1)(2) | | | 28,997 | | | | 794,228 | |
Axogen, Inc. (1)(2) | | | 43,399 | | | | 687,874 | |
Cardiovascular Systems, Inc. (1)(2) | | | 22,653 | | | | 1,097,085 | |
CONMED Corp. | | | 14,610 | | | | 1,472,250 | |
Glaukos Corp. (1)(2) | | | 14,550 | | | | 935,710 | |
Integer Holdings Corp. (2) | | | 10,731 | | | | 776,924 | |
Novocure, Ltd. (1)(2) | | | 13,999 | | | | 1,271,949 | |
Orthofix Medical, Inc. (2) | | | 17,915 | | | | 910,799 | |
| | | | | | | | |
| | | | | | | 7,946,819 | |
|
Healthcare Services — 2.0% | |
Amedisys, Inc. (1)(2) | | | 9,075 | | | | 1,168,043 | |
R1 RCM, Inc. (1)(2) | | | 67,089 | | | | 782,258 | |
| | | | | | | | |
| | | | | | | 1,950,301 | |
|
Healthcare Supplies — 0.9% | |
Lantheus Holdings, Inc. (2) | | | 41,871 | | | | 911,113 | |
|
Healthcare Technology — 3.7% | |
HMS Holdings Corp. (2) | | | 25,950 | | | | 947,953 | |
Inspire Medical Systems, Inc. (2) | | | 16,325 | | | | 1,134,751 | |
Omnicell, Inc. (1)(2) | | | 10,226 | | | | 734,227 | |
Teladoc Health, Inc. (1)(2) | | | 14,912 | | | | 863,107 | |
| | | | | | | | |
| | | | | | | 3,680,038 | |
| | | | | | | | |
| Description | | Shares | | | Value | |
| Common Stocks (continued) | | | | | | |
| | |
| Healthcare (continued) | | | | | | |
|
Life Sciences Tools & Services — 2.1% | |
Medpace Holdings, Inc. (1)(2) | | | 14,477 | | | $ | 1,171,334 | |
NeoGenomics, Inc. (1)(2) | | | 35,409 | | | | 884,517 | |
| | | | | | | | |
| | | | | | | 2,055,851 | |
|
Pharmaceuticals — 1.8% | |
Amphastar Pharmaceuticals, Inc. (2) | | | 33,808 | | | | 759,327 | |
Collegium Pharmaceutical, Inc. (1)(2) | | | 47,274 | | | | 547,433 | |
Supernus Pharmaceuticals, Inc. (1)(2) | | | 18,993 | | | | 513,381 | |
| | | | | | | | |
| | | | | | | 1,820,141 | |
| | | | | | | | |
Total Healthcare | | | | | | | 28,144,642 | |
| | |
| Industrials — 19.7% | | | | | | |
|
Air Freight & Logistics — 2.6% | |
Echo Global Logistics, Inc. (1)(2) | | | 34,360 | | | | 688,575 | |
Forward Air Corp. (1) | | | 13,931 | | | | 867,901 | |
Hub Group, Inc., Class A (2) | | | 23,565 | | | | 1,014,709 | |
| | | | | | | | |
| | | | | | | 2,571,185 | |
|
Building Products — 1.9% | |
Builders FirstSource, Inc. (2) | | | 55,957 | | | | 1,088,364 | |
CSW Industrials, Inc. | | | 12,238 | | | | 834,754 | |
| | | | | | | | |
| | | | | | | 1,923,118 | |
|
Commercial Printing — 0.8% | |
Cimpress NV (1)(2) | | | 7,072 | | | | 811,088 | |
|
Construction & Engineering — 0.7% | |
Comfort Systems USA, Inc. | | | 19,083 | | | | 737,749 | |
|
Electrical Components & Equipment — 2.3% | |
Atkore International Group, Inc. (2) | | | 41,980 | | | | 1,217,840 | |
Generac Holdings, Inc. (1)(2) | | | 13,422 | | | | 1,046,781 | |
| | | | | | | | |
| | | | | | | 2,264,621 | |
|
Environmental & Facilities Services — 1.1% | |
Covanta Holding Corp. (1) | | | 60,627 | | | | 1,042,784 | |
|
Human Resource & Employment Services — 1.9% | |
Insperity, Inc. (1) | | | 10,266 | | | | 1,016,950 | |
Korn Ferry (1) | | | 23,302 | | | | 910,642 | |
| | | | | | | | |
| | | | | | | 1,927,592 | |
|
Industrial Machinery — 6.5% | |
EnPro Industries, Inc. (1) | | | 12,437 | | | | 774,576 | |
Mueller Industries, Inc. | | | 29,990 | | | | 790,536 | |
Rexnord Corp. (1)(2) | | | 33,887 | | | | 887,162 | |
SPX Corp. (1)(2) | | | 26,298 | | | | 998,009 | |
SPX FLOW, Inc. (2) | | | 28,796 | | | | 970,713 | |
Tennant Co. (1) | | | 14,212 | | | | 971,959 | |
Watts Water Technologies, Inc., Class A (1) | | | 12,139 | | | | 1,112,297 | |
| | | | | | | | |
| | | | | | | 6,505,252 | |
|
Office Services & Supplies — 1.9% | |
Herman Miller, Inc. | | | 26,071 | | | | 1,102,282 | |
Steelcase, Inc., Class A | | | 50,357 | | | | 782,044 | |
| | | | | | | | |
| | | | | | | 1,884,326 | |
| | | | | | | | |
Total Industrials | | | | | | | 19,667,715 | |
| | |
| Information Technology — 18.9% | | | | | | |
|
Application Software — 6.3% | |
Bottomline Technologies DE, Inc. (2) | | | 19,534 | | | | 805,582 | |
Box, Inc., Class A (2) | | | 50,956 | | | | 745,486 | |
Cornerstone OnDemand, Inc. (2) | | | 18,913 | | | | 986,691 | |
j2 Global, Inc. (1) | | | 11,689 | | | | 988,890 | |
New Relic, Inc. (2) | | | 9,592 | | | | 550,005 | |
Paylocity Holding Corp. (1)(2) | | | 9,299 | | | | 1,015,637 | |
SPS Commerce, Inc. (2) | | | 23,726 | | | | 1,199,112 | |
| | | | | | | | |
| | | | | | | 6,291,403 | |
(See Notes to Schedules of Investments and Notes to Financial Statements, which are an integral part of the Financial Statements)
52
Small-Cap Growth Fund (continued)
| | | | | | | | |
| Description | | Shares | | | Value | |
| Common Stocks (continued) | | | | | | |
| |
| Information Technology (continued) | | | | |
|
Communications Equipment — 2.5% | |
Ciena Corp. (1)(2) | | | 21,311 | | | $ | 872,259 | |
NetScout Systems, Inc. (1)(2) | | | 33,906 | | | | 751,018 | |
Viavi Solutions, Inc. (1)(2) | | | 62,020 | | | | 861,458 | |
| | | | | | | | |
| | | | | | | 2,484,735 | |
|
Consulting & Other Services — 0.7% | |
Virtusa Corp. (1)(2) | | | 20,250 | | | | 731,835 | |
|
Internet Services & Infrastructure — 0.4% | |
Carbonite, Inc. (1)(2) | | | 30,109 | | | | 362,813 | |
|
Semiconductor Equipment — 2.6% | |
FormFactor, Inc. (1)(2) | | | 58,685 | | | | 1,002,927 | |
Photronics, Inc. (2) | | | 80,555 | | | | 869,994 | |
Rudolph Technologies, Inc. (2) | | | 31,708 | | | | 697,259 | |
| | | | | | | | |
| | | | | | | 2,570,180 | |
|
Semiconductors — 2.4% | |
Lattice Semiconductor Corp. (1)(2) | | | 56,047 | | | | 1,103,565 | |
Silicon Laboratories, Inc. (1)(2) | | | 12,107 | | | | 1,319,663 | |
| | | | | | | | |
| | | | | | | 2,423,228 | |
|
Systems Software — 3.0% | |
CommVault Systems, Inc. (2) | | | 20,352 | | | | 882,666 | |
ForeScout Technologies, Inc. (1)(2) | | | 25,120 | | | | 900,050 | |
Varonis Systems, Inc. (1)(2) | | | 17,221 | | | | 1,176,539 | |
| | | | | | | | |
| | | | | | | 2,959,255 | |
|
Technology Hardware, Storage & Peripherals — 1.0% | |
Stratasys, Ltd. (1)(2) | | | 42,110 | | | | 1,003,060 | |
| | | | | | | | |
Total Information Technology | | | | | | | 18,826,509 | |
| | |
| Materials — 2.6% | | | | | | |
|
Forest Products — 0.9% | |
Boise Cascade Co. | | | 27,031 | | | | 848,773 | |
|
Specialty Chemicals — 1.7% | |
Innospec, Inc. | | | 12,488 | | | | 1,038,752 | |
Kraton Corp. (2) | | | 25,113 | | | | 689,101 | |
| | | | | | | | |
| | | | | | | 1,727,853 | |
| | | | | | | | |
Total Materials | | | | | | | 2,576,626 | |
| | |
| Real Estate — 4.4% | | | | | | |
|
Diversified REIT’s — 1.2% | |
American Assets Trust, Inc. (1) | | | 26,425 | | | | 1,238,275 | |
|
Healthcare REIT’s — 0.9% | |
CareTrust REIT, Inc. | | | 36,519 | | | | 868,787 | |
|
Industrial REIT’s — 1.3% | |
EastGroup Properties, Inc. (1) | | | 10,046 | | | | 1,250,928 | |
|
Real Estate Operating Companies — 1.0% | |
Kennedy-Wilson Holdings, Inc. | | | 49,651 | | | | 1,041,678 | |
| | | | | | | | |
Total Real Estate | | | | | | | 4,399,668 | |
| | | | | | | | |
Total Common Stocks
(identified cost $88,933,836) | | | | | | | 98,291,092 | |
| | | | | | | | |
| Short-Term Investments — 36.2% | |
|
| Collateral Pool Investments for Securities on Loan — 35.0% | |
| | |
Collateral pool allocation (3) | | | | | | | 34,881,052 | |
| | | | | | | | |
| Description | | Shares | | | Value | |
| Short-Term Investments (continued) | |
| | |
| Mutual Funds — 1.2% | | | | | | |
BMO Institutional Prime Money Market Fund — Premier Class, 2.097% (4) | | | 1,221,267 | | | $ | 1,221,390 | |
| | | | | | | | |
Total Short-Term Investments
(identified cost $36,102,440) | | | | | | | 36,102,442 | |
| | | | | | | | |
Total Investments — 134.9%
(identified cost $125,036,276) | | | | | | | 134,393,534 | |
| Other Assets and Liabilities — (34.9)% | | | | (34,789,550 | ) |
| | | | | | | | |
| Total Net Assets — 100.0% | | | | | | $ | 99,603,984 | |
| | | | | | | | |
Global Low Volatility Equity Fund
| | | | | | | | |
| Description | | Shares | | | Value | |
| Common Stocks — 97.6% | | | | | | |
| | |
Australia — 0.4% | | | | | | | | |
OceanaGold Corp. | | | 55,774 | | | $ | 133,633 | |
| | |
Bermuda — 1.0% | | | | | | | | |
Argo Group International Holdings, Ltd. | | | 2,233 | | | | 146,753 | |
Enstar Group, Ltd. (2) | | | 971 | | | | 173,440 | |
Giordano International, Ltd. | | | 104,000 | | | | 32,498 | |
| | | | | | | | |
| | | | | | | 352,691 | |
| | |
Brazil — 1.3% | | | | | | | | |
IRB Brasil Resseguros S/A | | | 13,900 | | | | 364,200 | |
Sao Martinho SA | | | 20,700 | | | | 89,178 | |
| | | | | | | | |
| | | | | | | 453,378 | |
| | |
Canada — 10.1% | | | | | | | | |
Allied Properties Real Estate Investment Trust | | | 7,559 | | | | 298,068 | |
Atco, Ltd., Class I | | | 9,832 | | | | 351,364 | |
BCE, Inc. | | | 8,882 | | | | 420,284 | |
Canadian Imperial Bank of Commerce | | | 1,310 | | | | 101,472 | |
Cogeco Communications, Inc. | | | 3,538 | | | | 278,065 | |
Detour Gold Corp. (2) | | | 10,359 | | | | 185,566 | |
Emera, Inc. (1) | | | 3,654 | | | | 158,302 | |
First Capital Realty, Inc. | | | 4,859 | | | | 80,947 | |
George Weston, Ltd. | | | 4,543 | | | | 369,097 | |
Granite Real Estate Investment Trust | | | 5,622 | | | | 269,023 | |
Loblaw Cos., Ltd. | | | 4,687 | | | | 256,528 | |
Maple Leaf Foods, Inc. | | | 5,525 | | | | 131,382 | |
Quebecor, Inc., Class B | | | 22,567 | | | | 508,325 | |
Rogers Communications, Inc., Class B (1) | | | 2,700 | | | | 133,662 | |
| | | | | | | | |
| | | | | | | 3,542,085 | |
| | |
Cayman Islands — 0.8% | | | | | | | | |
361 Degrees International, Ltd. | | | 188,000 | | | | 39,804 | |
Fresh Del Monte Produce, Inc. | | | 1,521 | | | | 39,607 | |
HKBN, Ltd. | | | 115,000 | | | | 206,227 | |
| | | | | | | | |
| | | | | | | 285,638 | |
| | |
China — 0.9% | | | | | | | | |
Agricultural Bank of China, Ltd., Class H | | | 403,000 | | | | 155,229 | |
China Minsheng Banking Corp., Ltd., Class H | | | 161,600 | | | | 106,354 | |
China Telecom Corp., Ltd., Class H | | | 112,000 | | | | 50,140 | |
| | | | | | | | |
| | | | | | | 311,723 | |
(See Notes to Schedules of Investments and Notes to Financial Statements, which are an integral part of the Financial Statements)
53
August 31, 2019
Global Low Volatility Equity Fund (continued)
| | | | | | | | |
| Description | | Shares | | | Value | |
| Common Stocks (continued) | | | | | | |
| | |
Czech Republic — 2.3% | | | | | | | | |
CEZ AS | | | 19,316 | | | $ | 425,485 | |
Komercni banka AS | | | 5,456 | | | | 193,679 | |
Moneta Money Bank AS (5) | | | 61,590 | | | | 199,197 | |
| | | | | | | | |
| | | | | | | 818,361 | |
| | |
Denmark — 0.2% | | | | | | | | |
Pandora A/S (1) | | | 1,620 | | | | 69,007 | |
| | |
France — 0.1% | | | | | | | | |
Boiron SA | | | 480 | | | | 19,704 | |
| | |
Germany — 0.3% | | | | | | | | |
Talanx AG (2) | | | 2,234 | | | | 92,515 | |
| | |
Hong Kong — 8.4% | | | | | | | | |
CLP Holdings, Ltd. | | | 64,500 | | | | 664,300 | |
Dah Sing Financial Holdings, Ltd. | | | 18,400 | | | | 67,588 | |
Dairy Farm International Holdings, Ltd. | | | 10,900 | | | | 78,044 | |
Hang Seng Bank, Ltd. | | | 19,500 | | | | 406,893 | |
HK Electric Investments & HK Electric Investments, Ltd. | | | 528,000 | | | | 505,750 | |
HKT Trust & HKT, Ltd. | | | 66,000 | | | | 103,204 | |
Hysan Development Co., Ltd. | | | 45,000 | | | | 182,229 | |
PCCW, Ltd. | | | 530,000 | | | | 287,294 | |
SmarTone Telecommunications Holdings, Ltd. | | | 104,000 | | | | 92,454 | |
Vitasoy International Holdings, Ltd. | | | 44,000 | | | | 204,836 | |
WH Group, Ltd. (5) | | | 192,000 | | | | 154,523 | |
Yuexiu Real Estate Investment Trust | | | 269,000 | | | | 177,037 | |
| | | | | | | | |
| | | | | | | 2,924,152 | |
| | |
Hungary — 0.3% | | | | | | | | |
Magyar Telekom Telecommunications PLC | | | 66,801 | | | | 93,754 | |
| | |
Israel — 1.6% | | | | | | | | |
Bank Hapoalim BM (2) | | | 14,503 | | | | 106,282 | |
Bank LeumiLe-Israel BM | | | 44,852 | | | | 305,592 | |
Strauss Group, Ltd. | | | 4,906 | | | | 145,337 | |
| | | | | | | | |
| | | | | | | 557,211 | |
| | |
Italy — 2.4% | | | | | | | | |
Enel SpA | | | 113,767 | | | | 824,485 | |
| | |
Japan — 9.3% | | | | | | | | |
AOKI Holdings, Inc. | | | 8,200 | | | | 80,198 | |
Bridgestone Corp. | | | 1,800 | | | | 68,672 | |
Chubu Electric Power Co., Inc. | | | 34,200 | | | | 504,300 | |
Doutor Nichires Holdings Co., Ltd. | | | 5,600 | | | | 106,481 | |
Frontier Real Estate Investment Corp. | | | 91 | | | | 392,319 | |
Geo Holdings Corp. | | | 14,200 | | | | 178,177 | |
Hogy Medical Co., Ltd. | | | 1,900 | | | | 51,848 | |
Japan Rental Housing Investments, Inc. | | | 372 | | | | 344,214 | |
Kissei Pharmaceutical Co., Ltd. | | | 4,500 | | | | 102,975 | |
KYORIN Holdings, Inc. | | | 11,900 | | | | 198,716 | |
Mitsui Sugar Co., Ltd. | | | 3,500 | | | | 71,723 | |
Morinaga Milk Industry Co., Ltd. | | | 1,900 | | | | 78,515 | |
Nihon Kohden Corp. (1) | | | 3,400 | | | | 94,349 | |
Nippon Telegraph & Telephone Corp. | | | 6,500 | | | | 311,799 | |
Paramount Bed Holdings Co., Ltd. | | | 2,400 | | | | 87,994 | |
Shimachu Co., Ltd. (1) | | | 6,700 | | | | 157,922 | |
Suzuken Co., Ltd. | | | 2,200 | | | | 118,247 | |
Towa Pharmaceutical Co., Ltd. | | | 4,900 | | | | 112,312 | |
Valor Holdings Co., Ltd. | | | 4,500 | | | | 75,526 | |
| | | | | | | | |
| Description | | Shares | | | Value | |
| Common Stocks (continued) | | | | | | |
| | |
Japan(continued) | | | | | | | | |
Vital KSK Holdings, Inc. (1) | | | 7,700 | | | $ | 75,815 | |
Xebio Holdings Co., Ltd. | | | 4,600 | | | | 48,799 | |
| | | | | | | | |
| | | | | | | 3,260,901 | |
| | |
Malaysia — 1.7% | | | | | | | | |
Public Bank Bhd | | | 122,500 | | | | 591,892 | |
| | |
Mexico — 0.7% | | | | | | | | |
Arca Continental SAB de C.V. | | | 47,100 | | | | 246,363 | |
| | |
Myanmar — 1.3% | | | | | | | | |
Genting Bhd | | | 55,100 | | | | 78,612 | |
Hong Leong Bank Bhd | | | 48,700 | | | | 192,229 | |
RHB Bank Bhd | | | 147,600 | | | | 200,052 | |
| | | | | | | | |
| | | | | | | 470,893 | |
| | |
Netherlands — 2.1% | | | | | | | | |
Flow Traders (5) | | | 14,441 | | | | 387,579 | |
Intertrust NV (5) | | | 5,746 | | | | 119,166 | |
Koninklijke Ahold Delhaize NV | | | 10,046 | | | | 235,009 | |
| | | | | | | | |
| | | | | | | 741,754 | |
| | |
New Zealand — 2.9% | | | | | | | | |
Air New Zealand, Ltd. | | | 49,013 | | | | 88,480 | |
Argosy Property, Ltd. | | | 132,076 | | | | 121,919 | |
Chorus, Ltd. | | | 23,904 | | | | 75,912 | |
Fisher & Paykel Healthcare Corp., Ltd. | | | 23,555 | | | | 247,119 | |
Infratil, Ltd. | | | 50,726 | | | | 145,429 | |
Ryman Healthcare, Ltd. | | | 23,406 | | | | 192,021 | |
Summerset Group Holdings, Ltd. | | | 40,223 | | | | 153,081 | |
| | | | | | | | |
| | | | | | | 1,023,961 | |
| | |
Philippines — 3.6% | | | | | | | | |
Alliance Global Group, Inc. | | | 525,100 | | | | 128,104 | |
First Philippine Holdings Corp. | | | 39,110 | | | | 61,718 | |
International Container Terminal Services, Inc. | | | 95,010 | | | | 247,848 | |
Manila Electric Co. | | | 42,480 | | | | 297,848 | |
Megaworld Corp. | | | 1,150,800 | | | | 113,406 | |
Metropolitan Bank & Trust Co. | | | 150,400 | | | | 204,838 | |
PLDT, Inc. | | | 8,605 | | | | 194,886 | |
| | | | | | | | |
| | | | | | | 1,248,648 | |
| | |
Portugal — 0.3% | | | | | | | | |
REN — Redes Energeticas Nacionais SGPS SA | | | 37,632 | | | | 105,467 | |
| | |
Singapore — 5.0% | | | | | | | | |
Ascott Residence Trust | | | 127,800 | | | | 119,719 | |
BOC Aviation, Ltd. (5) | | | 16,000 | | | | 138,972 | |
Cache Logistics Trust | | | 115,100 | | | | 59,302 | |
CDL Hospitality Trusts | | | 114,300 | | | | 131,782 | |
Frasers Centrepoint Trust | | | 126,600 | | | | 250,874 | |
Mapletree Industrial Trust | | | 48,400 | | | | 80,565 | |
NetLink NBN Trust | | | 685,300 | | | | 439,501 | |
SATS, Ltd. | | | 84,800 | | | | 293,309 | |
Sheng Siong Group, Ltd. | | | 113,000 | | | | 96,083 | |
Singapore Airlines, Ltd. | | | 19,500 | | | | 124,075 | |
| | | | | | | | |
| | | | | | | 1,734,182 | |
| | |
South Africa — 1.8% | | | | | | | | |
AngloGold Ashanti, Ltd. | | | 17,515 | | | | 399,680 | |
Gold Fields, Ltd. | | | 38,785 | | | | 232,320 | |
| | | | | | | | |
| | | | | | | 632,000 | |
| | |
Spain — 0.7% | | | | | | | | |
Red Electrica Corp. SA | | | 13,102 | | | | 260,995 | |
(See Notes to Schedules of Investments and Notes to Financial Statements, which are an integral part of the Financial Statements)
54
Global Low Volatility Equity Fund (continued)
| | | | | | | | |
| Description | | Shares | | | Value | |
| Common Stocks (continued) | | | | | | |
| | |
Switzerland — 0.9% | | | | | | | | |
Roche Holding AG | | | 180 | | | $ | 49,212 | |
Sonova Holding AG | | | 1,077 | | | | 249,949 | |
| | | | | | | | |
| | | | | | | 299,161 | |
| | |
Taiwan — 3.1% | | | | | | | | |
Coretronic Corp. | | | 92,000 | | | | 112,620 | |
Far EasTone Telecommunications Co., Ltd. | | | 212,000 | | | | 494,059 | |
Great Wall Enterprise Co., Ltd. | | | 88,200 | | | | 103,616 | |
Pou Chen Corp. | | | 73,000 | | | | 91,105 | |
Taichung Commercial Bank Co., Ltd. | | | 349,476 | | | | 131,290 | |
Taiwan Secom Co., Ltd. | | | 26,075 | | | | 71,393 | |
Uni-President Enterprises Corp. | | | 40,000 | | | | 97,549 | |
| | | | | | | | |
| | | | | | | 1,101,632 | |
| | |
United Kingdom — 1.3% | | | | | | | | |
Assura PLC | | | 288,008 | | | | 242,860 | |
BT Group PLC | | | 79,912 | | | | 161,063 | |
Halfords Group PLC | | | 31,868 | | | | 70,148 | |
| | | | | | | | |
| | | | | | | 474,071 | |
| | |
United States — 32.8% | | | | | | | | |
ALLETE, Inc. | | | 2,026 | | | | 173,689 | |
Allstate Corp. | | | 6,911 | | | | 707,617 | |
American Assets Trust, Inc. | | | 12,075 | | | | 565,835 | |
American Express Co. | | | 1,102 | | | | 132,648 | |
Atrion Corp. | | | 234 | | | | 181,853 | |
AutoZone, Inc. (2) | | | 143 | | | | 157,542 | |
Bryn Mawr Bank Corp. | | | 2,364 | | | | 80,612 | |
Chevron Corp. | | | 5,427 | | | | 638,866 | |
Chico’s FAS, Inc. (1) | | | 12,355 | | | | 38,548 | |
CONMED Corp. | | | 1,473 | | | | 148,434 | |
Darden Restaurants, Inc. | | | 2,857 | | | | 345,640 | |
Discover Financial Services | | | 7,149 | | | | 571,706 | |
Eli Lilly & Co. | | | 1,960 | | | | 221,421 | |
Equity LifeStyle Properties, Inc. | | | 2,324 | | | | 313,089 | |
Essex Property Trust, Inc. | | | 1,742 | | | | 559,635 | |
Exelon Corp. | | | 14,674 | | | | 693,493 | |
IDACORP, Inc. | | | 3,484 | | | | 382,578 | |
Kroger Co. | | | 5,512 | | | | 130,524 | |
MDU Resources Group, Inc. | | | 3,768 | | | | 101,322 | |
Merck & Co., Inc. | | | 9,372 | | | | 810,397 | |
Meridian Bancorp, Inc. | | | 12,325 | | | | 215,441 | |
NorthWestern Corp. | | | 7,284 | | | | 527,653 | |
PepsiCo, Inc. | | | 4,187 | | | | 572,489 | |
Pfizer, Inc. | | | 17,522 | | | | 622,907 | |
Pinnacle West Capital Corp. | | | 755 | | | | 71,959 | |
Portland General Electric Co. | | | 15,397 | | | | 875,935 | |
Progressive Corp. | | | 1,724 | | | | 130,679 | |
Safety Insurance Group, Inc. | | | 2,337 | | | | 225,380 | |
Sprouts Farmers Market, Inc. (2) | | | 8,802 | | | | 157,996 | |
Sysco Corp. | | | 7,806 | | | | 580,220 | |
Walmart, Inc. | | | 4,817 | | | | 550,390 | |
| | | | | | | | |
| | | | | | | 11,486,498 | |
| | | | | | | | |
Total Common Stocks
(identified cost $30,536,123) | | | | | | | 34,156,755 | |
| | | | | | | | |
| Short-Term Investments — 3.9% | | | | |
|
| Collateral Investment for Securities on Loan — 2.1% | |
| | |
BMO Institutional Prime Money Market Fund — Premier Class, 2.097% (3)(4) | | | 743,529 | | | | 743,529 | |
| | | | | | | | |
| Description | | Shares | | | Value | |
| Short-Term Investments (continued) | | | | |
| | |
| Mutual Funds — 1.8% | | | | | | |
BMO Institutional Prime Money Market Fund — Premier Class, 2.097% (4) | | | 621,583 | | | $ | 621,645 | |
| | | | | | | | |
Total Short-Term Investments
(identified cost $1,365,111) | | | | | | | 1,365,174 | |
| | | | | | | | |
Total Investments — 101.5%
(identified cost $31,901,234) | | | | | | | 35,521,929 | |
| Other Assets and Liabilities — (1.5)% | | | | (527,559 | ) |
| | | | | | | | |
| Total Net Assets — 100.0% | | | | | | $ | 34,994,370 | |
| | | | | | | | |
| | | | | | | | |
| Industry | | Value | | | % of
Total
Net Assets | |
Airlines | | $ | 212,555 | | | | 0.7 | % |
Apparel | | | 91,105 | | | | 0.2 | |
Auto Parts & Equipment | | | 68,672 | | | | 0.2 | |
Banks | | | 3,043,199 | | | | 8.8 | |
Beverages | | | 1,023,688 | | | | 2.9 | |
Commercial Services | | | 190,559 | | | | 0.5 | |
Diversified Financial Services | | | 1,230,905 | | | | 3.5 | |
Electric | | | 7,132,072 | | | | 20.3 | |
Electronics | | | 112,620 | | | | 0.3 | |
Energy-Alternate Sources | | | 89,178 | | | | 0.3 | |
Engineering & Construction | | | 541,157 | | | | 1.5 | |
Food | | | 2,705,196 | | | | 7.8 | |
Healthcare-Products | | | 1,061,546 | | | | 3.1 | |
Healthcare-Services | | | 345,102 | | | | 1.0 | |
Holding Companies-Diversified | | | 128,104 | | | | 0.4 | |
Insurance | | | 1,840,584 | | | | 5.2 | |
Lodging | | | 78,612 | | | | 0.2 | |
Media | | | 786,390 | | | | 2.3 | |
Mining | | | 951,199 | | | | 2.7 | |
Oil & Gas | | | 638,866 | | | | 1.8 | |
Pharmaceuticals | | | 2,331,706 | | | | 6.7 | |
Real Estate | | | 498,501 | | | | 1.3 | |
Real Estate Investment Trusts | | | 3,804,322 | | | | 10.8 | |
Retail | | | 1,971,237 | | | | 5.7 | |
Savings & Loans | | | 215,441 | | | | 0.6 | |
Telecommunications | | | 3,064,239 | | | | 8.8 | |
| | | | | | | | |
Total Common Stocks | | | 34,156,755 | | | | 97.6 | |
Collateral Investment for Securities on Loan | | | 743,529 | | | | 2.1 | |
Mutual Funds | | | 621,645 | | | | 1.8 | |
| | | | | | | | |
Total Investments | | | 35,521,929 | | | | 101.5 | |
Other Assets and Liabilities | | | (527,559 | ) | | | (1.5 | ) |
| | | | | | | | |
Net Assets | | $ | 34,994,370 | | | | 100.0 | % |
| | | | | | | | |
(See Notes to Schedules of Investments and Notes to Financial Statements, which are an integral part of the Financial Statements)
55
August 31, 2019
Disciplined International Equity Fund
| | | | | | | | |
| Description | | Shares | | | Value | |
| Common Stocks — 98.5% | | | | | | |
|
Australia — 10.7% | |
BHP Group, Ltd. | | | 45,112 | | | $ | 1,102,515 | |
CSL, Ltd. | | | 1,585 | | | | 257,109 | |
Evolution Mining, Ltd. | | | 270,276 | | | | 942,850 | |
Qantas Airways, Ltd. | | | 201,679 | | | | 829,865 | |
Rio Tinto PLC | | | 27,100 | | | | 1,368,309 | |
Santos, Ltd. | | | 293,015 | | | | 1,422,756 | |
Whitehaven Coal, Ltd. (1) | | | 110,090 | | | | 254,301 | |
Woodside Petroleum, Ltd. | | | 16,928 | | | | 366,287 | |
| | | | | | | | |
| | | | | | | 6,543,992 | |
|
Cayman Islands — 0.2% | |
IGG, Inc. (1) | | | 170,000 | | | | 114,918 | |
|
Denmark — 4.1% | |
Novo Nordisk A/S, Class B | | | 34,604 | | | | 1,796,875 | |
Pandora A/S (1) | | | 16,718 | | | | 712,133 | |
| | | | | | | | |
| | | | | | | 2,509,008 | |
|
Finland — 2.0% | |
UPM-Kymmene OYJ | | | 44,666 | | | | 1,203,691 | |
|
France — 7.3% | |
Arkema SA | | | 4,949 | | | | 433,830 | |
Cie de Saint-Gobain | | | 4,248 | | | | 153,229 | |
Credit Agricole SA | | | 31,468 | | | | 359,337 | |
Eiffage SA | | | 3,017 | | | | 312,484 | |
Peugeot SA | | | 63,087 | | | | 1,409,596 | |
Sanofi | | | 8,183 | | | | 702,574 | |
Vinci SA | | | 10,026 | | | | 1,096,398 | |
| | | | | | | | |
| | | | | | | 4,467,448 | |
|
Germany — 7.6% | |
Allianz SE | | | 8,714 | | | | 1,920,212 | |
Covestro AG (5) | | | 24,475 | | | | 1,107,980 | |
Deutsche Lufthansa AG | | | 46,786 | | | | 718,854 | |
Fresenius Medical Care AG & Co. KGaA | | | 1,812 | | | | 121,878 | |
Fresenius SE & Co. KGaA | | | 10,504 | | | | 509,802 | |
Siltronic AG | | | 1,265 | | | | 81,416 | |
Talanx AG (2) | | | 4,450 | | | | 184,284 | |
| | | | | | | | |
| | | | | | | 4,644,426 | |
|
Hong Kong — 3.6% | |
CK Asset Holdings, Ltd. | | | 174,000 | | | | 1,181,764 | |
Sands China, Ltd. | | | 154,000 | | | | 699,250 | |
WH Group, Ltd. (5) | | | 410,000 | | | | 329,970 | |
| | | | | | | �� | |
| | | | | | | 2,210,984 | |
|
Israel — 1.3% | |
Bank LeumiLe-Israel BM | | | 116,374 | | | | 792,894 | |
|
Italy — 5.1% | |
Enel SpA | | | 253,769 | | | | 1,839,098 | |
Eni SpA | | | 85,589 | | | | 1,286,830 | |
| | | | | | | | |
| | | | | | | 3,125,928 | |
|
Japan — 22.8% | |
AGC, Inc. | | | 11,200 | | | | 323,133 | |
Aoyama Trading Co., Ltd. | | | 8,600 | | | | 152,191 | |
Chubu Electric Power Co., Inc. | | | 37,100 | | | | 547,062 | |
Daito Trust Construction Co., Ltd. (1) | | | 4,000 | | | | 515,084 | |
Daiwa House Industry Co., Ltd. | | | 10,400 | | | | 326,190 | |
Fujitsu, Ltd. | | | 5,400 | | | | 416,964 | |
Hitachi, Ltd. | | | 42,300 | | | | 1,444,973 | |
Honda Motor Co., Ltd. | | | 47,500 | | | | 1,128,312 | |
JVC Kenwood Corp. | | | 79,200 | | | | 228,128 | |
| | | | | | | | |
| Description | | Shares | | | Value | |
| Common Stocks (continued) | | | | | | |
| | |
Japan (continued) | | | | | | | | |
Kajima Corp. (1) | | | 29,100 | | | $ | 354,180 | |
Kansai Electric Power Co., Inc. (1) | | | 49,900 | | | | 607,104 | |
Konica Minolta, Inc. | | | 76,700 | | | | 545,820 | |
Mebuki Financial Group, Inc. | | | 76,200 | | | | 169,995 | |
Mizuho Financial Group, Inc. (1) | | | 388,300 | | | | 565,445 | |
MS&AD Insurance Group Holdings, Inc. (1) | | | 42,200 | | | | 1,341,454 | |
Nichias Corp. | | | 8,600 | | | | 142,962 | |
Nippon Telegraph & Telephone Corp. | | | 36,800 | | | | 1,765,264 | |
Obayashi Corp. | | | 60,000 | | | | 552,925 | |
ORIX Corp. (1) | | | 83,400 | | | | 1,231,747 | |
Sumitomo Electric Industries, Ltd. (1) | | | 10,200 | | | | 120,113 | |
Sumitomo Mitsui Construction Co., Ltd. | | | 25,200 | | | | 125,010 | |
Sumitomo Mitsui Financial Group, Inc. (1) | | | 10,700 | | | | 350,909 | |
Toppan Printing Co., Ltd. | | | 27,600 | | | | 439,844 | |
West Japan Railway Co. | | | 5,800 | | | | 488,634 | |
| | | | | | | | |
| | | | | | | 13,883,443 | |
|
Netherlands — 6.2% | |
AerCap Holdings NV (2) | | | 15,723 | | | | 843,067 | |
ASM International NV | | | 9,718 | | | | 816,422 | |
BE Semiconductor Industries NV | | | 7,064 | | | | 208,455 | |
Fiat Chrysler Automobiles NV | | | 45,188 | | | | 587,921 | |
Koninklijke Ahold Delhaize NV | | | 54,967 | | | | 1,285,858 | |
| | | | | | | | |
| | | | | | | 3,741,723 | |
|
Norway — 3.7% | |
Equinor ASA | | | 60,447 | | | | 1,033,520 | |
Telenor ASA | | | 60,537 | | | | 1,243,001 | |
| | | | | | | | |
| | | | | | | 2,276,521 | |
|
Singapore — 2.8% | |
DBS Group Holdings, Ltd. | | | 77,800 | | | | 1,375,200 | |
SATS, Ltd. | | | 43,400 | | | | 150,114 | |
United Overseas Bank, Ltd. | | | 9,300 | | | | 167,269 | |
| | | | | | | | |
| | | | | | | 1,692,583 | |
|
Spain — 0.8% | |
Banco Bilbao Vizcaya Argentaria SA | | | 26,454 | | | | 125,281 | |
Ence Energia y Celulosa SA (1) | | | 45,833 | | | | 179,730 | |
Merlin Properties Socimi SA | | | 12,721 | | | | 170,009 | |
| | | | | | | | |
| | | | | | | 475,020 | |
|
Sweden — 1.1% | |
Boliden AB | | | 5,648 | | | | 124,876 | |
Skandinaviska Enskilda Banken AB, Class A | | | 63,029 | | | | 541,754 | |
| | | | | | | | |
| | | | | | | 666,630 | |
|
Switzerland — 8.0% | |
Nestle SA | | | 3,462 | | | | 388,262 | |
Roche Holding AG | | | 9,027 | | | | 2,468,003 | |
Sonova Holding AG | | | 2,184 | | | | 506,860 | |
TE Connectivity, Ltd. | | | 12,374 | | | | 1,128,756 | |
Zurich Insurance Group AG | | | 983 | | | | 349,798 | |
| | | | | | | | |
| | | | | | | 4,841,679 | |
|
United Kingdom — 11.2% | |
Auto Trader Group PLC (5) | | | 204,046 | | | | 1,319,873 | |
BT Group PLC | | | 125,750 | | | | 253,450 | |
Diageo PLC | | | 7,621 | | | | 324,887 | |
GlaxoSmithKline PLC | | | 86,463 | | | | 1,800,742 | |
Imperial Brands PLC | | | 41,775 | | | | 1,079,922 | |
International Consolidated Airlines Group SA | | | 22,804 | | | | 117,013 | |
Legal & General Group PLC | | | 85,238 | | | | 227,764 | |
(See Notes to Schedules of Investments and Notes to Financial Statements, which are an integral part of the Financial Statements)
56
Disciplined International Equity Fund (continued)
| | | | | | | | |
| Description | | Shares | | | Value | |
| Common Stocks (continued) | | | | | | |
| | |
United Kingdom (continued) | | | | | | | | |
Micro Focus International PLC | | | 14,484 | | | $ | 195,416 | |
Persimmon PLC | | | 12,236 | | | | 283,259 | |
Tate & Lyle PLC | | | 44,876 | | | | 392,829 | |
Unilever PLC | | | 13,315 | | | | 841,840 | |
| | | | | | | | |
| | | | | | | 6,836,995 | |
| | | | | | | | |
Total Common Stocks
(identified cost $59,546,891) | | | | 60,027,883 | |
| | | | | | | | |
| Limited Partnership Units — 0.2% | |
| | |
Germany — 0.2% | | | | | | | | |
Schaeffler AG | | | 22,050 | | | | 149,524 | |
| | | | | | | | |
Total Limited Partnership Units
(identified cost $292,626) | | | | 149,524 | |
| | | | | | | | |
| Short-Term Investments — 10.6% | |
|
| Collateral Investment for Securities on Loan — 10.3% | |
| | |
BMO Institutional Prime Money Market Fund — Premier Class, 2.097% (3)(4) | | | 6,280,674 | | | | 6,280,673 | |
| | |
| Mutual Funds — 0.3% | | | | | | |
BMO Institutional Prime Money Market Fund — Premier Class, 2.097% (4) | | | 182,186 | | | | 182,205 | |
| | | | | | | | |
Total Short-Term Investments
(identified cost $6,462,875) | | | | 6,462,878 | |
| | | | | | | | |
Total Investments — 109.3%
(identified cost $66,302,392) | | | | 66,640,285 | |
| Other Assets and Liabilities — (9.3)% | | | | (5,671,125 | ) |
| | | | | | | | |
| Total Net Assets — 100.0% | | | | | | $ | 60,969,160 | |
| | | | | | | | |
| | | | | | | | |
| Industry | | Value | | | % of
Total
Net Assets | |
Agriculture | | $ | 1,079,922 | | | | 1.8 | % |
Airlines | | | 1,665,732 | | | | 2.8 | |
Auto Manufacturers | | | 3,125,829 | | | | 5.2 | |
Auto Parts & Equipment | | | 120,113 | | | | 0.2 | |
Banks | | | 4,278,089 | | | | 7.1 | |
Beverages | | | 324,887 | | | | 0.5 | |
Biotechnology | | | 257,109 | | | | 0.4 | |
Building Materials | | | 619,324 | | | | 0.9 | |
Chemicals | | | 1,541,810 | | | | 2.5 | |
Coal | | | 254,301 | | | | 0.4 | |
Commercial Services | | | 439,844 | | | | 0.7 | |
Computers | | | 416,964 | | | | 0.7 | |
Cosmetics/Personal Care | | | 841,840 | | | | 1.4 | |
Diversified Financial Services | | | 1,401,742 | | | | 2.3 | |
Electric | | | 2,993,264 | | | | 4.9 | |
Electronics | | | 1,128,756 | | | | 1.9 | |
Engineering & Construction | | | 2,591,111 | | | | 4.2 | |
Food | | | 2,396,919 | | | | 3.8 | |
Forest Products & Paper | | | 1,383,421 | | | | 2.3 | |
Healthcare-Products | | | 506,860 | | | | 0.8 | |
Healthcare-Services | | | 631,680 | | | | 1.0 | |
Home Builders | | | 283,259 | | | | 0.5 | |
Home Furnishings | | | 228,128 | | | | 0.4 | |
Insurance | | | 4,023,512 | | | | 6.7 | |
Internet | | | 1,319,873 | | | | 2.2 | |
Lodging | | | 699,250 | | | | 1.2 | |
Machinery-Construction & Mining | | | 1,444,973 | | | | 2.4 | |
| | | | | | | | |
| Industry | | Value | | | % of
Total
Net Assets | |
Mining | | $ | 3,538,550 | | | | 5.8 | % |
Office/Business Equipment | | | 545,820 | | | | 0.9 | |
Oil & Gas | | | 4,109,393 | | | | 6.7 | |
Pharmaceuticals | | | 6,768,194 | | | | 11.1 | |
Real Estate | | | 2,023,038 | | | | 3.2 | |
Real Estate Investment Trusts | | | 170,009 | | | | 0.3 | |
Retail | | | 864,324 | | | | 1.5 | |
Semiconductors | | | 1,106,293 | | | | 1.8 | |
Software | | | 310,334 | | | | 0.5 | |
Telecommunications | | | 3,261,715 | | | | 5.3 | |
Transportation | | | 488,634 | | | | 0.8 | |
Trucking & Leasing | | | 843,067 | | | | 1.4 | |
| | | | | | | | |
Total Common Stocks | | | 60,027,883 | | | | 98.5 | |
Auto Parts & Equipment | | | 149,524 | | | | 0.2 | |
Collateral Investment for Securities on Loan | | | 6,280,673 | | | | 10.3 | |
Mutual Funds | | | 182,205 | | | | 0.3 | |
| | | | | | | | |
Total Investments | | | 66,640,285 | | | | 109.3 | |
Other Assets and Liabilities | | | (5,671,125 | ) | | | (9.3 | ) |
| | | | | | | | |
Net Assets | | $ | 60,969,160 | | | | 100.0 | % |
| | | | | | | | |
Pyrford International Stock Fund
| | | | | | | | |
| Description | | Shares | | | Value | |
| Common Stocks — 93.2% | | | | | | |
| | |
Australia — 10.7% | | | | | | | | |
Brambles, Ltd. | | | 1,826,753 | | | $ | 13,901,565 | |
Computershare, Ltd. | | | 1,062,726 | | | | 11,007,357 | |
Newcrest Mining, Ltd. | | | 225,434 | | | | 5,617,287 | |
QBE Insurance Group, Ltd. | | | 1,067,496 | | | | 9,007,883 | |
Rio Tinto, Ltd. | | | 93,013 | | | | 5,485,978 | |
Woodside Petroleum, Ltd. | | | 522,844 | | | | 11,313,273 | |
Woolworths Group, Ltd. | | | 548,572 | | | | 13,953,593 | |
| | | | | | | | |
| | | | | | | 70,286,936 | |
| | |
Finland — 2.8% | | | | | | | | |
Kone OYJ, Class B | | | 167,451 | | | | 9,680,344 | |
Sampo OYJ, A Shares | | | 212,588 | | | | 8,443,922 | |
| | | | | | | | |
| | | | | | | 18,124,266 | |
| | |
France — 8.7% | | | | | | | | |
Air Liquide SA | | | 85,781 | | | | 11,940,255 | |
Bureau Veritas SA | | | 392,701 | | | | 9,391,570 | |
Legrand SA | | | 113,452 | | | | 8,007,552 | |
Rubis SCA | | | 123,036 | | | | 7,112,713 | |
Sanofi | | | 132,568 | | | | 11,381,991 | |
TOTAL SA | | | 175,457 | | | | 8,752,824 | |
| | | | | | | | |
| | | | | | | 56,586,905 | |
| | |
Germany — 6.6% | | | | | | | | |
Brenntag AG | | | 220,816 | | | | 10,637,004 | |
Deutsche Post AG | | | 251,493 | | | | 8,264,459 | |
Fielmann AG | | | 110,584 | | | | 7,869,541 | |
GEA Group AG | | | 280,160 | | | | 7,553,026 | |
SAP SE | | | 74,198 | | | | 8,856,035 | |
| | | | | | | | |
| | | | | | | 43,180,065 | |
| | |
Hong Kong — 4.6% | | | | | | | | |
AIA Group, Ltd. | | | 726,600 | | | | 7,066,381 | |
China Mobile, Ltd. | | | 1,252,000 | | | | 10,371,588 | |
Power Assets Holdings, Ltd. | | | 1,026,000 | | | | 6,830,927 | |
VTech Holdings, Ltd. | | | 741,900 | | | | 5,866,767 | |
| | | | | | | | |
| | | | | | | 30,135,663 | |
(See Notes to Schedules of Investments and Notes to Financial Statements, which are an integral part of the Financial Statements)
57
August 31, 2019
Pyrford International Stock Fund (continued)
| | | | | | | | |
| Description | | Shares | | | Value | |
| Common Stocks (continued) | | | | | | |
| | |
Japan — 11.1% | | | | | | | | |
ABC-Mart, Inc. (1) | | | 142,400 | | | $ | 9,101,483 | |
Japan Tobacco, Inc. | | | 810,668 | | | | 17,173,326 | |
KDDI Corp. | | | 491,500 | | | | 13,116,228 | |
Mitsubishi Electric Corp. | | | 943,000 | | | | 11,393,048 | |
Nihon Kohden Corp. | | | 335,600 | | | | 9,312,833 | |
Sumitomo Rubber Industries, Ltd. | | | 717,300 | | | | 8,095,663 | |
Toyota Tsusho Corp. | | | 145,900 | | | | 4,525,255 | |
| | | | | | | | |
| | | | | | | 72,717,836 | |
| | |
Malaysia — 2.8% | | | | | | | | |
Axiata Group Bhd | | | 6,356,107 | | | | 7,632,467 | |
Malayan Banking Bhd | | | 5,309,377 | | | | 10,970,987 | |
| | | | | | | | |
| | | | | | | 18,603,454 | |
| | |
Netherlands — 3.2% | | | | | | | | |
Koninklijke Vopak NV (1) | | | 210,942 | | | | 10,052,397 | |
Unilever NV | | | 178,461 | | | | 11,070,001 | |
| | | | | | | | |
| | | | | | | 21,122,398 | |
| | |
Norway — 1.9% | | | | | | | | |
Telenor ASA | | | 611,824 | | | | 12,562,528 | |
| | |
Singapore — 4.6% | | | | | | | | |
ComfortDelGro Corp., Ltd. | | | 4,661,900 | | | | 8,230,340 | |
Singapore Technologies Engineering, Ltd. | | | 1,628,500 | | | | 4,623,520 | |
Singapore Telecommunications, Ltd. | | | 3,467,300 | | | | 7,920,260 | |
United Overseas Bank, Ltd. | | | 498,702 | | | | 8,969,629 | |
| | | | | | | | |
| | | | | | | 29,743,749 | |
| | |
Sweden — 4.5% | | | | | | | | |
Assa Abloy AB, Class B | | | 419,349 | | | | 8,754,730 | |
Atlas Copco AB, A Shares | | | 305,164 | | | | 9,113,271 | |
Essity AB, Class B | | | 376,767 | | | | 11,750,636 | |
| | | | | | | | |
| | | | | | | 29,618,637 | |
| | |
Switzerland — 13.9% | | | | | | | | |
Geberit AG | | | 6,872 | | | | 3,125,120 | |
Givaudan SA | | | 1,660 | | | | 4,488,164 | |
Nestle SA | | | 221,117 | | | | 24,798,168 | |
Novartis AG | | | 205,159 | | | | 18,450,318 | |
Roche Holding AG | | | 75,784 | | | | 20,719,526 | |
Schindler Holding AG | | | 20,466 | | | | 4,673,217 | |
SGS SA | | | 1,979 | | | | 4,858,772 | |
Zurich Insurance Group AG | | | 28,051 | | | | 9,981,876 | |
| | | | | | | | |
| | | | | | | 91,095,161 | |
| | |
Taiwan — 3.9% | | | | | | | | |
Advantech Co., Ltd. | | | 600,118 | | | | 5,101,289 | |
Chunghwa Telecom Co., Ltd. | | | 2,421,000 | | | | 8,401,433 | |
Merida Industry Co., Ltd. | | | 444,000 | | | | 2,565,616 | |
Taiwan Semiconductor Manufacturing Co., Ltd. | | | 1,136,000 | | | | 9,367,208 | |
| | | | | | | | |
| | | | | | | 25,435,546 | |
| | |
United Kingdom — 13.9% | | | | | | | | |
BP PLC | | | 688,114 | | | | 4,188,159 | |
British American Tobacco PLC | | | 273,436 | | | | 9,582,244 | |
GlaxoSmithKline PLC | | | 489,193 | | | | 10,188,297 | |
IMI PLC | | | 342,301 | | | | 4,185,943 | |
Imperial Brands PLC | | | 230,750 | | | | 5,965,097 | |
Legal & General Group PLC | | | 2,892,375 | | | | 7,728,692 | |
National Grid PLC | | | 1,223,054 | | | | 12,776,297 | |
Reckitt Benckiser Group PLC | | | 107,484 | | | | 8,369,028 | |
Royal Dutch Shell PLC, A Shares | | | 245,264 | | | | 6,799,583 | |
| | | | | | | | |
| Description | | Shares | | | Value | |
| Common Stocks (continued) | | | | | | |
| | |
United Kingdom(continued) | | | | | | | | |
Royal Dutch Shell PLC,
B Shares | | | 191,591 | | | $ | 5,280,346 | |
SSE PLC | | | 442,144 | | | | 6,192,387 | |
Vodafone Group PLC | | | 4,954,215 | | | | 9,358,313 | |
| | | | | | | | |
| | | | | | | 90,614,386 | |
| | | | | | | | |
Total Common Stocks
(identified cost $558,374,964) | | | | | | | 609,827,530 | |
| | | | | | | | |
| Preferred Stocks — 1.4% | | | | | | |
| | |
Germany — 1.4% | | | | | | | | |
Fuchs Petrolub SE | | | 269,265 | | | | 9,404,834 | |
| | | | | | | | |
Total Preferred Stocks
(identified cost $10,585,770) | | | | | | | 9,404,834 | |
| | | | | | | | |
| Short-Term Investments — 6.1% | | | | |
|
| Collateral Investment for Securities on Loan — 2.0% | |
BMO Institutional Prime Money Market Fund — Premier Class, 2.097% (3)(4) | | | 12,915,868 | | | | 12,915,868 | |
| | |
| Mutual Funds — 4.1% | | | | | | |
BMO Institutional Prime Money Market Fund — Premier Class, 2.097% (4) | | | 26,957,020 | | | | 26,959,715 | |
| | | | | | | | |
Total Short-Term Investments
(identified cost $39,874,327) | | | | | | | 39,875,583 | |
| | | | | | | | |
Total Investments — 100.7%
(identified cost $608,835,061) | | | | | | | 659,107,947 | |
| Other Assets and Liabilities — (0.7)% | | | | (4,544,491 | ) |
| | | | | | | | |
| Total Net Assets — 100.0% | | | | | | $ | 654,563,456 | |
| | | | | | | | |
| | | | | | | | |
| Industry | | Value | | | % of
Total
Net Assets | |
Agriculture | | $ | 32,720,667 | | | | 5.0 | % |
Auto Parts & Equipment | | | 8,095,663 | | | | 1.2 | |
Banks | | | 19,940,616 | | | | 3.1 | |
Building Materials | | | 3,125,120 | | | | 0.5 | |
Chemicals | | | 27,065,423 | | | | 4.1 | |
Commercial Services | | | 28,151,907 | | | | 4.2 | |
Computers | | | 16,108,646 | | | | 2.5 | |
Cosmetics/Personal Care | | | 22,820,637 | | | | 3.5 | |
Distribution/Wholesale | | | 4,525,255 | | | | 0.7 | |
Electric | | | 13,023,314 | | | | 2.0 | |
Electrical Components & Equipment | | | 8,007,552 | | | | 1.2 | |
Electronics | | | 8,754,730 | | | | 1.3 | |
Engineering & Construction | | | 4,623,520 | | | | 0.7 | |
Food | | | 38,751,761 | | | | 5.9 | |
Gas | | | 19,889,010 | | | | 3.1 | |
Hand/Machine Tools | | | 4,673,217 | | | | 0.7 | |
Healthcare-Products | | | 9,312,833 | | | | 1.4 | |
Household Products/Wares | | | 8,369,028 | | | | 1.3 | |
Insurance | | | 42,228,754 | | | | 6.5 | |
Leisure Time | | | 2,565,616 | | | | 0.4 | |
Machinery-Construction & Mining | | | 20,506,319 | | | | 3.2 | |
Machinery-Diversified | | | 17,233,370 | | | | 2.7 | |
Mining | | | 11,103,265 | | | | 1.7 | |
Miscellaneous Manufacturing | | | 4,185,943 | | | | 0.6 | |
Oil & Gas | | | 36,334,185 | | | | 5.5 | |
Pharmaceuticals | | | 60,740,132 | | | | 9.4 | |
Pipelines | | | 10,052,397 | | | | 1.5 | |
Retail | | | 16,971,024 | | | | 2.6 | |
Semiconductors | | | 9,367,208 | | | | 1.4 | |
Software | | | 8,856,035 | | | | 1.3 | |
Telecommunications | | | 75,229,584 | | | | 11.4 | |
(See Notes to Schedules of Investments and Notes to Financial Statements, which are an integral part of the Financial Statements)
58
Pyrford International Stock Fund (continued)
| | | | | | | | |
| Industry | | Value | | | % of
Total
Net Assets | |
Transportation | | $ | 16,494,799 | | | | 2.6 | % |
| | | | | | | | |
Total Common Stocks | | | 609,827,530 | | | | 93.2 | |
Preferred Stocks | | | 9,404,834 | | | | 1.4 | |
Collateral Investment for Securities on Loan | | | 12,915,868 | | | | 2.0 | |
Mutual Funds | | | 26,959,715 | | | | 4.1 | |
| | | | | | | | |
Total Investments | | | 659,107,947 | | | | 100.7 | |
| | | | | | | | |
Other Assets and Liabilities | | | (4,544,491 | ) | | | (0.7 | ) |
| | | | | | | | |
Net Assets | | $ | 654,563,456 | | | | 100.0 | % |
| | | | | | | | |
LGM Emerging Markets Equity Fund
| | | | | | | | |
| Description | | Shares | | | Value | |
| Common Stocks — 91.4% | | | | | | |
| | |
Brazil — 2.3% | | | | | | | | |
Raia Drogasil SA | | | 305,300 | | | $ | 6,785,755 | |
| | |
Chile — 1.2% | | | | | | | | |
Aguas Andinas SA, Class A | | | 6,599,751 | | | | 3,630,961 | |
| | |
China — 16.5% | | | | | | | | |
ANTA Sports Products, Ltd. | | | 1,156,000 | | | | 9,583,695 | |
Inner Mongolia Yili Industrial Group Co., Ltd., Class A | | | 2,649,122 | | | | 10,621,996 | |
Ping An Healthcare and Technology Co.,
Ltd. (1)(2)(5) | | | 781,200 | | | | 4,628,174 | |
Tingyi Cayman Islands Holding Corp. | | | 8,620,000 | | | | 11,873,884 | |
Yum China Holdings, Inc. | | | 252,193 | | | | 11,457,128 | |
| | | | | | | | |
| | | | | | | 48,164,877 | |
| | |
Egypt — 4.3% | | | | | | | | |
Commercial International Bank Egypt SAE, GDR | | | 1,833,226 | | | | 8,524,501 | |
Eastern Co. SAE | | | 4,257,768 | | | | 3,961,911 | |
| | | | | | | | |
| | | | | | | 12,486,412 | |
| | |
Hong Kong — 8.2% | | | | | | | | |
AIA Group, Ltd. | | | 1,075,200 | | | | 10,456,609 | |
Dairy Farm International Holdings, Ltd. | | | 393,191 | | | | 2,815,248 | |
Sands China, Ltd. | | | 2,337,600 | | | | 10,614,071 | |
| | | | | | | | |
| | | | | | | 23,885,928 | |
| | |
India — 16.1% | | | | | | | | |
Colgate-Palmolive India, Ltd. | | | 421,044 | | | | 7,511,957 | |
Emami, Ltd. | | | 996,017 | | | | 4,135,687 | |
HDFC Bank, Ltd. | | | 463,576 | | | | 14,489,448 | |
ICICI Bank, Ltd. | | | 2,022,249 | | | | 11,649,366 | |
ITC, Ltd. | | | 2,689,417 | | | | 9,246,254 | |
| | | | | | | | |
| | | | | | | 47,032,712 | |
| | |
Indonesia — 5.7% | | | | | | | | |
Bank Mandiri Persero Tbk PT | | | 24,599,508 | | | | 12,572,889 | |
Bank Rakyat Indonesia Persero Tbk PT | | | 13,832,200 | | | | 4,163,799 | |
| | | | | | | | |
| | | | | | | 16,736,688 | |
| | |
Malaysia — 3.5% | | | | | | | | |
British American Tobacco Malaysia Bhd | | | 1,209,200 | | | | 5,670,057 | |
| | | | | | | | |
| Description | | Shares | | | Value | |
| Common Stocks (continued) | | | | | | |
| | |
Malaysia(continued) | | | | | | | | |
Public Bank Bhd | | | 939,900 | | | $ | 4,541,378 | |
| | | | | | | | |
| | | | | | | 10,211,435 | |
| | |
Mexico — 5.8% | | | | | | | | |
Bolsa Mexicana de Valores SAB de C.V. | | | 2,026,573 | | | | 3,748,475 | |
Wal-Mart de Mexico SAB de C.V. | | | 4,595,781 | | | | 13,038,750 | |
| | | | | | | | |
| | | | | | | 16,787,225 | |
| | |
Nigeria — 1.3% | | | | | | | | |
Guaranty Trust Bank PLC | | | 48,352,103 | | | | 3,643,861 | |
| | |
Peru — 1.5% | | | | | | | | |
Credicorp, Ltd. | | | 20,766 | | | | 4,301,054 | |
| | |
Philippines — 3.4% | | | | | | | | |
Universal Robina Corp. | | | 2,971,920 | | | | 9,876,428 | |
| | |
Russia — 3.6% | | | | | | | | |
Magnit PJSC, GDR | | | 786,472 | | | | 10,385,363 | |
|
South Africa — 11.3% | |
AVI, Ltd. | | | 983,812 | | | | 5,380,604 | |
Clicks Group, Ltd. | | | 407,009 | | | | 5,339,582 | |
Discovery, Ltd. | | | 903,136 | | | | 6,857,135 | |
Famous Brands, Ltd. | | | 305,889 | | | | 1,590,270 | |
Mr Price Group, Ltd. | | | 630,408 | | | | 7,135,377 | |
Multichoice Group, Ltd. (2) | | | 10,111 | | | | 88,734 | |
Naspers, Ltd., Class N | | | 29,271 | | | | 6,664,767 | |
| | | | | | | | |
| | | | | | | 33,056,469 | |
|
Thailand — 1.3% | |
Kasikornbank PCL | | | 694,469 | | | | 3,634,477 | |
|
United States — 2.9% | |
Western Union Co. | | | 378,338 | | | | 8,368,836 | |
|
Vietnam — 2.5% | |
Vietnam Dairy Products JSC | | | 1,368,611 | | | | 7,260,379 | |
| | | | | | | | |
Total Common Stocks
(identified cost $255,346,629) | | | | | | | 266,248,860 | |
| | | | | | | | |
| Common Stock Units — 3.0% | |
|
Mexico — 3.0% | |
Fomento Economico Mexicano SAB de C.V., | | | 971,600 | | | | 8,886,760 | |
| | | | | | | | |
Total Common Stock Units
(identified cost $8,477,860) | | | | | | | 8,886,760 | |
| | | | | | | | |
| Short-Term Investments — 6.4% | |
|
| Collateral Investment for Securities on Loan — 0.7% | |
| | |
BMO Institutional Prime Money Market Fund — Premier Class, 2.097% (3)(4) | | | 1,884,447 | | | | 1,884,447 | |
| | |
| Mutual Funds — 5.7% | | | | | | |
BMO Institutional Prime Money Market Fund — Premier Class, 2.097% (4) | | | 16,711,176 | | | | 16,712,847 | |
| | | | | | | | |
Total Short-Term Investments
(identified cost $18,596,901) | | | | | | | 18,597,294 | |
| | | | | | | | |
Total Investments — 100.8%
(identified cost $282,421,390) | | | | | | | 293,732,914 | |
| Other Assets and Liabilities — (0.8)% | | | | (2,349,927 | ) |
| | | | | | | | |
| Total Net Assets — 100.0% | | | | | | $ | 291,382,987 | |
| | | | | | | | |
(See Notes to Schedules of Investments and Notes to Financial Statements, which are an integral part of the Financial Statements)
59
August 31, 2019
LGM Emerging Markets Equity Fund (continued)
| | | | | | | | |
| Industry | | Value | | | % of
Total
Net Assets | |
Agriculture | | $ | 18,878,222 | | | | 6.5 | % |
Banks | | | 67,520,773 | | | | 23.2 | |
Cosmetics/Personal Care | | | 7,511,957 | | | | 2.6 | |
Diversified Financial Services | | | 12,117,311 | | | | 4.2 | |
Food | | | 52,833,298 | | | | 18.2 | |
Holding Companies-Diversified | | | 5,380,604 | | | | 1.8 | |
Insurance | | | 17,313,744 | | | | 6.0 | |
Internet | | | 6,664,767 | | | | 2.3 | |
Lodging | | | 10,614,071 | | | | 3.6 | |
Media | | | 88,734 | | | | 0.0 | |
Pharmaceuticals | | | 4,135,687 | | | | 1.4 | |
Retail | | | 54,930,557 | | | | 18.8 | |
Software | | | 4,628,174 | | | | 1.6 | |
Water | | | 3,630,961 | | | | 1.2 | |
| | | | | | | | |
Total Common Stocks | | | 266,248,860 | | | | 91.4 | |
Common Stock Units | | | 8,886,760 | | | | 3.0 | |
Collateral Investment for Securities on Loan | | | 1,884,447 | | | | 0.7 | |
| | | | | | | | |
Mutual Funds | | | 16,712,847 | | | | 5.7 | |
| | | | | | | | |
Total Investments | | | 293,732,914 | | | | 100.8 | |
Other Assets and Liabilities | | | (2,349,927 | ) | | | (0.8 | ) |
| | | | | | | | |
Net Assets | | $ | 291,382,987 | | | | 100.0 | % |
| | | | | | | | |
Alternative Strategies Fund
| | | | | | | | |
| Description | | Shares | | | Value | |
| Common Stocks — 20.8% | |
|
Australia — 0.6% | |
BHP Group PLC | | | 7,388 | | | $ | 159,388 | |
Regis Resources, Ltd. | | | 18,754 | | | | 64,917 | |
| | | | | | | | |
| | | | | | | 224,305 | |
|
Bermuda — 0.4% | |
Argo Group International Holdings, Ltd. | | | 525 | | | | 34,503 | |
Essent Group, Ltd. | | | 2,460 | | | | 119,310 | |
| | | | | | | | |
| | | | | | | 153,813 | |
|
Canada — 3.0% | |
Air Canada (2) | | | 6,799 | | | | 228,523 | |
Allied Properties Real Estate Investment Trust | | | 4,819 | | | | 190,024 | |
Canfor Corp. (2) | | | 6,205 | | | | 71,399 | |
Cascades, Inc. | | | 1,573 | | | | 13,327 | |
Cogeco Communications, Inc. | | | 744 | | | | 58,474 | |
Cogeco, Inc. | | | 338 | | | | 23,823 | |
Equitable Group, Inc. | | | 1,278 | | | | 94,856 | |
George Weston, Ltd. | | | 1,500 | | | | 121,868 | |
Hudbay Minerals, Inc. | | | 13,846 | | | | 46,486 | |
Husky Energy, Inc. | | | 4,273 | | | | 28,532 | |
Interfor Corp. (2) | | | 7,041 | | | | 70,653 | |
InterRent Real Estate Investment Trust | | | 5,354 | | | | 64,422 | |
Methanex Corp. | | | 1,266 | | | | 41,040 | |
Quebecor, Inc., Class B | | | 1,115 | | | | 25,115 | |
Teck Resources, Ltd., Class B | | | 3,364 | | | | 57,279 | |
| | | | | | | | |
| | | | | | | 1,135,821 | |
| | | | | | | | |
| Description | | Shares | | | Value | |
| Common Stocks (continued) | |
|
Cayman Islands — 0.1% | |
Tianneng Power International, Ltd. | | | 34,000 | | | $ | 26,843 | |
|
China — 0.0% | |
Agricultural Bank of China, Ltd., Class H | | | 45,000 | | | | 17,333 | |
|
Denmark — 0.2% | |
Novo Nordisk A/S, Class B | | | 608 | | | | 31,572 | |
Scandinavian Tobacco Group A/S, Class A (5) | | | 5,295 | | | | 60,875 | |
| | | | | | | | |
| | | | | | | 92,447 | |
|
France — 0.3% | |
Boiron SA | | | 370 | | | | 15,188 | |
Derichebourg SA | | | 11,432 | | | | 40,809 | |
Peugeot SA | | | 2,031 | | | | 45,380 | |
Sanofi | | | 331 | | | | 28,419 | |
| | | | | | | | |
| | | | | | | 129,796 | |
|
Germany — 0.0% | |
Hamburger Hafen und Logistik AG | | | 503 | | | | 12,151 | |
|
Hong Kong — 0.5% | |
HKT Trust & HKT, Ltd. | | | 56,000 | | | | 87,567 | |
SITC International Holdings Co., Ltd. | | | 10,000 | | | | 10,382 | |
SmarTone Telecommunications Holdings, Ltd. | | | 75,500 | | | | 67,119 | |
WH Group, Ltd. (5) | | | 28,500 | | | | 22,937 | |
| | | | | | | | |
| | | | | | | 188,005 | |
|
Indonesia — 0.2% | |
Bukit Asam Tbk PT | | | 375,400 | | | | 65,368 | |
Indo Tambangraya Megah Tbk PT | | | 16,300 | | | | 14,938 | |
| | | | | | | | |
| | | | | | | 80,306 | |
|
Italy — 0.7% | |
ASTM SpA | | | 830 | | | | 25,597 | |
Enel SpA | | | 29,626 | | | | 214,704 | |
Societa Iniziative Autostradali e Servizi SpA | | | 1,800 | | | | 30,208 | |
| | | | | | | | |
| | | | | | | 270,509 | |
|
Japan — 1.9% | |
Arcs Co., Ltd. | | | 2,100 | | | | 43,548 | |
Artnature, Inc. | | | 2,000 | | | | 11,879 | |
Frontier Real Estate Investment Corp. | | | 42 | | | | 181,070 | |
Fukuda Corp. | | | 700 | | | | 24,775 | |
Heiwado Co., Ltd. | | | 3,900 | | | | 72,211 | |
J-Oil Mills, Inc. | | | 700 | | | | 26,291 | |
KDDI Corp. | | | 1,400 | | | | 37,361 | |
Keihin Corp. | | | 2,900 | | | | 39,609 | |
Mitsui Sugar Co., Ltd. | | | 1,000 | | | | 20,492 | |
Nippon Telegraph & Telephone Corp. | | | 3,700 | | | | 177,486 | |
Okinawa Electric Power Co., Inc. | | | 2,850 | | | | 43,326 | |
Press Kogyo Co., Ltd. | | | 5,500 | | | | 22,935 | |
Yorozu Corp. | | | 1,100 | | | | 12,964 | |
| | | | | | | | |
| | | | | | | 713,947 | |
|
Luxembourg — 0.1% | |
Trinseo SA | | | 1,473 | | | | 51,688 | |
(See Notes to Schedules of Investments and Notes to Financial Statements, which are an integral part of the Financial Statements)
60
Alternative Strategies Fund (continued)
| | | | | | | | |
| Description | | Shares | | | Value | |
| Common Stocks (continued) | |
|
Malaysia — 0.0% | |
Malaysian Pacific Industries Bhd | | | 6,700 | | | $ | 14,179 | |
|
Netherlands — 0.4% | |
Koninklijke Ahold Delhaize NV | | | 6,564 | | | | 153,553 | |
|
New Zealand — 0.2% | |
Air New Zealand, Ltd. | | | 36,964 | | | | 66,729 | |
New Zealand Refining Co., Ltd. | | | 15,127 | | | | 19,539 | |
| | | | | | | | |
| | | | | | | 86,268 | |
|
Norway — 0.4% | |
Austevoll Seafood ASA | | | 3,526 | | | | 36,200 | |
DNO ASA | | | 12,302 | | | | 16,288 | |
Leroy Seafood Group ASA | | | 11,786 | | | | 77,295 | |
Sparebank 1 Oestlandet | | | 1,624 | | | | 14,757 | |
| | | | | | | | |
| | | | | | | 144,540 | |
|
Poland — 0.1% | |
Asseco Poland SA | | | 3,558 | | | | 50,007 | |
|
Portugal — 0.0% | |
Altri SGPS SA | | | 2,325 | | | | 14,693 | |
|
Singapore — 0.6% | |
ComfortDelGro Corp., Ltd. | | | 30,300 | | | | 53,493 | |
DBS Group Holdings, Ltd. | | | 8,700 | | | | 153,782 | |
First Resources, Ltd. | | | 16,600 | | | | 17,704 | |
| | | | | | | | |
| | | | | | | 224,979 | |
|
South Korea — 0.5% | |
DB HiTek Co., Ltd. | | | 2,574 | | | | 31,239 | |
KT Corp. | | | 4 | | | | 89 | |
Samsung Electronics Co., Ltd. | | | 4,070 | | | | 147,847 | |
| | | | | | | | |
| | | | | | | 179,175 | |
|
Sweden — 0.1% | |
Mycronic AB | | | 1,753 | | | | 21,398 | |
|
Switzerland — 0.5% | |
Ferrexpo PLC | | | 7,771 | | | | 19,110 | |
Roche Holding AG | | | 638 | | | | 174,431 | |
| | | | | | | | |
| | | | | | | 193,541 | |
|
Taiwan — 0.4% | |
Uni-President Enterprises Corp. | | | 44,000 | | | | 107,303 | |
United Integrated Services Co., Ltd. | | | 9,000 | | | | 44,413 | |
| | | | | | | | |
| | | | | | | 151,716 | |
|
United Kingdom — 1.4% | |
BT Group PLC | | | 58,172 | | | | 117,246 | |
DFS Furniture PLC | | | 4,705 | | | | 12,423 | |
GlaxoSmithKline PLC | | | 7,806 | | | | 162,574 | |
Imperial Brands PLC | | | 1,857 | | | | 48,005 | |
International Consolidated Airlines Group SA | | | 6,210 | | | | 31,865 | |
Legal & General Group PLC | | | 45,220 | | | | 120,832 | |
Reach PLC | | | 8,909 | | | | 9,865 | |
SThree PLC | | | 3,754 | | | | 11,602 | |
Watkin Jones PLC | | | 12,687 | | | | 33,345 | |
| | | | | | | | |
| | | | | | | 547,757 | |
|
United States — 8.2% | |
AbbVie, Inc. | | | 536 | | | | 35,237 | |
ArcBest Corp. | | | 1,745 | | | | 51,669 | |
Best Buy Co., Inc. | | | 1,280 | | | | 81,472 | |
| | | | | | | | |
| Description | | Shares | | | Value | |
| Common Stocks (continued) | |
| | |
United States (continued) | | | | | | | | |
Ciena Corp. (2) | | | 3,739 | | | $ | 153,037 | |
Citizens Financial Group, Inc. | | | 779 | | | | 26,283 | |
CONMED Corp. | | | 1,629 | | | | 164,154 | |
ConocoPhillips | | | 1,238 | | | | 64,599 | |
CRA International, Inc. | | | 1,337 | | | | 51,996 | |
Discover Financial Services | | | 1,280 | | | | 102,362 | |
Emergent BioSolutions,
Inc. (2) | | | 3,055 | | | | 133,809 | |
Employers Holdings, Inc. | | | 1,205 | | | | 51,972 | |
Enova International, Inc. (2) | | | 493 | | | | 11,783 | |
Essex Property Trust, Inc. | | | 687 | | | | 220,706 | |
F5 Networks, Inc. (2) | | | 289 | | | | 37,203 | |
FedNat Holding Co. | | | 757 | | | | 9,258 | |
Genomic Health, Inc. (2) | | | 443 | | | | 33,960 | |
Glaukos Corp. (2) | | | 1,149 | | | | 73,892 | |
Globus Medical, Inc., Class A (2) | | | 823 | | | | 42,031 | |
Haemonetics Corp. (2) | | | 556 | | | | 74,243 | |
HealthStream, Inc. (2) | | | 1,247 | | | | 31,512 | |
Huntington Ingalls Industries, Inc. | | | 534 | | | | 111,606 | |
Integer Holdings Corp. (2) | | | 1,136 | | | | 82,246 | |
Intersect ENT, Inc. (2) | | | 226 | | | | 3,702 | |
K12, Inc. (2) | | | 2,754 | | | | 72,568 | |
Lantheus Holdings, Inc. (2) | | | 2,135 | | | | 46,458 | |
LeMaitre Vascular, Inc. | | | 512 | | | | 16,210 | |
Luminex Corp. | | | 666 | | | | 13,653 | |
Marlin Business Services Corp. | | | 2,206 | | | | 47,716 | |
Masco Corp. | | | 3,616 | | | | 147,280 | |
Merit Medical Systems, Inc. (2) | | | 3,049 | | | | 106,044 | |
Myriad Genetics, Inc. (2) | | | 1,279 | | | | 30,095 | |
Natus Medical, Inc. (2) | | | 1,039 | | | | 28,759 | |
NetApp, Inc. | | | 1,139 | | | | 54,740 | |
NextGen Healthcare, Inc. (2) | | | 1,419 | | | | 20,164 | |
OraSure Technologies, Inc. (2) | | | 3,905 | | | | 25,773 | |
Orthofix Medical, Inc. (2) | | | 1,112 | | | | 56,534 | |
Owens-Illinois, Inc. | | | 1,035 | | | | 10,526 | |
Pacira BioSciences, Inc. (2) | | | 799 | | | | 29,755 | |
Regions Financial Corp. | | | 4,554 | | | | 66,579 | |
Rush Enterprises, Inc., Class A | | | 1,662 | | | | 60,015 | |
Southwest Airlines Co. | | | 591 | | | | 30,921 | |
SpartanNash Co. | | | 960 | | | | 10,339 | |
Supernus Pharmaceuticals, Inc. (2) | | | 1,791 | | | | 48,411 | |
Surmodics, Inc. (2) | | | 559 | | | | 26,306 | |
Sykes Enterprises, Inc. (2) | | | 1,991 | | | | 57,739 | |
Synchrony Financial | | | 828 | | | | 26,537 | |
Sysco Corp. | | | 1,247 | | | | 92,689 | |
U.S. Foods Holding Corp. (2) | | | 3,622 | | | | 146,510 | |
United Airlines Holdings, Inc. (2) | | | 660 | | | | 55,645 | |
Unum Group | | | 2,430 | | | | 61,746 | |
Vishay Intertechnology, Inc. | | | 4,034 | | | | 63,858 | |
Vishay Precision Group, Inc. (2) | | | 707 | | | | 22,094 | |
WW Grainger, Inc. | | | 61 | | | | 16,693 | |
| | | | | | | | |
| | | | | | | 3,141,089 | |
| | | | | | | | |
Total Common Stocks
(identified cost $8,472,645) | | | | 8,019,859 | |
(See Notes to Schedules of Investments and Notes to Financial Statements, which are an integral part of the Financial Statements)
61
August 31, 2019
Alternative Strategies Fund (continued)
| | | | | | | | |
| Description | | Shares or
Principal Amount | | | Value | |
| Short-Term Investments — 68.1% | |
|
| Mutual Funds — 49.3% | |
BMO Institutional Prime Money Market Fund — Premier Class, 2.097% (4) | | | 18,999,373 | | | $ | 19,001,273 | |
|
| U.S. Treasury Bills — 18.8% | |
United States Treasury Bill, 0.000% 9/5/2019 (6) | | $ | 3,050,000 | | | | 3,049,699 | |
United States Treasury Bill, 0.000% 9/12/2019 (6) | | | 2,550,000 | | | | 2,548,808 | |
United States Treasury Bill, 0.000% 10/10/2019 (6) | | | 1,650,000 | | | | 1,646,617 | |
| | | | | | | | |
Total Short-Term Investments
(identified cost $26,241,821) | | | | 26,246,397 | |
| | | | | | | | |
Total Investments — 88.9%
(identified cost $34,714,466) | | | | 34,266,256 | |
| Other Assets and Liabilities — 11.1% | | | | 4,297,571 | |
| | | | | | | | |
| Total Net Assets — 100.0% | | | $ | 38,563,827 | |
| | | | | | | | |
| | | | | | | | |
| |
| Industry Allocation | |
| |
| Industry | | Value | | | % of
Total
Net Assets | |
Common Stocks | | | | | | | | |
Agriculture | | $ | 126,584 | | | | 0.3 | % |
Airlines | | | 413,683 | | | | 1.1 | |
Auto Manufacturers | | | 45,380 | | | | 0.1 | |
Auto Parts & Equipment | | | 75,508 | | | | 0.2 | |
Banks | | | 278,734 | | | | 0.7 | |
Biotechnology | | | 163,904 | | | | 0.4 | |
Building Materials | | | 147,280 | | | | 0.4 | |
Chemicals | | | 41,040 | | | | 0.1 | |
Coal | | | 80,306 | | | | 0.2 | |
Commercial Services | | | 204,122 | | | | 0.5 | |
Computers | | | 162,486 | | | | 0.4 | |
Cosmetics/Personal Care | | | 11,879 | | | | 0.0 | |
Distribution/Wholesale | | | 16,693 | | | | 0.1 | |
Diversified Financial Services | | | 283,254 | | | | 0.7 | |
Electric | | | 258,030 | | | | 0.7 | |
Electrical Components & Equipment | | | 26,843 | | | | 0.1 | |
Electronics | | | 107,350 | | | | 0.3 | |
Engineering & Construction | | | 69,188 | | | | 0.2 | |
Environmental Control | | | 40,809 | | | | 0.1 | |
Food | | | 931,236 | | | | 2.4 | |
Forest Products & Paper | | | 170,072 | | | | 0.4 | |
Healthcare-Products | | | 793,965 | | | | 2.1 | |
Holding Companies-Diversified | | | 14,179 | | | | 0.0 | |
Insurance | | | 397,621 | | | | 1.0 | |
Internet | | | 68,715 | | | | 0.2 | |
Media | | | 117,277 | | | | 0.3 | |
Mining | | | 347,180 | | | | 0.9 | |
Miscellaneous Manufacturing | | | 51,688 | | | | 0.1 | |
Oil & Gas | | | 128,958 | | | | 0.3 | |
Packaging & Containers | | | 10,526 | | | | 0.0 | |
Pharmaceuticals | | | 525,587 | | | | 1.4 | |
Real Estate | | | 33,345 | | | | 0.1 | |
Real Estate Investment Trusts | | | 656,222 | | | | 1.7 | |
Retail | | | 153,910 | | | | 0.4 | |
Semiconductors | | | 179,086 | | | | 0.5 | |
Shipbuilding | | | 111,606 | | | | 0.3 | |
| | | | | | | | |
| |
| Industry Allocation(continued) | |
| Industry | | Value | | | % of
Total
Net Assets | |
Software | | $ | 20,164 | | | | 0.1 | % |
Telecommunications | | | 639,905 | | | | 1.7 | |
Transportation | | | 115,544 | | | | 0.3 | |
| | | | | | | | |
Total Common Stocks | | | 8,019,859 | | | | 20.8 | |
Short-Term Investments | | | 26,246,397 | | | | 68.1 | |
| | | | | | | | |
Total Investments | | | 34,266,256 | | | | 88.9 | |
Other Assets and Liabilities | | | 4,297,571 | | | | 11.1 | |
| | | | | | | | |
Total Net Assets | | $ | 38,563,827 | | | | 100.0 | % |
| | | | | | | | |
(See Notes to Schedules of Investments and Notes to Financial Statements, which are an integral part of the Financial Statements)
62
At August 31, 2019, the Alternative Strategies Fund had outstanding futures contracts as set forth below:
| | | | | | | | | | | | | | |
Expiration Date | | Number of
Contracts | | Description | | | Notional
Amount | | Value | | Unrealized
Appreciation
(Depreciation) | |
Long Futures | | | | | | | | | | | | | | |
|
Bond Futures | |
September 2019 | | 3 | | | SFE10-Year Australian Bond | | | $ 300,005 | | $ 300,605 | | $ | 607 | |
December 2019 | | 21 | | | Canadian Government Bond | | | 2,279,538 | | 2,288,328 | | | 8,850 | |
December 2019 | | 16 | | | United States Treasury Note | | | 2,104,601 | | 2,107,500 | | | 2,899 | |
December 2019 | | 16 | | | United States Treasury Bond | | | 2,633,101 | | 2,644,000 | | | 10,899 | |
Index Futures | |
September 2019 | | 12 | | | CMEE-Mini S&P 500® Index | | | 1,767,304 | | 1,754,880 | | | (12,424) | |
September 2019 | | 17 | | | LIFFE FTSE 100 Index | | | 1,509,030 | | 1,485,329 | | | (23,495) | |
September 2019 | | 1 | | | Russell 2000 Mini Index | | | 74,978 | | 74,710 | | | (268) | |
September 2019 | | 6 | | | CME E-Mini NASDAQ 100 Index | | | 914,487 | | 922,890 | | | 8,403 | |
September 2019 | | 37 | | | Eurex Euro STOXX 50 Index | | | 1,390,658 | | 1,390,331 | | | (327) | |
September 2019 | | 2 | | | DAX Index | | | 647,262 | | 654,621 | | | 7,359 | |
September 2019 | | 6 | | | CAC 40 10 Euro | | | 345,563 | | 361,235 | | | 15,672 | |
September 2019 | | 2 | | | CBOTE-Mini DJIA Index | | | 259,666 | | 264,060 | | | 4,394 | |
Interest Rate Futures | |
December 2020 | | 143 | | | CME3-Month Eurodollar | | | 35,205,305 | | 35,299,551 | | | 94,790 | |
September 2019 | | 1 | | | Eurex10-Year Euro BUND | | | 196,523 | | 196,840 | | | 2,102 | |
December 2020 | | 107 | | | LIFFE 90-Day Sterling | | | 16,171,763 | | 16,185,997 | | | 14,234 | |
December 2020 | | 51 | | | LIFFE3-Month Euro Euribor | | | 14,107,380 | | 14,112,376 | | | 3,436 | |
December 2019 | | 8 | | | LIFFE 10-Year Gilt Government Bond | | | 1,303,644 | | 1,307,135 | | | 3,491 | |
Short Futures | | | | | | | | | | | | | | |
| | | | | |
Index Futures | | | | | | | | | | | | | | |
September 2019 | | 7 | | | TSE TOPIX Index | | | (1,027,535) | | (994,966) | | | 32,690 | |
September 2019 | | 4 | | | OSE Nikkei 225 Index | | | (803,005) | | (779,027) | | | 23,978 | |
September 2019 | | 3 | | | TSE S&P 60 Index | | | (437,907) | | (442,316) | | | (4,418) | |
September 2019 | | 9 | | | MSCI E-Mini Emerging Markets Index | | | (431,749) | | (442,800) | | | (11,051) | |
September 2019 | | 2 | | | CME Nikkei 225 Index | | | (194,404) | | (194,428) | | | (24) | |
September 2019 | | 1 | | | HKG Hang Seng Index | | | (161,109) | | (163,321) | | | (2,208) | |
| | | | | |
Interest Rate Futures | | | | | | | | | | | | | | |
March 2020 | | 7 | | | CME3-Month Eurodollar | | | (1,712,700) | | (1,722,875) | | | (10,175) | |
| | | | | | | | | | | | | | |
Total Futures Contracts | | | | | | | | $76,442,399 | | $76,610,655 | | $ | 169,414 | |
| | | | | | | | | | | | | | |
At August 31, 2019, the Alternative Strategies Fund had outstanding forward foreign currency exchange contracts as set forth below:
| | | | | | | | | | | | | | | | | | | | |
| | | | | Contract Amount | | | | | | Unrealized
Appreciation | | | |
Settlement Date | | Currency | | Buy | | | Sell | | | Value | | | (Depreciation) | | | Counterparty |
September 20, 2019 | | Australian Dollar | | AUD | 581,000 | | | $ | 406,172 | | | $ | 391,473 | | | $ | (14,697 | ) | | Bank of America |
September 20, 2019 | | Australian Dollar | | $ | 2,168,000 | | | AUD | 3,125,000 | | | | 2,105,605 | | | | 62,395 | | | Bank of America |
September 20, 2019 | | Canadian Dollar | | CAD | 4,966,000 | | | $ | 3,781,762 | | | | 3,730,936 | | | | (50,824 | ) | | Bank of America |
September 20, 2019 | | Canadian Dollar | | $ | 3,232,717 | | | CAD | 4,292,000 | | | | 3,224,562 | | | | 8,151 | | | Bank of America |
September 20, 2019 | | Euro Currency | | EUR | 3,048,000 | | | $ | 3,451,392 | | | | 3,354,090 | | | | (97,302 | ) | | Bank of America |
September 20, 2019 | | Euro Currency | | $ | 7,311,374 | | | EUR | 6,443,000 | | | | 7,090,028 | | | | 221,345 | | | Bank of America |
September 20, 2019 | | Japanese Yen | | JPY | 774,432,000 | | | $ | 7,254,961 | | | | 7,298,285 | | | | 43,328 | | | Bank of America |
September 20, 2019 | | Japanese Yen | | $ | 4,685,712 | | | JPY | 502,444,000 | | | | 4,735,057 | | | | (49,343 | ) | | Bank of America |
September 20, 2019 | | Mexican Peso | | MXN | 11,467,000 | | | $ | 590,897 | | | | 570,570 | | | | (20,328 | ) | | Bank of America |
September 20, 2019 | | Mexican Peso | | $ | 411,312 | | | MXN | 8,140,000 | | | | 405,025 | | | | 6,289 | | | Bank of America |
September 20, 2019 | | New Zealand Dollar | | NZD | 597,000 | | | $ | 392,349 | | | | 376,358 | | | | (15,997 | ) | | Bank of America |
September 20, 2019 | | New Zealand Dollar | | $ | 966,418 | | | NZD | 1,467,000 | | | | 924,817 | | | | 41,603 | | | Bank of America |
September 20, 2019 | | Pound Sterling | | GBP | 365,000 | | | $ | 457,832 | | | | 444,445 | | | | (13,385 | ) | | Bank of America |
September 20, 2019 | | Pound Sterling | | $ | 2,795,987 | | | GBP | 2,201,000 | | | | 2,680,072 | | | | 115,915 | | | Bank of America |
September 20, 2019 | | Swiss Franc | | CHF | 569,000 | | | $ | 582,149 | | | | 575,731 | | | | (6,417 | ) | | Bank of America |
September 20, 2019 | | Swiss Franc | | $ | 1,725,800 | | | CHF | 1,699,000 | | | | 1,719,096 | | | | 6,699 | | | Bank of America |
November 7, 2019 | | Euro Currency | | EUR | 4,090,902 | | | PLN | 17,979,897 | | | | 4,518,156 | | | | (220 | ) | | BNP Paribas, N.A. |
November 7, 2019 | | Euro Currency | | EUR | 1,965,000 | | | PLN | 8,628,231 | | | | 2,170,225 | | | | 1,937 | | | Societe Generale |
November 7, 2019 | | Mexican Peso | | MXN | 3,972,886 | | | $ | 199,000 | | | | 195,885 | | | | (3,115 | ) | | HSBC Bank (USA) |
November 7, 2019 | | New Zealand Dollar | | NZD | 2,760,000 | | | $ | 1,773,589 | | | | 1,741,308 | | | | (32,280 | ) | | HSBC Bank (USA) |
November 7, 2019 | | Polish Zloty | | PLN | 26,608,128 | | | EUR | 6,117,000 | | | | 6,686,664 | | | | (69,196 | ) | | BNP Paribas, N.A. |
| | | | | | | | | | | | | | | | | | | | |
| | | | | | | | | | | | $ | 54,938,388 | | | $ | 134,558 | | | |
| | | | | | | | | | | | | | | | | | | | |
(See Notes to Schedules of Investments and Notes to Financial Statements, which are an integral part of the Financial Statements)
63
August 31, 2019
At August 31, 2019, the Alternative Strategies Fund had outstanding total return swap agreements as set forth below:
| | | | | | | | | | | | | | | | | | | | | | | | | | | | | | | | | | |
Swap Counterparty | | Index | | | Pay/Receive
Total Return
of Referenced
Index | | | Floating
Rate | | Payment
Frequency | | | Maturity
Date | | | Notional
Amount | | | Value | | | Upfront
Payment
Paid | | | Unrealized
Appreciation
(Depreciation) | |
JPMorgan Chase & Co. | | | + | | | | Pay | | | 1 Month USD LIBOR Plus 0.23% | | | Monthly | | | | 6/29/2020 | | | $ | 3,173,240 | | | $ | (93,786 | ) | | $ | — | | | $ | (93,786 | ) |
JPMorgan Chase & Co. | | | ++ | | | | Receive | | | 1 Month USD LIBOR Minus 0.15% | | | Monthly | | | | 9/13/2020 | | | | 7,432,333 | | | | (6,397 | ) | | | — | | | | (6,397 | ) |
JPMorgan Chase & Co. | | | +++ | | | | Pay | | | 1 Month USD LIBOR Plus 0.23% | | | Monthly | | | | 9/13/2020 | | | | 7,407,003 | | | | (57,664 | ) | | | — | | | | (57,664 | ) |
Bank of America Merrill Lynch | | | ++++ | | | | Pay | | | 1 Month USD LIBOR Plus 0.16% | | | Monthly | | | | 9/06/2019 | | | | 7,315,707 | | | | 6,697 | | | | — | | | | 6,697 | |
| | | | | | | | | | | | | | | | | | | | | | | | | | | | | | | | | | |
| | | | | | | | | | | | | | | | | | | | | | | | $ | (151,150 | ) | | $ | — | | | $ | (151,150 | ) |
| | | | | | | | | | | | | | | | | | | | | | | | | | | | | | | | | | |
| + | BMO Alternative Strategies Global Market Neutral Long Index |
| ++ | BMO Alternative Strategies Global Short Index |
| +++ | BMO Alternative Strategies Global Market Neutral Short Index |
| ++++ | BMO Global Equity Market Neutral Strategy Index-Long and Short (MLEIFCLS) |
The following table represents the equity basket holdings underlying the total return swap with BMO Alternative Strategies Global Market Neutral Long Index as of August 31, 2019:
| | | | | | | | | | | | |
Security Description | | Shares | | | Value | | | Index Weight | |
| BMO Alternative Strategies Global Market Neutral Long Index | |
AerCap Holdings NV | | | 812 | | | $ | 43,540 | | | | 0.51 | % |
AES Corp. | | | 1,776 | | | | 27,223 | | | | 0.32 | |
AGC, Inc. | | | 1,220 | | | | 35,236 | | | | 0.41 | |
AGCO Corp. | | | 879 | | | | 60,757 | | | | 0.71 | |
Air Canada | | | 795 | | | | 26,757 | | | | 0.31 | |
Akamai Technologies, Inc. | | | 390 | | | | 34,720 | | | | 0.40 | |
Alliance Data Systems Corp. | | | 386 | | | | 47,520 | | | | 0.55 | |
Ally Financial, Inc. | | | 1,392 | | | | 43,654 | | | | 0.51 | |
Altium Ltd. | | | 2,130 | | | | 52,756 | | | | 0.61 | |
Altri SGPS SA | | | 8,412 | | | | 53,269 | | | | 0.62 | |
Amano Corp. | | | 402 | | | | 12,032 | | | | 0.14 | |
American Eagle Outfitters, Inc. | | | 881 | | | | 23,185 | | | | 0.27 | |
American Eagle Outfitters, Inc. | | | 518 | | | | 8,705 | | | | 0.10 | |
Arcs Co., Ltd. | | | 1,017 | | | | 21,113 | | | | 0.25 | |
Asahi Co., Ltd. | | | 1,531 | | | | 17,289 | | | | 0.20 | |
Asia Cement China Holdings Corp. | | | 7,195 | | | | 8,448 | | | | 0.10 | |
Asseco Poland SA | | | 1,758 | | | | 24,769 | | | | 0.29 | |
ASTM SpA | | | 1,378 | | | | 42,576 | | | | 0.50 | |
AT&S Austria Technologie & Systemtechnik | | | 1,242 | | | | 19,864 | | | | 0.23 | |
Atkore International Group, Inc. | | | 1,932 | | | | 56,037 | | | | 0.65 | |
Axial Retailing, Inc. | | | 388 | | | | 13,899 | | | | 0.16 | |
BE Semiconductor Industries NV | | | 2,868 | | | | 84,799 | | | | 0.99 | |
Berry Global Group, Inc. | | | 1,833 | | | | 71,739 | | | | 0.83 | |
BH Co., Ltd. | | | 687 | | | | 8,909 | | | | 0.10 | |
Boston Properties, Inc. | | | 520 | | | | 66,816 | | | | 0.78 | |
Burlington Stores, Inc. | | | 96 | | | | 19,501 | | | | 0.23 | |
Cabot Corp. | | | 2,113 | | | | 84,501 | | | | 0.98 | |
Cabot Oil & Gas Corp. | | | 1,355 | | | | 23,204 | | | | 0.27 | |
Cadence Design Systems, Inc. | | | 3,073 | | | | 210,420 | | | | 2.45 | |
CAE, Inc. | | | 745 | | | | 19,527 | | | | 0.23 | |
Capital One Financial Corp. | | | 708 | | | | 61,343 | | | | 0.71 | |
Castlight Health, Inc. | | | 5,904 | | | | 8,325 | | | | 0.10 | |
Cementir Holding SpA | | | 2,123 | | | | 13,866 | | | | 0.16 | |
Central Pacific Financial Corp. | | | 3,281 | | | | 91,280 | | | | 1.06 | |
China Resources Cement Holdings Ltd. | | | 41,555 | | | | 11,031 | | | | 0.13 | |
China Resources Cement Holdings Ltd. | | | 10,729 | | | | 9,517 | | | | 0.11 | |
CI Financial Corp. | | | 1,956 | | | | 28,083 | | | | 0.33 | |
Citigroup, Inc. | | | 1,327 | | | | 85,401 | | | | 0.99 | |
Citizens Financial Group, Inc. | | | 1,054 | | | | 35,551 | | | | 0.41 | |
Cogeco, Inc. | | | 241 | | | | 17,019 | | | | 0.20 | |
Comfort Systems USA, Inc. | | | 55,715 | | | | 98,400 | | | | 1.14 | |
| | | | | | | | | | | | |
Security Description | | Shares | | | Value | | | Index Weight | |
Comfort Systems USA, Inc. | | | 532 | | | $ | 20,551 | | | | 0.24 | % |
Covestro AG | | | 1,005 | | | | 45,581 | | | | 0.53 | |
CTT-Correios de Portugal SA | | | 7,145 | | | | 14,793 | | | | 0.17 | |
Daiichikosho Co Ltd. | | | 1,623 | | | | 73,225 | | | | 0.85 | |
Daiwa Securities Group, Inc. | | | 12,201 | | | | 52,622 | | | | 0.61 | |
DB HiTek Co., Ltd. | | | 1,054 | | | | 12,787 | | | | 0.15 | |
Derichebourg SA | | | 2,457 | | | | 8,787 | | | | 0.10 | |
Detour Gold Corp. | | | 4,445 | | | | 79,788 | | | | 0.93 | |
DNO ASA | | | 23,360 | | | | 30,950 | | | | 0.36 | |
Dollar General Corp. | | | 415 | | | | 64,723 | | | | 0.75 | |
Enerflex Ltd. | | | 4,977 | | | | 45,698 | | | | 0.53 | |
Entegris, Inc. | | | 296 | | | | 12,675 | | | | 0.15 | |
Equinor ASA | | | 1,009 | | | | 17,264 | | | | 0.20 | |
Equitable Group, Inc. | | | 131 | | | | 9,768 | | | | 0.11 | |
Eramet | | | 389 | | | | 19,333 | | | | 0.22 | |
Essent Group Ltd. | | | 3,622 | | | | 175,660 | | | | 2.04 | |
Essex Property Trust, Inc. | | | 703 | | | | 225,963 | | | | 2.63 | |
Estee Lauder Cos, Inc. | | | 121 | | | | 23,954 | | | | 0.28 | |
Eutelsat Communications SA | | | 1,257 | | | | 21,897 | | | | 0.25 | |
F5 Networks, Inc. | | | 391 | | | | 50,281 | | | | 0.58 | |
Fabrinet | | | 1,076 | | | | 54,344 | | | | 0.63 | |
FedNat Holding Co. | | | 1,221 | | | | 14,936 | | | | 0.17 | |
Ferrexpo PLC | | | 20,229 | | | | 49,788 | | | | 0.58 | |
Finnair OYJ | | | 1,453 | | | | 9,938 | | | | 0.12 | |
Fortescue Metals Group Ltd. | | | 12,126 | | | | 65,361 | | | | 0.76 | |
Fortinet, Inc. | | | 986 | | | | 78,066 | | | | 0.91 | |
France Bed Holdings Co., Ltd. | | | 1,670 | | | | 15,893 | | | | 0.18 | |
Frontier Real Estate Investment Corp. | | | 3 | | | | 12,578 | | | | 0.15 | |
FTI Consulting, Inc. | | | 335 | | | | 36,223 | | | | 0.42 | |
Fujitsu Ltd. | | | 257 | | | | 19,885 | | | | 0.23 | |
Fukuda Corp. | | | 326 | | | | 11,550 | | | | 0.13 | |
Genting Singapore Ltd. | | | 28,610 | | | | 18,356 | | | | 0.21 | |
Glaukos Corp. | | | 642 | | | | 41,291 | | | | 0.48 | |
Globalwafers Co., Ltd. | | | 2,233 | | | | 20,471 | | | | 0.24 | |
Globus Medical, Inc. | | | 754 | | | | 38,520 | | | | 0.45 | |
Haemonetics Corp. | | | 238 | | | | 31,797 | | | | 0.37 | |
Hancock Whitney Corp. | | | 747 | | | | 26,240 | | | | 0.31 | |
Hanmi Financial Corp. | | | 3,823 | | | | 68,462 | | | | 0.80 | |
HealthStream, Inc. | | | 1,761 | | | | 44,505 | | | | 0.52 | |
Helmerich & Payne, Inc. | | | 278 | | | | 10,437 | | | | 0.12 | |
Herc Holdings, Inc. | | | 2,108 | | | | 87,022 | | | | 1.01 | |
Hibbett Sports, Inc. | | | 624 | | | | 10,326 | | | | 0.12 | |
Hitachi Ltd. | | | 2,461 | | | | 84,145 | | | | 0.98 | |
(See Notes to Schedules of Investments and Notes to Financial Statements, which are an integral part of the Financial Statements)
64
| | | | | | | | | | | | |
Security Description | | Shares | | | Value | | | Index Weight | |
BMO Alternative Strategies Global Market Neutral Long Index
(continued) | |
HMS Holdings Corp. | | | 325 | | | $ | 11,877 | | | | 0.14 | % |
Honda Motor Co., Ltd. | | | 743 | | | | 17,661 | | | | 0.21 | |
Host Hotels & Resorts, Inc. | | | 4,953 | | | | 79,452 | | | | 0.92 | |
Hudbay Minerals, Inc. | | | 8,293 | | | | 27,898 | | | | 0.32 | |
Huntington Ingalls Industries, Inc. | | | 545 | | | | 113,879 | | | | 1.32 | |
Husky Energy, Inc. | | | 3,369 | | | | 22,538 | | | | 0.26 | |
IAA, Inc. | | | 1,123 | | | | 54,877 | | | | 0.64 | |
IGG, Inc. | | | 22,681 | | | | 15,342 | | | | 0.18 | |
Insight Enterprises, Inc. | | | 2,304 | | | | 110,720 | | | | 1.29 | |
Integer Holdings Corp. | | | 132 | | | | 9,548 | | | | 0.11 | |
Interfor Corp. | | | 7,899 | | | | 40,569 | | | | 0.47 | |
Interfor Corp. | | | 3,513 | | | | 35,322 | | | | 0.41 | |
Israel Corp., Ltd. | | | 150 | | | | 29,044 | | | | 0.34 | |
JetBlue Airways Corp. | | | 1,154 | | | | 19,990 | | | | 0.23 | |
JTEKT Corp. | | | 6,167 | | | | 66,932 | | | | 0.78 | |
KAR Auction Services, Inc. | | | 1,123 | | | | 29,832 | | | | 0.35 | |
KDDI Corp. | | | 3,123 | | | | 83,412 | | | | 0.97 | |
Kerry Properties Ltd. | | | 10,185 | | | | 34,381 | | | | 0.40 | |
Kohl’s Corp. | | | 775 | | | | 36,616 | | | | 0.43 | |
Komori Corp. | | | 2,900 | | | | 28,602 | | | | 0.33 | |
Koninklijke Ahold Delhaize NV | | | 2,247 | | | | 52,664 | | | | 0.61 | |
Koninklijke Ahold Delhaize NV | | | 1,096 | | | | 18,830 | | | | 0.22 | |
Kraton Corp. | | | 1,655 | | | | 45,424 | | | | 0.53 | |
Kroger Co. | | | 493 | | | | 11,665 | | | | 0.14 | |
Kurabo Industries Ltd. | | | 813 | | | | 14,814 | | | | 0.17 | |
Lantheus Holdings, Inc. | | | 1,161 | | | | 25,265 | | | | 0.29 | |
Legal & General Group PLC | | | 60,478 | | | | 161,743 | | | | 1.88 | |
Leroy Seafood Group ASA | | | 10,422 | | | | 68,393 | | | | 0.80 | |
Lotte Chemical Corp. | | | 50 | | | | 9,195 | | | | 0.11 | |
Luminex Corp. | | | 1,330 | | | | 27,256 | | | | 0.32 | |
Marlin Business Services Corp. | | | 1,006 | | | | 21,761 | | | | 0.25 | |
Masco Corp. | | | 4,595 | | | | 187,170 | | | | 2.18 | |
Matrix Service Co. | | | 2,243 | | | | 44,565 | | | | 0.52 | |
Max Co Ltd. | | | 975 | | | | 15,747 | | | | 0.18 | |
Mebuki Financial Group, Inc. | | | 52,028 | | | | 116,167 | | | | 1.35 | |
Medical Facilities Corp. | | | 1,052 | | | | 5,338 | | | | 0.06 | |
Medpace Holdings, Inc. | | | 1,864 | | | | 150,823 | | | | 1.75 | |
Meet Group, Inc. | | | 2,485 | | | | 8,572 | | | | 0.10 | |
Meidensha Corp. | | | 786 | | | | 12,948 | | | | 0.15 | |
Meitec Corp. | | | 876 | | | | 45,215 | | | | 0.53 | |
Methanex Corp. | | | 1,452 | | | | 47,151 | | | | 0.55 | |
Micro Focus International PLC | | | 589 | | | | 7,960 | | | | 0.09 | |
Mitsuboshi Belting Ltd. | | | 1,486 | | | | 30,484 | | | | 0.35 | |
Mitsuboshi Belting Ltd. | | | 950 | | | | 15,630 | | | | 0.18 | |
Moneysupermarket.com Group PLC | | | 28,522 | | | | 129,739 | | | | 1.51 | |
Myriad Genetics, Inc. | | | 435 | | | | 10,247 | | | | 0.12 | |
Naphtha Israel Petroleum Corp., Ltd. | | | 1,320 | | | | 7,724 | | | | 0.09 | |
NEC Corp. | | | 409 | | | | 17,525 | | | | 0.20 | |
NetApp, Inc. | | | 1,530 | | | | 73,547 | | | | 0.86 | |
Nikkon Holdings Co., Ltd. | | | 2,570 | | | | 57,326 | | | | 0.67 | |
Nishi-Nippon Financial Holdings, Inc. | | | 8,375 | | | | 52,866 | | | | 0.61 | |
Nobina AB | | | 1,500 | | | | 8,468 | | | | 0.10 | |
Northrim BanCorp, Inc. | | | 330 | | | | 11,956 | | | | 0.14 | |
NS United Kaiun Kaisha Ltd. | | | 1,192 | | | | 24,074 | | | | 0.28 | |
Obayashi Corp. | | | 1,481 | | | | 13,663 | | | | 0.16 | |
Oesterreichische Post AG | | | 1,417 | | | | 50,555 | | | | 0.59 | |
Omnicell, Inc. | | | 122 | | | | 8,749 | | | | 0.10 | |
ORIX Corp. | | | 2,626 | | | | 38,814 | | | | 0.45 | |
Orthofix Medical, Inc. | | | 743 | | | | 37,770 | | | | 0.44 | |
Oshkosh Corp. | | | 2,138 | | | | 150,258 | | | | 1.75 | |
Persimmon PLC | | | 2,435 | | | | 56,421 | | | | 0.66 | |
Peugeot SA | | | 7,060 | | | | 158,054 | | | | 1.84 | |
| | | | | | | | | | | | |
Security Description | | Shares | | | Value | | | Index Weight | |
Quebecor, Inc. | | | 2,836 | | | $ | 64,007 | | | | 0.74 | % |
Raymond James Financial, Inc. | | | 346 | | | | 27,193 | | | | 0.32 | |
Regions Financial Corp. | | | 10,635 | | | | 155,484 | | | | 1.81 | |
Rio Tinto PLC | | | 1,296 | | | | 65,508 | | | | 0.76 | |
Roche Holding AG | | | 355 | | | | 97,214 | | | | 1.13 | |
Samsung Electronics Co., Ltd. | | | 812 | | | | 29,496 | | | | 0.34 | |
Sandfire Resources NL | | | 12,014 | | | | 50,428 | | | | 0.59 | |
Sandvik AB | | | 1,291 | | | | 18,523 | | | | 0.22 | |
Scandinavian Tobacco Group A/S | | | 3,756 | | | | 43,269 | | | | 0.50 | |
Schaeffler AG | | | 4,576 | | | | 31,092 | | | | 0.36 | |
Semapa-Sociedade de Investimento e Gesta | | | 858 | | | | 11,400 | | | | 0.13 | |
ServiceMaster Global Holdings, Inc. | | | 1,332 | | | | 76,002 | | | | 0.88 | |
Signify NV | | | 2,239 | | | | 65,617 | | | | 0.76 | |
Siltronic AG | | | 651 | | | | 42,002 | | | | 0.49 | |
Silvercorp Metals, Inc. | | | 4,235 | | | | 18,137 | | | | 0.21 | |
Sino-American Silicon Products, Inc. | | | 8,604 | | | | 20,326 | | | | 0.24 | |
Sinotruk Hong Kong Ltd. | | | 16,259 | | | | 25,109 | | | | 0.29 | |
SITC International Holdings Co., Ltd. | | | 32,947 | | | | 34,228 | | | | 0.40 | |
SK Hynix, Inc. | | | 718 | | | | 45,870 | | | | 0.53 | |
Soulbrain Co., Ltd. | | | 160 | | | | 8,969 | | | | 0.10 | |
Sprouts Farmers Market, Inc. | | | 732 | | | | 13,133 | | | | 0.15 | |
SPS Commerce, Inc. | | | 725 | | | | 36,655 | | | | 0.43 | |
St Barbara Ltd. | | | 7,898 | | | | 17,134 | | | | 0.20 | |
Steel Dynamics, Inc. | | | 2,404 | | | | 64,909 | | | | 0.75 | |
Stoneridge, Inc. | | | 1,241 | | | | 38,118 | | | | 0.44 | |
Sumitomo Seika Chemicals Co., Ltd. | | | 386 | | | | 11,325 | | | | 0.13 | |
Supernus Pharmaceuticals, Inc. | | | 431 | | | | 11,647 | | | | 0.14 | |
Surmodics, Inc. | | | 569 | | | | 26,781 | | | | 0.31 | |
Synchrony Financial | | | 1,939 | | | | 62,133 | | | | 0.72 | |
Taiheiyo Cement Corp. | | | 2,755 | | | | 69,600 | | | | 0.81 | |
Teck Resources Ltd. | | | 1,668 | | | | 28,463 | | | | 0.33 | |
Terex Corp. | | | 796 | | | | 19,768 | | | | 0.23 | |
Tianneng Power International Ltd. | | | 19,924 | | | | 15,741 | | | | 0.18 | |
Toyo Construction Co., Ltd. | | | 6,494 | | | | 25,942 | | | | 0.30 | |
Trinseo SA | | | 1,355 | | | | 47,530 | | | | 0.55 | |
Tsubakimoto Chain Co. | | | 1,202 | | | | 36,532 | | | | 0.42 | |
UCB SA | | | 146 | | | | 10,920 | | | | 0.13 | |
Under Armour, Inc. | | | 2,127 | | | | 39,584 | | | | 0.46 | |
Uni-President Enterprises Corp. | | | 14,381 | | | | 35,071 | | | | 0.41 | |
United Continental Holdings, Inc. | | | 293 | | | | 32,981 | | | | 0.38 | |
United Continental Holdings, Inc. | | | 276 | | | | 23,243 | | | | 0.27 | |
Unum Group | | | 2,043 | | | | 51,901 | | | | 0.60 | |
US Concrete, Inc. | | | 379 | | | | 15,377 | | | | 0.18 | |
US Foods Holding Corp. | | | 3,185 | | | | 128,830 | | | | 1.50 | |
Vanda Pharmaceuticals, Inc. | | | 1,343 | | | | 18,930 | | | | 0.22 | |
Vishay Intertechnology, Inc. | | | 2,329 | | | | 36,863 | | | | 0.43 | |
Vishay Intertechnology, Inc. | | | 428 | | | | 13,360 | | | | 0.15 | |
W&T Offshore, Inc. | | | 2,025 | | | | 8,867 | | | | 0.10 | |
Waddell & Reed Financial, Inc. | | | 1,643 | | | | 26,563 | | | | 0.31 | |
Walker & Dunlop, Inc. | | | 565 | | | | 31,582 | | | | 0.37 | |
Weichai Power Co., Ltd. | | | 7,885 | | | | 12,076 | | | | 0.14 | |
Wells Fargo & Co. | | | 951 | | | | 44,301 | | | | 0.52 | |
West Fraser Timber Co., Ltd. | | | 379 | | | | 13,370 | | | | 0.16 | |
WW Grainger, Inc. | | | 172 | | | | 47,076 | | | | 0.55 | |
Yanzhou Coal Mining Co., Ltd. | | | 37,500 | | | | 32,497 | | | | 0.38 | |
Yorozu Corp. | | | 1,100 | | | | 12,979 | | | | 0.15 | |
Yurtec Corp. | | | 1,525 | | | | 9,527 | | | | 0.11 | |
| | | | | | | | | | | | |
| | | | | | $ | 8,601,226 | | | | 100.00 | % |
| | | | | | | | | | | | |
(See Notes to Schedules of Investments and Notes to Financial Statements, which are an integral part of the Financial Statements)
65
August 31, 2019
The following table represents the equity basket holdings underlying the total return swap with BMO Alternative Strategies Global Short Index as of August 31, 2019:
| | | | | | | | | | | | |
Security Description | | Shares | | | Value | | | Index Weight | |
| BMO Alternative Strategies Global Short Index | |
AIXTRON SE | | | (16,181 | ) | | $ | (159,949 | ) | | | (1.74 | )% |
Albemarle Corp. | | | (2,474 | ) | | | (152,691 | ) | | | (1.66 | ) |
Asahi Holdings, Inc. | | | (6,717 | ) | | | (142,074 | ) | | | (1.55 | ) |
ASOS PLC | | | (3,935 | ) | | | (114,053 | ) | | | (1.24 | ) |
Atmos Energy Corp. | | | (2,179 | ) | | | (240,194 | ) | | | (2.61 | ) |
BOK Financial Corp. | | | (1,868 | ) | | | (142,198 | ) | | | (1.55 | ) |
Brown-Forman Corp. | | | (929 | ) | | | (54,788 | ) | | | (0.60 | ) |
Caverion OYJ | | | (5,763 | ) | | | (36,939 | ) | | | (0.40 | ) |
Cellnex Telecom SA | | | (6,128 | ) | | | (245,642 | ) | | | (2.67 | ) |
Century Aluminum Co. | | | (36,217 | ) | | | (199,558 | ) | | | (2.17 | ) |
Chugoku Marine Paints Ltd. | | | (7,205 | ) | | | (58,035 | ) | | | (0.63 | ) |
Daifuku Co., Ltd. | | | (4,744 | ) | | | (224,374 | ) | | | (2.44 | ) |
Easterly Government Properties, Inc. | | | (14,488 | ) | | | (297,730 | ) | | | (3.24 | ) |
Fugro NV | | | (11,001 | ) | | | (77,828 | ) | | | (0.85 | ) |
Fuji Seal International, Inc. | | | (4,121 | ) | | | (112,128 | ) | | | (1.22 | ) |
Goldwin, Inc. | | | (470 | ) | | | (64,995 | ) | | | (0.71 | ) |
GRENKE AG | | | (2,777 | ) | | | (225,421 | ) | | | (2.45 | ) |
HarborOne Bancorp, Inc. | | | (9,259 | ) | | | (92,223 | ) | | | (1.00 | ) |
Howard Bancorp, Inc. | | | (2,812 | ) | | | (41,584 | ) | | | (0.45 | ) |
Huatai Securities Co., Ltd. | | | (139,146 | ) | | | (202,805 | ) | | | (2.21 | ) |
Just Eat PLC | | | (17,841 | ) | | | (170,739 | ) | | | (1.86 | ) |
Kansai Paint Co., Ltd. | | | (13,782 | ) | | | (287,077 | ) | | | (3.12 | ) |
Kawasaki Kisen Kaisha Ltd. | | | (19,479 | ) | | | (196,171 | ) | | | (2.13 | ) |
Kura Sushi, Inc. | | | (1,019 | ) | | | (40,609 | ) | | | (0.44 | ) |
Lilis Energy, Inc. | | | (72,576 | ) | | | (21,780 | ) | | | (0.24 | ) |
M3, Inc. | | | (6,079 | ) | | | (129,152 | ) | | | (1.40 | ) |
Macerich Co. | | | (4,513 | ) | | | (128,763 | ) | | | (1.40 | ) |
MISUMI Group, Inc. | | | (10,944 | ) | | | (248,279 | ) | | | (2.70 | ) |
Money Forward, Inc. | | | (1,049 | ) | | | (33,313 | ) | | | (0.36 | ) |
NextEra Energy, Inc. | | | (1,113 | ) | | | (243,757 | ) | | | (2.65 | ) |
Nihon M&A Center, Inc. | | | (4,556 | ) | | | (133,047 | ) | | | (1.45 | ) |
Nippon Paint Holdings Co., Ltd. | | | (6,657 | ) | | | (315,459 | ) | | | (3.43 | ) |
| | | | | | | | | | | | |
Security Description | | Shares | | | Value | | | Index Weight | |
Nippon Paint Holdings Co., Ltd. | | | (16,461 | ) | | $ | (245,964 | ) | | | (2.67 | )% |
Nitori Holdings Co., Ltd. | | | (1,548 | ) | | | (223,553 | ) | | | (2.43 | ) |
Noodles & Co. | | | (10,281 | ) | | | (59,320 | ) | | | (0.64 | ) |
Nordic Semiconductor ASA | | | (11,306 | ) | | | (51,251 | ) | | | (0.56 | ) |
Northam Platinum Ltd. | | | (64,541 | ) | | | (334,317 | ) | | | (3.63 | ) |
Northam Platinum Ltd. | | | (2,758 | ) | | | (63,429 | ) | | | (0.69 | ) |
Nufarm Ltd. | | | (43,660 | ) | | | (141,785 | ) | | | (1.54 | ) |
OGE Energy Corp. | | | (5,332 | ) | | | (228,580 | ) | | | (2.49 | ) |
Okta, Inc. | | | (2,586 | ) | | | (327,143 | ) | | | (3.56 | ) |
Pacific Metals Co., Ltd. | | | (2,327 | ) | | | (41,299 | ) | | | (0.45 | ) |
Park24 Co., Ltd. | | | (10,098 | ) | | | (207,301 | ) | | | (2.25 | ) |
People’s United Financial Inc. | | | (6,604 | ) | | | (94,895 | ) | | | (1.03 | ) |
Pinnacle Financial Partners, Inc. | | | (3,776 | ) | | | (198,863 | ) | | | (2.16 | ) |
PROS Holdings, Inc. | | | (5,670 | ) | | | (402,717 | ) | | | (4.38 | ) |
Rayonier, Inc. | | | (2,123 | ) | | | (56,884 | ) | | | (0.62 | ) |
Republic First Bancorp, Inc. | | | (9,822 | ) | | | (39,729 | ) | | | (0.43 | ) |
Senior Housing Properties Trust | | | (5,080 | ) | | | (43,128 | ) | | | (0.47 | ) |
Shimano, Inc. | | | (240 | ) | | | (34,467 | ) | | | (0.37 | ) |
SMS Co., Ltd. | | | (11,584 | ) | | | (258,966 | ) | | | (2.82 | ) |
Square, Inc. | | | (1,004 | ) | | | (62,089 | ) | | | (0.68 | ) |
St James’s Place PLC | | | (7,775 | ) | | | (86,903 | ) | | | (0.94 | ) |
Takeaway.com NV | | | (1,190 | ) | | | (113,824 | ) | | | (1.24 | ) |
TFS Financial Corp. | | | (3,084 | ) | | | (53,997 | ) | | | (0.59 | ) |
TimkenSteel Corp. | | | (13,457 | ) | | | (70,248 | ) | | | (0.76 | ) |
Toridoll Holdings Corp. | | | (5,744 | ) | | | (130,731 | ) | | | (1.42 | ) |
Umicore SA | | | (1,690 | ) | | | (53,905 | ) | | | (0.59 | ) |
Wallenstam AB | | | (10,096 | ) | | | (113,548 | ) | | | (1.23 | ) |
Weir Group PLC | | | (14,203 | ) | | | (253,322 | ) | | | (2.75 | ) |
Weyerhaeuser Co. | | | (3,367 | ) | | | (88,596 | ) | | | (0.96 | ) |
Zalando SE | | | (5,157 | ) | | | (255,559 | ) | | | (2.78 | ) |
Zur Rose Group AG | | | (319 | ) | | | (27,854 | ) | | | (0.30 | ) |
| | | | | | | | | | | | |
| | | | | | $ | (9,197,522 | ) | | | (100.00 | )% |
| | | | | | | | | | | | |
The following table represents the equity basket holdings underlying the total return swap with BMO Alternative Strategies Global Market Neutral Short Index as of August 31, 2019:
| | | | | | | | | | | | |
Security Description | | Shares | | | Value | | | Index Weight | |
| BMO Alternative Strategies Global Market Neutral Short Index | |
a2 Milk Co Ltd | | | (3,272 | ) | | $ | (29,821 | ) | | | (0.32 | )% |
AAON Inc | | | (2,479 | ) | | | (118,933 | ) | | | (1.29 | ) |
Acadia Healthcare Co Inc | | | (518 | ) | | | (13,709 | ) | | | (0.15 | ) |
AEON Financial Service Co Ltd | | | (741 | ) | | | (10,862 | ) | | | (0.12 | ) |
AIA Group Ltd | | | (4,816 | ) | | | (46,870 | ) | | | (0.51 | ) |
Air Water Inc | | | (4,517 | ) | | | (76,807 | ) | | | (0.83 | ) |
Alacer Gold Corp | | | (6,441 | ) | | | (28,309 | ) | | | (0.31 | ) |
Albemarle Corp | | | (1,212 | ) | | | (74,814 | ) | | | (0.81 | ) |
Alteryx Inc | | | (247 | ) | | | (35,152 | ) | | | (0.38 | ) |
Amundi SA | | | (371 | ) | | | (23,734 | ) | | | (0.26 | ) |
Analog Devices Inc | | | (637 | ) | | | (70,014 | ) | | | (0.76 | ) |
Andersons Inc/The | | | (521 | ) | | | (11,938 | ) | | | (0.13 | ) |
AP Moller—Maersk A/S | | | (90 | ) | | | (95,604 | ) | | | (1.04 | ) |
Apache Corp | | | (1,310 | ) | | | (28,259 | ) | | | (0.31 | ) |
Aqua America Inc | | | (2,500 | ) | | | (110,706 | ) | | | (1.20 | ) |
Arbonia AG | | | (1,682 | ) | | | (18,567 | ) | | | (0.20 | ) |
Argan Inc | | | (658 | ) | | | (27,174 | ) | | | (0.30 | ) |
Ariake Japan Co Ltd | | | (758 | ) | | | (57,484 | ) | | | (0.62 | ) |
Arrow Electronics Inc | | | (1,554 | ) | | | (107,564 | ) | | | (1.17 | ) |
Asahi Holdings Inc | | | (1,976 | ) | | | (41,787 | ) | | | (0.45 | ) |
Assa Abloy AB | | | (3,088 | ) | | | (64,525 | ) | | | (0.70 | ) |
Astronics Corp | | | (971 | ) | | | (26,700 | ) | | | (0.29 | ) |
Atlantic Union Bankshares Corp | | | (439 | ) | | | (15,836 | ) | | | (0.17 | ) |
Atmos Energy Corp | | | (537 | ) | | | (59,236 | ) | | | (0.64 | ) |
| | | | | | | | | | | | |
Security Description | | Shares | | | Value | | | Index Weight | |
Avnet Inc | | | (2,231 | ) | | $ | (93,475 | ) | | | (1.02 | )% |
Bank of East Asia Ltd/The | | | (4,482 | ) | | | (11,336 | ) | | | (0.12 | ) |
Bank of New York Mellon Corp/The | | | (2,131 | ) | | | (89,645 | ) | | | (0.97 | ) |
boohoo Group PLC | | | (3,214 | ) | | | (9,448 | ) | | | (0.10 | ) |
Capital & Counties Properties PLC | | | (23,045 | ) | | | (57,477 | ) | | | (0.62 | ) |
Capstar Financial Holdings Inc | | | (657 | ) | | | (10,154 | ) | | | (0.11 | ) |
Century Aluminum Co | | | (4,328 | ) | | | (23,847 | ) | | | (0.26 | ) |
Chegg Inc | | | (1,135 | ) | | | (44,992 | ) | | | (0.49 | ) |
Chorus Aviation Inc | | | (6,869 | ) | | | (38,354 | ) | | | (0.42 | ) |
Chugoku Marine Paints Ltd | | | (2,099 | ) | | | (16,910 | ) | | | (0.18 | ) |
Clarus Corp | | | (1,188 | ) | | | (13,077 | ) | | | (0.14 | ) |
Clinigen Group Plc | | | (1,509 | ) | | | (16,264 | ) | | | (0.18 | ) |
CME Group Inc | | | (412 | ) | | | (89,565 | ) | | | (0.97 | ) |
Coats Group PLC | | | (15,628 | ) | | | (13,922 | ) | | | (0.15 | ) |
Cobham PLC | | | (55,716 | ) | | | (109,583 | ) | | | (1.19 | ) |
Commonwealth Bank of Australia | | | (1,835 | ) | | | (97,736 | ) | | | (1.06 | ) |
Community Health Systems Inc | | | (23,075 | ) | | | (57,457 | ) | | | (0.62 | ) |
COMSYS Holdings Corp | | | (1,492 | ) | | | (42,232 | ) | | | (0.46 | ) |
Copart Inc | | | (928 | ) | | | (69,978 | ) | | | (0.76 | ) |
Corning Inc | | | (970 | ) | | | (27,014 | ) | | | (0.29 | ) |
Credit Suisse Group AG | | | (2,868 | ) | | | (33,525 | ) | | | (0.36 | ) |
(See Notes to Schedules of Investments and Notes to Financial Statements, which are an integral part of the Financial Statements)
66
| | | | | | | | | | | | |
Security Description | | Shares | | | Value | | | Index Weight | |
BMO Alternative Strategies Global Market Neutral Short Index (continued) | |
Cubic Corp | | | (420 | ) | | $ | (29,070 | ) | | | (0.32 | )% |
Curo Group Holdings Corp | | | (1,339 | ) | | | (18,241 | ) | | | (0.20 | ) |
Diamondback Energy Inc | | | (362 | ) | | | (35,484 | ) | | | (0.39 | ) |
Digimarc Corp | | | (991 | ) | | | (39,204 | ) | | | (0.43 | ) |
DKSH Holding AG | | | (362 | ) | | | (17,650 | ) | | | (0.19 | ) |
Drive Shack Inc | | | (4,705 | ) | | | (22,159 | ) | | | (0.24 | ) |
ECN Capital Corp | | | (9,211 | ) | | | (32,303 | ) | | | (0.35 | ) |
eHealth Inc | | | (452 | ) | | | (37,638 | ) | | | (0.41 | ) |
Energizer Holdings Inc | | | (1,794 | ) | | | (69,083 | ) | | | (0.75 | ) |
Essentra PLC | | | (11,306 | ) | | | (55,349 | ) | | | (0.60 | ) |
Euronav NV | | | (9,249 | ) | | | (75,420 | ) | | | (0.82 | ) |
Europcar Mobility Group | | | (9,856 | ) | | | (60,676 | ) | | | (0.66 | ) |
Everbridge Inc | | | (1,080 | ) | | | (93,129 | ) | | | (1.01 | ) |
FANUC Corp | | | (142 | ) | | | (24,631 | ) | | | (0.27 | ) |
Farmer Brothers Co | | | (680 | ) | | | (8,251 | ) | | | (0.09 | ) |
Fastenal Co | | | (2,112 | ) | | | (64,666 | ) | | | (0.70 | ) |
Ferrari NV | | | (363 | ) | | | (57,290 | ) | | | (0.62 | ) |
First Financial Bancorp | | | (3,899 | ) | | | (91,321 | ) | | | (0.99 | ) |
First Hawaiian Inc | | | (3,656 | ) | | | (93,956 | ) | | | (1.00 | ) |
First Horizon National Corp | | | (1,151 | ) | | | (18,221 | ) | | | (0.20 | ) |
First Republic Bank/CA | | | (1,119 | ) | | | (100,354 | ) | | | (1.09 | ) |
Fletcher Building Ltd | | | (21,640 | ) | | | (60,599 | ) | | | (0.66 | ) |
Fluidra SA | | | (2,954 | ) | | | (35,976 | ) | | | (0.39 | ) |
FMC Corp | | | (890 | ) | | | (76,830 | ) | | | (0.83 | ) |
Franco-Nevada Corp | | | (459 | ) | | | (44,962 | ) | | | (0.49 | ) |
Front Yard Residential Corp | | | (2,027 | ) | | | (22,482 | ) | | | (0.24 | ) |
FUCHS PETROLUB SE | | | (2,038 | ) | | | (71,311 | ) | | | (0.77 | ) |
Fuji Seal International Inc | | | (744 | ) | | | (20,234 | ) | | | (0.22 | ) |
GAM Holding AG | | | (8,498 | ) | | | (33,051 | ) | | | (0.36 | ) |
Genuine Parts Co | | | (824 | ) | | | (74,402 | ) | | | (0.81 | ) |
Green Plains Inc | | | (1,577 | ) | | | (12,948 | ) | | | (0.14 | ) |
GrubHub Inc | | | (142 | ) | | | (8,443 | ) | | | (0.09 | ) |
Hanesbrands Inc | | | (945 | ) | | | (12,914 | ) | | | (0.14 | ) |
HarborOne Bancorp Inc | | | (3,348 | ) | | | (33,342 | ) | | | (0.36 | ) |
Haynes International Inc | | | (778 | ) | | | (23,226 | ) | | | (0.25 | ) |
Healthcare Services Group Inc | | | (2,705 | ) | | | (61,006 | ) | | | (0.66 | ) |
Helios Technologies Inc | | | (943 | ) | | | (40,349 | ) | | | (0.44 | ) |
Henry Schein Inc | | | (1,323 | ) | | | (81,523 | ) | | | (0.89 | ) |
Hilton Grand Vacations Inc | | | (704 | ) | | | (23,776 | ) | | | (0.26 | ) |
Huhtamaki Oyj | | | (2,026 | ) | | | (78,356 | ) | | | (0.85 | ) |
Hunting PLC | | | (10,309 | ) | | | (57,375 | ) | | | (0.62 | ) |
Iliad SA | | | (206 | ) | | | (21,611 | ) | | | (0.23 | ) |
IMCD NV | | | (1,067 | ) | | | (74,959 | ) | | | (0.81 | ) |
Independence Group NL | | | (10,612 | ) | | | (38,895 | ) | | | (0.42 | ) |
Infinera Corp | | | (5,549 | ) | | | (29,578 | ) | | | (0.32 | ) |
Instructure Inc | | | (2,649 | ) | | | (109,553 | ) | | | (1.19 | ) |
Interactive Brokers Group Inc | | | (930 | ) | | | (43,888 | ) | | | (0.48 | ) |
Intercontinental Exchange Inc | | | (138 | ) | | | (12,881 | ) | | | (0.14 | ) |
International Flavors & Fragrances Inc | | | (199 | ) | | | (21,817 | ) | | | (0.24 | ) |
InterXion Holding NV | | | (927 | ) | | | (75,042 | ) | | | (0.81 | ) |
Invesco Ltd | | | (536 | ) | | | (8,409 | ) | | | (0.09 | ) |
IPG Photonics Corp | | | (378 | ) | | | (46,790 | ) | | | (0.51 | ) |
JCDecaux SA | | | (2,757 | ) | | | (73,837 | ) | | | (0.80 | ) |
JCR Pharmaceuticals Co Ltd | | | (373 | ) | | | (28,694 | ) | | | (0.31 | ) |
JGC Corp | | | (7,323 | ) | | | (85,202 | ) | | | (0.92 | ) |
Jungheinrich AG | | | (1,584 | ) | | | (33,733 | ) | | | (0.37 | ) |
Kobayashi Pharmaceutical Co Ltd | | | (1,594 | ) | | | (119,515 | ) | | | (1.30 | ) |
Komatsu Ltd | | | (2,447 | ) | | | (52,026 | ) | | | (0.56 | ) |
Kratos Defense & Security Solutions Inc | | | (1,689 | ) | | | (33,723 | ) | | | (0.37 | ) |
Labrador Iron Ore Royalty Corp | | | (1,956 | ) | | | (38,338 | ) | | | (0.42 | ) |
| | | | | | | | | | | | |
Security Description | | Shares | | | Value | | | Index Weight | |
Lancashire Holdings Ltd | | | (1,446 | ) | | $ | (11,996 | ) | | | (0.13 | )% |
Leggett & Platt Inc | | | (588 | ) | | | (21,868 | ) | | | (0.24 | ) |
Liquidity Services Inc | | | (1,762 | ) | | | (13,338 | ) | | | (0.14 | ) |
Macerich Co/The | | | (1,788 | ) | | | (51,001 | ) | | | (0.55 | ) |
Manulife Financial Corp | | | (3,362 | ) | | | (55,887 | ) | | | (0.61 | ) |
Martin Marietta Materials Inc | | | (113 | ) | | | (28,725 | ) | | | (0.31 | ) |
MaxLinear Inc | | | (770 | ) | | | (15,255 | ) | | | (0.17 | ) |
MBIA Inc | | | (6,115 | ) | | | (55,032 | ) | | | (0.60 | ) |
McDonald’s Corp | | | (535 | ) | | | (116,681 | ) | | | (1.27 | ) |
Mid-America Apartment Communities Inc | | | (458 | ) | | | (57,986 | ) | | | (0.63 | ) |
MISUMI Group Inc | | | (507 | ) | | | (11,496 | ) | | | (0.12 | ) |
Mitsubishi Motors Corp | | | (6,048 | ) | | | (25,300 | ) | | | (0.27 | ) |
Mitsui E&S Holdings Co Ltd | | | (1,869 | ) | | | (14,211 | ) | | | (0.15 | ) |
Miura Co Ltd | | | (3,957 | ) | | | (109,252 | ) | | | (1.18 | ) |
MKS Instruments Inc | | | (622 | ) | | | (48,683 | ) | | | (0.53 | ) |
Mondelez International Inc | | | (960 | ) | | | (53,004 | ) | | | (0.58 | ) |
Monro Inc | | | (480 | ) | | | (37,311 | ) | | | (0.41 | ) |
Motorcar Parts of America Inc | | | (548 | ) | | | (7,969 | ) | | | (0.09 | ) |
Nanosonics Ltd | | | (25,786 | ) | | | (115,880 | ) | | | (1.26 | ) |
Netflix Inc | | | (76 | ) | | | (22,207 | ) | | | (0.24 | ) |
New York Community Bancorp Inc | | | (8,434 | ) | | | (97,330 | ) | | | (1.06 | ) |
Nippon Paint Holdings Co Ltd | | | (1,059 | ) | | | (50,198 | ) | | | (0.54 | ) |
Norsk Hydro ASA | | | (7,481 | ) | | | (23,694 | ) | | | (0.26 | ) |
Northwest Pipe Co | | | (679 | ) | | | (15,610 | ) | | | (0.17 | ) |
Nutanix Inc | | | (605 | ) | | | (14,662 | ) | | | (0.16 | ) |
Ocado Group PLC | | | (4,575 | ) | | | (72,182 | ) | | | (0.78 | ) |
Okta Inc | | | (711 | ) | | | (89,904 | ) | | | (0.98 | ) |
Oriental Land Co Ltd/Japan | | | (301 | ) | | | (43,901 | ) | | | (0.48 | ) |
Origin Energy Ltd | | | (3,532 | ) | | | (18,157 | ) | | | (0.20 | ) |
Pacific Premier Bancorp Inc | | | (1,144 | ) | | | (33,716 | ) | | | (0.37 | ) |
Parco Co Ltd | | | (2,681 | ) | | | (30,989 | ) | | | (0.34 | ) |
PATRIZIA AG | | | (1,501 | ) | | | (27,441 | ) | | | (0.30 | ) |
PDF Solutions Inc | | | (2,894 | ) | | | (33,886 | ) | | | (0.37 | ) |
Pebblebrook Hotel Trust | | | (2,413 | ) | | | (65,080 | ) | | | (0.71 | ) |
Penske Automotive Group Inc | | | (249 | ) | | | (10,661 | ) | | | (0.12 | ) |
Penumbra Inc | | | (259 | ) | | | (37,725 | ) | | | (0.41 | ) |
People’s United Financial Inc | | | (6,171 | ) | | | (88,684 | ) | | | (0.96 | ) |
PerkinElmer Inc | | | (1,264 | ) | | | (104,498 | ) | | | (1.13 | ) |
Persol Holdings Co Ltd | | | (3,959 | ) | | | (80,457 | ) | | | (0.87 | ) |
Pinnacle Financial Partners Inc | | | (962 | ) | | | (50,661 | ) | | | (0.55 | ) |
PJT Partners Inc | | | (526 | ) | | | (21,906 | ) | | | (0.24 | ) |
PRA Group Inc | | | (1,318 | ) | | | (45,001 | ) | | | (0.49 | ) |
PROS Holdings Inc | | | (1,706 | ) | | | (121,167 | ) | | | (1.32 | ) |
Puma SE | | | (303 | ) | | | (23,034 | ) | | | (0.25 | ) |
QBE Insurance Group Ltd | | | (6,473 | ) | | | (54,646 | ) | | | (0.59 | ) |
R1 RCM Inc | | | (2,147 | ) | | | (25,038 | ) | | | (0.27 | ) |
Radware Ltd | | | (1,900 | ) | | | (46,467 | ) | | | (0.50 | ) |
Renesas Electronics Corp | | | (11,707 | ) | | | (73,237 | ) | | | (0.79 | ) |
Roper Technologies Inc | | | (85 | ) | | | (31,093 | ) | | | (0.34 | ) |
RWS Holdings PLC | | | (2,212 | ) | | | (16,243 | ) | | | (0.18 | ) |
Sanne Group PLC | | | (2,719 | ) | | | (17,315 | ) | | | (0.19 | ) |
Sanyo Special Steel Co Ltd | | | (2,731 | ) | | | (35,589 | ) | | | (0.39 | ) |
Savaria Corp | | | (1,816 | ) | | | (14,977 | ) | | | (0.16 | ) |
Schoeller-Bleckmann Oilfield Equipment A | | | (600 | ) | | | (38,112 | ) | | | (0.41 | ) |
Sembcorp Industries Ltd | | | (9,149 | ) | | | (13,652 | ) | | | (0.15 | ) |
Serco Group PLC | | | (42,521 | ) | | | (75,553 | ) | | | (0.82 | ) |
Shin-Etsu Chemical Co Ltd | | | (202 | ) | | | (20,420 | ) | | | (0.22 | ) |
SHO-BOND Holdings Co Ltd | | | (1,451 | ) | | | (51,133 | ) | | | (0.55 | ) |
Shopify Inc | | | (172 | ) | | | (66,392 | ) | | | (0.72 | ) |
(See Notes to Schedules of Investments and Notes to Financial Statements, which are an integral part of the Financial Statements)
67
August 31, 2019
| | | | | | | | | | | | |
Security Description | | Shares | | | Value | | | Index Weight | |
BMO Alternative Strategies Global Market Neutral Short Index (continued) | |
Sims Metal Management Ltd | | | (1,387 | ) | | $ | (10,740 | ) | | | (0.12 | )% |
SOITEC | | | (234 | ) | | | (23,630 | ) | | | (0.26 | ) |
Sony Financial Holdings Inc | | | (4,814 | ) | | | (111,299 | ) | | | (1.21 | ) |
Sophos Group PLC | | | (5,968 | ) | | | (27,861 | ) | | | (0.30 | ) |
Spotify Technology SA | | | (153 | ) | | | (20,644 | ) | | | (0.22 | ) |
Square Inc | | | (550 | ) | | | (34,009 | ) | | | (0.37 | ) |
Stericycle Inc | | | (861 | ) | | | (38,655 | ) | | | (0.42 | ) |
Stobart Group Ltd | | | (6,435 | ) | | | (9,436 | ) | | | (0.10 | ) |
Sumitomo Metal Mining Co Ltd | | | (2,575 | ) | | | (72,573 | ) | | | (0.79 | ) |
SVB Financial Group | | | (441 | ) | | | (85,765 | ) | | | (0.93 | ) |
Svenska Cellulosa AB SCA | | | (2,486 | ) | | | (21,458 | ) | | | (0.23 | ) |
Symrise AG | | | (518 | ) | | | (48,400 | ) | | | (0.52 | ) |
Tadano Ltd | | | (1,124 | ) | | | (9,943 | ) | | | (0.11 | ) |
Taihei Dengyo Kaisha Ltd | | | (549 | ) | | | (12,394 | ) | | | (0.13 | ) |
TFS Financial Corp | | | (2,792 | ) | | | (48,888 | ) | | | (0.53 | ) |
Thor Industries Inc | | | (395 | ) | | | (18,127 | ) | | | (0.20 | ) |
TimkenSteel Corp | | | (8,428 | ) | | | (43,993 | ) | | | (0.48 | ) |
| | | | | | | | | | | | |
Security Description | | Shares | | | Value | | | Index Weight | |
TOTO Ltd | | | (2,324 | ) | | $ | (84,200 | ) | | | (0.91 | )% |
UMH Properties Inc | | | (2,802 | ) | | | (36,030 | ) | | | (0.39 | ) |
United Parcel Service Inc | | | (585 | ) | | | (69,469 | ) | | | (0.75 | ) |
Vapotherm Inc | | | (666 | ) | | | (7,721 | ) | | | (0.08 | ) |
Vicor Corp | | | (1,292 | ) | | | (39,384 | ) | | | (0.43 | ) |
Visteon Corp | | | (485 | ) | | | (33,474 | ) | | | (0.36 | ) |
Vivendi SA | | | (1,376 | ) | | | (38,530 | ) | | | (0.42 | ) |
Vulcan Materials Co | | | (557 | ) | | | (78,629 | ) | | | (0.85 | ) |
Wacom Co Ltd | | | (2,646 | ) | | | (8,252 | ) | | | (0.09 | ) |
Wallenstam AB | | | (5,169 | ) | | | (58,134 | ) | | | (0.63 | ) |
Weir Group PLC/The | | | (5,525 | ) | | | (98,541 | ) | | | (1.07 | ) |
Western Forest Products Inc | | | (15,504 | ) | | | (14,001 | ) | | | (0.15 | ) |
Weyerhaeuser Co | | | (3,687 | ) | | | (97,014 | ) | | | (1.05 | ) |
Wheaton Precious Metals Corp | | | (2,644 | ) | | | (77,923 | ) | | | (0.85 | ) |
Willis Towers Watson PLC | | | (347 | ) | | | (68,751 | ) | | | (0.75 | ) |
Yara International ASA | | | (2,044 | ) | | | (88,750 | ) | | | (0.96 | ) |
| | | | | | | | | | | | |
| | | | | | $ | (9,216,199 | ) | | | (100.00 | )% |
| | | | | | | | | | | | |
The following table represents the equity basket holdings underlying the total return swap with BMO Global Equity Market Neutral Strategy Long and Short Index as of August 31, 2019:
| | | | | | | | | | | | |
Security Description | | Shares | | | Value | | | Index Weight | |
| BMO Global Equity Market Neutral Strategy Long Index | |
Actividades de Construccion y Servicios | | | 841 | | | $ | 31,967 | | | | 0.44 | % |
adidas AG | | | 118 | | | | 34,719 | | | | 0.47 | |
Aena SME SA | | | 879 | | | | 159,429 | | | | 2.18 | |
AerCap Holdings NV | | | 2,003 | | | | 106,301 | | | | 1.45 | |
AGC Inc. | | | 1,290 | | | | 36,557 | | | | 0.50 | |
Agilent Technologies Inc. | | | 655 | | | | 46,337 | | | | 0.63 | |
Agnico Eagle Mines Limited | | | 1,529 | | | | 94,548 | | | | 1.29 | |
Akamai Technologies Inc. | | | 1,478 | | | | 132,085 | | | | 1.80 | |
Alcon Inc. | | | 269 | | | | 16,317 | | | | 0.22 | |
Alfresa Holdings Corporation | | | 1,543 | | | | 34,416 | | | | 0.47 | |
Alphabet Inc. Class A | | | 50 | | | | 59,115 | | | | 0.81 | |
Alstom SA | | | 779 | | | | 32,912 | | | | 0.45 | |
Altice USA Inc. Class A | | | 913 | | | | 26,354 | | | | 0.36 | |
Altria Group Inc. | | | 2,865 | | | | 126,776 | | | | 1.73 | |
AMADA HOLDINGS COLtd. | | | 2,112 | | | | 21,664 | | | | 0.30 | |
Anglo American plc | | | 3,432 | | | | 72,783 | | | | 0.99 | |
Annaly Capital Management Inc. | | | 4,413 | | | | 36,672 | | | | 0.50 | |
Anthem Inc. | | | 131 | | | | 33,907 | | | | 0.46 | |
AP Moller—Maersk AS Class B | | | 149 | | | | 159,309 | | | | 2.17 | |
ArcelorMittal SA | | | 2,202 | | | | 31,317 | | | | 0.43 | |
Arch Capital Group Ltd. | | | 1,597 | | | | 63,076 | | | | 0.86 | |
Archer-Daniels-Midland Company | | | 2,467 | | | | 93,091 | | | | 1.27 | |
Arrow Electronics Inc. | | | 682 | | | | 47,201 | | | | 0.64 | |
Asahi Group HoldingsLtd. | | | 619 | | | | 28,510 | | | | 0.39 | |
Ashtead Group plc | | | 1,868 | | | | 50,665 | | | | 0.69 | |
Astellas Pharma Inc. | | | 2,205 | | | | 30,131 | | | | 0.41 | |
AT&T Inc. | | | 2,921 | | | | 102,684 | | | | 1.40 | |
Aurizon Holdings Ltd. | | | 11,023 | | | | 43,261 | | | | 0.59 | |
Azrieli Group Ltd. | | | 178 | | | | 13,276 | | | | 0.18 | |
Ball Corporation | | | 200 | | | | 16,079 | | | | 0.22 | |
Baloise-Holding AG | | | 211 | | | | 36,349 | | | | 0.50 | |
Bank LeumiLe-Israel Ltd. | | | 3,190 | | | | 21,748 | | | | 0.30 | |
Barratt Developments PLC | | | 3,616 | | | | 27,629 | | | | 0.38 | |
Barrick Gold Corporation | | | 3,151 | | | | 60,716 | | | | 0.83 | |
BB&T Corporation | | | 1,978 | | | | 93,781 | | | | 1.28 | |
BCE Inc. | | | 648 | | | | 30,618 | | | | 0.42 | |
Berkeley Group Holdings plc | | | 550 | | | | 25,938 | | | | 0.35 | |
Biogen Inc. | | | 336 | | | | 74,052 | | | | 1.01 | |
Bluescope Steel Limited | | | 10,104 | | | | 83,598 | | | | 1.14 | |
Brambles Limited | | | 2,382 | | | | 17,992 | | | | 0.25 | |
British American Tobacco plc | | | 506 | | | | 17,709 | | | | 0.24 | |
| | | | | | | | | | | | |
Security Description | | Shares | | | Value | | | Index Weight | |
Broadcom Inc. | | | 458 | | | $ | 129,650 | | | | 1.77 | % |
Bunge Limited | | | 1,133 | | | | 59,598 | | | | 0.81 | |
Cabot Oil & Gas Corporation | | | 1,184 | | | | 20,395 | | | | 0.28 | |
Cadence Design Systems Inc. | | | 633 | | | | 43,673 | | | | 0.60 | |
Canadian Natural Resources Limited | | | 4,738 | | | | 114,342 | | | | 1.56 | |
Canon Inc. | | | 4,282 | | | | 109,689 | | | | 1.50 | |
CapitaLand Mall Trust | | | 12,211 | | | | 23,144 | | | | 0.32 | |
Capri Holdings Limited | | | 1,446 | | | | 38,395 | | | | 0.52 | |
Cash | | | 908 | | | | 908 | | | | 0.01 | |
Casino Guichard-Perrachon SA | | | 872 | | | | 35,655 | | | | 0.49 | |
Cellnex Telecom SA | | | 455 | | | | 18,393 | | | | 0.25 | |
Cenovus Energy Inc. | | | 2,521 | | | | 22,402 | | | | 0.31 | |
Central Japan Railway Company | | | 544 | | | | 106,677 | | | | 1.46 | |
Cerner Corporation | | | 3,541 | | | | 244,348 | | | | 3.33 | |
Check Point Software Technologies Ltd. | | | 572 | | | | 61,492 | | | | 0.84 | |
Chipotle Mexican Grill Inc. | | | 28 | | | | 23,743 | | | | 0.32 | |
Chubb Limited | | | 99 | | | | 15,607 | | | | 0.21 | |
Church & Dwight Co Inc. | | | 386 | | | | 30,853 | | | | 0.42 | |
CK Hutchison Holdings Ltd. | | | 21,059 | | | | 184,647 | | | | 2.52 | |
CK Infrastructure Holdings Limited | | | 2,957 | | | | 20,576 | | | | 0.28 | |
Clorox Company | | | 462 | | | | 73,518 | | | | 1.00 | |
CLP Holdings Limited | | | 6,651 | | | | 69,844 | | | | 0.95 | |
Coca-Cola Bottlers Japan Holdings Inc. | | | 1,374 | | | | 29,893 | | | | 0.41 | |
Coca-Cola European Partners Plc | | | 1,174 | | | | 65,787 | | | | 0.90 | |
Colgate-Palmolive Company | | | 219 | | | | 16,267 | | | | 0.22 | |
Compagnie de Saint-Gobain SA | | | 1,305 | | | | 46,079 | | | | 0.63 | |
Consolidated Edison Inc. | | | 1,082 | | | | 95,371 | | | | 1.30 | |
Continental AG | | | 485 | | | | 58,258 | | | | 0.80 | |
Corning Inc. | | | 2,977 | | | | 82,519 | | | | 1.13 | |
Covestro AG | | | 1,779 | | | | 80,544 | | | | 1.10 | |
CyberArk Software Ltd. | | | 187 | | | | 21,237 | | | | 0.29 | |
Dai Nippon Printing Co Ltd. | | | 4,978 | | | | 106,354 | | | | 1.45 | |
Daifuku Co Ltd. | | | 367 | | | | 17,041 | | | | 0.23 | |
Daito Trust Construction Co Ltd. | | | 318 | | | | 40,331 | | | | 0.55 | |
Daiwa House REIT Investment Corporation | | | 7 | | | | 19,281 | | | | 0.26 | |
Danaher Corporation | | | 287 | | | | 40,610 | | | | 0.55 | |
Danske Bank AS | | | 3,165 | | | | 41,264 | | | | 0.56 | |
Darden Restaurants Inc. | | | 1,614 | | | | 196,656 | | | | 2.68 | |
Dassault Aviation SA | | | 36 | | | | 50,380 | | | | 0.69 | |
Dassault Systemes SA | | | 394 | | | | 55,117 | | | | 0.75 | |
(See Notes to Schedules of Investments and Notes to Financial Statements, which are an integral part of the Financial Statements)
68
| | | | | | | | | | | | |
Security Description | | Shares | | | Value | | | Index Weight | |
BMO Global Equity Market Neutral Strategy Long Index
(continued) | |
Deutsche Lufthansa AG | | | 3,739 | | | $ | 57,768 | | | | 0.79 | % |
Deutsche Telekom AG | | | 13,279 | | | | 222,122 | | | | 3.03 | |
DexCom Inc. | | | 87 | | | | 14,919 | | | | 0.20 | |
Discovery Inc. Class A | | | 2,181 | | | | 60,475 | | | | 0.83 | |
DISH Network Corporation Class A | | | 2,976 | | | | 100,384 | | | | 1.37 | |
Dominion Energy Inc. | | | 256 | | | | 19,893 | | | | 0.27 | |
Dover Corporation | | | 176 | | | | 16,276 | | | | 0.22 | |
Dow Inc. | | | 1,070 | | | | 45,319 | | | | 0.62 | |
DR Horton Inc. | | | 1,359 | | | | 66,978 | | | | 0.91 | |
Dufry AG | | | 799 | | | | 64,389 | | | | 0.88 | |
Duke Energy Corporation | | | 1,229 | | | | 113,994 | | | | 1.56 | |
DuPont de Nemours Inc. | | | 285 | | | | 18,773 | | | | 0.26 | |
Eiffage SA | | | 596 | | | | 61,370 | | | | 0.84 | |
Elisa Oyj Class A | | | 358 | | | | 18,093 | | | | 0.25 | |
Enagas SA | | | 1,539 | | | | 33,123 | | | | 0.45 | |
Eni SpA | | | 8,624 | | | | 129,813 | | | | 1.77 | |
EOG Resources Inc. | | | 233 | | | | 17,366 | | | | 0.24 | |
EPAM Systems Inc. | | | 203 | | | | 38,983 | | | | 0.53 | |
EssilorLuxottica SA | | | 229 | | | | 34,025 | | | | 0.46 | |
Etablissementen Franz Colruyt NV | | | 750 | | | | 38,263 | | | | 0.52 | |
Everest Re Group Ltd. | | | 148 | | | | 35,621 | | | | 0.49 | |
Exelon Corporation | | | 697 | | | | 32,571 | | | | 0.44 | |
Exxon Mobil Corporation | | | 845 | | | | 57,848 | | | | 0.79 | |
F5 Networks Inc. | | | 1,200 | | | | 153,688 | | | | 2.10 | |
FamilyMart UNY Holdings Co Ltd. | | | 906 | | | | 21,104 | | | | 0.29 | |
Fiat Chrysler Automobiles NV | | | 4,688 | | | | 60,828 | | | | 0.83 | |
Fifth Third Bancorp | | | 1,535 | | | | 40,393 | | | | 0.55 | |
Ford Motor Company | | | 23,450 | | | | 213,860 | | | | 2.92 | |
Fortescue Metals Group Ltd. | | | 8,092 | | | | 41,838 | | | | 0.57 | |
Fortinet Inc. | | | 1,676 | | | | 130,650 | | | | 1.78 | |
Fox Corporation Class A | | | 3,852 | | | | 126,102 | | | | 1.72 | |
Franco-Nevada Corporation | | | 739 | | | | 71,925 | | | | 0.98 | |
Fuji Electric Co Ltd. | | | 3,782 | | | | 106,275 | | | | 1.45 | |
FUJIFILM Holdings Corp | | | 4,272 | | | | 180,949 | | | | 2.47 | |
Fujitsu Limited | | | 218 | | | | 16,736 | | | | 0.23 | |
Garmin Ltd. | | | 643 | | | | 52,016 | | | | 0.71 | |
Gildan Activewear Inc. | | | 1,080 | | | | 39,855 | | | | 0.54 | |
Glencore plc | | | 42,890 | | | | 117,081 | | | | 1.60 | |
Golden Agri-Resources Ltd. | | | 134,994 | | | | 25,294 | | | | 0.35 | |
H Lundbeck AS | | | 1,235 | | | | 44,924 | | | | 0.61 | |
H&R Block Inc. | | | 2,152 | | | | 52,441 | | | | 0.72 | |
HEICO Corporation | | | 410 | | | | 59,878 | | | | 0.82 | |
Hermes International SCA | | | 39 | | | | 26,405 | | | | 0.36 | |
Humana Inc. | | | 49 | | | | 13,747 | | | | 0.19 | |
Husky Energy Inc. | | | 8,783 | | | | 59,560 | | | | 0.81 | |
ICA Gruppen AB | | | 384 | | | | 19,194 | | | | 0.26 | |
IHI Corporation | | | 1,850 | | | | 34,358 | | | | 0.47 | |
Iliad SA | | | 216 | | | | 22,685 | | | | 0.31 | |
Imperial Oil Limited | | | 2,995 | | | | 73,396 | | | | 1.00 | |
Inc.yte Corporation | | | 281 | | | | 23,163 | | | | 0.32 | |
INPEX CORPORATION | | | 2,571 | | | | 21,714 | | | | 0.30 | |
Intact Financial Corporation | | | 525 | | | | 51,180 | | | | 0.70 | |
Intesa Sanpaolo SpA | | | 42,483 | | | | 94,547 | | | | 1.29 | |
Invitation Homes Inc. | | | 1,296 | | | | 37,483 | | | | 0.51 | |
Ionis Pharmaceuticals Inc. | | | 259 | | | | 16,594 | | | | 0.23 | |
Itochu Techno-Solutions Corporation | | | 714 | | | | 19,435 | | | | 0.27 | |
J Sainsbury plc | | | 40,473 | | | | 98,737 | | | | 1.35 | |
Japan Airlines Co Ltd. | | | 688 | | | | 21,311 | | | | 0.29 | |
Japan Real Estate Investment Corp | | | 4 | | | | 28,388 | | | | 0.39 | |
Jardine Cycle & Carriage Limited | | | 741 | | | | 16,007 | | | | 0.22 | |
| | | | | | | | | | | | |
Security Description | | Shares | | | Value | | | Index Weight | |
Jardine Matheson Holdings Limited | | | 1,237 | | | $ | 65,211 | | | | 0.89 | % |
Jazz Pharmaceuticals Plc | | | 595 | | | | 76,088 | | | | 1.04 | |
JM Smucker Company | | | 246 | | | | 25,309 | | | | 0.35 | |
Johnson & Johnson | | | 440 | | | | 56,378 | | | | 0.77 | |
Juniper Networks Inc. | | | 2,328 | | | | 53,937 | | | | 0.74 | |
Kajima Corporation | | | 9,571 | | | | 115,856 | | | | 1.58 | |
Kamigumi Co Ltd. | | | 759 | | | | 17,578 | | | | 0.24 | |
Kawasaki Heavy Industries Ltd. | | | 943 | | | | 17,996 | | | | 0.25 | |
Keio Corporation | | | 397 | | | | 24,756 | | | | 0.34 | |
Kerry Group Plc Class A | | | 159 | | | | 18,850 | | | | 0.26 | |
KeyCorp | | | 1,678 | | | | 27,608 | | | | 0.38 | |
Keysight Technologies Inc. | | | 374 | | | | 36,228 | | | | 0.49 | |
Kikkoman Corporation | | | 358 | | | | 15,926 | | | | 0.22 | |
Kinder Morgan Inc. Class P | | | 2,760 | | | | 56,314 | | | | 0.77 | |
Kingfisher Plc | | | 23,940 | | | | 56,448 | | | | 0.77 | |
Kinross Gold Corporation | | | 15,448 | | | | 76,888 | | | | 1.05 | |
Kobe Steel Ltd. | | | 17,497 | | | | 88,823 | | | | 1.21 | |
Kohls Corporation | | | 2,521 | | | | 118,998 | | | | 1.62 | |
Kraft Heinz Company | | | 1,456 | | | | 36,870 | | | | 0.50 | |
Lear Corporation | | | 1,287 | | | | 140,428 | | | | 1.92 | |
Lennar Corporation Class A | | | 1,271 | | | | 65,107 | | | | 0.89 | |
Lennox International Inc. | | | 126 | | | | 31,777 | | | | 0.43 | |
Leonardo SpA | | | 3,509 | | | | 43,376 | | | | 0.59 | |
Liberty Media Corp Series A Liberty Sir | | | 737 | | | | 29,766 | | | | 0.41 | |
Link Real Estate Investment Trust | | | 6,023 | | | | 68,663 | | | | 0.94 | |
Live Nation Entertainment Inc. | | | 285 | | | | 19,655 | | | | 0.27 | |
LIXIL Group Corp | | | 1,157 | | | | 18,458 | | | | 0.25 | |
Lockheed Martin Corporation | | | 174 | | | | 67,016 | | | | 0.91 | |
Magna International Inc. | | | 2,199 | | | | 109,316 | | | | 1.49 | |
ManpowerGroup Inc. | | | 584 | | | | 47,479 | | | | 0.65 | |
Marathon Petroleum Corporation | | | 457 | | | | 22,190 | | | | 0.30 | |
Marks and Spencer Group plc | | | 42,640 | | | | 97,912 | | | | 1.34 | |
Marubeni Corporation | | | 19,273 | | | | 120,897 | | | | 1.65 | |
Mazda Motor Corp | | | 2,512 | | | | 20,559 | | | | 0.28 | |
McDonalds Corporation | | | 533 | | | | 117,548 | | | | 1.60 | |
McKesson Corporation | | | 1,045 | | | | 144,172 | | | | 1.97 | |
Medtronic Plc | | | 617 | | | | 66,528 | | | | 0.91 | |
Meggitt PLC | | | 3,196 | | | | 23,975 | | | | 0.33 | |
Melco Resorts and Entertainment Ltd. Shs | | | 1,238 | | | | 25,758 | | | | 0.35 | |
MercadoLibre Inc. | | | 32 | | | | 18,800 | | | | 0.26 | |
MGM Resorts International | | | 649 | | | | 18,258 | | | | 0.25 | |
Micro Focus International plc | | | 1,153 | | | | 14,788 | | | | 0.20 | |
Micron Technology Inc. | | | 5,542 | | | | 247,547 | | | | 3.38 | |
Middleby Corporation | | | 234 | | | | 25,740 | | | | 0.35 | |
Mitsubishi Chemical Holdings Corporation | | | 14,800 | | | | 100,088 | | | | 1.37 | |
Mitsubishi Gas Chemical Company Inc. | | | 3,244 | | | | 37,779 | | | | 0.52 | |
Mitsubishi Heavy Industries Ltd. | | | 6,286 | | | | 230,317 | | | | 3.14 | |
Mitsubishi Materials Corp | | | 806 | | | | 19,107 | | | | 0.26 | |
Mitsubishi Tanabe Pharma Corporation | | | 1,434 | | | | 15,631 | | | | 0.21 | |
Molson Coors Brewing Company Class B | | | 4,091 | | | | 208,827 | | | | 2.85 | |
MongoDB Inc. Class A | | | 103 | | | | 15,924 | | | | 0.22 | |
Mosaic Company | | | 991 | | | | 18,202 | | | | 0.25 | |
Motorola Solutions Inc. | | | 468 | | | | 84,777 | | | | 1.16 | |
Mylan NV | | | 4,264 | | | | 84,854 | | | | 1.16 | |
Nagoya Railroad Co Ltd. | | | 531 | | | | 15,664 | | | | 0.21 | |
NEC Corp | | | 1,134 | | | | 48,960 | | | | 0.67 | |
Neste Corporation | | | 2,111 | | | | 67,280 | | | | 0.92 | |
Nestle SA | | | 844 | | | | 94,325 | | | | 1.29 | |
Newcrest Mining Limited | | | 7,357 | | | | 182,701 | | | | 2.49 | |
Newmont Goldcorp Corporation | | | 2,133 | | | | 85,568 | | | | 1.17 | |
(See Notes to Schedules of Investments and Notes to Financial Statements, which are an integral part of the Financial Statements)
69
August 31, 2019
| | | | | | | | | | | | |
Security Description | | Shares | | | Value | | | Index Weight | |
BMO Global Equity Market Neutral Strategy Long Index
(continued) | |
News Corporation Class A | | | 7,448 | | | $ | 102,789 | | | | 1.40 | % |
NextEra Energy Inc. | | | 186 | | | | 41,189 | | | | 0.56 | |
NH Foods Ltd. | | | 463 | | | | 17,318 | | | | 0.24 | |
NIKE Inc. Class B | | | 274 | | | | 23,378 | | | | 0.32 | |
Nikon Corp | | | 8,253 | | | | 100,524 | | | | 1.37 | |
Nippon Electric Glass Co Ltd. | | | 5,119 | | | | 104,094 | | | | 1.42 | |
Nippon Prologis REIT Inc. | | | 7 | | | | 19,718 | | | | 0.27 | |
NIPPON STEEL CORP | | | 1,949 | | | | 26,708 | | | | 0.36 | |
Nippon Telegraph and Telephone Corporati | | | 7,811 | | | | 370,939 | | | | 0.05 | |
NN Group NV | | | 1,032 | | | | 34,558 | | | | 0.47 | |
Nokia Oyj | | | 8,801 | | | | 43,303 | | | | 0.59 | |
Nomura Real Estate Master Fund Inc. | | | 15 | | | | 25,476 | | | | 0.35 | |
Northrop Grumman Corporation | | | 49 | | | | 18,170 | | | | 0.25 | |
Norwegian Cruise Line Holdings Ltd. | | | 5,531 | | | | 277,814 | | | | 3.79 | |
Novartis AG | | | 999 | | | | 88,949 | | | | 1.21 | |
NTT DATA Corporation | | | 2,816 | | | | 36,120 | | | | 0.49 | |
NTT DoCoMo Inc. | | | 9,219 | | | | 229,510 | | | | 3.13 | |
NVR Inc. | | | 12 | | | | 42,549 | | | | 0.58 | |
NWS Holdings Limited | | | 18,439 | | | | 31,302 | | | | 0.43 | |
Occidental Petroleum Corporation | | | 1,483 | | | | 64,321 | | | | 0.88 | |
Oji Holdings Corp | | | 11,128 | | | | 50,748 | | | | 0.69 | |
Okta Inc. Class A | | | 145 | | | | 18,447 | | | | 0.25 | |
ON Semiconductor Corporation | | | 5,837 | | | | 104,364 | | | | 1.42 | |
Open Text Corporation | | | 1,102 | | | | 42,782 | | | | 0.58 | |
Oriental Land Co Ltd. | | | 211 | | | | 30,400 | | | | 0.41 | |
Otsuka Corporation | | | 523 | | | | 18,935 | | | | 0.26 | |
Owens Corning | | | 2,130 | | | | 122,022 | | | | 1.67 | |
Palo Alto Networks Inc. | | | 121 | | | | 24,129 | | | | 0.33 | |
Pan Pacific International Holdings Corpo | | | 1,621 | | | | 25,052 | | | | 0.34 | |
Paycom Software Inc. | | | 94 | | | | 23,926 | | | | 0.33 | |
PayPal Holdings Inc. | | | 488 | | | | 53,314 | | | | 0.73 | |
PepsiCo Inc. | | | 782 | | | | 106,326 | | | | 1.45 | |
PerkinElmer Inc. | | | 188 | | | | 15,636 | | | | 0.21 | |
Peugeot SA | | | 6,974 | | | | 153,896 | | | | 2.10 | |
PNC Financial Services Group Inc. | | | 699 | | | | 89,698 | | | | 1.22 | |
Porsche Automobil Holding SE Pref | | | 2,245 | | | | 140,489 | | | | 1.92 | |
Poste Italiane SpA | | | 2,146 | | | | 23,346 | | | | 0.32 | |
Power Assets Holdings Limited | | | 5,793 | | | | 39,460 | | | | 0.54 | |
Procter & Gamble Company | | | 1,221 | | | | 147,964 | | | | 2.02 | |
Progressive Corporation | | | 224 | | | | 16,968 | | | | 0.23 | |
Public Storage | | | 540 | | | | 141,529 | | | | 1.93 | |
PulteGroup Inc. | | | 5,894 | | | | 198,510 | | | | 2.71 | |
PUMA SE | | | 331 | | | | 25,805 | | | | 0.35 | |
Qurate Retail Inc. Class A | | | 3,908 | | | | 42,203 | | | | 0.58 | |
Rakuten Inc. | | | 15,644 | | | | 140,042 | | | | 1.91 | |
RenaissanceRe Holdings Ltd. | | | 165 | | | | 29,910 | | | | 0.41 | |
Renault SA | | | 1,633 | | | | 93,542 | | | | 1.28 | |
Repsol SA | | | 5,071 | | | | 73,234 | | | | 1.00 | |
Republic Services Inc. | | | 881 | | | | 78,784 | | | | 1.08 | |
Rio Tinto Limited | | | 382 | | | | 22,048 | | | | 0.30 | |
Roche Holding AG | | | 637 | | | | 174,697 | | | | 2.38 | |
Rogers Communications Inc. Class B | | | 289 | | | | 14,244 | | | | 0.19 | |
Royal Ahold Delhaize NV | | | 3,824 | | | | 89,738 | | | | 1.22 | |
Royal Caribbean Cruises Ltd. | | | 424 | | | | 43,806 | | | | 0.60 | |
Safran SA | | | 240 | | | | 34,776 | | | | 0.47 | |
Sampo Oyj Class A | | | 810 | | | | 32,377 | | | | 0.44 | |
Santos Limited | | | 13,186 | | | | 62,314 | | | | 0.85 | |
Shangri-La Asia Limited | | | 25,037 | | | | 25,909 | | | | 0.35 | |
| | | | | | | | | | | | |
Security Description | | Shares | | | Value | | | Index Weight | |
Shaw Communications Inc. Class B | | | 1,465 | | | $ | 28,001 | | | | 0.38 | % |
Singapore Airlines Ltd. | | | 3,626 | | | | 22,889 | | | | 0.31 | |
Singapore Telecommunications Limited | | | 24,849 | | | | 56,410 | | | | 0.77 | |
Snam SpA | | | 8,960 | | | | 46,191 | | | | 0.63 | |
Snap-on Inc.orporated | | | 261 | | | | 38,845 | | | | 0.53 | |
Solvay SA | | | 236 | | | | 23,654 | | | | 0.32 | |
Sony Corporation | | | 1,018 | | | | 56,436 | | | | 0.77 | |
South32 Ltd. | | | 16,969 | | | | 29,359 | | | | 0.40 | |
Southern Company | | | 2,201 | | | | 127,899 | | | | 1.75 | |
Southwest Airlines Co | | | 4,287 | | | | 224,231 | | | | 3.06 | |
Spark New Zealand Limited | | | 7,324 | | | | 20,213 | | | | 0.28 | |
Spirit AeroSystems Holdings Inc. Class | | | 433 | | | | 34,784 | | | | 0.47 | |
Starbucks Corporation | | | 2,965 | | | | 289,656 | | | | 3.95 | |
Sumitomo Chemical Co Ltd. | | | 41,230 | | | | 177,967 | | | | 2.43 | |
Sumitomo Corporation | | | 19,816 | | | | 289,417 | | | | 3.95 | |
Sumitomo Dainippon Pharma Co Ltd. | | | 2,498 | | | | 42,589 | | | | 0.58 | |
Sumitomo Heavy Industries Ltd. | | | 4,294 | | | | 123,486 | | | | 1.69 | |
Sumitomo Rubber Industries Ltd. | | | 1,517 | | | | 16,695 | | | | 0.23 | |
Suntory Beverage & Food Ltd. | | | 620 | | | | 26,422 | | | | 0.36 | |
Suzuken Co Ltd. | | | 1,641 | | | | 86,535 | | | | 1.18 | |
Swiss Prime Site AG | | | 297 | | | | 29,522 | | | | 0.40 | |
Swisscom AG | | | 108 | | | | 53,689 | | | | 0.73 | |
Synopsys Inc. | | | 845 | | | | 119,422 | | | | 1.63 | |
Sysco Corporation | | | 1,433 | | | | 106,733 | | | | 1.46 | |
Taiheiyo Cement Corporation | | | 2,005 | | | | 50,244 | | | | 0.69 | |
TAISEI CORP | | | 3,237 | | | | 113,292 | | | | 1.55 | |
Techtronic Industries Co Ltd. | | | 3,350 | | | | 22,753 | | | | 0.31 | |
Teck Resources Limited Class B | | | 5,417 | | | | 91,188 | | | | 1.24 | |
Telefonaktiebolaget LM Ericsson Class B | | | 4,238 | | | | 33,291 | | | | 0.45 | |
Telstra Corporation Limited | | | 17,144 | | | | 42,241 | | | | 0.58 | |
TELUS Corporation | | | 933 | | | | 33,706 | | | | 0.46 | |
Tesco PLC | | | 13,533 | | | | 36,120 | | | | 0.49 | |
TJX Companies Inc. | | | 1,579 | | | | 87,499 | | | | 1.19 | |
T-Mobile US Inc. | | | 1,472 | | | | 114,870 | | | | 1.57 | |
Toppan Printing Co Ltd. | | | 6,953 | | | | 108,432 | | | | 1.48 | |
Toray Industries Inc. | | | 2,909 | | | | 20,435 | | | | 0.28 | |
Tourmaline Oil Corp | | | 2,493 | | | | 24,627 | | | | 0.34 | |
Toyo Seikan Group Holdings Ltd. | | | 6,390 | | | | 91,147 | | | | 1.24 | |
Tractor Supply Company | | | 205 | | | | 21,296 | | | | 0.29 | |
Travelers Companies Inc. | | | 515 | | | | 75,688 | | | | 1.03 | |
Treasury Wine Estates Limited | | | 2,408 | | | | 29,661 | | | | 0.40 | |
Twitter Inc. | | | 565 | | | | 24,015 | | | | 0.33 | |
Tyson Foods Inc. Class A | | | 1,570 | | | | 143,966 | | | | 1.96 | |
Ubisoft Entertainment SA | | | 1,233 | | | | 98,858 | | | | 1.35 | |
UCB SA | | | 1,007 | | | | 74,810 | | | | 1.02 | |
Ulta Beauty Inc. | | | 67 | | | | 22,637 | | | | 0.31 | |
Uniper SE | | | 839 | | | | 25,507 | | | | 0.35 | |
United Airlines Holdings Inc. | | | 920 | | | | 77,938 | | | | 1.06 | |
United Urban Investment Corporation | | | 12 | | | | 21,906 | | | | 0.30 | |
Universal Health Services Inc. Class B | | | 507 | | | | 73,103 | | | | 1.00 | |
UPM-Kymmene Oyj | | | 2,225 | | | | 59,177 | | | | 0.81 | |
Vail Resorts Inc. | | | 183 | | | | 43,624 | | | | 0.60 | |
Valeo SA | | | 3,119 | | | | 83,604 | | | | 1.14 | |
Veeva Systems Inc. Class A | | | 250 | | | | 42,084 | | | | 0.57 | |
Verisk Analytics Inc. | | | 168 | | | | 27,030 | | | | 0.37 | |
Verizon Communications Inc. | | | 1,242 | | | | 71,982 | | | | 0.98 | |
Vestas Wind Systems AS | | | 190 | | | | 13,726 | | | | 0.19 | |
VF Corporation | | | 624 | | | | 51,985 | | | | 0.71 | |
Vitasoy International Holdings Limited | | | 4,810 | | | | 22,468 | | | | 0.31 | |
(See Notes to Schedules of Investments and Notes to Financial Statements, which are an integral part of the Financial Statements)
70
| | | | | | | | | | | | |
Security Description | | Shares | | | Value | | | Index Weight | |
BMO Global Equity Market Neutral Strategy Long Index
(continued) | |
Vivendi SA | | | 808 | | | $ | 22,798 | | | | 0.31 | % |
Vodafone Group Plc | | | 61,916 | | | | 117,713 | | | | 1.61 | |
Volvo AB Class B | | | 7,370 | | | | 99,189 | | | | 1.35 | |
Walgreens Boots Alliance Inc. | | | 955 | | | | 48,154 | | | | 0.66 | |
Walmart Inc. | | | 1,006 | | | | 114,779 | | | | 1.57 | |
Waste Management Inc. | | | 1,200 | | | | 143,145 | | | | 1.95 | |
Waters Corporation | | | 104 | | | | 22,041 | | | | 0.30 | |
Wells Fargo & Company | | | 809 | | | | 37,355 | | | | 0.51 | |
West Fraser Timber Co Ltd. | | | 1,142 | | | | 39,832 | | | | 0.54 | |
West Japan Railway Company | | | 419 | | | | 34,994 | | | | 0.48 | |
WestRock Company | | | 697 | | | | 23,764 | | | | 0.32 | |
Wheaton Precious Metals Corp | | | 778 | | | | 22,717 | | | | 0.31 | |
| | | | | | | | | | | | |
Security Description | | Shares | | | Value | | | Index Weight | |
Whitbread PLC | | | 1,098 | | | $ | 58,153 | | | | 0.79 | % |
Wixcom Ltd. | | | 124 | | | | 17,305 | | | | 0.24 | |
Wm Morrison Supermarkets plc | | | 66,168 | | | | 148,388 | | | | 2.03 | |
Woodside Petroleum Ltd. | | | 8,313 | | | | 176,956 | | | | 2.41 | |
Xcel Energy Inc. | | | 814 | | | | 52,608 | | | | 0.72 | |
Xerox Holdings Corporation | | | 559 | | | | 16,081 | | | | 0.22 | |
Yamada Denki Co Ltd. | | | 15,260 | | | | 70,452 | | | | 0.96 | |
Yangzijiang Shipbuilding Holdings Ltd. | | | 75,698 | | | | 49,644 | | | | 0.68 | |
Zebra Technologies Corporation Class A | | | 147 | | | | 30,603 | | | | 0.42 | |
| | | | | | | | | | | | |
| | | | | | $ | 21,878,738 | | | | 293.58 | % |
| | | | | | | | | | | | |
| | | | | | | | | | | | |
Security Description | | Shares | | | Value | | | Index Weight | |
| BMO Global Equity Market Neutral Strategy Short Index | |
3M Company | | | (97 | ) | | $ | (15,515 | ) | | | (0.21 | )% |
ABB Ltd. | | | (2,054 | ) | | | (38,623 | ) | | | (0.53 | ) |
Abbott Laboratories | | | (317 | ) | | | (26,923 | ) | | | (0.37 | ) |
ABIOMED Inc. | | | (125 | ) | | | (23,968 | ) | | | (0.33 | ) |
Accenture Plc Class A | | | (109 | ) | | | (21,663 | ) | | | (0.30 | ) |
Accor SA | | | (4,251 | ) | | | (182,296 | ) | | | (2.49 | ) |
Activision Blizzard Inc. | | | (1,532 | ) | | | (78,068 | ) | | | (1.07 | ) |
Adobe Inc. | | | (95 | ) | | | (27,176 | ) | | | (0.37 | ) |
Advanced Micro Devices Inc. | | | (906 | ) | | | (28,484 | ) | | | (0.39 | ) |
AEON Co Ltd. | | | (3,448 | ) | | | (60,168 | ) | | | (0.82 | ) |
AIA Group Limited | | | (3,638 | ) | | | (35,537 | ) | | | (0.48 | ) |
Air Liquide SA | | | (147 | ) | | | (20,496 | ) | | | (0.28 | ) |
Air Products and Chemicals Inc. | | | (144 | ) | | | (32,321 | ) | | | (0.44 | ) |
Airbus SE | | | (1,304 | ) | | | (180,609 | ) | | | (2.46 | ) |
Akzo Nobel NV | | | (1,961 | ) | | | (174,780 | ) | | | (2.39 | ) |
Albemarle Corporation | | | (1,584 | ) | | | (95,846 | ) | | | (1.31 | ) |
Alfa Laval AB | | | (2,303 | ) | | | (41,888 | ) | | | (0.57 | ) |
Align Technology Inc. | | | (128 | ) | | | (22,973 | ) | | | (0.31 | ) |
Allianz SE | | | (116 | ) | | | (25,675 | ) | | | (0.35 | ) |
Alnylam Pharmaceuticals Inc. | | | (329 | ) | | | (27,103 | ) | | | (0.37 | ) |
Alumina Limited | | | (9,740 | ) | | | (13,901 | ) | | | (0.19 | ) |
Amadeus IT Group SA Class A | | | (240 | ) | | | (17,781 | ) | | | (0.24 | ) |
Amazoncom Inc. | | | (69 | ) | | | (122,594 | ) | | | (1.67 | ) |
American Airlines Group Inc. | | | (6,144 | ) | | | (161,723 | ) | | | (2.21 | ) |
American Express Company | | | (156 | ) | | | (18,811 | ) | | | (0.26 | ) |
American Tower Corporation | | | (117 | ) | | | (27,005 | ) | | | (0.37 | ) |
AmerisourceBergen Corporation | | | (236 | ) | | | (19,316 | ) | | | (0.26 | ) |
Amgen Inc. | | | (107 | ) | | | (22,119 | ) | | | (0.30 | ) |
Anheuser-Busch InBev SANV | | | (1,781 | ) | | | (169,556 | ) | | | (2.31 | ) |
Apple Inc. | | | (533 | ) | | | (111,439 | ) | | | (1.52 | ) |
Applied Materials Inc. | | | (470 | ) | | | (22,258 | ) | | | (0.30 | ) |
Aptiv PLC | | | (1,961 | ) | | | (163,354 | ) | | | (2.23 | ) |
Arconic Inc. | | | (5,159 | ) | | | (133,154 | ) | | | (1.82 | ) |
ASM Pacific Technology Limited | | | (5,636 | ) | | | (63,277 | ) | | | (0.86 | ) |
ASML Holding NV | | | (156 | ) | | | (34,470 | ) | | | (0.47 | ) |
AstraZeneca PLC | | | (2,595 | ) | | | (233,121 | ) | | | (3.18 | ) |
Atlantia SpA | | | (1,526 | ) | | | (38,374 | ) | | | (0.52 | ) |
Atos SE | | | (1,346 | ) | | | (100,893 | ) | | | (1.38 | ) |
Australia and New Zealand Banking Group | | | (1,401 | ) | | | (24,826 | ) | | | (0.34 | ) |
Autodesk Inc. | | | (301 | ) | | | (42,941 | ) | | | (0.59 | ) |
Autoliv Inc. | | | (854 | ) | | | (58,006 | ) | | | (0.79 | ) |
Automatic Data Processing Inc. | | | (99 | ) | | | (16,740 | ) | | | (0.23 | ) |
AutoZone Inc. | | | (28 | ) | | | (30,984 | ) | | | (0.42 | ) |
BAE Systems plc | | | (39,062 | ) | | | (259,109 | ) | | | (3.54 | ) |
Banco Bilbao Vizcaya Argentaria SA | | | (2,993 | ) | | | (14,302 | ) | | | (0.20 | ) |
| | | | | | | | | | | | |
Security Description | | Shares | | | Value | | | Index Weight | |
Banco Santander SA | | | (8,008 | ) | | $ | (30,609 | ) | | | (0.42 | )% |
Bank of Nova Scotia | | | (552 | ) | | | (29,269 | ) | | | (0.40 | ) |
Bausch Health Companies Inc. | | | (677 | ) | | | (14,540 | ) | | | (0.20 | ) |
Bayer AG | | | (897 | ) | | | (67,051 | ) | | | (0.92 | ) |
Bayerische Motoren Werke AG | | | (1,844 | ) | | | (122,665 | ) | | | (1.67 | ) |
BeiGene Ltd. Sponsored ADR | | | (585 | ) | | | (84,696 | ) | | | (1.16 | ) |
BlackBerry Limited | | | (5,290 | ) | | | (36,827 | ) | | | (0.50 | ) |
BNP Paribas SA Class A | | | (459 | ) | | | (20,701 | ) | | | (0.28 | ) |
Boeing Company | | | (89 | ) | | | (32,340 | ) | | | (0.44 | ) |
Boliden AB | | | (1,089 | ) | | | (23,281 | ) | | | (0.32 | ) |
Bombardier Inc. Class B | | | (65,035 | ) | | | (82,633 | ) | | | (1.13 | ) |
Booking Holdings Inc. | | | (11 | ) | | | (22,140 | ) | | | (0.30 | ) |
Boston Scientific Corporation | | | (394 | ) | | | (16,860 | ) | | | (0.23 | ) |
Bouygues SA | | | (704 | ) | | | (27,094 | ) | | | (0.37 | ) |
BP plc | | | (4,025 | ) | | | (24,690 | ) | | | (0.34 | ) |
Bridgestone Corporation | | | (843 | ) | | | (31,271 | ) | | | (0.43 | ) |
Bristol-Myers Squibb Company | | | (933 | ) | | | (45,047 | ) | | | (0.61 | ) |
BT Group plc | | | (21,895 | ) | | | (43,806 | ) | | | (0.60 | ) |
Bureau Veritas SA | | | (4,295 | ) | | | (101,580 | ) | | | (1.39 | ) |
Campbell Soup Company | | | (915 | ) | | | (39,638 | ) | | | (0.54 | ) |
Canadian National Railway Company | | | (177 | ) | | | (16,320 | ) | | | (0.22 | ) |
Canadian Pacific Railway Limited | | | (80 | ) | | | (19,184 | ) | | | (0.26 | ) |
Carrefour SA | | | (4,640 | ) | | | (78,986 | ) | | | (1.08 | ) |
CDK Global Inc. | | | (1,421 | ) | | | (62,445 | ) | | | (0.85 | ) |
CDW Corp | | | (431 | ) | | | (49,400 | ) | | | (0.67 | ) |
CenturyLink Inc. | | | (21,197 | ) | | | (239,743 | ) | | | (3.27 | ) |
Cheniere Energy Inc. | | | (1,784 | ) | | | (106,989 | ) | | | (1.46 | ) |
Chevron Corporation | | | (337 | ) | | | (39,632 | ) | | | (0.54 | ) |
Cisco Systems Inc. | | | (791 | ) | | | (37,372 | ) | | | (0.51 | ) |
Citigroup Inc. | | | (582 | ) | | | (37,194 | ) | | | (0.51 | ) |
Citrix Systems Inc. | | | (513 | ) | | | (47,620 | ) | | | (0.65 | ) |
CME Group Inc. Class A | | | (178 | ) | | | (38,385 | ) | | | (0.52 | ) |
Coca-Cola Company | | | (3,522 | ) | | | (193,906 | ) | | | (2.65 | ) |
Cochlear Limited | | | (569 | ) | | | (81,700 | ) | | | (1.11 | ) |
Cognizant Technology Solutions Corporati | | | (483 | ) | | | (29,674 | ) | | | (0.40 | ) |
Comcast Corporation Class A | | | (572 | ) | | | (25,252 | ) | | | (0.34 | ) |
Commonwealth Bank of Australia | | | (507 | ) | | | (26,433 | ) | | | (0.36 | ) |
CommScope Holding Co Inc. | | | (1,478 | ) | | | (16,068 | ) | | | (0.22 | ) |
Compagnie Financiere Richemont SA | | | (246 | ) | | | (19,091 | ) | | | (0.26 | ) |
Compass Group PLC | | | (1,480 | ) | | | (37,525 | ) | | | (0.51 | ) |
Conagra Brands Inc. | | | (3,707 | ) | | | (105,993 | ) | | | (1.45 | ) |
Constellation Brands Inc. Class A | | | (74 | ) | | | (15,147 | ) | | | (0.21 | ) |
(See Notes to Schedules of Investments and Notes to Financial Statements, which are an integral part of the Financial Statements)
71
August 31, 2019
| | | | | | | | | | | | |
Security Description | | Shares | | | Value | | | Index Weight | |
BMO Global Equity Market Neutral Strategy Short Index
(continued) | |
Costco Wholesale Corporation | | | (94 | ) | | $ | (27,873 | ) | | | (0.38 | )% |
Crown Holdings Inc. | | | (3,118 | ) | | | (206,581 | ) | | | (2.82 | ) |
CSL Limited | | | (92 | ) | | | (14,579 | ) | | | (0.20 | ) |
CyberAgent Inc. | | | (655 | ) | | | (28,524 | ) | | | (0.39 | ) |
Daiichi Sankyo Company Limited | | | (1,302 | ) | | | (83,925 | ) | | | (1.15 | ) |
DAIKIN INDUSTRIES Ltd. | | | (119 | ) | | | (14,717 | ) | | | (0.20 | ) |
Daimler AG | | | (3,930 | ) | | | (182,632 | ) | | | (2.49 | ) |
Danone SA | | | (769 | ) | | | (69,204 | ) | | | (0.94 | ) |
DaVita Inc. | | | (1,233 | ) | | | (68,438 | ) | | | (0.93 | ) |
Deere & Company | | | (482 | ) | | | (75,358 | ) | | | (1.03 | ) |
Delivery Hero SE | | | (762 | ) | | | (37,642 | ) | | | (0.51 | ) |
Dell Technologies Inc. Class C | | | (1,400 | ) | | | (65,480 | ) | | | (0.89 | ) |
Dentsu Inc. | | | (1,691 | ) | | | (56,558 | ) | | | (0.77 | ) |
Deutsche Post AG | | | (2,805 | ) | | | (92,051 | ) | | | (1.26 | ) |
Diageo plc | | | (463 | ) | | | (19,731 | ) | | | (0.27 | ) |
Disco Corporation | | | (551 | ) | | | (97,286 | ) | | | (1.33 | ) |
Discover Financial Services | | | (168 | ) | | | (13,447 | ) | | | (0.18 | ) |
Dollar General Corporation | | | (111 | ) | | | (17,257 | ) | | | (0.24 | ) |
Dollarama Inc. | | | (2,885 | ) | | | (110,007 | ) | | | (1.50 | ) |
Dominos Pizza Inc. | | | (160 | ) | | | (36,083 | ) | | | (0.49 | ) |
Dropbox Inc. Class A | | | (713 | ) | | | (12,769 | ) | | | (0.17 | ) |
DSV AS | | | (382 | ) | | | (37,552 | ) | | | (0.51 | ) |
easyJet plc | | | (1,120 | ) | | | (13,202 | ) | | | (0.18 | ) |
eBay Inc. | | | (327 | ) | | | (13,259 | ) | | | (0.18 | ) |
Edenred SA | | | (1,056 | ) | | | (51,344 | ) | | | (0.70 | ) |
Edison International | | | (274 | ) | | | (19,770 | ) | | | (0.27 | ) |
Edwards Lifesciences Corporation | | | (70 | ) | | | (15,506 | ) | | | (0.21 | ) |
Eisai Co Ltd. | | | (447 | ) | | | (22,230 | ) | | | (0.30 | ) |
Electronic Arts Inc. | | | (341 | ) | | | (31,764 | ) | | | (0.43 | ) |
Eli Lilly and Company | | | (198 | ) | | | (22,189 | ) | | | (0.30 | ) |
Enbridge Inc. | | | (2,344 | ) | | | (78,002 | ) | | | (1.06 | ) |
Epiroc AB Class A | | | (2,512 | ) | | | (25,729 | ) | | | (0.35 | ) |
Experian PLC | | | (496 | ) | | | (15,209 | ) | | | (0.21 | ) |
Facebook Inc. Class A | | | (128 | ) | | | (23,806 | ) | | | (0.32 | ) |
Fanuc Corporation | | | (649 | ) | | | (109,415 | ) | | | (1.49 | ) |
FAST RETAILING CO Ltd. | | | (160 | ) | | | (93,761 | ) | | | (1.28 | ) |
FedEx Corporation | | | (526 | ) | | | (82,861 | ) | | | (1.13 | ) |
Ferrovial SA | | | (1,748 | ) | | | (50,393 | ) | | | (0.69 | ) |
FirstEnergy Corp | | | (547 | ) | | | (25,120 | ) | | | (0.34 | ) |
Fiserv Inc. | | | (158 | ) | | | (17,052 | ) | | | (0.23 | ) |
Flex Ltd. | | | (5,787 | ) | | | (55,440 | ) | | | (0.76 | ) |
Flowserve Corporation | | | (2,813 | ) | | | (118,496 | ) | | | (1.62 | ) |
Fortive Corp | | | (348 | ) | | | (24,602 | ) | | | (0.34 | ) |
Fresenius SE & Co KGaA | | | (2,039 | ) | | | (100,632 | ) | | | (1.37 | ) |
Fuchs Petrolub SE Pref | | | (811 | ) | | | (27,980 | ) | | | (0.38 | ) |
G4S plc | | | (38,267 | ) | | | (79,632 | ) | | | (1.09 | ) |
General Dynamics Corporation | | | (711 | ) | | | (134,666 | ) | | | (1.84 | ) |
General Electric Company | | | (23,777 | ) | | | (192,832 | ) | | | (2.63 | ) |
General Mills Inc. | | | (301 | ) | | | (16,053 | ) | | | (0.22 | ) |
General Motors Company | | | (1,196 | ) | | | (44,128 | ) | | | (0.60 | ) |
Genmab AS | | | (143 | ) | | | (28,887 | ) | | | (0.39 | ) |
Gilead Sciences Inc. | | | (237 | ) | | | (15,091 | ) | | | (0.21 | ) |
Givaudan SA | | | (8 | ) | | | (20,323 | ) | | | (0.28 | ) |
GlaxoSmithKline plc | | | (1,321 | ) | | | (27,550 | ) | | | (0.38 | ) |
Global Payments Inc. | | | (408 | ) | | | (67,622 | ) | | | (0.92 | ) |
GoDaddy Inc. Class A | | | (351 | ) | | | (22,327 | ) | | | (0.30 | ) |
Grifols SA Class A | | | (1,985 | ) | | | (63,403 | ) | | | (0.87 | ) |
Grubhub Inc. | | | (478 | ) | | | (28,099 | ) | | | (0.38 | ) |
Halliburton Company | | | (3,601 | ) | | | (66,728 | ) | | | (0.91 | ) |
Hamamatsu Photonics KK | | | (1,536 | ) | | | (53,191 | ) | | | (0.73 | ) |
Hanesbrands Inc. | | | (973 | ) | | | (13,294 | ) | | | (0.18 | ) |
Heineken Holding NV | | | (142 | ) | | | (14,025 | ) | | | (0.19 | ) |
| | | | | | | | | | | | |
Security Description | | Shares | | | Value | | | Index Weight | |
Heineken NV | | | (134 | ) | | $ | (14,248 | ) | | | (0.19 | )% |
Hikari Tsushin Inc. | | | (307 | ) | | | (70,811 | ) | | | (0.97 | ) |
Hilton Worldwide Holdings Inc. | | | (3,000 | ) | | | (277,575 | ) | | | (3.79 | ) |
Hitachi Metals Ltd. | | | (4,713 | ) | | | (48,604 | ) | | | (0.66 | ) |
HitachiLtd. | | | (443 | ) | | | (14,625 | ) | | | (0.20 | ) |
Home Depot Inc. | | | (200 | ) | | | (45,380 | ) | | | (0.62 | ) |
Honeywell International Inc. | | | (133 | ) | | | (21,831 | ) | | | (0.30 | ) |
Hong Kong & China Gas Co Ltd. | | | (8,316 | ) | | | (16,343 | ) | | | (0.22 | ) |
Hong Kong Exchanges & Clearing Ltd. | | | (765 | ) | | | (23,618 | ) | | | (0.32 | ) |
HOYA CORPORATION | | | (776 | ) | | | (61,912 | ) | | | (0.84 | ) |
HP Inc. | | | (5,997 | ) | | | (108,490 | ) | | | (1.48 | ) |
HSBC Holdings Plc | | | (6,954 | ) | | | (50,172 | ) | | | (0.68 | ) |
HUGO BOSS AG | | | (292 | ) | | | (16,427 | ) | | | (0.22 | ) |
IHS Markit Ltd. | | | (216 | ) | | | (14,151 | ) | | | (0.19 | ) |
Imperial Brands PLC | | | (4,242 | ) | | | (108,505 | ) | | | (1.48 | ) |
Industria de Diseno Textil SA | | | (826 | ) | | | (25,297 | ) | | | (0.35 | ) |
Intel Corporation | | | (790 | ) | | | (37,007 | ) | | | (0.51 | ) |
Inter Pipeline Ltd. | | | (2,676 | ) | | | (48,502 | ) | | | (0.66 | ) |
InterContinental Hotels Group PLC | | | (565 | ) | | | (34,811 | ) | | | (0.48 | ) |
International Flavors & Fragrances Inc. | | | (1,552 | ) | | | (168,795 | ) | | | (2.30 | ) |
Interpublic Group of Companies Inc. | | | (5,651 | ) | | | (113,017 | ) | | | (1.54 | ) |
Intertek Group plc | | | (431 | ) | | | (28,382 | ) | | | (0.39 | ) |
Intuit Inc. | | | (62 | ) | | | (17,791 | ) | | | (0.24 | ) |
Intuitive Surgical Inc. | | | (48 | ) | | | (24,279 | ) | | | (0.33 | ) |
IQVIA Holdings Inc. | | | (1,006 | ) | | | (156,859 | ) | | | (2.14 | ) |
ISS AS | | | (933 | ) | | | (23,162 | ) | | | (0.32 | ) |
ITV plc | | | (22,831 | ) | | | (32,528 | ) | | | (0.44 | ) |
Jacobs Engineering Group Inc. | | | (2,199 | ) | | | (193,080 | ) | | | (2.63 | ) |
James Hardie Industries PLC Chess Units | | | (14,447 | ) | | | (216,975 | ) | | | (2.96 | ) |
Japan Tobacco Inc. | | | (1,229 | ) | | | (25,866 | ) | | | (0.35 | ) |
JGC Corp | | | (9,649 | ) | | | (110,642 | ) | | | (1.51 | ) |
John Wood Group PLC | | | (5,442 | ) | | | (23,911 | ) | | | (0.33 | ) |
JPMorgan Chase & Co | | | (628 | ) | | | (68,562 | ) | | | (0.94 | ) |
JXTG Holdings Inc. | | | (16,700 | ) | | | (67,149 | ) | | | (0.92 | ) |
Kakakucom Inc. | | | (1,673 | ) | | | (41,463 | ) | | | (0.57 | ) |
KDDI Corporation | | | (1,265 | ) | | | (33,588 | ) | | | (0.46 | ) |
Keikyu Corporation | | | (7,013 | ) | | | (127,065 | ) | | | (1.73 | ) |
Kellogg Company | | | (1,619 | ) | | | (101,951 | ) | | | (1.39 | ) |
Kering SA | | | (27 | ) | | | (12,884 | ) | | | (0.18 | ) |
Keyence Corporation | | | (77 | ) | | | (44,359 | ) | | | (0.61 | ) |
Keyera Corp | | | (1,173 | ) | | | (28,672 | ) | | | (0.39 | ) |
Kintetsu Group Holdings Co Ltd. | | | (573 | ) | | | (28,097 | ) | | | (0.38 | ) |
Koito Manufacturing Co Ltd. | | | (460 | ) | | | (21,021 | ) | | | (0.29 | ) |
Komatsu Ltd. | | | (1,815 | ) | | | (37,688 | ) | | | (0.51 | ) |
Kone Oyj Class B | | | (384 | ) | | | (22,027 | ) | | | (0.30 | ) |
Koninklijke Philips NV | | | (638 | ) | | | (29,920 | ) | | | (0.41 | ) |
Kuehne & Nagel International AG | | | (260 | ) | | | (37,213 | ) | | | (0.51 | ) |
L Brands Inc. | | | (5,045 | ) | | | (83,798 | ) | | | (1.14 | ) |
LafargeHolcim Ltd. | | | (404 | ) | | | (19,082 | ) | | | (0.26 | ) |
Leidos Holdings Inc. | | | (1,894 | ) | | | (165,193 | ) | | | (2.25 | ) |
Liberty Global Plc Class A | | | (1,626 | ) | | | (42,935 | ) | | | (0.59 | ) |
Linde plc | | | (188 | ) | | | (35,216 | ) | | | (0.48 | ) |
Lonza Group AG | | | (92 | ) | | | (32,336 | ) | | | (0.44 | ) |
LOreal SA | | | (52 | ) | | | (14,272 | ) | | | (0.19 | ) |
Lowes Companies Inc. | | | (188 | ) | | | (21,176 | ) | | | (0.29 | ) |
Lundin Petroleum AB | | | (1,792 | ) | | | (53,035 | ) | | | (0.72 | ) |
LVMH Moet Hennessy Louis Vuitton SE | | | (51 | ) | | | (20,435 | ) | | | (0.28 | ) |
(See Notes to Schedules of Investments and Notes to Financial Statements, which are an integral part of the Financial Statements)
72
| | | | | | | | | | | | |
Security Description | | Shares | | | Value | | | Index Weight | |
BMO Global Equity Market Neutral Strategy Short Index
(continued) | |
LyondellBasell Industries NV | | | (931 | ) | | $ | (70,132 | ) | | | (0.96 | )% |
M3 Inc. | | | (5,370 | ) | | | (115,886 | ) | | | (1.58 | ) |
Manulife Financial Corporation | | | (960 | ) | | | (15,861 | ) | | | (0.22 | ) |
Marriott International Inc. Class A | | | (778 | ) | | | (97,872 | ) | | | (1.34 | ) |
Marui Group Co Ltd. | | | (9,354 | ) | | | (186,604 | ) | | | (2.55 | ) |
Masco Corporation | | | (339 | ) | | | (13,944 | ) | | | (0.19 | ) |
Merck & Co Inc. | | | (286 | ) | | | (24,791 | ) | | | (0.34 | ) |
Microsoft Corporation | | | (1,148 | ) | | | (158,509 | ) | | | (2.16 | ) |
Misumi Group Inc. | | | (3,615 | ) | | | (79,415 | ) | | | (1.08 | ) |
Mitsubishi Estate Company Limited | | | (898 | ) | | | (17,243 | ) | | | (0.24 | ) |
Mitsubishi Motors Corporation | | | (7,235 | ) | | | (29,395 | ) | | | (0.40 | ) |
Mizuho Financial Group Inc. | | | (26,877 | ) | | | (38,510 | ) | | | (0.53 | ) |
Mondelez International Inc. Class A | | | (341 | ) | | | (18,832 | ) | | | (0.26 | ) |
Moodys Corporation | | | (157 | ) | | | (33,954 | ) | | | (0.46 | ) |
Mowi ASA | | | (1,359 | ) | | | (33,502 | ) | | | (0.46 | ) |
National Australia Bank Limited | | | (2,204 | ) | | | (40,198 | ) | | | (0.55 | ) |
National Grid plc | | | (1,915 | ) | | | (19,942 | ) | | | (0.27 | ) |
National Oilwell Varco Inc. | | | (1,302 | ) | | | (26,173 | ) | | | (0.36 | ) |
NetApp Inc. | | | (334 | ) | | | (15,994 | ) | | | (0.22 | ) |
Netflix Inc. | | | (83 | ) | | | (24,770 | ) | | | (0.34 | ) |
Newell Brands Inc. | | | (4,487 | ) | | | (73,810 | ) | | | (1.01 | ) |
Next plc | | | (1,230 | ) | | | (87,593 | ) | | | (1.20 | ) |
Nidec Corporation | | | (483 | ) | | | (62,047 | ) | | | (0.85 | ) |
Nintendo Co Ltd. | | | (97 | ) | | | (36,675 | ) | | | (0.50 | ) |
NIPPON PAINT HOLDINGS COLtd. | | | (2,636 | ) | | | (122,211 | ) | | | (1.67 | ) |
Nissan Chemical Corporation | | | (1,098 | ) | | | (45,901 | ) | | | (0.63 | ) |
Nitori Holdings Co Ltd. | | | (541 | ) | | | (77,449 | ) | | | (1.06 | ) |
Novo Nordisk AS Class B | | | (583 | ) | | | (30,681 | ) | | | (0.42 | ) |
NVIDIA Corporation | | | (822 | ) | | | (137,354 | ) | | | (1.87 | ) |
Odakyu Electric Railway Co Ltd. | | | (4,086 | ) | | | (92,087 | ) | | | (1.26 | ) |
Omnicom Group Inc. | | | (983 | ) | | | (74,309 | ) | | | (1.01 | ) |
ONEOK Inc. | | | (1,912 | ) | | | (135,414 | ) | | | (1.85 | ) |
Oracle Corporation | | | (461 | ) | | | (24,062 | ) | | | (0.33 | ) |
Oracle Corporation Japan | | | (1,196 | ) | | | (101,664 | ) | | | (1.39 | ) |
Otsuka Holdings Co Ltd. | | | (2,952 | ) | | | (121,095 | ) | | | (1.65 | ) |
Panasonic Corporation | | | (15,697 | ) | | | (119,631 | ) | | | (1.63 | ) |
Park24 Co Ltd. | | | (2,878 | ) | | | (64,465 | ) | | | (0.88 | ) |
Parker-Hannifin Corporation | | | (88 | ) | | | (14,390 | ) | | | (0.20 | ) |
PCCW Limited | | | (153,247 | ) | | | (83,005 | ) | | | (1.13 | ) |
Pentair plc | | | (2,371 | ) | | | (85,146 | ) | | | (1.16 | ) |
Persimmon Plc | | | (1,289 | ) | | | (29,469 | ) | | | (0.40 | ) |
Pfizer Inc. | | | (1,049 | ) | | | (37,059 | ) | | | (0.51 | ) |
Philip Morris International Inc. | | | (1,499 | ) | | | (109,021 | ) | | | (1.49 | ) |
Pigeon Corporation | | | (639 | ) | | | (22,871 | ) | | | (0.31 | ) |
Pirelli & C SpA | | | (5,611 | ) | | | (29,054 | ) | | | (0.40 | ) |
PPG Industries Inc. | | | (172 | ) | | | (18,989 | ) | | | (0.26 | ) |
PPL Corporation | | | (727 | ) | | | (21,311 | ) | | | (0.29 | ) |
PTC Inc. | | | (934 | ) | | | (61,353 | ) | | | (0.84 | ) |
Publicis Groupe SA | | | (625 | ) | | | (30,035 | ) | | | (0.41 | ) |
QUALCOMM Inc.orporated | | | (249 | ) | | | (19,023 | ) | | | (0.26 | ) |
Ramsay Health Care Limited | | | (296 | ) | | | (13,392 | ) | | | (0.18 | ) |
Recruit Holdings Co Ltd. | | | (427 | ) | | | (12,652 | ) | | | (0.17 | ) |
Restaurant Brands International Inc. | | | (401 | ) | | | (31,461 | ) | | | (0.43 | ) |
Rolls-Royce Holdings plc | | | (2,844 | ) | | | (26,161 | ) | | | (0.36 | ) |
Ross Stores Inc. | | | (162 | ) | | | (17,395 | ) | | | (0.24 | ) |
| | | | | | | | | | | | |
Security Description | | Shares | | | Value | | | Index Weight | |
Royal Dutch Shell Plc Class B | | | (711 | ) | | $ | (19,858 | ) | | | (0.27 | )% |
Ryohin Keikaku Co Ltd. | | | (1,255 | ) | | | (21,066 | ) | | | (0.29 | ) |
S&P Global Inc. | | | (112 | ) | | | (29,080 | ) | | | (0.40 | ) |
Sabre Corp | | | (1,209 | ) | | | (28,470 | ) | | | (0.39 | ) |
salesforcecom Inc. | | | (149 | ) | | | (23,181 | ) | | | (0.32 | ) |
Sands China Ltd. | | | (8,543 | ) | | | (38,925 | ) | | | (0.53 | ) |
Sanofi | | | (221 | ) | | | (19,040 | ) | | | (0.26 | ) |
SAP SE | | | (170 | ) | | | (20,287 | ) | | | (0.28 | ) |
SBA Communications Corp Class A | | | (75 | ) | | | (19,607 | ) | | | (0.27 | ) |
Schindler Holding AG Pref | | | (250 | ) | | | (56,696 | ) | | | (0.77 | ) |
Schlumberger NV | | | (1,113 | ) | | | (35,890 | ) | | | (0.49 | ) |
Sealed Air Corporation | | | (4,768 | ) | | | (190,612 | ) | | | (2.60 | ) |
Sega Sammy Holdings Inc. | | | (1,257 | ) | | | (17,092 | ) | | | (0.23 | ) |
Seven & I Holdings Co Ltd. | | | (3,367 | ) | | | (118,855 | ) | | | (1.62 | ) |
Sherwin-Williams Company | | | (150 | ) | | | (78,554 | ) | | | (1.07 | ) |
SHIMAMURA Co Ltd. | | | (512 | ) | | | (39,864 | ) | | | (0.54 | ) |
Shimano Inc. | | | (445 | ) | | | (62,868 | ) | | | (0.86 | ) |
Shin-Etsu Chemical Co Ltd. | | | (203 | ) | | | (20,039 | ) | | | (0.27 | ) |
Siemens Healthineers AG | | | (1,719 | ) | | | (67,453 | ) | | | (0.92 | ) |
Sika AG | | | (667 | ) | | | (93,728 | ) | | | (1.28 | ) |
Simon Property Group Inc. | | | (109 | ) | | | (16,155 | ) | | | (0.22 | ) |
Sirius XM Holdings Inc. | | | (8,725 | ) | | | (54,184 | ) | | | (0.74 | ) |
SJM Holdings Limited | | | (50,277 | ) | | | (47,800 | ) | | | (0.65 | ) |
SNC-Lavalin Group Inc. | | | (8,209 | ) | | | (100,476 | ) | | | (1.37 | ) |
SoftBank Corp | | | (1,050 | ) | | | (14,656 | ) | | | (0.20 | ) |
SoftBank Group Corp | | | (3,047 | ) | | | (134,042 | ) | | | (1.83 | ) |
Stanley Black & Decker Inc. | | | (125 | ) | | | (16,704 | ) | | | (0.23 | ) |
Stryker Corporation | | | (71 | ) | | | (15,718 | ) | | | (0.21 | ) |
SUBARU CORP | | | (4,792 | ) | | | (128,381 | ) | | | (1.75 | ) |
SUMCO Corporation | | | (1,251 | ) | | | (14,944 | ) | | | (0.20 | ) |
Sumitomo Mitsui Financial Group Inc. | | | (507 | ) | | | (16,310 | ) | | | (0.22 | ) |
Sun Life Financial Inc. | | | (454 | ) | | | (18,531 | ) | | | (0.25 | ) |
Suncor Energy Inc. | | | (506 | ) | | | (14,748 | ) | | | (0.20 | ) |
Suzuki Motor Corp | | | (1,135 | ) | | | (44,178 | ) | | | (0.60 | ) |
Swatch Group Ltd. Bearer | | | (99 | ) | | | (26,836 | ) | | | (0.37 | ) |
Symrise AG | | | (501 | ) | | | (45,848 | ) | | | (0.63 | ) |
Sysmex Corporation | | | (1,062 | ) | | | (66,438 | ) | | | (0.91 | ) |
Tabcorp Holdings Limited | | | (43,688 | ) | | | (135,879 | ) | | | (1.85 | ) |
Taiyo Nippon Sanso Corporation | | | (1,068 | ) | | | (21,079 | ) | | | (0.29 | ) |
Tapestry Inc. | | | (930 | ) | | | (18,869 | ) | | | (0.26 | ) |
Targa Resources Corp | | | (4,032 | ) | | | (143,175 | ) | | | (1.95 | ) |
Target Corporation | | | (172 | ) | | | (18,574 | ) | | | (0.25 | ) |
TC Energy Corporation | | | (2,172 | ) | | | (110,221 | ) | | | (1.50 | ) |
TE Connectivity Ltd. | | | (264 | ) | | | (24,225 | ) | | | (0.33 | ) |
TechnipFMC Plc | | | (6,585 | ) | | | (162,587 | ) | | | (2.22 | ) |
Teleflex Inc.orporated | | | (105 | ) | | | (38,295 | ) | | | (0.52 | ) |
Telefonica SA | | | (32,889 | ) | | | (228,803 | ) | | | (3.12 | ) |
Telenet Group Holding NV | | | (1,959 | ) | | | (96,128 | ) | | | (1.31 | ) |
Tenaris SA | | | (10,639 | ) | | | (117,353 | ) | | | (1.60 | ) |
Tesla Inc. | | | (146 | ) | | | (32,407 | ) | | | (0.44 | ) |
Teva Pharmaceutical Industries Limited S | | | (3,220 | ) | | | (22,446 | ) | | | (0.31 | ) |
Texas Instruments Inc.orporated | | | (175 | ) | | | (21,570 | ) | | | (0.29 | ) |
Textron Inc. | | | (713 | ) | | | (31,802 | ) | | | (0.43 | ) |
Thermo Fisher Scientific Inc. | | | (67 | ) | | | (19,066 | ) | | | (0.26 | ) |
Thomson Reuters Corporation | | | (467 | ) | | | (31,978 | ) | | | (0.44 | ) |
Tiffany & Co | | | (384 | ) | | | (32,833 | ) | | | (0.45 | ) |
Tobu Railway Co Ltd. | | | (694 | ) | | | (20,979 | ) | | | (0.29 | ) |
Tokio Marine Holdings Inc. | | | (364 | ) | | | (18,576 | ) | | | (0.25 | ) |
Total SA | | | (517 | ) | | | (25,720 | ) | | | (0.35 | ) |
Toyota Industries Corp | | | (393 | ) | | | (21,124 | ) | | | (0.29 | ) |
TransDigm Group Inc.orporated | | | (217 | ) | | | (114,803 | ) | | | (1.57 | ) |
(See Notes to Schedules of Investments and Notes to Financial Statements, which are an integral part of the Financial Statements)
73
August 31, 2019
| | | | | | | | | | | | |
Security Description | | Shares | | | Value | | | Index Weight | |
BMO Global Equity Market Neutral Strategy Short Index
(continued) | |
TSURUHA Holdings Inc. | | | (680 | ) | | $ | (73,433 | ) | | | (1.00 | )% |
Umicore | | | (2,361 | ) | | | (71,635 | ) | | | (0.98 | ) |
Unibail-Rodamco-Westfield SE Stapled Sec | | | (97 | ) | | | (13,118 | ) | | | (0.18 | ) |
Union Pacific Corporation | | | (140 | ) | | | (22,582 | ) | | | (0.31 | ) |
United Internet AG | | | (707 | ) | | | (23,057 | ) | | | (0.31 | ) |
United Rentals Inc. | | | (438 | ) | | | (48,796 | ) | | | (0.67 | ) |
United Technologies Corporation | | | (194 | ) | | | (25,065 | ) | | | (0.34 | ) |
US Bancorp | | | (610 | ) | | | (31,982 | ) | | | (0.44 | ) |
Walt Disney Company | | | (327 | ) | | | (45,126 | ) | | | (0.62 | ) |
Weir Group PLC | | | (4,977 | ) | | | (87,755 | ) | | | (1.20 | ) |
Welcia Holdings Co Ltd. | | | (578 | ) | | | (29,920 | ) | | | (0.41 | ) |
Wesfarmers Limited | | | (3,785 | ) | | | (100,166 | ) | | | (1.37 | ) |
Western Union Company | | | (5,095 | ) | | | (112,698 | ) | | | (1.54 | ) |
Westinghouse Air Brake Technologies Corp | | | (492 | ) | | | (33,254 | ) | | | (0.45 | ) |
Westpac Banking Corporation | | | (1,452 | ) | | | (27,014 | ) | | | (0.37 | ) |
Woolworths Group Ltd. | | | (5,621 | ) | | | (137,663 | ) | | | (1.88 | ) |
WPP Plc | | | (5,598 | ) | | | (66,370 | ) | | | (0.91 | ) |
Wynn Macau Ltd. | | | (22,071 | ) | | | (43,711 | ) | | | (0.60 | ) |
Xilinx Inc. | | | (569 | ) | | | (58,862 | ) | | | (0.80 | ) |
XPO Logistics Inc. | | | (1,233 | ) | | | (86,078 | ) | | | (1.17 | ) |
Yamaha Corporation | | | (2,607 | ) | | | (110,311 | ) | | | (1.51 | ) |
Yamaha Motor Co Ltd. | | | (1,898 | ) | | | (30,313 | ) | | | (0.41 | ) |
Yamato Holdings Co Ltd. | | | (991 | ) | | | (16,830 | ) | | | (0.23 | ) |
Yara International ASA | | | (1,639 | ) | | | (68,827 | ) | | | (0.94 | ) |
Yaskawa Electric Corporation | | | (2,585 | ) | | | (83,442 | ) | | | (1.14 | ) |
Yum! Brands Inc. | | | (387 | ) | | | (45,440 | ) | | | (0.62 | ) |
Zoetis Inc. Class A | | | (120 | ) | | | (15,156 | ) | | | (0.21 | ) |
ZOZO Inc. | | | (8,755 | ) | | | (170,635 | ) | | | (2.33 | ) |
| | | | | | | | | | | | |
| | | | | | $ | (20,051,610 | ) | | | (273.63 | )% |
| | | | | | | | | | | | |
(See Notes to Schedules of Investments and Notes to Financial Statements, which are an integral part of the Financial Statements)
74
Global Long/Short Equity Fund
| | | | | | | | |
| Description | | Shares | | | Value | |
| Common Stocks — 99.2% | |
|
Australia — 2.6% | |
BHP Group PLC | | | 2,346 | | | $ | 50,612 | |
Regis Resources, Ltd. | | | 5,230 | | | | 18,104 | |
| | | | | | | | |
| | | | | | | 68,716 | |
|
Bermuda — 2.0% | |
Argo Group International Holdings, Ltd. | | | 176 | | | | 11,567 | |
Essent Group, Ltd. | | | 832 | | | | 40,352 | |
| | | | | | | | |
| | | | | | | 51,919 | |
|
Canada — 13.9% | |
Air Canada (2) | | | 2,069 | | | | 69,542 | |
Allied Properties Real Estate Investment Trust | | | 1,466 | | | | 57,808 | |
Canfor Corp. (2) | | | 2,155 | | | | 24,797 | |
Cascades, Inc. (1) | | | 599 | | | | 5,075 | |
Cogeco Communications, Inc. | | | 242 | | | | 19,020 | |
Cogeco, Inc. | | | 133 | | | | 9,374 | |
Equitable Group, Inc. (1) | | | 422 | | | | 31,322 | |
George Weston, Ltd. | | | 506 | | | | 41,110 | |
Hudbay Minerals, Inc. | | | 4,212 | | | | 14,141 | |
Husky Energy, Inc. | | | 1,358 | | | | 9,068 | |
Interfor Corp. (2) | | | 2,439 | | | | 24,474 | |
InterRent Real Estate Investment Trust | | | 1,704 | | | | 20,503 | |
Methanex Corp. | | | 394 | | | | 12,772 | |
Quebecor, Inc., Class B (1) | | | 339 | | | | 7,636 | |
Teck Resources, Ltd., Class B | | | 1,069 | | | | 18,202 | |
| | | | | | | | |
| | | | | | | 364,844 | |
|
Cayman Islands — 0.4% | |
Tianneng Power International, Ltd. (1) | | | 12,000 | | | | 9,474 | |
|
China — 0.2% | |
Agricultural Bank of China, Ltd., Class H | | | 16,000 | | | | 6,163 | |
|
Denmark — 1.2% | |
Novo Nordisk A/S, Class B | | | 191 | | | | 9,918 | |
Scandinavian Tobacco Group A/S, Class A (5) | | | 1,777 | | | | 20,430 | |
| | | | | | | | |
| | | | | | | 30,348 | |
|
France — 1.6% | |
Boiron SA | | | 127 | | | | 5,213 | |
Derichebourg SA | | | 3,631 | | | | 12,962 | |
Peugeot SA | | | 640 | | | | 14,300 | |
Sanofi | | | 104 | | | | 8,929 | |
| | | | | | | | |
| | | | | | | 41,404 | |
|
Germany — 0.2% | |
Hamburger Hafen und Logistik AG | | | 191 | | | | 4,614 | |
|
Hong Kong — 2.2% | |
HKT Trust & HKT, Ltd. | | | 17,000 | | | | 26,583 | |
SITC International Holdings Co., Ltd. | | | 4,000 | | | | 4,153 | |
SmarTone Telecommunications Holdings, Ltd. | | | 23,500 | | | | 20,891 | |
WH Group, Ltd. (5) | | | 9,000 | | | | 7,243 | |
| | | | | | | | |
| | | | | | | 58,870 | |
|
Indonesia — 0.8% | |
Bukit Asam Tbk PT | | | 102,600 | | | | 17,866 | |
Indo Tambangraya Megah Tbk PT | | | 5,000 | | | | 4,582 | |
| | | | | | | | |
| | | | | | | 22,448 | |
|
Italy — 3.2% | |
ASTM SpA | | | 309 | | | | 9,529 | |
Enel SpA | | | 9,012 | | | | 65,311 | |
Societa Iniziative Autostradali e Servizi SpA | | | 568 | | | | 9,533 | |
| | | | | | | | |
| | | | | | | 84,373 | |
| | | | | | | | |
| Description | | Shares | | | Value | |
| Common Stocks (continued) | |
|
Japan — 9.6% | |
Arcs Co., Ltd. | | | 700 | | | $ | 14,516 | |
Artnature, Inc. | | | 900 | | | | 5,346 | |
Frontier Real Estate Investment Corp. | | | 13 | | | | 56,046 | |
Fukuda Corp. | | | 300 | | | | 10,618 | |
Heiwado Co., Ltd. | | | 1,200 | | | | 22,219 | |
J-Oil Mills, Inc. | | | 300 | | | | 11,267 | |
KDDI Corp. (1) | | | 700 | | | | 18,680 | |
Keihin Corp. | | | 1,100 | | | | 15,024 | |
Mitsui Sugar Co., Ltd. | | | 400 | | | | 8,197 | |
Nippon Telegraph & Telephone Corp. | | | 1,200 | | | | 57,563 | |
Okinawa Electric Power Co., Inc. | | | 1,099 | | | | 16,707 | |
Press Kogyo Co., Ltd. | | | 1,800 | | | | 7,506 | |
Yorozu Corp. | | | 600 | | | | 7,071 | |
| | | | | | | | |
| | | | | | | 250,760 | |
|
Luxembourg — 0.6% | |
Trinseo SA | | | 457 | | | | 16,036 | |
|
Malaysia — 0.2% | |
Malaysian Pacific Industries Bhd | | | 2,000 | | | | 4,233 | |
|
Netherlands — 1.8% | |
Koninklijke Ahold Delhaize NV | | | 1,997 | | | | 46,716 | |
|
New Zealand — 1.2% | |
Air New Zealand, Ltd. | | | 13,213 | | | | 23,853 | |
New Zealand Refining Co., Ltd. | | | 5,091 | | | | 6,576 | |
| | | | | | | | |
| | | | | | | 30,429 | |
|
Norway — 1.8% | |
Austevoll Seafood ASA | | | 1,112 | | | | 11,416 | |
DNO ASA | | | 3,907 | | | | 5,173 | |
Leroy Seafood Group ASA | | | 4,162 | | | | 27,296 | |
Sparebank 1 Oestlandet | | | 494 | | | | 4,489 | |
| | | | | | | | |
| | | | | | | 48,374 | |
|
Poland — 0.6% | |
Asseco Poland SA | | | 1,123 | | | | 15,783 | |
|
Portugal — 0.2% | |
Altri SGPS SA | | | 921 | | | | 5,820 | |
|
Singapore — 2.7% | |
ComfortDelGro Corp., Ltd. | | | 10,200 | | | | 18,008 | |
DBS Group Holdings, Ltd. | | | 2,700 | | | | 47,725 | |
First Resources, Ltd. | | | 5,000 | | | | 5,332 | |
| | | | | | | | |
| | | | | | | 71,065 | |
|
South Korea — 2.1% | |
DB HiTek Co., Ltd. | | | 832 | | | | 10,097 | |
KT Corp. | | | 2 | | | | 45 | |
Samsung Electronics Co., Ltd. | | | 1,239 | | | | 45,008 | |
| | | | | | | | |
| | | | | | | 55,150 | |
|
Sweden — 0.3% | |
Mycronic AB | | | 640 | | | | 7,812 | |
|
Switzerland — 2.3% | |
Ferrexpo PLC | | | 2,468 | | | | 6,069 | |
Roche Holding AG | | | 194 | | | | 53,040 | |
| | | | | | | | |
| | | | | | | 59,109 | |
|
Taiwan — 2.1% | |
Uni-President Enterprises Corp. | | | 14,000 | | | | 34,142 | |
United Integrated Services Co., Ltd. | | | 4,000 | | | | 19,739 | |
| | | | | | | | |
| | | | | | | 53,881 | |
| | |
United Kingdom — 6.6% | | | | | | | | |
BT Group PLC | | | 17,694 | | | | 35,662 | |
DFS Furniture PLC | | | 1,793 | | | | 4,734 | |
GlaxoSmithKline PLC | | | 2,374 | | | | 49,443 | |
Imperial Brands PLC | | | 586 | | | | 15,149 | |
(See Notes to Schedules of Investments and Notes to Financial Statements, which are an integral part of the Financial Statements)
75
August 31, 2019
Global Long/Short Equity Fund (continued)
| | | | | | | | |
| Description | | Shares | | | Value | |
| Common Stocks (continued) | |
| | |
United Kingdom(continued) | | | | | | | | |
International Consolidated Airlines Group SA | | | 2,085 | | | $ | 10,699 | |
Legal & General Group PLC | | | 13,755 | | | | 36,754 | |
Reach PLC | | | 4,014 | | | | 4,445 | |
SThree PLC | | | 1,434 | | | | 4,432 | |
Watkin Jones PLC | | | 3,860 | | | | 10,145 | |
| | | | | | | | |
| | | | | | | 171,463 | |
| | |
United States — 38.8% | | | | | | | | |
AbbVie, Inc. | | | 175 | | | | 11,504 | |
ArcBest Corp. | | | 555 | | | | 16,433 | |
Best Buy Co., Inc. | | | 433 | | | | 27,560 | |
Ciena Corp. (2) | | | 1,138 | | | | 46,578 | |
Citizens Financial Group, Inc. | | | 246 | | | | 8,300 | |
CONMED Corp. | | | 495 | | | | 49,881 | |
ConocoPhillips | | | 377 | | | | 19,672 | |
CRA International, Inc. | | | 425 | | | | 16,528 | |
Discover Financial Services | | | 433 | | | | 34,627 | |
Emergent BioSolutions, Inc. (2) | | | 971 | | | | 42,530 | |
Employers Holdings, Inc. | | | 374 | | | | 16,131 | |
Enova International, Inc. (2) | | | 201 | | | | 4,804 | |
Essex Property Trust, Inc. | | | 233 | | | | 74,854 | |
F5 Networks, Inc. (2) | | | 90 | | | | 11,586 | |
FedNat Holding Co. | | | 282 | | | | 3,449 | |
Genomic Health, Inc. (2) | | | 144 | | | | 11,039 | |
Glaukos Corp. (1)(2) | | | 350 | | | | 22,508 | |
Globus Medical, Inc., Class A (2) | | | 266 | | | | 13,585 | |
Haemonetics Corp. (2) | | | 184 | | | | 24,569 | |
HealthStream, Inc. (2) | | | 404 | | | | 10,209 | |
Huntington Ingalls Industries, Inc. | | | 180 | | | | 37,620 | |
Integer Holdings Corp. (2) | | | 384 | | | | 27,802 | |
Intersect ENT, Inc. (2) | | | 99 | | | | 1,622 | |
K12, Inc. (2) | | | 874 | | | | 23,030 | |
Lantheus Holdings, Inc. (2) | | | 707 | | | | 15,384 | |
LeMaitre Vascular, Inc. | | | 203 | | | | 6,427 | |
Luminex Corp. | | | 253 | | | | 5,186 | |
Marlin Business Services Corp. | | | 701 | | | | 15,163 | |
Masco Corp. | | | 1,101 | | | | 44,844 | |
Merit Medical Systems, Inc. (2) | | | 928 | | | | 32,276 | |
Myriad Genetics, Inc. (2) | | | 423 | | | | 9,953 | |
Natus Medical, Inc. (2) | | | 327 | | | | 9,051 | |
NetApp, Inc. | | | 386 | | | | 18,551 | |
NextGen Healthcare, Inc. (2) | | | 495 | | | | 7,034 | |
OraSure Technologies, Inc. (2) | | | 1,211 | | | | 7,993 | |
Orthofix Medical, Inc. (2) | | | 385 | | | | 19,573 | |
Owens-Illinois, Inc. | | | 389 | | | | 3,956 | |
Pacira BioSciences, Inc. (2) | | | 243 | | | | 9,049 | |
Regions Financial Corp. | | | 1,447 | | | | 21,155 | |
Rush Enterprises, Inc., Class A | | | 515 | | | | 18,597 | |
Southwest Airlines Co. | | | 196 | | | | 10,255 | |
SpartanNash Co. | | | 292 | | | | 3,145 | |
Supernus Pharmaceuticals, Inc. (2) | | | 556 | | | | 15,029 | |
Surmodics, Inc. (2) | | | 182 | | | | 8,565 | |
Sykes Enterprises, Inc. (2) | | | 618 | | | | 17,922 | |
Synchrony Financial | | | 285 | | | | 9,134 | |
Sysco Corp. | | | 423 | | | | 31,442 | |
U.S. Foods Holding Corp. (2) | | | 1,102 | | | | 44,576 | |
United Airlines Holdings, Inc. (2) | | | 218 | | | | 18,380 | |
Unum Group | | | 739 | | | | 18,778 | |
Vishay Intertechnology, Inc. | | | 1,396 | | | | 22,099 | |
Vishay Precision Group, Inc. (2) | | | 243 | | | | 7,594 | |
WW Grainger, Inc. | | | 22 | | | | 6,020 | |
| | | | | | | | |
| | | | | | | 1,013,552 | |
| | | | | | | | |
Total Common Stocks
(identified cost $2,567,938) | | | | | | | 2,593,356 | |
| | | | | | | | |
| | | | | | | | |
| Description | | Shares | | | Value | |
| Short-Term Investments — 3.7% | |
|
| Collateral Investment for Securities on Loan — 3.7% | |
BMO Institutional Prime Money Market Fund — Premier Class, 2.097% (3)(4) | | | 95,094 | | | $ | 95,094 | |
| | | | | | | | |
Total Short-Term Investments
(identified cost $95,094) | | | | | | | 95,094 | |
| | | | | | | | |
Total Investments — 102.9%
(identified cost $2,663,032) | | | | | | | 2,688,450 | |
| Other Assets and Liabilities — (2.9)% | | | | | | | (74,980 | ) |
| | | | | | | | |
| Total Net Assets — 100.0% | | | | | | $ | 2,613,470 | |
| | | | | | | | |
| | | | | | | | |
| Industry | | Value | | | % of
Total
Net Assets | |
Common Stocks | | | | | | | | |
Agriculture | | $ | 40,911 | | | | 1.6 | % |
Airlines | | | 132,729 | | | | 5.1 | |
Auto Manufacturers | | | 14,300 | | | | 0.5 | |
Auto Parts & Equipment | | | 29,601 | | | | 1.1 | |
Banks | | | 87,832 | | | | 3.4 | |
Biotechnology | | | 52,483 | | | | 2.0 | |
Building Materials | | | 44,844 | | | | 1.7 | |
Chemicals | | | 12,772 | | | | 0.5 | |
Coal | | | 22,448 | | | | 0.9 | |
Commercial Services | | | 67,666 | | | | 2.6 | |
Computers | | | 52,256 | | | | 2.0 | |
Cosmetics/Personal Care | | | 5,346 | | | | 0.2 | |
Distribution/Wholesale | | | 6,020 | | | | 0.2 | |
Diversified Financial Services | | | 95,050 | | | | 3.6 | |
Electric | | | 82,018 | | | | 3.1 | |
Electrical Components & Equipment | | | 9,474 | | | | 0.4 | |
Electronics | | | 37,505 | | | | 1.4 | |
Engineering & Construction | | | 30,357 | | | | 1.2 | |
Environmental Control | | | 12,962 | | | | 0.5 | |
Food | | | 303,285 | | | | 11.6 | |
Forest Products & Paper | | | 60,166 | | | | 2.3 | |
Healthcare-Products | | | 255,461 | | | | 9.8 | |
Holding Companies-Diversified | | | 4,233 | | | | 0.2 | |
Insurance | | | 127,031 | | | | 4.9 | |
Internet | | | 21,795 | | | | 0.8 | |
Media | | | 40,475 | | | | 1.5 | |
Mining | | | 107,128 | | | | 4.1 | |
Miscellaneous Manufacturing | | | 16,036 | | | | 0.6 | |
Oil & Gas | | | 40,489 | | | | 1.5 | |
Packaging & Containers | | | 3,956 | | | | 0.2 | |
Pharmaceuticals | | | 162,125 | | | | 6.2 | |
Real Estate | | | 10,145 | | | | 0.4 | |
Real Estate Investment Trusts | | | 209,211 | | | | 8.0 | |
Retail | | | 50,891 | | | | 1.9 | |
Semiconductors | | | 55,105 | | | | 2.1 | |
Shipbuilding | | | 37,620 | | | | 1.4 | |
Software | | | 7,034 | | | | 0.3 | |
Telecommunications | | | 206,002 | | | | 7.9 | |
Transportation | | | 38,594 | | | | 1.5 | |
| | | | | | | | |
Total Common Stocks Purchased Long | | | 2,593,356 | | | | 99.2 | |
Collateral Investment for Securities on Loan | | | 95,094 | | | | 3.7 | |
| | | | | | | | |
Total Investments | | | 2,688,450 | | | | 102.9 | |
Other Assets and Liabilities | | | (74,980 | ) | | | (2.9 | ) |
| | | | | | | | |
Total Net Assets | | $ | 2,613,470 | | | | 100.0 | % |
| | | | | | | | |
(See Notes to Schedules of Investments and Notes to Financial Statements, which are an integral part of the Financial Statements)
76
At August 31, 2019, the Global Long/Short Equity Fund had outstanding total return swap agreement as set forth below:
| | | | | | | | | | | | | | | | | | | | | | | | | | |
Swap Counterparty | | Index | | Pay/Receive
Total Return
of Referenced
Index | | Floating
Rate | | Payment
Frequency | | Maturity
Date | | Notional
Amount | | | Value | | | Upfront
Payment
Paid | | | Unrealized
Depreciation | |
JPMorgan Chase & Co. | | BMO Alternative Strategies Global Short Index | | Receive | | 1 Month USD
LIBOR
Plus 0.15% | | Monthly | | 06/29/2020 | | $ | 1,044,068 | | | $ | (30,858 | ) | | $ | — | | | $ | (30,858 | ) |
The following table represents the equity basket holdings underlying the total return swap with BMO Alternative Strategies Global Short Index as of August 31, 2019:
| | | | | | | | | | | | |
Security Description | | Shares | | | Value | | | Index Weight | |
| BMO Alternative Strategies Global Short Index | |
AIXTRON SE | | | (16,181 | ) | | $ | (159,949 | ) | | | (1.74 | )% |
Albemarle Corp. | | | (2,474 | ) | | | (152,691 | ) | | | (1.66 | ) |
Asahi Holdings, Inc. | | | (6,717 | ) | | | (142,074 | ) | | | (1.55 | ) |
ASOS PLC | | | (3,935 | ) | | | (114,053 | ) | | | (1.24 | ) |
Atmos Energy Corp. | | | (2,179 | ) | | | (240,194 | ) | | | (2.61 | ) |
BOK Financial Corp. | | | (1,868 | ) | | | (142,198 | ) | | | (1.55 | ) |
Brown-Forman Corp. | | | (929 | ) | | | (54,788 | ) | | | (0.60 | ) |
Caverion OYJ | | | (5,763 | ) | | | (36,939 | ) | | | (0.40 | ) |
Cellnex Telecom SA | | | (6,128 | ) | | | (245,642 | ) | | | (2.67 | ) |
Century Aluminum Co. | | | (36,217 | ) | | | (199,558 | ) | | | (2.17 | ) |
Chugoku Marine Paints Ltd. | | | (7,205 | ) | | | (58,035 | ) | | | (0.63 | ) |
Daifuku Co., Ltd. | | | (4,744 | ) | | | (224,374 | ) | | | (2.44 | ) |
Easterly Government Properties, Inc. | | | (14,488 | ) | | | (297,730 | ) | | | (3.24 | ) |
Fugro NV | | | (11,001 | ) | | | (77,828 | ) | | | (0.85 | ) |
Fuji Seal International, Inc. | | | (4,121 | ) | | | (112,128 | ) | | | (1.22 | ) |
Goldwin, Inc. | | | (470 | ) | | | (64,995 | ) | | | (0.71 | ) |
GRENKE AG | | | (2,777 | ) | | | (225,421 | ) | | | (2.45 | ) |
HarborOne Bancorp, Inc. | | | (9,259 | ) | | | (92,223 | ) | | | (1.00 | ) |
Howard Bancorp, Inc. | | | (2,812 | ) | | | (41,584 | ) | | | (0.45 | ) |
Huatai Securities Co., Ltd. | | | (139,146 | ) | | | (202,805 | ) | | | (2.21 | ) |
Just Eat PLC | | | (17,841 | ) | | | (170,739 | ) | | | (1.86 | ) |
Kansai Paint Co., Ltd. | | | (13,782 | ) | | | (287,077 | ) | | | (3.12 | ) |
Kawasaki Kisen Kaisha Ltd. | | | (19,479 | ) | | | (196,171 | ) | | | (2.13 | ) |
Kura Sushi, Inc. | | | (1,019 | ) | | | (40,609 | ) | | | (0.44 | ) |
Lilis Energy, Inc. | | | (72,576 | ) | | | (21,780 | ) | | | (0.24 | ) |
M3, Inc. | | | (6,079 | ) | | | (129,152 | ) | | | (1.40 | ) |
Macerich Co. | | | (4,513 | ) | | | (128,763 | ) | | | (1.40 | ) |
MISUMI Group, Inc. | | | (10,944 | ) | | | (248,279 | ) | | | (2.70 | ) |
Money Forward, Inc. | | | (1,049 | ) | | | (33,313 | ) | | | (0.36 | ) |
NextEra Energy, Inc. | | | (1,113 | ) | | | (243,757 | ) | | | (2.65 | ) |
Nihon M&A Center, Inc. | | | (4,556 | ) | | | (133,047 | ) | | | (1.45 | ) |
Nippon Paint Holdings Co., Ltd. | | | (6,657 | ) | | | (315,459 | ) | | | (3.43 | ) |
Nippon Paint Holdings Co., Ltd. | | | (16,461 | ) | | | (245,964 | ) | | | (2.67 | ) |
Nitori Holdings Co., Ltd. | | | (1,548 | ) | | | (223,553 | ) | | | (2.43 | ) |
Noodles & Co. | | | (10,281 | ) | | | (59,320 | ) | | | (0.64 | ) |
Nordic Semiconductor ASA | | | (11,306 | ) | | | (51,251 | ) | | | (0.56 | ) |
Northam Platinum Ltd. | | | (64,541 | ) | | | (334,317 | ) | | | (3.63 | ) |
Northam Platinum Ltd. | | | (2,758 | ) | | | (63,429 | ) | | | (0.69 | ) |
Nufarm Ltd. | | | (43,660 | ) | | | (141,785 | ) | | | (1.54 | ) |
OGE Energy Corp. | | | (5,332 | ) | | | (228,580 | ) | | | (2.49 | ) |
Okta, Inc. | | | (2,586 | ) | | | (327,143 | ) | | | (3.56 | ) |
Pacific Metals Co., Ltd. | | | (2,327 | ) | | | (41,299 | ) | | | (0.45 | ) |
Park24 Co., Ltd. | | | (10,098 | ) | | | (207,301 | ) | | | (2.25 | ) |
People’s United Financial Inc. | | | (6,604 | ) | | | (94,895 | ) | | | (1.03 | ) |
Pinnacle Financial Partners, Inc. | | | (3,776 | ) | | | (198,863 | ) | | | (2.16 | ) |
PROS Holdings, Inc. | | | (5,670 | ) | | | (402,717 | ) | | | (4.38 | ) |
Rayonier, Inc. | | | (2,123 | ) | | | (56,884 | ) | | | (0.62 | ) |
Republic First Bancorp, Inc. | | | (9,822 | ) | | | (39,729 | ) | | | (0.43 | ) |
Senior Housing Properties Trust | | | (5,080 | ) | | | (43,128 | ) | | | (0.47 | ) |
| | | | | | | | | | | | |
Security Description | | Shares | | | Value | | | Index Weight | |
Shimano, Inc. | | | (240 | ) | | $ | (34,467 | ) | | | (0.37 | )% |
SMS Co., Ltd. | | | (11,584 | ) | | | (258,966 | ) | | | (2.82 | ) |
Square, Inc. | | | (1,004 | ) | | | (62,089 | ) | | | (0.68 | ) |
St James’s Place PLC | | | (7,775 | ) | | | (86,903 | ) | | | (0.94 | ) |
Takeaway.com NV | | | (1,190 | ) | | | (113,824 | ) | | | (1.24 | ) |
TFS Financial Corp. | | | (3,084 | ) | | | (53,997 | ) | | | (0.59 | ) |
TimkenSteel Corp. | | | (13,457 | ) | | | (70,248 | ) | | | (0.76 | ) |
Toridoll Holdings Corp. | | | (5,744 | ) | | | (130,731 | ) | | | (1.42 | ) |
Umicore SA | | | (1,690 | ) | | | (53,905 | ) | | | (0.59 | ) |
Wallenstam AB | | | (10,096 | ) | | | (113,548 | ) | | | (1.23 | ) |
Weir Group PLC | | | (14,203 | ) | | | (253,322 | ) | | | (2.75 | ) |
Weyerhaeuser Co. | | | (3,367 | ) | | | (88,596 | ) | | | (0.96 | ) |
Zalando SE | | | (5,157 | ) | | | (255,559 | ) | | | (2.78 | ) |
Zur Rose Group AG | | | (319 | ) | | | (27,854 | ) | | | (0.30 | ) |
| | | | | | | | | | | | |
| | | | | | $ | (9,197,522 | ) | | | (100.00 | )% |
| | | | | | | | | | | | |
(See Notes to Schedules of Investments and Notes to Financial Statements, which are an integral part of the Financial Statements)
77
August 31, 2019
Ultra Short Tax-Free Fund*
| | | | | | | | |
| Description | | Principal
Amount | | | Value | |
| Municipals — 98.6% | | | | | | |
| | |
Alabama — 5.2% | | | | | | | | |
Black Belt Energy Gas District, 2.394, (LIBOR 1 Month), 12/01/2023,
Call 9/1/2023 (7) | | $ | 4,500,000 | | | $ | 4,452,750 | |
Chatom Industrial Development Board, 1.400, 2/03/2020,
Call 2/1/2020 (7) | | | 4,800,000 | | | | 4,798,992 | |
Health Care Authority for Baptist Health, 1.810, 11/01/2042,
Call 9/3/2019 (7) | | | 11,125,000 | | | | 11,125,000 | |
Southeast Alabama Gas Supply District, 2.394, (LIBOR 1 Month), 4/01/2024, Call 1/1/2024 (7) | | | 5,000,000 | | | | 4,971,900 | |
Other Securities | | | 3,515,000 | | | | 3,632,670 | |
| | | | | | | | |
| | | | | | | 28,981,312 | |
| | |
Arkansas — 1.8% | | | | | | | | |
Arkansas Development Finance Authority, 1.820, 9/01/2044,
Call 9/3/2019 (7) | | | 7,000,000 | | | | 7,000,000 | |
Other Securities | | | 3,005,000 | | | | 3,005,007 | |
| | | | | | | | |
| | | | | | | 10,005,007 | |
| | |
California — 2.7% | | | | | | | | |
California Municipal Finance Authority, 1.480, 10/01/2019 (7) | | | 4,500,000 | | | | 4,500,315 | |
California Pollution Control Financing Authority, 1.500, 10/15/2019 (5)(7) | | | 4,000,000 | | | | 4,000,320 | |
Other Securities | | | 6,735,000 | | | | 6,789,235 | |
| | | | | | | | |
| | | | | | | 15,289,870 | |
| | |
Colorado — 0.7% | | | | | | | | |
Other Securities | | | 4,080,000 | | | | 4,181,452 | |
| | |
Connecticut — 0.1% | | | | | | | | |
Other Security | | | 400,000 | | | | 412,500 | |
| | |
District of Columbia — 0.5% | | | | | | | | |
Other Securities | | | 2,860,000 | | | | 2,966,569 | |
| | |
Florida — 4.8% | | | | | | | | |
Florida Development Finance Corp., 1.900, 3/17/2020 (7) | | | 10,000,000 | | | | 10,003,200 | |
Lee Memorial Health System, 1.530, 4/01/2049,
Call 9/3/2019 (7) | | | 4,000,000 | | | | 4,000,000 | |
RBC Municipal Products, Inc. Trust, 1.550, (SIFMA Municipal Swap Index Yield), 3/02/2020 (5)(7)(8) | | | 5,000,000 | | | | 5,000,000 | |
Other Securities | | | 7,595,000 | | | | 7,735,360 | |
| | | | | | | | |
| | | | | | | 26,738,560 | |
| | |
Georgia — 4.9% | | | | | | | | |
Burke County Development Authority, 2.250, 5/25/2023 (7) | | | 4,000,000 | | | | 4,084,760 | |
Main Street Natural Gas, Inc. | | | | | | | | |
1.920%, (SIFMA Municipal Swap Index Yield), 12/01/2023, Call 9/1/2023 (7) | | | 5,000,000 | | | | 4,979,750 | |
2.324%, (LIBOR 1 Month), 12/01/2023, Call 9/1/2023 (7) | | | 5,000,000 | | | | 5,020,000 | |
Other Securities | | | 13,450,000 | | | | 13,511,882 | |
| | | | | | | | |
| | | | | | | 27,596,392 | |
| | |
Hawaii — 0.5% | | | | | | | | |
Other Security | | | 2,800,000 | | | | 2,800,168 | |
| | | | | | | | |
| Description | | Principal
Amount | | | Value | |
| Municipals (continued) | | | | | | |
| | |
Illinois — 7.5% | | | | | | | | |
Decatur Park District, 3.000, 12/15/2019 | | $ | 4,311,000 | | | $ | 4,328,934 | |
State of Illinois | | | | | | | | |
5.000%, 8/01/2020 | | | 4,000,000 | | | | 4,118,040 | |
5.000%, 2/01/2022 | | | 6,040,000 | | | | 6,460,324 | |
Tender Option Bond Trust Receipts/Certificates, 1.550, 6/15/2031,
Call 6/15/2026 (5)(7) | | | 4,355,000 | | | | 4,355,000 | |
Other Securities | | | 22,235,000 | | | | 22,649,890 | |
| | | | | | | | |
| | | | | | | 41,912,188 | |
| | |
Indiana — 5.8% | | | | | | | | |
Clark Pleasant Middle School Corp., 2.500, 7/16/2020, Call 1/16/2020 | | | 4,710,000 | | | | 4,730,206 | |
Indiana Housing & Community Development Authority, GNMA/FNMA/FHLMC, 1.500, 7/01/2047,
Call 9/6/2019 (7) | | | 5,450,000 | | | | 5,450,000 | |
Tender Option Bond Trust Receipts/Certificates, 1.600, 10/15/2019 (5)(7) | | | 8,500,000 | | | | 8,500,000 | |
Other Securities | | | 13,465,000 | | | | 13,663,184 | |
| | | | | | | | |
| | | | | | | 32,343,390 | |
| | |
Iowa — 0.9% | | | | | | | | |
Other Securities | | | 5,020,000 | | | | 5,018,040 | |
| | |
Kansas — 1.4% | | | | | | | | |
Other Securities | | | 7,800,000 | | | | 7,829,712 | |
| | |
Kentucky — 2.9% | | | | | | | | |
County of Carroll, 1.200, 6/01/2021 (7)(8) | | | 5,000,000 | | | | 4,995,700 | |
Other Securities | | | 11,145,000 | | | | 11,231,637 | |
| | | | | | | | |
| | | | | | | 16,227,337 | |
| | |
Louisiana — 1.0% | | | | | | | | |
Louisiana Public Facilities Authority, 2.000, (SIFMA Municipal Swap Index Yield), 9/01/2023,
Call 3/1/2023 (7) | | | 5,000,000 | | | | 5,002,200 | |
Other Security | | | 360,000 | | | | 365,771 | |
| | | | | | | | |
| | | | | | | 5,367,971 | |
| | |
Maryland — 0.8% | | | | | | | | |
Maryland Economic Development Corp., 1.700, 9/01/2022 | | | 4,000,000 | | | | 4,045,880 | |
Other Security | | | 350,000 | | | | 350,000 | |
| | | | | | | | |
| | | | | | | 4,395,880 | |
| | |
Massachusetts — 0.4% | | | | | | | | |
Other Securities | | | 2,500,000 | | | | 2,526,800 | |
| | |
Michigan — 1.7% | | | | | | | | |
Other Securities | | | 8,960,000 | | | | 9,229,283 | |
| | |
Minnesota — 1.4% | | | | | | | | |
JPMorgan Chase Putters/Drivers Trust, 1.700, 6/01/2021 (5)(7) | | | 5,000,000 | | | | 5,000,000 | |
Other Securities | | | 2,600,000 | | | | 2,609,552 | |
| | | | | | | | |
| | | | | | | 7,609,552 | |
| | |
Mississippi — 2.3% | | | | | | | | |
Mississippi Business Finance Corp., 1.350, 11/01/2035,
Call 9/3/2019 (7) | | | 8,310,000 | | | | 8,310,000 | |
Mississippi Development Bank, 2.500, 1/01/2020 | | | 4,600,000 | | | | 4,621,252 | |
Other Securities | | | | | | | | |
| | | | | | | | |
| | | | | | | 12,931,252 | |
(See Notes to Schedules of Investments and Notes to Financial Statements, which are an integral part of the Financial Statements)
78
Ultra Short Tax-Free Fund* (continued)
| | | | | | | | |
| Description | | Principal
Amount | | | Value | |
| Municipals (continued) | | | | | | |
| | |
Missouri — 1.9% | | | | | | | | |
City of St. Louis, 2.500, 6/01/2020 | | $ | 5,000,000 | | | $ | 5,045,000 | |
Rib Floater Trust Various States, 1.600, 6/01/2045,
Call 12/1/2020 (5)(7) | | | 4,000,000 | | | | 4,000,000 | |
Other Securities | | | 1,445,000 | | | | 1,451,179 | |
| | | | | | | | |
| | | | | | | 10,496,179 | |
| | |
Nevada — 0.7% | | | | | | | | |
Other Securities | | | 3,995,000 | | | | 4,043,390 | |
| | |
New Jersey — 4.9% | | | | | | | | |
New Jersey Economic Development Authority | | | | | | | | |
1.640%, 11/01/2031,
Call 9/6/2019 (7) | | | 4,510,000 | | | | 4,510,000 | |
1.640%, 11/01/2040,
Call 9/6/2019 (7) | | | 5,515,000 | | | | 5,515,000 | |
New Jersey Transportation Trust Fund Authority, 2.350, (SIFMA Municipal Swap Index Yield), 12/15/2019, Call 9/25/2019 (7) | | | 5,000,000 | | | | 5,001,500 | |
Other Securities | | | 12,435,000 | | | | 12,515,845 | |
| | | | | | | | |
| | | | | | | 27,542,345 | |
| | |
New Mexico — 0.3% | | | | | | | | |
Other Security | | | 1,525,000 | | | | 1,528,523 | |
| | |
New York — 12.1% | | | | | | | | |
City of New York, 1.430, 12/01/2047, Call 9/6/2019 (7) | | | 5,640,000 | | | | 5,640,000 | |
Hempstead Union Free School District, SAW, 2.500, 6/25/2020 | | | 6,000,000 | | | | 6,044,220 | |
Livonia Central School District, SAW, 2.500, 6/19/2020 | | | 5,485,000 | | | | 5,536,778 | |
Long Island Power Authority, 2.311, (LIBOR 1 Month), 10/01/2023,
Call 10/1/2022 (7) | | | 4,000,000 | | | | 4,018,800 | |
Nuveen New YorkAMT-Free Municipal Credit Income Fund, 1.700, 3/01/2029 (7) | | | 4,700,000 | | | | 4,700,000 | |
Orange & Ulster Counties Board Coop Educational Services Sole Supervisory District, 2.250, 7/22/2020 | | | 4,000,000 | | | | 4,034,760 | |
Triborough Bridge & Tunnel Authority, 2.194, (LIBOR 1 Month), 2/01/2021 (7) | | | 4,890,000 | | | | 4,920,074 | |
Other Securities | | | 32,475,000 | | | | 32,598,699 | |
| | | | | | | | |
| | | | | | | 67,493,331 | |
| | |
North Carolina — 0.2% | | | | | | | | |
Other Security | | | 1,000,000 | | | | 1,000,000 | |
| | |
North Dakota — 0.3% | | | | | | | | |
Other Securities | | | 1,775,000 | | | | 1,841,764 | |
| | |
Ohio — 8.3% | | | | | | | | |
Other Securities | | | 45,845,000 | | | | 46,190,213 | |
| | |
Oklahoma — 0.6% | | | | | | | | |
Other Securities | | | 3,410,000 | | | | 3,490,796 | |
| | |
Pennsylvania — 4.9% | | | | | | | | |
Allentown City School District, SAW, 2.050, 1/02/2020, Call 10/2/2019 | | | 4,000,000 | | | | 4,000,720 | |
| | | | | | | | |
| Description | | Principal
Amount | | | Value | |
| Municipals (continued) | | | | | | |
| | |
Pennsylvania(continued) | | | | | | | | |
Montgomery County Higher Education & Health Authority, 1.540, 9/01/2050,
Call 9/3/2019 (7) | | $ | 8,000,000 | | | $ | 8,000,000 | |
Other Securities | | | 15,390,000 | | | | 15,468,870 | |
| | | | | | | | |
| | | | | | | 27,469,590 | |
| | |
South Carolina — 2.9% | | | | | | | | |
Patriots Energy Group Financing Agency, 2.354, (LIBOR 1 Month), 2/01/2024, Call 11/1/2023 (7) | | | 6,000,000 | | | | 6,007,200 | |
Tender Option Bond Trust Receipts/Certificates, 1.600, 1/01/2020 (5)(7) | | | 6,000,000 | | | | 6,000,000 | |
Other Securities | | | 4,000,000 | | | | 4,001,470 | |
| | | | | | | | |
| | | | | | | 16,008,670 | |
| | |
Tennessee — 1.4% | | | | | | | | |
Tennessee Energy Acquisition Corp., 5.250, 9/01/2020 | | | 4,720,000 | | | | 4,893,082 | |
Other Securities | | | 3,115,000 | | | | 3,119,407 | |
| | | | | | | | |
| | | | | | | 8,012,489 | |
| | |
Texas — 6.1% | | | | | | | | |
Mission Economic Development Corp. | | | | | | | | |
1.550%, 11/01/2019 (7) | | | 4,000,000 | | | | 4,000,760 | |
2.500%, 8/01/2020, Call 9/30/2019 | | | 6,500,000 | | | | 6,505,720 | |
Port of Port Arthur Navigation District, 1.900, 10/03/2019, Call 10/3/2019 (5)(7) | | | 8,500,000 | | | | 8,500,595 | |
Other Securities | | | 14,920,000 | | | | 15,130,491 | |
| | | | | | | | |
| | | | | | | 34,137,566 | |
| | |
Utah — 0.9% | | | | | | | | |
Tender Option Bond Trust Receipts/Certificates, 1.550, 1/01/2025 (5)(7) | | | 4,800,000 | | | | 4,800,000 | |
Other Securities | | | | | | | | |
| | |
Virginia — 1.3% | | | | | | | | |
Other Securities | | | 7,330,000 | | | | 7,364,248 | |
| | |
Washington — 0.4% | | | | | | | | |
Other Securities | | | 2,175,000 | | | | 2,180,209 | |
| | |
West Virginia — 1.2% | | | | | | | | |
West Virginia Hospital Finance Authority, 1.530, 6/01/2033, Call 9/3/2019 (7) | | | 4,750,000 | | | | 4,750,000 | |
Other Securities | | | 1,660,000 | | | | 1,715,343 | |
| | | | | | | | |
| | | | | | | 6,465,343 | |
| | |
Wisconsin — 2.9% | | | | | | | | |
Public Finance Authority, 1.530, 11/01/2019 (7) | | | 5,000,000 | | | | 5,000,750 | |
Other Securities | | | 11,290,000 | | | | 11,330,138 | |
| | | | | | | | |
| | | | | | | 16,330,888 | |
| | | | | | | | |
Total Municipals
(identified cost $549,493,701) | | | | 550,758,779 | |
| | | | | | | | |
| | | | | | | | |
| Short-Term Investments — 3.2% | |
|
| Short-Term Municipals — 3.2% | |
| | |
Florida — 1.4% | | | | | | | | |
JEA Electric System Revenue | | | 5,000,000 | | | | 5,000,000 | |
Other Security | | | 3,000,000 | | | | 3,000,000 | |
| | | | | | | | |
| | | | | | | 8,000,000 | |
(See Notes to Schedules of Investments and Notes to Financial Statements, which are an integral part of the Financial Statements)
79
August 31, 2019
Ultra Short Tax-Free Fund* (continued)
| | | | | | | | |
| Description | | Principal
Amount | | | Value | |
| Short-Term Investments (continued) | |
|
| Short-Term Municipals (continued) | |
| | |
Texas — 1.8% | | | | | | | | |
Other Securities | | $ | 9,700,000 | | | $ | 9,700,000 | |
| | | | | | | | |
| | | | | | | 17,700,000 | |
| | | | | | | | |
Total Short-Term Investments
(identified cost $17,700,000) | | | | | | | 17,700,000 | |
| | | | | | | | |
Total Investments — 101.8%
(identified cost $567,193,701) | | | | | | | 568,458,779 | |
| Other Assets — (1.8)% | | | | (10,101,684 | ) |
| | | | | | | | |
| Net Assets — 100.0% | | | | | | $ | 558,357,095 | |
| | | | | | | | |
ShortTax-Free Fund*
| | | | | | | | |
| Description | | Principal
Amount | | | Value | |
| | |
| Municipals — 99.6% | | | | | | |
| | |
Alabama — 3.5% | | | | | | | | |
Black Belt Energy Gas District | | | | | | | | |
4.000%, 6/01/2021, Call 3/1/2021 (7) | | $ | 1,000,000 | | | $ | 1,045,640 | |
4.000%, 6/01/2023 | | | 1,000,000 | | | | 1,091,730 | |
County of Jefferson, 5.000, 9/15/2021 | | | 1,000,000 | | | | 1,075,960 | |
Other Securities | | | 2,375,000 | | | | 2,379,097 | |
| | | | | | | | |
| | | | | | | 5,592,427 | |
| | |
Alaska — 0.6% | | | | | | | | |
Other Security | | | 1,000,000 | | | | 1,003,860 | |
| | |
Arizona — 1.5% | | | | | | | | |
Other Securities | | | 2,390,000 | | | | 2,428,635 | |
| | |
Arkansas — 0.2% | | | | | | | | |
Other Securities | | | 270,000 | | | | 281,912 | |
| | |
California — 5.2% | | | | | | | | |
California Municipal Finance Authority, 5.000, 2/01/2022 | | | 1,000,000 | | | | 1,092,580 | |
Golden State Tobacco Securitization Corp., 5.000, 6/01/2022 | | | 1,000,000 | | | | 1,097,730 | |
Other Securities | | | 5,860,000 | | | | 6,190,641 | |
| | | | | | | | |
| | | | | | | 8,380,951 | |
| | |
Colorado — 3.9% | | | | | | | | |
Colorado Educational & Cultural Facilities Authority, 5.000, 10/01/2021 | | | 1,000,000 | | | | 1,065,890 | |
Colorado Health Facilities Authority | | | | | | | | |
3.125%, 5/15/2027, Call 5/15/2020 | | | 1,000,000 | | | | 1,005,030 | |
5.000%, 8/01/2025, Call 2/1/2025 (7) | | | 1,000,000 | | | | 1,183,680 | |
Other Securities | | | 2,800,000 | | | | 2,921,058 | |
| | | | | | | | |
| | | | | | | 6,175,658 | |
| | |
Connecticut — 1.1% | | | | | | | | |
State of Connecticut, 5.000, 4/15/2023 | | | 1,000,000 | | | | 1,132,830 | |
Other Securities | | | 615,000 | | | | 643,993 | |
| | | | | | | | |
| | | | | | | 1,776,823 | |
| | |
District of Columbia — 0.7% | | | | | | | | |
Metropolitan Washington Airports Authority, 5.000, 10/01/2024 | | | 1,000,000 | | | | 1,181,460 | |
Other Securities | | | | | | | | |
| | | | | | | | |
| Description | | Principal
Amount | | | Value | |
| | |
| Municipals (continued) | | | | | | |
| | |
Florida — 6.6% | | | | | | | | |
City of Atlantic Beach, 3.250, 11/15/2024, Call 11/15/2020 | | $ | 1,155,000 | | | $ | 1,174,947 | |
County of Okeechobee, 1.550, 7/01/2021 (7) | | | 1,000,000 | | | | 1,005,510 | |
Florida Development Finance Corp., 1.900, 3/17/2020 (7) | | | 3,000,000 | | | | 3,000,960 | |
Other Securities | | | 5,100,000 | | | | 5,336,932 | |
| | | | | | | | |
| | | | | | | 10,518,349 | |
| | |
Georgia — 6.9% | | | | | | | | |
Burke County Development Authority, 2.925, 3/12/2024 (7) | | | 1,250,000 | | | | 1,315,650 | |
Georgia State Road & Tollway Authority, 5.000, 6/01/2021 | | | 1,250,000 | | | | 1,334,750 | |
Main Street Natural Gas, Inc. | | | | | | | | |
2.244%, (LIBOR 1 Month), 9/01/2023, Call 6/1/2023 (7) | | | 1,000,000 | | | | 1,006,250 | |
5.000%, 5/15/2024 | | | 1,250,000 | | | | 1,440,125 | |
Other Securities | | | 5,735,000 | | | | 5,978,347 | |
| | | | | | | | |
| | | | | | | 11,075,122 | |
| | |
Guam — 0.3% | | | | | | | | |
Other Security | | | 500,000 | | | | 546,695 | |
| | |
Illinois — 16.2% | | | | | | | | |
Chicago Housing Authority, HUD SEC 8, 5.000, 1/01/2023 | | | 1,000,000 | | | | 1,115,880 | |
City of Chicago Waterworks Revenue, 5.000, 11/01/2021 | | | 1,445,000 | | | | 1,553,823 | |
Kane McHenry Cook & De Kalb Counties Unit School District No. 300, 5.000, 1/01/2023 | | | 1,000,000 | | | | 1,117,950 | |
Railsplitter Tobacco Settlement Authority, 5.000, 6/01/2023 | | | 1,000,000 | | | | 1,130,730 | |
Sales Tax Securitization Corp., 5.000, 1/01/2023 | | | 1,000,000 | | | | 1,101,440 | |
State of Illinois, 5.000, 11/01/2022 | | | 2,000,000 | | | | 2,166,820 | |
University of Illinois, 5.000, 3/15/2022 | | | 1,000,000 | | | | 1,090,630 | |
Other Securities | | | 15,810,000 | | | | 16,638,899 | |
| | | | | | | | |
| | | | | | | 25,916,172 | |
| | |
Indiana — 3.6% | | | | | | | | |
City of Whiting, 5.000, 6/05/2026 (7) | | | 1,000,000 | | | | 1,218,820 | |
Indiana Housing & Community Development Authority, GNMA/FNMA/FHLMC, 1.500, 7/01/2047, Call 9/6/2019 (7) | | | 2,000,000 | | | | 2,000,000 | |
Other Securities | | | 2,560,000 | | | | 2,593,369 | |
| | | | | | | | |
| | | | | | | 5,812,189 | |
| | |
Kansas — 0.4% | | | | | | | | |
Other Securities | | | 560,000 | | | | 577,195 | |
| | |
Kentucky — 2.3% | | | | | | | | |
Kentucky Rural Water Finance Corp., 2.250, 3/01/2020, Call 9/20/2019 | | | 1,200,000 | | | | 1,200,516 | |
Other Securities | | | 2,300,000 | | | | 2,469,472 | |
| | | | | | | | |
| | | | | | | 3,669,988 | |
| | |
Louisiana — 0.4% | | | | | | | | |
Other Securities | | | 565,000 | | | | 587,072 | |
| | |
Maine — 0.1% | | | | | | | | |
Other Security | | | 110,000 | | | | 112,199 | |
(See Notes to Schedules of Investments and Notes to Financial Statements, which are an integral part of the Financial Statements)
80
ShortTax-Free Fund* (continued)
| | | | | | | | |
| Description | | Principal
Amount | | | Value | |
| | |
| Municipals (continued) | | | | | | |
| | |
Maryland — 0.7% | | | | | | | | |
Other Securities | | $ | 1,060,000 | | | $ | 1,163,848 | |
| | |
Massachusetts — 2.0% | | | | | | | | |
Commonwealth of Massachusetts, 1.700, 8/01/2022 (7) | | | 1,000,000 | | | | 1,012,890 | |
Massachusetts Transportation Trust Fund Metropolitan Highway System Revenue, 5.000, 1/01/2023, Call 1/1/2023 (7) | | | 1,000,000 | | | | 1,122,120 | |
Other Securities | | | 970,000 | | | | 1,061,647 | |
| | | | | | | | |
| | | | | | | 3,196,657 | |
| | |
Michigan — 2.6% | | | | | | | | |
Michigan Finance Authority, 3.500, 11/15/2022 (7)(8) | | | 1,000,000 | | | | 1,063,470 | |
Other Securities | | | 2,935,000 | | | | 3,077,965 | |
| | | | | | | | |
| | | | | | | 4,141,435 | |
| | |
Minnesota — 1.0% | | | | | | | | |
Other Securities | | | 1,500,000 | | | | 1,540,130 | |
| | |
Mississippi — 1.4% | | | | | | | | |
Mississippi Business Finance Corp, 2.200, 6/03/2024 (7) | | | 1,250,000 | | | | 1,286,612 | |
Other Security | | | 750,000 | | | | 888,728 | |
| | | | | | | | |
| | | | | | | 2,175,340 | |
| | |
Missouri — 1.1% | | | | | | | | |
Other Securities | | | 1,780,000 | | | | 1,840,344 | |
| | |
Nebraska — 0.7% | | | | | | | | |
Central Plains Energy Project, 5.000, 1/01/2024, Call 10/1/2023 (7) | | | 1,000,000 | | | | 1,133,750 | |
Other Securities | | | | | | | | |
| | |
Nevada — 1.6% | | | | | | | | |
City of North Las Vegas NV, AGM, 5.000, 6/01/2023 | | | 1,000,000 | | | | 1,136,610 | |
Other Securities | | | 1,300,000 | | | | 1,349,741 | |
| | | | | | | | |
| | | | | | | 2,486,351 | |
| | |
New Jersey — 3.1% | | | | | | | | |
Tobacco Settlement Financing Corp., 5.000, 6/01/2022 | | | 1,000,000 | | | | 1,092,790 | |
Other Securities | | | 3,685,000 | | | | 3,845,191 | |
| | | | | | | | |
| | | | | | | 4,937,981 | |
| | |
New Mexico — 0.6% | | | | | | | | |
Other Securities | | | 1,005,000 | | | | 1,007,340 | |
| | |
New York — 8.4% | | | | | | | | |
Metropolitan Transportation Authority, 5.000, 11/15/2024 (7) | | | 1,000,000 | | | | 1,182,340 | |
Nuveen New YorkAMT-Free Municipal Credit Income Fund, 1.700, 3/01/2029 (7) | | | 1,300,000 | | | | 1,300,000 | |
TSASC, Inc., 5.000, 6/01/2021 | | | 1,000,000 | | | | 1,063,760 | |
Westchester Tobacco Asset Securitization, 5.000, 6/01/2020 | | | 1,155,000 | | | | 1,184,071 | |
Other Securities | | | 8,660,000 | | | | 8,748,963 | |
| | | | | | | | |
| | | | | | | 13,479,134 | |
| | |
North Carolina — 0.6% | | | | | | | | |
Other Securities | | | 950,000 | | | | 958,636 | |
| | | | | | | | |
| Description | | Principal
Amount | | | Value | |
| | |
| Municipals (continued) | | | | | | |
| | |
North Dakota — 0.2% | | | | | | | | |
Other Securities | | $ | 305,000 | | | $ | 312,990 | |
| | |
Ohio — 2.4% | | | | | | | | |
American Municipal Power, Inc., 2.300, 2/15/2022,
Call 8/15/2021 (7) | | | 1,000,000 | | | | 1,019,080 | |
Other Securities | | | 2,655,000 | | | | 2,777,767 | |
| | | | | | | | |
| | | | | | | 3,796,847 | |
| | |
Pennsylvania — 3.9% | | | | | | | | |
Commonwealth Financing Authority, 5.000, 6/01/2022 | | | 1,000,000 | | | | 1,096,020 | |
Other Securities | | | 4,965,000 | | | | 5,098,128 | |
| | | | | | | | |
| | | | | | | 6,194,148 | |
| | |
South Carolina — 1.3% | | | | | | | | |
Newberry Investing in Children’s Education, 5.000, 12/01/2019 | | | 1,000,000 | | | | 1,009,420 | |
Other Security | | | 1,000,000 | | | | 1,001,200 | |
| | | | | | | | |
| | | | | | | 2,010,620 | |
| | |
Tennessee — 2.0% | | | | | | | | |
Metropolitan Government Nashville & Davidson County Health & Educational Facility Board, 2.000, 1/01/2021 (7) | | | 1,000,000 | | | | 1,009,370 | |
Tennessee Energy Acquisition Corp., 4.000, 5/01/2023,
Call 2/1/2023 (7) | | | 1,000,000 | | | | 1,082,590 | |
Other Securities | | | 980,000 | | | | 1,072,460 | |
| | | | | | | | |
| | | | | | | 3,164,420 | |
| | |
Texas — 7.1% | | | | | | | | |
Fort Bend Independent School District, PSF, 1.950, 8/01/2022 (7) | | | 1,000,000 | | | | 1,017,990 | |
Houston Independent School District, PSF, 2.250, 6/01/2022 (7) | | | 1,250,000 | | | | 1,281,312 | |
Port of Port Arthur Navigation District, 1.900, 10/03/2019,
Call 10/3/2019 (5)(7) | | | 1,500,000 | | | | 1,500,105 | |
Tarrant County Cultural Education Facilities Finance Corp., 5.000, 11/15/2022 | | | 1,000,000 | | | | 1,097,700 | |
Other Securities | | | 6,250,000 | | | | 6,411,330 | |
| | | | | | | | |
| | | | | | | 11,308,437 | |
| | |
Utah — 0.1% | | | | | | | | |
Other Security | | | 200,000 | | | | 200,000 | |
| | |
Virginia — 1.1% | | | | | | | | |
Henrico County Economic Development Authority, AGM, 3.873, 8/23/2027,
Call 9/6/2019 (7)(9) | | | 1,100,000 | | | | 1,100,000 | |
Other Security | | | 575,000 | | | | 654,206 | |
| | | | | | | | |
| | | | | | | 1,754,206 | |
| | |
Washington — 0.9% | | | | | | | | |
State of Washington, 5.000, 2/01/2022 | | | 1,000,000 | | | | 1,094,080 | |
Other Security | | | 320,000 | | | | 333,574 | |
| | | | | | | | |
| | | | | | | 1,427,654 | |
| | |
West Virginia — 1.4% | | | | | | | | |
West Virginia Economic Development Authority, 2.550, 4/01/2024 (7) | | | 1,000,000 | | | | 1,043,990 | |
Other Securities | | | 1,075,000 | | | | 1,179,776 | |
| | | | | | | | |
| | | | | | | 2,223,766 | |
(See Notes to Schedules of Investments and Notes to Financial Statements, which are an integral part of the Financial Statements)
81
August 31, 2019
ShortTax-Free Fund* (continued)
| | | | | | | | |
| Description | | Principal
Amount | | | Value | |
| Municipals (continued) | | | | | | |
| | |
Wisconsin — 1.9% | | | | | | | | |
Other Securities | | $ | 2,830,000 | | | $ | 2,998,623 | |
| | | | | | | | |
Total Municipals
(identified cost $156,709,960) | | | | | | | 159,089,364 | |
| | | | | | | | |
| Short-Term Investments — 0.2% | |
|
| Repurchase Agreements — 0.2% | |
Other Security | | | 371,965 | | | | 371,965 | |
| | | | | | | | |
Total Short-Term Investments
(identified cost $371,965) | | | | | | | 371,965 | |
| | | | | | | | |
Total Investments — 99.8%
(identified cost $157,081,925) | | | | | | | 159,461,329 | |
| Other Assets — 0.2% | | | | 334,724 | |
| | | | | | | | |
| Net Assets — 100.0% | | | | | | $ | 159,796,053 | |
| | | | | | | | |
Short-Term Income Fund
| | | | | | | | |
| Description | | Principal
Amount | | | Value | |
| Asset-Backed Securities — 20.7% | |
| | |
Automobiles — 9.4% | | | | | | | | |
AmeriCredit Automobile Receivables Trust: | | | | | | | | |
Class C, (Series2017-3), 2.690%, 6/19/2023 | | $ | 1,755,000 | | | $ | 1,775,115 | |
Class D, (Series2016-1), 3.590%, 2/8/2022 | | | 2,000,000 | | | | 2,023,892 | |
Class D, (Series2017-1), 3.130%, 1/18/2023 | | | 1,500,000 | | | | 1,520,863 | |
CarMax Auto Owner Trust, Class A3, (Series2016-2), 1.520%, 2/16/2021 | | | 45,285 | | | | 45,251 | |
Chesapeake Funding II LLC, Class A1, (Series2019-2A), 1.950%, 9/15/2031 (5) | | | 1,000,000 | | | | 999,826 | |
Drive Auto Receivables Trust: | | | | | | | | |
Class A2A, (Series2019-2), 2.930%, 3/15/2022 | | | 744,933 | | | | 746,547 | |
Class C, (Series2017-AA), 2.980%, 1/18/2022 (5) | | | 405,232 | | | | 405,727 | |
Class C, (Series2018-1), 3.220%, 3/15/2023 | | | 1,735,000 | | | | 1,740,338 | |
Class D, (Series2015-BA), 3.840%, 7/15/2021 (5) | | | 266,562 | | | | 267,028 | |
Enterprise Fleet Financing LLC, Class A2, (Series2019-2), 2.290%, 2/20/2025 (5) | | | 2,000,000 | | | | 2,017,147 | |
GM Financial Automobile Leasing Trust: | | | | | | | | |
Class A3, (Series2017-2), 2.020%, 9/21/2020 | | | 441,319 | | | | 441,088 | |
Class A4, (Series2017-3), 2.120%, 9/20/2021 | | | 1,655,000 | | | | 1,654,883 | |
Class B, (Series2017-2), 2.430%, 6/21/2021 | | | 1,000,000 | | | | 1,000,340 | |
GM Financial Consumer Automobile, Class C, (Series2017-1A), 2.450%, 7/17/2023 (5) | | | 1,000,000 | | | | 1,002,302 | |
| | | | | | | | |
| Description | | Principal
Amount | | | Value | |
| Asset-Backed Securities (continued) | | | | |
| | |
Automobiles(continued) | | | | | | | | |
Hertz Vehicle Financing II LP, Class A, (Series2015-1A), 2.730%, 3/25/2021 (5) | | $ | 1,000,000 | | | $ | 1,002,091 | |
Mercedes-Benz Master Owner Trust, Class A, (Series2019-BA), 2.610%, 5/15/2024 (5) | | | 1,275,000 | | | | 1,301,087 | |
Nissan Auto Receivables Owner Trust, Class A2A, (Series2018-C), 3.070%, 10/15/2021 | | | 915,065 | | | | 919,447 | |
Santander Drive Auto Receivables Trust, Class D, (Series2015-2), 3.020%, 4/15/2021 | | | 563,293 | | | | 563,783 | |
Santander Retail Auto Lease Trust, Class C, (Series2017-A), 2.960%, 11/21/2022 (5) | | | 2,925,000 | | | | 2,942,316 | |
Tesla Auto Lease Trust, Class C,(Series 2018-A), 2.970%, 4/20/2020 (5) | | | 500,000 | | | | 500,734 | |
Toyota Auto Receivables, Class A3, (Series2016-C), 1.140%, 8/17/2020 | | | 60,568 | | | | 60,521 | |
Westlake Automobile Receivables Trust2017-2, Class C,(Series 2017-2A), 2.590%, 12/15/2022 (5) | | | 1,000,000 | | | | 1,000,715 | |
World Omni Auto Receivables Trust, Class A3, (Series2017-B), 1.950%, 2/15/2023 | | | 450,000 | | | | 449,968 | |
| | | | | | | | |
| | | | | | | 24,381,009 | |
| | |
Credit Cards — 4.7% | | | | | | | | |
Cabela’s Credit Card Master Note Trust: | | | | | | | | |
Class A1, (Series2015-1A), 2.260%, 3/15/2023 | | | 1,010,000 | | | | 1,010,067 | |
Class A1, (Series2015-2), 2.250%, 7/17/2023 | | | 2,208,000 | | | | 2,212,567 | |
Chase Issuance Trust, Class A4,(Series 2016-A4), 1.490%, 7/15/2022 | | | 2,500,000 | | | | 2,490,132 | |
GE Capital Credit Card Master Note Trust, Class B, (Series2012-7), 2.210%, 9/15/2022 | | | 1,885,483 | | | | 1,885,273 | |
Synchrony Card Issuance Trust, Class A, (Series2018-A1), 3.380%, 9/15/2024 | | | 2,200,000 | | | | 2,272,999 | |
World Financial Network Credit Card Master Trust: | | | | | | | | |
Class A, (Series2015-B), 2.550%, 6/17/2024 | | | 365,000 | | | | 366,694 | |
Class A, (Series2019-B), 2.490%, 4/15/2026 | | | 1,775,000 | | | | 1,804,731 | |
| | | | | | | | |
| | | | | | | 12,042,463 | |
| | |
Other Financial — 6.6% | | | | | | | | |
Ally Master Owner Trust, Class A, (Series2018-2), 3.290%, 5/15/2023 | | | 1,500,000 | | | | 1,536,114 | |
Consumers Securitization Funding LLC, Class A1, (Series2014-A), 1.334%, 11/1/2020 | | | 274,528 | | | | 274,056 | |
Daimler Trucks Retail Trust, Class A3, (Series2018-1), 2.850%, 7/15/2021 (5) | | | 1,944,509 | | | | 1,949,648 | |
(See Notes to Schedules of Investments and Notes to Financial Statements, which are an integral part of the Financial Statements)
82
Short-Term Income Fund (continued)
| | | | | | | | |
| Description | | Principal
Amount | | | Value | |
| Asset-Backed Securities (continued) | | | | |
| | |
Other Financial(continued) | | | | | | | | |
Hilton Grand Vacations Trust, Class A, (Series2014-AA), 1.770%, 11/25/2026 (5) | | $ | 310,346 | | | $ | 309,141 | |
Marlin Receivables LLC, Class B,(Series 2018-1A), 3.540%, 5/22/2023 (5) | | | 1,000,000 | | | | 1,020,351 | |
MMAF Equipment Finance LLC, 2.410%, 11/15/2024 (5) | | | 2,000,000 | | | | 2,021,025 | |
Navistar Financial Dealer Note Master Owner Trust II, Class A,(Series 2019-1), 2.906% (LIBOR 1 Month + 64 basis points), 5/28/2024 (5)(7) | | | 1,000,000 | | | | 1,002,357 | |
Sierra Timeshare Conduit Receivables Funding LLC, Class B,(Series 2017-1A), 3.200%, 3/20/2034 (5) | | | 1,033,195 | | | | 1,044,171 | |
Trafigura Securitisation Finance PLC, Class A1, (Series2017-1A), 3.334% (LIBOR 1 Month + 85 basis points), 12/15/2020 (5)(7) | | | 3,000,000 | | | | 3,005,250 | |
Volvo Financial Equipment LLC, Class A4, (Series2017-1A), 2.210%, 11/15/2021 (5) | | | 780,000 | | | | 780,925 | |
Wells Fargo Dealer Floorplan Master Note Trust, Class A,
(Series2015-2), 2.822%
(LIBOR 1 Month + 65 basis points), 1/20/2022 (7) | | | 1,070,000 | | | | 1,070,728 | |
Westgate Resorts LLC: | | | | | | | | |
4.050%, 12/20/2030 (5) | | | 2,040,667 | | | | 2,060,993 | |
Class B, (Series2018-1A), 3.580%, 12/20/2031 (5) | | | 1,015,100 | | | | 1,027,969 | |
| | | | | | | | |
| | | | | | | 17,102,728 | |
| | | | | | | | |
Total Asset-Backed Securities
(identified cost $53,226,390) | | | | | | | 53,526,200 | |
| | | | | | | | |
| Collateralized Mortgage Obligations — 8.1% | |
|
Federal Home Loan Mortgage Corporation — 1.7% | |
2.000%, 1/15/2024, (Series 4295) | | | 426,936 | | | | 426,655 | |
3.000%, 2/15/2031, (Series 4013) | | | 940,666 | | | | 975,303 | |
3.000%, 9/15/2032, (Series 4236) | | | 1,408,733 | | | | 1,435,878 | |
4.000%, 12/15/2038, (Seies 3738) | | | 999,662 | | | | 1,017,967 | |
4.500%, 8/15/2039, (Series 3778) | | | 591,109 | | | | 616,585 | |
| | | | | | | | |
| | | | | | | 4,472,388 | |
|
Federal National Mortgage Association — 1.1% | |
3.000%, 6/25/2033 | | | 1,539,010 | | | | 1,593,255 | |
3.000%, 8/25/2040,(Series 2015-15) | | | 1,239,269 | | | | 1,255,712 | |
| | | | | | | | |
| | | | | | | 2,848,967 | |
|
Federal National Mortgage Association — 0.9% | |
2.500%, 6/25/2029,(Series 2014-34) | | | 830,187 | | | | 842,266 | |
3.643%, 7/25/2021,(Series 2011-M3) | | | 1,458,477 | | | | 1,483,572 | |
| | | | | | | | |
| | | | | | | 2,325,838 | |
|
Private Sponsor — 4.4% | |
Banc of America Funding Trust: | | | | | | | | |
Class 1A3, (Series2007-C), 4.580%, 5/20/2036 (7) | | | 115,517 | | | | 115,675 | |
| | | | | | | | |
| Description | | Principal
Amount | | | Value | |
| Collateralized Mortgage Obligations (continued) | |
| | |
Private Sponsor(continued) | | | | | | | | |
Class 2A1, (Series2005-5), 5.500%, 9/25/2035 | | $ | 226,496 | | | $ | 253,157 | |
Chase Mortgage Finance Trust: | | | | | | | | |
Class A1, (Series2005-S2), 5.500%, 10/25/2035 | | | 141,625 | | | | 150,907 | |
Class A3, (Series2006-S4), 6.000%, 12/25/2036 | | | 189,841 | | | | 147,382 | |
FREMF Mortgage Trust: | | | | | | | | |
Class B, (Series 2013-K712), 3.408%, 5/25/2045 (5)(7) | | | 2,085,000 | | | | 2,083,399 | |
Class B, (Series 2013-K713), 3.261%, 4/25/2046 (5)(7) | | | 3,325,000 | | | | 3,334,370 | |
Class B, (Series 2014-K717), 3.753%, 11/25/2047 (5)(7) | | | 1,750,000 | | | | 1,797,646 | |
JP Morgan Mortgage Trust: | | | | | | | | |
Class 1A5, (Series2017-3), 3.500%, 8/25/2047 (5)(7) | | | 961,874 | | | | 980,338 | |
Class 2A2, (Series2005-S3), 5.500%, 1/25/2021 | | | 51,492 | | | | 49,937 | |
Class 3A1, (Series2007-A2), 3.984%, 4/25/2037 (7) | | | 11,147 | | | | 9,861 | |
Class A4, (Series2019-6), 3.500%, 12/25/2049 (5)(7) | | | 750,000 | | | | 759,609 | |
Morgan Stanley Mortgage Loan Trust, Class 2A2,
(Series 2004-10AR), 4.483%, 11/25/2034 (7) | | | 201,191 | | | | 207,361 | |
OBX 2019-INV1 Trust, Class A8, (Series 2019-INV1), 4.000%, 11/25/2048 (5)(7) | | | 1,131,810 | | | | 1,167,719 | |
Wells Fargo Mortgage Backed Securities Trust: | | | | | | | | |
Class 2A4, (Series2006-AR7), 5.088%, 5/25/2036 (7) | | | 76,345 | | | | 79,439 | |
Class 2A4, (Series2006-AR8), 4.894%, 4/25/2036 (7) | | | 24,713 | | | | 25,032 | |
Class A1, (Series 2006-AR19), 4.880%, 12/25/2036 (7) | | | 183,624 | | | | 182,571 | |
| | | | | | | | |
| | | | | | | 11,344,403 | |
| | | | | | | | |
Total Collateralized Mortgage Obligations
(identified cost $20,930,800) | | | | 20,991,596 | |
| | | | | | | | |
| Commercial Mortgage Securities — 5.5% | |
|
Government National Mortgage Association — 1.4% | |
1.800%, 7/16/2037,(Series 2013-179) | | | 774,757 | | | | 768,484 | |
2.100%, 4/16/2050,(Series 2016-92) | | | 1,224,755 | | | | 1,216,255 | |
2.205%, 1/16/2044,(Series 2014-61) | | | 591,739 | | | | 587,487 | |
2.650%, 2/16/2045,(Series 2015-33) | | | 1,031,063 | | | | 1,035,743 | |
| | | | | | | | |
| | | | | | | 3,607,969 | |
| | |
Private Sponsor — 4.1% | | | | | | | | |
BANK, Class A1, (Series 2017-BNK9), 2.322%, 11/15/2054 | | | 1,803,835 | | | | 1,812,564 | |
Citigroup Commercial Mortgage Trust, Class A1, (Series2017-P7), 2.008%, 4/14/2050 | | | 626,719 | | | | 626,118 | |
Great Wolf Trust, Class B,
(Series 2017-WOLF), 3.295% (LIBOR 1 Month + 110 basis points), 9/15/2034 (5)(7) | | | 2,000,000 | | | | 2,000,874 | |
(See Notes to Schedules of Investments and Notes to Financial Statements, which are an integral part of the Financial Statements)
83
August 31, 2019
Short-Term Income Fund (continued)
| | | | | | | | |
| Description | | Principal
Amount | | | Value | |
| Commercial Mortgage Securities (continued) | |
| | |
Private Sponsor(continued) | | | | | | | | |
GS Mortgage Securities Trust, Class A4, (Series2011-GC3), 4.753%, 3/10/2044 (5) | | $ | 699,017 | | | $ | 715,407 | |
Morgan Stanley BAML Trust, Class A1, (Series2016-C30), 1.389%, 9/15/2049 | | | 1,072,744 | | | | 1,064,878 | |
RAIT Trust, Class A, (Series2017-FL7), 3.145% (LIBOR 1 Month + 95 basis points), 6/15/2037 (acquisition cost - $268,012; acquired 6/13/2017) (5)(7) | | | 268,012 | | | | 267,957 | |
SLIDE, Class B, (Series2018-FUN), 3.446% (LIBOR 1 Month + 125 basis points), 6/15/2031 (5)(7) | | | 975,392 | | | | 976,282 | |
UBS Commercial Mortgage Trust, Class A1, (Series2017-C3), 1.935%, 8/15/2050 | | | 1,207,793 | | | | 1,205,678 | |
WFRBS Commercial Mortgage Trust, Class ASB, (Series2013-C18), 3.676%, 12/15/2046 | | | 1,754,838 | | | | 1,814,919 | |
| | | | | | | | |
| | | | | | | 10,484,677 | |
| | | | | | | | |
Total Commercial Mortgage Securities
(identified cost $14,067,270) | | | | 14,092,646 | |
| | | | | | | | |
| Corporate Bonds & Notes — 49.5% | |
| | |
Aerospace/Defense — 0.6% | | | | | | | | |
General Dynamics Corp., 3.000%, 5/11/2021 (1) | | | 750,000 | | | | 764,609 | |
United Technologies Corp., 3.100%, 6/1/2022 | | | 750,000 | | | | 774,223 | |
| | | | | | | | |
| | | | | | | 1,538,832 | |
|
Auto Manufacturers — 4.6% | |
American Honda Finance Corp.: | | | | | | | | |
2.391% (LIBOR 3 Month + 21 basis points), 2/12/2021 (7) | | | 1,000,000 | | | | 1,000,174 | |
2.650%, 2/12/2021 (1) | | | 1,000,000 | | | | 1,008,976 | |
3.450%, 7/14/2023 | | | 1,555,000 | | | | 1,639,500 | |
Ford Motor Credit Co. LLC, 3.600% (LIBOR 3 Month + 127 basis points), 3/28/2022 (7) | | | 1,000,000 | | | | 989,884 | |
General Motors Financial Co., Inc.: | | | | | | | | |
2.450%, 11/6/2020 | | | 1,000,000 | | | | 999,929 | |
3.450%, 1/14/2022 (1) | | | 750,000 | | | | 764,597 | |
3.583% (LIBOR 3 Month + 127 basis points), 10/4/2019 (7) | | | 1,500,000 | | | | 1,501,185 | |
3.853% (LIBOR 3 Month + 155 basis points), 1/14/2022 (7) | | | 750,000 | | | | 755,617 | |
PACCAR Financial Corp., 2.650%, 5/10/2022 | | | 600,000 | | | | 612,261 | |
Toyota Motor Corp., 3.183%, 7/20/2021 (1) | | | 740,000 | | | | 757,592 | |
Toyota Motor Credit Corp.: | | | | | | | | |
3.031% (LIBOR 3 Month + 69 basis points), 1/11/2022 (7) | | | 1,000,000 | | | | 1,009,234 | |
3.350%, 1/8/2024 (1) | | | 850,000 | | | | 900,397 | |
| | | | | | | | |
| | | | | | | 11,939,346 | |
| | |
Banks — 21.6% | | | | | | | | |
Australia & New Zealand Banking Group, Ltd., 3.300%, 5/17/2021 | | | 500,000 | | | | 511,444 | |
Bank of America Corp.: | | | | | | | | |
2.328% (LIBOR 3 Month + 63 basis points), 10/1/2021 (1)(7) | | | 750,000 | | | | 751,362 | |
| | | | | | | | |
| Description | | Principal
Amount | | | Value | |
| Corporate Bonds & Notes (continued) | | | | | | |
| | |
Banks(continued) | | | | | | | | |
3.283% (LIBOR 3 Month + 100 basis points), 4/24/2023 (7) | | $ | 2,000,000 | | | $ | 2,014,208 | |
3.499% (LIBOR 3 Month + 63 basis points), 5/17/2022 (1)(7) | | | 1,000,000 | | | | 1,022,688 | |
Branch Banking & Trust Co., 2.100%, 1/15/2020 | | | 750,000 | | | | 749,964 | |
Canadian Imperial Bank of Commerce: | | | | | | | | |
2.700%, 2/2/2021 | | | 750,000 | | | | 757,921 | |
3.500%, 9/13/2023 (1) | | | 650,000 | | | | 688,287 | |
Capital One Financial Corp., 3.050%, 3/9/2022 (1) | | | 1,000,000 | | | | 1,023,373 | |
Capital One NA, 3.416% (LIBOR 3 Month + 115 basis points), 1/30/2023 (1)(7) | | | 1,000,000 | | | | 1,007,909 | |
Citigroup, Inc.: | | | | | | | | |
2.350%, 8/2/2021 (1) | | | 520,000 | | | | 523,490 | |
2.700%, 10/27/2022 (1) | | | 1,000,000 | | | | 1,017,444 | |
3.235% (LIBOR 3 Month + 96 basis points), 4/25/2022 (1)(7) | | | 1,500,000 | | | | 1,516,888 | |
Customers Bancorp, Inc., 3.950%, 6/30/2022 | | | 2,000,000 | | | | 1,999,805 | |
Fifth Third Bancorp, 3.650%, 1/25/2024 | | | 1,200,000 | | | | 1,273,102 | |
Goldman Sachs Group, Inc.: | | | | | | | | |
2.350%, 11/15/2021 | | | 1,000,000 | | | | 1,002,051 | |
2.550%, 10/23/2019 | | | 1,500,000 | | | | 1,500,702 | |
3.625%, 1/22/2023 (1) | | | 1,000,000 | | | | 1,046,621 | |
Home BancShares, Inc., 5.625% (LIBOR 3 Month + 358 basis points), 4/15/2027 (7) | | | 1,000,000 | | | | 1,047,582 | |
Huntington Bancshares, Inc.: | | | | | | | | |
2.300%, 1/14/2022 (1) | | | 1,144,000 | | | | 1,149,783 | |
3.150%, 3/14/2021 | | | 1,000,000 | | | | 1,014,770 | |
Independent Bank Group, Inc., 5.875%, 8/1/2024 | | | 1,680,000 | | | | 1,782,263 | |
KeyBank NA: | | | | | | | | |
3.300%, 2/1/2022 | | | 1,500,000 | | | | 1,546,886 | |
3.375%, 3/7/2023 | | | 1,000,000 | | | | 1,044,223 | |
MB Financial Bank NA, 4.000% (LIBOR 3 Month + 187 basis points), 12/1/2027 (7) | | | 2,000,000 | | | | 2,044,677 | |
Mitsubishi UFJ Financial Group, Inc.: | | | | | | | | |
3.535%, 7/26/2021 (1) | | | 850,000 | | | | 871,394 | |
3.761%, 7/26/2023 | | | 1,000,000 | | | | 1,057,987 | |
Morgan Stanley: | | | | | | | | |
2.625%, 11/17/2021 (1) | | | 1,250,000 | | | | 1,263,478 | |
3.458% (LIBOR 3 Month + 118 basis points), 1/20/2022 (7) | | | 645,000 | | | | 651,443 | |
National Australia Bank, Ltd.: | | | | | | | | |
2.500%, 1/12/2021 | | | 1,400,000 | | | | 1,410,101 | |
2.625%, 7/23/2020 | | | 1,000,000 | | | | 1,005,678 | |
Peapack Gladstone Financial Corp., 6.000% (LIBOR 3 Month + 485 basis points), 6/30/2026 (7) | | | 500,000 | | | | 513,066 | |
PNC Bank NA: | | | | | | | | |
2.528% (LIBOR 3 Month + 25 basis points), 1/22/2021 (1)(7) | | | 750,000 | | | | 750,442 | |
3.500%, 6/8/2023 (1) | | | 1,000,000 | | | | 1,055,464 | |
PNC Financial Services Group, Inc., 4.375%, 8/11/2020 (1) | | | 950,000 | | | | 971,070 | |
Regions Bank, 2.699% (LIBOR 3 Month + 38 basis points), 4/1/2021 (1)(7) | | | 1,000,000 | | | | 998,610 | |
Renasant Corp., 5.000% (LIBOR 3 Month + 384 basis points), 9/1/2026 (7) | | | 825,000 | | | | 840,063 | |
(See Notes to Schedules of Investments and Notes to Financial Statements, which are an integral part of the Financial Statements)
84
Short-Term Income Fund (continued)
| | | | | | | | |
| Description | | Principal
Amount | | | Value | |
| Corporate Bonds & Notes (continued) | | | | |
| | |
Banks(continued) | | | | | | | | |
Royal Bank of Canada: | | | | | | | | |
2.578% (LIBOR 3 Month + 30 basis points), 7/22/2020 (7) | | $ | 1,000,000 | | | $ | 1,001,807 | |
2.750%, 2/1/2022 (1) | | | 400,000 | | | | 408,704 | |
State Street Corp., 1.950%, 5/19/2021 (1) | | | 1,000,000 | | | | 1,000,286 | |
SunTrust Bank: | | | | | | | | |
2.250%, 1/31/2020 | | | 1,000,000 | | | | 999,904 | |
3.502% (LIBOR 3 Month + 59 basis points), 8/2/2022 (1)(7) | | | 750,000 | | | | 767,911 | |
3.689% (LIBOR 3 Month + 74 basis points), 8/2/2024 (1)(7) | | | 700,000 | | | | 738,124 | |
Toronto-Dominion Bank: | | | | | | | | |
2.125%, 4/7/2021 (1) | | | 1,000,000 | | | | 1,003,362 | |
2.359% (LIBOR 3 Month + 15 basis points), 8/7/2020 (7) | | | 2,000,000 | | | | 2,001,919 | |
3.250%, 3/11/2024 (1) | | | 1,000,000 | | | | 1,052,730 | |
U.S. Bank NA: | | | | | | | | |
2.050%, 10/23/2020 | | | 1,000,000 | | | | 1,001,736 | |
2.500% (FEDL 1 Month + 38 basis points), 1/30/2020 (7) | | | 1,000,000 | | | | 1,000,629 | |
United Community Banks, Inc., 4.500% (LIBOR 3 Month + 212 basis points), 1/30/2028 (7) | | | 1,000,000 | | | | 1,029,991 | |
Wells Fargo & Co.: | | | | | | | | |
2.625%, 7/22/2022 (1) | | | 1,000,000 | | | | 1,017,229 | |
3.393% (LIBOR 3 Month + 111 basis points), 1/24/2023 (7) | | | 1,000,000 | | | | 1,012,137 | |
Westpac Banking Corp.: | | | | | | | | |
2.500%, 6/28/2022 (1) | | | 500,000 | | | | 508,475 | |
2.615% (LIBOR 3 Month + 34 basis points), 1/25/2021 (7) | | | 750,000 | | | | 751,057 | |
2.800%, 1/11/2022 (1) | | | 1,000,000 | | | | 1,022,532 | |
| | | | | | | | |
| | | | | | | 55,744,772 | |
| | |
Chemicals — 0.2% | | | | | | | | |
DuPont de Nemours, Inc., 3.766%, 11/15/2020 (1) | | | 425,000 | | | | 433,879 | |
| | |
Computers — 1.8% | | | | | | | | |
Apple, Inc.: | | | | | | | | |
2.400%, 5/3/2023 (1) | | | 1,500,000 | | | | 1,532,642 | |
3.450%, 5/6/2024 (1) | | | 1,500,000 | | | | 1,607,705 | |
Dell International LLC, 4.420%, 6/15/2021 (1)(5) | | | 1,000,000 | | | | 1,031,613 | |
IBM Credit LLC, 3.450%, 11/30/2020 | | | 550,000 | | | | 559,655 | |
| | | | | | | | |
| | | | | | | 4,731,615 | |
|
Cosmetics/Personal Care — 0.8% | |
Colgate-Palmolive Co., 2.250%, 11/15/2022 | | | 1,300,000 | | | | 1,317,850 | |
Procter & Gamble Co., 2.150%, 8/11/2022 | | | 775,000 | | | | 784,588 | |
| | | | | | | | |
| | | | | | | 2,102,438 | |
|
Diversified Financial Services — 1.9% | |
American Express Co., 3.400%, 2/22/2024 (1) | | | 1,000,000 | | | | 1,055,314 | |
American Express Credit Corp.: | | | | | | | | |
2.375%, 5/26/2020 | | | 1,000,000 | | | | 1,001,397 | |
2.700%, 3/3/2022 (1) | | | 1,500,000 | | | | 1,530,401 | |
2.600%, 9/14/2020 | | | 750,000 | | | | 754,257 | |
| | | | | | | | |
| Description | | Principal
Amount | | | Value | |
| Corporate Bonds & Notes (continued) | | | | | | |
| |
Diversified Financial Services(continued) | | | | | |
Capital One Financial Corp., 3.200%, 1/30/2023 (1) | | $ | 500,000 | | | $ | 514,990 | |
| | | | | | | | |
| | | | | | | 4,856,359 | |
| | |
Electric — 0.3% | | | | | | | | |
American Electric Power Co., Inc., 2.150%, 11/13/2020 | | | 750,000 | | | | 750,890 | |
| | |
Healthcare-Services — 0.8% | | | | | | | | |
Anthem, Inc., 2.500%, 11/21/2020 | | | 600,000 | | | | 603,163 | |
UnitedHealth Group, Inc., 2.875%, 3/15/2023 (1) | | | 1,500,000 | | | | 1,544,237 | |
| | | | | | | | |
| | | | | | | 2,147,400 | |
| | |
Insurance — 0.2% | | | | | | | | |
Allstate Corp., 2.760% (LIBOR 3 Month + 43 basis points), 3/29/2021 (7) | | | 500,000 | | | | 500,698 | |
|
Machinery-Construction & Mining — 1.2% | |
Caterpillar Financial Services Corp.: | | | | | | | | |
3.150%, 9/7/2021 (1) | | | 775,000 | | | | 795,483 | |
3.450%, 5/15/2023 (1) | | | 2,110,000 | | | | 2,219,824 | |
| | | | | | | | |
| | | | | | | 3,015,307 | |
|
Machinery-Diversified — 0.9% | |
John Deere Capital Corp.: | | | | | | | | |
2.800%, 3/6/2023 (1) | | | 750,000 | | | | 772,250 | |
3.200%, 1/10/2022 (1) | | | 1,500,000 | | | | 1,545,292 | |
| | | | | | | | |
| | | | | | | 2,317,542 | |
| | |
Media — 2.4% | | | | | | | | |
Comcast Corp.: | | | | | | | | |
2.750%, 3/1/2023 (1) | | | 1,500,000 | | | | 1,541,770 | |
3.300%, 10/1/2020 (1) | | | 1,000,000 | | | | 1,014,710 | |
3.700%, 4/15/2024 (1) | | | 1,000,000 | | | | 1,071,487 | |
Discovery Communications LLC, 2.200%, 9/20/2019 | | | 2,000,000 | | | | 1,999,702 | |
TWDC Enterprises 18 Corp., 1.950%, 3/4/2020 (1) | | | 500,000 | | | | 500,102 | |
| | | | | | | | |
| | | | | | | 6,127,771 | |
| | |
Oil & Gas — 2.9% | | | | | | | | |
BP Capital Markets PLC, 2.500%, 11/6/2022 (1) | | | 1,250,000 | | | | 1,268,706 | |
Equinor ASA, 2.450%, 1/17/2023 | | | 1,000,000 | | | | 1,016,400 | |
Exxon Mobil Corp., 2.397%, 3/6/2022 (1) | | | 850,000 | | | | 864,326 | |
Occidental Petroleum Corp., 2.700%, 8/15/2022 (1) | | | 2,000,000 | | | | 2,019,469 | |
Phillips 66, 2.732% (LIBOR 3 Month + 60 basis points), 2/26/2021 (7) | | | 1,200,000 | | | | 1,200,052 | |
Shell International Finance BV, 3.500%, 11/13/2023 (1) | | | 1,000,000 | | | | 1,064,693 | |
| | | | | | | | |
| | | | | | | 7,433,646 | |
| | |
Pharmaceuticals — 0.8% | | | | | | | | |
AbbVie, Inc., 3.750%, 11/14/2023 (1) | | | 500,000 | | | | 527,613 | |
CVS Health Corp., 3.350%, 3/9/2021 | | | 1,500,000 | | | | 1,529,922 | |
| | | | | | | | |
| | | | | | | 2,057,535 | |
| | |
Pipelines — 1.1% | | | | | | | | |
Energy Transfer Operating LP, 3.600%, 2/1/2023 (1) | | | 1,000,000 | | | | 1,029,360 | |
Kinder Morgan Energy Partners LP, 3.500%, 9/1/2023 | | | 1,903,000 | | | | 1,978,752 | |
| | | | | | | | |
| | | | | | | 3,008,112 | |
(See Notes to Schedules of Investments and Notes to Financial Statements, which are an integral part of the Financial Statements)
85
August 31, 2019
Short-Term Income Fund (continued)
| | | | | | | | |
| Description | | Shares or
Principal
Amount | | | Value | |
| Corporate Bonds & Notes (continued) | | | | |
| | |
Retail — 1.8% | | | | | | | | |
Lowe’s Cos., Inc.,
2.873% (LIBOR 3 Month + 42 basis points), 9/10/2019 (7) | | $ | 815,000 | | | $ | 815,085 | |
Walmart, Inc.: | | | | | | | | |
3.300%, 4/22/2024 | | | 1,500,000 | | | | 1,592,828 | |
3.400%, 6/26/2023 (1) | | | 2,275,000 | | | | 2,409,870 | |
| | | | | | | | |
| | | | | | | 4,817,783 | |
| | |
Savings & Loans — 1.2% | | | | | | | | |
Flagstar Bancorp, Inc., 6.125%, 7/15/2021 | | | 1,000,000 | | | | 1,054,413 | |
New York Community Bancorp, Inc., 5.900% (LIBOR 3 Month + 278 basis points),
11/6/2028 (1)(7) | | | 2,000,000 | | | | 2,108,231 | |
| | | | | | | | |
| | | | | | | 3,162,644 | |
| | |
Semiconductors — 0.4% | | | | | | | | |
Intel Corp., 2.450%, 7/29/2020 | | | 1,000,000 | | | | 1,004,707 | |
| | |
Software — 1.6% | | | | | | | | |
Microsoft Corp.: | | | | | | | | |
1.850%, 2/6/2020 (1) | | | 1,000,000 | | | | 999,340 | |
2.875%, 2/6/2024 (1) | | | 1,500,000 | | | | 1,571,395 | |
Oracle Corp.: | | | | | | | | |
1.900%, 9/15/2021 (1) | | | 525,000 | | | | 525,128 | |
2.500%, 5/15/2022 | | | 1,000,000 | | | | 1,015,114 | |
| | | | | | | | |
| | | | | | | 4,110,977 | |
|
Telecommunications — 2.0% | |
AT&T, Inc.: | | | | | | | | |
3.000%, 2/15/2022 (1) | | | 1,000,000 | | | | 1,022,794 | |
3.900%, 3/11/2024 (1) | | | 1,000,000 | | | | 1,068,143 | |
Verizon Communications, Inc.: | | | | | | | | |
3.125%, 3/16/2022 | | | 400,000 | | | | 412,051 | |
3.450%, 3/15/2021 | | | 500,000 | | | | 511,635 | |
4.150%, 3/15/2024 | | | 1,250,000 | | | | 1,356,991 | |
3.410% (LIBOR 3 Month + 100 basis points), 3/16/2022 (7) | | | 750,000 | | | | 762,196 | |
| | | | | | | | |
| | | | | | | 5,133,810 | |
| | |
Transportation — 0.4% | | | | | | | | |
Union Pacific Corp., 2.950%, 3/1/2022 (1) | | | 1,000,000 | | | | 1,024,662 | |
| | | | | | | | |
Total Corporate Bonds & Notes
(identified cost $125,251,468) | | | | 127,960,725 | |
| | | | | | | | |
| Mutual Funds — 0.4% | | | | | | |
Eaton Vance Institutional Senior Loan Fund,Open-end Cayman Islands Exempted Co. (10) | | | 110,732 | | | | 979,982 | |
| | | | | | | | |
Total Mutual Funds
(identified cost $995,329) | | | | 979,982 | |
| | | | | | | | |
| U.S. Government & U.S. Government Agency Obligations — 10.7% | |
|
Federal Home Loan Mortgage Corporation — 0.4% | |
2.375%, 2/16/2021 | | $ | 1,000,000 | | | | 1,011,284 | |
|
Federal National Mortgage Association — 0.8% | |
1.500%, 6/22/2020 | | | 1,000,000 | | | | 997,171 | |
2.500%, 4/13/2021 | | | 1,000,000 | | | | 1,015,092 | |
| | | | | | | | |
| | | | | | | 2,012,263 | |
|
U.S. Treasury Bonds & Notes — 9.5% | |
1.625%, 3/15/2020 | | | 2,000,000 | | | | 1,997,383 | |
1.875%, 2/28/2022 | | | 500,000 | | | | 504,981 | |
| | | | | | | | |
| Description | | Principal
Amount | | | Value | |
U.S. Government & U.S. Government Agency Obligations
(continued) | |
|
U.S. Treasury Bonds & Notes(continued) | |
2.000%, 5/31/2021 | | $ | 1,500,000 | | | $ | 1,511,074 | |
2.125%, 12/31/2022 | | | 2,000,000 | | | | 2,045,625 | |
2.125%, 2/29/2024 | | | 1,000,000 | | | | 1,030,742 | |
2.250%, 3/31/2021 | | | 1,200,000 | | | | 1,211,859 | |
2.250%, 1/31/2024 | | | 1,000,000 | | | | 1,035,488 | |
2.375%, 4/15/2021 | | | 2,000,000 | | | | 2,024,492 | |
2.625%, 7/15/2021 | | | 1,000,000 | | | | 1,019,668 | |
2.625%, 2/28/2023 | | | 1,250,000 | | | | 1,300,781 | |
2.625%, 12/31/2023 (1) | | | 1,500,000 | | | | 1,575,733 | |
2.750%, 8/15/2021 | | | 2,000,000 | | | | 2,046,406 | |
2.750%, 7/31/2023 | | | 2,000,000 | | | | 2,100,274 | |
2.750%, 8/31/2023 | | | 1,750,000 | | | | 1,839,722 | |
2.750%, 11/15/2023 | | | 1,500,000 | | | | 1,581,270 | |
2.875%, 9/30/2023 | | | 750,000 | | | | 793,110 | |
2.875%, 10/31/2023 (1) | | | 1,000,000 | | | | 1,058,535 | |
| | | | | | | | |
| | | | | | | 24,677,143 | |
| | | | | | | | |
Total U.S. Government & U.S. Government Agency Obligations
(identified cost $27,128,447) | | | | 27,700,690 | |
| | | | | | | | |
| U.S. Government Agency-Mortgage Securities — 1.5% | |
|
Federal Home Loan Mortgage Corporation — 0.8% | |
3.000%, 12/9/2022 | | | 2,000,000 | | | | 2,095,448 | |
|
Federal National Mortgage Association — 0.7% | |
2.490%, 11/1/2020 | | | 893,738 | | | | 892,323 | |
3.500%, 4/1/2026 | | | 74,821 | | | | 77,534 | |
4.000%, 11/1/2031 | | | 338,016 | | | | 358,339 | |
5.500%, 11/1/2033 | | | 94,215 | | | | 106,146 | |
5.500%, 2/1/2034 | | | 70,274 | | | | 79,535 | |
5.500%, 8/1/2037 | | | 155,657 | | | | 176,089 | |
10.000%, 7/1/2020 | | | 1,850 | | | | 1,859 | |
| | | | | | | | |
| | | | | | | 1,691,825 | |
|
Government National Mortgage Association — 0.0% | |
7.500%, 8/15/2037 | | | 12,660 | | | | 12,951 | |
9.000%, 12/15/2019 | | | 19 | | | | 18 | |
| | | | | | | | |
| | | | | | | 12,969 | |
| | | | | | | | |
Total U.S. Government Agency-Mortgage Securities
(identified cost $3,705,304) | | | | 3,800,242 | |
| | | | | | | | |
| Short-Term Investments — 15.8% | | | | | | |
| | |
Certificates of Deposit — 1.9% | | | | | | | | |
Bank of Nova Scotia: | | | | | | | | |
2.563% (LIBOR 3 Month + 22 basis points), 12/23/2019 (7) | | | 750,000 | | | | 749,858 | |
2.590% (U.S. Federal Funds Effective Rate (continuous series) + 47 basis points), 12/12/2019 (7) | | | 350,000 | | | | 349,967 | |
Mizuho Bank, Ltd., 2.729% (LIBOR 3 Month + 38 basis points), 6/25/2020 (7) | | | 1,000,000 | | | | 999,674 | |
MUFG Bank, Ltd., 2.747% (LIBOR 3 Month + 46 basis points), 2/4/2021 (7) | | | 1,500,000 | | | | 1,500,000 | |
Sumitomo Mitsui Banking Corp., 2.703% (LIBOR 3 Month + 42 basis points), 7/24/2020 (7) | | | 1,250,000 | | | | 1,250,000 | |
| | | | | | | | |
| | | | | | | 4,849,499 | |
(See Notes to Schedules of Investments and Notes to Financial Statements, which are an integral part of the Financial Statements)
86
Short-Term Income Fund (continued)
| | | | | | | | |
| Description | | Shares | | | Value | |
| Short-Term Investments (continued) | | | | |
|
| Collateral Pool Investments for Securities on Loan — 12.5% | |
| | |
Collateral pool allocation (3) | | | | | | $ | 32,406,363 | |
| | |
| Mutual Funds — 1.4% | | | | | | |
BMO Institutional Prime Money Market Fund — Premier Class, 2.097% (4) | | | 3,541,416 | | | | 3,541,770 | |
| | | | | | | | |
Total Short-Term Investments
(identified cost $40,797,618) | | | | | | | 40,797,632 | |
| | | | | | | | |
Total Investments — 112.2%
(identified cost $286,102,626) | | | | | | | 289,849,713 | |
| Other Assets and Liabilities — (12.2)% | | | | (31,502,387 | ) |
| | | | | | | | |
| Total Net Assets — 100.0% | | | | | | $ | 258,347,326 | |
| | | | | | | | |
IntermediateTax-Free Fund*
| | | | | | | | |
| Description | | Principal
Amount | | | Value | |
| Municipals — 100.3% | | | | | | |
| | |
Alabama — 2.9% | | | | | | | | |
Black Belt Energy Gas District,
4.000, 12/01/2025,
Call 9/1/2025 (7) | | $ | 6,500,000 | | | $ | 7,370,675 | |
Health Care Authority for Baptist Health,
1.810, 11/01/2042,
Call 9/3/2019 (7) | | | 8,175,000 | | | | 8,175,000 | |
Southeast Alabama Gas Supply District,
2.344, (LIBOR 1 Month), 6/01/2024,
Call 3/1/2024 (7) | | | 7,000,000 | | | | 6,939,800 | |
Other Securities | | | 30,415,000 | | | | 33,248,251 | |
| | | | | | | | |
| | | | | | | 55,733,726 | |
| | |
Alaska — 0.4% | | | | | | | | |
Other Securities | | | 6,850,000 | | | | 7,755,569 | |
| | |
Arizona — 2.6% | | | | | | | | |
Chandler Industrial Development Authority,
5.000, 6/03/2024 (7) | | | 5,000,000 | | | | 5,803,000 | |
Other Securities | | | 40,915,000 | | | | 44,507,761 | |
| | | | | | | | |
| | | | | | | 50,310,761 | |
| | |
Arkansas — 0.7% | | | | | | | | |
Other Securities | | | 12,705,000 | | | | 13,633,414 | |
| | |
California — 7.0% | | | | | | | | |
San Francisco City & County AirportComm-San Francisco International Airport | | | | | | | | |
5.000%, 5/01/2039,
Call 5/1/2029 (8) | | | 4,900,000 | | | | 6,111,133 | |
5.000%, 5/01/2040,
Call 5/1/2029 (8) | | | 5,335,000 | | | | 6,631,405 | |
5.000%, 5/01/2044,
Call 5/1/2029 | | | 5,500,000 | | | | 6,783,700 | |
State of California,
5.000, 4/01/2036,
Call 4/1/2029 | | | 4,500,000 | | | | 5,847,075 | |
| | | | | | | | |
| Description | | Principal
Amount | | | Value | |
| Municipals (continued) | | | | | | |
| | |
California(continued) | | | | | | | | |
Other Securities | | $ | 108,390,000 | | | $ | 108,039,336 | |
| | | | | | | | |
| | | | | | | 133,412,649 | |
| | |
Colorado — 3.4% | | | | | | | | |
Adams & Arapahoe Joint School District 28J Aurora, SAW,
5.000, 12/01/2031,
Call 12/1/2026 | | | 5,000,000 | | | | 6,235,700 | |
City & County of Denver,
5.000, 8/01/2041,
Call 8/1/2026 | | | 8,000,000 | | | | 9,643,280 | |
City & County of Denver Airport System Revenue | | | | | | | | |
5.000%, 11/15/2029,
Call 11/15/2027 | | | 4,945,000 | | | | 6,210,079 | |
5.000%, 11/15/2030,
Call 11/15/2027 | | | 5,010,000 | | | | 6,254,885 | |
Other Securities | | | 33,470,000 | | | | 37,682,994 | |
| | | | | | | | |
| | | | | | | 66,026,938 | |
| | |
Connecticut — 1.6% | | | | | | | | |
Other Securities | | | 25,905,000 | | | | 31,069,456 | |
| | |
Delaware — 0.4% | | | | | | | | |
Other Securities | | | 6,795,000 | | | | 7,614,321 | |
| | |
District of Columbia — 0.4% | | | | | | | | |
Other Securities | | | 6,365,000 | | | | 7,338,610 | |
| | |
Florida — 5.4% | | | | | | | | |
County of Orange Sales Tax Revenue,
5.000, 1/01/2027,
Call 1/1/2022 | | | 5,810,000 | | | | 6,315,528 | |
Florida Development Finance Corp.,
1.900, 3/17/2020 (7) | | | 10,770,000 | | | | 10,773,446 | |
Sarasota County Public Hospital District,
5.000, 7/01/2041,
Call 7/1/2028 | | | 5,000,000 | | | | 6,085,950 | |
Other Securities | | | 72,225,000 | | | | 80,787,507 | |
| | | | | | | | |
| | | | | | | 103,962,431 | |
| | |
Georgia — 4.8% | | | | | | | | |
Main Street Natural Gas, Inc. | | | | | | | | |
2.244%, (LIBOR 1 Month), 9/01/2023,
Call 6/1/2023 (7) | | | 7,000,000 | | | | 7,043,750 | |
4.000%, 12/02/2024,
Call 9/1/2024 (7) | | | 6,000,000 | | | | 6,824,700 | |
Other Securities | | | 70,310,000 | | | | 77,263,245 | |
| | | | | | | | |
| | | | | | | 91,131,695 | |
| | |
Guam — 0.1% | | | | | | | | |
Other Securities | | | 2,310,000 | | | | 2,668,923 | |
| | |
Hawaii — 0.1% | | | | | | | | |
Other Securities | | | 1,000,000 | | | | 1,138,490 | |
| | |
Idaho — 0.1% | | | | | | | | |
Other Security | | | 1,000,000 | | | | 1,149,420 | |
| | |
Illinois — 18.3% | | | | | | | | |
City of Chicago | | | | | | | | |
5.000%, 1/01/2039,
Call 1/1/2029 | | | 6,500,000 | | | | 7,485,660 | |
5.000%, 1/01/2040,
Call 1/1/2029 | | | 10,900,000 | | | | 12,520,285 | |
(See Notes to Schedules of Investments and Notes to Financial Statements, which are an integral part of the Financial Statements)
87
August 31, 2019
IntermediateTax-Free Fund* (continued)
| | | | | | | | |
| Description | | Principal
Amount | | | Value | |
| Municipals (continued) | | | | | | |
| | |
Illinois(continued) | | | | | | | | |
6.000%, 1/01/2038,
Call 1/1/2027 | | $ | 10,000,000 | | | $ | 12,004,400 | |
Illinois Finance Authority | | | | | | | | |
5.000%, 5/15/2043,
Call 11/15/2028 | | | 5,000,000 | | | | 6,023,800 | |
5.000%, 1/01/2044,
Call 1/1/2028 | | | 5,000,000 | | | | 5,816,950 | |
Illinois State Toll Highway Authority | | | | | | | | |
5.000%, 12/01/2032,
Call 1/1/2026 | | | 7,790,000 | | | | 9,302,428 | |
5.000%, 1/01/2044,
Call 7/1/2029 | | | 7,000,000 | | | | 8,669,570 | |
Sales Tax Securitization Corp.,
5.250, 1/01/2043,
Call 1/1/2029 | | | 5,000,000 | | | | 5,968,900 | |
State of Illinois | | | | | | | | |
5.000%, 6/01/2020 | | | 9,900,000 | | | | 10,139,481 | |
5.000%, 11/01/2025 | | | 7,000,000 | | | | 8,027,460 | |
5.000%, 2/01/2027 | | | 5,000,000 | | | | 5,854,350 | |
5.000%, 10/01/2028 | | | 4,700,000 | | | | 5,629,425 | |
5.000%, 11/01/2029,
Call 11/1/2027 | | | 5,000,000 | | | | 5,830,100 | |
5.000%, 6/15/2034,
Call 6/15/2028 | | | 5,000,000 | | | | 5,787,950 | |
Other Securities | | | 218,482,593 | | | | 241,312,136 | |
| | | | | | | | |
| | | | | | | 350,372,895 | |
| | |
Indiana — 2.0% | | | | | | | | |
Other Securities | | | 34,460,000 | | | | 38,183,530 | |
| | |
Iowa — 0.7% | | | | | | | | |
Other Securities | | | 11,270,000 | | | | 12,991,997 | |
| | |
Kansas — 0.2% | | | | | | | | |
Other Securities | | | 2,800,000 | | | | 2,925,822 | |
| | |
Kentucky — 1.0% | | | | | | | | |
Other Securities | | | 16,900,000 | | | | 19,860,625 | |
| | |
Louisiana — 1.1% | | | | | | | | |
Other Securities | | | 18,935,000 | | | | 20,330,534 | |
| | |
Maine — 0.5% | | | | | | | | |
Other Securities | | | 7,985,000 | | | | 8,944,430 | |
| | |
Maryland — 0.4% | | | | | | | | |
Other Securities | | | 7,305,000 | | | | 7,841,715 | |
| | |
Massachusetts — 1.6% | | | | | | | | |
Massachusetts Bay Transportation Authority,
5.000, 7/01/2046,
Call 7/1/2027 | | | 4,465,000 | | | | 5,444,174 | |
Massachusetts Transportation Trust Fund Metropolitan Highway System Revenue,
5.000, 1/01/2023,
Call 1/1/2023 (7) | | | 5,000,000 | | | | 5,610,600 | |
Other Securities | | | 16,370,000 | | | | 18,751,023 | |
| | | | | | | | |
| | | | | | | 29,805,797 | |
| | |
Michigan — 3.6% | | | | | | | | |
Other Securities | | | 60,185,000 | | | | 68,285,093 | |
| | |
Minnesota — 0.5% | | | | | | | | |
Other Securities | | | 9,039,858 | | | | 9,297,329 | |
| | | | | | | | |
| Description | | Principal
Amount | | | Value | |
| Municipals (continued) | | | | | | |
| | |
Mississippi — 0.9% | | | | | | | | |
Other Securities | | $ | 15,890,000 | | | $ | 18,077,818 | |
| | |
Missouri — 1.9% | | | | | | | | |
Other Securities | | | 32,815,000 | | | | 36,430,872 | |
| | |
Nebraska — 0.3% | | | | | | | | |
Other Securities | | | 5,620,000 | | | | 5,981,263 | |
| | |
Nevada — 0.7% | | | | | | | | |
Las Vegas Valley Water District,
5.000, 6/01/2028,
Call 6/1/2022 | | | 5,115,000 | | | | 5,638,162 | |
Other Securities | | | 7,200,000 | | | | 8,623,756 | |
| | | | | | | | |
| | | | | | | 14,261,918 | |
| | |
New Hampshire — 0.2% | | | | | | | | |
Other Securities | | | 4,600,000 | | | | 4,714,246 | |
| | |
New Jersey — 3.5% | | | | | | | | |
New Jersey Transportation Trust Fund Authority | | | | | | | | |
New Jersey Transportation Trust Fund Authority,
5.000, 6/15/2032,
Call 12/15/2024 | | | 5,000,000 | | | | 5,681,100 | |
BAM TCRs | | | | | | | | |
5.000%, 6/15/2028,
Call 6/15/2022 | | | 5,000,000 | | | | 5,457,350 | |
5.250%, 6/15/2033,
Call 6/15/2023 | | | 5,635,000 | | | | 6,320,160 | |
Other Securities | | | 45,355,000 | | | | 49,977,007 | |
| | | | | | | | |
| | | | | | | 67,435,617 | |
| | |
New Mexico — 0.5% | | | | | | | | |
Other Securities | | | 8,868,561 | | | | 9,728,026 | |
| | |
New York — 6.2% | | | | | | | | |
New York City Transitional Finance Authority Future Tax Secured Revenue | | | | | | | | |
5.000%, 11/01/2024,
Call 11/1/2022 | | | 5,715,000 | | | | 6,418,459 | |
5.000%, 8/01/2036,
Call 8/1/2028 | | | 5,555,000 | | | | 7,035,241 | |
New York City Water & Sewer System,
1.370, 6/15/2039,
Call 9/6/2019 (7) | | | 7,000,000 | | | | 7,000,000 | |
New York State Dormitory Authority,
5.000, 3/15/2027,
Call 3/15/2022 | | | 7,555,000 | | | | 8,295,314 | |
Other Securities | | | 80,405,000 | | | | 89,849,934 | |
| | | | | | | | |
| | | | | | | 118,598,948 | |
| | |
North Carolina — 0.6% | | | | | | | | |
Other Securities | | | 10,365,000 | | | | 11,321,498 | |
| | |
North Dakota — 1.4% | | | | | | | | |
Other Securities | | | 25,085,000 | | | | 26,881,260 | |
| | |
Ohio — 2.8% | | | | | | | | |
Other Securities | | | 49,145,000 | | | | 53,565,386 | |
| | |
Oklahoma — 0.6% | | | | | | | | |
Other Securities | | | 10,865,000 | | | | 11,762,283 | |
| | |
Oregon — 0.6% | | | | | | | | |
Other Securities | | | 11,905,000 | | | | 12,337,715 | |
(See Notes to Schedules of Investments and Notes to Financial Statements, which are an integral part of the Financial Statements)
88
IntermediateTax-Free Fund* (continued)
| | | | | | | | |
| Description | | Principal
Amount | | | Value | |
| Municipals (continued) | | | | | | |
| | |
Pennsylvania — 3.3% | | | | | | | | |
Pennsylvania Turnpike Commission,
5.000, 6/01/2042,
Call 6/1/2027 | | $ | 5,450,000 | | | $ | 6,449,203 | |
Other Securities | | | 49,440,000 | | | | 55,946,196 | |
| | | | | | | | |
| | | | | | | 62,395,399 | |
| | |
Rhode Island — 0.4% | | | | | | | | |
Other Securities | | | 7,795,000 | | | | 8,248,380 | |
| | |
South Carolina — 1.3% | | | | | | | | |
Patriots Energy Group Financing Agency,
2.354, (LIBOR 1 Month), 2/01/2024,
Call 11/1/2023 (7) | | | 8,000,000 | | | | 8,009,600 | |
Other Securities | | | 15,805,000 | | | | 17,582,102 | |
| | | | | | | | |
| | | | | | | 25,591,702 | |
| | |
South Dakota — 0.7% | | | | | | | | |
Other Securities | | | 12,530,000 | | | | 13,406,689 | |
| | |
Tennessee — 1.3% | | | | | | | | |
Knox County Health Educational & Housing Facility Board,
5.000, 1/01/2042,
Call 1/1/2027 | | | 5,815,000 | | | | 6,905,836 | |
Tennessee Energy Acquisition Corp.,
5.000, 2/01/2023 | | | 5,310,000 | | | | 5,893,463 | |
Other Securities | | | 11,040,000 | | | | 11,730,527 | |
| | | | | | | | |
| | | | | | | 24,529,826 | |
| | |
Texas — 6.4% | | | | | | | | |
City of Houston Airport System Revenue,
5.000, 7/01/2038,
Call 7/1/2028 | | | 5,000,000 | | | | 6,230,450 | |
North Texas Tollway Authority,
5.000, 1/01/2048,
Call 1/1/2028 | | | 5,000,000 | | | | 6,065,000 | |
Other Securities | | | 98,250,000 | | | | 110,436,634 | |
| | | | | | | | |
| | | | | | | 122,732,084 | |
|
U. S. Virgin Islands — 0.2% | |
Other Securities | | | 3,320,000 | | | | 3,728,844 | |
| | |
Utah — 0.6% | | | | | | | | |
Other Securities | | | 10,510,000 | | | | 11,411,961 | |
| | |
Vermont — 0.0% | | | | | | | | |
Other Securities | | | 810,000 | | | | 851,747 | |
| | |
Virginia — 0.7% | | | | | | | | |
Other Securities | | | 12,670,000 | | | | 14,056,425 | |
| | |
Washington — 1.9% | | | | | | | | |
FYI Properties,
5.000, 6/01/2031,
Call 6/1/2028 | | | 5,000,000 | | | | 6,338,350 | |
Spokane County School District No 81 Spokane, School Bond Gty,
5.000, 12/01/2036,
Call 6/1/2029 | | | 5,000,000 | | | | 6,439,300 | |
Other Securities | | | 20,810,000 | | | | 23,719,273 | |
| | | | | | | | |
| | | | | | | 36,496,923 | |
| | | | | | | | |
| Description | | Principal
Amount | | | Value | |
| Municipals (continued) | | | | | | |
| | |
West Virginia — 0.5% | | | | | | | | |
Other Securities | | $ | 8,435,000 | | | $ | 10,259,344 | |
| | |
Wisconsin — 2.9% | | | | | | | | |
Wisconsin Health & Educational Facilities Authority,
5.000, 8/15/2032,
Call 8/15/2022 | | | 5,000,000 | | | | 5,560,850 | |
Other Securities | | | 48,815,000 | | | | 49,481,239 | |
| | | | | | | | |
| | | | | | | 55,042,089 | |
| | |
Wyoming — 0.1% | | | | | | | | |
Other Security | | | 1,000,000 | | | | 1,056,790 | |
| | | | | | | | |
Total Municipals
(identified cost $1,806,919,552) | | | | 1,922,691,223 | |
| | | | | | | | |
| | | | | | | | |
| Short-Term Investments — 0.0% | | | | |
| |
| Repurchase Agreements — 0.0% | | | | |
Other Security | | | 175,593 | | | | 175,593 | |
| | | | | | | | |
Total Short-Term Investments
(identified cost $175,593) | | | | | | | 175,593 | |
| | | | | | | | |
Total Investments — 100.3%
(identified cost $1,807,095,145) | | | | 1,922,866,816 | |
| Other Assets — (0.3)% | | | | | | | (5,202,964 | ) |
| | | | | | | | |
| Net Assets — 100.0% | | | | | | $ | 1,917,663,852 | |
| | | | | | | | |
Strategic Income Fund
| | | | | | | | |
| Description | | Principal
Amount | | | Value | |
| Asset-Backed Securities — 0.2% | | | | |
|
Federal Home Loan Mortgage Corporation — 0.2% | |
2.275% (LIBOR 1 Month + 13 basis points), 8/25/2031,
(Series T-32) (7) | | $ | 177,026 | | | $ | 176,348 | |
| | | | | | | | |
Total Asset-Backed Securities
(identified cost $177,026) | | | | | | | 176,348 | |
| | | | | | | | |
| Collateralized Mortgage Obligations — 14.5% | |
|
Federal National Mortgage Association — 0.5% | |
2.545% (LIBOR 1 Month + 40 basis points), 4/25/2034,
(Series 2004-25) (7) | | | 120,657 | | | | 120,956 | |
4.000%, 3/25/2041,
(Series2012-21) | | | 212,820 | | | | 223,890 | |
| | | | | | | | |
| | | | | | | 344,846 | |
| | |
Private Sponsor — 14.0% | | | | | | | | |
Alternative Loan Trust,
Class 1A1, (Series 2004-24CB),
6.000%, 11/25/2034 | | | 606,749 | | | | 633,986 | |
Banc of America Funding Trust,
Class 2A1, (Series2005-5),
5.500%, 9/25/2035 | | | 226,496 | | | | 253,157 | |
Chase Mortgage Finance Trust: | | | | | | | | |
Class 7A1, (Series2007-A2),
3.771%, 7/25/2037 (7) | | | 352,927 | | | | 321,039 | |
Class A1, (Series2005-S2),
5.500%, 10/25/2035 | | | 424,874 | | | | 452,720 | |
ChaseFlex Trust ,
Class 4A3, (Series2005-2),
6.000%, 5/25/2020 | | | 28,202 | | | | 27,524 | |
(See Notes to Schedules of Investments and Notes to Financial Statements, which are an integral part of the Financial Statements)
89
August 31, 2019
Strategic Income Fund (continued)
| | | | | | | | |
| Description | | Principal
Amount | | | Value | |
| Collateralized Mortgage Obligations (continued) | |
| | |
Private Sponsor(continued) | | | | | | | | |
FREMF Mortgage Trust: | | | | | | | | |
Class B, (Series2019-K91),
4.397%, 4/25/2051 (5)(7) | | $ | 1,000,000 | | | $ | 1,100,480 | |
Class B, (Series2019-K95),
4.053%, 6/25/2029 (acquisition cost - $1,044,594; acquired 8/1/2019) (5) | | | 1,000,000 | | | | 1,073,524 | |
Class C, (Series2018-K77),
4.302%, 5/25/2051 (5)(7) | | | 1,000,000 | | | | 1,061,653 | |
GSR Mortgage Loan Trust,
Class 2A4, (Series2007-1F),
5.500%, 1/25/2037 | | | 101,249 | | | | 113,163 | |
Morgan Stanley Mortgage Loan Trust,
Class 2A2, (Series 2004-10AR),
4.483%, 11/25/2034 (7) | | | 371,193 | | | | 382,576 | |
Residential Asset Securitization Trust,
Class A4, (Series 2005-A8CB),
5.500%, 7/25/2035 | | | 630,630 | | | | 561,594 | |
RFMSI Trust,
Class A2, (Series2006-S4),
6.000%, 4/25/2036 | | | 394,570 | | | | 394,198 | |
Structured Adjustable Rate Mortgage Loan Trust,
Class 1A2, (Series2004-18),
4.248%, 12/25/2034 (7) | | | 411,944 | | | | 404,160 | |
Wells Fargo Mortgage Backed Securities Trust: | | | | | | | | |
Class 1A2, (Series2006-6),
5.750%, 5/25/2036 | | | 225,579 | | | | 223,064 | |
Class 1A9, (Series2007-8),
6.000%, 7/25/2037 | | | 1,975,796 | | | | 2,012,683 | |
Class 2A6, (Series2007-8),
6.000%, 7/25/2037 | | | 482,248 | | | | 487,630 | |
Class A1, (Series 2006-AR19),
4.880%, 12/25/2036 (7) | | | 485,503 | | | | 482,718 | |
Class A1, (Series2007-15),
6.000%, 11/25/2037 | | | 418,701 | | | | 430,475 | |
Class A6, (Series2007-7),
6.000%, 6/25/2037 | | | 248,040 | | | | 250,874 | |
Class A8, (Series2007-11),
6.000%, 8/25/2037 | | | 284,286 | | | | 291,051 | |
| | | | | | | | |
| | | | | | | 10,958,269 | |
| | | | | | | | |
Total Collateralized Mortgage Obligations
(identified cost $10,937,205) | | | | 11,303,115 | |
| | | | | | | | |
| Commercial Mortgage Securities — 3.8% | |
| | |
Private Sponsor — 3.8% | | | | | | | | |
BANK, Class A4,
(Series 2018-BN15),
4.407%, 11/15/2061 (7) | | | 750,000 | | | | 882,817 | |
UBS-Barclays Commercial Mortgage Trust,
Class B, (Series2013-C6),
3.875%, 4/10/2046 (5)(7) | | | 2,000,000 | | | | 2,096,073 | |
| | | | | | | | |
Total Commercial Mortgage Securities
(identified cost $2,770,441) | | | | 2,978,890 | |
| | | | | | | | |
| Corporate Bonds & Notes — 69.7% | |
| | |
Agriculture — 2.8% | | | | | | | | |
Altria Group, Inc.,
5.950%, 2/14/2049 (1) | | | 500,000 | | | | 642,818 | |
| | | | | | | | |
| Description | | Principal
Amount | | | Value | |
| Corporate Bonds & Notes (continued) | | | | | | |
| | |
Agriculture(continued) | | | | | | | | |
Bunge, Ltd. Finance Corp.,
4.350%, 3/15/2024 (1) | | $ | 1,000,000 | | | $ | 1,068,210 | |
Imperial Brands Finance PLC,
3.500%, 7/26/2026 (1)(5) | | | 500,000 | | | | 513,290 | |
| | | | | | | | |
| | | | | | | 2,224,318 | |
| | |
Apparel — 0.7% | | | | | | | | |
Marvell Technology Group, Ltd.,
4.875%, 6/22/2028 | | | 500,000 | | | | 564,620 | |
| | |
Auto Manufacturers — 0.6% | | | | | | | | |
Ford Motor Credit Co. LLC,
4.134%, 8/4/2025 (1) | | | 445,000 | | | | 448,825 | |
| | |
Banks — 1.3% | | | | | | | | |
Banco Nacional de Costa Rica,
6.250%, 11/1/2023 (1)(5) | | | 1,000,000 | | | | 1,056,150 | |
| | |
Chemicals — 4.9% | | | | | | | | |
Braskem Netherlands Finance BV,
4.500%, 1/10/2028 (1)(5) | | | 500,000 | | | | 500,975 | |
CF Industries, Inc.,
3.450%, 6/1/2023 (1) | | | 450,000 | | | | 461,867 | |
Mexichem SAB de C.V.,
5.500%, 1/15/2048 (5) | | | 1,000,000 | | | | 1,026,260 | |
OCP SA, 4.500%, 10/22/2025 (1)(5) | | | 750,000 | | | | 797,412 | |
Starfruit Finco BV,
8.000%, 10/1/2026 (1)(5) | | | 500,000 | | | | 490,000 | |
Syngenta Finance NV,
4.892%, 4/24/2025 (1)(5) | | | 500,000 | | | | 531,039 | |
| | | | | | | | |
| | | | | | | 3,807,553 | |
| | |
Commercial Services — 2.8% | | | | | | | | |
Refinitiv US Holdings, Inc.,
8.250%, 11/15/2026 (5) | | | 750,000 | | | | 845,625 | |
United Rentals North America, Inc.,
5.500%, 5/15/2027 (1) | | | 750,000 | | | | 807,570 | |
Weight Watchers International, Inc.,
8.625%, 12/1/2025 (5) | | | 500,000 | | | | 503,750 | |
| | | | | | | | |
| | | | | | | 2,156,945 | |
| | |
Computers — 2.0% | | | | | | | | |
Dell International LLC,
5.300%, 10/1/2029 (5) | | | 750,000 | | | | 813,364 | |
Seagate HDD Cayman,
4.875%, 6/1/2027 | | | 750,000 | | | | 772,391 | |
| | | | | | | | |
| | | | | | | 1,585,755 | |
|
Cosmetics/Personal Care — 0.9% | |
Coty, Inc.,
6.500%, 4/15/2026 (1)(5) | | | 750,000 | | | | 710,625 | |
| |
Diversified Financial Services — 2.5% | | | | | |
Ally Financial, Inc.,
5.750%, 11/20/2025 | | | 400,000 | | | | 459,500 | |
Cantor Fitzgerald LP,
4.875%, 5/1/2024 (5) | | | 500,000 | | | | 530,293 | |
GE Capital International Funding Co. Unlimited Co.,
3.373%, 11/15/2025 (1) | | | 500,000 | | | | 506,897 | |
Synchrony Financial,
4.375%, 3/19/2024 | | | 400,000 | | | | 427,487 | |
| | | | | | | | |
| | | | | | | 1,924,177 | |
| | |
Electric — 0.7% | | | | | | | | |
Abu Dhabi National Energy Co. PJSC,
4.375%, 4/23/2025 (5) | | | 500,000 | | | | 542,505 | |
(See Notes to Schedules of Investments and Notes to Financial Statements, which are an integral part of the Financial Statements)
90
Strategic Income Fund (continued)
| | | | | | | | |
| Description | | Principal
Amount | | | Value | |
| Corporate Bonds & Notes (continued) | | | | | | |
| | |
Electronics — 0.9% | | | | | | | | |
Diamond Offshore Drilling, Inc.,
7.875%, 8/15/2025 (1) | | $ | 750,000 | | | $ | 693,975 | |
| | |
Food — 2.0% | | | | | | | | |
Albertsons Cos. LLC,
5.750%, 3/15/2025 | | | 500,000 | | | | 515,000 | |
Minerva Luxembourg SA,
6.500%, 9/20/2026 (5) | | | 500,000 | | | | 519,375 | |
Post Holdings, Inc.,
5.000%, 8/15/2026 (5) | | | 500,000 | | | | 523,125 | |
| | | | | | | | |
| | | | | | | 1,557,500 | |
|
Forest Products & Paper — 1.1% | |
Suzano Austria GmbH,
7.000%, 3/16/2047 (5) | | | 750,000 | | | | 872,902 | |
| | |
Healthcare-Products — 0.7% | | | | | | | | |
Mallinckrodt International Finance SA,
4.875%, 4/15/2020 (1)(5) | | | 750,000 | | | | 586,875 | |
| | |
Healthcare-Services — 1.8% | | | | | | | | |
Catalent Pharma Solutions, Inc.,
4.875%, 1/15/2026 (5) | | | 634,000 | | | | 646,680 | |
Centene Corp.,
6.125%, 2/15/2024 | | | 750,000 | | | | 786,937 | |
| | | | | | | | |
| | | | | | | 1,433,617 | |
| | |
Home Builders — 1.2% | | | | | | | | |
Beazer Homes USA, Inc.,
5.875%, 10/15/2027 | | | 1,000,000 | | | | 952,500 | |
| | |
Home Furnishings — 0.9% | | | | | | | | |
Whirlpool Corp.,
4.750%, 2/26/2029 (1) | | | 650,000 | | | | 732,005 | |
| |
Investment Companies — 0.7% | | | | | |
Owl Rock Capital Corp.,
5.250%, 4/15/2024 | | | 500,000 | | | | 525,743 | |
| | |
Iron/Steel — 1.3% | | | | | | | | |
ArcelorMittal,
4.550%, 3/11/2026 (1) | | | 750,000 | | | | 786,697 | |
United States Steel Corp.,
6.875%, 8/15/2025 (1) | | | 250,000 | | | | 238,513 | |
| | | | | | | | |
| | | | | | | 1,025,210 | |
| | |
Media — 5.0% | | | | | | | | |
Altice Finco SA,
7.625%, 2/15/2025 (5) | | | 800,000 | | | | 827,000 | |
Discovery Communications LLC,
3.950%, 3/20/2028 (1) | | | 700,000 | | | | 735,425 | |
Sirius XM Radio, Inc.,
5.375%, 7/15/2026 (5) | | | 750,000 | | | | 795,000 | |
Time Warner Cable LLC,
4.500%, 9/15/2042 (1) | | | 1,000,000 | | | | 994,576 | |
Viacom, Inc.,
4.375%, 3/15/2043 (1) | | | 500,000 | | | | 531,228 | |
| | | | | | | | |
| | | | | | | 3,883,229 | |
| | |
Mining — 3.9% | | | | | | | | |
Glencore Funding LLC,
4.625%, 4/29/2024 (5) | | | 500,000 | | | | 530,725 | |
Hudbay Minerals, Inc.,
7.250%, 1/15/2023 (1)(5) | | | 750,000 | | | | 777,075 | |
| | | | | | | | |
| Description | | Principal
Amount | | | Value | |
| Corporate Bonds & Notes (continued) | | | | | | |
| | |
Mining(continued) | | | | | | | | |
Kinross Gold Corp.: | | | | | | | | |
4.500%, 7/15/2027 (1) | | $ | 825,000 | | | $ | 866,250 | |
6.875%, 9/1/2041 | | | 750,000 | | | | 882,675 | |
| | | | | | | | |
| | | | | | | 3,056,725 | |
|
Miscellaneous Manufacturing — 1.7% | |
Trinity Industries, Inc.,
4.550%, 10/1/2024 (1) | | | 1,300,000 | | | | 1,311,057 | |
| | |
Oil & Gas — 4.8% | | | | | | | | |
Aker BP ASA,
6.000%, 7/1/2022 (1)(5) | | | 250,000 | | | | 257,625 | |
Gulfport Energy Corp.,
6.000%, 10/15/2024 (1) | | | 350,000 | | | | 256,375 | |
Oasis Petroleum, Inc.,
6.875%, 3/15/2022 | | | 300,000 | | | | 280,500 | |
PBF Holding Co. LLC,
7.250%, 6/15/2025 (1) | | | 750,000 | | | | 779,745 | |
Petroleos Mexicanos,
5.350%, 2/12/2028 (1) | | | 1,000,000 | | | | 949,500 | |
W&T Offshore, Inc.,
9.750%, 11/1/2023 (5) | | | 700,000 | | | | 679,000 | |
Whiting Petroleum Corp.,
6.625%, 1/15/2026 (1) | | | 750,000 | | | | 546,525 | |
| | | | | | | | |
| | | | | | | 3,749,270 | |
| | |
Oil & Gas Services — 0.5% | | | | | | | | |
Nine Energy Service, Inc.,
8.750%, 11/1/2023 (5) | | | 400,000 | | | | 363,000 | |
| | |
Pharmaceuticals — 3.2% | | | | | | | | |
Mylan, Inc.,
5.200%, 4/15/2048 (1) | | | 700,000 | | | | 766,750 | |
Teva Pharmaceutical Finance Netherlands III BV: | | | | | | | | |
4.100%, 10/1/2046 (1) | | | 1,300,000 | | | | 840,125 | |
6.000%, 4/15/2024 (1) | | | 1,000,000 | | | | 906,250 | |
| | | | | | | | |
| | | | | | | 2,513,125 | |
| | |
Pipelines — 3.5% | | | | | | | | |
Cheniere Corpus Christi Holdings LLC,
5.125%, 6/30/2027 (1) | | | 625,000 | | | | 692,188 | |
Enable Midstream Partners LP,
4.950%, 5/15/2028 (1) | | | 500,000 | | | | 531,075 | |
EQM Midstream Partners LP,
4.000%, 8/1/2024 | | | 500,000 | | | | 493,434 | |
Sunoco Logistics Partners Operations LP,
5.400%, 10/1/2047 | | | 900,000 | | | | 1,005,043 | |
| | | | | | | | |
| | | | | | | 2,721,740 | |
| | |
Private Equity — 1.0% | | | | | | | | |
Icahn Enterprises LP,
5.875%, 2/1/2022 | | | 750,000 | | | | 765,000 | |
|
Real Estate Investment Trusts — 1.3% | |
SBA Communications Corp.,
4.875%, 9/1/2024 (1) | | | 500,000 | | | | 519,375 | |
Senior Housing Properties Trust,
4.750%, 2/15/2028 (1) | | | 500,000 | | | | 501,856 | |
| | | | | | | | |
| | | | | | | 1,021,231 | |
| | |
Retail — 3.1% | | | | | | | | |
Beacon Roofing Supply, Inc.,
4.875%, 11/1/2025 (1)(5) | | | 450,000 | | | | 445,500 | |
L Brands, Inc.: | | | | | | | | |
6.950%, 3/1/2033 (1) | | | 1,000,000 | | | | 805,000 | |
7.600%, 7/15/2037 | | | 500,000 | | | | 430,000 | |
(See Notes to Schedules of Investments and Notes to Financial Statements, which are an integral part of the Financial Statements)
91
August 31, 2019
Strategic Income Fund (continued)
| | | | | | | | |
| Description | | Principal
Amount | | | Value | |
| Corporate Bonds & Notes (continued) | | | | |
| | |
Retail(continued) | | | | | | | | |
New Red Finance, Inc.,
4.250%, 5/15/2024 (1)(5) | | $ | 250,000 | | | $ | 258,690 | |
Party City Holdings, Inc.,
6.125%, 8/15/2023 (1)(5) | | | 500,000 | | | | 501,250 | |
| | | | | | | | |
| | | | | | | 2,440,440 | |
| | |
Semiconductors — 0.8% | | | | | | | | |
Broadcom, Inc.,
4.750%, 4/15/2029 (5) | | | 600,000 | | | | 632,523 | |
| | |
Software — 1.0% | | | | | | | | |
VMware, Inc.,
3.900%, 8/21/2027 (1) | | | 750,000 | | | | 766,821 | |
| | |
Sovereign — 3.6% | | | | | | | | |
Argentine Republic Government International Bond,
5.875%, 1/11/2028 | | | 250,000 | | | | 95,000 | |
Costa Rica Government International Bond,
5.625%, 4/30/2043 (5) | | | 800,000 | | | | 711,208 | |
Export Credit Bank of Turkey,
5.000%, 9/23/2021 (5) | | | 450,000 | | | | 437,337 | |
Ivory Coast Government International Bond,
6.125%, 6/15/2033 (5) | | | 750,000 | | | | 710,576 | |
Oman Sovereign Sukuk SAOC,
4.397%, 6/1/2024 (5) | | | 500,000 | | | | 503,132 | |
Zambia Government International Bond,
8.970%, 7/30/2027 (5) | | | 500,000 | | | | 336,250 | |
| | | | | | | | |
| | | | | | | 2,793,503 | |
|
Telecommunications — 4.3% | |
CommScope, Inc.,
5.500%, 6/15/2024 (1)(5) | | | 1,000,000 | | | | 951,250 | |
Netflix, Inc.,
4.875%, 4/15/2028 | | | 500,000 | | | | 524,375 | |
Sprint Communications, Inc.,
6.000%, 11/15/2022 (1) | | | 500,000 | | | | 533,435 | |
Telecom Italia SpA,
5.303%, 5/30/2024 (1)(5) | | | 600,000 | | | | 644,250 | |
Turk Telekomunikasyon AS,
4.875%, 6/19/2024 (5) | | | 750,000 | | | | 713,304 | |
| | | | | | | | |
| | | | | | | 3,366,614 | |
|
Toys/Games/Hobbies — 0.9% | |
Mattel, Inc.,
2.350%, 8/15/2021 | | | 750,000 | | | | 725,625 | |
| | |
Transportation — 0.3% | | | | | | | | |
Pacific National Finance Pty, Ltd.,
4.625%, 9/23/2020 (5) | | | 250,000 | | | | 254,950 | |
| | |
Trucking & Leasing — 1.0% | | | | | | | | |
Fly Leasing, Ltd.,
6.375%, 10/15/2021 | | | 750,000 | | | | 765,937 | |
| | | | | | | | |
Total Corporate Bonds & Notes
(identified cost $53,506,688) | | | | 54,532,590 | |
| | | | | | | | |
| U.S. Government Agency-Mortgage Securities — 8.1% | |
|
Federal Home Loan Mortgage Corporation — 1.5% | |
3.500%, 4/1/2042 | | | 64,553 | | | | 67,905 | |
4.000%, 12/1/2040 | | | 303,256 | | | | 324,375 | |
4.500%, 9/1/2031 | | | 277,845 | | | | 298,135 | |
| | | | | | | | |
| Description | | Shares or
Principal
Amount | | | Value | |
| U.S. Government Agency-Mortgage Securities (continued) | |
|
Federal Home Loan Mortgage Corporation(continued) | |
4.500%, 7/1/2040 | | $ | 21,777 | | | $ | 23,610 | |
5.000%, 12/1/2022 | | | 44,580 | | | | 46,127 | |
5.000%, 1/1/2040 | | | 185,807 | | | | 205,101 | |
5.500%, 10/1/2021 | | | 34,650 | | | | 35,282 | |
5.500%, 7/1/2035 | | | 37,728 | | | | 42,144 | |
6.000%, 12/1/2036 | | | 17,006 | | | | 19,471 | |
6.000%, 12/1/2037 | | | 4,759 | | | | 5,244 | |
7.500%, 4/1/2024 | | | 17,325 | | | | 18,723 | |
7.500%, 4/1/2027 | | | 12,469 | | | | 14,333 | |
8.000%, 8/1/2030 | | | 14,929 | | | | 17,894 | |
8.500%, 9/1/2024 | | | 10,591 | | | | 11,465 | |
9.500%, 2/1/2025 | | | 1,053 | | | | 1,060 | |
| | | | | | | | |
| | | | | | | 1,130,869 | |
|
Federal National Mortgage Association — 6.3% | |
3.000%, 8/1/2032 | | | 164,541 | | | | 170,052 | |
3.500%, 7/1/2032 | | | 319,785 | | | | 333,456 | |
3.500%, 7/1/2038 | | | 662,553 | | | | 687,509 | |
4.000%, 11/1/2031 | | | 563,360 | | | | 597,231 | |
4.000%, 3/1/2041 | | | 232,150 | | | | 248,958 | |
4.500%, 6/1/2042 | | | 697,019 | | | | 755,412 | |
5.500%, 1/1/2023 | | | 57,904 | | | | 62,540 | |
5.500%, 2/1/2036 | | | 108,207 | | | | 122,235 | |
5.500%, 7/1/2036 | | | 238,495 | | | | 269,884 | |
5.500%, 8/1/2037 | | | 415,411 | | | | 469,939 | |
6.000%, 9/1/2021 | | | 61,720 | | | | 62,898 | |
6.000%, 5/1/2039 | | | 438,002 | | | | 502,421 | |
6.500%, 8/1/2030 | | | 251,994 | | | | 280,527 | |
6.500%, 12/1/2031 | | | 14,619 | | | | 16,942 | |
6.500%, 11/1/2037 | | | 32,512 | | | | 37,796 | |
7.000%, 3/1/2029 | | | 30,633 | | | | 35,291 | |
7.000%, 7/1/2029 | | | 91,436 | | | | 103,363 | |
7.000%, 2/1/2030 | | | 63,521 | | | | 70,811 | |
7.500%, 10/1/2030 | | | 7,091 | | | | 7,669 | |
8.000%, 10/1/2028 | | | 81,453 | | | | 90,019 | |
8.000%, 4/1/2030 | | | 23,873 | | | | 28,750 | |
| | | | | | | | |
| | | | | | | 4,953,703 | |
|
Government National Mortgage Association — 0.3% | |
5.000%, 4/15/2034 | | | 189,406 | | | | 209,251 | |
7.000%, 8/15/2031 | | | 27,180 | | | | 31,397 | |
9.500%, 10/15/2024 | | | 684 | | | | 685 | |
| | | | | | | | |
| | | | | | | 241,333 | |
| | | | | | | | |
| Total U.S. Government Agency-Mortgage Securities | |
(identified cost $6,063,301) | | | | 6,325,905 | |
| | | | | | | | |
| Short-Term Investments — 28.5% | |
|
| Collateral Pool Investments for Securities on Loan — 25.9% | |
| | |
Collateral pool allocation (3) | | | | | | | 20,275,719 | |
| | |
| Mutual Funds — 2.6% | | | | | | |
BMO Institutional Prime Money Market Fund — Premier Class,
2.097% (4) | | | 1,992,482 | | | | 1,992,682 | |
| | | | | | | | |
Total Short-Term Investments
(identified cost $22,268,393) | | | | | | | 22,268,401 | |
| | | | | | | | |
Total Investments — 124.8%
(identified cost $95,723,054) | | | | | | | 97,585,249 | |
| Other Assets and Liabilities — (24.8)% | | | | (19,369,317 | ) |
| | | | | | | | |
| Total Net Assets — 100.0% | | | | | | $ | 78,215,932 | |
| | | | | | | | |
(See Notes to Schedules of Investments and Notes to Financial Statements, which are an integral part of the Financial Statements)
92
TCH Corporate Income Fund
| | | | | | | | |
| Description | | Principal
Amount | | | Value | |
| Corporate Bonds & Notes — 93.4% | |
|
Aerospace/Defense — 1.3% | |
Boeing Co., 2.800%, 3/1/2024 (1) | | $ | 2,000,000 | | | $ | 2,062,994 | |
Lockheed Martin Corp., 2.500%, 11/23/2020 | | | 2,500,000 | | | | 2,513,963 | |
| | | | | | | | |
| | | | | | | 4,576,957 | |
|
Agriculture — 2.5% | |
BAT Capital Corp., 4.540%, 8/15/2047 (1) | | | 2,750,000 | | | | 2,762,180 | |
Bunge, Ltd. Finance Corp.: | | | | | | | | |
3.000%, 9/25/2022 | | | 1,000,000 | | | | 1,012,149 | |
3.750%, 9/25/2027 | | | 1,800,000 | | | | 1,858,476 | |
Imperial Brands Finance PLC, 3.500%, 7/26/2026 (1)(5) | | | 1,750,000 | | | | 1,796,514 | |
Philip Morris International, Inc., 2.900%, 11/15/2021 (1) | | | 1,000,000 | | | | 1,016,765 | |
| | | | | | | | |
| | | | | | | 8,446,084 | |
|
Apparel — 0.3% | |
Marvell Technology Group, Ltd., 4.875%, 6/22/2028 (1) | | | 1,000,000 | | | | 1,129,240 | |
|
Auto Manufacturers — 3.5% | |
Daimler Finance North America LLC: | | | | | | | | |
2.000%, 7/6/2021 (5) | | | 2,500,000 | | | | 2,485,115 | |
3.700%, 5/4/2023 (1)(5) | | | 750,000 | | | | 783,788 | |
Ford Motor Co., 5.291%, 12/8/2046 (1) | | | 2,000,000 | | | | 1,927,673 | |
Ford Motor Credit Co. LLC: | | | | | | | | |
3.600% (LIBOR 3 Month + 127 basis points), 3/28/2022 (7) | | | 750,000 | | | | 742,413 | |
4.134%, 8/4/2025 (1) | | | 1,500,000 | | | | 1,512,893 | |
General Motors Financial Co., Inc.: | | | | | | | | |
4.000%, 1/15/2025 | | | 1,000,000 | | | | 1,029,847 | |
4.350%, 1/17/2027 (1) | | | 1,500,000 | | | | 1,555,364 | |
Toyota Motor Credit Corp., 3.400%, 4/14/2025 | | | 2,000,000 | | | | 2,149,843 | |
| | | | | | | | |
| | | | | | | 12,186,936 | |
|
Banks — 14.2% | |
Banco Santander SA, 3.901% (LIBOR 3 Month + 156 basis points), 4/11/2022 (7) | | | 2,000,000 | | | | 2,032,722 | |
Bank of America Corp.: | | | | | | | | |
2.999% (LIBOR 3 Month + 65 basis points), 6/25/2022 (1)(7) | | | 1,000,000 | | | | 1,004,599 | |
3.824% (LIBOR 3 Month + 158 basis points), 1/20/2028 (1)(7) | | | 2,750,000 | | | | 2,982,160 | |
Canadian Imperial Bank of Commerce, 2.994% (LIBOR 3 Month + 52 basis points), 9/6/2019 (7) | | | 2,000,000 | | | | 2,000,096 | |
Capital One Financial Corp.: | | | | | | | | |
3.300%, 10/30/2024 (1) | | | 1,250,000 | | | | 1,297,123 | |
3.403% (LIBOR 3 Month + 95 basis points), 3/9/2022 (7) | | | 1,500,000 | | | | 1,509,976 | |
Citigroup, Inc., 3.568% (LIBOR 3 Month + 143 basis points), 9/1/2023 (1)(7) | | | 2,000,000 | | | | 2,038,670 | |
Deutsche Bank AG, 4.250%, 2/4/2021 (1) | | | 2,000,000 | | | | 2,023,052 | |
Fifth Third Bank, 2.200%, 10/30/2020 (1) | | | 2,000,000 | | | | 2,004,904 | |
| | | | | | | | |
| Description | | Principal
Amount | | | Value | |
| Corporate Bonds & Notes (continued) | |
| | |
Banks (continued) | | | | | | | | |
Goldman Sachs Group, Inc.: | | | | | | | | |
3.377% (LIBOR 3 Month + 111 basis points), 4/26/2022 (7) | | $ | 1,000,000 | | | $ | 1,008,195 | |
4.223% (LIBOR 3 Month + 130 basis points), 5/1/2029 (1)(7) | | | 2,750,000 | | | | 3,047,724 | |
HSBC Holdings PLC: | | | | | | | | |
3.792% (LIBOR 3 Month + 166 basis points), 5/25/2021 (7) | | | 1,500,000 | | | | 1,528,627 | |
3.973% (LIBOR 3 Month + 161 basis points), 5/22/2030 (7) | | | 2,150,000 | | | | 2,309,769 | |
JPMorgan Chase & Co., 3.509% (LIBOR 3 Month + 95 basis points), 1/23/2029 (7) | | | 3,000,000 | | | | 3,216,827 | |
Lloyds Banking Group PLC, 2.907% (LIBOR 3 Month + 81 basis points), 11/7/2023 (1)(7) | | | 2,000,000 | | | | 2,007,341 | |
Mizuho Financial Group, Inc., 2.953%, 2/28/2022 | | | 2,500,000 | | | | 2,546,482 | |
Morgan Stanley, 3.737% (LIBOR 3 Month + 85 basis points), 4/24/2024 (7) | | | 2,750,000 | | | | 2,894,085 | |
Royal Bank of Canada, 2.948% (LIBOR 3 Month + 66 basis points), 10/5/2023 (7) | | | 2,500,000 | | | | 2,508,640 | |
Royal Bank of Scotland Group PLC, 4.892% (LIBOR 3 Month + 175 basis points), 5/18/2029 (1)(7) | | | 1,500,000 | | | | 1,646,842 | |
Skandinaviska Enskilda Banken AB, 2.800%, 3/11/2022 (1) | | | 2,000,000 | | | | 2,036,005 | |
Toronto-Dominion Bank, 3.303% (LIBOR 3 Month + 100 basis points), 4/7/2021 (7) | | | 2,000,000 | | | | 2,024,820 | |
U.S. Bank NA, 2.603% (LIBOR 3 Month + 32 basis points), 1/24/2020 (7) | | | 1,500,000 | | | | 1,501,433 | |
Wells Fargo & Co.: | | | | | | | | |
3.111% (LIBOR 3 Month + 93 basis points), 2/11/2022 (7) | | | 1,640,000 | | | | 1,649,807 | |
3.584% (LIBOR 3 Month + 131 basis points), 5/22/2028 (1)(7) | | | 2,000,000 | | | | 2,145,906 | |
| | | | | | | | |
| | | | | | | 48,965,805 | |
|
Beverages — 3.1% | |
Anheuser-Busch Cos. LLC, 4.900%, 2/1/2046 (1) | | | 2,000,000 | | | | 2,388,001 | |
Anheuser-Busch InBev Worldwide, Inc., 4.750%, 1/23/2029 (1) | | | 2,000,000 | | | | 2,337,088 | |
Fomento Economico Mexicano SAB de C.V., 2.875%, 5/10/2023 | | | 2,750,000 | | | | 2,801,635 | |
Molson Coors Brewing Co., 4.200%, 7/15/2046 (1) | | | 3,000,000 | | | | 3,064,227 | |
| | | | | | | | |
| | | | | | | 10,590,951 | |
| | |
Chemicals — 3.7% | | | | | | | | |
Braskem Netherlands Finance BV, 4.500%, 1/10/2028 (1)(5) | | | 1,000,000 | | | | 1,001,950 | |
CF Industries, Inc., 5.375%, 3/15/2044 (1) | | | 1,500,000 | | | | 1,523,370 | |
Mexichem SAB de C.V.: | | | | | | | | |
5.875%, 9/17/2044 (5) | | | 500,000 | | | | 535,000 | |
6.750%, 9/19/2042 (1)(5) | | | 1,500,000 | | | | 1,777,515 | |
Mosaic Co., 4.050%, 11/15/2027 (1) | | | 2,500,000 | | | | 2,610,278 | |
OCP SA, 4.500%, 10/22/2025 (1)(5) | | | 2,000,000 | | | | 2,126,432 | |
(See Notes to Schedules of Investments and Notes to Financial Statements, which are an integral part of the Financial Statements)
93
August 31, 2019
TCH Corporate Income Fund (continued)
| | | | | | | | |
| Description | | Principal
Amount | | | Value | |
| Corporate Bonds & Notes (continued) | |
| | |
Chemicals(continued) | | | | | | | | |
Starfruit Finco BV, 8.000%, 10/1/2026 (1)(5) | | $ | 1,000,000 | | | $ | 980,000 | |
Syngenta Finance NV, 4.892%, 4/24/2025 (1)(5) | | | 2,000,000 | | | | 2,124,156 | |
| | | | | | | | |
| | | | | | | 12,678,701 | |
|
Commercial Services — 0.6% | |
ADT Security Corp., 4.125%, 6/15/2023 | | | 500,000 | | | | 509,219 | |
Refinitiv US Holdings, Inc., 8.250%, 11/15/2026 (1)(5) | | | 1,500,000 | | | | 1,691,250 | |
| | | | | | | | |
| | | | | | | 2,200,469 | |
|
Computers — 3.1% | |
Apple, Inc.: | | | | | | | | |
2.850%, 5/11/2024 | | | 2,000,000 | | | | 2,083,691 | |
3.750%, 11/13/2047 | | | 2,000,000 | | | | 2,294,192 | |
Dell International LLC, 8.350%, 7/15/2046 (1)(5) | | | 2,000,000 | | | | 2,630,333 | |
Hewlett Packard Enterprise Co.: | | | | | | | | |
3.009% (LIBOR 3 Month + 72 basis points), 10/5/2021 (7) | | | 1,700,000 | | | | 1,700,258 | |
4.900%, 10/15/2025 (1) | | | 1,000,000 | | | | 1,108,097 | |
Seagate HDD Cayman, 5.750%, 12/1/2034 | | | 1,000,000 | | | | 1,013,684 | |
| | | | | | | | |
| | | | | | | 10,830,255 | |
|
Diversified Financial Services — 6.2% | |
Ally Financial, Inc., 4.250%, 4/15/2021 (1) | | | 2,500,000 | | | | 2,578,125 | |
Cantor Fitzgerald LP, 4.875%, 5/1/2024 (1)(5) | | | 2,000,000 | | | | 2,121,172 | |
Discover Financial Services, 4.100%, 2/9/2027 | | | 2,000,000 | | | | 2,154,666 | |
E*TRADE Financial Corp., 3.800%, 8/24/2027 | | | 1,500,000 | | | | 1,587,106 | |
GE Capital International Funding Co. Unlimited Co., 4.418%, 11/15/2035 (1) | | | 2,500,000 | | | | 2,546,169 | |
High Street Funding Trust II, 4.682%, 2/15/2048 (5) | | | 2,500,000 | | | | 2,885,219 | |
Jefferies Financial Group, Inc., 6.625%, 10/23/2043 (1) | | | 500,000 | | | | 573,027 | |
Jefferies Group LLC, 6.500%, 1/20/2043 | | | 500,000 | | | | 583,629 | |
Legg Mason, Inc., 4.750%, 3/15/2026 | | | 500,000 | | | | 551,810 | |
Mastercard, Inc., 2.000%, 11/21/2021 (1) | | | 3,000,000 | | | | 3,014,257 | |
Synchrony Financial, 3.950%, 12/1/2027 (1) | | | 2,750,000 | | | | 2,852,680 | |
| | | | | | | | |
| | | | | | | 21,447,860 | |
| | |
Electric — 4.5% | | | | | | | | |
Abu Dhabi National Energy Co. PJSC, 4.375%, 4/23/2025 (5) | | | 750,000 | | | | 813,757 | |
AEP Transmission Co. LLC, 3.800%, 6/15/2049 | | | 2,000,000 | | | | 2,264,227 | |
Alabama Power Co., 3.750%, 3/1/2045 (1) | | | 3,000,000 | | | | 3,361,948 | |
CenterPoint Energy, Inc., 3.600%, 11/1/2021 | | | 3,000,000 | | | | 3,086,766 | |
| | | | | | | | |
| Description | | Principal
Amount | | | Value | |
| Corporate Bonds & Notes (continued) | |
| | |
Electric(continued) | | | | | | | | |
Public Service Electric & Gas Co., 3.200%, 8/1/2049 (1) | | $ | 3,000,000 | | | $ | 3,136,026 | |
San Diego Gas & Electric Co., 4.100%, 6/15/2049 | | | 2,500,000 | | | | 2,918,091 | |
| | | | | | | | |
| | | | | | | 15,580,815 | |
|
Electronics — 0.2% | |
Diamond Offshore Drilling, Inc., 7.875%, 8/15/2025 (1) | | | 750,000 | | | | 693,975 | |
|
Engineering & Construction — 0.4% | |
Fluor Corp., 4.250%, 9/15/2028 (1) | | | 1,500,000 | | | | 1,534,389 | |
|
Food — 2.2% | |
Conagra Brands, Inc., 3.800%, 10/22/2021 (1) | | | 2,500,000 | | | | 2,572,778 | |
Kraft Heinz Foods Co.: | | | | | | | | |
3.000%, 6/1/2026 (1) | | | 500,000 | | | | 492,080 | |
4.375%, 6/1/2046 (1) | | | 2,250,000 | | | | 2,165,220 | |
Kroger Co., 4.450%, 2/1/2047 (1) | | | 2,250,000 | | | | 2,357,390 | |
| | | | | | | | |
| | | | | | | 7,587,468 | |
|
Healthcare-Products — 1.3% | |
Medtronic, Inc., 3.210% (LIBOR 3 Month + 80 basis points), 3/15/2020 (7) | | | 2,000,000 | | | | 2,006,591 | |
Thermo Fisher Scientific, Inc., 3.000%, 4/15/2023 | | | 1,000,000 | | | | 1,029,241 | |
Zimmer Biomet Holdings, Inc., 3.550%, 4/1/2025 | | | 1,500,000 | | | | 1,580,318 | |
| | | | | | | | |
| | | | | | | 4,616,150 | |
|
Healthcare-Services — 0.6% | |
Laboratory Corp. of America Holdings, 3.250%, 9/1/2024 (1) | | | 2,000,000 | | | | 2,083,565 | |
|
Home Builders — 0.6% | |
DR Horton, Inc., 2.550%, 12/1/2020 (1) | | | 2,000,000 | | | | 2,005,971 | |
|
Insurance — 3.8% | |
Allstate Corp., 2.760% (LIBOR 3 Month + 43 basis points), 3/29/2021 (7) | | | 1,445,000 | | | | 1,447,016 | |
Lincoln National Corp., 3.625%, 12/12/2026 | | | 2,000,000 | | | | 2,130,364 | |
Metropolitan Life Global Funding I, 3.450%, 10/9/2021 (5) | | | 3,000,000 | | | | 3,089,615 | |
Prudential Financial, Inc., 3.935%, 12/7/2049 (1) | | | 3,000,000 | | | | 3,346,986 | |
Unum Group: | | | | | | | | |
4.000%, 3/15/2024 (1) | | | 2,000,000 | | | | 2,125,539 | |
4.000%, 6/15/2029 | | | 1,000,000 | | | | 1,047,284 | |
| | | | | | | | |
| | | | | | | 13,186,804 | |
|
Internet — 1.6% | |
Alibaba Group Holding, Ltd., 2.800%, 6/6/2023 | | | 2,000,000 | | | | 2,038,575 | |
Amazon.com, Inc., 4.050%, 8/22/2047 (1) | | | 1,500,000 | | | | 1,842,809 | |
eBay, Inc., 4.000%, 7/15/2042 | | | 1,500,000 | | | | 1,487,443 | |
| | | | | | | | |
| | | | | | | 5,368,827 | |
|
Lodging — 0.9% | |
Hyatt Hotels Corp., 5.375%, 8/15/2021 (1) | | | 1,000,000 | | | | 1,049,858 | |
Wyndham Destinations, Inc., 5.750%, 4/1/2027 | | | 2,000,000 | | | | 2,142,500 | |
| | | | | | | | |
| | | | | | | 3,192,358 | |
(See Notes to Schedules of Investments and Notes to Financial Statements, which are an integral part of the Financial Statements)
94
TCH Corporate Income Fund (continued)
| | | | | | | | |
| Description | | Principal
Amount | | | Value | |
| Corporate Bonds & Notes (continued) | |
|
Machinery-Construction & Mining — 0.7% | |
Caterpillar, Inc., 3.803%, 8/15/2042 (1) | | $ | 2,000,000 | | | $ | 2,314,816 | |
|
Machinery-Diversified — 0.5% | |
Wabtec Corp., 4.400%, 3/15/2024 (1) | | | 1,500,000 | | | | 1,607,372 | |
|
Media — 3.1% | |
Charter Communications Operating LLC, 5.375%, 5/1/2047 | | | 2,000,000 | | | | 2,223,993 | |
Comcast Corp.: | | | | | | | | |
2.934% (LIBOR 3 Month + 63 basis points), 4/15/2024 (7) | | | 1,500,000 | | | | 1,510,569 | |
4.600%, 10/15/2038 | | | 1,750,000 | | | | 2,121,025 | |
Cox Communications, Inc., 4.600%, 8/15/2047 (1)(5) | | | 1,500,000 | | | | 1,672,548 | |
Discovery Communications LLC, 3.950%, 3/20/2028 (1) | | | 2,000,000 | | | | 2,101,215 | |
Viacom, Inc., 4.375%, 3/15/2043 (1) | | | 1,050,000 | | | | 1,115,578 | |
| | | | | | | | |
| | | | | | | 10,744,928 | |
|
Mining — 1.1% | |
Glencore Funding LLC: | | | | | | | | |
4.125%, 5/30/2023 (1)(5) | | | 2,500,000 | | | | 2,634,504 | |
4.625%, 4/29/2024 (1)(5) | | | 1,000,000 | | | | 1,061,450 | |
| | | | | | | | |
| | | | | | | 3,695,954 | |
|
Miscellaneous Manufacturing — 1.3% | |
3M Co., 3.250%, 2/14/2024 (1) | | | 1,250,000 | | | | 1,321,106 | |
Siemens Financieringsmaatschappij NV: | | | | | |
2.750% (LIBOR 3 Month + 34 basis points), 3/16/2020 (1)(5)(7) | | | 1,000,000 | | | | 1,001,514 | |
3.300%, 9/15/2046 (1)(5) | | | 2,000,000 | | | | 2,053,439 | |
| | | | | | | | |
| | | | | | | 4,376,059 | |
|
Oil & Gas — 4.1% | |
BP Capital Markets PLC, 3.280% (LIBOR 3 Month + 87 basis points), 9/16/2021 (7) | | | 2,500,000 | | | | 2,529,936 | |
Ecopetrol SA, 7.375%, 9/18/2043 (1) | | | 1,500,000 | | | | 2,019,390 | |
EQT Corp., 3.900%, 10/1/2027 (1) | | | 1,500,000 | | | | 1,311,412 | |
Exxon Mobil Corp., 3.095%, 8/16/2049 (1) | | | 2,000,000 | | | | 2,078,493 | |
Occidental Petroleum Corp., 4.300%, 8/15/2039 | | | 1,250,000 | | | | 1,312,222 | |
Petroleos Mexicanos, 5.350%, 2/12/2028 | | | 3,000,000 | | | | 2,848,500 | |
Shell International Finance BV, 3.750%, 9/12/2046 (1) | | | 1,000,000 | | | | 1,141,028 | |
Valero Energy Corp., 4.000%, 4/1/2029 (1) | | | 1,000,000 | | | | 1,067,695 | |
| | | | | | | | |
| | | | | | | 14,308,676 | |
|
Oil & Gas Services — 1.1% | |
Baker Hughes a GE Co. LLC / Baker HughesCo-Obligor, Inc., 4.080%, 12/15/2047 (1) | | | 4,000,000 | | | | 3,920,414 | |
|
Pharmaceuticals — 7.8% | |
Allergan Funding SCS, 4.850%, 6/15/2044 (1) | | | 1,500,000 | | | | 1,647,421 | |
AstraZeneca PLC, 3.500%, 8/17/2023 | | | 2,000,000 | | | | 2,096,123 | |
| | | | | | | | |
| Description | | Principal
Amount | | | Value | |
| Corporate Bonds & Notes (continued) | |
| | |
Pharmaceuticals(continued) | | | | | | | | |
Bayer US Finance II LLC, 4.875%, 6/25/2048 (1)(5) | | $ | 2,350,000 | | | $ | 2,645,583 | |
Bristol-Myers Squibb Co.: | | | | | | | | |
2.000%, 8/1/2022 | | | 2,500,000 | | | | 2,502,256 | |
2.369% (LIBOR 3 Month + 20 basis points), 11/16/2020 (5)(7) | | | 1,000,000 | | | | 1,000,141 | |
Cigna Corp., 3.060% (LIBOR 3 Month + 65 basis points), 9/17/2021 (7) | | | 1,500,000 | | | | 1,500,047 | |
CVS Health Corp., 4.300%, 3/25/2028 | | | 2,500,000 | | | | 2,728,448 | |
Eli Lilly & Co., 3.700%, 3/1/2045 | | | 2,000,000 | | | | 2,228,507 | |
Express Scripts Holding Co., 4.800%, 7/15/2046 (1) | | | 1,500,000 | | | | 1,730,934 | |
Mylan, Inc., 5.200%, 4/15/2048 | | | 1,500,000 | | | | 1,643,035 | |
Perrigo Finance Unlimited Co., 3.500%, 3/15/2021 | | | 2,500,000 | | | | 2,514,018 | |
Shire Acquisitions Investments Ireland DAC: | | | | | | | | |
2.400%, 9/23/2021 (1) | | | 1,000,000 | | | | 1,003,389 | |
2.875%, 9/23/2023 | | | 2,000,000 | | | | 2,046,209 | |
Teva Pharmaceutical Finance Netherlands III BV, 4.100%, 10/1/2046 (1) | | | 2,500,000 | | | | 1,615,625 | |
| | | | | | | | |
| | | | | | | 26,901,736 | |
|
Pipelines — 2.7% | |
Enable Midstream Partners LP, 4.950%, 5/15/2028 (1) | | | 3,000,000 | | | | 3,186,452 | |
Enbridge, Inc., 3.110% (LIBOR 3 Month + 70 basis points), 6/15/2020 (7) | | | 1,500,000 | | | | 1,504,289 | |
EQM Midstream Partners LP, 4.000%, 8/1/2024 | | | 1,500,000 | | | | 1,480,302 | |
MPLX LP, 4.800%, 2/15/2029 (1) | | | 1,250,000 | | | | 1,391,200 | |
Sunoco Logistics Partners Operations LP, 5.300%, 4/1/2044 (1) | | | 1,500,000 | | | | 1,607,903 | |
| | | | | | | | |
| | | | | | | 9,170,146 | |
|
Real Estate Investment Trusts — 2.1% | |
EPR Properties, 5.250%, 7/15/2023 | | | 1,000,000 | | | | 1,082,917 | |
Hospitality Properties Trust: | | | | | | | | |
4.500%, 6/15/2023 (1) | | | 500,000 | | | | 521,969 | |
4.500%, 3/15/2025 | | | 1,500,000 | | | | 1,525,683 | |
Kimco Realty Corp., 3.300%, 2/1/2025 (1) | | | 1,250,000 | | | | 1,298,181 | |
Mid-America Apartments LP, 3.600%, 6/1/2027 (1) | | | 2,500,000 | | | | 2,681,998 | |
| | | | | | | | |
| | | | | | | 7,110,748 | |
|
Retail — 4.0% | |
Home Depot, Inc., 4.250%, 4/1/2046 | | | 2,000,000 | | | | 2,436,243 | |
L Brands, Inc.: | | | | | | | | |
6.950%, 3/1/2033 (1) | | | 1,350,000 | | | | 1,086,750 | |
7.600%, 7/15/2037 | | | 500,000 | | | | 430,000 | |
McDonald’s Corp., 2.750%, 12/9/2020 (1) | | | 1,500,000 | | | | 1,513,109 | |
Nucor Corp., 4.400%, 5/1/2048 | | | 2,000,000 | | | | 2,360,745 | |
Starbucks Corp., 3.750%, 12/1/2047 (1) | | | 1,000,000 | | | | 1,053,009 | |
Target Corp., 3.625%, 4/15/2046 (1) | | | 2,500,000 | | | | 2,815,901 | |
Walmart, Inc., 3.700%, 6/26/2028 (1) | | | 2,000,000 | | | | 2,247,398 | |
| | | | | | | | |
| | | | | | | 13,943,155 | |
(See Notes to Schedules of Investments and Notes to Financial Statements, which are an integral part of the Financial Statements)
95
August 31, 2019
TCH Corporate Income Fund (continued)
| | | | | | | | |
| Description | | Principal
Amount | | | Value | |
| Corporate Bonds & Notes (continued) | |
|
Semiconductors — 0.6% | |
Broadcom, Inc., 4.750%, 4/15/2029 (5) | | $ | 2,000,000 | | | $ | 2,108,411 | |
|
Software — 3.2% | |
CA, Inc., 4.700%, 3/15/2027 | | | 2,500,000 | | | | 2,630,510 | |
Fiserv, Inc., 4.400%, 7/1/2049 | | | 2,000,000 | | | | 2,311,441 | |
Microsoft Corp.: | | | | | | | | |
2.875%, 2/6/2024 | | | 500,000 | | | | 523,798 | |
3.700%, 8/8/2046 | | | 2,000,000 | | | | 2,355,096 | |
Oracle Corp., 4.000%, 11/15/2047 (1) | | | 1,000,000 | | | | 1,150,267 | |
VMware, Inc., 3.900%, 8/21/2027 (1) | | | 2,000,000 | | | | 2,044,856 | |
| | | | | | | | |
| | | | | | | 11,015,968 | |
|
Sovereign — 0.7% | |
Export-Import Bank of Korea, 3.000%, 11/1/2022 (1) | | | 2,250,000 | | | | 2,312,283 | |
|
Telecommunications — 3.7% | |
AT&T, Inc.: | | | | | | | | |
4.350%, 6/15/2045 (1) | | | 1,000,000 | | | | 1,065,574 | |
4.500%, 5/15/2035 (1) | | | 2,000,000 | | | | 2,228,508 | |
Colombia Telecomunicaciones SA ESP, 5.375%, 9/27/2022 | | | 800,000 | | | | 811,000 | |
Motorola Solutions, Inc.: | | | | | | | | |
4.600%, 2/23/2028 (1) | | | 1,000,000 | | | | 1,084,839 | |
5.500%, 9/1/2044 | | | 1,000,000 | | | | 1,084,224 | |
Telecom Italia Capital SA, 7.200%, 7/18/2036 | | | 1,500,000 | | | | 1,680,000 | |
Telefonica Emisiones SA, 5.213%, 3/8/2047 (1) | | | 2,000,000 | | | | 2,332,301 | |
Verizon Communications, Inc., 4.522%, 9/15/2048 | | | 2,000,000 | | | | 2,409,283 | |
| | | | | | | | |
| | | | | | | 12,695,729 | |
|
Toys/Games/Hobbies — 0.8% | |
Mattel, Inc., 2.350%, 8/15/2021 (1) | | | 2,750,000 | | | | 2,660,625 | |
|
Transportation — 0.7% | |
FedEx Corp., 4.050%, 2/15/2048 (1) | | | 2,500,000 | | | | 2,557,538 | |
|
Trucking & Leasing — 0.6% | |
Penske Truck Leasing Co. LP, 3.300%, 4/1/2021 (1)(5) | | | 2,000,000 | | | | 2,031,918 | |
| | | | | | | | |
Total Corporate Bonds & Notes
(identified cost $301,579,890) | | | | | | | 322,380,056 | |
| | | | | | | | |
| Municipals — 0.1% | | | | | | |
| | |
California — 0.1% | | | | | | | | |
Metropolitan Water District of Southern California, 6.947%, 7/1/2040, Call 7/1/2020 | | | 500,000 | | | | 521,095 | |
| | | | | | | | |
Total Municipals
(identified cost $500,000) | | | | | | | 521,095 | |
| | | | | | | | |
| Short-Term Investments — 28.7% | |
|
| Collateral Pool Investments for Securities on Loan — 23.2% | |
| | |
Collateral pool allocation (3) | | | | | | | 79,942,506 | |
| | | | | | | | |
| Description | | Shares | | | Value | |
| Short-Term Investments (continued) | |
| | |
| Mutual Funds — 5.5% | | | | | | |
BMO Institutional Prime Money Market Fund — Premier Class, 2.097% (4) | | | 19,018,494 | | | $ | 19,020,395 | |
| | | | | | | | |
Total Short-Term Investments
(identified cost $98,961,533) | | | | 98,962,901 | |
| | | | | | | | |
Total Investments — 122.2%
(identified cost $401,041,423) | | | | 421,864,052 | |
| Other Assets and Liabilities — (22.2)% | | | | (76,575,905 | ) |
| | | | | | | | |
| Total Net Assets — 100.0% | | | | | | $ | 345,288,147 | |
| | | | | | | | |
TCH Core Plus Bond Fund
| | | | | | | | |
| Description | | Principal
Amount | | | Value | |
| Asset-Backed Securities — 2.3% | | | | | | |
| | |
Automobiles — 1.1% | | | | | | | | |
Hyundai Auto Lease Securitization Trust, Class A2,
(Series2018-B),
2.810%, 12/15/2020 (5) | | $ | 5,554,948 | | | $ | 5,563,732 | |
Nissan Auto Receivables Owner Trust, Class A4,
(Series2016-B),
1.540%, 10/17/2022 | | | 6,000,000 | | | | 5,977,283 | |
| | | | | | | | |
| | | | | | | 11,541,015 | |
| | |
Credit Cards — 1.2% | | | | | | | | |
Discover Card Execution Note Trust, Class A5,
(Series2018-A5),
3.320%, 3/15/2024 | | | 11,815,000 | | | | 12,209,326 | |
| | | | | | | | |
Total Asset-Backed Securities
(identified cost $23,448,165) | | | | | | | 23,750,341 | |
| | | | | | | | |
| Collateralized Mortgage Obligations — 2.5% | | | | |
|
Federal Home Loan Mortgage Corporation — 2.0% | |
3.310%, 5/25/2023,
(Series K032) (7) | | | 19,000,000 | | | | 19,972,887 | |
| | |
Private Sponsor — 0.5% | | | | | | | | |
FREMF Mortgage Trust: | | | | | | | | |
Class B, (Series2019-K91),
4.397%, 4/25/2051 (5) (7) | | | 3,500,000 | | | | 3,851,680 | |
Class B, (Series2019-K95),
4.053%, 6/25/2029 (acquisition cost - $1,566,892; acquired 8/1/2019) (5) | | | 1,500,000 | | | | 1,610,287 | |
| | | | | | | | |
| | | | | | | 5,461,967 | |
| | | | | | | | |
Total Collateralized Mortgage Obligations
(identified cost $24,551,728) | | | | 25,434,854 | |
| | | | | | | | |
| Commercial Mortgage Securities — 3.7% | | | | |
| | |
Private Sponsor — 3.7% | | | | | | | | |
BANK: | | | | | | | | |
Class A4, (Series 2018-BN12),
4.255%, 5/15/2061 (7) | | | 7,500,000 | | | | 8,690,699 | |
Class A5, (Series 2017-BNK7),
3.435%, 9/15/2060 | | | 10,000,000 | | | | 10,925,248 | |
UBS-Barclays Commercial Mortgage Trust, Class A5, (Series2012-C4),
2.850%, 12/10/2045 | | | 9,888,381 | | | | 10,150,500 | |
(See Notes to Schedules of Investments and Notes to Financial Statements, which are an integral part of the Financial Statements)
96
TCH Core Plus Bond Fund (continued)
| | | | | | | | |
| Description | | Principal
Amount | | | Value | |
| Commercial Mortgage Securities (continued) | | | | |
| | |
Private Sponsor(continued) | | | | | | | | |
Wells Fargo Commercial Mortgage Trust, Class A4,
(Series2017-C41),
3.472%, 11/15/2050 | | $ | 7,000,000 | | | $ | 7,635,449 | |
| | | | | | | | |
Total Commercial Mortgage Securities
(identified cost $35,117,723) | | | | 37,401,896 | |
| | | | | | | | |
| Corporate Bonds & Notes — 36.5% | | | | |
| | |
Agriculture — 1.5% | | | | | | | | |
Altria Group, Inc.,
5.950%, 2/14/2049 (1) | | | 5,000,000 | | | | 6,428,184 | |
BAT Capital Corp.,
4.540%, 8/15/2047 (1) | | | 5,000,000 | | | | 5,022,145 | |
Bunge, Ltd. Finance Corp.,
3.750%, 9/25/2027 (1) | | | 4,000,000 | | | | 4,129,946 | |
| | | | | | | | |
| | | | | | | 15,580,275 | |
| | |
Apparel — 0.6% | | | | | | | | |
Marvell Technology Group, Ltd.,
4.875%, 6/22/2028 (1) | | | 5,000,000 | | | | 5,646,201 | |
| | |
Auto Manufacturers — 1.9% | | | | | | | | |
Ford Motor Co.: | | | | | | | | |
4.750%, 1/15/2043 | | | 5,000,000 | | | | 4,521,354 | |
5.291%, 12/8/2046 (1) | | | 1,500,000 | | | | 1,445,755 | |
General Motors Co.,
5.000%, 10/1/2028 | | | 2,000,000 | | | | 2,157,523 | |
General Motors Financial Co., Inc.,
4.000%, 1/15/2025 | | | 4,000,000 | | | | 4,119,389 | |
Hyundai Capital America,
3.750%, 7/8/2021 (5) | | | 6,500,000 | | | | 6,638,764 | |
| | | | | | | | |
| | | | | | | 18,882,785 | |
| | |
Banks — 8.7% | | | | | | | | |
Banco Santander SA, 3.901% (LIBOR 3 Month + 156 basis points), 4/11/2022 (7) | | | 4,000,000 | | | | 4,065,444 | |
Bank of America Corp.,
4.183%, 11/25/2027 (1) | | | 7,500,000 | | | | 8,165,681 | |
Barclays PLC,
5.200%, 5/12/2026 (1) | | | 5,000,000 | | | | 5,322,795 | |
BB&T Corp., 2.980% (LIBOR 3 Month + 57 basis points), 6/15/2020 (1) (7) | | | 3,000,000 | | | | 3,010,936 | |
Capital One Financial Corp., 3.403% (LIBOR 3 Month + 95 basis points), 3/9/2022 (7) | | | 1,500,000 | | | | 1,509,976 | |
Citigroup, Inc.: | | | | | | | | |
3.523% (LIBOR 3 Month + 107 basis points), 12/8/2021 (7) | | | 1,250,000 | | | | 1,264,872 | |
3.568% (LIBOR 3 Month + 143 basis points), 9/1/2023 (7) | | | 5,000,000 | | | | 5,096,674 | |
Goldman Sachs Group, Inc.: | | | | | | | | |
3.377% (LIBOR 3 Month + 111 basis points), 4/26/2022 (7) | | | 5,000,000 | | | | 5,040,974 | |
3.419% (LIBOR 3 Month + 116 basis points), 4/23/2020 (7) | | | 8,000,000 | | | | 8,041,814 | |
4.223% (LIBOR 3 Month + 130 basis points), 5/1/2029 (1) (7) | | | 5,000,000 | | | | 5,541,317 | |
HSBC Holdings PLC, 3.973% (LIBOR 3 Month + 161 basis points), 5/22/2030 (7) | | | 4,000,000 | | | | 4,297,244 | |
| | | | | | | | |
| Description | | Principal
Amount | | | Value | |
| Corporate Bonds & Notes (continued) | | | | |
| | |
Banks(continued) | | | | | | | | |
ING Groep NV,
4.100%, 10/2/2023 (1) | | $ | 5,000,000 | | | $ | 5,345,994 | |
JPMorgan Chase & Co.: | | | | | | | | |
3.303% (LIBOR 3 Month + 100 basis points), 1/15/2023 (7) | | | 4,000,000 | | | | 4,034,916 | |
3.571% (LIBOR 3 Month + 110 basis points), 6/7/2021 (7) | | | 5,000,000 | | | | 5,060,065 | |
3.625%, 12/1/2027 (1) | | | 5,000,000 | | | | 5,318,627 | |
Lloyds Banking Group PLC, 2.907% (LIBOR 3 Month + 81 basis points), 11/7/2023 (1)(7) | | | 7,500,000 | | | | 7,527,529 | |
Morgan Stanley,
3.950%, 4/23/2027 | | | 5,000,000 | | | | 5,354,902 | |
Toronto-Dominion Bank, 3.303% (LIBOR 3 Month + 100 basis points), 4/7/2021 (7) | | | 4,500,000 | | | | 4,555,845 | |
| | | | | | | | |
| | | | | | | 88,555,605 | |
| | |
Chemicals — 1.5% | | | | | | | | |
Mexichem SAB de C.V.,
6.750%, 9/19/2042 (5) | | | 4,400,000 | | | | 5,214,044 | |
Starfruit Finco BV,
8.000%, 10/1/2026 (1)(5) | | | 4,500,000 | | | | 4,410,000 | |
Syngenta Finance NV,
4.892%, 4/24/2025 (5) | | | 5,250,000 | | | | 5,575,911 | |
| | | | | | | | |
| | | | | | | 15,199,955 | |
| | |
Commercial Services — 0.6% | | | | | | | | |
Refinitiv US Holdings, Inc.,
8.250%, 11/15/2026 (1)(5) | | | 5,500,000 | | | | 6,201,250 | |
| | |
Computers — 1.4% | | | | | | | | |
Apple, Inc.,
2.250%, 2/23/2021 (1) | | | 1,500,000 | | | | 1,508,785 | |
Dell International LLC: | | | | | | | | |
5.300%, 10/1/2029 (1)(5) | | | 2,500,000 | | | | 2,711,213 | |
8.350%, 7/15/2046 (1)(5) | | | 2,000,000 | | | | 2,630,333 | |
Hewlett Packard Enterprise Co.,
4.900%, 10/15/2025 (1) | | | 2,000,000 | | | | 2,216,193 | |
Seagate HDD Cayman: | | | | | | | | |
4.875%, 6/1/2027 (1) | | | 2,000,000 | | | | 2,059,711 | |
5.750%, 12/1/2034 (1) | | | 3,500,000 | | | | 3,547,894 | |
| | | | | | | | |
| | | | | | | 14,674,129 | |
| |
Diversified Financial Services —2.7% | | | | | |
Cantor Fitzgerald LP,
4.875%, 5/1/2024 (5) | | | 5,000,000 | | | | 5,302,931 | |
Discover Financial Services,
4.100%, 2/9/2027 (1) | | | 5,000,000 | | | | 5,386,665 | |
GE Capital International Funding Co. Unlimited Co.,
4.418%, 11/15/2035 | | | 1,500,000 | | | | 1,527,701 | |
Jefferies Financial Group, Inc.,
6.625%, 10/23/2043 | | | 500,000 | | | | 573,027 | |
Jefferies Group LLC: | | | | | | | | |
4.150%, 1/23/2030 | | | 5,000,000 | | | | 5,064,863 | |
6.500%, 1/20/2043 | | | 1,000,000 | | | | 1,167,259 | |
Legg Mason, Inc.,
4.750%, 3/15/2026 | | | 1,950,000 | | | | 2,152,057 | |
Synchrony Financial,
3.950%, 12/1/2027 (1) | | | 6,500,000 | | | | 6,742,699 | |
| | | | | | | | |
| | | | | | | 27,917,202 | |
| | |
Electric — 0.7% | | | | | | | | |
Sempra Energy, 2.804% (LIBOR 3 Month + 50 basis points), 1/15/2021 (7) | | | 7,000,000 | | | | 6,991,565 | |
(See Notes to Schedules of Investments and Notes to Financial Statements, which are an integral part of the Financial Statements)
97
August 31, 2019
TCH Core Plus Bond Fund (continued)
| | | | | | | | |
| Description | | Principal
Amount | | | Value | |
| Corporate Bonds & Notes (continued) | | | | |
| | |
Food — 2.7% | | | | | | | | |
Albertsons Cos. LLC,
5.750%, 3/15/2025 | | $ | 1,375,000 | | | $ | 1,416,250 | |
Conagra Brands, Inc.,
5.400%, 11/1/2048 (1) | | | 5,000,000 | | | | 5,959,969 | |
General Mills, Inc., 2.862% (LIBOR 3 Month + 54 basis points), 4/16/2021 (1) (7) | | | 1,725,000 | | | | 1,726,466 | |
Kraft Heinz Foods Co.,
4.375%, 6/1/2046 (1) | | | 7,200,000 | | | | 6,928,703 | |
Kroger Co.,
4.450%, 2/1/2047 (1) | | | 5,000,000 | | | | 5,238,645 | |
Pilgrim’s Pride Corp.,
5.750%, 3/15/2025 (1)(5) | | | 5,500,000 | | | | 5,733,750 | |
| | | | | | | | |
| | | | | | | 27,003,783 | |
| |
Healthcare-Products — 0.3% | | | | | |
Mallinckrodt International Finance SA,
5.625%, 10/15/2023 (1)(5) | | | 6,500,000 | | | | 3,347,500 | |
| |
Insurance — 0.7% | | | | | |
Unum Group,
5.750%, 8/15/2042 | | | 5,930,000 | | | | 7,373,239 | |
| |
Internet — 1.1% | | | | | |
eBay, Inc.: | | | | | | | | |
3.136% (LIBOR 3 Month + 87 basis points), 1/30/2023 (7) | | | 7,500,000 | | | | 7,542,489 | |
4.000%, 7/15/2042 | | | 3,500,000 | | | | 3,470,700 | |
| | | | | | | | |
| | | | | | | 11,013,189 | |
| |
Lodging — 0.2% | | | | | |
Wyndham Destinations Inc.,
5.400%, 4/1/2024 (1) | | | 2,250,000 | | | | 2,373,047 | |
| |
Machinery-Construction & Mining — 0.5% | | | | | |
Caterpillar Financial Services Corp.,
2.850%, 5/17/2024 | | | 5,000,000 | | | | 5,188,080 | |
| |
Media — 1.6% | | | | | |
Charter Communications Operating LLC,
5.375%, 5/1/2047 | | | 6,500,000 | | | | 7,227,978 | |
Discovery Communications LLC,
5.300%, 5/15/2049 | | | 5,000,000 | | | | 5,714,288 | |
Viacom, Inc.,
4.375%, 3/15/2043 | | | 3,150,000 | | | | 3,346,734 | |
| | | | | | | | |
| | | | | | | 16,289,000 | |
| |
Mining — 0.6% | | | | | |
Glencore Funding LLC: | | | | | | | | |
4.000%, 3/27/2027 (5) | | | 5,000,000 | | | | 5,172,580 | |
4.625%, 4/29/2024 (5) | | | 1,000,000 | | | | 1,061,450 | |
| | | | | | | | |
| | | | | | | 6,234,030 | |
| |
Oil & Gas — 3.2% | | | | | |
Diamond Offshore Drilling, Inc.,
3.450%, 11/1/2023 | | | 5,000,000 | | | | 4,150,000 | |
EQT Corp.,
3.900%, 10/1/2027 (1) | | | 5,000,000 | | | | 4,371,374 | |
Exxon Mobil Corp.,
3.095%, 8/16/2049 | | | 6,000,000 | | | | 6,235,478 | |
Gulfport Energy Corp.,
6.000%, 10/15/2024 (1) | | | 5,500,000 | | | | 4,028,750 | |
Occidental Petroleum Corp.,
4.400%, 8/15/2049 | | | 2,250,000 | | | | 2,348,795 | |
| | | | | | | | |
| Description | | Principal
Amount | | | Value | |
| Corporate Bonds & Notes (continued) | | | | |
| | |
Oil & Gas (continued) | | | | | | | | |
Petroleos Mexicanos,
5.350%, 2/12/2028 (1) | | $ | 5,000,000 | | | $ | 4,747,500 | |
Valaris PLC,
5.750%, 10/1/2044 (1) | | | 2,168,000 | | | | 1,094,840 | |
W&T Offshore, Inc.,
9.750%, 11/1/2023 (5) | | | 5,500,000 | | | | 5,335,000 | |
| | | | | | | | |
| | | | | | | 32,311,737 | |
| |
Pharmaceuticals — 1.7% | | | | | |
Bausch Health Cos., Inc.,
5.500%, 3/1/2023 (5) | | | 1,092,000 | | | | 1,107,015 | |
Bayer US Finance II LLC,
4.250%, 12/15/2025 (1)(5) | | | 5,000,000 | | | | 5,392,268 | |
Bristol-Myers Squibb Co.,
2.000%, 8/1/2022 (1) | | | 2,500,000 | | | | 2,502,256 | |
Mylan, Inc., 5.200%, 4/15/2048 | | | 5,000,000 | | | | 5,476,784 | |
Teva Pharmaceutical Finance Netherlands III BV,
4.100%, 10/1/2046 (1) | | | 5,000,000 | | | | 3,231,250 | |
| | | | | | | | |
| | | | | | | 17,709,573 | |
| |
Pipelines — 0.6% | | | | | |
Energy Transfer Operating LP,
5.150%, 3/15/2045 (1) | | | 4,000,000 | | | | 4,255,492 | |
Sunoco Logistics Partners Operations LP,
5.300%, 4/1/2044 (1) | | | 2,000,000 | | | | 2,143,870 | |
| | | | | | | | |
| | | | | | | 6,399,362 | |
| |
Real Estate Investment Trusts — 0.6% | | | | | |
EPR Properties,
5.250%, 7/15/2023 | | | 910,000 | | | | 985,454 | |
Hospitality Properties Trust,
4.500%, 3/15/2025 | | | 2,500,000 | | | | 2,542,805 | |
Welltower, Inc.,
4.500%, 1/15/2024 (1) | | | 2,500,000 | | | | 2,707,466 | |
| | | | | | | | |
| | | | | | | 6,235,725 | |
| |
Retail — 1.2% | | | | | |
Bed Bath & Beyond, Inc.,
5.165%, 8/1/2044 (1) | | | 4,900,000 | | | | 3,427,603 | |
L Brands, Inc.: | | | | | | | | |
6.950%, 3/1/2033 (1) | | | 2,500,000 | | | | 2,012,500 | |
7.600%, 7/15/2037 | | | 1,500,000 | | | | 1,290,000 | |
Tapestry, Inc.,
4.125%, 7/15/2027 (1) | | | 5,500,000 | | | | 5,664,240 | |
| | | | | | | | |
| | | | | | | 12,394,343 | |
| |
Software — 0.6% | | | | | |
CA, Inc.,
4.700%, 3/15/2027 | | | 4,000,000 | | | | 4,208,816 | |
Oracle Corp.,
2.400%, 9/15/2023 (1) | | | 2,000,000 | | | | 2,031,236 | |
| | | | | | | | |
| | | | | | | 6,240,052 | |
| | |
Telecommunications — 1.3% | | | | | | | | |
CenturyLink, Inc.,
7.600%, 9/15/2039 (1) | | | 4,000,000 | | | | 3,860,000 | |
Motorola Solutions, Inc.,
5.500%, 9/1/2044 | | | 3,000,000 | | | | 3,252,673 | |
Telecom Italia SpA,
5.303%, 5/30/2024 (1) (5) | | | 6,000,000 | | | | 6,442,500 | |
| | | | | | | | |
| | | | | | | 13,555,173 | |
| | | | | | | | |
Total Corporate Bonds & Notes(identified cost $357,122,052) | | | | | | | 373,316,800 | |
| | | | | | | | |
(See Notes to Schedules of Investments and Notes to Financial Statements, which are an integral part of the Financial Statements)
98
TCH Core Plus Bond Fund (continued)
| | | | | | | | |
| Description | | Principal
Amount | | | Value | |
| Municipals — 0.0% | |
| |
California — 0.0% | | | | | |
Metropolitan Water District of Southern California,
6.947%, 7/1/2040, Call 7/1/2020 | | $ | 300,000 | | | $ | 312,657 | |
| | | | | | | | |
Total Municipals
(identified cost $300,000) | | | | | | | 312,657 | |
| | | | | | | | |
| U.S. Government & U.S. Government Agency Obligations — 20.0% | |
| |
Food Service — 1.5% | | | | | |
2.450%, 6/11/2021 | | $ | 15,000,000 | | | | 15,000,826 | |
| |
U.S. Treasury Bonds & Notes — 18.5% | | | | | |
0.375%, 7/15/2023 | | | 16,509,750 | | | | 16,729,375 | |
2.000%, 2/15/2025 | | | 25,000,000 | | | | 25,757,324 | |
2.000%, 8/15/2025 | | | 25,000,000 | | | | 25,790,527 | |
2.375%, 5/15/2029 (1) | | | 5,000,000 | | | | 5,389,453 | |
2.500%, 5/15/2024 | | | 5,000,000 | | | | 5,246,973 | |
2.625%, 2/28/2023 (1) | | | 31,000,000 | | | | 32,259,375 | |
2.750%, 6/30/2025 | | | 40,000,000 | | | | 42,918,750 | |
2.875%, 5/15/2049 | | | 10,000,000 | | | | 12,047,852 | |
3.000%, 8/15/2048 | | | 10,000,000 | | | | 12,279,297 | |
3.000%, 2/15/2049 | | | 5,000,000 | | | | 6,159,082 | |
3.375%, 11/15/2048 | | | 4,000,000 | | | | 5,261,094 | |
| | | | | | | | |
| | | | | | | 189,839,102 | |
| | | | | | | | |
| | | | | | | | |
Total U.S. Government & U.S. Government Agency Obligations
(identified cost $190,620,378) | | | | 204,839,928 | |
| | | | | | | | |
| U.S. Government Agency-Mortgage Securities — 32.1% | |
|
Federal Home Loan Mortgage Corporation — 7.2% | |
3.000%, 11/1/2042 | | | 988,424 | | | | 1,025,190 | |
3.000%, 4/1/2043 | | | 1,220,850 | | | | 1,266,459 | |
3.000%, 4/1/2043 | | | 1,928,590 | | | | 1,991,873 | |
3.000%, 5/1/2043 | | | 2,149,716 | | | | 2,224,260 | |
3.000%, 7/1/2043 | | | 8,458,276 | | | | 8,749,339 | |
3.000%, 9/1/2043 | | | 8,524,291 | | | | 8,812,598 | |
3.000%, 4/1/2045 | | | 7,647,406 | | | | 7,889,119 | |
3.000%, 5/1/2045 | | | 4,189,535 | | | | 4,321,957 | |
3.500%, 12/1/2040 | | | 720,907 | | | | 758,320 | |
3.500%, 12/1/2041 | | | 603,563 | | | | 634,996 | |
3.500%, 3/1/2042 | | | 231,410 | | | | 243,461 | |
3.500%, 12/1/2042 | | | 567,879 | | | | 595,680 | |
3.500%, 11/1/2043 | | | 5,604,061 | | | | 5,865,700 | |
3.500%, 1/1/2044 | | | 5,714,674 | | | | 5,981,573 | |
3.500%, 2/1/2044 | | | 5,988,074 | | | | 6,267,174 | |
3.500%, 11/1/2044 | | | 4,260,447 | | | | 4,454,679 | |
4.000%, 4/1/2026 | | | 266,697 | | | | 279,070 | |
4.000%, 12/1/2039 | | | 455,332 | | | | 486,944 | |
4.000%, 12/1/2040 | | | 200,179 | | | | 214,119 | |
4.000%, 12/1/2040 | | | 2,448,167 | | | | 2,618,502 | |
4.000%, 3/1/2041 | | | 204,014 | | | | 218,214 | |
4.000%, 4/1/2041 | | | 5,089,518 | | | | 5,443,854 | |
4.000%, 8/1/2041 | | | 126,818 | | | | 135,692 | |
4.000%, 11/1/2041 | | | 531,235 | | | | 568,407 | |
4.500%, 9/1/2031 | | | 218,307 | | | | 234,249 | |
4.500%, 3/1/2039 | | | 92,068 | | | | 99,733 | |
4.500%, 5/1/2039 | | | 368,316 | | | | 399,214 | |
4.500%, 2/1/2040 | | | 98,871 | | | | 107,220 | |
| | | | | | | | |
| Description | | Principal
Amount | | | Value | |
| U.S. Government Agency-Mortgage Securities (continued) | |
|
Federal Home Loan Mortgage Corporation(continued) | |
4.500%, 2/1/2041 | | $ | 792,304 | | | $ | 859,206 | |
5.000%, 12/1/2035 | | | 50,943 | | | | 56,698 | |
5.000%, 1/1/2038 | | | 27,414 | | | | 30,469 | |
5.000%, 3/1/2038 | | | 84,667 | | | | 94,288 | |
5.000%, 3/1/2038 | | | 27,560 | | | | 30,694 | |
5.000%, 2/1/2039 | | | 149,573 | | | | 159,516 | |
5.000%, 1/1/2040 | | | 133,297 | | | | 147,138 | |
6.000%, 6/1/2037 | | | 48,409 | | | | 55,237 | |
6.000%, 1/1/2038 | | | 59,255 | | | | 67,572 | |
| | | | | | | | |
| | | | | | | 73,388,414 | |
|
Federal National Mortgage Association — 24.8% | |
3.000%, 3/1/2043 | | | 2,505,873 | | | | 2,586,965 | |
3.000%, 7/1/2043 | | | 5,600,154 | | | | 5,788,768 | |
3.000%, 7/1/2043 | | | 10,982,019 | | | | 11,362,857 | |
3.000%, 9/1/2044 | �� | | 7,207,599 | | | | 7,430,970 | |
3.000%, 1/1/2045 | | | 7,309,627 | | | | 7,536,421 | |
3.000%, 2/1/2045 | | | 10,929,682 | | | | 11,269,197 | |
3.000%, 6/1/2045 | | | 6,122,521 | | | | 6,312,922 | |
3.000%, 3/1/2046 | | | 12,820,087 | | | | 13,217,552 | |
3.000%, 7/1/2046 | | | 15,038,979 | | | | 15,483,402 | |
3.000%, 4/1/2049 | | | 30,957,963 | | | | 31,577,492 | |
3.000%, 9/1/2049 | | | 25,000,000 | | | | 25,501,611 | |
3.000%, 9/1/2049 | | | 25,000,000 | | | | 25,501,611 | |
3.500%, 7/1/2032 | | | 319,785 | | | | 333,456 | |
3.500%, 5/1/2042 | | | 966,665 | | | | 1,011,216 | |
3.500%, 10/1/2042 | | | 665,650 | | | | 699,948 | |
3.500%, 10/1/2042 | | | 697,472 | | | | 729,772 | |
3.500%, 10/1/2042 | | | 909,511 | | | | 954,436 | |
3.500%, 11/1/2042 | | | 438,043 | | | | 458,327 | |
3.500%, 12/1/2042 | | | 871,607 | | | | 911,954 | |
3.500%, 12/1/2047 | | | 4,672,792 | | | | 4,838,179 | |
3.500%, 3/1/2049 | | | 25,678,938 | | | | 26,541,241 | |
3.500%, 4/1/2049 | | | 13,219,603 | | | | 13,658,625 | |
3.500%, 6/1/2049 | | | 24,506,004 | | | | 25,225,910 | |
4.000%, 11/1/2040 | | | 266,793 | | | | 285,276 | |
4.000%, 1/1/2041 | | | 383,547 | | | | 410,084 | |
4.000%, 2/1/2041 | | | 1,938,021 | | | | 2,072,102 | |
4.000%, 2/1/2041 | | | 373,669 | | | | 399,506 | |
4.000%, 3/1/2041 | | | 160,475 | | | | 172,093 | |
4.000%, 11/1/2041 | | | 321,688 | | | | 345,072 | |
4.000%, 9/1/2048 | | | 8,447,356 | | | | 8,775,750 | |
4.500%, 6/1/2039 | | | 558,865 | | | | 605,162 | |
4.500%, 8/1/2041 | | | 367,478 | | | | 399,384 | |
5.000%, 7/1/2022 | | | 84,632 | | | | 87,282 | |
5.000%, 3/1/2035 | | | 189,196 | | | | 210,223 | |
5.000%, 5/1/2042 | | | 478,105 | | | | 524,314 | |
5.500%, 2/1/2034 | | | 32,184 | | | | 36,426 | |
5.500%, 7/1/2036 | | | 171,819 | | | | 194,432 | |
5.500%, 8/1/2037 | | | 317,667 | | | | 359,365 | |
5.500%, 6/1/2038 | | | 45,154 | | | | 50,809 | |
6.000%, 12/1/2038 | | | 14,619 | | | | 16,394 | |
6.000%, 5/1/2039 | | | 139,887 | | | | 160,461 | |
6.500%, 10/1/2037 | | | 31,989 | | | | 37,654 | |
6.500%, 11/1/2037 | | | 16,256 | | | | 18,898 | |
| | | | | | | | |
| | | | | | | 254,093,519 | |
|
Government National Mortgage Association — 0.1% | |
4.000%, 10/15/2040 | | | 348,034 | | | | 371,310 | |
4.000%, 12/15/2040 | | | 416,551 | | | | 444,388 | |
4.000%, 4/15/2041 | | | 385,333 | | | | 411,116 | |
5.500%, 8/20/2038 | | | 66,735 | | | | 71,349 | |
(See Notes to Schedules of Investments and Notes to Financial Statements, which are an integral part of the Financial Statements)
99
August 31, 2019
TCH Core Plus Bond Fund (continued)
| | | | | | | | |
| Description | | Shares or
Principal
Amount | | | Value | |
| U.S. Government Agency-Mortgage Securities (continued) | |
|
Government National Mortgage Association(continued) | |
5.500%, 2/15/2039 | | $ | 43,940 | | | $ | 49,721 | |
6.000%, 12/15/2038 | | | 47,756 | | | | 54,924 | |
6.000%, 1/15/2039 | | | 21,773 | | | | 25,033 | |
| | | | | | | | |
| | | | | | | 1,427,841 | |
| | | | | | | | |
Total U.S. Government Agency-Mortgage Securities
(identified cost $321,308,349) | | | | | | | 328,909,774 | |
| | | | | | | | |
Short-Term Investments — 15.9% | | | | | |
| |
Collateral Pool Investments for Securities on Loan — 12.0% | | | | | |
Collateral pool allocation (3) | | | | | | | 122,747,158 | |
| | |
Mutual Funds — 3.9% | | | | | | | | |
BMO Institutional Prime Money Market Fund — Premier Class, 2.097% (4) | | | 40,245,108 | | | | 40,249,132 | |
| | | | | | | | |
Total Short-Term Investments
(identified cost $162,995,519) | | | | | | | 162,996,290 | |
| | | | | | | | |
Total Investments — 113.0%
(identified cost $1,115,463,914) | | | | 1,156,962,540 | |
| Other Assets and Liabilities — (13.0)% | | | | (132,845,899 | ) |
| | | | | | | | |
| Total Net Assets — 100.0% | | | | | | $ | 1,024,116,641 | |
| | | | | | | | |
High Yield Bond Fund
| | | | | | | | |
| Description | | Principal
Amount | | | Value | |
| Corporate Bonds & Notes — 93.5% | | | | | | |
| | |
Aerospace/Defense — 1.3% | | | | | | | | |
TransDigm, Inc., 6.500%, 7/15/2024 (1) | | $ | 115,000 | | | $ | 119,169 | |
| | |
Auto Manufacturers — 1.0% | | | | | | | | |
Telesat Canada, 8.875%, 11/15/2024 (5) | | | 82,000 | | | | 88,918 | |
| | |
Auto Parts & Equipment — 3.4% | | | | | | | | |
Allison Transmission, Inc., 4.750%, 10/1/2027 (5) | | | 75,000 | | | | 77,250 | |
American Axle & Manufacturing, Inc., 6.625%, 10/15/2022 | | | 82,000 | | | | 82,923 | |
Meritor, Inc., 6.250%, 2/15/2024 (1) | | | 75,000 | | | | 77,156 | |
Tenneco, Inc., 5.000%, 7/15/2026 | | | 100,000 | | | | 78,188 | |
| | | | | | | | |
| | | | | | | 315,517 | |
| | |
Banks — 1.2% | | | | | | | | |
CIT Group, Inc., 5.000%, 8/15/2022 | | | 103,000 | | | | 110,065 | |
| | |
Building Materials — 2.0% | | | | | | | | |
Builders FirstSource, Inc., 6.750%, 6/1/2027 (1)(5) | | | 75,000 | | | | 82,312 | |
U.S. Concrete, Inc., 6.375%, 6/1/2024 (1) | | | 100,000 | | | | 105,250 | |
| | | | | | | | |
| | | | | | | 187,562 | |
| | |
Chemicals — 2.4% | | | | | | | | |
CF Industries, Inc., 4.950%, 6/1/2043 | | | 25,000 | | | | 24,656 | |
Olin Corp., 5.125%, 9/15/2027 | | | 50,000 | | | | 51,625 | |
Starfruit Finco BV, 8.000%, 10/1/2026 (1)(5) | | | 150,000 | | | | 147,000 | |
| | | | | | | | |
| | | | | | | 223,281 | |
| | | | | | | | |
| Description | | Principal
Amount | | | Value | |
| Corporate Bonds & Notes (continued) | | | | | | |
| | |
Commercial Services — 4.6% | | | | | | | | |
Avis Budget Car Rental LLC, 5.250%, 3/15/2025 (5) | | $ | 75,000 | | | $ | 76,594 | |
Nielsen Finance LLC, 5.000%, 4/15/2022 (5) | | | 50,000 | | | | 50,500 | |
Prime Security Services Borrower LLC, 9.250%, 5/15/2023 (1)(5) | | | 80,000 | | | | 84,278 | |
Refinitiv US Holdings, Inc., 8.250%, 11/15/2026 (1)(5) | | | 100,000 | | | | 112,750 | |
Weight Watchers International, Inc., 8.625%, 12/1/2025 (5) | | | 100,000 | | | | 100,750 | |
| | | | | | | | |
| | | | | | | 424,872 | |
| | |
Computers — 0.8% | | | | | | | | |
Seagate HDD Cayman: | | | | | | | | |
4.750%, 1/1/2025 | | | 25,000 | | | | 26,039 | |
4.875%, 6/1/2027 (1) | | | 50,000 | | | | 51,493 | |
| | | | | | | | |
| | | | | | | 77,532 | |
| | |
Cosmetics/Personal Care — 0.9% | | | | | | | | |
Coty, Inc., 6.500%, 4/15/2026 (5) | | | 25,000 | | | | 23,687 | |
Revlon Consumer Products Corp., 6.250%, 8/1/2024 | | | 100,000 | | | | 58,000 | |
| | | | | | | | |
| | | | | | | 81,687 | |
| | |
Diversified Financial Services — 0.6% | | | | | | | | |
Cantor Fitzgerald LP, 4.875%, 5/1/2024 (5) | | | 50,000 | | | | 53,029 | |
| | |
Electric — 1.1% | | | | | | | | |
Drax Finco PLC, 6.625%, 11/1/2025 (5) | | | 100,000 | | | | 103,750 | |
| | |
Electronics — 0.8% | | | | | | | | |
Diamond Offshore Drilling, Inc., 7.875%, 8/15/2025 (1) | | | 75,000 | | | | 69,397 | |
| | |
Entertainment — 0.8% | | | | | | | | |
Scientific Games International, Inc., 5.000%, 10/15/2025 (1)(5) | | | 75,000 | | | | 77,680 | |
| | |
Food — 2.9% | | | | | | | | |
Albertsons Cos. LLC, 5.750%, 3/15/2025 | | | 100,000 | | | | 103,000 | |
Dean Foods Co., 6.500%, 3/15/2023 (5) | | | 85,000 | | | | 38,250 | |
Minerva Luxembourg SA, 6.500%, 9/20/2026 (5) | | | 75,000 | | | | 77,906 | |
Post Holdings, Inc., 5.000%, 8/15/2026 (5) | | | 50,000 | | | | 52,313 | |
| | | | | | | | |
| | | | | | | 271,469 | |
| | |
Forest Products & Paper — 1.4% | | | | | | | | |
Mercer International, Inc., 6.500%, 2/1/2024 | | | 125,000 | | | | 129,219 | |
| | |
Healthcare-Products — 1.3% | | | | | | | | |
Hologic, Inc., 4.625%, 2/1/2028 (5) | | | 50,000 | | | | 51,937 | |
Mallinckrodt International Finance SA, 5.625%, 10/15/2023 (1)(5) | | | 125,000 | | | | 64,375 | |
| | | | | | | | |
| | | | | | | 116,312 | |
| | |
Healthcare-Services — 5.9% | | | | | | | | |
Catalent Pharma Solutions, Inc., 4.875%, 1/15/2026 (5) | | | 100,000 | | | | 102,000 | |
Centene Corp., 6.125%, 2/15/2024 | | | 75,000 | | | | 78,694 | |
Encompass Health Corp., 5.750%, 11/1/2024 | | | 75,000 | | | | 76,219 | |
HCA, Inc.: | | | | | | | | |
5.375%, 9/1/2026 | | | 50,000 | | | | 55,875 | |
5.875%, 5/1/2023 (1) | | | 90,000 | | | | 99,618 | |
Select Medical Corp., 6.250%, 8/15/2026 (5) | | | 50,000 | | | | 52,150 | |
(See Notes to Schedules of Investments and Notes to Financial Statements, which are an integral part of the Financial Statements)
100
High Yield Bond Fund (continued)
| | | | | | | | |
| Description | | Principal
Amount | | | Value | |
| Corporate Bonds & Notes (continued) | | | | | | |
| | |
Healthcare-Services(continued) | | | | | | | | |
Tenet Healthcare Corp., 8.125%, 4/1/2022 | | $ | 75,000 | | | $ | 81,086 | |
| | | | | | | | |
| | | | | | | 545,642 | |
| | |
Home Builders — 3.9% | | | | | | | | |
Beazer Homes USA, Inc., 5.875%, 10/15/2027 (1) | | | 125,000 | | | | 119,062 | |
TRI Pointe Group, Inc., 5.875%, 6/15/2024 | | | 51,000 | | | | 54,953 | |
William Lyon Homes, Inc., 5.875%, 1/31/2025 (1) | | | 188,000 | | | | 190,820 | |
| | | | | | | | |
| | | | | | | 364,835 | |
| | |
Home Furnishings — 1.7% | | | | | | | | |
Tempur Sealy International, Inc., 5.625%, 10/15/2023 (1) | | | 150,000 | | | | 154,875 | |
| | |
Insurance — 0.9% | | | | | | | | |
CNO Financial Group, Inc., 5.250%, 5/30/2025 (1) | | | 75,000 | | | | 81,703 | |
| | |
Investment Companies — 0.9% | | | | | | | | |
Owl Rock Capital Corp., 5.250%, 4/15/2024 | | | 75,000 | | | | 78,861 | |
| | |
Iron/Steel — 1.0% | | | | | | | | |
United States Steel Corp., 6.875%, 8/15/2025 (1) | | | 100,000 | | | | 95,405 | |
| | |
Lodging — 1.7% | | | | | | | | |
Boyd Gaming Corp., 6.000%, 8/15/2026 | | | 50,000 | | | | 53,000 | |
Hilton Domestic Operating Co., Inc., 5.125%, 5/1/2026 | | | 50,000 | | | | 52,900 | |
Wynn Las Vegas LLC, 5.250%, 5/15/2027 (5) | | | 50,000 | | | | 51,875 | |
| | | | | | | | |
| | | | | | | 157,775 | |
| | |
Media — 9.1% | | | | | | | | |
Altice Finco SA, 7.625%, 2/15/2025 (5) | | | 200,000 | | | | 206,750 | |
Altice France SA, 7.375%, 5/1/2026 (5) | | | 100,000 | | | | 107,000 | |
AMC Networks, Inc., 5.000%, 4/1/2024 (1) | | | 100,000 | | | | 103,250 | |
CCO Holdings LLC, 5.500%, 5/1/2026 (5) | | | 200,000 | | | | 211,250 | |
Diamond Sports Group LLC/Diamond Sports Finance Co., 6.625%, 8/15/2027 (1)(5) | | | 100,000 | | | | 105,000 | |
Sirius XM Radio, Inc., 5.375%, 7/15/2026 (5) | | | 100,000 | | | | 106,000 | |
| | | | | | | | |
| | | | | | | 839,250 | |
| | |
Mining — 3.3% | | | | | | | | |
Alcoa Nederland Holding BV, 6.125%, 5/15/2028 (5) | | | 25,000 | | | | 26,063 | |
Freeport-McMoRan, Inc., 3.550%, 3/1/2022 | | | 100,000 | | | | 100,500 | |
Hudbay Minerals, Inc., 7.250%, 1/15/2023 (1)(5) | | | 75,000 | | | | 77,707 | |
Kaiser Aluminum Corp., 5.875%, 5/15/2024 | | | 100,000 | | | | 104,000 | |
| | | | | | | | |
| | | | | | | 308,270 | |
| | |
Oil & Gas — 9.3% | | | | | | | | |
Brazos Valley Longhorn LLC, 6.875%, 2/1/2025 | | | 75,000 | | | | 67,125 | |
Chesapeake Energy Corp., 8.000%, 1/15/2025 | | | 75,000 | | | | 57,188 | |
Gulfport Energy Corp., 6.000%, 10/15/2024 (1) | | | 100,000 | | | | 73,250 | |
| | | | | | | | |
| Description | | Principal
Amount | | | Value | |
| Corporate Bonds & Notes (continued) | | | | | | |
| | |
Oil & Gas(continued) | | | | | | | | |
Noble Holding International, Ltd., 7.750%, 1/15/2024 | | $ | 75,000 | | | $ | 50,250 | |
Oasis Petroleum, Inc., 6.875%, 3/15/2022 | | | 100,000 | | | | 93,500 | |
PBF Holding Co. LLC, 7.250%, 6/15/2025 (1) | | | 100,000 | | | | 103,966 | |
QEP Resources, Inc., 5.250%, 5/1/2023 | | | 150,000 | | | | 132,000 | |
Southwestern Energy Co., 7.500%, 4/1/2026 | | | 50,000 | | | | 44,010 | |
Transocean, Inc., 7.250%, 11/1/2025 (5) | | | 75,000 | | | | 68,531 | |
W&T Offshore, Inc., 9.750%, 11/1/2023 (5) | | | 75,000 | | | | 72,750 | |
Whiting Petroleum Corp., 5.750%, 3/15/2021 | | | 100,000 | | | | 93,895 | |
| | | | | | | | |
| | | | | | | 856,465 | |
| | |
Oil & Gas Services — 2.2% | | | | | | | | |
Archrock Partners LP, 6.875%, 4/1/2027 (5) | | | 50,000 | | | | 52,625 | |
Nine Energy Service, Inc., 8.750%, 11/1/2023 (5) | | | 100,000 | | | | 90,750 | |
SESI LLC, 7.750%, 9/15/2024 | | | 100,000 | | | | 60,500 | |
| | | | | | | | |
| | | | | | | 203,875 | |
| | |
Packaging & Containers — 0.6% | | | | | | | | |
Mauser Packaging Solutions Holding Co., 5.500%, 4/15/2024 (5) | | | 50,000 | | | | 51,563 | |
| | |
Pharmaceuticals — 2.3% | | | | | | | | |
Bausch Health Cos., Inc., 5.500%, 3/1/2023 (5) | | | 62,000 | | | | 62,853 | |
Par Pharmaceutical, Inc., 7.500%, 4/1/2027 (5) | | | 50,000 | | | | 46,750 | |
Teva Pharmaceutical Finance Netherlands III BV: | | | | | | | | |
2.800%, 7/21/2023 (1) | | | 100,000 | | | | 84,500 | |
6.000%, 4/15/2024 | | | 25,000 | | | | 22,656 | |
| | | | | | | | |
| | | | | | | 216,759 | |
| | |
Pipelines — 4.4% | | | | | | | | |
Antero Midstream Partners LP, 5.375%, 9/15/2024 (1) | | | 100,000 | | | | 94,750 | |
Cheniere Corpus Christi Holdings LLC, 5.125%, 6/30/2027 (1) | | | 50,000 | | | | 55,375 | |
Cheniere Energy Partners LP, 5.625%, 10/1/2026 | | | 100,000 | | | | 106,000 | |
Genesis Energy LP, 6.750%, 8/1/2022 | | | 150,000 | | | | 152,190 | |
| | | | | | | | |
| | | | | | | 408,315 | |
| | |
Private Equity — 0.6% | | | | | | | | |
Icahn Enterprises LP, 6.250%, 5/15/2026 (5) | | | 50,000 | | | | 52,313 | |
| | |
Real Estate Investment Trusts — 2.8% | | | | | | | | |
ESH Hospitality, Inc., 5.250%, 5/1/2025 (5) | | | 100,000 | | | | 103,625 | |
iStar, Inc., 6.000%, 4/1/2022 (1) | | | 75,000 | | | | 77,156 | |
Starwood Property Trust, Inc., 3.625%, 2/1/2021 | | | 75,000 | | | | 75,750 | |
| | | | | | | | |
| | | | | | | 256,531 | |
| | |
Retail — 4.3% | | | | | | | | |
Beacon Roofing Supply, Inc., 4.875%, 11/1/2025 (1)(5) | | | 50,000 | | | | 49,500 | |
New Red Finance, Inc., 5.000%, 10/15/2025 (5) | | | 100,000 | | | | 103,500 | |
Party City Holdings, Inc., 6.625%, 8/1/2026 (5) | | | 100,000 | | | | 95,500 | |
(See Notes to Schedules of Investments and Notes to Financial Statements, which are an integral part of the Financial Statements)
101
August 31, 2019
High Yield Bond Fund (continued)
| | | | | | | | |
| Description | | Shares or
Principal
Amount | | | Value | |
| Corporate Bonds & Notes (continued) | | | | | | |
| | |
Retail(continued) | | | | | | | | |
Penske Automotive Group, Inc., 5.375%, 12/1/2024 | | $ | 75,000 | | | $ | 77,531 | |
Staples, Inc., 10.750%, 4/15/2027 (5) | | | 75,000 | | | | 75,938 | |
| | | | | | | | |
| | | | | | | 401,969 | |
| | |
Software — 0.7% | | | | | | | | |
Rackspace Hosting, Inc., 8.625%, 11/15/2024 (1)(5) | | | 75,000 | | | | 69,188 | |
| | |
Telecommunications — 10.6% | | | | | | | | |
CenturyLink, Inc., 5.800%, 3/15/2022 (1) | | | 50,000 | | | | 52,687 | |
Cincinnati Bell, Inc., 7.000%, 7/15/2024 (5) | | | 100,000 | | | | 91,750 | |
CommScope, Inc., 5.500%, 6/15/2024 (1)(5) | | | 108,000 | | | | 102,735 | |
Consolidated Communications, Inc., 6.500%, 10/1/2022 (1) | | | 100,000 | | | | 94,000 | |
Inmarsat Finance PLC, 4.875%, 5/15/2022 (5) | | | 150,000 | | | | 152,250 | |
Netflix, Inc., 4.875%, 4/15/2028 | | | 50,000 | | | | 52,438 | |
Qwest Corp., 6.875%, 9/15/2033 (1) | | | 100,000 | | | | 100,650 | |
Sprint Communications, Inc., 6.000%, 11/15/2022 | | | 75,000 | | | | 80,015 | |
Sprint Corp.: | | | | | | | | |
7.125%, 6/15/2024 (1) | | | 110,000 | | | | 121,876 | |
7.625%, 3/1/2026 | | | 50,000 | | | | 56,312 | |
Telecom Italia Capital SA, 6.000%, 9/30/2034 | | | 25,000 | | | | 25,750 | |
T-Mobile USA, Inc., 4.500%, 2/1/2026 | | | 50,000 | | | | 52,063 | |
| | | | | | | | |
| | | | | | | 982,526 | |
| | |
Toys/Games/Hobbies — 0.5% | | | | | | | | |
Mattel, Inc., 2.350%, 8/15/2021 | | | 50,000 | | | | 48,375 | |
| | |
Trucking & Leasing — 0.3% | | | | | | | | |
Park Aerospace Holdings, Ltd., 4.500%, 3/15/2023 (5) | | | 25,000 | | | | 25,928 | |
| | | | | | | | |
Total Corporate Bonds & Notes
(identified cost $8,726,341) | | | | | | | 8,649,882 | |
| | | | | | | | |
| Short-Term Investments — 37.0% | |
|
| Collateral Pool Investments for Securities on Loan — 32.2% | |
| | |
Collateral pool allocation (3) | | | | | | | 2,981,780 | |
| | |
| Mutual Funds — 4.8% | | | | | | |
BMO Institutional Prime Money Market Fund — Premier Class, 2.097% (4) | | | 439,888 | | | | 439,932 | |
| | | | | | | | |
Total Short-Term Investments
(identified cost $3,421,706) | | | | 3,421,712 | |
| | | | | | | | |
Total Investments — 130.5%
(identified cost $12,148,047) | | | | 12,071,594 | |
| Other Assets and Liabilities — (30.5)% | | | | (2,821,697 | ) |
| | | | | | | | |
| Total Net Assets — 100.0% | | | | | | $ | 9,249,897 | |
| | | | | | | | |
Government Money Market Fund
| | | | | | | | |
| Description | | Shares or
Principal
Amount | | | Value | |
| Mutual Funds — 6.3% | |
BlackRock Liquidity FundsT-Fund Portfolio — Institutional Class, 1.980% | | | 85,000,000 | | | $ | 85,000,000 | |
Invesco Government & Agency Portfolio — Institutional Class, 2.016% | | | 115,000,000 | | | | 115,000,000 | |
| | | | | | | | |
| Total Mutual Funds | | | | | | | 200,000,000 | |
| | | | | | | | |
| Repurchase Agreements — 37.9% | |
Agreement with Fixed Income Clearing Corp., 1.200%, dated 8/30/2019, to be repurchased at $13,954,988 on 9/3/2019, collateralized by U.S. Government Treasury Obligation with various maturities to 12/31/2020, with a fair value of $14,233,284 | | $ | 13,953,128 | | | | 13,953,128 | |
Agreement with Fixed Income Clearing Corp., 2.150%, dated 8/30/2019, to be repurchased at $425,101,528 on 9/3/2019, collateralized by U.S.Government Treasury Obligations with various maturities to 5/15/2028, with a fair value of $433,503,140 | | | 425,000,000 | | | | 425,000,000 | |
Agreement with Goldman Sachs Group, Inc., 2.140%, dated 8/30/2019, to be repurchased at $300,071,333 on 9/3/2019, collateralized by U.S. Government Agency Obligations with various maturities to 8/20/2049, with a fair value of $306,000,000 | | | 300,000,000 | | | | 300,000,000 | |
Agreement with Goldman Sachs Group, Inc., 2.160%, dated 8/28/2019, to be repurchased at $275,115,500 on 9/4/2019, collateralized by U.S. Government Agency Obligations with various maturities to 8/20/2049, with a fair value of $280,500,000 | | | 275,000,000 | | | | 275,000,000 | |
Agreement with Merrill Lynch, Pierce, Fenner & Smith, Inc., 2.150%, dated 8/30/2019, to be repurchased at $45,010,750 on 9/3/2019, collateralized by U.S. Government Agency Obligation with a maturity of 3/1/2049, with a fair value of $45,900,001 | | | 45,000,000 | | | | 45,000,000 | |
(See Notes to Schedules of Investments and Notes to Financial Statements, which are an integral part of the Financial Statements)
102
Government Money Market Fund (continued)
| | | | | | | | |
| Description | | Principal
Amount | | | Value | |
| Repurchase Agreements (continued) | |
Agreement with Toronto Dominion Bank, 2.150%, dated 8/30/2019, to be repurchased at $150,035,833 on 9/3/2019, collateralized by U.S. Government Agency Obligations with various maturities to 3/1/2049, with a fair value of $153,036,551 | | $ | 150,000,000 | | | $ | 150,000,000 | |
| | | | | | | | |
| Total Repurchase Agreements | | | | | | | 1,208,953,128 | |
| | | | | | | | |
| U.S. Government & U.S. Government Agency Obligations — 51.9% | |
|
Federal Farm Credit Bank — 11.0% | |
2.170% (FCPR DLY - 308 basis points) 9/13/2019 (7) | | | 12,000,000 | | | | 11,999,993 | |
2.170% (FCPR DLY - 308 basis points) 10/10/2019 (7) | | | 15,000,000 | | | | 14,999,862 | |
2.175% (FCPR DLY - 308 basis points) 9/25/2019 (7) | | | 11,900,000 | | | | 11,900,007 | |
2.180% (FCPR DLY - 307 basis points) 11/4/2019 (7) | | | 23,000,000 | | | | 22,999,726 | |
2.180% (FCPR DLY - 307 basis points) 12/18/2019 (7) | | | 10,000,000 | | | | 9,999,926 | |
2.185% (FCPR DLY - 307 basis points) 12/26/2019 (7) | | | 15,000,000 | | | | 14,999,761 | |
2.200% (FCPR DLY - 305 basis points) 1/9/2020 (7) | | | 15,000,000 | | | | 14,999,734 | |
2.290% (FCPR DLY - 296 basis points) 7/9/2020 (7) | | | 10,000,000 | | | | 9,998,289 | |
1.940% 12/18/2019 (6) | | | 12,200,000 | | | | 12,128,996 | |
2.000% (LIBOR 1 Month - 10 basis points) 12/2/2019 (7) | | | 12,800,000 | | | | 12,798,788 | |
2.040% (LIBOR 1 Month - 11 basis points) 9/25/2019 (7) | | | 1,000,000 | | | | 999,984 | |
2.047% (LIBOR 1 Month - 7 basis points) 12/30/2019 (7) | | | 14,000,000 | | | | 13,999,771 | |
2.060% (LIBOR 1 Month - 4 basis points) 5/1/2020 (7) | | | 10,000,000 | | | | 9,997,087 | |
2.070% (LIBOR 1 Month - 3 basis points) 10/1/2019 (7) | | | 10,000,000 | | | | 9,999,979 | |
2.100% (LIBOR 1 Month - 5 basis points) 2/25/2020 (7) | | | 14,700,000 | | | | 14,699,013 | |
2.122% (LIBOR 1 Month + 1 basis points) 7/30/2020 (7) | | | 20,000,000 | | | | 19,999,686 | |
2.136% (LIBOR 3 Month - 12 basis points) 1/27/2020 (7) | | | 1,500,000 | | | | 1,500,459 | |
2.150% (SOFR + 3 basis points) 2/6/2020 (7) | | | 4,000,000 | | | | 4,000,000 | |
2.195% (LIBOR 1 Month + 5 basis points) 1/27/2020 (7) | | | 15,000,000 | | | | 15,006,415 | |
2.196% 4/14/2020 (7) | | | 15,000,000 | | | | 15,000,000 | |
2.206% (LIBOR 1 Month + 1 basis points) 1/12/2021 (7) | | | 7,000,000 | | | | 6,995,808 | |
2.211% (LIBOR 1 Month + 1 basis points) 12/11/2020 (7) | | | 4,150,000 | | | | 4,145,867 | |
2.219% (LIBOR 1 Month + 5 basis points) 2/21/2020 (7) | | | 8,500,000 | | | | 8,504,229 | |
2.240% (SOFR + 12 basis points) 3/18/2021 (7) | | | 10,000,000 | | | | 10,002,257 | |
2.240% (U.S. Federal Funds Effective Rate (continuous series) + 12 basis points) 2/18/2020 (7) | | | 10,000,000 | | | | 10,002,266 | |
| | | | | | | | |
| Description | | Principal
Amount | | | Value | |
U.S. Government & U.S. Government Agency Obligations
(continued) | |
|
Federal Farm Credit Bank(continued) | |
2.250% (FCPR DLY - 300 basis points) 3/22/2021 (7) | | $ | 10,000,000 | | | $ | 9,998,429 | |
2.320% (FCPR DLY - 293 basis points) 9/24/2020 (7) | | | 20,000,000 | | | | 20,033,759 | |
2.326% (LIBOR 1 Month + 18 basis points) 10/24/2019 (7) | | | 2,295,000 | | | | 2,295,995 | |
2.340% (FCPR DLY - 291 basis points) 1/25/2021 (7) | | | 24,000,000 | | | | 24,049,899 | |
2.362% (LIBOR 1 Month + 19 basis points) 9/20/2019 (7) | | | 1,510,000 | | | | 1,510,215 | |
2.381% (LIBOR 1 Month + 18 basis points) 10/11/2019 (7) | | | 12,315,000 | | | | 12,318,693 | |
| | | | | | | | |
| | | | | | | 351,884,893 | |
|
Federal Home Loan Bank — 29.2% | |
1.986% 2/7/2020 (6) | | | 15,000,000 | | | | 14,871,475 | |
2.015% 1/17/2020 (6) | | | 17,000,000 | | | | 16,868,689 | |
2.020% 1/22/2020 (6) | | | 18,500,000 | | | | 18,351,558 | |
2.029% (LIBOR 3 Month - 26 basis points) 10/7/2019 (7) | | | 15,000,000 | | | | 14,998,808 | |
2.050% 1/17/2020 (6) | | | 12,000,000 | | | | 11,905,700 | |
2.072% (LIBOR 1 Month - 10 basis points) 10/23/2019 (7) | | | 12,500,000 | | | | 12,500,000 | |
2.075% (LIBOR 1 Month - 7 basis points) 12/27/2019 (7) | | | 16,000,000 | | | | 15,997,069 | |
2.081% (LIBOR 3 Month - 26 basis points) 10/11/2019 (7) | | | 15,000,000 | | | | 14,998,469 | |
2.090% 8/14/2020 | | | 17,500,000 | | | | 17,500,000 | |
2.100% 8/12/2020 | | | 20,000,000 | | | | 20,000,000 | |
2.100% 9/11/2020 | | | 15,000,000 | | | | 15,000,000 | |
2.102% (LIBOR 1 Month - 7 basis points) 1/23/2020 (7) | | | 10,000,000 | | | | 10,000,004 | |
2.112% (LIBOR 1 Month - 6 basis points) 2/20/2020 (7) | | | 20,000,000 | | | | 20,000,000 | |
2.114% (LIBOR 1 Month - 8 basis points) 11/13/2019 (7) | | | 10,000,000 | | | | 9,999,321 | |
2.120% (SOFR) 12/11/2019 (7) | | | 17,000,000 | | | | 17,000,000 | |
2.122% (LIBOR 1 Month - 6 basis points) 9/18/2019 (7) | | | 15,000,000 | | | | 14,999,885 | |
2.125% (SOFR + 1 basis points) 10/10/2019 (7) | | | 25,000,000 | | | | 25,000,000 | |
2.125% (SOFR + 1 basis points) 1/17/2020 (7) | | | 20,000,000 | | | | 20,000,000 | |
2.130% 10/11/2019 (6) | | | 20,000,000 | | | | 19,952,667 | |
2.130% (SOFR + 1 basis points) 11/13/2019 (7) | | | 20,000,000 | | | | 20,000,321 | |
2.130% (SOFR + 1 basis points) 12/20/2019 (7) | | | 15,000,000 | | | | 15,000,000 | |
2.130% (SOFR + 1 basis points) 1/24/2020 (7) | | | 22,000,000 | | | | 22,000,000 | |
2.137% (LIBOR 1 Month - 6 basis points) 9/16/2019 (7) | | | 4,600,000 | | | | 4,600,042 | |
2.140% (SOFR + 2 basis points) 2/21/2020 (7) | | | 22,000,000 | | | | 22,000,000 | |
2.143% (LIBOR 1 Month - 8 basis points) 2/7/2020 (7) | | | 15,000,000 | | | | 14,999,823 | |
2.145% (SOFR + 3 basis points) 9/20/2019 (7) | | | 23,000,000 | | | | 23,000,000 | |
2.145% (SOFR + 3 basis points) 4/22/2020 (7) | | | 8,300,000 | | | | 8,300,000 | |
2.147% (LIBOR 1 Month - 3 basis points) 4/20/2020 (7) | | | 10,750,000 | | | | 10,749,365 | |
2.150% 7/30/2020 | | | 15,000,000 | | | | 15,000,000 | |
(See Notes to Schedules of Investments and Notes to Financial Statements, which are an integral part of the Financial Statements)
103
August 31, 2019
Government Money Market Fund (continued)
| | | | | | | | |
| Description | | Principal
Amount | | | Value | |
U.S. Government & U.S. Government Agency Obligations
(continued) | |
|
Federal Home Loan Bank(continued) | |
2.150% (SOFR + 3 basis points) 12/6/2019 (7) | | $ | 14,000,000 | | | $ | 14,000,000 | |
2.150% (SOFR + 3 basis points) 3/27/2020 (7) | | | 15,000,000 | | | | 15,000,000 | |
2.150% (SOFR + 3 basis points) 7/17/2020 (7) | | | 11,000,000 | | | | 11,000,000 | |
2.150% (SOFR + 3 basis points) 11/6/2020 (7) | | | 12,000,000 | | | | 12,000,000 | |
2.153% (LIBOR 3 Month - 15 basis points) 1/17/2020 (7) | | | 8,500,000 | | | | 8,500,000 | |
2.154% 10/11/2019 (6) | | | 15,000,000 | | | | 14,964,100 | |
2.155% (SOFR + 4 basis points) 5/8/2020 (7) | | | 20,000,000 | | | | 20,000,000 | |
2.155% (SOFR + 4 basis points) 6/19/2020 (7) | | | 17,000,000 | | | | 17,000,000 | |
2.160% 10/9/2019 (6) | | | 20,000,000 | | | | 19,954,400 | |
2.160% (SOFR + 4 basis points) 8/25/2020 (7) | | | 15,500,000 | | | | 15,500,000 | |
2.160% (SOFR + 4 basis points) 2/9/2021 (7) | | | 12,000,000 | | | | 12,000,000 | |
2.165% (SOFR + 5 basis points) 9/28/2020 (7) | | | 14,000,000 | | | | 14,000,000 | |
2.167% 10/23/2020 (7) | | | 14,750,000 | | | | 14,750,000 | |
2.170% 8/5/2020 | | | 20,000,000 | | | | 20,000,000 | |
2.170% (SOFR + 5 basis points) 1/17/2020 (7) | | | 2,000,000 | | | | 2,000,000 | |
2.170% (SOFR + 5 basis points) 1/22/2021 (7) | | | 5,700,000 | | | | 5,700,000 | |
2.171% 10/16/2019 (6) | | | 25,000,000 | | | | 24,933,437 | |
2.175% (SOFR + 6 basis points) 5/14/2021 (7) | | | 16,350,000 | | | | 16,350,000 | |
2.185% (SOFR + 7 basis points) 11/15/2019 (7) | | | 19,000,000 | | | | 19,000,826 | |
2.185% (SOFR + 7 basis points) 3/27/2020 (7) | | | 14,000,000 | | | | 14,000,000 | |
2.190% 10/2/2019 (6) | | | 13,500,000 | | | | 13,474,541 | |
2.195% 9/30/2019 (6) | | | 25,000,000 | | | | 24,956,601 | |
2.195% (SOFR + 8 basis points) 7/24/2020 (7) | | | 10,000,000 | | | | 10,000,000 | |
2.195% (SOFR + 8 basis points) 7/8/2021 (7) | | | 18,000,000 | | | | 18,000,000 | |
2.195% (SOFR + 8 basis points) 7/23/2021 (7) | | | 10,000,000 | | | | 10,000,000 | |
2.200% 9/4/2019 (6) | | | 25,000,000 | | | | 24,995,417 | |
2.209% (LIBOR 1 Month - 2 basis points) 1/6/2020 (7) | | | 20,000,000 | | | | 20,000,000 | |
2.225% (SOFR + 11 basis points) 10/1/2020 (7) | | | 13,000,000 | | | | 13,000,000 | |
2.235% (SOFR + 12 basis points) 3/12/2021 (7) | | | 11,000,000 | | | | 11,000,000 | |
2.400% 6/17/2020 | | | 15,650,000 | | | | 15,650,000 | |
2.450% 9/23/2019 (6) | | | 13,000,000 | | | | 12,999,782 | |
| | | | | | | | |
| | | | | | | 930,322,300 | |
|
Federal Home Loan Mortgage Corporation — 6.2% | |
0.010% 6/4/2020 | | | 15,000,000 | | | | 15,000,000 | |
1.930% 12/4/2019 (6) | | | 17,500,000 | | | | 17,411,810 | |
2.120% (SOFR) 2/12/2020 (7) | | | 26,000,000 | | | | 26,000,000 | |
2.125% (SOFR + 1 basis points) 5/13/2020 (7) | | | 20,000,000 | | | | 20,000,000 | |
2.140% 3/3/2020 | | | 15,000,000 | | | | 15,000,000 | |
| | | | | | | | |
| Description | | Principal
Amount | �� | | Value | |
U.S. Government & U.S. Government Agency Obligations
(continued) | |
|
Federal Home Loan Mortgage Corporation(continued) | |
2.145% (SOFR + 3 basis points) 5/22/2020 (7) | | $ | 20,000,000 | | | $ | 20,000,000 | |
2.150% (SOFR + 3 basis points) 8/21/2020 (7) | | | 15,000,000 | | | | 15,000,000 | |
2.400% 6/12/2020 | | | 18,650,000 | | | | 18,650,000 | |
2.440% 6/9/2020 | | | 18,000,000 | | | | 18,000,000 | |
2.495% 6/4/2020 | | | 20,000,000 | | | | 20,000,033 | |
2.520% 4/15/2020 | | | 11,150,000 | | | | 11,150,000 | |
| | | | | | | | |
| | | | | | | 196,211,843 | |
|
Federal National Mortgage Association — 2.5% | |
1.940% 11/1/2019 (6) | | | 20,000,000 | | | | 19,934,256 | |
1.959% 11/27/2019 (6) | | | 15,000,000 | | | | 14,928,986 | |
2.125% (SOFR + 1 basis points) 2/24/2020 (7) | | | 15,000,000 | | | | 15,000,000 | |
2.195% (SOFR + 8 basis points) 10/30/2020 (7) | | | 9,000,000 | | | | 9,000,000 | |
2.280% (SOFR + 16 basis points) 1/30/2020 (7) | | | 21,000,000 | | | | 21,002,710 | |
| | | | | | | | |
| | | | | | | 79,865,952 | |
| | |
Sovereign — 3.0% | | | | | | | | |
1.976% 1/20/2027 (7) | | | 15,000,000 | | | | 15,000,000 | |
1.976% 6/20/2027 (7) | | | 15,000,000 | | | | 15,000,000 | |
1.976% 6/20/2027 (7) | | | 5,000,000 | | | | 5,000,000 | |
1.976% 9/20/2027 (7) | | | 14,000,000 | | | | 14,000,000 | |
1.976% 10/15/2030 (7) | | | 10,000,000 | | | | 10,000,000 | |
1.977% 1/20/2035 (7) | | | 13,000,000 | | | | 13,000,000 | |
1.977% 1/20/2035 (7) | | | 5,000,000 | | | | 5,000,000 | |
1.977% 4/20/2035 (7) | | | 5,000,000 | | | | 5,000,000 | |
1.977% 4/20/2035 (7) | | | 15,000,000 | | | | 15,000,000 | |
| | | | | | | | |
| | | | | | | 97,000,000 | |
| | | | | | | | |
Total U.S. Government & U.S. Government Agency Obligations | | | | 1,655,284,988 | |
| | | | | | | | |
| U.S. Treasury Bills — 4.0% | | | | | | |
| |
U.S. Treasury Bonds & Notes — 4.0% | | | | | |
United States Treasury Bill: | | | | | | | | |
1.879% 2/20/2020 (6) | | | 15,000,000 | | | | 14,868,420 | |
1.935% 2/6/2020 (6) | | | 15,000,000 | | | | 14,875,509 | |
1.935% 2/13/2020 (6) | | | 15,000,000 | | | | 14,870,063 | |
1.957% 11/21/2019 (6) | | | 15,000,000 | | | | 14,935,166 | |
2.004% 10/22/2019 (6) | | | 15,000,000 | | | | 14,957,426 | |
2.029% 9/17/2019 (6) | | | 20,000,000 | | | | 19,981,969 | |
2.075% 10/1/2019 (6) | | | 20,000,000 | | | | 19,966,000 | |
2.090% 9/24/2019 (6) | | | 15,000,000 | | | | 14,979,966 | |
| | | | | | | | |
| | | | | | | 129,434,519 | |
| | | | | | | | |
Total Investments — 100.1%
(at amortized cost) | | | | 3,193,672,635 | |
| Other Assets and Liabilities — (0.1)% | | | | (3,858,092 | ) |
| | | | | | | | |
| Total Net Assets — 100.0% | | | $ | 3,189,814,543 | |
| | | | | | | | |
(See Notes to Schedules of Investments and Notes to Financial Statements, which are an integral part of the Financial Statements)
104
Tax-Free Money Market Fund
| | | | | | | | |
| Description | | Principal
Amount | | | Value | |
| Municipals — 95.6% | |
|
Alabama — 11.7% | |
Chatom Industrial Development Board, 1.400%, 8/1/2037 (7) | | $ | 5,500,000 | | | $ | 5,500,000 | |
City of Oxford, 1.420%, 9/1/2041 (7) | | | 12,745,000 | | | | 12,745,000 | |
Columbia Industrial Development Board, 1.430%, 12/1/2037 (7) | | | 3,700,000 | | | | 3,700,000 | |
Industrial Development Board of the City of Mobile Alabama, 1.460%, 6/1/2034 (7) | | | 10,000,000 | | | | 10,000,000 | |
Tender Option Bond Trust Receipts/Certificates: | | | | | | | | |
1.530% 5/1/2026 (5)(7) | | | 6,000,000 | | | | 6,000,000 | |
1.530% 7/1/2026 (5)(7) | | | 10,000,000 | | | | 10,000,000 | |
| | | | | | | | |
| | | | | | | 47,945,000 | |
| | |
Alaska — 0.5% | | | | | | | | |
City of Valdez, 1.350%, 12/1/2033 (7) | | | 2,115,000 | | | | 2,115,000 | |
| | |
California — 3.4% | | | | | | | | |
Tender Option Bond Trust Receipts/Certificates: | | | | | | | | |
1.450% 11/1/2023 (5)(7) | | | 5,070,000 | | | | 5,070,000 | |
1.500% 9/1/2042 (5)(7) | | | 8,945,000 | | | | 8,945,000 | |
| | | | | | | | |
| | | | | | | 14,015,000 | |
| | |
Connecticut — 3.0% | | | | | | | | |
State of Connecticut, 1.440%, 5/15/2034 (7) | | | 12,200,000 | | | | 12,200,000 | |
| | |
Delaware — 2.3% | | | | | | | | |
Delaware State Health Facilities Authority, 1.390%, 10/1/2038 (7) | | | 9,255,000 | | | | 9,255,000 | |
| | |
District of Columbia — 1.7% | | | | | | | | |
District of Columbia, 1.340%, 9/5/2019 | | | 7,000,000 | | | | 7,000,000 | |
| | |
Florida — 8.0% | | | | | | | | |
City of Jacksonville: | | | | | | | | |
1.330% 8/1/2036 (7) | | | 4,890,000 | | | | 4,890,000 | |
1.330% 8/1/2036 (7) | | | 3,000,000 | | | | 3,000,000 | |
1.430% 9/19/2019 | | | 12,300,000 | | | | 12,300,000 | |
Highlands County Health Facilities Authority: | | | | | | | | |
1.350% 11/15/2035 (7) | | | 2,000,000 | | | | 2,000,000 | |
1.350% 11/15/2037 (7) | | | 400,000 | | | | 400,000 | |
Miami-Dade County Industrial Development Authority, 1.410%, 6/1/2021 (7) | | | 2,000,000 | | | | 2,000,000 | |
School District of Broward County, 3.000%, 6/30/2020 | | | 4,000,000 | | | | 4,060,600 | |
Tender Option Bond Trust Receipts/Certificates, 1.380%, 7/1/2040 (5)(7) | | | 4,075,000 | | | | 4,075,000 | |
| | | | | | | | |
| | | | | | | 32,725,600 | |
| | |
Georgia — 2.2% | | | | | | | | |
Private Colleges & Universities Authority, 1.350%, 9/1/2036 (7) | | | 2,225,000 | | | | 2,225,000 | |
RBC Municipal Products, Inc.Trust, 1.410%, 10/1/2021 (5)(7) | | | 5,000,000 | | | | 5,000,000 | |
| | | | | | | | |
| Description | | Principal
Amount | | | Value | |
| Municipals (continued) | |
| | |
Georgia(continued) | | | | | | | | |
Tender Option Bond Trust Receipts/Certificates, 1.400%, 10/1/2024 (5)(7) | | $ | 1,600,000 | | | $ | 1,600,000 | |
| | | | | | | | |
| | | | | | | 8,825,000 | |
| | |
Idaho — 0.1% | | | | | | | | |
Idaho Health Facilities Authority, 1.350%, 12/1/2048 (7) | | | 500,000 | | | | 500,000 | |
| | |
Illinois — 7.1% | | | | | | | | |
Illinois Finance Authority: | | | | | | | | |
1.330% 7/1/2038 (7) | | | 5,417,000 | | | | 5,417,000 | |
1.340% 7/1/2039 (7) | | | 449,000 | | | | 449,000 | |
Illinois State Toll Highway Authority, 1.380%, 7/1/2030 (7) | | | 725,000 | | | | 725,000 | |
Phoenix Realty SpecialAccount-U LP, 1.380%, 4/1/2020 (7) | | | 8,075,000 | | | | 8,075,000 | |
Tender Option Bond Trust Receipts/Certificates: | | | | | | | | |
1.380% 1/15/2026 (5)(7) | | | 7,500,000 | | | | 7,500,000 | |
1.550% 11/15/2025 (5)(7) | | | 6,670,000 | | | | 6,670,000 | |
| | | | | | | | |
| | | | | | | 28,836,000 | |
| | |
Indiana — 1.9% | | | | | | | | |
Tender Option Bond Trust Receipts/Certificates, 1.500%, 5/14/2026 (5)(7) | | | 7,770,000 | | | | 7,770,000 | |
| | |
Iowa — 3.2% | | | | | | | | |
Iowa Finance Authority: | | | | | | | | |
1.380% 6/1/2039 (7) | | | 9,800,000 | | | | 9,800,000 | |
1.390% 9/1/2036 (7) | | | 3,200,000 | | | | 3,200,000 | |
| | | | | | | | |
| | | | | | | 13,000,000 | |
| | |
Maryland — 1.5% | | | | | | | | |
Maryland Economic Development Corp., 1.370%, 2/15/2043 (7) | | | 1,635,000 | | | | 1,635,000 | |
Washington Suburban Sanitary Commission, 1.380%, 6/1/2023 (7) | | | 4,575,000 | | | | 4,575,000 | |
| | | | | | | | |
| | | | | | | 6,210,000 | |
| | |
Massachusetts — 2.4% | | | | | | | | |
Massachusetts Bay Transportation Authority, 1.370%, 3/1/2030 (7) | | | 10,000,000 | | | | 10,000,000 | |
| | |
Michigan — 2.4% | | | | | | | | |
Michigan Finance Authority, 4.000%, 8/20/2020 | | | 2,000,000 | | | | 2,051,552 | |
Michigan State University: | | | | | | | | |
1.370% 8/15/2030 (7) | | | 1,610,000 | | | | 1,610,000 | |
1.370% 2/15/2033 (7) | | | 6,000,000 | | | | 6,000,000 | |
| | | | | | | | |
| | | | | | | 9,661,552 | |
| | |
Minnesota — 1.7% | | | | | | | | |
City of Ramsey, 1.550%, 12/1/2023 (7) | | | 1,600,000 | | | | 1,600,000 | |
Minnesota Higher Education Facilities Authority: | | | | | | | | |
1.450% 3/1/2024 (7) | | | 2,000,000 | | | | 2,000,000 | |
1.450% 3/1/2033 (7) | | | 3,415,000 | | | | 3,415,000 | |
| | | | | | | | |
| | | | | | | 7,015,000 | |
| | |
Mississippi — 1.0% | | | | | | | | |
Mississippi Business Finance Corp.: | | | | | | | | |
1.350% 11/1/2035 (7) | | | 3,235,000 | | | | 3,235,000 | |
1.900% 5/1/2037 (7) | | | 1,000,000 | | | | 1,000,000 | |
| | | | | | | | |
| | | | | | | 4,235,000 | |
(See Notes to Schedules of Investments and Notes to Financial Statements, which are an integral part of the Financial Statements)
105
August 31, 2019
Tax-Free Money Market Fund (continued)
| | | | | | | | |
| Description | | Principal
Amount | | | Value | |
| Municipals (continued) | |
| | |
Missouri — 3.7% | | | | | | | | |
Greene County Industrial Development Authority, 1.430%, 5/1/2039 (7) | | $ | 905,000 | | | $ | 905,000 | |
Missouri Development Finance Board, 1.400%, 12/1/2037 (7) | | | 4,000,000 | | | | 4,000,000 | |
Tender Option Bond Trust Receipts/Certificates, 1.450%, 5/15/2041 (5)(7) | | | 10,000,000 | | | | 10,000,000 | |
| | | | | | | | |
| | | | | | | 14,905,000 | |
| | |
Nebraska — 0.1% | | | | | | | | |
Nebraska Investment Finance Authority, 2.100%, 9/1/2031 (7) | | | 600,000 | | | | 600,000 | |
| | |
New Jersey — 0.5% | | | | | | | | |
Lyndhurst Township School District, 1.875%, 9/10/2020 (8) | | | 2,000,000 | | | | 2,011,700 | |
| | |
New York — 4.2% | | | | | | | | |
City of New York, 1.400%, 4/1/2042 (7) | | | 1,000,000 | | | | 1,000,000 | |
New York City Water & Sewer System: | | | | | | | | |
1.370% 6/15/2039 (7) | | | 1,100,000 | | | | 1,100,000 | |
1.380% 6/15/2044 (7) | | | 6,000,000 | | | | 6,000,000 | |
RBC Municipal Products, Inc.Trust, 1.410%, 3/1/2022 (5)(7) | | | 6,000,000 | | | | 6,000,000 | |
Whitney Point Central School District, 2.500%, SAW, 6/26/2020 | | | 3,000,000 | | | | 3,026,029 | |
| | | | | | | | |
| | | | | | | 17,126,029 | |
| | |
North Carolina — 3.3% | | | | | | | | |
City of Raleigh Combined Enterprise System Revenue, 1.390%, 3/1/2035 (7) | | | 6,000,000 | | | | 6,000,000 | |
Tender Option Bond Trust Receipts/Certificates, 1.400%, 7/1/2041 (5)(7) | | | 7,265,000 | | | | 7,265,000 | |
| | | | | | | | |
| | | | | | | 13,265,000 | |
| | |
Ohio — 6.1% | | | | | | | | |
American Municipal Power, Inc., 2.500%, 6/25/2020 | | | 1,600,000 | | | | 1,612,378 | |
County of Franklin, 1.350%, 12/1/2046 (7) | | | 3,750,000 | | | | 3,750,000 | |
County of Lake, 3.000%, 1/16/2020 | | | 2,500,000 | | | | 2,508,267 | |
County of Lorain, 3.000%, 2/7/2020 | | | 2,225,000 | | | | 2,234,974 | |
Port of Greater Cincinnati Development Authority: | | | | | | | | |
1.720% 11/1/2023 (7) | | | 1,230,000 | | | | 1,230,000 | |
1.720% 11/1/2025 (7) | | | 245,000 | | | | 245,000 | |
RBC Municipal Products, Inc.Trust, 1.380%, 10/1/2020 (5)(7) | | | 4,110,000 | | | | 4,110,000 | |
South-Western City School District, 3.000%, 12/5/2019 | | | 1,900,000 | | | | 1,906,029 | |
State of Ohio, 1.400%, 1/1/2052 (7) | | | 3,500,000 | | | | 3,500,000 | |
Tender Option Bond Trust Receipts/Certificates, 1.510%, 6/1/2026 (5)(7) | | | 4,000,000 | | | | 4,000,000 | |
| | | | | | | | |
| | | | | | | 25,096,648 | |
| | | | | | | | |
| Description | | Principal
Amount | | | Value | |
| Municipals (continued) | |
| | |
Pennsylvania — 1.1% | | | | | | | | |
RBC Municipal Products, Inc.Trust, 1.550%, (SIFMA Municipal Swap Index Yield), 12/1/2025 (5)(7) | | $ | 4,325,000 | | | $ | 4,325,000 | |
| | |
South Dakota — 3.1% | | | | | | | | |
South Dakota Housing Development Authority: | | | | | | | | |
1.470% 11/1/2048 (7) | | | 6,110,000 | | | | 6,110,000 | |
1.520% 5/1/2048 (7) | | | 6,470,000 | | | | 6,470,000 | |
| | | | | | | | |
| | | | | | | 12,580,000 | |
| | |
Tennessee — 1.9% | | | | | | | | |
City of Memphis, 1.360%, 10/3/2019 | | | 6,000,000 | | | | 6,000,000 | |
Metropolitan Government Nashville & Davidson County Health & Educational Facs Bd, 1.500%, 7/1/2020 | | | 1,750,000 | | | | 1,750,000 | |
| | | | | | | | |
| | | | | | | 7,750,000 | |
| | |
Texas — 13.6% | | | | | | | | |
Atascosa County Industrial Development Corp., 1.350%, 6/30/2020 (7) | | | 9,500,000 | | | | 9,500,000 | |
City of Austin, 1.360%, 11/15/2029 (7) | | | 1,260,000 | | | | 1,260,000 | |
City of San Antonio, 1.520%, 10/2/2019 | | | 4,300,000 | | | | 4,300,000 | |
Harris County Cultural Education Facilities Finance Corp., 1.390%, 12/1/2024 (7) | | | 8,390,000 | | | | 8,390,000 | |
Harris County Health Facilities Development Corp.: | | | | | | | | |
1.390% 12/1/2041 (7) | | | 4,000,000 | | | | 4,000,000 | |
1.390% 12/1/2041 (7) | | | 4,600,000 | | | | 4,600,000 | |
San Antonio Texas Water System, 1.350%, 11/4/2019 | | | 3,000,000 | | | | 3,000,000 | |
State of Texas: | | | | | | | | |
1.390% 6/1/2046 (7) | | | 3,400,000 | | | | 3,400,000 | |
1.500% 12/1/2049 (7) | | | 4,950,000 | | | | 4,950,000 | |
Tarrant County Cultural Education Facilities Finance Corp.: | | | | | | | | |
1.350% 11/15/2051 (7) | | | 1,445,000 | | | | 1,445,000 | |
1.380% 11/15/2033 (7) | | | 2,285,000 | | | | 2,285,000 | |
University of North Texas System, 1.350%, 9/19/2019 | | | 8,280,000 | | | | 8,280,000 | |
| | | | | | | | |
| | | | | | | 55,410,000 | |
| | |
Washington — 3.5% | | | | | | | | |
Seattle Housing Authority, 1.510%, 6/1/2040 (7) | | | 975,000 | | | | 975,000 | |
Tender Option Bond Trust Receipts/Certificates, 1.410%, 7/1/2026 (5)(7) | | | 5,000,000 | | | | 5,000,000 | |
Washington Higher Education Facilities Authority, 1.390%, 10/1/2029 (7) | | | 6,050,000 | | | | 6,050,000 | |
Washington State Housing Finance Commission, 1.460%, 7/1/2028 (7) | | | 2,290,000 | | | | 2,290,000 | |
| | | | | | | | |
| | | | | | | 14,315,000 | |
| | |
Wisconsin — 0.4% | | | | | | | | |
Wisconsin Health & Educational Facilities Authority, 1.410%, 5/1/2030 (7) | | | 1,480,000 | | | | 1,480,000 | |
| | | | | | | | |
| Total Municipals | | | | | | | 390,172,529 | |
| | | | | | | | |
(See Notes to Schedules of Investments and Notes to Financial Statements, which are an integral part of the Financial Statements)
106
Tax-Free Money Market Fund (continued)
| | | | | | | | |
| Description | | Shares | | | Value | |
| Mutual Funds — 4.7% | | | | | | |
BlackRock Liquidity FundsT-Fund Portfolio — Institutional Class, 1.980% | | | 1,231,459 | | | $ | 1,231,459 | |
Federated InstitutionalTax-Free Cash Trust — Institutional Class, 1.250% | | | 17,967,931 | | | | 17,967,931 | |
| | | | | | | | |
| Total Mutual Funds | | | | | | | 19,199,390 | |
| | | | | | | | |
Total Investments — 100.3%
(at amortized cost) | | | | | | | 409,371,919 | |
| Other Assets and Liabilities — (0.3)% | | | | (1,295,926 | ) |
| | | | | | | | |
| Total Net Assets — 100.0% | | | | | | $ | 408,075,993 | |
| | | | | | | | |
Prime Money Market Fund
| | | | | | | | |
| Description | | Principal
Amount | | | Value | |
| Certificates of Deposit — 23.2% | |
|
Banks — 23.2% | |
Bank of Nova Scotia, 2.558% (LIBOR 3 Month + 28 basis points), 10/21/2019 (7) | | $ | 2,500,000 | | | $ | 2,500,595 | |
Canadian Imperial Bank of Commerce: | | | | | | | | |
2.380% (FEDL 1 Month + 26 basis points), 6/8/2020 (7) | | | 3,000,000 | | | | 3,000,000 | |
2.487% (LIBOR 3 Month + 10 basis points), 9/20/2019 (7) | | | 3,000,000 | | | | 3,000,000 | |
Credit Suisse AG: | | | | | | | | |
2.310% (SOFR + 19 basis points), 10/10/2019 (7) | | | 3,000,000 | | | | 3,000,000 | |
2.332% (LIBOR 1 Month + 16 basis points), 12/20/2019 (7) | | | 1,500,000 | | | | 1,500,000 | |
2.360% (SOFR + 24 basis points), 10/1/2019 (7) | | | 3,000,000 | | | | 3,000,000 | |
2.440% (SOFR + 32 basis points), 7/27/2020 (7) | | | 3,000,000 | | | | 3,000,000 | |
2.500% (SOFR + 38 basis points), 3/6/2020 (7) | | | 2,500,000 | | | | 2,500,000 | |
2.500% (SOFR + 38 basis points), 5/4/2020 (7) | | | 2,500,000 | | | | 2,500,000 | |
Goldman Sachs Bank USA: | | | | | | | | |
2.389% (LIBOR 1 Month + 30 basis points), 11/4/2019 (7) | | | 3,000,000 | | | | 3,001,129 | |
2.527% (SOFR + 25 basis points), 6/25/2020 (7) | | | 2,750,000 | | | | 2,750,000 | |
HSBC Bank USA NA: | | | | | | | | |
2.285% (LIBOR 3 Month + 1 basis points), 10/25/2019 (7) | | | 2,500,000 | | | | 2,500,000 | |
2.339% (LIBOR 1 Month + 25 basis points), 10/3/2019 (7) | | | 2,500,000 | | | | 2,500,000 | |
2.351% (LIBOR 1 Month + 15 basis points), 9/11/2019 (7) | | | 2,500,000 | | | | 2,500,000 | |
Mizuho Bank, Ltd.: | | | | | | | | |
2.332% (LIBOR 1 Month + 15 basis points), 11/18/2019 (7) | | | 2,500,000 | | | | 2,500,063 | |
2.361% (LIBOR 1 Month + 16 basis points), 9/12/2019 (7) | | | 3,000,000 | | | | 3,000,000 | |
2.633% (LIBOR 3 Month + 33 basis points), 4/15/2020 (7) | | | 3,000,000 | | | | 3,003,433 | |
| | | | | | | | |
| Description | | Principal
Amount | | | Value | |
| Certificates of Deposit (continued) | |
| | |
Banks(continued) | | | | | | | | |
MUFG Bank, Ltd.: | | | | | | | | |
2.383% (LIBOR 3 Month + 10 basis points), 10/24/2019 (7) | | $ | 3,000,000 | | | $ | 3,000,000 | |
2.494% (LIBOR 1 Month + 25 basis points), 5/5/2020 (7) | | | 3,000,000 | | | | 3,000,016 | |
National Bank of Canada, 2.301% (LIBOR 1 Month + 10 basis points), 10/10/2019 (7) | | | 3,000,000 | | | | 3,000,000 | |
Nordea Bank AB, 2.720% 2/20/2020 | | | 2,850,000 | | | | 2,855,677 | |
Norinchukin Bank: | | | | | | | | |
2.220% 1/31/2020 | | | 3,500,000 | | | | 3,500,000 | |
2.250% 10/24/2019 | | | 3,000,000 | | | | 3,000,000 | |
2.270% 1/21/2020 | | | 3,000,000 | | | | 3,000,000 | |
2.530% 9/13/2019 | | | 3,000,000 | | | | 3,000,119 | |
2.530% 11/25/2019 | | | 2,500,000 | | | | 2,500,000 | |
2.540% 11/15/2019 | | | 2,500,000 | | | | 2,500,049 | |
Royal Bank of Canada, 2.363% (LIBOR 3 Month + 6 basis points), 4/17/2020 (7) | | | 2,750,000 | | | | 2,750,000 | |
Skandinaviska Enskilda Banken AB: | | | | | | | | |
2.410% 10/7/2019 | | | 2,500,000 | | | | 2,500,001 | |
2.570% 11/1/2019 | | | 2,500,000 | | | | 2,500,037 | |
Sumitomo Mitsui Banking Corp.: | | | | | | | | |
2.302% (LIBOR 1 Month + 12 basis points), 11/18/2019 (7) | | | 2,500,000 | | | | 2,500,000 | |
2.374% (LIBOR 1 Month + 13 basis points), 9/5/2019 (7) | | | 2,500,000 | | | | 2,500,000 | |
2.928% (LIBOR 3 Month + 45 basis points), 9/5/2019 (7) | | | 1,650,000 | | | | 1,650,071 | |
Sumitomo Mitsui Trust Bank, Ltd., 2.302% (LIBOR 1 Month + 19 basis points), 1/31/2020 (7) | | | 3,000,000 | | | | 2,999,947 | |
Swedbank AB, 2.610% (LIBOR 3 Month + 20 basis points), 9/16/2019 (7) | | | 2,500,000 | | | | 2,500,313 | |
Toronto-Dominion Bank: | | | | | | | | |
2.250% 1/8/2020 | | | 3,500,000 | | | | 3,500,000 | |
2.420% (FEDL 1 Month + 30 basis points), 2/27/2020 (7) | | | 2,500,000 | | | | 2,500,000 | |
2.469% (LIBOR 3 Month + 13 basis points), 10/15/2019 (7) | | | 3,000,000 | | | | 3,000,000 | |
2.470% (FEDL 1 Month + 35 basis points), 7/30/2020 (7) | | | 3,000,000 | | | | 3,000,000 | |
Wells Fargo Bank NA: | | | | | | | | |
2.460% (FEDL 1 Month + 30 basis points), 8/14/2020 (7) | | | 2,500,000 | | | | 2,500,000 | |
2.503% (LIBOR 3 Month + 20 basis points), 1/8/2020 (7) | | | 3,000,000 | | | | 3,000,000 | |
| | | | | | | | |
Westpac Banking Corp., 2.420% (U.S. Federal Funds Effective Rate (continuous series) + 30 basis points), 2/14/2020 (7) | | | 2,500,000 | | | | 2,500,000 | |
| | | | | | | | |
| Total Certificates of Deposit | | | | | | | 115,011,450 | |
| | | | | | | | |
| Commercial Paper — 50.9% | |
|
Asset-Backed Securities — 40.2% | |
Atlantic Asset Securitization LLC: | | | | | | | | |
2.190% 11/4/2019 (6) | | | 3,000,000 | | | | 2,988,320 | |
2.222% (LIBOR 1 Month + 11 basis points), 10/30/2019 (5) (7) | | | 3,000,000 | | | | 3,000,000 | |
2.255% (LIBOR 1 Month + 11 basis points), 11/26/2019 (5) (7) | | | 2,500,000 | | | | 2,500,000 | |
(See Notes to Schedules of Investments and Notes to Financial Statements, which are an integral part of the Financial Statements)
107
August 31, 2019
Prime Money Market Fund (continued)
| | | | | | | | |
| Description | | Principal
Amount | | | Value | |
| Commercial Paper (continued) | |
| |
Asset-Backed Securities (continued) | | | | | |
Bedford Row Funding Corp.: | | | | | | | | |
2.289% (LIBOR 3 Month + 3 basis points), 1/23/2020 (5) (7) | | $ | 2,500,000 | | | $ | 2,500,000 | |
2.297% (LIBOR 1 Month + 10 basis points), 12/16/2019 (5) (7) | | | 2,500,000 | | | | 2,500,000 | |
2.335% (LIBOR 1 Month + 19 basis points), 6/25/2020 (5) (7) | | | 3,000,000 | | | | 3,000,000 | |
2.350% (LIBOR 1 Month + 12 basis points), 11/1/2019 (5) (7) | | | 3,000,000 | | | | 3,000,049 | |
2.412% (LIBOR 1 Month + 24 basis points), 7/20/2020 (5) (7) | | | 3,000,000 | | | | 3,000,000 | |
2.431% (LIBOR 1 Month + 22 basis points), 9/9/2019 (5) (7) | | | 3,000,000 | | | | 3,000,000 | |
CAFCO LLC, 2.260% 9/27/2019 (6) | | | 3,500,000 | | | | 3,494,287 | |
Chariot Funding LLC, 2.420% 9/10/2019 (6) | | | 2,500,000 | | | | 2,498,487 | |
Chesham Finance Ltd., 2.150% 9/3/2019 (6) | | | 19,000,000 | | | | 18,997,731 | |
Columbia Funding Co. LLC: | | | | | | | | |
2.190% 12/6/2019 (6) | | | 5,000,000 | | | | 4,970,800 | |
2.200% 9/3/2019 (6) | | | 12,500,000 | | | | 12,498,472 | |
CRC Funding LLC, 2.260% 10/16/2019 (6) | | | 3,500,000 | | | | 3,490,112 | |
Crown Point Capital Co. LLC: | | | | | | | | |
2.130% 12/5/2019 (6) | | | 3,000,000 | | | | 2,983,137 | |
2.250% 9/27/2019 (6) | | | 4,000,000 | | | | 3,993,500 | |
Glencove Funding LLC: | | | | | | | | |
2.140% 9/4/2019 (6) | | | 4,000,000 | | | | 3,999,287 | |
2.150% 9/3/2019 (6) | | | 3,500,000 | | | | 3,499,582 | |
2.243% (1 year USD Swap + 10 basis points), 10/22/2019 (5) (7) | | | 5,000,000 | | | | 5,000,000 | |
2.243% (1 year USD Swap + 10 basis points), 10/31/2019 (5) (7) | | | 3,500,000 | | | | 3,500,000 | |
2.243% (1 year USD Swap + 10 basis points), 2/14/2020 (5) (7) | | | 3,000,000 | | | | 3,000,000 | |
Gotham Funding Corp., 2.200% 9/10/2019 (6) | | | 5,000,000 | | | | 4,997,250 | |
Lexington Parker Capital Co. LLC: | | | | | | | | |
2.200% 9/4/2019 (6) | | | 5,000,000 | | | | 4,999,083 | |
2.200% 10/4/2019 (6) | | | 3,000,000 | | | | 2,993,950 | |
2.200% 11/15/2019 (6) | | | 1,250,000 | | | | 1,244,271 | |
2.260% 11/1/2019 (6) | | | 3,000,000 | | | | 2,988,512 | |
2.279% 10/4/2019 (6) | | | 4,000,000 | | | | 3,991,787 | |
2.280% 10/30/2019 (6) | | | 2,500,000 | | | | 2,490,658 | |
Liberty Street Funding LLC, 2.120% 12/5/2019 (6) | | | 3,000,000 | | | | 2,983,217 | |
LMA Americas LLC: | | | | | | | | |
2.400% 11/4/2019 (6) | | | 2,500,000 | | | | 2,489,333 | |
2.540% 11/15/2019 (6) | | | 2,000,000 | | | | 1,989,417 | |
2.570% 9/18/2019 (6) | | | 3,000,000 | | | | 2,996,359 | |
2.600% 10/21/2019 (6) | | | 2,500,000 | | | | 2,490,972 | |
2.620% 1/27/2020 (6) | | | 2,000,000 | | | | 1,979,116 | |
Longship Funding LLC: | | | | | | | | |
2.150% 9/12/2019 (6) | | | 5,000,000 | | | | 4,996,715 | |
2.190% 9/19/2019 (6) | | | 3,000,000 | | | | 2,996,715 | |
2.200% 9/3/2019 (6) | | | 5,000,000 | | | | 4,999,389 | |
Old Line Funding LLC: | | | | | | | | |
2.265% (LIBOR 1 Month + 12 basis points), 9/27/2019 (5) (7) | | | 3,000,000 | | | | 3,000,000 | |
2.390% (LIBOR 1 Month + 16 basis points), 4/1/2020 (5) (7) | | | 2,750,000 | | | | 2,750,000 | |
| | | | | | | | |
| Description | | Principal
Amount | | | Value | |
| Commercial Paper (continued) | |
| |
Asset-Backed Securities (continued) | | | | | |
Regency Markets No. 1 LLC: | | | | | | | | |
2.210% 9/16/2019 (6) | | $ | 5,000,000 | | | $ | 4,995,396 | |
2.230% 9/9/2019 (6) | | | 7,500,000 | | | | 7,496,283 | |
Sheffield Receivables Co. LLC: | | | | | | | | |
2.020% 2/19/2020 (6) | | | 2,500,000 | | | | 2,476,013 | |
2.130% 12/6/2019 (6) | | | 2,500,000 | | | | 2,485,800 | |
2.260% 11/7/2019 (6) | | | 3,000,000 | | | | 2,987,382 | |
2.300% (SOFR + 18 basis points), 12/2/2019 (5) (7) | | | 3,000,000 | | | | 3,000,000 | |
2.320% (SOFR + 20 basis points), 10/18/2019 (5) (7) | | | 1,750,000 | | | | 1,750,000 | |
2.620% 10/1/2019 (6) | | | 2,500,000 | | | | 2,494,542 | |
Thunder Bay Funding LLC: | | | | | | | | |
2.282% (LIBOR 1 Month + 11 basis points), 12/20/2019 (5) (7) | | | 2,500,000 | | | | 2,500,000 | |
2.302% (LIBOR 1 Month + 12 basis points), 9/18/2019 (5) (7) | | | 2,500,000 | | | | 2,500,000 | |
2.311% (LIBOR 1 Month + 11 basis points), 10/10/2019 (5) (7) | | | 3,000,000 | | | | 3,000,000 | |
2.331% (LIBOR 1 Month + 13 basis points), 2/10/2020 (5) (7) | | | 2,750,000 | | | | 2,750,000 | |
2.362% (LIBOR 1 Month + 18 basis points), 3/19/2020 (5) (7) | | | 2,500,000 | | | | 2,500,000 | |
Victory Receivables Corp., 2.300% 9/6/2019 (6) | | | 4,000,000 | | | | 3,998,722 | |
| | | | | | | | |
| | | | | | | 199,724,646 | |
|
Auto Manufacturers — 2.4% | |
Toyota Motor Credit Corp.: | | | | | | | | |
2.272% (LIBOR 1 Month + 16 basis points), 2/28/2020 (7) | | | 2,500,000 | | | | 2,500,000 | |
2.373% (LIBOR 1 Month + 15 basis points), 1/31/2020 (7) | | | 3,000,000 | | | | 3,000,000 | |
2.377% (LIBOR 1 Month + 18 basis points), 4/9/2020 (7) | | | 3,275,000 | | | | 3,275,000 | |
2.404% (LIBOR 3 Month + 10 basis points), 10/11/2019 (7) | | | 3,000,000 | | | | 3,000,000 | |
| | | | | | | | |
| | | | | | | 11,775,000 | |
|
Banks — 1.1% | |
Bank of Nova Scotia: | | | | | | | | |
2.350% (SOFR + 23 basis points), 6/18/2020 (5) (7) | | | 2,500,000 | | | | 2,500,000 | |
2.430% (FEDL 1 Month + 31 basis points), 5/8/2020 (7) | | | 3,000,000 | | | | 3,000,000 | |
| | | | | | | | |
| | | | | | | 5,500,000 | |
|
Diversified Financial Services — 1.0% | |
Collateralized Commercial Paper Co. LLC, 2.466% (LIBOR 3 Month + 3 basis points), 9/12/2019 (7) | | | 3,000,000 | | | | 3,000,000 | |
JP Morgan Securities LLC, 2.376% (LIBOR 1 Month + 21 basis points), 9/23/2019 (5) (7) | | | 2,000,000 | | | | 1,999,796 | |
| | | | | | | | |
| | | | | | | 4,999,796 | |
|
Foreign Banks — 6.2% | |
Credit Suisse AG, 2.410% (SOFR + 29 basis points), 8/7/2020 (7) | | | 3,000,000 | | | | 3,000,000 | |
Mitsubishi UFJ Trust & Banking Corp., 2.326% (LIBOR 1 Month + 18 basis points), 1/24/2020 (7) | | | 3,650,000 | | | | 3,650,000 | |
Mizuho Bank, Ltd., 2.080% 2/7/2020 | | | 2,500,000 | | | | 2,500,211 | |
(See Notes to Schedules of Investments and Notes to Financial Statements, which are an integral part of the Financial Statements)
108
Prime Money Market Fund (continued)
| | | | | | | | |
| Description | | Shares or
Principal
Amount | | | Value | |
| Commercial Paper (continued) | |
| | |
Foreign Banks (continued) | | | | | | | | |
Royal Bank of Canada: | | | | | | | | |
2.380% (FEDL 1 Month + 26 basis points), 6/8/2020 (5) (7) | | $ | 2,500,000 | | | $ | 2,500,000 | |
2.400% (FEDL 1 Month + 28 basis points), 3/13/2020 (5) (7) | | | 2,500,000 | | | | 2,499,445 | |
Sumitomo Mitsui Trust Bank, Ltd.: | | | | | | | | |
2.260% 1/10/2020 | | | 3,000,000 | | | | 3,000,322 | |
2.300% 11/13/2019 | | | 3,000,000 | | | | 3,000,000 | |
Toronto-Dominion Bank: | | | | | | | | |
2.265% (LIBOR 1 Month + 12 basis points), 11/26/2019 (5) (7) | | | 2,500,000 | | | | 2,500,000 | |
2.390% (FEDL 1 Month + 27 basis points), 6/15/2020 (5) (7) | | | 2,500,000 | | | | 2,500,000 | |
Westpac Banking Corp.: | | | | | | | | |
2.413% (LIBOR 3 Month + 10 basis points), 10/4/2019 (5) (7) | | | 3,000,000 | | | | 2,999,967 | |
2.500% (LIBOR 3 Month + 18 basis points), 1/2/2020 (5) (7) | | | 2,500,000 | | | | 2,501,179 | |
| | | | | | | | |
| | | | | | | 30,651,124 | |
| | | | | | | | |
| Total Commercial Paper | | | | | | | 252,650,566 | |
| | | | | | | | |
| Municipals — 0.4% | |
|
Colorado — 0.4% | |
Colorado Housing & Finance Authority, 2.150%, 10/1/2036 (7) | | | 1,940,000 | | | | 1,940,000 | |
| Mutual Funds — 2.6% | |
BlackRock Liquidity FundsT-Fund Portfolio — Institutional Class, 1.980% | | | 6,000,000 | | | | 6,000,000 | |
| | | | | | | | |
Invesco Government & Agency Portfolio — Institutional Class, 2.016% | | | 7,000,000 | | | | 7,000,000 | |
| | | | | | | | |
| Total Mutual Funds | | | | | | | 13,000,000 | |
| | | | | | | | |
| Repurchase Agreements — 22.9% | |
Agreement with Fixed Income Clearing Corp., 1.200%, dated 8/30/2019, to be repurchased at $8,908,488 on 9/3/2019, collateralized by U.S. Government Treasury Obligations with a maturity of 12/31/2020, with a fair value of $9,089,490 | | $ | 8,907,300 | | | | 8,907,300 | |
Agreement with Fixed Income Clearing Corp., 2.150%, dated 8/30/2019, to be repurchased at $70,016,722 on 9/3/2019, collateralized by U.S.Government Treasury Obligations with various maturities to 5/15/2028, with a fair value of $71,400,128 | | | 70,000,000 | | | | 70,000,000 | |
| | | | | | | | |
| | | | | | | | |
| Description | | Principal
Amount | | | Value | |
| Repurchase Agreements (continued) | |
Agreement with Merrill Lynch, Pierce, Fenner & Smith, Inc., 2.150%, dated 8/30/2019, to be repurchased at $35,008,361 on 9/3/2019, collateralized by U.S. Government Agency Obligation with a maturity of 3/1/2049, with a fair value of $35,700,000 | | $ | 35,000,000 | | | $ | 35,000,000 | |
| | | | | | | | |
| Total Repurchase Agreements | | | | | | | 113,907,300 | |
| | | | | | | | |
Total Investments — 100.0%
(at amortized cost) | | | | 496,509,316 | |
| Other Assets and Liabilities — 0.0% | | | | 14,046 | |
| | | | | | | | |
| Total Net Assets — 100.0% | | | | | | $ | 496,523,362 | |
| | | | | | | | |
Institutional Prime Money Market Fund
| | | | | | | | |
| Description | | Principal
Amount | | | Value | |
| Certificates of Deposit — 23.4% | | | | | | |
| | |
Banks — 23.4% | | | | | | | | |
Bank of Nova Scotia, 2.558% (LIBOR 3 Month + 28 basis points), 10/21/2019 (7) | | $ | 2,500,000 | | | $ | 2,500,940 | |
Canadian Imperial Bank of Commerce: | | | | | | | | |
2.380% (FEDL 1 Month + 26 basis points), 6/8/2020 (7) | | | 3,000,000 | | | | 3,000,113 | |
2.487% (LIBOR 3 Month + 10 basis points), 9/20/2019 (7) | | | 3,500,000 | | | | 3,500,132 | |
Credit Suisse AG: | | | | | | | | |
2.310% (SOFR + 19 basis points), 10/10/2019 (7) | | | 3,500,000 | | | | 3,501,450 | |
2.332% (LIBOR 1 Month + 16 basis points), 12/20/2019 (7) | | | 3,500,000 | | | | 3,500,709 | |
2.360% (SOFR + 24 basis points), 10/1/2019 (7) | | | 3,500,000 | | | | 3,501,326 | |
2.500% (SOFR + 38 basis points), 3/6/2020 (7) | | | 2,500,000 | | | | 2,501,574 | |
2.500% (SOFR + 38 basis points), 5/4/2020 (7) | | | 3,500,000 | | | | 3,503,702 | |
Goldman Sachs Bank USA: | | | | | | | | |
2.389% (LIBOR 1 Month + 30 basis points), 11/4/2019 (7) | | | 4,000,000 | | | | 4,001,822 | |
2.527% (SOFR + 25 basis points), 6/25/2020 (7) | | | 3,000,000 | | | | 3,000,561 | |
HSBC Bank USA NA: | | | | | | | | |
2.285% (LIBOR 3 Month + 1 basis points), 10/25/2019 (7) | | | 3,500,000 | | | | 3,500,098 | |
2.339% (LIBOR 1 Month + 25 basis points), 10/3/2019 (7) | | | 3,000,000 | | | | 3,000,422 | |
2.351% (LIBOR 1 Month + 15 basis points), 9/11/2019 (7) | | | 3,000,000 | | | | 3,000,212 | |
Mizuho Bank, Ltd.: | | | | | | | | |
2.332% (LIBOR 1 Month + 15 basis points), 11/18/2019 (7) | | | 4,500,000 | | | | 4,501,071 | |
2.361% (LIBOR 1 Month + 16 basis points), 9/12/2019 (7) | | | 3,000,000 | | | | 3,000,241 | |
2.633% (LIBOR 3 Month + 33 basis points), 4/15/2020 (7) | | | 3,500,000 | | | | 3,503,770 | |
(See Notes to Schedules of Investments and Notes to Financial Statements, which are an integral part of the Financial Statements)
109
August 31, 2019
Institutional Prime Money Market Fund (continued)
| | | | | | | | |
| Description | | Principal
Amount | | | Value | |
| Certificates of Deposit (continued) | | | | | | |
| | |
Banks(continued) | | | | | | | | |
MUFG Bank, Ltd.: | | | | | | | | |
2.383% (LIBOR 3 Month + 10 basis points), 10/24/2019 (7) | | $ | 3,500,000 | | | $ | 3,500,530 | |
2.494% (LIBOR 1 Month + 25 basis points), 5/5/2020 (7) | | | 4,000,000 | | | | 4,000,116 | |
National Bank of Canada, 2.301% (LIBOR 1 Month + 10 basis points), 10/10/2019 (7) | | | 3,500,000 | | | | 3,500,300 | |
Nordea Bank AB, 2.720% 2/20/2020 | | | 2,850,000 | | | | 2,861,833 | |
Norinchukin Bank: | | | | | | | | |
2.220% 1/31/2020 | | | 3,000,000 | | | | 3,002,561 | |
2.250% 10/24/2019 | | | 2,500,000 | | | | 2,500,533 | |
2.270% 1/21/2020 | | | 3,000,000 | | | | 3,002,882 | |
2.530% 9/13/2019 | | | 3,000,000 | | | | 3,000,508 | |
2.530% 11/25/2019 (6) | | | 3,500,000 | | | | 3,503,836 | |
2.540% 11/15/2019 (6) | | | 4,000,000 | | | | 4,003,810 | |
Royal Bank of Canada, 2.363% (LIBOR 3 Month + 6 basis points), 4/17/2020 (7) | | | 3,500,000 | | | | 3,500,308 | |
Skandinaviska Enskilda Banken AB: | | | | | | | | |
2.410% 10/7/2019 | | | 2,500,000 | | | | 2,500,882 | |
2.570% 11/1/2019 | | | 3,500,000 | | | | 3,502,845 | |
Sumitomo Mitsui Banking Corp.: | | | | | | | | |
2.302% (LIBOR 1 Month + 12 basis points), 11/18/2019 (7) | | | 3,500,000 | | | | 3,500,603 | |
2.374% (LIBOR 1 Month + 13 basis points), 9/5/2019 (7) | | | 2,500,000 | | | | 2,500,098 | |
2.928% (LIBOR 3 Month + 45 basis points), 9/5/2019 (7) | | | 2,000,000 | | | | 2,000,023 | |
Sumitomo Mitsui Trust Bank, Ltd., 2.302% (LIBOR 1 Month + 19 basis points), 1/31/2020 (7) | | | 3,000,000 | | | | 3,000,092 | |
Swedbank AB, 2.610% (LIBOR 3 Month + 20 basis points), 9/16/2019 (7) | | | 2,500,000 | | | | 2,500,313 | |
Toronto-Dominion Bank: | | | | | | | | |
2.250% 1/8/2020 | | | 3,500,000 | | | | 3,502,763 | |
2.420% (FEDL 1 Month + 30 basis points), 2/27/2020 (7) | | | 2,500,000 | | | | 2,500,175 | |
2.469% (LIBOR 3 Month + 13 basis points), 10/15/2019 (7) | | | 4,000,000 | | | | 4,000,581 | |
2.470% (FEDL 1 Month + 35 basis points), 7/30/2020 (7) | | | 3,000,000 | | | | 3,000,387 | |
Wells Fargo Bank NA: | | | | | | | | |
2.460% (FEDL 1 Month + 30 basis points), 8/14/2020 (7) | | | 3,000,000 | | | | 3,000,419 | |
2.503% (LIBOR 3 Month + 20 basis points), 1/8/2020 (7) | | | 3,500,000 | | | | 3,502,654 | |
Westpac Banking Corp., 2.420% (U.S. Federal Funds Effective Rate (continuous series) + 30 basis points), 2/14/2020 (7) | | | 3,000,000 | | | | 3,001,254 | |
| | | | | | | | |
Total Certificates of Deposit
(identified cost $131,362,513) | | | | | | | 131,408,449 | |
| | | | | | | | |
| | | | | | | | |
| Description | | Principal
Amount | | | Value | |
| Commercial Paper — 48.8% | | | | | | |
| |
Asset-Backed Securities — 38.2% | | | | | |
Atlantic Asset Securitization LLC: | | | | | | | | |
2.190% 11/4/2019 (6) | | $ | 3,000,000 | | | $ | 2,988,389 | |
2.222% (LIBOR 1 Month + 11 basis points), 10/30/2019 (5)(7) | | | 4,500,000 | | | | 4,500,000 | |
2.255% (LIBOR 1 Month + 11 basis points), 11/26/2019 (5)(7) | | | 3,500,000 | | | | 3,500,000 | |
Bedford Row Funding Corp.: | | | | | | | | |
2.289% (LIBOR 3 Month + 3 basis points), 1/23/2020 (5)(7) | | | 3,500,000 | | | | 3,500,000 | |
2.297% (LIBOR 1 Month + 10 basis points), 12/16/2019 (5)(7) | | | 2,750,000 | | | | 2,750,000 | |
2.335% (LIBOR 1 Month + 19 basis points), 6/25/2020 (5)(7) | | | 3,000,000 | | | | 3,000,000 | |
2.350% (LIBOR 1 Month + 12 basis points), 11/1/2019 (5)(7) | | | 3,000,000 | | | | 3,000,367 | |
2.412% (LIBOR 1 Month + 24 basis points), 7/20/2020 (5)(7) | | | 3,000,000 | | | | 2,999,741 | |
2.431% (LIBOR 1 Month + 22 basis points), 9/9/2019 (5)(7) | | | 3,000,000 | | | | 3,000,000 | |
Chesham Finance Ltd., 2.150% 9/3/2019 (6) | | | 21,000,000 | | | | 20,994,916 | |
Columbia Funding Co. LLC: | | | | | | | | |
2.190% 12/6/2019 (6) | | | 5,000,000 | | | | 4,971,213 | |
2.200% 9/3/2019 (6) | | | 15,000,000 | | | | 14,996,368 | |
CRC Funding LLC, 2.260% 10/16/2019 (6) | | | 2,500,000 | | | | 2,493,054 | |
Crown Point Capital Co. LLC: | | | | | | | | |
2.130% 12/5/2019 (6) | | | 3,000,000 | | | | 2,982,677 | |
2.250% 9/27/2019 (6) | | | 4,000,000 | | | | 3,993,411 | |
Glencove Funding LLC: | | | | | | | | |
2.150% 9/3/2019 (6) | | | 3,500,000 | | | | 3,499,166 | |
2.243% (1 year USD Swap + 10 basis points), 10/22/2019 (5)(7) | | | 7,500,000 | | | | 7,500,000 | |
2.243% (1 year USD Swap + 10 basis points), 10/31/2019 (5)(7) | | | 4,500,000 | | | | 4,500,000 | |
2.243% (1 year USD Swap + 10 basis points), 2/14/2020 (5)(7) | | | 4,500,000 | | | | 4,500,000 | |
Gotham Funding Corp., 2.200% 9/10/2019 (6) | | | 5,000,000 | | | | 4,996,746 | |
Lexington Parker Capital Co. LLC: | | | | | | | | |
2.150% 11/15/2019 (6) | | | 3,000,000 | | | | 2,986,429 | |
2.170% 9/4/2019 (6) | | | 3,500,000 | | | | 3,498,959 | |
2.200% 9/4/2019 (6) | | | 5,000,000 | | | | 4,998,513 | |
2.200% 10/4/2019 (6) | | | 3,000,000 | | | | 2,993,720 | |
2.200% 11/15/2019 (6) | | | 1,250,000 | | | | 1,244,345 | |
2.279% 10/4/2019 (6) | | | 3,000,000 | | | | 2,993,720 | |
2.280% 10/30/2019 (6) | | | 2,500,000 | | | | 2,491,041 | |
Liberty Street Funding LLC, 2.120% 12/5/2019 (6) | | | 3,000,000 | | | | 2,983,332 | |
LMA Americas LLC: | | | | | | | | |
2.400% 11/4/2019 (6) | | | 2,500,000 | | | | 2,490,600 | |
2.540% 11/15/2019 (5)(6) | | | 2,000,000 | | | | 1,991,102 | |
2.570% 9/18/2019 (5)(6) | | | 4,000,000 | | | | 3,995,575 | |
2.600% 10/21/2019 (5)(6) | | | 3,500,000 | | | | 3,489,672 | |
2.620% 1/27/2020 (5)(6) | | | 3,000,000 | | | | 2,974,813 | |
LMA SA LMA AMERICAS, 2.150% 9/3/2019 (6) | | | 3,500,000 | | | | 3,499,167 | |
Longship Funding LLC: | | | | | | | | |
2.150% 9/12/2019 (6) | | | 5,000,000 | | | | 4,996,037 | |
2.190% 9/19/2019 (6) | | | 3,000,000 | | | | 2,996,347 | |
(See Notes to Schedules of Investments and Notes to Financial Statements, which are an integral part of the Financial Statements)
110
Institutional Prime Money Market Fund (continued)
| | | | | | | | |
| Description | | Principal
Amount | | | Value | |
| Commercial Paper (continued) | | | | | | |
| |
Asset-Backed Securities (continued) | | | | | |
2.200% 9/3/2019 (6) | | $ | 5,000,000 | | | $ | 4,998,781 | |
Old Line Funding LLC: | | | | | | | | |
2.265% (LIBOR 1 Month + 12 basis points), 9/27/2019 (5)(7) | | | 3,500,000 | | | | 3,500,000 | |
2.390% (LIBOR 1 Month + 16 basis points), 4/1/2020 (5)(7) | | | 3,000,000 | | | | 3,000,000 | |
Regency Markets No. 1 LLC: | | | | | | | | |
2.210% 9/16/2019 (6) | | | 5,000,000 | | | | 4,994,895 | |
2.230% 9/9/2019 (6) | | | 7,500,000 | | | | 7,495,477 | |
Sheffield Receivables Co. LLC: | | | | | | | | |
2.020% 2/19/2020 (6) | | | 3,000,000 | | | | 2,969,797 | |
2.130% 11/22/2019 (6) | | | 3,000,000 | | | | 2,985,307 | |
2.130% 12/6/2019 (6) | | | 2,500,000 | | | | 2,485,742 | |
2.260% 11/7/2019 (6) | | | 2,500,000 | | | | 2,489,894 | |
2.300% (SOFR + 18 basis points), 12/2/2019 (5)(7) | | | 4,000,000 | | | | 4,000,000 | |
2.320% (SOFR + 20 basis points), 10/18/2019 (5)(7) | | | 2,750,000 | | | | 2,750,000 | |
2.620% 10/1/2019 (5)(6) | | | 2,500,000 | | | | 2,495,284 | |
Thunder Bay Funding LLC: | | | | | | | | |
2.282% (LIBOR 1 Month + 11 basis points), 12/20/2019 (5)(7) | | | 3,000,000 | | | | 3,000,000 | |
2.302% (LIBOR 1 Month + 12 basis points), 9/18/2019 (5)(7) | | | 2,500,000 | | | | 2,500,000 | |
2.311% (LIBOR 1 Month + 11 basis points), 10/10/2019 (5)(7) | | | 3,500,000 | | | | 3,500,000 | |
2.331% (LIBOR 1 Month + 13 basis points), 2/10/2020 (5)(7) | | | 2,750,000 | | | | 2,750,000 | |
2.362% (LIBOR 1 Month + 18 basis points), 3/19/2020 (5)(7) | | | 3,500,000 | | | | 3,500,362 | |
| | | | | | | | |
| | | | | | | 214,704,959 | |
| | |
Auto Manufacturers — 2.5% | | | | | | | | |
Toyota Motor Credit Corp.: | | | | | | | | |
2.272% (LIBOR 1 Month + 16 basis points), 2/28/2020 (7) | | | 3,250,000 | | | | 3,250,000 | |
2.373% (LIBOR 1 Month + 15 basis points), 1/31/2020 (7) | | | 4,000,000 | | | | 4,000,000 | |
2.377% (LIBOR 1 Month + 18 basis points), 4/9/2020 (7) | | | 3,000,000 | | | | 3,000,000 | |
2.404% (LIBOR 3 Month + 10 basis points), 10/11/2019 (7) | | | 4,000,000 | | | | 4,000,526 | |
| | | | | | | | |
| | | | | | | 14,250,526 | |
| | |
Banks — 1.1% | | | | | | | | |
Bank of Nova Scotia: | | | | | | | | |
2.350% (SOFR + 23 basis points), 6/18/2020 (5)(7) | | | 3,000,000 | | | | 3,002,294 | |
2.430% (FEDL 1 Month + 31 basis points), 5/8/2020 (7) | | | 3,000,000 | | | | 3,000,315 | |
| | | | | | | | |
| | | | | | | 6,002,609 | |
| |
Diversified Financial Services — 1.1% | | | | | |
Collateralized Commercial Paper Co. LLC, 2.466% (LIBOR 3 Month + 3 basis points), 9/12/2019 (7) | | | 3,000,000 | | | | 3,000,023 | |
JP Morgan Securities LLC, 2.376% (LIBOR 1 Month + 21 basis points), 9/23/2019 (5)(7) | | | 3,000,000 | | | | 3,000,472 | |
| | | | | | | | |
| | | | | | | 6,000,495 | |
| | | | | | | | |
| Description | | Shares or
Principal
Amount | | | Value | |
| Commercial Paper (continued) | | | | | | |
| | |
Foreign Banks — 5.9% | | | | | | | | |
Credit Suisse AG, 2.410% (SOFR + 29 basis points), 8/7/2020 (7) | | $ | 3,000,000 | | | $ | 3,000,527 | |
Mitsubishi UFJ Trust & Banking Corp., 2.326% (LIBOR 1 Month + 18 basis points), 1/24/2020 (7) | | | 3,000,000 | | | | 3,000,069 | |
Mizuho Bank, Ltd., 2.080% 2/7/2020 | | | 2,500,000 | | | | 2,500,914 | |
Royal Bank of Canada: | | | | | | | | |
2.380% (FEDL 1 Month + 26 basis points), 6/8/2020 (5)(7) | | | 2,500,000 | | | | 2,500,092 | |
2.400% (FEDL 1 Month + 28 basis points), 3/13/2020 (5)(7) | | | 3,000,000 | | | | 3,000,385 | |
Sumitomo Mitsui Trust Bank, Ltd.: | | | | | | | | |
2.260% 1/10/2020 | | | 3,000,000 | | | | 3,002,116 | |
2.300% 11/13/2019 | | | 2,500,000 | | | | 2,501,059 | |
Toronto-Dominion Bank: | | | | | | | | |
2.265% (LIBOR 1 Month + 12 basis points), 11/26/2019 (5)(7) | | | 3,500,000 | | | | 3,500,602 | |
2.390% (FEDL 1 Month + 27 basis points), 6/15/2020 (5)(7) | | | 3,000,000 | | | | 3,000,343 | |
Westpac Banking Corp.: | | | | | | | | |
2.413% (LIBOR 3 Month + 10 basis points), 10/4/2019 (5)(7) | | | 3,500,000 | | | | 3,500,311 | |
2.500% (LIBOR 3 Month + 18 basis points), 1/2/2020 (5)(7) | | | 3,500,000 | | | | 3,501,983 | |
| | | | | | | | |
| | | | | | | 33,008,401 | |
| | | | | | | | |
Total Commercial Paper
(identified cost $273,953,854) | | | | | | | 273,966,990 | |
| | | | | | | | |
| | |
| Mutual Funds — 2.9% | | | | | | |
BlackRock Liquidity FundsT-Fund Portfolio — Institutional Class, 1.980% | | | 6,114,592 | | | | 6,114,592 | |
Invesco Government & Agency Portfolio — Institutional Class, 2.016% | | | 10,000,000 | | | | 10,000,000 | |
| | | | | | | | |
Total Mutual Funds
(identified cost $16,114,592) | | | | | | | 16,114,592 | |
| | | | | | | | |
| Repurchase Agreements — 24.9% | | | | |
Agreement with Fixed Income Clearing Corp., 2.150%, dated 8/30/2019, to be repurchased at $95,022,694 on 9/3/2019, collateralized by U.S.Government Treasury Obligations with various maturities to 5/15/2028, with a fair value of $96,900,034 | | $ | 95,000,000 | | | | 95,000,000 | |
(See Notes to Schedules of Investments and Notes to Financial Statements, which are an integral part of the Financial Statements)
111
August 31, 2019
Institutional Prime Money Market Fund (continued)
| | | | | | | | |
| Description | | Principal
Amount | | | Value | |
| Repurchase Agreements (continued) | | | | |
Agreement with Merrill Lynch, Pierce, Fenner & Smith, Inc., 2.150%, dated 8/30/2019, to be repurchased at $45,010,750 on 9/3/2019, collateralized by U.S. Government Agency Obligation with a maturity of 3/1/2049, with a fair value of $45,900,001 | | $ | 45,000,000 | | | $ | 45,000,000 | |
| | | | | | | | |
Total Repurchase Agreements
(identified cost $140,000,000) | | | | | | | 140,000,000 | |
| | | | | | | | |
Total Investments — 100.0%
(identified cost $561,430,959) | | | | | | | 561,490,031 | |
| Other Assets and Liabilities — (0.0)% | | | | | | | (54,792 | ) |
| | | | | | | | |
| Total Net Assets — 100.0% | | | | | | $ | 561,435,239 | |
| | | | | | | | |
(See Notes to Schedules of Investments and Notes to Financial Statements, which are an integral part of the Financial Statements)
112
| | |
| | |
| Notes to Schedules of Investments | | |
The categories of investments are shown as a percentage of total net assets for each Fund as of August 31, 2019. Call dates contained within the Schedules of Investments represent the next possible date the security can be redeemed, at the option of the issuer, determined as of August 31, 2019. Maturity dates contained within the Schedules of Investments represent the stated legal maturity date or mandatory put date. Certain securities may be subject to demand features which allow the security to be redeemed prior to final maturity date. In accordance with Rule2a-7, securities held in the money market funds provide for the return of principal and interest within 397 days due to a scheduled final maturity date or through specific demand features. Demand features entitle a Fund to receive the principal amount of the instrument from the issuer or a third party (1) on no more than 30 calendar days’ notice or (2) at specified intervals not exceeding 397 calendar days.
| * | A Summary Schedule of Investments is presented for this portfolio. A complete Schedule of Investments is available by accessing the SEC’s website, www.sec.gov. For all items listed as “Other securities” in this summary Schedule of Investments, this represents issues not identified astop-fifty unaffiliated holdings in terms of value and issues or issuers not exceeding one percent individually or in aggregate, respectively, as of August 31, 2019. In certain instances, securities for which footnotes listed below may otherwise apply are included in the “Other securities” caption. |
| (1) | Certain shares or principal amounts are temporarily on loan to unaffiliated brokers-dealers. |
| (3) | Please refer to Note 2, subsectionSecurities Lending, in the Notes to Financial Statements. |
| (4) | Denotes an investment in an affiliated entity. Please refer to Note 6, subsectionInvestments in Affiliated Issuers, in the Notes to Financial Statements. |
| (5) | Denotes a restricted security which is subject to restrictions on resale under federal securities laws. At August 31, 2019 these securities amounted to: |
| | | | | | | | |
| | | Amount | | | % of Total
Net Assets | |
Global Low Volatility Equity Fund | | $ | 999,437 | | | | 2.86 | % |
| | |
Disciplined International Equity Fund | | | 2,757,823 | | | | 4.53 | |
| | |
LGM Emerging Markets Equity Fund | | | 4,628,174 | | | | 1.59 | |
| | |
Alternative Strategies Fund | | | 83,812 | | | | 0.22 | |
| | |
Global Long/Short Equity Fund | | | 27,673 | | | | 1.06 | |
| | |
Ultra Short Tax-Free Fund | | | 70,633,090 | | | | 12.65 | |
| | |
Short Tax-Free Fund | | | 5,190,979 | | | | 3.25 | |
| | |
Short-Term Income Fund | | | 40,776,017 | | | | 15.78 | |
| | | | | | | | |
| | | Amount | | | % of Total
Net Assets | |
Intermediate Tax-Free Fund | | $ | 41,799,015 | | | | 2.18 | % |
| | |
Strategic Income Fund | | | 28,671,620 | | | | 36.65 | |
| | |
TCH Corporate Income Fund | | | 43,051,324 | | | | 12.47 | |
| | |
TCH Core Plus Bond Fund | | | 83,302,208 | | | | 8.13 | |
| | |
High Yield Bond Fund | | | 3,777,123 | | | | 40.83 | |
| | |
Tax-Free Money Market Fund | | | 103,330,000 | | | | 25.32 | |
| | |
Prime Money Market Fund | | | 77,750,436 | | | | 15.66 | |
| | |
Institutional Prime Money Market Fund | | | 111,203,398 | | | | 19.81 | |
| (6) | Each issue shows the rate of the discount at the time of purchase. |
| (7) | Denotes a variable rate security. The rate shown is the current interest rate as of August 31, 2019. Rate fluctuations are based underlying positions and/or other variables. For securities whose yields vary with a designated market index or market rate, the reference rate and spread are indicated in the description. |
| (8) | Purchased on a when-issued or delayed delivery basis. |
| (9) | Issue represents an Auction Rate Security. An Auction Rate Security is a corporate or municipal bond debt instrument with a long nominal maturity for which the interest rate is regularly reset through a Dutch auction. The rate presented is either the rate set through the auction or the maximum interest rate provided for in the security issuance provision. |
| (10) | Securities have redemption features that may delay redemption beyond seven days. |
The following acronyms may be referenced throughout this report:
| | |
ACA — American Capital Access Corporation ADED — Arkansas Department of Economic Development ADR — American Depository Receipt AGC — Assured Guaranty Corporation AGM — Assured Guaranty Municipal AMBAC — American Municipal Bond Assurance Corporation AMT — Alternative Minimum Tax BAM — Build America Mutual Assurance Company BHAC — Berkshire Hathaway Assurance Corporation BMA — Bond Market Association CFC — Cooperative Finance Corporation CIFG — CDC IXIS Financial Guaranty CMI — California Mortgage Insurance COLL — Collateralized DLY — Daily ETF — Exchange Traded Fund FCPR — Federal Reserve Bank Prime Loan Rate FDIC — Federal Depository Insurance Corporation FGIC — Financial Guaranty Insurance Corporation FHA — Federal Housing Administration FHLB — Federal Home Loan Bank FHLMC — Federal Home Loan Mortgage Corporation FNMA — Federal National Mortgage Association FRN — Floating Rate Note FSA — Financial Security Assurance Corporation GDR — Global Depository Receipt GNMA — Government National Mortgage Association GO — Government Obligation HFDC — Health Facility Development Corporation HUD — Department of Housing and Urban Development | | IDC — Industrial Development Corporation IMI — Investors Mortgage Insurance Company INS — Insured LIBOR — London Interbank Offered Rate LIQ — Liquidity Agreement LLC — Limited Liability Corporation LOC — Letter of Credit LP — Limited Partnership LT — Limited Tax MAC — Municipal Assurance Corporation MBIA — Municipal Bond Insurance Association MHF — Maryland Housing Fund MTN — Medium Term Note NATL — National Public Finance Guarantee PCA — Pollution Control Authority PLC — Public Limited Company PSF — Permanent School Fund Guaranteed PUFG — Permanent University Fund Guarantee Q-SBLF — Qualified School Bond Loan Fund RADIAN — Radian Asset Assurance REITs — Real Estate Investment Trusts REMIC — Real Estate Mortgage Investment Conduit SAW — State Aid Withholding SIFMA — Securities Industry and Financial Markets Association TCRs — Transferable Custody Receipts TLGP — Temporary Liquidity Guarantee Program TRANs — Tax and Revenue Anticipation Notes UT Unlimited Tax VRNs Variable Rate Notes XLCA XL Capital Assurance |
113
August 31, 2019
| | |
| | |
| Statements of Assets and Liabilities | | BMO Funds |
| | | | | | | | | | | | | | | | | | | | |
| | | | | | | | | | | | | | | | |
| | | Low Volatility
Equity Fund | | | Dividend
Income Fund | | | Large-Cap
Value Fund | | | Large-Cap
Growth Fund | | | Mid-Cap
Value Fund | |
Assets: | | | | | | | | | | | | | | | | | | | | |
Investments in unaffiliated issuers, at value | | $ | 269,067,787 | (1) | | $ | 378,427,047 | (1) | | $ | 378,588,962 | (1) | | $ | 557,477,231 | (1) | | $ | 179,809,904 | (1) |
Cash sweep investments in affiliated issuers, at value | | | 5,840,436 | | | | 28,264,217 | | | | 5,888,195 | | | | 5 | | | | 1,259,074 | |
Cash | | | — | | | | — | | | | — | | | | 621 | | | | — | |
Dividends and interest receivable | | | 487,114 | | | | 719,774 | | | | 769,116 | | | | 617,465 | | | | 249,647 | |
Receivable for investments sold | | | — | | | | — | | | | 14,994,426 | | | | 35,119,819 | | | | 1,726,166 | |
Receivable for capital stock sold | | | 2,725,384 | | | | 867,718 | | | | 268,918 | | | | 267,878 | | | | 262,430 | |
Prepaid expenses and other receivables | | | 40,397 | | | | 31,131 | | | | 31,592 | | | | 41,137 | | | | 30,810 | |
| | | | | | | | | | | | | | | | | | | | |
Total assets | | | 278,161,118 | | | | 408,309,887 | | | | 400,541,209 | | | | 593,524,156 | | | | 183,338,031 | |
| | | | | |
Liabilities: | | | | | | | | | | | | | | | | | | | | |
Payable for return of securities lending collateral | | | 64,845,551 | | | | 82,546,979 | | | | 87,405,013 | | | | 110,027,192 | | | | 42,152,765 | |
Payable for investments purchased | | | — | | | | 12,262,483 | | | | 15,643,746 | | | | — | | | | — | |
Payable for capital stock redeemed | | | 28,868 | | | | 369,813 | | | | 279,070 | | | | 742,397 | | | | 157,002 | |
Payable to affiliates for interfund lending (Note 6) | | | — | | | | — | | | | — | | | | 27,442,475 | | | | — | |
Payable to affiliates, net (Note 6) | | | 98,453 | | | | 112,587 | | | | 106,564 | | | | 166,931 | | | | 103,436 | |
Other liabilities | | | 23,867 | | | | 30,858 | | | | 43,475 | | | | 56,194 | | | | 42,440 | |
| | | | | | | | | | | | | | | | | | | | |
Total liabilities | | | 64,996,739 | | | | 95,322,720 | | | | 103,477,868 | | | | 138,435,189 | | | | 42,455,643 | |
| | | | | | | | | | | | | | | | | | | | |
Total net assets | | $ | 213,164,379 | | | $ | 312,987,167 | | | $ | 297,063,341 | | | $ | 455,088,967 | | | $ | 140,882,388 | |
| | | | | | | | | | | | | | | | | | | | |
Net assets consist of: | | | | | | | | | | | | | | | | | | | | |
Paid-in capital | | $ | 170,876,779 | | | $ | 284,167,290 | | | $ | 272,800,620 | | | $ | 334,229,712 | | | $ | 133,661,253 | |
Distributable earnings | | | 42,287,600 | | | | 28,819,877 | | | | 24,262,721 | | | | 120,859,255 | | | | 7,221,135 | |
| | | | | | | | | | | | | | | | | | | | |
Total net assets | | $ | 213,164,379 | | | $ | 312,987,167 | | | $ | 297,063,341 | | | $ | 455,088,967 | | | $ | 140,882,388 | |
| | | | | | | | | | | | | | | | | | | | |
Net asset value, offering price and redemption proceeds per share (unlimited shares authorized, no par value) | | | | | | | | | | | | | | | | | | | | |
Investor class of shares: | | | | | | | | | | | | | | | | | | | | |
Net asset value, offering price and redemption proceeds per share | | $ | — | | | $ | — | | | $ | — | | | $ | 17.96 | | | $ | — | |
Advisor class of shares: | | | | | | | | | | | | | | | | | | | | |
Net asset value, offering price and redemption proceeds per share | | | 15.81 | | | | 14.02 | | | | 13.72 | | | | 17.94 | | | | 9.99 | |
Offering price per share(2) | | | 16.64 | | | | 14.76 | | | | 14.44 | | | | 18.88 | | | | 10.52 | |
Institutional class of shares: | | | | | | | | | | | | | | | | | | | | |
Net asset value, offering price and redemption proceeds per share | | | 15.88 | | | | 13.98 | | | | 13.74 | | | | 18.15 | | | | 9.92 | |
Retirement classR-6 of shares: | | | | | | | | | | | | | | | | | | | | |
Net asset value, offering price and redemption proceeds per share | | | — | | | | — | | | | 13.75 | | | | 18.20 | | | | 9.93 | |
| | | | | |
Net assets: | | | | | | | | | | | | | | | | | | | | |
Investor class of shares | | $ | — | | | $ | — | | | $ | — | | | $ | 58,562,453 | | | $ | — | |
Advisor class of shares | | | 29,006,292 | | | | 15,364,818 | | | | 18,620,519 | | | | 711,504 | | | | 39,032,223 | |
Institutional class of shares | | | 184,158,087 | | | | 297,622,349 | | | | 224,929,744 | | | | 168,837,508 | | | | 87,893,124 | |
Retirement classR-6 of shares | | | — | | | | — | | | | 53,513,078 | | | | 226,977,502 | | | | 13,957,041 | |
| | | | | | | | | | | | | | | | | | | | |
Total net assets | | $ | 213,164,379 | | | $ | 312,987,167 | | | $ | 297,063,341 | | | $ | 455,088,967 | | | $ | 140,882,388 | |
| | | | | | | | | | | | | | | | | | | | |
Shares outstanding: | | | | | | | | | | | | | | | | | | | | |
Investor class of shares | | | — | | | | — | | | | — | | | | 3,260,111 | | | | — | |
Advisor class of shares | | | 1,834,250 | | | | 1,095,799 | | | | 1,356,710 | | | | 39,663 | | | | 3,908,239 | |
Institutional class of shares | | | 11,598,731 | | | | 21,289,358 | | | | 16,367,697 | | | | 9,300,299 | | | | 8,859,249 | |
Retirement classR-6 of shares | | | — | | | | — | | | | 3,890,502 | | | | 12,473,296 | | | | 1,404,983 | |
| | | | | | | | | | | | | | | | | | | | |
Total shares outstanding | | | 13,432,981 | | | | 22,385,157 | | | | 21,614,909 | | | | 25,073,369 | | | | 14,172,471 | |
| | | | | | | | | | | | | | | | | | | | |
Investments, at cost: | | | | | | | | | | | | | | | | | | | | |
Investments in unaffiliated issuers | | $ | 229,477,998 | | | $ | 348,093,921 | | | $ | 349,817,390 | | | $ | 454,982,662 | | | $ | 170,893,851 | |
Cash sweep investments in affiliated issuers | | | 5,840,299 | | | | 28,263,711 | | | | 5,887,933 | | | | 5 | | | | 1,259,073 | |
| | | | | | | | | | | | | | | | | | | | |
Total investments, at cost | | $ | 235,318,297 | | | $ | 376,357,632 | | | $ | 355,705,323 | | | $ | 454,982,667 | | | $ | 172,152,924 | |
| | | | | | | | | | | | | | | | | | | | |
| (1) | Including $64,398,826, $82,294,294, $87,060,670, $109,604,268 and $41,943,841, respectively, of securities on loan. A security on loan value represents both fair value and accrued interest. |
| (2) | Computation of offering price per share 100/95 of net asset value. |
(See Notes which are an integral part of the Financial Statements)
114
August 31, 2019
| | |
| | |
| Statements of Assets and Liabilities | | BMO Funds |
| | | | | | | | | | | | | | | | | | | | |
| | | | | | | | | | | | | | | | |
| | | Mid-Cap
Growth Fund | | | Small-Cap
Value Fund | | | Small-Cap
Core Fund | | | Small-Cap
Growth Fund | | | Global Low
Volatility
Equity Fund | |
Assets: | | | | | | | | | | | | | | | | | | | | |
Investments in unaffiliated issuers, at value | | $ | 117,699,498 | (1) | | $ | 74,688,705 | (1) | | $ | 17,839,700 | (1) | | $ | 133,172,144 | (1) | | $ | 34,156,755 | (1) |
Cash sweep investments in affiliated issuers, at value | | | 687,000 | | | | 511,829 | | | | 233,030 | | | | 1,221,390 | | | | 1,365,174 | |
Cash denominated in foreign currencies | | | — | | | | — | | | | — | | | | — | | | | 94,778 | (2) |
Dividends and interest receivable | | | 49,653 | | | | 73,357 | | | | 15,247 | | | | 42,522 | | | | 140,268 | |
Receivable for investments sold | | | 1,012,749 | | | | — | | | | — | | | | — | | | | — | |
Receivable for capital stock sold | | | 98,859 | | | | 226,676 | | | | 27,520 | | | | 223,780 | | | | — | |
Receivable from affiliates, net (Note 6) | | | — | | | | — | | | | 16,173 | | | | — | | | | — | |
Prepaid expenses and other receivables | | | 31,192 | | | | 29,812 | | | | 19,949 | | | | 23,398 | | | | 27,297 | |
| | | | | | | | | | | | | | | | | | | | |
Total assets | | | 119,578,951 | | | | 75,530,379 | | | | 18,151,619 | | | | 134,683,234 | | | | 35,784,272 | |
| | | | | |
Liabilities: | | | | | | | | | | | | | | | | | | | | |
Payable for return of securities lending collateral | | | 22,590,044 | | | | 19,580,233 | | | | 4,193,876 | | | | 34,881,052 | | | | 743,529 | |
Payable for capital stock redeemed | | | 104,597 | | | | 41,832 | | | | 2,073 | | | | 78,004 | | | | — | |
Payable for foreign tax expense | | | — | | | | — | | | | — | | | | — | | | | 8,454 | |
Payable to affiliates, net (Note 6) | | | 64,865 | | | | 56,014 | | | | — | | | | 73,553 | | | | 14,295 | |
Other liabilities | | | 35,628 | | | | 18,391 | | | | 18,735 | | | | 46,641 | | | | 23,624 | |
| | | | | | | | | | | | | | | | | | | | |
Total liabilities | | | 22,795,134 | | | | 19,696,470 | | | | 4,214,684 | | | | 35,079,250 | | | | 789,902 | |
| | | | | | | | | | | | | | | | | | | | |
Total net assets | | $ | 96,783,817 | | | $ | 55,833,909 | | | $ | 13,936,935 | | | $ | 99,603,984 | | | $ | 34,994,370 | |
| | | | | | | | | | | | | | | | | | | | |
Net assets consist of: | | | | | | | | | | | | | | | | | | | | |
Paid-in capital | | $ | 73,684,270 | | | $ | 55,560,160 | | | $ | 14,048,338 | | | $ | 89,051,422 | | | $ | 30,332,733 | |
Distributable earnings (accumulated loss) | | | 23,099,547 | | | | 273,749 | | | | (111,403 | ) | | | 10,552,562 | | | | 4,661,637 | |
| | | | | | | | | | | | | | | | | | | | |
Total net assets | | $ | 96,783,817 | | | $ | 55,833,909 | | | $ | 13,936,935 | | | $ | 99,603,984 | | | $ | 34,994,370 | |
| | | | | | | | | | | | | | | | | | | | |
Net asset value, offering price and redemption proceeds per share (unlimited shares authorized, no par value) | | | | | | | | | | | | | | | | | | | | |
Advisor class of shares: | | | | | | | | | | | | | | | | | | | | |
Net asset value, offering price and redemption proceeds per share | | $ | 14.20 | | | $ | 11.39 | | | $ | 11.33 | | | $ | 15.32 | | | $ | 11.42 | |
Offering price per share(3) | | | 14.95 | | | | 11.99 | | | | 11.93 | | | | 16.13 | | | | 12.02 | |
Institutional class of shares: | | | | | | | | | | | | | | | | | | | | |
Net asset value, offering price and redemption proceeds per share | | | 15.04 | | | | 11.60 | | | | 11.46 | | | | 16.10 | | | | 11.49 | |
Retirement classR-6 of shares: | | | | | | | | | | | | | | | | | | | | |
Net asset value, offering price and redemption proceeds per share | | | 15.19 | | | | 11.70 | | | | — | | | | — | | | | — | |
| | | | | |
Net assets: | | | | | | | | | | | | | | | | | | | | |
Advisor class of shares | | $ | 14,228,755 | | | $ | 3,140,157 | | | $ | 702,085 | | | $ | 31,378,414 | | | $ | 659,800 | |
Institutional class of shares | | | 74,574,902 | | | | 44,586,014 | | | | 13,234,850 | | | | 68,225,570 | | | | 34,334,570 | |
Retirement classR-6 of shares | | | 7,980,160 | | | | 8,107,738 | | | | — | | | | — | | | | — | |
| | | | | | | | | | | | | | | | | | | | |
Total net assets | | $ | 96,783,817 | | | $ | 55,833,909 | | | $ | 13,936,935 | | | $ | 99,603,984 | | | $ | 34,994,370 | |
| | | | | | | | | | | | | | | | | | | | |
Shares outstanding: | | | | | | | | | | | | | | | | | | | | |
Advisor class of shares | | | 1,002,199 | | | | 275,638 | | | | 61,947 | | | | 2,048,534 | | | | 57,788 | |
Institutional class of shares | | | 4,957,649 | | | | 3,844,618 | | | | 1,154,375 | | | | 4,236,372 | | | | 2,989,014 | |
Retirement classR-6 of shares | | | 525,524 | | | | 692,998 | | | | — | | | | — | | | | — | |
| | | | | | | | | | | | | | | | | | | | |
Total shares outstanding | | | 6,485,372 | | | | 4,813,254 | | | | 1,216,322 | | | | 6,284,906 | | | | 3,046,802 | |
| | | | | | | | | | | | | | | | | | | | |
Investments, at cost: | | | | | | | | | | | | | | | | | | | | |
Investments in unaffiliated issuers | | $ | 104,501,582 | | | $ | 74,737,354 | | | $ | 16,983,389 | | | $ | 123,814,888 | | | $ | 30,536,123 | |
Cash sweep investments in affiliated issuers | | | 686,997 | | | | 511,807 | | | | 233,029 | | | | 1,221,388 | | | | 1,365,111 | |
| | | | | | | | | | | | | | | | | | | | |
Total investments, at cost | | $ | 105,188,579 | | | $ | 75,249,161 | | | $ | 17,216,418 | | | $ | 125,036,276 | | | $ | 31,901,234 | |
| | | | | | | | | | | | | | | | | | | | |
| (1) | Including $22,442,225, $19,421,709, $4,154,536, $34,517,790 and $709,012, respectively, of securities on loan. A security on loan value represents both fair value and accrued interest. |
| (2) | Identified cost of cash denominated in foreign currencies is $95,943. |
| (3) | Computation of offering price per share 100/95 of net asset value. |
(See Notes which are an integral part of the Financial Statements)
115
August 31, 2019
| | |
| | |
| Statements of Assets and Liabilities | | BMO Funds |
| | | | | | | | | | | | | | | | | | | | |
| | | | | | | | | | | | | | | | |
| | | Disciplined
International
Equity Fund | | | Pyrford
International
Stock Fund | | | LGM
Emerging
Markets
Equity Fund | | | Alternative
Strategies Fund | | | Global
Long/Short
Equity Fund | |
Assets: | | | | | | | | | | | | | | | | | | | | |
Investments in unaffiliated issuers, at value | | $ | 60,177,407 | (1) | | $ | 619,232,364 | (1) | | $ | 275,135,620 | (1) | | $ | 15,264,983 | | | $ | 2,593,356 | (1) |
Cash sweep investments in affiliated issuers, at value | | | 6,462,878 | | | | 39,875,583 | | | | 18,597,294 | | | | 19,001,273 | | | | 95,094 | |
Deposit held at broker for: | | | | | | | | | | | | | | | | | | | | |
Futures contracts | | | — | | | | — | | | | — | | | | 2,183,759 | | | | — | |
Forward foreign currency contracts | | | — | | | | — | | | | — | | | | 191,700 | | | | — | |
Swap agreements | | | — | | | | — | | | | — | | | | 1,770,000 | | | | — | |
Cash denominated in foreign currencies | | | 133,433 | (2) | | | 2,078,249 | (2) | | | 850,104 | (2) | | | 8,477 | (2) | | | 8,454 | (2) |
Dividends and interest receivable | | | 433,258 | | | | 5,795,065 | | | | 219,566 | | | | 91,201 | | | | 19,075 | |
Receivable for investments sold | | | — | | | | — | | | | 2,114 | | | | 326,508 | | | | — | |
Receivable for capital stock sold | | | 71,447 | | | | 3,185,845 | | | | 722,607 | | | | — | | | | — | |
Receivable for daily variation margin on futures contracts | | | — | | | | — | | | | — | | | | 233,804 | | | | — | |
Receivable for forward foreign currency contracts | | | — | | | | — | | | | — | | | | 507,662 | | | | — | |
Receivable for swap agreements | | | — | | | | — | | | | — | | | | 6,697 | | | | — | |
Receivable from affiliates, net (Note 6) | | | — | | | | — | | | | — | | | | — | | | | 7,938 | |
Prepaid expenses and other receivables | | | 33,636 | | | | 42,971 | | | | 45,887 | | | | 33,158 | | | | 33,855 | |
| | | | | | | | | | | | | | | | | | | | |
Total assets | | | 67,312,059 | | | | 670,210,077 | | | | 295,573,192 | | | | 39,619,222 | | | | 2,757,772 | |
| | | | | |
Liabilities: | | | | | | | | | | | | | | | | | | | | |
Payable for dividends and interest on securities sold short | | | — | | | | — | | | | — | | | | 517 | | | | 50 | |
Payable for return of securities lending collateral | | | 6,280,673 | | | | 12,915,868 | | | | 1,884,447 | | | | — | | | | 95,094 | |
Payable for investments purchased | | | 22 | | | | 1,914,530 | | | | 1,788,632 | | | | — | | | | — | |
Payable for capital stock redeemed | | | — | | | | 132,327 | | | | 140,542 | | | | 8,216 | | | | — | |
Payable for daily variation margin on futures contracts | | | — | | | | — | | | | — | | | | 64,390 | | | | — | |
Payable for forward foreign currency contracts | | | — | | | | — | | | | — | | | | 373,104 | | | | — | |
Payable for swap agreements | | | — | | | | — | | | | — | | | | 157,847 | | | | 30,858 | |
Payable for foreign tax expense | | | 6,075 | | | | 126,787 | | | | 3,570 | | | | 1,486 | | | | 478 | |
Payable to affiliates for interfund lending (Note 6) | | | — | | | | — | | | | — | | | | — | | | | 4,206 | |
Payable to affiliates, net (Note 6) | | | 24,822 | | | | 449,208 | | | | 261,228 | | | | 26,516 | | | | — | |
Payable to custodian | | | — | | | | — | | | | — | | | | 326,473 | | | | — | |
Other liabilities | | | 31,307 | | | | 107,901 | | | | 111,786 | | | | 96,846 | | | | 13,616 | |
| | | | | | | | | | | | | | | | | | | | |
Total liabilities | | | 6,342,899 | | | | 15,646,621 | | | | 4,190,205 | | | | 1,055,395 | | | | 144,302 | |
| | | | | | | | | | | | | | | | | | | | |
Total net assets | | $ | 60,969,160 | | | $ | 654,563,456 | | | $ | 291,382,987 | | | $ | 38,563,827 | | | $ | 2,613,470 | |
| | | | | | | | | | | | | | | | | | | | |
Net assets consist of: | | | | | | | | | | | | | | | | | | | | |
Paid-in capital | | $ | 62,352,856 | | | $ | 631,764,703 | | | $ | 277,029,953 | | | $ | 42,040,941 | | | $ | 2,782,392 | |
Distributable earnings (accumulated loss) | | | (1,383,696 | ) | | | 22,798,753 | | | | 14,353,034 | | | | (3,477,114 | ) | | | (168,922 | ) |
| | | | | | | | | | | | | | | | | | | | |
Total net assets | | $ | 60,969,160 | | | $ | 654,563,456 | | | $ | 291,382,987 | | | $ | 38,563,827 | | | $ | 2,613,470 | |
| | | | | | | | | | | | | | | | | | | | |
Net asset value, offering price and redemption proceeds per share (unlimited shares authorized, no par value) | | | | | | | | | | | | | | | | | | | | |
Advisor class of shares: | | | | | | | | | | | | | | | | | | | | |
Net asset value, offering price and redemption proceeds per share | | $ | 10.01 | | | $ | 13.08 | | | $ | 14.89 | | | $ | 9.21 | | | $ | 10.55 | |
Offering price per share(3) | | | 10.54 | | | | 13.77 | | | | 15.67 | | | | 9.69 | | | | 11.11 | |
Institutional class of shares: | | | | | | | | | | | | | | | | | | | | |
Net asset value, offering price and redemption proceeds per share | | | 10.03 | | | | 12.84 | | | | 14.82 | | | | 9.32 | | | | 10.59 | |
Retirement classR-6 of shares: | | | | | | | | | | | | | | | | | | | | |
Net asset value, offering price and redemption proceeds per share | | | — | | | | 12.86 | | | | — | | | | — | | | | — | |
| | | | | |
Net assets: | | | | | | | | | | | | | | | | | | | | |
Advisor class of shares | | $ | 140,862 | | | $ | 4,620,627 | | | $ | 5,223,920 | | | $ | 20,203 | | | $ | 649,756 | |
Institutional class of shares | | | 60,828,298 | | | | 486,114,024 | | | | 286,159,067 | | | | 38,543,624 | | | | 1,963,714 | |
Retirement classR-6 of shares | | | — | | | | 163,828,805 | | | | — | | | | — | | | | — | |
| | | | | | | | | | | | | | | | | | | | |
Total net assets | | $ | 60,969,160 | | | $ | 654,563,456 | | | $ | 291,382,987 | | | $ | 38,563,827 | | | $ | 2,613,470 | |
| | | | | | | | | | | | | | | | | | | | |
Shares outstanding: | | | | | | | | | | | | | | | | | | | | |
Advisor class of shares | | | 14,066 | | | | 353,318 | | | | 350,919 | | | | 2,194 | | | | 61,610 | |
Institutional class of shares | | | 6,062,644 | | | | 37,855,930 | | | | 19,315,209 | | | | 4,134,201 | | | | 185,376 | |
Retirement classR-6 of shares | | | — | | | | 12,743,804 | | | | — | | | | — | | | | — | |
| | | | | | | | | | | | | | | | | | | | |
Total shares outstanding | | | 6,076,710 | | | | 50,953,052 | | | | 19,666,128 | | | | 4,136,395 | | | | 246,986 | |
| | | | | | | | | | | | | | | | | | | | |
Investments, at cost: | | | | | | | | | | | | | | | | | | | | |
Investments in unaffiliated issuers | | $ | 59,839,517 | | | $ | 568,960,734 | | | $ | 263,824,489 | | | $ | 15,716,614 | | | $ | 2,567,938 | |
Cash sweep investments in affiliated issuers | | | 6,462,875 | | | | 39,874,327 | | | | 18,596,901 | | | | 18,997,852 | | | | 95,094 | |
| | | | | | | | | | | | | | | | | | | | |
Total investments, at cost | | $ | 66,302,392 | | | $ | 608,835,061 | | | $ | 282,421,390 | | | $ | 34,714,466 | | | $ | 2,663,032 | |
| | | | | | | | | | | | | | | | | | | | |
| (1) | Including $5,951,936, $12,315,769, $1,800,107 and $90,602, respectively, of securities on loan. A security on loan value represents both fair value and accrued interest. |
| (2) | Identified cost of cash denominated in foreign currencies is $135,328, $2,079,971, $846,557, $12,178 and 8,674. |
| (3) | Computation of offering price per share 100/95 of net asset value. |
(See Notes which are an integral part of the Financial Statements)
116
August 31, 2019
| | |
| | |
| Statements of Assets and Liabilities | | BMO Funds |
| | | | | | | | | | | | | | | | | | | | |
| | | | | | | | | | | | | | | | |
| | | Ultra Short
Tax-Free Fund | | | Short
Tax-Free Fund | | | Short-Term
Income Fund | | | Intermediate
Tax-Free Fund | | | Strategic
Income Fund | |
Assets: | | | | | | | | | | | | | | | | | | | | |
Investments in unaffiliated issuers, at value | | $ | 568,458,779 | | | $ | 159,089,364 | | | $ | 286,307,943 | (1) | | $ | 1,922,691,223 | | | $ | 95,592,567 | (1) |
Cash sweep investments in affiliated issuers, at value | | | — | | | | — | | | | 3,541,770 | | | | — | | | | 1,992,682 | |
Investments in repurchase agreements | | | — | | | | 371,965 | | | | — | | | | 175,593 | | | | — | |
Cash | | | 237,328 | | | | — | | | | — | | | | 137,315 | | | | — | |
Deposit held at broker | | | — | | | | — | | | | — | | | | — | | | | 100,365 | |
Dividends and interest receivable | | | 2,776,233 | | | | 1,464,086 | | | | 1,330,788 | | | | 18,960,350 | | | | 925,934 | |
Receivable for capital stock sold | | | 505,540 | | | | 179,008 | | | | 150,018 | | | | 3,439,047 | | | | 3,083 | |
Prepaid expenses and other receivables | | | 34,243 | | | | 28,154 | | | | 27,749 | | | | 127,110 | | | | 33,415 | |
| | | | | | | | | | | | | | | | | | | | |
Total assets | | | 572,012,123 | | | | 161,132,577 | | | | 291,358,268 | | | | 1,945,530,638 | | | | 98,648,046 | |
| | | | | |
Liabilities: | | | | | | | | | | | | | | | | | | | | |
Payable for return of securities lending collateral | | | — | | | | — | | | | 32,406,363 | | | | — | | | | 20,275,719 | |
Payable for investments purchased | | | 12,805,320 | | | | 1,063,100 | | | | — | | | | 24,479,025 | | | | — | |
Payable for capital stock redeemed | | | 339,042 | | | | 34,090 | | | | 289,320 | | | | 1,744,926 | | | | 92,484 | |
Payable for foreign tax expense | | | — | | | | — | | | | 477 | | | | — | | | | — | |
Payable to affiliates, net (Note 6) | | | 114,876 | | | | 48,584 | | | | 46,127 | | | | 495,741 | | | | 25,863 | |
Payable for income distribution | | | 354,980 | | | | 162,836 | | | | 236,585 | | | | 1,017,823 | | | | 13,730 | |
Other liabilities | | | 40,810 | | | | 27,914 | | | | 32,070 | | | | 129,271 | | | | 24,318 | |
| | | | | | | | | | | | | | | | | | | | |
Total liabilities | | | 13,655,028 | | | | 1,336,524 | | | | 33,010,942 | | | | 27,866,786 | | | | 20,432,114 | |
| | | | | | | | | | | | | | | | | | | | |
Total net assets | | $ | 558,357,095 | | | $ | 159,796,053 | | | $ | 258,347,326 | | | $ | 1,917,663,852 | | | $ | 78,215,932 | |
| | | | | | | | | | | | | | | | | | | | |
Net assets consist of: | | | | | | | | | | | | | | | | | | | | |
Paid-in capital | | $ | 557,034,193 | | | $ | 157,585,090 | | | $ | 256,729,014 | | | $ | 1,817,801,148 | | | $ | 80,447,026 | |
Distributable earnings (accumulated loss) | | | 1,322,902 | | | | 2,210,963 | | | | 1,618,312 | | | | 99,862,704 | | | | (2,231,094 | ) |
| | | | | | | | | | | | | | | | | | | | |
Total net assets | | $ | 558,357,095 | | | $ | 159,796,053 | | | $ | 258,347,326 | | | $ | 1,917,663,852 | | | $ | 78,215,932 | |
| | | | | | | | | | | | | | | | | | | | |
Net asset value, offering price and redemption proceeds per share (unlimited shares authorized, no par value) | | | | | | | | | | | | | | | | | | | | |
Investor class of shares: | | | | | | | | | | | | | | | | | | | | |
Net asset value, offering price and redemption proceeds per share | | $ | — | | | $ | — | | | $ | — | | | $ | 11.60 | | | $ | 9.46 | |
Advisor class of shares: | | | | | | | | | | | | | | | | | | | | |
Net asset value, offering price and redemption proceeds per share | | | 10.09 | | | | 10.28 | | | | 9.45 | | | | 11.60 | | | | 9.46 | |
Offering price per share | | | 10.30 | (2) | | | 10.49 | (2) | | | 9.64 | (2) | | | 12.02 | (3) | | | 9.80 | (3) |
Institutional class of shares: | | | | | | | | | | | | | | | | | | | | |
Net asset value, offering price and redemption proceeds per share | | | 10.09 | | | | 10.29 | | | | 9.47 | | | | 11.59 | | | | 9.45 | |
| | | | | |
Net assets: | | | | | | | | | | | | | | | | | | | | |
Investor class of shares | | $ | — | | | $ | — | | | $ | — | | | $ | 528,980,449 | | | $ | 56,576,237 | |
Advisor class of shares | | | 16,497,996 | | | | 3,668,040 | | | | 24,531,432 | | | | 4,504,934 | | | | 12,522,994 | |
Institutional class of shares | | | 541,859,099 | | | | 156,128,013 | | | | 233,815,894 | | | | 1,384,178,469 | | | | 9,116,701 | |
| | | | | | | | | | | | | | | | | | | | |
Total net assets | | $ | 558,357,095 | | | $ | 159,796,053 | | | $ | 258,347,326 | | | $ | 1,917,663,852 | | | $ | 78,215,932 | |
| | | | | | | | | | | | | | | | | | | | |
Shares outstanding: | | | | | | | | | | | | | | | | | | | | |
Investor class of shares | | | — | | | | — | | | | — | | | | 45,602,608 | | | | 5,983,334 | |
Advisor class of shares | | | 1,634,393 | | | | 356,852 | | | | 2,595,121 | | | | 388,401 | | | | 1,324,443 | |
Institutional class of shares | | | 53,727,942 | | | | 15,178,910 | | | | 24,689,238 | | | | 119,442,656 | | | | 964,869 | |
| | | | | | | | | | | | | | | | | | | | |
Total shares outstanding | | | 55,362,335 | | | | 15,535,762 | | | | 27,284,359 | | | | 165,433,665 | | | | 8,272,646 | |
| | | | | | | | | | | | | | | | | | | | |
Investments, at cost: | | | | | | | | | | | | | | | | | | | | |
Investments in unaffiliated issuers | | $ | 567,193,701 | | | $ | 157,081,925 | | | $ | 282,560,870 | | | $ | 1,807,095,145 | | | $ | 93,730,380 | |
Cash sweep investments in affiliated issuers | | | — | | | | — | | | | 3,541,756 | | | | — | | | | 1,992,674 | |
| | | | | | | | | | | | | | | | | | | | |
Total investments, at cost | | $ | 567,193,701 | | | $ | 157,081,925 | | | $ | 286,102,626 | | | $ | 1,807,095,145 | | | $ | 95,723,054 | |
| | | | | | | | | | | | | | | | | | | | |
| (1) | Including $32,194,980 and $20,129,353, respectively, of securities on loan. A security on loan value represents both fair value and accrued interest. |
| (2) | Computation of offering price per share 100/98 of net asset value. |
| (3) | Computation of offering price per share 100/96.5 of net asset value. |
(See Notes which are an integral part of the Financial Statements)
117
August 31, 2019
| | |
| | |
| Statements of Assets and Liabilities | | BMO Funds |
| | | | | | | | | | | | |
| | | | | | | | | | |
| | | TCH
Corporate
Income Fund | | | TCH
Core Plus
Bond Fund | | | High Yield
Bond Fund | |
Assets: | | | | | | | | | | | | |
Investments in unaffiliated issuers, at value | | $ | 402,843,657 | (1) | | $ | 1,116,713,408 | (1) | | $ | 11,631,662 | (1) |
Cash sweep investments in affiliated issuers, at value | | | 19,020,395 | | | | 40,249,132 | | | | 439,932 | |
Deposit held at broker | | | 250,912 | | | | 250,912 | | | | — | |
Dividends and interest receivable | | | 3,220,548 | | | | 6,599,634 | | | | 156,003 | |
Receivable for capital stock sold | | | 579,363 | | | | 35,278,670 | | | | — | |
Receivable from affiliates, net (Note 6) | | | — | | | | — | | | | 7,512 | |
Prepaid expenses and other receivables | | | 27,650 | | | | 34,136 | | | | 20,491 | |
| | | | | | | | | | | | |
Total assets | | | 425,942,525 | | | | 1,199,125,892 | | | | 12,255,600 | |
| | | |
Liabilities: | | | | | | | | | | | | |
Payable for return of securities lending collateral | | | 79,942,506 | | | | 122,747,158 | | | | 2,981,780 | |
Payable for investments purchased | | | — | | | | 50,973,438 | | | | — | |
Payable for capital stock redeemed | | | 231,974 | | | | 727,107 | | | | 2,102 | |
Payable to affiliates, net (Note 6) | | | 106,597 | | | | 224,578 | | | | — | |
Payable for income distribution | | | 341,936 | | | | 248,193 | | | | 2,030 | |
Other liabilities | | | 31,365 | | | | 88,777 | | | | 19,791 | |
| | | | | | | | | | | | |
Total liabilities | | | 80,654,378 | | | | 175,009,251 | | | | 3,005,703 | |
| | | | | | | | | | | | |
Total net assets | | $ | 345,288,147 | | | $ | 1,024,116,641 | | | $ | 9,249,897 | |
| | | | | | | | | | | | |
Net assets consist of: | | | | | | | | | | | | |
Paid-in capital | | $ | 325,891,028 | | | $ | 992,132,282 | | | $ | 12,476,780 | |
Distributable earnings (accumulated loss) | | | 19,397,119 | | | | 31,984,359 | | | | (3,226,883 | ) |
| | | | | | | | | | | | |
Total net assets | | $ | 345,288,147 | | | $ | 1,024,116,641 | | | $ | 9,249,897 | |
| | | | | | | | | | | | |
Net asset value, offering price and redemption proceeds per share (unlimited shares authorized, no par value) | | | | | | | | | | | | |
Investor class of shares: | | | | | | | | | | | | |
Net asset value, offering price and redemption proceeds per share | | $ | 13.65 | | | $ | 12.00 | | | $ | — | |
Advisor class of shares: | | | | | | | | | | | | |
Net asset value, offering price and redemption proceeds per share | | | 13.65 | | | | 12.00 | | | | 9.25 | |
Offering price per share(2) | | | 14.15 | | | | 12.44 | | | | 9.59 | |
Institutional/Premier class of shares: | | | | | | | | | | | | |
Net asset value, offering price and redemption proceeds per share | | | 13.64 | | | | 12.00 | | | | 9.24 | |
| | | |
Net assets: | | | | | | | | | | | | |
Investor class of shares | | $ | 101,125,111 | | | $ | 74,969,718 | | | $ | — | |
Advisor class of shares | | | 7,207,683 | | | | 3,726,608 | | | | 868,345 | |
Institutional/Premier class of shares | | | 236,955,353 | | | | 945,420,315 | | | | 8,381,552 | |
| | | | | | | | | | | | |
Total net assets | | $ | 345,288,147 | | | $ | 1,024,116,641 | | | $ | 9,249,897 | |
| | | | | | | | | | | | |
Shares outstanding: | | | | | | | | | | | | |
Investor class of shares | | | 7,406,831 | | | | 6,246,266 | | | | — | |
Advisor class of shares | | | 527,933 | | | | 310,509 | | | | 93,901 | |
Institutional/Premier class of shares | | | 17,374,378 | | | | 78,794,323 | | | | 907,411 | |
| | | | | | | | | | | | |
Total shares outstanding | | | 25,309,142 | | | | 85,351,098 | | | | 1,001,312 | |
| | | | | | | | | | | | |
Investments, at cost: | | | | | | | | | | | | |
Investments in unaffiliated issuers | | $ | 382,022,396 | | | $ | 1,075,215,553 | | | $ | 11,708,121 | |
Cash sweep investments in affiliated issuers | | | 19,019,027 | | | | 40,248,361 | | | | 439,926 | |
| | | | | | | | | | | | |
Total investments, at cost | | $ | 401,041,423 | | | $ | 1,115,463,914 | | | $ | 12,148,047 | |
| | | | | | | | | | | | |
| (1) | Including $79,454,962, $121,750,502 and $2,967,664, respectively, of securities on loan. A security on loan value represents both fair value and accrued interest. |
| (2) | Computation of offering price per share 100/96.5 of net asset value. |
(See Notes which are an integral part of the Financial Statements)
118
August 31, 2019
| | |
| | |
| Statements of Assets and Liabilities | | BMO Funds |
| | | | | | | | | | | | | | | | |
| | | | | | | | | | | | | |
| | | Government
Money
Market Fund | | | Tax-Free
Money
Market Fund | | | Prime
Money
Market Fund | | | Institutional
Prime Money
Market Fund | |
Assets: | | | | | | | | | | | | | | | | |
Investments in unaffiliated issuers, at value | | $ | 1,984,719,507 | | | $ | 409,371,919 | | | $ | 382,602,016 | | | $ | 421,490,031 | |
Investments in repurchase agreements | | | 1,208,953,128 | | | | — | | | | 113,907,300 | | | | 140,000,000 | |
Cash | | | — | | | | 1,000 | | | | — | | | | — | |
Dividends and interest receivable | | | 3,979,644 | | | | 1,052,345 | | | | 585,639 | | | | 661,083 | |
Receivable for capital stock sold | | | 2 | | | | 100,000 | | | | 12 | | | | — | |
Prepaid expenses and other receivables | | | | | | | | | | | | | | | | |
Unaffiliated Issuers | | | 25,656 | | | | 26,021 | | | | 38,612 | | | | 22,284 | |
Receivable from affiliates for interfund lending (Note 6) | | | 27,451,905 | | | | — | | | | — | | | | — | |
| | | | | | | | | | | | | | | | |
Total assets | | | 3,225,129,842 | | | | 410,551,285 | | | | 497,133,579 | | | | 562,173,398 | |
| | | | |
Liabilities: | | | | | | | | | | | | | | | | |
Payable for investments purchased | | | 30,000,000 | | | | 2,011,700 | | | | — | | | | — | |
Payable for capital stock redeemed | | | 127,283 | | | | — | | | | — | | | | — | |
Payable to affiliates, net (Note 6) | | | 580,882 | | | | 55,939 | | | | 104,326 | | | | 12,249 | |
Payable for income distribution | | | 4,469,957 | | | | 363,594 | | | | 456,956 | | | | 656,907 | |
Other liabilities | | | 137,177 | | | | 44,059 | | | | 48,935 | | | | 69,003 | |
| | | | | | | | | | | | | | | | |
Total liabilities | | | 35,315,299 | | | | 2,475,292 | | | | 610,217 | | | | 738,159 | |
| | | | | | | | | | | | | | | | |
Total net assets | | $ | 3,189,814,543 | | | $ | 408,075,993 | | | $ | 496,523,362 | | | $ | 561,435,239 | |
| | | | | | | | | | | | | | | | |
Net assets consist of: | | | | | | | | | | | | | | | | |
Paid-in capital | | $ | 3,189,814,684 | | | $ | 408,075,653 | | | $ | 496,547,329 | | | $ | 561,359,747 | |
Distributable earnings (accumulated loss) | | | (141 | ) | | | 340 | | | | (23,967 | ) | | | 75,492 | |
| | | | | | | | | | | | | | | | |
Total net assets | | $ | 3,189,814,543 | | | $ | 408,075,993 | | | $ | 496,523,362 | | | $ | 561,435,239 | |
| | | | | | | | | | | | | | | | |
Net asset value, offering price and redemption proceeds per share (unlimited shares authorized, no par value) | | | | | | | | | | | | | | | | |
Investor class of shares: | | | | | | | | | | | | | | | | |
Net asset value, offering price and redemption proceeds per share | | $ | 1.00 | | | $ | 1.00 | | | $ | 1.00 | | | $ | 1.0001 | |
Institutional/Premier class of shares: | | | | | | | | | | | | | | | | |
Net asset value, offering price and redemption proceeds per share | | | 1.00 | | | | 1.00 | | | | 1.00 | | | | 1.0001 | |
| | | | |
Net assets: | | | | | | | | | | | | | | | | |
Investor class of shares | | $ | 805,269,563 | | | $ | 71,793,999 | | | $ | 247,742,419 | | | $ | 1,218,037 | |
Institutional/Premier class of shares | | | 2,384,544,980 | | | | 336,281,994 | | | | 248,780,943 | | | | 560,217,202 | |
| | | | | | | | | | | | | | | | |
Total net assets | | $ | 3,189,814,543 | | | $ | 408,075,993 | | | $ | 496,523,362 | | | $ | 561,435,239 | |
| | | | | | | | | | | | | | | | |
Shares outstanding: | | | | | | | | | | | | | | | | |
Investor class of shares | | | 805,270,705 | | | | 71,790,387 | | | | 247,804,348 | | | | 1,217,944 | |
Institutional/Premier class of shares | | | 2,384,543,979 | | | | 336,312,935 | | | | 248,743,017 | | | | 560,177,526 | |
| | | | | | | | | | | | | | | | |
Total shares outstanding | | | 3,189,814,684 | | | | 408,103,322 | | | | 496,547,365 | | | | 561,395,470 | |
| | | | | | | | | | | | | | | | |
Investments, at cost: | | | | | | | | | | | | | | | | |
Investments in unaffiliated issuers | | $ | 3,193,672,635 | | | $ | 409,371,919 | | | $ | 496,509,316 | | | $ | 561,430,959 | |
| | | | | | | | | | | | | | | | |
Total investments, at cost | | $ | 3,193,672,635 | | | $ | 409,371,919 | | | $ | 496,509,316 | | | $ | 561,430,959 | |
| | | | | | | | | | | | | | | | |
(See Notes which are an integral part of the Financial Statements)
119
Year Ended August 31, 2019
| | |
| | |
| Statements of Operations | | BMO Funds |
| | | | | | | | | | | | | | | | | | | | |
| | | | | | | | | | | | | | | | |
| | | Low Volatility
Equity Fund | | | Dividend
Income Fund | | | Large-Cap
Value Fund | | | Large-Cap
Growth Fund | | | Mid-Cap
Value Fund | |
Investment Income: | | | | | | | | | | | | | | | | | | | | |
Dividend income from: | | | | | | | | | | | | | | | | | | | | |
Unaffiliated issuers | | $ | 3,492,204 | (1) | | $ | 6,489,905 | | | $ | 8,199,197 | | | $ | 5,252,918 | | | $ | 3,608,672 | |
Affiliated issuers | | | 85,770 | | | | 115,857 | | | | 115,961 | | | | 200,024 | | | | 58,615 | |
Net securities lending income from: | | | | | | | | | | | | | | | | | | | | |
Unaffiliated issuers | | | 39,603 | | | | 46,956 | | | | 87,266 | | | | 116,550 | | | | 50,010 | |
Affiliated issuers (Note 6) | | | 19,449 | | | | 23,058 | | | | 41,560 | | | | 56,996 | | | | 23,801 | |
| | | | | | | | | | | | | | | | | | | | |
Total income | | | 3,637,026 | | | | 6,675,776 | | | | 8,443,984 | | | | 5,626,488 | | | | 3,741,098 | |
| | | | | |
Expenses: | | | | | | | | | | | | | | | | | | | | |
Investment advisory fees (Note 6) | | | 768,846 | | | | 1,039,529 | | | | 1,159,777 | | | | 1,512,628 | | | | 1,154,822 | |
Shareholder servicing fees (Note 6) | | | — | | | | — | | | | — | | | | 148,302 | | | | — | |
Administration fees (Note 6) | | | 230,654 | | | | 311,859 | | | | 392,393 | | | | 451,597 | | | | 213,255 | |
Portfolio accounting fees | | | 39,508 | | | | 45,763 | | | | 60,776 | | | | 70,416 | | | | 42,560 | |
Recordkeeping fees | | | 32,700 | | | | 75,721 | | | | 82,884 | | | | 103,313 | | | | 101,161 | |
Custodian fees (Note 6) | | | 8,583 | | | | 16,250 | | | | 7,560 | | | | 8,206 | | | | 6,992 | |
Registration fees | | | 42,729 | | | | 39,575 | | | | 53,656 | | | | 61,605 | | | | 45,413 | |
Professional fees | | | 22,297 | | | | 22,297 | | | | 22,687 | | | | 22,687 | | | | 22,687 | |
Printing and postage | | | 16,295 | | | | 32,997 | | | | 34,408 | | | | 36,190 | | | | 36,263 | |
Directors’ fees | | | 15,349 | | | | 15,349 | | | | 15,349 | | | | 15,349 | | | | 15,349 | |
Distribution services fees-Advisor Class (Note 6) | | | 64,369 | | | | 28,482 | | | | 50,743 | | | | 2,123 | | | | 114,929 | |
Miscellaneous | | | 15,473 | | | | 12,945 | | | | 35,651 | | | | 49,166 | | | | 19,662 | |
| | | | | | | | | | | | | | | | | | | | |
Total expenses | | | 1,256,803 | | | | 1,640,767 | | | | 1,915,884 | | | | 2,481,582 | | | | 1,773,093 | |
| | | | | |
Deduct: | | | | | | | | | | | | | | | | | | | | |
Expense waivers (Note 6) | | | (192,684 | ) | | | (260,714 | ) | | | (175,131 | ) | | | (183,125 | ) | | | (28,301 | ) |
| | | | | | | | | | | | | | | | | | | | |
Net expenses | | | 1,064,119 | | | | 1,380,053 | | | | 1,740,753 | | | | 2,298,457 | | | | 1,744,792 | |
| | | | | | | | | | | | | | | | | | | | |
Net investment income | | | 2,572,907 | | | | 5,295,723 | | | | 6,703,231 | | | | 3,328,031 | | | | 1,996,306 | |
| | | | | |
Realized and unrealized gain (loss) on investments: | | | | | | | | | | | | | | | | | | | | |
Net realized gain (loss) on transactions from: | | | | | | | | | | | | | | | | | | | | |
Investments in unaffiliated issuers | | | 2,908,105 | | | | (1,812,482 | ) | | | (3,260,849 | ) | | | 22,624,261 | | | | (2,371,515 | ) |
Investments in affiliated issuers | | | 857 | | | | (144 | ) | | | 424 | | | | (1,222 | ) | | | 23 | |
| | | | | | | | | | | | | | | | | | | | |
Total net realized gain (loss) | | | 2,908,962 | | | | (1,812,626 | ) | | | (3,260,425 | ) | | | 22,623,039 | | | | (2,371,492 | ) |
Net change in unrealized appreciation/depreciation on: | | | | | | | | | | | | | | | | | | | | |
Investments in unaffiliated issuers | | | 15,017,802 | | | | (6,514,412 | ) | | | (34,812,876 | ) | | | (26,450,154 | ) | | | (18,094,859 | ) |
Investments in affiliated issuers | | | (222 | ) | | | (44 | ) | | | (783 | ) | | | (81 | ) | | | (583 | ) |
| | | | | | | | | | | | | | | | | | | | |
Total net change in unrealized appreciation/depreciation | | | 15,017,580 | | | | (6,514,456 | ) | | | (34,813,659 | ) | | | (26,450,235 | ) | | | (18,095,442 | ) |
| | | | | | | | | | | | | | | | | | | | |
Net realized and unrealized gain (loss) | | | 17,926,542 | | | | (8,327,082 | ) | | | (38,074,084 | ) | | | (3,827,196 | ) | | | (20,466,934 | ) |
| | | | | | | | | | | | | | | | | | | | |
Change in net assets resulting from operations | | | 20,499,449 | | | $ | (3,031,359 | ) | | $ | (31,370,853 | ) | | $ | (499,165 | ) | | $ | (18,470,628 | ) |
| | | | | | | | | | | | | | | | | | | | |
| (1) | Net of foreign taxes withheld of $554. |
(See Notes which are an integral part of the Financial Statements)
120
Year Ended August 31, 2019
| | |
| | |
| Statements of Operations | | BMO Funds |
| | | | | | | | | | | | | | | | | | | | |
| | | | | | | | | | | | | | | | |
| | | Mid-Cap
Growth Fund | | | Small-Cap
Value Fund | | | Small-Cap
Core Fund | | | Small-Cap
Growth Fund | | | Global Low
Volatility
Equity Fund | |
Investment Income: | | | | | | | | | | | | | | | | | | | | |
Dividend income from: | | | | | | | | | | | | | | | | | | | | |
Unaffiliated issuers | | $ | 821,587 | | | $ | 1,057,730 | | | $ | 196,066 | | | $ | 754,862 | | | $ | 1,118,465 | (1) |
Affiliated issuers | | | 36,987 | | | | 23,969 | | | | 6,816 | | | | 38,566 | | | | 12,250 | |
Net securities lending income from: | | | | | | | | | | | | | | | | | | | | |
Unaffiliated issuers | | | 27,463 | | | | 21,369 | | | | 7,224 | | | | 40,791 | | | | 3,642 | |
Affiliated issuers (Note 6) | | | 13,128 | | | | 10,103 | | | | 3,410 | | | | 19,426 | | | | 1,161 | |
| | | | | | | | | | | | | | | | | | | | |
Total income | | | 899,165 | | | | 1,113,171 | | | | 213,516 | | | | 853,645 | | | | 1,135,518 | |
| | | | | |
Expenses: | | | | | | | | | | | | | | | | | | | | |
Investment advisory fees (Note 6) | | | 736,873 | | | | 431,698 | | | | 123,883 | | | | 830,505 | | | | 209,592 | |
Administration fees (Note 6) | | | 135,586 | | | | 77,894 | | | | 28,588 | | | | 181,862 | | | | 48,368 | |
Portfolio accounting fees | | | 34,843 | | | | 31,839 | | | | 27,053 | | | | 37,965 | | | | 9,342 | |
Recordkeeping fees | | | 82,646 | | | | 45,654 | | | | 21,951 | | | | 83,825 | | | | 20,511 | |
Custodian fees (Note 6) | | | 2,872 | | | | 12,331 | | | | 25,380 | | | | 11,583 | | | | 67,874 | |
Registration fees | | | 45,822 | | | | 43,467 | | | | 30,797 | | | | 37,927 | | | | 33,356 | |
Professional fees | | | 22,687 | | | | 22,297 | | | | 22,297 | | | | 22,687 | | | | 29,336 | |
Printing and postage | | | 33,364 | | | | 13,558 | | | | 14,939 | | | | 36,827 | | | | 8,015 | |
Directors’ fees | | | 15,349 | | | | 15,349 | | | | 15,349 | | | | 15,349 | | | | 15,349 | |
Distribution services fees-Advisor Class (Note 6) | | | 36,448 | | | | 9,398 | | | | 4,892 | | | | 103,573 | | | | 727 | |
Miscellaneous | | | 12,587 | | | | 10,216 | | | | 4,722 | | | | 18,649 | | | | 726 | |
| | | | | | | | | | | | | | | | | | | | |
Total expenses | | | 1,159,077 | | | | 713,701 | | | | 319,851 | | | | 1,380,752 | | | | 443,196 | |
| | | | | |
Deduct: | | | | | | | | | | | | | | | | | | | | |
Expense waivers (Note 6) | | | (82,492 | ) | | | (96,838 | ) | | | (142,620 | ) | | | (76,129 | ) | | | (167,958 | ) |
| | | | | | | | | | | | | | | | | | | | |
Net expenses | | | 1,076,585 | | | | 616,863 | | | | 177,231 | | | | 1,304,623 | | | | 275,238 | |
| | | | | | | | | | | | | | | | | | | | |
Net investment income (loss) | | | (177,420 | ) | | | 496,308 | | | | 36,285 | | | | (450,978 | ) | | | 860,280 | |
| | | | | |
Realized and unrealized gain (loss) on investments: | | | | | | | | | | | | | | | | | | | | |
Net realized gain (loss) on transactions from: | | | | | | | | | | | | | | | | | | | | |
Investments in unaffiliated issuers | | | 12,560,696 | | | | 289,284 | | | | (947,472 | ) | | | 1,931,571 | | | | 1,048,982 | |
Investments in affiliated issuers | | | (409 | ) | | | 118 | | | | (6 | ) | | | — | | | | 474 | |
Foreign currency transactions | | | — | | | | — | | | | — | | | | — | | | | (11,739 | ) |
| | | | | | | | | | | | | | | | | | | | |
Total net realized gain (loss) | | | 12,560,287 | | | | 289,402 | | | | (947,478 | ) | | | 1,931,571 | | | | 1,037,717 | |
Net change in unrealized appreciation/depreciation on: | | | | | | | | | | | | | | | | | | | | |
Investments in unaffiliated issuers | | | (16,369,427 | ) | | | (12,392,589 | ) | | | (3,431,815 | ) | | | (25,088,993 | ) | | | (1,042,499 | ) |
Investments in affiliated issuers | | | (149 | ) | | | (132 | ) | | | (65 | ) | | | (315 | ) | | | 49 | |
Foreign currency transactions | | | — | | | | — | | | | — | | | | — | | | | 651 | |
| | | | | | | | | | | | | | | | | | | | |
Total net change in unrealized appreciation/depreciation | | | (16,369,576 | ) | | | (12,392,721 | ) | | | (3,431,880 | ) | | | (25,089,308 | ) | | | (1,041,799 | ) |
| | | | | | | | | | | | | | | | | | | | |
Net realized and unrealized loss | | | (3,809,289 | ) | | | (12,103,319 | ) | | | (4,379,358 | ) | | | (23,157,737 | ) | | | (4,082 | ) |
| | | | | | | | | | | | | | | | | | | | |
Change in net assets resulting from operations | | $ | (3,986,709 | ) | | $ | (11,607,011 | ) | | $ | (4,343,073 | ) | | $ | (23,608,715 | ) | | $ | 856,198 | |
| | | | | | | | | | | | | | | | | | | | |
| (1) | Net of foreign taxes withheld of $78,352. |
(See Notes which are an integral part of the Financial Statements)
121
Year Ended August 31, 2019
| | |
| | |
| Statements of Operations | | BMO Funds |
| | | | | | | | | | | | | | | | | | | | |
| | | | | | | | | | | | | | | | |
| | | Disciplined
International
Equity Fund | | | Pyrford
International
Stock Fund | | | LGM
Emerging
Markets
Equity Fund | | | Alternative
Strategies
Fund | | | Global
Long/Short
Equity Fund | |
Investment Income: | | | | | | | | | | | | | | | | | | | | |
Dividend income from: | | | | | | | | | | | | | | | | | | | | |
Unaffiliated issuers | | $ | 2,902,108 | (1) | | $ | 22,942,822 | (1) | | $ | 6,327,680 | (1) | | $ | 338,856 | (1) | | $ | 127,011 | (1) |
Affiliated issuers | | | 30,064 | | | | 512,943 | | | | 247,747 | | | | 655,331 | | | | 13,814 | |
Interest income | | | — | | | | — | | | | — | | | | 205,172 | | | | — | |
Net securities lending income from: | | | | | | | | | | | | | | | | | | | | |
Unaffiliated issuers | | | 16,257 | | | | 226,778 | | | | 148,370 | | | | — | | | | 2,655 | |
Affiliated issuers (Note 6) | | | 760 | | | | 8,513 | | | | 7,938 | | | | — | | | | 762 | |
| | | | | | | | | | | | | | | | | | | | |
Total income | | | 2,949,189 | | | | 23,691,056 | | | | 6,731,735 | | | | 1,199,359 | | | | 144,242 | |
| | | | | |
Expenses: | | | | | | | | | | | | | | | | | | | | |
Investment advisory fees (Note 6) | | | 453,290 | | | | 4,752,945 | | | | 2,168,075 | | | | 623,131 | | | | 62,134 | |
Administration fees (Note 6) | | | 113,322 | | | | 728,215 | | | | 361,346 | | | | 88,929 | | | | 9,320 | |
Portfolio accounting fees | | | 7,891 | | | | 23,788 | | | | 24,069 | | | | 4,311 | | | | 3,717 | |
Recordkeeping fees | | | 19,757 | | | | 55,274 | | | | 38,708 | | | | 18,242 | | | | 20,087 | |
Custodian fees (Note 6) | | | 80,034 | | | | 243,320 | | | | 287,897 | | | | 352,152 | | | | 55,199 | |
Registration fees | | | 52,877 | | | | 72,658 | | | | 46,613 | | | | 26,773 | | | | 53,145 | |
Professional fees | | | 26,136 | | | | 32,861 | | | | 39,762 | | | | 66,031 | | | | 28,736 | |
Printing and postage | | | 8,053 | | | | 37,705 | | | | 34,672 | | | | 11,863 | | | | 8,683 | |
Directors’ fees | | | 15,349 | | | | 15,349 | | | | 15,349 | | | | 15,349 | | | | 15,349 | |
Interest expense and dividends on securities sold short | | | — | | | | — | | | | — | | | | 82,270 | | | | 19,362 | |
Distribution services fees-Advisor Class (Note 6) | | | 421 | | | | 12,912 | | | | 12,982 | | | | 123 | | | | 1,761 | |
Miscellaneous | | | 1,543 | | | | 12,188 | | | | 1,722 | | | | 733 | | | | 2,086 | |
| | | | | | | | | | | | | | | | | | | | |
Total expenses | | | 778,673 | | | | 5,987,215 | | | | 3,031,195 | | | | 1,289,907 | | | | 279,579 | |
| | | | | |
Deduct: | | | | | | | | | | | | | | | | | | | | |
Expense waivers (Note 6) | | | (97,532 | ) | | | (107,692 | ) | | | (248,190 | ) | | | (329,682 | ) | | | (172,587 | ) |
| | | | | | | | | | | | | | | | | | | | |
Net expenses | | | 681,141 | | | | 5,879,523 | | | | 2,783,005 | | | | 960,225 | | | | 106,992 | |
| | | | | | | | | | | | | | | | | | | | |
Net investment income | | | 2,268,048 | | | | 17,811,533 | | | | 3,948,730 | | | | 239,134 | | | | 37,250 | |
| | | | | |
Net realized and unrealized gain (loss) on investments: | | | | | | | | | | | | | | | | | | | | |
Net realized gain (loss) on transactions from: | | | | | | | | | | | | | | | | | | | | |
Investments in unaffiliated issuers | | | (3,345,895 | ) | | | (935,360 | ) | | | 1,510,745 | (2) | | | 71,161 | | | | 105,752 | |
Investments in affiliated issuers | | | 271 | | | | (650 | ) | | | 1,239 | | | | 1,605 | | | | (72 | ) |
Foreign currency transactions | | | 3,222 | | | | (204,940 | ) | | | (218,201 | ) | | | (19,135 | ) | | | (1,863 | ) |
Forward contracts | | | — | | | | — | | | | — | | | | 308,811 | | | | — | |
Futures contracts | | | — | | | | — | | | | — | | | | 259,425 | | | | — | |
Purchased options | | | — | | | | — | | | | — | | | | 7,542 | | | | — | |
Written options | | | — | | | | — | | | | — | | | | (28,525 | ) | | | — | |
Swap contracts | | | — | | | | — | | | | — | | | | (1,943,024 | ) | | | (106,666 | ) |
| | | | | | | | | | | | | | | | | | | | |
Total net realized gain (loss) | | | (3,342,402 | ) | | | (1,140,950 | ) | | | 1,293,783 | | | | (1,342,140 | ) | | | (2,849 | ) |
Net change in unrealized appreciation/depreciation on: | | | | | | | | | | | | | | | | | | | | |
Investments in unaffiliated issuers | | | (4,164,945 | ) | | | (16,261,777 | ) | | | (14,442,336 | ) | | | (3,873,477 | ) | | | (1,189,063 | ) |
Investments in affiliated issuers | | | (134 | ) | | | 277 | | | | (1,089 | ) | | | (1,770 | ) | | | (366 | ) |
Short sales | | | — | | | | — | | | | — | | | | 778,961 | | | | 319,139 | |
Foreign currency transactions | | | (10,881 | ) | | | (29,681 | ) | | | 408 | | | | 124 | | | | (1,247 | ) |
Forward contracts | | | — | | | | — | | | | — | | | | (45,363 | ) | | | — | |
Futures contracts | | | — | | | | — | | | | — | | | | 805,607 | | | | — | |
Purchased options | | | — | | | | — | | | | — | | | | 32,082 | | | | — | |
Written options | | | — | | | | — | | | | — | | | | (12,249 | ) | | | — | |
Swap contracts | | | — | | | | — | | | | — | | | | (151,150 | ) | | | (30,858 | ) |
| | | | | | | | | | | | | | | | | | | | |
Total net change in unrealized appreciation/depreciation | | | (4,175,960 | ) | | | (16,291,181 | ) | | | (14,443,017 | ) | | | (2,467,235 | ) | | | (902,395 | ) |
| | | | | | | | | | | | | | | | | | | | |
Net realized and unrealized loss | | | (7,518,362 | ) | | | (17,432,131 | ) | | | (13,149,234 | ) | | | (3,809,375 | ) | | | (905,244 | ) |
| | | | | | | | | | | | | | | | | | | | |
Change in net assets resulting from operations | | $ | (5,250,314 | ) | | $ | 379,402 | | | $ | (9,200,504 | ) | | $ | (3,570,241 | ) | | $ | (867,994 | ) |
| | | | | | | | | | | | | | | | | | | | |
| (1) | Net of foreign taxes withheld of $275,113, $1,967,989, $507,601, $23,966 and $12,453, respectively. |
| (2) | Net of foreign taxes withheld of $5,881 of which is related to appreciated investments held at period end. |
(See Notes which are an integral part of the Financial Statements)
122
Year Ended August 31, 2019
| | |
| | |
| Statements of Operations | | BMO Funds |
| | | | | | | | | | | | | | | | | | | | |
| | | | | | | | | | | | | | | | |
| | | Ultra Short
Tax-Free Fund | | | Short
Tax-Free Fund | | | Short-Term
Income Fund | | | Intermediate
Tax-Free Fund | | | Strategic
Income Fund | |
Investment Income: | | | | | | | | | | | | | | | | | | | | |
Dividend income from: | | | | | | | | | | | | | | | | | | | | |
Unaffiliated issuers | | $ | 159,974 | | | $ | 44,153 | | | $ | 47,626 | | | $ | 370,359 | | | $ | 10,366 | |
Affiliated issuers | | | 19,891 | | | | 9,252 | | | | 145,640 | | | | 48,905 | | | | 37,137 | |
Interest income | | | 11,234,614 | | | | 3,848,899 | | | | 7,022,636 | | | | 57,948,709 | | | | 4,075,360 | |
Net securities lending income from: | | | | | | | | | | | | | | | | | | | | |
Unaffiliated issuers | | | — | | | | — | | | | 23,757 | | | | — | | | | 25,660 | |
Affiliated issuers (Note 6) | | | — | | | | — | | | | 11,813 | | | | — | | | | 12,671 | |
| | | | | | | | | | | | | | | | | | | | |
Total income | | | 11,414,479 | | | | 3,902,304 | | | | 7,251,472 | | | | 58,367,973 | | | | 4,161,194 | |
| | | | | |
Expenses: | | | | | | | | | | | | | | | | | | | | |
Investment advisory fees (Note 6) | | | 991,361 | | | | 342,299 | | | | 483,014 | | | | 2,087,381 | | | | 199,680 | |
Shareholder servicing fees (Note 6) | | | — | | | | — | | | | — | | | | 1,690,594 | | | | 142,025 | |
Administration fees (Note 6) | | | 872,042 | | | | 262,342 | | | | 374,197 | | | | 2,696,072 | | | | 119,808 | |
Portfolio accounting fees | | | 119,870 | | | | 81,979 | | | | 75,342 | | | | 365,044 | | | | 47,770 | |
Recordkeeping fees | | | 36,874 | | | | 31,796 | | | | 77,638 | | | | 52,466 | | | | 75,516 | |
Custodian fees (Note 6) | | | 10,218 | | | | 4,425 | | | | 8,071 | | | | 17,349 | | | | 7,839 | |
Registration fees | | | 55,329 | | | | 35,219 | | | | 35,677 | | | | 130,599 | | | | 43,146 | |
Professional fees | | | 27,107 | | | | 27,107 | | | | 27,107 | | | | 27,107 | | | | 29,307 | |
Printing and postage | | | 13,614 | | | | 11,746 | | | | 16,644 | | | | 42,615 | | | | 14,067 | |
Directors’ fees | | | 15,349 | | | | 15,349 | | | | 15,349 | | | | 15,349 | | | | 15,349 | |
Interest expense and dividends on securities sold short | | | 916 | | | | 229 | | | | — | | | | 916 | | | | — | |
Distribution services fees-Advisor Class (Note 6) | | | 51,169 | | | | 13,482 | | | | 61,270 | | | | 20,876 | | | | 31,862 | |
Miscellaneous | | | 18,724 | | | | 6,541 | | | | 12,555 | | | | 46,705 | | | | 11,812 | |
| | | | | | | | | | | | | | | | | | | | |
Total expenses | | | 2,212,573 | | | | 832,514 | | | | 1,186,864 | | | | 7,193,073 | | | | 738,181 | |
| | | | | |
Deduct: | | | | | | | | | | | | | | | | | | | | |
Expense waivers (Note 6) | | | (415,484 | ) | | | (124,439 | ) | | | (252,467 | ) | | | (34,042 | ) | | | (124,989 | ) |
| | | | | | | | | | | | | | | | | | | | |
Net expenses | | | 1,797,089 | | | | 708,075 | | | | 934,397 | | | | 7,159,031 | | | | 613,192 | |
| | | | | | | | | | | | | | | | | | | | |
Net investment income | | | 9,617,390 | | | | 3,194,229 | | | | 6,317,075 | | | | 51,208,942 | | | | 3,548,002 | |
| | | | | |
Realized and unrealized gain (loss) on investments: | | | | | | | | | | | | | | | | | | | | |
Net realized gain (loss) on transactions from: | | | | | | | | | | | | | | | | | | | | |
Investments in unaffiliated issuers | | | 77,396 | | | | 35,504 | | | | (59,312 | ) | | | (4,358,967 | ) | | | (845,267 | ) |
Investments in affiliated issuers | | | — | | | | (1,681 | ) | | | (1,584 | ) | | | (9,860 | ) | | | 313 | |
| | | | | | | | | | | | | | | | | | | | |
Total net realized gain (loss) | | | 77,396 | | | | 33,823 | | | | (60,896 | ) | | | (4,368,827 | ) | | | (844,954 | ) |
Net change in unrealized appreciation/depreciation on: | | | | | | | | | | | | | | | | | | | | |
Investments in unaffiliated issuers | | | 1,187,090 | | | | 2,287,411 | | | | 5,248,576 | | | | 80,347,896 | | | | 3,983,112 | |
Investments in affiliated issuers | | | — | | | | 2,518 | | | | (609 | ) | | | 15,033 | | | | (478 | ) |
| | | | | | | | | | | | | | | | | | | | |
Total net change in unrealized appreciation/depreciation | | | 1,187,090 | | | | 2,289,929 | | | | 5,247,967 | | | | 80,362,929 | | | | 3,982,634 | |
| | | | | | | | | | | | | | | | | | | | |
Net realized and unrealized gain | | | 1,264,486 | | | | 2,323,752 | | | | 5,187,071 | | | | 75,994,102 | | | | 3,137,680 | |
| | | | | | | | | | | | | | | | | | | | |
Change in net assets resulting from operations | | $ | 10,881,876 | | | $ | 5,517,981 | | | $ | 11,504,146 | | | $ | 127,203,044 | | | $ | 6,685,682 | |
| | | | | | | | | | | | | | | | | | | | |
(See Notes which are an integral part of the Financial Statements)
123
Year Ended August 31, 2019
| | |
| | |
| Statements of Operations | | BMO Funds |
| | | | | | | | | | | | |
| | | | | | | | | | |
| | | TCH
Corporate
Income Fund | | | TCH
Core Plus
Bond Fund | | | High Yield
Bond Fund | |
Investment Income: | | | | | | | | | | | | |
Dividend income from: | | | | | | | | | | | | |
Unaffiliated issuers | | $ | — | | | $ | 11,547 | | | $ | — | |
Affiliated issuers | | | 288,511 | | | | 728,370 | | | | 10,834 | |
Interest income | | | 11,453,893 | | | | 36,660,261 | | | | 634,663 | |
Net securities lending income from: | | | | | | | | | | | | |
Unaffiliated issuers | | | 67,421 | | | | 224,365 | | | | 4,909 | |
Affiliated issuers (Note 6) | | | 33,419 | | | | 107,386 | | | | 2,406 | |
| | | | | | | | | | | | |
Total income | | | 11,843,244 | | | | 37,731,929 | | | | 652,812 | |
| | | |
Expenses: | | | | | | | | | | | | |
Investment advisory fees (Note 6) | | | 542,758 | | | | 1,280,810 | | | | 51,402 | |
Shareholder servicing fees (Note 6) | | | 234,411 | | | | 168,930 | | | | — | |
Administration fees (Note 6) | | | 432,894 | | | | 1,486,216 | | | | 15,421 | |
Portfolio accounting fees | | | 72,069 | | | | 156,944 | | | | 36,382 | |
Recordkeeping fees | | | 34,649 | | | | 42,321 | | | | 21,506 | |
Custodian fees (Note 6) | | | 8,088 | | | | 37,837 | | | | 984 | |
Registration fees | | | 48,624 | | | | 73,655 | | | | 29,959 | |
Professional fees | | | 29,307 | | | | 29,307 | | | | 28,727 | |
Printing and postage | | | 19,154 | | | | 41,034 | | | | 2,925 | |
Directors’ fees | | | 15,349 | | | | 15,349 | | | | 15,349 | |
Distribution services fees–Advisor Class (Note 6) | | | 9,789 | | | | 7,900 | | | | 2,026 | |
Miscellaneous | | | 21,207 | | | | 68,566 | | | | 2,343 | |
| | | | | | | | | | | | |
Total expenses | | | 1,468,299 | | | | 3,408,869 | | | | 207,024 | |
| | | |
Deduct: | | | | | | | | | | | | |
Expense waivers (Note 6) | | | (82,128 | ) | | | — | | | | (138,150 | ) |
| | | | | | | | | | | | |
Net expenses | | | 1,386,171 | | | | 3,408,869 | | | | 68,874 | |
| | | | | | | | | | | | |
Net investment income | | | 10,457,073 | | | | 34,323,060 | | | | 583,938 | |
| | | |
Realized and unrealized gain (loss) on investments: | | | | | | | | | | | | |
Net realized gain (loss) on transactions from: | | | | | | | | | | | | |
Investments in unaffiliated issuers | | | (1,423,050 | ) | | | (2,007,547 | ) | | | (33,204 | ) |
Investments in affiliated issuers | | | (401 | ) | | | 9,334 | | | | 142 | |
| | | | | | | | | | | | |
Total net realized loss | | | (1,423,451 | ) | | | (1,998,213 | ) | | | (33,062 | ) |
Net change in unrealized appreciation/depreciation on: | | | | | | | | | | | | |
Investments in unaffiliated issuers | | | 23,114,282 | | | | 50,837,125 | | | | (3,105 | ) |
Investments in affiliated issuers | | | 1,107 | | | | (4,081 | ) | | | (73 | ) |
| | | | | | | | | | | | |
Total net change in unrealized appreciation/depreciation | | | 23,115,389 | | | | 50,833,044 | | | | (3,178 | ) |
| | | | | | | | | | | | |
Net realized and unrealized gain (loss) | | | 21,691,938 | | | | 48,834,831 | | | | (36,240 | ) |
| | | | | | | | | | | | |
Change in net assets resulting from operations | | $ | 32,149,011 | | | $ | 83,157,891 | | | $ | 547,698 | |
| | | | | | | | | | | | |
(See Notes which are an integral part of the Financial Statements)
124
Year Ended August 31, 2019
| | |
| | |
| Statements of Operations | | BMO Funds |
| | | | | | | | | | | | | | | | |
| | | | | | | | | | | | | |
| | | Government
Money
Market Fund | | | Tax-Free
Money
Market Fund | | | Prime
Money
Market Fund | | | Institutional
Prime Money
Market Fund | |
Investment Income: | | | | | | | | | | | | | | | | |
Dividend income from: | | | | | | | | | | | | | | | | |
Unaffiliated issuers | | $ | — | | | $ | — | | | $ | 692 | | | $ | — | |
Interest income | | | 70,916,062 | (1) | | | 6,961,299 | | | | 11,459,325 | | | | 13,832,897 | |
| | | | | | | | | | | | | | | | |
Total income | | | 70,916,062 | | | | 6,961,299 | | | | 11,460,017 | | | | 13,832,897 | |
| | | | |
Expenses: | | | | | | | | | | | | | | | | |
Investment advisory fees (Note 6) | | | 5,928,663 | | | | 847,840 | | | | 695,095 | | | | 829,577 | |
Shareholder servicing fees (Note 6) | | | 1,623,081 | | | | 191,789 | | | | 527,509 | | | | 5,168 | |
Administration fees (Note 6) | | | 1,032,500 | | | | 149,273 | | | | 157,257 | | | | 187,768 | |
Portfolio accounting fees | | | 410,221 | | | | 115,563 | | | | 111,147 | | | | 134,467 | |
Recordkeeping fees | | | 30,237 | | | | 27,691 | | | | 78,680 | | | | 207,597 | |
Custodian fees (Note 6) | | | 49,475 | | | | 7,874 | | | | 25,167 | | | | 31,839 | |
Registration fees | | | 64,653 | | | | 52,620 | | | | 70,544 | | | | 25,689 | |
Professional fees | | | 25,997 | | | | 30,397 | | | | 30,397 | | | | 30,397 | |
Printing and postage | | | 27,788 | | | | 18,179 | | | | 24,905 | | | | 16,349 | |
Directors’ fees | | | 15,349 | | | | 15,349 | | | | 15,349 | | | | 15,349 | |
Miscellaneous | | | 89,384 | | | | 10,990 | | | | 12,644 | | | | 13,357 | |
| | | | | | | | | | | | | | | | |
Total expenses | | | 9,297,348 | | | | 1,467,565 | | | | 1,748,694 | | | | 1,497,557 | |
| | | | |
Deduct: | | | | | | | | | | | | | | | | |
Expense waivers (Note 6) | | | (1,589,294 | ) | | | (427,937 | ) | | | (294,393 | ) | | | (386,287 | ) |
| | | | | | | | | | | | | | | | |
Net expenses | | | 7,708,054 | | | | 1,039,628 | | | | 1,454,301 | | | | 1,111,270 | |
| | | | | | | | | | | | | | | | |
Net investment income | | | 63,208,008 | | | | 5,921,671 | | | | 10,005,716 | | | | 12,721,627 | |
| | | | |
Realized and unrealized gain (loss) on investments: | | | | | | | | | | | | | | | | |
Net realized gain on transactions from: | | | | | | | | | | | | | | | | |
Investments in unaffiliated issuers | | | 4,655 | | | | 19,607 | | | | 536 | | | | 1,072 | |
| | | | | | | | | | | | | | | | |
Total net realized gain | | | 4,655 | | | | 19,607 | | | | 536 | | | | 1,072 | |
Net change in unrealized appreciation on: | | | | | | | | | | | | | | | | |
Investments in unaffiliated issuers | | | — | | | | — | | | | — | | | | 2,973 | |
| | | | | | | | | | | | | | | | |
Total net change in unrealized appreciation | | | — | | | | — | | | | — | | | | 2,973 | |
| | | | | | | | | | | | | | | | |
Net realized and unrealized gain | | | 4,655 | | | | 19,607 | | | | 536 | | | | 4,045 | |
| | | | | | | | | | | | | | | | |
Change in net assets resulting from operations | | $ | 63,212,663 | | | $ | 5,941,278 | | | $ | 10,006,252 | | | $ | 12,725,672 | |
| | | | | | | | | | | | | | | | |
| (1) | Income earned from the interfund lending program is $33,817. See Note 6 for detail. |
(See Notes which are an integral part of the Financial Statements)
125
| | |
| | |
| Statements of Changes in Net Assets | | |
| | | | | | | | | | | | | | | | | | | | | | | | |
| | | | | | | | | | |
| | | Low Volatility
Equity Fund | | | Dividend
Income Fund | | | Large-Cap
Value Fund | |
| | | Year Ended
August 31,
2019 | | | Year Ended
August 31,
2018 | | | Year Ended
August 31,
2019 | | | Year Ended
August 31,
2018 | | | Year Ended
August 31,
2019 | | | Year Ended
August 31,
2018 | |
Change in net assets resulting from: | | | | | | | | | | | | | | | | | | | | | | | | |
| | | | | | |
Operations: | | | | | | | | | | | | | | | | | | | | | | | | |
Net investment income (loss) | | $ | 2,572,907 | | | $ | 2,075,471 | | | $ | 5,295,723 | | | $ | 2,973,997 | | | $ | 6,703,231 | | | $ | 5,944,043 | |
Net realized gain (loss) on investments | | | 2,908,962 | | | | 11,106,001 | | | | (1,812,626 | ) | | | 9,203,285 | | | | (3,260,425 | ) | | | 37,163,475 | |
Net change in unrealized appreciation/depreciation on investments | | | 15,017,580 | | | | 5,207,851 | | | | (6,514,456 | ) | | | 14,007,649 | | | | (34,813,659 | ) | | | 9,781,999 | |
| | | | | | | | | | | | | | | | | | | | | | | | |
Change in net assets resulting from operations | | | 20,499,449 | | | | 18,389,323 | | | | (3,031,359 | ) | | | 26,184,931 | | | | (31,370,853 | ) | | | 52,889,517 | |
| | | | | | |
Distributions to shareholders: | | | | | | | | | | | | | | | | | | | | | | | | |
Investor class of shares | | | — | | | | — | | | | — | | | | — | | | | — | | | | — | |
Advisor class of shares | | | (2,539,428 | ) | | | (1,173,549 | )(1) | | | (553,901 | ) | | | (383,528 | )(1) | | | (2,255,004 | ) | | | (2,503,182 | )(1) |
Institutional class of shares | | | (10,688,056 | ) | | | (5,176,158 | )(1) | | | (11,571,620 | ) | | | (15,850,320 | )(1) | | | (29,608,063 | ) | | | (31,515,433 | )(1) |
Retirement classR-3 of shares | | | — | | | | — | | | | — | | | | — | | | | — | | | | — | |
Retirement classR-6 of shares | | | — | | | | — | | | | — | | | | — | | | | (8,385,293 | ) | | | (868,635 | )(1) |
| | | | | | | | | | | | | | | | | | | | | | | | |
Change in net assets resulting from distributions to shareholders | | | (13,227,484 | ) | | | (6,349,707 | ) | | | (12,125,521 | ) | | | (16,233,848 | ) | | | (40,248,360 | ) | | | (34,887,250 | ) |
| | | | | | |
Capital stock transactions: | | | | | | | | | | | | | | | | | | | | | | | | |
Proceeds from sale of shares | | | 124,692,065 | | | | 16,593,121 | | | | 235,092,837 | | | | 39,940,202 | | | | 66,947,372 | | | | 158,173,583 | (3) |
Net asset value of shares issued to shareholders in payment of distributions declared | | | 12,448,685 | | | | 6,114,577 | | | | 11,734,440 | | | | 15,955,191 | | | | 39,419,230 | | | | 34,550,946 | |
Cost of shares redeemed | | | (59,633,706 | ) | | | (65,823,112 | ) | | | (73,784,496 | ) | | | (26,326,918 | ) | | | (129,756,728 | ) | | | (152,349,808 | ) |
| | | | | | | | | | | | | | | | | | | | | | | | |
Change in net assets resulting from capital stock transactions | | | 77,507,044 | | | | (43,115,414 | ) | | | 173,042,781 | | | | 29,568,475 | | | | (23,390,126 | ) | | | 40,374,721 | |
| | | | | | | | | | | | | | | | | | | | | | | | |
Change in net assets | | | 84,779,009 | | | | (31,075,798 | ) | | | 157,885,901 | | | | 39,519,558 | | | | (95,009,339 | ) | | | 58,376,988 | |
| | | | | | |
Net assets: | | | | | | | | | | | | | | | | | | | | | | | | |
Beginning of period | | | 128,385,370 | | | | 159,461,168 | | | | 155,101,266 | | | | 115,581,708 | | | | 392,072,680 | | | | 333,695,692 | |
| | | | | | | | | | | | | | | | | | | | | | | | |
End of period | | $ | 213,164,379 | | | $ | 128,385,370 | (4) | | $ | 312,987,167 | | | $ | 155,101,266 | (4) | | $ | 297,063,341 | | | $ | 392,072,680 | (4) |
| | | | | | | | | | | | | | | | | | | | | | | | |
| (1) | The following information was previously reported in the August 31, 2018 financial statements. The distribution information for the year ended August 31, 2018 presented on the Statements of Changes in Net Assets above is presented for comparative purposes to the August 31, 2019 financial statements, which conform to the SEC Final Rule on Disclosure Update and Simplification which was effective November 5, 2018. Distributions to shareholders from net investment income and net realized gain on investments for the year ended August 31, 2018, as previously presented were as follows: |
| | | | | | | | | | | | | | | | | | | | | | | | | | | | |
| | | | | | | | | | | | | | | | | | | | | | |
| | | Low Volatility
Equity Fund | | | Dividend
Income Fund | | | Large-Cap
Value Fund | | | Large-Cap
Growth Fund | | | Mid-Cap
Value Fund | | | Mid-Cap
Growth Fund | | | Small-Cap
Value Fund | |
Distributions to shareholders from net investment income: | | | | | | | | | | | | | | | | | | | | | | | | | | | | |
Advisor class of shares | | $ | (389,406 | ) | | $ | (63,632 | ) | | $ | (291,522 | ) | | $ | — | | | $ | (253,519 | ) | | $ | — | | | $ | — | |
Institutional class of shares | | | (1,853,997 | ) | | | (2,811,280 | ) | | | (4,276,822 | ) | | | (360,864 | ) | | | (1,253,472 | ) | | | — | | | | — | |
Retirement classR-3 of shares | | | — | | | | — | | | | — | | | | — | | | | (112 | ) | | | — | | | | — | |
Retirement classR-6 of shares | | | — | | | | — | | | | (733,087 | ) | | | (6,422 | ) | | | (165,182 | ) | | | — | | | | — | |
| | | | | | | |
Distributions to shareholders from net realized gain on investments: | | | | | | | | | | | | | | | | | | | | | | | | | | | | |
Investor class of shares | | | — | | | | — | | | | — | | | | (4,147,456 | ) | | | — | | | | — | | | | — | |
Advisor class of shares | | | (784,143 | ) | | | (319,896 | ) | | | (2,211,660 | ) | | | (31,962 | ) | | | (2,517,318 | ) | | | (1,110,456 | ) | | | (380,301 | ) |
Institutional class of shares | | | (3,322,161 | ) | | | (13,039,040 | ) | | | (27,238,611 | ) | | | (15,549,809 | ) | | | (5,309,557 | ) | | | (5,920,705 | ) | | | (4,628,962 | ) |
Retirement classR-3 of shares | | | — | | | | — | | | | — | | | | — | | | | (1,026 | ) | | | — | | | | (6,314 | ) |
Retirement classR-6 of shares | | | — | | | | — | | | | (135,548 | ) | | | (181,357 | ) | | | (651,050 | ) | | | (37,756 | ) | | | (215,890 | ) |
| (2) | Reflects operations for the period from September 1, 2017, to May 11, 2018 (termination of Retirement classR-3 of shares). |
| (3) | Includes $4,159,630 ofpaid-in-capital received from anin-kind subscription purchase on December 15, 2017. The total value received of $4,159,630 from thisnon-taxable event represented $2,408,685 in securities cost, $1,730,375 in net unrealized appreciation, $3,388 in accrued dividends, $17,172 in cash, and $10 in accrued interest in exchange for 258,754 Institutional Class of shares at time of purchase. |
| (4) | The following information was previously reported in the August 31, 2018 financial statements. Undistributed net investment income included in net assets at end of period for the year ended August 31, 2018 were as follows: |
| | | | | | | | | | | | |
| | | | | | | | | | | | |
Low Volatility Equity Fund | | Dividend
Income Fund | | Large-Cap Value Fund | | Large-Cap Growth Fund | | Mid-Cap Value Fund | | Mid-Cap Growth Fund | | Small-Cap Value Fund |
$ 292,281 | | $ 636,145 | | $ 1,544,909 | | $ 2,017,557 | | $ 1,319,763 | | $ — | | $ 326,452 |
(See Notes which are an integral part of the Financial Statements)
126
| | | | | | | | | | | | | | | | | | | | | | | | | | | | | | |
| | | | | | | | | | |
Large-Cap
Growth Fund | | | Mid-Cap
Value Fund | | | Mid-Cap
Growth Fund | | | Small-Cap
Value Fund | |
Year Ended
August 31,
2019 | | | Year Ended
August 31,
2018 | | | Year Ended
August 31,
2019 | | | Year Ended
August 31,
2018 | | | Year Ended
August 31,
2019 | | | Year Ended
August 31,
2018 | | | Year Ended
August 31,
2019 | | | Year Ended
August 31,
2018 | |
| | | | | | | | | | | | | | | | | | | | | | | | | | | | | | |
| | | | | | | |
| | | | | | | | | | | | | | | | | | | | | | | | | | | | | | |
| $ | 3,328,031 | | | $ | 2,039,377 | | | $ | 1,996,306 | | | $ | 1,973,147 | | | $ | (177,420) | | | $ | (231,180 | ) | | $ | 496,308 | | | $ | 298,228 | |
| | 22,623,039 | | | | 47,906,176 | | | | (2,371,492 | ) | | | 20,334,660 | | | | 12,560,287 | | | | 19,632,111 | | | | 289,402 | | | | 5,585,474 | |
| | | | | | | |
| | (26,450,235 | ) | | | 42,293,484 | | | | (18,095,442 | ) | | | (57,248 | ) | | | (16,369,576 | ) | | | 12,055,116 | | | | (12,392,721 | ) | | | 7,032,835 | |
| | | | | | | | | | | | | | | | | | | | | | | | | | | | | | |
| | | | | | | |
| | (499,165 | ) | | | 92,239,037 | | | | (18,470,628 | ) | | | 22,250,559 | | | | (3,986,709 | ) | | | 31,456,047 | | | | (11,607,011 | ) | | | 12,916,537 | |
| | | | | | | |
| | | | | | | | | | | | | | | | | | | | | | | | | | | | | | |
| | (8,151,650 | ) | | | (4,147,456 | )(1) | | | — | | | | — | | | | — | | | | — | | | | — | | | | — | |
| | (122,745 | ) | | | (31,962 | )(1) | | | (5,989,408 | ) | | | (2,770,837 | )(1) | | | (2,613,372 | ) | | | (1,110,456 | )(1) | | | (313,516 | ) | | | (380,301 | )(1) |
| | (36,189,535 | ) | | | (15,910,673 | )(1) | | | (12,798,593 | ) | | | (6,563,029 | )(1) | | | (12,980,336 | ) | | | (5,920,705 | )(1) | | | (3,915,187 | ) | | | (4,628,962 | )(1) |
| | — | | | | — | | | | — | | | | (1,138 | )(1)(2) | | | — | | | | — | | | | — | | | | (6,314 | )(1)(2) |
| | (9,011,688 | ) | | | (187,779 | )(1) | | | (3,943,242 | ) | | | (816,232 | )(1) | | | (3,595,774 | ) | | | (37,756 | )(1) | | | (1,032,489 | ) | | | (215,890 | )(1) |
| | | | | | | | | | | | | | | | | | | | | | | | | | | | | | |
| | | | | | | |
| | (53,475,618 | ) | | | (20,277,870 | ) | | | (22,731,243 | ) | | | (10,151,236 | ) | | | (19,189,482 | ) | | | (7,068,917 | ) | | | (5,261,192 | ) | | | (5,231,467 | ) |
| | | | | | | |
| | | | | | | | | | | | | | | | | | | | | | | | | | | | | | |
| | 288,967,578 | | | | 123,469,873 | | | | 20,727,668 | | | | 47,626,226 | | | | 16,077,740 | | | | 37,954,380 | | | | 12,512,229 | | | | 20,343,034 | |
| | | | | | | |
| | 48,947,018 | | | | 18,714,347 | | | | 22,534,196 | | | | 10,039,874 | | | | 19,124,023 | | | | 7,050,843 | | | | 5,218,811 | | | | 5,184,079 | |
| | (235,274,441 | ) | | | (164,177,220 | ) | | | (61,287,176 | ) | | | (76,159,820 | ) | | | (43,674,135 | ) | | | (53,982,490 | ) | | | (20,877,358 | ) | | | (21,649,285 | ) |
| | | | | | | | | | | | | | | | | | | | | | | | | | | | | | |
| | | | | | | |
| | 102,640,155 | | | | (21,993,000 | ) | | | (18,025,312 | ) | | | (18,493,720 | ) | | | (8,472,372 | ) | | | (8,977,267 | ) | | | (3,146,318 | ) | | | 3,877,828 | |
| | | | | | | | | | | | | | | | | | | | | | | | | | | | | | |
| | 48,665,372 | | | | 49,968,167 | | | | (59,227,183 | ) | | | (6,394,397 | ) | | | (31,648,563 | ) | | | 15,409,863 | | | | (20,014,521 | ) | | | 11,562,898 | |
| | | | | | | |
| | | | | | | | | | | | | | | | | | | | | | | | | | | | | | |
| | 406,423,595 | | | | 356,455,428 | | | | 200,109,571 | | | | 206,503,968 | | | | 128,432,380 | | | | 113,022,517 | | | | 75,848,430 | | | | 64,285,532 | |
| | | | | | | | | | | | | | | | | | | | | | | | | | | | | | |
| $ | 455,088,967 | | | $ | 406,423,595 | (4) | | $ | 140,882,388 | | | $ | 200,109,571 | (4) | | $ | 96,783,817 | | | $ | 128,432,380 | (4) | | $ | 55,833,909 | | | $ | 75,848,430 | (4) |
| | | | | | | | | | | | | | | | | | | | | | | | | | | | | | |
127
| | |
| | |
| Statements of Changes in Net Assets | �� | |
| | | | | | | | | | | | | | | | | | | | | | | | |
| | | | | | | | | | |
| | | Small-Cap
Core Fund | | | Small-Cap
Growth Fund | | | Global Low Volatility
Equity Fund | |
| | | Year Ended
August 31,
2019 | | | Year Ended
August 31,
2018 | | | Year Ended
August 31,
2019 | | | Year Ended
August 31,
2018 | | | Year Ended
August 31,
2019 | | | Year Ended
August 31,
2018 | |
Change in net assets resulting from: | | | | | | | | | | | | | | | | | | | | | | | | |
| | | | | | |
Operations: | | | | | | | | | | | | | | | | | | | | | | | | |
Net investment income (loss) | | $ | 36,285 | | | $ | 17,884 | | | $ | (450,978) | | | $ | (478,741 | ) | | $ | 860,280 | | | $ | 910,381 | |
Net realized gain (loss) on investments | | | (947,478 | ) | | | 2,368,080 | | | | 1,931,571 | | | | 20,263,486 | | | | 1,037,717 | | | | 5,421,320 | |
Net change in unrealized appreciation/depreciation on investments | | | (3,431,880 | ) | | | 1,740,394 | | | | (25,089,308 | ) | | | 19,507,410 | | | | (1,041,799 | ) | | | (1,869,925 | ) |
| | | | | | | | | | | | | | | | | | | | | | | | |
Change in net assets resulting from operations | | | (4,343,073 | ) | | | 4,126,358 | | | | (23,608,715 | ) | | | 39,292,155 | | | | 856,198 | | | | 4,461,776 | |
| | | | | | |
Distributions to shareholders: | | | | | | | | | | | | | | | | | | | | | | | | |
Advisor class of shares | | | (223,543 | ) | | | (170,343 | )(1) | | | (6,575,826 | ) | | | (6,213,359 | )(1) | | | (54,278 | ) | | | (40,891 | )(1) |
Institutional class of shares | | | (1,725,977 | ) | | | (1,106,052 | )(1) | | | (11,821,590 | ) | | | (8,546,401 | )(1) | | | (5,908,175 | ) | | | (1,821,652 | )(1) |
Retirement classR-6 of shares | | | — | | | | — | | | | — | | | | — | | | | — | | | | — | |
Class F-3 of shares | | | — | | | | — | | | | — | | | | — | | | | — | | | | — | |
| | | | | | | | | | | | | | | | | | | | | | | | |
Change in net assets resulting from distributions to shareholders | | | (1,949,520 | ) | | | (1,276,395 | ) | | | (18,397,416 | ) | | | (14,759,760 | ) | | | (5,962,453 | ) | | | (1,862,543 | ) |
| | | | | | |
Capital stock transactions: | | | | | | | | | | | | | | | | | | | | | | | | |
Proceeds from sale of shares | | | 4,593,694 | | | | 5,456,508 | | | | 21,977,695 | | | | 22,016,727 | | | | 8,165,404 | | | | 783,044 | |
Net asset value of shares issued to shareholders in payment of distributions declared | | | 1,709,986 | | | | 1,176,708 | | | | 18,153,178 | | | | 14,542,209 | | | | 5,947,142 | | | | 1,464,201 | |
Cost of shares redeemed | | | (10,469,665 | ) | | | (4,748,644 | ) | | | (51,603,896 | ) | | | (47,004,023 | ) | | | (4,555,760 | ) | | | (23,520,826 | ) |
Redemption fees | | | — | | | | — | | | | — | | | | — | | | | 4 | | | | — | |
| | | | | | | | | | | | | | | | | | | | | | | | |
Change in net assets resulting from capital stock transactions | | | (4,165,985 | ) | | | 1,884,572 | | | | (11,473,023 | ) | | | (10,445,087 | ) | | | 9,556,790 | | | | (21,273,581 | ) |
| | | | | | | | | | | | | | | | | | | | | | | | |
Change in net assets | | | (10,458,578 | ) | | | 4,734,535 | | | | (53,479,154 | ) | | | 14,087,308 | | | | 4,450,535 | | | | (18,674,348 | ) |
| | | | | | |
Net assets: | | | | | | | | | | | | | | | | | | | | | | | | |
Beginning of period | | | 24,395,513 | | | | 19,660,978 | | | | 153,083,138 | | | | 138,995,830 | | | | 30,543,835 | | | | 49,218,183 | |
| | | | | | | | | | | | | | | | | | | | | | | | |
End of period | | $ | 13,936,935 | | | $ | 24,395,513 | (2) | | $ | 99,603,984 | | | $ | 153,083,138 | (2) | | $ | 34,994,370 | | | $ | 30,543,835 | (2) |
| | | | | | | | | | | | | | | | | | | | | | | | |
| (1) | The following information was previously reported in the August 31, 2018 financial statements. The distribution information for the year ended August 31, 2018 presented on the Statements of Changes in Net Assets above is presented for comparative purposes to the August 31, 2019 financial statements, which conform to the SEC Final Rule on Disclosure Update and Simplification which was effective November 5, 2018. Distributions to shareholders from net investment income and net realized gain on investments for the year ended August 31, 2018, as previously presented were as follows: |
| | | | | | | | | | | | | | | | | | | | | | | | | | | | |
| | | | | | | | | | | | | | | | | | | | | | |
| | | Small-Cap
Core Fund | | | Small-Cap
Growth Fund | | | Global Low
Volatility
Equity Fund | | | Disciplined
International
Equity Fund | | | Pyrford International
Stock Fund | | | LGM Emerging
Markets Equity Fund | | | Alternative
Strategies Fund | |
Distributions to shareholders from net investment income: | | | | | | | | | | | | | | | | | | | | | | | | | | | | |
Advisor class of shares | | $ | — | | | $ | — | | | $ | (29,505 | ) | | $ | (3,470 | ) | | $ | — | | | $ | — | | | $ | — | |
Institutional class of shares | | | (11,539 | ) | | | — | | | | (1,337,341 | ) | | | (1,530,653 | ) | | | (15,185,511 | ) | | | (1,245,393 | ) | | | — | |
Retirement classR-6 of shares | | | — | | | | — | | | | — | | | | — | | | | (1,405,577 | ) | | | — | | | | — | |
Class F-3 of shares | | | — | | | | — | | | | — | | | | — | | | | (219,446 | ) | | | — | | | | — | |
| | | | | | | |
Distributions to shareholders from net realized gain on investments: | | | | | | | | | | | | | | | | | | | | | | | | | | | | |
Advisor class of shares | | | (170,343 | ) | | | (6,213,359 | ) | | | (11,386 | ) | | | — | | | | — | | | | — | | | | (6,924 | ) |
Institutional class of shares | | | (1,094,513 | ) | | | (8,546,401 | ) | | | (484,311 | ) | | | — | | | | — | | | | — | | | | (4,470,070 | ) |
| | | | | | | |
Distributions to shareholders from return of capital: | | | | | | | | | | | | | | | | | | | | | | | | | | | | |
Advisor class of shares | | | — | | | | — | | | | — | | | | — | | | | — | | | | — | | | | (687 | ) |
Institutional class of shares | | | — | | | | — | | | | — | | | | — | | | | — | | | | — | | | | (708,240 | ) |
| (2) | The following information was previously reported in the August 31, 2018 financial statements. Undistributed net investment income included in net assets at end of period for the year ended August 31, 2018 were as follows: |
| | | | | | | | | | | | |
| | | | | | | | | | | | |
Small-Cap Core Fund | | Small-Cap
Growth Fund | | Global Low Volatility
Equity Fund | | Disciplined
International
Equity Fund | | Pyrford International
Stock Fund | | LGM Emerging
Markets Equity Fund | | Alternative
Strategies Fund |
$ 8,280 | | $ — | | $ 457,212 | | $ 1,261,618 | | $ 15,265,819 | | $ 1,986,904 | | $ (999,239) |
(See Notes which are an integral part of the Financial Statements)
128
| | | | | | | | | | | | | | | | | | | | | | | | | | | | | | |
| | | | | | | | | | |
Disciplined International
Equity Fund | | | Pyrford International
Stock Fund | | | LGM Emerging Markets
Equity Fund | | | Alternative
Strategies Fund | |
Year Ended
August 31,
2019 | | | Year Ended
August 31,
2018 | | | Year Ended
August 31,
2019 | | | Year Ended
August 31,
2018 | | | Year Ended
August 31,
2019 | | | Year Ended
August 31,
2018 | | | Year Ended
August 31,
2019 | | | Year Ended
August 31,
2018 | |
| | | | | | | | | | | | | | | | | | | | | | | | | | | | | | |
| | | | | | | |
| | | | | | | | | | | | | | | | | | | | | | | | | | | | | | |
| $ | 2,268,048 | | | $ | 1,788,262 | | | $ | 17,811,533 | | | $ | 17,718,541 | | | $ | 3,948,730 | | | $ | 2,321,510 | | | $ | 239,134 | | | $ | (343,138 | ) |
| | (3,342,402 | ) | | | 4,596,949 | | | | (1,140,950 | ) | | | (3,196,252 | ) | | | 1,293,783 | | | | 10,901,774 | | | | (1,342,140 | ) | | | (584,715 | ) |
| | | | | | | |
| | (4,175,960 | ) | | | (6,394,997 | ) | | | (16,291,181 | ) | | | (59,981 | ) | | | (14,443,017 | ) | | | (13,442,920 | ) | | | (2,467,235 | ) | | | (1,485,702 | ) |
| | | | | | | | | | | | | | | | | | | | | | | | | | | | | | |
| | | | | | | |
| | (5,250,314 | ) | | | (9,786 | ) | | | 379,402 | | | | 14,462,308 | | | | (9,200,504 | ) | | | (219,636 | ) | | | (3,570,241 | ) | | | (2,413,555 | ) |
| | | | | | | |
| | | | | | | | | | | | | | | | | | | | | | | | | | | | | | |
| | (2,852 | ) | | | (3,470 | )(1) | | | (142,355 | ) | | | — | | | | (177,483 | ) | | | — | | | | — | | | | (7,611 | )(1) |
| | (1,525,583 | ) | | | (1,530,653 | )(1) | | | (12,873,242 | ) | | | (15,185,511 | )(1) | | | (8,498,978 | ) | | | (1,245,393 | )(1) | | | — | | | | (5,178,310 | )(1) |
| | — | | | | — | | | | (4,754,416 | ) | | | (1,405,577 | )(1) | | | — | | | | — | | | | — | | | | — | |
| | — | | | | — | | | | (1,250 | ) | | | (219,446 | )(1) | | | — | | | | — | | | | — | | | | — | |
| | | | | | | | | | | | | | | | | | | | | | | | | | | | | | |
| | | | | | | |
| | (1,528,435 | ) | | | (1,534,123 | ) | | | (17,771,263 | ) | | | (16,810,534 | ) | | | (8,676,461 | ) | | | (1,245,393 | ) | | | — | | | | (5,185,921 | ) |
| | | | | | | |
| | | | | | | | | | | | | | | | | | | | | | | | | | | | | | |
| | 21,711,420 | | | | 18,840,781 | | | | 179,398,812 | | | | 211,980,308 | | | | 184,565,106 | | | | 79,897,479 | | | | 15,071,203 | | | | 17,291,060 | |
| | | | | | | |
| | 1,341,526 | | | | 1,511,020 | | | | 15,571,565 | | | | 13,489,759 | | | | 8,184,014 | | | | 1,128,190 | | | | — | | | | 5,109,458 | |
| | (32,830,709 | ) | | | (13,670,472 | ) | | | (177,474,748 | ) | | | (218,410,088 | ) | | | (90,308,302 | ) | | | (35,100,313 | ) | | | (46,257,211 | ) | | | (37,221,147 | ) |
| | — | | | | 210 | | | | 7,393 | | | | 957 | | | | 1,285 | | | | 711 | | | | — | | | | — | |
| | | | | | | | | | | | | | | | | | | | | | | | | | | | | | |
| | | | | | | |
| | (9,777,763 | ) | | | 6,681,539 | | | | 17,503,022 | | | | 7,060,936 | | | | 102,442,103 | | | | 45,926,067 | | | | (31,186,008 | ) | | | (14,820,629 | ) |
| | | | | | | | | | | | | | | | | | | | | | | | | | | | | | |
| | (16,556,512 | ) | | | 5,137,630 | | | | 111,161 | | | | 4,712,710 | | | | 84,565,138 | | | | 44,461,038 | | | | (34,756,249 | ) | | | (22,420,105 | ) |
| | | | | | | |
| | | | | | | | | | | | | | | | | | | | | | | | | | | | | | |
| | 77,525,672 | | | | 72,388,042 | | | | 654,452,295 | | | | 649,739,585 | | | | 206,817,849 | | | | 162,356,811 | | | | 73,320,076 | | | | 95,740,181 | |
| | | | | | | | | | | | | | | | | | | | | | | | | | | | | | |
| $ | 60,969,160 | | | $ | 77,525,672 | (2) | | $ | 654,563,456 | | | $ | 654,452,295 | (2) | | $ | 291,382,987 | | | $ | 206,817,849 | (2) | | $ | 38,563,827 | | | $ | 73,320,076 | (2) |
| | | | | | | | | | | | | | | | | | | | | | | | | | | | | | |
129
| | |
| | |
| Statements of Changes in Net Assets | | |
| | | | | | | | | | | | | | | | | | | | | | | | |
| | | | | | | | | | |
| | | Global Long/Short
Equity Fund | | | Ultra Short
Tax-Free Fund | | | Short
Tax-Free Fund | |
| | | Year Ended
August 31,
2019 | | | Year Ended
August 31,
2018 | | | Year Ended
August 31,
2019 | | | Year Ended
August 31,
2018 | | | Year Ended
August 31,
2019 | | | Year Ended
August 31,
2018 | |
Change in net assets resulting from: | | | | | | | | | | | | | | | | | | | | | | | | |
| | | | | | |
Operations: | | | | | | | | | | | | | | | | | | | | | | | | |
Net investment income | | $ | 37,250 | | | $ | 33,591 | | | $ | 9,617,390 | | | $ | 7,993,960 | | | $ | 3,194,229 | | | $ | 2,930,092 | |
Net realized gain (loss) on investments | | | (2,849 | ) | | | 51,678 | | | | 77,396 | | | | 107,385 | | | | 33,823 | | | | 35,751 | |
Net change in unrealized appreciation/depreciation on investments | | | (902,395 | ) | | | (47,838 | ) | | | 1,187,090 | | | | (530,035 | ) | | | 2,289,929 | | | | (1,518,041 | ) |
| | | | | | | | | | | | | | | | | | | | | | | | |
Change in net assets resulting from operations | | | (867,994 | ) | | | 37,431 | | | | 10,881,876 | | | | 7,571,310 | | | | 5,517,981 | | | | 1,447,802 | |
| | | | | | |
Distributions to shareholders: | | | | | | | | | | | | | | | | | | | | | | | | |
Investor class of shares | | | — | | | | — | | | | — | | | | — | | | | — | | | | — | |
Advisor class of shares | | | (9,220 | ) | | | (26,598 | )(1) | | | (287,653 | ) | | | (346,173 | )(1) | | | (90,361 | ) | | | (94,769 | )(1) |
Institutional class of shares | | | (90,991 | ) | | | (387,851 | )(1) | | | (9,329,653 | ) | | | (7,963,530 | )(1) | | | (3,103,824 | ) | | | (2,832,847 | )(1) |
| | | | | | | | | | | | | | | | | | | | | | | | |
Change in net assets resulting from distributions to shareholders | | | (100,211 | ) | | | (414,449 | ) | | | (9,617,306 | ) | | | (8,309,703 | ) | | | (3,194,185 | ) | | | (2,927,616 | ) |
| | | | | | |
Capital stock transactions: | | | | | | | | | | | | | | | | | | | | | | | | |
Proceeds from sale of shares | | | 938,436 | | | | 6,276,658 | | | | 455,013,834 | | | | 445,096,133 | | | | 38,924,406 | | | | 51,370,080 | |
Net asset value of shares issued to shareholders in payment of distributions declared | | | 75,466 | | | | 319,024 | | | | 5,246,595 | | | | 3,582,390 | | | | 1,039,378 | | | | 942,829 | |
Cost of shares redeemed | | | (7,381,787 | ) | | | (5,967,606 | ) | | | (503,271,381 | ) | | | (508,223,943 | ) | | | (71,015,523 | ) | | | (44,929,515 | ) |
Redemption fees | | | 25 | | | | 1,407 | | | | — | | | | — | | | | — | | | | — | |
| | | | | | | | | | | | | | | | | | | | | | | | |
Change in net assets resulting from capital stock transactions | | | (6,367,860 | ) | | | 629,483 | | | | (43,010,952 | ) | | | (59,545,420 | ) | | | (31,051,739 | ) | | | 7,383,394 | |
| | | | | | | | | | | | | | | | | | | | | | | | |
Change in net assets | | | (7,336,065 | ) | | | 252,465 | | | | (41,746,382 | ) | | | (60,283,813 | ) | | | (28,727,943 | ) | | | 5,903,580 | |
| | | | | | |
Net assets: | | | | | | | | | | | | | | | | | | | | | | | | |
Beginning of period | | | 9,949,535 | | | | 9,697,070 | | | | 600,103,477 | | | | 660,387,290 | | | | 188,523,996 | | | | 182,620,416 | |
| | | | | | | | | | | | | | | | | | | | | | | | |
End of period | | $ | 2,613,470 | | | $ | 9,949,535 | (2) | | $ | 558,357,095 | | | $ | 600,103,477 | (2) | | $ | 159,796,053 | | | $ | 188,523,996 | (2) |
| | | | | | | | | | | | | | | | | | | | | | | | |
| (1) | The following information was previously reported in the August 31, 2018 financial statements. The distribution information for the year ended August 31, 2018 presented on the Statements of Changes in Net Assets above is presented for comparative purposes to the August 31, 2019 financial statements, which conform to the SEC Final Rule on Disclosure Update and Simplification which was effective November 5, 2018. Distributions to shareholders from net investment income and net realized gain on investments for the year ended August 31, 2018, as previously presented were as follows: |
| | | | | | | | | | | | | | | | | | | | | | | | | | | | |
| | | | | | | | | | | | | | | | | | | | | | |
| | | Global
Long/Short
Equity Fund | | | Ultra Short
Tax-Free Fund | | | Short Tax-
Free Fund | | | Short-Term
Income Fund | | | Intermediate
Tax-Free Fund | | | Strategic
Income Fund | | | TCH Corporate
Income Fund | |
Distributions to shareholders from net investment income: | | | | | | | | | | | | | | | | | | | | | | | | | | | | |
Investor class of shares | | $ | — | | | $ | — | | | $ | — | | | $ | — | | | $ | (24,188,815 | ) | | $ | (2,911,007 | ) | | $ | (3,505,065 | ) |
Advisor class of shares | | | (441 | ) | | | (328,441 | ) | | | (94,769 | ) | | | (552,617 | ) | | | (326,765 | ) | | | (702,151 | ) | | | (34,065 | ) |
Institutional class of shares | | | (28,606 | ) | | | (7,666,730 | ) | | | (2,832,847 | ) | | | (4,511,766 | ) | | | (21,349,941 | ) | | | (733,595 | ) | | | (4,433,400 | ) |
| | | | | | | |
Distributions to shareholders from net realized gain on investments: | | | | | | | | | | | | | | | | | | | | | | | | | | | | |
Investor class of shares | | | — | | | | — | | | | — | | | | — | | | | (109,132 | ) | | | — | | | | (142,642 | ) |
Advisor class of shares | | | (26,157 | ) | | | (17,732 | ) | | | — | | | | — | | | | (1,409 | ) | | | — | | | | (1,102 | ) |
Institutional class of shares | | | (359,245 | ) | | | (296,800 | ) | | | — | | | | — | | | | (75,420 | ) | | | — | | | | (162,178 | ) |
| (2) | The following information was previously reported in the August 31, 2018 financial statements. Undistributed net investment income included in net assets at end of period for the year ended August 31, 2018 were as follows: |
| | | | | | | | | | | | |
| | | | | | | | | | | | |
Global Long/Short
Equity Fund | | Ultra Short
Tax-Free Fund | | ShortTax- Free Fund | | Short-Term
Income Fund | | Intermediate
Tax-Free Fund | | Strategic Income Fund | | TCH Corporate
Income Fund |
| $ 44,180 | | $ (19,656) | | $ 2,011 | | $ 5,029 | | $ (293) | | $ (15,832) | | $ 1,244 |
(See Notes which are an integral part of the Financial Statements)
130
| | | | | | | | | | | | | | | | | | | | | | | | | | | | | | |
| | | | | | | | | | |
Short-Term
Income Fund | | | Intermediate
Tax-Free Fund | | | Strategic
Income Fund | | | TCH Corporate
Income Fund | |
Year Ended
August 31,
2019 | | | Year Ended
August 31,
2018 | | | Year Ended
August 31,
2019 | | | Year Ended
August 31,
2018 | | | Year Ended
August 31,
2019 | | | Year Ended
August 31,
2018 | | | Year Ended
August 31,
2019 | | | Year Ended
August 31,
2018 | |
| | | | | | | | | | | | | | | | | | | | | | | | | | | | | | |
| | | | | | | |
| | | | | | | | | | | | | | | | | | | | | | | | | | | | | | |
| $ | 6,317,075 | | | $ | 4,986,366 | | | $ | 51,208,942 | | | $ | 45,840,572 | | | $ | 3,548,002 | | | $ | 4,092,855 | | | $ | 10,457,073 | | | $ | 7,976,472 | |
| | (60,896 | ) | | | (257,306 | ) | | | (4,368,827 | ) | | | 1,936,751 | | | | (844,954 | ) | | | 807,459 | | | | (1,423,451 | ) | | | 888,736 | |
| | | | | | | |
| | 5,247,967 | | | | (2,814,462 | ) | | | 80,362,929 | | | | (37,308,698 | ) | | | 3,982,634 | | | | (4,311,530 | ) | | | 23,115,389 | | | | (8,512,340 | ) |
| | | | | | | | | | | | | | | | | | | | | | | | | | | | | | |
| | | | | | | |
| | 11,504,146 | | | | 1,914,598 | | | | 127,203,044 | | | | 10,468,625 | | | | 6,685,682 | | | | 588,784 | | | | 32,149,011 | | | | 352,868 | |
| | | | | | | |
| | | | | | | | | | | | | | | | | | | | | | | | | | | | | | |
| | — | | | | — | | | | (18,177,993 | ) | | | (24,297,947 | )(1) | | | (2,623,768 | ) | | | (2,911,007 | )(1) | | | (3,608,172 | ) | | | (3,647,707 | )(1) |
| | (572,105 | ) | | | (552,617 | )(1) | | | (224,682 | ) | | | (328,174 | )(1) | | | (588,494 | ) | | | (702,151 | )(1) | | | (141,929 | ) | | | (35,167 | )(1) |
| | (5,821,595 | ) | | | (4,511,766 | )(1) | | | (33,427,811 | ) | | | (21,425,361 | )(1) | | | (501,610 | ) | | | (733,595 | )(1) | | | (7,573,720 | ) | | | (4,595,578 | )(1) |
| | | | | | | | | | | | | | | | | | | | | | | | | | | | | | |
| | | | | | | |
| | (6,393,700 | ) | | | (5,064,383 | ) | | | (51,830,486 | ) | | | (46,051,482 | ) | | | (3,713,872 | ) | | | (4,346,753 | ) | | | (11,323,821 | ) | | | (8,278,452 | ) |
| | | | | | | |
| | | | | | | | | | | | | | | | | | | | | | | | | | | | | | |
| | 113,830,655 | | | | 135,318,169 | | | | 934,039,983 | | | | 602,268,382 | | | | 2,591,998 | | | | 3,650,450 | | | | 166,374,912 | | | | 50,384,104 | |
| | | | | | | |
| | 3,753,375 | | | | 2,938,785 | | | | 40,306,879 | | | | 36,968,906 | | | | 3,529,210 | | | | 4,064,138 | | | | 7,341,969 | | | | 5,111,900 | |
| | (104,426,395 | ) | | | (137,617,032 | ) | | | (911,414,361 | ) | | | (442,459,403 | ) | | | (16,904,030 | ) | | | (31,322,162 | ) | | | (94,036,984 | ) | | | (59,209,589 | ) |
| | — | | | | — | | | | 10 | | | | — | | | | — | | | | — | | | | — | | | | — | |
| | | | | | | | | | | | | | | | | | | | | | | | | | | | | | |
| | | | | | | |
| | 13,157,635 | | | | 639,922 | | | | 62,932,511 | | | | 196,777,885 | | | | (10,782,822 | ) | | | (23,607,574 | ) | | | 79,679,897 | | | | (3,713,585 | ) |
| | | | | | | | | | | | | | | | | | | | | | | | | | | | | | |
| | 18,268,081 | | | | (2,509,863 | ) | | | 138,305,069 | | | | 161,195,028 | | | | (7,811,012 | ) | | | (27,365,543 | ) | | | 100,505,087 | | | | (11,639,169 | ) |
| | | | | | | |
| | | | | | | | | | | | | | | | | | | | | | | | | | | | | | |
| | 240,079,245 | | | | 242,589,108 | | | | 1,779,358,783 | | | | 1,618,163,755 | | | | 86,026,944 | | | | 113,392,487 | | | | 244,783,060 | | | | 256,422,229 | |
| | | | | | | | | | | | | | | | | | | | | | | | | | | | | | |
| $ | 258,347,326 | | | $ | 240,079,245 | (2) | | $ | 1,917,663,852 | | | $ | 1,779,358,783 | (2) | | $ | 78,215,932 | | | $ | 86,026,944 | (2) | | $ | 345,288,147 | | | $ | 244,783,060 | (2) |
| | | | | | | | | | | | | | | | | | | | | | | | | | | | | | |
131
| | |
| | |
| Statements of Changes in Net Assets | | |
| | | | | | | | | | | | | | | | | | | | | | | | |
| | | | | | | | | | |
| | | TCH Core Plus
Bond Fund | | | High Yield
Bond Fund | | | Government Money
Market Fund | |
| | | Year Ended
August 31,
2019 | | | Year Ended
August 31,
2018 | | | Year Ended
August 31,
2019 | | | Year Ended
August 31,
2018 | | | Year Ended
August 31,
2019 | | | Year Ended
August 31,
2018 | |
Change in net assets resulting from: | | | | | | | | | | | | | | | | | | | | | | | | |
| | | | | | |
Operations: | | | | | | | | | | | | | | | | | | | | | | | | |
Net investment income | | $ | 34,323,060 | | | $ | 30,966,093 | | | $ | 583,938 | | | $ | 658,231 | | | $ | 63,208,008 | | | $ | 40,597,171 | |
Net realized gain (loss) on investments | | | (1,998,213 | ) | | | (4,328,218 | ) | | | (33,062 | ) | | | 120,095 | | | | 4,655 | | | | 5,012 | |
Net change in unrealized appreciation/depreciation on investments | | | 50,833,044 | | | | (29,057,856 | ) | | | (3,178 | ) | | | (571,851 | ) | | | — | | | | — | |
| | | | | | | | | | | | | | | | | | | | | | | | |
Change in net assets resulting from operations | | | 83,157,891 | | | | (2,419,981 | ) | | | 547,698 | | | | 206,475 | | | | 63,212,663 | | | | 40,602,183 | |
| | | | | | |
Distributions to shareholders: | | | | | | | | | | | | | | | | | | | | | | | | |
Investor class of shares | | | (2,203,494 | ) | | | (1,900,839 | )(1) | | | — | | | | — | | | | (12,256,532 | ) | | | (7,873,018 | )(1) |
Advisor class of shares | | | (102,886 | ) | | | (93,773 | )(1) | | | (44,387 | ) | | | (47,907 | )(1) | | | — | | | | — | |
Institutional/Premier class of shares | | | (32,251,533 | ) | | | (30,314,840 | )(1) | | | (539,551 | ) | | | (610,733 | )(1) | | | (50,956,131 | ) | | | (32,729,165 | )(1) |
| | | | | | | | | | | | | | | | | | | | | | | | |
Change in net assets resulting from distributions to shareholders | | | (34,557,913 | ) | | | (32,309,452 | ) | | | (583,938 | ) | | | (658,640 | ) | | | (63,212,663 | ) | | | (40,602,183 | ) |
| | | | | | |
Capital stock transactions: | | | | | | | | | | | | | | | | | | | | | | | | |
Proceeds from sale of shares | | | 264,740,954 | | | | 239,674,446 | | | | 1,031,125 | | | | 1,065,544 | | | | 16,062,057,054 | | | | 19,536,951,159 | |
Net asset value of shares issued to shareholders in payment of distributions declared | | | 31,159,017 | | | | 29,161,657 | | | | 551,976 | | | | 583,966 | | | | 8,714,362 | | | | 5,880,770 | |
Cost of shares redeemed | | | (366,234,660 | ) | | | (235,589,606 | ) | | | (3,622,572 | ) | | | (3,185,086 | ) | | | (16,270,006,965 | ) | | | (19,237,385,211 | ) |
| | | | | | | | | | | | | | | | | | | | | | | | |
Change in net assets resulting from capital stock transactions | | | (70,334,689 | ) | | | 33,246,497 | | | | (2,039,471 | ) | | | (1,535,576 | ) | | | (199,235,549 | ) | | | 305,446,718 | |
| | | | | | | | | | | | | | | | | | | | | | | | |
Change in net assets | | | (21,734,711 | ) | | | (1,482,936 | ) | | | (2,075,711 | ) | | | (1,987,741 | ) | | | (199,235,549 | ) | | | 305,446,718 | |
| | | | | | |
Net assets: | | | | | | | | | | | | | | | | | | | | | | | | |
Beginning of period | | | 1,045,851,352 | | | | 1,047,334,288 | | | | 11,325,608 | | | | 13,313,349 | | | | 3,389,050,092 | | | | 3,083,603,374 | |
| | | | | | | | | | | | | | | | | | | | | | | | |
End of period | | $ | 1,024,116,641 | | | $ | 1,045,851,352 | (2) | | $ | 9,249,897 | | | $ | 11,325,608 | (2) | | $ | 3,189,814,543 | | | $ | 3,389,050,092 | (2) |
| | | | | | | | | | | | | | | | | | | | | | | | |
| (1) | The following information was previously reported in the August 31, 2018 financial statements. The distribution information for the year ended August 31, 2018 presented on the Statements of Changes in Net Assets above is presented for comparative purposes to the August 31, 2019 financial statements, which conform to the SEC Final Rule on Disclosure Update and Simplification which was effective November 5, 2018. Distributions to shareholders from net investment income and net realized gain on investments for the year ended August 31, 2018, as previously presented were as follows: |
| | | | | | | | | | | | | | | | | | | | | | | | |
| | | | | | | | | | | | | | | | | | | |
| | | TCH Core Plus
Bond Fund | | | High Yield
Bond Fund | | | Government
Money
Market Fund | | | Tax-Free
Money
Market Fund | | | Prime Money
Market Fund | | | Institutional Prime
Money Market Fund | |
Distributions to shareholders from net investment income: | | | | | | | | | | | | | | | | | | | | | | | | |
Investor class of shares | | $ | (1,839,668 | ) | | $ | — | | | $ | (7,871,988 | ) | | $ | (698,806 | ) | | $ | (2,562,944 | ) | | $ | (20,183 | ) |
Advisor class of shares | | | (90,550 | ) | | | (47,907 | ) | | | — | | | | — | | | | — | | | | — | |
Institutional/Premier class of shares | | | (29,417,453 | ) | | | (610,733 | ) | | | (32,725,383 | ) | | | (2,975,703 | ) | | | (3,364,758 | ) | | | (6,805,848 | ) |
| | | | | | |
Distributions to shareholders from net realized gain on investments: | | | | | | | | | | | | | | | | | | | | | | | | |
Investor class of shares | | | (61,171 | ) | | | — | | | | (1,030 | ) | | | — | | | | (1,052 | ) | | | (8 | ) |
Advisor class of shares | | | (3,223 | ) | | | — | | | | — | | | | — | | | | — | | | | — | |
Institutional/Premier class of shares | | | (897,387 | ) | | | — | | | | (3,782 | ) | | | — | | | | (1,084 | ) | | | (2,285 | ) |
| (2) | The following information was previously reported in the August 31, 2018 financial statements. Undistributed net investment income included in net assets at end of period for the year ended August 31, 2018 were as follows: |
| | | | | | | | | | |
| | | | | | | | | | |
TCH Core Plus Bond Fund | | High Yield Bond Fund | | Government Money
Market Fund | | Tax-Free Money
Market Fund | | Prime Money
Market Fund | | Institutional Prime
Money Market Fund |
| $ (16,047) | | $ (3,660) | | $ (341) | | $ (24,201) | | $ (23,967) | | $ 16,438 |
(See Notes which are an integral part of the Financial Statements)
132
| | | | | | | | | | | | | | | | | | | | | | | | | | | | | | |
| | | | | | | | | | |
Tax-Free Money
Market Fund | | | Prime Money
Market Fund | | | Institutional Prime
Money Market Fund | | | | |
Year Ended
August 31,
2019 | | | Year Ended
August 31,
2018 | | | Year Ended
August 31,
2019 | | | Year Ended
August 31,
2018 | | | Year Ended
August 31,
2019 | | | Year Ended
August 31,
2018 | | | | | | | |
| | | | | | | | | | | | | | | | | | | | | | | | | | | | | | |
| | | | | | | |
| | | | | | | | | | | | | | | | | | | | | | | | | | | | | | |
| $ | 5,921,671 | | | $ | 3,674,509 | | | $ | 10,005,716 | | | $ | 5,927,686 | | | $ | 12,721,627 | | | $ | 6,826,042 | | | | | | | | | |
| | 19,607 | | | | — | | | | 536 | | | | 2,160 | | | | 1,072 | | | | 2,235 | | | | | | | | | |
| | | | | | | |
| | — | | | | — | | | | — | | | | — | | | | 2,973 | | | | 14,697 | | | | | | | | | |
| | | | | | | | | | | | | | | | | | | | | | | | | | | | | | |
| | | | | | | |
| | 5,941,278 | | | | 3,674,509 | | | | 10,006,252 | | | | 5,929,846 | | | | 12,725,672 | | | | 6,842,974 | | | | | | | | | |
| | | | | | | |
| | | | | | | | | | | | | | | | | | | | | | | | | | | | | | |
| | (919,719 | ) | | | (698,806 | )(1) | | | (4,275,427 | ) | | | (2,563,996 | )(1) | | | (42,124 | ) | | | (20,191 | )(1) | | | | | | | | |
| | — | | | | — | | | | — | | | | — | | | | — | | | | — | | | | | | | | | |
| | (5,021,273 | ) | | | (2,975,703 | )(1) | | | (5,730,825 | ) | | | (3,365,842 | )(1) | | | (12,680,593 | ) | | | (6,808,133 | )(1) | | | | | | | | |
| | | | | | | | | | | | | | | | | | | | | | | | | | | | | | |
| | | | | | | |
| | (5,940,992 | ) | | | (3,674,509 | ) | | | (10,006,252 | ) | | | (5,929,838 | ) | | | (12,722,717 | ) | | | (6,828,324 | ) | | | | | | | | |
| | | | | | | |
| | | | | | | | | | | | | | | | | | | | | | | | | | | | | | |
| | 828,334,151 | | | | 760,794,015 | | | | 775,417,901 | | | | 810,980,414 | | | | 2,739,102,472 | | | | 1,224,837,730 | | | | | | | | | |
| | | | | | | |
| | 919,257 | | | | 574,205 | | | | 4,030,461 | | | | 2,146,096 | | | | 4,242,411 | | | | 1,189,143 | | | | | | | | | |
| | (802,490,834 | ) | | | (694,856,500 | ) | | | (744,417,480 | ) | | | (720,222,805 | ) | | | (2,663,727,009 | ) | | | (1,145,851,073 | ) | | | | | | | | |
| | | | | | | | | | | | | | | | | | | | | | | | | | | | | | |
| | | | | | | |
| | 26,762,574 | | | | 66,511,720 | | | | 35,030,882 | | | | 92,903,705 | | | | 79,617,874 | | | | 80,175,800 | | | | | | | | | |
| | | | | | | | | | | | | | | | | | | | | | | | | | | | | | |
| | 26,762,860 | | | | 66,511,720 | | | | 35,030,882 | | | | 92,903,713 | | | | 79,620,829 | | | | 80,190,450 | | | | | | | | | |
| | | | | | | |
| | | | | | | | | | | | | | | | | | | | | | | | | | | | | | |
| | 381,313,133 | | | | 314,801,413 | | | | 461,492,480 | | | | 368,588,767 | | | | 481,814,410 | | | | 401,623,960 | | | | | | | | | |
| | | | | | | | | | | | | | | | | | | | | | | | | | | | | | |
| $ | 408,075,993 | | | $ | 381,313,133 | (2) | | $ | 496,523,362 | | | $ | 461,492,480 | (2) | | $ | 561,435,239 | | | $ | 481,814,410 | (2) | | | | | | | | |
| | | | | | | | | | | | | | | | | | | | | | | | | | | | | | |
133
| | |
| |
| Financial Highlights—Investor Class of Shares (For a share outstanding throughout each period) |
| | | | | | | | | | | | | | | | | | | | | | | | | | | | | | | | | | | | | | | | | | | | | | | | | | | | | | | | | | | | | | | | | | | | | | |
Period
Ended
August 31, | | Net asset
value,
beginning
of period | | Net
investment
income
(loss) | | Net realized
and unrealized
gain (loss) | | Total from
investment
operations | | Distributions to
shareholders
from net
investment
income | | Distributions to
shareholders from
net realized gain | | Total
distributions | | Net asset
value, end
of period | | Total
return (2)(3) | | Ratios to Average Net Assets (1) | | Net assets,
end of period
(000 omitted) | | Portfolio
turnover
rate (3) |
| | Gross
Expenses | | Net
Expenses (4) | | Net
investment
income (4) |
Large-Cap Growth Fund | | | | | | | | | | | | | | | | | | | | | | | | | | | | | | | | | | | | | | | | | | | | | | | | | | | | | | | | | | | | | |
| 2019 | | | $ | 20.95 | | | | $ | 0.09 | | | | $ | (0.47 | ) | | | $ | (0.38 | ) | | | $ | (0.06 | ) | | | $ | (2.55 | ) | | | $ | (2.61 | ) | | | $ | 17.96 | | | | | (0.62 | )% | | | | 0.84 | % | | | | 0.79 | % | | | | 0.50 | % | | | $ | 58,562 | | | | | 89 | % |
| 2018 | | | | 17.46 | | | | | 0.07 | | | | | 4.42 | | | | | 4.49 | | | | | — | | | | | (1.00 | ) | | | | (1.00 | ) | | | | 20.95 | | | | | 26.78 | | | | | 0.92 | | | | | 0.91 | | | | | 0.28 | | | | | 65,365 | | | | | 57 | |
| 2017 | | | | 15.34 | | | | | 0.06 | | | | | 3.03 | | | | | 3.09 | | | | | (0.07 | ) | | | | (0.90 | ) | | | | (0.97 | ) | | | | 17.46 | | | | | 21.30 | | | | | 1.03 | | | | | 1.00 | | | | | 0.34 | | | | | 74,359 | | | | | 75 | |
| 2016 | | | | 16.26 | | | | | 0.03 | | | | | 1.44 | | | | | 1.47 | | | | | (0.02 | ) | | | | (2.37 | ) | | | | (2.39 | ) | | | | 15.34 | | | | | 9.68 | | | | | 1.13 | | | | | 1.07 | | | | | 0.23 | | | | | 163,712 | | | | | 70 | |
| 2015 | | | | 17.94 | | | | | (0.01 | ) | | | | 0.93 | | | | | 0.92 | | | | | (0.01 | ) | | | | (2.59 | ) | | | | (2.60 | ) | | | | 16.26 | | | | | 5.58 | | | | | 1.23 | | | | | 1.21 | | | | | 0.03 | | | | | 161,918 | | | | | 94 | |
IntermediateTax-Free Fund | | | | | | | | | | | | | | | | | | | | | | | | | | | | | | | | | | | | | | | | | | | | | | | | | | | | | | | | | | | | | |
| 2019 | | | | 11.13 | | | | | 0.31 | | | | | 0.46 | | | | | 0.77 | | | | | (0.30 | ) | | | | — | | | | | (0.30 | ) | | | | 11.60 | | | | | 7.05 | | | | | 0.56 | | | | | 0.55 | | | | | 2.69 | | | | | 528,980 | | | | | 64 | |
| 2018 | | | | 11.37 | | | | | 0.30 | | | | | (0.24 | ) | | | | 0.06 | | | | | (0.30 | ) | | | | (0.00 | ) | | | | (0.30 | ) | | | | 11.13 | | | | | 0.53 | | | | | 0.55 | | | | | 0.55 | | | | | 2.65 | | | | | 870,195 | | | | | 45 | |
| 2017 | | | | 11.61 | | | | | 0.29 | | | | | (0.21 | ) | | | | 0.08 | | | | | (0.29 | ) | | | | (0.03 | ) | | | | (0.32 | ) | | | | 11.37 | | | | | 0.78 | | | | | 0.57 | | | | | 0.55 | | | | | 2.55 | | | | | 975,664 | | | | | 44 | |
| 2016 | | | | 11.26 | | | | | 0.25 | | | | | 0.37 | | | | | 0.62 | | | | | (0.25 | ) | | | | (0.02 | ) | | | | (0.27 | ) | | | | 11.61 | | | | | 5.56 | | | | | 0.57 | | | | | 0.55 | | | | | 2.19 | | | | | 1,241,387 | | | | | 42 | |
| 2015 | | | | 11.25 | | | | | 0.26 | | | | | 0.01 | | | | | 0.27 | | | | | (0.26 | ) | | | | — | | | | | (0.26 | ) | | | | 11.26 | | | | | 2.36 | | | | | 0.57 | | | | | 0.55 | | | | | 2.23 | | | | | 1,250,815 | | | | | 26 | |
Strategic Income Fund | | | | | | | | | | | | | | | | | | | | | | | | | | | | | | | | | | | | | | | | | | | | | | | | | | | | | | | | | | | | | |
| 2019 | | | | 9.08 | | | | | 0.42 | | | | | 0.38 | | | | | 0.80 | | | | | (0.42 | ) | | | | — | | | | | (0.42 | ) | | | | 9.46 | | | | | 9.08 | | | | | 0.96 | | | | | 0.80 | | | | | 4.41 | | | | | 56,576 | | | | | 39 | |
| 2018 | | | | 9.45 | | | | | 0.38 | | | | | (0.37 | ) | | | | 0.04 | | | | | (0.41 | ) | | | | — | | | | | (0.41 | ) | | | | 9.08 | | | | | 0.37 | | | | | 0.91 | | | | | 0.80 | | | | | 4.09 | | | | | 59,724 | | | | | 33 | |
| 2017 | | | | 9.43 | | | | | 0.23 | | | | | 0.08 | | | | | 0.31 | | | | | (0.29 | ) | | | | — | | | | | (0.29 | ) | | | | 9.45 | | | | | 3.32 | | | | | 0.90 | | | | | 0.80 | | | | | 2.46 | | | | | 73,488 | | | | | 65 | |
| 2016 | | | | 9.31 | | | | | 0.21 | | | | | 0.17 | | | | | 0.38 | | | | | (0.26 | ) | | | | — | | | | | (0.26 | ) | | | | 9.43 | | | | | 4.17 | | | | | 0.86 | | | | | 0.80 | | | | | 2.28 | | | | | 85,665 | | | | | 13 | |
| 2015 | | | | 9.36 | | | | | 0.22 | | | | | — | | | | | 0.22 | | | | | (0.27 | ) | | | | — | | | | | (0.27 | ) | | | | 9.31 | | | | | 2.34 | | | | | 0.93 | | | | | 0.80 | | | | | 2.36 | | | | | 94,380 | | | | | 44 | |
TCH Corporate Income Fund | | | | | | | | | | | | | | | | | | | | | | | | | | | | | | | | | | | | | | | | | | | | | | | | | | | | | | | | | | | | | |
| 2019 | | | | 12.79 | | | | | 0.45 | | | | | 0.90 | | | | | 1.35 | | | | | (0.45 | ) | | | | (0.04 | ) | | | | (0.49 | ) | | | | 13.65 | | | | | 10.88 | | | | | 0.67 | | | | | 0.59 | | | | | 3.52 | | | | | 101,125 | | | | | 37 | |
| 2018 | | | | 13.20 | | | | | 0.40 | | | | | (0.39 | ) | | | | 0.01 | | | | | (0.40 | ) | | | | (0.02 | ) | | | | (0.42 | ) | | | | 12.79 | | | | | 0.05 | | | | | 0.63 | | | | | 0.59 | | | | | 3.08 | | | | | 102,523 | | | | | 31 | |
| 2017 | | | | 13.17 | | | | | 0.35 | | | | | 0.14 | | | | | 0.49 | | | | | (0.35 | ) | | | | (0.11 | ) | | | | (0.46 | ) | | | | 13.20 | | | | | 3.86 | | | | | 0.71 | | | | | 0.59 | | | | | 2.70 | | | | | 120,745 | | | | | 44 | |
| 2016 | | | | 12.33 | | | | | 0.45 | | | | | 0.89 | | | | | 1.34 | | | | | (0.45 | ) | | | | (0.05 | ) | | | | (0.50 | ) | | | | 13.17 | | | | | 11.23 | | | | | 0.72 | | | | | 0.59 | | | | | 3.65 | | | | | 82,643 | | | | | 62 | |
| 2015 | | | | 13.09 | | | | | 0.36 | | | | | (0.71 | ) | | | | (0.35 | ) | | | | (0.36 | ) | | | | (0.05 | ) | | | | (0.41 | ) | | | | 12.33 | | | | | (2.73 | ) | | | | 0.70 | | | | | 0.59 | | | | | 2.83 | | | | | 137,987 | | | | | 26 | |
TCH Core Plus Bond Fund | | | | | | | | | | | | | | | | | | | | | | | | | | | | | | | | | | | | | | | | | | | | | | | | | | | | | | | | | | | | | |
| 2019 | | | | 11.41 | | | | | 0.37 | | | | | 0.59 | | | | | 0.96 | | | | | (0.37 | ) | | | | — | | | | | (0.37 | ) | | | | 12.00 | | | | | 8.63 | | | | | 0.58 | | | | | 0.58 | | | | | 3.24 | | | | | 74,970 | | | | | 51 | |
| 2018 | | | | 11.79 | | | | | 0.32 | | | | | (0.37 | ) | | | | (0.05 | ) | | | | (0.32 | ) | | | | (0.01 | ) | | | | (0.33 | ) | | | | 11.41 | | | | | (0.45 | ) | | | | 0.58 | | | | | 0.58 | | | | | 2.70 | | | | | 61,251 | | | | | 45 | |
| 2017 | | | | 11.89 | | | | | 0.24 | | | | | (0.02 | ) | | | | 0.22 | | | | | (0.28 | ) | | | | (0.04 | ) | | | | (0.32 | ) | | | | 11.79 | | | | | 1.91 | | | | | 0.59 | | | | | 0.59 | | | | | 2.37 | | | | | 68,946 | | | | | 34 | |
| 2016 | | | | 11.42 | | | | | 0.34 | | | | | 0.48 | | | | | 0.82 | | | | | (0.35 | ) | | | | (0.00 | ) | | | | (0.35 | ) | | | | 11.89 | | | | | 7.36 | | | | | 0.59 | | | | | 0.59 | | | | | 3.00 | | | | | 508,030 | | | | | 39 | |
| 2015 | | | | 11.95 | | | | | 0.32 | | | | | (0.47 | ) | | | | (0.15 | ) | | | | (0.32 | ) | | | | (0.06 | ) | | | | (0.38 | ) | | | | 11.42 | | | | | (1.28 | ) | | | | 0.58 | | | | | 0.58 | | | | | 2.69 | | | | | 602,588 | | | | | 25 | |
Government Money Market Fund | | | | | | | | | | | | | | | | | | | | | | | | | | | | | | | | | | | | | | | | | | | | | | | | | | | | | | | | |
| 2019 | | | | 1.00 | | | | | 0.02 | | | | | 0.00 | | | | | 0.02 | | | | | (0.02 | ) | | | | (0.00 | ) | | | | (0.02 | ) | | | | 1.00 | | | | | 1.89 | | | | | 0.50 | | | | | 0.45 | | | | | 1.89 | | | | | 805,270 | | | | | — | |
| 2018 | | | | 1.00 | | | | | 0.01 | | | | | 0.00 | | | | | 0.01 | | | | | (0.01 | ) | | | | (0.00 | ) | | | | (0.01 | ) | | | | 1.00 | | | | | 1.05 | | | | | 0.50 | | | | | 0.45 | | | | | 1.03 | | | | | 747,981 | | | | | — | |
| 2017 | | | | 1.00 | | | | | 0.00 | | | | | 0.00 | | | | | 0.00 | | | | | (0.00 | ) | | | | (0.00 | ) | | | | (0.00 | ) | | | | 1.00 | | | | | 0.24 | | | | | 0.50 | | | | | 0.42 | | | | | 0.24 | | | | | 814,242 | | | | | — | |
| 2016 | | | | 1.00 | | | | | 0.00 | | | | | 0.00 | | | | | 0.00 | | | | | (0.00 | ) | | | | (0.00 | ) | | | | (0.00 | ) | | | | 1.00 | | | | | 0.01 | | | | | 0.53 | | | | | 0.29 | | | | | 0.01 | | | | | 268,417 | | | | | — | |
| 2015 | | | | 1.00 | | | | | 0.00 | | | | | 0.00 | | | | | 0.00 | | | | | (0.00 | ) | | | | (0.00 | ) | | | | (0.00 | ) | | | | 1.00 | | | | | 0.01 | | | | | 0.53 | | | | | 0.08 | | | | | 0.01 | | | | | 101,593 | | | | | — | |
Tax-Free Money Market Fund | | | | | | | | | | | | | | | | | | | | | | | | | | | | | | | | | | | | | | | | | | | | | | | | | | | | | | | | | | | | | |
| 2019 | | | | 1.00 | | | | | 0.01 | | | | | 0.00 | | | | | 0.01 | | | | | (0.01 | ) | | | | (0.00 | ) | | | | (0.01 | ) | | | | 1.00 | | | | | 1.20 | | | | | 0.55 | | | | | 0.45 | | | | | 1.20 | | | | | 71,794 | | | | | — | |
| 2018 | | | | 1.00 | | | | | 0.01 | | | | | 0.00 | | | | | 0.01 | | | | | (0.01 | ) | | | | (0.00 | ) | | | | (0.01 | ) | | | | 1.00 | | | | | 0.80 | | | | | 0.56 | | | | | 0.45 | | | | | 0.79 | | | | | 75,889 | | | | | — | |
| 2017 | | | | 1.00 | | | | | 0.00 | | | | | 0.00 | | | | | 0.00 | | | | | (0.00 | ) | | | | (0.00 | ) | | | | (0.00 | ) | | | | 1.00 | | | | | 0.37 | | | | | 0.57 | | | | | 0.45 | | | | | 0.33 | | | | | 76,029 | | | | | — | |
| 2016 | | | | 1.00 | | | | | 0.00 | | | | | 0.00 | | | | | 0.00 | | | | | (0.00 | ) | | | | (0.00 | ) | | | | (0.00 | ) | | | | 1.00 | | | | | 0.06 | | | | | 0.53 | | | | | 0.26 | | | | | 0.03 | | | | | 90,098 | | | | | — | |
| 2015 | | | | 1.00 | | | | | 0.00 | | | | | 0.00 | | | | | 0.00 | | | | | (0.00 | ) | | | | (0.00 | ) | | | | (0.00 | ) | | | | 1.00 | | | | | 0.02 | | | | | 0.53 | | | | | 0.16 | | | | | 0.01 | | | | | 142,052 | | | | | — | |
Prime Money Market Fund | | | | | | | | | | | | | | | | | | | | | | | | | | | | | | | | | | | | | | | | | | | | | | | | | | | | | | | | | | | | | |
| 2019 | | | | 1.00 | | | | | 0.02 | | | | | 0.00 | | | | | 0.02 | | | | | (0.02 | ) | | | | (0.00 | ) | | | | (0.02 | ) | | | | 1.00 | | | | | 2.03 | | | | | 0.51 | | | | | 0.45 | | | | | 2.03 | | | | | 247,742 | | | | | — | |
| 2018 | | | | 1.00 | | | | | 0.01 | | | | | 0.00 | | | | | 0.01 | | | | | (0.01 | ) | | | | (0.00 | ) | | | | (0.01 | ) | | | | 1.00 | | | | | 1.25 | | | | | 0.52 | | | | | 0.45 | | | | | 1.24 | | | | | 193,006 | | | | | — | |
| 2017 | | | | 1.00 | | | | | 0.00 | | | | | 0.00 | | | | | 0.00 | | | | | (0.00 | ) | | | | (0.00 | ) | | | | (0.00 | ) | | | | 1.00 | | | | | 0.42 | | | | | 0.53 | | | | | 0.45 | | | | | 0.36 | | | | | 202,251 | | | | | — | |
| 2016 | | | | 1.00 | | | | | 0.00 | | | | | 0.00 | | | | | 0.00 | | | | | (0.00 | ) | | | | (0.00 | ) | | | | (0.00 | ) | | | | 1.00 | | | | | 0.03 | | | | | 0.45 | | | | | 0.38 | | | | | 0.03 | | | | | 903,864 | | | | | — | |
| 2015 | | | | 1.00 | | | | | 0.00 | | | | | 0.00 | | | | | 0.00 | | | | | (0.00 | ) | | | | (0.00 | ) | | | | (0.00 | ) | | | | 1.00 | | | | | 0.01 | | | | | 0.45 | | | | | 0.19 | | | | | 0.01 | | | | | 1,296,633 | | | | | — | |
(See Notes which are an integral part of the Financial Statements)
134
| | |
| |
| Financial Highlights—Investor Class of Shares (For a share outstanding throughout each period) |
| | | | | | | | | | | | | | | | | | | | | | | | | | | | | | | | | | | | | | | | | | | | | | | | | | | | | | | | | | | | | | | | | | | | | | |
Period
Ended
August 31, | | Net asset
value,
beginning
of period | | Net
investment
income | | Net realized
and unrealized
gain (loss) | | Total from
investment
operations | | Distributions to
shareholders
from net
investment
income | | Distributions to
shareholders from
net realized gain | | Total
distributions | | Net asset
value, end
of period | | Total
return (2)(3) | | Ratios to Average Net Assets (1) | | Net assets,
end of period
(000 omitted) | | Portfolio
turnover
rate (3) |
| | Gross
Expenses | | Net
Expenses (4) | | Net
investment
income (4) |
Institutional Prime Money Market Fund | | | | | | | | | | | | | | | | | | | | | | | | | | | | | | | | | | | | | | | | | | | | | | | | | | | | | | | | |
| 2019 | | | $ | 1.0001 | | | | $ | 0.0204 | | | | $ | 0.0000 | | | | $ | 0.0204 | | | | $ | (0.0204 | ) | | | $ | (0.0000 | ) | | | $ | (0.0204 | ) | | | $ | 1.0001 | | | | | 2.06 | % | | | | 0.52 | % | | | | 0.45 | % | | | | 2.04 | % | | | $ | 1,218 | | | | | — | % |
| 2018 | | | | 1.0001 | | | | | 0.0128 | | | | | 0.0000 | | | | | 0.0128 | | | | | (0.0128 | ) | | | | (0.0000 | ) | | | | (0.0128 | ) | | | | 1.0001 | | | | | 1.29 | | | | | 0.55 | | | | | 0.45 | | | | | 1.31 | | | | | 2,401 | | | | | — | |
| 2017(5) | | | | 1.00 | | | | | 0.0049 | | | | | 0.0001 | | | | | 0.0050 | | | | | (0.0049 | ) | | | | (0.0000 | ) | | | | (0.0049 | ) | | | | 1.0001 | | | | | 0.50 | | | | | 0.55 | | | | | 0.45 | | | | | 0.50 | | | | | 1,421 | | | | | — | |
| 2016(6) | | | | 1.00 | | | | | 0.00 | | | | | 0.00 | | | | | 0.00 | | | | | (0.00 | ) | | | | (0.00 | ) | | | | (0.00 | ) | | | | 1.00 | | | | | 0.03 | | | | | 0.54 | | | | | 0.45 | | | | | 0.14 | | | | | 992 | | | | | — | |
| (1) | Annualized for periods less than one year. |
| (2) | Based on net asset value as of end of period date. |
| (3) | Not annualized for periods less than one year. |
| (4) | The contractual and voluntary expense waivers pursuant to Note 6 of the financial statements are reflected in both the net expense and net investment income ratios. |
| (5) | Effective October 3, 2016, the BMO Institutional Prime Money Market Fund switched the valuation method of its securities from amortized cost to reflecting changes in market values, thus allowing the Fund’s NAV to “float”. In connection with this change, the Fund’s per share NAV is now calculated to four decimals (e.g., $1.0000). |
| (6) | Reflects operations for the period from June 3, 2016 (inception date) to August 31, 2016. |
(See Notes which are an integral part of the Financial Statements)
135
| | |
| |
| Financial Highlights—Advisor Class of Shares (For a share outstanding throughout each period) |
| | | | | | | | | | | | | | | | | | | | | | | | | | | | | | | | | | | | | | | | | | | | | | | | | | | | | | | | | | | | | | | | | | | | | | |
Period
Ended
August 31, | | Net asset
value,
beginning
of period | | Net
investment
income
(loss) | | Net realized
and unrealized
gain (loss) | | Total from
investment
operations | | Distributions to
shareholders
from net
investment
income | | Distributions to
shareholders from
net realized gain | | Total
distributions | | Net asset
value, end
of period | | Total
return (2)(3) | | Ratios to Average Net Assets (1) | | Net assets,
end of period
(000 omitted) | | Portfolio
turnover
rate (3) |
| | Gross
Expenses | | Net
Expenses (4) | | Net
investment
income
(loss) (4) |
Low Volatility Equity Fund | | | | | | | | | | | | | | | | | | | | | | | | | | | | | | | | | | | | | | | | | | | | | | | | | | | | | | | | |
| 2019 | | | $ | 15.72 | | | | $ | 0.22 | | | | $ | 1.43 | | | | $ | 1.65 | | | | $ | (0.22 | ) | | | $ | (1.34 | ) | | | $ | (1.56 | ) | | | $ | 15.81 | | | | | 11.80 | % | | | | 1.03 | % | | | | 0.90 | % | | | | 1.48 | % | | | $ | 29,006 | | | | | 32 | % |
| 2018 | | | | 14.36 | | | | | 0.19 | | | | | 1.76 | | | | | 1.95 | | | | | (0.20 | ) | | | | (0.39 | ) | | | | (0.59 | ) | | | | 15.72 | | | | | 13.96 | | | | | 1.03 | | | | | 0.90 | | | | | 1.25 | | | | | 25,571 | | | | | 43 | |
| 2017 | | | | 13.79 | | | | | 0.20 | | | | | 0.74 | | | | | 0.94 | | | | | (0.20 | ) | | | | (0.17 | ) | | | | (0.37 | ) | | | | 14.36 | | | | | 6.94 | | | | | 1.03 | | | | | 0.90 | | | | | 1.47 | | | | | 31,624 | | | | | 56 | |
| 2016 | | | | 12.81 | | | | | 0.16 | | | | | 1.35 | | | | | 1.51 | | | | | (0.17 | ) | | | | (0.36 | ) | | | | (0.53 | ) | | | | 13.79 | | | | | 12.13 | | | | | 1.05 | | | | | 0.90 | | | | | 1.40 | | | | | 15,064 | | | | | 40 | |
| 2015 | | | | 13.20 | | | | | 0.14 | | | | | 0.55 | | | | | 0.69 | | | | | (0.18 | ) | | | | (0.90 | ) | | | | (1.08 | ) | | | | 12.81 | | | | | 5.22 | | | | | 1.12 | | | | | 0.90 | | | | | 1.12 | | | | | 1,162 | | | | | 47 | |
Dividend Income Fund | | | | | | | | | | | | | | | | | | | | | | | | | | | | | | | | | | | | | | | | | | | | | | | | | | | | | | | | |
| 2019 | | | | 15.46 | | | | | 0.30 | | | | | (0.85 | ) | | | | (0.55 | ) | | | | (0.31 | ) | | | | (0.58 | ) | | | | (0.89 | ) | | | | 14.02 | | | | | (3.51 | ) | | | | 1.02 | | | | | 0.90 | | | | | 2.32 | | | | | 15,365 | | | | | 43 | |
| 2018 | | | | 14.51 | | | | | 0.28 | | | | | 2.67 | | | | | 2.95 | | | | | (0.30 | ) | | | | (1.70 | ) | | | | (2.00 | ) | | | | 15.46 | | | | | 21.90 | | | | | 1.04 | | | | | 0.90 | | | | | 2.07 | | | | | 6,092 | | | | | 39 | |
| 2017(5) | | | | 12.94 | | | | | 0.28 | | | | | 1.61 | | | | | 1.89 | | | | | (0.21 | ) | | | | (0.11 | ) | | | | (0.32 | ) | | | | 14.51 | | | | | 14.80 | | | | | 1.08 | | | | | 0.90 | | | | | 2.06 | | | | | 3,205 | | | | | 43 | |
| 2016 | | | | 12.59 | | | | | 0.30 | | | | | 1.11 | | | | | 1.41 | | | | | (0.30 | ) | | | | (0.76 | ) | | | | (1.06 | ) | | | | 12.94 | | | | | 11.89 | | | | | 1.08 | | | | | 0.90 | | | | | 2.44 | | | | | 78,531 | | | | | 51 | |
| 2015 | | | | 14.29 | | | | | 0.31 | | | | | (0.76 | ) | | | | (0.45 | ) | | | | (0.33 | ) | | | | (0.92 | ) | | | | (1.25 | ) | | | | 12.59 | | | | | (3.63 | ) | | | | 1.05 | | | | | 0.90 | | | | | 2.16 | | | | | 74,254 | | | | | 46 | |
Large-Cap Value Fund | | | | | | | | | | | | | | | | | | | | | | | | | | | | | | | | | | | | | | | | | | | | | | | | | | | | | | | | |
| 2019 | | | | 16.59 | | | | | 0.26 | | | | | (1.46 | ) | | | | (1.20 | ) | | | | (0.27 | ) | | | | (1.40 | ) | | | | (1.67 | ) | | | | 13.72 | | | | | (7.15 | ) | | | | 0.85 | | | | | 0.79 | | | | | 1.78 | | | | | 18,621 | | | | | 67 | |
| 2018 | | | | 15.85 | | | | | 0.16 | | | | | 2.22 | | | | | 2.38 | | | | | (0.19 | ) | | | | (1.45 | ) | | | | (1.64 | ) | | | | 16.59 | | | | | 15.57 | | | | | 0.91 | | | | | 0.89 | | | | | 0.82 | | | | | 22,602 | | | | | 54 | |
| 2017(5) | | | | 14.14 | | | | | 0.08 | | | | | 1.93 | | | | | 2.01 | | | | | (0.18 | ) | | | | (0.12 | ) | | | | (0.30 | ) | | | | 15.85 | | | | | 14.33 | | | | | 1.02 | | | | | 1.00 | | | | | 0.49 | | | | | 25,061 | | | | | 62 | |
| 2016 | | | | 15.23 | | | | | 0.21 | | | | | 0.53 | | | | | 0.74 | | | | | (0.22 | ) | | | | (1.61 | ) | | | | (1.83 | ) | | | | 14.14 | | | | | 5.31 | | | | | 1.10 | | | | | 1.07 | | | | | 1.61 | | | | | 37 | | | | | 60 | |
| 2015 | | | | 17.04 | | | | | 0.13 | | | | | (0.22 | ) | | | | (0.09 | ) | | | | (0.10 | ) | | | | (1.62 | ) | | | | (1.72 | ) | | | | 15.23 | | | | | (0.70 | ) | | | | 1.22 | | | | | 1.21 | | | | | 0.80 | | | | | 28 | | | | | 72 | |
Large-Cap Growth Fund | | | | | | | | | | | | | | | | | | | | | | | | | | | | | | | | | | | | | | | | | | | | | | | | | | | | | | | | |
| 2019 | | | | 20.96 | | | | | 0.09 | | | | | (0.48 | ) | | | | (0.39 | ) | | | | (0.08 | ) | | | | (2.55 | ) | | | | (2.63 | ) | | | | 17.94 | | | | | (0.63 | ) | | | | 0.84 | | | | | 0.79 | | | | | 0.49 | | | | | 712 | | | | | 89 | |
| 2018 | | | | 17.46 | | | | | 0.05 | | | | | 4.45 | | | | | 4.50 | | | | | — | | | | | (1.00 | ) | | | | (1.00 | ) | | | | 20.96 | | | | | 26.84 | | | | | 0.91 | | | | | 0.88 | | | | | 0.32 | | | | | 860 | | | | | 57 | |
| 2017 | | | | 15.34 | | | | | 0.03 | | | | | 3.06 | | | | | 3.09 | | | | | (0.07 | ) | | | | (0.90 | ) | | | | (0.97 | ) | | | | 17.46 | | | | | 21.30 | | | | | 1.03 | | | | | 1.00 | | | | | 0.39 | | | | | 808 | | | | | 75 | |
| 2016 | | | | 16.26 | | | | | 0.02 | | | | | 1.45 | | | | | 1.47 | | | | | (0.02 | ) | | | | (2.37 | ) | | | | (2.39 | ) | | | | 15.34 | | | | | 9.68 | | | | | 1.13 | | | | | 1.07 | | | | | 0.29 | | | | | 405 | | | | | 70 | |
| 2015 | | | | 17.94 | | | | | 0.00 | | | | | 0.92 | | | | | 0.92 | | | | | (0.01 | ) | | | | (2.59 | ) | | | | (2.60 | ) | | | | 16.26 | | | | | 5.58 | | | | | 1.23 | | | | | 1.21 | | | | | 0.03 | | | | | 37 | | | | | 94 | |
Mid-Cap Value Fund | | | | | | | | | | | | | | | | | | | | | | | | | | | | | | | | | | | | | | | | | | | | | | | | | | | | | | | | |
| 2019 | | | | 12.64 | | | | | 0.13 | | | | | (1.34 | ) | | | | (1.21 | ) | | | | (0.11 | ) | | | | (1.33 | ) | | | | (1.44 | ) | | | | 9.99 | | | | | (9.63 | ) | | | | 1.26 | | | | | 1.24 | | | | | 0.98 | | | | | 39,032 | | | | | 50 | |
| 2018 | | | | 11.91 | | | | | 0.11 | | | | | 1.17 | | | | | 1.28 | | | | | (0.05 | ) | | | | (0.50 | ) | | | | (0.55 | ) | | | | 12.64 | | | | | 10.89 | | | | | 1.25 | | | | | 1.24 | | | | | 0.79 | | | | | 55,151 | | | | | 64 | |
| 2017 | | | | 14.40 | | | | | 0.05 | | | | | 1.28 | | | | | 1.33 | | | | | (0.05 | ) | | | | (3.77 | ) | | | | (3.82 | ) | | | | 11.91 | | | | | 12.88 | | | | | 1.26 | | | | | 1.24 | | | | | 0.74 | | | | | 64,462 | | | | | 139 | |
| 2016 | | | | 15.02 | | | | | 0.11 | | | | | 0.86 | | | | | 0.97 | | | | | (0.12 | ) | | | | (1.47 | ) | | | | (1.59 | ) | | | | 14.40 | | | | | 7.27 | | | | | 1.23 | | | | | 1.23 | | | | | 0.90 | | | | | 39 | | | | | 24 | |
| 2015 | | | | 17.66 | | | | | 0.03 | | | | | (0.59 | ) | | | | (0.56 | ) | | | | (0.02 | ) | | | | (2.06 | ) | | | | (2.08 | ) | | | | 15.02 | | | | | (3.55 | ) | | | | 1.22 | | | | | 1.22 | | | | | 0.19 | | | | | 26 | | | | | 27 | |
Mid-Cap Growth Fund | | | | | | | | | | | | | | | | | | | | | | | | | | | | | | | | | | | | | | | | | | | | | | | | | | | | | | | | |
| 2019 | | | | 17.96 | | | | | (0.06 | ) | | | | (0.75 | ) | | | | (0.81 | ) | | | | — | | | | | (2.95 | ) | | | | (2.95 | ) | | | | 14.20 | | | | | (2.95 | ) | | | | 1.32 | | | | | 1.24 | | | | | (0.41 | ) | | | | 14,229 | | | | | 61 | |
| 2018 | | | | 14.79 | | | | | (0.08 | ) | | | | 4.24 | | | | | 4.16 | | | | | — | | | | | (0.99 | ) | | | | (0.99 | ) | | | | 17.96 | | | | | 29.40 | | | | | 1.31 | | | | | 1.24 | | | | | (0.43 | ) | | | | 16,399 | | | | | 63 | |
| 2017 | | | | 16.26 | | | | | (0.02 | ) | | | | 2.11 | | | | | 2.09 | | | | | (0.02 | ) | | | | (3.54 | ) | | | | (3.56 | ) | | | | 14.79 | | | | | 16.73 | | | | | 1.37 | | | | | 1.24 | | | | | (0.47 | ) | | | | 17,945 | | | | | 157 | |
| 2016 | | | | 20.02 | | | | | 0.03 | | | | | (0.91 | ) | | | | (0.88 | ) | | | | — | | | | | (2.88 | ) | | | | (2.88 | ) | | | | 16.26 | | | | | (4.23 | ) | | | | 1.29 | | | | | 1.24 | | | | | 0.09 | | | | | 31 | | | | | 59 | |
| 2015 | | | | 23.93 | | | | | (0.11 | ) | | | | (0.57 | ) | | | | (0.68 | ) | | | | — | | | | | (3.23 | ) | | | | (3.23 | ) | | | | 20.02 | | | | | (2.89 | ) | | | | 1.25 | | | | | 1.24 | | | | | (0.52 | ) | | | | 28 | | | | | 53 | |
Small-Cap Value Fund | | | | | | | | | | | | | | | | | | | | | | | | | | | | | | | | | | | | | | | | | | | | | | | | | | | | | | | | |
| 2019 | | | | 14.78 | | | | | 0.08 | | | | | (2.45 | ) | | | | (2.37 | ) | | | | (0.06 | ) | | | | (0.96 | ) | | | | (1.02 | ) | | | | 11.39 | | | | | (16.19 | ) | | | | 1.39 | | | | | 1.24 | | | | | 0.53 | | | | | 3,140 | | | | | 67 | |
| 2018 | | | | 13.30 | | | | | 0.03 | | | | | 2.57 | | | | | 2.60 | | | | | — | | | | | (1.12 | ) | | | | (1.12 | ) | | | | 14.78 | | | | | 20.32 | | | | | 1.41 | | | | | 1.24 | | | | | 0.25 | | | | | 4,741 | | | | | 70 | |
| 2017(5) | | | | 13.21 | | | | | 0.03 | | | | | 1.36 | | | | | 1.39 | | | | | (0.04 | ) | | | | (1.26 | ) | | | | (1.30 | ) | | | | 13.30 | | | | | 11.58 | | | | | 1.49 | | | | | 1.24 | | | | | 0.22 | | | | | 4,931 | | | | | 148 | |
| 2016 | | | | 12.72 | | | | | 0.03 | | | | | 0.98 | | | | | 1.01 | | | | | — | | | | | (0.52 | ) | | | | (0.52 | ) | | | | 13.21 | | | | | 8.23 | | | | | 1.39 | | | | | 1.24 | | | | | 0.17 | | | | | 42,615 | | | | | 39 | |
| 2015 | | | | 14.40 | | | | | (0.02 | ) | | | | (0.85 | ) | | | | (0.87 | ) | | | | — | | | | | (0.81 | ) | | | | (0.81 | ) | | | | 12.72 | | | | | (6.18 | ) | | | | 1.46 | | | | | 1.24 | | | | | (0.46 | ) | | | | 72,822 | | | | | 53 | |
Small-Cap Core Fund | | | | | | | | | | | | | | | | | | | | | | | | | | | | | | | | | | | | | | | | | | | | | | | | | | | | | | | | |
| 2019 | | | | 15.11 | | | | | (0.06 | ) | | | | (2.56 | ) | | | | (2.62 | ) | | | | (0.01 | ) | | | | (1.15 | ) | | | | (1.16 | ) | | | | 11.33 | | | | | (17.39 | ) | | | | 1.88 | | | | | 1.15 | | | | | (0.04 | ) | | | | 702 | | | | | 81 | |
| 2018 | | | | 13.22 | | | | | (0.01 | ) | | | | 2.73 | | | | | 2.72 | | | | | — | | | | | (0.83 | ) | | | | (0.83 | ) | | | | 15.11 | | | | | 21.20 | | | | | 1.62 | | | | | 1.15 | | | | | (0.04 | ) | | | | 2,988 | | | | | 89 | |
| 2017 | | | | 11.57 | | | | | (0.02 | ) | | | | 1.88 | | | | | 1.86 | | | | | (0.01 | ) | | | | (0.20 | ) | | | | (0.21 | ) | | | | 13.22 | | | | | 16.09 | | | | | 1.83 | | | | | 1.15 | | | | | (0.18 | ) | | | | 2,612 | | | | | 90 | |
| 2016 | | | | 10.41 | | | | | 0.02 | | | | | 1.22 | | | | | 1.24 | | | | | — | | | | | (0.08 | ) | | | | (0.08 | ) | | | | 11.57 | | | | | 11.97 | | | | | 2.54 | | | | | 1.15 | | | | | 0.19 | | | | | 647 | | | | | 70 | |
| 2015 | | | | 10.38 | | | | | (0.01 | ) | | | | 0.04 | | | | | 0.03 | | | | | — | | | | | — | | | | | — | | | | | 10.41 | | | | | 0.29 | | | | | 5.02 | | | | | 1.15 | | | | | (0.28 | ) | | | | 629 | | | | | 64 | |
(See Notes which are an integral part of the Financial Statements)
136
| | |
| |
| Financial Highlights—Advisor Class of Shares (For a share outstanding throughout each period) |
| | | | | | | | | | | | | | | | | | | | | | | | | | | | | | | | | | | | | | | | | | | | | | | | | | | | | | | | | | | | | | | | | | | | | | |
Period
Ended
August 31, | | Net asset
value,
beginning
of period | | Net
investment
income
(loss) | | Net realized
and unrealized
gain (loss) | | Total from
investment
operations | | Distributions to
shareholders
from net
investment
income | | Distributions to
shareholders from
net realized gain | | Total
distributions | | Net asset
value, end
of period | | Total
return (2)(3) | | Ratios to Average Net Assets (1) | | Net assets,
end of period
(000 omitted) | | Portfolio
turnover
rate (3) |
| | Gross
Expenses | | Net
Expenses (4) | | Net
investment
income
(loss) (4) |
Small-Cap Growth Fund | | | | | | | | | | | | | | | | | | | | | | | | | | | | | | | | | | | | | | | | | | | | | | | | | | | | | | | | |
| 2019 | | | $ | 21.60 | | | | $ | (0.02 | ) | | | $ | (3.51 | ) | | | $ | (3.53 | ) | | | $ | — | | | | $ | (2.75 | ) | | | $ | (2.75 | ) | | | $ | 15.32 | | | | | (16.12 | )% | | | | 1.30 | % | | | | 1.24 | % | | | | (0.54 | )% | | | $ | 31,378 | | | | | 61 | % |
| 2018 | | | | 18.37 | | | | | (0.12 | ) | | | | 5.43 | | | | | 5.31 | | | | | — | | | | | (2.08 | ) | | | | (2.08 | ) | | | | 21.60 | | | | | 31.55 | | | | | 1.28 | | | | | 1.24 | | | | | (0.47 | ) | | | | 53,772 | | | | | 80 | |
| 2017(6) | | | | 17.79 | | | | | (0.06 | ) | | | | 0.64 | | | | | 0.58 | | | | | — | | | | | — | | | | | — | | | | | 18.37 | | | | | 3.26 | | | | | 1.24 | | | | | 1.24 | | | | | (0.97 | ) | | | | 57,737 | | | | | 197 | |
Global Low Volatility Equity Fund | | | | | | | | | | | | | | | | | | | | | | | | | | | | | | | | | | | | | | | | | | | | | | | | | | | | | | | | |
| 2019(7) | | | | 14.00 | | | | | 0.52 | | | | | (0.37 | ) | | | | 0.15 | | | | | (0.38 | ) | | | | (2.35 | ) | | | | (2.73 | ) | | | | 11.42 | | | | | 2.21 | | | | | 1.62 | | | | | 1.10 | | | | | 2.50 | | | | | 660 | | | | | 44 | |
| 2018 | | | | 13.16 | | | | | (0.15 | ) | | | | 1.46 | | | | | 1.31 | | | | | (0.34 | ) | | | | (0.13 | ) | | | | (0.47 | ) | | | | 14.00 | | | | | 10.21 | | | | | 1.46 | | | | | 1.10 | | | | | 1.50 | | | | | 339 | | | | | 34 | |
| 2017(7) | | | | 12.61 | | | | | 0.14 | | | | | 0.66 | | | | | 0.80 | | | | | (0.17 | ) | | | | (0.08 | ) | | | | (0.25 | ) | | | | 13.16 | | | | | 6.59 | | | | | 1.52 | | | | | 1.10 | | | | | 1.96 | | | | | 997 | | | | | 74 | |
| 2016(7) | | | | 11.31 | | | | | 0.11 | | | | | 1.25 | | | | | 1.36 | | | | | (0.06 | ) | | | | (0.00 | ) | | | | (0.06 | ) | | | | 12.61 | | | | | 12.11 | | | | | 1.63 | | | | | 1.10 | | | | | 2.04 | | | | | 266 | | | | | 36 | |
| 2015(7) | | | | 11.47 | | | | | 0.14 | | | | | (0.17 | ) | | | | (0.03 | ) | | | | (0.08 | ) | | | | (0.05 | ) | | | | (0.13 | ) | | | | 11.31 | | | | | (0.28 | ) | | | | 5.76 | | | | | 1.10 | | | | | 2.38 | | | | | 142 | | | | | 31 | |
Disciplined International Equity Fund | | | | | | | | | | | | | | | | | | | | | | | | | | | | | | | | | | | | | | | | | | | | | | | | | | | | | | | | |
| 2019 | | | | 10.94 | | | | | 0.33 | | | | | (1.09 | ) | | | | (0.76 | ) | | | | (0.17 | ) | | | | — | | | | | (0.17 | ) | | | | 10.01 | | | | | (6.91 | ) | | | | 1.28 | | | | | 1.15 | | | | | 2.79 | | | | | 141 | | | | | 59 | |
| 2018(7) | | | | 11.17 | | | | | 0.21 | | | | | (0.22 | ) | | | | (0.01 | ) | | | | (0.22 | ) | | | | — | | | | | (0.22 | ) | | | | 10.94 | | | | | (0.15 | ) | | | | 1.27 | | | | | 1.15 | | | | | 2.11 | | | | | 186 | | | | | 52 | |
| 2017(7) | | | | 9.56 | | | | | 0.20 | | | | | 1.66 | | | | | 1.86 | | | | | (0.25 | ) | | | | — | | | | | (0.25 | ) | | | | 11.17 | | | | | 19.97 | | | | | 1.39 | | | | | 1.15 | | | | | 1.98 | | | | | 149 | | | | | 77 | |
| 2016(7)(8) | | | | 10.00 | | | | | 0.23 | | | | | (0.67 | ) | | | | (0.44 | ) | | | | — | | | | | — | | | | | — | | | | | 9.56 | | | | | (4.40 | ) | | | | 1.45 | | | | | 1.15 | | | | | 2.53 | | | | | 125 | | | | | 64 | |
Pyrford International Stock Fund | | | | | | | | | | | | | | | | | | | | | | | | | | | | | | | | | | | | | | | | | | | | | | | | | | | | | | | | |
| 2019(7) | | | | 13.43 | | | | | 0.32 | | | | | (0.34 | ) | | | | (0.02 | ) | | | | (0.33 | ) | | | | — | | | | | (0.33 | ) | | | | 13.08 | | | | | 0.04 | | | | | 1.21 | | | | | 1.19 | | | | | 2.32 | | | | | 4,621 | | | | | 16 | |
| 2018(7) | | | | 13.16 | | | | | (0.09 | ) | | | | 0.36 | | | | | 0.27 | | | | | — | | | | | — | | | | | — | | | | | 13.43 | | | | | 2.05 | | | | | 1.20 | | | | | 1.18 | | | | | 2.88 | | | | | 6,037 | | | | | 20 | |
| 2017(5)(7) | | | | 12.18 | | | | | 0.40 | | | | | 0.83 | | | | | 1.23 | | | | | (0.25 | ) | | | | — | | | | | (0.25 | ) | | | | 13.16 | | | | | 10.38 | | | | | 1.30 | | | | | 1.21 | | | | | 3.11 | | | | | 891 | | | | | 33 | |
| 2016(7) | | | | 11.74 | | | | | 0.33 | | | | | 0.35 | | | | | 0.68 | | | | | (0.24 | ) | | | | — | | | | | (0.24 | ) | | | | 12.18 | | | | | 5.96 | | | | | 1.31 | | | | | 1.24 | | | | | 0.92 | | | | | 88 | | | | | 12 | |
| 2015(7) | | | | 13.11 | | | | | 0.05 | | | | | (1.34 | ) | | | | (1.29 | ) | | | | (0.08 | ) | | | | — | | | | | (0.08 | ) | | | | 11.74 | | | | | (9.86 | ) | | | | 1.28 | | | | | 1.24 | | | | | 2.79 | | | | | 817 | | | | | 9 | |
LGM Emerging Markets Equity Fund | | | | | | | | | | | | | | | | | | | | | | | | | | | | | | | | | | | | | | | | | | | | | | | | | | | | | | | | |
| 2019(7) | | | | 16.04 | | | | | (0.02 | ) | | | | (0.49 | ) | | | | (0.51 | ) | | | | (0.13 | ) | | | | (0.51 | ) | | | | (0.64 | ) | | | | 14.89 | | | | | (3.05 | ) | | | | 1.51 | | | | | 1.40 | | | | | 1.30 | | | | | 5,224 | | | | | 24 | |
| 2018(7) | | | | 15.93 | | | | | 0.14 | | | | | (0.03 | ) | | | | 0.11 | | | | | — | | | | | — | | | | | — | | | | | 16.04 | | | | | 0.69 | | | | | 1.55 | | | | | 1.40 | | | | | 0.84 | | | | | 4,983 | | | | | 22 | |
| 2017(5)(7) | | | | 14.04 | | | | | 0.13 | | | | | 1.82 | | | | | 1.95 | | | | | (0.06 | ) | | | | — | | | | | (0.06 | ) | | | | 15.93 | | | | | 14.03 | | | | | 1.63 | | | | | 1.40 | | | | | 0.96 | | | | | 4,776 | | | | | 40 | |
| 2016(7) | | | | 12.12 | | | | | 0.16 | | | | | 1.86 | | | | | 2.02 | | | | | (0.10 | ) | | | | — | | | | | (0.10 | ) | | | | 14.04 | | | | | 16.88 | | | | | 1.64 | | | | | 1.40 | | | | | 0.92 | | | | | 51,879 | | | | | 24 | |
| 2015(7) | | | | 14.30 | | | | | 0.08 | | | | | (2.09 | ) | | | | (2.01 | ) | | | | (0.17 | ) | | | | — | | | | | (0.17 | ) | | | | 12.12 | | | | | (14.18 | ) | | | | 1.59 | | | | | 1.40 | | | | | 2.01 | | | | | 63,966 | | | | | 25 | |
Alternative Strategies Fund | | | | | | | | | | | | | | | | | | | | | | | | | | | | | | | | | | | | | | | | | | | | | | | | | | | | | | | | |
| 2019 | | | | 9.73 | | | | | (0.53 | ) | | | | 0.01 | | | | | (0.52 | ) | | | | — | | | | | — | | | | | — | | | | | 9.21 | | | | | (5.34 | ) | | | | 2.43 | (10) | | | | 1.87 | (10) | | | | 0.10 | | | | | 20 | | | | | 64 | |
| 2018 | | | | 10.74 | | | | | (0.14 | ) | | | | (0.20 | ) | | | | (0.34 | ) | | | | — | | | | | (0.67 | )(9) | | | | (0.67 | ) | | | | 9.73 | | | | | (3.53 | ) | | | | 3.08 | (10) | | | | 2.33 | (10) | | | | (0.74 | ) | | | | 70 | | | | | 122 | |
| 2017(7) | | | | 10.30 | | | | | (0.18 | ) | | | | 0.62 | | | | | 0.44 | | | | | — | | | | | — | | | | | — | | | | | 10.74 | | | | | 4.27 | | | | | 3.65 | (10) | | | | 2.95 | (10) | | | | (0.93 | ) | | | | 157 | | | | | 251 | |
| 2016(7) | | | | 10.40 | | | | | (0.23 | ) | | | | 0.23 | | | | | 0.00 | | | | | — | | | | | (0.10 | ) | | | | (0.10 | ) | | | | 10.30 | | | | | (0.02 | ) | | | | 3.88 | (10) | | | | 3.07 | (10) | | | | 1.11 | | | | | 286 | | | | | 279 | |
| 2015(7)(11) | | | | 10.00 | | | | | (0.06 | ) | | | | 0.46 | | | | | 0.40 | | | | | — | | | | | — | | | | | — | | | | | 10.40 | | | | | 4.00 | | | | | 4.94 | (10) | | | | 2.72 | (10) | | | | (1.07 | ) | | | | 1,011 | | | | | 119 | |
Global Long/Short Equity Fund | | | | | | | | | | | | | | | | | | | | | | | | | | | | | | | | | | | | | | | | | | | | | | | | | | | | | | | | |
| 2019(7) | | | | 12.00 | | | | | 0.18 | | | | | (1.49 | ) | | | | (1.31 | ) | | | | (0.11 | ) | | | | (0.03 | ) | | | | (0.14 | ) | | | | 10.55 | | | | | (10.94 | ) | | | | 4.62 | (10) | | | | 1.86 | (10) | | | | 0.50 | | | | | 650 | | | | | 38 | |
| 2018(7) | | | | 12.22 | | | | | 0.00 | | | | | 0.21 | | | | | 0.21 | | | | | (0.01 | ) | | | | (0.42 | ) | | | | (0.43 | ) | | | | 12.00 | | | | | 1.61 | | | | | 3.71 | (10) | | | | 2.47 | (10) | | | | 0.02 | | | | | 801 | | | | | 79 | |
| 2017(7) | | | | 10.68 | | | | | 0.01 | | | | | 1.66 | | | | | 1.67 | | | | | (0.04 | ) | | | | (0.09 | ) | | | | (0.13 | ) | | | | 12.22 | | | | | 15.77 | | | | | 5.05 | (10) | | | | 2.42 | (10) | | | | 0.03 | | | | | 730 | | | | | 42 | |
| 2016(7)(8) | | | | 10.00 | | | | | 0.03 | | | | | 0.65 | | | | | 0.68 | | | | | — | | | | | — | | | | | — | | | | | 10.68 | | | | | 6.80 | | | | | 9.46 | (10) | | | | 2.36 | (10) | | | | 0.46 | | | | | 510 | | | | | 45 | |
Ultra ShortTax-Free Fund | | | | | | | | | | | | | | | | | | | | | | | | | | | | | | | | | | | | | | | | | | | | | | | | | | | |
| 2019 | | | | 10.07 | | | | | 0.13 | | | | | 0.03 | | | | | 0.16 | | | | | (0.14 | ) | | | | — | | | | | (0.14 | ) | | | | 10.09 | | | | | 1.62 | | | | | 0.62 | | | | | 0.55 | | | | | 1.41 | | | | | 16,498 | | | | | 155 | |
| 2018 | | | | 10.08 | | | | | 0.10 | | | | | 0.00 | | | | | 0.10 | | | | | (0.10 | ) | | | | (0.01 | ) | | | | (0.11 | ) | | | | 10.07 | | | | | 0.95 | | | | | 0.62 | | | | | 0.55 | | | | | 0.99 | | | | | 27,434 | | | | | 156 | |
| 2017 | | | | 10.08 | | | | | 0.07 | | | | | 0.01 | | | | | 0.08 | | | | | (0.07 | ) | | | | (0.01 | ) | | | | (0.08 | ) | | | | 10.08 | | | | | 0.80 | | | | | 0.64 | | | | | 0.55 | | | | | 0.74 | | | | | 34,696 | | | | | 126 | |
| 2016 | | | | 10.08 | | | | | 0.04 | | | | | 0.01 | | | | | 0.05 | | | | | (0.04 | ) | | | | (0.01 | ) | | | | (0.05 | ) | | | | 10.08 | | | | | 0.50 | | | | | 0.64 | | | | | 0.55 | | | | | 0.39 | | | | | 25 | | | | | 56 | |
| 2015 | | | | 10.09 | | | | | 0.04 | | | | | (0.01 | ) | | | | 0.03 | | | | | (0.04 | ) | | | | — | | | | | (0.04 | ) | | | | 10.08 | | | | | 0.25 | | | | | 0.60 | | | | | 0.55 | | | | | 0.34 | | | | | 25 | | | | | 57 | |
ShortTax-Free Fund | | | | | | | | | | | | | | | | | | | | | | | | | | | | | | | | | | | | | | | | | | | | | | | | | | | | | | | | |
| 2019 | | | | 10.14 | | | | | 0.17 | | | | | 0.14 | | | | | 0.31 | | | | | (0.17 | ) | | | | — | | | | | (0.17 | ) | | | | 10.28 | | | | | 3.10 | | | | | 0.72 | | | | | 0.55 | | | | | 1.68 | | | | | 3,668 | | | | | 94 | |
| 2018 | | | | 10.22 | | | | | 0.14 | | | | | (0.08 | ) | | | | 0.06 | | | | | (0.14 | ) | | | | — | | | | | (0.14 | ) | | | | 10.14 | | | | | 0.62 | | | | | 0.67 | | | | | 0.55 | | | | | 1.40 | | | | | 6,502 | | | | | 95 | |
| 2017 | | | | 10.24 | | | | | 0.13 | | | | | (0.02 | ) | | | | 0.11 | | | | | (0.13 | ) | | | | (0.00 | ) | | | | (0.13 | ) | | | | 10.22 | | | | | 1.08 | | | | | 0.76 | | | | | 0.55 | | | | | 1.27 | | | | | 7,166 | | | | | 93 | |
| 2016 | | | | 10.20 | | | | | 0.11 | | | | | 0.06 | | | | | 0.17 | | | | | (0.11 | ) | | | | (0.02 | ) | | | | (0.13 | ) | | | | 10.24 | | | | | 1.69 | | | | | 0.77 | | | | | 0.55 | | | | | 1.04 | | | | | 1,151 | | | | | 39 | |
| 2015 | | | | 10.20 | | | | | 0.12 | | | | | 0.00 | | | | | 0.12 | | | | | (0.12 | ) | | | | — | | | | | (0.12 | ) | | | | 10.20 | | | | | 1.21 | | | | | 0.83 | | | | | 0.55 | | | | | 1.15 | | | | | 453 | | | | | 50 | |
(See Notes which are an integral part of the Financial Statements)
137
| | |
| |
| Financial Highlights—Advisor Class of Shares (For a share outstanding throughout each period) |
| | | | | | | | | | | | | | | | | | | | | | | | | | | | | | | | | | | | | | | | | | | | | | | | | | | | | | | | | | | | | | | | | | | | | | |
Period
Ended
August 31, | | Net asset
value,
beginning
of period | | Net
investment
income | | Net realized
and unrealized
gain (loss) | | Total from
investment
operations | | Distributions to
shareholders
from net
investment
income | | Distributions to
shareholders from
net realized gain | | Total
distributions | | Net asset
value, end
of period | | Total
return (2)(3) | | Ratios to Average Net Assets (1) | | Net assets,
end of period
(000 omitted) | | Portfolio
turnover
rate (3) |
| | Gross
Expenses | | Net
Expenses (4) | | Net
investment
income (4) |
Short-Term Income Fund | | | | | | | | | | | | | | | | | | | | | | | | | | | | | | | | | | | | | | | | | | | | | | | | | | | | | | | | | | | | | |
| 2019 | | | $ | 9.27 | | | | $ | 0.22 | | | | $ | 0.18 | | | | $ | 0.40 | | | | $ | (0.22 | ) | | | $ | — | | | | $ | (0.22 | ) | | | $ | 9.45 | | | | | 4.34 | % | | | | 0.70 | % | | | | 0.60 | % | | | | 2.30 | % | | | $ | 24,531 | | | | | 53 | % |
| 2018 | | | | 9.39 | | | | | 0.17 | | | | | (0.12 | ) | | | | 0.05 | | | | | (0.17 | ) | | | | — | | | | | (0.17 | ) | | | | 9.27 | | | | | 0.56 | | | | | 0.71 | | | | | 0.60 | | | | | 1.80 | | | | | 26,011 | | | | | 48 | |
| 2017 | | | | 9.40 | | | | | 0.15 | | | | | (0.01 | ) | | | | 0.14 | | | | | (0.15 | ) | | | | — | | | | | (0.15 | ) | | | | 9.39 | | | | | 1.46 | | | | | 0.72 | | | | | 0.60 | | | | | 1.61 | | | | | 33,311 | | | | | 53 | |
| 2016 | | | | 9.33 | | | | | 0.10 | | | | | 0.07 | | | | | 0.17 | | | | | (0.10 | ) | | | | — | | | | | (0.10 | ) | | | | 9.40 | | | | | 1.87 | | | | | 0.70 | | | | | 0.60 | | | | | 0.98 | | | | | 157 | | | | | 64 | |
| 2015 | | | | 9.40 | | | | | 0.09 | | | | | (0.05 | ) | | | | 0.04 | | | | | (0.11 | ) | | | | — | | | | | (0.11 | ) | | | | 9.33 | | | | | 0.43 | | | | | 0.69 | | | | | 0.60 | | | | | 1.02 | | | | | 25 | | | | | 29 | |
IntermediateTax-Free Fund | | | | | | | | | | | | | | | | | | | | | | | | | | | | | | | | | | | | | | | | | | | | | | | | | | | | | | | | | | | | | |
| 2019 | | | | 11.13 | | | | | 0.30 | | | | | 0.47 | | | | | 0.77 | | | | | (0.30 | ) | | | | — | | | | | (0.30 | ) | | | | 11.60 | | | | | 7.05 | | | | | 0.56 | | | | | 0.55 | | | | | 2.69 | | | | | 4,505 | | | | | 64 | |
| 2018 | | | | 11.37 | | | | | 0.30 | | | | | (0.24 | ) | | | | 0.06 | | | | | (0.30 | ) | | | | — | | | | | (0.30 | ) | | | | 11.13 | | | | | 0.53 | | | | | 0.55 | | | | | 0.55 | | | | | 2.65 | | | | | 14,701 | | | | | 45 | |
| 2017 | | | | 11.61 | | | | | 0.29 | | | | | (0.21 | ) | | | | 0.08 | | | | | (0.29 | ) | | | | (0.03 | ) | | | | (0.32 | ) | | | | 11.37 | | | | | 0.79 | | | | | 0.57 | | | | | 0.55 | | | | | 2.57 | | | | | 10,842 | | | | | 44 | |
| 2016 | | | | 11.26 | | | | | 0.25 | | | | | 0.37 | | | | | 0.62 | | | | | (0.25 | ) | | | | (0.02 | ) | | | | (0.27 | ) | | | | 11.61 | | | | | 5.56 | | | | | 0.57 | | | | | 0.55 | | | | | 2.18 | | | | | 1,693 | | | | | 42 | |
| 2015 | | | | 11.25 | | | | | 0.26 | | | | | 0.01 | | | | | 0.27 | | | | | (0.26 | ) | | | | — | | | | | (0.26 | ) | | | | 11.26 | | | | | 2.36 | | | | | 0.57 | | | | | 0.55 | | | | | 2.24 | | | | | 2,095 | | | | | 26 | |
Strategic Income Fund | | | | | | | | | | | | | | | | | | | | | | | | | | | | | | | | | | | | | | | | | | | | | | | | | | | | | | | | | | | | | |
| 2019 | | | | 9.08 | | | | | 0.42 | | | | | 0.38 | | | | | 0.80 | | | | | (0.42 | ) | | | | — | | | | | (0.42 | ) | | | | 9.46 | | | | | 9.08 | | | | | 0.96 | | | | | 0.80 | | | | | 4.41 | | | | | 12,523 | | | | | 39 | |
| 2018 | | | | 9.45 | | | | | 0.37 | | | | | (0.37 | ) | | | | 0.03 | | | | | (0.40 | ) | | | | — | | | | | (0.40 | ) | | | | 9.08 | | | | | 0.37 | | | | | 0.92 | | | | | 0.80 | | | | | 4.09 | | | | | 13,602 | | | | | 33 | |
| 2017 | | | | 9.43 | | | | | 0.28 | | | | | 0.03 | | | | | 0.31 | | | | | (0.29 | ) | | | | — | | | | | (0.29 | ) | | | | 9.45 | | | | | 3.32 | | | | | 0.90 | | | | | 0.80 | | | | | 3.14 | | | | | 18,354 | | | | | 65 | |
| 2016 | | | | 9.31 | | | | | 0.22 | | | | | 0.16 | | | | | 0.38 | | | | | (0.26 | ) | | | | — | | | | | (0.26 | ) | | | | 9.43 | | | | | 4.17 | | | | | 0.86 | | | | | 0.80 | | | | | 2.27 | | | | | 32 | | | | | 13 | |
| 2015 | | | | 9.36 | | | | | 0.22 | | | | | 0.00 | | | | | 0.22 | | | | | (0.27 | ) | | | | — | | | | | (0.27 | ) | | | | 9.31 | | | | | 2.34 | | | | | 0.93 | | | | | 0.80 | | | | | 2.36 | | | | | 26 | | | | | 44 | |
TCH Corporate Income Fund | | | | | | | | | | | | | | | | | | | | | | | | | | | | | | | | | | | | | | | | | | | | | | | | | | | | | | | | |
| 2019 | | | | 12.79 | | | | | 0.45 | | | | | 0.90 | | | | | 1.35 | | | | | (0.45 | ) | | | | (0.04 | ) | | | | (0.49 | ) | | | | 13.65 | | | | | 10.89 | | | | | 0.67 | | | | | 0.59 | | | | | 3.48 | | | | | 7,208 | | | | | 37 | |
| 2018 | | | | 13.20 | | | | | 0.40 | | | | | (0.39 | ) | | | | 0.01 | | | | | (0.40 | ) | | | | (0.02 | ) | | | | (0.42 | ) | | | | 12.79 | | | | | 0.06 | | | | | 0.63 | | | | | 0.59 | | | | | 3.15 | | | | | 1,864 | | | | | 31 | |
| 2017 | | | | 13.17 | | | | | 0.35 | | | | | 0.14 | | | | | 0.49 | | | | | (0.35 | ) | | | | (0.11 | ) | | | | (0.46 | ) | | | | 13.20 | | | | | 3.86 | | | | | 0.71 | | | | | 0.59 | | | | | 2.63 | | | | | 1,384 | | | | | 44 | |
| 2016 | | | | 12.33 | | | | | 0.45 | | | | | 0.89 | | | | | 1.34 | | | | | (0.45 | ) | | | | (0.05 | ) | | | | (0.50 | ) | | | | 13.17 | | | | | 11.23 | | | | | 0.72 | | | | | 0.59 | | | | | 3.77 | | | | | 66 | | | | | 62 | |
| 2015 | | | | 13.09 | | | | | 0.36 | | | | | (0.71 | ) | | | | (0.35 | ) | | | | (0.36 | ) | | | | (0.05 | ) | | | | (0.41 | ) | | | | 12.33 | | | | | (2.73 | ) | | | | 0.70 | | | | | 0.59 | | | | | 2.83 | | | | | 25 | | | | | 26 | |
TCH Core Plus Bond Fund | | | | | | | | | | | | | | | | | | | | | | | | | | | | | | | | | | | | | | | | | | | | | | | | | | | | | | | | |
| 2019 | | | | 11.41 | | | | | 0.37 | | | | | 0.59 | | | | | 0.96 | | | | | (0.37 | ) | | | | — | | | | | (0.37 | ) | | | | 12.00 | | | | | 8.63 | | | | | 0.58 | | | | | 0.58 | | | | | 3.23 | | | | | 3,727 | | | | | 51 | |
| 2018 | | | | 11.79 | | | | | 0.31 | | | | | (0.37 | ) | | | | (0.05 | ) | | | | (0.32 | ) | | | | (0.01 | ) | | | | (0.33 | ) | | | | 11.41 | | | | | (0.45 | ) | | | | 0.58 | | | | | 0.58 | | | | | 2.69 | | | | | 3,032 | | | | | 45 | |
| 2017 | | | | 11.89 | | | | | 0.28 | | | | | (0.06 | ) | | | | 0.22 | | | | | (0.28 | ) | | | | (0.04 | ) | | | | (0.32 | ) | | | | 11.79 | | | | | 1.91 | | | | | 0.59 | | | | | 0.59 | | | | | 2.36 | | | | | 3,337 | | | | | 34 | |
| 2016 | | | | 11.42 | | | | | 0.34 | | | | | 0.48 | | | | | 0.82 | | | | | (0.35 | ) | | | | (0.00 | ) | | | | (0.35 | ) | | | | 11.89 | | | | | 7.36 | | | | | 0.59 | | | | | 0.59 | | | | | 2.99 | | | | | 1,434 | | | | | 39 | |
| 2015 | | | | 11.95 | | | | | 0.32 | | | | | (0.47 | ) | | | | (0.15 | ) | | | | (0.32 | ) | | | | (0.06 | ) | | | | (0.38 | ) | | | | 11.42 | | | | | (1.28 | ) | | | | 0.58 | | | | | 0.58 | | | | | 2.71 | | | | | 312 | | | | | 25 | |
High Yield Bond Fund | | | | | | | | | | | | | | | | | | | | | | | | | | | | | | | | | | | | | | | | | | | | | | | | | | | | | | | | |
| 2019 | | | | 9.25 | | | | | 0.51 | | | | | (0.01 | ) | | | | 0.50 | | | | | (0.50 | ) | | | | 0.00 | | | | | (0.50 | ) | | | | 9.25 | | | | | 5.59 | | | | | 2.25 | | | | | 0.90 | | | | | 5.48 | | | | | 868 | | | | | 24 | |
| 2018 | | | | 9.58 | | | | | 0.48 | | | | | (0.33 | ) | | | | 0.15 | | | | | (0.48 | ) | | | | — | | | | | (0.48 | ) | | | | 9.25 | | | | | 1.62 | | | | | 2.00 | | | | | 0.90 | | | | | 5.12 | | | | | 864 | | | | | 37 | |
| 2017 | | | | 9.49 | | | | | 0.44 | | | | | 0.15 | | | | | 0.59 | | | | | (0.50 | ) | | | | — | | | | | (0.50 | ) | | | | 9.58 | | | | | 6.37 | | | | | 1.42 | | | | | 0.90 | | | | | 5.26 | | | | | 1,010 | | | | | 47 | |
| 2016 | | | | 9.41 | | | | | 0.48 | | | | | 0.08 | | | | | 0.56 | | | | | (0.48 | ) | | | | — | | | | | (0.48 | ) | | | | 9.49 | | | | | 6.22 | | | | | 1.21 | | | | | 0.90 | | | | | 5.15 | | | | | 72,010 | | | | | 51 | |
| 2015 | | | | 10.44 | | | | | 0.51 | | | | | (0.79 | ) | | | | (0.28 | ) | | | | (0.51 | ) | | | | (0.24 | ) | | | | (0.75 | ) | | | | 9.41 | | | | | (2.70 | ) | | | | 1.21 | | | | | 0.90 | | | | | 5.13 | | | | | 42,843 | | | | | 46 | |
| (1) | Annualized for periods less than one year. |
| (2) | Based on net asset value as of end of period date. |
| (3) | Not annualized for periods less than one year. |
| (4) | The contractual and voluntary expense waivers pursuant to Note 6 of the financial statements are reflected in both the net expense and net investment income (loss) ratios. |
| (5) | Calculated using the average shares method. |
| (6) | Reflects operations for the period from May 31, 2017 (inception date) to August 31, 2017. |
| (7) | Redemption fees consisted of per share amounts less than $0.01. |
| (8) | Reflects operations for the period from September 17, 2015 (inception date) to August 31, 2016. |
| (9) | Includes distribution to shareholders for return of capital in the amount of $0.09 per share. |
| (10) | Percentages shown include interest expense and dividends on securities sold short and overdraft expenses. Gross and net expense ratios, respectively, excluding interest expense and dividends on securities sold short and overdraft expenses are as follows: |
| | | | | | | | | | | | | | | | | | | | | | |
Alternatives Strategies Fund | | | | | | Global Long/Short Equity Fund | |
| | | Gross | | | Net | | | | | | | | Gross | | | Net | |
| 2019 | | | 2.29 | % | | | 1.73 | % | | | | | | 2019 | | | 4.36 | % | | | 1.60 | % |
| 2018 | | | 2.75 | | | | 2.00 | | | | | | | 2018 | | | 2.83 | | | | 1.60 | |
| 2017 | | | 2.85 | | | | 2.15 | | | | | | | 2017 | | | 4.23 | | | | 1.60 | |
| 2016 | | | 3.05 | | | | 2.20 | | | | | | | 2016 | | | 8.70 | | | | 1.60 | |
| 2015 | | | 4.42 | | | | 2.20 | | | | | | | | | | | | | | | |
| (11) | Reflects operations for the period from December 16, 2014 (inception date) to August 31, 2015. |
(See Notes which are an integral part of the Financial Statements)
138
| | |
| |
| Financial Highlights—Institutional Class of Shares (For a share outstanding throughout each period) |
| | | | | | | | | | | | | | | | | | | | | | | | | | | | | | | | | | | | | | | | | | | | | | | | | | | | | | | | | | | | | | | | | | | | | | |
Period
Ended
August 31, | | Net asset
value,
beginning
of period | | Net
investment
income
(loss) | | Net realized
and unrealized
gain (loss) | | Total from
investment
operations | | Distributions to
shareholders
from net
investment
income | | Distributions to
shareholders from
net realized gain | | Total
distributions | | Net asset
value, end
of period | | Total
return (2)(3) | | Ratios to Average Net Assets (1) | | Net assets,
end of period
(000 omitted) | | Portfolio
turnover
rate (3) |
| | Gross
Expenses | | Net
Expenses (4) | | Net
investment
income
(loss) (4) |
Low Volatility Equity Fund | | | | | | | | | | | | | | | | | | | | | | | | | | | | | | | | | | | | | | | | | | | | | | | | | | | | | | | | |
| 2019 | | | $ | 15.77 | | | | $ | 0.25 | | | | $ | 1.46 | | | | $ | 1.71 | | | | $ | (0.26 | ) | | | $ | (1.34 | ) | | | $ | (1.60 | ) | | | $ | 15.88 | | | | | 12.18 | % | | | | 0.78 | % | | | | 0.65 | % | | | | 1.71 | % | | | $ | 184,158 | | | | | 32 | % |
| 2018 | | | | 14.42 | | | | | 0.24 | | | | | 1.74 | | | | | 1.98 | | | | | (0.24 | ) | | | | (0.39 | ) | | | | (0.63 | ) | | | | 15.77 | | | | | 14.12 | | | | | 0.78 | | | | | 0.65 | | | | | 1.52 | | | | | 102,815 | | | | | 43 | |
| 2017 | | | | 13.84 | | | | | 0.24 | | | | | 0.74 | | | | | 0.98 | | | | | (0.23 | ) | | | | (0.17 | ) | | | | (0.40 | ) | | | | 14.42 | | | | | 7.24 | | | | | 0.78 | | | | | 0.65 | | | | | 1.69 | | | | | 127,837 | | | | | 56 | |
| 2016 | | | | 12.84 | | | | | 0.20 | | | | | 1.35 | | | | | 1.55 | | | | | (0.19 | ) | | | | (0.36 | ) | | | | (0.55 | ) | | | | 13.84 | | | | | 12.47 | | | | | 0.80 | | | | | 0.65 | | | | | 1.62 | | | | | 135,413 | | | | | 40 | |
| 2015 | | | | 13.22 | | | | | 0.20 | | | | | 0.53 | | | | | 0.73 | | | | | (0.21 | ) | | | | (0.90 | ) | | | | (1.11 | ) | | | | 12.84 | | | | | 5.56 | | | | | 0.87 | | | | | 0.65 | | | | | 1.52 | | | | | 76,792 | | | | | 47 | |
Dividend Income Fund | | | | | | | | | | | | | | | | | | | | | | | | | | | | | | | | | | | | | | | | | | | | | | | | | | | | | | | | | | | | | |
| 2019 | | | | 15.41 | | | | | 0.34 | | | | | (0.85 | ) | | | | (0.51 | ) | | | | (0.34 | ) | | | | (0.58 | ) | | | | (0.92 | ) | | | | 13.98 | | | | | (3.24 | ) | | | | 0.78 | | | | | 0.65 | | | | | 2.56 | | | | | 297,622 | | | | | 43 | |
| 2018 | | | | 14.47 | | | | | 0.34 | | | | | 2.64 | | | | | 2.98 | | | | | (0.34 | ) | | | | (1.70 | ) | | | | (2.04 | ) | | | | 15.41 | | | | | 22.17 | | | | | 0.79 | | | | | 0.65 | | | | | 2.31 | | | | | 149,009 | | | | | 39 | |
| 2017(5) | | | | 12.96 | | | | | 0.33 | | | | | 1.60 | | | | | 1.93 | | | | | (0.31 | ) | | | | (0.11 | ) | | | | (0.42 | ) | | | | 14.47 | | | | | 15.15 | | | | | 0.83 | | | | | 0.65 | | | | | 2.37 | | | | | 112,377 | | | | | 43 | |
| 2016 | | | | 12.62 | | | | | 0.35 | | | | | 1.08 | | | | | 1.43 | | | | | (0.33 | ) | | | | (0.76 | ) | | | | (1.09 | ) | | | | 12.96 | | | | | 12.07 | | | | | 0.83 | | | | | 0.65 | | | | | 2.68 | | | | | 38,719 | | | | | 51 | |
| 2015 | | | | 14.32 | | | | | 0.35 | | | | | (0.77 | ) | | | | (0.42 | ) | | | | (0.36 | ) | | | | (0.92 | ) | | | | (1.28 | ) | | | | 12.62 | | | | | (3.38 | ) | | | | 0.80 | | | | | 0.65 | | | | | 2.50 | | | | | 45,554 | | | | | 46 | |
Large-Cap Value Fund | | | | | | | | | | | | | | | | | | | | | | | | | | | | | | | | | | | | | | | | | | | | | | | | | | | | | | | | | | | | | |
| 2019 | | | | 16.61 | | | | | 0.30 | | | | | (1.46 | ) | | | | (1.16 | ) | | | | (0.31 | ) | | | | (1.40 | ) | | | | (1.71 | ) | | | | 13.74 | | | | | (6.97 | ) | | | | 0.59 | | | | | 0.54 | | | | | 2.01 | | | | | 224,930 | | | | | 67 | |
| 2018 | | | | 15.88 | | | | | 0.28 | | | | | 2.14 | | | | | 2.42 | | | | | (0.24 | ) | | | | (1.45 | ) | | | | (1.69 | ) | | | | 16.61 | | | | | 15.83 | | | | | 0.67 | | | | | 0.64 | | | | | 1.64 | | | | | 287,685 | | | | | 54 | |
| 2017(5) | | | | 14.16 | | | | | 0.22 | | | | | 1.83 | | | | | 2.05 | | | | | (0.21 | ) | | | | (0.12 | ) | | | | (0.33 | ) | | | | 15.88 | | | | | 14.66 | | | | | 0.77 | | | | | 0.75 | | | | | 1.47 | | | | | 307,156 | | | | | 62 | |
| 2016 | | | | 15.26 | | | | | 0.24 | | | | | 0.53 | | | | | 0.77 | | | | | (0.26 | ) | | | | (1.61 | ) | | | | (1.87 | ) | | | | 14.16 | | | | | 5.57 | | | | | 0.85 | | | | | 0.82 | | | | | 1.83 | | | | | 136,813 | | | | | 60 | |
| 2015 | | | | 17.06 | | | | | 0.18 | | | | | (0.23 | ) | | | | (0.05 | ) | | | | (0.13 | ) | | | | (1.62 | ) | | | | (1.75 | ) | | | | 15.26 | | | | | (0.45 | ) | | | | 0.97 | | | | | 0.96 | | | | | 1.04 | | | | | 94,439 | | | | | 72 | |
Large-Cap Growth Fund | | | | | | | | | | | | | | | | | | | | | | | | | | | | | | | | | | | | | | | | | | | | | | | | | | | | | | | | | | | | | |
| 2019 | | | | 21.17 | | | | | 0.18 | | | | | (0.53 | ) | | | | (0.35 | ) | | | | (0.12 | ) | | | | (2.55 | ) | | | | (2.67 | ) | | | | 18.15 | | | | | (0.40 | ) | | | | 0.59 | | | | | 0.54 | | | | | 0.75 | | | | | 168,838 | | | | | 89 | |
| 2018 | | | | 17.60 | | | | | 0.11 | | | | | 4.48 | | | | | 4.59 | | | | | (0.02 | ) | | | | (1.00 | ) | | | | (1.02 | ) | | | | 21.17 | | | | | 27.19 | | | | | 0.67 | | | | | 0.64 | | | | | 0.56 | | | | | 279,227 | | | | | 57 | |
| 2017 | | | | 15.47 | | | | | 0.10 | | | | | 3.06 | | | | | 3.16 | | | | | (0.13 | ) | | | | (0.90 | ) | | | | (1.03 | ) | | | | 17.60 | | | | | 21.63 | | | | | 0.78 | | | | | 0.75 | | | | | 0.65 | | | | | 278,436 | | | | | 75 | |
| 2016 | | | | 16.39 | | | | | 0.07 | | | | | 1.44 | | | | | 1.51 | | | | | (0.06 | ) | | | | (2.37 | ) | | | | (2.43 | ) | | | | 15.47 | | | | | 9.88 | | | | | 0.88 | | | | | 0.82 | | | | | 0.50 | | | | | 95,438 | | | | | 70 | |
| 2015 | | | | 18.06 | | | | | 0.07 | | | | | 0.90 | | | | | 0.97 | | | | | (0.04 | ) | | | | (2.60 | ) | | | | (2.64 | ) | | | | 16.39 | | | | | 5.85 | | | | | 0.98 | | | | | 0.96 | | | | | 0.29 | | | | | 72,958 | | | | | 94 | |
Mid-Cap Value Fund | | | | | | | | | | | | | | | | | | | | | | | | | | | | | | | | | | | | | | | | | | | | | | | | | | | | | | | | | | | | | |
| 2019 | | | | 12.58 | | | | | 0.13 | | | | | (1.32 | ) | | | | (1.19 | ) | | | | (0.14 | ) | | | | (1.33 | ) | | | | (1.47 | ) | | | | 9.92 | | | | | (9.47 | ) | | | | 1.01 | | | | | 0.99 | | | | | 1.23 | | | | | 87,893 | | | | | 50 | |
| 2018 | | | | 11.89 | | | | | 0.13 | | | | | 1.18 | | | | | 1.31 | | | | | (0.12 | ) | | | | (0.50 | ) | | | | (0.62 | ) | | | | 12.58 | | | | | 11.21 | | | | | 1.00 | | | | | 0.99 | | | | | 1.04 | | | | | 113,786 | | | | | 64 | |
| 2017 | | | | 14.38 | | | | | 0.08 | | | | | 1.27 | | | | | 1.35 | | | | | (0.07 | ) | | | | (3.77 | ) | | | | (3.84 | ) | | | | 11.89 | | | | | 13.10 | | | | | 1.01 | | | | | 0.99 | | | | | 0.91 | | | | | 127,304 | | | | | 139 | |
| 2016 | | | | 15.01 | | | | | 0.16 | | | | | 0.85 | | | | | 1.01 | | | | | (0.17 | ) | | | | (1.47 | ) | | | | (1.64 | ) | | | | 14.38 | | | | | 7.55 | | | | | 0.98 | | | | | 0.98 | | | | | 1.09 | | | | | 75,608 | | | | | 24 | |
| 2015 | | | | 17.63 | | | | | 0.08 | | | | | (0.60 | ) | | | | (0.52 | ) | | | | (0.04 | ) | | | | (2.06 | ) | | | | (2.10 | ) | | | | 15.01 | | | | | (3.29 | ) | | | | 0.97 | | | | | 0.97 | | | | | 0.43 | | | | | 99,160 | | | | | 27 | |
Mid-Cap Growth Fund | | | | | | | | | | | | | | | | | | | | | | | | | | | | | | | | | | | | | | | | | | | | | | | | | | | | | | | | | | | | | |
| 2019 | | | | 18.79 | | | | | (0.02 | ) | | | | (0.78 | ) | | | | (0.80 | ) | | | | — | | | | | (2.95 | ) | | | | (2.95 | ) | | | | 15.04 | | | | | (2.75 | ) | | | | 1.07 | | | | | 0.99 | | | | | (0.16 | ) | | | | 74,575 | | | | | 61 | |
| 2018 | | | | 15.39 | | | | | (0.03 | ) | | | | 4.42 | | | | | 4.39 | | | | | — | | | | | (0.99 | ) | | | | (0.99 | ) | | | | 18.79 | | | | | 29.76 | | | | | 1.06 | | | | | 0.99 | | | | | (0.18 | ) | | | | 89,028 | | | | | 63 | |
| 2017 | | | | 16.76 | | | | | 0.03 | | | | | 2.19 | | | | | 2.22 | | | | | (0.05 | ) | | | | (3.54 | ) | | | | (3.59 | ) | | | | 15.39 | | | | | 17.07 | | | | | 1.12 | | | | | 0.99 | | | | | (0.07 | ) | | | | 94,464 | | | | | 157 | |
| 2016 | | | | 20.51 | | | | | 0.04 | | | | | (0.91 | ) | | | | (0.87 | ) | | | | — | | | | | (2.88 | ) | | | | (2.88 | ) | | | | 16.76 | | | | | (4.06 | ) | | | | 1.04 | | | | | 0.99 | | | | | 0.33 | | | | | 39,569 | | | | | 59 | |
| 2015 | | | | 24.37 | | | | | (0.08 | ) | | | | (0.55 | ) | | | | (0.63 | ) | | | | — | | | | | (3.23 | ) | | | | (3.23 | ) | | | | 20.51 | | | | | (2.61 | ) | | | | 1.00 | | | | | 0.99 | | | | | (0.26 | ) | | | | 82,768 | | | | | 53 | |
Small-Cap Value Fund | | | | | | | | | | | | | | | | | | | | | | | | | | | | | | | | | | | | | | | | | | | | | | | | | | | | | | | | | | | | | |
| 2019 | | | | 15.03 | | | | | 0.09 | | | | | (2.47 | ) | | | | (2.38 | ) | | | | (0.09 | ) | | | | (0.96 | ) | | | | (1.05 | ) | | | | 11.60 | | | | | (15.93 | ) | | | | 1.14 | | | | | 0.99 | | | | | 0.78 | | | | | 44,586 | | | | | 67 | |
| 2018 | | | | 13.47 | | | | | 0.07 | | | | | 2.61 | | | | | 2.68 | | | | | — | | | | | (1.12 | ) | | | | (1.12 | ) | | | | 15.03 | | | | | 20.67 | | | | | 1.16 | | | | | 0.99 | | | | | 0.49 | | | | | 56,848 | | | | | 70 | |
| 2017(5) | | | | 13.37 | | | | | 0.04 | | | | | 1.41 | | | | | 1.45 | | | | | (0.09 | ) | | | | (1.26 | ) | | | | (1.35 | ) | | | | 13.47 | | | | | 11.87 | | | | | 1.24 | | | | | 0.99 | | | | | 0.33 | | | | | 56,585 | | | | | 148 | |
| 2016 | | | | 12.84 | | | | | 0.05 | | | | | 1.00 | | | | | 1.05 | | | | | — | | | | | (0.52 | ) | | | | (0.52 | ) | | | | 13.37 | | | | | 8.47 | | | | | 1.14 | | | | | 0.99 | | | | | 0.40 | | | | | 25,522 | | | | | 39 | |
| 2015 | | | | 14.50 | | | | | (0.01 | ) | | | | (0.84 | ) | | | | (0.85 | ) | | | | — | | | | | (0.81 | ) | | | | (0.81 | ) | | | | 12.84 | | | | | (5.99 | ) | | | | 1.21 | | | | | 0.99 | | | | | (0.14 | ) | | | | 19,186 | | | | | 53 | |
Small-Cap Core Fund | | | | | | | | | | | | | | | | | | | | | | | | | | | | | | | | | | | | | | | | | | | | | | | | | | | | | | | | | | | | | |
| 2019 | | | | 15.23 | | | | | 0.04 | | | | | (2.65 | ) | | | | (2.61 | ) | | | | (0.01 | ) | | | | (1.15 | ) | | | | (1.16 | ) | | | | 11.46 | | | | | (17.18 | ) | | | | 1.65 | | | | | 0.90 | | | | | 0.22 | | | | | 13,235 | | | | | 81 | |
| 2018 | | | | 13.30 | | | | | 0.03 | | | | | 2.74 | | | | | 2.77 | | | | | (0.01 | ) | | | | (0.83 | ) | | | | (0.84 | ) | | | | 15.23 | | | | | 21.46 | | | | | 1.37 | | | | | 0.90 | | | | | 0.21 | | | | | 21,407 | | | | | 89 | |
| 2017 | | | | 11.64 | | | | | 0.01 | | | | | 1.89 | | | | | 1.90 | | | | | (0.04 | ) | | | | (0.20 | ) | | | | (0.24 | ) | | | | 13.30 | | | | | 16.33 | | | | | 1.58 | | | | | 0.90 | | | | | 0.14 | | | | | 17,049 | | | | | 90 | |
| 2016 | | | | 10.45 | | | | | 0.03 | | | | | 1.25 | | | | | 1.28 | | | | | (0.01 | ) | | | | (0.08 | ) | | | | (0.09 | ) | | | | 11.64 | | | | | 12.37 | | | | | 2.29 | | | | | 0.90 | | | | | 0.44 | | | | | 10,780 | | | | | 70 | |
| 2015 | | | | 10.40 | | | | | 0.02 | | | | | 0.03 | | | | | 0.05 | | | | | — | | | | | — | | | | | — | | | | | 10.45 | | | | | 0.48 | | | | | 4.77 | | | | | 0.90 | | | | | 0.17 | | | | | 3,632 | | | | | 64 | |
Small-Cap Growth Fund | | | | | | | | | | | | | | | | | | | | | | | | | | | | | | | | | | | | | | | | | | | | | | | | | | | | | | | | | | | | | |
| 2019 | | | | 22.48 | | | | | 0.01 | | | | | (3.64 | ) | | | | (3.63 | ) | | | | — | | | | | (2.75 | ) | | | | (2.75 | ) | | | | 16.10 | | | | | (15.92 | ) | | | | 1.05 | | | | | 0.99 | | | | | (0.29 | ) | | | | 68,226 | | | | | 61 | |
| 2018 | | | | 19.00 | | | | | (0.03 | ) | | | | 5.59 | | | | | 5.56 | | | | | — | | | | | (2.08 | ) | | | | (2.08 | ) | | | | 22.48 | | | | | 31.83 | | | | | 1.02 | | | | | 0.99 | | | | | (0.21 | ) | | | | 99,311 | | | | | 80 | |
| 2017 | | | | 16.62 | | | | | (0.14 | ) | | | | 2.52 | | | | | 2.38 | | | | | — | | | | | — | | | | | — | | | | | 19.00 | | | | | 14.32 | | | | | 1.02 | | | | | 1.02 | | | | | (0.37 | ) | | | | 81,259 | | | | | 197 | |
| 2016 | | | | 18.60 | | | | | (0.10 | ) | | | | (0.64 | ) | | | | (0.74 | ) | | | | — | | | | | (1.24 | ) | | | | (1.24 | ) | | | | 16.62 | | | | | (3.72 | ) | | | | 1.18 | | | | | 1.18 | | | | | (0.21 | ) | | | | 179,726 | | | | | 63 | |
| 2015 | | | | 22.75 | | | | | (0.07 | ) | | | | (0.29 | ) | | | | (0.36 | ) | | | | — | | | | | (3.79 | ) | | | | (3.79 | ) | | | | 18.60 | | | | | (1.27 | ) | | | | 1.15 | | | | | 1.15 | | | | | (0.35 | ) | | | | 339,016 | | | | | 59 | |
(See Notes which are an integral part of the Financial Statements)
139
| | |
| |
| Financial Highlights—Institutional Class of Shares (For a share outstanding throughout each period) |
| | | | | | | | | | | | | | | | | | | | | | | | | | | | | | | | | | | | | | | | | | | | | | | | | | | | | | | | | | | | | | | | | | | | | | |
Period
Ended
August 31, | | Net asset
value,
beginning
of period | | Net
investment
income
(loss) | | Net realized
and unrealized
gain (loss) | | Total from
investment
operations | | Distributions to
shareholders
from net
investment
income | | Distributions to
shareholders from
net realized gain | | Total
distributions | | Net asset
value, end
of period | | Total
return (2)(3) | | Ratios to Average Net Assets (1) | | Net assets,
end of period
(000 omitted) | | Portfolio
turnover
rate (3) |
| | Gross
Expenses | | Net
Expenses (4) | | Net
investment
income
(loss) (4) |
Global Low Volatility Equity Fund | | | | | | | | | | | | | | | | | | | | | | | | | | | | | | | | | | | | | | | | | | | | | | | | | | | | | | | | |
| 2019(6) | | | $ | 14.05 | | | | $ | 0.38 | | | | $ | (0.19 | ) | | | $ | 0.19 | | | | $ | (0.40 | ) | | | $ | (2.35 | ) | | | $ | (2.75 | ) | | | $ | 11.49 | | | | | 2.48 | % | | | | 1.37 | % | | | | 0.85 | % | | | | 2.67 | % | | | $ | 34,335 | | | | | 44 | % |
| 2018 | | | | 13.20 | | | | | 0.30 | | | | | 1.05 | | | | | 1.35 | | | | | (0.37 | ) | | | | (0.13 | ) | | | | (0.50 | ) | | | | 14.05 | | | | | 10.44 | | | | | 1.19 | | | | | 0.85 | | | | | 1.94 | | | | | 30,205 | | | | | 34 | |
| 2017(6) | | | | 12.65 | | | | | 0.19 | | | | | 0.64 | | | | | 0.83 | | | | | (0.20 | ) | | | | (0.08 | ) | | | | (0.28 | ) | | | | 13.20 | | | | | 6.76 | | | | | 1.27 | | | | | 0.85 | | | | | 1.98 | | | | | 48,221 | | | | | 74 | |
| 2016(6) | | | | 11.34 | | | | | 0.07 | | | | | 1.33 | | | | | 1.40 | | | | | (0.09 | ) | | | | (0.00 | ) | | | | (0.09 | ) | | | | 12.65 | | | | | 12.44 | | | | | 1.38 | | | | | 0.85 | | | | | 2.26 | | | | | 38,909 | | | | | 36 | |
| 2015(6) | | | | 11.50 | | | | | 0.25 | | | | | (0.26 | ) | | | | (0.01 | ) | | | | (0.10 | ) | | | | (0.05 | ) | | | | (0.15 | ) | | | | 11.34 | | | | | (0.08 | ) | | | | 5.51 | | | | | 0.85 | | | | | 2.16 | | | | | 4,144 | | | | | 31 | |
Disciplined International Equity Fund | | | | | | | | | | | | | | | | | | | | | | | | | | | | | | | | | | | | | | | | | | | | | | | | | | | | | | | | |
| 2019 | | | | 10.96 | | | | | 0.34 | | | | | (1.08 | ) | | | | (0.74 | ) | | | | (0.19 | ) | | | | — | | | | | (0.19 | ) | | | | 10.03 | | | | | (6.64 | ) | | | | 1.03 | | | | | 0.90 | | | | | 3.00 | | | | | 60,828 | | | | | 59 | |
| 2018(6) | | | | 11.19 | | | | | 0.26 | | | | | (0.25 | ) | | | | 0.01 | | | | | (0.24 | ) | | | | — | | | | | (0.24 | ) | | | | 10.96 | | | | | 0.05 | | | | | 1.03 | | | | | 0.90 | | | | | 2.33 | | | | | 77,339 | | | | | 52 | |
| 2017(6) | | | | 9.58 | | | | | 0.25 | | | | | 1.64 | | | | | 1.89 | | | | | (0.28 | ) | | | | — | | | | | (0.28 | ) | | | | 11.19 | | | | | 20.30 | | | | | 1.14 | | | | | 0.90 | | | | | 2.13 | | | | | 72,239 | | | | | 77 | |
| 2016(6)(7) | | | | 10.00 | | | | | 0.23 | | | | | (0.65 | ) | | | | (0.42 | ) | | | | — | | | | | — | | | | | — | | | | | 9.58 | | | | | (4.20 | ) | | | | 1.20 | | | | | 0.90 | | | | | 2.51 | | | | | 67,434 | | | | | 64 | |
Pyrford International Stock Fund | | | | | | | | | | | | | | | | | | | | | | | | | | | | | | | | | | | | | | | | | | | | | | | | | | | | | | | | |
| 2019(6) | | | | 13.18 | | | | | 0.33 | | | | | (0.33 | ) | | | | 0.00 | | | | | (0.34 | ) | | | | — | | | | | (0.34 | ) | | | | 12.84 | | | | | 0.25 | | | | | 0.96 | | | | | 0.94 | | | | | 2.71 | | | | | 486,114 | | | | | 16 | |
| 2018(6) | | | | 13.21 | | | | | 0.37 | | | | | (0.06 | ) | | | | 0.31 | | | | | (0.34 | ) | | | | — | | | | | (0.34 | ) | | | | 13.18 | | | | | 2.34 | | | | | 0.96 | | | | | 0.94 | | | | | 2.41 | | | | | 485,053 | | | | | 20 | |
| 2017(5)(6) | | | | 12.22 | | | | | 0.32 | | | | | 0.94 | | | | | 1.26 | | | | | (0.27 | ) | | | | — | | | | | (0.27 | ) | | | | 13.21 | | | | | 10.68 | | | | | 1.05 | | | | | 0.96 | | | | | 2.59 | | | | | 593,746 | | | | | 33 | |
| 2016(6) | | | | 11.78 | | | | | 0.35 | | | | | 0.36 | | | | | 0.71 | | | | | (0.27 | ) | | | | — | | | | | (0.27 | ) | | | | 12.22 | | | | | 6.21 | | | | | 1.06 | | | | | 0.99 | | | | | 2.44 | | | | | 485,787 | | | | | 12 | |
| 2015(6) | | | | 13.14 | | | | | 0.22 | | | | | (1.48 | ) | | | | (1.26 | ) | | | | (0.10 | ) | | | | — | | | | | (0.10 | ) | | | | 11.78 | | | | | (9.63 | ) | | | | 1.03 | | | | | 0.99 | | | | | 2.52 | | | | | 626,232 | | | | | 9 | |
LGM Emerging Markets Equity Fund | | | | | | | | | | | | | | | | | | | | | | | | | | | | | | | | | | | | | | | | | | | | | | | | | | | | | | | | |
| 2019(6) | | | | 15.99 | | | | | 0.22 | | | | | (0.69 | ) | | | | (0.47 | ) | | | | (0.19 | ) | | | | (0.51 | ) | | | | (0.70 | ) | | | | 14.82 | | | | | (2.76 | ) | | | | 1.25 | | | | | 1.15 | | | | | 1.65 | | | | | 286,159 | | | | | 24 | |
| 2018(6) | | | | 15.97 | | | | | 0.19 | | | | | (0.04 | ) | | | | 0.15 | | | | | (0.13 | ) | | | | — | | | | | (0.13 | ) | | | | 15.99 | | | | | 0.92 | | | | | 1.29 | | | | | 1.15 | | | | | 1.20 | | | | | 201,835 | | | | | 22 | |
| 2017(5)(6) | | | | 14.08 | | | | | 0.15 | | | | | 1.84 | | | | | 1.99 | | | | | (0.10 | ) | | | | — | | | | | (0.10 | ) | | | | 15.97 | | | | | 14.36 | | | | | 1.38 | | | | | 1.15 | | | | | 1.04 | | | | | 157,581 | | | | | 40 | |
| 2016(6) | | | | 12.16 | | | | | 0.15 | | | | | 1.90 | | | | | 2.05 | | | | | (0.13 | ) | | | | — | | | | | (0.13 | ) | | | | 14.08 | | | | | 17.12 | | | | | 1.39 | | | | | 1.15 | | | | | 1.07 | | | | | 78,851 | | | | | 24 | |
| 2015(6) | | | | 14.33 | | | | | 0.16 | | | | | (2.13 | ) | | | | (1.97 | ) | | | | (0.20 | ) | | | | — | | | | | (0.20 | ) | | | | 12.16 | | | | | (13.88 | ) | | | | 1.34 | | | | | 1.15 | | | | | 1.15 | | | | | 85,034 | | | | | 25 | |
Alternative Strategies Fund | | | | | | | | | | | | | | | | | | | | | | | | | | | | | | | | | | | | | | | | | | | | | | | | | | | | | | | | |
| 2019 | | | | 9.82 | | | | | (0.05 | ) | | | | (0.45 | ) | | | | (0.50 | ) | | | | — | | | | | — | | | | | — | | | | | 9.32 | | | | | (5.09 | ) | | | | 2.18 | (9) | | | | 1.62 | (9) | | | | 0.40 | | | | | 38,544 | | | | | 64 | |
| 2018(6) | | | | 10.81 | | | | | (0.05 | ) | | | | (0.27 | ) | | | | (0.32 | ) | | | | — | | | | | (0.67 | )(8) | | | | (0.67 | ) | | | | 9.82 | | | | | (3.31 | ) | | | | 2.79 | (9) | | | | 2.08 | (9) | | | | (0.42 | ) | | | | 73,250 | | | | | 122 | |
| 2017(6) | | | | 10.33 | | | | | (0.09 | ) | | | | 0.57 | | | | | 0.48 | | | | | — | | | | | — | | | | | — | | | | | 10.81 | | | | | 4.65 | | | | | 3.40 | (9) | | | | 2.70 | (9) | | | | (0.67 | ) | | | | 95,583 | | | | | 251 | |
| 2016(6) | | | | 10.42 | | | | | (0.05 | ) | | | | 0.07 | | | | | 0.02 | | | | | (0.01 | ) | | | | (0.10 | ) | | | | (0.11 | ) | | | | 10.33 | | | | | 0.16 | | | | | 3.63 | (9) | | | | 2.82 | (9) | | | | (0.75 | ) | | | | 109,128 | | | | | 279 | |
| 2015(6)(10) | | | | 10.00 | | | | | (0.08 | ) | | | | 0.50 | | | | | 0.42 | | | | | — | | | | | — | | | | | — | | | | | 10.42 | | | | | 4.20 | | | | | 4.69 | (9) | | | | 2.47 | (9) | | | | (1.11 | ) | | | | 34,261 | | | | | 119 | |
Global Long/Short Equity Fund | | | | | | | | | | | | | | | | | | | | | | | | | | | | | | | | | | | | | | | | | | | | | | | | | | | | | | | | |
| 2019(6) | | | | 12.04 | | | | | 0.39 | | | | | (1.70 | ) | | | | (1.31 | ) | | | | (0.11 | ) | | | | (0.03 | ) | | | | (0.14 | ) | | | | 10.59 | | | | | (10.91 | ) | | | | 4.48 | (9) | | | | 1.70 | (9) | | | | 0.61 | | | | | 1,964 | | | | | 38 | |
| 2018(6) | | | | 12.25 | | | | | 0.04 | | | | | 0.20 | | | | | 0.24 | | | | | (0.03 | ) | | | | (0.42 | ) | | | | (0.45 | ) | | | | 12.04 | | | | | 1.91 | | | | | 3.47 | (9) | | | | 2.22 | (9) | | | | 0.28 | | | | | 9,148 | | | | | 79 | |
| 2017(6) | | | | 10.70 | | | | | 0.05 | | | | | 1.66 | | | | | 1.71 | | | | | (0.07 | ) | | | | (0.09 | ) | | | | (0.16 | ) | | | | 12.25 | | | | | 16.10 | | | | | 4.80 | (9) | | | | 2.17 | (9) | | | | 0.27 | | | | | 8,967 | | | | | 42 | |
| 2016(6)(7) | | | | 10.00 | | | | | 0.04 | | | | | 0.66 | | | | | 0.70 | | | | | — | | | | | — | | | | | — | | | | | 10.70 | | | | | 7.00 | | | | | 9.21 | (9) | | | | 2.11 | (9) | | | | 0.50 | | | | | 3,717 | | | | | 45 | |
Ultra ShortTax-Free Fund | | | | | | | | | | | | | | | | | | | | | | | | | | | | | | | | | | | | | | | | | | | | | | | | | | | | | | | | |
| 2019 | | | | 10.06 | | | | | 0.17 | | | | | 0.03 | | | | | 0.20 | | | | | (0.17 | ) | | | | — | | | | | (0.17 | ) | | | | 10.09 | | | | | 1.98 | | | | | 0.37 | | | | | 0.30 | | | | | 1.66 | | | | | 541,859 | | | | | 155 | |
| 2018 | | | | 10.08 | | | | | 0.13 | | | | | (0.01 | ) | | | | 0.12 | | | | | (0.13 | ) | | | | (0.01 | ) | | | | (0.14 | ) | | | | 10.06 | | | | | 1.10 | | | | | 0.37 | | | | | 0.30 | | | | | 1.25 | | | | | 572,669 | | | | | 156 | |
| 2017 | | | | 10.07 | | | | | 0.10 | | | | | 0.02 | | | | | 0.12 | | | | | (0.10 | ) | | | | (0.01 | ) | | | | (0.11 | ) | | | | 10.08 | | | | | 1.15 | | | | | 0.39 | | | | | 0.30 | | | | | 0.94 | | | | | 625,691 | | | | | 126 | |
| 2016 | | | | 10.08 | | | | | 0.07 | | | | | 0.00 | | | | | 0.07 | | | | | (0.07 | ) | | | | (0.01 | ) | | | | (0.08 | ) | | | | 10.07 | | | | | 0.65 | | | | | 0.39 | | | | | 0.30 | | | | | 0.65 | | | | | 548,641 | | | | | 56 | |
| 2015 | | | | 10.09 | | | | | 0.06 | | | | | (0.01 | ) | | | | 0.05 | | | | | (0.06 | ) | | | | — | | | | | (0.06 | ) | | | | 10.08 | | | | | 0.50 | | | | | 0.35 | | | | | 0.30 | | | | | 0.59 | | | | | 702,324 | | | | | 57 | |
ShortTax-Free Fund | | | | | | | | | | | | | | | | | | | | | | | | | | | | | | | | | | | | | | | | | | | | | | | | | | | | | | | | | | | | | |
| 2019 | | | | 10.14 | | | | | 0.19 | | | | | 0.15 | | | | | 0.34 | | | | | (0.19 | ) | | | | — | | | | | (0.19 | ) | | | | 10.29 | | | | | 3.35 | | | | | 0.47 | | | | | 0.40 | | | | | 1.83 | | | | | 156,128 | | | | | 94 | |
| 2018 | | | | 10.22 | | | | | 0.16 | | | | | (0.08 | ) | | | | 0.08 | | | | | (0.16 | ) | | | | — | | | | | (0.16 | ) | | | | 10.14 | | | | | 0.77 | | | | | 0.48 | | | | | 0.40 | | | | | 1.56 | | | | | 182,022 | | | | | 95 | |
| 2017 | | | | 10.25 | | | | | 0.14 | | | | | (0.03 | ) | | | | 0.11 | | | | | (0.14 | ) | | | | (0.00 | ) | | | | (0.14 | ) | | | | 10.22 | | | | | 1.14 | | | | | 0.51 | | | | | 0.40 | | | | | 1.39 | | | | | 175,454 | | | | | 93 | |
| 2016 | | | | 10.20 | | | | | 0.13 | | | | | 0.07 | | | | | 0.20 | | | | | (0.13 | ) | | | | (0.02 | ) | | | | (0.15 | ) | | | | 10.25 | | | | | 1.94 | | | | | 0.52 | | | | | 0.40 | | | | | 1.18 | | | | | 168,592 | | | | | 39 | |
| 2015 | | | | 10.21 | | | | | 0.14 | | | | | (0.01 | ) | | | | 0.13 | | | | | (0.14 | ) | | | | — | | | | | (0.14 | ) | | | | 10.20 | | | | | 1.26 | | | | | 0.58 | | | | | 0.40 | | | | | 1.32 | | | | | 105,734 | | | | | 50 | |
Short-Term Income Fund | | | | | | | | | | | | | | | | | | | | | | | | | | | | | | | | | | | | | | | | | | | | | | | | | | | | | | | | | | | | | |
| 2019 | | | | 9.29 | | | | | 0.24 | | | | | 0.18 | | | | | 0.42 | | | | | (0.24 | ) | | | | — | | | | | (0.24 | ) | | | | 9.47 | | | | | 4.59 | | | | | 0.45 | | | | | 0.35 | | | | | 2.56 | | | | | 233,816 | | | | | 53 | |
| 2018 | | | | 9.40 | | | | | 0.20 | | | | | (0.11 | ) | | | | 0.09 | | | | | (0.20 | ) | | | | — | | | | | (0.20 | ) | | | | 9.29 | | | | | 0.92 | | | | | 0.46 | | | | | 0.35 | | | | | 2.06 | | | | | 214,068 | | | | | 48 | |
| 2017 | | | | 9.42 | | | | | 0.17 | | | | | (0.02 | ) | | | | 0.15 | | | | | (0.17 | ) | | | | — | | | | | (0.17 | ) | | | | 9.40 | | | | | 1.60 | | | | | 0.47 | | | | | 0.35 | | | | | 1.76 | | | | | 209,278 | | | | | 53 | |
| 2016 | | | | 9.35 | | | | | 0.11 | | | | | 0.09 | | | | | 0.20 | | | | | (0.13 | ) | | | | — | | | | | (0.13 | ) | | | | 9.42 | | | | | 2.12 | | | | | 0.45 | | | | | 0.35 | | | | | 1.16 | | | | | 234,507 | | | | | 64 | |
| 2015 | | | | 9.42 | | | | | 0.12 | | | | | (0.06 | ) | | | | 0.06 | | | | | (0.13 | ) | | | | — | | | | | (0.13 | ) | | | | 9.35 | | | | | 0.69 | | | | | 0.44 | | | | | 0.35 | | | | | 1.24 | | | | | 263,894 | | | | | 29 | |
(See Notes which are an integral part of the Financial Statements)
140
| | |
| |
| Financial Highlights—Institutional Class of Shares (For a share outstanding throughout each period) |
| | | | | | | | | | | | | | | | | | | | | | | | | | | | | | | | | | | | | | | | | | | | | | | | | | | | | | | | | | | | | | | | | | | | | | |
Period
Ended
August 31, | | Net asset
value,
beginning
of period | | Net
investment
income | | Net realized
and unrealized
gain (loss) | | Total from
investment
operations | | Distributions to
shareholders
from net
investment
income | | Distributions to
shareholders from
net realized gain | | Total
distributions | | Net asset
value, end
of period | | Total
return (2)(3) | | Ratios to Average Net Assets (1) | | Net assets,
end of period
(000 omitted) | | Portfolio
turnover
rate (3) |
| | Gross
Expenses | | Net
Expenses (4) | | Net
investment
income (4) |
IntermediateTax-Free Fund | | | | | | | | | | | | | | | | | | | | | | | | | | | | | | | | | | | | | | | | | | | | | | | | | | | | | | | | | | | | | |
| 2019 | | | $ | 11.12 | | | | $ | 0.33 | | | | $ | 0.47 | | | | $ | 0.80 | | | | $ | (0.33 | ) | | | $ | — | | | | $ | (0.33 | ) | | | $ | 11.59 | | | | | 7.40 | % | | | | 0.30 | % | | | | 0.30 | % | | | | 2.95 | % | | | $ | 1,384,178 | | | | | 64 | % |
| 2018 | | | | 11.37 | | | | | 0.32 | | | | | (0.25 | ) | | | | 0.07 | | | | | (0.32 | ) | | | | — | | | | | (0.32 | ) | | | | 11.12 | | | | | 0.68 | | | | | 0.31 | | | | | 0.31 | | | | | 2.88 | | | | | 894,463 | | | | | 45 | |
| 2017 | | | | 11.60 | | | | | 0.31 | | | | | (0.20 | ) | | | | 0.11 | | | | | (0.31 | ) | | | | (0.03 | ) | | | | (0.34 | ) | | | | 11.37 | | | | | 1.11 | | | | | 0.32 | | | | | 0.32 | | | | | 2.79 | | | | | 631,658 | | | | | 44 | |
| 2016 | | | | 11.26 | | | | | 0.28 | | | | | 0.36 | | | | | 0.64 | | | | | (0.28 | ) | | | | (0.02 | ) | | | | (0.30 | ) | | | | 11.60 | | | | | 5.71 | | | | | 0.32 | | | | | 0.32 | | | | | 2.43 | | | | | 601,873 | | | | | 42 | |
| 2015 | | | | 11.25 | | | | | 0.28 | | | | | 0.01 | | | | | 0.29 | | | | | (0.28 | ) | | | | — | | | | | (0.28 | ) | | | | 11.26 | | | | | 2.60 | | | | | 0.32 | | | | | 0.32 | | | | | 2.46 | | | | | 559,937 | | | | | 26 | |
Strategic Income Fund | | | | | | | | | | | | | | | | | | | | | | | | | | | | | | | | | | | | | | | | | | | | | | | | | | | | | | | | | | | | | |
| 2019 | | | | 9.08 | | | | | 0.43 | | | | | 0.38 | | | | | 0.81 | | | | | (0.44 | ) | | | | — | | | | | (0.44 | ) | | | | 9.45 | | | | | 9.23 | | | | | 0.70 | | | | | 0.55 | | | | | 4.65 | | | | | 9,117 | | | | | 39 | |
| 2018 | | | | 9.44 | | | | | 0.40 | | | | | (0.36 | ) | | | | 0.07 | | | | | (0.43 | ) | | | | — | | | | | (0.43 | ) | | | | 9.08 | | | | | 0.72 | | | | | 0.67 | | | | | 0.55 | | | | | 4.31 | | | | | 12,701 | | | | | 33 | |
| 2017 | | | | 9.42 | | | | | 0.27 | | | | | 0.06 | | | | | 0.33 | | | | | (0.31 | ) | | | | — | | | | | (0.31 | ) | | | | 9.44 | | | | | 3.58 | | | | | 0.65 | | | | | 0.55 | | | | | 2.68 | | | | | 21,550 | | | | | 65 | |
| 2016 | | | | 9.31 | | | | | 0.23 | | | | | 0.17 | | | | | 0.40 | | | | | (0.29 | ) | | | | — | | | | | (0.29 | ) | | | | 9.42 | | | | | 4.32 | | | | | 0.61 | | | | | 0.55 | | | | | 2.53 | | | | | 21,663 | | | | | 13 | |
| 2015 | | | | 9.35 | | | | | 0.24 | | | | | 0.01 | | | | | 0.25 | | | | | (0.29 | ) | | | | — | | | | | (0.29 | ) | | | | 9.31 | | | | | 2.70 | | | | | 0.68 | | | | | 0.55 | | | | | 2.61 | | | | | 22,981 | | | | | 44 | |
TCH Corporate Income Fund | | | | | | | | | | | | | | | | | | | | | | | | | | | | | | | | | | | | | | | | | | | | | | | | | | | | | | | | | | | | | |
| 2019 | | | | 12.78 | | | | | 0.47 | | | | | 0.90 | | | | | 1.37 | | | | | (0.47 | ) | | | | (0.04 | ) | | | | (0.51 | ) | | | | 13.64 | | | | | 11.07 | | | | | 0.42 | | | | | 0.42 | | | | | 3.68 | | | | | 236,955 | | | | | 37 | |
| 2018 | | | | 13.19 | | | | | 0.42 | | | | | (0.39 | ) | | | | 0.03 | | | | | (0.42 | ) | | | | (0.02 | ) | | | | (0.44 | ) | | | | 12.78 | | | | | 0.19 | | | | | 0.45 | | | | | 0.45 | | | | | 3.24 | | | | | 140,395 | | | | | 31 | |
| 2017 | | | | 13.15 | | | | | 0.37 | | | | | 0.15 | | | | | 0.52 | | | | | (0.37 | ) | | | | (0.11 | ) | | | | (0.48 | ) | | | | 13.19 | | | | | 4.07 | | | | | 0.46 | | | | | 0.46 | | | | | 2.84 | | | | | 134,293 | | | | | 44 | |
| 2016 | | | | 12.32 | | | | | 0.46 | | | | | 0.88 | | | | | 1.34 | | | | | (0.46 | ) | | | | (0.05 | ) | | | | (0.51 | ) | | | | 13.15 | | | | | 11.28 | | | | | 0.47 | | | | | 0.47 | | | | | 3.77 | | | | | 129,429 | | | | | 62 | |
| 2015 | | | | 13.07 | | | | | 0.38 | | | | | (0.70 | ) | | | | (0.32 | ) | | | | (0.38 | ) | | | | (0.05 | ) | | | | (0.43 | ) | | | | 12.32 | | | | | (2.53 | ) | | | | 0.45 | | | | | 0.45 | | | | | 2.97 | | | | | 162,107 | | | | | 26 | |
TCH Core Plus Bond Fund | | | | | | | | | | | | | | | | | | | | | | | | | | | | | | | | | | | | | | | | | | | | | | | | | | | | | | | | | | | | | |
| 2019 | | | | 11.40 | | | | | 0.40 | | | | | 0.60 | | | | | 1.00 | | | | | (0.40 | ) | | | | — | | | | | (0.40 | ) | | | | 12.00 | | | | | 8.99 | | | | | 0.33 | | | | | 0.33 | | | | | 3.48 | | | | | 945,420 | | | | | 51 | |
| 2018 | | | | 11.78 | | | | | 0.34 | | | | | (0.37 | ) | | | | (0.03 | ) | | | | (0.34 | ) | | | | (0.01 | ) | | | | (0.35 | ) | | | | 11.40 | | | | | (0.20 | ) | | | | 0.33 | | | | | 0.33 | | | | | 2.95 | | | | | 981,569 | | | | | 45 | |
| 2017 | | | | 11.89 | | | | | 0.31 | | | | | (0.07 | ) | | | | 0.24 | | | | | (0.31 | ) | | | | (0.04 | ) | | | | (0.35 | ) | | | | 11.78 | | | | | 2.08 | | | | | 0.34 | | | | | 0.34 | | | | | 2.62 | | | | | 975,051 | | | | | 34 | |
| 2016 | | | | 11.42 | | | | | 0.37 | | | | | 0.48 | | | | | 0.85 | | | | | (0.38 | ) | | | | (0.00 | ) | | | | (0.38 | ) | | | | 11.89 | | | | | 7.63 | | | | | 0.34 | | | | | 0.34 | | | | | 3.25 | | | | | 459,228 | | | | | 39 | |
| 2015 | | | | 11.94 | | | | | 0.34 | | | | | (0.45 | ) | | | | (0.11 | ) | | | | (0.35 | ) | | | | (0.06 | ) | | | | (0.41 | ) | | | | 11.42 | | | | | (0.96 | ) | | | | 0.33 | | | | | 0.33 | | | | | 2.94 | | | | | 472,576 | | | | | 25 | |
High Yield Bond Fund | | | | | | | | | | | | | | | | | | | | | | | | | | | | | | | | | | | | | | | | | | | | | | | | | | | | | | | | | | | | | |
| 2019 | | | | 9.24 | | | | | 0.52 | | | | | (0.00 | ) | | | | 0.52 | | | | | (0.52 | ) | | | | 0.00 | | | | | (0.52 | ) | | | | 9.24 | | | | | 5.84 | | | | | 1.99 | | | | | 0.65 | | | | | 5.70 | | | | | 8,382 | | | | | 24 | |
| 2018 | | | | 9.57 | | | | | 0.50 | | | | | (0.33 | ) | | | | 0.17 | | | | | (0.50 | ) | | | | — | | | | | (0.50 | ) | | | | 9.24 | | | | | 1.87 | | | | | 1.75 | | | | | 0.65 | | | | | 5.36 | | | | | 10,462 | | | | | 37 | |
| 2017 | | | | 9.49 | | | | | 0.52 | | | | | 0.08 | | | | | 0.60 | | | | | (0.52 | ) | | | | — | | | | | (0.52 | ) | | | | 9.57 | | | | | 6.53 | | | | | 1.17 | | | | | 0.65 | | | | | 5.50 | | | | | 12,303 | | | | | 47 | |
| 2016 | | | | 9.41 | | | | | 0.50 | | | | | 0.08 | | | | | 0.58 | | | | | (0.50 | ) | | | | — | | | | | (0.50 | ) | | | | 9.49 | | | | | 6.47 | | | | | 0.96 | | | | | 0.65 | | | | | 5.43 | | | | | 34,345 | | | | | 51 | |
| 2015 | | | | 10.44 | | | | | 0.54 | | | | | (0.79 | ) | | | | (0.25 | ) | | | | (0.54 | ) | | | | (0.24 | ) | | | | (0.78 | ) | | | | 9.41 | | | | | (2.46 | ) | | | | 0.96 | | | | | 0.65 | | | | | 5.46 | | | | | 30,173 | | | | | 46 | |
| (1) | Annualized for periods less than one year. |
| (2) | Based on net asset value as of end of period date. |
| (3) | Not annualized for periods less than one year. |
| (4) | The contractual and voluntary expense waivers pursuant to Note 6 of the financial statements are reflected in both the net expense and net investment income (loss) ratios. |
| (5) | Calculated using the average shares method. |
| (6) | Redemption fees consisted of per share amounts less than $0.01. |
| (7) | Reflects operations for the period from September 17, 2015 (inception date) to August 31, 2016. |
| (8) | Includes distribution to shareholders for return of capital in the amount of $0.09 per share. |
| (9) | Percentages shown include interest expense and dividends on securities sold short and overdraft expenses. Gross and net expense ratios, respectively, excluding interest expense and dividends on securities sold short and overdraft expenses are as follows: |
| | | | | | | | | | | | | | | | | | | | | | |
Alternatives Strategies Fund | | | | | | Global Long/Short Equity Fund | |
| | | Gross | | | Net | | | | | | | | Gross | | | Net | |
| 2019 | | | 2.04 | % | | | 1.48 | % | | | | | | 2019 | | | 4.13 | % | | | 1.35 | % |
| 2018 | | | 2.46 | | | | 1.75 | | | | | | | 2018 | | | 2.60 | | | | 1.35 | |
| 2017 | | | 2.60 | | | | 1.90 | | | | | | | 2017 | | | 3.98 | | | | 1.35 | |
| 2016 | | | 2.76 | | | | 1.95 | | | | | | | 2016 | | | 8.45 | | | | 1.35 | |
| 2015 | | | 4.17 | | | | 1.95 | | | | | | | | | | | | | | | |
| (10) | Reflects operations for the period from December 16, 2014 (inception date) to August 31, 2015. |
(See Notes which are an integral part of the Financial Statements)
141
| | |
| |
| Financial Highlights—Premier Class of Shares (For a share outstanding throughout each period) |
| | | | | | | | | | | | | | | | | | | | | | | | | | | | | | | | | | | | | | | | | | | | | | | | | | | | | | | | | | | | | | | | | | | | | | |
Period
Ended
August 31, | | Net asset
value,
beginning
of period | | Net
investment
income | | Net realized
and unrealized
gain | | Total from
investment
operations | | Distributions to
shareholders
from net
investment
income | | Distributions to
shareholders from
net realized gain | | Total
distributions | | Net asset
value, end
of period | | Total
return (2)(3) | | Ratios to Average Net Assets (1) | | Net assets,
end of period
(000 omitted) | | Portfolio
turnover
rate (3) |
| | Gross
Expenses | | Net
Expenses (4) | | Net
investment
income (4) |
Government Money Market Fund | | | | | | | | | | | | | | | | | | | | | | | | | | | | | | | | | | | | | | | | | | | | | | | | | | | | | | | | |
| 2019 | | | $ | 1.00 | | | | $ | 0.02 | | | | $ | 0.00 | | | | $ | 0.02 | | | | $ | (0.02 | ) | | | $ | (0.00 | ) | | | $ | (0.02 | ) | | | $ | 1.00 | | | | | 2.14 | % | | | | 0.25 | % | | | | 0.20 | % | | | | 2.13 | % | | | $ | 2,384,545 | | | | | — | % |
| 2018 | | | | 1.00 | | | | | 0.01 | | | | | 0.00 | | | | | 0.01 | | | | | (0.01 | ) | | | | — | | | | | (0.01 | ) | | | | 1.00 | | | | | 1.30 | | | | | 0.25 | | | | | 0.20 | | | | | 1.30 | | | | | 2,641,069 | | | | | — | |
| 2017 | | | | 1.00 | | | | | 0.00 | | | | | 0.00 | | | | | 0.00 | | | | | (0.00 | ) | | | | (0.00 | ) | | | | (0.00 | ) | | | | 1.00 | | | | | 0.45 | | | | | 0.25 | | | | | 0.20 | | | | | 0.45 | | | | | 2,269,361 | | | | | — | |
| 2016 | | | | 1.00 | | | | | 0.00 | | | | | 0.00 | | | | | 0.00 | | | | | (0.00 | ) | | | | (0.00 | ) | | | | (0.00 | ) | | | | 1.00 | | | | | 0.11 | | | | | 0.28 | | | | | 0.18 | | | | | 0.12 | | | | | 1,967,459 | | | | | — | |
| 2015 | | | | 1.00 | | | | | 0.00 | | | | | 0.00 | | | | | 0.00 | | | | | (0.00 | ) | | | | (0.00 | ) | | | | (0.00 | ) | | | | 1.00 | | | | | 0.01 | | | | | 0.28 | | | | | 0.08 | | | | | 0.01 | | | | | 467,294 | | | | | — | |
Tax-Free Money Market Fund | | | | | | | | | | | | | | | | | | | | | | | | | | | | | | | | | | | | | | | | | | | | | | | | | | | | | | | | | | | | | |
| 2019 | | | | 1.00 | | | | | 0.01 | | | | | 0.00 | | | | | 0.01 | | | | | (0.01 | ) | | | | (0.00 | ) | | | | (0.01 | ) | | | | 1.00 | | | | | 1.46 | | | | | 0.30 | | | | | 0.20 | | | | | 1.44 | | | | | 336,282 | | | | | — | |
| 2018 | | | | 1.00 | | | | | 0.01 | | | | | 0.00 | | | | | 0.01 | | | | | (0.01 | ) | | | | (0.00 | ) | | | | (0.01 | ) | | | | 1.00 | | | | | 1.05 | | | | | 0.31 | | | | | 0.20 | | | | | 1.07 | | | | | 305,424 | | | | | — | |
| 2017 | | | | 1.00 | | | | | 0.01 | | | | | 0.00 | | | | | 0.01 | | | | | (0.01 | ) | | | | (0.00 | ) | | | | (0.01 | ) | | | | 1.00 | | | | | 0.62 | | | | | 0.32 | | | | | 0.20 | | | | | 0.57 | | | | | 238,772 | | | | | — | |
| 2016 | | | | 1.00 | | | | | 0.00 | | | | | 0.00 | | | | | 0.00 | | | | | (0.00 | ) | | | | (0.00 | ) | | | | (0.00 | ) | | | | 1.00 | | | | | 0.17 | | | | | 0.28 | | | | | 0.16 | | | | | 0.13 | | | | | 313,954 | | | | | — | |
| 2015 | | | | 1.00 | | | | | 0.00 | | | | | 0.00 | | | | | 0.00 | | | | | (0.00 | ) | | | | (0.00 | ) | | | | (0.00 | ) | | | | 1.00 | | | | | 0.02 | | | | | 0.28 | | | | | 0.16 | | | | | 0.01 | | | | | 515,005 | | | | | — | |
Prime Money Market Fund | | | | | | | | | | | | | | | | | | | | | | | | | | | | | | | | | | | | | | | | | | | | | | | | | | | | | | | | | | | | | |
| 2019 | | | | 1.00 | | | | | 0.02 | | | | | 0.00 | | | | | 0.02 | | | | | (0.02 | ) | | | | (0.00 | ) | | | | (0.02 | ) | | | | 1.00 | | | | | 2.28 | | | | | 0.26 | | | | | 0.20 | | | | | 2.27 | | | | | 248,781 | | | | | — | |
| 2018 | | | | 1.00 | | | | | 0.01 | | | | | 0.00 | | | | | 0.01 | | | | | (0.01 | ) | | | | (0.00 | ) | | | | (0.01 | ) | | | | 1.00 | | | | | 1.50 | | | | | 0.27 | | | | | 0.20 | | | | | 1.52 | | | | | 268,487 | | | | | — | |
| 2017 | | | | 1.00 | | | | | 0.01 | | | | | 0.00 | | | | | 0.01 | | | | | (0.01 | ) | | | | (0.00 | ) | | | | (0.01 | ) | | | | 1.00 | | | | | 0.67 | | | | | 0.28 | | | | | 0.20 | | | | | 0.61 | | | | | 166,338 | | | | | — | |
| 2016 | | | | 1.00 | | | | | 0.00 | | | | | 0.00 | | | | | 0.00 | | | | | (0.00 | ) | | | | (0.00 | ) | | | | (0.00 | ) | | | | 1.00 | | | | | 0.22 | | | | | 0.20 | | | | | 0.20 | | | | | 0.21 | | | | | 668,609 | | | | | — | |
| 2015 | | | | 1.00 | | | | | 0.00 | | | | | 0.00 | | | | | 0.00 | | | | | (0.00 | ) | | | | (0.00 | ) | | | | (0.00 | ) | | | | 1.00 | | | | | 0.02 | | | | | 0.20 | | | | | 0.18 | | | | | 0.01 | | | | | 2,576,245 | | | | | — | |
Institutional Prime Money Market Fund | | | | | | | | | | | | | | | | | | | | | | | | | | | | | | | | | | | | | | | | | | | | | | | | | | | | | | | | |
| 2019 | | | | 1.0001 | | | | | 0.0229 | | | | | 0.0000 | | | | | 0.0229 | | | | | (0.0229 | ) | | | | (0.0000 | ) | | | | (0.0229 | ) | | | | 1.0001 | | | | | 2.31 | | | | | 0.27 | | | | | 0.20 | | | | | 2.30 | | | | | 560,217 | | | | | — | |
| 2018 | | | | 1.0001 | | | | | 0.0153 | | | | | 0.0000 | | | | | 0.0153 | | | | | (0.0153 | ) | | | | (0.0000 | ) | | | | (0.0153 | ) | | | | 1.0001 | | | | | 1.54 | | | | | 0.29 | | | | | 0.20 | | | | | 1.55 | | | | | 479,413 | | | | | — | |
| 2017(5) | | | | 1.00 | | | | | 0.0074 | | | | | 0.0001 | | | | | 0.0075 | | | | | (0.0074 | ) | | | | (0.0000 | ) | | | | (0.0074 | ) | | | | 1.0001 | | | | | 0.75 | | | | | 0.30 | | | | | 0.20 | | | | | 0.74 | | | | | 400,203 | | | | | — | |
| 2016(6) | | | | 1.00 | | | | | 0.00 | | | | | 0.00 | | | | | 0.00 | | | | | (0.00 | ) | | | | (0.00 | ) | | | | (0.00 | ) | | | | 1.00 | | | | | 0.00 | | | | | 0.29 | | | | | 0.20 | | | | | 0.37 | | | | | 415,218 | | | | | — | |
| (1) | Annualized for periods less than one year. |
| (2) | Based on net asset value as of end of period date. |
| (3) | Not annualized for periods less than one year. |
| (4) | The contractual and voluntary expense waivers pursuant to Note 6 of the financial statements are reflected in both the net expense and net investment income ratios. |
| (5) | Effective October 3, 2016, the BMO Institutional Prime Money Market Fund switched the valuation method of its securities from amortized cost to reflecting changes in market values, thus allowing the Fund’s NAV to “float”. In connection with this change, the Fund’s per share NAV is now calculated to four decimals (e.g., $1.0000). |
| (6) | Reflects operations for the period from June 3, 2016 (inception date) to August 31, 2016. |
(See Notes which are an integral part of the Financial Statements)
142
| | |
| |
| Financial Highlights—RetirementClass R-6 of Shares (For a share outstanding throughout each period) |
| | | | | | | | | | | | | | | | | | | | | | | | | | | | | | | | | | | | | | | | | | | | | | | | | | | | | | | | | | | | | | | | | | | | | | |
Period
Ended
August 31, | | Net asset
value,
beginning
of period | | Net
investment
income
(loss) | | Net realized
and unrealized
gain (loss) | | Total from
investment
operations | | Distributions to
shareholders
from net
investment
income | | Distributions to
shareholders from
net realized gain | | Total
distributions | | Net asset
value, end
of period | | Total
return (2)(3) | | Ratios to Average Net Assets (1) | | Net assets,
end of period
(000 omitted) | | Portfolio
turnover
rate (3) |
| | Gross
Expenses | | Net
Expenses (4) | | Net
investment
income
(loss) (4) |
Large-Cap Value Fund | | | | | | | | | | | | | | | | | | | | | | | | | | | | | | | | | | | | | | | | | | | | | | | | | | | | | | | | | | | | | |
| 2019 | | | $ | 16.62 | | | | $ | 0.31 | | | | $ | (1.46 | ) | | | $ | (1.15 | ) | | | $ | (0.32 | ) | | | $ | (1.40 | ) | | | $ | (1.72 | ) | | | $ | 13.75 | | | | | (6.80 | )% | | | | 0.45 | % | | | | 0.39 | % | | | | 2.15 | % | | | $ | 53,513 | | | | | 67 | % |
| 2018 | | | | 15.88 | | | | | (0.48 | ) | | | | 2.94 | | | | | 2.46 | | | | | (0.27 | ) | | | | (1.45 | ) | | | | (1.72 | ) | | | | 16.62 | | | | | 16.07 | | | | | 0.42 | | | | | 0.39 | | | | | 1.97 | | | | | 81,786 | | | | | 54 | |
| 2017(5) | | | | 14.17 | | | | | 0.26 | | | | | 1.81 | | | | | 2.07 | | | | | (0.24 | ) | | | | (0.12 | ) | | | | (0.36 | ) | | | | 15.88 | | | | | 14.75 | | | | | 0.62 | | | | | 0.60 | | | | | 1.64 | | | | | 1,479 | | | | | 62 | |
| 2016(6) | | | | 13.81 | | | | | 0.21 | | | | | 0.30 | | | | | 0.51 | | | | | (0.15 | ) | | | | — | | | | | (0.15 | ) | | | | 14.17 | | | | | 3.77 | | | | | 0.63 | | | | | 0.60 | | | | | 2.27 | | | | | 52 | | | | | 60 | |
Large-Cap Growth Fund | | | | | | | | | | | | | | | | | | | | | | | | | | | | | | | | | | | | | | | | | | | | | | | | | | | | | | | | | | | | | |
| 2019 | | | | 21.21 | | | | | 0.13 | | | | | (0.44 | ) | | | | (0.31 | ) | | | | (0.15 | ) | | | | (2.55 | ) | | | | (2.70 | ) | | | | 18.20 | | | | | (0.22 | ) | | | | 0.43 | | | | | 0.39 | | | | | 0.94 | | | | | 226,978 | | | | | 89 | |
| 2018 | | | | 17.62 | | | | | 0.11 | | | | | 4.52 | | | | | 4.63 | | | | | (0.04 | ) | | | | (1.00 | ) | | | | (1.04 | ) | | | | 21.21 | | | | | 27.36 | | | | | 0.43 | | | | | 0.40 | | | | | 0.87 | | | | | 60,971 | | | | | 57 | |
| 2017 | | | | 15.49 | | | | | 0.09 | | | | | 3.10 | | | | | 3.19 | | | | | (0.16 | ) | | | | (0.90 | ) | | | | (1.06 | ) | | | | 17.62 | | | | | 21.83 | | | | | 0.63 | | | | | 0.60 | | | | | 0.75 | | | | | 2,852 | | | | | 75 | |
| 2016(6) | | | | 14.75 | | | | | 0.07 | | | | | 0.67 | | | | | 0.74 | | | | | — | | | | | — | | | | | — | | | | | 15.49 | | | | | 5.02 | | | | | 0.66 | | | | | 0.60 | | | | | 0.72 | | | | | 53 | | | | | 70 | |
Mid-Cap Value Fund | | | | | | | | | | | | | | | | | | | | | | | | | | | | | | | | | | | | | | | | | | | | | | | | | | | | | | | | | | | | | |
| 2019 | | | | 12.60 | | | | | 0.17 | | | | | (1.35 | ) | | | | (1.18 | ) | | | | (0.16 | ) | | | | (1.33 | ) | | | | (1.49 | ) | | | | 9.93 | | | | | (9.37 | ) | | | | 0.86 | | | | | 0.84 | | | | | 1.37 | | | | | 13,957 | | | | | 50 | |
| 2018 | | | | 11.90 | | | | | 0.14 | | | | | 1.19 | | | | | 1.33 | | | | | (0.13 | ) | | | | (0.50 | ) | | | | (0.63 | ) | | | | 12.60 | | | | | 11.41 | | | | | 0.83 | | | | | 0.83 | | | | | 1.24 | | | | | 31,173 | | | | | 64 | |
| 2017 | | | | 14.38 | | | | | 0.11 | | | | | 1.26 | | | | | 1.37 | | | | | (0.08 | ) | | | | (3.77 | ) | | | | (3.85 | ) | | | | 11.90 | | | | | 13.31 | | | | | 0.86 | | | | | 0.84 | | | | | 1.05 | | | | | 14,714 | | | | | 139 | |
| 2016 | | | | 15.03 | | | | | 0.18 | | | | | 0.84 | | | | | 1.02 | | | | | (0.20 | ) | | | | (1.47 | ) | | | | (1.67 | ) | | | | 14.38 | | | | | 7.65 | | | | | 0.83 | | | | | 0.83 | | | | | 1.28 | | | | | 11,332 | | | | | 24 | |
| 2015 | | | | 17.65 | | | | | 0.11 | | | | | (0.62 | ) | | | | (0.51 | ) | | | | (0.05 | ) | | | | (2.06 | ) | | | | (2.11 | ) | | | | 15.03 | | | | | (3.19 | ) | | | | 0.82 | | | | | 0.82 | | | | | 0.64 | | | | | 8,776 | | | | | 27 | |
Mid-Cap Growth Fund | | | | | | | | | | | | | | | | | | | | | | | | | | | | | | | | | | | | | | | | | | | | | | | | | | | | | | | | | | | | | |
| 2019 | | | | 18.91 | | | | | 0.02 | | | | | (0.79 | ) | | | | (0.77 | ) | | | | — | | | | | (2.95 | ) | | | | (2.95 | ) | | | | 15.19 | | | | | (2.54 | ) | | | | 0.92 | | | | | 0.84 | | | | | 0.01 | | | | | 7,980 | | | | | 61 | |
| 2018 | | | | 15.46 | | | | | 0.00 | | | | | 4.44 | | | | | 4.44 | | | | | — | | | | | (0.99 | ) | | | | (0.99 | ) | | | | 18.91 | | | | | 29.96 | | | | | 0.88 | | | | | 0.84 | | | | | — | | | | | 23,005 | | | | | 63 | |
| 2017 | | | | 16.83 | | | | | 0.07 | | | | | 2.18 | | | | | 2.25 | | | | | (0.08 | ) | | | | (3.54 | ) | | | | (3.62 | ) | | | | 15.46 | | | | | 17.22 | | | | | 0.97 | | | | | 0.84 | | | | | (0.13 | ) | | | | 592 | | | | | 157 | |
| 2016 | | | | 20.55 | | | | | 0.09 | | | | | (0.93 | ) | | | | (0.84 | ) | | | | — | | | | | (2.88 | ) | | | | (2.88 | ) | | | | 16.83 | | | | | (3.89 | ) | | | | 0.89 | | | | | 0.84 | | | | | 0.49 | | | | | 25 | | | | | 59 | |
| 2015 | | | | 24.38 | | | | | (0.03 | ) | | | | (0.57 | ) | | | | (0.60 | ) | | | | — | | | | | (3.23 | ) | | | | (3.23 | ) | | | | 20.55 | | | | | (2.47 | ) | | | | 0.85 | | | | | 0.84 | | | | | (0.12 | ) | | | | 26 | | | | | 53 | |
Small-Cap Value Fund | | | | | | | | | | | | | | | | | | | | | | | | | | | | | | | | | | | | | | | | | | | | | | | | | | | | | | | | | | | | | |
| 2019 | | | | 15.13 | | | | | 0.12 | | | | | (2.50 | ) | | | | (2.38 | ) | | | | (0.09 | ) | | | | (0.96 | ) | | | | (1.05 | ) | | | | 11.70 | | | | | (15.81 | ) | | | | 1.00 | | | | | 0.84 | | | | | 0.91 | | | | | 8,108 | | | | | 67 | |
| 2018 | | | | 13.53 | | | | | 0.04 | | | | | 2.68 | | | | | 2.72 | | | | | — | | | | | (1.12 | ) | | | | (1.12 | ) | | | | 15.13 | | | | | 20.89 | | | | | 0.97 | | | | | 0.84 | | | | | 0.69 | | | | | 14,260 | | | | | 70 | |
| 2017(5) | | | | 13.42 | | | | | 0.05 | | | | | 1.42 | | | | | 1.47 | | | | | (0.10 | ) | | | | (1.26 | ) | | | | (1.36 | ) | | | | 13.53 | | | | | 12.05 | | | | | 1.09 | | | | | 0.84 | | | | | 0.37 | | | | | 2,653 | | | | | 148 | |
| 2016 | | | | 12.87 | | | | | 0.07 | | | | | 1.00 | | | | | 1.07 | | | | | — | | | | | (0.52 | ) | | | | (0.52 | ) | | | | 13.42 | | | | | 8.61 | | | | | 0.99 | | | | | 0.84 | | | | | 0.60 | | | | | 926 | | | | | 39 | |
| 2015 | | | | 14.50 | | | | | (0.00 | ) | | | | (0.82 | ) | | | | (0.82 | ) | | | | — | | | | | (0.81 | ) | | | | (0.81 | ) | | | | 12.87 | | | | | (5.78 | ) | | | | 1.06 | | | | | 0.84 | | | | | 0.01 | | | | | 134 | | | | | 53 | |
Pyrford International Stock Fund | | | | | | | | | | | | | | | | | | | | | | | | | | | | | | | | | | | | | | | | | | | | | | | | | | | | | | | | |
| 2019(7) | | | | 13.20 | | | | | 0.34 | | | | | (0.31 | ) | | | | 0.03 | | | | | (0.37 | ) | | | | — | | | | | (0.37 | ) | | | | 12.86 | | | | | 0.44 | | | | | 0.81 | | | | | 0.79 | | | | | 2.86 | | | | | 163,829 | | | | | 16 | |
| 2018(7) | | | | 13.22 | | | | | 0.35 | | | | | (0.01 | ) | | | | 0.34 | | | | | (0.36 | ) | | | | — | | | | | (0.36 | ) | | | | 13.20 | | | | | 2.55 | | | | | 0.81 | | | | | 0.79 | | | | | 3.32 | | | | | 155,368 | | | | | 20 | |
| 2017(5)(7) | | | | 12.23 | | | | | 0.40 | | | | | 0.88 | | | | | 1.28 | | | | | (0.29 | ) | | | | — | | | | | (0.29 | ) | | | | 13.22 | | | | | 10.85 | | | | | 0.90 | | | | | 0.81 | | | | | 3.21 | | | | | 48,889 | | | | | 33 | |
| 2016(7) | | | | 11.79 | | | | | 0.20 | | | | | 0.53 | | | | | 0.73 | | | | | (0.29 | ) | | | | — | | | | | (0.29 | ) | | | | 12.23 | | | | | 6.35 | | | | | 0.91 | | | | | 0.84 | | | | | 2.85 | | | | | 16,100 | | | | | 12 | |
| 2015(7) | | | | 13.15 | | | | | 0.20 | | | | | (1.45 | ) | | | | (1.25 | ) | | | | (0.11 | ) | | | | — | | | | | (0.11 | ) | | | | 11.79 | | | | | (9.56 | ) | | | | 0.88 | | | | | 0.84 | | | | | 3.42 | | | | | 6,560 | | | | | 9 | |
| (1) | Annualized for periods less than one year. |
| (2) | Based on net asset value as of end of period date. |
| (3) | Not annualized for periods less than one year. |
| (4) | The contractual and voluntary expense waivers pursuant to Note 6 of the financial statements are reflected in both the net expense and net investment income (loss) ratios. |
| (5) | Calculated using the average shares method. |
| (6) | Reflects operations for the period from December 28, 2015 (inception date) to August 31, 2016. |
| (7) | Redemption fees consisted of per share amounts less than $0.01. |
(See Notes which are an integral part of the Financial Statements)
143
August 31, 2019
| | |
| | |
| Notes to Financial Statements | | |
BMO Funds, Inc. (the “Corporation”) is registered under the Investment Company Act of 1940, as amended (the “Act”), as anopen-end management investment company. As of August 31, 2019, the Corporation consisted of 32 portfolios, including 27 diversified portfolios within this annual report (individually referred to as the “Fund,” or collectively as the “Funds”) each with differing share class offerings, and 5 target risk portfolios whose annual report is available under a separate cover. BMO Asset Management Corp. serves as the Funds’ investment adviser (the “Adviser”), a Delaware corporation headquartered in Chicago, Illinois that is a wholly-owned subsidiary of BMO Financial Corp.
| | | | |
| Funds | | Fund Inception
Date | | Investment Objective |
Low Volatility Equity Fund | | September 28, 2012 | | To provide capital appreciation. |
Dividend Income Fund | | December 29, 2011 | | To provide capital appreciation and current income. |
Large-Cap Value Fund | | September 30, 1993 | | To provide capital appreciation. |
Large-Cap Growth Fund | | November 20, 1992 | | To provide capital appreciation. |
Mid-Cap Value Fund | | September 30, 1993 | | To provide capital appreciation. |
Mid-Cap Growth Fund | | September 30, 1993 | | To provide capital appreciation. |
Small-Cap Value Fund | | February 28, 2011 | | To provide capital appreciation. |
Small-Cap Core Fund | | December 27, 2013 | | To provide capital appreciation. |
Small-Cap Growth Fund | | October 31, 1995 | | To provide capital appreciation. |
Global Low Volatility Equity Fund (1) | | September 30, 2013 | | To provide capital appreciation. |
Disciplined International Equity Fund (1) | | September 17, 2015 | | To provide capital appreciation. |
Pyrford International Stock Fund (1) | | December 29, 2011 | | To provide capital appreciation. |
LGM Emerging Markets Equity Fund (1) | | December 22, 2008 | | To provide capital appreciation. |
Alternative Strategies Fund (1) | | December 16, 2014 | | To provide capital appreciation. |
Global Long/Short Equity Fund (1) | | September 17, 2015 | | To provide capital appreciation. |
Ultra ShortTax-Free Fund | | September 30, 2009 | | To provide current income exempt from federal income tax consistent with preservation of capital. |
ShortTax-Free Fund | | November 29, 2012 | | To provide current income exempt from federal income tax consistent with preservation of capital. |
Short-Term Income Fund | | November 1, 1992 | | To maximize total return consistent with current income. |
IntermediateTax-Free Fund | | February 1, 1994 | | To provide a high level of current income exempt from federal income tax consistent with preservation of capital. |
Strategic Income Fund | | December 13, 1992 | | To maximize total return consistent with current income. |
TCH Corporate Income Fund | | December 22, 2008 | | To maximize total return consistent with current income. |
TCH Core Plus Bond Fund | | December 22, 2008 | | To maximize total return consistent with current income. |
High Yield Bond Fund | | December 29, 2011 | | To maximize total return consistent with current income. |
Government Money Market Fund | | May 17, 2004 | | To provide current income consistent with stability of principal. |
Tax-Free Money Market Fund | | September 22, 2004 | | To provide current income that is exempt from federal income tax and is consistent with stability of principal. |
Prime Money Market Fund | | November 23, 1992 | | To provide current income consistent with stability of principal. |
Institutional Prime Money Market Fund | | June 3, 2016 | | To provide current income consistent with preservation of capital. |
| (1) | Collectively referred to as the “International Funds.” |
| 2. | | Significant Accounting Policies |
The Funds are investment companies and follow the accounting and reporting guidance under Financial Accounting Standards Board (“FASB”) Accounting Standards Codification (“ASC”) Topic 946,Financial Services—Investment Companies. The following is a summary of significant accounting policies consistently followed by the Funds in the preparation of their financial statements.
Use of Estimates—The preparation of financial statements in conformity with accounting principles generally accepted in the United States of America (“GAAP”) requires management to make estimates and assumptions that affect the reported amounts of assets and liabilities at the date of the financial statements and the reported amounts of increases and decreases in net assets from operations during the reporting period. Actual results may differ from those estimates.
Investment Valuations—Listed equity securities are valued each trading day at the last sale price or official closing price reported on a national securities exchange, including NASDAQ. Securities listed on a foreign exchange are valued each trading day at the last closing price on the principal exchange on which they are traded immediately prior to the time for determination of Net Asset Value (“NAV”) or at fair value as discussed below. Equity securities without a reported trade, U.S. government securities, listed corporate bonds, other fixed income and asset-backed securities with maturities of 60 days or more, unlisted securities, and private placement securities are generally valued at the mean of the latest bid and asked price as furnished by an independent pricing service. Fixed income securities that are not exchange traded are valued by an
144
independent pricing service, taking into consideration yield, liquidity, risk, credit quality, coupon, maturity, type of issue, and any other factors or market data the pricing service deems relevant. Fixed income securities with remaining maturities of 60 days or less at the time of purchase and of sufficient credit quality are valued at amortized cost, which approximates fair value. Investments inopen-end registered investment companies are valued at net asset value.
Securities or other assets for which market valuations are not readily available, or are deemed to be inaccurate, are valued at fair value as determined in good faith using methods approved by the Board of Directors (the “Directors”). The Directors have established a Pricing Committee, which is responsible for determinations of fair value, subject to the supervision of the Directors. In determining fair value, the Pricing Committee takes into account all information available and any factors it deems appropriate. Consequently, the price of securities used by the Fund to calculate its NAV may differ from quoted or published prices for the same securities. Fair value pricing involves subjective judgments and it is possible that the fair value determined for a security is materially different than the value that would be realized upon the sale of that security and the differences may be material to the NAV of the Fund or the financial statements presented.
Securities held in certain funds may be listed on foreign exchanges that do not value their listed securities at the same time each Fund calculates its NAV. Most foreign markets close well before each Fund values its securities, generally 3:00 p.m. (Central Time). The earlier close of these foreign markets gives rise to the possibility that significant events, including broad market moves, may have occurred in the interim.
The Pricing Committee may determine that a security needs to be fair valued if, among other things, it believes the value of the security might have been materially affected by events occurring after the close of the market in which the security was principally traded, but before the time for determination of the NAV (“a subsequent event”). A subsequent event might include a company-specific development (for example, announcement of a merger that is made after the close of the foreign market), a development that might affect an entire market or region (for example, weather related events) or a potentially global development (such as a terrorist attack that may be expected to have an effect on investor expectations worldwide). The Funds have retained an independent fair value pricing service to assist in fair valuing foreign securities. The service utilizes statistical data based on historical performance of securities, markets, and other data in developing factors used to estimate a fair value.
Investment Income, Expenses, and Distributions—Interest income and expenses are accrued daily. Dividend income, realized gain distributions from underlying funds, and distributions to shareholders are recorded on theex-dividend date except in the case of certain foreign securities, for which dividends are recorded as soon after theex-dividend date as the Funds’ information agents become aware of such dividends.Non-cash dividends included in dividend income, if any, are recorded at fair value.Paid-in-kind interest included in interest income, if any, is accrued daily.
The Funds offer multiple classes of shares which differ in their respective distribution, administration, and service fees. All shareholders bear the common expenses of the Funds. Dividends are declared separately for each class. No class has preferential dividend rights; differences in per share dividend rates are generally due to differences in class-specific expenses. Income,non-class specific expenses, and realized and unrealized gains and losses are allocated daily to each class of shares based on the value of total shares outstanding of each class without distinction between share classes.
Expenses attributable to a particular class of shares, such as shareholder servicing fees, are allocated directly to that class.
Foreign Currency Translation—The accounting records of the Funds are maintained in U.S. dollars. All assets and liabilities denominated in foreign currencies are translated into U.S. dollars based on the rate of exchange of such currencies against U.S. dollars on the date of valuation. Purchases and sales of securities, income, and expenses are translated at the rate of exchange quoted on the respective date that such transactions are recorded. The effect of changes in foreign exchange rates on realized and unrealized gains or losses on securities is reflected as a component of such gains or losses.
Reported net realized foreign exchange gains or losses arise from sales of portfolio securities, sales and maturities of short-term securities, sales of foreign currencies, currency gains or losses realized between the trade and settlement dates on securities transactions, and the difference between the amounts of dividends, interest, and foreign withholding taxes recorded on the Funds’ books and the U.S. dollar equivalent of the amounts actually received or paid. Net unrealized foreign exchange gains and losses arise from changes in the value of assets and liabilities other than investments in securities at each reporting period, resulting from changes in the exchange rate.
Premium and Discount Amortization/Paydown Gains and Losses—Premiums and discounts on fixed income securities are amortized/accreted for tax and financial statement purposes. Gains and losses realized on principal payments of mortgage-backed and asset-backed securities (paydown gains and losses) are classified as part of interest income.
Repurchase Agreements—The Funds’ policy requires the custodian bank to take possession, to have legally segregated in the Federal Reserve Book Entry System, or to have segregated within the custodian bank’s vault, all securities held as collateral under repurchase agreement transactions. Additionally, procedures have been established by the Funds to monitor, on a daily basis, the fair value of each repurchase agreement’s collateral to ensure that the value of collateral at least equals the repurchase price to be paid under the repurchase agreement, including accrued interest.
The Funds will enter into repurchase agreements only with banks and other recognized financial institutions, such as broker-dealers, which are deemed by the Adviser (orsub-advisers, as applicable) to be creditworthy pursuant to the guidelines and/ or standards reviewed or established by the Directors. Risks may arise from the potential inability of counterparties to honor the terms of the repurchase agreement. Accordingly, the Funds could receive less than the repurchase price on the sale of collateral securities.
145
| | |
| | |
| Notes to Financial Statements(continued) | | |
Short Sales—Certain Funds may sell a security they do not own in anticipation that the price of the security will decline. To complete such a transaction, the Fund must borrow the security to make delivery to the buyer. The Fund closes the short sale by purchasing the security at the market price at the time of closure. The price at such time may be more or less than the price at which the security was sold by the Fund. Until the transaction is closed, the Fund is required to pay the lender amounts equal to dividend or interest that accrue during the period of the loan which is recorded as an expense. To borrow the security, the Fund also may be required to pay a premium or an interest fee, which are recorded as interest expense. The proceeds of the short sale will be retained by the broker, to the extent necessary to meet margin requirements, until the short position is closed out. A gain, limited to the price at which the Fund sells the security short, or a loss potentially unlimited in size, will be recognized upon the closing of a short sale. The Fund may not always be able to borrow a security or to close out a short position at a particular time or at an acceptable price. If the price of the borrowed security increases between the date of the short sale and the date on which the Fund closes the short sale, the Fund will experience a loss. The Fund’s loss on a short sale is the maximum attainable price of the security (which could be limitless) less the price the Fund paid for the security at the time it was borrowed.
Futures Contracts—Certain Funds may purchase futures contracts to manage cash flows, enhance yield, or to potentially reduce transaction costs. Upon entering into a futures contract with a broker, the Fund is required to deposit in a segregated account a specified amount of cash or U.S. government securities. Futures contracts are valued daily and unrealized gains or losses are recorded in a “variation margin” account. Daily, the Fund receives from, or pays to, the broker a specified amount of cash based upon changes in the variation margin account. When a contract is closed, the Fund recognizes a realized gain or loss. Futures contracts have market risks, including the risk that the change in the value of the contract may not correlate with changes in the value of the underlying securities.
Options Contracts—Certain Funds may write covered call and put options on futures, swaps, securities, or currencies a Fund owns, or in which it may invest to create investment exposure consistent with their investment objectives. Writing put options tends to increase a Fund’s exposure to the underlying instrument. Writing call options tends to decrease a Fund’s exposure to the underlying instrument. When a Fund writes a call or put option, an amount equal to the premium received is recorded as a liability and subsequentlymarked-to-market to reflect the current value of the option written. These liabilities are reflected as written options outstanding in the Statements of Assets and Liabilities. Payments received, or made, from writing options with premiums to be determined on a future date are reflected as such on the Statements of Assets and Liabilities. Premiums received from writing options that expire are treated as realized gains. Premiums received from writing options which are exercised or closed are added to the proceeds or offset against amounts paid on the underlying future, swap, security, or currency transaction to determine the realized gain or loss. A Fund, as a writer of an option, has no control over whether the underlying future, swap, security, or currency may be sold (called) or purchased (put) and, as a result, bears the market risk of an unfavorable change in the price of the future, swap, security, or currency underlying the written option. The risk exists that a Fund may not be able to enter into a closing transaction because of an illiquid market.
Certain Funds also may purchase put and call options. Purchasing call options tends to increase a Fund’s exposure to the underlying instrument. Purchasing put options tends to decrease a Fund’s exposure to the underlying instrument. A Fund pays a premium, which is included in a Fund’s Statement of Assets and Liabilities as an investment and subsequentlymarked-to-market to reflect the current value of the option. Premiums paid for purchasing options that expire are treated as realized losses. The risk associated with purchasing put and call options is limited to the premium paid. Premiums paid for purchasing options which are exercised or closed are added to the amounts paid or offset against the proceeds on the underlying future, swap, security, or currency transaction to determine the realized gain or loss.
Foreign Exchange Contracts—Certain Funds may enter into foreign currency exchange contracts as a way of managing foreign exchange rate risk. Certain Funds may enter into these contracts for the purchase or sale of a specific foreign currency at a fixed price on a future date as a hedge or cross hedge against either specific transactions or portfolio positions. The objective of foreign currency hedging transactions is to reduce the risk that the U.S. dollar value of these Funds’ foreign currency denominated securities will decline in value due to changes in foreign currency exchange rates. All foreign currency exchange contracts aremarked-to-market daily at the applicable translation rates resulting in unrealized gains or losses. Realized gains or losses are recorded at the time the foreign currency exchange contract is offset by entering into a closing transaction or by the delivery or receipt of the currency. Risk may arise upon entering into these contracts from the potential inability of counterparties to meet the terms of their contracts and from unanticipated movements in the value of a foreign currency relative to the U.S. dollar.
Total Return Basket Swaps—Certain Funds may enter into total return basket swap agreements to obtain exposure to a portfolio of long and/or short securities. Under the terms of the agreements, the swaps are designed to model a portfolio of direct investments of long and short equity positions. The value of the swap represents the accumulated value of the underlying long and short positions within the model portfolio at period end. The swap value will reflect all of the economic benefits and risks equivalent to direct investments in these positions such as: capital appreciation/depreciation, corporate actions, dividends, and interest. The swap value also includes finance charges and credits, primarily associated with short positions, that are based on defined market rates plus or minus a specified spread and accrued monthly. All positions within the swap are reset periodically. During a reset, the Funds have the ability to increase, reduce, add, or eliminate long and short positions within the swap, any realized gains (losses) from positions, income, proceeds from corporate actions, and accrued financing costs affect the periodic cash settlement between the Funds and the swap counterparty and are included in the swap value in net cash and other receivables (payables). Cash settlement in and out of the swap may occur at a reset date, or any other date, at the discretion of the Funds and the counterparty over the life of the agreement. A change in the market value of a swap contract is recognized as net change in unrealized appreciation/depreciation on swap contracts in the Statements of Operations. Cash settlements between a Fund and the counterparty are recognized as net realized gain
146
(loss) from expiration or closing of swap contracts in the Statements of Operations. Total return basket swap contracts outstanding at period end, if any, are listed after each Fund’s Schedule of Investments and include the list of security positions within the current model portfolio of the swap.
Restricted Securities—Restricted securities are securities that may be resold only upon registration under federal securities laws or in transactions exempt from such registration. In some cases, the issuer of restricted securities has agreed to register such securities for resale at the issuer’s expense either upon demand by the Funds or in connection with another registered offering of the securities. Many restricted securities may be resold in the secondary market in transactions exempt from registration. Such restricted securities may be determined to be liquid under criteria established by the Directors.
When-Issued and Delayed Delivery Transactions—The Funds may engage in when-issued or delayed delivery transactions. The Funds record when-issued securities on the trade date and maintain security positions such that sufficient liquid assets will be available to make payment for the commitment to purchase securities. Securities purchased on a when-issued or delayed delivery basis aremarked-to-market daily and begin earning interest on the settlement date. Losses may occur on these transactions due to changes in market conditions or the failure of counterparties to perform under the contract.
Money Market Funds—Rule2a-7 under the Act effectively includes three categories of money market funds: “Government,” “Retail,” and “Institutional.” The BMO Government Money Market Fund operates as a Government money market fund. The BMOTax-Free Money Market Fund and BMO Prime Money Market Fund operate as Retail money market funds. The BMO Institutional Prime Money Market Fund operates as an Institutional money market fund. Each money market fund is operated to comply with the various requirements of Rule2a-7.
As a Government money market fund, the BMO Government Money Market Fund invests at least 99.5% of its total assets in U.S. government securities, cash, and/or repurchase agreements that are collateralized fully (as defined in Rule2a-7 under the Act). As Retail money market funds, BMOTax-Free Money Market Fund and BMO Prime Money Market Fund have adopted policies and procedures reasonably designed to limit investments in the Fund to accounts beneficially owned by natural persons. Each Government and Retail money market fund uses the amortized cost method of valuing portfolio instruments, which approximates fair value, and seeks to transact shares at a stable $1.00 NAV per share.
As an Institutional money market fund, BMO Institutional Prime Money Market Fund operates with a floating NAV reflecting the current market-based values of its portfolio securities, except as otherwise generally permitted for securities with remaining maturities of 60 days or less, which generally are valued at amortized cost. BMO Institutional Prime Money Market Fund also is required to round its NAV to four decimal places (e.g., $1.0000).
The Institutional and Retail money market funds have adopted policies and procedures imposing a fee upon the sale of shares (“Liquidity Fee”) or temporarily suspending the ability to sell shares if the Fund’s liquidity falls below designated thresholds (“Redemption Gate”). The Board of Directors has chosen not to subject the BMO Government Money Market Fund to a Liquidity Fee or a Redemption Gate, and may do so in the future only with advance notice to shareholders.
Redemption Fees—The International Funds impose a 2% redemption fee on shares held for 30 days or less. All redemption fees are recorded by the International Funds aspaid-in-capital.
Securities Lending—Certain Funds participate in one of two securities lending programs, providing for the lending of corporate bonds, equity, and government securities to qualified brokers, in exchange for the opportunity to earn additional income for participating. State Street Bank & Trust Company and BMO Harris Bank N.A. serve as the securities lending agents for the International Funds andnon-International Funds participating in the programs, respectively. The Funds receive cash as collateral in return for the securities and record a corresponding payable for collateral due to the respective broker. The amount of cash collateral received is maintained at a minimum level of 100% of the prior day’s market value on securities and accrued interest loaned. Collateral is reinvested in short-term securities including overnight repurchase agreements, commercial paper, master notes, floating rate corporate notes (with at least quarterly reset rates), and money market funds. The valuation of these collateral securities is discussed in “Investment Valuations” above. When a Fund lends its portfolio securities, it is subject to the risk that it may not be able to get the portfolio securities back from the borrower on a timely basis, in which case the Fund may lose certain investment opportunities. A Fund also is subject to the risks associated with the investments of cash collateral received from the borrower.
147
| | |
| | |
| Notes to Financial Statements(continued) | | |
Cash collateral received as part of the International Funds securities lending program was invested in the following security as of August 31, 2019:
| | | | |
Description | | Value | |
BMO Institutional Prime Money Market Fund – Premier Class, 2.097% | | $ | 21,919,611 | |
Cash collateral received as part of thenon-International Funds securities lending program was jointly pooled and invested in the following securities as of August 31, 2019 (1):
| | | | |
Description | | Value | |
Atlantic Asset Securitization LLC, 2.222% (LIBOR 1 Month + 11 Basis point), 10/31/2019(2) | | $ | 5,000,000 | |
Atlantic Asset Securitization LLC, 2.255% (LIBOR 1 Month + 11 Basis point), 11/26/2019(2) | | | 5,000,000 | |
Bank of Nova Scotia, 2.35%, 06/18/2020(3) | | | 5,000,000 | |
Bank of Nova Scotia, 2.386% (LIBOR 3 Month + 28 Basis point), 10/21/2019(2) | | | 5,001,782 | |
Bank of Nova Scotia, 2.43%, 05/08/2020(3) | | | 3,500,014 | |
Bedford Row Funding Corp., 2.431% (LIBOR 1 Month + 22 Basis point), 09/09/2019(2) | | | 5,750,000 | |
Bedford Row Funding Corp., 2.289% (LIBOR 3 Month + 3 Basis point), 01/23/2020(2) | | | 5,300,000 | |
Bedford Row Funding Corp., 2.335% (LIBOR 1 Month + 19 Basis point), 06/25/2020(2) | | | 5,000,000 | |
Bedford Row Funding Corp., 2.34% (LIBOR 1 Month + 12 Basis point), 11/01/2019(2) | | | 5,000,570 | |
BlackRock Liquidity Funds FedFund Portfolio, 2.1%, 09/03/2019 | | | 5,674,281 | |
BMO Government Money Market Fund, 1.971%, 09/03/2019 (4) | | | 49,000,000 | |
BMO Institutional Prime Money Market Fund, 2.097%, 09/03/2019 (4) | | | 310,031,000 | |
CAFCO LLC, 2.141%, 09/06/2019(3) | | | 14,995,542 | |
Canadian Imperial Bank of Commerce/New York NY, 2.487% (LIBOR 3 Month + 10 Basis point), 09/20/2019(2) | | | 7,500,233 | |
Credit Suisse New York Branch, 2.31%, 10/10/2019(3) | | | 5,002,015 | |
Credit Suisse New York Branch, 2.5%, 05/04/2020(3) | | | 5,004,945 | |
Credit Suisse New York Branch, 2.5%, 03/06/2020(3) | | | 5,503,179 | |
Glencove Funding DAC, 2.15%, 09/03/2019(3) | | | 4,999,403 | |
Glencove Funding DAC, 2.15%, 09/04/2019(3) | | | 14,997,312 | |
Goldman Sachs Bank USA, 2.37%, 06/25/2020(3) | | | 5,200,657 | |
HSBC Bank USA NA, 2.351% (LIBOR 1 Month + 15 Basis point), 09/11/2019(2) | | | 5,000,345 | |
HSBC Bank USA NA, 2.494% (LIBOR 1 Month + 25 Basis point), 10/03/2019(2) | | | 5,000,643 | |
Lexington Parker Capital Co. LP, 2.204%, 10/04/2019(3) | | | 4,989,917 | |
Lexington Parker Capital Co. LP, 2.182%, 09/13/2019(3) | | | 7,494,550 | |
Lexington Parker Capital Co. LP, 2.16%, 11/15/2019(3) | | | 4,977,604 | |
LMA Americas LLC, 2.15%, 09/03/2019(3) | | | 7,499,104 | |
LMA Americas LLC, 2.41%, 11/04/2019(3) | | | 4,978,667 | |
LMA Americas LLC, 2.573%, 09/18/2019(3) | | | 6,492,112 | |
LMA Americas LLC, 2.609%, 10/21/2019(3) | | | 5,480,139 | |
Longship Funding LLC, 2.2%, 09/03/2019(3) | | | 14,998,167 | |
Longship Funding LLC, 2.151%, 09/12/2019(3) | | | 6,495,730 | |
Longship Funding LLC, 2.192%, 09/19/2019(3) | | | 4,994,525 | |
Manhattan Asset Funding Co. LLC, 2.151%, 09/11/2019(3) | | | 4,997,014 | |
Mizuho Bank Ltd., 2.361% (LIBOR 1 Month + 16 Basis point), 09/12/2019(2) | | | 5,000,390 | |
| | | | |
Description | | Value | |
MUFG Bank, Ltd., 2.383% (LIBOR 3 Month + 10 Basis point), 10/24/2019(2) | | $ | 7,500,981 | |
National Bank of Canada, 2.301% (LIBOR 1 Month + 10 Basis point), 10/10/2019(2) | | | 5,500,440 | |
Old Line Funding LLC, 2.265% (LIBOR 1 Month + 12 Basis point), 09/27/2019(2) | | | 7,500,000 | |
Old Line Funding LLC, 2.39% (LIBOR 1 Month + 16 Basis point), 04/01/2020(2) | | | 4,000,000 | |
Regency Markets LLC, 2.231%, 09/09/2019(3) | | | 4,997,522 | |
Regency Markets LLC, 2.212%, 09/16/2019(3) | | | 6,494,015 | |
Royal Bank of Canada, 2.442%, 03/13/2020(3) | | | 3,250,164 | |
Royal Bank of Canada, 2.38%, 06/08/2020(3) | | | 4,000,000 | |
Sheffield Receivables Co. LLC, 2.32%, 10/18/2019(3) | | | 6,750,000 | |
Sheffield Receivables Co. LLC, 2.3%, 12/02/2019(3) | | | 7,500,000 | |
Sumitomo Mitsui Banking Corp., 2.539% (LIBOR 3 Month + 45 Basis point), 09/05/2019(2) | | | 3,500,039 | |
Sumitomo Mitsui Trust Bank, Ltd., 2.306% (LIBOR 1 Month + 19 Basis point), 01/31/2020(2) | | | 5,000,045 | |
Thunder Bay Funding LLC, 2.302% (LIBOR 1 Month + 12 Basis point), 09/18/2019(2) | | | 6,500,000 | |
Thunder Bay Funding LLC, 2.331% (LIBOR 1 Month + 13 Basis point), 02/10/2020(2) | | | 4,000,000 | |
Thunder Bay Funding LLC, 2.311% (LIBOR 1 Month + 11 Basis point), 10/10/2019(2) | | | 5,500,000 | |
Thunder Bay Funding LLC, 2.282% (LIBOR 1 Month + 11 Basis point), 12/20/2019(2) | | | 5,000,000 | |
Thunder Bay Funding LLC, 2.362% (LIBOR 1 Month + 18 Basis point), 03/19/2020(2) | | | 5,000,206 | |
Toronto-Dominion Bank, 2.265% (LIBOR 1 Month + 12 Basis point), 11/26/2019(2) | | | 5,000,000 | |
Toronto-Dominion Bank, 2.39%, 06/15/2020(3) | | | 5,000,000 | |
Toronto-Dominion Bank, 2.469%, 10/15/2019(3) | | | 5,650,723 | |
Toronto-Dominion Bank, 2.42%, 02/27/2020(3) | | | 3,499,993 | |
Toyota Motor Credit Corp., 2.403% (LIBOR 3 Month + 10 Basis point), 10/11/2019(2) | | | 7,500,000 | |
Toyota Motor Credit Corp., 2.404% (LIBOR 1 Month + 16 Basis point), 02/28/2020(2) | | | 7,500,000 | |
Toyota Motor Credit Corp., 2.377% (LIBOR 1 Month + 18 Basis point), 04/09/2020(2) | | | 5,500,000 | |
Victory Receivables Corp., 2.505%, 10/01/2019(3) | | | 4,989,583 | |
Wells Fargo Bank NA, 2.503% (LIBOR 3 Month + 20 Basis point), 01/08/2020(2) | | | 7,505,301 | |
Wells Fargo Bank NA, 2.46%, 08/14/2020(3) | | | 3,499,998 | |
Westpac Banking Corp., 2.42%, 02/14/2020(3) | | | 7,252,547 | |
Westpac Banking Corp., 2.401% (LIBOR 3 Month + 10 Basis point), 10/04/2019(2) | | | 5,000,382 | |
Westpac Banking Corp., 2.361% (LIBOR 3 Month + 18 Basis point), 01/02/2020(2) | | | 6,000,000 | |
Other | | | (175,546 | ) |
| | | | |
Total | | $ | 726,576,230 | |
| | | | |
| | (1) | The collateral pool is managed by the fixed income group within the Adviser. Each Fund owns apro-rata interest in the collateral pool determined by the value of securities on loan for such Fund. |
| | (2) | Denotes a floating rate security. Floating rate securities are securities whose yields vary with a designated market index or market rate. These securities are shown at their current rates as of August 31, 2019. |
| | (3) | Each issue shows the rate of the discount at the time of purchase. |
| | (4) | Denotes an investment in an affiliated entity. Please refer to Note 6, subsectionInvestments in Affiliated Issuers, in the Notes to Financial Statements. |
148
Federal Income Taxes—The policies and procedures of the Funds require compliance with Subchapter M of the Internal Revenue Code of 1986, as amended (the “Code”), and distribution to shareholders each year of substantially all of their income. Accordingly, no provisions for federal tax are necessary. Withholding taxes on foreign dividends and unrealized appreciation on investments have been provided for in accordance with the applicable country’s tax rules and rates.
Commitments and Contingencies—In the normal course of business, the Corporation enters into contracts that provide general indemnifications to other parties. The Corporation’s maximum exposure under these arrangements is unknown as this would involve future claims that may be made against the Corporation that have not yet occurred. However, the Corporation has not had prior claims or losses pursuant to these contracts and expects the risk of loss to be remote.
Other—Investment transactions are accounted for on a trade date basis. Net realized gains and losses on securities are computed on the basis of specific security lot identification.
| 3. | | Fair Value Measurement |
Fair Valuation Measurement defines fair value, establishes a framework for measuring fair value in accordance with GAAP, and requires disclosure about fair value measurements. It establishes a fair value hierarchy that distinguishes between (1) market participant assumptions developed based on market data obtained from sources independent of the reporting issuer (observable inputs), and (2) the reporting issuer’s own assumptions about market participant assumptions developed based on the best information available in the circumstances (unobservable inputs). It also provides guidance on determining when there has been a significant decrease in the volume and level of activity for an asset or liability, when a transaction is not orderly and how that information must be incorporated into fair value measurement.
In August 2018, the “FASB” issued Accounting Standards Update2018-13,Fair Value Measurement (Topic 820) — Disclosures Framework — Changes to Disclosure Requirements of Fair Value Measurement (“ASU2018-13”) which introduces new fair value disclosure requirements as well as eliminates and modifies certain existing fair value disclosure requirements. ASU2018-13 would be effective for fiscal years beginning after December 15, 2019 and for interim periods within those fiscal years; however, management has elected to early adopt ASU2018-13 effective with the current reporting period as permitted by the standard. The impact of the Funds’ adoption was limited to changes in the Funds’ financial statement disclosures regarding fair value, primarily those disclosures related to transfers between levels of the fair value hierarchy and disclosure of the range and weighted average used to develop significant unobservable inputs for Level 3 fair value measurements, when applicable.
Various inputs are used in determining the value of the Funds’ investments. The inputs or methodology used for valuing securities are not necessarily an indication of the risk associated with investing in those securities. These inputs are summarized in the three broad levels listed below:
Level 1—quoted prices in active markets for identical securities. An active market for the security is a market in which transactions occur with sufficient frequency and volume to provide pricing information on an ongoing basis. Common and preferred stocks, options and futures contracts, and U.S. registered mutual funds are generally categorized as Level 1.
Level 2—other significant observable inputs (including quoted prices for similar securities, interest rates, prepayment speeds, credit risk, etc.). Fixed income securities, repurchase agreements, cash collateral received as part of the securities lending program, and securities valued by an independent fair value pricing service are generally categorized as Level 2.
Level 3—significant unobservable inputs, including management’s own assumptions in determining the fair value of investments.
For the year ended August 31, 2019, the Funds had no investments in private investment funds, and there were no investments excluded from the fair value hierarchy. The Funds did not hold any Level 3 securities as of August 31, 2019.
The following is a summary of the inputs used, as of August 31, 2019, in valuing the Funds’ assets:
| | | | | | | | | | | | | | | | |
| | | Low Volatility Equity Fund | | | | |
| | | Level 1 | | | Level 2 | | | Level 3 | | | Total | |
Common Stocks(1) | | $ | 204,222,236 | | | $ | — | | | $ | — | | | $ | 204,222,236 | |
Short-Term Investments | | | 5,840,436 | | | | 64,845,551 | | | | — | | | | 70,685,987 | |
| | | | | | | | | | | | | | | | |
Total | | $ | 210,062,672 | | | $ | 64,845,551 | | | $ | — | | | $ | 274,908,223 | |
| | | | | | | | | | | | | | | | |
| | |
| | | Dividend Income Fund | | | | |
| | | Level 1 | | | Level 2 | | | Level 3 | | | Total | |
Common Stocks(1) | | $ | 295,880,068 | | | $ | — | | | $ | — | | | $ | 295,880,068 | |
Short-Term Investments | | | 28,264,217 | | | | 82,546,979 | | | | — | | | | 110,811,196 | |
| | | | | | | | | | | | | | | | |
Total | | $ | 324,144,285 | | | $ | 82,546,979 | | | $ | — | | | $ | 406,691,264 | |
| | | | | | | | | | | | | | | | |
| | | | | | | | | | | | | | | | |
| | | Large-Cap Value Fund | | | | |
| | | Level 1 | | | Level 2 | | | Level 3 | | | Total | |
Common Stocks(1) | | $ | 291,183,949 | | | $ | — | | | $ | — | | | $ | 291,183,949 | |
Short-Term Investments | | | 5,888,195 | | | | 87,405,013 | | | | — | | | | 93,293,208 | |
| | | | | | | | | | | | | | | | |
Total | | $ | 297,072,144 | | | $ | 87,405,013 | | | $ | — | | | $ | 384,477,157 | |
| | | | | | | | | | | | | | | | |
| | |
| | | Large-Cap Growth Fund | | | | |
| | | Level 1 | | | Level 2 | | | Level 3 | | | Total | |
Common Stocks(1) | | $ | 447,450,039 | | | $ | — | | | $ | — | | | $ | 447,450,039 | |
Short-Term Investments | | | 5 | | | | 110,027,192 | | | | — | | | | 110,027,197 | |
| | | | | | | | | | | | | | | | |
Total | | $ | 447,450,044 | | | $ | 110,027,192 | | | $ | — | | | $ | 557,477,236 | |
| | | | | | | | | | | | | | | | |
149
| | |
| | |
| Notes to Financial Statements(continued) | | |
| | | | | | | | | | | | | | | | |
| | | Mid-Cap Value Fund | | | | |
| | | Level 1 | | | Level 2 | | | Level 3 | | | Total | |
Common Stocks(1) | | $ | 137,657,139 | | | $ | — | | | $ | — | | | $ | 137,657,139 | |
Short-Term Investments | | | 1,259,074 | | | | 42,152,765 | | | | — | | | | 43,411,839 | |
| | | | | | | | | | | | | | | | |
Total | | $ | 138,916,213 | | | $ | 42,152,765 | | | $ | — | | | $ | 181,068,978 | |
| | | | | | | | | | | | | | | | |
| | |
| | | Mid-Cap Growth Fund | | | | |
| | | Level 1 | | | Level 2 | | | Level 3 | | | Total | |
Common Stocks(1) | | $ | 95,109,454 | | | $ | — | | | $ | — | | | $ | 95,109,454 | |
Short-Term Investments | | | 687,000 | | | | 22,590,044 | | | | — | | | | 23,277,044 | |
| | | | | | | | | | | | | | | | |
Total | | $ | 95,796,454 | | | $ | 22,590,044 | | | $ | — | | | $ | 118,386,498 | |
| | | | | | | | | | | | | | | | |
| | |
| | | Small-Cap Value Fund | | | | |
| | | Level 1 | | | Level 2 | | | Level 3 | | | Total | |
Common Stocks(1) | | $ | 55,108,472 | | | $ | — | | | $ | — | | | $ | 55,108,472 | |
Short-Term Investments | | | 511,829 | | | | 19,580,233 | | | | — | | | | 20,092,062 | |
| | | | | | | | | | | | | | | | |
Total | | $ | 55,620,301 | | | $ | 19,580,233 | | | $ | — | | | $ | 75,200,534 | |
| | | | | | | | | | | | | | | | |
| | |
| | | Small-Cap Core Fund | | | | |
| | | Level 1 | | | Level 2 | | | Level 3 | | | Total | |
Common Stocks(1) | | $ | 13,645,824 | | | $ | — | | | $ | — | | | $ | 13,645,824 | |
Short-Term Investments | | | 233,030 | | | | 4,193,876 | | | | — | | | | 4,426,906 | |
| | | | | | | | | | | | | | | | |
Total | | $ | 13,878,854 | | | $ | 4,193,876 | | | $ | — | | | $ | 18,072,730 | |
| | | | | | | | | | | | | | | | |
| | |
| | | Small-Cap Growth Fund | | | | |
| | | Level 1 | | | Level 2 | | | Level 3 | | | Total | |
Common Stocks(1) | | $ | 98,291,092 | | | $ | — | | | $ | — | | | $ | 98,291,092 | |
Short-Term Investments | | | 1,221,390 | | | | 34,881,052 | | | | — | | | | 36,102,442 | |
| | | | | | | | | | | | | | | | |
Total | | $ | 99,512,482 | | | $ | 34,881,052 | | | $ | — | | | $ | 134,393,534 | |
| | | | | | | | | | | | | | | | |
| | |
| | | Global Low Volatility Equity Fund | | | | |
| | | Level 1 | | | Level 2 | | | Level 3 | | | Total | |
Common Stocks | | | | | | | | | | | | | | | | |
Australia | | $ | 133,633 | | | $ | — | | | $ | — | | | $ | 133,633 | |
Bermuda | | | 352,691 | | | | — | | | | — | | | | 352,691 | |
Brazil | | | 453,378 | | | | — | | | | — | | | | 453,378 | |
Canada | | | 3,542,085 | | | | — | | | | — | | | | 3,542,085 | |
Cayman Islands | | | 285,638 | | | | — | | | | — | | | | 285,638 | |
China | | | 311,723 | | | | — | | | | — | | | | 311,723 | |
Czech Republic | | | 818,361 | | | | — | | | | — | | | | 818,361 | |
Denmark | | | 69,007 | | | | — | | | | — | | | | 69,007 | |
France | | | 19,704 | | | | — | | | | — | | | | 19,704 | |
Germany | | | 92,515 | | | | — | | | | — | | | | 92,515 | |
Hong Kong | | | 2,924,152 | | | | — | | | | — | | | | 2,924,152 | |
Hungary | | | 93,754 | | | | — | | | | — | | | | 93,754 | |
Israel | | | 557,211 | | | | — | | | | — | | | | 557,211 | |
Italy | | | 824,485 | | | | — | | | | — | | | | 824,485 | |
Japan | | | 3,260,901 | | | | — | | | | — | | | | 3,260,901 | |
Malaysia | | | 591,892 | | | | — | | | | — | | | | 591,892 | |
Mexico | | | 246,363 | | | | — | | | | — | | | | 246,363 | |
Myanmar | | | 470,893 | | | | — | | | | — | | | | 470,893 | |
Netherlands | | | 741,754 | | | | — | | | | — | | | | 741,754 | |
New Zealand | | | 1,023,961 | | | | — | | | | — | | | | 1,023,961 | |
Philippines | | | 1,248,648 | | | | — | | | | — | | | | 1,248,648 | |
Portugal | | | 105,467 | | | | — | | | | — | | | | 105,467 | |
Singapore | | | 1,734,182 | | | | — | | | | — | | | | 1,734,182 | |
South Africa | | | 632,000 | | | | — | | | | — | | | | 632,000 | |
Spain | | | 260,995 | | | | — | | | | — | | | | 260,995 | |
Switzerland | | | 299,161 | | | | — | | | | — | | | | 299,161 | |
Taiwan | | | 1,101,632 | | | | — | | | | — | | | | 1,101,632 | |
United Kingdom | | | 474,071 | | | | — | | | | — | | | | 474,071 | |
United States | | | 11,486,498 | | | | — | | | | — | | | | 11,486,498 | |
Short-Term Investments | | | 1,365,174 | | | | — | | | | — | | | | 1,365,174 | |
| | | | | | | | | | | | | | | | |
Total | | $ | 35,521,929 | | | $ | — | | | $ | — | | | $ | 35,521,929 | |
| | | | | | | | | | | | | | | | |
| | | | | | | | | | | | | | | | |
| | | Disciplined International Equity Fund | | | | |
| | | Level 1 | | | Level 2 | | | Level 3 | | | Total | |
Common Stocks | | | | | | | | | | | | | | | | |
Australia | | $ | 6,543,992 | | | $ | — | | | $ | — | | | $ | 6,543,992 | |
Cayman Islands | | | 114,918 | | | | — | | | | — | | | | 114,918 | |
Denmark | | | 2,509,008 | | | | — | | | | — | | | | 2,509,008 | |
Finland | | | 1,203,691 | | | | — | | | | — | | | | 1,203,691 | |
France | | | 4,467,448 | | | | — | | | | — | | | | 4,467,448 | |
Germany | | | 4,644,426 | | | | — | | | | — | | | | 4,644,426 | |
Hong Kong | | | 2,210,984 | | | | — | | | | — | | | | 2,210,984 | |
Israel | | | 792,894 | | | | — | | | | — | | | | 792,894 | |
Italy | | | 3,125,928 | | | | — | | | | — | | | | 3,125,928 | |
Japan | | | 13,883,443 | | | | — | | | | — | | | | 13,883,443 | |
Netherlands | | | 3,741,723 | | | | — | | | | — | | | | 3,741,723 | |
Norway | | | 2,276,521 | | | | — | | | | — | | | | 2,276,521 | |
Singapore | | | 1,692,583 | | | | — | | | | — | | | | 1,692,583 | |
Spain | | | 475,020 | | | | — | | | | — | | | | 475,020 | |
Sweden | | | 666,630 | | | | — | | | | — | | | | 666,630 | |
Switzerland | | | 4,841,679 | | | | — | | | | — | | | | 4,841,679 | |
United Kingdom | | | 6,836,995 | | | | — | | | | — | | | | 6,836,995 | |
Limited Partnership Units | | | | | | | | | | | | | | | | |
Germany | | | 149,524 | | | | — | | | | — | | | | 149,524 | |
Short-Term Investments | | | 6,462,878 | | | | — | | | | — | | | | 6,462,878 | |
| | | | | | | | | | | | | | | | |
Total | | $ | 66,640,285 | | | $ | — | | | $ | — | | | $ | 66,640,285 | |
| | | | | | | | | | | | | | | | |
| | |
| | | Pyrford International Stock Fund | | | | |
| | | Level 1 | | | Level 2 | | | Level 3 | | | Total | |
Common Stocks | | | | | | | | | | | | | | | | |
Australia | | $ | 70,286,936 | | | $ | — | | | $ | — | | | $ | 70,286,936 | |
Finland | | | 18,124,266 | | | | — | | | | — | | | | 18,124,266 | |
France | | | 56,586,905 | | | | — | | | | — | | | | 56,586,905 | |
Germany | | | 43,180,065 | | | | — | | | | — | | | | 43,180,065 | |
Hong Kong | | | 30,135,663 | | | | — | | | | — | | | | 30,135,663 | |
Japan | | | 72,717,836 | | | | — | | | | — | | | | 72,717,836 | |
Malaysia | | | 18,603,454 | | | | — | | | | — | | | | 18,603,454 | |
Netherlands | | | 21,122,398 | | | | — | | | | — | | | | 21,122,398 | |
Norway | | | 12,562,528 | | | | — | | | | — | | | | 12,562,528 | |
Singapore | | | 29,743,749 | | | | — | | | | — | | | | 29,743,749 | |
Sweden | | | 29,618,637 | | | | — | | | | — | | | | 29,618,637 | |
Switzerland | | | 91,095,161 | | | | — | | | | — | | | | 91,095,161 | |
Taiwan | | | 25,435,546 | | | | — | | | | — | | | | 25,435,546 | |
United Kingdom | | | 90,614,386 | | | | — | | | | — | | | | 90,614,386 | |
Preferred Stocks | | | | | | | | | | | | | | | | |
Germany | | | 9,404,834 | | | | — | | | | — | | | | 9,404,834 | |
Short-Term Investments | | | 39,875,583 | | | | — | | | | — | | | | 39,875,583 | |
| | | | | | | | | | | | | | | | |
Total | | $ | 659,107,947 | | | $ | — | | | $ | — | | | $ | 659,107,947 | |
| | | | | | | | | | | | | | | | |
| | |
| | | LGM Emerging Markets Equity Fund | | | | |
| | | Level 1 | | | Level 2 | | | Level 3 | | | Total | |
Common Stocks | | | | | | | | | | | | | | | | |
Brazil | | $ | 6,785,755 | | | $ | — | | | $ | — | | | $ | 6,785,755 | |
Chile | | | 3,630,961 | | | | — | | | | — | | | | 3,630,961 | |
China | | | 48,164,877 | | | | — | | | | — | | | | 48,164,877 | |
Egypt | | | 12,486,412 | | | | — | | | | — | | | | 12,486,412 | |
Hong Kong | | | 23,885,928 | | | | — | | | | — | | | | 23,885,928 | |
India | | | 47,032,712 | | | | — | | | | — | | | | 47,032,712 | |
Indonesia | | | 16,736,688 | | | | — | | | | — | | | | 16,736,688 | |
Malaysia | | | 10,211,435 | | | | — | | | | — | | | | 10,211,435 | |
Mexico | | | 16,787,225 | | | | — | | | | — | | | | 16,787,225 | |
Nigeria | | | 3,643,861 | | | | — | | | | — | | | | 3,643,861 | |
Peru | | | 4,301,054 | | | | — | | | | — | | | | 4,301,054 | |
Philippines | | | 9,876,428 | | | | — | | | | — | | | | 9,876,428 | |
Russia | | | 10,385,363 | | | | — | | | | — | | | | 10,385,363 | |
South Africa | | | 33,056,469 | | | | — | | | | — | | | | 33,056,469 | |
Thailand | | | 3,634,477 | | | | — | | | | — | | | | 3,634,477 | |
United States | | | 8,368,836 | | | | — | | | | — | | | | 8,368,836 | |
Vietnam | | | 7,260,379 | | | | — | | | | — | | | | 7,260,379 | |
Common Stock Units | | | 8,886,760 | | | | — | | | | — | | | | 8,886,760 | |
Short-Term Investments | | | 18,597,294 | | | | — | | | | — | | | | 18,597,294 | |
| | | | | | | | | | | | | | | | |
Total | | $ | 293,732,914 | | | $ | — | | | $ | — | | | $ | 293,732,914 | |
| | | | | | | | | | | | | | | | |
150
| | | | | | | | | | | | | | | | |
| | | Alternative Strategies Fund(2) | | | | |
| | | Level 1 | | | Level 2 | | | Level 3 | | | Total | |
| | | | |
Common Stocks | | | | | | | | | | | | | | | | |
Australia | | $ | 224,305 | | | $ | — | | | $ | — | | | $ | 224,305 | |
Bermuda | | | 153,813 | | | | — | | | | — | | | | 153,813 | |
Canada | | | 1,135,821 | | | | — | | | | — | | | | 1,135,821 | |
Cayman Islands | | | 26,843 | | | | — | | | | — | | | | 26,843 | |
China | | | 17,333 | | | | — | | | | — | | | | 17,333 | |
Denmark | | | 92,447 | | | | — | | | | — | | | | 92,447 | |
France | | | 129,796 | | | | — | | | | — | | | | 129,796 | |
Germany | | | 12,151 | | | | — | | | | — | | | | 12,151 | |
Hong Kong | | | 188,005 | | | | — | | | | — | | | | 188,005 | |
Indonesia | | | 80,306 | | | | — | | | | — | | | | 80,306 | |
Italy | | | 270,509 | | | | — | | | | — | | | | 270,509 | |
Japan | | | 713,947 | | | | — | | | | — | | | | 713,947 | |
Luxembourg | | | 51,688 | | | | — | | | | — | | | | 51,688 | |
Malaysia | | | 14,179 | | | | — | | | | — | | | | 14,179 | |
Netherlands | | | 153,553 | | | | — | | | | — | | | | 153,553 | |
New Zealand | | | 86,268 | | | | — | | | | — | | | | 86,268 | |
Norway | | | 144,540 | | | | — | | | | — | | | | 144,540 | |
Poland | | | 50,007 | | | | — | | | | — | | | | 50,007 | |
Portugal | | | 14,693 | | | | — | | | | — | | | | 14,693 | |
Singapore | | | 224,979 | | | | — | | | | — | | | | 224,979 | |
South Korea | | | 179,175 | | | | — | | | | — | | | | 179,175 | |
Sweden | | | 21,398 | | | | — | | | | — | | | | 21,398 | |
Switzerland | | | 193,541 | | | | — | | | | — | | | | 193,541 | |
Taiwan | | | 151,716 | | | | — | | | | — | | | | 151,716 | |
United Kingdom | | | 547,757 | | | | — | | | | — | | | | 547,757 | |
United States | | | 3,141,089 | | | | — | | | | — | | | | 3,141,089 | |
Short-Term Investments | | | 19,001,273 | | | | 7,245,124 | | | | — | | | | 26,246,397 | |
| | | | | | | | | | | | | | | | |
Total | | $ | 27,021,132 | | | $ | 7,245,124 | | | $ | — | | | $ | 34,266,256 | |
| | | | | | | | | | | | | | | | |
| | |
| | | Global Long/Short Equity Fund(2) | | | | |
| | | Level 1 | | | Level 2 | | | Level 3 | | | Total | |
| | | | |
Common Stocks | | | | | | | | | | | | | | | | |
Australia | | $ | 68,716 | | | $ | — | | | $ | — | | | $ | 68,716 | |
Bermuda | | | 51,919 | | | | — | | | | — | | | | 51,919 | |
Canada | | | 364,844 | | | | — | | | | — | | | | 364,844 | |
Cayman Islands | | | 9,474 | | | | — | | | | — | | | | 9,474 | |
China | | | 6,163 | | | | — | | | | — | | | | 6,163 | |
Denmark | | | 30,348 | | | | — | | | | — | | | | 30,348 | |
France | | | 41,404 | | | | — | | | | — | | | | 41,404 | |
Germany | | | 4,614 | | | | — | | | | — | | | | 4,614 | |
Hong Kong | | | 58,870 | | | | — | | | | — | | | | 58,870 | |
Indonesia | | | 22,448 | | | | — | | | | — | | | | 22,448 | |
Italy | | | 84,373 | | | | — | | | | — | | | | 84,373 | |
Japan | | | 250,760 | | | | — | | | | — | | | | 250,760 | |
Luxembourg | | | 16,036 | | | | — | | | | — | | | | 16,036 | |
Malaysia | | | 4,233 | | | | — | | | | — | | | | 4,233 | |
Netherlands | | | 46,716 | | | | — | | | | — | | | | 46,716 | |
New Zealand | | | 30,429 | | | | — | | | | — | | | | 30,429 | |
Norway | | | 48,374 | | | | — | | | | — | | | | 48,374 | |
Poland | | | 15,783 | | | | — | | | | — | | | | 15,783 | |
Portugal | | | 5,820 | | | | — | | | | — | | | | 5,820 | |
Singapore | | | 71,065 | | | | — | | | | — | | | | 71,065 | |
South Korea | | | 55,150 | | | | — | | | | — | | | | 55,150 | |
Sweden | | | 7,812 | | | | — | | | | — | | | | 7,812 | |
Switzerland | | | 59,109 | | | | — | | | | — | | | | 59,109 | |
Taiwan | | | 53,881 | | | | — | | | | — | | | | 53,881 | |
United Kingdom | | | 171,463 | | | | — | | | | — | | | | 171,463 | |
United States | | | 1,013,552 | | | | — | | | | — | | | | 1,013,552 | |
Short-Term Investments | | | 95,094 | | | | — | | | | — | | | | 95,094 | |
| | | | | | | | | | | | | | | | |
Total | | $ | 2,688,450 | | | $ | — | | | $ | — | | | $ | 2,688,450 | |
| | | | | | | | | | | | | | | | |
| | | | | | | | | | | | | | | | |
| | | Ultra ShortTax-Free Fund | | | | |
| | | Level 1 | | | Level 2 | | | Level 3 | | | Total | |
Municipals | | $ | 12,000,000 | | | $ | 538,758,779 | | | $ | — | | | $ | 550,758,779 | |
Short-Term Investments | | | — | | | | 17,700,000 | | | | — | | | | 17,700,000 | |
| | | | | | | | | | | | | | | | |
Total | | $ | 12,000,000 | | | $ | 556,458,779 | | | $ | — | | | $ | 568,458,779 | |
| | | | | | | | | | | | | | | | |
| | |
| | | ShortTax-Free Fund | | | | |
| | | Level 1 | | | Level 2 | | | Level 3 | | | Total | |
Municipals | | $ | 2,300,000 | | | $ | 156,789,364 | | | $ | — | | | $ | 159,089,364 | |
Repurchase Agreements | | | — | | | | 371,965 | | | | — | | | | 371,965 | |
| | | | | | | | | | | | | | | | |
Total | | $ | 2,300,000 | | | $ | 157,161,329 | | | $ | — | | | $ | 159,461,329 | |
| | | | | | | | | | | | | | | | |
| | |
| | | Short-Term Income Fund | | | | |
| | | Level 1 | | | Level 2 | | | Level 3 | | | Total | |
Asset-Backed Securities | | $ | — | | | $ | 53,526,200 | | | $ | — | | | $ | 53,526,200 | |
Collateralized Mortgage Obligations | | | — | | | | 20,991,596 | | | | — | | | | 20,991,596 | |
Commercial Mortgage Securities | | | — | | | | 14,092,646 | | | | — | | | | 14,092,646 | |
Corporate Bonds & Notes | | | — | | | | 127,960,725 | | | | — | | | | 127,960,725 | |
Mutual Funds | | | 979,982 | | | | — | | | | — | | | | 979,982 | |
U.S. Government & U.S. Government Agency Obligations | | | — | | | | 27,700,690 | | | | — | | | | 27,700,690 | |
U.S. Government Agency-Mortgage Securities | | | — | | | | 3,800,242 | | | | — | | | | 3,800,242 | |
Short-Term Investments | | | 3,541,770 | | | | 37,255,862 | | | | — | | | | 40,797,632 | |
| | | | | | | | | | | | | | | | |
Total | | $ | 4,521,752 | | | $ | 285,327,961 | | | $ | — | | | $ | 289,849,713 | |
| | | | | | | | | | | | | | | | |
| | |
| | | IntermediateTax-Free Fund | | | | |
| | | Level 1 | | | Level 2 | | | Level 3 | | | Total | |
Municipals | | $ | 8,200,000 | | | $ | 1,914,491,223 | | | $ | — | | | $ | 1,922,691,223 | |
Repurchase Agreements | | | — | | | | 175,593 | | | | — | | | | 175,593 | |
| | | | | | | | | | | | | | | | |
Total | | $ | 8,200,000 | | | $ | 1,914,666,816 | | | $ | — | | | $ | 1,922,866,816 | |
| | | | | | | | | | | | | | | | |
| | |
| | | Strategic Income Fund | | | | |
| | | Level 1 | | | Level 2 | | | Level 3 | | | Total | |
Asset-Backed Securities | | $ | — | | | $ | 176,348 | | | $ | — | | | $ | 176,348 | |
Collateralized Mortgage Obligations | | | — | | | | 11,303,115 | | | | — | | | | 11,303,115 | |
Commercial Mortgage Securities | | | — | | | | 2,978,890 | | | | — | | | | 2,978,890 | |
Corporate Bonds & Notes | | | — | | | | 54,532,590 | | | | — | | | | 54,532,590 | |
U.S. Government Agency-Mortgage Securities | | | — | | | | 6,325,905 | | | | — | | | | 6,325,905 | |
Short-Term Investments | | | 1,992,682 | | | | 20,275,719 | | | | — | | | | 22,268,401 | |
| | | | | | | | | | | | | | | | |
Total | | $ | 1,992,682 | | | $ | 95,592,567 | | | $ | — | | | $ | 97,585,249 | |
| | | | | | | | | | | | | | | | |
151
| | |
| | |
| Notes to Financial Statements(continued) | | |
| | | | | | | | | | | | | | | | |
| | | TCH Corporate Income Fund | | | | |
| | | Level 1 | | | Level 2 | | | Level 3 | | | Total | |
Corporate Bonds & Notes | | $ | — | | | $ | 322,380,056 | | | $ | — | | | $ | 322,380,056 | |
Municipals | | | — | | | | 521,095 | | | | — | | | | 521,095 | |
Short-Term Investments | | | 19,020,395 | | | | 79,942,506 | | | | — | | | | 98,962,901 | |
| | | | | | | | | | | | | | | | |
Total | | $ | 19,020,395 | | | $ | 402,843,657 | | | $ | — | | | $ | 421,864,052 | |
| | | | | | | | | | | | | | | | |
| | |
| | | TCH Core Plus Bond Fund | | | | |
| | | Level 1 | | | Level 2 | | | Level 3 | | | Total | |
Asset-Backed Securities | | $ | — | | | $ | 23,750,341 | | | $ | — | | | $ | 23,750,341 | |
Collateralized Mortgage Obligations | | | — | | | | 25,434,854 | | | | — | | | | 25,434,854 | |
Commercial Mortgage Securities | | | — | | | | 37,401,896 | | | | — | | | | 37,401,896 | |
Corporate Bonds & Notes | | | — | | | | 373,316,800 | | | | — | | | | 373,316,800 | |
Municipals | | | — | | | | 312,657 | | | | — | | | | 312,657 | |
U.S. Government & U.S. Government Agency Obligations | | | — | | | | 204,839,928 | | | | — | | | | 204,839,928 | |
U.S. Government Agency-Mortgage Securities | | | — | | | | 328,909,774 | | | | — | | | | 328,909,774 | |
Short-Term Investments | | | 40,249,132 | | | | 122,747,158 | | | | — | | | | 162,996,290 | |
| | | | | | | | | | | | | | | | |
Total | | $ | 40,249,132 | | | $ | 1,116,713,408 | | | $ | — | | | $ | 1,156,962,540 | |
| | | | | | | | | | | | | | | | |
| | |
| | | High Yield Bond Fund | | | | |
| | | Level 1 | | | Level 2 | | | Level 3 | | | Total | |
Corporate Bonds & Notes | | $ | — | | | $ | 8,649,882 | | | $ | — | | | $ | 8,649,882 | |
Short-Term Investments | | | 439,932 | | | | 2,981,780 | | | | — | | | | 3,421,712 | |
| | | | | | | | | | | | | | | | |
Total | | $ | 439,932 | | | $ | 11,631,662 | | | $ | — | | | $ | 12,071,594 | |
| | | | | | | | | | | | | | | | |
| | |
| | | Government Money Market Fund | | | | |
| | | Level 1 | | | Level 2 | | | Level 3 | | | Total | |
Mutual Funds | | $ | 200,000,000 | | | $ | — | | | $ | — | | | $ | 200,000,000 | |
Repurchase Agreements | | | — | | | | 1,208,953,128 | | | | — | | | | 1,208,953,128 | |
U.S. Government & U.S. Government Agency Obligations | | | — | | | | 1,655,284,989 | | | | — | | | | 1,655,284,989 | |
U.S. Treasury Bills | | | — | | | | 129,434,518 | | | | — | | | | 129,434,518 | |
| | | | | | | | | | | | | | | | |
Total | | $ | 200,000,000 | | | $ | 2,993,672,635 | | | $ | — | | | $ | 3,193,672,635 | |
| | | | | | | | | | | | | | | | |
| | | | | | | | | | | | | | | | |
| | | Tax-Free Money Market Fund | | | | |
| | | Level 1 | | | Level 2 | | | Level 3 | | | Total | |
Municipals | | $ | — | | | $ | 390,172,529 | | | $ | — | | | $ | 390,172,529 | |
Mutual Funds | | | 19,199,390 | | | | — | | | | — | | | | 19,199,390 | |
| | | | | | | | | | | | | | | | |
Total | | $ | 19,199,390 | | | $ | 390,172,529 | | | $ | — | | | $ | 409,371,919 | |
| | | | | | | | | | | | | | | | |
| | |
| | | Prime Money Market Fund | | | | |
| | | Level 1 | | | Level 2 | | | Level 3 | | | Total | |
Certificates of Deposit | | $ | — | | | $ | 115,011,450 | | | $ | — | | | $ | 115,011,450 | |
Commercial Paper | | | — | | | | 252,650,566 | | | | — | | | | 252,650,566 | |
Municipals | | | — | | | | 1,940,000 | | | | — | | | | 1,940,000 | |
Mutual Funds | | | 13,000,000 | | | | — | | | | — | | | | 13,000,000 | |
Repurchase Agreements | | | — | | | | 113,907,300 | | | | — | | | | 113,907,300 | |
| | | | | | | | | | | | | | | | |
Total | | $ | 13,000,000 | | | $ | 483,509,316 | | | $ | — | | | $ | 496,509,316 | |
| | | | | | | | | | | | | | | | |
| | |
| | | Institutional Prime Money Market
Fund | | | | |
| | | Level 1 | | | Level 2 | | | Level 3 | | | Total | |
Certificates of Deposit | | $ | — | | | $ | 131,408,449 | | | $ | — | | | $ | 131,408,449 | |
Commercial Paper | | | — | | | | 273,966,990 | | | | — | | | | 273,966,990 | |
Mutual Funds | | | 16,114,592 | | | | — | | | | — | | | | 16,114,592 | |
Repurchase Agreements | | | — | | | | 140,000,000 | | | | — | | | | 140,000,000 | |
| | | | | | | | | | | | | | | | |
Total | | $ | 16,114,592 | | | $ | 545,375,439 | | | $ | — | | | $ | 561,490,031 | |
| | | | | | | | | | | | | | | | |
| (1) | Allsub-categories within Common Stocks and Preferred Stocks represent either entire Level 1 or Level 2 evaluation status. |
| (2) | The following is a summary of other financial instruments that are derivative investments not reflected in the Schedules of Investments, such as futures contracts, forwards contracts and swap agreements. Amounts below are the unrealized appreciation (depreciation) on these investments. |
| | | | | | | | | | | | | | | | |
| | | Unrealized Appreciation (Depreciation)
On Other Financial Instruments | |
Fund | | Level 1 | | | Level 2 | | | Level 3 | | | Total | |
Alternative Strategies Fund: | | | | | | | | | | | | | | | | |
Long Futures Contracts | | $ | 140,622 | | | $ | — | | | $ | — | | | $ | 140,622 | |
Short Futures Contracts | | | 28,792 | | | | — | | | | — | | | | 28,792 | |
| | | | | | | | | | | | | | | | |
Total Futures Contracts | | $ | 169,414 | | | $ | — | | | $ | — | | | $ | 169,414 | |
| | | | | | | | | | | | | | | | |
Total Forward Contracts | | $ | — | | | $ | 134,558 | | | $ | — | | | $ | 134,558 | |
| | | | | | | | | | | | | | | | |
Total Return Swap Agreements | | $ | — | | | $ | (151,150 | ) | | $ | — | | | $ | (151,150 | ) |
| | | | | | | | | | | | | | | | |
Global Long/Short Equity Fund: | | | | | | | | | | | | | | | | |
Total Return Swap Agreements | | $ | — | | | $ | (30,858 | ) | | $ | — | | | $ | (30,858 | ) |
| | | | | | | | | | | | | | | | |
| 4. | | Derivative Holdings and Activity Detail |
Derivatives and Hedging Disclosures—Derivatives and hedging require enhanced disclosures about the Funds’ derivative and hedging activities, including how such activities are accounted for and their effects on the Funds’ financial positions, performance and cash flows. For the year ended August 31, 2019, certain strategies within the Alternative Strategies Fund and Global Long/Short Equity Fund utilize derivatives for the purposes of generating and enhancing total return.
During the year ended August 31, 2019, the Alternative Strategies Fund and Global Long/Short Equity Fund had average quarterly contracts or notional values outstanding:
| | | | | | | | | | | | | | | | | | | | | | | | | | | | | | | | |
| | | Average Quarterly Contracts | | | Average Quarterly Notional Values | | | | | | | |
| | | Long
Futures | | | Short Futures | | | Purchased
Options | | | Written Options | | | Long
Forwards | | | Short
Forwards | | | Long Total
Return
Swaps | | | Short Total
Return
Swaps | |
Alternative Strategies Fund | | | 357 | | | | 242 | | | | 323 | | | | 240 | | | $ | 21,989,089 | | | $ | 26,832,773 | | | $ | 22,758,660 | | | $ | 22,757,987 | |
Global Long/Short Equity Fund | | | — | | | | — | | | | — | | | | — | | | | — | | | | 658 | | | | 1,990,071 | | | | 2,022,313 | |
152
The effects of these derivative instruments on the Alternative Strategies Fund’s and the Global Long/Short Equity Fund’s financial positions and financial performance are reflected in the Statements of Assets and Liabilities and Statements of Operations, and are presented in the table below. The values of derivative instruments as of August 31, 2019 by risk category are as follows:
| | | | | | | | | | | | |
| | | Statement of
Asset and Liabilities | | | Statement of Operations | |
Fund/Financial Instrument Type | | Amount | | | Realized
Gain (Loss) | | | Net Change in
Appreciation/
Depreciation | |
Alternative Strategies Fund | | | | | | | | | | | | |
Interest rate futures contracts: | | | | | | | | | | | | |
Receivables for daily variation margin | | $ | 141,308 | | | | | | | | | |
Payables for daily variation margin | | | (10,175 | ) | | | | | | | | |
| | | | | | | | | | | | |
Net | | | 131,133 | | | $ | 615,440 | | | $ | 101,774 | |
| | | |
Equity futures contracts: | | | | | | | | | | | | |
Receivables for daily variation margin | | | 92,496 | | | | | | | | | |
Payables for daily variation margin | | | (54,215 | ) | | | | | | | | |
| | | | | | | | | | | | |
Net | | | 38,281 | | | | (356,015 | ) | | | 703,833 | |
| | | |
Total receivables for interest rate and equity futures contracts | | | 233,804 | | | | | | | | | |
Total payables for interest rate and equity futures contracts | | | (64,390 | ) | | | | | | | | |
| | | | | | | | | | | | |
Net | | $ | 169,414 | | | $ | 259,425 | | | $ | 805,607 | |
| | | | | | | | | | | | |
| | | |
Forward foreign exchange contracts: | | | | | | | | | | | | |
Receivables for forward foreign exchange contracts | | $ | 507,662 | | | | | | | | | |
Payables for forward foreign exchange contracts | | | (373,104 | ) | | | | | | | | |
| | | | | | | | | | | | |
Net | | $ | 134,558 | | | $ | 308,811 | | | $ | (45,363 | ) |
| | | | | | | | | | | | |
| | | |
Equity option contracts: | | | | | | | | | | | | |
Purchased options | | $ | — | | | $ | 7,542 | | | $ | 32,082 | |
| | | | | | | | | | | | |
Written options | | $ | — | | | $ | (28,525 | ) | | $ | (12,249 | ) |
| | | | | | | | | | | | |
| | | |
Equity total return swap agreements: | | | | | | | | | | | | |
Receivables for swap agreements | | $ | 6,697 | | | | | | | | | |
Payables for swap agreements | | | (157,847 | ) | | | | | | | | |
| | | | | | | | | | | | |
Net | | $ | (151,150 | ) | | $ | (1,943,024 | ) | | $ | (151,150 | ) |
| | | | | | | | | | | | |
Global Long/Short Equity Fund | | | | | | | | | | | | |
Equity total return swap agreements: | | | | | | | | | | | | |
Receivables for swap agreements | | $ | — | | | | | | | | | |
Payables for swap agreements | | | (30,858 | ) | | | | | | | | |
| | | | | | | | | | | | |
Net | | $ | (30,858 | ) | | $ | (106,666 | ) | | $ | (30,858 | ) |
| | | | | | | | | | | | |
Offsetting of Assets and Liabilities—Disclosures about offsetting assets and liabilities require an entity to disclose information about offsetting and related arrangements to enable users of its financial statements to understand the effect of those arrangements on its financial position. The guidance requires retrospective application for all comparative periods presented. As of August 31, 2019, master netting arrangements exist for swap contracts in the Funds. The Funds’ Statements of Assets and Liabilities (“SAL”) presents derivative instruments on a gross basis, therefore, no net amounts and no offset amounts exist within the SAL to present below. Gross amounts of the derivative instruments, amounts related to financial instruments/cash collateral not offset in the SAL and net amounts are presented below:
| | | | | | | | | | | | | | | | | | | | | | | | | | | | | | | | | | | | | | | | |
| | | Derivative Assets | | | Derivative Liabilities | | | Net
Derivative
Assets
(Liabilities) | | | Collateral Pledged
(Received)(1) | | | | |
Fund/Counterparty | | Forward
Currency
Contracts | | | Futures
Contracts | | | Swaps | | | Forward
Currency
Contracts | | | Futures
Contracts | | | Swaps | | | Financial
Instruments | | | Cash | | | Net
Amount | |
Alternative Strategies Fund | | | | | | | | | | | | | | | | | | | | | | | | | | | | | | | | | | | | | | | | |
Bank of America Merrill Lynch (OTC) | | $ | 505,725 | | | $ | — | | | $ | — | | | $ | (268,293 | ) | | $ | — | | | $ | — | | | $ | 237,432 | | | $ | — | | | $ | — | | | $ | 237,432 | |
Bank of America Merrill Lynch (OTC) | | | — | | | | — | | | | 6,697 | | | | — | | | | — | | | | — | | | | 6,697 | | | | — | | | | — | | | | 6,697 | |
BNP Paribas, N.A. (OTC) | | | — | | | | — | | | | — | | | | (69,416 | ) | | | — | | | | — | | | | (69,416 | ) | | | — | | | | — | | | | (69,416 | ) |
HSBC Bank (USA) (OTC) | | | — | | | | — | | | | — | | | | (35,395 | ) | | | — | | | | — | | | | (35,395 | ) | | | — | | | | — | | | | (35,395 | ) |
Societe Generale (OTC) | | | 1,937 | | | | — | | | | — | | | | — | | | | — | | | | — | | | | 1,937 | | | | — | | | | — | | | | 1,937 | |
JPMorgan Chase & Co. | | | — | | | | — | | | | — | | | | — | | | | — | | | | (157,847 | ) | | | (157,847 | ) | | | — | | | | 157,847 | | | | — | |
Global Long/Short Equity Fund | | | | | | | | | | | | | | | | | | | | | | | | | | | | | | | | | | | | | | | | |
JPMorgan Chase & Co. | | | — | | | | — | | | | — | | | | — | | | | — | | | | (30,858 | ) | | | (30,858 | ) | | | — | | | | — | | | | (30,858 | ) |
| (1) | Collateral pledged may exceed amount of liability balance. |
153
| | |
| | |
| Notes to Financial Statements(continued) | | |
The Articles of Incorporation permit the Directors to issue an indefinite number of full and fractional shares of common stock, par value $0.0001 per share. Transactions in capital stock were as follows:
| | | | | | | | | | | | | | | | |
| | | Low Volatility
Equity Fund | | | Dividend
Income Fund | |
| | | Year Ended
August 31,
2019 | | | Year Ended
August 31,
2018 | | | Year Ended
August 31,
2019 | | | Year Ended
August 31,
2018 | |
Capital stock transactions in dollars: | | | | | | | | | | | | | | | | |
Proceeds from sale of shares: | | | | | | | | | | | | | | | | |
Investor class of shares | | $ | — | | | $ | — | | | $ | — | | | $ | — | |
Advisor class of shares | | | 9,668,503 | | | | 2,286,790 | | | | 12,698,198 | | | | 3,699,050 | |
Institutional class of shares | | | 115,023,562 | | | | 14,306,331 | | | | 222,394,639 | | | | 36,241,152 | |
Retirement classR-3 of shares | | | — | | | | — | | | | — | | | | — | |
Retirement classR-6 of shares | | | — | | | | — | | | | — | | | | — | |
| | | | | | | | | | | | | | | | |
Net proceeds from sale of shares | | | 124,692,065 | | | | 16,593,121 | | | | 235,092,837 | | | | 39,940,202 | |
Net asset value of shares issued to shareholders in payment of distributions declared: | | | | | | | | | | | | | | | | |
Investor class of shares | | | — | | | | — | | | | — | | | | — | |
Advisor class of shares | | | 2,438,172 | | | | 1,153,738 | | | | 543,537 | | | | 356,437 | |
Institutional class of shares | | | 10,010,513 | | | | 4,960,839 | | | | 11,190,903 | | | | 15,598,754 | |
Retirement classR-3 of shares | | | — | | | | — | | | | — | | | | — | |
Retirement classR-6 of shares | | | — | | | | — | | | | — | | | | — | |
| | | | | | | | | | | | | | | | |
Net proceeds from shares issued: | | | 12,448,685 | | | | 6,114,577 | | | | 11,734,440 | | | | 15,955,191 | |
Cost of shares redeemed: | | | | | | | | | | | | | | | | |
Investor class of shares | | | — | | | | — | | | | — | | | | — | |
Advisor class of shares | | | (9,069,238 | ) | | | (11,884,791 | ) | | | (3,157,993 | ) | | | (1,523,536 | ) |
Institutional class of shares | | | (50,564,468 | ) | | | (53,938,321 | ) | | | (70,626,503 | ) | | | (24,803,382 | ) |
Retirement classR-3 of shares | | | — | | | | — | | | | — | | | | — | |
Retirement classR-6 of shares | | | — | | | | — | | | | — | | | | — | |
| | | | | | | | | | | | | | | | |
Net cost of shares redeemed | | | (59,633,706 | ) | | | (65,823,112 | ) | | | (73,784,496 | ) | | | (26,326,918 | ) |
| | | | | | | | | | | | | | | | |
Net change resulting from fund share transactions in dollars | | $ | 77,507,044 | | | $ | (43,115,414 | ) | | $ | 173,042,781 | | | $ | 29,568,475 | |
| | | | | | | | | | | | | | | | |
| | | | |
Capital stock transactions in shares: | | | | | | | | | | | | | | | | |
Sale of shares: | | | | | | | | | | | | | | | | |
Investor class of shares | | | — | | | | — | | | | — | | | | — | |
Advisor class of shares | | | 641,978 | | | | 155,588 | | | | 890,265 | | | | 250,661 | |
Institutional class of shares | | | 7,766,860 | | | | 963,075 | | | | 15,839,792 | | | | 2,481,080 | |
Retirement classR-3 of shares | | | — | | | | — | | | | — | | | | — | |
Retirement classR-6 of shares | | | — | | | | — | | | | — | | | | — | |
| | | | | | | | | | | | | | | | |
Net sale of shares | | | 8,408,838 | | | | 1,118,663 | | | | 16,730,057 | | | | 2,731,741 | |
Shares issued to shareholders in payment of distributions declared: | | | | | | | | | | | | | | | | |
Investor class of shares | | | — | | | | — | | �� | | — | | | | — | |
Advisor class of shares | | | 171,813 | | | | 79,316 | | | | 38,845 | | | | 25,309 | |
Institutional class of shares | | | 700,704 | | | | 339,986 | | | | 803,639 | | | | 1,111,368 | |
Retirement classR-3 of shares | | | — | | | | — | | | | — | | | | — | |
Retirement classR-6 of shares | | | — | | | | — | | | | — | | | | — | |
| | | | | | | | | | | | | | | | |
Net shares issued | | | 872,517 | | | | 419,302 | | | | 842,484 | | | | 1,136,677 | |
Shares redeemed: | | | | | | | | | | | | | | | | |
Investor class of shares | | | — | | | | — | | | | — | | | | — | |
Advisor class of shares | | | (606,674 | ) | | | (809,235 | ) | | | (227,462 | ) | | | (102,595 | ) |
Institutional class of shares | | | (3,387,527 | ) | | | (3,652,276 | ) | | | (5,024,544 | ) | | | (1,686,199 | ) |
Retirement classR-3 of shares | | | — | | | | — | | | | — | | | | — | |
Retirement classR-6 of shares | | | — | | | | — | | | | — | | | | — | |
| | | | | | | | | | | | | | | | |
Net shares redeemed | | | (3,994,201 | ) | | | (4,461,511 | ) | | | (5,252,006 | ) | | | (1,788,794 | ) |
| | | | | | | | | | | | | | | | |
Net change resulting from fund share transactions in shares | | | 5,287,154 | | | | (2,923,546 | ) | | | 12,320,535 | | | | 2,079,624 | |
| | | | | | | | | | | | | | | | |
| (1) | Includes $4,159,630 ofpaid-in-capital received from anin-kind subscription purchase on December 15, 2017. The total value received of $4,159,630 from thisnon-taxable event represented $2,408,685 in securities cost, $1,730,375 in net unrealized appreciation, $3,388 in accrued dividends, $17,172 in cash, and $10 in accrued interest in exchange for 258,754 Institutional Class of shares at time of purchase. |
| (2) | Reflects operations for the period from September 1, 2017, to May 11, 2018 (termination of Retirement classR-3 of shares). |
| (3) | Reflects operations for the period from September 1, 2017, to April 27, 2018 (termination of Investor class of shares). |
154
| | | | | | | | | | | | | | | | | | | | | | | | | | | | | | |
Large-Cap
Value Fund | | | Large-Cap
Growth Fund | | | Mid-Cap
Value Fund | | | Mid-Cap
Growth Fund | |
Year Ended
August 31,
2019 | | | Year Ended
August 31,
2018 | | | Year Ended
August 31,
2019 | | | Year Ended
August 31,
2018 | | | Year Ended
August 31,
2019 | | | Year Ended
August 31,
2018 | | | Year Ended
August 31,
2019 | | | Year Ended
August 31,
2018 | |
| | | | | | | | | | | | | | | | | | | | | | | | | | | | | | |
| | | | | | | | | | | | | | | | | | | | | | | | | | | | | | |
| $ | — | | | $ | — | | | $ | 5,143,147 | | | $ | 8,890,108 | | | $ | — | | | $ | — | | | $ | — | | | $ | — | |
| | 702,179 | | | | 1,269,566 | | | | 754,845 | | | | 266,934 | | | | 1,384,665 | | | | 2,177,622 | | | | 805,182 | | | | 984,230 | |
| | 44,351,441 | | | | 69,446,391 | (1) | | | 66,582,901 | | | | 50,667,833 | | | | 11,581,825 | | | | 17,358,535 | | | | 8,697,238 | | | | 12,719,389 | |
| | — | | | | — | | | | — | | | | — | | | | — | | | | 768 | (2) | | | — | | | | — | |
| | 21,893,752 | | | | 87,457,626 | | | | 216,486,685 | | | | 63,644,998 | | | | 7,761,178 | | | | 28,089,301 | | | | 6,575,320 | | | | 24,250,761 | |
| | | | | | | | | | | | | | | | | | | | | | | | | | | | | | |
| | 66,947,372 | | | | 158,173,583 | | | | 288,967,578 | | | | 123,469,873 | | | | 20,727,668 | | | | 47,626,226 | | | | 16,077,740 | | | | 37,954,380 | |
|
|
| | | | | | | | | | | | | | | | | | | | | | | | | | | | |
| | — | | | | — | | | | 7,903,690 | | | | 4,067,641 | | | | — | | | | — | | | | — | | | | — | |
| | 2,194,121 | | | | 2,439,169 | | | | 116,339 | | | | 28,989 | | | | 5,843,113 | | | | 2,704,039 | | | | 2,598,569 | | | | 1,100,667 | |
| | 28,839,817 | | | | 31,249,109 | | | | 31,915,301 | | | | 14,433,447 | | | | 12,747,841 | | | | 6,519,523 | | | | 12,929,680 | | | | 5,913,858 | |
| | — | | | | — | | | | — | | | | — | | | | — | | | | 79 | (2) | | | — | | | | — | |
| | 8,385,292 | | | | 862,668 | | | | 9,011,688 | | | | 184,270 | | | | 3,943,242 | | | | 816,233 | | | | 3,595,774 | | | | 36,318 | |
| | | | | | | | | | | | | | | | | | | | | | | | | | | | | | |
| | 39,419,230 | | | | 34,550,946 | | | | 48,947,018 | | | | 18,714,347 | | | | 22,534,196 | | | | 10,039,874 | | | | 19,124,023 | | | | 7,050,843 | |
| | | | | | | | | | | | | | | | | | | | | | | | | | | | | | |
| | — | | | | — | | | | (10,901,192 | ) | | | (35,301,963 | ) | | | — | | | | — | | | | — | | | | — | |
| | (3,014,034 | ) | | | (7,185,801 | ) | | | (859,315 | ) | | | (372,881 | ) | | | (12,282,708 | ) | | | (17,789,671 | ) | | | (2,413,973 | ) | | | (6,893,086 | ) |
| | (81,627,562 | ) | | | (135,297,594 | ) | | | (169,560,029 | ) | | | (116,167,629 | ) | | | (26,636,484 | ) | | | (44,333,122 | ) | | | (20,445,365 | ) | | | (42,795,496 | ) |
| | — | | | | — | | | | — | | | | — | | | | — | | | | (25,338 | )(2) | | | — | | | | (24,268 | )(3) |
| | (45,115,132 | ) | | | (9,866,413 | ) | | | (53,953,905 | ) | | | (12,334,747 | ) | | | (22,367,984 | ) | | | (14,011,689 | ) | | | (20,814,797 | ) | | | (4,269,640 | ) |
| | | | | | | | | | | | | | | | | | | | | | | | | | | | | | |
| | (129,756,728 | ) | | | (152,349,808 | ) | | | (235,274,441 | ) | | | (164,177,220 | ) | | | (61,287,176 | ) | | | (76,159,820 | ) | | | (43,674,135 | ) | | | (53,982,490 | ) |
| | | | | | | | | | | | | | | | | | | | | | | | | | | | | | |
| $ | (23,390,126 | ) | | $ | 40,374,721 | | | $ | 102,640,155 | | | $ | (21,993,000 | ) | | $ | (18,025,312 | ) | | $ | (18,493,720 | ) | | $ | (8,472,372 | ) | | $ | (8,977,267 | ) |
| | | | | | | | | | | | | | | | | | | | | | | | | | | | | | |
| | | | | | | |
| | | | | | | | | | | | | | | | | | | | | | | | | | | | | | | |
| | | | | | | | | | | | | | | | | | | | | | | | | | | | | | |
| | — | | | | — | | | | 285,200 | | | | 479,102 | | | | — | | | | — | | | | — | | | | — | |
| | 48,101 | | | | 78,249 | | | | 39,698 | | | | 14,070 | | | | 130,653 | | | | 172,720 | | | | 54,552 | | | | 61,162 | |
| | 3,087,120 | | | | 4,307,244 | (1) | | | 3,686,092 | | | | 2,690,356 | | | | 1,120,182 | | | | 1,412,871 | | | | 568,485 | | | | 757,625 | |
| | — | | | | — | | | | — | | | | — | | | | — | | | | 63 | (2) | | | — | | | | — | |
| | 1,551,696 | | | | 5,392,425 | | | | 12,113,349 | | | | 3,340,294 | | | | 720,902 | | | | 2,291,863 | | | | 440,599 | | | | 1,419,933 | |
| | | | | | | | | | | | | | | | | | | | | | | | | | | | | | |
| | 4,686,917 | | | | 9,777,918 | | | | 16,124,339 | | | | 6,523,822 | | | | 1,971,737 | | �� | | 3,877,517 | | | | 1,063,636 | | | | 2,238,720 | |
| | | | | | | | | | | | | | | | | | | | | | | | | | | | | | |
| | — | | | | — | | | | 481,932 | | | | 230,331 | | | | — | | | | — | | | | — | | | | — | |
| | 158,402 | | | | 153,737 | | | | 7,102 | | | | 1,642 | | | | 581,404 | | | | 220,370 | | | | 200,507 | | | | 73,182 | |
| | 2,079,204 | | | | 1,968,958 | | | | 1,928,417 | | | | 810,356 | | | | 1,278,620 | | | | 536,253 | | | | 943,084 | | | | 376,679 | |
| | — | | | | — | | | | — | | | | — | | | | — | | | | 7 | (2) | | | — | | | | — | |
| | 603,955 | | | | 54,032 | | | | 543,856 | | | | 10,341 | | | | 395,511 | | | | 67,103 | | | | 260,186 | | | | 2,300 | |
| | | | | | | | | | | | | | | | | | | | | | | | | | | | | | |
| | 2,841,561 | | | | 2,176,727 | | | | 2,961,307 | | | | 1,052,670 | | | | 2,255,535 | | | | 823,733 | | | | 1,403,777 | | | | 452,161 | |
| | | | | | | | | | | | | | | | | | | | | | | | | | | | | | |
| | — | | | | — | | | | (626,865 | ) | | | (1,849,507 | ) | | | — | | | | — | | | | — | | | | — | |
| | (211,798 | ) | | | (450,944 | ) | | | (48,183 | ) | | | (20,984 | ) | | | (1,165,342 | ) | | | (1,443,400 | ) | | | (165,917 | ) | | | (434,884 | ) |
| | (6,116,012 | ) | | | (8,306,456 | ) | | | (9,504,674 | ) | | | (6,128,458 | ) | | | (2,584,495 | ) | | | (3,608,429 | ) | | | (1,291,903 | ) | | | (2,534,418 | ) |
| | — | | | | — | | | | — | | | | — | | | | — | | | | (2,093 | )(2) | | | — | | | | (1,460 | )(3) |
| | (3,186,393 | ) | | | (618,306 | ) | | | (3,058,871 | ) | | | (637,550 | ) | | | (2,186,144 | ) | | | (1,120,225 | ) | | | (1,391,659 | ) | | | (244,098 | ) |
| | | | | | | | | | | | | | | | | | | | | | | | | | | | | | |
| | (9,514,203 | ) | | | (9,375,706 | ) | | | (13,238,593 | ) | | | (8,636,499 | ) | | | (5,935,981 | ) | | | (6,174,147 | ) | | | (2,849,479 | ) | | | (3,214,860 | ) |
| | | | | | | | | | | | | | | | | | | | | | | | | | | | | | |
| | (1,985,725 | ) | | | 2,578,939 | | | | 5,847,053 | | | | (1,060,007 | ) | | | (1,708,709 | ) | | | (1,472,897 | ) | | | (382,066 | ) | | | (523,979 | ) |
| | | | | | | | | | | | | | | | | | | | | | | | | | | | | | |
155
| | |
| | |
| Notes to Financial Statements(continued) | | |
| | | | | | | | | | | | | | | | |
| | | | | | | |
| | |
Small-Cap
Value Fund | | | Small-Cap
Core Fund | |
| | | Year Ended
August 31,
2019 | | | Year Ended
August 31,
2018 | | | Year Ended
August 31,
2019 | | | Year Ended
August 31,
2018 | |
Capital stock transactions in dollars: | | | | | | | | | | | | | | | | |
Proceeds from sale of shares: | | | | | | | | | | | | | | | | |
Investor class of shares | | $ | — | | | $ | — | | | $ | — | | | $ | — | |
Advisor class of shares | | | 305,655 | | | | 158,365 | | | | 25,507 | | | | 810,118 | |
Institutional class of shares | | | 7,431,075 | | | | 7,360,861 | | | | 4,568,187 | | | | 4,646,390 | |
Retirement classR-3 of shares | | | — | | | | 9,605 | (2) | | | — | | | | — | |
Retirement classR-6 of shares | | | 4,775,499 | | | | 12,814,203 | | | | — | | | | — | |
Class F-3 of shares | | | — | | | | — | | | | — | | | | — | |
| | | | | | | | | | | | | | | | |
Net proceeds from sale of shares | | | 12,512,229 | | | | 20,343,034 | | | | 4,593,694 | | | | 5,456,508 | |
Net asset value of shares issued to shareholders in payment of distributions declared: | | | | | | | | | | | | | | | | |
Advisor class of shares | | | 310,252 | | | | 374,648 | | | | 162,495 | | | | 126,053 | |
Institutional class of shares | | | 3,876,070 | | | | 4,591,637 | | | | 1,547,491 | | | | 1,050,655 | |
Retirement classR-3 of shares | | | — | | | | 4,108 | (2) | | | — | | | | — | |
Retirement classR-6 of shares | | | 1,032,489 | | | | 213,686 | | | | — | | | | — | |
Class F-3 of shares | | | — | | | | — | | | | — | | | | — | |
| | | | | | | | | | | | | | | | |
Net proceeds from shares issued: | | | 5,218,811 | | | | 5,184,079 | | | | 1,709,986 | | | | 1,176,708 | |
Cost of shares redeemed: | | | | | | | | | | | | | | | | |
Investor class of shares | | | — | | | | — | | | | — | | | | — | |
Advisor class of shares | | | (1,168,307 | ) | | | (1,238,217 | ) | | | (1,825,618 | ) | | | (939,096 | ) |
Institutional class of shares | | | (10,640,892 | ) | | | (17,739,504 | ) | | | (8,644,047 | ) | | | (3,809,548 | ) |
Retirement classR-3 of shares | | | — | | | | (136,151 | )(2) | | | — | | | | — | |
Retirement classR-6 of shares | | | (9,068,159 | ) | | | (2,535,413 | ) | | | — | | | | — | |
Class F-3 of shares | | | — | | | | — | | | | — | | | | — | |
| | | | | | | | | | | | | | | | |
Net cost of shares redeemed | | | (20,877,358 | ) | | | (21,649,285 | ) | | | (10,469,665 | ) | | | (4,748,644 | ) |
Redemption fees | | | — | | | | — | | | | — | | | | — | |
| | | | | | | | | | | | | | | | |
Net change resulting from fund share transactions in dollars | | $ | (3,146,318 | ) | | $ | 3,877,828 | | | $ | (4,165,985 | ) | | $ | 1,884,572 | |
| | | | | | | | | | | | | | | | |
| | | | |
Capital stock transactions in shares: | | | | | | | | | | | | | | | | |
Sale of shares: | | | | | | | | | | | | | | | | |
Investor class of shares | | | — | | | | — | | | | — | | | | — | |
Advisor class of shares | | | 24,728 | | | | 10,987 | | | | 1,890 | | | | 58,097 | |
Institutional class of shares | | | 604,137 | | | | 511,721 | | | | 367,782 | | | | 319,404 | |
Retirement classR-3 of shares | | | — | | | | 685 | (2) | | | — | | | | — | |
Retirement classR-6 of shares | | | 384,484 | | | | 907,840 | | | | — | | | | — | |
Class F-3 of shares | | | — | | | | — | | | | — | | | | — | |
| | | | | | | | | | | | | | | | |
Net sale of shares | | | 1,013,349 | | | | 1,431,233 | | | | 369,672 | | | | 377,501 | |
Shares issued to shareholders in payment of distributions declared: | | | | | | | | | | | | | | | | |
Advisor class of shares | | | 26,815 | | | | 27,629 | | | | 14,305 | | | | 9,228 | |
Institutional class of shares | | | 329,598 | | | | 333,452 | | | | 134,916 | | | | 76,411 | |
Retirement classR-3 of shares | | | — | | | | 304 | (2) | | | — | | | | — | |
Retirement classR-6 of shares | | | 87,130 | | | | 15,440 | | | | — | | | | — | |
Class F-3 of shares | | | — | | | | — | | | | — | | | | — | |
| | | | | | | | | | | | | | | | |
Net shares issued | | | 443,543 | | | | 376,825 | | | | 149,221 | | | | 85,639 | |
Shares redeemed: | | | | | | | | | | | | | | | | |
Investor class of shares | | | — | | | | — | | | | — | | | | — | |
Advisor class of shares | | | (96,723 | ) | | | (88,641 | ) | | | (152,050 | ) | | | (67,035 | ) |
Institutional class of shares | | | (871,408 | ) | | | (1,262,801 | ) | | | (753,886 | ) | | | (271,869 | ) |
Retirement classR-3 of shares | | | — | | | | (9,790 | )(2) | | | — | | | | — | |
Retirement classR-6 of shares | | | (720,951 | ) | | | (176,995 | ) | | | — | | | | — | |
Class F-3 of shares | | | — | | | | — | | | | — | | | | — | |
| | | | | | | | | | | | | | | | |
Net shares redeemed | | | (1,689,082 | ) | | | (1,538,227 | ) | | | (905,936 | ) | | | (338,904 | ) |
| | | | | | | | | | | | | | | | |
Net change resulting from fund share transactions in shares | | | (232,190 | ) | | | 269,831 | | | | (387,043 | ) | | | 124,236 | |
| | | | | | | | | | | | | | | | |
| (1) | Reflects operations for the period from September 1, 2017, to April 27, 2018 (termination of Investor class of shares). |
| (2) | Reflects operations for the period from September 1, 2017, to May 11, 2018 (termination of Retirement classR-3 of shares). |
| (3) | Reflects operations for the period from September 1, 2017, to December 3, 2017 (termination of Retirement classR-3 of shares). |
| (4) | Reflects operations for the period from September 1, 2018, to December 28, 2018 (termination of Retirement class F-3 of shares). |
156
| | | | | | | | | | | | | | | | | | | | | | | | | | | | | | |
| | | | | | | | | | |
Small-Cap
Growth Fund | | | Global Low
Volatility
Equity Fund | | | Disciplined
International
Equity Fund | | | Pyrford
International
Stock Fund | |
Year Ended
August 31,
2019 | | | Year Ended
August 31,
2018 | | | Year Ended
August 31,
2019 | | | Year Ended
August 31,
2018 | | | Year Ended
August 31,
2019 | | | Year Ended
August 31,
2018 | | | Year Ended
August 31,
2019 | | | Year Ended
August 31,
2018 | |
| | | | | | | | | | | | | | | | | | | | | | | | | | | | | | |
| | | | | | | | | | | | | | | | | | | | | | | | | | | | | | |
| $ | — | | | $ | — | | | $ | — | | | $ | — | | | $ | — | | | $ | — | | | $ | — | | | $ | 83,571 | (1) |
| | 2,309,900 | | | | 4,764,611 | | | | 497,821 | | | | 209,656 | | | | 2,561 | | | | 42,573 | | | | 109,625 | | | | 5,864,823 | |
| | 19,667,795 | | | | 17,252,116 | | | | 7,667,583 | | | | 573,388 | | | | 21,708,859 | | | | 18,798,208 | | | | 114,884,836 | | | | 76,904,679 | |
| | — | | | | — | | | | — | | | | — | | | | — | | | | — | | | | — | | | | — | |
| | — | | | | — | | | | — | | | | — | | | | — | | | | — | | | | 64,243,843 | | | | 120,732,668 | |
| | — | | | | — | | | | — | | | | — | | | | — | | | | — | | | | 160,508 | (4) | | | 8,394,567 | |
| | | | | | | | | | | | | | | | | | | | | | | | | | | | | | |
| | 21,977,695 | | | | 22,016,727 | | | | 8,165,404 | | | | 783,044 | | | | 21,711,420 | | | | 18,840,781 | | | | 179,398,812 | | | | 211,980,308 | |
| | | | | | | |
| | | | | | | | | | | | | | | | | | | | | | | | | | | | | | |
| | 6,414,028 | | | | 6,081,376 | | | | 48,910 | | | | 35,577 | | | | 1,185 | | | | 1,308 | | | | 113,890 | | | | — | |
| | 11,739,150 | | | | 8,460,833 | | | | 5,898,232 | | | | 1,428,624 | | | | 1,340,341 | | | | 1,509,712 | | | | 10,702,009 | | | | 12,082,424 | |
| | — | | | | — | | | | — | | | | — | | | | — | | | | — | | | | — | | | | — | |
| | — | | | | — | | | | — | | | | — | | | | — | | | | — | | | | 4,754,416 | | | | 1,405,577 | |
| | — | | | | — | | | | — | | | | — | | | | — | | | | — | | | | 1,250 | | | | 1,758 | |
| | | | | | | | | | | | | | | | | | | | | | | | | | | | | | |
| | 18,153,178 | | | | 14,542,209 | | | | 5,947,142 | | | | 1,464,201 | | | | 1,341,526 | | | | 1,511,020 | | | | 15,571,565 | | | | 13,489,759 | |
| | | | | | | | | | | | | | | | | | | | | | | | | | | | | | |
| | — | | | | — | | | | — | | | | — | | | | — | | | | — | | | | — | | | | (6,445,368 | )(1) |
| | (16,029,451 | ) | | | (23,380,533 | ) | | | (177,171 | ) | | | (955,585 | ) | | | (33,953 | ) | | | (2,155 | ) | | | (1,449,652 | ) | | | (690,070 | ) |
| | (35,574,445 | ) | | | (23,623,490 | ) | | | (4,378,589 | ) | | | (22,565,241 | ) | | | (32,796,756 | ) | | | (13,668,317 | ) | | | (111,399,473 | ) | | | (197,218,546 | ) |
| | — | | | | — | | | | — | | | | — | | | | — | | | | — | | | | — | | | | (26,363 | )(3) |
| | — | | | | — | | | | — | | | | — | | | | — | | | | — | | | | (56,842,037 | ) | | | (13,639,793 | ) |
| | — | | | | — | | | | — | | | | — | | | | — | | | | — | | | | (7,783,586 | )(4) | | | (389,948 | ) |
| | | | | | | | | | | | | | | | | | | | | | | | | | | | | | |
| | (51,603,896 | ) | | | (47,004,023 | ) | | | (4,555,760 | ) | | | (23,520,826 | ) | | | (32,830,709 | ) | | | (13,670,472 | ) | | | (177,474,748 | ) | | | (218,410,088 | ) |
| | — | | | | — | | | | 4 | | | | — | | | | — | | | | 210 | | | | 7,393 | | | | 957 | |
| | | | | | | | | | | | | | | | | | | | | | | | | | | | | | |
| $ | (11,473,023 | ) | | $ | (10,445,087 | ) | | $ | 9,556,790 | | | $ | (21,273,581 | ) | | $ | (9,777,763 | ) | | $ | 6,681,539 | | | $ | 17,503,022 | | | $ | 7,060,936 | |
| | | | | | | | | | | | | | | | | | | | | | | | | | | | | | |
| | | | | | | |
| | | | | | | | | | | | | | | | | | | | | | | | | | | | | | |
| | | | | | | | | | | | | | | | | | | | | | | | | | | | | | |
| | — | | | | — | | | | — | | | | — | | | | — | | | | — | | | | — | | | | 6,173 | (1) |
| | 132,193 | | | | 245,534 | | | | 43,760 | | | | 15,520 | | | | 251 | | | | 3,721 | | | | 8,503 | | | | 432,072 | |
| | 1,153,609 | | | | 867,331 | | | | 689,325 | | | | 41,566 | | | | 2,078,327 | | | | 1,662,757 | | | | 9,063,446 | | | | 5,768,243 | |
| | — | | | | — | | | | — | | | | — | | | | — | | | | — | | | | — | | | | — | |
| | — | | | | — | | | | — | | | | — | | | | — | | | | — | | | | 5,014,709 | | | | 8,998,114 | |
| | — | | | | — | | | | — | | | | — | | | | — | | | | — | | | | 12,198 | (4) | | | 633,138 | |
| | | | | | | | | | | | | | | | | | | | | | | | | | | | | | |
| | 1,285,802 | | | | 1,112,865 | | | | 733,085 | | | | 57,086 | | | | 2,078,578 | | | | 1,666,478 | | | | 14,098,856 | | | | 15,837,740 | |
| | | | | | | | | | | | | | | | | | | | | | | | | | | | | | |
| | 425,898 | | | | 347,706 | | | | 4,533 | | | | 2,693 | | | | 123 | | | | 118 | | | | 9,435 | | | | — | |
| | 742,514 | | | | 465,392 | | | | 544,117 | | | | 107,902 | | | | 139,474 | | | | 136,256 | | | | 904,650 | | | | 915,335 | |
| | — | | | | — | | | | — | | | | — | | | | — | | | | — | | | | — | | | | — | |
| | — | | | | — | | | | — | | | | — | | | | — | | | | — | | | | 401,895 | | | | 106,483 | |
| | — | | | | — | | | | — | | | | — | | | | — | | | | — | | | | 106 | | | | 133 | |
| | | | | | | | | | | | | | | | | | | | | | | | | | | | | | |
| | 1,168,412 | | | | 813,098 | | | | 548,650 | | | | 110,595 | | | | 139,597 | | | | 136,374 | | | | 1,316,086 | | | | 1,021,951 | |
| | | | | | | | | | | | | | | | | | | | | | | | | | | | | | |
| | — | | | | — | | | | — | | | | — | | | | — | | | | — | | | | — | | | | (474,563 | )(1) |
| | (999,522 | ) | | | (1,245,843 | ) | | | (14,712 | ) | | | (69,805 | ) | | | (3,338 | ) | | | (184 | ) | | | (113,979 | ) | | | (50,399 | ) |
| | (2,077,157 | ) | | | (1,191,794 | ) | | | (394,255 | ) | | | (1,653,359 | ) | | | (3,208,824 | ) | | | (1,201,084 | ) | | | (8,909,877 | ) | | | (14,834,806 | ) |
| | — | | | | — | | | | — | | | | — | | | | — | | | | — | | | | — | | | | (1,946 | )(3) |
| | — | | | | — | | | | — | | | | — | | | | — | | | | — | | | | (4,442,295 | ) | | | (1,031,978 | ) |
| | — | | | | — | | | | — | | | | — | | | | — | | | | — | | | | (617,942 | )(4) | | | (29,583 | ) |
| | | | | | | | | | | | | | | | | | | | | | | | | | | | | | |
| | (3,076,679 | ) | | | (2,437,637 | ) | | | (408,967 | ) | | | (1,723,164 | ) | | | (3,212,162 | ) | | | (1,201,268 | ) | | | (14,084,093 | ) | | | (16,423,275 | ) |
| | | | | | | | | | | | | | | | | | | | | | | | | | | | | | |
| | (622,465 | ) | | | (511,674 | ) | | | 872,768 | | | | (1,555,483 | ) | | | (993,987 | ) | | | 601,584 | | | | 1,330849 | | | | 436,416 | |
| | | | | | | | | | | | | | | | | | | | | | | | | | | | | | |
157
| | |
| | |
| Notes to Financial Statements(continued) | | |
| | | | | | | | | | | | | | | | |
| | | | | | | |
| | | LGM
Emerging
Markets
Equity Fund | | | Alternative
Strategies Fund | |
| | | Year Ended
August 31,
2019 | | | Year Ended
August 31,
2018 | | | Year Ended
August 31,
2019 | | | Year Ended
August 31,
2018 | |
Capital stock transactions in dollars: | | | | | | | | | | | | | | | | |
Proceeds from sale of shares: | | | | | | | | | | | | | | | | |
Advisor class of shares | | $ | 1,942,673 | | | $ | 2,061,792 | | | $ | 875 | | | $ | 949 | |
Institutional class of shares | | | 182,622,433 | | | | 77,835,687 | | | | 15,070,328 | | | | 17,290,111 | |
| | | | | | | | | | | | | | | | |
Net proceeds from sale of shares | | | 184,565,106 | | | | 79,897,479 | | | | 15,071,203 | | | | 17,291,060 | |
Net asset value of shares issued to shareholders in payment of distributions declared: | | | | | | | | | | | | | | | | |
Advisor class of shares | | | 171,004 | | | | — | | | | — | | | | 3,248 | |
Institutional class of shares | | | 8,013,010 | | | | 1,128,190 | | | | — | | | | 5,106,210 | |
| | | | | | | | | | | | | | | | |
Net proceeds from shares issued: | | | 8,184,014 | | | | 1,128,190 | | | | — | | | | 5,109,458 | |
Cost of shares redeemed: | | | | | | | | | | | | | | | | |
Advisor class of shares | | | (1,548,285 | ) | | | (1,950,533 | ) | | | (47,396 | ) | | | (80,003 | ) |
Institutional class of shares | | | (88,760,017 | ) | | | (33,149,780 | ) | | | (46,209,815 | ) | | | (37,141,144 | ) |
| | | | | | | | | | | | | | | | |
Net cost of shares redeemed | | | (90,308,302 | ) | | | (35,100,313 | ) | | | (46,257,211 | ) | | | (37,221,147 | ) |
Redemption fees | | | 1,285 | | | | 711 | | | | — | | | | — | |
| | | | | | | | | | | | | | | | |
Net change resulting from fund share transactions in dollars | | $ | 102,442,103 | | | $ | 45,926,067 | | | $ | (31,186,008 | ) | | $ | (14,820,629 | ) |
| | | | | | | | | | | | | | | | |
| | | | |
Capital stock transactions in shares: | | | | | | | | | | | | | | | | |
Sale of shares: | | | | | | | | | | | | | | | | |
Advisor class of shares | | | 130,398 | | | | 127,075 | | | | 93 | | | | 94 | |
Institutional class of shares | | | 12,069,702 | | | | 4,692,595 | | | | 1,592,774 | | | | 1,681,475 | |
| | | | | | | | | | | | | | | | |
Net sale of shares | | | 12,200,100 | | | | 4,819,670 | | | | 1,592,867 | | | | 1,681,569 | |
Shares issued to shareholders in payment of distributions declared: | | | | | | | | | | | | | | | | |
Advisor class of shares | | | 11,917 | | | | — | | | | — | | | | 322 | |
Institutional class of shares | | | 561,636 | | | | 70,030 | | | | — | | | | 502,085 | |
| | | | | | | | | | | | | | | | |
Net shares issued | | | 573,553 | | | | 70,030 | | | | — | | | | 502,407 | |
Shares redeemed: | | | | | | | | | | | | | | | | |
Advisor class of shares | | | (102,088 | ) | | | (116,190 | ) | | | (5,139 | ) | | | (7,777 | ) |
Institutional class of shares | | | (5,935,508 | ) | | | (2,010,904 | ) | | | (4,920,224 | ) | | | (3,567,218 | ) |
| | | | | | | | | | | | | | | | |
Net shares redeemed | | | (6,037,596 | ) | | | (2,127,094 | ) | | | (4,925,363 | ) | | | (3,574,995 | ) |
| | | | | | | | | | | | | | | | |
Net change resulting from fund share transactions in shares | | | 6,736,057 | | | | 2,762,606 | | | | (3,332,496 | ) | | | (1,391,019 | ) |
| | | | | | | | | | | | | | | | |
158
| | | | | | | | | | | | | | | | | | | | | | | | | | | | | | |
| | | | | | | | | | |
Global
Long/Short
Equity Fund | | | Ultra Short
Tax-Free Fund | | | Short
Tax-Free Fund | | | Short-Term
Income Fund | |
Year Ended
August 31,
2019 | | | Year Ended
August 31,
2018 | | | Year Ended
August 31,
2019 | | | Year Ended
August 31,
2018 | | | Year Ended
August 31,
2019 | | | Year Ended
August 31,
2018 | | | Year Ended
August 31,
2019 | | | Year Ended
August 31,
2018 | |
| | | | | | | | | | | | | | | | | | | | | | | | | | | | | | |
| | | | | | | | | | | | | | | | | | | | | | | | | | | | | | |
| $ | 11,979 | | | $ | 195,339 | | | $ | 4,379,161 | | | $ | 5,741,914 | | | $ | 818,333 | | | $ | 2,495,879 | | | $ | 4,131,141 | | | $ | 4,288,667 | |
| | 926,457 | | | | 6,081,319 | | | | 450,634,673 | | | | 439,354,219 | | | | 38,106,073 | | | | 48,874,201 | | | | 109,699,514 | | | | 131,029,502 | |
| | | | | | | | | | | | | | | | | | | | | | | | | | | | | | |
| | 938,436 | | | | 6,276,658 | | | | 455,013,834 | | | | 445,096,133 | | | | 38,924,406 | | | | 51,370,080 | | | | 113,830,655 | | | | 135,318,169 | |
| | | | | | | |
| | | | | | | | | | | | | | | | | | | | | | | | | | | | | | |
| | 7,776 | | | | 22,321 | | | | 270,051 | | | | 329,380 | | | | 72,771 | | | | 81,745 | | | | 499,349 | | | | 492,639 | |
| | 67,690 | | | | 296,703 | | | | 4,976,544 | | | | 3,253,010 | | | | 966,607 | | | | 861,084 | | | | 3,254,026 | | | | 2,446,146 | |
| | | | | | | | | | | | | | | | | | | | | | | | | | | | | | |
| | 75,466 | | | | 319,024 | | | | 5,246,595 | | | | 3,582,390 | | | | 1,039,378 | | | | 942,829 | | | | 3,753,375 | | | | 2,938,785 | |
| | | | | | | | | | | | | | | | | | | | | | | | | | | | | | |
| | (78,446 | )�� | | | (129,883 | ) | | | (15,620,257 | ) | | | (13,292,423 | ) | | | (3,792,675 | ) | | | (3,186,874 | ) | | | (6,587,838 | ) | | | (11,677,805 | ) |
| | (7,303,341 | ) | | | (5,837,723 | ) | | | (487,651,124 | ) | | | (494,931,520 | ) | | | (67,222,848 | ) | | | (41,742,641 | ) | | | (97,838,557 | ) | | | (125,939,227 | ) |
| | | | | | | | | | | | | | | | | | | | | | | | | | | | | | |
| | (7,381,787 | ) | | | (5,967,606 | ) | | | (503,271,381 | ) | | | (508,223,943 | ) | | | (71,015,523 | ) | | | (44,929,515 | ) | | | (104,426,395 | ) | | | (137,617,032 | ) |
| | 25 | | | | 1,407 | | | | — | | | | — | | | | — | | | | — | | | | — | | | | — | |
| | | | | | | | | | | | | | | | | | | | | | | | | | | | | | |
| $ | (6,367,860 | ) | | $ | 629,483 | | | $ | (43,010,952 | ) | | $ | (59,545,420 | ) | | $ | (31,051,739 | ) | | $ | 7,383,394 | | | $ | 13,157,635 | | | $ | 639,922 | |
| | | | | | | | | | | | | | | | | | | | | | | | | | | | | | |
| | | | | | | |
| | | | | | | | | | | | | | | | | | | | | | | | | | | | | | |
| | | | | | | | | | | | | | | | | | | | | | | | | | | | | | |
| | 1,058 | | | | 16,081 | | | | 434,741 | | | | 570,266 | | | | 80,413 | | | | 245,629 | | | | 443,854 | | | | 460,682 | |
| | 82,235 | | | | 491,377 | | | | 44,771,183 | | | | 43,650,785 | | | | 3,745,703 | | | | 4,803,882 | | | | 11,770,026 | | | | 14,032,354 | |
| | | | | | | | | | | | | | | | | | | | | | | | | | | | | | |
| | 83,293 | | | | 507,458 | | | | 45,205,924 | | | | 44,221,051 | | | | 3,826,116 | | | | 5,049,511 | | | | 12,213,880 | | | | 14,493,036 | |
| | | | | | | | | | | | | | | | | | | | | | | | | | | | | | |
| | 697 | | | | 1,812 | | | | 26,801 | | | | 32,709 | | | | 7,159 | | | | 8,058 | | | | 53,561 | | | | 52,968 | |
| | 6,044 | | | | 24,064 | | | | 494,260 | | | | 323,236 | | | | 94,908 | | | | 84,831 | | | | 348,309 | | | | 262,630 | |
| | | | | | | | | | | | | | | | | | | | | | | | | | | | | | |
| | 6,741 | | | | 25,876 | | | | 521,061 | | | | 355,945 | | | | 102,067 | | | | 92,889 | | | | 401,870 | | | | 315,598 | |
| | | | | | | | | | | | | | | | | | | | | | | | | | | | | | |
| | (6,877 | ) | | | (10,892 | ) | | | (1,551,260 | ) | | | (1,319,835 | ) | | | (372,079 | ) | | | (313,760 | ) | | | (708,704 | ) | | | (1,256,655 | ) |
| | (662,569 | ) | | | (487,768 | ) | | | (48,442,329 | ) | | | (49,159,262 | ) | | | (6,606,010 | ) | | | (4,107,724 | ) | | | (10,482,728 | ) | | | (13,497,981 | ) |
| | | | | | | | | | | | | | | | | | | | | | | | | | | | | | |
| | (669,446 | ) | | | (498,660 | ) | | | (49,993,589 | ) | | | (50,479,097 | ) | | | (6,978,089 | ) | | | (4,421,484 | ) | | | (11,191,432 | ) | | | (14,754,636 | ) |
| | | | | | | | | | | | | | | | | | | | | | | | | | | | | | |
| | (579,412 | ) | | | 34,674 | | | | (4,266,604 | ) | | | (5,902,101 | ) | | | (3,049,906 | ) | | | 720,916 | | | | 1,424,318 | | | | 53,998 | |
| | | | | | | | | | | | | | | | | | | | | | | | | | | | | | |
159
| | |
| | |
| Notes to Financial Statements(continued) | | |
| | | | | | | | | | | | | | | | |
| | | | | | | |
| | |
Intermediate
Tax-Free Fund | | |
Strategic
Income Fund | |
| | | Year Ended
August 31,
2019 | | | Year Ended
August 31,
2018 | | | Year Ended
August 31,
2019 | | | Year Ended
August 31,
2018 | |
Capital stock transactions in dollars: | | | | | | | | | | | | | | | | |
Proceeds from sale of shares: | | | | | | | | | | | | | | | | |
Investor class of shares | | $ | 216,805,372 | | | $ | 148,016,165 | | | $ | 992,911 | | | $ | 1,560,960 | |
Advisor class of shares | | | 5,193,016 | | | | 7,369,713 | | | | 277,237 | | | | 510,237 | |
Institutional class of shares | | | 712,041,595 | | | | 446,882,504 | | | | 1,321,850 | | | | 1,579,253 | |
| | | | | | | | | | | | | | | | |
Net proceeds from sale of shares | | | 934,039,983 | | | | 602,268,382 | | | | 2,591,998 | | | | 3,650,450 | |
Net asset value of shares issued to shareholders in payment of distributions declared: | | | | | | | | | | | | | | | | |
Investor class of shares | | | 17,880,753 | | | | 23,973,740 | | | | 2,584,595 | | | | 2,868,223 | |
Advisor class of shares | | | 219,608 | | | | 323,030 | | | | 572,728 | | | | 681,181 | |
Institutional class of shares | | | 22,206,518 | | | | 12,672,136 | | | | 371,887 | | | | 514,734 | |
| | | | | | | | | | | | | | | | |
Net proceeds from shares issued: | | | 40,306,879 | | | | 36,968,906 | | | | 3,529,210 | | | | 4,064,138 | |
Cost of shares redeemed: | | | | | | | | | | | | | | | | |
Investor class of shares | | | (598,428,311 | ) | | | (256,803,140 | ) | | | (8,927,747 | ) | | | (15,601,053 | ) |
Advisor class of shares | | | (15,779,341 | ) | | | (3,558,242 | ) | | | (2,424,528 | ) | | | (5,319,901 | ) |
Institutional class of shares | | | (297,206,709 | ) | | | (182,098,021 | ) | | | (5,551,755 | ) | | | (10,401,208 | ) |
| | | | | | | | | | | | | | | | |
Net cost of shares redeemed | | | (911,414,361 | ) | | | (442,459,403 | ) | | | (16,904,030 | ) | | | (31,322,162 | ) |
Redemption fees | | | 10 | | | | — | | | | — | | | | — | |
| | | | | | | | | | | | | | | | |
Net change resulting from fund share transactions in dollars | | $ | 62,932,511 | | | $ | 196,777,885 | | | $ | (10,782,822 | ) | | $ | (23,607,574 | ) |
| | | | | | | | | | | | | | | | |
| | | | |
Capital stock transactions in shares: | | | | | | | | | | | | | | | | |
Sale of shares: | | | | | | | | | | | | | | | | |
Investor class of shares | | | 19,477,473 | | | | 13,228,190 | | | | 107,030 | | | | 165,685 | |
Advisor class of shares | | | 465,275 | | | | 656,770 | | | | 30,251 | | | | 54,439 | |
Institutional class of shares | | | 63,694,084 | | | | 40,007,123 | | | | 146,666 | | | | 171,048 | |
| | | | | | | | | | | | | | | | |
Net sale of shares | | | 83,636,832 | | | | 53,892,083 | | | | 283,947 | | | | 391,172 | |
Shares issued to shareholders in payment of distributions declared: | | | | | | | | | | | | | | | | |
Investor class of shares | | | 1,596,327 | | | | 2,141,524 | | | | 283,183 | | | | 309,135 | |
Advisor class of shares | | | 19,628 | | | | 28,873 | | | | 62,763 | | | | 73,367 | |
Institutional class of shares | | | 1,970,954 | | | | 1,133,383 | | | | 40,885 | | | | 55,436 | |
| | | | | | | | | | | | | | | | |
Net shares issued | | | 3,586,909 | | | | 3,303,780 | | | | 386,831 | | | | 437,938 | |
Shares redeemed: | | | | | | | | | | | | | | | | |
Investor class of shares | | | (53,682,031 | ) | | | (22,940,721 | ) | | | (982,294 | ) | | | (1,677,547 | ) |
Advisor class of shares | | | (1,417,837 | ) | | | (317,526 | ) | | | (266,152 | ) | | | (572,837 | ) |
Institutional class of shares | | | (26,636,202 | ) | | | (16,277,135 | ) | | | (622,082 | ) | | | (1,109,628 | ) |
| | | | | | | | | | | | | | | | |
Net shares redeemed | | | (81,736,070 | ) | | | (39,535,382 | ) | | | (1,870,528 | ) | | | (3,360,012 | ) |
| | | | | | | | | | | | | | | | |
Net change resulting from fund share transactions in shares | | | 5,487,671 | | | | 17,660,481 | | | | (1,199,750 | ) | | | (2,530,902 | ) |
| | | | | | | | | | | | | | | | |
160
| | | | | | | | | | | | | | | | | | | | | | |
| | | | | | | |
TCH Corporate
Income Fund | | | TCH Core Plus
Bond Fund | | | High Yield
Bond Fund | |
Year Ended
August 31,
2019 | | | Year Ended
August 31,
2018 | | | Year Ended
August 31,
2019 | | | Year Ended
August 31,
2018 | | | Year Ended
August 31,
2019 | | | Year Ended
August 31,
2018 | |
| | | | | | | | | | | | | | | | | | | | | | | |
| | | | | | | | | | | | | | | | | | | | | | | |
| $ | 20,311,265 | | | $ | 13,469,510 | | | $ | 32,098,000 | | | $ | 33,247,967 | | | $ | — | | | $ | — | |
| | 5,361,083 | | | | 1,883,339 | | | | 905,069 | | | | 692,466 | | | | 457,013 | | | | 75,077 | |
| | 140,702,564 | | | | 35,031,255 | | | | 231,737,885 | | | | 205,734,013 | | | | 574,112 | | | | 990,467 | |
| | | | | | | | | | | | | | | | | | | | | | |
| | 166,374,912 | | | | 50,384,104 | | | | 264,740,954 | | | | 239,674,446 | | | | 1,031,125 | | | | 1,065,544 | |
|
|
| | | | | | | | | | | | | | | | | | | | |
| | 3,586,826 | | | | 3,631,617 | | | | 2,187,496 | | | | 1,885,553 | | | | — | | | | — | |
| | 141,683 | | | | 34,627 | | | | 102,848 | | | | 93,214 | | | | 41,891 | | | | 45,200 | |
| | 3,613,460 | | | | 1,445,656 | | | | 28,868,673 | | | | 27,182,890 | | | | 510,085 | | | | 538,766 | |
| | | | | | | | | | | | | | | | | | | | | | |
| | 7,341,969 | | | | 5,111,900 | | | | 31,159,017 | | | | 29,161,657 | | | | 551,976 | | | | 583,966 | |
| | | | | | | | | | | | | | | | | | | | | | | |
| | (31,034,788 | ) | | | (31,633,728 | ) | | | (24,315,803 | ) | | | (40,591,447 | ) | | | — | | | | — | |
| | (608,000 | ) | | | (1,412,711 | ) | | | (484,940 | ) | | | (977,655 | ) | | | (493,323 | ) | | | (233,705 | ) |
| | (62,394,196 | ) | | | (26,163,150 | ) | | | (341,433,917 | ) | | | (194,020,504 | ) | | | (3,129,249 | ) | | | (2,951,381 | ) |
| | | | | | | | | | | | | | | | | | | | | | |
| | (94,036,984 | ) | | | (59,209,589 | ) | | | (366,234,660 | ) | | | (235,589,606 | ) | | | (3,622,572 | ) | | | (3,185,086 | ) |
| | — | | | | — | | | | — | | | | — | | | | — | | | | — | |
| | | | | | | | | | | | | | | | | | | | | | |
| $ | 79,679,897 | | | $ | (3,713,585 | ) | | $ | (70,334,689 | ) | | $ | 33,246,497 | | | $ | (2,039,471 | ) | | $ | (1,535,576 | ) |
| | | | | | | | | | | | | | | | | | | | | | |
| | | | | |
| | | | | | | | | | | | | | | | | | | | | | | |
| | | | | | | | | | | | | | | | | | | | | | | |
| | 1,556,211 | | | | 1,033,637 | | | | 2,807,800 | | | | 2,877,804 | | | | — | | | | — | |
| | 417,871 | | | | 147,035 | | | | 77,989 | | | | 59,334 | | | | 50,060 | | | | 8,021 | |
| | 11,033,820 | | | | 2,718,202 | | | | 20,143,950 | | | | 17,783,100 | | | | 62,845 | | | | 105,106 | |
| | | | | | | | | | | | | | | | | | | | | | |
| | 13,007,902 | | | | 3,898,874 | | | | 23,029,739 | | | | 20,720,238 | | | | 112,905 | | | | 113,127 | |
| | | | | | | | | | | | | | | | | | | | | | | |
| | 280,292 | | | | 280,072 | | | | 190,146 | | | | 163,324 | | | | — | | | | — | |
| | 10,894 | | | | 2,678 | | | | 8,937 | | | | 8,071 | | | | 4,590 | | | | 4,811 | |
| | 281,658 | | | | 111,718 | | | | 2,515,292 | | | | 2,355,406 | | | | 55,970 | | | | 57,369 | |
| | | | | | | | | | | | | | | | | | | | | | |
| | 572,844 | | | | 394,468 | | | | 2,714,375 | | | | 2,526,801 | | | | 60,560 | | | | 62,180 | |
| | | | | | | | | | | | | | | | | | | | | | | |
| | (2,442,676 | ) | | | (2,446,009 | ) | | | (2,120,689 | ) | | | (3,521,472 | ) | | | — | | | | — | |
| | (46,572 | ) | | | (108,819 | ) | | | (42,173 | ) | | | (84,744 | ) | | | (54,206 | ) | | | (24,867 | ) |
| | (4,926,377 | ) | | | (2,027,663 | ) | | | (29,932,723 | ) | | | (16,816,251 | ) | | | (344,084 | ) | | | (315,664 | ) |
| | | | | | | | | | | | | | | | | | | | | | |
| | (7,415,625 | ) | | | (4,582,491 | ) | | | (32,095,585 | ) | | | (20,422,467 | ) | | | (398,290 | ) | | | (340,531 | ) |
| | | | | | | | | | | | | | | | | | | | | | |
| | 6,165,121 | | | | (289,149 | ) | | | (6,351,471 | ) | | | 2,824,572 | | | | (224,825 | ) | | | (165,224 | ) |
| | | | | | | | | | | | | | | | | | | | | | |
161
| | |
| | |
| Notes to Financial Statements(continued) | | |
| | | | | | | | | | | | | | | | |
| | | | | | | |
| | | Government Money
Market Fund | | |
Tax-Free Money
Market Fund | |
| | | Year Ended
August 31,
2019 | | | Year Ended
August 31,
2018 | | | Year Ended
August 31,
2019 | | | Year Ended
August 31,
2018 | |
Capital stock transactions in dollars: | | | | | | | | | | | | | | | | |
Proceeds from sale of shares: | | | | | | | | | | | | | | | | |
Investor class of shares | | $ | 3,185,455,821 | | | $ | 2,836,535,603 | | | $ | 76,238,873 | | | $ | 103,523,007 | |
Institutional/Premier class of shares | | | 12,876,601,233 | | | | 16,700,415,556 | | | | 752,095,278 | | | | 657,271,008 | |
| | | | | | | | | | | | | | | | |
Net proceeds from sale of shares | | | 16,062,057,054 | | | | 19,536,951,159 | | | | 828,334,151 | | | | 760,794,015 | |
Net asset value of shares issued to shareholders in payment of distributions declared: | | | | | | | | | | | | | | | | |
Investor class of shares | | | 2,297,317 | | | | 1,534,889 | | | | 900,019 | | | | 570,108 | |
Institutional/Premier class of shares | | | 6,417,045 | | | | 4,345,881 | | | | 19,238 | | | | 4,097 | |
| | | | | | | | | | | | | | | | |
Net proceeds from shares issued: | | | 8,714,362 | | | | 5,880,770 | | | | 919,257 | | | | 574,205 | |
Cost of shares redeemed: | | | | | | | | | | | | | | | | |
Investor class of shares | | | (3,130,464,509 | ) | | | (2,904,331,903 | ) | | | (81,235,290 | ) | | | (104,233,256 | ) |
Institutional/Premier class of shares | | | (13,139,542,456 | ) | | | (16,333,053,308 | ) | | | (721,255,544 | ) | | | (590,623,244 | ) |
| | | | | | | | | | | | | | | | |
Net cost of shares redeemed | | | (16,270,006,965 | ) | | | (19,237,385,211 | ) | | | (802,490,834 | ) | | | (694,856,500 | ) |
| | | | | | | | | | | | | | | | |
Net change resulting from fund share transactions in dollars | | $ | (199,235,549 | ) | | $ | 305,446,718 | | | $ | 26,762,574 | | | $ | 66,511,720 | |
| | | | | | | | | | | | | | | | |
| | | | |
Capital stock transactions in shares: | | | | | | | | | | | | | | | | |
Sale of shares: | | | | | | | | | | | | | | | | |
Investor class of shares | | | 3,185,455,821 | | | | 2,836,535,603 | | | | 76,238,873 | | | | 103,523,007 | |
Institutional/Premier class of shares | | | 12,876,601,233 | | | | 16,700,415,556 | | | | 752,095,278 | | | | 657,271,008 | |
| | | | | | | | | | | | | | | | |
Net sale of shares | | | 16,062,057,054 | | | | 19,536,951,159 | | | | 828,334,151 | | | | 760,794,015 | |
Shares issued to shareholders in payment of distributions declared: | | | | | | | | | | | | | | | | |
Investor class of shares | | | 2,297,317 | | | | 1,534,889 | | | | 900,019 | | | | 570,108 | |
Institutional/Premier class of shares | | | 6,417,045 | | | | 4,345,881 | | | | 19,238 | | | | 4,097 | |
| | | | | | | | | | | | | | | | |
Net shares issued | | | 8,714,362 | | | | 5,880,770 | | | | 919,257 | | | | 574,205 | |
Shares redeemed: | | | | | | | | | | | | | | | | |
Investor class of shares | | | (3,130,464,509 | ) | | | (2,904,331,903 | ) | | | (81,235,290 | ) | | | (104,233,256 | ) |
Institutional/Premier class of shares | | | (13,139,542,456 | ) | | | (16,333,053,308 | ) | | | (721,255,544 | ) | | | (590,623,244 | ) |
| | | | | | | | | | | | | | | | |
Net shares redeemed | | | (16,270,006,965 | ) | | | (19,237,385,211 | ) | | | (802,490,834 | ) | | | (694,856,500 | ) |
| | | | | | | | | | | | | | | | |
Net change resulting from fund share transactions in shares | | | (199,235,549 | ) | | | 305,446,718 | | | | 26,762,574 | | | | 66,511,720 | |
| | | | | | | | | | | | | | | | |
162
| | | | | | | | | | | | | | |
| | | | |
Prime Money
Market Fund | | | Institutional
Prime Money
Market Fund | |
Year Ended
August 31,
2019 | | | Year Ended
August 31,
2018 | | | Year Ended
August 31,
2019 | | | Year Ended
August 31,
2018 | |
| | | | | | | | | | | | | | |
| | | | | | | | | | | | | | |
| $ | 289,687,624 | | | $ | 323,252,291 | | | $ | 94,325 | | | $ | 1,046,364 | |
| | 485,730,277 | | | | 487,728,123 | | | | 2,739,008,147 | | | | 1,223,791,366 | |
| | | | | | | | | | | | | | |
| | 775,417,901 | | | | 810,980,414 | | | | 2,739,102,472 | | | | 1,224,837,730 | |
| | | |
| | | | | | | | | | | | | | |
| | 3,862,824 | | | | 1,907,375 | | | | 42,122 | | | | 19,861 | |
| | 167,637 | | | | 238,721 | | | | 4,200,289 | | | | 1,169,282 | |
| | | | | | | | | | | | | | |
| | 4,030,461 | | | | 2,146,096 | | | | 4,242,411 | | | | 1,189,143 | |
| | | | | | | | | | | | | | |
| | (238,814,009 | ) | | | (334,404,979 | ) | | | (1,319,323 | ) | | | (86,707 | ) |
| | (505,603,471 | ) | | | (385,817,826 | ) | | | (2,662,407,686 | ) | | | (1,145,764,366 | ) |
| | | | | | | | | | | | | | |
| | (744,417,480 | ) | | | (720,222,805 | ) | | | (2,663,727,009 | ) | | | (1,145,851,073 | ) |
| | | | | | | | | | | | | | |
| $ | 35,030,882 | | | $ | 92,903,705 | | | $ | 79,617,874 | | | $ | 80,175,800 | |
| | | | | | | | | | | | | | |
| | | |
| | | | | | | | | | | | | | |
| | | | | | | | | | | | | | |
| | 289,687,624 | | | | 323,252,291 | | | | 94,320 | | | | 1,046,368 | |
| | 485,730,277 | | | | 487,728,123 | | | | 2,738,976,101 | | | | 1,223,793,306 | |
| | | | | | | | | | | | | | |
| | 775,417,901 | | | | 810,980,414 | | | | 2,739,070,421 | | | | 1,224,839,674 | |
| | | | | | | | | | | | | | |
| | 3,862,824 | | | | 1,907,375 | | | | 42,122 | | | | 19,860 | |
| | 167,637 | | | | 238,721 | | | | 4,200,220 | | | | 1,169,202 | |
| | | | | | | | | | | | | | |
| | 4,030,461 | | | | 2,146,096 | | | | 4,242,342 | | | | 1,189,062 | |
| | | | | | | | | | | | | | |
| | (238,814,024 | ) | | | (334,404,979 | ) | | | (1,319,283 | ) | | | (86,724 | ) |
| | (505,603,471 | ) | | | (385,817,826 | ) | | | (2,662,374,872 | ) | | | (1,145,753,981 | ) |
| | | | | | | | | | | | | | |
| | (744,417,495 | ) | | | (720,222,805 | ) | | | (2,663,694,155 | ) | | | (1,145,840,705 | ) |
| | | | | | | | | | | | | | |
| | 35,030,867 | | | | 92,903,705 | | | | 79,618,608 | | | | 80,188,031 | |
| | | | | | | | | | | | | | |
163
| | |
| | |
| Notes to Financial Statements(continued) | | |
| 6. | | Investment Adviser Fee and Other Transactions with Affiliates |
General—Certain of the Officers and Directors of the Corporation are also Officers and Directors/Trustees of one or more portfolios within the Fund complex, which are affiliates of the Corporation. None of the Fund Officers or interested Directors receives any compensation from the Funds. Certain Officers and Directors are also Officers of the Adviser.
Investment Advisory Fees—The Adviser receives for its services an investment adviser fee based on a percentage of each Fund’s average daily net assets (“ADNA”) as listed below.
| | | | | | | | | | | | | | | | | | | | |
| | | Fund’s ADNA | | | | |
Fund | | on the
first
$500
million | | | on the
next
$200
million | | | on the
next
$100
million | | | in
excess
of $800
million | | | | |
Low Volatility Equity Fund | | | 0.500 | % | | | 0.490 | % | | | 0.450 | % | | | 0.400 | % | | | | |
Dividend Income Fund | | | 0.500 | | | | 0.490 | | | | 0.450 | | | | 0.400 | | | | | |
Mid-Cap Value Fund | | | 0.685 | | | | 0.670 | | | | 0.570 | | | | 0.510 | | | | | |
Mid-Cap Growth Fund | | | 0.685 | | | | 0.670 | | | | 0.570 | | | | 0.510 | | | | | |
Small-Cap Value Fund | | | 0.685 | | | | 0.680 | | | | 0.620 | | | | 0.610 | | | | | |
Small-Cap Growth Fund | | | 0.685 | | | | 0.680 | | | | 0.620 | | | | 0.610 | | | | | |
Global Low Volatility Equity Fund | | | 0.650 | | | | 0.640 | | | | 0.600 | | | | 0.550 | | | | | |
Pyrford International Stock Fund | | | 0.735 | | | | 0.720 | | | | 0.620 | | | | 0.560 | | | | | |
LGM Emerging Markets Equity Fund | | | 0.900 | | | | 0.890 | | | | 0.850 | | | | 0.800 | | | | | |
| | |
| | | Fund’s ADNA | | | | |
Fund | | on the
first
$100
million | | | on the
next
$150
million | | | on the
next
$250
million | | | in
excess
of $500
million | | | | |
Ultra ShortTax-Free Fund | | | 0.200 | % | | | 0.190 | % | | | 0.170 | % | | | 0.100 | % | | | | |
ShortTax-Free Fund | | | 0.200 | | | | 0.190 | | | | 0.170 | | | | 0.150 | | | | | |
Short-Term Income Fund | | | 0.200 | | | | 0.190 | | | | 0.170 | | | | 0.100 | | | | | |
IntermediateTax-Free Fund | | | 0.250 | | | | 0.160 | | | | 0.120 | | | | 0.100 | | | | | |
Strategic Income Fund | | | 0.250 | | | | 0.200 | | | | 0.200 | | | | 0.200 | | | | | |
TCH Corporate Income Fund | | | 0.200 | | | | 0.190 | | | | 0.150 | | | | 0.100 | | | | | |
TCH Core Plus Bond Fund | | | 0.250 | | | | 0.160 | | | | 0.120 | | | | 0.100 | | | | | |
High Yield Bond Fund | | | 0.500 | | | | 0.500 | | | | 0.500 | | | | 0.500 | | | | | |
| | | |
| | | Fund’s ADNA | | | | | | | |
Fund | | on the
first
$1
billion | | | on the
next
$1
billion | | | on the
next
$2
billion | | | | | | | |
Large-Cap Value Fund | | | 0.350 | % | | | 0.325 | % | | | 0.300 | % | | | | | | | | |
Large-Cap Growth Fund | | | 0.350 | | | | 0.325 | | | | 0.300 | | | | | | | | | |
Small-Cap Core Fund | | | 0.650 | | | | 0.625 | | | | 0.600 | | | | | | | | | |
Disciplined International Equity Fund | | | 0.600 | | | | 0.575 | | | | 0.550 | | | | | | | | | |
Alternative Strategies Fund | | | 1.000 | (1) | | | 0.975 | (1) | | | 0.950 | (1) | | | | | | | | |
Global Long/Short Equity Fund | | | 1.000 | | | | 0.975 | | | | 0.950 | | | | | | | | | |
| | (1) | Effective October 1, 2018 the Advisory Rate was changed from 1.500% to 1.000% on the first $1 billion, the next $1 billion rate was lowered from 1.475% to 0.975%, and the next $2 billion the rate was lowered from 1.450% to 0.950% |
| | | | | | | | | | | | | | | | | | | | |
| |
| | | Fund’s ADNA | |
Fund | | on the
first
$2
billion | | | on the
next
$2
billion | | | on the
next
$2
billion | | | on the
next
$2
billion | | | in excess
of $8
billion | |
Government Money Market Fund | | | 0.200 | % | | | 0.185 | % | | | 0.170 | % | | | 0.155 | % | | | 0.140 | % |
Tax-Free Money Market Fund | | | 0.200 | | | | 0.185 | | | | 0.170 | | | | 0.155 | | | | 0.140 | |
Prime Money Market Fund | | | 0.150 | | | | 0.135 | | | | 0.120 | | | | 0.105 | | | | 0.090 | |
Institutional Prime Money Market Fund | | | 0.150 | | | | 0.135 | | | | 0.120 | | | | 0.105 | | | | 0.090 | |
The Pyrford International Stock Fund’ssub-adviser is Pyrford International Ltd., an affiliate of the Adviser. The LGM Emerging Markets Equity Fund’ssub-adviser is LGM Investments Limited, an affiliate of the Adviser. The TCH Corporate Income Fund’s and TCH Core Plus Bond Fund’ssub-adviser is Taplin, Canida & Habacht, LLC, an affiliate of the Adviser. One of thesub-advisers of the Alternative Strategies Fund is BMO Asset Management Limited, an affiliate of the Adviser. The Adviser compensates eachsub-adviser based on the level of average daily net assets of each respective Fund managed by eachsub-adviser.
164
Contractual Expense Limitation—The Adviser has agreed to waive or reduce its investment advisory fee or reimburse expenses to the extent necessary to prevent class specific total annual operating expenses (excluding taxes, dividend and interest expense, brokerage commissions, other investment related costs, Acquired Fund Fees and Expenses and extraordinary expenses, such as litigation and other expenses not incurred in the ordinary course of a Fund’s business) from exceeding the amounts for the periods set forth below. The Adviser may not terminate this arrangement prior to December 31, 2020, without the consent of the Directors, unless the investment advisory agreement is terminated. The Adviser may voluntarily choose to waive any portion of its fee beyond its contractual agreement. The Adviser can modify or terminate this voluntary waiver at any time at its sole discretion. Additionally, the agreement does not provide for recoupment by the Adviser of waived fees or reimbursed expenses.
| | | | | | | | | | | | | | | | | | | | |
| | | Annualized Contractual Expense Limitation | |
Fund | | Investor
Class | | | Advisor
Class | | | Institutional
Class | | | Premier
Class | | | Retirement
ClassR-6 | |
Low Volatility Equity Fund | | | | | | | 0.90 | % | | | 0.65 | % | | | | | | | | |
Dividend Income Fund | | | | | | | 0.90 | | | | 0.65 | | | | | | | | | |
Large-Cap Value Fund | | | | | | | 0.79 | | | | 0.54 | | | | | | | | 0.39 | % |
Large-Cap Growth Fund | | | 0.79 | % | | | 0.79 | | | | 0.54 | | | | | | | | 0.39 | |
Mid-Cap Value Fund | | | | | | | 1.24 | | | | 0.99 | | | | | | | | 0.84 | |
Mid-Cap Growth Fund | | | | | | | 1.24 | | | | 0.99 | | | | | | | | 0.84 | |
Small-Cap Value Fund | | | | | | | 1.24 | | | | 0.99 | | | | | | | | 0.84 | |
Small-Cap Core Fund | | | | | | | 1.15 | | | | 0.90 | | | | | | | | | |
Small-Cap Growth Fund | | | | | | | 1.24 | | | | 0.99 | | | | | | | | | |
Global Low Volatility Equity Fund | | | | | | | 1.10 | | | | 0.85 | | | | | | | | | |
Disciplined International Equity Fund | | | | | | | 1.15 | | | | 0.90 | | | | | | | | | |
Pyrford International Stock Fund | | | | | | | 1.19 | | | | 0.94 | | | | | | | | 0.79 | |
LGM Emerging Markets Equity Fund | | | | | | | 1.40 | | | | 1.15 | | | | | | | | | |
Alternative Strategies Fund | | | | | | | 1.70 | (1) | | | 1.45 | (1) | | | | | | | | |
Global Long/Short Equity Fund | | | | | | | 1.60 | | | | 1.35 | | | | | | | | | |
Ultra ShortTax-Free Fund | | | | | | | 0.55 | | | | 0.30 | | | | | | | | | |
ShortTax-Free Fund | | | | | | | 0.55 | | | | 0.40 | | | | | | | | | |
Short-Term Income Fund | | | | | | | 0.60 | | | | 0.35 | | | | | | | | | |
IntermediateTax-Free Fund | | | 0.54 | (2) | | | 0.54 | (2) | | | 0.50 | | | | | | | | | |
Strategic Income Fund | | | 0.80 | | | | 0.80 | | | | 0.55 | | | | | | | | | |
TCH Corporate Income Fund | | | 0.59 | | | | 0.59 | | | | 0.55 | | | | | | | | | |
TCH Core Plus Bond Fund | | | 0.59 | | | | 0.59 | | | | 0.55 | | | | | | | | | |
High Yield Bond Fund | | | | | | | 0.90 | | | | 0.65 | | | | | | | | | |
Government Money Market Fund | | | 0.45 | | | | | | | | | | | | 0.20 | % | | | | |
Tax-Free Money Market Fund | | | 0.45 | | | | | | | | | | | | 0.20 | | | | | |
Prime Money Market Fund | | | 0.45 | | | | | | | | | | | | 0.20 | | | | | |
Institutional Prime Money Market Fund | | | 0.45 | | | | | | | | | | | | 0.20 | | | | | |
| | (1) | Effective October 1, 2018 the expense limitation changed from 2.00% to 1.70% for Advisor and 1.75% to 1.45% for Institutional. |
| | (2) | Effective February 12, 2019 the expense limitation changed from 0.55% to 0.54% for the Investor and Advisor Class. |
Shareholder Servicing Fees—Under the terms of a Shareholder Services Agreement with the Adviser, each Fund pays the Adviser at the annual rate of 0.25% of average daily net assets of the Fund’s Investor Class shares for the period. The fee paid to the Adviser is used to finance certain services for shareholders and to maintain shareholder accounts.
Distribution Services Fees—Certain Funds are subject to a Distribution Plan (the “Plan”) pursuant to Rule12b-1 under the Act. The Plan authorizes payments by the Fund to finance activities intended to result in the sale of its Advisor Class shares. The Plan provides that the Fund may incur distribution expenses of 0.25% of the average daily net assets of the Fund’s Advisor Class shares .
165
| | |
| | |
| Notes to Financial Statements(continued) | | |
Administration Fees—The fee paid to the Adviser is based on each Fund’s average daily net assets with respect to Administration Fee Schedule A and the aggregate average daily net assets of all Funds representing Administration Fee Schedule B as listed below.
| | | | | | | | | | |
| Administration Fee Schedule A | | | | Administration Fee Schedule B |
Annual Rate | | | | | | | | Annual Rate | | ADNA |
| 0.1500% | | | | | | | | 0.0400% | | on the first $2 billion |
| | | | | | | | 0.0300 | | on the next $2 billion |
| | | | | | | | 0.0250 | | on the next $2 billion |
| | | | | | | | 0.0200 | | on the next $2 billion |
| | | | | | | | 0.0100 | | in excess of $8 billion |
| | | | | | | | | | |
| | |
| Fund | | | | Fund |
| Low Volatility Equity Fund(1) | | Alternative Strategies Fund(1) | | | | Government Money Market Fund(1) |
| Dividend Income Fund(1) | | Global Long/Short Equity Fund(1) | | | | Tax-Free Money Market Fund(1) |
| Large-Cap Value Fund(1) | | Ultra Short Tax-Free Fund(1) | | | | Prime Money Market Fund(1) |
| Large-Cap Growth Fund(1) | | Short Tax-Free Fund(1) | | | | Institutional Prime Money Market Fund(1) |
| Mid-Cap Value Fund(1) | | Short-Term Income Fund(1) | | | | |
| Mid-Cap Growth Fund(1) | | Intermediate Tax-Free Fund(1) | | | | |
| Small-Cap Value Fund(1) | | Strategic Income Fund(1) | | | | |
| Small-Cap Core Fund(1) | | TCH Corporate Income Fund(1) | | | | |
| Small-Cap Growth Fund(1) | | TCH Core Plus Bond Fund(1) | | | | |
| Global Low Volatility Equity Fund | | High Yield Bond Fund(1) | | | | |
| Disciplined International Equity(1) | | | | | | |
| Pyrford International Stock Fund(1) | | | | | | |
| LGM Emerging Markets Equity Fund | | | | | | |
| | (1) | For the year ended August 31, 2019, the Funds with class-specific Administration Fees were as follows: |
| | | | | | | | | | | | | | | | |
Fund | | Investor
Class | | | Advisor
Class | | | Institutional
Class | | | Premier
Class | |
Low Volatility Equity Fund | | $ | — | | | $ | 38,621 | | | $ | 192,033 | | | $ | — | |
Dividend Income Fund | | | — | | | | 17,089 | | | | 294,770 | | | | — | |
Large-Cap Value Fund | | | — | | | | 30,446 | | | | 361,947 | | | | — | |
Large-Cap Growth Fund | | | 88,981 | | | | 1,274 | | | | 361,342 | | | | — | |
Mid-Cap Value Fund | | | — | | | | 68,958 | | | | 144,297 | | | | — | |
Mid-Cap Growth Fund | | | — | | | | 21,869 | | | | 113,717 | | | | — | |
Small-Cap Value Fund | | | — | | | | 5,639 | | | | 72,255 | | | | — | |
Small-Cap Core Fund | | | — | | | | 2,935 | | | | 25,653 | | | | — | |
Small-Cap Growth Fund | | | — | | | | 62,144 | | | | 119,718 | | | | — | |
Disciplined International Equity Fund | | | — | | | | 253 | | | | 113,069 | | | | — | |
Pyrford International Stock Fund | | | — | | | | 7,747 | | | | 720,468 | | | | — | |
Alternative Strategies Fund | | | — | | | | 73 | | | | 88,856 | | | | — | |
Global Long/Short Equity Fund | | | — | | | | 1,057 | | | | 8,263 | | | | — | |
Ultra ShortTax-Free Fund | | | — | | | | 30,702 | | | | 841,340 | | | | — | |
ShortTax-Free Fund | | | — | | | | 8,089 | | | | 254,253 | | | | — | |
Short-Term Income Fund | | | — | | | | 36,762 | | | | 337,435 | | | | — | |
IntermediateTax-Free Fund | | | 1,014,356 | | | | 12,526 | | | | 1,669,190 | | | | — | |
Strategic Income Fund | | | 85,215 | | | | 19,117 | | | | 15,476 | | | | — | |
TCH Corporate Income Fund | | | 140,647 | | | | 5,873 | | | | 286,374 | | | | — | |
TCH Core Plus Bond Fund | | | 101,359 | | | | 4,740 | | | | 1,380,117 | | | | — | |
High Yield Bond Fund | | | — | | | | 1,215 | | | | 14,206 | | | | — | |
Government Money Market Fund | | | 220,370 | | | | — | | | | — | | | | 812,130 | |
Tax-Free Money Market Fund | | | 27,030 | | | | — | | | | — | | | | 122,243 | |
Prime Money Market Fund | | | 71,643 | | | | — | | | | — | | | | 85,614 | |
Institutional Prime Money Market Fund | | | 700 | | | | — | | | | — | | | | 187,068 | |
Securities Lending—Certain Funds pay a fee to BMO Harris for its services as the securities lending agent. The securities lending income as shown in the Statements of Operations is net of these fees. The following amounts were paid for the year ended August 31, 2019:
| | | | |
Fund | | Fees Paid | |
Low Volatility Equity Fund | | $ | 21,771 | |
Dividend Income Fund | | | 26,275 | |
Large-Cap Value Fund | | | 43,261 | |
Large-Cap Growth Fund | | | 63,266 | |
Mid-Cap Value Fund | | | 24,399 | |
Mid-Cap Growth Fund | | | 13,592 | |
Small-Cap Value Fund | | | 10,198 | |
| | | | |
Fund | | Fees Paid | |
Small-Cap Core Fund | | $ | 3,471 | |
Small-Cap Growth Fund | | | 19,893 | |
Short-Term Income Fund | | | 13,609 | |
Strategic Income Fund | | | 14,304 | |
TCH Corporate Income Fund | | | 38,167 | |
TCH Core Plus Bond Fund | | | 110,952 | |
High Yield Bond Fund | | | 2,710 | |
166
Investments in Affiliated Issuers—An affiliated issuer is an entity in which the Fund has ownership of at least 5% of the voting securities or any investment in a BMO Fund. Issuers that are affiliates of the Fund atperiod-end are noted in the Fund’s Schedule of Investments. Additional security purchases and the reduction of certain securities shares outstanding of existing portfolio holdings that were not considered affiliated in prior periods may result in the Funds owning in excess of 5% of the outstanding shares atperiod-end. The table below reflects transactions during the period with entities that are affiliates as of August 31, 2019 and may include acquisitions of new investments, prior period holdings that became affiliated during the period and prior period affiliated holdings that are no longer affiliated as ofperiod-end.
| | | | | | | | | | | | | | | | | | | | | | | | | | | | | | | | |
Security/Fund Description | | Value,
Beginning
of Period | | | Purchases(1) | | | Sales
Proceeds(1) | | | Change in
Unrealized
Appreciation
(Depreciation) | | | Net
Realized
Gain(Loss) | | | Value,
End
of Period | | | Dividends
Credited
to
Income | | | Net Realized
Gain on
Capital Gain
Distributions | |
Cash Sweep Investments in BMO Institutional Prime Money Market Fund, Premier Class, 2.097% | |
Low Volatility Equity Fund | | $ | 1,494,204 | | | $ | 106,602,938 | | | $ | 102,257,341 | | | $ | (222 | ) | | $ | 857 | | | $ | 5,840,436 | | | $ | 85,770 | | | $ | — | |
Dividend Income Fund | | | 3,591,099 | | | | 192,213,274 | | | | 167,539,968 | | | | (44 | ) | | | (144 | ) | | | 28,264,217 | | | | 115,857 | | | | — | |
Large-Cap Value Fund | | | 7,482,313 | | | | 60,894,603 | | | | 62,488,362 | | | | (783 | ) | | | 424 | | | | 5,888,195 | | | | 115,961 | | | | — | |
Large-Cap Growth Fund | | | 6,735,831 | | | | 265,816,556 | | | | 272,551,079 | | | | (81 | ) | | | (1,222 | ) | | | 5 | | | | 200,024 | | | | — | |
Mid-Cap Value Fund | | | 2,420,873 | | | | 38,684,588 | | | | 39,845,827 | | | | (583 | ) | | | 23 | | | | 1,259,074 | | | | 58,615 | | | | — | |
Mid-Cap Growth Fund | | | 1,583,732 | | | | 21,364,577 | | | | 22,260,751 | | | | (149 | ) | | | (409 | ) | | | 687,000 | | | | 36,987 | | | | — | |
Small-Cap Value Fund | | | 1,486,191 | | | | 12,526,757 | | | | 13,501,105 | | | | (132 | ) | | | 118 | | | | 511,829 | | | | 23,969 | | | | — | |
Small-Cap Core Fund | | | 440,742 | | | | 7,595,543 | | | | 7,803,184 | | | | (65 | ) | | | (6 | ) | | | 233,030 | | | | 6,816 | | | | — | |
Small-Cap Growth Fund | | | 2,038,642 | | | | 30,702,440 | | | | 31,519,377 | | | | (315 | ) | | | — | | | | 1,221,390 | | | | 38,566 | | | | — | |
Global Low Volatility Equity Fund | | | 143,976 | | | | 14,649,452 | | | | 14,172,306 | | | | 49 | | | | 474 | | | | 621,645 | | | | 12,250 | | | | — | |
Disciplined International Equity Fund | | | 2,615,976 | | | | 28,376,942 | | | | 30,810,480 | | | | (134 | ) | | | (99 | ) | | | 182,205 | | | | 30,064 | | | | — | |
Pyrford International Stock Fund | | | 16,792,467 | | | | 179,136,135 | | | | 168,966,824 | | | | 277 | | | | (2,340 | ) | | | 26,959,715 | | | | 512,943 | | | | — | |
LGM Emerging Markets Equity Fund | | | 7,268,280 | | | | 149,494,135 | | | | 140,049,718 | | | | (1,089 | ) | | | 1,239 | | | | 16,712,847 | | | | 247,747 | | | | — | |
Alternative Strategies Fund | | | 24,540,402 | | | | 140,169,264 | | | | 145,708,228 | | | | (1,770 | ) | | | 1,605 | | | | 19,001,273 | | | | 655,331 | | | | — | |
Global Long/Short Equity Fund | | | 3,434,203 | | | | 2,229,961 | | | | 5,663,726 | | | | (366 | ) | | | (72 | ) | | | — | | | | 13,814 | | | | — | |
Short-Term Income Fund | | | 3,242,065 | | | | 161,838,087 | | | | 161,536,189 | | | | (609 | ) | | | (1,584 | ) | | | 3,541,770 | | | | 145,640 | | | | — | |
Strategic Income Fund | | | 5,787,248 | | | | 28,648,041 | | | | 32,442,442 | | | | (478 | ) | | | 313 | | | | 1,992,682 | | | | 37,137 | | | | — | |
TCH Corporate Income Fund | | | 4,850,884 | | | | 175,452,390 | | | | 161,283,587 | | | | 1,107 | | | | (401 | ) | | | 19,020,393 | | | | 288,511 | | | | — | |
TCH Core Plus Bond Fund | | | 40,862,111 | | | | 471,994,762 | | | | 472,612,995 | | | | (4,081 | ) | | | 9,334 | | | | 40,249,132 | | | | 728,370 | | | | — | |
High Yield Bond Fund | | | 813,997 | | | | 4,451,229 | | | | 4,825,363 | | | | (73 | ) | | | 142 | | | | 439,932 | | | | 10,834 | | | | — | |
|
Cash Sweep Investments in BMO Government Money Market Fund, Premier Class, 1.971% | |
Ultra ShortTax-Free Fund | | | 159,901 | | | | 78,634,835 | | | | 78,794,736 | | | | — | | | | — | | | | — | | | | 19,891 | | | | — | |
ShortTax-Free Fund | | | 121,200 | | | | 15,064,886 | | | | 15,186,086 | | | | — | | | | — | | | | — | | | | 3,286 | | | | — | |
IntermediateTax-Free Fund | | | 85,922 | | | | 66,237,217 | | | | 66,323,139 | | | | — | | | | — | | | | — | | | | 13,717 | | | | — | |
|
Collateral Investment for Securities on Loan in BMO Institutional Prime Money Market Fund, Premier Class, 2.097% | |
Disciplined International Equity Fund | | | — | | | | 26,399,159 | | | | 20,118,856 | | | | — | | | | 370 | | | | 6,280,673 | | | | 760 | | | | — | |
Global Low Volatility Equity Fund | | | — | | | | 8,435,538 | | | | 7,692,009 | | | | — | | | | — | | | | 743,529 | | | | 1,161 | | | | — | |
Pyrford International Stock Fund | | | — | | | | 172,612,693 | | | | 159,698,515 | | | | — | | | | 1,690 | | | | 12,915,868 | | | | 8,513 | | | | — | |
LGM Emerging Markets Equity Fund | | | — | | | | 7 1,181,366 | | | | 69,296,919 | | | | — | | | | — | | | | 1,884,447 | | | | 7,938 | | | | — | |
Global Long/Short Equity Fund | | | — | | | | 1,448,180 | | | | 1,353,086 | | | | — | | | | — | | | | 95,094 | | | | 762 | | | | — | |
|
Collateral Pool Pro Rata Allocation for Securities on Loan in BMO Government Money Market Fund, Premier Class, 1.971% | |
Low Volatility Equity Fund | | | 3,410,538 | | | | 111,787,522 | | | | 110,829,533 | | | | — | | | | — | | | | 4,368,527 | | | | 1,311 | | | | — | |
Dividend Income Fund | | | 4,173,135 | | | | 150,194,171 | | | | 148,784,831 | | | | — | | | | — | | | | 5,582,475 | | | | 1,554 | | | | — | |
Large-Cap Value Fund | | | 9,394,657 | | | | 200,774,194 | | | | 204,263,047 | | | | — | | | | — | | | | 5,905,804 | | | | 2,801 | | | | — | |
Large-Cap Growth Fund | | | 8,900,000 | | | | 227,225,090 | | | | 228,690,029 | | | | — | | | | — | | | | 7,435,061 | | | | 3,842 | | | | — | |
Mid-Cap Value Fund | | | 5,511,767 | | | | 117,402,979 | | | | 120,069,464 | | | | — | | | | — | | | | 2,845,282 | | | | 1,604 | | | | — | |
Mid-Cap Growth Fund | | | 3,448,553 | | | | 71,100,960 | | | | 73,027,133 | | | | — | | | | — | | | | 1,522,380 | | | | 885 | | | | — | |
Small-Cap Value Fund | | | 2,166,338 | | | | 46,693,552 | | | | 47,542,409 | | | | — | | | | — | | | | 1,317,481 | | | | 681 | | | | — | |
Small-Cap Core Fund | | | 662,439 | | | | 13,539,799 | | | | 13,920,413 | | | | — | | | | — | | | | 281,825 | | | | 230 | | | | — | |
Small-Cap Growth Fund | | | 4,064,991 | | | | 86,547,542 | | | | 88,271,002 | | | | — | | | | — | | | | 2,341,531 | | | | 1,309 | | | | — | |
Short-Term Income Fund | | | 2,244,100 | | | | 57,155,670 | | | | 57,215,807 | | | | — | | | | — | | | | 2,183,963 | | | | 796 | | | | — | |
Strategic Income Fund | | | 1,265,051 | | | | 33,765,776 | | | | 33,665,342 | | | | — | | | | — | | | | 1,365,485 | | | | 854 | | | | — | |
TCH Corporate Income Fund | | | 2,999,415 | | | | 124,360,859 | | | | 121,970,407 | | | | — | | | | — | | | | 5,389,867 | | | | 2,252 | | | | — | |
TCH Core Plus Bond Fund | | | 21,467,610 | | | | 323,582,498 | | | | 336,791,102 | | | | — | | | | — | | | | 8,259,006 | | | | 7,238 | | | | — | |
High Yield Bond Fund | | | 291,406 | | | | 6,527,589 | | | | 6,617,682 | | | | — | | | | — | | | | 201,313 | | | | 162 | | | | — | |
167
| | |
| | |
| Notes to Financial Statements(continued) | | |
| | | | | | | | | | | | | | | | | | | | | | | | | | | | | | | | |
Security/Fund Description | | Value,
Beginning of
Period | | | Purchases(1) | | | Sales
Proceeds(1) | | | Change in
Unrealized
Appreciation
(Depreciation) | | | Net
Realized
Gain(Loss) | | | Value, End
of
Period | | | Dividends
Credited
to
Income | | | Net Realized
Gain on
Capital Gain
Distributions | |
Collateral Pool Pro Rata Allocation for Securities on Loan in BMO Institutional Prime Money Market Fund, 2.097% | |
Low Volatility Equity Fund | | $ | 15,105,321 | | | $ | 12,535,061 | | | $ | — | | | $ | — | | | $ | — | | | $ | 27,640,382 | | | $ | 8,299 | | | $ | — | |
Dividend Income Fund | | | 18,482,875 | | | | 16,838,355 | | | | — | | | | — | | | | — | | | | 35,321,230 | | | | 9,839 | | | | — | |
Large-Cap Value Fund | | | 41,609,071 | | | | — | | | | 4,242,083 | | | | — | | | | — | | | | 37,366,988 | | | | 17,734 | | | | — | |
Large-Cap Growth Fund | | | 39,418,228 | | | | 7,624,614 | | | | — | | | | — | | | | — | | | | 47,042,842 | | | | 24,320 | | | | — | |
Mid-Cap Value Fund | | | 24,411,695 | | | | — | | | | 6,409,134 | | | | — | | | | — | | | | 18,002,561 | | | | 10,156 | | | | — | |
Mid-Cap Growth Fund | | | 15,273,692 | | | | — | | | | 5,641,348 | | | | — | | | | — | | | | 9,632,344 | | | | 5,602 | | | | — | |
Small-Cap Value Fund | | | 9,594,744 | | | | — | | | | 1,258,824 | | | | — | | | | — | | | | 8,335,920 | | | | 4,311 | | | | — | |
Small-Cap Core Fund | | | 2,933,952 | | | | — | | | | 1,150,799 | | | | — | | | | — | | | | 1,783,153 | | | | 1,455 | | | | — | |
Small-Cap Growth Fund | | | 18,003,903 | | | | — | | | | 3,188,650 | | | | — | | | | — | | | | 14,815,253 | | | | 8,289 | | | | — | |
Short-Term Income Fund | | | 9,939,149 | | | | 3,879,139 | | | | — | | | | — | | | | — | | | | 13,818,288 | | | | 5,041 | | | | — | |
Strategic Income Fund | | | 5,602,929 | | | | 3,036,716 | | | | — | | | | — | | | | — | | | | 8,639,645 | | | | 5,407 | | | | — | |
TCH Corporate Income Fund | | | 13,284,450 | | | | 20,818,121 | | | | — | | | | — | | | | — | | | | 34,102,571 | | | | 14,260 | | | | — | |
TCH Core Plus Bond Fund | | | 95,080,353 | | | | — | | | | 42,824,270 | | | | — | | | | — | | | | 52,256,083 | | | | 45,822 | | | | — | |
High Yield Bond Fund | | | 1,290,638 | | | | — | | | | 16,898 | | | | — | | | | — | | | | 1,273,740 | | | | 1,027 | | | | — | |
| | | | | | | | |
Investments in Other Affiliates | | | | | | | | | | | | | | | | | | | | | | | | |
Fund/Security Description | | | | | | | | | | | | | | | | | | | | | | | | | | | | | | | | |
ShortTax-Free Fund | | | | | | | | | | | | | | | | | | | | | | | | | | | | | | | | |
BMO Ultra ShortTax-Free Fund - Institutional Class | | | 875,303 | | | | 5,883 | | | | 882,023 | | | | 2,518 | | | | (1,681 | ) | | | — | | | | 5,966 | | | | — | |
IntermediateTax-Free Fund | | | | | | | | | | | | | | | | | | | | | | | | | | | | | | | | |
BMO Ultra ShortTax-Free Fund - Institutional Class | | | 5,162,410 | | | | 34,700 | | | | 5,202,283 | | | | 15,033 | | | | (9,860 | ) | | | — | | | | 35,188 | | | | — | |
LGM Emerging Markets Fund | | | | | | | | | | | | | | | | | | | | | | | | | | | | | | | | |
BMO Institutional Prime Money Market Fund Premier Class | | | 7,268,280 | | | | 149,494,134 | | | | 140,049,717 | | | | 1,089 | | | | 1,239 | | | | 16,712,847 | | | | 7,938 | | | | — | |
Global Low Volatility Equity Fund | | | | | | | | | | | | | | | | | | | | | | | | | | | | | | | | |
BMO Institutional Prime Money Market Fund Premier Class | | | 143,976 | | | | 14,649,450 | | | | 14,172,306 | | | | 51 | | | | 474 | | | | 621,645 | | | | 1,161 | | | | — | |
| (1) | Includes adjustment for net change in Collateral Pool Pro Rata Allocation of value, at end of period. |
Interfund Borrowing and Lending—The Funds participate in an interfund lending program. This program allows the Funds to borrow cash from any of the BMO Money Market Funds for temporary purposes. The program is subject to a number of conditions, including the requirement that the interfund loan rate to be charged to the Funds under the program is (i) more favorable to the lending Fund than the rate it could otherwise obtain from investing cash in repurchase agreements or purchasing shares of the BMO Money Market Funds and (ii) more favorable to the borrowing Fund than the lowest interest rate at which bank short-term loans would be available to the Funds. In addition, a Fund may participate in the program only if its participation is consistent with the Fund’s investment policies and limitations. The Directors are responsible for the oversight of the interfund lending program.
Funds utilizing the Interfund lending program, borrowing from the BMO Government Money Market Fund during the year ended August 31, 2019, were as follows:
| | | | | | | | |
Fund | | Average Daily
Loan Balance
Outstanding | | | Weighted Average
Interest Rate | |
Low Volatility Equity Fund | | $ | 9,730 | | | | 2.544 | % |
Dividend Income Fund | | | 6,996 | | | | 2.579 | |
Large-Cap Value Fund | | | 277,279 | | | | 1.883 | |
Large-Cap Growth Fund | | | 436,634 | | | | 2.470 | |
Mid-Cap Value Fund | | | 20,403 | | | | 2.305 | |
Mid-Cap Growth Fund | | | 70,292 | | | | 1.935 | |
Small-Cap Value Fund | | | 7,318 | | | | 2.565 | |
Small-Cap Core Fund | | | 33,042 | | | | 2.375 | |
Small-Cap Growth Fund | | | 30,714 | | | | 2.477 | |
Global Low Volatility Equity Fund | | | 20,229 | | | | 2.004 | |
| | | | | | | | |
Fund | | Average Daily
Loan Balance
Outstanding | | | Weighted Average
Interest Rate | |
Disciplined International Equity Fund | | $ | 30,576 | | | | 2.532 | % |
Global Long/Short Equity Fund | | | 81,537 | | | | 2.274 | |
Ultra ShortTax-Free Fund | | | 62,896 | | | | 2.212 | |
IntermediateTax-Free Fund | | | 20,100 | | | | 1.981 | |
Strategic Income Fund | | | 341 | | | | 2.581 | |
TCH Corporate Income Fund | | | 2,190 | | | | 1.890 | |
Pyford International Stock Fund | | | 225,033 | | | | 2.543 | |
Short Tax-Free Fund | | | 6,985 | | | | 2.527 | |
High Yield Bond Fund | | | 1,023 | | | | 2.527 | |
Concentration of Shareholder—As of August 31, 2019, one shareholder held 36% of the outstanding shares of the BMO Global Low Volatility Equity Fund.
The Corporation, on behalf of the respective Funds, participated in a $25 million unsecured, committed revolving line of credit (“LOC”) agreement with State Street Bank. The LOC was made available for extraordinary or emergency purposes, primarily for financing redemption payments. Borrowings currently are charged interest at a rate of the London Interbank
168
Offering Rate (“LIBOR”) plus 1.25% and a commitment fee of 0.20% per annum on the daily unused portion with no administrative fee. No borrowings were outstanding under the LOC during the year ended August 31, 2019.
| 8. | | Investment Transactions |
Purchases and sales of investments, excluding short-term U.S. government securities, short-term obligations, andin-kind contributions, for the year ended August 31, 2019 were as follows:
| | | | | | | | | | | | | | | | |
| | | Other than
U.S Government
Securities | | | U.S Government
Securities | |
Fund | | Purchases | | | Sales | | | Purchases | | | Sales | |
Low Volatility Equity Fund | | $ | 107,175,735 | | | $ | 47,433,628 | | | $ | — | | | $ | — | |
Dividend Income Fund | | | 241,621,302 | | | | 88,674,518 | | | | — | | | | — | |
Large-Cap Value Fund | | | 217,239,084 | | | | 271,391,192 | | | | — | | | | — | |
Large-Cap Growth Fund | | | 423,231,107 | | | | 371,329,046 | | | | — | | | | — | |
Mid-Cap Value Fund | | | 82,363,233 | | | | 121,707,041 | | | | — | | | | — | |
Mid-Cap Growth Fund | | | 65,054,826 | | | | 93,043,404 | | | | — | | | | — | |
Small-Cap Value Fund | | | 41,520,749 | | | | 48,675,231 | | | | — | | | | — | |
Small-Cap Core Fund | | | 15,239,366 | | | | 21,151,781 | | | | — | | | | — | |
Small-Cap Growth Fund | | | 73,793,584 | | | | 103,956,706 | | | | — | | | | — | |
Global Low Volatility Equity Fund | | | 17,942,637 | | | | 14,051,089 | | | | — | | | | — | |
Disciplined International Equity Fund | | | 43,437,412 | | | | 50,188,905 | | | | — | | | | — | |
Pyrford International Stock Fund | | | 105,563,206 | | | | 100,819,171 | | | | — | | | | — | |
LGM Emerging Markets Equity Fund | | | 143,642,027 | | | | 54,847,299 | | | | — | | | | — | |
Alternative Strategies Fund | | | 15,395,324 | | | | 54,295,177 | | | | — | | | | — | |
Global Long/Short Equity Fund | | | 2,292,288 | | | | 8,207,449 | | | | — | | | | — | |
Ultra ShortTax-Free Fund | | | 826,610,918 | | | | 907,057,444 | | | | 3,000,000 | | | | 70,000 | |
ShortTax-Free Fund | | | 159,740,080 | | | | 188,937,847 | | | | 1,000,000 | | | | 2,345,000 | |
Short-Term Income Fund | | | 103,367,250 | | | | 87,076,495 | | | | 33,869,067 | | | | 34,202,523 | |
IntermediateTax-Free Fund | | | 1,225,445,779 | | | | 1,132,699,943 | | | | 2,000,000 | | | | 5,495,000 | |
Strategic Income Fund | | | 29,079,771 | | | | 32,679,120 | | | | 1,482,279 | | | | 6,816,555 | |
TCH Corporate Income Fund | | | 163,225,466 | | | | 98,535,116 | | | | 1,895,000 | | | | 3,256,191 | |
TCH Core Plus Bond Fund | | | 191,718,538 | | | | 319,743,952 | | | | 295,730,121 | | | | 222,871,092 | |
High Yield Bond Fund | | | 2,297,469 | | | | 4,040,494 | | | | — | | | | — | |
| 9. | | Federal Tax Information |
The timing and character of income and capital gain distributions are determined in accordance with income tax regulations, which may differ from GAAP. These differences are due in part to differing treatments for net operating loss, foreign currency transactions, paydown gain or loss, market discount accretion, premium amortization and expiring capital loss carryforwards.
To the extent that differences arise that are permanent in nature, such amounts are reclassified within the capital accounts on the Statements of Assets and Liabilities based on their Federal tax basis treatment; temporary differences do not require reclassification and had no impact on the NAV of the Funds.
The Funds complied with FASB interpretationAccounting for Uncertainty in Income Taxes which provides guidance for how uncertain tax provisions should be recognized, measured, presented and disclosed in the financial statements.Accounting for Uncertainty in Income Taxes requires the affirmative evaluation of tax positions taken, or expected to be taken, in the course of preparing the Funds’ tax returns to determine whether it is“more-likely-than-not,” (i.e., greater than 50 percent) of being sustained by the applicable tax authority. Tax positions not deemed to meet themore-likely-than-not threshold may result in a tax benefit or expense in the current year.
Accounting for Uncertainty in Income Taxes requires management of the Funds to analyze all open tax years, as defined by the statutes of limitations, for all major jurisdictions, which includes federal and certain states. Open tax years are those that are open for exam by the taxing authorities (i.e., the last four tax years and the interim tax period since then). There are no examinations in progress. For all open tax years and all major taxing jurisdictions through the end of the reporting period, management of the Fund reviewed all tax positions taken or expected to be taken in the preparation of the Funds’ tax returns and concluded thatAccounting for Uncertainty in Income Taxes resulted in no effect on the Funds’ reported net assets or results of operations as of and during the year ended August 31, 2019. Management of the Funds also is not aware of any tax positions for which it is reasonably possible that the total amounts of recognized tax benefits will significantly change in the next twelve months.
169
| | |
| | |
| Notes to Financial Statements(continued) | | |
The difference between book basis and tax basis unrealized appreciation/depreciation is attributable in part to the tax deferral of losses on wash sales, the realization for tax purposes of unrealized gains on investments in passive foreign investment companies, derivatives, foreign unrealized capital gains tax, foreign currency and the discount accretion/premium amortization of debt securities.
| | | | | | | | | | | | | | | | |
Fund | | Cost of
Investments
for Federal
Tax Purposes | | | Gross
Unrealized
Appreciation
for Federal
Tax Purposes | | | Gross
Unrealized
(Depreciation)
for Federal
Tax Purposes | | | Net
Unrealized
Appreciation
(Depreciation)
for Federal
Tax Purposes | |
BMO Low Volatility Equity Fund | | $ | 236,156,194 | | | $ | 41,976,453 | | | $ | (3,224,424 | ) | | $ | 38,752,029 | |
BMO Dividend Income Fund | | | 378,789,530 | | | | 35,835,018 | | | | (7,933,283 | ) | | | 27,901,735 | |
BMO Large-Cap Value Fund | | | 357,887,840 | | | | 37,682,870 | | | | (11,093,553 | ) | | | 26,589,317 | |
BMO Large-Cap Growth Fund | | | 456,542,850 | | | | 112,135,443 | | | | (11,201,057 | ) | | | 100,934,386 | |
BMO Mid-Cap Value Fund | | | 172,420,915 | | | | 19,649,940 | | | | (11,001,877 | ) | | | 8,648,063 | |
BMO Mid-Cap Growth Fund | | | 105,256,570 | | | | 16,985,834 | | | | (3,855,906 | ) | | | 13,129,928 | |
BMO Small-Cap Value Fund | | | 75,374,885 | | | | 6,454,311 | | | | (6,628,661 | ) | | | (174,350 | ) |
BMO Small-Cap Core Fund | | | 17,401,718 | | | | 1,869,818 | | | | (1,198,807 | ) | | | 671,011 | |
BMO Small-Cap Growth Fund | | | 125,312,822 | | | | 15,654,347 | | | | (6,573,635 | ) | | | 9,080,712 | |
BMO Global Low Volatility Equity Fund | | | 32,232,658 | | | | 4,689,946 | | | | (1,400,675 | ) | | | 3,289,271 | |
BMO Disciplined International Equity Fund | | | 66,788,045 | | | | 6,131,369 | | | | (6,279,130 | ) | | | (147,761 | ) |
BMO Pyrford International Stock Fund | | | 621,840,330 | | | | 80,328,953 | | | | (43,061,336 | ) | | | 37,267,617 | |
BMO LGM Emerging Markets Equity Fund | | | 284,291,826 | | | | 34,218,911 | | | | (24,777,822 | ) | | | 9,441,089 | |
BMO Alternative Strategies Fund | | | 34,817,317 | | | | 75,949 | | | | (708,117 | ) | | | (632,168 | ) |
BMO Global Long/Short Equity Fund | | | 2,685,527 | | | | 320,791 | | | | (317,868 | ) | | | 2,923 | |
BMO Ultra Short Tax-Free Fund | | | 567,193,701 | | | | 1,405,652 | | | | (140,573 | ) | | | 1,265,079 | |
BMO Short Tax-Free Fund | | | 157,083,188 | | | | 2,418,764 | | | | (40,623 | ) | | | 2,378,141 | |
BMO Short-Term Income Fund | | | 286,113,668 | | | | 3,958,528 | | | | (222,483 | ) | | | 3,736,045 | |
BMO Intermediate Tax-Free Fund | | | 1,807,909,219 | | | | 115,249,079 | | | | (291,482 | ) | | | 114,957,597 | |
BMO Strategic Income Fund | | | 95,724,310 | | | | 3,527,939 | | | | (1,667,000 | ) | | | 1,860,939 | |
BMO TCH Corporate Income Fund | | | 401,042,748 | | | | 21,911,681 | | | | (1,090,377 | ) | | | 20,821,304 | |
BMO TCH Core Plus Bond Fund | | | 1,115,468,110 | | | | 49,852,757 | | | | (8,358,327 | ) | | | 41,494,430 | |
BMO High Yield Bond Fund | | | 12,148,460 | | | | 303,227 | | | | (380,093 | ) | | | (76,866 | ) |
BMO Government Money Market Fund | | | 3,193,672,635 | | | | — | | | | — | | | | — | |
BMO Tax-Free Money Market Fund | | | 409,371,919 | | | | — | | | | — | | | | — | |
BMO Prime Money Market Fund | | | 496,509,316 | | | | — | | | | — | | | | — | |
BMO Institutional Prime Money Market Fund | | | 561,430,959 | | | | 71,924 | | | | (12,853 | ) | | | 59,071 | |
The tax character of distributions reported on the Statements of Changes in Net Assets for the years ended August 31, 2019 and August 31, 2018, were as follows:
| | | | | | | | | | | | | | | | | | | | | | | | | | | | |
| | | 2019 | | | 2018 | |
Fund | | Ordinary
Income | | | Tax-Exempt
Income | | | Long-Term
Capital Gains | | | Return of
Capital | | | Ordinary
Income | | | Tax-Exempt
Income | | | Long-Term
Capital Gains | |
BMO Low Volatility Equity Fund | | $ | 3,779,573 | | | $ | — | | | $ | 9,447,911 | | | $ | — | | | $ | 3,160,478 | | | $ | — | | | $ | 3,189,229 | |
BMO Dividend Income Fund | | | 4,756,191 | | | | — | | | | 7,369,330 | | | | — | | | | 5,133,814 | | | | — | | | | 11,100,034 | |
BMO Large-Cap Value Fund | | | 9,866,179 | | | | — | | | | 30,382,182 | | | | — | | | | 11,266,495 | | | | — | | | | 23,620,755 | |
BMO Large-Cap Growth Fund | | | 13,206,950 | | | | — | | | | 40,268,668 | | | | — | | | | 5,872,237 | | | | — | | | | 14,405,633 | |
BMO Mid-Cap Value Fund | | | 3,044,221 | | | | — | | | | 19,687,022 | | | | — | | | | 5,417,735 | | | | — | | | | 4,733,501 | |
BMO Mid-Cap Growth Fund | | | 8,149,700 | | | | — | | | | 11,039,782 | | | | — | | | | 3,084,500 | | | | — | | | | 3,984,417 | |
BMO Small-Cap Value Fund | | | 1,961,121 | | | | — | | | | 3,300,073 | | | | — | | | | 3,505,522 | | | | — | | | | 1,725,945 | |
BMO Small-Cap Core Fund | | | 492,526 | | | | — | | | | 1,456,995 | | | | — | | | | 454,372 | | | | — | | | | 822,023 | |
BMO Small-Cap Growth Fund | | | 5,123,756 | | | | — | | | | 13,273,660 | | | | — | | | | — | | | | — | | | | 14,759,760 | |
BMO Global Low Volatility Equity Fund | | | 1,231,016 | | | | — | | | | 4,731,437 | | | | — | | | | 1,366,846 | | | | — | | | | 495,697 | |
BMO Disciplined International Equity Fund | | | 1,528,435 | | | | — | | | | — | | | | — | | | | 1,534,123 | | | | — | | | | — | |
BMO Pyrford International Stock Fund | | | 17,771,263 | | | | — | | | | — | | | | — | | | | 16,810,534 | | | | — | | | | — | |
BMO LGM Emerging Markets Equity Fund | | | 4,193,042 | | | | — | | | | 4,483,419 | | | | — | | | | 1,245,393 | | | | — | | | | — | |
BMO Alternative Strategies Fund | | | — | | | | — | | | | — | | | | — | | | | 49,511 | | | | — | | | | 4,427,483 | |
BMO Global Long/Short Equity Fund | | | 79,183 | | | | — | | | | 21,028 | | | | — | | | | 188,423 | | | | — | | | | 226,026 | |
BMO Ultra Short Tax-Free Fund | | | 16,759 | | | | 9,600,547 | | | | — | | | | — | | | | 94,095 | | | | 7,997,980 | | | | 217,628 | |
BMO Short Tax-Free Fund | | | 9,597 | | | | 3,184,588 | | | | — | | | | — | | | | — | | | | 2,927,616 | | | | — | |
BMO Short-Term Inco me Fund | | | 6,393,700 | | | | — | | | | — | | | | — | | | | 5,064,383 | | | | — | | | | — | |
BMO Intermediate Tax-Free Fund | | | 620,457 | | | | 51,210,030 | | | | — | | | | — | | | | — | | | | — | | | | — | |
BMO Strategic Income Fund | | | 3,713,872 | | | | — | | | | — | | | | — | | | | 4,339,645 | | | | — | | | | — | |
BMO TCH Corporate Income Fund | | | 10,884,025 | | | | — | | | | 439,797 | | | | — | | | | 8,278,452 | | | | — | | | | — | |
BMO TCH Core Plus Bond Fund | | | 34,557,913 | | | | — | | | | — | | | | — | | | | 32,309,452 | | | | — | | | | — | |
BMO High Yield Bond Fund | | | 582,308 | | | | — | | | | — | | | | — | | | | 652,504 | | | | — | | | | — | |
BMO Government Money Market Fund | | | 63,212,461 | | | | — | | | | 200 | | | | — | | | | 40,601,282 | | | | — | | | | 900 | |
BMO Tax-Free Money Market Fund | | | 12,023 | | | | 5,921,385 | | | | 7,584 | | | | — | | | | — | | | | 3,674,509 | | | | — | |
BMO Prime Money Market Fund | | | 10,006,252 | | | | — | | | | — | | | | — | | | | 5,929,727 | | | | — | | | | 111 | |
BMO Institutional Prime Money Market Fund | | | 12,722,718 | | | | — | | | | — | | | | — | | | | 6,828,289 | | | | — | | | | 35 | |
170
As of August 31, 2019, the components of distributable earnings on a tax basis are as follows:
| | | | | | | | | | | | | | | | | | | | |
| | | Undistributed
Ordinary
Income | | | Undistributed
Tax-Exempt
Income | | | Undistributed
Long-Term
Capital Gains | | | Accumulated
Capital and
Other Losses | | | Unrealized
Appreciation
(Depreciation) | |
BMO Low Volatility Equity Fund | | $ | 836,856 | | | $ | — | | | $ | 2,698,713 | | | $ | — | | | $ | 38,752,029 | |
BMO Dividend Income Fund | | | 1,220,262 | | | | — | | | | — | | | | (302,119 | ) | | | 27,901,735 | |
BMO Large-Cap Value Fund | | | 1,107,980 | | | | — | | | | — | | | | (3,434,577 | ) | | | 26,589,317 | |
BMO Large-Cap Growth Fund | | | 3,767,821 | | | | — | | | | 16,157,050 | | | | — | | | | 100,934,386 | |
BMO Mid-Cap Value Fund | | | 1,217,500 | | | | — | | | | 9,401 | | | | (2,653,830 | ) | | | 8,648,063 | |
BMO Mid-Cap Growth Fund | | | — | | | | — | | | | 11,748,567 | | | | (1,778,946 | ) | | | 13,129,928 | |
BMO Small-Cap Value Fund | | | 336,771 | | | | — | | | | 111,328 | | | | — | | | | (174,350 | ) |
BMO Small-Cap Core Fund | | | 36,075 | | | | — | | | | — | | | | (818,490 | ) | | | 671,011 | |
BMO Small-Cap Growth Fund | | | — | | | | — | | | | 1,771,713 | | | | (299,863 | ) | | | 9,080,712 | |
BMO Global Low Volatility Equity Fund | | | 902,024 | | | | — | | | | 556,529 | | | | (84,907 | ) | | | 3,287,991 | |
BMO Disciplined International Equity Fund | | | 2,013,964 | | | | — | | | | — | | | | (3,243,470 | ) | | | (154,190 | ) |
BMO Pyrford International Stock Fund | | | 15,101,148 | | | | — | | | | — | | | | (29,537,487 | ) | | | 37,235,092 | |
BMO LGM Emerging Markets Equity Fund | | | 3,334,446 | | | | — | | | | 1,584,231 | | | | — | | | | 9,434,358 | |
BMO Alternative Strategies Fund | | | 212,222 | | | | — | | | | — | | | | (3,205,129 | ) | | | (484,206 | ) |
BMO Global Long/Short Equity Fund | | | 78,273 | | | | — | | | | 1,754 | | | | (220,835 | ) | | | (28,114 | ) |
BMO Ultra Short Tax-Free Fund | | | 8,255 | | | | 335,408 | | | | 69,141 | | | | — | | | | 1,265,079 | |
BMO Short Tax-Free Fund | | | — | | | | 164,891 | | | | — | | | | (169,234 | ) | | | 2,378,141 | |
BMO Short-Term Income Fund | | | 249,859 | | | | — | | | | — | | | | (2,131,007 | ) | | | 3,736,045 | |
BMO Intermediate Tax-Free Fund | | | 148,436 | | | | 1,244,054 | | | | — | | | | (15,469,562 | ) | | | 114,957,597 | |
BMO Strategic Income Fund | | | 1,318 | | | | — | | | | — | | | | (4,079,621 | ) | | | 1,860,939 | |
BMO TCH Corporate Income Fund | | | 340,095 | | | | — | | | | — | | | | (1,422,345 | ) | | | 20,821,304 | |
BMO TCH Core Plus Bond Fund | | | 232,146 | | | | — | | | | — | | | | (9,494,023 | ) | | | 41,494,430 | |
BMO High Yield Bond Fund | | | — | | | | — | | | | — | | | | (3,147,987 | ) | | | (76,866 | ) |
BMO Government Money Market Fund | | | 4,469,817 | | | | — | | | | — | | | | — | | | | — | |
BMO Tax-Free Money Market Fund | | | — | | | | 363,934 | | | | — | | | | — | | | | — | |
BMO Prime Money Market Fund | | | 432,989 | | | | — | | | | — | | | | — | | | | — | |
BMO Institutional Prime Money Market Fund | | | 673,327 | | | | — | | | | — | | | | — | | | | 59,071 | |
At August 31, 2019, the Funds had capital loss carryforwards, which reduce the Funds’ taxable income arising from future net realized gains on investments, if any, to the extent permitted by the Code, and thus will reduce the amount of distributions to shareholders which would otherwise be necessary to relieve the Funds of any liability for federal tax. Pursuant to the Code, such capital loss carryforwards are not subject to expiration and are as follows:
| | | | | | | | | | | | |
| | | Capital Loss Carryforwards | | | | |
Fund | | Short-Term | | | Long-Term | | | Total | |
BMO Small-Cap Core Fund | | $ | 818,490 | | | $ | — | | | $ | 818,490 | |
BMO Disciplined International Equity Fund | | | 2,046,816 | | | | 1,196,654 | | | | 3,243,470 | |
BMO Pyrford International Stock Fund | | | 1,980,518 | | | | 27,556,969 | | | | 29,537,487 | |
BMO Alternative Strategies Fund | | | 3,205,129 | | | | — | | | | 3,205,129 | |
BMO Short Tax-Free Fund | | | 169,234 | | | | — | | | | 169,234 | |
BMO Short-Term Income Fund | | | 548,479 | | | | 1,582,528 | | | | 2,131,007 | |
BMO Intermediate Tax-Free Fund | | | 13,509,692 | | | | 1,959,870 | | | | 15,469,562 | |
BMO Strategic Income Fund | | | 538,072 | | | | 3,541,549 | | | | 4,079,621 | |
BMO TCH Corporate Income Fund | | | 517,980 | | | | 904,365 | | | | 1,422,345 | |
BMO TCH Core Plus Bond Fund | | | 1,103,076 | | | | 8,390,947 | | | | 9,494,023 | |
BMO High Yield Bond Fund | | | 1,136,105 | | | | 2,011,882 | | | | 3,147,987 | |
As of August 31, 2019, the following funds had post-October losses, which are deferred until fiscal year 2020 for tax purposes, of:
| | | | | | | | |
| | | Post-October Losses | |
Fund | | Short-Term | | | Long-Term | |
BMO Dividend Income Fund | | $ | 1,840,032 | | | $ | (1,537,913 | ) |
BMO Large-Cap Value Fund | | | 8,844,355 | | | | (5,409,778 | ) |
BMO Mid-Cap Value Fund | | | 3,245,093 | | | | (591,263 | ) |
BMO Mid-Cap Growth Fund | | | 1,661,810 | | | | — | |
BMO Global Low Volatility Equity Fund | | | 84,907 | | | | — | |
BMO Global Long/Short Equity Fund | | | 386,612 | | | | (165,777 | ) |
171
| | |
| | |
| Notes to Financial Statements(continued) | | |
Net capital losses incurred after October 31, and within the taxable year, are deemed to arise on the first day of the Fund’s next taxable year.
As of August 31, 2019, the Mid-Cap Growth Fund and Small-Cap Growth Fund had qualified late-year ordinary losses of $117,136 and $299,863, respectively, which are deferred until fiscal year 2020 for tax purposes. Net late-year losses incurred after December 31, and within the taxable year, are deemed to arise on the first day of the Fund’s next taxable year.
| 10. | | Shareholder Tax Information (unaudited) |
Of the ordinary income (including short-term capital gain) distributions made by the Funds during the year ended August 31, 2019, the percentages that qualify for the dividend received deduction available to corporate shareholders were as follows:
| | | | |
Low Volatility Equity Fund | | | 49.40 | % |
Dividend Income Fund | | | 54.43 | |
Large-Cap Value Fund | | | 68.84 | |
Large-Cap Growth Fund | | | 24.72 | |
Mid-Cap Value Fund | | | 52.10 | |
Mid-Cap Growth Fund | | | 10.45 | |
| | | | |
Small-Cap Value Fund | | | 26.66 | % |
Small-Cap Core Fund | | | 16.57 | |
Small-Cap Growth Fund | | | 4.74 | |
LGM Emerging Markets Equity Fund | | | 5.27 | |
Global Long/Short Equity Fund | | | 35.74 | |
Of the ordinary income (including short-term capital gain) distributions made by the Funds during the year ended August 31, 2019, the percentages that are designated as qualified dividend income were as follows:
| | | | |
Low Volatility Equity Fund | | | 50.37 | % |
Dividend Income Fund | | | 54.78 | |
Large-Cap Value Fund | | | 69.10 | |
Large-Cap Growth Fund | | | 24.34 | |
Mid-Cap Value Fund | | | 36.15 | |
Mid-Cap Growth Fund | | | 10.69 | |
Small-Cap Value Fund | | | 24.57 | |
| | | | |
Small-Cap Core Fund | | | 17.65 | % |
Small-Cap Growth Fund | | | 8.07 | |
Global Low Volatility Equity Fund | | | 58.63 | |
Disciplined International Equity Fund | | | 93.66 | |
Pyrford International Stock Fund | | | 78.82 | |
LGM Emerging Markets Equity Fund | | | 68.19 | |
Global Long/Short Equity Fund | | | 97.40 | |
For Federal tax purposes, for the year ended August 31, 2019, the following Funds designate long-term capital gains, or the amounts determined to be necessary, of:
| | | | |
Low Volatility Equity Fund | | $ | 9,447,911 | |
Dividend Income Fund | | | 7,369,330 | |
Large-Cap Value Fund | | | 30,382,182 | |
Large-Cap Growth Fund | | | 40,268,668 | |
Mid-Cap Value Fund | | | 19,687,022 | |
Mid-Cap Growth Fund | | | 11,039,782 | |
Small-Cap Value Fund | | | 3,300,073 | |
Small-Cap Core Fund | | | 1,456,995 | |
| | | | |
Small-Cap Growth Fund | | $ | 13,273,660 | |
Global Low Volatility Equity Fund | | | 4,731,437 | |
LGM Emerging Markets Equity Fund | | | 4,483,419 | |
Global Long/Short Equity Fund | | | 21,028 | |
TCH Corporate Income Fund | | | 439,797 | |
Government Money Market Fund | | | 200 | |
Tax-Free Money Market Fund | | | 7,584 | |
For Federal tax purposes, for the year ended August 31, 2019, the following Funds designate qualified short-term capital gains, or the amounts determined to be necessary, of:
| | | | |
Low Volatility Equity Fund | | $ | 1,364,287 | |
Dividend Income Fund | | | 44,619 | |
Large-Cap Value Fund | | | 2,726,018 | |
Large-Cap Growth Fund | | | 10,862,365 | |
Mid-Cap Growth Fund | | | 8,149,700 | |
Small-Cap Value Fund | | | 1,475,132 | |
Small-Cap Core Fund | | | 484,035 | |
| | | | |
Small-Cap Growth Fund | | $ | 5,123,756 | |
Global Low Volatility Equity Fund | | | 371,771 | |
LGM Emerging Markets Equity Fund | | | 1,815,936 | |
TCH Corporate Income Fund | | | 423,868 | |
Tax-Free Money Market Fund | | | 12,023 | |
Prime Money Market Fund | | | 536 | |
Institutional Prime Money Market Fund | | | 1,074 | |
For Federal tax purposes, for the year ended August 31, 2019, the following Funds designate qualified tax-exempt dividends, or the amounts determined to be necessary, of:
| | | | |
Ultra Short Tax-Free Fund | | $ | 11,397,720 | |
Short Tax-Free Fund | | | 3,902,304 | |
Intermediate Tax-Free Fund | | | 58,345,095 | |
BMO Tax-Free Money Market Fund | | | 6,961,299 | |
For the year ended August 31, 2019, Pursuant to Section 853 of the Code, the following Funds designate income derived from foreign sources and foreign taxes paid, or the amounts determined to be necessary, of:
| | | | | | | | | | | | | | | | |
Fund | | Income
Derived from
Foreign Sources | | | Foreign
Source Income
Distributed
per Share | | | Foreign Taxes
Paid | | | Foreign
Taxes Paid
per share | |
Global Low Volatility Equity Fund | | $ | 889,445 | | | $ | 0.29 | | | $ | 64,709 | | | $ | 0.02 | |
Disciplined International Equity Fund | | | 3,182,753 | | | | 0.52 | | | | 209,819 | | | | 0.03 | |
Pyrford International Stock Fund | | | 24,914,079 | | | | 0.49 | | | | 1,288,518 | | | | 0.03 | |
LGM Emerging Markets Equity Fund | | | 6,502,429 | | | | 0.33 | | | | 390,612 | | | | 0.02 | |
Global Long/Short Equity | | | 109,109 | | | | 0.44 | | | | 10,294 | | | | 0.41 | |
For the year ended August 31, 2019, Pursuant to Section 871 of the Code, the Government Money Market Fund designated
interest related dividends for non-resident alien shareholders of $63,207,808.
172
| 11. | | Recently Issued Accounting Pronouncements |
In March 2017, FASB issued an Accounting Standard Update, ASU2017-08, Receivables Nonrefundable Fees and Other Costs (Subtopic310-20), Premium Amortization on Purchased Callable Debt Securities (the “ASU”) which amends the amortization period for certain purchased callable debt securities held at a premium, shortening such period to the earliest call date. The ASU does not require any accounting change for debt securities held at a discount; the discount continues to be accreted to maturity. The ASU is effective for fiscal years, and interim periods within those fiscal years, beginning after December 15, 2018. At this time, management is evaluating the implications of these changes on the financial statements.
During August 2018, the Securities and Exchange Commission (the “SEC”) issued Final Rule Release No. 33-10532, Disclosure Update and Simplification (“Final Rule Release No. 33-10532”). Final Rule Release No. 33-10532 amends certain financial statement disclosure requirements to conform to U.S. GAAP. The amendments to Rule 6-04.17 of Regulation S-X (balance sheet) remove the requirement to separately state the book basis components of net assets: undistributed (over-distribution of) net investment income (“UNII”), accumulated undistributed net realized gains (losses), and net unrealized appreciation (depreciation) at the balance sheet date. Instead, consistent with U.S. GAAP, funds will be required to disclose total distributable earnings. The amendments to Rule 6-09 of Regulation S-X (statement of changes in net assets) remove the requirement to separately state the sources of distributions paid. Instead, consistent with U.S. GAAP, funds will be required to disclose the total amount of distributions paid, except that any tax return of capital must be separately disclosed. The amendments also remove the requirement to parenthetically state the book basis amount of UNII on the statement of changes in net assets.
The requirements of Final Rule Release No. 33-10532 were effective November 5, 2018, and the Funds’ Statements of Assets and Liabilities and Statements of Changes in Net Assets for the current reporting period have been modified accordingly. In addition, certain amounts within each Fund’s Statement of Changes in Net Assets for the prior fiscal period have been modified to conform to Final Rule Release No. 33-10532.
The Funds’ distributions from the prior fiscal period are disclosed in the Statements of Changes in Net Assets.
173
|
| |
| Report of Independent Registered Public Accounting Firm |
To the Board of Directors and Shareholders of BMO Funds, Inc.:
Opinion on the Financial Statements
We have audited the accompanying statements of assets and liabilities of BMO Low Volatility Equity Fund, BMO Dividend Income Fund, BMOLarge-Cap Value Fund, BMOLarge-Cap Growth Fund, BMOMid-Cap Value Fund, BMOMid-Cap Growth Fund, BMOSmall-Cap Value Fund, BMOSmall-Cap Core Fund, BMOSmall-Cap Growth Fund, BMO Global Low Volatility Equity Fund, BMO Disciplined International Equity Fund, BMO Pyrford International Stock Fund, BMO LGM Emerging Markets Equity Fund, BMO Alternative Strategies Fund, BMO Global Long/Short Equity Fund, BMO Ultra ShortTax-Free Fund, BMO ShortTax-Free Fund, BMO Short-Term Income Fund, BMO IntermediateTax-Free Fund, BMO Strategic Income Fund, BMO TCH Corporate Income Fund, BMO TCH Core Plus Bond Fund, BMO High Yield Bond Fund, BMO Government Money Market Fund, BMOTax-Free Money Market Fund, BMO Prime Money Market Fund, and BMO Institutional Prime Money Market Fund (each a series of BMO Funds, Inc., collectively referred to as the Funds), including the schedules of investments, as of August 31, 2019, the related statements of operations for the year then ended, the statements of changes in net assets for each of the years in thetwo-year period then ended, and the related notes (collectively, the financial statements) and the financial highlights for each of the years or periods in thefive-year period then ended. In our opinion, the financial statements and financial highlights present fairly, in all material respects, the financial position of the Funds as of August 31, 2019, the results of their operations for the year then ended, the changes in their net assets for each of the years in thetwo-year period then ended, and the financial highlights for each of the years or periods in thefive-year period then ended, in conformity with U.S. generally accepted accounting principles.
Basis for Opinion
These financial statements and financial highlights are the responsibility of the Funds’ management. Our responsibility is to express an opinion on these financial statements and financial highlights based on our audits. We are a public accounting firm registered with the Public Company Accounting Oversight Board (United States) (PCAOB) and are required to be independent with respect to the Funds in accordance with the U.S. federal securities laws and the applicable rules and regulations of the Securities and Exchange Commission and the PCAOB.
We conducted our audits in accordance with the standards of the PCAOB. Those standards require that we plan and perform the audit to obtain reasonable assurance about whether the financial statements and financial highlights are free of material misstatement, whether due to error or fraud. Our audits included performing procedures to assess the risks of material misstatement of the financial statements and financial highlights, whether due to error or fraud, and performing procedures that respond to those risks. Such procedures included examining, on a test basis, evidence regarding the amounts and disclosures in the financial statements and financial highlights. Such procedures also included confirmation of securities owned as of August 31, 2019 by correspondence with the custodians and brokers or by other appropriate auditing procedures. Our audits also included evaluating the accounting principles used and significant estimates made by management, as well as evaluating the overall presentation of the financial statements and financial highlights. We believe that our audits provide a reasonable basis for our opinion.
/s/ KPMG LLP
We have served as the auditor of one or more BMO Funds, Inc. investment companies since 2011.
Columbus, Ohio
October 28, 2019
174
| | |
| |
| Directors and Officers of the Funds(Unaudited) |
The following tables provide information about each Director and Officer of the Funds as of August 31, 2019. The address of each Director is c/o BMO Funds, 111 East Kilbourn Avenue, Suite 200, Milwaukee, Wisconsin 53202. There are currently 33 separate portfolios or funds in the BMO Funds complex, of which 32 are registered as BMO Funds, Inc. and one is registered as BMO LGM Frontier Markets Equity Fund with the Securities and Exchange Commission. The Funds’ Statement of Additional Information includes additional information about the Directors and is available, without charge and upon request, by calling 1-800-236-FUND (3863).
| | | | | | | | | | |
| INDEPENDENT DIRECTORS | | | | | | |
| Name and Age | | Position(s) Held
with the Corporation | | Term of
Office and
Length of
Time Served* | | Principal Occupation(s)
During Past 5 Years | | Number of
Portfolios in
Fund
Complex
Overseen by
Director | | Other
Directorships
Held by
Director |
| | | | | |
Ridge A. Braunschweig Age: 66 | | Independent Director | | Since
October
2009 | | President and Chief Executive Officer, CPL Industries, Inc. (a manufacturing holding company prior to May 2009 and a family office since May 2009), since January 2012. | | 33 | | None |
| | | | | |
Benjamin M. Cutler Age: 74 | | Independent Director | | Since July
2004 | | Chairman, USHEALTH Group, Inc. (a health insurance company), since 2004; CEO and President, USHEALTH Group, Inc., from 2004 to 2016; Director, Freedom from Hunger (a non-profit organization), since 2016. | | 33 | | None |
| | | | | |
John A. Lubs Age: 71 | | Independent Director | | Since July
2004 | | Retired; formerly, Vice Chairman, Mason Companies, Inc. (a footwear distributor), from 2004 to 2010 and Chief Operating Officer, from 2003 to 2010. | | 33 | | None |
| | | | | |
Vincent P. Lyles Age: 58 | | Independent Director | | Since
September
2017 | | Vice President of Community Relations, Advocate Aurora Health Care, since 2019; President and Chief Executive Officer, Boys & Girls Clubs of Greater Milwaukee, from 2012 to 2018. | | 33 | | None |
| | | | | |
James Mitchell Age: 72 | | Independent Director | | Since
March
1999 | | Chairman, Ayrshire Precision Engineering (a precision machining company), since 1992; Chief Executive Officer, NOG, Inc. (a metal processing and consulting company), from 1999 to 2015. | | 33 | | None |
| | | | | |
Barbara J. Pope
Age: 71 | | Independent Director | | Since
March
1999 | | Retired; formerly, President of Barbara J. Pope, P.C. (a financial consulting firm), 1992-2015; President of Sedgwick Street Fund LLC (a private investment partnership), 1996-2015; Tax Partner, Price Waterhouse. | | 33 | | None |
* Each Director serves an indefinite term until he or she retires or otherwise resigns, is removed, dies or until his or her successor is duly elected. Retirement
for a Director occurs no later than August 31 following his or her 75th birthday. |
175
| | |
| |
| Directors and Officers of the Funds(Unaudited) (continued) |
| | | | | | | | | | |
| INTERESTED DIRECTORS |
| Name and Age | | Position(s) Held with
the Corporation | | Term of
Office and
Length of
Time Served* | | Principal Occupation(s)
During Past 5 Years | | Number of
Portfolios in
Fund
Complex
Overseen by
Director | | Other
Directorships
Held by
Director |
| | | | | |
John M. Blaser** Age: 62 | | Director and President | | Since
May
1999 | | Managing Director of the Adviser, since June 2012. | | 33 | | None |
| | | | | |
Daniela O’Leary - Gill** Age: 54 | | Director | | Since
August
2018 | | Chief Operating Officer of BMO Financial Group, since February 1, 2018; Director of the Adviser, since June 1, 2018; Head, Communications, Government & Investor Relations 2016-2018; Head, AML Program Oversight 2014-2016; SVP, Personal Banking & Chief CRA Officer 2011-2014. | | 33 | | None |
* Each Director serves an indefinite term until he or she retires or otherwise resigns, is removed, dies or until his or her successor is duly elected. Retirement
for a Director occurs no later than August 31 following his or her 75th birthday. |
** Mr. Blaser is an “interested person” of the Corporation (as defined in the 1940 Act) due to the positions that he holds with the Corporation, and the
Adviser. Ms. O’Leary - Gill is an “interested person” of the Corporation due to the positions that she holds with the Adviser and BMO. |
| | | | | | |
| PRINCIPAL OFFICERS |
| Name and Age | | Position(s) Held with
the Corporation | | Term of Office and Length of
Time Served | | Principal Occupation(s) During Past 5
Years |
| | | |
Brett Black Age: 47 | | Chief Compliance Officer and Anti-Money Laundering Compliance Officer | | Elected by the Board annually; since November 2017 | | Vice President and Chief Compliance Officer of BMO Harris Bank, since 2017; Assistant Vice President, Deputy Chief Compliance Officer, since 2014; Senior Compliance Officer of BMO Harris Bank, since 2012. |
| | | |
Timothy M. Bonin Age: 46 | | Vice President, Chief Financial Officer and Treasurer | | Elected by the Board annually; since February 2006 | | Vice President of the Adviser, since February 2006. |
| | | |
Michael J. Murphy Age: 40 | | Secretary | | Elected by the Board annually; since May 2016 | | Senior Counsel and Vice President of BMO Harris Bank N.A., since 2014; Associate, Vedder Price P.C., 2010 to 2014. |
176
| | |
| |
Shareholder Report Disclosure of Directors’ Approval of
Continuation of Contracts(Unaudited) |
Approval of Continuation of Advisory and Subadvisory Agreements
During the reporting period, the Board of Directors (the “Board”) of BMO Funds, Inc. (the “Corporation”), including the Directors who are not “interested persons” of the Corporation as defined in the Investment Company Act of 1940, as amended (the “Independent Directors”), met to discuss the advisory and subadvisory agreements, as applicable, of each portfolio of the Corporation included in this shareholder report (each, a “Fund” and collectively, the “Funds”). The Board approved the continuation of the following agreements, all for an additional year ending August 31, 2020 (except as noted): (1) the investment advisory agreement (the “Advisory Agreement”) between the Corporation and BMO Asset Management Corp. (the “Adviser”) on behalf of each Fund (for an additional year ending August 26, 2020 for BMO Disciplined Equity Fund and BMO Global Long/Short Equity Fund); (2) an investment subadvisory agreement with each of the following subadvisers that are affiliates of the Adviser: (i) Taplin, Canida & Habacht, LLC on behalf of BMO TCH Corporate Income Fund and BMO TCH Core Plus Bond Fund; (ii) LGM Investments Limited on behalf of BMO LGM Emerging Markets Equity Fund; (iii) Pyrford International Ltd. on behalf of BMO Pyrford International Stock Fund;and (iv) BMO Asset Management Limited on behalf of BMO Alternative Strategies Fund; and (3) an investment subadvisory agreement on behalf of BMO Alternative Strategies Fund with the following subadviser that is not affiliated with the Adviser: Graham Capital Management, L.P. The subadvisers listed above are referred to herein each as a “Subadviser” and collectively as the “Subadvisers.” The subadvisory agreements listed above are referred to herein each as a “Subadvisory Agreement” and collectively as the “Subadvisory Agreements.”
At Board meetings held on July 10, 2019 (“July Meeting”) and August 6-7, 2019 (“August Meeting”), the Board met with management of the Adviser regarding the annual approval of the continuation of the Funds’ Advisory and Subadvisory Agreements. In connection with its consideration of the Advisory and Subadvisory Agreements, the Board considered the information furnished and discussed throughout the year at regularly scheduled Board and Committee meetings, as applicable, and the information provided specifically in relation to the annual consideration of the approval of the Advisory Agreement and Subadvisory Agreements in response to requests of the Independent Directors and their independent legal counsel. Information furnished in connection with Board or Committee meetings throughout the year included, among other things, presentations given by the portfolio managers of the Funds on each Fund’s investment strategies, risks, absolute performance, and comparative performance of each Fund against its benchmark indices; reports regarding each Fund’s asset levels including sales and redemption activities; and various reports on the monitoring of the Funds’ compliance with the securities laws, regulations, policies, and procedures.
In preparation for the Board’s annual consideration of the approval of the Advisory and Subadvisory Agreements, the Board requested and received a wide variety of information and reports concerning the Adviser (and its affiliates) and the Subadvisers, including information on: (1) the nature, extent and quality of services provided to each Fund by the Adviser (and its affiliates) and the Subadvisers, as applicable; (2) the investment performance of each Fund as compared to a group of comparable funds; (3) the level of the advisory and subadvisory fees charged to each Fund as compared to: (a) other clients of the Adviser and the Subadvisers and (b) a group of comparable funds; (4) the expense ratios of each Fund as compared to a group of comparable funds; (5) the profitability of the Adviser and, to the extent made available, profitability of the Subadvisers; and (6) the Adviser’s and each Subadviser’s compliance program. The Board also considered information related to potential “fall out” or ancillary benefits enjoyed by the Adviser (and its affiliates) and each Subadviser as a result of their relationships with the Funds.
In addition to evaluating, among other things, the written information provided by the Adviser, the Board also considered the answers to questions posed by the Board to representatives of the Adviser at various meetings and took into account their accumulated experience in working with the Adviser on matters related to the Funds. The Independent Directors also met separately in executive sessions with their independent legal counsel to review and consider the information provided regarding the Advisory Agreement and the Subadvisory Agreements.
Based on their review, the Independent Directors and the full Board concluded that it was in the best interests of each Fund to approve the continuation of each Advisory and Subadvisory Agreement, as applicable. Although the Advisory Agreement and the Subadvisory Agreements for all of the Funds were considered at the same Board meeting, the Board considered each Fund separately. In their deliberations, the Board did not identify any single factor or group of factors as all-important or controlling, but considered all factors together. The material factors and conclusions that formed the basis for the Board’s determinations are discussed below.
Nature, Extent and Quality of Services
In evaluating the nature, extent, and quality of the services provided by the Adviser and each Subadviser to the Funds, the Board reviewed information describing the financial strength, experience, resources, and key personnel of the Adviser and each Subadviser, including the personnel who provide investment management services to the Funds. With respect to the Adviser, the Board considered the administrative services that are provided to each Fund, as well as other services performed by the Adviser, including the selection and monitoring of the Subadvisers, as applicable; monitoring of the execution of portfolio transactions; monitoring adherence to the Funds’ investment restrictions; monitoring the Funds’ compliance with their compliance policies and procedures and with applicable securities laws and regulations; producing shareholder reports; providing support services for the Board and Board committees; communicating with shareholders; and overseeing the activities of other service providers. The Board also considered the Adviser’s experience in providing investment advisory services to funds and the differentiation of the advisory services provided by the management team versus the portfolio management services provided by the Subadvisers, as applicable. With respect to each Subadviser, the Board noted each Subadviser’s experience in managing the strategies of its respective Fund and each Subadviser’s compliance program as it relates to the
177
| | |
| |
Shareholder Report Disclosure of Directors’ Approval of
Continuation of Contracts(Unaudited)(continued) |
Fund. The Board considered the other services provided by the Subadvisers under the Subadvisory Agreements, including selecting broker-dealers for execution of portfolio transactions; monitoring adherence to the Fund’s investment restrictions; and assisting with portfolio compliance with securities laws, regulations, policies, and procedures.
Based upon this review, the Board concluded that the nature, quality, and extent of the services to be provided to each Fund by the Adviser and each Subadviser, as applicable, are expected to be satisfactory.
Review of Fund Performance
The Board reviewed the investment performance of each of the Funds. While consideration was given to performance reports provided in connection with, and discussions held at, regular Board meetings throughout the year, particular attention was given to the performance reports provided specifically in connection with the July and August Meetings. In particular, the Board noted the performance of each Fund relative to its Lipper Inc. (“Lipper”) peer universe. The Directors also considered updated performance information for each Fund relative to its benchmark and, as applicable, its Morningstar, Inc. (“Morningstar”) ratings.
With respect to each Fund’s performance as compared to its Lipper peer universe (“peer group”), the Board reviewed each Fund’s performance percentile rankings over the year-to-date and one-, three-, five-, and ten-year trailing periods (as applicable) through May 31, 2019, as provided by the Adviser. The Board considered that each Fund ranked in one of the top two quartiles for performance as compared to its peer group in at least half of the periods reviewed, except for the following Funds.
With respect to the BMO Mid-Cap Value Fund, the Board considered that its year-to-date one-year and ten-year performance was in the third quartile of its peer group, while its three and five-year performance was in the second quartile. The Board considered that the Fund was ranked three stars by Morningstar. The Board noted the Fund’s performance returns relative to its benchmark over various periods and considered the Adviser’s explanation for the recent underperformance of the Fund.
With respect to the BMO Mid-Cap Growth Fund, the Board considered that its year-to-date, one-year, five-year, and ten-year performance was in the fourth quartile of its peer group, while its three-year performance was in the second quartile. The Board considered that Class A and Class R6 shares of the Fund were ranked four stars by Morningstar. The Board noted the Fund’s performance returns relative to its benchmark over various periods. The Board considered that Fund management is closely monitoring the Fund and noted the Adviser’s explanation for the underperformance of the Fund.
With respect to the BMO Small-Cap Value Fund, the Board considered that its year-to-date, one-year, three-year, and five-year performance was in the fourth quartile of its peer group. The Board considered that the Fund was ranked three stars by Morningstar. The Board noted the Fund’s performance returns relative to its benchmark over various periods. The Board considered that Fund management is closely monitoring the Fund and noted the Adviser’s explanation for the underperformance of the Fund.
With respect to the BMO Small-Cap Core Fund, the Board considered that its year-to-date and one-year performance was in the fourth quartile of its peer group, its three-year performance was in the third quartile, and its five-year performance was in the second quartile. The Board considered that Class I shares of the Fund were ranked three stars by Morningstar. The Board noted the Fund’s performance returns relative to its benchmark over various periods. The Board considered that Fund management is closely monitoring the Fund and noted the Adviser’s explanation for the recent underperformance of the Fund.
With respect to the BMO Small-Cap Growth Fund, the Board considered that its year-to-date, one-year, three-year, five-year and ten-year performance was in the fourth quartile of its peer group. The Board noted the Fund’s performance returns relative to its benchmark over various periods. The Board considered that Fund management is closely monitoring the Fund and noted the Adviser’s explanation for the underperformance of the Fund.
With respect to the BMO Disciplined International Equity Fund, the Board considered its limited performance history and noted that its year-to-date, one-year, and three-year performance was in the fourth quartile of its peer group. The Board noted the Fund’s performance returns relative to its benchmark over various periods. The Board considered that Fund management is closely monitoring the Fund and noted the Adviser’s explanation for the underperformance of the Fund.
With respect to the BMO Global Long/Short Equity Fund, the Board considered its limited performance history and noted that its year-to-date and one-year performance was in the fourth quartile of its peer group and its three-year performance was in the third quartile. The Board considered that Class I shares of the Fund were ranked three stars by Morningstar. The Board noted the Fund’s performance returns relative to its benchmark over various periods. The Board considered that Fund management is closely monitoring the Fund and noted the Adviser’s explanation for the recent underperformance of the Fund.
With respect to the BMO Alternative Strategies Fund, the Board considered its limited performance history and noted that its year-to-date, one-year, and three-year performance was in the fourth quartile of its peer group. The Board noted the Fund’s performance returns relative to its benchmark over various periods and considered the Adviser’s explanation for the recent underperformance of the Fund. The Board noted that Fund management is closely monitoring the Fund and considered the Fund management changes that occurred over the last two years.
The Board determined that it was generally satisfied with each Fund’s performance and would continue to monitor each Fund’s performance results.
178
Costs of Services Provided and Profits Realized by the Adviser and Subadvisers
The Board considered the fees payable by each Fund under the Advisory Agreement and each Subadvisory Agreement. The Board first reviewed the management fees charged to comparable accounts managed by the Adviser and the Subadvisers of each Fund, if any, taking into consideration differences in style, size, and services provided to such other accounts. The Board noted that, in some cases, the fees for certain accounts or average fees for certain investment strategies were lower than the fees charged to certain Funds with similar investment strategies. The Board considered the Adviser’s explanation that registered investment companies generally require additional advisory and administrative services than other clients due to the enhanced regulatory structure and legal requirements with which investment companies must comply. With respect to the Subadvisers, the Board also considered the affiliation of each Subadviser (if any) with the Adviser.
The Board next reviewed information provided by the Adviser, comparing each Fund’s contractual (gross) advisory fee to the median fee of its Morningstar peer category (“Morningstar peers”)or Strategic Insight’s Simfund peer category (“Simfund peers”).In addition, the Board reviewed information provided by the Adviser, comparing each Fund’s net expense ratio to the median net expense ratio of the comparable Morningstar peer group and Lipper peer group (“Lipper peers”). With respect to the Subadvisers, the Board considered the fees payable under the Subadvisory Agreements, noting that the fees would be paid by the Adviser (not the Fund). The Board also considered the division of services provided and fee split between the Adviser each Subadviser.
The Board considered that substantially all of the equity and fixed income Funds’ contractual advisory fees were lower than their Morningstar peers and all of the money market Funds’ contractual advisory fees were lower than or within ten basis points of their Simfund peers.
With respect to the BMO Alternative Strategies Fund, the Board considered that its contractual investment advisory fees were in the fourth quartile of its Morningstar peers and its net expense ratio was in the third quartile of its Morningstar peers. The Board noted that the Fund’s net expense ratio was above the median of its Lipper peers for Class I shares and Class A shares. The Board took into consideration the Adviser’s efforts to lower Fund expenses and the Fund’s relatively small peer group.
The Board considered that the Adviser has agreed to contractual expense limitations for the Funds (the “Expense Limitations”) and that the net expense ratios for the Funds take into account the effect of the Expense Limitations.
The Board considered the methodology used by the Adviser and each Subadviser in determining compensation payable to its portfolio managers and the competitive environment for investment management talent. The Board also considered the financial condition of the Adviser and certain of its affiliates and each Subadviser and particularly focused on the financial strength of the ultimate parent company of the Adviser and the parent company’s commitment, financial and otherwise, to the global asset management business and the Funds.
The Board reviewed profitability information it received from the Adviser in connection with the services provided to each Fund and the Corporation as a whole. The materials provided in this regard showed, and the Directors acknowledged, that the Adviser experienced positive net margins with respect to certain Funds and did not experience positive net margins with respect to other Funds. The Board also reviewed the comparative profitability information provided by the Adviser from Strategic Insight regarding other public investment advisory firms. The Board also reviewed and considered profitability information it received from each Subadviser, if provided, in connection with the services provided to each Fund.
Economies of Scale
The Board considered the extent to which economies of scale would be realized as the Funds grow and whether the Funds’ fee levels reflect these economies of scale for the benefit of Fund shareholders. The Board considered each Fund’s fee structure, asset size, and net expense ratio giving effect to each Fund’s Expense Limitation. The Board was satisfied with the fee structures and also considered the Adviser’s commitment to continue to evaluate advisory fee breakpoints in the future.
Other Benefits to the Adviser and Subadvisers
The Board considered benefits that accrue to the Adviser and its affiliates from their relationships with the Funds, including revenue in the form of administration fees, custody fees, shareholder service fees, and securities lending revenue. In addition, the Board considered information relating to any soft dollar arrangements in connection with equity security brokerage transactions for the Funds and/or other clients. The Board noted that, other than the services provided by the Adviser and Subadvisers pursuant to the Advisory and Subadvisory Agreements and the related fees to be paid by each Fund, the Adviser and Subadvisers may potentially benefit from their relationship with each Fund in other ways. The Board also considered that the success of any Fund could attract other business to the Adviser and that the success of the Adviser could enhance the Adviser’s ability to serve the Funds.
The Board concluded that, taking into account all of the information reviewed, each Fund’s advisory and subadvisory fee was reasonable.
Overall Conclusions
Based on all of the information considered and the conclusions reached, the Board determined that the terms of the Advisory and Subadvisory Agreements are fair and reasonable and that the approval of the continuation of the Advisory Agreement and each Subadvisory Agreement is in the best interests of each applicable Fund.
179
180
This report is authorized for distribution to prospective investors only when preceded or accompanied by the Funds’ prospectuses, which contain facts concerning each Fund’s objective and policies, management fees, expenses, and other information.
Proxy Voting
A description of the policies and procedures that the Funds use to determine how to vote proxies relating to portfolio securities is available without charge, upon request, by calling toll free, 1-800-236-FUND (3863) and by accessing the Funds’ Statement of Additional Information, which is available on the Funds’ website at http://www.bmofunds.com and on the SEC’s website at http://www.sec.gov.
Each Fund’s proxy voting record for the most recent 12-month period ended June 30 is available without charge, upon request, by calling toll free,1-800-236-FUND (3863) and by accessing the SEC’s website at http://www.sec.gov.
Disclosure of Portfolio Holdings
The Funds file their complete schedules of portfolio holdings with the SEC periodically. The schedule of portfolio holdings for the first and third quarter of the fiscal year for each Fund (other than the money market funds) is included as an exhibit on Form N-PORT. The schedule of portfolio holdings for the money market funds is filed monthly onForm N-MFP. Each Fund’s Form N-PORT or N-MFP is available on the SEC’s website at http://www.sec.gov and may be reviewed and copied at the SEC’s Public Reference Room in Washington, D.C. Information on the operation of the Public Reference Room may be obtained by calling 1-800-SEC-0330.
Shares of the BMO Funds are not bank deposits or other obligations of, or issued, endorsed or guaranteed by, BMO Harris Bank, NA, or any of its affiliates. Shares of the BMO Funds, like shares of all mutual funds, are not insured or guaranteed by the U.S. government, the Federal Deposit Insurance Corporation, the Federal Reserve Board, or any other government agency. Investment in mutual funds involves investment risk, including the possible loss of principal.
| | |
| | PRSRT STD U.S. POSTAGE PAID LANCASTER, PA PERMIT NO. 1793 |
| | |
 | | BMO Funds U.S. Services P.O. Box 55931 Boston, MA 02205-5931 |
| | |
 | | Contact us 1-800-236-FUND (3863) 414-287-8555 |
| | |
 | | Learn more bmofunds.com |
BMO Investment Distributors, LLC, Distributor
BMO Asset Management Corp., Investment Adviser
Investment products are:NOT FDIC INSURED — NO BANK GUARANTEE — MAY LOSE VALUE.
© 2019 BMO Financial Corp. (9/19)
Annualreport
Conservative Allocation Fund
Moderate Allocation Fund
Balanced Allocation Fund
Growth Allocation Fund
Aggressive Allocation Fund
Notification of electronic delivery of shareholder materials
Beginning on January 1, 2021, as permitted by regulations adopted by the Securities and Exchange Commission, paper copies of the Funds’ shareholder reports will no longer be sent by mail, unless you specifically request paper copies of the reports from the Funds or from your broker/dealer, investment professional, or financial institution. Instead, the reports will be made available online at bmofunds.com/documents, and you will be notified by mail each time a report is posted and provided with a website link to access the report.
If you already elected to receive shareholder reports electronically, you will not be affected by this change and you need not take any action. You may elect to receive shareholder reports and other communications from the Funds electronically by calling 1-800-236-FUND (3863), by sending an email request to bmofundsus.services@bmo.com, or by asking your broker/dealer, investment professional, or financial institution.
Beginning on January 1, 2019, you may elect to receive all future reports in paper free of charge. If you invest through a financial intermediary, you can contact your financial intermediary to request that you continue to receive paper copies of your shareholder reports. If you invest directly with the Funds, you can call the Funds toll-free at1-800-236-FUND (3863) or send an email request to bmofundsus.services@bmo.com. Your election to receive reports in paper will apply to all funds held in your account if you invest through your financial intermediary or all funds held with the fund complex if you invest directly with the Funds.

Table of Contents
| | | | |
Not FDIC Insured | | No Bank Guarantee | | May Lose Value |
| | |
| | |
| Annual Report — Commentary | | BMO Funds |
Performance for the One-Year Period Ending August 31, 2019 (%)
| | | | | | | | | | | | | | | | |
| | | Retirement Class (R-6) | | | Lipper Mixed-Asset | | | Bloomberg Barclays
U.S. Aggregate Bond Index | | | S&P 500 Index | |
| BMO Conservative Allocation | | | 5.51 | | | | 4.44 | | | | 10.17 | | | | | |
| BMO Moderate Allocation | | | 3.63 | | | | 3.53 | | | | 10.17 | | | | | |
| BMO Balanced Allocation | | | 1.48 | | | | -1.30 | | | | | | | | 2.92 | |
| BMO Growth Allocation | | | -0.68 | | | | 2.07 | | | | | | | | 2.92 | |
| BMO Aggressive Allocation | | | -1.77 | | | | -0.85 | | | | | | | | 2.92 | |
The BMO Target Risk Funds mostly outperformed their Lipper peer group medians over theone-year period. Returns ranged from-1.77% for the Aggressive Allocation Fund (Retirement Class(R-6)) to 5.51% for the Conservative Allocation Fund (Retirement Class(R-6)). The disparity in relative performance was mostly due to the outperformance of bonds versus equities.
Fiscal year 2019 was defined by the reemergence of market volatility as geopolitical uncertainty, driven by U.S. trade policy and slowing global growth, led to multiple equity market sell-offs. This uncertain climate led to the first rate cut by the Federal Reserve since the global financial crisis. Despite souring sentiments, U.S. large-cap equities were still slightly positive with the S&P 500 returning 2.9% over the one year period. Performance diverged amongst market caps in the U.S. market as small caps lagged significantly, finishing down-12.9%. International developed equities finished down-2.6% as economic data continued to falter - especially in Germany - and the odds of a no deal Brexit increased. Emerging market equities were negative for the year as well returning-4.0%. Fixed income markets were the notable standout, with the10-year treasury yield falling from 2.9% at the beginning of the fiscal year to 1.5% at the end. The Bloomberg Barclays U.S. Aggregate Bond Index finished up 10.2%, while U.S. corporate high yield and emerging market debt indicies finished up 6.6% and 13.1%, respectively.
Fixed income managers either underperformed or performed in line with benchmarks. BMO TCH Core Plus Bond was the largest detractor while Metropolitan West Total Return Bond performed in line with their core bond benchmark. TCW Emerging Markets Income slightly underperformed its benchmark. The alternatives allocation detracted value during the year as BMO Alternative Strategies underperformed bonds and equities.
Domestic equity strategies widely underperformed benchmarks. Large- and mid-cap managers struggled with BMO Large Cap Growth, BMO Large Cap Value, and Dodge & Cox Stock the largest detractors for the period. On the positive side, T. Rowe Price Growth Stock and BMO Low Volatility Equity beat their benchmarks. Domestic small-cap managers were mixed as Goldman Sachs Small Cap Value slightly outperformed, BMO Small Cap Value performed in line, and BMO Small Cap Growth largely underperformed their benchmarks.
International equity fund performance was slightly positive. MFS International Value added the most value, while BMO Pyrford International also outperformed its benchmark. BMO Disciplined International, Dodge & Cox International, and T. Rowe Price International Discovery were the main laggards. On the emerging markets side, BMO LGM Emerging Markets Equity underperformed the benchmark.
Looking forward, slowing global economic data and the U.S. and China trade conflict will continue to force central banks to ease monetary policy and drive swings in markets. Recession risks are rising; however, the U.S. consumer has been resilient. Going into the 2020 elections, we believe the Trump administration’s top priority will be to maintain economic momentum, which should lead to eventual easing in trade tensions. We believe the Federal Reserve is ready to continue cutting rates to offset weakness in manufacturing and to try to insulate the U.S. consumer, but the risk remains that further consumer focused tariffs are scheduled to go into effect in December.
Our portfolios are positioned for slightly positive risk with an overweight in U.S. large cap equities and a commensurate underweight to core bonds. Within equities we are overweight U.S. equities versus international developed. We believe U.S. equities should remain attractive due to a strong consumer and further monetary easing. Within fixed income we increased duration at the end of the year and are overweight high yield bonds versus emerging market debt.
2
| | | | | | | | | | | | | | | | | | | | | | | | |
| |
| BMO Conservative Allocation Fund | |
Average annual total returns (%) | | | | | Ticker | | Cusip | | Inception
date | | Expenses (%)* | |
| | | 1-year | | | Since inception | | | |
| | | | | Gross | | | Net | |
| Investor Class (Y) | | | 5.13 | | | | 3.16 | | | | | BDVYX | | 09658L299 | | 5/30/2014 | | | 1.34 | | | | 0.88 | |
| Institutional Class (I) | | | 5.32 | | | | 3.41 | | | | | BDVIX | | 09658L331 | | 5/30/2014 | | | 1.07 | | | | 0.63 | |
| Retirement Class(R-3) | | | 4.78 | | | | 2.90 | | | | | BDVRX | | 09658L323 | | 5/30/2014 | | | 1.59 | | | | 1.13 | |
| Retirement Class(R-6) | | | 5.51 | | | | 3.58 | | | | | BDVSX | | 09658L315 | | 5/30/2014 | | | 0.94 | | | | 0.48 | |
| Bloomberg Barclays U.S. Aggregate Bond Index | | | 10.17 | | | | 3.36 | | | | | | | | | | | | | | | | | |
Lipper Mixed-Asset Target Allocation
Conservative Funds Index | | | 4.44 | | | | 3.68 | | | | | | | | | | | | | | | | | |
| | | | | | | | |
| | | | | | | | | | | | | | | | | | | | | | | | |
| Growth of an assumed $10,000 investment | | | | | Portfolio sector allocation** | |
| | | | | | Sector | | | | | Fund (%) | |
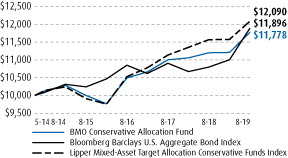 | | | | | Large-Cap Funds | | | | | | | 12.7 | |
| | | | Mid-Cap Funds | | | | | | | 1.3 | |
| | | | Small-Cap Funds | | | | | | | 1.1 | |
| | | | International Funds | | | | | | | 6.2 | |
| | | | Fixed Income Funds | | | | | | | 66.3 | |
| | | | Alternative Funds | | | | | | | 10.4 | |
| | | | Other Assets & Liabilities, Net | | | | | | | 2.0 | |
| | | | Total | | | | | | | 100.0 | |
| | | | | | | | | | | | | | | | |
| | | | | | | | | | | | | | | | |
| | | | | | | | | | | | | | | | |
| | | | | | | | | | | | | | | | |
| | | | | | | | | | | | | | | | | | | | | | | | |
| | | | | | | | |
| | | | | | | | | | | | | | | | | | | | | | | | |
| |
| BMO Moderate Allocation Fund | |
Average annual total returns (%) | | | | | Ticker | | Cusip | | Inception
date | | Expenses (%)* | |
| | | 1-year | | | Since inception | | | |
| | | | | Gross | | | Net | |
| Investor Class (Y) | | | 3.15 | | | | 3.94 | | | | | BMBYX | | 09658L166 | | 5/30/2014 | | | 1.18 | | | | 0.88 | |
| Institutional Class (I) | | | 3.42 | | | | 4.23 | | | | | BMBHX | | 09658L190 | | 5/30/2014 | | | 0.94 | | | | 0.63 | |
| Retirement Class(R-3) | | | 2.94 | | | | 3.70 | | | | | BMBQX | | 09658L182 | | 5/30/2014 | | | 1.43 | | | | 1.13 | |
| Retirement Class(R-6) | | | 3.63 | | | | 4.38 | | | | | BMBTX | | 09658L174 | | 5/30/2014 | | | 0.78 | | | | 0.48 | |
| Bloomberg Barclays U.S. Aggregate Bond Index | | | 10.17 | | | | 3.36 | | | | | | | | | | | | | | | | | |
Lipper Mixed-Asset Target Allocation Moderate
Funds Index | | | 3.53 | | | | 5.08 | | | | | | | | | | | | | | | | | |
| | | | | | | | |
| | | | | | | | | | | | | | | | | | | | | | | | |
| Growth of an assumed $10,000 investment | | | | | Portfolio sector allocation** | |
| | | | | | Sector | | | | | Fund (%) | |
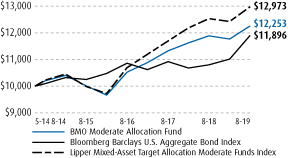 | | | | | Large-Cap Funds | | | | | | | 25.0 | |
| | | | Mid-Cap Funds | | | | | | | 2.5 | |
| | | | Small-Cap Funds | | | | | | | 2.2 | |
| | | | International Funds | | | | | | | 12.1 | |
| | | | Fixed Income Funds | | | | | | | 48.7 | |
| | | | Alternative Funds | | | | | | | 8.4 | |
| | | | Other Assets & Liabilities, Net | | | | | | | 1.1 | |
| | | | Total | | | | | | | 100.0 | |
| | | | | | | | | | | | | | | | |
| | | | | | | | | | | | | | | | |
| | | | | | | | | | | | | | | | |
| | | | | | | | | | | | | | | | |
The above graphs relate to the Investor Class shares of the Fund. Performance for the Institutional, RetirementR-3 and RetirementR-6 will vary from the performance of the Investor Class shares shown above due to differences in charges and expenses. These graphs illustrate the hypothetical investment of $10,000 in the Investor Class shares of the Fund from each Fund’s inception date to August 31, 2019.
The performance data quoted represents past performance which is no guarantee of future results. Investment return and principal value will fluctuate so that an investor’s shares, when redeemed, may be worth more or less than their original costs. Mutual fund performance changes over time and current performance may be lower or higher than what is stated. To receive current performance to the most recentmonth-end, please call1-800-236-3863 or visit www.bmofunds.com.
| * | The above expense ratios are from the Funds’ Prospectus dated December 28, 2018, and are inclusive of Acquired Fund Fees and Expenses. See Note 5, subsection Contractual Expense Limitation, in the Notes to Financial Statements for additional information. Net expense ratios reflect contractual fee waivers and/or expense reimbursements if applicable, made by BMO Asset Management Corp., the investment adviser (Adviser). The Adviser may not terminate these fee waivers and/or expense reimbursements prior to December 31, 2020 without the consent of the Board of Directors, unless the investment advisory agreement is terminated. Without these contractual waivers, the Fund’s returns would have been lower. |
| ** | Portfolio composition will change due to ongoing management of the Fund. The percentages are based on net assets as of August 31, 2019 and may not necessarily reflect adjustments that are routinely made when presenting net assets for formal financial statement processes. |
The Standard & Poor’s 500 Index is an unmanaged index oflarge-cap common stocks.
Lipper indices measure the performance of the 30 largest mutual funds in each respective fund category.
3
| | | | | | | | | | | | | | | | | | | | | | | | |
| |
| BMO Balanced Allocation Fund | |
Average annual total returns (%) | | | | | Ticker | | Cusip | | Inception
date | | Expenses (%)* | |
| | | 1-year | | | Since inception | | | |
| | | | | Gross | | | Net | |
| Investor Class (Y) | | | 0.94 | | | | 4.62 | | | | | BGRYX | | 09658L216 | | 5/30/2014 | | | 1.09 | | | | 0.94 | |
| Institutional Class (I) | | | 1.23 | | | | 4.89 | | | | | BGRHX | | 09658L240 | | 5/30/2014 | | | 0.84 | | | | 0.69 | |
| Retirement Class(R-3) | | | 0.75 | | | | 4.37 | | | | | BGRRX | | 09658L232 | | 5/30/2014 | | | 1.34 | | | | 1.19 | |
| Retirement Class(R-6) | | | 1.48 | | | | 5.06 | | | | | BGRQX | | 09658L224 | | 5/30/2014 | | | 0.69 | | | | 0.54 | |
| Standard & Poor’s 500 Index | | | 2.92 | | | | 10.55 | | | | | | | | | | | | | | | | | |
Lipper Mixed-Asset Target Allocation Growth
Funds Index | | | (1.30 | ) | | | 5.36 | | | | | | | | | | | | | | | | | |
| | | | | | | | |
| | | | | | | | | | | | | | | | | | | | | | | | |
| Growth of an assumed $10,000 investment | | | | | Portfolio sector allocation** | |
| | | | | | Sector | | | | | Fund (%) | |
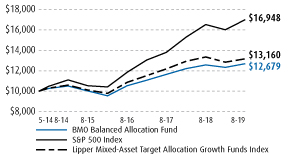 | | | | | Large-Cap Funds | | | | | | | 36.7 | |
| | | | Mid-Cap Funds | | | | | | | 3.6 | |
| | | | Small-Cap Funds | | | | | | | 3.2 | |
| | | | International Funds | | | | | | | 17.8 | |
| | | | Fixed Income Funds | | | | | | | 30.7 | |
| | | | Alternative Funds | | | | | | | 6.9 | |
| | | | Other Assets & Liabilities, Net | | | | | | | 1.1 | |
| | | | Total | | | | | | | 100.0 | |
| | | | | | | | | | | | | | | | |
| | | | | | | | | | | | | | | | |
| | | | | | | | | | | | | | | | |
| | | | | | | | | | | | | | | | |
| | | | | | | | | | | | | | | | | | | | | | | | |
| | | | | | | | |
| | | | | | | | | | | | | | | | | | | | | | | | |
| |
| BMO Growth Allocation Fund | |
Average annual total returns (%) | | | | | Ticker | | Cusip | | Inception
date | | Expenses (%)* | |
| | | 1-year | | | Since inception | | | |
| | | | | Gross | | | Net | |
| Investor Class (Y) | | | (1.00 | ) | | | 5.32 | | | | | BABYX | | 09658L380 | | 5/30/2014 | | | 1.20 | | | | 0.94 | |
| Institutional Class (I) | | | (0.88 | ) | | | 5.58 | | | | | BABHX | | 09658L422 | | 5/30/2014 | | | 0.95 | | | | 0.69 | |
| Retirement Class(R-3) | | | (1.29 | ) | | | 5.07 | | | | | BABRX | | 09658L414 | | 5/30/2014 | | | 1.45 | | | | 1.19 | |
| Retirement Class(R-6) | | | (0.68 | ) | | | 5.73 | | | | | BABQX | | 09658L398 | | 5/30/2014 | | | 0.81 | | | | 0.54 | |
| Standard & Poor’s 500 Index | | | 2.92 | | | | 10.55 | | | | | | | | | | | | | | | | | |
Lipper Mixed-Asset Target Allocation Aggressive
Funds Index | | | 2.07 | | | | 6.59 | | | | | | | | | | | | | | | | | |
| | | | | | | | |
| | | | | | | | | | | | | | | | | | | | | | | | |
| Growth of an assumed $10,000 investment | | | | | Portfolio sector allocation** | |
| | | | | | Sector | | | | | Fund (%) | |
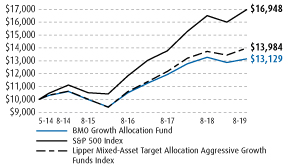 | | | | | Large-Cap Funds | | | | | | | 48.5 | |
| | | | Mid-Cap Funds | | | | | | | 4.8 | |
| | | | Small-Cap Funds | | | | | | | 4.2 | |
| | | | International Funds | | | | | | | 23.5 | |
| | | | Fixed Income Funds | | | | | | | 12.2 | |
| | | | Alternative Funds | | | | | | | 5.6 | |
| | | | Other Assets & Liabilities, Net | | | | | | | 1.2 | |
| | | | Total | | | | | | | 100.0 | |
| | | | | | | | | | | | | | | | |
| | | | | | | | | | | | | | | | |
| | | | | | | | | | | | | | | | |
| | | | | | | | | | | | | | | | |
| | | | | | | | | | | | | | | | |
The above graphs relate to the Investor Class shares of the Fund. Performance for the Institutional, RetirementR-3 and RetirementR-6 will vary from the performance of the Investor Class shares shown above due to differences in charges and expenses. These graphs illustrate the hypothetical investment of $10,000 in the Investor Class shares of the Fund from each Fund’s inception date to August 31, 2019.
The performance data quoted represents past performance which is no guarantee of future results. Investment return and principal value will fluctuate so that an investor’s shares, when redeemed, may be worth more or less than their original costs. Mutual fund performance changes over time and current performance may be lower or higher than what is stated. To receive current performance to the most recentmonth-end, please call1-800-236-3863 or visit www.bmofunds.com.
| * | The above expense ratios are from the Funds’ Prospectus dated December 28, 2018, and are inclusive of Acquired Fund Fees and Expenses. See Note 5, subsection Contractual Expense Limitation, in the Notes to Financial Statements for additional information. Net expense ratios reflect contractual fee waivers and/or expense reimbursements if applicable, made by BMO Asset Management Corp., the investment adviser (Adviser). The Adviser may not terminate these fee waivers and/or expense reimbursements prior to December 31, 2020 without the consent of the Board of Directors, unless the investment advisory agreement is terminated. Without these contractual waivers, the Fund’s returns would have been lower. |
| ** | Portfolio composition will change due to ongoing management of the Fund. The percentages are based on net assets as of August 31, 2019 and may not necessarily reflect adjustments that are routinely made when presenting net assets for formal financial statement processes. |
The Standard & Poor’s 500 Index is an unmanaged index oflarge-cap common stocks.
Lipper indices measure the performance of the 30 largest mutual funds in each respective fund category.
4
| | | | | | | | | | | | | | | | | | | | | | | | |
| |
| BMO Aggressive Allocation Fund | |
Average annual total returns (%) | | | | | Ticker | | Cusip | | Inception
date | | Expenses (%)* | |
| | | 1-year | | | Since inception | | | |
| | | | | Gross | | | Net | |
| Investor Class (Y) | | | (2.10 | ) | | | 6.10 | | | | | BDSYX | | 09658L257 | | 5/30/2014 | | | 1.13 | | | | 0.93 | |
| Institutional Class (I) | | | (1.79 | ) | | | 6.38 | | | | | BDSHX | | 09658L281 | | 5/30/2014 | | | 0.88 | | | | 0.68 | |
| Retirement Class(R-3) | | | (2.47 | ) | | | 5.82 | | | | | BDSRX | | 09658L273 | | 5/30/2014 | | | 1.38 | | | | 1.18 | |
| Retirement Class(R-6) | | | (1.77 | ) | | | 6.54 | | | | | BDSQX | | 09658L265 | | 5/30/2014 | | | 0.73 | | | | 0.53 | |
| Standard & Poor’s 500 Index | | | 2.92 | | | | 10.55 | | | | | | | | | | | | | | | | | |
| LipperMulti-Cap Core Funds Index | | | (0.85 | ) | | | 8.34 | | | | | | | | | | | | | | | | | |
| | | | | | | | |
| | | | | | | | | | | | | | | | | | | | | | | | |
| Growth of an assumed $10,000 investment | | | | | Portfolio sector allocation** | |
| | | | | | Sector | | | | | Fund (%) | |
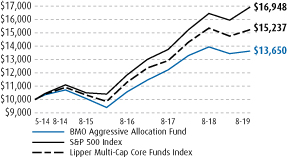 | | | | | Large-Cap Funds | | | | | | | 58.9 | |
| | | | Mid-Cap Funds | | | | | | | 5.8 | |
| | | | Small-Cap Funds | | | | | | | 5.1 | |
| | | | International Funds | | | | | | | 28.7 | |
| | | | Alternative Funds | | | | | | | 0.5 | |
| | | | Other Assets & Liabilities, Net | | | | | | | 1.0 | |
| | | | Total | | | | | | | 100.0 | |
| | | | | | | | | | | | | | | | |
| | | | | | | | | | | | | | | | |
| | | | | | | | | | | | | | | | |
| | | | | | | | | | | | | | | | |
| | | | | | | | | | | | | | | | |
The above graphs relate to the Investor Class shares of the Fund. Performance for the Institutional, RetirementR-3 and RetirementR-6 will vary from the performance of the Investor Class shares shown above due to differences in charges and expenses. These graphs illustrate the hypothetical investment of $10,000 in the Investor Class shares of the Fund from each Fund’s inception date to August 31, 2019.
The performance data quoted represents past performance which is no guarantee of future results. Investment return and principal value will fluctuate so that an investor’s shares, when redeemed, may be worth more or less than their original costs. Mutual fund performance changes over time and current performance may be lower or higher than what is stated. To receive current performance to the most recentmonth-end, please call1-800-236-3863 or visit www.bmofunds.com.
| * | The above expense ratios are from the Funds’ Prospectus dated December 28, 2018, and are inclusive of Acquired Fund Fees and Expenses. See Note 5, subsection Contractual Expense Limitation, in the Notes to Financial Statements for additional information. Net expense ratios reflect contractual fee waivers and/or expense reimbursements if applicable, made by BMO Asset Management Corp., the investment adviser (Adviser). The Adviser may not terminate these fee waivers and/or expense reimbursements prior to December 31, 2020 without the consent of the Board of Directors, unless the investment advisory agreement is terminated. Without these contractual waivers, the Fund’s returns would have been lower. |
| ** | Portfolio composition will change due to ongoing management of the Fund. The percentages are based on net assets as of August 31, 2019 and may not necessarily reflect adjustments that are routinely made when presenting net assets for formal financial statement processes. |
The Standard & Poor’s 500 Index is an unmanaged index oflarge-cap common stocks.
Lipper indices measure the performance of the 30 largest mutual funds in each respective fund category.
5
| | |
| | |
| Expense Example(Unaudited) | | |
For the Six Months Ended August 31, 2019
As a shareholder of the Fund, you may incur two types of costs: (1) transaction costs, which may include sales charges (loads) on purchase payments, reinvested dividends, or other distributions; redemption fees; and exchange fees; and (2) ongoing costs, including management fees; distribution and/or service(12b-1) fees; and other Fund expenses. This Example is intended to help you understand your ongoing costs (in dollars) of investing in the Funds and to compare these costs with the ongoing costs of investing in other mutual funds.
The Example is based on an investment of $1,000 invested at the beginning of the period and held for the entire six month period ended August 31, 2019(3/1/19-8/31/19).
Actual Expenses
The information in the table under the heading “Actual Expenses” provides information about actual account values and actual expenses. You may use the information in these columns, together with the amount you invested, to estimate the expenses that you paid over the period. Simply divide your account value by $1,000 (for example, an $8,600 account value divided by $1,000 = 8.6), then multiply the result by the number in the first line under the heading entitled “Expenses Paid During Period” to estimate the expenses you paid on your account during this period.
Hypothetical Example for Comparison Purposes
The information in the table under the heading “Hypothetical Expenses” provides information about hypothetical account values and hypothetical expenses based on a Fund’s actual expense ratio and an assumed rate of return of 5% per year before expenses, which is not the Fund’s actual return. The hypothetical account values and expenses may not be used to estimate the actual ending account balance or expenses you paid for the period. You may use this information to compare the ongoing costs of investing in a Fund and other funds. To do so, compare this 5% hypothetical example with the 5% hypothetical examples that appear in the shareholder reports of the other funds.
Please note that the expenses shown in the table are meant to highlight your ongoing costs only and do not reflect any transaction costs, such as sales charges (loads), redemption fees, or exchange fees. Therefore, the information under the heading “Hypothetical Expenses” is useful in comparing ongoing costs only, and will not help you determine the relative total costs of owning different funds. In addition, if these transaction costs were included, your costs would have been higher.
| | | | | | | | | | | | | | | | | | | | | | | | |
| | | Actual Expenses | | | Hypothetical Expenses | |
Fund | | Beginning
account
value
3/1/19 | | | Ending
account
value
8/31/19 | | | Expenses
paid during
period
3/1/19-
8/31/19(1) | | | Ending
account
value
8/31/19 | | | Expenses
paid during
period
3/1/19-
8/31/19(1) | | | Annualized
Expense
Ratio(1) | |
Conservative Allocation Fund | | | | | | | | | | | | | | | | | | | | | | | | |
| Investor | | $ | 1,000.00 | | | $ | 1,050.30 | | | $ | 1.71 | | | $ | 1,023.54 | | | $ | 1.68 | | | | 0.33 | % |
| Institutional | | | 1,000.00 | | | | 1,050.90 | | | | 0.41 | | | | 1,024.80 | | | | 0.41 | | | | 0.08 | |
| Retirement classR-3 | | | 1,000.00 | | | | 1,049.30 | | | | 3.00 | | | | 1,022.28 | | | | 2.96 | | | | 0.58 | |
| Retirement classR-6 | | | 1,000.00 | | | | 1,052.90 | | | | 0.00 | | | | 1,025.21 | | | | 0.00 | | | | 0.00 | |
Moderate Allocation Fund | | | | | | | | | | | | | | | | | | | | | | | | |
| Investor | | | 1,000.00 | | | | 1,041.00 | | | | 1.54 | | | | 1,023.69 | | | | 1.53 | | | | 0.30 | |
| Institutional | | | 1,000.00 | | | | 1,043.30 | | | | 0.26 | | | | 1,024.95 | | | | 0.26 | | | | 0.05 | |
| Retirement classR-3 | | | 1,000.00 | | | | 1,041.00 | | | | 2.83 | | | | 1,022.43 | | | | 2.80 | | | | 0.55 | |
| Retirement classR-6 | | | 1,000.00 | | | | 1,043.30 | | | | 0.00 | | | | 1,025.21 | | | | 0.00 | | | | 0.00 | |
Balanced Allocation Fund | | | | | | | | | | | | | | | | | | | | | | | | |
| Investor | | | 1,000.00 | | | | 1,030.30 | | | | 1.69 | | | | 1,023.54 | | | | 1.68 | | | | 0.33 | |
| Institutional | | | 1,000.00 | | | | 1,031.60 | | | | 0.41 | | | | 1,024.80 | | | | 0.41 | | | | 0.08 | |
| Retirement classR-3 | | | 1,000.00 | | | | 1,030.30 | | | | 2.97 | | | | 1,022.28 | | | | 2.96 | | | | 0.58 | |
| Retirement classR-6 | | | 1,000.00 | | | | 1,034.00 | | | | 0.00 | | | | 1,025.21 | | | | 0.00 | | | | 0.00 | |
Growth Allocation Fund | | | | | | | | | | | | | | | | | | | | | | | | |
| Investor | | | 1,000.00 | | | | 1,020.80 | | | | 1.53 | | | | 1,023.69 | | | | 1.53 | | | | 0.30 | |
| Institutional | | | 1,000.00 | | | | 1,020.80 | | | | 0.25 | | | | 1,024.95 | | | | 0.26 | | | | 0.05 | |
| Retirement classR-3 | | | 1,000.00 | | | | 1,019.70 | | | | 2.80 | | | | 1,022.43 | | | | 2.80 | | | | 0.55 | |
| Retirement classR-6 | | | 1,000.00 | | | | 1,021.90 | | | | 0.00 | | | | 1,025.21 | | | | 0.00 | | | | 0.00 | |
Aggressive Allocation Fund | | | | | | | | | | | | | | | | | | | | | | | | |
| Investor | | | 1,000.00 | | | | 1,015.50 | | | | 1.68 | | | | 1,023.54 | | | | 1.68 | | | | 0.33 | |
| Institutional | | | 1,000.00 | | | | 1,016.70 | | | | 0.41 | | | | 1,024.80 | | | | 0.41 | | | | 0.08 | |
| Retirement classR-3 | | | 1,000.00 | | | | 1,014.30 | | | | 2.94 | | | | 1,022.28 | | | | 2.96 | | | | 0.58 | |
| Retirement classR-6 | | | 1,000.00 | | | | 1,017.90 | | | | 0.00 | | | | 1,025.21 | | | | 0.00 | | | | 0.00 | |
| (1) | Expenses are equal to the Funds’ annualized expense ratios for the period March 1, 2019 through August 31, 2019, multiplied by the average account value over the period, multiplied by 184/365 (to reflect theone-half year period). These expenses and ratios are exclusive of acquired fund fees and expenses. |
6
August 31, 2019
| | |
| | |
| Schedules of Investments | | BMO Funds |
Conservative Allocation Fund
| | | | | | | | |
| Description | | Shares | | | Value | |
| Mutual Funds — 98.0% | | | | | | |
| | |
| Large-Cap Funds — 12.7% | | | | | | |
BMO Dividend Income Fund — Institutional Class (1) | | | 20,925 | | | $ | 292,539 | |
BMOLarge-Cap Growth Fund — Class R6 (1) | | | 40,864 | | | | 743,735 | |
BMOLarge-Cap Value Fund — Class R6 (1) | | | 63,418 | | | | 872,627 | |
BMO Low Volatility Equity Fund — Institutional Class (1) | | | 29,925 | | | | 475,209 | |
Dodge & Cox Stock Fund — Retail Class | | | 1,925 | | | | 349,334 | |
Harbor Capital Appreciation Fund — Retirement Class | | | 3,961 | | | | 294,520 | |
T. Rowe Price Growth Stock Fund — Institutional Class | | | 3,813 | | | | 261,837 | |
Vanguard Institutional Index Fund — Institutional Class | | | 5,730 | | | | 1,523,223 | |
| | | | | | | | |
TotalLarge-Cap Funds | | | | | | | 4,813,024 | |
| | |
| Mid-Cap Funds — 1.3% | | | | | | |
BMOMid-Cap Growth Fund — Class R6 (1) | | | 9,054 | | | | 137,532 | |
BMOMid-Cap Value Fund — Class R6 (1) | | | 13,978 | | | | 138,801 | |
VanguardMid-Cap Index Fund — Institutional Class | | | 4,399 | | | | 198,286 | |
| | | | | | | | |
TotalMid-Cap Funds | | | | | | | 474,619 | |
| | |
| Small-Cap Funds — 1.1% | | | | | | |
BMOSmall-Cap Growth Fund — Institutional Class (1) | | | 12,984 | | | | 209,043 | |
BMOSmall-Cap Value Fund — Class R6 (1) | | | 10,220 | | | | 119,570 | |
Goldman Sachs Small Cap Value Fund — Institutional Class | | | 1,742 | | | | 89,831 | |
| | | | | | | | |
TotalSmall-Cap Funds | | | | | | | 418,444 | |
| | |
| International Funds — 6.2% | | | | | | |
BMO Disciplined International Equity Fund — Institutional Class (1) | | | 39,637 | | | | 397,559 | |
BMO LGM Emerging Markets Equity Fund — Institutional Class (1) | | | 15,805 | | | | 234,221 | |
BMO Pyrford International Stock
Fund — Class R6 (1) | | | 28,315 | | | | 364,133 | |
Dodge & Cox International Stock Fund — Retail Class | | | 12,855 | | | | 504,429 | |
MFS International Value Fund — Class R6 | | | 10,980 | | | | 477,315 | |
T. Rowe Price International Discovery Fund — Institutional Class | | | 4,248 | | | | 263,110 | |
Vanguard Emerging Markets Stock Index Fund — Admiral Class | | | 3,147 | | | | 105,686 | |
| | | | | | | | |
Total International Funds | | | | | | | 2,346,453 | |
| | |
| Fixed Income Funds — 66.3% | | | | | | |
BMO TCH Core Plus Bond Fund — Institutional Class (1) | | | 637,154 | | | | 7,645,843 | |
Metropolitan West Total Return Bond Fund — Plan Class | | | 871,919 | | | | 9,146,427 | |
TCW Emerging Markets Income Fund — Institutional Class | | | 332,334 | | | | 2,774,993 | |
Vanguard Total Bond Market Index Fund — Institutional Class | | | 490,573 | | | | 5,499,326 | |
| | | | | | | | |
Total Fixed Income Funds | | | | | | | 25,066,589 | |
| | | | | | | | |
| Description | | Shares | | | Value | |
| Mutual Funds (continued) | | | | | | |
| | |
| Alternative Funds — 10.4% | | | | | | |
BMO Alternative Strategies Fund — Institutional Class (1) (2) | | | 420,826 | | | $ | 3,922,099 | |
| | | | | | | | |
Total Mutual Funds
(identified cost $31,919,678) | | | | | | | 37,041,228 | |
| | |
| Short-Term Investments — 0.8% | | | | | | |
| | |
| Mutual Funds — 0.8% | | | | | | |
BMO Institutional Prime Money Market Fund — Premier Class, 2.097% (1) | | | 290,884 | | | | 290,913 | |
| | | | | | | | |
Total Short-Term Investments — 0.8%
(identified cost $290,855) | | | | 290,913 | |
| | | | | | | | |
Total Investments — 98.8%
(identified cost $32,210,533) | | | | | | | 37,332,141 | |
| Other Assets and Liabilities — 1.2% | | | | | | | 458,680 | |
| | | | | | | | |
| Total Net Assets — 100.0% | | | | | | $ | 37,790,821 | |
| | | | | | | | |
Moderate Allocation Fund
| | | | | | | | |
| Description | | Shares | | | Value | |
| Mutual Funds — 98.9% | | | | | | |
| | |
| Large-Cap Funds — 25.0% | | | | | | |
BMO Dividend Income Fund — Institutional Class (1) | | | 77,677 | | | $ | 1,085,928 | |
BMOLarge-Cap Growth Fund — Class R6 (1) | | | 152,487 | | | | 2,775,255 | |
BMOLarge-Cap Value Fund — Class R6 (1) | | | 236,112 | | | | 3,248,906 | |
BMO Low Volatility Equity Fund — Institutional Class (1) | | | 111,001 | | | | 1,762,692 | |
Dodge & Cox Stock Fund — Retail Class | | | 7,161 | | | | 1,299,506 | |
Harbor Capital Appreciation Fund — Retirement Class | | | 14,874 | | | | 1,106,056 | |
T. Rowe Price Growth Stock Fund — Institutional Class | | | 14,328 | | | | 983,912 | |
Vanguard Institutional Index Fund — Institutional Class | | | 21,495 | | | | 5,714,393 | |
| | | | | | | | |
TotalLarge-Cap Funds | | | | | | | 17,976,648 | |
| | |
| Mid-Cap Funds — 2.5% | | | | | | |
BMOMid-Cap Growth Fund — Class R6 (1) | | | 33,819 | | | | 513,703 | |
BMOMid-Cap Value Fund —
Class R6 (1) | | | 52,014 | | | | 516,503 | |
VanguardMid-Cap Index Fund — Institutional Class | | | 16,356 | | | | 737,323 | |
| | | | | | | | |
TotalMid-Cap Funds | | | | | | | 1,767,529 | |
| | |
| Small-Cap Funds — 2.2% | | | | | | |
BMOSmall-Cap Growth Fund — Institutional Class (1) | | | 49,165 | | | | 791,550 | |
BMOSmall-Cap Value Fund — Class R6 (1) | | | 37,847 | | | | 442,812 | |
Goldman Sachs Small Cap Value Fund — Institutional Class | | | 6,480 | | | | 334,129 | |
| | | | | | | | |
TotalSmall-Cap Funds | | | | | | | 1,568,491 | |
| | |
| International Funds — 12.1% | | | | | | |
BMO Disciplined International Equity Fund — Institutional Class (1) | | | 146,588 | | | | 1,470,274 | |
BMO LGM Emerging Markets Equity Fund — Institutional Class (1) | | | 58,118 | | | | 861,314 | |
(See Notes which are an integral part of the Financial Statements)
7
August 31, 2019
Moderate Allocation Fund (continued)
| | | | | | | | |
| Description | | Shares | | | Value | |
| Mutual Funds (continued) | | | | | | |
| | |
| International Funds (continued) | | | | | | |
BMO Pyrford International Stock Fund — Class R6 (1) | | | 104,895 | | | $ | 1,348,953 | |
Dodge & Cox International Stock Fund — Retail Class | | | 47,680 | | | | 1,870,949 | |
MFS International Value Fund — Class R6 | | | 40,816 | | | | 1,774,275 | |
T. Rowe Price International Discovery Fund — Institutional Class | | | 15,843 | | | | 981,322 | |
Vanguard Emerging Markets Stock Index Fund — Admiral Class | | | 11,665 | | | | 391,722 | |
| | | | | | | | |
Total International Funds | | | | | | | 8,698,809 | |
| | |
| Fixed Income Funds — 48.7% | | | | | | |
BMO TCH Core Plus Bond Fund — Institutional Class (1) | | | 890,577 | | | | 10,686,927 | |
Metropolitan West Total Return Bond Fund — Plan Class | | | 1,197,370 | | | | 12,560,409 | |
TCW Emerging Markets Income Fund — Institutional Class | | | 457,167 | | | | 3,817,341 | |
Vanguard Total Bond Market Index Fund — Institutional Class | | | 708,670 | | | | 7,944,191 | |
| | | | | | | | |
Total Fixed Income Funds | | | | | | | 35,008,868 | |
| | |
| Alternative Funds — 8.4% | | | | | | |
BMO Alternative Strategies Fund — Institutional Class (1) (2) | | | 644,488 | | | | 6,006,630 | |
| | | | | | | | |
Total Mutual Funds
(identified cost $58,304,547) | | | | | | | 71,026,975 | |
| | |
| Short-Term Investments — 1.0% | | | | | | |
| | |
| Mutual Funds — 1.0% | | | | | | |
BMO Institutional Prime Money Market Fund — Premier Class, 2.097% (1) | | | 696,436 | | | | 696,506 | |
| | | | | | | | |
Total Short-Term
Investments — 1.0%
(identified cost $696,402) | | | | | | | 696,506 | |
| | | | | | | | |
Total Investments — 99.9%
(identified cost $59,000,949) | | | | | | | 71,723,481 | |
| Other Assets and Liabilities — 0.1% | | | | 97,330 | |
| | | | | | | | |
| Total Net Assets — 100.0% | | | | | | $ | 71,820,811 | |
| | | | | | | | |
Balanced Allocation Fund
| | | | | | | | |
| Description | | Shares | | | Value | |
| Mutual Funds — 98.9% | | | | | | |
| | |
| Large-Cap Funds — 36.7% | | | | | | |
BMO Dividend Income Fund — Institutional Class (1) | | | 432,830 | | | $ | 6,050,960 | |
BMOLarge-Cap Growth Fund — Class R6 (1) | | | 852,391 | | | | 15,513,513 | |
BMOLarge-Cap Value Fund — Class R6 (1) | | | 1,318,584 | | | | 18,143,713 | |
BMO Low Volatility Equity Fund — Institutional Class (1) | | | 619,663 | | | | 9,840,258 | |
Dodge & Cox Stock Fund — Retail Class | | | 39,971 | | | | 7,253,900 | |
Harbor Capital Appreciation Fund — Retirement Class | | | 83,103 | | | | 6,179,546 | |
| | | | | | | | |
| Description | | Shares | | | Value | |
| Mutual Funds (continued) | | | | | | |
| | |
| Large-Cap Funds (continued) | | | | | | |
T. Rowe Price Growth Stock Fund — Institutional Class | | | 80,052 | | | $ | 5,497,146 | |
Vanguard Institutional Index Fund — Institutional Class | | | 119,806 | | | | 31,850,590 | |
| | | | | | | | |
TotalLarge-Cap Funds | | | | | | | 100,329,626 | |
| | |
| Mid-Cap Funds — 3.6% | | | | | | |
BMOMid-Cap Growth Fund — Class R6 (1) | | | 190,009 | | | | 2,886,233 | |
BMOMid-Cap Value Fund — Class R6 (1) | | | 292,243 | | | | 2,901,971 | |
VanguardMid-Cap Index Fund — Institutional Class | | | 91,381 | | | | 4,119,458 | |
| | | | | | | | |
TotalMid-Cap Funds | | | | | | | 9,907,662 | |
| | |
| Small-Cap Funds — 3.2% | | | | | | |
BMOSmall-Cap Growth Fund — Institutional Class (1) | | | 274,178 | | | | 4,414,268 | |
BMOSmall-Cap Value Fund — Class R6 (1) | | | 212,146 | | | | 2,482,108 | |
Goldman Sachs Small Cap Value Fund — Institutional Class | | | 36,395 | | | | 1,876,527 | |
| | | | | | | | |
TotalSmall-Cap Funds | | | | | | | 8,772,903 | |
| | |
| International Funds — 17.8% | | | | | | |
BMO Disciplined International Equity Fund — Institutional Class (1) | | | 818,996 | | | | 8,214,534 | |
BMO LGM Emerging Markets Equity Fund — Institutional Class (1) | | | 324,713 | | | | 4,812,244 | |
BMO Pyrford International Stock Fund — Class R6 (1) | | | 586,058 | | | | 7,536,704 | |
Dodge & Cox International Stock Fund — Retail Class | | | 265,773 | | | | 10,428,936 | |
MFS International Value Fund — Class R6 | | | 227,855 | | | | 9,904,883 | |
T. Rowe Price International Discovery Fund — Institutional Class | | | 88,517 | | | | 5,482,723 | |
Vanguard Emerging Markets Stock Index Fund — Admiral Class | | | 65,658 | | | | 2,204,792 | |
| | | | | | | | |
Total International Funds | | | | | | | 48,584,816 | |
| | |
| Fixed Income Funds — 30.7% | | | | | | |
BMO TCH Core Plus Bond Fund — Institutional Class (1) | | | 1,986,327 | | | | 23,835,921 | |
Metropolitan West Total Return Bond Fund — Plan Class | | | 2,762,510 | | | | 28,978,730 | |
TCW Emerging Markets Income Fund — Institutional Class | | | 1,282,373 | | | | 10,707,815 | |
Vanguard Total Bond Market Index Fund — Institutional Class | | | 1,825,029 | | | | 20,458,570 | |
| | | | | | | | |
Total Fixed Income Funds | | | | | | | 83,981,036 | |
| | |
| Alternative Funds — 6.9% | | | | | | |
BMO Alternative Strategies
Fund — Institutional Class (1) (2) | | | 2,040,465 | | | | 19,017,134 | |
| | | | | | | | |
Total Mutual Funds
(identified cost $201,150,494) | | | | | | | 270,593,177 | |
(See Notes which are an integral part of the Financial Statements)
8
Balanced Allocation Fund (continued)
| | | | | | | | |
| Description | | Shares | | | Value | |
| Short-Term Investments — 1.0% | | | | | | |
| | |
| Mutual Funds — 1.0% | | | | | | |
BMO Institutional Prime Money Market Fund — Premier Class, 2.097% (1) | | | 2,721,224 | | | $ | 2,721,496 | |
| | | | | | | | |
Total Short-Term
Investments — 1.0%
(identified cost $2,720,974) | | | | | | | 2,721,496 | |
| | | | | | | | |
Total Investments — 99.9%
(identified cost $203,871,468) | | | | | | | 273,314,673 | |
| Other Assets and Liabilities — 0.1% | | | | 376,048 | |
| | | | | | | | |
| Total Net Assets — 100.0% | | | | | | $ | 273,690,721 | |
| | | | | | | | |
Growth Allocation Fund
| | | | | | | | |
| Description | | Shares | | | Value | |
| Mutual Funds — 98.8% | | | | | | |
| | |
| Large-Cap Funds — 48.5% | | | | | | |
BMO Dividend Income Fund — Institutional Class (1) | | | 238,256 | | | $ | 3,330,821 | |
BMOLarge-Cap Growth Fund — Class R6 (1) | | | 469,246 | | | | 8,540,272 | |
BMOLarge-Cap Value Fund — Class R6 (1) | | | 725,819 | | | | 9,987,271 | |
BMO Low Volatility Equity Fund — Institutional Class (1) | | | 341,233 | | | | 5,418,771 | |
Dodge & Cox Stock Fund — Retail Class | | | 21,998 | | | | 3,992,203 | |
Harbor Capital Appreciation Fund — Retirement Class | | | 45,799 | | | | 3,405,618 | |
T. Rowe Price Growth Stock Fund — Institutional Class | | | 44,161 | | | | 3,032,546 | |
Vanguard Institutional Index Fund — Institutional Class | | | 66,020 | | | | 17,551,384 | |
| | | | | | | | |
TotalLarge-Cap Funds | | | | | | | 55,258,886 | |
| | |
| Mid-Cap Funds — 4.8% | | | | | | |
BMOMid-Cap Growth Fund — Class R6 (1) | | | 104,322 | | | | 1,584,650 | |
BMOMid-Cap Value Fund — Class R6 (1) | | | 160,452 | | | | 1,593,287 | |
VanguardMid-Cap Index Fund — Institutional Class | | | 50,532 | | | | 2,277,982 | |
| | | | | | | | |
TotalMid-Cap Funds | | | | | | | 5,455,919 | |
| | |
| Small-Cap Funds — 4.2% | | | | | | |
BMOSmall-Cap Growth Fund — Institutional Class (1) | | | 150,664 | | | | 2,425,688 | |
BMOSmall-Cap Value Fund — Class R6 (1) | | | 117,311 | | | | 1,372,534 | |
Goldman Sachs Small Cap Value Fund — Institutional Class | | | 19,977 | | | | 1,030,031 | |
| | | | | | | | |
TotalSmall-Cap Funds | | | | | | | 4,828,253 | |
| | |
| International Funds — 23.5% | | | | | | |
BMO Disciplined International Equity Fund — Institutional Class (1) | | | 450,639 | | | | 4,519,910 | |
BMO LGM Emerging Markets Equity Fund — Institutional Class (1) | | | 180,080 | | | | 2,668,786 | |
BMO Pyrford International Stock Fund — Class R6 (1) | | | 322,624 | | | | 4,148,947 | |
Dodge & Cox International Stock Fund — Retail Class | | | 146,490 | | | | 5,748,247 | |
| | | | | | | | |
| Description | | Shares | | | Value | |
| Mutual Funds (continued) | | | | | | |
| | |
| International Funds (continued) | | | | | | |
MFS International Value Fund — Class R6 | | | 125,481 | | | $ | 5,454,661 | |
T. Rowe Price International Discovery Fund — Institutional Class | | | 48,645 | | | | 3,013,099 | |
Vanguard Emerging Markets Stock Index Fund — Admiral Class | | | 36,083 | | | | 1,211,658 | |
| | | | | | | | |
Total International Funds | | | | | | | 26,765,308 | |
| | |
| Fixed Income Funds — 12.2% | | | | | | |
BMO TCH Core Plus Bond Fund — Institutional Class (1) | | | 266,805 | | | | 3,201,664 | |
Metropolitan West Total Return Bond Fund — Plan Class | | | 384,414 | | | | 4,032,507 | |
TCW Emerging Markets Income Fund — Institutional Class | | | 281,419 | | | | 2,349,850 | |
Vanguard Total Bond Market Index Fund — Institutional Class | | | 387,160 | | | | 4,340,059 | |
| | | | | | | | |
Total Fixed Income Funds | | | | | | | 13,924,080 | |
| | |
| Alternative Funds — 5.6% | | | | | | |
BMO Alternative Strategies
Fund — Institutional Class (1) (2) | | | 677,018 | | | | 6,309,807 | |
| | | | | | | | |
Total Mutual Funds
(identified cost $81,711,544) | | | | | | | 112,542,253 | |
| | |
| Short-Term Investments — 1.0% | | | | | | |
| | |
| Mutual Funds — 1.0% | | | | | | |
BMO Institutional Prime Money Market Fund — Premier Class, 2.097% (1) | | | 1,152,402 | | | | 1,152,517 | |
| | | | | | | | |
Total Short-Term
Investments — 1.0%
(identified cost $1,152,313) | | | | | | | 1,152,517 | |
| | | | | | | | |
Total Investments — 99.8%
(identified cost $82,863,857) | | | | | | | 113,694,770 | |
| Other Assets and Liabilities — 0.2% | | | | 189,089 | |
| | | | | | | | |
| Total Net Assets — 100.0% | | | | | | $ | 113,883,859 | |
| | | | | | | | |
Aggressive Allocation Fund
| | | | | | | | |
| Description | | Shares | | | Value | |
| Mutual Funds — 99.0% | | | | | | |
| | |
| Large-Cap Funds — 58.9% | | | | | | |
BMO Dividend Income Fund — Institutional Class (1) | | | 412,355 | | | $ | 5,764,728 | |
BMOLarge-Cap Growth Fund — Class R6 (1) | | | 810,892 | | | | 14,758,236 | |
BMOLarge-Cap Value Fund — Class R6 (1) | | | 1,256,257 | | | | 17,286,092 | |
BMO Low Volatility Equity Fund — Institutional Class (1) | | | 593,786 | | | | 9,429,318 | |
Dodge & Cox Stock Fund — Retail Class | | | 38,086 | | | | 6,911,929 | |
Harbor Capital Appreciation Fund — Retirement Class | | | 78,802 | | | | 5,859,713 | |
T. Rowe Price Growth Stock Fund — Institutional Class | | | 76,180 | | | | 5,231,272 | |
Vanguard Institutional Index Fund — Institutional Class | | | 114,106 | | | | 30,335,003 | |
| | | | | | | | |
TotalLarge-Cap Funds | | | | | | | 95,576,291 | |
(See Notes which are an integral part of the Financial Statements)
9
August 31, 2019
Aggressive Allocation Fund (continued)
| | | | | | | | |
| Description | | Shares | | | Value | |
| Mutual Funds (continued) | | | | | | |
| | |
| Mid-Cap Funds — 5.8% | | | | | | |
BMOMid-Cap Growth Fund — Class R6 (1) | | | 180,129 | | | $ | 2,736,158 | |
BMOMid-Cap Value Fund — Class R6 (1) | | | 278,065 | | | | 2,761,184 | |
VanguardMid-Cap Index Fund — Institutional Class | | | 86,959 | | | | 3,920,145 | |
| | | | | | | | |
TotalMid-Cap Funds | | | | | | | 9,417,487 | |
| | |
| Small-Cap Funds — 5.1% | | | | | | |
BMOSmall-Cap Growth Fund — Institutional Class (1) | | | 259,008 | | | | 4,170,031 | |
BMOSmall-Cap Value Fund —
Class R6 (1) | | | 200,505 | | | | 2,345,901 | |
Goldman Sachs Small Cap Value Fund — Institutional Class | | | 34,574 | | | | 1,782,653 | |
| | | | | | | | |
TotalSmall-Cap Funds | | | | | | | 8,298,585 | |
| | |
| International Funds — 28.7% | | | | | | |
BMO Disciplined International Equity Fund — Institutional Class (1) | | | 783,624 | | | | 7,859,748 | |
BMO LGM Emerging Markets Equity Fund — Institutional Class (1) | | | 311,226 | | | | 4,612,374 | |
BMO Pyrford International Stock
Fund — Class R6 (1) | | | 561,169 | | | | 7,216,629 | |
Dodge & Cox International Stock
Fund — Retail Class | | | 255,028 | | | | 10,007,297 | |
| | | | | | | | |
| Description | | Shares | | | Value | |
| Mutual Funds (continued) | | | | | | |
| | |
| International Funds (continued) | | | | | | |
MFS International Value Fund — Class R6 | | | 217,492 | | | $ | 9,454,371 | |
T. Rowe Price International Discovery Fund — Institutional Class | | | 84,865 | | | | 5,256,548 | |
Vanguard Emerging Markets Stock Index Fund — Admiral Class | | | 62,778 | | | | 2,108,087 | |
| | | | | | | | |
Total International Funds | | | | | | | 46,515,054 | |
| | |
| Alternative Funds — 0.5% | | | | | | |
BMO Alternative Strategies
Fund — Institutional Class (1) (2) | | | 86,770 | | | | 808,700 | |
| | | | | | | | |
Total Mutual Funds
(identified cost $107,130,398) | | | | | | | 160,616,117 | |
| | |
| Short-Term Investments — 0.8% | | | | | | |
| | |
| Mutual Funds — 0.8% | | | | | | |
BMO Institutional Prime Money Market Fund — Premier Class, 2.097% (1) | | | 1,351,667 | | | | 1,351,802 | |
| | | | | | | | |
Total Short-Term
Investments — 0.8%
(identified cost $1,351,796) | | | | | | | 1,351,802 | |
| | | | | | | | |
Total Investments — 99.8%
(identified cost $108,482,194) | | | | | | | 161,967,919 | |
| Other Assets and Liabilities — 0.2% | | | | 307,077 | |
| | | | | | | | |
| Total Net Assets — 100.0% | | | | | | $ | 162,274,996 | |
| | | | | | | | |
| | |
| | |
| Notes to Schedules of Investments | | |
The categories of investments are shown as a percentage of total net assets for each Fund as of August 31, 2019.
| (1) | Denotes an investment in an affiliated entity. Please refer to Note 5, subsectionInvestments in Affiliated Issuers, in the Notes to Financial Statements. |
(See Notes which are an integral part of the Financial Statements)
10
August 31, 2019
| | |
| | |
| Statements of Assets and Liabilities | | BMO Funds |
| | | | | | | | | | | | | | | | | | | | |
| | | | | | | | | | | | | | | | |
| | | Conservative
Allocation
Fund | | | Moderate
Allocation
Fund | | | Balanced
Allocation
Fund | | | Growth
Allocation
Fund | | | Aggressive
Allocation
Fund | |
Assets: | | | | | | | | | | | | | | | | | | | | |
Investments in unaffiliated issuers, at value | | $ | 21,488,317 | | | $ | 39,515,528 | | | $ | 144,943,616 | | | $ | 57,439,845 | | | $ | 80,867,018 | |
Cash sweep investments in affiliated issuers, at value | | | 290,913 | | | | 696,506 | | | | 2,721,496 | | | | 1,152,517 | | | | 1,351,802 | |
Investments in other affiliated issuers, at value | | | 15,552,911 | | | | 31,511,447 | | | | 125,649,561 | | | | 55,102,408 | | | | 79,749,099 | |
Dividends and interest receivable | | | 65,862 | | | | 93,488 | | | | 228,960 | | | | 39,858 | | | | 2,773 | |
Receivable for investments sold | | | 110,125 | | | | — | | | | — | | | | — | | | | 418,617 | |
Receivable for capital stock sold | | | 288,108 | | | | 98,755 | | | | 159,559 | | | | 161,101 | | | | 49,343 | |
Receivable from affiliates, net (Note 5) | | | 13,577 | | | | 16,444 | | | | 9,455 | | | | 19,525 | | | | 11,070 | |
Prepaid expenses and other receivables | | | 40,104 | | | | 40,241 | | | | 41,060 | | | | 40,578 | | | | 40,577 | |
| | | | | | | | | | | | | | | | | | | | |
Total assets | | | 37,849,917 | | | | 71,972,409 | | | | 273,753,707 | | | | 113,955,832 | | | | 162,490,299 | |
| | | | | |
Liabilities: | | | | | | | | | | | | | | | | | | | | |
Payable for investments purchased | | | 27,104 | | | | — | | | | — | | | | — | | | | 151,286 | |
Payable for capital stock redeemed | | | 13,265 | | | | 132,595 | | | | 34,757 | | | | 53,480 | | | | 40,579 | |
Other liabilities | | | 18,727 | | | | 19,003 | | | | 28,229 | | | | 18,493 | | | | 23,438 | |
| | | | | | | | | | | | | | | | | | | | |
Total liabilities | | | 59,096 | | | | 151,598 | | | | 62,986 | | | | 71,973 | | | | 215,303 | |
| | | | | | | | | | | | | | | | | | | | |
Total net assets | | $ | 37,790,821 | | | $ | 71,820,811 | | | $ | 273,690,721 | | | $ | 113,883,859 | | | $ | 162,274,996 | |
| | | | | | | | | | | | | | | | | | | | |
| | | | | |
Net assets consist of: | | | | | | | | | | | | | | | | | | | | |
Paid-in capital | | $ | 31,532,629 | | | $ | 56,742,173 | | | $ | 185,870,648 | | | $ | 77,382,730 | | | $ | 98,678,076 | |
Distributable earnings | | | 6,258,192 | | | | 15,078,638 | | | | 87,820,073 | | | | 36,501,129 | | | | 63,596,920 | |
| | | | | | | | | | | | | | | | | | | | |
Total net assets | | $ | 37,790,821 | | | $ | 71,820,811 | | | $ | 273,690,721 | | | $ | 113,883,859 | | | $ | 162,274,996 | |
| | | | | | | | | | | | | | | | | | | | |
| | | | | |
Net asset value, offering price and redemption proceeds per share (unlimited shares authorized, no par value) | | | | | | | | | | | | | | | | | | | | |
Investor class of shares | | $ | 7.72 | | | $ | 9.13 | | | $ | 8.49 | | | $ | 9.33 | | | $ | 8.53 | |
Institutional class of shares | | | 8.05 | | | | 9.16 | | | | 8.50 | | | | 9.32 | | | | 8.53 | |
Retirement classR-3 of shares | | | 7.88 | | | | 9.14 | | | | 8.50 | | | | 9.34 | | | | 8.50 | |
Retirement classR-6 of shares | | | 7.76 | | | | 9.16 | | | | 8.52 | | | | 9.34 | | | | 8.54 | |
| | | | | |
Net assets: | | | | | | | | | | | | | | | | | | | | |
Investor class of shares | | $ | 10,526,406 | | | $ | 3,485,631 | | | $ | 62,661,582 | | | $ | 5,883,071 | | | $ | 23,715,441 | |
Institutional class of shares | | | 564,316 | | | | 6,997,007 | | | | 37,231,728 | | | | 13,389,590 | | | | 12,095,364 | |
Retirement classR-3 of shares | | | 633,433 | | | | 6,974,849 | | | | 13,631,695 | | | | 8,219,610 | | | | 16,078,512 | |
Retirement classR-6 of shares | | | 26,066,666 | | | | 54,363,324 | | | | 160,165,716 | | | | 86,391,588 | | | | 110,385,679 | |
| | | | | | | | | | | | | | | | | | | | |
Total net assets | | $ | 37,790,821 | | | $ | 71,820,811 | | | $ | 273,690,721 | | | $ | 113,883,859 | | | $ | 162,274,996 | |
| | | | | | | | | | | | | | | | | | | | |
| | | | | |
Shares outstanding: | | | | | | | | | | | | | | | | | | | | |
Investor class of shares | | | 1,363,532 | | | | 381,706 | | | | 7,376,470 | | | | 630,655 | | | | 2,781,090 | |
Institutional class of shares | | | 70,062 | | | | 764,264 | | | | 4,378,523 | | | | 1,436,319 | | | | 1,418,519 | |
Retirement classR-3 of shares | | | 80,343 | | | | 763,225 | | | | 1,603,707 | | | | 880,513 | | | | 1,890,644 | |
Retirement classR-6 of shares | | | 3,359,158 | | | | 5,934,795 | | | | 18,805,861 | | | | 9,247,108 | | | | 12,932,270 | |
| | | | | | | | | | | | | | | | | | | | |
Total shares outstanding | | | 4,873,095 | | | | 7,843,990 | | | | 32,164,561 | | | | 12,194,595 | | | | 19,022,523 | |
| | | | | | | | | | | | | | | | | | | | |
| | | | | |
Investments, at cost: | | | | | | | | | | | | | | | | | | | | |
Investments in unaffiliated issuers | | $ | 18,486,043 | | | $ | 31,085,413 | | | $ | 97,049,105 | | | $ | 34,788,646 | | | $ | 42,839,928 | |
Cash sweep investments in affiliated issuers | | | 290,855 | | | | 696,402 | | | | 2,720,974 | | | | 1,152,313 | | | | 1,351,796 | |
Investments in other affiliated issuers | | | 13,433,635 | | | | 27,219,134 | | | | 104,101,389 | | | | 46,922,898 | | | | 64,290,470 | |
| | | | | | | | | | | | | | | | | | | | |
Total investments, at cost | | $ | 32,210,533 | | | $ | 59,000,949 | | | $ | 203,871,468 | | | $ | 82,863,857 | | | $ | 108,482,194 | |
| | | | | | | | | | | | | | | | | | | | |
(See Notes which are an integral part of the Financial Statements)
11
August 31, 2019
| | |
| | |
| Statements of Operations | | BMO Funds |
| | | | | | | | | | | | | | | | | | | | |
| | | | | | | | | | | | | | | | |
| | | Conservative
Allocation
Fund | | | Moderate
Allocation
Fund | | | Balanced
Allocation
Fund | | | Growth
Allocation
Fund | | | Aggressive
Allocation
Fund | |
Investment Income: | | | | | | | | | | | | | | | | | | | | |
Dividend income from: | | | | | | | | | | | | | | | | | | | | |
Unaffiliated issuers | | $ | 625,597 | | | $ | 1,090,147 | | | $ | 3,912,585 | | | $ | 1,203,658 | | | $ | 1,754,331 | |
Affiliated issuers | | | 383,380 | | | | 749,007 | | | | 2,857,731 | | | | 996,122 | | | | 1,403,036 | |
Excess expense reimbursement from investment adviser (Note 5) | | | 17,146 | | | | 56,361 | | | | 120,764 | | | | 84,621 | | | | 78,798 | |
| | | | | | | | | | | | | | | | | | | | |
Total income | | | 1,026,123 | | | | 1,895,515 | | | | 6,891,080 | | | | 2,284,401 | | | | 3,236,165 | |
| | | | | |
Expenses: | | | | | | | | | | | | | | | | | | | | |
Shareholder servicing fees (Note 5) | | | 29,706 | | | | 12,061 | | | | 216,226 | | | | 18,658 | | | | 66,618 | |
Administration fees (Note 5) | | | 20,039 | | | | 27,943 | | | | 209,798 | | | | 47,486 | | | | 83,726 | |
Portfolio accounting fees | | | 27,872 | | | | 31,028 | | | | 57,787 | | | | 34,145 | | | | 39,302 | |
Recordkeeping fees | | | 37,738 | | | | 37,630 | | | | 40,599 | | | | 37,937 | | | | 39,242 | |
Custodian fees (Note 5) | | | 1,963 | | | | 3,800 | | | | 15,929 | | | | 5,916 | | | | 8,561 | |
Registration fees | | | 51,221 | | | | 51,514 | | | | 51,812 | | | | 51,597 | | | | 51,597 | |
Professional fees | | | 20,372 | | | | 20,372 | | | | 20,372 | | | | 20,372 | | | | 20,372 | |
Printing and postage | | | 11,698 | | | | 12,810 | | | | 13,505 | | | | 11,571 | | | | 14,652 | |
Directors’ fees | | | 15,349 | | | | 15,349 | | | | 15,349 | | | | 15,349 | | | | 15,349 | |
Distribution services fees - Retirement class R-3 (Note 5) | | | 4,243 | | | | 36,899 | | | | 82,409 | | | | 46,942 | | | | 79,722 | |
Miscellaneous | | | 5,256 | | | | 5,847 | | | | 13,773 | | | | 6,755 | | | | 7,958 | |
| | | | | | | | | | | | | | | | | | | | |
Total expenses | | | 225,457 | | | | 255,253 | | | | 737,559 | | | | 296,728 | | | | 427,099 | |
| | | | | |
Deduct: | | | | | | | | | | | | | | | | | | | | |
Expense waivers (Note 5) | | | (180,794 | ) | | | (196,769 | ) | | | (325,736 | ) | | | (214,837 | ) | | | (235,914 | ) |
| | | | | | | | | | | | | | | | | | | | |
Net expenses | | | 44,663 | | | | 58,484 | | | | 411,823 | | | | 81,891 | | | | 191,185 | |
| | | | | | | | | | | | | | | | | | | | |
Net investment income | | | 981,460 | | | | 1,837,031 | | | | 6,479,257 | | | | 2,202,510 | | | | 3,044,980 | |
| | | | | |
Realized and unrealized gain (loss) on investments: | | | | | | | | | | | | | | | | | | | | |
Net realized gain (loss) on transactions from: | | | | | | | | | | | | | | | | | | | | |
Investments in unaffiliated issuers | | | 249,512 | | | | 926,039 | | | | 8,534,296 | | | | 2,041,296 | | | | 4,304,713 | |
Investments in affiliated issuers | | | 267,492 | | | | (305,290 | ) | | | 2,167,784 | | | | (377,018 | ) | | | (593,997 | ) |
Net realized gain on capital gains distributions from: | | | | | | | | | | | | | | | | | | | | |
Investments in unaffiliated issuers | | | 111,201 | | | | 453,045 | | | | 2,473,211 | | | | 1,247,103 | | | | 1,969,046 | |
Investments in affiliated issuers | | | 348,241 | | | | 1,553,808 | | | | 8,225,472 | | | | 4,092,561 | | | | 7,002,858 | |
| | | | | | | | | | | | | | | | | | | | |
Total net realized gain | | | 976,446 | | | | 2,627,602 | | | | 21,400,763 | | | | 7,003,942 | | | | 12,682,620 | |
Net change in unrealized appreciation/depreciation on: | | | | | | | | | | | | | | | | | | | | |
Investments in unaffiliated issuers | | | 709,505 | | | | (593,457 | ) | | | (8,887,865 | ) | | | (3,681,691 | ) | | | (8,097,300 | ) |
Investments in affiliated issuers | | | (614,608 | ) | | | (2,443,769 | ) | | | (15,442,448 | ) | | | (6,357,404 | ) | | | (11,018,080 | ) |
| | | | | | | | | | | | | | | | | | | | |
Total net change in unrealized appreciation/depreciation | | | 94,897 | | | | (3,037,226 | ) | | | (24,330,313 | ) | | | (10,039,095 | ) | | | (19,115,380 | ) |
| | | | | | | | | | | | | | | | | | | | |
Net realized and unrealized gain (loss) | | | 1,071,343 | | | | (409,624 | ) | | | (2,929,550 | ) | | | (3,035,153 | ) | | | (6,432,760 | ) |
| | | | | | | | | | | | | | | | | | | | |
Change in net assets resulting from operations | | $ | 2,052,803 | | | $ | 1,427,407 | | | $ | 3,549,707 | | | $ | (832,643 | ) | | $ | (3,387,780 | ) |
| | | | | | | | | | | | | | | | | | | | |
(See Notes which are an integral part of the Financial Statements)
12
| | |
| | |
| Statements of Changes in Net Assets | | BMO Funds |
| | | | | | | | | | | | | | | | |
| | | | | | | |
| | | Conservative
Allocation
Fund | | | Moderate
Allocation
Fund | |
| | | Year Ended
August 31,
2019 | | | Year Ended
August 31,
2018 | | | Year Ended
August 31,
2019 | | | Year Ended
August 31,
2018 | |
Change in net assets resulting from: | | | | | | | | | | | | | | | | |
| | | | |
Operations: | | | | | | | | | | | | | | | | |
Net investment income | | $ | 981,460 | | | $ | 1,016,989 | | | $ | 1,837,031 | | | $ | 1,997,551 | |
Net realized gain on investments | | | 976,446 | | | | 4,784,296 | | | | 2,627,602 | | | | 6,773,470 | |
Net change in unrealized appreciation/depreciation on investments | | | 94,897 | | | | (4,580,014 | ) | | | (3,037,226 | ) | | | (3,766,825 | ) |
| | | | | | | | | | | | | | | | |
Change in net assets resulting from operations | | | 2,052,803 | | | | 1,221,271 | | | | 1,427,407 | | | | 5,004,196 | |
| | | | |
Distributions to shareholders: | | | | | | | | | | | | | | | | |
Investor class of shares | | | (1,832,308 | ) | | | (2,226,207 | )(1) | | | (498,960 | ) | | | (507,983 | )(3) |
Institutional class of shares | | | (80,131 | ) | | | (161,066 | )(1) | | | (652,823 | ) | | | (330,580 | )(3) |
Retirement classR-3 of shares | | | (138,410 | ) | | | (129,410 | )(1) | | | (807,355 | ) | | | (835,913 | )(3) |
Retirement classR-6 of shares | | | (3,516,104 | ) | | | (4,482,536 | )(1) | | | (6,601,234 | ) | | | (5,493,805 | )(1) |
| | | | | | | | | | | | | | | | |
Change in net assets resulting from distributions to shareholders | | | (5,566,953 | ) | | | (6,999,219 | ) | | | (8,560,372 | ) | | | (7,168,281 | ) |
| | | | |
Capital stock transactions: | | | | | | | | | | | | | | | | |
Proceeds from sale of shares | | | 12,833,774 | | | | 9,067,886 | | | | 21,406,373 | | | | 14,875,830 | |
Net asset value of shares issued to shareholders in payment of distributions declared | | | 5,566,953 | | | | 6,999,219 | | | | 8,560,371 | | | | 7,168,281 | |
Cost of shares redeemed | | | (14,610,744 | ) | | | (46,708,558 | ) | | | (32,977,344 | ) | | | (49,075,766 | ) |
| | | | | | | | | | | | | | | | |
Change in net assets resulting from capital stock transactions | | | 3,789,983 | | | | (30,641,453 | ) | | | (3,010,600 | ) | | | (27,031,655 | ) |
| | | | | | | | | | | | | | | | |
Change in net assets | | | 275,833 | | | | (36,419,401 | ) | | | (10,143,565 | ) | | | (29,195,740 | ) |
| | | | |
Net assets: | | | | | | | | | | | | | | | | |
Beginning of period | | | 37,514,988 | | | | 73,934,389 | | | | 81,964,376 | | | | 111,160,116 | |
| | | | | | | | | | | | | | | | |
End of period | | $ | 37,790,821 | | | $ | 37,514,988 | (2) | | $ | 71,820,811 | | | $ | 81,964,376 | (2) |
| | | | | | | | | | | | | | | | |
| (1) | The following information was previously reported in the August 31, 2018 financial statements. The distribution information for the year ended August 31, 2018 presented on the Statements of Changes in Net Assets is presented for comparative purposes to the August 31, 2019 financial statements, which conform to the SEC Final Rule on Disclosure Update and Simplification which was effective November 5, 2018. Distributions to shareholders from net investment income and net realized gain on investments for the year ended August 31, 2018, were as follows: |
| | | | | | | | |
| | | | | | | |
| | | Conservative
Allocation
Fund | | | Moderate
Allocation
Fund | |
Distributions to shareholders from net investment income: | | | | | | | | |
Investor class of shares | | $ | (582,115 | ) | | $ | (148,319 | ) |
Institutional class of shares | | | (16,401 | ) | | | (102,870 | ) |
Retirement classR-3 of shares | | | (19,493 | ) | | | (227,674 | ) |
Retirement classR-6 of shares | | | (1,264,591 | ) | | | (1,874,292 | ) |
| | |
Distributions to shareholders from net realized gain on investments: | | | | | | | | |
Investor class of shares | | | (1,644,092 | ) | | | (359,664 | ) |
Institutional class of shares | | | (144,665 | ) | | | (227,710 | ) |
Retirement classR-3 of shares | | | (109,917 | ) | | | (608,239 | ) |
Retirement classR-6 of shares | | | (3,217,945 | ) | | | (3,619,513 | ) |
| (2) | The following information was previously reported in the August 31, 2018 financial statements. Undistributed net investment income included in net assets at end of period for the year ended August 31, 2018 was $543,197 and $1,074,455 for Conservative Allocation Fund and Moderate Allocation Fund, respectively. |
(See Notes which are an integral part of the Financial Statements)
13
| | |
| | |
| Statements of Changes in Net Assets | | BMO Funds |
| | | | | | | | | | | | | | | | | | | | | | | | |
| | | | | | | | | | |
| | | Balanced
Allocation
Fund | | | Growth
Allocation
Fund | | | Aggressive
Allocation
Fund | |
| | | Year Ended
August 31,
2019 | | | Year Ended
August 31,
2018 | | | Year Ended
August 31,
2019 | | | Year Ended
August 31,
2018 | | | Year Ended
August 31,
2019 | | | Year Ended
August 31,
2018 | |
Change in net assets resulting from: | | | | | | | | | | | | | | | | | | | | | | | | |
| | | | | | |
Operations: | | | | | | | | | | | | | | | | | | | | | | | | |
Net investment income | | $ | 6,479,257 | | | $ | 5,881,606 | | | $ | 2,202,510 | | | $ | 1,856,974 | | | $ | 3,044,980 | | | $ | 2,334,738 | |
Net realized gain on investments | | | 21,400,763 | | | | 25,719,914 | | | | 7,003,942 | | | | 10,176,852 | | | | 12,682,620 | | | | 16,137,603 | |
Net change in unrealized appreciation/depreciation on investments | | | (24,330,313 | ) | | | (2,844,819 | ) | | | (10,039,095 | ) | | | 1,888,866 | | | | (19,115,380 | ) | | | 5,693,932 | |
| | | | | | | | | | | | | | | | | | | | | | | | |
Change in net assets resulting from operations | | | 3,549,707 | | | | 28,756,701 | | | | (832,643 | ) | | | 13,922,692 | | | | (3,387,780 | ) | | | 24,166,273 | |
| | | | | | |
Distributions to shareholders: | | | | | | | | | | | | | | | | | | | | | | | | |
Investor class of shares | | | (8,967,196 | ) | | | (9,914,908 | )(1) | | | (690,676 | ) | | | (1,164,273 | )(1) | | | (3,116,691 | ) | | | (4,758,561 | )(1) |
Institutional class of shares | | | (3,335,219 | ) | | | (4,372,016 | )(1) | | | (1,735,406 | ) | | | (650,895 | )(1) | | | (1,541,577 | ) | | | (1,722,650 | )(1) |
Retirement classR-3 of shares | | | (1,767,800 | ) | | | (2,022,307 | )(1) | | | (976,684 | ) | | | (1,259,889 | )(1) | | | (1,805,967 | ) | | | (2,052,160 | )(1) |
Retirement classR-6 of shares | | | (17,482,928 | ) | | | (20,648,922 | )(1) | | | (8,566,608 | ) | | | (6,735,393 | )(1) | | | (13,423,510 | ) | | | (14,467,294 | )(1) |
| | | | | | | | | | | | | | | | | | | | | | | | |
Change in net assets resulting from distributions to shareholders | | | (31,553,143 | ) | | | (36,958,153 | ) | | | (11,969,374 | ) | | | (9,810,450 | ) | | | (19,887,745 | ) | | | (23,000,665 | ) |
| | | | | | |
Capital stock transactions: | | | | | | | | | | | | | | | | | | | | | | | | |
Proceeds from sale of shares | | | 54,213,225 | | | | 47,232,899 | | | | 26,450,385 | | | | 23,670,844 | | | | 26,760,381 | | | | 24,497,608 | |
Net asset value of shares issued to shareholders in payment of distributions declared | | | 31,544,597 | | | | 36,944,164 | | | | 11,969,373 | | | | 9,810,450 | | | | 19,878,744 | | | | 23,000,665 | |
Cost of shares redeemed | | | (129,776,859 | ) | | | (101,939,289 | ) | | | (34,353,214 | ) | | | (43,963,867 | ) | | | (40,818,080 | ) | | | (44,328,338 | ) |
| | | | | | | | | | | | | | | | | | | | | | | | |
Change in net assets resulting from capital stock transactions | | | (44,019,037 | ) | | | (17,762,226 | ) | | | 4,066,544 | | | | (10,482,573 | ) | | | 5,821,045 | | | | 3,169,935 | |
| | | | | | | | | | | | | | | | | | | | | | | | |
Change in net assets | | | (72,022,473 | ) | | | (25,963,678 | ) | | | (8,735,473 | ) | | | (6,370,331 | ) | | | (17,454,480 | ) | | | 4,335,543 | |
| | | | | | |
Net assets: | | | | | | | | | | | | | | | | | | | | | | | | |
Beginning of period | | | 345,713,194 | | | | 371,676,872 | | | | 122,619,332 | | | | 128,989,663 | | | | 179,729,476 | | | | 175,393,933 | |
| | | | | | | | | | | | | | | | | | | | | | | | |
End of period | | $ | 273,690,721 | | | $ | 345,713,194 | (2) | | $ | 113,883,859 | | | $ | 122,619,332 | (2) | | $ | 162,274,996 | | | $ | 179,729,476 | (2) |
| | | | | | | | | | | | | | | | | | | | | | | | |
| (1) | The following information was previously reported in the August 31, 2018 financial statements. The distribution information for the year ended August 31, 2018 presented on the Statements of Changes in Net Assets is presented for comparative purposes to the August 31, 2019 financial statements, which conform to the SEC Final Rule on Disclosure Update and Simplification which was effective November 5, 2018. Distributions to shareholders from net investment income and net realized gain on investments for the year ended August 31, 2018, were as follows: |
| | | | | | | | | | | | |
| | | | | | | | | | |
| | | Balanced
Allocation
Fund | | | Growth
Allocation
Fund | | | Aggressive
Allocation
Fund | |
Distributions to shareholders from net investment income: | | | | | | | | | | | | |
Investor class of shares | | $ | (1,792,384 | ) | | $ | (276,000 | ) | | $ | (671,533 | ) |
Institutional class of shares | | | (860,496 | ) | | | (173,710 | ) | | | (266,766 | ) |
Retirement classR-3 of shares | | | (304,632 | ) | | | (266,254 | ) | | | (248,785 | ) |
Retirement classR-6 of shares | | | (4,398,480 | ) | | | (1,905,407 | ) | | | (2,439,933 | ) |
| | | |
Distributions to shareholders from net realized gain on investments: | | | | | | | | | | | | |
Investor class of shares | | | (8,122,524 | ) | | | (888,273 | ) | | | (4,087,028 | ) |
Institutional class of shares | | | (3,511,520 | ) | | | (477,185 | ) | | | (1,455,884 | ) |
Retirement classR-3 of shares | | | (1,717,675 | ) | | | (993,635 | ) | | | (1,803,375 | ) |
Retirement classR-6 of shares | | | (16,250,442 | ) | | | (4,829,986 | ) | | | (12,027,361 | ) |
| (2) | The following information was previously reported in the August 31, 2018 financial statements. Undistributed net investment income included in net assets at end of period for the year ended August 31, 2018 was $2,845,915, $687,893, and $727,704 for Balanced Allocation Fund, Growth Allocation Fund, and Aggressive Allocation Fund, respectively. |
(See Notes which are an integral part of the Financial Statements)
14
| | |
| |
| Financial Highlights—Investor Class of Shares (For a share outstanding throughout each period) |
| | | | | | | | | | | | | | | | | | | | | | | | | | | | | | | | | | | | | | | | | | | | | | | | | | | | | | | | | | | | | | | | | | | | | | |
| | | | | | | | | | | | |
Period
Ended
August 31, | | Net asset
value,
beginning
of period | | Net
investment
income | | Net realized
and unrealized
gain (loss) | | Total from
investment
operations | | Distributions to
shareholders
from net
investment
income | | Distributions to
shareholders
from net
realized gain | | Total
distributions | | Net asset
value, end
of period | | Total
return (1) | | Ratios to Average Net Assets | | | | |
| | Gross
Expenses | | Net
Expenses (2) | | Net
investment
income (2) | | Net assets,
end of period
(000 omitted) | | Portfolio
turnover
rate |
Conservative Allocation Fund | | | | | | | | | | | | | | | | | | | | | | | | | | | | | | | | | | | | |
| 2019 | | | $ | 8.67 | | | | $ | 0.18 | (3) | | | $ | 0.14 | | | | $ | 0.32 | | | | $ | (0.22 | ) | | | $ | (1.05 | ) | | | $ | (1.27 | ) | | | $ | 7.72 | | | | | 5.13 | % | | | | 0.85 | % | | | | 0.33 | % | | | | 2.36 | % | | | $ | 10,526 | | | | | 50 | % |
| 2018 | | | | 10.02 | | | | | 0.21 | | | | | (0.03 | ) | | | | 0.18 | | | | | (0.40 | ) | | | | (1.13 | ) | | | | (1.53 | ) | | | | 8.67 | | | | | 1.79 | | | | | 0.79 | | | | | 0.33 | | | | | 1.99 | | | | | 13,395 | | | | | 29 | |
| 2017 | | | | 9.80 | | | | | 0.18 | | | | | 0.28 | | | | | 0.46 | | | | | (0.24 | ) | | | | (0.00 | ) | | | | (0.24 | ) | | | | 10.02 | | | | | 4.83 | | | | | 0.58 | | | | | 0.33 | | | | | 1.55 | | | | | 15,531 | | | | | 40 | |
| 2016 | | | | 9.76 | | | | | 0.25 | | | | | 0.21 | | | | | 0.46 | | | | | (0.23 | ) | | | | (0.19 | ) | | | | (0.42 | ) | | | | 9.80 | | | | | 4.98 | | | | | 0.56 | | | | | 0.33 | | | | | 2.23 | | | | | 17,919 | | | | | 31 | |
| 2015 | | | | 10.14 | | | | | 0.20 | | | | | (0.34 | ) | | | | (0.14 | ) | | | | (0.16 | ) | | | | (0.08 | ) | | | | (0.24 | ) | | | | 9.76 | | | | | (1.37 | ) | | | | 0.57 | | | | | 0.33 | | | | | 1.97 | | | | | 23,598 | | | | | 39 | |
Moderate Allocation Fund | | | | | | | | | | | | | | | | | | | | | | | | | | | | | | | | | | | | |
| 2019 | | | | 9.92 | | | | | 0.19 | (3) | | | | 0.02 | | | | | 0.21 | | | | | (0.26 | ) | | | | (0.74 | ) | | | | (1.00 | ) | | | | 9.13 | | | | | 3.15 | | | | | 0.64 | | | | | 0.30 | | | | | 2.05 | | | | | 3,486 | | | | | 57 | |
| 2018 | | | | 10.08 | | | | | 0.18 | | | | | 0.31 | | | | | 0.49 | | | | | (0.19 | ) | | | | (0.46 | ) | | | | (0.65 | ) | | | | 9.92 | | | | | 4.94 | | | | | 0.60 | | | | | 0.30 | | | | | 1.69 | | | | | 7,126 | | | | | 31 | |
| 2017 | | | | 9.72 | | | | | 0.17 | | | | | 0.55 | | | | | 0.72 | | | | | (0.22 | ) | | | | (0.14 | ) | | | | (0.36 | ) | | | | 10.08 | | | | | 7.59 | | | | | 0.58 | | | | | 0.30 | | | | | 1.43 | | | | | 7,777 | | | | | 39 | |
| 2016 | | | | 9.78 | | | | | 0.24 | | | | | 0.23 | | | | | 0.47 | | | | | (0.20 | ) | | | | (0.33 | ) | | | | (0.53 | ) | | | | 9.72 | | | | | 5.13 | | | | | 0.56 | | | | | 0.30 | | | | | 1.92 | | | | | 13,119 | | | | | 38 | |
| 2015 | | | | 10.20 | | | | | 0.17 | | | | | (0.36 | ) | | | | (0.19 | ) | | | | (0.17 | ) | | | | (0.06 | ) | | | | (0.23 | ) | | | | 9.78 | | | | | (1.89 | ) | | | | 0.57 | | | | | 0.30 | | | | | 1.72 | | | | | 22,595 | | | | | 30 | |
Balanced Allocation Fund | | | | | | | | | | | | | | | | | | | | | | | | | | | | | | | | | | | | |
| 2019 | | | | 9.41 | | | | | 0.23 | | | | | (0.25 | ) | | | | (0.02 | ) | | | | (0.21 | ) | | | | (0.69 | ) | | | | (0.90 | ) | | | | 8.49 | | | | | 0.94 | | | | | 0.47 | | | | | 0.33 | | | | | 1.87 | | | | | 62,662 | | | | | 52 | |
| 2018 | | | | 9.65 | | | | | 0.15 | | | | | 0.60 | | | | | 0.75 | | | | | (0.18 | ) | | | | (0.81 | ) | | | | (0.99 | ) | | | | 9.41 | | | | | 8.06 | | | | | 0.48 | | | | | 0.33 | | | | | 1.39 | | | | | 98,453 | | | | | 29 | |
| 2017 | | | | 9.42 | | | | | 0.13 | | | | | 0.79 | | | | | 0.92 | | | | | (0.18 | ) | | | | (0.51 | ) | | | | (0.69 | ) | | | | 9.65 | | | | | 10.33 | | | | | 0.48 | | | | | 0.33 | | | | | 1.19 | | | | | 101,517 | | | | | 35 | |
| 2016 | | | | 9.78 | | | | | 0.15 | | | | | 0.32 | | | | | 0.47 | | | | | (0.17 | ) | | | | (0.66 | ) | | | | (0.83 | ) | | | | 9.42 | | | | | 5.23 | | | | | 0.47 | | | | | 0.33 | | | | | 1.54 | | | | | 110,814 | | | | | 33 | |
| 2015 | | | | 10.26 | | | | | 0.15 | | | | | (0.39 | ) | | | | (0.24 | ) | | | | (0.17 | ) | | | | (0.07 | ) | | | | (0.24 | ) | | | | 9.78 | | | | | (2.41 | ) | | | | 0.47 | | | | | 0.33 | | | | | 1.38 | | | | | 157,207 | | | | | 29 | |
Growth Allocation Fund | | | | | | | | | | | | | | | | | | | | | | | | | | | | | | | | | | | | |
| 2019 | | | | 10.58 | | | | | 0.15 | (3) | | | | (0.39 | ) | | | | (0.24 | ) | | | | (0.22 | ) | | | | (0.79 | ) | | | | (1.01 | ) | | | | 9.33 | | | | | (1.00 | ) | | | | 0.56 | | | | | 0.30 | | | | | 1.63 | | | | | 5,883 | | | | | 44 | |
| 2018 | | | | 10.23 | | | | | 0.13 | | | | | 0.98 | | | | | 1.11 | | | | | (0.18 | ) | | | | (0.58 | ) | | | | (0.76 | ) | | | | 10.58 | | | | | 11.15 | | | | | 0.56 | | | | | 0.30 | | | | | 1.18 | | | | | 13,887 | | | | | 32 | |
| 2017 | | | | 9.57 | | | | | 0.10 | | | | | 1.11 | | | | | 1.21 | | | | | (0.12 | ) | | | | (0.43 | ) | | | | (0.55 | ) | | | | 10.23 | | | | | 13.27 | | | | | 0.57 | | | | | 0.30 | | | | | 1.10 | | | | | 16,758 | | | | | 42 | |
| 2016 | | | | 9.82 | | | | | 0.12 | | | | | 0.37 | | | | | 0.49 | | | | | (0.16 | ) | | | | (0.58 | ) | | | | (0.74 | ) | | | | 9.57 | | | | | 5.28 | | | | | 0.56 | | | | | 0.30 | | | | | 1.22 | | | | | 24,691 | | | | | 38 | |
| 2015 | | | | 10.31 | | | | | 0.11 | | | | | (0.41 | ) | | | | (0.30 | ) | | | | (0.16 | ) | | | | (0.03 | ) | | | | (0.19 | ) | | | | 9.82 | | | | | (2.95 | ) | | | | 0.57 | | | | | 0.30 | | | | | 1.10 | | | | | 43,023 | | | | | 20 | |
Aggressive Allocation Fund | | | | | | | | | | | | | | | | | | | | | | | | | | | | | | | | | | | | |
| 2019 | | | | 10.01 | | | | | 0.24 | | | | | (0.61 | ) | | | | (0.37 | ) | | | | (0.21 | ) | | | | (0.90 | ) | | | | (1.11 | ) | | | | 8.53 | | | | | (2.10 | ) | | | | 0.52 | | | | | 0.33 | | | | | 1.59 | | | | | 23,715 | | | | | 47 | |
| 2018 | | | | 10.01 | | | | | 0.12 | | | | | 1.20 | | | | | 1.32 | | | | | (0.19 | ) | | | | (1.13 | ) | | | | (1.32 | ) | | | | 10.01 | | | | | 13.90 | | | | | 0.53 | | | | | 0.33 | | | | | 1.06 | | | | | 34,898 | | | | | 27 | |
| 2017 | | | | 9.56 | | | | | 0.11 | | | | | 1.27 | | | | | 1.38 | | | | | (0.10 | ) | | | | (0.83 | ) | | | | (0.93 | ) | | | | 10.01 | | | | | 15.60 | | | | | 0.53 | | | | | 0.33 | | | | | 1.03 | | | | | 37,632 | | | | | 33 | |
| 2016 | | | | 9.85 | | | | | 0.10 | | | | | 0.38 | | | | | 0.48 | | | | | (0.13 | ) | | | | (0.64 | ) | | | | (0.77 | ) | | | | 9.56 | | | | | 5.14 | | | | | 0.52 | | | | | 0.33 | | | | | 1.04 | | | | | 52,260 | | | | | 33 | |
| 2015 | | | | 10.36 | | | | | 0.12 | | | | | (0.41 | ) | | | | (0.29 | ) | | | | (0.18 | ) | | | | (0.04 | ) | | | | (0.22 | ) | | | | 9.85 | | | | | (2.79 | ) | | | | 0.53 | | | | | 0.34 | | | | | 0.73 | | | | | 83,064 | | | | | 44 | |
| (1) | Based on net asset value as of end of period date. |
| (2) | The contractual and voluntary expense waivers pursuant to Note 5 of the financial statements are reflected in both the net expense and net investment income ratios. |
| (3) | Calculated using the average shares method. |
(See Notes which are an integral part of the Financial Statements)
15
| | |
| |
| Financial Highlights—Institutional Class of Shares (For a share outstanding throughout each period) |
| | | | | | | | | | | | | | | | | | | | | | | | | | | | | | | | | | | | | | | | | | | | | | | | | | | | | | | | | | | | | | | | | | | | | | |
| | | | | | | | | | | | |
Period
Ended
August 31, | | Net asset
value,
beginning
of period | | Net
investment
income | | Net realized
and unrealized
gain (loss) | | Total from
investment
operations | | Distributions to
shareholders
from net
investment
income | | Distributions to
shareholders
from net
realized gain | | Total
distributions | | Net asset
value, end
of period | | Total
return (1) | | Ratios to Average Net Assets | | | | |
| | Gross
Expenses | | Net
Expenses (2) | | Net
investment
income (2) | | Net assets,
end of period
(000 omitted) | | Portfolio
turnover
rate |
Conservative Allocation Fund | | | | | | | | | | | | | | | | | | | | | | | | | | | | | | | | | | | | |
| 2019 | | | $ | 8.97 | | | | $ | 0.21 | (3) | | | $ | 0.14 | | | | $ | 0.35 | | | | $ | (0.22 | ) | | | $ | (1.05 | ) | | | $ | (1.27 | ) | | | $ | 8.05 | | | | | 5.32 | % | | | | 0.60 | % | | | | 0.08 | % | | | | 2.57 | % | | | $ | 564 | | | | | 50 | % |
| 2018 | | | | 10.02 | | | | | 3.41 | | | | | (3.20 | ) | | | | 0.21 | | | | | (0.13 | ) | | | | (1.13 | ) | | | | (1.26 | ) | | | | 8.97 | | | | | 2.11 | | | | | 0.52 | | | | | 0.08 | | | | | 1.10 | | | | | 1,416 | | | | | 29 | |
| 2017 | | | | 9.81 | | | | | 0.18 | | | | | 0.30 | | | | | 0.48 | | | | | (0.27 | ) | | | | (0.00 | ) | | | | (0.27 | ) | | | | 10.02 | | | | | 5.07 | | | | | 0.33 | | | | | 0.08 | | | | | 1.78 | | | | | 26,464 | | | | | 40 | |
| 2016 | | | | 9.77 | | | | | 0.24 | | | | | 0.25 | | | | | 0.49 | | | | | (0.26 | ) | | | | (0.19 | ) | | | | (0.45 | ) | | | | 9.81 | | | | | 5.29 | | | | | 0.31 | | | | | 0.08 | | | | | 2.46 | | | | | 29,479 | | | | | 31 | |
| 2015 | | | | 10.15 | | | | | 0.23 | | | | | (0.35 | ) | | | | (0.12 | ) | | | | (0.17 | ) | | | | (0.09 | ) | | | | (0.26 | ) | | | | 9.77 | | | | | (1.22 | ) | | | | 0.32 | | | | | 0.08 | | | | | 2.23 | | | | | 29,104 | | | | | 39 | |
Moderate Allocation Fund | | | | | | | | | | | | | | | | | | | | | | | | | | | | | | | | | | | | |
| 2019 | | | | 9.94 | | | | | 0.21 | (3) | | | | 0.02 | | | | | 0.23 | | | | | (0.27 | ) | | | | (0.74 | ) | | | | (1.01 | ) | | | | 9.16 | | | | | 3.42 | | | | | 0.39 | | | | | 0.05 | | | | | 2.27 | | | | | 6,997 | | | | | 57 | |
| 2018 | | | | 10.08 | | | | | 0.28 | | | | | 0.25 | | | | | 0.53 | | | | | (0.21 | ) | | | | (0.46 | ) | | | | (0.67 | ) | | | | 9.94 | | | | | 5.33 | | | | | 0.36 | | | | | 0.05 | | | | | 1.68 | | | | | 5,888 | | | | | 31 | |
| 2017 | | | | 9.73 | | | | | 0.17 | | | | | 0.57 | | | | | 0.74 | | | | | (0.25 | ) | | | | (0.14 | ) | | | | (0.39 | ) | | | | 10.08 | | | | | 7.82 | | | | | 0.33 | | | | | 0.05 | | | | | 1.66 | | | | | 9,375 | | | | | 39 | |
| 2016 | | | | 9.79 | | | | | 0.23 | | | | | 0.28 | | | | | 0.51 | | | | | (0.24 | ) | | | | (0.33 | ) | | | | (0.57 | ) | | | | 9.73 | | | | | 5.50 | | | | | 0.31 | | | | | 0.05 | | | | | 2.15 | | | | | 11,990 | | | | | 38 | |
| 2015 | | | | 10.21 | | | | | 0.21 | | | | | (0.38 | ) | | | | (0.17 | ) | | | | (0.18 | ) | | | | (0.07 | ) | | | | (0.25 | ) | | | | 9.79 | | | | | (1.75 | ) | | | | 0.32 | | | | | 0.05 | | | | | 1.95 | | | | | 16,112 | | | | | 30 | |
Balanced Allocation Fund | | | | | | | | | | | | | | | | | | | | | | | | | | | | | | | | | | | | |
| 2019 | | | | 9.42 | | | | | 0.26 | | | | | (0.26 | ) | | | | — | | | | | (0.23 | ) | | | | (0.69 | ) | | | | (0.92 | ) | | | | 8.50 | | | | | 1.23 | | | | | 0.22 | | | | | 0.08 | | | | | 1.99 | | | | | 37,232 | | | | | 52 | |
| 2018 | | | | 9.66 | | | | | 0.19 | | | | | 0.58 | | | | | 0.77 | | | | | (0.20 | ) | | | | (0.81 | ) | | | | (1.01 | ) | | | | 9.42 | | | | | 8.27 | | | | | 0.23 | | | | | 0.08 | | | | | 1.61 | | | | | 47,597 | | | | | 29 | |
| 2017 | | | | 9.43 | | | | | 0.13 | | | | | 0.81 | | | | | 0.94 | | | | | (0.20 | ) | | | | (0.51 | ) | | | | (0.71 | ) | | | | 9.66 | | | | | 10.67 | | | | | 0.23 | | | | | 0.08 | | | | | 1.42 | | | | | 52,821 | | | | | 35 | |
| 2016 | | | | 9.79 | | | | | 0.17 | | | | | 0.33 | | | | | 0.50 | | | | | (0.20 | ) | | | | (0.66 | ) | | | | (0.86 | ) | | | | 9.43 | | | | | 5.54 | | | | | 0.22 | | | | | 0.08 | | | | | 1.73 | | | | | 74,515 | | | | | 33 | |
| 2015 | | | | 10.26 | | | | | 0.17 | | | | | (0.39 | ) | | | | (0.22 | ) | | | | (0.19 | ) | | | | (0.06 | ) | | | | (0.25 | ) | | | | 9.79 | | | | | (2.17 | ) | | | | 0.22 | | | | | 0.08 | | | | | 1.59 | | | | | 81,475 | | | | | 29 | |
Growth Allocation Fund | | | | | | | | | | | | | | | | | | | | | | | | | | | | | | | | | | | | |
| 2019 | | | | 10.59 | | | | | 0.18 | (3) | | | | (0.42 | ) | | | | (0.24 | ) | | | | (0.24 | ) | | | | (0.79 | ) | | | | (1.03 | ) | | | | 9.32 | | | | | (0.88 | ) | | | | 0.31 | | | | | 0.05 | | | | | 1.96 | | | | | 13,390 | | | | | 44 | |
| 2018 | | | | 10.23 | | | | | 0.15 | | | | | 1.00 | | | | | 1.15 | | | | | (0.21 | ) | | | | (0.58 | ) | | | | (0.79 | ) | | | | 10.59 | | | | | 11.59 | | | | | 0.31 | | | | | 0.05 | | | | | 1.42 | | | | | 11,441 | | | | | 32 | |
| 2017 | | | | 9.58 | | | | | 0.09 | | | | | 1.14 | | | | | 1.23 | | | | | (0.15 | ) | | | | (0.43 | ) | | | | (0.58 | ) | | | | 10.23 | | | | | 13.51 | | | | | 0.32 | | | | | 0.05 | | | | | 1.15 | | | | | 8,969 | | | | | 42 | |
| 2016 | | | | 9.84 | | | | | 0.14 | | | | | 0.37 | | | | | 0.51 | | | | | (0.19 | ) | | | | (0.58 | ) | | | | (0.77 | ) | | | | 9.58 | | | | | 5.50 | | | | | 0.31 | | | | | 0.05 | | | | | 1.48 | | | | | 9,696 | | | | | 38 | |
| 2015 | | | | 10.32 | | | | | 0.15 | | | | | (0.42 | ) | | | | (0.27 | ) | | | | (0.18 | ) | | | | (0.03 | ) | | | | (0.21 | ) | | | | 9.84 | | | | | (2.72 | ) | | | | 0.32 | | �� | | | 0.05 | | | | | 1.32 | | | | | 15,252 | | | | | 20 | |
Aggressive Allocation Fund | | | | | | | | | | | | | | | | | | | | | | | | | | | | | | | | | | | | |
| 2019 | | | | 10.01 | | | | | 0.26 | | | | | (0.61 | ) | | | | (0.35 | ) | | | | (0.23 | ) | | | | (0.90 | ) | | | | (1.13 | ) | | | | 8.53 | | | | | (1.79 | ) | | | | 0.27 | | | | | 0.08 | | | | | 1.79 | | | | | 12,095 | | | | | 47 | |
| 2018 | | | | 10.00 | | | | | 0.15 | | | | | 1.20 | | | | | 1.35 | | | | | (0.21 | ) | | | | (1.13 | ) | | | | (1.34 | ) | | | | 10.01 | | | | | 14.26 | | | | | 0.28 | | | | | 0.08 | | | | | 1.23 | | | | | 15,878 | | | | | 27 | |
| 2017 | | | | 9.57 | | | | | 0.14 | | | | | 1.25 | | | | | 1.39 | | | | | (0.13 | ) | | | | (0.83 | ) | | | | (0.96 | ) | | | | 10.00 | | | | | 15.79 | | | | | 0.28 | | | | | 0.08 | | | | | 1.29 | | | | | 14,685 | | | | | 33 | |
| 2016 | | | | 9.87 | | | | | 0.11 | | | | | 0.39 | | | | | 0.50 | | | | | (0.16 | ) | | | | (0.64 | ) | | | | (0.80 | ) | | | | 9.57 | | | | | 5.41 | | | | | 0.27 | | | | | 0.08 | | | | | 1.31 | | | | | 24,026 | | | | | 33 | |
| 2015 | | | | 10.37 | | | | | 0.14 | | | | | (0.40 | ) | | | | (0.26 | ) | | | | (0.19 | ) | | | | (0.05 | ) | | | | (0.24 | ) | | | | 9.87 | | | | | (2.55 | ) | | | | 0.28 | | | | | 0.09 | | | | | 1.06 | | | | | 31,770 | | | | | 44 | |
| (1) | Based on net asset value as of end of period date. |
| (2) | The contractual and voluntary expense waivers pursuant to Note 5 of the financial statements are reflected in both the net expense and net investment income ratios. |
| (3) | Calculated using the average shares method. |
(See Notes which are an integral part of the Financial Statements)
16
| | |
| |
| Financial Highlights—RetirementClass R-3 of Shares (For a share outstanding throughout each period) |
| | | | | | | | | | | | | | | | | | | | | | | | | | | | | | | | | | | | | | | | | | | | | | | | | | | | | | | | | | | | | | | | | | | | | | |
| | | | | | | | | | | | |
Period
Ended
August 31, | | Net asset
value,
beginning
of period | | Net
investment
income | | Net realized
and unrealized
gain (loss) | | Total from
investment
operations | | Distributions to
shareholders
from net
investment
income | | Distributions to
shareholders
from net
realized gain | | Total
distributions | | Net asset
value, end
of period | | Total
return (1) | | Ratios to Average Net Assets | | | | |
| | Gross
Expenses | | Net
Expenses (2) | | Net
investment
income (2) | | Net assets,
end of period
(000 omitted) | | Portfolio
turnover
rate |
Conservative Allocation Fund | | | | | | | | | | | | | | | | | | | | | | | | | | |
| 2019 | | | $ | 8.84 | | | | $ | 0.17 | (3) | | | $ | 0.13 | | | | $ | 0.30 | | | | $ | (0.21 | ) | | | $ | (1.05 | ) | | | $ | (1.26 | ) | | | $ | 7.88 | | | | | 4.78 | % | | | | 1.10 | % | | | | 0.58 | % | | | | 2.14 | % | | | $ | 633 | | | | | 50 | % |
| 2018 | | | | 10.01 | | | | | 0.52 | | | | | (0.36 | ) | | | | 0.16 | | | | | (0.20 | ) | | | | (1.13 | ) | | | | (1.33 | ) | | | | 8.84 | | | | | 1.58 | | | | | 1.04 | | | | | 0.58 | | | | | 1.41 | | | | | 956 | | | | | 29 | |
| 2017 | | | | 9.80 | | | | | 0.13 | | | | | 0.30 | | | | | 0.43 | | | | | (0.22 | ) | | | | (0.00 | ) | | | | (0.22 | ) | | | | 10.01 | | | | | 4.52 | | | | | 0.83 | | | | | 0.58 | | | | | 1.34 | | | | | 3,012 | | | | | 40 | |
| 2016 | | | | 9.74 | | | | | 0.21 | | | | | 0.24 | | | | | 0.45 | | | | | (0.20 | ) | | | | (0.19 | ) | | | | (0.39 | ) | | | | 9.80 | | | | | 4.82 | | | | | 0.81 | | | | | 0.58 | | | | | 1.97 | | | | | 6,802 | | | | | 31 | |
| 2015 | | | | 10.14 | | | | | 0.20 | | | | | (0.37 | ) | | | | (0.17 | ) | | | | (0.15 | ) | | | | (0.08 | ) | | | | (0.23 | ) | | | | 9.74 | | | | | (1.72 | ) | | | | 0.82 | | | | | 0.58 | | | | | 1.74 | | | | | 7,624 | | | | | 39 | |
Moderate Allocation Fund | | | | | | | | | | | | | | | | | | | | | | | | | | |
| 2019 | | | | 9.91 | | | | | 0.17 | (3) | | | | 0.02 | | | | | 0.19 | | | | | (0.22 | ) | | | | (0.74 | ) | | | | (0.96 | ) | | | | 9.14 | | | | | 2.94 | | | | | 0.89 | | | | | 0.55 | | | | | 1.89 | | | | | 6,975 | | | | | 57 | |
| 2018 | | | | 10.08 | | | | | 0.20 | | | | | 0.26 | | | | | 0.46 | | | | | (0.17 | ) | | | | (0.46 | ) | | | | (0.63 | ) | | | | 9.91 | | | | | 4.65 | | | | | 0.85 | | | | | 0.55 | | | | | 1.43 | | | | | 8,095 | | | | | 31 | |
| 2017 | | | | 9.72 | | | | | 0.11 | | | | | 0.58 | | | | | 0.69 | | | | | (0.19 | ) | | | | (0.14 | ) | | | | (0.33 | ) | | | | 10.08 | | | | | 7.37 | | | | | 0.83 | | | | | 0.55 | | | | | 1.10 | | | | | 13,725 | | | | | 39 | |
| 2016 | | | | 9.76 | | | | | 0.26 | | | | | 0.19 | | | | | 0.45 | | | | | (0.16 | ) | | | | (0.33 | ) | | | | (0.49 | ) | | | | 9.72 | | | | | 4.90 | | | | | 0.81 | | | | | 0.55 | | | | | 1.65 | | | | | 12,695 | | | | | 38 | |
| 2015 | | | | 10.20 | | | | | 0.15 | | | | | (0.37 | ) | | | | (0.22 | ) | | | | (0.16 | ) | | | | (0.06 | ) | | | | (0.22 | ) | | | | 9.76 | | | | | (2.23 | ) | | | | 0.82 | | | | | 0.55 | | | | | 1.45 | | | | | 22,279 | | | | | 30 | |
Balanced Allocation Fund | | | | | | | | | | | | | | | | | | | | | | | | | | |
| 2019 | | | | 9.41 | | | | | 0.21 | | | | | (0.24 | ) | | | | (0.03 | ) | | | | (0.19 | ) | | | | (0.69 | ) | | | | (0.88 | ) | | | | 8.50 | | | | | 0.75 | | | | | 0.72 | | | | | 0.58 | | | | | 1.73 | | | | | 13,632 | | | | | 52 | |
| 2018 | | | | 9.64 | | | | | 0.13 | | | | | 0.59 | | | | | 0.72 | | | | | (0.14 | ) | | | | (0.81 | ) | | | | (0.95 | ) | | | | 9.41 | | | | | 7.77 | | | | | 0.73 | | | | | 0.58 | | | | | 1.16 | | | | | 19,213 | | | | | 29 | |
| 2017 | | | | 9.40 | | | | | 0.09 | | | | | 0.80 | | | | | 0.89 | | | | | (0.14 | ) | | | | (0.51 | ) | | | | (0.65 | ) | | | | 9.64 | | | | | 10.11 | | | | | 0.73 | | | | | 0.58 | | | | | 0.92 | | | | | 23,649 | | | | | 35 | |
| 2016 | | | | 9.76 | | | | | 0.13 | | | | | 0.31 | | | | | 0.44 | | | | | (0.14 | ) | | | | (0.66 | ) | | | | (0.80 | ) | | | | 9.40 | | | | | 4.94 | | | | | 0.72 | | | | | 0.58 | | | | | 1.28 | | | | | 29,095 | | | | | 33 | |
| 2015 | | | | 10.25 | | | | | 0.12 | | | | | (0.38 | ) | | | | (0.26 | ) | | | | (0.16 | ) | | | | (0.07 | ) | | | | (0.23 | ) | | | | 9.76 | | | | | (2.64 | ) | | | | 0.72 | | | | | 0.58 | | | | | 1.15 | | | | | 38,677 | | | | | 29 | |
Growth Allocation Fund | | | | | | | | | | | | | | | | | | | | | | | | | | |
| 2019 | | | | 10.58 | | | | | 0.15 | (3) | | | | (0.42 | ) | | | | (0.27 | ) | | | | (0.18 | ) | | | | (0.79 | ) | | | | (0.97 | ) | | | | 9.34 | | | | | (1.29 | ) | | | | 0.81 | | | | | 0.55 | | | | | 1.59 | | | | | 8,220 | | | | | 44 | |
| 2018 | | | | 10.22 | | | | | 0.10 | | | | | 0.99 | | | | | 1.09 | | | | | (0.15 | ) | | | | (0.58 | ) | | | | (0.73 | ) | | | | 10.58 | | | | | 11.00 | | | | | 0.81 | | | | | 0.55 | | | | | 0.91 | | | | | 15,107 | | | | | 32 | |
| 2017 | | | | 9.55 | | | | | 0.10 | | | | | 1.08 | | | | | 1.18 | | | | | (0.08 | ) | | | | (0.43 | ) | | | | (0.51 | ) | | | | 10.22 | | | | | 12.96 | | | | | 0.82 | | | | | 0.55 | | | | | 0.85 | | | | | 18,846 | | | | | 42 | |
| 2016 | | | | 9.81 | | | | | 0.09 | | | | | 0.37 | | | | | 0.46 | | | | | (0.14 | ) | | | | (0.58 | ) | | | | (0.72 | ) | | | | 9.55 | | | | | 4.95 | | | | | 0.81 | | | | | 0.55 | | | | | 0.91 | | | | | 25,876 | | | | | 38 | |
| 2015 | | | | 10.30 | | | | | 0.09 | | | | | (0.40 | ) | | | | (0.31 | ) | | | | (0.15 | ) | | | | (0.03 | ) | | | | (0.18 | ) | | | | 9.81 | | | | | (3.10 | ) | | | | 0.82 | | | | | 0.55 | | | | | 0.83 | | | | | 28,903 | | | | | 20 | |
Aggressive Allocation Fund | | | | | | | | | | | | | | | | | | | | | | | | | | |
| 2019 | | | | 9.99 | | | | | 0.20 | | | | | (0.60 | ) | | | | (0.40 | ) | | | | (0.19 | ) | | | | (0.90 | ) | | | | (1.09 | ) | | | | 8.50 | | | | | (2.47 | ) | | | | 0.77 | | | | | 0.58 | | | | | 1.29 | | | | | 16,079 | | | | | 47 | |
| 2018 | | | | 9.98 | | | | | 0.10 | | | | | 1.20 | | | | | 1.30 | | | | | (0.16 | ) | | | | (1.13 | ) | | | | (1.29 | ) | | | | 9.99 | | | | | 13.70 | | | | | 0.78 | | | | | 0.58 | | | | | 0.79 | | | | | 16,950 | | | | | 27 | |
| 2017 | | | | 9.55 | | | | | 0.06 | | | | | 1.29 | | | | | 1.35 | | | | | (0.09 | ) | | | | (0.83 | ) | | | | (0.92 | ) | | | | 9.98 | | | | | 15.24 | | | | | 0.78 | | | | | 0.58 | | | | | 0.63 | | | | | 17,152 | | | | | 33 | |
| 2016 | | | | 9.84 | | | | | 0.07 | | | | | 0.38 | | | | | 0.45 | | | | | (0.10 | ) | | | | (0.64 | ) | | | | (0.74 | ) | | | | 9.55 | | | | | 4.87 | | | | | 0.77 | | | | | 0.58 | | | | | 0.77 | | | | | 19,395 | | | | | 33 | |
| 2015 | | | | 10.35 | | | | | 0.10 | | | | | (0.40 | ) | | | | (0.30 | ) | | | | (0.17 | ) | | | | (0.04 | ) | | | | (0.21 | ) | | | | 9.84 | | | | | (2.94 | ) | | | | 0.78 | | | | | 0.59 | | | | | 0.48 | | | | | 22,578 | | | | | 44 | |
| (1) | Based on net asset value as of end of period date. |
| (2) | The contractual and voluntary expense waivers pursuant to Note 5 of the financial statements are reflected in both the net expense and net investment income ratios. |
| (3) | Calculated using the average shares method. |
(See Notes which are an integral part of the Financial Statements)
17
| | |
| |
| Financial Highlights—RetirementClass R-6 of Shares (For a share outstanding throughout each period) |
| | | | | | | | | | | | | | | | | | | | | | | | | | | | | | | | | | | | | | | | | | | | | | | | | | | | | | | | | | | | | | | | | | | | | | |
| | | | | | | | | | | | |
Period
Ended
August 31, | | Net asset
value,
beginning
of period | | Net
investment
income | | Net realized
and unrealized
gain (loss) | | Total from
investment
operations | | Distributions to
shareholders
from net
investment
income | | Distributions to
shareholders
from net
realized gain | | Total
distributions | | Net asset
value, end
of period | | Total
return (1) | | Ratios to Average Net Assets | | | | |
| | Gross
Expenses | | Net
Expenses (2)(3) | | Net
investment
income (2) | | Net assets,
end of period
(000 omitted) | | Portfolio
turnover
rate |
Conservative Allocation Fund | | | | | | | | | | | | | | | | | | | | | | | | | | |
| 2019 | | | $ | 8.68 | | | | $ | 0.21 | (4) | | | $ | 0.14 | | | | $ | 0.35 | | | | $ | (0.22 | ) | | | $ | (1.05 | ) | | | $ | (1.27 | ) | | | $ | 7.76 | | | | | 5.51 | % | | | | 0.45 | % | | | | 0.00 | % | | | | 2.72 | % | | | $ | 26,067 | | | | | 50 | % |
| 2018 | | | | 10.03 | | | | | 0.21 | | | | | 0.01 | | | | | 0.22 | | | | | (0.44 | ) | | | | (1.13 | ) | | | | (1.57 | ) | | | | 8.68 | | | | | 2.28 | | | | | 0.39 | | | | | 0.00 | | | | | 2.42 | | | | | 21,748 | | | | | 29 | |
| 2017 | | | | 9.82 | | | | | 0.27 | | | | | 0.23 | | | | | 0.50 | | | | | (0.29 | ) | | | | (0.00 | ) | | | | (0.29 | ) | | | | 10.03 | | | | | 5.22 | | | | | 0.18 | | | | | 0.00 | | | | | 1.96 | | | | | 28,927 | | | | | 40 | |
| 2016 | | | | 9.79 | | | | | 0.25 | | | | | 0.24 | | | | | 0.49 | | | | | (0.27 | ) | | | | (0.19 | ) | | | | (0.46 | ) | | | | 9.82 | | | | | 5.34 | | | | | 0.16 | | | | | 0.00 | | | | | 2.61 | | | | | 88,818 | | | | | 31 | |
| 2015 | | | | 10.15 | | | | | 0.25 | | | | | (0.34 | ) | | | | (0.09 | ) | | | | (0.19 | ) | | | | (0.08 | ) | | | | (0.27 | ) | | | | 9.79 | | | | | (0.94 | ) | | | | 0.17 | | | | | 0.00 | | | | | 2.38 | | | | | 86,637 | | | | | 39 | |
Moderate Allocation Fund | | | | | | | | | | | | | | | | | | | | | | | | | | |
| 2019 | | | | 9.92 | | | | | 0.23 | (4) | | | | 0.02 | | | | | 0.25 | | | | | (0.27 | ) | | | | (0.74 | ) | | | | (1.01 | ) | | | | 9.16 | | | | | 3.63 | | | | | 0.24 | | | | | 0.00 | | | | | 2.58 | | | | | 54,363 | | | | | 57 | |
| 2018 | | | | 10.09 | | | | | 0.22 | | | | | 0.31 | | | | | 0.53 | | | | | (0.24 | ) | | | | (0.46 | ) | | | | (0.70 | ) | | | | 9.92 | | | | | 5.33 | | | | | 0.20 | | | | | 0.00 | | | | | 2.12 | | | | | 60,855 | | | | | 31 | |
| 2017 | | | | 9.74 | | | | | 0.21 | | | | | 0.54 | | | | | 0.75 | | | | | (0.26 | ) | | | | (0.14 | ) | | | | (0.40 | ) | | | | 10.09 | | | | | 8.02 | | | | | 0.18 | | | | | 0.00 | | | | | 1.83 | | | | | 80,283 | | | | | 39 | |
| 2016 | | | | 9.80 | | | | | 0.22 | | | | | 0.30 | | | | | 0.52 | | | | | (0.25 | ) | | | | (0.33 | ) | | | | (0.58 | ) | | | | 9.74 | | | | | 5.67 | | | | | 0.16 | | | | | 0.00 | | | | | 2.27 | | | | | 101,327 | | | | | 38 | |
| 2015 | | | | 10.21 | | | | | 0.21 | | | | | (0.37 | ) | | | | (0.16 | ) | | | | (0.19 | ) | | | | (0.06 | ) | | | | (0.25 | ) | | | | 9.80 | | | | | (1.56 | ) | | | | 0.17 | | | | | 0.00 | | | | | 2.11 | | | | | 93,206 | | | | | 30 | |
Balanced Allocation Fund | | | | | | | | | | | | | | | | | | | | | | | | | | |
| 2019 | | | | 9.42 | | | | | 0.25 | | | | | (0.23 | ) | | | | 0.02 | | | | | (0.23 | ) | | | | (0.69 | ) | | | | (0.92 | ) | | | | 8.52 | | | | | 1.48 | | | | | 0.07 | | | | | 0.00 | | | | | 2.23 | | | | | 160,166 | | | | | 52 | |
| 2018 | | | | 9.66 | | | | | 0.18 | | | | | 0.61 | | | | | 0.79 | | | | | (0.22 | ) | | | | (0.81 | ) | | | | (1.03 | ) | | | | 9.42 | | | | | 8.51 | | | | | 0.08 | | | | | 0.00 | | | | | 1.82 | | | | | 180,451 | | | | | 29 | |
| 2017 | | | | 9.44 | | | | | 0.19 | | | | | 0.76 | | | | | 0.95 | | | | | (0.22 | ) | | | | (0.51 | ) | | | | (0.73 | ) | | | | 9.66 | | | | | 10.73 | | | | | 0.08 | | | | | 0.00 | | | | | 1.67 | | | | | 193,690 | | | | | 35 | |
| 2016 | | | | 9.80 | | | | | 0.18 | | | | | 0.33 | | | | | 0.51 | | | | | (0.21 | ) | | | | (0.66 | ) | | | | (0.87 | ) | | | | 9.44 | | | | | 5.70 | | | | | 0.07 | | | | | 0.00 | | | | | 1.87 | | | | | 252,982 | | | | | 33 | |
| 2015 | | | | 10.27 | | | | | 0.18 | | | | | (0.39 | ) | | | | (0.21 | ) | | | | (0.19 | ) | | | | (0.07 | ) | | | | (0.26 | ) | | | | 9.80 | | | | | (2.08 | ) | | | | 0.07 | | | | | 0.00 | | | | | 1.78 | | | | | 247,496 | | | | | 29 | |
Growth Allocation Fund | | | | | | | | | | | | | | | | | | | | | | | | | | |
| 2019 | | | | 10.59 | | | | | 0.18 | (4) | | | | (0.40 | ) | | | | (0.22 | ) | | | | (0.24 | ) | | | | (0.79 | ) | | | | (1.03 | ) | | | | 9.34 | | | | | (0.68 | ) | | | | 0.16 | | | | | 0.00 | | | | | 1.94 | | | | | 86,392 | | | | | 44 | |
| 2018 | | | | 10.24 | | | | | 0.17 | | | | | 0.99 | | | | | 1.16 | | | | | (0.23 | ) | | | | (0.58 | ) | | | | (0.81 | ) | | | | 10.59 | | | | | 11.66 | | | | | 0.17 | | | | | 0.00 | | | | | 1.59 | | | | | 82,185 | | | | | 32 | |
| 2017 | | | | 9.59 | | | | | 0.16 | | | | | 1.09 | | | | | 1.25 | | | | | (0.17 | ) | | | | (0.43 | ) | | | | (0.60 | ) | | | | 10.24 | | | | | 13.69 | | | | | 0.17 | | | | | 0.00 | | | | | 1.49 | | | | | 84,417 | | | | | 42 | |
| 2016 | | | | 9.85 | | | | | 0.15 | | | | | 0.37 | | | | | 0.52 | | | | | (0.20 | ) | | | | (0.58 | ) | | | | (0.78 | ) | | | | 9.59 | | | | | 5.67 | | | | | 0.16 | | | | | 0.00 | | | | | 1.51 | | | | | 79,852 | | | | | 38 | |
| 2015 | | | | 10.32 | | | | | 0.16 | | | | | (0.41 | ) | | | | (0.25 | ) | | | | (0.19 | ) | | | | (0.03 | ) | | | | (0.22 | ) | | | | 9.85 | | | | | (2.52 | ) | | | | 0.17 | | | | | 0.00 | | | | | 1.47 | | | | | 67,727 | | | | | 20 | |
Aggressive Allocation Fund | | | | | | | | | | | | | | | | | | | | | | | | | | |
| 2019 | | | | 10.02 | | | | | 0.25 | | | | | (0.60 | ) | | | | (0.35 | ) | | | | (0.23 | ) | | | | (0.90 | ) | | | | (1.13 | ) | | | | 8.54 | | | | | (1.77 | ) | | | | 0.12 | | | | | 0.00 | | | | | 1.94 | | | | | 110,386 | | | | | 47 | |
| 2018 | | | | 10.01 | | | | | 0.16 | | | | | 1.21 | | | | | 1.37 | | | | | (0.23 | ) | | | | (1.13 | ) | | | | (1.36 | ) | | | | 10.02 | | | | | 14.51 | | | | | 0.13 | | | | | 0.00 | | | | | 1.47 | | | | | 112,003 | | | | | 27 | |
| 2017 | | | | 9.58 | | | | | 0.15 | | | | | 1.26 | | | | | 1.41 | | | | | (0.15 | ) | | | | (0.83 | ) | | | | (0.98 | ) | | | | 10.01 | | | | | 16.00 | | | | | 0.13 | | | | | 0.00 | | | | | 1.43 | | | | | 105,925 | | | | | 33 | |
| 2016 | | | | 9.88 | | | | | 0.14 | | | | | 0.38 | | | | | 0.52 | | | | | (0.18 | ) | | | | (0.64 | ) | | | | (0.82 | ) | | | | 9.58 | | | | | 5.58 | | | | | 0.12 | | | | | 0.00 | | | | | 1.38 | | | | | 123,203 | | | | | 33 | |
| 2015 | | | | 10.37 | | | | | 0.17 | | | | | (0.41 | ) | | | | (0.24 | ) | | | | (0.21 | ) | | | | (0.04 | ) | | | | (0.25 | ) | | | | 9.88 | | | | | (2.37 | ) | | | | 0.12 | | | | | 0.00 | | | | | 1.12 | | | | | 113,933 | | | | | 44 | |
| (1) | Based on net asset value as of end of period date. |
| (2) | The contractual and voluntary expense waivers pursuant to Note 5 of the financial statements are reflected in both the net expense and net investment income ratios. |
| (3) | Please refer to Note 5, subsection Investment Adviser Fee and Other Transactions with Affiliates, in the Notes to Financial Statements. |
| (4) | Calculated using the average shares method. |
(See Notes which are an integral part of the Financial Statements)
18
August 31, 2019
| | |
| | |
| Notes to Financial Statements | | BMO Funds |
BMO Funds, Inc. (the “Corporation”) is registered under the Investment Company Act of 1940, as amended (the “Act”), as anopen-end management investment company. As of August 31, 2019, the Corporation consisted of 32 portfolios, including 5 target risk diversified portfolios within this annual report (individually referred to as the “Fund,” or collectively as the “Funds”), each with differing share class offerings as well as 27 other portfolios whose annual report is available under a separate cover. BMO Asset Management Corp. serves as the Funds’ investment adviser (the “Adviser”), a Delaware corporation headquartered in Chicago, Illinois that is a wholly-owned subsidiary of BMO Financial Corp.
| | | | |
| Fund | | Inception Date | | Investment Objective |
Conservative Allocation Fund | | May 30, 2014 | | To provide total return primarily from income, secondarily from appreciation. |
Moderate Allocation Fund | | May 30, 2014 | | To provide total investment return from income and appreciation. |
Balanced Allocation Fund | | May 30, 2014 | | To provide total investment return from income and appreciation. |
Growth Allocation Fund | | May 30, 2014 | | To provide total investment return from income and appreciation. |
Aggressive Allocation Fund | | May 30, 2014 | | To provide total investment return primarily from appreciation, secondarily from income. |
The target investment allocation for each of the Funds, based on each Fund’s total assets, is set forth below.
| | | | | | | | | | | | | | | | |
Fund | | Equity | | | Fixed Income | | | Alternatives | | | Money Market Funds | |
Conservative Allocation Fund | | | 10%–30% | | | | 60%–80% | | | | 0%–15% | | | | 0%–10% | |
Moderate Allocation Fund | | | 30%–50% | | | | 40%–60% | | | | 0%–15% | | | | 0%–10% | |
Balanced Allocation Fund | | | 50%–70% | | | | 25%–45% | | | | 0%–15% | | | | 0%–10% | |
Growth Allocation Fund | | | 70%–90% | | | | 5%–25% | | | | 0%–15% | | | | 0%–10% | |
Aggressive Allocation Fund | | | 90%–100% | | | | 0% | | | | 0%–10% | | | | 0%–10% | |
Each Fund seeks to achieve its investment objectives by investing in a mix (without limitation) of BMO Funds and unaffiliated mutual funds. The Funds are designed to provide investors with investment management, asset allocation, and ongoing reallocation over time. Each Fund is considered a “fund of funds” because it invests in other mutual funds. A fund of funds bears its own direct expenses in addition to bearing a proportionate share of expenses charged to the underlying funds in which it invests.
| 2. | | Significant Accounting Policies |
The Funds are investment companies and follow the accounting and reporting guidance under Financial Accounting Standards Board (“FASB”) Accounting Standards Codification (“ASC”) Topic 946,Financial Services—Investment Companies. The following is a summary of significant accounting policies consistently followed by the Funds in the preparation of their financial statements.
Use of Estimates—The preparation of financial statements in conformity with accounting principles generally accepted in the United States of America (“GAAP”) requires management to make estimates and assumptions that affect the reported amounts of assets and liabilities at the date of the financial statements and the reported amounts of increases and decreases in net assets from operations during the reporting period. Actual results may differ from those estimates.
Investment Valuations—Investments in otheropen-end registered investment companies are valued at net asset value.
Securities or other assets for which market valuations are not readily available, or are deemed to be inaccurate, are valued at fair value as determined in good faith using methods approved by the Board of Directors (the “Directors”). The Directors have established a Pricing Committee, which is responsible for determinations of fair value, subject to the supervision of the Directors. In determining fair value, the Pricing Committee takes into account all information available and any factors it deems appropriate. Consequently, the price of securities used by a Fund to calculate its NAV may differ from quoted or published prices for the same securities. Fair value pricing involves subjective judgments and it is possible that the fair value determined for a security is materially different than the value that would be realized upon the sale of that security and the differences may be material to the NAV of the Fund or the financial statements presented.
In valuing underlying fund investments, the Funds use the NAVs reported by the underlying funds. An underlying fund may need to fair value one or more of its investments, which may, in turn, require a Fund to do the same because of delays in obtaining the underlying fund’s NAV.
Investment Income, Expenses, and Distributions—Investment income and expenses are accrued daily. The Funds distribute net investment income, if any, and net realized gains (net of any capital loss carryovers) annually. Dividend income, realized gain distributions from underlying funds, and distributions to shareholders are recorded on theex-dividend date except in the case of certain foreign securities, for which dividends are recorded as soon after theex-dividend date as the Fund’s information agents become aware of such dividends.Non-cash dividends included in dividend income, if any, are recorded at fair value.Paid-in-kind interest included in interest income, if any, is accrued daily.
The Funds offer multiple classes of shares which differ in their respective distribution, administration, and service fees. All shareholders bear the common expenses of the Funds. Dividends are declared separately for each class. No class has preferential dividend rights; differences in per share dividend rates are generally due to differences in class-specific expenses. Income,non-class specific expenses, and realized and unrealized gains and losses are allocated daily to each class of shares based on the value of total shares outstanding of each class without distinction between share classes. Expenses attributable to a particular class of shares, such as shareholder servicing fees, are allocated directly to that class.
19
| | |
| | |
| Notes to Financial Statements (continued) | | |
Federal Income Taxes—The policies and procedures of the Funds require compliance with Subchapter M of the Internal Revenue Code of 1986, as amended (the “Code”), and distribution to shareholders each year of substantially all of their income. Accordingly, no provisions for federal tax are necessary. Withholding taxes on foreign dividends have been provided for in accordance with the applicable country’s tax rules and rates.
Securities of Other Investment Companies & Underlying Fund Investment Risk—The Funds invest in the securities of other investment companies, including exchange-traded funds, within the limits prescribed by the 1940 Act and the rules promulgated thereunder. Investments in the securities of other investment companies may involve duplication of advisory fees and certain other expenses. By investing in another investment company, a Fund becomes a shareholder of that investment company. As a result, Fund shareholders indirectly will bear the Fund’s proportionate share of the fees and expenses paid by shareholders of the other investment company, in addition to the fees and expenses Fund shareholders directly bear in connection with the Fund’s own operations. The Funds also may invest in investment companies that are not organized under the laws of the United States. The Funds’ risks are directly related to the risks of the underlying funds. It is important to understand the risks associated with investing in the underlying funds.
Commitments and Contingencies—In the normal course of business, the Corporation enters into contracts that provide general indemnifications to other parties. The Corporation’s maximum exposure under these arrangements is unknown as this would involve future claims that may be made against the Corporation that have not yet occurred. However, the Corporation has not had prior claims or losses pursuant to these contracts and expects the risk of loss to be remote.
Other—Investment transactions are accounted for on a trade date basis. Net realized gains and losses on securities are computed on the basis of specific security lot identification.
| 3. | | Fair Value Measurement |
Fair Valuation Measurement defines fair value, establishes a framework for measuring fair value in accordance with GAAP, and requires disclosure about fair value measurements. It establishes a fair value hierarchy that distinguishes between (1) market participant assumptions developed based on market data obtained from sources independent of the reporting issuer (observable inputs), and (2) the reporting issuer’s own assumptions about market participant assumptions developed based on the best information available in the circumstances (unobservable inputs). It also provides guidance on determining when there has been a significant decrease in the volume and level of activity for an asset or liability, when a transaction is not orderly and how that information must be incorporated into fair value measurement.
In August 2018, the FASB issued Accounting Standards Update2018-13,Fair Value Measurement (Topic 820)—Disclosures Framework—Changes to Disclosure Requirements of Fair Value Measurement (“ASU2018-13”) which introduces new fair value disclosure requirements as well as eliminates and modifies certain existing fair value disclosure requirements. ASU2018-13 would be effective for fiscal years beginning after December 15, 2019 and for interim periods within those fiscal years; however, management has elected to early adopt ASU2018-13 effective with the current reporting period as permitted by the standard. The impact of the Funds’ adoption was limited to changes in the Funds’ financial statement disclosures regarding fair value, primarily those disclosures related to transfers between levels of the fair value hierarchy and disclosure of the range and weighted average used to develop significant unobservable inputs for Level 3 fair value measurements, when applicable.
Various inputs are used in determining the value of the Funds’ investments. The inputs or methodology used for valuing securities are not necessarily an indication of the risk associated with investing in those securities. These inputs are summarized in the three broad levels listed below:
Level 1—quoted prices in active markets for identical securities. An active market for the security is a market in which transactions occur with sufficient frequency and volume to provide pricing information on an ongoing basis. Common and preferred stocks, options and futures contracts, and U.S. registered mutual funds are generally categorized as Level 1.
Level 2—other significant observable inputs (including quoted prices for similar securities, interest rates, prepayment speeds, credit risk, etc.). Fixed income securities, repurchase agreements, cash collateral received as part of the securities lending program, and securities valued by an independent fair value pricing service are generally categorized as Level 2.
Level 3—significant unobservable inputs, including management��s own assumptions in determining the fair value of investments.
For the year ended August 31, 2019, the Funds had no investments in private investment funds, and there were no investments excluded from the fair value hierarchy. It is the Funds’ policy to recognize transfers between category levels at the end of the period. For the year ended August 31, 2019, there were no transfers in and out of Level 1, Level 2 , and Level 3. The Funds did not hold any Level 2 or Level 3 securities as of August 31, 2019.
20
The following is a summary of the inputs used, as of August 31, 2019, in valuing the Funds’ assets:
| | | | | | | | | | | | | | | | |
| | | Conservative Allocation Fund | |
| | | Level 1 | | | Level 2 | | | Level 3 | | | Total | |
Mutual Funds | | $ | 37,041,228 | | | $ | — | | | $ | — | | | $ | 37,041,228 | |
Short-Term Investments | | | 290,913 | | | | — | | | | — | | | | 290,913 | |
| | | | | | | | | | | | | | | | |
Total | | $ | 37,332,141 | | | $ | — | | | $ | — | | | $ | 37,332,141 | |
| | | | | | | | | | | | | | | | |
| |
| | | Moderate Allocation Fund | |
| | | Level 1 | | | Level 2 | | | Level 3 | | | Total | |
Mutual Funds | | $ | 71,026,975 | | | $ | — | | | $ | — | | | $ | 71,026,975 | |
Short-Term Investments | | | 696,506 | | | | — | | | | — | | | | 696,506 | |
| | | | | | | | | | | | | | | | |
Total | | $ | 71,723,481 | | | $ | — | | | $ | — | | | $ | 71,723,481 | |
| | | | | | | | | | | | | | | | |
| |
| | | Balanced Allocation Fund | |
| | | Level 1 | | | Level 2 | | | Level 3 | | | Total | |
Mutual Funds | | $ | 270,593,177 | | | $ | — | | | $ | — | | | $ | 270,593,177 | |
Short-Term Investments | | | 2,721,496 | | | | — | | | | — | | | | 2,721,496 | |
| | | | | | | | | | | | | | | | |
Total | | $ | 273,314,673 | | | $ | — | | | $ | — | | | $ | 273,314,673 | |
| | | | | | | | | | | | | | | | |
| | | | | | | | | | | | | | | | |
| | | Growth Allocation Fund | |
| | | Level 1 | | | Level 2 | | | Level 3 | | | Total | |
Mutual Funds | | $ | 112,542,253 | | | $ | — | | | $ | — | | | $ | 112,542,253 | |
Short-Term Investments | | | 1,152,517 | | | | — | | | | — | | | | 1,152,517 | |
| | | | | | | | | | | | | | | | |
Total | | $ | 113,694,770 | | | $ | — | | | $ | — | | | $ | 113,694,770 | |
| | | | | | | | | | | | | | | | |
| |
| | | Aggressive Allocation Fund | |
| | | Level 1 | | | Level 2 | | | Level 3 | | | Total | |
Mutual Funds | | $ | 160,616,117 | | | $ | — | | | $ | — | | | $ | 160,616,117 | |
Short-Term Investments | | | 1,351,802 | | | | — | | | | — | | | | 1,351,802 | |
| | | | | | | | | | | | | | | | |
Total | | $ | 161,967,919 | | | $ | — | | | $ | — | | | $ | 161,967,919 | |
| | | | | | | | | | | | | | | | |
The Articles of Incorporation permit the Directors to issue an indefinite number of full and fractional shares of common stock, par value $0.0001 per share. Transactions in capital stock were as follows:
| | | | | | | | | | | | | | | | |
| | | | | | | |
| | | Conservative
Allocation
Fund | | | Moderate
Allocation
Fund | |
| | | Year Ended
August 31,
2019 | | | Year Ended
August 31,
2018 | | | Year Ended
August 31,
2019 | | | Year Ended
August 31,
2018 | |
Capital stock transactions in dollars: | | | | | | | | | | | | | | | | |
Proceeds from sale of shares: | | | | | | | | | | | | | | | | |
Investor class of shares | | $ | 2,465,164 | | | $ | 936,151 | | | $ | 950,509 | | | $ | 1,088,222 | |
Institutional class of shares | | | 117,705 | | | | 606,867 | | | | 3,116,147 | | | | 1,152,648 | |
Retirement classR-3 of shares | | | 121,181 | | | | 176,946 | | | | 1,154,804 | | | | 3,326,610 | |
Retirement classR-6 of shares | | | 10,129,724 | | | | 7,347,922 | | | | 16,184,913 | | | | 9,308,350 | |
| | | | | | | | | | | | | | | | |
Net proceeds from sale of shares | | | 12,833,774 | | | | 9,067,886 | | | | 21,406,373 | | | | 14,875,830 | |
Net asset value of shares issued to shareholders in payment of distributions declared: | | | | | | | | | | | | | | | | |
Investor class of shares | | | 1,832,308 | | | | 2,226,207 | | | | 498,960 | | | | 507,983 | |
Institutional class of shares | | | 80,131 | | | | 161,066 | | | | 652,822 | | | | 330,580 | |
Retirement classR-3 of shares | | | 138,410 | | | | 129,410 | | | | 807,355 | | | | 835,913 | |
Retirement classR-6 of shares | | | 3,516,104 | | | | 4,482,536 | | | | 6,601,234 | | | | 5,493,805 | |
| | | | | | | | | | | | | | | | |
Net proceeds from shares issued | | | 5,566,953 | | | | 6,999,219 | | | | 8,560,371 | | | | 7,168,281 | |
Cost of shares redeemed: | | | | | | | | | | | | | | | | |
Investor class of shares | | | (5,875,859 | ) | | | (3,340,646 | ) | | | (4,670,009 | ) | | | (2,102,542 | ) |
Institutional class of shares | | | (995,816 | ) | | | (26,007,088 | ) | | | (2,215,134 | ) | | | (5,030,603 | ) |
Retirement classR-3 of shares | | | (478,752 | ) | | | (2,262,492 | ) | | | (2,437,709 | ) | | | (9,541,470 | ) |
Retirement classR-6 of shares | | | (7,260,317 | ) | | | (15,098,332 | ) | | | (23,654,492 | ) | | | (32,401,151 | ) |
| | | | | | | | | | | | | | | | |
Net cost of shares redeemed | | | (14,610,744 | ) | | | (46,708,558 | ) | | | (32,977,344 | ) | | | (49,075,766 | ) |
| | | | | | | | | | | | | | | | |
Net change resulting from fund share transactions in dollars | | $ | 3,789,983 | | | $ | (30,641,453 | ) | | $ | (3,010,600 | ) | | $ | (27,031,655 | ) |
| | | | | | | | | | | | | | | | |
| | | | |
Capital stock transactions in shares: | | | | | | | | | | | | | | | | |
Sale of shares: | | | | | | | | | | | | | | | | |
Investor class of shares | | | 324,199 | | | | 104,749 | | | | 105,457 | | | | 109,748 | |
Institutional class of shares | | | 15,097 | | | | 62,126 | | | | 335,532 | | | | 117,831 | |
Retirement classR-3 of shares | | | 15,349 | | | | 18,976 | | | | 125,926 | | | | 336,495 | |
Retirement classR-6 of shares | | | 1,296,852 | | | | 812,723 | | | | 1,750,383 | | | | 940,146 | |
| | | | | | | | | | | | | | | | |
Net sale of shares | | | 1,651,497 | | | | 998,574 | | | | 2,317,298 | | | | 1,504,220 | |
Shares issued to shareholders in payment of distributions declared: | | | | | | | | | | | | | | | | |
Investor class of shares | | | 260,642 | | | | 257,663 | | | | 60,701 | | | | 52,154 | |
Institutional class of shares | | | 10,947 | | | | 18,077 | | | | 79,419 | | | | 33,940 | |
Retirement classR-3 of shares | | | 19,250 | | | | 14,672 | | | | 97,980 | | | | 85,735 | |
Retirement classR-6 of shares | | | 498,738 | | | | 520,016 | | | | 803,070 | | | | 565,206 | |
| | | | | | | | | | | | | | | | |
Net shares issued | | | 789,577 | | | | 810,428 | | | | 1,041,170 | | | | 737,035 | |
Shares redeemed: | | | | | | | | | | | | | | | | |
Investor class of shares | | | (765,774 | ) | | | (368,501 | ) | | | (502,486 | ) | | | (215,417 | ) |
Institutional class of shares | | | (113,856 | ) | | | (2,563,855 | ) | | | (243,374 | ) | | | (488,867 | ) |
Retirement classR-3 of shares | | | (62,442 | ) | | | (226,512 | ) | | | (277,395 | ) | | | (967,835 | ) |
Retirement classR-6 of shares | | | (942,390 | ) | | | (1,710,933 | ) | | | (2,750,279 | ) | | | (3,332,428 | ) |
| | | | | | | | | | | | | | | | |
Net shares redeemed | | | (1,884,462 | ) | | | (4,869,801 | ) | | | (3,773,534 | ) | | | (5,004,547 | ) |
| | | | | | | | | | | | | | | | |
Net change resulting from fund share transactions in shares | | | 556,612 | | | | (3,060,799 | ) | | | (415,066 | ) | | | (2,763,292 | ) |
| | | | | | | | | | | | | | | | |
21
| | |
| | |
| Notes to Financial Statements (continued) | | |
| | | | | | | | | | | | | | | | | | | | | | | | |
| | | | | | | | | | |
| | | Balanced
Allocation
Fund | | | Growth
Allocation
Fund | | | Aggressive
Allocation
Fund | |
| | | Year Ended
August 31,
2019 | | | Year Ended
August 31,
2018 | | | Year Ended
August 31,
2019 | | | Year Ended
August 31,
2018 | | | Year Ended
August 31,
2019 | | | Year Ended
August 31,
2018 | |
Capital stock transactions in dollars: | | | | | | | | | | | | | | | | | | | | | | | | |
Proceeds from sale of shares: | | | | | | | | | | | | | | | | | | | | | | | | |
Investor class of shares | | $ | 6,856,544 | | | $ | 9,428,384 | | | $ | 1,098,046 | | | $ | 965,898 | | | $ | 2,496,835 | | | $ | 1,903,201 | |
Institutional class of shares | | | 15,613,631 | | | | 11,240,431 | | | | 7,043,334 | | | | 3,238,898 | | | | 1,002,999 | | | | 3,038,729 | |
Retirement classR-3 of shares | | | 933,516 | | | | 1,792,133 | | | | 1,187,845 | | | | 1,655,777 | | | | 1,551,068 | | | | 1,954,612 | |
Retirement classR-6 of shares | | | 30,809,534 | | | | 24,771,951 | | | | 17,121,160 | | | | 17,810,271 | | | | 21,709,479 | | | | 17,601,066 | |
| | | | | | | | | | | | | | | | | | | | | | | | |
Net proceeds from sale of shares | | | 54,213,225 | | | | 47,232,899 | | | | 26,450,385 | | | | 23,670,844 | | | | 26,760,381 | | | | 24,497,608 | |
Net asset value of shares issued to shareholders in payment of distributions declared: | | | | | | | | | | | | | | | | | | | | | | | | |
Investor class of shares | | | 8,958,651 | | | | 9,900,919 | | | | 690,675 | | | | 1,164,273 | | | | 3,107,692 | | | | 4,758,561 | |
Institutional class of shares | | | 3,335,219 | | | | 4,372,016 | | | | 1,735,406 | | | | 650,895 | | | | 1,541,575 | | | | 1,722,650 | |
Retirement classR-3 of shares | | | 1,767,800 | | | | 2,022,307 | | | | 976,684 | | | | 1,259,889 | | | | 1,805,967 | | | | 2,052,160 | |
Retirement classR-6 of shares | | | 17,482,927 | | | | 20,648,922 | | | | 8,566,608 | | | | 6,735,393 | | | | 13,423,510 | | | | 14,467,294 | |
| | | | | | | | | | | | | | | | | | | | | | | | |
Net proceeds from shares issued | | | 31,544,597 | | | | 36,944,164 | | | | 11,969,373 | | | | 9,810,450 | | | | 19,878,744 | | | | 23,000,665 | |
Cost of shares redeemed: | | | | | | | | | | | | | | | | | | | | | | | | |
Investor class of shares | | | (43,512,389 | ) | | | (20,253,986 | ) | | | (8,973,691 | ) | | | (5,530,492 | ) | | | (12,956,666 | ) | | | (9,554,575 | ) |
Institutional class of shares | | | (26,307,153 | ) | | | (20,375,381 | ) | | | (4,945,775 | ) | | | (1,712,928 | ) | | | (4,555,850 | ) | | | (3,837,651 | ) |
Retirement classR-3 of shares | | | (6,503,889 | ) | | | (7,869,477 | ) | | | (7,834,425 | ) | | | (7,318,054 | ) | | | (2,002,966 | ) | | | (4,375,465 | ) |
Retirement classR-6 of shares | | | (53,453,428 | ) | | | (53,440,445 | ) | | | (12,599,323 | ) | | | (29,402,393 | ) | | | (21,302,598 | ) | | | (26,560,647 | ) |
| | | | | | | | | | | | | | | | | | | | | | | | |
Net cost of shares redeemed | | | (129,776,859 | ) | | | (101,939,289 | ) | | | (34,353,214 | ) | | | (43,963,867 | ) | | | (40,818,080 | ) | | | (44,328,338 | ) |
| | | | | | | | | | | | | | | | | | | | | | | | |
Net change resulting from fund share transactions in dollars | | $ | (44,019,037 | ) | | $ | (17,762,226 | ) | | $ | 4,066,544 | | | $ | (10,482,573 | ) | | $ | 5,821,045 | | | $ | 3,169,935 | |
| | | | | | | | | | | | | | | | | | | | | | | | |
| | | | | | |
Capital stock transactions in shares: | | | | | | | | | | | | | | | | | | | | | | | | |
Sale of shares: | | | | | | | | | | | | | | | | | | | | | | | | |
Investor class of shares | | | 817,103 | | | | 1,008,765 | | | | 116,942 | | | | 93,446 | | | | 300,242 | | | | 191,793 | |
Institutional class of shares | | | 1,817,532 | | | | 1,208,350 | | | | 676,329 | | | | 306,230 | | | | 118,215 | | | | 309,899 | |
Retirement classR-3 of shares | | | 109,123 | | | | 191,386 | | | | 126,403 | | | | 159,360 | | | | 179,397 | | | | 199,277 | |
Retirement classR-6 of shares | | | 3,504,426 | | | | 2,638,289 | | | | 1,785,288 | | | | 1,722,411 | | | | 2,442,138 | | | | 1,787,826 | |
| | | | | | | | | | | | | | | | | | | | | | | | |
Net sale of shares | | | 6,248,184 | | | | 5,046,790 | | | | 2,704,962 | | | | 2,281,447 | | | | 3,039,992 | | | | 2,488,795 | |
Shares issued to shareholders in payment of distributions declared: | | | | | | | | | | | | | | | | | | | | | | | | |
Investor class of shares | | | 1,185,007 | | | | 1,085,627 | | | | 84,023 | | | | 114,933 | | | | 418,826 | | | | 502,497 | |
Institutional class of shares | | | 441,166 | | | | 479,388 | | | | 211,635 | | | | 64,381 | | | | 208,040 | | | | 182,099 | |
Retirement classR-3 of shares | | | 233,219 | | | | 221,259 | | | | 118,530 | | | | 124,249 | | | | 243,720 | | | | 216,701 | |
Retirement classR-6 of shares | | | 2,312,557 | | | | 2,266,621 | | | | 1,043,437 | | | | 666,211 | | | | 1,811,540 | | | | 1,530,931 | |
| | | | | | | | | | | | | | | | | | | | | | | | |
Net shares issued | | | 4,171,949 | | | | 4,052,895 | | | | 1,457,625 | | | | 969,774 | | | | 2,682,126 | | | | 2,432,228 | |
Shares redeemed: | | | | | | | | | | | | | | | | | | | | | | | | |
Investor class of shares | | | (5,090,096 | ) | | | (2,149,362 | ) | | | (882,257 | ) | | | (535,059 | ) | | | (1,422,575 | ) | | | (970,523 | ) |
Institutional class of shares | | | (2,932,262 | ) | | | (2,104,543 | ) | | | (532,221 | ) | | | (166,362 | ) | | | (493,342 | ) | | | (374,598 | ) |
Retirement classR-3 of shares | | | (780,552 | ) | | | (823,864 | ) | | | (792,576 | ) | | | (699,180 | ) | | | (229,147 | ) | | | (438,117 | ) |
Retirement classR-6 of shares | | | (6,163,445 | ) | | | (5,793,032 | ) | | | (1,340,347 | ) | | | (2,873,684 | ) | | | (2,502,659 | ) | | | (2,717,654 | ) |
| | | | | | | | | | | | | | | | | | | | | | | | |
Net shares redeemed | | | (14,966,355 | ) | | | (10,870,801 | ) | | | (3,547,401 | ) | | | (4,274,285 | ) | | | (4,647,723 | ) | | | (4,500,892 | ) |
| | | | | | | | | | | | | | | | | | | | | | | | |
Net change resulting from fund share transactions in shares | | | (4,546,222 | ) | | | (1,771,116 | ) | | | 615,186 | | | | (1,023,064 | ) | | | 1,074,395 | | | | 420,131 | |
| | | | | | | | | | | | | | | | | | | | | | | | |
22
| 5. | | Investment Adviser Fee and Other Transactions with Affiliates |
General—Certain of the Officers and Directors of the Corporation are also Officers and Directors/Trustees of one or more portfolios within the Fund complex, which are affiliates of the Corporation. None of the Fund Officers or interested Directors receives any compensation from the funds. Certain Officers and Directors are also Officers of the Adviser.
Investment Advisory Fees—The Adviser does not receive an investment advisory fee for the services it performs for the Funds. However, the Adviser is entitled to receive an investment advisory fee from each of the BMO Funds that serve as underlying funds.
Contractual Expense Limitation—The Adviser has contractually agreed to waive or reduce fees and reimburse expenses to the extent necessary to prevent class total annual operating expenses (excluding acquired fund fees and expenses, interest, taxes, brokerage commissions, other investment-related costs and extraordinary expenses, such as litigation and other expenses not incurred in the ordinary course of a Fund’s business) from exceeding the levels set out in the table below through December 31, 2020. This agreement may not be terminated prior to December 31, 2020 without the consent of the Funds’ Board of Directors, unless terminated due to the termination of the investment advisory agreement. Additionally, the agreement does not provide for recoupment by the Adviser of waived fees or reimbursed expenses.
| | | | | | | | | | | | | | | | | | | | | | | | | | | | | | | | |
| | | Annualized Contractual Expense Limitation
Exclusive of Acquired Fund Fees and Expenses | | | Annualized Contractual Expense Limitation
Inclusive of Acquired Fund Fees and Expenses per
the Funds’ Prospectus Dated December 28, 2018 | |
Fund | | Investor
Class | | | Institutional
Class | | | Retirement
ClassR-3 | | | Retirement
Class R-6(1) | | | Investor
Class | | | Institutional
Class | | | Retirement
ClassR-3 | | | Retirement
Class R-6(1) | |
Conservative Allocation Fund | | | 0.33 | % | | | 0.08 | % | | | 0.58 | % | | | (0.07 | )% | | | 0.88 | % | | | 0.63 | % | | | 1.13 | % | | | 0.48 | % |
Moderate Allocation Fund | | | 0.30 | | | | 0.05 | | | | 0.55 | | | | (0.10 | ) | | | 0.88 | | | | 0.63 | | | | 1.13 | | | | 0.48 | |
Balanced Allocation Fund | | | 0.33 | | | | 0.08 | | | | 0.58 | | | | (0.07 | ) | | | 0.94 | | | | 0.69 | | | | 1.19 | | | | 0.54 | |
Growth Allocation Fund | | | 0.30 | | | | 0.05 | | | | 0.55 | | | | (0.10 | ) | | | 0.94 | | | | 0.69 | | | | 1.19 | | | | 0.54 | |
Aggressive Allocation Fund | | | 0.33 | | | | 0.08 | | | | 0.58 | | | | (0.07 | ) | | | 0.93 | | | | 0.68 | | | | 1.18 | | | | 0.53 | |
| | (1) | As a result of reimbursing expenses including acquired fund expenses, the Adviser reimbursed amounts in excess of the respective share classes operating expenses. The aggregate excess reimbursement is accounted for as “Excess expense reimbursement from investment adviser” included in investment income on the Statements of Operations |
Shareholder Servicing Fees—Under the terms of a Shareholder Services Agreement with the Adviser, each Fund pays the Adviser at the annual rate of 0.25% of average daily net assets of the Fund’s Investor Class shares for the period. The fee paid to the Adviser is used to finance certain services for shareholders and to maintain shareholder accounts.
Distribution Services Fees—The Funds are subject to a Distribution Plan (the “Plan”) pursuant to Rule12b-1 under the Act. The Plan authorizes payments by the Fund to finance activities intended to result in the sale of its RetirementClass R-3 shares. The Plan provides that the Fund may incur distribution expenses of 0.50% of the average daily net assets of the Fund’s RetirementClass R-3 shares.
Administration Fees—Each Fund pays the Adviser at the annual rate of 0.15% of average daily net assets per class (except the Retirement classR-6, which does not pay an Administration Fee).
For the year ended August 31, 2019, the Funds were charged the following Administration Fees per class:
| | | | | | | | | | | | |
Fund | | Investor
Class | | | Institutional
Class | | | Retirement
Class R-3 | |
Conservative Allocation Fund | | $ | 17,823 | | | $ | 943 | | | $ | 1,273 | |
Moderate Allocation Fund | | | 7,237 | | | | 9,637 | | | | 11,069 | |
Balanced Allocation Fund | | | 129,735 | | | | 55,340 | | | | 24,723 | |
Growth Allocation Fund | | | 11,194 | | | | 22,209 | | | | 14,083 | |
Aggressive Allocation Fund | | | 39,971 | | | | 19,838 | | | | 23,917 | |
Custodian Fees—BMO Harris Bank N.A. (“BMO Harris”) is the Funds’ custodian. BMO Harris receives fees based on 0.0050% on the first $10 billion average daily net assets, based on the collective net assets of the Corporation custodied by BMO Harris, and 0.0025% on all assets in excess of $10 billion.
23
| | |
| | |
| Notes to Financial Statements (continued) | | |
Investments in Affiliated Issuers—An affiliated issuer is an entity in which the Fund has ownership of at least 5% of the voting securities or any investment in the BMO Funds. Issuers that are affiliates of the Fund atperiod-end are noted in the Fund’s Schedule of Investments. Additional security purchases and the reduction of certain securities shares outstanding of existing portfolio holdings that were not considered affiliated in prior years may result in the Funds owning in excess of 5% of the outstanding shares atperiod-end. The table below reflects transactions during the period with entities that are affiliates as of August 31, 2019. Please refer to the Schedule of Investments for which class each Fund’s underlying affiliated issuer represents.
| | | | | | | | | | | | | | | | | | | | | | | | | | | | | | | | |
Fund/Security Description | | Value,
Beginning
of Period | | | Purchases | | | Sales
Proceeds | | | Change In
Unrealized
Appreciation
(Depreciation) | | | Net
Realized
Gain(Loss) | | | Value, End
of Period | | | Dividends
Credited
to
Income | | | Net Realized
Gain on
Capital Gain
Distributions | |
Conservative Allocation Fund | | | | | | | | | | | | | | | | | | | | | | | | | | | | | | | | |
Large-Cap Funds — 6.3% | | | | | | | | | | | | | | | | | | | | | | | | | | | | | | | | |
BMO Low Volatility Equity Fund | | $ | 502,366 | | | $ | 205,976 | | | $ | 241,804 | | | $ | (7,749 | ) | | $ | 16,420 | | | $ | 475,209 | | | $ | 8,259 | | | $ | 40,635 | |
BMO Dividend Income Fund | | | 272,453 | | | | 173,203 | | | | 129,939 | | | | (25,280 | ) | | | 2,102 | | | | 292,539 | | | | 6,371 | | | | 10,040 | |
BMOLarge-Cap Value Fund | | | 939,524 | | | | 608,195 | | | | 520,010 | | | | (161,009 | ) | | | 5,927 | | | | 872,627 | | | | 18,977 | | | | 79,256 | |
BMOLarge-Cap Growth Fund | | | 759,172 | | | | 716,235 | | | | 615,292 | | | | (97,064 | ) | | | (19,316 | ) | | | 743,735 | | | | 6,423 | | | | 112,527 | |
| | | | | | | | | | | | | | | | | | | | | | | | | | | | | | | | |
| | | | | | | | | | | | | | | | | | | | | | | 2,384,110 | | | | | | | | | |
Mid-Cap Funds — 0.8% | | | | | | | | | | | | | | | | | | | | | | | | | | | | | | | | |
BMOMid-Cap Growth Fund | | | 187,974 | | | | 119,292 | | | | 136,244 | | | | (42,694 | ) | | | 9,204 | | | | 137,532 | | | | — | | | | 30,298 | |
BMOMid-Cap Value Fund | | | 186,532 | | | | 107,648 | | | | 117,950 | | | | (43,770 | ) | | | 6,341 | | | | 138,801 | | | | 2,431 | | | | 20,163 | |
| | | | | | | | | | | | | | | | | | | | | | | | | | | | | | | | |
| | | | | | | | | | | | | | | | | | | | | | | 276,333 | | | | | | | | | |
Small-Cap Funds — 0.8% | | | | | | | | | | | | | | | | | | | | | | | | | | | | | | | | |
BMOSmall-Cap Growth Fund | | | 273,366 | | | | 229,899 | | | | 220,958 | | | | (60,312 | ) | | | (12,952 | ) | | | 209,043 | | | | — | | | | 35,928 | |
BMOSmall-Cap Value Fund | | | 179,494 | | | | 124,601 | | | | 148,723 | | | | (24,340 | ) | | | (11,462 | ) | | | 119,570 | | | | 1,200 | | | | 12,132 | |
| | | | | | | | | | | | | | | | | | | | | | | | | | | | | | | | |
| | | | | | | | | | | | | | | | | | | | | | | 328,613 | | | | | | | | | |
International Funds — 2.6% | | | | | | | | | | | | | | | | | | | | | | | | | | | | | | | | |
BMO LGM Emerging Markets Equity Fund | | | 370,501 | | | | 272,636 | | | | 372,386 | | | | (52,499 | ) | | | 15,969 | | | | 234,221 | | | | 2,750 | | | | 7,262 | |
BMO Pyrford International Stock Fund | | | 463,225 | | | | 164,805 | | | | 255,359 | | | | (32,936 | ) | | | 24,398 | | | | 364,133 | | | | 12,835 | | | | — | |
BMO Disciplined International Equity Fund | | | 434,906 | | | | 249,489 | | | | 254,246 | | | | (34,921 | ) | | | 2,331 | | | | 397,559 | | | | 8,609 | | | | — | |
| | | | | | | | | | | | | | | | | | | | | | | | | | | | | | | | |
| | | | | | | | | | | | | | | | | | | | | | | 995,913 | | | | | | | | | |
Fixed Income Funds — 20.2% | | | | | | | | | | | | | | | | | | | | | | | | | | | | | | | | |
BMO TCH Core Plus Bond Fund | | | 9,213,483 | | | | 2,556,332 | | | | 4,516,573 | | | | 92,451 | | | | 300,150 | | | | 7,645,843 | | | | 291,892 | | | | — | |
| | | | | | | | |
Alternative Funds — 10.4% | | | | | | | | | | | | | | | | | | | | | | | | | | | | | | | | |
BMO Alternative Strategies Fund | | | 3,899,071 | | | | 1,314,260 | | | | 1,095,001 | | | | (124,522 | ) | | | (71,709 | ) | | | 3,922,099 | | | | — | | | | — | |
| | | | | | | | |
Short-Term Investment — 0.8% | | | | | | | | | | | | | | | | | | | | | | | | | | | | | | | | |
BMO Institutional Prime Money Market Fund | | | 355,561 | | | | 14,734,095 | | | | 14,798,869 | | | | 37 | | | | 89 | | | | 290,913 | | | | 23,633 | | | | — | |
| | | | | | | | | | | | | | | | | | | | | | | | | | | | | | | | |
Totals | | $ | 18,037,628 | | | $ | 21,576,666 | | | $ | 23,423,354 | | | $ | (614,608 | ) | | $ | 267,492 | | | $ | 15,843,824 | | | $ | 383,380 | | | $ | 348,241 | |
| | | | | | | | | | | | | | | | | | | | | | | | | | | | | | | | |
24
| | | | | | | | | | | | | | | | | | | | | | | | | | | | | | | | |
Fund/Security Description | | Value,
Beginning
of Period | | | Purchases | | | Sales
Proceeds | | | Change In
Unrealized
Appreciation
(Depreciation) | | | Net
Realized
Gain(Loss) | | | Value, End
of Period | | | Dividends
Credited
to
Income | | | Net Realized
Gain on
Capital Gain
Distributions | |
Moderate Allocation Fund | | | | | | | | | | | | | | | | | | | | | | | | | | | | | | | | |
Large-Cap Funds — 12.3% | | | | | | | | | | | | | | | | | | | | | | | | | | | | | | | | |
BMO Low Volatility Equity Fund | | $ | 2,032,002 | | | $ | 886,771 | | | $ | 1,125,255 | | | $ | (77,201 | ) | | $ | 46,375 | | | $ | 1,762,692 | | | $ | 32,641 | | | $ | 177,035 | |
BMO Dividend Income Fund | | | 1,106,088 | | | | 577,717 | | | | 474,097 | | | | (131,030 | ) | | | 7,250 | | | | 1,085,928 | | | | 24,809 | | | | 44,282 | |
BMOLarge-Cap Value Fund | | | 3,809,217 | | | | 2,537,107 | | | | 2,352,090 | | | | (622,101 | ) | | | (123,227 | ) | | | 3,248,906 | | | | 75,036 | | | | 348,347 | |
BMOLarge-Cap Growth Fund | | | 3,099,756 | | | | 3,260,641 | | | | 2,936,112 | | | | (436,136 | ) | | | (212,894 | ) | | | 2,775,255 | | | | 29,063 | | | | 509,192 | |
| | | | | | | | | | | | | | | | | | | | | | | | | | | | | | | | |
| | | | | | | | | | | | | | | | | | | | | | | 8,872,781 | | | | | | | | | |
Mid-Cap Funds — 1.4% | | | | | | | | | | | | | | | | | | | | | | | | | | | | | | | | |
BMOMid-Cap Growth Fund | | | 781,319 | | | | 545,283 | | | | 628,424 | | | | (195,565 | ) | | | 11,090 | | | | 513,703 | | | | — | | | | 138,567 | |
BMOMid-Cap Value Fund | | | 760,158 | | | | 438,020 | | | | 497,777 | | | | (185,536 | ) | | | 1,638 | | | | 516,503 | | | | 10,789 | | | | 89,479 | |
| | | | | | | | | | | | | | | | | | | | | | | | | | | | | | | | |
| | | | | | | | | | | | | | | | | | | | | | | 1,030,206 | | | | | | | | | |
Small-Cap Funds — 1.7% | | | | | | | | | | | | | | | | | | | | | | | | | | | | | | | | |
BMOSmall-Cap Growth Fund | | | 1,126,518 | | | | 921,840 | | | | 899,021 | | | | (266,595 | ) | | | (91,192 | ) | | | 791,550 | | | | — | | | | 161,720 | |
BMOSmall-Cap Value Fund | | | 737,511 | | | | 434,842 | | | | 553,641 | | | | (94,319 | ) | | | (81,581 | ) | | | 442,812 | | | | 5,295 | | | | 53,511 | |
| | | | | | | | | | | | | | | | | | | | | | | | | | | | | | | | |
| | | | | | | | | | | | | | | | | | | | | | | 1,234,362 | | | | | | | | | |
International Funds — 5.1% | | | | | | | | | | | | | | | | | | | | | | | | | | | | | | | | |
BMO LGM Emerging Markets Equity Fund | | | 1,529,751 | | | | 963,493 | | | | 1,472,481 | | | | (216,604 | ) | | | 57,155 | | | | 861,314 | | | | 11,921 | | | | 31,675 | |
BMO Pyrford International Stock Fund | | �� | 1,891,995 | | | | 577,674 | | | | 1,045,286 | | | | (163,631 | ) | | | 88,201 | | | | 1,348,953 | | | | 55,718 | | | | — | |
BMO Disciplined International Equity Fund | | | 1,773,218 | | | | 890,762 | | | | 1,023,053 | | | | (139,730 | ) | | | (30,923 | ) | | | 1,470,274 | | | | 37,330 | | | | — | |
| | | | | | | | | | | | | | | | | | | | | | | | | | | | | | | | |
| | | | | | | | | | | | | | | | | | | | | | | 3,680,541 | | | | | | | | | |
Fixed Income Funds — 14.9% | | | | | | | | | | | | | | | | | | | | | | | | | | | | | | | | |
BMO TCH Core Plus Bond Fund | | | 14,497,972 | | | | 4,170,163 | | | | 8,450,354 | | | | 298,276 | | | | 170,870 | | | | 10,686,927 | | | | 423,198 | | | | — | |
| | | | | | | | |
Alternative Funds — 8.4% | | | | | | | | | | | | | | | | | | | | | | | | | | | | | | | | |
BMO Alternative Strategies Fund | | | 6,790,183 | | | | 1,745,698 | | | | 2,167,469 | | | | (213,590 | ) | | | (148,192 | ) | | | 6,006,630 | | | | — | | | | — | |
| | | | | | | | |
Short-Term Investment — 1.0% | | | | | | | | | | | | | | | | | | | | | | | | | | | | | | | | |
BMO Institutional Prime Money Market Fund | | | 775,889 | | | | 23,602,734 | | | | 23,682,250 | | | | (7 | ) | | | 140 | | | | 696,506 | | | | 43,207 | | | | — | |
| | | | | | | | | | | | | | | | | | | | | | | | | | | | | | | | |
Totals | | $ | 40,711,577 | | | $ | 41,552,745 | | | $ | 47,307,310 | | | $ | (2,443,769 | ) | | $ | (305,290 | ) | | $ | 32,207,953 | | | $ | 749,007 | | | $ | 1,553,808 | |
| | | | | | | | | | | | | | | | | | | | | | | | | | | | | | | | |
25
| | |
| | |
| Notes to Financial Statements (continued) | | |
| | | | | | | | | | | | | | | | | | | | | | | | | | | | | | | | |
Fund/Security Description | | Value,
Beginning
of Period | | | Purchases | | | Sales
Proceeds | | | Change In
Unrealized
Appreciation
(Depreciation) | | | Net
Realized
Gain(Loss) | | | Value, End
of Period | | | Dividends
Credited
to
Income | | | Net Realized
Gain on
Capital Gain
Distributions | |
Balanced Allocation Fund | | | | | | | | | | | | | | | | | | | | | | | | | | | | | | | | |
Large-Cap Funds — 18.1% | | | | | | | | | | | | | | | | | | | | | | | | | | | | | | | | |
BMO Low Volatility Equity Fund | | $ | 12,453,938 | | | $ | 3,388,237 | | | $ | 6,151,367 | | | $ | (758,469 | ) | | $ | 907,919 | | | $ | 9,840,258 | | | $ | 194,469 | | | $ | 959,334 | |
BMO Dividend Income Fund | | | 6,738,334 | | | | 2,706,111 | | | | 2,814,994 | | | | (719,941 | ) | | | 141,450 | | | | 6,050,960 | | | | 147,622 | | | | 236,735 | |
BMOLarge-Cap Value Fund | | | 23,327,787 | | | | 10,803,939 | | | | 12,272,556 | | | | (3,793,331 | ) | | | 77,874 | | | | 18,143,713 | | | | 441,763 | | | | 1,872,055 | |
BMOLarge-Cap Growth Fund | | | 18,934,980 | | | | 15,917,899 | | | | 16,471,799 | | | | (2,826,265 | ) | | | (41,302 | ) | | | 15,513,513 | | | | 151,508 | | | | 2,654,452 | |
| | | | | | | | | | | | | | | | | | | | | | | | | | | | | | | | |
| | | | | | | | | | | | | | | | | | | | | | | 49,548,444 | | | | | | | | | |
Mid-Cap Funds — 2.2% | | | | | | | | | | | | | | | | | | | | | | | | | | | | | | | | |
BMOMid-Cap Growth Fund | | | 4,740,219 | | | | 2,546,267 | | | | 3,546,227 | | | | (1,290,248 | ) | | | 436,222 | | | | 2,886,233 | | | | — | | | | 716,265 | |
BMOMid-Cap Value Fund | | | 4,653,183 | | | | 1,904,699 | | | | 2,724,677 | | | | (1,188,613 | ) | | | 257,379 | | | | 2,901,971 | | | | 57,516 | | | | 476,997 | |
| | | | | | | | | | | | | | | | | | | | | | | | | | | | | | | | |
| | | | | | | | | | | | | | | | | | | | | | | 5,788,204 | | | | | | | | | |
Small-Cap Funds — 2.5% | | | | | | | | | | | | | | | | | | | | | | | | | | | | | | | | |
BMOSmall-Cap Growth Fund | | | 6,798,574 | | | | 4,664,745 | | | | 5,234,313 | | | | (1,557,328 | ) | | | (257,410 | ) | | | 4,414,268 | | | | — | | | | 849,909 | |
BMOSmall-Cap Value Fund | | | 4,471,911 | | | | 2,182,956 | | | | 3,280,892 | | | | (527,644 | ) | | | (364,223 | ) | | | 2,482,108 | | | | 28,510 | | | | 288,111 | |
| | | | | | | | | | | | | | | | | | | | | | | | | | | | | | | | |
| | | | | | | | | | | | | | | | | | | | | | | 6,896,376 | | | | | | | | | |
International Funds — 7.5% | | | | | | | | | | | | | | | | | | | | | | | | | | | | | | | | |
BMO LGM Emerging Markets Equity Fund | | | 9,217,067 | | | | 4,955,114 | | | | 8,493,956 | | | | (913,416 | ) | | | 47,435 | | | | 4,812,244 | | | | 64,678 | | | | 171,614 | |
BMO Pyrford International Stock Fund | | | 11,571,062 | | | | 1,951,553 | | | | 5,749,195 | | | | (1,028,717 | ) | | | 792,001 | | | | 7,536,704 | | | | 304,398 | | | | — | |
BMO Disciplined International Equity Fund | | | 10,878,121 | | | | 3,496,886 | | | | 5,350,295 | | | | (837,432 | ) | | | 27,254 | | | | 8,214,534 | | | | 203,386 | | | | — | |
| | | | | | | | | | | | | | | | | | | | | | | | | | | | | | | | |
| | | | | | | | | | | | | | | | | | | | | | | 20,563,482 | | | | | | | | | |
Fixed Income Funds — 8.7% | | | | | | | | | | | | | | | | | | | | | | | | | | | | | | | | |
BMO TCH Core Plus Bond Fund | | | 37,665,037 | | | | 10,308,060 | | | | 25,426,029 | | | | 504,043 | | | | 784,810 | | | | 23,835,921 | | | | 1,081,449 | | | | — | |
| | | | | | | | |
Alternative Funds — 6.9% | | | | | | | | | | | | | | | | | | | | | | | | | | | | | | | | |
BMO Alternative Strategies Fund | | | 23,958,550 | | | | 5,529,509 | | | | 9,325,113 | | | | (505,067 | ) | | | (640,745 | ) | | | 19,017,134 | | | | — | | | | — | |
| | | | | | | | |
Short-Term Investment — 1.0% | | | | | | | | | | | | | | | | | | | | | | | | | | | | | | | | |
BMO Institutional Prime Money Market Fund | | | 3,049,731 | | | | 66,870,359 | | | | 67,197,694 | | | | (20 | ) | | | (880 | ) | | | 2,721,496 | | | | 182,432 | | | | — | |
| | | | | | | | | | | | | | | | | | | | | | | | | | | | | | | | |
Totals | | $ | 178,458,494 | | | $ | 137,226,334 | | | $ | 174,039,107 | | | $ | (15,442,448 | ) | | $ | 2,167,784 | | | $ | 128,371,057 | | | $ | 2,857,731 | | | $ | 8,225,472 | |
| | | | | | | | | | | | | | | | | | | | | | | | | | | | | | | | |
26
| | | | | | | | | | | | | | | | | | | | | | | | | | | | | | | | |
Fund/Security Description | | Value,
Beginning
of Period | | | Purchases | | | Sales
Proceeds | | | Change In
Unrealized
Appreciation
(Depreciation) | | | Net
Realized
Gain(Loss) | | | Value, End
of Period | | | Dividends
Credited
to
Income | | | Net Realized
Gain on
Capital Gain
Distributions | |
Growth Allocation Fund | | | | | | | | | | | | | | | | | | | | | | | | | | | | | | | | |
Large-Cap Funds — 24.0% | | | | | | | | | | | | | | | | | | | | | | | | | | | | | | | | |
BMO Low Volatility Equity Fund | | $ | 5,855,374 | | | $ | 1,237,242 | | | $ | 1,753,203 | | | $ | (11,686 | ) | | $ | 91,044 | | | $ | 5,418,771 | | | $ | 95,006 | | | $ | 473,379 | |
BMO Dividend Income Fund | | | 3,172,832 | | | | 1,015,735 | | | | 577,187 | | | | (309,015 | ) | | | 28,456 | | | | 3,330,821 | | | | 72,815 | | | | 117,389 | |
BMOLarge-Cap Value Fund | | | 10,921,715 | | | | 3,718,066 | | | | 2,806,585 | | | | (1,831,344 | ) | | | (14,581 | ) | | | 9,987,271 | | | | 218,388 | | | | 926,539 | |
BMOLarge-Cap Growth Fund | | | 8,812,911 | | | | 5,170,251 | | | | 4,013,984 | | | | (1,124,006 | ) | | | (304,900 | ) | | | 8,540,272 | | | | 75,772 | | | | 1,327,538 | |
| | | | | | | | | | | | | | | | | | | | | | | | | | | | | | | | |
| | | | | | | | | | | | | | | | | | | | | | | 27,277,135 | | | | | | | | | |
Mid-Cap Funds — 2.8% | | | | | | | | | | | | | | | | | | | | | | | | | | | | | | | | |
BMOMid-Cap Growth Fund | | | 2,202,922 | | | | 829,780 | | | | 1,038,778 | | | | (495,887 | ) | | | 86,613 | | | | 1,584,650 | | | | — | | | | 359,314 | |
BMOMid-Cap Value Fund | | | 2,186,018 | | | | 654,050 | | | | 799,253 | | | | (489,258 | ) | | | 41,730 | | | | 1,593,287 | | | | 28,561 | | | | 236,869 | |
| | | | | | | | | | | | | | | | | | | | | | | | | | | | | | | | |
| | | | | | | | | | | | | | | | | | | | | | | 3,177,937 | | | | | | | | | |
Small-Cap Funds — 3.3% | | | | | | | | | | | | | | | | | | | | | | | | | | | | | | | | |
BMOSmall-Cap Growth Fund | | | 3,184,146 | | | | 1,754,421 | | | | 1,652,261 | | | | (708,279 | ) | | | (152,339 | ) | | | 2,425,688 | | | | — | | | | 424,225 | |
BMOSmall-Cap Value Fund | | | 2,108,363 | | | | 900,025 | | | | 1,210,857 | | | | (273,481 | ) | | | (151,516 | ) | | | 1,372,534 | | | | 14,147 | | | | 142,963 | |
| | | | | | | | | | | | | | | | | | | | | | | | | | | | | | | | |
| | | | | | | | | | | | | | | | | | | | | | | 3,798,222 | | | | | | | | | |
International Funds — 10.0% | | | | | | | | | | | | | | | | | | | | | | | | | | | | | | | | |
BMO LGM Emerging Markets Equity Fund | | | 4,339,273 | | | | 2,432,259 | | | | 3,668,611 | | | | (425,731 | ) | | | (8,404 | ) | | | 2,668,786 | | | | 31,692 | | | | 84,345 | |
BMO Pyrford International Stock Fund | | | 5,384,484 | | | | 799,323 | | | | 1,914,900 | | | | (308,385 | ) | | | 188,425 | | | | 4,148,947 | | | | 149,183 | | | | — | |
BMO Disciplined International Equity Fund | | | 5,055,538 | | | | 1,555,926 | | | | 1,695,969 | | | | (381,316 | ) | | | (14,269 | ) | | | 4,519,910 | | | | 99,823 | | | | — | |
| | | | | | | | | | | | | | | | | | | | | | | | | | | | | | | | |
| | | | | | | | | | | | | | | | | | | | | | | 11,337,643 | | | | | | | | | |
Fixed Income Funds — 2.8% | | | | | | | | | | | | | | | | | | | | | | | | | | | | | | | | |
BMO TCH Core Plus Bond Fund | | | 4,857,916 | | | | 1,446,245 | | | | 3,275,614 | | | | 181,135 | | | | (8,018 | ) | | | 3,201,664 | | | | 141,529 | | | | — | |
| | | | | | | | |
Alternative Funds — 5.5% | | | | | | | | | | | | | | | | | | | | | | | | | | | | | | | | |
BMO Alternative Strategies Fund | | | 6,869,639 | | | | 1,591,597 | | | | 1,811,946 | | | | (180,356 | ) | | | (159,127 | ) | | | 6,309,807 | | | | — | | | | — | |
| | | | | | | | |
Short-Term Investment — 1.0% | | | | | | | | | | | | | | | | | | | | | | | | | | | | | | | | |
BMO Institutional Prime Money Market Fund | | | 1,153,827 | | | | 22,894,226 | | | | 22,895,609 | | | | 205 | | | | (132 | ) | | | 1,152,517 | | | | 69,206 | | | | — | |
| | | | | | | | | | | | | | | | | | | | | | | | | | | | | | | | |
Totals | | $ | 66,104,958 | | | $ | 45,999,146 | | | $ | 49,114,757 | | | $ | (6,357,404 | ) | | $ | (377,018 | ) | | $ | 56,254,925 | | | $ | 996,122 | | | $ | 4,092,561 | |
| | | | | | | | | | | | | | | | | | | | | | | | | | | | | | | | |
| | | | | | | | |
Aggressive Allocation Fund | | | | | | | | | | | | | | | | | | | | | | | | | | | | | | | | |
Large-Cap Funds — 29.2% | | | | | | | | | | | | | | | | | | | | | | | | | | | | | | | | |
BMO Low Volatility Equity Fund | | $ | 10,152,602 | | | $ | 2,945,724 | | | $ | 3,816,332 | | | $ | (43,463 | ) | | $ | 190,787 | | | $ | 9,429,318 | | | $ | 166,672 | | | $ | 815,473 | |
BMO Dividend Income Fund | | | 5,485,222 | | | | 1,791,819 | | | | 1,011,616 | | | | (533,346 | ) | | | 32,649 | | | | 5,764,728 | | | | 127,906 | | | | 201,486 | |
BMOLarge-Cap Value Fund | | | 18,863,548 | | | | 7,410,827 | | | | 5,748,551 | | | | (3,114,868 | ) | | | (124,864 | ) | | | 17,286,092 | | | | 382,531 | | | | 1,592,306 | |
BMOLarge-Cap Growth Fund | | | 15,287,855 | | | | 10,243,268 | | | | 8,340,146 | | | | (1,906,151 | ) | | | (526,590 | ) | | | 14,758,236 | | | | 129,049 | | | | 2,260,969 | |
| | | | | | | | | | | | | | | | | | | | | | | | | | | | | | | | |
| | | | | | | | | | | | | | | | | | | | | | | 47,238,374 | | | | | | | | | |
Mid-Cap Funds — 3.4% | | | | | | | | | | | | | | | | | | | | | | | | | | | | | | | | |
BMOMid-Cap Growth Fund | | | 3,822,358 | | | | 1,712,794 | | | | 2,074,747 | | | | (868,706 | ) | | | 144,459 | | | | 2,736,158 | | | | — | | | | 608,298 | |
BMOMid-Cap Value Fund | | | 3,793,047 | | | | 1,324,200 | | | | 1,558,547 | | | | (846,251 | ) | | | 48,735 | | | | 2,761,184 | | | | 48,792 | | | | 404,651 | |
| | | | | | | | | | | | | | | | | | | | | | | | | | | | | | | | |
| | | | | | | | | | | | | | | | | | | | | | | 5,497,342 | | | | | | | | | |
Small-Cap Funds — 4.0% | | | | | | | | | | | | | | | | | | | | | | | | | | | | | | | | |
BMOSmall-Cap Growth Fund | | | 5,525,370 | | | | 3,390,812 | | | | 3,206,982 | | | | (1,242,540 | ) | | | (296,629 | ) | | | 4,170,031 | | | | — | | | | 724,290 | |
BMOSmall-Cap Value Fund | | | 3,657,921 | | | | 1,588,007 | | | | 2,143,079 | | | | (482,067 | ) | | | (274,881 | ) | | | 2,345,901 | | | | 24,301 | | | | 245,584 | |
| | | | | | | | | | | | | | | | | | | | | | | | | | | | | | | | |
| | | | | | | | | | | | | | | | | | | | | | | 6,515,932 | | | | | | | | | |
International Funds — 12.1% | | | | | | | | | | | | | | | | | | | | | | | | | | | | | | | | |
BMO LGM Emerging Markets Equity Fund | | | 7,494,805 | | | | 4,633,555 | | | | 6,754,303 | | | | (628,730 | ) | | | (132,953 | ) | | | 4,612,374 | | | | 55,015 | | | | 146,801 | |
BMO Pyrford International Stock Fund | | | 9,357,100 | | | | 2,107,343 | | | | 4,019,101 | | | | (659,459 | ) | | | 430,746 | | | | 7,216,629 | | | | 258,802 | | | | — | |
BMO Disciplined International Equity Fund | | | 8,880,022 | | | | 3,150,490 | | | | 3,437,005 | | | | (673,239 | ) | | | (60,520 | ) | | | 7,859,748 | | | | 172,869 | | | | — | |
| | | | | | | | | | | | | | | | | | | | | | | | | | | | | | | | |
| | | | | | | | | | | | | | | | | | | | | | | 19,688,751 | | | | | | | | | |
Alternative Funds — 0.5% | | | | | | | | | | | | | | | | | | | | | | | | | | | | | | | | |
BMO Alternative Strategies Fund | | | 896,397 | | | | 301,450 | | | | 344,844 | | | | (19,136 | ) | | | (25,167 | ) | | | 808,700 | | | | — | | | | — | |
| | | | | | | | |
Short-Term Investment — 0.8% | | | | | | | | | | | | | | | | | | | | | | | | | | | | | | | | |
BMO Institutional Prime Money Market Fund | | | 1,600,930 | | | | 25,399,979 | | | | 25,649,215 | | | | (124 | ) | | | 232 | | | | 1,351,802 | | | | 37,099 | | | | — | |
| | | | | | | | | | | | | | | | | | | | | | | | | | | | | | | | |
Totals | | $ | 94,817,177 | | | $ | 66,000,268 | | | $ | 68,104,468 | | | $ | (11,018,080 | ) | | $ | (593,997 | ) | | $ | 81,100,901 | | | | 1,403,036 | | | $ | 7,002,858 | |
| | | | | | | | | | | | | | | | | | | | | | | | | | | | | | | | |
27
| | |
| | |
| Notes to Financial Statements (continued) | | |
Interfund Borrowing and Lending—The Funds participate in an interfund lending program. This program allows the Funds to borrow cash from any of the BMO Money Market Funds for temporary purposes. The program is subject to a number of conditions, including the requirement that the interfund loan rate to be charged to the Funds under the program is (i) more favorable to the lending Fund than the rate it could otherwise obtain from investing cash in repurchase agreements or purchasing shares of the BMO Money Market Funds and (ii) more favorable to the borrowing Fund than the lowest interest rate at which bank short-term loans would be available to the Funds. In addition, a Fund may participate in the program only if its participation is consistent with the Fund’s investment policies and limitations. The Directors are responsible for the oversight of the interfund lending program.
Funds utilizing the interfund lending program, borrowing from the BMO Government Money Market Fund during the year ended August 31, 2019, were as follows:
| | | | | | | | |
Fund | | Average Daily Loan
Balance Outstanding | | | Weighted Average
Interest Rate | |
Conservative Allocation Fund | | $ | 1,543 | | | | 1.762 | % |
Moderate Allocation Fund | | | 12,023 | | | | 1.717 | |
Balanced Allocation Fund | | | 70,949 | | | | 1.802 | |
Growth Allocation Fund | | | 25,853 | | | | 1.763 | |
Aggressive Allocation Fund | | | 10,648 | | | | 1.792 | |
The Corporation, on behalf of the respective Funds, participated in a $25 million unsecured, committed revolving line of credit (“LOC”) agreement with State Street Bank. The LOC was made available for extraordinary or emergency purposes, primarily for financing redemption payments. Borrowings currently are charged interest at a rate of the London Interbank Offering Rate (“LIBOR”) plus 1.25% and a commitment fee of 0.20% per annum on the daily unused portion with no administrative fee. No borrowings were outstanding under the LOC during the year ended August 31, 2019.
| 7. | | Investment Transactions |
Purchases and sales of investments, excluding short-term U.S. government securities, short-term obligations, andin-kind contributions, for the year ended August 31, 2019 were as follows:
| | | | | | | | | | | | | | | | |
| | | Other than
U.S Government
Securities | | | U.S Government
Securities | |
Fund | | Purchases | | | Sales | | | Purchases | | | Sales | |
Conservative Allocation Fund | | $ | 18,291,706 | | | $ | 18,806,543 | | | $ | — | | | $ | — | |
Moderate Allocation Fund | | | 41,820,792 | | | | 49,258,149 | | | | — | | | | — | |
Balanced Allocation Fund | | | 159,635,366 | | | | 217,417,876 | | | | — | | | | — | |
Growth Allocation Fund | | | 49,745,346 | | | | 50,616,849 | | | | — | | | | — | |
Aggressive Allocation Fund | | | 77,950,981 | | | | 79,932,987 | | | | — | | | | — | |
| 8. | | Federal Tax Information |
The timing and character of income and capital gain distributions are determined in accordance with income tax regulations, which may differ from GAAP. These differences are due in part to differing treatments for net operating loss, foreign currency transactions, paydown gain or loss, market discount accretion, premium amortization and expiring capital loss carryforwards.
To the extent that differences arise that are permanent in nature, such amounts are reclassified within the capital accounts on the Statements of Assets and Liabilities based on their Federal tax basis treatment; temporary differences do not require reclassification and had no impact on the NAV of the Funds.
The Funds complied with FASB interpretationAccounting for Uncertainty in Income Taxes which provides guidance for how uncertain tax provisions should be recognized, measured, presented and disclosed in the financial statements.Accounting for Uncertainty in Income Taxes requires the affirmative evaluation of tax positions taken, or expected to be taken, in the course of preparing the Funds’ tax returns to determine whether it is“more-likely-than-not,” (i.e., greater than 50 percent) of being sustained by the applicable tax authority. Tax positions not deemed to meet themore-likely-than-not threshold may result in a tax benefit or expense in the current year.
Accounting for Uncertainty in Income Taxes requires management of the Funds to analyze all open tax years, as defined by the statutes of limitations, for all major jurisdictions, which includes federal and certain states. Open tax years are those that are open for exam by the taxing authorities (i.e., the last four tax years and the interim tax period since then). The Funds has no examinations in progress. For all open tax years and all major taxing jurisdictions through the end of the reporting period, management of the Fund reviewed all tax positions taken or expected to be taken in the preparation of the Funds’ tax returns and concluded thatAccounting for Uncertainty in Income Taxes resulted in no effect on the Funds’ reported net assets or results of operations as of and during the year ended August 31, 2019. Management of the Funds also is not aware of any tax positions for which it is reasonably possible that the total amounts of recognized tax benefits will significantly change in the next twelve months.
28
| | | | | | | | | | | | | | | | |
Fund | | Cost of
Investments
for Federal
Tax Purposes | | | Gross
Unrealized
Appreciation
for Federal
Tax Purposes | | | Gross
Unrealized
Depreciation
for Federal
Tax Purposes | | | Net
Unrealized
Appreciation
for Federal
Tax Purposes | |
Conservative Allocation Fund | | $ | 32,551,988 | | | $ | 4,987,131 | | | $ | (206,978 | ) | | $ | 4,780,153 | |
Moderate Allocation Fund | | | 59,938,450 | | | | 12,177,964 | | | | (392,933 | ) | | | 11,785,031 | |
Balanced Allocation Fund | | | 206,610,093 | | | | 68,100,362 | | | | (1,395,782 | ) | | | 66,704,580 | |
Growth Allocation Fund | | | 84,145,418 | | | | 30,196,615 | | | | (647,263 | ) | | | 29,549,352 | |
Aggressive Allocation Fund | | | 110,210,844 | | | | 52,257,579 | | | | (500,504 | ) | | | 51,757,075 | |
The difference between book basis and tax basis unrealized appreciation/depreciation is attributable in part to the tax deferral of losses on wash sales.
The tax character of distributions reported on the Statements of Changes in Net Assets for the years ended August 31, 2019 and August 31, 2018, were as follows:
| | | | | | | | | | | | | | | | |
| | | 2019 | | | 2018 | |
| | | Ordinary
Income (1) | | | Long-Term
Capital Gains | | | Ordinary
Income (1) | | | Long-Term
Capital Gains | |
Conservative Allocation Fund | | $ | 1,102,589 | | | $ | 4,464,364 | | | $ | 2,519,961 | | | $ | 4,479,258 | |
Moderate Allocation Fund | | | 2,532,120 | | | | 6,028,252 | | | | 2,959,918 | | | | 4,208,363 | |
Balanced Allocation Fund | | | 8,637,637 | | | | 22,915,506 | | | | 10,019,454 | | | | 26,938,699 | |
Growth Allocation Fund | | | 3,086,814 | | | | 8,882,560 | | | | 3,864,557 | | | | 5,945,893 | |
Aggressive Allocation Fund | | | 4,733,699 | | | | 15,154,046 | | | | 5,593,851 | | | | 17,406,814 | |
| | (1) | For tax purposes, short-term capital gain distributions are considered ordinary income |
As of August 31, 2019, the components of distributable earnings on a tax basis are as follows:
| | | | | | | | | | | | | | | | | | | | |
Fund | | Undistributed
Ordinary
Income | | | Undistributed
Long-Term
Capital Gains | | | Accumulated
Capital and
Other Losses | | | Other
Adjustments | | | Unrealized
Appreciation | |
Conservative Allocation Fund | | $ | 690,142 | | | $ | 787,897 | | | $ | — | | | $ | — | | | $ | 4,780,153 | |
Moderate Allocation Fund | | | 965,609 | | | | 2,327,997 | | | | — | | | | — | | | | 11,785,031 | |
Balanced Allocation Fund | | | 4,157,125 | | | | 16,958,368 | | | | — | | | | — | | | | 66,704,580 | |
Growth Allocation Fund | | | 1,113,882 | | | | 5,837,895 | | | | — | | | | — | | | | 29,549,352 | |
Aggressive Allocation Fund | | | 1,109,573 | | | | 10,730,272 | | | | — | | | | — | | | | 51,757,075 | |
| 9. | | Shareholder Tax Information (unaudited) |
Of the ordinary income (including short-term capital gain) distributions made by the Funds during the year ended August 31, 2019, the percentages that qualify for the dividend received deduction available to corporate shareholders and the percentages that are designated as qualified dividend income were as follows:
| | | | | | | | |
| | | Dividends
Received
Deduction | | | Qualified
Dividend
Income | |
Conservative Allocation Fund | | | 6.75 | % | | | 10.27 | % |
Moderate Allocation Fund | | | 14.59 | | | | 21.09 | |
Balanced Allocation Fund | | | 21.03 | | | | 29.73 | |
Growth Allocation Fund | | | 31.08 | | | | 37.83 | |
Aggressive Allocation Fund | | | 38.65 | | | | 49.31 | |
For Federal tax purposes, for the year ended August 31, 2019, the following Funds designate long-term capital gains and qualified short-term capital gains, or the amounts determined to be necessary, of:
| | | | | | | | |
| | | Long-term
Capital
Gains | | | Qualified
Short-term
Capital Gains | |
Conservative Allocation Fund | | $ | 4,464,364 | | | $ | 122,280 | |
Moderate Allocation Fund | | | 6,028,252 | | | | 272,296 | |
Balanced Allocation Fund | | | 22,915,506 | | | | 888,682 | |
Growth Allocation Fund | | | 8,882,560 | | | | 323,425 | |
Aggressive Allocation Fund | | | 15,154,046 | | | | 767,723 | |
| 10. | | Recently Issued Accounting Pronouncements |
During August 2018, the Securities and Exchange Commission (the “SEC”) issued Final Rule ReleaseNo. 33-10532, Disclosure Update and Simplification (“Final Rule ReleaseNo. 33-10532”). Final Rule ReleaseNo. 33-10532 amends certain financial statement disclosure requirements to conform to U.S. GAAP. The amendments to Rule6-04.17 of RegulationS-X (balance
29
| | |
| | |
| Notes to Financial Statements (continued) | | |
sheet) remove the requirement to separately state the book basis components of net assets: undistributed (over-distribution of) net investment income (“UNII”), accumulated undistributed net realized gains (losses), and net unrealized appreciation (depreciation) at the balance sheet date. Instead, consistent with U.S. GAAP, funds will be required to disclose total distributable earnings. The amendments to Rule6-09 of RegulationS-X (statement of changes in net assets) remove the requirement to separately state the sources of distributions paid. Instead, consistent with U.S. GAAP, funds will be required to disclose the total amount of distributions paid, except that any tax return of capital must be separately disclosed. The amendments also remove the requirement to parenthetically state the book basis amount of UNII on the statement of changes in net assets.
The requirements of Final Rule ReleaseNo. 33-10532 were effective November 5, 2018, and the Funds’ Statements of Assets and Liabilities and Statement of Changes in Net Assets for the current reporting period have been modified accordingly. In addition, certain amounts within each Fund’s Statements of Changes in Net Assets for the prior fiscal period have been modified to conform to Final Rule ReleaseNo. 33-10532.
The Funds’ distributions from the prior fiscal period are disclosed in the Statements of Changes in Net Assets.
30
| | |
| |
| Report of Independent Registered Public Accounting Firm |
To the Shareholders and Board of Directors of
BMO Funds, Inc.:
Opinion on the Financial Statements
We have audited the accompanying statements of assets and liabilities of BMO Conservative Allocation Fund, BMO Moderate Allocation Fund, BMO Balanced Allocation Fund, BMO Growth Allocation Fund, BMO Aggressive Allocation Fund (each a series of BMO Funds, Inc., collectively referred to as the Funds), including the schedules of investments, as of August 31, 2019, the related statements of operations for the year then ended, the statements of changes in net assets for each of the years in the two-year period then ended, and the related notes (collectively, the financial statements) and the financial highlights for each of the years in the five-year period then ended. In our opinion, the financial statements and financial highlights present fairly, in all material respects, the financial position of the Funds as of August 31, 2019, the results of their operations for the year then ended, the changes in their net assets for each of the years in the two-year period then ended, and the financial highlights for each of the years in the five-year period then ended, in conformity with U.S. generally accepted accounting principles.
Basis for Opinion
These financial statements and financial highlights are the responsibility of the Funds’ management. Our responsibility is to express an opinion on these financial statements and financial highlights based on our audits. We are a public accounting firm registered with the Public Company Accounting Oversight Board (United States) (PCAOB) and are required to be independent with respect to the Funds in accordance with the U.S. federal securities laws and the applicable rules and regulations of the Securities and Exchange Commission and the PCAOB.
We conducted our audits in accordance with the standards of the PCAOB. Those standards require that we plan and perform the audit to obtain reasonable assurance about whether the financial statements and financial highlights are free of material misstatement, whether due to error or fraud. Our audits included performing procedures to assess the risks of material misstatement of the financial statements and financial highlights, whether due to error or fraud, and performing procedures that respond to those risks. Such procedures included examining, on a test basis, evidence regarding the amounts and disclosures in the financial statements and financial highlights. Such procedures also included confirmation of securities owned as of August 31, 2019 by correspondence with the custodian and transfer agents or by other appropriate auditing procedures. Our audits also included evaluating the accounting principles used and significant estimates made by management, as well as evaluating the overall presentation of the financial statements and financial highlights. We believe that our audits provide a reasonable basis for our opinion.
/s/ KPMG LLP
We have served as the auditor of one or more BMO Funds, Inc. investment companies since 2011.
Columbus, Ohio
October 28, 2019
31
| | |
| |
| Directors and Officers of the Funds (Unaudited) |
The following tables provide information about each Director and Officer of the Funds as of August 31, 2019. The address of each Director is c/o BMO Funds, 111 East Kilbourn Avenue, Suite 200, Milwaukee, Wisconsin 53202. There are currently 33 separate portfolios or funds in the BMO Funds complex, of which 32 are registered as BMO Funds, Inc. and one is registered as BMO LGM Frontier Markets Equity Fund with the Securities and Exchange Commission. The Funds’ Statement of Additional Information includes additional information about the Directors and is available, without charge and upon request, by calling1-800-236-FUND (3863).
| | | | | | | | | | |
| INDEPENDENT DIRECTORS |
| Name and Age | | Position(s) Held with
the Corporation | | Term of
Office and
Length of
Time Served* | | Principal Occupation(s)
During Past 5 Years | | Number of
Portfolios in
Fund
Complex
Overseen by
Director | | Other
Directorships
Held by
Director |
| | | | | |
Ridge A. Braunschweig
Age: 66 | | Independent Director | | Since October 2009 | | President and Chief Executive Officer, CPL Industries, Inc. (a manufacturing holding company prior to May 2009 and a family office since May 2009), since January 2012. | | 33 | | None |
| | | | | |
Benjamin M. Cutler
Age: 74 | | Independent Director | | Since July 2004 | | Chairman, USHEALTH Group, Inc. (a health insurance company), since 2004; CEO and President, USHEALTH Group, Inc., from 2004 to 2016; Director, Freedom from Hunger (anon-profit organization), since 2016. | | 33 | | None |
| | | | | |
John A. Lubs
Age: 71 | | Independent Director | | Since July 2004 | | Retired; formerly, Vice Chairman, Mason Companies, Inc. (a footwear distributor), from 2004 to 2010 and Chief Operating Officer, from 2003 to 2010. | | 33 | | None |
| | | | | |
Vincent P. Lyles
Age: 58 | | Independent Director | | Since September 2017 | | Vice President of Community Relations, Advocate Aurora Health Care, since 2019; President and Chief Executive Officer, Boys & Girls Clubs of Greater Milwaukee, from 2012 to 2018. | | 33 | | None |
| | | | | |
James Mitchell
Age: 72 | | Independent Director | | Since March 1999 | | Chairman, Ayrshire Precision Engineering (a precision machining company), since 1992; Chief Executive Officer, NOG, Inc. (a metal processing and consulting company), from 1999 to 2015. | | 33 | | None |
| | | | | |
Barbara J. Pope
Age: 71 | | Independent Director | | Since March 1999 | | Retired; formerly, President of Barbara J. Pope, P.C. (a financial consulting firm), 1992-2015; President of Sedgwick Street Fund LLC (a private investment partnership), 1996-2015; Tax Partner, Price Waterhouse. | | 33 | | None |
|
| * Each Director serves an indefinite term until he or she retires or otherwise resigns, is removed, dies or until his or her successor is duly elected. Retirement for a Director occurs no later than August 31 following his or her 75th birthday. |
32
| | |
| |
| Directors and Officers of the Funds (Unaudited) (continued) |
| | | | | | | | | | |
| INTERESTED DIRECTORS | | | | | | | | |
| Name and Age | | Position(s) Held with
the Corporation | | Term of
Office and
Length of
Time Served* | | Principal Occupation(s)
During Past 5 Years | | Number of
Portfolios in
Fund
Complex
Overseen by
Director | | Other
Directorships
Held by
Director |
| | | | | |
John M. Blaser**
Age: 62 | | Director and President | | Since May 1999 | | Managing Director of the Adviser, since June 2012. | | 33 | | None |
| | | | | |
Daniela O’Leary-Gill**
Age: 54 | | Director | | Since August 2018 | | Chief Operating Officer of BMO Financial Group, since February 1, 2018; Director of the Adviser, since June 1, 2018; Head, Communications, Government & Investor Relations 2016-2018; Head, AML Program Oversight 2014-2016; SVP, Personal Banking & Chief CRA Officer 2011-2014. | | 33 | | None |
|
| * Each Director serves an indefinite term until he or she retires or otherwise resigns, is removed, dies or until his or her successor is duly elected. Retirement for a Director occurs no later than August 31 following his or her 75th birthday. |
|
| ** Mr. Blaser is an “interested person” of the Corporation (as defined in the 1940 Act) due to the positions that he holds with the Corporation, and the Adviser. Ms. O’Leary-Gill is an “interested person” of the Corporation due to the positions that she holds with the Adviser and BMO. |
| | | | | | |
| PRINCIPAL OFFICERS | | | | |
| Name and Age | | Position(s) Held with
the Corporation | | Term of Office and Length of
Time Served | | Principal Occupation(s) During Past 5
Years |
| | | |
Brett Black
Age: 47 | | Chief Compliance Officer and Anti-Money Laundering Compliance Officer | | Elected by the Board annually; since November 2017 | | Vice President and Chief Compliance Officer of BMO Harris Bank, since 2017; Assistant Vice President, Deputy Chief Compliance Officer, since 2014; Senior Compliance Officer of BMO Harris Bank, since 2012. |
| | | |
Timothy M. Bonin
Age: 46 | | Vice President, Chief Financial Officer and Treasurer | | Elected by the Board annually; since February 2006 | | Vice President of the Adviser, since February 2006. |
| | | |
Michael J. Murphy
Age: 40 | | Secretary | | Elected by the Board annually; since May 2016 | | Senior Counsel and Vice President of BMO Harris Bank N.A., since 2014; Associate, Vedder Price P.C., 2010 to 2014. |
33
| | |
| |
Shareholder Report Disclosure of Directors’ Approval of
Continuation of Contracts(Unaudited) |
Approval of Continuation of Advisory Agreement
During the reporting period, the Board of Directors (the “Board”) of BMO Funds, Inc. (the “Corporation”), including the Directors who are not “interested persons” of the Corporation as defined in the Investment Company Act of 1940, as amended (the “Independent Directors”), met to discuss the advisory agreement of each portfolio of the Corporation included in this shareholder report (each, a “Fund” and collectively, the “Funds”). The Board approved the continuation of the investment advisory agreement (the “Advisory Agreement”) between the Corporation and BMO Asset Management Corp. (the “Adviser”) on behalf of each Fund for an additional year ending August 31, 2020.
At Board meetings held on July 10, 2019 (“July Meeting”) and August6-7, 2019 (“August Meeting”), the Board met with management of the Adviser regarding the annual approval of the continuation of the Funds’ Advisory Agreement. In connection with its consideration of the Advisory Agreement, the Board considered the information furnished and discussed throughout the year at regularly scheduled Board and Committee meetings, as applicable, and the information provided specifically in relation to the annual consideration of the approval of the Advisory Agreement in response to requests of the Independent Directors and their independent legal counsel. Information furnished in connection with Board or Committee meetings throughout the year included, among other things, presentations given by the portfolio managers of the Funds on each Fund’s investment strategies, risks, absolute performance, and comparative performance of each Fund against its benchmark indices; reports regarding each Fund’s asset levels including sales and redemption activities; and various reports on the monitoring of the Funds’ compliance with the securities laws, regulations, policies, and procedures.
In preparation for the Board’s annual consideration of the approval of the Advisory Agreement, the Board requested and received a wide variety of information and reports concerning the Adviser (and its affiliates), including information on: (1) the nature, extent, and quality of services provided to each Fund by the Adviser (and its affiliates); (2) the investment performance of each Fund as compared to a group of comparable funds; (3) the expense ratios of each Fund as compared to a group of comparable funds; (4) profitability information for the Adviser; and (5) the Adviser’s compliance program. The Board also considered information related to potential “fall out” or ancillary benefits enjoyed by the Adviser and its affiliates as a result of their relationships with the Funds.
In addition to evaluating, among other things, the written information provided by the Adviser, the Board also considered the answers to questions posed by the Board to representatives of the Adviser at various meetings and took into account their accumulated experience in working with the Adviser on matters related to the Funds. The Independent Directors also met separately in executive sessions with their independent legal counsel to review and consider the information provided regarding the Advisory Agreement.
Based on their review, the Independent Directors and the full Board concluded that it was in the best interests of each Fund to approve the continuation of the Advisory Agreement. Although the Advisory Agreement for all of the Funds was considered at the same Board meeting, the Board considered each Fund separately. In their deliberations, the Board did not identify any single factor or group of factors asall-important or controlling but considered all factors together. The material factors and conclusions that formed the basis for the Board’s determinations are discussed below.
Nature, Extent and Quality of Services
In evaluating the nature, extent, and quality of the services provided by the Adviser to the Funds, the Board reviewed information describing the financial strength, experience, resources and key personnel of the Adviser, including the personnel who provide investment management services to the Funds. The Board considered the administrative services that are provided to each Fund, as well as other services performed by the Adviser, including the selection and monitoring of the underlying funds; monitoring adherence to the Funds’ investment restrictions; monitoring the Funds’ compliance with their compliance policies and procedures and with applicable securities laws and regulations; producing shareholder reports; providing support services for the Board and Board committees; communicating with shareholders; and overseeing the activities of other service providers. The Board also considered the Adviser’s experience in providing investment advisory services to funds.
Based upon this review, the Board concluded that the nature, quality, and extent of the services to be provided to each Fund by the Adviser are expected to be satisfactory.
Review of Fund Performance
The Board reviewed the investment performance of each of the Funds. While consideration was given to performance reports provided in connection with, and discussions held at, regular Board meetings throughout the year, particular attention was given to the performance reports provided specifically in connection with the July and August Meetings. In particular, the Board noted the performance of each Fund relative to its Lipper Inc. (“Lipper”) peer universe. The Directors also considered updated performance information for each Fund relative to its benchmark and its Morningstar, Inc. (“Morningstar”) ratings.
With respect to each Fund’s performance as compared to its Lipper peer universe (“peer group”), the Board reviewed each Fund’s performance percentile rankings over theyear-to-date andone-, three-, and five-year trailing periods through May 31, 2019, as provided by the Adviser. The Board considered that each of the Funds ranked in the third or fourth quartile for performance as compared to its peer group for theyear-to-date period, the first or second quartile for theone-year period (except for the BMO Aggressive Allocation Fund which was in the third quartile), and the third quartile for the
34
three- and five-year periods. The Board considered that each class of each Fund was ranked three or four stars by Morningstar. The Board noted the Funds’ performance returns relative to their respective benchmarks over various periods. The Board also considered the Fund management changes that occurred in 2017.
The Board determined that it was generally satisfied with each Fund’s performance and would continue to monitor each Fund’s performance results.
Costs of Services Provided and Profits Realized by the Adviser
The Board considered the fees payable by each Fund under the Advisory Agreement, noting that the Funds do not pay a management fee to the Adviser.
The Board reviewed information provided by the Adviser comparing each Fund’s net expense ratio to the median net expense ratio of the comparable Lipper peer group (“Lipper peers”). The Board considered that each Fund’s net expense ratio was lower than the median of its Lipper peers for Class I, Class R3, and Class R6 shares. The Board noted that, with the exception of the BMO Growth Allocation Fund, the net expense ratios for Class Y shares of the Funds were higher than the median of its Lipper peers. The Board considered that the net expense ratios included the fees and expenses of the underlying funds in which the Funds invest. The Board also considered the size of the Funds and that economies of scale with respect to certain other expenses may not have been realized.
The Board considered that the Adviser has agreed to contractual expense limitations for the Funds (the “Expense Limitations”), and that the net expense ratios for the Funds take into account the effect of the Expense Limitations.
The Board considered the methodology used by the Adviser in determining compensation payable to its portfolio managers and the competitive environment for investment management talent. The Board also considered the financial condition of the Adviser and certain of its affiliates and particularly focused on the financial strength of the ultimate parent company of the Adviser, and the parent company’s commitment, financial and otherwise, to the global asset management business and the BMO Fund complex.
The Board reviewed profitability information it received from the Adviser in connection with the services provided to each Fund and the Corporation as a whole. The materials provided in this regard showed, and the Directors acknowledged, that the Adviser would not have a profit with respect to the Funds because the Funds do not pay management fees to the Adviser.
Economies of Scale
With respect to the management fee levels for the Funds, the Board did not consider the extent to which economies of scale would be realized as the Funds grow because the Funds do not pay management fees to the Adviser.
Other Benefits to the Adviser
The Board considered benefits that accrue to the Adviser and its affiliates from their relationships with the Funds, including revenue in the form of administration fees, custody fees, and shareholder service fees. In addition, the Board considered information relating to any soft dollar arrangements in connection with equity security brokerage transactions for the underlying funds and/or other clients. The Board noted that the Adviser may potentially benefit from its relationship with each Fund in other ways. The Board also considered that the success of any Fund could attract other business to the Adviser and that the success of the Adviser could enhance the Adviser’s ability to serve the Funds.
The Board concluded that, taking into account all of the information reviewed, each Fund’s advisory fee was reasonable.
Overall Conclusions
Based on all of the information considered and the conclusions reached, the Board determined that the terms of the Advisory Agreement are fair and reasonable and that the approval of the continuation of the Advisory Agreement is in the best interests of each Fund.
35
36
This report is authorized for distribution to prospective investors only when preceded or accompanied by the Funds’ prospectuses, which contain facts concerning each Fund’s objective and policies, management fees, expenses, and other information.
Proxy Voting
A description of the policies and procedures that the Funds use to determine how to vote proxies relating to portfolio securities is available without charge, upon request, by calling toll free, 1-800-236-FUND (3863) and by accessing the Funds’ Statement of Additional Information, which is available on the Funds’ website at http://www.bmofunds.com and on the SEC’s website at http://www.sec.gov.
Each Fund’s proxy voting record for the most recent 12-month period ended June 30 is available without charge, upon request, by calling toll free,1-800-236-FUND (3863) and by accessing the SEC’s website at http://www.sec.gov.
Disclosure of Portfolio Holdings
The Funds file their complete schedules of portfolio holdings with the SEC for the first and third quarters of each fiscal year on as an attachment to Form N-PORT. Each Fund’s Form N-PORT is available on the SEC’s website at http://www.sec.gov and may be reviewed and copied at the SEC’s Public Reference Room in Washington, D.C. Information on the operation of the Public Reference Room may be obtained by calling 1-800-SEC-0330.
Shares of the BMO Funds are not bank deposits or other obligations of, or issued, endorsed or guaranteed by, BMO Harris Bank, NA, or any of its affiliates. Shares of the BMO Funds, like shares of all mutual funds, are not insured or guaranteed by the U.S. government, the Federal Deposit Insurance Corporation, the Federal Reserve Board, or any other government agency. Investment in mutual funds involves investment risk, including the possible loss of principal.
| | |
| | PRSRT STD U.S. POSTAGE PAID LANCASTER, PA PERMIT NO. 1793 |
| | |
 | | BMO Funds U.S. Services P.O. Box 55931 Boston, MA 02205-5931 |
| | |
 | | Contact us 1-800-236-FUND (3863) 414-287-8555 |
| | |
 | | Learn more bmofunds.com |
BMO Investment Distributors, LLC, Distributor
BMO Asset Management Corp., Investment Adviser
Investment products are:NOT FDIC INSURED — NO BANK GUARANTEE — MAY LOSE VALUE.
© 2019 BMO Financial Corp. (9/19)
Item 2. Code of Ethics.
The Registrant has a code of ethics (the “Code”) that applies to the Registrant’s principal executive officer and principal financial officer. During the period covered by this report, there were no amendments to the provisions of the Code, nor were there any implicit or explicit waivers to the provisions of the Code. The Code is filed herewith.
Item 3. Audit Committee Financial Expert.
The Registrant’s Board of Directors has determined that the Registrant has four audit committee financial experts serving on its audit committee, each of whom is “independent” within the meaning ofForm N-CSR: Ridge A. Braunschweig, Barbara J. Pope, John A. Lubs, and Benjamin M. Cutler. Under applicable securities laws, a person who is determined to be an audit committee financial expert will not be deemed an “expert” for any purpose, including without limitation for purposes of Section 11 of the Securities Act of 1933, as amended, as a result of being designated or identified as an audit committee financial expert. The designation or identification of a person as an audit committee financial expert does not impose on such person any duties, obligations, or liabilities that are greater than the duties, obligations, and liabilities imposed on such person as a member of the audit committee and Board of Directors in the absence of such designation or identification.
Item 4. Principal Accountant Fees and Services.
The aggregate fees for professional services by KPMG LLP during the fiscal year 2019 and 2018 were as follows:
| (a) | Audit Fees for Registrant. |
| | | | | | |
| Fiscal year ended August 31, 2019 | | | $544,100 | | | |
| Fiscal year ended August 31, 2018 | | | $631,150 | | | |
| (b) | Audit-Related Fees for Registrant. These are fees by the Registrant’s independent auditors for assurance and related services that were reasonably related to the performance of the audit of the Registrant’s financial statements that are not reported under “Audit Fees”. These fees include amounts related to FormN-17f-2 filings. |
| | | | |
Fiscal year ended August 31, 2019 | | $5,500 | | |
Fiscal year ended August 31, 2018 | | $16,500 | | |
| (c) | Tax Fees for Registrant. These are fees for professional services rendered by the Registrant’s independent auditors for tax compliance, tax advice, and tax planning. These fees include federal, excise and state tax reviews; performed by KPMG LLP. |
| | | | |
Fiscal year ended August 31, 2019 | | $184,080 | | |
Fiscal year ended August 31, 2018 | | $169,840 | | |
| | | | |
Fiscal year ended August 31, 2019 | | None | | |
Fiscal year ended August 31, 2018 | | None | | |
| (e) | Audit Committee’spre-approval policies and procedures. |
| | (1) | The Audit Committee has adoptedpre-approval policies and procedures that require the Audit Committee topre-approve all audit andnon-audit services of the Registrant, including services provided to the Registrant’s investment adviser or any entity controlling, controlled by or under common control with the Registrant’s investment adviser that provides ongoing services to the Registrant with respect to any engagement that directly relates to the operations and financial reporting of the Registrant. |
| | (2) | None of the services described in paragraphs (b) through (d) of this Item 4 were approved by the audit committee pursuant to paragraph (c)(7)(i)(C) of Rule2-01 of RegulationS-X. |
| (g) | During the last two fiscal years, othernon-audit services rendered by the Registrant’s independent auditors to the Registrant, its investment adviser or any entity controlling, controlled by or under the common control with the investment adviser that provides ongoing services to the Registrant included the following: |
Statement on Standards for Attestation Engagements No. 16 (SSAE No. 16) examinations for BMO Harris Bank N.A.
| | | | |
| | Fiscal year ended August 31, 2019 | | $220,000 |
| | Fiscal year ended August 31, 2018 | | $220,000 |
Item 5. Audit Committee of Listed Registrants.
Not applicable.
Item 6. Investments.
Except as noted below, the schedules of investments are included as part of the report to shareholders filed under Item 1 of this Form. The schedules of investments for BMO IntermediateTax-Free Fund, BMO ShortTax-Free Fund and BMO Ultra ShortTax-Free Fund are filed under this Item.
IntermediateTax-Free Fund
| | | | | | | | |
Description | |
| Shares or
Principal Amount |
| | | Value | |
| | |
Municipals — 100.3% | | | | | | | | |
| | |
Alabama — 2.9% | | | | | | | | |
Alabama Board of Education: | | | | | | | | |
3.000%, 6/1/2021 | | $ | 305,000 | | | $ | 314,967 | |
4.000%, 7/1/2021 | | | 1,895,000 | | | | 1,993,995 | |
5.000%, 10/1/2020, Call 9/30/2019 | | | 230,000 | | | | 230,644 | |
Black Belt Energy Gas District: | | | | | | | | |
2.394%, (LIBOR 1 Month), 12/1/2023, Call 9/1/2023 (1) | | | 4,000,000 | | | | 3,958,000 | |
4.000%, 12/1/2025, Call 9/1/2025 (1) | | | 6,500,000 | | | | 7,370,675 | |
Butler County Board of Education, AGM, 4.000%, 7/1/2020 | | | 585,000 | | | | 598,888 | |
City of Birmingham, 4.000%, 3/1/2022 (2) | | | 1,725,000 | | | | 1,788,325 | |
Health Care Authority for Baptist Health, 1.810%, 11/1/2042, Call 9/3/2019 (1) | | | 8,175,000 | | | | 8,175,000 | |
Industrial Development Board of the City of Mobile Alabama, 1.420%, 6/1/2034, Call 9/6/2019 (1) | | | 4,800,000 | | | | 4,800,000 | |
Mobile County Board of School Commissioners, 5.000%, 3/1/2027, Call 3/1/2026 | | | 4,015,000 | | | | 4,821,332 | |
Southeast Alabama Gas Supply District, 2.344%, (LIBOR 1 Month), 6/1/2024, Call 3/1/2024 (1) | | | 7,000,000 | | | | 6,939,800 | |
Special Care Facilities Financing Authority of the City of Pell City Alabama, 5.000%, 12/1/2025, Call 12/1/2021 | | | 4,000,000 | | | | 4,300,680 | |
UAB Medicine Finance Authority: | | | | | | | | |
4.000%, 9/1/2038, Call 9/1/2029 | | | 1,000,000 | | | | 1,151,350 | |
4.000%, 9/1/2044, Call 9/1/2029 | | | 2,470,000 | | | | 2,791,767 | |
5.000%, 9/1/2036, Call 3/1/2027 | | | 2,340,000 | | | | 2,831,845 | |
5.000%, 9/1/2037, Call 3/1/2027 | | | 2,030,000 | | | | 2,448,139 | |
5.000%, 9/1/2041, Call 3/1/2027 | | | 1,020,000 | | | | 1,218,319 | |
| | | | | | | | |
| | | | | | | 55,733,726 | |
Alaska — 0.4% | | | | | | | | |
Alaska Housing Finance Corp.: | | | | | | | | |
5.000%, 12/1/2027, Call 6/1/2022 | | | 1,065,000 | | | | 1,176,548 | |
5.000%, 12/1/2027, Call 6/1/2022 | | | 310,000 | | | | 340,030 | |
5.000%, 12/1/2028, Call 12/1/2024 | | | 2,500,000 | | | | 2,946,875 | |
5.000%, 6/1/2029, Call 12/1/2024 | | | 1,000,000 | | | | 1,176,980 | |
Borough of Matanuska-Susitna: | | | | | | | | |
5.000%, 11/1/2022 | | | 500,000 | | | | 559,890 | |
5.000%, 4/1/2031, Call 4/1/2021 | | | 150,000 | | | | 159,327 | |
Borough of North Slope, 5.000%, 6/30/2024, Call 6/1/2021 | | | 1,020,000 | | | | 1,090,074 | |
City of Anchorage Electric Revenue,NATL-RE, 5.000%, 12/1/2024, Call 9/30/2019 | | | 305,000 | | | | 305,845 | |
| | | | | | | | |
| | | | | | | 7,755,569 | |
Arizona — 2.6% | | | | | | | | |
Arizona Department of Transportation State Highway Fund Revenue, 5.250%, 7/1/2029, Call 7/1/2021 | | | 3,000,000 | | | | 3,226,560 | |
Arizona Health Facilities Authority, 5.000%, 2/1/2022 | | | 1,000,000 | | | | 1,083,110 | |
Arizona Industrial Development Authority: | | | | | | | | |
3.550%, 7/15/2029, Call 7/15/2027 (3) | | | 1,350,000 | | | | 1,411,276 | |
3.750%, 12/15/2029, Call 12/15/2027 (3) | | | 570,000 | | | | 599,840 | |
5.000%, 3/1/2037, Call 9/1/2027 (3) | | | 1,250,000 | | | | 1,382,475 | |
5.000%, 7/15/2039, Call 7/15/2027 (3) | | | 1,325,000 | | | | 1,472,088 | |
5.000%, 12/15/2039, Call 12/15/2027 (3) | | | 400,000 | | | | 442,788 | |
5.000%, 3/1/2042, Call 9/1/2027 (3) | | | 1,000,000 | | | | 1,094,270 | |
5.000%, 7/15/2049, Call 7/15/2027 (3) | | | 1,675,000 | | | | 1,839,100 | |
5.000%, 12/15/2049, Call 12/15/2027 (3) | | | 700,000 | | | | 763,833 | |
5.750%, 7/15/2038, Call 7/15/2026 (3) | | | 1,750,000 | | | | 2,006,707 | |
Arizona Transportation Board: | | | | | | | | |
5.000%, 7/1/2022, Call 7/1/2020 | | | 1,260,000 | | | | 1,300,648 | |
| | | | | | | | |
5.000%, 7/1/2023, Call 7/1/2020 | | | 1,405,000 | | | | 1,450,325 | |
Chandler Industrial Development Authority, 5.000%, 6/3/2024 (1) | | | 5,000,000 | | | | 5,803,000 | |
City of Goodyear Water & Sewer Revenue, 5.125%, 7/1/2025, Call 7/1/2020 | | | 345,000 | | | | 355,902 | |
City of Phoenix Civic Improvement Corp., 5.000%, 7/1/2026, Call 7/1/2020 | | | 1,050,000 | | | | 1,083,873 | |
City of Phoenix Civic Improvement Corp., BHAC FGIC, 5.500%, 7/1/2027 (2) | | | 500,000 | | | | 649,810 | |
City of Phoenix Civic Improvement Corp.,NATL-RE: | | | | | | | | |
5.500%, 7/1/2021 (2) | | | 555,000 | | | | 599,833 | |
5.500%, 7/1/2036 (2) | | | 530,000 | | | | 793,659 | |
City of Tucson, AGM, 5.000%, 7/1/2020 | | | 500,000 | | | | 516,045 | |
County of Pima Sewer System Revenue, 5.000%, 7/1/2027, Call 7/1/2022 | | | 1,450,000 | | | | 1,602,714 | |
Glendale Industrial Development Authority, 5.000%, 5/15/2023, Call 5/15/2020 | | | 500,000 | | | | 512,965 | |
Greater Arizona Development Authority, BHACNATL-RE, 5.000%, 8/1/2027, Call 9/30/2019 | | | 155,000 | | | | 155,428 | |
Industrial Development Authority of the City of Phoenix: | | | | | | | | |
3.000%, 7/1/2020 (3) | | | 145,000 | | | | 145,609 | |
5.000%, 7/1/2031, Call 7/1/2026 (3) | | | 3,000,000 | | | | 3,336,360 | |
La Paz County Industrial Development Authority: | | | | | | | | |
5.000%, 2/15/2046, Call 2/15/2026 (3) | | | 1,000,000 | | | | 1,124,260 | |
5.000%, 2/15/2048, Call 2/15/2028 | | | 1,185,000 | | | | 1,370,287 | |
Maricopa County Industrial Development Authority: | | | | | | | | |
5.000%, 7/1/2035, Call 7/1/2026 | | | 2,325,000 | | | | 2,539,365 | |
5.000%, 7/1/2036, Call 7/1/2026 (3) | | | 1,225,000 | | | | 1,353,637 | |
5.000%, 7/1/2036, Call 7/1/2026 | | | 750,000 | | | | 861,247 | |
Maricopa County Unified School District No. 60 Higley,AGM: | | | | | | | | |
5.000%, 7/1/2023 | | | 1,000,000 | | | | 1,141,990 | |
5.000%, 7/1/2024 | | | 575,000 | | | | 676,723 | |
Salt Verde Financial Corp., 5.250%, 12/1/2022 | | | 110,000 | | | | 122,636 | |
State of Arizona,AGM: | | | | | | | | |
5.000%, 10/1/2023, Call 4/1/2020 | | | 1,000,000 | | | | 1,022,170 | |
5.250%, 10/1/2024, Call 10/1/2019 | | | 5,000,000 | | | | 5,015,600 | |
Town of Marana, 5.000%, 7/1/2023 | | | 450,000 | | | | 514,076 | |
University Medical Center Corp., 5.000%, 7/1/2021 | | | 425,000 | | | | 454,380 | |
University of Arizona, 5.000%, 8/1/2026, Call 8/1/2021 | | | 455,000 | | | | 486,172 | |
| | | | | | | | |
| | | | | | | 50,310,761 | |
Arkansas — 0.7% | | | | | | | | |
Arkansas Development Finance Authority: | | | | | | | | |
5.000%, 2/1/2020 | | | 255,000 | | | | 258,794 | |
5.000%, 2/1/2021 | | | 315,000 | | | | 330,438 | |
5.000%, 2/1/2022 | | | 150,000 | | | | 162,281 | |
Arkansas Development Finance Authority,GNMA/FNMA/FHLMC: | | | | | | | | |
4.000%, 1/1/2025, Call 7/1/2021 | | | 180,000 | | | | 187,720 | |
4.000%, 7/1/2025, Call 7/1/2021 | | | 390,000 | | | | 406,793 | |
Arkansas State University: | | | | | | | | |
4.000%, 3/1/2021 | | | 390,000 | | | | 406,154 | |
4.000%, 3/1/2022 | | | 1,140,000 | | | | 1,213,644 | |
4.000%, 3/1/2023 | | | 985,000 | | | | 1,071,976 | |
City of Fayetteville, 3.300%, 11/1/2023 | | | 70,000 | | | | 70,241 | |
City of Maumelle, 2.600%, 3/1/2030, Call 3/1/2022 | | | 475,000 | | | | 483,384 | |
City of Springdale Sales & Use Tax Revenue: | | | | | | | | |
3.000%, 11/1/2021 | | | 1,000,000 | | | | 1,036,870 | |
5.000%, 11/1/2028, Call 11/1/2022 | | | 1,000,000 | | | | 1,110,870 | |
City of Stuttgart, AGM, 3.800%, 6/1/2042, Call 6/1/2020 | | | 430,000 | | | | 433,560 | |
Conway Health Facilities Board, 4.250%, 8/1/2021 | | | 410,000 | | | | 420,590 | |
County of Greene, AGM, 4.000%, 3/1/2020, Call 9/30/2019 | | | 1,430,000 | | | | 1,433,189 | |
Henderson State University,BAM: | | | | | | | | |
5.000%, 11/1/2022 | | | 905,000 | | | | 1,005,935 | |
5.000%, 11/1/2023, Call 11/1/2022 | | | 860,000 | | | | 955,073 | |
University of Arkansas: | | | | | | | | |
5.000%, 12/1/2021 | | | 300,000 | | | | 326,370 | |
5.000%, 12/1/2022 | | | 520,000 | | | | 585,307 | |
5.000%, 12/1/2023, Call 12/1/2022 | | | 500,000 | | | | 561,775 | |
5.000%, 11/1/2030, Call 11/1/2024 | | | 1,000,000 | | | | 1,172,450 | |
| | | | | | | | |
| | | | | | | 13,633,414 | |
California — 7.0% | | | | | | | | |
Abag Finance Authority for Nonprofit Corps., 5.000%, 7/1/2020 | | | 515,000 | | | | 532,309 | |
| | | | | | | | |
Abag Finance Authority for Nonprofit Corps., CMI, 5.000%, 4/1/2020 | | | 1,000,000 | | | | 1,023,920 | |
ABC Unified School District,NATL-RE, 5.000%, 2/1/2021 | | | 1,250,000 | | | | 1,322,463 | |
Alvord Unified School District, AGM, 0.000%, 8/1/2046, Call 8/1/2036 | | | 1,150,000 | | | | 1,361,278 | |
Bay Area Toll Authority, 2.600%, (SIFMA Municipal Swap Index Yield), 4/1/2027, Call 10/1/2026 (1) | | | 5,000,000 | | | | 5,232,600 | |
Bellevue Union School District,AGM: | | | | | | | | |
0.000%, 8/1/2030 | | | 585,000 | | | | 470,656 | |
0.000%, 8/1/2031 | | | 615,000 | | | | 469,251 | |
Bonita Unified School District, 5.500%, 8/1/2035, Call 8/1/2021 | | | 940,000 | | | | 1,022,748 | |
Burbank Unified School District, 0.000%, 8/1/2031, Call 2/1/2025 (2) | | | 1,325,000 | | | | 1,308,570 | |
California County Tobacco Securitization Agency, 4.000%, 6/1/2029, Call 9/30/2019 | | | 3,115,000 | | | | 3,167,394 | |
California Health Facilities Financing Authority: | | | | | | | | |
5.000%, 7/1/2037, Call 7/1/2023 | | | 2,000,000 | | | | 2,260,720 | |
5.000%, 8/15/2042, Call 8/15/2027 | | | 1,000,000 | | | | 1,206,680 | |
California Infrastructure & Economic Development Bank, 1.878%, (LIBOR 1 Month), 8/1/2021, Call 2/1/2021 (1) | | | 2,500,000 | | | | 2,501,425 | |
California Municipal Finance Authority, 5.000%, 2/1/2042, Call 2/1/2027 | | | 1,500,000 | | | | 1,790,910 | |
California State Public Works Board, 5.000%, 4/1/2037, Call 4/1/2022 | | | 1,000,000 | | | | 1,091,650 | |
California Statewide Communities Development Authority: | | | | | | | | |
5.000%, 12/1/2031, Call 6/1/2026 (3) | | | 1,000,000 | | | | 1,162,990 | |
5.000%, 12/1/2046, Call 6/1/2026 (3) | | | 1,000,000 | | | | 1,129,680 | |
Carson Redevelopment Agency Successor Agency, AGM, 5.000%, 10/1/2021 | | | 850,000 | | | | 921,256 | |
City of Fairfield, XLCA, 0.000%, 4/1/2022 | | | 1,205,000 | | | | 1,165,898 | |
City of Madera Water Revenue: | | | | | | | | |
5.750%, 1/1/2026, Call 1/1/2020 | | | 1,550,000 | | | | 1,574,676 | |
6.500%, 1/1/2040, Call 1/1/2020 | | | 1,280,000 | | | | 1,303,437 | |
County of Los Angeles, AMBAC TCRs, 0.000%, 9/1/2020 | | | 600,000 | | | | 592,806 | |
County of San Joaquin, 5.000%, 4/1/2022 | | | 350,000 | | | | 384,230 | |
Duarte Unified School District, 5.125%, 8/1/2026 (2) | | | 585,000 | | | | 738,767 | |
El Centro Financing Authority,AGM: | | | | | | | | |
4.000%, 10/1/2021 | | | 460,000 | | | | 488,345 | |
5.000%, 10/1/2022 | | | 580,000 | | | | 649,548 | |
5.000%, 10/1/2023 | | | 800,000 | | | | 925,656 | |
Encinitas Union School District, 0.000%, 8/1/2035, Call 8/1/2032 | | | 500,000 | | | | 668,485 | |
Escondido Union High School District, 0.000%, 8/1/2032, Call 8/1/2025 (2) | | | 1,250,000 | | | | 1,434,788 | |
Escondido Union High School District, AGC, 0.000%, 8/1/2031 | | | 480,000 | | | | 377,635 | |
Fresno Joint Powers Financing Authority, AGM, 5.000%, 4/1/2033, Call 4/1/2027 | | | 1,000,000 | | | | 1,224,490 | |
Fresno Unified School District, 0.000%, 8/1/2034, Call 8/1/2021 | | | 1,045,000 | | | | 415,837 | |
Fresno Unified School District,NATL-RE, 6.000%, 8/1/2026 | | | 2,890,000 | | | | 3,468,867 | |
Golden State Tobacco Securitization Corp.: | | | | | | | | |
5.000%, 6/1/2028, Call 6/1/2027 | | | 1,000,000 | | | | 1,215,500 | |
5.000%, 6/1/2029, Call 6/1/2027 | | | 1,000,000 | | | | 1,209,330 | |
Hacienda La Puente Unified School District,AGM: | | | | | | | | |
5.000%, 6/1/2022 | | | 400,000 | | | | 443,432 | |
5.000%, 6/1/2023 | | | 400,000 | | | | 458,436 | |
5.000%, 6/1/2024 | | | 775,000 | | | | 916,484 | |
5.000%, 6/1/2025 | | | 425,000 | | | | 516,031 | |
Imperial Community College District, AGC, 0.000%, 8/1/2028 | | | 330,000 | | | | 278,678 | |
Imperial County Local Transportation Authority, 5.000%, 6/1/2032, Call 6/1/2022 | | | 2,000,000 | | | | 2,193,660 | |
Jefferson School District/San Joaquin County, 0.000%, 8/1/2029, Call 8/1/2024 | | | 170,000 | | | | 122,679 | |
Jurupa Community Services District, 5.000%, 9/1/2029, Call 9/1/2020 | | | 375,000 | | | | 389,194 | |
Lakeside Union School District/Kern County, AGC, 0.000%, 9/1/2027 | | | 295,000 | | | | 257,517 | |
Long Beach Bond Finance Authority: | | | | | | | | |
5.000%, 11/1/2025, Call 11/1/2021 | | | 1,000,000 | | | | 1,085,350 | |
5.000%, 11/1/2030, Call 11/1/2021 | | | 1,750,000 | | | | 1,893,482 | |
Lynwood Unified School District,AGM: | | | | | | | | |
5.000%, 8/1/2024, Call 8/1/2023 | | | 620,000 | | | | 710,154 | |
5.000%, 8/1/2025, Call 8/1/2023 | | | 760,000 | | | | 866,765 | |
McKinleyville Union School District, AGM, 0.000%, 8/1/2041, Call 8/1/2026 (2) | | | 165,000 | | | | 193,781 | |
McKinleyville Union School District,BAM: | | | | | | | | |
0.000%, 8/1/2036, Call 8/1/2021 | | | 1,200,000 | | | | 543,756 | |
0.000%, 8/1/2037, Call 8/1/2021 | | | 1,980,000 | | | | 844,371 | |
Mendocino-Lake Community College District, AGM, 5.600%, 8/1/2031, Call 8/1/2026 (2) | | | 300,000 | | | | 381,684 | |
Midpeninsula Regional Open Space District, 5.000%, 9/1/2029, Call 9/1/2022 | | | 2,000,000 | | | | 2,248,460 | |
| | | | | | | | |
Modesto Irrigation District, 5.000%, 7/1/2021 | | | 500,000 | | | | 537,490 | |
Mount Diablo Unified School District, AGM, 0.000%, 8/1/2035, Call 8/1/2025 | | | 2,125,000 | | | | 2,251,501 | |
Murrieta Valley Unified School District,NATL-RE, 0.000%, 9/1/2020 | | | 500,000 | | | | 494,055 | |
Norman Y Mineta San Jose International Airport SJC: | | | | | | | | |
5.000%, 3/1/2041, Call 3/1/2027 (4) | | | 1,000,000 | | | | 1,199,880 | |
5.000%, 3/1/2042, Call 3/1/2027 | | | 1,665,000 | | | | 2,025,739 | |
Northern California Gas Authority No. 1, 2.274%, (LIBOR 3 Month), 7/1/2027 (1) | | | 1,915,000 | | | | 1,881,775 | |
Northern California Power Agency: | | | | | | | | |
5.000%, 7/1/2031, Call 7/1/2022 | | | 500,000 | | | | 552,955 | |
5.000%, 7/1/2032, Call 7/1/2022 | | | 700,000 | | | | 773,108 | |
Orchard School District,NATL-RE, 0.000%, 8/1/2023 | | | 590,000 | | | | 559,308 | |
Pasadena Public Financing Authority, 0.000%, 3/1/2029 | | | 2,000,000 | | | | 1,683,660 | |
Roseville Joint Union High School District, 0.000%, 8/1/2022 | | | 305,000 | | | | 293,828 | |
Sacramento Redevelopment Agency Successor Agency,BAM: | | | | | | | | |
5.000%, 12/1/2027, Call 12/1/2025 | | | 235,000 | | | | 285,680 | |
5.000%, 12/1/2028, Call 12/1/2025 | | | 425,000 | | | | 516,804 | |
5.000%, 12/1/2030, Call 12/1/2025 | | | 1,000,000 | | | | 1,209,930 | |
5.000%, 12/1/2031, Call 12/1/2025 | | | 2,000,000 | | | | 2,413,000 | |
San Francisco City & County Airport Comm-San Francisco International Airport: | | | | | | | | |
4.000%, 5/1/2050, Call 5/1/2029 (5) | | | 2,700,000 | | | | 3,034,206 | |
5.000%, 5/1/2024, Call 5/1/2021 | | | 745,000 | | | | 795,451 | |
5.000%, 5/1/2024, Call 5/1/2021 | | | 295,000 | | | | 314,417 | |
5.000%, 5/1/2038, Call 5/1/2029 (5) | | | 4,220,000 | | | | 5,280,866 | |
5.000%, 5/1/2039, Call 5/1/2029 (5) | | | 4,900,000 | | | | 6,111,133 | |
5.000%, 5/1/2040, Call 5/1/2029 (5) | | | 5,335,000 | | | | 6,631,405 | |
5.000%, 5/1/2044, Call 5/1/2029 | | | 5,500,000 | | | | 6,783,700 | |
San Jose Financing Authority, 5.000%, 6/1/2039, Call 6/1/2023 | | | 1,435,000 | | | | 1,627,089 | |
San Jose Unified School District,NATL-RE, 0.000%, 8/1/2027 | | | 1,495,000 | | | | 1,327,037 | |
San Miguel Joint Union School District,AGM: | | | | | | | | |
0.000%, 6/15/2020 | | | 415,000 | | | | 411,207 | |
0.000%, 6/15/2021 | | | 490,000 | | | | 479,338 | |
0.000%, 6/15/2022 | | | 505,000 | | | | 486,371 | |
Santa Ana Unified School District, 0.000%, 8/1/2021 | | | 500,000 | | | | 487,690 | |
Santa Barbara County College School District: | | | | | | | | |
0.000%, 8/1/2027 | | | 365,000 | | | | 319,200 | |
0.000%, 8/1/2031 | | | 470,000 | | | | 365,439 | |
State of California: | | | | | | | | |
5.000%, 4/1/2036, Call 4/1/2029 | | | 4,500,000 | | | | 5,847,075 | |
5.250%, 9/1/2025, Call 9/1/2021 | | | 2,045,000 | | | | 2,218,027 | |
6.000%, 3/1/2033, Call 3/1/2020 | | | 1,550,000 | | | | 1,587,680 | |
Twin Rivers Unified School District, AGM, 3.200%, 6/1/2020, Call 10/1/2019 (1) | | | 1,365,000 | | | | 1,367,170 | |
Vallejo City Unified School District,NATL-RE, 5.900%, 8/1/2025 | | | 1,225,000 | | | | 1,440,490 | |
Walnut Creek Elementary School District Contra Costa County, 0.000%, 9/1/2023 | | | 1,560,000 | | | | 1,480,081 | |
Watereuse Finance Authority, BAM TCRs, 5.500%, 5/1/2036, Call 5/1/2024 | | | 2,635,000 | | | | 3,126,217 | |
| | |
West Contra Costa Unified School District, AGMNATL-RE FGIC, 0.000%, 8/1/2025 | | | 310,000 | | | | 283,535 | |
West Kern Water District, 5.000%, 6/1/2028, Call 6/1/2021 | | | 2,000,000 | | | | 2,130,620 | |
Westminster School District, BAM, 0.000%, 8/1/2048, Call 8/1/2023 | | | 7,045,000 | | | | 1,205,188 | |
Windsor Unified School District,AGM: | | | | | | | | |
0.000%, 8/1/2020 | | | 105,000 | | | | 103,884 | |
0.000%, 8/1/2023 | | | 240,000 | | | | 226,985 | |
0.000%, 8/1/2024, Call 8/1/2023 | | | 330,000 | | | | 297,997 | |
0.000%, 8/1/2025, Call 8/1/2023 | | | 270,000 | | | | 231,798 | |
0.000%, 8/1/2026, Call 8/1/2023 | | | 330,000 | | | | 268,293 | |
0.000%, 8/1/2028, Call 8/1/2023 | | | 420,000 | | | | 305,638 | |
| | | | | | | | |
| | | | | | | 133,412,649 | |
Colorado — 3.4% | | | | | | | | |
Adams & Arapahoe Joint School District 28J Aurora, SAW, 5.000%, 12/1/2031, Call 12/1/2026 | | | 5,000,000 | | | | 6,235,700 | |
Adams County School District No. 14,SAW: | | | | | | | | |
5.000%, 12/1/2024 | | | 500,000 | | | | 596,390 | |
5.000%, 12/1/2026, Call 12/1/2024 | | | 355,000 | | | | 426,887 | |
5.000%, 12/1/2027, Call 12/1/2024 | | | 500,000 | | | | 600,225 | |
Arkansas River Power Authority, 5.000%, 10/1/2043, Call 10/1/2028 | | | 2,250,000 | | | | 2,628,495 | |
City & County of Denver, 5.000%, 8/1/2041, Call 8/1/2026 | | | 8,000,000 | | | | 9,643,280 | |
| | | | | | | | |
City & County of Denver Airport System Revenue: | | | | | | | | |
5.000%, 11/15/2021 | | | 500,000 | | | | 542,520 | |
5.000%, 11/15/2029, Call 11/15/2027 | | | 4,945,000 | | | | 6,210,079 | |
5.000%, 11/15/2030, Call 11/15/2027 | | | 5,010,000 | | | | 6,254,885 | |
5.000%, 12/1/2048, Call 12/1/2028 | | | 3,000,000 | | | | 3,661,350 | |
Colorado Educational & Cultural Facilities Authority: | | | | | | | | |
4.000%, 12/15/2025 | | | 535,000 | | | | 573,242 | |
5.000%, 9/1/2020 (2) | | | 1,060,000 | | | | 1,098,944 | |
5.000%, 9/1/2021 (2) | | | 865,000 | | | | 927,877 | |
Colorado Health Facilities Authority: | | | | | | | | |
3.125%, 5/15/2027, Call 5/15/2020 | | | 250,000 | | | | 251,258 | |
4.000%, 11/15/2038, Call 11/15/2029 | | | 1,000,000 | | | | 1,166,280 | |
4.000%, 11/15/2043, Call 11/15/2029 | | | 1,000,000 | | | | 1,145,420 | |
4.000%, 8/1/2044, Call 8/1/2029 | | | 2,000,000 | | | | 2,216,240 | |
4.000%, 8/1/2049, Call 8/1/2029 | | | 2,000,000 | | | | 2,201,680 | |
4.500%, 2/1/2020 | | | 455,000 | | | | 459,741 | |
5.000%, 9/1/2019 | | | 560,000 | | | | 560,000 | |
5.000%, 2/1/2021 | | | 475,000 | | | | 494,518 | |
5.000%, 9/1/2022 | | | 750,000 | | | | 829,815 | |
5.000%, 12/1/2023 | | | 215,000 | | | | 245,025 | |
5.000%, 2/1/2024 | | | 420,000 | | | | 469,279 | |
5.000%, 6/1/2047, Call 6/1/2027 | | | 1,000,000 | | | | 1,262,400 | |
5.250%, 1/1/2025, Call 1/1/2020 | | | 460,000 | | | | 466,150 | |
5.250%, 5/15/2037, Call 5/15/2027 | | | 1,000,000 | | | | 1,159,540 | |
Commerce City Northern Infrastructure General Improvement District,AGM: | | | | | | | | |
5.000%, 12/1/2020 | | | 785,000 | | | | 823,638 | |
5.000%, 12/1/2021 | | | 725,000 | | | | 786,871 | |
5.000%, 12/1/2022 | | | 1,185,000 | | | | 1,328,172 | |
County of Boulder, 5.000%, 12/1/2025, Call 12/1/2020 | | | 475,000 | | | | 497,030 | |
| | |
Denver City & County School District No. 1, SAW, 5.000%, 12/1/2032, Call 12/1/2022 | | | 1,500,000 | | | | 1,689,870 | |
Denver Convention Center Hotel Authority: | | | | | | | | |
5.000%, 12/1/2033, Call 12/1/2026 | | | 1,000,000 | | | | 1,177,790 | |
5.000%, 12/1/2034, Call 12/1/2026 | | | 1,000,000 | | | | 1,177,540 | |
Denver Health & Hospital Authority, 5.500%, 12/1/2019 | | | 615,000 | | | | 621,408 | |
Park Creek Metropolitan District, 5.000%, 12/1/2030, Call 12/1/2025 | | | 1,895,000 | | | | 2,249,270 | |
Rangely Hospital District, 6.000%, 11/1/2026, Call 11/1/2021 | | | 2,000,000 | | | | 2,167,100 | |
| | |
Weld County School District No.RE-7 Platte Valley, SAW, 4.000%, 12/1/2023, Call 12/1/2020 | | | 1,140,000 | | | | 1,181,029 | |
| | | | | | | | |
| | | | | | | 66,026,938 | |
Connecticut — 1.6% | | | | | | | | |
City of New Haven,AGM: | | | | | | | | |
5.000%, 8/1/2023 | | | 295,000 | | | | 339,259 | |
5.000%, 8/1/2023 | | | 1,765,000 | | | | 1,997,080 | |
Connecticut Housing Finance Authority, 3.600%, 11/15/2030, Call 11/15/2024 | | | 305,000 | | | | 326,402 | |
Connecticut State Health & Educational Facilities Authority: | | | | | | | | |
4.000%, 7/1/2041, Call 7/1/2029 | | | 3,000,000 | | | | 3,367,590 | |
4.000%, 7/1/2049, Call 7/1/2029 | | | 2,500,000 | | | | 2,770,950 | |
5.000%, 7/1/2029, Call 7/1/2028 | | | 1,000,000 | | | | 1,272,770 | |
State of Connecticut: | | | | | | | | |
5.000%, 3/15/2027, Call 3/15/2026 | | | 2,155,000 | | | | 2,631,557 | |
5.000%, 4/15/2028 | | | 1,250,000 | | | | 1,593,675 | |
5.000%, 4/15/2030, Call 4/15/2029 | | | 1,150,000 | | | | 1,480,360 | |
5.000%, 4/15/2034, Call 4/15/2027 | | | 3,000,000 | | | | 3,648,000 | |
University of Connecticut: | | | | | | | | |
5.000%, 3/15/2032, Call 3/15/2026 | | | 2,000,000 | | | | 2,400,860 | |
5.000%, 1/15/2033, Call 1/15/2027 | | | 4,000,000 | | | | 4,882,680 | |
5.000%, 11/1/2034, Call 11/1/2028 | | | 1,000,000 | | | | 1,254,800 | |
5.000%, 11/1/2035, Call 11/1/2028 | | | 1,000,000 | | | | 1,251,040 | |
5.000%, 11/1/2036, Call 11/1/2028 | | | 1,485,000 | | | | 1,852,433 | |
| | | | | | | | |
| | | | | | | 31,069,456 | |
Delaware — 0.4% | | | | | | | | |
City of Wilmington, 5.000%, 10/1/2025, Call 10/1/2023 | | | 3,715,000 | | | | 4,285,624 | |
Delaware State Economic Development Authority: | | | | | | | | |
| | | | | | | | |
5.000%, 6/1/2036, Call 6/1/2026 | | | 500,000 | | | | 550,965 | |
5.000%, 6/1/2046, Call 6/1/2026 | | | 1,000,000 | | | | 1,084,320 | |
Sustainable Energy Utility, Inc., 5.000%, 9/15/2034, Call 9/15/2021 | | | 1,580,000 | | | | 1,693,412 | |
| | | | | | | | |
| | | | | | | 7,614,321 | |
District of Columbia — 0.4% | | | | | | | | |
District of Columbia: | | | | | | | | |
5.000%, 10/1/2025, Call 10/1/2021 | | | 1,865,000 | | | | 2,002,935 | |
5.000%, 6/1/2036, Call 6/1/2026 | | | 2,500,000 | | | | 2,902,375 | |
5.000%, 12/1/2036, Call 12/1/2021 | | | 500,000 | | | | 540,120 | |
Washington Convention & Sports Authority, 5.000%, 10/1/2030, Call 10/1/2027 | | | 1,500,000 | | | | 1,893,180 | |
| | | | | | | | |
| | | | | | | 7,338,610 | |
Florida — 5.4% | | | | | | | | |
Central Florida Expressway Authority, 4.000%, 7/1/2041, Call 7/1/2027 | | | 4,000,000 | | | | 4,481,320 | |
City of Atlantic Beach: | | | | | | | | |
5.000%, 11/15/2043, Call 11/15/2025 | | | 1,085,000 | | | | 1,253,056 | |
5.000%, 11/15/2048, Call 11/15/2025 | | | 1,750,000 | | | | 2,013,602 | |
City of Boynton Beach Utility System Revenue, AGM, 5.000%, 11/1/2027, Call 11/1/2021 | | | 1,000,000 | | | | 1,079,090 | |
City of Gulf Breeze, 5.000%, 12/1/2023, Call 12/1/2020 | | | 2,000,000 | | | | 2,093,020 | |
City of Lakeland Department of Electric Utilities, AGM, 5.250%, 10/1/2028 | | | 1,250,000 | | | | 1,680,800 | |
City of North Port, BAM, 5.000%, 7/1/2022 | | | 200,000 | | | | 220,242 | |
City of Orlando, AGM, 5.000%, 11/1/2035, Call 11/1/2027 | | | 2,270,000 | | | | 2,795,982 | |
City of Sunrise,NATL-RE: | | | | | | | | |
0.000%, 10/1/2019 | | | 905,000 | | | | 904,231 | |
0.000%, 10/1/2020 | | | 975,000 | | | | 962,227 | |
0.000%, 10/1/2021 | | | 175,000 | | | | 170,322 | |
City of Sunrise Utility System Revenue, 4.000%, 10/1/2019 | | | 540,000 | | | | 541,210 | |
City of Tallahassee: | | | | | | | | |
5.000%, 12/1/2026, Call 12/1/2025 | | | 450,000 | | | | 536,927 | |
5.000%, 12/1/2027, Call 12/1/2025 | | | 400,000 | | | | 475,544 | |
City of Tampa, 5.250%, 11/15/2026, Call 5/15/2020 | | | 2,000,000 | | | | 2,058,020 | |
City of Tampa, AMBAC, 0.000%, 4/1/2021 | | | 460,000 | | | | 449,816 | |
Columbia County School Board, BAM, 5.000%, 7/1/2026, Call 7/1/2025 | | | 495,000 | | | | 593,852 | |
County of Broward, AGM, 5.000%, 4/1/2033, Call 4/1/2023 | | | 740,000 | | | | 816,634 | |
County of Broward Airport System Revenue: | | | | | | | | |
5.000%, 10/1/2026, Call 10/1/2025 (4) | | | 750,000 | | | | 907,582 | |
5.000%, 10/1/2031, Call 10/1/2025 (4) | | | 1,000,000 | | | | 1,187,590 | |
County of Lee County Water & Sewer Revenue, 5.000%, 10/1/2029, Call 10/1/2022 | | | 2,000,000 | | | | 2,215,420 | |
County of Manatee, 1.410%, 9/1/2024, Call 9/6/2019 (1) | | | 3,000,000 | | | | 3,000,000 | |
County of Miami-Dade, AGC, 0.000%, 10/1/2021 | | | 610,000 | | | | 594,158 | |
County of Miami-Dade Aviation Revenue: | | | | | | | | |
4.000%, 10/1/2044, Call 10/1/2029 | | | 1,000,000 | | | | 1,132,030 | |
5.000%, 10/1/2025, Call 10/1/2024 | | | 800,000 | | | | 950,792 | |
5.000%, 10/1/2044, Call 10/1/2029 | | | 3,000,000 | | | | 3,734,250 | |
5.500%, 10/1/2026, Call 10/1/2020 | | | 450,000 | | | | 471,299 | |
5.500%, 10/1/2026, Call 10/1/2020 | | | 1,450,000 | | | | 1,519,426 | |
County of Miami-Dade Aviation Revenue, AGC, 5.000%, 10/1/2029, Call 10/1/2019 | | | 400,000 | | | | 401,188 | |
County of Miami-Dade Water & Sewer System Revenue: | | | | | | | | |
5.000%, 10/1/2033, Call 10/1/2025 | | | 2,000,000 | | | | 2,397,160 | |
5.250%, 10/1/2029, Call 10/1/2023 | | | 100,000 | | | | 115,489 | |
County of Orange Sales Tax Revenue, 5.000%, 1/1/2027, Call 1/1/2022 | | | 5,810,000 | | | | 6,315,528 | |
County of St. Johns,AGM: | | | | | | | | |
5.000%, 10/1/2020 | | | 1,625,000 | | | | 1,692,892 | |
5.000%, 10/1/2021 | | | 1,110,000 | | | | 1,200,898 | |
Emerald Coast Utilities Authority, BAM, 5.000%, 1/1/2032, Call 1/1/2025 | | | 1,445,000 | | | | 1,697,037 | |
Florida Development Finance Corp., 1.900%, 3/17/2020 (1) | | | 10,770,000 | | | | 10,773,446 | |
Florida Housing Finance Corp., GNMA/FNMA/FHLMC, 4.450%, 1/1/2030, Call 7/1/2021 | | | 260,000 | | | | 264,615 | |
Halifax Hospital Medical Center: | | | | | | | | |
5.000%, 6/1/2026 | | | 1,525,000 | | | | 1,844,045 | |
5.000%, 6/1/2027, Call 6/1/2026 | | | 1,295,000 | | | | 1,564,943 | |
Lee County Industrial Development Authority, 5.000%, 11/1/2025, Call 11/1/2020 | | | 2,000,000 | | | | 2,090,640 | |
Lee County School Board, 5.000%, 8/1/2028, Call 8/1/2024 | | | 2,500,000 | | | | 2,923,300 | |
| | | | | | | | |
Miami-Dade County Educational Facilities Authority, 5.000%, 4/1/2031, Call 4/1/2025 | | | 2,000,000 | | | | 2,353,000 | |
Miami-Dade County Industrial Development Authority, 2.125%, 11/1/2019 (1) | | | 4,400,000 | | | | 4,405,544 | |
Monroe County School District, 5.000%, 6/1/2034, Call 6/1/2027 | | | 1,000,000 | | | | 1,231,020 | |
Palm Beach County Health Facilities Authority: | | | | | | | | |
5.000%, 5/15/2036, Call 5/15/2027 | | | 1,000,000 | | | | 1,167,340 | |
5.000%, 5/15/2037, Call 5/15/2027 | | | 1,000,000 | | | | 1,164,890 | |
5.000%, 11/15/2045, Call 11/15/2025 | | | 4,000,000 | | | | 4,663,680 | |
Polk County Housing Finance Authority, GNMA COLL, 5.000%, 9/1/2029, Call 8/1/2020 | | | 150,000 | | | | 155,625 | |
Polk County Industrial Development Authority: | | | | | | | | |
5.000%, 1/1/2029, Call 1/1/2025 | | | 400,000 | | | | 464,668 | |
5.000%, 1/1/2039, Call 1/1/2025 | | | 300,000 | | | | 340,029 | |
5.000%, 1/1/2049, Call 1/1/2025 | | | 1,000,000 | | | | 1,122,250 | |
Sarasota County Health Facilities Authority: | | | | | | | | |
5.000%, 1/1/2030, Call 1/1/2025 | | | 750,000 | | | | 856,058 | |
5.000%, 1/1/2031, Call 1/1/2025 | | | 935,000 | | | | 1,063,188 | |
5.000%, 1/1/2032, Call 1/1/2025 | | | 1,100,000 | | | | 1,246,091 | |
Sarasota County Public Hospital District, 5.000%, 7/1/2041, Call 7/1/2028 | | | 5,000,000 | | | | 6,085,950 | |
St. Lucie County School Board, AGM, 5.000%, 7/1/2022, Call 7/1/2021 | | | 2,500,000 | | | | 2,660,650 | |
Sumter County Industrial Development Authority, 5.000%, 7/1/2020 | | | 500,000 | | | | 515,755 | |
Town of Davie: | | | | | | | | |
5.000%, 4/1/2021 | | | 615,000 | | | | 650,953 | |
5.000%, 4/1/2022 | | | 830,000 | | | | 906,958 | |
| | |
Volusia County Educational Facility Authority, AGM, 5.000%, 10/15/2029, Call 10/15/2021 | | | 730,000 | | | | 789,159 | |
| | | | | | | | |
| | | | | | | 103,962,431 | |
Georgia — 4.8% | | | | | | | | |
Appling County Development Authority, 1.460%, 9/1/2041, Call 10/7/2019 (1) | | | 500,000 | | | | 500,000 | |
Bartow County Development Authority, 1.550%, 8/19/2022 (1) | | | 2,000,000 | | | | 1,995,540 | |
Burke County Development Authority: | | | | | | | | |
2.250%, 5/25/2023 (1) | | | 3,000,000 | | | | 3,063,570 | |
2.925%, 3/12/2024 (1) | | | 4,250,000 | | | | 4,473,210 | |
Carroll City-County Hospital Authority,County Guarantee: | | | | | | | | |
5.000%, 7/1/2023, Call 7/1/2020 | | | 1,185,000 | | | | 1,222,932 | |
5.000%, 7/1/2023, Call 7/1/2020 | | | 1,605,000 | | | | 1,654,482 | |
5.000%, 7/1/2024, Call 7/1/2020 | | | 695,000 | | | | 717,247 | |
5.000%, 7/1/2024, Call 7/1/2020 | | | 945,000 | | | | 973,983 | |
City of Atlanta Department of Aviation: | | | | | | | | |
5.000%, 1/1/2031, Call 1/1/2024 | | | 1,000,000 | | | | 1,149,070 | |
5.000%, 1/1/2032, Call 1/1/2024 | | | 2,500,000 | | | | 2,865,900 | |
5.000%, 1/1/2033, Call 1/1/2024 | | | 1,000,000 | | | | 1,144,550 | |
5.000%, 1/1/2034, Call 1/1/2024 | | | 1,000,000 | | | | 1,142,740 | |
City of Atlanta Water & Wastewater Revenue: | | | | | | | | |
5.000%, 11/1/2040, Call 11/1/2027 | | | 1,000,000 | | | | 1,239,650 | |
5.000%, 11/1/2043, Call 11/1/2027 | | | 3,000,000 | | | | 3,701,220 | |
City of Atlanta Water & Wastewater Revenue,NATL-RE, 5.500%, 11/1/2022 | | | 1,000,000 | | | | 1,096,530 | |
Cobb County Kennestone Hospital Authority, 5.000%, 4/1/2031, Call 4/1/2021 | | | 3,000,000 | | | | 3,152,370 | |
Floyd County Hospital Authority,County Guarantee: | | | | | | | | |
5.000%, 7/1/2020 | | | 1,335,000 | | | | 1,376,385 | |
5.000%, 7/1/2021 | | | 1,155,000 | | | | 1,231,161 | |
5.000%, 7/1/2027, Call 7/1/2022 | | | 1,250,000 | | | | 1,365,213 | |
Gainesville & Hall County Development Authority: | | | | | | | | |
5.000%, 3/1/2027 | | | 750,000 | | | | 824,850 | |
5.000%, 3/1/2037, Call 3/1/2027 | | | 500,000 | | | | 565,185 | |
5.000%, 3/1/2047, Call 3/1/2027 | | | 3,000,000 | | | | 3,352,170 | |
Gainesville & Hall County Hospital Authority: | | | | | | | | |
5.000%, 2/15/2036, Call 2/15/2027 | | | 1,500,000 | | | | 1,788,315 | |
5.000%, 2/15/2037, Call 2/15/2027 | | | 2,000,000 | | | | 2,378,300 | |
5.000%, 2/15/2042, Call 2/15/2027 | | | 3,000,000 | | | | 3,536,970 | |
Jefferson City School District, SAW, 5.250%, 2/1/2029, Call 2/1/2021 | | | 1,350,000 | | | | 1,429,245 | |
Main Street Natural Gas, Inc.: | | | | | | | | |
1.920%, (SIFMA Municipal Swap Index Yield), 12/1/2023, Call 9/1/2023 (1) | | | 5,000,000 | | | | 4,979,750 | |
2.244%, (LIBOR 1 Month), 9/1/2023, Call 6/1/2023 (1) | | | 7,000,000 | | | | 7,043,750 | |
2.324%, (LIBOR 1 Month), 12/1/2023, Call 9/1/2023 (1) | | | 5,000,000 | | | | 5,020,000 | |
| | | | | | | | |
4.000%, 12/2/2024, Call 9/1/2024 (1) | | | 6,000,000 | | | | 6,824,700 | |
5.000%, 5/15/2030, Call 5/15/2029 | | | 2,750,000 | | | | 3,477,237 | |
5.000%, 5/15/2031, Call 5/15/2029 | | | 4,000,000 | | | | 5,024,960 | |
Monroe County Development Authority, 2.250%, 7/1/2025, Call 6/13/2024 | | | 3,000,000 | | | | 3,074,850 | |
Private Colleges & Universities Authority, 5.000%, 10/1/2020 | | | 575,000 | | | | 596,873 | |
South Fulton Municipal Regional Water & Sewer Authority,BAM: | | | | | | | | |
5.000%, 1/1/2023 | | | 800,000 | | | | 896,024 | |
5.000%, 1/1/2024 | | | 1,000,000 | | | | 1,153,160 | |
5.000%, 1/1/2025, Call 1/1/2024 | | | 700,000 | | | | 815,486 | |
South Regional Joint Development Authority, 5.250%, 8/1/2023 | | | 25,000 | | | | 28,677 | |
Valdosta & Lowndes County Hospital Authority, County Guarantee, 5.000%, 10/1/2025, Call 10/1/2021 | | | 2,940,000 | | | | 3,175,200 | |
| | |
Winder-Barrow Industrial Building Authority, AGM, 5.000%, 12/1/2029, Call 12/1/2021 | | | 1,000,000 | | | | 1,080,240 | |
| | | | | | | | |
| | | | | | | 91,131,695 | |
Guam — 0.1% | | | | | | | | |
Territory of Guam: | | | | | | | | |
5.000%, 12/1/2032, Call 12/1/2026 | | | 1,310,000 | | | | 1,514,923 | |
5.000%, 12/1/2033, Call 12/1/2026 | | | 1,000,000 | | | | 1,154,000 | |
| | | | | | | | |
| | | | | | | 2,668,923 | |
Hawaii — 0.1% | | | | | | | | |
City & County of Honolulu: | | | | | | | | |
5.000%, 10/1/2022 | | | 500,000 | | | | 559,955 | |
5.000%, 10/1/2023 | | | 500,000 | | | | 578,535 | |
| | | | | | | | |
| | | | | | | 1,138,490 | |
Idaho — 0.1% | | | | | | | | |
| | |
Canyon County School District No. 131 Nampa, School Bond Gty, 5.000%, 9/15/2023 | | | 1,000,000 | | | | 1,149,420 | |
| | |
Illinois — 18.3% | | | | | | | | |
Bureau County Township High School District No. 502, BAM, 6.625%, 10/1/2043, Call 12/1/2023 | | | 3,400,000 | | | | 4,176,322 | |
Chicago Board of Education: | | | | | | | | |
5.000%, 4/1/2042, Call 4/1/2028 | | | 1,500,000 | | | | 1,721,100 | |
5.000%, 4/1/2046, Call 4/1/2028 | | | 1,250,000 | | | | 1,426,200 | |
6.000%, 4/1/2046, Call 4/1/2027 | | | 1,500,000 | | | | 1,818,255 | |
Chicago Board of Education,NATL-RE: | | | | | | | | |
0.000%, 12/1/2022 | | | 365,000 | | | | 338,282 | |
5.000%, 12/1/2019 | | | 70,000 | | | | 70,545 | |
5.250%, 12/1/2021 | | | 1,000,000 | | | | 1,066,930 | |
Chicago Housing Authority,HUD SEC 8: | | | | | | | | |
5.000%, 1/1/2023 | | | 710,000 | | | | 792,275 | |
5.000%, 1/1/2037, Call 1/1/2028 | | | 2,500,000 | | | | 3,007,975 | |
Chicago O’Hare International Airport: | | | | | | | | |
5.000%, 1/1/2026, Call 1/1/2025 (4) | | | 1,500,000 | | | | 1,767,435 | |
5.000%, 1/1/2031, Call 1/1/2025 (4) | | | 1,000,000 | | | | 1,162,690 | |
5.000%, 1/1/2037, Call 1/1/2029 | | | 1,200,000 | | | | 1,481,448 | |
5.000%, 1/1/2038, Call 1/1/2027 | | | 2,290,000 | | | | 2,765,564 | |
5.000%, 1/1/2038, Call 1/1/2029 | | | 4,250,000 | | | | 5,230,390 | |
5.000%, 1/1/2039, Call 1/1/2029 | | | 1,250,000 | | | | 1,534,475 | |
5.250%, 1/1/2030, Call 1/1/2020 | | | 2,595,000 | | | | 2,629,020 | |
Chicago O’Hare International Airport, AGC, 5.250%, 1/1/2026, Call 1/1/2020 | | | 775,000 | | | | 785,695 | |
Chicago Park District: | | | | | | | | |
5.000%, 1/1/2023, Call 1/1/2022 | | | 1,060,000 | | | | 1,138,578 | |
5.000%, 1/1/2025, Call 7/1/2020 | | | 230,000 | | | | 236,171 | |
5.000%, 1/1/2026, Call 1/1/2021 | | | 730,000 | | | | 760,915 | |
5.000%, 1/1/2028, Call 1/1/2024 | | | 2,500,000 | | | | 2,820,750 | |
5.000%, 1/1/2031, Call 1/1/2026 | | | 1,790,000 | | | | 2,073,321 | |
5.000%, 1/1/2040, Call 1/1/2026 | | | 1,000,000 | | | | 1,131,920 | |
Chicago Transit Authority, 5.000%, 12/1/2046, Call 12/1/2026 | | | 3,000,000 | | | | 3,448,860 | |
City of Chicago: | | | | | | | | |
5.000%, 1/1/2039, Call 1/1/2029 | | | 6,500,000 | | | | 7,485,660 | |
5.000%, 1/1/2040, Call 1/1/2029 | | | 10,900,000 | | | | 12,520,285 | |
5.000%, 1/1/2044, Call 1/1/2029 | | | 3,750,000 | | | | 4,274,250 | |
| | | | | | | | |
5.500%, 1/1/2035, Call 1/1/2029 | | | 2,000,000 | | | | 2,430,880 | |
6.000%, 1/1/2038, Call 1/1/2027 | | | 10,000,000 | | | | 12,004,400 | |
City of Chicago Wastewater Transmission Revenue: | | | | | | | | |
5.000%, 1/1/2031, Call 1/1/2025 | | | 3,715,000 | | | | 4,252,300 | |
5.000%, 1/1/2032, Call 1/1/2027 | | | 2,000,000 | | | | 2,376,540 | |
5.000%, 1/1/2035, Call 1/1/2027 | | | 3,310,000 | | | | 3,905,502 | |
5.000%, 1/1/2039, Call 1/1/2025 | | | 500,000 | | | | 562,020 | |
City of Chicago Waterworks Revenue: | | | | | | | | |
5.000%, 11/1/2025 | | | 2,000,000 | | | | 2,388,220 | |
5.000%, 11/1/2027, Call 11/1/2026 | | | 2,500,000 | | | | 3,019,175 | |
5.000%, 11/1/2027, Call 11/1/2026 | | | 1,000,000 | | | | 1,207,670 | |
5.000%, 11/1/2028, Call 11/1/2026 | | | 1,000,000 | | | | 1,202,030 | |
5.000%, 11/1/2029, Call 11/1/2026 | | | 1,000,000 | | | | 1,197,150 | |
City of Chicago Waterworks Revenue, AGM, 5.000%, 11/1/2027, Call 9/30/2019 | | | 60,000 | | | | 60,176 | |
City of Springfield, 5.000%, 12/1/2022 | | | 905,000 | | | | 997,916 | |
City of Springfield Electric Revenue: | | | | | | | | |
5.000%, 3/1/2028, Call 3/1/2025 | | | 1,000,000 | | | | 1,176,400 | |
5.000%, 3/1/2029, Call 3/1/2025 | | | 1,000,000 | | | | 1,173,340 | |
Cook County Community Consolidated School District No. 65 Evanston: | | | | | | | | |
0.000%, 12/1/2027, Call 12/1/2024 | | | 300,000 | | | | 234,459 | |
0.000%, 12/1/2029, Call 12/1/2024 | | | 400,000 | | | | 281,908 | |
0.000%, 12/1/2030, Call 12/1/2024 | | | 1,130,000 | | | | 757,948 | |
0.000%, 12/1/2031, Call 12/1/2024 | | | 1,500,000 | | | | 952,740 | |
Cook County School District No 63 East Maine, 5.000%, 12/1/2027 | | | 2,350,000 | | | | 2,967,016 | |
Cook County School District No. 103 Lyons, AGM, 0.000%, 12/1/2021 | | | 850,000 | | | | 819,383 | |
Cook County School District No. 124 Evergreen Park, BAM, 4.000%, 12/1/2020 | | | 450,000 | | | | 465,251 | |
Cook County School District No. 144 Prairie Hills,AGM: | | | | | | | | |
0.000%, 12/1/2028 | | | 2,830,000 | | | | 2,285,395 | |
0.000%, 12/1/2029 | | | 2,580,000 | | | | 2,011,884 | |
Cook County School District No. 83 Mannheim, 5.625%, 6/1/2033 | | | 2,980,000 | | | | 3,829,985 | |
Cook County Township High School District No. 201 J Sterling Morton, AMBAC, 0.000%, 12/1/2019 | | | 675,000 | | | | 672,273 | |
Cook County Township High School District No. 220 Reavis, 6.000%, 12/1/2030, Call 12/1/2023 | | | 1,000,000 | | | | 1,181,630 | |
Cook County Township High School District No. 220 Reavis,BAM: | | | | | | | | |
6.000%, 12/1/2031, Call 12/1/2023 | | | 2,035,000 | | | | 2,413,673 | |
6.000%, 12/1/2032, Call 12/1/2023 | | | 2,160,000 | | | | 2,550,701 | |
6.000%, 6/1/2033, Call 12/1/2023 | | | 2,235,000 | | | | 2,638,730 | |
County of Cook: | | | | | | | | |
5.000%, 11/15/2029, Call 11/15/2026 | | | 3,270,000 | | | | 3,920,730 | |
5.000%, 11/15/2030, Call 11/15/2026 | | | 2,750,000 | | | | 3,281,272 | |
5.250%, 11/15/2023, Call 11/15/2020 | | | 350,000 | | | | 366,020 | |
County of Cook, BAM TCRs, 5.000%, 11/15/2023 | | | 1,000,000 | | | | 1,140,420 | |
County of Cook Sales Tax Revenue: | | | | | | | | |
5.250%, 11/15/2035, Call 11/15/2027 | | | 1,520,000 | | | | 1,868,566 | |
5.250%, 11/15/2036, Call 11/15/2027 | | | 3,000,000 | | | | 3,678,270 | |
County of St. Clair: | | | | | | | | |
5.250%, 10/1/2024, Call 10/1/2019 | | | 485,000 | | | | 486,494 | |
5.250%, 10/1/2024, Call 10/1/2019 | | | 215,000 | | | | 215,660 | |
5.250%, 10/1/2027, Call 10/1/2019 | | | 835,000 | | | | 837,572 | |
5.250%, 10/1/2027, Call 10/1/2019 | | | 315,000 | | | | 315,967 | |
County of St. Clair Highway Revenue, 5.500%, 1/1/2038, Call 1/1/2023 | | | 825,000 | | | | 936,688 | |
DeKalb County Community Unit School District No. 424 Genoa-Kingston, AMBAC, 0.000%, 1/1/2020 | | | 600,000 | | | | 596,976 | |
DeKalb County Community Unit School District No. 428 DeKalb: | | | | | | | | |
0.000%, 1/1/2025, Call 7/1/2020 | | | 400,000 | | | | 308,460 | |
0.000%, 1/1/2028, Call 7/1/2020 | | | 1,000,000 | | | | 637,580 | |
DeKalb Kane & LaSalle Counties Community College District No. 523 Kishwaukee, 0.000%, 2/1/2035, Call 2/1/2021 | | | 470,000 | | | | 175,089 | |
DuPage County School District No. 16 Queen Bee,NATL-RE FGIC, 0.000%, 11/1/2019 | | | 530,000 | | | | 528,521 | |
Frankfort Square Park District, AMBAC, 0.000%, 1/1/2022 | | | 670,000 | | | | 625,418 | |
Illinois Development Finance Authority,AGM: | | | | | | | | |
0.000%, 1/1/2020 | | | 450,000 | | | | 448,209 | |
0.000%, 1/1/2020 | | | 500,000 | | | | 497,510 | |
| | | | | | | | |
0.000%, 1/1/2021 | | | 95,000 | | | | 93,433 | |
0.000%, 1/1/2021 | | | 160,000 | | | | 156,979 | |
Illinois Finance Authority: | | | | | | | | |
5.000%, 5/15/2023 | | | 445,000 | | | | 492,829 | |
5.000%, 11/15/2023, Call 11/15/2022 | | | 215,000 | | | | 238,981 | |
5.000%, 8/15/2024 | | | 250,000 | | | | 288,038 | |
5.000%, 5/15/2025 | | | 1,000,000 | | | | 1,117,860 | |
5.000%, 11/15/2026, Call 11/15/2025 | | | 1,000,000 | | | | 1,205,080 | |
5.000%, 11/15/2027, Call 11/15/2025 | | | 500,000 | | | | 600,675 | |
5.000%, 11/1/2029, Call 11/1/2026 | | | 2,000,000 | | | | 2,392,820 | |
5.000%, 5/15/2030, Call 5/15/2025 | | | 1,000,000 | | | | 1,099,030 | |
5.000%, 1/1/2036, Call 1/1/2027 | | | 2,000,000 | | | | 2,352,600 | |
5.000%, 12/1/2037, Call 12/1/2027 | | | 1,000,000 | | | | 1,150,440 | |
5.000%, 8/1/2042, Call 8/1/2027 | | | 580,000 | | | | 668,380 | |
5.000%, 5/15/2043, Call 11/15/2028 | | | 5,000,000 | | | | 6,023,800 | |
5.000%, 1/1/2044, Call 1/1/2028 | | | 5,000,000 | | | | 5,816,950 | |
5.000%, 10/1/2044, Call 10/1/2029 | | | 1,000,000 | | | | 1,231,580 | |
5.000%, 8/1/2046, Call 8/1/2027 | | | 515,000 | | | | 591,534 | |
5.000%, 8/1/2047, Call 8/1/2027 | | | 750,000 | | | | 861,157 | |
5.000%, 12/1/2047, Call 12/1/2027 | | | 1,000,000 | | | | 1,130,560 | |
5.000%, 10/1/2049, Call 10/1/2029 | | | 1,250,000 | | | | 1,529,512 | |
5.250%, 2/15/2030, Call 2/15/2020 | | | 250,000 | | | | 254,603 | |
6.000%, 10/1/2024, Call 10/1/2021 | | | 1,010,000 | | | | 1,069,863 | |
6.000%, 8/15/2041, Call 8/15/2021 | | | 2,665,000 | | | | 2,879,746 | |
6.875%, 10/1/2043, Call 10/1/2021 | | | 3,000,000 | | | | 3,199,560 | |
Illinois Housing Development Authority, GNMA/FNMA/FHLMC, 2.450%, 6/1/2043, Call 1/1/2023 | | | 487,593 | | | | 489,309 | |
Illinois State Toll Highway Authority: | | | | | | | | |
5.000%, 1/1/2026 | | | 2,180,000 | | | | 2,652,951 | |
5.000%, 1/1/2028, Call 1/1/2023 | | | 1,000,000 | | | | 1,117,260 | |
5.000%, 1/1/2029, Call 1/1/2023 | | | 1,000,000 | | | | 1,120,650 | |
5.000%, 1/1/2030, Call 1/1/2026 | | | 1,000,000 | | | | 1,205,100 | |
5.000%, 1/1/2031, Call 1/1/2029 | | | 500,000 | | | | 640,555 | |
5.000%, 12/1/2032, Call 1/1/2026 | | | 7,790,000 | | | | 9,302,428 | |
5.000%, 1/1/2044, Call 7/1/2029 | | | 7,000,000 | | | | 8,669,570 | |
Kane & DeKalb Counties Community Unit School District No. 302 Kaneland,NATL-RE, 0.000%, 2/1/2023 | | | 5,450,000 | | | | 5,146,271 | |
Kane Cook & DuPage Counties School District No.U-46 Elgin,AMBAC: | | | | | | | | |
0.000%, 1/1/2023 | | | 350,000 | | | | 335,129 | |
0.000%, 1/1/2023 | | | 650,000 | | | | 614,439 | |
Kane McHenry Cook & De Kalb Counties Unit School District No. 300: | | | | | | | | |
5.000%, 1/1/2023 | | | 1,000,000 | | | | 1,117,950 | |
5.000%, 1/1/2024 | | | 1,000,000 | | | | 1,148,170 | |
5.000%, 1/1/2026, Call 1/1/2025 | | | 4,000,000 | | | | 4,713,160 | |
5.250%, 1/1/2033, Call 1/1/2023 | | | 900,000 | | | | 1,015,092 | |
Knox & Warren Counties Community Unit School District No. 205 Galesburg, 6.125%, 1/1/2036, Call 1/1/2021 | | | 1,435,000 | | | | 1,521,043 | |
Lake County School District No. 33 Emmons,XLCA: | | | | | | | | |
0.000%, 12/1/2026 | | | 525,000 | | | | 441,950 | |
0.000%, 12/1/2028 | | | 335,000 | | | | 262,027 | |
Lake County School District No. 56 Gurnee, 5.000%, 1/1/2024 | | | 440,000 | | | | 505,195 | |
McHenry & Kane Counties Community Consolidated School District No. 158 Huntley, AGM FGIC, 0.000%, 1/1/2024 | | | 500,000 | | | | 459,305 | |
McHenry & Kane Counties Community Consolidated School District No. 158 Huntley,NATL-RE: | | | | | | | | |
0.000%, 1/1/2021 | | | 1,070,000 | | | | 1,052,345 | |
0.000%, 1/1/2021 | | | 830,000 | | | | 810,487 | |
McHenry County Community Unit School District No. 12 Johnsburg,AGM: | | | | | | | | |
5.000%, 1/1/2020 | | | 550,000 | | | | 556,133 | |
5.000%, 1/1/2021 | | | 810,000 | | | | 844,749 | |
5.000%, 1/1/2022 | | | 895,000 | | | | 961,525 | |
Metropolitan Pier & Exposition Authority,NATL-RE: | | | | | | | | |
0.000%, 6/15/2020 | | | 440,000 | | | | 434,157 | |
0.000%, 12/15/2023 | | | 20,000 | | | | 18,881 | |
0.000%, 12/15/2023 | | | 835,000 | | | | 764,142 | |
| | | | | | | | |
0.000%, 6/15/2024 | | | 1,000,000 | | | | 903,100 | |
5.700%, 6/15/2023 | | | 1,710,000 | | | | 1,999,075 | |
5.700%, 6/15/2023 | | | 1,820,000 | | | | 2,072,434 | |
Metropolitan Water Reclamation District of Greater Chicago, 5.000%, 12/1/2031, Call 12/1/2026 | | | 3,500,000 | | | | 4,244,100 | |
Peoria Public Building Commission, AGM, 5.000%, 12/1/2029, Call 12/1/2027 (5) | | | 2,000,000 | | | | 2,470,160 | |
Railsplitter Tobacco Settlement Authority: | | | | | | | | |
5.000%, 6/1/2027, Call 6/1/2026 | | | 2,000,000 | | | | 2,435,380 | |
5.250%, 6/1/2021 | | | 1,120,000 | | | | 1,194,536 | |
Sales Tax Securitization Corp.: | | | | | | | | |
5.000%, 1/1/2029, Call 1/1/2028 | | | 1,000,000 | | | | 1,209,970 | |
5.000%, 1/1/2030, Call 1/1/2028 | | | 1,450,000 | | | | 1,741,798 | |
5.000%, 1/1/2031, Call 1/1/2028 | | | 2,000,000 | | | | 2,387,720 | |
5.250%, 1/1/2043, Call 1/1/2029 | | | 5,000,000 | | | | 5,968,900 | |
South Suburban College Community School District No. 510, AGC, 0.000%, 12/1/2025 | | | 1,000,000 | | | | 884,210 | |
Southern Illinois University, BAM, 5.000%, 4/1/2026, Call 4/1/2025 | | | 1,175,000 | | | | 1,389,437 | |
Southwestern Illinois Development Authority: | | | | | | | | |
5.000%, 10/15/2029, Call 10/15/2025 | | | 1,780,000 | | | | 2,070,959 | |
5.000%, 10/15/2032, Call 10/15/2025 | | | 1,335,000 | | | | 1,546,851 | |
St. Clair County Community Unit School District No. 187 Cahokia, AGM, 5.000%, 1/1/2020 | | | 630,000 | | | | 637,604 | |
State of Illinois: | | | | | | | | |
5.000%, 3/1/2020 | | | 500,000 | | | | 508,045 | |
5.000%, 6/1/2020 | | | 9,900,000 | | | | 10,139,481 | |
5.000%, 8/1/2020 | | | 2,000,000 | | | | 2,059,020 | |
5.000%, 4/1/2024, Call 4/1/2023 | | | 500,000 | | | | 544,040 | |
5.000%, 11/1/2025 | | | 7,000,000 | | | | 8,027,460 | |
5.000%, 2/1/2027 | | | 5,000,000 | | | | 5,854,350 | |
5.000%, 10/1/2028 | | | 4,700,000 | | | | 5,629,425 | |
5.000%, 2/1/2029, Call 2/1/2027 | | | 1,000,000 | | | | 1,163,180 | |
5.000%, 11/1/2029, Call 11/1/2027 | | | 5,000,000 | | | | 5,830,100 | |
5.000%, 6/15/2034, Call 6/15/2028 | | | 5,000,000 | | | | 5,787,950 | |
6.500%, 6/15/2022 | | | 195,000 | | | | 202,925 | |
State of Illinois, AGM, 5.000%, 4/1/2028, Call 4/1/2023 | | | 3,205,000 | | | | 3,551,204 | |
Tazewell County School District No. 51 Washington Central,NATL-RE, 9.000%, 12/1/2025 | | | 165,000 | | | | 233,025 | |
Town of Cicero,AGM: | | | | | | | | |
5.000%, 1/1/2020 | | | 1,000,000 | | | | 1,011,610 | |
5.000%, 1/1/2021 | | | 1,000,000 | | | | 1,043,570 | |
Village of Bolingbrook, AGM, 5.000%, 1/1/2025, Call 1/1/2020 | | | 1,425,000 | | | | 1,441,102 | |
Village of Elwood,AGC: | | | | | | | | |
0.000%, 3/1/2024, Call 9/1/2019 | | | 250,000 | | | | 199,608 | |
0.000%, 3/1/2026, Call 9/1/2019 | | | 1,280,000 | | | | 913,690 | |
Village of Franklin Park,BAM: | | | | | | | | |
4.000%, 10/1/2019 | | | 420,000 | | | | 420,869 | |
4.000%, 10/1/2020 | | | 615,000 | | | | 633,198 | |
5.000%, 10/1/2022, Call 10/1/2021 | | | 730,000 | | | | 782,436 | |
5.000%, 10/1/2023, Call 10/1/2021 | | | 685,000 | | | | 733,621 | |
5.000%, 10/1/2024, Call 10/1/2021 | | | 425,000 | | | | 455,779 | |
5.000%, 10/1/2025, Call 10/1/2021 | | | 920,000 | | | | 987,528 | |
Village of Justice, AMBAC, 0.000%, 1/1/2021 | | | 635,000 | | | | 616,826 | |
Will & Kankakee Counties School District No. 255: | | | | | | | | |
5.000%, 6/1/2026, Call 6/1/2025 | | | 500,000 | | | | 579,150 | |
5.000%, 6/1/2029, Call 6/1/2025 | | | 600,000 | | | | 688,446 | |
Will County Community High School District No. 210Lincoln-Way: | | | | | | | | |
5.000%, 1/1/2027, Call 1/1/2023 | | | 1,250,000 | | | | 1,335,975 | |
5.000%, 1/1/2028, Call 1/1/2023 | | | 3,500,000 | | | | 3,734,465 | |
5.000%, 1/1/2030, Call 1/1/2023 | | | 2,000,000 | | | | 2,126,280 | |
Will County Community Unit School District No.201-U Crete-Monee,NATL-RE: | | | | | | | | |
0.000%, 11/1/2020 | | | 245,000 | | | | 241,546 | |
0.000%, 11/1/2020 | | | 1,755,000 | | | | 1,722,673 | |
0.000%, 11/1/2021 | | | 55,000 | | | | 53,472 | |
0.000%, 11/1/2021 | | | 245,000 | | | | 236,045 | |
0.000%, 11/1/2022 | | | 60,000 | | | | 57,413 | |
| | | | | | | | |
0.000%, 11/1/2022 | | | 190,000 | | | | 179,385 | |
Will County School District No 114 Manhattan,NATL-RE, 0.000%, 12/1/2020 | | | 550,000 | | | | 536,888 | |
Will County School District No. 114 Manhattan,NATL-RE: | | | | | | | | |
0.000%, 12/1/2020 | | | 630,000 | | | | 620,481 | |
0.000%, 12/1/2023 | | | 1,600,000 | | | | 1,458,048 | |
Will County Township High School District No. 204 Joliet, 6.250%, 1/1/2031, Call 1/1/2021 | | | 500,000 | | | | 532,510 | |
Will Grundy Counties Community College District No. 525, 5.250%, 6/1/2036, Call 12/1/2023 | | | 3,400,000 | | | | 3,879,944 | |
Winnebago & Boone Counties School District No. 205 Rockford: | | | | | | | | |
0.000%, 2/1/2020 | | | 500,000 | | | | 496,555 | |
4.000%, 2/1/2027, Call 2/1/2023 | | | 4,680,000 | | | | 5,053,932 | |
| | | | | | | | |
| | | | | | | 350,372,895 | |
Indiana — 2.0% | | | | | | | | |
Carmel Redevelopment Authority, 5.000%, 7/1/2023, Call 7/1/2020 | | | 350,000 | | | | 361,144 | |
City of Rockport, 3.050%, 6/1/2025 | | | 2,100,000 | | | | 2,263,296 | |
City of Whiting, 5.000%, 6/5/2026 (1) | | | 2,200,000 | | | | 2,681,404 | |
Fishers Redevelopment District: | | | | | | | | |
5.125%, 7/15/2026, Call 1/15/2020 | | | 1,875,000 | | | | 1,902,919 | |
5.250%, 7/15/2023, Call 1/15/2020 | | | 1,605,000 | | | | 1,629,637 | |
Frankfort High School Elementary School Building Corp., 5.000%, 7/15/2025 | | | 115,000 | | | | 138,688 | |
Franklin Township-Marion County Multiple School Building Corp.,SAW: | | | | | | | | |
5.000%, 7/10/2021 | | | 580,000 | | | | 620,304 | |
5.000%, 7/15/2029, Call 1/15/2023 | | | 2,565,000 | | | | 2,869,209 | |
Indiana Bond Bank, 2.010%, (SIFMA Municipal Swap Index Yield), 10/15/2022 (1) | | | 1,650,000 | | | | 1,639,242 | |
Indiana Finance Authority: | | | | | | | | |
5.000%, 8/15/2020 | | | 360,000 | | | | 371,077 | |
5.000%, 10/1/2022 | | | 300,000 | | | | 329,931 | |
5.000%, 10/1/2023 | | | 400,000 | | | | 451,044 | |
5.000%, 10/1/2024, Call 10/1/2023 | | | 275,000 | | | | 311,113 | |
5.000%, 5/1/2029, Call 5/1/2022 | | | 130,000 | | | | 143,029 | |
5.000%, 5/1/2029, Call 5/1/2022 | | | 3,940,000 | | | | 4,291,960 | |
5.000%, 11/15/2038, Call 11/15/2025 | | | 2,000,000 | | | | 2,311,240 | |
5.250%, 10/1/2024, Call 10/1/2021 | | | 710,000 | | | | 768,717 | |
5.250%, 10/1/2031, Call 10/1/2021 | | | 2,190,000 | | | | 2,364,061 | |
5.250%, 11/15/2046, Call 11/15/2026 | | | 2,500,000 | | | | 2,887,950 | |
Indiana Housing & Community Development Authority, GNMA/FNMA/FHLMC, 1.500%, 7/1/2047, Call 9/6/2019 (1) | | | 1,100,000 | | | | 1,100,000 | |
Indianapolis Local Public Improvement Bond Bank: | | | | | | | | |
5.000%, 1/1/2021 | | | 175,000 | | | | 184,140 | |
5.000%, 1/1/2022, Call 1/1/2021 | | | 200,000 | | | | 210,082 | |
5.000%, 2/1/2044, Call 2/1/2029 | | | 3,500,000 | | | | 4,403,875 | |
Indianapolis Local Public Improvement Bond Bank,NATL-RE, 5.250%, 7/1/2022 | | | 500,000 | | | | 556,565 | |
Marion High School Building Corp.,SAW: | | | | | | | | |
4.000%, 7/15/2020, Call 1/15/2020 | | | 935,000 | | | | 944,088 | |
4.000%, 7/15/2021, Call 1/15/2020 | | | 375,000 | | | | 378,604 | |
Portage Redevelopment District: | | | | | | | | |
5.000%, 1/15/2023 | | | 280,000 | | | | 312,914 | |
5.000%, 1/15/2024 | | | 215,000 | | | | 247,527 | |
Porter County Jail Building Corp., AGM, 5.500%, 7/10/2021 | | | 110,000 | | | | 114,752 | |
Steuben Lakes Regional Waste District, 5.000%, 9/1/2024, Call 9/1/2023 | | | 1,225,000 | | | | 1,395,018 | |
| | | | | | | | |
| | | | | | | 38,183,530 | |
Iowa — 0.7% | | | | | | | | |
Iowa Finance Authority: | | | | | | | | |
5.000%, 5/15/2036, Call 5/15/2026 | | | 4,065,000 | | | | 4,664,262 | |
5.000%, 5/15/2043, Call 5/15/2027 | | | 1,000,000 | | | | 1,148,780 | |
5.000%, 3/1/2048, Call 3/1/2024 | | | 1,250,000 | | | | 1,365,988 | |
Johnston Community School District, AGM, 5.000%, 7/1/2027, Call 7/1/2022 | | | 1,455,000 | | | | 1,597,532 | |
PEFA, Inc., 5.000%, 9/1/2026, Call 6/1/2026 (1) | | | 3,500,000 | | | | 4,215,435 | |
| | | | | | | | |
| | | | | | | 12,991,997 | |
Kansas — 0.2% | | | | | | | | |
Kansas Development Finance Authority: | | | | | | | | |
5.000%, 11/15/2020, Call 11/15/2019 | | | 35,000 | | | | 35,256 | |
5.000%, 11/15/2020, Call 11/15/2019 | | | 765,000 | | | | 770,906 | |
| | | | | | | | |
5.000%, 3/1/2031, Call 3/1/2020 | | | 1,000,000 | | | | 1,017,230 | |
Wyandotte County-Kansas City Unified Government Utility System Revenue, 5.000%, 9/1/2032, Call 9/1/2022 | | | 1,000,000 | | | | 1,102,430 | |
| | | | | | | | |
| | | | | | | 2,925,822 | |
Kentucky — 1.0% | | | | | | | | |
Kentucky Asset Liability Commission: | | | | | | | | |
5.000%, 9/1/2024 | | | 1,000,000 | | | | 1,181,780 | |
5.000%, 9/1/2025 | | | 1,250,000 | | | | 1,516,862 | |
Kentucky Economic Development Finance Authority: | | | | | | | | |
1.600%, 12/2/2019 (1)(5) | | | 2,500,000 | | | | 2,500,000 | |
5.000%, 8/15/2041, Call 8/15/2027 | | | 3,500,000 | | | | 4,115,300 | |
Louisville/Jefferson County Metropolitan Government: | | | | | | | | |
5.000%, 10/1/2030, Call 10/1/2026 | | | 1,300,000 | | | | 1,583,283 | |
5.000%, 10/1/2031, Call 10/1/2026 | | | 3,500,000 | | | | 4,237,450 | |
Paducah Electric Plant Board,AGM: | | | | | | | | |
5.000%, 10/1/2027, Call 10/1/2026 | | | 2,000,000 | | | | 2,458,960 | |
5.000%, 10/1/2028, Call 10/1/2026 | | | 1,850,000 | | | | 2,266,990 | |
| | | | | | | | |
| | | | | | | 19,860,625 | |
Louisiana — 1.1% | | | | | | | | |
City of Bossier City Utilities Revenue, 5.000%, 10/1/2031, Call 10/1/2024 | | | 1,160,000 | | | | 1,358,093 | |
| | |
City of Shreveport Water & Sewer Revenue, BAM, 4.000%, 12/1/2025, Call 12/1/2024 | | | 2,210,000 | | | | 2,471,907 | |
Lafayette Public Trust Financing Authority,AGM: | | | | | | | | |
4.000%, 10/1/2020 | | | 690,000 | | | | 710,569 | |
4.000%, 10/1/2021 | | | 675,000 | | | | 713,016 | |
Louisiana Housing Corp., GNMA COLL, 4.750%, 6/1/2027, Call 6/1/2020 | | | 525,000 | | | | 540,272 | |
Louisiana Public Facilities Authority: | | | | | | | | |
3.375%, 9/1/2028, Call 3/1/2021 | | | 2,440,000 | | | | 2,483,652 | |
5.000%, 5/15/2042, Call 5/15/2027 | | | 2,500,000 | | | | 2,944,600 | |
Louisiana Stadium & Exposition District, 5.000%, 7/1/2023 | | | 800,000 | | | | 912,304 | |
Parish of St. Bernard: | | | | | | | | |
4.000%, 3/1/2020 | | | 3,470,000 | | | | 3,518,511 | |
4.000%, 3/1/2021 | | | 3,585,000 | | | | 3,736,215 | |
Port New Orleans Board of Commissioners, 5.000%, 4/1/2032, Call 4/1/2023 | | | 725,000 | | | | 801,219 | |
Regional Transit Authority,NATL-RE, 0.000%, 12/1/2021 | | | 155,000 | | | | 140,176 | |
| | | | | | | | |
| | | | | | | 20,330,534 | |
Maine — 0.5% | | | | | | | | |
City of Portland General Airport Revenue, 5.000%, 7/1/2022 | | | 300,000 | | | | 327,912 | |
Maine Health & Higher Educational Facilities Authority, 5.000%, 7/1/2043, Call 7/1/2028 | | | 3,500,000 | | | | 4,242,245 | |
Maine State Housing Authority, 3.850%, 11/15/2029, Call 11/15/2021 | | | 2,685,000 | | | | 2,724,228 | |
Maine Turnpike Authority, 5.000%, 7/1/2029, Call 7/1/2022 | | | 1,500,000 | | | | 1,650,045 | |
| | | | | | | | |
| | | | | | | 8,944,430 | |
Maryland — 0.4% | | | | | | | | |
City of Rockville: | | | | | | | | |
5.000%, 11/1/2030, Call 11/1/2024 | | | 765,000 | | | | 879,207 | |
5.000%, 11/1/2037, Call 11/1/2024 | | | 1,000,000 | | | | 1,135,100 | |
5.000%, 11/1/2042, Call 11/1/2024 | | | 1,000,000 | | | | 1,123,700 | |
Maryland Health & Higher Educational Facilities Authority, 5.750%, 7/1/2034, Call 7/1/2021 | | | 775,000 | | | | 839,038 | |
Montgomery County Housing Opportunities Commission: | | | | | | | | |
5.000%, 7/1/2031, Call 7/1/2020 | | | 655,000 | | | | 672,410 | |
5.125%, 7/1/2037, Call 7/1/2020 | | | 3,110,000 | | | | 3,192,260 | |
| | | | | | | | |
| | | | | | | 7,841,715 | |
Massachusetts — 1.6% | | | | | | | | |
Commonwealth of Massachusetts, 5.000%, 1/1/2037, Call 1/1/2029 | | | 3,000,000 | | | | 3,822,570 | |
Massachusetts Bay Transportation Authority, 5.000%, 7/1/2046, Call 7/1/2027 | | | 4,465,000 | | | | 5,444,174 | |
Massachusetts Development Finance Agency: | | | | | | | | |
4.000%, 6/1/2049, Call 6/1/2029 | | | 1,000,000 | | | | 1,095,160 | |
5.000%, 7/1/2025, Call 7/1/2021 | | | 1,425,000 | | | | 1,527,272 | |
5.000%, 7/1/2027, Call 7/1/2025 | | | 125,000 | | | | 151,978 | |
5.000%, 7/1/2029, Call 1/1/2029 | | | 750,000 | | | | 950,475 | |
5.000%, 7/1/2031, Call 1/1/2029 | | | 2,000,000 | | | | 2,502,560 | |
| | | | | | | | |
5.000%, 7/1/2037, Call 7/1/2027 | | | 1,400,000 | | | | 1,621,886 | |
5.000%, 10/1/2037, Call 10/1/2022 (3) | | | 500,000 | | | | 558,645 | |
5.000%, 6/1/2039, Call 6/1/2029 | | | 750,000 | | | | 919,155 | |
5.000%, 10/1/2047, Call 10/1/2022 (3) | | | 500,000 | | | | 554,500 | |
Massachusetts Educational Financing Authority, 5.000%, 7/1/2025, Call 7/1/2022 (4) | | | 365,000 | | | | 391,733 | |
Massachusetts Health & Educational Facilities Authority, 5.000%, 7/1/2024, Call 9/30/2019 | | | 3,105,000 | | | | 3,113,973 | |
Massachusetts Housing Finance Agency, 3.700%, 12/1/2027, Call 6/1/2022 (4) | | | 635,000 | | | | 637,648 | |
Massachusetts School Building Authority, 5.000%, 8/15/2030, Call 8/15/2022 | | | 815,000 | | | | 903,468 | |
Massachusetts Transportation Trust Fund Metropolitan Highway System Revenue, 5.000%, 1/1/2023, Call 1/1/2023 (1) | | | 5,000,000 | | | | 5,610,600 | |
| | | | | | | | |
| | | | | | | 29,805,797 | |
Michigan — 3.6% | | | | | | | | |
Alma Public Schools,Q-SBLF, 5.000%, 5/1/2021 | | | 890,000 | | | | 946,720 | |
Bay City School District,Q-SBLF: | | | | | | | | |
5.000%, 11/1/2027, Call 5/1/2024 | | | 645,000 | | | | 745,775 | |
5.000%, 11/1/2028, Call 5/1/2024 | | | 1,305,000 | | | | 1,516,071 | |
Caledonia Community Schools,Q-SBLF: | | | | | | | | |
5.000%, 5/1/2025 | | | 600,000 | | | | 724,524 | |
5.000%, 5/1/2026 | | | 500,000 | | | | 620,870 | |
Carman-Ainsworth Community School District, BAM, 5.000%, 5/1/2020 | | | 375,000 | | | | 384,435 | |
Charter Township of Northville: | | | | | | | | |
4.000%, 4/1/2021 | | | 400,000 | | | | 418,512 | |
4.000%, 4/1/2022 | | | 240,000 | | | | 255,946 | |
Chippewa Valley Schools,Q-SBLF, 5.000%, 5/1/2027, Call 11/1/2025 | | | 20,000 | | | | 24,419 | |
City of Detroit Sewage Disposal System Revenue,NATL-RE, 0.000%, 7/1/2020 | | | 110,000 | | | | 108,607 | |
City of Wyandotte Electric System Revenue,BAM: | | | | | | | | |
5.000%, 10/1/2020 | | | 200,000 | | | | 206,976 | |
5.000%, 10/1/2021 | | | 290,000 | | | | 309,845 | |
5.000%, 10/1/2022 | | | 290,000 | | | | 319,391 | |
5.000%, 10/1/2023 | | | 250,000 | | | | 283,590 | |
5.000%, 10/1/2024 | | | 300,000 | | | | 348,348 | |
Coloma Community School District,Q-SBLF, 3.000%, 5/1/2021 | | | 905,000 | | | | 934,231 | |
Comstock Park Public Schools,Q-SBLF, 5.000%, 5/1/2028, Call 5/1/2021 | | | 400,000 | | | | 423,736 | |
Detroit City School District, AGMQ-SBLF, 5.250%, 5/1/2026 | | | 300,000 | | | | 372,315 | |
Dundee Community Schools,Q-SBLF: | | | | | | | | |
5.000%, 5/1/2022 | | | 1,200,000 | | | | 1,320,072 | |
5.000%, 5/1/2025 | | | 1,000,000 | | | | 1,200,870 | |
Fraser Public School District,Q-SBLF: | | | | | | | | |
5.000%, 5/1/2021 | | | 1,000,000 | | | | 1,063,390 | |
5.000%, 5/1/2022 | | | 1,000,000 | | | | 1,100,060 | |
5.000%, 5/1/2025 | | | 1,700,000 | | | | 2,041,479 | |
Great Lakes Water Authority Sewage Disposal System Revenue, 5.000%, 7/1/2029 | | | 3,600,000 | | | | 4,761,036 | |
Grosse Ile Township School District,Q-SBLF: | | | | | | | | |
5.000%, 5/1/2026, Call 5/1/2025 | | | 200,000 | | | | 239,690 | |
5.000%, 5/1/2027, Call 5/1/2025 | | | 230,000 | | | | 273,985 | |
Hartland Consolidated Schools,AGMQ-SBLF: | | | | | | | | |
5.250%, 5/1/2026, Call 5/1/2021 | | | 1,625,000 | | | | 1,729,162 | |
5.250%, 5/1/2027, Call 5/1/2021 | | | 600,000 | | | | 638,256 | |
5.250%, 5/1/2028, Call 5/1/2021 | | | 1,575,000 | | | | 1,674,619 | |
Howell Public Schools,Q-SBLF, 4.250%, 5/1/2024, Call 5/1/2022 | | | 1,000,000 | | | | 1,083,020 | |
Jackson County Hospital Finance Authority, AGC, 4.500%, 6/1/2026, Call 6/1/2020 | | | 415,000 | | | | 425,670 | |
Jenison Public Schools: | | | | | | | | |
5.000%, 5/1/2021 | | | 500,000 | | | | 532,290 | |
5.000%, 5/1/2022, Call 5/1/2021 | | | 560,000 | | | | 596,646 | |
Kent Hospital Finance Authority, 5.000%, 11/15/2029, Call 11/15/2021 | | | 1,000,000 | | | | 1,074,610 | |
Lansing Board of Water & Light, 5.000%, 7/1/2037, Call 7/1/2021 | | | 1,000,000 | | | | 1,066,950 | |
Lansing School District,Q-SBLF, 5.000%, 5/1/2020 | | | 1,825,000 | | | | 1,872,395 | |
Livonia Public Schools School District, BAM, 5.000%, 5/1/2021 | | | 1,600,000 | | | | 1,701,424 | |
Marshall Public Schools,Q-SBLF: | | | | | | | | |
4.000%, 11/1/2028, Call 5/1/2025 | | | 1,380,000 | | | | 1,556,806 | |
4.000%, 11/1/2029, Call 5/1/2025 | | | 940,000 | | | | 1,055,235 | |
Michigan Finance Authority: | | | | | | | | |
4.000%, 2/15/2044, Call 8/15/2029 | | | 4,000,000 | | | | 4,510,920 | |
5.000%, 11/1/2020 | | | 2,000,000 | | | | 2,088,560 | |
| | | | | | | | |
5.000%, 7/1/2026, Call 7/1/2025 | | | 175,000 | | | | 210,082 | |
5.000%, 7/1/2027, Call 7/1/2025 | | | 600,000 | | | | 718,272 | |
5.000%, 7/1/2029, Call 7/1/2025 | | | 950,000 | | | | 1,133,986 | |
5.000%, 7/1/2032, Call 7/1/2025 | | | 1,500,000 | | | | 1,776,075 | |
5.000%, 7/1/2034, Call 7/1/2025 | | | 500,000 | | | | 589,170 | |
5.000%, 12/1/2035, Call 12/1/2027 | | | 1,000,000 | | | | 1,239,650 | |
5.000%, 11/15/2041, Call 11/15/2026 | | | 1,000,000 | | | | 1,195,800 | |
Michigan Finance Authority,AGM: | | | | | | | | |
5.000%, 7/1/2029, Call 7/1/2024 | | | 1,500,000 | | | | 1,755,375 | |
5.000%, 7/1/2030, Call 7/1/2024 | | | 1,500,000 | | | | 1,749,735 | |
Michigan State Housing Development Authority, 5.625%, 10/1/2031, Call 10/1/2020 | | | 850,000 | | | | 888,148 | |
Michigan Strategic Fund, 5.000%, 12/31/2043, Call 12/31/2028 | | | 3,400,000 | | | | 4,122,942 | |
North Branch Area Schools,Q-SBLF, 5.000%, 5/1/2024 | | | 200,000 | | | | 233,900 | |
Plymouth-Canton Community School District,Q-SBLF, 5.000%, 5/1/2021 | | | 450,000 | | | | 479,295 | |
Redford Union School District No. 1, AMBACQ-SBLF, 5.000%, 5/1/2022 | | | 195,000 | | | | 207,656 | |
River Rouge School District,Q-SBLF: | | | | | | | | |
5.000%, 5/1/2020 | | | 1,700,000 | | | | 1,743,809 | |
5.000%, 5/1/2021 | | | 1,155,000 | | | | 1,229,590 | |
Taylor Tax Increment Finance Authority, AGM, 3.250%, 5/1/2020 | | | 90,000 | | | | 91,080 | |
Wayne County Airport Authority: | | | | | | | | |
5.000%, 12/1/2026, Call 12/1/2025 (4) | | | 3,000,000 | | | | 3,616,950 | |
5.000%, 12/1/2030, Call 12/1/2025 | | | 1,250,000 | | | | 1,508,262 | |
Western Township Utilities Authority, 4.000%, 1/1/2021 | | | 1,200,000 | | | | 1,243,860 | |
| | | | | | | | |
| | | | | | | 68,285,093 | |
Minnesota — 0.5% | | | | | | | | |
City of Minneapolis St. Paul Housing & Redevelopment Authority, 5.250%, 8/15/2025, Call 8/15/2020 | | | 275,000 | | | | 285,004 | |
City of Minneapolis St. Paul Housing & Redevelopment Authority, AGM, 5.000%, 8/15/2025, Call 8/15/2020 | | | 215,000 | | | | 222,153 | |
Duluth Economic Development Authority, 5.000%, 2/15/2043, Call 2/15/2028 | | | 1,000,000 | | | | 1,194,480 | |
JPMorgan Chase Putters/Drivers Trust, 1.700%, 6/1/2021 (1)(3) | | | 5,000,000 | | | | 5,000,000 | |
Minnesota Higher Education Facilities Authority, 5.000%, 10/1/2019 | | | 400,000 | | | | 401,128 | |
| | |
Minnesota Housing Finance Agency, GNMA COLL, 2.600%, 9/1/2042, Call 7/1/2022 | | | 661,969 | | | | 671,045 | |
Minnesota Housing Finance Agency,GNMA/FNMA/FHLMC: | | | | | | | | |
2.250%, 12/1/2042, Call 1/1/2022 | | | 452,889 | | | | 451,992 | |
3.900%, 7/1/2030, Call 1/1/2022 | | | 475,000 | | | | 493,663 | |
5.000%, 1/1/2031, Call 7/1/2021 | | | 560,000 | | | | 577,864 | |
| | | | | | | | |
| | | | | | | 9,297,329 | |
Mississippi — 0.9% | | | | | | | | |
Mississippi Business Finance Corp., 3.200%, 9/1/2028, Call 3/13/2024 | | | 4,000,000 | | | | 4,119,080 | |
Mississippi Development Bank: | | | | | | | | |
3.125%, 10/1/2023 | | | 170,000 | | | | 175,947 | |
5.000%, 10/1/2023 | | | 2,390,000 | | | | 2,615,735 | |
5.000%, 1/1/2027, Call 1/1/2022 | | | 1,200,000 | | | | 1,308,276 | |
Mississippi Hospital Equipment & Facilities Authority: | | | | | | | | |
4.000%, 1/1/2039, Call 1/1/2030 | | | 1,500,000 | | | | 1,688,025 | |
4.000%, 1/1/2040, Call 1/1/2030 | | | 1,100,000 | | | | 1,233,397 | |
Mississippi State University Educational Building Corp., 5.000%, 11/1/2022 | | | 135,000 | | | | 150,857 | |
State of Mississippi: | | | | | | | | |
5.000%, 10/15/2036, Call 10/15/2028 | | | 3,395,000 | | | | 4,277,021 | |
5.000%, 10/15/2037, Call 10/15/2028 | | | 2,000,000 | | | | 2,509,480 | |
| | | | | | | | |
| | | | | | | 18,077,818 | |
Missouri — 1.9% | | | | | | | | |
Bi-State Development Agency of the Missouri-Illinois Metropolitan District, 5.000%, 10/1/2033, Call 10/1/2022 | | | 4,000,000 | | | | 4,439,800 | |
Chesterfield Valley Transportation Development District: | | | | | | | | |
5.000%, 5/15/2020 | | | 125,000 | | | | 128,339 | |
5.000%, 5/15/2021 | | | 490,000 | | | | 517,097 | |
City of Kansas City: | | | | | | | | |
5.000%, 9/1/2021, Call 9/30/2019 | | | 500,000 | | | | 501,360 | |
5.000%, 9/1/2023, Call 9/30/2019 | | | 300,000 | | | | 300,816 | |
5.000%, 10/1/2026, Call 10/1/2025 | | | 120,000 | | | | 145,603 | |
5.000%, 10/1/2028, Call 10/1/2025 | | | 115,000 | | | | 138,690 | |
| | | | | | | | |
5.000%, 9/1/2032, Call 9/30/2019 | | | 1,000,000 | | | | 1,002,520 | |
Health & Educational Facilities Authority of the State of Missouri: | | | | | | | | |
4.000%, 2/15/2044, Call 2/15/2029 | | | 2,000,000 | | | | 2,253,040 | |
4.000%, 2/15/2049, Call 2/15/2029 | | | 2,500,000 | | | | 2,798,675 | |
5.000%, 2/1/2024, Call 2/1/2021 | | | 1,050,000 | | | | 1,093,018 | |
5.000%, 2/1/2034, Call 2/1/2024 | | | 1,250,000 | | | | 1,426,975 | |
5.000%, 11/15/2034, Call 5/15/2026 | | | 3,000,000 | | | | 3,582,150 | |
5.000%, 2/1/2042, Call 2/1/2024 | | | 2,000,000 | | | | 2,256,200 | |
5.250%, 10/1/2031, Call 10/1/2021 | | | 1,000,000 | | | | 1,077,340 | |
Independence School District, SAW, 5.250%, 3/1/2030, Call 3/1/2021 | | | 2,000,000 | | | | 2,121,540 | |
Joplin Industrial Development Authority, 5.000%, 2/15/2020 | | | 330,000 | | | | 335,739 | |
Kansas City Industrial Development Authority: | | | | | | | | |
5.000%, 3/1/2033, Call 3/1/2029 | | | 1,000,000 | | | | 1,267,880 | |
5.000%, 3/1/2046, Call 3/1/2029 | | | 2,000,000 | | | | 2,449,420 | |
Lees Summit Industrial Development Authority: | | | | | | | | |
5.000%, 8/15/2036, Call 8/15/2024 | | | 1,100,000 | | | | 1,226,973 | |
5.000%, 8/15/2046, Call 8/15/2024 | | | 2,000,000 | | | | 2,203,480 | |
Missouri Housing Development Commission,GNMA/FNMA/FHLMC: | | | | | | | | |
3.800%, 5/1/2025, Call 5/1/2021 | | | 535,000 | | | | 552,436 | |
4.000%, 5/1/2027, Call 5/1/2021 | | | 525,000 | | | | 542,924 | |
5.000%, 11/1/2027, Call 11/1/2019 | | | 60,000 | | | | 60,279 | |
Missouri State Environmental Improvement & Energy Resources Authority, 5.750%, 1/1/2029, Call 9/30/2019 | | | 65,000 | | | | 65,218 | |
St. Louis County Industrial Development Authority, 5.000%, 9/1/2048, Call 9/1/2027 | | | 1,000,000 | | | | 1,141,180 | |
Stone County Reorganized School District No. 4 Reeds Spring,SAW: | | | | | | | | |
5.000%, 3/1/2030, Call 3/1/2020 | | | 1,000,000 | | | | 1,018,970 | |
5.000%, 3/1/2031, Call 3/1/2020 | | | 750,000 | | | | 764,190 | |
5.000%, 3/1/2032, Call 3/1/2020 | | | 1,000,000 | | | | 1,019,020 | |
| | | | | | | | |
| | | | | | | 36,430,872 | |
Nebraska — 0.3% | | | | | | | | |
Central Plains Energy Project, 5.000%, 12/1/2019, Call 12/1/2019 (1) | | | 1,000,000 | | | | 1,008,600 | |
Hospital Authority No. 1 of Lancaster County, 5.500%, 1/1/2030, Call 1/1/2020 | | | 1,000,000 | | | | 1,012,860 | |
Nebraska Public Power District, 5.000%, 1/1/2032, Call 1/1/2022 | | | 1,000,000 | | | | 1,082,240 | |
Omaha-Douglas Public Building Commission: | | | | | | | | |
5.000%, 5/1/2026, Call 5/1/2022 | | | 825,000 | | | | 907,327 | |
5.000%, 5/1/2027, Call 5/1/2022 | | | 585,000 | | | | 642,564 | |
5.000%, 5/1/2028, Call 5/1/2022 | | | 550,000 | | | | 603,817 | |
5.000%, 5/1/2029, Call 5/1/2022 | | | 660,000 | | | | 723,855 | |
| | | | | | | | |
| | | | | | | 5,981,263 | |
Nevada — 0.7% | | | | | | | | |
City of North Las Vegas NV, AGM, 5.000%, 6/1/2023 | | | 1,000,000 | | | | 1,136,610 | |
County of Clark Department of Aviation: | | | | | | | | |
5.000%, 7/1/2029, Call 7/1/2024 | | | 1,200,000 | | | | 1,417,236 | |
5.000%, 7/1/2030, Call 7/1/2024 | | | 1,000,000 | | | | 1,177,430 | |
5.000%, 7/1/2040, Call 7/1/2027 | | | 4,000,000 | | | | 4,892,480 | |
Las Vegas Valley Water District, 5.000%, 6/1/2028, Call 6/1/2022 | | | 5,115,000 | | | | 5,638,162 | |
| | | | | | | | |
| | | | | | | 14,261,918 | |
New Hampshire — 0.2% | | | | | | | | |
New Hampshire Business Finance Authority, 2.150%, 7/1/2024, Call 4/2/2024 (1) | | | 4,000,000 | | | | 4,104,280 | |
New Hampshire Housing Finance Authority, 4.800%, 7/1/2028, Call 1/1/2022 | | | 600,000 | | | | 609,966 | |
| | | | | | | | |
| | | | | | | 4,714,246 | |
New Jersey — 3.5% | | | | | | | | |
Lyndhurst Township School District, School Bond Gty, 3.000%, 9/13/2019 | | | 3,000,000 | | | | 3,001,200 | |
New Jersey Economic Development Authority: | | | | | | | | |
5.000%, 6/15/2020 | | | 1,500,000 | | | | 1,541,145 | |
5.000%, 11/1/2021 | | | 4,600,000 | | | | 4,953,602 | |
5.500%, 6/15/2030, Call 12/15/2026 | | | 2,500,000 | | | | 3,036,325 | |
New Jersey Higher Education Student Assistance Authority, 4.875%, 12/1/2024, Call 12/1/2019 | | | 5,060,000 | | | | 5,104,933 | |
| | |
New Jersey Housing & Mortgage Finance Agency, 4.250%, 10/1/2032, Call 10/1/2021 | | | 140,000 | | | | 141,715 | |
New Jersey Transportation Trust Fund Authority: | | | | | | | | |
2.350%, (SIFMA Municipal Swap Index Yield), 12/15/2019, Call 9/25/2019 (1) | | | 5,000,000 | | | | 5,001,500 | |
5.000%, 6/15/2022 | | | 500,000 | | | | 548,240 | |
| | | | | | | | |
5.000%, 6/15/2030, Call 6/15/2026 | | | 1,000,000 | | | | 1,191,110 | |
5.000%, 6/15/2031, Call 6/15/2026 | | | 1,000,000 | | | | 1,183,360 | |
5.000%, 6/15/2032, Call 12/15/2024 | | | 5,000,000 | | | | 5,681,100 | |
5.000%, 6/15/2035, Call 12/15/2028 | | | 3,000,000 | | | | 3,608,430 | |
5.250%, 12/15/2023 | | | 240,000 | | | | 276,286 | |
New Jersey Transportation Trust Fund Authority,BAM TCRs: | | | | | | | | |
5.000%, 6/15/2028, Call 6/15/2022 | | | 5,000,000 | | | | 5,457,350 | |
5.000%, 6/15/2033, Call 6/15/2022 | | | 3,000,000 | | | | 3,250,560 | |
5.250%, 6/15/2033, Call 6/15/2023 | | | 5,635,000 | | | | 6,320,160 | |
| | |
New Jersey Transportation Trust Fund Authority, BHAC AMBAC, 0.000%, 12/15/2024 | | | 440,000 | | | | 404,813 | |
New Jersey Turnpike Authority: | | | | | | | | |
5.000%, 1/1/2031, Call 1/1/2025 | | | 500,000 | | | | 593,925 | |
5.000%, 1/1/2032, Call 7/1/2022 | | | 3,440,000 | | | | 3,821,255 | |
5.000%, 1/1/2035, Call 1/1/2022 | | | 1,685,000 | | | | 1,839,076 | |
Tobacco Settlement Financing Corp.: | | | | | | | | |
5.000%, 6/1/2031, Call 6/1/2028 | | | 2,750,000 | | | | 3,360,142 | |
5.000%, 6/1/2032, Call 6/1/2028 | | | 2,000,000 | | | | 2,430,640 | |
5.000%, 6/1/2033, Call 6/1/2028 | | | 1,500,000 | | | | 1,817,250 | |
5.000%, 6/1/2046, Call 6/1/2028 | | | 2,500,000 | | | | 2,871,500 | |
| | | | | | | | |
| | | | | | | 67,435,617 | |
New Mexico — 0.5% | | | | | | | | |
City of Santa Fe, 4.000%, 6/1/2025, Call 6/1/2022 | | | 655,000 | | | | 700,706 | |
New Mexico Hospital Equipment Loan Council: | | | | | | | | |
2.375%, 7/1/2024, Call 1/1/2021 | | | 550,000 | | | | 551,287 | |
5.000%, 7/1/2039, Call 7/1/2026 | | | 1,225,000 | | | | 1,418,795 | |
5.000%, 7/1/2049, Call 7/1/2026 | | | 4,000,000 | | | | 4,567,760 | |
New Mexico Mortgage Finance Authority, GNMA COLL, 2.600%, 2/1/2043, Call 1/1/2023 | | | 713,561 | | | | 726,227 | |
New Mexico Mortgage Finance Authority,GNMA/FNMA/FHLMC: | | | | | | | | |
4.500%, 9/1/2024, Call 9/1/2019 | | | 175,000 | | | | 175,000 | |
4.625%, 3/1/2028, Call 9/1/2021 | | | 450,000 | | | | 463,919 | |
5.350%, 3/1/2030, Call 9/1/2020 | | | 1,100,000 | | | | 1,124,332 | |
| | | | | | | | |
| | | | | | | 9,728,026 | |
New York — 6.2% | | | | | | | | |
Albany Capital Resource Corp.: | | | | | | | | |
5.000%, 12/1/2023 | | | 150,000 | | | | 172,412 | |
5.000%, 12/1/2024 | | | 200,000 | | | | 236,656 | |
Buffalo & Erie County Industrial Land Development Corp.: | | | | | | | | |
5.000%, 6/1/2035, Call 6/1/2024 | | | 1,000,000 | | | | 1,130,900 | |
5.000%, 8/1/2037, Call 8/1/2027 | | | 1,300,000 | | | | 1,458,457 | |
5.000%, 8/1/2047, Call 8/1/2027 | | | 1,000,000 | | | | 1,103,540 | |
City of New York: | | | | | | | | |
1.400%, 4/1/2042, Call 9/6/2019 (1) | | | 400,000 | | | | 400,000 | |
1.430%, 10/1/2046, Call 9/6/2019 (1) | | | 1,100,000 | | | | 1,100,000 | |
1.440%, 8/1/2035, Call 9/6/2019 (1) | | | 200,000 | | | | 200,000 | |
5.000%, 8/1/2032, Call 2/1/2022 | | | 3,000,000 | | | | 3,277,020 | |
5.000%, 3/1/2037, Call 3/1/2028 | | | 1,120,000 | | | | 1,403,976 | |
5.250%, 3/1/2034, Call 3/1/2028 | | | 3,000,000 | | | | 3,871,860 | |
5.250%, 3/1/2035, Call 3/1/2028 | | | 2,500,000 | | | | 3,216,850 | |
City of New York, AGC, 1.820%, 10/1/2021, Call 9/3/2019 (1)(6) | | | 400,000 | | | | 400,000 | |
Long Island Power Authority, 2.311%, (LIBOR 1 Month), 10/1/2023, Call 10/1/2022 (1) | | | 5,000,000 | | | | 5,023,500 | |
Metropolitan Transportation Authority: | | | | | | | | |
1.800%, (SIFMA Municipal Swap Index Yield), 11/15/2022 (1) | | | 1,000,000 | | | | 998,260 | |
4.000%, 2/3/2020 | | | 5,000,000 | | | | 5,056,550 | |
5.000%, 11/15/2034, Call 5/15/2028 | | | 1,815,000 | | | | 2,282,235 | |
5.000%, 11/15/2036, Call 11/15/2026 | | | 2,325,000 | | | | 2,828,944 | |
New York City Transitional Finance Authority Future Tax Secured Revenue: | | | | | | | | |
1.410%, 11/1/2022 (1) | | | 400,000 | | | | 400,000 | |
1.420%, 8/1/2042, Call 9/6/2019 (1) | | | 4,380,000 | | | | 4,380,000 | |
1.430%, 11/1/2042, Call 9/6/2019 (1) | | | 2,200,000 | | | | 2,200,000 | |
5.000%, 11/1/2024, Call 11/1/2022 | | | 5,715,000 | | | | 6,418,459 | |
5.000%, 11/1/2026, Call 5/1/2025 | | | 1,000,000 | | | | 1,216,610 | |
| | | | | | | | |
5.000%, 11/1/2026, Call 5/1/2025 | | | 2,000,000 | | | | 2,433,220 | |
5.000%, 8/1/2034, Call 8/1/2026 | | | 4,000,000 | | | | 4,907,160 | |
5.000%, 8/1/2036, Call 8/1/2028 | | | 5,555,000 | | | | 7,035,241 | |
5.000%, 5/1/2038, Call 5/1/2027 | | | 4,000,000 | | | | 4,916,560 | |
5.250%, 8/1/2037, Call 8/1/2028 | | | 3,500,000 | | | | 4,523,260 | |
New York City Water & Sewer System: | | | | | | | | |
1.370%, 6/15/2039, Call 9/6/2019 (1) | | | 7,000,000 | | | | 7,000,000 | |
1.420%, 6/15/2045, Call 9/6/2019 (1) | | | 1,600,000 | | | | 1,600,000 | |
5.000%, 6/15/2028, Call 6/15/2024 | | | 500,000 | | | | 592,580 | |
5.000%, 6/15/2029, Call 6/15/2024 | | | 600,000 | | | | 710,184 | |
5.000%, 6/15/2048, Call 12/15/2027 | | | 1,000,000 | | | | 1,229,100 | |
New York Liberty Development Corp., 2.800%, 9/15/2069, Call 3/15/2029 (5) | | | 1,000,000 | | | | 1,040,620 | |
New York State Dormitory Authority: | | | | | | | | |
5.000%, 3/15/2027, Call 3/15/2022 | | | 7,555,000 | | | | 8,295,314 | |
5.000%, 12/1/2035, Call 6/1/2027 (3) | | | 500,000 | | | | 595,180 | |
5.000%, 12/1/2037, Call 6/1/2027 (3) | | | 500,000 | | | | 592,050 | |
5.250%, 3/15/2037, Call 9/15/2028 | | | 1,695,000 | | | | 2,188,109 | |
6.000%, 7/1/2038, Call 7/1/2020 | | | 1,000,000 | | | | 1,035,630 | |
New York State Dormitory Authority,NATL-RE, 4.300%, 7/1/2029, Call 9/3/2019 (1)(6) | | | 2,400,000 | | | | 2,400,000 | |
New York State Urban Development Corp., 5.000%, 3/15/2028, Call 3/15/2023 | | | 1,000,000 | | | | 1,135,800 | |
New York Transportation Development Corp., AGM, 4.000%, 7/1/2032, Call 7/1/2024 (4) | | | 2,500,000 | | | | 2,722,750 | |
Nuveen New YorkAMT-Free Municipal Credit Income Fund, 1.700%, 3/1/2029 (1) | | | 4,700,000 | | | | 4,700,000 | |
Nuveen New YorkAMT-Free Quality Municipal Income Fund, 1.700%, 3/1/2029 (1) | | | 3,500,000 | | | | 3,500,000 | |
State of New York Mortgage Agency, 5.000%, 10/1/2019 | | | 500,000 | | | | 501,495 | |
Triborough Bridge & Tunnel Authority: | | | | | | | | |
1.850%, (SOFR + 43 basis points), 9/26/2019 (1) | | | 1,420,000 | | | | 1,420,256 | |
5.000%, 11/15/2037, Call 11/15/2028 | | | 1,500,000 | | | | 1,919,775 | |
TSASC, Inc.: | | | | | | | | |
5.000%, 6/1/2036, Call 6/1/2027 | | | 1,000,000 | | | | 1,181,330 | |
5.000%, 6/1/2041, Call 6/1/2027 | | | 1,000,000 | | | | 1,118,160 | |
Westchester Tobacco Asset Securitization, 5.000%, 6/1/2021 | | | 500,000 | | | | 528,945 | |
| | | | | | | | |
| | | | | | | 118,598,948 | |
North Carolina — 0.6% | | | | | | | | |
County of Catawba: | | | | | | | | |
4.000%, 10/1/2025, Call 10/1/2021 | | | 585,000 | | | | 618,240 | |
5.000%, 10/1/2023, Call 10/1/2021 | | | 1,000,000 | | | | 1,077,810 | |
5.000%, 10/1/2024, Call 10/1/2021 | | | 835,000 | | | | 899,612 | |
County of Cumberland, 5.125%, 12/1/2028, Call 12/1/2019 | | | 250,000 | | | | 252,473 | |
County of Union: | | | | | | | | |
5.000%, 12/1/2026, Call 6/1/2023 | | | 1,390,000 | | | | 1,587,019 | |
5.000%, 12/1/2027, Call 6/1/2023 | | | 1,645,000 | | | | 1,874,905 | |
North Carolina Housing Finance Agency, 4.250%, 1/1/2028, Call 7/1/2021 | | | 120,000 | | | | 122,339 | |
North Carolina Medical Care Commission: | | | | | | | | |
4.000%, 6/1/2020 | | | 470,000 | | | | 479,292 | |
5.000%, 6/1/2027, Call 6/1/2022 | | | 500,000 | | | | 549,145 | |
North Carolina Turnpike Authority, 5.000%, 7/1/2047, Call 7/1/2026 | | | 750,000 | | | | 865,500 | |
Orange County Public Facilities Co., 5.000%, 10/1/2026, Call 10/1/2022 | | | 1,130,000 | | | | 1,265,803 | |
Raleigh Durham Airport Authority, 5.000%, 5/1/2036, Call 5/1/2020 | | | 1,690,000 | | | | 1,729,360 | |
| | | | | | | | |
| | | | | | | 11,321,498 | |
North Dakota — 1.4% | | | | | | | | |
Barnes County North Public School District Building Authority: | | | | | | | | |
4.000%, 5/1/2021 | | | 635,000 | | | | 661,880 | |
4.500%, 5/1/2030, Call 5/1/2021 | | | 1,515,000 | | | | 1,569,267 | |
4.500%, 5/1/2033, Call 5/1/2021 | | | 1,850,000 | | | | 1,907,035 | |
City of Dickinson, 5.000%, 10/1/2025, Call 10/1/2021 | | | 2,240,000 | | | | 2,383,987 | |
City of Grand Forks: | | | | | | | | |
4.000%, 12/1/2019 | | | 535,000 | | | | 538,290 | |
5.000%, 12/1/2032, Call 12/1/2021 | | | 1,000,000 | | | | 1,067,590 | |
City of West Fargo, 3.000%, 5/1/2023, Call 9/30/2019 | | | 185,000 | | | | 185,141 | |
County of Ward: | | | | | | | | |
5.000%, 6/1/2034, Call 6/1/2028 | | | 2,500,000 | | | | 2,951,225 | |
5.000%, 6/1/2043, Call 6/1/2028 | | | 2,500,000 | | | | 2,870,375 | |
| | | | | | | | |
North Dakota Public Finance Authority: | | | | | | | | |
4.000%, 6/1/2023 | | | 2,440,000 | | | | 2,683,488 | |
4.000%, 6/1/2024, Call 6/1/2023 | | | 2,190,000 | | | | 2,397,590 | |
4.000%, 6/1/2025, Call 6/1/2023 | | | 1,145,000 | | | | 1,257,279 | |
Williston Parks & Recreation District: | | | | | | | | |
4.500%, 3/1/2020 | | | 1,205,000 | | | | 1,213,110 | |
4.500%, 3/1/2025, Call 3/1/2021 | | | 2,525,000 | | | | 2,550,401 | |
4.625%, 3/1/2026, Call 3/1/2021 | | | 2,620,000 | | | | 2,644,602 | |
| | | | | | | | |
| | | | | | | 26,881,260 | |
Ohio — 2.8% | | | | | | | | |
Akron Bath Copley Joint Township Hospital District, 5.000%, 11/15/2021 | | | 1,000,000 | | | | 1,078,900 | |
City of Cleveland Airport System Revenue,AGM: | | | | | | | | |
5.000%, 1/1/2030, Call 1/1/2022 | | | 3,900,000 | | | | 4,210,323 | |
5.000%, 1/1/2031, Call 1/1/2022 | | | 1,000,000 | | | | 1,078,380 | |
City of Cleveland Airport System Revenue,MAC: | | | | | | | | |
5.000%, 1/1/2022, Call 1/1/2021 | | | 2,320,000 | | | | 2,443,911 | |
5.000%, 1/1/2031, Call 1/1/2022 | | | 1,270,000 | | | | 1,371,054 | |
City of Cleveland Income Tax Revenue: | | | | | | | | |
5.000%, 10/1/2024, Call 10/1/2022 | | | 460,000 | | | | 515,283 | |
5.000%, 10/1/2028, Call 10/1/2022 | | | 1,075,000 | | | | 1,204,193 | |
5.000%, 10/1/2029, Call 10/1/2022 | | | 1,130,000 | | | | 1,265,803 | |
5.000%, 10/1/2029, Call 10/1/2022 | | | 2,290,000 | | | | 2,565,212 | |
City of Middleburg Heights, 5.125%, 8/1/2031, Call 8/1/2021 | | | 1,000,000 | | | | 1,065,380 | |
City of Springboro, 3.000%, 1/23/2020 | | | 1,500,000 | | | | 1,509,600 | |
Cleveland Department of Public Utilities Division of Water: | | | | | | | | |
4.000%, 1/1/2028, Call 1/1/2024 | | | 500,000 | | | | 555,880 | |
4.000%, 1/1/2029, Call 1/1/2024 | | | 1,000,000 | | | | 1,109,550 | |
4.000%, 1/1/2030, Call 1/1/2024 | | | 1,000,000 | | | | 1,106,530 | |
Cleveland Heights & University Heights City School District: | | | | | | | | |
0.000%, 12/1/2024 | | | 400,000 | | | | 369,584 | |
0.000%, 12/1/2025 | | | 600,000 | | | | 542,472 | |
Cleveland-Cuyahoga County Port Authority, 5.000%, 10/1/2022, Call 10/1/2020 | | | 1,000,000 | | | | 1,042,530 | |
County of Franklin: | | | | | | | | |
5.000%, 5/15/2028, Call 5/15/2023 | | | 2,000,000 | | | | 2,266,960 | |
5.000%, 7/1/2029, Call 7/1/2026 | | | 2,000,000 | | | | 2,359,480 | |
5.000%, 5/15/2031, Call 5/15/2023 | | | 405,000 | | | | 454,066 | |
County of Hamilton Sales Tax Revenue, 5.000%, 12/1/2029, Call 12/1/2021 | | | 975,000 | | | | 1,053,234 | |
County of Hancock, 5.750%, 12/1/2026, Call 6/1/2021 | | | 1,120,000 | | | | 1,209,376 | |
County of Lucas, 5.000%, 11/15/2022, Call 11/15/2021 | | | 925,000 | | | | 988,816 | |
County of Miami, 5.000%, 8/1/2045, Call 8/1/2028 | | �� | 2,220,000 | | | | 2,675,855 | |
Delaware City School District, 5.250%, 12/1/2038, Call 6/1/2023 | | | 1,240,000 | | | | 1,403,184 | |
Elyria City School District, School District Credit Program, 4.000%, 12/1/2028, Call 12/1/2022 | | | 1,130,000 | | | | 1,224,411 | |
Johnstown-Monroe Local School District, 5.000%, 12/1/2030, Call 12/1/2021 | | | 715,000 | | | | 777,234 | |
Lake County Community College District: | | | | | | | | |
4.000%, 12/1/2022, Call 12/1/2019 | | | 695,000 | | | | 699,907 | |
4.000%, 12/1/2024, Call 12/1/2019 | | | 835,000 | | | | 840,895 | |
4.000%, 12/1/2025, Call 12/1/2019 | | | 855,000 | | | | 861,036 | |
Lake Local School District/Stark County,School District Credit Program: | | | | | | | | |
4.000%, 12/1/2023, Call 12/1/2021 | | | 1,550,000 | | | | 1,654,857 | |
4.000%, 12/1/2025, Call 12/1/2021 | | | 1,660,000 | | | | 1,772,731 | |
New Albany Community Authority: | | | | | | | | |
4.000%, 10/1/2020 | | | 590,000 | | | | 608,679 | |
5.000%, 10/1/2022 | | | 1,000,000 | | | | 1,114,110 | |
5.000%, 10/1/2023, Call 10/1/2022 | | | 1,105,000 | | | | 1,229,677 | |
North Olmsted City School District: | | | | | | | | |
5.000%, 12/1/2027, Call 12/1/2023 | | | 220,000 | | | | 256,155 | |
5.000%, 12/1/2028, Call 12/1/2023 | | | 365,000 | | | | 424,984 | |
5.000%, 12/1/2029, Call 12/1/2023 | | | 500,000 | | | | 582,170 | |
Ohio Higher Educational Facility Commission: | | | | | | | | |
4.000%, 12/1/2020 | | | 1,050,000 | | | | 1,084,661 | |
4.000%, 12/1/2021 | | | 795,000 | | | | 842,199 | |
4.000%, 12/1/2022 | | | 845,000 | | | | 917,493 | |
Ohio Turnpike & Infrastructure Commission, 5.250%, 2/15/2033, Call 2/15/2023 | | | 1,330,000 | | | | 1,497,434 | |
Ohio University, 5.000%, 12/1/2028, Call 6/1/2022 | | | 225,000 | | | | 246,476 | |
| | | | | | | | |
Ohio Water Development Authority, 5.000%, 6/1/2022 | | | 1,100,000 | | | | 1,217,546 | |
University of Toledo, 5.000%, 6/1/2030, Call 6/1/2021 | | | 250,000 | | | | 267,175 | |
| | | | | | | | |
| | | | | | | 53,565,386 | |
Oklahoma — 0.6% | | | | | | | | |
Cushing Educational Facilities Authority, 5.000%, 9/1/2022 | | | 2,000,000 | | | | 2,216,580 | |
Delaware County Justice Authority: | | | | | | | | |
3.750%, 9/1/2029, Call 9/30/2019 | | | 1,620,000 | | | | 1,621,604 | |
4.000%, 9/1/2019 | | | 740,000 | | | | 740,000 | |
4.000%, 9/1/2020 | | | 700,000 | | | | 719,894 | |
4.000%, 9/1/2021 | | | 805,000 | | | | 842,537 | |
Oklahoma Housing Finance Agency,GNMA COLL: | | | | | | | | |
2.500%, 3/1/2022 | | | 180,000 | | | | 185,571 | |
3.300%, 3/1/2031, Call 3/1/2022 | | | 415,000 | | | | 418,166 | |
Tulsa Airports Improvement Trust, BAM, 5.000%, 6/1/2028, Call 6/1/2023 (4) | | | 1,405,000 | | | | 1,569,596 | |
Tulsa County Industrial Authority: | | | | | | | | |
5.250%, 11/15/2037, Call 11/15/2025 | | | 1,500,000 | | | | 1,734,810 | |
5.250%, 11/15/2045, Call 11/15/2025 | | | 1,500,000 | | | | 1,713,525 | |
| | | | | | | | |
| | | | | | | 11,762,283 | |
Oregon — 0.6% | | | | | | | | |
City of Portland, 5.000%, 6/15/2027, Call 6/15/2022 | | | 1,000,000 | | | | 1,096,770 | |
City of Tigard Water Revenue, 5.000%, 8/1/2029, Call 8/1/2022 | | | 690,000 | | | | 762,264 | |
City of Woodburn Wastewater Revenue: | | | | | | | | |
0.000%, 3/1/2020 | | | 1,380,000 | | | | 1,371,030 | |
0.000%, 3/1/2021 | | | 1,215,000 | | | | 1,190,226 | |
Clackamas & Washington Counties School District No. 3,NATL-RE School Bond Gty, 0.000%, 6/15/2023 | | | 2,000,000 | | | | 1,907,180 | |
Klamath Falls Intercommunity Hospital Authority: | | | | | | | | |
5.000%, 9/1/2021 | | | 250,000 | | | | 267,710 | |
5.000%, 9/1/2022 | | | 505,000 | | | | 557,333 | |
Oregon State Business Development Commission, 5.000%, 3/1/2022 (1) | | | 1,000,000 | | | | 1,088,500 | |
Port of Morrow: | | | | | | | | |
3.500%, 6/1/2020, Call 9/30/2019 | | | 210,000 | | | | 210,208 | |
3.750%, 6/1/2021, Call 9/30/2019 | | | 220,000 | | | | 220,231 | |
4.000%, 6/1/2022, Call 9/30/2019 | | | 235,000 | | | | 235,261 | |
Port of Portland Airport Revenue, 5.500%, 7/1/2031, Call 7/1/2021 | | | 3,000,000 | | | | 3,230,430 | |
| | |
State of Oregon Housing & Community Services Department, 4.450%, 7/1/2023, Call 1/1/2020 (4) | | | 200,000 | | | | 200,572 | |
| | | | | | | | |
| | | | | | | 12,337,715 | |
Pennsylvania — 3.3% | | | | | | | | |
Allegheny County Hospital Development Authority: | | | | | | | | |
4.000%, 7/15/2038, Call 7/15/2029 | | | 500,000 | | | | 570,730 | |
4.000%, 7/15/2039, Call 7/15/2029 | | | 500,000 | | | | 567,785 | |
Berks County Industrial Development Authority: | | | | | | | | |
5.000%, 5/15/2032, Call 5/15/2027 | | | 1,050,000 | | | | 1,240,302 | |
5.000%, 5/15/2038, Call 5/15/2025 | | | 255,000 | | | | 291,950 | |
5.000%, 5/15/2042, Call 5/15/2024 | | | 1,655,000 | | | | 1,863,199 | |
5.000%, 5/15/2043, Call 5/15/2025 | | | 350,000 | | | | 396,956 | |
5.000%, 5/15/2047, Call 5/15/2027 | | | 1,630,000 | | | | 1,867,377 | |
Bucks County Industrial Development Authority, 5.000%, 10/1/2037, Call 10/1/2024 | | | 1,250,000 | | | | 1,422,325 | |
Central Bradford Progress Authority, 5.375%, 12/1/2041, Call 12/1/2021 | | | 500,000 | | | | 536,075 | |
City of Pittsburgh, 4.000%, 9/1/2021 | | | 750,000 | | | | 792,863 | |
Commonwealth Financing Authority: | | | | | | | | |
5.000%, 6/1/2032, Call 6/1/2028 | | | 1,000,000 | | | | 1,247,880 | |
5.000%, 6/1/2033, Call 6/1/2028 | | | 1,250,000 | | | | 1,556,212 | |
5.000%, 6/1/2034, Call 6/1/2028 | | | 1,000,000 | | | | 1,240,330 | |
5.000%, 6/1/2035, Call 6/1/2028 | | | 1,000,000 | | | | 1,233,000 | |
Geisinger Authority, 5.000%, 2/15/2039, Call 2/15/2027 | | | 2,500,000 | | | | 2,995,250 | |
Kiski Area School District, AGM SAW, 4.000%, 3/1/2021 | | | 1,450,000 | | | | 1,512,263 | |
Lancaster County Hospital Authority: | | | | | | | | |
2.875%, 12/15/2023, Call 12/15/2019 | | | 500,000 | | | | 500,570 | |
5.000%, 6/15/2044, Call 6/15/2026 | | | 1,000,000 | | | | 1,127,160 | |
Lancaster Industrial Development Authority: | | | | | | | | |
5.000%, 5/1/2021 | | | 360,000 | | | | 376,632 | |
5.000%, 5/1/2022 | | | 430,000 | | | | 460,268 | |
| | | | | | | | |
Lehigh County General Purpose Authority, 4.000%, 11/1/2019 | | | 555,000 | | | | 557,547 | |
Montgomery County Higher Education & Health Authority: | | | | | | | | |
4.000%, 9/1/2044, Call 9/1/2029 | | | 1,000,000 | | | | 1,109,740 | |
5.000%, 9/1/2033, Call 9/1/2029 | | | 1,500,000 | | | | 1,906,155 | |
Montgomery County Industrial Development Authority: | | | | | | | | |
5.000%, 12/1/2038, Call 12/1/2025 | | | 1,000,000 | | | | 1,149,780 | |
5.000%, 12/1/2044, Call 12/1/2025 | | | 500,000 | | | | 583,010 | |
5.000%, 12/1/2049, Call 12/1/2025 | | | 750,000 | | | | 871,275 | |
6.250%, 11/15/2029, Call 11/15/2019 | | | 715,000 | | | | 722,200 | |
Montgomery County Industrial Development Authority, FHA, 5.000%, 8/1/2024, Call 8/1/2020 | | | 1,350,000 | | | | 1,397,304 | |
Pennsylvania Economic Development Financing Authority,AGM: | | | | | | | | |
0.000%, 1/1/2020 | | | 600,000 | | | | 597,012 | |
0.000%, 1/1/2021 | | | 600,000 | | | | 587,202 | |
5.000%, 1/1/2022 | | | 305,000 | | | | 329,998 | |
Pennsylvania Turnpike Commission: | | | | | | | | |
2.330%, (SIFMA Municipal Swap Index Yield), 12/1/2021, Call 6/1/2021 (1) | | | 5,000,000 | | | | 5,069,950 | |
4.000%, 12/1/2023, Call 12/1/2019 | | | 105,000 | | | | 105,741 | |
4.000%, 12/1/2023, Call 12/1/2019 | | | 95,000 | | | | 95,610 | |
4.000%, 12/1/2037, Call 12/1/2027 | | | 2,975,000 | | | | 3,316,827 | |
5.000%, 12/1/2030, Call 12/1/2020 (2) | | | 215,000 | | | | 225,419 | |
5.000%, 12/1/2030, Call 12/1/2020 (2) | | | 120,000 | | | | 125,815 | |
5.000%, 12/1/2030, Call 12/1/2020 (2) | | | 250,000 | | | | 262,115 | |
5.000%, 12/1/2037, Call 12/1/2027 | | | 1,250,000 | | | | 1,537,713 | |
5.000%, 12/1/2037, Call 12/1/2029 | | | 1,000,000 | | | | 1,279,600 | |
5.000%, 12/1/2038, Call 12/1/2029 | | | 2,000,000 | | | | 2,552,180 | |
5.000%, 12/1/2039, Call 12/1/2029 | | | 1,000,000 | | | | 1,272,650 | |
5.000%, 6/1/2042, Call 6/1/2027 | | | 5,450,000 | | | | 6,449,203 | |
5.500%, 12/1/2042, Call 12/1/2026 | | | 3,000,000 | | | | 3,669,810 | |
6.000%, 12/1/2034, Call 12/1/2020 (2) | | | 55,000 | | | | 58,342 | |
6.000%, 12/1/2034, Call 12/1/2020 (2) | | | 70,000 | | | | 74,253 | |
6.000%, 12/1/2034, Call 12/1/2020 (2) | | | 270,000 | | | | 286,405 | |
6.000%, 12/1/2036, Call 12/1/2020 | | | 975,000 | | | | 1,034,241 | |
Pittsburgh School District, BAM SAW, 5.000%, 9/1/2024, Call 9/1/2022 | | | 1,000,000 | | | | 1,112,970 | |
Pittsburgh Water & Sewer Authority, AGM, 2.201%, (LIBOR 1 Month), 12/1/2020, Call 6/1/2020 (1) | | | 2,055,000 | | | | 2,055,781 | |
Sayre Health Care Facilities Authority, 2.469%, (LIBOR 3 Month), 12/1/2024, Call 9/30/2019 (1) | | | 200,000 | | | | 200,424 | |
| | | | | | | | |
| | | | | | | 62,395,399 | |
Rhode Island — 0.4% | | | | | | | | |
| | |
Rhode Island Housing & Mortgage Finance Corp., 3.625%, 10/1/2029, Call 10/1/2021 | | | 760,000 | | | | 785,278 | |
Rhode Island Student Loan Authority: | | | | | | | | |
3.375%, 12/1/2023, Call 12/1/2020 (4) | | | 20,000 | | | | 20,340 | |
4.000%, 12/1/2022, Call 12/1/2021 (4) | | | 2,885,000 | | | | 3,037,530 | |
4.250%, 12/1/2020, Call 9/30/2019 | | | 500,000 | | | | 501,385 | |
4.250%, 12/1/2025, Call 12/1/2021 (4) | | | 2,205,000 | | | | 2,325,547 | |
4.500%, 12/1/2021, Call 9/17/2019 | | | 170,000 | | | | 170,209 | |
Town of Cumberland,SAW: | | | | | | | | |
4.000%, 3/15/2024 | | | 795,000 | | | | 893,135 | |
4.000%, 3/15/2026, Call 3/15/2024 | | | 460,000 | | | | 514,956 | |
| | | | | | | | |
| | | | | | | 8,248,380 | |
South Carolina — 1.3% | | | | | | | | |
City of Rock Hill Combined Utility System Revenue,AGM: | | | | | | | | |
5.250%, 1/1/2026, Call 1/1/2022 | | | 730,000 | | | | 794,167 | |
5.250%, 1/1/2028, Call 1/1/2022 | | | 475,000 | | | | 515,612 | |
County of Dorchester Waterworks & Sewer System Revenue: | | | | | | | | |
5.000%, 10/1/2022 | | | 480,000 | | | | 534,773 | |
5.000%, 10/1/2026, Call 10/1/2022 | | | 400,000 | | | | 445,772 | |
County of Florence: | | | | | | | | |
5.000%, 11/1/2025, Call 11/1/2020 | | | 2,000,000 | | | | 2,084,020 | |
5.000%, 11/1/2030, Call 11/1/2020 | | | 500,000 | | | | 520,060 | |
5.000%, 11/1/2031, Call 11/1/2024 | | | 360,000 | | | | 418,111 | |
| | | | | | | | |
Patriots Energy Group Financing Agency, 2.354%, (LIBOR 1 Month), 2/1/2024, Call 11/1/2023 (1) | | | 8,000,000 | | | | 8,009,600 | |
Piedmont Municipal Power Agency,AGC: | | | | | | | | |
5.000%, 1/1/2030, Call 7/1/2021 | | | 450,000 | | | | 479,003 | |
5.750%, 1/1/2034, Call 7/1/2021 | | | 1,000,000 | | | | 1,079,180 | |
South Carolina Jobs-Economic Development Authority: | | | | | | | | |
5.000%, 7/1/2022 | | | 1,735,000 | | | | 1,895,418 | |
5.000%, 4/1/2038, Call 4/1/2024 | | | 2,000,000 | | | | 2,202,120 | |
South Carolina Public Service Authority, 5.000%, 12/1/2032, Call 12/1/2026 | | | 3,265,000 | | | | 3,977,684 | |
| | |
South Carolina State Housing Finance & Development Authority, GNMA COLL, 5.000%, 1/1/2028, Call 1/1/2020 | | | 10,000 | | | | 10,102 | |
Spartanburg Sanitation Sewer District, 5.000%, 3/1/2030, Call 3/1/2023 (2) | | | 1,500,000 | | | | 1,675,230 | |
| | |
St. Peters Parish-Jasper County Public Facilities Corp., AGM, 5.000%, 4/1/2031, Call 4/1/2021 | | | 900,000 | | | | 950,850 | |
| | | | | | | | |
| | | | | | | 25,591,702 | |
South Dakota — 0.7% | | | | | | | | |
City of Rapid City Airport Revenue: | | | | | | | | |
5.500%, 12/1/2022, Call 12/1/2019 | | | 225,000 | | | | 227,518 | |
6.750%, 12/1/2031, Call 12/1/2019 | | | 500,000 | | | | 507,075 | |
7.000%, 12/1/2035, Call 12/1/2019 | | | 750,000 | | | | 761,092 | |
South Dakota Health & Educational Facilities Authority: | | | | | | | | |
4.250%, 9/1/2023 | | | 740,000 | | | | 805,594 | |
4.500%, 9/1/2020 | | | 900,000 | | | | 930,006 | |
4.500%, 9/1/2021, Call 9/1/2020 | | | 1,080,000 | | | | 1,114,798 | |
4.500%, 9/1/2022, Call 9/1/2020 | | | 1,005,000 | | | | 1,036,607 | |
5.000%, 9/1/2019 | | | 200,000 | | | | 200,000 | |
5.000%, 11/1/2022 | | | 715,000 | | | | 797,568 | |
5.000%, 8/1/2023 | | | 375,000 | | | | 429,068 | |
5.000%, 11/1/2023 | | | 625,000 | | | | 718,787 | |
5.000%, 8/1/2024 | | | 195,000 | | | | 230,178 | |
5.000%, 11/1/2024 | | | 650,000 | | | | 769,450 | |
5.000%, 11/1/2024, Call 11/1/2019 | | | 1,000,000 | | | | 1,005,750 | |
5.000%, 11/1/2025, Call 11/1/2024 | | | 600,000 | | | | 710,742 | |
5.000%, 9/1/2027, Call 9/1/2024 | | | 720,000 | | | | 831,096 | |
| | |
South Dakota Housing Development Authority, 3.550%, 11/1/2033, Call 11/1/2022 | | | 2,250,000 | | | | 2,331,360 | |
| | | | | | | | |
| | | | | | | 13,406,689 | |
Tennessee — 1.3% | | | | | | | | |
Knox County Health Educational & Housing Facility Board, 5.000%, 1/1/2042, Call 1/1/2027 | | | 5,815,000 | | | | 6,905,836 | |
Metropolitan Government Nashville & Davidson County Health & Educational Facility Board: | | | | | | | | |
2.000%, 1/1/2021 (1) | | | 3,000,000 | | | | 3,028,110 | |
5.000%, 11/1/2027, Call 11/1/2021 | | | 1,500,000 | | | | 1,610,970 | |
5.000%, 7/1/2031, Call 7/1/2026 | | | 1,000,000 | | | | 1,204,020 | |
Tennessee Energy Acquisition Corp.: | | | | | | | | |
5.000%, 2/1/2023 | | | 5,310,000 | | | | 5,893,463 | |
5.250%, 9/1/2021 | | | 3,810,000 | | | | 4,086,073 | |
5.250%, 9/1/2022 | | | 250,000 | | | | 276,338 | |
Tennessee Housing Development Agency: | | | | | | | | |
4.000%, 7/1/2025, Call 1/1/2021 | | | 890,000 | | | | 917,812 | |
4.125%, 1/1/2025, Call 1/1/2021 | | | 590,000 | | | | 607,204 | |
| | | | | | | | |
| | | | | | | 24,529,826 | |
Texas — 6.4% | | | | | | | | |
Bexar County Health Facilities Development Corp., 5.000%, 7/15/2033, Call 7/15/2023 | | | 1,000,000 | | | | 1,151,410 | |
Bexar County Hospital District: | | | | | | | | |
5.000%, 2/15/2034, Call 2/15/2028 | | | 1,000,000 | | | | 1,256,150 | |
5.000%, 2/15/2038, Call 2/15/2028 | | | 1,250,000 | | | | 1,552,362 | |
| | |
Brazoria-Fort Bend County Municipal Utility District No. 1, MAC, 3.000%, 9/1/2020 | | | 700,000 | | | | 711,480 | |
Capital Area Cultural Education Facilities Finance Corp., 5.250%, 4/1/2021, Call 4/1/2020 | | | 400,000 | | | | 408,372 | |
Central Texas Regional Mobility Authority, 0.000%, 1/1/2025 | | | 1,000,000 | | | | 902,560 | |
| | | | | | | | |
City of Beaumont Waterworks & Sewer System Revenue,BAM: | | | | | | | | |
5.000%, 9/1/2026, Call 9/1/2025 | | | 1,000,000 | | | | 1,205,760 | |
5.000%, 9/1/2027, Call 9/1/2025 | | | 600,000 | | | | 721,140 | |
5.000%, 9/1/2030, Call 9/1/2025 | | | 1,000,000 | | | | 1,199,210 | |
City of Galveston Wharves & Terminal Revenue, 4.625%, 2/1/2024, Call 2/1/2021 | | | 1,130,000 | | | | 1,177,517 | |
City of Houston Airport System Revenue: | | | | | | | | |
5.000%, 7/1/2030, Call 7/1/2028 | | | 1,375,000 | | | | 1,761,251 | |
5.000%, 7/1/2038, Call 7/1/2028 | | | 5,000,000 | | | | 6,230,450 | |
City of Houston Hotel Occupancy Tax & Special Revenue, 5.000%, 9/1/2026, Call 9/1/2024 | | | 250,000 | | | | 294,475 | |
City of Houston Hotel Occupancy Tax & Special Revenue, AMBAC, 0.000%, 9/1/2019 | | | 400,000 | | | | 400,000 | |
City of Laredo International Toll Bridge System Revenue,AGM: | | | | | | | | |
5.000%, 10/1/2026, Call 10/1/2024 | | | 225,000 | | | | 264,159 | |
5.000%, 10/1/2027, Call 10/1/2024 | | | 240,000 | | | | 281,266 | |
City of San Marcos Electric Utility System Revenue,BAM: | | | | | | | | |
4.500%, 11/1/2028, Call 11/1/2022 | | | 600,000 | | | | 654,714 | |
5.000%, 11/1/2033, Call 11/1/2022 | | | 1,215,000 | | | | 1,349,075 | |
Clifton Higher Education Finance Corp.,PSF: | | | | | | | | |
5.000%, 8/15/2026, Call 8/15/2025 | | | 675,000 | | | | 817,655 | |
5.000%, 8/15/2027, Call 8/15/2025 | | | 545,000 | | | | 657,788 | |
5.000%, 8/15/2028, Call 8/15/2025 | | | 835,000 | | | | 1,003,403 | |
5.000%, 8/15/2029, Call 8/15/2025 | | | 335,000 | | | | 402,281 | |
5.000%, 8/15/2030, Call 8/15/2025 | | | 1,250,000 | | | | 1,497,487 | |
Corpus Christi Business & Job Development Corp., 5.000%, 9/1/2022 | | | 1,000,000 | | | | 1,106,730 | |
County of Bexar, AGM, 5.000%, 8/15/2031, Call 8/15/2024 | | | 1,280,000 | | | | 1,485,069 | |
County of Wise, 8.000%, 8/15/2034, Call 8/15/2021 | | | 4,000,000 | | | | 4,341,360 | |
Crane County Water District: | | | | | | | | |
5.000%, 2/15/2026, Call 2/15/2025 | | | 915,000 | | | | 1,081,073 | |
5.000%, 2/15/2030, Call 2/15/2025 | | | 1,000,000 | | | | 1,169,890 | |
Cypress-Fairbanks Independent School District, PSF, 5.000%, 2/15/2034, Call 2/15/2021 | | | 675,000 | | | | 710,235 | |
Dallas Area Rapid Transit: | | | | | | | | |
5.000%, 12/1/2030, Call 12/1/2029 | | | 2,000,000 | | | | 2,683,000 | |
5.000%, 12/1/2031, Call 12/1/2029 | | | 2,500,000 | | | | 3,336,400 | |
Dallas/Fort Worth International Airport: | | | | | | | | |
5.000%, 11/1/2024, Call 11/1/2022 | | | 1,000,000 | | | | 1,121,100 | |
5.000%, 11/1/2032, Call 11/1/2020 | | | 5,000,000 | | | | 5,215,950 | |
5.000%, 11/1/2033, Call 11/1/2023 | | | 2,000,000 | | | | 2,278,340 | |
5.250%, 11/1/2033, Call 11/1/2023 | | | 1,200,000 | | | | 1,382,712 | |
Georgetown Independent School District,PSF: | | | | | | | | |
5.000%, 8/15/2025, Call 8/15/2020 | | | 645,000 | | | | 668,575 | |
5.000%, 8/15/2027 | | | 1,000,000 | | | | 1,277,190 | |
5.000%, 8/15/2028 | | | 1,000,000 | | | | 1,302,890 | |
Grand Parkway Transportation Corp., 0.000%, 10/1/2030, Call 10/1/2028 (2) | | | 1,000,000 | | | | 1,094,130 | |
Gulf Coast Authority,AGM: | | | | | | | | |
5.000%, 10/1/2029, Call 10/1/2022 | | | 1,430,000 | | | | 1,588,029 | |
5.000%, 10/1/2030, Call 10/1/2022 | | | 1,505,000 | | | | 1,669,617 | |
Gulf Coast Industrial Development Authority, 1.350%, 11/1/2041, Call 10/7/2019 (1) | | | 1,600,000 | | | | 1,600,000 | |
Harris County Cultural Education Facilities Finance Corp.: | | | | | | | | |
1.390%, 12/1/2024, Call 9/6/2019 (1) | | | 300,000 | | | | 300,000 | |
2.100%, (SIFMA Municipal Swap Index Yield), 6/1/2020 (1) | | | 2,000,000 | | | | 2,003,500 | |
2.180%, (SIFMA Municipal Swap Index Yield), 6/1/2021 (1) | | | 2,400,000 | | | | 2,408,928 | |
5.250%, 10/1/2029, Call 10/1/2019 | | | 1,550,000 | | | | 1,554,836 | |
Harris County Health Facilities Development Corp.: | | | | | | | | |
1.390%, 12/1/2041, Call 9/6/2019 (1) | | | 800,000 | | | | 800,000 | |
1.390%, 12/1/2041, Call 9/6/2019 (1) | | | 600,000 | | | | 600,000 | |
Harris County Municipal Utility District No. 165, BAM, 5.000%, 3/1/2025 | | | 400,000 | | | | 473,652 | |
Harris County Municipal Utility District No. 374, AGM, 5.000%, 9/1/2036, Call 9/1/2019 | | | 550,000 | | | | 550,000 | |
Lancaster Independent School District, BAM, 4.000%, 2/15/2029, Call 2/15/2025 | | | 3,000,000 | | | | 3,372,510 | |
Lower Colorado River Authority: | | | | | | | | |
5.000%, 5/15/2026, Call 5/15/2025 | | | 695,000 | | | | 837,419 | |
5.000%, 5/15/2027, Call 5/15/2025 | | | 1,355,000 | | | | 1,624,482 | |
5.000%, 5/15/2036, Call 5/15/2029 | | | 1,500,000 | | | | 1,911,870 | |
| | | | | | | | |
Matagorda County Navigation District No. 1, 2.600%, 11/1/2029 | | | 1,000,000 | | | | 1,040,850 | |
Mesquite Independent School District, PSF, 0.000%, 8/15/2021 | | | 635,000 | | | | 619,163 | |
Mission Economic Development Corp., 1.550%, 11/1/2019 (1) | | | 1,000,000 | | | | 1,000,190 | |
New Hope Cultural Education Facilities Finance Corp.: | | | | | | | | |
4.000%, 11/15/2021 | | | 615,000 | | | | 633,936 | |
5.000%, 11/15/2031, Call 11/15/2024 | | | 850,000 | | | | 944,027 | |
5.000%, 8/15/2036, Call 8/15/2021 (3) | | | 1,700,000 | | | | 1,752,088 | |
5.000%, 8/15/2037, Call 8/15/2021 (3) | | | 1,260,000 | | | | 1,297,649 | |
5.500%, 8/15/2036, Call 8/15/2021 | | | 1,000,000 | | | | 1,034,260 | |
New Hope Cultural Education Facilities Finance Corp., AGM, 4.000%, 4/1/2024 | | | 440,000 | | | | 485,113 | |
North Texas Tollway Authority: | | | | | | | | |
5.000%, 1/1/2027, Call 1/1/2025 | | | 2,090,000 | | | | 2,490,465 | |
5.000%, 1/1/2048, Call 1/1/2028 | | | 5,000,000 | | | | 6,065,000 | |
Northside Independent School District, PSF, 2.125%, 8/1/2020, Call 2/1/2020 (1) | | | 1,975,000 | | | | 1,982,248 | |
Pleasanton Independent School District, PSF, 5.000%, 8/15/2029, Call 8/15/2024 | | | 1,000,000 | | | | 1,173,500 | |
Prosper Independent School District, PSF, 5.000%, 2/15/2044, Call 2/15/2029 | | | 2,880,000 | | | | 3,626,381 | |
San Antonio Municipal Facilities Corp., 5.000%, 8/15/2036, Call 8/15/2021 | | | 500,000 | | | | 533,445 | |
Sienna Plantation Levee Improvement District, BAM, 4.000%, 9/1/2020 | | | 400,000 | | | | 411,048 | |
Tarrant County Cultural Education Facilities Finance Corp.: | | | | | | | | |
5.000%, 10/1/2028, Call 10/1/2023 | | | 2,030,000 | | | | 2,320,026 | |
5.000%, 5/15/2037, Call 5/15/2024 | | | 1,895,000 | | | | 2,091,000 | |
5.000%, 11/15/2037, Call 11/15/2027 | | | 2,175,000 | | | | 2,561,584 | |
5.000%, 5/15/2045, Call 5/15/2024 | | | 3,250,000 | | | | 3,544,157 | |
5.000%, 11/15/2046, Call 11/15/2026 | | | 2,000,000 | | | | 2,275,240 | |
5.000%, 11/15/2046, Call 11/15/2027 | | | 1,250,000 | | | | 1,443,263 | |
Texas Municipal Gas Acquisition & Supply Corp. III, 5.000%, 12/15/2021 | | | 2,000,000 | | | | 2,156,620 | |
Waco Independent School District,PSF: | | | | | | | | |
4.000%, 8/15/2028, Call 8/15/2024 | | | 1,000,000 | | | | 1,128,020 | |
4.000%, 8/15/2029, Call 8/15/2024 | | | 2,380,000 | | | | 2,673,359 | |
| | | | | | | | |
| | | | | | | 122,732,084 | |
U. S. Virgin Islands — 0.2% | | | | | | | | |
Virgin Islands Public Finance Authority: | | | | | | | | |
5.000%, 9/1/2030, Call 9/1/2025 (3) | | | 2,320,000 | | | | 2,613,364 | |
5.000%, 9/1/2033, Call 9/1/2025 (3) | | | 1,000,000 | | | | 1,115,480 | |
| | | | | | | | |
| | | | | | | 3,728,844 | |
Utah — 0.6% | | | | | | | | |
Central Utah Water Conservancy District: | | | | | | | | |
5.000%, 10/1/2026, Call 10/1/2019 | | | 850,000 | | | | 852,525 | |
5.000%, 10/1/2028, Call 10/1/2019 | | | 1,000,000 | | | | 1,002,970 | |
City of Draper, 5.000%, 5/1/2032, Call 5/1/2022 | | | 325,000 | | | | 356,532 | |
City of Riverton: | | | | | | | | |
5.250%, 12/1/2034, Call 6/1/2023 | | | 1,455,000 | | | | 1,657,856 | |
5.250%, 12/1/2036, Call 6/1/2023 | | | 2,150,000 | | | | 2,446,377 | |
Jordan Valley Water Conservancy District, 5.000%, 10/1/2035, Call 4/1/2021 | | | 920,000 | | | | 975,715 | |
Utah Charter School Finance Authority, UT, 5.250%, 10/15/2028, Call 10/15/2023 | | | 480,000 | | | | 543,086 | |
Utah Infrastructure Agency,AGM: | | | | | | | | |
5.400%, 10/15/2036, Call 10/15/2021 | | | 1,000,000 | | | | 1,090,470 | |
5.500%, 10/15/2030, Call 10/15/2021 | | | 1,300,000 | | | | 1,420,328 | |
Utah State Board of Regents, 5.000%, 8/1/2031, Call 8/1/2020 | | | 1,030,000 | | | | 1,066,102 | |
| | | | | | | | |
| | | | | | | 11,411,961 | |
Vermont — 0.0% | | | | | | | | |
Vermont Housing Finance Agency, GNMA/FNMA/FHLMC, 4.000%, 11/1/2043, Call 5/1/2023 | | | 685,000 | | | | 723,278 | |
Vermont Student Assistance Corp., 5.000%, 6/15/2020 (4) | | | 125,000 | | | | 128,469 | |
| | | | | | | | |
| | | | | | | 851,747 | |
Virginia — 0.7% | | | | | | | | |
Charles City County Economic Development Authority, 2.125%, 4/1/2020 (1) | | | 1,220,000 | | | | 1,225,868 | |
City of Chesapeake Chesapeake Expressway Toll Road Revenue, 5.000%, 7/15/2022 | | | 500,000 | | | | 549,355 | |
Henrico County Economic Development Authority, 5.000%, 10/1/2037, Call 10/1/2024 | | | 1,000,000 | | | | 1,157,120 | |
Henrico County Economic Development Authority, AGM, 3.873%, 8/23/2027, Call 9/6/2019 (1)(6) | | | 50,000 | | | | 50,000 | |
Stafford County Economic Development Authority: | | | | | | | | |
5.000%, 6/15/2028, Call 6/15/2026 | | | 1,000,000 | | | | 1,222,570 | |
| | | | | | | | |
5.000%, 6/15/2030, Call 6/15/2026 | | | 700,000 | | | | 849,114 | |
Virginia College Building Authority: | | | | | | | | |
5.000%, 3/1/2023, Call 3/1/2020 | | | 745,000 | | | | 759,096 | |
5.000%, 3/1/2024, Call 3/1/2020 | | | 1,755,000 | | | | 1,788,029 | |
5.000%, 2/1/2031, Call 2/1/2027 | | | 2,200,000 | | | | 2,760,868 | |
Virginia Small Business Financing Authority: | | | | | | | | |
4.250%, 11/1/2021, Call 5/1/2020 | | | 1,000,000 | | | | 1,021,380 | |
5.000%, 1/1/2044, Call 1/1/2022 | | | 2,500,000 | | | | 2,673,025 | |
| | | | | | | | |
| | | | | | | 14,056,425 | |
Washington — 1.9% | | | | | | | | |
Chelan County Public Utility District No. 1,NATL-RE, 0.000%, 6/1/2024 | | | 210,000 | | | | 195,972 | |
FYI Properties, 5.000%, 6/1/2031, Call 6/1/2028 | | | 5,000,000 | | | | 6,338,350 | |
King County Housing Authority,County Guarantee: | | | | | | | | |
5.200%, 5/1/2028, Call 9/30/2019 | | | 480,000 | | | | 481,397 | |
5.500%, 12/1/2028, Call 9/30/2019 | | | 1,000,000 | | | | 1,003,830 | |
King County Public Hospital District No. 1, 5.000%, 12/1/2031, Call 12/1/2026 | | | 4,000,000 | | | | 4,856,480 | |
King County Public Hospital District No. 2, 5.250%, 12/1/2028, Call 12/1/2020 | | | 200,000 | | | | 209,688 | |
Mason & Kitsap Counties School District No. 403 North Mason, School Bond Gty, 5.000%, 12/1/2035, Call 12/1/2023 | | | 2,025,000 | | | | 2,312,266 | |
Port of Bellingham, 5.250%, 12/1/2022, Call 12/1/2020 | | | 1,060,000 | | | | 1,111,887 | |
Port of Seattle, 4.000%, 4/1/2044, Call 4/1/2029 | | | 1,000,000 | | | | 1,127,860 | |
Snohomish County Housing Authority, 5.000%, 4/1/2031, Call 4/1/2029 | | | 1,000,000 | | | | 1,261,130 | |
Spokane County School District No 81 Spokane, School Bond Gty, 5.000%, 12/1/2036, Call 6/1/2029 | | | 5,000,000 | | | | 6,439,300 | |
Spokane County School District No. 81 Spokane, School Bond Gty, 5.000%, 12/1/2030, Call 12/1/2021 | | | 650,000 | | | | 707,330 | |
Washington Health Care Facilities Authority, 5.000%, 10/1/2030, Call 10/1/2022 | | | 750,000 | | | | 829,110 | |
Washington State Housing Finance Commission: | | | | | | | | |
5.000%, 1/1/2029, Call 1/1/2026 (3) | | | 840,000 | | | | 989,948 | |
5.000%, 1/1/2036, Call 1/1/2025 (3) | | | 2,125,000 | | | | 2,394,747 | |
5.000%, 1/1/2038, Call 1/1/2026 (3) | | | 2,000,000 | | | | 2,295,200 | |
Washington State Housing Finance Commission, GNMA/FNMA/FHLMC, 3.050%, 6/1/2022 | | | 750,000 | | | | 784,478 | |
WBRP 3.2: | | | | | | | | |
5.000%, 1/1/2026, Call 7/1/2025 | | | 750,000 | | | | 911,130 | |
5.000%, 1/1/2031, Call 7/1/2025 | | | 940,000 | | | | 1,127,859 | |
Whidbey Island Public Hospital District: | | | | | | | | |
5.000%, 12/1/2021 | | | 520,000 | | | | 556,941 | |
5.000%, 12/1/2022 | | | 510,000 | | | | 562,020 | |
| | | | | | | | |
| | | | | | | 36,496,923 | |
West Virginia — 0.5% | | | | | | | | |
West Virginia Hospital Finance Authority: | | | | | | | | |
5.000%, 9/1/2031, Call 9/1/2029 | | | 2,020,000 | | | | 2,553,805 | |
5.000%, 9/1/2032, Call 9/1/2029 | | | 1,000,000 | | | | 1,259,470 | |
5.000%, 6/1/2042, Call 6/1/2027 | | | 3,665,000 | | | | 4,351,161 | |
5.000%, 1/1/2043, Call 1/1/2029 | | | 1,750,000 | | | | 2,094,908 | |
| | | | | | | | |
| | | | | | | 10,259,344 | |
Wisconsin — 2.9% | | | | | | | | |
City of Oak Creek, 3.000%, 6/1/2027, Call 6/1/2025 | | | 100,000 | | | | 108,207 | |
Public Finance Authority: | | | | | | | | |
1.450%, 10/1/2049, Call 9/6/2019 (1) | | | 2,100,000 | | | | 2,100,000 | |
1.530%, 11/1/2019 (1) | | | 1,000,000 | | | | 1,000,150 | |
4.750%, 12/1/2035, Call 12/1/2020 | | | 525,000 | | | | 572,990 | |
4.750%, 12/1/2035, Call 12/1/2020 | | | 1,475,000 | | | | 1,498,792 | |
5.000%, 11/15/2029 | | | 2,500,000 | | | | 3,034,300 | |
5.000%, 11/15/2030 | | | 1,620,000 | | | | 1,978,846 | |
5.000%, 7/1/2037, Call 7/1/2024 | | | 820,000 | | | | 904,534 | |
5.000%, 7/1/2047, Call 7/1/2024 | | | 1,000,000 | | | | 1,091,600 | |
5.125%, 7/15/2037, Call 7/15/2027 (3) | | | 2,500,000 | | | | 2,775,250 | |
State of Wisconsin: | | | | | | | | |
4.000%, 5/1/2027, Call 5/1/2022 | | | 800,000 | | | | 862,576 | |
5.000%, 3/1/2023, Call 9/1/2021 | | | 2,000,000 | | | | 2,149,060 | |
5.000%, 5/1/2027, Call 5/1/2022 | | | 25,000 | | | | 27,540 | |
5.000%, 5/1/2027, Call 5/1/2022 | | | 1,580,000 | | | | 1,740,718 | |
| | | | | | | | |
Wisconsin Center District: | | | | | | | | |
0.000%, 12/15/2033, Call 6/15/2026 | | | 2,200,000 | | | | 1,448,524 | |
0.000%, 12/15/2034, Call 6/15/2026 | | | 6,665,000 | | | | 4,180,555 | |
Wisconsin Center District,AGM: | | | | | | | | |
5.250%, 12/15/2023 | | | 520,000 | | | | 576,914 | |
5.250%, 12/15/2027 | | | 1,930,000 | | | | 2,358,325 | |
Wisconsin Health & Educational Facilities Authority: | | | | | | | | |
4.750%, 10/15/2029, Call 10/15/2021 | | | 605,000 | | | | 641,167 | |
5.000%, 8/15/2020 | | | 1,060,000 | | | | 1,098,224 | |
5.000%, 3/1/2021 | | | 240,000 | | | | 247,037 | |
5.000%, 8/15/2021 | | | 1,160,000 | | | | 1,245,515 | |
5.000%, 10/1/2022 | | | 750,000 | | | | 834,862 | |
5.000%, 12/15/2022 | | | 500,000 | | | | 558,550 | |
5.000%, 12/15/2023 | | | 500,000 | | | | 575,815 | |
5.000%, 12/15/2024 | | | 500,000 | | | | 593,135 | |
5.000%, 3/1/2025, Call 3/1/2024 | | | 315,000 | | | | 340,395 | |
5.000%, 6/1/2026, Call 6/1/2020 | | | 135,000 | | | | 138,866 | |
5.000%, 8/15/2027, Call 8/15/2022 | | | 500,000 | | | | 555,315 | |
5.000%, 12/15/2028, Call 12/15/2024 | | | 100,000 | | | | 117,377 | |
5.000%, 8/15/2029, Call 8/15/2022 | | | 1,700,000 | | | | 1,890,689 | |
5.000%, 4/1/2032, Call 10/1/2022 | | | 4,560,000 | | | | 4,987,637 | |
5.000%, 6/1/2032, Call 6/1/2022 | | | 1,000,000 | | | | 1,076,940 | |
5.000%, 8/15/2032, Call 8/15/2022 | | | 5,000,000 | | | | 5,560,850 | |
5.125%, 4/15/2031, Call 4/15/2023 | | | 250,000 | | | | 285,840 | |
5.250%, 6/1/2034, Call 6/1/2020 | | | 300,000 | | | | 309,144 | |
5.375%, 8/15/2024, Call 2/15/2020 | | | 1,625,000 | | | | 1,655,826 | |
| | |
Wisconsin Health & Educational Facilities Authority, AGM, 5.000%, 7/15/2027, Call 7/15/2021 | | | 3,655,000 | | | | 3,920,024 | |
| | | | | | | | |
| | | | | | | 55,042,089 | |
Wyoming — 0.1% | | | | | | | | |
County of Laramie, 5.000%, 5/1/2027, Call 5/1/2021 | | | 1,000,000 | | | | 1,056,790 | |
| | | | | | | | |
Total Municipals
(identified cost $1,806,919,552) | | | | | | | 1,922,691,223 | |
| | | | | | | | |
| | |
Short-Term Investments — 0.0% | | | | | | | | |
| | |
Repurchase Agreements — 0.0% | | | | | | | | |
| | |
Agreement with Fixed Income Clearing Corp., 2.150%, dated 8/30/2019, to be repurchased at $175,593 on 9/3/2019, collateralized by a U.S. Government Treasury Obligation with a maturity of 12/31/2020, with a fair value of $182,601, 2.50% | | | 175,593 | | | | 175,593 | |
| | | | | | | | |
Total Short-Term Investments
(identified cost $175,593) | | | | | | | 175,593 | |
| | | | | | | | |
| | |
Total Investments — 100.3%
(identified cost $1,807,095,145) | | | | | | | 1,922,866,816 | |
| | |
Other Assets and Liabilities — (0.3)% | | | | | | | (5,202,964 | ) |
| | | | | | | | |
Total Net Assets — 100.0% | | | | | | $ | 1,917,663,852 | |
| | | | | | | | |
| (1) | Denotes a variable rate security. The rate shown is the current interest rate as of August 31, 2019. Rate fluctuations are based underlying positions and/or other variables. For securities whose yields vary with a designated market index or market rate, the reference rate and spread are indicated in the description. |
| (2) | Issue represents a convertible capital appreciation bond. These securities aretax-exempt bonds that originate as capital appreciation bonds with zero coupon features at time of issuance and convert to an interest paying bond at apre-specified rate determined at time of issuance. |
| (3) | Denotes a restricted security which is subject to restrictions on resale under federal securities laws. These securities have been deemed liquid based on criteria approved by the Board of Directors of the BMO Funds. At August 31, 2019 these securities amounted to: |
| | | | | | |
| Fund | | Amount | | | % of Total Net Assets |
IntermediateTax-Free Fund | | | 41,799,015 | | | 2.18% |
| (4) | Securities that are subject to alternative minimum tax of the IntermediateTax-Free Fund portfolio represents 2.34%, as calculated based upon total portfolio market value. |
| (5) | Purchased on a when-issued or delayed delivery basis. |
| (6) | Issue represents an Auction Rate Security. An Auction Rate Security is a corporate or municipal bond debt instrument with a long nominal maturity for which the interest rate is regularly reset through a Dutch auction. The rate presented is either the rate set through the auction or the maximum interest rate provided for in the security issuance provision. |
| | |
LIBOR | | London Interbank Offered Rate |
SAW | | State Aid Withholding |
BAM | | Build America Mutual Assurance Company |
TCRs | | Transferable Custody Receipts |
ShortTax-Free Fund
| | | | | | | | |
Description | |
| Shares or
Principal Amount |
| | | Value | |
| | |
Municipals — 99.6% | | | | | | | | |
| | |
Alabama — 3.5% | | | | | | | | |
Black Belt Energy Gas District: | | | | | | | | |
2.394%, (LIBOR 1 Month), 12/1/2023, Call 9/1/2023 (1) | | $ | 1,000,000 | | | $ | 989,500 | |
4.000%, 6/1/2021, Call 3/1/2021 (1) | | | 1,000,000 | | | | 1,045,640 | |
4.000%, 6/1/2023 | | | 1,000,000 | | | | 1,091,730 | |
County of Jefferson, 5.000%, 9/15/2021 | | | 1,000,000 | | | | 1,075,960 | |
Southeast Alabama Gas Supply District, 2.394%, (LIBOR 1 Month), 4/1/2024, Call 1/1/2024 (1) | | | 1,000,000 | | | | 994,380 | |
Tuscaloosa City Board of Education: | | | | | | | | |
5.000%, 8/1/2020 | | | 200,000 | | | | 207,158 | |
5.000%, 8/1/2021 | | | 175,000 | | | | 188,059 | |
| | | | | | | | |
| | | | | | | 5,592,427 | |
Alaska — 0.6% | | | | | | | | |
Alaska Industrial Development & Export Authority, 3.500%, 12/1/2020, Call 12/1/2019 | | | 1,000,000 | | | | 1,003,860 | |
| | |
Arizona — 1.5% | | | | | | | | |
City of El Mirage, 5.000%, 7/1/2022, Call 7/1/2020 | | | 465,000 | | | | 479,494 | |
Coconino County Pollution Control Corp., 1.600%, 5/21/2020 (1) | | | 750,000 | | | | 751,372 | |
Industrial Development Authority of the City of Phoenix, 3.000%, 7/1/2020 (2) | | | 25,000 | | | | 25,105 | |
La Paz County Industrial Development Authority, 5.000%, 2/15/2021 (2) | | | 540,000 | | | | 554,958 | |
Maricopa County Industrial Development Authority: | | | | | | | | |
2.550%, 7/1/2021 | | | 225,000 | | | | 226,355 | |
2.875%, 7/1/2021 (2) | | | 135,000 | | | | 135,498 | |
Pinal County School District No. 1 Florence, BAM, 4.000%, 7/1/2020 | | | 250,000 | | | | 255,853 | |
| | | | | | | | |
| | | | | | | 2,428,635 | |
Arkansas — 0.2% | | | | | | | | |
City of Hot Springs Wastewater Revenue, 5.000%, 12/1/2020 | | | 245,000 | | | | 256,405 | |
City of Rogers, 2.125%, 11/1/2029, Call 11/1/2021 | | | 25,000 | | | | 25,507 | |
| | | | | | | | |
| | | | | | | 281,912 | |
California — 5.2% | | | | | | | | |
Abag Finance Authority for Nonprofit Corps., 5.000%, 7/1/2020 | | | 500,000 | | | | 516,805 | |
Bay Area Toll Authority, 2.450%, (SIFMA Municipal Swap Index Yield), 4/1/2024, Call 10/1/2023 (1) | | | 500,000 | | | | 514,875 | |
California Housing Finance Agency, AGM, 5.320%, 2/1/2037, Call 9/5/2019 (1)(3) | | | 5,000 | | | | 5,000 | |
California Municipal Finance Authority, 5.000%, 2/1/2022 | | | 1,000,000 | | | | 1,092,580 | |
California Public Finance Authority: | | | | | | | | |
5.000%, 10/15/2021 | | | 350,000 | | | | 371,903 | |
5.000%, 10/15/2022 | | | 300,000 | | | | 327,525 | |
California State Public Works Board: | | | | | | | | |
5.000%, 4/1/2020 | | | 320,000 | | | | 327,430 | |
5.000%, 11/1/2020, Call 11/1/2019 | | | 35,000 | | | | 35,224 | |
5.125%, 10/1/2022, Call 10/1/2019 | | | 245,000 | | | | 245,779 | |
California Statewide Communities Development Authority, 5.000%, 12/1/2025 (2) | | | 200,000 | | | | 233,994 | |
California Statewide Communities Development Authority, CMI, 3.500%, 11/1/2021, Call 11/1/2019 | | | 750,000 | | | | 753,067 | |
California Statewide Communities Development Authority,NATL-RE, 5.400%, 4/1/2028 (1)(3) | | | 75,000 | | | | 75,000 | |
Carson Redevelopment Agency Successor Agency, AGM, 5.000%, 10/1/2020 | | | 675,000 | | | | 704,389 | |
City of Redding Electric System Revenue,NATL-RE, 3.356%, 7/1/2022 (1)(3) | | | 50,000 | | | | 50,000 | |
Fresno Joint Powers Financing Authority, AGM, 5.000%, 4/1/2022 | | | 875,000 | | | | 961,984 | |
Golden State Tobacco Securitization Corp., 5.000%, 6/1/2022 | | | 1,000,000 | | | | 1,097,730 | |
Palomar Health, 5.000%, 11/1/2022 | | | 375,000 | | | | 412,909 | |
| | | | | | | | |
Sacramento Redevelopment Agency Successor Agency, BAM, 5.000%, 12/1/2022 | | | 385,000 | | | | 434,407 | |
Twin Rivers Unified School District, AGM, 3.200%, 6/1/2020, Call 10/1/2019 (1) | | | 220,000 | | | | 220,350 | |
| | | | | | | | |
| | | | | | | 8,380,951 | |
Colorado — 3.9% | | | | | | | | |
City of Burlington Water & Sewer Revenue, AGM, 3.000%, 11/1/2019 | | | 100,000 | | | | 100,217 | |
Colorado Educational & Cultural Facilities Authority: | | | | | | | | |
2.500%, 12/15/2019 | | | 50,000 | | | | 50,077 | |
5.000%, 10/1/2021 | | | 1,000,000 | | | | 1,065,890 | |
Colorado Health Facilities Authority: | | | | | | | | |
3.125%, 5/15/2027, Call 5/15/2020 | | | 1,000,000 | | | | 1,005,030 | |
5.000%, 6/1/2021 | | | 250,000 | | | | 266,275 | |
5.000%, 6/1/2022 | | | 250,000 | | | | 275,115 | �� |
5.000%, 8/1/2025, Call 2/1/2025 (1) | | | 1,000,000 | | | | 1,183,680 | |
County of Montrose, 4.000%, 12/1/2019 | | | 200,000 | | | | 201,310 | |
E-470 Public Highway Authority, 2.468%, (LIBOR 1 Month), 9/1/2021, Call 3/1/2021 (1) | | | 575,000 | | | | 579,353 | |
Regional Transportation District, 5.000%, 6/1/2025, Call 6/1/2020 | | | 500,000 | | | | 514,695 | |
University of Colorado Hospital Authority, 5.000%, 3/1/2022, Call 9/1/2021 (1) | | | 750,000 | | | | 805,282 | |
Wheatlands Metropolitan District, BAM, 4.000%, 12/1/2020 | | | 125,000 | | | | 128,734 | |
| | | | | | | | |
| | | | | | | 6,175,658 | |
Connecticut — 1.1% | | | | | | | | |
State of Connecticut: | | | | | | | | |
2.270%, (SIFMA Municipal Swap Index Yield), 9/15/2019 (1) | | | 115,000 | | | | 115,028 | |
5.000%, 3/15/2021 | | | 500,000 | | | | 528,965 | |
5.000%, 4/15/2023 | | | 1,000,000 | | | | 1,132,830 | |
| | | | | | | | |
| | | | | | | 1,776,823 | |
District of Columbia — 0.7% | | | | | | | | |
Metropolitan Washington Airports Authority, 5.000%, 10/1/2024 | | | 1,000,000 | | | | 1,181,460 | |
| | |
Florida — 6.6% | | | | | | | | |
Brevard County Health Facilities Authority: | | | | | | | | |
5.000%, 4/1/2020 | | | 500,000 | | | | 510,790 | |
5.000%, 4/1/2021 | | | 400,000 | | | | 422,672 | |
City of Atlantic Beach, 3.250%, 11/15/2024, Call 11/15/2020 | | | 1,155,000 | | | | 1,174,947 | |
City of Orlando,AGM: | | | | | | | | |
4.000%, 11/1/2021 | | | 460,000 | | | | 487,328 | |
5.000%, 11/1/2022 | | | 350,000 | | | | 391,111 | |
City of Port St. Lucie, 5.000%, 7/1/2020 | | | 295,000 | | | | 304,393 | |
City of Tampa, 5.000%, 11/15/2020, Call 5/15/2020 | | | 25,000 | | | | 25,675 | |
Columbia County School Board, BAM, 5.000%, 7/1/2021 | | | 400,000 | | | | 427,804 | |
County of Broward Half-Cent Sales Tax Revenue, 5.000%, 10/1/2020 | | | 100,000 | | | | 104,266 | |
County of Manatee, 1.410%, 9/1/2024, Call 9/6/2019 (1) | | | 400,000 | | | | 400,000 | |
County of Okeechobee, 1.550%, 7/1/2021 (1) | | | 1,000,000 | | | | 1,005,510 | |
Emerald Coast Utilities Authority, BAM, 5.000%, 1/1/2021 | | | 300,000 | | | | 315,753 | |
Florida Development Finance Corp., 1.900%, 3/17/2020 (1) | | | 3,000,000 | | | | 3,000,960 | |
Florida Housing Finance Corp., GNMA/FNMA/FHLMC, 4.600%, 1/1/2029, Call 1/1/2020 | | | 45,000 | | | | 45,340 | |
Halifax Hospital Medical Center: | | | | | | | | |
5.000%, 6/1/2020 | | | 325,000 | | | | 333,570 | |
5.000%, 6/1/2021 | | | 300,000 | | | | 317,604 | |
Miami-Dade County Educational Facilities Authority, AMBAC, 5.250%, 4/1/2020 | | | 40,000 | | | | 40,928 | |
Pinellas County Health Facilities Authority,NATL-RE, 3.203%, 11/15/2023, Call 9/6/2019 (1)(3) | | | 125,000 | | | | 125,000 | |
Sarasota County Health Facilities Authority, 5.000%, 1/1/2022 | | | 500,000 | | | | 532,840 | |
Sumter County Industrial Development Authority: | | | | | | | | |
5.000%, 7/1/2020 | | | 235,000 | | | | 242,405 | |
5.000%, 7/1/2020 | | | 300,000 | | | | 309,453 | |
| | | | | | | | |
| | | | | | | 10,518,349 | |
Georgia — 6.9% | | | | | | | | |
Atlanta Development Authority, 4.000%, 9/1/2020 | | | 500,000 | | | | 514,310 | |
Bartow County Development Authority: | | | | | | | | |
1.550%, 8/19/2022 (1) | | | 500,000 | | | | 498,885 | |
2.050%, 11/19/2021 (1) | | | 500,000 | | | | 505,260 | |
Burke County Development Authority, 2.925%, 3/12/2024 (1) | | | 1,250,000 | | | | 1,315,650 | |
| | | | | | | | |
City of Atlanta: | | | | | | | | |
5.000%, 1/1/2021 | | | 250,000 | | | | 262,990 | �� |
5.000%, 1/1/2022 | | | 700,000 | | | | 758,044 | |
City of Atlanta Water & Wastewater Revenue, 6.000%, 11/1/2029, Call 11/1/2019 | | | 290,000 | | | | 292,265 | |
County of DeKalb Water & Sewerage Revenue, 5.000%, 10/1/2020 | | | 150,000 | | | | 156,383 | |
DeKalb Private Hospital Authority, 5.000%, 11/15/2021, Call 11/15/2019 | | | 420,000 | | | | 423,259 | |
Gainesville & Hall County Hospital Authority: | | | | | | | | |
2.300%, (SIFMA Municipal Swap Index Yield), 2/18/2020, Call 9/30/2019 (1) | | | 350,000 | | | | 350,053 | |
5.000%, 2/15/2021 | | | 700,000 | | | | 736,386 | |
Georgia State Road & Tollway Authority, 5.000%, 6/1/2021 | | | 1,250,000 | | | | 1,334,750 | |
Main Street Natural Gas, Inc.: | | | | | | | | |
2.244%, (LIBOR 1 Month), 9/1/2023, Call 6/1/2023 (1) | | | 1,000,000 | | | | 1,006,250 | |
2.324%, (LIBOR 1 Month), 12/1/2023, Call 9/1/2023 (1) | | | 500,000 | | | | 502,000 | |
5.000%, 5/15/2024 | | | 1,250,000 | | | | 1,440,125 | |
Municipal Electric Authority of Georgia, 5.000%, 1/1/2023 | | | 875,000 | | | | 978,512 | |
| | | | | | | | |
| | | | | | | 11,075,122 | |
Guam — 0.3% | | | | | | | | |
Territory of Guam, 5.000%, 12/1/2022 | | | 500,000 | | | | 546,695 | |
| | |
Illinois — 16.2% | | | | | | | | |
Chicago Housing Authority, HUD SEC 8, 5.000%, 1/1/2023 | | | 1,000,000 | | | | 1,115,880 | |
Chicago O’Hare International Airport: | | | | | | | | |
5.000%, 1/1/2022 | | | 100,000 | | | | 108,701 | |
5.000%, 1/1/2022 | | | 200,000 | | | | 217,402 | |
Chicago Park District: | | | | | | | | |
5.000%, 1/1/2022 | | | 250,000 | | | | 268,495 | |
5.000%, 1/1/2022 | | | 500,000 | | | | 536,990 | |
Chicago Transit Authority, 5.000%, 6/1/2021 | | | 750,000 | | | | 795,075 | |
City of Chicago Wastewater Transmission Revenue: | | | | | | | | |
5.000%, 1/1/2021 | | | 840,000 | | | | 880,001 | |
5.000%, 1/1/2022 | | | 500,000 | | | | 540,025 | |
City of Chicago Waterworks Revenue: | | | | | | | | |
5.000%, 11/1/2019 | | | 620,000 | | | | 623,540 | |
5.000%, 11/1/2021 | | | 1,445,000 | | | | 1,553,823 | |
City of Waukegan, 5.000%, 12/30/2020 | | | 250,000 | | | | 262,388 | |
Cook County Township High School District No. 201 J Sterling Morton, AMBAC, 0.000%, 12/1/2019 | | | 100,000 | | | | 99,596 | |
County of Cook: | | | | | | | | |
5.000%, 11/15/2020, Call 11/15/2019 | | | 250,000 | | | | 251,785 | |
5.000%, 11/15/2021 | | | 720,000 | | | | 775,800 | |
County of Cook Sales Tax Revenue, 5.000%, 11/15/2024, Call 11/15/2022 | | | 810,000 | | | | 901,425 | |
Illinois Finance Authority: | | | | | | | | |
1.400%, 8/15/2042, Call 9/6/2019 (1) | | | 200,000 | | | | 200,000 | |
2.911%, (LIBOR 1 Month), 5/1/2021, Call 11/1/2020 (1) | | | 1,000,000 | | | | 1,002,540 | |
5.000%, 1/1/2021 | | | 200,000 | | | | 208,580 | |
5.000%, 11/15/2021 | | | 400,000 | | | | 432,196 | |
5.000%, 1/1/2022 | | | 150,000 | | | | 161,150 | |
5.000%, 7/15/2022 | | | 750,000 | | | | 831,397 | |
5.000%, 11/15/2022 | | | 555,000 | | | | 619,119 | |
5.000%, 12/1/2022 | | | 290,000 | | | | 315,273 | |
5.000%, 5/15/2023 | | | 250,000 | | | | 276,870 | |
5.000%, 5/15/2024 | | | 450,000 | | | | 509,935 | |
Illinois Housing Development Authority, 1.900%, 10/1/2021 (1) | | | 500,000 | | | | 505,790 | |
Illinois Housing Development Authority, AGM, 4.400%, 9/1/2020, Call 9/30/2019 | | | 40,000 | | | | 40,086 | |
Kane McHenry Cook & De Kalb Counties Unit School District No. 300, 5.000%, 1/1/2023 | | | 1,000,000 | | | | 1,117,950 | |
Lake County Forest Preserve District, 2.095%, (LIBOR 3 Month), 12/15/2020 (1) | | | 140,000 | | | | 140,119 | |
Marion-Clinton Etc Counties High School District No.200-Centralia, BAM, 3.000%, 12/1/2019 | | | 185,000 | | | | 185,237 | |
Metropolitan Pier & Exposition Authority,NATL-RE, 0.000%, 6/15/2020 | | | 30,000 | | | | 29,602 | |
Quad Cities Regional Economic Development Authority, 4.000%, 10/1/2019 | | | 400,000 | | | | 400,708 | |
Railsplitter Tobacco Settlement Authority, 5.000%, 6/1/2023 | | | 1,000,000 | | | | 1,130,730 | |
Sales Tax Securitization Corp., 5.000%, 1/1/2023 | | | 1,000,000 | | | | 1,101,440 | |
State of Illinois: | | | | | | | | |
5.000%, 4/1/2020 | | | 100,000 | | | | 101,879 | |
| | | | | | | | |
5.000%, 6/1/2020 | | | 500,000 | | | | 512,095 | |
5.000%, 8/1/2020 | | | 900,000 | | | | 926,559 | |
5.000%, 2/1/2021 | | | 240,000 | | | | 250,766 | |
5.000%, 11/1/2022 | | | 2,000,000 | | | | 2,166,820 | |
Town of Cicero, AGM, 5.000%, 1/1/2020 | | | 500,000 | | | | 505,805 | |
University of Illinois, 5.000%, 3/15/2022 | | | 1,000,000 | | | | 1,090,630 | |
Village of Bolingbrook,AGM: | | | | | | | | |
4.000%, 3/1/2022 | | | 630,000 | | | | 668,619 | |
4.000%, 3/1/2023 | | | 510,000 | | | | 552,131 | |
Will County Community High School District No. 210Lincoln-Way, 4.000%, 1/1/2022, Call 9/30/2019 | | | 1,000,000 | | | | 1,001,220 | |
| | | | | | | | |
| | | | | | | 25,916,172 | |
Indiana — 3.6% | | | | | | | | |
City of Whiting: | | | | | | | | |
1.850%, 10/1/2019 (1) | | | 1,000,000 | | | | 1,000,360 | |
5.000%, 6/5/2026 (1) | | | 1,000,000 | | | | 1,218,820 | |
Indiana Finance Authority: | | | | | | | | |
1.600%, 12/2/2019 (1)(4) | | | 830,000 | | | | 830,000 | |
5.000%, 5/1/2020 | | | 100,000 | | | | 102,443 | |
5.000%, 8/15/2020 | | | 130,000 | | | | 134,000 | |
5.250%, 10/1/2022, Call 10/1/2021 | | | 150,000 | | | | 162,632 | |
Indiana Housing & Community Development Authority, GNMA/FNMA/FHLMC, 1.500%, 7/1/2047, Call 9/6/2019 (1) | | | 2,000,000 | | | | 2,000,000 | |
Indianapolis Local Public Improvement Bond Bank, 5.000%, 6/1/2020 | | | 100,000 | | | | 102,864 | |
Jasper Hospital Authority, 5.000%, 11/1/2020 | | | 250,000 | | | | 261,070 | |
| | | | | | | | |
| | | | | | | 5,812,189 | |
Kansas — 0.4% | | | | | | | | |
Bourbon County Unified School District No.234-Fort Scott, 5.000%, 9/1/2020 | | | 420,000 | | | | 435,897 | |
Kansas Development Finance Authority, BAM TCRs, 5.000%, 12/1/2019 | | | 140,000 | | | | 141,298 | |
| | | | | | | | |
| | | | | | | 577,195 | |
Kentucky — 2.3% | | | | | | | | |
Kentucky Asset Liability Commission, 5.000%, 9/1/2023 | | | 500,000 | | | | 574,010 | |
Kentucky Public Energy Authority, 4.000%, 7/1/2023 | | | 750,000 | | | | 819,397 | |
Kentucky Rural Water Finance Corp., 2.250%, 3/1/2020, Call 9/20/2019 | | | 1,200,000 | | | | 1,200,516 | |
Louisville/Jefferson County Metropolitan Government: | | | | | | | | |
1.850%, 4/1/2021 (1) | | | 500,000 | | | | 504,895 | |
5.000%, 10/1/2020 | | | 550,000 | | | | 571,170 | |
| | | | | | | | |
| | | | | | | 3,669,988 | |
Louisiana — 0.4% | | | | | | | | |
Evangeline Parish Road & Drain Sales Tax District No. 1, AGM, 5.000%, 12/1/2020 | | | 400,000 | | | | 418,976 | |
Louisiana Housing Corp., FHA, 2.500%, 12/1/2031, Call 6/1/2020 | | | 5,000 | | | | 5,080 | |
Louisiana Public Facilities Authority, AMBAC, 2.936%, 9/1/2027, Call 10/1/2019 (1)(3) | | | 50,000 | | | | 50,000 | |
State of Louisiana, 5.000%, 11/15/2020, Call 5/15/2020 | | | 110,000 | | | | 113,016 | |
| | | | | | | | |
| | | | | | | 587,072 | |
Maine — 0.1% | | | | | | | | |
City of Portland General Airport Revenue, 4.000%, 7/1/2020 | | | 110,000 | | | | 112,199 | |
| | |
Maryland — 0.7% | | | | | | | | |
City of Baltimore: | | | | | | | | |
3.618%, 7/1/2037, Call 6/19/2019 (3) | | | 0 | | | | 0 | |
5.000%, 9/1/2022 | | | 500,000 | | | | 552,745 | |
City of Baltimore,NATL-RE, 3.225%, 7/1/2020 (1)(3) | | | 50,000 | | | | 50,000 | |
City of Rockville, 5.000%, 11/1/2022 | | | 500,000 | | | | 550,845 | |
Maryland Community Development Administration, GNMA/FNMA/FHLMC, 4.500%, 3/1/2027, Call 3/1/2021 | | | 10,000 | | | | 10,258 | |
| | | | | | | | |
| | | | | | | 1,163,848 | |
Massachusetts — 2.0% | | | | | | | | |
Commonwealth of Massachusetts, 1.700%, 8/1/2022 (1) | | | 1,000,000 | | | | 1,012,890 | |
Massachusetts Development Finance Agency: | | | | | | | | |
4.000%, 4/15/2020 | | | 115,000 | | | | 116,324 | |
5.000%, 7/1/2021 | | | 280,000 | | | | 297,886 | |
5.000%, 7/1/2022 | | | 315,000 | | | | 345,681 | |
| | | | | | | | |
5.000%, 7/1/2024 | | | 260,000 | | | | 301,756 | |
Massachusetts Transportation Trust Fund Metropolitan Highway System Revenue, 5.000%, 1/1/2023, Call 1/1/2023 (1) | | | 1,000,000 | | | | 1,122,120 | |
| | | | | | | | |
| | | | | | | 3,196,657 | |
Michigan — 2.6% | | | | | | | | |
City of Wyandotte Electric System Revenue, BAM, 5.000%, 10/1/2019 | | | 250,000 | | | | 250,592 | |
Great Lakes Water Authority Water Supply System Revenue, 5.000%, 7/1/2023 | | | 800,000 | | | | 911,336 | |
Grosse Ile Township School District,Q-SBLF, 5.000%, 5/1/2020 | | | 595,000 | | | | 609,970 | |
Lake St. Claire Clean Water Initiative, County Guarantee, 5.000%, 10/1/2020 | | | 150,000 | | | | 156,350 | |
Marquette Board of Light & Power, 5.000%, 7/1/2020 | | | 150,000 | | | | 154,751 | |
Michigan Finance Authority, 3.500%, 11/15/2022 (1)(4) | | | 1,000,000 | | | | 1,063,470 | |
Michigan State Hospital Finance Authority, 5.000%, 11/15/2020, Call 11/15/2019 | | | 520,000 | | | | 523,962 | |
Muskegon Public Schools,Q-SBLF, 4.250%, 5/1/2021, Call 9/30/2019 | | | 200,000 | | | | 200,440 | |
Taylor Tax Increment Finance Authority, AGM, 4.000%, 5/1/2021, Call 9/30/2019 | | | 270,000 | | | | 270,564 | |
| | | | | | | | |
| | | | | | | 4,141,435 | |
Minnesota — 1.0% | | | | | | | | |
Housing & Redevelopment Authority of The City of St. Paul, 5.000%, 11/15/2021 | | | 500,000 | | | | 540,130 | |
JPMorgan Chase Putters/Drivers Trust, 1.700%, 6/1/2021 (1)(2) | | | 1,000,000 | | | | 1,000,000 | |
| | | | | | | | |
| | | | | | | 1,540,130 | |
Mississippi — 1.4% | | | | | | | | |
Mississippi Business Finance Corp, 2.200%, 6/3/2024 (1) | | | 1,250,000 | | | | 1,286,612 | |
State of Mississippi, 5.000%, 10/15/2024 | | | 750,000 | | | | 888,728 | |
| | | | | | | | |
| | | | | | | 2,175,340 | |
Missouri — 1.1% | | | | | | | | |
Health & Educational Facilities Authority of the State of Missouri: | | | | | | | | |
2.875%, 2/1/2022, Call 4/1/2020 | | | 600,000 | | | | 604,512 | |
5.000%, 2/1/2022 | | | 250,000 | | | | 267,762 | |
5.000%, 2/1/2024, Call 2/1/2021 | | | 250,000 | | | | 260,243 | |
Missouri Housing Development Commission, GNMA/FNMA/FHLMC, 4.700%, 3/1/2035, Call 9/30/2019 | | | 180,000 | | | | 180,427 | |
Missouri State Environmental Improvement & Energy Resources Authority,NATL-RE, 2.363%, 12/1/2022, Call 6/26/2019 (3) | | | 0 | | | | 0 | |
St. Louis Municipal Finance Corp., 5.000%, 2/15/2021 | | | 500,000 | | | | 527,400 | |
| | | | | | | | |
| | | | | | | 1,840,344 | |
Nebraska — 0.7% | | | | | | | | |
Central Plains Energy Project, 5.000%, 1/1/2024, Call 10/1/2023 (1) | | | 1,000,000 | | | | 1,133,750 | |
| | |
Nevada — 1.6% | | | | | | | | |
City of Carson City, 5.000%, 9/1/2022 | | | 500,000 | | | | 548,885 | |
City of North Las Vegas NV, AGM, 5.000%, 6/1/2023 | | | 1,000,000 | | | | 1,136,610 | |
State of Nevada Department of Business & Industry, 1.875%, 12/2/2019 (1)(2) | | | 800,000 | | | | 800,856 | |
| | | | | | | | |
| | | | | | | 2,486,351 | |
New Jersey — 3.1% | | | | | | | | |
Lyndhurst Township School District, School Bond Gty, 3.000%, 9/13/2019 | | | 1,000,000 | | | | 1,000,400 | |
New Jersey Economic Development Authority, 5.000%, 11/1/2021 | | | 400,000 | | | | 430,748 | |
New Jersey Health Care Facilities Financing Authority, 5.000%, 7/1/2022 | | | 790,000 | | | | 875,533 | |
New Jersey Higher Education Student Assistance Authority, 4.875%, 12/1/2024, Call 12/1/2019 | | | 300,000 | | | | 302,664 | |
New Jersey Transportation Trust Fund Authority: | | | | | | | | |
2.350%, (SIFMA Municipal Swap Index Yield), 12/15/2019, Call 9/25/2019 (1) | | | 475,000 | | | | 475,142 | |
4.000%, 12/15/2019 | | | 75,000 | | | | 75,581 | |
5.000%, 12/15/2023 | | | 250,000 | | | | 285,220 | |
New Jersey Transportation Trust Fund Authority, AGM, 5.250%, 12/15/2019 | | | 250,000 | | | | 252,750 | |
New Jersey Transportation Trust Fund Authority,NATL-RE: | | | | | | | | |
5.500%, 12/15/2019 | | | 135,000 | | | | 136,611 | |
5.500%, 12/15/2020 | | | 10,000 | | | | 10,542 | |
Tobacco Settlement Financing Corp., 5.000%, 6/1/2022 | | | 1,000,000 | | | | 1,092,790 | |
| | | | | | | | |
| | | | | | | 4,937,981 | |
New Mexico — 0.6% | | | | | | | | |
New Mexico Hospital Equipment Loan Council, 2.375%, 7/1/2024, Call 1/1/2021 | | | 1,000,000 | | | | 1,002,340 | |
| | | | | | | | |
New Mexico Mortgage Finance Authority, GNMA/FNMA/FHLMC, 5.300%, 9/1/2040, Call 9/1/2019 | | | 5,000 | | | | 5,000 | |
| | | | | | | | |
| | | | | | | 1,007,340 | |
New York — 8.4% | | | | | | | | |
Long Island Power Authority, 2.311%, (LIBOR 1 Month), 10/1/2023, Call 10/1/2022 (1) | | | 1,000,000 | | | | 1,004,700 | |
Metropolitan Transportation Authority: | | | | | | | | |
4.000%, 2/3/2020 | | | 850,000 | | | | 859,614 | |
5.000%, 11/15/2024 (1) | | | 1,000,000 | | | | 1,182,340 | |
New York City Transitional Finance Authority Future Tax Secured Revenue, 1.430%, 11/1/2042, Call 9/6/2019 (1) | | | 800,000 | | | | 800,000 | |
New York City Water & Sewer System, 1.430%, 6/15/2044, Call 9/6/2019 (1) | | | 300,000 | | | | 300,000 | |
New York State Dormitory Authority, 5.000%, 12/1/2022 (2) | | | 600,000 | | | | 661,602 | |
New York State Dormitory Authority,NATL-RE, 4.300%, 7/1/2029, Call 9/3/2019 (1)(3) | | | 475,000 | | | | 475,000 | |
New York State Energy Research & Development Authority, 2.000%, 5/1/2020 (1) | | | 350,000 | | | | 351,995 | |
New York State Housing Finance Agency, SONYMA, 1.875%, 11/1/2021, Call 5/1/2020 (1) | | | 750,000 | | | | 753,000 | |
Nuveen New YorkAMT-Free Municipal Credit Income Fund, 1.700%, 3/1/2029 (1) | | | 1,300,000 | | | | 1,300,000 | |
Nuveen New YorkAMT-Free Quality Municipal Income Fund, 1.700%, 3/1/2029 (1) | | | 1,000,000 | | | | 1,000,000 | |
State of New York Mortgage Agency, 5.000%, 10/1/2019 | | | 600,000 | | | | 601,794 | |
Triborough Bridge & Tunnel Authority: | | | | | | | | |
1.850%, (SOFR + 43 basis points), 9/26/2019 (1) | | | 945,000 | | | | 945,170 | |
2.194%, (LIBOR 1 Month), 2/1/2021 (1) | | | 990,000 | | | | 996,088 | |
TSASC, Inc., 5.000%, 6/1/2021 | | | 1,000,000 | | | | 1,063,760 | |
Westchester Tobacco Asset Securitization, 5.000%, 6/1/2020 | | | 1,155,000 | | | | 1,184,071 | |
| | | | | | | | |
| | | | | | | 13,479,134 | |
North Carolina — 0.6% | | | | | | | | |
North Carolina Eastern Municipal Power Agency, FGIC, 3.144%, 1/1/2025 (1)(3) | | | 600,000 | | | | 571,830 | |
North Carolina Medical Care Commission, 5.000%, 10/1/2022 | | | 350,000 | | | | 386,806 | |
| | | | | | | | |
| | | | | | | 958,636 | |
North Dakota — 0.2% | | | | | | | | |
City of Williston, 5.000%, 5/1/2020 | | | 240,000 | | | | 245,750 | |
North Dakota Housing Finance Agency, 3.750%, 7/1/2042, Call 7/1/2022 | | | 65,000 | | | | 67,240 | |
| | | | | | | | |
| | | | | | | 312,990 | |
Ohio — 2.4% | | | | | | | | |
Akron Bath Copley Joint Township Hospital District, 5.000%, 11/15/2021 | | | 805,000 | | | | 868,514 | |
American Municipal Power, Inc., 2.300%, 2/15/2022, Call 8/15/2021 (1) | | | 1,000,000 | | | | 1,019,080 | |
County of Hamilton: | | | | | | | | |
4.000%, 1/1/2021 | | | 445,000 | | | | 457,220 | |
5.000%, 1/1/2022 | | | 465,000 | | | | 497,071 | |
County of Lorain, 3.000%, 2/7/2020 | | | 500,000 | | | | 503,805 | |
Ohio Housing Finance Agency, GNMA/FNMA/FHLMC, 4.000%, 5/1/2022, Call 5/1/2021 | | | 65,000 | | | | 65,616 | |
University of Toledo, 5.000%, 6/1/2020 | | | 375,000 | | | | 385,541 | |
| | | | | | | | |
| | | | | | | 3,796,847 | |
Pennsylvania — 3.9% | | | | | | | | |
Allegheny County Hospital Development Authority, 2.230%, (LIBOR 3 Month), 2/1/2021, Call 11/1/2019 (1) | | | 55,000 | | | | 55,073 | |
Berks County Industrial Development Authority, 5.000%, 11/1/2022 | | | 250,000 | | | | 277,718 | |
Berks County Municipal Authority, 2.850%, (SIFMA Municipal Swap Index Yield), 7/1/2022, Call 9/16/2019 (1) | | | 350,000 | | | | 353,255 | |
Commonwealth Financing Authority, 5.000%, 6/1/2022 | | | 1,000,000 | | | | 1,096,020 | |
Lancaster County Hospital Authority, 2.875%, 12/15/2023, Call 12/15/2019 | | | 500,000 | | | | 500,570 | |
Lancaster County Solid Waste Management Authority, 5.000%, 12/15/2020 | | | 200,000 | | | | 209,338 | |
Lancaster Industrial Development Authority, 5.000%, 5/1/2020 | | | 285,000 | | | | 290,614 | |
Montgomery County Industrial Development Authority: | | | | | | | | |
4.000%, 12/1/2022 | | | 250,000 | | | | 266,190 | |
4.000%, 12/1/2023 | | | 100,000 | | | | 109,706 | |
4.000%, 12/1/2024 | | | 100,000 | | | | 111,728 | |
5.000%, 12/1/2023 | | | 320,000 | | | | 359,504 | |
North Penn Water Authority, 1.994%, (LIBOR 1 Month), 11/1/2019, Call 9/20/2019 (1) | | | 800,000 | | | | 800,064 | |
| | | | | | | | |
Northampton County General Purpose Authority: | | | | | | | | |
2.601%, (LIBOR 1 Month), 8/15/2024, Call 2/15/2023 (1) | | | 1,000,000 | | | | 1,002,090 | |
2.750%, (SIFMA Municipal Swap Index Yield), 8/15/2020, Call 2/15/2020 (1) | | | 150,000 | | | | 150,534 | |
Pennsylvania Economic Development Financing Authority, 5.000%, 3/1/2020 | | | 200,000 | | | | 203,506 | |
Pennsylvania Turnpike Commission: | | | | | | | | |
2.230%, (SIFMA Municipal Swap Index Yield), 12/1/2020, Call 6/1/2020 (1) | | | 325,000 | | | | 327,119 | |
2.330%, (SIFMA Municipal Swap Index Yield), 12/1/2021, Call 6/1/2021 (1) | | | 80,000 | | | | 81,119 | |
| | | | | | | | |
| | | | | | | 6,194,148 | |
South Carolina — 1.3% | | | | | | | | |
Newberry Investing in Children’s Education, 5.000%, 12/1/2019 | | | 1,000,000 | | | | 1,009,420 | |
Patriots Energy Group Financing Agency, 2.354%, (LIBOR 1 Month), 2/1/2024, Call 11/1/2023 (1) | | | 1,000,000 | | | | 1,001,200 | |
| | | | | | | | |
| | | | | | | 2,010,620 | |
Tennessee — 2.0% | | | | | | | | |
Clarksville Natural Gas Acquisition Corp., 5.000%, 12/15/2019 | | | 125,000 | | | | 126,303 | |
Metropolitan Government Nashville & Davidson County Health & Educational Facility Board, 2.000%, 1/1/2021 (1) | | | 1,000,000 | | | | 1,009,370 | |
Tennessee Energy Acquisition Corp.: | | | | | | | | |
4.000%, 5/1/2023, Call 2/1/2023 (1) | | | 1,000,000 | | | | 1,082,590 | |
5.000%, 2/1/2023 | | | 790,000 | | | | 876,805 | |
5.250%, 9/1/2020 | | | 10,000 | | | | 10,367 | |
5.250%, 9/1/2021 | | | 55,000 | | | | 58,985 | |
| | | | | | | | |
| | | | | | | 3,164,420 | |
Texas — 7.1% | | | | | | | | |
Clifton Higher Education Finance Corp., PSF, 5.000%, 8/15/2020 | | | 160,000 | | | | 165,723 | |
County of Cameron, BAM, 5.000%, 2/15/2020 | | | 240,000 | | | | 244,260 | |
Crane County Water District, 3.000%, 2/15/2021 | | | 605,000 | | | | 620,313 | |
Fort Bend Independent School District, PSF, 1.950%, 8/1/2022 (1) | | | 1,000,000 | | | | 1,017,990 | |
Harris County Cultural Education Facilities Finance Corp., 2.180%, (SIFMA Municipal Swap Index Yield), 6/1/2021 (1) | | | 350,000 | | | | 351,302 | |
Harris County Health Facilities Development Corp., 1.390%, 12/1/2041, Call 9/6/2019 (1) | | | 500,000 | | | | 500,000 | |
Houston Independent School District, PSF, 2.250%, 6/1/2022 (1) | | | 1,250,000 | | | | 1,281,312 | |
Irving Hospital Authority, 5.000%, 10/15/2022 | | | 215,000 | | | | 237,541 | |
Mission Economic Development Corp., 2.500%, 8/1/2020, Call 9/30/2019 | | | 1,000,000 | | | | 1,000,880 | |
New Hope Cultural Education Facilities Finance Corp.: | | | | | | | | |
3.375%, 8/15/2021 (2) | | | 275,000 | | | | 278,861 | |
4.000%, 11/15/2021 | | | 615,000 | | | | 633,936 | |
New Hope Cultural Education Facilities Finance Corp., AGM, 4.000%, 4/1/2020 | | | 250,000 | | | | 253,303 | |
North Texas Higher Education Authority, Inc., 3.219%, (LIBOR 3 Month), 7/1/2030 (1) | | | 90,000 | | | | 89,932 | |
North Texas Tollway Authority, 5.000%, 1/1/2022 | | | 250,000 | | | | 272,477 | |
Northside Independent School District, PSF, 2.125%, 8/1/2020, Call 2/1/2020 (1) | | | 655,000 | | | | 657,404 | |
Panhandle-Plains Higher Education Authority, Inc., 3.569%, (LIBOR 3 Month), 4/1/2035 (1) | | | 195,000 | | | | 196,552 | |
Port of Port Arthur Navigation District, 1.900%, 10/3/2019, Call 10/3/2019 (1)(2) | | | 1,500,000 | | | | 1,500,105 | |
Tarrant County Cultural Education Facilities Finance Corp.: | | | | | | | | |
5.000%, 5/15/2021 | | | 500,000 | | | | 524,550 | |
5.000%, 11/15/2022 | | | 1,000,000 | | | | 1,097,700 | |
Texas State University System, 5.000%, 3/15/2022 | | | 350,000 | | | | 384,296 | |
| | | | | | | | |
| | | | | | | 11,308,437 | |
Utah — 0.1% | | | | | | | | |
Salt Lake City Corp., AMBAC, 2.458%, 5/15/2020, Call 9/6/2019 (1)(3) | | | 200,000 | | | | 200,000 | |
| | |
Virginia — 1.1% | | | | | | | | |
Henrico County Economic Development Authority, 5.000%, 10/1/2023 | | | 575,000 | | | | 654,206 | |
| | |
Henrico County Economic Development Authority, AGM, 3.873%, 8/23/2027, Call 9/6/2019 (1)(3) | | | 1,100,000 | | | | 1,100,000 | |
| | | | | | | | |
| | | | | | | 1,754,206 | |
Washington — 0.9% | | | | | | | | |
State of Washington, 5.000%, 2/1/2022 | | | 1,000,000 | | | | 1,094,080 | |
| | | | | | | | |
Washington State Housing Finance Commission, GNMA/FNMA/FHLMC, 5.000%, 10/1/2020 | | | 320,000 | | | | 333,574 | |
| | | | | | | | |
| | | | | | | 1,427,654 | |
West Virginia — 1.4% | | | | | | | | |
West Virginia Economic Development Authority, 2.550%, 4/1/2024 (1) | | | 1,000,000 | | | | 1,043,990 | |
West Virginia Hospital Finance Authority: | | | | | | | | |
5.000%, 1/1/2022 | | | 520,000 | | | | 562,000 | |
5.000%, 1/1/2023 | | | 555,000 | | | | 617,776 | |
| | | | | | | | |
| | | | | | | 2,223,766 | |
Wisconsin — 1.9% | | | | | | | | |
Public Finance Authority: | | | | | | | | |
1.450%, 10/1/2049, Call 9/6/2019 (1) | | | 300,000 | | | | 300,000 | |
5.000%, 11/15/2021 | | | 610,000 | | | | 647,466 | |
5.000%, 11/15/2022 | | | 500,000 | | | | 542,840 | |
State of Wisconsin: | | | | | | | | |
5.000%, 9/1/2020 | | | 175,000 | | | | 181,802 | |
5.000%, 3/1/2021 | | | 300,000 | | | | 317,355 | |
Wisconsin Health & Educational Facilities Authority: | | | | | | | | |
5.000%, 3/1/2020 | | | 200,000 | | | | 201,956 | |
5.000%, 8/15/2020 | | | 260,000 | | | | 269,503 | |
5.000%, 8/15/2022 | | | 200,000 | | | | 222,142 | |
5.000%, 8/15/2023 | | | 205,000 | | | | 234,588 | |
5.500%, 12/15/2020, Call 12/15/2019 | | | 80,000 | | | | 80,971 | |
| | | | | | | | |
| | | | | | | 2,998,623 | |
| | | | | | | | |
Total Municipals
(identified cost $156,709,960) | | | | | | | 159,089,364 | |
| | | | | | | | |
| | |
Short-Term Investments — 0.2% | | | | | | | | |
| | |
Repurchase Agreements — 0.2% | | | | | | | | |
Agreement with Fixed Income Clearing Corp., 2.150%, dated 8/30/2019, to be repurchased at $371,965 on 9/3/2019, collateralized by U.S. Government Treasury Obligations with a maturity of 12/31/2020, with a fair value $380,420, 2.50% | | | 371,965 | | | | 371,965 | |
| | | | | | | | |
Total Short-Term Investments
(identified cost $371,965) | | | | | | | 371,965 | |
| | | | | | | | |
| | |
Total Investments — 99.8%
(identified cost $157,081,925) | | | | | | | 159,461,329 | |
| | | | | | | | |
| | |
Other Assets and Liabilities — 0.2% | | | | | | | 334,724 | |
| | | | | | | | |
Total Net Assets — 100.0% | | | | | | $ | 159,796,053 | |
| | | | | | | | |
| (1) | Denotes a variable rate security. The rate shown is the current interest rate as of August 31, 2019. Rate fluctuations are based underlying positions and/or other variables. For securities whose yields vary with a designated market index or market rate, the reference rate and spread are indicated in the description. |
| (2) | Denotes a restricted security which is subject to restrictions on resale under federal securities laws. These securities have been deemed liquid based on criteria approved by the Board of Directors of the BMO Funds. At August 31, 2019 these securities amounted to: |
| | | | | | | | |
| Fund | | Amount | | | % of Total Net Assets | |
ShortTax-Free Fund | | | 5,190,979 | | | | 3.25% | |
| (3) | Issue represents an Auction Rate Security. An Auction Rate Security is a corporate or municipal bond debt instrument with a long nominal maturity for which the interest rate is regularly reset through a Dutch auction. The rate presented is either the rate set through the auction or the maximum interest rate provided for in the security issuance provision. |
| (4) | Purchased on a when-issued or delayed delivery basis. |
| | |
LIBOR | | London Interbank Offered Rate |
HUD | | Department of Housing and Urban Development |
AGM | | Assured Guaranty Municipal |
PSF | | Permanent School Fund Guaranteed |
Ultra ShortTax-Free Fund
| | | | | | | | |
Description | |
| Shares or
Principal Amount |
| | | Value | |
| | |
Municipals — 98.6% | | | | | | | | |
| | |
Alabama — 5.2% | | | | | | | | |
Albertville Municipal Utilities Board - Water System, AGM, 2.000%, 8/15/2020 | | $ | 355,000 | | | $ | 357,197 | |
Black Belt Energy Gas District: | | | | | | | | |
2.394%, (LIBOR 1 Month), 12/1/2023, Call 9/1/2023 (1) | | | 4,500,000 | | | | 4,452,750 | |
4.000%, 6/1/2021 | | | 1,000,000 | | | | 1,045,290 | |
4.000%, 6/1/2022 | | | 1,000,000 | | | | 1,068,660 | |
Chatom Industrial Development Board, 1.400%, 2/3/2020, Call 2/1/2020 (1) | | | 4,800,000 | | | | 4,798,992 | |
County of Jefferson, 5.000%, 9/15/2019 | | | 1,000,000 | | | | 1,001,190 | |
Health Care Authority for Baptist Health, 1.810%, 11/1/2042, Call 9/3/2019 (1) | | | 11,125,000 | | | | 11,125,000 | |
Limestone County Water & Sewer Authority, BAM, 2.000%, 12/1/2019 | | | 160,000 | | | | 160,333 | |
| | |
Southeast Alabama Gas Supply District, 2.394%, (LIBOR 1 Month), 4/1/2024, Call 1/1/2024 (1) | | | 5,000,000 | | | | 4,971,900 | |
| | | | | | | | |
| | | | | | | 28,981,312 | |
Arkansas — 1.8% | | | | | | | | |
Arkansas Development Finance Authority: | | | | | | | | |
1.820%, 9/1/2044, Call 9/3/2019 (1) | | | 7,000,000 | | | | 7,000,000 | |
2.450%, (SIFMA Municipal Swap Index Yield), 10/1/2020 (1) | | | 3,000,000 | | | | 3,000,000 | |
City of Cabot, 2.550%, 6/1/2043, Call 6/1/2023 | | | 5,000 | | | | 5,007 | |
| | | | | | | | |
| | | | | | | 10,005,007 | |
California — 2.7% | | | | | | | | |
Bay Area Toll Authority, 2.450%, (SIFMA Municipal Swap Index Yield), 4/1/2024, Call 10/1/2023 (1) | | | 1,750,000 | | | | 1,802,063 | |
California Municipal Finance Authority, 1.480%, 10/1/2019 (1) | | | 4,500,000 | | | | 4,500,315 | |
California Pollution Control Financing Authority, 1.500%, 10/15/2019 (1)(2) | | | 4,000,000 | | | | 4,000,320 | |
Palomar Health, 4.000%, 11/1/2019 | | | 505,000 | | | | 506,752 | |
State of California, 1.640%, (SIFMA Municipal Swap Index Yield), 12/1/2020, Call 12/1/2019 (1) | | | 750,000 | | | | 750,420 | |
Tender Option Bond Trust Receipts/Certificates, 1.550%, 8/1/2042, Call 2/1/2026 (1)(2) | | | 3,730,000 | | | | 3,730,000 | |
| | | | | | | | |
| | | | | | | 15,289,870 | |
Colorado — 0.7% | | | | | | | | |
City & County of Denver Airport System Revenue, AGC, 1.470%, 11/15/2025, Call 9/6/2019 (1)(3) | | | 525,000 | | | | 525,000 | |
Colorado Health Facilities Authority, 5.000%, 6/1/2022 | | | 1,000,000 | | | | 1,100,460 | |
Colorado School of Mines, 1.994%, (LIBOR 1 Month), 2/1/2023, Call 8/1/2022 (1) | | | 1,185,000 | | | | 1,185,663 | |
E-470 Public Highway Authority, 1.873%, (LIBOR 1 Month), 9/1/2021, Call 9/1/2020 (1) | | | 1,370,000 | | | | 1,370,329 | |
| | | | | | | | |
| | | | | | | 4,181,452 | |
Connecticut — 0.1% | | | | | | | | |
Connecticut State Health & Educational Facilities Authority, 5.000%, 7/1/2020 | | | 400,000 | | | | 412,500 | |
| | |
District of Columbia — 0.5% | | | | | | | | |
District of Columbia Housing Finance Agency, AGM, 5.000%, 7/1/2021, Call 9/30/2019 | | | 360,000 | | | | 361,019 | |
Washington Convention & Sports Authority, 5.000%, 10/1/2020 | | | 2,500,000 | | | | 2,605,550 | |
| | | | | | | | |
| | | | | | | 2,966,569 | |
Florida — 4.8% | | | | | | | | |
Citizens Property Insurance Corp., 5.000%, 6/1/2020 | | | 3,870,000 | | | | 3,980,837 | |
City of Atlantic Beach, 3.000%, 11/15/2023, Call 5/15/2020 | | | 2,000,000 | | | | 2,017,180 | |
City of Orlando, AGM, 3.000%, 11/1/2019 | | | 850,000 | | | | 852,473 | |
Florida Development Finance Corp., 1.900%, 3/17/2020 (1) | | | 10,000,000 | | | | 10,003,200 | |
Lee Memorial Health System, 1.530%, 4/1/2049, Call 9/3/2019 (1) | | | 4,000,000 | | | | 4,000,000 | |
| | | | | | | | |
North Broward Hospital District, 5.000%, 1/1/2020 | | | 875,000 | | | | 884,870 | |
RBC Municipal Products, Inc. Trust, 1.550%, (SIFMA Municipal Swap Index Yield), 3/2/2020 (1)(2)(4) | | | 5,000,000 | | | | 5,000,000 | |
| | | | | | | | |
| | | | | | | 26,738,560 | |
Georgia — 4.9% | | | | | | | | |
Atkinson/Coffee Counties Joint Development Authority, 1.650%, 12/1/2019, Call 9/20/2019 | | | 3,000,000 | | | | 3,000,510 | |
Bartow County Development Authority, 2.050%, 11/19/2021 (1) | | | 1,400,000 | | | | 1,414,728 | |
Burke County Development Authority: | | | | | | | | |
1.550%, 8/19/2022 (1) | | | 3,000,000 | | | | 2,993,310 | |
2.250%, 5/25/2023 (1) | | | 4,000,000 | | | | 4,084,760 | |
Heard County Development Authority, 1.480%, 9/1/2026, Call 9/6/2019 (1) | | | 600,000 | | | | 600,000 | |
Main Street Natural Gas, Inc.: | | | | | | | | |
1.920%, (SIFMA Municipal Swap Index Yield), 12/1/2023, Call 9/1/2023 (1) | | | 5,000,000 | | | | 4,979,750 | |
2.324%, (LIBOR 1 Month), 12/1/2023, Call 9/1/2023 (1) | | | 5,000,000 | | | | 5,020,000 | |
5.000%, 5/15/2021 | | | 700,000 | | | | 741,034 | |
Morgan County Hospital Authority, 2.750%, 9/1/2019 | | | 3,750,000 | | | | 3,750,000 | |
Municipal Electric Authority of Georgia, 5.000%, 1/1/2020 | | | 1,000,000 | | | | 1,012,300 | |
| | | | | | | | |
| | | | | | | 27,596,392 | |
Hawaii — 0.5% | | | | | | | | |
City & County of Honolulu, 1.650%, (SIFMA Municipal Swap Index Yield), 9/1/2020, Call 9/16/2019 (1) | | | 2,800,000 | | | | 2,800,168 | |
| | |
Illinois — 7.5% | | | | | | | | |
Chicago Housing Authority, HUD SEC 8, 5.000%, 1/1/2021 | | | 1,400,000 | | | | 1,467,046 | |
Chicago Park District: | | | | | | | | |
4.000%, 1/1/2020 | | | 1,000,000 | | | | 1,008,250 | |
4.000%, 1/1/2020 | | | 1,520,000 | | | | 1,533,133 | |
City of Chicago Waterworks Revenue: | | | | | | | | |
5.000%, 11/1/2019 | | | 250,000 | | | | 251,427 | |
5.000%, 11/1/2019 | | | 1,000,000 | | | | 1,005,710 | |
5.000%, 11/1/2021 | | | 1,000,000 | | | | 1,073,320 | |
Decatur Park District, 3.000%, 12/15/2019 | | | 4,311,000 | | | | 4,328,934 | |
Illinois Educational Facilities Authority: | | | | | | | | |
1.800%, 2/13/2020 (1) | | | 2,400,000 | | | | 2,406,216 | |
1.875%, 2/13/2020 (1) | | | 2,250,000 | | | | 2,256,570 | |
Illinois Finance Authority: | | | | | | | | |
2.100%, (SIFMA Municipal Swap Index Yield), 7/1/2023, Call 7/1/2022 (1) | | | 2,000,000 | | | | 2,000,000 | |
3.000%, 12/1/2019 | | | 200,000 | | | | 200,474 | |
5.000%, 11/15/2019 | | | 605,000 | | | | 609,525 | |
5.000%, 11/15/2019 | | | 250,000 | | | | 251,830 | |
Illinois Housing Development Authority, 1.900%, 10/1/2021 (1) | | | 1,790,000 | | | | 1,810,728 | |
Illinois State University, 5.000%, 4/1/2020 | | | 200,000 | | | | 203,306 | |
Lake County Forest Preserve District, 2.095%, (LIBOR 3 Month), 12/15/2020 (1) | | | 250,000 | | | | 250,213 | |
Rockford Park District, 3.000%, 12/15/2020 | | | 1,165,000 | | | | 1,185,131 | |
State of Illinois: | | | | | | | | |
5.000%, 6/1/2020 | | | 1,000,000 | | | | 1,024,190 | |
5.000%, 7/1/2020 | | | 2,110,000 | | | | 2,166,759 | |
5.000%, 8/1/2020 | | | 4,000,000 | | | | 4,118,040 | |
5.000%, 10/1/2021 | | | 1,500,000 | | | | 1,596,615 | |
5.000%, 2/1/2022 | | | 6,040,000 | | | | 6,460,324 | |
Tender Option Bond Trust Receipts/Certificates, 1.550%, 6/15/2031, Call 6/15/2026 (1)(2) | | | 4,355,000 | | | | 4,355,000 | |
Village of Bolingbrook, 4.000%, 3/1/2020 | | | 345,000 | | | | 349,447 | |
| | | | | | | | |
| | | | | | | 41,912,188 | |
Indiana — 5.8% | | | | | | | | |
Brownsburg 1999 School Building Corp., 2.500%, 4/10/2020, Call 10/10/2019 | | | 1,950,000 | | | | 1,952,379 | |
Center Grove Multi-Facility School Building Corp., 2.500%, 12/15/2020, Call 6/15/2020 | | | 3,000,000 | | | | 3,019,260 | |
City of Rockport: | | | | | | | | |
1.350%, 9/1/2022 (1)(4) | | | 1,000,000 | | | | 999,240 | |
1.350%, 9/1/2022 (1)(4) | | | 1,000,000 | | | | 999,240 | |
City of Whiting, 5.000%, 11/1/2022 (1) | | | 1,345,000 | | | | 1,495,465 | |
Clark Pleasant Middle School Corp., 2.500%, 7/16/2020, Call 1/16/2020 | | | 4,710,000 | | | | 4,730,206 | |
| | | | | | | | |
Indiana Bond Bank, 4.000%, 1/3/2020 | | | 3,000,000 | | | | 3,027,600 | |
Indiana Finance Authority, 1.600%, 12/2/2019 (1)(4) | | | 1,170,000 | | | | 1,170,000 | |
Indiana Housing & Community Development Authority, GNMA/FNMA/FHLMC, 1.500%, 7/1/2047, Call 9/6/2019 (1) | | | 5,450,000 | | | | 5,450,000 | |
Indiana Housing & Community Development Authority, GNMA/FNMA/FHLMC COLL, 1.500%, 7/1/2047, Call 9/6/2019 (1) | | | 1,000,000 | | | | 1,000,000 | |
Tender Option Bond Trust Receipts/Certificates, 1.600%, 10/15/2019 (1)(2) | | | 8,500,000 | | | | 8,500,000 | |
| | | | | | | | |
| | | | | | | 32,343,390 | |
Iowa — 0.9% | | | | | | | | |
Iowa Finance Authority, 1.925%, (SIFMA Municipal Swap Index Yield), 1/4/2024, Call 3/20/2020 (1)(2) | | | 3,520,000 | | | | 3,520,035 | |
Iowa Finance Authority, GNMA/FNMA/FHLMC, 1.650%, (SIFMA Municipal Swap Index Yield), 5/3/2021, Call 11/2/2020 (1) | | | 1,500,000 | | | | 1,498,005 | |
| | | | | | | | |
| | | | | | | 5,018,040 | |
Kansas — 1.4% | | | | | | | | |
City of Lenexa, 1.625%, 9/1/2021, Call 9/1/2020 | | | 1,000,000 | | | | 1,000,820 | |
City of Valley Center, 2.000%, 12/1/2020, Call 12/1/2019 | | | 3,400,000 | | | | 3,402,652 | |
City of Washington, 2.000%, 12/1/2022, Call 12/1/2020 | | | 3,000,000 | | | | 3,025,800 | |
State of Kansas Department of Transportation, 1.861%, (LIBOR 1 Month), 9/1/2021 (1) | | | 400,000 | | | | 400,440 | |
| | | | | | | | |
| | | | | | | 7,829,712 | |
Kentucky — 2.9% | | | | | | | | |
County of Carroll, 1.200%, 6/1/2021 (1)(4) | | | 5,000,000 | | | | 4,995,700 | |
Kentucky Economic Development Finance Authority, 1.600%, 12/2/2019 (1)(4) | | | 500,000 | | | | 500,000 | |
Kentucky Housing Corp., 2.000%, 4/1/2021 (1) | | | 1,400,000 | | | | 1,412,670 | |
Kentucky Public Energy Authority, 4.000%, 7/1/2020 | | | 2,115,000 | | | | 2,159,563 | |
Kentucky Rural Water Finance Corp., 1.550%, 3/1/2020 | | | 1,500,000 | | | | 1,502,415 | |
Laurel County Judicial Center Public Properties Corp., 4.000%, 3/1/2020 | | | 530,000 | | | | 537,409 | |
Louisville/Jefferson County Metropolitan Government, 1.850%, 4/1/2021 (1) | | | 2,000,000 | | | | 2,019,580 | |
Tender Option Bond Trust Receipts/Certificates, 1.550%, 4/1/2032, Call 4/1/2027 (1)(2) | | | 3,100,000 | | | | 3,100,000 | |
| | | | | | | | |
| | | | | | | 16,227,337 | |
Louisiana — 1.0% | | | | | | | | |
Louisiana Housing Corp., FHA, 2.500%, 12/1/2031, Call 6/1/2020 | | | 360,000 | | | | 365,771 | |
Louisiana Public Facilities Authority, 2.000%, (SIFMA Municipal Swap Index Yield), 9/1/2023, Call 3/1/2023 (1) | | | 5,000,000 | | | | 5,002,200 | |
| | | | | | | | |
| | | | | | | 5,367,971 | |
Maryland — 0.8% | | | | | | | | |
City of Baltimore, 4.000%, 9/1/2019 | | | 350,000 | | | | 350,000 | |
Maryland Economic Development Corp., 1.700%, 9/1/2022 | | | 4,000,000 | | | | 4,045,880 | |
| | | | | | | | |
| | | | | | | 4,395,880 | |
Massachusetts — 0.4% | | | | | | | | |
Massachusetts Development Finance Agency: | | | | | | | | |
1.830%, (SIFMA Municipal Swap Index Yield), 1/29/2020, Call 9/30/2019 (1) | | | 500,000 | | | | 500,080 | |
5.000%, 7/1/2021 | | | 300,000 | | | | 319,614 | |
Town of Northbridge, 2.000%, 6/26/2020 | | | 1,700,000 | | | | 1,707,106 | |
| | | | | | | | |
| | | | | | | 2,526,800 | |
Michigan — 1.7% | | | | | | | | |
Michigan Finance Authority: | | | | | | | | |
1.958%, (LIBOR 1 Month), 12/1/2020, Call 6/1/2020 (1) | | | 200,000 | | | | 200,962 | |
3.500%, 11/15/2022 (1)(4) | | | 3,000,000 | | | | 3,190,410 | |
5.000%, 11/15/2019 | | | 400,000 | | | | 402,880 | |
Michigan Finance Authority, SAW, 4.000%, 8/20/2020 | | | 2,000,000 | | | | 2,051,360 | |
Michigan State Hospital Finance Authority, 1.500%, 5/1/2020 (1) | | | 775,000 | | | | 776,519 | |
Taylor Tax Increment Finance Authority,AGM: | | | | | | | | |
4.000%, 5/1/2020, Call 9/30/2019 | | | 785,000 | | | | 786,617 | |
4.000%, 5/1/2021, Call 9/30/2019 | | | 600,000 | | | | 601,254 | |
Wayne-Westland Community Schools,Q-SBLF: | | | | | | | | |
4.000%, 11/1/2019 | | | 700,000 | | | | 703,171 | |
4.000%, 11/1/2020 | | | 500,000 | | | | 516,110 | |
| | | | | | | | |
| | | | | | | 9,229,283 | |
Minnesota — 1.4% | | | | | | | | |
| | | | | | | | |
Housing & Redevelopment Authority of the City of St. Paul, 3.000%, 11/15/2019 | | | 600,000 | | | | 602,172 | |
JPMorgan Chase Putters/Drivers Trust, 1.700%, 6/1/2021 (1)(2) | | | 5,000,000 | | | | 5,000,000 | |
Minnesota Rural Water Finance Authority, Inc., 2.000%, 8/1/2020, Call 2/1/2020 | | | 2,000,000 | | | | 2,007,380 | |
| | | | | | | | |
| | | | | | | 7,609,552 | |
Mississippi — 2.3% | | | | | | | | |
Mississippi Business Finance Corp., 1.350%, 11/1/2035, Call 9/3/2019 (1) | | | 8,310,000 | | | | 8,310,000 | |
Mississippi Development Bank, 2.500%, 1/1/2020 | | | 4,600,000 | | | | 4,621,252 | |
| | | | | | | | |
| | | | | | | 12,931,252 | |
Missouri — 1.9% | | | | | | | | |
City of St. Louis, 2.500%, 6/1/2020 | | | 5,000,000 | | | | 5,045,000 | |
Health & Educational Facilities Authority of the State of Missouri: | | | | | | | | |
1.440%, 6/1/2036, Call 9/6/2019 (1) | | | 500,000 | | | | 500,000 | |
2.875%, 2/1/2022, Call 4/1/2020 | | | 765,000 | | | | 770,753 | |
Missouri Housing Development Commission, GNMA/FNMA/FHLMC, 4.700%, 3/1/2035, Call 9/30/2019 | | | 180,000 | | | | 180,426 | |
Rib Floater Trust Various States, 1.600%, 6/1/2045, Call 12/1/2020 (1)(2) | | | 4,000,000 | | | | 4,000,000 | |
| | | | | | | | |
| | | | | | | 10,496,179 | |
Nevada — 0.7% | | | | | | | | |
City of Carson City, 5.000%, 9/1/2019 | | | 345,000 | | | | 345,000 | |
City of North Las Vegas NV, AGM, 5.000%, 6/1/2020 | | | 1,650,000 | | | | 1,696,250 | |
State of Nevada Department of Business & Industry, 1.875%, 12/2/2019 (1)(2) | | | 2,000,000 | | | | 2,002,140 | |
| | | | | | | | |
| | | | | | | 4,043,390 | |
New Jersey — 4.9% | | | | | | | | |
City of Union City, SAW, 4.000%, 11/1/2019 | | | 1,000,000 | | | | 1,003,790 | |
Lyndhurst Township School District, 1.875%, 9/10/2020 (4) | | | 1,100,000 | | | | 1,106,138 | |
Lyndhurst Township School District, School Bond Gty, 3.000%, 9/13/2019 | | | 2,000,000 | | | | 2,000,800 | |
New Jersey Economic Development Authority: | | | | | | | | |
1.640%, 11/1/2031, Call 9/6/2019 (1) | | | 4,510,000 | | | | 4,510,000 | |
1.640%, 11/1/2040, Call 9/6/2019 (1) | | | 5,515,000 | | | | 5,515,000 | |
New Jersey Health Care Facilities Financing Authority: | | | | | | | | |
1.570%, 7/1/2028, Call 9/4/2019 (1) | | | 300,000 | | | | 300,000 | |
1.640%, 7/1/2038, Call 9/6/2019 (1) | | | 2,935,000 | | | | 2,935,000 | |
New Jersey Transportation Trust Fund Authority: | | | | | | | | |
2.350%, (SIFMA Municipal Swap Index Yield), 12/15/2019, Call 9/25/2019 (1) | | | 5,000,000 | | | | 5,001,500 | |
4.000%, 6/15/2020 | | | 200,000 | | | | 204,050 | |
New Jersey Turnpike Authority: | | | | | | | | |
1.901%, (LIBOR 1 Month), 1/1/2021 (1) | | | 1,750,000 | | | | 1,751,785 | |
2.041%, (LIBOR 1 Month), 1/1/2022 (1) | | | 750,000 | | | | 751,522 | |
Tobacco Settlement Financing Corp., 5.000%, 6/1/2020 | | | 2,400,000 | | | | 2,462,760 | |
| | | | | | | | |
| | | | | | | 27,542,345 | |
New Mexico — 0.3% | | | | | | | | |
New Mexico Hospital Equipment Loan Council, 2.250%, 7/1/2023, Call 1/1/2021 | | | 1,525,000 | | | | 1,528,523 | |
| | |
New York — 12.1% | | | | | | | | |
City of New York: | | | | | | | | |
1.430%, 12/1/2047, Call 9/6/2019 (1) | | | 5,640,000 | | | | 5,640,000 | |
1.440%, 8/1/2035, Call 9/6/2019 (1) | | | 600,000 | | | | 600,000 | |
City of New York, AGC, 1.820%, 10/1/2021, Call 9/3/2019 (1)(3) | | | 100,000 | | | | 100,000 | |
County of Nassau, 5.000%, 6/1/2020 | | | 3,000,000 | | | | 3,081,900 | |
Hempstead Union Free School District, SAW, 2.500%, 6/25/2020 | | | 6,000,000 | | | | 6,044,220 | |
Livonia Central School District, SAW, 2.500%, 6/19/2020 | | | 5,485,000 | | | | 5,536,778 | |
Long Island Power Authority, 2.311%, (LIBOR 1 Month), 10/1/2023, Call 10/1/2022 (1) | | | 4,000,000 | | | | 4,018,800 | |
Metropolitan Transportation Authority: | | | | | | | | |
1.800%, (SIFMA Municipal Swap Index Yield), 11/15/2022 (1) | | | 3,000,000 | | | | 2,994,780 | |
2.044%, (LIBOR 1 Month), 11/1/2022 (1) | | | 2,985,000 | | | | 2,971,717 | |
2.194%, (LIBOR 1 Month), 2/1/2020 (1) | | | 3,500,000 | | | | 3,504,095 | |
4.000%, 2/3/2020 | | | 3,000,000 | | | | 3,033,930 | |
5.000%, 11/15/2019, Call 11/15/2019 (1) | | | 600,000 | | | | 604,248 | |
New York City Transitional Finance Authority Future Tax Secured Revenue: | | | | | | | | |
1.420%, 8/1/2042, Call 9/6/2019 (1) | | | 2,500,000 | | | | 2,500,000 | |
1.430%, 11/1/2042, Call 9/6/2019 (1) | | | 1,500,000 | | | | 1,500,000 | |
New York State Housing Finance Agency, SONYMA, 1.800%, 5/1/2020, Call 9/20/2019 (1) | | | 970,000 | | | | 970,213 | |
| | | | | | | | |
Nuveen New York AMT-Free Municipal Credit Income Fund, 1.700%, 3/1/2029 (1) | | | 4,700,000 | | | | 4,700,000 | |
Nuveen New YorkAMT-Free Quality Municipal Income Fund: | | | | | | | | |
1.650%, 5/1/2047, Call 9/6/2019 (1)(2) | | | 3,800,000 | | | | 3,800,000 | |
1.700%, 3/1/2029 (1) | | | 3,500,000 | | | | 3,500,000 | |
Orange & Ulster Counties Board Coop Educational Services Sole Supervisory District, 2.250%, 7/22/2020 | | | 4,000,000 | | | | 4,034,760 | |
Triborough Bridge & Tunnel Authority: | | | | | | | | |
1.850%, (SOFR + 43 basis points), 9/26/2019 (1) | | | 1,420,000 | | | | 1,420,256 | |
2.194%, (LIBOR 1 Month), 2/1/2021 (1) | | | 4,890,000 | | | | 4,920,074 | |
Whitney Point Central School District, SAW, 2.500%, 6/26/2020 | | | 2,000,000 | | | | 2,017,560 | |
| | | | | | | | |
| | | | | | | 67,493,331 | |
North Carolina — 0.2% | | | | | | | | |
North Carolina Medical Care Commission, 1.670%, 6/1/2029, Call 6/1/2020 (1)(2) | | | 1,000,000 | | | | 1,000,000 | |
| | |
North Dakota — 0.3% | | | | | | | | |
City of Williston: | | | | | | | | |
5.000%, 7/15/2020 | | | 1,025,000 | | | | 1,051,804 | |
5.000%, 7/15/2021 | | | 750,000 | | | | 789,960 | |
| | | | | | | | |
| | | | | | | 1,841,764 | |
Ohio — 8.3% | | | | | | | | |
American Municipal Power, Inc.: | | | | | | | | |
2.250%, 8/13/2020 | | | 500,000 | | | | 503,455 | |
2.500%, 6/25/2020 | | | 1,525,000 | | | | 1,537,596 | |
City of Avon: | | | | | | | | |
3.000%, 9/5/2019 | | | 1,250,000 | | | | 1,250,125 | |
3.000%, 1/22/2020 | | | 700,000 | | | | 704,858 | |
City of Bowling Green, 2.500%, 5/29/2020 | | | 1,000,000 | | | | 1,008,420 | |
City of Gahanna, 3.000%, 8/6/2020 | | | 1,100,000 | | | | 1,116,005 | |
City of Lakewood, 3.000%, 3/26/2020 | | | 1,600,000 | | | | 1,616,032 | |
City of Moraine, 2.500%, 6/25/2020 | | | 2,725,000 | | | | 2,749,062 | |
City of North Olmsted, 3.000%, 4/9/2020 | | | 1,110,000 | | | | 1,120,834 | |
City of Parma, 2.500%, 7/23/2020 | | | 3,000,000 | | | | 3,029,550 | |
City of Seven Hills, 3.000%, 4/9/2020 | | | 875,000 | | | | 883,488 | |
City of Sharonville, 3.000%, 6/25/2020 | | | 2,920,000 | | | | 2,957,756 | |
City of Springfield, 2.500%, 4/15/2020 | | | 735,000 | | | | 740,123 | |
County of Belmont: | | | | | | | | |
2.000%, 8/27/2020 | | | 2,510,000 | | | | 2,525,637 | |
2.500%, 4/16/2020 | | | 1,900,000 | | | | 1,913,300 | |
3.000%, 1/29/2020 | | | 1,000,000 | | | | 1,006,480 | |
County of Lake, 3.000%, 4/2/2020 | | | 1,265,000 | | | | 1,277,384 | |
County of Lorain, 3.000%, 2/7/2020 | | | 2,000,000 | | | | 2,015,220 | |
County of Lucas, 5.000%, 11/15/2019 | | | 1,165,000 | | | | 1,172,712 | |
County of Trumbull: | | | | | | | | |
2.000%, 7/23/2020 | | | 2,275,000 | | | | 2,287,808 | |
2.500%, 7/23/2020 | | | 2,250,000 | | | | 2,272,567 | |
County of Union, 2.000%, 9/9/2020 (4) | | | 1,500,000 | | | | 1,509,780 | |
FHLMC Multifamily VRD Certificates, 1.560%, (SIFMA Municipal Swap Index Yield), 9/15/2033 (1) | | | 3,440,000 | | | | 3,440,000 | |
Little Miami Local School District, 3.000%, 11/21/2019 | | | 1,000,000 | | | | 1,003,340 | |
Ohio Housing Finance Agency, 1.750%, 6/1/2021, Call 6/1/2021 (1) | | | 2,775,000 | | | | 2,796,118 | |
Township of Liberty OH/Ross County, 3.000%, 3/26/2020 | | | 1,150,000 | | | | 1,161,006 | |
Village of Orange, 2.000%, 8/27/2020 | | | 2,575,000 | | | | 2,591,557 | |
| | | | | | | | |
| | | | | | | 46,190,213 | |
Oklahoma — 0.6% | | | | | | | | |
Canadian County Educational Facilities Authority, 5.000%, 12/1/2020 | | | 1,900,000 | | | | 1,976,912 | |
Oklahoma County Finance Authority, 5.000%, 10/1/2019 | | | 510,000 | | | | 511,474 | |
Oklahoma Housing Finance Agency, 1.600%, 1/1/2022 (1) | | | 1,000,000 | | | | 1,002,410 | |
| | | | | | | | |
| | | | | | | 3,490,796 | |
Pennsylvania — 4.9% | | | | | | | | |
Allentown City School District, SAW, 2.050%, 1/2/2020, Call 10/2/2019 | | | 4,000,000 | | | | 4,000,720 | |
Bethlehem Area School District, SAW, 1.961%, (LIBOR 1 Month), 11/1/2021, Call 11/2/2020 (1) | | | 2,990,000 | | | | 2,990,718 | |
Commonwealth Financing Authority, 5.000%, 6/1/2020 | | | 1,000,000 | | | | 1,026,670 | |
| | | | | | | | |
Manheim Township School District, 1.986%, (LIBOR 1 Month), 11/1/2021, Call 5/1/2021 (1) | | | 2,000,000 | | | | 2,004,700 | |
Montgomery County Higher Education & Health Authority: | | | | | | | | |
1.540%, 9/1/2050, Call 9/3/2019 (1) | | | 8,000,000 | | | | 8,000,000 | |
2.070%, (SIFMA Municipal Swap Index Yield), 9/1/2023, Call 9/20/2019 (1) | | | 2,500,000 | | | | 2,500,025 | |
Montgomery County Industrial Development Authority, 4.000%, 12/1/2021 | | | 100,000 | | | | 105,391 | |
North Penn Water Authority, 1.994%, (LIBOR 1 Month), 11/1/2019, Call 9/20/2019 (1) | | | 2,000,000 | | | | 2,000,160 | |
Northampton County General Purpose Authority, 2.601%, (LIBOR 1 Month), 8/15/2024, Call 2/15/2023 (1) | | | 1,000,000 | | | | 1,002,090 | |
Pennsylvania Economic Development Financing Authority, 2.150%, 11/1/2021 (1) | | | 2,000,000 | | | | 2,027,380 | |
Pennsylvania Turnpike Commission, 2.230%, (SIFMA Municipal Swap Index Yield), 12/1/2020, Call 6/1/2020 (1) | | | 1,800,000 | | | | 1,811,736 | |
| | | | | | | | |
| | | | | | | 27,469,590 | |
South Carolina — 2.9% | | | | | | | | |
Lexington County Health Services District, Inc., 5.000%, 11/1/2019 | | | 250,000 | | | | 251,470 | |
Patriots Energy Group Financing Agency, 2.354%, (LIBOR 1 Month), 2/1/2024, Call 11/1/2023 (1) | | | 6,000,000 | | | | 6,007,200 | |
South Carolina Jobs-Economic Development Authority, 1.530%, 5/1/2048, Call 9/6/2019 (1) | | | 3,750,000 | | | | 3,750,000 | |
Tender Option Bond Trust Receipts/Certificates, 1.600%, 1/1/2020 (1)(2) | | | 6,000,000 | | | | 6,000,000 | |
| | | | | | | | |
| | | | | | | 16,008,670 | |
Tennessee — 1.4% | | | | | | | | |
Eclipse Funding Trust, 1.440%, 7/1/2036, Call 7/1/2027 (1)(2) | | | 1,700,000 | | | | 1,700,000 | |
Metropolitan Government Nashville & Davidson County Health & Educational Facility Board, 1.875%, 7/1/2020 (1) | | | 1,400,000 | | | | 1,404,284 | |
Tennessee Energy Acquisition Corp., 5.250%, 9/1/2020 | | | 4,720,000 | | | | 4,893,082 | |
Tennessee Housing Development Agency, 4.500%, 7/1/2028, Call 1/1/2020 | | | 15,000 | | | | 15,123 | |
| | | | | | | | |
| | | | | | | 8,012,489 | |
Texas — 6.1% | | | | | | | | |
Bexar County Health Facilities Development Corp., 5.000%, 7/15/2020 | | | 175,000 | | | | 179,744 | |
Deer Park Independent School District, PSF, 3.000%, 10/1/2019 (1) | | | 2,000,000 | | | | 2,002,720 | |
Harris County Municipal Utility District No. 371, BAM, 2.000%, 9/1/2019 | | | 295,000 | | | | 295,000 | |
Houston Independent School District, PSF, 2.250%, 6/1/2022 (1) | | | 3,250,000 | | | | 3,331,413 | |
Irving Hospital Authority, 2.450%, (SIFMA Municipal Swap Index Yield), 10/15/2023, Call 4/15/2023 (1) | | | 1,000,000 | | | | 1,009,970 | |
Midlothian Independent School District, PSF, 2.500%, 8/1/2020 (1) | | | 1,500,000 | | | | 1,518,645 | |
Mission Economic Development Corp.: | | | | | | | | |
1.550%, 11/1/2019 (1) | | | 4,000,000 | | | | 4,000,760 | |
2.500%, 8/1/2020, Call 9/30/2019 | | | 6,500,000 | | | | 6,505,720 | |
Northside Independent School District, PSF, 2.125%, 8/1/2020, Call 2/1/2020 (1) | | | 1,800,000 | | | | 1,806,606 | |
Panhandle Regional Housing Finance Agency, 2.000%, 5/1/2020 (1) | | | 1,500,000 | | | | 1,506,255 | |
Port of Port Arthur Navigation District, 1.900%, 10/3/2019, Call 10/3/2019 (1)(2) | | | 8,500,000 | | | | 8,500,595 | |
Travis County Health Facilities Development Corp., 5.250%, 1/1/2047, Call 1/1/2020 (1) | | | 3,400,000 | | | | 3,480,138 | |
| | | | | | | | |
| | | | | | | 34,137,566 | |
Utah — 0.9% | | | | | | | | |
Tender Option Bond Trust Receipts/Certificates, 1.550%, 1/1/2025 (1)(2) | | | 4,800,000 | | | | 4,800,000 | |
| | |
Virginia — 1.3% | | | | | | | | |
FHLMC Multifamily VRD Certificates, 1.560%, (SIFMA Municipal Swap Index Yield), 6/15/2035, Call 10/15/2029 (1) | | | 2,980,000 | | | | 2,980,000 | |
Henrico County Economic development Authority, 5.000%, 10/1/2020 | | | 900,000 | | | | 934,524 | |
Peninsula Ports Authority, 1.550%, 10/1/2019 (1) | | | 3,450,000 | | | | 3,449,724 | |
| | | | | | | | |
| | | | | | | 7,364,248 | |
Washington — 0.4% | | | | | | | | |
| | |
City of Bellingham Water & Sewer Revenue, 1.550%, 2/1/2021 (acquisition cost 1,625,000; acquired 6/12/2018) (1)(2) | | | 1,625,000 | | | | 1,625,000 | |
| | |
Washington Health Care Facilities Authority, 2.518%, (LIBOR 1 Month), 7/1/2022, Call 1/1/2022 (1) | | | 550,000 | | | | 555,209 | |
| | | | | | | | |
| | | | | | | 2,180,209 | |
West Virginia — 1.2% | | | | | | | | |
West Virginia Economic Development Authority, 3.000%, 4/1/2022 (1) | | | 1,000,000 | | | | 1,034,920 | |
| | | | | | | | |
West Virginia Hospital Finance Authority: | | | | | | | | |
1.530%, 6/1/2033, Call 9/3/2019 (1) | | | 4,750,000 | | | | 4,750,000 | |
5.000%, 1/1/2020 | | | 300,000 | | | | 303,543 | |
5.000%, 1/1/2021 | | | 360,000 | | | | 376,880 | |
| | | | | | | | |
| | | | | | | 6,465,343 | |
Wisconsin — 2.9% | | | | | | | | |
City of Lancaster, 4.000%, 5/1/2021, Call 5/1/2020 | | | 1,010,000 | | | | 1,024,594 | |
D C Everest Area School District, 2.000%, 4/1/2022, Call 4/1/2020 | | | 1,290,000 | | | | 1,295,341 | |
Maple School District, 3.000%, 10/29/2019 | | | 1,300,000 | | | | 1,302,587 | |
Milwaukee & Ozaukee County Joint School District No. 2 Fox Point & Bayside, 2.000%, 8/20/2020 | | | 2,250,000 | | | | 2,264,377 | |
Port Washington-Saukville School District, 2.500%, 10/1/2020, Call 10/1/2019 | | | 1,000,000 | | | | 1,000,980 | |
Public Finance Authority: | | | | | | | | |
1.450%, 10/1/2049, Call 9/6/2019 (1) | | | 2,000,000 | | | | 2,000,000 | |
1.530%, 11/1/2019 (1) | | | 5,000,000 | | | | 5,000,750 | |
2.300%, 10/1/2019, Call 9/30/2019 | | | 1,500,000 | | | | 1,500,285 | |
5.000%, 11/15/2019 | | | 440,000 | | | | 442,834 | |
| | |
Wisconsin Health & Educational Facilities Authority, 1.700%, (SIFMA Municipal Swap Index Yield), 7/28/2021, Call 1/28/2021 (1) | | | 500,000 | | | | 499,140 | |
| | | | | | | | |
| | | | | | | 16,330,888 | |
| | | | | | | | |
Total Municipals
(identified cost $549,493,701) | | | | | | | 550,758,779 | |
| | | | | | | | |
Short-Term Investments — 3.2% | | | | | | | | |
| | |
Short-Term Municipals — 3.2% | | | | | | | | |
| | |
Florida — 1.4% | | | | | | | | |
City of Jacksonville, 1.430%, 9/19/2019 | | | 3,000,000 | | | | 3,000,000 | |
JEA Electric System Revenue, 1.750%, 9/3/2019 | | | 5,000,000 | | | | 5,000,000 | |
| | | | | | | | |
| | | | | | | 8,000,000 | |
Texas — 1.8% | | | | | | | | |
City of San Antonio, 0.010%, 10/2/2019 | | | 3,700,000 | | | | 3,700,000 | |
City of San Antonio, 1.350%, 11/4/2019 | | | 3,000,000 | | | | 3,000,000 | |
| | |
University of North Texas System, 1.350%, 9/19/2019 | | | 3,000,000 | | | | 3,000,000 | |
| | | | | | | | |
| | | | | | | 9,700,000 | |
| | | | | | | | |
Total Short-Term Investments
(identified cost $17,700,000) | | | | | | | 17,700,000 | |
| | | | | | | | |
| | |
Total Investments — 101.8%
(identified cost $567,193,701) | | | | | | | 568,458,779 | |
| | |
Other Assets and Liabilities — (1.8)% | | | | | | | (10,101,684 | ) |
| | | | | | | | |
Total Net Assets — 100.0% | | | | | | $ | 558,357,095 | |
| | | | | | | | |
| (1) | Denotes a variable rate security. The rate shown is the current interest rate as of November 30, 2018. Rate fluctuations are based underlying positions and/or other variables. For securities whose yields vary with a designated market index or market rate, the reference rate and spread are indicated in the description. |
| (2) | Denotes a restricted security which is subject to restrictions on resale under federal securities laws. These securities have been deemed liquid based on criteria approved by the Board of Directors of the BMO Funds. At August 31, 2019 these securities amounted to: |
| | | | | | | | |
| Fund | | Amount | | | % of Total Net Assets | |
Ultra ShortTax-Free Fund | | | 70,933,090 | | | | 12.65% | |
| (3) | Issue represents an Auction Rate Security. An Auction Rate Security is a corporate or municipal bond debt instrument with a long nominal maturity for which the interest rate is regularly reset through a Dutch auction. The rate presented is either the rate set through the auction or the maximum interest rate provided for in the security issuance provision. |
| (4) | Purchased on a when-issued or delayed delivery basis. |
| | |
LIBOR | | London Interbank Offered Rate |
SIFMA | | Securities Industry and Financial Markets Association |
SAW | | State Aid Withholding |
Item 7. Disclosure of Proxy Voting Policies and Procedures forClosed-End Management Investment Companies.
Not applicable toopen-end management investment companies.
Item 8. Portfolio Managers ofClosed-End Management Investment Companies.
Not applicable toopen-end management investment companies.
Item 9. Purchases of Equity Securities byClosed-End Management Investment Company and Affiliated Purchasers.
Not applicable toopen-end management investment companies.
Item 10. Submission of Matters to a Vote of Security Holders.
Not applicable.
Item 11. Controls and Procedures.
| (a) | The Registrant’s principal executive officer and principal financial officer have reviewed the Registrant’s disclosure controls and procedures (as defined in Rule30a-3(c) under the Investment Company Act of 1940, as amended, (the “Act”)) as of a date within 90 days of the filing of this report, as required by Rule30a-3(b) under the Act. Based on their review, such officers have concluded that the disclosure controls and procedures were effective in ensuring that information required to be disclosed in this report was appropriately recorded, processed, summarized and reported and made known to them by others within the Registrant and by the Registrant’s service providers. |
| (b) | There were no changes in the Registrant’s internal control over financial reporting (as defined in Rule30a-3(d) under the Act (17 CFR270.30a-3(d)) that occurred during the period covered by this report that materially affected, or were reasonably likely to materially affect, the Registrant’s internal control over financial reporting. |
Item 12. Disclosure of Securities Lending Activities forClosed-End Management Investment Companies
Not applicable toopen-end management investment companies.
Item 13. Exhibits.
(a) (1) Code of Ethics. Filed herewith.
(a) (2) Certifications required pursuant to Section 302 of the Sarbanes-Oxley Act of 2002. Filed herewith.
(a) (3) Not applicable.
(a)(4) Not applicable.
(b) Certification pursuant to Section 906 of the Sarbanes-Oxley Act of 2002. Filed herewith.
SIGNATURES
Pursuant to the requirements of the Securities Exchange Act of 1934 and the Investment Company Act of 1940, the Registrant has duly caused this report to be signed on its behalf by the undersigned, thereunto duly authorized.
BMO Funds, Inc.
Date: November 8, 2019
Pursuant to the requirements of the Securities Exchange Act of 1934 and the Investment Company Act of 1940, this report has been signed below by the following persons on behalf of the Registrant and in the capacities and on the dates indicated.
| | |
| | | John M. Blaser |
| | President |
| | (Principal Executive Officer) |
Date: November 8, 2019
| | |
| | | Timothy M. Bonin |
| | Treasurer |
| | (Principal Financial Officer) |
Date: November 8, 2019