UNITED STATES
SECURITIES AND EXCHANGE COMMISSION
Washington, D.C. 20549
FORMN-CSR
CERTIFIED SHAREHOLDER REPORT OF REGISTERED MANAGEMENT
INVESTMENT COMPANIES
Investment Company Act File Number811-58433
BMO Funds, Inc.
(Exact name of registrant as specified in charter)
111 East Kilbourn Avenue, Suite 200
Milwaukee, WI 53202
(Address of principal executive offices) (Zip code)
John M. Blaser
BMO Asset Management Corp.
111 East Kilbourn Avenue, Suite 200
Milwaukee, WI 53202
(Name and address of agent for service)
Copies to:
Michael P. O’Hare, Esq.
Stradley, Ronon, Stevens & Young, LLP
2005 Market Street, Suite 2600
Philadelphia, PA 19103
Registrant’s telephone number, including area code:(800)236-3863
Date of fiscal year end:August 31
Date of reporting period:August 31, 2018
Item 1. Reports to Stockholders.
The following is a copy of the report transmitted to shareholders pursuant to Rule30e-1 under the Investment Company Act of 1940, as amended (the “Act”).
Annualreport
Equity Funds
International & Global Funds
Alternative Funds
Fixed Income Funds
Money Market Funds

Table of Contents
| | | | |
Not FDIC Insured | | No Bank Guarantee | | May Lose Value |
| | |
| | |
| Annual Report | | BMO Low Volatility Equity Fund |
| | | | | | | | | | | | |
Average annual total returns (%) | |
| | | 1-year | | | 5-years | | | Since
inception | |
| Advisor Class (A) NAV | | | 13.96 | | | | — | | | | 9.91 | |
| Advisor Class (A) OFFER | | | 8.23 | | | | — | | | | 8.59 | |
| Institutional Class (I) | | | 14.12 | | | | 11.76 | | | | 12.21 | |
| Russell 1000® Index | | | 19.82 | | | | 14.37 | | | | 14.97 | |
| Lipper U.S.Multi-Cap Core Funds Index | | | 18.81 | | | | 12.65 | | | | 13.76 | |
| * | Benchmarks since inception reflect the inception date of the Institutional Class. |
The performance data quoted represents past performance which is no guarantee of future results. Investment return and principal value will fluctuate so that an investor’s shares, when redeemed, may be worth more or less than their original costs. Mutual fund performance changes over time and current performance may be lower or higher than what is stated. To receive current performance to the most recentmonth-end, please call1-800-236-3863 or visit www.bmofunds.com.
Commentary
The BMO Low Volatility Equity Fund (the Fund) returned 14.12% for the fiscal year ended August 31, 2018 versus the Russell 1000 Index and the Lipper U.S.Multi-Cap Core Funds Index, which returned 19.82% and 18.81%, respectively.
Global equities posted double digit gains over the 12 month period, led by strong returns in the U.S., while Emerging Market equities lagged. Stock returns have been largely supported by strong corporate earnings and a resilient global economy, despite the emergence of several geopolitical and policy-related risks. During the period, companies with higher sales and earnings growth continued to outperform, while more attractively valued securities in the global market have been some of the worst performers. In fact, the recent underperformance of value investing is comparable only to the 1990s tech bubble. After a remarkable stretch of underperformance in the year prior, smaller companies in the market outpaced their larger counterparts, driven mostly by a strong domestic economy and ongoing trade war rhetoric between the U.S. and China. With more revenue being sourced from the U.S. economy, investors favored domestically-oriented small cap companies over larger multinationals. Finally, as interest rates increased during the period, defensive “bond proxy” stocks in sectors such as Utilities, Telecommunications, and Consumer Staples underperformed. In conjunction with a recovery in crude oil prices, higher risk stocks in the market outpaced lower risk stocks.
Consistent with our long term objective, the Fund provided upside participation during another positive year for equities, while offering downside risk mitigation during periods of heighted volatility. Our emphasis on stocks with attractive valuations detracted from returns, as investors favored more expensive companies particularly in more growth-oriented areas of the market such as Information Technology. Our focus on risk reduction was a detractor as higher risk stocks were some of the best performers in the U.S. large cap market over the period. This factor was evident at the sector level where overweights in more defensive sectors like Consumer Staples and Utilities detracted from returns. On the other hand, an underweight to Materials and Industrials contributed positively to performance over the period. By security, Costco Wholesale Corporation (2.1% of the Fund, +50.37%) and Morningstar Inc. (1.2% of the Fund, +73.78%) contributed positively to performance, while Edison International (0.0% of the Fund,-19.82%) and Everest Re Group Ltd. (2.0% of the Fund,-9.74%) were top detractors.
As we look ahead, the fundamental landscape supporting global equities remains strong despite the increased market volatility. While corporate earnings could continue to benefit from accelerating global economic growth and accommodative tax policy, the threat of trade wars, geopolitical tensions, and inflationary pressures from rising commodity prices could cause markets to react negatively. In addition, elevated volatility and multiyear-low stock correlations create opportunities for active stock selection. Accordingly, we have positioned the Fund to participate in up markets, while managing downside risks through a combination of disciplined stock selection and thoughtful risk management.
Fund Managers; Investment Experience
David A. Corris, CFA; since 1999
Jason C. Hans, CFA; since 1999
Jay Kaufman, CFA; since 2006
Ernesto Ramos, Ph.D.; since 1988
| | | | | | | | | | | | | | | | | | | | |
| | | | | | | | | Inception
date | | | Expenses (%) | |
| Share class | | Ticker | | | Cusip | | | Gross | | | Net | |
| Advisor (A) | | | BLVAX | | | | 09658W105 | | | | 5/27/2014 | | | | 1.03 | | | | 0.90 | |
| Institutional (I) | | | MLVEX | | | | 09658L208 | | | | 9/28/2012 | | | | 0.78 | | | | 0.65 | |
The above expense ratios are from the Funds’ Prospectus dated December 29, 2017, and are inclusive of Acquired Fund Fees and Expenses. See Note 6 in the Notes to Financial Statements for additional information. Net expense ratios reflect contractual fee waivers and/or expense reimbursements if applicable, made by BMO Asset Management Corp., the investment adviser (Adviser). The Adviser may not terminate these fee waivers and/or expense reimbursements prior to December 31, 2019 without the consent of the Board of Directors, unless the investment advisory agreement is terminated. Without these contractual waivers, the Fund’s returns would have been lower.
| | | | |
Portfolio sector allocation | |
| Sector | | Fund (%) | |
| Consumer Discretionary | | | 14.2 | |
| Consumer Staples | | | 14.5 | |
| Energy | | | 4.9 | |
| Financials | | | 14.2 | |
| Healthcare | | | 17.3 | |
| Industrials | | | 7.0 | |
| Information Technology | | | 7.4 | |
| Materials | | | 0.6 | |
| Real Estate | | | 7.8 | |
| Telecommunication Services | | | 0.4 | |
| Utilities | | | 10.3 | |
| Other Assets & Liabilities, Net | | | 1.4 | |
| Total | | | 100.0 | |
Portfolio composition will change due to the ongoing management of the Fund. The percentages are based on net assets as of August 31, 2018 and may not necessarily reflect adjustments that are routinely made when presenting net assets for formal financial statement processes.
Growth of an assumed $10,000 investment
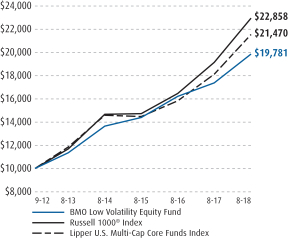
See Explanation of the Indices and Notes in the Commentary for additional information.The above graph relates to the Institutional Class shares of the Fund. Performance for the Advisor Class shares will vary from the performance of the Institutional Class shares shown above due to differences in charges and expenses. This graph illustrates the hypothetical investment of $10,000 in the Institutional Class shares of the Fund from the lesser of the Fund’s inception date or August 31, 2008 to August 31, 2018.
2
| | |
| | |
| Annual Report | | BMO Dividend Income Fund |
| | | | | | | | | | | | |
Average annual total returns (%) | |
| | | 1-year | | | 5-years | | | Since
inception | |
| Advisor Class (A) NAV | | | 21.90 | | | | — | | | | 11.61 | |
| Advisor Class (A) OFFER | | | 15.83 | | | | — | | | | 10.28 | |
| Institutional Class (I) | | | 22.17 | | | | 13.54 | | | | 14.11 | |
| Russell 1000® Value Index | | | 12.47 | | | | 11.22 | | | | 13.58 | |
| Standard & Poor’s 500® Index | | | 19.66 | | | | 14.52 | | | | 15.67 | |
| Lipper Equity Income Funds Index | | | 13.47 | | | | 10.87 | | | | 12.39 | |
| * | Benchmarks since inception reflect the inception date of the Institutional Class. |
The performance data quoted represents past performance which is no guarantee of future results. Investment return and principal value will fluctuate so that an investor’s shares, when redeemed, may be worth more or less than their original costs. Mutual fund performance changes over time and current performance may be lower or higher than what is stated. To receive current performance to the most recentmonth-end, please call1-800-236-3863 or visit www.bmofunds.com.
Commentary
The BMO Dividend Income Fund (the Fund) returned 22.17% for the fiscal year ended August 31, 2018 versus the Russell 1000® Value Index, the Standard & Poor’s 500® Index and the Lipper Equity Income Funds Index, which returned 12.47%, 19.66% and 13.47%, respectively.
Taxes, trade, and interest rates were some of the primary influences of the market environment during the 2018 fiscal year. The 2017 tax reform package significantly boosted corporate earnings during the year. Forced repatriation also facilitated corporate stock buybacks. On trade, news on NAFTA and tariffs with the EU and China caused investor concern that negatively affected Industrial stocks. Finally, the steady increase in interest rates hurt bond-proxy sectors (e.g. Real Estate and Utilities) and helped Financials.
The Fund’s performance was hampered by our sector allocation as we were underweight cyclical sectors like Information Technology and Consumer Discretionary, while we were overweight defensive sectors like Real Estate, Telecom, and Utilities. Our sector allocation is partially a result of the Fund’s yield mandate. Defensive sectors typically have many stocks with above average yields, while higher growth sectors like Information Technology and Consumer Discretionary have been dominated by stocks with low or no dividend yield.
The Fund benefited from strong stock selection within the Industrial and Consumer Staples sectors. Boeing (2.0% of the Fund, +46.0% return) benefited from global growth and has seen demand for its airplanes grow. Investors have been attracted to the company’s cash flow generation and healthy capital return growth. Sysco (2.3% of the Fund, +45.4% return) benefited from strong industry dynamics, resulting in a string of positive revenue and earnings surprises.
Heading into fiscal year 2019, we believe several themes exist that will influence equity markets. From a policy standpoint, we believe investor sentiment will be influenced by the outcome of the November elections and any developments around trade. We expect corporate earnings will continue to benefit from tax reform and repatriation. Finally, the actions of the Federal Reserve will likely play an important role in the markets over the coming year. Accordingly, we have positioned the Fund to participate in appreciating markets while managing downside risks.
Fund Managers; Investment Experience
Kenneth M. Conrad, Ph.D., CFA; since 2000
Casey J. Sambs, CFA; since 2004
| | | | | | | | | | | | | | | | | | | | |
| | | | | | | | | Inception
date | | | Expenses (%) | |
| Share class | | Ticker | | | Cusip | | | Gross | | | Net | |
| Advisor (A) | | | BADIX | | | | 09658W204 | | | | 5/27/2014 | | | | 1.08 | | | | 0.90 | |
| Institutional (I) | | | MDIVX | | | | 09658L604 | | | | 12/29/2011 | | | | 0.83 | | | | 0.65 | |
The above expense ratios are from the Funds’ Prospectus dated December 29, 2017, and are inclusive of Acquired Fund Fees and Expenses. See Note 6 in the Notes to Financial Statements for additional information. Net expense ratios reflect contractual fee waivers and/or expense reimbursements if applicable, made by BMO Asset Management Corp., the investment adviser (Adviser). The Adviser may not terminate these fee waivers and/or expense reimbursements prior to December 31, 2019 without the consent of the Board of Directors, unless the investment advisory agreement is terminated. Without these contractual waivers, the Fund’s returns would have been lower.
| | | | |
Portfolio sector allocation | |
| Sector | | Fund (%) | |
| Consumer Discretionary | | | 9.1 | |
| Consumer Staples | | | 6.3 | |
| Energy | | | 9.1 | |
| Financials | | | 14.4 | |
| Healthcare | | | 11.4 | |
| Industrials | | | 6.0 | |
| Information Technology | | | 21.4 | |
| Materials | | | 2.7 | |
| Real Estate | | | 5.8 | |
| Telecommunication Services | | | 4.3 | |
| Utilities | | | 7.0 | |
| Other Assets & Liabilities, Net | | | 2.5 | |
| Total | | | 100.0 | |
Portfolio composition will change due to the ongoing management of the Fund. The percentages are based on net assets as of August 31, 2018 and may not necessarily reflect adjustments that are routinely made when presenting net assets for formal financial statement processes.
Growth of an assumed $10,000 investment
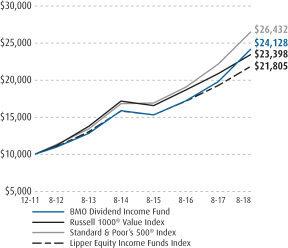
See Explanation of the Indices and Notes in the Commentary for additional information.The above graph relates to the Institutional Class shares of the Fund. Performance for the Advisor Class shares will vary from the performance of the Institutional Class shares shown above due to differences in charges and expenses. This graph illustrates the hypothetical investment of $10,000 in the Institutional Class shares of the Fund from the lesser of the Fund’s inception date or August 31, 2008 to August 31, 2018.
3
| | |
| | |
| Annual Report | | BMOLarge-Cap Value Fund |
| | | | | | | | | | | | | | | | |
Average annual total returns (%) | |
| | | 1-year | | | 5-years | | | 10-years | | | Since
inception | |
| Advisor Class (A) NAV | | | 15.57 | | | | — | | | | — | | | | 9.20 | |
| Advisor Class (A) OFFER | | | 9.82 | | | | | | | | | | | | 7.90 | |
| Institutional Class (I) | | | 15.83 | | | | 12.09 | | | | — | | | | 7.44 | |
| Retirement Class(R-6) | | | 16.07 | | | | — | | | | — | | | | 12.85 | |
| Russell 1000® Value Index | | | 12.47 | | | | 11.22 | | | | 8.93 | | | | — | |
| Lipper U.S.Multi-Cap Value Funds Index | | | 11.28 | | | | 10.09 | | | | 8.37 | | | | — | |
| * | Benchmarks since inception reflect the inception date of the Institutional Class. |
The performance data quoted represents past performance which is no guarantee of future results. Investment return and principal value will fluctuate so that an investor’s shares, when redeemed, may be worth more or less than their original costs. Mutual fund performance changes over time and current performance may be lower or higher than what is stated. To receive current performance to the most recentmonth-end, please call1-800-236-3863 or visit www.bmofunds.com.
Commentary
The BMOLarge-Cap Value Fund (the Fund) returned 15.83% for the fiscal year ended August 31, 2018 versus the Russell 1000® Value Index and the Lipper U.S.Multi-Cap Value Funds Index, which returned 12.47% and 11.28%, respectively.
Global equities posted double digit gains over the 12 month period, led by strong returns in the U.S., while Emerging Market equities lagged. Stock returns have been largely supported by strong corporate earnings and a resilient global economy, despite the emergence of several geopolitical and policy-related risks. During the period, companies with higher sales and earnings growth continued to outperform, while more attractively valued securities in the global market have been some of the worst performers. In fact, the recent underperformance of value investing is comparable only to the 1990s tech bubble. After a remarkable stretch of underperformance in the year prior, smaller companies in the market outpaced their larger counterparts, driven mostly by a strong domestic economy and ongoing trade war rhetoric between the U.S. and China. With more revenue being sourced from the U.S. economy, investors favored domestically-oriented small cap companies over larger multinationals. Finally, as interest rates increased during the period, defensive “bond proxy” stocks in sectors such as Utilities, Telecommunications, and Consumer Staples underperformed. In conjunction with a recovery in crude oil prices, higher risk stocks in the market outpaced lower risk stocks.
Over the12-month period, the Fund outperformed its benchmark, primarily driven by strong performance of attractively valued companies with improving fundamentals. Additionally, both sector allocation and stock selection contributed positively to performance. The Fund’s underweight position to Consumer Staples and Telecommunications added to performance, while the Fund’s overweight to Industrials and underweight allocation to Information Technology detracted. Stock selection was strongest in Energy and Industrials and weakest in Financials and Materials. By security, top contributors to the Fund’s performance included Valero Energy Corp. (2.2% of the Fund, +78.61%) and F5 Networks Inc. (1.9% of the Fund, +58.42%). Top detractors included Owens Corning (1.0% of the Fund,-22.80%) and Unum Group (1.1% of the Fund,-21.92%).
As we look ahead, the fundamental landscape supporting global equities remains strong despite the increased market volatility. While corporate earnings could continue to benefit from accelerating global economic growth and accommodative tax policy, the threat of trade wars, geopolitical tensions, and inflationary pressures from rising commodity prices could cause markets to react negatively. In addition, elevated volatility andmultiyear-low stock correlations create opportunities for active stock selection. Accordingly, we have positioned the Fund to participate in up markets, while managing downside risks through a combination of disciplined stock selection and thoughtful risk management.
Fund Managers; Investment Experience
David A. Corris, CFA; since 1999
Jason C. Hans, CFA; since 1999
Ernesto Ramos, Ph.D.; since 1988
| | | | | | | | | | | | | | | | | | | | |
| | | | | | | | | Inception
date | | | Expenses (%) | |
| Share class | | Ticker | | | Cusip | | | Gross | | | Net | |
| Advisor (A) | | | BALVX | | | | 09658W303 | | | | 5/27/2014 | | | | 0.88 | | | | 0.80 | |
| Institutional (I) | | | MLVIX | | | | 09658L844 | | | | 1/31/2008 | | | | 0.63 | | | | 0.55 | |
| Retirement(R-6) | | | BLCRX | | | | 09658W568 | | | | 12/28/2015 | | | | 0.48 | | | | 0.40 | |
The above expense ratios are from the Funds’ Prospectus dated December 29, 2017, and are inclusive of Acquired Fund Fees and Expenses. See Note 6 in the Notes to Financial Statements for additional information. Net expense ratios reflect contractual fee waivers and/or expense reimbursements if applicable, made by BMO Asset Management Corp., the investment adviser (Adviser). The Adviser may not terminate these fee waivers and/or expense reimbursements prior to December 31, 2019 without the consent of the Board of Directors, unless the investment advisory agreement is terminated. Without these contractual waivers, the Fund’s returns would have been lower.
| | | | |
Portfolio sector allocation | |
| Sector | | Fund (%) | |
| Consumer Discretionary | | | 9.4 | |
| Consumer Staples | | | 4.6 | |
| Energy | | | 10.5 | |
| Financials | | | 20.9 | |
| Healthcare | | | 15.3 | |
| Industrials | | | 7.8 | |
| Information Technology | | | 9.9 | |
| Materials | | | 3.6 | |
| Real Estate | | | 7.3 | |
| Utilities | | | 8.5 | |
| Other Assets & Liabilities, Net | | | 2.2 | |
| Total | | | 100.0 | |
Portfolio composition will change due to the ongoing management of the Fund. The percentages are based on net assets as of August 31, 2018 and may not necessarily reflect adjustments that are routinely made when presenting net assets for formal financial statement processes.
Growth of an assumed $10,000 investment
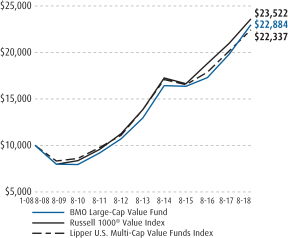
See Explanation of the Indices and Notes in the Commentary for additional information.The above graph relates to the Institutional Class shares of the Fund. Performance for the Advisor Class and RetirementR-6 shares will vary from the performance of the Institutional Class shares shown above due to differences in charges and expenses. This graph illustrates the hypothetical investment of $10,000 in the Institutional Class shares of the Fund from the lesser of the Fund’s inception date or August 31, 2008 to August 31, 2018.
4
| | |
| | |
| Annual Report | | BMOLarge-Cap Growth Fund |
| | | | | | | | | | | | | | | | |
Average annual total returns (%) | |
| | | 1-year | | | 5-years | | | 10-years | | | Since
inception | |
| Investor Class (Y) | | | 26.78 | | | | 18.34 | | | | 12.38 | | | | 8.47 | |
| Advisor Class (A) NAV | | | 26.84 | | | | — | | | | — | | | | 16.27 | |
| Advisor Class (A) OFFER | | | 20.49 | | | | — | | | | — | | | | 14.89 | |
| Institutional Class (I) | | | 27.19 | | | | 18.64 | | | | — | | | | 11.81 | |
| Retirement Class(R-6) | | | 27.36 | | | | — | | | | — | | | | 20.01 | |
| Russell 1000® Growth Index | | | 27.23 | | | | 17.47 | | | | 12.85 | | | | — | |
| Lipper U.S.Multi-Cap Growth Funds Index | | | 24.61 | | | | 15.22 | | | | 11.43 | | | | — | |
| * | Benchmarks since inception reflect the inception date of the Institutional Class. |
The performance data quoted represents past performance which is no guarantee of future results. Investment return and principal value will fluctuate so that an investor’s shares, when redeemed, may be worth more or less than their original costs. Mutual fund performance changes over time and current performance may be lower or higher than what is stated. To receive current performance to the most recentmonth-end, please call1-800-236-3863 or visit www.bmofunds.com.
Commentary
The BMOLarge-Cap Growth Fund (the Fund) returned 27.19% for the fiscal year ended August 31, 2018 versus the Russell 1000® Growth Index and the Lipper U.S.Multi-Cap Growth Funds Index, which returned 27.23% and 24.61%, respectively.
Global equities posted double digit gains over the 12 month period, led by strong returns in the U.S., while Emerging Market equities lagged. Stock returns have been largely supported by strong corporate earnings and a resilient global economy, despite the emergence of several geopolitical and policy-related risks. During the period, companies with higher sales and earnings growth continued to outperform, while more attractively valued securities in the global market have been some of the worst performers. In fact, the recent underperformance of value investing is comparable only to the 1990s tech bubble. After a remarkable stretch of underperformance in the year prior, smaller companies in the market outpaced their larger counterparts, driven mostly by a strong domestic economy and ongoing trade war rhetoric between the and China. With more revenue being sourced from the U.S. economy, investors favored domestically-oriented small cap companies over larger multinationals. Finally, as interest rates increased during the period, defensive “bond proxy” stocks in sectors such as Utilities, Telecommunications, and Consumer Staples underperformed. In conjunction with a recovery in crude oil prices, higher risk stocks in the market outpaced lower risk stocks.
Over the12-month period, fundamentally strong companies with positive investor interest contributed favorably to the Fund’s performance, while poor performance of attractively valued stocks detracted from returns. Additionally, the Fund’s performance was enhanced by strong stock selection, as sector allocation was a modest detractor to returns. The Fund’s underweight allocation to Telecommunications and Consumer Staples added to performance, while an overweight position in Real Estate and Health Care detracted. Stock selection was particularly strong in Information Technology and Consumer Staples while selection in Materials and Real Estate detracted from performance. By security, top contributors included Align Technology Inc. (0.0% of the Fund, +118.68%) and Fortinet Inc. (2.0% of the Fund, +94.71%) while Celgene Corporation (2.2% of the Fund,-32.02%) and Owens Corning (0.0% of the Fund,-26.89%) were top detractors during the period.
As we look ahead, the fundamental landscape supporting global equities remains strong despite the increased market volatility. While corporate earnings could continue to benefit from accelerating global economic growth and accommodative tax policy, the threat of trade wars, geopolitical tensions, and inflationary pressures from rising commodity prices could cause markets to react negatively. In addition, elevated volatility andmultiyear-low stock correlations create opportunities for active stock selection. Accordingly, we have positioned the Fund to participate in up markets, while managing downside risks through a combination of disciplined stock selection and thoughtful risk management.
Fund Managers; Investment Experience
David A. Corris, CFA; since 1999
Jason C. Hans, CFA; since 1999
Ernesto Ramos, Ph.D.; since 1988
| | | | | | | | | | | | | | | | | | | | |
| | | | | | | | | Inception
date | | | Expenses (%) | |
| Share class | | Ticker | | | Cusip | | | Gross | | | Net | |
| Investor (Y) | | | MASTX | | | | 09658L745 | | | | 11/20/1992 | | | | 0.88 | | | | 0.79 | |
| Advisor (A) | | | BALGX | | | | 09658W402 | | | | 5/27/2014 | | | | 0.88 | | | | 0.79 | |
| Institutional (I) | | | MLCIX | | | | 09658L752 | | | | 1/31/2008 | | | | 0.63 | | | | 0.54 | |
| Retirement(R-6) | | | BLGRX | | | | 09658W576 | | | | 12/28/2015 | | | | 0.48 | | | | 0.39 | |
The above expense ratios are from the Funds’ Prospectus dated December 29, 2017, and are inclusive of Acquired Fund Fees and Expenses. See Note 6 in the Notes to Financial Statements for additional information. Net expense ratios reflect contractual fee waivers and/or expense reimbursements if applicable, made by BMO Asset Management Corp., the investment adviser (Adviser). The Adviser may not terminate these fee waivers and/or expense reimbursements prior to December 31, 2019 without the consent of the Board of Directors, unless the investment advisory agreement is terminated. Without these contractual waivers, the Fund’s returns would have been lower.
| | | | |
Portfolio sector allocation | |
| Sector | | Fund (%) | |
| Consumer Discretionary | | | 16.1 | |
| Consumer Staples | | | 3.7 | |
| Energy | | | 2.0 | |
| Financials | | | 6.4 | |
| Healthcare | | | 13.4 | |
| Industrials | | | 10.7 | |
| Information Technology | | | 40.7 | |
| Materials | | | 1.9 | |
| Real Estate | | | 3.4 | |
| Other Assets & Liabilities, Net | | | 1.7 | |
| Total | | | 100.0 | |
Portfolio composition will change due to the ongoing management of the Fund. The percentages are based on net assets as of August 31, 2018 and may not necessarily reflect adjustments that are routinely made when presenting net assets for formal financial statement processes.
Growth of an assumed $10,000 investment
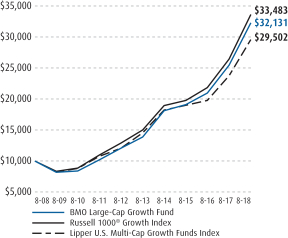
See Explanation of the Indices and Notes in the Commentary for additional information.The above graph relates to the Investor Class shares of the Fund. Performance for the Institutional Class, Advisor Class and RetirementR-6 shares will vary from the performance of the Investor Class shares shown above due to differences in charges and expenses. This graph illustrates the hypothetical investment of $10,000 in the Investor Class shares of the Fund from the lesser of the Fund’s inception date or August 31, 2008 to August 31, 2018.
5
| | |
| | |
| Annual Report | | BMOMid-Cap Value Fund |
| | | | | | | | | | | | | | | | |
Average annual total returns (%) | |
| | | 1-year | | | 5-years | | | 10-years | | | Since
inception | |
| Advisor Class (A) NAV | | | 10.89 | | | | — | | | | — | | | | 7.79 | |
| Advisor Class (A) OFFER | | | 5.32 | | | | — | | | | — | | | | 6.51 | |
| Institutional Class (I) | | | 11.21 | | | | 10.33 | | | | — | | | | 8.91 | |
| Retirement Class(R-6) | | | 11.41 | | | | — | | | | — | | | | 8.22 | |
| Russell Midcap® Value Index | | | 12.67 | | | | 11.81 | | | | 10.33 | | | | — | |
| Lipper U.S.Mid-Cap Value Funds Index | | | 12.86 | | | | 10.22 | | | | 9.36 | | | | — | |
| * | Benchmarks since inception reflect the inception date of the Institutional Class. |
The performance data quoted represents past performance which is no guarantee of future results. Investment return and principal value will fluctuate so that an investor’s shares, when redeemed, may be worth more or less than their original costs. Mutual fund performance changes over time and current performance may be lower or higher than what is stated. To receive current performance to the most recentmonth-end, please call1-800-236-3863 or visit www.bmofunds.com.
Commentary
The BMOMid-Cap Value Fund (the Fund) returned 11.21% for the fiscal year ended August 31, 2018 versus the RussellMid-Cap® Value Index and the Lipper U.S.Mid-Cap Value Funds Index, which returned 12.67% and 12.86%, respectively.
Global equities posted double digit gains over the 12 month period, led by strong returns in the U.S., while Emerging Market equities lagged. Stock returns have been largely supported by strong corporate earnings and a resilient global economy, despite the emergence of several geopolitical and policy-related risks. During the period, companies with higher sales and earnings growth continued to outperform, while more attractively valued securities in the global market have been some of the worst performers. In fact, the recent underperformance of value investing is comparable only to the 1990s tech bubble. After a remarkable stretch of underperformance in the year prior, smaller companies in the market outpaced their larger counterparts, driven mostly by a strong domestic economy and ongoing trade war rhetoric between the U.S. and China. With more revenue being sourced from the U.S. economy, investors favored domestically-oriented small cap companies over larger multinationals. Finally, as interest rates increased during the period, defensive “bond proxy” stocks in sectors such as Utilities, Telecommunications, and Consumer Staples underperformed. In conjunction with a recovery in crude oil prices, higher risk stocks in the market outpaced lower risk stocks.
Over the12-month period, fundamentally strong companies with positive investor interest contributed to the Fund’s performance. Conversely, our focus on stocks with attractive valuations was less effective as more expensive companies were in favor. Strong stock selection enhanced the Fund’s performance while sector allocation detracted from returns. The Fund’s underweight allocation to Real Estate contributed to performance, but was offset by our underweight to Financials. Stock selection was particularly strong in Healthcare and Consumer Discretionary, while selection in Information Technology and Materials detracted. By security, top contributors included Kohl’s Corporation (1.9% of the Fund, +107.44%) and Valero Energy Corp. (0.0% of the Fund, +78.61%) while Owens Corning (0.0% of the Fund,-22.80%) and Unum Group (1.1% of the Fund,-21.92%) were top detractors during the period.
As we look ahead, the fundamental landscape supporting global equities remains strong despite the increased market volatility. While corporate earnings could continue to benefit from accelerating global economic growth and accommodative tax policy, the threat of trade wars, geopolitical tensions, and inflationary pressures from rising commodity prices could cause markets to react negatively. In addition, elevated volatility andmultiyear-low stock correlations create opportunities for active stock selection. Accordingly, we have positioned the Fund to participate in up markets, while managing downside risks through a combination of disciplined stock selection and thoughtful risk management.
Fund Managers; Investment Experience
David A. Corris, CFA; since 1999
Thomas Lettenberger, CFA; since 1994
| | | | | | | | | | | | | | | | | | | | |
| | | | | | | | | Inception
date | | | Expenses (%) | |
| Share class | | Ticker | | | Cusip | | | Gross | | | Net | |
| Advisor (A) | | | BAMCX | | | | 09658W501 | | | | 5/27/2014 | | | | 1.27 | | | | 1.25 | |
| Institutional (I) | | | MRVIX | | | | 09658L711 | | | | 1/31/2008 | | | | 1.02 | | | | 1.00 | |
| Retirement(R-6) | | | BMVGX | | | | 09658V438 | | | | 5/27/2014 | | | | 0.87 | | | | 0.85 | |
The above expense ratios are from the Funds’ Prospectus dated December 29, 2017, and are inclusive of Acquired Fund Fees and Expenses. See Note 6 in the Notes to Financial Statements for additional information. Net expense ratios reflect contractual fee waivers and/or expense reimbursements if applicable, made by BMO Asset Management Corp., the investment adviser (Adviser). The Adviser may not terminate these fee waivers and/or expense reimbursements prior to December 31, 2019 without the consent of the Board of Directors, unless the investment advisory agreement is terminated. Without these contractual waivers, the Fund’s returns would have been lower.
| | | | |
Portfolio sector allocation | |
| Sector | | Fund (%) | |
| Consumer Discretionary | | | 12.3 | |
| Consumer Staples | | | 3.4 | |
| Energy | | | 6.6 | |
| Financials | | | 18.1 | |
| Healthcare | | | 7.7 | |
| Industrials | | | 10.8 | |
| Information Technology | | | 10.4 | |
| Materials | | | 5.7 | |
| Real Estate | | | 13.9 | |
| Utilities | | | 9.8 | |
| Other Assets & Liabilities, Net | | | 1.3 | |
| Total | | | 100.0 | |
Portfolio composition will change due to the ongoing management of the Fund. The percentages are based on net assets as of August 31, 2018 and may not necessarily reflect adjustments that are routinely made when presenting net assets for formal financial statement processes.
Growth of an assumed $10,000 investment
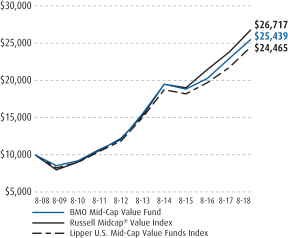
See Explanation of the Indices and Notes in the Commentary for additional information.The above graph relates to the Institutional Class shares of the Fund. Performance for the Advisor Class and RetirementR-6 Class shares will vary from the performance of the Institutional Class shares shown above due to differences in charges and expenses. This graph illustrates the hypothetical investment of $10,000 in the Institutional Class shares of the Fund from the lesser of the Fund’s inception date or August 31, 2008 to August 31, 2018.
6
| | |
| | |
| Annual Report | | BMOMid-Cap Growth Fund |
| | | | | | | | | | | | | | | | |
Average annual total returns (%) | |
| | | 1-year | | | 5-years | | | 10-years | | | Since
inception | |
| Advisor Class (A) NAV | | | 29.40 | | | | — | | | | — | | | | 9.43 | |
| Advisor Class (A) OFFER | | | 22.92 | | | | — | | | | — | | | | 8.13 | |
| Institutional Class (I) | | | 29.76 | | | | 11.14 | | | | — | | | | 9.44 | |
| Retirement Class(R-6) | | | 29.96 | | | | — | | | | — | | | | 9.88 | |
| Russell Midcap® Growth Index | | | 25.06 | | | | 14.19 | | | | 11.64 | | | | — | |
| Lipper U.S.Mid-Cap Growth Funds Index | | | 25.84 | | | | 13.63 | | | | 10.72 | | | | — | |
| * | Benchmarks since inception reflect the inception date of the Institutional Class. |
The performance data quoted represents past performance which is no guarantee of future results. Investment return and principal value will fluctuate so that an investor’s shares, when redeemed, may be worth more or less than their original costs. Mutual fund performance changes over time and current performance may be lower or higher than what is stated. To receive current performance to the most recentmonth-end, please call1-800-236-3863 or visit www.bmofunds.com.
Commentary
The BMOMid-Cap Growth Fund (the Fund) returned 29.76% for the fiscal year ended August 31, 2018 versus the RussellMid-Cap® Growth Index and the Lipper U.S.Mid-Cap Growth Funds Index, which returned 25.06% and 25.84%, respectively.
Global equities posted double digit gains over the 12 month period, led by strong returns in the U.S., while Emerging Market equities lagged. Stock returns have been largely supported by strong corporate earnings and a resilient global economy, despite the emergence of several geopolitical and policy-related risks. During the period, companies with higher sales and earnings growth continued to outperform, while more attractively valued securities in the global market have been some of the worst performers. In fact, the recent underperformance of value investing is comparable only to the 1990s tech bubble. After a remarkable stretch of underperformance in the year prior, smaller companies in the market outpaced their larger counterparts, driven mostly by a strong domestic economy and ongoing trade war rhetoric between the U.S. and China. With more revenue being sourced from the U.S. economy, investors favored domestically-oriented small cap companies over larger multinationals. Finally, as interest rates increased during the period, defensive “bond proxy” stocks in sectors such as Utilities, Telecommunications, and Consumer Staples underperformed. In conjunction with a recovery in crude oil prices, higher risk stocks in the market outpaced lower risk stocks.
Over the12-month period, our preference for companies with positive or improving investor interest contributed favorably to the Fund’s performance. Additionally, our focus on fundamentals was rewarded as high-quality companies outperformed lower quality counterparts. The Fund’s performance also was enhanced by strong stock selection, while sector allocation was a modest detractor to returns. The Fund’s slight underweight position in Materials and Consumer Staples added to performance, while an overweight position in Real Estate detracted. Stock selection was particularly strong in Healthcare and Information Technology while selection in Consumer Discretionary and Real Estate detracted from performance. By security, Fortinet Inc. (1.9% of the Fund, +119.27%) and Bioverativ Inc. (0.0% of the Fund, +106.04%) and were top contributors, while Skechers U.S.A. Inc. (1.4% of the Fund,-27.96%) and Owens-Illinois Inc. (0.0% of the Fund,-26.04%) were top detractors.
As we look ahead, the fundamental landscape supporting global equities remains strong despite the increased market volatility. While corporate earnings could continue to benefit from accelerating global economic growth and accommodative tax policy, the threat of trade wars, geopolitical tensions, and inflationary pressures from rising commodity prices could cause markets to react negatively. In addition, elevated volatility andmultiyear-low stock correlations create opportunities for active stock selection. Accordingly, we have positioned the Fund to participate in up markets, while managing downside risks through a combination of disciplined stock selection and thoughtful risk management.
Fund Managers; Investment Experience
David A. Corris, CFA; since 1999
Thomas Lettenberger, CFA; since 1994
| | | | | | | | | | | | |
| | | | | | | | Inception
date | | Expenses (%) |
| Share class | | Ticker | | | Cusip | | Gross | | Net |
| Advisor (A) | | | BGMAX | | | 09658W600 | | 5/27/2014 | | 1.38 | | 1.25 |
| Institutional (I) | | | MRMIX | | | 09658L737 | | 1/31/2008 | | 1.13 | | 1.00 |
| Retirement(R-6) | | | BMGGX | | | 09658V412 | | 5/27/2014 | | 0.98 | | 0.85 |
The above expense ratios are from the Funds’ Prospectus dated December 29, 2017, and are inclusive of Acquired Fund Fees and Expenses. See Note 6 in the Notes to Financial Statements for additional information. Net expense ratios reflect contractual fee waivers and/or expense reimbursements if applicable, made by BMO Asset Management Corp., the investment adviser (Adviser). The Adviser may not terminate these fee waivers and/or expense reimbursements prior to December 31, 2019 without the consent of the Board of Directors, unless the investment advisory agreement is terminated. Without these contractual waivers, the Fund’s returns would have been lower.
| | | | |
Portfolio sector allocation | |
| Sector | | Fund (%) | |
| Consumer Discretionary | | | 15.9 | |
| Consumer Staples | | | 2.9 | |
| Energy | | | 2.9 | |
| Financials | | | 7.0 | |
| Healthcare | | | 17.0 | |
| Industrials | | | 15.5 | |
| Information Technology | | | 31.1 | |
| Materials | | | 3.0 | |
| Real Estate | | | 3.5 | |
| Other Assets & Liabilities, Net | | | 1.2 | |
| Total | | | 100.0 | |
Portfolio composition will change due to the ongoing management of the Fund. The percentages are based on net assets as of August 31, 2018 and may not necessarily reflect adjustments that are routinely made when presenting net assets for formal financial statement processes.
Growth of an assumed $10,000 investment
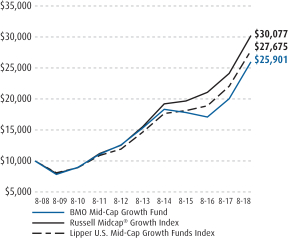
See Explanation of the Indices and Notes in the Commentary for additional information.The above graph relates to the Institutional Class shares of the Fund. Performance for the Advisor Class and RetirementR-6 Class shares will vary from the performance of the Institutional Class shares shown above due to differences in charges and expenses. This graph illustrates the hypothetical investment of $10,000 in the Institutional Class shares of the Fund from the lesser of the Fund’s inception date or August 31, 2008 to August 31, 2018.
7
| | |
| | |
| Annual Report | | BMOSmall-Cap Value Fund |
| | | | | | | | | | | | |
Average annual total returns (%) | |
| | | 1-year | | | 5-years | | | Since
inception | |
| Advisor Class (A) NAV | | | 20.32 | | | | — | | | | 8.27 | |
| Advisor Class (A) OFFER | | | 14.31 | | | | — | | | | 6.97 | |
| Institutional Class (I) | | | 20.67 | | | | 10.13 | | | | 11.56 | |
| Retirement Class(R-6) | | | 20.89 | | | | — | | | | 8.73 | |
| Russell 2000® Value Index | | | 20.05 | | | | 11.72 | | | | 10.72 | |
| Lipper U.S.Small-Cap Core Funds Index | | | 23.40 | | | | 12.36 | | | | 11.38 | |
| * | Benchmarks since inception reflect the inception date of the Institutional Class. |
The performance data quoted represents past performance which is no guarantee of future results. Investment return and principal value will fluctuate so that an investor’s shares, when redeemed, may be worth more or less than their original costs. Mutual fund performance changes over time and current performance may be lower or higher than what is stated. To receive current performance to the most recentmonth-end, please call1-800-236-3863 or visit www.bmofunds.com.
Commentary
The BMOSmall-Cap Value Fund (the Fund) returned 20.67% for the fiscal year ended August 31, 2018 versus the Russell 2000® Value Index and the Lipper U.S.Small-Cap Core Funds Index, which returned 20.05% and 23.40%, respectively.
Global equities posted double digit gains over the 12 month period, led by strong returns in the U.S., while Emerging Market equities lagged. Stock returns have been largely supported by strong corporate earnings and a resilient global economy, despite the emergence of several geopolitical and policy-related risks. During the period, companies with higher sales and earnings growth continued to outperform, while more attractively valued securities in the global market have been some of the worst performers. In fact, the recent underperformance of value investing is comparable only to the 1990s tech bubble. After a remarkable stretch of underperformance in the year prior, smaller companies in the market outpaced their larger counterparts, driven mostly by a strong domestic economy and ongoing trade war rhetoric between the U.S. and China. With more revenue being sourced from the U.S. economy, investors favored domestically-oriented small cap companies over larger multinationals. Finally, as interest rates increased during the period, defensive “bond proxy” stocks in sectors such as Utilities, Telecommunications, and Consumer Staples underperformed. In conjunction with a recovery in crude oil prices, higher risk stocks in the market outpaced lower risk stocks.
Over the12-month period, strong performance from fundamentals contributed positively to performance, while our preference for companies with attractive valuations and positive investor interest was less effective. At the sector level, our overweight position in Healthcare and Industrials added to performance, while an overweight to Materials modestly detracted. Stock selection was strongest in Consumer Discretionary and Information Technology and weakest in Energy and Financials. By security, top contributors included Integer Holdings Corporation (1.1% of the Fund, +73.88%) and Enanta Pharmaceuticals Inc. (0.0% of the Fund, +112.16%) while Benchmark Electronics Inc. (0.5% of the Fund,-19.64%) and Hilltop Holdings Inc. (0.9% of the Fund,-11.29%) were top detractors for the period.
As we look ahead, the fundamental landscape supporting global equities remains strong despite the increased market volatility. While corporate earnings could continue to benefit from accelerating global economic growth and accommodative tax policy, the threat of trade wars, geopolitical tensions, and inflationary pressures from rising commodity prices could cause markets to react negatively. In addition, elevated volatility andmultiyear-low stock correlations create opportunities for active stock selection. Accordingly, we have positioned the Fund to participate in up markets, while managing downside risks through a combination of disciplined stock selection and thoughtful risk management.
Fund Managers; Investment Experience
David A. Corris, CFA; since 1999
Thomas Lettenberger, CFA; since 1994
| | | | | | | | | | | | | | | | | | | | |
| | | | | | | | | Inception
date | | | Expenses (%) | |
| Share class | | Ticker | | | Cusip | | | Gross | | | Net | |
| Advisor (A) | | | BACVX | | | | 09658W709 | | | | 5/27/2014 | | | | 1.49 | | | | 1.24 | |
| Institutional (I) | | | MRSNX | | | | 09658L596 | | | | 2/28/2011 | | | | 1.24 | | | | 0.99 | |
| Retirement(R-6) | | | BSVGX | | | | 09658V388 | | | | 5/27/2014 | | | | 1.09 | | | | 0.84 | |
The above expense ratios are from the Funds’ Prospectus dated December 29, 2017, and are inclusive of Acquired Fund Fees and Expenses. See Note 6 in the Notes to Financial Statements for additional information. Net expense ratios reflect contractual fee waivers and/or expense reimbursements if applicable, made by BMO Asset Management Corp., the investment adviser (Adviser). The Adviser may not terminate these fee waivers and/or expense reimbursements prior to December 31, 2019 without the consent of the Board of Directors, unless the investment advisory agreement is terminated. Without these contractual waivers, the Fund’s returns would have been lower.
| | | | |
Portfolio sector allocation | |
| Sector | | Fund (%) | |
| Consumer Discretionary | | | 8.7 | |
| Consumer Staples | | | 0.9 | |
| Energy | | | 7.1 | |
| Financials | | | 25.7 | |
| Healthcare | | | 8.5 | |
| Industrials | | | 12.3 | |
| Information Technology | | | 12.4 | |
| Materials | | | 6.1 | |
| Real Estate | | | 8.8 | |
| Telecommunication Services | | | 1.1 | |
| Utilities | | | 6.5 | |
| Other Assets & Liabilities, Net | | | 1.9 | |
| Total | | | 100.0 | |
Portfolio composition will change due to the ongoing management of the Fund. The percentages are based on net assets as of August 31, 2018 and may not necessarily reflect adjustments that are routinely made when presenting net assets for formal financial statement processes.
Growth of an assumed $10,000 investment
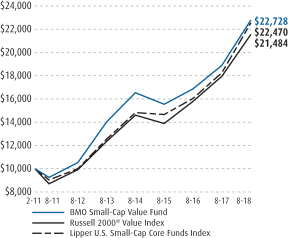
See Explanation of the Indices and Notes in the Commentary for additional information.The above graph relates to the Institutional Class shares of the Fund. Performance for the Advisor Class and RetirementR-6 Class shares will vary from the performance of the Institutional Class shares shown above due to differences in charges and expenses. This graph illustrates the hypothetical investment of $10,000 in the Institutional Class shares of the Fund from the lesser of the Fund’s inception date or August 31, 2008 to August 31, 2018.
8
| | |
| | |
| Annual Report | | BMOSmall-Cap Core Fund |
| | | | | | | | |
Average annual total returns (%) | |
| | | 1-year | | | Since
inception | |
| Advisor Class (A) NAV | | | 21.20 | | | | 12.09 | |
| Advisor Class (A) OFFER | | | 15.11 | | | | 10.76 | |
| Institutional Class (I) | | | 21.46 | | | | 11.43 | |
| Russell 2000® Index | | | 25.45 | | | | 10.52 | |
| Lipper U.S.Small-Cap Core Funds Index | | | 23.40 | | | | 9.95 | |
| * | Benchmarks since inception reflect the inception date of the Institutional Class. |
The performance data quoted represents past performance which is no guarantee of future results. Investment return and principal value will fluctuate so that an investor’s shares, when redeemed, may be worth more or less than their original costs. Mutual fund performance changes over time and current performance may be lower or higher than what is stated. To receive current performance to the most recentmonth-end, please call1-800-236-3863 or visit www.bmofunds.com.
Commentary
The BMOSmall-Cap Core Fund (the Fund) returned 21.46% for the fiscal year ended August 31, 2018 versus the Russell 2000® Index and the Lipper U.S.Small-Cap Core Funds Index, which returned 25.45% and 23.40%, respectively.
Global equities posted double digit gains over the 12 month period, led by strong returns in the U.S., while Emerging Market equities lagged. Stock returns have been largely supported by strong corporate earnings and a resilient global economy, despite the emergence of several geopolitical and policy-related risks. During the period, companies with higher sales and earnings growth continued to outperform, while more attractively valued securities in the global market have been some of the worst performers. In fact, the recent underperformance of value investing is comparable only to the 1990s tech bubble. After a remarkable stretch of underperformance in the year prior, smaller companies in the market outpaced their larger counterparts, driven mostly by a strong domestic economy and ongoing trade war rhetoric between the U.S. and China. With more revenue being sourced from the U.S. economy, investors favored domestically-oriented small cap companies over larger multinationals. Finally, as interest rates increased during the period, defensive “bond proxy” stocks in sectors such as Utilities, Telecommunications, and Consumer Staples underperformed. In conjunction with a recovery in crude oil prices, higher risk stocks in the market outpaced lower risk stocks.
Over the12-month period, fundamentally strong companies with positive investor interest contributed favorably to the Fund’s performance, while poor performance of attractively valued stocks detracted from returns. The Fund’s underperformance was primarily driven by poor stock selection as sector allocation contributed modestly to returns. At the sector level, our overweight allocation to Healthcare and underweight to Real Estate added to performance, while a slight underweight to Consumer Discretionary detracted. Stock selection was particularly strong in Consumer Discretionary and weakest in Healthcare and Information Technology. By security, top performing contributors included Inogen Inc. (0.8% of the Fund, +176.52%) and BJ Restaurants Inc. (0.0% of the Fund, +153.97%) while OraSure Technologies Inc. (0.5% of the Fund,-21.56%) and Big Lots Inc. (0.0% of the Fund,-7.37%) detracted from returns.
As we look ahead, the fundamental landscape supporting global equities remains strong despite the increased market volatility. While corporate earnings could continue to benefit from accelerating global economic growth and accommodative tax policy, the threat of trade wars, geopolitical tensions, and inflationary pressures from rising commodity prices could cause markets to react negatively. In addition, elevated volatility andmultiyear-low stock correlations create opportunities for active stock selection. Accordingly, we have positioned the Fund to participate in up markets, while managing downside risks through a combination of disciplined stock selection and thoughtful risk management.
Fund Managers; Investment Experience
David A. Corris, CFA; since 1999
Thomas Lettenberger, CFA; since 1994
| | | | | | | | | | | | | | | | | | | | |
| | | | | | | | | Inception date | | | Expenses (%) | |
| Share class | | Ticker | | | Cusip | | | Gross | | | Net | |
| Advisor (A) | | | BCCAX | | | | 09658W808 | | | | 5/27/2014 | | | | 1.83 | | | | 1.15 | |
| Institutional (I) | | | BSCNX | | | | 09658V537 | | | | 12/27/2013 | | | | 1.58 | | | | 0.90 | |
The above expense ratios are from the Funds’ Prospectus dated December 29, 2017, and are inclusive of Acquired Fund Fees and Expenses. See Note 6 in the Notes to Financial Statements for additional information. Net expense ratios reflect contractual fee waivers and/or expense reimbursements if applicable, made by BMO Asset Management Corp., the investment adviser (Adviser). The Adviser may not terminate these fee waivers and/or expense reimbursements prior to December 31, 2019 without the consent of the Board of Directors, unless the investment advisory agreement is terminated. Without these contractual waivers, the Fund’s returns would have been lower.
| | | | |
Portfolio sector allocation | |
| Sector | | Fund (%) | |
| Consumer Discretionary | | | 12.8 | |
| Consumer Staples | | | 0.9 | |
| Energy | | | 4.7 | |
| Financials | | | 15.6 | |
| Healthcare | | | 19.3 | |
| Industrials | | | 13.6 | |
| Information Technology | | | 18.1 | |
| Materials | | | 4.0 | |
| Real Estate | | | 5.3 | |
| Telecommunication Services | | | 1.2 | |
| Utilities | | | 2.7 | |
| Other Assets & Liabilities, Net | | | 1.8 | |
| Total | | | 100.0 | |
Portfolio composition will change due to the ongoing management of the Fund. The percentages are based on net assets as of August 31, 2018 and may not necessarily reflect adjustments that are routinely made when presenting net assets for formal financial statement processes.
Growth of an assumed $10,000 investment
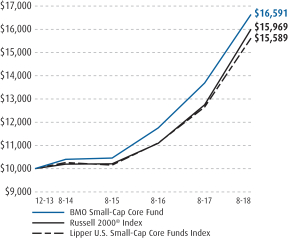
See Explanation of the Indices and Notes in the Commentary for additional information.The above graph relates to the Institutional Class shares of the Fund. Performance for the Advisor Class shares will vary from the performance of the Institutional Class shares shown above due to differences in charges and expenses. This graph illustrates the hypothetical investment of $10,000 in the Institutional Class shares of the Fund from the lesser of the Fund’s inception date or August 31, 2008 to August 31, 2018.
9
| | |
| | |
| Annual Report | | BMOSmall-Cap Growth Fund |
| | | | | | | | | | | | | | | | |
Average annual total returns (%) | |
| | | 1-year | | | 5-years | | | 10-years | | | Since
inception | |
| Advisor Class (A) NAV | | | 31.55 | | | | — | | | | — | | | | 27.71 | |
| Advisor Class (A) OFFER | | | 24.95 | | | | — | | | | — | | | | 22.57 | |
| Institutional Class (I) | | | 31.83 | | | | 10.44 | | | | — | | | | 10.49 | |
| Russell 2000® Growth Index | | | 30.72 | | | | 14.20 | | | | 11.57 | | | | — | |
| Lipper U.S.Small-Cap Growth Funds Index | | | 36.02 | | | | 13.94 | | | | 11.45 | | | | — | |
| * | Benchmarks since inception reflect the inception date of the Institutional Class. |
The performance data quoted represents past performance which is no guarantee of future results. Investment return and principal value will fluctuate so that an investor’s shares, when redeemed, may be worth more or less than their original costs. Mutual fund performance changes over time and current performance may be lower or higher than what is stated. To receive current performance to the most recentmonth-end, please call1-800-236-3863 or visit www.bmofunds.com.
Commentary
The BMOSmall-Cap Growth Fund (the Fund) returned 31.83% for the fiscal year ended August 31, 2018 versus the Russell 2000® Growth Index and the Lipper U.S.Small-Cap Growth Funds Index, which returned 30.72% and 36.02%, respectively.
Global equities posted double digit gains over the 12 month period, led by strong returns in the U.S., while Emerging Market equities lagged. Stock returns have been largely supported by strong corporate earnings and a resilient global economy, despite the emergence of several geopolitical and policy-related risks. During the period, companies with higher sales and earnings growth continued to outperform, while more attractively valued securities in the global market have been some of the worst performers. In fact, the recent underperformance of value investing is comparable only to the 1990s tech bubble. After a remarkable stretch of underperformance in the year prior, smaller companies in the market outpaced their larger counterparts, driven mostly by a strong domestic economy and ongoing trade war rhetoric between the U.S. and China. With more revenue being sourced from the U.S. economy, investors favored domestically-oriented small cap companies over larger multinationals. Finally, as interest rates increased during the period, defensive “bond proxy” stocks in sectors such as Utilities, Telecommunications, and Consumer Staples underperformed. In conjunction with a recovery in crude oil prices, higher risk stocks in the market outpaced lower risk stocks.
Over the12-month period, fundamentally strong companies with positive investor interest contributed favorably to the Fund’s performance, while poor performance of attractively valued stocks detracted from returns. At the sector level, our overweight allocation to Information Technology and modest underweight to Real Estate added to performance, while an overweight position in Materials and Utilities detracted from returns. Stock selection was particularly strong in Industrials and and weakest in Healthcare. By security, top performing contributors included Insperity Inc. (1.3% of the Fund, +207.14%) and Inogen Inc. (1.0% of the Fund, +176.52%) while Versartis Inc. (0.0% of the Fund,-86.32%) and Extreme Networks Inc. (0.0% of the Fund,-45.14%) were top detractors for the period.
As we look ahead, the fundamental landscape supporting global equities remains strong despite the increased market volatility. While corporate earnings could continue to benefit from accelerating global economic growth and accommodative tax policy, the threat of trade wars, geopolitical tensions, and inflationary pressures from rising commodity prices could cause markets to react negatively. In addition, elevated volatility andmultiyear-low stock correlations create opportunities for active stock selection. Accordingly, we have positioned the Fund to participate in up markets, while managing downside risks through a combination of disciplined stock selection and thoughtful risk management.
Fund Managers; Investment Experience
David A. Corris, CFA; since 1999
Thomas Lettenberger, CFA; since 1994
| | | | | | | | | | | | |
| | | | | | | | Inception date | | Expenses (%) |
| Share class | | Ticker | | | Cusip | | Gross | | Net |
| Advisor (A) | | | BSLAX | | | 09658V339 | | 5/31/2017 | | 1.25 | | 1.25 |
| Institutional (I) | | | MSGIX | | | 09658L620 | | 1/31/2008 | | 1.00 | | 1.00 |
The above expense ratios are from the Funds’ Prospectus dated December 29, 2017, and are inclusive of Acquired Fund Fees and Expenses. See Note 6 in the Notes to Financial Statements for additional information. Net expense ratios reflect contractual fee waivers and/or expense reimbursements if applicable, made by BMO Asset Management Corp., the investment adviser (Adviser). The Adviser may not terminate these fee waivers and/or expense reimbursements prior to December 31, 2019 without the consent of the Board of Directors, unless the investment advisory agreement is terminated. Without these contractual waivers, the Fund’s returns would have been lower.
| | | | |
Portfolio sector allocation | |
| Sector | | Fund (%) | |
| Consumer Discretionary | | | 12.1 | |
| Consumer Staples | | | 2.5 | |
| Energy | | | 2.4 | |
| Financials | | | 5.1 | |
| Healthcare | | | 27.3 | |
| Industrials | | | 18.9 | |
| Information Technology | | | 21.6 | |
| Materials | | | 5.5 | |
| Real Estate | | | 2.7 | |
| Telecommunication Services | | | 0.9 | |
| Other Assets & Liabilities, Net | | | 1.0 | |
| Total | | | 100.0 | |
Portfolio composition will change due to the ongoing management of the Fund. The percentages are based on net assets as of August 31, 2018 and may not necessarily reflect adjustments that are routinely made when presenting net assets for formal financial statement processes.
Growth of an assumed $10,000 investment
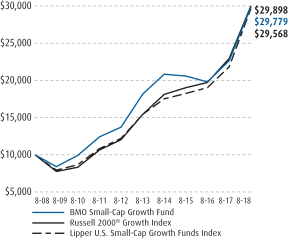
See Explanation of the Indices and Notes in the Commentary for additional information.The above graph relates to the Institutional Class shares of the Fund. Performance for the Advisor Class shares will vary from the performance of the Institutional Class shares shown above due to differences in charges and expenses. This graph illustrates the hypothetical investment of $10,000 in the Institutional Class shares of the Fund from the lesser of the Fund’s inception date or August 31, 2008 to August 31, 2018.
10
| | |
| | |
| Annual Report | | BMO Global Low Volatility Equity Fund |
| | | | | | | | |
Average annual total returns (%) | |
| | | 1-year | | | Since
inception | |
| Advisor Class (A) NAV | | | 10.21 | | | | 7.38 | |
| Advisor Class (A) OFFER | | | 4.72 | | | | 6.08 | |
| Institutional Class (I) | | | 10.44 | | | | 8.94 | |
| Morgan Stanley Capital International All Country World Index (Gross Div) | | | 11.41 | | | | 8.72 | |
| Lipper GlobalMulti-Cap Value Funds Index | | | 7.34 | | | | 6.53 | |
| * | Cumulative for periods less than one year. Benchmarks since inception reflect the inception date of the Institutional Class. |
The performance data quoted represents past performance which is no guarantee of future results. Investment return and principal value will fluctuate so that an investor’s shares, when redeemed, may be worth more or less than their original costs. Mutual fund performance changes over time and current performance may be lower or higher than what is stated. To receive current performance to the most recentmonth-end, please call1-800-236-3863 or visit www.bmofunds.com.
Commentary
The BMO Global Low Volatility Equity Fund (the Fund) returned 10.44% for the fiscal year ended August 31, 2018 versus the Morgan Stanley Capital International All Country World Index (Gross Div) and the Lipper GlobalMulti-Cap Value Funds Index, which returned 11.41% and 7.34%, respectively.
Global equities posted double digit gains over the 12 month period, led by strong returns in the U.S., while Emerging Market equities lagged. Stock returns have been largely supported by strong corporate earnings and a resilient global economy, despite the emergence of several geopolitical and policy-related risks. During the period, companies with higher sales and earnings growth continued to outperform, while more attractively valued securities in the global market have been some of the worst performers. In fact, the recent underperformance of value investing is comparable only to the 1990s tech bubble. After a remarkable stretch of underperformance in the year prior, smaller companies in the market outpaced their larger counterparts, driven mostly by a strong domestic economy and ongoing trade war rhetoric between the U.S. and China. With more revenue being sourced from the U.S. economy, investors favored domestically-oriented small cap companies over larger multinationals. Finally, as interest rates increased during the period, defensive “bond proxy” stocks in sectors such as Utilities, Telecommunications, and Consumer Staples underperformed. In conjunction with a recovery in crude oil prices, higher risk stocks in the market outpaced lower risk stocks.
Consistent with our long term objective, the Fund provided upside participation during another positive year for equities, while offering downside risk mitigation during periods of heightened volatility. Our emphasis on stocks with attractive valuations detracted from returns, as investors favored more expensive growth companies. This factor was evident at the sector level with an underweight in Information Technology being the leading detractor during the period. Our sector positioning reflects our emphasis on risk reduction with significant weights in defensive sectors like Consumer Staples and Utilities, which detracted from returns, as investors favored higher risk stocks during the period. By security, Chemed Corporation (1.2% of the Fund, +64.66%) and Keurig Dr Pepper Inc. (0.0% of the Fund, +34.06%) contributed positively to performance, while Thai Beverage Public Co. Ltd. (0.7% of the Fund,-31.91%) and Owens & Minor Inc. (0.0% of the Fund,-22.89%) were top detractors.
As we look ahead, the fundamental landscape supporting global equities remains strong despite the increased market volatility. While corporate earnings could continue to benefit from accelerating global economic growth and accommodative tax policy, the threat of trade wars, geopolitical tensions, and inflationary pressures from rising commodity prices could cause markets to react negatively. In addition, elevated volatility andmultiyear-low stock correlations create opportunities for active stock selection. Accordingly, we have positioned the Fund to participate in up markets, while managing downside risks through a combination of disciplined stock selection and thoughtful risk management.
Fund Managers; Investment Experience
Jay Kaufman, CFA; since 2006
Ernesto Ramos, Ph.D.; since 1988
David Rosenblatt, CFA; since 2007
| | | | | | | | | | | | | | | | | | | | |
| | | | | | | | | Inception
date | | | Expenses (%) | |
| Share class | | Ticker | | | Cusip | | | Gross | | | Net | |
| Advisor (A) | | | BAEGX | | | | 09658W873 | | | | 5/27/2014 | | | | 1.52 | | | | 1.10 | |
| Institutional (I) | | | BGLBX | | | | 09658V768 | | | | 9/30/2013 | | | | 1.27 | | | | 0.85 | |
The above expense ratios are from the Funds’ Prospectus dated December 29, 2017, and are inclusive of Acquired Fund Fees and Expenses. See Note 6 in the Notes to Financial Statements for additional information. Net expense ratios reflect contractual fee waivers and/or expense reimbursements if applicable, made by BMO Asset Management Corp., the investment adviser (Adviser). The Adviser may not terminate these fee waivers and/or expense reimbursements prior to December 31, 2019 without the consent of the Board of Directors, unless the investment advisory agreement is terminated. Without these contractual waivers, the Fund’s returns would have been lower.
| | | | |
Portfolio sector allocation | |
| Sector | | Fund (%) | |
| Consumer Discretionary | | | 7.8 | |
| Consumer Staples | | | 11.8 | |
| Energy | | | 2.9 | |
| Financials | | | 18.0 | |
| Healthcare | | | 16.8 | |
| Industrials | | | 6.7 | |
| Information Technology | | | 3.5 | |
| Materials | | | 0.6 | |
| Real Estate | | | 6.4 | |
| Telecommunication Services | | | 6.1 | |
| Utilities | | | 18.4 | |
| Other Assets & Liabilities, Net | | | 1.0 | |
| Total | | | 100.0 | |
Portfolio composition will change due to the ongoing management of the Fund. The percentages are based on net assets as of August 31, 2018 and may not necessarily reflect adjustments that are routinely made when presenting net assets for formal financial statement processes.
Growth of an assumed $10,000 investment
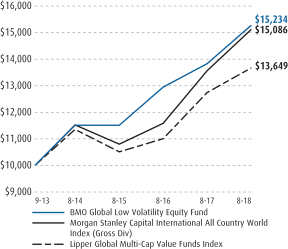
See Explanation of the Indices and Notes in the Commentary for additional information.The above graph relates to the Institutional Class shares of the Fund. Performance for the Advisor Class shares will vary from the performance of the Institutional Class shares shown above due to differences in charges and expenses. This graph illustrates the hypothetical investment of $10,000 in the Institutional Class shares of the Fund from the lesser of the Fund’s inception date or August 31, 2008 to August 31, 2018.
11
| | |
| | |
| Annual Report | | BMO Disciplined International Equity Fund |
| | | | | | | | |
Average annual total returns (%) | |
| | | 1-year | | | Since
inception | |
| Advisor Class (A) NAV | | | (0.15 | ) | | | 4.69 | |
| Advisor Class (A) OFFER | | | (5.16 | ) | | | 2.88 | |
| Institutional Class (I) | | | 0.05 | | | | 4.93 | |
| Morgan Stanley Capital International Europe, Australasia, Far East (Gross Div) | | | 4.39 | | | | 7.60 | |
| Lipper InternationalMulti-Cap Core Funds Index | | | 3.74 | | | | 14.02 | |
| * | Benchmarks since inception reflect the inception date of the Institutional Class. |
The performance data quoted represents past performance which is no guarantee of future results. Investment return and principal value will fluctuate so that an investor’s shares, when redeemed, may be worth more or less than their original costs. Mutual fund performance changes over time and current performance may be lower or higher than what is stated. To receive current performance to the most recentmonth-end, please call1-800-236-3863 or visit www.bmofunds.com.
Commentary
The BMO Disciplined International Equity Fund (the Fund) returned 0.05% for the fiscal year ended August 31, 2018 versus the Morgan Stanley Capital International Europe, Australasia, Far East Index (Gross Div) and the Lipper InternationalMulti-Cap Core Funds Index, which returned 4.39% and 3.74%, respectively.
Global equities posted double digit gains over the 12 month period, led by strong returns in the U.S., while Emerging Market equities lagged. Stock returns have been largely supported by strong corporate earnings and a resilient global economy, despite the emergence of several geopolitical and policy-related risks. During the period, companies with higher sales and earnings growth continued to outperform, while more attractively valued securities in the global market have been some of the worst performers. In fact, the recent underperformance of value investing is comparable only to the 1990s tech bubble. After a remarkable stretch of underperformance in the year prior, smaller companies in the market outpaced their larger counterparts, driven mostly by a strong domestic economy and ongoing trade war rhetoric between the U.S. and China. With more revenue being sourced from the U.S. economy, investors favored domestically-oriented small cap companies over larger multinationals. Finally, as interest rates increased during the period, defensive “bond proxy” stocks in sectors such as Utilities, Telecommunications, and Consumer Staples underperformed. In conjunction with a recovery in crude oil prices, higher risk stocks in the market outpaced lower risk stocks.
Our focus on stocks with attractive valuations detracted from returns as more expensive stocks were in favor during the period. However, weak performance from valuation factors was partially offset by our emphasis on companies with strong fundamental characteristics as investors preferred higher-quality companies given elevated volatility. Sector allocation and stock selection were negative during the period. The Fund’s underweight position in Energy detracted from returns, while overweight positions in Information Technology and Healthcare modestly contributed. In terms of country weights, an underweight position in Spain added to performance while an underweight position in Japan detracted. Stock selection was strongest in Materials and weakest in Industrials. By security,UPM-Kymmene Oyj (2.8% of the Fund, +54.57%) and Seagate Technology PLC (0.0% of the Fund, +79.50%) added to the Fund’s performance, while Fortescue Metals Group Ltd. (1.5% of the Fund,-36.01%) and Nordea Bank AB (0.0% of the Fund,-15.05%) detracted from returns.
As we look ahead, the fundamental landscape supporting global equities remains strong despite the increased market volatility. While corporate earnings could continue to benefit from accelerating global economic growth and accommodative tax policy, the threat of trade wars, geopolitical tensions, and inflationary pressures from rising commodity prices could cause markets to react negatively. In addition, elevated volatility andmultiyear-low stock correlations create opportunities for active stock selection. Accordingly, we have positioned the Fund to participate in up markets, while managing downside risks through a combination of disciplined stock selection and thoughtful risk management.
Fund Managers; Investment Experience
Jay Kaufman, CFA; since 2006
Ernesto Ramos, Ph.D.; since 1988
David Rosenblatt, CFA; since 2007
| | | | | | | | | | | | | | | | | | | | |
| | | | | | | | | Inception
date | | | Expenses (%) | |
| Share class | | Ticker | | | Cusip | | | Gross | | | Net | |
| Advisor (A) | | | BDAQX | | | | 09658W667 | | | | 9/17/2015 | | | | 1.39 | | | | 1.15 | |
| Institutional (I) | | | BDIQX | | | | 09658W659 | | | | 9/17/2015 | | | | 1.14 | | | | 0.90 | |
The above expense ratios are from the Funds’ Prospectus dated December 29, 2017, and are inclusive of Acquired Fund Fees and Expenses. See Note 6 in the Notes to Financial Statements for additional information. Net expense ratios reflect contractual fee waivers and/or expense reimbursements if applicable, made by BMO Asset Management Corp., the investment adviser (Adviser). The Adviser may not terminate these fee waivers and/or expense reimbursements prior to December 31, 2019 without the consent of the Board of Directors, unless the investment advisory agreement is terminated. Without these contractual waivers, the Fund’s returns would have been lower.
| | | | |
Portfolio sector allocation | |
| Sector | | Fund (%) | |
| Consumer Discretionary | | | 13.1 | |
| Consumer Staples | | | 7.2 | |
| Energy | | | 4.2 | |
| Financials | | | 19.2 | |
| Healthcare | | | 12.7 | |
| Industrials | | | 12.3 | |
| Information Technology | | | 7.3 | |
| Materials | | | 11.9 | |
| Real Estate | | | 1.8 | |
| Telecommunication Services | | | 2.4 | |
| Utilities | | | 2.3 | |
| Other Assets & Liabilities, Net | | | 5.6 | |
| Total | | | 100.0 | |
Portfolio composition will change due to the ongoing management of the Fund. The percentages are based on net assets as of August 31, 2018 and may not necessarily reflect adjustments that are routinely made when presenting net assets for formal financial statement processes.
Growth of an assumed $10,000 investment
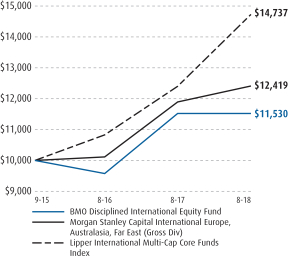
See Explanation of the Indices and Notes in the Commentary for additional information.The above graph relates to the Institutional Class shares of the Fund. Performance for the Advisor Class shares will vary from the performance of the Institutional Class shares shown above due to differences in charges and expenses. This graph illustrates the hypothetical investment of $10,000 in the Institutional Class shares of the Fund from the lesser of the Fund’s inception date or August 31, 2008 to August 31, 2018.
12
| | |
| | |
| Annual Report | | BMO Pyrford International Stock Fund |
| | | | | | | | | | | | |
Average annual total returns (%) | |
| | | 1-year | | | 5-years | | | Since
inception | |
| Advisor Class (A) NAV | | | 2.05 | | | | — | | | | 1.69 | |
| Advisor Class (A) OFFER | | | (3.03 | ) | | | — | | | | 0.48 | |
| Institutional Class (I) | | | 2.34 | | | | 4.39 | | | | 6.69 | |
| ClassF-3 | | | 2.55 | | | | — | | | | 2.10 | |
| Retirement Class(R-6) | | | 2.55 | | | | — | | | | 2.12 | |
| Morgan Stanley Capital International Europe, Australasia, Far East Index | | | 4.39 | | | | 5.73 | | | | 8.27 | |
| Lipper InternationalMulti-Cap Core Funds Index | | | 3.74 | | | | 5.79 | | | | 8.22 | |
| * | Benchmarks since inception reflect the inception date of the Institutional Class. |
The performance data quoted represents past performance which is no guarantee of future results. Investment return and principal value will fluctuate so that an investor’s shares, when redeemed, may be worth more or less than their original costs. Mutual fund performance changes over time and current performance may be lower or higher than what is stated. To receive current performance to the most recentmonth-end, please call1-800-236-3863 or visit www.bmofunds.com.
Commentary
The BMO Pyrford International Stock Fund (the Fund) returned 2.34% for the fiscal year ended August 31, 2018 versus the Morgan Stanley Capital International (MSCI) Europe, Australasia, Far East Index (EAFE) and the Lipper InternationalMulti-Cap Core Funds Index, which returned 4.39% and 3.74%, respectively.
Given the market backdrop and our focus on not overpaying for earnings meant we lagged a steadily rising market over the first half of the period. Moreover, international equities have recently been driven more by momentum than fundamentals of value and quality meaning some of the names in the higher yielding, defensive sectors we own have lagged. We maintained a very defensive stance during the year, concentrating on characteristics of value and quality—high dividend yield, low financial leverage, and high return on equity.
Relative underperformance was predominantly driven by Asia Pacific as our underweight to Japan and the Japanese Yen detracted. Our underweight is based on the burdensome debt level in Japan combined with the soft economic growth. However, ETF buying measures by the Bank of Japan have provided support for the equity market. On the positive side, Australia stock selection performed well led by a rebound in companies with an exposure to the U.S. market and higher rates. Following the selloff in the Malaysian Ringgit after the unexpected election result in May, the market and the currency have recovered to add further to relative returns.
Avoiding peripheral EU banks provided a tailwind for performance in Europe as they underperformed. Peripheral EU banks continue to focus on recapitalising balance sheets to improve asset quality with little signs of a meaningful dividend being paid in the near term. Our UK utility holdings struggled due to heightened political risk and as the market penalised more defensive, higher yielding names. One concern is that the regulator will not offer as favorable a debt allowance; we reduced our UK utility exposure over Q1 2018 to reflect such concerns.
Investment Adviser:
BMO Asset Management Corp.
Sub-adviser:
Pyrford International Ltd.
Fund Managers; Investment Experience
Tony Cousins, CFA; since 1985
Daniel McDonagh, CFA; since 1997
Paul Simons, CFA; since 1996
| | | | | | | | | | | | | | | | |
| | | | | | | | | Inception
date | | | Expenses (%) |
| Share class | | Ticker | | | Cusip | | | Gross | | Net |
| Advisor (A) | | | BPIAX | | | | 09658W840 | | | | 5/27/2014 | | | 1.30 | | 1.19 |
| Institutional (I) | | | MISNX | | | | 09658L513 | | | | 12/29/2011 | | | 1.05 | | 0.94 |
| Retirement(R-6) | | | BISGX | | | | 09658V362 | | | | 5/27/2014 | | | 0.90 | | 0.79 |
| Class F-3 | | | BISBX | | | | 09658V321 | | | | 5/31/2017 | | | 0.90 | | 0.79 |
The above expense ratios are from the Funds’ Prospectus dated December 29, 2017, and are inclusive of Acquired Fund Fees and Expenses. See Note 6 in the Notes to Financial Statements for additional information. Net expense ratios reflect contractual fee waivers and/or expense reimbursements if applicable, made by BMO Asset Management Corp., the investment adviser (Adviser). The Adviser may not terminate these fee waivers and/or expense reimbursements prior to December 31, 2019 without the consent of the Board of Directors, unless the investment advisory agreement is terminated. Without these contractual waivers, the Fund’s returns would have been lower.
| | | | |
Portfolio sector allocation | |
| Sector | | Fund (%) | |
| Consumer Discretionary | | | 3.7 | |
| Consumer Staples | | | 15.8 | |
| Energy | | | 7.6 | |
| Financials | | | 9.4 | |
| Healthcare | | | 10.5 | |
| Industrials | | | 21.1 | |
| Information Technology | | | 6.0 | |
| Materials | | | 5.9 | |
| Telecommunication Services | | | 11.8 | |
| Utilities | | | 4.7 | |
| Other Assets & Liabilities, Net | | | 3.5 | |
| Total | | | 100.0 | |
Portfolio composition will change due to the ongoing management of the Fund. The percentages are based on net assets as of August 31, 2018 and may not necessarily reflect adjustments that are routinely made when presenting net assets for formal financial statement processes.
Growth of an assumed $10,000 investment
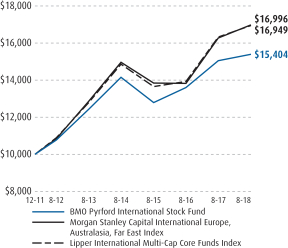
See Explanation of the Indices and Notes in the Commentary for additional information.The above graph relates to the Institutional Class shares of the Fund. Performance for the Advisor Class, RetirementR-6 andClass F-3 shares will vary from the performance of the Institutional Class shares shown above due to differences in charges and expenses. This graph illustrates the hypothetical investment of $10,000 in the Institutional Class shares of the Fund from the lesser of the Fund’s inception date or August 31, 2008 to August 31, 2018.
13
| | |
| | |
| Annual Report | | BMO LGM Emerging Markets Equity Fund |
| | | | | | | | | | | | |
Average annual total returns (%) | |
| | | 1-year | | | 5-years | | | Since
inception | |
| Advisor Class (A) NAV | | | 0.69 | | | | — | | | | 4.43 | |
| Advisor Class (A) OFFER | | | (4.35 | ) | | | — | | | | 3.18 | |
| Institutional Class (I) | | | 0.92 | | | | 6.11 | | | | 8.78 | |
| Morgan Stanley Capital International Emerging Markets Index | | | (0.68 | ) | | | 5.04 | | | | 9.45 | |
| Lipper Emerging Markets Funds Index | | | (2.36 | ) | | | 4.90 | | | | 9.43 | |
| * | Cumulative for periods less than one year. Benchmarks since inception reflect the inception date of the Institutional Class. |
The performance data quoted represents past performance which is no guarantee of future results. Investment return and principal value will fluctuate so that an investor’s shares, when redeemed, may be worth more or less than their original costs. Mutual fund performance changes over time and current performance may be lower or higher than what is stated. To receive current performance to the most recentmonth-end, please call1-800-236-3863 or visit www.bmofunds.com.
Commentary
The BMO LGM Emerging Markets Equity Fund (the Fund) returned 0.92% for the fiscal year ended August 31, 2018 versus the Morgan Stanley Capital International Emerging Markets Index and the Lipper Emerging Markets Funds Index, which returned -0.68% and -2.36%, respectively.
Emerging market equities lost ground over the twelve-month period as earlier gains, on the back of continuing economic growth, were overtaken by escalating trade disputes between the U.S. and its trading partners. An eruption of currency crises also occurred where government mismanagement left countries vulnerable to the rise of U.S. interest rates and the dollar. This effect occurred in Turkey(-56.4%) and Argentina(-43.8%), despite the latter’s more recent attempts at reform. However, certain markets outperformed, including Russia helped by a rally in the price of oil, and Malaysia which saw a change of government promising better economic management. Overall, the asset class underperformed developed market equites.
Relative performance was supported by exposures in South Africa, Hong Kong/China, and Mexico while alpha was lost mainly in the Fund’s exposures in Russia (costing 2% alpha alone), Turkey and Malaysia. The Fund’s South African exposures returned on average 14.7% in the period. Returns were supported by improving fundamentals of the underlying holdings while the positive political change at the end of 2017 also saw the currency materially appreciate. This currency gain has reversed in 2018 as sentiment soured somewhat. Mr. Price (+13%, 3.1% of the Fund), which is an apparel retailer was the standout performer.
In China, Foshan Haitian (+64%, 0.5% of the Fund) was the strongest contributor in the period. Foshan is China’s largest condiments producer. They delivered impressively throughout the period and we have been impressed with the management team and their focus on value creation.
Magnit(-44%, 4% of the Fund), a major retailer in Russia, was the primary underperformer. Magnit was added during the period as the stock was correcting after a period of sustained poor reported financials. The company also went through a change in ownership in early 2018, where the owner/CEO was bought out by VTB Bank. This change was not well communicated and further weakness in the stock followed. While sentiment remains negative, their market position has, in our view, not been eroded to a level justifying the current valuation. They have installed strong management and a professional board in the past six months and they have announced an ambitious plan to regain their best in class position.
Investment Adviser:
BMO Asset Management Corp.
Sub-adviser:
LGM Investments Limited
Fund Managers; Investment Experience
Damian Bird, CFA; since 2008
Irina Hunter; since 1994
Rishikesh Patel; since 2003
| | | | | | | | | | | | | | | | | | | | |
| | | | | | | | | Inception
date | | | Expenses (%) | |
| Share class | | Ticker | | | Cusip | | | Gross | | | Net | |
| Advisor (A) | | | BAEMX | | | | 09658W824 | | | | 5/27/2014 | | | | 1.63 | | | | 1.40 | |
| Institutional (I) | | | MIEMX | | | | 09658L489 | | | | 12/22/2008 | | | | 1.38 | | | | 1.15 | |
The above expense ratios are from the Funds’ Prospectus dated December 29, 2017, and are inclusive of Acquired Fund Fees and Expenses. See Note 6 in the Notes to Financial Statements for additional information. Net expense ratios reflect contractual fee waivers and/or expense reimbursements if applicable, made by BMO Asset Management Corp., the investment adviser (Adviser). The Adviser may not terminate these fee waivers and/or expense reimbursements prior to December 31, 2019 without the consent of the Board of Directors, unless the investment advisory agreement is terminated. Without these contractual waivers, the Fund’s returns would have been lower.
| | | | |
Portfolio sector allocation | |
| Sector | | Fund (%) | |
| Consumer Discretionary | | | 14.9 | |
| Consumer Staples | | | 48.1 | |
| Financials | | | 29.6 | |
| Healthcare | | | 1.0 | |
| Information Technology | | | 1.9 | |
| Utilities | | | 1.2 | |
| Other Assets & Liabilities, Net | | | 3.3 | |
| Total | | | 100.0 | |
Portfolio composition will change due to the ongoing management of the Fund. The percentages are based on net assets as of August 31, 2018 and may not necessarily reflect adjustments that are routinely made when presenting net assets for formal financial statement processes.
Growth of an assumed $10,000 investment
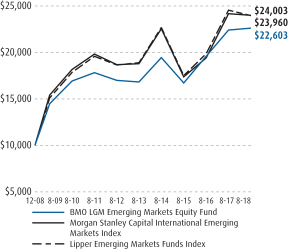
See Explanation of the Indices and Notes in the Commentary for additional information.The above graph relates to the Institutional Class shares of the Fund. Performance for the Advisor Class shares will vary from the performance of the Institutional Class shares shown above due to differences in charges and expenses. This graph illustrates the hypothetical investment of $10,000 in the Institutional Class shares of the Fund from the lesser of the Fund’s inception date or August 31, 2008 to August 31, 2018.
14
| | |
| | |
| Annual Report | | BMO Alternative Strategies Fund |
| | | | | | | | |
Average annual total returns (%) | |
| | | 1-year | | | Since
inception | |
| Advisor Class (A) NAV | | | (3.53 | ) | | | 1.22 | |
| Advisor Class (A) OFFER | | | (8.39 | ) | | | (0.18 | ) |
| Institutional Class (I) | | | (3.31 | ) | | | 1.48 | |
| Bank of America Merrill Lynch3-MonthT-Bill Index | | | 1.52 | | | | 0.61 | |
| HFRX Global Hedge Fund Index | | | 1.54 | | | | 1.58 | |
| Lipper Alternative Multi-Strategy Funds Index | | | 0.78 | | | | 1.42 | |
| * | Benchmarks since inception reflect the inception date of the Institutional Class. |
The performance data quoted represents past performance which is no guarantee of future results. Investment return and principal value will fluctuate so that an investor’s shares, when redeemed, may be worth more or less than their original costs. Mutual fund performance changes over time and current performance may be lower or higher than what is stated. To receive current performance to the most recentmonth-end, please call1-800-236-3863 or visit www.bmofunds.com.
Commentary
The BMO Alternative Strategies Fund (the Fund) returned -3.31% for the fiscal year ended August 31, 2018 versus the HFRX Global Hedge Fund Index and the Bank of America Merrill Lynch3-MonthT-Bill Index which returned 1.54% and 1.52%, respectively.
Fiscal year 2018 witnessed a significant divergence between U.S. economic growth and the rest of the world. The U.S. economy showed signs of acceleration, driven by tax cuts passed in December 2017 along with a stimulative 2018 budget. This strong backdrop pushed the Federal Reserve (the Fed) to hike rates in three of the four quarters and signal further rate hikes on the horizon. Abroad, growth decelerated with particularly weakness in Europe and certain emerging markets such as Turkey and Argentina.
Losses primarily came from our global macro strategy, relative value strategy and portfolio hedge, while equity long short strategies were positive. The systematic macro strategy struggled to find trends in a relatively choppy market. For example, the 10 year Treasury yield traded within a very tight 0.2% band for the entire month of June, July, and August. The options relative value strategy struggled particularly in February when markets significantly sold off and volatility spiked. Equity long short strategies were positive due to strong equity markets but returns were largely underwhelming and below our expectations. Two of the equity long short strategies struggled due to a strong tilt towards value companies, which significantly underperformed high-flying growth stocks over the year.
Looking forward, all eyes are turned towards the Fed as the market attempts to glean its path forward. The U.S. economy has proven resilient to the recent rate hikes but the Fed is approaching the rate level they estimate could provide a drag on growth. More importantly, economies abroad have suffered due to secondary effects from higher U.S. rates such as the strong dollar and increased borrowing costs. International central banks such as the European Central Bank and Bank of Japan have the unenviable task of gradually shifting away from highly stimulative policy without upending markets. The success of these central banks in this endeavor along with the Fed’s policy path will help dictate the trajectory for the market over the coming year.
Investment Adviser:
BMO Asset Management Corp.
Sub-advisers:
CTC myCFO, LLC
Cramer Rosenthan McGlynn, LLC
Graham Capital Management, L.P.
Iridian Asset Management LLC
| | | | | | | | | | | | | | | | | | | | |
| | | | | | | | | Inception
date | | | Expenses (%) | |
| Share class | | Ticker | | | Cusip | | | Gross | | | Net | |
| Advisor (A) | | | BMATX | | | | 09658W683 | | | | 12/16/2014 | | | | 3.54 | | | | 2.84 | |
| Institutional (I) | | | BMASX | | | | 09658W675 | | | | 12/16/2014 | | | | 3.29 | | | | 2.59 | |
The above expense ratios are from the Funds’ Prospectus dated December 29, 2017, and are inclusive of Acquired Fund Fees and Expenses. See Note 6 in the Notes to Financial Statements for additional information. Net expense ratios reflect contractual fee waivers and/or expense reimbursements if applicable, made by BMO Asset Management Corp., the investment adviser (Adviser). The Adviser may not terminate these fee waivers and/or expense reimbursements prior to December 31, 2019 without the consent of the Board of Directors, unless the investment advisory agreement is terminated. Without these contractual waivers, the Fund’s returns would have been lower.
| | | | | | | | |
Portfolio sector allocation | |
| Sector | | Fund (%) | |
| | | Short | | | Long | |
| Common Stocks Sold Short or Purchased Long | | | | | | | | |
Consumer Discretionary | | | (5.4 | ) | | | 7.7 | |
Consumer Staples | | | (3.3 | ) | | | 4.8 | |
Energy | | | (0.3 | ) | | | 2.3 | |
Financials | | | (2.3 | ) | | | 7.2 | |
Healthcare | | | (0.6 | ) | | | 11.3 | |
Industrials | | | (5.6 | ) | | | 10.9 | |
Information Technology | | | (2.5 | ) | | | 9.7 | |
Materials | | | (2.2 | ) | | | 9.1 | |
Real Estate | | | (1.2 | ) | | | 3.7 | |
Telecommunication Services | | | (0.2 | ) | | | 1.0 | |
Utilities | | | — | | | | 0.9 | |
| | | | |
| Total Common Stocks | | | (23.6 | ) | | | 68.6 | |
| Total Common Stocks Sold Short | | | | | | | (23.6 | ) |
| | | | | | | | |
| Total Net Sold Short and Purchased Long Common Stocks | | | | | | | 45.0 | |
| Other Investments Purchased Long* | | | | | | | 0.2 | |
| Other Investments Sold Short* | | | | | | | (2.3 | ) |
| Short-Term Investments | | | | | | | 33.5 | |
| Other Assets & Liabilities | | | | | | | 23.6 | |
| Total | | | | | | | 100.0 | |
| * | See Schedules of Investments for additional detail on investment type. |
Portfolio composition will change due to the ongoing management of the Fund. The percentages are based on net assets as of August 31, 2018 and may not necessarily reflect adjustments that are routinely made when presenting net assets for formal financial statement processes.
Growth of an assumed $10,000 investment
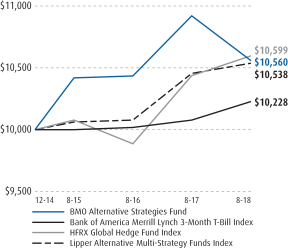
See Explanation of the Indices and Notes in the Commentary for additional information.The above graph relates to the Institutional Class shares of the Fund. Performance for the Advisor Class shares will vary from the performance of the Institutional Class shares shown above due to differences in charges and expenses. This graph illustrates the hypothetical investment of $10,000 in the Institutional Class shares of the Fund from the lesser of the Fund’s inception date or August 31, 2008 to August 31, 2018.
15
| | |
| | |
| Annual Report | | BMO Global Long/Short Equity Fund |
| | | | | | | | |
Average annual total returns (%) | |
| | | 1-year | | | Since
inception | |
| Advisor Class (A) NAV | | | 1.61 | | | | 8.02 | |
| Advisor Class (A) OFFER | | | (3.45 | ) | | | 6.15 | |
| Institutional Class (I) | | | 1.91 | | | | 8.30 | |
| Morgan Stanley Capital International All Country World (Net) | | | 11.41 | | | | 12.26 | |
| Lipper Alternative Long/Short Equity Funds Index | | | 5.67 | | | | 4.26 | |
| * | Benchmarks since inception reflect the inception date of the Institutional Class. |
The performance data quoted represents past performance which is no guarantee of future results. Investment return and principal value will fluctuate so that an investor’s shares, when redeemed, may be worth more or less than their original costs. Mutual fund performance changes over time and current performance may be lower or higher than what is stated. To receive current performance to the most recentmonth-end, please call1-800-236-3863 or visit www.bmofunds.com.
Commentary
The BMO Global Long/Short Equity Fund (the Fund) returned 1.91% for the fiscal year ended August 31, 2018 versus the Morgan Stanley Capital International All Country World Index (Net) and the Lipper Alternative Long/Short Equity Funds Index, which returned 11.41% and 5.67%, respectively.
Global equities posted double digit gains over the 12 month period, led by strong returns in the U.S., while Emerging Market equities lagged. Stock returns have been largely supported by strong corporate earnings and a resilient global economy, despite the emergence of several geopolitical and policy-related risks. During the period, companies with higher sales and earnings growth continued to outperform, while more attractively valued securities in the global market have been some of the worst performers. In fact, the recent underperformance of value investing is comparable only to the 1990s tech bubble. After a remarkable stretch of underperformance in the year prior, smaller companies in the market outpaced their larger counterparts, driven mostly by a strong domestic economy and ongoing trade war rhetoric between the U.S. and China. With more revenue being sourced from the U.S. economy, investors favored domestically-oriented small cap companies over larger multinationals. Finally, as interest rates increased during the period, defensive “bond proxy” stocks in sectors such as Utilities, Telecommunications, and Consumer Staples underperformed. In conjunction with a recovery in crude oil prices, higher risk stocks in the market outpaced lower risk stocks.
Our focus on fundamentally strong companies with attractive valuations detracted from returns in the long portfolio as more expensive stocks were in favor in what has been a predominately a growth-oriented market. Conversely, underperformance of valuation factors contributed positively to performance in the short portfolio. The Fund’s country allocation was negative for the period, though underperformance was primarily driven by stock selection within the long portfolio. A strong domestic economy and concerns over international tariffs was evident at the country level as our underweight allocation to the U.S. negatively impacted performance while an underweight position in China contributed positively. Additionally, underweights to the more expensive sectors like Information Technology and Energy detracted from performance, while an underweight to defensive sectors like Consumer Staples and Telecommunications added to performance. By security, top contributors included Inogen Inc. (1.2% of the Fund, +176.52%) in the long portfolio and Verso Corp. (0.0% of the Fund, +224.06%) in the short portfolio. Top detractors included PG&E Corporation (0.0% of the Fund,-40.53%) in the long portfolio and Macquarie Infrastructure Corp. (0.0% of the Fund,-44.40%) in the short portfolio.
As we look ahead, the fundamental landscape supporting global equities remains strong despite the increased market volatility. While corporate earnings could continue to benefit from accelerating global economic growth and accommodative tax policy, the threat of trade wars, geopolitical tensions, and inflationary pressures from rising commodity prices could cause markets to react negatively. In addition, elevated volatility andmultiyear-low stock correlations create opportunities for active stock selection. Accordingly, we have positioned the Fund to participate in up markets, while managing downside risks through a combination of disciplined stock selection and thoughtful risk management.
Fund Managers; Investment Experience
Jay Kaufman, CFA; since 2006
Ernesto Ramos, Ph.D.; since 1988
David Rosenblatt, CFA; since 2006
| | | | | | | | | | | | | | | | | | | | |
| | | | | | | | | Inception
date | | | Expenses (%) | |
| Share class | | Ticker | | | Cusip | | | Gross | | | Net | |
| Advisor (A) | | | BGAQX | | | | 09658W626 | | | | 9/17/2015 | | | | 5.09 | | | | 2.46 | |
| Institutional (I) | | | BGIQX | | | | 09658W618 | | | | 9/17/2015 | | | | 4.84 | | | | 2.21 | |
The above expense ratios are from the Funds’ Prospectus dated December 29, 2017, and are inclusive of Acquired Fund Fees and Expenses. See Note 6 in the Notes to Financial Statements for additional information. Net expense ratios reflect contractual fee waivers and/or expense reimbursements if applicable, made by BMO Asset Management Corp., the investment adviser (Adviser). The Adviser may not terminate these fee waivers and/or expense reimbursements prior to December 31, 2019 without the consent of the Board of Directors, unless the investment advisory agreement is terminated. Without these contractual waivers, the Fund’s returns would have been lower.
| | | | | | | | |
Portfolio sector allocation | |
| Sector | | Fund (%) | |
| | | Short | | | Long | |
| Common Stocks Sold Short or Purchased Long | | | | | | | | |
Consumer Discretionary | | | (5.7 | ) | | | 8.2 | |
Consumer Staples | | | (1.8 | ) | | | 9.7 | |
Energy | | | (0.5 | ) | | | 3.4 | |
Financials | | | (4.3 | ) | | | 12.6 | |
Healthcare | | | (1.2 | ) | | | 17.6 | |
Industrials | | | (7.9 | ) | | | 12.6 | |
Information Technology | | | (4.7 | ) | | | 9.4 | |
Materials | | | (5.8 | ) | | | 10.1 | |
Real Estate | | | (4.1 | ) | | | 8.9 | |
Telecommunication Services | | | (0.6 | ) | | | 2.0 | |
Utilities | | | — | | | | 3.7 | |
| | | | |
| Total Common Stocks | | | (36.6 | ) | | | 98.2 | |
| Total Common Stocks Sold Short | | | | | | | (36.6 | ) |
| | | | | | | | |
| Total Net Sold Short and Purchased Long Common Stocks | | | | | | | 61.6 | |
| Short-Term Investments | | | | | | | 37.5 | |
| Other Assets & Liabilities | | | | | | | 0.9 | |
| Total | | | | | | | 100.0 | |
Portfolio composition will change due to the ongoing management of the Fund. The percentages are based on net assets as of August 31, 2018 and may not necessarily reflect adjustments that are routinely made when presenting net assets for formal financial statement processes.
Growth of an assumed $10,000 investment
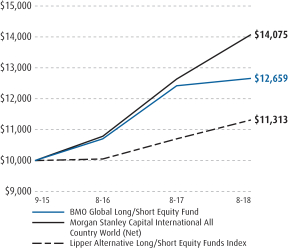
See Explanation of the Indices and Notes in the Commentary for additional information.The above graph relates to the Institutional Class shares of the Fund. Performance for the Advisor Class shares will vary from the performance of the Institutional Class shares shown above due to differences in charges and expenses. This graph illustrates the hypothetical investment of $10,000 in the Institutional Class shares of the Fund from the lesser of the Fund’s inception date or August 31, 2008 to August 31, 2018.
16
| | |
| | |
| Annual Report | | BMO Ultra ShortTax-Free Fund |
| | | | | | | | | | | | |
Average annual total returns (%) | |
| | | 1-year | | | 5-years | | | Since
inception | |
| Advisor Class (A) NAV | | | 0.95 | | | | — | | | | 0.62 | |
| Advisor Class (A) OFFER | | | (1.11 | ) | | | — | | | | 0.13 | |
| Institutional Class (I) | | | 1.10 | | | | 0.95 | | | | 1.18 | |
| Blended Index (50% Bloomberg Barclays 1 Year Municipal Bond Index and 50% iMoneyNet, Inc. Money Market FundTax-Free National Retail Index) | | | 0.68 | | | | 0.50 | | | | 0.55 | |
| Lipper Short Municipal Debt Funds Index | | | 0.50 | | | | 0.86 | | | | 1.12 | |
| * | Benchmarks since inception reflect the inception date of the Institutional Class. |
The performance data quoted represents past performance which is no guarantee of future results. Investment return and principal value will fluctuate so that an investor’s shares, when redeemed, may be worth more or less than their original costs. Mutual fund performance changes over time and current performance may be lower or higher than what is stated. To receive current performance to the most recentmonth-end, please call1-800-236-3863 or visit www.bmofunds.com.
Commentary
The BMO Ultra ShortTax-Free Fund returned 1.10% for the fiscal year ended August, 31, 2018 versus the blended (50% Bloomberg Barclays 1 Year Muni Bond Index and 50% iMoneyNet Money Fund Tax Free National Retail) Index and the Lipper Short Municipal Debt Funds Index, which returned 0.68% and 0.50%, respectively.
During the fiscal year, market participants were confronted with the combined effects of the 5 T’s: taxes, trade, tariffs, tightening and Trump. While most of these could be described as headwinds or concerns for municipal bond investors, the largest changes in the tax code since 1986 along with efforts at regulatory reform were tailwinds, resulting in U.S. GDP growth for Q2 2018 clocking in at 4.2% and corporate profits, at least as measured by the S&P 500, growing over 20% Y/Y through Q2 2018. The Federal Reserve (the Fed) continued on its path of interest rate normalization during the year, raising rates to a current Fed Funds target of1.75-2%. Seven rate increases have occurred since the current tightening cycle began in December 2015 and given the resilience of the U.S. economy, with unemployment at multi-decade lows and some signs of inflation emerging, it is likely the Fed will continue to raise short term rates in the months ahead. Yields were higher and both the U.S. Treasury and municipal bond curves flattened for the year in response to Fed action.
While overall returns for municipal securities remained muted with the Fed in the midst of a tightening cycle, the asset class, as measured by the Bloomberg Barclays Municipal Bond Index, managed to outperform both U.S. Treasuries and taxable bonds. The Fund benefited from its use of floating rate securities, which can reset higher as short-term interest rates rise, along with security selection within the Hospital and Transportation sectors. An underweight to the 1 year maturity bucket detracted slightly from performance.
While the U.S. economy remains on solid ground at present, with consumer and small business confidence measures at cycle highs, concern remains around U.S. protectionism. For now, markets seem to think this tough talk on trade is nothing more than a negotiating tactic rather than a long-term strategy from the President. Should these tariffs persist, however, continued economic growth in the U.S. could be threatened.
Fund Managers; Investment Experience
Thomas Byron; since 1981
Brian Sipich, CFA; since 1998
Robert Wimmel; since 1992
| | | | | | | | | | | | | | | | | | | | |
| | | | | | | | | Inception
date | | | Expenses (%) | |
| Share class | | Ticker | | | Cusip | | | Gross | | | Net | |
| Advisor (A) | | | BAUSX | | | | 09658W790 | | | | 5/27/2014 | | | | 0.64 | | | | 0.55 | |
| Institutional (I) | | | MUISX | | | | 09658L539 | | | | 9/30/2009 | | | | 0.39 | | | | 0.30 | |
The above expense ratios are from the Funds’ Prospectus dated December 29, 2017, and are inclusive of Acquired Fund Fees and Expenses. See Note 6 in the Notes to Financial Statements for additional information. Net expense ratios reflect contractual fee waivers and/or expense reimbursements if applicable, made by BMO Asset Management Corp., the investment adviser (Adviser). The Adviser may not terminate these fee waivers and/or expense reimbursements prior to December 31, 2019 without the consent of the Board of Directors, unless the investment advisory agreement is terminated. Without these contractual waivers, the Fund’s returns would have been lower.
| | | | |
Municipal Issuance/Industry Type | |
| Issuance/Industry | | Fund (%) | |
| General Obligation — 21.1 | | | | |
School District | | | 8.6 | |
State or Local | | | 12.5 | |
| Revenue Bonds — 79.9 | | | | |
Appropriation | | | 21.4 | |
Education | | | 6.0 | |
General Revenue | | | 0.4 | |
Health Care | | | 23.6 | |
Housing | | | 5.0 | |
Industrial Revenue | | | 3.9 | |
Power | | | 1.6 | |
Special Tax | | | 2.2 | |
Tobacco | | | 0.6 | |
Transportation | | | 9.5 | |
Water & Sewer | | | 5.7 | |
| Other Assets & Liabilities, Net | | | (1.0 | ) |
| Total | | | 100.0 | |
Portfolio composition will change due to the ongoing management of the Fund. The percentages are based on net assets as of August 31, 2018 and may not necessarily reflect adjustments that are routinely made when presenting net assets for formal financial statement processes.
Growth of an assumed $10,000 investment
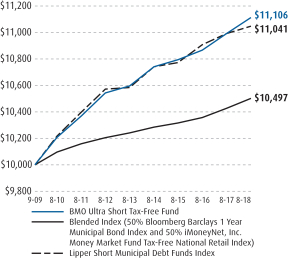
See Explanation of the Indices and Notes in the Commentary for additional information.The above graph relates to the Institutional Class shares of the Fund. Performance for the Advisor Class shares will vary from the performance of the Institutional Class shares shown above due to differences in charges and expenses. This graph illustrates the hypothetical investment of $10,000 in the Institutional Class shares of the Fund from the lesser of the Fund’s inception date or August 31, 2008 to August 31, 2018.
17
| | |
| | |
| Annual Report | | BMO ShortTax-Free Fund |
| | | | | | | | | | | | |
Average annual total returns (%) | |
| | | 1-year | | | 5-years | | | Since
inception | |
| Advisor Class (A) NAV | | | 0.62 | | | | — | | | | 1.23 | |
| Advisor Class (A) OFFER | | | (1.40 | ) | | | — | | | | 0.75 | |
| Institutional Class (I) | | | 0.77 | | | | 1.84 | | | | 1.68 | |
| Bloomberg Barclays Short(1-5 Year) Municipal Index | | | 0.06 | | | | 1.24 | | | | 1.10 | |
| Lipper Short Municipal Debt Funds Index | | | 0.50 | | | | 0.86 | | | | 0.70 | |
| * | Benchmarks since inception reflect the inception date of the Institutional Class. |
The performance data quoted represents past performance which is no guarantee of future results. Investment return and principal value will fluctuate so that an investor’s shares, when redeemed, may be worth more or less than their original costs. Mutual fund performance changes over time and current performance may be lower or higher than what is stated. To receive current performance to the most recentmonth-end, please call1-800-236-3863 or visit www.bmofunds.com.
Commentary
The BMO ShortTax-Free Fund returned 0.77% for the fiscal year ended August, 31, 2018 versus the Bloomberg Barclays Muni Short1-5 Year Index and the Lipper Short Municipal Debt Funds Index, which returned 0.06% and 0.50%, respectively.
During the fiscal year, market participants were confronted with the combined effects of the 5 T’s: taxes, trade, tariffs, tightening and Trump. While most of these could be described as headwinds or concerns for municipal bond investors, the largest changes in the tax code since 1986 along with efforts at regulatory reform were tailwinds, resulting in U.S. GDP growth for Q2 2018 clocking in at 4.2% and corporate profits, at least as measured by the S&P 500, growing over 20% Y/Y through Q2 2018. The Federal Reserve (the Fed) continued on its path of interest rate normalization during the year, raising rates to a current Fed Funds target of1.75-2%. Seven rate increases have occurred since the current tightening cycle began in December 2015 and given the resilience of the U.S. economy, with unemployment at multi-decade lows and some signs of inflation emerging, it is likely the Fed will continue to raise short term rates in the months ahead. Yields were higher and both the U.S. Treasury and municipal bond curves flattened for the year in response to Fed action.
While overall returns for municipal securities remained muted with the Fed in the midst of a tightening cycle, the asset class, as measured by the Bloomberg Barclays Municipal Bond Index, managed to outperform both U.S. Treasuries and taxable bonds. The Fund benefited from its shorter duration relative to the benchmark, along with its use of floating rate securities, which can reset higher as interest rates rise, on the front end of the yield curve. Security selection within the AA and A credits tiers also contributed positively to results. An underweight position in the1-2 year portion of the yield curve did detract from results.
While the U.S. economy remains on solid ground at present, with consumer and small business confidence measures at cycle highs, concern remains around U.S. protectionism. For now, markets seem to think this tough talk on trade is nothing more than a negotiating tactic rather than a long-term strategy from the President. Should these tariffs persist, however, continued economic growth in the U.S. could be threatened.
Fund Managers; Investment Experience
Thomas Byron; since 1981
Brian Sipich, CFA; since 1998
Robert Wimmel; since 1992
| | | | | | | | | | | | | | | | | | | | |
| | | | | | | | | Inception
date | | | Expenses (%) | |
| Share class | | Ticker | | | Cusip | | | Gross | | | Net | |
| Advisor (A) | | | BASFX | | | | 09658W782 | | | | 5/27/2014 | | | | 0.76 | | | | 0.55 | |
| Institutional (I) | | | MTFIX | | | | 09658L646 | | | | 11/29/2012 | | | | 0.51 | | | | 0.40 | |
The above expense ratios are from the Funds’ Prospectus dated December 29, 2017, and are inclusive of Acquired Fund Fees and Expenses. See Note 6 in the Notes to Financial Statements for additional information. Net expense ratios reflect contractual fee waivers and/or expense reimbursements if applicable, made by BMO Asset Management Corp., the investment adviser (Adviser). The Adviser may not terminate these fee waivers and/or expense reimbursements prior to December 31, 2019 without the consent of the Board of Directors, unless the investment advisory agreement is terminated. Without these contractual waivers, the Fund’s returns would have been lower.
| | | | |
Municipal Issuance/Industry Type | |
| Issuance/Industry | | Fund (%) | |
| General Obligation — 16.5 | | | | |
School District | | | 6.5 | |
State or Local | | | 10.0 | |
| Revenue Bonds — 84.1 | | | | |
Appropriation | | | 17.0 | |
Education | | | 9.5 | |
General Revenue | | | 0.4 | |
Health Care | | | 30.0 | |
Housing | | | 4.1 | |
Industrial Revenue | | | 2.9 | |
Power | | | 1.2 | |
Special Tax | | | 3.7 | |
Student Loan | | | 0.2 | |
Tobacco | | | 3.5 | |
Transportation | | | 7.4 | |
Water & Sewer | | | 4.2 | |
| Other Assets & Liabilities, Net | | | (0.6 | ) |
| Total | | | 100.0 | |
Portfolio composition will change due to the ongoing management of the Fund. The percentages are based on net assets as of August 31, 2018 and may not necessarily reflect adjustments that are routinely made when presenting net assets for formal financial statement processes.
Growth of an assumed $10,000 investment
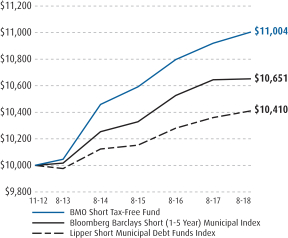
See Explanation of the Indices and Notes in the Commentary for additional information.The above graph relates to the Institutional Class shares of the Fund. Performance for the Advisor Class shares will vary from the performance of the Institutional Class shares shown above due to differences in charges and expenses. This graph illustrates the hypothetical investment of $10,000 in the Institutional Class shares of the Fund from the lesser of the Fund’s inception date or August 31, 2008 to August 31, 2018
18
| | |
| | |
| Annual Report | | BMO Short-Term Income Fund |
| | | | | | | | | | | | | | | | |
Average annual total returns (%) | |
| | | 1-year | | | 5-years | | | 10-years | | | Since
inception | |
| Advisor Class (A) NAV | | | 0.56 | | | | — | | | | — | | | | 1.04 | |
| Advisor Class (A) OFFER | | | (1.44 | ) | | | — | | | | — | | | | 0.56 | |
| Institutional Class (I) | | | 0.92 | | | | 1.43 | | | | 2.65 | | | | 2.80 | |
| Bank of America Merrill Lynch1-3 Year U.S. Government/Corporate Index | | | 0.22 | | | | 0.92 | | | | 1.63 | | | | — | |
| Lipper Short Investment-Grade Debt Funds Index | | | 0.72 | | | | 1.37 | | | | 2.21 | | | | — | |
| * | Benchmarks since inception reflect the inception date of the Institutional Class. |
The performance data quoted represents past performance which is no guarantee of future results. Investment return and principal value will fluctuate so that an investor’s shares, when redeemed, may be worth more or less than their original costs. Mutual fund performance changes over time and current performance may be lower or higher than what is stated. To receive current performance to the most recentmonth-end, please call1-800-236-3863 or visit www.bmofunds.com.
Commentary
The BMO Short-Term Income Fund (the Fund) returned 0.92% for the fiscal year ended August 31, 2018 versus the Bank of America Merrill Lynch1-3 Year U.S. Government/Corporate Index and the Lipper Short Investment-Grade Debt Funds Index, which returned 0.22% and 0.72%, respectively.
The most significant episodes affecting the marketplace over the past twelve months were the three interest rate increases by the Federal Reserve (the Fed), tax reform, and the emergence of tariff/trade issues. The overall strength of the economy, further bolstered by a big reduction in corporate tax rates, combined with 75 basis points of interest rate increases, driving yields higher across the entire curve. Interest rates in thefront-end of the curve rose at a faster pace than longer dated maturities, which is known as a “bear flattener”. As would be expected in an active Fed environment, the largest increases, on a percentage basis, were seen in maturities of 2 years and shorter.
An overweight in percentage and duration exposure to the Corporate (particularly Finance) and Asset-Backed sectors, as compared to the benchmark index, benefited performance as they were top performers. Conversely, exposure to longer-dated U.S. Government securities detracted from performance, as interest rates rose dramatically all across the yield curve. A barbell term structure, aided by the liberal use of floating rate instruments, was beneficial as the yield curve flattened in maturities greater than 2 years.
Similar to last year, the Fed increased interest rates in December, March, and June. Helping spur things along, the Fed’s preferred measure of inflation (core PCE price index) reached its 2% target level in May. However, at his press conference in June, Fed Chair Jay Powell stressed that being at, or slightly above, their inflation target was not an urgent signal for more policy tightening. According to the Fed Funds Futures market, as of August 31, 2018, nearly 95% of market participants felt that the Fed would increase the overnight lending rate by 0.25% at the September meeting, with approximately 65% expecting the fourth and final rate hike of 2018 to occur in December. The most recent Fed statement showed that committee members anticipate between 3 and 4 rate increases for 2019, which is more aggressive than the market is projecting.
The trends of rising rates out to five years and a flatter yield curve beyond one year are likely to remain in place. Looking forward, tenuous geopolitics, increasing anxiety over the upcoming U.S. midterm-elections, and trade policy/tariff impacts are apt to trigger near-term rate volatility across the yield curve.
Fund Managers; Investment Experience
Peter J. Arts; since 1992
Boyd R. Eager; since 1997
| | | | | | | | | | | | | | | | | | | | |
| | | | | | | | | Inception
date | | | Expenses (%) | |
| Share class | | Ticker | | | Cusip | | | Gross | | | Net | |
| Advisor (A) | | | BTMAX | | | | 09658W774 | | | | 5/27/2014 | | | | 0.74 | | | | 0.62 | |
| Institutional (I) | | | MSIFX | | | | 09658L570 | | | | 5/31/2007 | | | | 0.49 | | | | 0.37 | |
The above expense ratios are from the Funds’ Prospectus dated December 29, 2017, and are inclusive of Acquired Fund Fees and Expenses. See Note 6 in the Notes to Financial Statements for additional information. Net expense ratios reflect contractual fee waivers and/or expense reimbursements if applicable, made by BMO Asset Management Corp., the investment adviser (Adviser). The Adviser may not terminate these fee waivers and/or expense reimbursements prior to December 31, 2019 without the consent of the Board of Directors, unless the investment advisory agreement is terminated. Without these contractual waivers, the Fund’s returns would have been lower.
| | | | |
Portfolio sector allocation | |
| Sector | | Fund (%) | |
| Asset-Backed Securities | | | 23.5 | |
| Certificates of Deposit | | | 1.4 | |
| Collateralized Mortgage Obligations | | | 7.2 | |
| Commercial Mortgage Securities | | | 6.1 | |
| Corporate Bonds & Notes | | | 43.9 | |
| Mutual Funds | | | 0.4 | |
| U.S. Government & U.S. Government Agency Obligations | | | 11.7 | |
| U.S. Government Agency-Mortgage Securities | | | 1.0 | |
| Other Assets & Liabilities, Net | | | 4.8 | |
| Total | | | 100.0 | |
Portfolio composition will change due to the ongoing management of the Fund. The percentages are based on net assets as of August 31, 2018 and may not necessarily reflect adjustments that are routinely made when presenting net assets for formal financial statement processes.
Growth of an assumed $10,000 investment
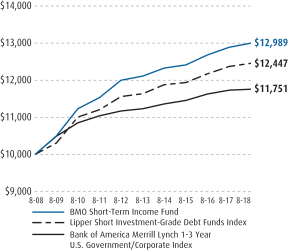
See Explanation of the Indices and Notes in the Commentary for additional information.The above graph relates to the Institutional Class shares of the Fund. Performance for the Advisor Class shares will vary from the performance of the Institutional Class shares shown above due to differences in charges and expenses. This graph illustrates the hypothetical investment of $10,000 in the Institutional Class shares of the Fund from the lesser of the Fund’s inception date or August 31, 2008 to August 31, 2018
19
| | |
| | |
| Annual Report | | BMO IntermediateTax-Free Fund |
| | | | | | | | | | | | | | | | |
Average annual total returns (%) | |
| | | 1-year | | | 5-years | | | 10-years | | | Since
inception | |
| Investor Class (Y) | | | 0.53 | | | | 3.46 | | | | 4.12 | | | | 4.29 | |
| Advisor Class (A) NAV | | | 0.53 | | | | — | | | | — | | | | 2.50 | |
| Advisor Class (A) OFFER | | | (2.97 | ) | | | — | | | | — | | | | 1.65 | |
| Institutional Class (I) | | | 0.68 | | | | 3.68 | | | | — | | | | 3.94 | |
| Bloomberg Barclays1-15 Year Blend Municipal Bond Index | | | 0.11 | | | | 3.17 | | | | 3.73 | | | | — | |
| Lipper Intermediate Municipal Debt Funds Index | | | 0.30 | | | | 3.10 | | | | 3.48 | | | | — | |
| * | Benchmarks since inception reflect the inception date of the Institutional Class. |
The performance data quoted represents past performance which is no guarantee of future results. Investment return and principal value will fluctuate so that an investor’s shares, when redeemed, may be worth more or less than their original costs. Mutual fund performance changes over time and current performance may be lower or higher than what is stated. To receive current performance to the most recentmonth-end, please call1-800-236-3863 or visit www.bmofunds.com.
Commentary
The BMO IntermediateTax-Free Fund returned 0.68% for the fiscal year ended August 31, 2018 versus the Bloomberg Barclays1-15 Year Muni Blend Index and the Lipper Intermediate Municipal Debt Funds Index, which returned 0.11% and 0.30%, respectively.
During the fiscal year, market participants were confronted with the combined effects of the 5 T’s: taxes, trade, tariffs, tightening and Trump. While most of these could be described as headwinds or concerns for municipal bond investors, the largest changes in the tax code since 1986 along with efforts at regulatory reform were tailwinds, resulting in U.S. GDP growth for Q2 2018 clocking in at 4.2% and corporate profits, at least as measured by the S&P 500, growing over 20% Y/Y through Q2 2018. The Federal Reserve (the Fed) continued on its path of interest rate normalization during the year, raising rates to a current Fed Funds target of1.75-2%. Seven rate increases have occurred since the current tightening cycle began in December 2015 and given the resilience of the U.S. economy, with unemployment at multi-decade lows and some signs of inflation emerging, it is likely the Fed will continue to raise short term rates in the months ahead. Yields were higher and both the U.S. Treasury and municipal bond curves flattened for the year in response to Fed action.
While overall returns for municipal securities remained muted with the Fed in the midst of a tightening cycle, the asset class, as measured by the Bloomberg Barclays Municipal Bond Index, managed to outperform both U.S. Treasuries and taxable bonds. The Fund’s returns were driven by a slightly shorter duration relative to the benchmark and peer group, along with the use of floating rate securities on the front end of the yield curve, which can reset higher as interest rates rise. The Fund’s security selection within the AA and A credit tiers also was additive to relative performance. Underweight exposure within the 2 year and 15 year portions of the yield curve detracted slightly from overall results.
While the U.S. economy remains on solid ground at present, with consumer and small business confidence measures at cycle highs, concern remains around U.S. protectionism. For now, markets seem to think this tough talk on trade is nothing more than a negotiating tactic rather than a long-term strategy from the President. Should these tariffs persist, however, continued economic growth in the U.S. could be threatened.
Fund Managers; Investment Experience
Thomas Byron; since 1981
Brian Sipich, CFA; since 1998
Robert Wimmel; since 1992
| | | | | | | | | | | | | | | | |
| | | | | | | | | Inception
date | | | Expenses (%) |
| Share class | | Ticker | | | Cusip | | | Gross | | Net |
| Investor (Y) | | | MITFX | | | | 09658L760 | | | | 2/1/1994 | | | 0.58 | | 0.56 |
| Advisor (A) | | | BITAX | | | | 09658W766 | | | | 5/27/2014 | | | 0.58 | | 0.56 |
| Institutional (I) | | | MIITX | | | | 09658L778 | | | | 12/27/2010 | | | 0.33 | | 0.33 |
The above expense ratios are from the Funds’ Prospectus dated December 29, 2017, and are inclusive of Acquired Fund Fees and Expenses. See Note 6 in the Notes to Financial Statements for additional information. Net expense ratios reflect contractual fee waivers and/or expense reimbursements if applicable, made by BMO Asset Management Corp., the investment adviser (Adviser). The Adviser may not terminate these fee waivers and/or expense reimbursements prior to December 31, 2019 without the consent of the Board of Directors, unless the investment advisory agreement is terminated. Without these contractual waivers, the Fund’s returns would have been lower.
| | | | |
Municipal Issuance/Industry Type | |
| Issuance/Industry | | Fund (%) | |
| General Obligation — 18.7 | |
School District | | | 10.6 | |
State or Local | | | 8.1 | |
| Revenue Bonds — 80.1 | |
Appropriation | | | 21.0 | |
Education | | | 8.6 | |
General Revenue | | | 0.5 | |
Health Care | | | 21.1 | |
Housing | | | 3.2 | |
Industrial Revenue | | | 0.3 | |
Power | | | 2.4 | |
Special Tax | | | 2.4 | |
Student Loan | | | 0.5 | |
Tobacco | | | 1.8 | |
Transportation | | | 10.8 | |
Water & Sewer | | | 7.5 | |
| Other Assets & Liabilities, Net | | | 1.2 | |
| Total | | | 100.0 | |
Portfolio composition will change due to the ongoing management of the Fund. The percentages are based on net assets as of August 31, 2018 and may not necessarily reflect adjustments that are routinely made when presenting net assets for formal financial statement processes.
Growth of an assumed $10,000 investment
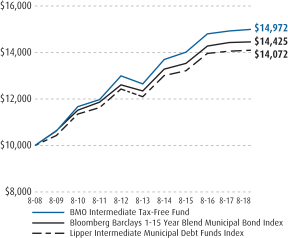
See Explanation of the Indices and Notes in the Commentary for additional information.The above graph relates to the Investor Class shares of the Fund. Performance for the Institutional Class and Advisor Class shares will vary from the performance of the Investor Class shares shown above due to differences in charges and expenses. This graph illustrates the hypothetical investment of $10,000 in the Investor Class shares of the Fund from the lesser of the Fund’s inception date or August 31, 2008 to August 31, 2018.
20
| | |
| | |
| Annual Report | | BMO Strategic Income Fund |
| | | | | | | | | | | | | | | | |
Average annual total returns (%) | |
| | | 1-year | | | 5-years | | | 10-years | | | Since
inception | |
| Investor Class (Y) | | | 0.37 | | | | 3.00 | | | | 3.94 | | | | | |
| Advisor Class (A) NAV | | | 0.37 | | | | — | | | | — | | | | 2.58 | |
| Advisor Class (A) OFFER | | | (3.12 | ) | | | — | | | | — | | | | 1.73 | |
| Institutional Class (I) | | | 0.72 | | | | 3.28 | | | | 4.21 | | | | | |
| Bloomberg Barclays U.S. Aggregate Bond Index* | | | (1.05 | ) | | | 2.49 | | | | 3.70 | | | | | |
| Bloomberg Barclays U.S. Mortgage Backed Securities Index | | | (0.53 | ) | | | 2.43 | | | | 3.48 | | | | | |
| Lipper Multi-Sector Income Funds Index | | | 0.68 | | | | 3.56 | | | | 5.59 | | | | | |
| * | Benchmarks since inception reflect the inception date of the Institutional Class. |
The performance data quoted represents past performance which is no guarantee of future results. Investment return and principal value will fluctuate so that an investor’s shares, when redeemed, may be worth more or less than their original costs. Mutual fund performance changes over time and current performance may be lower or higher than what is stated. To receive current performance to the most recentmonth-end, please call1-800-236-3863 or visit www.bmofunds.com.
Commentary
The BMO Strategic Income Fund (the Fund) returned 0.72% for the fiscal year ended August 31, 2018 versus the Bloomberg Barclays U.S. Aggregate Bond Index and the Lipper Multi-Sector Income Funds Index, which returned-1.05% and 0.68%, respectively.
The Fund outperformed its benchmark and peer group during the trailing year. Sector allocations to credit, both investment grade (+90 basis points of excess return) and high yield (+436 basis points of excess return) were beneficial during the period as credit benefitted from strong economic data and fiscal policy support. In particular, lower quality high yield outperformed, in part due to its lower duration profile as rates rose. By contrast, allocations to emerging market debt(-109 basis points of excess return) detracted from portfolio returns as higher U.S. rates put pressure on emerging market currencies and lead to volatility in their debt. Allocations to securitized products were additive with positive contributions from commercial mortgage backed securities andnon-agency residential mortgage backed securities, which continued to enhance portfolio income with their significant yield advantage relative to agency equivalents.
Security selection was beneficial for the Fund during the period. In particular, selection within the Energy, Technology, and Home Builders sectors was additive to performance, while selection within the Food & Beverage, Media, and Telecommunications sectors reduced relative performance. The portfolio’s below benchmark duration contributed positively to relative returns, while the rise in rates detracted from absolute returns.
Looking forward, our view remains constructive for U.S. fixed income, particularlynon-governmental sectors, based on robust economic data and supportive fiscal policy, particularly the effects of tax reform. Economic data and geopolitical events outside of the U.S. suggest a less sanguine market environment abroad, one which at times has weighed on the U.S. market furthering volatility. We expect U.S. monetary policy to continue to tighten gradually and to a greater degree than global policy. In this environment, heightened volatility is likely to persist, while U.S. fundamentals remain supportive. U.S. monetary policy tightening is likely to lead to further yield curve flattening, which along with the increase in volatility is worth monitoring. At the same time, economic fundamentals remain strong and the combination of higher Treasury rates and wider spreads has led to the most attractive yields on broad bond benchmarks since 2010.
Fund Managers; Investment Experience
Scott M. Kimball, CFA; since 2004
Daniela Mardarovici, CFA; since 2000
Frank J. Reda, CMT; since 2001
Janelle Woodward, CFA; since 2003
| | | | | | | | | | | | | | | | | | | | |
| | | | | | | | | Inception
date | | | Expenses (%) | |
| Share class | | Ticker | | | Cusip | | | Gross | | | Net | |
| Investor (Y) | | | MRGIX | | | | 09658L810 | | | | 12/13/1992 | | | | 0.90 | | | | 0.80 | |
| Advisor (A) | | | BMTAX | | | | 09658W758 | | | | 5/27/2014 | | | | 0.90 | | | | 0.80 | |
| Institutional (I) | | | MGIIX | | | | 09658L828 | | | | 5/31/2007 | | | | 0.65 | | | | 0.55 | |
The above expense ratios are from the Funds’ Prospectus dated December 29, 2017, and are inclusive of Acquired Fund Fees and Expenses. See Note 6 in the Notes to Financial Statements for additional information. Net expense ratios reflect contractual fee waivers and/or expense reimbursements if applicable, made by BMO Asset Management Corp., the investment adviser (Adviser). The Adviser may not terminate these fee waivers and/or expense reimbursements prior to December 31, 2019 without the consent of the Board of Directors, unless the investment advisory agreement is terminated. Without these contractual waivers, the Fund’s returns would have been lower.
| | | | |
Portfolio sector allocation | |
| Sector | | Fund (%) | |
| Asset-Backed Securities | | | 4.0 | |
| Collateralized Mortgage Obligations | | | 10.6 | |
| Commercial Mortgage Securities | | | 7.0 | |
| Corporate Bonds & Notes | | | 59.6 | |
| U.S. Government & U.S. Government Agency Obligations | | | 2.3 | |
| U.S. Government Agency-Mortgage Securities | | | 11.0 | |
| Other Assets & Liabilities, Net | | | 5.5 | |
| Total | | | 100.0 | |
Portfolio composition will change due to the ongoing management of the Fund. The percentages are based on net assets as of August 31, 2018 and may not necessarily reflect adjustments that are routinely made when presenting net assets for formal financial statement processes.
Growth of an assumed $10,000 investment
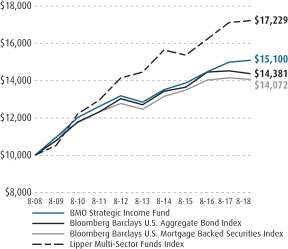
See Explanation of the Indices and Notes in the Commentary for additional information.The above graph relates to the Institutional Class shares of the Fund. Performance for the Investor Class and Advisor Class shares will vary from the performance of the Institutional Class shares shown above due to differences in charges and expenses. This graph illustrates the hypothetical investment of $10,000 in the Institutional Class shares of the Fund from the lesser of the Fund’s inception date or August 31, 2008 to August 31, 2018.
21
| | |
| | |
| Annual Report | | BMO TCH Corporate Income Fund |
| | | | | | | | | | | | |
Average annual total returns (%) | |
| | | 1-year | | | 5-years | | | Since
inception | |
| Investor Class (Y) | | | 0.05 | | | | 4.57 | | | | 7.34 | |
| Advisor Class (A) NAV | | | 0.06 | | | | — | | | | 3.27 | |
| Advisor Class (A) OFFER | | | (3.45 | ) | | | — | | | | 2.41 | |
| Institutional Class (I) | | | 0.19 | | | | 4.71 | | | | 7.52 | |
| Bloomberg Barclays U.S. Credit Index | | | (0.99 | ) | | | 3.63 | | | | 5.42 | |
| Lipper Corporate Debt FundsBBB-Rated Index | | | (1.08 | ) | | | 3.70 | | | | 6.54 | |
| * | Benchmarks since inception reflect the inception date of the Institutional Class. |
The performance data quoted represents past performance which is no guarantee of future results. Investment return and principal value will fluctuate so that an investor’s shares, when redeemed, may be worth more or less than their original costs. Mutual fund performance changes over time and current performance may be lower or higher than what is stated. To receive current performance to the most recentmonth-end, please call1-800-236-3863 or visit www.bmofunds.com.
Commentary
The BMO TCH Corporate Income Fund (the Fund) returned 0.19% for the fiscal year ended August 31, 2018 versus the Bloomberg Barclays U.S. Credit Index and the Lipper Corporate Debt Funds BBB-Rated Index, which returned-0.99% and-1.08%, respectively.
The Fund outperformed its benchmark and peer group, delivering positive absolute returns despite negative benchmark and peer group returns. Negative returns for the market were driven by rising interest rates.
Interest rates on the 10 year U.S. Treasury rose from 2.12% on August 31, 2017 to 2.86% at the end of August, 2018, resulting in a-1.54% return for Treasuries. The Fund maintained portfolio duration below the benchmark throughout the period and that positioning contributed to positive relative performance against the benchmark as yields rose. The portfolio benefitted from its barbelled term structure, which positioned it well to capture the effect of the continued flattening of the yield curve. Investment grade corporate floating rate notes, part of the yield curve positioning, benefitted the portfolio as the Fed hiked rates three times (December, March, June) during the period.
Sector and quality selection was positive. The portfolio was overweight corporate credit, which outperformed duration-matched Treasuries by 94 basis points due to positive carry as spreads widened modestly. Within credit, the Fund was overweight lower quality investment grade securities, which outperformed higher quality securities with BBB rated bonds outperforming overall credit by 40 basis points of excess return. Allocations to high yield securities further added to outperformance. Within corporate credit, the overweight to Industrials (+116 basis points of excess returns) added to outperformance.
Individual security selection within corporate credit was modestly positive during the period. In particular, names within the Energy, Basic Industries, and Healthcare sectors contributed to returns while selection within other sectors such as Auto Manufacturers, Consumer Products, and Telecommunications reduced relative returns.
Looking forward, our view remains constructive for U.S. fixed income, particularlynon-governmental sectors, based on robust economic data and supportive fiscal policy, particularly the effects of tax reform. Economic data and geopolitical events outside of the U.S. suggest a less sanguine market environment abroad, one which at times has weighed on the U.S. market furthering volatility. We expect U.S. monetary policy to continue to tighten gradually and to a greater degree than global policy. In this environment, heightened volatility is likely to persist, while U.S. fundamentals remain supportive. U.S. monetary policy tightening is likely to lead to further yield curve flattening, which along with the increase in volatility is worth monitoring. At the same time, economic fundamentals remain strong and the combination of higher Treasury rates and wider spreads has led to the most attractive yields on broad bond benchmarks since 2010.
Investment Adviser:
BMO Asset Management Corp.
Sub-adviser:
Taplin, Canida & Habacht, LLC
Fund Managers; Investment Experience
Scott M. Kimball, CFA; since 2004
Daniela Mardarovici, CFA; since 2000
Frank J. Reda, CMT; since 2001
Janelle Woodward, CFA; since 2003
| | | | | | | | | | | | | | | | | | | | |
| | | | | | | | | Inception
date | | | Expenses (%) | |
| Share class | | Ticker | | | Cusip | | | Gross | | | Net | |
| Investor (Y) | | | MCIYX | | | | 09658L851 | | | | 12/22/2008 | | | | 0.72 | | | | 0.60 | |
| Advisor (A) | | | BATIX | | | | 09658W733 | | | | 5/27/2014 | | | | 0.72 | | | | 0.60 | |
| Institutional (I) | | | MCIIX | | | | 09658L869 | | | | 12/22/2008 | | | | 0.47 | | | | 0.47 | |
The above expense ratios are from the Funds’ Prospectus dated December 29, 2017, and are inclusive of Acquired Fund Fees and Expenses. See Note 6 in the Notes to Financial Statements for additional information. Net expense ratios reflect contractual fee waivers and/or expense reimbursements if applicable, made by BMO Asset Management Corp., the investment adviser (Adviser). The Adviser may not terminate these fee waivers and/or expense reimbursements prior to December 31, 2019 without the consent of the Board of Directors, unless the investment advisory agreement is terminated. Without these contractual waivers, the Fund’s returns would have been lower.
| | | | |
Portfolio sector allocation | |
| Sector | | Fund (%) | |
| Corporate Bonds & Notes | | | 96.3 | |
| Municipals | | | 0.2 | |
| U.S. Government & U.S. Government Agency Obligations | | | 0.6 | |
| Other Assets & Liabilities, Net | | | 2.9 | |
| Total | | | 100.0 | |
Portfolio composition will change due to the ongoing management of the Fund. The percentages are based on net assets as of August 31, 2018 and may not necessarily reflect adjustments that are routinely made when presenting net assets for formal financial statement processes.
Growth of an assumed $10,000 investment
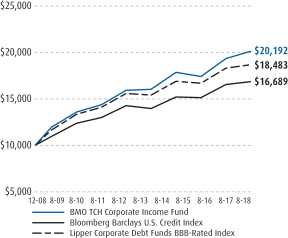
See Explanation of the Indices and Notes in the Commentary for additional information.The above graph relates to the Institutional Class shares of the Fund. Performance for the Investor Class and Advisor Class shares will vary from the performance of the Institutional Class shares shown above due to differences in charges and expenses. This graph illustrates the hypothetical investment of $10,000 in the Institutional Class shares of the Fund from the lesser of the Fund’s inception date or August 31, 2008 to August 31, 2018.
22
| | |
| | |
| Annual Report | | BMO TCH Core Plus Bond Fund |
| | | | | | | | | | | | |
Average annual total returns (%) | |
| | | 1-year | | | 5-years | | | Since
inception | |
| Investor Class (Y) | | | (0.45 | ) | | | 3.16 | | | | 5.32 | |
| Advisor Class (A) NAV | | | (0.45 | ) | | | — | | | | 2.15 | |
| Advisor Class (A) OFFER | | | (3.95 | ) | | | — | | | | 1.30 | |
| Institutional Class (I) | | | (0.20 | ) | | | 3.40 | | | | 5.56 | |
| Bloomberg Barclays U.S. Aggregate Bond Index | | | (1.05 | ) | | | 2.49 | | | | 3.51 | |
| Lipper Core Plus Bond Funds Index | | | (0.76 | ) | | | 2.98 | | | | 5.31 | |
| * | Benchmarks since inception reflect the inception date of the Institutional Class. |
The performance data quoted represents past performance which is no guarantee of future results. Investment return and principal value will fluctuate so that an investor’s shares, when redeemed, may be worth more or less than their original costs. Mutual fund performance changes over time and current performance may be lower or higher than what is stated. To receive current performance to the most recentmonth-end, please call1-800-236-3863 or visit www.bmofunds.com.
Commentary
The BMO TCH Core Plus Bond Fund (the Fund) returned-0.20% for the fiscal year ended August 31, 2018 versus the Bloomberg Barclays U.S. Aggregate Bond Index and the Lipper Core Plus Bond Funds Index, which returned-1.05% and-0.76%, respectively.
The Fund outperformed its benchmark and peer group. Negative absolute returns for the Fund and the market were driven by rising interest rates.
Interest rates on the 10 year U.S. Treasury rose from 2.12% on August 31, 2017 to 2.86% at the end of August, 2018, resulting in a-1.54% return for Treasuries. The Fund maintained portfolio duration below the benchmark throughout the period and that positioning contributed to positive relative performance against the benchmark as yields rose. The portfolio benefitted from its barbelled term structure, which positioned it well to capture the effect of the continued flattening of the yield curve. Investment grade corporate floating rate notes, part of the yield curve positioning, benefitted the portfolio as the Fed hiked rates three times (December, March, June) during the period.
Sector and quality selection was positive. The portfolio was overweight credit, which outperformed duration-matched Treasuries by 90 basis points due to its yield advantage as spreads widened modestly. Within credit, the Fund was overweight lower quality investment grade securities, which outperformed higher quality securities with BBB rated bonds outperforming overall credit by 40 basis points of excess return. Allocations to high yield securities further added to outperformance. Overweights to corporate versusnon-corporate credit and, in particular, the overweight to Industrials added to outperformance.
Individual security selection within corporate credit contributed to performance, in particular, selection was positive within the Energy and Basic Industries sectors, while selection within the Retail sector mildly detracted from returns.
Looking forward, our view remains constructive for U.S. fixed income, particularlynon-governmental sectors, based on robust economic data and supportive fiscal policy, particularly the effects of tax reform. Economic data and geopolitical events outside of the U.S. suggest a less sanguine market environment abroad, one which at times has weighed on the U.S. market furthering volatility. We expect U.S. monetary policy to continue to tighten gradually and to a greater degree than global policy. In this environment, heightened volatility is likely to persist, while U.S. fundamentals remain supportive. U.S. monetary policy tightening is likely to lead to further yield curve flattening, which along with the increase in volatility is worth monitoring. At the same time, economic fundamentals remain strong and the combination of higher Treasury rates and wider spreads has led to the most attractive yields on broad bond benchmarks since 2010.
Investment Adviser:
BMO Asset Management Corp.
Sub-adviser:
Taplin, Canida & Habacht, LLC
Fund Managers; Investment Experience
Scott M. Kimball, CFA; since 2004
Daniela Mardarovici, CFA; since 2000
Frank J. Reda, CMT; since 2001
Janelle Woodward, CFA; since 2003
| | | | | | | | | | | | | | | | |
| | | | | | | | | Inception date | | | Expenses (%) |
| Share class | | Ticker | | | Cusip | | | Gross | | Net |
| Investor (Y) | | | MCYBX | | | | 09658L877 | | | | 12/22/2008 | | | 0.60 | | 0.60 |
| Advisor (A) | | | BATCX | | | | 09658W725 | | | | 5/27/2014 | | | 0.60 | | 0.60 |
| Institutional (I) | | | MCBIX | | | | 09658L885 | | | | 12/22/2008 | | | 0.35 | | 0.35 |
The above expense ratios are from the Funds’ Prospectus dated December 29, 2017, and are inclusive of Acquired Fund Fees and Expenses. See Note 6 in the Notes to Financial Statements for additional information. Net expense ratios reflect contractual fee waivers and/or expense reimbursements if applicable, made by BMO Asset Management Corp., the investment adviser (Adviser). The Adviser may not terminate these fee waivers and/or expense reimbursements prior to December 31, 2019 without the consent of the Board of Directors, unless the investment advisory agreement is terminated. Without these contractual waivers, the Fund’s returns would have been lower.
| | | | |
Portfolio sector allocation | |
| Sector | | Fund (%) | |
| Asset-Backed Securities | | | 2.7 | |
| Commercial Mortgage Securities | | | 4.2 | |
| Corporate Bonds & Notes | | | 45.2 | |
| U.S. Government & U.S. Government Agency Obligations | | | 24.4 | |
| U.S. Government Agency-Mortgage Securities | | | 19.0 | |
| Other Assets & Liabilities, Net | | | 4.5 | |
| Total | | | 100.0 | |
Portfolio composition will change due to the ongoing management of the Fund. The percentages are based on net assets as of August 31, 2018 and may not necessarily reflect adjustments that are routinely made when presenting net assets for formal financial statement processes.
Growth of an assumed $10,000 investment
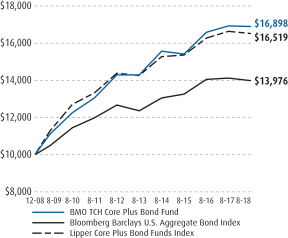
See Explanation of the Indices and Notes in the Commentary for additional information.The above graph relates to the Institutional Class shares of the Fund. Performance for the Investor Class and Advisor Class shares will vary from the performance of the Institutional Class shares shown above due to differences in charges and expenses. This graph illustrates the hypothetical investment of $10,000 in the Institutional Class shares of the Fund from the lesser of the Fund’s inception date or August 31, 2008 to August 31, 2018
23
| | |
| | |
| Annual Report | | BMO High Yield Bond Fund |
| | | | | | | | | | | | |
Average annual total returns (%) | |
| | | 1-year | | | 5-years | | | Since
inception | |
| Advisor Class (A) NAV | | | 1.62 | | | | — | | | | 2.77 | |
| Advisor Class (A) OFFER | | | (1.96 | ) | | | — | | | | 1.92 | |
| Institutional Class (I) | | | 1.87 | | | | 4.07 | | | | 4.96 | |
| Bank of America Merrill Lynch U.S. High Yield, Master II Constrained Index | | | 3.27 | | | | 5.64 | | | | 6.91 | |
| Bank of America Merrill Lynch U.S. High Yield,BB-B Rated, Constrained Index | | | 2.63 | | | | 5.50 | | | | 6.54 | |
| Lipper High Yield Bond Funds Index | | | 3.04 | | | | 4.93 | | | | 6.41 | |
| * | Benchmarks since inception reflect the inception date of the Institutional Class. |
The performance data quoted represents past performance which is no guarantee of future results. Investment return and principal value will fluctuate so that an investor’s shares, when redeemed, may be worth more or less than their original costs. Mutual fund performance changes over time and current performance may be lower or higher than what is stated. To receive current performance to the most recentmonth-end, please call1-800-236-3863 or visit www.bmofunds.com.
Commentary
The BMO High Yield Bond Fund (the Fund) returned 1.87% for the fiscal year ended August 31, 2018 versus the BofA Merrill Lynch U.S. High Yield Master II Constrained Index and the Lipper High Yield Bond Funds Index, which returned 3.27% and 3.04%, respectively.
The Fund underperformed the benchmark and peer group during the period. Quality selection was the biggest factor in underperformance. Given our views on the valuations on lower quality high yield, the portfolio was underweight that segment. However, CCC rated bonds delivered 816 basis points of excess returns, partially driven by continued strong economic data and investor demand for assets with limited interest rate sensitivity. Allocations to BB (+260 basis points excess return) and B (+429 basis points excess returns) performed well, but did not keep up with the lower quality rating bucket. The portfolio’s allocations to lower quality investment grade (BBB rated bonds +130 basis points of excess returns) underperformed high yield.
Security selection was positive, offsetting some of the negative effect of the quality allocation. Selection within the Energy, Technology, and Pharmaceuticals sectors added to performance, while selection within the Consumer Products, Telecommunications, and Food & Beverage sectors detracted from returns.
Default rates for high yield bonds and loans remained low, ending the second quarter just above 2%. With expectations of receptive capital markets, an improving economic backdrop, and manageable maturity schedules, defaults are expected to remain below long-term trends near-term.
High yield continues to be an attractive asset class for investors due to its diversification benefits and short duration, which will benefit reinvestment activity as rates increase over the coming years. As markets respond to U.S. fiscal policy and global monetary policy shifts, we see opportunities and risks across the spectrum of high yield sectors and expectsub-sector and security selection opportunities to be important drivers of returns for the upcoming period. We expect returns for full year 2018 to be in the low single digits, driven primarily by interest income and offset by mild spread widening and rising rates.
Fund Managers; Investment Experience
Ronald J. Salinas, CFA; since 2000
Eduardo J. Simpson, CFA; since 1999
Janelle Woodward, CFA; since 2003
| | | | | | | | | | | | | | | | | | | | |
| | | | | | | | | Inception
date | | | Expenses (%) | |
| Share class | | Ticker | | | Cusip | | | Gross | | | Net | |
| Advisor (A) | | | BMHAX | | | | 09658W717 | | | | 5/27/2014 | | | | 1.43 | | | | 0.91 | |
| Institutional (I) | | | MHBNX | | | | 09658L406 | | | | 12/29/2011 | | | | 1.18 | | | | 0.66 | |
The above expense ratios are from the Funds’ Prospectus dated December 29, 2017, and are inclusive of Acquired Fund Fees and Expenses. See Note 6 in the Notes to Financial Statements for additional information. Net expense ratios reflect contractual fee waivers and/or expense reimbursements if applicable, made by BMO Asset Management Corp., the investment adviser (Adviser). The Adviser may not terminate these fee waivers and/or expense reimbursements prior to December 31, 2019 without the consent of the Board of Directors, unless the investment advisory agreement is terminated. Without these contractual waivers, the Fund’s returns would have been lower.
| | | | |
Portfolio sector allocation | |
| Sector | | Fund (%) | |
| Corporate Bonds & Notes | | | 91.9 | |
| Other Assets & Liabilities, Net | | | 8.1 | |
| Total | | | 100.0 | |
Portfolio composition will change due to the ongoing management of the Fund. The percentages are based on net assets as of August 31, 2018 and may not necessarily reflect adjustments that are routinely made when presenting net assets for formal financial statement processes.
Growth of an assumed $10,000 investment
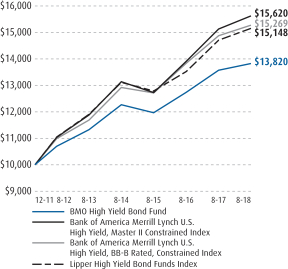
See Explanation of the Indices and Notes in the Commentary for additional information.The above graph relates to the Institutional Class shares of the Fund. Performance for the Advisor Class shares will vary from the performance of the Institutional Class shares shown above due to differences in charges and expenses. This graph illustrates the hypothetical investment of $10,000 in the Institutional Class shares of the Fund from the lesser of the Fund’s inception date or August 31, 2008 to August 31, 2018.
24
| | |
| | |
| Annual Report | | BMO Government Money Market Fund |
| | | | | | | | | | | | |
Average annual total returns (%) | |
| | | 1-year | | | 5-years | | | 10-years | |
| Investor Class (Y) | | | 1.05 | | | | 0.26 | | | | 0.19 | |
| Premier Class | | | 1.30 | | | | 0.38 | | | | 0.28 | |
| iMoneyNet, Inc. Government Money Market Index | | | 1.05 | | | | 0.27 | | | | 0.17 | |
| Lipper U.S. Government Money Market Funds Index | | | 0.99 | | | | 0.24 | | | | 0.17 | |
The performance data quoted represents past performance which is no guarantee of future results. Investment return and principal value will fluctuate so that an investor’s shares, when redeemed, may be worth more or less than their original costs. Mutual fund performance changes over time and current performance may be lower or higher than what is stated. To receive current performance to the most recentmonth-end, please call1-800-236-3863 or visit www.bmofunds.com.
An investment in the Fund is neither insured nor guaranteed by the Federal Deposit Insurance Corporation or any other government agency. Although the Fund seeks to preserve the value of your investment at $1.00 per share, it is possible to lose money by investing in the Fund.
Commentary
The BMO Government Money Market Fund (the Fund) returned 1.30% for the fiscal year-ended August 31, 2018 versus the iMoneyNet, Inc. Government Money Market Index and the Lipper U.S. Government Money Market Funds Index, which returned 1.05% and 0.99%, respectively.
The most significant episodes affecting the marketplace over the past twelve months were the three interest rate increases by the Federal Reserve (the Fed), tax reform, and the emergence of tariff/trade issues. The overall strength of the economy, further bolstered by a big reduction in corporate tax rates, combined with 75 basis points of interest rate increases, drove yields higher across the entire curve. As would be expected in an active Fed environment, the largest increases, on a percentage basis, were seen in maturities of 2 years and shorter.
The Fund’s low Weighted Average Maturity and increased allocation to floating rate securities were strong contributors to performance during the fiscal year. An increased Treasury issuance following the tax reform passed in December also drove short term rates higher. Strong demand for short dated government securities persists, as expected with an active Fed; however, pricing pressure has abated somewhat. Floating rate instruments remain attractive as the Fed projects a further reduction in policy accommodation for the remainder of 2018 and into 2019.
Similar to last year, the Fed increased interest rates in December, March and June. Helping spur things along, the Fed’s preferred measure of inflation (core PCE price index) reached its 2% target level in May. However, at his press conference in June, Fed Chair Jay Powell stressed that being at, or slightly above their inflation target was not an urgent signal for more policy tightening. According to the Fed Funds futures market, as of August 31, 2018, nearly 95% of market participants felt that the Fed would increase the overnight lending rate by 0.25% at the September meeting, with approximately 65% expecting the fourth and final rate hike of 2018 to occur in December. The most recent Fed statement showed that committee members anticipate between 3 and 4 rate increases for 2019, which is more aggressive than the market is projecting.
The trends of rising short term rates out and a flatter yield curve beyond one year are likely to remain in place. Looking forward, tenuous geopolitics, increasing anxiety over the upcoming U.S. midterm-elections and trade policy/tariff impacts are apt to trigger near-term rate volatility across the yield curve.
Fund Managers; Investment Experience
Peter J. Arts; since 1992
Boyd R. Eager; since 1997
| | | | | | | | | | | | | | | | | | | | |
| | | | | | | | | Inception
date | | | Expenses (%) | |
| Share class | | Ticker | | | Cusip | | | Gross | | | Net | |
| Investor (Y) | | | MGYXX | | | | 09658L786 | | | | 5/17/2004 | | | | 0.51 | | | | 0.46 | |
| Premier | | | MGNXX | | | | 09658L794 | | | | 5/28/2004 | | | | 0.26 | | | | 0.21 | |
The above expense ratios are from the Funds’ Prospectus dated December 29, 2017, and are inclusive of Acquired Fund Fees and Expenses. See Note 6 in the Notes to Financial Statements for additional information. Net expense ratios reflect contractual fee waivers and/or expense reimbursements if applicable, made by BMO Asset Management Corp., the investment adviser (Adviser). The Adviser may not terminate these fee waivers and/or expense reimbursements prior to December 31, 2019 without the consent of the Board of Directors, unless the investment advisory agreement is terminated. Without these contractual waivers, the Fund’s returns would have been lower.
| | | | |
Portfolio sector allocation | |
| Sector | | Fund (%) | |
| Mutual Funds | | | 6.5 | |
| Repurchase Agreements | | | 38.5 | |
| U.S. Government & U.S. Government Agency Obligations | | | 55.1 | |
| Other Assets & Liabilities, Net | | | (0.1 | ) |
| Total | | | 100.0 | |
Portfolio composition will change due to the ongoing management of the Fund. The percentages are based on net assets as of August 31, 2018 and may not necessarily reflect adjustments that are routinely made when presenting net assets for formal financial statement processes.
Growth of an assumed $10,000 investment
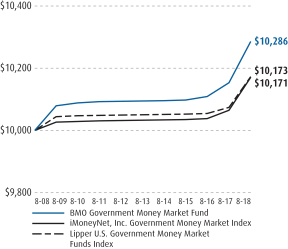
See Explanation of the Indices and Notes in the Commentary for additional information.The above graph relates to the Premier Class shares of the Fund. Performance for the Investor Class shares will vary from the performance of the Premier Class shares shown above due to differences in charges and expenses. This graph illustrates the hypothetical investment of $10,000 in the Premier Class shares of the Fund from the lesser of the Fund’s inception date or August 31, 2008 to August 31, 2018.
25
| | |
| | |
| Annual Report | | BMOTax-Free Money Market Fund |
| | | | | | | | | | | | |
Average annual total returns (%) | |
| | | 1-year | | | 5-years | | | 10-years | |
| Investor Class (Y) | | | 0.80 | | | | 0.25 | | | | 0.31 | |
| Premier Class | | | 1.05 | | | | 0.38 | | | | 0.48 | |
| iMoneyNet, Inc. FundReport/Tax-Free National Retail Index | | | 0.74 | | | | 0.23 | | | | 0.20 | |
| LipperTax-Exempt Money Market Funds Index | | | 0.85 | | | | 0.26 | | | | 0.22 | |
The performance data quoted represents past performance which is no guarantee of future results. Investment return and principal value will fluctuate so that an investor’s shares, when redeemed, may be worth more or less than their original costs. Mutual fund performance changes over time and current performance may be lower or higher than what is stated. To receive current performance to the most recentmonth-end, please call1-800-236-3863 or visit www.bmofunds.com.
An investment in the Fund is neither insured nor guaranteed by the Federal Deposit Insurance Corporation or any other government agency. Although the Fund seeks to preserve the value of your investment at $1.00 per share, it is possible to lose money by investing in the Fund.
Commentary
The BMOTax-Free Money Market Fund returned 1.05% for the fiscal year ended August 31, 2018 versus the iMoneyNet,Inc. Fund Report/Tax-Free National Retail Index and the Lipper Tax-Exempt Money Market Funds Index, which returned 0.74% and 0.85%, respectively.
During the fiscal year, market participants were confronted with the combined effects of the 5 T’s: taxes, trade, tariffs, tightening and Trump. While most of these could be described as headwinds or concerns for municipal bond investors, the largest changes in the tax code since 1986 along with efforts at regulatory reform were tailwinds, resulting in U.S. GDP growth for Q2 2018 clocking in at 4.2% and corporate profits, at least as measured by the S&P 500, growing over 20% Y/Y through Q2 2018. The Federal Reserve (the Fed) continued on its path of interest rate normalization during the year, raising rates to a current Fed Funds target of1.75-2%. There have now been seven rate increases since the current tightening cycle began in December 2015 and given the resilience of the U.S. economy, with unemployment at multi-decade lows and some signs of inflation emerging, it is likely the Fed will continue to raise short term rates in the months ahead. Yields were higher and both the U.S. Treasury and municipal bond curves flattened for the year in response to Fed action.
While overall returns for municipal securities remained muted with the Fed in the midst of a tightening cycle, the asset class, as measured by the Bloomberg Barclays Municipal Bond Index, managed to outperform both U.S. Treasuries and taxable bonds. The Fund stayed shorter than its peers from a duration perspective and also continued its emphasis on floating rate securities in the rising interest rate environment.
While the U.S. economy remains on solid ground at present, with consumer and small business confidence measures at cycle highs, concern remains around U.S. protectionism. For now, markets seem to think this tough talk on trade is nothing more than a negotiating tactic rather than a long-term strategy from the President. Should these tariffs persist, however, continued economic growth in the U.S. could be threatened.
Fund Managers; Investment Experience
Thomas Byron; since 1981
Brian Sipich, CFA; since 1998
Robert Wimmel; since 1992
| | | | | | | | | | | | | | | | | | | | |
| | | | | | | | | Inception
date | | | Expenses (%) | |
| Share class | | Ticker | | | Cusip | | | Gross | | | Net | |
| Investor (Y) | | | MTFXX | | | | 09658L547 | | | | 9/22/2004 | | | | 0.58 | | | | 0.46 | |
| Premier | | | MFIXX | | | | 09658L554 | | | | 6/29/2005 | | | | 0.33 | | | | 0.21 | |
The above expense ratios are from the Funds’ Prospectus dated December 29, 2017, and are inclusive of Acquired Fund Fees and Expenses. See Note 6 in the Notes to Financial Statements for additional information. Net expense ratios reflect contractual fee waivers and/or expense reimbursements if applicable, made by BMO Asset Management Corp., the investment adviser (Adviser). The Adviser may not terminate these fee waivers and/or expense reimbursements prior to December 31, 2019 without the consent of the Board of Directors, unless the investment advisory agreement is terminated. Without these contractual waivers, the Fund’s returns would have been lower.
| | | | |
Municipal Issuance/Industry Type | |
| Issuance/Industry | | Fund (%) | |
| General Obligation — 24.5 | | | | |
State or Local | | | 24.5 | |
| Revenue Bonds — 72.9 | | | | |
Appropriation | | | 15.1 | |
Education | | | 5.0 | |
General Revenue | | | 2.0 | |
Health Care | | | 15.6 | |
Housing | | | 8.9 | |
Industrial Revenue | | | 3.3 | |
Power | | | 1.9 | |
Special Tax | | | 9.0 | |
Transportation | | | 2.0 | |
Water & Sewer | | | 10.1 | |
| Other Assets & Liabilities, Net | | | 2.6 | |
| Total | | | 100.0 | |
Portfolio composition will change due to the ongoing management of the Fund. The percentages are based on net assets as of August 31, 2018 and may not necessarily reflect adjustments that are routinely made when presenting net assets for formal financial statement processes.
Growth of an assumed $10,000 investment
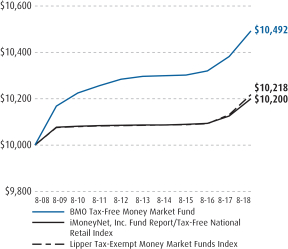
See Explanation of the Indices and Notes in the Commentary for additional information.The above graph relates to the Premier Class shares of the Fund. Performance for the Investor Class shares will vary from the performance of the Premier Class shares shown above due to differences in charges and expenses. This graph illustrates the hypothetical investment of $10,000 in the Premier Class shares of the Fund from the lesser of the Fund’s inception date or August 31, 2008 to August 31, 2018.
26
| | |
| | |
| Annual Report | | BMO Prime Money Market Fund |
| | | | | | | | | | | | |
Average annual total returns (%) | |
| | | 1-year | | | 5-years | | | 10-years | |
| Investor Class (Y) | | | 1.25 | | | | 0.34 | | | | 0.29 | |
| Premier Class | | | 1.50 | | | | 0.48 | | | | 0.45 | |
| iMoneyNet, Inc. Money Fund Report Averages | | | 1.12 | | | | 0.32 | | | | 0.23 | |
| Lipper Money Market Instrument Funds Index | | | 1.25 | | | | 0.35 | | | | 0.27 | |
The performance data quoted represents past performance which is no guarantee of future results. Investment return and principal value will fluctuate so that an investor’s shares, when redeemed, may be worth more or less than their original costs. Mutual fund performance changes over time and current performance may be lower or higher than what is stated. To receive current performance to the most recentmonth-end, please call1-800-236-3863 or visit www.bmofunds.com.
An investment in the Fund is neither insured nor guaranteed by the Federal Deposit Insurance Corporation or any other government agency. Although the Fund seeks to preserve the value of your investment at $1.00 per share, it is possible to lose money by investing in the Fund.
Commentary
The BMO Prime Money Market Fund (the Fund) returned 1.50% for the fiscal year-ended August 31, 2018 versus the iMoneyNet, Inc. Money Fund Report Averages and the Lipper Money Market Instrument Funds Index, which returned 1.12% and 1.25%, respectively.
The most significant episodes affecting the marketplace over the past twelve months were the three interest rate increases by the Federal Reserve (the Fed), tax reform, and the emergence of tariff/trade issues. The overall strength of the economy, further bolstered by a big reduction in corporate tax rates, combined with 75 basis points of interest rate increases, drove yields higher across the entire curve. As would be expected in an active Fed environment, the largest increases, on a percentage basis, were seen in maturities of 2 years and shorter.
The Fund’s low Weighted Average Maturity and increased allocation to floating rate securities were strong contributors to performance during the fiscal year. An increased Treasury issuance following the tax reform passed in December also drove short term rates higher. The Fund’s allocation to commercial paper, particularly in financial and asset-backed names, also helped performance. Strong demand for short dated government securities persists, as expected with an active Fed; however, pricing pressure has abated somewhat. Floating rate instruments remain attractive as the Fed projects a further reduction in policy accommodation for the remainder of 2018 and into 2019.
Similar to last year, the Fed increased interest rates in December, March and June. Helping spur things along, the Fed’s preferred measure of inflation (core PCE price index) reached its 2% target level in May. However, at his press conference in June, Fed Chair Jay Powell stressed that being at, or slightly above their inflation target was not an urgent signal for more policy tightening. According to the Fed Funds futures market, as of August 31, 2018, nearly 95% of market participants felt that the Fed would increase the overnight lending rate by 0.25% at the September meeting, with approximately 65% expecting the fourth and final rate hike of 2018 to occur in December. The most recent Fed statement showed that committee members anticipate between 3 and 4 rate increases for 2019, which is more aggressive than the market is projecting.
The trends of rising short term rates out and a flatter yield curve beyond one year are likely to remain in place. Looking forward, tenuous geopolitics, increasing anxiety over the upcoming U.S. midterm-elections and trade policy/tariff impacts are apt to trigger near-term rate volatility across the yield curve.
Fund Managers; Investment Experience
Peter J. Arts; since 1992
Boyd R. Eager; since 1997
| | | | | | | | | | | | | | | | | | | | |
| | | | | | | | | Inception
date | | | Expenses (%) | |
| Share class | | Ticker | | | Cusip | | | Gross | | | Net | |
| Investor (Y) | | | MARXX | | | | 09658L679 | | | | 11/23/1992 | | | | 0.54 | | | | 0.46 | |
| Premier | | | MAIXX | | | | 09658L687 | | | | 4/3/2000 | | | | 0.29 | | | | 0.21 | |
The above expense ratios are from the Funds’ Prospectus dated December 29, 2017, and are inclusive of Acquired Fund Fees and Expenses. See Note 6 in the Notes to Financial Statements for additional information. Net expense ratios reflect contractual fee waivers and/or expense reimbursements if applicable, made by BMO Asset Management Corp., the investment adviser (Adviser). The Adviser may not terminate these fee waivers and/or expense reimbursements prior to December 31, 2019 without the consent of the Board of Directors, unless the investment advisory agreement is terminated. Without these contractual waivers, the Fund’s returns would have been lower.
| | | | |
Portfolio sector allocation | |
| Sector | | Fund (%) | |
| Certificates of Deposit | | | 15.1 | |
| Commercial Paper | | | 57.8 | |
| Municipals | | | 0.4 | |
| Mutual Funds | | | 3.9 | |
| Repurchase Agreements | | | 22.9 | |
| Other Assets & Liabilities, Net | | | (0.1 | ) |
| Total | | | 100.0 | |
Portfolio composition will change due to the ongoing management of the Fund. The percentages are based on net assets as of August 31, 2018 and may not necessarily reflect adjustments that are routinely made when presenting net assets for formal financial statement processes.
Growth of an assumed $10,000 investment
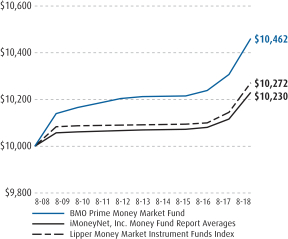
See Explanation of the Indices and Notes in the Commentary for additional information.The above graph relates to the Premier Class shares of the Fund. Performance for the Investor Class shares will vary from the performance of the Premier Class shares shown above due to differences in charges and expenses. This graph illustrates the hypothetical investment of $10,000 in the Premier Class shares of the Fund from the lesser of the Fund’s inception date or August 31, 2008 to August 31, 2018.
27
| | |
| | |
| Annual Report | | BMO Institutional Prime Money Market Fund |
| | | | | | | | |
Average annual total returns (%) | |
| | | 1-year | | | Since
inception | |
| Investor Class (Y) | | | 1.29 | | | | 0.81 | |
| Premier Class | | | 1.54 | | | | 1.06 | |
| iMoneyNet, Inc. Money Fund Report Averages | | | 1.12 | | | | 0.67 | |
| Lipper Institutional Money Market Funds Index | | | 1.65 | | | | 1.16 | |
The performance data quoted represents past performance which is no guarantee of future results. Investment return and principal value will fluctuate so that an investor’s shares, when redeemed, may be worth more or less than their original costs. Mutual fund performance changes over time and current performance may be lower or higher than what is stated. To receive current performance to the most recentmonth-end, please call1-800-236-3863 or visit www.bmofunds.com.
An investment in the Fund is neither insured nor guaranteed by the Federal Deposit Insurance Corporation or any other government agency. Although the Fund seeks to preserve the value of your investment at $1.00 per share, it is possible to lose money by investing in the Fund.
Commentary
The BMO Institutional Prime Money Market Fund (the Fund) returned 1.54% for the fiscal year-ended August 31, 2018 versus the iMoneyNet, Inc. Money Fund Report Averages and the Lipper Institutional Money Market Funds Index, which returned 1.12% and 1.65%, respectively.
The most significant episodes affecting the marketplace over the past twelve months were the three interest rate increases by the Federal Reserve (the Fed), tax reform, and the emergence of tariff/trade issues. The overall strength of the economy, further bolstered by a big reduction in corporate tax rates, combined with 75 basis points of interest rate increases, drove yields higher across the entire curve. As would be expected in an active Fed environment, the largest increases, on a percentage basis, were seen in maturities of 2 years and shorter.
The Fund’s low Weighted Average Maturity and increased allocation to floating rate securities were strong contributors to performance during the fiscal year. An increased Treasury issuance following the tax reform passed in December also drove short term rates higher. The Fund’s allocation to commercial paper, particularly in financial and asset-backed names, also helped performance. Strong demand for short dated government securities persists, as expected with an active Fed; however, pricing pressure has abated somewhat. Floating rate instruments remain attractive as the Fed projects a further reduction in policy accommodation for the remainder of 2018 and into 2019.
Similar to last year, the Fed increased interest rates in December, March and June. Helping spur things along, the Fed’s preferred measure of inflation (core PCE price index) reached its 2% target level in May. However, at his press conference in June, Fed Chair Jay Powell stressed that being at, or slightly above their inflation target was not an urgent signal for more policy tightening. According to the Fed Funds futures market, as of August 31, 2018, nearly 95% of market participants felt that the Fed would increase the overnight lending rate by 0.25% at the September meeting, with approximately 65% expecting the fourth and final rate hike of 2018 to occur in December. The most recent Fed statement showed that committee members anticipate between 3 and 4 rate increases for 2019, which is more aggressive than the market is projecting.
The trends of rising short term rates out and a flatter yield curve beyond one year are likely to remain in place. Looking forward, tenuous geopolitics, increasing anxiety over the upcoming U.S. midterm-elections and trade policy/tariff impacts are apt to trigger near-term rate volatility across the yield curve.
Fund Managers; Investment Experience
Peter J. Arts; since 1992
Boyd R. Eager; since 1997
| | | | | | | | | | | | | | | | | | | | |
| | | | | | | | | Inception
date | | | Expenses (%) | |
| Share class | | Ticker | | | Cusip | | | Gross | | | Net | |
| Investor (Y) | | | BYFXX | | | | 09658V354 | | | | 6/3/2016 | | | | 0.56 | | | | 0.46 | |
| Premier | | | BPFXX | | | | 09658V347 | | | | 6/3/2016 | | | | 0.31 | | | | 0.21 | |
The above expense ratios are from the Funds’ Prospectus dated December 29, 2017, and are inclusive of Acquired Fund Fees and Expenses. See Note 6 in the Notes to Financial Statements for additional information. Net expense ratios reflect contractual fee waivers and/or expense reimbursements if applicable, made by BMO Asset Management Corp., the investment adviser (Adviser). The Adviser may not terminate these fee waivers and/or expense reimbursements prior to December 31, 2019 without the consent of the Board of Directors, unless the investment advisory agreement is terminated. Without these contractual waivers, the Fund’s returns would have been lower.
| | | | |
Portfolio sector allocation | |
| Sector | | Fund (%) | |
| Certificates of Deposit | | | 17.0 | |
| Commercial Paper | | | 61.1 | |
| Mutual Funds | | | 3.3 | |
| Repurchase Agreements | | | 18.7 | |
| Other Assets & Liabilities, Net | | | (0.1 | ) |
| Total | | | 100.0 | |
Portfolio composition will change due to the ongoing management of the Fund. The percentages are based on net assets as of August 31, 2018 and may not necessarily reflect adjustments that are routinely made when presenting net assets for formal financial statement processes.
Growth of an assumed $10,000 investment
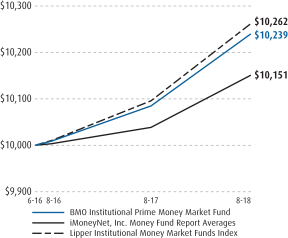
See Explanation of the Indices and Notes in the Commentary for additional information.The above graph relates to the Premier Class shares of the Fund. Performance for the Investor Class shares will vary from the performance of the Premier Class shares shown above due to differences in charges and expenses. This graph illustrates the hypothetical investment of $10,000 in the Premier Class shares of the Fund from the lesser of the Fund’s inception date or August 31, 2008 to August 31, 2018.
28
| | |
| |
| Explanation of the Indices and Notes in the Commentary |
The views expressed in the commentary are as of August 31, 2018 and are those of the Funds’ investment adviser and/or portfolio manager(s). The views are subject to change at any time in response to changing circumstances in the market and are not intended to predict or guarantee the future performance of the Funds or any individual security, industry, market sector or the markets generally. Statements involving predictions, assessments, analyses or outlook for individual securities, industries, market sectors and/or markets involve risks and uncertainties. In addition to the general risks described for the Funds in their current Prospectuses, other factors bearing on these commentaries include the accuracy of the investment adviser’s or portfolio manager’s forecasts and predictions and the appropriateness of the investment programs designed by the investment adviser or portfolio managers to implement their strategies efficiently and effectively. Any one, or more, of these factors, as well as other risks affecting the securities markets and investment instruments generally, could cause the actual results of a Fund to differ materially as compared to benchmarks associated with that Fund. The line graphs and tables do not reflect the deduction of taxes that a shareholder would pay on Fund distributions or the redemption of Fund shares. The gross and net expense ratios are based on expenses incurred by a Fund as disclosed in the Funds’ Prospectus dated December 29, 2017. Each Fund’s performance assumes the reinvestment of all dividends and distributions. Performance returns for all benchmark comparisons assume dividends and distributions were reinvested for the entire period. All indices are unmanaged and are not available for direct investment.
| | | | |
| Fund/Benchmark Comparison per Fund | | Explanation |
| Low Volatility Equity Fund | | Russell 1000® Index | | The Russell 1000® Index consists of approximately 1,000 of the largest companies in the U.S. equity markets.(4) |
| | Lipper U.S. Multi-Cap Core Funds Index | | Lipper indices are comprised of a certain number of eligible mutual funds designated by Lipper, Inc. as falling into the respective categories indicated.(5) |
| Dividend Income Fund | | Russell 1000® Value Index | | The Russell 1000® Value Index measures the performance of those Russell 1000 companies with lower price-to-book ratios and lower forecasted growth values.(4) |
| | Standard & Poor’S 500® Index | | The S&P 500® is an unmanaged index of large-cap common stocks. |
| | Lipper Equity Income Funds Index | | Lipper indices are comprised of a certain number of eligible mutual funds designated by Lipper, Inc. as falling into the respective categories indicated.(5) |
| Large-Cap Value Fund | | Russell 1000® Value Index | | The Russell 1000® Value Index measures the performance of those Russell 1000 companies with lower price-to-book ratios and lower forecasted growth values.(4) |
| | Lipper U.S. Multi-Cap Value Funds Index | | Lipper indices are comprised of a certain number of eligible mutual funds designated by Lipper, Inc. as falling into the respective categories indicated.(5) |
| Large-Cap Growth Fund | | Russell 1000® Growth Index | | The Russell 1000® Growth Index measures the performance of those Russell 1000 companies with higher price-to-book ratios and higher forecasted growth values.(4) |
| | Lipper U.S. Multi-Cap Growth Funds Index | | Lipper indices are comprised of a certain number of eligible mutual funds designated by Lipper, Inc. as falling into the respective categories indicated.(5) |
| Mid-Cap Value Fund | | Russell Midcap® Value Index | | Russell Midcap® Value index measures the performance of those Russell Midcap companies with lower price-to-book ratios and lower forecasted growth values. The stocks are also members of the Russell 1000® Value Index.(4) |
| | Lipper U.S. Mid-Cap Value Funds Index | | Lipper indices are comprised of a certain number of eligible mutual funds designated by Lipper, Inc. as falling into the respective categories indicated.(5) |
| Mid-Cap Growth Fund | | Russell Midcap® Growth Index | | Russell Midcap® Growth index measures the performance of those Russell Midcap companies with higher price-to-book ratios and higher forecasted growth values. The stocks are also members of the Russell 1000® Growth Index.(4) |
| | Lipper U.S. Mid-Cap Growth Funds Index | | Lipper indices are comprised of a certain number of eligible mutual funds designated by Lipper, Inc. as falling into the respective categories indicated.(5) |
| Small-Cap Value Fund(1) | | Russell 2000® Value Index | | The Russell 2000® Value Index measures the performance of those Russell 2000 companies with lower price-to-book ratios and lower forecasted growth values.(4) |
| | Lipper U.S. Small-Cap Core Funds Index | | Lipper indices are comprised of a certain number of eligible mutual funds designated by Lipper, Inc. as falling into the respective categories indicated.(5) |
| Small-Cap Core Fund(1) | | Russell 2000® Index | | The Russell 2000® Index measures the performance of the small-cap segment of the U.S. equity universe. The Russell 2000® Index is a subset of the Russell 3000® Index representing approximately 10% of the total market capitalization of that index. It includes approximately 2000 of the smallest securities based on a combination of their market cap and current index membership.(4) |
| | Lipper U.S. Small-Cap Core Funds Index | | Lipper indices are comprised of a certain number of eligible mutual funds designated by Lipper, Inc. as falling into the respective categories indicated.(5) |
29
| | |
| |
| Explanation of the Indices and Notes in the Commentary(continued) |
| | | | |
| Fund/Benchmark Comparison per Fund | | Explanation |
| Small-Cap Growth Fund(1) | | Russell 2000® Growth Index | | The Russell 2000® Growth Index measures the performance of those Russell 2000 companies with higher price-to-book ratios and higher forecasted growth values.(4) |
| | Lipper U.S. Small-Cap Growth Funds Index | | Lipper indices are comprised of a certain number of eligible mutual funds designated by Lipper, Inc. as falling into the respective categories indicated.(5) |
| Global Low Volatility Equity Fund(1) | | Morgan Stanley Capital International All Country World Index | | The MSCI All Country World Index is a free float-adjusted market capitalization weighted index that is designed to measure the equity market performance of developed and emerging markets.(4) |
| | Lipper Global Multi-Cap Value Funds Index | | Lipper indices are comprised of a certain number of eligible mutual funds designated by Lipper, Inc. as falling into the respective categories indicated.(5) |
| Disciplined International Equity Fund(3) | | Morgan Stanley Capital International Europe, Australasia, Far East Index | | The MSCI Europe, Australasia and Far East Index is a standard unmanaged foreign securities index representing major non-U.S. stock markets, as monitored by Morgan Stanley Capital International.(4) |
| | Lipper International Multi-Cap Core Funds Index | | Lipper indices are comprised of a certain number of eligible mutual funds designated by Lipper, Inc. as falling into the respective categories indicated.(5) |
| Pyrford International Stock Fund(3) | | Morgan Stanley Capital International Europe, Australasia, Far East Index | | The MSCI Europe, Australasia and Far East Index is a standard unmanaged foreign securities index representing major non-U.S. stock markets, as monitored by Morgan Stanley Capital International.(4) |
| | Lipper International Multi-Cap Core Funds Index | | Lipper indices are comprised of a certain number of eligible mutual funds designated by Lipper, Inc. as falling into the respective categories indicated.(5) |
| LGM Emerging Markets Equity Fund(3) | | Morgan Stanley Capital International Emerging Markets Index | | The MSCI Emerging Markets Index is a market capitalization weighted index comprised of over 800 companies representative of the market structure of the emerging countries in Europe, Latin America, Africa, Middle East and Asia, as monitored by Morgan Stanley Capital International.(4) |
| | Lipper Emerging Markets Funds Index | | Lipper indices are comprised of a certain number of eligible mutual funds designated by Lipper, Inc. as falling into the respective categories indicated.(5) |
| Alternative Strategies Fund(3) | | Bank Of America Merrill Lynch3-Month T-Bill Index | | Bank of America Merrill Lynch 3-Month T-Bill Index comprises a single issue purchased at the beginning of the month and held for a full month. At the end of the month that issue is sold and rolled into a newly selected issue. The issue selected at each month-end rebalancing is the outstanding Treasury Bill that matures closest to, but not beyond, three months from the rebalancing date. To qualify for selection, an issue must have settled on or before the month-end rebalancing date. While the index will often hold the Treasury Bill issued at the most recent 3-month auction, it is also possible for a seasoned 6-month Bill to be selected.(4) |
| | HFRX Global Hedge Fund Index | | HFRX Global Hedge Fund Index is designed to be representative of the overall composition of the hedge fund universe. It comprises all eligible hedge fund strategies, including but not limited to convertible arbitrage, distressed securities, equity hedge, equity market neutral, event-driven, macro, merger arbitrage, and relative value arbitrage. The strategies are asset weighted based on the distribution of assets in the hedge fund industry. |
| | Lipper Alternative Multi-Strategy Funds Index | | Lipper indices are comprised of a certain number of eligible mutual funds designated by Lipper, Inc. as falling into the respective categories indicated.(5) |
| Global Long/Short Equity Fund(3) | | Morgan Stanley Capital International All Country World Index | | The MSCI All Country World Index is a free float-adjusted market capitalization weighted index that is designed to measure the equity market performance of developed and emerging markets.(4) |
| | Lipper Alternative Long/Short Equity Funds Index | | Lipper indices are comprised of a certain number of eligible mutual funds designated by Lipper, Inc. as falling into the respective categories indicated.(5) |
Ultra Short Tax-Free
Fund(2)(6) | | Blended Index (50% Bloomberg Barclays 1 Year Municipal Bond Index And 50% iMoneyNet Money Market Fund Tax-Free National Retail Index) | | The blended index consists of 50% Bloomberg Barclays 1 Year Municipal Bond Index and 50% iMoneyNet Money Market Fund Tax-Free National Retail Index. The Bloomberg Barclays 1 Year Municipal Bond Index is the 1 year component of the Bloomberg Barclays Capital Municipal Bond Index, which is an unmanaged index composed of longterm tax-exempt bonds with a minimum credit rating of Baa. The iMoneyNet Money Market Fund Tax-Free National Retail Index is an average of money funds with investment objectives similar to that of the Fund.(4) |
| | Lipper Short Municipal Debt Funds Index | | Lipper indices are comprised of a certain number of eligible mutual funds designated by Lipper, Inc. as falling into the respective categories indicated.(5) |
| Short Tax-Free Fund(2)(6) | | Bloomberg Barclays Short (1-5 Year) Municipal Index | | The Bloomberg Barclays Short (1-5 Year) Municipal Index includes invetment-grade tax-exempt bonds that are issued by state and local governments and have maturities of 1 to 5 years.(4) |
| | Lipper Short Municipal Debt Funds Index | | Lipper indices are comprised of a certain number of eligible mutual funds designated by Lipper, Inc. as falling into the respective categories indicated.(5) |
30
| | |
| |
| Explanation of the Indices and Notes in the Commentary(continued) |
| | | | |
| Fund/Benchmark Comparison per Fund | | Explanation |
Short-Term Income
Fund(6) | | Bank of America Merrill Lynch 1-3 Year U.S. Government/ Corporate Index | | Bank of America Merrill Lynch 1-3 Year U.S. Government/ Corporate Index is an index tracking short-term U.S. government and corporate securities with maturities between 1 and 2.99 years. The index is produced by Merrill Lynch, Pierce, Fenner & Smith.(4) |
| | Lipper Short Investment-Grade Debt Funds Index | | Lipper indices are comprised of a certain number of eligible mutual funds designated by Lipper, Inc. as falling into the respective categories indicated.(5) |
| Intermediate Tax-Free Fund(2)(6) | | Bloomberg Barclays 1-15 Year Blend Municipal Bond Index | | Bloomberg Barclays 1-15 Year Blend Municipal Bond Index is the 1-15 year Blend component of the Bloomberg Barclays Municipal Bond Index, which is an unmanaged index composed of long-term tax-exempt bonds with a minimum credit rating of Baa and a range of maturities between 1-17 years. To qualify for inclusion, a bond or security must have outstanding par value of at least $7 million, issued as part of a transaction of at least $75 million, fixed rate, dated-date after December 31, 1990 and must have at least one year from final maturity.(4) |
| | Lipper Intermediate Municipal Debt Funds Index | | Lipper indices are comprised of a certain number of eligible mutual funds designated by Lipper, Inc. as falling into the respective categories indicated.(5) |
| Strategic Income Fund(6) | | Bloomberg Barclays U.S. Aggregate Bond Index | | Bloomberg Barclays U.S. Aggregate Bond Index is an unmanaged Index that covers the U.S. investment-grade fixed-rate bond market, including government and credit securities, agency mortgage pass-through securities, asset-backed securities and commercial mortgage-based securities.(4) |
| | Bloomberg Barclays U.S. Mortgage Backed Securities Index | | Bloomberg Barclays U.S. Mortgage Backed Securities Index is an unmanaged index that includes 15 and 30 year fixed-rate securities backed by mortgage pools of the Government National Mortgage Association (GNMA), Federal Home Loan Mortgage Corp. (FHLMC) and the Federal National Mortgage Corporation (FNMC).(4) |
| | Lipper Multi-Sector Funds Index | | Lipper indices are comprised of a certain number of eligible mutual funds designated by Lipper, Inc. as falling into the respective categories indicated.(5) |
| TCH Corporate Income Fund(6) | | Bloomberg Barclays U.S. Credit Index | | Bloomberg Barclays U.S. Credit Index represents securities that are SEC registered, taxable and U.S. dollar denominated. The index covers U.S. corporate and specified foreign debentures and secured notes that meet the specified maturity, liquidity and quality requirements.(4) |
| | Lipper Corporate Debt FundsBBB-Rated Index | | Lipper indices are comprised of a certain number of eligible mutual funds designated by Lipper, Inc. as falling into the respective categories indicated.(5) |
TCH Core Plus Bond
Fund(6) | | Bloomberg Barclays U.S. Aggregate Bond Index | | Bloomberg Barclays U.S. Aggregate Bond Index is an unmanaged Index that covers the U.S. investment-grade fixed-rate bond market, including government and credit securities, agency mortgage pass-through securities, asset-backed securities and commercial mortgage-based securities. To qualify for inclusion, a bond or security must have at least one year to final maturity, rated investment grade Baa3 or better, dollar denominated, non-convertible, fixed rate and be publicly issued.(4) |
| | Lipper Core Plus Bond Funds Index | | Lipper indices are comprised of a certain number of eligible mutual funds designated by Lipper, Inc. as falling into the respective categories indicated.(5) |
| High Yield Bond Fund(3)(6) | | Bank of America Merrill Lynch U.S. High Yield Master II Constrained Index | | Bank of America Merrill Lynch U.S. High Yield Master II Constrained Index is an Index that tracks the performance of U.S. dollar denominated below investment grade rated corporate debt publically issued in the U.S. domestic market.(4) |
| | Bank of America Merrill Lynch U.S. High Yield, BB-B Rated, Constrained Index | | Bank of America Merrill Lynch U.S. High Yield, BB-B Rated, Constrained Index is a benchmark index for high yield corporate bonds which excludes lower-rated securities and caps exposure to any one issuer at 2% and is administrated by Merrill
Lynch.(4) |
| | Lipper High Yield Bond Funds Index | | Lipper indices are comprised of a certain number of eligible mutual funds designated by Lipper, Inc. as falling into the respective categories indicated.(5) |
| Government Money Market Fund | | iMoneyNet, Inc. Government Money Market Index | | iMoneyNet, Inc. Government Money Market Index is an average of money funds with investment objectives similar to that of the Fund. |
| | Lipper U.S. Government Money Market Funds Index | | Lipper indices are comprised of a certain number of eligible mutual funds designated by Lipper, Inc. as falling into the respective categories indicated.(5) |
| Tax-Free Money Market Fund | | iMoneyNet, Inc. Fund Report/Tax-Free National Retail Index | | iMoneyNet, Inc. Fund Report/ Tax-Free National Retail Index is an average of money funds with investment objectives similar to that of the Fund. |
| | Lipper Tax-Exempt Money Market Funds Index | | Lipper indices are comprised of a certain number of eligible mutual funds designated by Lipper, Inc. as falling into the respective categories indicated.(5) |
31
| | |
| |
| Explanation of the Indices and Notes in the Commentary(continued) |
| | | | |
| Fund/Benchmark Comparison per Fund | | Explanation |
| Prime Money Market Fund | | iMoneyNet, Inc. Money Fund Report Averages | | iMoneyNet, Inc. Money Fund Report Averages index is an average of money funds with investment objectives similar to that of the Fund. |
| | Lipper Institutional Money Market Funds Index | | Lipper indices are comprised of a certain number of eligible mutual funds designated by Lipper, Inc. as falling into the respective categories indicated.(5) |
| Institutional Prime Money Market Fund | | iMoneyNet, Inc. Money Fund Report Averages | | iMoneyNet, Inc. Money Fund Report Averages index is an average of money funds with investment objectives similar to that of the Fund. |
| | Lipper Institutional Money Market Funds Index | | Lipper indices are comprised of a certain number of eligible mutual funds designated by Lipper, Inc. as falling into the respective categories indicated.(5) |
| (1) | Small-Cap stocks are less liquid and more volatile than large-cap stocks. |
| (2) | Income generated by the Fund may be subject to the federal alternative minimum tax. |
| (3) | International investing involves special risks including currency risk, political risk, increased volatility of foreign securities, and differences in auditing and other financial standards. |
| (4) | Performance returns do not reflect the deduction of sales charges, expenses, or other fees that the Securities and Exchange Commission requires to be reflected in a mutual fund’s performance. |
| (5) | Performance returns do not reflect the deduction of sales charges of component funds, or taxes, but do reflect the deduction of fund expenses. |
| (6) | Investors should be aware that in an environment of rising interest rates, they may expect to see declining bond prices. |
32
| | |
| |
| Expense Example(Unaudited) |
For the Six Months Ended August 31, 2018
As a shareholder of the Fund, you may incur two types of costs: (1) transaction costs, which may include sales charges (loads) on purchase payments, reinvested dividends, or other distributions; redemption fees; and exchange fees; and (2) ongoing costs, including management fees; distribution and/or service (12b-1) fees; and other Fund expenses. This Example is intended to help you understand your ongoing costs (in dollars) of investing in the Funds and to compare these costs with the ongoing costs of investing in other mutual funds.
The Example is based on an investment of $1,000 invested at the beginning of the period and held for the entire six month period ended August 31, 2018 (3/1/18-8/31/18).
Actual Expenses
The information in the table under the heading “Acutal Expenses” provides information about actual account values and actual expenses. You may use the information in these columns, together with the amount you invested, to estimate the expenses that you paid over the period. Simply divide your account value by $1,000 (for example, an $8,600 account value divided by $1,000 = 8.6), then multiply the result by the number in the column under the heading entitled “Expenses Paid During Period” to estimate the expenses you paid on your account during this period.
Hypothetical Example for Comparison Purposes
The information in the table under the heading “Hypothetical Expenses” provides information about hypothetical account values and hypothetical expenses based on a Fund’s actual expense ratio and an assumed rate of return of 5% per year before expenses, which is not the Fund’s actual return. The hypothetical account values and expenses may not be used to estimate the actual ending account balance or expenses you paid for the period. You may use this information to compare the ongoing costs of investing in a Fund and other funds. To do so, compare this 5% hypothetical example with the 5% hypothetical examples that appear in the shareholder reports of the other funds.
Please note that the expenses shown in the table are meant to highlight your ongoing costs only and do not reflect any transaction costs, such as sales charges (loads), redemption fees, or exchange fees. Therefore, the information under the heading “Hypothetical Expenses” is useful in comparing ongoing costs only, and will not help determine the relative total costs of owning different funds. In addition, if these transaction costs were included, your costs would have been higher.
| | | | | | | | | | | | | | | | | | | | | | | | |
| | | Actual Expenses | | | Hypothetical Expenses | |
Fund | | Beginning
account
value
3/1/18 | | | Ending
account
value
8/31/18 | | | Expenses
paid during
period
3/1/18-
8/31/18(1) | | | Ending
account
value
8/31/18 | | | Expenses
paid during
period
3/1/18-
8/31/18(1) | | | Annualized
Expense
Ratio(1) | |
Low Volatility Equity Fund | | | | | | | | | | | | | | | | | | | | | | | | |
| Advisor | | $ | 1,000.00 | | | $ | 1,085.30 | | | $ | 4.73 | | | $ | 1,020.67 | | | $ | 4.58 | | | | 0.90 | % |
| Institutional | | | 1,000.00 | | | | 1,086.50 | | | | 3.42 | | | | 1,021.93 | | | | 3.31 | | | | 0.65 | |
Dividend Income Fund | | | | | | | | | | | | | | | | | | | | | | | | |
| Advisor | | | 1,000.00 | | | | 1,078.70 | | | | 4.72 | | | | 1,020.67 | | | | 4.58 | | | | 0.90 | |
| Institutional | | | 1,000.00 | | | | 1,079.60 | | | | 3.41 | | | | 1,021.93 | | | | 3.31 | | | | 0.65 | |
Large-Cap Value Fund | | | | | | | | | | | | | | | | | | | | | | | | |
| Advisor | | | 1,000.00 | | | | 1,046.60 | | | | 4.08 | | | | 1,021.22 | | | | 4.02 | | | | 0.79 | |
| Institutional | | | 1,000.00 | | | | 1,048.60 | | | | 2.79 | | | | 1,022.48 | | | | 2.75 | | | | 0.54 | |
| Retirement class R-6 | | | 1,000.00 | | | | 1,049.40 | | | | 1.96 | | | | 1,023.29 | | | | 1.94 | | | | 0.38 | |
33
| | |
| |
| Expense Example(Unaudited)(continued) |
| | | | | | | | | | | | | | | | | | | | | | | | |
| | | Actual Expenses | | | Hypothetical Expenses | |
Fund | | Beginning
account
value
3/1/18 | | | Ending
account
value
8/31/18 | | | Expenses
paid during
period
3/1/18-
8/31/18(1) | | | Ending
account
value
8/31/18 | | | Expenses
paid during
period
3/1/18-
8/31/18(1) | | | Annualized
Expense
Ratio(1) | |
Large-Cap Growth Fund | | | | | | | | | | | | | | | | | | | | | | | | |
| Investor | | $ | 1,000.00 | | | $ | 1,124.50 | | | $ | 4.50 | | | $ | 1,020.97 | | | $ | 4.28 | | | | 0.84 | % |
| Advisor | | | 1,000.00 | | | | 1,125.00 | | | | 4.23 | | | | 1,021.22 | | | | 4.02 | | | | 0.79 | |
| Institutional | | | 1,000.00 | | | | 1,126.00 | | | | 2.89 | | | | 1,022.48 | | | | 2.75 | | | | 0.54 | |
| Retirement class R-6 | | | 1,000.00 | | | | 1,126.90 | | | | 2.09 | | | | 1,023.24 | | | | 1.99 | | | | 0.39 | |
Mid-Cap Value Fund | | | | | | | | | | | | | | | | | | | | | | | | |
| Advisor | | | 1,000.00 | | | | 1,041.20 | | | | 6.38 | | | | 1,018.95 | | | | 6.31 | | | | 1.24 | |
| Institutional | | | 1,000.00 | | | | 1,043.10 | | | | 5.10 | | | | 1,020.21 | | | | 5.04 | | | | 0.99 | |
| Retirement class R-6 | | | 1,000.00 | | | | 1,043.90 | | | | 4.28 | | | | 1,021.02 | | | | 4.23 | | | | 0.83 | |
Mid-Cap Growth Fund | | | | | | | | | | | | | | | | | | | | | | | | |
| Advisor | | | 1,000.00 | | | | 1,119.00 | | | | 6.62 | | | | 1,018.95 | | | | 6.31 | | | | 1.24 | |
| Institutional | | | 1,000.00 | | | | 1,120.50 | | | | 5.29 | | | | 1,020.21 | | | | 5.04 | | | | 0.99 | |
| Retirement class R-6 | | | 1,000.00 | | | | 1,121.60 | | | | 4.49 | | | | 1,020.97 | | | | 4.28 | | | | 0.84 | |
Small-Cap Value Fund | | | | | | | | | | | | | | | | | | | | | | | | |
| Advisor | | | 1,000.00 | | | | 1,129.10 | | | | 6.65 | | | | 1,018.95 | | | | 6.31 | | | | 1.24 | |
| Institutional | | | 1,000.00 | | | | 1,130.10 | | | | 5.32 | | | | 1,020.21 | | | | 5.04 | | | | 0.99 | |
| Retirement class R-6 | | | 1,000.00 | | | | 1,130.80 | | | | 4.46 | | | | 1,021.02 | | | | 4.23 | | | | 0.83 | |
Small-Cap Core Fund | | | | | | | | | | | | | | | | | | | | | | | | |
| Advisor | | | 1,000.00 | | | | 1,125.10 | | | | 6.16 | | | | 1,019.41 | | | | 5.85 | | | | 1.15 | |
| Institutional | | | 1,000.00 | | | | 1,126.50 | | | | 4.82 | | | | 1,020.67 | | | | 4.58 | | | | 0.90 | |
Small-Cap Growth Fund | | | | | | | | | | | | | | | | | | | | | | | | |
| Advisor | | | 1,000.00 | | | | 1,202.00 | | | | 6.88 | | | | 1,018.95 | | | | 6.31 | | | | 1.24 | |
| Institutional | | | 1,000.00 | | | | 1,203.40 | | | | 5.50 | | | | 1,020.21 | | | | 5.04 | | | | 0.99 | |
Global Low Volatility Equity Fund | | | | | | | | | | | | | | | | | | | | | | | | |
| Advisor | | | 1,000.00 | | | | 1,035.50 | | | | 5.69 | | | | 1,019.61 | | | | 5.65 | | | | 1.11 | |
| Institutional | | | 1,000.00 | | | | 1,036.10 | | | | 4.41 | | | | 1,020.87 | | | | 4.38 | | | | 0.86 | |
Disciplined International Equity Fund | | | | | | | | | | | | | | | | | | | | | | | | |
| Advisor | | | 1,000.00 | | | | 956.30 | | | | 5.67 | | | | 1,019.41 | | | | 5.85 | | | | 1.15 | |
| Institutional | | | 1,000.00 | | | | 957.20 | | | | 4.44 | | | | 1,020.67 | | | | 4.58 | | | | 0.90 | |
Pyrford International Stock Fund | | | | | | | | | | | | | | | | | | | | | | | | |
| Advisor | | | 1,000.00 | | | | 995.60 | | | | 5.94 | | | | 1,019.26 | | | | 6.01 | | | | 1.18 | |
| Institutional | | | 1,000.00 | | | | 997.00 | | | | 4.73 | | | | 1,020.47 | | | | 4.79 | | | | 0.94 | |
| Retirement class R-6 | | | 1,000.00 | | | | 997.70 | | | | 3.98 | | | | 1,021.22 | | | | 4.02 | | | | 0.79 | |
| Class F-3 | | | 1,000.00 | | | | 997.70 | | | | 3.98 | | | | 1,021.22 | | | | 4.02 | | | | 0.79 | |
LGM Emerging Markets Equity Fund | | | | | | | | | | | | | | | | | | | | | | | | |
| Advisor | | | 1,000.00 | | | | 946.90 | | | | 6.87 | | | | 1,018.15 | | | | 7.12 | | | | 1.40 | |
| Institutional | | | 1,000.00 | | | | 947.80 | | | | 5.65 | | | | 1,019.41 | | | | 5.85 | | | | 1.15 | |
Alternative Strategies Fund | | | | | | | | | | | | | | | | | | | | | | | | |
| Advisor | | | 1,000.00 | | | | 1,000.00 | | | | 11.95 | | | | 1,013.26 | | | | 12.03 | | | | 2.37 | |
| Institutional | | | 1,000.00 | | | | 1,000.00 | | | | 10.59 | | | | 1,014.62 | | | | 10.66 | | | | 2.10 | |
Global Long/Short Equity Fund | | | | | | | | | | | | | | | | | | | | | | | | |
| Advisor | | | 1,000.00 | | | | 998.30 | | | | 12.84 | | | | 1,012.35 | | | | 12.93 | | | | 2.55 | |
| Institutional | | | 1,000.00 | | | | 1,000.00 | | | | 11.54 | | | | 1,013.66 | | | | 11.62 | | | | 2.29 | |
Ultra Short Tax-Free Fund | | | | | | | | | | | | | | | | | | | | | | | | |
| Advisor | | | 1,000.00 | | | | 1,005.60 | | | | 2.78 | | | | 1,022.43 | | | | 2.80 | | | | 0.55 | |
| Institutional | | | 1,000.00 | | | | 1,006.90 | | | | 1.52 | | | | 1,023.69 | | | | 1.53 | | | | 0.30 | |
34
| | |
| |
| Expense Example(Unaudited)(continued) |
| | | | | | | | | | | | | | | | | | | | | | | | |
| | | Actual Expenses | | | Hypothetical Expenses | |
Fund | | Beginning
account
value
3/1/18 | | | Ending
account
value
8/31/18 | | | Expenses
paid during
period
3/1/18-
8/31/18(1) | | | Ending
account
value
8/31/18 | | | Expenses
paid during
period
3/1/18-
8/31/18(1) | | | Annualized
Expense
Ratio(1) | |
Short Tax-Free Fund | | | | | | | | | | | | | | | | | | | | | | | | |
| Advisor | | $ | 1,000.00 | | | $ | 1,008.30 | | | $ | 2.78 | | | $ | 1,022.43 | | | $ | 2.80 | | | | 0.55 | % |
| Institutional | | | 1,000.00 | | | | 1,008.10 | | | | 2.02 | | | | 1,023.19 | | | | 2.04 | | | | 0.40 | |
Short-Term Income Fund | | | | | | | | | | | | | | | | | | | | | | | | |
| Advisor | | | 1,000.00 | | | | 1,007.90 | | | | 3.04 | | | | 1,022.18 | | | | 3.06 | | | | 0.60 | |
| Institutional | | | 1,000.00 | | | | 1,010.30 | | | | 1.77 | | | | 1,023.44 | | | | 1.79 | | | | 0.35 | |
Intermediate Tax-Free Fund | | | | | | | | | | | | | | | | | | | | | | | | |
| Investor | | | 1,000.00 | | | | 1,012.30 | | | | 2.79 | | | | 1,022.43 | | | | 2.80 | | | | 0.55 | |
| Advisor | | | 1,000.00 | | | | 1,012.30 | | | | 2.79 | | | | 1,022.43 | | | | 2.80 | | | | 0.55 | |
| Institutional | | | 1,000.00 | | | | 1,012.60 | | | | 1.52 | | | | 1,023.69 | | | | 1.53 | | | | 0.30 | |
Strategic Income Fund | | | | | | | | | | | | | | | | | | | | | | | | |
| Investor | | | 1,000.00 | | | | 998.90 | | | | 4.03 | | | | 1,021.17 | | | | 4.08 | | | | 0.80 | |
| Advisor | | | 1,000.00 | | | | 998.90 | | | | 4.03 | | | | 1,021.17 | | | | 4.08 | | | | 0.80 | |
| Institutional | | | 1,000.00 | | | | 1,001.20 | | | | 2.77 | | | | 1,022.43 | | | | 2.80 | | | | 0.55 | |
TCH Corporate Income Fund | | | | | | | | | | | | | | | | | | | | | | | | |
| Investor | | | 1,000.00 | | | | 1,004.90 | | | | 2.98 | | | | 1,022.23 | | | | 3.01 | | | | 0.59 | |
| Advisor | | | 1,000.00 | | | | 1,005.00 | | | | 2.93 | | | | 1,022.28 | | | | 2.96 | | | | 0.58 | |
| Institutional | | | 1,000.00 | | | | 1,006.50 | | | | 2.23 | | | | 1,022.99 | | | | 2.24 | | | | 0.44 | |
TCH Core Plus Bond Fund | | | | | | | | | | | | | | | | | | | | | | | | |
| Investor | | | 1,000.00 | | | | 1,006.70 | | | | 2.88 | | | | 1,022.33 | | | | 2.91 | | | | 0.57 | |
| Advisor | | | 1,000.00 | | | | 1,006.70 | | | | 2.88 | | | | 1,022.33 | | | | 2.91 | | | | 0.57 | |
| Institutional | | | 1,000.00 | | | | 1,007.10 | | | | 1.62 | | | | 1,023.59 | | | | 1.63 | | | | 0.32 | |
High Yield Bond Fund | | | | | | | | | | | | | | | | | | | | | | | | |
| Advisor | | | 1,000.00 | | | | 1,009.60 | | | | 4.56 | | | | 1,020.67 | | | | 4.58 | | | | 0.90 | |
| Institutional | | | 1,000.00 | | | | 1,010.80 | | | | 3.29 | | | | 1,021.93 | | | | 3.31 | | | | 0.65 | |
Government Money Market Fund | | | | | | | | | | | | | | | | | | | | | | | | |
| Investor | | | 1,000.00 | | | | 1,006.80 | | | | 2.28 | | | | 1,022.94 | | | | 2.29 | | | | 0.45 | |
| Premier | | | 1,000.00 | | | | 1,008.10 | | | | 1.01 | | | | 1,024.20 | | | | 1.02 | | | | 0.20 | |
Tax-Free Money Market Fund | | | | | | | | | | | | | | | | | | | | | | | | |
| Investor | | | 1,000.00 | | | | 1,004.80 | | | | 2.27 | | | | 1,022.94 | | | | 2.29 | | | | 0.45 | |
| Premier | | | 1,000.00 | | | | 1,006.10 | | | | 1.01 | | | | 1,024.20 | | | | 1.02 | | | | 0.20 | |
Prime Money Market Fund | | | | | | | | | | | | | | | | | | | | | | | | |
| Investor | | | 1,000.00 | | | | 1,007.80 | | | | 2.28 | | | | 1,022.94 | | | | 2.29 | | | | 0.45 | |
| Premier | | | 1,000.00 | | | | 1,009.10 | | | | 1.01 | | | | 1,024.20 | | | | 1.02 | | | | 0.20 | |
Institutional Prime Money Market Fund | | | | | | | | | | | | | | | | | | | | | | | | |
| Investor | | | 1,000.00 | | | | 1,008.10 | | | | 2.28 | | | | 1,022.94 | | | | 2.29 | | | | 0.45 | |
| Premier | | | 1,000.00 | | | | 1,009.40 | | | | 1.01 | | | | 1,024.20 | | | | 1.02 | | | | 0.20 | |
| (1) | Expenses are equal to the Funds’ annualized expense ratios for the period March 1, 2018 through August 31, 2018, multiplied by the average account value over the period, multiplied by 184/365 (to reflect the one-half year period). These expenses and ratios are exclusive of acquired fund fees and expenses. |
35
August 31, 2018
Low Volatility Equity Fund
| | | | | | | | |
| Description | | Shares | | | Value | |
| Common Stocks — 98.6% | |
|
| Consumer Discretionary — 14.2% | |
|
Advertising — 1.2% | |
Omnicom Group, Inc. (1) | | | 21,619 | | | $ | 1,498,629 | |
|
Apparel Retail — 1.5% | |
TJX Cos., Inc. (1) | | | 17,063 | | | | 1,876,418 | |
|
Apparel, Accessories & Luxury Goods — 0.8% | |
Carter’s, Inc. (1) | | | 5,087 | | | | 538,866 | |
Michael Kors Holdings, Ltd. (2) | | | 6,627 | | | | 481,253 | |
| | | | | | | | |
| | | | | | | 1,020,119 | |
|
Cable & Satellite — 1.4% | |
Comcast Corp., Class A (1) | | | 30,635 | | | | 1,133,189 | |
Sirius XM Holdings, Inc. (1) | | | 92,088 | | | | 653,825 | |
| | | | | | | | |
| | | | | | | 1,787,014 | |
|
Computer & Electronics Retail — 0.3% | |
Best Buy Co., Inc. (1) | | | 5,646 | | | | 449,196 | |
|
Education Services — 3.1% | |
Bright Horizons Family Solutions, Inc. (1)(2) | | | 23,617 | | | | 2,820,578 | |
Graham Holdings Co., Class B (1) | | | 500 | | | | 281,325 | |
Grand Canyon Education,
Inc. (1)(2) | | | 7,329 | | | | 873,177 | |
| | | | | | | | |
| | | | | | | 3,975,080 | |
|
General Merchandise Stores — 1.2% | |
Dollar General Corp. (1) | | | 8,678 | | | | 934,881 | |
Target Corp. (1) | | | 6,627 | | | | 579,862 | |
| | | | | | | | |
| | | | | | | 1,514,743 | |
|
Movies & Entertainment — 2.2% | |
Madison Square Garden Co., Class A (1)(2) | | | 2,295 | | | | 692,952 | |
Walt Disney Co. (1) | | | 19,089 | | | | 2,138,350 | |
| | | | | | | | |
| | | | | | | 2,831,302 | |
|
Publishing — 0.3% | |
John Wiley & Sons, Inc., Class A (1) | | | 5,509 | | | | 355,606 | |
|
Restaurants — 1.5% | |
Brinker International, Inc. (1) | | | 17,083 | | | | 756,435 | |
Darden Restaurants, Inc. | | | 10,689 | | | | 1,240,352 | |
| | | | | | | | |
| | | | | | | 1,996,787 | |
|
Specialized Consumer Services — 0.7% | |
ServiceMaster Global Holdings, Inc. (2) | | | 15,215 | | | | 917,008 | |
| | | | | | | | |
Total Consumer Discretionary | | | | | | | 18,221,902 | |
|
| Consumer Staples — 14.5% | |
|
Agricultural Products — 0.2% | |
Ingredion, Inc. (1) | | | 2,521 | | | | 254,797 | |
|
Food Distributors — 2.9% | |
Sysco Corp. (1) | | | 24,038 | | | | 1,798,523 | |
U.S. Foods Holding Corp. (2) | | | 60,487 | | | | 1,971,271 | |
| | | | | | | | |
| | | | | | | 3,769,794 | |
|
Food Retail — 1.1% | |
Kroger Co. (1) | | | 45,179 | | | | 1,423,139 | |
|
Household Products — 0.3% | |
Church & Dwight Co., Inc. (1) | | | 7,655 | | | | 433,120 | |
|
Hypermarkets & Super Centers — 4.1% | |
Costco Wholesale Corp. (1) | | | 11,575 | | | | 2,698,480 | |
Walmart, Inc. | | | 27,001 | | | | 2,588,316 | |
| | | | | | | | |
| | | | | | | 5,286,796 | |
| | | | | | | | |
| Description | | Shares | | | Value | |
| Common Stocks (continued) | |
|
| Consumer Staples (continued) | |
|
Packaged Foods & Meats — 2.2% | |
ConAgra Brands, Inc. (1) | | | 30,570 | | | $ | 1,123,448 | |
Flowers Foods, Inc. (1) | | | 51,293 | | | | 1,033,554 | |
J.M. Smucker Co. (1) | | | 2,472 | | | | 255,555 | |
Kellogg Co. (1) | | | 5,646 | | | | 405,326 | |
| | | | | | | | |
| | | | | | | 2,817,883 | |
|
Personal Products — 1.7% | |
Estee Lauder Cos., Inc., Class A (1) | | | 15,215 | | | | 2,131,926 | |
|
Soft Drinks — 2.0% | |
PepsiCo, Inc. (1) | | | 22,225 | | | | 2,489,422 | |
| | | | | | | | |
Total Consumer Staples | | | | | | | 18,606,877 | |
|
| Energy — 4.9% | |
|
Integrated Oil & Gas — 3.6% | |
Chevron Corp. | | | 20,536 | | | | 2,432,694 | |
Exxon Mobil Corp. | | | 10,729 | | | | 860,144 | |
Occidental Petroleum Corp. | | | 17,330 | | | | 1,384,147 | |
| | | | | | | | |
| | | | | | | 4,676,985 | |
|
Oil & Gas-Equipment & Services — 0.4% | |
Schlumberger, Ltd. (1) | | | 8,725 | | | | 551,071 | |
|
Oil & Gas-Exploration & Production — 0.3% | |
ConocoPhillips | | | 4,869 | | | | 357,531 | |
|
Oil & Gas-Refining & Marketing — 0.6% | |
Valero Energy Corp. (1) | | | 6,627 | | | | 781,191 | |
| | | | | | | | |
Total Energy | | | | | | | 6,366,778 | |
|
| Financials — 14.2% | |
|
Consumer Finance — 1.5% | |
American Express Co. | | | 17,779 | | | | 1,884,218 | |
|
Financial Exchanges & Data — 1.2% | |
Morningstar, Inc. (1) | | | 10,921 | | | | 1,554,277 | |
|
Life & Health Insurance — 2.2% | |
Aflac, Inc. (1) | | | 61,236 | | | | 2,831,553 | |
|
Multi-Line Insurance — 0.3% | |
Hartford Financial Services Group, Inc. | | | 7,763 | | | | 391,022 | |
|
Property & Casualty Insurance — 4.3% | |
Allstate Corp. | | | 27,257 | | | | 2,741,237 | |
Aspen Insurance Holdings, Ltd. (1) | | | 7,420 | | | | 305,333 | |
Progressive Corp. | | | 21,097 | | | | 1,424,680 | |
Travelers Cos., Inc. (1) | | | 7,890 | | | | 1,038,324 | |
| | | | | | | | |
| | | | | | | 5,509,574 | |
|
Regional Banks — 1.9% | |
BB&T Corp. (1) | | | 5,459 | | | | 282,012 | |
PNC Financial Services Group, Inc. | | | 12,601 | | | | 1,808,748 | |
Regions Financial Corp. | | | 15,635 | | | | 304,257 | |
| | | | | | | | |
| | | | | | | 2,395,017 | |
|
Reinsurance — 2.8% | |
Everest Re Group, Ltd. (1) | | | 11,747 | | | | 2,619,816 | |
RenaissanceRe Holdings, Ltd. (1) | | | 7,536 | | | | 1,001,986 | |
| | | | | | | | |
| | | | | | | 3,621,802 | |
| | | | | | | | |
Total Financials | | | | 18,187,463 | |
|
| Healthcare — 17.3% | |
|
Healthcare Equipment — 3.3% | |
Baxter International, Inc. (1) | | | 37,992 | | | | 2,825,465 | |
Hill-Rom Holdings, Inc. | | | 5,601 | | | | 544,809 | |
Medtronic PLC | | | 9,054 | | | | 872,896 | |
| | | | | | | | |
| | | | | | | 4,243,170 | |
(See Notes which are an integral part of the Financial Statements)
36
Low Volatility Equity Fund (continued)
| | | | | | | | |
| Description | | Shares | | | Value | |
| Common Stocks (continued) | |
|
| Healthcare (continued) | |
|
Healthcare Facilities — 0.3% | |
Universal Health Services, Inc., Class B (1) | | | 2,531 | | | $ | 329,435 | |
|
Healthcare Services — 1.5% | |
CVS Health Corp. (1) | | | 16,841 | | | | 1,267,117 | |
DaVita, Inc. (1)(2) | | | 5,601 | | | | 388,093 | |
MEDNAX, Inc. (2) | | | 6,761 | | | | 320,134 | |
| | | | | | | | |
| | | | | | | 1,975,344 | |
|
Healthcare Supplies — 1.1% | |
Cooper Cos., Inc. (1) | | | 5,415 | | | | 1,385,049 | |
|
Life Sciences Tools & Services — 0.3% | |
Bio-Rad Laboratories, Inc.,
Class A (1)(2) | | | 1,067 | | | | 347,095 | |
|
Managed Healthcare — 2.6% | |
Anthem, Inc. (1) | | | 1,680 | | | | 444,746 | |
Cigna Corp. | | | 6,580 | | | | 1,239,277 | |
Humana, Inc. | | | 5,141 | | | | 1,713,290 | |
| | | | | | | | |
| | | | | | | 3,397,313 | |
|
Pharmaceuticals — 8.2% | |
Bristol-Myers Squibb Co. | | | 16,351 | | | | 990,053 | |
Eli Lilly & Co. (1) | | | 21,732 | | | | 2,295,986 | |
Johnson & Johnson | | | 20,069 | | | | 2,703,093 | |
Merck & Co., Inc. | | | 25,297 | | | | 1,735,121 | |
Pfizer, Inc. | | | 66,461 | | | | 2,759,461 | |
| | | | | | | | |
| | | | | | | 10,483,714 | |
| | | | | | | | |
Total Healthcare | | | | 22,161,120 | |
|
| Industrials — 7.0% | |
|
Aerospace & Defense — 3.5% | |
Huntington Ingalls Industries, Inc. (1) | | | 2,333 | | | | 570,348 | |
Lockheed Martin Corp. (1) | | | 7,563 | | | | 2,423,261 | |
Northrop Grumman Corp. (1) | | | 3,826 | | | | 1,142,023 | |
Raytheon Co. (1) | | | 1,914 | | | | 381,728 | |
| | | | | | | | |
| | | | | | | 4,517,360 | |
|
Environmental & Facilities Services — 3.2% | |
Republic Services, Inc. (1) | | | 18,902 | | | | 1,386,651 | |
Waste Management, Inc. | | | 30,244 | | | | 2,749,179 | |
| | | | | | | | |
| | | | | | | 4,135,830 | |
|
Industrial Conglomerates — 0.3% | |
Carlisle Cos., Inc. (1) | | | 2,614 | | | | 331,482 | |
| | | | | | | | |
Total Industrials | | | | 8,984,672 | |
|
| Information Technology — 7.4% | |
|
Communications Equipment — 2.1% | |
Motorola Solutions, Inc. (1) | | | 20,816 | | | | 2,671,942 | |
|
Consulting & Other Services — 1.4% | |
Amdocs, Ltd. | | | 28,238 | | | | 1,843,377 | |
|
Data Processing & Outsourced Services — 1.5% | |
Genpact, Ltd. (1) | | | 64,502 | | | | 1,976,341 | |
|
Electronic Components — 0.4% | |
Dolby Laboratories, Inc., Class A (1) | | | 7,599 | | | | 533,374 | |
|
Internet Software & Services — 0.5% | |
eBay, Inc. (2) | | | 9,335 | | | | 323,084 | |
VeriSign, Inc. (2) | | | 2,065 | | | | 327,530 | |
| | | | | | | | |
| | | | | | | 650,614 | |
| | | | | | | | |
| Description | | Shares | | | Value | |
| Common Stocks (continued) | |
|
| Information Technology (continued) | |
|
Technology Hardware, Storage & Peripherals — 1.5% | |
Apple, Inc. | | | 8,199 | | | $ | 1,866,338 | |
| | | | | | | | |
Total Information Technology | | | | 9,541,986 | |
|
| Materials — 0.6% | |
|
Metal & Glass Containers — 0.6% | |
Berry Global Group, Inc. (1)(2) | | | 15,449 | | | | 737,381 | |
|
| Real Estate — 7.8% | |
|
Hotel & Resort REIT’s — 1.3% | |
Apple Hospitality REIT, Inc. (1) | | | 93,749 | | | | 1,654,670 | |
|
Office REIT’s — 2.2% | |
Equity Commonwealth (1)(2) | | | 71,966 | | | | 2,307,230 | |
Highwoods Properties, Inc. | | | 6,488 | | | | 322,713 | |
Piedmont Office Realty Trust, Inc., Class A (1) | | | 12,695 | | | | 251,869 | |
| | | | | | | | |
| | | | | | | 2,881,812 | |
|
Residential REIT’s — 3.5% | |
Essex Property Trust, Inc. | | | 10,735 | | | | 2,643,816 | |
UDR, Inc. (1) | | | 47,000 | | | | 1,878,590 | |
| | | | | | | | |
| | | | | | | 4,522,406 | |
|
Specialized REIT’s — 0.8% | |
Equinix, Inc. | | | 2,333 | | | | 1,017,491 | |
| | | | | | | | |
Total Real Estate | | | | 10,076,379 | |
|
| Telecommunication Services — 0.4% | |
|
Integrated Telecommunication Services — 0.4% | |
AT&T, Inc. (1) | | | 14,561 | | | | 465,078 | |
|
| Utilities — 10.3% | |
|
Electric Utilities — 8.2% | |
American Electric Power Co., Inc. | | | 35,985 | | | | 2,581,204 | |
Entergy Corp. (1) | | | 30,076 | | | | 2,514,053 | |
Exelon Corp. | | | 64,502 | | | | 2,819,383 | |
Xcel Energy, Inc. (1) | | | 53,428 | | | | 2,567,215 | |
| | | | | | | | |
| | | | | | | 10,481,855 | |
|
Multi-Utilities — 2.1% | |
Ameren Corp. | | | 43,594 | | | | 2,756,448 | |
| | | | | | | | |
Total Utilities | | | | 13,238,303 | |
| | | | | | | | |
Total Common Stocks
(identified cost $102,015,952) | | | | | | | 126,587,939 | |
| | | | | | | | |
| Short-Term Investments — 46.2% | |
|
| Collateral Pool Investments for Securities on Loan — 45.0% | |
| | |
Collateral pool allocation (3) | | | | | | | 57,761,573 | |
|
| Mutual Funds — 1.2% | |
BMO Institutional Prime Money Market Fund — Premier Class, 1.987% (4) | | | 1,494,054 | | | | 1,494,204 | |
| | | | | | | | |
Total Short-Term Investments
(identified cost $59,255,418) | | | | | | | 59,255,777 | |
| | | | | | | | |
Total Investments — 144.8%
(identified cost $161,271,370) | | | | | | | 185,843,716 | |
| Other Assets and Liabilities — (44.8)% | | | | (57,458,346 | ) |
| | | | | | | | |
| Total Net Assets — 100.0% | | | | | | $ | 128,385,370 | |
| | | | | | | | |
(See Notes which are an integral part of the Financial Statements)
37
August 31, 2018
Dividend Income Fund
| | | | | | | | |
| Description | | Shares | | | Value | |
| Common Stocks — 97.5% | | | | | | |
| | |
| Consumer Discretionary — 9.1% | | | | | | |
| |
Automobile Manufacturers — 0.5% | | | | | |
Ford Motor Co. | | | 76,361 | | | $ | 723,902 | |
| |
Cable & Satellite — 1.9% | | | | | |
Comcast Corp., Class A (1) | | | 81,699 | | | | 3,022,046 | |
| |
Computer & Electronics Retail — 1.1% | | | | | |
Best Buy Co., Inc. (1) | | | 21,788 | | | | 1,733,453 | |
| |
Department Stores — 2.7% | | | | | |
Kohl’s Corp. (1) | | | 37,218 | | | | 2,944,316 | |
Nordstrom, Inc. (1) | | | 19,310 | | | | 1,213,634 | |
| | | | | | | | |
| | | | | | | 4,157,950 | |
| |
Hotels, Resorts & Cruise Lines — 1.1% | | | | | |
Carnival Corp. (1) | | | 28,110 | | | | 1,728,484 | |
| |
Restaurants — 1.8% | | | | | |
Darden Restaurants, Inc. (1) | | | 23,990 | | | | 2,783,800 | |
| | | | | | | | |
Total Consumer Discretionary | | | | 14,149,635 | |
| | |
| Consumer Staples — 6.3% | | | | | | |
| |
Food Distributors — 2.2% | | | | | |
Sysco Corp. (1) | | | 46,802 | | | | 3,501,726 | |
| |
Food Retail — 0.6% | | | | | |
Kroger Co. (1) | | | 28,905 | | | | 910,507 | |
| |
Hypermarkets & Super Centers — 2.3% | | | | | |
Walmart, Inc. | | | 36,728 | | | | 3,520,746 | |
| |
Soft Drinks — 1.2% | | | | | |
PepsiCo, Inc. (1) | | | 16,486 | | | | 1,846,597 | |
| | | | | | | | |
Total Consumer Staples | | | | | | | 9,779,576 | |
| | |
| Energy — 9.1% | | | | | | |
| | |
Integrated Oil & Gas — 3.7% | | | | | | | | |
Chevron Corp. | | | 32,341 | | | | 3,831,115 | |
Occidental Petroleum Corp. | | | 24,312 | | | | 1,941,799 | |
| | | | | | | | |
| | | | | | | 5,772,914 | |
| |
Oil & Gas-Refining & Marketing — 3.7% | | | | | |
Marathon Petroleum Corp. (1) | | | 27,286 | | | | 2,245,365 | |
Valero Energy Corp. (1) | | | 29,053 | | | | 3,424,768 | |
| | | | | | | | |
| | | | | | | 5,670,133 | |
|
Oil & Gas-Storage & Transportation — 1.7% | |
Kinder Morgan, Inc. | | | 40,700 | | | | 720,390 | |
Williams Cos., Inc. | | | 62,834 | | | | 1,859,258 | |
| | | | | | | | |
| | | | | | | 2,579,648 | |
| | | | | | | | |
Total Energy | | | | | | | 14,022,695 | |
| | |
| Financials — 14.4% | | | | | | |
| | |
Consumer Finance — 1.6% | | | | | | | | |
Discover Financial Services (1) | | | 21,289 | | | | 1,663,097 | |
Navient Corp. | | | 66,992 | | | | 913,771 | |
| | | | | | | | |
| | | | | | | 2,576,868 | |
| | |
Diversified Banks — 4.8% | | | | | | | | |
Citigroup, Inc. | | | 14,587 | | | | 1,039,178 | |
JPMorgan Chase & Co. | | | 16,320 | | | | 1,869,945 | |
Wells Fargo & Co. (1) | | | 77,202 | | | | 4,514,773 | |
| | | | | | | | |
| | | | | | | 7,423,896 | |
|
Life & Health Insurance — 2.7% | |
Aflac, Inc. (1) | | | 25,769 | | | | 1,191,559 | |
Prudential Financial, Inc. | | | 30,273 | | | | 2,974,322 | |
| | | | | | | | |
| | | | | | | 4,165,881 | |
| | | | | | | | |
| Description | | Shares | | | Value | |
| Common Stocks (continued) | | | | | | |
| | |
| Financials (continued) | | | | | | |
| | |
Regional Banks — 5.3% | | | | | | | | |
BB&T Corp. (1) | | | 13,484 | | | $ | 696,583 | |
Citizens Financial Group, Inc. | | | 40,753 | | | | 1,677,394 | |
Regions Financial Corp. | | | 125,877 | | | | 2,449,566 | |
SunTrust Banks, Inc. (1) | | | 46,142 | | | | 3,394,206 | |
| | | | | | | | |
| | | | | | | 8,217,749 | |
| | | | | | | | |
Total Financials | | | | | | | 22,384,394 | |
| | |
| Healthcare — 11.4% | | | | | | |
| | |
Biotechnology — 3.2% | | | | | | | | |
AbbVie, Inc. (1) | | | 35,514 | | | | 3,408,634 | |
Amgen, Inc. (1) | | | 7,920 | | | | 1,582,495 | |
| | | | | | | | |
| | | | | | | 4,991,129 | |
| | |
Healthcare Services — 1.4% | | | | | | | | |
CVS Health Corp. (1) | | | 28,779 | | | | 2,165,332 | |
| | |
Pharmaceuticals — 6.8% | | | | | | | | |
Bristol-Myers Squibb Co. | | | 24,683 | | | | 1,494,556 | |
Eli Lilly & Co. (1) | | | 34,348 | | | | 3,628,866 | |
Merck & Co., Inc. | | | 17,050 | | | | 1,169,459 | |
Pfizer, Inc. | | | 102,687 | | | | 4,263,564 | |
| | | | | | | | |
| | | | | | | 10,556,445 | |
| | | | | | | | |
Total Healthcare | | | | | | | 17,712,906 | |
| | |
| Industrials — 6.0% | | | | | | |
| | |
Aerospace & Defense — 2.6% | | | | | | | | |
Boeing Co. | | | 9,012 | | | | 3,089,223 | |
Lockheed Martin Corp. (1) | | | 2,689 | | | | 861,583 | |
| | | | | | | | |
| | | | | | | 3,950,806 | |
| | |
Airlines — 0.6% | | | | | | | | |
Delta Air Lines, Inc. (1) | | | 16,798 | | | | 982,347 | |
|
Construction Machinery & Heavy Trucks — 0.5% | |
Caterpillar, Inc. | | | 5,578 | | | | 774,505 | |
|
Environmental & Facilities Services — 1.0% | |
Republic Services, Inc. (1) | | | 10,417 | | | | 764,191 | |
Waste Management, Inc. | | | 8,772 | | | | 797,375 | |
| | | | | | | | |
| | | | | | | 1,561,566 | |
| | |
Industrial Machinery — 0.5% | | | | | | | | |
Ingersoll-Rand PLC (1) | | | 7,973 | | | | 807,585 | |
| | |
Trucking — 0.8% | | | | | | | | |
Ryder System, Inc. (1) | | | 15,281 | | | | 1,174,192 | |
| | | | | | | | |
Total Industrials | | | | | | | 9,251,001 | |
|
| Information Technology — 21.4% | |
| |
Communications Equipment — 3.2% | | | | | |
Cisco Systems, Inc. | | | 87,972 | | | | 4,202,423 | |
Motorola Solutions, Inc. (1) | | | 6,367 | | | | 817,268 | |
| | | | | | | | |
| | | | | | | 5,019,691 | |
|
Data Processing & Outsourced Services — 1.3% | |
Automatic Data Processing, Inc. (1) | | | 14,076 | | | | 2,065,653 | |
|
Electronic Equipment & Instruments — 0.7% | |
FLIR Systems, Inc. | | | 16,975 | | | | 1,065,011 | |
| |
Semiconductor Equipment — 2.8% | | | | | |
KLA-Tencor Corp. (1) | | | 27,429 | | | | 3,187,524 | |
Lam Research Corp. (1) | | | 6,476 | | | | 1,120,931 | |
| | | | | | | | |
| | | | | | | 4,308,455 | |
| | |
Semiconductors — 5.2% | | | | | | | | |
Broadcom, Inc. | | | 5,561 | | | | 1,218,026 | |
Intel Corp. | | | 65,784 | | | | 3,185,919 | |
Maxim Integrated Products, Inc. (1) | | | 26,307 | | | | 1,590,784 | |
Texas Instruments, Inc. (1) | | | 18,409 | | | | 2,069,172 | |
| | | | | | | | |
| | | | | | | 8,063,901 | |
(See Notes which are an integral part of the Financial Statements)
38
Dividend Income Fund (continued)
| | | | | | | | |
| Description | | Shares | | | Value | |
| Common Stocks (continued) | | | | | | |
|
| Information Technology (continued) | |
| | |
Systems Software — 3.7% | | | | | | | | |
Microsoft Corp. | | | 51,570 | | | $ | 5,792,858 | |
|
Technology Hardware, Storage & Peripherals — 4.5% | |
Apple, Inc. | | | 5,184 | | | | 1,180,034 | |
HP, Inc. (1) | | | 87,638 | | | | 2,160,277 | |
NetApp, Inc. (1) | | | 21,964 | | | | 1,906,695 | |
Seagate Technology PLC (1) | | | 16,985 | | | | 909,377 | |
Western Digital Corp. | | | 11,744 | | | | 742,690 | |
| | | | | | | | |
| | | | | | | 6,899,073 | |
| | | | | | | | |
Total Information Technology | | | | 33,214,642 | |
| | |
| Materials — 2.7% | | | | | | |
|
Commodity Chemicals — 0.9% | |
LyondellBasell Industries NV, Class A (1) | | | 12,764 | | | | 1,439,524 | |
|
Fertilizers & Agricultural Chemicals — 1.2% | |
CF Industries Holdings, Inc. (1) | | | 35,339 | | | | 1,835,861 | |
| | |
Paper Packaging — 0.6% | | | | | | | | |
WestRock Co. (1) | | | 15,273 | | | | 841,237 | |
| | | | | | | | |
Total Materials | | | | | | | 4,116,622 | |
| | |
| Real Estate — 5.8% | | | | | | |
|
Hotel & Resort REIT’s — 2.2% | |
Host Hotels & Resorts, Inc. (1) | | | 160,799 | | | | 3,462,002 | |
| | |
Office REIT’s — 0.8% | | | | | | | | |
Alexandria Real Estate Equities, Inc. (1) | | | 9,993 | | | | 1,282,602 | |
| | |
Residential REIT’s — 1.8% | | | | | | | | |
Essex Property Trust, Inc. | | | 8,049 | | | | 1,982,308 | |
UDR, Inc. | | | 19,411 | | | | 775,857 | |
| | | | | | | | |
| | | | | | | 2,758,165 | |
| | |
Retail REIT’s — 0.5% | | | | | | | | |
Simon Property Group, Inc. (1) | | | 4,157 | | | | 760,856 | |
| | |
Specialized REIT’s — 0.5% | | | | | | | | |
Crown Castle International Corp. (1) | | | 6,954 | | | | 792,965 | |
| | | | | | | | |
Total Real Estate | | | | | | | 9,056,590 | |
|
| Telecommunication Services — 4.3% | |
|
Integrated Telecommunication Services — 4.3% | |
AT&T, Inc. (1) | | | 81,639 | | | | 2,607,550 | |
Verizon Communications, Inc. (1) | | | 74,685 | | | | 4,060,623 | |
| | | | | | | | |
Total Telecommunication Services | | | | 6,668,173 | |
| | |
| Utilities — 7.0% | | | | | | |
| | |
Electric Utilities — 3.6% | | | | | | | | |
American Electric Power Co., Inc. | | | 18,468 | | | | 1,324,710 | |
Entergy Corp. (1) | | | 8,926 | | | | 746,124 | |
Exelon Corp. | | | 79,659 | | | | 3,481,895 | |
| | | | | | | | |
| | | | | | | 5,552,729 | |
|
Independent Power Producers & Energy Traders — 2.2% | |
AES Corp. (1) | | | 251,089 | | | | 3,379,658 | |
| | |
Multi-Utilities — 1.2% | | | | | | | | |
Ameren Corp. | | | 31,255 | | | | 1,976,253 | |
| | | | | | | | |
Total Utilities | | | | | | | 10,908,640 | |
| | | | | | | | |
Total Common Stocks
(identified cost $114,417,336) | | | | | | | 151,264,874 | |
| | | | | | | | |
| Description | | Shares | | | Value | |
| Short-Term Investments — 47.9% | |
|
| Collateral Pool Investments for Securities on Loan — 45.6% | |
| | |
Collateral pool allocation (3) | | | | | | $ | 70,677,075 | |
| | |
| Mutual Funds — 2.3% | | | | | | |
BMO Institutional Prime Money Market Fund — Premier Class, 1.987% (4) | | | 3,590,739 | | | | 3,591,099 | |
| | | | | | | | |
Total Short-Term Investments
(identified cost $74,267,624) | | | | | | | 74,268,174 | |
| | | | | | | | |
Total Investments — 145.4%
(identified cost $188,684,960) | | | | | | | 225,533,048 | |
| Other Assets and Liabilities — (45.4)% | | | | (70,431,782 | ) |
| | | | | | | | |
| Total Net Assets — 100.0% | | | | | | $ | 155,101,266 | |
| | | | | | | | |
Large-Cap Value Fund
| | | | | | | | |
| Description | | Shares | | | Value | |
| Common Stocks — 97.8% | |
|
| Consumer Discretionary — 9.4% | |
|
Apparel Retail — 0.6% | |
Gap, Inc. (1) | | | 76,414 | | | $ | 2,319,165 | |
|
Apparel, Accessories & Luxury Goods — 0.8% | |
Michael Kors Holdings, Ltd. (1)(2) | | | 43,435 | | | | 3,154,250 | |
|
Auto Parts & Equipment — 1.2% | |
Lear Corp. | | | 29,693 | | | | 4,816,204 | |
|
Automotive Retail — 0.3% | |
AutoZone, Inc. (1)(2) | | | 1,477 | | | | 1,132,682 | |
|
Broadcasting — 0.5% | |
AMC Networks, Inc.,
Class A (1)(2) | | | 31,057 | | | | 1,950,690 | |
|
Cable & Satellite — 3.0% | |
Comcast Corp., Class A (1) | | | 313,229 | | | | 11,586,341 | |
|
Department Stores — 1.4% | |
Kohl’s Corp. (1) | | | 39,460 | | | | 3,121,681 | |
Nordstrom, Inc. (1) | | | 38,479 | | | | 2,418,405 | |
| | | | | | | | |
| | | | | | | 5,540,086 | |
|
Home Improvement Retail — 1.6% | |
Lowe’s Cos., Inc. | | | 58,566 | | | | 6,369,052 | |
| | | | | | | | |
Total Consumer Discretionary | | | | 36,868,470 | |
|
| Consumer Staples — 4.6% | |
|
Food Distributors — 0.3% | |
Sysco Corp. (1) | | | 15,528 | | | | 1,161,805 | |
|
Household Products — 0.4% | |
Kimberly-Clark Corp. (1) | | | 14,355 | | | | 1,658,577 | |
|
Hypermarkets & Super Centers — 2.8% | |
Walmart, Inc. (1) | | | 114,791 | | | | 11,003,865 | |
|
Packaged Foods & Meats — 1.1% | |
Campbell Soup Co. (1) | | | 35,769 | | | | 1,411,087 | |
J.M. Smucker Co. (1) | | | 27,025 | | | | 2,793,845 | |
| | | | | | | | |
| | | | | | | 4,204,932 | |
| | | | | | | | |
Total Consumer Staples | | | | 18,029,179 | |
|
| Energy — 10.5% | |
|
Integrated Oil & Gas — 3.3% | |
Chevron Corp. | | | 107,364 | | | | 12,718,339 | |
|
Oil & Gas-Equipment & Services — 0.7% | |
Schlumberger, Ltd. (1) | | | 45,416 | | | | 2,868,475 | |
(See Notes which are an integral part of the Financial Statements)
39
August 31, 2018
Large-Cap Value Fund (continued)
| | | | | | | | |
| Description | | Shares | | | Value | |
| Common Stocks (continued) | |
|
| Energy (continued) | |
|
Oil & Gas-Exploration & Production — 2.3% | |
ConocoPhillips | | | 125,004 | | | $ | 9,179,044 | |
|
Oil & Gas-Refining & Marketing — 4.2% | |
Marathon Petroleum Corp. (1) | | | 95,592 | | | | 7,866,266 | |
Valero Energy Corp. (1) | | | 73,921 | | | | 8,713,807 | |
| | | | | | | | |
| | | | | | | 16,580,073 | |
| | | | | | | | |
Total Energy | | | | | | | 41,345,931 | |
|
| Financials — 20.9% | |
|
Asset Management & Custody Banks — 0.3% | |
Northern Trust Corp. | | | 12,450 | | | | 1,337,877 | |
|
Consumer Finance — 3.6% | |
American Express Co. (1) | | | 27,479 | | | | 2,912,224 | |
Capital One Financial Corp. (1) | | | 55,842 | | | | 5,533,384 | |
Synchrony Financial (1) | | | 174,852 | | | | 5,537,563 | |
| | | | | | | | |
| | | | | | | 13,983,171 | |
|
Diversified Banks — 6.1% | |
Bank of America Corp. (1) | | | 133,664 | | | | 4,134,228 | |
Citigroup, Inc. | | | 174,148 | | | | 12,406,303 | |
Wells Fargo & Co. (1) | | | 124,880 | | | | 7,302,982 | |
| | | | | | | | |
| | | | | | | 23,843,513 | |
|
Investment Banking & Brokerage — 0.3% | |
Lazard, Ltd., Class A | | | 26,252 | | | | 1,263,771 | |
|
Life & Health Insurance — 2.9% | |
Prudential Financial, Inc. | | | 72,750 | | | | 7,147,688 | |
Unum Group | | | 120,223 | | | | 4,433,824 | |
| | | | | | | | |
| | | | | | | 11,581,512 | |
|
Multi-Line Insurance — 0.5% | |
American International Group, Inc. (1) | | | 33,674 | | | | 1,790,447 | |
|
Property & Casualty Insurance — 1.4% | |
Allstate Corp. (1) | | | 13,182 | | | | 1,325,714 | |
Travelers Cos., Inc. (1) | | | 31,922 | | | | 4,200,935 | |
| | | | | | | | |
| | | | | | | 5,526,649 | |
|
Regional Banks — 5.8% | |
Citizens Financial Group, Inc. | | | 180,624 | | | | 7,434,484 | |
Regions Financial Corp. (1) | | | 363,897 | | | | 7,081,435 | |
SunTrust Banks, Inc. (1) | | | 109,387 | | | | 8,046,508 | |
| | | | | | | | |
| | | | | | | 22,562,427 | |
| | | | | | | | |
Total Financials | | | | | | | 81,889,367 | |
|
| Healthcare — 15.3% | |
|
Biotechnology — 3.0% | |
AbbVie, Inc. (1) | | | 34,117 | | | | 3,274,550 | |
Amgen, Inc. (1) | | | 18,323 | | | | 3,661,119 | |
Celgene Corp. (1)(2) | | | 50,281 | | | | 4,749,040 | |
| | | | | | | | |
| | | | | | | 11,684,709 | |
|
Healthcare Equipment — 1.0% | |
Hill-Rom Holdings, Inc. | | | 41,011 | | | | 3,989,140 | |
|
Healthcare Services — 1.6% | |
CVS Health Corp. (1) | | | 81,496 | | | | 6,131,759 | |
|
Life Sciences Tools & Services — 0.7% | |
Charles River Laboratories International, Inc. (1)(2) | | | 23,585 | | | | 2,912,983 | |
|
Managed Healthcare — 0.4% | |
Cigna Corp. (1) | | | 8,538 | | | | 1,608,047 | |
| | | | | | | | |
| Description | | Shares | | | Value | |
| Common Stocks (continued) | |
|
| Healthcare (continued) | |
|
Pharmaceuticals — 8.6% | |
Bristol-Myers Squibb Co. (1) | | | 139,373 | | | $ | 8,439,035 | |
Eli Lilly & Co. (1) | | | 82,278 | | | | 8,692,671 | |
Merck & Co., Inc. (1) | | | 33,174 | | | | 2,275,405 | |
Pfizer, Inc. | | | 344,546 | | | | 14,305,550 | |
| | | | | | | | |
| | | | | | | 33,712,661 | |
| | | | | | | | |
Total Healthcare | | | | | | | 60,039,299 | |
|
| Industrials — 7.8% | |
|
Aerospace & Defense — 2.6% | |
Boeing Co. (1) | | | 8,493 | | | | 2,911,315 | |
Huntington Ingalls Industries, Inc. (1) | | | 30,523 | | | | 7,461,958 | |
| | | | | | | | |
| | | | | | | 10,373,273 | |
|
Airlines — 2.3% | |
Southwest Airlines Co. (1) | | | 101,826 | | | | 6,241,934 | |
United Continental Holdings, Inc. (1)(2) | | | 31,360 | | | | 2,741,491 | |
| | | | | | | | |
| | | | | | | 8,983,425 | |
|
Building Products — 1.7% | |
Masco Corp. (1) | | | 68,974 | | | | 2,618,943 | |
Owens Corning | | | 70,197 | | | | 3,974,554 | |
| | | | | | | | |
| | | | | | | 6,593,497 | |
|
Construction Machinery & Heavy Trucks — 1.2% | |
Oshkosh Corp. (1) | | | 29,712 | | | | 2,087,565 | |
Terex Corp. (1) | | | 63,574 | | | | 2,463,493 | |
| | | | | | | | |
| | | | | | | 4,551,058 | |
| | | | | | | | |
Total Industrials | | | | | | | 30,501,253 | |
|
| Information Technology — 9.9% | |
|
Communications Equipment — 4.1% | |
Cisco Systems, Inc. (1) | | | 181,364 | | | | 8,663,758 | |
F5 Networks, Inc. (1)(2) | | | 38,391 | | | | 7,260,506 | |
| | | | | | | | |
| | | | | | | 15,924,264 | |
|
Consulting & Other Services — 0.6% | |
DXC Technology Co. (1) | | | 25,713 | | | | 2,342,197 | |
|
Data Processing & Outsourced Services — 1.1% | |
Alliance Data Systems Corp. (1) | | | 17,578 | | | | 4,193,759 | |
|
Semiconductor Equipment — 0.6% | |
Applied Materials, Inc. | | | 58,448 | | | | 2,514,433 | |
|
Semiconductors — 2.1% | |
Intel Corp. (1) | | | 79,530 | | | | 3,851,638 | |
ON Semiconductor Corp. (1)(2) | | | 214,695 | | | | 4,581,591 | |
| | | | | | | | |
| | | | | | | 8,433,229 | |
|
Technology Hardware, Storage & Peripherals — 1.4% | |
NetApp, Inc. (1) | | | 28,145 | | | | 2,443,268 | |
Western Digital Corp. (1) | | | 48,904 | | | | 3,092,689 | |
| | | | | | | | |
| | | | | | | 5,535,957 | |
| | | | | | | | |
Total Information Technology | | | | | | | 38,943,839 | |
|
| Materials — 3.6% | |
|
Commodity Chemicals — 1.4% | |
LyondellBasell Industries NV, Class A (1) | | | 48,794 | | | | 5,502,987 | |
|
Diversified Chemicals — 0.4% | |
Huntsman Corp. (1) | | | 51,249 | | | | 1,562,582 | |
|
Metal & Glass Containers — 1.1% | |
Berry Global Group, Inc. (1)(2) | | | 85,540 | | | | 4,082,824 | |
|
Steel — 0.7% | |
Steel Dynamics, Inc. (1) | | | 63,382 | | | | 2,898,459 | |
| | | | | | | | |
Total Materials | | | | | | | 14,046,852 | |
(See Notes which are an integral part of the Financial Statements)
40
Large-Cap Value Fund (continued)
| | | | | | | | |
| Description | | Shares | | | Value | |
| Common Stocks (continued) | |
|
| Real Estate — 7.3% | |
|
Hotel & Resort REIT’s — 0.7% | |
Host Hotels & Resorts, Inc. (1) | | | 132,165 | | | $ | 2,845,512 | |
|
Office REIT’s — 3.4% | |
Boston Properties, Inc. (1) | | | 49,746 | | | | 6,489,366 | |
Highwoods Properties, Inc. | | | 69,861 | | | | 3,474,886 | |
Kilroy Realty Corp. (1) | | | 42,770 | | | | 3,128,198 | |
| | | | | | | | |
| | | | | | | 13,092,450 | |
|
Residential REIT’s — 1.9% | |
Essex Property Trust, Inc. (1) | | | 30,818 | | | | 7,589,857 | |
|
Specialized REIT’s — 1.3% | |
Equinix, Inc. (1) | | | 11,428 | | | | 4,984,094 | |
| | | | | | | | |
Total Real Estate | | | | | | | 28,511,913 | |
|
| Utilities — 8.5% | |
|
Electric Utilities — 5.2% | |
American Electric Power Co., Inc. | | | 100,610 | | | | 7,216,755 | |
Entergy Corp. (1) | | | 57,581 | | | | 4,813,196 | |
Exelon Corp. (1) | | | 192,288 | | | | 8,404,909 | |
| | | | | | | | |
| | | | | | | 20,434,860 | |
|
Independent Power Producers & Energy Traders — 1.5% | |
AES Corp. (1) | | | 434,727 | | | | 5,851,425 | |
|
Multi-Utilities — 1.8% | |
Ameren Corp. (1) | | | 110,744 | | | | 7,002,343 | |
| | | | | | | | |
Total Utilities | | | | | | | 33,288,628 | |
| | | | | | | | |
Total Common Stocks
(identified cost $319,880,283) | | | | | | | 383,464,731 | |
| | | | | | | | |
| Short-Term Investments — 42.5% | |
|
| Collateral Pool Investments for Securities on Loan — 40.6% | |
| | |
Collateral pool allocation (3) | | | | | | | 159,109,849 | |
| | |
| Mutual Funds — 1.9% | | | | | | |
BMO Institutional Prime Money Market Fund — Premier Class, 1.987% (4) | | | 7,481,565 | | | | 7,482,313 | |
| | | | | | | | |
Total Short-Term Investments
(identified cost $166,591,117) | | | | 166,592,162 | |
| | | | | | | | |
Total Investments — 140.3%
(identified cost $486,471,400) | | | | 550,056,893 | |
| Other Assets and Liabilities — (40.3)% | | | | (157,984,213 | ) |
| | | | | | | | |
| Total Net Assets — 100.0% | | | | | | $ | 392,072,680 | |
| | | | | | | | |
Large-Cap Growth Fund
| | | | | | | | |
| Description | | Shares | | | Value | |
| Common Stocks — 98.3% | |
|
| Consumer Discretionary — 16.1% | |
|
Apparel Retail — 1.0% | |
Burlington Stores, Inc. (1)(2) | | | 25,448 | | | $ | 4,279,845 | |
|
Apparel, Accessories & Luxury Goods — 2.7% | |
Lululemon Athletica, Inc. (1)(2) | | | 36,615 | | | | 5,672,762 | |
Michael Kors Holdings, Ltd. (2) | | | 72,084 | | | | 5,234,740 | |
| | | | | | | | |
| | | | | | | 10,907,502 | |
|
Automotive Retail — 1.3% | |
O’Reilly Automotive, Inc. (2) | | | 15,923 | | | | 5,340,893 | |
| | | | | | | | |
| Description | | Shares | | | Value | |
| Common Stocks (continued) | |
|
| Consumer Discretionary (continued) | |
|
Cable & Satellite — 2.6% | |
Comcast Corp., Class A (1) | | | 193,061 | | | $ | 7,141,326 | |
Sirius XM Holdings, Inc. (1) | | | 515,112 | | | | 3,657,295 | |
| | | | | | | | |
| | | | | | | 10,798,621 | |
|
Department Stores — 0.6% | |
Nordstrom, Inc. (1) | | | 36,862 | | | | 2,316,777 | |
|
Footwear — 0.6% | |
Deckers Outdoor Corp. (1)(2) | | | 19,439 | | | | 2,368,448 | |
|
Internet & Direct Marketing Retail — 7.3% | |
Amazon.com, Inc. (2) | | | 13,114 | | | | 26,394,679 | |
Expedia Group, Inc. (1) | | | 24,303 | | | | 3,171,541 | |
| | | | | | | | |
| | | | | | | 29,566,220 | |
| | | | | | | | |
Total Consumer Discretionary | | | | | | | 65,578,306 | |
|
| Consumer Staples — 3.7% | |
|
Food Distributors — 0.9% | |
Sysco Corp. (1) | | | 47,515 | | | | 3,555,072 | |
|
Food Retail — 0.4% | |
Sprouts Farmers Market,
Inc. (1)(2) | | | 69,812 | | | | 1,847,924 | |
|
Hypermarkets & Super Centers — 1.4% | |
Walmart, Inc. | | | 58,023 | | | | 5,562,085 | |
|
Personal Products — 1.0% | |
Estee Lauder Cos., Inc., Class A (1) | | | 28,852 | | | | 4,042,742 | |
| | | | | | | | |
Total Consumer Staples | | | | | | | 15,007,823 | |
|
| Energy — 2.0% | |
|
Integrated Oil & Gas — 0.7% | |
Occidental Petroleum Corp. | | | 33,830 | | | | 2,702,002 | |
|
Oil & Gas-Equipment & Services — 0.8% | |
Schlumberger, Ltd. (1) | | | 55,214 | | | | 3,487,316 | |
|
Oil & Gas-Exploration & Production — 0.5% | |
Pioneer Natural Resources Co. (1) | | | 11,400 | | | | 1,991,580 | |
| | | | | | | | |
Total Energy | | | | | | | 8,180,898 | |
|
| Financials — 6.4% | |
|
Consumer Finance — 2.1% | |
American Express Co. | | | 80,737 | | | | 8,556,507 | |
|
Diversified Banks — 1.2% | |
U.S. Bancorp (1) | | | 86,732 | | | | 4,693,069 | |
|
Financial Exchanges & Data — 0.7% | |
S&P Global, Inc. | | | 13,345 | | | | 2,763,082 | |
|
Investment Banking & Brokerage — 0.8% | |
Evercore, Inc., Class A (1) | | | 32,681 | | | | 3,469,088 | |
|
Property & Casualty Insurance — 1.6% | |
Allstate Corp. | | | 32,874 | | | | 3,306,138 | |
Progressive Corp. | | | 45,962 | | | | 3,103,814 | |
| | | | | | | | |
| | | | | | | 6,409,952 | |
| | | | | | | | |
Total Financials | | | | | | | 25,891,698 | |
|
| Healthcare — 13.4% | |
|
Biotechnology — 6.3% | |
AbbVie, Inc. (1) | | | 101,276 | | | | 9,720,471 | |
Amgen, Inc. (1) | | | 34,157 | | | | 6,824,910 | |
Celgene Corp. (1)(2) | | | 95,207 | | | | 8,992,301 | |
| | | | | | | | |
| | | | | | | 25,537,682 | |
|
Healthcare Equipment — 1.1% | |
Edwards Lifesciences Corp. (1)(2) | | | 12,957 | | | | 1,868,918 | |
Intuitive Surgical, Inc. (1)(2) | | | 4,565 | | | | 2,556,400 | |
| | | | | | | | |
| | | | | | | 4,425,318 | |
(See Notes which are an integral part of the Financial Statements)
41
August 31, 2018
Large-Cap Growth Fund (continued)
| | | | | | | | |
| Description | | Shares | | | Value | |
| Common Stocks (continued) | |
|
| Healthcare (continued) | |
|
Healthcare Technology — 0.6% | |
Veeva Systems, Inc.,
Class A (1)(2) | | | 25,096 | | | $ | 2,619,019 | |
|
Managed Healthcare — 1.4% | |
Cigna Corp. | | | 30,447 | | | | 5,734,388 | |
|
Pharmaceuticals — 4.0% | |
Eli Lilly & Co. (1) | | | 91,995 | | | | 9,719,271 | |
Jazz Pharmaceuticals PLC (1)(2) | | | 16,553 | | | | 2,829,239 | |
Zoetis, Inc. | | | 41,830 | | | | 3,789,798 | |
| | | | | | | | |
| | | | | | | 16,338,308 | |
| | | | | | | | |
Total Healthcare | | | | | | | 54,654,715 | |
|
| Industrials — 10.7% | |
|
Aerospace & Defense — 3.4% | |
Boeing Co. (1) | | | 28,534 | | | | 9,781,170 | |
Huntington Ingalls Industries, Inc. | | | 16,383 | | | | 4,005,152 | |
| | | | | | | | |
| | | | | | | 13,786,322 | |
|
Airlines — 0.9% | |
Southwest Airlines Co. (1) | | | 59,978 | | | | 3,676,651 | |
|
Building Products — 1.2% | |
Masco Corp. | | | 131,336 | | | | 4,986,828 | |
|
Construction Machinery & Heavy Trucks — 0.5% | |
Allison Transmission Holdings, Inc. (1) | | | 39,922 | | | | 1,982,527 | |
|
Diversified Support Services — 0.5% | |
KAR Auction Services, Inc. (1) | | | 32,550 | | | | 2,040,559 | |
|
Railroads — 1.5% | |
Genesee & Wyoming, Inc., Class A (1)(2) | | | 70,112 | | | | 6,162,144 | |
|
Research & Consulting Services — 1.0% | |
CoStar Group, Inc. (1)(2) | | | 4,670 | | | | 2,064,887 | |
Dun & Bradstreet Corp. | | | 12,172 | | | | 1,739,622 | |
| | | | | | | | |
| | | | | | | 3,804,509 | |
|
Trading Companies & Distributors — 1.7% | |
WW Grainger, Inc. (1) | | | 19,554 | | | | 6,923,485 | |
| | | | | | | | |
Total Industrials | | | | | | | 43,363,025 | |
|
| Information Technology — 40.7% | |
|
Application Software — 4.9% | |
Adobe Systems, Inc. (2) | | | 41,519 | | | | 10,940,672 | |
salesforce.com, Inc. (2) | | | 57,350 | | | | 8,756,198 | |
| | | | | | | | |
| | | | | | | 19,696,870 | |
|
Communications Equipment — 3.3% | |
F5 Networks, Inc. (1)(2) | | | 27,593 | | | | 5,218,388 | |
Palo Alto Networks, Inc. (1)(2) | | | 35,126 | | | | 8,119,375 | |
| | | | | | | | |
| | | | | | | 13,337,763 | |
|
Data Processing & Outsourced Services — 7.5% | |
Alliance Data Systems Corp. (1) | | | 23,769 | | | | 5,670,808 | |
Black Knight, Inc. (1)(2) | | | 42,508 | | | | 2,269,928 | |
Mastercard, Inc., Class A (1) | | | 51,052 | | | | 11,004,769 | |
Sabre Corp. (1) | | | 58,863 | | | | 1,536,913 | |
Visa, Inc., Class A (1) | | | 66,908 | | | | 9,828,116 | |
| | | | | | | | |
| | | | | | | 30,310,534 | |
|
Internet Software & Services — 6.7% | |
Akamai Technologies, Inc. (1)(2) | | | 24,837 | | | | 1,866,252 | |
Alphabet, Inc., Class A (2) | | | 3,905 | | | | 4,810,179 | |
Alphabet, Inc., Class C (1)(2) | | | 11,509 | | | | 14,020,149 | |
| | | | | | | | |
| Description | | Shares | | | Value | |
| Common Stocks (continued) | |
|
| Information Technology (continued) | |
|
Internet Software & Services(continued) | |
Facebook, Inc., Class A (2) | | | 21,298 | | | $ | 3,742,697 | |
VeriSign, Inc. (1)(2) | | | 17,685 | | | | 2,805,018 | |
| | | | | | | | |
| | | | | | | 27,244,295 | |
|
Semiconductor Equipment — 0.6% | |
Applied Materials, Inc. | | | 59,565 | | | | 2,562,486 | |
|
Semiconductors — 2.3% | |
Intel Corp. (1) | | | 134,673 | | | | 6,522,213 | |
Texas Instruments, Inc. (1) | | | 24,681 | | | | 2,774,145 | |
| | | | | | | | |
| | | | | | | 9,296,358 | |
|
Systems Software — 8.0% | |
Fortinet, Inc. (1)(2) | | | 96,336 | | | | 8,069,103 | |
Microsoft Corp. | | | 191,683 | | | | 21,531,751 | |
Red Hat, Inc. (1)(2) | | | 20,461 | | | | 3,022,704 | |
| | | | | | | | |
| | | | | | | 32,623,558 | |
|
Technology Hardware, Storage & Peripherals — 7.4% | |
Apple, Inc. | | | 103,202 | | | | 23,491,871 | |
NetApp, Inc. (1) | | | 77,490 | | | | 6,726,907 | |
| | | | | | | | |
| | | | | | | 30,218,778 | |
| | | | | | | | |
Total Information Technology | | | | 165,290,642 | |
|
| Materials — 1.9% | |
|
Commodity Chemicals — 0.6% | |
Westlake Chemical Corp. (1) | | | 26,794 | | | | 2,533,908 | |
|
Metal & Glass Containers — 1.3% | |
Berry Global Group, Inc. (2) | | | 106,975 | | | | 5,105,917 | |
| | | | | | | | |
Total Materials | | | | | | | 7,639,825 | |
|
| Real Estate — 3.4% | |
|
Office REIT’s �� 2.3% | |
Alexandria Real Estate Equities, Inc. (1) | | | 44,732 | | | | 5,741,352 | |
Douglas Emmett, Inc. (1) | | | 93,054 | | | | 3,634,690 | |
| | | | | | | | |
| | | | | | | 9,376,042 | |
|
Residential REIT’s — 0.9% | |
Essex Property Trust, Inc. (1) | | | 13,980 | | | | 3,442,994 | |
|
Specialized REIT’s — 0.2% | |
Equinix, Inc. | | | 2,237 | | | | 975,623 | |
| | | | | | | | |
Total Real Estate | | | | | | | 13,794,659 | |
| | | | | | | | |
Total Common Stocks
(identified cost $270,456,868) | | | | | | | 399,401,591 | |
| | | | | | | | |
| Short-Term Investments — 38.7% | |
|
| Collateral Pool Investments for Securities on Loan — 37.1% | |
| | |
Collateral pool allocation (3) | | | | | | | 150,732,234 | |
| | |
| Mutual Funds — 1.6% | | | | | | |
BMO Institutional Prime Money Market Fund — Premier Class, 1.987% (4) | | | 6,735,157 | | | | 6,735,831 | |
| | | | | | | | |
Total Short-Term Investments
(identified cost $157,467,984) | | | | 157,468,065 | |
| | | | | | | | |
Total Investments — 137.0%
(identified cost $427,924,852) | | | | 556,869,656 | |
| Other Assets and Liabilities — (37.0)% | | | | (150,446,061 | ) |
| | | | | | | | |
| Total Net Assets — 100.0% | | | $ | 406,423,595 | |
| | | | | | | | |
(See Notes which are an integral part of the Financial Statements)
42
Mid-Cap Value Fund
| | | | | | | | |
| Description | | Shares | | | Value | |
| Common Stocks — 98.7% | |
|
| Consumer Discretionary — 12.3% | |
|
Auto Parts & Equipment — 1.2% | |
Lear Corp. | | | 14,805 | | | $ | 2,401,371 | |
|
Automotive Retail — 1.4% | |
AutoZone, Inc. (1)(2) | | | 3,681 | | | | 2,822,885 | |
| | |
Broadcasting — 1.3% | | | | | | | | |
AMC Networks, Inc.,
Class A (1)(2) | | | 39,972 | | | | 2,510,641 | |
|
Department Stores — 1.9% | |
Kohl’s Corp. (1) | | | 48,968 | | | | 3,873,858 | |
|
Homefurnishing Retail — 2.5% | |
Bed Bath & Beyond, Inc. (1) | | | 109,372 | | | | 1,962,134 | |
Williams-Sonoma, Inc. (1) | | | 44,793 | | | | 3,145,812 | |
| | | | | | | | |
| | | | | | | 5,107,946 | |
|
Leisure Products — 1.4% | |
Brunswick Corp. (1) | | | 41,825 | | | | 2,778,017 | |
| | |
Publishing — 1.0% | | | | | | | | |
News Corp., Class A (1) | | | 150,896 | | | | 1,972,211 | |
|
Specialized Consumer Services — 1.6% | |
ServiceMaster Global Holdings, Inc. (2) | | | 52,880 | | | | 3,187,078 | |
| | | | | | | | |
Total Consumer Discretionary | | | | 24,654,007 | |
| | |
| Consumer Staples — 3.4% | | | | | | |
|
Agricultural Products — 0.7% | |
Ingredion, Inc. (1) | | | 14,808 | | | | 1,496,644 | |
|
Food Distributors — 1.5% | |
Sysco Corp. (1) | | | 39,889 | | | | 2,984,495 | |
| | |
Food Retail — 1.2% | | | | | | | | |
Kroger Co. (1) | | | 76,334 | | | | 2,404,521 | |
| | | | | | | | |
Total Consumer Staples | | | | | | | 6,885,660 | |
| | |
| Energy — 6.6% | | | | | | |
|
Oil & Gas-Exploration & Production — 3.7% | |
Cimarex Energy Co. (1) | | | 29,669 | | | | 2,506,437 | |
Devon Energy Corp. (1) | | | 59,770 | | | | 2,565,926 | |
Newfield Exploration Co. (1)(2) | | | 86,439 | | | | 2,358,056 | |
| | | | | | | | |
| | | | | | | 7,430,419 | |
|
Oil & Gas-Refining & Marketing — 2.9% | |
Marathon Petroleum Corp. (1) | | | 36,829 | | | | 3,030,658 | |
PBF Energy, Inc. (1) | | | 52,378 | | | | 2,719,466 | |
| | | | | | | | |
| | | | | | | 5,750,124 | |
| | | | | | | | |
Total Energy | | | | | | | 13,180,543 | |
| | |
| Financials — 18.1% | | | | | | |
|
Asset Management & Custody Banks — 2.8% | |
Ameriprise Financial, Inc. (1) | | | 20,095 | | | | 2,852,686 | |
Northern Trust Corp. | | | 25,273 | | | | 2,715,837 | |
| | | | | | | | |
| | | | | | | 5,568,523 | |
|
Consumer Finance — 2.3% | |
Discover Financial Services (1) | | | 36,699 | | | | 2,866,926 | |
Synchrony Financial | | | 56,147 | | | | 1,778,175 | |
| | | | | | | | |
| | | | | | | 4,645,101 | |
|
Investment Banking & Brokerage — 1.4% | |
E*TRADE Financial Corp. (2) | | | 46,006 | | | | 2,707,913 | |
|
Life & Health Insurance — 1.1% | |
Unum Group | | | 61,082 | | | | 2,252,704 | |
| | | | | | | | |
| Description | | Shares | | | Value | |
| Common Stocks (continued) | |
| | |
| Financials (continued) | | | | | | |
|
Multi-Line Insurance — 3.8% | |
American Financial Group, Inc. | | | 22,392 | | | $ | 2,493,573 | |
American National Insurance Co. (1) | | | 18,164 | | | | 2,331,168 | |
Hartford Financial Services Group, Inc. (1) | | | 54,260 | | | | 2,733,076 | |
| | | | | | | | |
| | | | | | | 7,557,817 | |
|
Regional Banks — 6.7% | |
BankUnited, Inc. | | | 57,340 | | | | 2,224,219 | |
Comerica, Inc. (1) | | | 22,508 | | | | 2,194,080 | |
Regions Financial Corp. (1) | | | 149,883 | | | | 2,916,723 | |
SunTrust Banks, Inc. (1) | | | 40,021 | | | | 2,943,945 | |
TCF Financial Corp. (1) | | | 126,029 | | | | 3,194,835 | |
| | | | | | | | |
| | | | | | | 13,473,802 | |
| | | | | | | | |
Total Financials | | | | | | | 36,205,860 | |
|
| Healthcare — 7.7% | |
|
Biotechnology — 0.7% | |
United Therapeutics Corp. (2) | | | 12,072 | | | | 1,484,735 | |
|
Healthcare Equipment — 4.4% | |
Hill-Rom Holdings, Inc. | | | 35,925 | | | | 3,494,425 | |
Hologic, Inc. (1)(2) | | | 59,189 | | | | 2,353,355 | |
STERIS PLC (1) | | | 25,146 | | | | 2,877,205 | |
| | | | | | | | |
| | | | | | | 8,724,985 | |
|
Healthcare Services — 1.1% | |
MEDNAX, Inc. (1)(2) | | | 46,839 | | | | 2,217,827 | |
|
Life Sciences Tools & Services — 1.5% | |
Charles River Laboratories International, Inc. (1)(2) | | | 23,510 | | | | 2,903,720 | |
| | | | | | | | |
Total Healthcare | | | | | | | 15,331,267 | |
|
| Industrials — 10.8% | |
|
Airlines — 1.0% | |
JetBlue Airways Corp. (1)(2) | | | 100,939 | | | | 1,925,916 | |
|
Construction Machinery & Heavy Trucks — 1.2% | |
Allison Transmission Holdings, Inc. (1) | | | 49,172 | | | | 2,441,882 | |
|
Electrical Components & Equipment — 1.2% | |
Regal Beloit Corp. (1) | | | 28,977 | | | | 2,425,375 | |
|
Environmental & Facilities Services — 1.3% | |
Republic Services, Inc. (1) | | | 36,450 | | | | 2,673,972 | |
|
Human Resource & Employment Services — 1.2% | |
Robert Half International, Inc. (1) | | | 31,500 | | | | 2,462,670 | |
|
Industrial Machinery — 1.0% | |
Crane Co. | | | 22,331 | | | | 2,038,374 | |
|
Trading Companies & Distributors — 2.3% | |
United Rentals, Inc. (1)(2) | | | 13,561 | | | | 2,113,753 | |
WESCO International, Inc. (1)(2) | | | 41,875 | | | | 2,560,656 | |
| | | | | | | | |
| | | | | | | 4,674,409 | |
|
Trucking — 1.6% | |
Ryder System, Inc. (1) | | | 40,228 | | | | 3,091,119 | |
| | | | | | | | |
Total Industrials | | | | | | | 21,733,717 | |
|
| Information Technology — 10.4% | |
|
Communications Equipment — 2.7% | |
ARRIS International PLC (1)(2) | | | 92,114 | | | | 2,386,674 | |
Juniper Networks, Inc. | | | 106,483 | | | | 3,027,312 | |
| | | | | | | | |
| | | | | | | 5,413,986 | |
|
Data Processing & Outsourced Services — 2.0% | |
Alliance Data Systems Corp. (1) | | | 7,059 | | | | 1,684,136 | |
Sabre Corp. | | | 89,498 | | | | 2,336,793 | |
| | | | | | | | |
| | | | | | | 4,020,929 | |
(See Notes which are an integral part of the Financial Statements)
43
August 31, 2018
Mid-Cap Value Fund (continued)
| | | | | | | | |
| Description | | Shares | | | Value | |
| Common Stocks (continued) | |
|
| Information Technology (continued) | |
|
Electronic Manufacturing Services — 1.5% | |
Jabil, Inc. (1) | | | 102,536 | | | $ | 3,030,964 | |
|
Internet Software & Services — 1.2% | |
Akamai Technologies, Inc. (1)(2) | | | 31,631 | | | | 2,376,753 | |
|
Semiconductors — 1.0% | |
ON Semiconductor Corp. (1)(2) | | | 92,214 | | | | 1,967,847 | |
|
Technology Distributors — 1.2% | |
CDW Corp. (1) | | | 28,177 | | | | 2,467,178 | |
|
Technology Hardware, Storage & Peripherals — 0.8% | |
Western Digital Corp. (1) | | | 24,484 | | | | 1,548,368 | |
| | | | | | | | |
Total Information Technology | | | | 20,826,025 | |
|
| Materials — 5.7% | |
|
Commodity Chemicals — 1.3% | |
Cabot Corp. (1) | | | 39,595 | | | | 2,570,508 | |
|
Copper — 0.9% | |
Freeport-McMoRan, Inc. (1) | | | 122,897 | | | | 1,726,703 | |
|
Gold — 1.1% | |
Newmont Mining Corp. (1) | | | 68,778 | | | | 2,134,181 | |
|
Metal & Glass Containers — 1.3% | |
Owens-Illinois, Inc. (1)(2) | | | 151,873 | | | | 2,683,596 | |
|
Paper Packaging — 1.1% | |
Avery Dennison Corp. | | | 21,562 | | | | 2,267,891 | |
| | | | | | | | |
Total Materials | | | | | | | 11,382,879 | |
|
| Real Estate — 13.9% | |
|
Hotel & Resort REIT’s — 1.6% | |
Host Hotels & Resorts, Inc. (1) | | | 151,395 | | | | 3,259,534 | |
|
Office REIT’s — 4.7% | |
Boston Properties, Inc. (1) | | | 24,231 | | | | 3,160,934 | |
Highwoods Properties, Inc. | | | 72,789 | | | | 3,620,525 | |
Piedmont Office Realty Trust, Inc., Class A (1) | | | 129,599 | | | | 2,571,244 | |
| | | | | | | | |
| | | | | | | 9,352,703 | |
|
Real Estate Services — 1.3% | |
Realogy Holdings Corp. (1) | | | 125,087 | | | | 2,675,611 | |
|
Residential REIT’s — 3.5% | |
Essex Property Trust, Inc. (1) | | | 14,685 | | | | 3,616,622 | |
UDR, Inc. (1) | | | 84,519 | | | | 3,378,224 | |
| | | | | | | | |
| | | | | | | 6,994,846 | |
|
Retail REIT’s — 1.1% | |
Brixmor Property Group, Inc. (1) | | | 119,828 | | | | 2,183,266 | |
|
Specialized REIT’s — 1.7% | |
Digital Realty Trust, Inc. (1) | | | 26,752 | | | | 3,324,739 | |
| | | | | | | | |
Total Real Estate | | | | | | | 27,790,699 | |
|
| Utilities — 9.8% | |
|
Electric Utilities �� 3.2% | |
Entergy Corp. (1) | | | 38,782 | | | | 3,241,787 | |
Xcel Energy, Inc. | | | 64,870 | | | | 3,117,004 | |
| | | | | | | | |
| | | | | | | 6,358,791 | |
|
Gas Utilities — 1.5% | |
UGI Corp. (1) | | | 56,797 | | | | 3,069,878 | |
|
Independent Power Producers & Energy Traders — 1.5% | |
AES Corp. (1) | | | 225,076 | | | | 3,029,523 | |
| | | | | | | | |
| Description | | Shares | | | Value | |
| Common Stocks (continued) | |
|
| Utilities (continued) | |
|
Multi-Utilities — 3.6% | |
Ameren Corp. | | | 53,435 | | | $ | 3,378,695 | |
CenterPoint Energy, Inc. (1) | | | 133,205 | | | | 3,701,767 | |
| | | | | | | | |
| | | | | | | 7,080,462 | |
| | | | | | | | |
Total Utilities | | | | | | | 19,538,654 | |
| | | | | | | | |
Total Common Stocks
(identified cost $170,518,399) | | | | | | | 197,529,311 | |
| | | | | | | | |
| Short-Term Investments — 47.9% | |
|
| Collateral Pool Investments for Securities on Loan — 46.7% | |
| | |
Collateral pool allocation (3) | | | | | | | 93,348,421 | |
|
| Mutual Funds — 1.2% | |
BMO Institutional Prime Money Market Fund — Premier Class, 1.987% (4) | | | 2,420,630 | | | | 2,420,873 | |
| | | | | | | | |
Total Short-Term Investments
(identified cost $95,768,710) | | | | | | | 95,769,294 | |
| | | | | | | | |
Total Investments — 146.6%
(identified cost $266,287,109) | | | | | | | 293,298,605 | |
| Other Assets and Liabilities — (46.6)% | | | | (93,189,034 | ) |
| | | | | | | | |
| Total Net Assets — 100.0% | | | | | | $ | 200,109,571 | |
| | | | | | | | |
Mid-Cap Growth Fund
| | | | | | | | |
| Description | | Shares | | | Value | |
| Common Stocks — 98.8% | |
|
| Consumer Discretionary — 15.9% | |
|
Apparel Retail — 2.1% | |
Burlington Stores, Inc. (1)(2) | | | 16,006 | | | $ | 2,691,889 | |
|
Apparel, Accessories & Luxury Goods — 1.5% | |
Columbia Sportswear Co. (1) | | | 21,010 | | | | 1,905,607 | |
|
Automotive Retail — 1.7% | |
O’Reilly Automotive, Inc. (2) | | | 6,633 | | | | 2,224,841 | |
|
Footwear — 1.4% | |
Skechers U.S.A., Inc.,
Class A (1)(2) | | | 61,128 | | | | 1,802,054 | |
|
Homebuilding — 1.0% | |
D.R. Horton, Inc. | | | 27,988 | | | | 1,245,746 | |
|
Hotels, Resorts & Cruise Lines — 0.8% | |
Wyndham Hotels & Resorts, Inc. | | | 17,087 | | | | 969,687 | |
|
Internet & Direct Marketing Retail — 2.6% | |
Expedia Group, Inc. (1) | | | 14,362 | | | | 1,874,241 | |
TripAdvisor, Inc. (1)(2) | | | 27,313 | | | | 1,483,369 | |
| | | | | | | | |
| | | | | | | 3,357,610 | |
|
Leisure Products — 1.5% | |
Brunswick Corp. (1) | | | 28,981 | | | | 1,924,918 | |
|
Specialty Stores — 3.3% | |
Tractor Supply Co. (1) | | | 26,308 | | | | 2,322,470 | |
Ulta Salon Cosmetics & Fragrance, Inc. (1)(2) | | | 7,488 | | | | 1,946,880 | |
| | | | | | | | |
| | | | | | | 4,269,350 | |
| | | | | | | | |
Total Consumer Discretionary | | | | 20,391,702 | |
|
| Consumer Staples — 2.9% | |
|
Food Distributors — 1.2% | |
U.S. Foods Holding Corp. (2) | | | 47,803 | | | | 1,557,900 | |
(See Notes which are an integral part of the Financial Statements)
44
Mid-Cap Growth Fund (continued)
| | | | | | | | |
| Description | | Shares | | | Value | |
| Common Stocks (continued) | |
|
| Consumer Staples (continued) | |
|
Food Retail — 1.7% | |
Sprouts Farmers Market,
Inc. (1)(2) | | | 80,575 | | | $ | 2,132,820 | |
| | | | | | | | |
Total Consumer Staples | | | | 3,690,720 | |
|
| Energy — 2.9% | |
|
Oil & Gas-Exploration & Production — 1.4% | |
Newfield Exploration Co. (1)(2) | | | 64,392 | | | | 1,756,614 | |
|
Oil & Gas-Storage & Transportation — 1.5% | |
Cheniere Energy, Inc. (1)(2) | | | 28,520 | | | | 1,908,843 | |
| | | | | | | | |
Total Energy | | | | 3,665,457 | |
|
| Financials — 7.0% | |
|
Asset Management & Custody Banks — 1.0% | |
Legg Mason, Inc. (1) | | | 42,357 | | | | 1,321,538 | |
|
Financial Exchanges & Data — 1.3% | |
MSCI, Inc. (1) | | | 8,989 | | | | 1,620,357 | |
|
Investment Banking & Brokerage — 1.7% | |
LPL Financial Holdings, Inc. (1) | | | 33,767 | | | | 2,236,726 | |
|
Property & Casualty Insurance — 1.4% | |
Progressive Corp. | | | 26,669 | | | | 1,800,958 | |
|
Regional Banks — 1.6% | |
Citizens Financial Group, Inc. | | | 49,081 | | | | 2,020,174 | |
| | | | | | | | |
Total Financials | | | | 8,999,753 | |
|
| Healthcare — 17.0% | |
|
Biotechnology — 3.3% | |
Exelixis, Inc. (1)(2) | | | 69,144 | | | | 1,299,216 | |
Incyte Corp. (1)(2) | | | 17,670 | | | | 1,305,989 | |
Neurocrine Biosciences, Inc. (1)(2) | | | 13,243 | | | | 1,628,227 | |
| | | | | | | | |
| | | | | | | 4,233,432 | |
|
Healthcare Equipment — 6.5% | |
DexCom, Inc. (1)(2) | | | 16,284 | | | | 2,351,084 | |
Hill-Rom Holdings, Inc. | | | 20,575 | | | | 2,001,330 | |
Insulet Corp. (1)(2) | | | 18,451 | | | | 1,923,886 | |
Masimo Corp. (2) | | | 17,213 | | | | 2,029,241 | |
| | | | | | | | |
| | | | | | | 8,305,541 | |
|
Healthcare Supplies — 1.4% | |
Align Technology, Inc. (1)(2) | | | 4,734 | | | | 1,829,644 | |
|
Healthcare Technology — 1.3% | |
Veeva Systems, Inc., Class A (2) | | | 16,343 | | | | 1,705,556 | |
|
Life Sciences Tools & Services — 1.5% | |
Bio-Rad Laboratories, Inc., Class A (1)(2) | | | 5,984 | | | | 1,946,595 | |
|
Managed Healthcare — 1.9% | |
WellCare Health Plans, Inc. (2) | | | 7,899 | | | | 2,390,000 | |
|
Pharmaceuticals — 1.1% | |
Jazz Pharmaceuticals PLC (2) | | | 8,609 | | | | 1,471,450 | |
| | | | | | | | |
Total Healthcare | | | | 21,882,218 | |
|
| Industrials — 15.5% | |
|
Aerospace & Defense — 1.3% | |
Huntington Ingalls Industries, Inc. | | | 6,813 | | | | 1,665,574 | |
|
Air Freight & Logistics — 1.6% | |
XPO Logistics, Inc. (1)(2) | | | 19,761 | | | | 2,104,546 | |
|
Building Products — 1.4% | |
Masco Corp. | | | 45,412 | | | | 1,724,294 | |
| | | | | | | | |
| Description | | Shares | | | Value | |
| Common Stocks (continued) | |
|
| Industrials (continued) | |
|
Diversified Support Services — 1.5% | |
KAR Auction Services, Inc. | | | 31,436 | | | $ | 1,970,723 | |
|
Industrial Machinery — 1.5% | |
ITT, Inc. | | | 32,826 | | | | 1,940,345 | |
|
Research & Consulting Services — 1.9% | |
Dun & Bradstreet Corp. | | | 17,005 | | | | 2,430,355 | |
|
Trading Companies & Distributors — 3.5% | |
HD Supply Holdings, Inc. (2) | | | 46,614 | | | | 2,125,132 | |
WW Grainger, Inc. (1) | | | 6,771 | | | | 2,397,408 | |
| | | | | | | | |
| | | | | | | 4,522,540 | |
|
Trucking — 2.8% | |
Landstar System, Inc. (1) | | | 18,096 | | | | 2,095,517 | |
Schneider National, Inc., Class B (1) | | | 56,168 | | | | 1,519,344 | |
| | | | | | | | |
| | | | | | | 3,614,861 | |
| | | | | | | | |
Total Industrials | | | | 19,973,238 | |
|
| Information Technology — 31.1% | |
|
Application Software — 4.7% | |
Splunk, Inc. (1)(2) | | | 16,638 | | | | 2,132,160 | |
Ultimate Software Group, Inc. (1)(2) | | | 6,865 | | | | 2,125,885 | |
Workday, Inc., Class A (1)(2) | | | 11,419 | | | | 1,764,692 | |
| | | | | | | | |
| | | | | | | 6,022,737 | |
|
Communications Equipment — 3.6% | |
F5 Networks, Inc. (1)(2) | | | 12,708 | | | | 2,403,337 | |
Palo Alto Networks, Inc. (2) | | | 9,699 | | | | 2,241,924 | |
| | | | | | | | |
| | | | | | | 4,645,261 | |
|
Consulting & Other Services — 4.4% | |
Acxiom Corp. (1)(2) | | | 43,864 | | | | 2,004,146 | |
DXC Technology Co. | | | 18,537 | | | | 1,688,535 | |
EPAM Systems, Inc. (1)(2) | | | 13,829 | | | | 1,976,579 | |
| | | | | | | | |
| | | | | | | 5,669,260 | |
|
Data Processing & Outsourced Services — 4.1% | |
Euronet Worldwide, Inc. (1)(2) | | | 18,368 | | | | 1,796,390 | |
FleetCor Technologies, Inc. (1)(2) | | | 8,202 | | | | 1,753,096 | |
Sabre Corp. | | | 63,749 | | | | 1,664,486 | |
| | | | | | | | |
| | | | | | | 5,213,972 | |
|
Electronic Equipment & Instruments — 1.7% | |
FLIR Systems, Inc. | | | 34,965 | | | | 2,193,704 | |
|
Internet Software & Services — 2.8% | |
GoDaddy, Inc., Class A (1)(2) | | | 27,121 | | | | 2,209,277 | |
VeriSign, Inc. (1)(2) | | | 9,079 | | | | 1,440,020 | |
| | | | | | | | |
| | | | | | | 3,649,297 | |
|
Semiconductor Equipment — 2.3% | |
Lam Research Corp. | | | 8,441 | | | | 1,461,053 | |
Teradyne, Inc. (1) | | | 36,761 | | | | 1,514,185 | |
| | | | | | | | |
| | | | | | | 2,975,238 | |
|
Semiconductors — 2.6% | |
Maxim Integrated Products, Inc. (1) | | | 29,672 | | | | 1,794,266 | |
ON Semiconductor Corp. (1)(2) | | | 69,746 | | | | 1,488,380 | |
| | | | | | | | |
| | | | | | | 3,282,646 | |
|
Systems Software — 4.9% | |
Fortinet, Inc. (1)(2) | | | 29,408 | | | | 2,463,214 | |
Proofpoint, Inc. (1)(2) | | | 12,952 | | | | 1,536,755 | |
Red Hat, Inc. (1)(2) | | | 15,171 | | | | 2,241,212 | |
| | | | | | | | |
| | | | | | | 6,241,181 | |
| | | | | | | | |
Total Information Technology | | | | 39,893,296 | |
(See Notes which are an integral part of the Financial Statements)
45
August 31, 2018
Mid-Cap Growth Fund (continued)
| | | | | | | | |
| Description | | Shares | | | Value | |
| Common Stocks (continued) | |
|
| Materials — 3.0% | |
|
Copper — 0.9% | |
Freeport-McMoRan, Inc. | | | 87,164 | | | $ | 1,224,654 | |
|
Diversified Chemicals — 1.1% | |
Huntsman Corp. | | | 47,724 | | | | 1,455,105 | |
|
Steel — 1.0% | |
Steel Dynamics, Inc. | | | 27,071 | | | | 1,237,957 | |
| | | | | | | | |
Total Materials | | | | 3,917,716 | |
|
| Real Estate — 3.5% | |
|
Office REIT’s — 2.4% | |
Boston Properties, Inc. | | | 14,132 | | | | 1,843,520 | |
Highwoods Properties, Inc. | | | 25,714 | | | | 1,279,014 | |
| | | | | | | | |
| | | | | | | 3,122,534 | |
|
Residential REIT’s — 1.1% | |
Essex Property Trust, Inc. | | | 5,630 | | | | 1,386,556 | |
| | | | | | | | |
Total Real Estate | | | | 4,509,090 | |
| | | | | | | | |
Total Common Stocks
(identified cost $97,355,847) | | | | | | | 126,923,190 | |
| | | | | | | | |
| Short-Term Investments — 46.7% | |
|
| Collateral Pool Investments for Securities on Loan — 45.5% | |
| | |
Collateral pool allocation (3) | | | | | | | 58,405,407 | |
|
| Mutual Funds — 1.2% | |
BMO Institutional Prime Money Market Fund — Premier Class, 1.987% (4) | | | 1,583,573 | | | | 1,583,732 | |
| | | | | | | | |
Total Short-Term Investments
(identified cost $59,988,987) | | | | 59,989,139 | |
| | | | | | | | |
Total Investments — 145.5%
(identified cost $157,344,834) | | | | 186,912,329 | |
| Other Assets and Liabilities — (45.5)% | | | | (58,479,949 | ) |
| | | | | | | | |
| Total Net Assets — 100.0% | | | $ | 128,432,380 | |
| | | | | | | | |
Small-Cap Value Fund
| | | | | | | | |
| Description | | Shares | | | Value | |
| Common Stocks — 98.1% | |
|
| Consumer Discretionary — 8.7% | |
|
Apparel Retail — 2.0% | |
DSW, Inc., Class A (1) | | | 24,371 | | | $ | 810,579 | |
Genesco, Inc. (1)(2) | | | 6,492 | | | | 330,118 | |
Tailored Brands, Inc. (1) | | | 16,538 | | | | 389,305 | |
| | | | | | | | |
| | | | | | | 1,530,002 | |
|
Auto Parts & Equipment — 3.7% | |
American Axle & Manufacturing Holdings, Inc. (1)(2) | | | 39,724 | | | | 703,512 | |
Cooper-Standard Holdings,
Inc. (1)(2) | | | 5,738 | | | | 794,311 | |
Stoneridge, Inc. (2) | | | 20,730 | | | | 620,449 | |
Tenneco, Inc. (1) | | | 7,127 | | | | 304,964 | |
Tower International, Inc. (1) | | | 10,092 | | | | 341,110 | |
| | | | | | | | |
| | | | | | | 2,764,346 | |
|
Broadcasting — 0.4% | |
Sinclair Broadcast Group, Inc., Class A (1) | | | 11,214 | | | | 324,645 | |
| | | | | | | | |
| Description | | Shares | | | Value | |
| Common Stocks (continued) | |
|
| Consumer Discretionary (continued) | |
|
Footwear — 0.6% | |
Deckers Outdoor Corp. (1)(2) | | | 3,926 | | | $ | 478,344 | |
|
Homebuilding — 0.9% | |
KB Home (1) | | | 25,511 | | | | 633,949 | |
|
Leisure Products — 0.5% | |
Johnson Outdoors, Inc., Class A (1) | | | 4,003 | | | | 405,424 | |
|
Specialty Stores — 0.6% | |
Hibbett Sports, Inc. (1)(2) | | | 23,049 | | | | 473,657 | |
| | | | | | | | |
Total Consumer Discretionary | | | | | | | 6,610,367 | |
|
| Consumer Staples — 0.9% | |
|
Food Retail — 0.5% | |
Smart & Final Stores, Inc. (1)(2) | | | 51,275 | | | | 358,925 | |
|
Household Products — 0.4% | |
Central Garden & Pet Co.,
Class A (1)(2) | | | 9,190 | | | | 333,873 | |
| | | | | | | | |
Total Consumer Staples | | | | | | | 692,798 | |
|
| Energy — 7.1% | |
|
Oil & Gas-Equipment & Services — 2.9% | |
Exterran Corp. (1)(2) | | | 15,207 | | | | 416,520 | |
Matrix Service Co. (1)(2) | | | 19,824 | | | | 414,321 | |
Newpark Resources, Inc. (1)(2) | | | 49,206 | | | | 516,663 | |
TETRA Technologies, Inc. (1)(2) | | | 91,176 | | | | 418,498 | |
U.S. Silica Holdings, Inc. (1) | | | 18,155 | | | | 384,704 | |
| | | | | | | | |
| | | | | | | 2,150,706 | |
|
Oil & Gas-Exploration & Production — 3.4% | |
Callon Petroleum Co. (1)(2) | | | 26,323 | | | | 297,450 | |
Gulfport Energy Corp. (1)(2) | | | 34,560 | | | | 406,426 | |
PDC Energy, Inc. (1)(2) | | | 7,759 | | | | 408,822 | |
Southwestern Energy Co. (1)(2) | | | 103,500 | | | | 581,670 | |
SRC Energy, Inc. (1)(2) | | | 43,832 | | | | 408,076 | |
W&T Offshore, Inc. (1)(2) | | | 71,015 | | | | 480,771 | |
| | | | | | | | |
| | | | | | | 2,583,215 | |
|
Oil & Gas-Refining & Marketing — 0.8% | |
Delek US Holdings, Inc. (1) | | | 11,160 | | | | 608,220 | |
| | | | | | | | |
Total Energy | | | | | | | 5,342,141 | |
|
| Financials — 25.7% | |
|
Asset Management & Custody Banks — 0.6% | |
Waddell & Reed Financial, Inc., Class A (1) | | | 21,217 | | | | 424,764 | |
|
Consumer Finance — 0.5% | |
Nelnet, Inc., Class A (1) | | | 6,845 | | | | 394,614 | |
|
Investment Banking & Brokerage — 0.9% | |
Stifel Financial Corp. (1) | | | 12,173 | | | | 680,105 | |
|
Life & Health Insurance — 1.7% | |
American Equity Investment Life Holding Co. | | | 24,184 | | | | 896,985 | |
CNO Financial Group, Inc. (1) | | | 18,748 | | | | 405,144 | |
| | | | | | | | |
| | | | | | | 1,302,129 | |
|
Multi-Line Insurance — 1.8% | |
Horace Mann Educators Corp. | | | 15,973 | | | | 739,550 | |
National General Holdings Corp. (1) | | | 21,923 | | | | 598,717 | |
| | | | | | | | |
| | | | | | | 1,338,267 | |
|
Property & Casualty Insurance — 2.5% | |
Argo Group International Holdings, Ltd. (1) | | | 12,063 | | | | 768,413 | |
Employers Holdings, Inc. (1) | | | 14,819 | | | | 679,451 | |
Safety Insurance Group, Inc. | | | 4,719 | | | | 456,328 | |
| | | | | | | | |
| | | | | | | 1,904,192 | |
(See Notes which are an integral part of the Financial Statements)
46
Small-Cap Value Fund (continued)
| | | | | | | | |
| Description | | Shares | | | Value | |
| Common Stocks (continued) | |
|
| Financials (continued) | |
|
Regional Banks — 15.0% | |
1st Source Corp. (1) | | | 6,408 | | | $ | 358,784 | |
BancFirst Corp. (1) | | | 5,831 | | | | 372,018 | |
Banner Corp. | | | 12,117 | | | | 779,487 | |
Cathay General Bancorp (1) | | | 19,300 | | | | 816,390 | |
Central Pacific Financial Corp. | | | 18,292 | | | | 518,212 | |
Community Trust Bancorp, Inc. | | | 5,078 | | | | 250,853 | |
Customers Bancorp, Inc. (1)(2) | | | 20,302 | | | | 501,459 | |
Eagle Bancorp, Inc. (2) | | | 8,825 | | | | 475,226 | |
Enterprise Financial Services Corp. | | | 8,670 | | | | 488,121 | |
Financial Institutions, Inc. | | | 6,346 | | | | 204,976 | |
Franklin Financial Network,
Inc. (1)(2) | | | 6,317 | | | | 244,152 | |
Great Southern Bancorp, Inc. | | | 2,686 | | | | 159,280 | |
Great Western Bancorp, Inc. (1) | | | 19,238 | | | | 837,623 | |
Hancock Whitney Corp. (1) | | | 13,352 | | | | 688,296 | |
Hanmi Financial Corp. (1) | | | 20,822 | | | | 543,454 | |
Hilltop Holdings, Inc. (1) | | | 31,895 | | | | 661,821 | |
Independent Bank Corp. | | | 12,118 | | | | 302,344 | |
International Bancshares Corp. (1) | | | 16,422 | | | | 769,371 | |
Investors Bancorp, Inc. (1) | | | 59,971 | | | | 767,629 | |
Peapack Gladstone Financial Corp. (1) | | | 6,859 | | | | 229,159 | |
Peoples Bancorp, Inc. | | | 4,897 | | | | 175,606 | |
S&T Bancorp, Inc. (1) | | | 5,178 | | | | 241,606 | |
TriCo Bancshares (1) | | | 10,206 | | | | 396,809 | |
Wintrust Financial Corp. | | | 6,866 | | | | 607,984 | |
| | | | | | | | |
| | | | | | | 11,390,660 | |
|
Thrifts & Mortgage Finance — 2.7% | |
First Defiance Financial Corp. | | | 6,774 | | | | 216,700 | |
NMI Holdings, Inc.,
Class A (1)(2) | | | 24,899 | | | | 537,819 | |
TrustCo Bank Corp. (1) | | | 37,484 | | | | 346,727 | |
Walker & Dunlop, Inc. (1) | | | 13,197 | | | | 719,237 | |
Washington Federal, Inc. (1) | | | 7,434 | | | | 253,499 | |
| | | | | | | | |
| | | | | | | 2,073,982 | |
| | | | | | | | |
Total Financials | | | | | | | 19,508,713 | |
|
| Healthcare — 8.5% | |
|
Biotechnology — 1.6% | |
Emergent BioSolutions,
Inc. (1)(2) | | | 8,042 | | | | 498,604 | |
Myriad Genetics, Inc. (1)(2) | | | 13,908 | | | | 692,479 | |
| | | | | | | | |
| | | | | | | 1,191,083 | |
|
Healthcare Equipment — 2.9% | |
AngioDynamics, Inc. (1)(2) | | | 12,228 | | | | 274,152 | |
CONMED Corp. (1) | | | 4,936 | | | | 397,002 | |
Integer Holdings Corp. (2) | | | 10,002 | | | | 799,160 | |
Natus Medical, Inc. (2) | | | 9,319 | | | | 347,599 | |
Orthofix Medical, Inc. (2) | | | 7,424 | | | | 397,629 | |
| | | | | | | | |
| | | | | | | 2,215,542 | |
|
Healthcare Supplies — 1.5% | |
Lantheus Holdings, Inc. (1)(2) | | | 19,170 | | | | 308,637 | |
Meridian Bioscience, Inc. (1) | | | 11,769 | | | | 184,773 | |
Merit Medical Systems,
Inc. (1)(2) | | | 10,819 | | | | 636,698 | |
| | | | | | | | |
| | | | | | | 1,130,108 | |
|
Healthcare Technology — 0.7% | |
Computer Programs & Systems, Inc. (1) | | | 8,727 | | | | 238,247 | |
HMS Holdings Corp. (1)(2) | | | 10,158 | | | | 325,564 | |
| | | | | | | | |
| | | | | | | 563,811 | |
|
Life Sciences Tools & Services — 0.6% | |
Cambrex Corp. (1)(2) | | | 6,267 | | | | 422,396 | |
| | | | | | | | |
| Description | | Shares | | | Value | |
| Common Stocks (continued) | |
|
| Healthcare (continued) | |
|
Pharmaceuticals — 1.2% | |
Assertio Therapeutics, Inc. (1)(2) | | | 40,615 | | | $ | 259,124 | |
Phibro Animal Health Corp., Class A (1) | | | 14,240 | | | | 672,128 | |
| | | | | | | | |
| | | | | | | 931,252 | |
| | | | | | | | |
Total Healthcare | | | | | | | 6,454,192 | |
|
| Industrials — 12.3% | |
|
Aerospace & Defense — 0.5% | |
Esterline Technologies Corp. (1)(2) | | | 4,231 | | | | 363,654 | |
|
Airlines — 0.9% | |
Hawaiian Holdings, Inc. (1) | | | 15,981 | | | | 663,212 | |
|
Building Products — 0.8% | |
Apogee Enterprises, Inc. | | | 6,638 | | | | 326,722 | |
Quanex Building Products Corp. (1) | | | 19,805 | | | | 324,802 | |
| | | | | | | | |
| | | | | | | 651,524 | |
|
Construction & Engineering — 0.8% | |
EMCOR Group, Inc. (1) | | | 7,557 | | | | 605,316 | |
|
Construction Machinery & Heavy Trucks — 0.4% | |
Meritor, Inc. (2) | | | 13,306 | | | | 288,208 | |
|
Diversified Support Services — 0.7% | |
UniFirst Corp. | | | 2,873 | | | | 532,080 | |
|
Human Resource & Employment Services — 1.3% | |
Korn/Ferry International (1) | | | 5,266 | | | | 353,506 | |
TrueBlue, Inc. (1)(2) | | | 21,066 | | | | 617,234 | |
| | | | | | | | |
| | | | | | | 970,740 | |
|
Industrial Machinery — 1.4% | |
Columbus McKinnon Corp. (1) | | | 7,566 | | | | 321,782 | |
Global Brass & Copper Holdings, Inc. (1) | | | 7,461 | | | | 287,622 | |
Rexnord Corp. (1)(2) | | | 14,914 | | | | 432,953 | |
| | | | | | | | |
| | | | | | | 1,042,357 | |
|
Office Services & Supplies — 2.5% | |
ACCO Brands Corp. | | | 40,910 | | | | 507,284 | |
Herman Miller, Inc. | | | 15,425 | | | | 590,778 | |
Kimball International, Inc., Class B (1) | | | 13,162 | | | | 229,940 | |
Steelcase, Inc., Class A | | | 38,802 | | | | 566,509 | |
| | | | | | | | |
| | | | | | | 1,894,511 | |
|
Research & Consulting Services — 1.1% | |
ICF International, Inc. (1) | | | 10,232 | | | | 835,443 | |
|
Trading Companies & Distributors — 0.7% | |
Rush Enterprises, Inc., Class A | | | 13,066 | | | | 561,315 | |
|
Trucking — 1.2% | |
ArcBest Corp. (1) | | | 11,170 | | | | 537,277 | |
Covenant Transportation Group, Inc., Class A (2) | | | 11,711 | | | | 349,808 | |
| | | | | | | | |
| | | | | | | 887,085 | |
| | | | | | | | |
Total Industrials | | | | | | | 9,295,445 | |
|
| Information Technology — 12.4% | |
|
Communications Equipment — 1.7% | |
Ciena Corp. (1)(2) | | | 23,031 | | | | 727,319 | |
Comtech Telecommunications Corp. (1) | | | 15,776 | | | | 565,570 | |
| | | | | | | | |
| | | | | | | 1,292,889 | |
|
Consulting & Other Services — 1.4% | |
CACI International, Inc.,
Class A (1)(2) | | | 1,347 | | | | 262,665 | |
Perficient, Inc. (1)(2) | | | 8,946 | | | | 257,019 | |
Virtusa Corp. (1)(2) | | | 9,212 | | | | 536,691 | |
| | | | | | | | |
| | | | | | | 1,056,375 | |
(See Notes which are an integral part of the Financial Statements)
47
August 31, 2018
Small-Cap Value Fund (continued)
| | | | | | | | |
| Description | | Shares | | | Value | |
| Common Stocks (continued) | |
|
| Information Technology (continued) | |
|
Data Processing & Outsourced Services — 1.9% | |
CSG Systems International, Inc. | | | 9,243 | | | $ | 345,226 | |
Sykes Enterprises, Inc. (1)(2) | | | 14,048 | | | | 424,811 | |
Travelport Worldwide, Ltd. | | | 38,026 | | | | 706,143 | |
| | | | | | | | |
| | | | | | | 1,476,180 | |
|
Electronic Components — 1.0% | |
Vishay Intertechnology, Inc. (1) | | | 30,348 | | | | 722,283 | |
|
Electronic Manufacturing Services — 1.3% | |
Benchmark Electronics, Inc. (1) | | | 14,226 | | | | 367,742 | |
TTM Technologies, Inc. (1)(2) | | | 34,990 | | | | 654,313 | |
| | | | | | | | |
| | | | | | | 1,022,055 | |
|
Internet Software & Services — 0.4% | |
XO Group, Inc. (1)(2) | | | 10,287 | | | | 309,227 | |
|
Semiconductor Equipment — 2.4% | |
Amkor Technology, Inc. (1)(2) | | | 59,738 | | | | 521,513 | |
Cohu, Inc. (1) | | | 12,425 | | | | 327,772 | |
Entegris, Inc. (1) | | | 13,495 | | | | 457,480 | |
Rudolph Technologies, Inc. (1)(2) | | | 17,515 | | | | 486,917 | |
| | | | | | | | |
| | | | | | | 1,793,682 | |
|
Semiconductors — 0.9% | |
Diodes, Inc. (1)(2) | | | 18,324 | | | | 694,846 | |
|
Technology Distributors — 1.4% | |
Insight Enterprises, Inc. (2) | | | 10,366 | | | | 571,581 | |
Tech Data Corp. (1)(2) | | | 6,476 | | | | 471,129 | |
| | | | | | | | |
| | | | | | | 1,042,710 | |
| | | | | | | | |
Total Information Technology | | | | | | | 9,410,247 | |
|
| Materials — 6.1% | |
|
Aluminum — 0.3% | |
Kaiser Aluminum Corp. (1) | | | 1,891 | | | | 207,235 | |
|
Commodity Chemicals — 1.5% | |
Koppers Holdings, Inc. (2) | | | 12,396 | | | | 439,438 | |
Trinseo SA | | | 8,939 | | | | 689,644 | |
| | | | | | | | |
| | | | | | | 1,129,082 | |
|
Forest Products — 1.9% | |
Boise Cascade Co. (1) | | | 12,559 | | | | 548,828 | |
Louisiana-Pacific Corp. | | | 30,342 | | | | 884,773 | |
| | | | | | | | |
| | | | | | | 1,433,601 | |
|
Metal & Glass Containers — 0.3% | |
Owens-Illinois, Inc. (1)(2) | | | 15,245 | | | | 269,379 | |
|
Paper Products — 0.4% | |
Domtar Corp. | | | 6,137 | | | | 312,373 | |
|
Specialty Chemicals — 1.7% | |
Kraton Corp. (1)(2) | | | 14,438 | | | | 679,019 | |
Stepan Co. (1) | | | 6,981 | | | | 622,775 | |
| | | | | | | | |
| | | | | | | 1,301,794 | |
| | | | | | | | |
Total Materials | | | | | | | 4,653,464 | |
| | |
| Real Estate — 8.8% | | | | | | |
|
Diversified REIT’s — 1.0% | |
American Assets Trust, Inc. (1) | | | 19,008 | | | | 750,816 | |
|
Hotel & Resort REIT’s — 3.4% | |
Ashford Hospitality Trust, Inc. (1) | | | 23,749 | | | | 154,131 | |
Chesapeake Lodging Trust (1) | | | 23,685 | | | | 779,473 | |
Hersha Hospitality Trust (1) | | | 33,901 | | | | 800,064 | |
| | | | | | | | |
| Description | | Shares | | | Value | |
| Common Stocks (continued) | |
| | |
| Real Estate (continued) | | | | | | |
|
Hotel & Resort REIT’s(continued) | |
Xenia Hotels & Resorts, Inc. | | | 34,052 | | | $ | 826,101 | |
| | | | | | | | |
| | | | | | | 2,559,769 | |
|
Industrial REIT’s — 1.1% | |
First Industrial Realty Trust, Inc. | | | 13,460 | | | | 436,912 | |
STAG Industrial, Inc. (1) | | | 13,415 | | | | 387,291 | |
| | | | | | | | |
| | | | | | | 824,203 | |
|
Office REIT’s — 1.6% | |
Brandywine Realty Trust | | | 23,844 | | | | 399,625 | |
Piedmont Office Realty Trust, Inc., Class A (1) | | | 40,089 | | | | 795,366 | |
| | | | | | | | |
| | | | | | | 1,194,991 | |
|
Real Estate Services — 0.7% | |
Realogy Holdings Corp. (1) | | | 27,036 | | | | 578,300 | |
|
Residential REIT’s — 0.8% | |
Preferred Apartment Communities, Inc., Class A (1) | | | 32,952 | | | | 587,205 | |
|
Retail REIT’s — 0.2% | |
Saul Centers, Inc. (1) | | | 3,402 | | | | 204,120 | |
| | | | | | | | |
Total Real Estate | | | | | | | 6,699,404 | |
|
| Telecommunication Services — 1.1% | |
|
Alternative Carriers — 1.1% | |
Iridium Communications, Inc. (1)(2) | | | 40,456 | | | | 819,234 | |
| | |
| Utilities — 6.5% | | | | | | |
|
Electric Utilities — 4.4% | |
El Paso Electric Co. (1) | | | 9,825 | | | | 602,272 | |
IDACORP, Inc. (1) | | | 9,908 | | | | 969,498 | |
PNM Resources, Inc. (1) | | | 21,123 | | | | 822,741 | |
Portland General Electric Co. (1) | | | 20,199 | | | | 937,234 | |
| | | | | | | | |
| | | | | | | 3,331,745 | |
|
Multi-Utilities — 2.1% | |
Black Hills Corp. (1) | | | 13,923 | | | | 819,368 | |
NorthWestern Corp. (1) | | | 12,900 | | | | 773,484 | |
| | | | | | | | |
| | | | | | | 1,592,852 | |
| | | | | | | | |
Total Utilities | | | | | | | 4,924,597 | |
| | | | | | | | |
Total Common Stocks
(identified cost $62,066,662) | | | | | | | 74,410,602 | |
| | | | | | | | |
| Short-Term Investments — 50.3% | |
|
| Collateral Pool Investments for Securities on Loan — 48.4% | |
| | |
Collateral pool allocation (3) | | | | | | | 36,689,352 | |
|
| Mutual Funds — 1.9% | |
BMO Institutional Prime Money Market Fund — Premier Class, 1.987% (4) | | | 1,486,043 | | | | 1,486,191 | |
| | | | | | | | |
Total Short-Term Investments
(identified cost $38,175,389) | | | | | | | 38,175,543 | |
| | | | | | | | |
Total Investments — 148.4%
(identified cost $100,242,051) | | | | | | | 112,586,145 | |
| Other Assets and Liabilities — (48.4)% | | | | (36,737,715 | ) |
| | | | | | | | |
| Total Net Assets — 100.0% | | | | | | $ | 75,848,430 | |
| | | | | | | | |
(See Notes which are an integral part of the Financial Statements)
48
Small-Cap Core Fund
| | | | | | | | |
| Description | | Shares | | | Value | |
| Common Stocks — 98.2% | |
|
| Consumer Discretionary — 12.8% | |
|
Apparel Retail — 1.7% | |
Chico’s FAS, Inc. (1) | | | 19,228 | | | $ | 175,359 | |
DSW, Inc., Class A (1) | | | 4,961 | | | | 165,003 | |
Tailored Brands, Inc. (1) | | | 3,001 | | | | 70,644 | |
| | | | | | | | |
| | | | | | | 411,006 | |
|
Apparel, Accessories & Luxury Goods — 0.6% | |
Movado Group, Inc. (1) | | | 3,373 | | | | 143,690 | |
|
Auto Parts & Equipment — 3.6% | |
American Axle & Manufacturing Holdings, Inc. (1)(2) | | | 9,813 | | | | 173,788 | |
Cooper-Standard Holdings, Inc. (2) | | | 1,594 | | | | 220,657 | |
Dana, Inc. | | | 4,960 | | | | 97,067 | |
Stoneridge, Inc. (2) | | | 6,849 | | | | 204,991 | |
Tenneco, Inc. (1) | | | 4,344 | | | | 185,880 | |
| | | | | | | | |
| | | | | | | 882,383 | |
|
Casinos & Gaming — 0.8% | |
Penn National Gaming, Inc. (1)(2) | | | 5,518 | | | | 190,150 | |
|
Consumer Electronics — 0.6% | |
ZAGG, Inc. (1)(2) | | | 8,511 | | | | 137,878 | |
|
Footwear — 1.0% | |
Deckers Outdoor Corp. (1)(2) | | | 2,029 | | | | 247,213 | |
|
Homebuilding — 0.7% | |
KB Home (1) | | | 7,189 | | | | 178,647 | |
|
Homefurnishing Retail — 0.8% | |
RH (1)(2) | | | 1,240 | | | | 197,160 | |
|
Leisure Products — 1.5% | |
Johnson Outdoors, Inc., Class A | | | 1,233 | | | | 124,878 | |
MCBC Holdings, Inc. (1)(2) | | | 4,752 | | | | 131,013 | |
Nautilus, Inc. (1)(2) | | | 8,335 | | | | 122,108 | |
| | | | | | | | |
| | | | | | | 377,999 | |
|
Restaurants — 1.0% | |
BJ’s Restaurants, Inc. (1) | | | 3,062 | | | | 231,793 | |
|
Specialty Stores — 0.5% | |
Container Store Group, Inc. (2) | | | 10,013 | | | | 113,147 | |
| | | | | | | | |
Total Consumer Discretionary | | | | | | | 3,111,066 | |
|
| Consumer Staples — 0.9% | |
|
Food Distributors — 0.9% | |
Performance Food Group Co. (2) | | | 6,746 | | | | 223,293 | |
|
| Energy — 4.7% | |
|
Oil & Gas-Equipment & Services — 1.6% | |
Mammoth Energy Services, Inc. | | | 5,468 | | | | 150,261 | |
SEACOR Holdings, Inc. (2) | | | 2,804 | | | | 144,266 | |
U.S. Silica Holdings, Inc. (1) | | | 4,213 | | | | 89,273 | |
| | | | | | | | |
| | | | | | | 383,800 | |
|
Oil & Gas-Exploration & Production — 2.8% | |
PDC Energy, Inc. (1)(2) | | | 1,759 | | | | 92,682 | |
SM Energy Co. | | | 2,749 | | | | 82,717 | |
Southwestern Energy Co. (1)(2) | | | 39,201 | | | | 220,310 | |
SRC Energy, Inc. (1)(2) | | | 9,372 | | | | 87,253 | |
W&T Offshore, Inc. (1)(2) | | | 29,694 | | | | 201,028 | |
| | | | | | | | |
| | | | | | | 683,990 | |
|
Oil & Gas-Refining & Marketing — 0.3% | |
Delek US Holdings, Inc. (1) | | | 1,507 | | | | 82,132 | |
| | | | | | | | |
Total Energy | | | | | | | 1,149,922 | |
| | | | | | | | |
| Description | | Shares | | | Value | |
| Common Stocks (continued) | |
|
| Financials — 15.6% | |
|
Asset Management & Custody Banks — 0.3% | |
Waddell & Reed Financial, Inc., Class A | | | 4,514 | | | $ | 90,370 | |
|
Consumer Finance — 0.3% | |
Nelnet, Inc., Class A (1) | | | 1,329 | | | | 76,617 | |
|
Investment Banking & Brokerage — 1.4% | |
Evercore, Inc., Class A (1) | | | 1,937 | | | | 205,613 | |
Stifel Financial Corp. | | | 2,358 | | | | 131,741 | |
| | | | | | | | |
| | | | | | | 337,354 | |
|
Life & Health Insurance — 2.4% | |
American Equity Investment Life Holding Co. | | | 5,320 | | | | 197,319 | |
CNO Financial Group, Inc. (1) | | | 4,573 | | | | 98,823 | |
Primerica, Inc. (1) | | | 2,313 | | | | 282,764 | |
| | | | | | | | |
| | | | | | | 578,906 | |
|
Multi-Line Insurance — 1.1% | |
Horace Mann Educators Corp. | | | 1,865 | | | | 86,350 | |
National General Holdings Corp. (1) | | | 6,501 | | | | 177,542 | |
| | | | | | | | |
| | | | | | | 263,892 | |
|
Property & Casualty Insurance — 0.2% | |
Employers Holdings, Inc. (1) | | | 1,059 | | | | 48,555 | |
|
Regional Banks — 7.8% | |
1st Source Corp. (1) | | | 2,051 | | | | 114,836 | |
BancFirst Corp. | | | 1,807 | | | | 115,287 | |
Bancorp, Inc. (1)(2) | | | 8,217 | | | | 82,417 | |
Cathay General Bancorp (1) | | | 5,391 | | | | 228,039 | |
Central Pacific Financial Corp. | | | 5,575 | | | | 157,940 | |
Community Trust Bancorp, Inc. | | | 1,105 | | | | 54,587 | |
Customers Bancorp, Inc. (1)(2) | | | 6,333 | | | | 156,425 | |
Enterprise Financial Services Corp. | | | 1,238 | | | | 69,699 | |
First Financial Corp. (1) | | | 1,280 | | | | 65,856 | |
Great Western Bancorp, Inc. (1) | | | 5,856 | | | | 254,970 | |
Hanmi Financial Corp. | | | 5,734 | | | | 149,657 | |
Hilltop Holdings, Inc. (1) | | | 7,952 | | | | 165,004 | |
Independent Bank Corp. | | | 4,413 | | | | 110,104 | |
Peapack Gladstone Financial Corp. | | | 2,399 | | | | 80,151 | |
TriCo Bancshares (1) | | | 2,823 | | | | 109,758 | |
| | | | | | | | |
| | | | | | | 1,914,730 | |
|
Thrifts & Mortgage Finance — 2.1% | |
NMI Holdings, Inc., Class A (1)(2) | | | 8,283 | | | | 178,913 | |
TrustCo Bank Corp. | | | 12,271 | | | | 113,507 | |
Walker & Dunlop, Inc. (1) | | | 3,921 | | | | 213,694 | |
| | | | | | | | |
| | | | | | | 506,114 | |
| | | | | | | | |
Total Financials | | | | | | | 3,816,538 | |
|
| Healthcare — 19.3% | |
|
Biotechnology — 5.0% | |
BioSpecifics Technologies
Corp. (1)(2) | | | 1,442 | | | | 77,349 | |
ChemoCentryx, Inc. (1)(2) | | | 8,896 | | | | 117,249 | |
Emergent BioSolutions, Inc. (1)(2) | | | 3,043 | | | | 188,666 | |
Genomic Health, Inc. (2) | | | 2,627 | | | | 160,693 | |
Ligand Pharmaceuticals, Inc. (1)(2) | | | 504 | | | | 130,884 | |
Myriad Genetics, Inc. (1)(2) | | | 4,324 | | | | 215,292 | |
REGENXBIO, Inc. (2) | | | 1,060 | | | | 74,677 | |
Retrophin, Inc. (1)(2) | | | 4,146 | | | | 131,387 | |
Vanda Pharmaceuticals, Inc. (1)(2) | | | 6,840 | | | | 132,183 | |
| | | | | | | | |
| | | | | | | 1,228,380 | |
|
Healthcare Equipment — 5.2% | |
AxoGen, Inc. (1)(2) | | | 2,610 | | | | 114,448 | |
Cardiovascular Systems, Inc. (2) | | | 3,138 | | | | 120,907 | |
CONMED Corp. | | | 1,630 | | | | 131,101 | |
Globus Medical, Inc., Class A (2) | | | 2,733 | | | | 145,587 | |
Inogen, Inc. (1)(2) | | | 705 | | | | 186,761 | |
(See Notes which are an integral part of the Financial Statements)
49
August 31, 2018
Small-Cap Core Fund (continued)
| | | | | | | | |
| Description | | Shares | | | Value | |
| Common Stocks (continued) | |
|
| Healthcare (continued) | |
|
Healthcare Equipment(continued) | |
Integer Holdings Corp. (2) | | | 3,082 | | | $ | 246,252 | |
Novocure, Ltd. (1)(2) | | | 4,476 | | | | 201,644 | |
Varex Imaging Corp. (1)(2) | | | 4,075 | | | | 127,955 | |
| | | | | | | | |
| | | | | | | 1,274,655 | |
|
Healthcare Supplies — 2.0% | |
BioLife Solutions, Inc. (2) | | | 4,049 | | | | 97,014 | |
Cerus Corp. (1)(2) | | | 15,557 | | | | 121,033 | |
Lantheus Holdings, Inc. (1)(2) | | | 8,695 | | | | 139,990 | |
OraSure Technologies, Inc. (1)(2) | | | 7,615 | | | | 121,916 | |
| | | | | | | | |
| | | | | | | 479,953 | |
|
Healthcare Technology — 2.1% | |
Allscripts Healthcare Solutions, Inc. (1)(2) | | | 7,330 | | | | 107,091 | |
Computer Programs & Systems, Inc. (1) | | | 2,737 | | | | 74,720 | |
HealthStream, Inc. (1) | | | 4,599 | | | | 145,926 | |
Simulations Plus, Inc. | | | 3,343 | | | | 69,702 | |
Vocera Communications,
Inc. (1)(2) | | | 3,134 | | | | 103,924 | |
| | | | | | | | |
| | | | | | | 501,363 | |
|
Life Sciences Tools & Services — 1.4% | |
Cambrex Corp. (1)(2) | | | 3,057 | | | | 206,042 | |
Luminex Corp. | | | 4,714 | | | | 132,982 | |
| | | | | | | | |
| | | | | | | 339,024 | |
|
Pharmaceuticals — 3.6% | |
ANI Pharmaceuticals, Inc. (1)(2) | | | 1,577 | | | | 91,781 | |
Assertio Therapeutics, Inc. (2) | | | 18,518 | | | | 118,145 | |
Intersect ENT, Inc. (1)(2) | | | 5,321 | | | | 155,905 | |
Pacira Pharmaceuticals, Inc. (1)(2) | | | 3,170 | | | | 149,466 | |
Phibro Animal Health Corp., Class A (1) | | | 3,849 | | | | 181,673 | |
Supernus Pharmaceuticals,
Inc. (1)(2) | | | 4,047 | | | | 179,282 | |
| | | | | | | | |
| | | | | | | 876,252 | |
| | | | | | | | |
Total Healthcare | | | | | | | 4,699,627 | |
|
| Industrials — 13.6% | |
|
Airlines — 0.9% | |
Hawaiian Holdings, Inc. (1) | | | 5,134 | | | | 213,061 | |
|
Building Products — 0.7% | |
Builders FirstSource, Inc. (1)(2) | | | 6,562 | | | | 102,499 | |
Masonite International Corp. (1)(2) | | | 894 | | | | 59,853 | |
| | | | | | | | |
| | | | | | | 162,352 | |
|
Construction & Engineering — 1.1% | |
Comfort Systems USA, Inc. | | | 2,510 | | | | 144,074 | |
EMCOR Group, Inc. (1) | | | 1,508 | | | | 120,791 | |
| | | | | | | | |
| | | | | | | 264,865 | |
|
Construction Machinery & Heavy Trucks — 0.7% | |
Greenbrier Cos., Inc. (1) | | | 3,191 | | | | 185,078 | |
|
Electrical Components & Equipment — 0.6% | |
Atkore International Group, Inc. (2) | | | 5,480 | | | | 150,042 | |
|
Environmental & Facilities Services — 0.5% | |
Advanced Disposal Services, Inc. (2) | | | 4,603 | | | | 122,808 | |
|
Human Resource & Employment Services — 0.8% | |
TrueBlue, Inc. (1)(2) | | | 7,086 | | | | 207,620 | |
|
Industrial Machinery — 2.7% | |
Lydall, Inc. (2) | | | 1,772 | | | | 75,841 | |
Milacron Holdings Corp. (2) | | | 10,480 | | | | 222,176 | |
SPX FLOW, Inc. (1)(2) | | | 3,048 | | | | 146,121 | |
Watts Water Technologies, Inc., Class A | | | 2,637 | | | | 217,421 | |
| | | | | | | | |
| | | | | | | 661,559 | |
| | | | | | | | |
| Description | | Shares | | | Value | |
| Common Stocks (continued) | |
|
| Industrials (continued) | |
|
Office Services & Supplies — 1.4% | |
ACCO Brands Corp. | | | 7,653 | | | $ | 94,897 | |
Herman Miller, Inc. | | | 6,210 | | | | 237,843 | |
| | | | | | | | |
| | | | | | | 332,740 | |
|
Research & Consulting Services — 0.9% | |
ICF International, Inc. | | | 2,626 | | | | 214,413 | |
|
Trading Companies & Distributors — 2.2% | |
H&E Equipment Services, Inc. (1) | | | 4,830 | | | | 168,132 | |
Rush Enterprises, Inc., Class A | | | 4,839 | | | | 207,883 | |
WESCO International, Inc. (2) | | | 2,504 | | | | 153,120 | |
| | | | | | | | |
| | | | | | | 529,135 | |
|
Trucking — 1.1% | |
ArcBest Corp. (1) | | | 3,851 | | | | 185,233 | |
Covenant Transportation Group, Inc., Class A (2) | | | 3,295 | | | | 98,422 | |
| | | | | | | | |
| | | | | | | 283,655 | |
| | | | | | | | |
Total Industrials | | | | | | | 3,327,328 | |
|
| Information Technology — 18.1% | |
|
Application Software — 0.7% | |
Verint Systems, Inc. (1)(2) | | | 3,747 | | | | 181,917 | |
|
Communications Equipment — 2.1% | |
Ciena Corp. (1)(2) | | | 8,718 | | | | 275,314 | |
Comtech Telecommunications Corp. (1) | | | 6,541 | | | | 234,495 | |
| | | | | | | | |
| | | | | | | 509,809 | |
|
Consulting & Other Services — 1.3% | |
Hackett Group, Inc. (1) | | | 4,162 | | | | 85,196 | |
Virtusa Corp. (1)(2) | | | 3,982 | | | | 231,992 | |
| | | | | | | | |
| | | | | | | 317,188 | |
|
Data Processing & Outsourced Services — 1.8% | |
MAXIMUS, Inc. (1) | | | 2,178 | | | | 144,837 | |
Sykes Enterprises, Inc. (1)(2) | | | 5,410 | | | | 163,598 | |
Travelport Worldwide, Ltd. | | | 6,989 | | | | 129,786 | |
| | | | | | | | |
| | | | | | | 438,221 | |
|
Electronic Components — 0.7% | |
Vishay Intertechnology, Inc. (1) | | | 7,269 | | | | 173,002 | |
|
Electronic Equipment & Instruments — 1.1% | |
Itron, Inc. (1)(2) | | | 2,597 | | | | 172,441 | |
Vishay Precision Group, Inc. (1)(2) | | | 2,045 | | | | 88,548 | |
| | | | | | | | |
| | | | | | | 260,989 | |
|
Electronic Manufacturing Services — 2.2% | |
Fabrinet (1)(2) | | | 2,769 | | | | 132,552 | |
Methode Electronics, Inc. (1) | | | 4,425 | | | | 175,451 | |
TTM Technologies, Inc. (1)(2) | | | 12,194 | | | | 228,028 | |
| | | | | | | | |
| | | | | | | 536,031 | |
|
Internet Software & Services — 2.7% | |
Care.com, Inc. (2) | | | 5,250 | | | | 102,007 | |
Etsy, Inc. (2) | | | 5,295 | | | | 257,814 | |
Meet Group, Inc. (2) | | | 13,727 | | | | 70,008 | |
SPS Commerce, Inc. (1)(2) | | | 2,209 | | | | 217,078 | |
| | | | | | | | |
| | | | | | | 646,907 | |
|
Semiconductor Equipment — 3.2% | |
Axcelis Technologies, Inc. (2) | | | 6,032 | | | | 121,846 | |
Cabot Microelectronics Corp. (1) | | | 1,345 | | | | 151,622 | |
Entegris, Inc. | | | 6,829 | | | | 231,503 | |
Nanometrics, Inc. (1)(2) | | | 2,609 | | | | 114,300 | |
Rudolph Technologies, Inc. (2) | | | 6,253 | | | | 173,834 | |
| | | | | | | | |
| | | | | | | 793,105 | |
(See Notes which are an integral part of the Financial Statements)
50
Small-Cap Core Fund (continued)
| | | | | | | | |
| Description | | Shares | | | Value | |
| Common Stocks (continued) | |
|
| Information Technology (continued) | |
|
Semiconductors — 0.7% | |
Diodes, Inc. (1)(2) | | | 4,332 | | | $ | 164,269 | |
|
Systems Software — 1.1% | |
CommVault Systems, Inc. (1)(2) | | | 1,986 | | | | 138,325 | |
Imperva, Inc. (1)(2) | | | 2,827 | | | | 133,293 | |
| | | | | | | | |
| | | | | | | 271,618 | |
|
Technology Distributors — 0.5% | |
Insight Enterprises, Inc. (2) | | | 2,169 | | | | 119,599 | |
| | | | | | | | |
Total Information Technology | | | | | | | 4,412,655 | |
|
| Materials — 4.0% | |
|
Commodity Chemicals — 1.0% | |
Trinseo SA | | | 3,097 | | | | 238,934 | |
|
Forest Products — 1.7% | |
Boise Cascade Co. (1) | | | 3,858 | | | | 168,595 | |
Louisiana-Pacific Corp. | | | 8,005 | | | | 233,426 | |
| | | | | | | | |
| | | | | | | 402,021 | |
|
Specialty Chemicals — 1.0% | |
Kraton Corp. (1)(2) | | | 4,196 | | | | 197,338 | |
OMNOVA Solutions, Inc. (1)(2) | | | 5,787 | | | | 52,372 | |
| | | | | | | | |
| | | | | | | 249,710 | |
|
Steel — 0.3% | |
Ryerson Holding Corp. (1)(2) | | | 8,081 | | | | 84,042 | |
| | | | | | | | |
Total Materials | | | | | | | 974,707 | |
|
| Real Estate — 5.3% | |
|
Diversified REIT’s — 0.9% | |
American Assets Trust, Inc. | | | 5,518 | | | | 217,961 | |
|
Hotel & Resort REIT’s — 2.8% | |
Chesapeake Lodging Trust (1) | | | 7,422 | | | | 244,258 | |
Hersha Hospitality Trust (1) | | | 9,804 | | | | 231,374 | |
Xenia Hotels & Resorts, Inc. | | | 8,429 | | | | 204,488 | |
| | | | | | | | |
| | | | | | | 680,120 | |
|
Office REIT’s — 0.5% | |
Brandywine Realty Trust | | | 7,149 | | | | 119,817 | |
|
Real Estate Services — 0.7% | |
Realogy Holdings Corp. (1) | | | 8,037 | | | | 171,911 | |
|
Retail REIT’s — 0.4% | |
Kite Realty Group Trust (1) | | | 6,149 | | | | 107,485 | |
| | | | | | | | |
Total Real Estate | | | | | | | 1,297,294 | |
|
| Telecommunication Services — 1.2% | |
|
Alternative Carriers — 1.2% | |
Cogent Communications Holdings, Inc. (1) | | | 3,902 | | | | 213,439 | |
Vonage Holdings Corp. (1)(2) | | | 5,332 | | | | 75,608 | |
| | | | | | | | |
Total Telecommunication Services | | | | | | | 289,047 | |
|
| Utilities — 2.7% | |
|
Electric Utilities — 2.0% | |
PNM Resources, Inc. | | | 6,240 | | | | 243,048 | |
Portland General Electric Co. (1) | | | 5,284 | | | | 245,178 | |
| | | | | | | | |
| | | | | | | 488,226 | |
|
Multi-Utilities — 0.7% | |
Black Hills Corp. (1) | | | 1,014 | | | | 59,674 | |
| | | | | | | | |
| Description | | Shares | | | Value | |
| Common Stocks (continued) | |
|
| Utilities (continued) | |
|
Multi-Utilities(continued) | |
NorthWestern Corp. | | | 1,671 | | | $ | 100,193 | |
| | | | | | | | |
| | | | | | | 159,867 | |
| | | | | | | | |
Total Utilities | | | | | | | 648,093 | |
| | | | | | | | |
Total Common Stocks
(identified cost $19,661,444) | | | | 23,949,570 | |
| | | | | | | | |
| Short-Term Investments — 47.8% | |
|
| Collateral Pool Investments for Securities on Loan — 46.0% | |
| | |
Collateral pool allocation (3) | | | | | | | 11,219,203 | |
|
| Mutual Funds — 1.8% | |
BMO Institutional Prime Money Market Fund — Premier Class, 1.987% (4) | | | 440,698 | | | | 440,742 | |
| | | | | | | | |
Total Short-Term Investments
(identified cost $11,659,879) | | | | 11,659,945 | |
| | | | | | | | |
Total Investments — 146.0%
(identified cost $31,321,323) | | | | 35,609,515 | |
| Other Assets and Liabilities — (46.0)% | | | | (11,214,002 | ) |
| | | | | | | | |
| Total Net Assets — 100.0% | | | $ | 24,395,513 | |
| | | | | | | | |
Small-Cap Growth Fund
| | | | | | | | |
| Description | | Shares | | | Value | |
| Common Stocks — 99.0% | |
|
| Consumer Discretionary — 12.1% | |
|
Apparel Retail — 2.1% | |
Boot Barn Holdings, Inc. (1)(2) | | | 60,302 | | | $ | 1,804,839 | |
Chico’s FAS, Inc. (1) | | | 154,425 | | | | 1,408,356 | |
| | | | | | | | |
| | | | | | | 3,213,195 | |
|
Apparel, Accessories & Luxury Goods — 1.9% | |
G-III Apparel Group, Ltd. (1)(2) | | | 33,524 | | | | 1,524,671 | |
Oxford Industries, Inc. (1) | | | 15,462 | | | | 1,439,358 | |
| | | | | | | | |
| | | | | | | 2,964,029 | |
|
Auto Parts & Equipment — 1.6% | |
Gentherm, Inc. (1)(2) | | | 30,448 | | | | 1,498,042 | |
Tenneco, Inc. (1) | | | 21,919 | | | | 937,914 | |
| | | | | | | | |
| | | | | | | 2,435,956 | |
|
Casinos & Gaming — 1.0% | |
Boyd Gaming Corp. (1) | | | 40,060 | | | | 1,458,985 | |
|
Homefurnishing Retail — 0.8% | |
Sleep Number Corp. (1)(2) | | | 37,689 | | | | 1,270,119 | |
|
Leisure Products — 1.0% | |
Callaway Golf Co. (1) | | | 69,130 | | | | 1,576,855 | |
|
Restaurants — 1.5% | |
Bloomin’ Brands, Inc. (1) | | | 61,394 | | | | 1,184,904 | |
Chuy’s Holdings, Inc. (2) | | | 36,044 | | | | 1,043,474 | |
| | | | | | | | |
| | | | | | | 2,228,378 | |
|
Specialized Consumer Services — 0.8% | |
Sotheby’s (1)(2) | | | 25,092 | | | | 1,204,918 | |
|
Specialty Stores — 1.4% | |
Five Below, Inc. (1)(2) | | | 18,547 | | | | 2,160,169 | |
| | | | | | | | |
Total Consumer Discretionary | | | | 18,512,604 | |
(See Notes which are an integral part of the Financial Statements)
51
August 31, 2018
Small-Cap Growth Fund (continued)
| | | | | | | | |
| Description | | Shares | | | Value | |
| Common Stocks (continued) | |
|
| Consumer Staples — 2.5% | |
|
Food Distributors — 0.9% | |
Performance Food Group
Co. (1)(2) | | | 42,960 | | | $ | 1,421,976 | |
|
Household Products — 0.8% | |
Central Garden & Pet Co., Class A (1)(2) | | | 32,213 | | | | 1,170,298 | |
|
Soft Drinks — 0.8% | |
Primo Water Corp. (2) | | | 63,205 | | | | 1,264,100 | |
| | | | | | | | |
Total Consumer Staples | | | | 3,856,374 | |
|
| Energy — 2.4% | |
|
Oil & Gas-Equipment & Services — 0.8% | |
SEACOR Holdings, Inc. (2) | | | 23,803 | | | | 1,224,664 | |
|
Oil & Gas-Exploration & Production — 1.6% | |
HighPoint Resources Corp. (1)(2) | | | 194,593 | | | | 1,072,208 | |
Matador Resources Co. (1)(2) | | | 44,631 | | | | 1,461,219 | |
| | | | | | | | |
| | | | | | | 2,533,427 | |
| | | | | | | | |
Total Energy | | | | 3,758,091 | |
|
| Financials — 5.1% | |
|
Diversified Banks — 0.9% | |
Bank of NT Butterfield & Son, Ltd. | | | 26,184 | | | | 1,383,563 | |
|
Investment Banking & Brokerage — 0.8% | |
Houlihan Lokey, Inc. | | | 25,490 | | | | 1,198,795 | |
|
Property & Casualty Insurance — 0.7% | |
Employers Holdings, Inc. (1) | | | 23,010 | | | | 1,055,008 | |
|
Regional Banks — 2.7% | |
Great Western Bancorp, Inc. (1) | | | 30,349 | | | | 1,321,395 | |
LegacyTexas Financial Group, Inc. (1) | | | 30,944 | | | | 1,431,779 | |
Trustmark Corp. (1) | | | 38,122 | | | | 1,352,569 | |
| | | | | | | | |
| | | | | | | 4,105,743 | |
| | | | | | | | |
Total Financials | | | | 7,743,109 | |
|
| Healthcare — 27.3% | |
|
Biotechnology — 9.2% | |
ChemoCentryx, Inc. (1)(2) | | | 78,353 | | | | 1,032,693 | |
Emergent BioSolutions,
Inc. (1)(2) | | | 24,894 | | | | 1,543,428 | |
Genomic Health, Inc. (2) | | | 26,086 | | | | 1,595,681 | |
Lexicon Pharmaceuticals,
Inc. (1)(2) | | | 94,281 | | | | 1,090,831 | |
Ligand Pharmaceuticals,
Inc. (1)(2) | | | 6,070 | | | | 1,576,318 | |
Loxo Oncology, Inc. (2) | | | 7,921 | | | | 1,338,491 | |
Momenta Pharmaceuticals, Inc. (1)(2) | | | 41,954 | | | | 1,111,781 | |
REGENXBIO, Inc. (1)(2) | | | 17,654 | | | | 1,243,724 | |
Repligen Corp. (1)(2) | | | 21,082 | | | | 1,156,980 | |
Retrophin, Inc. (1)(2) | | | 43,045 | | | | 1,364,096 | |
Vanda Pharmaceuticals,
Inc. (1)(2) | | | 54,748 | | | | 1,058,005 | |
| | | | | | | | |
| | | | | | | 14,112,028 | |
|
Healthcare Equipment — 7.9% | |
AtriCure, Inc. (1)(2) | | | 37,490 | | | | 1,295,279 | |
Cardiovascular Systems,
Inc. (1)(2) | | | 42,206 | | | | 1,626,197 | |
CONMED Corp. | | | 18,646 | | | | 1,499,698 | |
Cutera, Inc. (1)(2) | | | 29,457 | | | | 1,001,538 | |
Glaukos Corp. (1)(2) | | | 30,270 | | | | 2,069,560 | |
Inogen, Inc. (1)(2) | | | 5,991 | | | | 1,587,076 | |
Integer Holdings Corp. (2) | | | 20,630 | | | | 1,648,337 | |
Masimo Corp. (2) | | | 11,661 | | | | 1,374,715 | |
| | | | | | | | |
| | | | | | | 12,102,400 | |
| | | | | | | | |
| Description | | Shares | | | Value | |
| Common Stocks (continued) | |
|
| Healthcare (continued) | |
|
Healthcare Services — 1.2% | |
Amedisys, Inc. (1)(2) | | | 14,130 | | | $ | 1,766,391 | |
|
Healthcare Supplies — 1.3% | |
Lantheus Holdings, Inc. (1)(2) | | | 64,964 | | | | 1,045,921 | |
OraSure Technologies, Inc. (1)(2) | | | 59,608 | | | | 954,324 | |
| | | | | | | | |
| | | | | | | 2,000,245 | |
|
Healthcare Technology — 2.9% | |
Evolent Health, Inc., Class A (1)(2) | | | 59,314 | | | | 1,512,507 | |
Medidata Solutions, Inc. (1)(2) | | | 18,944 | | | | 1,609,861 | |
Vocera Communications,
Inc. (1)(2) | | | 38,383 | | | | 1,272,780 | |
| | | | | | | | |
| | | | | | | 4,395,148 | |
|
Life Sciences Tools & Services — 1.9% | |
Cambrex Corp. (1)(2) | | | 22,216 | | | | 1,497,358 | |
Medpace Holdings, Inc. (2) | | | 23,782 | | | | 1,421,926 | |
| | | | | | | | |
| | | | | | | 2,919,284 | |
|
Pharmaceuticals — 2.9% | |
Assertio Therapeutics, Inc. (1)(2) | | | 126,059 | | | | 804,257 | |
Intersect ENT, Inc. (2) | | | 44,301 | | | | 1,298,019 | |
Pacira Pharmaceuticals, Inc. (1)(2) | | | 26,379 | | | | 1,243,770 | |
Supernus Pharmaceuticals, Inc. (1)(2) | | | 24,597 | | | | 1,089,647 | |
| | | | | | | | |
| | | | | | | 4,435,693 | |
| | | | | | | | |
Total Healthcare | | | | 41,731,189 | |
|
| Industrials — 18.9% | |
|
Air Freight & Logistics — 1.9% | |
Echo Global Logistics, Inc. (1)(2) | | | 44,433 | | | | 1,475,176 | |
Hub Group, Inc., Class A (2) | | | 26,779 | | | | 1,415,270 | |
| | | | | | | | |
| | | | | | | 2,890,446 | |
|
Building Products — 1.6% | |
Builders FirstSource, Inc. (1)(2) | | | 71,411 | | | | 1,115,440 | |
PGT Innovations, Inc. (1)(2) | | | 55,244 | | | | 1,342,429 | |
| | | | | | | | |
| | | | | | | 2,457,869 | |
|
Commercial Printing — 0.8% | |
Cimpress NV (2) | | | 9,025 | | | | 1,263,500 | |
|
Construction & Engineering — 1.2% | |
Comfort Systems USA, Inc. | | | 32,333 | | | | 1,855,914 | |
|
Construction Machinery & Heavy Trucks — 0.6% | |
Spartan Motors, Inc. | | | 67,145 | | | | 970,245 | |
|
Electrical Components & Equipment — 1.0% | |
Atkore International Group, Inc. (2) | | | 54,158 | | | | 1,482,846 | |
|
Human Resource & Employment Services — 2.7% | |
Insperity, Inc. (1) | | | 17,059 | | | | 2,044,521 | |
Korn/Ferry International (1) | | | 30,250 | | | | 2,030,683 | |
| | | | | | | | |
| | | | | | | 4,075,204 | |
|
Industrial Machinery — 6.6% | |
Hillenbrand, Inc. (1) | | | 27,077 | | | | 1,384,989 | |
Milacron Holdings Corp. (1)(2) | | | 66,352 | | | | 1,406,662 | |
Proto Labs, Inc. (1)(2) | | | 10,680 | | | | 1,660,206 | |
Rexnord Corp. (1)(2) | | | 43,243 | | | | 1,255,344 | |
SPX FLOW, Inc. (1)(2) | | | 31,242 | | | | 1,497,741 | |
Tennant Co. | | | 18,138 | | | | 1,388,464 | |
Watts Water Technologies, Inc., Class A | | | 18,151 | | | | 1,496,550 | |
| | | | | | | | |
| | | | | | | 10,089,956 | |
|
Office Services & Supplies — 0.8% | |
Herman Miller, Inc. | | | 33,722 | | | | 1,291,553 | |
|
Research & Consulting Services — 1.0% | |
ICF International, Inc. | | | 18,245 | | | | 1,489,704 | |
(See Notes which are an integral part of the Financial Statements)
52
Small-Cap Growth Fund (continued)
| | | | | | | | |
| Description | | Shares | | | Value | |
| Common Stocks (continued) | |
|
| Industrials (continued) | |
|
Trading Companies & Distributors — 0.7% | |
Herc Holdings, Inc. (1)(2) | | | 21,522 | | | $ | 1,131,627 | |
| | | | | | | | |
Total Industrials | | | | 28,998,864 | |
|
| Information Technology — 21.6% | |
|
Application Software — 1.5% | |
HubSpot, Inc. (1)(2) | | | 8,926 | | | | 1,282,667 | |
Monotype Imaging Holdings, Inc. | | | 48,202 | | | | 992,961 | |
| | | | | | | | |
| | | | | | | 2,275,628 | |
|
Communications Equipment — 3.5% | |
CalAmp Corp. (1)(2) | | | 43,144 | | | | 1,013,884 | |
Ciena Corp. (1)(2) | | | 49,492 | | | | 1,562,957 | |
Lumentum Holdings, Inc. (1)(2) | | | 20,608 | | | | 1,399,283 | |
Quantenna Communications, Inc. (1)(2) | | | 72,473 | | | | 1,324,082 | |
| | | | | | | | |
| | | | | | | 5,300,206 | |
|
Electronic Equipment & Instruments — 0.8% | |
Control4 Corp. (1)(2) | | | 38,147 | | | | 1,236,344 | |
|
Internet Software & Services — 6.1% | |
Carbonite, Inc. (1)(2) | | | 38,422 | | | | 1,596,434 | |
Cornerstone OnDemand,
Inc. (1)(2) | | | 28,876 | | | | 1,633,227 | |
j2 Global, Inc. | | | 17,648 | | | | 1,457,195 | |
SPS Commerce, Inc. (1)(2) | | | 17,555 | | | | 1,725,130 | |
TrueCar, Inc. (1)(2) | | | 123,778 | | | | 1,591,785 | |
Yelp, Inc. (1)(2) | | | 29,358 | | | | 1,383,349 | |
| | | | | | | | |
| | | | | | | 9,387,120 | |
|
Semiconductor Equipment — 4.4% | |
Entegris, Inc. | | | 47,806 | | | | 1,620,623 | |
FormFactor, Inc. (1)(2) | | | 75,675 | | | | 1,169,179 | |
Nanometrics, Inc. (1)(2) | | | 37,986 | | | | 1,664,167 | |
Photronics, Inc. (1)(2) | | | 102,802 | | | | 1,099,981 | |
Rudolph Technologies, Inc. (1)(2) | | | 41,160 | | | | 1,144,248 | |
| | | | | | | | |
| | | | | | | 6,698,198 | |
|
Semiconductors — 1.6% | |
Rambus, Inc. (1)(2) | | | 96,205 | | | | 1,175,625 | |
Silicon Laboratories, Inc. (1)(2) | | | 13,885 | | | | 1,360,730 | |
| | | | | | | | |
| | | | | | | 2,536,355 | |
|
Systems Software — 3.7% | |
CommVault Systems, Inc. (1)(2) | | | 20,431 | | | | 1,423,019 | |
Imperva, Inc. (2) | | | 27,374 | | | | 1,290,684 | |
Rapid7, Inc. (1)(2) | | | 40,430 | | | | 1,542,405 | |
Varonis Systems, Inc. (2) | | | 19,244 | | | | 1,422,132 | |
| | | | | | | | |
| | | | | | | 5,678,240 | |
| | | | | �� | | | |
Total Information Technology | | | | 33,112,091 | |
|
| Materials — 5.5% | |
|
Commodity Chemicals — 0.9% | |
Trinseo SA | | | 16,960 | | | | 1,308,464 | |
|
Forest Products — 1.9% | |
Boise Cascade Co. (1) | | | 34,912 | | | | 1,525,654 | |
Louisiana-Pacific Corp. | | | 49,987 | | | | 1,457,621 | |
| | | | | | | | |
| | | | | | | 2,983,275 | |
|
Specialty Chemicals — 1.8% | |
Innospec, Inc. | | | 16,146 | | | | 1,252,930 | |
Kraton Corp. (1)(2) | | | 32,333 | | | | 1,520,621 | |
| | | | | | | | |
| | | | | | | 2,773,551 | |
| | | | | | | | |
| Description | | Shares | | | Value | |
| Common Stocks (continued) | |
|
| Materials (continued) | |
|
Steel — 0.9% | |
Commercial Metals Co. (1) | | | 61,790 | | | $ | 1,334,664 | |
| | | | | | | | |
Total Materials | | | | 8,399,954 | |
|
| Real Estate — 2.7% | |
|
Diversified REIT’s — 0.9% | |
American Assets Trust, Inc. | | | 33,722 | | | | 1,332,019 | |
|
Hotel & Resort REIT’s — 0.7% | |
Hersha Hospitality Trust (1) | | | 48,698 | | | | 1,149,273 | |
|
Industrial REIT’s — 1.1% | |
EastGroup Properties, Inc. (1) | | | 16,833 | | | | 1,637,346 | |
| | | | | | | | |
Total Real Estate | | | | | | | 4,118,638 | |
|
| Telecommunication Services — 0.9% | |
|
Alternative Carriers — 0.9% | |
Cogent Communications Holdings, Inc. (1) | | | 25,292 | | | | 1,383,472 | |
| | | | | | | | |
Total Common Stocks
(identified cost $117,168,137) | | | | | | | 151,614,386 | |
| | | | | | | | |
| Short-Term Investments — 46.3% | | | | |
|
| Collateral Pool Investments for Securities on Loan — 45.0% | |
| | |
Collateral pool allocation (3) | | | | | | | 68,845,157 | |
|
| Mutual Funds — 1.3% | |
BMO Institutional Prime Money Market Fund — Premier Class, 1.987% (4) | | | 2,038,438 | | | | 2,038,642 | |
| | | | | | | | |
Total Short-Term Investments
(identified cost $70,883,482) | | | | | | | 70,883,799 | |
| | | | | | | | |
Total Investments — 145.3%
(identified cost $188,051,619) | | | | | | | 222,498,185 | |
| Other Assets and Liabilities — (45.3)% | | | | (69,415,047 | ) |
| | | | | | | | |
| Total Net Assets — 100.0% | | | | | | $ | 153,083,138 | |
| | | | | | | | |
Global Low Volatility Equity Fund
| | | | | | | | |
| Description | | Shares | | | Value | |
| Common Stocks — 98.6% | |
|
Belgium — 0.2% | |
bpost SA | | | 3,458 | | | $ | 52,381 | |
|
Bermuda — 1.2% | |
Argo Group International Holdings, Ltd. | | | 1,954 | | | | 124,470 | |
Enstar Group, Ltd. (2) | | | 849 | | | | 181,261 | |
Giordano International, Ltd. | | | 94,000 | | | | 52,816 | |
| | | | | | | | |
| | | | | | | 358,547 | |
|
Brazil — 0.6% | |
IRB Brasil Resseguros S/A | | | 12,000 | | | | 175,120 | |
|
Canada — 9.5% | |
Allied Properties Real Estate Investment Trust | | | 6,612 | | | | 220,856 | |
Atco, Ltd., Class I | | | 6,957 | | | | 207,964 | |
BCE, Inc. | | | 7,769 | | | | 316,892 | |
Canadian Imperial Bank of Commerce | | | 1,146 | | | | 107,399 | |
Cogeco Communications, Inc. | | | 3,094 | | | | 153,562 | |
Detour Gold Corp. (2) | | | 9,060 | | | | 74,007 | |
Emera, Inc. (1) | | | 3,197 | | | | 101,153 | |
First Capital Realty, Inc. | | | 4,251 | | | | 66,583 | |
(See Notes which are an integral part of the Financial Statements)
53
August 31, 2018
Global Low Volatility Equity Fund (continued)
| | | | | | | | |
| Description | | Shares | | | Value | |
| Common Stocks (continued) | |
|
Canada(continued) | |
George Weston, Ltd. (1) | | | 3,420 | | | $ | 266,367 | |
Granite Real Estate Investment Trust | | | 3,928 | | | | 165,096 | |
Laurentian Bank of Canada (1) | | | 4,870 | | | | 173,603 | |
Loblaw Cos., Ltd. | | | 4,099 | | | | 212,017 | |
Maple Leaf Foods, Inc. | | | 6,033 | | | | 146,087 | |
Quebecor, Inc., Class B | | | 19,929 | | | | 401,329 | |
Rogers Communications, Inc., Class B | | | 2,361 | | | | 122,338 | |
Transcontinental, Inc., Class A | | | 6,984 | | | | 170,131 | |
| | | | | | | | |
| | | | | | | 2,905,384 | |
|
Cayman Islands — 1.5% | |
361 Degrees International, Ltd. | | | 165,000 | | | | 47,300 | |
Dali Foods Group Co., Ltd. (5) | | | 201,000 | | | | 145,972 | |
Fresh Del Monte Produce, Inc. | | | 1,331 | | | | 49,833 | |
Melco Resorts & Entertainment, Ltd., ADR | | | 3,678 | | | | 87,831 | |
WH Group, Ltd. (5) | | | 168,500 | | | | 127,093 | |
| | | | | | | | |
| | | | | | | 458,029 | |
|
China — 1.0% | |
Agricultural Bank of China, Ltd., Class H | | | 353,000 | | | | 170,906 | |
China Minsheng Banking Corp., Ltd., Class H | | | 141,600 | | | | 101,391 | |
China Telecom Corp., Ltd., Class H | | | 98,000 | | | | 46,074 | |
| | | | | | | | |
| | | | | | | 318,371 | |
|
Czech Republic — 2.7% | |
CEZ AS | | | 17,063 | | | | 432,483 | |
Komercni banka AS | | | 4,772 | | | | 198,615 | |
Moneta Money Bank AS (5) | | | 53,865 | | | | 188,423 | |
| | | | | | | | |
| | | | | | | 819,521 | |
|
Denmark — 0.6% | |
Dfds AS | | | 2,089 | | | | 110,204 | |
Pandora AS (1) | | | 1,417 | | | | 84,660 | |
| | | | | | | | |
| | | | | | | 194,864 | |
|
France — 0.1% | |
Boiron SA | | | 420 | | | | 32,712 | |
|
Germany — 0.7% | |
RHOEN-KLINIKUM AG | | | 5,678 | | | | 149,082 | |
Talanx AG (2) | | | 1,955 | | | | 73,797 | |
| | | | | | | | |
| | | | | | | 222,879 | |
|
Guernsey — 1.9% | |
Amdocs, Ltd. | | | 8,825 | | | | 576,096 | |
|
Hong Kong — 8.8% | |
CLP Holdings, Ltd. | | | 57,500 | | | | 675,824 | |
Dah Sing Financial Holdings, Ltd. | | | 16,800 | | | | 104,455 | |
Dairy Farm International Holdings, Ltd. | | | 9,700 | | | | 89,919 | |
Hang Seng Bank, Ltd. | | | 17,200 | | | | 466,337 | |
HK Electric Investments & HK Electric Investments, Ltd. (1)(5) | | | 461,500 | | | | 466,865 | |
Hysan Development Co., Ltd. | | | 40,000 | | | | 205,128 | |
PCCW, Ltd. | | | 464,000 | | | | 246,521 | |
Vitasoy International Holdings, Ltd. | | | 40,000 | | | | 128,428 | |
VTech Holdings, Ltd. | | | 12,400 | | | | 137,212 | |
Yuexiu Real Estate Investment Trust | | | 236,000 | | | | 160,265 | |
| | | | | | | | |
| | | | | | | 2,680,954 | |
|
Hungary — 0.4% | |
Magyar Telekom Telecommunications PLC | | | 58,422 | | | | 85,636 | |
Richter Gedeon Nyrt | | | 2,437 | | | | 47,889 | |
| | | | | | | | |
| | | | | | | 133,525 | |
| | | | | | | | |
| Description | | Shares | | | Value | |
| Common Stocks (continued) | |
|
Israel — 1.9% | |
Bank Hapoalim BM | | | 12,684 | | | $ | 95,069 | |
Bank Leumi Le-Israel BM | | | 39,227 | | | | 263,653 | |
Bezeq — The Israeli Telecommunication Corp., Ltd. | | | 116,783 | | | | 139,621 | |
Strauss Group, Ltd. | | | 4,291 | | | | 94,616 | |
| | | | | | | | |
| | | | | | | 592,959 | |
|
Japan — 8.1% | |
AOKI Holdings, Inc. (1) | | | 7,100 | | | | 95,723 | |
Bridgestone Corp. | | | 1,500 | | | | 55,256 | |
Daiichi Sankyo Co., Ltd. | | | 3,200 | | | | 124,936 | |
Doutor Nichires Holdings Co., Ltd. | | | 4,900 | | | | 86,216 | |
Duskin Co., Ltd. | | | 7,900 | | | | 190,123 | |
Geo Holdings Corp. | | | 12,600 | | | | 183,256 | |
Hogy Medical Co., Ltd. (1) | | | 1,600 | | | | 55,297 | |
Kissei Pharmaceutical Co., Ltd. | | | 4,000 | | | | 118,261 | |
KYORIN Holdings, Inc. | | | 10,600 | | | | 220,185 | |
Mitsui Sugar Co., Ltd. | | | 3,200 | | | | 87,265 | |
Morinaga Milk Industry Co., Ltd. | | | 1,600 | | | | 43,416 | |
Nihon Kohden Corp. | | | 3,100 | | | | 90,676 | |
Nippon Telegraph & Telephone Corp. | | | 5,800 | | | | 258,393 | |
Paramount Bed Holdings Co., Ltd. | | | 2,100 | | | | 96,580 | |
Shimachu Co., Ltd. (1) | | | 6,000 | | | | 196,022 | |
Suzuken Co., Ltd | | | 4,500 | | | | 204,527 | |
Takeda Pharmaceutical Co., Ltd. (1) | | | 2,800 | | | | 117,257 | |
Towa Pharmaceutical Co., Ltd. | | | 1,400 | | | | 97,525 | |
Vital KSK Holdings, Inc. | | | 6,800 | | | | 77,235 | |
Xebio Holdings Co., Ltd. | | | 4,200 | | | | 61,048 | |
| | | | | | | | |
| | | | | | | 2,459,197 | |
|
Malaysia — 4.7% | |
Malayan Banking Bhd | | | 53,500 | | | | 129,665 | |
Public Bank Bhd | | | 108,200 | | | | 661,390 | |
Tenaga Nasional Bhd | | | 165,000 | | | | 629,566 | |
| | | | | | | | |
| | | | | | | 1,420,621 | |
|
Netherlands — 0.7% | |
Intertrust NV (5) | | | 5,027 | | | | 91,903 | |
Koninklijke Ahold Delhaize NV | | | 3,824 | | | | 93,035 | |
Sligro Food Group NV | | | 767 | | | | 32,896 | |
| | | | | | | | |
| | | | | | | 217,834 | |
|
New Zealand — 3.2% | |
Argosy Property, Ltd. | | | 115,510 | | | | 82,917 | |
Chorus, Ltd. (1) | | | 20,907 | | | | 63,904 | |
Fisher & Paykel Healthcare Corp., Ltd. | | | 20,602 | | | | 223,400 | |
Infratil, Ltd. | | | 44,363 | | | | 99,939 | |
Metlifecare, Ltd. | | | 22,877 | | | | 96,110 | |
Ryman Healthcare, Ltd. | | | 26,268 | | | | 244,869 | |
Summerset Group Holdings, Ltd. | | | 35,178 | | | | 178,743 | |
| | | | | | | | |
| | | | | | | 989,882 | |
|
Philippines — 1.9% | |
Alliance Global Group, Inc. (2) | | | 459,300 | | | | 118,545 | |
First Philippine Holdings Corp. | | | 34,210 | | | | 41,525 | |
Manila Electric Co. | | | 37,150 | | | | 259,441 | |
PLDT, Inc. | | | 5,840 | | | | 152,149 | |
| | | | | | | | |
| | | | | | | 571,660 | |
|
Singapore — 4.0% | |
Ascott Residence Trust (1) | | | 47,000 | | | | 37,325 | |
Cache Logistics Trust | | | 100,700 | | | | 54,292 | |
CDL Hospitality Trusts (1) | | | 76,000 | | | | 86,379 | |
Frasers Centrepoint Trust | | | 110,700 | | | | 185,502 | |
Mapletree Industrial Trust | | | 42,300 | | | | 61,329 | |
Mapletree Logistics Trust | | | 274,000 | | | | 255,524 | |
RHT Health Trust | | | 121,400 | | | | 67,663 | |
(See Notes which are an integral part of the Financial Statements)
54
Global Low Volatility Equity Fund (continued)
| | | | | | | | |
| Description | | Shares | | | Value | |
| Common Stocks (continued) | |
|
Singapore(continued) | |
SATS, Ltd. | | | 74,200 | | | $ | 274,084 | |
Sheng Siong Group, Ltd. | | | 98,900 | | | | 84,305 | |
Singapore Airlines, Ltd. | | | 17,200 | | | | 122,808 | |
| | | | | | | | |
| | | | | | | 1,229,211 | |
|
Switzerland — 1.3% | |
Cembra Money Bank AG | | | 1,986 | | | | 185,845 | |
Roche Holding AG | | | 158 | | | | 39,253 | |
Sonova Holding AG | | | 943 | | | | 178,920 | |
| | | | | | | | |
| | | | | | | 404,018 | |
|
Taiwan — 2.6% | |
Far EasTone Telecommunications Co., Ltd. | | | 187,000 | | | | 445,659 | |
LCY Chemical Corp. | | | 58,000 | | | | 97,815 | |
Pou Chen Corp. | | | 65,000 | | | | 71,634 | |
Taichung Commercial Bank Co., Ltd. | | | 291,202 | | | | 99,074 | |
Taiwan Secom Co., Ltd. | | | 23,075 | | | | 65,886 | |
| | | | | | | | |
| | | | | | | 780,068 | |
|
Thailand — 0.7% | |
Thai Beverage PCL (1) | | | 461,300 | | | | 208,376 | |
|
United Kingdom — 0.4% | |
Halfords Group PLC | | | 27,871 | | | | 118,951 | |
|
United States — 39.9% | |
ALLETE, Inc. | | | 1,772 | | | | 133,042 | |
Allstate Corp. | | | 6,111 | | | | 614,583 | |
Ameren Corp. | | | 9,625 | | | | 608,589 | |
American Electric Power Co., Inc. | | | 5,680 | | | | 407,426 | |
American Express Co. | | | 965 | | | | 102,271 | |
Atrion Corp. | | | 206 | | | | 134,940 | |
Bryn Mawr Bank Corp. | | | 2,068 | | | | 100,918 | |
Carter’s, Inc. | | | 471 | | | | 49,893 | |
Chemed Corp. | | | 1,162 | | | | 375,953 | |
Chevron Corp. | | | 4,799 | | | | 568,490 | |
Chico’s FAS, Inc. | | | 10,806 | | | | 98,551 | |
Children’s Place, Inc. (1) | | | 625 | | | | 87,969 | |
Darden Restaurants, Inc. | | | 2,499 | | | | 289,984 | |
Discover Financial Services | | | 6,321 | | | | 493,796 | |
Eli Lilly & Co. | | | 1,715 | | | | 181,190 | |
Essex Property Trust, Inc. | | | 1,136 | | | | 279,774 | |
Exelon Corp. | | | 2,826 | | | | 123,524 | |
Fiserv, Inc. (2) | | | 2,310 | | | | 184,962 | |
Foot Locker, Inc. | | | 1,008 | | | | 49,694 | |
Forrester Research, Inc. | | | 1,198 | | | | 58,942 | |
Getty Realty Corp. | | | 3,522 | | | | 102,525 | |
Harris Corp. | | | 2,023 | | | | 328,758 | |
Huntington Ingalls Industries, Inc. | | | 637 | | | | 155,727 | |
ICU Medical, Inc. (2) | | | 772 | | | | 236,232 | |
IDACORP, Inc. | | | 2,429 | | | | 237,678 | |
Invacare Corp. | | | 4,785 | | | | 72,732 | |
Jack Henry & Associates, Inc. | | | 1,082 | | | | 171,432 | |
Kroger Co. | | | 4,821 | | | | 151,861 | |
Lockheed Martin Corp. | | | 634 | | | | 203,140 | |
Masimo Corp. (2) | | | 1,070 | | | | 126,142 | |
Merck & Co., Inc. | | | 8,286 | | | | 568,337 | |
Meridian Bancorp, Inc. | | | 10,779 | | | | 192,944 | |
NorthWestern Corp. | | | 6,441 | | | | 386,202 | |
PepsiCo, Inc. | | | 3,701 | | | | 414,549 | |
Pfizer, Inc. | | | 15,493 | | | | 643,269 | |
Pinnacle West Capital Corp. | | | 661 | | | | 51,922 | |
Portland General Electric Co. | | | 13,614 | | | | 631,690 | |
Progressive Corp. | | | 1,508 | | | | 101,835 | |
| | | | | | | | |
| Description | | Shares or
Units | | | Value | |
| Common Stocks (continued) | |
|
United States(continued) | |
Safety Insurance Group, Inc. | | | 2,044 | | | $ | 197,655 | |
Spirit AeroSystems Holdings, Inc., Class A | | | 1,165 | | | | 99,607 | |
Sysco Corp. | | | 6,902 | | | | 516,408 | |
U.S. Physical Therapy, Inc. | | | 1,204 | | | | 150,801 | |
Unum Group | | | 5,034 | | | | 185,654 | |
USANA Health Sciences, Inc. (2) | | | 2,229 | | | | 294,117 | |
Valero Energy Corp. | | | 1,684 | | | | 198,510 | |
Walmart, Inc. | | | 4,259 | | | | 408,268 | |
WellCare Health Plans, Inc. (2) | | | 545 | | | | 164,901 | |
Williams Cos., Inc. | | | 4,139 | | | | 122,473 | |
Xcel Energy, Inc. | | | 2,738 | | | | 131,561 | |
| | | | | | | | |
| | | | | | | 12,191,421 | |
| | | | | | | | |
Total Common Stocks
(identified cost $25,461,117) | | | | | | | 30,112,581 | |
| | | | | | | | |
| Common Stock Units — 0.4% | |
|
Mexico — 0.4% | |
Megacable Holdings SAB de C.V., | | | 23,300 | | | | 109,822 | |
| | | | | | | | |
Total Common Stock Units
(identified cost $98,155) | | | | | | | 109,822 | |
| | | | | | | | |
| Short-Term Investments — 7.1% | |
|
| Collateral Investment for Securities on Loan — 6.6% | |
| | |
State Street Navigator Securities Lending Government Money Market Portfolio, 1.920% (3) | | | 2,034,554 | | | | 2,034,554 | |
|
| Mutual Funds — 0.5% | |
BMO Institutional Prime Money Market Fund — Premier Class, 1.987% (4) | | | 143,962 | | | | 143,976 | |
| | | | | | | | |
Total Short-Term Investments
(identified cost $2,178,516) | | | | | | | 2,178,530 | |
| | | | | | | | |
Total Investments — 106.1%
(identified cost $27,737,788) | | | | | | | 32,400,933 | |
| Other Assets and Liabilities — (6.1)% | | | | (1,857,098 | ) |
| | | | | | | | |
| Total Net Assets — 100.0% | | | $ | 30,543,835 | |
| | | | | | | | |
| | | | | | | | |
| |
| Industry Allocation | |
| Industry | | Value | | | % of
Total
Net Assets | |
Advertising | | $ | 58,942 | | | | 0.2 | % |
Aerospace/Defense | | | 631,505 | | | | 2.1 | |
Airlines | | | 122,808 | | | | 0.4 | |
Apparel | | | 121,527 | | | | 0.5 | |
Auto Parts & Equipment | | | 55,256 | | | | 0.2 | |
Banks | | | 2,860,898 | | | | 9.5 | |
Beverages | | | 751,353 | | | | 2.5 | |
Chemicals | | | 97,815 | | | | 0.3 | |
Commercial Services | | | 518,043 | | | | 1.7 | |
Computers | | | 576,096 | | | | 1.9 | |
Diversified Financial Services | | | 781,912 | | | | 2.5 | |
Electric | | | 5,626,394 | | | | 18.4 | |
Engineering & Construction | | | 274,084 | | | | 0.9 | |
Food | | | 2,056,785 | | | | 6.8 | |
Healthcare-Products | | | 1,214,919 | | | | 3.9 | |
Healthcare-Services | | | 1,360,459 | | | | 4.4 | |
Holding Companies-Diversified | | | 118,545 | | | | 0.4 | |
Insurance | | | 1,654,375 | | | | 5.3 | |
Lodging | | | 87,831 | | | | 0.3 | |
Media | | | 554,891 | | | | 1.8 | |
(See Notes which are an integral part of the Financial Statements)
55
August 31, 2018
Global Low Volatility Equity Fund (continued)
| | | | | | | | |
| |
| Industry Allocation(continued) | |
| Industry | | Value | | | % of
Total
Net Assets | |
Mining | | $ | 74,007 | | | | 0.2 | % |
Oil & Gas | | | 767,000 | | | | 2.6 | |
Pharmaceuticals | | | 2,766,693 | | | | 9.1 | |
Pipelines | | | 122,473 | | | | 0.4 | |
Private Equity | | | 82,917 | | | | 0.3 | |
Real Estate | | | 339,374 | | | | 1.1 | |
Real Estate Investment Trusts | | | 1,608,867 | | | | 5.1 | |
Retail | | | 1,944,763 | | | | 6.4 | |
Savings & Loans | | | 192,944 | | | | 0.6 | |
Shipbuilding | | | 155,727 | | | | 0.5 | |
Software | | | 356,394 | | | | 1.2 | |
Telecommunications | | | 2,014,399 | | | | 6.6 | |
Transportation | | | 162,585 | | | | 0.5 | |
| | | | | | | | |
Total Common Stocks | | | 30,112,581 | | | | 98.6 | |
Common Stock Units | | | 109,822 | | | | 0.4 | |
Collateral Investment for Securities on Loan | | | 2,034,554 | | | | 6.6 | |
Mutual Funds | | | 143,976 | | | | 0.5 | |
| | | | | | | | |
Total Investments | | | 32,400,933 | | | | 106.1 | |
Other Assets and Liabilities | | | (1,857,098 | ) | | | (6.1 | ) |
| | | | | | | | |
Net Assets | | $ | 30,543,835 | | | | 100.0 | % |
| | | | | | | | |
Disciplined International Equity Fund
| | | | | | | | |
| Description | | Shares | | | Value | |
| Common Stocks — 94.0% | |
|
Australia — 7.1% | |
CSL, Ltd. | | | 1,770 | | | $ | 289,241 | |
Evolution Mining, Ltd. | | | 364,443 | | | | 694,295 | |
Fortescue Metals Group, Ltd. | | | 417,831 | | | | 1,153,454 | |
Qantas Airways, Ltd. | | | 225,218 | | | | 1,041,076 | |
Rio Tinto PLC | | | 16,563 | | | | 785,701 | |
St. Barbara, Ltd. | | | 142,653 | | | | 404,060 | |
Whitehaven Coal, Ltd. | | | 185,921 | | | | 672,303 | |
Woodside Petroleum, Ltd. | | | 18,902 | | | | 501,014 | |
| | | | | | | | |
| | | | | | | 5,541,144 | |
|
Belgium — 0.2% | |
bpost SA | | | 10,292 | | | | 155,901 | |
|
Cayman Islands — 0.5% | |
IGG, Inc. | | | 191,000 | | | | 230,697 | |
WH Group, Ltd. (5) | | | 194,000 | | | | 146,326 | |
| | | | | | | | |
| | | | | | | 377,023 | |
|
Denmark — 3.1% | |
Danske Bank A/S | | | 16,573 | | | | 487,601 | |
Novo Nordisk A/S, Class B | | | 38,642 | | | | 1,893,832 | |
| | | | | | | | |
| | | | | | | 2,381,433 | |
|
Finland — 2.8% | |
UPM-Kymmene OYJ | | | 55,615 | | | | 2,143,230 | |
|
France — 11.3% | |
Arkema SA | | | 7,987 | | | | 1,000,331 | |
Bouygues SA | | | 4,289 | | | | 189,331 | |
Capgemini SE | | | 2,002 | | | | 257,363 | |
CNP Assurances | | | 20,229 | | | | 466,564 | |
Credit Agricole SA | | | 48,070 | | | | 657,961 | |
Eiffage SA | | | 2,754 | | | | 309,953 | |
| | | | | | | | |
| Description | | Shares | | | Value | |
| Common Stocks (continued) | |
|
France(continued) | |
Eramet | | | 2,743 | | | $ | 234,656 | |
Peugeot SA | | | 71,532 | | | | 1,967,829 | |
Sanofi | | | 19,936 | | | | 1,705,239 | |
Societe Generale SA | | | 21,578 | | | | 882,644 | |
Vinci SA | | | 11,196 | | | | 1,072,930 | |
| | | | | | | | |
| | | | | | | 8,744,801 | |
|
Germany — 7.1% | |
Allianz SE | | | 9,845 | | | | 2,098,561 | |
Covestro AG (5) | | | 17,387 | | | | 1,480,952 | |
Deutsche Lufthansa AG | | | 20,507 | | | | 535,341 | |
Fresenius Medical Care AG & Co. KGaA | | | 2,025 | | | | 205,106 | |
Fresenius SE & Co. KGaA | | | 13,223 | | | | 1,009,631 | |
Talanx AG (2) | | | 4,969 | | | | 187,568 | |
| | | | | | | | |
| | | | | | | 5,517,159 | |
|
Hong Kong — 7.0% | |
BOC Hong Kong Holdings, Ltd. | | | 161,500 | | | | 788,081 | |
CK Asset Holdings, Ltd. | | | 194,500 | | | | 1,386,498 | |
Galaxy Entertainment Group, Ltd. | | | 126,000 | | | | 932,709 | |
Hang Seng Bank, Ltd. | | | 41,400 | | | | 1,122,462 | |
Hong Kong Exchanges & Clearing, Ltd. | | | 12,900 | | | | 367,174 | |
Sands China, Ltd. | | | 171,600 | | | | 837,366 | |
| | | | | | | | |
| | | | | | | 5,434,290 | |
|
Italy — 1.2% | |
ASTM SpA | | | 12,052 | | | | 245,933 | |
Enel SpA | | | 70,934 | | | | 350,754 | |
Societa Iniziative Autostradali e Servizi SpA | | | 25,047 | | | | 348,880 | |
| | | | | | | | |
| | | | | | | 945,567 | |
|
Japan — 20.7% | |
AGC, Inc. | | | 12,600 | | | | 504,635 | |
Aoyama Trading Co., Ltd. (1) | | | 9,500 | | | | 288,565 | |
Bridgestone Corp. | | | 5,300 | | | | 195,238 | |
Chubu Electric Power Co., Inc. | | | 41,200 | | | | 599,034 | |
Daiwa Securities Group, Inc. (1) | | | 265,700 | | | | 1,593,578 | |
Foster Electric Co., Ltd. | | | 11,100 | | | | 155,646 | |
Fujikura, Ltd. | | | 54,300 | | | | 335,252 | |
Fujitsu, Ltd. | | | 59,000 | | | | 431,761 | |
Hitachi, Ltd. | | | 237,000 | | | | 1,547,507 | |
Honda Motor Co., Ltd. | | | 48,600 | | | | 1,439,935 | |
JVC Kenwood Corp. | | | 88,500 | | | | 251,697 | |
Kansai Electric Power Co., Inc. | | | 55,700 | | | | 798,328 | |
Kirin Holdings Co., Ltd. | | | 50,100 | | | | 1,238,860 | |
Konica Minolta, Inc. | | | 85,700 | | | | 872,349 | |
Maxell Holdings, Ltd. | | | 10,700 | | | | 172,571 | |
Mitsubishi UFJ Financial Group, Inc. | | | 21,900 | | | | 132,216 | |
NEC Corp. | | | 6,600 | | | | 182,360 | |
Nippon Telegraph & Telephone Corp. | | | 41,000 | | | | 1,826,568 | |
Nishimatsu Construction Co., Ltd. | | | 26,500 | | | | 634,655 | |
Nisshinbo Holdings, Inc. | | | 44,000 | | | | 493,817 | |
ORIX Corp. | | | 93,000 | | | | 1,495,734 | |
Sumitomo Electric Industries, Ltd. | | | 11,300 | | | | 178,790 | |
Toho Holdings Co., Ltd. (1) | | | 6,500 | | | | 171,231 | |
Toppan Printing Co., Ltd. | | | 62,000 | | | | 483,791 | |
| | | | | | | | |
| | | | | | | 16,024,118 | |
|
Jersey — 3.2% | |
Aptiv PLC | | | 15,804 | | | | 1,390,910 | |
Wizz Air Holdings PLC (2)(5) | | | 26,699 | | | | 1,097,607 | |
| | | | | | | | |
| | | | | | | 2,488,517 | |
(See Notes which are an integral part of the Financial Statements)
56
Disciplined International Equity Fund (continued)
| | | | | | | | |
| Description | | Shares | | | Value | |
| Common Stocks (continued) | |
|
Luxembourg — 0.4% | |
Ternium SA, ADR | | | 11,388 | | | $ | 321,142 | |
|
Netherlands — 4.5% | |
ABN AMRO Group NV (5) | | | 53,000 | | | | 1,435,256 | |
AerCap Holdings NV (2) | | | 9,553 | | | | 544,234 | |
ASM International NV | | | 7,748 | | | | 417,478 | |
Fiat Chrysler Automobiles NV (2) | | | 50,461 | | | | 852,817 | |
Koninklijke Ahold Delhaize NV | | | 8,832 | | | | 214,876 | |
| | | | | | | | |
| | | | | | | 3,464,661 | |
|
New Zealand — 0.2% | |
Air New Zealand, Ltd. | | | 77,496 | | | | 169,195 | |
|
Norway — 4.8% | |
Austevoll Seafood ASA | | | 41,886 | | | | 551,411 | |
DNO ASA (2) | | | 182,847 | | | | 354,633 | |
Equinor ASA | | | 67,502 | | | | 1,731,388 | |
Salmar ASA | | | 23,194 | | | | 1,117,916 | |
| | | | | | | | |
| | | | | | | 3,755,348 | |
|
Portugal — 0.2% | |
Mota-Engil SGPS SA (2) | | | 42,835 | | | | 133,003 | |
|
Singapore — 1.1% | |
DBS Group Holdings, Ltd. | | | 25,300 | | | | 459,899 | |
SATS, Ltd. | | | 48,400 | | | | 178,783 | |
United Overseas Bank, Ltd. | | | 10,300 | | | | 203,066 | |
| | | | | | | | |
| | | | | | | 841,748 | |
|
Spain — 1.4% | |
Banco Bilbao Vizcaya Argentaria SA | | | 38,573 | | | | 240,434 | |
Ence Energia y Celulosa SA | | | 87,879 | | | | 824,715 | |
| | | | | | | | |
| | | | | | | 1,065,149 | |
|
Sweden — 0.4% | |
Boliden AB | | | 6,307 | | | | 165,104 | |
Skandinaviska Enskilda Banken AB, Class A | | | 16,171 | | | | 172,582 | |
| | | | | | | | |
| | | | | | | 337,686 | |
|
Switzerland — 5.5% | |
Roche Holding AG | | | 10,863 | | | | 2,698,798 | |
TE Connectivity, Ltd. | | | 13,485 | | | | 1,236,305 | |
Zurich Insurance Group AG | | | 1,097 | | | | 334,108 | |
| | | | | | | | |
| | | | | | | 4,269,211 | |
|
United Kingdom — 11.3% | |
Berkeley Group Holdings PLC | | | 15,567 | | | | 735,225 | |
GlaxoSmithKline PLC | | | 94,092 | | | | 1,903,463 | |
Imperial Brands PLC | | | 42,145 | | | | 1,499,291 | |
International Consolidated Airlines Group SA | | | 25,465 | | | | 228,062 | |
Jupiter Fund Management PLC | | | 29,900 | | | | 162,498 | |
Legal & General Group PLC | | | 476,490 | | | | 1,570,927 | |
Moneysupermarket.com Group PLC | | | 83,930 | | | | 309,023 | |
Persimmon PLC | | | 20,705 | | | | 653,090 | |
QinetiQ Group PLC | | | 103,230 | | | | 362,686 | |
Royal Mail PLC | | | 87,245 | | | | 506,727 | |
Unilever PLC | | | 13,910 | | | | 792,037 | |
| | | | | | | | |
| | | | | | | 8,723,029 | |
| | | | | | | | |
Total Common Stocks
(identified cost $68,371,138) | | | | | | | 72,833,355 | |
| | | | | | | | |
| | | | | | | | |
| Description | | Shares or
Units | | | Value | |
| Exchange Traded Funds — 1.6% | |
|
United States — 1.6% | |
iShares Core MSCI EAFE | | | 20,000 | | | $ | 1,274,200 | |
| | | | | | | | |
Total Exchange Traded Funds
(identified cost $1,233,798) | | | | | | | 1,274,200 | |
| | | | | | | | |
| Limited Partnership Units — 0.4% | |
|
Germany — 0.4% | |
Schaeffler AG | | | 24,623 | | | | 334,400 | |
| | | | | | | | |
Total Limited Partnership Units
(identified cost $334,184) | | | | | | | 334,400 | |
| | | | | | | | |
| Short-Term Investments — 4.5% | |
|
| Collateral Investment for Securities on Loan — 1.1% | |
| | |
State Street Navigator Securities Lending Government Money Market Portfolio, 1.920% (3) | | | 819,722 | | | | 819,722 | |
|
| Mutual Funds — 3.4% | |
BMO Institutional Prime Money Market Fund — Premier Class, 1.987% (4) | | | 2,615,714 | | | | 2,615,976 | |
| | | | | | | | |
Total Short-Term Investments
(identified cost $3,435,561) | | | | | | | 3,435,698 | |
| | | | | | | | |
Total Investments — 100.5%
(identified cost $73,374,681) | | | | | | | 77,877,653 | |
| Other Assets and Liabilities — (0.5)% | | | | (351,981 | ) |
| | | | | | | | |
| Total Net Assets — 100.0% | | | | | | $ | 77,525,672 | |
| | | | | | | | |
| | | | | | | | |
| |
| Industry Allocation | |
| Industry | | Value | | | % of
Total
Net Assets | |
Agriculture | | $ | 1,499,291 | | | | 1.9 | % |
Airlines | | | 3,071,281 | | | | 3.9 | |
Auto Manufacturers | | | 4,260,581 | | | | 5.5 | |
Auto Parts & Equipment | | | 1,764,938 | | | | 2.3 | |
Banks | | | 6,582,202 | | | | 8.5 | |
Beverages | | | 1,238,860 | | | | 1.6 | |
Biotechnology | | | 289,241 | | | | 0.4 | |
Building Materials | | | 504,635 | | | | 0.7 | |
Chemicals | | | 2,481,283 | | | | 3.2 | |
Coal | | | 672,303 | | | | 0.9 | |
Commercial Services | | | 1,441,290 | | | | 1.8 | |
Computers | | | 871,484 | | | | 1.1 | |
Cosmetics/Personal Care | | | 792,037 | | | | 1.0 | |
Diversified Financial Services | | | 3,618,984 | | | | 4.7 | |
Electric | | | 1,748,116 | | | | 2.3 | |
Electrical Components & Equipment | | | 335,252 | | | | 0.4 | |
Electronics | | | 1,236,305 | | | | 1.6 | |
Engineering & Construction | | | 2,518,655 | | | | 3.3 | |
Food | | | 2,030,529 | | | | 2.6 | |
Forest Products & Paper | | | 2,967,945 | | | | 3.9 | |
Healthcare-Services | | | 1,214,737 | | | | 1.6 | |
Home Builders | | | 1,388,315 | | | | 1.8 | |
Home Furnishings | | | 579,914 | | | | 0.7 | |
Insurance | | | 4,657,728 | | | | 5.9 | |
Internet | | | 309,023 | | | | 0.4 | |
Iron/Steel | | | 1,474,596 | | | | 1.9 | |
Lodging | | | 1,770,075 | | | | 2.3 | |
Machinery-Construction & Mining | | | 1,547,507 | | | | 2.0 | |
Mining | | | 2,283,816 | | | | 2.9 | |
Office/Business Equipment | | | 872,349 | | | | 1.1 | |
Oil & Gas | | | 2,587,035 | | | | 3.3 | |
(See Notes which are an integral part of the Financial Statements)
57
August 31, 2018
Disciplined International Equity Fund (continued)
| | | | | | | | |
| |
| Industry Allocation(continued) | |
| Industry | | Value | | | % of
Total
Net Assets | |
Pharmaceuticals | | $ | 8,372,563 | | | | 10.9 | % |
Real Estate | | | 1,386,498 | | | | 1.8 | |
Retail | | | 288,565 | | | | 0.4 | |
Semiconductors | | | 417,478 | | | | 0.5 | |
Software | | | 230,697 | | | | 0.3 | |
Telecommunications | | | 2,320,385 | | | | 3.0 | |
Transportation | | | 662,628 | | | | 0.9 | |
Trucking & Leasing | | | 544,234 | | | | 0.7 | |
| | | | | | | | |
Total Common Stocks | | | 72,833,355 | | | | 94.0 | |
Exchange Traded Funds | | | 1,274,200 | | | | 1.6 | |
Limited Partnership Units | | | 334,400 | | | | 0.4 | |
Collateral Investment for Securities on Loan | | | 819,722 | | | | 1.1 | |
Mutual Funds | | | 2,615,976 | | | | 3.4 | |
| | | | | | | | |
Total Investments | | | 77,877,653 | | | | 100.5 | |
Other Assets and Liabilities | | | (351,981 | ) | | | (0.5 | ) |
| | | | | | | | |
Net Assets | | $ | 77,525,672 | | | | 100.0 | % |
| | | | | | | | |
Pyrford International Stock Fund
| | | | | | | | |
| Description | | Shares | | | Value | |
| Common Stocks — 94.7% | |
|
Australia — 10.8% | |
Brambles, Ltd. | | | 1,880,358 | | | $ | 14,829,130 | |
Computershare, Ltd. | | | 825,072 | | | | 11,400,233 | |
Newcrest Mining, Ltd. | | | 349,929 | | | | 4,877,825 | |
QBE Insurance Group, Ltd. | | | 1,119,023 | | | | 8,857,167 | |
Rio Tinto, Ltd. | | | 113,387 | | | | 5,929,322 | |
Woodside Petroleum, Ltd. | | | 443,540 | | | | 11,756,402 | |
Woolworths Group, Ltd. | | | 632,131 | | | | 12,860,624 | |
| | | | | | | | |
| | | | | | | 70,510,703 | |
|
Finland — 2.4% | |
Kone OYJ, Class B | | | 149,369 | | | | 8,063,907 | |
Sampo OYJ, A Shares | | | 152,489 | | | | 7,800,460 | |
| | | | | | | | |
| | | | | | | 15,864,367 | |
|
France — 8.3% | |
Air Liquide SA | | | 87,295 | | | | 10,994,052 | |
Bureau Veritas SA | | | 332,331 | | | | 8,540,575 | |
Legrand SA | | | 110,951 | | | | 8,358,235 | |
Rubis SCA | | | 92,245 | | | | 5,460,742 | |
Sanofi | | | 129,126 | | | | 11,044,878 | |
TOTAL SA | | | 155,704 | | | | 9,736,109 | |
| | | | | | | | |
| | | | | | | 54,134,591 | |
|
Germany — 6.2% | |
Brenntag AG | | | 189,638 | | | | 11,433,152 | |
Deutsche Post AG | | | 239,638 | | | | 8,736,999 | |
Fielmann AG | | | 96,419 | | | | 6,508,052 | |
GEA Group AG | | | 149,643 | | | | 5,685,139 | |
SAP SE | | | 69,690 | | | | 8,382,098 | |
| | | | | | | | |
| | | | | | | 40,745,440 | |
|
Hong Kong — 3.8% | |
AIA Group, Ltd. | | | 642,400 | | | | 5,541,071 | |
China Mobile, Ltd. | | | 1,000,000 | | | | 9,402,771 | |
Power Assets Holdings, Ltd. | | | 754,500 | | | | 5,291,954 | |
VTech Holdings, Ltd. | | | 429,100 | | | | 4,748,187 | |
| | | | | | | | |
| | | | | | | 24,983,983 | |
| | | | | | | | |
| Description | | Shares | | | Value | |
| Common Stocks (continued) | |
|
Israel — 1.5% | |
Bezeq — The Israeli Telecommunication Corp., Ltd. | | | 8,198,023 | | | $ | 9,801,242 | |
|
Japan — 10.2% | |
ABC-Mart, Inc. (1) | | | 122,100 | | | | 6,659,400 | |
Japan Tobacco, Inc. | | | 652,468 | | | | 17,158,775 | |
KDDI Corp. | | | 449,000 | | | | 11,884,700 | |
Mitsubishi Electric Corp. | | | 575,000 | | | | 7,762,578 | |
Nihon Kohden Corp. | | | 316,700 | | | | 9,263,568 | |
Sumitomo Rubber Industries, Ltd. | | | 592,400 | | | | 8,786,565 | |
Toyota Tsusho Corp. | | | 162,800 | | | | 5,553,163 | |
| | | | | | | | |
| | | | | | | 67,068,749 | |
|
Malaysia — 3.0% | |
Axiata Group Bhd | | | 7,068,174 | | | | 8,255,806 | |
Malayan Banking Bhd | | | 4,699,782 | | | | 11,390,639 | |
| | | | | | | | |
| | | | | | | 19,646,445 | |
|
Netherlands — 4.7% | |
Koninklijke Vopak NV (1) | | | 192,563 | | | | 9,924,176 | |
RELX NV | | | 435,534 | | | | 9,645,819 | |
Unilever NV | | | 192,272 | | | | 11,057,439 | |
| | | | | | | | |
| | | | | | | 30,627,434 | |
|
Norway — 1.8% | |
Telenor ASA | | | 628,559 | | | | 11,849,917 | |
|
Singapore — 4.8% | |
ComfortDelGro Corp., Ltd. | | | 5,249,100 | | | | 8,757,742 | |
Singapore Technologies Engineering, Ltd. | | | 1,885,500 | | | | 4,588,226 | |
Singapore Telecommunications, Ltd. | | | 3,829,300 | | | | 9,011,431 | |
United Overseas Bank, Ltd. | | | 443,702 | | | | 8,747,642 | |
| | | | | | | | |
| | | | | | | 31,105,041 | |
|
Sweden — 5.4% | |
Assa Abloy AB, Class B | | | 548,121 | | | | 11,172,015 | |
Atlas Copco AB, A Shares | | | 256,023 | | | | 7,298,425 | |
Epiroc AB, Class A (2) | | | 256,023 | | | | 2,659,572 | |
Essity AB, Class B | | | 549,610 | | | | 14,243,350 | |
| | | | | | | | |
| | | | | | | 35,373,362 | |
|
Switzerland — 14.1% | |
Givaudan SA | | | 2,031 | | | | 4,941,035 | |
Nestle SA | | | 276,100 | | | | 23,181,860 | |
Novartis AG | | | 222,473 | | | | 18,449,708 | |
Panalpina Welttransport Holding AG (1) | | | 37,357 | | | | 5,596,323 | |
Roche Holding AG | | | 82,854 | | | | 20,584,208 | |
Schindler Holding AG | | | 20,466 | | | | 4,881,856 | |
SGS SA | | | 1,834 | | | | 4,830,748 | |
Zurich Insurance Group AG | | | 32,775 | | | | 9,982,131 | |
| | | | | | | | |
| | | | | | | 92,447,869 | |
|
Taiwan — 4.0% | |
Advantech Co., Ltd. | | | 735,118 | | | | 5,002,105 | |
Chunghwa Telecom Co., Ltd. | | | 2,538,000 | | | | 8,965,424 | |
Merida Industry Co., Ltd. | | | 536,000 | | | | 2,573,987 | |
Taiwan Semiconductor Manufacturing Co., Ltd. | | | 1,136,000 | | | | 9,468,208 | |
| | | | | | | | |
| | | | | | | 26,009,724 | |
|
United Kingdom — 13.7% | |
BP PLC | | | 688,114 | | | | 4,882,494 | |
British American Tobacco PLC | | | 206,021 | | | | 9,939,976 | |
GlaxoSmithKline PLC | | | 453,315 | | | | 9,170,476 | |
Imperial Brands PLC | | | 180,170 | | | | 6,409,474 | |
Legal & General Group PLC | | | 2,892,375 | | | | 9,535,793 | |
National Grid PLC | | | 1,154,904 | | | | 12,127,932 | |
(See Notes which are an integral part of the Financial Statements)
58
Pyrford International Stock Fund (continued)
| | | | | | | | |
| Description | | Shares | | | Value | |
| Common Stocks (continued) | |
|
United Kingdom(continued) | |
Reckitt Benckiser Group PLC | | | 97,928 | | | $ | 8,327,226 | |
Royal Dutch Shell PLC, A Shares | | | 233,748 | | | | 7,594,330 | |
Royal Dutch Shell PLC, B Shares | | | 175,947 | | | | 5,795,046 | |
SSE PLC | | | 482,557 | | | | 7,838,907 | |
Vodafone Group PLC | | | 3,898,271 | | | | 8,313,689 | |
| | | | | | | | |
| | | | | | | 89,935,343 | |
| | | | | | | | |
Total Common Stocks
(identified cost $557,739,581) | | | | | | | 620,104,210 | |
| | | | | | | | |
| Preferred Stocks — 1.8% | |
|
Germany — 1.8% | |
Fuchs Petrolub SE | | | 197,739 | | | | 11,579,563 | |
| | | | | | | | |
Total Preferred Stocks
(identified cost $7,410,785) | | | | | | | 11,579,563 | |
| | | | | | | | |
| Short-Term Investments — 4.7% | |
|
| Collateral Investment for Securities on Loan — 2.1% | |
| | |
State Street Navigator Securities Lending Government Money Market Portfolio, 1.920% (3) | | | 13,620,020 | | | | 13,620,020 | |
|
| Mutual Funds — 2.6% | |
BMO Institutional Prime Money Market Fund — Premier Class, 1.987% (4) | | | 16,790,788 | | | | 16,792,467 | |
| | | | | | | | |
Total Short-Term Investments
(identified cost $30,411,508) | | | | | | | 30,412,487 | |
| | | | | | | | |
Total Investments — 101.2%
(identified cost $595,561,874) | | | | | | | 662,096,260 | |
| Other Assets and Liabilities — (1.2)% | | | | (7,643,965 | ) |
| | | | | | | | |
| Total Net Assets — 100.0% | | | | | | $ | 654,452,295 | |
| | | | | | | | |
| | | | | | | | |
| |
| Industry Allocation | |
| Industry | | Value | | | % of
Total
Net Assets | |
Agriculture | | $ | 33,508,225 | | | | 5.1 | % |
Auto Parts & Equipment | | | 8,786,565 | | | | 1.3 | |
Banks | | | 20,138,281 | | | | 3.0 | |
Chemicals | | | 27,368,239 | | | | 4.2 | |
Commercial Services | | | 37,846,272 | | | | 5.8 | |
Computers | | | 16,402,338 | | | | 2.5 | |
Cosmetics/Personal Care | | | 25,300,789 | | | | 3.9 | |
Distribution/Wholesale | | | 5,553,163 | | | | 0.9 | |
Electric | | | 13,130,861 | | | | 2.0 | |
Electrical Components & Equipment | | | 8,358,235 | | | | 1.3 | |
Electronics | | | 11,172,015 | | | | 1.7 | |
Engineering & Construction | | | 4,588,226 | | | | 0.7 | |
Food | | | 36,042,484 | | | | 5.5 | |
Gas | | | 17,588,674 | | | | 2.6 | |
Hand/Machine Tools | | | 4,881,856 | | | | 0.8 | |
Healthcare-Products | | | 9,263,568 | | | | 1.4 | |
Household Products/Wares | | | 8,327,226 | | | | 1.3 | |
Insurance | | | 41,716,622 | | | | 6.4 | |
Leisure Time | | | 2,573,987 | | | | 0.4 | |
Machinery-Construction & Mining | | | 17,720,575 | | | | 2.7 | |
Machinery-Diversified | | | 13,749,046 | | | | 2.1 | |
| | | | | | | | |
| |
| Industry Allocation(continued) | |
| Industry | | Value | | | % of
Total
Net Assets | |
Mining | | $ | 10,807,147 | | | | 1.6 | % |
Oil & Gas | | | 39,764,381 | | | | 6.1 | |
Pharmaceuticals | | | 59,249,270 | | | | 9.0 | |
Pipelines | | | 9,924,176 | | | | 1.5 | |
Retail | | | 13,167,452 | | | | 2.0 | |
Semiconductors | | | 9,468,208 | | | | 1.4 | |
Software | | | 8,382,098 | | | | 1.3 | |
Telecommunications | | | 82,233,167 | | | | 12.6 | |
Transportation | | | 23,091,064 | | | | 3.6 | |
| | | | | | | | |
Total Common Stocks | | | 620,104,210 | | | | 94.7 | |
Preferred Stocks | | | 11,579,563 | | | | 1.8 | |
Collateral Investment for Securities on Loan | | | 13,620,020 | | | | 2.1 | |
Mutual Funds | | | 16,792,467 | | | | 2.6 | |
| | | | | | | | |
Total Investments | | | 662,096,260 | | | | 101.2 | |
Other Assets and Liabilities | | | (7,643,965 | ) | | | (1.2 | ) |
| | | | | | | | |
Net Assets | | $ | 654,452,295 | | | | 100.0 | % |
| | | | | | | | |
LGM Emerging Markets Equity Fund
| | | | | | | | |
| Description | | Shares | | | Value | |
| Common Stocks — 94.1% | |
|
Brazil — 1.4% | |
Raia Drogasil SA | | | 154,800 | | | $ | 2,926,420 | |
|
Chile — 1.3% | |
Aguas Andinas SA, Class A | | | 4,782,906 | | | | 2,575,138 | |
|
China — 8.6% | |
Foshan Haitian Flavouring & Food Co., Ltd., Class A | | | 105,100 | | | | 1,054,139 | |
Tingyi Cayman Islands Holding Corp. | | | 3,002,000 | | | | 5,362,388 | |
Yum China Holdings, Inc. | | | 294,293 | | | | 11,383,253 | |
| | | | | | | | |
| | | | | | | 17,799,780 | |
|
Egypt — 4.1% | |
Commercial International Bank Egypt SAE, GDR | | | 997,824 | | | | 4,719,708 | |
Eastern Tobacco | | | 628,557 | | | | 3,656,770 | |
| | | | | | | | |
| | | | | | | 8,376,478 | |
|
Hong Kong — 10.8% | |
AIA Group, Ltd. | | | 709,800 | | | | 6,122,435 | |
Dairy Farm International Holdings, Ltd. | | | 570,105 | | | | 5,284,873 | |
Sands China, Ltd. | | | 2,249,600 | | | | 10,977,503 | |
| | | | | | | | |
| | | | | | | 22,384,811 | |
|
India — 21.6% | |
Colgate-Palmolive India, Ltd. | | | 186,204 | | | | 3,066,372 | |
Emami, Ltd. | | | 764,896 | | | | 6,120,138 | |
HDFC Bank, Ltd. | | | 277,503 | | | | 8,059,672 | |
Housing Development Finance Corp., Ltd. | | | 109,279 | | | | 2,990,348 | |
ICICI Bank, Ltd. | | | 1,281,438 | | | | 6,171,752 | |
ITC, Ltd. | | | 1,984,151 | | | | 8,940,761 | |
Nestle India, Ltd. | | | 24,339 | | | | 3,970,353 | |
Yes Bank, Ltd. | | | 1,113,951 | | | | 5,387,077 | |
| | | | | | | | |
| | | | | | | 44,706,473 | |
(See Notes which are an integral part of the Financial Statements)
59
August 31, 2018
LGM Emerging Markets Equity Fund (continued)
| | | | | | | | |
| Description | | Shares or
Units | | | Value | |
| Common Stocks (continued) | |
|
Indonesia — 8.5% | |
Bank Mandiri Persero Tbk PT | | | 24,043,508 | | | $ | 11,262,743 | |
Bank Rakyat Indonesia Persero Tbk PT | | | 20,225,200 | | | | 4,366,337 | |
Kalbe Farma Tbk PT | | | 21,708,900 | | | | 1,982,245 | |
| | | | | | | | |
| | | | | | | 17,611,325 | |
|
Malaysia — 3.9% | |
British American Tobacco Malaysia Bhd | | | 748,600 | | | | 6,168,049 | |
Public Bank Bhd | | | 316,600 | | | | 1,935,270 | |
| | | | | | | | |
| | | | | | | 8,103,319 | |
|
Mexico — 7.1% | |
Bolsa Mexicana de Valores SAB de C.V. | | | 1,855,577 | | | | 3,737,329 | |
Grupo Herdez SAB de C.V., Series *(1) | | | 635,817 | | | | 1,367,463 | |
Wal-Mart de Mexico SAB de C.V. | | | 3,435,110 | | | | 9,511,381 | |
| | | | | | | | |
| | | | | | | 14,616,173 | |
|
Nigeria — 0.7% | |
Guaranty Trust Bank PLC | | | 15,198,387 | | | | 1,511,651 | |
|
Peru — 1.4% | |
Credicorp, Ltd. | | | 13,299 | | | | 2,899,448 | |
|
Philippines — 4.2% | |
Universal Robina Corp. | | | 3,362,430 | | | | 8,772,705 | |
| | |
Russia — 4.1% | | | | | | | | |
Magnit PJSC, GDR | | | 573,408 | | | | 8,469,236 | |
| | |
South Africa — 8.0% | | | | | | | | |
AVI, Ltd. | | | 557,083 | | | | 4,397,904 | |
Clicks Group, Ltd. | | | 276,219 | | | | 3,815,750 | |
Famous Brands, Ltd. (1)(2) | | | 305,889 | | | | 2,118,638 | |
Mr Price Group, Ltd. | | | 410,536 | | | | 6,295,351 | |
| | | | | | | | |
| | | | | | | 16,627,643 | |
| | |
Taiwan — 3.3% | | | | | | | | |
President Chain Store Corp. | | | 619,000 | | | | 6,751,262 | |
| | |
Thailand — 1.0% | | | | | | | | |
Kasikornbank PCL | | | 333,469 | | | | 2,149,770 | |
| | |
Turkey — 0.3% | | | | | | | | |
BIM Birlesik Magazalar AS | | | 48,355 | | | | 537,589 | |
| | |
United States — 1.9% | | | | | | | | |
Western Union Co. | | | 211,481 | | | | 4,001,220 | |
| | |
Vietnam — 1.9% | | | | | | | | |
Vietnam Dairy Products JSC | | | 577,243 | | | | 3,881,479 | |
| | | | | | | | |
Total Common Stocks
(identified cost $169,478,159) | | | | | | | 194,701,920 | |
| | | | | | | | |
| Common Stock Units — 2.6% | |
| | |
Mexico — 2.6% | | | | | | | | |
Fomento Economico Mexicano SAB de C.V., | | | 557,300 | | | | 5,338,108 | |
| | | | | | | | |
Total Common Stock Units
(identified cost $4,808,402) | | | | | | | 5,338,108 | |
| | | | | | | | |
| Short-Term Investments — 4.5% | |
|
| Collateral Investment for Securities on Loan — 1.0% | |
| | |
State Street Navigator Securities Lending Government Money Market Portfolio, 1.920% (3) | | | 1,923,465 | | | | 1,923,465 | |
| | | | | | | | |
| Description | | Shares | | | Value | |
| Short-Term Investments (continued) | |
|
| Mutual Funds — 3.5% | |
BMO Institutional Prime Money Market Fund — Premier Class, 1.987% (4) | | | 7,267,553 | | | $ | 7,268,280 | |
| | | | | | | | |
Total Short-Term Investments
(identified cost $9,190,263) | | | | | | | 9,191,745 | |
| | | | | | | | |
Total Investments — 101.2%
(identified cost $183,476,824) | | | | | | | 209,231,773 | |
| Other Assets and Liabilities — (1.2)% | | | | (2,413,924 | ) |
| | | | | | | | |
| Total Net Assets — 100.0% | | | | | | $ | 206,817,849 | |
| | | | | | | | |
| | | | | | | | |
| |
| Industry Allocation | |
| Industry | | Value | | | % of
Total
Net Assets | |
Agriculture | | $ | 18,765,580 | | | | 9.1 | % |
Banks | | | 48,463,428 | | | | 23.3 | |
Commercial Services | | | 4,001,220 | | | | 1.9 | |
Cosmetics/Personal Care | | | 3,066,372 | | | | 1.5 | |
Diversified Financial Services | | | 6,727,677 | | | | 3.2 | |
Food | | | 38,700,225 | | | | 18.7 | |
Holding Companies-Diversified | | | 4,397,904 | | | | 2.1 | |
Insurance | | | 6,122,435 | | | | 3.0 | |
Lodging | | | 10,977,503 | | | | 5.3 | |
Pharmaceuticals | | | 8,102,383 | | | | 4.0 | |
Retail | | | 42,802,055 | | | | 20.7 | |
Water | | | 2,575,138 | | | | 1.3 | |
| | | | | | | | |
Total Common Stocks | | | 194,701,920 | | | | 94.1 | |
Common Stock Units | | | 5,338,108 | | | | 2.6 | |
Collateral Investment for Securities on Loan | | | 1,923,465 | | | | 1.0 | |
Mutual Funds | | | 7,268,280 | | | | 3.5 | |
| | | | | | | | |
Total Investments | | | 209,231,773 | | | | 101.2 | |
Other Assets and Liabilities | | | (2,413,924 | ) | | | (1.2 | ) |
| | | | | | | | |
Net Assets | | $ | 206,817,849 | | | | 100.0 | % |
| | | | | | | | |
Alternative Strategies Fund
| | | | | | | | |
| Description | | Shares | | | Value | |
| Common Stocks Purchased Long — 68.6% | |
|
Australia — 0.2% | |
Regis Resources, Ltd. | | | 43,985 | | | $ | 132,491 | |
|
Bermuda — 1.2% | |
Argo Group International Holdings, Ltd. | | | 3,374 | | | | 214,924 | |
Essent Group, Ltd. (2) | | | 5,090 | | | | 220,702 | |
IHS Markit, Ltd. (2) | | | 7,516 | | | | 413,380 | |
Travelport Worldwide, Ltd. | | | 2,822 | | | | 52,405 | |
| | | | | | | | |
| | | | | | | 901,411 | |
|
Canada — 4.0% | |
Air Canada (2) | | | 1,659 | | | | 34,095 | |
Allied Properties Real Estate Investment Trust (6) | | | 9,974 | | | | 333,155 | |
BlackBerry, Ltd. (2)(6) | | | 30,511 | | | | 325,552 | |
Canfor Corp. (2)(6) | | | 12,843 | | | | 296,127 | |
Cascades, Inc. | | | 2,983 | | | | 30,333 | |
Cogeco Communications, Inc. | | | 1,411 | | | | 70,031 | |
Cogeco, Inc. | | | 643 | | | | 30,583 | |
Cott Corp. | | | 26,205 | | | | 408,798 | |
Equitable Group, Inc. | | | 2,233 | | | | 111,171 | |
George Weston, Ltd. | | | 3,103 | | | | 241,677 | |
(See Notes which are an integral part of the Financial Statements)
60
Alternative Strategies Fund (continued)
| | | | | | | | |
| Description | | Shares | | | Value | |
| Common Stocks Purchased Long (continued) | |
|
Canada(continued) | |
Husky Energy, Inc. | | | 8,108 | | | $ | 134,077 | |
Interfor Corp. (2) | | | 14,572 | | | | 250,795 | |
InterRent Real Estate Investment Trust | | | 10,160 | | | | 88,988 | |
Methanex Corp. | | | 2,403 | | | | 175,336 | |
Premier Gold Mines, Ltd. (2) | | | 8,605 | | | | 12,397 | |
Teck Resources, Ltd., Class B (6) | | | 15,268 | | | | 344,086 | |
Transcontinental, Inc., Class A | | | 3,025 | | | | 73,689 | |
| | | | | | | | |
| | | | | | | 2,960,890 | |
|
China — 0.3% | |
Agricultural Bank of China, Ltd., Class H | | | 85,000 | | | | 41,153 | |
Yum China Holdings, Inc. | | | 3,600 | | | | 139,248 | |
| | | | | | | | |
| | | | | | | 180,401 | |
|
Denmark — 0.2% | |
Novo Nordisk A/S, Class B | | | 1,154 | | | | 56,557 | |
Scandinavian Tobacco Group A/S (5) | | | 7,329 | | | | 120,397 | |
| | | | | | | | |
| | | | | | | 176,954 | |
|
France — 0.3% | |
Boiron SA | | | 702 | | | | 54,676 | |
Peugeot SA | | | 3,852 | | | | 105,968 | |
Sanofi | | | 628 | | | | 53,716 | |
| | | | | | | | |
| | | | | | | 214,360 | |
|
Germany — 0.0% | |
Hamburger Hafen und Logistik AG | | | 953 | | | | 22,987 | |
|
Indonesia — 0.4% | |
Bukit Asam Tbk PT | | | 776,700 | | | | 213,553 | |
Indo Tambangraya Megah Tbk PT | | | 30,800 | | | | 59,174 | |
Japfa Comfeed Indonesia Tbk PT | | | 218,900 | | | | 32,694 | |
| | | | | | | | |
| | | | | | | 305,421 | |
|
Ireland — 2.5% | |
Allergan PLC (6) | | | 7,802 | | | | 1,495,721 | |
Perrigo Co. PLC | | | 3,927 | | | | 300,455 | |
| | | | | | | | |
| | | | | | | 1,796,176 | |
|
Italy — 0.1% | |
ASTM SpA | | | 1,575 | | | | 32,139 | |
Societa Iniziative Autostradali e Servizi SpA | | | 3,415 | | | | 47,568 | |
| | | | | | | | |
| | | | | | | 79,707 | |
|
Japan — 2.0% | |
Arcs Co., Ltd. | | | 3,900 | | | | 95,684 | |
Fujibo Holdings, Inc. | | | 1,400 | | | | 39,312 | |
Fukuda Corp. | | | 1,000 | | | | 50,130 | |
Heiwado Co., Ltd. | | | 7,400 | | | | 193,675 | |
Keihin Corp. | | | 5,600 | | | | 117,786 | |
Mitsui Sugar Co., Ltd. | | | 1,900 | | | | 51,814 | |
Nippon Road Co., Ltd. | | | 1,100 | | | | 60,787 | |
Nippon Telegraph & Telephone Corp. (6) | | | 7,700 | | | | 343,038 | |
Nissan Motor Co., Ltd. | | | 12,300 | | | | 115,129 | |
Okinawa Electric Power Co., Inc. | | | 5,550 | | | | 111,639 | |
Press Kogyo Co., Ltd. | | | 10,500 | | | | 55,000 | |
Shimachu Co., Ltd. | | | 4,000 | | | | 130,681 | |
Warabeya Nichiyo Holdings Co., Ltd. | | | 4,000 | | | | 78,769 | |
Yorozu Corp. | | | 2,300 | | | | 34,342 | |
| | | | | | | | |
| | | | | | | 1,477,786 | |
|
Jersey — 0.1% | |
Wizz Air Holdings PLC (2)(5) | | | 1,514 | | | | 62,241 | |
| | | | | | | | |
| Description | | Shares | | | Value | |
| Common Stocks Purchased Long (continued) | |
|
Luxembourg — 0.3% | |
Trinseo SA | | | 2,797 | | | $ | 215,789 | |
|
Netherlands — 0.2% | |
BE Semiconductor Industries NV | | | 8,165 | | | | 177,230 | |
|
New Zealand — 0.3% | |
Air New Zealand, Ltd. | | | 76,510 | | | | 167,043 | |
New Zealand Refining Co., Ltd. | | | 28,706 | | | | 48,999 | |
| | | | | | | | |
| | | | | | | 216,042 | |
|
Norway — 0.4% | |
Austevoll Seafood ASA | | | 6,692 | | | | 88,097 | |
Leroy Seafood Group ASA | | | 24,396 | | | | 185,832 | |
| | | | | | | | |
| | | | | | | 273,929 | |
|
Panama — 0.1% | |
Copa Holdings SA, Class A | | | 892 | | | | 71,306 | |
|
Poland — 0.1% | |
Asseco Poland SA | | | 6,752 | | | | 83,610 | |
|
South Korea — 0.6% | |
DB HiTek Co., Ltd. | | | 4,885 | | | | 80,528 | |
Samsung Electronics Co., Ltd. | | | 8,422 | | | | 366,569 | |
| | | | | | | | |
| | | | | | | 447,097 | |
|
Sweden — 0.1% | |
Mycronic AB | | | 6,505 | | | | 67,716 | |
|
Switzerland — 0.2% | |
Roche Holding AG | | | 570 | | | | 141,611 | |
|
Taiwan — 0.4% | |
HannStar Display Corp. | | | 190,000 | | | | 50,786 | |
Uni-President Enterprises Corp. | | | 91,000 | | | | 229,907 | |
| | | | | | | | |
| | | | | | | 280,693 | |
|
United Kingdom — 1.0% | |
Aon PLC | | | 1,604 | | | | 233,478 | |
DFS Furniture PLC | | | 8,929 | | | | 25,467 | |
Imperial Brands PLC | | | 3,523 | | | | 125,330 | |
Legal & General Group PLC | | | 93,595 | | | | 308,571 | |
Reach PLC | | | 16,907 | | | | 15,124 | |
SThree PLC | | | 7,125 | | | | 32,561 | |
| | | | | | | | |
| | | | | | | 740,531 | |
|
United States — 53.6% | |
AbbVie, Inc. | | | 1,017 | | | | 97,612 | |
Aerojet Rocketdyne Holdings, Inc. (2) | | | 9,288 | | | | 326,102 | |
Air Products & Chemicals, Inc. | | | 3,711 | | | | 617,102 | |
Albemarle Corp. | | | 2,185 | | | | 208,711 | |
Alexion Pharmaceuticals, Inc. (2) | | | 4,199 | | | | 513,286 | |
Allegheny Technologies, Inc. (2) | | | 3,709 | | | | 100,254 | |
American International Group, Inc. | | | 7,285 | | | | 387,343 | |
Amkor Technology, Inc. (2) | | | 7,797 | | | | 68,068 | |
Anthem, Inc. | | | 1,980 | | | | 524,165 | |
ArcBest Corp. (6) | | | 7,215 | | | | 347,042 | |
Armstrong World Industries, Inc. (2)(6) | | | 2,248 | | | | 156,910 | |
Associated Banc-Corp (6) | | | 15,358 | | | | 418,505 | |
AutoZone, Inc. (2) | | | 619 | | | | 474,699 | |
Best Buy Co., Inc. | | | 2,650 | | | | 210,834 | |
Boston Private Financial Holdings, Inc. | | | 9,245 | | | | 133,590 | |
Boston Properties, Inc. (6) | | | 2,696 | | | | 351,693 | |
Broadcom, Inc. | | | 2,439 | | | | 534,214 | |
Camden Property Trust | | | 3,275 | | | | 311,322 | |
Chemours Co. (6) | | | 11,624 | | | | 506,806 | |
Citizens Financial Group, Inc. | | | 1,479 | | | | 60,876 | |
Clean Harbors, Inc. (2)(6) | | | 11,025 | | | | 756,205 | |
CommVault Systems, Inc. (2) | | | 5,690 | | | | 396,309 | |
CONMED Corp. | | | 2,906 | | | | 233,730 | |
ConocoPhillips | | | 1,766 | | | | 129,677 | |
(See Notes which are an integral part of the Financial Statements)
61
August 31, 2018
Alternative Strategies Fund (continued)
| | | | | | | | |
| Description | | Shares | | | Value | |
| Common Stocks Purchased Long (continued) | |
|
United States(continued) | |
Cooper-Standard Holdings, Inc. (2) | | | 1,244 | | | $ | 172,207 | |
Corepoint Lodging, Inc. (6) | | | 11,212 | | | | 233,770 | |
CSX Corp. (6) | | | 8,665 | | | | 642,596 | |
Danaher Corp. (6) | | | 9,080 | | | | 940,143 | |
Discover Financial Services | | | 2,650 | | | | 207,018 | |
Dover Corp. (6) | | | 7,645 | | | | 656,476 | |
DowDuPont, Inc. (6) | | | 11,685 | | | | 819,469 | |
DXC Technology Co. (6) | | | 14,740 | | | | 1,342,667 | |
Eagle Pharmaceuticals, Inc. (2) | | | 2,488 | | | | 171,995 | |
Edgewell Personal Care Co. (2) | | | 7,840 | | | | 442,725 | |
EMCOR Group, Inc. | | | 2,306 | | | | 184,711 | |
Emergent BioSolutions, Inc. (2)(6) | | | 6,705 | | | | 415,710 | |
Employers Holdings, Inc. | | | 2,286 | | | | 104,813 | |
Enova International, Inc. (2) | | | 936 | | | | 31,075 | |
EQT Corp. | | | 10,850 | | | | 553,567 | |
Equinix, Inc. (6) | | | 672 | | | | 293,079 | |
Essex Property Trust, Inc. (6) | | | 1,424 | | | | 350,703 | |
Expedia Group, Inc. | | | 3,860 | | | | 503,730 | |
Extreme Networks, Inc. (2) | | | 27,535 | | | | 172,644 | |
F5 Networks, Inc. (2) | | | 548 | | | | 103,638 | |
FedEx Corp. | | | 2,190 | | | | 534,250 | |
FedNat Holding Co. | | | 1,437 | | | | 37,793 | |
FLIR Systems, Inc. | | | 7,394 | | | | 463,900 | |
Freeport-McMoRan, Inc. | | | 17,172 | | | | 241,267 | |
Genomic Health, Inc. (2) | | | 841 | | | | 51,444 | |
G-III Apparel Group, Ltd. (2) | | | 6,845 | | | | 311,311 | |
Globus Medical, Inc., Class A (2) | | | 1,563 | | | | 83,261 | |
Haemonetics Corp. (2) | | | 895 | | | | 99,918 | |
Halozyme Therapeutics, Inc. (2)(6) | | | 25,044 | | | | 461,060 | |
Hancock Whitney Corp. | | | 8,710 | | | | 449,000 | |
HD Supply Holdings, Inc. (2) | | | 6,561 | | | | 299,116 | |
HealthStream, Inc. | | | 2,366 | | | | 75,073 | |
Highwoods Properties, Inc. | | | 2,306 | | | | 114,700 | |
HP, Inc. | | | 13,510 | | | | 333,022 | |
Humana, Inc. (6) | | | 620 | | | | 206,621 | |
Huntington Ingalls Industries, Inc. (6) | | | 1,103 | | | | 269,650 | |
Huntsman Corp. (6) | | | 11,224 | | | | 342,220 | |
Inogen, Inc. (2) | | | 776 | | | | 205,570 | |
Integer Holdings Corp. (2) | | | 2,351 | | | | 187,845 | |
Intercontinental Exchange, Inc. | | | 4,016 | | | | 306,140 | |
Intersect ENT, Inc. (2) | | | 428 | | | | 12,540 | |
KKR & Co., Inc., Class A | | | 7,607 | | | | 198,391 | |
Kraton Corp. (2) | | | 2,607 | | | | 122,607 | |
Lantheus Holdings, Inc. (2) | | | 4,051 | | | | 65,221 | |
Lear Corp. (6) | | | 2,049 | | | | 332,348 | |
LeMaitre Vascular, Inc. | | | 2,698 | | | | 101,202 | |
Luminex Corp. | | | 1,262 | | | | 35,601 | |
Marathon Petroleum Corp. (6) | | | 7,095 | | | | 583,848 | |
Marlin Business Services Corp. | | | 4,186 | | | | 119,720 | |
Martin Marietta Materials, Inc. (6) | | | 2,509 | | | | 498,588 | |
Masco Corp. (6) | | | 13,610 | | | | 516,772 | |
Medicines Co. (2) | | | 6,314 | | | | 250,098 | |
Merit Medical Systems, Inc. (2)(6) | | | 6,310 | | | | 371,344 | |
Microsoft Corp. (6) | | | 7,940 | | | | 891,900 | |
Myriad Genetics, Inc. (2) | | | 2,061 | | | | 102,617 | |
Natus Medical, Inc. (2) | | | 1,970 | | | | 73,481 | |
NetApp, Inc. | | | 2,358 | | | | 204,698 | |
Olin Corp. | | | 6,708 | | | | 206,137 | |
OraSure Technologies, Inc. (2) | | | 7,412 | | | | 118,666 | |
Orthofix Medical, Inc. (2) | | | 2,302 | | | | 123,295 | |
Owens Corning | | | 723 | | | | 40,936 | |
Owens-Illinois, Inc. (2) | | | 6,594 | | | | 116,516 | |
PennyMac Financial Services, Inc., Class A | | | 4,651 | | | | 98,369 | |
| | | | | | | | |
| Description | | Shares,
Contracts or
Principal
Amount | | | Value | |
| Common Stocks Purchased Long (continued) | |
|
United States(continued) | |
Philip Morris International, Inc. | | | 6,260 | | | $ | 487,591 | |
PNM Resources, Inc. | | | 5,665 | | | | 220,652 | |
Portland General Electric Co. (6) | | | 6,301 | | | | 292,366 | |
PVH Corp. | | | 3,200 | | | | 458,112 | |
Regions Financial Corp. | | | 8,642 | | | | 168,173 | |
Rush Enterprises, Inc., Class A | | | 3,152 | | | | 135,410 | |
S&P Global, Inc. | | | 1,379 | | | | 285,522 | |
SBA Communications Corp. (2)(6) | | | 3,868 | | | | 600,430 | |
Sherwin-Williams Co. | | | 474 | | | | 215,945 | |
Southwest Airlines Co. | | | 1,122 | | | | 68,779 | |
Steel Dynamics, Inc. | | | 1,168 | | | | 53,413 | |
Supernus Pharmaceuticals, Inc. (2) | | | 3,398 | | | | 150,531 | |
Surmodics, Inc. (2) | | | 1,061 | | | | 83,554 | |
Sykes Enterprises, Inc. (2) | | | 3,777 | | | | 114,216 | |
Synchrony Financial | | | 1,572 | | | | 49,785 | |
Sysco Corp. | | | 2,588 | | | | 193,634 | |
Tiffany & Co. (6) | | | 3,898 | | | | 478,090 | |
TriCo Bancshares | | | 5,613 | | | | 218,233 | |
TriNet Group, Inc. (2)(6) | | | 12,405 | | | | 732,763 | |
Tyson Foods, Inc., Class A (6) | | | 8,357 | | | | 524,903 | |
United Continental Holdings, Inc. (2) | | | 830 | | | | 72,559 | |
United Rentals, Inc. (2) | | | 523 | | | | 81,520 | |
United Technologies Corp. (6) | | | 4,685 | | | | 617,014 | |
Univar, Inc. (2)(6) | | | 17,125 | | | | 476,417 | |
Unum Group | | | 5,028 | | | | 185,433 | |
Vail Resorts, Inc. | | | 1,290 | | | | 384,485 | |
Versum Materials, Inc. | | | 6,878 | | | | 273,676 | |
Vishay Intertechnology, Inc. | | | 8,345 | | | | 198,611 | |
Vishay Precision Group, Inc. (2) | | | 1,342 | | | | 58,109 | |
Visteon Corp. (2)(6) | | | 3,408 | | | | 376,209 | |
Warrior Met Coal, Inc. | | | 9,236 | | | | 222,126 | |
Wells Fargo & Co. (6) | | | 11,918 | | | | 696,965 | |
Western Digital Corp. (6) | | | 10,721 | | | | 677,996 | |
WR Grace & Co. | | | 13,199 | | | | 932,641 | |
WW Grainger, Inc. | | | 116 | | | | 41,072 | |
Wyndham Destinations, Inc. (6) | | | 13,081 | | | | 578,180 | |
Wyndham Hotels & Resorts, Inc. (6) | | | 9,111 | | | | 517,049 | |
Zayo Group Holdings, Inc. (2)(6) | | | 11,700 | | | | 405,522 | |
Zimmer Biomet Holdings, Inc. | | | 3,560 | | | | 440,123 | |
Zynga, Inc., Class A (2) | | | 18,327 | | | | 76,240 | |
| | | | | | | | |
| | | | | | | 39,309,896 | |
| | | | | | | | |
Total Common Stocks Purchased Long
(identified cost $46,914,429) | | | | 50,336,275 | |
| | | | | | | | |
| Purchased Call Options — 0.2% | |
|
United States — 0.2% | |
Intercontinental Exchange, Inc., Exercise Price: $55.00, Notional: $55,000, 1/18/2019 | | | 10 | | | | 21,200 | |
iShares Silver Trust, Exercise Price: $13.00, Notional: $208,000, 1/18/2019 | | | 160 | | | | 16,800 | |
MBIA, Inc., Exercise Price: $5.00, Notional: $76,500, 1/18/2019 | | | 153 | | | | 79,942 | |
| | | | | | | | |
| | | | | | | 117,942 | |
| | | | | | | | |
Total Purchased Call Options
(identified cost $150,024) | | | | 117,942 | |
| | | | | | | | |
(See Notes which are an integral part of the Financial Statements)
62
Alternative Strategies Fund (continued)
| | | | | | | | |
| Description | | Shares | | | Value | |
| Short-Term Investments — 33.5% | |
|
| Mutual Funds — 33.5% | |
BMO Institutional Prime Money Market Fund — Premier Class, 1.987% (4) | | | 24,537,948 | | | $ | 24,540,402 | |
| | | | | | | | |
Total Short-Term Investments
(identified cost $24,535,211) | | | | 24,540,402 | |
| | | | | | | | |
Total Investments — 102.3%
(identified cost $71,599,664) | | | | 74,994,619 | |
| Other Assets and Liabilities — 23.6% | | | | 17,304,968 | |
| Securities Sold Short and Written Options (see below) — (25.9)% | | | | (18,979,511 | ) |
| | | | | | | | |
| Total Net Assets — 100.0% | | | $ | 73,320,076 | |
| | | | | | | | |
| | | | | | | | |
| Securities Sold Short & Written Options — (25.8)% | |
|
| Common Stocks Sold Short — (23.6)% | |
|
Australia — (0.1)% | |
Nanosonics, Ltd. (2) | | | (18,943 | ) | | $ | (47,936 | ) |
|
Canada — (0.9)% | |
Alimentation Couche-Tard, Inc., Class B | | | (4,500 | ) | | | (215,448 | ) |
National Bank of Canada | | | (8,440 | ) | | | (422,388 | ) |
| | | | | | | | |
| | | | | | | (637,836 | ) |
|
Cayman Islands — (0.0)% | |
LexinFintech Holdings, Ltd.ADR (2) | | | (911 | ) | | | (10,805 | ) |
|
Denmark — (0.3)% | |
Vestas Wind Systems AS | | | (3,470 | ) | | | (241,790 | ) |
|
Finland — (0.0)% | |
Caverion OYJ (2) | | | (3,694 | ) | | | (29,886 | ) |
|
France — (0.3)% | |
Publicis Groupe SA | | | (2,914 | ) | | | (187,048 | ) |
|
Germany — (0.5)% | |
GRENKE AG | | | (1,475 | ) | | | (177,888 | ) |
Zalando SE (2)(5) | | | (3,363 | ) | | | (176,911 | ) |
| | | | | | | | |
| | | | | | | (354,799 | ) |
|
Japan — (3.5)% | |
ABC-Mart, Inc. | | | (800 | ) | | | (43,632 | ) |
Acom Co., Ltd. | | | (9,200 | ) | | | (37,592 | ) |
Ain Holdings, Inc. | | | (500 | ) | | | (38,250 | ) |
Asahi Holdings, Inc. | | | (4,800 | ) | | | (91,110 | ) |
Daifuku Co., Ltd. | | | (2,400 | ) | | | (124,633 | ) |
Don Quijote Holdings Co., Ltd. | | | (1,600 | ) | | | (77,761 | ) |
Fuji Seal International, Inc. | | | (2,900 | ) | | | (102,313 | ) |
Funai Soken Holdings, Inc. | | | (4,200 | ) | | | (90,418 | ) |
Goldwin, Inc. | | | (300 | ) | | | (20,790 | ) |
Hoshizaki Corp. | | | (1,800 | ) | | | (170,750 | ) |
Kansai Paint Co., Ltd. | | | (8,900 | ) | | | (175,981 | ) |
Kose Corp. | | | (500 | ) | | | (92,251 | ) |
Kura Corp. | | | (900 | ) | | | (53,299 | ) |
LIFULL Co., Ltd. | | | (7,700 | ) | | | (47,332 | ) |
M3, Inc. | | | (2,300 | ) | | | (101,328 | ) |
MISUMI Group, Inc. | | | (5,600 | ) | | | (144,347 | ) |
Money Forward, Inc. (2) | | | (700 | ) | | | (29,484 | ) |
Nihon M&A Center, Inc. | | | (3,100 | ) | | | (81,162 | ) |
Nippon Paint Holdings Co., Ltd. | | | (4,500 | ) | | | (177,797 | ) |
Nitori Holdings Co., Ltd. | | | (1,100 | ) | | | (167,015 | ) |
Park24 Co., Ltd. | | | (6,600 | ) | | | (193,646 | ) |
Prestige International, Inc. | | | (6,000 | ) | | | (69,013 | ) |
Shima Seiki Manufacturing, Ltd. | | | (800 | ) | | | (37,368 | ) |
| | | | | | | | |
| Description | | Shares | | | Value | |
| Securities Sold Short & Written Options (continued) | |
|
| Common Stocks Sold Short (continued) | |
|
Japan(continued) | |
Shimano, Inc. | | | (1,100 | ) | | $ | (169,688 | ) |
SMS Co., Ltd. | | | (9,000 | ) | | | (170,750 | ) |
Toridoll Holdings Corp. | | | (4,000 | ) | | | (90,577 | ) |
| | | | | | | | |
| | | | | | | (2,598,287 | ) |
|
Netherlands — (0.9)% | |
Fugro NV (2) | | | (6,958 | ) | | | (89,286 | ) |
LyondellBasell Industries N.V., Class A | | | (2,690 | ) | | | (303,378 | ) |
Signify N.V. (5) | | | (7,465 | ) | | | (210,040 | ) |
Takeaway.com NV (2)(5) | | | (731 | ) | | | (57,783 | ) |
| | | | | | | | |
| | | | | | | (660,487 | ) |
|
Norway — (0.1)% | |
Nordic Semiconductor ASA (2) | | | (7,039 | ) | | | (43,059 | ) |
|
Spain — (0.6)% | |
Cellnex Telecom SA (5) | | | (4,336 | ) | | | (111,330 | ) |
Siemens Gamesa Renewable Energy SA | | | (21,460 | ) | | | (320,214 | ) |
| | | | | | | | |
| | | | | | | (431,544 | ) |
|
Sweden — (0.6)% | |
AAK AB | | | (4,939 | ) | | | (81,021 | ) |
Volvo AB, Class B | | | (18,245 | ) | | | (314,220 | ) |
Wallenstam AB, Class B | | | (6,521 | ) | | | (64,888 | ) |
| | | | | | | | |
| | | | | | | (460,129 | ) |
|
Switzerland — (0.3)% | |
Roche Holding AG | | | (835 | ) | | | (207,447 | ) |
Zur Rose Group AG (2) | | | (211 | ) | | | (30,129 | ) |
| | | | | | | | |
| | | | | | | (237,576 | ) |
|
United Kingdom — (0.8)% | |
Cineworld Group PLC | | | (38,845 | ) | | | (156,219 | ) |
Cobham PLC (2) | | | (88,462 | ) | | | (142,670 | ) |
Just Eat PLC (2) | | | (9,931 | ) | | | (98,700 | ) |
Serco Group PLC (2) | | | (50,011 | ) | | | (63,313 | ) |
Sophos Group PLC (5) | | | (17,758 | ) | | | (120,752 | ) |
Victoria PLC (2) | | | (3,325 | ) | | | (36,296 | ) |
| | | | | | | | |
| | | | | | | (617,950 | ) |
|
United States — (14.7)% | |
Advanced Micro Devices, Inc. (2) | | | (2,234 | ) | | | (56,230 | ) |
Albemarle Corp. | | | (1,583 | ) | | | (151,208 | ) |
Altria Group, Inc. | | | (5,099 | ) | | | (298,394 | ) |
Arista Networks, Inc. (2) | | | (780 | ) | | | (233,204 | ) |
Bank OZK | | | (2,098 | ) | | | (84,885 | ) |
BioScrip, Inc. (2) | | | (24,228 | ) | | | (70,261 | ) |
Brown-Forman Corp., Class B | | | (592 | ) | | | (30,914 | ) |
Brunswick Corp. | | | (1,565 | ) | | | (103,947 | ) |
Carter’s, Inc. | | | (1,395 | ) | | | (147,772 | ) |
Cloudera, Inc. (2) | | | (14,415 | ) | | | (216,369 | ) |
Dollar General Corp. | | | (2,231 | ) | | | (240,346 | ) |
Estee Lauder Cos., Inc., Class A | | | (2,195 | ) | | | (307,564 | ) |
Flowers Foods, Inc. | | | (15,215 | ) | | | (306,582 | ) |
Fossil Group, Inc. (2) | | | (6,275 | ) | | | (142,254 | ) |
Fulton Financial Corp. | | | (17,085 | ) | | | (310,947 | ) |
General Dynamics Corp. | | | (1,045 | ) | | | (202,103 | ) |
General Electric Co. | | | (14,425 | ) | | | (186,660 | ) |
Hershey Co. | | | (2,020 | ) | | | (203,050 | ) |
Home Depot, Inc. | | | (1,550 | ) | | | (311,194 | ) |
Hormel Foods Corp. | | | (5,639 | ) | | | (220,767 | ) |
Hubbell, Inc. | | | (895 | ) | | | (113,092 | ) |
Instructure, Inc. (2) | | | (2,989 | ) | | | (122,400 | ) |
Intel Corp. | | | (7,565 | ) | | | (366,373 | ) |
Interactive Brokers Group, Inc., Class A | | | (2,757 | ) | | | (171,375 | ) |
(See Notes which are an integral part of the Financial Statements)
63
August 31, 2018
Alternative Strategies Fund (continued)
| | | | | | | | |
| Description | | Shares | | | Value | |
| Securities Sold Short & Written Options (continued) | |
|
| Common Stocks Sold Short (continued) | |
|
United States(continued) | |
International Flavors & Fragrances, Inc. | | | (1,160 | ) | | $ | (151,136 | ) |
Intrepid Potash, Inc. (2) | | | (29,537 | ) | | | (100,426 | ) |
JM Smucker Co. | | | (2,122 | ) | | | (219,372 | ) |
Kopin Corp. (2) | | | (28,640 | ) | | | (66,445 | ) |
Landstar System, Inc. | | | (1,325 | ) | | | (153,435 | ) |
Leggett & Platt, Inc. | | | (3,435 | ) | | | (156,086 | ) |
Lennox International, Inc. | | | (947 | ) | | | (211,001 | ) |
LSB Industries, Inc. (2) | | | (11,275 | ) | | | (98,318 | ) |
Macerich Co. | | | (2,976 | ) | | | (174,810 | ) |
Mercury Systems, Inc. (2) | | | (3,940 | ) | | | (214,769 | ) |
Netflix, Inc. (2) | | | (519 | ) | | | (190,826 | ) |
Northwest Pipe Co. (2) | | | (1,774 | ) | | | (32,039 | ) |
NOW, Inc. (2) | | | (2,154 | ) | | | (37,027 | ) |
Okta, Inc. (2) | | | (1,273 | ) | | | (78,710 | ) |
Old Line Bancshares, Inc. | | | (415 | ) | | | (14,193 | ) |
Omnicom Group, Inc. | | | (3,815 | ) | | | (264,456 | ) |
PACCAR, Inc. | | | (3,795 | ) | | | (259,654 | ) |
Pinnacle Financial Partners, Inc. | | | (2,473 | ) | | | (159,632 | ) |
PROS Holdings, Inc. (2) | | | (3,949 | ) | | | (145,639 | ) |
Qorvo, Inc. (2) | | | (2,430 | ) | | | (194,619 | ) |
Ralph Lauren Corp. | | | (1,560 | ) | | | (207,184 | ) |
Range Resources Corp. | | | (10,120 | ) | | | (166,170 | ) |
Rayonier, Inc. | | | (4,430 | ) | | | (154,297 | ) |
Realogy Holdings Corp. | | | (6,925 | ) | | | (148,126 | ) |
Republic First Bancorp, Inc. (2) | | | (6,628 | ) | | | (51,698 | ) |
Robert Half International, Inc. | | | (1,335 | ) | | | (104,370 | ) |
Rockwell Automation, Inc. | | | (1,195 | ) | | | (216,247 | ) |
Scotts Miracle-Gro Co. | | | (1,978 | ) | | | (147,796 | ) |
Senior Housing Properties Trust | | | (3,386 | ) | | | (64,707 | ) |
Sleep Number Corp. (2) | | | (3,260 | ) | | | (109,862 | ) |
Starbucks Corp. | | | (5,960 | ) | | | (318,562 | ) |
Stitch Fix, Inc., Class A (2) | | | (3,440 | ) | | | (139,595 | ) |
TFS Financial Corp. | | | (2,049 | ) | | | (31,637 | ) |
TimkenSteel Corp. (2) | | | (7,824 | ) | | | (109,614 | ) |
Tractor Supply Co. | | | (1,180 | ) | | | (104,170 | ) |
VF Corp. | | | (2,070 | ) | | | (190,709 | ) |
Walgreens Boots Alliance, Inc. | | | (5,975 | ) | | | (409,646 | ) |
Weyerhaeuser Co. | | | (2,238 | ) | | | (77,681 | ) |
Whitestone REIT | | | (12,850 | ) | | | (175,274 | ) |
Winnebago Industries, Inc. | | | (2,545 | ) | | | (94,038 | ) |
WR Berkley Corp. | | | (2,695 | ) | | | (210,911 | ) |
| | | | | | | | |
| | | | | | | (10,752,778 | ) |
| | | | | | | | |
Total Common Stocks Sold Short
(proceeds $(16,687,111)) | | | | (17,311,910 | ) |
| | | | | | | | |
| Exchange Traded Funds Sold Short — (2.2)% | |
|
United States — (2.2)% | |
Invesco QQQ Trust Series 1 | | | (740 | ) | | | (138,121 | ) |
iShares Russell 1000 ETF | | | (658 | ) | | | (106,484 | ) |
iShares Russell 1000 Growth ETF | | | (2,018 | ) | | | (313,819 | ) |
iShares Russell 2000 Growth ETF | | | (1,020 | ) | | | (224,737 | ) |
iShares Russell Mid-Cap Growth ETF | | | (3,126 | ) | | | (427,043 | ) |
Materials Select Sector SPDR Fund | | | (1,664 | ) | | | (98,625 | ) |
SPDR S&P 500 ETF Trust | | | (587 | ) | | | (170,412 | ) |
SPDR S&P MidCap 400 ETF Trust | | | (226 | ) | | | (84,183 | ) |
| | | | | | | | |
| | | | | | | (1,563,424 | ) |
| | | | | | | | |
Total Exchange Traded Funds Sold Short
(proceeds $(1,409,262)) | | | | (1,563,424 | ) |
| | | | | | | | |
| | | | | | | | |
| Description | | Contracts | | | Value | |
| Securities Sold Short & Written Options (continued) | |
| | |
| Written Call Options — (0.1)% | | | | | | |
| | |
United States — (0.1)% | | | | | | | | |
Alexion Pharmaceuticals, Inc.: | | | | | | | | |
Exercise Price: $120.00, Notional: $(24,000), 11/16/2018 (2) | | | (2 | ) | | $ | (1,740 | ) |
Exercise Price: $130.00, Notional: $(52,000), 1/18/2019 (2) | | | (4 | ) | | | (2,800 | ) |
Allegheny Technologies, Inc., Exercise Price: $27.50, Notional: $(8,250), 10/19/2018 (2) | | | (3 | ) | | | (327 | ) |
Anthem, Inc., Exercise Price: $262.50, Notional: $(52,500), 9/21/2018 (2) | | | (2 | ) | | | (890 | ) |
Armstrong World Industries, Inc.: | | | | | | | | |
Exercise Price: $70.00, Notional: $(7,000), 9/21/2018 (2) | | | (1 | ) | | | (155 | ) |
Exercise Price: $65.00, Notional: $(6,500), 9/21/2018 (2) | | | (1 | ) | | | (560 | ) |
BlackBerry, Ltd., Exercise Price: $10.00, Notional: $(15,000), 9/21/2018 (2) | | | (15 | ) | | | (1,170 | ) |
Eagle Pharmaceuticals, Inc., Exercise Price: $70.00, Notional: $(21,000), 10/19/2018 (2) | | | (3 | ) | | | (1,350 | ) |
Halozyme Therapeutics, Inc., Exercise Price: $17.00, Notional: $(23,800), 9/21/2018 (2) | | | (14 | ) | | | (2,226 | ) |
HD Supply Holdings, Inc., Exercise Price: $45.00, Notional: $(67,500), 9/21/2018 (2) | | | (15 | ) | | | (2,597 | ) |
HP, Inc.: | | | | | | | | |
Exercise Price: $25.00, Notional: $(50,000), 9/21/2018 (2) | | | (20 | ) | | | (420 | ) |
Exercise Price: $24.00, Notional: $(33,600), 9/21/2018 (2) | | | (14 | ) | | | (1,078 | ) |
Exercise Price: $23.00, Notional: $(16,100), 9/21/2018 (2) | | | (7 | ) | | | (1,169 | ) |
iShares Russell 1000 ETF, Exercise Price: $146.00, Notional: $(116,800), 9/21/2018 (2) | | | (8 | ) | | | (12,640 | ) |
iShares Russell 1000 Growth ETF, Exercise Price: $136.00, Notional: $(272,000), 9/21/2018 (2) | | | (20 | ) | | | (39,200 | ) |
Marathon Petroleum Corp., Exercise Price: $80.00, Notional: $(48,000), 9/21/2018 (2) | | | (6 | ) | | | (1,980 | ) |
MBIA, Inc., Exercise Price: $10.00, Notional: $(7,000), 1/18/2019 (2) | | | (7 | ) | | | (788 | ) |
Olin Corp.: | | | | | | | | |
Exercise Price: $30.50, Notional: $(15,250), 9/21/2018 (2) | | | (5 | ) | | | (460 | ) |
Exercise Price: $31.00, Notional: $(15,500), 9/21/2018 (2) | | | (5 | ) | | | (325 | ) |
Perrigo Co. PLC: | | | | | | | | |
Exercise Price: $70.00, Notional: $(35,000), 9/21/2018 (2) | | | (5 | ) | | | (3,150 | ) |
Exercise Price: $76.00, Notional: $(38,000), 9/21/2018 (2) | | | (5 | ) | | | (1,055 | ) |
Exercise Price: $80.00, Notional: $(40,000), 11/16/2018 (2) | | | (5 | ) | | | (1,587 | ) |
S&P Global, Inc., Exercise Price: $200.00, Notional: $(80,000), 9/21/2018 (2) | | | (4 | ) | | | (3,040 | ) |
SBA Communications Corp.: | | | | | | | | |
Exercise Price: $160.00, Notional: $(128,000), 9/21/2018 (2) | | | (8 | ) | | | (680 | ) |
Exercise Price: $155.00, Notional: $(248,000), 9/21/2018 (2) | | | (16 | ) | | | (3,920 | ) |
(See Notes which are an integral part of the Financial Statements)
64
Alternative Strategies Fund (continued)
| | | | | | | | |
| Description | | Contracts | | | Value | |
| Securities Sold Short & Written Options (continued) | |
| | |
| Written Call Options (continued) | | | | | | |
| | |
United States(continued) | | | | | | | | |
Exercise Price: $150.00, Notional: $(225,000), 12/21/2018 (2) | | | (15 | ) | | $ | (15,375 | ) |
Sherwin-Williams Co.: | | | | | | | | |
Exercise Price: $450.00, Notional: $(45,000), 9/21/2018 (2) | | | (1 | ) | | | (1,020 | ) |
Exercise Price: $440.00, Notional: $(44,000), 9/21/2018 (2) | | | (1 | ) | | | (1,750 | ) |
Warrior Met Coal, Inc., Exercise Price: $30.00, Notional: $(51,000), 10/19/2018 (2) | | | (17 | ) | | | (340 | ) |
WR Grace & Co., Exercise Price: $75.00, Notional: $(82,500), 9/21/2018 (2) | | | (11 | ) | | | (385 | ) |
| | | | | | | | |
Total Written Call Options
(proceeds $(116,426)) | | | | (104,177 | ) |
| | | | | | | | |
Total Securities Sold Short & Written Options
(proceeds $(18,212,799)) | | | $ | (18,979,511 | ) |
| | | | | | | | |
| | | | | | | | |
| |
| Industry Allocation | |
| Industry | | Value | | | % of
Total
Net Assets | |
Common Stocks Purchased Long | | | | | | | | |
Aerospace/Defense | | $ | 943,116 | | | | 1.3 | % |
Agriculture | | | 766,012 | | | | 1.0 | |
Airlines | | | 476,023 | | | | 0.6 | |
Apparel | | | 458,112 | | | | 0.6 | |
Auto Manufacturers | | | 221,097 | | | | 0.3 | |
Auto Parts & Equipment | | | 1,087,892 | | | | 1.5 | |
Banks | | | 2,186,495 | | | | 3.0 | |
Beverages | | | 408,798 | | | | 0.6 | |
Biotechnology | | | 1,742,771 | | | | 2.4 | |
Building Materials | | | 1,213,206 | | | | 1.6 | |
Chemicals | | | 4,897,067 | | | | 6.7 | |
Coal | | | 494,853 | | | | 0.7 | |
Commercial Services | | | 1,774,534 | | | | 2.4 | |
Computers | | | 3,081,761 | | | | 4.2 | |
Cosmetics/Personal Care | | | 442,725 | | | | 0.6 | |
Distribution/Wholesale | | | 651,499 | | | | 0.9 | |
Diversified Financial Services | | | 923,278 | | | | 1.3 | |
Electric | | | 624,657 | | | | 0.8 | |
Electronics | | | 839,122 | | | | 1.1 | |
Engineering & Construction | | | 295,628 | | | | 0.4 | |
Entertainment | | | 384,485 | | | | 0.5 | |
Environmental Control | | | 756,205 | | | | 1.0 | |
Food | | | 1,883,992 | | | | 2.6 | |
Forest Products & Paper | | | 577,255 | | | | 0.8 | |
Healthcare-Products | | | 3,226,938 | | | | 4.4 | |
Healthcare-Services | | | 730,786 | | | | 1.0 | |
Insurance | | | 1,693,057 | | | | 2.3 | |
Internet | | | 682,441 | | | | 0.9 | |
Iron/Steel | | | 153,667 | | | | 0.2 | |
Lodging | | | 1,095,229 | | | | 1.5 | |
Media | | | 115,738 | | | | 0.2 | |
Mining | | | 730,241 | | | | 1.0 | |
Miscellaneous Manufacturing | | | 872,265 | | | | 1.2 | |
Oil & Gas | | | 1,450,168 | | | | 2.0 | |
Packaging & Containers | | | 116,516 | | | | 0.2 | |
Pharmaceuticals | | | 2,522,874 | | | | 3.4 | |
Private Equity | | | 198,391 | | | | 0.3 | |
Real Estate Investment Trusts | | | 2,677,840 | | | | 3.6 | |
Retail | | | 1,594,429 | | | | 2.2 | |
Semiconductors | | | 1,226,609 | | | | 1.7 | |
| | | | | | | | |
| |
| Industry Allocation(continued) | |
| Industry | | Value | | | % of
Total
Net Assets | |
Shipbuilding | | $ | 269,650 | | | | 0.4 | % |
Software | | | 1,364,449 | | | | 1.9 | |
Telecommunications | | | 921,204 | | | | 1.2 | |
Textiles | | | 39,312 | | | | 0.0 | |
Transportation | | | 1,523,888 | | | | 2.1 | |
| | | | | | | | |
Total Common Stocks Purchased Long | | | 50,336,275 | | | | 68.6 | |
Purchased Call Options | | | 117,942 | | | | 0.2 | |
Short-Term Investments | | | 24,540,402 | | | | 33.5 | |
| | | | | | | | |
Total Investments | | | 74,994,619 | | | | 102.3 | |
Other Assets and Liabilities | | | 17,304,968 | | | | 23.6 | |
Securities Sold Short & Written Options (see below) | | | (18,979,511 | ) | | | (25.9 | ) |
| | | | | | | | |
Total Net Assets | | $ | 73,320,076 | | | | 100.0 | % |
| | | | | | | | |
Common Stocks Sold Short | | | | | | | | |
Advertising | | $ | (451,504 | ) | | | (0.6 | )% |
Aerospace/Defense | | | (344,773 | ) | | | (0.5 | ) |
Agriculture | | | (298,394 | ) | | | (0.4 | ) |
Apparel | | | (545,665 | ) | | | (0.7 | ) |
Auto Manufacturers | | | (573,874 | ) | | | (0.8 | ) |
Banks | | | (1,043,743 | ) | | | (1.4 | ) |
Beverages | | | (30,914 | ) | | | (0.0 | ) |
Building Materials | | | (247,297 | ) | | | (0.3 | ) |
Chemicals | | | (1,059,926 | ) | | | (1.5 | ) |
Commercial Services | | | (568,495 | ) | | | (0.8 | ) |
Computers | | | (398,834 | ) | | | (0.5 | ) |
Cosmetics/Personal Care | | | (399,815 | ) | | | (0.6 | ) |
Distribution/Wholesale | | | (142,254 | ) | | | (0.2 | ) |
Diversified Financial Services | | | (397,660 | ) | | | (0.5 | ) |
Electrical Components & Equipment | | | (323,132 | ) | | | (0.4 | ) |
Energy-Alternate Sources | | | (562,004 | ) | | | (0.8 | ) |
Entertainment | | | (156,219 | ) | | | (0.2 | ) |
Environmental Control | | | (91,110 | ) | | | (0.1 | ) |
Food | | | (1,088,575 | ) | | | (1.5 | ) |
Healthcare-Products | | | (47,936 | ) | | | (0.1 | ) |
Healthcare-Services | | | (38,250 | ) | | | (0.1 | ) |
Home Builders | | | (94,038 | ) | | | (0.1 | ) |
Home Furnishings | | | (436,698 | ) | | | (0.6 | ) |
Housewares | | | (147,796 | ) | | | (0.2 | ) |
Insurance | | | (210,911 | ) | | | (0.3 | ) |
Internet | | | (827,241 | ) | | | (1.1 | ) |
Leisure Time | | | (273,635 | ) | | | (0.4 | ) |
Machinery-Diversified | | | (378,248 | ) | | | (0.5 | ) |
Metal Fabricate/Hardware | | | (286,000 | ) | | | (0.4 | ) |
Miscellaneous Manufacturing | | | (284,978 | ) | | | (0.4 | ) |
Oil & Gas | | | (166,170 | ) | | | (0.2 | ) |
Oil & Gas Services | | | (126,313 | ) | | | (0.2 | ) |
Packaging & Containers | | | (102,313 | ) | | | (0.1 | ) |
Pharmaceuticals | | | (277,708 | ) | | | (0.4 | ) |
Real Estate | | | (213,014 | ) | | | (0.3 | ) |
Real Estate Investment Trusts | | | (646,769 | ) | | | (0.9 | ) |
Retail | | | (2,259,480 | ) | | | (3.1 | ) |
Savings & Loans | | | (31,637 | ) | | | (0.0 | ) |
Semiconductors | | | (726,726 | ) | | | (1.0 | ) |
Software | | | (513,892 | ) | | | (0.7 | ) |
Telecommunications | | | (344,534 | ) | | | (0.5 | ) |
Transportation | | | (153,435 | ) | | | (0.2 | ) |
| | | | | | | | |
Total Common Stocks Sold Short | | | (17,311,910 | ) | | | (23.6 | ) |
Exchange Traded Funds Sold Short | | | (1,563,424 | ) | | | (2.2 | ) |
Written Call Options | | | (104,177 | ) | | | (0.1 | ) |
| | | | | | | | |
Total Securities Sold Short & Written Options | | $ | (18,979,511 | ) | | | (25.9 | )% |
| | | | | | | | |
(See Notes which are an integral part of the Financial Statements)
65
August 31, 2018
At August 31, 2018, the Alternative Strategies Fund had outstanding futures contracts as set forth below:
| | | | | | | | | | | | |
Expiration Date | | Number of
Contracts | | Description | | Notional
Amount | | Value at
August 31,
2018 | | Unrealized
Appreciation
(Depreciation) | |
Long Futures | | | | | | | | | | | | |
| | | | | |
Bond Futures | | | | | | | | | | | | |
September 2018 | | 21 | | SFE 10-Year Australian Bond | | $1,942,255 | | $1,971,540 | | $ | 29,285 | |
Index Futures | | | | | | | | | | | | |
September 2018 | | 11 | | CME E-Mini S&P 500® Index | | 1,565,981 | | 1,596,155 | | | 30,174 | |
September 2018 | | 13 | | CME E-Mini NASDAQ 100 Index | | 1,925,087 | | 1,991,925 | | | 66,838 | |
September 2018 | | 1 | | TSE TOPIX Index | | 156,022 | | 156,017 | | | (5) | |
September 2018 | | 36 | | Eurex Euro STOXX 50 Index | | 1,447,373 | | 1,416,161 | | | (31,212) | |
September 2018 | | 25 | | Russell 2000 Mini Index | | 2,101,101 | | 2,175,750 | | | 74,649 | |
September 2018 | | 22 | | LIFFE FTSE 100 Index | | 2,172,345 | | 2,117,466 | | | (54,879) | |
September 2018 | | 10 | | CAC 40 10 Euro | | 619,512 | | 627,443 | | | 7,931 | |
September 2018 | | 12 | | CBOT E-Mini DJIA Index | | 1,537,244 | | 1,559,280 | | | 22,036 | |
September 2018 | | 9 | | OSE Nikkei 225 Index | | 1,817,892 | | 1,851,679 | | | 33,787 | |
September 2018 | | 2 | | DAX Index | | 725,038 | | 716,734 | | | (8,304) | |
Interest Rate Futures | | | | | | | | | | |
December 2019 | | 116 | | LIFFE 3-Month Euro Euribor | | 33,683,620 | | 33,703,825 | | | 20,205 | |
December 2018 | | 19 | | LIFFE 10-Year Gilt Government Bond | | 3,012,206 | | 3,013,300 | | | 1,094 | |
December 2018 | | 16 | | Eurex 10-Year Euro BUND | | 2,985,385 | | 2,986,007 | | | 622 | |
Short Futures | | | | | | | | | | | | |
| | | | | |
Bond Futures | | | | | | | | | | | | |
December 2018 | | 26 | | Canadian Government Bond | | (2,678,790) | | (2,685,472) | | | (6,682) | |
December 2018 | | 41 | | United States Treasury Note | | (4,929,159) | | (4,930,891) | | | (1,732) | |
Index Futures | | | | | | | | | | | | |
September 2018 | | 110 | | CME E-Mini S&P 500® Index | | (15,304,025) | | (15,961,550) | | | (657,525) | |
September 2018 | | 45 | | Russell 2000 Mini Index | | (3,771,675) | | (3,916,350) | | | (144,675) | |
September 2018 | | 3 | | HKG Hang Seng Index | | (526,259) | | (530,626) | | | (4,367) | |
Interest Rate Futures | | | | | | | | | | |
December 2019 | | 231 | | CME 3-Month Eurodollar | | (56,030,356) | | (56,043,487) | | | (13,131) | |
December 2019 | | 6 | | LIFFE 90-Day Sterling | | (960,659) | | (960,961) | | | (302) | |
| | | | | | | | | | | | |
Total Futures Contracts | | | | | | $(28,509,862) | | $(29,146,055) | | $ | (636,193) | |
| | | | | | | | | | | | |
At August 31, 2018, the Alternative Strategies Fund had outstanding forward foreign currency exchange contracts as set forth below:
| | | | | | | | | | | | | | | | | | | | |
Settlement Date | | Currency | | Contract Amount | | | Value | | | Unrealized
Appreciation
(Depreciation) | | | Counterparty |
| | Buy | | | Sell | |
September 21, 2018 | | Australian Dollar | | AUD | 1,092,000 | | | $ | 804,076 | | | $ | 785,022 | | | $ | (19,054 | ) | | Bank of America |
September 21, 2018 | | Australian Dollar | | $ | 3,695,363 | | | AUD | 4,928,000 | | | | 3,542,651 | | | | 152,712 | | | Bank of America |
September 21, 2018 | | Canadian Dollar | | CAD | 1,078,000 | | | $ | 819,235 | | | | 826,316 | | | | 7,081 | | | Bank of America |
September 21, 2018 | | Canadian Dollar | | $ | 3,696,953 | | | CAD | 4,811,000 | | | | 3,687,749 | | | | 9,204 | | | Bank of America |
September 21, 2018 | | Euro Currency | | EUR | 2,622,000 | | | $ | 3,054,936 | | | | 3,047,049 | | | | (7,887 | ) | | Bank of America |
September 21, 2018 | | Euro Currency | | $ | 6,817,467 | | | EUR | 5,828,000 | | | | 6,772,775 | | | | 44,692 | | | Bank of America |
September 21, 2018 | | Japanese Yen | | JPY | 462,069,000 | | | $ | 4,198,419 | | | | 4,163,190 | | | | (35,229 | ) | | Bank of America |
September 21, 2018 | | Japanese Yen | | $ | 8,509,323 | | | JPY | 938,322,000 | | | | 8,454,174 | | | | 55,149 | | | Bank of America |
September 21, 2018 | | Mexican Peso | | MXN | 35,547,000 | | | $ | 1,845,163 | | | | 1,855,770 | | | | 10,607 | | | Bank of America |
September 21, 2018 | | Mexican Peso | | $ | 926,914 | | | MXN | 19,103,000 | | | | 997,294 | | | | (70,380 | ) | | Bank of America |
September 21, 2018 | | New Zealand Dollar | | NZD | 1,026,000 | | | $ | 703,690 | | | | 678,797 | | | | (24,893 | ) | | Bank of America |
September 21, 2018 | | New Zealand Dollar | | $ | 1,774,984 | | | NZD | 2,577,000 | | | | 1,704,932 | | | | 70,052 | | | Bank of America |
September 21, 2018 | | Pound Sterling | | GBP | 3,183,000 | | | $ | 4,221,211 | | | | 4,129,205 | | | | (92,006 | ) | | Bank of America |
September 21, 2018 | | Pound Sterling | | $ | 7,612,040 | | | GBP | 5,775,000 | | | | 7,491,731 | | | | 120,309 | | | Bank of America |
September 21, 2018 | | Swiss Franc | | CHF | 981,000 | | | $ | 996,225 | | | | 1,013,494 | | | | 17,269 | | | Bank of America |
September 21, 2018 | | Swiss Franc | | $ | 3,040,628 | | | CHF | 2,999,000 | | | | 3,098,333 | | | | (57,705 | ) | | Bank of America |
| | | | | | | | | | | | | | | | | | | | |
| | | | | | | | | | | | | | | | $ | 179,921 | | | |
| | | | | | | | | | | | | | | | | | | | |
(See Notes which are an integral part of the Financial Statements)
66
Global Long/Short Equity Fund
| | | | | | | | |
| Description | | Shares | | | Value | |
| Common Stocks Purchased Long — 98.2% | |
|
Australia — 0.8% | |
Regis Resources, Ltd. | | | 24,978 | | | $ | 75,239 | |
|
Bermuda — 2.8% | |
Argo Group International Holdings, Ltd. | | | 1,915 | | | | 121,986 | |
Essent Group, Ltd. (2) | | | 2,893 | | | | 125,440 | |
Travelport Worldwide, Ltd. | | | 1,682 | | | | 31,235 | |
| | | | | | | | |
| | | | | | | 278,661 | |
|
Canada — 13.0% | |
Air Canada (2) | | | 989 | | | | 20,326 | |
Allied Properties Real Estate Investment Trust (6) | | | 5,948 | | | | 198,677 | |
Canfor Corp. (2)(6) | | | 7,490 | | | | 172,700 | |
Cascades, Inc. | | | 1,636 | | | | 16,636 | |
Cogeco Communications, Inc. | | | 823 | | | | 40,847 | |
Cogeco, Inc. | | | 383 | | | | 18,217 | |
Equitable Group, Inc. | | | 1,299 | | | | 64,671 | |
George Weston, Ltd. (6) | | | 1,760 | | | | 137,078 | |
Husky Energy, Inc. | | | 4,717 | | | | 78,002 | |
Interfor Corp. (2)(6) | | | 8,478 | | | | 145,912 | |
InterRent Real Estate Investment Trust | | | 5,925 | | | | 51,895 | |
Methanex Corp. | | | 1,365 | | | | 99,598 | |
Premier Gold Mines, Ltd. (2) | | | 5,018 | | | | 7,229 | |
Teck Resources, Ltd., Class B (6) | | | 8,674 | | | | 195,481 | |
Transcontinental, Inc., Class A | | | 1,716 | | | | 41,802 | |
| | | | | | | | |
| | | | | | | 1,289,071 | |
|
China — 0.2% | |
Agricultural Bank of China, Ltd., Class H | | | 47,000 | | | | 22,755 | |
|
Denmark — 1.0% | |
Novo Nordisk A/S, Class B | | | 654 | | | | 32,052 | |
Scandinavian Tobacco Group A/S (5) | | | 4,263 | | | | 70,030 | |
| | | | | | | | |
| | | | | | | 102,082 | |
|
France — 1.2% | |
Boiron SA | | | 398 | | | | 30,999 | |
Peugeot SA | | | 2,186 | | | | 60,136 | |
Sanofi | | | 354 | | | | 30,280 | |
| | | | | | | | |
| | | | | | | 121,415 | |
|
Germany — 0.1% | |
Hamburger Hafen und Logistik AG | | | 522 | | | | 12,591 | |
|
Indonesia — 1.8% | |
Bukit Asam Tbk PT | | | 451,800 | | | | 124,222 | |
Indo Tambangraya Megah Tbk PT | | | 17,900 | | | | 34,390 | |
Japfa Comfeed Indonesia Tbk PT | | | 127,300 | | | | 19,013 | |
| | | | | | | | |
| | | | | | | 177,625 | |
|
Italy — 0.5% | |
ASTM SpA | | | 894 | | | | 18,243 | |
Societa Iniziative Autostradali e Servizi SpA | | | 1,938 | | | | 26,994 | |
| | | | | | | | |
| | | | | | | 45,237 | |
|
Japan — 8.3% | |
Arcs Co., Ltd. | | | 2,300 | | | | 56,429 | |
Fujibo Holdings, Inc. | | | 600 | | | | 16,848 | |
Fukuda Corp. | | | 500 | | | | 25,065 | |
Heiwado Co., Ltd. (6) | | | 4,300 | | | | 112,541 | |
Keihin Corp. | | | 3,000 | | | | 63,100 | |
Mitsui Sugar Co., Ltd. | | | 1,000 | | | | 27,270 | |
Nippon Road Co., Ltd. | | | 600 | | | | 33,156 | |
| | | | | | | | |
| Description | | Shares | | | Value | |
| Common Stocks Purchased Long (continued) | |
|
Japan(continued) | |
Nippon Telegraph & Telephone Corp. (6) | | | 4,400 | | | $ | 196,022 | |
Nissan Motor Co., Ltd. (1) | | | 6,900 | | | | 64,585 | |
Okinawa Electric Power Co., Inc. | | | 3,299 | | | | 66,360 | |
Press Kogyo Co., Ltd. | | | 5,800 | | | | 30,381 | |
Shimachu Co., Ltd. (1) | | | 2,100 | | | | 68,608 | |
Warabeya Nichiyo Holdings Co., Ltd. | | | 2,400 | | | | 47,261 | |
Yorozu Corp. | | | 1,200 | | | | 17,917 | |
| | | | | | | | |
| | | | | | | 825,543 | |
|
Jersey — 0.4% | |
Wizz Air Holdings PLC (2)(5) | | | 858 | | | | 35,273 | |
|
Luxembourg — 1.2% | |
Trinseo SA | | | 1,587 | | | | 122,437 | |
|
Netherlands — 1.1% | |
BE Semiconductor Industries NV | | | 4,894 | | | | 106,229 | |
|
New Zealand — 1.2% | |
Air New Zealand, Ltd. | | | 43,448 | | | | 94,859 | |
New Zealand Refining Co., Ltd. | | | 16,741 | | | | 28,576 | |
| | | | | | | | |
| | | | | | | 123,435 | |
|
Norway — 1.6% | |
Austevoll Seafood ASA | | | 3,800 | | | | 50,025 | |
Leroy Seafood Group ASA (6) | | | 14,227 | | | | 108,372 | |
| | | | | | | | |
| | | | | | | 158,397 | |
|
Panama — 0.4% | |
Copa Holdings SA, Class A | | | 506 | | | | 40,450 | |
|
Poland — 0.5% | |
Asseco Poland SA | | | 3,838 | | | | 47,526 | |
|
South Korea — 2.6% | |
DB HiTek Co., Ltd. | | | 2,842 | | | | 46,849 | |
Samsung Electronics Co., Ltd. | | | 4,785 | | | | 208,268 | |
| | | | | | | | |
| | | | | | | 255,117 | |
|
Sweden — 0.6% | |
AAK AB | | | 1,152 | | | | 18,898 | |
Mycronic AB (1) | | | 3,693 | | | | 38,443 | |
| | | | | | | | |
| | | | | | | 57,341 | |
|
Switzerland — 0.8% | |
Roche Holding AG | | | 332 | | | | 82,482 | |
|
Taiwan — 1.6% | |
HannStar Display Corp. | | | 107,000 | | | | 28,601 | |
Uni-President Enterprises Corp. | | | 53,000 | | | | 133,902 | |
| | | | | | | | |
| | | | | | | 162,503 | |
|
United Kingdom — 2.9% | |
DFS Furniture PLC | | | 4,895 | | | | 13,961 | |
Imperial Brands PLC | | | 2,000 | | | | 71,149 | |
Legal & General Group PLC | | | 54,584 | | | | 179,957 | |
Reach PLC | | | 9,860 | | | | 8,820 | |
SThree PLC | | | 4,156 | | | | 18,993 | |
| | | | | | | | |
| | | | | | | 292,880 | |
|
United States — 53.6% | |
AbbVie, Inc. (6) | | | 606 | | | | 58,164 | |
Amkor Technology, Inc. (2) | | | 4,426 | | | | 38,639 | |
ArcBest Corp. (6) | | | 4,197 | | | | 201,876 | |
Best Buy Co., Inc. (6) | | | 1,503 | | | | 119,579 | |
Boston Properties, Inc. (6) | | | 1,532 | | | | 199,849 | |
Citizens Financial Group, Inc. | | | 840 | | | | 34,574 | |
CONMED Corp. (6) | | | 1,690 | | | | 135,927 | |
ConocoPhillips | | | 1,003 | | | | 73,650 | |
Cooper-Standard Holdings, Inc. (2)(6) | | | 706 | | | | 97,732 | |
Discover Financial Services (6) | | | 1,503 | | | | 117,414 | |
(See Notes which are an integral part of the Financial Statements)
67
August 31, 2018
Global Long/Short Equity Fund (continued)
| | | | | | | | |
| Description | | Shares | | | Value | |
| Common Stocks Purchased Long (continued) | |
|
United States(continued) | |
EMCOR Group, Inc. (6) | | | 1,375 | | | $ | 110,138 | |
Emergent BioSolutions, Inc. (2)(6) | | | 4,019 | | | | 249,178 | |
Employers Holdings, Inc. (6) | | | 1,297 | | | | 59,468 | |
Enova International, Inc. (2) | | | 546 | | | | 18,127 | |
Equinix, Inc. (6) | | | 402 | | | | 175,324 | |
Essex Property Trust, Inc. (6) | | | 809 | | | | 199,241 | |
F5 Networks, Inc. (2)(6) | | | 309 | | | | 58,438 | |
FedNat Holding Co. | | | 816 | | | | 21,461 | |
Genomic Health, Inc. (2) | | | 489 | | | | 29,912 | |
Globus Medical, Inc., Class A (2) | | | 908 | | | | 48,369 | |
Haemonetics Corp. (2) | | | 521 | | | | 58,164 | |
HealthStream, Inc. | | | 1,376 | | | | 43,661 | |
Highwoods Properties, Inc. (6) | | | 1,308 | | | | 65,060 | |
Huntington Ingalls Industries, Inc. (6) | | | 626 | | | | 153,038 | |
Inogen, Inc. (2)(6) | | | 451 | | | | 119,474 | |
Integer Holdings Corp. (2)(6) | | | 1,335 | | | | 106,667 | |
Intersect ENT, Inc. (2) | | | 243 | | | | 7,120 | |
Kraton Corp. (2)(6) | | | 1,554 | | | | 73,085 | |
Lantheus Holdings, Inc. (2) | | | 2,415 | | | | 38,882 | |
Lear Corp. (6) | | | 1,227 | | | | 199,019 | |
LeMaitre Vascular, Inc. (1) | | | 1,530 | | | | 57,390 | |
Luminex Corp. | | | 734 | | | | 20,706 | |
Marlin Business Services Corp. | | | 2,435 | | | | 69,641 | |
Masco Corp. (6) | | | 4,462 | | | | 169,422 | |
Merit Medical Systems, Inc. (2)(6) | | | 3,786 | | | | 222,806 | |
Myriad Genetics, Inc. (2) | | | 1,228 | | | | 61,142 | |
Natus Medical, Inc. (2) | | | 1,117 | | | | 41,664 | |
NetApp, Inc. (6) | | | 1,340 | | | | 116,325 | |
OraSure Technologies, Inc. (2)(6) | | | 4,207 | | | | 67,354 | |
Orthofix Medical, Inc. (2) | | | 1,339 | | | | 71,717 | |
Owens Corning | | | 411 | | | | 23,271 | |
Owens-Illinois, Inc. (2)(6) | | | 3,748 | | | | 66,227 | |
PennyMac Financial Services, Inc., Class A | | | 2,773 | | | | 58,649 | |
PNM Resources, Inc. (6) | | | 3,217 | | | | 125,302 | |
Portland General Electric Co. (6) | | | 3,777 | | | | 175,253 | |
Regions Financial Corp. (6) | | | 5,027 | | | | 97,825 | |
Rush Enterprises, Inc., Class A (6) | | | 1,789 | | | | 76,855 | |
Southwest Airlines Co. | | | 668 | | | | 40,948 | |
Steel Dynamics, Inc. | | | 662 | | | | 30,273 | |
Supernus Pharmaceuticals, Inc. (1)(2) | | | 1,929 | | | | 85,455 | |
Surmodics, Inc. (2) | | | 618 | | | | 48,668 | |
Sykes Enterprises, Inc. (2) | | | 2,144 | | | | 64,835 | |
Synchrony Financial | | | 893 | | | | 28,281 | |
Sysco Corp. (6) | | | 1,468 | | | | 109,836 | |
TriCo Bancshares (6) | | | 3,190 | | | | 124,027 | |
United Continental Holdings, Inc. (2) | | | 471 | | | | 41,175 | |
United Rentals, Inc. (2) | | | 297 | | | | 46,293 | |
Unum Group (6) | | | 3,014 | | | | 111,156 | |
Vishay Intertechnology, Inc. (6) | | | 4,855 | | | | 115,549 | |
Vishay Precision Group, Inc. (2) | | | 799 | | | | 34,597 | |
WW Grainger, Inc. | | | 68 | | | | 24,077 | |
| | | | | | | | |
| | | | | | | 5,337,949 | |
| | | | | | | | |
Total Common Stocks Purchased Long
(identified cost $8,557,757) | | | | 9,772,238 | |
| | | | | | | | |
| Short-Term Investments — 37.5% | |
|
| Collateral Investment for Securities on Loan — 3.0% | |
| | |
State Street Navigator Securities Lending Government Money Market Portfolio, 1.920% (3) | | | 293,674 | | | | 293,674 | |
| | | | | | | | |
| Description | | Shares | | | Value | |
| Short-Term Investments (continued) | |
|
| Mutual Funds — 34.5% | |
BMO Institutional Prime Money Market Fund — Premier Class, 1.987% (4) | | | 3,433,859 | | | $ | 3,434,203 | |
| | | | | | | | |
Total Short-Term Investments
(identified cost $3,727,511) | | | | 3,727,877 | |
| | | | | | | | |
Total Investments — 135.7%
(identified cost $12,285,268) | | | | 13,500,115 | |
| Other Assets and Liabilities — 0.9% | | | | 91,636 | |
| Securities Sold Short (see below) — (36.6)% | | | | (3,642,216 | ) |
| | | | | | | | |
| Total Net Assets — 100.0% | | | $ | 9,949,535 | |
| | | | | | | | |
|
| Securities Sold Short — (36.6)% | |
|
| Common Stocks Sold Short — (36.6)% | |
|
Australia — (0.2)% | |
Nanosonics, Ltd. (2) | | | (9,724 | ) | | $ | (24,607 | ) |
|
Cayman Islands — (0.1)% | |
LexinFintech Holdings, Ltd.ADR (2) | | | (517 | ) | | | (6,132 | ) |
|
Finland — (0.2)% | |
Caverion OYJ (2) | | | (2,025 | ) | | | (16,383 | ) |
|
Germany — (2.0)% | |
GRENKE AG | | | (838 | ) | | | (101,064 | ) |
Zalando SE (2)(5) | | | (1,787 | ) | | | (94,006 | ) |
| | | | | | | | |
| | | | | | | (195,070 | ) |
|
Japan — (14.5)% | |
ABC-Mart, Inc. | | | (300 | ) | | | (16,362 | ) |
Acom Co., Ltd. | | | (5,000 | ) | | | (20,430 | ) |
Ain Holdings, Inc. | | | (300 | ) | | | (22,950 | ) |
Asahi Holdings, Inc. | | | (2,700 | ) | | | (51,249 | ) |
Daifuku Co., Ltd. | | | (1,400 | ) | | | (72,703 | ) |
Don Quijote Holdings Co., Ltd. | | | (700 | ) | | | (34,020 | ) |
Fuji Seal International, Inc. | | | (1,600 | ) | | | (56,449 | ) |
Funai Soken Holdings, Inc. | | | (2,400 | ) | | | (51,668 | ) |
Goldwin, Inc. | | | (200 | ) | | | (13,860 | ) |
Hoshizaki Corp. | | | (900 | ) | | | (85,375 | ) |
Kansai Paint Co., Ltd. | | | (5,100 | ) | | | (100,843 | ) |
Kose Corp. | | | (300 | ) | | | (55,351 | ) |
Kura Corp. | | | (400 | ) | | | (23,688 | ) |
LIFULL Co., Ltd. | | | (4,400 | ) | | | (27,047 | ) |
M3, Inc. | | | (1,200 | ) | | | (52,867 | ) |
MISUMI Group, Inc. | | | (3,000 | ) | | | (77,329 | ) |
Money Forward, Inc. (2) | | | (400 | ) | | | (16,848 | ) |
Nihon M&A Center, Inc. | | | (1,800 | ) | | | (47,126 | ) |
Nippon Paint Holdings Co., Ltd. | | | (2,600 | ) | | | (102,727 | ) |
Nitori Holdings Co., Ltd. | | | (600 | ) | | | (91,099 | ) |
Park24 Co., Ltd. | | | (3,900 | ) | | | (114,427 | ) |
Prestige International, Inc. | | | (3,500 | ) | | | (40,258 | ) |
Shima Seiki Manufacturing, Ltd. | | | (500 | ) | | | (23,355 | ) |
Shimano, Inc. | | | (600 | ) | | | (92,557 | ) |
SMS Co., Ltd. | | | (5,200 | ) | | | (98,655 | ) |
Toridoll Holdings Corp. | | | (2,300 | ) | | | (52,082 | ) |
| | | | | | | | |
| | | | | | | (1,441,325 | ) |
|
Netherlands — (0.8)% | |
Fugro NV (2) | | | (3,953 | ) | | | (50,725 | ) |
Takeaway.com NV (2)(5) | | | (425 | ) | | | (33,595 | ) |
| | | | | | | | |
| | | | | | | (84,320 | ) |
|
Norway — (0.2)% | |
Nordic Semiconductor ASA (2) | | | (4,105 | ) | | | (25,111 | ) |
|
Spain — (0.6)% | |
Cellnex Telecom SA (5) | | | (2,460 | ) | | | (63,162 | ) |
(See Notes which are an integral part of the Financial Statements)
68
Global Long/Short Equity Fund (continued)
| | | | | | | | |
| Description | | Shares | | | Value | |
|
| Securities Sold Short (continued) | |
|
| Common Stocks Sold Short (continued) | |
|
Sweden — (1.0)% | |
AAK AB | | | (3,954 | ) | | $ | (64,863 | ) |
Wallenstam AB, Class B | | | (3,703 | ) | | | (36,847 | ) |
| | | | | | | | |
| | | | | | | (101,710 | ) |
|
Switzerland — (0.2)% | |
Zur Rose Group AG (2) | | | (120 | ) | | | (17,135 | ) |
|
United Kingdom — (2.7)% | |
Cobham PLC (2) | | | (50,236 | ) | | | (81,020 | ) |
Just Eat PLC (2) | | | (5,922 | ) | | | (58,856 | ) |
Serco Group PLC (2) | | | (28,401 | ) | | | (35,955 | ) |
Sophos Group PLC (5) | | | (10,083 | ) | | | (68,563 | ) |
Victoria PLC (2) | | | (1,889 | ) | | | (20,621 | ) |
| | | | | | | | |
| | | | | | | (265,015 | ) |
|
United States — (14.1)% | |
Advanced Micro Devices, Inc. (2) | | | (1,269 | ) | | | (31,941 | ) |
Albemarle Corp. | | | (899 | ) | | | (85,872 | ) |
Bank OZK | | | (1,191 | ) | | | (48,188 | ) |
BioScrip, Inc. (2) | | | (13,766 | ) | | | (39,921 | ) |
Brown-Forman Corp., Class B | | | (346 | ) | | | (18,068 | ) |
Instructure, Inc. (2) | | | (1,695 | ) | | | (69,410 | ) |
Interactive Brokers Group, Inc., Class A | | | (1,644 | ) | | | (102,191 | ) |
Intrepid Potash, Inc. (2) | | | (17,226 | ) | | | (58,568 | ) |
Kopin Corp. (2) | | | (16,272 | ) | | | (37,751 | ) |
LSB Industries, Inc. (2) | | | (6,418 | ) | | | (55,965 | ) |
Macerich Co. | | | (1,691 | ) | | | (99,329 | ) |
Netflix, Inc. (2) | | | (294 | ) | | | (108,098 | ) |
Northwest Pipe Co. (2) | | | (1,035 | ) | | | (18,692 | ) |
NOW, Inc. (2) | | | (1,224 | ) | | | (21,041 | ) |
Okta, Inc. (2) | | | (723 | ) | | | (44,703 | ) |
Old Line Bancshares, Inc. | | | (235 | ) | | | (8,037 | ) |
Pinnacle Financial Partners, Inc. | | | (1,405 | ) | | | (90,693 | ) |
PROS Holdings, Inc. (2) | | | (2,241 | ) | | | (82,648 | ) |
Rayonier, Inc. | | | (2,514 | ) | | | (87,563 | ) |
Republic First Bancorp, Inc. (2) | | | (3,767 | ) | | | (29,383 | ) |
Senior Housing Properties Trust | | | (1,922 | ) | | | (36,729 | ) |
TFS Financial Corp. | | | (1,195 | ) | | | (18,451 | ) |
TimkenSteel Corp. (2) | | | (4,666 | ) | | | (65,371 | ) |
Weyerhaeuser Co. | | | (1,269 | ) | | | (44,047 | ) |
Whitestone REIT | | | (7,301 | ) | | | (99,586 | ) |
| | | | | | | | |
| | | | | | | (1,402,246 | ) |
| | | | | | | | |
Total Securities Sold Short
(proceeds $(3,323,077)) | | | $ | (3,642,216 | ) |
| | | | | | | | |
| | | | | | | | |
| |
| Industry Allocation | |
| Industry | | Value | | | % of
Total
Net Assets | |
Common Stocks Purchased Long | | | | | | | | |
Agriculture | | $ | 160,192 | | | | 1.6 | % |
Airlines | | | 273,031 | | | | 2.7 | |
Auto Manufacturers | | | 124,721 | | | | 1.3 | |
Auto Parts & Equipment | | | 408,149 | | | | 4.1 | |
Banks | | | 279,181 | | | | 2.8 | |
Biotechnology | | | 310,320 | | | | 3.1 | |
Building Materials | | | 192,693 | | | | 1.9 | |
Chemicals | | | 172,683 | | | | 1.7 | |
Coal | | | 158,612 | | | | 1.6 | |
Commercial Services | | | 196,151 | | | | 2.0 | |
Computers | | | 228,686 | | | | 2.3 | |
| | | | | | | | |
| |
| Industry Allocation(continued) | |
| Industry | | Value | | | % of
Total
Net Assets | |
Distribution/Wholesale | | $ | 24,077 | | | | 0.2 | % |
Diversified Financial Services | | | 356,783 | | | | 3.6 | |
Electric | | | 366,915 | | | | 3.7 | |
Electronics | | | 217,190 | | | | 2.2 | |
Engineering & Construction | | | 168,359 | | | | 1.7 | |
Food | | | 801,612 | | | | 8.1 | |
Forest Products & Paper | | | 335,248 | | | | 3.4 | |
Healthcare-Products | | | 1,074,820 | | | | 10.8 | |
Insurance | | | 619,468 | | | | 6.2 | |
Internet | | | 102,099 | | | | 1.0 | |
Iron/Steel | | | 30,273 | | | | 0.3 | |
Media | | | 67,884 | | | | 0.7 | |
Mining | | | 277,949 | | | | 2.8 | |
Miscellaneous Manufacturing | | | 122,437 | | | | 1.2 | |
Oil & Gas | | | 180,228 | | | | 1.8 | |
Packaging & Containers | | | 66,227 | | | | 0.7 | |
Pharmaceuticals | | | 319,432 | | | | 3.2 | |
Real Estate Investment Trusts | | | 890,046 | | | | 9.0 | |
Retail | | | 279,003 | | | | 2.8 | |
Semiconductors | | | 399,985 | | | | 4.0 | |
Shipbuilding | | | 153,038 | | | | 1.5 | |
Telecommunications | | | 196,022 | | | | 2.0 | |
Textiles | | | 16,848 | | | | 0.2 | |
Transportation | | | 201,876 | | | | 2.0 | |
| | | | | | | | |
Total Common Stocks Purchased Long | | | 9,772,238 | | | | 98.2 | |
Collateral Investment for Securities on Loan | | | 293,674 | | | | 3.0 | |
Mutual Funds | | | 3,434,203 | | | | 34.5 | |
| | | | | | | | |
Total Investments | | | 13,500,115 | | | | 135.7 | |
Other Assets and Liabilities | | | 91,636 | | | | 0.9 | |
Securities Sold Short (see below) | | | (3,642,216 | ) | | | (36.6 | ) |
| | | | | | | | |
Total Net Assets | | $ | 9,949,535 | | | | 100.0 | % |
| | | | | | | | |
Securities Sold Short | | | | | | | | |
Aerospace/Defense | | $ | (81,020 | ) | | | (0.8 | )% |
Banks | | | (176,301 | ) | | | (1.8 | ) |
Beverages | | | (18,068 | ) | | | (0.2 | ) |
Building Materials | | | (20,621 | ) | | | (0.2 | ) |
Chemicals | | | (348,010 | ) | | | (3.5 | ) |
Commercial Services | | | (269,862 | ) | | | (2.7 | ) |
Computers | | | (104,518 | ) | | | (1.0 | ) |
Cosmetics/Personal Care | | | (55,351 | ) | | | (0.6 | ) |
Diversified Financial Services | | | (229,817 | ) | | | (2.3 | ) |
Environmental Control | | | (51,249 | ) | | | (0.5 | ) |
Food | | | (98,458 | ) | | | (1.0 | ) |
Healthcare-Products | | | (24,607 | ) | | | (0.2 | ) |
Healthcare-Services | | | (22,950 | ) | | | (0.2 | ) |
Home Furnishings | | | (85,375 | ) | | | (0.9 | ) |
Internet | | | (390,226 | ) | | | (3.9 | ) |
Leisure Time | | | (92,557 | ) | | | (0.9 | ) |
Machinery-Diversified | | | (96,058 | ) | | | (1.0 | ) |
Metal Fabricate/Hardware | | | (161,392 | ) | | | (1.6 | ) |
Miscellaneous Manufacturing | | | (55,965 | ) | | | (0.6 | ) |
Oil & Gas Services | | | (71,766 | ) | | | (0.7 | ) |
Packaging & Containers | | | (56,449 | ) | | | (0.6 | ) |
Pharmaceuticals | | | (39,921 | ) | | | (0.4 | ) |
Real Estate | | | (36,847 | ) | | | (0.4 | ) |
Real Estate Investment Trusts | | | (367,254 | ) | | | (3.7 | ) |
Retail | | | (342,252 | ) | | | (3.4 | ) |
Savings & Loans | | | (18,451 | ) | | | (0.2 | ) |
Semiconductors | | | (94,803 | ) | | | (1.0 | ) |
Software | | | (168,906 | ) | | | (1.7 | ) |
Telecommunications | | | (63,162 | ) | | | (0.6 | ) |
| | | | | | | | |
Total Securities Sold Short | | $ | (3,642,216 | ) | | | (36.6 | )% |
| | | | | | | | |
(See Notes which are an integral part of the Financial Statements)
69
August 31, 2018
Ultra Short Tax-Free Fund*
| | | | | | | | |
| Description | | Principal
Amount | | | Value | |
| Municipals — 97.3% | |
|
Alabama — 7.1% | |
Black Belt Energy Gas District,
2.295%, 12/1/2048,
Call 9/1/2023 (7) | | $ | 4,500,000 | | | $ | 4,500,000 | |
Chatom Industrial Development Board, 1.650%, 8/1/2037,
Call 2/1/2019 (7) | | | 4,800,000 | | | | 4,797,456 | |
Health Care Authority for Baptist Health, 2.130%, 11/1/2042 (7) | | | 11,125,000 | | | | 11,125,000 | |
Southeast Alabama Gas Supply District, 2.282%, 4/1/2049,
Call 1/1/2024 (7) | | | 5,000,000 | | | | 4,995,900 | |
Tender Option Bond Trust Receipts/Certificates: | | | | | | | | |
1.660%, 5/1/2026 (5)(7) | | | 3,000,000 | | | | 3,000,000 | |
1.660%, 7/1/2026 (5)(7) | | | 4,500,000 | | | | 4,500,000 | |
1.710%, 10/5/2020 (5)(7) | | | 5,000,000 | | | | 5,000,000 | |
Other securities | | | | | | | 4,470,384 | |
| | | | | | | | |
| | | | | | | 42,388,740 | |
|
Arizona — 0.7% | |
Other securities | | | | | | | 4,048,520 | |
|
Arkansas — 2.2% | |
Arkansas Development Finance Authority: | | | | | | | | |
2.110%, 9/1/2044,
Call 9/4/2018 (7) | | | 7,000,000 | | | | 7,000,000 | |
2.660%, 9/1/2044,
Call 3/1/2019 (7) | | | 3,000,000 | | | | 3,006,360 | |
Other securities | | | | | | | 3,210,916 | |
| | | | | | | | |
| | | | | | | 13,217,276 | |
|
California — 3.1% | |
Rib Floater Trust Various States, 1.710%, 8/15/2051 (5)(7) | | | 3,000,000 | | | | 3,000,000 | |
Tender Option Bond Trust Receipts/Certificates,
1.710%, 8/1/2024 (5)(7) | | | 4,760,000 | | | | 4,760,000 | |
Other securities | | | | | | | 10,594,667 | |
| | | | | | | | |
| | | | | | | 18,354,667 | |
|
Colorado — 1.6% | |
Colorado Health Facilities Authority, 2.200%, 7/1/2034,
Call 7/1/2019 (5)(7) | | | 4,300,000 | | | | 4,300,000 | |
Other securities | | | | | | | 5,637,723 | |
| | | | | | | | |
| | | | | | | 9,937,723 | |
|
Connecticut — 0.1% | |
Other securities | | | | | | | 422,464 | |
|
District of Columbia — 0.5% | |
Other securities | | | | | | | 3,019,146 | |
|
Florida — 6.0% | |
Citizens Property Insurance Corp.: | | | | | | | | |
5.000%, 6/1/2019 | | | 2,640,000 | | | | 2,701,274 | |
5.000%, 6/1/2020 | | | 3,870,000 | | | | 4,079,599 | |
RBC Municipal Products, Inc. Trust, 1.760%, 3/1/2026 (5)(7) | | | 5,000,000 | | | | 5,000,000 | |
School Board of Miami-Dade County, FGIC, 1.790%, 5/1/2037,
Call 9/1/2018 (5)(7) | | | 8,000,000 | | | | 8,000,000 | |
Other securities | | | | | | | 16,411,258 | |
| | | | | | | | |
| | | | | | | 36,192,131 | |
| | | | | | | | |
| Description | | Principal
Amount | | | Value | |
| Municipals (continued) | |
|
Georgia — 4.0% | |
Main Street Natural Gas, Inc.: | | | | | | | | |
2.130%, 8/1/2048,
Call 9/1/2023 (7) | | $ | 5,000,000 | | | $ | 4,992,400 | |
2.225%, 8/1/2048,
Call 9/1/2023 (7) | | | 5,000,000 | | | | 4,982,500 | |
Other securities | | | | | | | 13,980,198 | |
| | | | | | | | |
| | | | | | | 23,955,098 | |
|
Guam — 0.0% | |
Other securities | | | | | | | 251,743 | |
|
Hawaii — 0.5% | |
Other securities | | | | | | | 2,797,060 | |
|
Idaho — 0.7% | |
Other securities | | | | | | | 4,015,000 | |
|
Illinois — 6.9% | |
Rib Floater Trust Various States, 1.740%, 8/15/2030,
Call 10/1/2018 (5)(7) | | | 5,000,000 | | | | 5,000,000 | |
State of Illinois: | | | | | | | | |
5.000%, 10/1/2021 (9) | | | 1,500,000 | | | | 1,577,925 | |
5.000%, 2/1/2022 | | | 6,040,000 | | | | 6,346,107 | |
Tender Option Bond Trust Receipts/Certificates: | | | | | | | | |
1.710%, 6/15/2020 (5)(7) | | | 2,000,000 | | | | 2,000,000 | |
1.710%, 6/15/2031,
Call 6/15/2026 (5)(7) | | | 4,355,000 | | | | 4,355,000 | |
1.710%, 1/1/2035,
Call 1/1/2026 (5)(7) | | | 2,605,000 | | | | 2,605,000 | |
Other securities | | | | | | | 19,414,165 | |
| | | | | | | | |
| | | | | | | 41,298,197 | |
|
Indiana — 2.4% | |
Indiana Housing & Community Development Authority, GNMA/FNMA/FHLMC, 1.780%, 7/1/2047,
Call 9/19/2018 (7) | | | 6,000,000 | | | | 6,000,000 | |
Tender Option Bond Trust Receipts/Certificates,
1.830%, 10/15/2019 (5)(7) | | | 8,500,000 | | | | 8,500,000 | |
| | | | | | | | |
| | | | | | | 14,500,000 | |
|
Iowa — 1.5% | |
Other securities | | | | | | | 9,332,337 | |
|
Kansas — 0.1% | |
Other securities | | | | | | | 400,348 | |
|
Kentucky — 1.8% | |
Other securities | | | | | | | 10,613,138 | |
|
Louisiana — 1.9% | |
Louisiana Public Facilities Authority, 2.210%, 9/1/2057,
Call 3/1/2023 (7) | | | 5,000,000 | | | | 5,002,100 | |
Parish of St. James, 1.730%, 11/1/2040,
Call 9/19/2018 (7) | | | 5,000,000 | | | | 5,000,000 | |
Other securities | | | | | | | 1,503,536 | |
| | | | | | | | |
| | | | | | | 11,505,636 | |
|
Maine — 0.0% | |
Other securities | | | | | | | 308,132 | |
|
Maryland — 1.4% | |
Maryland Industrial Development Financing Authority, 1.720%, 3/1/2030,
Call 9/19/2018 (7) | | | 5,000,000 | | | | 5,000,000 | |
(See Notes which are an integral part of the Financial Statements)
70
Ultra Short Tax-Free Fund* (continued)
| | | | | | | | |
| Description | | Principal
Amount | | | Value | |
| Municipals (continued) | |
|
Maryland(continued) | |
RBC Municipal Products, Inc. Trust,
1.760%, 1/1/2025 (5)(7) | | $ | 3,000,000 | | | $ | 3,000,000 | |
Other securities | | | | | | | 606,853 | |
| | | | | | | | |
| | | | | | | 8,606,853 | |
|
Massachusetts — 0.2% | |
Other securities | | | | | | | 1,250,700 | |
|
Michigan — 1.1% | |
Tender Option Bond Trust Receipts/Certificates,Q-SBLF, 1.660%, 5/1/2026 (5)(7) | | | 2,000,000 | | | | 2,000,000 | |
Other securities | | | | | | | 4,888,170 | |
| | | | | | | | |
| | | | | | | 6,888,170 | |
|
Minnesota — 0.5% | |
Other securities | | | | | | | 2,757,586 | |
|
Mississippi — 1.2% | |
Mississippi Development Bank, 2.500%, 1/1/2020 | | | 4,600,000 | | | | 4,635,788 | |
Other securities | | | | | | | 2,623,013 | |
| | | | | | | | |
| | | | | | | 7,258,801 | |
|
Missouri — 1.4% | |
City of St. Louis, 3.000%, 5/30/2019 | | | 5,000,000 | | | | 5,036,400 | |
Other securities | | | | | | | 3,176,584 | |
| | | | | | | | |
| | | | | | | 8,212,984 | |
|
Nevada — 0.1% | |
Other securities | | | | | | | 354,877 | |
|
New Jersey — 7.2% | |
Lyndhurst Township School District, School Bond Gty, 2.750%, 9/14/2018 | | | 5,500,000 | | | | 5,501,485 | |
New Jersey Economic Development Authority: | | | | | | | | |
1.850%, 11/1/2040, Call 9/19/2018 (7) | | | 4,600,000 | | | | 4,600,000 | |
1.850%, 11/1/2040, Call 9/19/2018 (7) | | | 5,665,000 | | | | 5,665,000 | |
1.910%, 11/1/2031, Call 9/19/2018 (7) | | | 4,995,000 | | | | 4,995,000 | |
New Jersey Transportation Trust Fund Authority: | | | | | | | | |
2.560%, 6/15/2034, Call 6/15/2019 (7) | | | 5,000,000 | | | | 5,004,100 | |
4.000%, 6/15/2019 | | | 500,000 | | | | 508,095 | |
4.000%, 6/15/2020 | | | 200,000 | | | | 206,840 | |
5.000%, 6/15/2019 | | | 4,500,000 | | | | 4,607,415 | |
Tender Option Bond Trust Receipts/Certificates,
1.710%, 7/1/2025 (5)(7) | | | 2,175,000 | | | | 2,175,000 | |
Other securities | | | | | | | 9,774,221 | |
| | | | | | | | |
| | | | | | | 43,037,156 | |
|
New Mexico — 1.4% | |
New Mexico Municipal Energy Acquisition Authority, 2.145%, 11/1/2039,
Call 2/1/2019 (7) | | | 5,500,000 | | | | 5,505,830 | |
Other securities | | | | | | | 2,869,422 | |
| | | | | | | | |
| | | | | | | 8,375,252 | |
| | | | | | | | |
| Description | | Principal
Amount | | | Value | |
| Municipals (continued) | |
|
New York — 10.4% | |
City of New York, 1.560%, 8/1/2035,
Call 9/19/2018 (7) | | $ | 6,300,000 | | | $ | 6,300,000 | |
City of New York, AGC, 1.590%, 10/1/2021,
Call 9/4/2018 (7)(8) | | | 100,000 | | | | 100,000 | |
New York City Transitional Finance Authority Future Tax Secured Revenue: | | | | | | | | |
1.520%, 8/1/2022,
Call 9/19/2018 (7) | | | 4,320,000 | | | | 4,320,000 | |
1.520%, 8/1/2023,
Call 9/19/2018 (7) | | | 6,550,000 | | | | 6,550,000 | |
1.560%, 11/1/2029,
Call 9/19/2018 (7) | | | 3,700,000 | | | | 3,700,000 | |
1.560%, 5/1/2034,
Call 9/19/2018 (7) | | | 3,800,000 | | | | 3,800,000 | |
Nuveen New YorkAMT-Free Quality Municipal Income Fund, 1.860%, 5/1/2047, Call 9/19/2018 (5)(7) | | | 5,000,000 | | | | 5,000,000 | |
RBC Municipal Products, Inc. Trust, 1.530%, 3/1/2022,
Call 9/19/2018 (5)(7) | | | 6,000,000 | | | | 6,000,000 | |
South Glens Falls Central School District, SAW, 3.000%, 7/26/2019 | | | 4,500,000 | | | | 4,540,455 | |
Triborough Bridge & Tunnel Authority,
2.095%, 1/1/2032 (7) | | | 4,935,000 | | | | 4,982,376 | |
Other securities | | | | | | | 16,984,185 | |
| | | | | | | | |
| | | | | | | 62,277,016 | |
|
North Carolina — 0.2% | |
Other securities | | | | | | | 1,000,000 | |
|
North Dakota — 0.2% | |
Other securities | | | | | | | 1,253,441 | |
|
Ohio — 9.1% | |
Dublin City School District, 2.500%, 4/18/2019 | | | 4,500,000 | | | | 4,514,625 | |
Lancaster Port Authority, 2.115%, 5/1/2038,
Call 2/1/2019 (7) | | | 5,000,000 | | | | 5,004,700 | |
Rib Floater Trust Various States, 1.810%, 11/15/2048,
Call 10/1/2018 (5)(7) | | | 4,000,000 | | | | 4,000,000 | |
Tender Option Bond Trust Receipts/Certificates,
1.710%, 8/1/2024 (5)(7) | | | 5,580,000 | | | | 5,580,000 | |
Other securities | | | | | | | 35,267,153 | |
| | | | | | | | |
| | | | | | | 54,366,478 | |
|
Oklahoma — 0.2% | |
Other securities | | | | | | | 1,529,865 | |
|
Oregon — 0.7% | |
Other securities | | | | | | | 4,209,620 | |
|
Pennsylvania — 4.5% | |
Other securities | | | | | | | 26,968,121 | |
|
South Carolina — 1.5% | |
Patriots Energy Group Financing Agency, 2.243%, 10/1/2048,
Call 11/1/2023 (7) | | | 6,000,000 | | | | 6,000,000 | |
Other securities | | | | | | | 3,247,380 | |
| | | | | | | | |
| | | | | | | 9,247,380 | |
(See Notes which are an integral part of the Financial Statements)
71
August 31, 2018
Ultra Short Tax-Free Fund* (continued)
| | | | | | | | |
| Description | | Principal
Amount | | | Value | |
| Municipals (continued) | |
|
Tennessee — 1.0% | |
Tender Option Bond Trust Receipts/Certificates, 1.760%, 7/1/2046,
Call 9/6/2018 (5)(7) | | $ | 3,100,000 | | | $ | 3,100,000 | |
Other securities | | | | | | | 2,703,600 | |
| | | | | | | | |
| | | | | | | 5,803,600 | |
|
Texas — 7.9% | |
Rib Floater Trust Various States: | | | | | | | | |
1.740%, 6/1/2032,
Call 4/1/2020 (5)(7) | | | 6,000,000 | | | | 6,000,000 | |
1.740%, 11/1/2042,
Call 11/1/2020 (5)(7) | | | 5,000,000 | | | | 5,000,000 | |
Tender Option Bond Trust Receipts/Certificates, 1.760%, 7/1/2021 (5)(7) | | | 11,000,000 | | | | 11,000,000 | |
Other securities | | | | | | | 25,311,600 | |
| | | | | | | | |
| | | | | | | 47,311,600 | |
|
Utah — 0.4% | |
Tender Option Bond Trust Receipts/Certificates, 1.740%, 1/1/2025 (5)(7) | | | 2,500,000 | | | | 2,500,000 | |
|
Virginia — 1.6% | |
Tender Option Bond Trust Receipts/Certificates, 1.710%, 1/1/2025 (5)(7) | | | 5,400,000 | | | | 5,400,000 | |
Other securities | | | | | | | 4,485,285 | |
| | | | | | | | |
| | | | | | | 9,885,285 | |
|
Washington — 2.0% | |
Tender Option Bond Trust Receipts/Certificates: | | | | | | | | |
1.710%, 6/15/2033,
Call 6/1/2019 (5)(7) | | | 5,050,000 | | | | 5,050,000 | |
1.730%, 1/1/2035 (5)(7) | | | 5,000,000 | | | | 5,000,000 | |
Other securities | | | | | | | 1,946,652 | |
| | | | | | | | |
| | | | | | | 11,996,652 | |
|
West Virginia — 0.9% | |
West Virginia Hospital Finance Authority, 1.840%, 6/1/2033,
Call 9/4/2018 (7) | | | 5,000,000 | | | | 5,000,000 | |
Other securities | | | | | | | 694,837 | |
| | | | | | | | |
| | | | | | | 5,694,837 | |
|
Wisconsin — 1.1% | |
Other securities | | | | | | | 6,389,067 | |
| | | | | | | | |
Total Municipals
(identified cost $583,645,965) | | | | 583,732,697 | |
| | | | | | | | |
| Short-Term Investments — 3.7% | |
|
| Mutual Funds — 0.0% | |
Other securities (4) | | | | | | | 159,901 | |
| Short-Term Municipals — 3.7% | |
|
Florida — 0.4% | |
Other securities | | | | | | | 2,500,000 | |
|
Illinois — 0.1% | |
Other securities | | | | | | | 360,349 | |
|
Indiana — 0.5% | |
Other securities | | | | | | | 2,904,495 | |
| | | | | | | | |
| Description | | Principal
Amount | | | Value | |
| Short-Term Municipals (continued) | |
|
Kentucky — 0.3% | |
Other securities | | | | | | $ | 2,000,000 | |
|
Massachusetts — 0.4% | |
Other securities | | | | | | | 2,270,957 | |
|
Nevada — 0.1% | |
Other securities | | | | | | | 460,000 | |
|
New York — 0.1% | |
Other securities | | | | | | | 500,280 | |
|
Ohio — 0.4% | |
Other securities | | | | | | | 2,350,024 | |
|
Oregon — 0.3% | |
Other securities | | | | | | | 2,004,440 | |
|
South Carolina — 0.1% | |
Other securities | | | | | | | 502,560 | |
|
Texas — 0.8% | |
City of Dallas, 1.300%, 9/26/2018 | | $ | 5,000,000 | | | | 5,000,000 | |
|
Wisconsin — 0.2% | |
Other securities | | | | | | | 1,469,824 | |
| | | | | | | | |
Total Short-Term Municipals | | | | 22,322,929 | |
| | | | | | | | |
Total Short-Term Investments(identified cost $22,491,574) | | | | | | | 22,482,830 | |
| | | | | | | | |
Total Investments — 101.0%
(identified cost $606,137,539) | | | | | | | 606,215,527 | |
| Other Assets and Liabilities — (1.0)% | | | | (6,112,050 | ) |
| | | | | | | | |
| Total Net Assets — 100.0% | | | | | | $ | 600,103,477 | |
| | | | | | | | |
ShortTax-Free Fund*
| | | | | | | | |
| Description | | Principal
Amount | | | Value | |
| Municipals — 100.6% | |
|
Alabama — 3.8% | |
Black Belt Energy Gas District: | | | | | | | | |
2.295%, 12/1/2048,
Call 9/1/2023 (7) | | $ | 1,000,000 | | | $ | 1,000,000 | |
4.000%, 7/1/2046,
Call 3/1/2021 (7) | | | 1,000,000 | | | | 1,045,390 | |
County of Jefferson, 5.000%, 9/15/2021 | | | 1,000,000 | | | | 1,083,410 | |
Other securities | | | | | | | 3,996,142 | |
| | | | | | | | |
| | | | | | | 7,124,942 | |
|
Alaska — 0.8% | |
Alaska Industrial Development & Export Authority, 3.500%, 12/1/2020,
Call 12/1/2019 | | | 1,000,000 | | | | 1,013,200 | |
Other securities | | | | | | | 533,035 | |
| | | | | | | | |
| | | | | | | 1,546,235 | |
|
Arizona — 1.8% | |
Other securities | | | | | | | 3,458,753 | |
|
Arkansas — 0.7% | |
Other securities | | | | | | | 1,267,858 | |
|
California — 9.0% | |
California Municipal Finance Authority, 5.000%, 2/01/2022 | | | 1,000,000 | | | | 1,091,370 | |
Golden State Tobacco Securitization Corp., 5.000%, 6/1/2022 | | | 1,000,000 | | | | 1,110,200 | |
Rib Floater Trust Various States, 1.710%, 3/1/2042,
Call 10/1/2018 (5)(7) | | | 2,000,000 | | | | 2,000,000 | |
(See Notes which are an integral part of the Financial Statements)
72
ShortTax-Free Fund* (continued)
| | | | | | | | |
| Description | | Principal
Amount | | | Value | |
| Municipals (continued) | |
|
California(continued) | |
Tender Option Bond Trust Receipts/Certificates: | | | | | | | | |
1.660%, 11/1/2023 (5)(7) | | $ | 1,500,000 | | | $ | 1,500,000 | |
1.710%, 8/1/2022 (5)(7) | | | 2,000,000 | | | | 2,000,000 | |
Other securities | | | | | | | 9,310,823 | |
| | | | | | | | |
| | | | | | | 17,012,393 | |
|
Colorado — 4.5% | |
Colorado Educational & Cultural Facilities Authority, 5.000%, 10/01/2021 | | | 1,000,000 | | | | 1,077,160 | |
Tender Option Bond Trust Receipts/Certificates, 1.670%, 12/1/2032,
Call 12/1/2022 (5)(7) | | | 500,000 | | | | 500,000 | |
Other securities | | | | | | | 6,964,840 | |
| | | | | | | | |
| | | | | | | 8,542,000 | |
|
Connecticut — 0.3% | |
Other securities | | | | | | | 648,901 | |
|
Florida — 6.7% | |
Escambia County Health Facilities Authority, AGC, 1.650%, 11/15/2029,
Call 9/4/2018 (7) | | | 1,700,000 | | | | 1,700,000 | |
School Board of Miami-Dade County, 1.790%, 8/1/2027,
Call 2/1/2019 (5)(7) | | | 1,515,000 | | | | 1,515,000 | |
School District of Broward County, 5.000%, 7/1/2019 | | | 1,000,000 | | | | 1,026,720 | |
Other securities | | | | | | | 8,451,597 | |
| | | | | | | | |
| | | | | | | 12,693,317 | |
|
Georgia — 5.0% | |
Georgia State Road & Tollway Authority, 5.000%, 6/1/2021 | | | 1,250,000 | | | | 1,355,000 | |
Main Street Natural Gas, Inc.: | | | | | | | | |
2.145%, 4/1/2048,
Call 6/1/2023 (7) | | | 1,000,000 | | | | 995,490 | |
2.225%, 8/1/2048,
Call 9/1/2023 (7) | | | 500,000 | | | | 498,250 | |
5.000%, 3/15/2019 | | | 1,000,000 | | | | 1,016,040 | |
5.250%, 9/15/2018 | | | 100,000 | | | | 100,092 | |
Tender Option Bond Trust Receipts/Certificates,
1.710%, 4/1/2025 (5)(7) | | | 1,250,000 | | | | 1,250,000 | |
Tender Option Bond Trust Receipts/Certificates, County Guarantee, 1.690%, 8/15/2049,
Call 2/1/2025 (5)(7) | | | 500,000 | | | | 500,000 | |
Other securities | | | | | | | 3,800,955 | |
| | | | | | | | |
| | | | | | | 9,515,827 | |
|
Guam — 0.3% | |
Other securities | | | | | | | 549,540 | |
|
Idaho — 0.1% | |
Other securities | | | | | | | 228,292 | |
|
Illinois — 13.6% | |
City of Chicago Waterworks Revenue, 5.000%, 11/1/2021 | | | 1,000,000 | | | | 1,080,110 | |
Cook County School District No. 130 Blue Island, 2.350%, 12/1/2028,
Call 9/10/2018 (5)(7)(9) | | | 1,000,000 | | | | 1,000,000 | |
| | | | | | | | |
| Description | | Principal
Amount | | | Value | |
| Municipals (continued) | |
|
Illinois(continued) | |
Illinois Finance Authority: | | | | | | | | |
2.807%, 5/1/2036,
Call 11/1/2020 (7) | | $ | 1,000,000 | | | $ | 1,005,820 | |
4.000%, 10/1/2018 | | | 275,000 | | | | 275,382 | |
5.000%, 1/1/2021 | | | 200,000 | | | | 211,392 | |
5.000%, 11/15/2021 | | | 400,000 | | | | 434,224 | |
5.000%, 1/1/2022 | | | 150,000 | | | | 161,333 | |
5.000%, 7/15/2022 | | | 750,000 | | | | 830,243 | |
5.000%, 11/15/2022 | | | 555,000 | | | | 613,636 | |
5.000%, 12/1/2022 | | | 290,000 | | | | 310,523 | |
Kane McHenry Cook & De Kalb Counties Unit School District No. 300, 5.000%, 1/1/2023 | | | 1,000,000 | | | | 1,110,020 | |
Railsplitter Tobacco Settlement Authority, 5.000%, 6/1/2023 | | | 1,000,000 | | | | 1,112,450 | |
Rib Floater Trust Various States, 1.740%, 8/15/2030,
Call 10/1/2018 (5)(7) | | | 2,000,000 | | | | 2,000,000 | |
State of Illinois: | | | | | | | | |
5.000%, 4/1/2020 | | | 100,000 | | | | 103,594 | |
5.000%, 2/1/2021 | | | 240,000 | | | | 250,315 | |
5.000%, 11/1/2022 | | | 2,000,000 | | | | 2,116,580 | |
Tender Option Bond Trust Receipts/Certificates,
1.710%, 6/15/2020 (5)(7) | | | 955,000 | | | | 955,000 | |
Other securities | | | | | | | 12,135,949 | |
| | | | | | | | |
| | | | | | | 25,706,571 | |
|
Indiana — 2.6% | |
Indiana Housing & Community Development Authority, GNMA/FNMA/FHLMC, 1.780%, 7/1/2047,
Call 9/19/2018 (7) | | | 2,000,000 | | | | 2,000,000 | |
Other securities | | | | | | | 2,897,242 | |
| | | | | | | | |
| | | | | | | 4,897,242 | |
|
Iowa — 1.1% | |
Other securities | | | | | | | 1,997,940 | |
|
Kansas — 0.4% | |
Other securities | | | | | | | 749,581 | |
|
Kentucky — 1.7% | |
Kentucky Rural Water Finance Corp., 2.250%, 3/1/2020,
Call 9/1/2019 (9) | | | 1,200,000 | | | | 1,203,144 | |
Other securities | | | | | | | 1,930,053 | |
| | | | | | | | |
| | | | | | | 3,133,197 | |
|
Louisiana — 0.3% | |
Other securities | | | | | | | 596,332 | |
|
Maine — 0.1% | |
Other securities | | | | | | | 246,057 | |
|
Maryland — 1.2% | |
Other securities | | | | | | | 2,184,589 | |
|
Massachusetts — 1.0% | |
Other securities | | | | | | | 1,856,154 | |
|
Michigan — 3.3% | |
Tender Option Bond Trust Receipts/Certificates,Q-SBLF: | | | | | | | | |
1.660%, 5/1/2026 (5)(7) | | | 1,000,000 | | | | 1,000,000 | |
1.660%, 5/1/2026 (5)(7) | | | 2,000,000 | | | | 2,000,000 | |
Other securities | | | | | | | 3,223,343 | |
| | | | | | | | |
| | | | | | | 6,223,343 | |
(See Notes which are an integral part of the Financial Statements)
73
August 31, 2018
ShortTax-Free Fund* (continued)
| | | | | | | | |
| Description | | Principal
Amount | | | Value | |
| Municipals (continued) | |
|
Minnesota — 0.3% | |
Other securities | | | | | | $ | 545,530 | |
|
Mississippi — 1.1% | |
Mississippi Business Finance Corp., 1.560%, 11/1/2035,
Call 9/4/2018 (7) | | $ | 1,450,000 | | | | 1,450,000 | |
Other securities | | | | | | | 658,788 | |
| | | | | | | | |
| | | | | | | 2,108,788 | |
|
Missouri — 2.5% | |
Southeast Missouri State University, 5.000%, 4/1/2019 | | | 1,000,000 | | | | 1,018,470 | |
Other securities | | | | | | | 3,672,982 | |
| | | | | | | | |
| | | | | | | 4,691,452 | |
|
Nevada — 0.3% | |
Other securities | | | | | | | 549,170 | |
|
New Jersey — 3.9% | |
Lyndhurst Township School District, School Bond Gty, 2.750%, 9/14/2018 | | | 1,500,000 | | | | 1,500,405 | |
Tender Option Bond Trust Receipts/Certificates, 1.690%, 7/1/2025 (5)(7) | | | 1,000,000 | | | | 1,000,000 | |
Tobacco Settlement Financing Corp., 5.000%, 6/1/2022 | | | 1,000,000 | | | | 1,096,170 | |
Other securities | | | | | | | 3,731,950 | |
| | | | | | | | |
| | | | | | | 7,328,525 | |
|
New Mexico — 0.4% | |
Other securities | | | | | | | 666,260 | |
|
New York — 7.3% | |
New York State Thruway Authority, 5.000%, 5/1/2019 | | | 1,000,000 | | | | 1,021,530 | |
Nuveen New YorkAMT-Free Quality Municipal Income Fund, 1.860%, 5/1/2047, Call 9/19/2018 (5)(7) | | | 1,500,000 | | | | 1,500,000 | |
RBC Municipal Products, Inc. Trust, 1.530%, 3/1/2022,
Call 9/19/2018 (5)(7) | | | 1,700,000 | | | | 1,700,000 | |
Triborough Bridge & Tunnel Authority, 2.095%, 1/1/2032 (7) | | | 1,000,000 | | | | 1,009,600 | |
TSASC, Inc., 5.000%, 6/1/2021 | | | 1,000,000 | | | | 1,072,060 | |
Westchester Tobacco Asset Securitization, 5.000%, 6/1/2020 | | | 1,155,000 | | | | 1,212,265 | |
Other securities | | | | | | | 6,176,295 | |
| | | | | | | | |
| | | | | | | 13,691,750 | |
|
North Carolina — 0.5% | |
Other securities | | | | | | | 980,296 | |
|
North Dakota — 0.2% | |
Other securities | | | | | | | 344,280 | |
|
Ohio — 3.6% | |
City of Akron, 3.000%, 12/12/2018 | | | 1,000,000 | | | | 1,003,210 | |
FHLMC Multifamily VRD Certificates, 1.860%, 9/15/2033 (7) | | | 1,345,000 | | | | 1,345,000 | |
Rib Floater Trust Various States, 1.810%, 11/15/2048,
Call 10/1/2018 (5)(7) | | | 1,000,000 | | | | 1,000,000 | |
Other securities | | | | | | | 3,455,834 | |
| | | | | | | | |
| | | | | | | 6,804,044 | |
| | | | | | | | |
| Description | | Principal
Amount | | | Value | |
| Municipals (continued) | |
|
Oregon — 0.5% | |
Other securities | | | | | | $ | 1,000,000 | |
|
Pennsylvania — 4.4% | |
Commonwealth Financing Authority, 5.000%, 6/1/2022 | | $ | 1,000,000 | | | | 1,091,660 | |
Other securities | | | | | | | 7,192,952 | |
| | | | | | | | |
| | | | | | | 8,284,612 | |
|
Rhode Island — 0.1% | |
Other securities | | | | | | | 275,267 | |
|
South Carolina — 1.1% | |
Newberry Investing in Children’s Education, 5.000%, 12/01/2019 | | | 1,000,000 | | | | 1,040,760 | |
Other securities | | | | | | | 1,000,000 | |
| | | | | | | | |
| | | | | | | 2,040,760 | |
|
Tennessee — 1.7% | |
Tender Option Bond Trust Receipts/Certificates, 1.760%, 7/1/2046,
Call 9/6/2018 (5)(7) | | | 900,000 | | | | 900,000 | |
Tennessee Energy Acquisition Corp., 4.000%, 5/1/2048,
Call 2/1/2023 (7) | | | 1,000,000 | | | | 1,059,640 | |
Other securities | | | | | | | 1,199,853 | |
| | | | | | | | |
| | | | | | | 3,159,493 | |
|
Texas — 7.6% | |
Lower Colorado River Authority, 5.000%, 5/15/2019 | | | 1,000,000 | | | | 1,023,150 | |
Rib Floater Trust Various States: | | | | | | | | |
1.740%, 6/1/2032,
Call 4/1/2020 (5)(7) | | | 2,000,000 | | | | 2,000,000 | |
1.740%, 11/1/2042,
Call 11/1/2020 (5)(7) | | | 2,000,000 | | | | 2,000,000 | |
Tarrant County Cultural Education Facilities Finance Corp., 5.000%, 11/15/2022 | | | 1,000,000 | | | | 1,093,090 | |
Tender Option Bond Trust Receipts/Certificates,
1.760%, 7/1/2021 (5)(7) | | | 1,500,000 | | | | 1,500,000 | |
Other securities | | | | | | | 6,693,416 | |
| | | | | | | | |
| | | | | | | 14,309,656 | |
|
Utah — 0.2% | |
Other securities | | | | | | | 400,000 | |
|
Vermont — 0.1% | |
Other securities | | | | | | | 102,515 | |
|
Virginia — 0.6% | |
Henrico County Economic Development Authority, AGM, 3.616%, 8/23/2027,
Call 9/19/2018 (7)(8) | | | 1,100,000 | | | | 1,100,000 | |
|
Washington — 1.2% | |
State of Washington, 5.000%, 2/1/2022 | | | 1,000,000 | | | | 1,100,700 | |
Other securities | | | | | | | 1,224,494 | |
| | | | | | | | |
| | | | | | | 2,325,194 | |
|
West Virginia — 2.4% | |
West Virginia Commissioner of Highways, 5.000%, 9/1/2018 | | | 1,250,000 | | | | 1,250,000 | |
West Virginia Hospital Finance Authority: | | | | | | | | |
1.840%, 6/1/2033,
Call 9/4/2018 (7) | | | 2,000,000 | | | | 2,000,000 | |
(See Notes which are an integral part of the Financial Statements)
74
ShortTax-Free Fund* (continued)
| | | | | | | | |
| Description | | Principal
Amount | | | Value | |
| Municipals (continued) | |
|
West Virginia(continued) | |
5.000%, 1/1/2022 (9) | | $ | 520,000 | | | $ | 564,392 | |
5.000%, 1/1/2023 (9) | | | 555,000 | | | | 612,443 | |
| | | | | | | | |
| | | | | | | 4,426,835 | |
|
Wisconsin — 2.3% | |
Other securities | | | | | | | 4,353,919 | |
| | | | | | | | |
Total Municipals
(identified cost $189,575,417) | | | | | | | 189,667,410 | |
| | | | | | | | |
| Mutual Funds — 0.5% | |
Other securities (4) | | | | | | | 875,303 | |
| | | | | | | | |
Total Mutual Funds
(identified cost $877,821) | | | | | | | 875,303 | |
| | | | | | | | |
| Short-Term Investments — 0.0% | |
|
| Mutual Funds — 0.0% | |
Other securities (4) | | | | | | | 121,200 | |
| | | | | | | | |
Total Short-Term Investments
(identified cost $121,200) | | | | | | | 121,200 | |
| | | | | | | | |
Total Investments — 101.1%
(identified cost $190,574,438) | | | | | | | 190,663,913 | |
| Other Assets and Liabilities — (1.1)% | | | | (2,139,917 | ) |
| | | | | | | | |
| Total Net Assets — 100.0% | | | | | | $ | 188,523,996 | |
| | | | | | | | |
Short-Term Income Fund
| | | | | | | | |
| Description | | Principal
Amount | | | Value | |
| Asset-Backed Securities — 23.5% | |
|
Automobiles — 11.0% | |
American Credit Acceptance Receivables Trust, Class D,(Series 2015-1), 5.450%, 5/12/2022 (5) | | $ | 2,500,000 | | | $ | 2,501,877 | |
Americredit Automobile Receivables Trust, Class A3, (Series2018-2), 3.150%, 3/20/2023 | | | 1,500,000 | | | | 1,502,129 | |
CarMax Auto Owner Trust, Class A3, (Series2016-2), 1.520%, 2/16/2021 | | | 271,131 | | | | 269,350 | |
Drive Auto Receivables Trust, Class C, (Series2015-DA), 3.380%, 11/15/2021 (5) | | | 2,676,984 | | | | 2,682,021 | |
Enterprise Fleet Financing LLC, Class A1, (Series2018-2), 2.550%, 8/20/2019 (5) | | | 2,092,415 | | | | 2,092,670 | |
Flagship Credit Auto Trust, Class A, (Series2016-1), 2.770%, 12/15/2020 (5) | | | 290,563 | | | | 290,650 | |
GM Financial Automobile Leasing Trust: | | | | | | | | |
Class A3, (Series2017-1), 2.060%, 5/20/2020 | | | 1,264,000 | | | | 1,258,808 | |
Class A3, (Series2017-2), 2.020%, 9/21/2020 | | | 1,000,000 | | | | 992,452 | |
Class A4, (Series2017-3), 2.120%, 9/20/2021 | | | 1,655,000 | | | | 1,635,508 | |
GM Financial Consumer Automobile, Class C, (Series2017-1A), 2.450%, 7/17/2023 (5) | | | 1,000,000 | | | | 980,957 | |
| | | | | | | | |
| Description | | Principal
Amount | | | Value | |
| Asset-Backed Securities (continued) | |
|
Automobiles(continued) | |
Hertz Vehicle Financing II LP, Class A, (Series2016-3A), 2.270%, 7/25/2020 (5) | | $ | 2,500,000 | | | $ | 2,483,794 | |
Mercedes-Benz Auto Lease Trust, Class A3, (Series2017-A), 1.790%, 4/15/2020 | | | 2,400,000 | | | | 2,390,097 | |
Nissan Auto Receivables Owner Trust, Class A3, (Series2017-B), 1.750%, 10/15/2021 | | | 2,000,000 | | | | 1,972,937 | |
Santander Drive Auto Receivables Trust: | | | | | | | | |
Class C, (Series2015-2), 2.440%, 4/15/2021 | | | 652,761 | | | | 652,422 | |
Class D, (Series2015-2), 3.020%, 4/15/2021 | | | 960,000 | | | | 961,099 | |
Santander Retail Auto Lease Trust, Class C, (Series2017-A), 2.960%, 11/21/2022 (5) | | | 1,500,000 | | | | 1,480,617 | |
Tesla Auto Lease Trust, Class C, (Series2018-A), 2.970%, 4/20/2020 (5) | | | 500,000 | | | | 498,142 | |
Toyota Auto Receivables, Class A3, (Series2016-C), 1.140%, 8/17/2020 | | | 559,409 | | | | 555,689 | |
World Omni Auto Receivables Trust: | | | | | | | | |
Class A3, (Series2015-B), 1.490%, 12/15/2020 | | | 629,614 | | | | 627,799 | |
Class A3, (Series2017-B), 1.950%, 2/15/2023 | | | 450,000 | | | | 441,472 | |
| | | | | | | | |
| | | | | | | 26,270,490 | |
|
Credit Cards — 4.9% | |
Cabela’s Credit Card Master Note Trust: | | | | | | | | |
Class A, (Series2014-2), 2.513% (LIBOR 1 Month + 45 basis points), 7/15/2022 (10) | | | 1,000,000 | | | | 1,002,192 | |
Class A1, (Series2015-1A), 2.260%, 3/15/2023 | | | 1,010,000 | | | | 999,267 | |
Class A1, (Series2015-2), 2.250%, 7/17/2023 | | | 2,208,000 | | | | 2,183,554 | |
Chase Issuance Trust, Class A4, (Series2016-A4), 1.490%, 7/15/2022 | | | 2,500,000 | | | | 2,436,905 | |
GE Capital Credit Card Master Note Trust, Class B, (Series2012-7), 2.210%, 9/15/2022 | | | 1,885,483 | | | | 1,870,291 | |
World Financial Network Credit Card Master Trust: | | | | | | | | |
Class A, (Series2015-B), 2.550%, 6/17/2024 | | | 365,000 | | | | 360,909 | |
Class A, (Series2016-A), 2.030%, 4/15/2025 | | | 2,000,000 | | | | 1,939,004 | |
Class A, (Series2017-C), 2.310%, 8/15/2024 | | | 1,000,000 | | | | 983,918 | |
| | | | | | | | |
| | | | | | | 11,776,040 | |
|
Other Financial — 7.6% | |
Ally Master Owner Trust, Class A, (Series2018-2), 3.290%, 5/15/2023 | | | 1,500,000 | | | | 1,507,312 | |
Consumers Securitization Funding LLC, Class A1, (Series2014-A), 1.334%, 11/1/2020 | | | 923,641 | | | | 917,379 | |
(See Notes which are an integral part of the Financial Statements)
75
August 31, 2018
Short-Term Income Fund (continued)
| | | | | | | | |
| Description | | Principal
Amount | | | Value | |
| Asset-Backed Securities (continued) | |
|
Other Financial(continued) | |
Daimler Trucks Retail Trust, Class A3, (Series2018-1), 2.850%, 7/15/2021 (5) | | $ | 2,000,000 | | | $ | 1,999,146 | |
Dell Equipment Finance Trust, Class A3, (Series2017-1), 2.140%, 4/22/2022 (5) | | | 1,300,000 | | | | 1,295,482 | |
Ford Credit Floorplan Master Owner Trust A, Class A1, (Series2016-3), 1.550%, 7/15/2021 | | | 2,000,000 | | | | 1,980,485 | |
Hilton Grand Vacations Trust, Class A, (Series2014-AA), 1.770%, 11/25/2026 (5) | | | 483,397 | | | | 475,687 | |
Marlin Receivables LLC, Class B, (Series2018-1A), 3.540%, 5/22/2023 (5) | | | 1,000,000 | | | | 1,001,111 | |
Sierra Receivables Funding Co. LLC, Class B,(Series 2017-1A), 3.200%, 3/20/2034 (5) | | | 1,106,856 | | | | 1,086,102 | |
Trafigura Securitisation Finance PLC, Class A1, (Series2017-1A), 2.913% (LIBOR 1 Month + 85 basis points), 12/15/2020 (5)(10) | | | 3,000,000 | | | | 3,001,785 | |
Verizon Owner Trust, Class A,(Series 2016-1A), 1.420%, 1/20/2021 (5) | | | 1,113,647 | | | | 1,109,360 | |
Volvo Financial Equipment LLC, Class A4,(Series 2017-1A), 2.210%, 11/15/2021 (5) | | | 780,000 | | | | 767,812 | |
Wells Fargo Dealer Floorplan Master Note Trust, Class A,(Series 2015-2), 2.727% (LIBOR 1 Month + 65 basis points), 1/20/2022 (10) | | | 1,000,000 | | | | 1,006,418 | |
Westgate Resorts LLC: | | | | | | | | |
Class B, (Series2014-1A), 3.250%, 12/20/2026 (5) | | | 716,276 | | | | 715,365 | |
Class B, (Series2018-1A), 3.580%, 12/20/2031 (5) | | | 1,398,632 | | | | 1,390,907 | |
| | | | | | | | |
| | | | | | | 18,254,351 | |
| | | | | | | | |
Total Asset-Backed Securities
(identified cost $56,660,562) | | | | | | | 56,300,881 | |
| | | | | | | | |
| Certificates of Deposit — 1.4% | |
|
U.S. Domestic — 1.4% | |
Bank of Nova Scotia: | | | | | | | | |
2.390% (U.S. Federal Funds Effective Rate (continuous series) + 47 basis points), 12/12/2019 (10) | | | 350,000 | | | | 349,848 | |
2.552% (LIBOR 3 Month + 22 basis points), 12/23/2019 (10) | | | 750,000 | | | | 749,399 | |
Mizuho Bank, Ltd., 2.715% (LIBOR 3 Month + 38 basis points), 6/25/2020 (10) | | | 1,000,000 | | | | 999,275 | |
Sumitomo Mitsui Banking Corp., 2.759% (LIBOR 3 Month + 42 basis points), 7/24/2020 (10) | | | 1,250,000 | | | | 1,250,000 | |
| | | | | | | | |
Total Certificates of Deposit
(identified cost $3,348,522) | | | | | | | 3,348,522 | |
| | | | | | | | |
| Collateralized Mortgage Obligations — 7.2% | |
|
Federal Home Loan Mortgage Corporation — 1.8% | |
2.000%, 1/15/2024,
(Series 4295) | | | 594,152 | | | | 582,392 | |
| | | | | | | | |
| Description | | Principal
Amount | | | Value | |
| Collateralized Mortgage Obligations (continued) | |
|
Federal Home Loan Mortgage Corporation(continued) | |
3.000%, 2/15/2031,
(Series 4013) | | $ | 1,177,809 | | | $ | 1,198,581 | |
3.000%, 9/15/2032,
(Series 4236) | | | 1,759,718 | | | | 1,752,785 | |
4.500%, 8/15/2039,
(Series 3778) | | | 675,567 | | | | 701,930 | |
| | | | | | | | |
| | | | | | | 4,235,688 | |
|
Federal National Mortgage Association — 1.3% | |
3.000%, 6/25/2033,
(Series2014-20) | | | 1,810,378 | | | | 1,789,679 | |
3.000%, 8/25/2040,
(Series2015-15) | | | 1,421,216 | | | | 1,401,584 | |
| | | | | | | | |
| | | | | | | 3,191,263 | |
|
Private Sponsor — 4.1% | |
Banc of America Funding Trust: | | | | | | | | |
Class 1A3, (Series2007-C), 3.789%, 5/20/2036 (7) | | | 154,038 | | | | 149,253 | |
Class 2A1, (Series2005-5), 5.500%, 9/25/2035 | | | 228,572 | | | | 241,977 | |
Chase Mortgage Finance Trust: | | | | | | | | |
Class A1, (Series2005-S2), 5.500%, 10/25/2035 | | | 162,039 | | | | 167,985 | |
Class A3, (Series2006-S4), 6.000%, 12/25/2036 | | | 208,441 | | | | 171,073 | |
FREMF Mortgage Trust: | | | | | | | | |
Class B, (Series 2012-K705), 4.316%, 9/25/2044 (5)(7) | | | 217,211 | | | | 216,782 | |
Class B, (Series 2012-K709), 3.872%, 4/25/2045 (5)(7) | | | 1,000,000 | | | | 1,003,076 | |
Class B, (Series 2012-K710), 3.941%, 6/25/2047 (5)(7) | | | 475,000 | | | | 477,269 | |
Class B, (Series 2013-K712), 3.474%, 5/25/2045 (5)(7) | | | 2,085,000 | | | | 2,088,449 | |
Class B, (Series 2013-K713), 3.263%, 4/25/2046 (5)(7) | | | 3,025,000 | | | | 3,022,770 | |
Class C, (Series2013-K35), 4.075%, 8/25/2023 (5)(7) | �� | | 500,000 | | | | 499,648 | |
JP Morgan Mortgage Trust: | | | | | | | | |
Class 1A5, (Series2017-3), 3.500%, 8/25/2047 (5)(7) | | | 1,167,164 | | | | 1,158,011 | |
Class 2A2, (Series2005-S3), 5.500%, 1/25/2021 | | | 87,299 | | | | 83,888 | |
Class 3A1, (Series2007-A2), 3.585%, 4/25/2037 (7) | | | 14,817 | | | | 13,569 | |
Morgan Stanley Mortgage Loan Trust, Class 2A2,(Series 2004-10AR), 3.969%, 11/25/2034 (7) | | | 261,535 | | | | 266,113 | |
Wells Fargo Mortgage Backed Securities Trust: | | | | | | | | |
Class 2A4,(Series 2006-AR7), 4.323%, 5/25/2036 (7) | | | 114,679 | | | | 117,656 | |
Class 2A4,(Series 2006-AR8), 4.198%, 4/25/2036 (7) | | | 34,473 | | | | 35,149 | |
Class A1, (Series 2006-AR19), 3.827%, 12/25/2036 (7) | | | 235,232 | | | | 221,357 | |
| | | | | | | | |
| | | | | | | 9,934,025 | |
| | | | | | | | |
Total Collateralized Mortgage Obligations
(identified cost $17,692,601) | | | | 17,360,976 | |
| | | | | | | | |
| Commercial Mortgage Securities — 6.1% | |
|
Government National Mortgage Association — 1.7% | |
1.800%, 7/16/2037,
(Series2013-179) | | | 888,974 | | | | 864,885 | |
(See Notes which are an integral part of the Financial Statements)
76
Short-Term Income Fund (continued)
| | | | | | | | |
| Description | | Principal
Amount | | | Value | |
| Commercial Mortgage Securities (continued) | |
|
Government National Mortgage Association(continued) | |
2.100%, 4/16/2050,
(Series2016-92) | | $ | 1,400,058 | | | $ | 1,343,731 | |
2.205%, 1/16/2044,
(Series2014-61) | | | 792,479 | | | | 788,087 | |
2.650%, 2/16/2045,
(Series2015-33) | | | 1,083,558 | | | | 1,077,159 | |
| | | | | | | | |
| | | | | | | 4,073,862 | |
|
Private Sponsor — 4.4% | |
Assurant Commercial Mortgage Trust, Class A1, (Series2016-1A), 1.362%, 5/15/2049 (5) | | | 485,019 | | | | 483,179 | |
BANK, Class A1, (Series 2017-BNK9), 2.322%, 11/15/2054 | | | 2,167,359 | | | | 2,128,570 | |
Citigroup Commercial Mortgage Trust, Class A1, (Series2017-P7), 2.008%, 4/14/2050 | | | 822,179 | | | | 809,588 | |
Great Wolf Trust, Class B, (Series 2017-WOLF), 3.263% (LIBOR 1 Month + 110 basis points), 9/15/2034 (5)(10) | | | 2,000,000 | | | | 2,003,156 | |
GS Mortgage Securities Trust, Class A4,(Series 2011-GC3), 4.753%, 3/10/2044 (5) | | | 721,945 | | | | 744,655 | |
JPMBB Commercial Mortgage Securities Trust, Class A2,(Series 2013-C14), 3.019%, 8/15/2046 | | | 354,767 | | | | 355,067 | |
Morgan Stanley BAML Trust, Class A1,(Series 2016-C30), 1.389%, 9/15/2049 | | | 1,477,394 | | | | 1,441,841 | |
RAIT Trust, Class A,(Series 2017-FL7), 3.013% (LIBOR 1 Month + 95 basis points), 6/15/2037 (5)(10) | | | 1,102,263 | | | | 1,102,968 | |
UBS Commercial Mortgage Trust, Class A1,(Series 2017-C3), 1.935%, 8/15/2050 | | | 1,536,939 | | | | 1,503,484 | |
| | | | | | | | |
| | | | | | | 10,572,508 | |
| | | | | | | | |
Total Commercial Mortgage Securities
(identified cost $14,866,601) | | | | 14,646,370 | |
| | | | | | | | |
| Corporate Bonds & Notes — 43.9% | |
|
Aerospace/Defense — 0.3% | |
General Dynamics Corp., 3.000%, 5/11/2021 | | | 750,000 | | | | 748,917 | |
|
Auto Manufacturers — 6.0% | |
American Honda Finance Corp.: | | | | | | | | |
2.548% (LIBOR 3 Month + 21 basis points), 2/12/2021 (10) | | | 1,000,000 | | | | 1,000,496 | |
2.650%, 2/12/2021 (1) | | | 1,000,000 | | | | 991,576 | |
2.659% (LIBOR 3 Month + 34 basis points), 2/14/2020 (10) | | | 900,000 | | | | 902,902 | |
3.450%, 7/14/2023 | | | 1,555,000 | | | | 1,567,709 | |
Ford Motor Credit Co. LLC: | | | | | | | | |
2.021%, 5/3/2019 | | | 500,000 | | | | 496,506 | |
2.551%, 10/5/2018 | | | 500,000 | | | | 499,886 | |
2.943%, 1/8/2019 | | | 1,500,000 | | | | 1,499,722 | |
3.606% (LIBOR 3 Month + 127 basis points), 3/28/2022 (1)(10) | | | 1,000,000 | | | | 999,650 | |
General Motors Financial Co., Inc.: | | | | | | | | |
2.450%, 11/6/2020 | | | 1,000,000 | | | | 977,879 | |
3.450%, 1/14/2022 (1) | | | 750,000 | | | | 741,881 | |
| | | | | | | | |
| Description | | Principal
Amount | | | Value | |
| Corporate Bonds & Notes (continued) | |
|
Auto Manufacturers(continued) | |
3.613% (LIBOR 3 Month + 127 basis points), 10/4/2019 (10) | | $ | 1,500,000 | | | $ | 1,513,482 | |
3.889% (LIBOR 3 Month + 155 basis points), 1/14/2022 (10) | | | 750,000 | | | | 767,924 | |
Toyota Motor Credit Corp.: | | | | | | | | |
2.582% (LIBOR 3 Month + 24 basis points), 7/15/2020 (10) | | | 1,500,000 | | | | 1,500,945 | |
3.023% (LIBOR 3 Month + 69 basis points), 1/11/2022 (10) | | | 1,000,000 | | | | 1,012,343 | |
| | | | | | | | |
| | | | | | | 14,472,901 | |
|
Banks — 23.2% | |
Australia & New Zealand Banking Group, Ltd., 3.300%, 5/17/2021 | | | 500,000 | | | | 499,798 | |
Bank of America Corp.: | | | | | | | | |
2.328%, 10/1/2021 (7) | | | 750,000 | | | | 734,722 | |
3.342% (LIBOR 3 Month + 100 basis points), 4/24/2023 (1)(10) | | | 2,000,000 | | | | 2,024,926 | |
3.499%, 5/17/2022 (1)(7) | | | 1,000,000 | | | | 1,002,200 | |
Bank of the Ozarks, Inc., 5.500%, 7/1/2026 (1)(7) | | | 1,200,000 | | | | 1,236,247 | |
Branch Banking & Trust Co., 2.100%, 1/15/2020 (1) | | | 1,200,000 | | | | 1,186,584 | |
Canadian Imperial Bank of Commerce, 2.700%, 2/2/2021 (1) | | | 750,000 | | | | 740,600 | |
Capital One Financial Corp.: | | | | | | | | |
2.500%, 5/12/2020 | | | 900,000 | | | | 891,145 | |
3.050%, 3/9/2022 (1) | | | 1,000,000 | | | | 982,101 | |
Capital One NA, 3.489% (LIBOR 3 Month + 115 basis points), 1/30/2023 (10) | | | 1,000,000 | | | | 1,010,443 | |
Citigroup, Inc.: | | | | | | | | |
2.350%, 8/2/2021 (1) | | | 520,000 | | | | 506,354 | |
3.295% (LIBOR 3 Month + 96 basis points), 4/25/2022 (10) | | | 1,500,000 | | | | 1,522,863 | |
Customers Bancorp, Inc., 3.950%, 6/30/2022 | | | 2,000,000 | | | | 1,941,278 | |
Eagle Bancorp, Inc., 5.000%, 8/1/2026 (7) | | | 1,230,000 | | | | 1,233,480 | |
Goldman Sachs Group, Inc., 2.550%, 10/23/2019 | | | 1,500,000 | | | | 1,494,935 | |
Hanmi Financial Corp., 5.450%, 3/30/2027 (7) | | | 2,000,000 | | | | 2,021,623 | |
Home BancShares, Inc., 5.625%, 4/15/2027 (7) | | | 1,000,000 | | | | 1,024,801 | |
Huntington Bancshares, Inc.: | | | | | | | | |
2.300%, 1/14/2022 | | | 700,000 | | | | 674,460 | |
3.150%, 3/14/2021 | | | 1,000,000 | | | | 996,236 | |
Independent Bank Group, Inc., 5.875%, 8/1/2024 | | | 1,680,000 | | | | 1,718,760 | |
KeyCorp, 2.900%, 9/15/2020 | | | 1,000,000 | | | | 994,545 | |
MB Financial Bank NA, 4.000%, 12/1/2027 (7) | | | 2,000,000 | | | | 1,971,718 | |
Mitsubishi UFJ Financial Group, Inc.: | | | | | | | | |
3.535%, 7/26/2021 | | | 850,000 | | | | 853,827 | |
3.761%, 7/26/2023 | | | 1,000,000 | | | | 1,007,917 | |
Morgan Stanley: | | | | | | | | |
2.625%, 11/17/2021 | | | 750,000 | | | | 732,476 | |
3.192% (LIBOR 3 Month + 85 basis points), 1/24/2019 (10) | | | 500,000 | | | | 501,596 | |
3.528% (LIBOR 3 Month + 118 basis points), 1/20/2022 (10) | | | 645,000 | | | | 655,118 | |
National Australia Bank, Ltd.: | | | | | | | | |
2.500%, 1/12/2021 | | | 1,400,000 | | | | 1,375,430 | |
2.625%, 7/23/2020 | | | 1,250,000 | | | | 1,236,089 | |
(See Notes which are an integral part of the Financial Statements)
77
August 31, 2018
Short-Term Income Fund (continued)
| | | | | | | | |
| Description | | Principal
Amount | | | Value | |
| Corporate Bonds & Notes (continued) | |
|
Banks(continued) | |
Peapack Gladstone Financial Corp., 6.000%, 6/30/2026 (7) | | $ | 1,525,000 | | | $ | 1,540,930 | |
PNC Bank NA, 2.597% (LIBOR 3 Month + 25 basis points), 1/22/2021 (10) | | | 750,000 | | | | 750,791 | |
PNC Financial Services Group, Inc., 4.375%, 8/11/2020 | | | 950,000 | | | | 973,862 | |
Regions Bank, 2.717% (LIBOR 3 Month + 38 basis points), 4/1/2021 (10) | | | 1,000,000 | | | | 999,609 | |
Renasant Corp., 5.000%, 9/1/2026 (7) | | | 825,000 | | | | 829,442 | |
Royal Bank of Canada: | | | | | | | | |
2.125%, 3/2/2020 | | | 1,400,000 | | | | 1,385,105 | |
2.635% (LIBOR 3 Month + 30 basis points), 7/22/2020 (10) | | | 1,000,000 | | | | 1,003,055 | |
SunTrust Bank: | | | | | | | | |
2.250%, 1/31/2020 (1) | | | 1,000,000 | | | | 990,153 | |
3.502%, 8/2/2022 (7) | | | 750,000 | | | | 750,827 | |
3.689%, 8/2/2024 (7) | | | 700,000 | | | | 700,720 | |
Toronto-Dominion Bank: | | | | | | | | |
2.125%, 4/7/2021 (1) | | | 1,000,000 | | | | 973,451 | |
2.900%, 8/7/2020 (7) | | | 2,000,000 | | | | 1,991,039 | |
Towne Bank, 4.500%, 7/30/2027 (7) | | | 2,000,000 | | | | 2,019,159 | |
U.S. Bank NA: | | | | | | | | |
2.050%, 10/23/2020 | | | 1,450,000 | | | | 1,420,216 | |
2.300% (U.S. Federal Funds Effective Rate (continuous series) + 38 basis points), 1/30/2020 (10) | | | 1,000,000 | | | | 1,000,324 | |
2.462% (LIBOR 3 Month + 15 basis points), 5/24/2019 (10) | | | 750,000 | | | | 750,547 | |
United Community Bank, 4.500%, 1/30/2028 (7) | | | 1,000,000 | | | | 992,202 | |
Wells Fargo & Co., 3.452% (LIBOR 3 Month + 111 basis points), 1/24/2023 (10) | | | 1,000,000 | | | | 1,017,000 | |
Wells Fargo Bank NA, 1.750%, 5/24/2019 | | | 700,000 | | | | 695,991 | |
Westpac Banking Corp.: | | | | | | | | |
2.500%, 6/28/2022 | | | 500,000 | | | | 483,131 | |
2.675% (LIBOR 3 Month + 34 basis points), 1/25/2021 (10) | | | 750,000 | | | | 751,659 | |
2.800%, 1/11/2022 | | | 1,000,000 | | | | 980,782 | |
| | | | | | | | |
| | | | | | | 55,772,267 | |
|
Biotechnology — 1.0% | |
Amgen, Inc., 2.200%, 5/22/2019 | | | 1,450,000 | | | | 1,445,873 | |
Gilead Sciences, Inc., 2.495% (LIBOR 3 Month + 17 basis points), 9/20/2018 (1)(10) | | | 1,000,000 | | | | 1,000,197 | |
| | | | | | | | |
| | | | | | | 2,446,070 | |
|
Computers — 0.4% | |
Dell International LLC, 4.420%, 6/15/2021 (1)(5) | | | 1,000,000 | | | | 1,017,828 | |
|
Cosmetics/Personal Care — 0.9% | |
Colgate-Palmolive Co., 2.250%, 11/15/2022 (1) | | | 1,300,000 | | | | 1,261,688 | |
Procter & Gamble Co., 2.150%, 8/11/2022 | | | 775,000 | | | | 751,572 | |
| | | | | | | | |
| | | | | | | 2,013,260 | |
| | | | | | | | |
| Description | | Principal
Amount | | | Value | |
| Corporate Bonds & Notes (continued) | |
|
Diversified Financial Services — 1.6% | |
American Express Credit Corp.: | | | | | | | | |
2.375%, 5/26/2020 | | $ | 1,000,000 | | | $ | 988,678 | |
2.700%, 3/3/2022 (1) | | | 1,500,000 | | | | 1,466,206 | |
National Rural Utilities Cooperative Finance Corp., 1.500%, 11/1/2019 | | | 1,285,000 | | | | 1,264,492 | |
| | | | | | | | |
| | | | | | | 3,719,376 | |
|
Electric — 0.5% | |
American Electric Power Co., Inc., 2.150%, 11/13/2020 | | | 750,000 | | | | 734,898 | |
NextEra Energy Capital Holdings, Inc., 2.300%, 4/1/2019 | | | 500,000 | | | | 498,939 | |
| | | | | | | | |
| | | | | | | 1,233,837 | |
|
Healthcare-Services — 0.3% | |
Anthem, Inc., 2.500%, 11/21/2020 | | | 600,000 | | | | 591,374 | |
|
Insurance — 0.2% | |
Allstate Corp., 2.764% (LIBOR 3 Month + 43 basis points), 3/29/2021 (10) | | | 500,000 | | | | 500,798 | |
|
Machinery-Construction & Mining — 1.3% | |
Caterpillar Financial Services Corp.: | | | | | | | | |
2.841% (LIBOR 3 Month + 51 basis points), 1/10/2020 (10) | | | 1,000,000 | | | | 1,005,729 | |
3.450%, 5/15/2023 (1) | | | 2,110,000 | | | | 2,128,253 | |
| | | | | | | | |
| | | | | | | 3,133,982 | |
|
Machinery-Diversified — 0.3% | |
John Deere Capital Corp., 1.250%, 10/9/2019 | | | 775,000 | | | | 762,118 | |
|
Media — 1.0% | |
Discovery Communications LLC, 2.200%, 9/20/2019 | | | 2,000,000 | | | | 1,984,300 | |
Walt Disney Co.,
1.950%, 3/4/2020 (1) | | | 500,000 | | | | 493,701 | |
| | | | | | | | |
| | | | | | | 2,478,001 | |
|
Oil & Gas — 1.5% | |
BP Capital Markets PLC, 2.500%, 11/6/2022 | | | 500,000 | | | | 484,860 | |
Chevron Corp., 1.961%, 3/3/2020 | | | 1,000,000 | | | | 988,320 | |
Exxon Mobil Corp., 2.397%, 3/6/2022 | | | 850,000 | | | | 834,948 | |
Phillips 66, 2.911% (LIBOR 3 Month + 60 basis points), 2/26/2021 (10) | | | 1,200,000 | | | | 1,201,614 | |
| | | | | | | | |
| | | | | | | 3,509,742 | |
|
Pharmaceuticals — 0.8% | |
Express Scripts Holding Co., 2.250%, 6/15/2019 | | | 1,000,000 | | | | 996,252 | |
Novartis Capital Corp., 1.800%, 2/14/2020 (1) | | | 1,000,000 | | | | 985,795 | |
| | | | | | | | |
| | | | | | | 1,982,047 | |
|
Retail — 1.0% | |
Walmart, Inc.: | | | | | | | | |
3.125%, 6/23/2021 | | | 950,000 | | | | 955,266 | |
3.400%, 6/26/2023 | | | 1,275,000 | | | | 1,291,768 | |
| | | | | | | | |
| | | | | | | 2,247,034 | |
|
Savings & Loans — 0.4% | |
Flagstar Bancorp, Inc., 6.125%, 7/15/2021 | | | 1,000,000 | | | | 1,045,170 | |
|
Semiconductors — 0.4% | |
Intel Corp., 2.450%, 7/29/2020 | | | 1,000,000 | | | | 993,925 | |
|
Software — 0.4% | |
Microsoft Corp., 1.850%, 2/6/2020 | | | 1,000,000 | | | | 989,351 | |
(See Notes which are an integral part of the Financial Statements)
78
Short-Term Income Fund (continued)
| | | | | | | | |
| Description | | Shares or
Principal
Amount | | | Value | |
| Corporate Bonds & Notes (continued) | |
|
Telecommunications — 2.4% | |
AT&T, Inc.: | | | | | | | | |
2.450%, 6/30/2020 (1) | | $ | 500,000 | | | $ | 493,758 | |
2.989% (LIBOR 3 Month + 65 basis points), 1/15/2020 (1)(10) | | | 1,500,000 | | | | 1,508,832 | |
Cisco Systems, Inc.: | | | | | | | | |
1.400%, 9/20/2019 | | | 500,000 | | | | 493,446 | |
2.125%, 3/1/2019 (1) | | | 1,500,000 | | | | 1,498,207 | |
Verizon Communications, Inc.: | | | | | | | | |
2.625%, 2/21/2020 | | | 500,000 | | | | 498,724 | |
3.450%, 3/15/2021 | | | 500,000 | | | | 504,368 | |
3.335% (LIBOR 3 Month + 100 basis points), 3/16/2022 (1)(10) | | | 750,000 | | | | 762,715 | |
| | | | | | | | |
| | | | | | | 5,760,050 | |
| | | | | | | | |
Total Corporate Bonds & Notes
(identified cost $105,745,404) | | | | 105,418,048 | |
| | | | | | | | |
| Mutual Funds — 0.4% | |
Eaton Vance Institutional Senior Loan Fund,Open-end Cayman Islands Exempted Co. (11) | | | 110,732 | | | | 1,007,665 | |
| | | | | | | | |
Total Mutual Funds
(identified cost $995,329) | | | | | | | 1,007,665 | |
| | | | | | | | |
| U.S. Government & U.S. Government Agency Obligations — 11.7% | |
|
Federal Home Loan Mortgage Corporation — 1.2% | |
1.750%, 5/30/2019 (1) | | $ | 2,000,000 | | | | 1,990,424 | |
2.375%, 2/16/2021 (1) | | | 1,000,000 | | | | 992,599 | |
| | | | | | | | |
| | | | | | | 2,983,023 | |
|
Federal National Mortgage Association — 1.6% | |
1.500%, 6/22/2020 (1) | | | 1,000,000 | | | | 980,629 | |
1.750%, 11/26/2019 (1) | | | 1,750,000 | | | | 1,733,590 | |
2.500%, 4/13/2021 (1) | | | 1,000,000 | | | | 994,816 | |
| | | | | | | | |
| | | | | | | 3,709,035 | |
|
U.S. Treasury Bonds & Notes — 8.9% | |
1.000%, 9/30/2019 (1) | | | 1,500,000 | | | | 1,476,445 | |
1.250%, 1/31/2020 (1) | | | 1,000,000 | | | | 982,129 | |
1.250%, 3/31/2021 (1) | | | 1,500,000 | | | | 1,447,412 | |
1.375%, 10/31/2020 (1) | | | 2,000,000 | | | | 1,947,031 | |
1.500%, 4/15/2020 (1) | | | 2,000,000 | | | | 1,965,664 | |
1.750%, 9/30/2019 (1) | | | 1,500,000 | | | | 1,488,252 | |
1.750%, 12/31/2020 (1) | | | 1,000,000 | | | | 979,707 | |
2.000%, 5/31/2021 (1) | | | 1,500,000 | | | | 1,473,135 | |
2.000%, 8/31/2021 (1) | | | 1,000,000 | | | | 980,137 | |
2.125%, 12/31/2021 (1) | | | 2,000,000 | | | | 1,963,086 | |
2.125%, 12/31/2022 (1) | | | 2,000,000 | | | | 1,950,352 | |
2.250%, 3/31/2021 (1) | | | 1,200,000 | | | | 1,187,484 | |
2.625%, 11/15/2020 (1) | | | 1,000,000 | | | | 999,238 | |
2.625%, 5/15/2021 (1) | | | 2,500,000 | | | | 2,496,192 | |
| | | | | | | | |
| | | | | | | 21,336,264 | |
| | | | | | | | |
Total U.S. Government & U.S. Government Agency Obligations
(identified cost $28,295,610) | | | | 28,028,322 | |
| | | | | | | | |
| U.S. Government Agency-Mortgage Securities — 1.0% | |
|
Federal National Mortgage Association — 1.0% | |
2.567%, 11/1/2020 | | | 1,522,795 | | | | 1,520,102 | |
3.500%, 4/1/2026 | | | 93,876 | | | | 94,976 | |
4.000%, 11/1/2031 | | | 399,997 | | | | 413,491 | |
| | | | | | | | |
| Description | | Shares or
Principal
Amount | | | Value | |
| U.S. Government Agency-Mortgage Securities (continued) | |
|
Federal National Mortgage Association(continued) | |
5.500%, 11/1/2033 | | $ | 111,806 | | | $ | 121,934 | |
5.500%, 2/1/2034 | | | 84,086 | | | | 91,745 | |
5.500%, 8/1/2037 | | | 188,531 | | | | 205,190 | |
9.500%, 1/1/2025 | | | 2,082 | | | | 2,091 | |
10.000%, 7/1/2020 | | | 5,630 | | | | 5,700 | |
| | | | | | | | |
| | | | | | | 2,455,229 | |
|
Government National Mortgage Association — 0.0% | |
7.500%, 8/15/2037 | | | 12,963 | | | | 13,224 | |
9.000%, 12/15/2019 | | | 1,192 | | | | 1,201 | |
| | | | | | | | |
| | | | | | | 14,425 | |
| | | | | | | | |
| Total U.S. Government Agency-Mortgage Securities | |
(identified cost $2,477,313) | | | | 2,469,654 | |
| | | | | | | | |
| Short-Term Investments — 20.7% | |
|
| Certificates of Deposit — 2.3% | |
Canadian Imperial Bank of Commerce: | | | | | | | | |
2.520% (LIBOR 3 Month + 18 basis points), 11/5/2018 (10) | | | 1,250,000 | | | | 1,249,652 | |
2.657% (LIBOR 3 Month + 32 basis points), 7/5/2019 (10) | | | 750,000 | | | | 750,994 | |
Mizuho Bank, Ltd., 2.835% (LIBOR 3 Month + 50 basis points), 9/24/2018 (10) | | | 1,125,000 | | | | 1,125,108 | |
Sumitomo Mitsui Banking Corp.: | | | | | | | | |
2.729% (LIBOR 3 Month + 38 basis points), 8/2/2019 (10) | | | 1,000,000 | | | | 999,349 | |
2.774% (LIBOR 3 Month + 46 basis points), 5/15/2019 (10) | | | 1,300,000 | | | | 1,299,237 | |
| | | | | | | | |
| | | | | | | 5,424,340 | |
|
| Collateral Pool Investments for Securities on Loan — 15.8% | |
| | |
Collateral pool allocation (3) | | | | | | | 38,006,514 | |
|
| Commercial Paper — 1.2% | |
Dominion Resources, 2.285%, 9/24/2018 (12) | | | 1,500,000 | | | | 1,497,844 | |
NextEra Energy Capital Holdings, Inc., 2.212%, 9/14/2018 (12) | | | 1,500,000 | | | | 1,498,819 | |
| | | | | | | | |
| | | | | | | 2,996,663 | |
|
| Mutual Funds — 1.4% | |
BMO Institutional Prime Money Market Fund — Premier Class, 1.987% (4) | | | 3,241,741 | | | | 3,242,065 | |
| | | | | | | | |
Total Short-Term Investments
(identified cost $49,668,958) | | | | | | | 49,669,582 | |
| | | | | | | | |
Total Investments — 115.9%
(identified cost $279,750,900) | | | | 278,250,020 | |
| Other Assets and Liabilities — (15.9)% | | | | (38,170,775 | ) |
| | | | | | | | |
| Total Net Assets — 100.0% | | | | | | $ | 240,079,245 | |
| | | | | | | | |
(See Notes which are an integral part of the Financial Statements)
79
August 31, 2018
IntermediateTax-Free Fund*
| | | | | | | | |
| Description | | Principal
Amount | | | Value | |
| Municipals — 98.8% | |
|
Alabama — 2.6% | |
Southeast Alabama Gas Supply District, 2.245%, 6/1/2049,
Call 3/1/2024 (7) | | $ | 7,000,000 | | | $ | 6,968,220 | |
Tender Option Bond Trust Receipts/Certificates: | | | | | | | | |
1.660%, 7/1/2026 (5)(7) | | | 4,590,000 | | | | 4,590,000 | |
1.710%, 10/5/2020 (5)(7) | | | 3,000,000 | | | | 3,000,000 | |
Other securities | | | | | | | 30,978,064 | |
| | | | | | | | |
| | | | | | | 45,536,284 | |
|
Alaska — 0.5% | |
Other securities | | | | | | | 8,877,516 | |
|
Arizona — 2.4% | |
State of Arizona, AGM, 5.250%, 10/01/2024,
Call 10/1/2019 | | | 5,000,000 | | | | 5,177,950 | |
Other securities | | | | | | | 37,046,074 | |
| | | | | | | | |
| | | | | | | 42,224,024 | |
|
Arkansas — 1.2% | |
Other securities | | | | | | | 21,590,524 | |
|
California — 6.9% | |
Bay Area Toll Authority, 2.810%, 4/1/2036,
Call 10/1/2026 (7) | | | 5,000,000 | | | | 5,199,400 | |
Tender Option Bond Trust Receipts/Certificates: | | | | | | | | |
1.660%, 2/1/2023 (5)(7) | | | 2,410,000 | | | | 2,410,000 | |
1.660%, 11/1/2023 (5)(7) | | | 6,000,000 | | | | 6,000,000 | |
1.660%, 8/15/2042,
Call 8/15/2020 (5)(7) | | | 5,000,000 | | | | 5,000,000 | |
1.660%, 10/1/2054 (5)(7) | | | 800,000 | | | | 800,000 | |
Tender Option Bond Trust Receipts/Certificates, AGM, 1.640%, 11/15/2049,
Call 11/15/2024 (5)(7) | | | 5,760,000 | | | | 5,760,000 | |
Other securities | | | | | | | 98,019,187 | |
| | | | | | | | |
| | | | | | | 123,188,587 | |
|
Colorado — 2.7% | |
Adams & Arapahoe Joint School District 28J Aurora, SAW, 5.000%, 12/1/2031,
Call 12/1/2026 | | | 5,000,000 | | | | 5,832,150 | |
Tender Option Bond Trust Receipts/Certificates, 1.670%, 12/1/2032,
Call 12/1/2022 (5)(7) | | | 1,685,000 | | | | 1,685,000 | |
Other securities | | | | | | | 40,593,731 | |
| | | | | | | | |
| | | | | | | 48,110,881 | |
|
Connecticut — 0.9% | |
Other securities | | | | | | | 16,519,683 | |
|
Delaware — 0.4% | |
Other securities | | | | | | | 7,635,451 | |
|
District of Columbia — 0.4% | |
Other securities | | | | | | | 7,022,499 | |
|
Florida — 6.0% | |
County of Orange Sales Tax Revenue, 5.000%, 1/1/2027,
Call 1/1/2022 | | | 5,810,000 | | | | 6,338,013 | |
| | | | | | | | |
| Description | | Principal
Amount | | | Value | |
| Municipals (continued) | |
|
Florida(continued) | |
School Board of Miami-Dade County, 1.790%, 8/1/2027,
Call 2/1/2019 (5)(7) | | $ | 6,305,000 | | | $ | 6,305,000 | |
School Board of Miami-Dade County, FGIC, 1.790%, 5/1/2037,
Call 9/1/2018 (5)(7) | | | 6,500,000 | | | | 6,500,000 | |
Tender Option Bond Trust Receipts/Certificates, 1.660%, 10/1/2042,
Call 4/1/2022 (5)(7) | | | 7,500,000 | | | | 7,500,000 | |
Other securities | | | | | | | 80,478,257 | |
| | | | | | | | |
| | | | | | | 107,121,270 | |
|
Georgia — 4.4% | |
Main Street Natural Gas, Inc., 2.145%, 4/1/2048,
Call 6/1/2023 (7) | | | 7,000,000 | | | | 6,968,430 | |
Tender Option Bond Trust Receipts/Certificates,
1.710%, 4/1/2025 (5)(7) | | | 4,000,000 | | | | 4,000,000 | |
Tender Option Bond Trust Receipts/Certificates, County Guarantee, 1.690%, 8/15/2049,
Call 2/1/2025 (5)(7) | | | 2,520,000 | | | | 2,520,000 | |
Other securities | | | | | | | 63,914,106 | |
| | | | | | | | |
| | | | | | | 77,402,536 | |
|
Guam — 0.1% | |
Other securities | | | | | | | 2,564,468 | |
|
Hawaii — 0.1% | |
Other securities | | | | | | | 1,129,190 | |
|
Idaho — 0.1% | |
Other securities | | | | | | | 1,652,550 | |
|
Illinois — 14.5% | |
City of Chicago, 6.000%, 1/1/2038,
Call 1/1/2027 | | | 10,000,000 | | | | 11,335,100 | |
Cook County School District No. 130 Blue Island, 2.350%, 12/1/2028,
Call 9/10/2018 (5)(7)(9) | | | 5,000,000 | | | | 5,000,000 | |
Illinois State Toll Highway Authority, 5.000%, 12/1/2032,
Call 1/1/2026 | | | 7,790,000 | | | | 8,790,703 | |
Rib Floater Trust Various States, 1.740%, 8/15/2030,
Call 10/1/2018 (5)(7) | | | 5,000,000 | | | | 5,000,000 | |
State of Illinois, 5.000%, 11/1/2025 | | | 7,000,000 | | | | 7,462,910 | |
Tender Option Bond Trust Receipts/Certificates: | | | | | | | | |
1.660%, 11/15/2037,
Call 11/15/2027 (5)(7) | | | 4,075,000 | | | | 4,075,000 | |
1.660%, 11/1/2039,
Call 5/1/2019 (5)(7) | | | 1,000,000 | | | | 1,000,000 | |
1.710%, 6/15/2020 (5)(7) | | | 3,705,000 | | | | 3,705,000 | |
1.740%, 4/1/2046,
Call 4/1/2027 (5)(7) | | | 2,500,000 | | | | 2,500,000 | |
Other securities | | | | | | | 209,929,441 | |
| | | | | | | | |
| | | | | | | 258,798,154 | |
|
Indiana — 2.1% | |
Other securities | | | | | | | 36,886,384 | |
(See Notes which are an integral part of the Financial Statements)
80
IntermediateTax-Free Fund* (continued)
| | | | | | | | |
| Description | | Principal
Amount | | | Value | |
| Municipals (continued) | |
|
Iowa — 0.4% | |
Other securities | | | | | | $ | 6,943,076 | |
|
Kansas — 0.2% | |
Other securities | | | | | | | 3,449,112 | |
|
Kentucky — 1.0% | |
Other securities | | | | | | | 17,646,661 | |
|
Louisiana — 2.0% | |
Parish of St. James, 1.730%, 11/1/2040,
Call 9/19/2018 (7) | | $ | 6,000,000 | | | | 6,000,000 | |
Other securities | | | | | | | 29,816,331 | |
| | | | | | | | |
| | | | | | | 35,816,331 | |
|
Maine — 0.7% | |
Maine State Housing Authority, 3.850%, 11/15/2029,
Call 11/15/2021 | | | 7,025,000 | | | | 7,140,983 | |
Other securities | | | | | | | 5,898,599 | |
| | | | | | | | |
| | | | | | | 13,039,582 | |
|
Maryland — 1.0% | |
Maryland Health & Higher Educational Facilities Authority, 5.000%, 5/15/2042,
Call 5/15/2027 | | | 4,750,000 | | | | 5,302,520 | |
Maryland Industrial Development Financing Authority, 1.720%, 3/1/2030,
Call 9/19/2018 (7) | | | 5,000,000 | | | | 5,000,000 | |
Other securities | | | | | | | 7,762,139 | |
| | | | | | | | |
| | | | | | | 18,064,659 | |
|
Massachusetts — 1.5% | |
Commonwealth of Massachusetts, 5.250%, 9/1/2043,
Call 9/1/2028 (9) | | | 5,000,000 | | | | 5,903,250 | |
Massachusetts Water Resources Authority, 5.000%, 8/1/2043,
Call 8/1/2028 | | | 8,600,000 | | | | 9,984,256 | |
Other securities | | | | | | | 11,124,392 | |
| | | | | | | | |
| | | | | | | 27,011,898 | |
|
Michigan — 3.4% | |
Tender Option Bond Trust Receipts/Certificates,Q-SBLF, 1.660%, 5/1/2026 (5)(7) | | | 3,000,000 | | | | 3,000,000 | |
Other securities | | | | | | | 58,165,896 | |
| | | | | | | | |
| | | | | | | 61,165,896 | |
|
Minnesota — 0.3% | |
Other securities | | | | | | | 4,860,151 | |
|
Mississippi — 0.8% | |
Mississippi Business Finance Corp., 1.560%, 11/1/2035,
Call 9/4/2018 (7) | | | 6,600,000 | | | | 6,600,000 | |
Other securities | | | | | | | 7,597,383 | |
| | | | | | | | |
| | | | | | | 14,197,383 | |
|
Missouri — 1.7% | |
Other securities | | | | | | | 29,951,831 | |
|
Nebraska — 0.6% | |
Tender Option Bond Trust Receipts/Certificates, 1.630%, 11/1/2048,
Call 11/1/2025 (5)(7) | | | 1,200,000 | | | | 1,200,000 | |
| | | | | | | | |
| Description | | Principal
Amount | | | Value | |
| Municipals (continued) | |
|
Nebraska(continued) | |
Other securities | | | | | | $ | 8,946,470 | |
| | | | | | | | |
| | | | | | | 10,146,470 | |
|
Nevada — 1.1% | |
Las Vegas Valley Water District, 5.000%, 6/01/2028,
Call 6/1/2022 | | $ | 5,115,000 | | | | 5,624,250 | |
Other securities | | | | | | | 14,219,135 | |
| | | | | | | | |
| | | | | | | 19,843,385 | |
|
New Hampshire — 0.0% | |
Other securities | | | | | | | 738,132 | |
|
New Jersey — 3.9% | |
New Jersey Higher Education Student Assistance Authority, 4.875%, 12/1/2024,
Call 12/1/2019 | | | 5,520,000 | | | | 5,685,600 | |
New Jersey Transportation Trust Fund Authority: | | | | | | | | |
2.560%, 6/15/2034,
Call 6/15/2019 (7) | | | 5,000,000 | | | | 5,004,100 | |
5.000%, 6/15/2022 | | | 500,000 | | | | 541,205 | |
5.000%, 6/15/2030,
Call 6/15/2026 | | | 1,000,000 | | | | 1,112,110 | |
5.000%, 6/15/2031,
Call 6/15/2026 | | | 1,000,000 | | | | 1,107,770 | |
5.000%, 6/15/2032,
Call 12/15/2024 | | | 5,000,000 | | | | 5,389,950 | |
5.250%, 12/15/2023 | | | 240,000 | | | | 267,655 | |
New Jersey Transportation Trust Fund Authority, BAM TCRs: | | | | | | | | |
5.000%, 6/15/2028,
Call 6/15/2022 | | | 5,000,000 | | | | 5,352,550 | |
5.000%, 6/15/2033,
Call 6/15/2022 | | | 3,000,000 | | | | 3,182,880 | |
5.250%, 6/15/2033,
Call 6/15/2023 | | | 5,635,000 | | | | 6,132,345 | |
New Jersey Transportation Trust Fund Authority, BHAC AMBAC, 0.000%, 12/15/2024 | | | 440,000 | | | | 367,928 | |
Tender Option Bond Trust Receipts/Certificates, 1.690%, 7/1/2025 (5)(7) | | | 4,035,000 | | | | 4,035,000 | |
Other securities | | | | | | | 30,767,548 | |
| | | | | | | | |
| | | | | | | 68,946,641 | |
|
New Mexico — 0.8% | |
New Mexico Municipal Energy Acquisition Authority, 2.145%, 11/1/2039,
Call 2/1/2019 (7) | | | 10,000,000 | | | | 10,010,600 | |
Other securities | | | | | | | 3,587,031 | |
| | | | | | | | |
| | | | | | | 13,597,631 | |
|
New York — 5.8% | |
New York City Transitional Finance Authority Future Tax Secured Revenue: | | | | | | | | |
1.520%, 8/1/2023,
Call 9/19/2018 (7) | | | 4,600,000 | | | | 4,600,000 | |
1.560%, 11/1/2029,
Call 9/19/2018 (7) | | | 5,000,000 | | | | 5,000,000 | |
1.560%, 5/1/2034,
Call 9/19/2018 (7) | | | 6,700,000 | | | | 6,700,000 | |
5.000%, 11/1/2024,
Call 11/1/2022 | | | 5,715,000 | | | | 6,380,740 | |
(See Notes which are an integral part of the Financial Statements)
81
August 31, 2018
IntermediateTax-Free Fund* (continued)
| | | | | | | | |
| Description | | Principal
Amount | | | Value | |
| Municipals (continued) | |
|
New York(continued) | |
5.000%, 11/1/2026,
Call 5/1/2025 | | $ | 1,000,000 | | | $ | 1,161,690 | |
5.000%, 11/1/2026,
Call 5/1/2025 | | | 2,000,000 | | | | 2,323,380 | |
5.000%, 2/1/2038,
Call 2/1/2027 | | | 4,000,000 | | | | 4,552,120 | |
5.000%, 2/1/2039,
Call 2/1/2027 | | | 4,000,000 | | | | 4,545,800 | |
New York State Dormitory Authority, 5.000%, 3/15/2027,
Call 3/15/2022 | | | 7,555,000 | | | | 8,279,978 | |
Nuveen New YorkAMT-Free Quality Municipal Income Fund, 1.860%, 5/1/2047,
Call 9/19/2018 (5)(7) | | | 5,000,000 | | | | 5,000,000 | |
RBC Municipal Products, Inc. Trust, 1.530%, 3/1/2022,
Call 9/19/2018 (5)(7) | | | 6,000,000 | | | | 6,000,000 | |
Tender Option Bond Trust Receipts/Certificates, 1.660%, 11/15/2044,
Call 11/15/2021 (5)(7) | | | 6,000,000 | | | | 6,000,000 | |
Other securities | | | | | | | 42,875,615 | |
| | | | | | | | |
| | | | | | | 103,419,323 | |
|
North Carolina — 0.7% | |
Other securities | | | | | | | 12,056,948 | |
|
North Dakota — 1.5% | |
Other securities | | | | | | | 26,427,926 | |
|
Ohio — 3.9% | |
Rib Floater Trust Various States, 1.810%, 11/15/2048,
Call 10/1/2018 (5)(7) | | | 5,000,000 | | | | 5,000,000 | |
Tender Option Bond Trust Receipts/Certificates,
1.660%, 4/1/2026 (5)(7) | | | 2,000,000 | | | | 2,000,000 | |
Other securities | | | | | | | 62,021,265 | |
| | | | | | | | |
| | | | | | | 69,021,265 | |
|
Oklahoma — 0.7% | |
Other securities | | | | | | | 12,549,782 | |
|
Oregon — 0.6% | |
Other securities | | | | | | | 11,522,289 | |
|
Pennsylvania — 2.8% | |
Montgomery County Higher Education & Health Authority, 1.820%, 9/1/2050,
Call 9/4/2018 (7) | | | 8,000,000 | | | | 8,000,000 | |
Pennsylvania Turnpike Commission, 2.540%, 12/1/2021,
Call 6/1/2021 (7) | | | 5,000,000 | | | | 5,074,500 | |
Other securities | | | | | | | 37,509,190 | |
| | | | | | | | |
| | | | | | | 50,583,690 | |
|
Rhode Island — 0.6% | |
Other securities | | | | | | | 9,853,580 | |
|
South Carolina — 1.6% | |
Patriots Energy Group Financing Agency, 2.243%, 10/1/2048,
Call 11/1/2023 (7) | | | 8,000,000 | | | | 8,000,000 | |
| | | | | | | | |
| Description | | Principal
Amount | | | Value | |
| Municipals (continued) | |
|
South Carolina(continued) | |
Tender Option Bond Trust Receipts/Certificates,
1.710%, 1/1/2020 (5)(7) | | $ | 2,390,000 | | | $ | 2,390,000 | |
Other securities | | | | | | | 17,664,705 | |
| | | | | | | | |
| | | | | | | 28,054,705 | |
|
South Dakota — 0.8% | |
Other securities | | | | | | | 13,864,329 | |
|
Tennessee — 1.3% | |
Knox County Health Educational & Housing Facility Board, 5.000%, 1/01/2042,
Call 1/1/2027 | | | 5,815,000 | | | | 6,312,880 | |
Tennessee Energy Acquisition Corp., 5.000%, 2/01/2023 | | | 5,310,000 | | | | 5,853,426 | |
Other securities | | | | | | | 10,671,899 | |
| | | | | | | | |
| | | | | | | 22,838,205 | |
| | |
Texas — 6.7% | | | | | | | | |
City of Houston Airport System Revenue, 5.000%, 7/1/2038,
Call 7/1/2028 | | | 5,000,000 | | | | 5,716,950 | |
Dallas/Fort Worth International Airport, 5.000%, 11/1/2032,
Call 11/1/2020 | | | 5,000,000 | | | | 5,302,800 | |
Grand Parkway Transportation Corp., 5.000%, 10/1/2043,
Call 4/1/2028 | | | 5,000,000 | | | | 5,719,150 | |
Rib Floater Trust Various States: | | | | | | | | |
1.740%, 6/1/2032,
Call 4/1/2020 (5)(7) | | | 7,000,000 | | | | 7,000,000 | |
1.740%, 11/1/2042,
Call 11/1/2020 (5)(7) | | | 3,165,000 | | | | 3,165,000 | |
Tender Option Bond Trust Receipts/Certificates, 1.630%, 8/15/2027,
Call 8/15/2022 (5)(7) | | | 300,000 | | | | 300,000 | |
Other securities | | | | | | | 91,156,035 | |
| | | | | | | | |
| | | | | | | 118,359,935 | |
| | |
U.S. Virgin Islands — 0.2% | | | | | | | | |
Other securities | | | | | | | 3,507,811 | |
| | |
Utah — 0.6% | | | | | | | | |
Other securities | | | | | | | 11,484,017 | |
| | |
Vermont — 0.1% | | | | | | | | |
Other securities | | | | | | | 1,188,645 | |
| | |
Virginia — 0.3% | | | | | | | | |
Other securities | | | | | | | 6,170,837 | |
| | |
Washington — 1.5% | | | | | | | | |
Tender Option Bond Trust Receipts/Certificates: | | | | | | | | |
1.710%, 6/15/2033,
Call 6/1/2019 (5)(7) | | | 2,900,000 | | | | 2,900,000 | |
1.710%, 8/15/2042,
Call 8/15/2022 (5)(7) | | | 3,375,000 | | | | 3,375,000 | |
Other securities | | | | | | | 21,279,240 | |
| | | | | | | | |
| | | | | | | 27,554,240 | |
| | |
West Virginia — 0.7% | | | | | | | | |
West Virginia Hospital Finance Authority, 1.840%, 6/1/2033,
Call 9/4/2018 (7) | | | 8,000,000 | | | | 8,000,000 | |
Other securities | | | | | | | 4,474,797 | |
| | | | | | | | |
| | | | | | | 12,474,797 | |
(See Notes which are an integral part of the Financial Statements)
82
IntermediateTax-Free Fund* (continued)
| | | | | | | | |
| Description | | Shares or
Principal
Amount | | | Value | |
| Municipals (continued) | |
| | |
Wisconsin — 3.6% | | | | | | | | |
Tender Option Bond Trust Receipts/Certificates,
1.630%, 11/15/2044 (5)(7) | | $ | 4,320,000 | | | $ | 4,320,000 | |
Wisconsin Health & Educational Facilities Authority: | | | | | | | | |
4.000%, 2/15/2042,
Call 2/15/2027 | | | 1,000,000 | | | | 1,001,400 | |
4.750%, 10/15/2029,
Call 10/15/2021 | | | 605,000 | | | | 641,385 | |
5.000%, 6/1/2019 | | | 105,000 | | | | 107,381 | |
5.000%, 7/1/2019 | | | 340,000 | | | | 349,115 | |
5.000%, 7/1/2019 | | | 650,000 | | | | 667,427 | |
5.000%, 8/15/2019 | | | 250,000 | | | | 257,765 | |
5.000%, 8/15/2019 | | | 955,000 | | | | 983,755 | |
5.000%, 8/15/2020 | | | 1,060,000 | | | | 1,123,049 | |
5.000%, 3/1/2021 | | | 240,000 | | | | 249,847 | |
5.000%, 8/15/2021 | | | 1,160,000 | | | | 1,259,714 | |
5.000%, 3/1/2022 | | | 205,000 | | | | 215,705 | |
5.000%, 10/1/2022 | | | 750,000 | | | | 832,282 | |
5.000%, 12/15/2022 | | | 500,000 | | | | 553,610 | |
5.000%, 12/15/2023 | | | 500,000 | | | | 562,480 | |
5.000%, 12/15/2024 | | | 500,000 | | | | 569,075 | |
5.000%, 3/1/2025,
Call 3/1/2024 | | | 315,000 | | | | 335,173 | |
5.000%, 6/1/2026,
Call 6/1/2020 | | | 135,000 | | | | 142,407 | |
5.000%, 8/15/2027,
Call 8/15/2022 | | | 500,000 | | | | 554,610 | |
5.000%, 12/15/2028,
Call 12/15/2024 | | | 100,000 | | | | 111,605 | |
5.000%, 8/15/2029,
Call 8/15/2022 | | | 1,700,000 | | | | 1,882,274 | |
5.000%, 4/1/2032,
Call 10/1/2022 | | | 4,560,000 | | | | 4,948,968 | |
5.000%, 6/1/2032,
Call 6/1/2022 | | | 1,000,000 | | | | 1,069,830 | |
5.000%, 8/15/2032,
Call 8/15/2022 | | | 5,000,000 | | | | 5,536,100 | |
5.125%, 4/15/2031,
Call 4/15/2023 | | | 250,000 | | | | 283,655 | |
5.250%, 6/1/2034,
Call 6/1/2020 | | | 300,000 | | | | 316,941 | |
5.375%, 8/15/2024,
Call 2/15/2020 | | | 1,625,000 | | | | 1,711,027 | |
Wisconsin Health & Educational Facilities Authority, AGM, 5.000%, 7/15/2027,
Call 7/15/2021 | | | 3,655,000 | | | | 3,973,241 | |
Other securities | | | | | | | 29,763,285 | |
| | | | | | | | |
| | | | | | | 64,323,106 | |
| | |
Wyoming — 0.1% | | | | | | | | |
Other securities | | | | | | | 1,074,500 | |
| | | | | | | | |
Total Municipals
(identified cost $1,722,346,529) | | | | | | | 1,758,008,770 | |
| | | | | | | | |
| | |
| Mutual Funds — 0.9% | | | | | | |
BMO Ultra ShortTax-Free Fund — Institutional Class (4) | | | 513,162 | | | | 5,162,410 | |
Other securities | | | | | | | 10,363,592 | |
| | | | | | | | |
Total Mutual Funds
(identified cost $15,779,501) | | | | | | | 15,526,002 | |
| | | | | | | | |
| | | | | | | | |
| Description | | | | | Value | |
| Short-Term Investments — 0.0% | | | | | | |
| | |
| Mutual Funds — 0.0% | | | | | | |
Other securities | | | | | | $ | 85,922 | |
| | | | | | | | |
Total Short-Term Investments
(identified cost $85,922) | | | | | | | 85,922 | |
| | | | | | | | |
Total Investments — 99.7%
(identified cost $1,738,211,952) | | | | | | | 1,773,620,694 | |
| Other Assets and Liabilities — 0.3% | | | | | | | 5,738,089 | |
| | | | | | | | |
| Total Net Assets — 100.0% | | | | | | $ | 1,779,358,783 | |
| | | | | | | | |
Strategic Income Fund
| | | | | | | | |
| Description | | Principal
Amount | | | Value | |
| Asset-Backed Securities — 4.0% | |
|
Automobiles — 3.8% | |
CarMax Auto Owner Trust, Class B, (Series2018-3), 3.440%, 3/15/2024 | | $ | 1,000,000 | | | $ | 1,001,929 | |
Honda Auto Receivables Owner Trust, Class A3,(Series 2018-3), 2.950%, 8/22/2022 | | | 1,000,000 | | | | 999,868 | |
Nissan Auto Receivables Owner Trust, Class A4,(Series 2017-A), 2.110%, 5/15/2023 | | | 1,250,000 | | | | 1,227,078 | |
| | | | | | | | |
| | | | | | | 3,228,875 | |
|
Federal Home Loan Mortgage Corporation — 0.2% | |
2.195% (LIBOR 1 Month + 13 basis points), 8/25/2031,(Series T-32) (10) | | | 216,562 | | | | 215,607 | |
| | | | | | | | |
Total Asset-Backed Securities
(identified cost $3,441,454) | | | | 3,444,482 | |
| | | | | | | | |
| Collateralized Mortgage Obligations — 10.6% | |
|
Federal National Mortgage Association — 0.5% | |
2.465% (LIBOR 1 Month + 40 basis points), 4/25/2034,(Series 2004-25) (10) | | | 158,762 | | | | 159,736 | |
4.000%, 3/25/2041,(Series 2012-21) | | | 259,448 | | | | 265,302 | |
| | | | | | | | |
| | | | | | | 425,038 | |
|
Private Sponsor — 10.1% | |
Alternative Loan Trust, Class 1A1, (Series 2004-24CB), 6.000%, 11/25/2034 | | | 712,216 | | | | 719,836 | |
Banc of America Funding Trust, Class 2A1, (Series2005-5), 5.500%, 9/25/2035 | | | 228,572 | | | | 241,977 | |
Chase Mortgage Finance Trust: | | | | | | | | |
Class 7A1, (Series2007-A2), 3.558%, 7/25/2037 (7) | | | 417,098 | | | | 374,371 | |
Class A1, (Series2005-S2), 5.500%, 10/25/2035 | | | 486,117 | | | | 503,956 | |
ChaseFlex Trust , Class 4A3,(Series 2005-2), 6.000%, 5/25/2020 | | | 66,332 | | | | 55,666 | |
GSR Mortgage Loan Trust, Class 2A4, (Series2007-1F), 5.500%, 1/25/2037 | | | 125,820 | | | | 134,335 | |
Morgan Stanley Mortgage Loan Trust, Class 2A2,(Series 2004-10AR), 3.969%, 11/25/2034 (7) | | | 482,526 | | | | 490,973 | |
(See Notes which are an integral part of the Financial Statements)
83
August 31, 2018
Strategic Income Fund (continued)
| | | | | | | | |
| Description | | Principal
Amount | | | Value | |
| Collateralized Mortgage Obligations (continued) | |
|
Private Sponsor(continued) | |
Residential Asset Securitization Trust, Class A4,(Series 2005-A8CB), 5.500%, 7/25/2035 | | $ | 685,990 | | | $ | 612,956 | |
RFMSI Series Trust, Class A2,(Series 2006-S4), 6.000%, 4/25/2036 | | | 488,544 | | | | 474,927 | |
Structured Adjustable Rate Mortgage Loan Trust, Class 1A2,(Series 2004-18), 3.935%, 12/25/2034 (7) | | | 540,704 | | | | 523,708 | |
Wells Fargo Mortgage Backed Securities Trust: | | | | | | | | |
Class 1A2, (Series2006-6), 5.750%, 5/25/2036 | | | 298,156 | | | | 294,924 | |
Class 1A9, (Series2007-8), 6.000%, 7/25/2037 | | | 2,478,199 | | | | 2,475,363 | |
Class A1, (Series 2006-AR19), 3.827%, 12/25/2036 (7) | | | 621,954 | | | | 585,266 | |
Class A1, (Series2007-15), 6.000%, 11/25/2037 | | | 514,276 | | | | 511,506 | |
Class A6, (Series2007-7), 6.000%, 6/25/2037 | | | 316,321 | | | | 315,763 | |
Class A8, (Series2007-11), 6.000%, 8/25/2037 | | | 375,200 | | | | 373,617 | |
| | | | | | | | |
| | | | | | | 8,689,144 | |
| | | | | | | | |
Total Collateralized Mortgage Obligations
(identified cost $9,087,872) | | | | 9,114,182 | |
| | | | | | | | |
| Commercial Mortgage Securities — 7.0% | |
|
Private Sponsor — 7.0% | |
Citigroup Commercial Mortgage Trust, Class B,(Series 2014-GC23), 4.175%, 7/10/2047 (7) | | | 1,000,000 | | | | 1,014,649 | |
JP Morgan Chase Commercial Mortgage Securities Trust, Class B, (Series2014-C20), 4.399%, 7/15/2047 (7) | | | 2,000,000 | | | | 2,037,499 | |
Morgan Stanley BAML Trust, Class C, (Series2016-C32), 4.438%, 12/15/2049 (7) | | | 1,000,000 | | | | 991,053 | |
UBS-Barclays Commercial Mortgage Trust, Class B, (Series2013-C6), 3.875%, 4/10/2046 (5)(7) | | | 2,000,000 | | | | 1,998,962 | |
| | | | | | | | |
Total Commercial Mortgage Securities
(identified cost $6,089,138) | | | | 6,042,163 | |
| | | | | | | | |
| Corporate Bonds & Notes — 59.6% | |
|
Auto Manufacturers — 1.4% | |
Daimler Finance North America LLC, 2.000%, 7/6/2021 (5) | | | 1,250,000 | | | | 1,202,933 | |
|
Auto Parts & Equipment — 1.1% | |
Allison Transmission, Inc., 4.750%, 10/1/2027 (1)(5) | | | 1,000,000 | | | | 942,500 | |
|
Banks — 1.8% | |
Australia & New Zealand Banking Group, Ltd., 4.500%, 3/19/2024 (1)(5) | | | 500,000 | | | | 502,825 | |
Banco Nacional de Costa Rica, 6.250%, 11/1/2023 (5) | | | 1,000,000 | | | | 1,017,500 | |
| | | | | | | | |
| | | | | | | 1,520,325 | |
| | | | | | | | |
| Description | | Principal
Amount | | | Value | |
| Corporate Bonds & Notes (continued) | |
|
Chemicals — 2.2% | |
Braskem Netherlands Finance BV, 4.500%, 1/10/2028 (5) | | $ | 500,000 | | | $ | 459,375 | |
Mexichem SAB de C.V., 5.500%, 1/15/2048 (5) | | | 1,000,000 | | | | 922,500 | |
Syngenta Finance NV, 4.892%, 4/24/2025 (5) | | | 500,000 | | | | 499,223 | |
| | | | | | | | |
| | | | | | | 1,881,098 | |
|
Commercial Services — 3.5% | |
Avis Budget Car Rental LLC, 5.125%, 6/1/2022 (1)(5) | | | 750,000 | | | | 748,125 | |
Hertz Corp., 5.875%, 10/15/2020 (1) | | | 1,000,000 | | | | 999,690 | |
United Rentals North America, Inc., 5.500%, 5/15/2027 (1) | | | 750,000 | | | | 750,000 | |
Weight Watchers International, Inc., 8.625%, 12/1/2025 (5) | | | 500,000 | | | | 542,500 | |
| | | | | | | | |
| | | | | | | 3,040,315 | |
|
Computers — 0.8% | |
Seagate HDD Cayman, 4.875%, 6/1/2027 | | | 750,000 | | | | 705,592 | |
|
Cosmetics/Personal Care — 0.8% | |
Coty, Inc., 6.500%, 4/15/2026 (5) | | | 750,000 | | | | 707,344 | |
|
Diversified Financial Services — 1.4% | |
Ally Financial, Inc., 5.750%, 11/20/2025 | | | 400,000 | | | | 416,000 | |
Jefferies Finance LLC, 7.500%, 4/15/2021 (1)(5) | | | 750,000 | | | | 776,250 | |
| | | | | | | | |
| | | | | | | 1,192,250 | |
|
Electric — 1.5% | |
Abu Dhabi National Energy Co. PJSC, 4.375%, 4/23/2025 (5) | | | 500,000 | | | | 500,240 | |
Vistra Energy Corp., 7.375%, 11/1/2022 | | | 750,000 | | | | 782,813 | |
| | | | | | | | |
| | | | | | | 1,283,053 | |
|
Food — 2.2% | |
Dean Foods Co., 6.500%, 3/15/2023 (1)(5) | | | 750,000 | | | | 716,250 | |
Minerva Luxembourg SA, 6.500%, 9/20/2026 (1)(5) | | | 750,000 | | | | 671,257 | |
Post Holdings, Inc., 5.000%, 8/15/2026 (5) | | | 500,000 | | | | 481,250 | |
| | | | | | | | |
| | | | | | | 1,868,757 | |
|
Forest Products & Paper — 0.9% | |
Suzano Austria GmbH, 7.000%, 3/16/2047 (1)(5) | | | 750,000 | | | | 770,625 | |
|
Healthcare-Services — 1.5% | |
Centene Corp., 6.125%, 2/15/2024 (1) | | | 750,000 | | | | 790,312 | |
HCA, Inc., 5.000%, 3/15/2024 (1) | | | 500,000 | | | | 512,500 | |
| | | | | | | | |
| | | | | | | 1,302,812 | |
|
Home Builders — 1.8% | |
Beazer Homes USA, Inc., 5.875%, 10/15/2027 (1) | | | 1,000,000 | | | | 857,500 | |
Lennar Corp., 5.000%, 6/15/2027 | | | 750,000 | | | | 728,437 | |
| | | | | | | | |
| | | | | | | 1,585,937 | |
|
Internet — 1.1% | |
Netflix, Inc., 4.875%, 4/15/2028 (1)(5) | | | 1,000,000 | | | | 948,750 | |
|
Media — 3.2% | |
Altice Finco SA, 7.625%, 2/15/2025 (1)(5) | | | 800,000 | | | | 707,000 | |
(See Notes which are an integral part of the Financial Statements)
84
Strategic Income Fund (continued)
| | | | | | | | |
| Description | | Principal
Amount | | | Value | |
| Corporate Bonds & Notes (continued) | |
|
Media(continued) | |
Sirius XM Radio, Inc., 5.375%, 7/15/2026 (1)(5) | | $ | 750,000 | | | $ | 750,000 | |
Time Warner Cable LLC, 4.500%, 9/15/2042 (1) | | | 1,000,000 | | | | 847,368 | |
Viacom, Inc., 4.375%, 3/15/2043 | | | 500,000 | | | | 432,994 | |
| | | | | | | | |
| | | | | | | 2,737,362 | |
|
Mining — 3.2% | |
Glencore Funding LLC, 4.625%, 4/29/2024 (5) | | | 500,000 | | | | 504,140 | |
Hudbay Minerals, Inc., 7.250%, 1/15/2023 (1)(5) | | | 750,000 | | | | 766,875 | |
Kinross Gold Corp.: | | | | | | | | |
4.500%, 7/15/2027 | | | 825,000 | | | | 750,750 | |
6.875%, 9/1/2041 | | | 750,000 | | | | 774,375 | |
| | | | | | | | |
| | | | | | | 2,796,140 | |
|
Miscellaneous Manufacturing — 1.5% | |
Trinity Industries, Inc., 4.550%, 10/1/2024 | | | 1,300,000 | | | | 1,262,359 | |
|
Oil & Gas — 7.3% | |
Diamond Offshore Drilling, Inc., 7.875%, 8/15/2025 | | | 750,000 | | | | 766,875 | |
Ecopetrol SA, 5.875%, 5/28/2045 (1) | | | 500,000 | | | | 497,575 | |
Ensco PLC: | | | | | | | | |
4.500%, 10/1/2024 (1) | | | 1,000,000 | | | | 833,750 | |
5.200%, 3/15/2025 (1) | | | 750,000 | | | | 630,000 | |
PBF Holding Co. LLC, 7.250%, 6/15/2025 (1) | | | 750,000 | | | | 793,125 | |
Petrobras Global Finance BV, 5.999%, 1/27/2028 (5) | | | 575,000 | | | | 517,356 | |
Petroleos Mexicanos: | | | | | | | | |
5.350%, 2/12/2028 (1)(5) | | | 1,000,000 | | | | 935,500 | |
5.500%, 6/27/2044 (1) | | | 500,000 | | | | 414,600 | |
Rowan Cos., Inc., 4.750%, 1/15/2024 (1) | | | 1,000,000 | | | | 865,000 | |
| | | | | | | | |
| | | | | | | 6,253,781 | |
|
Pharmaceuticals — 2.3% | |
Teva Pharmaceutical Finance Netherlands III BV: | | | | | | | | |
4.100%, 10/1/2046 (1) | | | 1,300,000 | | | | 960,883 | |
6.000%, 4/15/2024 | | | 1,000,000 | | | | 1,017,170 | |
| | | | | | | | |
| | | | | | | 1,978,053 | |
|
Pipelines — 2.2% | |
Cheniere Corpus Christi Holdings LLC, 5.125%, 6/30/2027 (1) | | | 625,000 | | | | 638,281 | |
Sunoco Logistics Partners Operations LP, 5.400%, 10/1/2047 | | | 1,250,000 | | | | 1,229,475 | |
| | | | | | | | |
| | | | | | | 1,867,756 | |
|
Private Equity — 0.9% | |
Icahn Enterprises LP, 5.875%, 2/1/2022 (1) | | | 750,000 | | | | 765,593 | |
|
Real Estate Investment Trusts — 1.7% | |
GEO Group, Inc., 5.125%, 4/1/2023 | | | 1,000,000 | | | | 970,000 | |
SBA Communications Corp., 4.875%, 9/1/2024 (1) | | | 500,000 | | | | 494,600 | |
| | | | | | | | |
| | | | | | | 1,464,600 | |
|
Retail — 3.2% | |
Beacon Roofing Supply, Inc., 4.875%, 11/1/2025 (1)(5) | | | 750,000 | | | | 695,625 | |
| | | | | | | | |
| Description | | Principal
Amount | | | Value | |
| Corporate Bonds & Notes (continued) | |
|
Retail(continued) | |
L Brands, Inc.: | | | | | | | | |
6.950%, 3/1/2033 (1) | | $ | 1,000,000 | | | $ | 845,000 | |
7.600%, 7/15/2037 (1) | | | 500,000 | | | | 423,935 | |
New Red Finance, Inc., 4.250%, 5/15/2024 (1)(5) | | | 250,000 | | | | 239,375 | |
Party City Holdings, Inc., 6.125%, 8/15/2023 (1)(5) | | | 500,000 | | | | 510,000 | |
| | | | | | | | |
| | | | | | | 2,713,935 | |
|
Software — 0.8% | |
VMware, Inc., 3.900%, 8/21/2027 (1) | | | 750,000 | | | | 711,886 | |
|
Sovereign — 5.7% | |
Angolan Government International Bond, 8.250%, 5/9/2028 (5) | | | 500,000 | | | | 498,623 | |
Argentine Republic Government International Bond, 5.875%, 1/11/2028 | | | 500,000 | | | | 365,125 | |
Costa Rica Government International Bond, 5.625%, 4/30/2043 (5) | | | 800,000 | | | | 657,796 | |
Ecuador Government International Bond, 7.875%, 1/23/2028 (5) | | | 750,000 | | | | 645,937 | |
Export Credit Bank of Turkey, 5.000%, 9/23/2021 (5) | | | 750,000 | | | | 616,920 | |
Ivory Coast Government International Bond, 6.125%, 6/15/2033 (5) | | | 750,000 | | | | 650,624 | |
Oman Sovereign Sukuk SAOC, 4.397%, 6/1/2024 (1)(5) | | | 500,000 | | | | 479,035 | |
Sri Lanka Government International Bond, 6.000%, 1/14/2019 (5) | | | 1,000,000 | | | | 1,004,540 | |
| | | | | | | | |
| | | | | | | 4,918,600 | |
| | |
Telecommunications — 3.6% | | | | | | | | |
Batelco International Finance No. 1, Ltd., 4.250%, 5/1/2020 | | | 800,000 | | | | 791,680 | |
CommScope, Inc., 5.500%, 6/15/2024 (1)(5) | | | 1,000,000 | | | | 1,016,250 | |
Sprint Communications, Inc., 6.000%, 11/15/2022 (1) | | | 500,000 | | | | 507,345 | |
Turk Telekomunikasyon AS, 4.875%, 6/19/2024 (5) | | | 750,000 | | | | 603,277 | |
Turkcell Iletisim Hizmetleri AS, 5.800%, 4/11/2028 (5) | | | 200,000 | | | | 161,937 | |
| | | | | | | | |
| | | | | | | 3,080,489 | |
| | |
Toys/Games/Hobbies — 0.8% | | | | | | | | |
Mattel, Inc., 2.350%, 8/15/2021 | | | 750,000 | | | | 678,750 | |
| | |
Transportation — 0.3% | | | | | | | | |
Asciano Finance, Ltd., 4.625%, 9/23/2020 (5) | | | 250,000 | | | | 253,432 | |
| | |
Trucking & Leasing — 0.9% | | | | | | | | |
Fly Leasing, Ltd., 6.375%, 10/15/2021 | | | 750,000 | | | | 777,188 | |
| | | | | | | | |
Total Corporate Bonds & Notes
(identified cost $53,344,666) | | | | 51,212,215 | |
| | | | | | | | |
| U.S. Government & U.S. Government Agency Obligations — 2.3% | |
|
U.S. Treasury Bonds & Notes — 2.3% | |
0.500%, 1/15/2028 (1) | | | 1,021,530 | | | | 994,701 | |
0.750%, 7/15/2028 | | | 1,003,820 | | | | 1,003,010 | |
| | | | | | | | |
Total U.S. Government & U.S. Government Agency Obligations
(identified cost $1,989,740) | | | | 1,997,711 | |
| | | | | | | | |
(See Notes which are an integral part of the Financial Statements)
85
August 31, 2018
Strategic Income Fund (continued)
| | | | | | | | |
| Description | | Principal
Amount | | | Value | |
| U.S. Government Agency-Mortgage Securities — 11.0% | |
|
Federal Home Loan Mortgage Corporation — 2.5% | |
3.500%, 4/1/2042 | | $ | 73,223 | | | $ | 73,413 | |
4.000%, 12/1/2040 | | | 347,753 | | | | 357,414 | |
4.500%, 9/1/2031 | | | 328,655 | | | | 343,492 | |
4.500%, 7/1/2040 | | | 25,147 | | | | 26,414 | |
4.500%, 11/1/2040 | | | 740,316 | | | | 777,601 | |
5.000%, 12/1/2022 | | | 69,687 | | | | 70,675 | |
5.000%, 1/1/2040 | | | 209,951 | | | | 224,575 | |
5.500%, 11/1/2018 | | | 743 | | | | 742 | |
5.500%, 10/1/2021 | | | 71,079 | | | | 72,722 | |
5.500%, 7/1/2035 | | | 45,168 | | | | 49,154 | |
6.000%, 12/1/2036 | | | 21,172 | | | | 23,308 | |
6.000%, 12/1/2037 | | | 10,079 | | | | 10,940 | |
7.500%, 4/1/2024 | | | 23,120 | | | | 25,006 | |
7.500%, 4/1/2027 | | | 15,070 | | | | 16,926 | |
8.000%, 8/1/2030 | | | 17,463 | | | | 20,246 | |
8.500%, 9/1/2024 | | | 14,336 | | | | 15,479 | |
9.000%, 6/1/2019 | | | 110 | | | | 111 | |
9.500%, 2/1/2025 | | | 3,402 | | | | 3,428 | |
| | | | | | | | |
| | | | | | | 2,111,646 | |
|
Federal National Mortgage Association — 8.2% | |
3.000%, 8/1/2032 | | | 190,952 | | | | 189,808 | |
3.500%, 7/1/2032 | | | 371,826 | | | | 377,172 | |
4.000%, 11/1/2031 | | | 666,662 | | | | 689,152 | |
4.000%, 3/1/2041 | | | 250,843 | | | | 257,404 | |
4.500%, 4/1/2041 | | | 1,948,193 | | | | 2,039,459 | |
4.500%, 6/1/2042 | | | 821,721 | | | | 861,247 | |
5.500%, 1/1/2023 | | | 91,803 | | | | 98,513 | |
5.500%, 2/1/2036 | | | 134,131 | | | | 146,193 | |
5.500%, 7/1/2036 | | | 283,965 | | | | 309,881 | |
5.500%, 8/1/2037 | | | 503,144 | | | | 547,604 | |
6.000%, 9/1/2021 | | | 103,884 | | | | 106,042 | |
6.000%, 5/1/2039 | | | 505,131 | | | | 558,595 | |
6.500%, 8/1/2030 | | | 304,964 | | | | 334,440 | |
6.500%, 12/1/2031 | | | 16,797 | | | | 18,772 | |
6.500%, 11/1/2037 | | | 42,917 | | | | 48,177 | |
7.000%, 3/1/2029 | | | 38,095 | | | | 42,844 | |
7.000%, 7/1/2029 | | | 121,519 | | | | 134,419 | |
7.000%, 2/1/2030 | | | 78,353 | | | | 85,413 | |
7.500%, 10/1/2030 | | | 11,885 | | | | 12,802 | |
8.000%, 10/1/2028 | | | 117,454 | | | | 127,392 | |
8.000%, 4/1/2030 | | | 31,273 | | | | 36,571 | |
| | | | | | | | |
| | | | | | | 7,021,900 | |
|
Government National Mortgage Association — 0.3% | |
5.000%, 4/15/2034 | | | 239,707 | | | | 256,240 | |
7.000%, 8/15/2031 | | | 32,263 | | | | 35,919 | |
9.500%, 10/15/2024 | | | 2,410 | | | | 2,416 | |
| | | | | | | | |
| | | | | | | 294,575 | |
| | | | | | | | |
| Total U.S. Government Agency-Mortgage Securities | |
(identified cost $9,406,929) | | | | 9,428,121 | |
| | | | | | | | |
| Short-Term Investments — 31.6% | |
|
| Collateral Pool Investments for Securities on Loan — 24.9% | |
| | |
Collateral pool allocation (3) | | | | | | | 21,425,129 | |
| | | | | | | | |
| Description | | Shares | | | Value | |
| Short-Term Investments (continued) | |
| | |
| Mutual Funds — 6.7% | | | | | | |
BMO Institutional Prime Money Market Fund — Premier Class, 1.987% (4) | | | 5,786,669 | | | $ | 5,787,248 | |
| | | | | | | | |
Total Short-Term Investments
(identified cost $27,211,891) | | | | 27,212,377 | |
| | | | | | | | |
Total Investments — 126.1%
(identified cost $110,571,690) | | | | 108,451,251 | |
| Other Assets and Liabilities — (26.1)% | | | | (22,424,307 | ) |
| | | | | | | | |
| Total Net Assets — 100.0% | | | $ | 86,026,944 | |
| | | | | | | | |
TCH Corporate Income Fund
| | | | | | | | |
| Description | | Principal
Amount | | | Value | |
| Corporate Bonds & Notes — 96.3% | |
|
Aerospace/Defense — 1.0% | |
Lockheed Martin Corp., 2.500%, 11/23/2020 | | $ | 2,500,000 | | | $ | 2,472,221 | |
|
Agriculture — 2.0% | |
Bunge, Ltd. Finance Corp., 3.000%, 9/25/2022 | | | 2,000,000 | | | | 1,935,197 | |
Philip Morris International, Inc.: | | | | | | | | |
2.000%, 2/21/2020 | | | 2,000,000 | | | | 1,974,258 | |
2.900%, 11/15/2021 (1) | | | 1,000,000 | | | | 992,549 | |
| | | | | | | | |
| | | | | | | 4,902,004 | |
|
Apparel — 0.8% | |
Ralph Lauren Corp., 2.125%, 9/26/2018 | | | 2,000,000 | | | | 1,999,610 | |
|
Auto Manufacturers — 3.7% | |
Daimler Finance North America LLC, 2.000%, 7/6/2021 (1)(5) | | | 2,500,000 | | | | 2,405,865 | |
Ford Motor Co., 5.291%, 12/8/2046 (1) | | | 2,000,000 | | | | 1,785,270 | |
Ford Motor Credit Co. LLC, 3.270% (LIBOR 3 Month + 93 basis points), 11/4/2019 (10) | | | 1,500,000 | | | | 1,508,075 | |
General Motors Financial Co., Inc.: | | | | | | | | |
4.000%, 1/15/2025 | | | 1,000,000 | | | | 970,674 | |
4.350%, 1/17/2027 (1) | | | 500,000 | | | | 488,818 | |
Toyota Motor Credit Corp., 3.400%, 4/14/2025 (1) | | | 2,000,000 | | | | 1,997,792 | |
| | | | | | | | |
| | | | | | | 9,156,494 | |
|
Banks — 12.2% | |
Banco Santander SA, 3.893% (LIBOR 3 Month + 156 basis points), 4/11/2022 (10) | | | 2,000,000 | | | | 2,055,108 | |
Bank of America Corp.: | | | | | | | | |
2.985% (LIBOR 3 Month + 65 basis points), 6/25/2022 (1)(10) | | | 1,000,000 | | | | 1,003,293 | |
3.824%, 1/20/2028 (7) | | | 2,000,000 | | | | 1,957,884 | |
Canadian Imperial Bank of Commerce, 2.834% (LIBOR 3 Month + 52 basis points), 9/6/2019 (10) | | | 2,000,000 | | | | 2,007,258 | |
Capital One Financial Corp., 3.300%, 10/30/2024 | | | 1,250,000 | | | | 1,203,243 | |
Citigroup, Inc., 3.751% (LIBOR 3 Month + 143 basis points), 9/1/2023 (1)(10) | | | 2,000,000 | | | | 2,046,062 | |
Fifth Third Bank,
2.200%, 10/30/2020 | | | 2,000,000 | | | | 1,959,592 | |
(See Notes which are an integral part of the Financial Statements)
86
TCH Corporate Income Fund (continued)
| | | | | | | | |
| Description | | Principal
Amount | | | Value | |
| Corporate Bonds & Notes (continued) | |
|
Banks(continued) | |
Goldman Sachs Group, Inc.: | | | | | | | | |
3.414% (LIBOR 3 Month + 110 basis points), 11/15/2018 (10) | | $ | 1,000,000 | | | $ | 1,002,122 | |
3.445% (LIBOR 3 Month + 111 basis points), 4/26/2022 (10) | | | 1,000,000 | | | | 1,012,682 | |
4.223%, 5/1/2029 (7) | | | 2,000,000 | | | | 1,984,255 | |
HSBC Holdings PLC, 3.971% (LIBOR 3 Month + 166 basis points), 5/25/2021 (10) | | | 1,500,000 | | | | 1,548,807 | |
JPMorgan Chase & Co., 3.172% (LIBOR 3 Month + 84 basis points), 3/22/2019 (10) | | | 2,000,000 | | | | 2,007,807 | |
Mizuho Financial Group, Inc., 2.953%, 2/28/2022 | | | 1,500,000 | | | | 1,472,166 | |
Morgan Stanley, 3.087% (LIBOR 3 Month + 74 basis points), 7/23/2019 (10) | | | 1,500,000 | | | | 1,507,769 | |
Royal Bank of Scotland Group PLC,
4.892%, 5/18/2029 (1)(7) | | | 1,500,000 | | | | 1,504,093 | |
Toronto-Dominion Bank, 3.338% (LIBOR 3 Month + 100 basis points), 4/7/2021 (1)(10) | | | 2,000,000 | | | | 2,036,173 | |
U.S. Bank NA, 2.662% (LIBOR 3 Month + 32 basis points), 1/24/2020 (10) | | | 1,500,000 | | | | 1,503,697 | |
Wells Fargo Bank NA, 2.912% (LIBOR 3 Month + 60 basis points), 5/24/2019 (10) | | | 1,000,000 | | | | 1,004,193 | |
Westpac Banking Corp., 2.882% (LIBOR 3 Month + 56 basis points), 8/19/2019 (10) | | | 1,000,000 | | | | 1,004,812 | |
| | | | | | | | |
| | | | | | | 29,821,016 | |
|
Beverages — 3.1% | |
Anheuser-Busch InBev Finance, Inc.: | | | | | | | | |
2.650%, 2/1/2021 (1) | | | 1,500,000 | | | | 1,483,697 | |
3.603% (LIBOR 3 Month + 126 basis points), 2/1/2021 (10) | | | 1,250,000 | | | | 1,284,433 | |
Fomento Economico Mexicano SAB de C.V., 2.875%, 5/10/2023 (1) | | | 2,000,000 | | | | 1,924,818 | |
Molson Coors Brewing Co.: | | | | | | | | |
2.250%, 3/15/2020 | | | 1,500,000 | | | | 1,480,869 | |
4.200%, 7/15/2046 (1) | | | 1,500,000 | | | | 1,341,978 | |
| | | | | | | | |
| | | | | | | 7,515,795 | |
|
Biotechnology — 0.5% | |
Amgen, Inc., 2.200%, 5/22/2019 | | | 1,300,000 | | | | 1,296,300 | |
|
Chemicals — 4.8% | |
Braskem Netherlands Finance BV: | | | | | | | | |
3.500%, 1/10/2023 (5) | | | 1,000,000 | | | | 933,760 | |
4.500%, 1/10/2028 (1)(5) | | | 1,000,000 | | | | 918,750 | |
CF Industries, Inc., 5.375%, 3/15/2044 (1) | | | 2,000,000 | | | | 1,832,500 | |
EI du Pont de Nemours & Co., 2.873% (LIBOR 3 Month + 53 basis points), 5/1/2020 (10) | | | 1,500,000 | | | | 1,509,952 | |
Mexichem SAB de C.V.: | | | | | | | | |
5.875%, 9/17/2044 (5) | | | 500,000 | | | | 480,975 | |
6.750%, 9/19/2042 (5) | | | 1,500,000 | | | | 1,593,750 | |
Mosaic Co., 4.050%, 11/15/2027 (1) | | | 2,500,000 | | | | 2,434,907 | |
Syngenta Finance NV, 4.892%, 4/24/2025 (5) | | | 2,000,000 | | | | 1,996,890 | |
| | | | | | | | |
| | | | | | | 11,701,484 | |
| | | | | | | | |
| Description | | Principal
Amount | | | Value | |
| Corporate Bonds & Notes (continued) | |
|
Commercial Services — 0.6% | |
ADT Corp., 4.125%, 6/15/2023 (1) | | $ | 500,000 | | | $ | 476,875 | |
Hertz Corp., 5.875%, 10/15/2020 (1) | | | 1,000,000 | | | | 999,690 | |
| | | | | | | | |
| | | | | | | 1,476,565 | |
|
Computers — 2.6% | |
Apple, Inc., 2.250%, 2/23/2021 | | | 2,000,000 | | | | 1,972,956 | |
Dell International LLC, 8.350%, 7/15/2046 (1)(5) | | | 2,000,000 | | | | 2,461,166 | |
Hewlett Packard Enterprise Co., 4.900%, 10/15/2025 (1) | | | 1,000,000 | | | | 1,032,810 | |
Seagate HDD Cayman, 5.750%, 12/1/2034 (1) | | | 1,000,000 | | | | 905,533 | |
| | | | | | | | |
| | | | | | | 6,372,465 | |
|
Diversified Financial Services — 7.3% | |
AerCap Ireland Capital DAC, 3.500%, 1/15/2025 | | | 2,000,000 | | | | 1,912,599 | |
Ally Financial, Inc., 4.250%, 4/15/2021 | | | 1,500,000 | | | | 1,507,770 | |
American Express Credit Corp., 2.885% (LIBOR 3 Month + 55 basis points), 3/18/2019 (10) | | | 1,500,000 | | | | 1,504,198 | |
Capital One Bank USA NA, 2.250%, 2/13/2019 | | | 1,200,000 | | | | 1,198,104 | |
Discover Financial Services, 4.100%, 2/9/2027 | | | 2,000,000 | | | | 1,942,757 | |
E*TRADE Financial Corp., 3.800%, 8/24/2027 | | | 1,000,000 | | | | 963,845 | |
GE Capital International Funding Co. Unlimited Co.: | | | | | | | | |
3.373%, 11/15/2025 (1) | | | 1,500,000 | | | | 1,453,768 | |
4.418%, 11/15/2035 (1) | | | 1,500,000 | | | | 1,448,524 | |
High Street Funding Trust II, 4.682%, 2/15/2048 (5) | | | 1,700,000 | | | | 1,744,285 | |
Jefferies Financial Group, Inc., 6.625%, 10/23/2043 (1) | | | 500,000 | | | | 505,705 | |
Jefferies Group LLC, 6.500%, 1/20/2043 | | | 500,000 | | | | 523,745 | |
Legg Mason, Inc., 4.750%, 3/15/2026 | | | 500,000 | | | | 517,277 | |
Mastercard, Inc., 2.000%, 11/21/2021 | | | 1,000,000 | | | | 971,226 | |
Synchrony Financial, 3.950%, 12/1/2027 | | | 1,750,000 | | | | 1,598,964 | |
| | | | | | | | |
| | | | | | | 17,792,767 | |
|
Electric — 1.1% | |
Abu Dhabi National Energy Co. PJSC, 4.375%, 4/23/2025 (5) | | | 750,000 | | | | 750,360 | |
Comision Federal de Electricidad, 4.750%, 2/23/2027 (5) | | | 2,000,000 | | | | 1,982,500 | |
| | | | | | | | |
| | | | | | | 2,732,860 | |
|
Engineering & Construction — 0.6% | |
Fluor Corp., 4.250%, 9/15/2028 (1) | | | 1,500,000 | | | | 1,490,673 | |
|
Food — 4.2% | |
Dean Foods Co.,
6.500%, 3/15/2023 (1)(5) | | | 2,500,000 | | | | 2,387,500 | |
Kellogg Co., 3.250%, 5/14/2021 | | | 2,000,000 | | | | 2,001,588 | |
Kraft Heinz Foods Co.: | | | | | | | | |
3.000%, 6/1/2026 (1) | | | 500,000 | | | | 457,064 | |
4.375%, 6/1/2046 | | | 1,500,000 | | | | 1,318,924 | |
Kroger Co., 4.450%, 2/1/2047 (1) | | | 2,250,000 | | | | 2,106,039 | |
(See Notes which are an integral part of the Financial Statements)
87
August 31, 2018
TCH Corporate Income Fund (continued)
| | | | | | | | |
| Description | | Principal
Amount | | | Value | |
| Corporate Bonds & Notes (continued) | |
|
Food(continued) | |
Mondelez International, Inc., 2.863% (LIBOR 3 Month + 52 basis points), 2/1/2019 (10) | | $ | 2,000,000 | | | $ | 2,003,678 | |
| | | | | | | | |
| | | | | | | 10,274,793 | |
|
Forest Products & Paper — 0.8% | |
International Paper Co., 3.000%, 2/15/2027 (1) | | | 2,000,000 | | | | 1,855,714 | |
|
Healthcare-Products — 3.9% | |
Abbott Laboratories, 4.750%, 11/30/2036 (1) | | | 1,500,000 | | | | 1,603,747 | |
Becton Dickinson and Co.: | | | | | | | | |
2.675%, 12/15/2019 (1) | | | 1,500,000 | | | | 1,492,879 | |
4.685%, 12/15/2044 | | | 2,000,000 | | | | 1,988,694 | |
Medtronic, Inc., 3.141% (LIBOR 3 Month + 80 basis points), 3/15/2020 (10) | | | 2,000,000 | | | | 2,019,486 | |
Thermo Fisher Scientific, Inc., 3.000%, 4/15/2023 | | | 1,000,000 | | | | 974,295 | |
Zimmer Biomet Holdings, Inc., 3.550%, 4/1/2025 | | | 1,500,000 | | | | 1,449,110 | |
| | | | | | | | |
| | | | | | | 9,528,211 | |
|
Healthcare-Services — 1.2% | |
HCA, Inc., 5.000%, 3/15/2024 (1) | | | 1,000,000 | | | | 1,025,000 | |
Laboratory Corp. of America Holdings, 3.250%, 9/1/2024 (1) | | | 2,000,000 | | | | 1,935,381 | |
| | | | | | | | |
| | | | | | | 2,960,381 | |
|
Home Builders — 0.6% | |
DR Horton, Inc., 2.550%, 12/1/2020 | | | 1,500,000 | | | | 1,472,353 | |
|
Insurance — 2.0% | |
Berkshire Hathaway Finance Corp., 2.583% (LIBOR 3 Month + 25 basis points), 1/11/2019 (10) | | | 1,000,000 | | | | 1,001,154 | |
Lincoln National Corp., 3.625%, 12/12/2026 | | | 2,000,000 | | | | 1,943,598 | |
Unum Group, 4.000%, 3/15/2024 | | | 2,000,000 | | | | 1,996,195 | |
| | | | | | | | |
| | | | | | | 4,940,947 | |
|
Internet — 4.6% | |
Alibaba Group Holding, Ltd., 2.800%, 6/6/2023 | | | 2,000,000 | | | | 1,941,796 | |
Amazon.com, Inc.: | | | | | | | | |
2.500%, 11/29/2022 (1) | | | 2,500,000 | | | | 2,443,598 | |
2.800%, 8/22/2024 | | | 1,500,000 | | | | 1,457,863 | |
4.050%, 8/22/2047 | | | 1,500,000 | | | | 1,490,004 | |
eBay, Inc.: | | | | | | | | |
3.209% (LIBOR 3 Month + 87 basis points), 1/30/2023 (10) | | | 2,500,000 | | | | 2,530,841 | |
4.000%, 7/15/2042 | | | 1,500,000 | | | | 1,256,880 | |
| | | | | | | | |
| | | | | | | 11,120,982 | |
|
Iron/Steel — 0.9% | |
GTL Trade Finance, Inc., 7.250%, 4/16/2044 (5) | | | 1,000,000 | | | | 1,008,750 | |
Vale Overseas, Ltd., 8.250%, 1/17/2034 | | | 1,000,000 | | | | 1,272,600 | |
| | | | | | | | |
| | | | | | | 2,281,350 | |
|
Lodging — 1.2% | |
Hyatt Hotels Corp., 5.375%, 8/15/2021 | | | 1,000,000 | | | | 1,050,868 | |
Wyndham Destinations, Inc., 4.500%, 4/1/2027 (1) | | | 2,000,000 | | | | 1,920,600 | |
| | | | | | | | |
| | | | | | | 2,971,468 | |
| | | | | | | | |
| Description | | Principal
Amount | | | Value | |
| Corporate Bonds & Notes (continued) | |
|
Media — 1.4% | |
Cox Communications, Inc., 4.600%, 8/15/2047 (1)(5) | | $ | 1,500,000 | | | $ | 1,408,748 | |
Scripps Networks Interactive, Inc., 2.750%, 11/15/2019 | | | 1,000,000 | | | | 990,546 | |
Viacom, Inc.,
4.375%, 3/15/2043 (1) | | | 1,050,000 | | | | 909,288 | |
| | | | | | | | |
| | | | | | | 3,308,582 | |
|
Mining — 0.4% | |
Glencore Funding LLC, 4.625%, 4/29/2024 (5) | | | 1,000,000 | | | | 1,008,280 | |
|
Miscellaneous Manufacturing — 0.4% | |
Siemens Financieringsmaatschappij NV, 2.675% (LIBOR 3 Month + 34 basis points), 3/16/2020 (5)(10) | | | 1,000,000 | | | | 1,003,391 | |
|
Oil & Gas — 3.7% | |
BP Capital Markets PLC, 3.205% (LIBOR 3 Month + 87 basis points), 9/16/2021 (10) | | | 2,000,000 | | | | 2,039,114 | |
Diamond Offshore Drilling, Inc., 7.875%, 8/15/2025 | | | 750,000 | | | | 766,875 | |
Ecopetrol SA, 7.375%, 9/18/2043 (1) | | | 1,500,000 | | | | 1,693,125 | |
Ensco PLC: | | | | | | | | |
4.500%, 10/1/2024 (1) | | | 1,000,000 | | | | 833,750 | |
5.200%, 3/15/2025 (1) | | | 1,000,000 | | | | 840,000 | |
Petroleos Mexicanos, 5.350%, 2/12/2028 (1)(5) | | | 2,000,000 | | | | 1,871,000 | |
Shell International Finance BV, 3.750%, 9/12/2046 | | | 1,000,000 | | | | 940,310 | |
| | | | | | | | |
| | | | | | | 8,984,174 | |
|
Pharmaceuticals — 11.1% | |
Allergan Funding SCS: | | | | | | | | |
4.550%, 3/15/2035 | | | 500,000 | | | | 492,548 | |
4.850%, 6/15/2044 | | | 1,500,000 | | | | 1,492,992 | |
AstraZeneca PLC,
3.500%, 8/17/2023 (1) | | | 2,000,000 | | | | 2,000,954 | |
Bayer US Finance II LLC, 4.875%, 6/25/2048 (5) | | | 1,850,000 | | | | 1,819,921 | |
Bristol-Myers Squibb Co., 2.000%, 8/1/2022 | | | 2,500,000 | | | | 2,394,426 | |
CVS Health Corp.: | | | | | | | | |
2.125%, 6/1/2021 | | | 2,000,000 | | | | 1,937,120 | |
3.125%, 3/9/2020 | | | 1,000,000 | | | | 1,000,874 | |
4.300%, 3/25/2028 (1) | | | 2,000,000 | | | | 1,988,408 | |
Express Scripts Holding Co., 4.800%, 7/15/2046 (1) | | | 1,500,000 | | | | 1,452,456 | |
Johnson & Johnson, 2.591% (LIBOR 3 Month + 27 basis points), 3/1/2019 (10) | | | 2,000,000 | | | | 2,003,405 | |
Merck & Co., Inc., 2.350%, 2/10/2022 | | | 2,500,000 | | | | 2,449,041 | |
Novartis Capital Corp., 2.400%, 5/17/2022 | | | 1,000,000 | | | | 974,637 | |
Perrigo Finance Unlimited Co., 3.500%, 3/15/2021 | | | 1,500,000 | | | | 1,491,054 | |
Shire Acquisitions Investments Ireland DAC: | | | | | | | | |
2.400%, 9/23/2021 | | | 1,000,000 | | | | 967,244 | |
2.875%, 9/23/2023 (1) | | | 2,000,000 | | | | 1,912,091 | |
Teva Pharmaceutical Finance Netherlands III BV, 4.100%, 10/1/2046 (1) | | | 2,500,000 | | | | 1,847,851 | |
Zoetis, Inc., 3.250%, 2/1/2023 (1) | | | 1,000,000 | | | | 988,383 | |
| | | | | | | | |
| | | | | | | 27,213,405 | |
(See Notes which are an integral part of the Financial Statements)
88
TCH Corporate Income Fund (continued)
| | | | | | | | |
| Description | | Principal
Amount | | | Value | |
| Corporate Bonds & Notes (continued) | |
|
Pipelines — 2.8% | |
Energy Transfer Partners LP, 6.500%, 2/1/2042 | | $ | 1,500,000 | | | $ | 1,651,720 | |
Enterprise Products Operating LLC, 4.250%, 2/15/2048 (1) | | | 2,000,000 | | | | 1,893,531 | |
Kinder Morgan Energy Partners LP, 7.500%, 11/15/2040 | | | 250,000 | | | | 309,071 | |
Kinder Morgan, Inc., 5.300%, 12/1/2034 (1) | | | 3,000,000 | | | | 3,068,402 | |
| | | | | | | | |
| | | | | | | 6,922,724 | |
|
Real Estate Investment Trusts — 2.5% | |
EPR Properties, 5.250%, 7/15/2023 | | | 1,000,000 | | | | 1,035,410 | |
Hospitality Properties Trust: | | | | | | | | |
4.500%, 6/15/2023 | | | 500,000 | | | | 505,425 | |
4.500%, 3/15/2025 | | | 1,500,000 | | | | 1,475,209 | |
Kimco Realty Corp., 3.300%, 2/1/2025 | | | 1,250,000 | | | | 1,194,405 | |
Senior Housing Properties Trust, 3.250%, 5/1/2019 | | | 2,000,000 | | | | 2,000,630 | |
| | | | | | | | |
| | | | | | | 6,211,079 | |
|
Retail — 4.1% | |
Bed Bath & Beyond, Inc., 5.165%, 8/1/2044 (1) | | | 1,000,000 | | | | 760,659 | |
L Brands, Inc.: | | | | | | | | |
6.950%, 3/1/2033 (1) | | | 600,000 | | | | 507,000 | |
7.600%, 7/15/2037 | | | 500,000 | | | | 423,935 | |
McDonald’s Corp.: | | | | | | | | |
2.100%, 12/7/2018 | | | 750,000 | | | | 749,407 | |
2.750%, 12/9/2020 | | | 1,500,000 | | | | 1,492,674 | |
Nucor Corp., 4.400%, 5/1/2048 | | | 2,000,000 | | | | 1,992,993 | |
O’Reilly Automotive, Inc., 3.600%, 9/1/2027 (1) | | | 2,000,000 | | | | 1,915,600 | |
Target Corp., 3.625%, 4/15/2046 (1) | | | 2,500,000 | | | | 2,297,694 | |
| | | | | | | | |
| | | | | | | 10,139,962 | |
|
Software — 3.4% | |
CA, Inc., 4.700%, 3/15/2027 | | | 2,500,000 | | | | 2,488,227 | |
Microsoft Corp.: | | | | | | | | |
2.000%, 8/8/2023 | | | 1,450,000 | | | | 1,378,503 | |
2.875%, 2/6/2024 | | | 500,000 | | | | 492,458 | |
Oracle Corp.: | | | | | | | | |
2.400%, 9/15/2023 (1) | | | 1,000,000 | | | | 959,584 | |
4.000%, 11/15/2047 (1) | | | 1,000,000 | | | | 966,265 | |
VMware, Inc., 3.900%, 8/21/2027 (1) | | | 2,000,000 | | | | 1,898,363 | |
| | | | | | | | |
| | | | | | | 8,183,400 | |
|
Sovereign — 0.6% | |
Export-Import Bank of Korea, 3.000%, 11/1/2022 | | | 1,500,000 | | | | 1,467,318 | |
|
Telecommunications — 3.5% | |
AT&T, Inc., 4.350%, 6/15/2045 | | | 1,000,000 | | | | 860,710 | |
CenturyLink, Inc., 7.600%, 9/15/2039 | | | 550,000 | | | | 495,000 | |
Colombia Telecomunicaciones SA ESP, 5.375%, 9/27/2022 | | | 800,000 | | | | 802,000 | |
Motorola Solutions, Inc., 5.500%, 9/1/2044 | | | 1,000,000 | | | | 951,608 | |
Telecom Italia Capital SA, 7.200%, 7/18/2036 (1) | | | 1,500,000 | | | | 1,608,750 | |
| | | | | | | | |
| Description | | Shares or
Principal
Amount | | | Value | |
| Corporate Bonds & Notes (continued) | |
|
Telecommunications(continued) | |
Telefonica Emisiones SAU, 5.213%, 3/8/2047 (1) | | $ | 2,000,000 | | | $ | 1,993,940 | |
Verizon Communications, Inc., 2.625%, 8/15/2026 (1) | | | 2,000,000 | | | | 1,815,941 | |
| | | | | | | | |
| | | | | | | 8,527,949 | |
|
Toys/Games/Hobbies — 0.9% | |
Mattel, Inc., 2.350%, 8/15/2021 | | | 2,500,000 | | | | 2,262,500 | |
|
Transportation — 1.0% | |
FedEx Corp., 4.050%, 2/15/2048 (1) | | | 2,000,000 | | | | 1,835,220 | |
Kazakhstan Temir Zholy Finance BV,
6.950%, 7/10/2042 (5) | | | 500,000 | | | | 549,375 | |
| | | | | | | | |
| | | | | | | 2,384,595 | |
|
Trucking & Leasing — 0.8% | |
Penske Truck Leasing Co. LP, 3.300%, 4/1/2021 (5) | | | 2,000,000 | | | | 1,988,303 | |
| | | | | | | | |
Total Corporate Bonds & Notes
(identified cost $237,954,113) | | | | | | | 235,742,115 | |
| | | | | | | | |
| Municipals — 0.2% | |
|
California — 0.2% | |
Metropolitan Water District of Southern California, 6.947%, 7/1/2040, Call 7/1/2020 | | | 500,000 | | | | 534,320 | |
| | | | | | | | |
Total Municipals
(identified cost $500,000) | | | | | | | 534,320 | |
| | | | | | | | |
| U.S. Government & U.S. Government Agency Obligations — 0.6% | |
|
U.S. Treasury Bonds & Notes — 0.6% | |
2.000%, 8/15/2025 (1) | | | 1,500,000 | | | | 1,423,535 | |
| | | | | | | | |
Total U.S. Government & U.S. Government Agency Obligations
(identified cost $1,538,878) | | | | 1,423,535 | |
| | | | | | | | |
| Short-Term Investments — 22.7% | |
|
| Collateral Pool Investments for Securities on Loan — 20.7% | |
| | |
Collateral pool allocation (3) | | | | | | | 50,798,784 | |
|
| Mutual Funds — 2.0% | |
BMO Institutional Prime Money Market Fund — Premier Class, 1.987% (4) | | | 4,850,399 | | | | 4,850,884 | |
| | | | | | | | |
Total Short-Term Investments
(identified cost $55,649,407) | | | | 55,649,668 | |
| | | | | | | | |
Total Investments — 119.8%
(identified cost $295,642,398) | | | | 293,349,638 | |
| Other Assets and Liabilities — (19.8)% | | | | (48,566,578 | ) |
| | | | | | | | |
| Total Net Assets — 100.0% | | | | | | $ | 244,783,060 | |
| | | | | | | | |
(See Notes which are an integral part of the Financial Statements)
89
August 31, 2018
TCH Core Plus Bond Fund
| | | | | | | | |
| Description | | Principal
Amount | | | Value | |
| Asset-Backed Securities — 2.7% | |
| | |
Automobiles — 2.7% | | | | | | | | |
Honda Auto Receivables Owner Trust, Class A4, (Series2015-2), 1.470%, 8/23/2021 | | $ | 3,045,088 | | | $ | 3,043,217 | |
Hyundai Auto Lease Securitization Trust, Class A2, (Series2018-B), 2.810%, 12/15/2020 (5) | | | 10,000,000 | | | | 9,999,172 | |
Toyota Auto Receivables Owner Trust, Class A2A,(Series 2017-D), 1.740%, 8/17/2020 | | | 14,966,333 | | | | 14,906,331 | |
| | | | | | | | |
Total Asset-Backed Securities
(identified cost $28,007,428) | | | | | | | 27,948,720 | |
| | | | | | | | |
| Commercial Mortgage Securities — 4.2% | |
| | |
Private Sponsor — 4.2% | | | | | | | | |
BANK: | | | | | | | | |
Class A4, (Series 2018-BN12), 4.255%, 5/15/2061 (7) | | | 7,500,000 | | | | 7,868,618 | |
Class A5, (Series 2017-BNK7), 3.435%, 9/15/2060 | | | 10,000,000 | | | | 9,873,889 | |
GS Mortgage Securities Trust, Class A4,(Series 2017-GS8), 3.469%, 11/10/2050 | | | 10,000,000 | | | | 9,857,770 | |
UBS-Barclays Commercial Mortgage Trust, Class A5,(Series 2012-C4), 2.850%, 12/10/2045 | | | 9,888,381 | | | | 9,723,022 | |
Wells Fargo Commercial Mortgage Trust, Class A4,(Series 2017-C41), 3.472%, 11/15/2050 | | | 7,000,000 | | | | 6,902,898 | |
| | | | | | | | |
Total Commercial Mortgage Securities
(identified cost $45,422,426) | | | | 44,226,197 | |
| | | | | | | | |
| Corporate Bonds & Notes — 45.2% | |
| | |
Agriculture — 0.4% | | | | | | | | |
Bunge, Ltd. Finance Corp., 3.750%, 9/25/2027 (1) | | | 4,000,000 | | | | 3,743,161 | |
|
Apparel — 0.4% | |
Ralph Lauren Corp., 2.125%, 9/26/2018 | | | 4,000,000 | | | | 3,999,220 | |
|
Auto Manufacturers — 3.0% | |
Daimler Finance North America LLC, 2.967% (LIBOR 3 Month + 63 basis points), 1/6/2020 (5)(10) | | | 10,000,000 | | | | 10,040,295 | |
Ford Motor Co.: | | | | | | | | |
4.750%, 1/15/2043 (1) | | | 5,000,000 | | | | 4,159,289 | |
5.291%, 12/8/2046 (1) | | | 1,500,000 | | | | 1,338,952 | |
Ford Motor Credit Co. LLC, 3.271% (LIBOR 3 Month + 93 basis points), 11/4/2019 (10) | | | 4,000,000 | | | | 4,021,533 | |
General Motors Financial Co., Inc., 4.000%, 1/15/2025 | | | 5,000,000 | | | | 4,853,369 | |
Hyundai Capital America, 3.750%, 7/8/2021 (5) | | | 6,500,000 | | | | 6,493,950 | |
| | | | | | | | |
| | | | | | | 30,907,388 | |
| | |
Banks — 10.8% | | | | | | | | |
Banco Santander SA, 3.893% (LIBOR 3 Month + 156 basis points), 4/11/2022 (10) | | | 4,000,000 | | | | 4,110,215 | |
Bank of America Corp., 4.183%, 11/25/2027 (1) | | | 5,000,000 | | | | 4,897,536 | |
| | | | | | | | |
| Description | | Principal
Amount | | | Value | |
| Corporate Bonds & Notes (continued) | |
| | |
Banks(continued) | | | | | | | | |
BB&T Corp.: | | | | | | | | |
2.625%, 6/29/2020 (1) | | $ | 2,500,000 | | | $ | 2,484,657 | |
2.911% (LIBOR 3 Month + 57 basis points), 6/15/2020 (10) | | | 3,000,000 | | | | 3,021,709 | |
Canadian Imperial Bank of Commerce, 2.834% (LIBOR 3 Month + 52 basis points), 9/6/2019 (10) | | | 5,000,000 | | | | 5,018,144 | |
Capital One Financial Corp., 3.277% (LIBOR 3 Month + 95 basis points), 3/9/2022 (10) | | | 1,500,000 | | | | 1,511,389 | |
CIT Group, Inc., 5.375%, 5/15/2020 | | | 5,000,000 | | | | 5,162,500 | |
Citigroup, Inc.: | | | | | | | | |
3.249% (LIBOR 3 Month + 93 basis points), 6/7/2019 (10) | | | 4,500,000 | | | | 4,527,069 | |
3.391% (LIBOR 3 Month + 107 basis points), 12/8/2021 (10) | | | 1,250,000 | | | | 1,271,734 | |
3.751% (LIBOR 3 Month + 143 basis points), 9/1/2023 (1)(10) | | | 5,000,000 | | | | 5,115,156 | |
Goldman Sachs Group, Inc.: | | | | | | | | |
3.414% (LIBOR 3 Month + 110 basis points), 11/15/2018 (10) | | | 5,000,000 | | | | 5,010,612 | |
3.445% (LIBOR 3 Month + 111 basis points), 4/26/2022 (10) | | | 5,000,000 | | | | 5,063,411 | |
3.507% (LIBOR 3 Month + 116 basis points), 4/23/2020 (10) | | | 8,000,000 | | | | 8,106,174 | |
4.223%, 5/1/2029 (7) | | | 5,000,000 | | | | 4,960,637 | |
HSBC Holdings PLC, 3.971% (LIBOR 3 Month + 166 basis points), 5/25/2021 (10) | | | 5,000,000 | | | | 5,162,691 | |
JPMorgan Chase & Co.: | | | | | | | | |
3.172% (LIBOR 3 Month + 84 basis points), 3/22/2019 (10) | | | 3,500,000 | | | | 3,513,663 | |
3.419% (LIBOR 3 Month + 110 basis points), 6/7/2021 (10) | | | 5,000,000 | | | | 5,100,897 | |
3.544% (LIBOR 3 Month + 121 basis points), 10/29/2020 (10) | | | 4,000,000 | | | | 4,082,534 | |
3.625%, 12/1/2027 (1) | | | 5,000,000 | | | | 4,771,272 | |
Lloyds Banking Group PLC, 2.907%, 11/7/2023 (1)(7) | | | 10,000,000 | | | | 9,568,648 | |
Morgan Stanley, 3.950%, 4/23/2027 | | | 5,000,000 | | | | 4,829,148 | |
Toronto-Dominion Bank, 3.338% (LIBOR 3 Month + 100 basis points), 4/7/2021 (10) | | | 4,500,000 | | | | 4,581,389 | |
U.S. Bank NA, 2.662% (LIBOR 3 Month + 32 basis points), 1/24/2020 (10) | | | 4,000,000 | | | | 4,009,858 | |
Wells Fargo Bank NA, 2.912% (LIBOR 3 Month + 60 basis points), 5/24/2019 (10) | | | 3,000,000 | | | | 3,012,580 | |
Westpac Banking Corp., 2.882% (LIBOR 3 Month + 56 basis points), 8/19/2019 (10) | | | 4,000,000 | | | | 4,019,247 | |
| | | | | | | | |
| | | | | | | 112,912,870 | |
|
Beverages — 0.3% | |
Anheuser-Busch InBev Finance, Inc., 3.603% (LIBOR 3 Month + 126 basis points),
2/1/2021 (1)(10) | | | 3,000,000 | | | | 3,082,639 | |
|
Biotechnology — 0.5% | |
Celgene Corp., 4.550%, 2/20/2048 (1) | | | 5,000,000 | | | | 4,749,533 | |
(See Notes which are an integral part of the Financial Statements)
90
TCH Core Plus Bond Fund (continued)
| | | | | | | | |
| Description | | Principal
Amount | | | Value | |
| Corporate Bonds & Notes (continued) | |
|
Chemicals — 0.9% | |
Mexichem SAB de C.V., 6.750%, 9/19/2042 (5) | | $ | 4,400,000 | | | $ | 4,675,000 | |
Syngenta Finance NV, 4.892%, 4/24/2025 (5) | | | 5,250,000 | | | | 5,241,837 | |
| | | | | | | | |
| | | | | | | 9,916,837 | |
|
Commercial Services — 0.5% | |
Hertz Corp., 5.875%, 10/15/2020 (1) | | | 5,500,000 | | | | 5,498,295 | |
|
Computers — 2.2% | |
Apple, Inc., 2.250%, 2/23/2021 | | | 1,500,000 | | | | 1,479,717 | |
Dell International LLC: | | | | | | | | |
4.420%, 6/15/2021 (1)(5) | | | 7,000,000 | | | | 7,124,795 | |
8.350%, 7/15/2046 (1)(5) | | | 5,500,000 | | | | 6,768,207 | |
Hewlett Packard Enterprise Co., 4.900%, 10/15/2025 (1) | | | 2,000,000 | | | | 2,065,620 | |
Seagate HDD Cayman: | | | | | | | | |
4.875%, 6/1/2027 | | | 2,000,000 | | | | 1,881,578 | |
5.750%, 12/1/2034 (1) | | | 3,500,000 | | | | 3,169,366 | |
| | | | | | | | |
| | | | | | | 22,489,283 | |
|
Diversified Financial Services — 3.9% | |
AerCap Ireland Capital DAC: | | | | | | | | |
3.500%, 1/15/2025 (1) | | | 5,750,000 | | | | 5,498,724 | |
4.450%, 10/1/2025 | | | 1,250,000 | | | | 1,252,972 | |
Ally Financial, Inc., 4.250%, 4/15/2021 | | | 5,000,000 | | | | 5,025,900 | |
American Express Credit Corp., 3.120% (LIBOR 3 Month + 78 basis points), 11/5/2018 (10) | | | 5,000,000 | | | | 5,003,323 | |
Discover Financial Services, 4.100%, 2/9/2027 | | | 5,000,000 | | | | 4,856,894 | |
GE Capital International Funding Co. Unlimited Co., 4.418%, 11/15/2035 (1) | | | 5,500,000 | | | | 5,311,257 | |
Jefferies Financial Group, Inc., 6.625%, 10/23/2043 | | | 500,000 | | | | 505,705 | |
Jefferies Group LLC: | | | | | | | | |
4.150%, 1/23/2030 | | | 5,000,000 | | | | 4,569,744 | |
6.500%, 1/20/2043 | | | 1,000,000 | | | | 1,047,489 | |
Legg Mason, Inc., 4.750%, 3/15/2026 | | | 1,950,000 | | | | 2,017,379 | |
Synchrony Financial, 3.950%, 12/1/2027 (1) | | | 6,500,000 | | | | 5,939,009 | |
| | | | | | | | |
| | | | | | | 41,028,396 | |
|
Electric — 1.0% | |
Comision Federal de Electricidad, 4.750%, 2/23/2027 (5) | | | 4,000,000 | | | | 3,965,000 | |
Sempra Energy, 2.839% (LIBOR 3 Month + 50 basis points), 1/15/2021 (1)(10) | | | 7,000,000 | | | | 7,005,963 | |
| | | | | | | | |
| | | | | | | 10,970,963 | |
|
Food — 2.0% | |
Albertsons Cos. LLC, 5.750%, 3/15/2025 | | | 5,000,000 | | | | 4,550,000 | |
Dean Foods Co., 6.500%, 3/15/2023 (1)(5) | | | 5,750,000 | | | | 5,491,250 | |
Kraft Heinz Foods Co., 4.375%, 6/1/2046 | | | 7,200,000 | | | | 6,330,834 | |
Kroger Co., 4.450%, 2/1/2047 (1) | | | 5,000,000 | | | | 4,680,087 | |
| | | | | | | | |
| | | | | | | 21,052,171 | |
| | | | | | | | |
| Description | | Principal
Amount | | | Value | |
| Corporate Bonds & Notes (continued) | |
|
Forest Products & Paper — 0.6% | |
International Paper Co., 4.400%, 8/15/2047 | | $ | 7,000,000 | | | $ | 6,482,262 | |
|
Healthcare-Products — 1.7% | |
Mallinckrodt International Finance SA, 5.625%, 10/15/2023 (1)(5) | | | 6,500,000 | | | | 5,825,625 | |
Medtronic, Inc., 3.141% (LIBOR 3 Month + 80 basis points), 3/15/2020 (10) | | | 7,000,000 | | | | 7,068,202 | |
Zimmer Biomet Holdings, Inc., 3.550%, 4/1/2025 | | | 5,000,000 | | | | 4,830,367 | |
| | | | | | | | |
| | | | | | | 17,724,194 | |
|
Healthcare-Services — 1.4% | |
Anthem, Inc., 2.500%, 11/21/2020 | | | 10,000,000 | | | | 9,856,225 | |
HCA, Inc., 5.000%, 3/15/2024 (1) | | | 4,750,000 | | | | 4,868,750 | |
| | | | | | | | |
| | | | | | | 14,724,975 | |
|
Home Builders — 0.3% | |
DR Horton, Inc., 2.550%, 12/1/2020 | | | 3,500,000 | | | | 3,435,489 | |
|
Insurance — 0.4% | |
Lincoln National Corp., 3.625%, 12/12/2026 (1) | | | 4,500,000 | | | | 4,373,094 | |
|
Internet — 1.0% | |
eBay, Inc.: | | | | | | | | |
3.209% (LIBOR 3 Month + 87 basis points), 1/30/2023 (10) | | | 7,500,000 | | | | 7,592,522 | |
4.000%, 7/15/2042 (1) | | | 4,000,000 | | | | 3,351,679 | |
| | | | | | | | |
| | | | | | | 10,944,201 | |
|
Iron/Steel — 0.2% | |
Vale Overseas, Ltd., 8.250%, 1/17/2034 (1) | | | 1,500,000 | | | | 1,908,900 | |
|
Lodging — 0.3% | |
Wyndham Destinations Inc., 4.150%, 4/1/2024 (1) | | | 3,000,000 | | | | 2,979,000 | |
|
Media — 0.9% | |
Charter Communications Operating LLC: | | | | | | | | |
4.464%, 7/23/2022 (1) | | | 1,000,000 | | | | 1,021,251 | |
5.375%, 5/1/2047 | | | 5,000,000 | | | | 4,726,881 | |
Viacom, Inc., 4.375%, 3/15/2043 (1) | | | 4,000,000 | | | | 3,463,953 | |
| | | | | | | | |
| | | | | | | 9,212,085 | |
| | |
Mining — 0.5% | | | | | | | | |
Glencore Funding LLC: | | | | | | | | |
4.000%, 3/27/2027 (1)(5) | | | 5,000,000 | | | | 4,705,806 | |
4.625%, 4/29/2024 (5) | | | 1,000,000 | | | | 1,008,280 | |
| | | | | | | | |
| | | | | | | 5,714,086 | |
| | |
Oil & Gas — 2.0% | | | | | | | | |
BP Capital Markets PLC, 3.205% (LIBOR 3 Month + 87 basis points), 9/16/2021 (10) | | | 7,000,000 | | | | 7,136,899 | |
Ensco PLC: | | | | | | | | |
5.200%, 3/15/2025 (1) | | | 4,500,000 | | | | 3,780,000 | |
5.750%, 10/1/2044 (1) | | | 2,168,000 | | | | 1,585,350 | |
Petroleos Mexicanos: | | | | | | | | |
5.350%, 2/12/2028 (1)(5) | | | 5,000,000 | | | | 4,677,500 | |
5.625%, 1/23/2046 (1) | | | 1,500,000 | | | | 1,239,600 | |
Phillips 66, 2.989% (LIBOR 3 Month + 65 basis points), 4/15/2019 (5)(10) | | | 2,000,000 | | | | 2,000,985 | |
| | | | | | | | |
| | | | | | | 20,420,334 | |
(See Notes which are an integral part of the Financial Statements)
91
August 31, 2018
TCH Core Plus Bond Fund (continued)
| | | | | | | | |
| Description | | Principal
Amount | | | Value | |
| Corporate Bonds & Notes (continued) | |
| | |
Pharmaceuticals — 2.2% | | | | | | | | |
Bausch Health Cos., Inc., 5.500%, 3/1/2023 (1)(5) | | $ | 1,500,000 | | | $ | 1,421,445 | |
Bayer US Finance II LLC, 4.250%, 12/15/2025 (5) | | | 5,000,000 | | | | 5,018,842 | |
Bristol-Myers Squibb Co., 2.000%, 8/1/2022 | | | 2,500,000 | | | | 2,394,426 | |
CVS Health Corp., 2.250%, 12/5/2018 | | | 1,500,000 | | | | 1,498,925 | |
Shire Acquisitions Investments Ireland DAC, 2.875%, 9/23/2023 (1) | | | 7,000,000 | | | | 6,692,317 | |
Teva Pharmaceutical Finance Netherlands III BV, 4.100%, 10/1/2046 (1) | | | 5,000,000 | | | | 3,695,703 | |
Zoetis, Inc., 3.250%, 2/1/2023 (1) | | | 2,500,000 | | | | 2,470,958 | |
| | | | | | | | |
| | | | | | | 23,192,616 | |
| | |
Pipelines — 0.9% | | | | | | | | |
Energy Transfer Partners LP: | | | | | | | | |
5.150%, 3/15/2045 (1) | | | 4,000,000 | | | | 3,809,524 | |
6.500%, 2/1/2042 (1) | | | 1,000,000 | | | | 1,101,146 | |
Kinder Morgan Energy Partners LP, 5.000%, 3/1/2043 | | | 5,000,000 | | | | 4,885,580 | |
| | | | | | | | |
| | | | | | | 9,796,250 | |
|
Real Estate Investment Trusts — 1.9% | |
Crown Castle International Corp., 3.650%, 9/1/2027 | | | 5,000,000 | | | | 4,742,536 | |
EPR Properties: | | | | | | | | |
4.500%, 6/1/2027 (1) | | | 1,000,000 | | | | 966,621 | |
5.250%, 7/15/2023 | | | 5,000,000 | | | | 5,177,049 | |
Hospitality Properties Trust: | | | | | | | | |
4.500%, 6/15/2023 | | | 1,000,000 | | | | 1,010,850 | |
4.500%, 3/15/2025 | | | 2,500,000 | | | | 2,458,681 | |
Kimco Realty Corp., 4.450%, 9/1/2047 (1) | | | 3,000,000 | | | | 2,838,356 | |
Welltower, Inc., 4.500%, 1/15/2024 | | | 2,500,000 | | | | 2,563,831 | |
| | | | | | | | |
| | | | | | | 19,757,924 | |
| | |
Retail — 2.5% | | | | | | | | |
Bed Bath & Beyond, Inc., 5.165%, 8/1/2044 | | | 4,900,000 | | | | 3,727,231 | |
L Brands, Inc.: | | | | | | | | |
6.950%, 3/1/2033 (1) | | | 2,500,000 | | | | 2,112,500 | |
7.600%, 7/15/2037 | | | 1,500,000 | | | | 1,271,805 | |
McDonald’s Corp., 2.100%, 12/7/2018 | | | 2,000,000 | | | | 1,998,418 | |
O’Reilly Automotive, Inc., 3.600%, 9/1/2027 (1) | | | 5,000,000 | | | | 4,789,001 | |
Tapestry, Inc., 4.125%, 7/15/2027 | | | 5,500,000 | | | | 5,280,800 | |
Walgreens Boots Alliance, Inc., 4.800%, 11/18/2044 | | | 7,000,000 | | | | 6,779,656 | |
| | | | | | | | |
| | | | | | | 25,959,411 | |
| | |
Software — 0.7% | | | | | | | | |
CA, Inc., 4.700%, 3/15/2027 | | | 4,000,000 | | | | 3,981,162 | |
Oracle Corp., 2.400%, 9/15/2023 (1) | | | 4,000,000 | | | | 3,838,337 | |
| | | | | | | | |
| | | | | | | 7,819,499 | |
| | |
Telecommunications — 1.8% | | | | | | | | |
AT&T, Inc.: | | | | | | | | |
4.350%, 6/15/2045 | | | 2,500,000 | | | | 2,151,775 | |
5.150%, 3/15/2042 (1) | | | 4,000,000 | | | | 3,890,555 | |
CenturyLink, Inc., 7.600%, 9/15/2039 | | | 4,000,000 | | | | 3,600,000 | |
| | | | | | | | |
| Description | | Principal
Amount | | | Value | |
| Corporate Bonds & Notes (continued) | |
|
Telecommunications(continued) | |
Motorola Solutions, Inc., 5.500%, 9/1/2044 | | $ | 3,000,000 | | | $ | 2,854,825 | |
Telecom Italia SpA, 5.303%, 5/30/2024 (1)(5) | | | 6,000,000 | | | | 6,007,500 | |
| | | | | | | | |
| | | | | | | 18,504,655 | |
| | | | | | | | |
Total Corporate Bonds & Notes
(identified cost $474,843,993) | | | | | | | 473,299,731 | |
| | | | | | | | |
| Municipals — 0.0% | | | | | | |
| | |
California — 0.0% | | | | | | | | |
Metropolitan Water District of Southern California, 6.947%, 7/1/2040, Call 7/1/2020 | | | 300,000 | | | | 320,592 | |
| | | | | | | | |
Total Municipals
(identified cost $300,000) | | | | | | | 320,592 | |
| | | | | | | | |
| U.S. Government & U.S. Government Agency Obligations — 24.4% | |
|
U.S. Treasury Bonds & Notes — 24.4% | |
0.375%, 7/15/2023 (1) | | | 16,241,250 | | | | 16,038,105 | |
1.875%, 7/31/2022 (1) | | | 17,500,000 | | | | 16,949,023 | |
2.000%, 7/31/2020 (1) | | | 15,000,000 | | | | 14,828,613 | |
2.000%, 9/30/2020 (1) | | | 5,000,000 | | | | 4,936,523 | |
2.000%, 11/30/2020 (1) | | | 20,000,000 | | | | 19,717,188 | |
2.000%, 11/15/2021 (1) | | | 10,000,000 | | | | 9,785,938 | |
2.000%, 7/31/2022 (1) | | | 50,000,000 | | | | 48,662,109 | |
2.000%, 2/15/2023 (1) | | | 15,000,000 | | | | 14,543,262 | |
2.000%, 2/15/2025 (1) | | | 5,000,000 | | | | 4,765,137 | |
2.000%, 8/15/2025 (1) | | | 5,000,000 | | | | 4,745,117 | |
2.125%, 8/15/2021 (1) | | | 12,500,000 | | | | 12,300,049 | |
2.250%, 2/29/2020 (1) | | | 12,000,000 | | | | 11,943,984 | |
2.500%, 5/15/2024 (1) | | | 5,000,000 | | | | 4,929,004 | |
2.625%, 2/28/2023 (1) | | | 31,000,000 | | | | 30,866,191 | |
2.750%, 6/30/2025 (1) | | | 20,000,000 | | | | 19,934,766 | |
3.000%, 2/15/2048 (1) | | | 20,000,000 | | | | 19,966,016 | |
| | | | | | | | |
Total U.S. Government & U.S. Government Agency Obligations
(identified cost $256,680,814) | | | | 254,911,025 | |
| | | | | | | | |
| U.S. Government Agency-Mortgage Securities — 19.0% | |
|
Federal Home Loan Mortgage Corporation — 9.4% | |
3.000%, 11/1/2042 | | | 1,153,343 | | | | 1,126,209 | |
3.000%, 4/1/2043 | | | 1,377,722 | | | | 1,345,492 | |
3.000%, 4/1/2043 | | | 2,127,793 | | | | 2,077,976 | |
3.000%, 4/1/2043 | | | 4,688,403 | | | | 4,578,878 | |
3.000%, 5/1/2043 | | | 2,393,488 | | | | 2,336,453 | |
3.000%, 7/1/2043 | | | 9,399,445 | | | | 9,176,004 | |
3.000%, 9/1/2043 | | | 9,536,270 | | | | 9,310,272 | |
3.000%, 4/1/2045 | | | 8,490,167 | | | | 8,257,635 | |
3.000%, 5/1/2045 | | | 4,677,398 | | | | 4,547,998 | |
3.000%, 9/1/2045 | | | 14,836,462 | | | | 14,410,091 | |
3.500%, 12/1/2040 | | | 750,162 | | | | 752,098 | |
3.500%, 12/1/2041 | | | 769,008 | | | | 771,001 | |
3.500%, 3/1/2042 | | | 259,658 | | | | 260,331 | |
3.500%, 12/1/2042 | | | 640,474 | | | | 642,133 | |
3.500%, 11/1/2043 | | | 6,298,165 | | | | 6,314,452 | |
3.500%, 1/1/2044 | | | 6,471,935 | | | | 6,488,684 | |
3.500%, 2/1/2044 | | | 6,801,530 | | | | 6,819,081 | |
3.500%, 11/1/2044 | | | 4,862,239 | | | | 4,858,770 | |
4.000%, 4/1/2026 | | | 333,864 | | | | 342,970 | |
4.000%, 12/1/2039 | | | 514,420 | | | | 528,673 | |
4.000%, 12/1/2040 | | | 229,551 | | | | 235,929 | |
4.000%, 12/1/2040 | | | 2,875,327 | | | | 2,955,171 | |
4.000%, 3/1/2041 | | | 230,838 | | | | 237,247 | |
4.000%, 4/1/2041 | | | 5,642,567 | | | | 5,799,267 | |
(See Notes which are an integral part of the Financial Statements)
92
TCH Core Plus Bond Fund (continued)
| | | | | | | | |
| Description | | Principal
Amount | | | Value | |
| U.S. Government Agency-Mortgage Securities (continued) | |
|
Federal Home Loan Mortgage Corporation(continued) | |
4.000%, 8/1/2041 | | $ | 148,900 | | | $ | 153,060 | |
4.000%, 11/1/2041 | | | 594,220 | | | | 610,818 | |
4.500%, 9/1/2031 | | | 258,229 | | | | 269,886 | |
4.500%, 3/1/2039 | | | 112,489 | | | | 117,651 | |
4.500%, 5/1/2039 | | | 426,079 | | | | 445,435 | |
4.500%, 2/1/2040 | | | 114,629 | | | | 120,411 | |
4.500%, 11/1/2040 | | | 444,189 | | | | 466,561 | |
4.500%, 2/1/2041 | | | 897,861 | | | | 943,159 | |
5.000%, 12/1/2035 | | | 56,413 | | | | 60,077 | |
5.000%, 1/1/2038 | | | 31,350 | | | | 33,445 | |
5.000%, 3/1/2038 | | | 97,353 | | | | 103,970 | |
5.000%, 3/1/2038 | | | 31,597 | | | | 33,747 | |
5.000%, 2/1/2039 | | | 161,073 | | | | 170,310 | |
5.000%, 1/1/2040 | | | 150,617 | | | | 161,108 | |
6.000%, 6/1/2037 | | | 60,260 | | | | 65,921 | |
6.000%, 1/1/2038 | | | 69,097 | | | | 75,648 | |
| | | | | | | | |
| | | | | | | 98,004,022 | |
|
Federal National Mortgage Association — 9.4% | |
3.000%, 3/1/2043 | | | 2,726,860 | | | | 2,662,210 | �� |
3.000%, 7/1/2043 | | | 6,237,093 | | | | 6,089,205 | |
3.000%, 7/1/2043 | | | 12,363,039 | | | | 12,075,504 | |
3.000%, 9/1/2044 | | | 8,089,040 | | | | 7,891,583 | |
3.000%, 1/1/2045 | | | 8,655,445 | | | | 8,433,881 | |
3.000%, 2/1/2045 | | | 12,310,345 | | | | 11,973,425 | |
3.000%, 6/1/2045 | | | 6,979,384 | | | | 6,784,403 | |
3.000%, 3/1/2046 | | | 14,252,282 | | | | 13,816,206 | |
3.000%, 7/1/2046 | | | 16,794,330 | | | | 16,275,248 | |
3.500%, 7/1/2032 | | | 371,826 | | | | 377,172 | |
3.500%, 5/1/2042 | | | 1,091,711 | | | | 1,097,668 | |
3.500%, 10/1/2042 | | | 765,822 | | | | 767,865 | |
3.500%, 10/1/2042 | | | 817,047 | | | | 819,238 | |
3.500%, 10/1/2042 | | | 1,026,491 | | | | 1,029,402 | |
3.500%, 11/1/2042 | | | 489,901 | | | | 491,821 | |
3.500%, 12/1/2042 | | | 949,211 | | | | 951,755 | |
4.000%, 11/1/2040 | | | 304,454 | | | | 312,381 | |
4.000%, 1/1/2041 | | | 421,032 | | | | 431,961 | |
4.000%, 2/1/2041 | | | 2,211,629 | | | | 2,270,673 | |
4.000%, 2/1/2041 | | | 408,700 | | | | 419,382 | |
4.000%, 3/1/2041 | | | 173,397 | | | | 177,932 | |
4.000%, 11/1/2041 | | | 370,520 | | | | 380,440 | |
4.500%, 6/1/2039 | | | 640,246 | | | | 671,215 | |
4.500%, 8/1/2041 | | | 418,805 | | | | 438,831 | |
5.000%, 7/1/2022 | | | 148,678 | | | | 152,858 | |
5.000%, 3/1/2035 | | | 227,770 | | | | 243,650 | |
5.000%, 5/1/2042 | | | 589,225 | | | | 631,716 | |
5.500%, 2/1/2034 | | | 38,510 | | | | 42,018 | |
5.500%, 7/1/2036 | | | 204,577 | | | | 223,247 | |
5.500%, 8/1/2037 | | | 384,757 | | | | 418,756 | |
5.500%, 6/1/2038 | | | 52,522 | | | | 56,933 | |
6.000%, 12/1/2038 | | | 15,582 | | | | 16,914 | |
6.000%, 5/1/2039 | | | 161,326 | | | | 178,401 | |
6.500%, 10/1/2037 | | | 40,301 | | | | 45,394 | |
6.500%, 11/1/2037 | | | 21,458 | | | | 24,089 | |
| | | | | | | | |
| | | | | | | 98,673,377 | |
|
Government National Mortgage Association — 0.2% | |
4.000%, 10/15/2040 | | | 410,151 | | | | 422,347 | |
4.000%, 12/15/2040 | | | 470,044 | | | | 483,972 | |
4.000%, 4/15/2041 | | | 481,535 | | | | 495,842 | |
5.500%, 8/20/2038 | | | 74,141 | | | | 77,219 | |
5.500%, 2/15/2039 | | | 45,209 | | | | 48,811 | |
6.000%, 12/15/2038 | | | 56,421 | | | | 61,187 | |
| | | | | | | | |
| Description | | Shares or
Principal
Amount | | | Value | |
| U.S. Government Agency-Mortgage Securities (continued) | |
|
Government National Mortgage Association(continued) | |
6.000%, 1/15/2039 | | $ | 26,215 | | | $ | 28,420 | |
| | | | | | | | |
| | | | | | | 1,617,798 | |
| | | | | | | | |
Total U.S. Government Agency-Mortgage Securities | |
(identified cost $203,086,071) | | | | 198,295,197 | |
| | | | | | | | |
| Short-Term Investments — 38.7% | |
|
| Collateral Pool Investments for Securities on Loan — 34.8% | |
| | |
Collateral pool allocation (3) | | | | | | | 363,577,000 | |
| | |
| Mutual Funds — 3.9% | | | | | | |
BMO Institutional Prime Money Market Fund — Premier Class, 1.987% (4) | | | 40,858,025 | | | | 40,862,111 | |
| | | | | | | | |
Total Short-Term Investments
(identified cost $404,434,259) | | | | 404,439,111 | |
| | | | | | | | |
Total Investments — 134.2%
(identified cost $1,412,774,991) | | | | 1,403,440,573 | |
| Other Assets and Liabilities — (34.2)% | | | | (357,589,221 | ) |
| | | | | | | | |
| Total Net Assets — 100.0% | | | $ | 1,045,851,352 | |
| | | | | | | | |
High Yield Bond Fund
| | | | | | | | |
| Description | | Principal
Amount | | | Value | |
| Corporate Bonds & Notes — 91.9% | | | | | | |
| | |
Aerospace/Defense — 1.0% | | | | | | | | |
TransDigm, Inc., 6.500%, 7/15/2024 (1) | | $ | 115,000 | | | $ | 117,156 | |
| | |
Agriculture — 0.3% | | | | | | | | |
Vector Group, Ltd., 6.125%, 2/1/2025 (5) | | | 38,000 | | | | 36,575 | |
| | |
Auto Parts & Equipment — 4.5% | | | | | | | | |
Allison Transmission, Inc., 4.750%, 10/1/2027 (1)(5) | | | 100,000 | | | | 94,250 | |
American Axle & Manufacturing, Inc., 6.625%, 10/15/2022 (1) | | | 82,000 | | | | 84,152 | |
Goodyear Tire & Rubber Co., 5.000%, 5/31/2026 (1) | | | 150,000 | | | | 141,375 | |
Meritor, Inc., 6.250%, 2/15/2024 | | | 75,000 | | | | 76,586 | |
Tenneco, Inc., 5.000%, 7/15/2026 | | | 125,000 | | | | 111,250 | |
| | | | | | | | |
| | | | | | | 507,613 | |
| | |
Banks — 0.9% | | | | | | | | |
CIT Group, Inc., 5.000%, 8/15/2022 | | | 103,000 | | | | 105,318 | |
| | |
Building Materials — 2.2% | | | | | | | | |
Builders FirstSource, Inc., 5.625%, 9/1/2024 (5) | | | 150,000 | | | | 146,250 | |
U.S. Concrete, Inc., 6.375%, 6/1/2024 (1) | | | 100,000 | | | | 101,375 | |
| | | | | | | | |
| | | | | | | 247,625 | |
| | |
Chemicals — 1.9% | | | | | | | | |
Braskem Netherlands Finance BV, 3.500%, 1/10/2023 (5) | | | 50,000 | | | | 46,688 | |
CF Industries, Inc., 5.150%, 3/15/2034 | | | 75,000 | | | | 70,969 | |
Trinseo Materials Operating SCA, 5.375%, 9/1/2025 (5) | | | 50,000 | | | | 49,187 | |
Valvoline, Inc., 4.375%, 8/15/2025 | | | 50,000 | | | | 47,813 | |
| | | | | | | | |
| | | | | | | 214,657 | |
| | |
Commercial Services — 2.7% | | | | | | | | |
Avis Budget Car Rental LLC, 5.250%, 3/15/2025 (5) | | | 75,000 | | | | 70,594 | |
(See Notes which are an integral part of the Financial Statements)
93
August 31, 2018
High Yield Bond Fund (continued)
| | | | | | | | |
| Description | | Principal
Amount | | | Value | |
| Corporate Bonds & Notes (continued) | | | | | | |
| | |
Commercial Services(continued) | | | | | | | | |
Hertz Corp., 5.875%, 10/15/2020 | | $ | 100,000 | | | $ | 99,969 | |
Prime Security Services Borrower LLC, 9.250%, 5/15/2023 (5) | | | 80,000 | | | | 85,904 | |
Weight Watchers International, Inc., 8.625%, 12/1/2025 (5) | | | 50,000 | | | | 54,250 | |
| | | | | | | | |
| | | | | | | 310,717 | |
| | |
Computers — 2.8% | | | | | | | | |
Dell, Inc., 6.500%, 4/15/2038 | | | 125,000 | | | | 121,875 | |
GCI LLC, 6.750%, 6/1/2021 | | | 79,000 | | | | 80,063 | |
Seagate HDD Cayman: | | | | | | | | |
4.750%, 1/1/2025 | | | 25,000 | | | | 23,995 | |
4.875%, 6/1/2027 (1) | | | 50,000 | | | | 47,040 | |
Western Digital Corp., 4.750%, 2/15/2026 | | | 50,000 | | | | 49,115 | |
| | | | | | | | |
| | | | | | | 322,088 | |
| | |
Cosmetics/Personal Care — 1.4% | | | | | | | | |
Coty, Inc., 6.500%, 4/15/2026 (1)(5) | | | 100,000 | | | | 94,312 | |
Revlon Consumer Products Corp., 6.250%, 8/1/2024 | | | 100,000 | | | | 58,500 | |
| | | | | | | | |
| | | | | | | 152,812 | |
| | |
Electric — 3.6% | | | | | | | | |
AES Corp., 4.000%, 3/15/2021 | | | 50,000 | | | | 50,260 | |
Drax Finco PLC, 6.625%, 11/1/2025 (5) | | | 100,000 | | | | 102,000 | |
NextEra Energy Operating Partners LP, 4.250%, 9/15/2024 (1)(5) | | | 100,000 | | | | 97,750 | |
NRG Energy, Inc., 5.750%, 1/15/2028 (1)(5) | | | 100,000 | | | | 101,250 | |
Vistra Energy Corp., 7.375%, 11/1/2022 | | | 50,000 | | | | 52,187 | |
| | | | | | | | |
| | | | | | | 403,447 | |
| | |
Entertainment — 1.2% | | | | | | | | |
Cinemark USA, Inc., 4.875%, 6/1/2023 | | | 60,000 | | | | 59,550 | |
Scientific Games International, Inc., 5.000%, 10/15/2025 (5) | | | 75,000 | | | | 71,438 | |
| | | | | | | | |
| | | | | | | 130,988 | |
| | |
Food — 2.8% | | | | | | | | |
Albertsons Cos. LLC, 5.750%, 3/15/2025 | | | 75,000 | | | | 68,250 | |
Dean Foods Co., 6.500%, 3/15/2023 (1)(5) | | | 85,000 | | | | 81,175 | |
Minerva Luxembourg SA, 6.500%, 9/20/2026 (5) | | | 75,000 | | | | 67,126 | |
Post Holdings, Inc., 5.000%, 8/15/2026 (5) | | | 100,000 | | | | 96,250 | |
| | | | | | | | |
| | | | | | | 312,801 | |
| | |
Forest Products & Paper — 1.1% | | | | | | | | |
Mercer International, Inc., 6.500%, 2/1/2024 | | | 125,000 | | | | 128,438 | |
| | |
Healthcare-Products — 1.4% | | | | | | | | |
Hologic, Inc., 4.625%, 2/1/2028 (5) | | | 100,000 | | | | 94,250 | |
Mallinckrodt International Finance SA, 5.625%, 10/15/2023 (5) | | | 75,000 | | | | 67,219 | |
| | | | | | | | |
| | | | | | | 161,469 | |
| | |
Healthcare-Services — 9.1% | | | | | | | | |
Acadia Healthcare Co., Inc., 6.500%, 3/1/2024 | | | 50,000 | | | | 52,063 | |
Catalent Pharma Solutions, Inc., 4.875%, 1/15/2026 (5) | | | 100,000 | | | | 95,875 | |
Centene Corp., 6.125%, 2/15/2024 | | | 75,000 | | | | 79,031 | |
| | | | | | | | |
| Description | | Principal
Amount | | | Value | |
| Corporate Bonds & Notes (continued) | | | | | | |
| | |
Healthcare-Services(continued) | | | | | | | | |
Encompass Health Corp., 5.750%, 11/1/2024 | | $ | 75,000 | | | $ | 76,219 | |
Envision Healthcare Corp., 5.625%, 7/15/2022 (1) | | | 150,000 | | | | 154,500 | |
HCA, Inc.: | | | | | | | | |
5.375%, 9/1/2026 | | | 50,000 | | | | 50,375 | |
5.875%, 5/1/2023 (1) | | | 90,000 | | | | 94,725 | |
LifePoint Health, Inc., 5.375%, 5/1/2024 (1) | | | 159,000 | | | | 165,757 | |
Select Medical Corp., 6.375%, 6/1/2021 (1) | | | 150,000 | | | | 152,062 | |
Tenet Healthcare Corp., 8.125%, 4/1/2022 (1) | | | 75,000 | | | | 79,500 | |
WellCare Health Plans, Inc., 5.375%, 8/15/2026 (5) | | | 25,000 | | | | 25,813 | |
| | | | | | | | |
| | | | | | | 1,025,920 | |
| | |
Home Builders — 3.0% | | | | | | | | |
Beazer Homes USA, Inc., 5.875%, 10/15/2027 | | | 125,000 | | | | 107,188 | |
TRI Pointe Group, Inc., 5.875%, 6/15/2024 | | | 51,000 | | | | 51,061 | |
William Lyon Homes, Inc., 5.875%, 1/31/2025 (1) | | | 188,000 | | | | 178,835 | |
| | | | | | | | |
| | | | | | | 337,084 | |
| | |
Home Furnishings — 1.3% | | | | | | | | |
Tempur Sealy International, Inc., 5.625%, 10/15/2023 | | | 150,000 | | | | 150,750 | |
| | |
Insurance — 0.7% | | | | | | | | |
CNO Financial Group, Inc., 5.250%, 5/30/2025 (1) | | | 75,000 | | | | 76,500 | |
| | |
Internet — 1.3% | | | | | | | | |
Netflix, Inc., 4.875%, 4/15/2028 (1)(5) | | | 150,000 | | | | 142,312 | |
| | |
Iron/Steel — 0.5% | | | | | | | | |
United States Steel Corp., 6.875%, 8/15/2025 | | | 50,000 | | | | 51,000 | |
| | |
Lodging — 2.8% | | | | | | | | |
Boyd Gaming Corp., 6.000%, 8/15/2026 | | | 50,000 | | | | 50,625 | |
Hilton Domestic Operating Co., Inc., 5.125%, 5/1/2026 (1)(5) | | | 50,000 | | | | 50,312 | |
MGM Resorts International, 4.625%, 9/1/2026 | | | 175,000 | | | | 165,812 | |
Wynn Las Vegas LLC, 5.250%, 5/15/2027 (5) | | | 50,000 | | | | 46,813 | |
| | | | | | | | |
| | | | | | | 313,562 | |
| | |
Media — 5.9% | | | | | | | | |
Altice Finco SA, 7.625%, 2/15/2025 (5) | | | 200,000 | | | | 176,750 | |
Altice France SA, 7.375%, 5/1/2026 (5) | | | 100,000 | | | | 98,625 | |
AMC Networks, Inc., 5.000%, 4/1/2024 (1) | | | 100,000 | | | | 98,625 | |
CCO Holdings LLC, 5.500%, 5/1/2026 (1)(5) | | | 200,000 | | | | 198,000 | |
Sirius XM Radio, Inc., 5.375%, 7/15/2026 (1)(5) | | | 100,000 | | | | 100,000 | |
| | | | | | | | |
| | | | | | | 672,000 | |
| | |
Mining — 4.2% | | | | | | | | |
Alcoa Nederland Holding BV, 6.125%, 5/15/2028 (5) | | | 25,000 | | | | 25,875 | |
Freeport-McMoRan, Inc., 3.550%, 3/1/2022 (1) | | | 150,000 | | | | 145,125 | |
Hudbay Minerals, Inc., 7.250%, 1/15/2023 (5) | | | 75,000 | | | | 76,687 | |
(See Notes which are an integral part of the Financial Statements)
94
High Yield Bond Fund (continued)
| | | | | | | | |
| Description | | Principal
Amount | | | Value | |
| Corporate Bonds & Notes (continued) | |
| | |
Mining(continued) | | | | | | | | |
Kaiser Aluminum Corp., 5.875%, 5/15/2024 | | $ | 100,000 | | | $ | 102,750 | |
Kinross Gold Corp.: | | | | | | | | |
4.500%, 7/15/2027 | | | 75,000 | | | | 68,250 | |
6.875%, 9/1/2041 | | | 50,000 | | | | 51,625 | |
| | | | | | | | |
| | | | | | | 470,312 | |
|
Miscellaneous Manufacturing — 0.4% | |
Trinity Industries, Inc., 4.550%, 10/1/2024 | | | 50,000 | | | | 48,552 | |
| | |
Oil & Gas — 9.1% | | | | | | | | |
Chesapeake Energy Corp., 8.000%, 1/15/2025 | | | 75,000 | | | | 76,781 | |
Diamond Offshore Drilling, Inc., 7.875%, 8/15/2025 | | | 75,000 | | | | 76,687 | |
Ensco PLC: | | | | | | | | |
4.500%, 10/1/2024 | | | 100,000 | | | | 83,375 | |
7.750%, 2/1/2026 (1) | | | 100,000 | | | | 95,875 | |
Gulfport Energy Corp., 6.000%, 10/15/2024 | | | 100,000 | | | | 99,250 | |
Noble Holding International, Ltd., 7.750%, 1/15/2024 | | | 75,000 | | | | 73,688 | |
Oasis Petroleum, Inc., 6.875%, 3/15/2022 (1) | | | 71,000 | | | | 72,420 | |
PBF Holding Co. LLC, 7.250%, 6/15/2025 (1) | | | 100,000 | | | | 105,750 | |
QEP Resources, Inc., 5.250%, 5/1/2023 (1) | | | 150,000 | | | | 147,000 | |
Rowan Cos., Inc., 7.375%, 6/15/2025 | | | 50,000 | | | | 48,250 | |
Southwestern Energy Co., 7.500%, 4/1/2026 | | | 50,000 | | | | 52,625 | |
Whiting Petroleum Corp., 5.750%, 3/15/2021 (1) | | | 100,000 | | | | 102,750 | |
| | | | | | | | |
| | | | | | | 1,034,451 | |
|
Oil & Gas Services — 0.9% | |
SESI LLC, 7.750%, 9/15/2024 | | | 100,000 | | | | 103,750 | |
| | |
Pharmaceuticals — 3.2% | | | | | | | | |
Bausch Health Cos., Inc., 5.500%, 3/1/2023 (5) | | | 125,000 | | | | 118,454 | |
HLF Financing Sarl LLC, 7.250%, 8/15/2026 (5) | | | 125,000 | | | | 126,919 | |
Teva Pharmaceutical Finance Netherlands III BV: | | | | | | | | |
2.800%, 7/21/2023 (1) | | | 100,000 | | | | 88,632 | |
6.000%, 4/15/2024 | | | 25,000 | | | | 25,429 | |
| | | | | | | | |
| | | | | | | 359,434 | |
| | |
Pipelines — 3.1% | | | | | | | | |
Antero Midstream Partners LP, 5.375%, 9/15/2024 (1) | | | 100,000 | | | | 101,250 | |
Cheniere Corpus Christi Holdings LLC, 5.125%, 6/30/2027 (1) | | | 50,000 | | | | 51,062 | |
Genesis Energy LP, 6.750%, 8/1/2022 (1) | | | 150,000 | | | | 153,750 | |
Targa Resources Partners LP, 5.000%, 1/15/2028 (5) | | | 50,000 | | | | 48,688 | |
| | | | | | | | |
| | | | | | | 354,750 | |
|
Real Estate Investment Trusts — 1.9% | |
ESH Hospitality, Inc., 5.250%, 5/1/2025 (1)(5) | | | 100,000 | | | | 97,125 | |
| | | | | | | | |
| Description | | Principal
Amount | | | Value | |
| Corporate Bonds & Notes (continued) | |
|
Real Estate Investment Trusts(continued) | |
SBA Communications Corp., 4.875%, 9/1/2024 (1) | | $ | 50,000 | | | $ | 49,460 | |
Starwood Property Trust, Inc., 3.625%, 2/1/2021 (5) | | | 75,000 | | | | 73,312 | |
| | | | | | | | |
| | | | | | | 219,897 | |
| | |
Retail — 3.3% | | | | | | | | |
Asbury Automotive Group, Inc., 6.000%, 12/15/2024 (1) | | | 100,000 | | | | 100,750 | |
Beacon Roofing Supply, Inc., 4.875%, 11/1/2025 (1)(5) | | | 100,000 | | | | 92,750 | |
Hot Topic, Inc., 9.250%, 6/15/2021 (5) | | | 50,000 | | | | 48,750 | |
KFC Holding Co., 5.000%, 6/1/2024 (5) | | | 50,000 | | | | 50,000 | |
Party City Holdings, Inc., 6.125%, 8/15/2023 (5) | | | 75,000 | | | | 76,500 | |
| | | | | | | | |
| | | | | | | 368,750 | |
| | |
Semiconductors — 0.9% | | | | | | | | |
Amkor Technology, Inc., 6.375%, 10/1/2022 (1) | | | 100,000 | | | | 102,000 | |
| | |
Software — 1.7% | | | | | | | | |
Donnelley Financial Solutions, Inc., 8.250%, 10/15/2024 (1) | | | 74,000 | | | | 77,700 | |
Rackspace Hosting, Inc., 8.625%, 11/15/2024 (5) | | | 122,000 | | | | 120,399 | |
| | | | | | | | |
| | | | | | | 198,099 | |
| | |
Telecommunications — 8.8% | | | | | | | | |
CenturyLink, Inc., 5.800%, 3/15/2022 (1) | | | 50,000 | | | | 51,360 | |
Cincinnati Bell, Inc., 7.000%, 7/15/2024 (1)(5) | | | 150,000 | | | | 132,750 | |
CommScope, Inc., 5.500%, 6/15/2024 (1)(5) | | | 158,000 | | | | 160,567 | |
Inmarsat Finance PLC, 4.875%, 5/15/2022 (1)(5) | | | 150,000 | | | | 151,125 | |
Qwest Corp., 6.875%, 9/15/2033 | | | 100,000 | | | | 98,563 | |
Sprint Communications, Inc., 6.000%, 11/15/2022 | | | 75,000 | | | | 76,102 | |
Sprint Corp.: | | | | | | | | |
7.125%, 6/15/2024 (1) | | | 110,000 | | | | 114,400 | |
7.625%, 3/1/2026 | | | 50,000 | | | | 52,633 | |
Telecom Italia Capital SA, 6.000%, 9/30/2034 | | | 25,000 | | | | 24,745 | |
Telesat Canada, 8.875%, 11/15/2024 (5) | | | 82,000 | | | | 88,048 | |
T-Mobile USA, Inc., 4.500%, 2/1/2026 (1) | | | 50,000 | | | | 47,750 | |
| | | | | | | | |
| | | | | | | 998,043 | |
| | |
Toys/Games/Hobbies — 0.4% | | | | | | | | |
Mattel, Inc., 2.350%, 8/15/2021 | | | 50,000 | | | | 45,250 | |
| | |
Transportation — 1.6% | | | | | | | | |
XPO Logistics, Inc., 6.500%, 6/15/2022 (1)(5) | | | 175,000 | | | | 181,426 | |
| | | | | | | | |
Total Corporate Bonds & Notes
(identified cost $10,478,900) | | | | | | | 10,405,546 | |
| | | | | | | | |
| Short-Term Investments — 50.7% | |
|
| Collateral Pool Investments for Securities on Loan — 43.5% | |
| | |
Collateral pool allocation (3) | | | | | | | 4,935,287 | |
(See Notes which are an integral part of the Financial Statements)
95
August 31, 2018
High Yield Bond Fund (continued)
| | | | | | | | |
| Description | | Shares | | | Value | |
| Short-Term Investments (continued) | | | | | | |
| | |
| Mutual Funds — 7.2% | | | | | | |
BMO Institutional Prime Money
Market Fund — Premier Class, 1.987% (4) | | | 813,916 | | | $ | 813,997 | |
| | | | | | | | |
Total Short-Term Investments
(identified cost $5,749,205) | | | | | | | 5,749,284 | |
| | | | | | | | |
Total Investments — 142.6%
(identified cost $16,228,105) | | | | | | | 16,154,830 | |
| Other Assets and Liabilities — (42.6)% | | | | (4,829,222 | ) |
| | | | | | | | |
| Total Net Assets — 100.0% | | | | | | $ | 11,325,608 | |
| | | | | | | | |
Government Money Market Fund
| | | | | | | | |
| Description | | Shares or
Principal
Amount | | | Value | |
| Mutual Funds — 6.5% | |
BlackRock Liquidity FundsT-Fund Portfolio — Institutional Class, 1.840% | | | 70,000,000 | | | $ | 70,000,000 | |
Invesco Government & Agency Portfolio — Institutional Class, 1.855% | | | 150,000,000 | | | | 150,000,000 | |
| | | | | | | | |
| Total Mutual Funds | | | | | | | 220,000,000 | |
| | | | | | | | |
| Repurchase Agreements — 38.5% | |
Agreement with Fixed Income Clearing Corp., 1.000%, dated 8/31/2018, to be repurchased at $13,480,966 on 9/4/2018, collateralized by U.S. Government Treasury Obligations with various maturities to 4/15/2019, with a fair value of $13,752,237 | | $ | 13,479,468 | | | | 13,479,468 | |
Agreement with Fixed Income Clearing Corp., 1.960%, dated 8/31/2018, to be repurchased at $540,117,600 on 9/4/2018, collateralized by a U.S. Government Treasury Obligation with a maturity of 11/15/2043, with a fair value of $550,801,296 | | | 540,000,000 | | | | 540,000,000 | |
Agreement with Goldman Sachs Group, Inc., 1.930%, dated 8/30/2018, to be repurchased at $250,093,819 on 9/6/2018, collateralized by U.S. Government Agency Obligations with various maturities to 6/1/2056, with a fair value of $255,000,000 | | | 250,000,000 | | | | 250,000,000 | |
Agreement with Goldman Sachs Group, Inc., 1.960%, dated 8/31/2018, to be repurchased at $325,070,778 on 9/4/2018, collateralized by U.S. Government Agency Obligations with various maturities to 8/1/2048, with a fair value of $331,500,000 | | | 325,000,000 | | | | 325,000,000 | |
| | | | | | | | |
| Description | | Principal
Amount | | | Value | |
| Repurchase Agreements (continued) | |
Agreement with Merrill Lynch, Pierce, Fenner & Smith, Inc., 1.970%, dated 8/31/2018, to be repurchased at $25,005,472 on 9/4/2018, collateralized by U.S. Government Agency Obligations with various maturities to 2/1/2048, with a fair value of $25,500,001 | | $ | 25,000,000 | | | $ | 25,000,000 | |
Agreement with Toronto Dominion Bank, 1.960%, dated 8/31/2018, to be repurchased at $150,032,667 on 9/4/2018, collateralized by U.S. Government Agency Obligations with various maturities to 8/1/2048, with a fair value of $153,033,320 | | | 150,000,000 | | | | 150,000,000 | |
| | | | | | | | |
| Total Repurchase Agreements | | | | | | | 1,303,479,468 | |
| | | | | | | | |
| U.S. Government & U.S. Government Agency Obligations — 55.1% | |
|
Federal Farm Credit Bank — 16.4% | |
1.895% (FCPR DLY - 311 basis points) 4/10/2019 (10) | | | 14,000,000 | | | | 13,999,567 | |
1.895% (U.S. Federal Funds Effective Rate (continuous series) - 3 basis points) 4/25/2019 (10) | | | 18,000,000 | | | | 17,999,407 | |
1.920% (FCPR DLY - 308 basis points) 6/27/2019 (10) | | | 25,000,000 | | | | 24,999,789 | |
1.920% (FCPR DLY - 308 basis points) 9/13/2019 (10) | | | 12,000,000 | | | | 11,999,793 | |
1.920% (FCPR DLY - 308 basis
points) 10/10/2019 (10) | | | 15,000,000 | | | | 14,998,566 | |
1.920% (U.S. Federal Funds Effective Rate (continuous series) + 0 basis points) 4/15/2019 (10) | | | 16,000,000 | | | | 15,998,990 | |
1.925% (FCPR DLY - 308 basis points) 9/25/2019 (10) | | | 11,900,000 | | | | 11,900,119 | |
1.930% (FCPR DLY - 307 basis points) 11/4/2019 (10) | | | 23,000,000 | | | | 22,998,160 | |
1.930% (FCPR DLY - 307 basis points) 12/18/2019 (10) | | | 10,000,000 | | | | 9,999,676 | |
1.930% (U.S. Federal Funds Effective Rate (continuous series) + 1 basis points) 4/24/2019 (10) | | | 15,000,000 | | | | 14,999,031 | |
1.935% (FCPR DLY - 307 basis points) 12/26/2019 (10) | | | 15,000,000 | | | | 14,999,010 | |
1.940% (FCPR DLY - 306 basis points) 4/25/2019 (10) | | | 14,000,000 | | | | 14,000,116 | |
1.950% (FCPR DLY - 305 basis points) 1/9/2020 (10) | | | 15,000,000 | | | | 14,998,987 | |
1.975% (LIBOR 1 Month - 10 basis points) 8/30/2019 (10) | | | 15,000,000 | | | | 14,999,912 | |
1.990% (LIBOR 1 Month - 9 basis points) 5/30/2019 (10) | | | 12,000,000 | | | | 11,996,848 | |
1.991% (LIBOR 1 Month - 8 basis points) 11/9/2018 (10) | | | 10,000,000 | | | | 9,999,907 | |
2.004% (LIBOR 1 Month - 10 basis points) 12/2/2019 (10) | | | 12,800,000 | | | | 12,793,978 | |
(See Notes which are an integral part of the Financial Statements)
96
Government Money Market Fund (continued)
| | | | | | | | |
| Description | | Principal
Amount | | | Value | |
U.S. Government & U.S. Government Agency Obligations
(continued) | |
|
Federal Farm Credit Bank(continued) | |
2.009% (LIBOR 1 Month - 10 basis points) 12/3/2018 (10) | | $ | 15,000,000 | | | $ | 15,000,000 | |
2.010% (LIBOR 1 Month - 7 basis points) 12/30/2019 (10) | | | 14,000,000 | | | | 13,999,073 | |
2.016% (LIBOR 1 Month - 5 basis points) 1/23/2019 (10) | | | 21,300,000 | | | | 21,304,780 | |
2.022% (LIBOR 1 Month - 6 basis points) 12/20/2018 (10) | | | 15,500,000 | | | | 15,499,875 | |
2.026% (LIBOR 1 Month - 4 basis points) 4/24/2019 (10) | | | 23,445,000 | | | | 23,456,633 | |
2.044% (LIBOR 1 Month - 6 basis points) 4/3/2019 (10) | | | 25,814,000 | | | | 25,822,067 | |
2.076% (LIBOR 3 Month - 26 basis points) 9/28/2018 (10) | | | 18,000,000 | | | | 18,000,121 | |
2.106% (LIBOR 3 Month - 23 basis points) 4/3/2019 (10) | | | 15,000,000 | | | | 14,999,940 | |
2.115% (LIBOR 1 Month + 5 basis points) 1/27/2020 (10) | | | 15,000,000 | | | | 15,022,237 | |
2.119% (LIBOR 1 Month + 5 basis points) 2/21/2020 (10) | | | 8,500,000 | | | | 8,513,151 | |
2.132% (LIBOR 1 Month + 7 basis points) 10/22/2018 (10) | | | 5,000,000 | | | | 5,001,239 | |
2.141% (Treasury Money Market Yield 3 Month + 5 basis points) 12/5/2018 (10) | | | 11,000,000 | | | | 10,999,853 | |
2.142% (LIBOR 3 Month - 20 basis points) 7/12/2019 (10) | | | 15,000,000 | | | | 14,999,354 | |
2.187% (LIBOR 1 Month + 12 basis points) 11/13/2018 (10) | | | 4,220,000 | | | | 4,222,185 | |
2.199% (LIBOR 1 Month + 10 basis points) 10/3/2018 (10) | | | 15,050,000 | | | | 15,050,386 | |
2.213% (LIBOR 1 Month + 15 basis points) 3/15/2019 (10) | | | 6,715,000 | | | | 6,724,678 | |
2.237% (LIBOR 1 Month + 17 basis points) 1/22/2019 (10) | | | 23,835,000 | | | | 23,861,598 | |
2.240% (LIBOR 1 Month + 18 basis points) 2/25/2019 (10) | | | 10,000,000 | | | | 10,012,444 | |
2.246% (LIBOR 1 Month + 18 basis points) 10/24/2019 (10) | | | 2,295,000 | | | | 2,302,846 | |
2.247% (LIBOR 1 Month + 18 basis points) 10/11/2019 (10) | | | 12,315,000 | | | | 12,352,394 | |
2.253% (LIBOR 1 Month + 19 basis points) 5/16/2019 (10) | | | 8,615,000 | | | | 8,632,589 | |
2.335% (LIBOR 1 Month + 27 basis points) 2/25/2019 (10) | | | 16,200,000 | | | | 16,226,852 | |
| | | | | | | | |
| | | | | | | 555,686,151 | |
|
Federal Home Loan Bank — 35.8% | |
1.924% (LIBOR 1 Month - 14 basis points) 10/16/2018 (10) | | | 10,000,000 | | | | 10,000,000 | |
1.928% 9/5/2018 (12) | | | 19,000,000 | | | | 18,995,989 | |
1.929% 9/5/2018 (12) | | | 15,922,000 | | | | 15,918,639 | |
1.929% (LIBOR 1 Month - 14 basis points) 10/16/2018 (10) | | | 13,500,000 | | | | 13,500,000 | |
1.933% (LIBOR 1 Month - 13 basis points) 10/10/2018 (10) | | | 5,300,000 | | | | 5,300,137 | |
1.933% (LIBOR 1 Month - 13 basis points) 10/10/2018 (10) | | | 9,000,000 | | | | 9,000,000 | |
1.935% (LIBOR 1 Month - 13 basis points) 9/17/2018 (10) | | | 10,000,000 | | | | 10,000,000 | |
1.937% 9/5/2018 (12) | | | 21,000,000 | | | | 20,995,543 | |
1.938% 9/12/2018 (12) | | | 25,000,000 | | | | 24,985,410 | |
| | | | | | | | |
| Description | | Principal
Amount | | | Value | |
U.S. Government & U.S. Government Agency Obligations
(continued) | |
|
Federal Home Loan Bank(continued) | |
1.939% (LIBOR 1 Month - 13 basis points) 7/16/2019 (10) | | $ | 25,000,000 | | | $ | 25,000,000 | |
1.940% (LIBOR 1 Month - 14 basis points) 10/5/2018 (10) | | | 17,000,000 | | | | 17,000,000 | |
1.941% (LIBOR 1 Month - 13 basis points) 11/23/2018 (10) | | | 40,000,000 | | | | 40,001,797 | |
1.943% 9/25/2018 (12) | | | 20,000,000 | | | | 19,974,533 | |
1.943% 9/27/2018 (12) | | | 2,000,000 | | | | 1,997,241 | |
1.945% (LIBOR 1 Month - 12 basis points) 9/26/2018 (10) | | | 18,000,000 | | | | 18,000,000 | |
1.948% 9/18/2018 (12) | | | 20,000,000 | | | | 19,981,914 | |
1.948% 9/24/2018 (12) | | | 25,000,000 | | | | 24,969,413 | |
1.950% 9/17/2018 (12) | | | 25,000,000 | | | | 24,978,667 | |
1.950% (LIBOR 1 Month - 12 basis points) 1/25/2019 (10) | | | 18,000,000 | | | | 17,999,478 | |
1.950% (LIBOR 1 Month - 12 basis points) 4/26/2019 (10) | | | 25,000,000 | | | | 25,000,000 | |
1.950% (LIBOR 1 Month - 13 basis points) 2/6/2019 (10) | | | 13,400,000 | | | | 13,400,000 | |
1.951% (LIBOR 1 Month - 12 basis points) 12/24/2018 (10) | | | 20,000,000 | | | | 20,000,993 | |
1.951% (LIBOR 1 Month - 12 basis points) 2/25/2019 (10) | | | 20,000,000 | | | | 20,000,000 | |
1.952% 9/28/2018 (12) | | | 25,000,000 | | | | 24,964,000 | |
1.952% (LIBOR 1 Month - 12 basis points) 9/11/2018 (10) | | | 15,000,000 | | | | 15,000,000 | |
1.952% (LIBOR 1 Month - 13 basis points) 11/20/2018 (10) | | | 25,000,000 | | | | 25,000,402 | |
1.953% 9/14/2018 (12) | | | 20,000,000 | | | | 19,986,133 | |
1.953% (LIBOR 1 Month - 11 basis points) 12/14/2018 (10) | | | 25,000,000 | | | | 25,000,249 | |
1.956% 9/27/2018 (12) | | | 30,000,000 | | | | 29,958,292 | |
1.957% 9/28/2018 (12) | | | 28,000,000 | | | | 27,959,575 | |
1.957% (LIBOR 1 Month - 12 basis points) 1/18/2019 (10) | | | 15,000,000 | | | | 15,000,000 | |
1.960% 9/21/2018 (12) | | | 25,000,000 | | | | 24,973,194 | |
1.961% 9/25/2018 (12) | | | 27,000,000 | | | | 26,965,260 | |
1.961% (LIBOR 1 Month - 11 basis points) 1/24/2019 (10) | | | 15,000,000 | | | | 15,000,000 | |
1.964% 9/18/2018 (12) | | | 6,000,000 | | | | 5,994,532 | |
1.964% 9/19/2018 (12) | | | 20,000,000 | | | | 19,980,700 | |
1.965% 9/27/2018 (12) | | | 20,000,000 | | | | 19,972,050 | |
1.966% 9/21/2018 (12) | | | 23,400,000 | | | | 23,374,910 | |
1.966% 9/26/2018 (12) | | | 25,000,000 | | | | 24,966,406 | |
1.966% 9/27/2018 (12) | | | 25,000,000 | | | | 24,965,062 | |
1.967% 9/18/2018 (12) | | | 16,600,000 | | | | 16,584,871 | |
1.968% 9/25/2018 (12) | | | 1,200,000 | | | | 1,198,456 | |
1.969% 9/6/2018 (12) | | | 9,000,000 | | | | 8,997,581 | |
1.969% (LIBOR 1 Month - 10 basis points) 12/21/2018 (10) | | | 17,500,000 | | | | 17,500,000 | |
1.970% 9/28/2018 (12) | | | 20,000,000 | | | | 19,970,900 | |
1.971% (LIBOR 1 Month - 10 basis points) 10/23/2019 (10) | | | 12,500,000 | | | | 12,500,000 | |
1.972% (LIBOR 1 Month - 11 basis points) 7/19/2019 (10) | | | 20,000,000 | | | | 20,000,000 | |
1.975% (LIBOR 1 Month - 9 basis points) 7/26/2019 (10) | | | 12,850,000 | | | | 12,850,000 | |
1.977% 9/7/2018 (12) | | | 10,350,000 | | | | 10,346,653 | |
1.977% (LIBOR 1 Month - 9 basis points) 1/11/2019 (10) | | | 13,500,000 | | | | 13,500,000 | |
1.977% (LIBOR 1 Month - 9 basis points) 1/22/2019 (10) | | | 15,000,000 | | | | 15,000,000 | |
1.977% (LIBOR 1 Month - 9 basis points) 8/12/2019 (10) | | | 10,150,000 | | | | 10,150,000 | |
(See Notes which are an integral part of the Financial Statements)
97
August 31, 2018
Government Money Market Fund (continued)
| | | | | | | | |
| Description | | Principal
Amount | | | Value | |
U.S. Government & U.S. Government Agency Obligations
(continued) | |
|
Federal Home Loan Bank(continued) | |
1.986% (LIBOR 1 Month - 8 basis points) 11/23/2018 (10) | | $ | 14,500,000 | | | $ | 14,500,000 | |
1.987% (LIBOR 1 Month - 8 basis points) 3/14/2019 (10) | | | 14,000,000 | | | | 14,000,000 | |
1.987% (LIBOR 1 Month - 8 basis points) 8/22/2019 (10) | | | 13,000,000 | | | | 13,000,000 | |
1.993% (LIBOR 1 Month - 9 basis points) 11/8/2018 (10) | | | 15,000,000 | | | | 15,000,000 | |
1.994% (LIBOR 1 Month - 11 basis points) 1/4/2019 (10) | | | 2,500,000 | | | | 2,500,109 | |
1.994% (LIBOR 1 Month - 11 basis points) 1/4/2019 (10) | | | 1,100,000 | | | | 1,100,048 | |
1.997% (LIBOR 1 Month - 8 basis points) 3/20/2019 (10) | | | 16,100,000 | | | | 16,098,625 | |
1.999% (LIBOR 1 Month - 8 basis points) 2/7/2020 (10) | | | 15,000,000 | | | | 14,999,418 | |
1.999% (LIBOR 3 Month - 34 basis points) 4/9/2019 (10) | | | 9,000,000 | | | | 9,000,000 | |
2.001% (LIBOR 1 Month - 7 basis points) 1/23/2020 (10) | | | 10,000,000 | | | | 10,000,013 | |
2.005% (LIBOR 1 Month - 6 basis points) 8/28/2019 (10) | | | 10,000,000 | | | | 10,000,000 | |
2.007% (LIBOR 1 Month - 7 basis points) 7/19/2019 (10) | | | 15,000,000 | | | | 15,000,070 | |
2.017% (LIBOR 1 Month - 6 basis points) 2/20/2020 (10) | | | 20,000,000 | | | | 20,000,000 | |
2.017% (LIBOR 3 Month - 32 basis points) 4/12/2019 (10) | | | 16,000,000 | | | | 16,000,000 | |
2.023% (LIBOR 3 Month - 31 basis points) 1/3/2019 (10) | | | 20,000,000 | | | | 20,000,000 | |
2.024% (LIBOR 1 Month - 8 basis points) 2/4/2019 (10) | | | 10,000,000 | | | | 10,000,000 | |
2.059% (LIBOR 1 Month - 5 basis points) 2/1/2019 (10) | | | 10,000,000 | | | | 10,000,015 | |
2.125% (LIBOR 3 Month - 21 basis points) 10/26/2018 (10) | | | 6,120,000 | | | | 6,120,479 | |
2.129% (LIBOR 3 Month - 21 basis points) 4/9/2019 (10) | | | 14,500,000 | | | | 14,500,000 | |
2.133% (LIBOR 3 Month - 20 basis points) 1/18/2019 (10) | | | 2,950,000 | | | | 2,949,740 | |
2.150% (FCPR DLY - 285 basis points) 11/7/2018 (10) | | | 2,000,000 | | | | 2,000,998 | |
2.180% (LIBOR 3 Month - 16 basis points) 7/5/2019 (10) | | | 23,300,000 | | | | 23,324,871 | |
2.186% (LIBOR 3 Month - 15 basis points) 1/17/2020 (10) | | | 8,500,000 | | | | 8,500,000 | |
| | | | | | | | |
| | | | | | | 1,213,253,366 | |
|
Federal Home Loan Mortgage Corporation — 1.1% | |
1.940% (LIBOR 1 Month - 13 basis points) 11/27/2018 (10) | | | 10,000,000 | | | | 10,000,000 | |
2.081% (LIBOR 3 Month - 25 basis points) 10/10/2018 (10) | | | 20,000,000 | | | | 20,000,000 | |
2.172% (LIBOR 3 Month - 17 basis points) 7/5/2019 (10) | | | 8,890,000 | | | | 8,897,248 | |
| | | | | | | | |
| | | | | | | 38,897,248 | |
|
Federal National Mortgage Association — 1.8% | |
2.010% (LIBOR 3 Month + 8 basis points) 1/30/2019 (10) | | | 20,000,000 | | | | 20,000,000 | |
2.050% (LIBOR 3 Month + 12 basis points) 7/30/2019 (10) | | | 25,000,000 | | | | 25,000,000 | |
| | | | | | | | |
| Description | | Principal
Amount | | | Value | |
U.S. Government & U.S. Government Agency Obligations
(continued) | |
|
Federal National Mortgage Association(continued) | |
2.090% (LIBOR 3 Month + 16 basis points) 1/30/2020 (10) | | $ | 15,000,000 | | | $ | 15,000,000 | |
| | | | | | | | |
| | | | | | | 60,000,000 | |
| | | | | | | | |
| Total U.S. Government & U.S. Government Agency Obligations | | | | 1,867,836,765 | |
| | | | | | | | |
Total Investments — 100.1%
(at amortized cost) | | | | 3,391,316,233 | |
| Other Assets and Liabilities — (0.1)% | | | | (2,266,141 | ) |
| | | | | | | | |
| Total Net Assets — 100.0% | | | $ | 3,389,050,092 | |
| | | | | | | | |
Tax-Free Money Market Fund
| | | | | | | | |
| Description | | Principal
Amount | | | Value | |
| Municipals — 97.4% | |
|
Alabama — 11.8% | |
Chatom Industrial Development Board, 1.650%, 8/1/2037 (7) | | $ | 5,500,000 | | | $ | 5,500,000 | |
City of Oxford, 1.630%, 9/1/2041 (7) | | | 12,745,000 | | | | 12,745,000 | |
Columbia Industrial Development Board, 1.600%, 12/1/2037 (7) | | | 3,000,000 | | | | 3,000,000 | |
Industrial Development Board of the City of Mobile Alabama: | | | | | | | | |
1.550% 6/1/2034 (7) | | | 2,550,000 | | | | 2,550,000 | |
1.680% 6/1/2034 (7) | | | 10,000,000 | | | | 10,000,000 | |
Tender Option Bond Trust Receipts/Certificates: | | | | | | | | |
1.660% 5/1/2026 (5)(7) | | | 6,650,000 | | | | 6,650,000 | |
1.660% 7/1/2026 (5)(7) | | | 4,500,000 | | | | 4,500,000 | |
| | | | | | | | |
| | | | | | | 44,945,000 | |
|
California — 3.7% | |
Tender Option Bond Trust Receipts/Certificates: | | | | | | | | |
1.660% 11/1/2023 (5)(7) | | | 5,070,000 | | | | 5,070,000 | |
1.710% 9/1/2042 (5)(7) | | | 8,945,000 | | | | 8,945,000 | |
| | | | | | | | |
| | | | | | | 14,015,000 | |
|
Colorado — 2.5% | |
Colorado Health Facilities Authority, 1.600%, 1/1/2035 (7) | | | 9,500,000 | | | | 9,500,000 | |
|
Connecticut — 3.3% | |
State of Connecticut, 1.670%, 5/15/2034 (7) | | | 12,700,000 | | | | 12,700,000 | |
|
Delaware — 0.9% | |
Delaware State Health Facilities Authority, 1.550%, 10/1/2040 (7) | | | 3,360,000 | | | | 3,360,000 | |
|
Florida — 11.9% | |
Alachua County Housing Finance Authority, 1.560%, 4/15/2041 (7) | | | 4,020,000 | | | | 4,020,000 | |
City of Gainesville Utilities System Revenue, 1.530%, 10/1/2036 (7) | | | 11,200,000 | | | | 11,200,000 | |
City of Jacksonville, 1.600%, 10/9/2018 | | | 12,300,000 | | | | 12,300,000 | |
County of Brevard, 1.720%, 10/1/2019 (7) | | | 500,000 | | | | 500,000 | |
(See Notes which are an integral part of the Financial Statements)
98
Tax-Free Money Market Fund (continued)
| | | | | | | | |
| Description | | Principal
Amount | | | Value | |
| Municipals (continued) | |
|
Florida(continued) | |
County of St. Lucie, 1.530%, 9/1/2028 (7) | | $ | 2,100,000 | | | $ | 2,100,000 | |
Highlands County Health Facilities Authority, 1.560%, 11/15/2035 (7) | | | 8,000,000 | | | | 8,000,000 | |
Miami-Dade County Industrial Development Authority, 1.510%, 6/1/2021 (7) | | | 200,000 | | | | 200,000 | |
Pinellas County Health Facilities Authority, 1.560%, 11/1/2038 (7) | | | 3,000,000 | | | | 3,000,000 | |
Tender Option Bond Trust Receipts/Certificates, 1.590%, 7/1/2040 (5)(7) | | | 4,075,000 | | | | 4,075,000 | |
| | | | | | | | |
| | | | | | | 45,395,000 | |
|
Georgia — 1.3% | |
RBC Municipal Products, Inc. Trust,
1.620%, 10/1/2021 (5)(7) | | | 5,000,000 | | | | 5,000,000 | |
|
Illinois — 6.1% | |
Illinois Finance Authority, 1.550%, 8/15/2038 (7) | | | 800,000 | | | | 800,000 | |
Illinois Housing Development Authority, 1.560%, 1/1/2041 (7) | | | 5,000,000 | | | | 5,000,000 | |
Illinois State Toll Highway Authority, 1.570%, AGM, 1/1/2031 (7) | | | 1,485,000 | | | | 1,485,000 | |
Jackson-Union Counties Regional Port District, 1.600%, 4/1/2024 (7) | | | 2,400,000 | | | | 2,400,000 | |
Phoenix Realty SpecialAccount-U LP, 1.590%, 4/1/2020 (7) | | | 8,075,000 | | | | 8,075,000 | |
Tender Option Bond Trust Receipts/Certificates, 1.590%, 1/15/2026 (5)(7) | | | 5,600,000 | | | | 5,600,000 | |
| | | | | | | | |
| | | | | | | 23,360,000 | |
|
Indiana — 4.2% | |
Hamilton Southeastern Consolidated School Building Corp., 3.000%, 12/15/2018 | | | 2,350,000 | | | | 2,357,696 | |
Indiana Finance Authority, 1.530%, 7/1/2036 (7) | | | 6,000,000 | | | | 6,000,000 | |
Tender Option Bond Trust Receipts/Certificates, 1.710%, 5/14/2026 (5)(7) | | | 7,770,000 | | | | 7,770,000 | |
| | | | | | | | |
| | | | | | | 16,127,696 | |
|
Iowa — 3.4% | |
Iowa Finance Authority: | | | | | | | | |
1.600% 6/1/2039 (7) | | | 9,800,000 | | | | 9,800,000 | |
1.610% 9/1/2036 (7) | | | 3,200,000 | | | | 3,200,000 | |
| | | | | | | | |
| | | | | | | 13,000,000 | |
|
Kentucky — 0.3% | |
Louisville/Jefferson County Metropolitan Government, 1.550%, 9/7/2018 | | | 1,300,000 | | | | 1,300,000 | |
|
Maryland — 0.5% | |
RBC Municipal Products, Inc. Trust,
1.760%, 1/1/2025 (5)(7) | | | 2,000,000 | | | | 2,000,000 | |
|
Michigan — 1.0% | |
Michigan Finance Authority, 1.400%, 12/1/2034 (7) | | | 4,000,000 | | | | 4,000,000 | |
|
Minnesota — 1.9% | |
City of Ramsey, 1.760%, 12/1/2023 (7) | | | 1,860,000 | | | | 1,860,000 | |
| | | | | | | | |
| Description | | Principal
Amount | | | Value | |
| Municipals (continued) | |
|
Minnesota(continued) | |
Minnesota Higher Education Facilities Authority: | | | | | | | | |
1.630% 3/1/2024 (7) | | $ | 2,000,000 | | | $ | 2,000,000 | |
1.630% 3/1/2033 (7) | | | 3,215,000 | | | | 3,215,000 | |
| | | | | | | | |
| | | | | | | 7,075,000 | |
|
Mississippi — 3.6% | |
Mississippi Business Finance Corp.: | | | | | | | | |
1.560% 12/1/2030 (7) | | | 2,815,000 | | | | 2,815,000 | |
1.560% 12/1/2030 (7) | | | 2,030,000 | | | | 2,030,000 | |
1.560% 11/1/2035 (7) | | | 8,250,000 | | | | 8,250,000 | |
1.950% 5/1/2037 (7) | | | 595,000 | | | | 595,236 | |
| | | | | | | | |
| | | | | | | 13,690,236 | |
|
Missouri — 3.7% | |
City of St. Louis, 3.000%, 5/30/2019 | | | 3,000,000 | | | | 3,027,225 | |
Greene County Industrial Development Authority, 1.640%, 5/1/2039 (7) | | | 965,000 | | | | 965,000 | |
Tender Option Bond Trust Receipts/Certificates, 1.660%, 5/15/2041 (5)(7) | | | 10,000,000 | | | | 10,000,000 | |
| | | | | | | | |
| | | | | | | 13,992,225 | |
|
Nebraska — 0.2% | |
Nebraska Investment Finance Authority, 1.570%, 9/1/2031 (7) | | | 600,000 | | | | 600,000 | |
|
New York — 8.9% | |
City of New York, 1.560%, 8/1/2035 (7) | | | 1,250,000 | | | | 1,250,000 | |
County of Nassau, 3.000%, 9/18/2018 | | | 1,800,000 | | | | 1,801,175 | |
New York City Transitional Finance Authority Future Tax Secured Revenue, 1.560%, 11/1/2029 (7) | | | 8,000,000 | | | | 8,000,000 | |
New York City Water & Sewer System: | | | | | | | | |
1.470% 6/15/2050 (7) | | | 3,470,000 | | | | 3,470,000 | |
1.530% 6/15/2049 (7) | | | 4,000,000 | | | | 4,000,000 | |
1.580% 6/15/2039 (7) | | | 7,500,000 | | | | 7,500,000 | |
RBC Municipal Products, Inc. Trust,
1.530%, 3/1/2022 (5)(7) | | | 6,000,000 | | | | 6,000,000 | |
Tender Option Bond Trust Receipts/Certificates, 1.600%, 1/1/2024 (5)(7) | | | 2,000,000 | | | | 2,000,000 | |
| | | | | | | | |
| | | | | | | 34,021,175 | |
|
North Carolina — 0.5% | |
Tender Option Bond Trust Receipts/Certificates, 1.600%, 7/1/2019 (5)(7) | | | 1,835,000 | | | | 1,835,000 | |
|
Ohio — 3.6% | |
City of Fairborn, 2.250%, 3/21/2019 | | | 2,000,000 | | | | 2,006,494 | |
Ohio Higher Educational Facility Commission, 1.550%, 1/1/2039 (7) | | | 1,705,000 | | | | 1,705,000 | |
Port of Greater Cincinnati Development Authority: | | | | | | | | |
1.800% 11/1/2023 (7) | | | 1,455,000 | | | | 1,455,000 | |
1.800% 11/1/2025 (7) | | | 280,000 | | | | 280,000 | |
RBC Municipal Products, Inc. Trust, 1.590%, 10/1/2020 (5)(7) | | | 4,110,000 | | | | 4,110,000 | |
(See Notes which are an integral part of the Financial Statements)
99
August 31, 2018
Tax-Free Money Market Fund (continued)
| | | | | | | | |
| Description | | Principal
Amount | | | Value | |
| Municipals (continued) | |
|
Ohio(continued) | |
Tender Option Bond Trust Receipts/Certificates, 1.660%, 6/1/2026 (5)(7) | | $ | 4,000,000 | | | $ | 4,000,000 | |
| | | | | | | | |
| | | | | | | 13,556,494 | |
|
Pennsylvania — 3.0% | |
RBC Municipal Products, Inc. Trust: | | | | | | | | |
1.530% 4/1/2022 (5)(7) | | | 7,000,000 | | | | 7,000,000 | |
1.760% 12/1/2025 (5)(7) | | | 4,325,000 | | | | 4,325,000 | |
| | | | | | | | |
| | | | | | | 11,325,000 | |
|
South Dakota — 3.3% | |
South Dakota Housing Development Authority: | | | | | | | | |
1.680% 11/1/2048 (7) | | | 6,185,000 | | | | 6,185,000 | |
1.740% 5/1/2048 (7) | | | 6,580,000 | | | | 6,580,000 | |
| | | | | | | | |
| | | | | | | 12,765,000 | |
|
Tennessee — 0.7% | |
Shelby County Health Educational & Housing Facilities Board, 1.550%, 6/15/2036 (7) | | | 2,600,000 | | | | 2,600,000 | |
|
Texas — 10.2% | |
City of Austin, 1.600%, 11/15/2029 (7) | | | 1,360,000 | | | | 1,360,000 | |
City of Dallas, 1.300%, 9/26/2018 | | | 4,500,000 | | | | 4,500,000 | |
City of San Antonio, 1.250%, 9/24/2018 | | | 4,000,000 | | | | 4,000,000 | |
County of Harris: | | | | | | | | |
1.350% 9/6/2018 | | | 9,225,000 | | | | 9,225,000 | |
1.350% 9/6/2018 | | | 590,000 | | | | 590,000 | |
1.520% 10/1/2018 | | | 5,000,000 | | | | 5,000,000 | |
Harris County Cultural Education Facilities Finance Corp., 1.460%, 12/1/2024 (7) | | | 2,355,000 | | | | 2,355,000 | |
State of Texas: | | | | | | | | |
1.550% 6/1/2046 (7) | | | 7,000,000 | | | | 7,000,000 | |
1.550% 12/1/2049 (7) | | | 5,000,000 | | | | 5,000,000 | |
| | | | | | | | |
| | | | | | | 39,030,000 | |
|
Washington — 5.5% | |
Seattle Housing Authority, 1.720%, 6/1/2040 (7) | | | 1,000,000 | | | | 1,000,000 | |
Tender Option Bond Trust Receipts/Certificates: | | | | | | | | |
1.620% 7/1/2026 (5)(7) | | | 5,000,000 | | | | 5,000,000 | |
1.710% 6/15/2029 (5)(7) | | | 11,320,000 | | | | 11,320,000 | |
Washington Higher Education Facilities Authority, 1.550%, 10/1/2029 (7) | | | 1,100,000 | | | | 1,100,000 | |
Washington State Housing Finance Commission, 1.670%, 7/1/2028 (7) | | | 2,505,000 | | | | 2,505,000 | |
| | | | | | | | |
| | | | | | | 20,925,000 | |
|
Wisconsin — 1.4% | |
Chippewa Falls Area Unified School District, 3.000%, 1/10/2019 | | | 1,225,000 | | | | 1,228,035 | |
Tender Option Bond Trust Receipts/Certificates, 1.600%, 7/1/2047 (5)(7) | | | 2,385,000 | | | | 2,385,000 | |
| | | | | | | | |
| Description | | Shares or
Principal
Amount | | | Value | |
| Municipals (continued) | |
|
Wisconsin(continued) | |
Wisconsin Health & Educational Facilities Authority, 1.640%, 5/1/2030 (7) | | $ | 1,655,000 | | | $ | 1,655,000 | |
| | | | | | | | |
| | | | | | | 5,268,035 | |
| | | | | | | | |
| Total Municipals | | | | | | | 371,385,861 | |
|
| Mutual Funds — 2.5% | |
BlackRock Liquidity FundsT-Fund Portfolio — Institutional Class, 1.840% | | | 100,000 | | | | 100,000 | |
Federated InstitutionalTax-Free Cash Trust — Institutional Class, 1.430% | | | 9,455,886 | | | | 9,455,886 | |
| | | | | | | | |
| Total Mutual Funds | | | | | | | 9,555,886 | |
| | | | | | | | |
Total Investments — 99.9%
(at amortized cost) | | | | | | | 380,941,747 | |
| Other Assets and Liabilities — 0.1% | | | | 371,386 | |
| | | | | | | | |
| Total Net Assets — 100.0% | | | | | | $ | 381,313,133 | |
| | | | | | | | |
Prime Money Market Fund
| | | | | | | | |
| Description | | Principal
Amount | | | Value | |
| Certificates of Deposit — 15.1% | |
|
Banks — 15.1% | |
Canadian Imperial Bank of Commerce, 2.410% (LIBOR 3 Month + 10 basis points), 9/20/2019 (10) | | $ | 3,000,000 | | | $ | 3,000,000 | |
HSBC Bank USA NA: | | | | | | | | |
2.287% (LIBOR 1 Month + 21 basis points), 11/20/2018 (10) | | | 2,500,000 | | | | 2,500,000 | |
2.305% (LIBOR 1 Month + 24 basis points), 4/25/2019 (10) | | | 3,000,000 | | | | 3,000,000 | |
2.324% (LIBOR 1 Month + 26 basis points), 11/16/2018 (10) | | | 3,000,000 | | | | 3,000,374 | |
2.354% (LIBOR 1 Month + 24 basis points), 12/4/2018 (10) | | | 2,500,000 | | | | 2,500,000 | |
Mitsubishi UFJ Trust & Banking Corp., 2.297% (LIBOR 1 Month + 23 basis points), 1/22/2019 (10) | | | 2,500,000 | | | | 2,500,000 | |
Mizuho Bank, Ltd.: | | | | | | | | |
2.255% (LIBOR 1 Month + 19 basis points), 3/11/2019 (10) | | | 3,000,000 | | | | 3,000,000 | |
2.327% (LIBOR 1 Month + 25 basis points), 12/18/2018 (10) | | | 3,000,000 | | | | 3,000,000 | |
2.383% (LIBOR 1 Month + 32 basis points), 9/10/2018 (10) | | | 3,000,000 | | | | 2,999,934 | |
2.504% (LIBOR 1 Month + 44 basis points), 10/10/2018 (10) | | | 2,500,000 | | | | 2,500,000 | |
2.643% (LIBOR 3 Month + 30 basis points), 4/30/2019 (10) | | | 2,500,000 | | | | 2,502,791 | |
2.835% (LIBOR 3 Month + 50 basis points), 9/24/2018 (10) | | | 1,000,000 | | | | 1,000,189 | |
MUFG Bank, Ltd., 2.440% (LIBOR 1 Month + 38 basis points), 10/17/2018 (10) | | | 2,500,000 | | | | 2,500,000 | |
Nordea Bank AB, 2.467% (LIBOR 1 Month + 40 basis points), 3/14/2019 (10) | | | 2,500,000 | | | | 2,500,000 | |
(See Notes which are an integral part of the Financial Statements)
100
Prime Money Market Fund (continued)
| | | | | | | | |
| Description | | Principal
Amount | | | Value | |
| Certificates of Deposit (continued) | |
|
Banks(continued) | |
Norinchukin Bank, 2.381% (LIBOR 1 Month + 30 basis points), 9/4/2018 (10) | | $ | 1,750,000 | | | $ | 1,750,013 | |
Sumitomo Mitsui Banking Corp.: | | | | | | | | |
2.230% (LIBOR 1 Month + 17 basis points), 2/19/2019 (10) | | | 3,000,000 | | | | 3,000,000 | |
2.273% (LIBOR 1 Month + 20 basis points), 3/28/2019 (10) | | | 3,000,000 | | | | 3,000,000 | |
2.316% (LIBOR 1 Month + 25 basis points), 10/24/2018 (10) | | | 2,500,000 | | | | 2,500,000 | |
Toronto-Dominion Bank: | | | | | | | | |
2.400% (LIBOR 1 Month + 32 basis points), 9/5/2018 (10) | | | 2,750,000 | | | | 2,750,000 | |
2.443% (LIBOR 3 Month + 11 basis points), 10/18/2018 (10) | | | 2,000,000 | | | | 2,000,514 | |
2.469% (LIBOR 3 Month + 13 basis points), 7/16/2019 (10) | | | 2,000,000 | | | | 2,000,000 | |
Wells Fargo Bank NA: | | | | | | | | |
2.299% (LIBOR 1 Month + 22 basis points), 10/5/2018 (10) | | | 2,000,000 | | | | 2,000,000 | |
2.307% (LIBOR 1 Month + 24 basis points), 11/9/2018 (10) | | | 2,500,000 | | | | 2,500,000 | |
2.476% (LIBOR 3 Month + 14 basis points), 6/28/2019 (10) | | | 3,000,000 | | | | 3,000,000 | |
2.491% (LIBOR 1 Month + 42 basis points), 10/9/2018 (10) | | | 3,000,000 | | | | 3,000,379 | |
Westpac Banking Corp.: | | | | | | | | |
2.370% (U.S. Federal Funds Effective Rate (continuous series) + 45 basis points), 2/15/2019 (10) | | | 2,500,000 | | | | 2,500,000 | |
2.469% (LIBOR 3 Month + 13 basis points), 1/9/2019 (10) | | | 3,000,000 | | | | 3,000,000 | |
| | | | | | | | |
| Total Certificates of Deposit | | | | | | | 69,504,194 | |
| | | | | | | | |
| Commercial Paper — 57.8% | |
|
Asset-Backed Securities — 37.4% | |
Atlantic Asset Securitization LLC: | | | | | | | | |
2.239% (LIBOR 1 Month + 17 basis points), 2/21/2019 (5)(10) | | | 3,000,000 | | | | 3,000,000 | |
2.306% 11/9/2018 (12) | | | 3,000,000 | | | | 2,987,005 | |
2.307% (LIBOR 1 Month + 24 basis points), 12/14/2018 (5)(10) | | | 2,500,000 | | | | 2,500,000 | |
2.364% (LIBOR 1 Month + 30 basis points), 11/16/2018 (5)(10) | | | 3,000,000 | | | | 3,000,000 | |
2.380% (LIBOR 1 Month + 30 basis points), 11/6/2018 (5)(10) | | | 3,000,000 | | | | 3,000,000 | |
Bedford Row Funding Corp.: | | | | | | | | |
2.353% (LIBOR 1 Month + 29 basis points), 3/15/2019 (5)(10) | | | 2,500,000 | | | | 2,500,000 | |
2.367% (LIBOR 1 Month + 30 basis points), 4/11/2019 (5)(10) | | | 2,000,000 | | | | 2,000,000 | |
2.381% (LIBOR 1 Month + 30 basis points), 9/12/2018 (5)(10) | | | 3,000,000 | | | | 3,000,000 | |
2.400% (LIBOR 1 Month + 32 basis points),
6/6/2019 (5)(10) | | | 3,000,000 | | | | 3,000,000 | |
2.413% (LIBOR 1 Month + 35 basis points), 2/15/2019 (5)(10) | | | 3,000,000 | | | | 3,000,000 | |
2.467% (LIBOR 3 Month + 13 basis points), 6/27/2019 (5)(10) | | | 2,500,000 | | | | 2,500,000 | |
| | | | | | | | |
| Description | | Principal
Amount | | | Value | |
| Commercial Paper (continued) | |
|
Asset-Backed Securities(continued) | |
Chesham Finance, Ltd., 1.967% 9/4/2018 (12) | | $ | 18,000,000 | | | $ | 17,997,090 | |
Lexington Parker Capital Co. LLC: | | | | | | | | |
2.029% 9/7/2018 (12) | | | 6,500,000 | | | | 6,497,833 | |
2.050% 9/4/2018 (12) | | | 3,000,000 | | | | 2,999,488 | |
2.080% 9/5/2018 (12) | | | 4,500,000 | | | | 4,498,975 | |
2.187% 9/7/2018 (12) | | | 3,000,000 | | | | 2,998,925 | |
Liberty Street Funding LLC, 2.381% (LIBOR 1 Month + 30 basis points), 11/2/2018 (5)(10) | | | 3,500,000 | | | | 3,500,000 | |
LMA Americas LLC: | | | | | | | | |
1.998% 9/6/2018 (12) | | | 6,000,000 | | | | 5,998,358 | |
2.345% 10/15/2018 (12) | | | 3,000,000 | | | | 2,991,567 | |
2.401% 11/16/2018 (12) | | | 3,000,000 | | | | 2,985,117 | |
2.499% 1/9/2019 (12) | | | 2,000,000 | | | | 1,982,378 | |
2.556% 2/4/2019 (12) | | | 3,000,000 | | | | 2,967,630 | |
Longship Funding LLC: | | | | | | | | |
2.019% 9/5/2018 (12) | | | 3,500,000 | | | | 3,499,226 | |
2.019% 9/6/2018 (12) | | | 5,000,000 | | | | 4,998,618 | |
2.029% 9/11/2018 (12) | | | 3,000,000 | | | | 2,998,333 | |
2.083% 9/17/2018 (12) | | | 3,500,000 | | | | 3,496,811 | |
Manhattan Asset Funding Co. LLC: | | | | | | | | |
2.187% 9/12/2018 (12) | | | 3,000,000 | | | | 2,998,029 | |
2.390% (LIBOR 1 Month + 31 basis points), 11/5/2018 (5)(10) | | | 2,500,000 | | | | 2,500,000 | |
Old Line Funding LLC: | | | | | | | | |
2.405% (LIBOR 1 Month + 34 basis points), 10/25/2018 (5)(10) | | | 3,000,000 | | | | 3,000,000 | |
2.570% (LIBOR 1 Month + 50 basis points), 3/21/2019 (5)(10) | | | 2,500,000 | | | | 2,500,000 | |
Regency Markets No. 1 LLC: | | | | | | | | |
2.029% 9/7/2018 (12) | | | 7,500,000 | | | | 7,497,500 | |
2.072% 9/6/2018 (12) | | | 3,500,000 | | | | 3,499,008 | |
2.082% 9/17/2018 (12) | | | 5,000,000 | | | | 4,995,444 | |
Ridgefield Funding Co. LLC, 2.535% 11/13/2018 (12) | | | 2,500,000 | | | | 2,487,479 | |
Sheffield Receivables Co. LLC: | | | | | | | | |
2.305% 11/1/2018 (12) | | | 3,500,000 | | | | 3,486,597 | |
2.323% 11/15/2018 (12) | | | 3,000,000 | | | | 2,985,750 | |
2.324% 11/14/2018 (12) | | | 3,500,000 | | | | 3,483,597 | |
2.371% 12/7/2018 (12) | | | 3,500,000 | | | | 3,478,121 | |
Starbird Funding Corp.,, 1.978% 9/4/2018 (12) | | | 17,500,000 | | | | 17,497,156 | |
Thunder Bay Funding LLC: | | | | | | | | |
2.252% (LIBOR 1 Month + 17 basis points), 2/1/2019 (5)(10) | | | 3,000,000 | | | | 3,000,000 | |
2.317% (LIBOR 1 Month + 25 basis points), 1/14/2019 (5)(10) | | | 3,000,000 | | | | 3,000,000 | |
2.417% (LIBOR 1 Month + 34 basis points), 2/19/2019 (5)(10) | | | 3,000,000 | | | | 3,000,000 | |
2.449% (LIBOR 1 Month + 37 basis points), 3/7/2019 (5)(10) | | | 2,500,000 | | | | 2,500,000 | |
| | | | | | | | |
| | | | | | | 172,806,035 | |
|
Automobiles — 2.6% | |
Toyota Motor Credit Corp.: | | | | | | | | |
2.330% (LIBOR 1 Month + 25 basis points), 9/4/2018 (10) | | | 3,500,000 | | | | 3,500,000 | |
(See Notes which are an integral part of the Financial Statements)
101
August 31, 2018
Prime Money Market Fund (continued)
| | | | | | | | |
| Description | | Principal
Amount | | | Value | |
| Commercial Paper (continued) | |
|
Automobiles(continued) | |
2.358% (LIBOR 3 Month + 2 basis points), 1/3/2019 (10) | | $ | 3,000,000 | | | $ | 3,000,000 | |
2.419% (LIBOR 3 Month + 8 basis points), 4/12/2019 (10) | | | 3,000,000 | | | | 3,000,000 | |
2.450% (LIBOR 1 Month + 37 basis points), 10/3/2018 (10) | | | 2,500,000 | | | | 2,500,000 | |
| | | | | | | | |
| | | | | | | 12,000,000 | |
|
Diversified Financial Services — 4.4% | |
Cargill Global Funding PLC, 1.978% 9/6/2018 (12) | | | 5,000,000 | | | | 4,998,646 | |
Collateralized Commercial Paper Co. LLC: | | | | | | | | |
2.514% 2/12/2019 (12) | | | 3,000,000 | | | | 2,966,517 | |
2.536% 1/14/2019 (12) | | | 3,000,000 | | | | 2,972,212 | |
2.545% (LIBOR 3 Month + 22 basis points), 12/20/2018 (10) | | | 2,500,000 | | | | 2,500,000 | |
JP Morgan Securities LLC, 2.546% 2/25/2019 (12) | | | 3,000,000 | | | | 2,963,420 | |
National Rural Utilities Cooperative Finance Corp., 2.030% 9/21/2018 (12) | | | 4,000,000 | | | | 3,995,556 | |
| | | | | | | | |
| | | | | | | 20,396,351 | |
|
Foreign Banks — 8.4% | |
Bank of Nova Scotia/Houston, 2.290% (LIBOR 1 Month + 23 basis points), 9/17/2018 (10) | | | 2,500,000 | | | | 2,500,011 | |
Commonwealth Bank of Australia: | | | | | | | | |
2.267% (LIBOR 1 Month + 20 basis points), 10/11/2018 (5)(10) | | | 2,500,000 | | | | 2,500,000 | |
2.285% (LIBOR 1 Month + 21 basis points), 11/30/2018 (5)(10) | | | 2,500,000 | | | | 2,499,942 | |
Credit Suisse AG: | | | | | | | | |
2.303% (LIBOR 1 Month + 24 basis points), 9/10/2018 (10) | | | 3,000,000 | | | | 3,000,000 | |
2.327% (LIBOR 1 Month + 26 basis points), 10/22/2018 (10) | | | 2,500,000 | | | | 2,500,000 | |
Mitsubishi UFJ Trust & Banking Corp., 2.345% (LIBOR 1 Month + 28 basis points), 1/25/2019 (10) | | | 2,500,000 | | | | 2,500,000 | |
National Australia Bank, Ltd., 2.273% (LIBOR 1 Month + 20 basis points), 10/29/2018 (5)(10) | | | 2,500,000 | | | | 2,500,000 | |
Natixis, NY Branch, 2.466% 12/14/2018 (12) | | | 2,500,000 | | | | 2,482,594 | |
Swedbank, 1.989% 9/11/2018 (12) | | | 5,000,000 | | | | 4,997,278 | |
Toronto-Dominion Bank: | | | | | | | | |
2.272% 10/3/2018 (12) | | | 2,000,000 | | | | 2,000,000 | |
2.316% 12/21/2018 (12) | | | 2,500,000 | | | | 2,500,000 | |
2.353% 2/8/2019 (12) | | | 3,500,000 | | | | 3,499,226 | |
2.497% (LIBOR 3 Month + 15 basis points), 4/23/2019 (5)(10) | | | 3,000,000 | | | | 3,000,000 | |
Westpac Banking Corp., 2.253% (LIBOR 1 Month + 19 basis points), 9/10/2018 (5)(10) | | | 2,500,000 | | | | 2,500,000 | |
| | | | | | | | |
| | | | | | | 38,979,051 | |
| | | | | | | | |
| Description | | Shares or
Principal
Amount | | | Value | |
| Commercial Paper (continued) | |
|
Miscellaneous Manufacturing — 3.3% | |
General Electric Co.: | | | | | | | | |
1.968% 9/4/2018 (12) | | $ | 10,000,000 | | | $ | 9,998,383 | |
1.968% 9/6/2018 (12) | | | 5,000,000 | | | | 4,998,653 | |
| | | | | | | | |
| | | | | | | 14,997,036 | |
|
Retail — 0.8% | |
Walmart, Inc., 2.011% 9/10/2018 (12) | | | 3,500,000 | | | | 3,498,268 | |
|
Utilities — 0.9% | |
Praxair, Inc.,, 1.989% 9/4/2018 (12) | | | 4,000,000 | | | | 3,999,347 | |
| | | | | | | | |
| Total Commercial Paper | | | | | | | 266,676,088 | |
| | | | | | | | |
| Municipals — 0.4% | |
|
Colorado — 0.4% | |
Colorado Housing & Finance Authority, 1.950%, 10/1/2036 (7) | | | 2,080,000 | | | | 2,080,000 | |
| | | | | | | | |
| Total Municipals | | | | | | | 2,080,000 | |
| | | | | | | | |
| Mutual Funds — 3.9% | |
BlackRock Liquidity FundsT-Fund Portfolio — Institutional Class, 1.840% | | | 3,000,000 | | | | 3,000,000 | |
Invesco Government & Agency Portfolio — Institutional Class, 1.855% | | | 15,000,000 | | | | 15,000,000 | |
| | | | | | | | |
| Total Mutual Funds | | | | | | | 18,000,000 | |
| | | | | | | | |
| Repurchase Agreements — 22.9% | |
Agreement with Fixed Income Clearing Corp., 1.000%, dated 8/31/2018, to be repurchased at $10,529,947 on 9/4/2018, collateralized by a U.S. Government Treasury Obligation with a maturity of 3/31/2019, with a fair value of $10,741,412 | | $ | 10,528,778 | | | | 10,528,777 | |
Agreement with Fixed Income Clearing Corp., 1.960%, dated 8/31/2018, to be repurchased at $45,009,800 on 9/4/2018, collateralized by U.S. Government Treasury Obligations with various maturities to 11/15/2043, with a fair value of $45,901,335 | | | 45,000,000 | | | | 45,000,000 | |
Agreement with Merrill Lynch, Pierce, Fenner & Smith, Inc., 1.970%, dated 8/31/2018, to be repurchased at $50,010,944 on 9/4/2018, collateralized by a U.S. Government Agency Obligation with a maturity of 6/1/2048, with a fair value of $51,000,000 | | | 50,000,000 | | | | 50,000,000 | |
| | | | | | | | |
| Total Repurchase Agreements | | | | | | | 105,528,777 | |
| | | | | | | | |
Total Investments — 100.1%
(at amortized cost) | | | | | | | 461,789,059 | |
| Other Assets and Liabilities — (0.1)% | | | | (296,579 | ) |
| | | | | | | | |
| Total Net Assets — 100.0% | | | | | | $ | 461,492,480 | |
| | | | | | | | |
(See Notes which are an integral part of the Financial Statements)
102
Institutional Prime Money Market Fund
| | | | | | | | |
| Description | | Principal
Amount | | | Value | |
| Certificates of Deposit — 17.0% | |
|
Banks — 17.0% | |
Canadian Imperial Bank of Commerce, 2.410% (LIBOR 3 Month + 10 basis points), 9/20/2019 (10) | | $ | 3,500,000 | | | $ | 3,500,185 | |
HSBC Bank USA NA: | | | | | | | | |
2.287% (LIBOR 1 Month + 21 basis points), 11/20/2018 (10) | | | 2,500,000 | | | | 2,501,095 | |
2.305% (LIBOR 1 Month + 24 basis points), 4/25/2019 (10) | | | 3,000,000 | | | | 3,001,360 | |
2.324% (LIBOR 1 Month + 26 basis points), 11/16/2018 (10) | | | 3,000,000 | | | | 3,001,621 | |
2.354% (LIBOR 1 Month + 24 basis points), 12/4/2018 (10) | | | 5,000,000 | | | | 5,002,658 | |
Mitsubishi UFJ Trust & Banking Corp., 2.297% (LIBOR 1 Month + 23 basis points), 1/22/2019 (10) | | | 2,500,000 | | | | 2,501,068 | |
Mizuho Bank, Ltd.: | | | | | | | | |
2.255% (LIBOR 1 Month + 19 basis points), 3/11/2019 (10) | | | 3,500,000 | | | | 3,499,898 | |
2.327% (LIBOR 1 Month + 25 basis points), 12/18/2018 (10) | | | 4,000,000 | | | | 4,001,078 | |
2.383% (LIBOR 1 Month + 32 basis points), 9/10/2018 (10) | | | 3,250,000 | | | | 3,250,378 | |
2.503% (LIBOR 1 Month + 44 basis points), 10/10/2018 (10) | | | 2,500,000 | | | | 2,501,088 | |
2.643% (LIBOR 3 Month + 30 basis points), 4/30/2019 (10) | | | 5,500,000 | | | | 5,505,855 | |
MUFG Bank, Ltd., 2.440% (LIBOR 1 Month + 38 basis points), 10/17/2018 (10) | | | 3,000,000 | | | | 3,001,644 | |
Nordea Bank AB, 2.467% (LIBOR 1 Month + 40 basis points), 3/14/2019 (10) | | | 2,500,000 | | | | 2,502,149 | |
Norinchukin Bank, 2.381% (LIBOR 1 Month + 30 basis points), 9/4/2018 (10) | | | 3,000,000 | | | | 3,000,143 | |
Sumitomo Mitsui Banking Corp.: | | | | | | | | |
2.230% (LIBOR 1 Month + 17 basis points), 2/19/2019 (10) | | | 3,500,000 | | | | 3,500,000 | |
2.273% (LIBOR 1 Month + 20 basis points), 3/28/2019 (10) | | | 3,500,000 | | | | 3,499,941 | |
2.316% (LIBOR 1 Month + 25 basis points), 10/24/2018 (10) | | | 2,500,000 | | | | 2,500,685 | |
Toronto-Dominion Bank: | | | | | | | | |
2.400% (LIBOR 1 Month + 32 basis points), 9/5/2018 (10) | | | 2,750,000 | | | | 2,750,170 | |
2.443% (LIBOR 3 Month + 11 basis points), 10/18/2018 (10) | | | 3,000,000 | | | | 3,001,558 | |
2.469% (LIBOR 3 Month + 13 basis points), 7/16/2019 (10) | | | 2,500,000 | | | | 2,500,094 | |
Wells Fargo Bank NA: | | | | | | | | |
2.299% (LIBOR 1 Month + 22 basis points), 10/5/2018 (10) | | | 3,000,000 | | | | 3,000,892 | |
2.307% (LIBOR 1 Month + 24 basis points), 11/9/2018 (10) | | | 2,500,000 | | | | 2,501,215 | |
2.476% (LIBOR 3 Month + 14 basis points), 6/28/2019 (10) | | | 3,500,000 | | | | 3,500,411 | |
2.491% (LIBOR 1 Month + 42 basis points), 10/9/2018 (10) | | | 3,000,000 | | | | 3,001,593 | |
Westpac Banking Corp.: | | | | | | | | |
2.370% (U.S. Federal Funds Effective Rate (continuous series) + 45 basis points), 2/15/2019 (10) | | | 2,500,000 | | | | 2,500,047 | |
| | | | | | | | |
| Description | | Principal
Amount | | | Value | |
| Certificates of Deposit (continued) | |
|
Banks(continued) | |
2.469% (LIBOR 3 Month + 13 basis points), 1/9/2019 (10) | | $ | 3,000,000 | | | $ | 3,001,064 | |
| | | | | | | | |
Total Certificates of Deposit
(identified cost $82,007,846) | | | | | | | 82,027,890 | |
| | | | | | | | |
| Commercial Paper — 61.1% | |
|
Asset-Backed Securities — 39.3% | |
Atlantic Asset Securitization LLC: | | | | | | | | |
2.239% (LIBOR 1 Month + 17 basis points), 2/21/2019 (5)(10) | | | 3,000,000 | | | | 3,000,067 | |
2.306% 11/9/2018 (12) | | | 3,000,000 | | | | 2,987,178 | |
2.307% (LIBOR 1 Month + 24 basis points), 12/14/2018 (5)(10) | | | 4,000,000 | | | | 4,000,000 | |
2.364% (LIBOR 1 Month + 30 basis points), 11/16/2018 (5)(10) | | | 3,000,000 | | | | 3,000,000 | |
2.380% (LIBOR 1 Month + 30 basis points), 11/6/2018 (5)(10) | | | 3,000,000 | | | | 3,000,000 | |
Bedford Row Funding Corp.: | | | | | | | | |
2.353% (LIBOR 1 Month + 29 basis points), 3/15/2019 (5)(10) | | | 4,500,000 | | | | 4,500,000 | |
2.367% (LIBOR 1 Month + 30 basis points), 4/11/2019 (5)(10) | | | 2,500,000 | | | | 2,500,000 | |
2.381% (LIBOR 1 Month + 30 basis points), 9/12/2018 (5)(10) | | | 3,000,000 | | | | 3,000,431 | |
2.400% (LIBOR 1 Month + 32 basis points), 6/6/2019 (5)(10) | | | 4,000,000 | | | | 4,004,726 | |
2.413% (LIBOR 1 Month + 35 basis points), 2/15/2019 (5)(10) | | | 3,000,000 | | | | 3,003,423 | |
2.467% (LIBOR 3 Month + 13 basis points), 6/27/2019 (5)(10) | | | 2,500,000 | | | | 2,500,000 | |
Chesham Finance, Ltd., 1.967% 9/4/2018 (12) | | | 19,000,000 | | | | 18,995,828 | |
Lexington Parker Capital Co. LLC: | | | | | | | | |
2.029% 9/7/2018 (12) | | | 6,500,000 | | | | 6,497,466 | |
2.080% 9/5/2018 (12) | | | 5,500,000 | | | | 5,498,477 | |
2.081% 9/4/2018 (12) | | | 4,000,000 | | | | 3,999,116 | |
2.187% 9/7/2018 (12) | | | 3,000,000 | | | | 2,998,830 | |
Liberty Street Funding LLC, 2.381% (LIBOR 1 Month + 30 basis points), 11/2/2018 (5)(10) | | | 3,500,000 | | | | 3,502,007 | |
LMA Americas LLC: | | | | | | | | |
1.998% 9/6/2018 (12) | | | 5,000,000 | | | | 4,998,382 | |
2.345% 10/15/2018 (12) | | | 3,000,000 | | | | 2,992,256 | |
2.381% 12/14/2018 (12) | | | 3,000,000 | | | | 2,979,822 | |
2.401% 11/16/2018 (12) | | | 3,000,000 | | | | 2,985,774 | |
2.499% 1/9/2019 (12) | | | 2,650,000 | | | | 2,627,204 | |
2.556% 2/4/2019 (12) | | | 3,000,000 | | | | 2,968,522 | |
Longship Funding LLC: | | | | | | | | |
2.019% 9/5/2018 (12) | | | 5,000,000 | | | | 4,998,616 | |
2.019% 9/6/2018 (12) | | | 5,000,000 | | | | 4,998,338 | |
2.029% 9/11/2018 (12) | | | 3,000,000 | | | | 2,998,167 | |
2.083% 9/17/2018 (12) | | | 3,500,000 | | | | 3,496,675 | |
Manhattan Asset Funding Co. LLC, 2.390% (LIBOR 1 Month + 31 basis points), 11/5/2018 (5)(10) | | | 3,000,000 | | | | 3,001,382 | |
(See Notes which are an integral part of the Financial Statements)
103
August 31, 2018
Institutional Prime Money Market Fund (continued)
| | | | | | | | |
| Description | | Principal
Amount | | | Value | |
| Commercial Paper (continued) | |
|
Asset-Backed Securities(continued) | |
Old Line Funding LLC: | | | | | | | | |
2.405% (LIBOR 1 Month + 34 basis points), 10/25/2018 (5)(10) | | $ | 3,000,000 | | | $ | 3,000,000 | |
2.570% (LIBOR 1 Month + 50 basis points), 3/21/2019 (5)(10) | | | 2,500,000 | | | | 2,504,890 | |
Regency Markets No. 1 LLC: | | | | | | | | |
2.029% 9/7/2018 (12) | | | 7,500,000 | | | | 7,497,105 | |
2.072% 9/6/2018 (12) | | | 5,000,000 | | | | 4,998,348 | |
2.082% 9/17/2018 (12) | | | 5,000,000 | | | | 4,995,242 | |
Ridgefield Funding Co. LLC, 2.535% 11/13/2018 (12) | | | 3,500,000 | | | | 3,483,956 | |
Sheffield Receivables Co. LLC: | | | | | | | | |
2.305% 11/1/2018 (12) | | | 4,000,000 | | | | 3,985,354 | |
2.323% 11/15/2018 (12) | | | 3,000,000 | | | | 2,986,067 | |
2.324% 11/14/2018 (12) | | | 3,500,000 | | | | 3,483,995 | |
2.371% 12/7/2018 (12) | | | 3,500,000 | | | | 3,478,191 | |
Starbird Funding Corp.,, 1.978% 9/4/2018 (12) | | | 17,500,000 | | | | 17,496,158 | |
Thunder Bay Funding LLC: | | | | | | | | |
2.252% (LIBOR 1 Month + 17 basis points), 2/1/2019 (5)(10) | | | 3,000,000 | | | | 3,000,000 | |
2.317% (LIBOR 1 Month + 25 basis points), 1/14/2019 (5)(10) | | | 3,500,000 | | | | 3,500,000 | |
2.417% (LIBOR 1 Month + 34 basis points), 2/19/2019 (5)(10) | | | 3,000,000 | | | | 3,000,000 | |
2.449% (LIBOR 1 Month + 37 basis points), 3/7/2019 (5)(10) | | | 2,500,000 | | | | 2,502,821 | |
Victory Receivables Corp., 2.347% 9/17/2018 (12) | | | 3,500,000 | | | | 3,496,675 | |
| | | | | | | | |
| | | | | | | 189,441,489 | |
|
Automobiles — 2.7% | |
Toyota Motor Credit Corp.: | | | | | | | | |
2.330% (LIBOR 1 Month + 25 basis points), 9/4/2018 (10) | | | 3,500,000 | | | | 3,500,147 | |
2.358% (LIBOR 3 Month + 2 basis points), 1/3/2019 (10) | | | 3,500,000 | | | | 3,500,000 | |
2.419% (LIBOR 3 Month + 8 basis points), 4/12/2019 (10) | | | 3,500,000 | | | | 3,500,000 | |
2.450% (LIBOR 1 Month + 37 basis points), 10/3/2018 (10) | | | 2,500,000 | | | | 2,500,000 | |
| | | | | | | | |
| | | | | | | 13,000,147 | |
|
Diversified Financial Services — 4.5% | |
Cargill Global Funding PLC, 1.978% 9/6/2018 (12) | | | 5,000,000 | | | | 4,998,399 | |
Collateralized Commercial Paper Co. LLC: | | | | | | | | |
2.514% 2/12/2019 (12) | | | 3,000,000 | | | | 2,966,478 | |
2.536% 1/14/2019 (12) | | | 3,500,000 | | | | 3,468,769 | |
2.545% (LIBOR 3 Month + 22 basis points), 12/20/2018 (10) | | | 2,500,000 | | | | 2,501,261 | |
JP Morgan Securities LLC, 2.546% 2/25/2019 (12) | | | 3,500,000 | | | | 3,457,567 | |
National Rural Utilities Cooperative Finance Corp., 2.030% 9/21/2018 (12) | | | 4,200,000 | | | | 4,195,161 | |
| | | | | | | | |
| | | | | | | 21,587,635 | |
| | | | | | | | |
| Description | | Shares or
Principal
Amount | | | Value | |
| Commercial Paper (continued) | |
|
Foreign Banks — 9.9% | |
Bank of Nova Scotia/Houston, 2.290% (LIBOR 1 Month + 23 basis points), 9/17/2018 (10) | | $ | 2,500,000 | | | $ | 2,500,367 | |
Commonwealth Bank of Australia: | | | | | | | | |
2.267% (LIBOR 1 Month + 20 basis points), 10/11/2018 (5)(10) | | | 3,000,000 | | | | 3,000,915 | |
2.285% (LIBOR 1 Month + 21 basis points), 11/30/2018 (5)(10) | | | 2,500,000 | | | | 2,501,068 | |
2.448% (LIBOR 3 Month + 10 basis points), 5/3/2019 (5)(10) | | | 5,500,000 | | | | 5,500,529 | |
Credit Suisse AG: | | | | | | | | |
2.304% (LIBOR 1 Month + 24 basis points), 9/10/2018 (10) | | | 3,000,000 | | | | 3,000,285 | |
2.327% (LIBOR 1 Month + 26 basis points), 10/22/2018 (10) | | | 2,500,000 | | | | 2,501,079 | |
Mitsubishi UFJ Trust & Banking Corp., 2.345% (LIBOR 1 Month + 28 basis points), 1/25/2019 (10) | | | 3,500,000 | | | | 3,502,221 | |
National Australia Bank, Ltd., 2.273% (LIBOR 1 Month + 20 basis points), 10/29/2018 (5)(10) | | | 3,000,000 | | | | 3,001,096 | |
Natixis, NY Branch, 2.466% 12/14/2018 (12) | | | 2,500,000 | | | | 2,483,338 | |
Swedbank, 1.989% 9/11/2018 (12) | | | 5,000,000 | | | | 4,997,065 | |
Toronto-Dominion Bank: | | | | | | | | |
2.272% 10/3/2018 (12) | | | 2,500,000 | | | | 2,499,708 | |
2.316% 12/21/2018 (7) | | | 2,500,000 | | | | 2,501,302 | |
2.353% 2/8/2019 (7) | | | 3,500,000 | | | | 3,502,584 | |
2.497% (LIBOR 3 Month + 15 basis points), 4/23/2019 (5)(10) | | | 3,000,000 | | | | 3,002,148 | |
Westpac Banking Corp., 2.253% (LIBOR 1 Month + 19 basis points), 9/10/2018 (5)(10) | | | 3,000,000 | | | | 3,000,241 | |
| | | | | | | | |
| | | | | | | 47,493,946 | |
|
Miscellaneous Manufacturing — 3.1% | |
General Electric Co.: | | | | | | | | |
1.968% 9/4/2018 (12) | | | 10,000,000 | | | | 9,997,848 | |
1.968% 9/6/2018 (12) | | | 5,000,000 | | | | 4,998,383 | |
| | | | | | | | |
| | | | | | | 14,996,231 | |
|
Retail — 0.7% | |
Walmart, Inc., 2.011% 9/10/2018 (12) | | | 3,500,000 | | | | 3,498,118 | |
|
Utilities — 0.9% | |
Praxair, Inc.,, 1.989% 9/4/2018 (12) | | | 4,350,000 | | | | 4,349,072 | |
| | | | | | | | |
Total Commercial Paper
(identified cost $294,330,583) | | | | 294,366,638 | |
| | | | | | | | |
| Mutual Funds — 3.3% | |
Invesco Government & Agency Portfolio — Institutional Class, 1.855% | | | 15,743,894 | | | | 15,743,894 | |
| | | | | | | | |
Total Mutual Funds
(identified cost $15,743,894) | | | | 15,743,894 | |
| | | | | | | | |
(See Notes which are an integral part of the Financial Statements)
104
Institutional Prime Money Market Fund (continued)
| | | | | | | | |
| Description | | Principal
Amount | | | Value | |
| Repurchase Agreements — 18.7% | |
Agreement with Fixed Income Clearing Corp., 1.960%, dated 8/31/2018, to be repurchased at $40,008,711 on 9/4/2018, collateralized by a U.S. Government Treasury Obligation with a maturity of 11/15/2042, with a fair value of $40,802,441 | | $ | 40,000,000 | | | $ | 40,000,000 | |
Agreement with Merrill Lynch, Pierce, Fenner & Smith, Inc., 1.970%, dated 8/31/2018, to be repurchased at $50,010,944 on 9/4/2018, collateralized by U.S. Government Agency Obligations with various maturities to 6/1/2048, with a fair value of $51,000,000 | | | 50,000,000 | | | | 50,000,000 | |
| | | | | | | | |
Total Repurchase Agreements
(identified cost $90,000,000) | | | | 90,000,000 | |
| | | | | | | | |
Total Investments — 100.1%
(identified cost $482,082,323) | | | | 482,138,422 | |
| Other Assets and Liabilities — (0.1)% | | | | (324,012 | ) |
| | | | | | | | |
| Total Net Assets — 100.0% | | | | | | $ | 481,814,410 | |
| | | | | | | | |
(See Notes which are an integral part of the Financial Statements)
105
| | |
| | |
| Notes to Schedules of Investments | | |
The categories of investments are shown as a percentage of total net assets for each Fund as of August 31, 2018. Call dates contained within the Schedules of Investments represent the next possible date the security can be redeemed, at the option of the issuer, determined as of August 31, 2018. Maturity dates contained within the Schedules of Investments represent the stated legal maturity date or mandatory put date. Certain securities may be subject to demand features which allow the security to be redeemed prior to final maturity date. In accordance with Rule2a-7, securities held in the money market funds provide for the return of principal and interest within 397 days due to a scheduled final maturity date or through specific demand features. Demand features entitle a Fund to receive the principal amount of the instrument from the issuer or a third party (1) on no more than 30 calendar days’ notice or (2) at specified intervals not exceeding 397 calendar days.
| * | A Summary Schedule of Investments is presented for this portfolio. A complete Schedule of Investments is available by accessing the SEC’s website, www.sec.gov. For all items listed as “Other securities” in this summary Schedule of Investments, this represents issues not identified astop-fifty unaffiliated holdings in terms of value and issues or issuers not exceeding one percent individually or in aggregate, respectively, as of August 31, 2018. In certain instances, securities for which footnotes listed below may otherwise apply are included in the “Other securities” caption. |
| (1) | Certain shares or principal amounts are temporarily on loan to unaffiliated brokers-dealers. |
| (3) | Please refer to Note 2, subsectionSecurities Lending, in the Notes to Financial Statements. |
| (4) | Denotes an investment in an affiliated entity. Please refer to Note 6, subsectionInvestments in Affiliated Issuers, in the Notes to Financial Statements. |
| (5) | Denotes a restricted security which is subject to restrictions on resale under federal securities laws. These securities have been deemed liquid based on criteria approved by the Board of Directors of the BMO Funds. At August 31, 2018 these securities amounted to: |
| | | | | | | | |
| Fund | | Amount | | | % of Total
Net Assets | |
Global Low Volatility Equity Fund | | $ | 1,020,256 | | | | 3.34 | % |
| | |
Disciplined International Equity Fund | | | 4,160,141 | | | | 5.37 | |
| | |
Alternative Strategies Fund | | | | | | | | |
| | |
Long | | | 182,638 | | | | 0.25 | |
| | |
Short | | | 676,811 | | | | 0.92 | |
| | |
Global Long/Short Equity Fund | | | | | | | | |
| | |
Long | | | 105,303 | | | | 1.06 | |
| | |
Short | | | 259,326 | | | | 2.61 | |
| | |
Ultra ShortTax-Free Fund | | | 147,017,607 | | | | 24.50 | |
| | |
ShortTax-Free Fund | | | 32,475,671 | | | | 17.23 | |
| | | | | | | | |
| Fund | | Amount | | | % of Total
Net Assets | |
Short-Term Income Fund | | $ | 39,671,275 | | | | 16.52 | % |
| | |
IntermediateTax-Free Fund | | | 169,630,650 | | | | 9.53 | |
| | |
Strategic Income Fund | | | 26,622,651 | | | | 30.95 | |
| | |
TCH Corporate Income Fund | | | 28,313,569 | | | | 11.57 | |
| | |
TCH Core Plus Bond Fund | | | 90,465,489 | | | | 8.65 | |
| | |
High Yield Bond Fund | | | 4,060,343 | | | | 35.85 | |
| | |
Tax-Free Money Market Fund | | | 107,585,000 | | | | 28.21 | |
| | |
Prime Money Market Fund | | | 63,499,942 | | | | 13.76 | |
| | |
Institutional Prime Money Market Fund | | | 76,525,742 | | | | 15.88 | |
| (6) | All or a portion of this security is segregated as collateral for securities sold short. |
| (7) | Denotes a variable rate security. The rate shown is the current interest rate as of August 31, 2018. Rate fluctuations are based underlying positions and/or other variables. For securities whose yields vary with a designated market index or market rate, the reference rate and spread are indicated in the description. |
| (8) | Issue represents an Auction Rate Security. An Auction Rate Security is a corporate or municipal bond debt instrument with a long nominal maturity for which the interest rate is regularly reset through a Dutch auction. The rate presented is either the rate set through the auction or the maximum interest rate provided for in the security issuance provision. |
| (9) | Purchased on a when-issued or delayed delivery basis. |
| (10) | Denotes a floating rate security. Floating rate securities are securities whose yields vary with a designated market index or market rate. These securities are shown at their current rates as of August 31, 2018. |
| (11) | Securities have redemption features that may delay redemption beyond seven days. |
| (12) | Each issue shows the rate of the discount at the time of purchase. |
The following acronyms may be referenced throughout this report:
| | |
ACA — American Capital Access Corporation ADED — Arkansas Department of Economic Development ADR — American Depository Receipt AGC — Assured Guaranty Corporation AGM — Assured Guaranty Municipal AMBAC — American Municipal Bond Assurance Corporation AMT — Alternative Minimum Tax BAM — Build America Mutual Assurance Company BHAC — Berkshire Hathaway Assurance Corporation BMA — Bond Market Association CFC — Cooperative Finance Corporation CIFG — CDC IXIS Financial Guaranty CMI — California Mortgage Insurance COLL — Collateralized ETF — Exchange Traded Fund FDIC — Federal Depository Insurance Corporation FGIC — Financial Guaranty Insurance Corporation FHA — Federal Housing Administration FHLB — Federal Home Loan Bank FHLMC — Federal Home Loan Mortgage Corporation FNMA — Federal National Mortgage Association FRN — Floating Rate Note FSA — Financial Security Assurance Corporation GDR — Global Depository Receipt GNMA — Government National Mortgage Association GO — Government Obligation HFDC — Health Facility Development Corporation HUD — Department of Housing and Urban Development IDC — Industrial Development Corporation | | IMI — Investors Mortgage Insurance Company INS — Insured LIBOR — London Interbank Offered Rate LIQ — Liquidity Agreement LLC — Limited Liability Corporation LOC — Letter of Credit LP — Limited Partnership LT — Limited Tax MAC — Municipal Assurance Corporation MBIA — Municipal Bond Insurance Association MHF — Maryland Housing Fund MTN — Medium Term Note NATL — National Public Finance Guarantee PCA — Pollution Control Authority PLC — Public Limited Company PSF — Permanent School Fund Guaranteed PUFG — Permanent University Fund Guarantee Q-SBLF — Qualified School Bond Loan Fund RADIAN — Radian Asset Assurance REITs — Real Estate Investment Trusts REMIC — Real Estate Mortgage Investment Conduit SAW — State Aid Withholding SIFMA — Securities Industry and Financial Markets Association TCRs — Transferable Custody Receipts TLGP — Temporary Liquidity Guarantee Program TRANs — Tax and Revenue Anticipation Notes UT — Unlimited Tax VRNs — Variable Rate Notes XLCA — XL Capital Assurance |
106
August 31, 2018
| | |
| | |
| Statements of Assets and Liabilities | | BMO Funds |
| | | | | | | | | | | | | | | | | | | | |
| | | | | | | | | | | | | | | | |
| | | Low Volatility
Equity Fund | | | Dividend
Income Fund | | | Large-Cap
Value Fund | | | Large-Cap
Growth Fund | | | Mid-Cap
Value Fund | |
Assets: | | | | | | | | | | | | | | | | | | | | |
Investments in unaffiliated issuers, at value | | $ | 184,349,512 | (1) | | $ | 221,941,949 | (1) | | $ | 542,574,580 | (1) | | $ | 550,133,825 | (1) | | $ | 290,877,732 | (1) |
Cash sweep investments in affiliated issuers, at value | | | 1,494,204 | | | | 3,591,099 | | | | 7,482,313 | | | | 6,735,831 | | | | 2,420,873 | |
Dividends and interest receivable | | | 301,845 | | | | 428,394 | | | | 1,101,990 | | | | 495,018 | | | | 339,150 | |
Receivable for capital stock sold | | | 84,782 | | | | 489,996 | | | | 334,508 | | | | 265,966 | | | | 64,720 | |
Prepaid expenses and other receivables | | | 25,496 | | | | 16,167 | | | | 25,636 | | | | 34,621 | | | | 26,522 | |
| | | | | | | | | | | | | | | | | | | | |
Total assets | | | 186,255,839 | | | | 226,467,605 | | | | 551,519,027 | | | | 557,665,261 | | | | 293,728,997 | |
| | | | | |
Liabilities: | | | | | | | | | | | | | | | | | | | | |
Payable for return of securities lending collateral | | | 57,761,573 | | | | 70,677,075 | | | | 159,109,849 | | | | 150,732,234 | | | | 93,348,421 | |
Payable for investments purchased | | | — | | | | 521,155 | | | | — | | | | — | | | | — | |
Payable for capital stock redeemed | | | 18,732 | | | | 66,040 | | | | 138,886 | | | | 295,993 | | | | 58,659 | |
Payable to affiliates, net (Note 6) | | | 61,759 | | | | 67,139 | | | | 147,493 | | | | 157,151 | | | | 164,027 | |
Other liabilities | | | 28,405 | | | | 34,930 | | | | 50,119 | | | | 56,288 | | | | 48,319 | |
| | | | | | | | | | | | | | | | | | | | |
Total liabilities | | | 57,870,469 | | | | 71,366,339 | | | | 159,446,347 | | | | 151,241,666 | | | | 93,619,426 | |
| | | | | | | | | | | | | | | | | | | | |
Total net assets | | $ | 128,385,370 | | | $ | 155,101,266 | | | $ | 392,072,680 | | | $ | 406,423,595 | | | $ | 200,109,571 | |
| | | | | | | | | | | | | | | | | | | | |
Net assets consist of: | | | | | | | | | | | | | | | | | | | | |
Paid-in capital | | $ | 93,369,737 | | | $ | 111,124,509 | | | $ | 296,190,746 | | | $ | 231,589,557 | | | $ | 151,686,565 | |
Net unrealized appreciation on investments | | | 24,572,346 | | | | 36,848,088 | | | | 63,585,494 | | | | 128,944,804 | | | | 27,011,496 | |
Accumulated net realized gain on investments | | | 10,151,006 | | | | 6,492,524 | | | | 30,751,531 | | | | 43,871,677 | | | | 20,091,747 | |
Undistributed net investment income | | | 292,281 | | | | 636,145 | | | | 1,544,909 | | | | 2,017,557 | | | | 1,319,763 | |
| | | | | | | | | | | | | | | | | | | | |
Total net assets | | $ | 128,385,370 | | | $ | 155,101,266 | | | $ | 392,072,680 | | | $ | 406,423,595 | | | $ | 200,109,571 | |
| | | | | | | | | | | | | | | | | | | | |
Net asset value, offering price and redemption proceeds per share (unlimited shares authorized, no par value) | | | | | | | | | | | | | | | | | | | | |
Investor class of shares: | | | | | | | | | | | | | | | | | | | | |
Net asset value, offering price and redemption proceeds per share | | $ | — | | | $ | — | | | $ | — | | | $ | 20.95 | | | $ | — | |
Advisor class of shares: | | | | | | | | | | | | | | | | | | | | |
Net asset value and redemption proceeds per share | | | 15.72 | | | | 15.46 | | | | 16.59 | | | | 20.96 | | | | 12.64 | |
Offering price per share(2) | | | 16.55 | | | | 16.27 | | | | 17.46 | | | | 22.06 | | | | 13.31 | |
Institutional class of shares: | | | | | | | | | | | | | | | | | | | | |
Net asset value, offering price and redemption proceeds per share | | | 15.77 | | | | 15.41 | | | | 16.61 | | | | 21.17 | | | | 12.58 | |
Retirement class R-6 of shares: | | | | | | | | | | | | | | | | | | | | |
Net asset value, offering price and redemption proceeds per share | | | — | | | | — | | | | 16.62 | | | | 21.21 | | | | 12.60 | |
| | | | | |
Net assets: | | | | | | | | | | | | | | | | | | | | |
Investor class of shares | | $ | — | | | $ | — | | | $ | — | | | $ | 65,364,865 | | | $ | — | |
Advisor class of shares | | | 25,570,611 | | | | 6,091,946 | | | | 22,601,811 | | | | 860,181 | | | | 55,150,530 | |
Institutional class of shares | | | 102,814,759 | | | | 149,009,320 | | | | 287,685,063 | | | | 279,227,390 | | | | 113,786,329 | |
Retirement classR-6 of shares | | | — | | | | — | | | | 81,785,806 | | | | 60,971,159 | | | | 31,172,712 | |
| | | | | | | | | | | | | | | | | | | | |
Total net assets | | $ | 128,385,370 | | | $ | 155,101,266 | | | $ | 392,072,680 | | | $ | 406,423,595 | | | $ | 200,109,571 | |
| | | | | | | | | | | | | | | | | | | | |
Shares outstanding: | | | | | | | | | | | | | | | | | | | | |
Investor class of shares | | | — | | | | — | | | | — | | | | 3,119,844 | | | | — | |
Advisor class of shares | | | 1,627,133 | | | | 394,151 | | | | 1,362,005 | | | | 41,046 | | | | 4,361,524 | |
Institutional class of shares | | | 6,518,694 | | | | 9,670,471 | | | | 17,317,385 | | | | 13,190,464 | | | | 9,044,942 | |
Retirement classR-6 of shares | | | — | | | | — | | | | 4,921,244 | | | | 2,874,962 | | | | 2,474,714 | |
| | | | | | | | | | | | | | | | | | | | |
Total shares outstanding | | | 8,145,827 | | | | 10,064,622 | | | | 23,600,634 | | | | 19,226,316 | | | | 15,881,180 | |
| | | | | | | | | | | | | | | | | | | | |
Investments, at cost: | | | | | | | | | | | | | | | | | | | | |
Investments in unaffiliated issuers | | $ | 159,777,525 | | | $ | 185,094,411 | | | $ | 478,990,132 | | | $ | 421,189,102 | | | $ | 263,866,820 | |
Cash sweep investments in affiliated issuers | | | 1,493,845 | | | | 3,590,549 | | | | 7,481,268 | | | | 6,735,750 | | | | 2,420,289 | |
| | | | | | | | | | | | | | | | | | | | |
Total investments, at cost | | $ | 161,271,370 | | | $ | 188,684,960 | | | $ | 486,471,400 | | | $ | 427,924,852 | | | $ | 266,287,109 | |
| | | | | | | | | | | | | | | | | | | | |
| (1) | Including $56,485,120, $69,115,207, $155,593,737, $147,401,256 and $91,285,547, respectively, of securities on loan. A security on loan value represents both fair value and accrued interest. |
| (2) | Computation of offering price per share 100/95 of net asset value. |
(See Notes which are an integral part of the Financial Statements)
107
August 31, 2018
| | |
| | |
| Statements of Assets and Liabilities | | BMO Funds |
| | | | | | | | | | | | | | | | | | | | |
| | | | | | | | | | | | | | | | |
| | | Mid-Cap
Growth Fund | | | Small-Cap
Value Fund | | | Small-Cap
Core Fund | | | Small-Cap
Growth Fund | | | Global Low
Volatility
Equity Fund | |
Assets: | | | | | | | | | | | | | | | | | | | | |
Investments in unaffiliated issuers, at value | | $ | 185,328,597 | (1) | | $ | 111,099,954 | (1) | | $ | 35,168,773 | (1) | | $ | 220,459,543 | (1) | | $ | 32,256,957 | (1) |
Cash sweep investments in affiliated issuers, at value | | | 1,583,732 | | | | 1,486,191 | | | | 440,742 | | | | 2,038,642 | | | | 143,976 | |
Cash denominated in foreign currencies | | | — | | | | — | | | | — | | | | — | | | | 153,319 | (2) |
Dividends and interest receivable | | | 75,646 | | | | 68,121 | | | | 15,893 | | | | 75,015 | | | | 88,482 | |
Receivable for investments sold | | | — | | | | — | | | | — | | | | 1,018,111 | | | | — | |
Receivable for capital stock sold | | | 42,815 | | | | 19,552 | | | | 5,000 | | | | 26,225 | | | | — | |
Prepaid expenses and other receivables | | | 27,523 | | | | 23,585 | | | | 16,186 | | | | 25,657 | | | | 25,460 | |
| | | | | | | | | | | | | | | | | | | | |
Total assets | | | 187,058,313 | | | | 112,697,403 | | | | 35,646,594 | | | | 223,643,193 | | | | 32,668,194 | |
| | | | | |
Liabilities: | | | | | | | | | | | | | | | | | | | | |
Payable for return of securities lending collateral | | | 58,405,407 | | | | 36,689,352 | | | | 11,219,203 | | | | 68,845,157 | | | | 2,034,554 | |
Payable for investments purchased | | | — | | | | — | | | | — | | | | 1,474,777 | | | | — | |
Payable for capital stock redeemed | | | 82,544 | | | | 64,428 | | | | — | | | | 59,930 | | | | — | |
Payable for foreign tax expense | | | — | | | | — | | | | — | | | | — | | | | 4,785 | |
Payable to affiliates, net (Note 6) | | | 96,740 | | | | 57,227 | | | | 12,772 | | | | 133,178 | | | | 52,257 | |
Other liabilities | | | 41,242 | | | | 37,966 | | | | 19,106 | | | | 47,013 | | | | 32,763 | |
| | | | | | | | | | | | | | | | | | | | |
Total liabilities | | | 58,625,933 | | | | 36,848,973 | | | | 11,251,081 | | | | 70,560,055 | | | | 2,124,359 | |
| | | | | | | | | | | | | | | | | | | | |
Total net assets | | $ | 128,432,380 | | | $ | 75,848,430 | | | $ | 24,395,513 | | | $ | 153,083,138 | | | $ | 30,543,835 | |
| | | | | | | | | | | | | | | | | | | | |
Net assets consist of: | | | | | | | | | | | | | | | | | | | | |
Paid-in capital | | $ | 82,156,642 | | | $ | 58,706,478 | | | $ | 18,214,323 | | | $ | 100,674,544 | | | $ | 20,775,943 | |
Net unrealized appreciation on investments and foreign currency translation | | | 29,567,495 | | | | 12,344,094 | | | | 4,288,192 | | | | 34,446,566 | | | | 4,661,215 | |
Accumulated net realized gain on investments and foreign currency transactions | | | 16,708,243 | | | | 4,471,406 | | | | 1,884,718 | | | | 17,962,028 | | | | 4,649,465 | |
Undistributed net investment income | | | — | | | | 326,452 | | | | 8,280 | | | | — | | | | 457,212 | |
| | | | | | | | | | | | | | | | | | | | |
Total net assets | | $ | 128,432,380 | | | $ | 75,848,430 | | | $ | 24,395,513 | | | $ | 153,083,138 | | | $ | 30,543,835 | |
| | | | | | | | | | | | | | | | | | | | |
Net asset value, offering price and redemption proceeds per share (unlimited shares authorized, no par value) | | | | | | | | | | | | | | | | | | | | |
Advisor class of shares: | | | | | | | | | | | | | | | | | | | | |
Net asset value and redemption proceeds per share | | $ | 17.96 | | | $ | 14.78 | | | $ | 15.11 | | | $ | 21.60 | | | $ | 14.00 | |
Offering price per share(3) | | | 18.91 | | | | 15.56 | | | | 15.91 | | | | 22.74 | | | | 14.74 | |
Institutional class of shares: | | | | | | | | | | | | | | | | | | | | |
Net asset value, offering price and redemption proceeds per share | | | 18.79 | | | | 15.03 | | | | 15.23 | | | | 22.48 | | | | 14.05 | |
Retirement classR-6 of shares: | | | | | | | | | | | | | | | | | | | | |
Net asset value, offering price and redemption proceeds per share | | | 18.91 | | | | 15.13 | | | | — | | | | — | | | | — | |
| | | | | |
Net assets: | | | | | | | | | | | | | | | | | | | | |
Advisor class of shares | | $ | 16,399,393 | | | $ | 4,741,031 | | | $ | 2,988,199 | | | $ | 53,772,320 | | | $ | 338,843 | |
Institutional class of shares | | | 89,028,384 | | | | 56,847,789 | | | | 21,407,314 | | | | 99,310,818 | | | | 30,204,992 | |
Retirement classR-6 of shares | | | 23,004,603 | | | | 14,259,610 | | | | — | | | | — | | | | — | |
| | | | | | | | | | | | | | | | | | | | |
Total net assets | | $ | 128,432,380 | | | $ | 75,848,430 | | | $ | 24,395,513 | | | $ | 153,083,138 | | | $ | 30,543,835 | |
| | | | | | | | | | | | | | | | | | | | |
Shares outstanding: | | | | | | | | | | | | | | | | | | | | |
Advisor class of shares | | | 913,057 | | | | 320,818 | | | | 197,802 | | | | 2,489,965 | | | | 24,207 | |
Institutional class of shares | | | 4,737,983 | | | | 3,782,291 | | | | 1,405,563 | | | | 4,417,406 | | | | 2,149,827 | |
Retirement classR-6 of shares | | | 1,216,398 | | | | 942,335 | | | | — | | | | — | | | | — | |
| | | | | | | | | | | | | | | | | | | | |
Total shares outstanding | | | 6,867,438 | | | | 5,045,444 | | | | 1,603,365 | | | | 6,907,371 | | | | 2,174,034 | |
| | | | | | | | | | | | | | | | | | | | |
Investments, at cost: | | | | | | | | | | | | | | | | | | | | |
Investments in unaffiliated issuers | | $ | 155,761,254 | | | $ | 98,756,014 | | | $ | 30,880,647 | | | $ | 186,013,294 | | | $ | 27,593,826 | |
Cash sweep investments in affiliated issuers | | | 1,583,580 | | | | 1,486,037 | | | | 440,676 | | | | 2,038,325 | | | | 143,962 | |
| | | | | | | | | | | | | | | | | | | | |
Total investments, at cost | | $ | 157,344,834 | | | $ | 100,242,051 | | | $ | 31,321,323 | | | $ | 188,051,619 | | | $ | 27,737,788 | |
| | | | | | | | | | | | | | | | | | | | |
| (1) | Including $57,114,727, $35,878,567, $10,971,274, $67,323,772 and $1,900,206, respectively, of securities on loan. A security on loan value represents both fair value and accrued interest. |
| (2) | Identified cost of cash denominated in foreign currencies is $155,490. |
| (3) | Computation of offering price per share 100/95 of net asset value. |
(See Notes which are an integral part of the Financial Statements)
108
August 31, 2018
| | |
| | |
| Statements of Assets and Liabilities | | BMO Funds |
| | | | | | | | | | | | | | | | | | | | |
| | | | | | | | | | | | | | | | |
| | | Disciplined
International
Equity Fund | | | Pyrford
International
Stock Fund | | | LGM
Emerging
Markets
Equity Fund | | | Alternative
Strategies
Fund | | | Global
Long/Short
Equity Fund | |
Assets: | |
Investments in unaffiliated issuers, at value | | $ | 75,261,677 | (1) | | $ | 645,303,793 | (1) | | $ | 201,963,493 | (1) | | $ | 50,336,275 | | | $ | 10,065,912 | (1) |
Cash sweep investments in affiliated issuers, at value | | | 2,615,976 | | | | 16,792,467 | | | | 7,268,280 | | | | 24,540,402 | | | | 3,434,203 | |
Purchased options, at value | | | — | | | | — | | | | — | | | | 117,942 | | | | — | |
Cash | | | — | | | | 322 | | | | — | | | | — | | | | — | |
Deposit held at broker for: | | | | | | | | | | | | | | | | | | | | |
Securities sold short | | | — | | | | — | | | | — | | | | 11,745,800 | | | | — | |
Options | | | — | | | | — | | | | — | | | | 98,554 | | | | — | |
Futures contracts | | | — | | | | — | | | | — | | | | 3,145,541 | | | | — | |
Forward foreign currency contracts | | | — | | | | — | | | | — | | | | 26,700 | | | | — | |
Cash denominated in foreign currencies | | | 142,737 | (2) | | | 339,015 | (2) | | | 231,518 | (2) | | | 2,096,743 | (2) | | | — | |
Dividends and interest receivable | | | 417,135 | | | | 5,142,543 | | | | 640,014 | | | | 182,156 | | | | 39,894 | |
Receivable for investments sold | | | — | | | | 91,366 | | | | 441,203 | | | | 1,484,860 | | | | 462,821 | |
Receivable for capital stock sold | | | 2,349 | | | | 1,496,421 | | | | 705,538 | | | | 53,632 | | | | — | |
Receivable for daily variation margin on futures contracts | | | — | | | | — | | | | — | | | | 286,621 | | | | — | |
Receivable for forward foreign currency contracts | | | — | | | | — | | | | — | | | | 487,075 | | | | — | |
Prepaid expenses and other receivables | | | 38,322 | | | | 49,769 | | | | 17,275 | | | | 22,551 | | | | 39,577 | |
| | | | | | | | | | | | | | | | | | | | |
Total assets | | | 78,478,196 | | | | 669,215,696 | | | | 211,267,321 | | | | 94,624,852 | | | | 14,042,407 | |
|
Liabilities: | |
Securities sold short, at value (proceeds $18,096,373 and $3,323,077, respectively) | | | — | | | | — | | | | — | | | | 18,875,334 | | | | 3,642,216 | |
Options written, at value (proceeds $116,426) | | | — | | | | — | | | | — | | | | 104,177 | | | | — | |
Payable for dividends and interest on securities sold short | | | — | | | | — | | | | — | | | | 27,226 | | | | 3,658 | |
Payable for return of securities lending collateral | | | 819,722 | | | | 13,620,020 | | | | 1,923,465 | | | | — | | | | 293,674 | |
Payable for investments purchased | | | 33 | | | | 446 | | | | 996,376 | | | | 714,912 | | | | 52,209 | |
Payable for capital stock redeemed | | | 2 | | | | 386,551 | | | | 335,148 | | | | — | | | | — | |
Payable for daily variation margin on futures contracts | | | — | | | | — | | | | — | | | | 922,814 | | | | — | |
Payable for forward foreign currency contracts | | | — | | | | — | | | | — | | | | 307,154 | | | | — | |
Payable for foreign tax expense | | | 8,513 | | | | 145,166 | | | | 897,511 | | | | 5,104 | | | | 3,428 | |
Payable to affiliates, net (Note 6) | | | 94,179 | | | | 503,854 | | | | 205,063 | | | | 206,353 | | | | 14,702 | |
Payable to custodian | | | — | | | | — | | | | — | | | | 11,041 | | | | 56,676 | |
Other liabilities | | | 30,075 | | | | 107,364 | | | | 91,909 | | | | 130,661 | | | | 26,309 | |
| | | | | | | | | | | | | | | | | | | | |
Total liabilities | | | 952,524 | | | | 14,763,401 | | | | 4,449,472 | | | | 21,304,776 | | | | 4,092,872 | |
| | | | | | | | | | | | | | | | | | | | |
Total net assets | | $ | 77,525,672 | | | $ | 654,452,295 | | | $ | 206,817,849 | | | $ | 73,320,076 | | | $ | 9,949,535 | |
| | | | | | | | | | | | | | | | | | | | |
Net assets consist of: | |
Paid-in capital | | $ | 72,130,619 | | | $ | 614,261,681 | | | $ | 174,587,850 | | | $ | 73,209,127 | | | $ | 9,150,252 | |
Net unrealized appreciation on investments, options, futures contracts and foreign currency translation | | | 4,507,424 | | | | 66,531,543 | | | | 25,747,810 | | | | 2,167,026 | | | | 896,776 | |
Accumulated net realized gain (loss) on investments, options, futures contracts and foreign currency transactions | | | (373,989 | ) | | | (41,606,748 | ) | | | 4,495,285 | | | | (1,056,838 | ) | | | (141,673 | ) |
Undistributed net investment income (distributions in excess of net investment income) | | | 1,261,618 | | | | 15,265,819 | | | | 1,986,904 | | | | (999,239 | ) | | | 44,180 | |
| | | | | | | | | | | | | | | | | | | | |
Total net assets | | $ | 77,525,672 | | | $ | 654,452,295 | | | $ | 206,817,849 | | | $ | 73,320,076 | | | $ | 9,949,535 | |
| | | | | | | | | | | | | | | | | | | | |
Net asset value, offering price and redemption proceeds per share (unlimited shares authorized, no par value) | | | | | | | | | | | | | | | | | | | | |
Advisor class of shares: | | | | | | | | | | | | | | | | | | | | |
Net asset value and redemption proceeds per share | | $ | 10.94 | | | $ | 13.43 | | | $ | 16.04 | | | $ | 9.73 | | | $ | 12.00 | |
Offering price per share(3) | | | 11.52 | | | | 14.14 | | | | 16.88 | | | | 10.24 | | | | 12.63 | |
Institutional class of shares: | | | | | | | | | | | | | | | | | | | | |
Net asset value, offering price and redemption proceeds per share | | | 10.96 | | | | 13.18 | | | | 15.99 | | | | 9.82 | | | | 12.04 | |
Retirement classR-6 of shares: | | | | | | | | | | | | | | | | | | | | |
Net asset value, offering price and redemption proceeds per share | | | — | | | | 13.20 | | | | — | | | | — | | | | — | |
Class F-3 of shares: | | | | | | | | | | | | | | | | | | | | |
Net asset value, offering price and redemption proceeds per share | | | — | | | | 13.20 | | | | — | | | | — | | | | — | |
| | | | | |
Net assets: | | | | | | | | | | | | | | | | | | | | |
Advisor class of shares | | $ | 186,295 | | | $ | 6,036,608 | | | $ | 4,982,868 | | | $ | 70,441 | | | $ | 801,051 | |
Institutional class of shares | | | 77,339,377 | | | | 485,053,050 | | | | 201,834,981 | | | | 73,249,635 | | | | 9,148,484 | |
Retirement classR-6 of shares | | | — | | | | 155,367,646 | | | | — | | | | — | | | | — | |
Class F-3 of shares | | | — | | | | 7,994,991 | | | | — | | | | — | | | | — | |
| | | | | | | | | | | | | | | | | | | | |
Total net assets | | $ | 77,525,672 | | | $ | 654,452,295 | | | $ | 206,817,849 | | | $ | 73,320,076 | | | $ | 9,949,535 | |
| | | | | | | | | | | | | | | | | | | | |
Shares outstanding: | | | | | | | | | | | | | | | | | | | | |
Advisor class of shares | | | 17,030 | | | | 449,359 | | | | 310,692 | | | | 7,240 | | | | 66,732 | |
Institutional class of shares | | | 7,053,667 | | | | 36,797,711 | | | | 12,619,379 | | | | 7,461,651 | | | | 759,666 | |
Retirement classR-6 of shares | | | — | | | | 11,769,495 | | | | — | | | | — | | | | — | |
Class F-3 of shares | | | — | | | | 605,638 | | | | — | | | | — | | | | — | |
| | | | | | | | | | | | | | | | | | | | |
Total shares outstanding | | | 7,070,697 | | | | 49,622,203 | | | | 12,930,071 | | | | 7,468,891 | | | | 826,398 | |
| | | | | | | | | | | | | | | | | | | | |
(Continued on next page)
(See Notes which are an integral part of the Financial Statements)
109
August 31, 2018
| | |
| | |
| Statements of Assets and Liabilities | | BMO Funds |
| | | | | | | | | | | | | | | | | | | | |
| | | | | | | | | | | | | | | | |
| | | Disciplined
International
Equity Fund | | | Pyrford
International
Stock Fund | | | LGM
Emerging
Markets
Equity Fund | | | Alternative
Strategies
Fund | | | Global
Long/Short
Equity Fund | |
Investments, at cost: | | | | | | | | | | | | | | | | | | | | |
Investments in unaffiliated issuers | | $ | 70,758,842 | | | $ | 578,770,386 | | | $ | 176,210,026 | | | $ | 46,914,429 | | | $ | 8,851,431 | |
Cash sweep investments in affiliated issuers | | | 2,615,839 | | | | 16,791,488 | | | | 7,266,798 | | | | 24,535,211 | | | | 3,433,837 | |
Purchased options | | | — | | | | — | | | | — | | | | 150,024 | | | | — | |
| | | | | | | | | | | | | | | | | | | | |
Total investments, at cost | | $ | 73,374,681 | | | $ | 595,561,874 | | | $ | 183,476,824 | | | $ | 71,599,664 | | | $ | 12,285,268 | |
| | | | | | | | | | | | | | | | | | | | |
| (1) | Including $776,193, $12,915,448, $1,791,291 and $286,005, respectively, of securities on loan. A security on loan value represents both fair value and accrued interest. |
| (2) | Identified cost of cash denominated in foreign currencies are $140,746, $338,290, $235,344 and $2,103,555, respectively. |
| (3) | Computation of offering price per share 100/95 of net asset value. |
(See Notes which are an integral part of the Financial Statements)
110
August 31, 2018
| | |
| | |
| Statements of Assets and Liabilities | | BMO Funds |
| | | | | | | | | | | | | | | | | | | | |
| | | | | | | | | | | | | | | | |
| | | Ultra Short
Tax-Free Fund | | | Short
Tax-Free Fund | | | Short-Term
Income Fund | | | Intermediate
Tax-Free Fund | | | Strategic
Income Fund | |
Assets: | |
Investments in unaffiliated issuers, at value | | $ | 606,055,626 | | | $ | 189,667,410 | | | $ | 275,007,955 | (1) | | $ | 1,768,372,362 | | | $ | 102,664,003 | (1) |
Cash sweep investments in affiliated issuers, at value | | | 159,901 | | | | 121,200 | | | | 3,242,065 | | | | 85,922 | | | | 5,787,248 | |
Investments in other affiliated issuers, at value | | | — | | | | 875,303 | | | | — | | | | 5,162,410 | | | | — | |
Deposit held at broker | | | — | | | | — | | | | — | | | | — | | | | 100,365 | |
Dividends and interest receivable | | | 2,687,673 | | | | 1,520,076 | | | | 1,012,336 | | | | 16,858,981 | | | | 972,585 | |
Receivable for investments sold | | | — | | | | — | | | | — | | | | 6,000,526 | | | | 1,284,260 | |
Receivable for capital stock sold | | | 554,151 | | | | 31,365 | | | | 233,541 | | | | 2,046,462 | | | | 6,690 | |
Prepaid expenses and other receivables | | | 31,865 | | | | 25,449 | | | | 22,337 | | | | 56,204 | | | | 29,630 | |
| | | | | | | | | | | | | | | | | | | | |
Total assets | | | 609,489,216 | | | | 192,240,803 | | | | 279,518,234 | | | | 1,798,582,867 | | | | 110,844,781 | |
|
Liabilities: | |
Payable for return of securities lending collateral | | | — | | | | — | | | | 38,006,514 | | | | — | | | | 21,425,129 | |
Payable for investments purchased | | | 7,278,418 | | | | 3,379,017 | | | | 497,609 | | | | 14,951,758 | | | | 1,934,528 | |
Payable for capital stock redeemed | | | 1,482,809 | | | | 49,737 | | | | 652,172 | | | | 2,705,968 | | | | 65,873 | |
Payable for foreign tax expense | | | — | | | | — | | | | 477 | | | | — | | | | — | |
Payable to affiliates, net (Note 6) | | | 145,229 | | | | 68,657 | | | | 57,436 | | | | 541,178 | | | | 50,538 | |
Payable for income distribution | | | 422,300 | | | | 178,355 | | | | 180,027 | | | | 887,982 | | | | 15,832 | |
Payable to custodian | | | 74 | | | | — | | | | — | | | | — | | | | 1,284,260 | |
Other liabilities | | | 56,909 | | | | 41,041 | | | | 44,754 | | | | 137,198 | | | | 41,677 | |
| | | | | | | | | | | | | | | | | | | | |
Total liabilities | | | 9,385,739 | | | | 3,716,807 | | | | 39,438,989 | | | | 19,224,084 | | | | 24,817,837 | |
| | | | | | | | | | | | | | | | | | | | |
Total net assets | | $ | 600,103,477 | | | $ | 188,523,996 | | | $ | 240,079,245 | | | $ | 1,779,358,783 | | | $ | 86,026,944 | |
| | | | | | | | | | | | | | | | | | | | |
Net assets consist of: | |
Paid-in capital | | $ | 600,045,145 | | | $ | 188,636,829 | | | $ | 243,571,379 | | | $ | 1,754,868,637 | | | $ | 91,229,848 | |
Net unrealized appreciation (depreciation) on investments | | | 77,988 | | | | 89,475 | | | | (1,500,880 | ) | | | 35,408,742 | | | | (2,120,439 | ) |
Accumulated net realized loss on investments | | | — | | | | (204,319 | ) | | | (1,996,283 | ) | | | (10,918,303 | ) | | | (3,066,633 | ) |
Undistributed net investment income (distributions in excess of net investment income) | | | (19,656 | ) | | | 2,011 | | | | 5,029 | | | | (293 | ) | | | (15,832 | ) |
| | | | | | | | | | | | | | | | | | | | |
Total net assets | | $ | 600,103,477 | | | $ | 188,523,996 | | | $ | 240,079,245 | | | $ | 1,779,358,783 | | | $ | 86,026,944 | |
| | | | | | | | | | | | | | | | | | | | |
Net asset value, offering price and redemption proceeds per share (unlimited shares authorized, no par value) | | | | | | | | | | | | | | | | | | | | |
Investor class of shares: | |
Net asset value, offering price and redemption proceeds per share | | $ | — | | | $ | — | | | $ | — | | | $ | 11.13 | | | $ | 9.08 | |
Advisor class of shares: | |
Net asset value and redemption proceeds per share | | | 10.07 | | | | 10.14 | | | | 9.27 | | | | 11.13 | | | | 9.08 | |
Offering price per share | | | 10.28 | (2) | | | 10.35 | (2) | | | 9.46 | (2) | | | 11.53 | (3) | | | 9.41 | (3) |
Institutional class of shares: | |
Net asset value, offering price and redemption proceeds per share | | | 10.06 | | | | 10.14 | | | | 9.29 | | | | 11.12 | | | | 9.08 | |
|
Net assets: | |
Investor class of shares | | $ | — | | | $ | — | | | $ | — | | | $ | 870,194,683 | | | $ | 59,723,775 | |
Advisor class of shares | | | 27,434,256 | | | | 6,501,787 | | | | 26,010,998 | | | | 14,701,169 | | | | 13,601,933 | |
Institutional class of shares | | | 572,669,221 | | | | 182,022,209 | | | | 214,068,247 | | | | 894,462,931 | | | | 12,701,236 | |
| | | | | | | | | | | | | | | | | | | | |
Total net assets | | $ | 600,103,477 | | | $ | 188,523,996 | | | $ | 240,079,245 | | | $ | 1,779,358,783 | | | $ | 86,026,944 | |
| | | | | | | | | | | | | | | | | | | | |
Shares outstanding: | |
Investor class of shares | | | — | | | | — | | | | — | | | | 78,210,839 | | | | 6,575,415 | |
Advisor class of shares | | | 2,724,111 | | | | 641,359 | | | | 2,806,410 | | | | 1,321,335 | | | | 1,497,581 | |
Institutional class of shares | | | 56,904,828 | | | | 17,944,309 | | | | 23,053,631 | | | | 80,413,820 | | | | 1,399,400 | |
| | | | | | | | | | | | | | | | | | | | |
Total shares outstanding | | | 59,628,939 | | | | 18,585,668 | | | | 25,860,041 | | | | 159,945,994 | | | | 9,472,396 | |
| | | | | | | | | | | | | | | | | | | | |
Investments, at cost: | |
Investments in unaffiliated issuers | | $ | 605,977,638 | | | $ | 189,575,417 | | | $ | 276,509,458 | | | $ | 1,732,948,587 | | | $ | 104,784,928 | |
Cash sweep investments in affiliated issuers | | | 159,901 | | | | 121,200 | | | | 3,241,442 | | | | 85,922 | | | | 5,786,762 | |
Investments in other affiliated issuers | | | — | | | | 877,821 | | | | — | | | | 5,177,443 | | | | — | |
| | | | | | | | | | | | | | | | | | | | |
Total investments, at cost | | $ | 606,137,539 | | | $ | 190,574,438 | | | $ | 279,750,900 | | | $ | 1,738,211,952 | | | $ | 110,571,690 | |
| | | | | | | | | | | | | | | | | | | | |
| (1) | Including $37,166,621 and $20,951,662, respectively, of securities on loan. A security on loan value represents both fair value and accrued interest. |
| (2) | Computation of offering price per share 100/98 of net asset value. |
| (3) | Computation of offering price per share 100/96.5 of net asset value. |
(See Notes which are an integral part of the Financial Statements)
111
August 31, 2018
| | |
| | |
| Statements of Assets and Liabilities | | BMO Funds |
| | | | | | | | | | | | |
| | | | | | | | | | |
| | | TCH
Corporate
Income Fund | | | TCH
Core Plus
Bond Fund | | | High Yield
Bond Fund | |
Assets: | | | | | | | | | | | | |
Investments in unaffiliated issuers, at value | | $ | 288,498,754 | (1) | | $ | 1,362,578,462 | (1) | | $ | 15,340,833 | (1) |
Cash sweep investments in affiliated issuers, at value | | | 4,850,884 | | | | 40,862,111 | | | | 813,997 | |
Deposit held at broker | | | 250,913 | | | | 250,912 | | | | — | |
Dividends and interest receivable | | | 2,279,770 | | | | 6,614,926 | | | | 173,708 | |
Receivable for investments sold | | | — | | | | — | | | | 49,698 | |
Receivable for capital stock sold | | | 217,853 | | | | 765,940 | | | | 2,285 | |
Prepaid expenses and other receivables | | | 20,430 | | | | 31,375 | | | | 14,841 | |
| | | | | | | | | | | | |
Total assets | | | 296,118,604 | | | | 1,411,103,726 | | | | 16,395,362 | |
| | | |
Liabilities: | | | | | | | | | | | | |
Payable for return of securities lending collateral | | | 50,798,784 | | | | 363,577,000 | | | | 4,935,287 | |
Payable for investments purchased | | | — | | | | — | | | | 44,847 | |
Payable for capital stock redeemed | | | 138,461 | | | | 1,080,016 | | | | 1,657 | |
Payable to affiliates, net (Note 6) | | | 78,206 | | | | 232,593 | | | | 23,288 | |
Payable for income distribution | | | 278,988 | | | | 271,744 | | | | 3,660 | |
Payable to custodian | | | — | | | | — | | | | 23,620 | |
Other liabilities | | | 41,105 | | | | 91,021 | | | | 37,395 | |
| | | | | | | | | | | | |
Total liabilities | | | 51,335,544 | | | | 365,252,374 | | | | 5,069,754 | |
| | | | | | | | | | | | |
Total net assets | | $ | 244,783,060 | | | $ | 1,045,851,352 | | | $ | 11,325,608 | |
| | | | | | | | | | | | |
Net assets consist of: | | | | | | | | | | | | |
Paid-in capital | | $ | 246,211,131 | | | $ | 1,062,466,971 | | | $ | 14,517,881 | |
Net unrealized depreciation on investments | | | (2,292,760 | ) | | | (9,334,418 | ) | | | (73,275 | ) |
Accumulated net realized gain (loss) on investments | | | 863,445 | | | | (7,265,154 | ) | | | (3,115,338 | ) |
Undistributed net investment income (distributions in excess of net investment income) | | | 1,244 | | | | (16,047 | ) | | | (3,660 | ) |
| | | | | | | | | | | | |
Total net assets | | $ | 244,783,060 | | | $ | 1,045,851,352 | | | $ | 11,325,608 | |
| | | | | | | | | | | | |
Net asset value, offering price and redemption proceeds per share (unlimited shares authorized, no par value) | | | | | | | | | | | | |
Investor class of shares: | | | | | | | | | | | | |
Net asset value, offering price and redemption proceeds per share | | $ | 12.79 | | | $ | 11.41 | | | $ | — | |
Advisor class of shares: | | | | | | | | | | | | |
Net asset value and redemption proceeds per share | | | 12.79 | | | | 11.41 | | | | 9.25 | |
Offering price per share(2) | | | 13.25 | | | | 11.41 | | | | 9.59 | |
Institutional class of shares: | | | | | | | | | | | | |
Net asset value, offering price and redemption proceeds per share | | | 12.78 | | | | 11.40 | | | | 9.24 | |
| | | |
Net assets: | | | | | | | | | | | | |
Investor class of shares | | $ | 102,523,494 | | | $ | 61,251,011 | | | $ | — | |
Advisor class of shares | | | 1,864,464 | | | | 3,031,610 | | | | 864,038 | |
Institutional class of shares | | | 140,395,102 | | | | 981,568,731 | | | | 10,461,570 | |
| | | | | | | | | | | | |
Total net assets | | $ | 244,783,060 | | | $ | 1,045,851,352 | | | $ | 11,325,608 | |
| | | | | | | | | | | | |
Shares outstanding: | | | | | | | | | | | | |
Investor class of shares | | | 8,013,004 | | | | 5,369,009 | | | | — | |
Advisor class of shares | | | 145,740 | | | | 265,756 | | | | 93,457 | |
Institutional class of shares | | | 10,985,277 | | | | 86,067,804 | | | | 1,132,680 | |
| | | | | | | | | | | | |
Total shares outstanding | | | 19,144,021 | | | | 91,702,569 | | | | 1,226,137 | |
| | | | | | | | | | | | |
Investments, at cost: | | | | | | | | | | | | |
Investments in unaffiliated issuers | | $ | 290,791,775 | | | $ | 1,371,917,732 | | | $ | 15,414,187 | |
Cash sweep investments in affiliated issuers | | | 4,850,623 | | | | 40,857,259 | | | | 813,918 | |
| | | | | | | | | | | | |
Total investments, at cost | | $ | 295,642,398 | | | $ | 1,412,774,991 | | | $ | 16,228,105 | |
| | | | | | | | | | | | |
| (1) | Including $49,676,200, $355,542,440 and $4,826,224, respectively, of securities on loan. A security on loan value represents both fair value and accrued interest. |
| (2) | Computation of offering price per share 100/96.5 of net asset value. |
(See Notes which are an integral part of the Financial Statements)
112
August 31, 2018
| | |
| | |
| Statements of Assets and Liabilities | | BMO Funds |
| | | | | | | | | | | | | | | | |
| | | | | | | | | | | | | |
| | | Government
Money
Market Fund | | | Tax-Free
Money
Market Fund | | | Prime
Money
Market Fund | | | Institutional
Prime Money
Market Fund | |
Assets: | | | | | | | | | | | | | | | | |
Investments in unaffiliated issuers, at value | | $ | 2,087,836,765 | | | $ | 380,941,747 | | | $ | 356,260,282 | | | $ | 392,138,422 | |
Investments in repurchase agreements | | | 1,303,479,468 | | | | — | | | | 105,528,777 | | | | 90,000,000 | |
Cash | | | — | | | | 1,000 | | | | — | | | | — | |
Dividends and interest receivable | | | 2,394,145 | | | | 809,594 | | | | 303,507 | | | | 327,009 | |
Receivable for capital stock sold | | | 98,561 | | | | — | | | | — | | | | — | |
Prepaid expenses and other receivables | | | 20,859 | | | | 21,178 | | | | 40,645 | | | | 10,915 | |
| | | | | | | | | | | | | | | | |
Total assets | | | 3,393,829,798 | | | | 381,773,519 | | | | 462,133,211 | | | | 482,476,346 | |
| | | | |
Liabilities: | | | | | | | | | | | | | | | | |
Payable for capital stock redeemed | | | 2,917 | | | | — | | | | 1,879 | | | | — | |
Payable to affiliates, net (Note 6) | | | 519,975 | | | | 39,217 | | | | 99,773 | | | | 6,665 | |
Payable for income distribution | | | 4,112,713 | | | | 367,182 | | | | 460,504 | | | | 561,043 | |
Other liabilities | | | 144,101 | | | | 53,987 | | | | 78,575 | | | | 94,228 | |
| | | | | | | | | | | | | | | | |
Total liabilities | | | 4,779,706 | | | | 460,386 | | | | 640,731 | | | | 661,936 | |
| | | | | | | | | | | | | | | | |
Total net assets | | $ | 3,389,050,092 | | | $ | 381,313,133 | | | $ | 461,492,480 | | | $ | 481,814,410 | |
| | | | | | | | | | | | | | | | |
Net assets consist of: | | | | | | | | | | | | | | | | |
Paid-in capital | | $ | 3,389,050,233 | | | $ | 381,313,079 | | | $ | 461,516,447 | | | $ | 481,741,873 | |
Net unrealized appreciation on investments | | | — | | | | — | | | | — | | | | 56,099 | |
Accumulated net realized gain on investments | | | 200 | | | | 24,255 | | | | — | | | | — | |
Undistributed net investment income (distributions in excess of net investment income) | | | (341 | ) | | | (24,201 | ) | | | (23,967 | ) | | | 16,438 | |
| | | | | | | | | | | | | | | | |
Total net assets | | $ | 3,389,050,092 | | | $ | 381,313,133 | | | $ | 461,492,480 | | | $ | 481,814,410 | |
| | | | | | | | | | | | | | | | |
Net asset value, offering price and redemption proceeds per share (unlimited shares authorized, no par value) | | | | | | | | | | | | | | | | |
Investor class of shares: | | | | | | | | | | | | | | | | |
Net asset value, offering price and redemption proceeds per share | | $ | 1.00 | | | $ | 1.00 | | | $ | 1.00 | | | $ | 1.0001 | |
Premier class of shares: | | | | | | | | | | | | | | | | |
Net asset value, offering price and redemption proceeds per share | | | 1.00 | | | | 1.00 | | | | 1.00 | | | | 1.0001 | |
| | | | |
Net assets: | | | | | | | | | | | | | | | | |
Investor class of shares | | $ | 747,980,742 | | | $ | 75,889,170 | | | $ | 193,005,925 | | | $ | 2,400,949 | |
Premier class of shares | | | 2,641,069,350 | | | | 305,423,963 | | | | 268,486,555 | | | | 479,413,461 | |
| | | | | | | | | | | | | | | | |
Total net assets | | $ | 3,389,050,092 | | | $ | 381,313,133 | | | $ | 461,492,480 | | | $ | 481,814,410 | |
| | | | | | | | | | | | | | | | |
Shares outstanding: | | | | | | | | | | | | | | | | |
Investor class of shares | | | 747,982,076 | | | | 75,886,785 | | | | 193,067,924 | | | | 2,400,785 | |
Premier class of shares | | | 2,641,068,157 | | | | 305,453,963 | | | | 268,448,574 | | | | 479,376,077 | |
| | | | | | | | | | | | | | | | |
Total shares outstanding | | | 3,389,050,233 | | | | 381,340,748 | | | | 461,516,498 | | | | 481,776,862 | |
| | | | | | | | | | | | | | | | |
Investments, at cost: | | | | | | | | | | | | | | | | |
Investments in unaffiliated issuers | | $ | 3,391,316,233 | | | $ | 380,941,747 | | | $ | 461,789,059 | | | $ | 482,082,323 | |
| | | | | | | | | | | | | | | | |
Total investments, at cost | | $ | 3,391,316,233 | | | $ | 380,941,747 | | | $ | 461,789,059 | | | $ | 482,082,323 | |
| | | | | | | | | | | | | | | | |
(See Notes which are an integral part of the Financial Statements)
113
Year Ended August 31, 2018
| | |
| | |
| Statements of Operations | | BMO Funds |
| | | | | | | | | | | | | | | | | | | | |
| | | | | | | | | | | | | | | | |
| | | Low Volatility
Equity Fund | | | Dividend
Income Fund | | | Large-Cap
Value Fund | | | Large-Cap
Growth Fund | | | Mid-Cap
Value Fund | |
Investment income: | | | | | | | | | | | | | | | | | | | | |
Dividend income from: | | | | | | | | | | | | | | | | | | | | |
Unaffiliated issuers | | $ | 2,988,441 | (1) | | $ | 3,735,207 | | | $ | 8,003,134 | | | $ | 4,304,149 | | | $ | 3,988,877 | |
Affiliated issuers | | | 30,037 | | | | 37,587 | | | | 86,527 | | | | 79,081 | | | | 40,465 | |
Net securities lending income (Note 6) | | | 64,238 | | | | 61,331 | | | | 149,457 | | | | 235,653 | | | | 89,244 | |
| | | | | | | | | | | | | | | | | | | | |
Total income: | | | 3,082,716 | | | | 3,834,125 | | | | 8,239,118 | | | | 4,618,883 | | | | 4,118,586 | |
| | | | | |
Expenses: | | | | | | | | | | | | | | | | | | | | |
Investment advisory fees (Note 6) | | | 719,277 | | | | 655,187 | | | | 1,510,324 | | | | 1,590,581 | | | | 1,403,156 | |
Shareholder servicing fees (Note 6) | | | — | | | | — | | | | — | | | | 188,242 | | | | — | |
Administration fees (Note 6) | | | 215,783 | | | | 196,556 | | | | 483,853 | | | | 528,627 | | | | 273,945 | |
Portfolio accounting fees | | | 52,915 | | | | 47,415 | | | | 100,302 | | | | 109,839 | | | | 75,507 | |
Recordkeeping fees | | | 32,278 | | | | 28,119 | | | | 85,450 | | | | 95,889 | | | | 111,539 | |
Custodian fees (Note 6) | | | 7,368 | | | | 8,360 | | | | 11,170 | | | | 17,905 | | | | 7,195 | |
Registration fees | | | 38,808 | | | | 35,649 | | | | 57,893 | | | | 65,619 | | | | 61,816 | |
Professional fees | | | 16,334 | | | | 16,334 | | | | 16,723 | | | | 16,724 | | | | 16,724 | |
Printing and postage | | | 16,750 | | | | 33,241 | | | | 36,833 | | | | 39,248 | | | | 33,067 | |
Directors’ fees | | | 15,349 | | | | 15,348 | | | | 15,348 | | | | 15,348 | | | | 15,348 | |
Distribution services fees (Note 6): | | | | | | | | | | | | | | | | | | | | |
Advisor | | | 70,240 | | | | 8,409 | | | | 61,230 | | | | 1,692 | | | | 150,458 | |
Retirement classR-3 | | | — | | | | — | | | | — | | | | — | | | | 88 | |
Miscellaneous | | | 10,108 | | | | 4,894 | | | | 10,677 | | | | 11,520 | | | | 9,952 | |
| | | | | | | | | | | | | | | | | | | | |
Total expenses: | | | 1,195,210 | | | | 1,049,512 | | | | 2,389,803 | | | | 2,681,234 | | | | 2,158,795 | |
| | | | | |
Deduct: | | | | | | | | | | | | | | | | | | | | |
Expense waivers (Note 6) | | | (187,965 | ) | | | (189,384 | ) | | | (94,728 | ) | | | (101,728 | ) | | | (13,356 | ) |
| | | | | | | | | | | | | | | | | | | | |
Net expenses | | | 1,007,245 | | | | 860,128 | | | | 2,295,075 | | | | 2,579,506 | | | | 2,145,439 | |
| | | | | | | | | | | | | | | | | | | | |
Net investment income | | | 2,075,471 | | | | 2,973,997 | | | | 5,944,043 | | | | 2,039,377 | | | | 1,973,147 | |
| | | | | |
Net realized and unrealized gain (loss) on investments: | | | | | | | | | | | | | | | | | | | | |
Net realized gain (loss) on transactions from: | |
Investments in unaffiliated issuers | | | 11,106,218 | | | | 9,203,594 | | | | 37,164,314 | | | | 47,905,994 | | | | 20,334,659 | |
Investments in affiliated issuers | | | (217 | ) | | | (309 | ) | | | (839 | ) | | | 182 | | | | 1 | |
| | | | | | | | | | | | | | | | | | | | |
Total net realized gain | | | 11,106,001 | | | | 9,203,285 | | | | 37,163,475 | | | | 47,906,176 | | | | 20,334,660 | |
Net change in unrealized appreciation (depreciation) on: | | | | | | | | | | | | | | | | | |
Investments in unaffiliated issuers | | | 5,207,492 | | | | 14,007,131 | | | | 9,780,980 | | | | 42,293,453 | | | | (57,832 | ) |
Investments in affiliated issuers | | | 359 | | | | 518 | | | | 1,019 | | | | 31 | | | | 584 | |
| | | | | | | | | | | | | | | | | | | | |
Total net change in unrealized appreciation (depreciation) | | | 5,207,851 | | | | 14,007,649 | | | | 9,781,999 | | | | 42,293,484 | | | | (57,248 | ) |
| | | | | | | | | | | | | | | | | | | | |
Net realized and unrealized gain on investments | | | 16,313,852 | | | | 23,210,934 | | | | 46,945,474 | | | | 90,199,660 | | | | 20,277,412 | |
| | | | | | | | | | | | | | | | | | | | |
Change in net assets resulting from operations | | $ | 18,389,323 | | | $ | 26,184,931 | | | $ | 52,889,517 | | | $ | 92,239,037 | | | $ | 22,250,559 | |
| | | | | | | | | | | | | | | | | | | | |
| (1) | Net of foreign taxes withheld of $2,249. |
(See Notes which are an integral part of the Financial Statements)
114
Year Ended August 31, 2018
| | |
| | |
| Statements of Operations | | BMO Funds |
| | | | | | | | | | | | | | | | | | | | |
| | | | | | | | | | | | | | | | |
| | | Mid-Cap
Growth Fund | | | Small-Cap
Value Fund | | | Small-Cap
Core Fund | | | Small-Cap
Growth Fund | | | Global Low
Volatility
Equity Fund | |
Investment income: | | | | | | | | | | | | | | | | | | | | |
Dividend income from: | | | | | | | | | | | | | | | | | | | | |
Unaffiliated issuers | | $ | 921,135 | | | $ | 931,415 | (1) | | $ | 199,492 | | | $ | 925,626 | | | $ | 1,305,394 | (1) |
Affiliated issuers | | | 25,170 | | | | 14,956 | | | | 5,889 | | | | 28,964 | | | | 4,696 | |
Net securities lending income (Note 6) | | | 50,977 | | | | 40,651 | | | | 11,940 | | | | 107,712 | | | | 5,382 | |
| | | | | | | | | | | | | | | | | | | | |
Total income: | | | 997,282 | | | | 987,022 | | | | 217,321 | | | | 1,062,302 | | | | 1,315,472 | |
|
Expenses: | |
Investment advisory fees (Note 6) | | | 832,345 | | | | 475,449 | | | | 138,660 | | | | 970,668 | | | | 307,096 | |
Administration fees (Note 6) | | | 164,446 | | | | 93,419 | | | | 31,998 | | | | 212,555 | | | | 70,868 | |
Portfolio accounting fees | | | 53,560 | | | | 48,389 | | | | 26,385 | | | | 51,159 | | | | 57,646 | |
Recordkeeping fees | | | 86,818 | | | | 47,309 | | | | 21,871 | | | | 95,153 | | | | 19,907 | |
Custodian fees (Note 6) | | | 4,342 | | | | 8,266 | | | | 2,252 | | | | 10,264 | | | | 29,500 | |
Registration fees | | | 61,138 | | | | 56,481 | | | | 33,283 | | | | 41,301 | | | | 33,688 | |
Professional fees | | | 16,724 | | | | 16,334 | | | | 16,334 | | | | 16,724 | | | | 19,554 | |
Printing and postage | | | 30,376 | | | | 28,262 | | | | 3,994 | | | | 29,780 | | | | 3,737 | |
Directors’ fees | | | 15,349 | | | | 15,349 | | | | 15,349 | | | | 15,349 | | | | 15,348 | |
Distribution services fees (Note 6): | | | | | | | | | | | | | | | | | | | | |
Advisor | | | 43,308 | | | | 12,035 | | | | 7,122 | | | | 137,915 | | | | 2,087 | |
Retirement classR-3 | | | — | | | | 289 | | | | — | | | | — | | | | — | |
Miscellaneous | | | 5,390 | | | | 5,022 | | | | 2,958 | | | | 6,703 | | | | 1,899 | |
| | | | | | | | | | | | | | | | | | | | |
Total expenses: | | | 1,313,796 | | | | 806,604 | | | | 300,206 | | | | 1,587,571 | | | | 561,330 | |
| | | | | |
Deduct: | | | | | | | | | | | | | | | | | | | | |
Expense waivers (Note 6) | | | (85,334 | ) | | | (117,810 | ) | | | (100,769 | ) | | | (46,528 | ) | | | (156,239 | ) |
| | | | | | | | | | | | | | | | | | | | |
Net expenses | | | 1,228,462 | | | | 688,794 | | | | 199,437 | | | | 1,541,043 | | | | 405,091 | |
| | | | | | | | | | | | | | | | | | | | |
Net investment income (loss) | | | (231,180 | ) | | | 298,228 | | | | 17,884 | | | | (478,741 | ) | | | 910,381 | |
| | | | | |
Net realized and unrealized gain (loss) on investments and foreign currency: | | | | | | | | | | | | | | | | | | | | |
Net realized gain (loss) on transactions from: | |
Investments in unaffiliated issuers | | | 19,631,818 | | | | 5,585,654 | | | | 2,368,100 | | | | 20,262,798 | | | | 5,421,939 | |
Investments in affiliated issuers | | | 293 | | | | (180 | ) | | | (20 | ) | | | 688 | | | | 26 | |
Foreign currency transactions | | | — | | | | — | | | | — | | | | — | | | | (645 | ) |
| | | | | | | | | | | | | | | | | | | | |
Total net realized gain | | | 19,632,111 | | | | 5,585,474 | | | | 2,368,080 | | | | 20,263,486 | | | | 5,421,320 | |
Net change in unrealized appreciation (depreciation) on: | | | | | | | | | | | | | | | | | | | | |
Investments in unaffiliated issuers | | | 12,054,964 | | | | 7,032,681 | | | | 1,740,328 | | | | 19,507,093 | | | | (1,858,119 | ) |
Investments in affiliated issuers | | | 152 | | | | 154 | | | | 66 | | | | 317 | | | | 14 | |
Foreign currency translations | | | — | | | | — | | | | — | | | | — | | | | (11,820 | ) |
| | | | | | | | | | | | | | | | | | | | |
Total net change in unrealized appreciation (depreciation) | | | 12,055,116 | | | | 7,032,835 | | | | 1,740,394 | | | | 19,507,410 | | | | (1,869,925 | ) |
| | | | | | | | | | | | | | | | | | | | |
Net realized and unrealized gain on investments and foreign currency | | | 31,687,227 | | | | 12,618,309 | | | | 4,108,474 | | | | 39,770,896 | | | | 3,551,395 | |
| | | | | | | | | | | | | | | | | | | | |
Change in net assets resulting from operations | | $ | 31,456,047 | | | $ | 12,916,537 | | | $ | 4,126,358 | | | $ | 39,292,155 | | | $ | 4,461,776 | |
| | | | | | | | | | | | | | | | | | | | |
| (1) | Net of foreign taxes withheld of $1,122 and $82,800, respectively. |
(See Notes which are an integral part of the Financial Statements)
115
Year Ended August 31, 2018
| | |
| | |
| Statements of Operations | | BMO Funds |
| | | | | | | | | | | | | | | | | | | | |
| | | | | | | | | | | | | | | | |
| | | Disciplined
International
Equity Fund | | | Pyrford
International
Stock Fund | | | LGM
Emerging
Markets
Equity Fund | | | Alternative
Strategies
Fund | | | Global
Long/Short
Equity Fund | |
Investment income: | | | | | | | | | | | | | | | | | | | | |
Dividend income from: | | | | | | | | | | | | | | | | | | | | |
Unaffiliated issuers | | $ | 2,443,198 | (1) | | $ | 23,710,730 | (1) | | $ | 4,489,274 | (1) | | $ | 1,210,007 | (1) | | $ | 271,331 | (1) |
Affiliated issuers | | | 11,964 | | | | 143,287 | | | | 62,307 | | | | 15,008 | | | | 42,148 | |
Interest income | | | — | | | | — | | | | — | | | | 134,278 | | | | — | |
Net securities lending income (Note 6) | | | 24,029 | | | | 210,119 | | | | 14,289 | | | | — | | | | 2,414 | |
| | | | | | | | | | | | | | | | | | | | |
Total income: | | | 2,479,191 | | | | 24,064,136 | | | | 4,565,870 | | | | 1,359,293 | | | | 315,893 | |
| | | | | |
Expenses: | | | | | | | | | | | | | | | | | | | | |
Investment advisory fees (Note 6) | | | 460,337 | | | | 5,047,112 | | | | 1,746,359 | | | | 1,230,628 | | | | 126,067 | |
Shareholder servicing fees (Note 6) | | | — | | | | 9,826 | | | | — | | | | — | | | | — | |
Administration fees (Note 6) | | | 115,084 | | | | 860,622 | | | | 291,060 | | | | 123,063 | | | | 18,910 | |
Portfolio accounting fees | | | 56,864 | | | | 138,866 | | | | 78,240 | | | | 236,638 | | | | 50,600 | |
Recordkeeping fees | | | 19,242 | | | | 21 | | | | 31,124 | | | | 20,037 | | | | 19,749 | |
Custodian fees (Note 6) | | | 45,043 | | | | 236,892 | | | | 250,070 | | | | 314,470 | | | | 17,645 | |
Registration fees | | | 52,583 | | | | 95,263 | | | | 37,315 | | | | 32,619 | | | | 53,126 | |
Professional fees | | | 19,084 | | | | 20,034 | | | | 27,174 | | | | 36,058 | | | | 21,684 | |
Printing and postage | | | 3,701 | | | | 40,592 | | | | 37,212 | | | | 5,758 | | | | 3,854 | |
Directors’ fees | | | 15,349 | | | | 15,349 | | | | 15,349 | | | | 15,349 | | | | 15,349 | |
Interest expense and dividends on securities sold short | | | — | | | | — | | | | — | | | | 261,407 | | | | 110,128 | |
Distribution services fees (Note 6): | | | | | | | | | | | | | | | | | | | | |
Advisor | | | 447 | | | | 6,463 | | | | 13,057 | | | | 273 | | | | 1,990 | |
Retirement classR-3 | | | — | | | | 34 | | | | — | | | | — | | | | — | |
Miscellaneous | | | 570 | | | | 10,486 | | | | 1,434 | | | | 6,043 | | | | 136 | |
| | | | | | | | | | | | | | | | | | | | |
Total expenses: | | | 788,304 | | | | 6,481,560 | | | | 2,528,394 | | | | 2,282,343 | | | | 439,238 | |
| | | | | |
Deduct: | | | | | | | | | | | | | | | | | | | | |
Expense waivers (Note 6) | | | (97,375 | ) | | | (135,965 | ) | | | (284,034 | ) | | | (579,912 | ) | | | (156,936 | ) |
| | | | | | | | | | | | | | | | | | | | |
Net expenses | | | 690,929 | | | | 6,345,595 | | | | 2,244,360 | | | | 1,702,431 | | | | 282,302 | |
| | | | | | | | | | | | | | | | | | | | |
Net investment income (loss) | | | 1,788,262 | | | | 17,718,541 | | | | 2,321,510 | | | | (343,138 | ) | | | 33,591 | |
| | | | | |
Net realized and unrealized gain (loss) on investments, options, futures contracts and foreign currency: | | | | | | | | | | | | | | | | | | | | |
Net realized gain (loss) on transactions from: | |
Investments in unaffiliated issuers | | | 4,590,940 | | | | (2,803,385 | ) | | | 11,055,075 | (2) | | | 4,969,474 | | | | 622,795 | |
Investments in affiliated issuers | | | 369 | | | | 4,409 | | | | 1,303 | | | | 462 | | | | 1,296 | |
Foreign currency transactions | | | 5,640 | | | | (397,276 | ) | | | (154,604 | ) | | | (21,995 | ) | | | (3,261 | ) |
Forward contracts | | | — | | | | — | | | | — | | | | (1,114,134 | ) | | | — | |
Futures contracts | | | — | | | | — | | | | — | | | | (2,049,683 | ) | | | — | |
Purchased options | | | — | | | | — | | | | — | | | | (1,068,981 | ) | | | — | |
Written options | | | — | | | | — | | | | — | | | | 1,288,709 | | | | — | |
Short sales | | | — | | | | — | | | | — | | | | (2,588,567 | ) | | | (569,152 | ) |
| | | | | | | | | | | | | | | | | | | | |
Total net realized gain (loss) | | | 4,596,949 | | | | (3,196,252 | ) | | | 10,901,774 | | | | (584,715 | ) | | | 51,678 | |
Net change in unrealized appreciation (depreciation) on: | | | | | | | | | | | | | | | | | | | | |
Investments in unaffiliated issuers | | | (6,393,089 | ) | | | (22,876 | ) | | | (13,458,070 | ) | | | 60,859 | | | | (13,216 | ) |
Investments in affiliated issuers | | | 137 | | | | 979 | | | | 1,482 | | | | 5,191 | | | | 366 | |
Foreign currency translations | | | (2,045 | ) | | | (38,084 | ) | | | 13,668 | | | | (5,445 | ) | | | 1,106 | |
Forward contracts | | | — | | | | — | | | | — | | | | (20,476 | ) | | | — | |
Future contracts | | | — | | | | — | | | | — | | | | (865,047 | ) | | | — | |
Purchased options | | | — | | | | — | | | | — | | | | 554,826 | | | | — | |
Written options | | | — | | | | — | | | | — | | | | (672,299 | ) | | | — | |
Short sales | | | — | | | | — | | | | — | | | | (543,311 | ) | | | (36,094 | ) |
| | | | | | | | | | | | | | | | | | | | |
Total net change in unrealized depreciation | | | (6,394,997 | ) | | | (59,981 | ) | | | (13,442,920 | ) | | | (1,485,702 | ) | | | (47,838 | ) |
| | | | | | | | | | | | | | | | | | | | |
Net realized and unrealized gain (loss) on investments, options, futures contracts and foreign currency | | | (1,798,048 | ) | | | (3,256,233 | ) | | | (2,541,146 | ) | | | (2,070,417 | ) | | | 3,840 | |
| | | | | | | | | | | | | | | | | | | | |
Change in net assets resulting from operations | | $ | (9,786 | ) | | $ | 14,462,308 | | | $ | (219,636 | ) | | $ | (2,413,555 | ) | | $ | 37,431 | |
| | | | | | | | | | | | | | | | | | | | |
| (1) | Net of foreign taxes withheld of $216,334, $2,212,558, $428,619, $26,297 and $19,246, respectively. |
| (2) | Net of foreign taxes withheld of $970,098, $790,415 of which is related to appreciated investments held at period end. |
(See Notes which are an integral part of the Financial Statements)
116
Year Ended August 31, 2018
| | |
| | |
| Statements of Operations | | BMO Funds |
| | | | | | | | | | | | | | | | | | | | |
| | | | | | | | | | | | | | | | |
| | | Ultra Short
Tax-Free Fund | | | Short
Tax-Free Fund | | | Short-Term
Income Fund | | | Intermediate
Tax-Free Fund | | | Strategic
Income Fund | |
Investment income: | | | | | | | | | | | | | | | | | | | | |
Dividend income from: | | | | | | | | | | | | | | | | | | | | |
Unaffiliated issuers | | $ | 38,461 | | | $ | 12,703 | | | $ | 160,167 | | | $ | 595,743 | | | $ | 6,270 | |
Affiliated issuers | | | 13,324 | | | | 12,994 | | | | 96,893 | | | | 67,876 | | | | 34,703 | |
Interest income | | | 9,970,898 | | | | 3,670,558 | | | | 5,619,206 | | | | 52,557,420 | | | | 4,723,548 | |
Net securities lending income (Note 6) | | | — | | | | — | | | | 48,157 | | | | — | | | | 82,547 | |
| | | | | | | | | | | | | | | | | | | | |
Total income: | | | 10,022,683 | | | | 3,696,255 | | | | 5,924,423 | | | | 53,221,039 | | | | 4,847,068 | |
| | | | | |
Expenses: | | | | | | | | | | | | | | | | | | | | |
Investment advisory fees (Note 6) | | | 1,058,435 | | | | 369,033 | | | | 477,303 | | | | 1,953,177 | | | | 246,258 | |
Shareholder servicing fees (Note 6) | | | — | | | | — | | | | — | | | | 2,182,749 | | | | 167,493 | |
Administration fees (Note 6) | | | 972,653 | | | | 283,447 | | | | 369,595 | | | | 2,494,766 | | | | 148,969 | |
Portfolio accounting fees | | | 193,881 | | | | 115,497 | | | | 98,411 | | | | 410,032 | | | | 65,165 | |
Recordkeeping fees | | | 38,238 | | | | 34,656 | | | | 77,632 | | | | 44,640 | | | | 86,715 | |
Custodian fees (Note 6) | | | 24,935 | | | | 6,534 | | | | 10,937 | | | | 53,468 | | | | 5,291 | |
Registration fees | | | 54,258 | | | | 38,721 | | | | 43,969 | | | | 89,429 | | | | 52,262 | |
Professional fees | | | 21,144 | | | | 21,144 | | | | 21,144 | | | | 21,144 | | | | 23,042 | |
Printing and postage | | | 9,508 | | | | 7,690 | | | | 9,768 | | | | 48,525 | | | | 11,794 | |
Directors’ fees | | | 15,349 | | | | 15,349 | | | | 15,349 | | | | 15,349 | | | | 15,349 | |
Distribution services fees (Note 6): | | | | | | | | | | | | | | | | | | | | |
Advisor | | | 83,060 | | | | 12,924 | | | | 75,617 | | | | 29,550 | | | | 40,472 | |
Miscellaneous | | | 18,545 | | | | 6,727 | | | | 8,138 | | | | 43,387 | | | | 4,894 | |
| | | | | | | | | | | | | | | | | | | | |
Total expenses: | | | 2,490,006 | | | | 911,722 | | | | 1,207,863 | | | | 7,386,216 | | | | 867,704 | |
| | | | | |
Deduct: | | | | | | | | | | | | | | | | | | | | |
Expense waivers (Note 6) | | | (461,283 | ) | | | (145,559 | ) | | | (269,806 | ) | | | (5,749 | ) | | | (113,491 | ) |
| | | | | | | | | | | | | | | | | | | | |
Net expenses | | | 2,028,723 | | | | 766,163 | | | | 938,057 | | | | 7,380,467 | | | | 754,213 | |
| | | | | | | | | | | | | | | | | | | | |
Net investment income | | | 7,993,960 | | | | 2,930,092 | | | | 4,986,366 | | | | 45,840,572 | | | | 4,092,855 | |
| | | | | |
Net realized and unrealized gain (loss) on investments | | | | | | | | | | | | | | | | | | | | |
Net realized gain (loss) on transactions from: | | | | | | | | | | | | | | | | | | | | |
Investments in unaffiliated issuers | | | 107,385 | | | | 35,303 | | | | (258,278 | ) | | | 1,934,107 | | | | 807,966 | |
Investments in affiliated issuers | | | — | | | | — | | | | 972 | | | | — | | | | (507 | ) |
Net realized gain on capital gains distributions from: | | | | | | | | | | | | | | | | | | | | |
Investments in unaffiliated issuers | | | — | | | | 448 | | | | — | | | | 2,644 | | | | — | |
| | | | | | | | | | | | | | | | | | | | |
Total net realized gain (loss) | | | 107,385 | | | | 35,751 | | | | (257,306 | ) | | | 1,936,751 | | | | 807,459 | |
Net change in unrealized appreciation (depreciation) on: | | | | | | | | | | | | | | | | | | | | |
Investments in unaffiliated issuers | | | (530,035 | ) | | | (1,516,347 | ) | | | (2,814,997 | ) | | | (37,298,526 | ) | | | (4,312,016 | ) |
Investments in affiliated issuers | | | — | | | | (1,694 | ) | | | 535 | | | | (10,172 | ) | | | 486 | |
| | | | | | | | | | | | | | | | | | | | |
Total net change in unrealized depreciation | | | (530,035 | ) | | | (1,518,041 | ) | | | (2,814,462 | ) | | | (37,308,698 | ) | | | (4,311,530 | ) |
| | | | | | | | | | | | | | | | | | | | |
Net realized and unrealized loss on investments | | | (422,650 | ) | | | (1,482,290 | ) | | | (3,071,768 | ) | | | (35,371,947 | ) | | | (3,504,071 | ) |
| | | | | | | | | | | | | | | | | | | | |
Change in net assets resulting from operations | | $ | 7,571,310 | | | $ | 1,447,802 | | | $ | 1,914,598 | | | $ | 10,468,625 | | | $ | 588,784 | |
| | | | | | | | | | | | | | | | | | | | |
(See Notes which are an integral part of the Financial Statements)
117
Year Ended August 31, 2018
| | |
| | |
| Statements of Operations | | BMO Funds |
| | | | | | | | | | | | |
| | | | | | | | | | |
| | | TCH
Corporate
Income Fund | | | TCH
Core Plus
Bond Fund | | | High Yield
Bond Fund | |
Investment income: | | | | | | | | | | | | |
Dividend income from: | | | | | | | | | | | | |
Affiliated issuers | | $ | 60,075 | | | $ | 459,304 | | | $ | 5,811 | |
Interest income | | | 9,087,321 | | | | 33,782,210 | | | | 733,448 | |
Net securities lending income (Note 6) | | | 119,230 | | | | 344,691 | | | | 1,387 | |
| | | | | | | | | | | | |
Total income: | | | 9,266,626 | | | | 34,586,205 | | | | 740,646 | |
| | | |
Expenses: | | | | | | | | | | | | |
Investment advisory fees (Note 6) | | | 487,180 | | | | 1,345,520 | | | | 61,593 | |
Shareholder servicing fees (Note 6) | | | 203,658 | | | | 168,342 | | | | — | |
Administration fees (Note 6) | | | 377,990 | | | | 1,583,280 | | | | 18,478 | |
Portfolio accounting fees | | | 95,140 | | | | 227,209 | | | | 29,390 | |
Recordkeeping fees | | | 33,911 | | | | 39,535 | | | | 21,708 | |
Custodian fees (Note 6) | | | 8,895 | | | | 52,844 | | | | 910 | |
Registration fees | | | 57,413 | | | | 81,125 | | | | 36,627 | |
Professional fees | | | 23,344 | | | | 23,344 | | | | 22,764 | |
Printing and postage | | | 17,850 | | | | 48,376 | | | | 5,964 | |
Directors’ fees | | | 15,349 | | | | 15,349 | | | | 15,349 | |
Distribution services fees (Note 6): | | | | | | | | | | | | |
Advisor | | | 2,035 | | | | 8,298 | | | | 2,341 | |
Miscellaneous | | | 8,385 | | | | 26,890 | | | | 2,388 | |
| | | | | | | | | | | | |
Total expenses: | | | 1,331,150 | | | | 3,620,112 | | | | 217,512 | |
| | | |
Deduct: | | | | | | | | | | | | |
Expense waivers (Note 6) | | | (40,996 | ) | | | — | | | | (135,097 | ) |
| | | | | | | | | | | | |
Net expenses | | | 1,290,154 | | | | 3,620,112 | | | | 82,415 | |
| | | | | | | | | | | | |
Net investment income | | | 7,976,472 | | | | 30,966,093 | | | | 658,231 | |
| | | |
Net realized and unrealized gain (loss) on investments: | | | | | | | | | | | | |
Net realized gain (loss) on transactions from: | | | | | | | | | | | | |
Investments in unaffiliated issuers | | | 889,119 | | | | (4,322,493 | ) | | | 120,127 | |
Investments in affiliated issuers | | | (383 | ) | | | (5,725 | ) | | | (32 | ) |
| | | | | | | | | | | | |
Total net realized gain (loss) | | | 888,736 | | | | (4,328,218 | ) | | | 120,095 | |
Net change in unrealized appreciation (depreciation) on: | | | | | | | | | | | | |
Investments in unaffiliated issuers | | | (8,512,601 | ) | | | (29,061,816 | ) | | | (571,930 | ) |
Investments in affiliated issuers | | | 261 | | | | 3,960 | | | | 79 | |
| | | | | | | | | | | | |
Total net change in unrealized depreciation | | | (8,512,340 | ) | | | (29,057,856 | ) | | | (571,851 | ) |
| | | | | | | | | | | | |
Net realized and unrealized loss on investments | | | (7,623,604 | ) | | | (33,386,074 | ) | | | (451,756 | ) |
| | | | | | | | | | | | |
Change in net assets resulting from operations | | $ | 352,868 | | | $ | (2,419,981 | ) | | $ | 206,475 | |
| | | | | | | | | | | | |
(See Notes which are an integral part of the Financial Statements)
118
Year Ended August 31, 2018
| | |
| | |
| Statements of Operations | | BMO Funds |
| | | | | | | | | | | | | | | | |
| | | | | | | | | | | | | |
| | | Government
Money
Market Fund | | | Tax-Free
Money
Market Fund | | | Prime
Money
Market Fund | | | Institutional
Prime Money
Market Fund | |
Investment income: | | | | | | | | | | | | | | | | |
Dividend income from: | | | | | | | | | | | | | | | | |
Unaffiliated issuers | | $ | 1,516,953 | | | $ | 105,736 | | | $ | 124,265 | | | $ | 101,556 | |
Interest income | | | 47,564,146 | | | | 4,523,500 | | | | 7,172,068 | | | | 7,605,817 | |
| | | | | | | | | | | | | | | | |
Total income: | | | 49,081,099 | | | | 4,629,236 | | | | 7,296,333 | | | | 7,707,373 | |
| | | | |
Expenses: | | | | | | | | | | | | | | | | |
Investment advisory fees (Note 6) | | | 6,379,345 | | | | 733,875 | | | | 639,739 | | | | 658,060 | |
Shareholder servicing fees (Note 6) | | | 1,909,847 | | | | 221,090 | | | | 515,536 | | | | 3,842 | |
Administration fees (Note 6) | | | 1,112,451 | | | | 124,679 | | | | 144,375 | | | | 148,516 | |
Portfolio accounting fees | | | 386,119 | | | | 100,195 | | | | 104,204 | | | | 138,010 | |
Recordkeeping fees | | | 27,946 | | | | 28,297 | | | | 79,136 | | | | 218,944 | |
Custodian fees (Note 6) | | | 113,571 | | | | 22,297 | | | | 22,962 | | | | 24,897 | |
Registration fees | | | 64,092 | | | | 66,568 | | | | 70,579 | | | | 32,641 | |
Professional fees | | | 20,034 | | | | 24,434 | | | | 24,434 | | | | 24,434 | |
Printing and postage | | | 32,117 | | | | 18,265 | | | | 40,044 | | | | 12,647 | |
Directors’ fees | | | 15,349 | | | | 15,349 | | | | 15,349 | | | | 15,349 | |
Distribution services fees (Note 6): | | | | | | | | | | | | | | | | |
Miscellaneous | | | 88,875 | | | | 10,932 | | | | 12,363 | | | | 12,458 | |
| | | | | | | | | | | | | | | | |
Total expenses: | | | 10,149,746 | | | | 1,365,981 | | | | 1,668,721 | | | | 1,289,798 | |
| | | | |
Deduct: | | | | | | | | | | | | | | | | |
Expense waivers (Note 6) | | | (1,665,818 | ) | | | (411,254 | ) | | | (300,074 | ) | | | (408,467 | ) |
| | | | | | | | | | | | | | | | |
Net expenses | | | 8,483,928 | | | | 954,727 | | | | 1,368,647 | | | | 881,331 | |
| | | | | | | | | | | | | | | | |
Net investment income | | | 40,597,171 | | | | 3,674,509 | | | | 5,927,686 | | | | 6,826,042 | |
| | | | |
Net realized and unrealized gain on investments: | | | | | | | | | | | | | | | | |
Net realized gain on transactions from: | | | | | | | | | | | | | | | | |
Investments in unaffiliated issuers | | | 4,812 | | | | — | | | | 2,136 | | | | 2,233 | |
Net realized gain on capital gains distributions from: | | | | | | | | | | | | | | | | |
Investments in unaffiliated issuers | | | 200 | | | | — | | | | 24 | | | | 2 | |
| | | | | | | | | | | | | | | | |
Total net realized gain | | | 5,012 | | | | — | | | | 2,160 | | | | 2,235 | |
Net change in unrealized appreciation on: | | | | | | | | | | | | | | | | |
Investments in unaffiliated issuers | | | — | | | | — | | | | — | | | | 14,697 | |
| | | | | | | | | | | | | | | | |
Total net change in unrealized appreciation | | | — | | | | — | | | | — | | | | 14,697 | |
| | | | | | | | | | | | | | | | |
Net realized and unrealized gain on investments | | | 5,012 | | | | — | | | | 2,160 | | | | 16,932 | |
| | | | | | | | | | | | | | | | |
Change in net assets resulting from operations | | $ | 40,602,183 | | | $ | 3,674,509 | | | $ | 5,929,846 | | | $ | 6,842,974 | |
| | | | | | | | | | | | | | | | |
(See Notes which are an integral part of the Financial Statements)
119
| | |
| | |
| Statements of Changes in Net Assets | | |
| | | | | | | | | | | | | | | | | | | | | | | | |
| | | | | | | | | | |
| | | Low Volatility
Equity Fund | | | Dividend
Income Fund | | | Large-Cap
Value Fund | |
| | | Year Ended
August 31,
2018 | | | Year Ended
August 31,
2017 | | | Year Ended
August 31,
2018 | | | Year Ended
August 31,
2017 | | | Year Ended
August 31,
2018 | | | Year Ended
August 31,
2017 | |
Change in net assets resulting from: | | | | | | | | | | | | | | | | | | | | | | | | |
| | | | | | |
Operations: | | | | | | | | | | | | | | | | | | | | | | | | |
Net investment income (loss) | | $ | 2,075,471 | | | $ | 2,642,377 | | | $ | 2,973,997 | | | $ | 2,567,548 | | | $ | 5,944,043 | | | $ | 4,132,223 | |
Net realized gain on investments | | | 11,106,001 | | | | 3,958,004 | | | | 9,203,285 | | | | 11,550,017 | | | | 37,163,475 | | | | 26,066,853 | |
Net change in unrealized appreciation (depreciation) on investments | | | 5,207,851 | | | | 4,847,208 | | | | 14,007,649 | | | | 2,280,372 | | | | 9,781,999 | | | | 14,277,386 | |
| | | | | | | | | | | | | | | | | | | | | | | | |
Change in net assets resulting from operations | | | 18,389,323 | | | | 11,447,589 | | | | 26,184,931 | | | | 16,397,937 | | | | 52,889,517 | | | | 44,476,462 | |
| | | | | | |
Distributions to shareholders: | | | | | | | | | | | | | | | | | | | | | | | | |
Distributions to shareholders from net investment income: | | | | | | | | | | | | | | | | | | | | | | | | |
Investor class of shares | | | — | | | | — | | | | — | | | | — | | | | — | | | | (1,604,050 | )(1) |
Advisor class of shares | | | (389,406 | ) | | | (369,362 | ) | | | (63,632 | ) | | | (1,243,935 | ) | | | (291,522 | ) | | | (525,994 | ) |
Institutional class of shares | | | (1,853,997 | ) | | | (2,199,344 | ) | | | (2,811,280 | ) | | | (1,256,597 | ) | | | (4,276,822 | ) | | | (2,082,733 | ) |
Retirement classR-3 of shares | | | — | | | | — | | | | — | | | | — | | | | — | | | | — | |
Retirement classR-6 of shares | | | — | | | | — | | | | — | | | | — | | | | (733,087 | ) | | | (6,226 | ) |
Distributions to shareholders from net realized gain on investments: | | | | | | | | | | | | | | | | | | | | | | | | |
Investor class of shares | | | — | | | | — | | | | — | | | | — | | | | — | | | | (1,409,302 | )(1) |
Advisor class of shares | | | (784,143 | ) | | | (242,749 | ) | | | (319,896 | ) | | | (664,793 | ) | | | (2,211,660 | ) | | | (310 | ) |
Institutional class of shares | | | (3,322,161 | ) | | | (1,697,222 | ) | | | (13,039,040 | ) | | | (294,696 | ) | | | (27,238,611 | ) | | | (1,185,002 | ) |
Retirement classR-3 of shares | | | — | | | | — | | | | — | | | | — | | | | — | | | | — | |
Retirement classR-6 of shares | | | — | | | | — | | | | — | | | | — | | | | (135,548 | ) | | | (429 | ) |
| | | | | | | | | | | | | | | | | | | | | | | | |
Change in net assets resulting from distributions to shareholders | | | (6,349,707 | ) | | | (4,508,677 | ) | | | (16,233,848 | ) | | | (3,460,021 | ) | | | (34,887,250 | ) | | | (6,814,046 | ) |
| | | | | | |
Capital stock transactions: | | | | | | | | | | | | | | | | | | | | | | | | |
Proceeds from sale of shares | | | 16,593,121 | | | | 54,505,942 | | | | 39,940,202 | | | | 94,718,963 | | | | 158,173,583 | (4) | | | 425,435,120 | |
Net asset value of shares issued to shareholders in payment of distributions declared | | | 6,114,577 | | | | 4,155,724 | | | | 15,955,191 | | | | 3,335,815 | | | | 34,550,946 | | | | 6,683,858 | |
Cost of shares redeemed | | | (65,823,112 | ) | | | (56,616,611 | ) | | | (26,326,918 | ) | | | (112,660,977 | ) | | | (152,349,808 | ) | | | (443,263,199 | ) |
| | | | | | | | | | | | | | | | | | | | | | | | |
Change in net assets resulting from capital stock transactions | | | (43,115,414 | ) | | | 2,045,055 | | | | 29,568,475 | | | | (14,606,199 | ) | | | 40,374,721 | | | | (11,144,221 | ) |
| | | | | | | | | | | | | | | | | | | | | | | | |
Change in net assets | | | (31,075,798 | ) | | | 8,983,967 | | | | 39,519,558 | | | | (1,668,283 | ) | | | 58,376,988 | | | | 26,518,195 | |
| | | | | | |
Net assets: | | | | | | | | | | | | | | | | | | | | | | | | |
Beginning of period | | | 159,461,168 | | | | 150,477,201 | | | | 115,581,708 | | | | 117,249,991 | | | | 333,695,692 | | | | 307,177,497 | |
| | | | | | | | | | | | | | | | | | | | | | | | |
End of period | | $ | 128,385,370 | | | $ | 159,461,168 | | | $ | 155,101,266 | | | $ | 115,581,708 | | | $ | 392,072,680 | | | $ | 333,695,692 | |
| | | | | | | | | | | | | | | | | | | | | | | | |
Undistributed net investment income included in net assets at end of period | | $ | 292,281 | | | $ | 460,213 | | | $ | 636,145 | | | $ | 523,336 | | | $ | 1,544,909 | | | $ | 902,298 | |
| | | | | | | | | | | | | | | | | | | | | | | | |
| (1) | Reflects operations for the period from September 1, 2016, to June 2, 2017 (termination of Investor class of shares). |
| (2) | Reflects operations for the period from September 1, 2017, to May 11, 2018 (termination of Retirement classR-3 of shares). |
| (3) | Reflects operations for the period from September 1, 2017, to December 3, 2017 (termination of Retirement classR-3 of shares). |
| (4) | Includes $4,159,630 ofpaid-in-capital received from anin-kind purchase on December 15, 2017. The total value received of $4,159,630 from thisnon-taxable event represented $2,408,685 in securities cost, $1,730,375 in net unrealized appreciation, $3,388 in accrued dividends, $17,172 in cash, and $10 in accrued interest in exchange for 258,754 Institutional Class of shares at time of purchase. |
(See Notes which are an integral part of the Financial Statements)
120
| | | | | | | | | | | | | | | | | | | | | | | | | | | | | | |
| | | | | | | | | | |
Large-Cap
Growth Fund | | | Mid-Cap
Value Fund | | | Mid-Cap
Growth Fund | | | Small-Cap
Value Fund | |
Year Ended
August 31,
2018 | | | Year Ended
August 31,
2017 | | | Year Ended
August 31,
2018 | | | Year Ended
August 31,
2017 | | | Year Ended
August 31,
2018 | | | Year Ended
August 31,
2017 | | | Year Ended
August 31,
2018 | | | Year Ended
August 31,
2017 | |
| | | | | | | | | | | | | | | | | | | | | | | | | | | | | | |
| | | | | | | |
| | | | | | | | | | | | | | | | | | | | | | | | | | | | | | |
| $ | 2,039,377 | | | $ | 1,470,450 | | | $ | 1,973,147 | | | $ | 1,681,428 | | | $ | (231,180 | ) | | $ | (243,501 | ) | | $ | 298,228 | | | $ | 181,976 | |
| | 47,906,176 | | | | 18,480,996 | | | | 20,334,660 | | | | 46,314,670 | | | | 19,632,111 | | | | 30,467,892 | | | | 5,585,474 | | | | 9,972,670 | |
| | | | | | | |
| | 42,293,484 | | | | 39,702,491 | | | | (57,248 | ) | | | (20,600,805 | ) | | | 12,055,116 | | | | (11,980,712 | ) | | | 7,032,835 | | | | (2,759,597 | ) |
| | | | | | | | | | | | | | | | | | | | | | | | | | | | | | |
| | | | | | | |
| | 92,239,037 | | | | 59,653,937 | | | | 22,250,559 | | | | 27,395,293 | | | | 31,456,047 | | | | 18,243,679 | | | | 12,916,537 | | | | 7,395,049 | |
| | | | | | | |
| | | | | | | | | | | | | | | | | | | | | | | | | | | | | | |
| | | | | | | |
| | | | | | | | | | | | | | | | | | | | | | | | | | | | | | |
| | — | | | | (850,301 | ) | | | — | | | | (620,800 | )(1) | | | — | | | | (154,340 | )(1) | | | — | | | | — | |
| | — | | | | (3,292 | ) | | | (253,519 | ) | | | (141 | ) | | | — | | | | (48 | ) | | | — | | | | (127,825 | ) |
| | (360,864 | ) | | | (962,258 | ) | | | (1,253,472 | ) | | | (406,171 | ) | | | — | | | | (120,879 | ) | | | — | | | | (140,161 | ) |
| | — | | | | — | | | | (112 | )(2) | | | (40 | ) | | | — | | | | — | | | | — | | | | (288 | ) |
| | (6,422 | ) | | | (9,663 | ) | | | (165,182 | ) | | | (86,426 | ) | | | — | | | | (115 | ) | | | — | | | | (7,836 | ) |
| | | | | | | |
| | | | | | | | | | | | | | | | | | | | | | | | | | | | | | |
| | (4,147,456 | ) | | | (9,731,477 | ) | | | — | | | | (37,656,722 | )(1) | | | — | | | | (18,668,185 | )(1) | | | — | | | | — | |
| | (31,962 | ) | | | (23,105 | ) | | | (2,517,318 | ) | | | (10,206 | ) | | | (1,110,456 | ) | | | (6,793 | ) | | | (380,301 | ) | | | (4,014,102 | ) |
| | (15,549,809 | ) | | | (5,612,118 | ) | | | (5,309,557 | ) | | | (19,251,433 | ) | | | (5,920,705 | ) | | | (7,922,531 | ) | | | (4,628,962 | ) | | | (2,247,077 | ) |
| | — | | | | — | | | | (1,026 | )(2) | | | (7,265 | ) | | | — | | | | (5,167 | ) | | | (6,314 | )(3) | | | (8,082 | ) |
| | (181,357 | ) | | | (3,064 | ) | | | (651,050 | ) | | | (3,042,303 | ) | | | (37,756 | ) | | | (5,155 | ) | | | (215,890 | ) | | | (90,268 | ) |
| | | | | | | | | | | | | | | | | | | | | | | | | | | | | | |
| | | | | | | |
| | (20,277,870 | ) | | | (17,195,278 | ) | | | (10,151,236 | ) | | | (61,081,507 | ) | | | (7,068,917 | ) | | | (26,883,213 | ) | | | (5,231,467 | ) | | | (6,635,639 | ) |
| | | | | | | |
| | | | | | | | | | | | | | | | | | | | | | | | | | | | | | |
| | 123,469,873 | | | | 260,299,527 | | | | 47,626,226 | | | | 235,382,599 | | | | 37,954,380 | | | | 172,115,168 | | | | 20,343,034 | | | | 51,649,898 | |
| | | | | | | |
| | 18,714,347 | | | | 16,862,068 | | | | 10,039,874 | | | | 60,113,519 | | | | 7,050,843 | | | | 26,605,786 | | | | 5,184,079 | | | | 6,551,653 | |
| | (164,177,220 | ) | | | (222,772,588 | ) | | | (76,159,820 | ) | | | (286,548,985 | ) | | | (53,982,490 | ) | | | (203,548,530 | ) | | | (21,649,285 | ) | | | (63,822,053 | ) |
| | | | | | | | | | | | | | | | | | | | | | | | | | | | | | |
| | | | | | | |
| | (21,993,000 | ) | | | 54,389,007 | | | | (18,493,720 | ) | | | 8,947,133 | | | | (8,977,267 | ) | | | (4,827,576 | ) | | | 3,877,828 | | | | (5,620,502 | ) |
| | | | | | | | | | | | | | | | | | | | | | | | | | | | | | |
| | 49,968,167 | | | | 96,847,666 | | | | (6,394,397 | ) | | | (24,739,081 | ) | | | 15,409,863 | | | | (13,467,110 | ) | | | 11,562,898 | | | | (4,861,092 | ) |
| | | | | | | |
| | | | | | | | | | | | | | | | | | | | | | | | | | | | | | |
| | 356,455,428 | | | | 259,607,762 | | | | 206,503,968 | | | | 231,243,049 | | | | 113,022,517 | | | | 126,489,627 | | | | 64,285,532 | | | | 69,146,624 | |
| | | | | | | | | | | | | | | | | | | | | | | | | | | | | | |
| $ | 406,423,595 | | | $ | 356,455,428 | | | $ | 200,109,571 | | | $ | 206,503,968 | | | $ | 128,432,380 | | | $ | 113,022,517 | | | $ | 75,848,430 | | | $ | 64,285,532 | |
| | | | | | | | | | | | | | | | | | | | | | | | | | | | | | |
| | | | | | | |
| $ | 2,017,557 | | | $ | 345,466 | | | $ | 1,319,763 | | | $ | 1,018,784 | | | $ | — | | | $ | — | | | $ | 326,452 | | | $ | 28,224 | |
| | | | | | | | | | | | | | | | | | | | | | | | | | | | | | |
121
| | |
| | |
| Statements of Changes in Net Assets | | |
| | | | | | | | | | | | | | | | | | | | | | | | |
| | | | | | | | | | |
| | | Small-Cap
Core Fund | | | Small-Cap
Growth Fund | | | Global Low Volatility
Equity Fund | |
| | | Year Ended
August 31,
2018 | | | Year Ended
August 31,
2017 | | | Year Ended
August 31,
2018 | | | Year Ended
August 31,
2017 | | | Year Ended
August 31,
2018 | | | Year Ended
August 31,
2017 | |
Change in net assets resulting from: | | | | | | | | | | | | | | | | | | | | | | | | |
| | | | | | |
Operations: | | | | | | | | | | | | | | | | | | | | | | | | |
Net investment income (loss) | | $ | 17,884 | | | $ | 19,874 | | | $ | (478,741 | ) | | $ | (1,032,393 | ) | | $ | 910,381 | | | $ | 998,054 | |
Net realized gain (loss) on investments, options, futures contracts and foreign currency transactions | | | 2,368,080 | | | | 952,376 | | | | 20,263,486 | | | | 81,425,451 | | | | 5,421,320 | | | | 283,500 | |
Net change in unrealized appreciation (depreciation) on investments, options, futures contracts and foreign currency translation | | | 1,740,394 | | | | 1,428,444 | | | | 19,507,410 | | | | (53,783,096 | ) | | | (1,869,925 | ) | | | 2,428,227 | |
| | | | | | | | | | | | | | | | | | | | | | | | |
Change in net assets resulting from operations | | | 4,126,358 | | | | 2,400,694 | | | | 39,292,155 | | | | 26,609,962 | | | | 4,461,776 | | | | 3,709,781 | |
| | | | | | |
Distributions to shareholders: | | | | | | | | | | | | | | | | | | | | | | | | |
Distributions to shareholders from net investment income: | | | | | | | | | | | | | | | | | | | | | | | | |
Investor class of shares | | | — | | | | — | | | | — | | | | — | | | | — | | | | — | |
Advisor class of shares | | | — | | | | (558 | ) | | | — | | | | — | | | | (29,505 | ) | | | (3,979 | ) |
Institutional class of shares | | | (11,539 | ) | | | (45,376 | ) | | | — | | | | — | | | | (1,337,341 | ) | | | (903,509 | ) |
Retirement classR-3 of shares | | | — | | | | — | | | | — | | | | — | | | | — | | | | — | |
Retirement classR-6 of shares | | | — | | | | — | | | | — | | | | — | | | | — | | | | — | |
Class F-3 of shares | | | — | | | | — | | | | — | | | | — | | | | — | | | | — | |
Distributions to shareholders from net realized gain on investments: | | | | | | | | | | | | | | | | | | | | | | | | |
Advisor class of shares | | | (170,343 | ) | | | (10,911 | ) | | | (6,213,359 | ) | | | — | | | | (11,386 | ) | | | (1,779 | ) |
Institutional class of shares | | | (1,094,513 | ) | | | (235,448 | ) | | | (8,546,401 | ) | | | — | | | | (484,311 | ) | | | (358,652 | ) |
Distributions to shareholders from return of capital: | | | | | | | | | | | | | | | | | | | | | | | | |
Advisor class of shares | | | — | | | | — | | | | — | | | | — | | | | — | | | | — | |
Institutional class of shares | | | — | | | | — | | | | — | | | | — | | | | — | | | | — | |
| | | | | | | | | | | | | | | | | | | | | | | | |
Change in net assets resulting from distributions to shareholders | | | (1,276,395 | ) | | | (292,293 | ) | | | (14,759,760 | ) | | | — | | | | (1,862,543 | ) | | | (1,267,919 | ) |
| | | | | | |
Capital stock transactions: | | | | | | | | | | | | | | | | | | | | | | | | |
Proceeds from sale of shares | | | 5,456,508 | | | | 9,920,241 | | | | 22,016,727 | | | | 164,623,919 | | | | 783,044 | | | | 25,974,881 | |
Net asset value of shares issued to shareholders in payment of distributions declared | | | 1,176,708 | | | | 233,520 | | | | 14,542,209 | | | | — | | | | 1,464,201 | | | | 1,088,741 | |
Cost of shares redeemed | | | (4,748,644 | ) | | | (4,028,666 | ) | | | (47,004,023 | ) | | | (388,067,585 | ) | | | (23,520,826 | ) | | | (19,462,032 | ) |
Redemption fees | | | — | | | | — | | | | — | | | | — | | | | — | | | | 50 | |
| | | | | | | | | | | | | | | | | | | | | | | | |
Change in net assets resulting from capital stock transactions | | | 1,884,572 | | | | 6,125,095 | | | | (10,445,087 | ) | | | (223,443,666 | ) | | | (21,273,581 | ) | | | 7,601,640 | |
| | | | | | | | | | | | | | | | | | | | | | | | |
Change in net assets | | | 4,734,535 | | | | 8,233,496 | | | | 14,087,308 | | | | (196,833,704 | ) | | | (18,674,348 | ) | | | 10,043,502 | |
| | | | | | |
Net assets: | | | | | | | | | | | | | | | | | | | | | | | | |
Beginning of period | | | 19,660,978 | | | | 11,427,482 | | | | 138,995,830 | | | | 335,829,534 | | | | 49,218,183 | | | | 39,174,681 | |
| | | | | | | | | | | | | | | | | | | | | | | | |
End of period | | $ | 24,395,513 | | | $ | 19,660,978 | | | $ | 153,083,138 | | | $ | 138,995,830 | | | $ | 30,543,835 | | | $ | 49,218,183 | |
| | | | | | | | | | | | | | | | | | | | | | | | |
Undistributed net investment income (distributions in excess of net investment income) included in net assets at end of period | | $ | 8,280 | | | $ | 598 | | | $ | — | | | $ | (487,076 | ) | | $ | 457,212 | | | $ | 676,369 | |
| | | | | | | | | | | | | | | | | | | | | | | | |
(See Notes which are an integral part of the Financial Statements)
122
| | | | | | | | | | | | | | | | | | | | | | | | | | | | | | |
| | | | | | | | | | |
Disciplined International
Equity Fund | | | Pyrford International
Stock Fund | | | LGM Emerging Markets
Equity Fund | | | Alternative
Strategies Fund | |
Year Ended
August 31,
2018 | | | Year Ended
August 31,
2017 | | | Year Ended
August 31,
2018 | | | Year Ended
August 31,
2017 | | | Year Ended
August 31,
2018 | | | Year Ended
August 31,
2017 | | | Year Ended
August 31,
2018 | | | Year Ended
August 31,
2017 | |
| | | | | | | | | | | | | | | | | | | | | | | | | | | | | | |
| | | | | | | |
| | | | | | | | | | | | | | | | | | | | | | | | | | | | | | |
| $ | 1,788,262 | | | $ | 1,379,999 | | | $ | 17,718,541 | | | $ | 16,304,285 | | | $ | 2,321,510 | | | $ | 1,469,715 | | | $ | (343,138 | ) | | $ | (706,130 | ) |
| | | | | | | |
| | 4,596,949 | | | | (949,832 | ) | | | (3,196,252 | ) | | | (10,023,582 | ) | | | 10,901,774 | | | | 1,695,929 | | | | (584,715 | ) | | | 5,519,292 | |
| | | | | | | |
| | (6,394,997 | ) | | | 10,642,466 | | | | (59,981 | ) | | | 59,354,740 | | | | (13,442,920 | ) | | | 17,569,337 | | | | (1,485,702 | ) | | | (95,123 | ) |
| | | | | | | | | | | | | | | | | | | | | | | | | | | | | | |
| | | | | | | |
| | (9,786 | ) | | | 11,072,633 | | | | 14,462,308 | | | | 65,635,443 | | | | (219,636 | ) | | | 20,734,981 | | | | (2,413,555 | ) | | | 4,718,039 | |
| | | | | | | |
| | | | | | | | | | | | | | | | | | | | | | | | | | | | | | |
| | | | | | | |
| | | | | | | | | | | | | | | | | | | | | | | | | | | | | | |
| | — | | | | — | | | | — | | | | (2,021,310 | ) | | | — | | | | — | | | | — | | | | — | |
| | (3,470 | ) | | | (3,317 | ) | | | — | | | | (2,390 | ) | | | — | | | | (239,982 | ) | | | — | | | | — | |
| | (1,530,653 | ) | | | (1,673,168 | ) | | | (15,185,511 | ) | | | (11,624,253 | ) | | | (1,245,393 | ) | | | (717,841 | ) | | | — | | | | — | |
| | — | | | | — | | | | — | | | | (421 | ) | | | — | | | | — | | | | — | | | | — | |
| | — | | | | — | | | | (1,405,577 | ) | | | (652,041 | ) | | | — | | | | — | | | | — | | | | — | |
| | — | | | | — | | | | (219,446 | ) | | | — | | | | — | | | | — | | | | — | | | | — | |
| | | | | | | |
| | | | | | | | | | | | | | | | | | | | | | | | | | | | | | |
| | — | | | | — | | | | — | | | | — | | | | — | | | | — | | | | (6,924 | ) | | | — | |
| | — | | | | — | | | | — | | | | — | | | | — | | | | — | | | | (4,470,070 | ) | | | — | |
| | | | | | | | | | | | | | | | | | | | | | | | | | | | | | |
| | — | | | | — | | | | — | | | | — | | | | — | | | | — | | | | (687 | ) | | | — | |
| | — | | | | — | | | | — | | | | — | | | | — | | | | — | | | | (708,240 | ) | | | — | |
| | | | | | | | | | | | | | | | | | | | | | | | | | | | | | |
| | | | | | | |
| | (1,534,123 | ) | | | (1,676,485 | ) | | | (16,810,534 | ) | | | (14,300,415 | ) | | | (1,245,393 | ) | | | (957,823 | ) | | | (5,185,921 | ) | | | — | |
| | | | | | | |
| | | | | | | | | | | | | | | | | | | | | | | | | | | | | | |
| | 18,840,781 | | | | 22,343,033 | | | | 211,980,308 | | | | 396,261,133 | | | | 79,897,479 | | | | 109,773,573 | | | | 17,291,060 | | | | 21,309,308 | |
| | | | | | | |
| | 1,511,020 | | | | 1,670,654 | | | | 13,489,759 | | | | 9,352,958 | | | | 1,128,190 | | | | 866,512 | | | | 5,109,458 | | | | — | |
| | (13,670,472 | ) | | | (28,580,607 | ) | | | (218,410,088 | ) | | | (409,127,462 | ) | | | (35,100,313 | ) | | | (98,790,975 | ) | | | (37,221,147 | ) | | | (39,701,160 | ) |
| | 210 | | | | — | | | | 957 | | | | 3,133 | | | | 711 | | | | 680 | | | | — | | | | — | |
| | | | | | | | | | | | | | | | | | | | | | | | | | | | | | |
| | | | | | | |
| | 6,681,539 | | | | (4,566,920 | ) | | | 7,060,936 | | | | (3,510,238 | ) | | | 45,926,067 | | | | 11,849,790 | | | | (14,820,629 | ) | | | (18,391,852 | ) |
| | | | | | | | | | | | | | | | | | | | | | | | | | | | | | |
| | 5,137,630 | | | | 4,829,228 | | | | 4,712,710 | | | | 47,824,790 | | | | 44,461,038 | | | | 31,626,948 | | | | (22,420,105 | ) | | | (13,673,813 | ) |
| | | | | | | |
| | | | | | | | | | | | | | | | | | | | | | | | | | | | | | |
| | 72,388,042 | | | | 67,558,814 | | | | 649,739,585 | | | | 601,914,795 | | | | 162,356,811 | | | | 130,729,863 | | | | 95,740,181 | | | | 109,413,994 | |
| | | | | | | | | | | | | | | | | | | | | | | | | | | | | | |
| $ | 77,525,672 | | | $ | 72,388,042 | | | $ | 654,452,295 | | | $ | 649,739,585 | | | $ | 206,817,849 | | | $ | 162,356,811 | | | $ | 73,320,076 | | | $ | 95,740,181 | |
| | | | | | | | | | | | | | | | | | | | | | | | | | | | | | |
| | | | | | | |
| $ | 1,261,618 | | | $ | 968,844 | | | $ | 15,265,819 | | | $ | 14,755,088 | | | $ | 1,986,904 | | | $ | 1,245,074 | | | $ | (999,239 | ) | | $ | (203,177 | ) |
| | | | | | | | | | | | | | | | | | | | | | | | | | | | | | |
123
| | |
| | |
| Statements of Changes in Net Assets | | |
| | | | | | | | | | | | | | | | | | | | | | | | |
| | | | | | | | | | |
| | | Global Long/Short
Equity Fund | | | Ultra Short
Tax-Free Fund | | | Short
Tax-Free Fund | |
| | | Year Ended
August 31,
2018 | | | Year Ended
August 31,
2017 | | | Year Ended
August 31,
2018 | | | Year Ended
August 31,
2017 | | | Year Ended
August 31,
2018 | | | Year Ended
August 31,
2017 | |
Change in net assets resulting from: | | | | | | | | | | | | | | | | | | | | | | | | |
| | | | | | |
Operations: | | | | | | | | | | | | | | | | | | | | | | | | |
Net investment income | | $ | 33,591 | | | $ | 18,214 | | | $ | 7,993,960 | | | $ | 5,642,492 | | | $ | 2,930,092 | | | $ | 2,522,885 | |
Net realized gain (loss) on investments and foreign currency transactions | | | 51,678 | | | | 248,976 | | | | 107,385 | | | | 727,984 | | | | 35,751 | | | | (225,946 | ) |
Net change in unrealized appreciation (depreciation) on investments and foreign currency translation | | | (47,838 | ) | | | 712,754 | | | | (530,035 | ) | | | 208,911 | | | | (1,518,041 | ) | | | (180,383 | ) |
| | | | | | | | | | | | | | | | | | | | | | | | |
Change in net assets resulting from operations | | | 37,431 | | | | 979,944 | | | | 7,571,310 | | | | 6,579,387 | | | | 1,447,802 | | | | 2,116,556 | |
| | | | | | |
Distributions to shareholders: | | | | | | | | | | | | | | | | | | | | | | | | |
Distributions to shareholders from net investment income: | | | | | | | | | | | | | | | | | | | | | | | | |
Investor class of shares | | | — | | | | — | | | | — | | | | (241,956 | )(1) | | | — | | | | (167,597 | )(1) |
Advisor class of shares | | | (441 | ) | | | (1,759 | ) | | | (328,441 | ) | | | (69,829 | ) | | | (94,769 | ) | | | (52,821 | ) |
Institutional class of shares | | | (28,606 | ) | | | (23,821 | ) | | | (7,666,730 | ) | | | (5,330,707 | ) | | | (2,832,847 | ) | | | (2,303,362 | ) |
Distributions to shareholders from net realized gain on investments: | | | | | | | | | | | | | | | | | | | | | | | | |
Investor class of shares | | | — | | | | — | | | | — | | | | (49,470 | )(1) | | | — | | | | (5,100 | )(1) |
Advisor class of shares | | | (26,157 | ) | | | (3,694 | ) | | | (17,732 | ) | | | (91 | ) | | | — | | | | (377 | ) |
Institutional class of shares | | | (359,245 | ) | | | (31,174 | ) | | | (296,800 | ) | | | (590,147 | ) | | | — | | | | (51,518 | ) |
| | | | | | | | | | | | | | | | | | | | | | | | |
Change in net assets resulting from distributions to shareholders | | | (414,449 | ) | | | (60,448 | ) | | | (8,309,703 | ) | | | (6,282,200 | ) | | | (2,927,616 | ) | | | (2,580,775 | ) |
| | | | | | |
Capital stock transactions: | | | | | | | | | | | | | | | | | | | | | | | | |
Proceeds from sale of shares | | | 6,276,658 | | | | 4,825,632 | | | | 445,096,133 | | | | 524,112,502 | | | | 51,370,080 | | | | 122,858,814 | |
Net asset value of shares issued to shareholders in payment of distributions declared | | | 319,024 | | | | 27,773 | | | | 3,582,390 | | | | 2,303,408 | | | | 942,829 | | | | 852,087 | |
Cost of shares redeemed | | | (5,967,606 | ) | | | (303,296 | ) | | | (508,223,943 | ) | | | (468,304,972 | ) | | | (44,929,515 | ) | | | (125,930,060 | ) |
Redemption fees | | | 1,407 | | | | — | | | | — | | | | — | | | | — | | | | — | |
| | | | | | | | | | | | | | | | | | | | | | | | |
Change in net assets resulting from capital stock transactions | | | 629,483 | | | | 4,550,109 | | | | (59,545,420 | ) | | | 58,110,938 | | | | 7,383,394 | | | | (2,219,159 | ) |
| | | | | | | | | | | | | | | | | | | | | | | | |
Change in net assets | | | 252,465 | | | | 5,469,605 | | | | (60,283,813 | ) | | | 58,408,125 | | | | 5,903,580 | | | | (2,683,378 | ) |
| | | | | | |
Net assets: | | | | | | | | | | | | | | | | | | | | | | | | |
Beginning of period | | | 9,697,070 | | | | 4,227,465 | | | | 660,387,290 | | | | 601,979,165 | | | | 182,620,416 | | | | 185,303,794 | |
| | | | | | | | | | | | | | | | | | | | | | | | |
End of period | | $ | 9,949,535 | | | $ | 9,697,070 | | | $ | 600,103,477 | | | $ | 660,387,290 | | | $ | 188,523,996 | | | $ | 182,620,416 | |
| | | | | | | | | | | | | | | | | | | | | | | | |
Undistributed net investment income (distributions in excess of net investment income) included in net assets at end of period | | $ | 44,180 | | | $ | 7,322 | | | $ | (19,656 | ) | | $ | (15,636 | ) | | $ | 2,011 | | | $ | (465 | ) |
| | | | | | | | | | | | | | | | | | | | | | | | |
| (1) | Reflects operations for the period from September 1, 2016, to June 2, 2017 (termination of Investor class of shares). |
| (2) | Includespaid-in-capital received from anon-taxablein-kind subscription merger of the BMO TCH Intermediate Income Fund effective as of the close of business on June 29, 2017. The BMO TCH Intermediate Income Fund’s net assets at that date of $32,584,449 included the following: |
| | | | |
Assets: | | | | |
Investments cost | | $ | 31,747,731 | |
Net unrealized appreciation on investments | | | 580,466 | |
Deposit held at broker | | | 100,000 | |
Dividends & interest receivable | | | 267,709 | |
| | | | |
Total assets | | | 32,695,906 | |
| |
Liabilities: | | | | |
Payable to affiliates | | | 16,595 | |
Payable for income distribution | | | 67,250 | |
Other liabilities | | | 27,612 | |
| | | | |
Total liabilities | | | 111,457 | |
| | | | |
Total Net Assets: | | $ | 32,584,449 | |
| | | | |
Assuming the Reorganization had been completed on March 1, 2016, the beginning of a twelve month period of the BMO Strategic Income Fund, the BMO TCH Intermediate Income Fund’s pro forma of operations (unaudited) for the period ended February 28, 2017, are as follows:
| | | | |
Net investment income | | $ | 4,057,835 | |
Net realized gain on investments | | | 54,565 | |
Change in net unrealized appreciation on investments | | | 2,733,039 | |
| | | | |
Net increase in net assets resulting from operations | | | 6,845,439 | |
| | | | |
(See Notes which are an integral part of the Financial Statements)
124
| | | | | | | | | | | | | | | | | | | | | | | | | | | | | | |
| | | | | | | | | | |
Short-Term
Income Fund | | | Intermediate
Tax-Free Fund | | | Strategic
Income Fund | | | TCH Corporate
Income Fund | |
Year Ended
August 31,
2018 | | | Year Ended
August 31,
2017 | | | Year Ended
August 31,
2018 | | | Year Ended
August 31,
2017 | | | Year Ended
August 31,
2018 | | | Year Ended
August 31,
2017 | | | Year Ended
August 31,
2018 | | | Year Ended
August 31,
2017 | |
| | | | | | | | | | | | | | | | | | | | | | | | | | | | | | |
| | | | | | | |
| | | | | | | | | | | | | | | | | | | | | | | | | | | | | | |
| $ | 4,986,366 | | | $ | 4,317,011 | | | $ | 45,840,572 | | | $ | 43,778,125 | | | $ | 4,092,855 | | | $ | 2,457,886 | | | $ | 7,976,472 | | | $ | 6,357,759 | |
| | | | | | | |
| | (257,306 | ) | | | 237,100 | | | | 1,936,751 | | | | (11,054,527 | ) | | | 807,459 | | | | 2,392,636 | | | | 888,736 | | | | 1,720,876 | |
| | | | | | | |
| | (2,814,462 | ) | | | (716,399 | ) | | | (37,308,698 | ) | | | (26,171,948 | ) | | | (4,311,530 | ) | | | (1,889,424 | ) | | | (8,512,340 | ) | | | 1,352,901 | |
| | | | | | | | | | | | | | | | | | | | | | | | | | | | | | |
| | | | | | | |
| | 1,914,598 | | | | 3,837,712 | | | | 10,468,625 | | | | 6,551,650 | | | | 588,784 | | | | 2,961,098 | | | | 352,868 | | | | 9,431,536 | |
| | | | | | | |
| | | | | | | | | | | | | | | | | | | | | | | | | | | | | | |
| | | | | | | |
| | | | | | | | | | | | | | | | | | | | | | | | | | | | | | |
| | — | | | | (632,772 | )(1) | | | (24,188,815 | ) | | | (27,728,210 | ) | | | (2,911,007 | ) | | | (2,360,082 | ) | | | (3,505,065 | ) | | | (2,785,140 | ) |
| | (552,617 | ) | | | (155,425 | ) | | | (326,765 | ) | | | (83,767 | ) | | | (702,151 | ) | | | (121,105 | ) | | | (34,065 | ) | | | (14,625 | ) |
| | (4,511,766 | ) | | | (3,644,261 | ) | | | (21,349,941 | ) | | | (15,971,429 | ) | | | (733,595 | ) | | | (551,185 | ) | | | (4,433,400 | ) | | | (3,557,995 | ) |
| | | | | | | |
| | | | | | | | | | | | | | | | | | | | | | | | | | | | | | |
| | — | | | | — | | | | (109,132 | ) | | | (3,552,901 | ) | | | — | | | | — | | | | (142,642 | ) | | | (669,458 | ) |
| | — | | | | — | | | | (1,409 | ) | | | (5,750 | ) | | | — | | | | — | | | | (1,102 | ) | | | (392 | ) |
| | — | | | | — | | | | (75,420 | ) | | | (1,761,746 | ) | | | — | | | | — | | | | (162,178 | ) | | | (1,035,668 | ) |
| | | | | | | | | | | | | | | | | | | | | | | | | | | | | | |
| | | | | | | |
| | (5,064,383 | ) | | | (4,432,458 | ) | | | (46,051,482 | ) | | | (49,103,803 | ) | | | (4,346,753 | ) | | | (3,032,372 | ) | | | (8,278,452 | ) | | | (8,063,278 | ) |
| | | | | | | |
| | | | | | | | | | | | | | | | | | | | | | | | | | | | | | |
| | 135,318,169 | | | | 204,775,746 | | | | 602,268,382 | | | | 512,577,117 | | | | 3,650,450 | | | | 39,469,441 | (2) | | | 50,384,104 | | | | 117,056,559 | |
| | | | | | | |
| | 2,938,785 | | | | 2,472,081 | | | | 36,968,906 | | | | 40,385,928 | | | | 4,064,138 | | | | 2,752,071 | | | | 5,111,900 | | | | 5,060,623 | |
| | (137,617,032 | ) | | | (257,682,881 | ) | | | (442,459,403 | ) | | | (737,200,006 | ) | | | (31,322,162 | ) | | | (36,107,475 | ) | | | (59,209,589 | ) | | | (79,201,504 | ) |
| | — | | | | — | | | | — | | | | — | | | | — | | | | — | | | | — | | | | — | |
| | | | | | | | | | | | | | | | | | | | | | | | | | | | | | |
| | | | | | | |
| | 639,922 | | | | (50,435,054 | ) | | | 196,777,885 | | | | (184,236,961 | ) | | | (23,607,574 | ) | | | 6,114,037 | | | | (3,713,585 | ) | | | 42,915,678 | |
| | | | | | | | | | | | | | | | | | | | | | | | | | | | | | |
| | (2,509,863 | ) | | | (51,029,800 | ) | | | 161,195,028 | | | | (226,789,114 | ) | | | (27,365,543 | ) | | | 6,042,763 | | | | (11,639,169 | ) | | | 44,283,936 | |
| | | | | | | |
| | | | | | | | | | | | | | | | | | | | | | | | | | | | | | |
| | 242,589,108 | | | | 293,618,908 | | | | 1,618,163,755 | | | | 1,844,952,869 | | | | 113,392,487 | | | | 107,349,724 | | | | 256,422,229 | | | | 212,138,293 | |
| | | | | | | | | | | | | | | | | | | | | | | | | | | | | | |
| $ | 240,079,245 | | | $ | 242,589,108 | | | $ | 1,779,358,783 | | | $ | 1,618,163,755 | | | $ | 86,026,944 | | | $ | 113,392,487 | | | $ | 244,783,060 | | | $ | 256,422,229 | |
| | | | | | | | | | | | | | | | | | | | | | | | | | | | | | |
| | | | | | | |
| $ | 5,029 | | | $ | 1,360 | | | $ | (293 | ) | | $ | 217,765 | | | $ | (15,832 | ) | | $ | (14,926 | ) | | $ | 1,244 | | | $ | (2,698 | ) |
| | | | | | | | | | | | | | | | | | | | | | | | | | | | | | |
125
| | |
| | |
| Statements of Changes in Net Assets | | |
| | | | | | | | | | | | | | | | | | | | | | | | |
| | | | | | | | | | |
| | | TCH Core Plus
Bond Fund | | | High Yield
Bond Fund | | | Government Money
Market Fund | |
| | | Year Ended
August 31,
2018 | | | Year Ended
August 31,
2017 | | | Year Ended
August 31,
2018 | | | Year Ended
August 31,
2017 | | | Year Ended
August 31,
2018 | | | Year Ended
August 31,
2017 | |
Change in net assets resulting from: | | | | | | | | | | | | | | | | | | | | | | | | |
| | | | | | |
Operations: | | | | | | | | | | | | | | | | | | | | | | | | |
Net investment income | | $ | 30,966,093 | | | $ | 24,622,439 | | | $ | 658,231 | | | $ | 2,221,025 | | | $ | 40,597,171 | | | $ | 13,190,436 | |
Net realized gain (loss) on
investments | | | (4,328,218 | ) | | | 3,199,087 | | | | 120,095 | | | | 2,637,071 | | | | 5,012 | | | | 4,140 | |
Net change in unrealized appreciation (depreciation) on investments | | | (29,057,856 | ) | | | (7,556,515 | ) | | | (571,851 | ) | | | (2,865,438 | ) | | | — | | | | — | |
| | | | | | | | | | | | | | | | | | | | | | | | |
Change in net assets resulting
from operations | | | (2,419,981 | ) | | | 20,265,011 | | | | 206,475 | | | | 1,992,658 | | | | 40,602,183 | | | | 13,194,576 | |
| | | | | | |
Distributions to shareholders: | | | | | | | | | | | | | | | | | | | | | | | | |
Distributions to shareholders from net investment income: | | | | | | | | | | | | | | | | | | | | | | | | |
Investor class of shares | | | (1,839,668 | ) | | | (10,958,410 | ) | | | — | | | | — | | | | (7,871,988 | ) | | | (2,102,345 | ) |
Advisor class of shares | | | (90,550 | ) | | | (52,010 | ) | | | (47,907 | ) | | | (1,179,592 | ) | | | — | | | | — | |
Institutional/Premier class of shares | | | (29,417,453 | ) | | | (14,084,186 | ) | | | (610,733 | ) | | | (1,041,433 | ) | | | (32,725,383 | ) | | | (11,088,991 | ) |
Distributions to shareholders from net realized gain on investments: | | | | | | | | | | | | | | | | | | | | | | | | |
Investor class of shares | | | (61,171 | ) | | | (1,604,981 | ) | | | — | | | | — | | | | (1,030 | ) | | | (873 | ) |
Advisor class of shares | | | (3,223 | ) | | | (5,068 | ) | | | — | | | | — | | | | — | | | | — | |
Institutional/Premier class of shares | | | (897,387 | ) | | | (1,455,998 | ) | | | — | | | | — | | | | (3,782 | ) | | | (2,367 | ) |
| | | | | | | | | | | | | | | | | | | | | | | | |
Change in net assets resulting
from distributions to shareholders | | | (32,309,452 | ) | | | (28,160,653 | ) | | | (658,640 | ) | | | (2,221,025 | ) | | | (40,602,183 | ) | | | (13,194,576 | ) |
| | | | | | |
Capital stock transactions: | | | | | | | | | | | | | | | | | | | | | | | | |
Proceeds from sale of shares | | | 239,674,446 | | | | 781,831,952 | | | | 1,065,544 | | | | 4,246,536 | | | | 19,536,951,159 | | | | 14,334,494,569 | |
Net asset value of shares issued to shareholders in payment of distributions declared | | | 29,161,657 | | | | 25,943,203 | | | | 583,966 | | | | 2,021,657 | | | | 5,880,770 | | | | 1,300,125 | |
Cost of shares redeemed | | | (235,589,606 | ) | | | (721,237,192 | ) | | | (3,185,086 | ) | | | (99,081,869 | ) | | | (19,237,385,211 | ) | | | (13,488,067,651 | ) |
| | | | | | | | | | | | | | | | | | | | | | | | |
Change in net assets resulting
from capital stock transactions | | | 33,246,497 | | | | 86,537,963 | | | | (1,535,576 | ) | | | (92,813,676 | ) | | | 305,446,718 | | | | 847,727,043 | |
| | | | | | | | | | | | | | | | | | | | | | | | |
Change in net assets | | | (1,482,936 | ) | | | 78,642,321 | | | | (1,987,741 | ) | | | (93,042,043 | ) | | | 305,446,718 | | | | 847,727,043 | |
| | | | | | |
Net assets: | | | | | | | | | | | | | | | | | | | | | | | | |
Beginning of period | | | 1,047,334,288 | | | | 968,691,967 | | | | 13,313,349 | | | | 106,355,392 | | | | 3,083,603,374 | | | | 2,235,876,331 | |
| | | | | | | | | | | | | | | | | | | | | | | | |
End of period | | $ | 1,045,851,352 | | | $ | 1,047,334,288 | | | $ | 11,325,608 | | | $ | 13,313,349 | | | $ | 3,389,050,092 | | | $ | 3,083,603,374 | |
| | | | | | | | | | | | | | | | | | | | | | | | |
Undistributed net investment income (distributions in excess of net
investment income) included in net
assets at end of period | | $ | (16,047 | ) | | $ | (13,105 | ) | | $ | (3,660 | ) | | $ | (9,387 | ) | | $ | (341 | ) | | $ | (1,041 | ) |
| | | | | | | | | | | | | | | | | | | | | | | | |
(See Notes which are an integral part of the Financial Statements)
126
| | | | | | | | | | | | | | | | | | | | | | | | | | | | | | |
| | | | | | | | | | | | | |
Tax-Free Money
Market Fund | | | Prime Money
Market Fund | | | Institutional Prime
Money Market Fund | | | | | | | |
Year Ended
August 31,
2018 | | | Year Ended
August 31,
2017 | | | Year Ended
August 31,
2018 | | | Year Ended
August 31,
2017 | | | Year Ended
August 31,
2018 | | | Year Ended
August 31,
2017 | | | | | | | |
| | | | | | | | | | | | | | | | | | | | | | | | | | | | | | |
| | | | | | | |
| | | | | | | | | | | | | | | | | | | | | | | | | | | | | | |
| $ | 3,674,509 | | | $ | 1,896,315 | | | $ | 5,927,686 | | | $ | 2,440,138 | | | $ | 6,826,042 | | | $ | 3,082,655 | | | | | | | | | |
| | | | | | | |
| | — | | | | 68,798 | | | | 2,160 | | | | 265,930 | | | | 2,235 | | | | 1,934 | | | | | | | | | |
| — | | | | — | | | | — | | | | — | | | | 14,697 | | | | 41,402 | | | | | | | | | |
| | | | | | | | | | | | | | | | | | | | | | | | | | | | | | |
| | | | | | | |
| | 3,674,509 | | | | 1,965,113 | | | | 5,929,846 | | | | 2,706,068 | | | | 6,842,974 | | | | 3,125,991 | | | | | | | | | |
| | | | | | | |
| | | | | | | | | | | | | | | | | | | | | | | | | | | | | | |
| | | | | | | |
| | | | | | | | | | | | | | | | | | | | | | | | | | | | | | |
| | (698,806 | ) | | | (273,064 | ) | | | (2,562,944 | ) | | | (908,840 | ) | | | (20,183 | ) | | | (6,848 | ) | | | | | | | | |
| | — | | | | — | | | | — | | | | — | | | | — | | | | — | | | | | | | | | |
| | (2,975,703 | ) | | | (1,656,960 | ) | | | (3,364,758 | ) | | | (1,531,386 | ) | | | (6,805,848 | ) | | | (3,075,841 | ) | | | | | | | | |
| | | | | | | |
| | | | | | | | | | | | | | | | | | | | | | | | | | | | | | | |
| | — | | | | (20,917 | ) | | | (1,052 | ) | | | (603 | ) | | | (8 | ) | | | (6 | ) | | | | | | | | |
| | — | | | | — | | | | — | | | | — | | | | — | | | | — | | | | | | | | | |
| | — | | | | (76,487 | ) | | | (1,084 | ) | | | (685 | ) | | | (2,285 | ) | | | (1,894 | ) | | | | | | | | |
| | | | | | | | | | | | | | | | | | | | | | | | | | | | | | |
| | | | | | | |
| | (3,674,509 | ) | | | (2,027,428 | ) | | | (5,929,838 | ) | | | (2,441,514 | ) | | | (6,828,324 | ) | | | (3,084,589 | ) | | | | | | | | |
| | | | | | | |
| | | | | | | | | | | | | | | | | | | | | | | | | | | | | | |
| | 760,794,015 | | | | 705,359,534 | | | | 810,980,414 | | | | 783,415,206 | | | | 1,224,837,730 | | | | 914,326,979 | | | | | | | | | |
| | | | | | | |
| | 574,205 | | | | 275,718 | | | | 2,146,096 | | | | 780,900 | | | | 1,189,143 | | | | 8,930 | | | | | | | | | |
| | (694,856,500 | ) | | | (794,823,978 | ) | | | (720,222,805 | ) | | | (1,988,344,911 | ) | | | (1,145,851,073 | ) | | | (928,963,735 | ) | | | | | | | | |
| | | | | | | | | | | | | | | | | | | | | | | | | | | | | | |
| | | | | | | |
| | 66,511,720 | | | | (89,188,726 | ) | | | 92,903,705 | | | | (1,204,148,805 | ) | | | 80,175,800 | | | | (14,627,826 | ) | | | | | | | | |
| | | | | | | | | | | | | | | | | | | | | | | | | | | | | | |
| | 66,511,720 | | | | (89,251,041 | ) | | | 92,903,713 | | | | (1,203,884,251 | ) | | | 80,190,450 | | | | (14,586,424 | ) | | | | | | | | |
| | | | | | | |
| | | | | | | | | | | | | | | | | | | | | | | | | | | | | | |
| | 314,801,413 | | | | 404,052,454 | | | | 368,588,767 | | | | 1,572,473,018 | | | | 401,623,960 | | | | 416,210,384 | | | | | | | | | |
| | | | | | | | | | | | | | | | | | | | | | | | | | | | | | |
| $ | 381,313,133 | | | $ | 314,801,413 | | | $ | 461,492,480 | | | $ | 368,588,767 | | | $ | 481,814,410 | | | $ | 401,623,960 | | | | | | | | | |
| | | | | | | | | | | | | | | | | | | | | | | | | | | | | | |
| | | | | | | |
| $ | (24,201 | ) | | $ | (24,201 | ) | | $ | (23,967 | ) | | $ | (24,062 | ) | | $ | 16,438 | | | $ | 16,452 | | | | | | | | | |
| | | | | | | | | | | | | | | | | | | | | | | | | | | | | | |
127
| | |
| |
| Financial Highlights—Investor Class of Shares (For a share outstanding throughout each period) |
| | | | | | | | | | | | | | | | | | | | | | | | | | | | | | | | | | | | | | | | | | | | | | | | | | | | | | | | | | | | | | | | | | | | | | |
Period
Ended
August 31, | | Net asset
value,
beginning
of period | | Net
investment
income
(loss) | | Net realized
and unrealized
gain (loss) | | Total from
investment
operations | | Distributions to
shareholders
from net
investment
income | | Distributions to
shareholders
from net
realized gain | | Total
distributions | | Ratios to Average Net Assets (1) | | Net assets,
end of period
(000 omitted) | | Portfolio
turnover
rate (3) |
| | Net asset
value, end
of period | | Total
return (2)(3) | | Gross
Expenses | | Net
Expenses (4) | | Net
investment
income (4) |
Large-Cap Growth Fund | | | | | | | | | | | | | | | | | | | | | | | | | | | | | | | | | | | | | | | | | | | | | | | | | | | | | | | | | | | | | |
| 2018 | | | $ | 17.46 | | | | $ | 0.07 | | | | $ | 4.42 | | | | $ | 4.49 | | | | $ | — | | | | $ | (1.00 | ) | | | $ | (1.00 | ) | | | $ | 20.95 | | | | | 26.78 | % | | | | 0.92 | % | | | | 0.91 | % | | | | 0.28 | % | | | $ | 65,365 | | | | | 57 | % |
| 2017 | | | | 15.34 | | | | | 0.06 | | | | | 3.03 | | | | | 3.09 | | | | | (0.07 | ) | | | | (0.90 | ) | | | | (0.97 | ) | | | | 17.46 | | | | | 21.30 | | | | | 1.03 | | | | | 1.00 | | | | | 0.34 | | | | | 74,359 | | | | | 75 | |
| 2016 | | | | 16.26 | | | | | 0.03 | | | | | 1.44 | | | | | 1.47 | | | | | (0.02 | ) | | | | (2.37 | ) | | | | (2.39 | ) | | | | 15.34 | | | | | 9.68 | | | | | 1.13 | | | | | 1.07 | | | | | 0.23 | | | | | 163,712 | | | | | 70 | |
| 2015 | | | | 17.94 | | | | | (0.01 | ) | | | | 0.93 | | | | | 0.92 | | | | | (0.01 | ) | | | | (2.59 | ) | | | | (2.60 | ) | | | | 16.26 | | | | | 5.58 | | | | | 1.23 | | | | | 1.21 | | | | | 0.03 | | | | | 161,918 | | | | | 94 | |
| 2014 | | | | 15.08 | | | | | 0.01 | | | | | 4.34 | | | | | 4.35 | | | | | (0.04 | ) | | | | (1.45 | ) | | | | (1.49 | ) | | | | 17.94 | | | | | 30.33 | | | | | 1.24 | | | | | 1.24 | | | | | 0.03 | | | | | 97,738 | | | | | 67 | |
Intermediate Tax-Free Fund | | | | | | | | | | | | | | | | | | | | | | | | | | | | | | | | | | | | | | | | | | | | | | | | | | | | | | | | |
| 2018 | | | | 11.37 | | | | | 0.30 | | | | | (0.24 | ) | | | | 0.06 | | | | | (0.30 | ) | | | | (0.00 | ) | | | | (0.30 | ) | | | | 11.13 | | | | | 0.53 | | | | | 0.55 | | | | | 0.55 | | | | | 2.65 | | | | | 870,195 | | | | | 45 | |
| 2017 | | | | 11.61 | | | | | 0.29 | | | | | (0.21 | ) | | | | 0.08 | | | | | (0.29 | ) | | | | (0.03 | ) | | | | (0.32 | ) | | | | 11.37 | | | | | 0.78 | | | | | 0.57 | | | | | 0.55 | | | | | 2.55 | | | | | 975,664 | | | | | 44 | |
| 2016 | | | | 11.26 | | | | | 0.25 | | | | | 0.37 | | | | | 0.62 | | | | | (0.25 | ) | | | | (0.02 | ) | | | | (0.27 | ) | | | | 11.61 | | | | | 5.56 | | | | | 0.57 | | | | | 0.55 | | | | | 2.19 | | | | | 1,241,387 | | | | | 42 | |
| 2015 | | | | 11.25 | | | | | 0.26 | | | | | 0.01 | | | | | 0.27 | | | | | (0.26 | ) | | | | — | | | | | (0.26 | ) | | | | 11.26 | | | | | 2.36 | | | | | 0.57 | | | | | 0.55 | | | | | 2.23 | | | | | 1,250,815 | | | | | 26 | |
| 2014 | | | | 10.66 | | | | | 0.28 | | | | | 0.59 | | | | | 0.87 | | | | | (0.28 | ) | | | | (0.00 | ) | | | | (0.28 | ) | | | | 11.25 | | | | | 8.29 | | | | | 0.61 | | | | | 0.55 | | | | | 2.58 | | | | | 1,003,132 | | | | | 35 | |
Strategic Income Fund | | | | | | | | | | | | | | | | | | | | | | | | | | | | | | | | | | | | | | | | | | | | | | | | | | | | | | | | | | | | | |
| 2018 | | | | 9.45 | | | | | 0.38 | | | | | (0.37 | ) | | | | 0.04 | | | | | (0.41 | ) | | | | — | | | | | (0.41 | ) | | | | 9.08 | | | | | 0.37 | | | | | 0.91 | | | | | 0.80 | | | | | 4.09 | | | | | 59,724 | | | | | 33 | |
| 2017 | | | | 9.43 | | | | | 0.23 | | | | | 0.08 | | | | | 0.31 | | | | | (0.29 | ) | | | | — | | | | | (0.29 | ) | | | | 9.45 | | | | | 3.32 | | | | | 0.90 | | | | | 0.80 | | | | | 2.46 | | | | | 73,488 | | | | | 65 | |
| 2016 | | | | 9.31 | | | | | 0.21 | | | | | 0.17 | | | | | 0.38 | | | | | (0.26 | ) | | | | — | | | | | (0.26 | ) | | | | 9.43 | | | | | 4.17 | | | | | 0.86 | | | | | 0.80 | | | | | 2.28 | | | | | 85,665 | | | | | 13 | |
| 2015 | | | | 9.36 | | | | | 0.22 | | | | | — | | | | | 0.22 | | | | | (0.27 | ) | | | | — | | | | | (0.27 | ) | | | | 9.31 | | | | | 2.34 | | | | | 0.93 | | | | | 0.80 | | | | | 2.36 | | | | | 94,380 | | | | | 44 | |
| 2014 | | | | 9.17 | | | | | 0.20 | | | | | 0.24 | | | | | 0.44 | | | | | (0.25 | ) | | | | — | | | | | (0.25 | ) | | | | 9.36 | | | | | 4.87 | | | | | 0.92 | | | | | 0.80 | | | | | 2.21 | | | | | 105,888 | | | | | 129 | |
TCH Corporate Income Fund | | | | | | | | | | | | | | | | | | | | | | | | | | | | | | | | | | | | | | | | | | | | | | | | | | | | | | | | |
| 2018 | | | | 13.20 | | | | | 0.40 | | | | | (0.39 | ) | | | | 0.01 | | | | | (0.40 | ) | | | | (0.02 | ) | | | | (0.42 | ) | | | | 12.79 | | | | | 0.05 | | | | | 0.63 | | | | | 0.59 | | | | | 3.08 | | | | | 102,523 | | | | | 31 | |
| 2017 | | | | 13.17 | | | | | 0.35 | | | | | 0.14 | | | | | 0.49 | | | | | (0.35 | ) | | | | (0.11 | ) | | | | (0.46 | ) | | | | 13.20 | | | | | 3.86 | | | | | 0.71 | | | | | 0.59 | | | | | 2.70 | | | | | 120,745 | | | | | 44 | |
| 2016 | | | | 12.33 | | | | | 0.45 | | | | | 0.89 | | | | | 1.34 | | | | | (0.45 | ) | | | | (0.05 | ) | | | | (0.50 | ) | | | | 13.17 | | | | | 11.23 | | | | | 0.72 | | | | | 0.59 | | | | | 3.65 | | | | | 82,643 | | | | | 62 | |
| 2015 | | | | 13.09 | | | | | 0.36 | | | | | (0.71 | ) | | | | (0.35 | ) | | | | (0.36 | ) | | | | (0.05 | ) | | | | (0.41 | ) | | | | 12.33 | | | | | (2.73 | ) | | | | 0.70 | | | | | 0.59 | | | | | 2.83 | | | | | 137,987 | | | | | 26 | |
| 2014 | | | | 12.39 | | | | | 0.44 | | | | | 0.91 | | | | | 1.35 | | | | | (0.44 | ) | | | | (0.21 | ) | | | | (0.65 | ) | | | | 13.09 | | | | | 11.20 | | | | | 0.74 | | | | | 0.59 | | | | | 3.32 | | | | | 78,347 | | | | | 25 | |
TCH Core Plus Bond Fund | | | | | | | | | | | | | | | | | | | | | | | | | | | | | | | | | | | | | | | | | | | | | | | | | | | | | | | | |
| 2018 | | | | 11.79 | | | | | 0.32 | | | | | (0.37 | ) | | | | (0.05 | ) | | | | (0.32 | ) | | | | (0.01 | ) | | | | (0.33 | ) | | | | 11.41 | | | | | (0.45 | ) | | | | 0.58 | | | | | 0.58 | | | | | 2.70 | | | | | 61,251 | | | | | 45 | |
| 2017 | | | | 11.89 | | | | | 0.24 | | | | | (0.02 | ) | | | | 0.22 | | | | | (0.28 | ) | | | | (0.04 | ) | | | | (0.32 | ) | | | | 11.79 | | | | | 1.91 | | | | | 0.59 | | | | | 0.59 | | | | | 2.37 | | | | | 68,946 | | | | | 34 | |
| 2016 | | | | 11.42 | | | | | 0.34 | | | | | 0.48 | | | | | 0.82 | | | | | (0.35 | ) | | | | (0.00 | ) | | | | (0.35 | ) | | | | 11.89 | | | | | 7.36 | | | | | 0.59 | | | | | 0.59 | | | | | 3.00 | | | | | 508,030 | | | | | 39 | |
| 2015 | | | | 11.95 | | | | | 0.32 | | | | | (0.47 | ) | | | | (0.15 | ) | | | | (0.32 | ) | | | | (0.06 | ) | | | | (0.38 | ) | | | | 11.42 | | | | | (1.28 | ) | | | | 0.58 | | | | | 0.58 | | | | | 2.69 | | | | | 602,588 | | | | | 25 | |
| 2014 | | | | 11.32 | | | | | 0.31 | | | | | 0.66 | | | | | 0.97 | | | | | (0.32 | ) | | | | (0.02 | ) | | | | (0.34 | ) | | | | 11.95 | | | | | 8.68 | | | | | 0.62 | | | | | 0.59 | | | | | 2.66 | | | | | 517,753 | | | | | 44 | |
Government Money Market Fund | | | | | | | | | | | | | | | | | | | | | | | | | | | | | | | | | | | | | | | | | | | | | | | | | | | | | | | | |
| 2018 | | | | 1.00 | | | | | 0.01 | | | | | 0.00 | | | | | 0.01 | | | | | (0.01 | ) | | | | (0.00 | ) | | | | (0.01 | ) | | | | 1.00 | | | | | 1.05 | | | | | 0.50 | | | | | 0.45 | | | | | 1.03 | | | | | 747,981 | | | | | — | |
| 2017 | | | | 1.00 | | | | | 0.00 | | | | | 0.00 | | | | | 0.00 | | | | | (0.00 | ) | | | | (0.00 | ) | | | | (0.00 | ) | | | | 1.00 | | | | | 0.24 | | | | | 0.50 | | | | | 0.42 | | | | | 0.24 | | | | | 814,242 | | | | | — | |
| 2016 | | | | 1.00 | | | | | 0.00 | | | | | 0.00 | | | | | 0.00 | | | | | (0.00 | ) | | | | (0.00 | ) | | | | (0.00 | ) | | | | 1.00 | | | | | 0.01 | | | | | 0.53 | | | | | 0.29 | | | | | 0.01 | | | | | 268,417 | | | | | — | |
| 2015 | | | | 1.00 | | | | | 0.00 | | | | | 0.00 | | | | | 0.00 | | | | | (0.00 | ) | | | | (0.00 | ) | | | | (0.00 | ) | | | | 1.00 | | | | | 0.01 | | | | | 0.53 | | | | | 0.08 | | | | | 0.01 | | | | | 101,593 | | | | | — | |
| 2014 | | | | 1.00 | | | | | 0.00 | | | | | — | | | | | 0.00 | | | | | (0.00 | ) | | | | — | | | | | (0.00 | ) | | | | 1.00 | | | | | 0.01 | | | | | 0.54 | | | | | 0.07 | | | | | 0.01 | | | | | 105,267 | | | | | — | |
Tax-Free Money Market Fund | | | | | | | | | | | | | | | | | | | | | | | | | | | | | | | | | | | | | | | | | | | | | | | | | | | | | | | | |
| 2018 | | | | 1.00 | | | | | 0.01 | | | | | 0.00 | | | | | 0.01 | | | | | (0.01 | ) | | | | (0.00 | ) | | | | (0.01 | ) | | | | 1.00 | | | | | 0.80 | | | | | 0.56 | | | | | 0.45 | | | | | 0.79 | | | | | 75,889 | | | | | — | |
| 2017 | | | | 1.00 | | | | | 0.00 | | | | | 0.00 | | | | | 0.00 | | | | | (0.00 | ) | | | | (0.00 | ) | | | | (0.00 | ) | | | | 1.00 | | | | | 0.37 | | | | | 0.57 | | | | | 0.45 | | | | | 0.33 | | | | | 76,029 | | | | | — | |
| 2016 | | | | 1.00 | | | | | 0.00 | | | | | 0.00 | | | | | 0.00 | | | | | (0.00 | ) | | | | (0.00 | ) | | | | (0.00 | ) | | | | 1.00 | | | | | 0.06 | | | | | 0.53 | | | | | 0.26 | | | | | 0.03 | | | | | 90,098 | | | | | — | |
| 2015 | | | | 1.00 | | | | | 0.00 | | | | | 0.00 | | | | | 0.00 | | | | | (0.00 | ) | | | | (0.00 | ) | | | | (0.00 | ) | | | | 1.00 | | | | | 0.02 | | | | | 0.53 | | | | | 0.16 | | | | | 0.01 | | | | | 142,052 | | | | | — | |
| 2014 | | | | 1.00 | | | | | 0.00 | | | | | 0.00 | | | | | 0.00 | | | | | (0.00 | ) | | | | (0.00 | ) | | | | (0.00 | ) | | | | 1.00 | | | | | 0.02 | | | | | 0.53 | | | | | 0.20 | | | | | 0.01 | | | | | 131,175 | | | | | — | |
Prime Money Market Fund | | | | | | | | | | | | | | | | | | | | | | | | | | | | | | | | | | | | | | | | | | | | | | | | | | | | | | | | | | | | | |
| 2018 | | | | 1.00 | | | | | 0.01 | | | | | 0.00 | | | | | 0.01 | | | | | (0.01 | ) | | | | (0.00 | ) | | | | (0.01 | ) | | | | 1.00 | | | | | 1.25 | | | | | 0.52 | | | | | 0.45 | | | | | 1.24 | | | | | 193,006 | | | | | — | |
| 2017 | | | | 1.00 | | | | | 0.00 | | | | | 0.00 | | | | | 0.00 | | | | | (0.00 | ) | | | | (0.00 | ) | | | | (0.00 | ) | | | | 1.00 | | | | | 0.42 | | | | | 0.53 | | | | | 0.45 | | | | | 0.36 | | | | | 202,251 | | | | | — | |
| 2016 | | | | 1.00 | | | | | 0.00 | | | | | 0.00 | | | | | 0.00 | | | | | (0.00 | ) | | | | (0.00 | ) | | | | (0.00 | ) | | | | 1.00 | | | | | 0.03 | | | | | 0.45 | | | | | 0.38 | | | | | 0.03 | | | | | 903,864 | | | | | — | |
| 2015 | | | | 1.00 | | | | | 0.00 | | | | | 0.00 | | | | | 0.00 | | | | | (0.00 | ) | | | | (0.00 | ) | | | | (0.00 | ) | | | | 1.00 | | | | | 0.01 | | | | | 0.45 | | | | | 0.19 | | | | | 0.01 | | | | | 1,296,633 | | | | | — | |
| 2014 | | | | 1.00 | | | | | 0.00 | | | | | 0.00 | | | | | 0.00 | | | | | (0.00 | ) | | | | (0.00 | ) | | | | (0.00 | ) | | | | 1.00 | | | | | 0.01 | | | | | 0.45 | | | | | 0.18 | | | | | 0.01 | | | | | 1,356,875 | | | | | — | |
(See Notes which are an integral part of the Financial Statements)
128
| | |
| |
| Financial Highlights—Investor Class of Shares (For a share outstanding throughout each period) |
| | | | | | | | | | | | | | | | | | | | | | | | | | | | | | | | | | | | | | | | | | | | | | | | | | | | | | | | | | | | | | | | | | | | | | |
Period
Ended
August 31, | | Net asset
value,
beginning
of period | | Net
investment
income
(loss) | | Net realized
and unrealized
gain (loss) | | Total from
investment
operations | | Distributions to
shareholders
from net
investment
income | | Distributions to
shareholders
from net
realized gain | | Total
distributions | | Ratios to Average Net Assets (1) | | Net assets,
end of period
(000 omitted) | | Portfolio
turnover
rate (3) |
| | Net asset
value, end
of period | | Total
return (2)(3) | | Gross
Expenses | | Net
Expenses (4) | | Net
investment
income (4) |
Institutional Prime Money Market Fund | | | | | | | | | | | | | | | | | | | | | | | | | | | | | | | | | | | | | | | | | | | | | | | | | | | |
| 2018 | | | $ | 1.0001 | | | | $ | 0.0128 | | | | $ | 0.0000 | | | | $ | 0.0128 | | | | $ | (0.0128 | ) | | | $ | (0.0000 | ) | | | $ | (0.0128 | ) | | | $ | 1.0001 | | | | | 1.29 | % | | | | 0.55 | % | | | | 0.45 | % | | | | 1.31 | % | | | $ | 2,401 | | | | | — | % |
| 2017(5) | | | | 1.00 | | | | | 0.0049 | | | | | 0.0001 | | | | | 0.0050 | | | | | (0.0049 | ) | | | | (0.0000 | ) | | | | (0.0049 | ) | | | | 1.0001 | | | | | 0.50 | | | | | 0.55 | | | | | 0.45 | | | | | 0.50 | | | | | 1,421 | | | | | — | |
| 2016(6) | | | | 1.00 | | | | | 0.00 | | | | | 0.00 | | | | | 0.00 | | | | | (0.00 | ) | | | | (0.00 | ) | | | | (0.00 | ) | | | | 1.00 | | | | | 0.03 | | | | | 0.54 | | | | | 0.45 | | | | | 0.14 | | | | | 992 | | | | | — | |
| (1) | Annualized for periods less than one year. |
| (2) | Based on net asset value as of end of period date. |
| (3) | Not annualized for periods less than one year. |
| (4) | The contractual and voluntary expense waivers pursuant to Note 6 of the financial statements are reflected in both the net expense and net investment income ratios. |
| (5) | Effective October 3, 2016, the BMO Institutional Prime Money Market Fund switched the valuation method of its securities from amortized cost to reflecting changes in market values, thus allowing the Fund’s NAV to “float”. In connection with this change, the Fund’s per share NAV is now calculated to four decimals (e.g., $1.0000). |
| (6) | Reflects operations for the period from June 3, 2016 (inception date) to August 31, 2016. |
(See Notes which are an integral part of the Financial Statements)
129
| | |
| |
| Financial Highlights—Advisor Class of Shares (For a share outstanding throughout each period) |
| | | | | | | | | | | | | | | | | | | | | | | | | | | | | | | | | | | | | | | | | | | | | | | | | | | | | | | | | | | | | | | | | | | | | | |
Period
Ended
August 31, | | Net asset
value,
beginning
of period | | Net
investment
income
(loss) | | Net realized
and unrealized
gain (loss) | | Total from
investment
operations | | Distributions to
shareholders
from net
investment
income | | Distributions to
shareholders
from net
realized gain | | Total
distributions | | Net asset
value, end
of period | | Ratios to Average Net Assets (1) | | Net assets,
end of period
(000 omitted) | | Portfolio
turnover
rate (3) |
| | Total
return (2)(3) | | Gross
Expenses | | Net
Expenses (4) | | Net
investment
income
(loss) (4) |
Low Volatility Equity Fund | | | | | | | | | | | | | | | | | | | | | | | | | | | | | | | | | | | | | | | | | | | | | | |
| 2018 | | | $ | 14.36 | | | | $ | 0.19 | | | | $ | 1.76 | | | | $ | 1.95 | | | | $ | (0.20 | ) | | | $ | (0.39 | ) | | | $ | (0.59 | ) | | | $ | 15.72 | | | | | 13.96 | % | | | | 1.03 | % | | | | 0.90 | % | | | | 1.25 | % | | | $ | 25,571 | | | | | 43 | % |
| 2017 | | | | 13.79 | | | | | 0.20 | | | | | 0.74 | | | | | 0.94 | | | | | (0.20 | ) | | | | (0.17 | ) | | | | (0.37 | ) | | | | 14.36 | | | | | 6.94 | | | | | 1.03 | | | | | 0.90 | | | | | 1.47 | | | | | 31,624 | | | | | 56 | |
| 2016 | | | | 12.81 | | | | | 0.16 | | | | | 1.35 | | | | | 1.51 | | | | | (0.17 | ) | | | | (0.36 | ) | | | | (0.53 | ) | | | | 13.79 | | | | | 12.13 | | | | | 1.05 | | | | | 0.90 | | | | | 1.40 | | | | | 15,064 | | | | | 40 | |
| 2015 | | | | 13.20 | | | | | 0.14 | | | | | 0.55 | | | | | 0.69 | | | | | (0.18 | ) | | | | (0.90 | ) | | | | (1.08 | ) | | | | 12.81 | | | | | 5.22 | | | | | 1.12 | | | | | 0.90 | | | | | 1.12 | | | | | 1,162 | | | | | 47 | |
| 2014(5) | | | | 12.74 | | | | | 0.04 | | | | | 0.47 | | | | | 0.51 | | | | | (0.05 | ) | | | | — | | | | | (0.05 | ) | | | | 13.20 | | | | | 4.03 | | | | | 1.02 | | | | | 0.90 | | | | | 1.17 | | | | | 26 | | | | | 47 | |
Dividend Income Fund | | | | | | | | | | | | | | | | | | | | | | | | | | | | | | | | | | | | | | | | | | | | | | | | | | | |
| 2018 | | | | 14.51 | | | | | 0.28 | | | | | 2.67 | | | | | 2.95 | | | | | (0.30 | ) | | | | (1.70 | ) | | | | (2.00 | ) | | | | 15.46 | | | | | 21.90 | | | | | 1.04 | | | | | 0.90 | | | | | 2.07 | | | | | 6,092 | | | | | 39 | |
| 2017(6) | | | | 12.94 | | | | | 0.28 | | | | | 1.61 | | | | | 1.89 | | | | | (0.21 | ) | | | | (0.11 | ) | | | | (0.32 | ) | | | | 14.51 | | | | | 14.80 | | | | | 1.08 | | | | | 0.90 | | | | | 2.06 | | | | | 3,205 | | | | | 43 | |
| 2016 | | | | 12.59 | | | | | 0.30 | | | | | 1.11 | | | | | 1.41 | | | | | (0.30 | ) | | | | (0.76 | ) | | | | (1.06 | ) | | | | 12.94 | | | | | 11.89 | | | | | 1.08 | | | | | 0.90 | | | | | 2.44 | | | | | 78,531 | | | | | 51 | |
| 2015 | | | | 14.29 | | | | | 0.31 | | | | | (0.76 | ) | | | | (0.45 | ) | | | | (0.33 | ) | | | | (0.92 | ) | | | | (1.25 | ) | | | | 12.59 | | | | | (3.63 | ) | | | | 1.05 | | | | | 0.90 | | | | | 2.16 | | | | | 74,254 | | | | | 46 | |
| 2014(5) | | | | 13.57 | | | | | 0.08 | | | | | 0.71 | | | | | 0.79 | | | | | (0.07 | ) | | | | — | | | | | (0.07 | ) | | | | 14.29 | | | | | 5.84 | | | | | 1.08 | | | | | 0.90 | | | | | 2.09 | | | | | 26 | | | | | 45 | |
Large-Cap Value Fund | | | | | | | | | | | | | | | | | | | | | | | | | | | | | | | | | | | | | | | | | | | | | | | | | | | |
| 2018 | | | | 15.85 | | | | | 0.16 | | | | | 2.22 | | | | | 2.38 | | | | | (0.19 | ) | | | | (1.45 | ) | | | | (1.64 | ) | | | | 16.59 | | | | | 15.57 | | | | | 0.91 | | | | | 0.89 | | | | | 0.82 | | | | | 22,602 | | | | | 54 | |
| 2017(6) | | | | 14.14 | | | | | 0.08 | | | | | 1.93 | | | | | 2.01 | | | | | (0.18 | ) | | | | (0.12 | ) | | | | (0.30 | ) | | | | 15.85 | | | | | 14.33 | | | | | 1.02 | | | | | 1.00 | | | | | 0.49 | | | | | 25,061 | | | | | 62 | |
| 2016 | | | | 15.23 | | | | | 0.21 | | | | | 0.53 | | | | | 0.74 | | | | | (0.22 | ) | | | | (1.61 | ) | | | | (1.83 | ) | | | | 14.14 | | | | | 5.31 | | | | | 1.10 | | | | | 1.07 | | | | | 1.61 | | | | | 37 | | | | | 60 | |
| 2015 | | | | 17.04 | | | | | 0.13 | | | | | (0.22 | ) | | | | (0.09 | ) | | | | (0.10 | ) | | | | (1.62 | ) | | | | (1.72 | ) | | | | 15.23 | | | | | (0.70 | ) | | | | 1.22 | | | | | 1.21 | | | | | 0.80 | | | | | 28 | | | | | 72 | |
| 2014(5) | | | | 16.23 | | | | | 0.04 | | | | | 0.82 | | | | | 0.86 | | | | | (0.05 | ) | | | | — | | | | | (0.05 | ) | | | | 17.04 | | | | | 5.32 | | | | | 1.23 | | | | | 1.23 | | | | | 0.83 | | | | | 27 | | | | | 68 | |
Large-Cap Growth Fund | | | | | | | | | | | | | | | | | | | | | | | | | | | | | | | | | | | | | | | | | | | | | | | | | | | |
| 2018 | | | | 17.46 | | | | | 0.05 | | | | | 4.45 | | | | | 4.50 | | | | | — | | | | | (1.00 | ) | | | | (1.00 | ) | | | | 20.96 | | | | | 26.84 | | | | | 0.91 | | | | | 0.88 | | | | | 0.32 | | | | | 860 | | | | | 57 | |
| 2017 | | | | 15.34 | | | | | 0.03 | | | | | 3.06 | | | | | 3.09 | | | | | (0.07 | ) | | | | (0.90 | ) | | | | (0.97 | ) | | | | 17.46 | | | | | 21.30 | | | | | 1.03 | | | | | 1.00 | | | | | 0.39 | | | | | 808 | | | | | 75 | |
| 2016 | | | | 16.26 | | | | | 0.02 | | | | | 1.45 | | | | | 1.47 | | | | | (0.02 | ) | | | | (2.37 | ) | | | | (2.39 | ) | | | | 15.34 | | | | | 9.68 | | | | | 1.13 | | | | | 1.07 | | | | | 0.29 | | | | | 405 | | | | | 70 | |
| 2015 | | | | 17.94 | | | | | 0.00 | | | | | 0.92 | | | | | 0.92 | | | | | (0.01 | ) | | | | (2.59 | ) | | | | (2.60 | ) | | | | 16.26 | | | | | 5.58 | | | | | 1.23 | | | | | 1.21 | | | | | 0.03 | | | | | 37 | | | | | 94 | |
| 2014(5) | | | | 16.81 | | | | | 0.01 | | | | | 1.12 | | | | | 1.13 | | | | | — | | | | | — | | | | | — | | | | | 17.94 | | | | | 6.72 | | | | | 1.24 | | | | | 1.24 | | | | | 0.17 | | | | | 26 | | | | | 67 | |
Mid-Cap Value Fund | | | | | | | | | | | | | | | | | | | | | | | | | | | | | | | | | | | | | | | | | | | | | | |
| 2018 | | | | 11.91 | | | | | 0.11 | | | | | 1.17 | | | | | 1.28 | | | | | (0.05 | ) | | | | (0.50 | ) | | | | (0.55 | ) | | | | 12.64 | | | | | 10.89 | | | | | 1.25 | | | | | 1.24 | | | | | 0.79 | | | | | 55,151 | | | | | 64 | |
| 2017 | | | | 14.40 | | | | | 0.05 | | | | | 1.28 | | | | | 1.33 | | | | | (0.05 | ) | | | | (3.77 | ) | | | | (3.82 | ) | | | | 11.91 | | | | | 12.88 | | | | | 1.26 | | | | | 1.24 | | | | | 0.74 | | | | | 64,462 | | | | | 139 | |
| 2016 | | | | 15.02 | | | | | 0.11 | | | | | 0.86 | | | | | 0.97 | | | | | (0.12 | ) | | | | (1.47 | ) | | | | (1.59 | ) | | | | 14.40 | | | | | 7.27 | | | | | 1.23 | | | | | 1.23 | | | | | 0.90 | | | | | 39 | | | | | 24 | |
| 2015 | | | | 17.66 | | | | | 0.03 | | | | | (0.59 | ) | | | | (0.56 | ) | | | | (0.02 | ) | | | | (2.06 | ) | | | | (2.08 | ) | | | | 15.02 | | | | | (3.55 | ) | | | | 1.22 | | | | | 1.22 | | | | | 0.19 | | | | | 26 | | | | | 27 | |
| 2014(5) | | | | 16.61 | | | | | 0.01 | | | | | 1.04 | | | | | 1.05 | | | | | — | | | | | — | | | | | — | | | | | 17.66 | | | | | 6.32 | | | | | 1.20 | | | | | 1.20 | | | | | 0.31 | | | | | 27 | | | | | 30 | |
Mid-Cap Growth Fund | | | | | | | | | | | | | | | | | | | | | | | | | | | | | | | | | | | | | | | | | | | | | | |
| 2018 | | | | 14.79 | | | | | (0.08 | ) | | | | 4.24 | | | | | 4.16 | | | | | — | | | | | (0.99 | ) | | | | (0.99 | ) | | | | 17.96 | | | | | 29.40 | | | | | 1.31 | | | | | 1.24 | | | | | (0.43 | ) | | | | 16,399 | | | | | 63 | |
| 2017 | | | | 16.26 | | | | | (0.02 | ) | | | | 2.11 | | | | | 2.09 | | | | | (0.02 | ) | | | | (3.54 | ) | | | | (3.56 | ) | | | | 14.79 | | | | | 16.73 | | | | | 1.37 | | | | | 1.24 | | | | | (0.47 | ) | | | | 17,945 | | | | | 157 | |
| 2016 | | | | 20.02 | | | | | 0.03 | | | | | (0.91 | ) | | | | (0.88 | ) | | | | — | | | | | (2.88 | ) | | | | (2.88 | ) | | | | 16.26 | | | | | (4.23 | ) | | | | 1.29 | | | | | 1.24 | | | | | 0.09 | | | | | 31 | | | | | 59 | |
| 2015 | | | | 23.93 | | | | | (0.11 | ) | | | | (0.57 | ) | | | | (0.68 | ) | | | | — | | | | | (3.23 | ) | | | | (3.23 | ) | | | | 20.02 | | | | | (2.89 | ) | | | | 1.25 | | | | | 1.24 | | | | | (0.52 | ) | | | | 28 | | | | | 53 | |
| 2014(5) | | | | 22.89 | | | | | (0.04 | ) | | | | 1.08 | | | | | 1.04 | | | | | — | | | | | — | | | | | — | | | | | 23.93 | | | | | 4.54 | | | | | 1.24 | | | | | 1.24 | | | | | (0.63 | ) | | | | 26 | | | | | 57 | |
Small-Cap Value Fund | | | | | | | | | | | | | | | | | | | | | | | | | | | | | | | | | | | | | | | | | | | | | | |
| 2018 | | | | 13.30 | | | | | 0.03 | | | | | 2.57 | | | | | 2.60 | | | | | — | | | | | (1.12 | ) | | | | (1.12 | ) | | | | 14.78 | | | | | 20.32 | | | | | 1.41 | | | | | 1.24 | | | | | 0.25 | | | | | 4,741 | | | | | 70 | |
| 2017(6) | | | | 13.21 | | | | | 0.03 | | | | | 1.36 | | | | | 1.39 | | | | | (0.04 | ) | | | | (1.26 | ) | | | | (1.30 | ) | | | | 13.30 | | | | | 11.58 | | | | | 1.49 | | | | | 1.24 | | | | | 0.22 | | | | | 4,931 | | | | | 148 | |
| 2016 | | | | 12.72 | | | | | 0.03 | | | | | 0.98 | | | | | 1.01 | | | | | — | | | | | (0.52 | ) | | | | (0.52 | ) | | | | 13.21 | | | | | 8.23 | | | | | 1.39 | | | | | 1.24 | | | | | 0.17 | | | | | 42,615 | | | | | 39 | |
| 2015 | | | | 14.40 | | | | | (0.02 | ) | | | | (0.85 | ) | | | | (0.87 | ) | | | | — | | | | | (0.81 | ) | | | | (0.81 | ) | | | | 12.72 | | | | | (6.18 | ) | | | | 1.46 | | | | | 1.24 | | | | | (0.46 | ) | | | | 72,822 | | | | | 53 | |
| 2014(5) | | | | 13.99 | | | | | (0.01 | ) | | | | 0.42 | | | | | 0.41 | | | | | — | | | | | — | | | | | — | | | | | 14.40 | | | | | 2.93 | | | | | 1.46 | | | | | 1.24 | | | | | (0.14 | ) | | | | 26 | | | | | 43 | |
Small-Cap Core Fund | | | | | | | | | | | | | | | | | | | | | | | | | | | | | | | | | | | | | | | | | | | | | | | | | | | |
| 2018 | | | | 13.22 | | | | | (0.01 | ) | | | | 2.73 | | | | | 2.72 | | | | | — | | | | | (0.83 | ) | | | | (0.83 | ) | | | | 15.11 | | | | | 21.20 | | | | | 1.62 | | | | | 1.15 | | | | | (0.04 | ) | | | | 2,988 | | | | | 89 | |
| 2017 | | | | 11.57 | | | | | (0.02 | ) | | | | 1.88 | | | | | 1.86 | | | | | (0.01 | ) | | | | (0.20 | ) | | | | (0.21 | ) | | | | 13.22 | | | | | 16.09 | | | | | 1.83 | | | | | 1.15 | | | | | (0.18 | ) | | | | 2,612 | | | | | 90 | |
| 2016 | | | | 10.41 | | | | | 0.02 | | | | | 1.22 | | | | | 1.24 | | | | | — | | | | | (0.08 | ) | | | | (0.08 | ) | | | | 11.57 | | | | | 11.97 | | | | | 2.54 | | | | | 1.15 | | | | | 0.19 | | | | | 647 | | | | | 70 | |
| 2015 | | | | 10.38 | | | | | (0.01 | ) | | | | 0.04 | | | | | 0.03 | | | | | — | | | | | — | | | | | — | | | | | 10.41 | | | | | 0.29 | | | | | 5.02 | | | | | 1.15 | | | | | (0.28 | ) | | | | 629 | | | | | 64 | |
| 2014(5) | | | | 10.08 | | | | | (0.01 | ) | | | | 0.31 | | | | | 0.30 | | | | | — | | | | | — | | | | | — | | | | | 10.38 | | | | | 2.98 | | | | | 4.82 | | | | | 1.15 | | | | | (0.30 | ) | | | | 26 | | | | | 43 | |
(See Notes which are an integral part of the Financial Statements)
130
| | |
| |
| Financial Highlights—Advisor Class of Shares (For a share outstanding throughout each period) |
| | | | | | | | | | | | | | | | | | | | | | | | | | | | | | | | | | | | | | | | | | | | | | | | | | | | | | | | | | | | | | | | | | | | | | |
Period
Ended
August 31, | | Net asset
value,
beginning
of period | | Net
investment
income
(loss) | | Net realized
and unrealized
gain (loss) | | Total from
investment
operations | | Distributions to
shareholders
from net
investment
income | | Distributions to
shareholders
from net
realized gain | | Total
distributions | | Net asset
value, end
of period | | Ratios to Average Net Assets (1) | | Net assets,
end of period
(000 omitted) | | Portfolio
turnover
rate (3) |
| | Total
return (2)(3) | | Gross
Expenses | | Net
Expenses (4) | | Net
investment
income
(loss) (4) |
Small-Cap Growth Fund | | | | | | | | | | | | | | | | | | | | | | | | | | | | | | | | | | | | | | | | | | | | | | |
| 2018 | | | $ | 18.37 | | | | $ | (0.12 | ) | | | $ | 5.43 | | | | $ | 5.31 | | | | $ | — | | | | $ | (2.08 | ) | | | $ | (2.08 | ) | | | $ | 21.60 | | | | | 31.55 | % | | | | 1.28 | % | | | | 1.24 | % | | | | (0.47 | )% | | | $ | 53,772 | | | | | 80 | % |
| 2017(7) | | | | 17.79 | | | | | (0.06 | ) | | | | 0.64 | | | | | 0.58 | | | | | — | | | | | — | | | | | — | | | | | 18.37 | | | | | 3.26 | | | | | 1.24 | | | | | 1.24 | | | | | (0.97 | ) | | | | 57,737 | | | | | 197 | |
Global Low Volatility Equity Fund | | | | | | | | | | | | | | | | | | | | | | | | | | | | | | | | | | | | | | | | | | | | | | |
| 2018 | | | | 13.16 | | | | | (0.15 | ) | | | | 1.46 | | | | | 1.31 | | | | | (0.34 | ) | | | | (0.13 | ) | | | | (0.47 | ) | | | | 14.00 | | | | | 10.21 | | | | | 1.46 | | | | | 1.10 | | | | | 1.50 | | | | | 339 | | | | | 34 | |
| 2017(8) | | | | 12.61 | | | | | 0.14 | | | | | 0.66 | | | | | 0.80 | | | | | (0.17 | ) | | | | (0.08 | ) | | | | (0.25 | ) | | | | 13.16 | | | | | 6.59 | | | | | 1.52 | | | | | 1.10 | | | | | 1.96 | | | | | 997 | | | | | 74 | |
| 2016(8) | | | | 11.31 | | | | | 0.11 | | | | | 1.25 | | | | | 1.36 | | | | | (0.06 | ) | | | | (0.00 | ) | | | | (0.06 | ) | | | | 12.61 | | | | | 12.11 | | | | | 1.63 | | | | | 1.10 | | | | | 2.04 | | | | | 266 | | | | | 36 | |
| 2015(8) | | | | 11.47 | | | | | 0.14 | | | | | (0.17 | ) | | | | (0.03 | ) | | | | (0.08 | ) | | | | (0.05 | ) | | | | (0.13 | ) | | | | 11.31 | | | | | (0.28 | ) | | | | 5.76 | | | | | 1.10 | | | | | 2.38 | | | | | 142 | | | | | 31 | |
| 2014(5)(8) | | | | 11.12 | | | | | 0.05 | | | | | 0.30 | | | | | 0.35 | | | | | — | | | | | — | | | | | — | | | | | 11.47 | | | | | 3.15 | | | | | 11.55 | | | | | 1.10 | | | | | 1.53 | | | | | 26 | | | | | 29 | |
Disciplined International Equity Fund | | | | | | | | | | | | | | | | | | | | | | | | | | | | | | | | | | | | | | | | | | | | | | |
| 2018(8) | | | | 11.17 | | | | | 0.21 | | | | | (0.22 | ) | | | | (0.01 | ) | | | | (0.22 | ) | | | | — | | | | | (0.22 | ) | | | | 10.94 | | | | | (0.15 | ) | | | | 1.27 | | | | | 1.15 | | | | | 2.11 | | | | | 186 | | | | | 52 | |
| 2017(8) | | | | 9.56 | | | | | 0.20 | | | | | 1.66 | | | | | 1.86 | | | | | (0.25 | ) | | | | — | | | | | (0.25 | ) | | | | 11.17 | | | | | 19.97 | | | | | 1.39 | | | | | 1.15 | | | | | 1.98 | | | | | 149 | | | | | 77 | |
| 2016(8)(9) | | | | 10.00 | | | | | 0.23 | | | | | (0.67 | ) | | | | (0.44 | ) | | | | — | | | | | — | | | | | — | | | | | 9.56 | | | | | (4.40 | ) | | | | 1.45 | | | | | 1.15 | | | | | 2.53 | | | | | 125 | | | | | 64 | |
Pyrford International Stock Fund | | | | | | | | | | | | | | | | | | | | | | | | | | | | | | | | | | | | | | | | | | | | | | |
| 2018(8) | | | | 13.16 | | | | | (0.09 | ) | | | | 0.36 | | | | | 0.27 | | | | | — | | | | | — | | | | | — | | | | | 13.43 | | | | | 2.05 | | | | | 1.20 | | | | | 1.18 | | | | | 2.88 | | | | | 6,037 | | | | | 20 | |
| 2017(6)(8) | | | | 12.18 | | | | | 0.40 | | | | | 0.83 | | | | | 1.23 | | | | | (0.25 | ) | | | | — | | | | | (0.25 | ) | | | | 13.16 | | | | | 10.38 | | | | | 1.30 | | | | | 1.21 | | | | | 3.11 | | | | | 891 | | | | | 33 | |
| 2016(8) | | | | 11.74 | | | | | 0.33 | | | | | 0.35 | | | | | 0.68 | | | | | (0.24 | ) | | | | — | | | | | (0.24 | ) | | | | 12.18 | | | | | 5.96 | | | | | 1.31 | | | | | 1.24 | | | | | 0.92 | | | | | 88 | | | | | 12 | |
| 2015(8) | | | | 13.11 | | | | | 0.05 | | | | | (1.34 | ) | | | | (1.29 | ) | | | | (0.08 | ) | | | | — | | | | | (0.08 | ) | | | | 11.74 | | | | | (9.86 | ) | | | | 1.28 | | | | | 1.24 | | | | | 2.79 | | | | | 817 | | | | | 9 | |
| 2014(5)(8) | | | | 13.13 | | | | | 0.07 | | | | | (0.09 | ) | | | | (0.02 | ) | | | | — | | | | | — | | | | | — | | | | | 13.11 | | | | | (0.15 | ) | | | | 1.28 | | | | | 1.24 | | | | | 1.95 | | | | | 25 | | | | | 6 | |
LGM Emerging Markets Equity Fund | | | | | | | | | | | | | | | | | | | | | | | | | | | | | | | | | | | | | | | | | | | | | | |
| 2018(8) | | | | 15.93 | | | | | 0.14 | | | | | (0.03 | ) | | | | 0.11 | | | | | — | | | | | — | | | | | — | | | | | 16.04 | | | | | 0.69 | | | | | 1.55 | | | | | 1.40 | | | | | 0.84 | | | | | 4,983 | | | | | 22 | |
| 2017(6)(8) | | | | 14.04 | | | | | 0.13 | | | | | 1.82 | | | | | 1.95 | | | | | (0.06 | ) | | | | — | | | | | (0.06 | ) | | | | 15.93 | | | | | 14.03 | | | | | 1.63 | | | | | 1.40 | | | | | 0.96 | | | | | 4,776 | | | | | 40 | |
| 2016(8) | | | | 12.12 | | | | | 0.16 | | | | | 1.86 | | | | | 2.02 | | | | | (0.10 | ) | | | | — | | | | | (0.10 | ) | | | | 14.04 | | | | | 16.88 | | | | | 1.64 | | | | | 1.40 | | | | | 0.92 | | | | | 51,879 | | | | | 24 | |
| 2015(8) | | | | 14.30 | | | | | 0.08 | | | | | (2.09 | ) | | | | (2.01 | ) | | | | (0.17 | ) | | | | — | | | | | (0.17 | ) | | | | 12.12 | | | | | (14.18 | ) | | | | 1.59 | | | | | 1.40 | | | | | 2.01 | | | | | 63,966 | | | | | 25 | |
| 2014(5)(8) | | | | 13.69 | | | | | 0.08 | | | | | 0.53 | | | | | 0.61 | | | | | — | | | | | — | | | | | — | | | | | 14.30 | | | | | 4.46 | | | | | 1.66 | | | | | 1.40 | | | | | 2.05 | | | | | 26 | | | | | 38 | |
Alternative Strategies Fund | | | | | | | | | | | | | | | | | | | | | | | | | | | | | | | | | | | | | | | | | | | | | | |
| 2018 | | | | 10.74 | | | | | (0.14 | ) | | | | (0.20 | ) | | | | (0.34 | ) | | | | — | | | | | (0.67 | )(12) | | | | (0.67 | ) | | | | 9.73 | | | | | (3.53 | ) | | | | 3.08 | (10) | | | | 2.33 | (10) | | | | (0.74 | ) | | | | 70 | | | | | 122 | |
| 2017(8) | | | | 10.30 | | | | | (0.18 | ) | | | | 0.62 | | | | | 0.44 | | | | | — | | | | | — | | | | | — | | | | | 10.74 | | | | | 4.27 | | | | | 3.65 | (10) | | | | 2.95 | (10) | | | | (0.93 | ) | | | | 157 | | | | | 251 | |
| 2016(8) | | | | 10.40 | | | | | (0.23 | ) | | | | 0.23 | | | | | 0.00 | | | | | — | | | | | (0.10 | ) | | | | (0.10 | ) | | | | 10.30 | | | | | (0.02 | ) | | | | 3.88 | (10) | | | | 3.07 | (10) | | | | 1.11 | | | | | 286 | | | | | 279 | |
| 2015(8)(11) | | | | 10.00 | | | | | (0.06 | ) | | | | 0.46 | | | | | 0.40 | | | | | — | | | | | — | | | | | — | | | | | 10.40 | | | | | 4.00 | | | | | 4.94 | (10) | | | | 2.72 | (10) | | | | (1.07 | ) | | | | 1,011 | | | | | 119 | |
Global Long/Short Equity Fund | | | | | | | | | | | | | | | | | | | | | | | | | | | | | | | | | | | | | | | | | | | | | | |
| 2018(8) | | | | 12.22 | | | | | 0.00 | | | | | 0.21 | | | | | 0.21 | | | | | (0.01 | ) | | | | (0.42 | ) | | | | (0.43 | ) | | | | 12.00 | | | | | 1.61 | | | | | 3.71 | (10) | | | | 2.47 | (10) | | | | 0.02 | | | | | 801 | | | | | 79 | |
| 2017(8) | | | | 10.68 | | | | | 0.01 | | | | | 1.66 | | | | | 1.67 | | | | | (0.04 | ) | | | | (0.09 | ) | | | | (0.13 | ) | | | | 12.22 | | | | | 15.77 | | | | | 5.05 | (10) | | | | 2.42 | (10) | | | | 0.03 | | | | | 730 | | | | | 42 | |
| 2016(8) | | | | 10.00 | | | | | 0.03 | | | | | 0.65 | | | | | 0.68 | | | | | — | | | | | — | | | | | — | | | | | 10.68 | | | | | 6.80 | | | | | 9.46 | (10) | | | | 2.36 | (10) | | | | 0.46 | | | | | 510 | | | | | 45 | |
Ultra Short Tax-Free Fund | | | | | | | | | | | | | | | | | | | | | | | | | | | | | | | | | | | | | | | | | | | | | | |
| 2018 | | | | 10.08 | | | | | 0.10 | | | | | 0.00 | | | | | 0.10 | | | | | (0.10 | ) | | | | (0.01 | ) | | | | (0.11 | ) | | | | 10.07 | | | | | 0.95 | | | | | 0.62 | | | | | 0.55 | | | | | 0.99 | | | | | 27,434 | | | | | 156 | |
| 2017 | | | | 10.08 | | | | | 0.07 | | | | | 0.01 | | | | | 0.08 | | | | | (0.07 | ) | | | | (0.01 | ) | | | | (0.08 | ) | | | | 10.08 | | | | | 0.80 | | | | | 0.64 | | | | | 0.55 | | | | | 0.74 | | | | | 34,696 | | | | | 126 | |
| 2016 | | | | 10.08 | | | | | 0.04 | | | | | 0.01 | | | | | 0.05 | | | | | (0.04 | ) | | | | (0.01 | ) | | | | (0.05 | ) | | | | 10.08 | | | | | 0.50 | | | | | 0.64 | | | | | 0.55 | | | | | 0.39 | | | | | 25 | | | | | 56 | |
| 2015 | | | | 10.09 | | | | | 0.04 | | | | | (0.01 | ) | | | | 0.03 | | | | | (0.04 | ) | | | | — | | | | | (0.04 | ) | | | | 10.08 | | | | | 0.25 | | | | | 0.60 | | | | | 0.55 | | | | | 0.34 | | | | | 25 | | | | | 57 | |
| 2014(5) | | | | 10.09 | | | | | 0.01 | | | | | 0.00 | | | | | 0.01 | | | | | (0.01 | ) | | | | — | | | | | (0.01 | ) | | | | 10.09 | | | | | 0.13 | | | | | 0.59 | | | | | 0.55 | | | | | 0.50 | | | | | 25 | | | | | 86 | |
Short Tax-Free Fund | | | | | | | | | | | | | | | | | | | | | | | | | | | | | | | | | | | | | | | | | | | | | | |
| 2018 | | | | 10.22 | | | | | 0.14 | | | | | (0.08 | ) | | | | 0.06 | | | | | (0.14 | ) | | | | — | | | | | (0.14 | ) | | | | 10.14 | | | | | 0.62 | | | | | 0.67 | | | | | 0.55 | | | | | 1.40 | | | | | 6,502 | | | | | 95 | |
| 2017 | | | | 10.24 | | | | | 0.13 | | | | | (0.02 | ) | | | | 0.11 | | | | | (0.13 | ) | | | | (0.00 | ) | | | | (0.13 | ) | | | | 10.22 | | | | | 1.08 | | | | | 0.76 | | | | | 0.55 | | | | | 1.27 | | | | | 7,166 | | | | | 93 | |
| 2016 | | | | 10.20 | | | | | 0.11 | | | | | 0.06 | | | | | 0.17 | | | | | (0.11 | ) | | | | (0.02 | ) | | | | (0.13 | ) | | | | 10.24 | | | | | 1.69 | | | | | 0.77 | | | | | 0.55 | | | | | 1.04 | | | | | 1,151 | | | | | 39 | |
| 2015 | | | | 10.20 | | | | | 0.12 | | | | | 0.00 | | | | | 0.12 | | | | | (0.12 | ) | | | | — | | | | | (0.12 | ) | | | | 10.20 | | | | | 1.21 | | | | | 0.83 | | | | | 0.55 | | | | | 1.15 | | | | | 453 | | | | | 50 | |
| 2014(5) | | | | 10.17 | | | | | 0.03 | | | | | 0.03 | | | | | 0.06 | | | | | (0.03 | ) | | | | — | | | | | (0.03 | ) | | | | 10.20 | | | | | 0.64 | | | | | 0.83 | | | | | 0.55 | | | | | 1.29 | | | | | 25 | | | | | 69 | |
(See Notes which are an integral part of the Financial Statements)
131
| | |
| |
| Financial Highlights—Advisor Class of Shares (For a share outstanding throughout each period) |
| | | | | | | | | | | | | | | | | | | | | | | | | | | | | | | | | | | | | | | | | | | | | | | | | | | | | | | | | | | | | | | | | | | | | | |
Period
Ended
August 31, | | Net asset
value,
beginning
of period | | Net
investment
income | | Net realized
and unrealized
gain (loss) | | Total from
investment
operations | | Distributions to
shareholders
from net
investment
income | | Distributions to
shareholders
from net
realized gain | | Total
distributions | | Net asset
value, end
of period | | Ratios to Average Net Assets (1) | | Net assets,
end of period
(000 omitted) | | Portfolio
turnover
rate (3) |
| | Total
return (2)(3) | | Gross
Expenses | | Net
Expenses (4) | | Net
investment
income
(loss) (4) |
Short-Term Income Fund | | | | | | | | | | | | | | | | | | | | | | | | | | | | | | | | | | | | | | | | | | | | | | |
| 2018 | | | $ | 9.39 | | | | $ | 0.17 | | | | $ | (0.12 | ) | | | $ | 0.05 | | | | $ | (0.17 | ) | | | $ | — | | | | $ | (0.17 | ) | | | $ | 9.27 | | | | | 0.56 | % | | | | 0.71 | % | | | | 0.60 | % | | | | 1.80 | % | | | $ | 26,011 | | | | | 48 | % |
| 2017 | | | | 9.40 | | | | | 0.15 | | | | | (0.01 | ) | | | | 0.14 | | | | | (0.15 | ) | | | | — | | | | | (0.15 | ) | | | | 9.39 | | | | | 1.46 | | | | | 0.72 | | | | | 0.60 | | | | | 1.61 | | | | | 33,311 | | | | | 53 | |
| 2016 | | | | 9.33 | | | | | 0.10 | | | | | 0.07 | | | | | 0.17 | | | | | (0.10 | ) | | | | — | | | | | (0.10 | ) | | | | 9.40 | | | | | 1.87 | | | | | 0.70 | | | | | 0.60 | | | | | 0.98 | | | | | 157 | | | | | 64 | |
| 2015 | | | | 9.40 | | | | | 0.09 | | | | | (0.05 | ) | | | | 0.04 | | | | | (0.11 | ) | | | | — | | | | | (0.11 | ) | | | | 9.33 | | | | | 0.43 | | | | | 0.69 | | | | | 0.60 | | | | | 1.02 | | | | | 25 | | | | | 29 | |
| 2014(5) | | | | 9.42 | | | | | 0.02 | | | | | (0.01 | ) | | | | 0.01 | | | | | (0.03 | ) | | | | — | | | | | (0.03 | ) | | | | 9.40 | | | | | 0.10 | | | | | 0.71 | | | | | 0.60 | | | | | 1.10 | | | | | 25 | | | | | 43 | |
Intermediate Tax-Free Fund | | | | | | | | | | | | | | | | | | | | | | | | | | | | | | | | | | | | | | | | | | | | | | |
| 2018 | | | | 11.37 | | | | | 0.30 | | | | | (0.24 | ) | | | | 0.06 | | | | | (0.30 | ) | | | | — | | | | | (0.30 | ) | | | | 11.13 | | | | | 0.53 | | | | | 0.55 | | | | | 0.55 | | | | | 2.65 | | | | | 14,701 | | | | | 45 | |
| 2017 | | | | 11.61 | | | | | 0.29 | | | | | (0.21 | ) | | | | 0.08 | | | | | (0.29 | ) | | | | (0.03 | ) | | | | (0.32 | ) | | | | 11.37 | | | | | 0.79 | | | | | 0.57 | | | | | 0.55 | | | | | 2.57 | | | | | 10,842 | | | | | 44 | |
| 2016 | | | | 11.26 | | | | | 0.25 | | | | | 0.37 | | | | | 0.62 | | | | | (0.25 | ) | | | | (0.02 | ) | | | | (0.27 | ) | | | | 11.61 | | | | | 5.56 | | | | | 0.57 | | | | | 0.55 | | | | | 2.18 | | | | | 1,693 | | | | | 42 | |
| 2015 | | | | 11.25 | | | | | 0.26 | | | | | 0.01 | | | | | 0.27 | | | | | (0.26 | ) | | | | — | | | | | (0.26 | ) | | | | 11.26 | | | | | 2.36 | | | | | 0.57 | | | | | 0.55 | | | | | 2.24 | | | | | 2,095 | | | | | 26 | |
| 2014(5) | | | | 11.16 | | | | | 0.07 | | | | | 0.09 | | | | | 0.16 | | | | | (0.07 | ) | | | | — | | | | | (0.07 | ) | | | | 11.25 | | | | | 1.46 | | | | | 0.60 | | | | | 0.55 | | | | | 2.41 | | | | | 2,044 | | | | | 35 | |
Strategic Income Fund | | | | | | | | | | | | | | | | | | | | | | | | | | | | | | | | | | | | | | | | | | | | | | |
| 2018 | | | | 9.45 | | | | | 0.37 | | | | | (0.37 | ) | | | | 0.03 | | | | | (0.40 | ) | | | | — | | | | | (0.40 | ) | | | | 9.08 | | | | | 0.37 | | | | | 0.92 | | | | | 0.80 | | | | | 4.09 | | | | | 13,602 | | | | | 33 | |
| 2017 | | | | 9.43 | | | | | 0.28 | | | | | 0.03 | | | | | 0.31 | | | | | (0.29 | ) | | | | — | | | | | (0.29 | ) | | | | 9.45 | | | | | 3.32 | | | | | 0.90 | | | | | 0.80 | | | | | 3.14 | | | | | 18,354 | | | | | 65 | |
| 2016 | | | | 9.31 | | | | | 0.22 | | | | | 0.16 | | | | | 0.38 | | | | | (0.26 | ) | | | | — | | | | | (0.26 | ) | | | | 9.43 | | | | | 4.17 | | | | | 0.86 | | | | | 0.80 | | | | | 2.27 | | | | | 32 | | | | | 13 | |
| 2015 | | | | 9.36 | | | | | 0.22 | | | | | 0.00 | | | | | 0.22 | | | | | (0.27 | ) | | | | — | | | | | (0.27 | ) | | | | 9.31 | | | | | 2.34 | | | | | 0.93 | | | | | 0.80 | | | | | 2.36 | | | | | 26 | | | | | 44 | |
| 2014(5) | | | | 9.35 | | | | | 0.03 | | | | | 0.05 | | | | | 0.08 | | | | | (0.07 | ) | | | | — | | | | | (0.07 | ) | | | | 9.36 | | | | | 0.86 | | | | | 0.94 | | | | | 0.80 | | | | | 2.38 | | | | | 25 | | | | | 129 | |
TCH Corporate Income Fund | | | | | | | | | | | | | | | | | | | | | | | | | | | | | | | | | | | | | | | | | | | | | | |
| 2018 | | | | 13.20 | | | | | 0.40 | | | | | (0.39 | ) | | | | 0.01 | | | | | (0.40 | ) | | | | (0.02 | ) | | | | (0.42 | ) | | | | 12.79 | | | | | 0.06 | | | | | 0.63 | | | | | 0.59 | | | | | 3.15 | | | | | 1,864 | | | | | 31 | |
| 2017 | | | | 13.17 | | | | | 0.35 | | | | | 0.14 | | | | | 0.49 | | | | | (0.35 | ) | | | | (0.11 | ) | | | | (0.46 | ) | | | | 13.20 | | | | | 3.86 | | | | | 0.71 | | | | | 0.59 | | | | | 2.63 | | | | | 1,384 | | | | | 44 | |
| 2016 | | | | 12.33 | | | | | 0.45 | | | | | 0.89 | | | | | 1.34 | | | | | (0.45 | ) | | | | (0.05 | ) | | | | (0.50 | ) | | | | 13.17 | | | | | 11.23 | | | | | 0.72 | | | | | 0.59 | | | | | 3.77 | | | | | 66 | | | | | 62 | |
| 2015 | | | | 13.09 | | | | | 0.36 | | | | | (0.71 | ) | | | | (0.35 | ) | | | | (0.36 | ) | | | | (0.05 | ) | | | | (0.41 | ) | | | | 12.33 | | | | | (2.73 | ) | | | | 0.70 | | | | | 0.59 | | | | | 2.83 | | | | | 25 | | | | | 26 | |
| 2014(5) | | | | 12.93 | | | | | 0.09 | | | | | 0.17 | | | | | 0.26 | | | | | (0.10 | ) | | | | — | | | | | (0.10 | ) | | | | 13.09 | | | | | 2.02 | | | | | 0.72 | | | | | 0.59 | | | | | 2.92 | | | | | 25 | | | | | 25 | |
TCH Core Plus Bond Fund | | | | | | | | | | | | | | | | | | | | | | | | | | | | | | | | | | | | | | | | | | | | | | |
| 2018 | | | | 11.79 | | | | | 0.31 | | | | | (0.37 | ) | | | | (0.05 | ) | | | | (0.32 | ) | | | | (0.01 | ) | | | | (0.33 | ) | | | | 11.41 | | | | | (0.45 | ) | | | | 0.58 | | | | | 0.58 | | | | | 2.69 | | | | | 3,032 | | | | | 45 | |
| 2017 | | | | 11.89 | | | | | 0.28 | | | | | (0.06 | ) | | | | 0.22 | | | | | (0.28 | ) | | | | (0.04 | ) | | | | (0.32 | ) | | | | 11.79 | | | | | 1.91 | | | | | 0.59 | | | | | 0.59 | | | | | 2.36 | | | | | 3,337 | | | | | 34 | |
| 2016 | | | | 11.42 | | | | | 0.34 | | | | | 0.48 | | | | | 0.82 | | | | | (0.35 | ) | | | | (0.00 | ) | | | | (0.35 | ) | | | | 11.89 | | | | | 7.36 | | | | | 0.59 | | | | | 0.59 | | | | | 2.99 | | | | | 1,434 | | | | | 39 | |
| 2015 | | | | 11.95 | | | | | 0.32 | | | | | (0.47 | ) | | | | (0.15 | ) | | | | (0.32 | ) | | | | (0.06 | ) | | | | (0.38 | ) | | | | 11.42 | | | | | (1.28 | ) | | | | 0.58 | | | | | 0.58 | | | | | 2.71 | | | | | 312 | | | | | 25 | |
| 2014(5) | | | | 11.82 | | | | | 0.08 | | | | | 0.14 | | | | | 0.22 | | | | | (0.09 | ) | | | | — | | | | | (0.09 | ) | | | | 11.95 | | | | | 1.85 | | | | | 0.60 | | | | | 0.59 | | | | | 2.74 | | | | | 25 | | | | | 44 | |
High Yield Bond Fund | | | | | | | | | | | | | | | | | | | | | | | | | | | | | | | | | | | | | | | | | | | | | | |
| 2018 | | | | 9.58 | | | | | 0.48 | | | | | (0.33 | ) | | | | 0.15 | | | | | (0.48 | ) | | | | — | | | | | (0.48 | ) | | | | 9.25 | | | | | 1.62 | | | | | 2.00 | | | | | 0.90 | | | | | 5.12 | | | | | 864 | | | | | 37 | |
| 2017 | | | | 9.49 | | | | | 0.44 | | | | | 0.15 | | | | | 0.59 | | | | | (0.50 | ) | | | | — | | | | | (0.50 | ) | | | | 9.58 | | | | | 6.37 | | | | | 1.42 | | | | | 0.90 | | | | | 5.26 | | | | | 1,010 | | | | | 47 | |
| 2016 | | | | 9.41 | | | | | 0.48 | | | | | 0.08 | | | | | 0.56 | | | | | (0.48 | ) | | | | — | | | | | (0.48 | ) | | | | 9.49 | | | | | 6.22 | | | | | 1.21 | | | | | 0.90 | | | | | 5.15 | | | | | 72,010 | | | | | 51 | |
| 2015 | | | | 10.44 | | | | | 0.51 | | | | | (0.79 | ) | | | | (0.28 | ) | | | | (0.51 | ) | | | | (0.24 | ) | | | | (0.75 | ) | | | | 9.41 | | | | | (2.70 | ) | | | | 1.21 | | | | | 0.90 | | | | | 5.13 | | | | | 42,843 | | | | | 46 | |
| 2014(5) | | | | 10.52 | | | | | 0.14 | | | | | (0.08 | ) | | | | 0.06 | | | | | (0.14 | ) | | | | — | | | | | (0.14 | ) | | | | 10.44 | | | | | 0.58 | | | | | 1.17 | | | | | 0.90 | | | | | 5.09 | | | | | 25 | | | | | 42 | |
| (1) | Annualized for periods less than one year. |
| (2) | Based on net asset value as of end of period date. |
| (3) | Not annualized for periods less than one year. |
| (4) | The contractual and voluntary expense waivers pursuant to Note 6 of the financial statements are reflected in both the net expense and net investment income (loss) ratios. |
| (5) | Reflects operations for the period from May 27, 2014 (inception date) to August 31, 2014. |
| (6) | Calculated using the average shares method. |
| (7) | Reflects operations for the period from May 31, 2017 (inception date) to August 31, 2017. |
| (8) | Redemption fees consisted of per share amounts less than $0.01. |
| (9) | Reflects operations for the period from September 17, 2015 (inception date) to August 31, 2016. |
| (10) | Percentages shown include interest expense and dividends on securities sold short. Gross and net expense ratios, respectively, excluding interest expense and dividends on securities sold short are as follows: |
| | | | | | | | | | | | | | | | | | | | | | |
Alternatives Strategies Fund | | | | | | Global Long/Short Equity Fund | |
| | | Gross | | | Net | | | | | | | | Gross | | | Net | |
| 2018 | | | 2.75 | % | | | 2.00 | % | | | | | | 2018 | | | 2.83 | % | | | 1.60 | % |
| 2017 | | | 2.85 | | | | 2.15 | | | | | | | 2017 | | | 4.23 | | | | 1.60 | |
| 2016 | | | 3.05 | | | | 2.20 | | | | | | | 2016 | | | 8.70 | | | | 1.60 | |
| 2015 | | | 4.42 | | | | 2.20 | | | | | | | | | | | | | | | |
| (11) | Reflects operations for the period from December 16, 2014 (inception date) to August 31, 2015. |
| (12) | Includes distribution to shareholders for return of capital in the amount of $0.09 per share. |
(See Notes which are an integral part of the Financial Statements)
132
| | |
| |
| Financial Highlights—Institutional Class of Shares (For a share outstanding throughout each period) |
| | | | | | | | | | | | | | | | | | | | | | | | | | | | | | | | | | | | | | | | | | | | | | | | | | | | | | | | | | | | | | | | | | | | | | |
Period
Ended
August 31, | | Net asset
value,
beginning
of period | | Net
investment
income
(loss) | | Net realized
and unrealized
gain (loss) | | Total from
investment
operations | | Distributions to
shareholders
from net
investment
income | | Distributions to
shareholders
from net
realized gain | | Total
distributions | | Net asset
value, end
of period | | Ratios to Average Net Assets (1) | | Net assets,
end of period
(000 omitted) | | Portfolio
turnover
rate (3) |
| | Total
return (2)(3) | | Gross
Expenses | | Net
Expenses (4) | | Net
investment
income
(loss) (4) |
Low Volatility Equity Fund | | | | | | | | | | | | | | | | | | | | | | | | | | | | | | | | | | | | | | | | | | | | | | |
| 2018 | | | $ | 14.42 | | | | $ | 0.24 | | | | $ | 1.74 | | | | $ | 1.98 | | | | $ | (0.24 | ) | | | $ | (0.39 | ) | | | $ | (0.63 | ) | | | $ | 15.77 | | | | | 14.12 | % | | | | 0.78 | % | | | | 0.65 | % | | | | 1.52 | % | | | $ | 102,815 | | | | | 43 | % |
| 2017 | | | | 13.84 | | | | | 0.24 | | | | | 0.74 | | | | | 0.98 | | | | | (0.23 | ) | | | | (0.17 | ) | | | | (0.40 | ) | | | | 14.42 | | | | | 7.24 | | | | | 0.78 | | | | | 0.65 | | | | | 1.69 | | | | | 127,837 | | | | | 56 | |
| 2016 | | | | 12.84 | | | | | 0.20 | | | | | 1.35 | | | | | 1.55 | | | | | (0.19 | ) | | | | (0.36 | ) | | | | (0.55 | ) | | | | 13.84 | | | | | 12.47 | | | | | 0.80 | | | | | 0.65 | | | | | 1.62 | | | | | 135,413 | | | | | 40 | |
| 2015 | | | | 13.22 | | | | | 0.20 | | | | | 0.53 | | | | | 0.73 | | | | | (0.21 | ) | | | | (0.90 | ) | | | | (1.11 | ) | | | | 12.84 | | | | | 5.56 | | | | | 0.87 | | | | | 0.65 | | | | | 1.52 | | | | | 76,792 | | | | | 47 | |
| 2014 | | | | 11.28 | | | | | 0.18 | | | | | 2.05 | | | | | 2.23 | | | | | (0.18 | ) | | | | (0.11 | ) | | | | (0.29 | ) | | | | 13.22 | | | | | 19.97 | | | | | 0.89 | | | | | 0.65 | | | | | 1.49 | | | | | 57,421 | | | | | 47 | |
Dividend Income Fund | | | | | | | | | | | | | | | | | | | | | | | | | | | | | | | | | | | | | | | | | | | | | | |
| 2018 | | | | 14.47 | | | | | 0.34 | | | | | 2.64 | | | | | 2.98 | | | | | (0.34 | ) | | | | (1.70 | ) | | | | (2.04 | ) | | | | 15.41 | | | | | 22.17 | | | | | 0.79 | | | | | 0.65 | | | | | 2.31 | | | | | 149,009 | | | | | 39 | |
| 2017(5) | | | | 12.96 | | | | | 0.33 | | | | | 1.60 | | | | | 1.93 | | | | | (0.31 | ) | | | | (0.11 | ) | | | | (0.42 | ) | | | | 14.47 | | | | | 15.15 | | | | | 0.83 | | | | | 0.65 | | | | | 2.37 | | | | | 112,377 | | | | | 43 | |
| 2016 | | | | 12.62 | | | | | 0.35 | | | | | 1.08 | | | | | 1.43 | | | | | (0.33 | ) | | | | (0.76 | ) | | | | (1.09 | ) | | | | 12.96 | | | | | 12.07 | | | | | 0.83 | | | | | 0.65 | | | | | 2.68 | | | | | 38,719 | | | | | 51 | |
| 2015 | | | | 14.32 | | | | | 0.35 | | | | | (0.77 | ) | | | | (0.42 | ) | | | | (0.36 | ) | | | | (0.92 | ) | | | | (1.28 | ) | | | | 12.62 | | | | | (3.38 | ) | | | | 0.80 | | | | | 0.65 | | | | | 2.50 | | | | | 45,554 | | | | | 46 | |
| 2014 | | | | 12.27 | | | | | 0.32 | | | | | 2.51 | | | | | 2.83 | | | | | (0.31 | ) | | | | (0.47 | ) | | | | (0.78 | ) | | | | 14.32 | | | | | 23.87 | | | | | 0.80 | | | | | 0.65 | | | | | 2.43 | | | | | 55,387 | | | | | 45 | |
Large-Cap Value Fund | | | | | | | | | | | | | | | | | | | | | | | | | | | | | | | | | | | | | | | | | | | | | | |
| 2018 | | | | 15.88 | | | | | 0.28 | | | | | 2.14 | | | | | 2.42 | | | | | (0.24 | ) | | | | (1.45 | ) | | | | (1.69 | ) | | | | 16.61 | | | | | 15.83 | | | | | 0.67 | | | | | 0.64 | | | | | 1.64 | | | | | 287,685 | | | | | 54 | |
| 2017(5) | | | | 14.16 | | | | | 0.22 | | | | | 1.83 | | | | | 2.05 | | | | | (0.21 | ) | | | | (0.12 | ) | | | | (0.33 | ) | | | | 15.88 | | | | | 14.66 | | | | | 0.77 | | | | | 0.75 | | | | | 1.47 | | | | | 307,156 | | | | | 62 | |
| 2016 | | | | 15.26 | | | | | 0.24 | | | | | 0.53 | | | | | 0.77 | | | | | (0.26 | ) | | | | (1.61 | ) | | | | (1.87 | ) | | | | 14.16 | | | | | 5.57 | | | | | 0.85 | | | | | 0.82 | | | | | 1.83 | | | | | 136,813 | | | | | 60 | |
| 2015 | | | | 17.06 | | | | | 0.18 | | | | | (0.23 | ) | | | | (0.05 | ) | | | | (0.13 | ) | | | | (1.62 | ) | | | | (1.75 | ) | | | | 15.26 | | | | | (0.45 | ) | | | | 0.97 | | | | | 0.96 | | | | | 1.04 | | | | | 94,439 | | | | | 72 | |
| 2014 | | | | 14.56 | | | | | 0.16 | | | | | 3.56 | | | | | 3.72 | | | | | (0.16 | ) | | | | (1.06 | ) | | | | (1.22 | ) | | | | 17.06 | | | | | 26.74 | | | | | 0.98 | | | | | 0.98 | | | | | 0.95 | | | | | 119,263 | | | | | 68 | |
Large-Cap Growth Fund | | | | | | | | | | | | | | | | | | | | | | | | | | | | | | | | | | | | | | | | | | | | | | |
| 2018 | | | | 17.60 | | | | | 0.11 | | | | | 4.48 | | | | | 4.59 | | | | | (0.02 | ) | | | | (1.00 | ) | | | | (1.02 | ) | | | | 21.17 | | | | | 27.19 | | | | | 0.67 | | | | | 0.64 | | | | | 0.56 | | | | | 279,227 | | | | | 57 | |
| 2017 | | | | 15.47 | | | | | 0.10 | | | | | 3.06 | | | | | 3.16 | | | | | (0.13 | ) | | | | (0.90 | ) | | | | (1.03 | ) | | | | 17.60 | | | | | 21.63 | | | | | 0.78 | | | | | 0.75 | | | | | 0.65 | | | | | 278,436 | | | | | 75 | |
| 2016 | | | | 16.39 | | | | | 0.07 | | | | | 1.44 | | | | | 1.51 | | | | | (0.06 | ) | | | | (2.37 | ) | | | | (2.43 | ) | | | | 15.47 | | | | | 9.88 | | | | | 0.88 | | | | | 0.82 | | | | | 0.50 | | | | | 95,438 | | | | | 70 | |
| 2015 | | | | 18.06 | | | | | 0.07 | | | | | 0.90 | | | | | 0.97 | | | | | (0.04 | ) | | | | (2.60 | ) | | | | (2.64 | ) | | | | 16.39 | | | | | 5.85 | | | | | 0.98 | | | | | 0.96 | | | | | 0.29 | | | | | 72,958 | | | | | 94 | |
| 2014 | | | | 15.18 | | | | | 0.06 | | | | | 4.36 | | | | | 4.42 | | | | | (0.09 | ) | | | | (1.45 | ) | | | | (1.54 | ) | | | | 18.06 | | | | | 30.63 | | | | | 0.99 | | | | | 0.99 | | | | | 0.28 | | | | | 130,948 | | | | | 67 | |
Mid-Cap Value Fund | | | | | | | | | | | | | | | | | | | | | | | | | | | | | | | | | | | | | | | | | | | | | | |
| 2018 | | | | 11.89 | | | | | 0.13 | | | | | 1.18 | | | | | 1.31 | | | | | (0.12 | ) | | | | (0.50 | ) | | | | (0.62 | ) | | | | 12.58 | | | | | 11.21 | | | | | 1.00 | | | | | 0.99 | | | | | 1.04 | | | | | 113,786 | | | | | 64 | |
| 2017 | | | | 14.38 | | | | | 0.08 | | | | | 1.27 | | | | | 1.35 | | | | | (0.07 | ) | | | | (3.77 | ) | | | | (3.84 | ) | | | | 11.89 | | | | | 13.10 | | | | | 1.01 | | | | | 0.99 | | | | | 0.91 | | | | | 127,304 | | | | | 139 | |
| 2016 | | | | 15.01 | | | | | 0.16 | | | | | 0.85 | | | | | 1.01 | | | | | (0.17 | ) | | | | (1.47 | ) | | | | (1.64 | ) | | | | 14.38 | | | | | 7.55 | | | | | 0.98 | | | | | 0.98 | | | | | 1.09 | | | | | 75,608 | | | | | 24 | |
| 2015 | | | | 17.63 | | | | | 0.08 | | | | | (0.60 | ) | | | | (0.52 | ) | | | | (0.04 | ) | | | | (2.06 | ) | | | | (2.10 | ) | | | | 15.01 | | | | | (3.29 | ) | | | | 0.97 | | | | | 0.97 | | | | | 0.43 | | | | | 99,160 | | | | | 27 | |
| 2014 | | | | 16.23 | | | | | 0.08 | | | | | 3.64 | | | | | 3.72 | | | | | (0.12 | ) | | | | (2.20 | ) | | | | (2.32 | ) | | | | 17.63 | | | | | 24.96 | | | | | 0.95 | | | | | 0.95 | | | | | 0.49 | | | | | 145,606 | | | | | 30 | |
Mid-Cap Growth Fund | | | | | | | | | | | | | | | | | | | | | | | | | | | | | | | | | | | | | | | | | | | | | | |
| 2018 | | | | 15.39 | | | | | (0.03 | ) | | | | 4.42 | | | | | 4.39 | | | | | — | | | | | (0.99 | ) | | | | (0.99 | ) | | | | 18.79 | | | | | 29.76 | | | | | 1.06 | | | | | 0.99 | | | | | (0.18 | ) | | | | 89,028 | | | | | 63 | |
| 2017 | | | | 16.76 | | | | | 0.03 | | | | | 2.19 | | | | | 2.22 | | | | | (0.05 | ) | | | | (3.54 | ) | | | | (3.59 | ) | | | | 15.39 | | | | | 17.07 | | | | | 1.12 | | | | | 0.99 | | | | | (0.07 | ) | | | | 94,464 | | | | | 157 | |
| 2016 | | | | 20.51 | | | | | 0.04 | | | | | (0.91 | ) | | | | (0.87 | ) | | | | — | | | | | (2.88 | ) | | | | (2.88 | ) | | | | 16.76 | | | | | (4.06 | ) | | | | 1.04 | | | | | 0.99 | | | | | 0.33 | | | | | 39,569 | | | | | 59 | |
| 2015 | | | | 24.37 | | | | | (0.08 | ) | | | | (0.55 | ) | | | | (0.63 | ) | | | | — | | | | | (3.23 | ) | | | | (3.23 | ) | | | | 20.51 | | | | | (2.61 | ) | | | | 1.00 | | | | | 0.99 | | | | | (0.26 | ) | | | | 82,768 | | | | | 53 | |
| 2014 | | | | 23.26 | | | | | (0.09 | ) | | | | 4.26 | | | | | 4.17 | | | | | — | | | | | (3.06 | ) | | | | (3.06 | ) | | | | 24.37 | | | | | 19.43 | | | | | 0.97 | | | | | 0.97 | | | | | (0.36 | ) | | | | 144,807 | | | | | 57 | |
Small-Cap Value Fund | | | | | | | | | | | | | | | | | | | | | | | | | | | | | | | | | | | | | | | | | | | | | | |
| 2018 | | | | 13.47 | | | | | 0.07 | | | | | 2.61 | | | | | 2.68 | | | | | — | | | | | (1.12 | ) | | | | (1.12 | ) | | | | 15.03 | | | | | 20.67 | | | | | 1.16 | | | | | 0.99 | | | | | 0.49 | | | | | 56,848 | | | | | 70 | |
| 2017(5) | | | | 13.37 | | | | | 0.04 | | | | | 1.41 | | | | | 1.45 | | | | | (0.09 | ) | | | | (1.26 | ) | | | | (1.35 | ) | | | | 13.47 | | | | | 11.87 | | | | | 1.24 | | | | | 0.99 | | | | | 0.33 | | | | | 56,585 | | | | | 148 | |
| 2016 | | | | 12.84 | | | | | 0.05 | | | | | 1.00 | | | | | 1.05 | | | | | — | | | | | (0.52 | ) | | | | (0.52 | ) | | | | 13.37 | | | | | 8.47 | | | | | 1.14 | | | | | 0.99 | | | | | 0.40 | | | | | 25,522 | | | | | 39 | |
| 2015 | | | | 14.50 | | | | | (0.01 | ) | | | | (0.84 | ) | | | | (0.85 | ) | | | | — | | | | | (0.81 | ) | | | | (0.81 | ) | | | | 12.84 | | | | | (5.99 | ) | | | | 1.21 | | | | | 0.99 | | | | | (0.14 | ) | | | | 19,186 | | | | | 53 | |
| 2014 | | | | 13.62 | | | | | 0.01 | | | | | 2.25 | | | | | 2.26 | | | | | — | | | | | (1.38 | ) | | | | (1.38 | ) | | | | 14.50 | | | | | 17.68 | | | | | 1.15 | | | | | 0.99 | | | | | 0.04 | | | | | 16,369 | | | | | 43 | |
Small-Cap Core Fund | | | | | | | | | | | | | | | | | | | | | | | | | | | | | | | | | | | | | | | | | | | | | | |
| 2018 | | | | 13.30 | | | | | 0.03 | | | | | 2.74 | | | | | 2.77 | | | | | (0.01 | ) | | | | (0.83 | ) | | | | (0.84 | ) | | | | 15.23 | | | | | 21.46 | | | | | 1.37 | | | | | 0.90 | | | | | 0.21 | | | | | 21,407 | | | | | 89 | |
| 2017 | | | | 11.64 | | | | | 0.01 | | | | | 1.89 | | | | | 1.90 | | | | | (0.04 | ) | | | | (0.20 | ) | | | | (0.24 | ) | | | | 13.30 | | | | | 16.33 | | | | | 1.58 | | | | | 0.90 | | | | | 0.14 | | | | | 17,049 | | | | | 90 | |
| 2016 | | | | 10.45 | | | | | 0.03 | | | | | 1.25 | | | | | 1.28 | | | | | (0.01 | ) | | | | (0.08 | ) | | | | (0.09 | ) | | | | 11.64 | | | | | 12.37 | | | | | 2.29 | | | | | 0.90 | | | | | 0.44 | | | | | 10,780 | | | | | 70 | |
| 2015 | | | | 10.40 | | | | | 0.02 | | | | | 0.03 | | | | | 0.05 | | | | | — | | | | | — | | | | | — | | | | | 10.45 | | | | | 0.48 | | | | | 4.77 | | | | | 0.90 | | | | | 0.17 | | | | | 3,632 | | | | | 64 | |
| 2014(6) | | | | 10.00 | | | | | 0.00 | | | | | 0.40 | | | | | 0.40 | | | | | — | | | | | — | | | | | — | | | | | 10.40 | | | | | 4.00 | | | | | 6.75 | | | | | 0.90 | | | | | (0.03 | ) | | | | 3,030 | | | | | 43 | |
(See Notes which are an integral part of the Financial Statements)
133
| | |
| |
| Financial Highlights—Institutional Class of Shares (For a share outstanding throughout each period) |
| | | | | | | | | | | | | | | | | | | | | | | | | | | | | | | | | | | | | | | | | | | | | | | | | | | | | | | | | | | | | | | | | | | | | | |
Period
Ended
August 31, | | Net asset
value,
beginning
of period | | Net
investment
income
(loss) | | Net realized
and unrealized
gain (loss) | | Total from
investment
operations | | Distributions to
shareholders
from net
investment
income | | Distributions to
shareholders
from net
realized gain | | Total
distributions | | Net asset
value, end
of period | | Ratios to Average Net Assets (1) | | Net assets,
end of period
(000 omitted) | | Portfolio
turnover
rate (3) |
| | Total
return (2)(3) | | Gross
Expenses | | Net
Expenses (4) | | Net
investment
income
(loss) (4) |
Small-Cap Growth Fund | | | | | | | | | | | | | | | | | | | | | | | | | | | | | | | | | | | | | | | | | | | | | | |
| 2018 | | | $ | 19.00 | | | | $ | (0.03 | ) | | | $ | 5.59 | | | | $ | 5.56 | | | | $ | — | | | | $ | (2.08 | ) | | | $ | (2.08 | ) | | | $ | 22.48 | | | | | 31.83 | % | | | | 1.02 | % | | | | 0.99 | % | | | | (0.21 | )% | | | $ | 99,311 | | | | | 80 | % |
| 2017 | | | | 16.62 | | | | | (0.14 | ) | | | | 2.52 | | | | | 2.38 | | | | | — | | | | | — | | | | | — | | | | | 19.00 | | | | | 14.32 | | | | | 1.02 | | | | | 1.02 | | | | | (0.37 | ) | | | | 81,259 | | | | | 197 | |
| 2016 | | | | 18.60 | | | | | (0.10 | ) | | | | (0.64 | ) | | | | (0.74 | ) | | | | — | | | | | (1.24 | ) | | | | (1.24 | ) | | | | 16.62 | | | | | (3.72 | ) | | | | 1.18 | | | | | 1.18 | | | | | (0.21 | ) | | | | 179,726 | | | | | 63 | |
| 2015 | | | | 22.75 | | | | | (0.07 | ) | | | | (0.29 | ) | | | | (0.36 | ) | | | | — | | | | | (3.79 | ) | | | | (3.79 | ) | | | | 18.60 | | | | | (1.27 | ) | | | | 1.15 | | | | | 1.15 | | | | | (0.35 | ) | | | | 339,016 | | | | | 59 | |
| 2014 | | | | 22.55 | | | | | (0.02 | ) | | | | 3.16 | | | | | 3.14 | | | | | — | | | | | (2.94 | ) | | | | (2.94 | ) | | | | 22.75 | | | | | 14.69 | | | | | 1.15 | | | | | 1.15 | | | | | (0.09 | ) | | | | 363,988 | | | | | 82 | |
Global Low Volatility Equity Fund | | | | | | | | | | | | | | | | | | | | | | | | | | | | | | | | | | | | | | | | | | | | | | |
| 2018 | | | | 13.20 | | | | | 0.30 | | | | | 1.05 | | | | | 1.35 | | | | | (0.37 | ) | | | | (0.13 | ) | | | | (0.50 | ) | | | | 14.05 | | | | | 10.44 | | | | | 1.19 | | | | | 0.85 | | | | | 1.94 | | | | | 30,205 | | | | | 34 | |
| 2017(7) | | | | 12.65 | | | | | 0.19 | | | | | 0.64 | | | | | 0.83 | | | | | (0.20 | ) | | | | (0.08 | ) | | | | (0.28 | ) | | | | 13.20 | | | | | 6.76 | | | | | 1.27 | | | | | 0.85 | | | | | 1.98 | | | | | 48,221 | | | | | 74 | |
| 2016(7) | | | | 11.34 | | | | | 0.07 | | | | | 1.33 | | | | | 1.40 | | | | | (0.09 | ) | | | | (0.00 | ) | | | | (0.09 | ) | | | | 12.65 | | | | | 12.44 | | | | | 1.38 | | | | | 0.85 | | | | | 2.26 | | | | | 38,909 | | | | | 36 | |
| 2015(7) | | | | 11.50 | | | | | 0.25 | | | | | (0.26 | ) | | | | (0.01 | ) | | | | (0.10 | ) | | | | (0.05 | ) | | | | (0.15 | ) | | | | 11.34 | | | | | (0.08 | ) | | | | 5.51 | | | | | 0.85 | | | | | 2.16 | | | | | 4,144 | | | | | 31 | |
| 2014(7)(8) | | | | 10.00 | | | | | 0.07 | | | | | 1.43 | | | | | 1.50 | | | | | — | | | | | — | | | | | — | | | | | 11.50 | | | | | 15.00 | | | | | 13.27 | | | | | 0.85 | | | | | 1.76 | | | | | 3,947 | | | | | 29 | |
Disciplined International Equity Fund | | | | | | | | | | | | | | | | | | | | | | | | | | | | | | | | | | | | | | | | | | | | | | |
| 2018(7) | | | | 11.19 | | | | | 0.26 | | | | | (0.25 | ) | | | | 0.01 | | | | | (0.24 | ) | | | | — | | | | | (0.24 | ) | | | | 10.96 | | | | | 0.05 | | | | | 1.03 | | | | | 0.90 | | | | | 2.33 | | | | | 77,339 | | | | | 52 | |
| 2017(7) | | | | 9.58 | | | | | 0.25 | | | | | 1.64 | | | | | 1.89 | | | | | (0.28 | ) | | | | — | | | | | (0.28 | ) | | | | 11.19 | | | | | 20.30 | | | | | 1.14 | | | | | 0.90 | | | | | 2.13 | | | | | 72,239 | | | | | 77 | |
| 2016(7)(9) | | | | 10.00 | | | | | 0.23 | | | | | (0.65 | ) | | | | (0.42 | ) | | | | — | | | | | — | | | | | — | | | | | 9.58 | | | | | (4.20 | ) | | | | 1.20 | | | | | 0.90 | | | | | 2.51 | | | | | 67,434 | | | | | 64 | |
Pyrford International Stock Fund | | | | | | | | | | | | | | | | | | | | | | | | | | | | | | | | | | | | | | | | | | | | | | |
| 2018(7) | | | | 13.21 | | | | | 0.37 | | | | | (0.06 | ) | | | | 0.31 | | | | | (0.34 | ) | | | | — | | | | | (0.34 | ) | | | | 13.18 | | | | | 2.34 | | | | | 0.96 | | | | | 0.94 | | | | | 2.41 | | | | | 485,053 | | | | | 20 | |
| 2017(5)(7) | | | | 12.22 | | | | | 0.32 | | | | | 0.94 | | | | | 1.26 | | | | | (0.27 | ) | | | | — | | | | | (0.27 | ) | | | | 13.21 | | | | | 10.68 | | | | | 1.05 | | | | | 0.96 | | | | | 2.59 | | | | | 593,746 | | | | | 33 | |
| 2016(7) | | | | 11.78 | | | | | 0.35 | | | | | 0.36 | | | | | 0.71 | | | | | (0.27 | ) | | | | — | | | | | (0.27 | ) | | | | 12.22 | | | | | 6.21 | | | | | 1.06 | | | | | 0.99 | | | | | 2.44 | | | | | 485,787 | | | | | 12 | |
| 2015(7) | | | | 13.14 | | | | | 0.22 | | | | | (1.48 | ) | | | | (1.26 | ) | | | | (0.10 | ) | | | | — | | | | | (0.10 | ) | | | | 11.78 | | | | | (9.63 | ) | | | | 1.03 | | | | | 0.99 | | | | | 2.52 | | | | | 626,232 | | | | | 9 | |
| 2014(7) | | | | 12.10 | | | | | 0.39 | | | | | 1.27 | | | | | 1.66 | | | | | (0.59 | ) | | | | (0.03 | ) | | | | (0.62 | ) | | | | 13.14 | | | | | 14.00 | | | | | 1.02 | | | | | 0.99 | | | | | 3.32 | | | | | 272,486 | | | | | 6 | |
LGM Emerging Markets Equity Fund | | | | | | | | | | | | | | | | | | | | | | | | | | | | | | | | | | | | | | | | | | | | | | |
| 2018(7) | | | | 15.97 | | | | | 0.19 | | | | | (0.04 | ) | | | | 0.15 | | | | | (0.13 | ) | | | | — | | | | | (0.13 | ) | | | | 15.99 | | | | | 0.92 | | | | | 1.29 | | | | | 1.15 | | | | | 1.20 | | | | | 201,835 | | | | | 22 | |
| 2017(5)(7) | | | | 14.08 | | | | | 0.15 | | | | | 1.84 | | | | | 1.99 | | | | | (0.10 | ) | | | | — | | | | | (0.10 | ) | | | | 15.97 | | | | | 14.36 | | | | | 1.38 | | | | | 1.15 | | | | | 1.04 | | | | | 157,581 | | | | | 40 | |
| 2016(7) | | | | 12.16 | | | | | 0.15 | | | | | 1.90 | | | | | 2.05 | | | | | (0.13 | ) | | | | — | | | | | (0.13 | ) | | | | 14.08 | | | | | 17.12 | | | | | 1.39 | | | | | 1.15 | | | | | 1.07 | | | | | 78,851 | | | | | 24 | |
| 2015(7) | | | | 14.33 | | | | | 0.16 | | | | | (2.13 | ) | | | | (1.97 | ) | | | | (0.20 | ) | | | | — | | | | | (0.20 | ) | | | | 12.16 | | | | | (13.88 | ) | | | | 1.34 | | | | | 1.15 | | | | | 1.15 | | | | | 85,034 | | | | | 25 | |
| 2014(7) | | | | 12.61 | | | | | 0.23 | | | | | 1.71 | | | | | 1.94 | | | | | (0.22 | ) | | | | — | | | | | (0.22 | ) | | | | 14.33 | | | | | 15.57 | | | | | 1.30 | | | | | 1.15 | | | | | 1.89 | | | | | 111,807 | | | | | 38 | |
Alternative Strategies Fund | | | | | | | | | | | | | | | | | | | | | | | | | | | | | | | | | | | | | | | | | | | | | | |
| 2018 | | | | 10.81 | | | | | (0.05 | ) | | | | (0.27 | ) | | | | (0.32 | ) | | | | — | | | | | (0.67 | )(12) | | | | (0.67 | ) | | | | 9.82 | | | | | (3.31 | ) | | | | 2.79 | (10) | | | | 2.08 | (10) | | | | (0.42 | ) | | | | 73,250 | | | | | 122 | |
| 2017(7) | | | | 10.33 | | | | | (0.09 | ) | | | | 0.57 | | | | | 0.48 | | | | | — | | | | | — | | | | | — | | | | | 10.81 | | | | | 4.65 | | | | | 3.40 | (10) | | | | 2.70 | (10) | | | | (0.67 | ) | | | | 95,583 | | | | | 251 | |
| 2016(7) | | | | 10.42 | | | | | (0.05 | ) | | | | 0.07 | | | | | 0.02 | | | | | (0.01 | ) | | | | (0.10 | ) | | | | (0.11 | ) | | | | 10.33 | | | | | 0.16 | | | | | 3.63 | (10) | | | | 2.82 | (10) | | | | (0.75 | ) | | | | 109,128 | | | | | 279 | |
| 2015(7)(11) | | | | 10.00 | | | | | (0.08 | ) | | | | 0.50 | | | | | 0.42 | | | | | — | | | | | — | | | | | — | | | | | 10.42 | | | | | 4.20 | | | | | 4.69 | (10) | | | | 2.47 | (10) | | | | (1.11 | ) | | | | 34,261 | | | | | 119 | |
Global Long/Short Equity Fund | | | | | | | | | | | | | | | | | | | | | | | | | | | | | | | | | | | | | | | | | | | | | | |
| 2018(7) | | | | 12.25 | | | | | 0.04 | | | | | 0.20 | | | | | 0.24 | | | | | (0.03 | ) | | | | (0.42 | ) | | | | (0.45 | ) | | | | 12.04 | | | | | 1.91 | | | | | 3.47 | (10) | | | | 2.22 | (10) | | | | 0.28 | | | | | 9,148 | | | | | 79 | |
| 2017(7) | | | | 10.70 | | | | | 0.05 | | | | | 1.66 | | | | | 1.71 | | | | | (0.07 | ) | | | | (0.09 | ) | | | | (0.16 | ) | | | | 12.25 | | | | | 16.10 | | | | | 4.80 | (10) | | | | 2.17 | (10) | | | | 0.27 | | | | | 8,967 | | | | | 42 | |
| 2016(7)(9) | | | | 10.00 | | | | | 0.04 | | | | | 0.66 | | | | | 0.70 | | | | | — | | | | | — | | | | | — | | | | | 10.70 | | | | | 7.00 | | | | | 9.21 | (10) | | | | 2.11 | (10) | | | | 0.50 | | | | | 3,717 | | | | | 45 | |
Ultra Short Tax-Free Fund | | | | | | | | | | | | | | | | | | | | | | | | | | | | | | | | | | | | | | | | | | | | | | |
| 2018 | | | | 10.08 | | | | | 0.13 | | | | | (0.01 | ) | | | | 0.12 | | | | | (0.13 | ) | | | | (0.01 | ) | | | | (0.14 | ) | | | | 10.06 | | | | | 1.10 | | | | | 0.37 | | | | | 0.30 | | | | | 1.25 | | | | | 572,669 | | | | | 156 | |
| 2017 | | | | 10.07 | | | | | 0.10 | | | | | 0.02 | | | | | 0.12 | | | | | (0.10 | ) | | | | (0.01 | ) | | | | (0.11 | ) | | | | 10.08 | | | | | 1.15 | | | | | 0.39 | | | | | 0.30 | | | | | 0.94 | | | | | 625,691 | | | | | 126 | |
| 2016 | | | | 10.08 | | | | | 0.07 | | | | | 0.00 | | | | | 0.07 | | | | | (0.07 | ) | | | | (0.01 | ) | | | | (0.08 | ) | | | | 10.07 | | | | | 0.65 | | | | | 0.39 | | | | | 0.30 | | | | | 0.65 | | | | | 548,641 | | | | | 56 | |
| 2015 | | | | 10.09 | | | | | 0.06 | | | | | (0.01 | ) | | | | 0.05 | | | | | (0.06 | ) | | | | — | | | | | (0.06 | ) | | | | 10.08 | | | | | 0.50 | | | | | 0.35 | | | | | 0.30 | | | | | 0.59 | | | | | 702,324 | | | | | 57 | |
| 2014 | | | | 10.04 | | | | | 0.09 | | | | | 0.05 | | | | | 0.14 | | | | | (0.09 | ) | | | | (0.00 | ) | | | | (0.09 | ) | | | | 10.09 | | | | | 1.35 | | | | | 0.34 | | | | | 0.30 | | | | | 0.82 | | | | | 663,538 | | | | | 86 | |
Short Tax-Free Fund | | | | | | | | | | | | | | | | | | | | | | | | | | | | | | | | | | | | | | | | | | | | | | |
| 2018 | | | | 10.22 | | | | | 0.16 | | | | | (0.08 | ) | | | | 0.08 | | | | | (0.16 | ) | | | | — | | | | | (0.16 | ) | | | | 10.14 | | | | | 0.77 | | | | | 0.48 | | | | | 0.40 | | | | | 1.56 | | | | | 182,022 | | | | | 95 | |
| 2017 | | | | 10.25 | | | | | 0.14 | | | | | (0.03 | ) | | | | 0.11 | | | | | (0.14 | ) | | | | (0.00 | ) | | | | (0.14 | ) | | | | 10.22 | | | | | 1.14 | | | | | 0.51 | | | | | 0.40 | | | | | 1.39 | | | | | 175,454 | | | | | 93 | |
| 2016 | | | | 10.20 | | | | | 0.13 | | | | | 0.07 | | | | | 0.20 | | | | | (0.13 | ) | | | | (0.02 | ) | | | | (0.15 | ) | | | | 10.25 | | | | | 1.94 | | | | | 0.52 | | | | | 0.40 | | | | | 1.18 | | | | | 168,592 | | | | | 39 | |
| 2015 | | | | 10.21 | | | | | 0.14 | | | | | (0.01 | ) | | | | 0.13 | | | | | (0.14 | ) | | | | — | | | | | (0.14 | ) | | | | 10.20 | | | | | 1.26 | | | | | 0.58 | | | | | 0.40 | | | | | 1.32 | | | | | 105,734 | | | | | 50 | |
| 2014 | | | | 9.95 | | | | | 0.15 | | | | | 0.26 | | | | | 0.41 | | | | | (0.15 | ) | | | | — | | | | | (0.15 | ) | | | | 10.21 | | | | | 4.12 | | | | | 0.62 | | | | | 0.40 | | | | | 1.45 | | | | | 78,050 | | | | | 69 | |
(See Notes which are an integral part of the Financial Statements)
134
| | |
| |
| Financial Highlights—Institutional Class of Shares (For a share outstanding throughout each period) |
| | | | | | | | | | | | | | | | | | | | | | | | | | | | | | | | | | | | | | | | | | | | | | | | | | | | | | | | | | | | | | | | | | | | | | |
Period
Ended
August 31, | | Net asset
value,
beginning
of period | | Net
investment
income | | Net realized
and unrealized
gain (loss) | | Total from
investment
operations | | Distributions to
shareholders
from net
investment
income | | Distributions to
shareholders
from net
realized gain | | Total
distributions | | Net asset
value, end
of period | | Ratios to Average Net Assets (1) | | Net assets,
end of period
(000 omitted) | | Portfolio
turnover
rate (3) |
| | Total
return (2)(3) | | Gross
Expenses | | Net
Expenses (4) | | Net
investment
income
(loss) (4) |
Short-Term Income Fund | | | | | | | | | | | | | | | | | | | | | | | | | | | | | | | | | | | | | | | | | | | | | | |
| 2018 | | | $ | 9.40 | | | | $ | 0.20 | | | | $ | (0.11 | ) | | | $ | 0.09 | | | | $ | (0.20 | ) | | | $ | — | | | | $ | (0.20 | ) | | | $ | 9.29 | | | | | 0.92 | % | | | | 0.46 | % | | | | 0.35 | % | | | | 2.06 | % | | | $ | 214,068 | | | | | 48 | % |
| 2017 | | | | 9.42 | | | | | 0.17 | | | | | (0.02 | ) | | | | 0.15 | | | | | (0.17 | ) | | | | — | | | | | (0.17 | ) | | | | 9.40 | | | | | 1.60 | | | | | 0.47 | | | | | 0.35 | | | | | 1.76 | | | | | 209,278 | | | | | 53 | |
| 2016 | | | | 9.35 | | | | | 0.11 | | | | | 0.09 | | | | | 0.20 | | | | | (0.13 | ) | | | | — | | | | | (0.13 | ) | | | | 9.42 | | | | | 2.12 | | | | | 0.45 | | | | | 0.35 | | | | | 1.16 | | | | | 234,507 | | | | | 64 | |
| 2015 | | | | 9.42 | | | | | 0.12 | | | | | (0.06 | ) | | | | 0.06 | | | | | (0.13 | ) | | | | — | | | | | (0.13 | ) | | | | 9.35 | | | | | 0.69 | | | | | 0.44 | | | | | 0.35 | | | | | 1.24 | | | | | 263,894 | | | | | 29 | |
| 2014 | | | | 9.39 | | | | | 0.13 | | | | | 0.04 | | | | | 0.17 | | | | | (0.14 | ) | | | | — | | | | | (0.14 | ) | | | | 9.42 | | | | | 1.80 | | | | | 0.43 | | | | | 0.35 | | | | | 1.35 | | | | | 142,526 | | | | | 43 | |
Intermediate Tax-Free Fund | | | | | | | | | | | | | | | | | | | | | | | | | | | | | | | | | | | | | | | | | | | | | | |
| 2018 | | | | 11.37 | | | | | 0.32 | | | | | (0.25 | ) | | | | 0.07 | | | | | (0.32 | ) | | | | — | | | | | (0.32 | ) | | | | 11.12 | | | | | 0.68 | | | | | 0.31 | | | | | 0.31 | | | | | 2.88 | | | | | 894,463 | | | | | 45 | |
| 2017 | | | | 11.60 | | | | | 0.31 | | | | | (0.20 | ) | | | | 0.11 | | | | | (0.31 | ) | | | | (0.03 | ) | | | | (0.34 | ) | | | | 11.37 | | | | | 1.11 | | | | | 0.32 | | | | | 0.32 | | | | | 2.79 | | | | | 631,658 | | | | | 44 | |
| 2016 | | | | 11.26 | | | | | 0.28 | | | | | 0.36 | | | | | 0.64 | | | | | (0.28 | ) | | | | (0.02 | ) | | | | (0.30 | ) | | | | 11.60 | | | | | 5.71 | | | | | 0.32 | | | | | 0.32 | | | | | 2.43 | | | | | 601,873 | | | | | 42 | |
| 2015 | | | | 11.25 | | | | | 0.28 | | | | | 0.01 | | | | | 0.29 | | | | | (0.28 | ) | | | | — | | | | | (0.28 | ) | | | | 11.26 | | | | | 2.60 | | | | | 0.32 | | | | | 0.32 | | | | | 2.46 | | | | | 559,937 | | | | | 26 | |
| 2014 | | | | 10.66 | | | | | 0.31 | | | | | 0.59 | | | | | 0.90 | | | | | (0.31 | ) | | | | (0.00 | ) | | | | (0.31 | ) | | | | 11.25 | | | | | 8.50 | | | | | 0.36 | | | | | 0.36 | | | | | 2.77 | | | | | 396,291 | | | | | 35 | |
Strategic Income Fund | | | | | | | | | | | | | | | | | | | | | | | | | | | | | | | | | | | | | | | | | | | | | | |
| 2018 | | | | 9.44 | | | | | 0.40 | | | | | (0.36 | ) | | | | 0.07 | | | | | (0.43 | ) | | | | — | | | | | (0.43 | ) | | | | 9.08 | | | | | 0.72 | | | | | 0.67 | | | | | 0.55 | | | | | 4.31 | | | | | 12,701 | | | | | 33 | |
| 2017 | | | | 9.42 | | | | | 0.27 | | | | | 0.06 | | | | | 0.33 | | | | | (0.31 | ) | | | | — | | | | | (0.31 | ) | | | | 9.44 | | | | | 3.58 | | | | | 0.65 | | | | | 0.55 | | | | | 2.68 | | | | | 21,550 | | | | | 65 | |
| 2016 | | | | 9.31 | | | | | 0.23 | | | | | 0.17 | | | | | 0.40 | | | | | (0.29 | ) | | | | — | | | | | (0.29 | ) | | | | 9.42 | | | | | 4.32 | | | | | 0.61 | | | | | 0.55 | | | | | 2.53 | | | | | 21,663 | | | | | 13 | |
| 2015 | | | | 9.35 | | | | | 0.24 | | | | | 0.01 | | | | | 0.25 | | | | | (0.29 | ) | | | | — | | | | | (0.29 | ) | | | | 9.31 | | | | | 2.70 | | | | | 0.68 | | | | | 0.55 | | | | | 2.61 | | | | | 22,981 | | | | | 44 | |
| 2014 | | | | 9.16 | | | | | 0.23 | | | | | 0.23 | | | | | 0.46 | | | | | (0.27 | ) | | | | — | | | | | (0.27 | ) | | | | 9.35 | | | | | 5.13 | | | | | 0.67 | | | | | 0.55 | | | | | 2.45 | | | | | 28,473 | | | | | 129 | |
TCH Corporate Income Fund | | | | | | | | | | | | | | | | | | | | | | | | | | | | | | | | | | | | | | | | | | | | | | |
| 2018 | | | | 13.19 | | | | | 0.42 | | | | | (0.39 | ) | | | | 0.03 | | | | | (0.42 | ) | | | | (0.02 | ) | | | | (0.44 | ) | | | | 12.78 | | | | | 0.19 | | | | | 0.45 | | | | | 0.45 | | | | | 3.24 | | | | | 140,395 | | | | | 31 | |
| 2017 | | | | 13.15 | | | | | 0.37 | | | | | 0.15 | | | | | 0.52 | | | | | (0.37 | ) | | | | (0.11 | ) | | | | (0.48 | ) | | | | 13.19 | | | | | 4.07 | | | | | 0.46 | | | | | 0.46 | | | | | 2.84 | | | | | 134,293 | | | | | 44 | |
| 2016 | | | | 12.32 | | | | | 0.46 | | | | | 0.88 | | | | | 1.34 | | | | | (0.46 | ) | | | | (0.05 | ) | | | | (0.51 | ) | | | | 13.15 | | | | | 11.28 | | | | | 0.47 | | | | | 0.47 | | | | | 3.77 | | | | | 129,429 | | | | | 62 | |
| 2015 | | | | 13.07 | | | | | 0.38 | | | | | (0.70 | ) | | | | (0.32 | ) | | | | (0.38 | ) | | | | (0.05 | ) | | | | (0.43 | ) | | | | 12.32 | | | | | (2.53 | ) | | | | 0.45 | | | | | 0.45 | | | | | 2.97 | | | | | 162,107 | | | | | 26 | |
| 2014 | | | | 12.37 | | | | | 0.45 | | | | | 0.91 | | | | | 1.36 | | | | | (0.45 | ) | | | | (0.21 | ) | | | | (0.66 | ) | | | | 13.07 | | | | | 11.32 | | | | | 0.49 | | | | | 0.49 | | | | | 3.50 | | | | | 121,773 | | | | | 25 | |
TCH Core Plus Bond Fund | | | | | | | | | | | | | | | | | | | | | | | | | | | | | | | | | | | | | | | | | | | | | | |
| 2018 | | | | 11.78 | | | | | 0.34 | | | | | (0.37 | ) | | | | (0.03 | ) | | | | (0.34 | ) | | | | (0.01 | ) | | | | (0.35 | ) | | | | 11.40 | | | | | (0.20 | ) | | | | 0.33 | | | | | 0.33 | | | | | 2.95 | | | | | 981,569 | | | | | 45 | |
| 2017 | | | | 11.89 | | | | | 0.31 | | | | | (0.07 | ) | | | | 0.24 | | | | | (0.31 | ) | | | | (0.04 | ) | | | | (0.35 | ) | | | | 11.78 | | | | | 2.08 | | | | | 0.34 | | | | | 0.34 | | | | | 2.62 | | | | | 975,051 | | | | | 34 | |
| 2016 | | | | 11.42 | | | | | 0.37 | | | | | 0.48 | | | | | 0.85 | | | | | (0.38 | ) | | | | (0.00 | ) | | | | (0.38 | ) | | | | 11.89 | | | | | 7.63 | | | | | 0.34 | | | | | 0.34 | | | | | 3.25 | | | | | 459,228 | | | | | 39 | |
| 2015 | | | | 11.94 | | | | | 0.34 | | | | | (0.45 | ) | | | | (0.11 | ) | | | | (0.35 | ) | | | | (0.06 | ) | | | | (0.41 | ) | | | | 11.42 | | | | | (0.96 | ) | | | | 0.33 | | | | | 0.33 | | | | | 2.94 | | | | | 472,576 | | | | | 25 | |
| 2014 | | | | 11.32 | | | | | 0.33 | | | | | 0.65 | | | | | 0.98 | | | | | (0.34 | ) | | | | (0.02 | ) | | | | (0.36 | ) | | | | 11.94 | | | | | 8.82 | | | | | 0.37 | | | | | 0.37 | | | | | 2.89 | | | | | 422,941 | | | | | 44 | |
High Yield Bond Fund | | | | | | | | | | | | | | | | | | | | | | | | | | | | | | | | | | | | | | | | | | | | | | |
| 2018 | | | | 9.57 | | | | | 0.50 | | | | | (0.33 | ) | | | | 0.17 | | | | | (0.50 | ) | | | | — | | | | | (0.50 | ) | | | | 9.24 | | | | | 1.87 | | | | | 1.75 | | | | | 0.65 | | | | | 5.36 | | | | | 10,462 | | | | | 37 | |
| 2017 | | | | 9.49 | | | | | 0.52 | | | | | 0.08 | | | | | 0.60 | | | | | (0.52 | ) | | | | — | | | | | (0.52 | ) | | | | 9.57 | | | | | 6.53 | | | | | 1.17 | | | | | 0.65 | | | | | 5.50 | | | | | 12,303 | | | | | 47 | |
| 2016 | | | | 9.41 | | | | | 0.50 | | | | | 0.08 | | | | | 0.58 | | | | | (0.50 | ) | | | | — | | | | | (0.50 | ) | | | | 9.49 | | | | | 6.47 | | | | | 0.96 | | | | | 0.65 | | | | | 5.43 | | | | | 34,345 | | | | | 51 | |
| 2015 | | | | 10.44 | | | | | 0.54 | | | | | (0.79 | ) | | | | (0.25 | ) | | | | (0.54 | ) | | | | (0.24 | ) | | | | (0.78 | ) | | | | 9.41 | | | | | (2.46 | ) | | | | 0.96 | | | | | 0.65 | | | | | 5.46 | | | | | 30,173 | | | | | 46 | |
| 2014 | | | | 10.32 | | | | | 0.58 | | | | | 0.26 | | | | | 0.84 | | | | | (0.58 | ) | | | | (0.14 | ) | | | | (0.72 | ) | | | | 10.44 | | | | | 8.32 | | | | | 0.85 | | | | | 0.65 | | | | | 5.53 | | | | | 37,307 | | | | | 42 | |
| (1) | Annualized for periods less than one year. |
| (2) | Based on net asset value as of end of period date. |
| (3) | Not annualized for periods less than one year. |
| (4) | The contractual and voluntary expense waivers pursuant to Note 6 of the financial statements are reflected in both the net expense and net investment income (loss) ratios. |
| (5) | Calculated using the average shares method. |
| (6) | Reflects operations for the period from December 27, 2013 (inception date) to August 31, 2014. |
| (7) | Redemption fees consisted of per share amounts less than $0.01. |
| (8) | Reflects operations for the period from September 30, 2013 (inception date) to August 31, 2014. |
| (9) | Reflects operations for the period from September 17, 2015 (inception date) to August 31, 2016. |
| (10) | Percentages shown include interest expense and dividends on securities sold short. Gross and net expense ratios, respectively, excluding interest expense and dividends on securities sold short are as follows: |
| | | | | | | | | | | | | | | | | | | | | | |
Alternatives Strategies Fund | | | | | | Global Long/Short Equity Fund | |
| | | Gross | | | Net | | | | | | | | Gross | | | Net | |
| 2018 | | | 2.46 | % | | | 1.75 | % | | | | | | 2018 | | | 2.60 | % | | | 1.35 | % |
| 2017 | | | 2.60 | | | | 1.90 | | | | | | | 2017 | | | 3.98 | | | | 1.35 | |
| 2016 | | | 2.76 | | | | 1.95 | | | | | | | 2016 | | | 8.45 | | | | 1.35 | |
| 2015 | | | 4.17 | | | | 1.95 | | | | | | | | | | | | | | | |
| (11) | Reflects operations for the period from December 16, 2014 (inception date) to August 31, 2015. |
| (12) | Includes distribution to shareholders for return of capital in the amount of $0.09 per share. |
(See Notes which are an integral part of the Financial Statements)
135
| | |
| |
| Financial Highlights—Premier Class of Shares (For a share outstanding throughout each period) |
| | | | | | | | | | | | | | | | | | | | | | | | | | | | | | | | | | | | | | | | | | | | | | | | | | | | | | | | | | | | | | | | | | | | | | |
Period
Ended
August 31, | | Net asset
value,
beginning
of period | | Net
investment
income | | Net realized
and unrealized
gain | | Total from
investment
operations | | Distributions to
shareholders
from net
investment
income | | Distributions to
shareholders
from net
realized gain | | Total
distributions | | Net asset
value, end
of period | | Ratios to Average Net Assets (1) | | Net assets,
end of period
(000 omitted) | | Portfolio
turnover
rate (3) |
| | Total
return (2)(3) | | Gross
Expenses | | Net
Expenses (4) | | Net
investment
income (4) |
Government Money Market Fund | | | | | | | | | | | | | | | | | | | | | | | | | | | | | | | | | | | | | | | | | | | | | | |
| 2018 | | | $ | 1.00 | | | | $ | 0.01 | | | | $ | 0.00 | | | | $ | 0.01 | | | | $ | (0.01 | ) | | | $ | — | | | | $ | (0.01 | ) | | | $ | 1.00 | | | | | 1.30 | % | | | | 0.25 | % | | | | 0.20 | % | | | | 1.30 | % | | | $ | 2,641,069 | | | | | — | % |
| 2017 | | | | 1.00 | | | | | 0.00 | | | | | 0.00 | | | | | 0.00 | | | | | 0.00 | | | | | 0.00 | | | | | 0.00 | | | | | 1.00 | | | | | 0.45 | | | | | 0.25 | | | | | 0.20 | | | | | 0.45 | | | | | 2,269,361 | | | | | — | |
| 2016 | | | | 1.00 | | | | | 0.00 | | | | | 0.00 | | | | | 0.00 | | | | | (0.00 | ) | | | | (0.00 | ) | | | | (0.00 | ) | | | | 1.00 | | | | | 0.11 | | | | | 0.28 | | | | | 0.18 | | | | | 0.12 | | | | | 1,967,459 | | | | | — | |
| 2015 | | | | 1.00 | | | | | 0.00 | | | | | 0.00 | | | | | 0.00 | | | | | (0.00 | ) | | | | (0.00 | ) | | | | (0.00 | ) | | | | 1.00 | | | | | 0.01 | | | | | 0.28 | | | | | 0.08 | | | | | 0.01 | | | | | 467,294 | | | | | — | |
| 2014 | | | | 1.00 | | | | | 0.00 | | | | | — | | | | | 0.00 | | | | | (0.00 | ) | | | | — | | | | | (0.00 | ) | | | | 1.00 | | | | | 0.01 | | | | | 0.29 | | | | | 0.07 | | | | | 0.01 | | | | | 427,913 | | | | | — | |
Tax-Free Money Market Fund | | | | | | | | | | | | | | | | | | | | | | | | | | | | | | | | | | | | | | | | | | | | | | |
| 2018 | | | | 1.00 | | | | | 0.01 | | | | | 0.00 | | | | | 0.01 | | | | | (0.01 | ) | | | | (0.00 | ) | | | | (0.01 | ) | | | | 1.00 | | | | | 1.05 | | | | | 0.31 | | | | | 0.20 | | | | | 1.07 | | | | | 305,424 | | | | | — | |
| 2017 | | | | 1.00 | | | | | 0.01 | | | | | 0.00 | | | | | 0.01 | | | | | (0.01 | ) | | | | (0.00 | ) | | | | (0.01 | ) | | | | 1.00 | | | | | 0.62 | | | | | 0.32 | | | | | 0.20 | | | | | 0.57 | | | | | 238,772 | | | | | — | |
| 2016 | | | | 1.00 | | | | | 0.00 | | | | | 0.00 | | | | | 0.00 | | | | | (0.00 | ) | | | | (0.00 | ) | | | | (0.00 | ) | | | | 1.00 | | | | | 0.17 | | | | | 0.28 | | | | | 0.16 | | | | | 0.13 | | | | | 313,954 | | | | | — | |
| 2015 | | | | 1.00 | | | | | 0.00 | | | | | 0.00 | | | | | 0.00 | | | | | (0.00 | ) | | | | (0.00 | ) | | | | (0.00 | ) | | | | 1.00 | | | | | 0.02 | | | | | 0.28 | | | | | 0.16 | | | | | 0.01 | | | | | 515,005 | | | | | — | |
| 2014 | | | | 1.00 | | | | | 0.00 | | | | | 0.00 | | | | | 0.00 | | | | | (0.00 | ) | | | | (0.00 | ) | | | | (0.00 | ) | | | | 1.00 | | | | | 0.03 | | | | | 0.28 | | | | | 0.19 | | | | | 0.02 | | | | | 453,901 | | | | | — | |
Prime Money Market Fund | | | | | | | | | | | | | | | | | | | | | | | | | | | | | | | | | �� | | | | | | | | | | | | | |
| 2018 | | | | 1.00 | | | | | 0.01 | | | | | 0.00 | | | | | 0.01 | | | | | (0.01 | ) | | | | (0.00 | ) | | | | (0.01 | ) | | | | 1.00 | | | | | 1.50 | | | | | 0.27 | | | | | 0.20 | | | | | 1.52 | | | | | 268,487 | | | | | — | |
| 2017 | | | | 1.00 | | | | | 0.01 | | | | | 0.00 | | | | | 0.01 | | | | | (0.01 | ) | | | | (0.00 | ) | | | | (0.01 | ) | | | | 1.00 | | | | | 0.67 | | | | | 0.28 | | | | | 0.20 | | | | | 0.61 | | | | | 166,338 | | | | | — | |
| 2016 | | | | 1.00 | | | | | 0.00 | | | | | 0.00 | | | | | 0.00 | | | | | (0.00 | ) | | | | (0.00 | ) | | | | (0.00 | ) | | | | 1.00 | | | | | 0.22 | | | | | 0.20 | | | | | 0.20 | | | | | 0.21 | | | | | 668,609 | | | | | — | |
| 2015 | | | | 1.00 | | | | | 0.00 | | | | | 0.00 | | | | | 0.00 | | | | | (0.00 | ) | | | | (0.00 | ) | | | | (0.00 | ) | | | | 1.00 | | | | | 0.02 | | | | | 0.20 | | | | | 0.18 | | | | | 0.01 | | | | | 2,576,245 | | | | | — | |
| 2014 | | | | 1.00 | | | | | 0.00 | | | | | 0.00 | | | | | 0.00 | | | | | (0.00 | ) | | | | (0.00 | ) | | | | (0.00 | ) | | | | 1.00 | | | | | 0.01 | | | | | 0.20 | | | | | 0.18 | | | | | 0.01 | | | | | 1,968,436 | | | | | — | |
Institutional Prime Money Market Fund | | | | | | | | | | | | | | | | | | | | | | | | | | | | | | | | | | | | | | | | | | | | | | |
| 2018 | | | | 1.0001 | | | | | 0.0153 | | | | | 0.00 | | | | | 0.0153 | | | | | (0.0153 | ) | | | | (0.00 | ) | | | | (0.0153 | ) | | | | 1.0001 | | | | | 1.54 | | | | | 0.29 | | | | | 0.20 | | | | | 1.55 | | | | | 479,413 | | | | | — | |
| 2017(5) | | | | 1.00 | | | | | 0.0074 | | | | | 0.0001 | | | | | 0.0075 | | | | | (0.0074 | ) | | | | (0.00 | ) | | | | (0.0074 | ) | | | | 1.0001 | | | | | 0.75 | | | | | 0.30 | | | | | 0.20 | | | | | 0.74 | | | | | 400,203 | | | | | — | |
| 2016(6) | | | | 1.00 | | | | | 0.00 | | | | | 0.00 | | | | | 0.00 | | | | | (0.00 | ) | | | | (0.00 | ) | | | | (0.00 | ) | | | | 1.00 | | | | | 0.00 | | | | | 0.29 | | | | | 0.20 | | | | | 0.37 | | | | | 415,218 | | | | | — | |
| (1) | Annualized for periods less than one year. |
| (2) | Based on net asset value as of end of period date. |
| (3) | Not annualized for periods less than one year. |
| (4) | The contractual and voluntary expense waivers pursuant to Note 6 of the financial statements are reflected in both the net expense and net investment income ratios. |
| (5) | Effective October 3, 2016, the BMO Institutional Prime Money Market Fund switched the valuation method of its securities from amortized cost to reflecting changes in market values, thus allowing the Fund’s NAV to “float”. In connection with this change, the Fund’s per share NAV is now calculated to four decimals (e.g., $1.0000). |
| (6) | Reflects operations for the period from June 3, 2016 (inception date) to August 31, 2016. |
(See Notes which are an integral part of the Financial Statements)
136
| | |
| |
| Financial Highlights—Retirement Class R-6 of Shares (For a share outstanding throughout each period) |
| | | | | | | | | | | | | | | | | | | | | | | | | | | | | | | | | | | | | | | | | | | | | | | | | | | | | | | | | | | | | | | | | | | | | | |
Period
Ended
August 31, | | Net asset
value,
beginning
of period | | Net
investment
income
(loss) | | Net realized
and unrealized
gain (loss) | | Total from
investment
operations | | Distributions to
shareholders
from net
investment
income | | Distributions to
shareholders
from net
realized gain | | Total
distributions | | Net asset
value, end
of period | | Ratios to Average Net Assets (1) | | Net assets,
end of period
(000 omitted) | | Portfolio
turnover
rate (3) |
| | Total
return (2)(3) | | Gross
Expenses | | Net
Expenses (4) | | Net
investment
income
(loss) (4) |
Large-Cap Value Fund | | | | | | | | | | | | | | | | | | | | | | | | | | | | | | | | | | | | | | | | | | | | | | |
| 2018 | | | $ | 15.88 | | | | $ | (0.48 | ) | | | $ | 2.94 | | | | $ | 2.46 | | | | $ | (0.27 | ) | | | $ | (1.45 | ) | | | $ | (1.72 | ) | | | $ | 16.62 | | | | | 16.07 | % | | | | 0.42 | % | | | | 0.39 | % | | | | 1.97 | % | | | $ | 81,786 | | | | | 54 | % |
| 2017(5) | | | | 14.17 | | | | | 0.26 | | | | | 1.81 | | | | | 2.07 | | | | | (0.24 | ) | | | | (0.12 | ) | | | | (0.36 | ) | | | | 15.88 | | | | | 14.75 | | | | | 0.62 | | | | | 0.60 | | | | | 1.64 | | | | | 1,479 | | | | | 62 | |
| 2016(6) | | | | 13.81 | | | | | 0.21 | | | | | 0.30 | | | | | 0.51 | | | | | (0.15 | ) | | | | — | | | | | (0.15 | ) | | | | 14.17 | | | | | 3.77 | | | | | 0.63 | | | | | 0.60 | | | | | 2.27 | | | | | 52 | | | | | 60 | |
Large-Cap Growth Fund | | | | | | | | | | | | | | | | | | | | | | | | | | | | | | | | | | | | | | | | | | | | | | |
| 2018 | | | | 17.62 | | | | | 0.11 | | | | | 4.52 | | | | | 4.63 | | | | | (0.04 | ) | | | | (1.00 | ) | | | | (1.04 | ) | | | | 21.21 | | | | | 27.36 | | | | | 0.43 | | | | | 0.40 | | | | | 0.87 | | | | | 60,971 | | | | | 57 | |
| 2017 | | | | 15.49 | | | | | 0.09 | | | | | 3.10 | | | | | 3.19 | | | | | (0.16 | ) | | | | (0.90 | ) | | | | (1.06 | ) | | | | 17.62 | | | | | 21.83 | | | | | 0.63 | | | | | 0.60 | | | | | 0.75 | | | | | 2,852 | | | | | 75 | |
| 2016(6) | | | | 14.75 | | | | | 0.07 | | | | | 0.67 | | | | | 0.74 | | | | | — | | | | | — | | | | | — | | | | | 15.49 | | | | | 5.02 | | | | | 0.66 | | | | | 0.60 | | | | | 0.72 | | | | | 53 | | | | | 70 | |
Mid-Cap Value Fund | | | | | | | | | | | | | | | | | | | | | | | | | | | | | | | | | | | | | | | | | | | | | | |
| 2018 | | | | 11.90 | | | | | 0.14 | | | | | 1.19 | | | | | 1.33 | | | | | (0.13 | ) | | | | (0.50 | ) | | | | (0.63 | ) | | | | 12.60 | | | | | 11.41 | | | | | 0.83 | | | | | 0.83 | | | | | 1.24 | | | | | 31,173 | | | | | 64 | |
| 2017 | | | | 14.38 | | | | | 0.11 | | | | | 1.26 | | | | | 1.37 | | | | | (0.08 | ) | | | | (3.77 | ) | | | | (3.85 | ) | | | | 11.90 | | | | | 13.31 | | | | | 0.86 | | | | | 0.84 | | | | | 1.05 | | | | | 14,714 | | | | | 139 | |
| 2016 | | | | 15.03 | | | | | 0.18 | | | | | 0.84 | | | | | 1.02 | | | | | (0.20 | ) | | | | (1.47 | ) | | | | (1.67 | ) | | | | 14.38 | | | | | 7.65 | | | | | 0.83 | | | | | 0.83 | | | | | 1.28 | | | | | 11,332 | | | | | 24 | |
| 2015 | | | | 17.65 | | | | | 0.11 | | | | | (0.62 | ) | | | | (0.51 | ) | | | | (0.05 | ) | | | | (2.06 | ) | | | | (2.11 | ) | | | | 15.03 | | | | | (3.19 | ) | | | | 0.82 | | | | | 0.82 | | | | | 0.64 | | | | | 8,776 | | | | | 27 | |
| 2014(7) | | | | 16.58 | | | | | 0.03 | | | | | 1.04 | | | | | 1.07 | | | | | — | | | | | — | | | | | — | | | | | 17.65 | | | | | 6.45 | | | | | 0.80 | | | | | 0.80 | | | | | 0.71 | | | | | 27 | | | | | 30 | |
Mid-Cap Growth Fund | | | | | | | | | | | | | | | | | | | | | | | | | | | | | | | | | | | | | | | | | | | | | | |
| 2018 | | | | 15.46 | | | | | — | | | | | 4.44 | | | | | 4.44 | | | | | — | | | | | (0.99 | ) | | | | (0.99 | ) | | | | 18.91 | | | | | 29.96 | | | | | 0.88 | | | | | 0.84 | | | | | — | | | | | 23,005 | | | | | 63 | |
| 2017 | | | | 16.83 | | | | | 0.07 | | | | | 2.18 | | | | | 2.25 | | | | | (0.08 | ) | | | | (3.54 | ) | | | | (3.62 | ) | | | | 15.46 | | | | | 17.22 | | | | | 0.97 | | | | | 0.84 | | | | | (0.13 | ) | | | | 592 | | | | | 157 | |
| 2016 | | | | 20.55 | | | | | 0.09 | | | | | (0.93 | ) | | | | (0.84 | ) | | | | — | | | | | (2.88 | ) | | | | (2.88 | ) | | | | 16.83 | | | | | (3.89 | ) | | | | 0.89 | | | | | 0.84 | | | | | 0.49 | | | | | 25 | | | | | 59 | |
| 2015 | | | | 24.38 | | | | | (0.03 | ) | | | | (0.57 | ) | | | | (0.60 | ) | | | | — | | | | | (3.23 | ) | | | | (3.23 | ) | | | | 20.55 | | | | | (2.47 | ) | | | | 0.85 | | | | | 0.84 | | | | | (0.12 | ) | | | | 26 | | | | | 53 | |
| 2014(7) | | | | 23.30 | | | | | (0.02 | ) | | | | 1.10 | | | | | 1.08 | | | | | — | | | | | — | | | | | — | | | | | 24.38 | | | | | 4.64 | | | | | 0.84 | | | | | 0.84 | | | | | (0.24 | ) | | | | 26 | | | | | 57 | |
Small-Cap Value Fund | | | | | | | | | | | | | | | | | | | | | | | | | | | | | | | | | | | | | | | | | | | | | | |
| 2018 | | | | 13.53 | | | | | 0.04 | | | | | 2.68 | | | | | 2.72 | | | | | — | | | | | (1.12 | ) | | | | (1.12 | ) | | | | 15.13 | | | | | 20.89 | | | | | 0.97 | | | | | 0.84 | | | | | 0.69 | | | | | 14,260 | | | | | 70 | |
| 2017(5) | | | | 13.42 | | | | | 0.05 | | | | | 1.42 | | | | | 1.47 | | | | | (0.10 | ) | | | | (1.26 | ) | | | | (1.36 | ) | | | | 13.53 | | | | | 12.05 | | | | | 1.09 | | | | | 0.84 | | | | | 0.37 | | | | | 2,653 | | | | | 148 | |
| 2016 | | | | 12.87 | | | | | 0.07 | | | | | 1.00 | | | | | 1.07 | | | | | — | | | | | (0.52 | ) | | | | (0.52 | ) | | | | 13.42 | | | | | 8.61 | | | | | 0.99 | | | | | 0.84 | | | | | 0.60 | | | | | 926 | | | | | 39 | |
| 2015 | | | | 14.50 | | | | | (0.00 | ) | | | | (0.82 | ) | | | | (0.82 | ) | | | | — | | | | | (0.81 | ) | | | | (0.81 | ) | | | | 12.87 | | | | | (5.78 | ) | | | | 1.06 | | | | | 0.84 | | | | | 0.01 | | | | | 134 | | | | | 53 | |
| 2014(7) | | | | 14.07 | | | | | 0.01 | | | | | 0.42 | | | | | 0.43 | | | | | — | | | | | — | | | | | — | | | | | 14.50 | | | | | 3.06 | | | | | 1.06 | | | | | 0.84 | | | | | 0.25 | | | | | 26 | | | | | 43 | |
Pyrford International Stock Fund | | | | | | | | | | | | | | | | | | | | | | | | | | | | | | | | | | | | | | | | | | | | | | |
| 2018(8) | | | | 13.22 | | | | | 0.35 | | | | | (0.01 | ) | | | | 0.34 | | | | | (0.36 | ) | | | | — | | | | | (0.36 | ) | | | | 13.20 | | | | | 2.55 | | | | | 0.81 | | | | | 0.79 | | | | | 3.32 | | | | | 155,368 | | | | | 20 | |
| 2017(5)(8) | | | | 12.23 | | | | | 0.40 | | | | | 0.88 | | | | | 1.28 | | | | | (0.29 | ) | | | | — | | | | | (0.29 | ) | | | | 13.22 | | | | | 10.85 | | | | | 0.90 | | | | | 0.81 | | | | | 3.21 | | | | | 48,889 | | | | | 33 | |
| 2016(8) | | | | 11.79 | | | | | 0.20 | | | | | 0.53 | | | | | 0.73 | | | | | (0.29 | ) | | | | — | | | | | (0.29 | ) | | | | 12.23 | | | | | 6.35 | | | | | 0.91 | | | | | 0.84 | | | | | 2.85 | | | | | 16,100 | | | | | 12 | |
| 2015(8) | | | | 13.15 | | | | | 0.20 | | | | | (1.45 | ) | | | | (1.25 | ) | | | | (0.11 | ) | | | | — | | | | | (0.11 | ) | | | | 11.79 | | | | | (9.56 | ) | | | | 0.88 | | | | | 0.84 | | | | | 3.42 | | | | | 6,560 | | | | | 9 | |
| 2014(7)(8) | | | | 13.15 | | | | | 0.08 | | | | | (0.08 | ) | | | | 0.00 | | | | | — | | | | | — | | | | | — | | | | | 13.15 | | | | | 0.00 | | | | | 0.88 | | | | | 0.84 | | | | | 2.36 | | | | | 25 | | | | | 6 | |
| (1) | Annualized for periods less than one year. |
| (2) | Based on net asset value as of end of period date. |
| (3) | Not annualized for periods less than one year. |
| (4) | The contractual and voluntary expense waivers pursuant to Note 6 of the financial statements are reflected in both the net expense and net investment income (loss) ratios. |
| (5) | Calculated using the average shares method. |
| (6) | Reflects operations for the period from December 28, 2015 (inception date) to August 31, 2016. |
| (7) | Reflects operations for the period from May 27, 2014 (inception date) to August 31, 2014. |
| (8) | Redemption fees consisted of per share amounts less than $0.01. |
(See Notes which are an integral part of the Financial Statements)
137
| | |
| |
| Financial Highlights—Class F-3 of Shares (For a share outstanding throughout each period) |
| | | | | | | | | | | | | | | | | | | | | | | | | | | | | | | | | | | | | | | | | | | | | | | | | | | | | | | | | | | | | | | | | | | | | | |
Period
Ended
August 31, | | Net asset
value,
beginning
of period | | Net
investment
income | | Net realized
and unrealized
gain (loss) | | Total from
investment
operations | | Distributions to
shareholders
from net
investment
income | | Distributions to
shareholders
from net
realized gain | | Total
distributions | | Net asset
value, end
of period | | Ratios to Average Net Assets (1) | | Net assets,
end of period
(000 omitted) | | Portfolio
turnover
rate (3) |
| | Total
return (2)(3) | | Gross
Expenses | | Net
Expenses (4) | | Net
investment
income (4) |
Pyrford International Stock Fund | | | | | | | | | | | | | | | | | | | | | | | | | | | | | | | | | | | | | | | | | | | | | | |
| 2018(7) | | | $ | 13.22 | | | | $ | 0.04 | | | | $ | 0.30 | | | | $ | 0.34 | | | | $ | (0.36 | ) | | | $ | — | | | | $ | (0.36 | ) | | | $ | 13.20 | | | | | 2.55 | % | | | | 0.81 | % | | | | 0.79 | % | | | | 2.75 | % | | | $ | 7,995 | | | | | 20 | % |
| 2017(5)(6)(7) | | | | 13.21 | | | | | 0.12 | | | | | (0.11 | ) | | | | 0.01 | | | | | — | | | | | — | | | | | — | | | | | 13.22 | | | | | 0.08 | | | | | 0.88 | | | | | 0.79 | | | | | 3.52 | | | | | 26 | | | | | 33 | |
| (1) | Annualized for periods less than one year. |
| (2) | Based on net asset value as of end of period date. |
| (3) | Not annualized for periods less than one year. |
| (4) | The contractual and voluntary expense waivers pursuant to Note 6 of the financial statements are reflected in both the net expense and net investment income ratios. |
| (5) | Calculated using the average shares method. |
| (6) | Reflects operations for the period from May 31, 2017 (inception date) to August 31, 2017. |
| (7) | Redemption fees consisted of per share amounts less than $0.01. |
(See Notes which are an integral part of the Financial Statements)
138
August 31, 2018
| | |
| | |
| Notes to Financial Statements | | |
BMO Funds, Inc. (the “Corporation”) is registered under the Investment Company Act of 1940, as amended (the “Act”), as an open-end management investment company. As of August 31, 2018, the Corporation consisted of 42 portfolios, including 27 diversified portfolios within this annual report (individually referred to as the “Fund,” or collectively as the “Funds”) each with differing share class offerings, as well as 10 target retirement and 5 target risk portfolios whose annual report is available under a separate cover. BMO Asset Management Corp. serves as the Funds’ investment adviser (the “Adviser”), a Delaware corporation headquartered in Chicago, Illinois that is a wholly-owned subsidiary of BMO Financial Corp.
| | | | |
BMO Fund names as displayed
throughout this report | | Fund Inception
Date | | Investment Objective |
Low Volatility Equity Fund | | September 28, 2012 | | To provide capital appreciation. |
Dividend Income Fund | | December 29, 2011 | | To provide capital appreciation and current income. |
Large-Cap Value Fund | | September 30, 1993 | | To provide capital appreciation. |
Large-Cap Growth Fund | | November 20, 1992 | | To provide capital appreciation. |
Mid-Cap Value Fund | | September 30, 1993 | | To provide capital appreciation. |
Mid-Cap Growth Fund | | September 30, 1993 | | To provide capital appreciation. |
Small-Cap Value Fund | | February 28, 2011 | | To provide capital appreciation. |
Small-Cap Core Fund | | December 27, 2013 | | To provide capital appreciation. |
Small-Cap Growth Fund | | October 31, 1995 | | To provide capital appreciation. |
Global Low Volatility Equity Fund(1) | | September 30, 2013 | | To provide capital appreciation. |
Disciplined International Equity Fund(1) | | September 17, 2015 | | To provide capital appreciation. |
Pyrford International Stock Fund(1) | | December 29, 2011 | | To provide capital appreciation. |
LGM Emerging Markets Equity Fund(1) | | December 22, 2008 | | To provide capital appreciation. |
Alternative Strategies Fund(1) | | December 16, 2014 | | To provide capital appreciation with an emphasis on absolute returns. |
Global Long/Short Equity Fund(1) | | September 17, 2015 | | To provide capital appreciation. |
Ultra Short Tax-Free Fund | | September 30, 2009 | | To provide current income exempt from federal income tax consistent with preservation of capital. |
Short Tax-Free Fund | | November 29, 2012 | | To provide current income exempt from federal income tax consistent with preservation of capital. |
Short-Term Income Fund | | November 1, 1992 | | To maximize total return consistent with current income. |
Intermediate Tax-Free Fund | | February 1, 1994 | | To provide a high level of current income exempt from federal income tax consistent with preservation of capital. |
Strategic Income Fund | | December 13, 1992 | | To maximize total return consistent with current income. |
TCH Corporate Income Fund | | December 22, 2008 | | To maximize total return consistent with current income. |
TCH Core Plus Bond Fund | | December 22, 2008 | | To maximize total return consistent with current income. |
High Yield Bond Fund | | December 29, 2011 | | To maximize total return consistent with current income. |
Government Money Market Fund | | May 17, 2004 | | To provide current income consistent with stability of principal. |
Tax-Free Money Market Fund | | September 22, 2004 | | To provide current income that is exempt from federal income tax and is consistent with stability of principal. |
Prime Money Market Fund | | November 23, 1992 | | To provide current income consistent with stability of principal. |
Institutional Prime Money Market Fund | | June 3, 2016 | | To provide current income consistent with preservation of capital. |
| (1) | Collectively referred to as the “International Funds”. |
| 2. | | Significant Accounting Policies |
The Funds are investment companies and follow the accounting and reporting guidance under Financial Accounting Standards Board (“FASB”) Accounting Standards Codification (“ASC”) Topic 946, Financial Services—Investment Companies. The following is a summary of significant accounting policies consistently followed by the Funds in the preparation of their financial statements.
Use of Estimates—The preparation of financial statements in conformity with accounting principles generally accepted in the United States of America (“GAAP”) requires management to make estimates and assumptions that affect the reported amounts of assets and liabilities at the date of the financial statements and the reported amounts of increases and decreases in net assets from operations during the reporting period. Actual results may differ from those estimates.
Investment Valuations—Listed equity securities are valued each trading day at the last sale price or official closing price reported on a national securities exchange. Securities listed on a foreign exchange are valued each trading day at the last closing price on the principal exchange on which they are traded immediately prior to the time for determination of Net Asset Value (“NAV”) or at fair value as discussed below. Equity securities without a reported trade, U.S. government securities, listed corporate bonds, other fixed income and asset-backed securities with maturities of 60 days or more, unlisted securities, and private placement securities are generally valued at the mean of the latest bid and asked price as furnished by an independent pricing service. Fixed income securities that are not exchange traded are valued by an independent pricing service, taking into consideration yield, liquidity, risk,
139
| | |
| | |
| Notes to Financial Statements(continued) | | |
credit quality, coupon, maturity, type of issue, and any other factors or market data the pricing service deems relevant. Fixed income securities with remaining maturities of 60 days or less at the time of purchase and of sufficient credit quality, are valued at amortized cost, which approximates fair value. Investments in other open-end registered investment companies are valued at net asset value.
Securities or other assets for which market valuations are not readily available, or are deemed to be inaccurate, are valued at fair value as determined in good faith using methods approved by the Board of Directors (the “Directors”). The Directors have established a Pricing Committee, which is responsible for determinations of fair value, subject to the supervision of the Directors. In determining fair value, the Pricing Committee takes into account all information available and any factors it deems appropriate. Consequently, the price of securities used by the Fund to calculate its NAV may differ from quoted or published prices for the same securities. Fair value pricing involves subjective judgments and it is possible that the fair value determined for a security is materially different than the value that would be realized upon the sale of that security and the differences may be material to the NAV of the Fund or the financial statements presented.
Securities held in certain funds may be listed on foreign exchanges that do not value their listed securities at the same time each Fund calculates its NAV. Most foreign markets close well before each Fund values its securities, generally 3:00 p.m. (Central Time). The earlier close of these foreign markets gives rise to the possibility that significant events, including broad market moves, may have occurred in the interim.
The Pricing Committee may determine that a security needs to be fair valued if, among other things, it believes the value of the security might have been materially affected by events occurring after the close of the market in which the security was principally traded, but before the time for determination of the NAV (“a subsequent event”). A subsequent event might include a company-specific development (for example, announcement of a merger that is made after the close of the foreign market), a development that might affect an entire market or region (for example, weather related events) or a potentially global development (such as a terrorist attack that may be expected to have an effect on investor expectations worldwide). The Funds have retained an independent fair value pricing service to assist in fair valuing foreign securities in these circumstances. The service utilizes statistical data based on historical performance of securities, markets, and other data in developing factors used to estimate a fair value.
Repurchase Agreements—The Funds’ policy requires the custodian bank to take possession, to have legally segregated in the Federal Reserve Book Entry System, or to have segregated within the custodian bank’s vault, all securities held as collateral under repurchase agreement transactions. Additionally, procedures have been established by the Funds to monitor, on a daily basis, the market value of each repurchase agreement’s collateral to ensure that the value of collateral at least equals the repurchase price to be paid under the repurchase agreement, including accrued interest.
The Funds will enter into repurchase agreements only with banks and other recognized financial institutions, such as broker-dealers, which are deemed by the Adviser (or sub-advisers, as applicable) to be creditworthy pursuant to the guidelines and/ or standards reviewed or established by the Directors. Risks may arise from the potential inability of counterparties to honor the terms of the repurchase agreement. Accordingly, the Funds could receive less than the repurchase price on the sale of collateral securities.
Investment Income, Expenses, and Distributions—Interest income and expenses are accrued daily. Dividend income, realized gain distributions from underlying funds, and distributions to shareholders are recorded on the ex-dividend date except in the case of certain foreign securities, in which dividends are recorded as soon after the ex-dividend date as the Funds’ information agents become aware of such dividends. Non-cash dividends included in dividend income, if any, are recorded at fair value. Paid-in-kind interest included in interest income, if any, is accrued daily.
The Funds offer multiple classes of shares which differ in their respective distribution, administration, and service fees. All shareholders bear the common expenses of the Funds. Dividends are declared separately for each class. No class has preferential dividend rights; differences in per share dividend rates are generally due to differences in class-specific expenses. Income, non-class specific expenses, and realized and unrealized gains and losses are allocated daily to each class of shares based on the value of total shares outstanding of each class without distinction between share classes.
Expenses attributable to a particular class of shares, such as shareholder servicing fees, are allocated directly to that class.
Premium and Discount Amortization/Paydown Gains and Losses—Premiums and discounts on fixed income securities are amortized/accreted for tax and financial statement purposes. Gains and losses realized on principal payments of mortgage-backed and asset-backed securities (paydown gains and losses) are classified as part of interest income.
Federal Income Taxes—The policies and procedures of the Funds require compliance with Subchapter M of the Internal Revenue Code of 1986, as amended (the “Code”), and distribution to shareholders each year of substantially all of their income. Accordingly, no provisions for federal tax are necessary. Withholding taxes on foreign dividends and unrealized appreciation on investments have been recognized in accordance with the applicable country’s tax rules and rates.
When-Issued and Delayed Delivery Transactions—The Funds may engage in when-issued or delayed delivery transactions. The Funds record when-issued securities on the trade date and maintain security positions such that sufficient liquid assets will be available to make payment for the commitment to purchase securities. Securities purchased on a when-issued or delayed delivery basis are marked-to-market daily and begin earning interest on the settlement date. Losses may occur on these transactions due to changes in market conditions or the failure of counterparties to perform under the contract.
Short Sales—Certain Funds may sell a security they do not own in anticipation that the price of the security will decline. To complete such a transaction, the Fund must borrow the security to make delivery to the buyer. The Fund closes the short sale
140
by purchasing the security at the market price at the time of closure. The price at such time may be more or less than the price at which the security was sold by the Fund. Until the transaction is closed, the Fund is required to pay the lender amounts equal to dividend or interest that accrue during the period of the loan which is recorded as an expense. To borrow the security, the Fund also may be required to pay a premium or an interest fee, which are recorded as interest expense. The proceeds of the short sale will be retained by the broker, to the extent necessary to meet margin requirements, until the short position is closed out. A gain, limited to the price at which the Fund sells the security short, or a loss potentially unlimited in size, will be recognized upon the closing of a short sale. The Fund may not always be able to borrow a security or to close out a short position at a particular time or at an acceptable price. If the price of the borrowed security increases between the date of the short sale and the date on which the Fund closes the short sale, the Fund will experience a loss. The Fund’s loss on a short sale is the maximum attainable price of the security (which could be limitless) less the price the Fund paid for the security at the time it was borrowed.
Futures Contracts—Certain Funds may purchase futures contracts to manage cash flows, enhance yield, or to potentially reduce transaction costs. Upon entering into a futures contract with a broker, the Fund is required to deposit in a segregated account a specified amount of cash or U.S. government securities. Futures contracts are valued daily and unrealized gains or losses are recorded in a “variation margin” account. Daily, the Fund receives from, or pays to, the broker a specified amount of cash based upon changes in the variation margin account. When a contract is closed, the Fund recognizes a realized gain or loss. Futures contracts have market risks, including the risk that the change in the value of the contract may not correlate with changes in the value of the underlying securities.
Options Contracts—Certain Funds may write covered call and put options on futures, swaps, securities, or currencies a Fund owns, or in which it may invest to create investment exposure consistent with their investment objectives. Writing put options tends to increase a Fund’s exposure to the underlying instrument. Writing call options tends to decrease a Fund’s exposure to the underlying instrument. When a Fund writes a call or put option, an amount equal to the premium received is recorded as a liability and subsequently marked-to-market to reflect the current value of the option written. These liabilities are reflected as written options outstanding in the Statements of Assets and Liabilities. Payments received, or made, from writing options with premiums to be determined on a future date are reflected as such on the Statements of Assets and Liabilities. Premiums received from writing options that expire are treated as realized gains. Premiums received from writing options which are exercised or closed are added to the proceeds or offset against amounts paid on the underlying future, swap, security, or currency transaction to determine the realized gain or loss. A Fund, as a writer of an option, has no control over whether the underlying future, swap, security, or currency may be sold (called) or purchased (put) and, as a result, bears the market risk of an unfavorable change in the price of the future, swap, security, or currency underlying the written option. The risk exists that a Fund may not be able to enter into a closing transaction because of an illiquid market.
Certain Funds also may purchase put and call options. Purchasing call options tends to increase a Fund’s exposure to the underlying instrument. Purchasing put options tends to decrease a Fund’s exposure to the underlying instrument. A Fund pays a premium, which is included in a Fund’s Statement of Assets and Liabilities as an investment and subsequently marked- to-market to reflect the current value of the option. Premiums paid for purchasing options that expire are treated as realized losses. The risk associated with purchasing put and call options is limited to the premium paid. Premiums paid for purchasing options which are exercised or closed are added to the amounts paid or offset against the proceeds on the underlying future, swap, security, or currency transaction to determine the realized gain or loss.
Foreign Exchange Contracts—Certain Funds may enter into foreign currency exchange contracts as a way of managing foreign exchange rate risk. Certain Funds may enter into these contracts for the purchase or sale of a specific foreign currency at a fixed price on a future date as a hedge or cross hedge against either specific transactions or portfolio positions. The objective of foreign currency hedging transactions is to reduce the risk that the U.S. dollar value of these Funds’ foreign currency denominated securities will decline in value due to changes in foreign currency exchange rates. All foreign currency exchange contracts are marked-to-market daily at the applicable translation rates resulting in unrealized gains or losses. Realized gains or losses are recorded at the time the foreign currency exchange contract is offset by entering into a closing transaction or by the delivery or receipt of the currency. Risk may arise upon entering into these contracts from the potential inability of counterparties to meet the terms of their contracts and from unanticipated movements in the value of a foreign currency relative to the U.S. dollar.
Foreign Currency Translation—The accounting records of the Funds are maintained in U.S. dollars. All assets and liabilities denominated in foreign currencies are translated into U.S. dollars based on the rate of exchange of such currencies against U.S. dollars on the date of valuation. Purchases and sales of securities, income, and expenses are translated at the rate of exchange quoted on the respective date that such transactions are recorded. The effect of changes in foreign exchange rates on realized and unrealized gains or losses on securities is reflected as a component of such gains or losses.
Reported net realized foreign exchange gains or losses arise from sales of portfolio securities, sales and maturities of short-term securities, sales of foreign currencies, currency gains or losses realized between the trade and settlement dates on securities transactions, and the difference between the amounts of dividends, interest, and foreign withholding taxes recorded on the Funds’ books and the U.S. dollar equivalent of the amounts actually received or paid. Net unrealized foreign exchange gains and losses arise from changes in the value of assets and liabilities other than investments in securities at each reporting period, resulting from changes in the exchange rate.
Restricted Securities—Restricted securities are securities that may be resold only upon registration under federal securities laws or in transactions exempt from such registration. In some cases, the issuer of restricted securities has agreed to register such securities for resale at the issuer’s expense either upon demand by the Funds or in connection with another registered offering of the securities. Many restricted securities may be resold in the secondary market in transactions exempt from registration. Such restricted securities may be determined to be liquid under criteria established by the Directors.
141
| | |
| | |
| Notes to Financial Statements(continued) | | |
Redemption Fees—The International Funds impose a 2% redemption fee to shareholders who redeem shares held for 30 days or less. All redemption fees are recorded by the International Funds as paid-in-capital.
Securities Lending—Certain Funds participate in one of two securities lending programs, providing for the lending of corporate bonds, equity, and government securities to qualified brokers, in exchange for the opportunity to earn additional income for participating. State Street Bank & Trust Company and BMO Harris Bank N.A. serve as the securities lending agents for the International Funds and non-International Funds participating in the programs, respectively. The Funds receive cash as collateral in return for the securities and record a corresponding payable for collateral due to the respective broker. The amount of cash collateral received is maintained at a minimum level of 100% of the prior day’s market value on securities and accrued interest loaned. Collateral is reinvested in short-term securities including overnight repurchase agreements, commercial paper, master notes, floating rate corporate notes (with at least quarterly reset rates), and money market funds. The valuation of these collateral securities is discussed in “Investment Valuations” above. When a Fund lends its portfolio securities, it is subject to the risk that it may not be able to get the portfolio securities back from the borrower on a timely basis, in which case the Fund may lose certain investment opportunities. A Fund also is subject to the risks associated with the investments of cash collateral received from the borrower.
Cash collateral received as part of the International Funds securities lending program was invested in the following security as of August 31, 2018:
| | | | |
Description | | Value | |
State Street Navigator Securities Lending Government Money Market Portfolio, 1.920% | | $ | 18,691,435 | |
Cash collateral received as part of the non-International Funds securities lending program was jointly pooled and invested in the following securities as of August 31, 2018 (1):
| | | | |
Description | | Value | |
Atlantic Asset Securitization LLC, 2.239%
(LIBOR 1 Month + 17 basis points),
2/21/2019(2) | | $ | 7,499,655 | |
Atlantic Asset Securitization LLC,
2.303%, 9/20/2018(3) | | | 5,992,717 | |
Atlantic Asset Securitization LLC, 2.307%
(LIBOR 1 Month + 24 basis points),
12/14/2018(2) | | | 6,500,000 | |
Atlantic Asset Securitization LLC, 2.363%
(LIBOR 1 Month + 30 basis points),
11/16/2018(2) | | | 6,650,000 | |
Atlantic Asset Securitization LLC, 2.380%
(LIBOR 1 Month + 30 basis points),
11/06/2018(2) | | | 7,000,000 | |
Bank of Nova Scotia, 2.280%
(LIBOR 1 Month + 23 basis points),
9/17/2018(2) | | | 5,000,720 | |
Bedford Row Funding Corp., 2.353%
(LIBOR 1 Month + 29 basis points),
3/15/2019(2) | | | 7,500,000 | |
Bedford Row Funding Corp., 2.367%
(LIBOR 1 Month + 30 basis points),
4/11/2019(2) | | | 5,500,000 | |
Bedford Row Funding Corp., 2.381%
(LIBOR 1 Month + 30 basis points),
9/12/2018(2) | | | 7,250,000 | |
Bedford Row Funding Corp., 2.400%
(LIBOR 1 Month + 32 basis points),
6/06/2019(2) | | | 8,500,000 | |
Bedford Row Funding Corp., 2.413%
(LIBOR 1 Month + 35 basis points),
2/15/2019(2) | | | 7,500,000 | |
Bedford Row Funding Corp., 2.467%
(LIBOR 3 Month + 13 basis points),
6/27/2019(2) | | | 7,500,000 | |
BlackRock Liquidity Funds FedFund Portfolio,
1.933%, 9/04/2018 | | | 8,116,490 | |
BMO Government Money Market Fund,
1.783%, 9/04/2018(4) | | | 70,000,000 | |
BMO Institutional Prime Money Market Fund, 1.977%, 9/04/2018(4) | | | 310,031,000 | |
Canadian Imperial Bank of Commerce/New York NY, 2.410% (LIBOR 3 Month + 10 basis points), 9/20/2019(2) | | | 7,499,243 | |
Cargill, Inc., 1.941%, 9/06/2018(3) | | | 14,995,958 | |
Coca-Cola Co., 2.441%, 1/09/2019(3) | | | 4,956,305 | |
Collateralized Commercial Paper Co. LLC,
2.478%, 2/12/2019(3) | | | 6,378,011 | |
Collateralized Commercial Paper Co. LLC,
2.493%, 1/14/2019(3) | | | 9,412,006 | |
Collateralized Commercial Paper Co. LLC,
2.545% (LIBOR 3 Month + 22 basis points), 12/20/2018(2) | | | 5,000,000 | |
| | | | |
Description | | Value | |
Commonwealth Bank of Australia, 2.267%
(LIBOR 1 Month + 20 basis points),
10/11/2018(2) | | $ | 5,500,000 | |
Commonwealth Bank of Australia, 2.294%
(LIBOR 1 Month + 21 basis points),
11/30/2018(2) | | | 7,503,113 | |
Credit Suisse New York, 2.304%
(LIBOR 1 Month + 24 basis points), 9/10/2018(2) | | | 7,850,738 | |
Credit Suisse New York, 2.327%
(LIBOR 1 Month + 26 basis points),
10/22/2018(2) | | | 5,002,120 | |
Equinor ASA, 1.950%, 9/04/2018(3) | | | 9,998,375 | |
General Electric Co., 1.940%, 9/04/2018(3) | | | 19,996,767 | |
General Electric Co., 1.940%, 9/05/2018(3) | | | 19,995,689 | |
General Electric Co., 1.941%, 9/06/2018(3) | | | 7,497,979 | |
HSBC Bank USA NA, 2.264% (LIBOR 1 Month + 26 basis points), 11/16/2018(2) | | | 6,003,180 | |
HSBC Bank USA NA, 2.287% (LIBOR 1 Month + 21 basis points), 11/20/2018(2) | | | 7,503,202 | |
HSBC Bank USA NA, 2.305% (LIBOR 1 Month + 24 basis points), 4/25/2019(2) | | | 7,503,158 | |
HSBC Bank USA NA, 2.320% (LIBOR 1 Month + 24 basis points), 12/04/2018(2) | | | 12,756,604 | |
John Deere Capital Corp., 2.051%,
9/13/2018(3) | | | 8,175,410 | |
JP Morgan Securities LLC, 2.511%,
2/25/2019(3) | | | 7,408,550 | |
Lexington Parker Capital Co. LLC,
2.029%, 9/04/2018(3) | | | 17,497,042 | |
Lexington Parker Capital Co. LLC,
2.051%, 9/05/2018(3) | | | 7,498,292 | |
Lexington Parker Capital Co. LLC,
2.065%, 9/07/2018(3) | | | 17,493,979 | |
Lexington Parker Capital Co. LLC,
2.101%, 9/12/2018(3) | | | 7,495,188 | |
Liberty Street Funding LLC, 2.271%, 11/16/2018(3) | | | 12,440,361 | |
Liberty Street Funding LLC, 2.381% (LIBOR 1 Month + 30 basis points), 11/02/2018(2) | | | 6,500,000 | |
LMA Americas LLC, 1.951%, 9/05/2018(3) | | | 3,999,133 | |
LMA Americas LLC, 1.971%, 9/13/2018(3) | | | 10,742,941 | |
LMA Americas LLC, 2.042%, 9/20/2018(3) | | | 9,070,224 | |
LMA Americas LLC, 2.307%, 10/15/2018(3) | | | 7,478,917 | |
LMA Americas LLC, 2.362%, 11/16/2018(3) | | | 7,462,792 | |
LMA Americas LLC, 2.517%, 2/04/2019(3) | | | 5,440,655 | |
Longship Funding DAC, 1.990%, 9/05/2018(3) | | | 7,748,286 | |
Longship Funding DAC, 1.991%, 9/06/2018(3) | | | 9,997,236 | |
Longship Funding DAC, 2.001%, 9/11/2018(3) | | | 7,495,833 | |
142
| | | | |
Description | | Value | |
Longship Funding DAC, 2.052%, 9/17/2018(3) | | $ | 8,991,800 | |
Manhattan Asset Funding Co. LLC, 2.284%, 9/27/2018(3) | | | 4,991,767 | |
Manhattan Asset Funding Co. LLC, 2.390% (LIBOR 1 Month + 31 basis points),
11/05/2018(2) | | | 7,500,000 | |
Metlife Short Term Funding LLC, 2.207%, 10/22/2018(3) | | | 9,968,833 | |
Mitsubishi UFJ Trust & Banking Corp., 2.297% (LIBOR 1 Month + 23 basis points),
1/22/2019(2) | | | 5,002,035 | |
Mitsubishi UFJ Trust & Banking Corp., 2.345% (LIBOR 1 Month + 28 basis points),
1/25/2019(2) | | | 9,005,526 | |
Mizuho Bank Ltd., 2.255% (LIBOR 1 Month + 19 basis points), 3/11/2019(2) | | | 6,999,608 | |
Mizuho Bank Ltd., 2.327% (LIBOR 1 Month + 25 basis points), 12/18/2018(2) | | | 7,501,905 | |
Mizuho Bank Ltd., 2.473% (LIBOR 3 Month + 30 basis points), 4/30/2019(2) | | | 7,507,252 | |
Mizuho Bank Ltd., 2.503% (LIBOR 1 Month + 44 basis points), 10/10/2018(2) | | | 5,002,150 | |
MUFG Bank Ltd., 2.440% (LIBOR 1 Month + 38 basis points), 10/17/2018(2) | | | 5,252,840 | |
National Australia Bank Ltd., 2.273% (LIBOR 1 Month + 20 basis points),
10/29/2018(2) | | | 10,000,000 | |
Nordea Bank AB, 2.467% (LIBOR 1 Month + 40 basis points), 3/14/2019(2) | | | 5,003,905 | |
Old Line Funding LLC, 2.405% (LIBOR 1 Month + 34 basis points), 10/25/2018(2) | | | 7,100,000 | |
Old Line Funding LLC, 2.581% (LIBOR 1 Month + 50 basis points), 3/21/2019(2) | | | 5,000,000 | |
Regency Markets No. 1 LLC, 2.001%,
9/07/2018(3) | | | 6,997,667 | |
Regency Markets No. 1 LLC, 2.041%,
9/06/2018(3) | | | 3,998,867 | |
Regency Markets No. 1 LLC, 2.052%,
9/17/2018(3) | | | 9,990,889 | |
Sheffield Receivables Co. LLC, 2.104%, 10/01/2018(3) | | | 9,982,500 | |
Sheffield Receivables Co. LLC, 2.269%, 11/01/2018(3) | | | 4,980,853 | |
Sheffield Receivables Co. LLC, 2.291%, 11/14/2018(3) | | | 4,976,567 | |
Sheffield Receivables Co. LLC, 2.291%, 11/15/2018(3) | | | 7,464,375 | |
Sheffield Receivables Co. LLC, 2.335%, 12/07/2018(3) | | | 4,968,744 | |
Starbird Funding Corp., 1.950%, 9/04/2018(3) | | | 9,998,375 | |
Starbird Funding Corp., 2.281%, 11/14/2018(3) | | | 7,962,671 | |
Starbird Funding Corp., 2.356%, 12/18/2018(3) | | | 7,447,350 | |
Sumitomo Mitsui Banking Corp., 2.230% (LIBOR 1 Month + 17 basis points),
2/19/2019(2) | | | 8,750,000 | |
Sumitomo Mitsui Banking Corp., 2.273% (LIBOR 1 Month + 20 basis points),
3/28/2019(2) | | | 7,499,655 | |
Sumitomo Mitsui Banking Corp., 2.316% (LIBOR 1 Month + 25 basis points),
10/24/2018(2) | | | 7,501,995 | |
| | | | |
Description | | Value | |
Swedbank, 1.961%, 9/11/2018(3) | | $ | 7,495,917 | |
Swedbank, 2.001%, 9/12/2018(3) | | | 13,791,567 | |
Thunder Bay Funding LLC, 2.252% (LIBOR 1 Month + 17 basis points),
1/01/1900(2) | | | 8,500,000 | |
Thunder Bay Funding LLC, 2.317% (LIBOR 1 Month + 25 basis points),
1/14/2019(2) | | | 10,000,000 | |
Thunder Bay Funding LLC, 2.417% (LIBOR 1 Month + 34 basis points),
2/19/2019(2) | | | 7,500,000 | |
Thunder Bay Funding LLC, 2.449% (LIBOR 1 Month + 37 basis points),
3/07/2019(2) | | | 5,850,000 | |
Toronto-Dominion Bank, 2.245% (LIBOR 3 Month + 11 basis points), 10/18/2018(2) | | | 12,506,412 | |
Toronto-Dominion Bank, 2.272% (LIBOR 1 Month + 19 basis points), 10/03/2018(2) | | | 5,000,000 | |
Toronto-Dominion Bank, 2.353% (LIBOR 1 Month + 27 basis points), 2/08/2019(2) | | | 7,500,000 | |
Toronto-Dominion Bank, 2.400% (LIBOR 1 Month + 32 basis points), 9/05/2018(2) | | | 6,450,393 | |
Toronto-Dominion Bank, 2.469% (LIBOR 3 Month + 13 basis points), 7/16/2019(2) | | | 7,499,325 | |
Toronto-Dominion Bank, 2.497% (LIBOR 3 Month + 15 basis points), 4/23/2019(2) | | | 5,000,000 | |
Toyota Motor Credit Corp., 2.330% (LIBOR 1 Month + 25 basis points),
9/04/2018(2) | | | 7,500,000 | |
Toyota Motor Credit Corp., 2.357% (LIBOR 3 Month + 2 basis points),
1/03/2019(2) | | | 7,500,000 | |
Toyota Motor Credit Corp., 2.419% (LIBOR 3 Month + 8 basis points),
4/12/2019(2) | | | 7,500,000 | |
Toyota Motor Credit Corp., 2.450% (LIBOR 1 Month + 37 basis points),
10/03/2018(2) | | | 5,000,000 | |
Wal-Mart Stores, Inc., 1.971%, 9/10/2018(3) | | | 7,496,306 | |
Wal-Mart Stores, Inc., 1.972%, 9/19/2018(3) | | | 7,992,120 | |
Wells Fargo Bank NA, 2.299% (LIBOR 1 Month + 22 basis points), 10/05/2018(2) | | | 6,501,898 | |
Wells Fargo Bank NA, 2.307% (LIBOR 1 Month + 24 basis points), 11/09/2018(2) | | | 7,253,451 | |
Wells Fargo Bank NA, 2.371% (LIBOR 1 Month + 42 basis points), 10/09/2018(2) | | | 7,754,076 | |
Wells Fargo Bank NA, 2.476% (LIBOR 3 Month + 14 basis points), 6/28/2019(2) | | | 7,499,970 | |
Westpac Banking Corp., 2.254% (LIBOR 1 Month + 19 basis points), 9/10/2018(2) | | | 7,500,000 | |
Westpac Banking Corp., 2.370% (U.S. Federal Funds Effective Rate (continuous series) + 45 basis points), 2/15/2019(2) | | | 6,699,678 | |
Westpac Banking Corp., 2.469% (LIBOR 3 Month + 13 basis points), 1/09/2019(2) | | | 5,501,667 | |
Other | | | (447,793 | ) |
| | | | |
Total | | $ | 1,185,530,985 | |
| | | | |
| | (1) | The collateral pool is managed by the fixed income group within the Adviser. Each Fund owns a pro-rata interest in the collateral pool determined by the value of securities on loan for such Fund. |
| | (2) | Denotes a floating rate security. Floating rate securities are securities whose yields vary with a designated market index or market rate. These securities are shown at their current rates as of August 31, 2018. |
| | (3) | Each issue shows the rate of the discount at the time of purchase. |
| | (4) | Denotes an investment in an affiliated entity. Please refer to Note 6, subsectionInvestments in Affiliated Issuers, in the Notes to Financial Statements. |
Commitments and Contingencies—In the normal course of business, the Corporation enters into contracts that provide general indemnifications to other parties. The Corporation’s maximum exposure under these arrangements is unknown as this would involve future claims that may be made against the Corporation that have not yet occurred. However, the Corporation has not had prior claims or losses pursuant to these contracts and expects the risk of loss to be remote.
Other—Investment transactions are accounted for on a trade date basis. Net realized gains and losses on securities are computed on the basis of specific security lot identification.
143
| | |
| | |
| Notes to Financial Statements(continued) | | |
| 3. | | Fair Value Measurement |
Fair Valuation Measurement defines fair value, establishes a framework for measuring fair value in accordance with GAAP, and requires disclosure about fair value measurements. It establishes a fair value hierarchy that distinguishes between (1) market participant assumptions developed based on market data obtained from sources independent of the reporting issuer (observable inputs), and (2) the reporting issuer’s own assumptions about market participant assumptions developed based on the best information available in the circumstances (unobservable inputs). It also provides guidance on determining when there has been a significant decrease in the volume and level of activity for an asset or liability, when a transaction is not orderly and how that information must be incorporated into fair value measurement.
Various inputs are used in determining the value of the Funds’ investments. The inputs or methodology used for valuing securities are not necessarily an indication of the risk associated with investing in those securities. These inputs are summarized in the three broad levels listed below:
Level 1—quoted prices in active markets for identical securities. An active market for the security is a market in which transactions occur with sufficient frequency and volume to provide pricing information on an ongoing basis. Common and preferred stocks, options and futures contracts, and U.S. registered mutual funds are generally categorized as Level 1.
Level 2—other significant observable inputs (including quoted prices for similar securities, interest rates, prepayment speeds, credit risk, etc.). Fixed income securities, repurchase agreements, cash collateral received as part of the securities lending program, and securities valued by an independent fair value pricing service are generally categorized as Level 2.
Level 3—significant unobservable inputs, including management’s own assumptions in determining the fair value of investments.
For the year ended August 31, 2018, the Funds had no investments in private investment funds, and there were no investments excluded from the fair value hierarchy. The Funds did not hold any Level 3 securities as of August 31, 2018.
The following is a summary of the inputs used, as of August 31, 2018, in valuing the Funds’ assets:
| | | | | | | | | | | | | | | | |
| | | Low Volatility Equity Fund | | | | |
| | | Level 1 | | | Level 2 | | | Level 3 | | | Total | |
Common Stocks(1) | | $ | 126,587,939 | | | $ | — | | | $ | — | | | $ | 126,587,939 | |
Short-Term Investments | | | 1,494,204 | | | | 57,761,573 | | | | — | | | | 59,255,777 | |
| | | | | | | | | | | | | | | | |
Total | | $ | 128,082,143 | | | $ | 57,761,573 | | | $ | — | | | $ | 185,843,716 | |
| | | | | | | | | | | | | | | | |
| | |
| | | Dividend Income Fund | | | | |
| | | Level 1 | | | Level 2 | | | Level 3 | | | Total | |
Common Stocks(1) | | $ | 151,264,874 | | | $ | — | | | $ | — | | | $ | 151,264,874 | |
Short-Term Investments | | | 3,591,099 | | | | 70,677,075 | | | | — | | | | 74,268,174 | |
| | | | | | | | | | | | | | | | |
Total | | $ | 154,855,973 | | | $ | 70,677,075 | | | $ | — | | | $ | 225,533,048 | |
| | | | | | | | | | | | | | | | |
| | |
| | | Large-Cap Value Fund | | | | |
| | | Level 1 | | | Level 2 | | | Level 3 | | | Total | |
Common Stocks(1) | | $ | 383,464,731 | | | $ | — | | | $ | — | | | $ | 383,464,731 | |
Short-Term Investments | | | 7,482,313 | | | | 159,109,849 | | | | — | | | | 166,592,162 | |
| | | | | | | | | | | | | | | | |
Total | | $ | 390,947,044 | | | $ | 159,109,849 | | | $ | — | | | $ | 550,056,893 | |
| | | | | | | | | | | | | | | | |
| | |
| | | Large-Cap Growth Fund | | | | |
| | | Level 1 | | | Level 2 | | | Level 3 | | | Total | |
Common Stocks(1) | | $ | 399,401,591 | | | $ | — | | | $ | — | | | $ | 399,401,591 | |
Short-Term Investments | | | 6,735,831 | | | | 150,732,234 | | | | — | | | | 157,468,065 | |
| | | | | | | | | | | | | | | | |
Total | | $ | 406,137,422 | | | $ | 150,732,234 | | | $ | — | | | $ | 556,869,656 | |
| | | | | | | | | | | | | | | | |
| | |
| | | Mid-Cap Value Fund | | | | |
| | | Level 1 | | | Level 2 | | | Level 3 | | | Total | |
Common Stocks(1) | | $ | 197,529,311 | | | $ | — | | | $ | — | | | $ | 197,529,311 | |
Short-Term Investments | | | 2,420,873 | | | | 93,348,421 | | | | — | | | | 95,769,294 | |
| | | | | | | | | | | | | | | | |
Total | | $ | 199,950,184 | | | $ | 93,348,421 | | | $ | — | | | $ | 293,298,605 | |
| | | | | | | | | | | | | | | | |
| | | | | | | | | | | | | | | | |
| | |
| | | Mid-Cap Growth Fund | | | | |
| | | Level 1 | | | Level 2 | | | Level 3 | | | Total | |
Common Stocks(1) | | $ | 126,923,190 | | | $ | — | | | $ | — | | | $ | 126,923,190 | |
Short-Term Investments | | | 1,583,732 | | | | 58,405,407 | | | | — | | | | 59,989,139 | |
| | | | | | | | | | | | | | | | |
Total | | $ | 128,506,922 | | | $ | 58,405,407 | | | $ | — | | | $ | 186,912,329 | |
| | | | | | | | | | | | | | | | |
| | |
| | | Small-Cap Value Fund | | | | |
| | | Level 1 | | | Level 2 | | | Level 3 | | | Total | |
Common Stocks(1) | | $ | 74,410,602 | | | $ | — | | | $ | — | | | $ | 74,410,602 | |
Short-Term Investments | | | 1,486,191 | | | | 36,689,352 | | | | — | | | | 38,175,543 | |
| | | | | | | | | | | | | | | | |
Total | | $ | 75,896,793 | | | $ | 36,689,352 | | | $ | — | | | $ | 112,586,145 | |
| | | | | | | | | | | | | | | | |
| | |
| | | Small-Cap Core Fund | | | | |
| | | Level 1 | | | Level 2 | | | Level 3 | | | Total | |
Common Stocks(1) | | $ | 23,949,570 | | | $ | — | | | $ | — | | | $ | 23,949,570 | |
Short-Term Investments | | | 440,742 | | | | 11,219,203 | | | | — | | | | 11,659,945 | |
| | | | | | | | | | | | | | | | |
Total | | $ | 24,390,312 | | | $ | 11,219,203 | | | $ | — | | | $ | 35,609,515 | |
| | | | | | | | | | | | | | | | |
| | |
| | | Small-Cap Growth Fund | | | | |
| | | Level 1 | | | Level 2 | | | Level 3 | | | Total | |
Common Stocks(1) | | $ | 151,614,386 | | | $ | — | | | $ | — | | | $ | 151,614,386 | |
Short-Term Investments | | | 2,038,642 | | | | 68,845,157 | | | | — | | | | 70,883,799 | |
| | | | | | | | | | | | | | | | |
Total | | $ | 153,653,028 | | | $ | 68,845,157 | | | $ | — | | | $ | 222,498,185 | |
| | | | | | | | | | | | | | | | |
144
| | | | | | | | | | | | | | | | |
| | | Global Low Volatility Equity Fund | | | | |
| | | Level 1 | | | Level 2 | | | Level 3 | | | Total | |
Common Stocks | | | | | | | | | | | | | | | | |
Belgium | | $ | 52,381 | | | $ | — | | | $ | — | | | $ | 52,381 | |
Bermuda | | | 358,547 | | | | — | | | | — | | | | 358,547 | |
Brazil | | | 175,120 | | | | — | | | | — | | | | 175,120 | |
Canada | | | 2,905,384 | | | | — | | | | — | | | | 2,905,384 | |
Cayman Islands | | | 458,029 | | | | — | | | | — | | | | 458,029 | |
China | | | 318,371 | | | | — | | | | — | | | | 318,371 | |
Czech Republic | | | 819,521 | | | | — | | | | — | | | | 819,521 | |
Denmark | | | 194,864 | | | | — | | | | — | | | | 194,864 | |
France | | | 32,712 | | | | — | | | | — | | | | 32,712 | |
Germany | | | 222,879 | | | | — | | | | — | | | | 222,879 | |
Guernsey | | | 576,096 | | | | — | | | | — | | | | 576,096 | |
Hong Kong | | | 2,680,954 | | | | — | | | | — | | | | 2,680,954 | |
Hungary | | | 133,525 | | | | — | | | | — | | | | 133,525 | |
Israel | | | 592,959 | | | | — | | | | — | | | | 592,959 | |
Japan | | | 2,459,197 | | | | — | | | | — | | | | 2,459,197 | |
Malaysia | | | 1,420,621 | | | | — | | | | — | | | | 1,420,621 | |
Netherlands | | | 217,834 | | | | — | | | | — | | | | 217,834 | |
New Zealand | | | 989,882 | | | | — | | | | — | | | | 989,882 | |
Philippines | | | 571,660 | | | | — | | | | — | | | | 571,660 | |
Singapore | | | 1,229,211 | | | | — | | | | — | | | | 1,229,211 | |
Switzerland | | | 404,018 | | | | — | | | | — | | | | 404,018 | |
Taiwan | | | 780,068 | | | | — | | | | — | | | | 780,068 | |
Thailand | | | 208,376 | | | | — | | | | — | | | | 208,376 | |
United Kingdom | | | 118,951 | | | | — | | | | — | | | | 118,951 | |
United States | | | 12,191,421 | | | | — | | | | — | | | | 12,191,421 | |
Common Stock Units | | | 109,822 | | | | — | | | | — | | | | 109,822 | |
Short-Term Investments | | | 2,178,530 | | | | — | | | | — | | | | 2,178,530 | |
| | | | | | | | | | | | | | | | |
Total | | $ | 32,400,933 | | | $ | — | | | $ | — | | | $ | 32,400,933 | |
| | | | | | | | | | | | | | | | |
| | |
| | | Disciplined International Equity Fund | | | | |
| | | Level 1 | | | Level 2 | | | Level 3 | | | Total | |
Common Stocks | | | | | | | | | | | | | | | | |
Australia | | $ | 5,541,144 | | | $ | — | | | $ | — | | | $ | 5,541,144 | |
Belgium | | | 155,901 | | | | — | | | | — | | | | 155,901 | |
Cayman Islands | | | 377,023 | | | | — | | | | — | | | | 377,023 | |
Denmark | | | 2,381,433 | | | | — | | | | — | | | | 2,381,433 | |
Finland | | | 2,143,230 | | | | — | | | | — | | | | 2,143,230 | |
France | | | 8,744,801 | | | | — | | | | — | | | | 8,744,801 | |
Germany | | | 5,517,159 | | | | — | | | | — | | | | 5,517,159 | |
Hong Kong | | | 5,434,290 | | | | — | | | | — | | | | 5,434,290 | |
Italy | | | 945,567 | | | | — | | | | — | | | | 945,567 | |
Japan | | | 16,024,118 | | | | — | | | | — | | | | 16,024,118 | |
Jersey | | | 2,488,517 | | | | — | | | | — | | | | 2,488,517 | |
Luxembourg | | | 321,142 | | | | — | | | | — | | | | 321,142 | |
Netherlands | | | 3,464,661 | | | | — | | | | — | | | | 3,464,661 | |
New Zealand | | | 169,195 | | | | — | | | | — | | | | 169,195 | |
Norway | | | 3,755,348 | | | | — | | | | — | | | | 3,755,348 | |
Portugal | | | 133,003 | | | | — | | | | — | | | | 133,003 | |
Singapore | | | 841,748 | | | | — | | | | — | | | | 841,748 | |
Spain | | | 1,065,149 | | | | — | | | | — | | | | 1,065,149 | |
Sweden | | | 337,686 | | | | — | | | | — | | | | 337,686 | |
Switzerland | | | 4,269,211 | | | | — | | | | — | | | | 4,269,211 | |
United Kingdom | | | 8,723,029 | | | | — | | | | — | | | | 8,723,029 | |
Exchange Traded Funds | | | 1,274,200 | | | | — | | | | — | | | | 1,274,200 | |
Limited Partnership Units | | | 334,400 | | | | — | | | | — | | | | 334,400 | |
Short-Term Investments | | | 3,435,698 | | | | — | | | | — | | | | 3,435,698 | |
| | | | | | | | | | | | | | | | |
Total | | $ | 77,877,653 | | | $ | — | | | $ | — | | | $ | 77,877,653 | |
| | | | | | | | | | | | | | | | |
| | |
| | | Pyrford International Stock Fund | | | | |
| | | Level 1 | | | Level 2 | | | Level 3 | | | Total | |
Common Stocks(1) | | $ | 620,104,210 | | | $ | — | | | $ | — | | | $ | 620,104,210 | |
Preferred Stocks(1) | | | 11,579,563 | | | | — | | | | — | | | | 11,579,563 | |
Short-Term Investments | | | 30,412,487 | | | | — | | | | — | | | | 30,412,487 | |
| | | | | | | | | | | | | | | | |
Total | | $ | 662,096,260 | | | $ | — | | | $ | — | | | $ | 662,096,260 | |
| | | | | | | | | | | | | | | | |
| | | | | | | | | | | | | | | | |
| | | LGM Emerging Markets Equity Fund | | | | |
| | | Level 1 | | | Level 2 | | | Level 3 | | | Total | |
Common Stocks | | | | | | | | | | | | | | | | |
Brazil | | $ | 2,926,420 | | | $ | — | | | $ | — | | | $ | 2,926,420 | |
Chile | | | 2,575,138 | | | | — | | | | — | | | | 2,575,138 | |
China | | | 17,799,780 | | | | — | | | | — | | | | 17,799,780 | |
Egypt | | | 8,376,478 | | | | — | | | | — | | | | 8,376,478 | |
Hong Kong | | | 22,384,811 | | | | — | | | | — | | | | 22,384,811 | |
India | | | 44,706,473 | | | | — | | | | — | | | | 44,706,473 | |
Indonesia | | | 17,611,325 | | | | — | | | | — | | | | 17,611,325 | |
Malaysia | | | 8,103,319 | | | | — | | | | — | | | | 8,103,319 | |
Mexico | | | 14,616,173 | | | | — | | | | — | | | | 14,616,173 | |
Nigeria | | | 1,511,651 | | | | — | | | | — | | | | 1,511,651 | |
Peru | | | 2,899,448 | | | | — | | | | — | | | | 2,899,448 | |
Philippines | | | 8,772,705 | | | | — | | | | — | | | | 8,772,705 | |
Russia | | | 8,469,236 | | | | — | | | | — | | | | 8,469,236 | |
South Africa | | | 16,627,643 | | | | — | | | | — | | | | 16,627,643 | |
Taiwan | | | 6,751,262 | | | | — | | | | — | | | | 6,751,262 | |
Thailand | | | 2,149,770 | | | | — | | | | — | | | | 2,149,770 | |
Turkey | | | 537,589 | | | | — | | | | — | | | | 537,589 | |
United States | | | 4,001,220 | | | | — | | | | — | | | | 4,001,220 | |
Vietnam | | | 3,881,479 | | | | — | | | | — | | | | 3,881,479 | |
Common Stock Units | | | 5,338,108 | | | | — | | | | — | | | | 5,338,108 | |
Short-Term Investments | | | 9,191,745 | | | | — | | | | — | | | | 9,191,745 | |
| | | | | | | | | | | | | | | | |
Total | | $ | 209,231,773 | | | $ | — | | | $ | — | | | $ | 209,231,773 | |
| | | | | | | | | | | | | | | | |
| | |
| | | Alternative Strategies Fund(2) | | | | |
| | | Level 1 | | | Level 2 | | | Level 3 | | | Total | |
| Assets-Long | | | | | | | | | | | | | | | | |
| | | | |
Common Stocks | | | | | | | | | | | | | | | | |
Australia | | $ | 132,491 | | | $ | — | | | $ | — | | | $ | 132,491 | |
Bermuda | | | 901,411 | | | | — | | | | — | | | | 901,411 | |
Canada | | | 2,960,890 | | | | — | | | | — | | | | 2,960,890 | |
China | | | 180,401 | | | | — | | | | — | | | | 180,401 | |
Denmark | | | 176,954 | | | | — | | | | — | | �� | | 176,954 | |
France | | | 214,360 | | | | — | | | | — | | | | 214,360 | |
Germany | | | 22,987 | | | | — | | | | — | | | | 22,987 | |
Indonesia | | | 305,421 | | | | — | | | | — | | | | 305,421 | |
Ireland | | | 1,796,176 | | | | — | | | | — | | | | 1,796,176 | |
Italy | | | 79,707 | | | | — | | | | — | | | | 79,707 | |
Japan | | | 1,477,786 | | | | — | | | | — | | | | 1,477,786 | |
Jersey | | | 62,241 | | | | — | | | | — | | | | 62,241 | |
Luxembourg | | | 215,789 | | | | — | | | | — | | | | 215,789 | |
Netherlands | | | 177,230 | | | | — | | | | — | | | | 177,230 | |
New Zealand | | | 216,042 | | | | — | | | | — | | | | 216,042 | |
Norway | | | 273,929 | | | | — | | | | — | | | | 273,929 | |
Panama | | | 71,306 | | | | — | | | | — | | | | 71,306 | |
Poland | | | 83,610 | | | | — | | | | — | | | | 83,610 | |
South Korea | | | 447,097 | | | | — | | | | — | | | | 447,097 | |
Sweden | | | 67,716 | | | | — | | | | — | | | | 67,716 | |
Switzerland | | | 141,611 | | | | — | | | | — | | | | 141,611 | |
Taiwan | | | 280,693 | | | | — | | | | — | | | | 280,693 | |
United Kingdom | | | 740,531 | | | | — | | | | — | | | | 740,531 | |
United States | | | 39,309,896 | | | | — | | | | — | | | | 39,309,896 | |
Corporate Bonds & Notes | | | — | | | | — | | | | — | | | | — | |
Purchased Options | | | 117,942 | | | | — | | | | — | | | | 117,942 | |
Short-Term Investments | | | 24,540,402 | | | | — | | | | — | | | | 24,540,402 | |
| | | | | | | | | | | | | | | | |
Total | | $ | 74,994,619 | | | $ | — | | | $ | — | | | $ | 74,994,619 | |
| | | | | | | | | | | | | | | | |
Liabilities-Short | | | | | | | | | | | | | | | | |
| | | | |
Common Stocks | | | | | | | | | | | | | | | | |
Australia | | $ | 47,936 | | | $ | — | | | $ | — | | | $ | 47,936 | |
Canada | | | 637,836 | | | | — | | | | — | | | | 637,836 | |
Cayman Islands | | | 10,805 | | | | — | | | | — | | | | 10,805 | |
Denmark | | | 241,790 | | | | — | | | | — | | | | 241,790 | |
Finland | | | 29,886 | | | | — | | | | — | | | | 29,886 | |
France | | | 187,048 | | | | — | | | | — | | | | 187,048 | |
Germany | | | 354,799 | | | | — | | | | — | | | | 354,799 | |
Japan | | | 2,598,287 | | | | — | | | | — | | | | 2,598,287 | |
Netherlands | | | 660,487 | | | | — | | | | — | | | | 660,487 | |
Norway | | | 43,059 | | | | — | | | | — | | | | 43,059 | |
Spain | | | 431,544 | | | | — | | | | — | | | | 431,544 | |
Sweden | | | 460,129 | | | | — | | | | — | | | | 460,129 | |
Switzerland | | | 237,576 | | | | — | | | | — | | | | 237,576 | |
United Kingdom | | | 617,950 | | | | — | | | | — | | | | 617,950 | |
United States | | | 10,752,778 | | | | — | | | | — | | | | 10,752,778 | |
Exchange Traded Funds | | | 1,563,424 | | | | — | | | | — | | | | 1,563,424 | |
Written Options | | | 104,177 | | | | — | | | | — | | | | 104,177 | |
| | | | | | | | | | | | | | | | |
Total | | $ | 18,979,511 | | | $ | — | | | $ | — | | | $ | 18,979,511 | |
| | | | | | | | | | | | | | | | |
145
| | |
| | |
| Notes to Financial Statements(continued) | | |
| | | | | | | | | | | | | | | | |
| | | Global Long/Short Equity Fund | | | | |
| | | Level 1 | | | Level 2 | | | Level 3 | | | Total | |
Assets-Long | | | | | | | | | | | | | | | | |
| | | | |
Common Stocks | | | | | | | | | | | | | | | | |
Australia | | $ | 75,239 | | | $ | — | | | $ | — | | | $ | 75,239 | |
Bermuda | | | 278,661 | | | | — | | | | — | | | | 278,661 | |
Canada | | | 1,289,071 | | | | — | | | | — | | | | 1,289,071 | |
China | | | 22,755 | | | | — | | | | — | | | | 22,755 | |
Denmark | | | 102,082 | | | | — | | | | — | | | | 102,082 | |
France | | | 121,415 | | | | — | | | | — | | | | 121,415 | |
Germany | | | 12,591 | | | | — | | | | — | | | | 12,591 | |
Indonesia | | | 177,625 | | | | — | | | | — | | | | 177,625 | |
Italy | | | 45,237 | | | | — | | | | — | | | | 45,237 | |
Japan | | | 825,543 | | | | — | | | | — | | | | 825,543 | |
Jersey | | | 35,273 | | | | — | | | | — | | | | 35,273 | |
Luxembourg | | | 122,437 | | | | — | | | | — | | | | 122,437 | |
Netherlands | | | 106,229 | | | | — | | | | — | | | | 106,229 | |
New Zealand | | | 123,435 | | | | — | | | | — | | | | 123,435 | |
Norway | | | 158,397 | | | | — | | | | — | | | | 158,397 | |
Panama | | | 40,450 | | | | — | | | | — | | | | 40,450 | |
Poland | | | 47,526 | | | | — | | | | — | | | | 47,526 | |
South Korea | | | 255,117 | | | | — | | | | — | | | | 255,117 | |
Sweden | | | 57,341 | | | | — | | | | — | | | | 57,341 | |
Switzerland | | | 82,482 | | | | — | | | | — | | | | 82,482 | |
Taiwan | | | 162,503 | | | | — | | | | — | | | | 162,503 | |
United Kingdom | | | 292,880 | | | | — | | | | — | | | | 292,880 | |
United States | | | 5,337,949 | | | | — | | | | — | | | | 5,337,949 | |
Short-Term Investments | | | 3,727,877 | | | | — | | | | — | | | | 3,727,877 | |
| | | | | | | | | | | | | | | | |
Total | | $ | 13,500,115 | | | $ | — | | | $ | — | | | $ | 13,500,115 | |
| | | | | | | | | | | | | | | | |
Liabilities-Short | | | | | | | | | | | | | | | | |
| | | | |
Common Stocks | | | | | | | | | | | | | | | | |
Australia | | $ | 24,607 | | | $ | — | | | $ | — | | | $ | 24,607 | |
Cayman Islands | | | 6,132 | | | | — | | | | — | | | | 6,132 | |
Finland | | | 16,383 | | | | — | | | | — | | | | 16,383 | |
Germany | | | 195,070 | | | | — | | | | — | | | | 195,070 | |
Japan | | | 1,441,325 | | | | — | | | | — | | | | 1,441,325 | |
Netherlands | | | 84,320 | | | | — | | | | — | | | | 84,320 | |
Norway | | | 25,111 | | | | — | | | | — | | | | 25,111 | |
Spain | | | 63,162 | | | | — | | | | — | | | | 63,162 | |
Sweden | | | 101,710 | | | | — | | | | — | | | | 101,710 | |
Switzerland | | | 17,135 | | | | — | | | | — | | | | 17,135 | |
United Kingdom | | | 265,015 | | | | — | | | | — | | | | 265,015 | |
United States | | | 1,402,246 | | | | — | | | | — | | | | 1,402,246 | |
| | | | | | | | | | | | | | | | |
Total | | $ | 3,642,216 | | | $ | — | | | $ | — | | | $ | 3,642,216 | |
| | | | | | | | | | | | | | | | |
| | |
| | | Ultra Short Tax-Free Fund | | | | |
| | | Level 1 | | | Level 2 | | | Level 3 | | | Total | |
Municipals | | $ | — | | | $ | 583,732,697 | | | $ | — | | | $ | 583,732,697 | |
Short-Term Investments | | | 159,901 | | | | 22,322,929 | | | | — | | | | 22,482,830 | |
| | | | | | | | | | | | | | | | |
Total | | $ | 159,901 | | | $ | 606,055,626 | | | $ | — | | | $ | 606,215,527 | |
| | | | | | | | | | | | | | | | |
| | |
| | | Short Tax-Free Fund | | | | |
| | | Level 1 | | | Level 2 | | | Level 3 | | | Total | |
Municipals | | $ | — | | | $ | 189,667,410 | | | $ | — | | | $ | 189,667,410 | |
Mutual Funds | | | 875,303 | | | | — | | | | — | | | | 875,303 | |
Short-Term Investments | | | 121,200 | | | | — | | | | — | | | | 121,200 | |
| | | | | | | | | | | | | | | | |
Total | | $ | 996,503 | | | $ | 189,667,410 | | | $ | — | | | $ | 190,663,913 | |
| | | | | | | | | | | | | | | | |
| | | | | | | | | | | | | | | | |
| | |
| | | Short-Term Income Fund | | | | |
| | | Level 1 | | | Level 2 | | | Level 3 | | | Total | |
Asset-Backed Securities | | $ | — | | | $ | 56,300,881 | | | $ | — | | | $ | 56,300,881 | |
Certificates of Deposit | | | — | | | | 3,348,522 | | | | — | | | | 3,348,522 | |
Collateralized Mortgage Obligations | | | — | | | | 17,360,976 | | | | — | | | | 17,360,976 | |
Commercial Mortgage Securities | | | — | | | | 14,646,370 | | | | — | | | | 14,646,370 | |
Corporate Bonds & Notes | | | — | | | | 105,418,048 | | | | — | | | | 105,418,048 | |
Mutual Funds | | | 1,007,665 | | | | — | | | | — | | | | 1,007,665 | |
U.S. Government & U.S. Government Agency Obligations | | | — | | | | 28,028,322 | | | | — | | | | 28,028,322 | |
U.S. Government Agency-Mortgage Securities | | | — | | | | 2,469,654 | | | | — | | | | 2,469,654 | |
Short-Term Investments | | | 3,242,065 | | | | 46,427,517 | | | | — | | | | 49,669,582 | |
| | | | | | | | | | | | | | | | |
Total | | $ | 4,249,730 | | | $ | 274,000,290 | | | $ | — | | | $ | 278,250,020 | |
| | | | | | | | | | | | | | | | |
| | |
| | | Intermediate Tax-Free Fund | | | | |
| | | Level 1 | | | Level 2 | | | Level 3 | | | Total | |
Municipals | | $ | — | | | $ | 1,758,008,770 | | | $ | — | | | $ | 1,758,008,770 | |
Mutual Funds | | | 15,526,002 | | | | — | | | | — | | | | 15,526,002 | |
Short-Term Investments | | | 85,922 | | | | — | | | | — | | | | 85,922 | |
| | | | | | | | | | | | | | | | |
Total | | $ | 15,611,924 | | | $ | 1,758,008,770 | | | $ | — | | | $ | 1,773,620,694 | |
| | | | | | | | | | | | | | | | |
| | |
| | | Strategic Income Fund | | | | |
| | | Level 1 | | | Level 2 | | | Level 3 | | | Total | |
Asset-Backed Securities | | $ | — | | | $ | 3,444,482 | | | $ | — | | | $ | 3,444,482 | |
Collateralized Mortgage Obligations | | | — | | | | 9,114,182 | | | | — | | | | 9,114,182 | |
Commercial Mortgage Securities | | | — | | | | 6,042,163 | | | | — | | | | 6,042,163 | |
Corporate Bonds & Notes | | | — | | | | 51,212,215 | | | | — | | | | 51,212,215 | |
U.S. Government & U.S. Government Agency Obligations | | | — | | | | 1,997,711 | | | | — | | | | 1,997,711 | |
U.S. Government Agency-Mortgage Securities | | | — | | | | 9,428,121 | | | | — | | | | 9,428,121 | |
Short-Term Investments | | | 5,787,248 | | | | 21,425,129 | | | | — | | | | 27,212,377 | |
| | | | | | | | | | | | | | | | |
Total | | $ | 5,787,248 | | | $ | 102,664,003 | | | $ | — | | | $ | 108,451,251 | |
| | | | | | | | | | | | | | | | |
| | |
| | | TCH Corporate Income Fund | | | | |
| | | Level 1 | | | Level 2 | | | Level 3 | | | Total | |
Corporate Bonds & Notes | | $ | — | | | $ | 235,742,115 | | | $ | — | | | $ | 235,742,115 | |
Municipals | | | — | | | | 534,320 | | | | — | | | | 534,320 | |
U.S. Government & U.S. Government Agency Obligations | | | — | | | | 1,423,535 | | | | — | | | | 1,423,535 | |
Short-Term Investments | | | 4,850,884 | | | | 50,798,784 | | | | — | | | | 55,649,668 | |
| | | | | | | | | | | | | | | | |
Total | | $ | 4,850,884 | | | $ | 288,498,754 | | | $ | — | | | $ | 293,349,638 | |
| | | | | | | | | | | | | | | | |
146
| | | | | | | | | | | | | | | | |
| | | TCH Core Plus Bond Fund | | | | |
| | | Level 1 | | | Level 2 | | | Level 3 | | | Total | |
Asset-Backed Securities | | $ | — | | | $ | 27,948,720 | | | $ | — | | | $ | 27,948,720 | |
Commercial Mortgage Securities | | | — | | | | 44,226,197 | | | | — | | | | 44,226,197 | |
Corporate Bonds & Notes | | | — | | | | 473,299,731 | | | | — | | | | 473,299,731 | |
Municipals | | | — | | | | 320,592 | | | | — | | | | 320,592 | |
U.S. Government & U.S. Government Agency Obligations | | | — | | | | 254,911,025 | | | | — | | | | 254,911,025 | |
U.S. Government Agency-Mortgage Securities | | | — | | | | 198,295,197 | | | | — | | | | 198,295,197 | |
Short-Term Investments | | | 40,862,111 | | | | 363,577,000 | | | | — | | | | 404,439,111 | |
| | | | | | | | | | | | | | | | |
Total | | $ | 40,862,111 | | | $ | 1,362,578,462 | | | $ | — | | | $ | 1,403,440,573 | |
| | | | | | | | | | | | | | | | |
| | |
| | | High Yield Bond Fund | | | | |
| | | Level 1 | | | Level 2 | | | Level 3 | | | Total | |
Corporate Bonds & Notes | | $ | — | | | $ | 10,405,546 | | | $ | — | | | $ | 10,405,546 | |
Short-Term Investments | | | 813,997 | | | | 4,935,287 | | | | — | | | | 5,749,284 | |
| | | | | | | | | | | | | | | | |
Total | | $ | 813,997 | | | $ | 15,340,833 | | | $ | — | | | $ | 16,154,830 | |
| | | | | | | | | | | | | | | | |
| | |
| | | Government Money Market Fund | | | | |
| | | Level 1 | | | Level 2 | | | Level 3 | | | Total | |
Mutual Funds | | $ | 220,000,000 | | | $ | — | | | $ | — | | | $ | 220,000,000 | |
Repurchase Agreements | | | — | | | | 1,303,479,468 | | | | — | | | | 1,303,479,468 | |
U.S. Government & U.S. Government Agency Obligations | | | — | | | | 1,867,836,765 | | | | — | | | | 1,867,836,765 | |
| | | | | | | | | | | | | | | | |
Total | | $ | 220,000,000 | | | $ | 3,171,316,233 | | | $ | — | | | $ | 3,391,316,233 | |
| | | | | | | | | | | | | | | | |
| | | | | | | | | | | | | | | | |
| | | Tax-Free Money Market Fund | | | | |
| | | Level 1 | | | Level 2 | | | Level 3 | | | Total | |
Municipals | | $ | — | | | $ | 371,385,861 | | | $ | — | | | $ | 371,385,861 | |
Mutual Funds | | | 9,555,886 | | | | — | | | | — | | | | 9,555,886 | |
| | | | | | | | | | | | | | | | |
Total | | $ | 9,555,886 | | | $ | 371,385,861 | | | $ | — | | | $ | 380,941,747 | |
| | | | | | | | | | | | | | | | |
| | |
| | | Prime Money Market Fund | | | | |
| | | Level 1 | | | Level 2 | | | Level 3 | | | Total | |
Certificates of Deposit | | $ | — | | | $ | 69,504,194 | | | $ | — | | | $ | 69,504,194 | |
Commercial Paper | | | — | | | | 266,676,088 | | | | — | | | | 266,676,088 | |
Municipals | | | — | | | | 2,080,000 | | | | — | | | | 2,080,000 | |
Mutual Funds | | | 18,000,000 | | | | — | | | | — | | | | 18,000,000 | |
Repurchase Agreements | | | — | | | | 105,528,777 | | | | — | | | | 105,528,777 | |
| | | | | | | | | | | | | | | | |
Total | | $ | 18,000,000 | | | $ | 443,789,059 | | | $ | — | | | $ | 461,789,059 | |
| | | | | | | | | | | | | | | | |
| | |
| | | Institutional Prime Money Market
Fund | | | | |
| | | Level 1 | | | Level 2 | | | Level 3 | | | Total | |
Certificates of Deposit | | $ | — | | | $ | 82,027,890 | | | $ | — | | | $ | 82,027,890 | |
Commercial Paper | | | — | | | | 294,366,638 | | | | — | | | | 294,366,638 | |
Mutual Funds | | | 15,743,894 | | | | — | | | | — | | | | 15,743,894 | |
Repurchase Agreements | | | — | | | | 90,000,000 | | | | — | | | | 90,000,000 | |
| | | | | | | | | | | | | | | | |
Total | | $ | 15,743,894 | | | $ | 466,394,528 | | | $ | — | | | $ | 482,138,422 | |
| | | | | | | | | | | | | | | | |
| (1) | All sub-categories within Common Stocks and Preferred Stocks represent either entire Level 1 or Level 2 evaluation status. |
| (2) | The following is a summary of other financial instruments that are derivative instruments not reflected in the Schedules of Investments, such as futures and forward contracts. Amounts below are the unrealized appreciation/(depreciation) on the investment. |
| | | | | | | | | | | | | | | | |
| | | Unrealized Appreciation/(Depreciation)
On Other Financial Instruments | |
Fund | | Level 1 | | | Level 2 | | | Level 3 | | | Total | |
Alternative Strategies Fund | | | | | | | | | | | | | | | | |
Long Futures Contracts | | $ | 192,221 | | | $ | — | | | $ | — | | | $ | 192,221 | |
Short Futures Contracts | | | (828,414 | ) | | | — | | | | — | | | | (828,414 | ) |
| | | | | | | | | | | | | | | | |
Total Futures Contracts | | $ | (636,193 | ) | | $ | — | | | $ | — | | | $ | (636,193 | ) |
| | | | | | | | | | | | | | | | |
Long Forward Contracts | | $ | — | | | $ | (144,112 | ) | | $ | — | | | $ | (144,112 | ) |
Short Forward Contracts | | | — | | | | 324,033 | | | | — | | | | 324,033 | |
| | | | | | | | | | | | | | | | |
Total Forward Contracts | | $ | — | | | $ | 179,921 | | | $ | — | | | $ | 179,921 | |
| | | | | | | | | | | | | | | | |
It is the Funds’ policy to recognize transfers between category levels at the end of the period. As described in Note 2, the Funds have retained an independent pricing service to fair value foreign equity securities for events occurring after the close of the market in which the security is principally traded. These valuations did not occur on August 31, 2018, but did on August 31, 2017, resulting in transfers between Level 2 and Level 1 categories.
The following is a reconciliation of transfers between category levels from August 31, 2017 to August 31, 2018:
| | | | | | | | | | | | | | | | | | | | | | | | | | | | | | | | |
| | | Global Low
Volatility
Equity Fund | | | Disciplined
International
Equity Fund | | | Pyrford
International
Stock Fund | | | LGM
Emerging
Markets
Equity Fund | | | Alternative
Strategies Fund
- Long
Transfers | | | Alternative
Strategies Fund
- Short
Transfers | | | Global
Long/Short
Equity Fund
- Long
Transfers | | | Global
Long/Short
Equity Fund
- Short
Transfers | |
Transfers into Level 1 | | $ | 11,494,455 | | | $ | 37,163,468 | | | $ | 605,177,492 | | | $ | 124,204,528 | | | $ | 2,592,351 | | | $ | 2,320,799 | | | $ | 1,747,672 | | | $ | 1,207,773 | |
Transfers out of Level 1 | | | — | | | | — | | | | — | | | | — | | | | — | | | | — | | | | — | | | | — | |
| | | | | | | | | | | | | | | | | | | | | | | | | | | | | | | | |
Net transfers into Level 1 | | $ | 11,494,455 | | | $ | 37,163,468 | | | $ | 605,177,492 | | | $ | 124,204,528 | | | $ | 2,592,351 | | | $ | 2,320,799 | | | $ | 1,747,672 | | | $ | 1,207,773 | |
| | | | | | | | | | | | | | | | | | | | | | | | | | | | | | | | |
Transfers into Level 2 | | $ | — | | | $ | — | | | $ | — | | | $ | — | | | $ | — | | | $ | — | | | $ | — | | | $ | — | |
Transfers out of Level 2 | | | (11,494,455 | ) | | | (37,163,468 | ) | | | (605,177,492 | ) | | | (124,204,528 | ) | | | (2,592,351 | ) | | | (2,320,799 | ) | | | (1,747,672 | ) | | | (1,207,773 | ) |
| | | | | | | | | | | | | | | | | | | | | | | | | | | | | | | | |
Net transfers out of Level 2 | | $ | (11,494,455 | ) | | $ | (37,163,468 | ) | | $ | (605,177,492 | ) | | $ | (124,204,528 | ) | | $ | (2,592,351 | ) | | $ | (2,320,799 | ) | | $ | (1,747,672 | ) | | $ | (1,207,773 | ) |
| | | | | | | | | | | | | | | | | | | | | | | | | | | | | | | | |
147
| | |
| | |
| Notes to Financial Statements(continued) | | |
| 4. | | Derivative Holdings and Activity Detail |
Derivatives and Hedging Disclosures—Derivatives and hedging require enhanced disclosures about the Funds’ derivative and hedging activities, including how such activities are accounted for and their effects on the Funds’ financial positions, performance and cash flows. For the year ended August 31, 2018, the Alternative Strategies Fund utilized all derivatives for the purposes of generating and enhancing total return.
During the year ended August 31, 2018, the Alternative Strategies Fund had average quarterly contracts or notional values outstanding:
| | | | | | | | | | |
Average Quarterly Contracts | | Average Quarterly Notional Values |
Long Futures | | Short Futures | | Purchased Options | | Written Options | | Long Forwards | | Short Forwards |
| 555 | | 816 | | 757 | | 1,260 | | $20,754,527 | | $21,120,567 |
The effects of these derivative instruments on the Alternative Strategies Fund’s financial positions and financial performance are reflected in the Statements of Assets and Liabilities and Statements of Operations, and are presented in the table below. The values of derivative instruments as of August 31, 2018 by risk category are as follows:
| | | | | | | | | | | | |
| | | Statement of
Asset and Liabilities | | | Statement of Operations | |
Fund/Financial Instrument Type | | Amount | | | Realized
Gain (Loss) | | | Net Change in
Appreciation
(Depreciation) | |
Alternative Strategies Fund | | | | | | | | | | | | |
Interest rate futures contracts: | | | | | | | | | | | | |
Receivables for daily variation margin | | $ | 51,206 | | | | | | | | | |
Payables for daily variation margin | | | (21,847 | ) | | | | | | | | |
| | | | | | | | | | | | |
Net | | | 29,359 | | | $ | (605,150 | ) | | $ | (37,901 | ) |
| | | |
Equity futures contracts: | | | | | | | | | | | | |
Receivables for daily variation margin | | | 235,415 | | | | | | | | | |
Payables for daily variation margin | | | (900,967 | ) | | | | | | | | |
| | | | | | | | | | | | |
Net | | | (665,552 | ) | | | (1,444,533 | ) | | | (827,146 | ) |
| | | |
Total receivables for interest rate and equity futures contracts | | | 286,621 | | | | | | | | | |
Total payables for interest rate and equity futures contracts | | | (922,814 | ) | | | | | | | | |
| | | | | | | | | | | | |
Net | | $ | (636,193 | ) | | $ | (2,049,683 | ) | | $ | (865,047 | ) |
| | | | | | | | | | | | |
Forward foreign exchange contracts: | | | | | | | | | | | | |
Receivables for forward foreign exchange contracts | | $ | 487,075 | | | | | | | | | |
Payables for forward foreign exchange contracts | | | (307,154 | ) | | | | | | | | |
| | | | | | | | | | | | |
Net | | $ | 179,921 | | | $ | (1,114,134 | ) | | $ | (20,476 | ) |
| | | | | | | | | | | | |
Equity option contracts: | | | | | | | | | | | | |
Purchased options | | $ | 117,942 | | | $ | (1,068,981 | ) | | $ | 554,826 | |
| | | | | | | | | | | | |
Written options | | $ | (104,177 | ) | | $ | 1,288,709 | | | $ | (672,299 | ) |
| | | | | | | | | | | | |
Offsetting of Assets and Liabilities—Disclosures about offsetting assets and liabilities require an entity to disclose information about offsetting and related arrangements to enable users of its financial statements to understand the effect of those arrangements on its financial position. The guidance requires retrospective application for all comparative periods presented. As of August 31, 2018 no master netting arrangements exist related to the Funds. The Funds’ Statements of Assets and Liabilities (“SAL”) presents derivative instruments on a gross basis, therefore, no net amounts and no offset amounts exist within the SAL to present below. Gross amounts of the derivative instruments, amounts related to financial instruments/cash collateral not offset in the SAL and net amounts are presented below:
| | | | | | | | | | | | | | | | | | | | | | | | | | | | | | | | | | | | |
| | | Derivative Assets | | | Derivative Liabilities | | | Net
Derivative
Assets
(Liabilities) | | | Collateral Pledged
(Received) (1) | | | | |
Fund/Counterparty | | Forward
Currency
Contracts | | | Futures
Contracts | | | Forward
Currency
Contracts | | | Futures
Contracts | | | Written
Options | | | Financial
Instruments | | | Cash | | | Net
Amount | |
Alternative Strategies Fund | | | | | | | | | | | | | | | | | | | | | | | | | | | | | | | | | | | | |
Bank of America Merrill Lynch (Over the Counter) | | $ | 487,075 | | | $ | — | | | $ | (307,154 | ) | | $ | — | | | $ | — | | | $ | 179,921 | | | $ | — | | | $ | (86,700 | ) | | $ | 93,221 | |
Exchange Traded Futures Contracts | | | — | | | | 286,621 | | | | — | | | | (922,814 | ) | | | — | | | | (636,193 | ) | | | 344,437 | | | | — | | | | (291,756 | ) |
Exchange Traded Options Contracts | | | — | | | | — | | | | — | | | | — | | | | (104,177 | ) | | | (104,177 | ) | | | — | | | | 104,177 | | | | — | |
| (1) | Collateral pledged may exceed amount of liability balance. |
148
This page is intentionally left blank.
| | |
| | |
| Notes to Financial Statements(continued) | | |
The Articles of Incorporation permit the Directors to issue an indefinite number of full and fractional shares of common stock, par value $0.0001 per share. Transactions in capital stock were as follows:
| | | | | | | | | | | | | | | | |
| | | | | | | |
| | | Low Volatility
Equity Fund | | | Dividend
Income Fund | |
| | | Year Ended
August 31,
2018 | | | Year Ended
August 31,
2017 | | | Year Ended
August 31,
2018 | | | Year Ended
August 31,
2017 | |
Capital stock transactions in dollars: | | | | | | | | | | | | | | | | |
Proceeds from sale of shares: | | | | | | | | | | | | | | | | |
Investor class of shares | | $ | — | | | $ | — | | | $ | — | | | $ | — | |
Advisor class of shares | | | 2,286,790 | | | | 30,709,923 | | | | 3,699,050 | | | | 9,963,731 | |
Institutional class of shares | | | 14,306,331 | | | | 23,796,019 | | | | 36,241,152 | | | | 84,755,232 | |
Retirement class R-3 of shares | | | — | | | | — | | | | — | | | | — | |
Retirement class R-6 of shares | | | — | | | | — | | | | — | | | | — | |
Advisor class transfers from termination of Investor class | | | — | | | | — | | | | — | | | | — | |
| | | | | | | | | | | | | | | | |
Net proceeds from sale of shares | | | 16,593,121 | | | | 54,505,942 | | | | 39,940,202 | | | | 94,718,963 | |
Net asset value of shares issued to shareholders in payment of distributions declared: | | | | | | | | | | | | | | | | |
Investor class of shares | | | — | | | | — | | | | — | | | | — | |
Advisor class of shares | | | 1,153,738 | | | | 600,108 | | | | 356,437 | | | | 1,904,772 | |
Institutional class of shares | | | 4,960,839 | | | | 3,555,616 | | | | 15,598,754 | | | | 1,431,043 | |
Retirement class R-3 of shares | | | — | | | | — | | | | — | | | | — | |
Retirement class R-6 of shares | | | — | | | | — | | | | — | | | | — | |
| | | | | | | | | | | | | | | | |
Net proceeds from shares issued: | | | 6,114,577 | | | | 4,155,724 | | | | 15,955,191 | | | | 3,335,815 | |
Cost of shares redeemed: | | | | | | | | | | | | | | | | |
Investor class of shares | | | — | | | | — | | | | — | | | | — | |
Advisor class of shares | | | (11,884,791 | ) | | | (16,253,010 | ) | | | (1,523,536 | ) | | | (95,290,255 | ) |
Institutional class of shares | | | (53,938,321 | ) | | | (40,363,601 | ) | | | (24,803,382 | ) | | | (17,370,722 | ) |
Retirement class R-3 of shares | | | — | | | | — | | | | — | | | | — | |
Retirement class R-6 of shares | | | — | | | | — | | | | — | | | | — | |
Advisor class transfers from termination of Investor class | | | — | | | | — | | | | — | | | | — | |
| | | | | | | | | | | | | | | | |
Net cost of shares redeemed | | | (65,823,112 | ) | | | (56,616,611 | ) | | | (26,326,918 | ) | | | (112,660,977 | ) |
| | | | | | | | | | | | | | | | |
Net change resulting from fund share transactions in dollars | | $ | (43,115,414 | ) | | $ | 2,045,055 | | | $ | 29,568,475 | | | $ | (14,606,199 | ) |
| | | | | | | | | | | | | | | | |
| | | | |
Capital stock transactions in shares: | | | | | | | | | | | | | | | | |
Sale of shares: | | | | | | | | | | | | | | | | |
Investor class of shares | | | — | | | | — | | | | — | | | | — | |
Advisor class of shares | | | 155,588 | | | | 2,223,381 | | | | 250,661 | | | | 734,704 | |
Institutional class of shares | | | 963,075 | | | | 1,717,254 | | | | 2,481,080 | | | | 5,932,931 | |
Retirement class R-3 of shares | | | — | | | | — | | | | — | | | | — | |
Retirement class R-6 of shares | | | — | | | | — | | | | — | | | | — | |
Advisor class transfers from termination of Investor class | | | — | | | | — | | | | — | | | | — | |
| | | | | | | | | | | | | | | | |
Net sale of shares | | | 1,118,663 | | | | 3,940,635 | | | | 2,731,741 | | | | 6,667,635 | |
Shares issued to shareholders in payment of distributions declared: | | | | | | | | | | | | | | | | |
Investor class of shares | | | — | | | | — | | | | — | | | | — | |
Advisor class of shares | | | 79,316 | | | | 43,466 | | | | 25,309 | | | | 142,063 | |
Institutional class of shares | | | 339,986 | | | | 258,635 | | | | 1,111,368 | | | | 104,269 | |
Retirement class R-3 of shares | | | — | | | | — | | | | — | | | | — | |
Retirement class R-6 of shares | | | — | | | | — | | | | — | | | | — | |
| | | | | | | | | | | | | | | | |
Net shares issued | | | 419,302 | | | | 302,101 | | | | 1,136,677 | | | | 246,332 | |
Shares redeemed: | | | | | | | | | | | | | | | | |
Investor class of shares | | | — | | | | — | | | | — | | | | — | |
Advisor class of shares | | | (809,235 | ) | | | (1,157,535 | ) | | | (102,595 | ) | | | (6,726,795 | ) |
Institutional class of shares | | | (3,652,276 | ) | | | (2,894,759 | ) | | | (1,686,199 | ) | | | (1,260,014 | ) |
Retirement class R-3 of shares | | | — | | | | — | | | | — | | | | — | |
Retirement class R-6 of shares | | | — | | | | — | | | | — | | | | — | |
Advisor class transfers from termination of Investor class | | | — | | | | — | | | | — | | | | — | |
| | | | | | | | | | | | | | | | |
Net shares redeemed | | | (4,461,511 | ) | | | (4,052,294 | ) | | | (1,788,794 | ) | | | (7,986,809 | ) |
| | | | | | | | | | | | | | | | |
Net change resulting from fund share transactions in shares | | | (2,923,546 | ) | | | 190,442 | | | | 2,079,624 | | | | (1,072,842 | ) |
| | | | | | | | | | | | | | | | |
| (1) | Reflects operations for the period from September 1, 2016, to June 2, 2017 (termination of Investor class of shares). |
| (2) | Includes $4,159,630 of paid-in-capital received from an in-kind purchase on December 15, 2017. The total value received of $4,159,630 from this non-taxable event represented $2,408,685 in securities cost, $1,730,375 in net unrealized appreciation, $3,388 in accrued dividends, $17,172 in cash, and $10 in accrued interest in exchange for 258,754 Institutional Class of shares at time of purchase. |
| (3) | Reflects operations for the period from September 1, 2017, to May 11, 2018 (termination of Retirement class R-3 of shares). |
| (4) | Reflects operations for the period from September 1, 2017, to December 3, 2017 (termination of Retirement class R-3 of shares). |
150
| | | | | | | | | | | | | | | | | | | | | | | | | | | | | | |
| | | | | | | | | | |
Large-Cap
Value Fund | | | Large-Cap
Growth Fund | | | Mid-Cap
Value Fund | | | Mid-Cap
Growth Fund | |
Year Ended
August 31,
2018 | | | Year Ended
August 31,
2017 | | | Year Ended
August 31,
2018 | | | Year Ended
August 31,
2017 | | | Year Ended
August 31,
2018 | | | Year Ended
August 31,
2017 | | | Year Ended
August 31,
2018 | | | Year Ended
August 31,
2017 | |
| | | | | | | | | | | | | | | | | | | | | | | | | | | | | | |
| | | | | | | | | | | | | | | | | | | | | | | | | | | | | | |
| $ | — | | | $ | 25,782,143 | (1) | | $ | 8,890,108 | | | $ | 47,552,629 | | | $ | — | | | $ | 12,630,560 | (1) | | $ | — | | | $ | 8,328,558 | (1) |
| | 1,269,566 | | | | 2,132,939 | | | | 266,934 | | | | 989,079 | | | | 2,177,622 | | | | 3,288,541 | | | | 984,230 | | | | 3,531,002 | |
| | 69,446,391 | (2) | | | 209,105,302 | | | | 50,667,833 | | | | 208,981,585 | | | | 17,358,535 | | | | 80,906,095 | | | | 12,719,389 | | | | 73,932,023 | |
| | — | | | | — | | | | — | | | | — | | | | 768 | (3) | | | 1,057 | | | | — | | | | — | |
| | 87,457,626 | | | | 1,523,544 | | | | 63,644,998 | | | | 2,776,234 | | | | 28,089,301 | | | | 3,976,868 | | | | 24,250,761 | | | | 563,173 | |
| | — | | | | 186,891,192 | | | | — | | | | — | | | | — | | | | 134,579,478 | | | | — | | | | 85,760,412 | |
| | | | | | | | | | | | | | | | | | | | | | | | | | | | | | |
| | 158,173,583 | | | | 425,435,120 | | | | 123,469,873 | | | | 260,299,527 | | | | 47,626,226 | | | | 235,382,599 | | | | 37,954,380 | | | | 172,115,168 | |
| | | | | | | |
| | | | | | | | | | | | | | | | | | | | | | | | | | | | | | | |
| | — | | | | 3,003,799 | (1) | | | 4,067,641 | | | | 10,511,010 | | | | — | | | | 37,960,691 | (1) | | | — | | | | 18,801,115 | (1) |
| | 2,439,169 | | | | 523,217 | | | | 28,989 | | | | 23,490 | | | | 2,704,039 | | | | 3,053 | | | | 1,100,667 | | | | 1,518 | |
| | 31,249,109 | | | | 3,151,481 | | | | 14,433,447 | | | | 6,318,459 | | | | 6,519,523 | | | | 19,028,243 | | | | 5,913,858 | | | | 7,803,153 | |
| | — | | | | — | | | | — | | | | — | | | | 79 | (3) | | | 76 | | | | — | | | | — | |
| | 862,668 | | | | 5,361 | | | | 184,270 | | | | 9,109 | | | | 816,233 | | | | 3,121,456 | | | | 36,318 | | | | — | |
| | | | | | | | | | | | | | | | | | | | | | | | | | | | | | |
| | 34,550,946 | | | | 6,683,858 | | | | 18,714,347 | | | | 16,862,068 | | | | 10,039,874 | | | | 60,113,519 | | | | 7,050,843 | | | | 26,605,786 | |
| | | | | | | | | | | | | | | | | | | | | | | | | | | | | | |
| | — | | | | (29,944,864 | )(1) | | | (35,301,963 | ) | | | (167,909,613 | ) | | | — | | | | (37,912,274 | )(1) | | | — | | | | (21,939,370 | )(1) |
| | (7,185,801 | ) | | | (163,849,415 | ) | | | (372,881 | ) | | | (684,033 | ) | | | (17,789,671 | ) | | | (74,055,945 | ) | | | (6,893,086 | ) | | | (71,617,531 | ) |
| | (135,297,594 | ) | | | (62,434,365 | ) | | | (116,167,629 | ) | | | (54,111,950 | ) | | | (44,333,122 | ) | | | (37,859,484 | ) | | | (42,795,496 | ) | | | (24,230,419 | ) |
| | — | | | | — | | | | — | | | | — | | | | (25,338 | )(3) | | | (9 | ) | | | (24,268 | )(4) | | | — | |
| | (9,866,413 | ) | | | (143,363 | ) | | | (12,334,747 | ) | | | (66,992 | ) | | | (14,011,689 | ) | | | (2,141,795 | ) | | | (4,269,640 | ) | | | (798 | ) |
| | — | | | | (186,891,192 | ) | | | — | | | | — | | | | — | | | | (134,579,478 | ) | | | — | | | | (85,760,412 | ) |
| | | | | | | | | | | | | | | | | | | | | | | | | | | | | | |
| | (152,349,808 | ) | | | (443,263,199 | ) | | | (164,177,220 | ) | | | (222,772,588 | ) | | | (76,159,820 | ) | | | (286,548,985 | ) | | | (53,982,490 | ) | | | (203,548,530 | ) |
| | | | | | | | | | | | | | | | | | | | | | | | | | | | | | |
| $ | 40,374,721 | | | $ | (11,144,221 | ) | | $ | (21,993,000 | ) | | $ | 54,389,007 | | | $ | (18,493,720 | ) | | $ | 8,947,133 | | | $ | (8,977,267 | ) | | $ | (4,827,576 | ) |
| | | | | | | | | | | | | | | | | | | | | | | | | | | | | | |
| | | | | | | |
| | | | | | | | | | | | | | | | | | | | | | | | | | | | | | |
| | | | | | | | | | | | | | | | | | | | | | | | | | | | | | |
| | — | | | | 1,721,277 | (1) | | | 479,102 | | | | 2,983,477 | | | | — | | | | 1,079,783 | (1) | | | — | | | | 603,003 | (1) |
| | 78,249 | | | | 136,008 | | | | 14,070 | | | | 60,502 | | | | 172,720 | | | | 277,019 | | | | 61,162 | | | | 245,836 | |
| | 4,307,244 | (2) | | | 13,571,425 | | | | 2,690,356 | | | | 12,557,523 | | | | 1,412,871 | | | | 6,898,100 | | | | 757,625 | | | | 4,865,381 | |
| | — | | | | — | | | | — | | | | — | | | | 63 | (3) | | | 92 | | | | — | | | | — | (1) |
| | 5,392,425 | | | | 98,226 | | | | 3,340,294 | | | | 161,842 | | | | 2,291,863 | | | | 337,095 | | | | 1,419,933 | | | | 36,858 | |
| | — | | | | 11,959,735 | | | | — | | | | — | | | | — | | | | 11,426,538 | | | | — | | | | 5,852,195 | |
| | | | | | | | | | | | | | | | | | | | | | | | | | | | | | |
| | 9,777,918 | | | | 27,486,671 | | | | 6,523,822 | | | | 15,763,344 | | | | 3,877,517 | | | | 20,018,627 | | | | 2,238,720 | | | | 11,603,272 | |
| | | | | | | | | | | | | | | | | | | | | | | | | | | | | | |
| | — | | | | 202,894 | (1) | | | 230,331 | | | | 704,400 | | | | — | | | | 3,609,940 | (1) | | | — | | | | 1,480,172 | (1) |
| | 153,737 | | | | 33,497 | | | | 1,642 | | | | 1,564 | | | | 220,370 | | | | 290 | | | | 73,182 | | | | 120 | |
| | 1,968,958 | | | | 210,885 | | | | 810,356 | | | | 419,303 | | | | 536,253 | | | | 1,812,569 | | | | 376,679 | | | | 591,039 | |
| | — | | | | — | | | | — | | | | — | | | | 7 | (3) | | | 7 | | | | — | | | | — | |
| | 54,032 | | | | 343 | | | | 10,341 | | | | 531 | | | | 67,103 | | | | 296,837 | | | | 2,300 | | | | — | |
| | | | | | | | | | | | | | | | | | | | | | | | | | | | | | |
| | 2,176,727 | | | | 447,619 | | | | 1,052,670 | | | | 1,125,798 | | | | 823,733 | | | | 5,719,643 | | | | 452,161 | | | | 2,071,331 | |
| | | | | | | | | | | | | | | | | | | | | | | | | | | | | | |
| | — | | | | (2,003,359 | )(1) | | | (1,849,507 | ) | | | (10,102,414 | ) | | | — | | | | (3,280,928 | )(1) | | | — | | | | (1,572,244 | )(1) |
| | (450,944 | ) | | | (10,550,915 | ) | | | (20,984 | ) | | | (42,166 | ) | | | (1,443,400 | ) | | | (6,294,719 | ) | | | (434,884 | ) | | | (4,886,470 | ) |
| | (8,306,456 | ) | | | (4,093,910 | ) | | | (6,128,458 | ) | | | (3,325,891 | ) | | | (3,608,429 | ) | | | (3,265,545 | ) | | | (2,534,418 | ) | | | (1,678,679 | ) |
| | — | | | | — | | | | — | | | | — | | | | (2,093 | )(3) | | | (1 | ) | | | (1,460 | )(4) | | | — | |
| | (618,306 | ) | | | (9,119 | ) | | | (637,550 | ) | | | (3,886 | ) | | | (1,120,225 | ) | | | (185,873 | ) | | | (244,098 | ) | | | (52 | ) |
| | — | | | | (11,959,735 | ) | | | — | | | | — | | | | — | | | | (11,426,538 | ) | | | — | | | | (5,852,195 | ) |
| | | | | | | | | | | | | | | | | | | | | | | | | | | | | | |
| | (9,375,706 | ) | | | (28,617,038 | ) | | | (8,636,499 | ) | | | (13,474,357 | ) | | | (6,174,147 | ) | | | (24,453,604 | ) | | | (3,214,860 | ) | | | (13,989,640 | ) |
| | | | | | | | | | | | | | | | | | | | | | | | | | | | | | |
| | 2,578,939 | | | | (682,748 | ) | | | (1,060,007 | ) | | | 3,414,785 | | | | (1,472,897 | ) | | | 1,284,666 | | | | (523,979 | ) | | | (315,037 | ) |
| | | | | | | | | | | | | | | | | | | | | | | | | | | | | | |
151
| | |
| | |
| Notes to Financial Statements(continued) | | |
| | | | | | | | | | | | | | | | |
| | | | | | | |
| | | Small-Cap
Value Fund | | | Small-Cap
Core Fund | |
| | | Year Ended
August 31,
2018 | | | Year Ended
August 31,
2017 | | | Year Ended
August 31,
2018 | | | Year Ended
August 31,
2017 | |
Capital stock transactions in dollars: | | | | | | | | | | | | | | | | |
Proceeds from sale of shares: | | | | | | | | | | | | | | | | |
Investor class of shares | | $ | — | | | $ | — | | | $ | — | | | $ | — | |
Advisor class of shares | | | 158,365 | | | | 4,344,594 | | | | 810,118 | | | | 2,075,979 | |
Institutional class of shares | | | 7,360,861 | | | | 45,025,931 | | | | 4,646,390 | | | | 7,844,262 | |
Retirement class R-3 of shares | | | 9,605 | (1) | | | 30,591 | | | | — | | | | — | |
Retirement class R-6 of shares | | | 12,814,203 | | | | 2,248,782 | | | | — | | | | — | |
Class F-3 of shares | | | — | | | | — | | | | — | | | | — | |
Advisor class transfers from termination of Investor class | | | — | | | | — | | | | — | | | | — | |
| | | | | | | | | | | | | | | | |
Net proceeds from sale of shares | | | 20,343,034 | | | | 51,649,898 | | | | 5,456,508 | | | | 9,920,241 | |
Net asset value of shares issued to shareholders in payment of distributions declared: | | | | | | | | | | | | | | | | |
Investor class of shares | | | — | | | | — | | | | — | | | | — | |
Advisor class of shares | | | 374,648 | | | | 4,111,818 | | | | 126,053 | | | | 627 | |
Institutional class of shares | | | 4,591,637 | | | | 2,338,598 | | | | 1,050,655 | | | | 232,893 | |
Retirement class R-3 of shares | | | 4,108 | (1) | | | 5,814 | | | | — | | | | — | |
Retirement class R-6 of shares | | | 213,686 | | | | 95,423 | | | | — | | | | — | |
Class F-3 of shares | | | — | | | | — | | | | — | | | | — | |
| | | | | | | | | | | | | | | | |
Net proceeds from shares issued: | | | 5,184,079 | | | | 6,551,653 | | | | 1,176,708 | | | | 233,520 | |
Cost of shares redeemed: | | | | | | | | | | | | | | | | |
Investor class of shares | | | — | | | | — | | | | — | | | | — | |
Advisor class of shares | | | (1,238,217 | ) | | | (47,396,459 | ) | | | (939,096 | ) | | | (211,102 | ) |
Institutional class of shares | | | (17,739,504 | ) | | | (15,809,625 | ) | | | (3,809,548 | ) | | | (3,817,564 | ) |
Retirement class R-3 of shares | | | (136,151 | )(1) | | | (4,887 | ) | | | — | | | | — | |
Retirement class R-6 of shares | | | (2,535,413 | ) | | | (611,082 | ) | | | — | | | | — | |
Class F-3 of shares | | | — | | | | — | | | | — | | | | — | |
Advisor class transfers from termination of Investor class | | | — | | | | — | | | | — | | | | — | |
| | | | | | | | | | | | | | | | |
Net cost of shares redeemed | | | (21,649,285 | ) | | | (63,822,053 | ) | | | (4,748,644 | ) | | | (4,028,666 | ) |
Redemption fees | | | — | | | | — | | | | — | | | | — | |
| | | | | | | | | | | | | | | | |
Net change resulting from fund share transactions in dollars | | $ | 3,877,828 | | | $ | (5,620,502 | ) | | $ | 1,884,572 | | | $ | 6,125,095 | |
| | | | | | | | | | | | | | | | |
| | | | |
Capital stock transactions in shares: | | | | | | | | | | | | | | | | |
Sale of shares: | | | | | | | | | | | | | | | | |
Investor class of shares | | | — | | | | — | | | | — | | | | — | |
Advisor class of shares | | | 10,987 | | | | 327,444 | | | | 58,097 | | | | 157,501 | |
Institutional class of shares | | | 511,721 | | | | 3,311,166 | | | | 319,404 | | | | 629,056 | |
Retirement class R-3 of shares | | | 685 | (1) | | | 2,331 | | | | — | | | | — | |
Retirement class R-6 of shares | | | 907,840 | | | | 165,453 | | | | — | | | | — | |
Class F-3 of shares | | | — | | | | — | | | | — | | | | — | |
Advisor class transfers from termination of Investor class | | | — | | | | — | | | | — | | | | — | |
| | | | | | | | | | | | | | | | |
Net sale of shares | | | 1,431,233 | | | | 3,806,394 | | | | 377,501 | | | | 786,557 | |
Shares issued to shareholders in payment of distributions declared: | | | | | | | | | | | | | | | | |
Investor class of shares | | | — | | | | — | | | | — | | | | — | |
Advisor class of shares | | | 27,629 | | | | 340,483 | | | | 9,228 | | | | 49 | |
Institutional class of shares | | | 333,452 | | | | 190,485 | | | | 76,411 | | | | 18,110 | |
Retirement class R-3 of shares | | | 304 | (1) | | | 481 | | | | — | | | | — | |
Retirement class R-6 of shares | | | 15,440 | | | | 7,719 | | | | — | | | | — | |
Class F-3 of shares | | | — | | | | — | | | | — | | | | — | |
| | | | | | | | | | | | | | | | |
Net shares issued | | | 376,825 | | | | 539,168 | | | | 85,639 | | | | 18,159 | |
Shares redeemed: | | | | | | | | | | | | | | | | |
Investor class of shares | | | — | | | | — | | | | — | | | | — | |
Advisor class of shares | | | (88,641 | ) | | | (3,524,240 | ) | | | (67,035 | ) | | | (15,970 | ) |
Institutional class of shares | | | (1,262,801 | ) | | | (1,210,294 | ) | | | (271,869 | ) | | | (291,933 | ) |
Retirement class R-3 of shares | | | (9,790 | )(1) | | | (367 | ) | | | — | | | | — | |
Retirement class R-6 of shares | | | (176,995 | ) | | | (46,103 | ) | | | — | | | | — | |
Class F-3 of shares | | | — | | | | — | | | | — | | | | — | |
Advisor class transfers from termination of Investor class | | | — | | | | — | | | | — | | | | — | |
| | | | | | | | | | | | | | | | |
Net shares redeemed | | | (1,538,227 | ) | | | (4,781,004 | ) | | | (338,904 | ) | | | (307,903 | ) |
| | | | | | | | | | | | | | | | |
Net change resulting from fund share transactions in shares | | | 269,831 | | | | (435,442 | ) | | | 124,236 | | | | 496,813 | |
| | | | | | | | | | | | | | | | |
| (1) | Reflects operations for the period from September 1, 2017, to May 11, 2018 (termination of Retirement class R-3 of shares). |
| (2) | Reflects operations for the period from September 1, 2016, to June 2, 2017 (termination of Investor class of shares). |
| (3) | Reflects operations for the period from May 31, 2017 (inception date) to August 31, 2017. |
| (4) | Reflects operations for the period from September 1, 2017, to April 27, 2018 (termination of Investor class of shares). |
| (5) | Reflects operations for the period from September 1, 2017, to December 3, 2017 (termination of Retirement class R-3 of shares). |
152
| | | | | | | | | | | | | | | | | | | | | | | | | | | | | | |
| | | | | | | | | | |
Small-Cap
Growth Fund | | | Global Low Volatility
Equity Fund | | | Disciplined International
Equity Fund | | | Pyrford International
Stock Fund | |
Year Ended
August 31,
2018 | | | Year Ended
August 31,
2017 | | | Year Ended
August 31,
2018 | | | Year Ended
August 31,
2017 | | | Year Ended
August 31,
2018 | | | Year Ended
August 31,
2017 | | | Year Ended
August 31,
2018 | | | Year Ended
August 31,
2017 | |
| | | | | | | | | | | | | | | | | | | | | | | | | | | | | | |
| | | | | | | | | | | | | | | | | | | | | | | | | | | | | | |
| $ | — | | | $ | 8,270,106 | (2) | | $ | — | | | $ | — | | | $ | — | | | $ | — | | | $ | 83,571 | (4) | | $ | 13,163,350 | |
| | 4,764,611 | | | | 8,904,983 | (3) | | | 209,656 | | | | 795,975 | | | | 42,573 | | | | 2,000 | | | | 5,864,823 | | | | 822,444 | |
| | 17,252,116 | | | | 54,817,595 | | | | 573,388 | | | | 25,178,906 | | | | 18,798,208 | | | | 22,341,033 | | | | 76,904,679 | | | | 350,747,663 | |
| | — | | | | — | | | | — | | | | — | | | | — | | | | — | | | | — | | | | — | |
| | — | | | | — | | | | — | | | | — | | | | — | | | | — | | | | 120,732,668 | | | | 31,501,915 | |
| | — | | | | — | | | | — | | | | — | | | | — | | | | — | | | | 8,394,567 | | | | 25,761 | (3) |
| | — | | | | 92,631,103 | | | | — | | | | — | | | | — | | | | — | | | | — | | | | — | |
| | | | | | | | | | | | | | | | | | | | | | | | | | | | | | |
| | 22,016,727 | | | | 164,623,787 | | | | 783,044 | | | | 25,974,881 | | | | 18,840,781 | | | | 22,343,033 | | | | 211,980,308 | | | | 396,261,133 | |
| | | | | | | |
| | | | | | | | | | | | | | | | | | | | | | | | | | | | | | |
| | — | | | | — | | | | — | | | | — | | | | — | | | | — | | | | — | | | | 1,999,666 | |
| | 6,081,376 | | | | — | | | | 35,577 | | | | 2,983 | | | | 1,308 | | | | 787 | | | | — | | | | 1,905 | |
| | 8,460,833 | | | | — | | | | 1,428,624 | | | | 1,085,758 | | | | 1,509,712 | | | | 1,669,867 | | | | 12,082,424 | | | | 6,699,345 | |
| | — | | | | — | | | | — | | | | — | | | | — | | | | — | | | | — | | | | — | |
| | — | | | | — | | | | — | | | | — | | | | — | | | | — | | | | 1,405,577 | | | | 652,042 | |
| | — | | | | — | | | | — | | | | — | | | | — | | | | — | | | | 1,758 | | | | — | |
| | | | | | | | | | | | | | | | | | | | | | | | | | | | | | |
| | 14,542,209 | | | | — | | | | 1,464,201 | | | | 1,088,741 | | | | 1,511,020 | | | | 1,670,654 | | | | 13,489,759 | | | | 9,352,958 | |
| | | | | | | | | | | | | | | | | | | | | | | | | | | | | | |
| | — | | | | (85,059,894 | )(2) | | | — | | | | — | | | | — | | | | — | | | | (6,445,368 | )(4) | | | (115,429,633 | ) |
| | (23,380,533 | ) | | | (45,090,880 | )(3) | | | (955,585 | ) | | | (115,806 | ) | | | (2,155 | ) | | | — | | | | (690,070 | ) | | | (43,970 | ) |
| | (23,623,490 | ) | | | (165,285,708 | ) | | | (22,565,241 | ) | | | (19,346,226 | ) | | | (13,668,317 | ) | | | (28,580,607 | ) | | | (197,218,546 | ) | | | (290,612,247 | ) |
| | — | | | | — | | | | — | | | | — | | | | — | | | | — | | | | (26,363 | )(5) | | | — | |
| | — | | | | — | | | | — | | | | — | | | | — | | | | — | | | | (13,639,793 | ) | | | (3,041,612 | ) |
| | — | | | | — | | | | — | | | | — | | | | — | | | | — | | | | (389,948 | ) | | | — | |
| | — | | | | (92,631,103 | ) | | | — | | | | — | | | | — | | | | — | | | | — | | | | — | |
| | | | | | | | | | | | | | | | | | | | | | | | | | | | | | |
| | (47,004,023 | ) | | | (388,067,585 | ) | | | (23,520,826 | ) | | | (19,462,032 | ) | | | (13,670,472 | ) | | | (28,580,607 | ) | | | (218,410,088 | ) | | | (409,127,462 | ) |
| | — | | | | 132 | | | | — | | | | 50 | | | | 210 | | | | — | | | | 957 | | | | 3,133 | |
| | | | | | | | | | | | | | | | | | | | | | | | | | | | | | |
| $ | (10,445,087 | ) | | $ | (223,443,666 | ) | | $ | (21,273,581 | ) | | $ | 7,601,640 | | | $ | 6,681,539 | | | $ | (4,566,920 | ) | | $ | 7,060,936 | | | $ | (3,510,238 | ) |
| | | | | | | | | | | | | | | | | | | | | | | | | | | | | | |
| | | | | | | |
| | | | | | | | | | | | | | | | | | | | | | | | | | | | | | |
| | | | | | | | | | | | | | | | | | | | | | | | | | | | | | |
| | — | | | | 494,669 | (2) | | | — | | | | — | | | | — | | | | — | | | | 6,173 | (4) | | | 1,073,748 | |
| | 245,534 | | | | 498,846 | (3) | | | 15,520 | | | | 63,712 | | | | 3,721 | | | | 180 | | | | 432,072 | | | | 63,670 | |
| | 867,331 | | | | 2,932,428 | | | | 41,566 | | | | 2,042,381 | | | | 1,662,757 | | | | 2,090,763 | | | | 5,768,243 | | | | 27,977,151 | |
| | — | | | | — | | | | — | | | | — | | | | — | | | | — | | | | — | | | | — | |
| | — | | | | — | | | | — | | | | — | | | | — | | | | — | | | | 8,998,114 | | | | 2,563,451 | |
| | — | | | | — | | | | — | | | | — | | | | — | | | | — | | | | 633,138 | | | | 1,950 | (3) |
| | — | | | | 5,076,122 | | | | — | | | | — | | | | — | | | | — | | | | — | | | | — | |
| | | | | | | | | | | | | | | | | | | | | | | | | | | | | | |
| | 1,112,865 | | | | 9,002,065 | | | | 57,086 | | | | 2,106,093 | | | | 1,666,478 | | | | 2,090,943 | | | | 15,837,740 | | | | 31,679,970 | |
| | | | | | | | | | | | | | | | | | | | | | | | | | | | | | |
| | — | | | | — | | | | — | | | | — | | | | — | | | | — | | | | — | | | | 174,491 | |
| | 347,706 | | | | — | | | | 2,693 | | | | 251 | | | | 118 | | | | 84 | | | | — | | | | 166 | |
| | 465,392 | | | | — | | | | 107,902 | | | | 91,317 | | | | 136,256 | | | | 176,893 | | | | 915,335 | | | | 583,567 | |
| | — | | | | — | | | | — | | | | — | | | | — | | | | — | | | | — | | | | — | |
| | — | | | | — | | | | — | | | | — | | | | — | | | | — | | | | 106,483 | | | | 56,798 | |
| | — | | | | — | | | | — | | | | — | | | | — | | | | — | | | | 133 | | | | — | |
| | | | | | | | | | | | | | | | | | | | | | | | | | | | | | |
| | 813,098 | | | | — | | | | 110,595 | | | | 91,568 | | | | 136,374 | | | | 176,977 | | | | 1,021,951 | | | | 815,022 | |
| | | | | | | | | | | | | | | | | | | | | | | | | | | | | | |
| | — | | | | (5,106,058 | )(2) | | | — | | | | — | | | | — | | | | — | | | | (474,563 | )(4) | | | (8,986,498 | ) |
| | (1,245,843 | ) | | | (2,432,400 | )(3) | | | (69,805 | ) | | | (9,239 | ) | | | (184 | ) | | | — | | | | (50,399 | ) | | | (3,359 | ) |
| | (1,191,794 | ) | | | (9,469,711 | ) | | | (1,653,359 | ) | | | (1,556,987 | ) | | | (1,201,084 | ) | | | (2,848,966 | ) | | | (14,834,806 | ) | | | (23,381,161 | ) |
| | — | | | | — | | | | — | | | | — | | | | — | | | | — | | | | (1,946 | )(5) | | | — | |
| | — | | | | — | | | | — | | | | — | | | | — | | | | — | | | | (1,031,978 | ) | | | (239,843 | ) |
| | — | | | | — | | | | — | | | | — | | | | — | | | | — | | | | (29,583 | ) | | | — | |
| | — | | | | (5,076,122 | ) | | | — | | | | — | | | | — | | | | — | | | | — | | | | — | |
| | | | | | | | | | | | | | | | | | | | | | | | | | | | | | |
| | (2,437,637 | ) | | | (22,084,291 | ) | | | (1,723,164 | ) | | | (1,566,226 | ) | | | (1,201,268 | ) | | | (2,848,966 | ) | | | (16,423,275 | ) | | | (32,610,861 | ) |
| | | | | | | | | | | | | | | | | | | | | | | | | | | | | | |
| | (511,674 | ) | | | (13,082,226 | ) | | | (1,555,483 | ) | | | 631,435 | | | | 601,584 | | | | (581,046 | ) | | | 436,416 | | | | (115,869 | ) |
| | | | | | | | | | | | | | | | | | | | | | | | | | | | | | |
153
| | |
| | |
| Notes to Financial Statements(continued) | | |
| | | | | | | | | | | | | | | | |
| | | | | | | |
| | | LGM Emerging Markets
Equity Fund | | | Alternative
Strategies Fund | |
| | | Year Ended
August 31,
2018 | | | Year Ended
August 31,
2017 | | | Year Ended
August 31,
2018 | | | Year Ended
August 31,
2017 | |
Capital stock transactions in dollars: | | | | | | | | | | | | | | | | |
Proceeds from sale of shares: | | | | | | | | | | | | | | | | |
Investor class of shares | | $ | — | | | $ | — | | | $ | — | | | $ | — | |
Advisor class of shares | | | 2,061,792 | | | | 8,777,557 | | | | 949 | | | | 27,169 | |
Institutional class of shares | | | 77,835,687 | | | | 100,996,016 | | | | 17,290,111 | | | | 21,282,139 | |
Advisor class transfers from termination of Investor class | | | — | | | | — | | | | — | | | | — | |
| | | | | | | | | | | | | | | | |
Net proceeds from sale of shares | | | 79,897,479 | | | | 109,773,573 | | | | 17,291,060 | | | | 21,309,308 | |
Net asset value of shares issued to shareholders in payment of distributions declared: | | | | | | | | | | | | | | | | |
Investor class of shares | | | — | | | | — | | | | — | | | | — | |
Advisor class of shares | | | — | | | | 235,064 | | | | 3,248 | | | | — | |
Institutional class of shares | | | 1,128,190 | | | | 631,448 | | | | 5,106,210 | | | | — | |
| | | | | | | | | | | | | | | | |
Net proceeds from shares issued: | | | 1,128,190 | | | | 866,512 | | | | 5,109,458 | | | | — | |
Cost of shares redeemed: | | | | | | | | | | | | | | | | |
Investor class of shares | | | — | | | | — | | | | — | | | | — | |
Advisor class of shares | | | (1,950,533 | ) | | | (61,462,014 | ) | | | (80,003 | ) | | | (165,974 | ) |
Institutional class of shares | | | (33,149,780 | ) | | | (37,328,961 | ) | | | (37,141,144 | ) | | | (39,535,186 | ) |
Advisor class transfers from termination of Investor class | | | — | | | | — | | | | — | | | | — | |
| | | | | | | | | | | | | | | | |
Net cost of shares redeemed | | | (35,100,313 | ) | | | (98,790,975 | ) | | | (37,221,147 | ) | | | (39,701,160 | ) |
Redemption fees | | | 711 | | | | 680 | | | | — | | | | — | |
| | | | | | | | | | | | | | | | |
Net change resulting from fund share transactions in dollars | | $ | 45,926,067 | | | $ | 11,849,790 | | | $ | (14,820,629 | ) | | $ | (18,391,852 | ) |
| | | | | | | | | | | | | | | | |
| | | | |
Capital stock transactions in shares: | | | | | | | | | | | | | | | | |
Sale of shares: | | | | | | | | | | | | | | | | |
Investor class of shares | | | — | | | | — | | | | — | | | | — | |
Advisor class of shares | | | 127,075 | | | | 629,812 | | | | 94 | | | | 2,572 | |
Institutional class of shares | | | 4,692,595 | | | | 6,844,430 | | | | 1,681,475 | | | | 2,009,145 | |
Advisor class transfers from termination of Investor class | | | — | | | | — | | | | — | | | | — | |
| | | | | | | | | | | | | | | | |
Net sale of shares | | | 4,819,670 | | | | 7,474,242 | | | | 1,681,569 | | | | 2,011,717 | |
Shares issued to shareholders in payment of distributions declared: | | | | | | | | | | | | | | | | |
Investor class of shares | | | — | | | | — | | | | — | | | | — | |
Advisor class of shares | | | — | | | | 18,509 | | | | 322 | | | | — | |
Institutional class of shares | | | 70,030 | | | | 49,681 | | | | 502,085 | | | | — | |
| | | | | | | | | | | | | | | | |
Net shares issued | | | 70,030 | | | | 68,190 | | | | 502,407 | | | | — | |
Shares redeemed: | | | | | | | | | | | | | | | | |
Investor class of shares | | | — | | | | — | | | | — | | | | — | |
Advisor class of shares | | | (116,190 | ) | | | (4,044,334 | ) | | | (7,777 | ) | | | (15,772 | ) |
Institutional class of shares | | | (2,010,904 | ) | | | (2,627,477 | ) | | | (3,567,218 | ) | | | (3,732,936 | ) |
Advisor class transfers from termination of Investor class | | | — | | | | — | | | | — | | | | — | |
| | | | | | | | | | | | | | | | |
Net shares redeemed | | | (2,127,094 | ) | | | (6,671,811 | ) | | | (3,574,995 | ) | | | (3,748,708 | ) |
| | | | | | | | | | | | | | | | |
Net change resulting from fund share transactions in shares | | | 2,762,606 | | | | 870,621 | | | | (1,391,019 | ) | | | (1,736,991 | ) |
| | | | | | | | | | | | | | | | |
| (1) | Reflects operations for the period from September 1, 2016, to June 2, 2017 (termination of Investor class of shares). |
154
| | | | | | | | | | | | | | | | | | | | | | | | | | | | | | |
| | | | | | | | | | |
Global Long/Short
Equity Fund | | | Ultra Short
Tax-Free Fund | | | Short
Tax-Free Fund | | | Short-Term
Income Fund | |
Year Ended
August 31,
2018 | | | Year Ended
August 31,
2017 | | | Year Ended
August 31,
2018 | | | Year Ended
August 31,
2017 | | | Year Ended
August 31,
2018 | | | Year Ended
August 31,
2017 | | | Year Ended
August 31,
2018 | | | Year Ended
August 31,
2017 | |
| | | | | | | | | | | | | | | | | | | | | | | | | | | | | | |
| | | | | | | | | | | | | | | | | | | | | | | | | | | | | | |
| $ | — | | | $ | — | | | $ | — | | | $ | 6,104,616 | (1) | | $ | — | | | $ | 10,895,505 | (1) | | $ | — | | | $ | 11,653,364 | (1) |
| | 195,339 | | | | 269,383 | | | | 5,741,914 | | | | 6,200,069 | | | | 2,495,879 | | | | 1,819,564 | | | | 4,288,667 | | | | 10,184,761 | |
| | 6,081,319 | | | | 4,556,249 | | | | 439,354,219 | | | | 466,456,337 | | | | 48,874,201 | | | | 88,094,396 | | | | 131,029,502 | | | | 132,998,094 | |
| | — | | | | — | | | | — | | | | 45,351,480 | | | | — | | | | 22,049,349 | | | | — | | | | 49,939,527 | |
| | | | | | | | | | | | | | | | | | | | | | | | | | | | | | |
| | 6,276,658 | | | | 4,825,632 | | | | 445,096,133 | | | | 524,112,502 | | | | 51,370,080 | | | | 122,858,814 | | | | 135,318,169 | | | | 204,775,746 | |
|
|
| | | | | | | | | | | | | | | | | | | | | | | | | | | | |
| | — | | | | — | | | | — | | | | 286,536 | (1) | | | — | | | | 169,287 | (1) | | | — | | | | 618,739 | (1) |
| | 22,321 | | | | 4,145 | | | | 329,380 | | | | 71,269 | | | | 81,745 | | | | 46,057 | | | | 492,639 | | | | 143,243 | |
| | 296,703 | | | | 23,628 | | | | 3,253,010 | | | | 1,945,603 | | | | 861,084 | | | | 636,743 | | | | 2,446,146 | | | | 1,710,099 | |
| | | | | | | | | | | | | | | | | | | | | | | | | | | | | | |
| | 319,024 | | | | 27,773 | | | | 3,582,390 | | | | 2,303,408 | | | | 942,829 | | | | 852,087 | | | | 2,938,785 | | | | 2,472,081 | |
| | | | | | | | | | | | | | | | | | | | | | | | | | | | | | |
| | — | | | | — | | | | — | | | | (14,358,125 | )(1) | | | — | | | | (4,549,287 | )(1) | | | — | | | | (21,089,307 | )(1) |
| | (129,883 | ) | | | (128,015 | ) | | | (13,292,423 | ) | | | (16,963,463 | ) | | | (3,186,874 | ) | | | (17,897,661 | ) | | | (11,677,805 | ) | | | (27,139,404 | ) |
| | (5,837,723 | ) | | | (175,281 | ) | | | (494,931,520 | ) | | | (391,631,904 | ) | | | (41,742,641 | ) | | | (81,433,763 | ) | | | (125,939,227 | ) | | | (159,514,643 | ) |
| | — | | | | — | | | | — | | | | (45,351,480 | ) | | | — | | | | (22,049,349 | ) | | | — | | | | (49,939,527 | ) |
| | | | | | | | | | | | | | | | | | | | | | | | | | | | | | |
| | (5,967,606 | ) | | | (303,296 | ) | | | (508,223,943 | ) | | | (468,304,972 | ) | | | (44,929,515 | ) | | | (125,930,060 | ) | | | (137,617,032 | ) | | | (257,682,881 | ) |
| | 1,407 | | | | — | | | | — | | | | — | | | | — | | | | — | | | | — | | | | — | |
| | | | | | | | | | | | | | | | | | | | | | | | | | | | | | |
| $ | 629,483 | | | $ | 4,550,109 | | | $ | (59,545,420 | ) | | $ | 58,110,938 | | | $ | 7,383,394 | | | $ | (2,219,159 | ) | | $ | 639,922 | | | $ | (50,435,054 | ) |
| | | | | | | | | | | | | | | | | | | | | | | | | | | | | | |
| | | | | | | |
| | | | | | | | | | | | | | | | | | | | | | | | | | | | | | |
| | | | | | | | | | | | | | | | | | | | | | | | | | | | | | |
| | — | | | | — | | | | — | | | | 606,227 | (1) | | | — | | | | 1,076,290 | (1) | | | — | | | | 1,243,973 | (1) |
| | 16,081 | | | | 22,951 | | | | 570,266 | | | | 615,178 | | | | 245,629 | | | | 179,645 | | | | 460,682 | | | | 1,087,006 | |
| | 491,377 | | | | 397,699 | | | | 43,650,785 | | | | 46,336,954 | | | | 4,803,882 | | | | 8,670,982 | | | | 14,032,354 | | | | 14,175,534 | |
| | — | | | | — | | | | — | | | | 4,499,110 | | | | — | | | | 2,162,888 | | | | — | | | | 5,326,826 | |
| | | | | | | | | | | | | | | | | | | | | | | | | | | | | | |
| | 507,458 | | | | 420,650 | | | | 44,221,051 | | | | 52,057,469 | | | | 5,049,511 | | | | 12,089,805 | | | | 14,493,036 | | | | 21,833,339 | |
| | | | | | | | | | | | | | | | | | | | | | | | | | | | | | |
| | — | | | | — | | | | — | | | | 28,463 | (1) | | | — | | | | 16,686 | (1) | | | — | | | | 66,052 | (1) |
| | 1,812 | | | | 374 | | | | 32,709 | | | | 7,071 | | | | 8,058 | | | | 4,523 | | | | 52,968 | | | | 15,277 | |
| | 24,064 | | | | 2,129 | | | | 323,236 | | | | 193,296 | | | | 84,831 | | | | 62,642 | | | | 262,630 | | | | 182,198 | |
| | | | | | | | | | | | | | | | | | | | | | | | | | | | | | |
| | 25,876 | | | | 2,503 | | | | 355,945 | | | | 228,830 | | | | 92,889 | | | | 83,851 | | | | 315,598 | | | | 263,527 | |
| | | | | | | | | | | | | | | | | | | | | | | | | | | | | | |
| | — | | | | — | | | | — | | | | (1,426,090 | )(1) | | | — | | | | (449,187 | )(1) | | | — | | | | (2,253,283 | )(1) |
| | (10,892 | ) | | | (11,422 | ) | | | (1,319,835 | ) | | | (1,682,885 | ) | | | (313,760 | ) | | | (1,757,934 | ) | | | (1,256,655 | ) | | | (2,896,344 | ) |
| | (487,768 | ) | | | (15,094 | ) | | | (49,159,262 | ) | | | (38,912,011 | ) | | | (4,107,724 | ) | | | (8,016,682 | ) | | | (13,497,981 | ) | | | (16,993,915 | ) |
| | — | | | | — | | | | — | | | | (4,499,110 | ) | | | — | | | | (2,162,888 | ) | | | — | | | | (5,326,826 | ) |
| | | | | | | | | | | | | | | | | | | | | | | | | | | | | | |
| | (498,660 | ) | | | (26,516 | ) | | | (50,479,097 | ) | | | (46,520,096 | ) | | | (4,421,484 | ) | | | (12,386,691 | ) | | | (14,754,636 | ) | | | (27,470,368 | ) |
| | | | | | | | | | | | | | | | | | | | | | | | | | | | | | |
| | 34,674 | | | | 396,637 | | | | (5,902,101 | ) | | | 5,766,203 | | | | 720,916 | | | | (213,035 | ) | | | 53,998 | | | | (5,373,502 | ) |
| | | | | | | | | | | | | | | | | | | | | | | | | | | | | | |
155
| | |
| | |
| Notes to Financial Statements(continued) | | |
| | | | | | | | | | | | | | | | |
| | | | | | | |
| | | Intermediate
Tax-Free Fund | | | Strategic
Income Fund | |
| | | Year Ended
August 31,
2018 | | | Year Ended
August 31,
2017 | | | Year Ended
August 31,
2018 | | | Year Ended
August 31,
2017 | |
Capital stock transactions in dollars: | | | | | | | | | | | | | | | | |
Proceeds from sale of shares: | | | | | | | | | | | | | | | | |
Investor class of shares | | $ | 148,016,165 | | | $ | 213,547,673 | | | $ | 1,560,960 | | | $ | 2,074,321 | |
Advisor class of shares | | | 7,369,713 | | | | 9,967,233 | | | | 510,237 | | | | 18,617,076 | (1) |
Institutional class of shares | | | 446,882,504 | | | | 289,062,211 | | | | 1,579,253 | | | | 18,778,044 | (1) |
| | | | | | | | | | | | | | | | |
Net proceeds from sale of shares | | | 602,268,382 | | | | 512,577,117 | | | | 3,650,450 | | | | 39,469,441 | |
Net asset value of shares issued to shareholders in payment of distributions declared: | | | | | | | | | | | | | | | | |
Investor class of shares | | | 23,973,740 | | | | 30,885,014 | | | | 2,868,223 | | | | 2,325,868 | |
Advisor class of shares | | | 323,030 | | | | 83,901 | | | | 681,181 | | | | 148,215 | |
Institutional class of shares | | | 12,672,136 | | | | 9,417,013 | | | | 514,734 | | | | 277,988 | |
| | | | | | | | | | | | | | | | |
Net proceeds from shares issued: | | | 36,968,906 | | | | 40,385,928 | | | | 4,064,138 | | | | 2,752,071 | |
Cost of shares redeemed: | | | | | | | | | | | | | | | | |
Investor class of shares | | | (256,803,140 | ) | | | (480,822,580 | ) | | | (15,601,053 | ) | | | (16,498,767 | ) |
Advisor class of shares | | | (3,558,242 | ) | | | (930,368 | ) | | | (5,319,901 | ) | | | (531,749 | ) |
Institutional class of shares | | | (182,098,021 | ) | | | (255,447,058 | ) | | | (10,401,208 | ) | | | (19,076,959 | ) |
| | | | | | | | | | | | | | | | |
Net cost of shares redeemed | | | (442,459,403 | ) | | | (737,200,006 | ) | | | (31,322,162 | ) | | | (36,107,475 | ) |
| | | | | | | | | | | | | | | | |
Net change resulting from fund share transactions in dollars | | $ | 196,777,885 | | | $ | (184,236,961 | ) | | $ | (23,607,574 | ) | | $ | 6,114,037 | |
| | | | | | | | | | | | | | | | |
| | | | |
Capital stock transactions in shares: | | | | | | | | | | | | | | | | |
Sale of shares: | | | | | | | | | | | | | | | | |
Investor class of shares | | | 13,228,190 | | | | 19,005,661 | | | | 165,685 | | | | 221,723 | |
Advisor class of shares | | | 656,770 | | | | 883,384 | | | | 54,439 | | | | 1,979,944 | (1) |
Institutional class of shares | | | 40,007,123 | | | | 25,701,510 | | | | 171,048 | | | | 2,000,814 | (1) |
| | | | | | | | | | | | | | | | |
Net sale of shares | | | 53,892,083 | | | | 45,590,555 | | | | 391,172 | | | | 4,202,481 | |
Shares issued to shareholders in payment of distributions declared: | | | | | | | | | | | | | | | | |
Investor class of shares | | | 2,141,524 | | | | 2,750,131 | | | | 309,135 | | | | 249,197 | |
Advisor class of shares | | | 28,873 | | | | 7,446 | | | | 73,367 | | | | 15,702 | |
Institutional class of shares | | | 1,133,383 | | | | 838,538 | | | | 55,436 | | | | 29,730 | |
| | | | | | | | | | | | | | | | |
Net shares issued | | | 3,303,780 | | | | 3,596,115 | | | | 437,938 | | | | 294,629 | |
Shares redeemed: | | | | | | | | | | | | | | | | |
Investor class of shares | | | (22,940,721 | ) | | | (42,913,006 | ) | | | (1,677,547 | ) | | | (1,775,161 | ) |
Advisor class of shares | | | (317,526 | ) | | | (83,471 | ) | | | (572,837 | ) | | | (56,447 | ) |
Institutional class of shares | | | (16,277,135 | ) | | | (22,853,490 | ) | | | (1,109,628 | ) | | | (2,046,850 | ) |
| | | | | | | | | | | | | | | | |
Net shares redeemed | | | (39,535,382 | ) | | | (65,849,967 | ) | | | (3,360,012 | ) | | | (3,878,458 | ) |
| | | | | | | | | | | | | | | | |
Net change resulting from fund share transactions in shares | | | 17,660,481 | | | | (16,663,297 | ) | | | (2,530,902 | ) | | | 618,652 | |
| | | | | | | | | | | | | | | | |
| (1) | Includes paid-in-capital and shares received from a non-taxable in-kind subscription merger of the BMO TCH Intermediate Income Fund effective as of the close of business on June 29, 2017. |
156
| | | | | | | | | | | | | | | | | | | | | | |
| | | | | | | |
TCH Corporate
Income Fund | | | TCH Core Plus
Bond Fund | | | High Yield
Bond Fund | |
Year Ended
August 31,
2018 | | | Year Ended
August 31,
2017 | | | Year Ended
August 31,
2018 | | | Year Ended
August 31,
2017 | | | Year Ended
August 31,
2018 | | | Year Ended
August 31,
2017 | |
| | | | | | | | | | | | | | | | | | | | | | |
| | | | | | | | | | | | | | | | | | | | | | |
| $ | 13,469,510 | | | $ | 85,092,119 | | | $ | 33,247,967 | | | $ | 114,719,160 | | | $ | — | | | $ | — | |
| | 1,883,339 | | | | 1,376,817 | | | | 692,466 | | | | 1,956,570 | | | | 75,077 | | | | 2,426,855 | |
| | 35,031,255 | | | | 30,587,623 | | | | 205,734,013 | | | | 665,156,222 | | | | 990,467 | | | | 1,819,681 | |
| | | | | | | | | | | | | | | | | | | | | | |
| | 50,384,104 | | | | 117,056,559 | | | | 239,674,446 | | | | 781,831,952 | | | | 1,065,544 | | | | 4,246,536 | |
|
|
| | | | | | | | | | | | | | | | | | | | |
| | 3,631,617 | | | | 3,445,037 | | | | 1,885,553 | | | | 12,537,390 | | | | — | | | | — | |
| | 34,627 | | | | 13,619 | | | | 93,214 | | | | 55,571 | | | | 45,200 | | | | 1,174,457 | |
| | 1,445,656 | | | | 1,601,967 | | | | 27,182,890 | | | | 13,350,242 | | | | 538,766 | | | | 847,200 | |
| | | | | | | | | | | | | | | | | | | | | | |
| | 5,111,900 | | | | 5,060,623 | | | | 29,161,657 | | | | 25,943,203 | | | | 583,966 | | | | 2,021,657 | |
| | | | | | | | | | | | | | | | | | | | | | |
| | (31,633,728 | ) | | | (51,507,090 | ) | | | (40,591,447 | ) | | | (559,991,083 | ) | | | — | | | | — | |
| | (1,412,711 | ) | | | (94,009 | ) | | | (977,655 | ) | | | (118,015 | ) | | | (233,705 | ) | | | (74,352,589 | ) |
| | (26,163,150 | ) | | | (27,600,405 | ) | | | (194,020,504 | ) | | | (161,128,094 | ) | | | (2,951,381 | ) | | | (24,729,280 | ) |
| | | | | | | | | | | | | | | | | | | | | | |
| | (59,209,589 | ) | | | (79,201,504 | ) | | | (235,589,606 | ) | | | (721,237,192 | ) | | | (3,185,086 | ) | | | (99,081,869 | ) |
| | | | | | | | | | | | | | | | | | | | | | |
| $ | (3,713,585 | ) | | $ | 42,915,678 | | | $ | 33,246,497 | | | $ | 86,537,963 | | | $ | (1,535,576 | ) | | $ | (92,813,676 | ) |
| | | | | | | | | | | | | | | | | | | | | | |
| | | | | |
| | | | | | | | | | | | | | | | | | | | | | |
| | | | | | | | | | | | | | | | | | | | | | |
| | 1,033,637 | | | | 6,571,426 | | | | 2,877,804 | | | | 9,850,492 | | | | — | | | | — | |
| | 147,035 | | | | 105,997 | | | | 59,334 | | | | 167,833 | | | | 8,021 | | | | 256,453 | |
| | 2,718,202 | | | | 2,352,481 | | | | 17,783,100 | | | | 56,847,089 | | | | 105,106 | | | | 191,620 | |
| | | | | | | | | | | | | | | | | | | | | | |
| | 3,898,874 | | | | 9,029,904 | | | | 20,720,238 | | | | 66,865,414 | | | | 113,127 | | | | 448,073 | |
| | | | | | | | | | | | | | | | | | | | | | |
| | 280,072 | | | | 265,827 | | | | 163,324 | | | | 1,076,725 | | | | — | | | | — | |
| | 2,678 | | | | 1,039 | | | | 8,071 | | | | 4,763 | | | | 4,811 | | | | 123,996 | |
| | 111,718 | | | | 124,238 | | | | 2,355,406 | | | | 1,144,537 | | | | 57,369 | | | | 89,193 | |
| | | | | | | | | | | | | | | | | | | | | | |
| | 394,468 | | | | 391,104 | | | | 2,526,801 | | | | 2,226,025 | | | | 62,180 | | | | 213,189 | |
| | | | | | | | | | | | | | | | | | | | | | |
| | (2,446,009 | ) | | | (3,968,342 | ) | | | (3,521,472 | ) | | | (47,799,589 | ) | | | — | | | | — | |
| | (108,819 | ) | | | (7,234 | ) | | | (84,744 | ) | | | (10,119 | ) | | | (24,867 | ) | | | (7,860,812 | ) |
| | (2,027,663 | ) | | | (2,134,030 | ) | | | (16,816,251 | ) | | | (13,875,014 | ) | | | (315,664 | ) | | | (2,615,394 | ) |
| | | | | | | | | | | | | | | | | | | | | | |
| | (4,582,491 | ) | | | (6,109,606 | ) | | | (20,422,467 | ) | | | (61,684,722 | ) | | | (340,531 | ) | | | (10,476,206 | ) |
| | | | | | | | | | | | | | | | | | | | | | |
| | (289,149 | ) | | | 3,311,402 | | | | 2,824,572 | | | | 7,406,717 | | | | (165,224 | ) | | | (9,814,944 | ) |
| | | | | | | | | | | | | | | | | | | | | | |
157
| | |
| | |
| Notes to Financial Statements(continued) | | |
| | | | | | | | | | | | | | | | |
| | | | | | | |
| | | Government Money
Market Fund | | | Tax-Free Money
Market Fund | |
| | | Year Ended
August 31,
2018 | | | Year Ended
August 31,
2017 | | | Year Ended
August 31,
2018 | | | Year Ended
August 31,
2017 | |
Capital stock transactions in dollars: | | | | | | | | | | | | | | | | |
Proceeds from sale of shares: | | | | | | | | | | | | | | | | |
Investor class of shares | | $ | 2,836,535,603 | | | $ | 4,367,701,056 | | | $ | 103,523,007 | | | $ | 89,068,383 | |
Premier class of shares | | | 16,700,415,556 | | | | 9,966,793,513 | | | | 657,271,008 | | | | 616,291,151 | |
| | | | | | | | | | | | | | | | |
Net proceeds from sale of shares | | | 19,536,951,159 | | | | 14,334,494,569 | | | | 760,794,015 | | | | 705,359,534 | |
Net asset value of shares issued to shareholders in payment of distributions declared: | | | | | | | | | | | | | | | | |
Investor class of shares | | | 1,534,889 | | | | 329,721 | | | | 570,108 | | | | 274,041 | |
Premier class of shares | | | 4,345,881 | | | | 970,404 | | | | 4,097 | | | | 1,677 | |
| | | | | | | | | | | | | | | | |
Net proceeds from shares issued: | | | 5,880,770 | | | | 1,300,125 | | | | 574,205 | | | | 275,718 | |
Cost of shares redeemed: | | | | | | | | | | | | | | | | |
Investor class of shares | | | (2,904,331,903 | ) | | | (3,822,205,017 | ) | | | (104,233,256 | ) | | | (103,397,551 | ) |
Premier class of shares | | | (16,333,053,308 | ) | | | (9,665,862,634 | ) | | | (590,623,244 | ) | | | (691,426,427 | ) |
| | | | | | | | | | | | | | | | |
Net cost of shares redeemed | | | (19,237,385,211 | ) | | | (13,488,067,651 | ) | | | (694,856,500 | ) | | | (794,823,978 | ) |
| | | | | | | | | | | | | | | | |
Net change resulting from fund share transactions in dollars | | $ | 305,446,718 | | | $ | 847,727,043 | | | $ | 66,511,720 | | | $ | (89,188,726 | ) |
| | | | | | | | | | | | | | | | |
| | | | |
Capital stock transactions in shares: | | | | | | | | | | | | | | | | |
Sale of shares: | | | | | | | | | | | | | | | | |
Investor class of shares | | | 2,836,535,603 | | | | 4,367,701,056 | | | | 103,523,007 | | | | 89,068,383 | |
Premier class of shares | | | 16,700,415,556 | | | | 9,966,793,513 | | | | 657,271,008 | | | | 616,291,151 | |
| | | | | | | | | | | | | | | | |
Net sale of shares | | | 19,536,951,159 | | | | 14,334,494,569 | | | | 760,794,015 | | | | 705,359,534 | |
Shares issued to shareholders in payment of distributions declared: | | | | | | | | | | | | | | | | |
Investor class of shares | | | 1,534,889 | | | | 329,721 | | | | 570,108 | | | | 274,041 | |
Premier class of shares | | | 4,345,881 | | | | 970,404 | | | | 4,097 | | | | 1,677 | |
| | | | | | | | | | | | | | | | |
Net shares issued | | | 5,880,770 | | | | 1,300,125 | | | | 574,205 | | | | 275,718 | |
Shares redeemed: | | | | | | | | | | | | | | | | |
Investor class of shares | | | (2,904,331,903 | ) | | | (3,822,205,017 | ) | | | (104,233,256 | ) | | | (103,397,551 | ) |
Premier class of shares | | | (16,333,053,308 | ) | | | (9,665,862,634 | ) | | | (590,623,244 | ) | | | (691,426,427 | ) |
| | | | | | | | | | | | | | | | |
Net shares redeemed | | | (19,237,385,211 | ) | | | (13,488,067,651 | ) | | | (694,856,500 | ) | | | (794,823,978 | ) |
| | | | | | | | | | | | | | | | |
Net change resulting from fund share transactions in shares | | | 305,446,718 | | | | 847,727,043 | | | | 66,511,720 | | | | (89,188,726 | ) |
| | | | | | | | | | | | | | | | |
158
| | | | | | | | | | | | | | |
| | | | |
Prime Money
Market Fund | | | Institutional Prime
Money Market Fund | |
Year Ended
August 31,
2018 | | | Year Ended
August 31,
2017 | | | Year Ended
August 31,
2018 | | | Year Ended
August 31,
2017 | |
| | | | | | | | | | | | | | |
| | | | | | | | | | | | | | |
| $ | 323,252,291 | | | $ | 382,077,941 | | | $ | 1,046,364 | | | $ | 440,297 | |
| | 487,728,123 | | | | 401,337,265 | | | | 1,223,791,366 | | | | 913,886,682 | |
| | | | | | | | | | | | | | |
| | 810,980,414 | | | | 783,415,206 | | | | 1,224,837,730 | | | | 914,326,979 | |
|
|
| | | | | | | | | | | | |
| | 1,907,375 | | | | 644,425 | | | | 19,861 | | | | 6,606 | |
| | 238,721 | | | | 136,475 | | | | 1,169,282 | | | | 2,324 | |
| | | | | | | | | | | | | | |
| | 2,146,096 | | | | 780,900 | | | | 1,189,143 | | | | 8,930 | |
| | | | | | | | | | | | | | |
| | (334,404,979 | ) | | | (1,084,487,321 | ) | | | (86,707 | ) | | | (17,918 | ) |
| | (385,817,826 | ) | | | (903,857,590 | ) | | | (1,145,764,366 | ) | | | (928,945,817 | ) |
| | | | | | | | | | | | | | |
| | (720,222,805 | ) | | | (1,988,344,911 | ) | | | (1,145,851,073 | ) | | | (928,963,735 | ) |
| | | | | | | | | | | | | | |
| $ | 92,903,705 | | | $ | (1,204,148,805 | ) | | $ | 80,175,800 | | | $ | (14,627,826 | ) |
| | | | | | | | | | | | | | |
| | | |
| | | | | | | | | | | | | | |
| | | | | | | | | | | | | | |
| | 323,252,291 | | | | 382,077,940 | | | | 1,046,368 | | | | 440,281 | |
| | 487,728,123 | | | | 401,337,265 | | | | 1,223,793,306 | | | | 913,743,656 | |
| | | | | | | | | | | | | | |
| | 810,980,414 | | | | 783,415,205 | | | | 1,224,839,674 | | | | 914,183,937 | |
| | | | | | | | | | | | | | |
| | 1,907,375 | | | | 644,425 | | | | 19,860 | | | | 6,605 | |
| | 238,721 | | | | 136,475 | | | | 1,169,202 | | | | 2,324 | |
| | | | | | | | | | | | | | |
| | 2,146,096 | | | | 780,900 | | | | 1,189,062 | | | | 8,929 | |
| | | | | | | | | | | | | | |
| | (334,404,979 | ) | | | (1,084,487,321 | ) | | | (86,724 | ) | | | (17,916 | ) |
| | (385,817,826 | ) | | | (903,857,590 | ) | | | (1,145,753,981 | ) | | | (928,796,503 | ) |
| | | | | | | | | | | | | | |
| | (720,222,805 | ) | | | (1,988,344,911 | ) | | | (1,145,840,705 | ) | | | (928,814,419 | ) |
| | | | | | | | | | | | | | |
| | 92,903,705 | | | | (1,204,148,806 | ) | | | 80,188,031 | | | | (14,621,553 | ) |
| | | | | | | | | | | | | | |
159
| | |
| | |
| Notes to Financial Statements(continued) | | |
| 6. | | Investment Adviser Fee and Other Transactions with Affiliates |
Investment Advisory Fees—The Adviser receives for its services an investment adviser fee based on a percentage of each Fund’s average daily net assets (“ADNA”) as listed below.
| | | | | | | | | | | | | | | | | | | | |
| | | Fund’s ADNA | | | | |
Fund | | on the
first
$500
million | | | on the
next
$200
million | | | on the
next
$100
million | | | in excess
of $800
million | | | | |
Low Volatility Equity Fund | | | 0.500 | % | | | 0.490 | % | | | 0.450 | % | | | 0.400 | % | | | | |
Dividend Income Fund | | | 0.500 | | | | 0.490 | | | | 0.450 | | | | 0.400 | | | | | |
Mid-Cap Value Fund | | | 0.685 | | | | 0.670 | | | | 0.570 | | | | 0.510 | | | | | |
Mid-Cap Growth Fund | | | 0.685 | | | | 0.670 | | | | 0.570 | | | | 0.510 | | | | | |
Small-Cap Value Fund | | | 0.685 | | | | 0.680 | | | | 0.620 | | | | 0.610 | | | | | |
Small-Cap Growth Fund | | | 0.685 | | | | 0.680 | | | | 0.620 | | | | 0.610 | | | | | |
Global Low Volatility Equity Fund | | | 0.650 | | | | 0.640 | | | | 0.600 | | | | 0.550 | | | | | |
Pyrford International Stock Fund | | | 0.735 | | | | 0.720 | | | | 0.620 | | | | 0.560 | | | | | |
LGM Emerging Markets Equity Fund | | | 0.900 | | | | 0.890 | | | | 0.850 | | | | 0.800 | | | | | |
| | |
| | | Fund’s ADNA | | | | |
Fund | | on the
first
$100
million | | | on the
next
$150
million | | | on the
next
$250
million | | | in excess
of $500
million | | | | |
Ultra Short Tax-Free Fund | | | 0.200 | % | | | 0.190 | % | | | 0.170 | % | | | 0.100 | % | | | | |
Short Tax-Free Fund | | | 0.200 | | | | 0.190 | | | | 0.170 | | | | 0.150 | | | | | |
Short-Term Income Fund | | | 0.200 | | | | 0.190 | | | | 0.170 | | | | 0.100 | | | | | |
Intermediate Tax-Free Fund | | | 0.250 | | | | 0.160 | | | | 0.120 | | | | 0.100 | | | | | |
Strategic Income Fund | | | 0.250 | | | | 0.200 | | | | 0.200 | | | | 0.200 | | | | | |
TCH Corporate Income Fund | | | 0.200 | | | | 0.190 | | | | 0.150 | | | | 0.100 | | | | | |
TCH Core Plus Bond Fund | | | 0.250 | | | | 0.160 | | | | 0.120 | | | | 0.100 | | | | | |
High Yield Bond Fund | | | 0.500 | | | | 0.500 | | | | 0.500 | | | | 0.500 | | | | | |
| | | |
| | | Fund’s ADNA | | | | | | | |
Fund | | on the
first
$1
billion | | | on the
next
$1
billion | | | in excess
of $2
billion | | | | | | | |
Large-Cap Value Fund(1) | | | 0.350 | % | | | 0.325 | % | | | 0.300 | % | | | | | | | | |
Large-Cap Growth Fund(1) | | | 0.350 | | | | 0.325 | | | | 0.300 | | | | | | | | | |
Small-Cap Core Fund | | | 0.650 | | | | 0.625 | | | | 0.600 | | | | | | | | | |
Disciplined International Equity Fund | | | 0.600 | | | | 0.575 | | | | 0.550 | | | | | | | | | |
Alternative Strategies Fund | | | 1.500 | | | | 1.475 | | | | 1.450 | | | | | | | | | |
Global Long/Short Equity Fund | | | 1.000 | | | | 0.975 | | | | 0.950 | | | | | | | | | |
| |
| | | Fund’s ADNA | |
Fund | | on the
first
$2
billion | | | on the
next
$2
billion | | | on the
next
$2
billion | | | on the
next
$2
billion | | | in excess
of $8
billion | |
Government Money Market Fund | | | 0.200 | % | | | 0.185 | % | | | 0.170 | % | | | 0.155 | % | | | 0.140 | % |
Tax-Free Money Market Fund | | | 0.200 | | | | 0.185 | | | | 0.170 | | | | 0.155 | | | | 0.140 | |
Prime Money Market Fund | | | 0.150 | | | | 0.135 | | | | 0.120 | | | | 0.105 | | | | 0.090 | |
Institutional Prime Money Market Fund | | | 0.150 | | | | 0.135 | | | | 0.120 | | | | 0.105 | | | | 0.090 | |
| | (1) | Effective February 8, 2018 the investment adviser fees and breakpoint tiers were reduced for this BMO Fund. Prior to February 8, 2018, the fees charged based on the Funds’ ADNA were as follows: 0.500% on the first $1 billion, 0.475% on the next $1 billion, and 0.450% in excess of $2 billion. |
The Pyrford International Stock Fund’s sub-adviser is Pyrford International Ltd., an affiliate of the Adviser. The LGM Emerging Markets Equity Fund’s sub-adviser is LGM Investments Limited, an affiliate of the Adviser. The TCH Corporate Income Fund and TCH Core Plus Bond Fund’s sub-adviser is Taplin, Canida & Habacht, LLC, an affiliate of the Adviser. One of the sub-advisers of the Alternative Strategies Fund is CTC myCFO, LLC, an affiliate of the Adviser. The Adviser compensates each sub-adviser based on the level of average daily net assets of each respective Fund managed by each sub-adviser.
Contractual Expense Limitation—The Adviser has agreed to waive or reduce its investment advisory fee or reimburse expenses to the extent necessary to prevent class specific total annual operating expenses (excluding taxes, dividend and interest expense, brokerage commissions, other investment related costs, Acquired Fund Fees and Expenses and extraordinary
160
expenses, such as litigation and other expenses not incurred in the ordinary course of a Fund’s business) from exceeding the amounts for the periods set forth below. The Adviser may not terminate this arrangement prior to December 31, 2019, without the consent of the Directors, unless the investment advisory agreement is terminated. The Adviser may voluntarily choose to waive any portion of its fee beyond its contractual agreement. The Adviser can modify or terminate this voluntary waiver at any time at its sole discretion. Additionally, the agreement does not provide for recoupment by the Adviser of waived fees or reimbursed expenses.
| | | | | | | | | | | | | | | | | | | | | | | | | | | | |
| | | Annualized Contractual Expense Limitation | |
Fund | | Investor
Class | | | Advisor
Class | | | Institutional
Class | | | Premier
Class | | | Retirement
Class R-3 | | | Retirement
Class R-6 | | | Class F-3 | |
Low Volatility Equity Fund | | | | | | | 0.90 | % | | | 0.65 | % | | | | | | | | | | | | | | | | |
Dividend Income Fund | | | | | | | 0.90 | | | | 0.65 | | | | | | | | | | | | | | | | | |
Large-Cap Value Fund | | | | | | | 0.79 | (1) | | | 0.54 | (1) | | | | | | | | | | | 0.39 | %(1) | | | | |
Large-Cap Growth Fund | | | 0.79 | %(2) | | | 0.79 | (2) | | | 0.54 | (2) | | | | | | | | | | | 0.39 | (2) | | | | |
Mid-Cap Value Fund | | | | | | | 1.24 | | | | 0.99 | | | | | | | | 1.49 | %(3) | | | 0.84 | | | | | |
Mid-Cap Growth Fund | | | | | | | 1.24 | | | | 0.99 | | | | | | | | 1.49 | (4) | | | 0.84 | | | | | |
Small-Cap Value Fund | | | | | | | 1.24 | | | | 0.99 | | | | | | | | 1.49 | (3) | | | 0.84 | | | | | |
Small-Cap Core Fund | | | | | | | 1.15 | | | | 0.90 | | | | | | | | | | | | | | | | | |
Small-Cap Growth Fund | | | | | | | 1.24 | | | | 0.99 | | | | | | | | | | | | | | | | | |
Global Low Volatility Equity Fund | | | | | | | 1.10 | | | | 0.85 | | | | | | | | | | | | | | | | | |
Disciplined International Equity Fund | | | | | | | 1.15 | | | | 0.90 | | | | | | | | | | | | | | | | | |
Pyrford International Stock Fund | | | 1.19 | (5) | | | 1.19 | | | | 0.94 | | | | | | | | 1.44 | (4) | | | 0.79 | | | | 0.79 | % |
LGM Emerging Markets Equity Fund | | | | | | | 1.40 | | | | 1.15 | | | | | | | | | | | | | | | | | |
Alternative Strategies Fund | | | | | | | 2.00 | | | | 1.75 | | | | | | | | | | | | | | | | | |
Global Long/Short Equity Fund | | | | | | | 1.60 | | | | 1.35 | | | | | | | | | | | | | | | | | |
Ultra Short Tax-Free Fund | | | | | | | 0.55 | | | | 0.30 | | | | | | | | | | | | | | | | | |
Short Tax-Free Fund | | | | | | | 0.55 | | | | 0.40 | | | | | | | | | | | | | | | | | |
Short-Term Income Fund | | | | | | | 0.60 | | | | 0.35 | | | | | | | | | | | | | | | | | |
Intermediate Tax-Free Fund | | | 0.55 | | | | 0.55 | | | | 0.50 | | | | | | | | | | | | | | | | | |
Strategic Income Fund | | | 0.80 | | | | 0.80 | | | | 0.55 | | | | | | | | | | | | | | | | | |
TCH Corporate Income Fund | | | 0.59 | | | | 0.59 | | | | 0.55 | | | | | | | | | | | | | | | | | |
TCH Core Plus Bond Fund | | | 0.59 | | | | 0.59 | | | | 0.55 | | | | | | | | | | | | | | | | | |
High Yield Bond Fund | | | | | | | 0.90 | | | | 0.65 | | | | | | | | | | | | | | | | | |
Government Money Market Fund | | | 0.45 | | | | | | | | | | | | 0.20 | % | | | | | | | | | | | | |
Tax-Free Money Market Fund | | | 0.45 | | | | | | | | | | | | 0.20 | | | | | | | | | | | | | |
Prime Money Market Fund | | | 0.45 | | | | | | | | | | | | 0.20 | | | | | | | | | | | | | |
Institutional Prime Money Market Fund | | | 0.45 | | | | | | | | | | | | 0.20 | | | | | | | | | | | | | |
| | (1) | Effective February 8, 2018. Prior to February 8, 2018, the annual rates were 1.00%, 0.75%, and 0.60%, respectively. |
| | (2) | Effective February 8, 2018. Prior to February 8, 2018, the annual rates were 1.00%, 1.00%, 0.75%, and 0.60%, respectively. |
| | (3) | Effective through May 11, 2018 (termination of R-3 class of shares). |
| | (4) | Effective through December 3, 2017 (termination of R-3 class of shares). |
| | (5) | Effective through April 27, 2018 (termination of Investor class of shares). |
Shareholder Servicing Fees—Under the terms of a Shareholder Services Agreement with the Adviser, each Fund pays the Adviser at the annual rate of 0.25% of average daily net assets of the Fund’s Investor Class shares for the period. The fee paid to the Adviser is used to finance certain services for shareholders and to maintain shareholder accounts.
Distribution Services Fees—Certain Funds are subject to a Distribution Plan (the “Plan”) pursuant to Rule 12b-1 under the Act. The Plan authorizes payments by the Fund to finance activities intended to result in the sale of its Advisor Class and Retirement Class R-3 shares. The Plan provides that the Fund may incur distribution expenses of 0.25% and 0.50% of the average daily net assets of the Fund’s Advisor Class and Retirement Class R-3 shares, respectively.
161
| | |
| | |
| Notes to Financial Statements(continued) | | |
Administration Fees—The fee paid to the Adviser is based on each Fund’s average daily net assets with respect to Administration Fee Schedule A and the aggregate average daily net assets of all Funds representing Administration Fee Schedule B as listed below.
| | | | | | | | | | |
| Administration Fee Schedule A | | | | Administration Fee Schedule B |
Annual Rate | | | | | | | | Annual Rate | | ADNA |
| 0.1500% | | | | | | | | 0.0400% | | on the first $2 billion |
| | | | | | | | 0.0300 | | on the next $2 billion |
| | | | | | | | 0.0250 | | on the next $2 billion |
| | | | | | | | 0.0200 | | on the next $2 billion |
| | | | | | | | 0.0100 | | in excess of $8 billion |
| | | | | | | | | | |
| | |
| Fund | | | | Fund |
| Low Volatility Equity Fund | | Alternative Strategies Fund | | | | Government Money Market Fund |
| Dividend Income Fund | | Global Long/Short Equity Fund | | | | Tax-Free Money Market Fund |
| Large-Cap Value Fund(1) | | Ultra Short Tax-Free Fund | | | | Prime Money Market Fund |
| Large-Cap Growth Fund(1) | | Short Tax-Free Fund | | | | Institutional Prime Money Market Fund |
| Mid-Cap Value Fund(1) | | Short-Term Income Fund | | | | |
| Mid-Cap Growth Fund(1) | | Intermediate Tax-Free Fund | | | | |
| Small-Cap Value Fund(1) | | Strategic Income Fund | | | | |
| Small-Cap Core Fund | | TCH Corporate Income Fund | | | | |
| Small-Cap Growth Fund | | TCH Core Plus Bond Fund | | | | |
| Global Low Volatility Equity Fund | | High Yield Bond Fund | | | | |
| Disciplined International Equity | | | | | | |
| Pyrford International Stock Fund(1) | | | | | | |
| LGM Emerging Markets Equity Fund | | | | | | |
| | (1) | For the year ended August 31, 2018, the Funds with class-specific Administration Fees were as follows: |
| | | | | | | | | | | | | | | | | | | | | | | | |
Fund | | Investor
Class | | | Advisor
Class | | | Institutional
Class | | | Retirement
Class R-3 | | | Retirement
Class R-6(a) | | | Retirement
Class F-3(a) | |
Large-Cap Value Fund | | $ | — | | | $ | 36,738 | | | $ | 447,115 | | | $ | — | | | $ | — | | | $ | — | |
Large-Cap Growth Fund | | | 112,945 | | | | 1,015 | | | | 414,667 | | | | — | | | | — | | | | — | |
Mid-Cap Value Fund | | | — | | | | 90,275 | | | | 183,644 | | | | 26 | (b) | | | — | | | | — | |
Mid-Cap Growth Fund | | | — | | | | 25,967 | | | | 138,479 | | | | 9 | (c) | | | — | | | | — | |
Small-Cap Value Fund | | | — | | | | 7,221 | | | | 86,111 | | | | 87 | (b) | | | — | | | | — | |
Pyrford International Stock Fund | | | 5,895 | (d) | | | 3,878 | | | | 850,839 | | | | 10 | (c) | | | — | | | | — | |
| | (a) | Retirement Class R-6 and F-3 do not pay an Administrative Fee. |
| | (b) | Reflects operations for the period from September 1, 2017 to May 11, 2018 (termination of Class R-3 Shares). |
| | (c) | Reflects operations for the period from September 1, 2017 to December 3, 2017 (termination of Class R-3 Shares). |
| | (d) | Reflects operations for the period from September 1, 2017 to April 27, 2018 (termination of Investor Class Shares). |
Custodian Fees—Effective April 2, 2018, State Street Bank & Trust Company is the Funds’ custodian. Prior to April 2, 2018 BMO Harris was the Funds’ custodian, except for the International Funds, for which State Street Bank & Trust Company maintained custody. Prior to April 2, 2018, BMO Harris received fees consisting of 0.005% on the first $10 billion average daily net assets, based on the collective net assets of the Corporation custodied by BMO Harris, and 0.0025% on all assets in excess of $10 billion.
Securities Lending—The Funds pay a fee to BMO Harris for its services as the securities lending agent. The securities lending income as shown in the Statements of Operations is net of these fees. The following amounts were paid for the year ended August 31, 2018:
| | | | |
Fund | | Fees Paid | |
Low Volatility Equity Fund | | $ | 18,038 | |
Dividend Income Fund | | | 17,204 | |
Large-Cap Value Fund | | | 41,964 | |
Large-Cap Growth Fund | | | 65,871 | |
Mid-Cap Value Fund | | | 25,067 | |
Mid-Cap Growth Fund | | | 14,331 | |
Small-Cap Value Fund | | | 11,440 | |
Small-Cap Core Fund | | | 3,366 | |
| | | | |
Fund | | Fees Paid | |
Small-Cap Growth Fund | | $ | 30,251 | |
Short-Term Income Fund | | | 13,459 | |
Strategic Income Fund | | | 23,042 | |
TCH Corporate Income Fund | | | 33,492 | |
TCH Core Plus Bond Fund | | | 96,728 | |
High Yield Bond Fund | | | 396 | |
162
Investments in Affiliated Issuers—An affiliated issuer is an entity in which the Fund has ownership of at least 5% of the voting securities or any investment in a BMO Fund. Issuers that are affiliates of the Fund at period-end are noted in the Fund’s Schedule of Investments. Additional security purchases and the reduction of certain securities shares outstanding of existing portfolio holdings that were not considered affiliated in prior periods may result in the Funds owning in excess of 5% of the outstanding shares at period-end. The table below reflects transactions during the period with entities that are affiliates as of August 31, 2018 and may include acquisitions of new investments, prior period holdings that became affiliated during the period and prior period affiliated holdings that are no longer affiliated as of period-end.
| | | | | | | | | | | | | | | | | | | | | | | | | | | | | | | | |
Security/Fund Description | | Value,
Beginning
of Period | | | Purchases | | | Sales
Proceeds | | | Change in
Unrealized
Appreciation
(Depreciation) | | | Net
Realized
Gain (Loss) | | | Value,
End
of Period | | | Dividends
Credited
to
Income | | | Net Realized
Gain on
Capital Gain
Distributions | |
| |
Cash Sweep Investments in BMO Institutional Prime Money Market Fund, Premier Class, 1.987% | | | | | |
Low Volatility Equity Fund | | $ | 2,833,143 | | | $ | 34,175,404 | | | $ | 35,514,485 | | | $ | 359 | | | $ | (217 | ) | | $ | 1,494,204 | | | $ | 30,037 | | | $ | — | |
Dividend Income Fund | | | 2,075,405 | | | | 30,100,477 | | | | 28,584,992 | | | | 518 | | | | (309 | ) | | | 3,591,099 | | | | 37,587 | | | | — | |
Large-Cap Value Fund | | | 4,411,207 | | | | 55,872,931 | | | | 52,802,005 | | | | 1,019 | | | | (839 | ) | | | 7,482,313 | | | | 86,527 | | | | — | |
Large-Cap Growth Fund | | | 4,542,780 | | | | 67,488,598 | | | | 65,295,760 | | | | 31 | | | | 182 | | | | 6,735,831 | | | | 79,081 | | | | — | |
Mid-Cap Value Fund | | | 1,880,791 | | | | 33,662,325 | | | | 33,122,828 | | | | 584 | | | | 1 | | | | 2,420,873 | | | | 40,465 | | | | — | |
Mid-Cap Growth Fund | | | 1,947,313 | | | | 19,278,412 | | | | 19,642,438 | | | | 152 | | | | 293 | | | | 1,583,732 | | | | 25,170 | | | | — | |
Small-Cap Value Fund | | | 588,562 | | | | 14,914,425 | | | | 14,016,770 | | | | 154 | | | | (180 | ) | | | 1,486,191 | | | | 14,956 | | | | — | |
Small-Cap Core Fund | | | 369,001 | | | | 6,503,912 | | | | 6,432,217 | | | | 66 | | | | (20 | ) | | | 440,742 | | | | 5,889 | | | | — | |
Small-Cap Growth Fund | | | 1,560,493 | | | | 41,723,716 | | | | 41,246,572 | | | | 317 | | | | 688 | | | | 2,038,642 | | | | 28,964 | | | | — | |
Global Low Volatility Equity Fund | | | — | | | | 4,051,244 | | | | 3,907,308 | | | | 14 | | | | 26 | | | | 143,976 | | | | 4,696 | | | | — | |
Disciplined International Equity Fund | | | — | | | | 16,374,357 | | | | 13,758,887 | | | | 137 | | | | 369 | | | | 2,615,976 | | | | 11,964 | | | | — | |
Pyrford International Stock Fund | | | — | | | | 93,540,213 | | | | 76,753,134 | | | | 979 | | | | 4,409 | | | | 16,792,467 | | | | 143,287 | | | | — | |
LGM Emerging Markets Equity Fund | | | — | | | | 37,777,495 | | | | 30,512,000 | | | | 1,482 | | | | 1,303 | | | | 7,268,280 | | | | 62,307 | | | | — | |
Alternative Strategies Fund | | | — | | | | 66,189,857 | | | | 41,655,108 | | | | 5,191 | | | | 462 | | | | 24,540,402 | | | | 15,008 | | | | — | |
Global Long/Short Equity Fund | | | — | | | | 9,459,859 | | | | 6,027,318 | | | | 366 | | | | 1,296 | | | | 3,434,203 | | | | 42,148 | | | | — | |
Short-Term Income Fund | | | 4,464,102 | | | | 199,465,835 | | | | 200,689,379 | | | | 535 | | | | 972 | | | | 3,242,065 | | | | 96,893 | | | | — | |
Strategic Income Fund | | | 938,029 | | | | 41,408,840 | | | | 36,559,600 | | | | 486 | | | | (507 | ) | | | 5,787,248 | | | | 34,703 | | | | — | |
TCH Corporate Income Fund | | | 4,410,836 | | | | 84,524,902 | | | | 84,084,732 | | | | 261 | | | | (383 | ) | | | 4,850,884 | | | | 60,075 | | | | — | |
TCH Core Plus Bond Fund | | | 46,560,055 | | | | 410,079,134 | | | | 415,775,313 | | | | 3,960 | | | | (5,725 | ) | | | 40,862,111 | | | | 459,304 | | | | — | |
High Yield Bond Fund | | | 360,045 | | | | 5,156,137 | | | | 4,702,232 | | | | 79 | | | | (32 | ) | | | 813,997 | | | | 5,811 | | | | — | |
| |
| Cash Sweep Investments in BMO Government Money Market Fund, Premier Class, 1.773% | | | | | |
Ultra Short Tax-Free Fund | | | 80,322 | | | | 149,949,581 | | | | 149,870,002 | | | | — | | | | — | | | | 159,901 | | | | 13,324 | | | | — | |
Short Tax-Free Fund | | | 115,488 | | | | 26,908,124 | | | | 26,902,412 | | | | — | | | | — | | | | 121,200 | | | | 3,129 | | | | — | |
Intermediate Tax-Free Fund | | | 79,783 | | | | 107,646,377 | | | | 107,640,238 | | | | — | | | | — | | | | 85,922 | | | | 9,691 | | | | — | |
| | | | | | | |
Investments in Other Affiliates | | | | | | | | | | | | | | | | | | | | | | |
Fund/Security Description | | | | | | | | | | | | | | | | | | | | | | | | | | | | | | | | |
Short Tax-Free Fund | | | | | | | | | | | | | | | | | | | | | | | | | | | | | | | | |
Ultra Short Tax-Free Fund | | | 866,132 | | | | 10,865 | | | | — | | | | (1,694 | ) | | | — | | | | 875,303 | | | | 9,865 | | | | — | |
| | | | | | | | |
Intermediate Tax-Free Fund | | | | | | | | | | | | | | | | | | | | | | | | | | | | | | | | |
Ultra Short Tax-Free Fund | | | 5,108,497 | | | | 64,085 | | | | — | | | | (10,172 | ) | | | — | | | | 5,162,410 | | | | 58,185 | | | | — | |
Interfund Borrowing and Lending—The Funds participate in an interfund lending program. This program allows the Funds to lend cash to and/or borrow cash from other Funds for temporary purposes, although the Money Market Funds cannot participate as borrowers. The program is subject to a number of conditions, including the requirement that the interfund loan rate to be charged to the Funds under the program is (i) more favorable to the lending Fund than the rate it could otherwise obtain from investing cash in repurchase agreements or purchasing shares of a Money Market Fund and (ii) more favorable to the borrowing Fund than the lowest interest rate at which bank short-term loans would be available to the Funds. In addition, a Fund may participate in the program only if its participation is consistent with the Fund’s investment policies and limitations. The Directors are responsible for the oversight of the interfund lending program. No interfund borrowing or lending balances existed as of August 31, 2018.
Funds utilizing the Interfund lending program, borrowing from the BMO Government Money Market Fund during the year August 31, 2018, were as follows:
| | | | | | | | |
Fund | | Average Daily
Loan Balance
Outstanding | | | Weighted Average
Interest Rate | |
Low Volatility Equity Fund | | $ | 124,151 | | | | 1.554 | % |
Large-Cap Growth Fund | | | 43,989 | | | | 1.662 | |
Mid-Cap Value Fund | | | 36,006 | | | | 3.707 | |
Mid-Cap Growth Fund | | | 9,302 | | | | 3.445 | |
Small-Cap Value Fund | | | 456 | | | | 4.146 | |
Small-Cap Core Fund | | | 11,321 | | | | 2.687 | |
Small-Cap Growth Fund | | | 9,606 | | | | 3.053 | |
| | | | | | | | |
Fund | | Average Daily
Loan Balance
Outstanding | | | Weighted Average
Interest Rate | |
Global Low Volatility Equity Fund | | $ | 84,161 | | | | 1.672 | % |
Disciplined International Equity Fund | | | 245 | | | | 1.669 | |
Pyrford International Stock Fund | | | 63,401 | | | | 1.664 | |
Ultra Short Tax-Free Fund | | | 28,299 | | | | 1.286 | |
Short Tax-Free Fund | | | 3,659 | | | | 4.984 | |
Intermediate Tax-Free Fund | | | 38,791 | | | | 1.642 | |
Strategic Income Fund | | | 2,692 | | | | 1.531 | |
163
| | |
| | |
| Notes to Financial Statements(continued) | | |
General—Certain of the Officers and Directors of the Corporation are also Officers and Directors/Trustees of one or more of the above companies, which are affiliates of the Corporation. None of the Fund Officers or interested Directors receives any compensation from the Funds.
The Corporation, on behalf of the respective Funds, participated in a $25 million unsecured, committed revolving line of credit (“LOC”) agreement with UMB Bank, n.a. The LOC was made available for extraordinary or emergency purposes, primarily for financing redemption payments. Borrowings are charged interest at a rate of the London Interbank Offering Rate (“LIBOR”) plus 1.25% and a commitment fee of 0.20% per annum on the daily unused portion with no administrative fee. No borrowings were outstanding under the LOC at August 31, 2018. The Funds did not utilize the LOC during the year ended August 31, 2018.
| 8. | | Investment Transactions |
Purchases and sales of investments, excluding short-term U.S. government securities, short-term obligations, and in-kind contributions, for the year ended August 31, 2018 were as follows:
| | | | | | | | | | | | | | | | |
| | | Other than
U.S Government
Securities | | | U.S Government
Securities | |
Fund | | Purchases | | | Sales | | | Purchases | | | Sales | |
Low Volatility Equity Fund | | $ | 61,591,401 | | | $ | 107,648,818 | | | $ | — | | | $ | — | |
Dividend Income Fund | | | 65,109,929 | | | | 50,434,519 | | | | — | | | | — | |
Large-Cap Value Fund | | | 200,335,402 | | | | 196,472,697 | | | | — | | | | — | |
Large-Cap Growth Fund | | | 217,230,063 | | | | 259,782,166 | | | | — | | | | — | |
Mid-Cap Value Fund | | | 130,415,005 | | | | 157,620,875 | | | | — | | | | — | |
Mid-Cap Growth Fund | | | 75,599,018 | | | | 91,481,271 | | | | — | | | | — | |
Small-Cap Value Fund | | | 48,695,963 | | | | 50,634,520 | | | | — | | | | — | |
Small-Cap Core Fund | | | 19,588,574 | | | | 19,025,999 | | | | — | | | | — | |
Small-Cap Growth Fund | | | 112,730,853 | | | | 137,962,350 | | | | — | | | | — | |
Global Low Volatility Equity Fund | | | 15,291,417 | | | | 36,882,281 | | | | — | | | | — | |
Disciplined International Equity Fund | | | 43,759,401 | | | | 38,980,204 | | | | — | | | | — | |
Pyrford International Stock Fund | | | 168,248,005 | | | | 129,516,496 | | | | — | | | | — | |
LGM Emerging Markets Equity Fund | | | 92,793,810 | | | | 41,211,372 | | | | — | | | | — | |
Alternative Strategies Fund | | | 58,898,914 | | | | 58,684,644 | | | | — | | | | — | |
Global Long/Short Equity Fund | | | 9,419,989 | | | | 9,842,074 | | | | — | | | | — | |
Ultra Short Tax-Free Fund | | | 954,983,949 | | | | 1,039,900,665 | | | | 3,500,000 | | | | 10,000 | |
Short Tax-Free Fund | | | 191,432,710 | | | | 174,071,260 | | | | 1,345,000 | | | | — | |
Short-Term Income Fund | | | 128,920,200 | | | | 113,602,909 | | | | 33,352,012 | | | | 38,644,452 | |
Intermediate Tax-Free Fund | | | 955,850,271 | | | | 746,446,121 | | | | 3,500,000 | | | | 5,000 | |
Strategic Income Fund | | | 31,871,189 | | | | 58,339,845 | | | | 1,983,920 | | | | 8,212,871 | |
TCH Corporate Income Fund | | | 77,327,574 | | | | 81,218,627 | | | | — | | | | 6,865,230 | |
TCH Core Plus Bond Fund | | | 512,940,377 | | | | 473,193,013 | | | | 199,650,061 | | | | 206,764,309 | |
High Yield Bond Fund | | | 4,477,999 | | | | 6,415,334 | | | | — | | | | — | |
| 9. | | Federal Tax Information |
The timing and character of income and capital gain distributions are determined in accordance with income tax regulations, which may differ from GAAP. These differences are due in part to differing treatments for net operating loss, foreign currency transactions, paydown gain or loss, market discount accretion, premium amortization and expiring capital loss carryforwards.
To the extent that differences arise that are permanent in nature, such amounts are reclassified within the capital accounts, on the Statements of Assets and Liabilities, based on their Federal tax basis treatment; temporary differences do not require reclassification and had no impact on the NAV of the Funds.
The Funds complied with FASB interpretation Accounting for Uncertainty in Income Taxes which provides guidance for how uncertain tax provisions should be recognized, measured, presented and disclosed in the financial statements. Accounting for Uncertainty in Income Taxes requires the affirmative evaluation of tax positions taken or expected to be taken in the course of preparing the Funds’ tax returns to determine whether it is “more-likely-than-not,” (i.e., greater than 50 percent) of being sustained by the applicable tax authority. Tax positions not deemed to meet the more-likely-than-not threshold may result in a tax benefit or expense in the current year.
Accounting for Uncertainty in Income Taxes requires management of the Funds to analyze all open tax years, as defined by the statutes of limitations, for all major jurisdictions, which includes federal and certain states. Open tax years are those that are open for exam by the taxing authorities (i.e., the last four tax years and the interim tax period since then). There are no examinations in progress. For all open tax years and all major taxing jurisdictions through the end of the reporting period, management of the Funds reviewed all tax positions taken or expected to be taken in the preparation of the Funds’ tax returns and concluded that Accounting for Uncertainty in Income Taxes resulted in no effect on the Funds’ reported net assets
164
or results of operations as of and during the period ended August 31, 2018. Management of the Funds also is not aware of any tax positions for which it is reasonably possible that the total amounts of recognized tax benefits will significantly change in the next twelve months.
The difference between book basis and tax basis unrealized appreciation/depreciation is attributable in part to the tax deferral of losses on wash sales, the realization for tax purposes of unrealized gains on investments in passive foreign investment companies, derivatives, foreign unrealized capital gains tax, foreign currency and the discount accretion/premium amortization of debt securities.
| | | | | | | | | | | | | | | | |
Fund | | Cost of
Investments
for Federal
Tax Purposes | | | Gross
Unrealized
Appreciation
for Federal
Tax Purposes | | | Gross
Unrealized
(Depreciation)
for Federal
Tax Purposes | | | Net
Unrealized
Appreciation
(Depreciation)
for Federal
Tax Purposes | |
Low Volatility Equity Fund | | $ | 161,637,398 | | | $ | 25,102,689 | | | $ | (896,371 | ) | | $ | 24,206,318 | |
Dividend Income Fund | | | 189,109,960 | | | | 37,475,393 | | | | (1,052,306 | ) | | | 36,423,087 | |
Large-Cap Value Fund | | | 487,276,265 | | | | 68,252,586 | | | | (5,471,959 | ) | | | 62,780,627 | |
Large-Cap Growth Fund | | | 428,554,543 | | | | 131,069,429 | | | | (2,754,316 | ) | | | 128,315,113 | |
Mid-Cap Value Fund | | | 266,394,891 | | | | 32,947,700 | | | | (6,043,986 | ) | | | 26,903,714 | |
Mid-Cap Growth Fund | | | 157,471,958 | | | | 31,372,436 | | | | (1,932,065 | ) | | | 29,440,371 | |
Small-Cap Value Fund | | | 100,293,245 | | | | 13,373,555 | | | | (1,080,655 | ) | | | 12,292,900 | |
Small-Cap Core Fund | | | 31,377,512 | | | | 4,679,582 | | | | (447,579 | ) | | | 4,232,003 | |
Small-Cap Growth Fund | | | 188,486,477 | | | | 36,443,813 | | | | (2,432,105 | ) | | | 34,011,708 | |
Global Low Volatility Equity Fund | | | 28,035,500 | | | | 5,074,270 | | | | (710,767 | ) | | | 4,363,503 | |
Disciplined International Equity Fund | | | 73,735,215 | | | | 8,024,291 | | | | (3,872,949 | ) | | | 4,151,342 | |
Pyrford International Stock Fund | | | 608,623,715 | | | | 77,830,232 | | | | (24,360,530 | ) | | | 53,469,702 | |
LGM Emerging Markets Equity Fund | | | 184,681,895 | | | | 35,550,621 | | | | (11,015,022 | ) | | | 24,535,599 | |
Alternative Strategies Fund | | | 72,639,332 | | | | 5,656,143 | | | | (4,011,906 | ) | | | 1,644,237 | |
Global Long/Short Equity Fund | | | 12,318,637 | | | | 1,551,903 | | | | (689,564 | ) | | | 862,339 | |
Ultra ShortTax-Free Fund | | | 609,887,539 | | | | 502,817 | | | | (424,829 | ) | | | 77,988 | |
ShortTax-Free Fund | | | 190,578,751 | | | | 652,669 | | | | (567,507 | ) | | | 85,162 | |
Short-Term Income Fund | | | 279,774,417 | | | | 511,307 | | | | (2,035,704 | ) | | | (1,524,397 | ) |
IntermediateTax-Free Fund | | | 1,739,328,450 | | | | 39,030,139 | | | | (4,737,895 | ) | | | 34,292,244 | |
Strategic Income Fund | | | 110,573,141 | | | | 710,378 | | | | (2,832,269 | ) | | | (2,121,891 | ) |
TCH Corporate Income Fund | | | 295,642,618 | | | | 2,946,237 | | | | (5,239,217 | ) | | | (2,292,980 | ) |
TCH Core Plus Bond Fund | | | 1,412,784,177 | | | | 7,726,972 | | | | (17,070,577 | ) | | | (9,343,605 | ) |
High Yield Bond Fund | | | 16,228,563 | | | | 208,964 | | | | (282,697 | ) | | | (73,733 | ) |
Government Money Market Fund | | | 3,391,316,233 | | | | — | | | | — | | | | — | |
Tax-Free Money Market Fund | | | 380,941,747 | | | | — | | | | — | | | | — | |
Prime Money Market Fund | | | 461,789,059 | | | | — | | | | — | | | | — | |
Institutional Prime Money Market Fund | | | 482,082,323 | | | | 64,353 | | | | (8,254 | ) | | | 56,099 | |
The tax character of distributions reported on the Statement of Changes in Net Assets for the years ended August 31, 2018 and August 31, 2017, were as follows:
| | | | | | | | | | | | | | | | | | | | | | | | |
| | | 2018 | | | 2017 | |
Fund | | Ordinary
Income | | | Tax-Exempt
Income | | | Long-Term
Capital Gains | | | Ordinary
Income | | | Tax-Exempt
Income | | | Long-Term
Capital Gains | |
Low Volatility Equity Fund | | $ | 3,160,478 | | | $ | — | | | $ | 3,189,229 | | | $ | 2,603,123 | | | $ | — | | | $ | 1,905,554 | |
Dividend Income Fund | | | 5,133,814 | | | | — | | | | 11,100,034 | | | | 2,500,532 | | | | — | | | | 959,489 | |
Large-Cap Value Fund | | | 11,266,495 | | | | — | | | | 23,620,755 | | | | 4,510,036 | | | | — | | | | 2,304,010 | |
Large-Cap Growth Fund | | | 5,872,237 | | | | — | | | | 14,405,633 | | | | 1,825,514 | | | | — | | | | 15,369,764 | |
Mid-Cap Value Fund | | | 5,417,735 | | | | — | | | | 4,733,501 | | | | 4,684,525 | | | | — | | | | 56,396,982 | |
Mid-Cap Growth Fund | | | 3,084,500 | | | | — | | | | 3,984,417 | | | | 5,370,941 | | | | — | | | | 21,512,271 | |
Small-Cap Value Fund | | | 3,505,522 | | | | — | | | | 1,725,945 | | | | 3,050,561 | | | | — | | | | 3,585,078 | |
Small-Cap Core Fund | | | 454,372 | | | | — | | | | 822,023 | | | | 168,167 | | | | — | | | | 124,126 | |
Small-Cap Growth Fund | | | — | | | | — | | | | 14,759,760 | | | | — | | | | — | | | | — | |
Global Low Volatility Equity Fund | | | 1,366,846 | | | | — | | | | 495,697 | | | | 1,170,206 | | | | — | | | | 97,713 | |
Disciplined International Equity Fund | | | 1,534,123 | | | | — | | | | — | | | | 1,676,485 | | | | — | | | | — | |
Pyrford International Stock Fund | | | 16,810,534 | | | | — | | | | — | | | | 14,300,415 | | | | — | | | | — | |
LGM Emerging Markets Equity Fund | | | 1,245,393 | | | | — | | | | — | | | | 957,823 | | | | — | | | | — | |
Alternative Strategies Fund | | | 49,511 | | | | — | | | | 4,427,483 | | | | — | | | | — | | | | — | |
Global Long/Short Equity Fund | | | 188,423 | | | | — | | | | 226,026 | | | | 56,198 | | | | — | | | | 4,250 | |
Ultra ShortTax-Free Fund | | | 94,095 | | | | 7,997,980 | | | | 217,628 | | | | 2,011 | | | | 5,640,480 | | | | 639,708 | |
ShortTax-Free Fund | | | — | | | | 2,927,616 | | | | — | | | | 10,806 | | | | 2,531,848 | | | | 38,121 | |
Short-Term Income Fund | | | 5,064,383 | | | | — | | | | — | | | | 4,432,458 | | | | — | | | | — | |
IntermediateTax-Free Fund | | | — | | | | 46,051,482 | | | | — | | | | 2,084,903 | | | | 43,607,907 | | | | 3,410,963 | |
165
| | |
| | |
| Notes to Financial Statements(continued) | | |
| | | | | | | | | | | | | | | | | | | | | | | | |
| | | 2018 | | | 2017 | |
Fund | | Ordinary
Income | | | Tax-Exempt
Income | | | Long-Term
Capital Gains | | | Ordinary
Income | | | Tax-Exempt
Income | | | Long-Term
Capital Gains | |
Strategic Income Fund | | $ | 4,339,645 | | | $ | — | | | $ | — | | | $ | 3,032,372 | | | $ | — | | | $ | — | |
TCH Corporate Income Fund | | | 8,278,452 | | | | — | | | | — | | | | 7,493,830 | | | | — | | | | 569,448 | |
TCH Core Plus Bond Fund | | | 32,309,452 | | | | — | | | | — | | | | 28,160,653 | | | | — | | | | — | |
High Yield Bond Fund | | | 652,504 | | | | — | | | | — | | | | 2,221,025 | | | | — | | | | — | |
Government Money Market Fund | | | 40,601,282 | | | | — | | | | 900 | | | | 13,191,339 | | | | — | | | | 3,237 | |
Tax-Free Money Market Fund | | | — | | | | 3,674,509 | | | | — | | | | 20,120 | | | | 1,920,845 | | | | 86,463 | |
Prime Money Market Fund | | | 5,929,727 | | | | — | | | | 111 | | | | 2,441,514 | | | | — | | | | — | |
Institutional Prime Money Market Fund | | | 6,828,289 | | | | — | | | | 35 | | | | 3,084,589 | | | | — | | | | — | |
As of August 31, 2018, the components of distributable earnings on a tax basis are as follows:
| | | | | | | | | | | | | | | | | | | | | | | | |
Fund | | Undistributed
Ordinary
Income | | | Undistributed
Tax-Exempt
Income | | | Undistributed
Long-Term
Capital Gains | | | Accumulated
Capital and
Other Losses | | | Foreign
Currency, Futures
Dividend Payable,
and Other
Adjustments | | | Unrealized
Appreciation
(Depreciation) | |
Low Volatility Equity Fund | | $ | 1,633,663 | | | $ | — | | | $ | 9,175,654 | | | $ | — | | | $ | — | | | $ | 24,206,318 | |
Dividend Income Fund | | | 698,635 | | | | — | | | | 6,855,034 | | | | — | | | | — | | | | 36,423,087 | |
Large-Cap Value Fund | | | 4,270,259 | | | | — | | | | 28,831,046 | | | | — | | | | (2 | ) | | | 62,780,627 | |
Large-Cap Growth Fund | | | 11,523,583 | | | | — | | | | 34,995,341 | | | | — | | | | (1 | ) | | | 128,315,113 | |
Mid-Cap Value Fund | | | 2,264,935 | | | | — | | | | 19,254,357 | | | | — | | | | — | | | | 26,903,714 | |
Mid-Cap Growth Fund | | | 5,879,806 | | | | — | | | | 10,955,561 | | | | — | | | | — | | | | 29,440,371 | |
Small-Cap Value Fund | | | 1,801,630 | | | | — | | | | 3,047,422 | | | | — | | | | — | | | | 12,292,900 | |
Small-Cap Core Fund | | | 492,291 | | | | — | | | | 1,456,896 | | | | — | | | | — | | | | 4,232,003 | |
Small-Cap Growth Fund | | | 5,124,772 | | | | — | | | | 13,272,114 | | | | — | | | | — | | | | 34,011,708 | |
Global Low Volatility Equity Fund | | | 1,069,473 | | | | — | | | | 4,334,916 | | | | — | | | | — | | | | 4,363,503 | |
Disciplined International Equity Fund | | | 1,261,906 | | | | — | | | | — | | | | (13,743 | ) | | | 4,452 | | | | 4,151,342 | |
Pyrford International Stock Fund | | | 15,265,819 | | | | — | | | | — | | | | (28,544,907 | ) | | | — | | | | 53,469,702 | |
LGM Emerging Markets Equity Fund | | | 3,802,840 | | | | — | | | | 3,884,420 | | | | — | | | | — | | | | 24,542,739 | |
Alternative Strategies Fund | | | — | | | | — | | | | — | | | | — | | | | — | | | | 1,644,237 | |
Global Long/Short Equity Fund | | | 50,850 | | | | — | | | | — | | | | — | | | | — | | | | 863,407 | |
Ultra ShortTax-Free Fund | | | — | | | | 402,644 | | | | — | | | | — | | | | 422,300 | | | | 77,988 | |
ShortTax-Free Fund | | | — | | | | 180,366 | | | | — | | | | (200,006 | ) | | | 178,355 | | | | 85,162 | |
Short-Term Income Fund | | | 208,045 | | | | — | | | | — | | | | (1,995,755 | ) | | | 180,027 | | | | (1,524,397 | ) |
IntermediateTax-Free Fund | | | — | | | | 845,431 | | | | — | | | | (9,759,547 | ) | | | 887,982 | | | | 34,292,244 | |
Strategic Income Fund | | | — | | | | — | | | | — | | | | (3,065,182 | ) | | | 15,832 | | | | (2,121,890 | ) |
TCH Corporate Income Fund | | | 704,100 | | | | — | | | | 439,797 | | | | — | | | | 278,988 | | | | (2,292,980 | ) |
TCH Core Plus Bond Fund | | | 255,697 | | | | — | | | | — | | | | (7,255,968 | ) | | | 271,744 | | | | (9,343,604 | ) |
High Yield Bond Fund | | | — | | | | — | | | | — | | | | (3,114,880 | ) | | | 3,660 | | | | (73,733 | ) |
Government Money Market Fund | | | 4,112,372 | | | | — | | | | 200 | | | | — | | | | 4,112,713 | | | | — | |
Tax-Free Money Market Fund | | | 24,255 | | | | 342,981 | | | | — | | | | — | | | | 367,182 | | | | — | |
Prime Money Market Fund | | | 436,537 | | | | — | | | | — | | | | — | | | | 460,504 | | | | — | |
Institutional Prime Money Market Fund | | | 577,481 | | | | — | | | | — | | | | — | | | | 561,043 | | | | 56,099 | |
At August 31, 2018, the Funds had capital loss carryforwards, which reduce the Funds’ taxable income arising from future net realized gains on investments, if any, to the extent permitted by the Code, and thus will reduce the amount of distributions to shareholders which would otherwise be necessary to relieve the Funds of any liability for federal tax. Pursuant to the Code, such capital loss carryforwards are not subject to expiration and are as follows:
| | | | | | | | | | | | |
| | | Capital Loss
Carryforwards | | | | |
Fund | | Short-Term | | | Long-Term | | | Total | |
Disciplined International Equity Fund | | $ | 13,743 | | | $ | — | | | $ | 13,743 | |
Pyrford International Stock Fund | | | 1,449,091 | | | | 27,095,816 | | | | 28,544,907 | |
ShortTax-Free Fund | | | 200,006 | | | | — | | | | 200,006 | |
Short-Term Income Fund | | | 635,906 | | | | 1,359,849 | | | | 1,995,755 | |
IntermediateTax-Free Fund | | | 9,759,547 | | | | — | | | | 9,759,547 | |
Strategic Income Fund | | | — | | | | 3,065,182 | | | | 3,065,182 | |
TCH Core Plus Bond Fund | | | 1,323,964 | | | | 5,932,004 | | | | 7,255,968 | |
High Yield Bond Fund | | | 1,140,981 | | | | 1,973,899 | | | | 3,114,880 | |
166
As of August 31, 2018, the following funds had post-October losses, which are deferred until fiscal year 2019 for tax purposes, of:
| | | | | | | | |
| | | Post-October Losses | |
Fund | | Short-Term | | | Long-Term | |
Alternative Strategies Fund | | $ | 334,731 | | | $ | 544,222 | |
Global Long/Short Equity Fund | | | 643,808 | | | | (528,834 | ) |
Net capital losses incurred after October 31, and within the taxable year, are deemed to arise on the first day of the Funds’ next taxable year.
As of August 31, 2018, the Alternative Strategies Fund had qualified late-year ordinary losses of $654,336, which are deferred until fiscal year 2019 for tax purposes. Net late-year losses incurred after December 31, and within the taxable year, are deemed to arise on the first day of the Funds’ next taxable year.
| 10. | | Shareholder Tax Information (Unaudited) |
Of the ordinary income (including short-term capital gain) distributions made by the Funds during the year ended August 31, 2018, the percentages that qualify for the dividend received deduction available to corporate shareholders were as follows:
| | | | |
Low Volatility Equity Fund | | | 69.63 | % |
Dividend Income Fund | | | 71.16 | |
Large-Cap Value Fund | | | 69.85 | |
Large-Cap Growth Fund | | | 53.77 | |
Mid-Cap Value Fund | | | 33.93 | |
Mid-Cap Growth Fund | | | 9.15 | |
| | | | |
Small-Cap Value Fund | | | 18.15 | % |
Small-Cap Core Fund | | | 20.01 | |
Global Low Volatility Equity Fund | | | 26.50 | |
LGM Emerging Markets Equity Fund | | | 15.07 | |
Global Long/Short Equity Fund | | | 42.96 | |
Of the ordinary income (including short-term capital gain) distributions made by the Funds during the year ended August 31, 2018, the percentages that are designated as qualified dividend income were as follows:
| | | | |
Low Volatility Equity Fund | | | 73.80 | % |
Dividend Income Fund | | | 72.19 | |
Large-Cap Growth Fund | | | 54.93 | |
Large-Cap Value Fund | | | 69.97 | |
Mid-Cap Value Fund | | | 36.93 | |
Mid-Cap Growth Fund | | | 9.66 | |
Small-Cap Value Fund | | | 18.67 | |
| | | | |
Small-Cap Core Fund | | | 23.02 | % |
Global Low Volatility Equity Fund | | | 46.96 | |
Disciplined International Equity Fund | | | 89.29 | |
Pyrford International Stock Fund | | | 73.61 | |
LGM Emerging Markets Equity Fund | | | 91.40 | |
Global Long/Short Equity Fund | | | 100.00 | |
For Federal tax purposes, for the year ended August 31, 2018, the following Funds designate long-term capital gains, of:
| | | | |
Low Volatility Equity Fund | | $ | 3,189,229 | |
Dividend Income Fund | | | 11,100,034 | |
Large-Cap Value Fund | | | 23,620,755 | |
Large-Cap Growth Fund | | | 14,405,633 | |
Mid-Cap Value Fund | | | 4,733,501 | |
Mid-Cap Growth Fund | | | 3,984,417 | |
Small-Cap Value Fund | | | 1,725,945 | |
Small-Cap Core Fund | | | 822,023 | |
| | | | |
Small-Cap Growth Fund | | $ | 14,759,760 | |
Global Low Volatility Equity Fund | | | 495,697 | |
Alternative Strategies Fund | | | 4,427,483 | |
Global Long/Short Equity Fund | | | 226,026 | |
Ultra ShortTax-Free Fund | | | 217,628 | |
Prime Money Market Fund | | | 111 | |
Institutional Prime Money Market Fund | | | 35 | |
For Federal tax purposes, for the year ended August 31, 2018, the following Funds designate qualified short-term capital gains, of:
| | | | |
Low Volatility Equity Fund | | $ | 917,075 | |
Dividend Income Fund | | | 2,258,902 | |
Large-Cap Value Fund | | | 5,965,064 | |
Large-Cap Growth Fund | | | 5,504,951 | |
Mid-Cap Value Fund | | | 3,745,450 | |
Mid-Cap Growth Fund | | | 3,084,500 | |
Small-Cap Value Fund | | | 3,505,522 | |
Small-Cap Core Fund | | | 442,833 | |
| | | | |
Alternative Strategies Fund | | $ | 49,511 | |
Global Long/Short Equity Fund | | | 159,126 | |
Ultra ShortTax-Free Fund | | | 193,558 | |
IntermediateTax-Free Fund | | | 185,961 | |
TCH Corporate Income Fund | | | 305,922 | |
TCH Core Plus Bond Fund | | | 961,781 | |
Prime Money Market Fund | | | 2,136 | |
Institutional Prime Money Market Fund | | | 2,260 | |
For Federal tax purposes, for the year ended August 31, 2018, the following Funds designate qualifiedtax-exempt dividends, of:
| | | | |
Ultra ShortTax-Free Fund | | $ | 10,022,684 | |
ShortTax-Free Fund | | | 3,696,255 | |
IntermediateTax-Free Fund | | | 53,215,891 | |
Tax-Free Money Market Fund | | | 4,629,237 | |
167
| | |
| | |
| Notes to Financial Statements(continued) | | |
For the year ended August 31, 2018, Pursuant to Section 853 of the Code, the following Funds designated income and distributed ordinary income (including short-term capital gains) derived from foreign sources and foreign taxes paid of:
| | | | | | | | | | | | | | | | |
Fund | | Income
Derived from
Foreign Sources | | | Foreign
Source Income
Distributed
per Share | | | Foreign Taxes
Paid | | | Foreign
Taxes Paid
per Share | |
Global Low Volatility Equity Fund | | $ | 959,861 | | | $ | 0.4415 | | | $ | 61,561 | | | $ | 0.0283 | |
Disciplined International Equity Fund | | | 2,626,942 | | | | 0.3715 | | | | 140,949 | | | | 0.0199 | |
Pyrford International Stock Fund | | | 25,695,469 | | | | 0.5178 | | | | 1,428,048 | | | | 0.0288 | |
LGM Emerging Markets Equity Fund | | | 4,549,583 | | | | 0.3519 | | | | 389,168 | | | | 0.0301 | |
For the year ended August 31, 2018, Pursuant to Section 871 of the Code, the Government Money Market Fund designated short-term capital gain dividends and interest related dividends fornon-resident alien shareholders of $4,811 and $40,596,471, respectively.
| 11. | | Recently Issued Accounting Pronouncements |
In March 2017, FASB issued an Accounting Standard Update, ASU 2017-08, Receivables Nonrefundable Fees and Other Costs(Subtopic 310-20), Premium Amortization on Purchased Callable Debt Securities (the “ASU”) which amends the amortization period for certain purchased callable debt securities held at a premium, shortening such period to the earliest call date. The ASU does not require any accounting change for debt securities held at a discount; the discount continues to be accreted to maturity. The ASU is effective for fiscal years, and interim periods within those fiscal years, beginning after December 15, 2018. At this time, management is evaluating the implications of these changes on the financial statements.
In August 2018, FASB issued Accounting Standards Update 2018-13 Fair Value Measurement (Topic 820) Disclosure Framework—Changes to the Disclosure Requirements, which sets forth a methodology for disclosing the fair value hierarchy. Compliance is effective for interim and annual reporting periods in fiscal years that begin after December 15, 2019.
In August 2018, the Securities and Exchange Commission released its Final Rules that eliminates or amends disclosure requirements that are redundant or outdated in light of changes in SEC requirements, US GAAP, IFRS or changes in technology or the business environment. The Rules are effective 30 days from publication in the Federal Register.
Effective October 1, 2018, BMO Alternative Strategies Fund lowered its investment advisory fee as noted in the table below, and lowered its net expense ratios for the Advisor Class and Institutional Class from 2.00% and 1.75%, respectively, to 1.70% and 1.45%, respectively.
| | | | | | | | | | | | |
| | | Fund’s ADNA | |
| | | on the
first
$1
billion | | | on the
next
$1
billion | | | in excess
of $2
billion | |
Alternative Strategies Fund | | | 1.000 | % | | | 0.975 | % | | | 0.950 | % |
Effective October 18, 2018, the Corporation, on behalf of the respective Funds, terminated the LOC agreement with UMB Bank, n.a. and committed to a $25 million LOC with State Street Bank & Trust Company.
168
| | |
| | |
| | | Results of the Special Meeting of Shareholders (Unaudited) |
The special meeting of the shareholders of BMO Pyrford International Stock Fund was held on April 23, 2018. The matter voted on by the shareholders of record as of March 20, 2018 and the results of the vote at the shareholder meeting held April 23, 2018 are as follows:
| | | | To approve an amendment to the Articles of Incorporation, as amended, of BMO Funds, Inc. to redesignate and convert the Class Y shares of the Fund into Class A shares of the Fund and to terminate the Class Y shares of the Fund, as described in a plan of redesignation and conversion. |
| | | | | | | | | | | | |
| | | Affirmative | | | Against | | | Abstain | |
BMO Pyrford International Stock Fund | | | 286,921 | | | | 1,293 | | | | 98 | |
The special meeting of the shareholders of BMOMid-Cap Value Fund and BMOSmall-Cap Value Fund was held on April 23, 2018, and adjourned with respect to BMOSmall-Cap Value Fund and reconvened on May 7, 2018. The matter voted on by the shareholders of record of each Fund as of March 20, 2018 and the results of the vote at the shareholder meeting held April 23, 2018 with respect to BMOMid-Cap Value Fund, and May 7, 2018 with respect BMOSmall-Cap Value Fund, are as follows:
| | | | To approve an amendment to the Articles of Incorporation, as amended, of BMO Funds, Inc. to liquidate the Class R3 shares of the Fund and to terminate Class R3 as a share class of the Fund. |
| | | | | | | | | | | | |
| | | Affirmative | | | Against | | | Abstain | |
BMOMid-Cap Value Fund | | | 1,906 | | | | 0 | | | | 0 | |
BMOSmall-Cap Value Fund | | | 2,924 | | | | 0 | | | | 138 | |
169
|
| |
| Report of Independent Registered Public Accounting Firm |
To the Board of Directors and Shareholders of BMO Funds, Inc.:
Opinion on the Financial Statements
We have audited the accompanying statements of assets and liabilities of BMO Low Volatility Equity Fund, BMO Dividend Income Fund, BMOLarge-Cap Value Fund, BMOLarge-Cap Growth Fund, BMOMid-Cap Value Fund, BMOMid-Cap Growth Fund, BMOSmall-Cap Value Fund, BMOSmall-Cap Core Fund, BMOSmall-Cap Growth Fund, BMO Global Low Volatility Equity Fund, BMO Disciplined International Equity Fund, BMO Pyrford International Stock Fund, BMO LGM Emerging Markets Equity Fund, BMO Alternative Strategies Fund, BMO Global Long/Short Equity Fund, BMO Ultra ShortTax-Free Fund, BMO ShortTax-Free Fund, BMOShort-Term Income Fund, BMO IntermediateTax-Free Fund, BMO Strategic Income Fund, BMO TCH Corporate Income Fund, BMO TCH Core Plus Bond Fund, BMO High Yield Bond Fund, BMO Government Money Market Fund, BMOTax-Free Money Market Fund, BMO Prime Money Market Fund, and BMO Institutional Prime Money Market Fund (each a series of BMO Funds, Inc., collectively referred to as the Funds), including the schedules of investments as of August 31, 2018, the related statements of operations for the year then ended, the statements of changes in net assets for each of the years in thetwo-year period then ended, and the related notes to financial statements (collectively, the financial statements), and the financial highlights for each of the years or periods in thefive-year period then ended. In our opinion, the financial statements and financial highlights present fairly, in all material respects, the financial position of the Funds as of August 31, 2018, the results of their operations for the year then ended, the changes in their net assets for each of the years in thetwo-year period then ended, and the financial highlights for each of the years or periods in thefive-year period then ended, in conformity with U.S. generally accepted accounting principles.
Basis for Opinion
These financial statements and financial highlights are the responsibility of the Funds’ management. Our responsibility is to express an opinion on these financial statements and financial highlights based on our audits. We are a public accounting firm registered with the Public Company Accounting Oversight Board (United States) (PCAOB) and are required to be independent with respect to the Funds in accordance with the U.S. federal securities laws and the applicable rules and regulations of the Securities and Exchange Commission and the PCAOB.
We conducted our audits in accordance with the standards of the PCAOB. Those standards require that we plan and perform the audit to obtain reasonable assurance about whether the financial statements and financial highlights are free of material misstatement, whether due to error or fraud. Our audits included performing procedures to assess the risks of material misstatement of the financial statements and financial highlights, whether due to error or fraud, and performing procedures that respond to those risks. Such procedures included examining, on a test basis, evidence regarding the amounts and disclosures in the financial statements and financial highlights. Such procedures also included confirmation of securities owned as of August 31, 2018 by correspondence with custodians and brokers or by other appropriate auditing procedures. Our audits also included evaluating the accounting principles used and significant estimates made by management, as well as evaluating the overall presentation of the financial statements and financial highlights. We believe that our audits provide a reasonable basis for our opinion.
/s/ KPMG LLP
We have served as the auditor of one or more BMO Funds, Inc. investment companies since 2011.
Columbus, Ohio
October 26, 2018
170
| | |
| |
| Directors and Officers of the Funds(Unaudited) |
The following tables provide information about each Director and Officer of the Funds as of August 31, 2018. The address of each Director is c/o BMO Funds, 111 East Kilbourn Avenue, Suite 200, Milwaukee, Wisconsin 53202. There are currently 43 separate portfolios or funds in the BMO Funds complex, of which 42 are registered as BMO Funds, Inc. and one is registered as BMO LGM Frontier Markets Equity Fund with the Securities and Exchange Commission. The Funds’ Statement of Additional Information includes additional information about the Directors and is available, without charge and upon request, by calling 1-800-236-FUND (3863).
| | | | | | | | | | |
| INDEPENDENT DIRECTORS | | | | | | |
| Name and Age | | Position(s) Held
with the Corporation | | Term of
Office and
Length of
Time Served* | | Principal Occupation(s)
During Past 5 Years | | Number of
Portfolios in
Fund
Complex
Overseen by
Director | | Other
Directorships
Held by
Director |
| | | | | |
Ridge A. Braunschweig Age: 65 | | Independent Director | | Since
October
2009 | | President and Chief Executive Officer, CPL Industries, Inc. (a manufacturing holding company prior to May 2009 and a family office since May 2009), since January 2012. | | 43 | | None |
| | | | | |
Benjamin M. Cutler Age: 73 | | Independent Director | | Since July
2004 | | Chairman, USHEALTH Group, Inc. (a health insurance company), since 2004; CEO and President, USHEALTH Group, Inc., from 2004 to 2016; Director, Freedom from Hunger (a non-profit organization), since 2016. | | 43 | | None |
| | | | | |
John A. Lubs Age: 70 | | Independent Director | | Since July
2004 | | Retired; formerly, Vice Chairman, Mason Companies, Inc. (a footwear distributor), from 2004 to 2010 and Chief Operating Officer, from 2003 to 2010. | | 43 | | None |
| | | | | |
Vincent P. Lyles Age: 57 | | Independent Director | | Since
September
2017 | | President and Chief Executive Officer, Boys & Girls Clubs of Greater Milwaukee, since 2012. | | 43 | | None |
| | | | | |
James Mitchell Age: 71 | | Independent Director | | Since
March
1999 | | Chairman, Ayrshire Precision Engineering (a precision machining company), since 1992; Chief Executive Officer, NOG, Inc. (a metal processing and consulting company), from 1999 to 2015. | | 43 | | None |
| | | | | |
Barbara J. Pope
Age: 70 | | Independent Director | | Since
March
1999 | | Retired; formerly, President of Barbara J. Pope, P.C. (a financial consulting firm), 1992-2015; President of Sedgwick Street Fund LLC (a private investment partnership), 1996-2015; Tax Partner, Price Waterhouse | | 43 | | None |
* Each Director serves an indefinite term until he or she retires or otherwise resigns, is removed, dies or until his or her successor is duly elected. Retirement
for a Director occurs no later than August 31 following his or her 75th birthday. |
171
|
| |
| Directors and Officers of the Funds(Unaudited) (continued) |
| | | | | | | | | | |
| INTERESTED DIRECTORS |
| Name and Age | | Position(s) Held with
the Corporation | | Term of
Office and
Length of
Time Served* | | Principal Occupation(s)
During Past 5 Years | | Number of
Portfolios in
Fund
Complex
Overseen by
Director | | Other
Directorships
Held by
Director |
| | | | | |
John M. Blaser** Age: 61 | | Director and President | | Since
May
1999 | | Managing Director of the Adviser, since June 2012. | | 43 | | None |
| | | | | |
Daniela O’Leary - Gill** Age: 53 | | Director | | Since
August
2018 | | Chief Operating Officer of BMO Financial Group, since February 1, 2018; Director of the Adviser since June 1, 2018; Head, Communications, Government & Investor Relations 2016-2018; Head, AML Program Oversight 2014-2016; SVP, Personal Banking & Chief CRA Officer 2011-2014. | | 43 | | None |
* Each Director serves an indefinite term until he or she retires or otherwise resigns, is removed, dies or until his or her successor is duly elected. Retirement
for a Director occurs no later than August 31 following his or her 75th birthday. |
** Mr. Blaser is an “interested person” of the Corporation (as defined in the 1940 Act) due to the positions that he holds with the Corporation, and the
Adviser. Ms. O’Leary - Gill is an “interested person” of the Corporation due to the positions that she holds with the Adviser and BMO. |
| | | | | | |
| PRINCIPAL OFFICERS |
| Name and Age | | Position(s) Held with
the Corporation | | Term of Office and Length of
Time Served | | Principal Occupation(s) During Past 5
Years |
| | | |
Brett Black Age: 46 | | Chief Compliance Officer and Anti-Money Laundering Compliance Officer | | Elected by the Board annually; since November 2017 | | Vice President and Chief Compliance Officer of BMO Harris Bank, since 2017; Assistant Vice President, Deputy Chief Compliance Officer, from 2014 to 2017; Senior Compliance Officer of BMO Harris Bank, from 2012 to 2014. |
| | | |
Timothy M. Bonin Age: 45 | | Vice President, Chief Financial Officer and Treasurer | | Elected by the Board annually; since February 2006 | | Vice President of the Adviser, since February 2006. |
| | | |
Michael J. Murphy Age: 39 | | Secretary | | Elected by the Board annually; since May 2016 | | Senior Counsel and Vice President of BMO Harris Bank N.A., since 2014; Associate, Vedder Price P.C., 2010 to 2014. |
172
| | |
| |
Shareholder Report Disclosure of Directors’ Approval of
Continuation of Contracts(Unaudited) |
Approval of Continuation of Advisory and Subadvisory Agreements
During the reporting period, the Board of Directors (the “Board”) of BMO Funds, Inc. (the “Corporation”), including the Directors who are not “interested persons” of the Corporation as defined in the Investment Company Act of 1940, as amended (the “Independent Directors”), met to discuss the advisory and subadvisory agreements, as applicable, of each portfolio of the Corporation included in this shareholder report (each, a “Fund” and collectively, the “Funds”). The Board approved the continuation of the following agreements, all for an additional year ending August 31, 2019 (except as noted): (1) the investment advisory agreement (the “Advisory Agreement”) between the Corporation and BMO Asset Management Corp. (the “Adviser”) on behalf of each Fund(for an additional year ending August 26, 2019 for BMO Disciplined Equity Fund and BMO Global Long/Short Equity Fund); (2) an investment subadvisory agreement with each of the following subadvisers that are affiliates of the Adviser: (i) Taplin, Canida & Habacht, LLC on behalf of BMO TCH Corporate Income Fund and BMO TCH Core Plus Bond Fund; (ii) LGM Investments Limited on behalf of BMO LGM Emerging Markets Equity Fund; (iii) Pyrford International Ltd. on behalf of BMO Pyrford International Stock Fund; and (iv) CTC myCFO, LLC (“CTC”) on behalf of BMO Alternative Strategies Fund; and (3) an investment subadvisory agreement on behalf of BMO Alternative Strategies Fund with each of the following subadvisers that are not affiliated with the Adviser: (i) Cramer Rosenthal McGlynn, LLC; (ii) Graham Capital Management, L.P.; and (iii) Iridian Asset Management LLC. The subadvisers listed above are referred to herein each as a “Subadviser” and collectively as the “Subadvisers.” The subadvisory agreements listed above are referred to herein each as a “Subadvisory Agreement” and collectively as the “Subadvisory Agreements.”
At Board meetings held on July 11, 2018 (“July Meeting”) and August 7-8, 2018 (“August Meeting”), the Board met with management of the Adviser regarding the annual approval of the continuation of the Funds’ Advisory and Subadvisory Agreements. In connection with its consideration of the Advisory and Subadvisory Agreements, the Board considered the information furnished and discussed throughout the year at regularly scheduled Board and Committee meetings, as applicable, and the information provided specifically in relation to the annual consideration of the approval of the Advisory Agreement and Subadvisory Agreements in response to requests of the Independent Directors and their independent legal counsel. Information furnished in connection with Board or Committee meetings throughout the year included, among other things, presentations given by the portfolio managers of the Funds on each Fund’s investment strategies, risks, and performance, comparative performance of each Fund against its benchmark indices; reports regarding each Fund’s asset levels including sales and redemption activities; and various reports on the monitoring of the Funds’ compliance with the securities laws, regulations, policies, and procedures.
In preparation for the Board’s annual consideration of the approval of the Advisory and Subadvisory Agreements, the Board requested and received a wide variety of information and reports concerning the Adviser (and its affiliates) and the Subadvisers, including information on: (1) the nature, extent, and quality of services provided to each Fund by the Adviser (and its affiliates) and the Subadvisers, as applicable; (2) the investment performance of each Fund as compared to a group of comparable funds; (3) the level of the advisory and subadvisory fees charged to each Fund as compared to: (a) other clients of the Adviser and the Subadvisers and (b) a group of comparable funds; (4) the expense ratios of each Fund as compared to a group of comparable funds; (5) the profitability of the Adviser and, to the extent made available, profitability of the Subadvisers; and (6) the Adviser’s and each Subadviser’s compliance program. The Board also considered information related to potential “fall out” or ancillary benefits enjoyed by the Adviser (and its affiliates) and each Subadviser as a result of their relationships with the Funds.
In addition to evaluating, among other things, the written information provided by the Adviser, the Board also considered the answers to questions posed by the Board to representatives of the Adviser at various meetings and took into account their accumulated experience in working with the Adviser on matters related to the Funds. The Independent Directors also met separately in executive sessions with their independent legal counsel to review and consider the information provided regarding the Advisory Agreement and the Subadvisory Agreements.
Based on their review, the Independent Directors and the full Board concluded that it was in the best interests of each Fund to approve the continuation of each Advisory and Subadvisory Agreement, as applicable. Although the Advisory Agreement and Subadvisory Agreements for all of the Funds were considered at the same Board meeting, the Board considered each Fund separately. In their deliberations, the Board did not identify any single factor or group of factors as all-important or controlling, but considered all factors together. The material factors and conclusions that formed the basis for the Board’s determinations are discussed below.
Nature, Extent and Quality of Services
In evaluating the nature, extent, and quality of the services provided by the Adviser and each Subadviser to the Funds, the Board reviewed information describing the financial strength, experience, resources, and key personnel of the Adviser and each Subadviser, including the personnel who provide investment management services to the Funds. With respect to the Adviser, the Board considered the administrative services that are provided to each Fund, as well as other services performed by the Adviser, including the selection and monitoring of the Subadvisers, as applicable; monitoring of the execution of portfolio transactions; monitoring adherence to the Funds’ investment restrictions; monitoring the Funds’ compliance with their compliance policies and procedures and with applicable securities laws and regulations; producing shareholder reports; providing support services for the Board and Board committees; communicating with shareholders; and overseeing the activities of other service providers. The Board also considered the Adviser’s experience in providing investment advisory services to funds and the differentiation of the advisory services provided by the management team versus the portfolio management services provided by the Subadvisers, as applicable. With respect to each Subadviser, the
173
| | |
| |
Shareholder Report Disclosure of Directors’ Approval of
Advisory andSub-Advisory Contracts(Unaudited) (continued) |
Board noted each Subadviser’s experience in managing the strategies of its respective Fund and each Subadviser’s compliance program as it relates to the Fund. The Board considered the other services provided by the Subadvisers under the Subadvisory Agreements, including selecting broker-dealers for execution of portfolio transactions; monitoring adherence to the Fund’s investment restrictions; and assisting with portfolio compliance with securities laws, regulations, policies, and procedures. With respect to CTC, the Board noted CTC’s experience in the alternative strategies space, its Subadviser selection process, and its responsibility for assisting the Adviser in the selection of certain Subadvisers and related asset allocation.
Based upon this review, the Board concluded that the nature, quality, and extent of the services to be provided to each Fund by the Adviser and each Subadviser, as applicable, are expected to be satisfactory.
Review of Fund Performance
The Board reviewed the investment performance of each of the Funds. While consideration was given to performance reports provided in connection with, and discussions held at, regular Board meetings throughout the year, particular attention was given to the performance reports provided specifically in connection with the July and August Meetings. In particular, the Board noted the performance of each Fund relative to its Lipper Inc. (“Lipper”) peer universe. The Directors also considered updated performance information for each Fund relative to its benchmark and, if applicable, its Morningstar, Inc. (“Morningstar”) ratings.
With respect to each Fund’s performance as compared to its Lipper peer universe (“peer group”), the Board reviewed each Fund’s performance percentile rankings over the year-to-date and one-, three-, five-, and ten-year trailing periods (as applicable) through May 31, 2018, as provided by the Adviser. The Board considered that each Fund ranked in one of the top two quartiles for performance as compared to its peer group in at least half of the periods reviewed, except for the following Funds: BMO Low Volatility Equity Fund, BMO Mid-Cap Growth Fund, BMO Small-Cap Growth Fund, BMO Pyrford International Stock Fund, BMO Global Long/Short Equity Fund, BMO Alternative Strategies Fund, BMO Strategic Income Fund, and BMO High Yield Bond Fund.
With respect to the BMO Low Volatility Equity Fund, the Board considered that Class A and Class I shares of the Funds were rated three and four stars, respectively, by Morningstar and that the Fund’s one-year performance was in the fourth quartile of its peer group, while its year-to-date , three-year, and five-year performance were in the fourth quartile. The Board noted the Adviser’s explanation for the recent underperformance of the Fund and also considered the Adviser’s statement that the Fund’s longer-term performance continues to demonstrate the value of the strategy over a full market cycle.
With respect to the BMO Mid-Cap Growth Fund, the Board considered that its year-to-date and one-year performance was in the second quartile of its peer group, while its three-year and five-year performance were in the fourth quartile and its ten-year performance was in the third quartile. The Board noted the Adviser’s explanation that, since members of the disciplined equity team took over management of the Fund in late 2016, the Fund had seen an improvement in its relative performance and ranked in the 29th percentile for its one-year performance.
With respect to the BMO Small-Cap Growth Fund, the Board considered that its year-to-date, one-year, and ten-year performance was in the third quartile of its peer group, and its three-year and five-year performance were in the fourth quartile. The Board noted the Adviser’s explanation that, since members of the disciplined equity team took over management of the Fund in late 2016, the Fund had seen an improvement in its relative performance and ranked closer to the category median for its one-year performance.
With respect to the BMO Pyrford International Stock Fund, the Board considered that its year-to-date, one-year, three-year, and five-year performance were in the fourth quartile of its peer group. The Board considered the information provided by the Adviser about the specific contributors to the Fund’s underperformance, and noted the explanation provided that the Fund has underperformed primarily due to its defensive positioning given the recent market environment.
With respect to the BMO Global Long/Short Equity Fund, the Board considered its limited performance history and noted that its year-to-date performance was in the fourth quartile of its peer group and its one-year performance was in the third quartile. The Board noted the Adviser’s explanation for the recent underperformance of the Fund.
With respect to the BMO Alternative Strategies Fund, the Board considered its limited performance history and noted that its year-to-date and one year performance was in the fourth quartile of its peer group and its three-year performance was in the third quartile. The Board noted the Adviser’s explanation for the recent underperformance of the Fund and also considered the Fund management changes that occurred during the previous year and changes discussed and approved at the Meeting.
With respect to the BMO Strategic Income Fund, the Board considered that the Fund was ranked three stars by Morningstar, and that its year-to-date, one-year, three-year, five-year, and ten-year performance were in the third quartile of its peer group. The Board noted that the Fund’s name, investment objective, and principal investment strategy were changed in May 2017 and considered that the Fund ranked near the category median for its one-year, three-year, and five-year performance.
With respect to the BMO High Yield Bond Fund, the Board considered that Class I shares of the Fund were ranked three stars by Morningstar and that its year-to-date performance was in the fourth quartile of its peer group and its one-year, three-year, and five-year performance was in the third quartile. The Board noted the Adviser’s explanation for the recent underperformance of the Fund and also considered the Fund management changes that have occurred since a new investment team took over management of the Fund in March 2017.
174
The Board determined that it was generally satisfied with each Fund’s performance and would continue to monitor each Fund’s performance results.
Costs of Services Provided and Profits Realized by the Adviser and Subadvisers
The Board considered the fees payable by each Fund under the Advisory Agreement and each Subadvisory Agreement. The Board first reviewed the management fees charged to comparable accounts managed by the Adviser and the Subadvisers of each Fund, if any, taking into consideration differences in style, size, and services provided to such other accounts. The Board noted that, in some cases, the fees for certain accounts or average fees for certain investment strategies were lower than the fees charged to certain Funds with similar investment strategies. The Board considered the Adviser’s explanation that registered investment companies generally require additional advisory and administrative services than other clients due to the enhanced regulatory structure and legal requirements with which investment companies must comply. With respect to the Subadvisers, the Board also considered the affiliation of each Subadviser (if any) with the Adviser.
The Board next reviewed information provided by the Adviser comparing each Fund’s contractual (gross) advisory fee to the median fee of its Morningstar peer category (“Morningstar peers”) or Strategic Insight’s Simfund peer category (“Simfund peers”). In addition, the Board reviewed information provided by the Adviser comparing each Fund’s net expense ratio to the median net expense ratio of the comparable Morningstar peer group and Lipper peer group (“Lipper peers”). With respect to the Subadvisers, the Board considered the fees payable under the Subadvisory Agreements, noting that the fees would be paid by the Adviser (not the Fund).
The Board considered that substantially all of the equity and fixed income Funds’ contractual advisory fees were lower than or within a few basis points of their Morningstar peers and all of the money market Funds’ contractual advisory fees were lower than or within a few basis points of their Simfund peers.
With respect to the BMO Alternative Strategies Fund, the Board considered that its contractual investment advisory fees and net expense ratio were in the fourth quartile of its Morningstar peers, and its net expense ratio was below its Lipper peers by eight basis points for Class I shares and above the median by 17 basis points for Class A shares. The Board took into consideration the Adviser’s efforts to lower the Fund’s expenses.
The Board also considered that the Adviser has agreed to contractual expense limitations for the Funds (the “Expense Limitations”), and that the net expense ratios for the Funds take into account the effect of the Expense Limitations.
The Board considered the methodology used by the Adviser and each Subadviser in determining compensation payable to its portfolio managers and the competitive environment for investment management talent. The Board also considered the financial condition of the Adviser and certain of its affiliates and each Subadviser and particularly focused on the financial strength of the ultimate parent company of the Adviser, and the parent company’s commitment, financial and otherwise, to the global asset management business and the Funds.
The Board reviewed profitability information it received from the Adviser in connection with the services provided to each Fund and the Corporation as a whole. The materials provided in this regard showed, and the Directors acknowledged, that the Adviser experienced positive net margins with respect to certain Funds and did not experience positive net margins with respect to other Funds. The Board also reviewed and considered profitability information it received from each Subadviser, if provided, in connection with the services provided to each Fund.
Economies of Scale
The Board considered the extent to which economies of scale would be realized as the Funds grow and whether the Funds’ fee levels reflect these economies of scale for the benefit of Fund shareholders. The Board considered each Fund’s fee structure, asset size, and net expense ratio giving effect to each Fund’s Expense Limitation. The Board was satisfied with the fee structures and also considered the Adviser’s commitment to continue to evaluate advisory fee breakpoints in the future.
Other Benefits to the Adviser and Subadvisers
The Board considered benefits that accrue to the Adviser and its affiliates from their relationships with the Funds, including revenue in the form of administration fees, custody fees, shareholder service fees, and securities lending revenue. In addition, the Board considered information relating to any soft dollar arrangements in connection with equity security brokerage transactions for the Funds and/or other clients. The Board noted that, other than the services provided by the Adviser and Subadvisers pursuant to the Advisory and Subadvisory Agreements and the related fees to be paid by each Fund, the Adviser and Subadvisers may potentially benefit from their relationship with each other in other ways. The Board also considered that the success of any Fund could attract other business to the Adviser and that the success of the Adviser could enhance the Adviser’s ability to serve the Funds.
The Board concluded that, taking into account all of the information reviewed, each Fund’s advisory and subadvisory fee was reasonable.
Overall Conclusions
Based on all of the information considered and the conclusions reached, the Board determined that the terms of the Advisory and Subadvisory Agreements are fair and reasonable and that the approval of the continuation of the Advisory Agreement and each Subadvisory Agreement is in the best interests of each applicable Fund.
175
176
This report is authorized for distribution to prospective investors only when preceded or accompanied by the Funds’ prospectuses, which contain facts concerning each Fund’s objective and policies, management fees, expenses, and other information.
Proxy Voting
A description of the policies and procedures that the Funds use to determine how to vote proxies relating to portfolio securities is available without charge, upon request, by calling toll free, 1-800-236-FUND (3863) and by accessing the Funds’ Statement of Additional Information, which is available on the Funds’ website at http://www.bmofunds.com and on the SEC’s website at http://www.sec.gov.
Each Fund’s proxy voting record for the most recent 12-month period ended June 30 is available without charge, upon request, by calling toll free,1-800-236-FUND (3863) and by accessing the SEC’s website at http://www.sec.gov.
Disclosure of Portfolio Holdings
The Funds file their complete schedules of portfolio holdings with the SEC for the first and third quarters of each fiscal year on Form N-Q. Each Fund’s Form N-Q is available on the SEC’s website at http://www.sec.gov and may be reviewed and copied at the SEC’s Public Reference Room in Washington, D.C. Information on the operation of the Public Reference Room may be obtained by calling 1-800-SEC-0330.
Shares of the BMO Funds are not bank deposits or other obligations of, or issued, endorsed or guaranteed by, BMO Harris Bank, NA, or any of its affiliates. Shares of the BMO Funds, like shares of all mutual funds, are not insured or guaranteed by the U.S. government, the Federal Deposit Insurance Corporation, the Federal Reserve Board, or any other government agency. Investment in mutual funds involves investment risk, including the possible loss of principal.
| | |
| | PRSRT STD U.S. POSTAGE PAID LANCASTER, PA PERMIT NO. 1793 |
| | |
 | | BMO Funds U.S. Services P.O. Box 55931 Boston, MA 02205-5931 |
| | |
 | | Contact us 1-800-236-FUND (3863) 414-287-8555 |
| | |
 | | Learn more bmofunds.com |
BMO Investment Distributors, LLC, Distributor
BMO Asset Management Corp., Investment Adviser
Investment products are:NOT FDIC INSURED — NO BANK GUARANTEE — MAY LOSE VALUE.
© 2018 BMO Financial Corp. (9/18)
Annualreport
Target Retirement Funds
Target Risk Funds
Table of Contents
| | | | |
Not FDIC Insured | | No Bank Guarantee | | May Lose Value |
| | |
| | |
| Annual Report — Commentary | | BMO Target Retirement Funds |
BMO Target Date Funds
Performance for the One-Year Period Ending August 31, 2018 (%)
| | | | | | | | | | | | | | | | |
| | | | | | Target Date Index | | | | |
| | | Retirement Class (R-6) | | | S&P Target Date | | | Lipper Mixed Asset | | | Russell 3000 | |
| BMO In-Retirement | | | 3.99 | | | | 5.35 | | | | 4.45 | | | | | |
| BMO Target Retirement 2015 | | | 5.12 | | | | 6.31 | | | | 5.31 | | | | | |
| BMO Target Retirement 2020 | | | 7.72 | | | | 7.14 | | | | 5.94 | | | | | |
| BMO Target Retirement 2025 | | | 9.30 | | | | 8.48 | | | | 7.06 | | | | | |
| BMO Target Retirement 2030 | | | 10.34 | | | | | | | | | | | | | |
| BMO Target Retirement 2035 | | | 11.50 | | | | 11.11 | | | | 9.96 | | | | | |
| BMO Target Retirement 2040 | | | 11.90 | | | | 11.97 | | | | 9.70 | | | | | |
| BMO Target Retirement 2045 | | | 12.26 | | | | 12.37 | | | | 11.32 | | | | | |
| BMO Target Retirement 2050 | | | 12.11 | | | | | | | | 14.25 | | | | 20.25 | |
| BMO Target Retirement 2055 | | | 12.17 | | | | | | | | 11.73 | | | | 20.25 | |
The BMO Target Date Funds mostly outperformed their Lipper peer group medians for theone-year period. The return range was 3.99% for the BMOIn-Retirement Fund (Retirement Class (R-6)) to 12.26% for the BMO Target Retirement 2045 Fund (Retirement Class (R-6)). The disparity in relative performance was reflective of the divergence between the mix of stocks and bonds during the year, with stocks outperforming core bonds.
Fiscal year 2018 witnessed a significant divergence between U.S. economic growth and the rest of the world. The U.S. economy showed signs of acceleration, driven by tax cuts passed in December 2017 along with a stimulative 2018 budget. This strong backdrop pushed the Federal Reserve (the Fed) to hike rates in three of the four quarters and signal further rate hikes on the horizon. Abroad, growth decelerated with particularly weakness in Europe and certain emerging markets such as Turkey and Argentina. Given the U.S. economic outperformance and tax reform, it comes as no surprise that U.S. equities led the way with the S&P 500 returning 19.6% and theSmall-Cap Russell 2000 returning 25.5%. International equity returns were more muted with the international developed index MSCI EAFE up 4.4% and MSCI Emerging Markets down-0.68%. Therisk-on theme translated into the fixed income market where the Barclays High Yield Index’s return of 3.4% easily outpaced the Barclays Aggregate Bond Index’s return of-1.1%.
Fixed income managers performed flat in aggregate for the year. BMO TCH Core Plus Bond and Metropolitan West Total Return Bond slightly outperformed their core bond benchmark due to the managers’ positive tilt towards credit. TCW Emerging Market Income slightly underperformed its benchmark. Corporate high yield funds BMO High Yield, Federated High Yield and Fidelity Floating Rate all underperformed their benchmarks mainly due to their bias towards higher quality bonds. The alternatives allocation detracted value during the year as the BMO Alternative Strategies fund underperformed the Barclays U.S. Aggregate return.
Domestic equity strategies largely added to performance. Small cap managers were flat for the year, as Goldman Sachs Small Cap Value underperformed and BMO Small-Cap Growth outperformed their respective benchmarks. Large and mid cap managers outperformed benchmarks with T. Rowe Price Growth Stock, BMO Large-Cap Value and BMO Mid-Cap Growth performing exceptionally well. BMO Low Volatility Equity was unable to keep pace with the benchmark due to the lower risk of its holdings.
International equity fund performance was mixed, with managers detracting from performance in aggregate. MFS International Value added the most value, while BMO Pyrford International and DFA International Small Cap slightly underperformed their benchmark. BMO Disciplined International, Harbor International and Dodge and Cox International were the main laggards. On the emerging markets side, BMO LGM Emerging Markets Equity outperformed the benchmark.
All eyes are turned towards the Fed as the market attempts to glean its path forward. The U.S. economy has proven resilient to the recent rate hikes but the Fed is approaching the rate level they estimate could provide a drag on growth. More importantly, economies abroad have suffered due to secondary effects from higher U.S. rates such as the strong dollar and increased borrowing costs. International central banks such as the European Central Bank and Bank of Japan have the unenviable task of gradually shifting away from highly stimulative policy without upending markets. The success of these central banks in this endeavour along with the Fed’s policy path will help dictate the trajectory for the market over the coming year.
We favor U.S. large cap equities and U.S. small cap equities with a commensurate underweight to core bonds, high yield bonds and emerging market bonds. We believe U.S. equities should benefit from a strong economy, strong earnings momentum and positive investor sentiment. We believe that Fed rate hikes along with rising inflation should put modest pressure on bond yields, making fixed income less attractive.
2
| | |
| | |
| Annual Report | | BMO Target Retirement Funds |
| | | | | | | | | | | | | | | | | | | | | | | | | | | | |
| |
| BMOIn-Retirement Fund | |
Average annual total returns (%) | | | | | Ticker | | Cusip | | Inception
date | | Expenses (%)* | |
| | | 1-year | | | 5-year | | | Since
inception | | | |
| | | | | Gross | | | Net | |
| Investor Class (Y ) | | | 3.66 | | | | 5.05 | | | | 5.04 | | | | | BTRYX | | 09658L125 | | 8/30/2013 | | | 2.07 | | | | 0.98 | |
| Retirement Class(R-3) | | | 3.43 | | | | 4.80 | | | | 4.80 | | | | | BTRRX | | 09658L141 | | 8/30/2013 | | | 2.32 | | | | 1.23 | |
| Retirement Class(R-6) | | | 3.99 | | | | 5.47 | | | | 5.46 | | | | | BTRTX | | 09658L133 | | 8/30/2013 | | | 1.67 | | | | 0.58 | |
| Standard & Poor’s Target Date 2010 Index | | | 5.35 | | | | 5.65 | | | | 5.64 | | | | | | | | | | | | | | | | | |
| Lipper Mixed-Asset Target 2010 Funds Index | | | 4.45 | | | | 5.31 | | | | 5.31 | | | | | | | | | | | | | | | | | |
| | | | | | | | | |
| | | | | | | | | | | | | | | | | | | | | | | | | | | | |
| Growth of an assumed $10,000 investment | | | | | Portfolio sector allocation** | |
| | | | | | Sector | | | | | Fund (%) | |
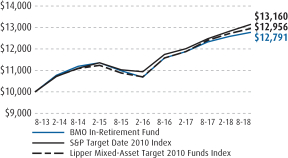 | | | | | Large-Cap Funds | | | | | | | 18.0 | |
| | | | Mid-Cap Funds | | | | | | | 3.1 | |
| | | | Small-Cap Funds | | | | | | | 1.2 | |
| | | | International Funds | | | | | | | 11.4 | |
| | | | Fixed Income Funds | | | | | | | 58.1 | |
| | | | Alternative Funds | | | | | | | 6.9 | |
| | | | Other Assets & Liabilities, Net | | | | | | | 1.3 | |
| | | | Total | | | | | | | 100.0 | |
| | | | | | | | | | | | | | | | |
| | | | | | | | | | | | | | | | |
| | | | | | | | | | | | | | | | |
| | | | | | | | | | | | | | | | |
| | | | | | | | | |
| | | | | | | | | | | | | | | | | | | | | | | | | | | | |
| |
| BMO Target Retirement 2015 Fund | |
Average annual total returns (%) | | | | | Ticker | | Cusip | | Inception
date | | Expenses (%)* | |
| | | | | | | | | Since
inception | | | |
| | | 1-year | | | | | Gross | | | Net | |
| Investor Class (Y ) | | | 4.72 | | | | | | | | 5.05 | | | | | BRTAX | | 09658V750 | | 12/27/2013 | | | 4.96 | | | | 1.00 | |
| Retirement Class(R-3) | | | 4.46 | | | | | | | | 4.80 | | | | | BRTCX | | 09658V735 | | 12/27/2013 | | | 5.21 | | | | 1.25 | |
| Retirement Class(R-6) | | | 5.12 | | | | | | | | 5.50 | | | | | BRTDX | | 09658V727 | | 12/27/2013 | | | 4.56 | | | | 0.60 | |
| Standard & Poor’s Target Date 2015 Index | | | 6.31 | | | | | | | | 5.46 | | | | | | | | | | | | | | | | | |
| Lipper Mixed-Asset Target 2015 Funds Index | | | 5.31 | | | | | | | | 4.96 | | | | | | | | | | | | | | | | | |
| | | | | | | | | |
| | | | | | | | | | | | | | | | | | | | | | | | | | | | |
| Growth of an assumed $10,000 investment | | | | | Portfolio sector allocation** | |
| | | | | | Sector | | | | | Fund (%) | |
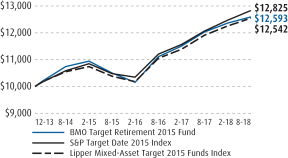 | | | | | Large-Cap Funds | | | | | | | 21.1 | |
| | | | Mid-Cap Funds | | | | | | | 4.2 | |
| | | | Small-Cap Funds | | | | | | | 1.7 | |
| | | | International Funds | | | | | | | 13.8 | |
| | | | Fixed Income Funds | | | | | | | 50.5 | |
| | | | Alternative Funds | | | | | | | 7.4 | |
| | | | Other Assets & Liabilities, Net | | | | | | | 1.3 | |
| | | | Total | | | | | | | 100.0 | |
| | | | | | | | | | | | | | | | |
| | | | | | | | | | | | | | | | |
| | | | | | | | | | | | | | | | |
| | | | | | | | | | | | | | | | |
The above graphs relate to the Investor Class shares of the Fund. Performance for the RetirementR-3 and RetirementR-6 will vary from the performance of the Investor Class shares shown above due to differences in charges and expenses. These graphs illustrate the hypothetical investment of $10,000 in the Investor Class shares of the Fund from each Fund’s inception date to August 31, 2018.
The performance data quoted represents past performance which is no guarantee of future results. Investment return and principal value will fluctuate so that an investor’s shares, when redeemed, may be worth more or less than their original costs. Mutual fund performance changes over time and current performance may be lower or higher than what is stated. To receive current performance to the most recentmonth-end, please call1-800-236-3863 or visit www.bmofunds.com.
| * | The above expense ratios are from the Funds’ Prospectus dated December 29, 2017, and are inclusive of Acquired Fund Fees and Expenses. See Note 5, subsection Contractual Expense Limitation, in the Notes to Financial Statements for additional information. Net expense ratios reflect contractual fee waivers and/or expense reimbursements if applicable, made by BMO Asset Management Corp., the investment adviser (Adviser). The Adviser may not terminate these fee waivers and/or expense reimbursements prior to December 31, 2019 without the consent of the Board of Directors, unless the investment advisory agreement is terminated. Without these contractual waivers, the Fund’s returns would have been lower. |
| ** | Portfolio composition will change due to ongoing management of the Fund. The percentages are based on net assets as of August 31, 2018 and may not necessarily reflect adjustments that are routinely made when presenting net assets for formal financial statement processes. |
The Standard & Poor’s Target Date Indices are designed to measure the performance of an asset allocation strategy that meets the objectives of investors with an approximate corresponding retirement date horizon.
Lipper indices measure the performance of the 30 largest mutual funds in each respective fund category.
3
| | |
| | |
| Annual Report | | BMO Target Retirement Funds |
| | | | | | | | | | | | | | | | | | | | | | | | | | | | |
| |
| BMO Target Retirement 2020 Fund | |
Average annual total returns (%) | | | | | Ticker | | Cusip | | Inception
date | | Expenses (%)* | |
| | | 1-year | | | 5-year | | | Since
inception | | | |
| | | | | Gross | | | Net | |
| Investor Class (Y ) | | | 7.28 | | | | 7.09 | | | | 7.08 | | | | | BTRDX | | 09658V404 | | 8/30/2013 | | | 1.33 | | | | 1.03 | |
| Retirement Class(R-3) | | | 7.06 | | | | 6.84 | | | | 6.83 | | | | | BTRFX | | 09658V206 | | 8/30/2013 | | | 1.58 | | | | 1.28 | |
| Retirement Class(R-6) | | | 7.72 | | | | 7.53 | | | | 7.52 | | | | | BTRGX | | 09658V305 | | 8/30/2013 | | | 0.93 | | | | 0.63 | |
| Standard & Poor’s Target Date 2020 Index | | | 7.14 | | | | 7.20 | | | | 7.20 | | | | | | | | | | | | | | | | | |
| Lipper Mixed-Asset Target 2020 Funds Index | | | 5.94 | | | | 6.43 | | | | 6.43 | | | | | | | | | | | | | | | | | |
| | | | | | | | | |
| | | | | | | | | | | | | | | | | | | | | | | | | | | | |
| Growth of an assumed $10,000 investment | | | | | Portfolio sector allocation** | |
| | | | | | Sector | | | | | Fund (%) | |
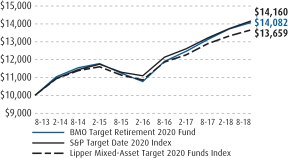 | | | | | Large-Cap Funds | | | | | | | 30.0 | |
| | | | Mid-Cap Funds | | | | | | | 6.9 | |
| | | | Small-Cap Funds | | | | | | | 2.6 | |
| | | | International Funds | | | | | | | 20.1 | |
| | | | Fixed Income Funds | | | | | | | 32.9 | |
| | | | Alternative Funds | | | | | | | 6.3 | |
| | | | Other Assets & Liabilities, Net | | | | | | | 1.2 | |
| | | | Total | | | | | | | 100.0 | |
| | | | | | | | | | | | | | | | |
| | | | | | | | | | | | | | | | |
| | | | | | | | | | | | | | | | |
| | | | | | | | | | | | | | | | |
| | | | | | | | | |
| | | | | | | | | | | | | | | | | | | | | | | | | | | | |
| |
| BMO Target Retirement 2025 Fund | |
Average annual total returns (%) | | | | | Ticker | | Cusip | | Inception
date | | Expenses (%)* | |
| | | | | | | | | Since
inception | | | |
| | | 1-year | | | | | Gross | | | Net | |
| Investor Class (Y ) | | | 8.85 | | | | | | | | 6.58 | | | | | BRTEX | | 09658V719 | | 12/27/2013 | | | 1.75 | | | | 1.04 | |
| Retirement Class(R-3) | | | 8.53 | | | | | | | | 6.35 | | | | | BRTGX | | 09658V685 | | 12/27/2013 | | | 2.00 | | | | 1.29 | |
| Retirement Class(R-6) | | | 9.30 | | | | | | | | 7.01 | | | | | BRTHX | | 09658V677 | | 12/27/2013 | | | 1.35 | | | | 0.64 | |
| Standard & Poor’s Target Date 2025 Index | | | 8.48 | | | | | | | | 6.54 | | | | | | | | | | | | | | | | | |
| Lipper Mixed-Asset Target 2025 Funds Index | | | 7.06 | | | | | | | | 6.04 | | | | | | | | | | | | | | | | | |
| | | | | | | | | |
| | | | | | | | | | | | | | | | | | | | | | | | | | | | |
| Growth of an assumed $10,000 investment | | | | | Portfolio sector allocation** | |
| | | | | | Sector | | | | | Fund (%) | |
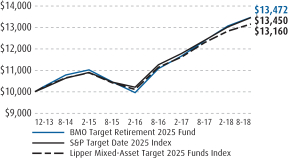 | | | | | Large-Cap Funds | | | | | | | 32.8 | |
| | | | Mid-Cap Funds | | | | | | | 9.1 | |
| | | | Small-Cap Funds | | | | | | | 3.8 | |
| | | | International Funds | | | | | | | 23.3 | |
| | | | Fixed Income Funds | | | | | | | 24.2 | |
| | | | Alternative Funds | | | | | | | 5.5 | |
| | | | Other Assets & Liabilities, Net | | | | | | | 1.3 | |
| | | | Total | | | | | | | 100.0 | |
| | | | | | | | | | | | | | | | |
| | | | | | | | | | | | | | | | |
| | | | | | | | | | | | | | | | |
| | | | | | | | | | | | | | | | |
The above graphs relate to the Investor Class shares of the Fund. Performance for the RetirementR-3 and RetirementR-6 will vary from the performance of the Investor Class shares shown above due to differences in charges and expenses. These graphs illustrate the hypothetical investment of $10,000 in the Investor Class shares of the Fund from each Fund’s inception date to August 31, 2018.
The performance data quoted represents past performance which is no guarantee of future results. Investment return and principal value will fluctuate so that an investor’s shares, when redeemed, may be worth more or less than their original costs. Mutual fund performance changes over time and current performance may be lower or higher than what is stated. To receive current performance to the most recentmonth-end, please call1-800-236-3863 or visit www.bmofunds.com.
| * | The above expense ratios are from the Funds’ Prospectus dated December 29, 2017, and are inclusive of Acquired Fund Fees and Expenses. See Note 5, subsection Contractual Expense Limitation, in the Notes to Financial Statements for additional information. Net expense ratios reflect contractual fee waivers and/or expense reimbursements if applicable, made by BMO Asset Management Corp., the investment adviser (Adviser). The Adviser may not terminate these fee waivers and/or expense reimbursements prior to December 31, 2019 without the consent of the Board of Directors, unless the investment advisory agreement is terminated. Without these contractual waivers, the Fund’s returns would have been lower. |
| ** | Portfolio composition will change due to ongoing management of the Fund. The percentages are based on net assets as of August 31, 2018 and may not necessarily reflect adjustments that are routinely made when presenting net assets for formal financial statement processes. |
The Standard & Poor’s Target Date Indices are designed to measure the performance of an asset allocation strategy that meets the objectives of investors with an approximate corresponding retirement date horizon.
Lipper indices measure the performance of the 30 largest mutual funds in each respective fund category.
4
| | |
| | |
| Annual Report | | BMO Target Retirement Funds |
| | | | | | | | | | | | | | | | | | | | | | | | | | | | |
| |
| BMO Target Retirement 2030 Fund | |
Average annual total returns (%) | | | | | Ticker | | Cusip | | Inception
date | | Expenses (%)* | |
| | | 1-year | | | 5-year | | | Since
inception | | | |
| | | | | Gross | | | Net | |
| Investor Class (Y ) | | | 9.95 | | | | 8.51 | | | | 8.51 | | | | | BTRHX | | 09658V800 | | 8/30/2013 | | | 1.33 | | | | 1.09 | |
| Retirement Class(R-3) | | | 9.63 | | | | 8.25 | | | | 8.25 | | | | | BTRKX | | 09658V602 | | 8/30/2013 | | | 1.58 | | | | 1.34 | |
| Retirement Class(R-6) | | | 10.34 | | | | 8.94 | | | | 8.94 | | | | | BTRLX | | 09658V701 | | 8/30/2013 | | | 0.93 | | | | 0.69 | |
| Standard & Poor’s Target Date 2030 Index | | | 9.87 | | | | 8.61 | | | | 8.60 | | | | | | | | | | | | | | | | | |
| Lipper Mixed-Asset Target 2030 Funds Index | | | 8.61 | | | | 8.20 | | | | 8.20 | | | | | | | | | | | | | | | | | |
| | | | | | | | | |
| | | | | | | | | | | | | | | | | | | | | | | | | | | | |
| Growth of an assumed $10,000 investment | | | | | Portfolio sector allocation** | |
| | | | | | Sector | | | | | Fund (%) | |
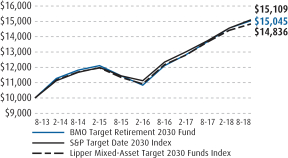 | | | | | Large-Cap Funds | | | | | | | 36.4 | |
| | | | Mid-Cap Funds | | | | | | | 10.2 | |
| | | | Small-Cap Funds | | | | | | | 4.2 | |
| | | | International Funds | | | | | | | 25.9 | |
| | | | Fixed Income Funds | | | | | | | 16.8 | |
| | | | Alternative Funds | | | | | | | 5.2 | |
| | | | Other Assets & Liabilities, Net | | | | | | | 1.3 | |
| | | | Total | | | | | | | 100.0 | |
| | | | | | | | | | | | | | | | |
| | | | | | | | | | | | | | | | |
| | | | | | | | | | | | | | | | |
| | | | | | | | | | | | | | | | |
| | | | | | | | | |
| | | | | | | | | | | | | | | | | | | | | | | | | | | | |
| |
| BMO Target Retirement 2035 Fund | |
Average annual total returns (%) | | | | | Ticker | | Cusip | | Inception
date | | Expenses (%)* | |
| | | | | | | | | Since
inception | | | |
| | | 1-year | | | | | Gross | | | Net | |
| Investor Class (Y ) | | | 10.95 | | | | | | | | 7.18 | | | | | BRTIX | | 09658V669 | | 12/27/2013 | | | 1.85 | | | | 1.09 | |
| Retirement Class(R-3) | | | 10.76 | | | | | | | | 6.90 | | | | | BRTKX | | 09658V644 | | 12/27/2013 | | | 2.10 | | | | 1.34 | |
| Retirement Class(R-6) | | | 11.50 | | | | | | | | 7.62 | | | | | BRTLX | | 09658V636 | | 12/27/2013 | | | 1.45 | | | | 0.69 | |
| Standard & Poor’s Target Date 2035 Index | | | 11.11 | | | | | | | | 7.63 | | | | | | | | | | | | | | | | | |
| Lipper Mixed-Asset Target 2035 Funds Index | | | 9.96 | | | | | | | | 7.43 | | | | | | | | | | | | | | | | | |
| | | | | | | | | |
| | | | | | | | | | | | | | | | | | | | | | | | | | | | |
| Growth of an assumed $10,000 investment | | | | | Portfolio sector allocation** | |
| | | | | | Sector | | | | | Fund (%) | |
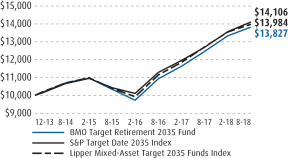 | | | | | Large-Cap Funds | | | | | | | 39.8 | |
| | | | Mid-Cap Funds | | | | | | | 11.1 | |
| | | | Small-Cap Funds | | | | | | | 4.6 | |
| | | | International Funds | | | | | | | 28.3 | |
| | | | Fixed Income Funds | | | | | | | 10.3 | |
| | | | Alternative Funds | | | | | | | 4.6 | |
| | | | Other Assets & Liabilities, Net | | | | | | | 1.3 | |
| | | | Total | | | | | | | 100.0 | |
| | | | | | | | | | | | | | | | |
| | | | | | | | | | | | | | | | |
| | | | | | | | | | | | | | | | |
| | | | | | | | | | | | | | | | |
The above graphs relate to the Investor Class shares of the Fund. Performance for the RetirementR-3 and RetirementR-6 will vary from the performance of the Investor Class shares shown above due to differences in charges and expenses. These graphs illustrate the hypothetical investment of $10,000 in the Investor Class shares of the Fund from each Fund’s inception date to August 31, 2018.
The performance data quoted represents past performance which is no guarantee of future results. Investment return and principal value will fluctuate so that an investor’s shares, when redeemed, may be worth more or less than their original costs. Mutual fund performance changes over time and current performance may be lower or higher than what is stated. To receive current performance to the most recentmonth-end, please call1-800-236-3863 or visit www.bmofunds.com.
| * | The above expense ratios are from the Funds’ Prospectus dated December 29, 2017, and are inclusive of Acquired Fund Fees and Expenses. See Note 5, subsection Contractual Expense Limitation, in the Notes to Financial Statements for additional information. Net expense ratios reflect contractual fee waivers and/or expense reimbursements if applicable, made by BMO Asset Management Corp., the investment adviser (Adviser). The Adviser may not terminate these fee waivers and/or expense reimbursements prior to December 31, 2019 without the consent of the Board of Directors, unless the investment advisory agreement is terminated. Without these contractual waivers, the Fund’s returns would have been lower. |
| ** | Portfolio composition will change due to ongoing management of the Fund. The percentages are based on net assets as of August 31, 2018 and may not necessarily reflect adjustments that are routinely made when presenting net assets for formal financial statement processes. |
The Standard & Poor’s Target Date Indices are designed to measure the performance of an asset allocation strategy that meets the objectives of investors with an approximate corresponding retirement date horizon.
Lipper indices measure the performance of the 30 largest mutual funds in each respective fund category.
5
| | |
| | |
| Annual Report | | BMO Target Retirement Funds |
| | | | | | | | | | | | | | | | | | | | | | | | | | | | |
| |
| BMO Target Retirement 2040 Fund | |
Average annual total returns (%) | | | | | Ticker | | Cusip | | Inception
date | | Expenses (%)* | |
| | | 1-year | | | 5-year | | | Since
inception | | | |
| | | | | Gross | | | Net | |
| Investor Class (Y ) | | | 11.50 | | | | 9.34 | | | | 9.33 | | | | | BTRMX | | 09658V859 | | 8/30/2013 | | | 1.45 | | | | 1.08 | |
| Retirement Class(R-3) | | | 11.31 | | | | 9.07 | | | | 9.07 | | | | | BTRPX | | 09658V875 | | 8/30/2013 | | | 1.70 | | | | 1.33 | |
| Retirement Class(R-6) | | | 11.90 | | | | 9.77 | | | | 9.77 | | | | | BTRQX | | 09658V867 | | 8/30/2013 | | | 1.05 | | | | 0.68 | |
| Standard & Poor’s Target Date 2040 Index | | | 11.97 | | | | 9.70 | | | | 9.69 | | | | | | | | | | | | | | | | | |
| Lipper Mixed-Asset Target 2040 Funds Index | | | 10.89 | | | | 9.26 | | | | 9.26 | | | | | | | | | | | | | | | | | |
| | | | | | | | | |
| | | | | | | | | | | | | | | | | | | | | | | | | | | | |
| Growth of an assumed $10,000 investment | | | | | Portfolio sector allocation** | |
| | | | | | Sector | | | | | Fund (%) | |
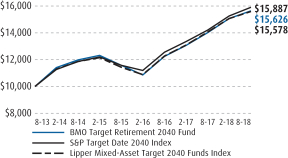 | | | | | Large-Cap Funds | | | | | | | 41.7 | |
| | | | Mid-Cap Funds | | | | | | | 11.6 | |
| | | | Small-Cap Funds | | | | | | | 4.9 | |
| | | | International Funds | | | | | | | 29.5 | |
| | | | Fixed Income Funds | | | | | | | 6.8 | |
| | | | Alternative Funds | | | | | | | 4.2 | |
| | | | Other Assets & Liabilities, Net | | | | | | | 1.3 | |
| | | | Total | | | | | | | 100.0 | |
| | | | | | | | | | | | | | | | |
| | | | | | | | | | | | | | | | |
| | | | | | | | | | | | | | | | |
| | | | | | | | | | | | | | | | |
| | | | | | | | | |
| | | | | | | | | | | | | | | | | | | | | | | | | | | | |
| |
| BMO Target Retirement 2045 Fund | |
Average annual total returns (%) | | | | | Ticker | | Cusip | | Inception
date | | Expenses (%)* | |
| | | | | | | | | Since
inception | | | |
| | | 1-year | | | | | Gross | | | Net | |
| Investor Class (Y ) | | | 11.73 | | | | | | | | 7.84 | | | | | BRTMX | | 09658V453 | | 12/27/2013 | | | 2.42 | | | | 1.06 | |
| Retirement Class(R-3) | | | 11.37 | | | | | | | | 7.55 | | | | | BRTPX | | 09658V610 | | 12/27/2013 | | | 2.67 | | | | 1.31 | |
| Retirement Class(R-6) | | | 12.26 | | | | | | | | 8.28 | | | | | BRTQX | | 09658V594 | | 12/27/2013 | | | 2.02 | | | | 0.66 | |
| Standard & Poor’s Target Date 2045 Index | | | 12.37 | | | | | | | | 8.20 | | | | | | | | | | | | | | | | | |
| Lipper Mixed-Asset Target 2045 Funds Index | | | 11.32 | | | | | | | | 7.96 | | | | | | | | | | | | | | | | | |
| | | | | | | | | |
| | | | | | | | | | | | | | | | | | | | | | | | | | | | |
| Growth of an assumed $10,000 investment | | | | | Portfolio sector allocation** | |
| | | | | | Sector | | | | | Fund (%) | |
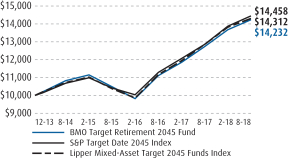 | | | | | Large-Cap Funds | | | | | | | 42.1 | |
| | | | Mid-Cap Funds | | | | | | | 11.7 | |
| | | | Small-Cap Funds | | | | | | | 5.0 | |
| | | | International Funds | | | | | | | 29.8 | |
| | | | Fixed Income Funds | | | | | | | 6.5 | |
| | | | Alternative Funds | | | | | | | 3.5 | |
| | | | Other Assets & Liabilities, Net | | | | | | | 1.4 | |
| | | | Total | | | | | | | 100.0 | |
| | | | | | | | | | | | | | | | |
| | | | | | | | | | | | | | | | |
| | | | | | | | | | | | | | | | |
| | | | | | | | | | | | | | | | |
The above graphs relate to the Investor Class shares of the Fund. Performance for the RetirementR-3 and RetirementR-6 will vary from the performance of the Investor Class shares shown above due to differences in charges and expenses. These graphs illustrate the hypothetical investment of $10,000 in the Investor Class shares of the Fund from each Fund’s inception date to August 31, 2018.
The performance data quoted represents past performance which is no guarantee of future results. Investment return and principal value will fluctuate so that an investor’s shares, when redeemed, may be worth more or less than their original costs. Mutual fund performance changes over time and current performance may be lower or higher than what is stated. To receive current performance to the most recentmonth-end, please call1-800-236-3863 or visit www.bmofunds.com.
| * | The above expense ratios are from the Funds’ Prospectus dated December 29, 2017, and are inclusive of Acquired Fund Fees and Expenses. See Note 5, subsection Contractual Expense Limitation, in the Notes to Financial Statements for additional information. Net expense ratios reflect contractual fee waivers and/or expense reimbursements if applicable, made by BMO Asset Management Corp., the investment adviser (Adviser). The Adviser may not terminate these fee waivers and/or expense reimbursements prior to December 31, 2019 without the consent of the Board of Directors, unless the investment advisory agreement is terminated. Without these contractual waivers, the Fund’s returns would have been lower. |
| ** | Portfolio composition will change due to ongoing management of the Fund. The percentages are based on net assets as of August 31, 2018 and may not necessarily reflect adjustments that are routinely made when presenting net assets for formal financial statement processes. |
The Standard & Poor’s Target Date Indices are designed to measure the performance of an asset allocation strategy that meets the objectives of investors with an approximate corresponding retirement date horizon.
Lipper indices measure the performance of the 30 largest mutual funds in each respective fund category.
6
| | |
| | |
| Annual Report | | BMO Target Retirement Funds |
| | | | | | | | | | | | | | | | | | | | | | | | | | | | |
| |
| BMO Target Retirement 2050 Fund | |
Average annual total returns (%) | | | | | Ticker | | Cusip | | Inception
date | | Expenses (%)* | |
| | | 1-year | | | 5-year | | | Since
inception | | | |
| | | | | Gross | | | Net | |
| Investor Class (Y ) | | | 11.64 | | | | 9.43 | | | | 9.42 | | | | | BTRUX | | 09658V818 | | 8/30/2013 | | | 1.55 | | | | 1.06 | |
| Retirement Class(R-3) | | | 11.38 | | | | 9.16 | | | | 9.15 | | | | | BTRWX | | 09658V834 | | 8/30/2013 | | | 1.80 | | | | 1.31 | |
| Retirement Class(R-6) | | | 12.11 | | | | 9.87 | | | | 9.86 | | | | | BTRZX | | 09658V826 | | 8/30/2013 | | | 1.15 | | | | 0.66 | |
| Russell 3000® Index | | | 20.25 | | | | 14.25 | | | | 14.24 | | | | | | | | | | | | | | | | | |
| Lipper Mixed-Asset Target 2050+ Funds Index | | | 11.58 | | | | 9.36 | | | | 9.35 | | | | | | | | | | | | | | | | | |
| | | | | | | | | |
| | | | | | | | | | | | | | | | | | | | | | | | | | | | |
| Growth of an assumed $10,000 investment | | | | | Portfolio sector allocation** | |
| | | | | | Sector | | | | | Fund (%) | |
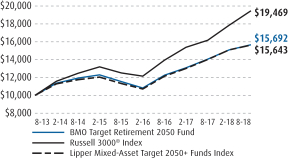 | | | | | Large-Cap Funds | | | | | | | 42.0 | |
| | | | Mid-Cap Funds | | | | | | | 11.7 | |
| | | | Small-Cap Funds | | | | | | | 5.0 | |
| | | | International Funds | | | | | | | 30.0 | |
| | | | Fixed Income Funds | | | | | | | 6.5 | |
| | | | Alternative Funds | | | | | | | 3.5 | |
| | | | Other Assets & Liabilities, Net | | | | | | | 1.3 | |
| | | | Total | | | | | | | 100.0 | |
| | | | | | | | | | | | | | | | |
| | | | | | | | | | | | | | | | |
| | | | | | | | | | | | | | | | |
| | | | | | | | | | | | | | | | |
| | | | | | | | | |
| | | | | | | | | | | | | | | | | | | | | | | | | | | | |
| |
| BMO Target Retirement 2055 Fund | |
Average annual total returns (%) | | | | | Ticker | | Cusip | | Inception
date | | Expenses (%)* | |
| | | | | | | | | Since
inception | | | |
| | | 1-year | | | | | Gross | | | Net | |
| Investor Class (Y ) | | | 11.65 | | | | | | | | 7.82 | | | | | BRTRX | | 09658V586 | | 12/27/2013 | | | 3.26 | | | | 1.06 | |
| Retirement Class(R-3) | | | 11.39 | | | | | | | | 7.57 | | | | | BRTTX | | 09658V560 | | 12/27/2013 | | | 3.51 | | | | 1.31 | |
| Retirement Class(R-6) | | | 12.17 | | | | | | | | 8.27 | | | | | BRTUX | | 09658V552 | | 12/27/2013 | | | 2.86 | | | | 0.66 | |
| Russell 3000® Index | | | 20.25 | | | | | | | | 12.17 | | | | | | | | | | | | | | | | | |
| Lipper Mixed-Asset Target 2055+ Funds Index | | | 11.73 | | | | | | | | 8.16 | | | | | | | | | | | | | | | | | |
| | | | | | | | | |
| | | | | | | | | | | | | | | | | | | | | | | | | | | | |
| Growth of an assumed $10,000 investment | | | | | Portfolio sector allocation** | |
| | | | | | Sector | | | | | Fund (%) | |
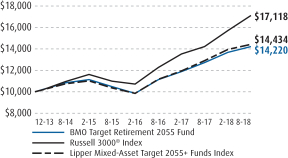 | | | | | Large-Cap Funds | | | | | | | 42.0 | |
| | | | Mid-Cap Funds | | | | | | | 11.6 | |
| | | | Small-Cap Funds | | | | | | | 5.0 | |
| | | | International Funds | | | | | | | 29.6 | |
| | | | Fixed Income Funds | | | | | | | 6.5 | |
| | | | Alternative Funds | | | | | | | 3.5 | |
| | | | Other Assets & Liabilities, Net | | | | | | | 1.8 | |
| | | | Total | | | | | | | 100.0 | |
| | | | | | | | | | | | | | | | |
| | | | | | | | | | | | | | | | |
| | | | | | | | | | | | | | | | |
| | | | | | | | | | | | | | | | |
The above graphs relate to the Investor Class shares of the Fund. Performance for the RetirementR-3 and RetirementR-6 will vary from the performance of the Investor Class shares shown above due to differences in charges and expenses. These graphs illustrate the hypothetical investment of $10,000 in the Investor Class shares of the Fund from each Fund’s inception date to August 31, 2018.
The performance data quoted represents past performance which is no guarantee of future results. Investment return and principal value will fluctuate so that an investor’s shares, when redeemed, may be worth more or less than their original costs. Mutual fund performance changes over time and current performance may be lower or higher than what is stated. To receive current performance to the most recentmonth-end, please call1-800-236-3863 or visit www.bmofunds.com.
| * | The above expense ratios are from the Funds’ Prospectus dated December 29, 2017, and are inclusive of Acquired Fund Fees and Expenses. See Note 5, subsection Contractual Expense Limitation, in the Notes to Financial Statements for additional information. Net expense ratios reflect contractual fee waivers and/or expense reimbursements if applicable, made by BMO Asset Management Corp., the investment adviser (Adviser). The Adviser may not terminate these fee waivers and/or expense reimbursements prior to December 31, 2019 without the consent of the Board of Directors, unless the investment advisory agreement is terminated. Without these contractual waivers, the Fund’s returns would have been lower. |
| ** | Portfolio composition will change due to ongoing management of the Fund. The percentages are based on net assets as of August 31, 2018 and may not necessarily reflect adjustments that are routinely made when presenting net assets for formal financial statement processes. |
The Standard & Poor’s Target Date Indices are designed to measure the performance of an asset allocation strategy that meets the objectives of investors with an approximate corresponding retirement date horizon.
Lipper indices measure the performance of the 30 largest mutual funds in each respective fund category.
7
| | |
| | |
| Annual Report — Commentary | | BMO Target Risk Funds |
Performance for the One-Year Period Ending August 31, 2018 (%)
| | | | | | | | | | | | | | | | |
| | | Retirement Class (R-6) | | | Bloomberg Barclays
U.S. Aggregate Bond Index | | | S&P 500 Index | | | Lipper Mixed Asset | |
| BMO Conservative Allocation | | | 2.28 | | | | -1.05 | | | | | | | | 3.93 | |
| BMO Moderate Allocation | | | 5.33 | | | | -1.05 | | | | | | | | 7.14 | |
| BMO Balanced Allocation | | | 8.51 | | | | | | | | 19.66 | | | | 9.49 | |
| BMO Growth Allocation | | | 11.66 | | | | | | | | 19.66 | | | | 12.54 | |
| BMO Aggressive Allocation | | | 14.51 | | | | | | | | 19.66 | | | | 18.81 | |
The BMO Target Risk Funds underperformed Lipper peer group medians for theone-year period. The return range was 2.28% for the Conservative Allocation Fund (Retirement Class (R-6)) to 14.51% for the Aggressive Allocation Fund (Retirement Class (R-6)). The disparity in relative performance was reflective of the divergence between the mix of stocks and bonds during the year, with stocks outperforming core bonds.
Fiscal year 2018 witnessed a significant divergence between U.S. economic growth and the rest of the world. The U.S. economy showed signs of acceleration, driven by tax cuts passed in December 2017 along with a stimulative 2018 budget. This strong backdrop pushed the Federal Reserve (the Fed) to hike rates in three of the four quarters and signal further rate hikes on the horizon. Abroad, growth decelerated with particularly weakness in Europe and certain emerging markets such as Turkey and Argentina. Given the U.S. economic outperformance and tax reform, it comes as no surprise that U.S. equities led the way with the S&P 500 returning 19.6% and theSmall-Cap Russell 2000 returning 25.5%. International equity returns were more muted with the international developed index MSCI EAFE up 4.4% and MSCI Emerging Markets down-0.68%. Therisk-on theme translated into the fixed income market where the Barclays High Yield Index’s return of 3.4% easily outpaced the Barclays Aggregate Bond Index’s return of-1.1%.
Fixed income managers had mixed results for the year. BMO TCH Core Plus Bond and Metropolitan West Total Return Bond outperformed their core bond benchmark due to the managers’ positive tilt towards credit. BMO TCH Emerging Markets Bond slightly underperformed its benchmark. The alternatives allocation detracted value during the year as BMO Alternative Strategies underperformed bonds and equities.
Domestic equity strategies largely added to performance. Small cap managers were flat for the year, as Goldman Sachs Small Cap Value underperformed and BMO Small-Cap Growth outperformed their respective benchmarks. Large and mid-cap managers outperformed benchmarks with T. Rowe Price Growth Stock, BMO Large-Cap Value and BMO Mid-Cap Growth performing exceptionally well. BMO Low Volatility Equity was unable to keep pace with the benchmark due to the lower risk of its holdings.
International equity fund performance was mixed, with managers adding to performance in aggregate. MFS International Value and T Rowe International Discovery added the most value, while BMO Pyrford International slightly underperformed its benchmark. BMO Disciplined International, Harbor International and Dodge and Cox International were the main laggards. On the emerging markets side, BMO LGM Emerging Markets Equity outperformed the benchmark.
All eyes are turned towards the Fed as the market attempts to glean its path forward. The U.S. economy has proven resilient to the recent rate hikes but the Fed is approaching the rate level they estimate could provide a drag on growth. More importantly, economies abroad have suffered due to secondary effects from higher U.S. rates such as the strong dollar and increased borrowing costs. International central banks such as the European Central Bank and Bank of Japan have the unenviable task of gradually shifting away from highly stimulative policy without upending markets. The success of these central banks in this endeavour along with the Fed’s policy path will help dictate the trajectory for the market over the coming year.
Our portfolios are positioned slightly positive risk with an overweight in U.S. large cap equities and U.S. small cap equities and a commensurate underweight to core bonds, high yield bonds and emerging market bonds. We believe U.S. equities should benefit from a strong economy, strong earnings momentum and positive investor sentiment. We believe that Fed rate hikes along with rising inflation should put modest pressure on bond yields, making fixed income less attractive.
8
| | |
| | |
| Annual Report | | BMO Target Risk Funds |
| | | | | | | | | | | | | | | | | | | | | | | | |
| |
| BMO Conservative Allocation Fund | |
Average annual total returns (%) | | | | | Ticker | | Cusip | | Inception
date | | Expenses (%)* | |
| | | 1-year | | | Since
inception | | | |
| | | | | Gross | | | Net | |
| Investor Class (Y ) | | | 1.79 | | | | 2.71 | | | | | BDVYX | | 09658L299 | | 5/30/2014 | | | 1.27 | | | | 1.02 | |
| Institutional Class (I) | | | 2.11 | | | | 2.97 | | | | | BDVIX | | 09658L331 | | 5/30/2014 | | | 1.02 | | | | 0.77 | |
| Retirement Class(R-3) | | | 1.58 | | | | 2.46 | | | | | BDVRX | | 09658L323 | | 5/30/2014 | | | 1.52 | | | | 1.27 | |
| Retirement Class(R-6) | | | 2.28 | | | | 3.13 | | | | | BDVSX | | 09658L315 | | 5/30/2014 | | | 0.87 | | | | 0.62 | |
| Bloomberg Barclays U.S. Aggregate Bond Index | | | (1.05 | ) | | | 1.82 | | | | | | | | | | | | | | | | | |
| Lipper Mixed-Asset Target Allocation Conservative Funds Index | | | 3.93 | | | | 3.50 | | | | | | | | | | | | | | | | | |
| | | | | | | | |
| | | | | | | | | | | | | | | | | | | | | | | | |
| Growth of an assumed $10,000 investment | | | | | Portfolio sector allocation** | |
| | | | | | Sector | | | | | Fund (%) | |
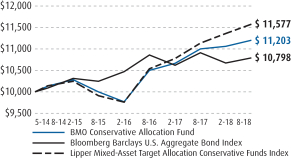 | | | | | Large-Cap Funds | | | | | | | 12.9 | |
| | | | Mid-Cap Funds | | | | | | | 1.9 | |
| | | | Small-Cap Funds | | | | | | | 1.5 | |
| | | | International Funds | | | | | | | 7.1 | |
| | | | Fixed Income Funds | | | | | | | 64.7 | |
| | | | Alternative Funds | | | | | | | 10.4 | |
| | | | Other Assets & Liabilities, Net | | | | | | | 1.5 | |
| | | | Total | | | | | | | 100.0 | |
| | | | | | | | | | | | | | | | |
| | | | | | | | | | | | | | | | |
| | | | | | | | | | | | | | | | |
| | | | | | | | | | | | | | | | |
| | | | | | | | |
| | | | | | | | | | | | | | | | | | | | | | | | |
| |
| BMO Moderate Allocation Fund | |
Average annual total returns (%) | | | | | Ticker | | Cusip | | Inception
date | | Expenses (%)* | |
| | | | | | Since
inception | | | |
| | | 1-year | | | | | Gross | | | Net | |
| Investor Class (Y ) | | | 4.94 | | | | 4.13 | | | | | BMBYX | | 09658L166 | | 5/30/2014 | | | 1.26 | | | | 0.98 | |
| Institutional Class (I) | | | 5.33 | | | | 4.42 | | | | | BMBHX | | 09658L190 | | 5/30/2014 | | | 1.01 | | | | 0.73 | |
| Retirement Class(R-3) | | | 4.65 | | | | 3.87 | | | | | BMBQX | | 09658L182 | | 5/30/2014 | | | 1.51 | | | | 1.23 | |
| Retirement Class(R-6) | | | 5.33 | | | | 4.55 | | | | | BMBTX | | 09658L174 | | 5/30/2014 | | | 0.86 | | | | 0.58 | |
| Bloomberg Barclays U.S. Aggregate Bond Index | | | (1.05 | ) | | | 1.82 | | | | | | | | | | | | | | | | | |
| Lipper Mixed-Asset Target Allocation Moderate Funds Index | | | 7.14 | | | | 5.44 | | | | | | | | | | | | | | | | | |
| | | | | | | | |
| | | | | | | | | | | | | | | | | | | | | | | | |
| Growth of an assumed $10,000 investment | | | | | Portfolio sector allocation** | |
| | | | | | Sector | | | | | Fund (%) | |
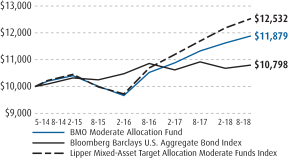 | | | | | Large-Cap Funds | | | | | | | 24.1 | |
| | | | Mid-Cap Funds | | | | | | | 3.5 | |
| | | | Small-Cap Funds | | | | | | | 2.8 | |
| | | | International Funds | | | | | | | 13.4 | |
| | | | Fixed Income Funds | | | | | | | 46.6 | |
| | | | Alternative Funds | | | | | | | 8.3 | |
| | | | Other Assets & Liabilities, Net | | | | | | | 1.3 | |
| | | | Total | | | | | | | 100.0 | |
| | | | | | | | | | | | | | | | |
| | | | | | | | | | | | | | | | |
| | | | | | | | | | | | | | | | |
The above graphs relate to the Investor Class shares of the Fund. Performance for the Institutional, RetirementR-3 and RetirementR-6 will vary from the performance of the Investor Class shares shown above due to differences in charges and expenses. These graphs illustrate the hypothetical investment of $10,000 in the Investor Class shares of the Fund from each Fund’s inception date to August 31, 2018.
The performance data quoted represents past performance which is no guarantee of future results. Investment return and principal value will fluctuate so that an investor’s shares, when redeemed, may be worth more or less than their original costs. Mutual fund performance changes over time and current performance may be lower or higher than what is stated. To receive current performance to the most recentmonth-end, please call1-800-236-3863 or visit www.bmofunds.com.
| * | The above expense ratios are from the Funds’ Prospectus dated December 29, 2017, and are inclusive of Acquired Fund Fees and Expenses. See Note 5, subsection Contractual Expense Limitation, in the Notes to Financial Statements for additional information. Net expense ratios reflect contractual fee waivers and/or expense reimbursements if applicable, made by BMO Asset Management Corp., the investment adviser (Adviser). The Adviser may not terminate these fee waivers and/or expense reimbursements prior to December 31, 2019 without the consent of the Board of Directors, unless the investment advisory agreement is terminated. Without these contractual waivers, the Fund’s returns would have been lower. |
| ** | Portfolio composition will change due to ongoing management of the Fund. The percentages are based on net assets as of August 31, 2018 and may not necessarily reflect adjustments that are routinely made when presenting net assets for formal financial statement processes. |
The Standard & Poor’s 500 Index is an unmanaged index oflarge-cap common stocks.
Lipper indices measure the performance of the 30 largest mutual funds in each respective fund category.
9
| | |
| | |
| Annual Report | | BMO Target Risk Funds |
| | | | | | | | | | | | | | | | | | | | | | | | |
| |
| BMO Balanced Allocation Fund | |
Average annual total returns (%) | | | | | Ticker | | Cusip | | Inception
date | | Expenses (%)* | |
| | | 1-year | | | Since
inception | | | |
| | | | | Gross | | | Net | |
| Investor Class (Y ) | | | 8.06 | | | | 5.50 | | | | | BGRYX | | 09658L216 | | 5/30/2014 | | | 1.17 | | | | 1.02 | |
| Institutional Class (I) | | | 8.27 | | | | 5.77 | | | | | BGRHX | | 09658L240 | | 5/30/2014 | | | 0.92 | | | | 0.77 | |
| Retirement Class(R-3) | | | 7.77 | | | | 5.24 | | | | | BGRRX | | 09658L232 | | 5/30/2014 | | | 1.42 | | | | 1.27 | |
| Retirement Class(R-6) | | | 8.51 | | | | 5.92 | | | | | BGRQX | | 09658L224 | | 5/30/2014 | | | 0.77 | | | | 0.62 | |
| Standard & Poor’s 500 Index | | | 19.66 | | | | 12.43 | | | | | | | | | | | | | | | | | |
| Lipper Mixed-Asset Target Allocation Growth Funds Index | | | 9.49 | | | | 6.99 | | | | | | | | | | | | | | | | | |
| | | | | | | | |
| | | | | | | | | | | | | | | | | | | | | | | | |
| Growth of an assumed $10,000 investment | | | | | Portfolio sector allocation** | |
| | | | | | Sector | | | | | Fund (%) | |
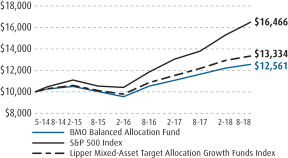 | | | | | Large-Cap Funds | | | | | | | 34.9 | |
| | | | Mid-Cap Funds | | | | | | | 5.1 | |
| | | | Small-Cap Funds | | | | | | | 3.9 | |
| | | | International Funds | | | | | | | 19.4 | |
| | | | Fixed Income Funds | | | | | | | 28.7 | |
| | | | Alternative Funds | | | | | | | 6.9 | |
| | | | Other Assets & Liabilities, Net | | | | | | | 1.1 | |
| | | | Total | | | | | | | 100.0 | |
| | | | | | | | | | | | | | | | |
| | | | | | | | | | | | | | | | |
| | | | | | | | | | | | | | | | |
| | | | | | | | | | | | | | | | |
| | | | | | | | |
| | | | | | | | | | | | | | | | | | | | | | | | |
| |
| BMO Growth Allocation Fund | |
Average annual total returns (%) | | | | | Ticker | | Cusip | | Inception
date | | Expenses (%)* | |
| | | | | | Since
inception | | | |
| | | 1-year | | | | | Gross | | | Net | |
| Investor Class (Y ) | | | 11.15 | | | | 6.86 | | | | | BABYX | | 09658L380 | | 5/30/2014 | | | 1.27 | | | | 1.00 | |
| Institutional Class (I) | | | 11.59 | | | | 7.15 | | | | | BABHX | | 09658L422 | | 5/30/2014 | | | 1.02 | | | | 0.75 | |
| Retirement Class(R-3) | | | 11.00 | | | | 6.62 | | | | | BABRX | | 09658L414 | | 5/30/2014 | | | 1.52 | | | | 1.25 | |
| Retirement Class(R-6) | | | 11.66 | | | | 7.30 | | | | | BABQX | | 09658L398 | | 5/30/2014 | | | 0.87 | | | | 0.60 | |
| Standard & Poor’s 500 Index | | | 19.66 | | | | 12.43 | | | | | | | | | | | | | | | | | |
| Lipper Mixed-Asset Target Allocation Aggressive Growth Funds Index | | | 12.54 | | | | 7.67 | | | | | | | | | | | | | | | | | |
| | | | | | | | |
| | | | | | | | | | | | | | | | | | | | | | | | |
| Growth of an assumed $10,000 investment | | | | | Portfolio sector allocation** | |
| | | | | | Sector | | | | | Fund (%) | |
.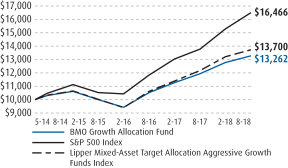 | | | | | Large-Cap Funds | | | | | | | 45.9 | |
| | | | Mid-Cap Funds | | | | | | | 6.7 | |
| | | | Small-Cap Funds | | | | | | | 5.2 | |
| | | | International Funds | | | | | | | 25.4 | |
| | | | Fixed Income Funds | | | | | | | 10.5 | |
| | | | Alternative Funds | | | | | | | 5.6 | |
| | | | Other Assets & Liabilities, Net | | | | | | | 0.7 | |
| | | | Total | | | | | | | 100.0 | |
| | | | | | | | | | | | | | | | |
| | | | | | | | | | | | | | | | |
| | | | | | | | | | | | | | | | |
The above graphs relate to the Investor Class shares of the Fund. Performance for the Institutional, RetirementR-3 and RetirementR-6 will vary from the performance of the Investor Class shares shown above due to differences in charges and expenses. These graphs illustrate the hypothetical investment of $10,000 in the Investor Class shares of the Fund from each Fund’s inception date to August 31, 2018.
The performance data quoted represents past performance which is no guarantee of future results. Investment return and principal value will fluctuate so that an investor’s shares, when redeemed, may be worth more or less than their original costs. Mutual fund performance changes over time and current performance may be lower or higher than what is stated. To receive current performance to the most recentmonth-end, please call1-800-236-3863 or visit www.bmofunds.com.
| * | The above expense ratios are from the Funds’ Prospectus dated December 29, 2017, and are inclusive of Acquired Fund Fees and Expenses. See Note 5, subsection Contractual Expense Limitation, in the Notes to Financial Statements for additional information. Net expense ratios reflect contractual fee waivers and/or expense reimbursements if applicable, made by BMO Asset Management Corp., the investment adviser (Adviser). The Adviser may not terminate these fee waivers and/or expense reimbursements prior to December 31, 2019 without the consent of the Board of Directors, unless the investment advisory agreement is terminated. Without these contractual waivers, the Fund’s returns would have been lower. |
| ** | Portfolio composition will change due to ongoing management of the Fund. The percentages are based on net assets as of August 31, 2018 and may not necessarily reflect adjustments that are routinely made when presenting net assets for formal financial statement processes. |
The Standard & Poor’s 500 Index is an unmanaged index oflarge-cap common stocks.
Lipper indices measure the performance of the 30 largest mutual funds in each respective fund category.
10
| | |
| | |
| Annual Report | | BMO Target Risk Funds |
| | | | | | | | | | | | | | | | | | | | | | | | |
| |
| BMO Aggressive Allocation Fund | |
Average annual total returns (%) | | | | | Ticker | | Cusip | | Inception
date | | Expenses (%)* | |
| | | 1-year | | | Since
inception | | | |
| | | | | Gross | | | Net | |
| Investor Class (Y ) | | | 13.90 | | | | 8.13 | | | | | BDSYX | | 09658L257 | | 5/30/2014 | | | 1.17 | | | | 0.97 | |
| Institutional Class (I) | | | 14.26 | | | | 8.40 | | | | | BDSHX | | 09658L281 | | 5/30/2014 | | | 0.92 | | | | 0.72 | |
| Retirement Class(R-3) | | | 13.70 | | | | 7.87 | | | | | BDSRX | | 09658L273 | | 5/30/2014 | | | 1.42 | | | | 1.22 | |
| Retirement Class(R-6) | | | 14.51 | | | | 8.59 | | | | | BDSQX | | 09658L265 | | 5/30/2014 | | | 0.77 | | | | 0.57 | |
| Standard & Poor’s 500 Index | | | 19.66 | | | | 12.43 | | | | | | | | | | | | | | | | | |
| LipperMulti-Cap Core Funds Index | | | 18.81 | | | | 10.62 | | | | | | | | | | | | | | | | | |
| | | | | | | | |
| | | | | | | | | | | | | | | | | | | | | | | | |
| Growth of an assumed $10,000 investment | | | | | Portfolio sector allocation** | |
| | | | | | Sector | | | | | Fund (%) | |
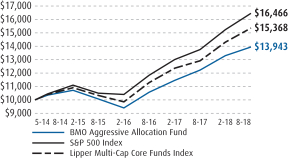 | | | | | Large-Cap Funds | | | | | | | 54.3 | |
| | | | Mid-Cap Funds | | | | | | | 7.9 | |
| | | | Small-Cap Funds | | | | | | | 6.2 | |
| | | | International Funds | | | | | | | 30.1 | |
| | | | Alternative Funds | | | | | | | 0.5 | |
| | | | Other Assets & Liabilities, Net | | | | | | | 1.0 | |
| | | | Total | | | | | | | 100.0 | |
| | | | | | | | | | | | | | | | |
| | | | | | | | | | | | | | | | |
| | | | | | | | | | | | | | | | |
| | | | | | | | | | | | | | | | |
| | | | | | | | | | | | | | | | |
The above graphs relate to the Investor Class shares of the Fund. Performance for the Institutional, RetirementR-3 and RetirementR-6 will vary from the performance of the Investor Class shares shown above due to differences in charges and expenses. These graphs illustrate the hypothetical investment of $10,000 in the Investor Class shares of the Fund from each Fund’s inception date to August 31, 2018.
The performance data quoted represents past performance which is no guarantee of future results. Investment return and principal value will fluctuate so that an investor’s shares, when redeemed, may be worth more or less than their original costs. Mutual fund performance changes over time and current performance may be lower or higher than what is stated. To receive current performance to the most recentmonth-end, please call1-800-236-3863 or visit www.bmofunds.com.
| * | The above expense ratios are from the Funds’ Prospectus dated December 29, 2017, and are inclusive of Acquired Fund Fees and Expenses. See Note 5, subsection Contractual Expense Limitation, in the Notes to Financial Statements for additional information. Net expense ratios reflect contractual fee waivers and/or expense reimbursements if applicable, made by BMO Asset Management Corp., the investment adviser (Adviser). The Adviser may not terminate these fee waivers and/or expense reimbursements prior to December 31, 2019 without the consent of the Board of Directors, unless the investment advisory agreement is terminated. Without these contractual waivers, the Fund’s returns would have been lower. |
| ** | Portfolio composition will change due to ongoing management of the Fund. The percentages are based on net assets as of August 31, 2018 and may not necessarily reflect adjustments that are routinely made when presenting net assets for formal financial statement processes. |
The Standard & Poor’s 500 Index is an unmanaged index oflarge-cap common stocks.
Lipper indices measure the performance of the 30 largest mutual funds in each respective fund category.
11
| | |
| | |
| Expense Example(Unaudited) | | |
For the Six Months ended August 31, 2018
As a shareholder of the Fund, you may incur two types of costs: (1) transaction costs, which may include sales charges (loads) on purchase payments, reinvested dividends, or other distributions; redemption fees; and exchange fees; and (2) ongoing costs, including management fees; distribution and/or service(12b-1) fees; and other Fund expenses. This Example is intended to help you understand your ongoing costs (in dollars) of investing in the Funds and to compare these costs with the ongoing costs of investing in other mutual funds.
The Example is based on an investment of $1,000 invested at the beginning of the period and held for the entire six month period ended August 31, 2018(3/1/18-8/31/18).
Actual Expenses
The information in the table under the heading “Actual Expenses” provides information about actual account values and actual expenses. You may use the information in these columns, together with the amount you invested, to estimate the expenses that you paid over the period. Simply divide your account value by $1,000 (for example, an $8,600 account value divided by $1,000 = 8.6), then multiply the result by the number in the column under the heading entitled “Expenses Paid During Period” to estimate the expenses you paid on your account during this period.
Hypothetical Example for Comparison Purposes
The information in the table under the heading “Hypothetical Expenses” provides information about hypothetical account values and hypothetical expenses based on a Fund’s actual expense ratio and an assumed rate of return of 5% per year before expenses, which is not the Fund’s actual return. The hypothetical account values and expenses may not be used to estimate the actual ending account balance or expenses you paid for the period. You may use this information to compare the ongoing costs of investing in a Fund and other funds. To do so, compare this 5% hypothetical example with the 5% hypothetical examples that appear in the shareholder reports of the other funds.
Please note that the expenses shown in the table are meant to highlight your ongoing costs only and do not reflect any transaction costs, such as sales charges (loads), redemption fees, or exchange fees. Therefore, the information under the heading “Hypothetical Expenses” is useful in comparing ongoing costs only, and will not help you determine the relative total costs of owning different funds. In addition, if these transaction costs were included, your costs would have been higher.
| | | | | | | | | | | | | | | | | | | | | | | | |
| | | Actual Expenses | | | Hypothetical Expenses | |
Fund | | Beginning
account
value
3/1/18 | | | Ending
account
value
8/31/18 | | | Expenses
paid during
period
3/1/18-
8/31/18(1) | | | Ending
account
value
8/31/18 | | | Expenses
paid during
period
3/1/18-
8/31/18(1) | | | Annualized
Expense
Ratio(1) | |
In-Retirement Fund | | | | | | | | | | | | | | | | | | | | | | | | |
| Investor | | $ | 1,000.00 | | | $ | 1,015.90 | | | $ | 1.68 | | | $ | 1,023.54 | | | $ | 1.68 | | | | 0.33 | % |
| Retirement classR-3 | | | 1,000.00 | | | | 1,015.80 | | | | 2.95 | | | | 1,022.28 | | | | 2.96 | | | | 0.58 | |
| Retirement classR-6 | | | 1,000.00 | | | | 1,018.20 | | | | 0.00 | | | | 1,025.21 | | | | 0.00 | | | | 0.00 | |
2015 Fund | | | | | | | | | | | | | | | | | | | | | | | | |
| Investor | | | 1,000.00 | | | | 1,018.40 | | | | 1.68 | | | | 1,023.54 | | | | 1.68 | | | | 0.33 | |
| Retirement classR-3 | | | 1,000.00 | | | | 1,017.60 | | | | 2.95 | | | | 1,022.28 | | | | 2.96 | | | | 0.58 | |
| Retirement classR-6 | | | 1,000.00 | | | | 1,020.10 | | | | 0.00 | | | | 1,025.21 | | | | 0.00 | | | | 0.00 | |
2020 Fund | | | | | | | | | | | | | | | | | | | | | | | | |
| Investor | | | 1,000.00 | | | | 1,026.20 | | | | 1.69 | | | | 1,023.54 | | | | 1.68 | | | | 0.33 | |
| Retirement classR-3 | | | 1,000.00 | | | | 1,026.10 | | | | 2.96 | | | | 1,022.28 | | | | 2.96 | | | | 0.58 | |
| Retirement classR-6 | | | 1,000.00 | | | | 1,029.10 | | | | 0.00 | | | | 1,025.21 | | | | 0.00 | | | | 0.00 | |
2025 Fund | | | | | | | | | | | | | | | | | | | | | | | | |
| Investor | | | 1,000.00 | | | | 1,031.10 | | | | 1.69 | | | | 1,023.54 | | | | 1.68 | | | | 0.33 | |
| Retirement classR-3 | | | 1,000.00 | | | | 1,029.90 | | | | 2.97 | | | | 1,022.28 | | | | 2.96 | | | | 0.58 | |
| Retirement classR-6 | | | 1,000.00 | | | | 1,033.40 | | | | 0.00 | | | | 1,025.21 | | | | 0.00 | | | | 0.00 | |
2030 Fund | | | | | | | | | | | | | | | | | | | | | | | | |
| Investor | | | 1,000.00 | | | | 1,033.40 | | | | 1.90 | | | | 1,023.34 | | | | 1.89 | | | | 0.37 | |
| Retirement classR-3 | | | 1,000.00 | | | | 1,032.50 | | | | 3.18 | | | | 1,022.08 | | | | 3.16 | | | | 0.62 | |
| Retirement classR-6 | | | 1,000.00 | | | | 1,035.10 | | | | 0.00 | | | | 1,025.21 | | | | 0.00 | | | | 0.00 | |
2035 Fund | | | | | | | | | | | | | | | | | | | | | | | | |
| Investor | | | 1,000.00 | | | | 1,036.70 | | | | 1.90 | | | | 1,023.34 | | | | 1.89 | | | | 0.37 | |
| Retirement classR-3 | | | 1,000.00 | | | | 1,035.50 | | | | 3.18 | | | | 1,022.08 | | | | 3.16 | | | | 0.62 | |
| Retirement classR-6 | | | 1,000.00 | | | | 1,039.00 | | | | 0.00 | | | | 1,025.21 | | | | 0.00 | | | | 0.00 | |
2040 Fund | | | | | | | | | | | | | | | | | | | | | | | | |
| Investor | | | 1,000.00 | | | | 1,038.00 | | | | 1.85 | | | | 1,023.39 | | | | 1.84 | | | | 0.36 | |
| Retirement classR-3 | | | 1,000.00 | | | | 1,037.00 | | | | 3.13 | | | | 1,022.13 | | | | 3.11 | | | | 0.61 | |
| Retirement classR-6 | | | 1,000.00 | | | | 1,039.80 | | | | 0.00 | | | | 1,025.21 | | | | 0.00 | | | | 0.00 | |
12
| | |
| | |
| | | Expense Example(Unaudited) (continued) |
| | | | | | | | | | | | | | | | | | | | | | | | |
| | | Actual Expenses | | | Hypothetical Expenses | |
Fund | | Beginning
account
value
3/1/18 | | | Ending
account
value
8/31/18 | | | Expenses
paid during
period
3/1/18-
8/31/18(1) | | | Ending
account
value
8/31/18 | | | Expenses
paid during
period
3/1/18-
8/31/18(1) | | | Annualized
Expense
Ratio(1) | |
2045 Fund | | | | | | | | | | | | | | | | | | | | | | | | |
| Investor | | $ | 1,000.00 | | | $ | 1,039.80 | | | $ | 1.85 | | | $ | 1,023.39 | | | $ | 1.84 | | | | 0.36 | % |
| Retirement classR-3 | | | 1,000.00 | | | | 1,037.70 | | | | 3.13 | | | | 1,022.13 | | | | 3.11 | | | | 0.61 | |
| Retirement classR-6 | | | 1,000.00 | | | | 1,042.10 | | | | 0.00 | | | | 1,025.21 | | | | 0.00 | | | | 0.00 | |
2050 Fund | | | | | | | | | | | | | | | | | | | | | | | | |
| Investor | | | 1,000.00 | | | | 1,038.90 | | | | 1.85 | | | | 1,023.39 | | | | 1.84 | | | | 0.36 | |
| Retirement classR-3 | | | 1,000.00 | | | | 1,037.20 | | | | 3.13 | | | | 1,022.13 | | | | 3.11 | | | | 0.61 | |
| Retirement classR-6 | | | 1,000.00 | | | | 1,040.50 | | | | 0.00 | | | | 1,025.21 | | | | 0.00 | | | | 0.00 | |
2055 Fund | | | | | | | | | | | | | | | | | | | | | | | | |
| Investor | | | 1,000.00 | | | | 1,038.60 | | | | 1.85 | | | | 1,023.39 | | | | 1.84 | | | | 0.36 | |
| Retirement classR-3 | | | 1,000.00 | | | | 1,038.10 | | | | 3.13 | | | | 1,022.13 | | | | 3.11 | | | | 0.61 | |
| Retirement classR-6 | | | 1,000.00 | | | | 1,040.90 | | | | 0.00 | | | | 1,025.21 | | | | 0.00 | | | | 0.00 | |
Conservative Allocation Fund | | | | | | | | | | | | | | | | | | | | | | | | |
| Investor | | | 1,000.00 | | | | 1,012.90 | | | | 1.67 | | | | 1,023.54 | | | | 1.68 | | | | 0.33 | |
| Institutional | | | 1,000.00 | | | | 1,014.70 | | | | 0.41 | | | | 1,024.80 | | | | 0.41 | | | | 0.08 | |
| Retirement classR-3 | | | 1,000.00 | | | | 1,012.60 | | | | 2.94 | | | | 1,022.28 | | | | 2.96 | | | | 0.58 | |
| Retirement classR-6 | | | 1,000.00 | | | | 1,015.20 | | | | 0.00 | | | | 1,025.21 | | | | 0.00 | | | | 0.00 | |
Moderate Allocation Fund | | | | | | | | | | | | | | | | | | | | | | | | |
| Investor | | | 1,000.00 | | | | 1,022.70 | | | | 1.53 | | | | 1,023.69 | | | | 1.53 | | | | 0.30 | |
| Institutional | | | 1,000.00 | | | | 1,024.70 | | | | 0.26 | | | | 1,024.95 | | | | 0.26 | | | | 0.05 | |
| Retirement classR-3 | | | 1,000.00 | | | | 1,021.60 | | | | 2.80 | | | | 1,022.43 | | | | 2.80 | | | | 0.55 | |
| Retirement classR-6 | | | 1,000.00 | | | | 1,024.80 | | | | 0.00 | | | | 1,025.21 | | | | 0.00 | | | | 0.00 | |
Balanced Allocation Fund | | | | | | | | | | | | | | | | | | | | | | | | |
| Investor | | | 1,000.00 | | | | 1,030.70 | | | | 1.69 | | | | 1,023.54 | | | | 1.68 | | | | 0.33 | |
| Institutional | | | 1,000.00 | | | | 1,031.80 | | | | 0.41 | | | | 1,024.80 | | | | 0.41 | | | | 0.08 | |
| Retirement classR-3 | | | 1,000.00 | | | | 1,029.50 | | | | 2.97 | | | | 1,022.28 | | | | 2.96 | | | | 0.58 | |
| Retirement classR-6 | | | 1,000.00 | | | | 1,032.90 | | | | 0.00 | | | | 1,025.21 | | | | 0.00 | | | | 0.00 | |
Growth Allocation Fund | | | | | | | | | | | | | | | | | | | | | | | | |
| Investor | | | 1,000.00 | | | | 1,039.30 | | | | 1.54 | | | | 1,023.69 | | | | 1.53 | | | | 0.30 | |
| Institutional | | | 1,000.00 | | | | 1,041.30 | | | | 0.26 | | | | 1,024.95 | | | | 0.26 | | | | 0.05 | |
| Retirement classR-3 | | | 1,000.00 | | | | 1,039.30 | | | | 2.83 | | | | 1,022.43 | | | | 2.80 | | | | 0.55 | |
| Retirement classR-6 | | | 1,000.00 | | | | 1,041.30 | | | | 0.00 | | | | 1,025.21 | | | | 0.00 | | | | 0.00 | |
Aggressive Allocation Fund | | | | | | | | | | | | | | | | | | | | | | | | |
| Investor | | | 1,000.00 | | | | 1,047.00 | | | | 1.70 | | | | 1,023.54 | | | | 1.68 | | | | 0.33 | |
| Institutional | | | 1,000.00 | | | | 1,048.20 | | | | 0.41 | | | | 1,024.80 | | | | 0.41 | | | | 0.08 | |
| Retirement classR-3 | | | 1,000.00 | | | | 1,046.10 | | | | 2.99 | | | | 1,022.28 | | | | 2.96 | | | | 0.58 | |
| Retirement classR-6 | | | 1,000.00 | | | | 1,050.30 | | | | 0.00 | | | | 1,025.21 | | | | 0.00 | | | | 0.00 | |
| (1) | Expenses are equal to the Funds’ annualized expense ratios for the period March 1, 2018 through August 31, 2018, multiplied by the average account value over the period, multiplied by 184/365 (to reflect theone-half year period). These expenses and ratios are exclusive of acquired fund fees and expenses. |
13
August 31, 2018
In-Retirement Fund
| | | | | | | | |
| Description | | Shares | | | Value | |
| Mutual Funds — 98.7% | |
|
| Large-Cap Funds — 18.0% | |
BMO Dividend Income Fund — Institutional Class (1) | | | 17,080 | | | $ | 263,207 | |
BMOLarge-Cap Growth Fund — Class R6 (1) | | | 7,922 | | | | 168,032 | |
BMOLarge-Cap Value Fund — Class R6 (1) | | | 23,315 | | | | 387,491 | |
BMO Low Volatility Equity Fund — Institutional Class (1) | | | 23,825 | | | | 375,716 | |
Harbor Capital Appreciation Fund — Retirement Class | | | 2,048 | | | | 167,209 | |
T Rowe Price Growth Stock Fund — Institutional Class | | | 2,305 | | | | 167,011 | |
Vanguard Equity Income Fund — Admiral Class | | | 3,969 | | | | 317,898 | |
Vanguard Institutional Index Fund — Institutional Class | | | 2,465 | | | | 653,949 | |
| | | | | | | | |
TotalLarge-Cap Funds | | | | | | | 2,500,513 | |
| | |
| Mid-Cap Funds — 3.1% | | | | | | |
BMOMid-Cap Growth Fund — Class R6 (1) | | | 3,686 | | | | 69,706 | |
BMOMid-Cap Value Fund — Class R6 (1) | | | 13,175 | | | | 166,007 | |
VanguardMid-Cap Index Fund — Institutional Class | | | 4,283 | | | | 194,194 | |
| | | | | | | | |
TotalMid-Cap Funds | | | | | | | 429,907 | |
| | |
| Small-Cap Funds — 1.2% | | | | | | |
BMOSmall-Cap Growth Fund — Institutional Class (1) | | | 1,885 | | | | 42,366 | |
Goldman Sachs Small Cap Value Fund — Institutional Class | | | 1,932 | | | | 125,384 | |
| | | | | | | | |
TotalSmall-Cap Funds | | | | | | | 167,750 | |
| | |
| International Funds — 11.4% | | | | | | |
BMO Disciplined International Equity Fund — Institutional Class (1) | | | 24,980 | | | | 273,785 | |
BMO LGM Emerging Markets Equity Fund — Institutional Class (1) | | | 13,701 | | | | 219,070 | |
BMO Pyrford International Stock Fund — Class R6 (1) | | | 28,133 | | | | 371,352 | |
DFA International Small Company Portfolio — Institutional Class | | | 2,013 | | | | 41,467 | |
Dodge & Cox International Stock Fund — Retail Class | | | 4,427 | | | | 191,347 | |
Harbor International Fund — Retirement Class | | | 2,961 | | | | 191,690 | |
MFS International Value Fund — Class R6 | | | 6,553 | | | | 290,968 | |
| | | | | | | | |
Total International Funds | | | | | | | 1,579,679 | |
| | |
| Fixed Income Funds — 58.1% | | | | | | |
BMO High Yield Bond Fund — Institutional Class (1) | | | 27,027 | | | | 249,728 | |
BMO TCH Core Plus Bond Fund — Institutional Class (1) | | | 226,607 | | | | 2,583,316 | |
Federated Institutional High-Yield Bond Fund — Class R6 | | | 41,183 | | | | 402,362 | |
Fidelity Advisor Floating Rate High Income Fund — Institutional Class | | | 43,357 | | | | 416,664 | |
Metropolitan West Total Return Bond Fund — Plan Class | | | 306,121 | | | | 2,996,926 | |
TCW Emerging Markets Income Fund — Institutional Class | | | 52,609 | | | | 411,404 | |
| | | | | | | | |
| Description | | Shares | | | Value | |
| Mutual Funds (continued) | |
| | |
| Fixed Income Funds (continued) | | | | | | |
Vanguard Short-Term Inflation-Protected Securities Index Fund — Institutional Class | | | 29,960 | | | $ | 736,706 | |
Vanguard Short-Term Investment Grade Fund — Admiral Class | | | 26,531 | | | | 278,041 | |
| | | | | | | | |
Total Fixed Income Funds | | | | | | | 8,075,147 | |
| | |
| Alternative Funds — 6.9% | | | | | | |
BMO Alternative Strategies Fund — Institutional Class (1) | | | 98,602 | | | | 967,286 | |
| | | | | | | | |
Total Mutual Funds
(identified cost $11,702,863) | | | | | | | 13,720,282 | |
| |
| Short-Term Investments — 1.0% | | | | |
| | |
| Mutual Funds — 1.0% | | | | | | |
BMO Institutional Prime Money Market Fund — Premier Class, 1.987% (1) | | | 139,436 | | | | 139,450 | |
| | | | | | | | |
Total Short-Term Investments — 1.0%
(identified cost $139,438) | | | | | | | 139,450 | |
| | | | | | | | |
Total Investments — 99.7%
(identified cost $11,842,301) | | | | | | | 13,859,732 | |
| Other Assets and Liabilities — 0.3% | | | | | | | 43,933 | |
| | | | | | | | |
| Total Net Assets — 100.0% | | | | | | $ | 13,903,665 | |
| | | | | | | | |
2015 Fund | |
| Description | | Shares | | | Value | |
| Mutual Funds — 98.7% | | | | | | |
| | |
| Large-Cap Funds — 21.1% | | | | | | |
BMO Dividend Income Fund — Institutional Class (1) | | | 3,010 | | | $ | 46,383 | |
BMOLarge-Cap Growth Fund — Class R6 (1) | | | 2,339 | | | | 49,607 | |
BMOLarge-Cap Value Fund — Class R6 (1) | | | 5,552 | | | | 92,266 | |
BMO Low Volatility Equity Fund — Institutional Class (1) | | | 5,537 | | | | 87,322 | |
Harbor Capital Appreciation Fund — Retirement Class | | | 613 | | | | 50,015 | |
T Rowe Price Growth Stock Fund — Institutional Class | | | 682 | | | | 49,449 | |
Vanguard Equity Income Fund — Admiral Class | | | 817 | | | | 65,451 | |
Vanguard Institutional Index Fund — Institutional Class | | | 584 | | | | 154,938 | |
| | | | | | | | |
TotalLarge-Cap Funds | | | | | | | 595,431 | |
| | |
| Mid-Cap Funds — 4.2% | | | | | | |
BMOMid-Cap Growth Fund — Class R6 (1) | | | 920 | | | | 17,401 | |
BMOMid-Cap Value Fund — Class R6 (1) | | | 3,672 | | | | 46,271 | |
VanguardMid-Cap Index Fund — Institutional Class | | | 1,193 | | | | 54,068 | |
| | | | | | | | |
TotalMid-Cap Funds | | | | | | | 117,740 | |
| | |
| Small-Cap Funds — 1.7% | | | | | | |
BMOSmall-Cap Growth Fund — Institutional Class (1) | | | 676 | | | | 15,204 | |
Goldman Sachs Small Cap Value Fund — Institutional Class | | | 490 | | | | 31,798 | |
| | | | | | | | |
TotalSmall-Cap Funds | | | | | | | 47,002 | |
(See Notes which are an integral part of the Financial Statements)
14
2015 Fund (continued)
| | | | | | | | |
| Description | | Shares | | | Value | |
| Mutual Funds (continued) | | | | | | |
| | |
| International Funds — 13.8% | | | | | | |
BMO Disciplined International Equity Fund — Institutional Class (1) | | | 5,968 | | | $ | 65,412 | |
BMO LGM Emerging Markets Equity Fund — Institutional Class (1) | | | 3,655 | | | | 58,438 | |
BMO Pyrford International Stock Fund — Class R6 (1) | | | 6,468 | | | | 85,379 | |
DFA International Small Company Portfolio — Institutional Class | | | 556 | | | | 11,463 | |
Dodge & Cox International Stock Fund — Retail Class | | | 1,180 | | | | 51,007 | |
Harbor International Fund — Retirement Class | | | 895 | | | | 57,945 | |
MFS International Value Fund — Class R6 | | | 1,393 | | | | 61,829 | |
| | | | | | | | |
Total International Funds | | | | | | | 391,473 | |
| | |
| Fixed Income Funds — 50.5% | | | | | | |
BMO High Yield Bond Fund — Institutional Class (1) | | | 4,563 | | | | 42,165 | |
BMO TCH Core Plus Bond Fund — Institutional Class (1) | | | 41,100 | | | | 468,537 | |
Federated Institutional High-Yield Bond Fund — Class R6 | | | 7,480 | | | | 73,082 | |
Fidelity Advisor Floating Rate High Income Fund — Institutional Class | | | 7,868 | | | | 75,613 | |
Metropolitan West Total Return Bond Fund — Plan Class | | | 56,874 | | | | 556,800 | |
TCW Emerging Markets Income Fund — Institutional Class | | | 10,013 | | | | 78,301 | |
Vanguard Short-Term Inflation-Protected Securities Index Fund — Institutional Class | | | 5,397 | | | | 132,697 | |
| | | | | | | | |
Total Fixed Income Funds | | | | | | | 1,427,195 | |
| | |
| Alternative Funds — 7.4% | | | | | | |
BMO Alternative Strategies Fund — Institutional Class (1) | | | 21,416 | | | | 210,087 | |
| | | | | | | | |
Total Mutual Funds
(identified cost $2,552,047) | | | | | | | 2,788,928 | |
| | |
| Short-Term Investments — 0.9% | | | | | | |
| | |
| Mutual Funds — 0.9% | | | | | | |
BMO Institutional Prime Money Market Fund — Premier Class, 1.987% (1) | | | 25,133 | | | | 25,136 | |
| | | | | | | | |
Total Short-Term Investments — 0.9%
(identified cost $25,134) | | | | | | | 25,136 | |
| | | | | | | | |
Total Investments — 99.6%
(identified cost $2,577,181) | | | | | | | 2,814,064 | |
| Other Assets and Liabilities — 0.4% | | | | | | | 9,954 | |
| | | | | | | | |
| Total Net Assets — 100.0% | | | | | | $ | 2,824,018 | |
| | | | | | | | |
2020 Fund | |
| Description | | Shares | | | Value | |
| Mutual Funds — 98.8% | | | | | | |
| | |
| Large-Cap Funds — 30.0% | | | | | | |
BMO Dividend Income Fund — Institutional Class (1) | | | 90,097 | | | $ | 1,388,399 | |
BMOLarge-Cap Growth Fund — Class R6 (1) | | | 94,872 | | | | 2,012,234 | |
| | | | | | | | |
| Description | | Shares | | | Value | |
| Mutual Funds (continued) | | | | | | |
| | |
| Large-Cap Funds (continued) | | | | | | |
BMOLarge-Cap Value Fund — Class R6 (1) | | | 204,204 | | | $ | 3,393,863 | |
BMO Low Volatility Equity Fund — Institutional Class (1) | | | 205,819 | | | | 3,245,763 | |
Harbor Capital Appreciation Fund — Retirement Class | | | 24,546 | | | | 2,003,951 | |
T Rowe Price Growth Stock Fund — Institutional Class | | | 27,657 | | | | 2,004,055 | |
Vanguard Equity Income Fund — Admiral Class | | | 26,919 | | | | 2,155,975 | |
Vanguard Institutional Index Fund — Institutional Class | | | 26,170 | | | | 6,943,581 | |
| | | | | | | | |
TotalLarge-Cap Funds | | | | | | | 23,147,821 | |
| | |
| Mid-Cap Funds — 6.9% | | | | | | |
BMOMid-Cap Growth Fund — Class R6 (1) | | | 73,818 | | | | 1,395,899 | |
BMOMid-Cap Value Fund — Class R6 (1) | | | 147,154 | | | | 1,854,132 | |
VanguardMid-Cap Index Fund — Institutional Class | | | 46,004 | | | | 2,085,832 | |
| | | | | | | | |
TotalMid-Cap Funds | | | | | | | 5,335,863 | |
| | |
| Small-Cap Funds — 2.6% | | | | | | |
BMOSmall-Cap Growth Fund — Institutional Class (1) | | | 34,562 | | | | 776,962 | |
Goldman Sachs Small Cap Value Fund — Institutional Class | | | 19,066 | | | | 1,237,358 | |
| | | | | | | | |
TotalSmall-Cap Funds | | | | | | | 2,014,320 | |
| | |
| International Funds — 20.1% | | | | | | |
BMO Disciplined International Equity Fund — Institutional Class (1) | | | 222,765 | | | | 2,441,500 | |
BMO LGM Emerging Markets Equity Fund — Institutional Class (1) | | | 163,603 | | | | 2,616,013 | |
BMO Pyrford International Stock Fund — Class R6 (1) | | | 260,564 | | | | 3,439,450 | |
DFA International Small Company Portfolio — Institutional Class | | | 18,630 | | | | 383,777 | |
Dodge & Cox International Stock Fund — Retail Class | | | 47,777 | | | | 2,064,919 | |
Harbor International Fund — Retirement Class | | | 34,320 | | | | 2,221,858 | |
MFS International Value Fund — Class R6 | | | 53,596 | | | | 2,379,654 | |
| | | | | | | | |
Total International Funds | | | | | | | 15,547,171 | |
| | |
| Fixed Income Funds — 32.9% | | | | | | |
BMO High Yield Bond Fund — Institutional Class (1) | | | 75,130 | | | | 694,199 | |
BMO TCH Core Plus Bond Fund — Institutional Class (1) | | | 723,970 | | | | 8,253,259 | |
Federated Institutional High-Yield Bond Fund — Class R6 | | | 134,214 | | | | 1,311,266 | |
Fidelity Advisor Floating Rate High Income Fund — Institutional Class | | | 144,474 | | | | 1,388,399 | |
Metropolitan West Total Return Bond Fund — Plan Class | | | 1,047,878 | | | | 10,258,724 | |
TCW Emerging Markets Income Fund — Institutional Class | | | 147,019 | | | | 1,149,691 | |
Vanguard Short-Term Inflation-Protected Securities Index Fund — Institutional Class | | | 94,141 | | | | 2,314,937 | |
| | | | | | | | |
Total Fixed Income Funds | | | | | | | 25,370,475 | |
(See Notes which are an integral part of the Financial Statements)
15
August 31, 2018
2020 Fund (continued)
| | | | | | | | |
| Description | | Shares | | | Value | |
| Mutual Funds (continued) | | | | | | |
| | |
| Alternative Funds — 6.3% | | | | | | |
BMO Alternative Strategies Fund — Institutional Class (1) | | | 495,351 | | | $ | 4,859,396 | |
| | | | | | | | |
Total Mutual Funds
(identified cost $56,833,558) | | | | | | | 76,275,046 | |
| | |
| Short-Term Investments — 0.8% | | | | | | |
| | |
| Mutual Funds — 0.8% | | | | | | |
BMO Institutional Prime Money Market Fund — Premier Class, 1.987% (1) | | | 633,849 | | | | 633,912 | |
| | | | | | | | |
Total Short-Term Investments — 0.8%
(identified cost $633,912) | | | | | | | 633,912 | |
| | | | | | | | |
Total Investments — 99.6%
(identified cost $57,467,470) | | | | | | | 76,908,958 | |
| Other Assets and Liabilities — 0.4% | | | | | | | 308,976 | |
| | | | | | | | |
| Total Net Assets — 100.0% | | | | | | $ | 77,217,934 | |
| | | | | | | | |
2025 Fund | |
| Description | | Shares | | | Value | |
| Mutual Funds — 98.7% | | | | | | |
| | |
| Large-Cap Funds — 32.8% | | | | | | |
BMO Dividend Income Fund — Institutional Class (1) | | | 22,320 | | | $ | 343,957 | |
BMOLarge-Cap Growth Fund — Class R6 (1) | | | 33,130 | | | | 702,684 | |
BMOLarge-Cap Value Fund — Class R6 (1) | | | 76,250 | | | | 1,267,274 | |
BMO Low Volatility Equity Fund — Institutional Class (1) | | | 51,972 | | | | 819,600 | |
Harbor Capital Appreciation Fund — Retirement Class | | | 13,631 | | | | 1,112,842 | |
T Rowe Price Growth Stock Fund — Institutional Class | | | 15,234 | | | | 1,103,863 | |
Vanguard Equity Income Fund — Admiral Class | | | 5,910 | | | | 473,313 | |
Vanguard Institutional Index Fund — Institutional Class | | | 10,871 | | | | 2,884,428 | |
| | | | | | | | |
TotalLarge-Cap Funds | | | | | | | 8,707,961 | |
| | |
| Mid-Cap Funds — 9.1% | | | | | | |
BMOMid-Cap Growth Fund — Class R6 (1) | | | 39,972 | | | | 755,872 | |
BMOMid-Cap Value Fund — Class R6 (1) | | | 60,716 | | | | 765,016 | |
VanguardMid-Cap Index Fund — Institutional Class | | | 19,931 | | | | 903,665 | |
| | | | | | | | |
TotalMid-Cap Funds | | | | | | | 2,424,553 | |
| | |
| Small-Cap Funds — 3.8% | | | | | | |
BMOSmall-Cap Growth Fund — Institutional Class (1) | | | 21,699 | | | | 487,780 | |
Goldman Sachs Small Cap Value Fund — Institutional Class | | | 8,125 | | | | 527,337 | |
| | | | | | | | |
TotalSmall-Cap Funds | | | | | | | 1,015,117 | |
| | |
| International Funds — 23.3% | | | | | | |
BMO Disciplined International Equity Fund — Institutional Class (1) | | | 64,474 | | | | 706,630 | |
BMO LGM Emerging Markets Equity Fund — Institutional Class (1) | | | 72,251 | | | | 1,155,289 | |
| | | | | | | | |
| Description | | Shares | | | Value | |
| Mutual Funds (continued) | | | | | | |
| | |
| International Funds (continued) | | | | | | |
BMO Pyrford International Stock Fund — Class R6 (1) | | | 96,067 | | | $ | 1,268,088 | |
DFA International Small Company Portfolio — Institutional Class | | | 9,064 | | | | 186,729 | |
Dodge & Cox International Stock Fund — Retail Class | | | 23,041 | | | | 995,835 | |
Harbor International Fund — Retirement Class | | | 16,923 | | | | 1,095,575 | |
MFS International Value Fund — Class R6 | | | 17,515 | | | | 777,665 | |
| | | | | | | | |
Total International Funds | | | | | | | 6,185,811 | |
| | |
| Fixed Income Funds — 24.2% | | | | | | |
BMO High Yield Bond Fund — Institutional Class (1) | | | 19,953 | | | | 184,368 | |
BMO TCH Core Plus Bond Fund — Institutional Class (1) | | | 177,585 | | | | 2,024,468 | |
Federated Institutional High-Yield Bond Fund — Class R6 | | | 35,081 | | | | 342,744 | |
Fidelity Advisor Floating Rate High Income Fund — Institutional Class | | | 38,410 | | | | 369,120 | |
Metropolitan West Total Return Bond Fund — Plan Class | | | 271,441 | | | | 2,657,410 | |
TCW Emerging Markets Income Fund — Institutional Class | | | 36,719 | | | | 287,140 | |
Vanguard Short-Term Inflation-Protected Securities Index Fund — Institutional Class | | | 22,520 | | | | 553,772 | |
| | | | | | | | |
Total Fixed Income Funds | | | | | | | 6,419,022 | |
| | |
| Alternative Funds — 5.5% | | | | | | |
BMO Alternative Strategies Fund — Institutional Class (1) | | | 149,442 | | | | 1,466,028 | |
| | | | | | | | |
Total Mutual Funds
(identified cost $23,007,755) | | | | | | | 26,218,492 | |
| | |
| Short-Term Investments — 1.1% | | | | | | |
| | |
| Mutual Funds — 1.1% | | | | | | |
BMO Institutional Prime Money Market Fund — Premier Class, 1.987% (1) | | | 284,620 | | | | 284,649 | |
| | | | | | | | |
Total Short-Term Investments — 1.1%
(identified cost $284,622) | | | | | | | 284,649 | |
| | | | | | | | |
Total Investments — 99.8%
(identified cost $23,292,377) | | | | | | | 26,503,141 | |
| Other Assets and Liabilities — 0.2% | | | | | | | 55,804 | |
| | | | | | | | |
| Total Net Assets — 100.0% | | | | | | $ | 26,558,945 | |
| | | | | | | | |
2030 Fund | |
| Description | | Shares | | | Value | |
| Mutual Funds — 98.7% | | | | | | |
| | |
| Large-Cap Funds — 36.4% | | | | | | |
BMO Dividend Income Fund — Institutional Class (1) | | | 90,489 | | | $ | 1,394,440 | |
BMOLarge-Cap Growth Fund — Class R6 (1) | | | 128,155 | | | | 2,718,171 | |
BMOLarge-Cap Value Fund — Class R6 (1) | | | 329,280 | | | | 5,472,625 | |
BMO Low Volatility Equity Fund — Institutional Class (1) | | | 222,054 | | | | 3,501,786 | |
Harbor Capital Appreciation Fund — Retirement Class | | | 56,444 | | | | 4,608,128 | |
(See Notes which are an integral part of the Financial Statements)
16
2030 Fund (continued)
| | | | | | | | |
| Description | | Shares | | | Value | |
| Mutual Funds (continued) | | | | | | |
| | |
| Large-Cap Funds (continued) | | | | | | |
T Rowe Price Growth Stock Fund — Institutional Class | | | 63,522 | | | $ | 4,602,830 | |
Vanguard Equity Income Fund — Admiral Class | | | 26,057 | | | | 2,086,928 | |
Vanguard Institutional Index Fund — Institutional Class | | | 45,244 | | | | 12,004,530 | |
| | | | | | | | |
TotalLarge-Cap Funds | | | | | | | 36,389,438 | |
| | |
| Mid-Cap Funds — 10.2% | | | | | | |
BMOMid-Cap Growth Fund — Class R6 (1) | | | 169,620 | | | | 3,207,506 | |
BMOMid-Cap Value Fund — Class R6 (1) | | | 252,613 | | | | 3,182,919 | |
VanguardMid-Cap Index Fund — Institutional Class | | | 83,585 | | | | 3,789,763 | |
| | | | | | | | |
TotalMid-Cap Funds | | | | | | | 10,180,188 | |
| | |
| Small-Cap Funds — 4.2% | | | | | | |
BMOSmall-Cap Growth Fund — Institutional Class (1) | | | 94,847 | | | | 2,132,168 | |
Goldman Sachs Small Cap Value Fund — Institutional Class | | | 32,412 | | | | 2,103,534 | |
| | | | | | | | |
TotalSmall-Cap Funds | | | | | | | 4,235,702 | |
| | |
| International Funds — 25.9% | | | | | | |
BMO Disciplined International Equity Fund — Institutional Class (1) | | | 260,441 | | | | 2,854,432 | |
BMO LGM Emerging Markets Equity Fund — Institutional Class (1) | | | 301,678 | | | | 4,823,831 | |
BMO Pyrford International Stock Fund — Class R6 (1) | | | 404,548 | | | | 5,340,034 | |
DFA International Small Company Portfolio — Institutional Class | | | 43,419 | | | | 894,435 | |
Dodge & Cox International Stock Fund — Retail Class | | | 97,772 | | | | 4,225,709 | |
Harbor International Fund — Retirement Class | | | 71,471 | | | | 4,627,057 | |
MFS International Value Fund — Class R6 | | | 69,554 | | | | 3,088,197 | |
| | | | | | | | |
Total International Funds | | | | | | | 25,853,695 | |
| | |
| Fixed Income Funds — 16.8% | | | | | | |
BMO High Yield Bond Fund — Institutional Class (1) | | | 53,979 | | | | 498,765 | |
BMO TCH Core Plus Bond Fund — Institutional Class (1) | | | 446,746 | | | | 5,092,907 | |
Federated Institutional High-Yield Bond Fund — Class R6 | | | 81,686 | | | | 798,070 | |
Fidelity Advisor Floating Rate High Income Fund — Institutional Class | | | 103,914 | | | | 998,609 | |
Metropolitan West Total Return Bond Fund — Plan Class | | | 754,057 | | | | 7,382,215 | |
TCW Emerging Markets Income Fund — Institutional Class | | | 88,261 | | | | 690,202 | |
Vanguard Short-Term Inflation-Protected Securities Index Fund — Institutional Class | | | 52,836 | | | | 1,299,251 | |
| | | | | | | | |
Total Fixed Income Funds | | | | | | | 16,760,019 | |
| | |
| Alternative Funds — 5.2% | | | | | | |
BMO Alternative Strategies Fund — Institutional Class (1) | | | 526,650 | | | | 5,166,435 | |
| | | | | | | | |
Total Mutual Funds
(identified cost $68,757,485) | | | | | | | 98,585,477 | |
| | | | | | | | |
| Description | | Shares | | | Value | |
| Short-Term Investments — 1.0% | | | | | | |
| | |
| Mutual Funds — 1.0% | | | | | | |
BMO Institutional Prime Money Market Fund — Premier Class, 1.987% (1) | | | 996,406 | | | $ | 996,505 | |
| | | | | | | | |
Total Short-Term Investments — 1.0%
(identified cost $996,505) | | | | | | | 996,505 | |
| | | | | | | | |
Total Investments — 99.7%
(identified cost $69,753,990) | | | | | | | 99,581,982 | |
| Other Assets and Liabilities — 0.3% | | | | | | | 322,719 | |
| | | | | | | | |
| Total Net Assets — 100.0% | | | | | | $ | 99,904,701 | |
| | | | | | | | |
2035 Fund | |
| Description | | Shares | | | Value | |
| Mutual Funds — 98.7% | | | | | | |
| | |
| Large-Cap Funds — 39.8% | | | | | | |
BMO Dividend Income Fund — Institutional Class (1) | | | 15,076 | | | $ | 232,312 | |
BMOLarge-Cap Growth Fund — Class R6 (1) | | | 21,490 | | | | 455,800 | |
BMOLarge-Cap Value Fund — Class R6 (1) | | | 54,971 | | | | 913,620 | |
BMO Low Volatility Equity Fund — Institutional Class (1) | | | 37,365 | | | | 589,250 | |
Harbor Capital Appreciation Fund — Retirement Class | | | 9,801 | | | | 800,176 | |
T Rowe Price Growth Stock Fund — Institutional Class | | | 11,012 | | | | 797,949 | |
Vanguard Equity Income Fund — Admiral Class | | | 4,437 | | | | 355,332 | |
Vanguard Institutional Index Fund — Institutional Class | | | 7,707 | | | | 2,044,798 | |
| | | | | | | | |
TotalLarge-Cap Funds | | | | | | | 6,189,237 | |
| | |
| Mid-Cap Funds — 11.1% | | | | | | |
BMOMid-Cap Growth Fund — Class R6 (1) | | | 28,979 | | | | 547,994 | |
BMOMid-Cap Value Fund — Class R6 (1) | | | 44,164 | | | | 556,464 | |
VanguardMid-Cap Index Fund — Institutional Class | | | 13,706 | | | | 621,447 | |
| | | | | | | | |
TotalMid-Cap Funds | | | | | | | 1,725,905 | |
| | |
| Small-Cap Funds — 4.6% | | | | | | |
BMOSmall-Cap Growth Fund — Institutional Class (1) | | | 16,109 | | | | 362,132 | |
Goldman Sachs Small Cap Value Fund — Institutional Class | | | 5,483 | | | | 355,853 | |
| | | | | | | | |
TotalSmall-Cap Funds | | | | | | | 717,985 | |
| | |
| International Funds — 28.3% | | | | | | |
BMO Disciplined International Equity Fund — Institutional Class (1) | | | 43,636 | | | | 478,252 | |
BMO LGM Emerging Markets Equity Fund — Institutional Class (1) | | | 51,844 | | | | 828,988 | |
BMO Pyrford International Stock Fund — Class R6 (1) | | | 69,141 | | | | 912,658 | |
DFA International Small Company Portfolio — Institutional Class | | | 7,544 | | | | 155,409 | |
Dodge & Cox International Stock Fund — Retail Class | | | 16,693 | | | | 721,466 | |
Harbor International Fund — Retirement Class | | | 12,336 | | | | 798,660 | |
(See Notes which are an integral part of the Financial Statements)
17
August 31, 2018
2035 Fund (continued)
| | | | | | | | |
| Description | | Shares | | | Value | |
| Mutual Funds (continued) | | | | | | |
| | |
| International Funds (continued) | | | | | | |
MFS International Value Fund — Class R6 | | | 11,591 | | | $ | 514,637 | |
| | | | | | | | |
Total International Funds | | | | | | | 4,410,070 | |
| | |
| Fixed Income Funds — 10.3% | | | | | | |
BMO High Yield Bond Fund — Institutional Class (1) | | | 5,019 | | | | 46,372 | |
BMO TCH Core Plus Bond Fund — Institutional Class (1) | | | 41,960 | | | | 478,344 | |
Federated Institutional High-Yield Bond Fund — Class R6 | | | 6,329 | | | | 61,830 | |
Fidelity Advisor Floating Rate High Income Fund — Institutional Class | | | 8,042 | | | | 77,287 | |
Metropolitan West Total Return Bond Fund — Plan Class | | | 78,784 | | | | 771,299 | |
TCW Emerging Markets Income Fund — Institutional Class | | | 7,817 | | | | 61,126 | |
Vanguard Short-Term Inflation-Protected Securities Index Fund — Institutional Class | | | 4,400 | | | | 108,202 | |
| | | | | | | | |
Total Fixed Income Funds | | | | | | | 1,604,460 | |
| | |
| Alternative Funds — 4.6% | | | | | | |
BMO Alternative Strategies Fund — Institutional Class (1) | | | 72,332 | | | | 709,577 | |
| | | | | | | | |
Total Mutual Funds
(identified cost $12,810,006) | | | | | | | 15,357,234 | |
| | |
| Short-Term Investments — 1.0% | | | | | | |
| | |
| Mutual Funds — 1.0% | | | | | | |
BMO Institutional Prime Money Market Fund — Premier Class, 1.987% (1) | | | 159,374 | | | | 159,390 | |
| | | | | | | | |
Total Short-Term Investments — 1.0%
(identified cost $159,362) | | | | | | | 159,390 | |
| | | | | | | | |
Total Investments — 99.7%
(identified cost $12,969,368) | | | | | | | 15,516,624 | |
| Other Assets and Liabilities — 0.3% | | | | | | | 51,130 | |
| | | | | | | | |
| Total Net Assets — 100.0% | | | | | | $ | 15,567,754 | |
| | | | | | | | |
2040 Fund | |
| Description | | Shares | | | Value | |
| Mutual Funds — 98.7% | | | | | | |
| | |
| Large-Cap Funds — 41.7% | | | | | | |
BMO Dividend Income Fund — Institutional Class (1) | | | 54,570 | | | $ | 840,928 | |
BMOLarge-Cap Growth Fund — Class R6 (1) | | | 88,733 | | | | 1,882,018 | |
BMOLarge-Cap Value Fund — Class R6 (1) | | | 223,848 | | | | 3,720,345 | |
BMO Low Volatility Equity Fund — Institutional Class (1) | | | 153,042 | | | | 2,413,476 | |
Harbor Capital Appreciation Fund — Retirement Class | | | 39,957 | | | | 3,262,083 | |
T Rowe Price Growth Stock Fund — Institutional Class | | | 44,967 | | | | 3,258,344 | |
Vanguard Equity Income Fund — Admiral Class | | | 17,959 | | | | 1,438,331 | |
Vanguard Institutional Index Fund — Institutional Class | | | 31,377 | | | | 8,325,169 | |
| | | | | | | | |
TotalLarge-Cap Funds | | | | | | | 25,140,694 | |
| | | | | | | | |
| Description | | Shares | | | Value | |
| Mutual Funds (continued) | | | | | | |
| | |
| Mid-Cap Funds — 11.6% | | | | | | |
BMOMid-Cap Growth Fund — Class R6 (1) | | | 111,879 | | | $ | 2,115,628 | |
BMOMid-Cap Value Fund — Class R6 (1) | | | 171,381 | | | | 2,159,406 | |
VanguardMid-Cap Index Fund — Institutional Class | | | 59,692 | | | | 2,706,432 | |
| | | | | | | | |
TotalMid-Cap Funds | | | | | | | 6,981,466 | |
| | |
| Small-Cap Funds — 4.9% | | | | | | |
BMOSmall-Cap Growth Fund — Institutional Class (1) | | | 65,371 | | | | 1,469,529 | |
Goldman Sachs Small Cap Value Fund — Institutional Class | | | 22,339 | | | | 1,449,808 | |
| | | | | | | | |
TotalSmall-Cap Funds | | | | | | | 2,919,337 | |
| | |
| International Funds — 29.5% | | | | | | |
BMO Disciplined International Equity Fund — Institutional Class (1) | | | 173,302 | | | | 1,899,386 | |
BMO LGM Emerging Markets Equity Fund — Institutional Class (1) | | | 211,626 | | | | 3,383,901 | |
BMO Pyrford International Stock Fund — Class R6 (1) | | | 275,587 | | | | 3,637,748 | |
DFA International Small Company Portfolio — Institutional Class | | | 32,002 | | | | 659,242 | |
Dodge & Cox International Stock Fund — Retail Class | | | 67,186 | | | | 2,903,785 | |
Harbor International Fund — Retirement Class | | | 50,437 | | | | 3,265,278 | |
MFS International Value Fund — Class R6 | | | 46,003 | | | | 2,042,529 | |
| | | | | | | | |
Total International Funds | | | | | | | 17,791,869 | |
| | |
| Fixed Income Funds — 6.8% | | | | | | |
BMO High Yield Bond Fund — Institutional Class (1) | | | 13,021 | | | | 120,313 | |
BMO TCH Core Plus Bond Fund — Institutional Class (1) | | | 89,806 | | | | 1,023,784 | |
Federated Institutional High-Yield Bond Fund — Class R6 | | | 24,631 | | | | 240,642 | |
Fidelity Advisor Floating Rate High Income Fund — Institutional Class | | | 25,066 | | | | 240,888 | |
Metropolitan West Total Return Bond Fund — Plan Class | | | 208,937 | | | | 2,045,495 | |
TCW Emerging Markets Income Fund — Institutional Class | | | 22,811 | | | | 178,385 | |
Vanguard Short-Term Inflation-Protected Securities Index Fund — Institutional Class | | | 9,804 | | | | 241,085 | |
| | | | | | | | |
Total Fixed Income Funds | | | | | | | 4,090,592 | |
| | |
| Alternative Funds — 4.2% | | | | | | |
BMO Alternative Strategies Fund — Institutional Class (1) | | | 256,524 | | | | 2,516,502 | |
| | | | | | | | |
Total Mutual Funds
(identified cost $39,341,715) | | | | | | | 59,440,460 | |
| | |
| Short-Term Investments — 1.0% | | | | | | |
| | |
| Mutual Funds — 1.0% | | | | | | |
BMO Institutional Prime Money Market Fund — Premier Class, 1.987% (1) | | | 593,040 | | | | 593,100 | |
| | | | | | | | |
Total Short-Term Investments — 1.0%
(identified cost $593,100) | | | | | | | 593,100 | |
| | | | | | | | |
Total Investments — 99.7%
(identified cost $39,934,815) | | | | | | | 60,033,560 | |
| Other Assets and Liabilities — 0.3% | | | | | | | 198,689 | |
| | | | | | | | |
| Total Net Assets — 100.0% | | | | | | $ | 60,232,249 | |
| | | | | | | | |
(See Notes which are an integral part of the Financial Statements)
18
2045 Fund
| | | | | | | | |
| Description | | Shares | | | Value | |
| Mutual Funds — 98.6% | | | | | | |
| | |
| Large-Cap Funds — 42.1% | | | | | | |
BMO Dividend Income Fund — Institutional Class (1) | | | 10,230 | | | $ | 157,649 | |
BMOLarge-Cap Growth Fund —
Class R6 (1) | | | 16,635 | | | | 352,828 | |
BMOLarge-Cap Value Fund —
Class R6 (1) | | | 42,642 | | | | 708,703 | |
BMO Low Volatility Equity Fund — Institutional Class (1) | | | 28,691 | | | | 452,452 | |
Harbor Capital Appreciation Fund — Retirement Class | | | 7,630 | | | | 622,898 | |
T Rowe Price Growth Stock Fund — Institutional Class | | | 8,586 | | | | 622,182 | |
Vanguard Equity Income Fund — Admiral Class | | | 3,367 | | | | 269,643 | |
Vanguard Institutional Index Fund — Institutional Class | | | 5,925 | | | | 1,572,055 | |
| | | | | | | | |
TotalLarge-Cap Funds | | | | | | | 4,758,410 | |
| | |
| Mid-Cap Funds — 11.7% | | | | | | |
BMOMid-Cap Growth Fund —
Class R6 (1) | | | 21,573 | | | | 407,953 | |
BMOMid-Cap Value Fund — Class R6 (1) | | | 32,129 | | | | 404,827 | |
VanguardMid-Cap Index Fund — Institutional Class | | | 11,191 | | | | 507,377 | |
| | | | | | | | |
TotalMid-Cap Funds | | | | | | | 1,320,157 | |
| | |
| Small-Cap Funds — 5.0% | | | | | | |
BMOSmall-Cap Growth Fund — Institutional Class (1) | | | 12,766 | | | | 286,966 | |
Goldman Sachs Small Cap Value Fund — Institutional Class | | | 4,362 | | | | 283,113 | |
| | | | | | | | |
TotalSmall-Cap Funds | | | | | | | 570,079 | |
| | |
| International Funds — 29.8% | | | | | | |
BMO Disciplined International Equity Fund — Institutional Class (1) | | | 32,490 | | | | 356,091 | |
BMO LGM Emerging Markets Equity Fund — Institutional Class (1) | | | 41,067 | | | | 656,658 | |
BMO Pyrford International Stock Fund — Class R6 (1) | | | 52,512 | | | | 693,158 | |
DFA International Small Company Portfolio — Institutional Class | | | 6,545 | | | | 134,827 | |
Dodge & Cox International Stock Fund — Retail Class | | | 12,853 | | | | 555,509 | |
Harbor International Fund — Retirement Class | | | 9,455 | | | | 612,153 | |
MFS International Value Fund — Class R6 | | | 8,117 | | | | 360,398 | |
| | | | | | | | |
Total International Funds | | | | | | | 3,368,794 | |
| | |
| Fixed Income Funds — 6.5% | | | | | | |
BMO High Yield Bond Fund — Institutional Class (1) | | | 2,441 | | | | 22,555 | |
BMO TCH Core Plus Bond Fund — Institutional Class (1) | | | 17,826 | | | | 203,217 | |
Federated Institutional High-Yield Bond Fund — Class R6 | | | 3,463 | | | | 33,835 | |
Fidelity Advisor Floating Rate High Income Fund — Institutional Class | | | 3,525 | | | | 33,869 | |
Metropolitan West Total Return Bond Fund — Plan Class | | | 38,017 | | | | 372,187 | |
TCW Emerging Markets Income Fund — Institutional Class | | | 2,851 | | | | 22,295 | |
| | | | | | | | |
| Description | | Shares | | | Value | |
| Mutual Funds (continued) | | | | | | |
| | |
| Fixed Income Funds (continued) | | | | | | |
Vanguard Short-Term Inflation-Protected Securities Index Fund — Institutional Class | | | 1,838 | | | $ | 45,196 | |
| | | | | | | | |
Total Fixed Income Funds | | | | | | | 733,154 | |
| | |
| Alternative Funds — 3.5% | | | | | | |
BMO Alternative Strategies Fund — Institutional Class (1) | | | 40,075 | | | | 393,140 | |
| | | | | | | | |
Total Mutual Funds
(identified cost $9,517,503) | | | | | | | 11,143,734 | |
| | |
| Short-Term Investments — 1.0% | | | | | | |
| | |
| Mutual Funds — 1.0% | | | | | | |
BMO Institutional Prime Money Market Fund — Premier Class, 1.987% (1) | | | 107,215 | | | | 107,226 | |
| | | | | | | | |
Total Short-Term Investments — 1.0%
(identified cost $107,219) | | | | | | | 107,226 | |
| | | | | | | | |
Total Investments — 99.6%
(identified cost $9,624,722) | | | | | | | 11,250,960 | |
| Other Assets and Liabilities — 0.4% | | | | | | | 46,212 | |
| | | | | | | | |
| Total Net Assets — 100.0% | | | | | | $ | 11,297,172 | |
| | | | | | | | |
2050 Fund | |
| Description | | Shares | | | Value | |
| Mutual Funds — 98.7% | | | | | | |
| | |
| Large-Cap Funds — 42.0% | | | | | | |
BMO Dividend Income Fund — Institutional Class (1) | | | 42,228 | | | $ | 650,742 | |
BMOLarge-Cap Growth Fund — Class R6 (1) | | | 68,163 | | | | 1,445,732 | |
BMOLarge-Cap Value Fund — Class R6 (1) | | | 176,194 | | | | 2,928,340 | |
BMO Low Volatility Equity Fund — Institutional Class (1) | | | 118,124 | | | | 1,862,809 | |
Harbor Capital Appreciation Fund — Retirement Class | | | 31,291 | | | | 2,554,600 | |
T Rowe Price Growth Stock Fund — Institutional Class | | | 35,257 | | | | 2,554,720 | |
Vanguard Equity Income Fund — Admiral Class | | | 13,904 | | | | 1,113,621 | |
Vanguard Institutional Index Fund — Institutional Class | | | 24,356 | | | | 6,462,406 | |
| | | | | | | | |
TotalLarge-Cap Funds | | | | | | | 19,572,970 | |
| | |
| Mid-Cap Funds — 11.7% | | | | | | |
BMOMid-Cap Growth Fund — Class R6 (1) | | | 88,960 | | | | 1,682,233 | |
BMOMid-Cap Value Fund — Class R6 (1) | | | 133,015 | | | | 1,675,987 | |
VanguardMid-Cap Index Fund — Institutional Class | | | 46,204 | | | | 2,094,899 | |
| | | | | | | | |
TotalMid-Cap Funds | | | | | | | 5,453,119 | |
| | |
| Small-Cap Funds — 5.0% | | | | | | |
BMOSmall-Cap Growth Fund — Institutional Class (1) | | | 52,066 | | | | 1,170,437 | |
Goldman Sachs Small Cap Value Fund — Institutional Class | | | 17,952 | | | | 1,165,092 | |
| | | | | | | | |
TotalSmall-Cap Funds | | | | | | | 2,335,529 | |
(See Notes which are an integral part of the Financial Statements)
19
August 31, 2018
2050 Fund (continued)
| | | | | | | | |
| Description | | Shares | | | Value | |
| Mutual Funds (continued) | | | | | | |
| | |
| International Funds — 30.0% | | | | | | |
BMO Disciplined International Equity Fund — Institutional Class (1) | | | 134,248 | | | $ | 1,471,361 | |
BMO LGM Emerging Markets Equity Fund — Institutional Class (1) | | | 171,087 | | | | 2,735,684 | |
BMO Pyrford International Stock Fund — Class R6 (1) | | | 216,356 | | | | 2,855,898 | |
DFA International Small Company Portfolio — Institutional Class | | | 26,946 | | | | 555,087 | |
Dodge & Cox International Stock Fund — Retail Class | | | 53,322 | | | | 2,304,564 | |
Harbor International Fund — Retirement Class | | | 39,225 | | | | 2,539,404 | |
MFS International Value Fund — Class R6 | | | 33,342 | | | | 1,480,383 | |
| | | | | | | | |
Total International Funds | | | | | | | 13,942,381 | |
| | |
| Fixed Income Funds — 6.5% | | | | | | |
BMO High Yield Bond Fund — Institutional Class (1) | | | 10,061 | | | | 92,963 | |
BMO TCH Core Plus Bond Fund — Institutional Class (1) | | | 73,392 | | | | 836,669 | |
Federated Institutional High-Yield Bond Fund — Class R6 | | | 14,273 | | | | 139,445 | |
Fidelity Advisor Floating Rate High Income Fund — Institutional Class | | | 14,510 | | | | 139,445 | |
Metropolitan West Total Return Bond Fund — Plan Class | | | 156,680 | | | | 1,533,892 | |
TCW Emerging Markets Income Fund — Institutional Class | | | 11,813 | | | | 92,376 | |
Vanguard Short-Term Inflation-Protected Securities Index Fund — Institutional Class | | | 7,564 | | | | 186,002 | |
| | | | | | | | |
Total Fixed Income Funds | | | | | | | 3,020,792 | |
| | |
| Alternative Funds — 3.5% | | | | | | |
BMO Alternative Strategies Fund — Institutional Class (1) | | | 165,836 | | | | 1,626,856 | |
| | | | | | | | |
Total Mutual Funds
(identified cost $31,960,281) | | | | | | | 45,951,647 | |
| | |
| Short-Term Investments — 1.2% | | | | | | |
| | |
| Mutual Funds — 1.2% | | | | | | |
BMO Institutional Prime Money Market Fund — Premier Class, 1.987% (1) | | | 548,379 | | | | 548,434 | |
| | | | | | | | |
Total Short-Term Investments — 1.2%
(identified cost $548,434) | | | | | | | 548,434 | |
| | | | | | | | |
Total Investments — 99.9%
(identified cost $32,508,715) | | | | | | | 46,500,081 | |
| Other Assets and Liabilities — 0.1% | | | | | | | 59,479 | |
| | | | | | | | |
| Total Net Assets — 100.0% | | | | | | $ | 46,559,560 | |
| | | | | | | | |
2055 Fund | |
| Description | | Shares | | | Value | |
| Mutual Funds — 98.2% | | | | | | |
| | |
| Large-Cap Funds — 42.0% | | | | | | |
BMO Dividend Income Fund — Institutional Class (1) | | | 10,168 | | | $ | 156,686 | |
| | | | | | | | |
| Description | | Shares | | | Value | |
| Mutual Funds (continued) | | | | | | |
| | |
| Large-Cap Funds (continued) | | | | | | |
BMOLarge-Cap Growth Fund — Class R6 (1) | | | 16,554 | | | $ | 351,105 | |
BMOLarge-Cap Value Fund — Class R6 (1) | | | 42,379 | | | | 704,332 | |
BMO Low Volatility Equity Fund — Institutional Class (1) | | | 28,515 | | | | 449,686 | |
Harbor Capital Appreciation Fund — Retirement Class | | | 7,588 | | | | 619,519 | |
T Rowe Price Growth Stock Fund — Institutional Class | | | 8,531 | | | | 618,127 | |
Vanguard Equity Income Fund — Admiral Class | | | 3,339 | | | | 267,422 | |
Vanguard Institutional Index Fund — Institutional Class | | | 5,886 | | | | 1,561,819 | |
| | | | | | | | |
TotalLarge-Cap Funds | | | | | | | 4,728,696 | |
| | |
| Mid-Cap Funds — 11.6% | | | | | | |
BMOMid-Cap Growth Fund — Class R6 (1) | | | 21,462 | | | | 405,851 | |
BMOMid-Cap Value Fund — Class R6 (1) | | | 31,962 | | | | 402,728 | |
VanguardMid-Cap Index Fund — Institutional Class | | | 11,125 | | | | 504,394 | |
| | | | | | | | |
TotalMid-Cap Funds | | | | | | | 1,312,973 | |
| | |
| Small-Cap Funds — 5.0% | | | | | | |
BMOSmall-Cap Growth Fund — Institutional Class (1) | | | 12,662 | | | | 284,652 | |
Goldman Sachs Small Cap Value Fund — Institutional Class | | | 4,332 | | | | 281,126 | |
| | | | | | | | |
TotalSmall-Cap Funds | | | | | | | 565,778 | |
| | |
| International Funds — 29.6% | | | | | | |
BMO Disciplined International Equity Fund — Institutional Class (1) | | | 32,265 | | | | 353,625 | |
BMO LGM Emerging Markets Equity Fund — Institutional Class (1) | | | 40,584 | | | | 648,940 | |
BMO Pyrford International Stock Fund — Class R6 (1) | | | 52,194 | | | | 688,964 | |
DFA International Small Company Portfolio — Institutional Class | | | 6,494 | | | | 133,780 | |
Dodge & Cox International Stock Fund — Retail Class | | | 12,724 | | | | 549,930 | |
Harbor International Fund — Retirement Class | | | 9,367 | | | | 606,384 | |
MFS International Value Fund — Class R6 | | | 8,075 | | | | 358,516 | |
| | | | | | | | |
Total International Funds | | | | | | | 3,340,139 | |
| | |
| Fixed Income Funds — 6.5% | | | | | | |
BMO High Yield Bond Fund — Institutional Class (1) | | | 2,427 | | | | 22,427 | |
BMO TCH Core Plus Bond Fund — Institutional Class (1) | | | 17,690 | | | | 201,673 | |
Federated Institutional High-Yield Bond Fund — Class R6 | | | 3,440 | | | | 33,607 | |
Fidelity Advisor Floating Rate High Income Fund — Institutional Class | | | 3,501 | | | | 33,641 | |
Metropolitan West Total Return Bond Fund — Plan Class | | | 37,761 | | | | 369,684 | |
TCW Emerging Markets Income Fund — Institutional Class | | | 2,832 | | | | 22,144 | |
Vanguard Short-Term Inflation-Protected Securities Index Fund — Institutional Class | | | 1,825 | | | | 44,873 | |
| | | | | | | | |
Total Fixed Income Funds | | | | | | | 728,049 | |
(See Notes which are an integral part of the Financial Statements)
20
2055 Fund (continued)
| | | | | | | | |
| Description | | Shares | | | Value | |
| Mutual Funds (continued) | | | | | | |
| | |
| Alternative Funds — 3.5% | | | | | | |
BMO Alternative Strategies Fund — Institutional Class (1) | | | 39,805 | | | $ | 390,483 | |
| | | | | | | | |
Total Mutual Funds
(identified cost $9,456,359) | | | | | | | 11,066,118 | |
| | |
| Short-Term Investments — 1.0% | | | | | | |
| | |
| Mutual Funds — 1.0% | | | | | | |
BMO Institutional Prime Money Market Fund — Premier Class, 1.987% (1) | | | 113,971 | | | | 113,983 | |
| | | | | | | | |
Total Short-Term Investments — 1.0%
(identified cost $113,971) | | | | | | | 113,983 | |
| | | | | | | | |
Total Investments — 99.2%
(identified cost $9,570,330) | | | | | | | 11,180,101 | |
| Other Assets and Liabilities — 0.8% | | | | | | | 85,943 | |
| | | | | | | | |
| Total Net Assets — 100.0% | | | | | | $ | 11,266,044 | |
| | | | | | | | |
Conservative Allocation Fund | |
| Description | | Shares | | | Value | |
| Mutual Funds — 98.5% | | | | | | |
| | |
| Large-Cap Funds — 12.9% | | | | | | |
BMO Dividend Income Fund — Institutional Class (1) | | | 17,680 | | | $ | 272,453 | |
BMOLarge-Cap Growth Fund — Class R6 (1) | | | 35,793 | | | | 759,172 | |
BMOLarge-Cap Value Fund — Class R6 (1) | | | 56,530 | | | | 939,524 | |
BMO Low Volatility Equity Fund — Institutional Class (1) | | | 31,856 | | | | 502,366 | |
Dodge & Cox Stock Fund — Retail Class | | | 1,614 | | | | 346,395 | |
Harbor Capital Appreciation Fund — Retirement Class | | | 4,279 | | | | 349,316 | |
T Rowe Price Growth Stock Fund — Institutional Class | | | 3,879 | | | | 281,080 | |
Vanguard Institutional Index Fund — Institutional Class | | | 5,253 | | | | 1,393,865 | |
| | | | | | | | |
TotalLarge-Cap Funds | | | | | | | 4,844,171 | |
| | |
| Mid-Cap Funds — 1.9% | | | | | | |
BMOMid-Cap Growth Fund — Class R6 (1) | | | 9,940 | | | | 187,974 | |
BMOMid-Cap Value Fund — Class R6 (1) | | | 14,804 | | | | 186,532 | |
VanguardMid-Cap Index Fund — Institutional Class | | | 7,255 | | | | 328,931 | |
| | | | | | | | |
TotalMid-Cap Funds | | | | | | | 703,437 | |
| | |
| Small-Cap Funds — 1.5% | | | | | | |
BMOSmall-Cap Growth Fund — Institutional Class (1) | | | 12,160 | | | | 273,366 | |
BMOSmall-Cap Value Fund — Class R6 (1) | | | 11,863 | | | | 179,494 | |
Goldman Sachs Small Cap Value Fund — Institutional Class | | | 1,445 | | | | 93,746 | |
| | | | | | | | |
TotalSmall-Cap Funds | | | | | | | 546,606 | |
| | |
| International Funds — 7.1% | | | | | | |
BMO Disciplined International Equity Fund — Institutional Class (1) | | | 39,681 | | | | 434,906 | |
BMO LGM Emerging Markets Equity Fund — Institutional Class (1) | | | 23,171 | | | | 370,501 | |
| | | | | | | | |
| Description | | Shares | | | Value | |
| Mutual Funds (continued) | | | | | | |
| | |
| International Funds (continued) | | | | | | |
BMO Pyrford International Stock Fund — Class R6 (1) | | | 35,093 | | | $ | 463,225 | |
Dodge & Cox International Stock Fund — Retail Class | | | 8,233 | | | | 355,809 | |
Harbor International Fund — Retirement Class | | | 5,509 | | | | 356,665 | |
MFS International Value Fund — Class R6 | | | 9,425 | | | | 418,456 | |
T Rowe Price International Discovery Fund — Institutional Class | | | 3,875 | | | | 278,793 | |
| | | | | | | | |
Total International Funds | | | | | | | 2,678,355 | |
| | |
| Fixed Income Funds — 64.7% | | | | | | |
BMO TCH Core Plus Bond Fund — Institutional Class (1) | | | 808,200 | | | | 9,213,483 | |
Metropolitan West Total Return Bond Fund — Plan Class (2) | | | 1,026,460 | | | | 10,049,043 | |
TCW Emerging Markets Income Fund — Institutional Class | | | 116,622 | | | | 911,982 | |
Vanguard Total Bond Market Index Fund — Institutional Class | | | 392,541 | | | | 4,098,129 | |
| | | | | | | | |
Total Fixed Income Funds | | | | | | | 24,272,637 | |
| | |
| Alternative Funds — 10.4% | | | | | | |
BMO Alternative Strategies Fund — Institutional Class (1) | | | 397,459 | | | | 3,899,071 | |
| | | | | | | | |
Total Mutual Funds
(identified cost $31,917,588) | | | | | | | 36,944,277 | |
| | |
| Short-Term Investments — 0.9% | | | | | | |
| | |
| Mutual Funds — 0.9% | | | | | | |
BMO Institutional Prime Money Market Fund — Premier Class, 1.987% (1) | | | 355,526 | | | | 355,561 | |
| | | | | | | | |
TotalShort-Term Investments — 0.9%
(identified cost $355,539) | | | | | | | 355,561 | |
| | | | | | | | |
Total Investments — 99.4%
(identified cost $32,273,127) | | | | | | | 37,299,838 | |
| Other Assets and Liabilities — 0.6% | | | | | | | 215,150 | |
| | | | | | | | |
| Total Net Assets — 100.0% | | | | | | $ | 37,514,988 | |
| | | | | | | | |
Moderate Allocation Fund | |
| Description | | Shares | | | Value | |
| Mutual Funds — 98.7% | | | | | | |
| | |
| Large-Cap Funds — 24.1% | | | | | | |
BMO Dividend Income Fund — Institutional Class (1) | | | 71,777 | | | $ | 1,106,088 | |
BMOLarge-Cap Growth Fund — Class R6 (1) | | | 146,146 | | | | 3,099,756 | |
BMOLarge-Cap Value Fund — Class R6 (1) | | | 229,195 | | | | 3,809,217 | |
BMO Low Volatility Equity Fund — Institutional Class (1) | | | 128,852 | | | | 2,032,002 | |
Dodge & Cox Stock Fund — Retail Class | | | 6,546 | | | | 1,404,894 | |
Harbor Capital Appreciation Fund — Retirement Class | | | 17,851 | | | | 1,457,347 | |
T Rowe Price Growth Stock Fund — Institutional Class | | | 15,862 | | | | 1,149,336 | |
(See Notes which are an integral part of the Financial Statements)
21
August 31, 2018
Moderate Allocation Fund (continued)
| | | | | | | | |
| Description | | Shares | | | Value | |
| Mutual Funds (continued) | | | | | | |
| | |
| Large-Cap Funds (continued) | | | | | | |
Vanguard Institutional Index Fund — Institutional Class | | | 21,434 | | | $ | 5,687,027 | |
| | | | | | | | |
TotalLarge-Cap Funds | | | | | | | 19,745,667 | |
| | |
| Mid-Cap Funds — 3.5% | | | | | | |
BMOMid-Cap Growth Fund — Class R6 (1) | | | 41,318 | | | | 781,319 | |
BMOMid-Cap Value Fund — Class R6 (1) | | | 60,330 | | | | 760,158 | |
VanguardMid-Cap Index Fund — Institutional Class | | | 29,455 | | | | 1,335,503 | |
| | | | | | | | |
TotalMid-Cap Funds | | | | | | | 2,876,980 | |
| | |
| Small-Cap Funds — 2.8% | | | | | | |
BMOSmall-Cap Growth Fund — Institutional Class (1) | | | 50,112 | | | | 1,126,518 | |
BMOSmall-Cap Value Fund — Class R6 (1) | | | 48,745 | | | | 737,511 | |
Goldman Sachs Small Cap Value Fund — Institutional Class | | | 5,956 | | | | 386,562 | |
| | | | | | | | |
TotalSmall-Cap Funds | | | | | | | 2,250,591 | |
| | |
| International Funds — 13.4% | | | | | | |
BMO Disciplined International Equity Fund — Institutional Class (1) | | | 161,790 | | | | 1,773,218 | |
BMO LGM Emerging Markets Equity Fund — Institutional Class (1) | | | 95,669 | | | | 1,529,751 | |
BMO Pyrford International Stock Fund — Class R6 (1) | | | 143,333 | | | | 1,891,995 | |
Dodge & Cox International Stock Fund — Retail Class | | | 34,010 | | | | 1,469,911 | |
Harbor International Fund — Retirement Class | | | 22,550 | | | | 1,459,893 | |
MFS International Value Fund — Class R6 | | | 38,843 | | | | 1,724,630 | |
T Rowe Price International Discovery Fund — Institutional Class | | | 15,947 | | | | 1,147,217 | |
| | | | | | | | |
Total International Funds | | | | | | | 10,996,615 | |
| | |
| Fixed Income Funds — 46.6% | | | | | | |
BMO TCH Core Plus Bond Fund — Institutional Class (1) | | | 1,271,752 | | | | 14,497,972 | |
Metropolitan West Total Return Bond Fund — Plan Class | | | 1,616,093 | | | | 15,821,547 | |
TCW Emerging Markets Income Fund — Institutional Class | | | 184,781 | | | | 1,444,987 | |
Vanguard Total Bond Market Index Fund — Institutional Class | | | 618,429 | | | | 6,456,402 | |
| | | | | | | | |
Total Fixed Income Funds | | | | | | | 38,220,908 | |
| | |
| Alternative Funds — 8.3% | | | | | | |
BMO Alternative Strategies Fund — Institutional Class (1) | | | 692,170 | | | | 6,790,183 | |
| | | | | | | | |
Total Mutual Funds
(identified cost $65,121,297) | | | | | | | 80,880,944 | |
| | | | | | | | |
| Description | | Shares | | | Value | |
| Short-Term Investments — 0.9% | | | | | | |
| | |
| Mutual Funds — 0.9% | | | | | | |
BMO Institutional Prime Money Market Fund — Premier Class, 1.987% (1) | | | 775,811 | | | $ | 775,889 | |
| | | | | | | | |
Total Short-Term Investments — 0.9%
(identified cost $775,778) | | | | | | | 775,889 | |
| | | | | | | | |
Total Investments — 99.6%
(identified cost $65,897,075) | | | | | | | 81,656,833 | |
| Other Assets and Liabilities — 0.4% | | | | | | | 307,543 | |
| | | | | | | | |
| Total Net Assets — 100.0% | | | | | | $ | 81,964,376 | |
| | | | | | | | |
Balanced Allocation Fund | |
| Description | | Shares | | | Value | |
| Mutual Funds — 98.9% | | | | | | |
| | |
| Large-Cap Funds — 34.9% | | | | | | |
BMO Dividend Income Fund — Institutional Class (1) | | | 437,270 | | | $ | 6,738,334 | |
BMOLarge-Cap Growth Fund — Class R6 (1) | | | 892,738 | | | | 18,934,980 | |
BMOLarge-Cap Value Fund — Class R6 (1) | | | 1,403,597 | | | | 23,327,787 | |
BMO Low Volatility Equity Fund — Institutional Class (1) | | | 789,723 | | | | 12,453,938 | |
Dodge & Cox Stock Fund — Retail Class | | | 40,102 | | | | 8,606,274 | |
Harbor Capital Appreciation Fund — Retirement Class | | | 108,198 | | | | 8,833,245 | |
T Rowe Price Growth Stock Fund — Institutional Class | | | 96,725 | | | | 7,008,677 | |
Vanguard Institutional Index Fund — Institutional Class | | | 130,947 | | | | 34,744,009 | |
| | | | | | | | |
TotalLarge-Cap Funds | | | | | | | 120,647,244 | |
| | |
| Mid-Cap Funds — 5.1% | | | | | | |
BMOMid-Cap Growth Fund — Class R6 (1) | | | 250,673 | | | | 4,740,219 | |
BMOMid-Cap Value Fund — Class R6 (1) | | | 369,300 | | | | 4,653,183 | |
VanguardMid-Cap Index Fund — Institutional Class | | | 180,205 | | | | 8,170,502 | |
| | | | | | | | |
TotalMid-Cap Funds | | | | | | | 17,563,904 | |
| | |
| Small-Cap Funds — 3.9% | | | | | | |
BMOSmall-Cap Growth Fund — Institutional Class (1) | | | 302,428 | | | | 6,798,574 | |
BMOSmall-Cap Value Fund — Class R6 (1) | | | 295,566 | | | | 4,471,911 | |
Goldman Sachs Small Cap Value Fund — Institutional Class | | | 36,121 | | | | 2,344,271 | |
| | | | | | | | |
TotalSmall-Cap Funds | | | | | | | 13,614,756 | |
| | |
| International Funds — 19.4% | | | | | | |
BMO Disciplined International Equity Fund — Institutional Class (1) | | | 992,529 | | | | 10,878,121 | |
BMO LGM Emerging Markets Equity Fund — Institutional Class (1) | | | 576,427 | | | | 9,217,067 | |
BMO Pyrford International Stock Fund — Class R6 (1) | | | 876,596 | | | | 11,571,062 | |
Dodge & Cox International Stock Fund — Retail Class | | | 206,524 | | | | 8,925,976 | |
Harbor International Fund — Retirement Class | | | 137,555 | | | | 8,905,313 | |
(See Notes which are an integral part of the Financial Statements)
22
Balanced Allocation Fund (continued)
| | | | | | | | |
| Description | | Shares | | | Value | |
| Mutual Funds (continued) | | | | | | |
| | |
| International Funds (continued) | | | | | | |
MFS International Value Fund — Class R6 | | | 235,853 | | | $ | 10,471,868 | |
T Rowe Price International Discovery Fund — Institutional Class | | | 96,791 | | | | 6,963,187 | |
| | | | | | | | |
Total International Funds | | | | | | | 66,932,594 | |
| | |
| Fixed Income Funds — 28.7% | | | | | | |
BMO TCH Core Plus Bond Fund — Institutional Class (1) | | | 3,303,951 | | | | 37,665,037 | |
Metropolitan West Total Return Bond Fund — Plan Class | | | 4,199,531 | | | | 41,113,407 | |
TCW Emerging Markets Income Fund — Institutional Class | | | 477,424 | | | | 3,733,460 | |
Vanguard Total Bond Market Index Fund — Institutional Class | | | 1,606,712 | | | | 16,774,070 | |
| | | | | | | | |
Total Fixed Income Funds | | | | | | | 99,285,974 | |
| | |
| Alternative Funds — 6.9% | | | | | | |
BMO Alternative Strategies Fund — Institutional Class (1) | | | 2,442,258 | | | | 23,958,550 | |
| | | | | | | | |
Total Mutual Funds
(identified cost $248,230,046) | | | | | | | 342,003,022 | |
| | |
| Short-Term Investments — 0.9% | | | | | | |
| | |
| Mutual Funds — 0.9% | | | | | | |
BMO Institutional Prime Money Market Fund — Premier Class, 1.987% (1) | | | 3,049,426 | | | | 3,049,731 | |
| | | | | | | | |
TotalShort-Term Investments — 0.9%
(identified cost $3,049,189) | | | | | | | 3,049,731 | |
| | | | | | | | |
Total Investments — 99.8%
(identified cost $251,279,235) | | | | | | | 345,052,753 | |
| Other Assets and Liabilities — 0.2% | | | | 660,441 | |
| | | | | | | | |
| Total Net Assets — 100.0% | | | | | | $ | 345,713,194 | |
| | | | | | | | |
Growth Allocation Fund | |
| Description | | Shares | | | Value | |
| Mutual Funds — 99.3% | | | | | | |
| | |
| Large-Cap Funds — 45.9% | | | | | | |
BMO Dividend Income Fund — Institutional Class (1) | | | 205,894 | | | $ | 3,172,832 | |
BMOLarge-Cap Growth Fund — Class R6 (1) | | | 415,507 | | | | 8,812,911 | |
BMOLarge-Cap Value Fund — Class R6 (1) | | | 657,143 | | | | 10,921,715 | |
BMO Low Volatility Equity Fund — Institutional Class (1) | | | 371,298 | | | | 5,855,374 | |
Dodge & Cox Stock Fund — Retail Class | | | 18,723 | | | | 4,018,044 | |
Harbor Capital Appreciation Fund — Retirement Class | | | 49,848 | | | | 4,069,548 | |
T Rowe Price Growth Stock Fund — Institutional Class | | | 44,842 | | | | 3,249,258 | |
Vanguard Institutional Index Fund — Institutional Class | | | 61,075 | | | | 16,205,124 | |
| | | | | | | | |
TotalLarge-Cap Funds | | | | | | | 56,304,806 | |
| | | | | | | | |
| Description | | Shares | | | Value | |
| Mutual Funds (continued) | | | | | | |
| | |
| Mid-Cap Funds — 6.7% | | | | | | |
BMOMid-Cap Growth Fund — Class R6 (1) | | | 116,495 | | | $ | 2,202,922 | |
BMOMid-Cap Value Fund — Class R6 (1) | | | 173,494 | | | | 2,186,018 | |
VanguardMid-Cap Index Fund — Institutional Class | | | 84,191 | | | | 3,817,230 | |
| | | | | | | | |
TotalMid-Cap Funds | | | | | | | 8,206,170 | |
| | |
| Small-Cap Funds — 5.2% | | | | | | |
BMOSmall-Cap Growth Fund — Institutional Class (1) | | | 141,643 | | | | 3,184,146 | |
BMOSmall-Cap Value Fund — Class R6 (1) | | | 139,350 | | | | 2,108,363 | |
Goldman Sachs Small Cap Value Fund — Institutional Class | | | 17,151 | | | | 1,113,077 | |
| | | | | | | | |
TotalSmall-Cap Funds | | | | | | | 6,405,586 | |
| | |
| International Funds — 25.4% | | | | | | |
BMO Disciplined International Equity Fund — Institutional Class (1) | | | 461,272 | | | | 5,055,538 | |
BMO LGM Emerging Markets Equity Fund — Institutional Class (1) | | | 271,374 | | | | 4,339,273 | |
BMO Pyrford International Stock Fund — Class R6 (1) | | | 407,915 | | | | 5,384,484 | |
Dodge & Cox International Stock Fund — Retail Class | | | 96,294 | | | | 4,161,809 | |
Harbor International Fund — Retirement Class | | | 64,399 | | | | 4,169,228 | |
MFS International Value Fund — Class R6 | | | 109,425 | | | | 4,858,464 | |
T Rowe Price International Discovery Fund — Institutional Class | | | 44,791 | | | | 3,222,236 | |
| | | | | | | | |
Total International Funds | | | | | | | 31,191,032 | |
| | |
| Fixed Income Funds — 10.5% | | | | | | |
BMO TCH Core Plus Bond Fund — Institutional Class (1) | | | 426,133 | | | | 4,857,916 | |
Metropolitan West Total Return Bond Fund — Plan Class | | | 541,010 | | | | 5,296,493 | |
TCW Emerging Markets Income Fund — Institutional Class | | | 62,273 | | | | 486,973 | |
Vanguard Total Bond Market Index Fund — Institutional Class | | | 207,858 | | | | 2,170,033 | |
| | | | | | | | |
Total Fixed Income Funds | | | | | | | 12,811,415 | |
| | |
| Alternative Funds — 5.6% | | | | | | |
BMO Alternative Strategies Fund — Institutional Class (1) | | | 700,269 | | | | 6,869,639 | |
| | | | | | | | |
Total Mutual Funds
(identified cost $80,918,640) | | | | | | | 121,788,648 | |
| | |
| Short-Term Investments — 1.0% | | | | | | |
| | |
| Mutual Funds — 1.0% | | | | | | |
BMO Institutional Prime Money Market Fund — Premier Class, 1.987% (1) | | | 1,153,712 | | | | 1,153,827 | |
| | | | | | | | |
TotalShort-Term Investments — 1.0%
(identified cost $1,153,827) | | | | | | | 1,153,827 | |
| | | | | | | | |
Total Investments — 100.3%
(identified cost $82,072,467) | | | | | | | 122,942,475 | |
| Other Assets and Liabilities — (0.3)% | | | | (323,143 | ) |
| | | | | | | | |
| Total Net Assets — 100.0% | | | | | | $ | 122,619,332 | |
| | | | | | | | |
(See Notes which are an integral part of the Financial Statements)
23
August 31, 2018
Aggressive Allocation Fund
| | | | | | | | |
| Description | | Shares | | | Value | |
| Mutual Funds — 99.0% | | | | | | |
| | |
| Large-Cap Funds — 54.3% | | | | | | |
BMO Dividend Income Fund — Institutional Class (1) | | | 355,952 | | | $ | 5,485,222 | |
BMOLarge-Cap Growth Fund — Class R6 (1) | | | 720,785 | | | | 15,287,855 | |
BMOLarge-Cap Value Fund — Class R6 (1) | | | 1,134,991 | | | | 18,863,548 | |
BMO Low Volatility Equity Fund — Institutional Class (1) | | | 643,792 | | | | 10,152,602 | |
Dodge & Cox Stock Fund — Retail Class | | | 32,449 | | | | 6,963,899 | |
Harbor Capital Appreciation Fund — Retirement Class | | | 86,685 | | | | 7,076,905 | |
T Rowe Price Growth Stock Fund — Institutional Class | | | 78,009 | | | | 5,652,544 | |
Vanguard Institutional Index Fund — Institutional Class | | | 105,952 | | | | 28,112,282 | |
| | | | | | | | |
TotalLarge-Cap Funds | | | | | | | 97,594,857 | |
| | |
| Mid-Cap Funds — 7.9% | | | | | | |
BMOMid-Cap Growth Fund — Class R6 (1) | | | 202,134 | | | | 3,822,358 | |
BMOMid-Cap Value Fund — Class R6 (1) | | | 301,036 | | | | 3,793,047 | |
VanguardMid-Cap Index Fund — Institutional Class | | | 145,792 | | | | 6,610,206 | |
| | | | | | | | |
TotalMid-Cap Funds | | | | | | | 14,225,611 | |
| | |
| Small-Cap Funds — 6.2% | | | | | | |
BMOSmall-Cap Growth Fund — Institutional Class (1) | | | 245,790 | | | | 5,525,370 | |
BMOSmall-Cap Value Fund — Class R6 (1) | | | 241,766 | | | | 3,657,921 | |
Goldman Sachs Small Cap Value Fund — Institutional Class | | | 29,513 | | | | 1,915,364 | |
| | | | | | | | |
TotalSmall-Cap Funds | | | | | | | 11,098,655 | |
| | | | | | | | |
| Description | | Shares | | | Value | |
| Mutual Funds (continued) | | | | | | |
| | |
| International Funds — 30.1% | | | | | | |
BMO Disciplined International Equity Fund — Institutional Class (1) | | | 810,221 | | | $ | 8,880,022 | |
BMO LGM Emerging Markets Equity Fund — Institutional Class (1) | | | 468,718 | | | | 7,494,805 | |
BMO Pyrford International Stock Fund — Class R6 (1) | | | 708,871 | | | | 9,357,100 | |
Dodge & Cox International Stock Fund — Retail Class | | | 166,450 | | | | 7,193,973 | |
Harbor International Fund — Retirement Class | | | 111,389 | | | | 7,211,334 | |
MFS International Value Fund — Class R6 | | | 190,171 | | | | 8,443,583 | |
T Rowe Price International Discovery Fund — Institutional Class | | | 77,934 | | | | 5,606,558 | |
| | | | | | | | |
Total International Funds | | | | | | | 54,187,375 | |
| | |
| Alternative Funds — 0.5% | | | | | | |
BMO Alternative Strategies Fund — Institutional Class (1) | | | 91,376 | | | | 896,397 | |
| | | | | | | | |
Total Mutual Funds
(identified cost $105,401,920) | | | | | | | 178,002,895 | |
| | |
| Short-Term Investments — 0.9% | | | | | | |
| | |
| Mutual Funds — 0.9% | | | | | | |
BMO Institutional Prime Money Market Fund — Premier Class, 1.987% (1) | | | 1,600,770 | | | | 1,600,930 | |
| | | | | | | | |
Total Short-Term Investments — 0.9%
(identified cost $1,600,800) | | | | | | | 1,600,930 | |
| | | | | | | | |
Total Investments — 99.9%
(identified cost $107,002,720) | | | | | | | 179,603,825 | |
| Other Assets and Liabilities — 0.1% | | | | 125,651 | |
| | | | | | | | |
| Total Net Assets — 100.0% | | | | | | $ | 179,729,476 | |
| | | | | | | | |
| | |
| | |
| Notes to Schedules of Investments | | |
The categories of investments are shown as a percentage of total net assets for each Fund as of August 31, 2018.
| (1) | Denotes an investment in an affiliated entity. Please refer to Note 5, subsectionInvestments in Affiliated Issuers, in the Notes to Financial Statements. |
| (2) | Holding is greater than 25% of portfolio value. Additional information regarding the underlying Fund’s holdings and financial statements may be found at https://www.sec.gov. |
(See Notes which are an integral part of the Financial Statements)
24
August 31, 2018
| | |
| | |
| Statements of Assets and Liabilities | | BMO Funds |
| | | | | | | | | | | | | | | | | | | | |
| | | | | | | | | | | | | | | | |
| | | In-Retirement
Fund | | | 2015 Fund | | | 2020 Fund | | | 2025 Fund | | | 2030 Fund | |
Assets: | | | | | | | | | | | | | | | | | | | | |
Investments in unaffiliated issuers, at value | | $ | 7,583,220 | | | $ | 1,504,456 | | | $ | 39,903,977 | | | $ | 14,271,438 | | | $ | 53,199,458 | |
Cash sweep investments in affiliated issuers, at value | | | 139,450 | | | | 25,136 | | | | 633,912 | | | | 284,649 | | | | 996,505 | |
Investments in other affiliated issuers, at value | | | 6,137,062 | | | | 1,284,472 | | | | 36,371,069 | | | | 11,947,054 | | | | 45,386,019 | |
Dividends and interest receivable | | | 20,977 | | | | 3,713 | | | | 66,012 | | | | 16,985 | | | | 44,568 | |
Receivable for investments sold | | | — | | | | — | | | | 340,160 | | | | — | | | | — | |
Receivable for capital stock sold | | | 2,577 | | | | 2,178 | | | | 85,414 | | | | 32,638 | | | | 261,234 | |
Receivable from affiliates, net (Note 5) | | | 7,305 | | | | 6,462 | | | | 7,329 | | | | 8,204 | | | | 4,028 | |
Prepaid expenses and other receivables | | | 34,952 | | | | 17,745 | | | | 35,476 | | | | 17,849 | | | | 35,521 | |
| | | | | | | | | | | | | | | | | | | | |
Total assets | | | 13,925,543 | | | | 2,844,162 | | | | 77,443,349 | | | | 26,578,817 | | | | 99,927,333 | |
| | | | | |
Liabilities: | | | | | | | | | | | | | | | | | | | | |
Payable for investments purchased | | | — | | | | — | | | | 202,742 | | | | — | | | | — | |
Payable for capital stock redeemed | | | 1,416 | | | | 916 | | | | — | | | | — | | | | — | |
Other liabilities | | | 20,462 | | | | 19,228 | | | | 22,673 | | | | 19,872 | | | | 22,632 | |
| | | | | | | | | | | | | | | | | | | | |
Total liabilities | | | 21,878 | | | | 20,144 | | | | 225,415 | | | | 19,872 | | | | 22,632 | |
| | | | | | | | | | | | | | | | | | | | |
Total net assets | | $ | 13,903,665 | | | $ | 2,824,018 | | | $ | 77,217,934 | | | $ | 26,558,945 | | | $ | 99,904,701 | |
| | | | | | | | | | | | | | | | | | | | |
| | | | | |
Net assets consist of: | | | | | | | | | | | | | | | | | | | | |
Paid-in capital | | $ | 11,490,987 | | | $ | 2,522,615 | | | $ | 54,312,772 | | | $ | 23,219,095 | | | $ | 67,284,754 | |
Net unrealized appreciation on investments | | | 2,017,431 | | | | 236,883 | | | | 19,441,488 | | | | 3,210,764 | | | | 29,827,992 | |
Accumulated net realized gain (loss) on investments | | | 202,272 | | | | 27,921 | | | | 2,754,216 | | | | (66,952 | ) | | | 2,188,655 | |
Undistributed net investment income | | | 192,975 | | | | 36,599 | | | | 709,458 | | | | 196,038 | | | | 603,300 | |
| | | | | | | | | | | | | | | | | | | | |
Total net assets | | $ | 13,903,665 | | | $ | 2,824,018 | | | $ | 77,217,934 | | | $ | 26,558,945 | | | $ | 99,904,701 | |
| | | | | | | | | | | | | | | | | | | | |
| | | | | |
Net asset value, offering price and redemption proceeds per share (unlimited shares authorized, no par value) | | | | | | | | | | | | | | | | | | | | |
Investor class of shares | | $ | 8.97 | | | $ | 11.64 | | | $ | 10.56 | | | $ | 12.28 | | | $ | 12.08 | |
Retirement classR-3 of shares | | | 9.01 | | | | 11.57 | | | | 10.59 | | | | 12.41 | | | | 12.09 | |
Retirement classR-6 of shares | | | 8.97 | | | | 11.66 | | | | 10.58 | | | | 12.36 | | | | 12.09 | |
| | | | | |
Net assets: | | | | | | | | | | | | | | | | | | | | |
Investor class of shares | | $ | 2,647,906 | | | $ | 322,673 | | | $ | 18,001,932 | | | $ | 1,184,571 | | | $ | 20,713,217 | |
Retirement classR-3 of shares | | | 766,091 | | | | 116,935 | | | | 4,532,943 | | | | 108,708 | | | | 3,844,396 | |
Retirement classR-6 of shares | | | 10,489,668 | | | | 2,384,410 | | | | 54,683,059 | | | | 25,265,666 | | | | 75,347,088 | |
| | | | | | | | | | | | | | | | | | | | |
Total net assets | | $ | 13,903,665 | | | $ | 2,824,018 | | | $ | 77,217,934 | | | $ | 26,558,945 | | | $ | 99,904,701 | |
| | | | | | | | | | | | | | | | | | | | |
| | | | | |
Shares outstanding: | | | | | | | | | | | | | | | | | | | | |
Investor class of shares | | | 295,041 | | | | 27,718 | | | | 1,704,057 | | | | 96,478 | | | | 1,714,692 | |
Retirement classR-3 of shares | | | 85,069 | | | | 10,108 | | | | 428,133 | | | | 8,760 | | | | 317,939 | |
Retirement classR-6 of shares | | | 1,168,794 | | | | 204,420 | | | | 5,167,045 | | | | 2,044,870 | | | | 6,230,187 | |
| | | | | | | | | | | | | | | | | | | | |
Total shares outstanding | | | 1,548,904 | | | | 242,246 | | | | 7,299,235 | | | | 2,150,108 | | | | 8,262,818 | |
| | | | | | | | | | | | | | | | | | | | |
| | | | | |
Investments, at cost: | | | | | | | | | | | | | | | | | | | | |
Investments in unaffiliated issuers | | $ | 6,239,570 | | | $ | 1,363,343 | | | $ | 26,504,463 | | | $ | 12,186,450 | | | $ | 31,427,707 | |
Cash sweep investments in affiliated issuers | | | 139,438 | | | | 25,134 | | | | 633,912 | | | | 284,622 | | | | 996,505 | |
Investments in other affiliated issuers | | | 5,463,293 | | | | 1,188,704 | | | | 30,329,095 | | | | 10,821,305 | | | | 37,329,778 | |
| | | | | | | | | | | | | | | | | | | | |
Total investments, at cost | | $ | 11,842,301 | | | $ | 2,577,181 | | | $ | 57,467,470 | | | $ | 23,292,377 | | | $ | 69,753,990 | |
| | | | �� | | | | | | | | | | | | | | | | |
(See Notes which are an integral part of the Financial Statements)
25
August 31, 2018
| | |
| | |
| Statements of Assets and Liabilities | | BMO Funds |
| | | | | | | | | | | | | | | | | | | | |
| | | | | | | | | | | | | | | | |
| | | 2035 Fund | | | 2040 Fund | | | 2045 Fund | | | 2050 Fund | | | 2055 Fund | |
Assets: | | | | | | | | | | | | | | | | | | | | |
Investments in unaffiliated issuers, at value | | $ | 8,245,471 | | | $ | 32,257,496 | | | $ | 6,047,537 | | | $ | 24,915,936 | | | $ | 6,004,966 | |
Cash sweep investments in affiliated issuers, at value | | | 159,390 | | | | 593,100 | | | | 107,226 | | | | 548,434 | | | | 113,983 | |
Investments in other affiliated issuers, at value | | | 7,111,763 | | | | 27,182,964 | | | | 5,096,197 | | | | 21,035,711 | | | | 5,061,152 | |
Dividends and interest receivable | | | 4,363 | | | | 11,775 | | | | 2,088 | | | | 8,519 | | | | 2,047 | |
Receivable for investments sold | | | — | | | | — | | | | — | | | | 56,979 | | | | — | |
Receivable for capital stock sold | | | 41,671 | | | | 168,025 | | | | 38,373 | | | | 115,282 | | | | 77,321 | |
Receivable from affiliates, net (Note 5) | | | 7,125 | | | | 5,284 | | | | 9,089 | | | | 5,425 | | | | 10,101 | |
Prepaid expenses and other receivables | | | 17,850 | | | | 35,476 | | | | 17,663 | | | | 35,475 | | | | 17,745 | |
| | | | | | | | | | | | | | | | | | | | |
Total assets | | | 15,587,633 | | | | 60,254,120 | | | | 11,318,173 | | | | 46,721,761 | | | | 11,287,315 | |
| | | | | |
Liabilities: | | | | | | | | | | | | | | | | | | | | |
Payable for investments purchased | | | — | | | | — | | | | — | | | | 140,624 | | | | — | |
Payable for capital stock redeemed | | | — | | | | 113 | | | | — | | | | — | | | | — | |
Other liabilities | | | 19,879 | | | | 21,758 | | | | 21,001 | | | | 21,577 | | | | 21,271 | |
| | | | | | | | | | | | | | | | | | | | |
Total liabilities | | | 19,879 | | | | 21,871 | | | | 21,001 | | | | 162,201 | | | | 21,271 | |
| | | | | | | | | | | | | | | | | | | | |
Total net assets | | $ | 15,567,754 | | | $ | 60,232,249 | | | $ | 11,297,172 | | | $ | 46,559,560 | | | $ | 11,266,044 | |
| | | | | | | | | | | | | | | | | | | | |
| | | | | |
Net assets consist of: | | | | | | | | | | | | | | | | | | | | |
Paid-in capital | | $ | 12,985,917 | | | $ | 38,508,846 | | | $ | 9,709,458 | | | $ | 31,832,166 | | | $ | 9,650,959 | |
Net unrealized appreciation on investments | | | 2,547,256 | | | | 20,098,745 | | | | 1,626,238 | | | | 13,991,366 | | | | 1,609,771 | |
Accumulated net realized gain (loss) on investments | | | (35,680 | ) | | | 1,407,190 | | | | (81,288 | ) | | | 597,122 | | | | (34,267 | ) |
Undistributed net investment income | | | 70,261 | | | | 217,468 | | | | 42,764 | | | | 138,906 | | | | 39,581 | |
| | | | | | | | | | | | | | | | | | | | |
Total net assets | | $ | 15,567,754 | | | $ | 60,232,249 | | | $ | 11,297,172 | | | $ | 46,559,560 | | | $ | 11,266,044 | |
| | | | | | | | | | | | | | | | | | | | |
| | | | | |
Net asset value, offering price and redemption proceeds per share (unlimited shares authorized, no par value) | | | | | | | | | | | | | | | | | | | | |
Investor class of shares | | $ | 12.16 | | | $ | 11.74 | | | $ | 12.54 | | | $ | 12.81 | | | $ | 12.93 | |
Retirement classR-3 of shares | | | 12.24 | | | | 11.78 | | | | 12.65 | | | | 12.80 | | | | 12.80 | |
Retirement classR-6 of shares | | | 12.24 | | | | 11.75 | | | | 12.62 | | | | 12.82 | | | | 12.97 | |
| | | | | |
Net assets: | | | | | | | | | | | | | | | | | | | | |
Investor class of shares | | $ | 921,090 | | | $ | 12,172,544 | | | $ | 913,958 | | | $ | 10,017,022 | | | $ | 393,887 | |
Retirement classR-3 of shares | | | 122,549 | | | | 2,060,793 | | | | 73,889 | | | | 1,978,439 | | | | 116,662 | |
Retirement classR-6 of shares | | | 14,524,115 | | | | 45,998,912 | | | | 10,309,325 | | | | 34,564,099 | | | | 10,755,495 | |
| | | | | | | | | | | | | | | | | | | | |
Total net assets | | $ | 15,567,754 | | | $ | 60,232,249 | | | $ | 11,297,172 | | | $ | 46,559,560 | | | $ | 11,266,044 | |
| | | | | | | | | | | | | | | | | | | | |
| | | | | |
Shares outstanding: | | | | | | | | | | | | | | | | | | | | |
Investor class of shares | | | 75,735 | | | | 1,036,932 | | | | 72,879 | | | | 781,996 | | | | 30,452 | |
Retirement classR-3 of shares | | | 10,014 | | | | 174,986 | | | | 5,839 | | | | 154,615 | | | | 9,116 | |
Retirement classR-6 of shares | | | 1,187,019 | | | | 3,914,030 | | | | 817,176 | | | | 2,696,029 | | | | 829,423 | |
| | | | | | | | | | | | | | | | | | | | |
Total shares outstanding | | | 1,272,768 | | | | 5,125,948 | | | | 895,894 | | | | 3,632,640 | | | | 868,991 | |
| | | | | | | | | | | | | | | | | | | | |
| | | | | |
Investments, at cost: | | | | | | | | | | | | | | | | | | | | |
Investments in unaffiliated issuers | | $ | 6,685,223 | | | $ | 17,648,692 | | | $ | 5,029,571 | | | $ | 14,790,821 | | | $ | 4,995,278 | |
Cash sweep investments in affiliated issuers | | | 159,362 | | | | 593,100 | | | | 107,219 | | | | 548,434 | | | | 113,971 | |
Investments in other affiliated issuers | | | 6,124,783 | | | | 21,693,023 | | | | 4,487,932 | | | | 17,169,460 | | | | 4,461,081 | |
| | | | | | | | | | | | | | | | | | | | |
Total investments, at cost | | $ | 12,969,368 | | | $ | 39,934,815 | | | $ | 9,624,722 | | | $ | 32,508,715 | | | $ | 9,570,330 | |
| | | | | | | | | | | | | | | | | | | | |
(See Notes which are an integral part of the Financial Statements)
26
August 31, 2018
| | |
| | |
| Statements of Assets and Liabilities | | BMO Funds |
| | | | | | | | | | | | | | | | | | | | |
| | | | | | | | | | | | | | | | |
| | | Conservative
Allocation
Fund | | | Moderate
Allocation
Fund | | | Balanced
Allocation
Fund | | | Growth
Allocation
Fund | | | Aggressive
Allocation
Fund | |
Assets: | | | | | | | | | | | | | | | | | | | | |
Investments in unaffiliated issuers, at value | | $ | 19,262,210 | | | $ | 40,945,256 | | | $ | 166,594,259 | | | $ | 56,837,517 | | | $ | 84,786,648 | |
Cash sweep investments in affiliated issuers, at value | | | 355,561 | | | | 775,889 | | | | 3,049,731 | | | | 1,153,827 | | | | 1,600,930 | |
Investments in other affiliated issuers, at value | | | 17,682,067 | | | | 39,935,688 | | | | 175,408,763 | | | | 64,951,131 | | | | 93,216,247 | |
Dividends and interest receivable | | | 61,619 | | | | 98,318 | | | | 256,783 | | | | 33,829 | | | | 2,694 | |
Receivable for capital stock sold | | | 129,228 | | | | 188,571 | | | | 600,057 | | | | 262,976 | | | | 137,647 | |
Receivable from affiliates, net (Note 5) | | | 16,911 | | | | 21,539 | | | | 3,647 | | | | 17,907 | | | | 15,090 | |
Prepaid expenses and other receivables | | | 31,361 | | | | 31,793 | | | | 31,610 | | | | 31,713 | | | | 31,712 | |
| | | | | | | | | | | | | | | | | | | | |
Total assets | | | 37,538,957 | | | | 81,997,054 | | | | 345,944,850 | | | | 123,288,900 | | | | 179,790,968 | |
| | | | | |
Liabilities: | | | | | | | | | | | | | | | | | | | | |
Payable for capital stock redeemed | | | 1,085 | | | | 8,144 | | | | 198,698 | | | | 644,460 | | | | 33,587 | |
Other liabilities | | | 22,884 | | | | 24,534 | | | | 32,958 | | | | 25,108 | | | | 27,905 | |
| | | | | | | | | | | | | | | | | | | | |
Total liabilities | | | 23,969 | | | | 32,678 | | | | 231,656 | | | | 669,568 | | | | 61,492 | |
| | | | | | | | | | | | | | | | | | | | |
Total net assets | | $ | 37,514,988 | | | $ | 81,964,376 | | | $ | 345,713,194 | | | $ | 122,619,332 | | | $ | 179,729,476 | |
| | | | | | | | | | | | | | | | | | | | |
| | | | | |
Net assets consist of: | | | | | | | | | | | | | | | | | | | | |
Paid-in capital | | $ | 27,742,646 | | | $ | 59,752,773 | | | $ | 229,889,685 | | | $ | 73,316,186 | | | $ | 92,857,031 | |
Net unrealized appreciation on investments | | | 5,026,711 | | | | 15,759,758 | | | | 93,773,518 | | | | 40,870,008 | | | | 72,601,105 | |
Accumulated net realized gain on investments | | | 4,202,434 | | | | 5,377,390 | | | | 19,204,076 | | | | 7,745,245 | | | | 13,543,636 | |
Undistributed net investment income | | | 543,197 | | | | 1,074,455 | | | | 2,845,915 | | | | 687,893 | | | | 727,704 | |
| | | | | | | | | | | | | | | | | | | | |
Total net assets | | $ | 37,514,988 | | | $ | 81,964,376 | | | $ | 345,713,194 | | | $ | 122,619,332 | | | $ | 179,729,476 | |
| | | | | | | | | | | | | | | | | | | | |
| | | | | |
Net asset value, offering price and redemption proceeds per share (unlimited shares authorized, no par value) | | | | | | | | | | | | | | | | | | | | |
Investor class of shares | | $ | 8.67 | | | $ | 9.92 | | | $ | 9.41 | | | $ | 10.58 | | | $ | 10.01 | |
Institutional class of shares | | | 8.97 | | | | 9.94 | | | | 9.42 | | | | 10.59 | | | | 10.01 | |
Retirement classR-3 of shares | | | 8.84 | | | | 9.91 | | | | 9.41 | | | | 10.58 | | | | 9.99 | |
Retirement classR-6 of shares | | | 8.68 | | | | 9.92 | | | | 9.42 | | | | 10.59 | | | | 10.02 | |
| | | | | |
Net assets: | | | | | | | | | | | | | | | | | | | | |
Investor class of shares | | $ | 13,395,367 | | | $ | 7,125,849 | | | $ | 98,452,944 | | | $ | 13,886,922 | | | $ | 34,897,780 | |
Institutional class of shares | | | 1,415,657 | | | | 5,888,467 | | | | 47,596,580 | | | | 11,440,675 | | | | 15,878,433 | |
Retirement classR-3 of shares | | | 956,269 | | | | 8,095,342 | | | | 19,212,853 | | | | 15,106,808 | | | | 16,950,417 | |
Retirement classR-6 of shares | | | 21,747,695 | | | | 60,854,718 | | | | 180,450,817 | | | | 82,184,927 | | | | 112,002,846 | |
| | | | | | | | | | | | | | | | | | | | |
Total net assets | | $ | 37,514,988 | | | $ | 81,964,376 | | | $ | 345,713,194 | | | $ | 122,619,332 | | | $ | 179,729,476 | |
| | | | | | | | | | | | | | | | | | | | |
| | | | | |
Shares outstanding: | | | | | | | | | | | | | | | | | | | | |
Investor class of shares | | | 1,544,465 | | | | 718,034 | | | | 10,464,456 | | | | 1,311,947 | | | | 3,484,597 | |
Institutional class of shares | | | 157,874 | | | | 592,687 | | | | 5,052,087 | | | | 1,080,576 | | | | 1,585,606 | |
Retirement classR-3 of shares | | | 108,186 | | | | 816,714 | | | | 2,041,917 | | | | 1,428,156 | | | | 1,696,674 | |
Retirement classR-6 of shares | | | 2,505,958 | | | | 6,131,621 | | | | 19,152,323 | | | | 7,758,730 | | | | 11,181,251 | |
| | | | | | | | | | | | | | | | | | | | |
Total shares outstanding | | | 4,316,483 | | | | 8,259,056 | | | | 36,710,783 | | | | 11,579,409 | | | | 17,948,128 | |
| | | | | | | | | | | | | | | | | | | | |
| | | | | |
Investments, at cost: | | | | | | | | | | | | | | | | | | | | |
Investments in unaffiliated issuers | | $ | 16,969,441 | | | $ | 31,921,684 | | | $ | 109,811,883 | | | $ | 30,504,627 | | | $ | 38,662,258 | |
Cash sweep investments in affiliated issuers | | | 355,539 | | | | 775,778 | | | | 3,049,189 | | | | 1,153,827 | | | | 1,600,800 | |
Investments in other affiliated issuers | | | 14,948,147 | | | | 33,199,613 | | | | 138,418,163 | | | | 50,414,013 | | | | 66,739,662 | |
| | | | | | | | | | | | | | | | | | | | |
Total investments, at cost | | $ | 32,273,127 | | | $ | 65,897,075 | | | $ | 251,279,235 | | | $ | 82,072,467 | | | $ | 107,002,720 | |
| | | | | | | | | | | | | | | | | | | | |
(See Notes which are an integral part of the Financial Statements)
27
August 31, 2018
| | |
| | |
| Statements of Operations | | BMO Funds |
| | | | | | | | | | | | | | | | | | | | |
| | | | | | | | | | | | | | | | |
| | | In-Retirement
Fund | | | 2015 Fund | | | 2020 Fund | | | 2025 Fund | | | 2030 Fund | |
Investment Income: | | | | | | | | | | | | | | | | | | | | |
Dividend income from: | | | | | | | | | | | | | | | | | | | | |
Unaffiliated issuers | | $ | 196,092 | | | $ | 44,186 | | | $ | 893,992 | | | $ | 238,037 | | | $ | 908,151 | |
Affiliated issuers | | | 159,718 | | | | 37,079 | | | | 672,990 | | | | 162,853 | | | | 632,097 | |
Excess expense reimbursement from investment adviser (Note 5) | | | 7,574 | | | | 2,136 | | | | 40,320 | | | | 15,851 | | | | 21,811 | |
| | | | | | | | | | | | | | | | | | | | |
Total income: | | | 363,384 | | | | 83,401 | | | | 1,607,302 | | | | 416,741 | | | | 1,562,059 | |
| | | | | |
Expenses: | | | | | | | | | | | | | | | | | | | | |
Shareholder servicing fees (Note 5) | | | 7,794 | | | | 846 | | | | 43,538 | | | | 2,628 | | | | 46,564 | |
Administration fees (Note 5) | | | 5,783 | | | | 682 | | | | 34,853 | | | | 1,750 | | | | 36,759 | |
Portfolio accounting fees | | | 29,592 | | | | 25,445 | | | | 44,253 | | | | 29,833 | | | | 46,965 | |
Recordkeeping fees | | | 32,775 | | | | 35,659 | | | | 33,728 | | | | 35,325 | | | | 33,248 | |
Custodian fees (Note 5) | | | 709 | | | | 169 | | | | 3,899 | | | | 1,138 | | | | 4,688 | |
Registration fees | | | 41,186 | | | | 42,892 | | | | 40,823 | | | | 43,238 | | | | 41,261 | |
Professional fees | | | 14,514 | | | | 14,514 | | | | 14,514 | | | | 14,514 | | | | 14,514 | |
Printing and postage | | | 3,783 | | | | 3,482 | | | | 4,712 | | | | 3,575 | | | | 4,420 | |
Directors’ fees | | | 15,349 | | | | 15,349 | | | | 15,349 | | | | 15,349 | | | | 15,349 | |
Distribution services fees (Note 5) | | | 3,687 | | | | 579 | | | | 29,101 | | | | 576 | | | | 29,402 | |
Miscellaneous | | | 3,184 | | | | 2,722 | | | | 4,798 | | | | 3,150 | | | | 5,109 | |
| | | | | | | | | | | | | | | | | | | | |
Total expenses: | | | 158,356 | | | | 142,339 | | | | 269,568 | | | | 151,076 | | | | 278,279 | |
| | | | | |
Deduct: | | | | | | | | | | | | | | | | | | | | |
Expense waivers (Note 5) | | | (143,768 | ) | | | (140,547 | ) | | | (178,319 | ) | | | (146,938 | ) | | | (172,860 | ) |
| | | | | | | | | | | | | | | | | | | | |
Net expenses | | | 14,588 | | | | 1,792 | | | | 91,249 | | | | 4,138 | | | | 105,419 | |
| | | | | | | | | | | | | | | | | | | | |
Net investment income | | | 348,796 | | | | 81,609 | | | | 1,516,053 | | | | 412,603 | | | | 1,456,640 | |
| | | | | |
Realized and unrealized gain (loss) on investments: | | | | | | | | | | | | | | | | | | | | |
Net realized gain (loss) on transactions from: | | | | | | | | | | | | | | | | | | | | |
Investments in unaffiliated issuers | | | 246,899 | | | | 72,038 | | | | 1,933,257 | | | | 54,905 | | | | 983,837 | |
Investments in affiliated issuers | | | 78,230 | | | | 35,933 | | | | 546,890 | | | | (19,106 | ) | | | 157,487 | |
Net realized gain on capital gains distributions from: | | | | | | | | | | | | | | | | | | | | |
Investments in unaffiliated issuers | | | 72,590 | | | | 24,609 | | | | 772,509 | | | | 297,543 | | | | 1,450,545 | |
Investments in affiliated issuers | | | 169,404 | | | | 48,057 | | | | 1,229,075 | | | | 345,242 | | | | 1,629,512 | |
| | | | | | | | | | | | | | | | | | | | |
Total net realized gain | | | 567,123 | | | | 180,637 | | | | 4,481,731 | | | | 678,584 | | | | 4,221,381 | |
Net change in unrealized appreciation (depreciation) on: | | | | | | | | | | | | | | | | | | | | |
Investments in unaffiliated issuers | | | (176,044 | ) | | | (35,412 | ) | | | (157,102 | ) | | | 621,049 | | | | 2,285,568 | |
Investments in affiliated issuers | | | (154,473 | ) | | | (43,113 | ) | | | 121,221 | | | | 327,758 | | | | 1,451,079 | |
| | | | | | | | | | | | | | | | | | | | |
Total net change in unrealized appreciation (depreciation) | | | (330,517 | ) | | | (78,525 | ) | | | (35,881 | ) | | | 948,807 | | | | 3,736,647 | |
| | | | | | | | | | | | | | | | | | | | |
Net realized and unrealized gain on investments | | | 236,606 | | | | 102,112 | | | | 4,445,850 | | | | 1,627,391 | | | | 7,958,028 | |
| | | | | | | | | | | | | | | | | | | | |
Change in net assets resulting from operations | | $ | 585,402 | | | $ | 183,721 | | | $ | 5,961,903 | | | $ | 2,039,994 | | | $ | 9,414,668 | |
| | | | | | | | | | | | | | | | | | | | |
(See Notes which are an integral part of the Financial Statements)
28
August 31, 2018
| | |
| | |
| Statements of Operations | | BMO Funds |
| | | | | | | | | | | | | | | | | | | | |
| | | | | | | | | | | | | | | | |
| | | 2035 Fund | | | 2040 Fund | | | 2045 Fund | | | 2050 Fund | | | 2055 Fund | |
Investment Income: | | | | | | | | | | | | | | | | | | | | |
Dividend income from: | | | | | | | | | | | | | | | | | | | | |
Unaffiliated issuers | | $ | 113,819 | | | $ | 468,984 | | | $ | 67,986 | | | $ | 346,988 | | | $ | 70,747 | |
Affiliated issuers | | | 83,109 | | | | 320,252 | | | | 48,173 | | | | 240,794 | | | | 49,148 | |
Excess expense reimbursement from investment adviser (Note 5) | | | 3,730 | | | | 17,360 | | | | 3,065 | | | | 12,600 | | | | 3,359 | |
| | | | | | | | | | | | | | | | | | | | |
Total income: | | | 200,658 | | | | 806,596 | | | | 119,224 | | | | 600,382 | | | | 123,254 | |
| | | | | |
Expenses: | | | | | | | | | | | | | | | | | | | | |
Shareholder servicing fees (Note 5) | | | 1,937 | | | | 27,212 | | | | 2,160 | | | | 21,041 | | | | 1,021 | |
Administration fees (Note 5) | | | 1,326 | | | | 20,285 | | | | 1,382 | | | | 17,071 | | | | 854 | |
Portfolio accounting fees | | | 28,151 | | | | 37,430 | | | | 28,990 | | | | 34,913 | | | | 29,572 | |
Recordkeeping fees | | | 35,301 | | | | 35,927 | | | | 35,736 | | | | 35,844 | | | | 35,734 | |
Custodian fees (Note 5) | | | 645 | | | | 2,741 | | | | 408 | | | | 2,063 | | | | 425 | |
Registration fees | | | 43,238 | | | | 40,805 | | | | 42,974 | | | | 40,805 | | | | 42,892 | |
Professional fees | | | 14,514 | | | | 14,514 | | | | 14,514 | | | | 14,514 | | | | 14,513 | |
Printing and postage | | | 3,587 | | | | 4,331 | | | | 3,830 | | | | 4,417 | | | | 3,715 | |
Directors’ fees | | | 15,349 | | | | 15,349 | | | | 15,349 | | | | 15,349 | | | | 15,349 | |
Distribution services fees (Note 5) | | | 544 | | | | 13,191 | | | | 288 | | | | 14,820 | | | | 806 | |
Miscellaneous | | | 3,020 | | | | 4,102 | | | | 2,823 | | | | 3,745 | | | | 2,791 | |
| | | | | | | | | | �� | | | | | | | | | | |
Total expenses: | | | 147,612 | | | | 215,887 | | | | 148,454 | | | | 204,582 | | | | 147,672 | |
| | | | | |
Deduct: | | | | | | | | | | | | | | | | | | | | |
Expense waivers (Note 5) | | | (144,064 | ) | | | (160,589 | ) | | | (144,988 | ) | | | (156,187 | ) | | | (145,219 | ) |
| | | | | | | | | | | | | | | | | | | | |
Net expenses | | | 3,548 | | | | 55,298 | | | | 3,466 | | | | 48,395 | | | | 2,453 | |
| | | | | | | | | | | | | | | | | | | | |
Net investment income | | | 197,110 | | | | 751,298 | | | | 115,758 | | | | 551,987 | | | | 120,801 | |
| | | | | |
Realized and unrealized gain (loss) on investments: | | | | | | | | | | | | | | | | | | | | |
Net realized gain (loss) on transactions from: | | | | | | | | | | | | | | | | | | | | |
Investments in unaffiliated issuers | | | 102,491 | | | | 582,499 | | | | 34,786 | | | | 394,385 | | | | (8,101 | ) |
Investments in affiliated issuers | | | 36,835 | | | | 185,627 | | | | 9,819 | | | | 142,810 | | | | (10,008 | ) |
Net realized gain on capital gains distributions from: | | | | | | | | | | | | | | | | | | | | |
Investments in unaffiliated issuers | | | 219,855 | | | | 959,233 | | | | 138,702 | | | | 723,398 | | | | 145,631 | |
Investments in affiliated issuers | | | 230,973 | | | | 947,102 | | | | 135,828 | | | | 690,577 | | | | 138,698 | |
| | | | | | | | | | | | | | | | | | | | |
Total net realized gain | | | 590,154 | | | | 2,674,461 | | | | 319,135 | | | | 1,951,170 | | | | 266,220 | |
Net change in unrealized appreciation on: | | | | | | | | | | | | | | | | | | | | |
Investments in unaffiliated issuers | | | 413,964 | | | | 1,753,264 | | | | 319,071 | | | | 1,388,835 | | | | 370,477 | |
Investments in affiliated issuers | | | 247,640 | | | | 1,091,940 | | | | 196,599 | | | | 882,607 | | | | 221,980 | |
| | | | | | | | | | | | | | | | | | | | |
Total net change in unrealized appreciation | | | 661,604 | | | | 2,845,204 | | | | 515,670 | | | | 2,271,442 | | | | 592,457 | |
| | | | | | | | | | | | | | | | | | | | |
Net realized and unrealized gain on investments | | | 1,251,758 | | | | 5,519,665 | | | | 834,805 | | | | 4,222,612 | | | | 858,677 | |
| | | | | | | | | | | | | | | | | | | | |
Change in net assets resulting from operations | | $ | 1,448,868 | | | $ | 6,270,963 | | | $ | 950,563 | | | $ | 4,774,599 | | | $ | 979,478 | |
| | | | | | | | | | | | | | | | | | | | |
(See Notes which are an integral part of the Financial Statements)
29
August 31, 2018
| | |
| | |
| Statements of Operations | | BMO Funds |
| | | | | | | | | | | | | | | | | | | | |
| | | | | | | | | | | | | | | | |
| | | Conservative
Allocation
Fund | | | Moderate
Allocation
Fund | | | Balanced
Allocation
Fund | | | Growth
Allocation
Fund | | | Aggressive
Allocation
Fund | |
Investment Income: | | | | | | | | | | | | | | | | | | | | |
Dividend income from: | | | | | | | | | | | | | | | | | | | | |
Unaffiliated issuers | | $ | 578,554 | | | $ | 1,093,026 | | | $ | 3,357,915 | | | $ | 1,027,401 | | | $ | 1,325,177 | |
Affiliated issuers | | | 482,144 | | | | 932,894 | | | | 2,876,029 | | | | 896,866 | | | | 1,168,809 | |
Excess expense reimbursement from investment adviser (Note 5) | | | 18,019 | | | | 73,293 | | | | 133,580 | | | | 85,908 | | | | 77,058 | |
| | | | | | | | | | | | | | | | | | | | |
Total income: | | | 1,078,717 | | | | 2,099,213 | | | | 6,367,524 | | | | 2,010,175 | | | | 2,571,044 | |
| | | | | |
Expenses: | | | | | | | | | | | | | | | | | | | | |
Shareholder servicing fees (Note 5) | | | 35,900 | | | | 19,534 | | | | 249,949 | | | | 40,181 | | | | 94,738 | |
Administration fees (Note 5) | | | 35,350 | | | | 41,917 | | | | 251,481 | | | | 64,684 | | | | 104,333 | |
Portfolio accounting fees | | | 43,533 | | | | 54,850 | | | | 107,699 | | | | 60,438 | | | | 70,307 | |
Recordkeeping fees | | | 38,538 | | | | 39,239 | | | | 41,591 | | | | 39,467 | | | | 41,364 | |
Custodian fees (Note 5) | | | 2,374 | | | | 4,892 | | | | 17,337 | | | | 6,184 | | | | 8,586 | |
Registration fees | | | 59,525 | | | | 59,679 | | | | 60,493 | | | | 59,674 | | | | 59,677 | |
Professional fees | | | 14,514 | | | | 14,514 | | | | 14,514 | | | | 14,514 | | | | 14,513 | |
Printing and postage | | | 11,207 | | | | 12,307 | | | | 13,463 | | | | 10,960 | | | | 15,225 | |
Directors’ fees | | | 15,348 | | | | 15,348 | | | | 15,349 | | | | 15,348 | | | | 15,348 | |
Distribution services fees (Note 5) | | | 6,841 | | | | 67,920 | | | | 101,511 | | | | 91,265 | | | | 85,894 | |
Miscellaneous | | | 6,814 | | | | 7,069 | | | | 14,024 | | | | 7,241 | | | | 8,302 | |
| | | | | | | | | | | | | | | | | | | | |
Total expenses: | | | 269,944 | | | | 337,269 | | | | 887,411 | | | | 409,956 | | | | 518,287 | |
| | | | | |
Deduct: | | | | | | | | | | | | | | | | | | | | |
Expense waivers (Note 5) | | | (208,216 | ) | | | (235,607 | ) | | | (401,493 | ) | | | (256,755 | ) | | | (281,981 | ) |
| | | | | | | | | | | | | | | | | | | | |
Net expenses | | | 61,728 | | | | 101,662 | | | | 485,918 | | | | 153,201 | | | | 236,306 | |
| | | | | | | | | | | | | | | | | | | | |
Net investment income | | | 1,016,989 | | | | 1,997,551 | | | | 5,881,606 | | | | 1,856,974 | | | | 2,334,738 | |
| | | | | |
Realized and unrealized gain on investments: | | | | | | | | | | | | | | | | | | | | |
Net realized gain on transactions from: | | | | | | | | | | | | | | | | | | | | |
Investments in unaffiliated issuers | | | 2,125,439 | | | | 3,281,368 | | | | 11,967,546 | | | | 4,447,091 | | | | 7,238,029 | |
Investments in affiliated issuers | | | 1,990,261 | | | | 1,261,677 | | | | 3,720,197 | | | | 1,199,946 | | | | 2,100,078 | |
Net realized gain on capital gains distributions from: | | | | | | | | | | | | | | | | | | | | |
Investments in unaffiliated issuers | | | 126,869 | | | | 586,454 | | | | 2,950,570 | | | | 1,442,641 | | | | 2,338,910 | |
Investments in affiliated issuers | | | 541,727 | | | | 1,643,971 | | | | 7,081,601 | | | | 3,087,174 | | | | 4,460,586 | |
| | | | | | | | | | | | | | | | | | | | |
Total net realized gain | | | 4,784,296 | | | | 6,773,470 | | | | 25,719,914 | | | | 10,176,852 | | | | 16,137,603 | |
Net change in unrealized appreciation (depreciation) on: | | | | | | | | | | | | | | | | | | | | |
Investments in unaffiliated issuers | | | (2,294,639 | ) | | | (2,564,529 | ) | | | (4,130,632 | ) | | | (47,470 | ) | | | 907,459 | |
Investments in affiliated issuers | | | (2,285,375 | ) | | | (1,202,296 | ) | | | 1,285,813 | | | | 1,936,336 | | | | 4,786,473 | |
| | | | | | | | | | | | | | | | | | | | |
Total net change in unrealized appreciation (depreciation) | | | (4,580,014 | ) | | | (3,766,825 | ) | | | (2,844,819 | ) | | | 1,888,866 | | | | 5,693,932 | |
| | | | | | | | | | | | | | | | | | | | |
Net realized and unrealized gain on investments | | | 204,282 | | | | 3,006,645 | | | | 22,875,095 | | | | 12,065,718 | | | | 21,831,535 | |
| | | | | | | | | | | | | | | | | | | | |
Change in net assets resulting from operations | | $ | 1,221,271 | | | $ | 5,004,196 | | | $ | 28,756,701 | | | $ | 13,922,692 | | | $ | 24,166,273 | |
| | | | | | | | | | | | | | | | | | | | |
(See Notes which are an integral part of the Financial Statements)
30
| | |
| | |
| Statements of Changes in Net Assets | | BMO Funds |
| | | | | | | | | | | | | | | | | | | | | | | | |
| | | | | | | | | | |
| | | In-Retirement
Fund | | | 2015 Fund | | | 2020 Fund | |
| | | Year Ended
August 31,
2018 | | | Year Ended
August 31,
2017 | | | Year Ended
August 31,
2018 | | | Year Ended
August 31,
2017 | | | Year Ended
August 31,
2018 | | | Year Ended
August 31,
2017 | |
Change in net assets resulting from: | | | | | | | | | | | | | | | | | | | | | | | | |
| | | | | | |
Operations: | | | | | | | | | | | | | | | | | | | | | | | | |
Net investment income | | $ | 348,796 | | | $ | 342,529 | | | $ | 81,609 | | | $ | 78,725 | | | $ | 1,516,053 | | | $ | 1,420,235 | |
Net realized gain on investments | | | 567,123 | | | | 1,042,764 | | | | 180,637 | | | | 45,513 | | | | 4,481,731 | | | | 4,372,487 | |
Net change in unrealized appreciation (depreciation) on investments | | | (330,517 | ) | | | (309,281 | ) | | | (78,525 | ) | | | 219,677 | | | | (35,881 | ) | | | 2,671,547 | |
| | | | | | | | | | | | | | | | | | | | | | | | |
Change in net assets resulting from operations | | | 585,402 | | | | 1,076,012 | | | | 183,721 | | | | 343,915 | | | | 5,961,903 | | | | 8,464,269 | |
| | | | | | |
Distributions to shareholders: | | | | | | | | | | | | | | | | | | | | | | | | |
Distributions to shareholders from net investment income: | | | | | | | | | | | | | | | | | | | | | | | | |
Investor class of shares | | | (68,163 | ) | | | (72,794 | ) | | | (5,300 | ) | | | (9,699 | ) | | | (320,460 | ) | | | (297,735 | ) |
Retirement classR-3 of shares | | | (13,242 | ) | | | (21,844 | ) | | | (2,159 | ) | | | (2,517 | ) | | | (94,130 | ) | | | (163,083 | ) |
Retirement classR-6 of shares | | | (273,528 | ) | | | (403,463 | ) | | | (83,495 | ) | | | (92,325 | ) | | | (1,295,271 | ) | | | (1,330,828 | ) |
Distributions to shareholders from net realized gain on investments: | | | | | | | | | | | | | | | | | | | | | | | | |
Investor class of shares | | | (193,387 | ) | | | (156,448 | ) | | | (472 | ) | | | — | | | | (818,613 | ) | | | (782,933 | ) |
Retirement classR-3 of shares | | | (44,555 | ) | | | (56,331 | ) | | | (175 | ) | | | — | | | | (303,004 | ) | | | (498,648 | ) |
Retirement classR-6 of shares | | | (650,050 | ) | | | (725,970 | ) | | | (4,971 | ) | | | — | | | | (2,707,665 | ) | | | (2,797,230 | ) |
| | | | | | | | | | | | | | | | | | | | | | | | |
Change in net assets resulting from distributions to shareholders | | | (1,242,925 | ) | | | (1,436,850 | ) | | | (96,572 | ) | | | (104,541 | ) | | | (5,539,143 | ) | | | (5,870,457 | ) |
| | | | | | |
Capital stock transactions: | | | | | | | | | | | | | | | | | | | | | | | | |
Proceeds from sale of shares | | | 3,053,583 | | | | 3,042,445 | | | | 400,743 | | | | 2,210,195 | | | | 13,439,436 | | | | 12,088,658 | |
Net asset value of shares issued to shareholders in payment of distributions declared | | | 1,242,925 | | | | 1,436,850 | | | | 92,093 | | | | 100,435 | | | | 5,539,143 | | | | 5,870,457 | |
Cost of shares redeemed | | | (4,715,123 | ) | | | (10,733,974 | ) | | | (1,670,660 | ) | | | (3,204,289 | ) | | | (22,830,789 | ) | | | (33,161,526 | ) |
| | | | | | | | | | | | | | | | | | | | | | | | |
Change in net assets resulting from capital stock transactions | | | (418,615 | ) | | | (6,254,679 | ) | | | (1,177,824 | ) | | | (893,659 | ) | | | (3,852,210 | ) | | | (15,202,411 | ) |
| | | | | | | | | | | | | | | | | | | | | | | | |
Change in net assets | | | (1,076,138 | ) | | | (6,615,517 | ) | | | (1,090,675 | ) | | | (654,285 | ) | | | (3,429,450 | ) | | | (12,608,599 | ) |
| | | | | | |
Net assets: | | | | | | | | | | | | | | | | | | | | | | | | |
Beginning of period | | | 14,979,803 | | | | 21,595,320 | | | | 3,914,693 | | | | 4,568,978 | | | | 80,647,384 | | | | 93,255,983 | |
| | | | | | | | | | | | | | | | | | | | | | | | |
End of period | | $ | 13,903,665 | | | $ | 14,979,803 | | | $ | 2,824,018 | | | $ | 3,914,693 | | | $ | 77,217,934 | | | $ | 80,647,384 | |
| | | | | | | | | | | | | | | | | | | | | | | | |
Undistributed net investment income included in net assets at end of period | | $ | 192,975 | | | $ | 168,906 | | | $ | 36,599 | | | $ | 37,094 | | | $ | 709,458 | | | $ | 637,700 | |
| | | | | | | | | | | | | | | | | | | | | | | | |
(See Notes which are an integral part of the Financial Statements)
31
| | |
| | |
| Statements of Changes in Net Assets | | BMO Funds |
| | | | | | | | | | | | | | | | | | | | | | | | |
| | | | | | | | | | |
| | | 2025 Fund | | | 2030 Fund | | | 2035 Fund | |
| | | Year Ended
August 31,
2018 | | | Year Ended
August 31,
2017 | | | Year Ended
August 31,
2018 | | | Year Ended
August 31,
2017 | | | Year Ended
August 31,
2018 | | | Year Ended
August 31,
2017 | |
Change in net assets resulting from: | | | | | | | | | | | | | | | | | | | | | | | | |
| | | | | | |
Operations: | | | | | | | | | | | | | | | | | | | | | | | | |
Net investment income | | $ | 412,603 | | | $ | 464,642 | | | $ | 1,456,640 | | | $ | 1,367,853 | | | $ | 197,110 | | | $ | 391,676 | |
Net realized gain on investments | | | 678,584 | | | | 490,321 | | | | 4,221,381 | | | | 4,690,998 | | | | 590,154 | | | | 990,389 | |
Net change in unrealized appreciation on investments | | | 948,807 | | | | 2,185,232 | | | | 3,736,647 | | | | 6,065,890 | | | | 661,604 | | | | 1,832,288 | |
| | | | | | | | | | | | | | | | | | | | | | | | |
Change in net assets resulting from operations | | | 2,039,994 | | | | 3,140,195 | | | | 9,414,668 | | | | 12,124,741 | | | | 1,448,868 | | | | 3,214,353 | |
| | | | | | |
Distributions to shareholders: | | | | | | | | | | | | | | | | | | | | | | | | |
Distributions to shareholders from net investment income: | | | | | | | | | | | | | | | | | | | | | | | | |
Investor class of shares | | | (17,298 | ) | | | (10,858 | ) | | | (261,657 | ) | | | (243,224 | ) | | | (13,075 | ) | | | (9,873 | ) |
Retirement classR-3 of shares | | | — | | | | (15,122 | ) | | | (63,635 | ) | | | (101,706 | ) | | | (457 | ) | | | (5,872 | ) |
Retirement classR-6 of shares | | | (458,277 | ) | | | (591,903 | ) | | | (1,434,361 | ) | | | (1,339,900 | ) | | | (276,293 | ) | | | (518,267 | ) |
Distributions to shareholders from net realized gain on investments: | | | | | | | | | | | | | | | | | | | | | | | | |
Investor class of shares | | | (10,616 | ) | | | (12,985 | ) | | | (598,423 | ) | | | (668,223 | ) | | | (31,243 | ) | | | (22,302 | ) |
Retirement classR-3 of shares | | | (964 | ) | | | (19,978 | ) | | | (193,799 | ) | | | (340,715 | ) | | | (4,137 | ) | | | (15,697 | ) |
Retirement classR-6 of shares | | | (232,053 | ) | | | (543,487 | ) | | | (2,545,545 | ) | | | (2,785,759 | ) | | | (530,766 | ) | | | (903,500 | ) |
| | | | | | | | | | | | | | | | | | | | | | | | |
Change in net assets resulting from distributions to shareholders | | | (719,208 | ) | | | (1,194,333 | ) | | | (5,097,420 | ) | | | (5,479,527 | ) | | | (855,971 | ) | | | (1,475,511 | ) |
| | | | | | |
Capital stock transactions: | | | | | | | | | | | | | | | | | | | | | | | | |
Proceeds from sale of shares | | | 7,548,244 | | | | 5,604,471 | | | | 21,273,459 | | | | 16,918,635 | | | | 3,530,973 | | | | 3,951,792 | |
Net asset value of shares issued to shareholders in payment of distributions declared | | | 719,208 | | | | 1,194,333 | | | | 5,097,420 | | | | 5,479,527 | | | | 855,971 | | | | 1,475,511 | |
Cost of shares redeemed | | | (4,584,961 | ) | | | (17,820,626 | ) | | | (23,592,808 | ) | | | (39,617,757 | ) | | | (2,482,495 | ) | | | (25,378,614 | ) |
| | | | | | | | | | | | | | | | | | | | | | | | |
Change in net assets resulting from capital stock transactions | | | 3,682,491 | | | | (11,021,822 | ) | | | 2,778,071 | | | | (17,219,595 | ) | | | 1,904,449 | | | | (19,951,311 | ) |
| | | | | | | | | | | | | | | | | | | | | | | | |
Change in net assets | | | 5,003,277 | | | | (9,075,960 | ) | | | 7,095,319 | | | | (10,574,381 | ) | | | 2,497,346 | | | | (18,212,469 | ) |
| | | | | | |
Net assets: | | | | | | | | | | | | | | | | | | | | | | | | |
Beginning of period | | | 21,555,668 | | | | 30,631,628 | | | | 92,809,382 | | | | 103,383,763 | | | | 13,070,408 | | | | 31,282,877 | |
| | | | | | | | | | | | | | | | | | | | | | | | |
End of period | | $ | 26,558,945 | | | $ | 21,555,668 | | | $ | 99,904,701 | | | $ | 92,809,382 | | | $ | 15,567,754 | | | $ | 13,070,408 | |
| | | | | | | | | | | | | | | | | | | | | | | | |
Undistributed net investment income included in net assets at end of period | | $ | 196,038 | | | $ | 178,800 | | | $ | 603,300 | | | $ | 520,129 | | | $ | 70,261 | | | $ | 105,912 | |
| | | | | | | | | | | | | | | | | | | | | | | | |
(See Notes which are an integral part of the Financial Statements)
32
| | |
| | |
| Statements of Changes in Net Assets | | BMO Funds |
| | | | | | | | | | | | | | | | | | | | | | | | |
| | | | | | | | | | |
| | | 2040 Fund | | | 2045 Fund | | | 2050 Fund | |
| | | Year Ended
August 31,
2018 | | | Year Ended
August 31,
2017 | | | Year Ended
August 31,
2018 | | | Year Ended
August 31,
2017 | | | Year Ended
August 31,
2018 | | | Year Ended
August 31,
2017 | |
Change in net assets resulting from: | | | | | | | | | | | | | | | | | | | | | | | | |
| | | | | | |
Operations: | | | | | | | | | | | | | | | | | | | | | | | | |
Net investment income | | $ | 751,298 | | | $ | 818,310 | | | $ | 115,758 | | | $ | 208,991 | | | $ | 551,987 | | | $ | 550,199 | |
Net realized gain on investments | | | 2,674,461 | | | | 4,903,883 | | | | 319,135 | | | | 571,381 | | | | 1,951,170 | | | | 1,562,211 | |
Net change in unrealized appreciation on investments | | | 2,845,204 | | | | 2,576,931 | | | | 515,670 | | | | 1,033,847 | | | | 2,271,442 | | | | 3,639,189 | |
| | | | | | | | | | | | | | | | | | | | | | | | |
Change in net assets resulting from operations | | | 6,270,963 | | | | 8,299,124 | | | | 950,563 | | | | 1,814,219 | | | | 4,774,599 | | | | 5,751,599 | |
| | | | | | |
Distributions to shareholders: | | | | | | | | | | | | | | | | | | | | | | | | |
Distributions to shareholders from net investment income: | | | | | | | | | | | | | | | | | | | | | | | | |
Investor class of shares | | | (154,503 | ) | | | (138,602 | ) | | | (13,400 | ) | | | (10,889 | ) | | | (124,235 | ) | | | (80,320 | ) |
Retirement classR-3 of shares | | | (27,713 | ) | | | (36,355 | ) | | | — | | | | (4,652 | ) | | | (35,520 | ) | | | (37,443 | ) |
Retirement classR-6 of shares | | | (845,531 | ) | | | (798,006 | ) | | | (146,697 | ) | | | (255,018 | ) | | | (614,075 | ) | | | (520,286 | ) |
Distributions to shareholders from net realized gain on investments: | | | | | | | | | | | | | | | | | | | | | | | | |
Investor class of shares | | | (748,680 | ) | | | (490,108 | ) | | | (35,138 | ) | | | (31,552 | ) | | | (214,045 | ) | | | (299,678 | ) |
Retirement classR-3 of shares | | | (179,564 | ) | | | (177,916 | ) | | | (2,323 | ) | | | (15,798 | ) | | | (76,962 | ) | | | (165,597 | ) |
Retirement classR-6 of shares | | | (3,182,971 | ) | | | (2,068,921 | ) | | | (302,655 | ) | | | (549,139 | ) | | | (837,856 | ) | | | (1,315,743 | ) |
| | | | | | | | | | | | | | | | | | | | | | | | |
Change in net assets resulting from distributions to shareholders | | | (5,138,962 | ) | | | (3,709,908 | ) | | | (500,213 | ) | | | (867,048 | ) | | | (1,902,693 | ) | | | (2,419,067 | ) |
| | | | | | |
Capital stock transactions: | | | | | | | | | | | | | | | | | | | | | | | | |
Proceeds from sale of shares | | | 13,362,068 | | | | 10,171,530 | | | | 4,409,123 | | | | 2,830,751 | | | | 12,025,565 | | | | 10,184,433 | |
Net asset value of shares issued to shareholders in payment of distributions declared | | | 5,138,962 | | | | 3,709,908 | | | | 500,213 | | | | 867,048 | | | | 1,902,693 | | | | 2,419,067 | |
Cost of shares redeemed | | | (11,998,268 | ) | | | (32,453,631 | ) | | | (1,990,475 | ) | | | (13,887,877 | ) | | | (9,928,815 | ) | | | (21,461,622 | ) |
| | | | | | | | | | | | | | | | | | | | | | | | |
Change in net assets resulting from capital stock transactions | | | 6,502,762 | | | | (18,572,193 | ) | | | 2,918,861 | | | | (10,190,078 | ) | | | 3,999,443 | | | | (8,858,122 | ) |
| | | | | | | | | | | | | | | | | | | | | | | | |
Change in net assets | | | 7,634,763 | | | | (13,982,977 | ) | | | 3,369,211 | | | | (9,242,907 | ) | | | 6,871,349 | | | | (5,525,590 | ) |
| | | | | | |
Net assets: | | | | | | | | | | | | | | | | | | | | | | | | |
Beginning of period | | | 52,597,486 | | | | 66,580,463 | | | | 7,927,961 | | | | 17,170,868 | | | | 39,688,211 | | | | 45,213,801 | |
| | | | | | | | | | | | | | | | | | | | | | | | |
End of period | | $ | 60,232,249 | | | $ | 52,597,486 | | | $ | 11,297,172 | | | $ | 7,927,961 | | | $ | 46,559,560 | | | $ | 39,688,211 | |
| | | | | | | | | | | | | | | | | | | | | | | | |
Undistributed net investment income included in net assets at end of period | | $ | 217,468 | | | $ | 256,257 | | | $ | 42,764 | | | $ | 52,210 | | | $ | 138,906 | | | $ | 183,185 | |
| | | | | | | | | | | | | | | | | | | | | | | | |
(See Notes which are an integral part of the Financial Statements)
33
| | |
| | |
| Statements of Changes in Net Assets | | BMO Funds |
| | | | | | | | | | | | | | | | | | | | | | | | |
| | | | | | | | | | |
| | | 2055 Fund | | | Conservative
Allocation Fund | | | Moderate
Allocation Fund | |
| | | Year Ended
August 31,
2018 | | | Year Ended
August 31,
2017 | | | Year Ended
August 31,
2018 | | | Year Ended
August 31,
2017 | | | Year Ended
August 31,
2018 | | | Year Ended
August 31,
2017 | |
Change in net assets resulting from: | | | | | | | | | | | | | | | | | | | | | | | | |
| | | | | | |
Operations: | | | | | | | | | | | | | | | | | | | | | | | | |
Net investment income | | $ | 120,801 | | | $ | 112,386 | | | $ | 1,016,989 | | | $ | 2,399,251 | | | $ | 1,997,551 | | | $ | 2,148,214 | |
Net realized gain on investments | | | 266,220 | | | | 186,917 | | | | 4,784,296 | | | | 5,967,792 | | | | 6,773,470 | | | | 5,316,154 | |
Net change in unrealized appreciation (depreciation) on investments | | | 592,457 | | | | 797,022 | | | | (4,580,014 | ) | | | (2,480,117 | ) | | | (3,766,825 | ) | | | 1,771,140 | |
| | | | | | | | | | | | | | | | | | | | | | | | |
Change in net assets resulting from operations | | | 979,478 | | | | 1,096,325 | | | | 1,221,271 | | | | 5,886,926 | | | | 5,004,196 | | | | 9,235,508 | |
| | | | | | |
Distributions to shareholders: | | | | | | | | | | | | | | | | | | | | | | | | |
Distributions to shareholders from net investment income: | | | | | | | | | | | | | | | | | | | | | | | | |
Investor class of shares | | | (3,581 | ) | | | (5,113 | ) | | | (582,115 | ) | | | (392,079 | ) | | | (148,319 | ) | | | (261,497 | ) |
Institutional class of shares | | | — | | | | — | | | | (16,401 | ) | | | (813,572 | ) | | | (102,870 | ) | | | (289,008 | ) |
Retirement classR-3 of shares | | | (4,147 | ) | | | (5,867 | ) | | | (19,493 | ) | | | (152,724 | ) | | | (227,674 | ) | | | (256,521 | ) |
Retirement classR-6 of shares | | | (146,093 | ) | | | (110,946 | ) | | | (1,264,591 | ) | | | (2,551,270 | ) | | | (1,874,292 | ) | | | (2,444,589 | ) |
Distributions to shareholders from net realized gain on investments: | | | | | | | | | | | | | | | | | | | | | | | | |
Investor class of shares | | | (4,746 | ) | | | (15,407 | ) | | | (1,644,092 | ) | | | (3,300 | ) | | | (359,664 | ) | | | (162,234 | ) |
Institutional class of shares | | | — | | | | — | | | | (144,665 | ) | | | (6,026 | ) | | | (227,710 | ) | | | (157,323 | ) |
Retirement classR-3 of shares | | | (4,805 | ) | | | (18,291 | ) | | | (109,917 | ) | | | (1,394 | ) | | | (608,239 | ) | | | (175,521 | ) |
Retirement classR-6 of shares | | | (117,638 | ) | | | (231,583 | ) | | | (3,217,945 | ) | | | (17,954 | ) | | | (3,619,513 | ) | | | (1,241,608 | ) |
| | | | | | | | | | | | | | | | | | | | | | | | |
Change in net assets resulting from distributions to shareholders | | | (281,010 | ) | | | (387,207 | ) | | | (6,999,219 | ) | | | (3,938,319 | ) | | | (7,168,281 | ) | | | (4,988,301 | ) |
| | | | | | |
Capital stock transactions: | | | | | | | | | | | | | | | | | | | | | | | | |
Proceeds from sale of shares | | | 4,631,390 | | | | 3,302,459 | | | | 9,067,886 | | | | 16,844,101 | | | | 14,875,830 | | | | 21,818,957 | |
Net asset value of shares issued to shareholders in payment of distributions declared | | | 279,158 | | | | 384,898 | | | | 6,999,219 | | | | 3,938,319 | | | | 7,168,281 | | | | 4,988,301 | |
Cost of shares redeemed | | | (1,549,051 | ) | | | (4,943,591 | ) | | | (46,708,558 | ) | | | (91,814,964 | ) | | | (49,075,766 | ) | | | (59,025,227 | ) |
| | | | | | | | | | | | | | | | | | | | | | | | |
Change in net assets resulting from capital stock transactions | | | 3,361,497 | | | | (1,256,234 | ) | | | (30,641,453 | ) | | | (71,032,544 | ) | | | (27,031,655 | ) | | | (32,217,969 | ) |
| | | | | | | | | | | | | | | | | | | | | | | | |
Change in net assets | | | 4,059,965 | | | | (547,116 | ) | | | (36,419,401 | ) | | | (69,083,937 | ) | | | (29,195,740 | ) | | | (27,970,762 | ) |
| | | | | | |
Net assets: | | | | | | | | | | | | | | | | | | | | | | | | |
Beginning of period | | | 7,206,079 | | | | 7,753,195 | | | | 73,934,389 | | | | 143,018,326 | | | | 111,160,116 | | | | 139,130,878 | |
| | | | | | | | | | | | | | | | | | | | | | | | |
End of period | | $ | 11,266,044 | | | $ | 7,206,079 | | | $ | 37,514,988 | | | $ | 73,934,389 | | | $ | 81,964,376 | | | $ | 111,160,116 | |
| | | | | | | | | | | | | | | | | | | | | | | | |
Undistributed net investment income included in net assets at end of period | | $ | 39,581 | | | $ | 36,833 | | | $ | 543,197 | | | $ | 1,337,631 | | | $ | 1,074,455 | | | $ | 1,135,807 | |
| | | | | | | | | | | | | | | | | | | | | | | | |
(See Notes which are an integral part of the Financial Statements)
34
| | |
| | |
| Statements of Changes in Net Assets | | BMO Funds |
| | | | | | | | | | | | | | | | | | | | | | | | |
| | | | | | | | | | |
| | | Balanced
Allocation Fund | | | Growth
Allocation Fund | | | Aggressive
Allocation Fund | |
| | | Year Ended
August 31,
2018 | | | Year Ended
August 31,
2017 | | | Year Ended
August 31,
2018 | | | Year Ended
August 31,
2017 | | | Year Ended
August 31,
2018 | | | Year Ended
August 31,
2017 | |
Change in net assets resulting from: | | | | | | | | | | | | | | | | | | | | | | | | |
| | | | | | |
Operations: | | | | | | | | | | | | | | | | | | | | | | | | |
Net investment income | | $ | 5,881,606 | | | $ | 6,172,823 | | | $ | 1,856,974 | | | $ | 1,771,157 | | | $ | 2,334,738 | | | $ | 2,527,808 | |
Net realized gain on investments | | | 25,719,914 | | | | 32,055,528 | | | | 10,176,852 | | | | 8,216,993 | | | | 16,137,603 | | | | 22,285,028 | |
Net change in unrealized appreciation (depreciation) on investments | | | (2,844,819 | ) | | | 3,277,801 | | | | 1,888,866 | | | | 7,336,431 | | | | 5,693,932 | | | | 4,477,343 | |
| | | | | | | | | | | | | | | | | | | | | | | | |
Change in net assets resulting from operations | | | 28,756,701 | | | | 41,506,152 | | | | 13,922,692 | | | | 17,324,581 | | | | 24,166,273 | | | | 29,290,179 | |
| | | | | | |
Distributions to shareholders: | | | | | | | | | | | | | | | | | | | | | | | | |
Distributions to shareholders from net investment income: | | | | | | | | | | | | | | | | | | | | | | | | |
Investor class of shares | | | (1,792,384 | ) | | | (1,887,442 | ) | | | (276,000 | ) | | | (293,423 | ) | | | (671,533 | ) | | | (444,228 | ) |
Institutional class of shares | | | (860,496 | ) | | | (1,543,662 | ) | | | (173,710 | ) | | | (170,199 | ) | | | (266,766 | ) | | | (306,784 | ) |
Retirement classR-3 of shares | | | (304,632 | ) | | | (417,940 | ) | | | (266,254 | ) | | | (160,972 | ) | | | (248,785 | ) | | | (181,480 | ) |
Retirement classR-6 of shares | | | (4,398,480 | ) | | | (4,927,720 | ) | | | (1,905,407 | ) | | | (1,340,617 | ) | | | (2,439,933 | ) | | | (1,802,775 | ) |
Distributions to shareholders from net realized gain on investments: | | | | | | | | | | | | | | | | | | | | | | | | |
Investor class of shares | | | (8,122,524 | ) | | | (5,403,978 | ) | | | (888,273 | ) | | | (1,064,644 | ) | | | (4,087,028 | ) | | | (3,575,428 | ) |
Institutional class of shares | | | (3,511,520 | ) | | | (3,791,371 | ) | | | (477,185 | ) | | | (491,722 | ) | | | (1,455,884 | ) | | | (1,848,747 | ) |
Retirement classR-3 of shares | | | (1,717,675 | ) | | | (1,439,192 | ) | | | (993,635 | ) | | | (844,909 | ) | | | (1,803,375 | ) | | | (1,664,710 | ) |
Retirement classR-6 of shares | | | (16,250,442 | ) | | | (11,266,539 | ) | | | (4,829,986 | ) | | | (3,505,544 | ) | | | (12,027,361 | ) | | | (9,629,541 | ) |
| | | | | | | | | | | | | | | | | | | | | | | | |
Change in net assets resulting from distributions to shareholders | | | (36,958,153 | ) | | | (30,677,844 | ) | | | (9,810,450 | ) | | | (7,872,030 | ) | | | (23,000,665 | ) | | | (19,453,693 | ) |
| | | | | | |
Capital stock transactions: | | | | | | | | | | | | | | | | | | | | | | | | |
Proceeds from sale of shares | | | 47,232,899 | | | | 65,025,586 | | | | 23,670,844 | | | | 30,658,746 | | | | 24,497,608 | | | | 35,561,036 | |
Net asset value of shares issued to shareholders in payment of distributions declared | | | 36,944,164 | | | | 30,301,890 | | | | 9,810,450 | | | | 7,872,030 | | | | 23,000,665 | | | | 19,453,693 | |
Cost of shares redeemed | | | (101,939,289 | ) | | | (201,885,039 | ) | | | (43,963,867 | ) | | | (59,108,452 | ) | | | (44,328,338 | ) | | | (108,341,684 | ) |
| | | | | | | | | | | | | | | | | | | | | | | | |
Change in net assets resulting from capital stock transactions | | | (17,762,226 | ) | | | (106,557,563 | ) | | | (10,482,573 | ) | | | (20,577,676 | ) | | | 3,169,935 | | | | (53,326,955 | ) |
| | | | | | | | | | | | | | | | | | | | | | | | |
Change in net assets | | | (25,963,678 | ) | | | (95,729,255 | ) | | | (6,370,331 | ) | | | (11,125,125 | ) | | | 4,335,543 | | | | (43,490,469 | ) |
| | | | | | |
Net assets: | | | | | | | | | | | | | | | | | | | | | | | | |
Beginning of period | | | 371,676,872 | | | | 467,406,127 | | | | 128,989,663 | | | | 140,114,788 | | | | 175,393,933 | | | | 218,884,402 | |
| | | | | | | | | | | | | | | | | | | | | | | | |
End of period | | $ | 345,713,194 | | | $ | 371,676,872 | | | $ | 122,619,332 | | | $ | 128,989,663 | | | $ | 179,729,476 | | | $ | 175,393,933 | |
| | | | | | | | | | | | | | | | | | | | | | | | |
Undistributed net investment income included in net assets at end of period | | $ | 2,845,915 | | | $ | 2,882,312 | | | $ | 687,893 | | | $ | 775,028 | | | $ | 727,704 | | | $ | 921,601 | |
| | | | | | | | | | | | | | | | | | | | | | | | |
(See Notes which are an integral part of the Financial Statements)
35
| | |
| |
| Financial Highlights—Investor Class of Shares (For a share outstanding throughout each period) |
| | | | | | | | | | | | | | | | | | | | | | | | | | | | | | | | | | | | | | | | | | | | | | | | | | | | | | | | | | | | | | | | | | | | | | |
Period
Ended
August 31, | | Net asset
value,
beginning
of period | | Net
investment
income
(loss) | | Net realized
and unrealized
gain (loss) | | Total from
investment
operations | | Distributions to
shareholders
from net
investment
income | | Distributions to
shareholders
from net
realized gain | | Total
distributions | | Net asset
value, end
of period | | Total
return (1)(2) | | Ratios to Average Net Assets (3) | | Net assets,
end of period
(000 omitted) | | Portfolio
turnover
rate (2) |
| | Gross
Expenses | | Net
Expenses (4) | | Net
investment
income (4) |
In-Retirement Fund | | | | | | | | | | | | | | | | | | | | | | | | | | | | | | | | | | | | | | | | | | | | | | | | | | | | | | | | |
| 2018 | | | $ | 9.39 | | | | $ | 0.21 | | | | $ | 0.13 | | | | $ | 0.34 | | | | $ | (0.20 | ) | | | $ | (0.56 | ) | | | $ | (0.76 | ) | | | $ | 8.97 | | | | | 3.66 | % | | | | 1.36 | % | | | | 0.33 | % | | | | 2.11 | % | | | $ | 2,648 | | | | | 35 | % |
| 2017 | | | | 9.54 | | | | | 0.18 | | | | | 0.39 | | | | | 0.57 | | | | | (0.23 | ) | | | | (0.49 | ) | | | | (0.72 | ) | | | | 9.39 | | | | | 6.52 | | | | | 1.42 | | | | | 0.33 | | | | | 1.65 | | | | | 3,461 | | | | | 26 | |
| 2016 | | | | 10.02 | | | | | 0.22 | | | | | 0.27 | | | | | 0.49 | | | | | (0.24 | ) | | | | (0.73 | ) | | | | (0.97 | ) | | | | 9.54 | | | | | 5.45 | | | | | 1.25 | | | | | 0.33 | | | | | 2.02 | | | | | 3,469 | | | | | 44 | |
| 2015 | | | | 11.05 | | | | | 0.24 | | | | | (0.44 | ) | | | | (0.20 | ) | | | | (0.29 | ) | | | | (0.54 | ) | | | | (0.83 | ) | | | | 10.02 | | | | | (1.94 | ) | | | | 1.03 | | | | | 0.33 | | | | | 1.96 | | | | | 4,804 | | | | | 53 | |
| 2014 | | | | 10.00 | | | | | 0.20 | | | | | 0.99 | | | | | 1.19 | | | | | (0.12 | ) | | | | (0.02 | ) | | | | (0.14 | ) | | | | 11.05 | | | | | 12.03 | | | | | 1.08 | | | | | 0.33 | | | | | 1.92 | | | | | 7,120 | | | | | 45 | |
2015 Fund | | | | | | | | | | | | | | | | | | | | | | | | | | | | | | | | | | | | | | | | | | | | | | | | | | | | | | | | | | | | | |
| 2018 | | | | 11.32 | | | | | 0.25 | | | | | 0.28 | | | | | 0.53 | | | | | (0.19 | ) | | | | (0.02 | ) | | | | (0.21 | ) | | | | 11.64 | | | | | 4.72 | | | | | 4.35 | | | | | 0.33 | | | | | 1.84 | | | | | 323 | | | | | 38 | |
| 2017 | | | | 10.66 | | | | | 0.34 | | | | | 0.53 | | | | | 0.87 | | | | | (0.21 | ) | | | | — | | | | | (0.21 | ) | | | | 11.32 | | | | | 8.33 | | | | | 4.29 | | | | | 0.33 | | | | | 1.47 | | | | | 411 | | | | | 72 | |
| 2016 | | | | 10.44 | | | | | 0.19 | | | | | 0.39 | | | | | 0.58 | | | | | (0.25 | ) | | | | (0.11 | ) | | | | (0.36 | ) | | | | 10.66 | | | | | 5.76 | | | | | 4.07 | | | | | 0.33 | | | | | 1.80 | | | | | 689 | | | | | 49 | |
| 2015 | | | | 10.74 | | | | | 0.11 | | | | | (0.35 | ) | | | | (0.24 | ) | | | | (0.06 | ) | | | | — | | | | | (0.06 | ) | | | | 10.44 | | | | | (2.27 | ) | | | | 4.21 | | | | | 0.33 | | | | | 1.54 | | | | | 632 | | | | | 83 | |
| 2014(5) | | | | 10.00 | | | | | 0.02 | | | | | 0.72 | | | | | 0.74 | | | | | — | | | | | — | | | | | — | | | | | 10.74 | | | | | 7.40 | | | | | 73.54 | | | | | 0.33 | | | | | 1.23 | | | | | 229 | | | | | 29 | |
2020 Fund | | | | | | | | | | | | | | | | | | | | | | | | | | | | | | | | | | | | | | | | | | | | | | | | | | | | | | | | |
| 2018 | | | | 10.52 | | | | | 0.17 | | | | | 0.58 | | | | | 0.75 | | | | | (0.20 | ) | | | | (0.51 | ) | | | | (0.71 | ) | | | | 10.56 | | | | | 7.28 | | | | | 0.60 | | | | | 0.33 | | | | | 1.54 | | | | | 18,002 | | | | | 29 | |
| 2017 | | | | 10.21 | | | | | 0.17 | | | | | 0.81 | | | | | 0.98 | | | | | (0.19 | ) | | | | (0.48 | ) | | | | (0.67 | ) | | | | 10.52 | | | | | 10.17 | | | | | 0.63 | | | | | 0.33 | | | | | 1.45 | | | | | 17,810 | | | | | 23 | |
| 2016 | | | | 10.49 | | | | | 0.17 | | | | | 0.41 | | | | | 0.58 | | | | | (0.22 | ) | | | | (0.64 | ) | | | | (0.86 | ) | | | | 10.21 | | | | | 5.96 | | | | | 0.63 | | | | | 0.33 | | | | | 1.67 | | | | | 18,913 | | | | | 39 | |
| 2015 | | | | 11.34 | | | | | 0.18 | | | | | (0.46 | ) | | | | (0.28 | ) | | | | (0.25 | ) | | | | (0.32 | ) | | | | (0.57 | ) | | | | 10.49 | | | | | (2.58 | ) | | | | 0.59 | | | | | 0.33 | | | | | 1.64 | | | | | 21,331 | | | | | 37 | |
| 2014 | | | | 10.00 | | | | | 0.18 | | | | | 1.35 | | | | | 1.53 | | | | | (0.15 | ) | | | | (0.04 | ) | | | | (0.19 | ) | | | | 11.34 | | | | | 15.43 | | | | | 0.63 | | | | | 0.33 | | | | | 1.72 | | | | | 32,064 | | | | | 35 | |
2025 Fund | | | | | | | | | | | | | | | | | | | | | | | | | | | | | | | | | | | | | | | | | | | | | | | | | | | | | | | | | | | | | |
| 2018 | | | | 11.61 | | | | | 0.14 | | | | | 0.87 | | | | | 1.01 | | | | | (0.21 | ) | | | | (0.13 | ) | | | | (0.34 | ) | | | | 12.28 | | | | | 8.85 | | | | | 1.01 | | | | | 0.33 | | | | | 1.23 | | | | | 1,185 | | | | | 33 | |
| 2017 | | | | 10.74 | | | | | 0.12 | | | | | 1.10 | | | | | 1.22 | | | | | (0.16 | ) | | | | (0.19 | ) | | | | (0.35 | ) | | | | 11.61 | | | | | 11.76 | | | | | 1.04 | | | | | 0.33 | | | | | 1.12 | | | | | 933 | | | | | 31 | |
| 2016 | | | | 10.42 | | | | | 0.15 | | | | | 0.44 | | | | | 0.59 | | | | | (0.18 | ) | | | | (0.09 | ) | | | | (0.27 | ) | | | | 10.74 | | | | | 5.78 | | | | | 1.01 | | | | | 0.33 | | | | | 1.78 | | | | | 674 | | | | | 33 | |
| 2015 | | | | 10.78 | | | | | 0.06 | | | | | (0.37 | ) | | | | (0.31 | ) | | | | (0.05 | ) | | | | — | | | | | (0.05 | ) | | | | 10.42 | | | | | (2.89 | ) | | | | 1.26 | | | | | 0.33 | | | | | 1.04 | | | | | 1,676 | | | | | 53 | |
| 2014(5) | | | | 10.00 | | | | | 0.01 | | | | | 0.77 | | | | | 0.78 | | | | | — | | | | | — | | | | | — | | | | | 10.78 | | | | | 7.80 | | | | | 24.60 | | | | | 0.33 | | | | | 0.56 | | | | | 289 | | | | | 22 | |
2030 Fund | | | | | | | | | | | | | | | | | | | | | | | | | | | | | | | | | | | | | | | | | | | | | | | | | | | | | | | | |
| 2018 | | | | 11.55 | | | | | 0.15 | | | | | 0.98 | | | | | 1.13 | | | | | (0.18 | ) | | | | (0.42 | ) | | | | (0.60 | ) | | | | 12.08 | | | | | 9.95 | | | | | 0.57 | | | | | 0.37 | | | | | 1.14 | | | | | 20,713 | | | | | 32 | |
| 2017 | | | | 10.79 | | | | | 0.15 | | | | | 1.18 | | | | | 1.33 | | | | | (0.15 | ) | | | | (0.42 | ) | | | | (0.57 | ) | | | | 11.55 | | | | | 12.89 | | | | | 0.61 | | | | | 0.37 | | | | | 1.25 | | | | | 19,498 | | | | | 25 | |
| 2016 | | | | 10.84 | | | | | 0.14 | | | | | 0.45 | | | | | 0.59 | | | | | (0.18 | ) | | | | (0.46 | ) | | | | (0.64 | ) | | | | 10.79 | | | | | 5.75 | | | | | 0.61 | | | | | 0.37 | | | | | 1.37 | | | | | 19,681 | | | | | 33 | |
| 2015 | | | | 11.61 | | | | | 0.15 | | | | | (0.49 | ) | | | | (0.34 | ) | | | | (0.18 | ) | | | | (0.25 | ) | | | | (0.43 | ) | | | | 10.84 | | | | | (3.07 | ) | | | | 0.59 | | | | | 0.37 | | | | | 1.30 | | | | | 23,332 | | | | | 45 | |
| 2014 | | | | 10.00 | | | | | 0.15 | | | | | 1.66 | | | | | 1.81 | | | | | (0.18 | ) | | | | (0.02 | ) | | | | (0.20 | ) | | | | 11.61 | | | | | 18.26 | | | | | 0.66 | | | | | 0.37 | | | | | 1.40 | | | | | 33,059 | | | | | 29 | |
2035 Fund | | | | | | | | | | | | | | | | | | | | | | | | | | | | | | | | | | | | | | | | | | | | | | | | | | | | | | | | |
| 2018 | | | | 11.70 | | | | | 0.15 | | | | | 1.09 | | | | | 1.24 | | | | | (0.23 | ) | | | | (0.55 | ) | | | | (0.78 | ) | | | | 12.16 | | | | | 10.95 | | | | | 1.45 | | | | | 0.37 | | | | | 1.01 | | | | | 921 | | | | | 32 | |
| 2017 | | | | 10.73 | | | | | 0.10 | | | | | 1.33 | | | | | 1.43 | | | | | (0.14 | ) | | | | (0.32 | ) | | | | (0.46 | ) | | | | 11.70 | | | | | 13.85 | | | | | 1.13 | | | | | 0.37 | | | | | 0.91 | | | | | 734 | | | | | 32 | |
| 2016 | | | | 10.33 | | | | | 0.10 | | | | | 0.49 | | | | | 0.59 | | | | | (0.15 | ) | | | | (0.04 | ) | | | | (0.19 | ) | | | | 10.73 | | | | | 5.84 | | | | | 1.02 | | | | | 0.37 | | | | | 1.35 | | | | | 659 | | | | | 29 | |
| 2015 | | | | 10.71 | | | | | 0.01 | | | | | (0.38 | ) | | | | (0.37 | ) | | | | (0.01 | ) | | | | — | | | | | (0.01 | ) | | | | 10.33 | | | | | (3.43 | ) | | | | 1.29 | | | | | 0.37 | | | | | 0.26 | | | | | 870 | | | | | 96 | |
| 2014(5) | | | | 10.00 | | | | | 0.00 | | | | | 0.71 | | | | | 0.71 | | | | | — | | | | | — | | | | | — | | | | | 10.71 | | | | | 7.10 | | | | | 23.63 | | | | | 0.37 | | | | | 0.16 | | | | | 348 | | | | | 29 | |
2040 Fund | | | | | | | | | | | | | | | | | | | | | | | | | | | | | | | | | | | | | | | | | | | | | | | | | | | | | | | | |
| 2018 | | | | 11.56 | | | | | 0.14 | | | | | 1.14 | | | | | 1.28 | | | | | (0.19 | ) | | | | (0.91 | ) | | | | (1.10 | ) | | | | 11.74 | | | | | 11.50 | | | | | 0.67 | | | | | 0.36 | | | | | 0.97 | | | | | 12,173 | | | | | 29 | |
| 2017 | | | | 10.68 | | | | | 0.16 | | | | | 1.32 | | | | | 1.48 | | | | | (0.13 | ) | | | | (0.47 | ) | | | | (0.60 | ) | | | | 11.56 | | | | | 14.59 | | | | | 0.73 | | | | | 0.36 | | | | | 1.30 | | | | | 11,098 | | | | | 24 | |
| 2016 | | | | 10.92 | | | | | 0.12 | | | | | 0.47 | | | | | 0.59 | | | | | (0.16 | ) | | | | (0.67 | ) | | | | (0.83 | ) | | | | 10.68 | | | | | 5.74 | | | | | 0.71 | | | | | 0.36 | | | | | 1.18 | | | | | 13,370 | | | | | 31 | |
| 2015 | | | | 11.75 | | | | | 0.12 | | | | | (0.51 | ) | | | | (0.39 | ) | | | | (0.20 | ) | | | | (0.24 | ) | | | | (0.44 | ) | | | | 10.92 | | | | | (3.46 | ) | | | | 0.67 | | | | | 0.36 | | | | | 1.14 | | | | | 12,852 | | | | | 36 | |
| 2014 | | | | 10.00 | | | | | 0.14 | | | | | 1.82 | | | | | 1.96 | | | | | (0.19 | ) | | | | (0.02 | ) | | | | (0.21 | ) | | | | 11.75 | | | | | 19.81 | | | | | 0.76 | | | | | 0.36 | | | | | 1.45 | | | | | 18,090 | | | | | 22 | |
2045 Fund | | | | | | | | | | | | | | | | | | | | | | | | | | | | | | | | | | | | | | | | | | | | | | | | | | | | | | | | |
| 2018 | | | | 11.93 | | | | | 0.15 | | | | | 1.22 | | | | | 1.37 | | | | | (0.21 | ) | | | | (0.55 | ) | | | | (0.76 | ) | | | | 12.54 | | | | | 11.73 | | | | | 2.10 | | | | | 0.36 | | | | | 1.01 | | | | | 914 | | | | | 35 | |
| 2017(6) | | | | 10.92 | | | | | 0.11 | | | | | 1.41 | | | | | 1.52 | | | | | (0.13 | ) | | | | (0.38 | ) | | | | (0.51 | ) | | | | 11.93 | | | | | 14.58 | | | | | 1.72 | | | | | 0.36 | | | | | 1.03 | | | | | 911 | | | | | 31 | |
| 2016 | | | | 10.48 | | | | | 0.09 | | | | | 0.53 | | | | | 0.62 | | | | | (0.15 | ) | | | | (0.03 | ) | | | | (0.18 | ) | | | | 10.92 | | | | | 6.02 | | | | | 1.53 | | | | | 0.36 | | | | | 1.33 | | | | | 868 | | | | | 32 | |
| 2015 | | | | 10.84 | | | | | (0.01 | ) | | | | (0.34 | ) | | | | (0.35 | ) | | | | (0.01 | ) | | | | — | | | | | (0.01 | ) | | | | 10.48 | | | | | (3.27 | ) | | | | 2.14 | | | | | 0.36 | | | | | 0.26 | | | | | 1,142 | | | | | 95 | |
| 2014(5) | | | | 10.00 | | | | | 0.00 | | | | | 0.84 | | | | | 0.84 | | | | | — | | | | | — | | | | | — | | | | | 10.84 | | | | | 8.40 | | | | | 33.37 | | | | | 0.36 | | | | | 0.04 | | | | | 154 | | | | | 35 | |
(See Notes which are an integral part of the Financial Statements)
36
| | |
| |
| Financial Highlights—Investor Class of Shares (For a share outstanding throughout each period) |
| | | | | | | | | | | | | | | | | | | | | | | | | | | | | | | | | | | | | | | | | | | | | | | | | | | | | | | | | | | | | | | | | | | | | | |
Period
Ended
August 31, | | Net asset
value,
beginning
of period | | Net
investment
income
| | Net realized
and unrealized
gain (loss) | | Total from
investment
operations | | Distributions to
shareholders
from net
investment
income | | Distributions to
shareholders
from net
realized gain | | Total
distributions | | Net asset
value, end
of period | | Total
return (1)(2) | | Ratios to Average Net Assets (3) | | Net assets,
end of period
(000 omitted) | | Portfolio
turnover
rate (2) |
| | Gross
Expenses | | Net
Expenses (4) | | Net
investment
income (4) |
2050 Fund | | | | | | | | | | | | | | | | | | | | | | | | | | | | | | | | | | | | | | | | | | | | | | | | | | | | | | | | |
| 2018 | | | $ | 11.99 | | | | $ | 0.13 | | | | $ | 1.24 | | | | $ | 1.37 | | | | $ | (0.20 | ) | | | $ | (0.35 | ) | | | $ | (0.55 | ) | | | $ | 12.81 | | | | | 11.64 | % | | | | 0.75 | % | | | | 0.36 | % | | | | 0.95 | % | | | $ | 10,017 | | | | | 27 | % |
| 2017 | | | | 11.05 | | | | | 0.21 | | | | | 1.34 | | | | | 1.55 | | | | | (0.13 | ) | | | | (0.48 | ) | | | | (0.61 | ) | | | | 11.99 | | | | | 14.67 | | | | | 0.85 | | | | | 0.36 | | | | | 1.55 | | | | | 8,400 | | | | | 27 | |
| 2016 | | | | 10.96 | | | | | 0.13 | | | | | 0.50 | | | | | 0.63 | | | | | (0.16 | ) | | | | (0.38 | ) | | | | (0.54 | ) | | | | 11.05 | | | | | 5.98 | | | | | 0.86 | | | | | 0.36 | | | | | 1.15 | | | | | 10,382 | | | | | 29 | |
| 2015 | | | | 11.76 | | | | | 0.12 | | | | | (0.50 | ) | | | | (0.38 | ) | | | | (0.19 | ) | | | | (0.23 | ) | | | | (0.42 | ) | | | | 10.96 | | | | | (3.37 | ) | | | | 0.84 | | | | | 0.36 | | | | | 1.06 | | | | | 10,275 | | | | | 39 | |
| 2014 | | | | 10.00 | | | | | 0.14 | | | | | 1.81 | | | | | 1.95 | | | | | (0.17 | ) | | | | (0.02 | ) | | | | (0.19 | ) | | | | 11.76 | | | | | 19.69 | | | | | 1.08 | | | | | 0.36 | | | | | 1.36 | | | | | 11,231 | | | | | 28 | |
2055 Fund | | | | | | | | | | | | | | | | | | | | | | | | | | | | | | | | | | | | | | | | | | | | | | | | | | | | | | | | | | | | | |
| 2018 | | | | 11.90 | | | | | 0.15 | | | | | 1.22 | | | | | 1.37 | | | | | (0.15 | ) | | | | (0.19 | ) | | | | (0.34 | ) | | | | 12.93 | | | | | 11.65 | | | | | 2.07 | | | | | 0.36 | | | | | 0.67 | | | | | 394 | | | | | 26 | |
| 2017 | | | | 10.85 | | | | | 0.11 | | | | | 1.40 | | | | | 1.51 | | | | | (0.12 | ) | | | | (0.34 | ) | | | | (0.46 | ) | | | | 11.90 | | | | | 14.39 | | | | | 2.56 | | | | | 0.36 | | | | | 0.91 | | | | | 551 | | | | | 56 | |
| 2016 | | | | 10.41 | | | | | 0.09 | | | | | 0.54 | | | | | 0.63 | | | | | (0.13 | ) | | | | (0.06 | ) | | | | (0.19 | ) | | | | 10.85 | | | | | 6.15 | | | | | 3.32 | | | | | 0.36 | | | | | 1.46 | | | | | 410 | | | | | 38 | |
| 2015 | | | | 10.85 | | | | | 0.06 | | | | | (0.42 | ) | | | | (0.36 | ) | | | | (0.06 | ) | | | | (0.02 | ) | | | | (0.08 | ) | | | | 10.41 | | | | | (3.33 | ) | | | | 6.91 | | | | | 0.36 | | | | | 0.57 | | | | | 1,049 | | | | | 61 | |
| 2014(5) | | | | 10.00 | | | | | 0.00 | | | | | 0.85 | | | | | 0.85 | | | | | — | | | | | — | | | | | — | | | | | 10.85 | | | | | 8.50 | | | | | 50.05 | | | | | 0.36 | | | | | 0.07 | | | | | 143 | | | | | 123 | |
Conservative Allocation Fund | | | | | | | | | | | | | | | | | | | | | | | | | | | | | | | | | | | | | | | | | | | | | | | | | | | | | | | | |
| 2018 | | | | 10.02 | | | | | 0.21 | | | | | (0.03 | ) | | | | 0.18 | | | | | (0.40 | ) | | | | (1.13 | ) | | | | (1.53 | ) | | | | 8.67 | | | | | 1.79 | | | | | 0.79 | | | | | 0.33 | | | | | 1.99 | | | | | 13,395 | | | | | 29 | |
| 2017 | | | | 9.80 | | | | | 0.18 | | | | | 0.28 | | | | | 0.46 | | | | | (0.24 | ) | | | | (0.00 | ) | | | | (0.24 | ) | | | | 10.02 | | | | | 4.83 | | | �� | | 0.58 | | | | | 0.33 | | | | | 1.55 | | | | | 15,531 | | | | | 40 | |
| 2016 | | | | 9.76 | | | | | 0.25 | | | | | 0.21 | | | | | 0.46 | | | | | (0.23 | ) | | | | (0.19 | ) | | | | (0.42 | ) | | | | 9.80 | | | | | 4.98 | | | | | 0.56 | | | | | 0.33 | | | | | 2.23 | | | | | 17,919 | | | | | 31 | |
| 2015 | | | | 10.14 | | | | | 0.20 | | | | | (0.34 | ) | | | | (0.14 | ) | | | | (0.16 | ) | | | | (0.08 | ) | | | | (0.24 | ) | | | | 9.76 | | | | | (1.37 | ) | | | | 0.57 | | | | | 0.33 | | | | | 1.97 | | | | | 23,598 | | | | | 39 | |
| 2014(7) | | | | 10.00 | | | | | 0.03 | | | | | 0.11 | | | | | 0.14 | | | | | — | | | | | — | | | | | — | | | | | 10.14 | | | | | 1.40 | | | | | 0.60 | | | | | 0.33 | | | | | 1.17 | | | | | 25,931 | | | | | 10 | |
Moderate Allocation Fund | | | | | | | | | | | | | | | | | | | | | | | | | | | | | | | | | | | | | | | | | | | | | | | | | | | | | | | | | | | | | |
| 2018 | | | | 10.08 | | | | | 0.18 | | | | | 0.31 | | | | | 0.49 | | | | | (0.19 | ) | | | | (0.46 | ) | | | | (0.65 | ) | | | | 9.92 | | | | | 4.94 | | | | | 0.60 | | | | | 0.30 | | | | | 1.69 | | | | | 7,126 | | | | | 31 | |
| 2017 | | | | 9.72 | | | | | 0.17 | | | | | 0.55 | | | | | 0.72 | | | | | (0.22 | ) | | | | (0.14 | ) | | | | (0.36 | ) | | | | 10.08 | | | | | 7.59 | | | | | 0.58 | | | | | 0.30 | | | | | 1.43 | | | | | 7,777 | | | | | 39 | |
| 2016 | | | | 9.78 | | | | | 0.24 | | | | | 0.23 | | | | | 0.47 | | | | | (0.20 | ) | | | | (0.33 | ) | | | | (0.53 | ) | | | | 9.72 | | | | | 5.13 | | | | | 0.56 | | | | | 0.30 | | | | | 1.92 | | | | | 13,119 | | | | | 38 | |
| 2015 | | | | 10.20 | | | | | 0.17 | | | | | (0.36 | ) | | | | (0.19 | ) | | | | (0.17 | ) | | | | (0.06 | ) | | | | (0.23 | ) | | | | 9.78 | | | | | (1.89 | ) | | | | 0.57 | | | | | 0.30 | | | | | 1.72 | | | | | 22,595 | | | | | 30 | |
| 2014(7) | | | | 10.00 | | | | | 0.04 | | | | | 0.16 | | | | | 0.20 | | | | | — | | | | | — | | | | | — | | | | | 10.20 | | | | | 2.00 | | | | | 0.60 | | | | | 0.30 | | | | | 1.60 | | | | | 24,928 | | | | | 8 | |
Balanced Allocation Fund | | | | | | | | | | | | | | | | | | | | | | | | | | | | | | | | | | | | | | | | | | | | | | | | | | | | | | | | | | | | | |
| 2018 | | | | 9.65 | | | | | 0.15 | | | | | 0.60 | | | | | 0.75 | | | | | (0.18 | ) | | | | (0.81 | ) | | | | (0.99 | ) | | | | 9.41 | | | | | 8.06 | | | | | 0.48 | | | | | 0.33 | | | | | 1.39 | | | | | 98,453 | | | | | 29 | |
| 2017 | | | | 9.42 | | | | | 0.13 | | | | | 0.79 | | | | | 0.92 | | | | | (0.18 | ) | | | | (0.51 | ) | | | | (0.69 | ) | | | | 9.65 | | | | | 10.33 | | | | | 0.48 | | | | | 0.33 | | | | | 1.19 | | | | | 101,517 | | | | | 35 | |
| 2016 | | | | 9.78 | | | | | 0.15 | | | | | 0.32 | | | | | 0.47 | | | | | (0.17 | ) | | | | (0.66 | ) | | | | (0.83 | ) | | | | 9.42 | | | | | 5.23 | | | | | 0.47 | | | | | 0.33 | | | | | 1.54 | | | | | 110,814 | | | | | 33 | |
| 2015 | | | | 10.26 | | | | | 0.15 | | | | | (0.39 | ) | | | | (0.24 | ) | | | | (0.17 | ) | | | | (0.07 | ) | | | | (0.24 | ) | | | | 9.78 | | | | | (2.41 | ) | | | | 0.47 | | | | | 0.33 | | | | | 1.38 | | | | | 157,207 | | | | | 29 | |
| 2014(7) | | | | 10.00 | | | | | 0.03 | | | | | 0.23 | | | | | 0.26 | | | | | — | | | | | — | | | | | — | | | | | 10.26 | | | | | 2.60 | | | | | 0.47 | | | | | 0.33 | | | | | 1.14 | | | | | 184,860 | | | | | 6 | |
Growth Allocation Fund | | | | | | | | | | | | | | | | | | | | | | | | | | | | | | | | | | | | | | | | | | | | | | | | | | | | | | | | | | | | | |
| 2018 | | | | 10.23 | | | | | 0.13 | | | | | 0.98 | | | | | 1.11 | | | | | (0.18 | ) | | | | (0.58 | ) | | | | (0.76 | ) | | | | 10.58 | | | | | 11.15 | | | | | 0.56 | | | | | 0.30 | | | | | 1.18 | | | | | 13,887 | | | | | 32 | |
| 2017 | | | | 9.57 | | | | | 0.10 | | | | | 1.11 | | | | | 1.21 | | | | | (0.12 | ) | | | | (0.43 | ) | | | | (0.55 | ) | | | | 10.23 | | | | | 13.27 | | | | | 0.57 | | | | | 0.30 | | | | | 1.10 | | | | | 16,758 | | | | | 42 | |
| 2016 | | | | 9.82 | | | | | 0.12 | | | | | 0.37 | | | | | 0.49 | | | | | (0.16 | ) | | | | (0.58 | ) | | | | (0.74 | ) | | | | 9.57 | | | | | 5.28 | | | | | 0.56 | | | | | 0.30 | | | | | 1.22 | | | | | 24,691 | | | | | 38 | |
| 2015 | | | | 10.31 | | | | | 0.11 | | | | | (0.41 | ) | | | | (0.30 | ) | | | | (0.16 | ) | | | | (0.03 | ) | | | | (0.19 | ) | | | | 9.82 | | | | | (2.95 | ) | | | | 0.57 | | | | | 0.30 | | | | | 1.10 | | | | | 43,023 | | | | | 20 | |
| 2014(7) | | | | 10.00 | | | | | 0.02 | | | | | 0.29 | | | | | 0.31 | | | | | — | | | | | — | | | | | — | | | | | 10.31 | | | | | 3.10 | | | | | 0.60 | | | | | 0.30 | | | | | 0.73 | | | | | 46,520 | | | | | 6 | |
Aggressive Allocation Fund | | | | | | | | | | | | | | | | | | | | | | | | | | | | | | | | | | | | | | | | | | | | | | | | | | | | | | | | | | | | | |
| 2018 | | | | 10.01 | | | | | 0.12 | | | | | 1.20 | | | | | 1.32 | | | | | (0.19 | ) | | | | (1.13 | ) | | | | (1.32 | ) | | | | 10.01 | | | | | 13.90 | | | | | 0.53 | | | | | 0.33 | | | | | 1.06 | | | | | 34,898 | | | | | 27 | |
| 2017 | | | | 9.56 | | | | | 0.11 | | | | | 1.27 | | | | | 1.38 | | | | | (0.10 | ) | | | | (0.83 | ) | | | | (0.93 | ) | | | | 10.01 | | | | | 15.60 | | | | | 0.53 | | | | | 0.33 | | | | | 1.03 | | | | | 37,632 | | | | | 33 | |
| 2016 | | | | 9.85 | | | | | 0.10 | | | | | 0.38 | | | | | 0.48 | | | | | (0.13 | ) | | | | (0.64 | ) | | | | (0.77 | ) | | | | 9.56 | | | | | 5.14 | | | | | 0.52 | | | | | 0.33 | | | | | 1.04 | | | | | 52,260 | | | | | 33 | |
| 2015 | | | | 10.36 | | | | | 0.12 | | | | | (0.41 | ) | | | | (0.29 | ) | | | | (0.18 | ) | | | | (0.04 | ) | | | | (0.22 | ) | | | | 9.85 | | | | | (2.79 | ) | | | | 0.53 | | | | | 0.34 | | | | | 0.73 | | | | | 83,064 | | | | | 44 | |
| 2014(7) | | | | 10.00 | | | | | 0.01 | | | | | 0.35 | | | | | 0.36 | | | | | — | | | | | — | | | | | — | | | | | 10.36 | | | | | 3.60 | | | | | 0.58 | | | | | 0.36 | | | | | 0.42 | | | | | 63,049 | | | | | 3 | |
| (1) | Based on net asset value as of end of period date. |
| (2) | Not annualized for periods less than one year. |
| (3) | Annualized for periods less than one year. Excludes acquired fund fees and expenses of underlying funds. |
| (4) | The contractual and voluntary expense waivers pursuant to Note 5 of the financial statements are reflected in both the net expense and net investment income ratios. |
| (5) | Reflects operations for the period from December 27, 2013 (inception date) to August 31, 2014. |
| (6) | Calculated using the average shares method. |
| (7) | Reflects operations for the period from May 30, 2014 (inception date) to August 31, 2014. |
(See Notes which are an integral part of the Financial Statements)
37
| | |
| |
| Financial Highlights—Institutional Class of Shares (For a share outstanding throughout each period) |
| | | | | | | | | | | | | | | | | | | | | | | | | | | | | | | | | | | | | | | | | | | | | | | | | | | | | | | | | | | | | | | | | | | | | | |
| | | | | | | | | | | | |
Period
Ended
August 31, | | Net asset
value,
beginning
of period | | Net
investment
income | | Net realized
and unrealized
gain (loss) | | Total from
investment
operations | | Distributions to
shareholders
from net
investment
income | | Distributions to
shareholders
from net
realized gain | | Total
distributions | | Net asset
value, end
of period | | Total
return (1)(2) | | Ratios to Average Net Assets (3) | | Net assets,
end of period
(000 omitted) | | Portfolio
turnover
rate (2) |
| | Gross
Expenses | | Net
Expenses (4) | | Net
investment
income (4) |
Conservative Allocation Fund | |
| 2018 | | | $ | 10.02 | | | | $ | 3.41 | | | | $ | (3.20 | ) | | | $ | 0.21 | | | | $ | (0.13 | ) | | | $ | (1.13 | ) | | | $ | (1.26 | ) | | | $ | 8.97 | | | | | 2.11 | % | | | | 0.52 | % | | | | 0.08 | % | | | | 1.10 | % | | | $ | 1,416 | | | | | 29 | % |
| 2017 | | | | 9.81 | | | | | 0.18 | | | | | 0.30 | | | | | 0.48 | | | | | (0.27 | ) | | | | (0.00 | ) | | | | (0.27 | ) | | | | 10.02 | | | | | 5.07 | | | | | 0.33 | | | | | 0.08 | | | | | 1.78 | | | | | 26,464 | | | | | 40 | |
| 2016 | | | | 9.77 | | | | | 0.24 | | | | | 0.25 | | | | | 0.49 | | | | | (0.26 | ) | | | | (0.19 | ) | | | | (0.45 | ) | | | | 9.81 | | | | | 5.29 | | | | | 0.31 | | | | | 0.08 | | | | | 2.46 | | | | | 29,479 | | | | | 31 | |
| 2015 | | | | 10.15 | | | | | 0.23 | | | | | (0.35 | ) | | | | (0.12 | ) | | | | (0.17 | ) | | | | (0.09 | ) | | | | (0.26 | ) | | | | 9.77 | | | | | (1.22 | ) | | | | 0.32 | | | | | 0.08 | | | | | 2.23 | | | | | 29,104 | | | | | 39 | |
| 2014(5) | | | | 10.00 | | | | | 0.04 | | | | | 0.11 | | | | | 0.15 | | | | | — | | | | | — | | | | | — | | | | | 10.15 | | | | | 1.50 | | | | | 0.35 | | | | | 0.08 | | | | | 1.41 | | | | | 29,082 | | | | | 10 | |
Moderate Allocation Fund | |
| 2018 | | | | 10.08 | | | | | 0.28 | | | | | 0.25 | | | | | 0.53 | | | | | (0.21 | ) | | | | (0.46 | ) | | | | (0.67 | ) | | | | 9.94 | | | | | 5.33 | | | | | 0.36 | | | | | 0.05 | | | | | 1.68 | | | | | 5,888 | | | | | 31 | |
| 2017 | | | | 9.73 | | | | | 0.17 | | | | | 0.57 | | | | | 0.74 | | | | | (0.25 | ) | | | | (0.14 | ) | | | | (0.39 | ) | | | | 10.08 | | | | | 7.82 | | | | | 0.33 | | | | | 0.05 | | | | | 1.66 | | | | | 9,375 | | | | | 39 | |
| 2016 | | | | 9.79 | | | | | 0.23 | | | | | 0.28 | | | | | 0.51 | | | | | (0.24 | ) | | | | (0.33 | ) | | | | (0.57 | ) | | | | 9.73 | | | | | 5.50 | | | | | 0.31 | | | | | 0.05 | | | | | 2.15 | | | | | 11,990 | | | | | 38 | |
| 2015 | | | | 10.21 | | | | | 0.21 | | | | | (0.38 | ) | | | | (0.17 | ) | | | | (0.18 | ) | | | | (0.07 | ) | | | | (0.25 | ) | | | | 9.79 | | | | | (1.75 | ) | | | | 0.32 | | | | | 0.05 | | | | | 1.95 | | | | | 16,112 | | | | | 30 | |
| 2014(5) | | | | 10.00 | | | | | 0.05 | | | | | 0.16 | | | | | 0.21 | | | | | — | | | | | — | | | | | — | | | | | 10.21 | | | | | 2.10 | | | | | 0.35 | | | | | 0.05 | | | | | 1.82 | | | | | 17,704 | | | | | 8 | |
Balanced Allocation Fund | |
| 2018 | | | | 9.66 | | | | | 0.19 | | | | | 0.58 | | | | | 0.77 | | | | | (0.20 | ) | | | | (0.81 | ) | | | | (1.01 | ) | | | | 9.42 | | | | | 8.27 | | | | | 0.23 | | | | | 0.08 | | | | | 1.61 | | | | | 47,597 | | | | | 29 | |
| 2017 | | | | 9.43 | | | | | 0.13 | | | | | 0.81 | | | | | 0.94 | | | | | (0.20 | ) | | | | (0.51 | ) | | | | (0.71 | ) | | | | 9.66 | | | | | 10.67 | | | | | 0.23 | | | | | 0.08 | | | | | 1.42 | | | | | 52,821 | | | | | 35 | |
| 2016 | | | | 9.79 | | | | | 0.17 | | | | | 0.33 | | | | | 0.50 | | | | | (0.20 | ) | | | | (0.66 | ) | | | | (0.86 | ) | | | | 9.43 | | | | | 5.54 | | | | | 0.22 | | | | | 0.08 | | | | | 1.73 | | | | | 74,515 | | | | | 33 | |
| 2015 | | | | 10.26 | | | | | 0.17 | | | | | (0.39 | ) | | | | (0.22 | ) | | | | (0.19 | ) | | | | (0.06 | ) | | | | (0.25 | ) | | | | 9.79 | | | | | (2.17 | ) | | | | 0.22 | | | | | 0.08 | | | | | 1.59 | | | | | 81,475 | | | | | 29 | |
| 2014(5) | | | | 10.00 | | | | | 0.04 | | | | | 0.22 | | | | | 0.26 | | | | | — | | | | | — | | | | | — | | | | | 10.26 | | | | | 2.60 | | | | | 0.22 | | | | | 0.08 | | | | | 1.39 | | | | | 79,584 | | | | | 6 | |
Growth Allocation Fund | |
| 2018 | | | | 10.23 | | | | | 0.15 | | | | | 1.00 | | | | | 1.15 | | | | | (0.21 | ) | | | | (0.58 | ) | | | | (0.79 | ) | | | | 10.59 | | | | | 11.59 | | | | | 0.31 | | | | | 0.05 | | | | | 1.42 | | | | | 11,441 | | | | | 32 | |
| 2017 | | | | 9.58 | | | | | 0.09 | | | | | 1.14 | | | | | 1.23 | | | | | (0.15 | ) | | | | (0.43 | ) | | | | (0.58 | ) | | | | 10.23 | | | | | 13.51 | | | | | 0.32 | | | | | 0.05 | | | | | 1.15 | | | | | 8,969 | | | | | 42 | |
| 2016 | | | | 9.84 | | | | | 0.14 | | | | | 0.37 | | | | | 0.51 | | | | | (0.19 | ) | | | | (0.58 | ) | | | | (0.77 | ) | | | | 9.58 | | | | | 5.50 | | | | | 0.31 | | | | | 0.05 | | | | | 1.48 | | | | | 9,696 | | | | | 38 | |
| 2015 | | | | 10.32 | | | | | 0.15 | | | | | (0.42 | ) | | | | (0.27 | ) | | | | (0.18 | ) | | | | (0.03 | ) | | | | (0.21 | ) | | | | 9.84 | | | | | (2.72 | ) | | | | 0.32 | | | | | 0.05 | | | | | 1.32 | | | | | 15,252 | | | | | 20 | |
| 2014(5) | | | | 10.00 | | | | | 0.02 | | | | | 0.30 | | | | | 0.32 | | | | | — | | | | | — | | | | | — | | | | | 10.32 | | | | | 3.20 | | | | | 0.35 | | | | | 0.05 | | | | | 0.96 | | | | | 18,598 | | | | | 6 | |
Aggressive Allocation Fund | |
| 2018 | | | | 10.00 | | | | | 0.15 | | | | | 1.20 | | | | | 1.35 | | | | | (0.21 | ) | | | | (1.13 | ) | | | | (1.34 | ) | | | | 10.01 | | | | | 14.26 | | | | | 0.28 | | | | | 0.08 | | | | | 1.23 | | | | | 15,878 | | | | | 27 | |
| 2017 | | | | 9.57 | | | | | 0.14 | | | | | 1.25 | | | | | 1.39 | | | | | (0.13 | ) | | | | (0.83 | ) | | | | (0.96 | ) | | | | 10.00 | | | | | 15.79 | | | | | 0.28 | | | | | 0.08 | | | | | 1.29 | | | | | 14,685 | | | | | 33 | |
| 2016 | | | | 9.87 | | | | | 0.11 | | | | | 0.39 | | | | | 0.50 | | | | | (0.16 | ) | | | | (0.64 | ) | | | | (0.80 | ) | | | | 9.57 | | | | | 5.41 | | | | | 0.27 | | | | | 0.08 | | | | | 1.31 | | | | | 24,026 | | | | | 33 | |
| 2015 | | | | 10.37 | | | | | 0.14 | | | | | (0.40 | ) | | | | (0.26 | ) | | | | (0.19 | ) | | | | (0.05 | ) | | | | (0.24 | ) | | | | 9.87 | | | | | (2.55 | ) | | | | 0.28 | | | | | 0.09 | | | | | 1.06 | | | | | 31,770 | | | | | 44 | |
| 2014(5) | | | | 10.00 | | | | | 0.02 | | | | | 0.35 | | | | | 0.37 | | | | | — | | | | | — | | | | | — | | | | | 10.37 | | | | | 3.70 | | | | | 0.33 | | | | | 0.11 | | | | | 0.66 | | | | | 27,401 | | | | | 3 | |
| (1) | Based on net asset value as of end of period date. |
| (2) | Not annualized for periods less than one year. |
| (3) | Annualized for periods less than one year. Excludes acquired fund fees and expenses of underlying funds. |
| (4) | The contractual and voluntary expense waivers pursuant to Note 5 of the financial statements are reflected in both the net expense and net investment income ratios. |
| (5) | Reflects operations for the period from May 30, 2014 (inception date) to August 31, 2014. |
(See Notes which are an integral part of the Financial Statements)
38
| | |
| |
| Financial Highlights—RetirementClass R-3 of Shares (For a share outstanding throughout each period) |
| | | | | | | | | | | | | | | | | | | | | | | | | | | | | | | | | | | | | | | | | | | | | | | | | | | | | | | | | | | | | | | | | | | | | | |
Period
Ended
August 31, | | Net asset
value,
beginning
of period | | Net
investment
income (loss) | | Net realized
and unrealized
gain (loss) | | Total from
investment
operations | | Distributions to
shareholders
from net
investment
income | | Distributions to
shareholders
from net
realized gain | | Total
distributions | | Net asset
value, end
of period | | Total
return (1)(2) | | Ratios to Average Net Assets (3) | | Net assets,
end of period
(000 omitted) | | Portfolio
turnover
rate (2) |
| | Gross
Expenses | | Net
Expenses (4) | | Net
investment
income
(loss) (4) |
In-Retirement Fund | | | | | | | | | | | | | | | | | | | | | | | | | | | | | | | | | | | | | | | | | | | | | | | | | | | | | | | | | | | | | |
| 2018 | | | $ | 9.42 | | | | $ | 0.15 | | | | $ | 0.17 | | | | $ | 0.32 | | | | $ | (0.17 | ) | | | $ | (0.56 | ) | | | $ | (0.73 | ) | | | $ | 9.01 | | | | | 3.43 | % | | | | 1.60 | % | | | | 0.58 | % | | | | 1.85 | % | | | $ | 766 | | | | | 35 | % |
| 2017 | | | | 9.54 | | | | | 0.32 | | | | | 0.25 | | | | | 0.57 | | | | | (0.20 | ) | | | | (0.49 | ) | | | | (0.69 | ) | | | | 9.42 | | | | | 6.39 | | | | | 1.67 | | | | | 0.58 | | | | | 1.57 | | | | | 634 | | | | | 26 | |
| 2016 | | | | 10.01 | | | | | 0.19 | | | | | 0.28 | | | | | 0.47 | | | | | (0.21 | ) | | | | (0.73 | ) | | | | (0.94 | ) | | | | 9.54 | | | | | 5.19 | | | | | 1.50 | | | | | 0.58 | | | | | 1.77 | | | | | 1,720 | | | | | 44 | |
| 2015 | | | | 11.03 | | | | | 0.19 | | | | | (0.42 | ) | | | | (0.23 | ) | | | | (0.26 | ) | | | | (0.53 | ) | | | | (0.79 | ) | | | | 10.01 | | | | | (2.24 | ) | | | | 1.28 | | | | | 0.58 | | | | | 1.76 | | | | | 2,149 | | | | | 53 | |
| 2014 | | | | 10.00 | | | | | 0.19 | | | | | 0.98 | | | | | 1.17 | | | | | (0.12 | ) | | | | (0.02 | ) | | | | (0.14 | ) | | | | 11.03 | | | | | 11.74 | | | | | 1.33 | | | | | 0.58 | | | | | 1.64 | | | | | 4,283 | | | | | 45 | |
2015 Fund | | | | | | | | | | | | | | | | | | | | | | | | | | | | | | | | | | | | | | | | | | | | | | | | | | | | | | | | | | | | | |
| 2018 | | | | 11.30 | | | | | 0.19 | | | | | 0.31 | | | | | 0.50 | | | | | (0.21 | ) | | | | (0.02 | ) | | | | (0.23 | ) | | | | 11.57 | | | | | 4.46 | | | | | 4.58 | | | | | 0.58 | | | | | 1.69 | | | | | 117 | | | | | 38 | |
| 2017 | | | | 10.65 | | | | | 0.14 | | | | | 0.70 | | | | | 0.84 | | | | | (0.19 | ) | | | | — | | | | | (0.19 | ) | | | | 11.30 | | | | | 8.07 | | | | | 4.54 | | | | | 0.58 | | | | | 1.31 | | | | | 114 | | | | | 72 | |
| 2016 | | | | 10.41 | | | | | 0.26 | | | | | 0.30 | | | | | 0.56 | | | | | (0.21 | ) | | | | (0.11 | ) | | | | (0.32 | ) | | | | 10.65 | | | | | 5.57 | | | | | 4.32 | | | | | 0.58 | | | | | 1.75 | | | | | 136 | | | | | 49 | |
| 2015 | | | | 10.72 | | | | | 0.09 | | | | | (0.36 | ) | | | | (0.27 | ) | | | | (0.04 | ) | | | | — | | | | | (0.04 | ) | | | | 10.41 | | | | | (2.50 | ) | | | | 4.46 | | | | | 0.58 | | | | | 1.33 | | | | | 221 | | | | | 83 | |
| 2014(5) | | | | 10.00 | | | | | 0.03 | | | | | 0.69 | | | | | 0.72 | | | | | — | | | | | — | | | | | — | | | | | 10.72 | | | | | 7.20 | | | | | 73.79 | | | | | 0.58 | | | | | 1.18 | | | | | 105 | | | | | 29 | |
2020 Fund | | | | | | | | | | | | | | | | | | | | | | | | | | | | | | | | | | | | | | | | | | | | | | | | | | | | | | | | | | | | | |
| 2018 | | | | 10.53 | | | | | 0.21 | | | | | 0.52 | | | | | 0.73 | | | | | (0.16 | ) | | | | (0.51 | ) | | | | (0.67 | ) | | | | 10.59 | | | | | 7.06 | | | | | 0.85 | | | | | 0.58 | | | | | 1.63 | | | | | 4,533 | | | | | 29 | |
| 2017 | | | | 10.22 | | | | | 0.16 | | | | | 0.79 | | | | | 0.95 | | | | | (0.16 | ) | | | | (0.48 | ) | | | | (0.64 | ) | | | | 10.53 | | | | | 9.87 | | | | | 0.88 | | | | | 0.58 | | | | | 1.32 | | | | | 6,813 | | | | | 23 | |
| 2016 | | | | 10.48 | | | | | 0.17 | | | | | 0.39 | | | | | 0.56 | | | | | (0.18 | ) | | | | (0.64 | ) | | | | (0.82 | ) | | | | 10.22 | | | | | 5.74 | | | | | 0.88 | | | | | 0.58 | | | | | 1.44 | | | | | 11,985 | | | | | 39 | |
| 2015 | | | | 11.33 | | | | | 0.17 | | | | | (0.48 | ) | | | | (0.31 | ) | | | | (0.22 | ) | | | | (0.32 | ) | | | | (0.54 | ) | | | | 10.48 | | | | | (2.88 | ) | | | | 0.84 | | | | | 0.58 | | | | | 1.39 | | | | | 15,177 | | | | | 37 | |
| 2014 | | | | 10.00 | | | | | 0.15 | | | | | 1.36 | | | | | 1.51 | | | | | (0.14 | ) | | | | (0.04 | ) | | | | (0.18 | ) | | | | 11.33 | | | | | 15.23 | | | | | 0.88 | | | | | 0.58 | | | | | 1.28 | | | | | 23,025 | | | | | 35 | |
2025 Fund | | | | | | | | | | | | | | | | | | | | | | | | | | | | | | | | | | | | | | | | | | | | | | | | | | | | | | | | | | | | | |
| 2018 | | | | 11.56 | | | | | 0.21 | | | | | 0.77 | | | | | 0.98 | | | | | — | | | | | (0.13 | ) | | | | (0.13 | ) | | | | 12.41 | | | | | 8.53 | | | | | 1.28 | | | | | 0.58 | | | | | 1.26 | | | | | 109 | | | | | 33 | |
| 2017 | | | | 10.69 | | | | | 0.24 | | | | | 0.97 | | | | | 1.21 | | | | | (0.15 | ) | | | | (0.19 | ) | | | | (0.34 | ) | | | | 11.56 | | | | | 11.66 | | | | | 1.29 | | | | | 0.58 | | | | | 1.17 | | | | | 150 | | | | | 31 | |
| 2016 | | | | 10.38 | | | | | 0.14 | | | | | 0.42 | | | | | 0.56 | | | | | (0.16 | ) | | | | (0.09 | ) | | | | (0.25 | ) | | | | 10.69 | | | | | 5.49 | | | | | 1.26 | | | | | 0.58 | | | | | 1.30 | | | | | 1,053 | | | | | 33 | |
| 2015 | | | | 10.76 | | | | | 0.03 | | | | | (0.36 | ) | | | | (0.33 | ) | | | | (0.05 | ) | | | | — | | | | | (0.05 | ) | | | | 10.38 | | | | | (3.06 | ) | | | | 1.51 | | | | | 0.58 | | | | | 0.74 | | | | | 1,388 | | | | | 53 | |
| 2014(5) | | | | 10.00 | | | | | 0.04 | | | | | 0.72 | | | | | 0.76 | | | | | — | | | | | — | | | | | — | | | | | 10.76 | | | | | 7.60 | | | | | 24.85 | | | | | 0.58 | | | | | 0.59 | | | | | 2 | | | | | 22 | |
2030 Fund | | | | | | | | | | | | | | | | | | | | | | | | | | | | | | | | | | | | | | | | | | | | | | | | | | | | | | | | | | | | | |
| 2018 | | | | 11.55 | | | | | 0.17 | | | | | 0.93 | | | | | 1.10 | | | | | (0.14 | ) | | | | (0.42 | ) | | | | (0.56 | ) | | | | 12.09 | | | | | 9.63 | | | | | 0.82 | | | | | 0.62 | | | | | 0.98 | | | | | 3,844 | | | | | 32 | |
| 2017 | | | | 10.78 | | | | | 0.14 | | | | | 1.17 | | | | | 1.31 | | | | | (0.12 | ) | | | | (0.42 | ) | | | | (0.54 | ) | | | | 11.55 | | | | | 12.70 | | | | | 0.86 | | | | | 0.62 | | | | | 1.13 | | | | | 6,316 | | | | | 25 | |
| 2016 | | | | 10.82 | | | | | 0.12 | | | | | 0.45 | | | | | 0.57 | | | | | (0.15 | ) | | | | (0.46 | ) | | | | (0.61 | ) | | | | 10.78 | | | | | 5.53 | | | | | 0.86 | | | | | 0.62 | | | | | 1.15 | | | | | 9,875 | | | | | 33 | |
| 2015 | | | | 11.59 | | | | | 0.13 | | | | | (0.51 | ) | | | | (0.38 | ) | | | | (0.14 | ) | | | | (0.25 | ) | | | | (0.39 | ) | | | | 10.82 | | | | | (3.39 | ) | | | | 0.84 | | | | | 0.62 | | | | | 1.09 | | | | | 12,812 | | | | | 45 | |
| 2014 | | | | 10.00 | | | | | 0.13 | | | | | 1.65 | | | | | 1.78 | | | | | (0.17 | ) | | | | (0.02 | ) | | | | (0.19 | ) | | | | 11.59 | | | | | 17.98 | | | | | 0.91 | | | | | 0.62 | | | | | 1.21 | | | | | 20,329 | | | | | 29 | |
2035 Fund | | | | | | | | | | | | | | | | | | | | | | | | | | | | | | | | | | | | | | | | | | | | | | | | | | | | | | | | | | | | | |
| 2018 | | | | 11.63 | | | | | 0.10 | | | | | 1.12 | | | | | 1.22 | | | | | (0.06 | ) | | | | (0.55 | ) | | | | (0.61 | ) | | | | 12.24 | | | | | 10.76 | | | | | 1.70 | | | | | 0.62 | | | | | 0.69 | | | | | 123 | | | | | 32 | |
| 2017 | | | | 10.67 | | | | | 0.11 | | | | | 1.29 | | | | | 1.40 | | | | | (0.12 | ) | | | | (0.32 | ) | | | | (0.44 | ) | | | | 11.63 | | | | | 13.59 | | | | | 1.38 | | | | | 0.62 | | | | | 0.99 | | | | | 120 | | | | | 32 | |
| 2016 | | | | 10.27 | | | | | 0.12 | | | | | 0.44 | | | | | 0.56 | | | | | (0.12 | ) | | | | (0.04 | ) | | | | (0.16 | ) | | | | 10.67 | | | | | 5.55 | | | | | 1.27 | | | | | 0.62 | | | | | 1.06 | | | | | 492 | | | | | 29 | |
| 2015 | | | | 10.68 | | | | | (0.03 | ) | | | | (0.36 | ) | | | | (0.39 | ) | | | | (0.02 | ) | | | | — | | | | | (0.02 | ) | | | | 10.27 | | | | | (3.65 | ) | | | | 1.54 | | | | | 0.62 | | | | | (0.13 | ) | | | | 734 | | | | | 96 | |
| 2014(5) | | | | 10.00 | | | | | 0.01 | | | | | 0.67 | | | | | 0.68 | | | | | — | | | | | — | | | | | — | | | | | 10.68 | | | | | 6.80 | | | | | 23.88 | | | | | 0.62 | | | | | 0.19 | | | | | 3 | | | | | 29 | |
2040 Fund | | | | | | | | | | | | | | | | | | | | | | | | | | | | | | | | | | | | | | | | | | | | | | | | | | | | | | | | | | | | | |
| 2018 | | | | 11.57 | | | | | 0.10 | | | | | 1.16 | | | | | 1.26 | | | | | (0.14 | ) | | | | (0.91 | ) | | | | (1.05 | ) | | | | 11.78 | | | | | 11.31 | | | | | 0.92 | | | | | 0.61 | | | | | 0.74 | | | | | 2,061 | | | | | 29 | |
| 2017 | | | | 10.69 | | | | | 0.19 | | | | | 1.26 | | | | | 1.45 | | | | | (0.10 | ) | | | | (0.47 | ) | | | | (0.57 | ) | | | | 11.57 | | | | | 14.17 | | | | | 0.98 | | | | | 0.61 | | | | | 1.22 | | | | | 2,555 | | | | | 24 | |
| 2016 | | | | 10.91 | | | | | 0.12 | | | | | 0.44 | | | | | 0.56 | | | | | (0.11 | ) | | | | (0.67 | ) | | | | (0.78 | ) | | | | 10.69 | | | | | 5.48 | | | | | 0.96 | | | | | 0.61 | | | | | 1.06 | | | | | 4,991 | | | | | 31 | |
| 2015 | | | | 11.72 | | | | | 0.10 | | | | | (0.50 | ) | | | | (0.40 | ) | | | | (0.17 | ) | | | | (0.24 | ) | | | | (0.41 | ) | | | | 10.91 | | | | | (3.57 | ) | | | | 0.92 | | | | | 0.61 | | | | | 0.92 | | | | | 7,748 | | | | | 36 | |
| 2014 | | | | 10.00 | | | | | 0.11 | | | | | 1.82 | | | | | 1.93 | | | | | (0.19 | ) | | | | (0.02 | ) | | | | (0.21 | ) | | | | 11.72 | | | | | 19.42 | | | | | 1.01 | | | | | 0.61 | | | | | 0.97 | | | | | 11,429 | | | | | 22 | |
2045 Fund | | | | | | | | | | | | | | | | | | | | | | | | | | | | | | | | | | | | | | | | | | | | | | | | | | | | | | | | | | | | | |
| 2018 | | | | 11.87 | | | | | 0.06 | | | | | 1.27 | | | | | 1.33 | | | | | — | | | | | (0.55 | ) | | | | (0.55 | ) | | | | 12.65 | | | | | 11.37 | | | | | 2.32 | | | | | 0.61 | | | | | 0.78 | | | | | 74 | | | | | 35 | |
| 2017(6) | | | | 10.87 | | | | | 0.09 | | | | | 1.41 | | | | | 1.50 | | | | | (0.12 | ) | | | | (0.38 | ) | | | | (0.50 | ) | | | | 11.87 | | | | | 14.35 | | | | | 1.97 | | | | | 0.61 | | | | | 0.80 | | | | | 53 | | | | | 31 | |
| 2016 | | | | 10.42 | | | | | 0.13 | | | | | 0.46 | | | | | 0.59 | | | | | (0.11 | ) | | | | (0.03 | ) | | | | (0.14 | ) | | | | 10.87 | | | | | 5.74 | | | | | 1.78 | | | | | 0.61 | | | | | 1.02 | | | | | 426 | | | | | 32 | |
| 2015 | | | | 10.82 | | | | | (0.07 | ) | | | | (0.31 | ) | | | | (0.38 | ) | | | | (0.02 | ) | | | | — | | | | | (0.02 | ) | | | | 10.42 | | | | | (3.53 | ) | | | | 2.39 | | | | | 0.61 | | | | | (0.90 | ) | | | | 746 | | | | | 95 | |
| 2014(5) | | | | 10.00 | | | | | 0.00 | | | | | 0.82 | | | | | 0.82 | | | | | — | | | | | — | | | | | — | | | | | 10.82 | | | | | 8.20 | | | | | 33.62 | | | | | 0.61 | | | | | 0.01 | | | | | 3 | | | | | 35 | |
(See Notes which are an integral part of the Financial Statements)
39
| | |
| |
| Financial Highlights—RetirementClass R-3 of Shares (For a share outstanding throughout each period) |
| | | | | | | | | | | | | | | | | | | | | | | | | | | | | | | | | | | | | | | | | | | | | | | | | | | | | | | | | | | | | | | | | | | | | | |
Period
Ended
August 31, | | Net asset
value,
beginning
of period | | Net
investment
income | | Net realized
and unrealized
gain (loss) | | Total from
investment
operations | | Distributions to
shareholders
from net
investment
income | | Distributions to
shareholders
from net
realized gain | | Total
distributions | | Net asset
value, end
of period | | Total
return (1)(2) | | Ratios to Average Net Assets (3) | | Net assets,
end of period
(000 omitted) | | Portfolio
turnover
rate (2) |
| | Gross
Expenses | | Net
Expenses (4) | | Net
investment
income
(loss) (4) |
2050 Fund | | | | | | | | | | | | | | | | | | | | | | | | | | | | | | | | | | | | | | | | | | | | | | | | | | | | | | | | | | | | | |
| 2018 | | | $ | 11.97 | | | | $ | 0.11 | | | | $ | 1.23 | | | | $ | 1.34 | | | | $ | (0.16 | ) | | | $ | (0.35 | ) | | | $ | (0.51 | ) | | | $ | 12.80 | | | | | 11.38 | % | | | | 1.00 | % | | | | 0.61 | % | | | | 0.74 | % | | | $ | 1,978 | | | | | 27 | % |
| 2017 | | | | 11.04 | | | | | 0.14 | | | | | 1.38 | | | | | 1.52 | | | | | (0.11 | ) | | | | (0.48 | ) | | | | (0.59 | ) | | | | 11.97 | | | | | 14.38 | | | | | 1.10 | | | | | 0.61 | | | | | 1.07 | | | | | 3,115 | | | | | 27 | |
| 2016 | | | | 10.95 | | | | | 0.10 | | | | | 0.50 | | | | | 0.60 | | | | | (0.13 | ) | | | | (0.38 | ) | | | | (0.51 | ) | | | | 11.04 | | | | | 5.66 | | | | | 1.11 | | | | | 0.61 | | | | | 0.98 | | | | | 4,515 | | | | | 29 | |
| 2015 | | | | 11.74 | | | | | 0.09 | | | | | (0.50 | ) | | | | (0.41 | ) | | | | (0.15 | ) | | | | (0.23 | ) | | | | (0.38 | ) | | | | 10.95 | | | | | (3.57 | ) | | | | 1.09 | | | | | 0.61 | | | | | 0.81 | | | | | 5,072 | | | | | 39 | |
| 2014 | | | | 10.00 | | | | | 0.11 | | | | | 1.82 | | | | | 1.93 | | | | | (0.17 | ) | | | | (0.02 | ) | | | | (0.19 | ) | | | | 11.74 | | | | | 19.40 | | | | | 1.33 | | | | | 0.61 | | | | | 0.87 | | | | | 6,826 | | | | | 28 | |
2055 Fund | | | | | | | | | | | | | | | | | | | | | | | | | | | | | | | | | | | | | | | | | | | | | | | | | | | | | | | | | | | | | |
| 2018 | | | | 11.83 | | | | | 0.14 | | | | | 1.19 | | | | | 1.33 | | | | | (0.17 | ) | | | | (0.19 | ) | | | | (0.36 | ) | | | | 12.80 | | | | | 11.39 | | | | | 2.37 | | | | | 0.61 | | | | | 2.44 | | | | | 117 | | | | | 26 | |
| 2017 | | | | 10.80 | | | | | 0.07 | | | | | 1.41 | | | | | 1.48 | | | | | (0.11 | ) | | | | (0.34 | ) | | | | (0.45 | ) | | | | 11.83 | | | | | 14.22 | | | | | 2.81 | | | | | 0.61 | | | | | 1.09 | | | | | 94 | | | | | 56 | |
| 2016 | | | | 10.38 | | | | | 0.09 | | | | | 0.50 | | | | | 0.59 | | | | | (0.11 | ) | | | | (0.06 | ) | | | | (0.17 | ) | | | | 10.80 | | | | | 5.73 | | | | | 3.57 | | | | | 0.61 | | | | | 0.82 | | | | | 477 | | | | | 38 | |
| 2015 | | | | 10.84 | | | | | 0.03 | | | | | (0.41 | ) | | | | (0.38 | ) | | | | (0.06 | ) | | | | (0.02 | ) | | | | (0.08 | ) | | | | 10.38 | | | | | (3.55 | ) | | | | 7.16 | | | | | 0.61 | | | | | 0.14 | | | | | 395 | | | | | 61 | |
| 2014(5) | | | | 10.00 | | | | | 0.01 | | | | | 0.83 | | | | | 0.84 | | | | | — | | | | | — | | | | | — | | | | | 10.84 | | | | | 8.40 | | | | | 50.30 | | | | | 0.61 | | | | | 0.44 | | | | | 54 | | | | | 123 | |
Conservative Allocation Fund | | | | | | | | | | | | | | | | | | | | | | | | | | | | | | | | | | | | | | | | | | | | | | | | | | | | | | | | | | | | | |
| 2018 | | | | 10.01 | | | | | 0.52 | | | | | (0.36 | ) | | | | 0.16 | | | | | (0.20 | ) | | | | (1.13 | ) | | | | (1.33 | ) | | | | 8.84 | | | | | 1.58 | | | | | 1.04 | | | | | 0.58 | | | | | 1.41 | | | | | 956 | | | | | 29 | |
| 2017 | | | | 9.80 | | | | | 0.13 | | | | | 0.30 | | | | | 0.43 | | | | | (0.22 | ) | | | | (0.00 | ) | | | | (0.22 | ) | | | | 10.01 | | | | | 4.52 | | | | | 0.83 | | | | | 0.58 | | | | | 1.34 | | | | | 3,012 | | | | | 40 | |
| 2016 | | | | 9.74 | | | | | 0.21 | | | | | 0.24 | | | | | 0.45 | | | | | (0.20 | ) | | | | (0.19 | ) | | | | (0.39 | ) | | | | 9.80 | | | | | 4.82 | | | | | 0.81 | | | | | 0.58 | | | | | 1.97 | | | | | 6,802 | | | | | 31 | |
| 2015 | | | | 10.14 | | | | | 0.20 | | | | | (0.37 | ) | | | | (0.17 | ) | | | | (0.15 | ) | | | | (0.08 | ) | | | | (0.23 | ) | | | | 9.74 | | | | | (1.72 | ) | | | | 0.82 | | | | | 0.58 | | | | | 1.74 | | | | | 7,624 | | | | | 39 | |
| 2014(7) | | | | 10.00 | | | | | 0.02 | | | | | 0.12 | | | | | 0.14 | | | | | — | | | | | — | | | | | — | | | | | 10.14 | | | | | 1.40 | | | | | 0.85 | | | | | 0.58 | | | | | 0.91 | | | | | 11,583 | | | | | 10 | |
Moderate Allocation Fund | | | | | | | | | | | | | | | | | | | | | | | | | | | | | | | | | | | | | | | | | | | | | | | | | | | | | | | | | | | | | |
| 2018 | | | | 10.08 | | | | | 0.20 | | | | | 0.26 | | | | | 0.46 | | | | | (0.17 | ) | | | | (0.46 | ) | | | | (0.63 | ) | | | | 9.91 | | | | | 4.65 | | | | | 0.85 | | | | | 0.55 | | | | | 1.43 | | | | | 8,095 | | | | | 31 | |
| 2017 | | | | 9.72 | | | | | 0.11 | | | | | 0.58 | | | | | 0.69 | | | | | (0.19 | ) | | | | (0.14 | ) | | | | (0.33 | ) | | | | 10.08 | | | | | 7.37 | | | | | 0.83 | | | | | 0.55 | | | | | 1.10 | | | | | 13,725 | | | | | 39 | |
| 2016 | | | | 9.76 | | | | | 0.26 | | | | | 0.19 | | | | | 0.45 | | | | | (0.16 | ) | | | | (0.33 | ) | | | | (0.49 | ) | | | | 9.72 | | | | | 4.90 | | | | | 0.81 | | | | | 0.55 | | | | | 1.65 | | | | | 12,695 | | | | | 38 | |
| 2015 | | | | 10.20 | | | | | 0.15 | | | | | (0.37 | ) | | | | (0.22 | ) | | | | (0.16 | ) | | | | (0.06 | ) | | | | (0.22 | ) | | | | 9.76 | | | | | (2.23 | ) | | | | 0.82 | | | | | 0.55 | | | | | 1.45 | | | | | 22,279 | | | | | 30 | |
| 2014(7) | | | | 10.00 | | | | | 0.03 | | | | | 0.17 | | | | | 0.20 | | | | | — | | | | | — | | | | | — | | | | | 10.20 | | | | | 2.00 | | | | | 0.85 | | | | | 0.55 | | | | | 1.33 | | | | | 19,949 | | | | | 8 | |
Balanced Allocation Fund | | | | | | | | | | | | | | | | | | | | | | | | | | | | | | | | | | | | | | | | | | | | | | | | | | | | | | | | | | | | | |
| 2018 | | | | 9.64 | | | | | 0.13 | | | | | 0.59 | | | | | 0.72 | | | | | (0.14 | ) | | | | (0.81 | ) | | | | (0.95 | ) | | | | 9.41 | | | | | 7.77 | | | | | 0.73 | | | | | 0.58 | | | | | 1.16 | | | | | 19,213 | | | | | 29 | |
| 2017 | | | | 9.40 | | | | | 0.09 | | | | | 0.80 | | | | | 0.89 | | | | | (0.14 | ) | | | | (0.51 | ) | | | | (0.65 | ) | | | | 9.64 | | | | | 10.11 | | | | | 0.73 | | | | | 0.58 | | | | | 0.92 | | | | | 23,649 | | | | | 35 | |
| 2016 | | | | 9.76 | | | | | 0.13 | | | | | 0.31 | | | | | 0.44 | | | | | (0.14 | ) | | | | (0.66 | ) | | | | (0.80 | ) | | | | 9.40 | | | | | 4.94 | | | | | 0.72 | | | | | 0.58 | | | | | 1.28 | | | | | 29,095 | | | | | 33 | |
| 2015 | | | | 10.25 | | | | | 0.12 | | | | | (0.38 | ) | | | | (0.26 | ) | | | | (0.16 | ) | | | | (0.07 | ) | | | | (0.23 | ) | | | | 9.76 | | | | | (2.64 | ) | | | | 0.72 | | | | | 0.58 | | | | | 1.15 | | | | | 38,677 | | | | | 29 | |
| 2014(7) | | | | 10.00 | | | | | 0.02 | | | | | 0.23 | | | | | 0.25 | | | | | — | | | | | — | | | | | — | | | | | 10.25 | | | | | 2.50 | | | | | 0.72 | | | | | 0.58 | | | | | 0.89 | | | | | 44,647 | | | | | 6 | |
Growth Allocation Fund | | | | | | | | | | | | | | | | | | | | | | | | | | | | | | | | | | | | | | | | | | | | | | | | | | | | | | | | | | | | | |
| 2018 | | | | 10.22 | | | | | 0.10 | | | | | 0.99 | | | | | 1.09 | | | | | (0.15 | ) | | | | (0.58 | ) | | | | (0.73 | ) | | | | 10.58 | | | | | 11.00 | | | | | 0.81 | | | | | 0.55 | | | | | 0.91 | | | | | 15,107 | | | | | 32 | |
| 2017 | | | | 9.55 | | | | | 0.10 | | | | | 1.08 | | | | | 1.18 | | | | | (0.08 | ) | | | | (0.43 | ) | | | | (0.51 | ) | | | | 10.22 | | | | | 12.96 | | | | | 0.82 | | | | | 0.55 | | | | | 0.85 | | | | | 18,846 | | | | | 42 | |
| 2016 | | | | 9.81 | | | | | 0.09 | | | | | 0.37 | | | | | 0.46 | | | | | (0.14 | ) | | | | (0.58 | ) | | | | (0.72 | ) | | | | 9.55 | | | | | 4.95 | | | | | 0.81 | | | | | 0.55 | | | | | 0.91 | | | | | 25,876 | | | | | 38 | |
| 2015 | | | | 10.30 | | | | | 0.09 | | | | | (0.40 | ) | | | | (0.31 | ) | | | | (0.15 | ) | | | | (0.03 | ) | | | | (0.18 | ) | | | | 9.81 | | | | | (3.10 | ) | | | | 0.82 | | | | | 0.55 | | | | | 0.83 | | | | | 28,903 | | | | | 20 | |
| 2014(7) | | | | 10.00 | | | | | 0.01 | | | | | 0.29 | | | | | 0.30 | | | | | — | | | | | — | | | | | — | | | | | 10.30 | | | | | 3.00 | | | | | 0.85 | | | | | 0.55 | | | | | 0.46 | | | | | 31,065 | | | | | 6 | |
Aggressive Allocation Fund | | | | | | | | | | | | | | | | | | | | | | | | | | | | | | | | | | | | | | | | | | | | | | | | | | | | | | | | | | | | | |
| 2018 | | | | 9.98 | | | | | 0.10 | | | | | 1.20 | | | | | 1.30 | | | | | (0.16 | ) | | | | (1.13 | ) | | | | (1.29 | ) | | | | 9.99 | | | | | 13.70 | | | | | 0.78 | | | | | 0.58 | | | | | 0.79 | | | | | 16,950 | | | | | 27 | |
| 2017 | | | | 9.55 | | | | | 0.06 | | | | | 1.29 | | | | | 1.35 | | | | | (0.09 | ) | | | | (0.83 | ) | | | | (0.92 | ) | | | | 9.98 | | | | | 15.24 | | | | | 0.78 | | | | | 0.58 | | | | | 0.63 | | | | | 17,152 | | | | | 33 | |
| 2016 | | | | 9.84 | | | | | 0.07 | | | | | 0.38 | | | | | 0.45 | | | | | (0.10 | ) | | | | (0.64 | ) | | | | (0.74 | ) | | | | 9.55 | | | | | 4.87 | | | | | 0.77 | | | | | 0.58 | | | | | 0.77 | | | | | 19,395 | | | | | 33 | |
| 2015 | | | | 10.35 | | | | | 0.10 | | | | | (0.40 | ) | | | | (0.30 | ) | | | | (0.17 | ) | | | | (0.04 | ) | | | | (0.21 | ) | | | | 9.84 | | | | | (2.94 | ) | | | | 0.78 | | | | | 0.59 | | | | | 0.48 | | | | | 22,578 | | | | | 44 | |
| 2014(7) | | | | 10.00 | | | | | 0.00 | | | | | 0.35 | | | | | 0.35 | | | | | — | | | | | — | | | | | — | | | | | 10.35 | | | | | 3.50 | | | | | 0.83 | | | | | 0.61 | | | | | 0.16 | | | | | 16,200 | | | | | 3 | |
| (1) | Based on net asset value as of end of period date. |
| (2) | Not annualized for periods less than one year. |
| (3) | Annualized for periods less than one year. Excludes acquired fund fees and expenses of underlying funds. |
| (4) | The contractual and voluntary expense waivers pursuant to Note 5 of the financial statements are reflected in both the net expense and net investment income (loss) ratios. |
| (5) | Reflects operations for the period from December 27, 2013 (inception date) to August 31, 2014. |
| (6) | Calculated using the average shares method. |
| (7) | Reflects operations for the period from May 30, 2014 (inception date) to August 31, 2014. |
(See Notes which are an integral part of the Financial Statements)
40
| | |
| |
| Financial Highlights—RetirementClass R-6 of Shares (For a share outstanding throughout each period) |
| | | | | | | | | | | | | | | | | | | | | | | | | | | | | | | | | | | | | | | | | | | | | | | | | | | | | | | | | | | | | | | | | | | | | | |
Period
Ended
August 31, | | Net asset
value,
beginning
of period | | Net
investment
income | | Net realized
and unrealized
gain (loss) | | Total from
investment
operations | | Distributions to
shareholders
from net
investment
income | | Distributions to
shareholders
from net
realized gain | | Total
distributions | | Net asset
value, end
of period | | Total
return (1)(2) | | Ratios to Average Net Assets (3) | | Net assets,
end of period
(000 omitted) | | Portfolio
turnover
rate (2) |
| | Gross
Expenses | | Net
Expenses (4)(5) | | Net
investment
income (4) |
In-Retirement Fund | | | | | | | | | | | | | | | | | | | | | | | | | | | | | | | | | | | | | | | | | | | | | | | | | | | | | | | | | | | | | |
| 2018 | | | $ | 9.40 | | | | $ | 0.23 | | | | $ | 0.14 | | | | $ | 0.37 | | | | $ | (0.24 | ) | | | $ | (0.56 | ) | | | $ | (0.80 | ) | | | $ | 8.97 | | | | | 3.99 | % | | | | 0.95 | % | | | | 0.00 | % | | | | 2.47 | % | | | $ | 10,490 | | | | | 35 | % |
| 2017 | | | | 9.55 | | | | | 0.22 | | | | | 0.40 | | | | | 0.62 | | | | | (0.28 | ) | | | | (0.49 | ) | | | | (0.77 | ) | | | | 9.40 | | | | | 7.04 | | | | | 1.02 | | | | | 0.00 | | | | | 2.11 | | | | | 10,885 | | | | | 26 | |
| 2016 | | | | 10.05 | | | | | 0.26 | | | | | 0.27 | | | | | 0.53 | | | | | (0.30 | ) | | | | (0.73 | ) | | | | (1.03 | ) | | | | 9.55 | | | | | 5.85 | | | | | 0.85 | | | | | 0.00 | | | | | 2.37 | | | | | 16,406 | | | | | 44 | |
| 2015 | | | | 11.08 | | | | | 0.29 | | | | | (0.45 | ) | | | | (0.16 | ) | | | | (0.34 | ) | | | | (0.53 | ) | | | | (0.87 | ) | | | | 10.05 | | | | | (1.54 | ) | | | | 0.63 | | | | | 0.00 | | | | | 2.35 | | | | | 16,611 | | | | | 53 | |
| 2014 | | | | 10.00 | | | | | 0.25 | | | | | 0.99 | | | | | 1.24 | | | | | (0.14 | ) | | | | (0.02 | ) | | | | (0.16 | ) | | | | 11.08 | | | | | 12.47 | | | | | 0.68 | | | | | 0.00 | | | | | 2.31 | | | | | 20,128 | | | | | 45 | |
2015 Fund | | | | | | | | | | | | | | | | | | | | | | | | | | | | | | | | | | | | | | | | | | | | | | | | | | | | | | | | | | | | | |
| 2018 | | | | 11.39 | | | | | 0.29 | | | | | 0.29 | | | | | 0.58 | | | | | (0.29 | ) | | | | (0.02 | ) | | | | (0.31 | ) | | | | 11.66 | | | | | 5.12 | | | | | 3.96 | | | | | 0.00 | | | | | 2.37 | | | | | 2,384 | | | | | 38 | |
| 2017 | | | | 10.73 | | | | | 0.19 | | | | | 0.73 | | | | | 0.92 | | | | | (0.26 | ) | | | | — | | | | | (0.26 | ) | | | | 11.39 | | | | | 8.80 | | | | | 3.89 | | | | | 0.00 | | | | | 1.97 | | | | | 3,390 | | | | | 72 | |
| 2016 | | | | 10.50 | | | | | 0.25 | | | | | 0.38 | | | | | 0.63 | | | | | (0.29 | ) | | | | (0.11 | ) | | | | (0.40 | ) | | | | 10.73 | | | | | 6.22 | | | | | 3.67 | | | | | 0.00 | | | | | 2.21 | | | | | 3,744 | | | | | 49 | |
| 2015 | | | | 10.78 | | | | | 0.13 | | | | | (0.34 | ) | | | | (0.21 | ) | | | | (0.07 | ) | | | | — | | | | | (0.07 | ) | | | | 10.50 | | | | | (1.92 | ) | | | | 3.81 | | | | | 0.00 | | | | | 1.94 | | | | | 4,234 | | | | | 83 | |
| 2014(6) | | | | 10.00 | | | | | 0.08 | | | | | 0.70 | | | | | 0.78 | | | | | — | | | | | — | | | | | — | | | | | 10.78 | | | | | 7.80 | | | | | 73.14 | | | | | 0.00 | | | | | 1.75 | | | | | 174 | | | | | 29 | |
2020 Fund | | | | | | | | | | | | | | | | | | | | | | | | | | | | | | | | | | | | | | | | | | | | | | | | | | | | | | | | | | | | | |
| 2018 | | | | 10.54 | | | | | 0.22 | | | | | 0.57 | | | | | 0.79 | | | | | (0.24 | ) | | | | (0.51 | ) | | | | (0.75 | ) | | | | 10.58 | | | | | 7.72 | | | | | 0.20 | | | | | 0.00 | | | | | 2.00 | | | | | 54,683 | | | | | 29 | |
| 2017 | | | | 10.23 | | | | | 0.19 | | | | | 0.83 | | | | | 1.02 | | | | | (0.23 | ) | | | | (0.48 | ) | | | | (0.71 | ) | | | | 10.54 | | | | | 10.66 | | | | | 0.23 | | | | | 0.00 | | | | | 1.76 | | | | | 56,024 | | | | | 23 | |
| 2016 | | | | 10.52 | | | | | 0.21 | | | | | 0.41 | | | | | 0.62 | | | | | (0.27 | ) | | | | (0.64 | ) | | | | (0.91 | ) | | | | 10.23 | | | | | 6.39 | | | | | 0.23 | | | | | 0.00 | | | | | 2.01 | | | | | 62,358 | | | | | 39 | |
| 2015 | | | | 11.38 | | | | | 0.25 | | | | | (0.50 | ) | | | | (0.25 | ) | | | | (0.29 | ) | | | | (0.32 | ) | | | | (0.61 | ) | | | | 10.52 | | | | | (2.28 | ) | | | | 0.19 | | | | | 0.00 | | | | | 1.98 | | | | | 53,085 | | | | | 37 | |
| 2014 | | | | 10.00 | | | | | 0.22 | | | | | 1.36 | | | | | 1.58 | | | | | (0.16 | ) | | | | (0.04 | ) | | | | (0.20 | ) | | | | 11.38 | | | | | 15.98 | | | | | 0.23 | | | | | 0.00 | | | | | 1.97 | | | | | 59,502 | | | | | 35 | |
2025 Fund | | | | | | | | | | | | | | | | | | | | | | | | | | | | | | | | | | | | | | | | | | | | | | | | | | | | | | | | | | | | | |
| 2018 | | | | 11.68 | | | | | 0.21 | | | | | 0.86 | | | | | 1.07 | | | | | (0.26 | ) | | | | (0.13 | ) | | | | (0.39 | ) | | | | 12.36 | | | | | 9.30 | | | | | 0.61 | | | | | 0.00 | | | | | 1.75 | | | | | 25,266 | | | | | 33 | |
| 2017 | | | | 10.81 | | | | | 0.17 | | | | | 1.11 | | | | | 1.28 | | | | | (0.22 | ) | | | | (0.19 | ) | | | | (0.41 | ) | | | | 11.68 | | | | | 12.20 | | | | | 0.64 | | | | | 0.00 | | | | | 1.75 | | | | | 20,473 | | | | | 31 | |
| 2016 | | | | 10.48 | | | | | 0.19 | | | | | 0.44 | | | | | 0.63 | | | | | (0.21 | ) | | | | (0.09 | ) | | | | (0.30 | ) | | | | 10.81 | | | | | 6.15 | | | | | 0.61 | | | | | 0.00 | | | | | 1.83 | | | | | 28,905 | | | | | 33 | |
| 2015 | | | | 10.81 | | | | | 0.09 | | | | | (0.35 | ) | | | | (0.26 | ) | | | | (0.07 | ) | | | | — | | | | | (0.07 | ) | | | | 10.48 | | | | | (2.45 | ) | | | | 0.86 | | | | | 0.00 | | | | | 1.48 | | | | | 26,042 | | | | | 53 | |
| 2014(6) | | | | 10.00 | | | | | 0.05 | | | | | 0.76 | | | | | 0.81 | | | | | — | | | | | — | | | | | — | | | | | 10.81 | | | | | 8.10 | | | | | 24.20 | | | | | 0.00 | | | | | 1.39 | | | | | 1,363 | | | | | 22 | |
2030 Fund | | | | | | | | | | | | | | | | | | | | | | | | | | | | | | | | | | | | | | | | | | | | | | | | | | | | | | | | | | | | | |
| 2018 | | | | 11.57 | | | | | 0.19 | | | | | 0.98 | | | | | 1.17 | | | | | (0.23 | ) | | | | (0.42 | ) | | | | (0.65 | ) | | | | 12.09 | | | | | 10.34 | | | | | 0.17 | | | | | 0.00 | | | | | 1.62 | | | | | 75,347 | | | | | 32 | |
| 2017 | | | | 10.81 | | | | | 0.16 | | | | | 1.22 | | | | | 1.38 | | | | | (0.20 | ) | | | | (0.42 | ) | | | | (0.62 | ) | | | | 11.57 | | | | | 13.38 | | | | | 0.21 | | | | | 0.00 | | | | | 1.48 | | | | | 66,995 | | | | | 25 | |
| 2016 | | | | 10.87 | | | | | 0.19 | | | | | 0.45 | | | | | 0.64 | | | | | (0.24 | ) | | | | (0.46 | ) | | | | (0.70 | ) | | | | 10.81 | | | | | 6.21 | | | | | 0.21 | | | | | 0.00 | | | | | 1.66 | | | | | 73,828 | | | | | 33 | |
| 2015 | | | | 11.64 | | | | | 0.16 | | | | | (0.46 | ) | | | | (0.30 | ) | | | | (0.22 | ) | | | | (0.25 | ) | | | | (0.47 | ) | | | | 10.87 | | | | | (2.70 | ) | | | | 0.19 | | | | | 0.00 | | | | | 1.57 | | | | | 60,302 | | | | | 45 | |
| 2014 | | | | 10.00 | | | | | 0.19 | | | | | 1.66 | | | | | 1.85 | | | | | (0.19 | ) | | | | (0.02 | ) | | | | (0.21 | ) | | | | 11.64 | | | | | 18.70 | | | | | 0.26 | | | | | 0.00 | | | | | 1.50 | | | | | 48,829 | | | | | 29 | |
2035 Fund | | | | | | | | | | | | | | | | | | | | | | | | | | | | | | | | | | | | | | | | | | | | | | | | | | | | | | | | | | | | | |
| 2018 | | | | 11.77 | | | | | 0.20 | | | | | 1.11 | | | | | 1.31 | | | | | (0.29 | ) | | | | (0.55 | ) | | | | (0.84 | ) | | | | 12.24 | | | | | 11.50 | | | | | 1.06 | | | | | 0.00 | | | | | 1.48 | | | | | 14,524 | | | | | 32 | |
| 2017 | | | | 10.79 | | | | | 0.14 | | | | | 1.34 | | | | | 1.48 | | | | | (0.18 | ) | | | | (0.32 | ) | | | | (0.50 | ) | | | | 11.77 | | | | | 14.31 | | | | | 0.73 | | | | | 0.00 | | | | | 1.70 | | | | | 12,216 | | | | | 32 | |
| 2016 | | | | 10.38 | | | | | 0.17 | | | | | 0.47 | | | | | 0.64 | | | | | (0.19 | ) | | | | (0.04 | ) | | | | (0.23 | ) | | | | 10.79 | | | | | 6.26 | | | | | 0.62 | | | | | 0.00 | | | | | 1.57 | | | | | 30,132 | | | | | 29 | |
| 2015 | | | | 10.73 | | | | | 0.04 | | | | | (0.36 | ) | | | | (0.32 | ) | | | | (0.03 | ) | | | | — | | | | | (0.03 | ) | | | | 10.38 | | | | | (2.99 | ) | | | | 0.89 | | | | | 0.00 | | | | | 0.97 | | | | | 27,613 | | | | | 96 | |
| 2014(6) | | | | 10.00 | | | | | 0.04 | | | | | 0.69 | | | | | 0.73 | | | | | — | | | | | — | | | | | — | | | | | 10.73 | | | | | 7.30 | | | | | 23.23 | | | | | 0.00 | | | | | 1.06 | | | | | 1,201 | | | | | 29 | |
2040 Fund | | | | | | | | | | | | | | | | | | | | | | | | | | | | | | | | | | | | | | | | | | | | | | | | | | | | | | | | | | | | | |
| 2018 | | | | 11.58 | | | | | 0.17 | | | | | 1.15 | | | | | 1.32 | | | | | (0.24 | ) | | | | (0.91 | ) | | | | (1.15 | ) | | | | 11.75 | | | | | 11.90 | | | | | 0.27 | | | | | 0.00 | | | | | 1.43 | | | | | 45,999 | | | | | 29 | |
| 2017 | | | | 10.71 | | | | | 0.14 | | | | | 1.38 | | | | | 1.52 | | | | | (0.18 | ) | | | | (0.47 | ) | | | | (0.65 | ) | | | | 11.58 | | | | | 14.98 | | | | | 0.33 | | | | | 0.00 | | | | | 1.40 | | | | | 38,944 | | | | | 24 | |
| 2016 | | | | 10.96 | | | | | 0.17 | | | | | 0.46 | | | | | 0.63 | | | | | (0.21 | ) | | | | (0.67 | ) | | | | (0.88 | ) | | | | 10.71 | | | | | 6.17 | | | | | 0.31 | | | | | 0.00 | | | | | 1.51 | | | | | 48,219 | | | | | 31 | |
| 2015 | | | | 11.78 | | | | | 0.16 | | | | | (0.50 | ) | | | | (0.34 | ) | | | | (0.24 | ) | | | | (0.24 | ) | | | | (0.48 | ) | | | | 10.96 | | | | | (2.98 | ) | | | | 0.27 | | | | | 0.00 | | | | | 1.45 | | | | | 40,193 | | | | | 36 | |
| 2014 | | | | 10.00 | | | | | 0.18 | | | | | 1.83 | | | | | 2.01 | | | | | (0.21 | ) | | | | (0.02 | ) | | | | (0.23 | ) | | | | 11.78 | | | | | 20.26 | | | | | 0.36 | | | | | 0.00 | | | | | 1.39 | | | | | 39,760 | | | | | 22 | |
2045 Fund | | | | | | | | | | | | | | | | | | | | | | | | | | | | | | | | | | | | | | | | | | | | | | | | | | | | | | | | | | | | | |
| 2018 | | | | 12.00 | | | | | 0.19 | | | | | 1.24 | | | | | 1.43 | | | | | (0.26 | ) | | | | (0.55 | ) | | | | (0.81 | ) | | | | 12.62 | | | | | 12.26 | | | | | 1.66 | | | | | 0.00 | | | | | 1.37 | | | | | 10,309 | | | | | 35 | |
| 2017(7) | | | | 10.98 | | | | | 0.19 | | | | | 1.39 | | | | | 1.58 | | | | | (0.18 | ) | | | | (0.38 | ) | | | | (0.56 | ) | | | | 12.00 | | | | | 15.08 | | | | | 1.32 | | | | | 0.00 | | | | | 1.71 | | | | | 6,964 | | | | | 31 | |
| 2016 | | | | 10.53 | | | | | 0.16 | | | | | 0.50 | | | | | 0.66 | | | | | (0.18 | ) | | | | (0.03 | ) | | | | (0.21 | ) | | | | 10.98 | | | | | 6.38 | | | | | 1.13 | | | | | 0.00 | | | | | 1.48 | | | | | 15,877 | | | | | 32 | |
| 2015 | | | | 10.87 | | | | | 0.03 | | | | | (0.35 | ) | | | | (0.32 | ) | | | | (0.02 | ) | | | | — | | | | | (0.02 | ) | | | | 10.53 | | | | | (2.91 | ) | | | | 1.74 | | | | | 0.00 | | | | | 0.85 | | | | | 13,046 | | | | | 95 | |
| 2014(6) | | | | 10.00 | | | | | 0.04 | | | | | 0.83 | | | | | 0.87 | | | | | — | | | | | — | | | | | — | | | | | 10.87 | | | | | 8.70 | | | | | 32.97 | | | | | 0.00 | | | | | 0.93 | | | | | 895 | | | | | 35 | |
(See Notes which are an integral part of the Financial Statements)
41
| | |
| |
| Financial Highlights—RetirementClass R-6 of Shares (For a share outstanding throughout each period) |
| | | | | | | | | | | | | | | | | | | | | | | | | | | | | | | | | | | | | | | | | | | | | | | | | | | | | | | | | | | | | | | | | | | | | | |
Period
Ended
August 31, | | Net asset
value,
beginning
of period | | Net
investment
income | | Net realized
and unrealized
gain (loss) | | Total from
investment
operations | | Distributions to
shareholders
from net
investment
income | | Distributions to
shareholders
from net
realized gain | | Total
distributions | | Net asset
value, end
of period | | Total
return (1)(2) | | Ratios to Average Net Assets (3) | | Net assets,
end of period
(000 omitted) | | Portfolio
turnover
rate (2) |
| | Gross
Expenses | | Net
Expenses (4)(5) | | Net
investment
income (4) |
2050 Fund | | | | | | | | | | | | | | | | | | | | | | | | | | | | | | | | | | | | | | | | | | | | | | | | | | | | | | | | | | | | | |
| 2018 | | | $ | 12.00 | | | | $ | 0.19 | | | | $ | 1.24 | | | | $ | 1.43 | | | | $ | (0.26 | ) | | | $ | (0.35 | ) | | | $ | (0.61 | ) | | | $ | 12.82 | | | | | 12.11 | % | | | | 0.35 | % | | | | 0.00 | % | | | | 1.42 | % | | | $ | 34,564 | | | | | 27 | % |
| 2017 | | | | 11.08 | | | | | 0.14 | | | | | 1.45 | | | | | 1.59 | | | | | (0.19 | ) | | | | (0.48 | ) | | | | (0.67 | ) | | | | 12.00 | | | | | 15.09 | | | | | 0.45 | | | | | 0.00 | | | | | 1.28 | | | | | 28,173 | | | | | 27 | |
| 2016 | | | | 11.00 | | | | | 0.17 | | | | | 0.50 | | | | | 0.67 | | | | | (0.21 | ) | | | | (0.38 | ) | | | | (0.59 | ) | | | | 11.08 | | | | | 6.37 | | | | | 0.46 | | | | | 0.00 | | | | | 1.48 | | | | | 30,317 | | | | | 29 | |
| 2015 | | | | 11.80 | | | | | 0.14 | | | | | (0.48 | ) | | | | (0.34 | ) | | | | (0.23 | ) | | | | (0.23 | ) | | | | (0.46 | ) | | | | 11.00 | | | | | (2.99 | ) | | | | 0.44 | | | | | 0.00 | | | | | 1.37 | | | | | 22,487 | | | | | 39 | |
| 2014 | | | | 10.00 | | | | | 0.18 | | | | | 1.83 | | | | | 2.01 | | | | | (0.19 | ) | | | | (0.02 | ) | | | | (0.21 | ) | | | | 11.80 | | | | | 20.24 | | | | | 0.68 | | | | | 0.00 | | | | | 1.39 | | | | | 17,346 | | | | | 28 | |
2055 Fund | | | | | | | | | | | | | | | | | | | | | | | | | | | | | | | | | | | | | | | | | | | | | | | | | | | | | | | | | | | | | | | | | | |
| 2018 | | | | 11.97 | | | | | 0.18 | | | | | 1.25 | | | | | 1.43 | | | | | (0.24 | ) | | | | (0.19 | ) | | | | (0.43 | ) | | | | 12.97 | | | | | 12.17 | | | | | 1.60 | | | | | 0.00 | | | | | 1.35 | | | | | 10,755 | | | | | 26 | |
| 2017 | | | | 10.91 | | | | | 0.16 | | | | | 1.41 | | | | | 1.57 | | | | | (0.17 | ) | | | | (0.34 | ) | | | | (0.51 | ) | | | | 11.97 | | | | | 14.93 | | | | | 2.16 | | | | | 0.00 | | | | | 1.53 | | | | | 6,561 | | | | | 56 | |
| 2016 | | | | 10.47 | | | | | 0.15 | | | | | 0.51 | | | | | 0.66 | | | | | (0.16 | ) | | | | (0.06 | ) | | | | (0.22 | ) | | | | 10.91 | | | | | 6.43 | | | | | 2.92 | | | | | 0.00 | | | | | 1.30 | | | | | 6,866 | | | | | 38 | |
| 2015 | | | | 10.89 | | | | | 0.07 | | | | | (0.39 | ) | | | | (0.32 | ) | | | | (0.08 | ) | | | | (0.02 | ) | | | | (0.10 | ) | | | | 10.47 | | | | | (2.96 | ) | | | | 6.51 | | | | | 0.00 | | | | | 0.90 | | | | | 2,809 | | | | | 61 | |
| 2014(6) | | | | 10.00 | | | | | 0.03 | | | | | 0.86 | | | | | 0.89 | | | | | — | | | | | — | | | | | — | | | | | 10.89 | | | | | 8.90 | | | | | 49.65 | | | | | 0.00 | | | | | 0.84 | | | | | 477 | | | | | 123 | |
Conservative Allocation Fund | | | | | | | | | | | | | | | | | | | | | | | | | | | | | | | | | | | | | | | | | | | | | | | | | | | |
| 2018 | | | | 10.03 | | | | | 0.21 | | | | | 0.01 | | | | | 0.22 | | | | | (0.44 | ) | | | | (1.13 | ) | | | | (1.57 | ) | | | | 8.68 | | | | | 2.28 | | | | | 0.39 | | | | | 0.00 | | | | | 2.42 | | | | | 21,748 | | | | | 29 | |
| 2017 | | | | 9.82 | | | | | 0.27 | | | | | 0.23 | | | | | 0.50 | | | | | (0.29 | ) | | | | (0.00 | ) | | | | (0.29 | ) | | | | 10.03 | | | | | 5.22 | | | | | 0.18 | | | | | 0.00 | | | | | 1.96 | | | | | 28,927 | | | | | 40 | |
| 2016 | | | | 9.79 | | | | | 0.25 | | | | | 0.24 | | | | | 0.49 | | | | | (0.27 | ) | | | | (0.19 | ) | | | | (0.46 | ) | | | | 9.82 | | | | | 5.34 | | | | | 0.16 | | | | | 0.00 | | | | | 2.61 | | | | | 88,818 | | | | | 31 | |
| 2015 | | | | 10.15 | | | | | 0.25 | | | | | (0.34 | ) | | | | (0.09 | ) | | | | (0.19 | ) | | | | (0.08 | ) | | | | (0.27 | ) | | | | 9.79 | | | | | (0.94 | ) | | | | 0.17 | | | | | 0.00 | | | | | 2.38 | | | | | 86,637 | | | | | 39 | |
| 2014(8) | | | | 10.00 | | | | | 0.04 | | | | | 0.11 | | | | | 0.15 | | | | | — | | | | | — | | | | | — | | | | | 10.15 | | | | | 1.50 | | | | | 0.20 | | | | | 0.00 | | | | | 1.57 | | | | | 92,207 | | | | | 10 | |
Moderate Allocation Fund | | | | | | | | | | | | | | | | | | | | | | | | | | | | | | | | | | | | | | | | | | | | | | | | | | | |
| 2018 | | | | 10.09 | | | | | 0.22 | | | | | 0.31 | | | | | 0.53 | | | | | (0.24 | ) | | | | (0.46 | ) | | | | (0.70 | ) | | | | 9.92 | | | | | 5.33 | | | | | 0.20 | | | | | 0.00 | | | | | 2.12 | | | | | 60,855 | | | | | 31 | |
| 2017 | | | | 9.74 | | | | | 0.21 | | | | | 0.54 | | | | | 0.75 | | | | | (0.26 | ) | | | | (0.14 | ) | | | | (0.40 | ) | | | | 10.09 | | | | | 8.02 | | | | | 0.18 | | | | | 0.00 | | | | | 1.83 | | | | | 80,283 | | | | | 39 | |
| 2016 | | | | 9.80 | | | | | 0.22 | | | | | 0.30 | | | | | 0.52 | | | | | (0.25 | ) | | | | (0.33 | ) | | | | (0.58 | ) | | | | 9.74 | | | | | 5.67 | | | | | 0.16 | | | | | 0.00 | | | | | 2.27 | | | | | 101,327 | | | | | 38 | |
| 2015 | | | | 10.21 | | | | | 0.21 | | | | | (0.37 | ) | | | | (0.16 | ) | | | | (0.19 | ) | | | | (0.06 | ) | | | | (0.25 | ) | | | | 9.80 | | | | | (1.56 | ) | | | | 0.17 | | | | | 0.00 | | | | | 2.11 | | | | | 93,206 | | | | | 30 | |
| 2014(8) | | | | 10.00 | | | | | 0.05 | | | | | 0.16 | | | | | 0.21 | | | | | — | | | | | — | | | | | — | | | | | 10.21 | | | | | 2.10 | | | | | 0.20 | | | | | 0.00 | | | | | 1.99 | | | | | 95,654 | | | | | 8 | |
Balanced Allocation Fund | | | | | | | | | | | | | | | | | | | | | | | | | | | | | | | | | | | | | | | | | | | | | | | | | | | |
| 2018 | | | | 9.66 | | | | | 0.18 | | | | | 0.61 | | | | | 0.79 | | | | | (0.22 | ) | | | | (0.81 | ) | | | | (1.03 | ) | | | | 9.42 | | | | | 8.51 | | | | | 0.08 | | | | | 0.00 | | | | | 1.82 | | | | | 180,451 | | | | | 29 | |
| 2017 | | | | 9.44 | | | | | 0.19 | | | | | 0.76 | | | | | 0.95 | | | | | (0.22 | ) | | | | (0.51 | ) | | | | (0.73 | ) | | | | 9.66 | | | | | 10.73 | | | | | 0.08 | | | | | 0.00 | | | | | 1.67 | | | | | 193,690 | | | | | 35 | |
| 2016 | | | | 9.80 | | | | | 0.18 | | | | | 0.33 | | | | | 0.51 | | | | | (0.21 | ) | | | | (0.66 | ) | | | | (0.87 | ) | | | | 9.44 | | | | | 5.70 | | | | | 0.07 | | | | | 0.00 | | | | | 1.87 | | | | | 252,982 | | | | | 33 | |
| 2015 | | | | 10.27 | | | | | 0.18 | | | | | (0.39 | ) | | | | (0.21 | ) | | | | (0.19 | ) | | | | (0.07 | ) | | | | (0.26 | ) | | | | 9.80 | | | | | (2.08 | ) | | | | 0.07 | | | | | 0.00 | | | | | 1.78 | | | | | 247,496 | | | | | 29 | |
| 2014(8) | | | | 10.00 | | | | | 0.04 | | | | | 0.23 | | | | | 0.27 | | | | | — | | | | | — | | | | | — | | | | | 10.27 | | | | | 2.70 | | | | | 0.07 | | | | | 0.00 | | | | | 1.54 | | | | | 284,021 | | | | | 6 | |
Growth Allocation Fund | | | | | | | | | | | | | | | | | | | | | | | | | | | | | | | | | | | | | | | | | | | | | | | | | | | |
| 2018 | | | | 10.24 | | | | | 0.17 | | | | | 0.99 | | | | | 1.16 | | | | | (0.23 | ) | | | | (0.58 | ) | | | | (0.81 | ) | | | | 10.59 | | | | | 11.66 | | | | | 0.17 | | | | | 0.00 | | | | | 1.59 | | | | | 82,185 | | | | | 32 | |
| 2017 | | | | 9.59 | | | | | 0.16 | | | | | 1.09 | | | | | 1.25 | | | | | (0.17 | ) | | | | (0.43 | ) | | | | (0.60 | ) | | | | 10.24 | | | | | 13.69 | | | | | 0.17 | | | | | 0.00 | | | | | 1.49 | | | | | 84,417 | | | | | 42 | |
| 2016 | | | | 9.85 | | | | | 0.15 | | | | | 0.37 | | | | | 0.52 | | | | | (0.20 | ) | | | | (0.58 | ) | | | | (0.78 | ) | | | | 9.59 | | | | | 5.67 | | | | | 0.16 | | | | | 0.00 | | | | | 1.51 | | | | | 79,852 | | | | | 38 | |
| 2015 | | | | 10.32 | | | | | 0.16 | | | | | (0.41 | ) | | | | (0.25 | ) | | | | (0.19 | ) | | | | (0.03 | ) | | | | (0.22 | ) | | | | 9.85 | | | | | (2.52 | ) | | | | 0.17 | | | | | 0.00 | | | | | 1.47 | | | | | 67,727 | | | | | 20 | |
| 2014(8) | | | | 10.00 | | | | | 0.03 | | | | | 0.29 | | | | | 0.32 | | | | | — | | | | | — | | | | | — | | | | | 10.32 | | | | | 3.20 | | | | | 0.20 | | | | | 0.00 | | | | | 1.11 | | | | | 56,647 | | | | | 6 | |
Aggressive Allocation Fund | | | | | | | | | | | | | | | | | | | | | | | | | | | | | | | | | | | | | | | | | | | | | | | | | | | |
| 2018 | | | | 10.01 | | | | | 0.16 | | | | | 1.21 | | | | | 1.37 | | | | | (0.23 | ) | | | | (1.13 | ) | | | | (1.36 | ) | | | | 10.02 | | | | | 14.51 | | | | | 0.13 | | | | | 0.00 | | | | | 1.47 | | | | | 112,003 | | | | | 27 | |
| 2017 | | | | 9.58 | | | | | 0.15 | | | | | 1.26 | | | | | 1.41 | | | | | (0.15 | ) | | | | (0.83 | ) | | | | (0.98 | ) | | | | 10.01 | | | | | 16.00 | | | | | 0.13 | | | | | 0.00 | | | | | 1.43 | | | | | 105,925 | | | | | 33 | |
| 2016 | | | | 9.88 | | | | | 0.14 | | | | | 0.38 | | | | | 0.52 | | | | | (0.18 | ) | | | | (0.64 | ) | | | | (0.82 | ) | | | | 9.58 | | | | | 5.58 | | | | | 0.12 | | | | | 0.00 | | | | | 1.38 | | | | | 123,203 | | | | | 33 | |
| 2015 | | | | 10.37 | | | | | 0.17 | | | | | (0.41 | ) | | | | (0.24 | ) | | | | (0.21 | ) | | | | (0.04 | ) | | | | (0.25 | ) | | | | 9.88 | | | | | (2.37 | ) | | | | 0.12 | | | | | 0.00 | | | | | 1.12 | | | | | 113,933 | | | | | 44 | |
| 2014(8) | | | | 10.00 | | | | | 0.02 | | | | | 0.35 | | | | | 0.37 | | | | | — | | | | | — | | | | | — | | | | | 10.37 | | | | | 3.70 | | | | | 0.18 | | | | | 0.00 | | | | | 0.82 | | | | | 73,040 | | | | | 3 | |
| (1) | Based on net asset value as of end of period date. |
| (2) | Not annualized for periods less than one year. |
| (3) | Annualized for periods less than one year. Excludes acquired fund fees and expenses of underlying funds. |
| (4) | The contractual and voluntary expense waivers pursuant to Note 5 of the financial statements are reflected in both the net expense and net investment income ratios. |
| (5) | Please refer to Note 5, subsection Investment Adviser Fee and Other Transactions with Affiliates, in the Notes to Financial Statements. |
| (6) | Reflects operations for the period from December 27, 2013 (inception date) to August 31, 2014. |
| (7) | Calculated using the average shares method. |
| (8) | Reflects operations for the period from May 30, 2014 (inception date) to August 31, 2014. |
(See Notes which are an integral part of the Financial Statements)
42
August 31, 2018
| | |
| | |
| Notes to Financial Statements | | BMO Funds |
BMO Funds, Inc. (the “Corporation”) is registered under the Investment Company Act of 1940, as amended (the “Act”), as anopen-end management investment company. As of August 31, 2018, the Corporation consisted of 42 portfolios, including 10 target retirement and 5 target risk diversified portfolios within this annual report (individually referred to as the “Fund,” or collectively as the “Funds”), each with differing share class offerings as well as 27 other portfolios whose annual report is available under a separate cover. BMO Asset Management Corp. serves as the Funds’ investment adviser (the “Adviser”), a Delaware corporation headquartered in Chicago, Illinois that is a wholly-owned subsidiary of BMO Financial Corp.
| | | | |
BMO Fund names as displayed
throughout this report | | Fund Inception
Date | | Investment Objective |
Target Retirement | | | | |
In-Retirement Fund | | August 30, 2013 | | The investment objective of each Target Retirement Fund is to achieve growth, income, and conservation of capital to varying degrees depending on its proximity to its target date. As the Fund passes its target date, the Fund will reduce its emphasis on growth and increase its emphasis on income and preservation of capital. |
2015 Fund | | December 27, 2013 |
2020 Fund | | August 30, 2013 |
2025 Fund | | December 27, 2013 |
2030 Fund | | August 30, 2013 |
2035 Fund | | December 27, 2013 |
2040 Fund | | August 30, 2013 |
2045 Fund | | December 27, 2013 |
2050 Fund | | August 30, 2013 |
2055 Fund | | December 27, 2013 |
Target Risk | | | | |
Conservative Allocation Fund | | May 30, 2014 | | To provide total return primarily from income, secondarily from appreciation. |
Moderate Allocation Fund | | May 30, 2014 | | To provide total investment return from income and appreciation. |
Balanced Allocation Fund | | May 30, 2014 | | To provide total investment return from income and appreciation. |
Growth Allocation Fund | | May 30, 2014 | | To provide total investment return from income and appreciation. |
Aggressive Allocation Fund | | May 30, 2014 | | To provide total investment return primarily from appreciation, secondarily from income. |
The target investment allocation for each of the Target Risk Funds, based on each Fund’s total assets, is set forth below.
| | | | | | | | | | | | |
Target Risk Fund | | Equity | | | Fixed Income | | | Money Market Funds | |
Conservative Allocation Fund | | | 10%–30% | | | | 70%–90% | | | | 0%–10% | |
Moderate Allocation Fund | | | 30%–50% | | | | 50%–70% | | | | 0%–10% | |
Balanced Allocation Fund | | | 50%–70% | | | | 30%–50% | | | | 0%–10% | |
Growth Allocation Fund | | | 70%–90% | | | | 10%–30% | | | | 0%–10% | |
Aggressive Allocation Fund | | | 90%–100% | | | | 0% | | | | 0%–10% | |
Each Fund seeks to achieve its investment objectives by investing in a mix (without limitation) of BMO Funds and unaffiliated mutual funds. The Funds are designed to provide investors with investment management, asset allocation, and ongoing reallocation over time. Each Fund is considered a “fund of funds” because it invests in other mutual funds. A fund of funds bears its own direct expenses in addition to bearing a proportionate share of expenses charged to the underlying funds in which it invests.
| 2. | | Significant Accounting Policies |
The Funds are investment companies and follow the accounting and reporting guidance under Financial Accounting Standards Board (“FASB”) Accounting Standards Codification (“ASC”) Topic 946,Financial Services—Investment Companies. The following is a summary of significant accounting policies consistently followed by the Funds in the preparation of their financial statements.
Use of Estimates—The preparation of financial statements in conformity with accounting principles generally accepted in the United States of America (“GAAP”) requires management to make estimates and assumptions that affect the reported amounts of assets and liabilities at the date of the financial statements and the reported amounts of increases and decreases in net assets from operations during the reporting period. Actual results may differ from those estimates.
Investment Valuations—Investments in otheropen-end registered investment companies are valued at net asset value.
Securities or other assets for which market valuations are not readily available, or are deemed to be inaccurate, are valued at fair value as determined in good faith using methods approved by the Board of Directors (the “Directors”). The Directors have established a Pricing Committee, which is responsible for determinations of fair value, subject to the supervision of the Directors. In determining fair value, the Pricing Committee takes into account all information available and any factors it deems appropriate. Consequently, the price of securities used by the Fund to calculate its NAV may differ from quoted or published prices for the same securities. Fair value pricing involves subjective judgments and it is possible that the fair value determined for a security is materially different than the value that would be realized upon the sale of that security and the differences may be material to the NAV of the Fund or the financial statements presented.
43
| | |
| | |
| Notes to Financial Statements (continued) | | |
The Pricing Committee may determine that a security needs to be fair valued. In valuing underlying fund investments, the Funds use the NAVs reported by the underlying funds. An underlying fund may need to fair value one or more of its investments, which may, in turn, require a Fund to do the same because of delays in obtaining the underlying fund’s NAV.
Investment Income, Expenses, and Distributions—Investment income and expenses are accrued daily. The Funds distribute net investment income, if any, and net realized gains (net of any capital loss carryovers) annually. Dividend income, realized gain distributions from underlying funds, and distributions to shareholders are recorded on theex-dividend date except in the case of certain foreign securities, in which dividends are recorded as soon after the ex-dividend date as the Fund’s information agents become aware of such dividends.Non-cash dividends included in dividend income, if any, are recorded at fair value.Paid-in-kind interest included in interest income, if any, is accrued daily.
The Funds offer multiple classes of shares which differ in their respective distribution, administration, and service fees. All shareholders bear the common expenses of the Funds. Dividends are declared separately for each class. No class has preferential dividend rights; differences in per share dividend rates are generally due to differences in class-specific expenses. Income,non-class specific expenses, and realized and unrealized gains and losses are allocated daily to each class of shares based on the value of total shares outstanding of each class without distinction between share classes. Expenses attributable to a particular class of shares, such as shareholder servicing fees, are allocated directly to that class.
Federal Income Taxes—The policies and procedures of the Funds require compliance with Subchapter M of the Internal Revenue Code of 1986, as amended (the “Code”), and distribution to shareholders each year substantially all of their income. Accordingly, no provisions for federal tax are necessary. Withholding taxes on foreign dividends have been provided for in accordance with the applicable country’s tax rules and rates.
Securities of Other Investment Companies & Underlying Fund Investment Risk—The Funds may invest in the securities of other investment companies, including exchange-traded funds, within the limits prescribed by the 1940 Act and the rules promulgated thereunder. Investments in the securities of other investment companies may involve duplication of advisory fees and certain other expenses. By investing in another investment company, a Fund becomes a shareholder of that investment company. As a result, Fund shareholders indirectly will bear the Fund’s proportionate share of the fees and expenses paid by shareholders of the other investment company, in addition to the fees and expenses Fund shareholders directly bear in connection with the Fund’s own operations. The Funds also may invest in investment companies that are not organized under the laws of the United States. The Fund’s risks are directly related to the risks of the underlying funds. It is important to understand the risks associated with investing in the underlying funds.
Commitments and Contingencies—In the normal course of business, the Corporation enters into contracts that provide general indemnifications to other parties. The Corporation’s maximum exposure under these arrangements is unknown as this would involve future claims that may be made against the Corporation that have not yet occurred. However, the Corporation has not had prior claims or losses pursuant to these contracts and expects the risk of loss to be remote.
Other—Investment transactions are accounted for on a trade date basis. Net realized gains and losses on securities are computed on the basis of specific security lot identification.
| 3. | | Fair Value Measurement |
Fair Valuation Measurement defines fair value, establishes a framework for measuring fair value in accordance with GAAP, and requires disclosure about fair value measurements. It establishes a fair value hierarchy that distinguishes between (1) market participant assumptions developed based on market data obtained from sources independent of the reporting issuer (observable inputs), and (2) the reporting issuer’s own assumptions about market participant assumptions developed based on the best information available in the circumstances (unobservable inputs). It also provides guidance on determining when there has been a significant decrease in the volume and level of activity for an asset or liability, when a transaction is not orderly and how that information must be incorporated into fair value measurement.
Various inputs are used in determining the value of the Funds’ investments. The inputs or methodology used for valuing securities are not necessarily an indication of the risk associated with investing in those securities. These inputs are summarized in the three broad levels listed below:
Level 1—quoted prices in active markets for identical securities. An active market for the security is a market in which transactions occur with sufficient frequency and volume to provide pricing information on an ongoing basis. Common and preferred stocks, options and futures contracts, and U.S. registered mutual funds are generally categorized as Level 1.
Level 2—other significant observable inputs (including quoted prices for similar securities, interest rates, prepayment speeds, credit risk, etc.). Fixed income securities, repurchase agreements, cash collateral received as part of the securities lending program, and securities valued by an independent fair value pricing service are generally categorized as Level 2.
Level 3—significant unobservable inputs, including management’s own assumptions in determining the fair value of investments.
For the year ended August 31, 2018, the Funds had no investments in private investment funds, and there were no investments excluded from the fair value hierarchy. It is the Funds’ policy to recognize transfers between category levels at the end of the period. For the year ended August 31, 2018, there were no transfers in and out of Level 1, Level 2 , and Level 3. The Funds did not hold any Level 2 or Level 3 securities as of August 31, 2018.
44
The following is a summary of the inputs used, as of August 31, 2018, in valuing the Funds’ assets:
| | | | | | | | | | | | | | | | |
| | | In-Retirement Fund | | | | |
| | | Level 1 | | | Level 2 | | | Level 3 | | | Total | |
Mutual Funds | | $ | 13,720,282 | | | $ | — | | | $ | — | | | $ | 13,720,282 | |
Short-Term Investments | | | 139,450 | | | | — | | | | — | | | | 139,450 | |
| | | | | | | | | | | | | | | | |
Total | | $ | 13,859,732 | | | $ | — | | | $ | — | | | $ | 13,859,732 | |
| | | | | | | | | | | | | | | | |
| | |
| | | 2015 Fund | | | | |
| | | Level 1 | | | Level 2 | | | Level 3 | | | Total | |
Mutual Funds | | $ | 2,788,928 | | | $ | — | | | $ | — | | | $ | 2,788,928 | |
Short-Term Investments | | | 25,136 | | | | — | | | | — | | | | 25,136 | |
| | | | | | | | | | | | | | | | |
Total | | $ | 2,814,064 | | | $ | — | | | $ | — | | | $ | 2,814,064 | |
| | | | | | | | | | | | | | | | |
| | |
| | | 2020 Fund | | | | |
| | | Level 1 | | | Level 2 | | | Level 3 | | | Total | |
Mutual Funds | | $ | 76,275,046 | | | $ | — | | | $ | — | | | $ | 76,275,046 | |
Short-Term Investments | | | 633,912 | | | | — | | | | — | | | | 633,912 | |
| | | | | | | | | | | | | | | | |
Total | | $ | 76,908,958 | | | $ | — | | | $ | — | | | $ | 76,908,958 | |
| | | | | | | | | | | | | | | | |
| | |
| | | 2025 Fund | | | | |
| | | Level 1 | | | Level 2 | | | Level 3 | | | Total | |
Mutual Funds | | $ | 26,218,492 | | | $ | — | | | $ | — | | | $ | 26,218,492 | |
Short-Term Investments | | | 284,649 | | | | — | | | | — | | | | 284,649 | |
| | | | | | | | | | | | | | | | |
Total | | $ | 26,503,141 | | | $ | — | | | $ | — | | | $ | 26,503,141 | |
| | | | | | | | | | | | | | | | |
| | |
| | | 2030 Fund | | | | |
| | | Level 1 | | | Level 2 | | | Level 3 | | | Total | |
Mutual Funds | | $ | 98,585,477 | | | $ | — | | | $ | — | | | $ | 98,585,477 | |
Short-Term Investments | | | 996,505 | | | | — | | | | — | | | | 996,505 | |
| | | | | | | | | | | | | | | | |
Total | | $ | 99,581,982 | | | $ | — | | | $ | — | | | $ | 99,581,982 | |
| | | | | | | | | | | | | | | | |
| | |
| | | 2035 Fund | | | | |
| | | Level 1 | | | Level 2 | | | Level 3 | | | Total | |
Mutual Funds | | $ | 15,357,234 | | | $ | — | | | $ | — | | | $ | 15,357,234 | |
Short-Term Investments | | | 159,390 | | | | — | | | | — | | | | 159,390 | |
| | | | | | | | | | | | | | | | |
Total | | $ | 15,516,624 | | | $ | — | | | $ | — | | | $ | 15,516,624 | |
| | | | | | | | | | | | | | | | |
| | |
| | | 2040 Fund | | | | |
| | | Level 1 | | | Level 2 | | | Level 3 | | | Total | |
Mutual Funds | | $ | 59,440,460 | | | $ | — | | | $ | — | | | $ | 59,440,460 | |
Short-Term Investments | | | 593,100 | | | | — | | | | — | | | | 593,100 | |
| | | | | | | | | | | | | | | | |
Total | | $ | 60,033,560 | | | $ | — | | | $ | — | | | $ | 60,033,560 | |
| | | | | | | | | | | | | | | | |
| | |
| | | 2045 Fund | | | | |
| | | Level 1 | | | Level 2 | | | Level 3 | | | Total | |
Mutual Funds | | $ | 11,143,734 | | | $ | — | | | $ | — | | | $ | 11,143,734 | |
Short-Term Investments | | | 107,226 | | | | — | | | | — | | | | 107,226 | |
| | | | | | | | | | | | | | | | |
Total | | $ | 11,250,960 | | | $ | — | | | $ | — | | | $ | 11,250,960 | |
| | | | | | | | | | | | | | | | |
| | | | | | | | | | | | | | | | |
| | | 2050 Fund | | | | |
| | | Level 1 | | | Level 2 | | | Level 3 | | | Total | |
Mutual Funds | | $ | 45,951,647 | | | $ | — | | | $ | — | | | $ | 45,951,647 | |
Short-Term Investments | | | 548,434 | | | | — | | | | — | | | | 548,434 | |
| | | | | | | | | | | | | | | | |
Total | | $ | 46,500,081 | | | $ | — | | | $ | — | | | $ | 46,500,081 | |
| | | | | | | | | | | | | | | | |
| | |
| | | 2055 Fund | | | | |
| | | Level 1 | | | Level 2 | | | Level 3 | | | Total | |
Mutual Funds | | $ | 11,066,118 | | | $ | — | | | $ | — | | | $ | 11,066,118 | |
Short-Term Investments | | | 113,983 | | | | — | | | | — | | | | 113,983 | |
| | | | | | | | | | | | | | | | |
Total | | $ | 11,180,101 | | | $ | — | | | $ | — | | | $ | 11,180,101 | |
| | | | | | | | | | | | | | | | |
| | |
| | | Conservative Allocation Fund | | | | |
| | | Level 1 | | | Level 2 | | | Level 3 | | | Total | |
Mutual Funds | | $ | 36,944,277 | | | $ | — | | | $ | — | | | $ | 36,944,277 | |
Short-Term Investments | | | 355,561 | | | | — | | | | — | | | | 355,561 | |
| | | | | | | | | | | | | | | | |
Total | | $ | 37,299,838 | | | $ | — | | | $ | — | | | $ | 37,299,838 | |
| | | | | | | | | | | | | | | | |
| | |
| | | Moderate Allocation Fund | | | | |
| | | Level 1 | | | Level 2 | | | Level 3 | | | Total | |
Mutual Funds | | $ | 80,880,944 | | | $ | — | | | $ | — | | | $ | 80,880,944 | |
Short-Term Investments | | | 775,889 | | | | — | | | | — | | | | 775,889 | |
| | | | | | | | | | | | | | | | |
Total | | $ | 81,656,833 | | | $ | — | | | $ | — | | | $ | 81,656,833 | |
| | | | | | | | | | | | | | | | |
| | |
| | | Balanced Allocation Fund | | | | |
| | | Level 1 | | | Level 2 | | | Level 3 | | | Total | |
Mutual Funds | | $ | 342,003,022 | | | $ | — | | | $ | — | | | $ | 342,003,022 | |
Short-Term Investments | | | 3,049,731 | | | | — | | | | — | | | | 3,049,731 | |
| | | | | | | | | | | | | | | | |
Total | | $ | 345,052,753 | | | $ | — | | | $ | — | | | $ | 345,052,753 | |
| | | | | | | | | | | | | | | | |
| | |
| | | Growth Allocation Fund | | | | |
| | | Level 1 | | | Level 2 | | | Level 3 | | | Total | |
Mutual Funds | | $ | 121,788,648 | | | $ | — | | | $ | — | | | $ | 121,788,648 | |
Short-Term Investments | | | 1,153,827 | | | | — | | | | — | | | | 1,153,827 | |
| | | | | | | | | | | | | | | | |
Total | | $ | 122,942,475 | | | $ | — | | | $ | — | | | $ | 122,942,475 | |
| | | | | | | | | | | | | | | | |
| | |
| | | Aggressive Allocation Fund | | | | |
| | | Level 1 | | | Level 2 | | | Level 3 | | | Total | |
Mutual Funds | | $ | 178,002,895 | | | $ | — | | | $ | — | | | $ | 178,002,895 | |
Short-Term Investments | | | 1,600,930 | | | | — | | | | — | | | | 1,600,930 | |
| | | | | | | | | | | | | | | | |
Total | | $ | 179,603,825 | | | $ | — | | | $ | — | | | $ | 179,603,825 | |
| | | | | | | | | | | | | | | | |
45
| | |
| | |
| Notes to Financial Statements (continued) | | |
The Articles of Incorporation permit the Directors to issue an indefinite number of full and fractional shares of common stock, par value $0.0001 per share. Transactions in capital stock were as follows:
| | | | | | | | | | | | | | | | | | | | | | | | |
| | | | | | | | | | |
| | | In-Retirement Fund | | | 2015 Fund | | | 2020 Fund | |
| | | Year Ended
August 31,
2018 | | | Year Ended
August 31,
2017 | | | Year Ended
August 31,
2018 | | | Year Ended
August 31,
2017 | | | Year Ended
August 31,
2018 | | | Year Ended
August 31,
2017 | |
Capital stock transactions in dollars: | | | | | | | | | | | | | | | | | | | | | | | | |
Proceeds from sale of shares: | | | | | | | | | | | | | | | | | | | | | | | | |
Investor class of shares | | $ | 183,205 | | | $ | 1,008,269 | | | $ | 31,490 | | | $ | 656,625 | | | $ | 2,658,760 | | | $ | 2,713,803 | |
Retirement classR-3 of shares | | | 157,831 | | | | 534,506 | | | | — | | | | 3,871 | | | | 238,558 | | | | 1,696,274 | |
Retirement classR-6 of shares | | | 2,712,547 | | | | 1,499,670 | | | | 369,253 | | | | 1,549,699 | | | | 10,542,118 | | | | 7,678,581 | |
| | | | | | | | | | | | | | | | | | | | | | | | |
Net proceeds from sale of shares | | | 3,053,583 | | | | 3,042,445 | | | | 400,743 | | | | 2,210,195 | | | | 13,439,436 | | | | 12,088,658 | |
Net asset value of shares issued to shareholders in payment of distributions declared: | | | | | | | | | | | | | | | | | | | | | | | | |
Investor class of shares | | | 261,550 | | | | 229,242 | | | | 3,627 | | | | 7,555 | | | | 1,139,073 | | | | 1,080,668 | |
Retirement classR-3 of shares | | | 57,797 | | | | 78,175 | | | | — | | | | 555 | | | | 397,134 | | | | 661,731 | |
Retirement classR-6 of shares | | | 923,578 | | | | 1,129,433 | | | | 88,466 | | | | 92,325 | | | | 4,002,936 | | | | 4,128,058 | |
| | | | | | | | | | | | | | | | | | | | | | | | |
Net proceeds from shares issued: | | | 1,242,925 | | | | 1,436,850 | | | | 92,093 | | | | 100,435 | | | | 5,539,143 | | | | 5,870,457 | |
Cost of shares redeemed: | | | | | | | | | | | | | | | | | | | | | | | | |
Investor class of shares | | | (1,112,611 | ) | | | (1,213,231 | ) | | | (133,922 | ) | | | (993,165 | ) | | | (3,719,151 | ) | | | (5,493,344 | ) |
Retirement classR-3 of shares | | | (48,983 | ) | | | (1,675,212 | ) | | | — | | | | (33,078 | ) | | | (2,972,276 | ) | | | (7,677,610 | ) |
Retirement classR-6 of shares | | | (3,553,529 | ) | | | (7,845,531 | ) | | | (1,536,738 | ) | | | (2,178,046 | ) | | | (16,139,362 | ) | | | (19,990,572 | ) |
| | | | | | | | | | | | | | | | | | | | | | | | |
Net cost of shares redeemed | | | (4,715,123 | ) | | | (10,733,974 | ) | | | (1,670,660 | ) | | | (3,204,289 | ) | | | (22,830,789 | ) | | | (33,161,526 | ) |
| | | | | | | | | | | | | | | | | | | | | | | | |
Net change resulting from fund share transactions in dollars | | $ | (418,615 | ) | | $ | (6,254,679 | ) | | $ | (1,177,824 | ) | | $ | (893,659 | ) | | $ | (3,852,210 | ) | | $ | (15,202,411 | ) |
| | | | | | | | | | | | | | | | | | | | | | | | |
Capital stock transactions in shares: | | | | | | | | | | | | | | | | | | | | | | | | |
Sale of shares: | | | | | | | | | | | | | | | | | | | | | | | | |
Investor class of shares | | | 20,342 | | | | 108,395 | | | | 2,737 | | | | 61,847 | | | | 252,294 | | | | 268,374 | |
Retirement classR-3 of shares | | | 16,761 | | | | 58,358 | | | | — | | | | 365 | | | | 22,745 | | | | 167,507 | |
Retirement classR-6 of shares | | | 301,530 | | | | 160,992 | | | | 32,017 | | | | 140,426 | | | | 1,001,321 | | | | 754,743 | |
| | | | | | | | | | | | | | | | | | | | | | | | |
Net sale of shares | | | 338,633 | | | | 327,745 | | | | 34,754 | | | | 202,638 | | | | 1,276,360 | | | | 1,190,624 | |
Shares issued to shareholders in payment of distributions declared: | | | | | | | | | | | | | | | | | | | | | | | | |
Investor class of shares | | | 29,454 | | | | 26,020 | | | | 316 | | | | 719 | | | | 110,697 | | | | 112,219 | |
Retirement classR-3 of shares | | | 6,480 | | | | 8,833 | | | | — | | | | 53 | | | | 38,445 | | | | 68,502 | |
Retirement classR-6 of shares | | | 104,359 | | | | 128,491 | | | | 7,713 | | | | 8,768 | | | | 389,391 | | | | 429,112 | |
| | | | | | | | | | | | | | | | | | | | | | | | |
Net shares issued | | | 140,293 | | | | 163,344 | | | | 8,029 | | | | 9,540 | | | | 538,533 | | | | 609,833 | |
Shares redeemed: | | | | | | | | | | | | | | | | | | | | | | | | |
Investor class of shares | | | (123,210 | ) | | | (129,631 | ) | | | (11,585 | ) | | | (90,952 | ) | | | (351,633 | ) | | | (540,360 | ) |
Retirement classR-3 of shares | | | (5,515 | ) | | | (180,106 | ) | | | — | | | | (3,051 | ) | | | (280,100 | ) | | | (762,158 | ) |
Retirement classR-6 of shares | | | (395,463 | ) | | | (849,082 | ) | | | (133,001 | ) | | | (200,328 | ) | | | (1,538,507 | ) | | | (1,962,803 | ) |
| | | | | | | | | | | | | | | | | | | | | | | | |
Net shares redeemed | | | (524,188 | ) | | | (1,158,819 | ) | | | (144,586 | ) | | | (294,331 | ) | | | (2,170,240 | ) | | | (3,265,321 | ) |
| | | | | | | | | | | | | | | | | | | | | | | | |
Net change resulting from fund share transactions in shares | | | (45,262 | ) | | | (667,730 | ) | | | (101,803 | ) | | | (82,153 | ) | | | (355,347 | ) | | | (1,464,864 | ) |
| | | | | | | | | | | | | | | | | | | | | | | | |
46
| | | | | | | | | | | | | | | | | | | | | | | | |
| | | | | | | | | | |
| | | 2025 Fund | | | 2030 Fund | | | 2035 Fund | |
| | | Year Ended
August 31,
2018 | | | Year Ended
August 31,
2017 | | | Year Ended
August 31,
2018 | | | Year Ended
August 31,
2017 | | | Year Ended
August 31,
2018 | | | Year Ended
August 31,
2017 | |
Capital stock transactions in dollars: | | | | | | | | | | | | | | | | | | | | | | | | |
Proceeds from sale of shares: | | | | | | | | | | | | | | | | | | | | | | | | |
Investor class of shares | | $ | 522,705 | | | $ | 298,184 | | | $ | 5,708,489 | | | $ | 3,090,018 | | | $ | 279,672 | | | $ | 510,807 | |
Retirement classR-3 of shares | | | 18,651 | | | | 141,111 | | | | 573,094 | | | | 1,391,128 | | | | 33,816 | | | | 102,195 | |
Retirement classR-6 of shares | | | 7,006,888 | | | | 5,165,176 | | | | 14,991,876 | | | | 12,437,489 | | | | 3,217,485 | | | | 3,338,790 | |
| | | | | | | | | | | | | | | | | | | | | | | | |
Net proceeds from sale of shares | | | 7,548,244 | | | | 5,604,471 | | | | 21,273,459 | | | | 16,918,635 | | | | 3,530,973 | | | | 3,951,792 | |
Net asset value of shares issued to shareholders in payment of distributions declared: | | | | | | | | | | | | | | | | | | | | | | | | |
Investor class of shares | | | 27,914 | | | | 23,843 | | | | 860,080 | | | | 911,447 | | | | 44,318 | | | | 32,175 | |
Retirement classR-3 of shares | | | 964 | | | | 35,100 | | | | 257,434 | | | | 442,421 | | | | 4,594 | | | | 21,569 | |
Retirement classR-6 of shares | | | 690,330 | | | | 1,135,390 | | | | 3,979,906 | | | | 4,125,659 | | | | 807,059 | | | | 1,421,767 | |
| | | | | | | | | | | | | | | | | | | | | | | | |
Net proceeds from shares issued: | | | 719,208 | | | | 1,194,333 | | | | 5,097,420 | | | | 5,479,527 | | | | 855,971 | | | | 1,475,511 | |
Cost of shares redeemed: | | | | | | | | | | | | | | | | | | | | | | | | |
Investor class of shares | | | (356,159 | ) | | | (137,454 | ) | | | (6,262,985 | ) | | | (5,492,840 | ) | | | (171,205 | ) | | | (549,772 | ) |
Retirement classR-3 of shares | | | (70,552 | ) | | | (1,135,416 | ) | | | (3,611,377 | ) | | | (5,859,197 | ) | | | (42,718 | ) | | | (525,837 | ) |
Retirement classR-6 of shares | | | (4,158,250 | ) | | | (16,547,756 | ) | | | (13,718,446 | ) | | | (28,265,720 | ) | | | (2,268,572 | ) | | | (24,303,005 | ) |
| | | | | | | | | | | | | | | | | | | | | | | | |
Net cost of shares redeemed | | | (4,584,961 | ) | | | (17,820,626 | ) | | | (23,592,808 | ) | | | (39,617,757 | ) | | | (2,482,495 | ) | | | (25,378,614 | ) |
| | | | | | | | | | | | | | | | | | | | | | | | |
Net change resulting from fund share transactions in dollars | | $ | 3,682,491 | | | $ | (11,021,822 | ) | | $ | 2,778,071 | | | $ | (17,219,595 | ) | | $ | 1,904,449 | | | $ | (19,951,311 | ) |
| | | | | | | | | | | | | | | | | | | | | | | | |
| | | | | | |
Capital stock transactions in shares: | | | | | | | | | | | | | | | | | | | | | | | | |
Sale of shares: | | | | | | | | | | | | | | | | | | | | | | | | |
Investor class of shares | | | 43,418 | | | | 27,606 | | | | 477,689 | | | | 282,733 | | | | 23,525 | | | | 47,612 | |
Retirement classR-3 of shares | | | 1,542 | | | | 13,162 | | | | 48,473 | | | | 127,664 | | | | 2,834 | | | | 9,520 | |
Retirement classR-6 of shares | | | 580,828 | | | | 467,516 | | | | 1,258,490 | | | | 1,136,600 | | | | 267,420 | | | | 302,467 | |
| | | | | | | | | | | | | | | | | | | | | | | | |
Net sale of shares | | | 625,788 | | | | 508,284 | | | | 1,784,652 | | | | 1,546,997 | | | | 293,779 | | | | 359,599 | |
Shares issued to shareholders in payment of distributions declared: | | | | | | | | | | | | | | | | | | | | | | | | |
Investor class of shares | | | 2,352 | | | | 2,266 | | | | 73,953 | | | | 87,808 | | | | 3,804 | | | | 3,079 | |
Retirement classR-3 of shares | | | 80 | | | | 3,353 | | | | 22,078 | | | | 42,540 | | | | 391 | | | | 2,072 | |
Retirement classR-6 of shares | | | 57,962 | | | | 107,620 | | | | 342,800 | | | | 397,846 | | | | 69,038 | | | | 135,535 | |
| | | | | | | | | | | | | | | | | | | | | | | | |
Net shares issued | | | 60,394 | | | | 113,239 | | | | 438,831 | | | | 528,194 | | | | 73,233 | | | | 140,686 | |
Shares redeemed: | | | | | | | | | | | | | | | | | | | | | | | | |
Investor class of shares | | | (29,645 | ) | | | (12,259 | ) | | | (524,803 | ) | | | (506,947 | ) | | | (14,329 | ) | | | (49,406 | ) |
Retirement classR-3 of shares | | | (5,845 | ) | | | (102,055 | ) | | | (299,579 | ) | | | (539,077 | ) | | | (3,542 | ) | | | (47,373 | ) |
Retirement classR-6 of shares | | | (346,361 | ) | | | (1,496,179 | ) | | | (1,161,905 | ) | | | (2,573,184 | ) | | | (187,113 | ) | | | (2,193,982 | ) |
| | | | | | | | | | | | | | | | | | | | | | | | |
Net shares redeemed | | | (381,851 | ) | | | (1,610,493 | ) | | | (1,986,287 | ) | | | (3,619,208 | ) | | | (204,984 | ) | | | (2,290,761 | ) |
| | | | | | | | | | | | | | | | | | | | | | | | |
Net change resulting from fund share transactions in shares | | | 304,331 | | | | (988,970 | ) | | | 237,196 | | | | (1,544,017 | ) | | | 162,028 | | | | (1,790,476 | ) |
| | | | | | | | | | | | | | | | | | | | | | | | |
47
| | |
| | |
| Notes to Financial Statements (continued) | | |
| | | | | | | | | | | | | | | | | | | | | | | | |
| | | | | | | | | | |
| | | 2040 Fund | | | 2045 Fund | | | 2050 Fund | |
| | | Year Ended
August 31,
2018 | | | Year Ended
August 31,
2017 | | | Year Ended
August 31,
2018 | | | Year Ended
August 31,
2017 | | | Year Ended
August 31,
2018 | | | Year Ended
August 31,
2017 | |
Capital stock transactions in dollars: | | | | | | | | | | | | | | | | | | | | | | | | |
Proceeds from sale of shares: | | | | | | | | | | | | | | | | | | | | | | | | |
Investor class of shares | | $ | 3,442,862 | | | $ | 1,883,014 | | | $ | 93,438 | | | $ | 170,177 | | | $ | 3,304,021 | | | $ | 2,360,706 | |
Retirement classR-3 of shares | | | 658,081 | | | | 585,454 | | | | 40,179 | | | | 143,679 | | | | 517,504 | | | | 803,818 | |
Retirement classR-6 of shares | | | 9,261,125 | | | | 7,703,062 | | | | 4,275,506 | | | | 2,516,895 | | | | 8,204,040 | | | | 7,019,909 | |
| | | | | | | | | | | | | | | | | | | | | | | | |
Net proceeds from sale of shares | | | 13,362,068 | | | | 10,171,530 | | | | 4,409,123 | | | | 2,830,751 | | | | 12,025,565 | | | | 10,184,433 | |
Net asset value of shares issued to shareholders in payment of distributions declared: | | | | | | | | | | | | | | | | | | | | | | | | |
Investor class of shares | | | 903,183 | | | | 628,710 | | | | 48,538 | | | | 42,441 | | | | 338,280 | | | | 379,998 | |
Retirement classR-3 of shares | | | 207,277 | | | | 214,271 | | | | 2,323 | | | | 20,450 | | | | 112,482 | | | | 203,040 | |
Retirement classR-6 of shares | | | 4,028,502 | | | | 2,866,927 | | | | 449,352 | | | | 804,157 | | | | 1,451,931 | | | | 1,836,029 | |
| | | | | | | | | | | | | | | | | | | | | | | | |
Net proceeds from shares issued: | | | 5,138,962 | | | | 3,709,908 | | | | 500,213 | | | | 867,048 | | | | 1,902,693 | | | | 2,419,067 | |
Cost of shares redeemed: | | | | | | | | | | | | | | | | | | | | | | | | |
Investor class of shares | | | (3,558,646 | ) | | | (5,649,232 | ) | | | (187,407 | ) | | | (253,382 | ) | | | (2,625,075 | ) | | | (5,369,123 | ) |
Retirement classR-3 of shares | | | (1,438,959 | ) | | | (3,487,878 | ) | | | (25,601 | ) | | | (563,598 | ) | | | (1,980,408 | ) | | | (2,653,255 | ) |
Retirement classR-6 of shares | | | (7,000,663 | ) | | | (23,316,521 | ) | | | (1,777,467 | ) | | | (13,070,897 | ) | | | (5,323,332 | ) | | | (13,439,244 | ) |
| | | | | | | | | | | | | | | | | | | | | | | | |
Net cost of shares redeemed | | | (11,998,268 | ) | | | (32,453,631 | ) | | | (1,990,475 | ) | | | (13,887,877 | ) | | | (9,928,815 | ) | | | (21,461,622 | ) |
| | | | | | | | | | | | | | | | | | | | | | | | |
Net change resulting from fund share transactions in dollars | | $ | 6,502,762 | | | $ | (18,572,193 | ) | | $ | 2,918,861 | | | $ | (10,190,078 | ) | | $ | 3,999,443 | | | $ | (8,858,122 | ) |
| | | | | | | | | | | | | | | | | | | | | | | | |
Capital stock transactions in shares: | | | | | | | | | | | | | | | | | | | | | | | | |
Sale of shares: | | | | | | | | | | | | | | | | | | | | | | | | |
Investor class of shares | | | 295,978 | | | | 173,576 | | | | 7,642 | | | | 15,219 | | | | 263,047 | | | | 209,620 | |
Retirement classR-3 of shares | | | 57,416 | | | | 53,880 | | | | 3,242 | | | | 13,190 | | | | 41,594 | | | | 71,209 | |
Retirement classR-6 of shares | | | 792,605 | | | | 713,031 | | | | 344,015 | | | | 223,749 | | | | 656,738 | | | | 622,506 | |
| | | | | | | | | | | | | | | | | | | | | | | | |
Net sale of shares | | | 1,145,999 | | | | 940,487 | | | | 354,899 | | | | 252,158 | | | | 961,379 | | | | 903,335 | |
Shares issued to shareholders in payment of distributions declared: | | | | | | | | | | | | | | | | | | | | | | | | |
Investor class of shares | | | 80,426 | | | | 61,158 | | | | 4,052 | | | | 4,004 | | | | 27,637 | | | | 35,681 | |
Retirement classR-3 of shares | | | 18,376 | | | | 20,763 | | | | 192 | | | | 1,935 | | | | 9,182 | | | | 19,065 | |
Retirement classR-6 of shares | | | 359,367 | | | | 279,155 | | | | 37,383 | | | | 75,579 | | | | 118,816 | | | | 172,721 | |
| | | | | | | | | | | | | | | | | | | | | | | | |
Net shares issued | | | 458,169 | | | | 361,076 | | | | 41,627 | | | | 81,518 | | | | 155,635 | | | | 227,467 | |
Shares redeemed: | | | | | | | | | | | | | | | | | | | | | | | | |
Investor class of shares | | | (299,793 | ) | | | (525,932 | ) | | | (15,209 | ) | | | (22,375 | ) | | | (209,546 | ) | | | (484,194 | ) |
Retirement classR-3 of shares | | | (121,554 | ) | | | (320,875 | ) | | | (2,052 | ) | | | (49,820 | ) | | | (156,502 | ) | | | (238,882 | ) |
Retirement classR-6 of shares | | | (602,010 | ) | | | (2,131,353 | ) | | | (144,396 | ) | | | (1,164,696 | ) | | | (427,535 | ) | | | (1,183,799 | ) |
| | | | | | | | | | | | | | | | | | | | | | | | |
Net shares redeemed | | | (1,023,357 | ) | | | (2,978,160 | ) | | | (161,657 | ) | | | (1,236,891 | ) | | | (793,583 | ) | | | (1,906,875 | ) |
| | | | | | | | | | | | | | | | | | | | | | | | |
Net change resulting from fund share transactions in shares | | | 580,811 | | | | (1,676,597 | ) | | | 234,869 | | | | (903,215 | ) | | | 323,431 | | | | (776,073 | ) |
| | | | | | | | | | | | | | | | | | | | | | | | |
48
| | | | | | | | | | | | | | | | | | | | | | | | |
| | | | | | | | | | |
| | | 2055 Fund | | | Conservative Allocation
Fund | | | Moderate Allocation
Fund | |
| | | Year Ended
August 31,
2018 | | | Year Ended
August 31,
2017 | | | Year Ended
August 31,
2018 | | | Year Ended
August 31,
2017 | | | Year Ended
August 31,
2018 | | | Year Ended
August 31,
2017 | |
Capital stock transactions in dollars: | | | | | | | | | | | | | | | | | | | | | | | | |
Proceeds from sale of shares: | | | | | | | | | | | | | | | | | | | | | | | | |
Investor class of shares | | $ | 178,043 | | | $ | 379,222 | | | $ | 936,151 | | | $ | 3,333,251 | | | $ | 1,088,222 | | | $ | 1,787,884 | |
Institutional class of shares | | | — | | | | — | | | | 606,867 | | | | 3,199,776 | | | | 1,152,648 | | | | 2,247,337 | |
RetirementClass R-3 of shares | | | 238,729 | | | | 235,131 | | | | 176,946 | | | | 594,944 | | | | 3,326,610 | | | | 3,698,491 | |
Retirement classR-6 of shares | | | 4,214,618 | | | | 2,688,106 | | | | 7,347,922 | | | | 9,716,130 | | | | 9,308,350 | | | | 14,085,245 | |
| | | | | | | | | | | | | | | | | | | | | | | | |
Net proceeds from sale of shares | | | 4,631,390 | | | | 3,302,459 | | | | 9,067,886 | | | | 16,844,101 | | | | 14,875,830 | | | | 21,818,957 | |
Net asset value of shares issued to shareholders in payment of distributions declared: | | | | | | | | | | | | | | | | | | | | | | | | |
Investor class of shares | | | 8,327 | | | | 20,520 | | | | 2,226,207 | | | | 395,379 | | | | 507,983 | | | | 423,731 | |
Institutional class of shares | | | — | | | | — | | | | 161,066 | | | | 819,598 | | | | 330,580 | | | | 446,331 | |
RetirementClass R-3 of shares | | | 7,100 | | | | 21,849 | | | | 129,410 | | | | 154,118 | | | | 835,913 | | | | 432,042 | |
Retirement classR-6 of shares | | | 263,731 | | | | 342,529 | | | | 4,482,536 | | | | 2,569,224 | | | | 5,493,805 | | | | 3,686,197 | |
| | | | | | | | | | | | | | | | | | | | | | | | |
Net proceeds from shares issued: | | | 279,158 | | | | 384,898 | | | | 6,999,219 | | | | 3,938,319 | | | | 7,168,281 | | | | 4,988,301 | |
Cost of shares redeemed: | | | | | | | | | | | | | | | | | | | | | | | | |
Investor class of shares | | | (383,799 | ) | | | (320,201 | ) | | | (3,340,646 | ) | | | (6,464,521 | ) | | | (2,102,542 | ) | | | (7,901,290 | ) |
Institutional class of shares | | | — | | | | — | | | | (26,007,088 | ) | | | (7,637,483 | ) | | | (5,030,603 | ) | | | (5,677,100 | ) |
RetirementClass R-3 of shares | | | (237,866 | ) | | | (672,795 | ) | | | (2,262,492 | ) | | | (4,559,252 | ) | | | (9,541,470 | ) | | | (3,601,940 | ) |
Retirement classR-6 of shares | | | (927,386 | ) | | | (3,950,595 | ) | | | (15,098,332 | ) | | | (73,153,708 | ) | | | (32,401,151 | ) | | | (41,844,897 | ) |
| | | | | | | | | | | | | | | | | | | | | | | | |
Net cost of shares redeemed | | | (1,549,051 | ) | | | (4,943,591 | ) | | | (46,708,558 | ) | | | (91,814,964 | ) | | | (49,075,766 | ) | | | (59,025,227 | ) |
| | | | | | | | | | | | | | | | | | | | | | | | |
Net change resulting from fund share transactions in dollars | | $ | 3,361,497 | | | $ | (1,256,234 | ) | | $ | (30,641,453 | ) | | $ | (71,032,544 | ) | | $ | (27,031,655 | ) | | $ | (32,217,969 | ) |
| | | | | | | | | | | | | | | | | | | | | | | | |
Capital stock transactions in shares: | | | | | | | | | | | | | | | | | | | | | | | | |
Sale of shares: | | | | | | | | | | | | | | | | | | | | | | | | |
Investor class of shares | | | 14,342 | | | | 34,155 | | | | 104,749 | | | | 341,654 | | | | 109,748 | | | | 184,063 | |
Institutional class of shares | | | — | | | | — | | | | 62,126 | | | | 327,989 | | | | 117,831 | | | | 231,324 | |
RetirementClass R-3 of shares | | | 19,497 | | | | 21,703 | | | | 18,976 | | | | 61,258 | | | | 336,495 | | | | 379,868 | |
Retirement classR-6 of shares | | | 334,134 | | | | 241,119 | | | | 812,723 | | | | 990,085 | | | | 940,146 | | | | 1,440,015 | |
| | | | | | | | | | | | | | | | | | | | | | | | |
Net sale of shares | | | 367,973 | | | | 296,977 | | | | 998,574 | | | | 1,720,986 | | | | 1,504,220 | | | | 2,235,270 | |
Shares issued to shareholders in payment of distributions declared: | | | | | | | | | | | | | | | | | | | | | | | | |
Investor class of shares | | | 673 | | | | 1,938 | | | | 257,663 | | | | 41,663 | | | | 52,154 | | | | 45,078 | |
Institutional class of shares | | | — | | | | — | | | | 18,077 | | | | 86,455 | | | | 33,940 | | | | 47,533 | |
RetirementClass R-3 of shares | | | 579 | | | | 2,071 | | | | 14,672 | | | | 16,240 | | | | 85,735 | | | | 45,913 | |
Retirement classR-6 of shares | | | 21,338 | | | | 32,223 | | | | 520,016 | | | | 271,015 | | | | 565,206 | | | | 392,985 | |
| | | | | | | | | | | | | | | | | | | | | | | | |
Net shares issued | | | 22,590 | | | | 36,232 | | | | 810,428 | | | | 415,373 | | | | 737,035 | | | | 531,509 | |
Shares redeemed: | | | | | | | | | | | | | | | | | | | | | | | | |
Investor class of shares | | | (30,838 | ) | | | (27,594 | ) | | | (368,501 | ) | | | (660,920 | ) | | | (215,417 | ) | | | (806,639 | ) |
Institutional class of shares | | | — | | | | — | | | | (2,563,855 | ) | | | (777,055 | ) | | | (488,867 | ) | | | (580,703 | ) |
RetirementClass R-3 of shares | | | (18,881 | ) | | | (59,996 | ) | | | (226,512 | ) | | | (470,782 | ) | | | (967,835 | ) | | | (369,030 | ) |
Retirement classR-6 of shares | | | (74,027 | ) | | | (354,505 | ) | | | (1,710,933 | ) | | | (7,418,823 | ) | | | (3,332,428 | ) | | | (4,274,881 | ) |
| | | | | | | | | | | | | | | | | | | | | | | | |
Net shares redeemed | | | (123,746 | ) | | | (442,095 | ) | | | (4,869,801 | ) | | | (9,327,580 | ) | | | (5,004,547 | ) | | | (6,031,253 | ) |
| | | | | | | | | | | | | | | | | | | | | | | | |
Net change resulting from fund share transactions in shares | | | 266,817 | | | | (108,886 | ) | | | (3,060,799 | ) | | | (7,191,221 | ) | | | (2,763,292 | ) | | | (3,264,474 | ) |
| | | | | | | | | | | | | | | | | | | | | | | | |
49
| | |
| | |
| Notes to Financial Statements (continued) | | |
| | | | | | | | | | | | | | | | | | | | | | | | |
| | | | | | | | | | |
| | | Balanced Allocation
Fund | | | Growth Allocation
Fund | | | Aggressive Allocation
Fund | |
| | | Year Ended
August 31,
2018 | | | Year Ended
August 31,
2017 | | | Year Ended
August 31,
2018 | | | Year Ended
August 31,
2017 | | | Year Ended
August 31,
2018 | | | Year Ended
August 31,
2017 | |
Capital stock transactions in dollars: | | | | | | | | | | | | | | | | | | | | | | | | |
Proceeds from sale of shares: | | | | | | | | | | | | | | | | | | | | | | | | |
Investor class of shares | | $ | 9,428,384 | | | $ | 9,596,115 | | | $ | 965,898 | | | $ | 1,521,150 | | | $ | 1,903,201 | | | $ | 2,549,571 | |
Institutional class of shares | | | 11,240,431 | | | | 18,188,630 | | | | 3,238,898 | | | | 3,782,554 | | | | 3,038,729 | | | | 3,231,792 | |
Retirement classR-3 of shares | | | 1,792,133 | | | | 3,462,896 | | | | 1,655,777 | | | | 1,995,735 | | | | 1,954,612 | | | | 1,545,438 | |
Retirement classR-6 of shares | | | 24,771,951 | | | | 33,777,945 | | | | 17,810,271 | | | | 23,359,307 | | | | 17,601,066 | | | | 28,234,235 | |
| | | | | | | | | | | | | | | | | | | | | | | | |
Net proceeds from sale of shares | | | 47,232,899 | | | | 65,025,586 | | | | 23,670,844 | | | | 30,658,746 | | | | 24,497,608 | | | | 35,561,036 | |
Net asset value of shares issued to shareholders in payment of distributions declared: | | | | | | | | | | | | | | | | | | | | | | | | |
Investor class of shares | | | 9,900,919 | | | | 7,291,420 | | | | 1,164,273 | | | | 1,358,067 | | | | 4,758,561 | | | | 4,019,656 | |
Institutional class of shares | | | 4,372,016 | | | | 4,959,081 | | | | 650,895 | | | | 661,921 | | | | 1,722,650 | | | | 2,155,531 | |
Retirement classR-3 of shares | | | 2,022,307 | | | | 1,857,132 | | | | 1,259,889 | | | | 1,005,881 | | | | 2,052,160 | | | | 1,846,190 | |
Retirement classR-6 of shares | | | 20,648,922 | | | | 16,194,257 | | | | 6,735,393 | | | | 4,846,161 | | | | 14,467,294 | | | | 11,432,316 | |
| | | | | | | | | | | | | | | | | | | | | | | | |
Net proceeds from shares issued: | | | 36,944,164 | | | | 30,301,890 | | | | 9,810,450 | | | | 7,872,030 | | | | 23,000,665 | | | | 19,453,693 | |
Cost of shares redeemed: | | | | | | | | | | | | | | | | | | | | | | | | |
Investor class of shares | | | (20,253,986 | ) | | | (28,809,458 | ) | | | (5,530,492 | ) | | | (12,160,876 | ) | | | (9,554,575 | ) | | | (23,138,517 | ) |
Institutional class of shares | | | (20,375,381 | ) | | | (46,186,859 | ) | | | (1,712,928 | ) | | | (5,854,651 | ) | | | (3,837,651 | ) | | | (15,771,306 | ) |
Retirement classR-3 of shares | | | (7,869,477 | ) | | | (11,399,285 | ) | | | (7,318,054 | ) | | | (11,372,090 | ) | | | (4,375,465 | ) | | | (6,476,231 | ) |
Retirement classR-6 of shares | | | (53,440,445 | ) | | | (115,489,437 | ) | | | (29,402,393 | ) | | | (29,720,835 | ) | | | (26,560,647 | ) | | | (62,955,630 | ) |
| | | | | | | | | | | | | | | | | | | | | | | | |
Net cost of shares redeemed | | | (101,939,289 | ) | | | (201,885,039 | ) | | | (43,963,867 | ) | | | (59,108,452 | ) | | | (44,328,338 | ) | | | (108,341,684 | ) |
| | | | | | | | | | | | | | | | | | | | | | | | |
Net change resulting from fund share transactions in dollars | | $ | (17,762,226 | ) | | $ | (106,557,563 | ) | | $ | (10,482,573 | ) | | $ | (20,577,676 | ) | | $ | 3,169,935 | | | $ | (53,326,955 | ) |
| | | | | | | | | | | | | | | | | | | | | | | | |
| | | | | | |
Capital stock transactions in shares: | | | | | | | | | | | | | | | | | | | | | | | | |
Sale of shares: | | | | | | | | | | | | | | | | | | | | | | | | |
Investor class of shares | | | 1,008,765 | | | | 1,025,790 | | | | 93,446 | | | | 157,085 | | | | 191,793 | | | | 269,537 | |
Institutional class of shares | | | 1,208,350 | | | | 1,949,386 | | | | 306,230 | | | | 397,357 | | | | 309,899 | | | | 339,793 | |
Retirement classR-3 of shares | | | 191,386 | | | | 373,495 | | | | 159,360 | | | | 206,661 | | | | 199,277 | | | | 162,532 | |
Retirement classR-6 of shares | | | 2,638,289 | | | | 3,612,043 | | | | 1,722,411 | | | | 2,396,103 | | | | 1,787,826 | | | | 2,925,969 | |
| | | | | | | | | | | | | | | | | | | | | | | | |
Net sale of shares | | | 5,046,790 | | | | 6,960,714 | | | | 2,281,447 | | | | 3,157,206 | | | | 2,488,795 | | | | 3,697,831 | |
Shares issued to shareholders in payment of distributions declared: | | | | | | | | | | | | | | | | | | | | | | | | |
Investor class of shares | | | 1,085,627 | | | | 822,031 | | | | 114,933 | | | | 146,659 | | | | 502,497 | | | | 449,626 | |
Institutional class of shares | | | 479,388 | | | | 559,716 | | | | 64,381 | | | | 71,559 | | | | 182,099 | | | | 241,651 | |
Retirement classR-3 of shares | | | 221,259 | | | | 209,372 | | | | 124,249 | | | | 108,509 | | | | 216,701 | | | | 206,740 | |
Retirement classR-6 of shares | | | 2,266,621 | | | | 1,827,794 | | | | 666,211 | | | | 524,476 | | | | 1,530,931 | | | | 1,281,650 | |
| | | | | | | | | | | | | | | | | | | | | | | | |
Net shares issued | | | 4,052,895 | | | | 3,418,913 | | | | 969,774 | | | | 851,203 | | | | 2,432,228 | | | | 2,179,667 | |
Shares redeemed: | | | | | | | | | | | | | | | | | | | | | | | | |
Investor class of shares | | | (2,149,362 | ) | | | (3,093,692 | ) | | | (535,059 | ) | | | (1,245,696 | ) | | | (970,523 | ) | | | (2,424,144 | ) |
Institutional class of shares | | | (2,104,543 | ) | | | (4,942,672 | ) | | | (166,362 | ) | | | (604,772 | ) | | | (374,598 | ) | | | (1,624,360 | ) |
Retirement classR-3 of shares | | | (823,864 | ) | | | (1,223,751 | ) | | | (699,180 | ) | | | (1,181,512 | ) | | | (438,117 | ) | | | (681,868 | ) |
Retirement classR-6 of shares | | | (5,793,032 | ) | | | (12,198,320 | ) | | | (2,873,684 | ) | | | (3,005,372 | ) | | | (2,717,654 | ) | | | (6,486,787 | ) |
| | | | | | | | | | | | | | | | | | | | | | | | |
Net shares redeemed | | | (10,870,801 | ) | | | (21,458,435 | ) | | | (4,274,285 | ) | | | (6,037,352 | ) | | | (4,500,892 | ) | | | (11,217,159 | ) |
| | | | | | | | | | | | | | | | | | | | | | | | |
Net change resulting from fund share transactions in shares | | | (1,771,116 | ) | | | (11,078,808 | ) | | | (1,023,064 | ) | | | (2,028,943 | ) | | | 420,131 | | | | (5,339,661 | ) |
| | | | | | | | | | | | | | | | | | | | | | | | |
| 5. | | Investment Adviser Fee and Other Transactions with Affiliates |
Investment Advisory Fees—The Adviser does not receive an investment advisory fee for the services it performs for the Funds. However, the Adviser is entitled to receive an investment advisory fee from each of the BMO Funds that serve as underlying funds.
Contractual Expense Limitation—The Adviser has contractually agreed to waive or reduce fees and reimburse expenses to the extent necessary to prevent class total annual operating expenses (excluding acquired fund fees and expenses, interest, taxes, brokerage commissions, other investment-related costs and extraordinary expenses, such as litigation and other expenses not incurred in the ordinary course of a Fund’s business) from exceeding the levels set out in the table below through December 31, 2019. This agreement may not be terminated prior to December 31, 2019 without the consent of the Funds’ Board of Directors, unless terminated due to the termination of the investment advisory agreement. Additionally, the agreement does not provide for recoupment by the Adviser of waived fees or reimbursed expenses.
50
| | | | | | | | | | | | | | | | | | | | | | | | | | | | | | | | |
| | | Annualized Contractual Expense Limitation
Exclusive of Acquired Fund Fees and Expenses | | | Annualized Contractual Expense Limitation
Inclusive of Acquired Fund Fees and Expenses per
the Funds’ Prospectus Dated December 29, 2017 | |
Fund | | Investor
Class | | | Institutional
Class | | | Retirement
ClassR-3 | | | Retirement
Class R-6(1) | | | Investor
Class | | | Institutional
Class | | | Retirement
Class R-3 | | | Retirement
Class R-6(1) | |
In-Retirement Fund | | | 0.33 | % | | | | | | | 0.58 | % | | | (0.07 | )% | | | 0.98 | % | | | | | | | 1.23 | % | | | 0.58 | % |
2015 Fund | | | 0.33 | | | | | | | | 0.58 | | | | (0.07 | ) | | | 1.00 | | | | | | | | 1.25 | | | | 0.60 | |
2020 Fund | | | 0.33 | | | | | | | | 0.58 | | | | (0.07 | ) | | | 1.03 | | | | | | | | 1.28 | | | | 0.63 | |
2025 Fund | | | 0.33 | | | | | | | | 0.58 | | | | (0.07 | ) | | | 1.04 | | | | | | | | 1.29 | | | | 0.64 | |
2030 Fund | | | 0.37 | | | | | | | | 0.62 | | | | (0.03 | ) | | | 1.09 | | | | | | | | 1.34 | | | | 0.69 | |
2035 Fund | | | 0.37 | | | | | | | | 0.62 | | | | (0.03 | ) | | | 1.09 | | | | | | | | 1.34 | | | | 0.69 | |
2040 Fund | | | 0.36 | | | | | | | | 0.61 | | | | (0.04 | ) | | | 1.08 | | | | | | | | 1.33 | | | | 0.68 | |
2045 Fund | | | 0.36 | | | | | | | | 0.61 | | | | (0.04 | ) | | | 1.06 | | | | | | | | 1.31 | | | | 0.66 | |
2050 Fund | | | 0.36 | | | | | | | | 0.61 | | | | (0.04 | ) | | | 1.06 | | | | | | | | 1.31 | | | | 0.66 | |
2055 Fund | | | 0.36 | | | | | | | | 0.61 | | | | (0.04 | ) | | | 1.06 | | | | | | | | 1.31 | | | | 0.66 | |
Conservative Allocation Fund | | | 0.33 | | | | 0.08 | % | | | 0.58 | | | | (0.07 | ) | | | 1.02 | | | | 0.77 | % | | | 1.27 | | | | 0.62 | |
Moderate Allocation Fund | | | 0.30 | | | | 0.05 | | | | 0.55 | | | | (0.10 | ) | | | 0.98 | | | | 0.73 | | | | 1.23 | | | | 0.58 | |
Balanced Allocation Fund | | | 0.33 | | | | 0.08 | | | | 0.58 | | | | (0.07 | ) | | | 1.02 | | | | 0.77 | | | | 1.27 | | | | 0.62 | |
Growth Allocation Fund | | | 0.30 | | | | 0.05 | | | | 0.55 | | | | (0.10 | ) | | | 1.00 | | | | 0.72 | | | | 1.25 | | | | 0.60 | |
Aggressive Allocation Fund | | | 0.33 | | | | 0.08 | | | | 0.58 | | | | (0.07 | ) | | | 0.97 | | | | 0.75 | | | | 1.22 | | | | 0.57 | |
| | (1) | As a result of reimbursing expenses including acquired fund expenses, the Adviser reimbursed amounts in excess of the respective share classes operating expenses. The aggregate excess reimbursement is accounted for as “Excess expense reimbursement from investment adviser” included in investment income on the Statements of Operations. |
Shareholder Servicing Fees—Under the terms of a Shareholder Services Agreement with the Adviser, each Fund pays the Adviser at the annual rate of 0.25% of average daily net assets of the Fund’s Investor Class shares for the period. The fee paid to the Adviser is used to finance certain services for shareholders and to maintain shareholder accounts.
Distribution Services Fees—The Funds are subject to a Distribution Plan (the “Plan”) pursuant to Rule12b-1 under the Act. The Plan authorizes payments by the Fund to finance activities intended to result in the sale of its RetirementClass R-3 shares. The Plan provides that the Fund may incur distribution expenses of 0.50% of the average daily net assets of the Fund’s RetirementClass R-3 shares.
Administration Fees—Each Fund pays the Adviser at the annual rate of 0.15% of average daily net assets per class (except the Retirement classR-6, which does not pay an Administration Fee).
For the year ended August 31, 2018, the Funds were charged the following Administration Fees per class:
| | | | | | | | | | | | |
Fund | | Investor
Class | | | Institutional
Class | | | Retirement
Class R-3 | |
In-Retirement Fund | | $ | 4,677 | | | | | | | $ | 1,106 | |
2015 Fund | | | 509 | | | | | | | | 173 | |
2020 Fund | | | 26,123 | | | | | | | | 8,730 | |
2025 Fund | | | 1,577 | | | | | | | | 173 | |
2030 Fund | | | 27,938 | | | | | | | | 8,821 | |
2035 Fund | | | 1,162 | | | | | | | | 164 | |
2040 Fund | | | 16,327 | | | | | | | | 3,958 | |
2045 Fund | | | 1,296 | | | | | | | | 86 | |
2050 Fund | | | 12,625 | | | | | | | | 4,446 | |
2055 Fund | | | 613 | | | | | | | | 241 | |
Conservative Allocation Fund | | | 21,540 | | | $ | 11,758 | | | | 2,052 | |
Moderate Allocation Fund | | | 11,720 | | | | 9,821 | | | | 20,376 | |
Balanced Allocation Fund | | | 149,970 | | | | 71,058 | | | | 30,453 | |
Growth Allocation Fund | | | 24,109 | | | | 13,196 | | | | 27,379 | |
Aggressive Allocation Fund | | | 56,843 | | | | 21,722 | | | | 25,768 | |
Custodian Fees—BMO Harris Bank N.A. (“BMO Harris”) is the Funds’ custodian. BMO Harris receives fees based on 0.0050% on the first $10 billion average daily net assets, based on the collective net assets of the Corporation custodied by BMO Harris, and 0.0025% on all assets in excess of $10 billion.
Investments in Affiliated Issuers—An affiliated issuer is an entity in which the Fund has ownership of at least 5% of the voting securities or any investment in the BMO Funds. Issuers that are affiliates of the Fund atperiod-end are noted in the Fund’s Schedule of Investments. Additional security purchases and the reduction of certain securities shares outstanding of existing portfolio holdings that were not considered affiliated in prior years may result in the Funds owning in excess of 5% of the outstanding shares atperiod-end. The table below reflects transactions during the period with entities that are affiliates as of August 31, 2018. Please refer to the Schedule of Investments for which class each Fund’s underlying affiliated issuer represents.
51
| | |
| | |
| Notes to Financial Statements (continued) | | |
| | | | | | | | | | | | | | | | | | | | | | | | | | | | | | | | |
Fund/Security Description | | Value,
Beginning
of Period | | | Purchases | | | Sales
Proceeds | | | Change In
Unrealized
Appreciation
(Depreciation) | | | Net
Realized
Gain(Loss) | | | Value, End
of Period | | | Dividends
Credited
to
Income | | | Net Realized
Gain on
Capital Gain
Distributions | |
In-Retirement Fund | | | | | | | | | | | | | | | | | | | | | | | | | | | | | | | | |
Large-Cap Funds — 8.6 % | | | | | | | | | | | | | | | | | | | | | | | | | | | | | | | | |
BMO Low Volatility Equity Fund | | $ | 402,614 | | | $ | 107,915 | | | $ | 171,076 | | | $ | 17,739 | | | $ | 18,524 | | | $ | 375,716 | | | $ | 6,424 | | | $ | 10,491 | |
BMO Dividend Income Fund | | | 284,696 | | | | 107,046 | | | | 149,261 | | | | 4,546 | | | | 16,180 | | | | 263,207 | | | | 6,314 | | | | 30,798 | |
BMOLarge-Cap Value Fund(1) | | | 420,871 | | | | 144,071 | | | | 199,320 | | | | 4,794 | | | | 17,075 | | | | 387,491 | | | | 6,413 | | | | 34,970 | |
BMOLarge-Cap Growth Fund(1) | | | 182,061 | | | | 54,751 | | | | 102,768 | | | | 21,346 | | | | 12,642 | | | | 168,032 | | | | 223 | | | | 9,628 | |
| | | | | | | | | | | | | | | | | | | | | | | | | | | | | | | | |
| | | | | | | | | | | | | | | | | | | | | | | 1,194,446 | | | | | | | | | |
Mid-Cap Funds — 1.7% | | | | | | | | | | | | | | | | | | | | | | | | | | | | | | | | |
BMOMid-Cap Growth Fund(1) | | | 75,778 | | | | 23,902 | | | | 45,426 | | | | 5,188 | | | | 10,264 | | | | 69,706 | | | | — | | | | 4,446 | |
BMOMid-Cap Value Fund(1) | | | 179,801 | | | | 56,095 | | | | 81,048 | | | | 517 | | | | 10,642 | | | | 166,007 | | | | 1,754 | | | | 7,045 | |
| | | | | | | | | | | | | | | | | | | | | | | | | | | | | | | | |
| | | | | | | | | | | | | | | | | | | | | | | 235,713 | | | | | | | | | |
Small-Cap Fund — 0.3% | | | | | | | | | | | | | | | | | | | | | | | | | | | | | | | | |
BMOSmall-Cap Growth Fund | | | 45,640 | | | | 18,833 | | | | 30,145 | | | | 1,224 | | | | 6,814 | | | | 42,366 | | | | — | | | | 4,613 | |
| | | | | | | | |
International Funds — 6.2% | | | | | | | | | | | | | | | | | | | | | | | | | | | | | | | | |
BMO LGM Emerging Markets Equity Fund | | | 237,323 | | | | 75,909 | | | | 96,794 | | | | (4,613 | ) | | | 7,245 | | | | 219,070 | | | | 1,883 | | | | — | |
BMO Pyrford International Stock Fund(1) | | | 401,797 | | | | 119,526 | | | | 151,219 | | | | ( 7,820 | ) | | | 9,068 | | | | 371,352 | | | | 10,164 | | | | — | |
BMO Disciplined International Equity Fund | | | 298,473 | | | | 100,740 | | | | 122,567 | | | | (10,432 | ) | | | 7,571 | | | | 273,785 | | | | 6,312 | | | | — | |
| | | | | | | | | | | | | | | | | | | | | | | | | | | | | | | | |
| | | | | | | | | | | | | | | | | | | | | | | 864,207 | | | | | | | | | |
Fixed Income Funds — 20.4% | | | | | | | | | | | | | | | | | | | | | | | | | | | | | | | | |
BMO High Yield Bond Fund | | | 268,504 | | | | 64,666 | | | | 74,048 | | | | (6,088 | ) | | | (3,306 | ) | | | 249,728 | | | | 14,297 | | | | — | |
BMO TCH Core Plus Bond Fund | | | 2,770,542 | | | | 756,150 | | | | 850,952 | | | | (81,250 | ) | | | (11,174 | ) | | | 2,583,316 | | | | 81,738 | | | | 2,541 | |
BMO TCH Emerging Markets Bond Fund* | | | 448,273 | | | | 67,618 | | | | 490,508 | | | | (7,616 | ) | | | (17,767 | ) | | | — | | | | 22,012 | | | | — | |
| | | | | | | | | | | | | | | | | | | | | | | | | | | | | | | | |
| | | | | | | | | | | | | | | | | | | | | | | 2,833,044 | | | | | | | | | |
Alternative Funds — 6.9% | | | | | | | | | | | | | | | | | | | | | | | | | | | | | | | | |
BMO Alternative Strategies Fund | | | 1,046,726 | | | | 309,306 | | | | 291,164 | | | | (92,020 | ) | | | (5,562 | ) | | | 967,286 | | | | — | | | | 64,872 | |
| | | | | | | | |
Short-Term Investment — 1.0% | | | | | | | | | | | | | | | | | | | | | | | | | | | | | | | | |
BMO Institutional Prime Money Market Fund | | | 144,477 | | | | 4,935,449 | | | | 4,940,502 | | | | 12 | | | | 14 | | | | 139,450 | | | | 2,184 | | | | — | |
| | | | | | | | | | | | | | | | | | | | | | | | | | | | | | | | |
Totals | | $ | 7,207,576 | | | $ | 6,941,977 | | | $ | 7,796,798 | | | $ | (154,473 | ) | | $ | 78,230 | | | $ | 6,276,512 | | | $ | 159,718 | | | $ | 169,404 | |
| | | | | | | | | | | | | | | | | | | | | | | | | | | | | | | | |
| | | | | | | | |
2015 Fund | | | | | | | | | | | | | | | | | | | | | | | | | | | | | | | | |
Large-Cap Funds — 9.8% | | | | | | | | | | | | | | | | | | | | | | | | | | | | | | | | |
BMO Low Volatility Equity Fund | | $ | 140,307 | | | $ | 31,347 | | | $ | 93,774 | | | $ | 3,863 | | | $ | 5,579 | | | $ | 87,322 | | | $ | 1,861 | | | $ | 3,095 | |
BMO Dividend Income Fund | | | 74,412 | | | | 18,056 | | | | 50,567 | | | | 1,060 | | | | 3,422 | | | | 46,383 | | | | 1,372 | | | | 6,832 | |
BMOLarge-Cap Value Fund(1) | | | 149,289 | | | | 34,874 | | | | 98,774 | | | | 1,470 | | | | 5,407 | | | | 92,266 | | | | 1,851 | | | | 10,518 | |
BMOLarge-Cap Growth Fund(1) | | | 79,310 | | | | 15,640 | | | | 57,280 | | | | 3,131 | | | | 8,806 | | | | 49,607 | | | | 81 | | | | 3,500 | |
| | | | | | | | | | | | | | | | | | | | | | | | | | | | | | | | |
| | | | | | | | | | | | | | | | | | | | | | | 275,578 | | | | | | | | | |
Mid-Cap Funds — 2.2% | | | | | | | | | | | | | | | | | | | | | | | | | | | | | | | | |
BMOMid-Cap Growth Fund(1) | | | 27,729 | | | | 5,905 | | | | 20,898 | | | | 2,534 | | | | 2,131 | | | | 17,401 | | | | — | | | | 1,351 | |
BMOMid-Cap Value Fund(1) | | | 74,407 | | | | 14,486 | | | | 46,851 | | | | 1,961 | | | | 2,268 | | | | 46,271 | | | | 695 | | | | 2,472 | |
| | | | | | | | | | | | | | | | | | | | | | | | | | | | | | | | |
| | | | | | | | | | | | | | | | | | | | | | | 63,672 | | | | | | | | | |
Small-Cap Fund — 0.5% | | | | | | | | | | | | | | | | | | | | | | | | | | | | | | | | |
BMOSmall-Cap Growth Fund | | | 23,860 | | | | 6,124 | | | | 18,221 | | | | 1,600 | | | | 1,841 | | | | 15,204 | | | | — | | | | 2,020 | |
| | | | | | | | |
International Funds — 7.4% | | | | | | | | | | | | | | | | | | | | | | | | | | | | | | | | |
BMO LGM Emerging Markets Equity Fund | | | 93,045 | | | | 27,694 | | | | 63,354 | | | | (6,836 | ) | | | 7,889 | | | | 58,438 | | | | 620 | | | | — | |
BMO Pyrford International Stock Fund(1) | | | 136,135 | | | | 28,794 | | | | 79,827 | | | | (3,733 | ) | | | 4,010 | | | | 85,379 | | | | 2,896 | | | | — | |
BMO Disciplined International Equity Fund | | | 105,317 | | | | 24,312 | | | | 64,250 | | | | (7,606 | ) | | | 7,639 | | | | 65,412 | | | | 1,870 | | | | — | |
| | | | | | | | | | | | | | | | | | | | | | | | | | | | | | | | |
| | | | | | | | | | | | | | | | | | | | | | | 209,229 | | | | | | | | | |
Fixed Income Funds — 18.1% | | | | | | | | | | | | | | | | | | | | | | | | | | | | | | | | |
BMO High Yield Bond Fund | | | 50,685 | | | | 18,996 | | | | 25,562 | | | | (1,324 | ) | | | (630 | ) | | | 42,165 | | | | 2,796 | | | | — | |
BMO TCH Core Plus Bond Fund | | | 580,093 | | | | 197,858 | | | | 289,212 | | | | (15,833 | ) | | | (4,369 | ) | | | 468,537 | | | | 17,290 | | | | 584 | |
BMO TCH Emerging Markets Bond Fund* | | | 97,638 | | | | 28,676 | | | | 120,371 | | | | (3,628 | ) | | | (2,315 | ) | | | — | | | | 5,221 | | | | — | |
| | | | | | | | | | | | | | | | | | | | | | | | | | | | | | | | |
| | | | | | | | | | | | | | | | | | | | | | | 510,702 | | | | | | | | | |
Alternative Funds — 7.4% | | | | | | | | | | | | | | | | | | | | | | | | | | | | | | | | |
BMO Alternative Strategies Fund | | | 261,859 | | | | 110,016 | | | | 136,269 | | | | (19,775 | ) | | | (5,744 | ) | | | 210,087 | | | | — | | | | 17,685 | |
| | | | | | | | |
Short-Term Investment — 0.9% | | | | | | | | | | | | | | | | | | | | | | | | | | | | | | | | |
BMO Institutional Prime Money Market Fund | | | 39,798 | | | | 920,831 | | | | 935,495 | | | | 3 | | | | (1 | ) | | | 25,136 | | | | 526 | | | | — | |
| | | | | | | | | | | | | | | | | | | | | | | | | | | | | | | | |
Totals | | $ | 1,933,884 | | | $ | 1,483,609 | | | $ | 2,100,705 | | | $ | (43,113 | ) | | $ | 35,933 | | | $ | 1,309,608 | | | $ | 37,079 | | | $ | 48,057 | |
| | | | | | | | | | | | | | | | | | | | | | | | | | | | | | | | |
52
| | | | | | | | | | | | | | | | | | | | | | | | | | | | | | | | |
Fund/Security Description | | Value,
Beginning
of Period | | | Purchases | | | Sales
Proceeds | | | Change In
Unrealized
Appreciation
(Depreciation) | | | Net
Realized
Gain(Loss) | | | Value, End
of Period | | | Dividends
Credited
to
Income | | | Net Realized
Gain on
Capital Gain
Distributions | |
2020 Fund | | | | | | | | | | | | | | | | | | | | | | | | | | | | | | | | |
Large-Cap Funds — 13.0% | | | | | | | | | | | | | | | | | | | | | | | | | | | | | | | | |
BMO Low Volatility Equity Fund | | $ | 3,364,618 | | | $ | 673,835 | | | $ | 1,096,799 | | | $ | 237,286 | | | $ | 66,823 | | | $ | 3,245,763 | | | $ | 55,029 | | | $ | 88,504 | |
BMO Dividend Income Fund | | | 1,453,988 | | | | 375,133 | | | | 543,851 | | | | 38,879 | | | | 64,250 | | | | 1,388,399 | | | | 32,789 | | | | 158,235 | |
BMOLarge-Cap Value Fund(1) | | | 3,551,516 | | | | 1,205,388 | | | | 1,540,930 | | | | 82,690 | | | | 95,199 | | | | 3,393,863 | | | | 55,471 | | | | 298,019 | |
BMOLarge-Cap Growth Fund(1) | | | 2,116,554 | | | | 415,851 | | | | 918,732 | | | | 273,460 | | | | 125,101 | | | | 2,012,234 | | | | 2,626 | | | | 113,136 | |
| | | | | | | | | | | | | | | | | | | | | | | | | | | | | | | | |
| | | | | | | | | | | | | | | | | | | | | | | 10,040,259 | | | | | | | | | |
Mid-Cap Funds — 4.2% | | | | | | | | | | | | | | | | | | | | | | | | | | | | | | | | |
BMOMid-Cap Growth Fund(1) | | | 1,474,968 | | | | 309,066 | | | | 687,958 | | | | 211,815 | | | | 88,008 | | | | 1,395,899 | | | | — | | | | 86,797 | |
BMOMid-Cap Value Fund(1) | | | 1,945,785 | | | | 388,224 | | | | 595,467 | | | | 84,567 | | | | 31,023 | | | | 1,854,132 | | | | 18,836 | | | | 76,419 | |
| | | | | | | | | | | | | | | | | | | | | | | | | | | | | | | | |
| | | | | | | | | | | | | | | | | | | | | | | 3,250,031 | | | | | | | | | |
Small-Cap Fund — 1.0% | | | | | | | | | | | | | | | | | | | | | | | | | | | | | | | | |
BMOSmall-Cap Growth Fund | | | 807,054 | | | | 221,435 | | | | 395,186 | | | | 65,646 | | | | 78,013 | | | | 776,962 | | | | — | | | | 83,410 | |
| | | | | | | | |
International Funds — 11.0% | | | | | | | | | | | | | | | | | | | | | | | | | | | | | | | | |
BMO LGM Emerging Markets Equity Fund | | | 2,725,130 | | | | 814,854 | | | | 947,636 | | | | (3,157 | ) | | | 26,822 | | | | 2,616,013 | | | | 21,706 | | | | — | |
BMO Pyrford International Stock Fund(1) | | | 3,618,021 | | | | 840,220 | | | | 1,023,779 | | | | (47,302 | ) | | | 52,290 | | | | 3,439,450 | | | | 91,869 | | | | — | |
BMO Disciplined International Equity Fund | | | 2,595,810 | | | | 701,804 | | | | 820,881 | | | | (69,412 | ) | | | 34,179 | | | | 2,441,500 | | | | 54,771 | | | | — | |
| | | | | | | | | | | | | | | | | | | | | | | | | | | | | | | | |
| | | | | | | | | | | | | | | | | | | | | | | 8,496,963 | | | | | | | | | |
Fixed Income Funds — 11.6% | | | | | | | | | | | | | | | | | | | | | | | | | | | | | | | | |
BMO High Yield Bond Fund | | | 729,037 | | | | 188,206 | | | | 196,861 | | | | (13,069 | ) | | | (13,114 | ) | | | 694,199 | | | | 38,487 | | | | — | |
BMO TCH Core Plus Bond Fund | | | 8,545,697 | | | | 2,468,236 | | | | 2,472,924 | | | | (258,155 | ) | | | (29,595 | ) | | | 8,253,259 | | | | 231,441 | | | | 7,927 | |
BMO TCH Emerging Markets Bond Fund* | | | 1,203,232 | | | | 211,402 | | | | 1,345,498 | | | | (22,689 | ) | | | (46,447 | ) | | | — | | | | 59,585 | | | | — | |
| | | | | | | | | | | | | | | | | | | | | | | | | | | | | | | | |
| | | | | | | | | | | | | | | | | | | | | | | 8,947,458 | | | | | | | | | |
Alternative Funds — 6.3% | | | | | | | | | | | | | | | | | | | | | | | | | | | | | | | | |
BMO Alternative Strategies Fund | | | 5,080,327 | | | | 1,336,401 | | | | 1,072,157 | | | | (459,338 | ) | | | (25,837 | ) | | | 4,859,396 | | | | — | | | | 316,628 | |
| | | | | | | | |
Short-Term Investment — 0.8% | | | | | | | | | | | | | | | | | | | | | | | | | | | | | | | | |
BMO Institutional Prime Money Market Fund | | | 720,855 | | | | 21,838,883 | | | | 21,926,001 | | | | — | | | | 175 | | | | 633,912 | | | | 10,380 | | | | — | |
| | | | | | | | | | | | | | | | | | | | | | | | | | | | | | | | |
Totals | | $ | 39,932,592 | | | $ | 31,988,938 | | | $ | 35,584,660 | | | $ | 121,221 | | | $ | 546,890 | | | $ | 37,004,981 | | | $ | 672,990 | | | $ | 1,229,075 | |
| | | | | | | | | | | | | | | | | | | | | | | | | | | | | | | | |
| | | | | | | | |
2025 Fund | | | | | | | | | | | | | | | | | | | | | | | | | | | | | | | | |
Large-Cap Funds — 11.8% | | | | | | | | | | | | | | | | | | | | | | | | | | | | | | | | |
BMO Low Volatility Equity Fund | | $ | 662,025 | | | $ | 289,131 | | | $ | 200,175 | | | $ | 68,134 | | | $ | 485 | | | $ | 819,600 | | | $ | 11,817 | | | $ | 17,584 | |
BMO Dividend Income Fund | | | 277,430 | | | | 134,888 | | | | 91,901 | | | | 21,438 | | | | 2,102 | | | | 343,957 | | | | 6,880 | | | | 30,764 | |
BMOLarge-Cap Value Fund(1) | | | 1,025,354 | | | | 493,504 | | | | 309,910 | | | | 55,784 | | | | 2,542 | | | | 1,267,274 | | | | 17,728 | | | | 87,515 | |
BMOLarge-Cap Growth Fund(1) | | | 557,727 | | | | 251,068 | | | | 226,795 | | | | 111,319 | | | | 9,365 | | | | 702,684 | | | | 707 | | | | 30,455 | |
| | | | | | | | | | | | | | | | | | | | | | | | | | | | | | | | |
| | | | | | | | | | | | | | | | | | | | | | | 3,133,515 | | | | | | | | | |
Mid-Cap Funds — 5.7% | | | | | | | | | | | | | | | | | | | | | | | | | | | | | | | | |
BMOMid-Cap Growth Fund(1) | | | 601,374 | | | | 250,174 | | | | 234,931 | | | | 141,728 | | | | (2,473 | ) | | | 755,872 | | | | — | | | | 36,347 | |
BMOMid-Cap Value Fund(1) | | | 619,875 | | | | 278,709 | | | | 174,589 | | | | 60,277 | | | | (19,256 | ) | | | 765,016 | | | | 6,165 | | | | 24,857 | |
| | | | | | | | | | | | | | | | | | | | | | | | | | | | | | | | |
| | | | | | | | | | | | | | | | | | | | | | | 1,520,888 | | | | | | | | | |
Small-Cap Fund — 1.8% | | | | | | | | | | | | | | | | | | | | | | | | | | | | | | | | |
BMOSmall-Cap Growth Fund | | | 385,873 | | | | 201,112 | | | | 180,978 | | | | 74,191 | | | | 7,582 | | | | 487,780 | | | | — | | | | 40,418 | |
| | | | | | | | |
International Funds — 11.9% | | | | | | | | | | | | | | | | | | | | | | | | | | | | | | | | |
BMO LGM Emerging Markets Equity Fund | | | 936,330 | | | | 524,225 | | | | 300,186 | | | | (5,895 | ) | | | 815 | | | | 1,155,289 | | | | 7,562 | | | | — | |
BMO Pyrford International Stock Fund(1) | | | 1,030,062 | | | | 513,054 | | | | 272,883 | | | | (2,153 | ) | | | 8 | | | | 1,268,088 | | | | 26,380 | | | | — | |
BMO Disciplined International Equity Fund | | | 580,360 | | | | 297,618 | | | | 155,865 | | | | (18,996 | ) | | | 3,513 | | | | 706,630 | | | | 12,441 | | | | — | |
| | | | | | | | | | | | | | | | | | | | | | | | | | | | | | | | |
| | | | | | | | | | | | | | | | | | | | | | | 3,130,007 | | | | | | | | | |
Fixed Income Funds — 8.3% | | | | | | | | | | | | | | | | | | | | | | | | | | | | | | | | |
BMO High Yield Bond Fund | | | 149,180 | | | | 87,848 | | | | 46,817 | | | | (4,732 | ) | | | (1,111 | ) | | | 184,368 | | | | 8,785 | | | | — | |
BMO TCH Core Plus Bond Fund | | | 1,638,946 | | | | 1,048,712 | | | | 605,153 | | | | (51,054 | ) | | | (6,983 | ) | | | 2,024,468 | | | | 48,824 | | | | 1,536 | |
BMO TCH Emerging Markets Bond Fund* | | | 234,389 | | | | 74,493 | | | | 295,062 | | | | (5,886 | ) | | | (7,934 | ) | | | — | | | | 11,783 | | | | — | |
| | | | | | | | | | | | | | | | | | | | | | | | | | | | | | | | |
| | | | | | | | | | | | | | | | | | | | | | | 2,208,836 | | | | | | | | | |
Alternative Funds — 5.5% | | | | | | | | | | | | | | | | | | | | | | | | | | | | | | | | |
BMO Alternative Strategies Fund | | | 1,195,363 | | | | 678,884 | | | | 283,898 | | | | (116,424 | ) | | | (7,897 | ) | | | 1,466,028 | | | | — | | | | 75,766 | |
| | | | | | | | |
Short-Term Investment — 1.1% | | | | | | | | | | | | | | | | | | | | | | | | | | | | | | | | |
BMO Institutional Prime Money Market Fund | | | 246,901 | | | | 7,372,532 | | | | 7,334,947 | | | | 27 | | | | 136 | | | | 284,649 | | | | 3,781 | | | | — | |
| | | | | | | | | | | | | | | | | | | | | | | | | | | | | | | | |
Totals | | $ | 10,141,189 | | | $ | 12,495,952 | | | $ | 10,714,090 | | | $ | 327,758 | | | $ | (19,106 | ) | | $ | 12,231,703 | | | $ | 162,853 | | | $ | 345,242 | |
| | | | | | | | | | | | | | | | | | | | | | | | | | | | | | | | |
53
| | |
| | |
| Notes to Financial Statements (continued) | | |
| | | | | | | | | | | | | | | | | | | | | | | | | | | | | | | | |
Fund/Security Description | | Value,
Beginning
of Period | | | Purchases | | | Sales
Proceeds | | | Change In
Unrealized
Appreciation
(Depreciation) | | | Net
Realized
Gain(Loss) | | | Value, End
of Period | | | Dividends
Credited
to
Income | | | Net Realized
Gain on
Capital Gain
Distributions | |
2030 Fund | | | | | | | | | | | | | | | | | | | | | | | | | | | | | | | | |
Large-Cap Funds — 13.1% | | | | | | | | | | | | | | | | | | | | | | | | | | | | | | | | |
BMO Low Volatility Equity Fund | | $ | 3,205,702 | | | $ | 799,502 | | | $ | 812,069 | | | $ | 296,964 | | | $ | 11,687 | | | $ | 3,501,786 | | | $ | 54,757 | | | $ | 87,389 | |
BMO Dividend Income Fund | | | 1,300,301 | | | | 406,900 | | | | 409,147 | | | | 76,384 | | | | 20,002 | | | | 1,394,440 | | | | 30,483 | | | | 145,418 | |
BMOLarge-Cap Value Fund(1) | | | 5,097,536 | | | | 1,431,054 | | | | 1,311,902 | | | | 227,507 | | | | 28,430 | | | | 5,472,625 | | | | 83,172 | | | | 441,870 | |
BMOLarge-Cap Growth Fund(1) | | | 2,516,757 | | | | 675,412 | | | | 978,256 | | | | 431,147 | | | | 73,111 | | | | 2,718,171 | | | | 3,186 | | | | 137,235 | |
| | | | | | | | | | | | | | | | | | | | | | | | | | | | | | | | |
| | | | | | | | | | | | | | | | | | | | | | | 13,087,022 | | | | | | | | | |
Mid-Cap Funds — 6.4% | | | | | | | | | | | | | | | | | | | | | | | | | | | | | | | | |
BMOMid-Cap Growth Fund(1) | | | 3,010,833 | | | | 776,582 | | | | 1,225,328 | | | | 611,178 | | | | 34,241 | | | | 3,207,506 | | | | — | | | | 180,032 | |
BMOMid-Cap Value Fund(1) | | | 2,971,588 | | | | 786,522 | | | | 753,658 | | | | 179,333 | | | | (866 | ) | | | 3,182,919 | | | | 28,980 | | | | 120,640 | |
| | | | | | | | | | | | | | | | | | | | | | | | | | | | | | | | |
| | | | | | | | | | | | | | | | | | | | | | | 6,390,425 | | | | | | | | | |
Small-Cap Fund — 2.1% | | | | | | | | | | | | | | | | | | | | | | | | | | | | | | | | |
BMOSmall-Cap Growth Fund | | | 1,963,556 | | | | 683,223 | | | | 884,399 | | | | 306,666 | | | | 63,122 | | | | 2,132,168 | | | | — | | | | 204,552 | |
| | | | | | | | |
International Funds — 13.0% | | | | | | | | | | | | | | | | | | | | | | | | | | | | | | | | |
BMO LGM Emerging Markets Equity Fund | | | 4,489,577 | | | | 1,678,632 | | | | 1,361,442 | | | | 3,208 | | | | 13,856 | | | | 4,823,831 | | | | 37,072 | | | | — | |
BMO Pyrford International Stock Fund(1) | | | 4,969,772 | | | | 1,554,858 | | | | 1,180,659 | | | | (353 | ) | | | (3,584 | ) | | | 5,340,034 | | | | 130,199 | | | | — | |
BMO Disciplined International Equity Fund | | | 2,689,172 | | | | 886,222 | | | | 667,298 | | | | (63,876 | ) | | | 10,212 | | | | 2,854,432 | | | | 58,535 | | | | — | |
| | | | | | | | | | | | | | | | | | | | | | | | | | | | | | | | |
| | | | | | | | | | | | | | | | | | | | | | | 13,018,297 | | | | | | | | | |
Fixed Income Funds — 5.6% | | | | | | | | | | | | | | | | | | | | | | | | | | | | | | | | |
BMO High Yield Bond Fund | | | 459,077 | | | | 181,064 | | | | 123,610 | | | | (10,344 | ) | | | (7,422 | ) | | | 498,765 | | | | 25,772 | | | | — | |
BMO TCH Core Plus Bond Fund | | | 4,656,159 | | | | 1,994,673 | | | | 1,391,164 | | | | (146,825 | ) | | | (19,936 | ) | | | 5,092,907 | | | | 133,184 | | | | 4,463 | |
BMO TCH Emerging Markets Bond Fund* | | | 644,966 | | | | 168,398 | | | | 774,689 | | | | (13,151 | ) | | | (25,524 | ) | | | — | | | | 32,892 | | | | — | |
| | | | | | | | | | | | | | | | | | | | | | | | | | | | | | | | |
| | | | | | | | | | | | | | | | | | | | | | | 5,591,672 | | | | | | | | | |
Alternative Funds — 5.2% | | | | | | | | | | | | | | | | | | | | | | | | | | | | | | | | |
BMO Alternative Strategies Fund | | | 4,793,501 | | | | 1,875,286 | | | | 1,015,643 | | | | (446,757 | ) | | | (39,952 | ) | | | 5,166,435 | | | | — | | | | 307,913 | |
| | | | | | | | |
Short-Term Investment — 1.0% | | | | | | | | | | | | | | | | | | | | | | | | | | | | | | | | |
BMO Institutional Prime Money Market Fund | | | 1,008,652 | | | | 21,688,552 | | | | 21,700,807 | | | | (2 | ) | | | 110 | | | | 996,505 | | | | 13,865 | | | | — | |
| | | | | | | | | | | | | | | | | | | | | | | | | | | | | | | | |
Totals | | $ | 43,777,149 | | | $ | 35,586,880 | | | $ | 34,590,071 | | | $ | 1,451,079 | | | $ | 157,487 | | | $ | 46,382,524 | | | $ | 632,097 | | | $ | 1,629,512 | |
| | | | | | | | | | | | | | | | | | | | | | | | | | | | | | | | |
| | | | | | | | |
2035 Fund | | | | | | | | | | | | | | | | | | | | | | | | | | | | | | | | |
Large-Cap Funds — 14.1% | | | | | | | | | | | | | | | | | | | | | | | | | | | | | | | | |
BMO Low Volatility Equity Fund | | $ | 495,147 | | | $ | 169,822 | | | $ | 124,229 | | | $ | 47,700 | | | $ | 810 | | | $ | 589,250 | | | $ | 8,287 | | | $ | 12,787 | |
BMO Dividend Income Fund | | | 195,316 | | | | 76,452 | | | | 55,166 | | | | 13,740 | | | | 1,970 | | | | 232,312 | | | | 4,549 | | | | 21,056 | |
BMOLarge-Cap Value Fund(1) | | | 768,994 | | | | 311,573 | | | | 210,217 | | | | 36,889 | | | | 6,381 | | | | 913,620 | | | | 12,441 | | | | 63,808 | |
BMOLarge-Cap Growth Fund(1) | | | 379,575 | | | | 129,272 | | | | 130,460 | | | | 69,153 | | | | 8,260 | | | | 455,800 | | | | 468 | | | | 20,149 | |
| | | | | | | | | | | | | | | | | | | | | | | | | | | | | | | | |
| | | | | | | | | | | | | | | | | | | | | | | 2,190,982 | | | | | | | | | |
Mid-Cap Funds — 7.1% | | | | | | | | | | | | | | | | | | | | | | | | | | | | | | | | |
BMOMid-Cap Growth Fund(1) | | | 458,679 | | | | 161,461 | | | | 172,835 | | | | 94,294 | | | | 6,395 | | | | 547,994 | | | | — | | | | 26,950 | |
BMOMid-Cap Value Fund(1) | | | 469,515 | | | | 182,588 | | | | 125,630 | | | | 28,066 | | | | 1,925 | | | | 556,464 | | | | 4,533 | | | | 18,305 | |
| | | | | | | | | | | | | | | | | | | | | | | | | | | | | | | | |
| | | | | | | | | | | | | | | | | | | | | | | 1,104,458 | | | | | | | | | |
Small-Cap Fund — 2.3% | | | | | | | | | | | | | | | | | | | | | | | | | | | | | | | | |
BMOSmall-Cap Growth Fund | | | 300,849 | | | | 134,203 | | | | 132,070 | | | | 53,299 | | | | 5,851 | | | | 362,132 | | | | — | | | | 30,635 | |
| | | | | | | | |
International Funds — 14.3% | | | | | | | | | | | | | | | | | | | | | | | | | | | | | | | | |
BMO LGM Emerging Markets Equity Fund | | | 701,128 | | | | 356,388 | | | | 226,552 | | | | (4,927 | ) | | | 2,951 | | | | 828,988 | | | | 5,505 | | | | — | |
BMO Pyrford International Stock Fund(1) | | | 772,549 | | | | 319,193 | | | | 178,024 | | | | (2,551 | ) | | | 1,491 | | | | 912,658 | | | | 19,234 | | | | — | |
BMO Disciplined International Equity Fund | | | 406,586 | | | | 179,777 | | | | 97,666 | | | | (16,959 | ) | | | 6,514 | | | | 478,252 | | | | 8,473 | | | | — | |
| | | | | | | | | | | | | | | | | | | | | | | | | | | | | | | | |
| | | | | | | | | | | | | | | | | | | | | | | 2,219,898 | | | | | | | | | |
Fixed Income Funds — 3.4% | | | | | | | | | | | | | | | | | | | | | | | | | | | | | | | | |
BMO High Yield Bond Fund | | | 39,009 | | | | 23,959 | | | | 15,189 | | | | (1,220 | ) | | | (187 | ) | | | 46,372 | | | | 2,179 | | | | — | |
BMO TCH Core Plus Bond Fund | | | 402,590 | | | | 245,423 | | | | 156,270 | | | | (12,455 | ) | | | (944 | ) | | | 478,344 | | | | 12,511 | | | | 367 | |
BMO TCH Emerging Markets Bond Fund* | | | 52,004 | | | | 14,454 | | | | 63,506 | | | | (1,831 | ) | | | (1,121 | ) | | | — | | | | 2,538 | | | | — | |
| | | | | | | | | | | | | | | | | | | | | | | | | | | | | | | | |
| | | | | | | | | | | | | | | | | | | | | | | 524,716 | | | | | | | | | |
Alternative Funds — 4.6% | | | | | | | | | | | | | | | | | | | | | | | | | | | | | | | | |
BMO Alternative Strategies Fund | | | 599,109 | | | | 329,691 | | | | 160,086 | | | | (55,587 | ) | | | (3,550 | ) | | | 709,577 | | | | — | | | | 36,916 | |
| | | | | | | | |
Short-Term Investment — 1.0% | | | | | | | | | | | | | | | | | | | | | | | | | | | | | | | | |
BMO Institutional Prime Money Market Fund | | | 58,671 | | | | 3,784,098 | | | | 3,683,497 | | | | 29 | | | | 89 | | | | 159,390 | | | | 2,391 | | | | — | |
| | | | | | | | | | | | | | | | | | | | | | | | | | | | | | | | |
Totals | | $ | 6,099,721 | | | $ | 6,418,354 | | | $ | 5,531,397 | | | $ | 247,640 | | | $ | 36,835 | | | $ | 7,271,153 | | | $ | 83,109 | | | $ | 230,973 | |
| | | | | | | | | | | | | | | | | | | | | | | | | | | | | | | | |
54
| | | | | | | | | | | | | | | | | | | | | | | | | | | | | | | | |
Fund/Security Description | | Value,
Beginning
of Period | | | Purchases | | | Sales
Proceeds | | | Change In
Unrealized
Appreciation
(Depreciation) | | | Net
Realized
Gain(Loss) | | | Value, End
of Period | | | Dividends
Credited
to
Income | | | Net Realized
Gain on
Capital Gain
Distributions | |
2040 Fund | | | | | | | | | | | | | | | | | | | | | | | | | | | | | | | | |
Large-Cap Funds — 14.7% | | | | | | | | | | | | | | | | | | | | | | | | | | | | | | | | |
BMO Low Volatility Equity Fund | | $ | 2,071,223 | | | $ | 686,340 | | | $ | 556,436 | | | $ | 193,526 | | | $ | 18,823 | | | $ | 2,413,476 | | | $ | 36,225 | | | $ | 54,743 | |
BMO Dividend Income Fund | | | 735,126 | | | | 259,619 | | | | 214,555 | | | | 39,874 | | | | 20,864 | | | | 840,928 | | | | 17,654 | | | | 79,942 | |
BMOLarge-Cap Value Fund(1) | | | 3,252,794 | | | | 1,135,097 | | | | 849,461 | | | | 129,022 | | | | 52,893 | | | | 3,720,345 | | | | 54,546 | | | | 272,766 | |
BMOLarge-Cap Growth Fund(1) | | | 1,637,988 | | | | 499,321 | | | | 601,004 | | | | 305,122 | | | | 40,591 | | | | 1,882,018 | | | | 2,034 | | | | 87,623 | |
| | | | | | | | | | | | | | | | | | | | | | | | | | | | | | | | |
| | | | | | | | | | | | | | | | | | | | | | | 8,856,767 | | | | | | | | | |
Mid-Cap Funds — 7.1% | | | | | | | | | | | | | | | | | | | | | | | | | | | | | | | | |
BMOMid-Cap Growth Fund(1) | | | 1,861,764 | | | | 494,497 | | | | 659,025 | | | | 390,613 | | | | 27,779 | | | | 2,115,628 | | | | — | | | | 109,626 | |
BMOMid-Cap Value Fund(1) | | | 1,897,246 | | | | 597,400 | | | | 455,769 | | | | 112,733 | | | | 7,796 | | | | 2,159,406 | | | | 18,274 | | | | 74,451 | |
| | | | | | | | | | | | | | | | | | | | | | | | | | | | | | | | |
| | | | | | | | | | | | | | | | | | | | | | | 4,275,034 | | | | | | | | | |
Small-Cap Fund — 2.4% | | | | | | | | | | | | | | | | | | | | | | | | | | | | | | | | |
BMOSmall-Cap Growth Fund | | | 1,268,690 | | | | 435,249 | | | | 493,655 | | | | 216,380 | | | | 42,865 | | | | 1,469,529 | | | | — | | | | 130,008 | |
| | | | | | | | |
International Funds — 14.8% | | | | | | | | | | | | | | | | | | | | | | | | | | | | | | | | |
BMO LGM Emerging Markets Equity Fund | | | 2,959,059 | | | | 1,393,954 | | | | 964,371 | | | | (3,067 | ) | | | (1,674 | ) | | | 3,383,901 | | | | 23,638 | | | | — | |
BMO Pyrford International Stock Fund(1) | | | 3,183,635 | | | | 1,208,773 | | | | 747,677 | | | | (4,485 | ) | | | (2,498 | ) | | | 3,637,748 | | | | 80,894 | | | | — | |
BMO Disciplined International Equity Fund | | | 1,685,537 | | | | 613,983 | | | | 359,835 | | | | (44,448 | ) | | | 4,149 | | | | 1,899,386 | | | | 35,579 | | | | — | |
| | | | | | | | | | | | | | | | | | | | | | | | | | | | | | | | |
| | | | | | | | | | | | | | | | | | | | | | | 8,921,035 | | | | | | | | | |
Fixed Income Funds — 1.9% | | | | | | | | | | | | | | | | | | | | | | | | | | | | | | | | |
BMO High Yield Bond Fund | | | 103,817 | | | | 51,641 | | | | 31,042 | | | | (1,999 | ) | | | (2,104 | ) | | | 120,313 | | | | 5,595 | | | | — | |
BMO TCH Core Plus Bond Fund | | | 880,066 | | | | 467,927 | | | | 292,367 | | | | (28,321 | ) | | | (3,521 | ) | | | 1,023,784 | | | | 28,872 | | | | 818 | |
BMO TCH Emerging Markets Bond Fund* | | | 156,274 | | | | 49,498 | | | | 196,510 | | | | (3,203 | ) | | | (6,059 | ) | | | — | | | | 7,798 | | | | — | |
| | | | | | | | | | | | | | | | | | | | | | | | | | | | | | | | |
| | | | | | | | | | | | | | | | | | | | | | | 1,144,097 | | | | | | | | | |
Alternative Funds — 4.2% | | | | | | | | | | | | | | | | | | | | | | | | | | | | | | | | |
BMO Alternative Strategies Fund | | | 2,193,574 | | | | 1,025,426 | | | | 478,228 | | | | (209,807 | ) | | | (14,463 | ) | | | 2,516,502 | | | | — | | | | 137,125 | |
| | | | | | | | |
Short-Term Investment — 1.0% | | | | | | | | | | | | | | | | | | | | | | | | | | | | | | | | |
BMO Institutional Prime Money Market Fund | | | 533,274 | | | | 11,667,969 | | | | 11,608,329 | | | | — | | | | 186 | | | | 593,100 | | | | 9,143 | | | | — | |
| | | | | | | | | | | | | | | | | | | | | | | | | | | | | | | | |
Totals | | $ | 24,420,067 | | | $ | 20,586,694 | | | $ | 18,508,264 | | | $ | 1,091,940 | | | $ | 185,627 | | | $ | 27,776,064 | | | $ | 320,252 | | | $ | 947,102 | |
| | | | | | | | | | | | | | | | | | | | | | | | | | | | | | | | |
| | | | | | | | |
2045 Fund | | | | | | | | | | | | | | | | | | | | | | | | | | | | | | | | |
Large-Cap Funds — 14.8% | | | | | | | | | | | | | | | | | | | | | | | | | | | | | | | | |
BMO Low Volatility Equity Fund | | $ | 314,892 | | | $ | 206,935 | | | $ | 102,744 | | | $ | 33,650 | | | $ | (281 | ) | | $ | 452,452 | | | $ | 5,443 | | | $ | 7,934 | |
BMO Dividend Income Fund | | | 110,360 | | | | 76,208 | | | | 38,891 | | | | 9,602 | | | | 370 | | | | 157,649 | | | | 2,657 | | | | 11,585 | |
BMOLarge-Cap Value Fund(1) | | | 498,822 | | | | 345,847 | | | | 166,486 | | | | 28,537 | | | | 1,983 | | | | 708,703 | | | | 8,343 | | | | 40,165 | |
BMOLarge-Cap Growth Fund(1) | | | 246,732 | | | | 151,685 | | | | 99,839 | | | | 51,486 | | | | 2,764 | | | | 352,828 | | | | 295 | | | | 12,698 | |
| | | | | | | | | | | | | | | | | | | | | | | | | | | | | | | | |
| | | | | | | | | | | | | | | | | | | | | | | 1,671,632 | | | | | | | | | |
Mid-Cap Funds — 7.2% | | | | | | | | | | | | | | | | | | | | | | | | | | | | | | | | |
BMOMid-Cap Growth Fund(1) | | | 287,401 | | | | 179,895 | | | | 126,790 | | | | 65,049 | | | | 2,398 | | | | 407,953 | | | | — | | | | 16,341 | |
BMOMid-Cap Value Fund(1) | | | 284,690 | | | | 191,623 | | | | 90,054 | | | | 18,949 | | | | (381 | ) | | | 404,827 | | | | 2,754 | | | | 10,790 | |
| | | | | | | | | | | | | | | | | | | | | | | | | | | | | | | | |
| | | | | | | | | | | | | | | | | | | | | | | 812,780 | | | | | | | | | |
Small-Cap Fund — 2.5% | | | | | | | | | | | | | | | | | | | | | | | | | | | | | | | | |
BMOSmall-Cap Growth Fund | | | 198,946 | | | | 151,899 | | | | 107,404 | | | | 40,710 | | | | 2,815 | | | | 286,966 | | | | — | | | | 19,630 | |
| | | | | | | | |
International Funds — 15.1% | | | | | | | | | | | | | | | | | | | | | | | | | | | | | | | | |
BMO LGM Emerging Markets Equity Fund | | | 463,592 | | | | 387,202 | | | | 187,868 | | | | (5,728 | ) | | | (540 | ) | | | 656,658 | | | | 3,546 | | | | — | |
BMO Pyrford International Stock Fund(1) | | | 489,469 | | | | 371,878 | | | | 166,741 | | | | (2,305 | ) | | | 857 | | | | 693,158 | | | | 11,915 | | | | — | |
BMO Disciplined International Equity Fund | | | 253,000 | | | | 191,929 | | | | 79,651 | | | | (12,735 | ) | | | 3,548 | | | | 356,091 | | | | 5,156 | | | | — | |
| | | | | | | | | | | | | | | | | | | | | | | | | | | | | | | | |
| | | | | | | | | | | | | | | | | | | | | | | 1,705,907 | | | | | | | | | |
Fixed Income Funds — 2.0% | | | | | | | | | | | | | | | | | | | | | | | | | | | | | | | | |
BMO High Yield Bond Fund | | | 15,707 | | | | 15,599 | | | | 8,165 | | | | (445 | ) | | | (141 | ) | | | 22,555 | | | | 922 | | | | — | |
BMO TCH Core Plus Bond Fund | | | 141,038 | | | | 136,789 | | | | 69,861 | | | | (4,112 | ) | | | (637 | ) | | | 203,217 | | | | 4,625 | | | | 126 | |
BMO TCH Emerging Markets Bond Fund* | | | 15,718 | | | | 5,356 | | | | 20,176 | | | | (452 | ) | | | (446 | ) | | | — | | | | 754 | | | | — | |
| | | | | | | | | | | | | | | | | | | | | | | | | | | | | | | | |
| | | | | | | | | | | | | | | | | | | | | | | 225,772 | | | | | | | | | |
Alternative Funds — 3.5% | | | | | | | | | | | | | | | | | | | | | | | | | | | | | | | | |
BMO Alternative Strategies Fund | | | 275,277 | | | | 242,795 | | | | 96,639 | | | | (25,614 | ) | | | (2,679 | ) | | | 393,140 | | | | — | | | | 16,559 | |
| | | | | | | | |
Short-Term Investment — 1.0% | | | | | | | | | | | | | | | | | | | | | | | | | | | | | | | | |
BMO Institutional Prime Money Market Fund | | | 78,288 | | | | 4,431,268 | | | | 4,402,526 | | | | 7 | | | | 189 | | | | 107,226 | | | | 1,763 | | | | — | |
| | | | | | | | | | | | | | | | | | | | | | | | | | | | | | | | |
Totals | | $ | 3,673,932 | | | $ | 7,086,908 | | | $ | 5,763,835 | | | $ | 196,599 | | | $ | 9,819 | | | $ | 5,203,423 | | | $ | 48,173 | | | $ | 135,828 | |
| | | | | | | | | | | | | | | | | | | | | | | | | | | | | | | | |
55
| | |
| | |
| Notes to Financial Statements (continued) | | |
| | | | | | | | | | | | | | | | | | | | | | | | | | | | | | | | |
Fund/Security Description | | Value,
Beginning
of Period | | | Purchases | | | Sales
Proceeds | | | Change In
Unrealized
Appreciation
(Depreciation) | | | Net
Realized
Gain(Loss) | | | Value, End
of Period | | | Dividends
Credited
to
Income | | | Net Realized
Gain on
Capital Gain
Distributions | |
2050 Fund | | | | | | | | | | | | | | | | | | | | | | | | | | | | | | | | |
Large-Cap Funds — 14.8% | | | | | | | | | | | | | | | | | | | | | | | | | | | | | | | | |
BMO Low Volatility Equity Fund | | $ | 1,573,932 | | | $ | 541,019 | | | $ | 412,634 | | | $ | 149,461 | | | $ | 11,031 | | | $ | 1,862,809 | | | $ | 27,288 | | | $ | 40,329 | |
BMO Dividend Income Fund | | | 551,643 | | | | 195,935 | | | | 144,209 | | | | 28,574 | | | | 18,799 | | | | 650,742 | | | | 13,279 | | | | 58,901 | |
BMOLarge-Cap Value Fund(1) | | | 2,493,529 | | | | 870,480 | | | | 580,676 | | | | 102,805 | | | | 42,202 | | | | 2,928,340 | | | | 41,682 | | | | 204,202 | |
BMOLarge-Cap Growth Fund(1) | | | 1,233,372 | | | | 361,409 | | | | 410,025 | | | | 231,014 | | | | 29,962 | | | | 1,445,732 | | | | 1,499 | | | | 64,566 | |
| | | | | | | | | | | | | | | | | | | | | | | | | | | | | | | | |
| | | | | | | | | | | | | | | | | | | | | | | 6,887,623 | | | | | | | | | |
Mid-Cap Funds — 7.2% | | | | | | | | | | | | | | | | | | | | | | | | | | | | | | | | |
BMOMid-Cap Growth Fund(1) | | | 1,436,717 | | | | 380,792 | | | | 460,440 | | | | 311,478 | | | | 13,686 | | | | 1,682,233 | | | | — | | | | 83,089 | |
BMOMid-Cap Value Fund(1) | | | 1,423,085 | | | | 474,043 | | | | 314,088 | | | | 88,429 | | | | 4,518 | | | | 1,675,987 | | | | 13,779 | | | | 54,852 | |
| | | | | | | | | | | | | | | | | | | | | | | | | | | | | | | | |
| | | | | | | | | | | | | | | | | | | | | | | 3,358,220 | | | | | | | | | |
Small-Cap Fund — 2.5% | | | | | | | | | | | | | | | | | | | | | | | | | | | | | | | | |
BMOSmall-Cap Growth Fund | | | 994,497 | | | | 380,473 | | | | 409,916 | | | | 175,903 | | | | 29,480 | | | | 1,170,437 | | | | — | | | | 99,798 | |
| | | | | | | | |
International Funds — 15.2% | | | | | | | | | | | | | | | | | | | | | | | | | | | | | | | | |
BMO LGM Emerging Markets Equity Fund | | | 2,317,358 | | | | 1,133,877 | | | | 709,074 | | | | (4,310 | ) | | | (2,167 | ) | | | 2,735,684 | | | | 18,031 | | | | — | |
BMO Pyrford International Stock Fund(1) | | | 2,446,437 | | | | 947,324 | | | | 534,474 | | | | (6,161 | ) | | | 2,772 | | | | 2,855,898 | | | | 60,587 | | | | — | |
BMO Disciplined International Equity Fund | | | 1,264,588 | | | | 516,905 | | | | 279,669 | | | | (34,972 | ) | | | 4,509 | | | | 1,471,361 | | | | 26,217 | | | | — | |
| | | | | | | | | | | | | | | | | | | | | | | | | | | | | | | | |
| | | | | | | | | | | | | | | | | | | | | | | 7,062,943 | | | | | | | | | |
Fixed Income Funds — 2.0% | | | | | | | | | | | | | | | | | | | | | | | | | | | | | | | | |
BMO High Yield Bond Fund | | | 78,506 | | | | 35,470 | | | | 17,949 | | | | (1,922 | ) | | | (1,142 | ) | | | 92,963 | | | | 4,602 | | | | — | |
BMO TCH Core Plus Bond Fund | | | 704,940 | | | | 354,088 | | | | 197,016 | | | | (22,551 | ) | | | (2,792 | ) | | | 836,669 | | | | 23,036 | | | | 638 | |
BMO TCH Emerging Markets Bond Fund* | | | 78,564 | | | | 23,673 | | | | 97,663 | | | | (1,729 | ) | | | (2,845 | ) | | | — | | | | 3,838 | | | | — | |
| | | | | | | | | | | | | | | | | | | | | | | | | | | | | | | | |
| | | | | | | | | | | | | | | | | | | | | | | 929,632 | | | | | | | | | |
Alternative Funds — 3.5% | | | | | | | | | | | | | | | | | | | | | | | | | | | | | | | | |
BMO Alternative Strategies Fund | | | 1,375,925 | | | | 649,376 | | | | 259,665 | | | | (133,412 | ) | | | (5,368 | ) | | | 1,626,856 | | | | — | | | | 84,202 | |
| | | | | | | | |
Short-Term Investment — 1.2% | | | | | | | | | | | | | | | | | | | | | | | | | | | | | | | | |
BMO Institutional Prime Money Market Fund | | | 391,301 | | | | 10,110,628 | | | | 9,953,660 | | | | — | | | | 165 | | | | 548,434 | | | | 6,956 | | | | — | |
| | | | | | | | | | | | | | | | | | | | | | | | | | | | | | | | |
Totals | | $ | 18,364,394 | | | $ | 16,975,492 | | | $ | 14,781,158 | | | $ | 882,607 | | | $ | 142,810 | | | $ | 21,584,145 | | | $ | 240,794 | | | $ | 690,577 | |
| | | | | | | | | | | | | | | | | | | | | | | | | | | | | | | | |
| | | | | | | | |
2055 Fund | | | | | | | | | | | | | | | | | | | | | | | | | | | | | | | | |
Large-Cap Funds — 14.8% | | | | | | | | | | | | | | | | | | | | | | | | | | | | | | | | |
BMO Low Volatility Equity Fund | | $ | 284,902 | | | $ | 212,475 | | | $ | 83,089 | | | $ | 35,482 | | | $ | (84 | ) | | $ | 449,686 | | | $ | 5,597 | | | $ | 8,101 | |
BMO Dividend Income Fund | | | 99,854 | | | | 73,516 | | | | 26,795 | | | | 10,175 | | | | (64 | ) | | | 156,686 | | | | 2,726 | | | | 11,830 | |
BMOLarge-Cap Value Fund(1) | | | 451,359 | | | | 341,214 | | | | 118,250 | | | | 30,572 | | | | (563 | ) | | | 704,332 | | | | 8,629 | | | | 41,013 | |
BMOLarge-Cap Growth Fund(1) | | | 223,263 | | | | 147,324 | | | | 75,479 | | | | 55,625 | | | | 372 | | | | 351,105 | | | | 301 | | | | 12,967 | |
| | | | | | | | | | | | | | | | | | | | | | | | | | | | | | | | |
| | | | | | | | | | | | | | | | | | | | | | | 1,661,809 | | | | | | | | | |
Mid-Cap Funds — 7.2% | | | | | | | | | | | | | | | | | | | | | | | | | | | | | | | | |
BMOMid-Cap Growth Fund(1) | | | 260,068 | | | | 167,303 | | | | 90,363 | | | | 68,351 | | | | 492 | | | | 405,851 | | | | — | | | | 16,687 | |
BMOMid-Cap Value Fund(1) | | | 257,593 | | | | 194,434 | | | | 68,125 | | | | 20,897 | | | | (2,071 | ) | | | 402,728 | | | | 2,597 | | | | 11,018 | |
| | | | | | | | | | | | | | | | | | | | | | | | | | | | | | | | |
| | | | | | | | | | | | | | | | | | | | | | | 808,579 | | | | | | | | | |
Small-Cap Fund — 2.5% | | | | | | | | | | | | | | | | | | | | | | | | | | | | | | | | |
BMOSmall-Cap Growth Fund | | | 180,023 | | | | 142,827 | | | | 82,880 | | | | 43,392 | | | | 1,290 | | | | 284,652 | | | | — | | | | 20,044 | |
| | | | | | | | |
International Funds — 15.0% | | | | | | | | | | | | | | | | | | | | | | | | | | | | | | | | |
BMO LGM Emerging Markets Equity Fund | | | 419,475 | | | | 381,696 | | | | 147,186 | | | | (3,203 | ) | | | (1,842 | ) | | | 648,940 | | | | 3,621 | | | | — | |
BMO Pyrford International Stock Fund(1) | | | 442,839 | | | | 362,206 | | | | 114,355 | | | | 87 | | | | (1,813 | ) | | | 688,964 | | | | 12,167 | | | | — | |
BMO Disciplined International Equity Fund | | | 228,907 | | | | 188,036 | | | | 54,091 | | | | (8,256 | ) | | | (971 | ) | | | 353,625 | | | | 5,265 | | | | — | |
| | | | | | | | | | | | | | | | | | | | | | | | | | | | | | | | |
| | | | | | | | | | | | | | | | | | | | | | | 1,691,529 | | | | | | | | | |
Fixed Income Funds — 2.0% | | | | | | | | | | | | | | | | | | | | | | | | | | | | | | | | |
BMO High Yield Bond Fund | | | 14,211 | | | | 13,831 | | | | 4,980 | | | | (529 | ) | | | (106 | ) | | | 22,427 | | | | 960 | | | | — | |
BMO TCH Core Plus Bond Fund | | | 127,602 | | | | 140,234 | | | | 61,043 | | | | (4,217 | ) | | | (903 | ) | | | 201,673 | | | | 4,824 | | | | 128 | |
BMO TCH Emerging Markets Bond Fund* | | | 14,221 | | | | 7,116 | | | | 20,400 | | | | (808 | ) | | | (129 | ) | | | — | | | | 774 | | | | — | |
| | | | | | | | | | | | | | | | | | | | | | | | | | | | | | | | |
| | | | | | | | | | | | | | | | | | | | | | | 224,100 | | | | | | | | | |
Alternative Funds — 3.5% | | | | | | | | | | | | | | | | | | | | | | | | | | | | | | | | |
BMO Alternative Strategies Fund | | | 249,058 | | | | 239,424 | | | | 68,677 | | | | (25,599 | ) | | | (3,723 | ) | | | 390,483 | | | | — | | | | 16,910 | |
| | | | | | | | |
Short-Term Investment — 1.0% | | | | | | | | | | | | | | | | | | | | | | | | | | | | | | | | |
BMO Institutional Prime Money Market Fund | | | 70,830 | | | | 4,194,759 | | | | 4,151,724 | | | | 11 | | | | 107 | | | | 113,983 | | | | 1,687 | | | | — | |
| | | | | | | | | | | | | | | | | | | | | | | | | | | | | | | | |
Totals | | $ | 3,324,205 | | | $ | 6,806,395 | | | $ | 5,167,437 | | | $ | 221,980 | | | $ | (10,008 | ) | | $ | 5,175,135 | | | $ | 49,148 | | | $ | 138,698 | |
| | | | | | | | | | | | | | | | | | | | | | | | | | | | | | | | |
56
| | | | | | | | | | | | | | | | | | | | | | | | | | | | | | | | |
Fund/Security Description | | Value,
Beginning
of Period | | | Purchases | | | Sales
Proceeds | | | Change In
Unrealized
Appreciation
(Depreciation) | | | Net
Realized
Gain(Loss) | | | Value, End
of Period | | | Dividends
Credited
to
Income | | | Net Realized
Gain on
Capital Gain
Distributions | |
Conservative Allocation Fund | | | | | | | | | | | | | | | | | | | | | | | | | | | | | | | | |
Large-Cap Funds — 6.6% | | | | | | | | | | | | | | | | | | | | | | | | | | | | | | | | |
BMO Low Volatility Equity Fund | | $ | 885,177 | | | $ | 213,212 | | | $ | 659,683 | | | $ | (60,297 | ) | | $ | 123,957 | | | $ | 502,366 | | | $ | 10,145 | | | $ | 14,472 | |
BMO Dividend Income Fund | | | 479,141 | | | | 153,979 | | | | 397,154 | | | | (50,922 | ) | | | 87,409 | | | | 272,453 | | | | 7,615 | | | | 32,704 | |
BMOLarge-Cap Value Fund(1) | | | 1,601,147 | | | | 552,255 | | | | 1,321,644 | | | | (80,684 | ) | | | 188,450 | | | | 939,524 | | | | 17,115 | | | | 84,117 | |
BMOLarge-Cap Growth Fund(1) | | | 1,267,061 | | | | 410,472 | | | | 1,103,929 | | | | 4,324 | | | | 181,244 | | | | 759,172 | | | | 989 | | | | 42,586 | |
| | | | | | | | | | | | | | | | | | | | | | | | | | | | | | | | |
| | | | | | | | | | | | | | | | | | | | | | | 2,473,515 | | | | | | | | | |
Mid-Cap Funds — 1.0% | | | | | | | | | | | | | | | | | | | | | | | | | | | | | | | | |
BMOMid-Cap Growth Fund(1) | | | 333,847 | | | | 93,013 | | | | 292,549 | | | | (20,289 | ) | | | 73,952 | | | | 187,974 | | | | — | | | | 12,420 | |
BMOMid-Cap Value Fund(1) | | | 332,243 | | | | 90,398 | | | | 257,648 | | | | (46,341 | ) | | | 67,880 | | | | 186,532 | | | | 2,829 | | | | 8,201 | |
| | | | | | | | | | | | | | | | | | | | | | | | | | | | | | | | |
| | | | | | | | | | | | | | | | | | | | | | | 374,506 | | | | | | | | | |
Small-Cap Funds — 1.2% | | | | | | | | | | | | | | | | | | | | | | | | | | | | | | | | |
BMOSmall-Cap Growth Fund | | | 385,069 | | | | 174,123 | | | | 341,092 | | | | (67,036 | ) | | | 122,302 | | | | 273,366 | | | | — | | | | 24,826 | |
BMOSmall-Cap Value Fund(1) | | | 214,629 | | | | 116,737 | | | | 178,033 | | | | 12,985 | | | | 13,176 | | | | 179,494 | | | | — | | | | 10,074 | |
| | | | | | | | | | | | | | | | | | | | | | | | | | | | | | | | |
| | | | | | | | | | | | | | | | | | | | | | | 452,860 | | | | | | | | | |
International Funds — 3.4% | | | | | | | | | | | | | | | | | | | | | | | | | | | | | | | | |
BMO LGM Emerging Markets Equity Fund | | | 514,528 | | | | 271,013 | | | | 420,001 | | | | (52,913 | ) | | | 57,874 | | | | 370,501 | | | | 2,558 | | | | — | |
BMO Pyrford International Stock Fund(1) | | | 830,213 | | | | 187,712 | | | | 566,919 | | | | (87,436 | ) | | | 99,655 | | | | 463,225 | | | | 13,087 | | | | — | |
BMO Disciplined International Equity Fund | | | 846,439 | | | | 256,508 | | | | 671,090 | | | | (52,291 | ) | | | 55,340 | | | | 434,906 | | | | 11,168 | | | | — | |
| | | | | | | | | | | | | | | | | | | | | | | | | | | | | | | | |
| | | | | | | | | | | | | | | | | | | | | | | 1,268,632 | | | | | | | | | |
Fixed Income Funds — 24.6% | | | | | | | | | | | | | | | | | | | | | | | | | | | | | | | | |
BMO TCH Core Plus Bond Fund | | | 17,850,814 | | | | 2,289,867 | | | | 10,530,833 | | | | (1,078,539 | ) | | | 682,174 | | | | 9,213,483 | | | | 355,353 | | | | 10,296 | |
BMO TCH Emerging Markets Bond Fund* | | | 1,788,501 | | | | 189,002 | | | | 1,920,710 | | | | (57,431 | ) | | | 638 | | | | — | | | | 54,737 | | | | — | |
| | | | | | | | | | | | | | | | | | | | | | | | | | | | | | | | |
| | | | | | | | | | | | | | | | | | | | | | | 9,213,483 | | | | | | | | | |
Alternative Funds — 10.4% | | | | | | | | | | | | | | | | | | | | | | | | | | | | | | | | |
BMO Alternative Strategies Fund | | | 7,741,816 | | | | 1,196,055 | | | | 4,626,477 | | | | (648,527 | ) | | | 236,204 | | | | 3,899,071 | | | | — | | | | 302,031 | |
| | | | | | | | |
Short-Term Investment — 0.9% | | | | | | | | | | | | | | | | | | | | | | | | | | | | | | | | |
BMO Institutional Prime Money Market Fund | | | 615,540 | | | | 15,779,049 | | | | 16,039,056 | | | | 22 | | | | 6 | | | | 355,561 | | | | 6,548 | | | | — | |
| | | | | | | | | | | | | | | | | | | | | | | | | | | | | | | | |
Totals | | $ | 35,686,165 | | | $ | 21,973,395 | | | $ | 39,326,818 | | | $ | (2,285,375 | ) | | $ | 1,990,261 | | | $ | 18,037,628 | | | $ | 482,144 | | | $ | 541,727 | |
| | | | | | | | | | | | | | | | | | | | | | | | | | | | | | | | |
| | | | | | | | |
Moderate Allocation Fund | | | | | | | | | | | | | | | | | | | | | | | | | | | | | | | | |
Large-Cap Funds — 12.3% | | | | | | | | | | | | | | | | | | | | | | | | | | | | | | | | |
BMO Low Volatility Equity Fund | | $ | 2,664,948 | | | $ | 465,651 | | | $ | 1,302,106 | | | $ | 85,488 | | | $ | 118,021 | | | $ | 2,032,002 | | | $ | 41,126 | | | $ | 67,799 | |
BMO Dividend Income Fund | | | 1,446,493 | | | | 406,051 | | | | 831,578 | | | | (51,160 | ) | | | 136,282 | | | | 1,106,088 | | | | 31,041 | | | | 153,252 | |
BMOLarge-Cap Value Fund(1) | | | 4,839,198 | | | | 1,472,898 | | | | 2,713,848 | | | | 47,495 | | | | 163,474 | | | | 3,809,217 | | | | 70,884 | | | | 394,082 | |
BMOLarge-Cap Growth Fund(1) | | | 3,848,515 | | | | 1,136,379 | | | | 2,531,137 | | | | 330,295 | | | | 315,704 | | | | 3,099,756 | | | | 4,570 | | | | 196,917 | |
| | | | | | | | | | | | | | | | | | | | | | | | | | | | | | | | |
| | | | | | | | | | | | | | | | | | | | | | | 10,047,063 | | | | | | | | | |
Mid-Cap Funds — 1.9% | | | | | | | | | | | | | | | | | | | | | | | | | | | | | | | | |
BMOMid-Cap Growth Fund(1) | | | 1,013,569 | | | | 280,907 | | | | 697,450 | | | | 33,091 | | | | 151,202 | | | | 781,319 | | | | — | | | | 57,326 | |
BMOMid-Cap Value Fund(1) | | | 1,003,944 | | | | 217,791 | | | | 513,005 | | | | (35,505 | ) | | | 86,933 | | | | 760,158 | | | | 9,704 | | | | 38,385 | |
| | | | | | | | | | | | | | | | | | | | | | | | | | | | | | | | |
| | | | | | | | | | | | | | | | | | | | | | | 1,541,477 | | | | | | | | | |
Small-Cap Funds — 2.3% | | | | | | | | | | | | | | | | | | | | | | | | | | | | | | | | |
BMOSmall-Cap Growth Fund | | | 1,158,671 | | | | 661,388 | | | | 878,071 | | | | 21,431 | | | | 163,099 | | | | 1,126,518 | | | | — | | | | 113,195 | |
BMOSmall-Cap Value Fund(1) | | | 649,128 | | | | 477,416 | | | | 463,097 | | | | 65,177 | | | | 8,887 | | | | 737,511 | | | | — | | | | 46,563 | |
| | | | | | | | | | | | | | | | | | | | | | | | | | | | | | | | |
| | | | | | | | | | | | | | | | | | | | | | | 1,864,029 | | | | | | | | | |
International Funds — 6.4% | | | | | | | | | | | | | | | | | | | | | | | | | | | | | | | | |
BMO LGM Emerging Markets Equity Fund | | | 1,542,955 | | | | 909,393 | | | | 939,629 | | | | (11,525 | ) | | | 28,557 | | | | 1,529,751 | | | | 11,857 | | | | — | |
BMO Pyrford International Stock Fund(1) | | | 2,464,340 | | | | 500,542 | | | | 1,079,659 | | | | (139,324 | ) | | | 146,096 | | | | 1,891,995 | | | | 60,490 | | | | — | |
BMO Disciplined International Equity Fund | | | 2,535,429 | | | | 789,119 | | | | 1,537,058 | | | | (86,306 | ) | | | 72,034 | | | | 1,773,218 | | | | 51,993 | | | | — | |
| | | | | | | | | | | | | | | | | | | | | | | | | | | | | | | | |
| | | | | | | | | | | | | | | | | | | | | | | 5,194,964 | | | | | | | | | |
Fixed Income Funds — 17.7% | | | | | | | | | | | | | | | | | | | | | | | | | | | | | | | | |
BMO TCH Core Plus Bond Fund | | | 19,722,005 | | | | 3,908,011 | | | | 8,484,245 | | | | (663,409 | ) | | | 15,610 | | | | 14,497,972 | | | | 542,405 | | | | 17,593 | |
BMO TCH Emerging Markets Bond Fund* | | | 1,973,164 | | | | 247,226 | | | | 2,113,207 | | | | (50,495 | ) | | | (56,688 | ) | | | — | | | | 93,651 | | | | — | |
| | | | | | | | | | | | | | | | | | | | | | | | | | | | | | | | |
| | | | | | | | | | | | | | | | | | | | | | | 14,497,972 | | | | | | | | | |
Alternative Funds — 8.3% | | | | | | | | | | | | | | | | | | | | | | | | | | | | | | | | |
BMO Alternative Strategies Fund | | | 9,318,675 | | | | 1,705,977 | | | | 3,399,244 | | | | (747,659 | ) | | | (87,566 | ) | | | 6,790,183 | | | | — | | | | 558,859 | |
| | | | | | | | |
Short-Term Investment — 0.9% | | | | | | | | | | | | | | | | | | | | | | | | | | | | | | | | |
BMO Institutional Prime Money Market Fund | | | 1,030,079 | | | | 14,566,142 | | | | 14,820,474 | | | | 110 | | | | 32 | | | | 775,889 | | | | 15,173 | | | | — | |
| | | | | | | | | | | | | | | | | | | | | | | | | | | | | | | | |
Totals | | $ | 55,211,113 | | | $ | 27,744,891 | | | $ | 42,303,808 | | | $ | (1,202,296 | ) | | $ | 1,261,677 | | | $ | 40,711,577 | | | $ | 932,894 | | | $ | 1,643,971 | |
| | | | | | | | | | | | | | | | | | | | | | | | | | | | | | | | |
57
| | |
| | |
| Notes to Financial Statements (continued) | | |
| | | | | | | | | | | | | | | | | | | | | | | | | | | | | | | | |
Fund/Security Description | | Value,
Beginning
of Period | | | Purchases | | | Sales
Proceeds | | | Change In
Unrealized
Appreciation
(Depreciation) | | | Net
Realized
Gain(Loss) | | | Value, End
of Period | | | Dividends
Credited
to
Income | | | Net Realized
Gain on
Capital Gain
Distributions | |
Balanced Allocation Fund | | | | | | | | | | | | | | | | | | | | | | | | | |
Large-Cap Funds — 17.8% | | | | | | | | | | | | | | | | | | | | | | | | | | | | | | | | |
BMO Low Volatility Equity Fund | | $ | 13,326,064 | | | $ | 1,853,768 | | | $ | 3,885,888 | | | $ | 967,945 | | | $ | 192,049 | | | $ | 12,453,938 | | | $ | 210,608 | | | $ | 345,993 | |
BMO Dividend Income Fund | | | 7,213,194 | | | | 1,640,635 | | | | 2,606,678 | | | | 143,592 | | | | 347,591 | | | | 6,738,334 | | | | 158,454 | | | | 779,680 | |
BMOLarge-Cap Value Fund(1) | | | 24,067,367 | | | | 6,331,210 | | | | 8,311,058 | | | | 766,953 | | | | 473,315 | | | | 23,327,787 | | | | 364,859 | | | | 2,010,095 | |
BMOLarge-Cap Growth Fund(1) | | | 19,073,398 | | | | 4,451,466 | | | | 8,131,156 | | | | 2,618,221 | | | | 923,051 | | | | 18,934,980 | | | | 23,291 | | | | 1,003,616 | |
| | | | | | | | | | | | | | | | | | | | | | | | | | | | | | | | |
| | | | | | | | | | | | | | | | | | | | | | | 61,455,039 | | | | | | | | | |
Mid-Cap Funds — 2.7% | | | | | | | | | | | | | | | | | | | | | | | | | | | | | | | | |
BMOMid-Cap Growth Fund(1) | | | 5,025,977 | | | | 884,435 | | | | 2,167,594 | | | | 489,361 | | | | 508,040 | | | | 4,740,219 | | | | — | | | | 292,344 | |
BMOMid-Cap Value Fund(1) | | | 5,001,760 | | | | 4,907,955 | | | | 5,548,860 | | | | 65,219 | | | | 227,109 | | | | 4,653,183 | | | | 48,350 | | | | 195,916 | |
| | | | | | | | | | | | | | | | | | | | | | | | | | | | | | | | |
| | | | | | | | | | | | | | | | | | | | | | | 9,393,402 | | | | | | | | | |
Small-Cap Funds — 3.3% | | | | | | | | | | | | | | | | | | | | | | | | | | | | | | | | |
BMOSmall-Cap Growth Fund | | | 5,759,143 | | | | 3,235,980 | | | | 3,245,760 | | | | 231,186 | | | | 818,025 | | | | 6,798,574 | | | | — | | | | 581,143 | |
BMOSmall-Cap Value Fund(1) | | | 3,231,150 | | | | 2,388,643 | | | | 1,548,203 | | | | 381,721 | | | | 18,600 | | | | 4,471,911 | | | | — | | | | 240,193 | |
| | | | | | | | | | | | | | | | | | | | | | | | | | | | | | | | |
| | | | | | | | | | | | | | | | | | | | | | | 11,270,485 | | | | | | | | | |
International Funds — 9.1% | | | | | | | | | | | | | | | | | | | | | | | | | | | | | | | | |
BMO LGM Emerging Markets Equity Fund | | | 7,746,000 | | | | 4,584,053 | | | | 3,121,893 | | | | (46,453 | ) | | | 55,360 | | | | 9,217,067 | | | | 61,167 | | | | — | |
BMO Pyrford International Stock Fund(1) | | | 12,462,254 | | | | 2,272,876 | | | | 3,182,475 | | | | (309,470 | ) | | | 327,877 | | | | 11,571,062 | | | | 310,932 | | | | — | |
BMO Disciplined International Equity Fund | | | 12,780,966 | | | | 3,928,220 | | | | 5,636,663 | | | | (285,873 | ) | | | 91,471 | | | | 10,878,121 | | | | 266,502 | | | | — | |
| | | | | | | | | | | | | | | | | | | | | | | | | | | | | | | | |
| | | | | | | | | | | | | | | | | | | | | | | 31,666,250 | | | | | | | | | |
Fixed Income Funds — 10.9% | | | | | | | | | | | | | | | | | | | | | | | | | | | | | | | | |
BMO TCH Core Plus Bond Fund | | | 40,584,040 | | | | 10,312,135 | | | | 11,896,483 | | | | (1,330,718 | ) | | | (3,937 | ) | | | 37,665,037 | | | | 1,180,231 | | | | 37,053 | |
BMO TCH Emerging Markets Bond Fund* | | | 4,062,873 | | | | 545,624 | | | | 4,381,098 | | | | (109,223 | ) | | | (118,176 | ) | | | — | | | | 197,546 | | | | — | |
| | | | | | | | | | | | | | | | | | | | | | | | | | | | | | | | |
| | | | | | | | | | | | | | | | | | | | | | | 37,665,037 | | | | | | | | | |
Alternative Funds — 6.9% | | | | | | | | | | | | | | | | | | | | | | | | | | | | | | | | |
BMO Alternative Strategies Fund | | | 25,900,196 | | | | 6,070,301 | | | | 5,575,319 | | | | (2,297,190 | ) | | | (139,438 | ) | | | 23,958,550 | | | | — | | | | 1,595,568 | |
| | | | | | | | |
Short-Term Investment — 0.9% | | | | | | | | | | | | | | | | | | | | | | | | | | | | | | | | |
BMO Institutional Prime Money Market Fund | | | 3,074,917 | | | | 55,202,099 | | | | 55,227,087 | | | | 542 | | | | (740 | ) | | | 3,049,731 | | | | 54,089 | | | | — | |
| | | | | | | | | | | | | | | | | | | | | | | | | | | | | | | | |
Totals | | $ | 189,309,299 | | | $ | 108,609,400 | | | $ | 124,466,215 | | | $ | 1,285,813 | | | $ | 3,720,197 | | | $ | 178,458,494 | | | $ | 2,876,029 | | | $ | 7,081,601 | |
| | | | | | | | | | | | | | | | | | | | | | | | | | | | | | | | |
| | | | | | | | |
Growth Allocation Fund | | | | | | | | | | | | | | | | | | | | | | | | | | | | | | | | |
Large-Cap Funds — 23.5% | | | | | | | | | | | | | | | | | | | | | | | | | | | | | | | | |
BMO Low Volatility Equity Fund | | $ | 6,167,311 | | | $ | 1,257,757 | | | $ | 2,095,215 | | | $ | 472,724 | | | $ | 52,797 | | | $ | 5,855,374 | | | $ | 100,175 | | | $ | 165,542 | |
BMO Dividend Income Fund | | | 3,345,242 | | | | 857,862 | | | | 1,247,590 | | | | 79,734 | | | | 137,584 | | | | 3,172,832 | | | | 75,597 | | | | 374,086 | |
BMOLarge-Cap Value Fund(1) | | | 11,205,176 | | | | 3,020,047 | | | | 3,825,508 | | | | 404,023 | | | | 117,977 | | | | 10,921,715 | | | | 173,859 | | | | 961,084 | |
BMOLarge-Cap Growth Fund(1) | | | 8,886,380 | | | | 2,150,642 | | | | 3,870,919 | | | | 1,247,660 | | | | 399,148 | | | | 8,812,911 | | | | 11,304 | | | | 487,097 | |
| | | | | | | | | | | | | | | | | | | | | | | | | | | | | | | | |
| | | | | | | | | | | | | | | | | | | | | | | 28,762,832 | | | | | | | | | |
Mid-Cap Funds — 3.6% | | | | | | | | | | | | | | | | | | | | | | | | | | | | | | | | |
BMOMid-Cap Growth Fund(1) | | | 2,345,710 | | | | 440,871 | | | | 1,046,975 | | | | 253,532 | | | | 209,784 | | | | 2,202,922 | | | | — | | | | 142,054 | |
BMOMid-Cap Value Fund(1) | | | 2,323,392 | | | | 427,937 | | | | 691,827 | | | | 57,998 | | | | 68,518 | | | | 2,186,018 | | | | 22,730 | | | | 93,806 | |
| | | | | | | | | | | | | | | | | | | | | | | | | | | | | | | | |
| | | | | | | | | | | | | | | | | | | | | | | 4,388,940 | | | | | | | | | |
Small-Cap Funds — 4.3% | | | | | | | | | | | | | | | | | | | | | | | | | | | | | | | | |
BMOSmall-Cap Growth Fund | | | 2,688,854 | | | | 1,540,684 | | | | 1,525,182 | | | | 241,434 | | | | 238,356 | | | | 3,184,146 | | | | — | | | | 282,588 | |
BMOSmall-Cap Value Fund(1) | | | 1,501,140 | | | | 1,187,015 | | | | 761,930 | | | | 178,654 | | | | 3,484 | | | | 2,108,363 | | | | — | | | | 115,222 | |
| | | | | | | | | | | | | | | | | | | | | | | | | | | | | | | | |
| | | | | | | | | | | | | | | | | | | | | | | 5,292,509 | | | | | | | | | |
International Funds — 12.0% | | | | | | | | | | | | | | | | | | | | | | | | | | | | | | | | |
BMO LGM Emerging Markets Equity Fund | | | 3,590,962 | | | | 2,350,881 | | | | 1,608,749 | | | | (5,344 | ) | | | 11,523 | | | | 4,339,273 | | | | 29,258 | | | | — | |
BMO Pyrford International Stock Fund(1) | | | 5,759,429 | | | | 1,259,776 | | | | 1,631,413 | | | | (56,699 | ) | | | 53,391 | | | | 5,384,484 | | | | 149,359 | | | | — | |
BMO Disciplined International Equity Fund | | | 5,896,903 | | | | 1,725,937 | | | | 2,472,673 | | | | (128,990 | ) | | | 34,361 | | | | 5,055,538 | | | | 128,022 | | | | — | |
| | | | | | | | | | | | | | | | | | | | | | | | | | | | | | | | |
| | | | | | | | | | | | | | | | | | | | | | | 14,779,295 | | | | | | | | | |
Fixed Income Funds — 4.0% | | | | | | | | | | | | | | | | | | | | | | | | | | | | | | | | |
BMO TCH Core Plus Bond Fund | | | 5,332,581 | | | | 2,139,774 | | | | 2,426,358 | | | | (158,793 | ) | | | (29,288 | ) | | | 4,857,916 | | | | 160,150 | | | | 5,056 | |
BMO TCH Emerging Markets Bond Fund* | | | 538,729 | | | | 137,510 | | | | 644,549 | | | | (17,204 | ) | | | (14,486 | ) | | | — | | | | 27,274 | | | | — | |
| | | | | | | | | | | | | | | | | | | | | | | | | | | | | | | | |
| | | | | | | | | | | | | | | | | | | | | | | 4,857,916 | | | | | | | | | |
Alternative Funds — 5.6% | | | | | | | | | | | | | | | | | | | | | | | | | | | | | | | | |
BMO Alternative Strategies Fund | | | 7,188,515 | | | | 2,637,224 | | | | 2,240,285 | | | | (632,393 | ) | | | (83,422 | ) | | | 6,869,639 | | | | — | | | | 460,639 | |
| | | | | | | | |
Short-Term Investment — 1.0% | | | | | | | | | | | | | | | | | | | | | | | | | | | | | | | | |
BMO Institutional Prime Money Market Fund | | | 1,222,859 | | | | 25,443,096 | | | | 25,512,347 | | | | — | | | | 219 | | | | 1,153,827 | | | | 19,138 | | | | — | |
| | | | | | | | | | | | | | | | | | | | | | | | | | | | | | | | |
Totals | | $ | 67,993,183 | | | $ | 46,577,013 | | | $ | 51,601,520 | | | $ | 1,936,336 | | | $ | 1,199,946 | | | $ | 66,104,958 | | | $ | 896,866 | | | $ | 3,087,174 | |
| | | | | | | | | | | | | | | | | | | | | | | | | | | | | | | | |
58
| | | | | | | | | | | | | | | | | | | | | | | | | | | | | | | | |
Fund/Security Description | | Value,
Beginning
of Period | | | Purchases | | | Sales
Proceeds | | | Change In
Unrealized
Appreciation
(Depreciation) | | | Net
Realized
Gain(Loss) | | | Value, End
of Period | | | Dividends
Credited
to
Income | | | Net Realized
Gain on
Capital Gain
Distributions | |
Aggressive Allocation Fund | | | | | | | | | | | | | | | | | | | | | | | | | | | | | | | | |
Large-Cap Funds — 27.7% | | | | | | | | | | | | | | | | | | | | | | | | | | | | | | | | |
BMO Low Volatility Equity Fund | | $ | 10,098,441 | | | $ | 2,201,088 | | | $ | 3,074,968 | | | $ | 835,703 | | | $ | 92,338 | | | $ | 10,152,602 | | | $ | 168,012 | | | $ | 271,895 | |
BMO Dividend Income Fund | | | 5,526,761 | | | | 1,271,604 | | | | 1,699,759 | | | | 218,401 | | | | 168,215 | | | | 5,485,222 | | | | 126,564 | | | | 613,928 | |
BMOLarge-Cap Value Fund(1) | | | 18,461,681 | | | | 4,691,144 | | | | 5,242,581 | | | | 706,880 | | | | 246,424 | | | | 18,863,548 | | | | 288,066 | | | | 1,578,146 | |
BMOLarge-Cap Growth Fund(1) | | | 14,572,342 | | | | 3,171,681 | | | | 5,266,874 | | | | 2,273,155 | | | | 537,551 | | | | 15,287,855 | | | | 18,560 | | | | 799,749 | |
| | | | | | | | | | | | | | | | | | | | | | | | | | | | | | | | |
| | | | | | | | | | | | | | | | | | | | | | | 49,789,227 | | | | | | | | | |
Mid-Cap Funds — 4.2% | | | | | | | | | | | | | | | | | | | | | | | | | | | | | | | | |
BMOMid-Cap Growth Fund(1) | | | 3,858,204 | | | | 585,449 | | | | 1,412,097 | | | | 453,956 | | | | 336,846 | | | | 3,822,358 | | | | — | | | | 233,066 | |
BMOMid-Cap Value Fund(1) | | | 3,838,366 | | | | 704,271 | | | | 976,128 | | | | 140,339 | | | | 86,199 | | | | 3,793,047 | | | | 37,226 | | | | 153,895 | |
| | | | | | | | | | | | | | | | | | | | | | | | | | | | | | | | |
| | | | | | | | | | | | | | | | | | | | | | | 7,615,405 | | | | | | | | | |
Small-Cap Funds — 5.1% | | | | | | | | | | | | | | | | | | | | | | | | | | | | | | | | |
BMOSmall-Cap Growth Fund | | | 4,435,179 | | | | 2,500,471 | | | | 2,249,637 | | | | 330,738 | | | | 508,619 | | | | 5,525,370 | | | | — | | | | 464,181 | |
BMOSmall-Cap Value Fund(1) | | | 2,499,768 | | | | 2,019,931 | | | | 1,179,885 | | | | 305,416 | | | | 12,691 | | | | 3,657,921 | | | | — | | | | 189,729 | |
| | | | | | | | | | | | | | | | | | | | | | | | | | | | | | | | |
| | | | | | | | | | | | | | | | | | | | | | | 9,183,291 | | | | | | | | | |
International Funds — 14.3% | | | | | | | | | | | | | | | | | | | | | | | | | | | | | | | | |
BMO LGM Emerging Markets Equity Fund | | | 5,908,535 | | | | 3,967,008 | | | | 2,361,292 | | | | (25,499 | ) | | | 6,053 | | | | 7,494,805 | | | | 48,127 | | | | — | |
BMO Pyrford International Stock Fund(1) | | | 9,480,721 | | | | 2,446,010 | | | | 2,563,876 | | | | (57,022 | ) | | | 51,267 | | | | 9,357,100 | | | | 245,325 | | | | — | |
BMO Disciplined International Equity Fund | | | 9,752,897 | | | | 2,232,571 | | | | 2,938,299 | | | | (212,920 | ) | | | 45,773 | | | | 8,880,022 | | | | 210,608 | | | | — | |
| | | | | | | | | | | | | | | | | | | | | | | | | | | | | | | | |
| | | | | | | | | | | | | | | | | | | | | | | 25,731,927 | | | | | | | | | |
Alternative Funds — 0.5% | | | | | | | | | | | | | | | | | | | | | | | | | | | | | | | | |
BMO Alternative Strategies Fund | | | 2,485,944 | | | | 498,423 | | | | 1,912,961 | | | | (182,804 | ) | | | 7,795 | | | | 896,397 | | | | — | | | | 155,997 | |
| | | | | | | | |
Short-Term Investment — 0.9% | | | | | | | | | | | | | | | | | | | | | | | | | | | | | | | | |
BMO Institutional Prime Money Market Fund | | | 444,956 | | | | 27,595,785 | | | | 26,440,248 | | | | 130 | | | | 307 | | | | 1,600,930 | | | | 26,321 | | | | — | |
| | | | | | | | | | | | | | | | | | | | | | | | | | | | | | | | |
Totals | | $ | 91,363,795 | | | $ | 53,885,436 | | | $ | 57,318,605 | | | $ | 4,786,473 | | | $ | 2,100,078 | | | $ | 94,817,177 | | | $ | 1,168,809 | | | $ | 4,460,586 | |
| | | | | | | | | | | | | | | | | | | | | | | | | | | | | | | | |
| * | Reflects operations for the period from September 1, 2017, to February 22, 2018 (termination date). |
| (1) | Effective February 26, 2018, certain underlying affiliated issuers’ Institutional Class of shares were exchanged for RetirementClass R-6 shares. |
Interfund Borrowing and Lending—The Funds participate in an interfund lending program. This program allows the Funds to lend cash to and/or borrow cash from other Funds for temporary purposes. The program is subject to a number of conditions, including the requirement that the interfund loan rate to be charged to the Funds under the program is (i) more favorable to the lending Fund than the rate it could otherwise obtain from investing cash in repurchase agreements or purchasing shares of BMO Prime Money Market Fund or BMO Government Money Market Fund and (ii) more favorable to the borrowing Fund than the lowest interest rate at which bank short-term loans would be available to the Funds. In addition, a Fund may participate in the program only if its participation is consistent with the Fund’s investment policies and limitations. The Directors are responsible for the oversight of the interfund lending program. No interfund borrowing or lending balances existed as of August 31, 2018.
Funds utilizing the Interfund lending program, borrowing from the BMO Government Money Market Fund during the year ended August 31, 2018, were as follows:
| | | | | | | | |
Fund | | Average Daily Loan
Balance Outstanding | | | Weighted Average
Interest Rate | |
In-Retirement Fund | | $ | 4,257 | | | | 1.864 | % |
2015 Fund | | | 3,353 | | | | 2.591 | |
2020 Fund | | | 4,391 | | | | 1.777 | |
2025 Fund | | | 1,647 | | | | 1.492 | |
2030 Fund | | | 6,549 | | | | 1.473 | |
2035 Fund | | | 3,603 | | | | 2.379 | |
2040 Fund | | | 3,287 | | | | 1.402 | |
2045 Fund | | | 2,590 | | | | 1.546 | |
2050 Fund | | | 3,851 | | | | 1.476 | |
2055 Fund | | | 1,357 | | | | 1.321 | |
Conservative Allocation Fund | | | 12,398 | | | | 2.318 | |
Moderate Allocation Fund | | | 46,695 | | | | 1.585 | |
Balanced Allocation Fund | | | 45,141 | | | | 1.585 | |
Growth Allocation Fund | | | 34,480 | | | | 1.596 | |
Aggressive Allocation Fund | | | 6,195 | | | | 1.585 | |
General—Certain of the Officers and Directors of the Corporation are also Officers and Directors/Trustees of one or more of the above companies, which are affiliates of the Corporation. None of the Fund Officers or interested Directors receives any compensation from the Funds.
59
| | |
| | |
| Notes to Financial Statements (continued) | | |
The Corporation, on behalf of the respective Funds, participated in a $25 million unsecured, committed revolving line of credit (“LOC”) agreement with UMB Bank, n.a. The LOC was made available for extraordinary or emergency purposes, primarily for financing redemption payments. Borrowings are charged interest at a rate of the London Interbank Offering Rate (“LIBOR”) plus 1.25% and a commitment fee of 0.20% per annum on the daily unused portion with no administrative fee. No borrowings were outstanding under the LOC at August 31, 2018. The Funds did not utilize the LOC during the year ended August 31, 2018.
| 7. | | Investment Transactions |
Purchases and sales of investments, excluding short-term U.S. government securities, short-term obligations, andin-kind contributions, for the year ended August 31, 2018 were as follows:
| | | | | | | | | | | | | | | | |
| | | Other than
U.S Government
Securities | | | U.S Government
Securities | |
Fund | | Purchases | | | Sales | | | Purchases | | | Sales | |
In-Retirement Fund | | $ | 5,091,114 | | | $ | 6,249,753 | | | $ | — | | | $ | — | |
2015 Fund | | | 1,346,519 | | | | 2,445,939 | | | | — | | | | — | |
2020 Fund | | | 23,664,551 | | | | 30,040,765 | | | | — | | | | — | |
2025 Fund | | | 11,885,433 | | | | 7,825,403 | | | | — | | | | — | |
2030 Fund | | | 33,025,469 | | | | 31,321,713 | | | | — | | | | — | |
2035 Fund | | | 5,932,878 | | | | 4,336,560 | | | | — | | | | — | |
2040 Fund | | | 20,008,676 | | | | 16,401,941 | | | | — | | | | — | |
2045 Fund | | | 5,815,585 | | | | 3,076,249 | | | | — | | | | — | |
2050 Fund | | | 15,043,950 | | | | 11,471,062 | | | | — | | | | — | |
2055 Fund | | | 5,695,607 | | | | 2,343,659 | | | | — | | | | — | |
Conservative Allocation Fund | | | 14,203,887 | | | | 49,637,232 | | | | — | | | | — | |
Moderate Allocation Fund | | | 31,349,476 | | | | 60,111,487 | | | | — | | | | — | |
Balanced Allocation Fund | | | 103,469,544 | | | | 141,851,903 | | | | — | | | | — | |
Growth Allocation Fund | | | 41,147,991 | | | | 54,603,542 | | | | — | | | | — | |
Aggressive Allocation Fund | | | 48,906,602 | | | | 59,703,046 | | | | — | | | | — | |
| 8. | | Federal Tax Information |
The timing and character of income and capital gain distributions are determined in accordance with income tax regulations, which may differ from GAAP. These differences are due in part to differing treatments for net operating loss, foreign currency transactions, paydown gain or loss, market discount accretion, premium amortization and expiring capital loss carryforwards.
To the extent that differences arise that are permanent in nature, such amounts are reclassified within the capital accounts, on the Statements of Assets and Liabilities, based on their Federal tax basis treatment; temporary differences do not require reclassification and had no impact on the NAV of the Funds.
The Funds complied with FASB interpretationAccounting for Uncertainty in Income Taxes which provides guidance for how uncertain tax provisions should be recognized, measured, presented and disclosed in the financial statements.Accounting for Uncertainty in Income Taxes requires the affirmative evaluation of tax positions taken or expected to be taken in the course of preparing the Funds’ tax returns to determine whether it is“more-likely-than-not,” (i.e., greater than 50 percent) of being sustained by the applicable tax authority. Tax positions not deemed to meet themore-likely-than-not threshold may result in a tax benefit or expense in the current year.
Accounting for Uncertainty in Income Taxes requires management of the Funds to analyze all open tax years, as defined by the statutes of limitations, for all major jurisdictions, which includes federal and certain states. Open tax years are those that are open for exam by the taxing authorities (i.e., the last four tax years and the interim tax period since then). The Funds have no examinations in progress. For all open tax years and all major taxing jurisdictions through the end of the reporting period, management of the Funds reviewed all tax positions taken or expected to be taken in the preparation of the Funds’ tax returns and concluded thatAccounting for Uncertainty in Income Taxes resulted in no effect on the Funds’ reported net assets or results of operations as of and during the period ended August 31, 2018. Management of the Funds also is not aware of any tax positions for which it is reasonably possible that the total amounts of recognized tax benefits will significantly change in the next twelve months.
| | | | | | | | | | | | | | | | |
Fund | | Cost of
Investments
for Federal
Tax Purposes | | | Gross
Unrealized
Appreciation
for Federal
Tax Purposes | | | Gross
Unrealized
(Depreciation)
for Federal
Tax Purposes | | | Net
Unrealized
Appreciation
for Federal
Tax Purposes | |
In-Retirement Fund | | $ | 12,037,037 | | | $ | 1,964,250 | | | $ | (141,555 | ) | | $ | 1,822,695 | |
2015 Fund | | | 2,667,640 | | | | 171,401 | | | | (24,977 | ) | | | 146,424 | |
2020 Fund | | | 58,141,085 | | | | 19,343,508 | | | | (575,635 | ) | | | 18,767,873 | |
2025 Fund | | | 23,924,657 | | | | 2,706,267 | | | | (127,783 | ) | | | 2,578,484 | |
60
| | | | | | | | | | | | | | | | |
Fund | | Cost of
Investments
for Federal
Tax Purposes | | | Gross
Unrealized
Appreciation
for Federal
Tax Purposes | | | Gross
Unrealized
(Depreciation)
for Federal
Tax Purposes | | | Net
Unrealized
Appreciation
for Federal
Tax Purposes | |
2030 Fund | | $ | 70,860,011 | | | $ | 29,142,377 | | | $ | (420,407 | ) | | $ | 28,721,970 | |
2035 Fund | | | 13,427,889 | | | | 2,125,058 | | | | (36,323 | ) | | | 2,088,735 | |
2040 Fund | | | 40,371,131 | | | | 19,805,207 | | | | (142,779 | ) | | | 19,662,428 | |
2045 Fund | | | 9,940,531 | | | | 1,328,710 | | | | (18,281 | ) | | | 1,310,429 | |
2050 Fund | | | 33,247,464 | | | | 13,353,426 | | | | (100,810 | ) | | | 13,252,616 | |
2055 Fund | | | 9,856,409 | | | | 1,343,561 | | | | (19,869 | ) | | | 1,323,692 | |
Conservative Allocation Fund | | | 32,489,610 | | | | 5,124,021 | | | | (313,793 | ) | | | 4,810,228 | |
Moderate Allocation Fund | | | 66,515,236 | | | | 15,689,859 | | | | (548,262 | ) | | | 15,141,597 | |
Balanced Allocation Fund | | | 252,780,274 | | | | 94,009,445 | | | | (1,736,966 | ) | | | 92,272,479 | |
Growth Allocation Fund | | | 82,629,711 | | | | 40,599,872 | | | | (287,108 | ) | | | 40,312,764 | |
Aggressive Allocation Fund | | | 107,651,907 | | | | 71,977,328 | | | | (25,410 | ) | | | 71,951,918 | |
The difference between book basis and tax basis unrealized appreciation/depreciation is attributable in part to the tax deferral of losses on wash sales.
The tax character of distributions reported on the Statements of Changes in Net Assets for the years ended August 31, 2018 and August 31, 2017, were as follows:
| | | | | | | | | | | | | | | | |
| | | 2018 | | | 2017 | |
Fund | | Ordinary
Income (1) | | | Long-Term
Capital Gains | | | Ordinary
Income (1) | | | Long-Term
Capital Gains | |
In-Retirement Fund | | $ | 376,688 | | | $ | 866,237 | | | $ | 511,590 | | | $ | 925,260 | |
2015 Fund | | | 90,954 | | | | 5,618 | | | | 104,541 | | | | — | |
2020 Fund | | | 1,892,064 | | | | 3,647,079 | | | | 1,860,077 | | | | 4,010,380 | |
2025 Fund | | | 553,263 | | | | 165,945 | | | | 619,664 | | | | 574,669 | |
2030 Fund | | | 2,051,535 | | | | 3,045,885 | | | | 1,684,830 | | | | 3,794,697 | |
2035 Fund | | | 414,773 | | | | 441,198 | | | | 534,601 | | | | 940,910 | |
2040 Fund | | | 1,240,302 | | | | 3,898,660 | | | | 997,987 | | | | 2,711,921 | |
2045 Fund | | | 244,424 | | | | 255,789 | | | | 271,179 | | | | 595,869 | |
2050 Fund | | | 990,070 | | | | 912,623 | | | | 641,782 | | | | 1,777,285 | |
2055 Fund | | | 208,481 | | | | 72,529 | | | | 122,469 | | | | 264,738 | |
Conservative Allocation Fund | | | 2,519,961 | | | | 4,479,258 | | | | 3,938,319 | | | | — | |
Moderate Allocation Fund | | | 2,959,918 | | | | 4,208,363 | | | | 3,317,223 | | | | 1,671,078 | |
Balanced Allocation Fund | | | 10,019,454 | | | | 26,938,699 | | | | 8,980,113 | | | | 21,697,731 | |
Growth Allocation Fund | | | 3,864,557 | | | | 5,945,893 | | | | 2,008,915 | | | | 5,863,115 | |
Aggressive Allocation Fund | | | 5,593,851 | | | | 17,406,814 | | | | 2,739,308 | | | | 16,714,385 | |
| | (1) | For tax purposes, short-term capital gain distributions are considered ordinary income. |
As of August 31, 2018, the components of distributable earnings on a tax basis are as follows:
| | | | | | | | | | | | | | | | | | | | |
Fund | | Undistributed
Ordinary
Income | | | Undistributed
Long-Term
Capital Gains | | | Accumulated
Capital and
Other Losses | | | Other
Adjustments | | | Unrealized
Appreciation | |
In-Retirement Fund | | $ | 230,035 | | | $ | 359,948 | | | $ | — | | | $ | — | | | $ | 1,822,695 | |
2015 Fund | | | 36,599 | | | | 118,380 | | | | — | | | | — | | | | 146,424 | |
2020 Fund | | | 913,852 | | | | 3,223,437 | | | | — | | | | — | | | | 18,767,873 | |
2025 Fund | | | 245,668 | | | | 515,698 | | | | — | | | | — | | | | 2,578,484 | |
2030 Fund | | | 943,939 | | | | 2,954,037 | | | | — | | | | — | | | | 28,721,970 | |
2035 Fund | | | 102,242 | | | | 390,860 | | | | — | | | | — | | | | 2,088,735 | |
2040 Fund | | | 461,950 | | | | 1,599,024 | | | | — | | | | — | | | | 19,662,428 | |
2045 Fund | | | 54,094 | | | | 223,191 | | | | — | | | | — | | | | 1,310,429 | |
2050 Fund | | | 277,954 | | | | 1,196,823 | | | | — | | | | — | | | | 13,252,616 | |
2055 Fund | | | 57,937 | | | | 233,456 | | | | — | | | | — | | | | 1,323,692 | |
Conservative Allocation Fund | | | 664,011 | | | | 4,298,103 | | | | — | | | | — | | | | 4,810,228 | |
Moderate Allocation Fund | | | 1,343,466 | | | | 5,726,540 | | | | — | | | | — | | | | 15,141,597 | |
Balanced Allocation Fund | | | 3,731,776 | | | | 19,819,254 | | | | — | | | | — | | | | 92,272,479 | |
Growth Allocation Fund | | | 1,008,149 | | | | 7,982,233 | | | | — | | | | — | | | | 40,312,764 | |
Aggressive Allocation Fund | | | 1,493,936 | | | | 13,426,591 | | | | — | | | | — | | | | 71,951,918 | |
61
| | |
| | |
| Notes to Financial Statements (continued) | | |
| 9. Shareholder | | Tax Information (unaudited) |
Of the ordinary income (including short-term capital gain) distributions made by the Funds during the year ended August 31, 2018, the percentages that qualify for the dividend received deduction available to corporate shareholders were as follows:
| | | | | | |
In-Retirement Fund | | | 7.46 | % | | |
2015 Fund | | | 14.56 | | | |
2020 Fund | | | 20.97 | | | |
2025 Fund | | | 22.17 | | | |
2030 Fund | | | 26.85 | | | |
2035 Fund | | | 26.72 | | | |
2040 Fund | | | 30.68 | | | |
2045 Fund | | | 28.09 | | | |
| | | | | | |
2050 Fund | | | 31.62 | % | | |
2055 Fund | | | 29.49 | | | |
Conservative Allocation Fund | | | 5.10 | | | |
Moderate Allocation Fund | | | 11.52 | | | |
Balanced Allocation Fund | | | 17.31 | | | |
Growth Allocation Fund | | | 24.61 | | | |
Aggressive Allocation Fund | | | 29.87 | | | |
Of the ordinary income (including short-term capital gain) distributions made by the Funds during the year ended August 31, 2018, the percentages that are designated as qualified dividend income were as follows:
| | | | | | |
In-Retirement Fund | | | 18.56 | % | | |
2015 Fund | | | 29.33 | | | |
2020 Fund | | | 38.85 | | | |
2025 Fund | | | 41.47 | | | |
2030 Fund | | | 48.96 | | | |
2035 Fund | | | 51.51 | | | |
2040 Fund | | | 55.24 | | | |
2045 Fund | | | 52.74 | | | |
| | | | | | |
2050 Fund | | | 55.89 | % | | |
2055 Fund | | | 52.65 | | | |
Conservative Allocation Fund | | | 9.63 | | | |
Moderate Allocation Fund | | | 21.22 | | | |
Balanced Allocation Fund | | | 33.13 | | | |
Growth Allocation Fund | | | 45.60 | | | |
Aggressive Allocation Fund | | | 54.64 | | | |
For Federal tax purposes, the Funds designate long-term capital gain dividends, or the amounts determined to be necessary, for the year ended August 31 2018:
| | | | | | |
In-Retirement Fund | | $ | 866,237 | | | |
2015 Fund | | | 5,618 | | | |
2020 Fund | | | 3,647,079 | | | |
2025 Fund | | | 165,945 | | | |
2030 Fund | | | 3,045,885 | | | |
2035 Fund | | | 441,198 | | | |
2040 Fund | | | 3,898,660 | | | |
2045 Fund | | | 255,789 | | | |
| | | | | | |
2050 Fund | | $ | 912,623 | | | |
2055 Fund | | | 72,529 | | | |
Conservative Allocation Fund | | | 4,479,258 | | | |
Moderate Allocation Fund | | | 4,208,363 | | | |
Balanced Allocation Fund | | | 26,938,699 | | | |
Growth Allocation Fund | | | 5,945,893 | | | |
Aggressive Allocation Fund | | | 17,406,814 | | | |
For Federal tax purposes, the Funds designate qualified short-term capital gain dividends, or the amounts determined to be necessary, for the year ended August 31 2018:
| | | | | | |
In-Retirement Fund | | $ | 21,755 | | | |
2015 Fund | | | — | | | |
2020 Fund | | | 182,203 | | | |
2025 Fund | | | 77,688 | | | |
2030 Fund | | | 291,882 | | | |
2035 Fund | | | 124,948 | | | |
2040 Fund | | | 212,555 | | | |
2045 Fund | | | 84,327 | | | |
| | | | | | |
2050 Fund | | $ | 216,240 | | | |
2055 Fund | | | 54,660 | | | |
Conservative Allocation Fund | | | 637,361 | | | |
Moderate Allocation Fund | | | 606,763 | | | |
Balanced Allocation Fund | | | 2,663,462 | | | |
Growth Allocation Fund | | | 1,243,186 | | | |
Aggressive Allocation Fund | | | 1,966,834 | | | |
| 10. | | Recently Issued Accounting Pronouncements |
In August 2018, FASB issued Accounting Standards Update2018-13 Fair Value Measurement (Topic 820) Disclosure Framework—Changes to the Disclosure Requirements, which sets forth a methodology for disclosing the fair value hierarchy. Compliance is effective for interim and annual reporting periods in fiscal years that begin after December 15, 2019.
In August 2018, the Securities and Exchange Commission released its Final Rules that eliminates or amends disclosure requirements that are redundant or outdated in light of changes in SEC requirements, US GAAP, IFRS or changes in technology or the business environment. The Rules are effective 30 days from publication in the Federal Register.
Effective October 18, 2018, the Corporation, on behalf of the respective Funds, terminated the LOC agreement with UMB Bank, n.a. and committed to a $25 million LOC with State Street Bank & Trust Company.
62
| | |
| |
| Report of Independent Registered Public Accounting Firm |
To the Board of Directors and Shareholders of BMO Funds, Inc.:
Opinion on the Financial Statements
We have audited the accompanying statements of assets and liabilities of BMO In-Retirement Fund, BMO Target Retirement 2015 Fund, BMO Target Retirement 2020 Fund, BMO Target Retirement 2025 Fund, BMO Target Retirement 2030 Fund, BMO Target Retirement 2035 Fund, BMO Target Retirement 2040 Fund, BMO Target Retirement 2045 Fund, BMO Target Retirement 2050 Fund, BMO Target Retirement 2055 Fund, BMO Conservative Allocation Fund, BMO Moderate Allocation Fund, BMO Balanced Allocation Fund, BMO Growth Allocation Fund, BMO Aggressive Allocation Fund (each a series of BMO Funds, Inc., collectively referred to as the Funds), including the schedules of investments as of August 31, 2018, the related statements of operations for the year then ended, the statements of changes in net assets for each of the years in the two-year period then ended, and the related notes to financial statements (collectively, the financial statements), and the financial highlights for each of the years or periods in the five-year period then ended. In our opinion, the financial statements and financial highlights present fairly, in all material respects, the financial position of the Funds as of August 31, 2018, the results of their operations for the year then ended, the changes in their net assets for each of the years in the two-year period then ended, and the financial highlights for each of the years or periods in the five-year period then ended, in conformity with U.S. generally accepted accounting principles.
Basis for Opinion
These financial statements and financial highlights are the responsibility of the Funds’ management. Our responsibility is to express an opinion on these financial statements and financial highlights based on our audits. We are a public accounting firm registered with the Public Company Accounting Oversight Board (United States) (PCAOB) and are required to be independent with respect to the Funds in accordance with the U.S. federal securities laws and the applicable rules and regulations of the Securities and Exchange Commission and the PCAOB.
We conducted our audits in accordance with the standards of the PCAOB. Those standards require that we plan and perform the audit to obtain reasonable assurance about whether the financial statements and financial highlights are free of material misstatement, whether due to error or fraud. Our audits included performing procedures to assess the risks of material misstatement of the financial statements and financial highlights, whether due to error or fraud, and performing procedures that respond to those risks. Such procedures included examining, on a test basis, evidence regarding the amounts and disclosures in the financial statements and financial highlights. Such procedures also included confirmation of securities owned as of August 31, 2018 by correspondence with custodian and transfer agents or by other appropriate auditing procedures. Our audits also included evaluating the accounting principles used and significant estimates made by management, as well as evaluating the overall presentation of the financial statements and financial highlights. We believe that our audits provide a reasonable basis for our opinion.
/s/ KPMG LLP
We have served as the auditor of one or more BMO Funds, Inc. investment companies since 2011.
Columbus, Ohio
October 26, 2018
63
| | |
| |
| Directors and Officers of the Funds (Unaudited) |
The following tables provide information about each Director and Officer of the Funds as of August 31, 2018. The address of each Director is c/o BMO Funds, 111 East Kilbourn Avenue, Suite 200, Milwaukee, Wisconsin 53202. There are currently 43 separate portfolios or funds in the BMO Funds complex, of which 42 are registered as BMO Funds, Inc. and one is registered as BMO LGM Frontier Markets Equity Fund with the Securities and Exchange Commission. The Funds’ Statement of Additional Information includes additional information about the Directors and is available, without charge and upon request, by calling1-800-236-FUND (3863).
| | | | | | | | | | |
| INDEPENDENT DIRECTORS |
| Name and Age | | Position(s) Held with
the Corporation | | Term of
Office and
Length of
Time Served* | | Principal Occupation(s)
During Past 5 Years | | Number of
Portfolios in
Fund
Complex
Overseen by
Director | | Other
Directorships
Held by
Director |
| | | | | |
Ridge A. Braunschweig
Age: 65 | | Independent Director | | Since October 2009 | | President and Chief Executive Officer, CPL Industries, Inc. (a manufacturing holding company prior to May 2009 and a family office since May 2009), since January 2012. | | 43 | | None |
| | | | | |
Benjamin M. Cutler
Age: 73 | | Independent Director | | Since July 2004 | | Chairman, USHEALTH Group, Inc. (a health insurance company), since 2004; CEO and President, USHEALTH Group, Inc., from 2004 to 2016; Director, Freedom from Hunger (anon-profit organization), since 2016. | | 43 | | None |
| | | | | |
John A. Lubs
Age: 70 | | Independent Director | | Since July 2004 | | Retired; formerly, Vice Chairman, Mason Companies, Inc. (a footwear distributor), from 2004 to 2010 and Chief Operating Officer, from 2003 to 2010. | | 43 | | None |
| | | | | |
Vincent P. Lyles
Age: 57 | | Independent Director | | Since September 2017 | | President and Chief Executive Officer, Boys & Girls Clubs of Greater Milwaukee, since 2012. | | 43 | | None |
| | | | | |
James Mitchell
Age: 71 | | Independent Director | | Since March 1999 | | Chairman, Ayrshire Precision Engineering (a precision machining company), since 1992; Chief Executive Officer, NOG, Inc. (a metal processing and consulting company), from 1999 to 2015. | | 43 | | None |
| | | | | |
Barbara J. Pope
Age: 70 | | Independent Director | | Since March 1999 | | Retired; formerly, President of Barbara J. Pope, P.C. (a financial consulting firm), 1992-2015; President of Sedgwick Street Fund LLC (a private investment partnership), 1996-2015; Tax Partner, Price Waterhouse | | 43 | | None |
|
| * Each Director serves an indefinite term until he or she retires or otherwise resigns, is removed, dies or until his or her successor is duly elected. Retirement for a Director occurs no later than August 31 following his or her 75th birthday. |
64
| | |
| |
| Directors and Officers of the Funds (Unaudited) (continued) |
| | | | | | | | | | |
| INTERESTED DIRECTORS | | | | | | | | |
| Name and Age | | Position(s) Held with
the Corporation | | Term of
Office and
Length of
Time Served* | | Principal Occupation(s)
During Past 5 Years | | Number of
Portfolios in
Fund
Complex
Overseen by
Director | | Other
Directorships
Held by
Director |
| | | | | |
John M. Blaser**
Age: 61 | | Director and President | | Since May 1999 | | Managing Director of the Adviser, since June 2012. | | 43 | | None |
| | | | | |
Daniela O’Leary-Gill**
Age: 53 | | Director | | Since August 2018 | | Chief Operating Officer of BMO Financial Group, since February 1, 2018; Director of the Adviser since June 1, 2018; Head, Communications, Government & Investor Relations 2016-2018; Head, AML Program Oversight 2014-2016; SVP, Personal Banking & Chief CRA Officer 2011-2014. | | 43 | | None |
|
| * Each Director serves an indefinite term until he or she retires or otherwise resigns, is removed, dies or until his or her successor is duly elected. Retirement for a Director occurs no later than August 31 following his or her 75th birthday. |
|
| ** Mr. Blaser is an “interested person” of the Corporation (as defined in the 1940 Act) due to the positions that he holds with the Corporation, and the Adviser. Ms. O’Leary-Gill is an “interested person” of the Corporation due to the positions that she holds with the Adviser and BMO. |
| | | | | | |
| PRINCIPAL OFFICERS | | | | |
| Name and Age | | Position(s) Held with
the Corporation | | Term of Office and Length of
Time Served | | Principal Occupation(s) During Past 5
Years |
| | | |
Brett Black
Age: 46 | | Chief Compliance Officer and Anti-Money Laundering Compliance Officer | | Elected by the Board annually; since November 2017 | | Vice President and Chief Compliance Officer of BMO Harris Bank, since 2017; Assistant Vice President, Deputy Chief Compliance Officer, from 2014 to 2017; Senior Compliance Officer of BMO Harris Bank, from 2012 to 2014. |
| | | |
Timothy M. Bonin
Age: 45 | | Vice President, Chief Financial Officer and Treasurer | | Elected by the Board annually; since February 2006 | | Vice President of the Adviser, since February 2006. |
| | | |
Michael J. Murphy
Age: 39 | | Secretary | | Elected by the Board annually; since May 2016 | | Senior Counsel and Vice President of BMO Harris Bank N.A., since 2014; Associate, Vedder Price P.C., 2010 to 2014. |
65
| | |
| |
Shareholder Report Disclosure of Directors’ Approval of
Continuation of Contracts(Unaudited) |
Approval of Continuation of Advisory Agreements
During the reporting period, the Board of Directors (the “Board”) of BMO Funds, Inc. (the “Corporation”), including the Directors who are not “interested persons” of the Corporation as defined in the Investment Company Act of 1940, as amended (the “Independent Directors”), met to discuss the advisory agreement of each portfolio of the Corporation included in this shareholder report (each, a “Fund” and collectively, the “Funds”). The Board approved the continuation of the investment advisory agreement (the “Advisory Agreement”) between the Corporation and BMO Asset Management Corp. (the “Adviser”) on behalf of each Funds for an additional year ending August 31, 2019, except for the BMO In-Retirement Fund, BMO Target Retirement 2020 Fund, BMO Target Retirement 2030 Fund, BMO Target Retirement 2040 Fund and BMO Target Retirement 2050 Fund, which were approved for an additional year ending August 29, 2019.
At Board meetings held on July 11, 2018 (“July Meeting”) and August 7-8, 2018 (“August Meeting”), the Board met with management of the Adviser regarding the annual approval of the continuation of the Funds’ Advisory Agreement. In connection with its consideration of the Advisory Agreement, the Board considered the information furnished and discussed throughout the year at regularly scheduled Board and Committee meetings, as applicable, and the information provided specifically in relation to the annual consideration of the approval of the Advisory Agreement in response to requests of the Independent Directors and their independent legal counsel. Information furnished in connection with Board or Committee meetings throughout the year included, among other things, presentations given by the portfolio managers of the Funds on each Fund’s investment strategies, risks, and performance, comparative performance of each Fund against its benchmark indices; reports regarding each Fund’s asset levels including sales and redemption activities; and various reports on the monitoring of the Funds’ compliance with the securities laws, regulations, policies, and procedures.
In preparation for the Board’s annual consideration of the approval of the Advisory Agreement, the Board requested and received a wide variety of information and reports concerning the Adviser (and its affiliates) including information on: (1) the nature, extent, and quality of services provided to each Fund by the Adviser (and its affiliates); (2) the investment performance of each Fund as compared to a group of comparable funds; (3) the expense ratios of each Fund as compared to a group of comparable funds; (4) profitability information for the Adviser; and (5) the Adviser’s compliance program. The Board also considered information related to potential “fall out” or ancillary benefits enjoyed by the Adviser (and its affiliates) as a result of their relationships with the Funds.
In addition to evaluating, among other things, the written information provided by the Adviser, the Board also considered the answers to questions posed by the Board to representatives of the Adviser at various meetings and took into account their accumulated experience in working with the Adviser on matters related to the Funds. The Independent Directors also met separately in executive sessions with their independent legal counsel to review and consider the information provided regarding the Advisory Agreement.
Based on their review, the Independent Directors and the full Board concluded that it was in the best interests of each Fund to approve the continuation of the Advisory Agreement. Although the Advisory Agreement for all of the Funds was considered at the same Board meeting, the Board considered each Fund separately. In their deliberations, the Board did not identify any single factor or group of factors as all-important or controlling but considered all factors together. The material factors and conclusions that formed the basis for the Board’s determinations are discussed below.
Nature, Extent and Quality of Services
In evaluating the nature, extent, and quality of the services provided by the Adviser to the Funds, the Board reviewed information describing the financial strength, experience, resources, and key personnel of the Adviser, including the personnel who provide investment management services to the Funds. The Board considered the administrative services that are provided to each Fund, as well as other services performed by the Adviser, including the selection and monitoring of the underlying funds; monitoring adherence to the Funds’ investment restrictions; monitoring the Funds’ compliance with their compliance policies and procedures and with applicable securities laws and regulations; producing shareholder reports; providing support services for the Board and Board committees; communicating with shareholders; and overseeing the activities of other service providers. The Board also considered the Adviser’s experience in providing investment advisory services to funds.
Based upon this review, the Board concluded that the nature, quality, and extent of the services to be provided to each Fund by the Adviser are expected to be satisfactory.
Review of Fund Performance
The Board reviewed the investment performance of each of the Funds. While consideration was given to performance reports provided in connection with, and discussions held at, regular Board meetings throughout the year, particular attention was given to the performance reports provided specifically in connection with the July and August Meetings. In particular, the Board noted the performance of each Fund relative to its Lipper Inc. (“Lipper”) peer universe. The Directors also considered updated performance information for each Fund relative to its benchmark and, if applicable, its Morningstar, Inc. (“Morningstar”) ratings.
With respect to each Fund’s performance as compared to its Lipper peer universe (“peer group”), the Board reviewed each Fund’s performance percentile rankings over the year-to-date and one- and three-year periods through May 31, 2018, as provided by the Adviser. The Board considered that each Fund ranked in one of the top two quartiles for performance as
66
compared to its peer group in two out of the three periods reviewed, except for the following Funds: BMO In-Retirement Fund, BMO Target Retirement 2015 Fund, BMO Target Retirement 2045 Fund, BMO Target Retirement 2055 Fund, and each of the BMO Target Risk Funds. The Board took into consideration that each Fund has a limited performance history.
With respect to the BMO In-Retirement Fund, BMO Target Retirement 2015 Fund, BMO Target Retirement 2045 Fund and BMO Target Retirement 2055 Fund, the Board noted that the BMO In-Retirement Fund ranked in the third or fourth quartile for performance as compared to its peer group for the year-to-date, one-year and three-year periods, and each of the other Funds ranked in the second or third quartile for each period presented. The Board noted the Adviser’s explanation for the underperformance of the Funds over applicable periods.
With respect to the BMO Target Risk Funds, the Board considered that each of the Funds ranked in the third or fourth quartile for performance as compared to its peer group for the year-to-date, one-year and three-year periods. The Board took into consideration that certain classes of each Fund are rated three stars by Morningstar and also noted portfolio management changes to the Funds in 2017. The Board also considered the Adviser’s explanation for the recent underperformance of the Funds.
The Board determined that it was generally satisfied with each Fund’s performance and would continue to monitor each Fund’s performance results.
Costs of Services Provided and Profits Realized by the Adviser
The Board considered the fees payable by each Fund under the Advisory Agreement, noting that the Funds do not pay a management fee to the Adviser. The Board reviewed information provided by the Adviser comparing each Fund’s net expense ratio to the median net expense ratio of the comparable Lipper peer group (“Lipper peers”). The Board considered that each Target Date Fund’s net expense ratio was equal to or higher than the median of its Lipper peers and that, with the exception of certain Class Y shares, each Target Risk Fund’s net expense ratio was lower than or within a basis point of the median of its Lipper peers. The Board considered that the net expense ratios included the fees and expenses of the underlying funds in which the Funds invest. The Board also gave consideration to the fact that the Funds were still relatively new and, with the exception of the BMO Balanced Fund, relatively small in size and, therefore, economies of scale with respect to other expenses may not have been realized.
The Board also considered that the Adviser has agreed to contractual expense limitations for the Funds (the “Expense Limitations”), and that the net expense ratios for the Funds take into account the effect of the Expense Limitations.
The Board considered the methodology used by the Adviser in determining compensation payable to its portfolio managers and the competitive environment for investment management talent. The Board also considered the financial condition of the Adviser and certain of its affiliates and particularly focused on the financial strength of the ultimate parent company of the Adviser, and the parent company’s commitment, financial and otherwise, to the global asset management business and the Funds.
The Board reviewed profitability information it received from the Adviser in connection with the services provided to each Fund and the Corporation as a whole. The materials provided in this regard showed, and the Board acknowledged, that the Adviser would not have a profit with respect to these Funds because the Funds do not pay management fees to the Adviser.
Economies of Scale
The Board did not consider the extent to which economies of scale would be realized as the Funds grow because the Funds do not pay management fees to the Adviser.
Other Benefits to the Adviser
The Board considered benefits that accrue to the Adviser and its affiliates from their relationships with the Funds, including revenue in the form of administration fees and custody fees. The Board noted that the Adviser may potentially benefit from its relationship with each Fund in other ways. The Board also considered that the success of any Fund could attract other business to the Adviser and that the success of the Adviser could enhance the Adviser’s ability to serve the Funds.
The Board concluded that, taking into account all of the information reviewed, each Fund’s advisory fee was reasonable.
Overall Conclusions
Based on all of the information considered and the conclusions reached, the Board determined that the terms of the Advisory Agreement are fair and reasonable and that the approval of the continuation of the Advisory Agreement is in the best interests of each Fund.
67
68
This report is authorized for distribution to prospective investors only when preceded or accompanied by the Funds’ prospectuses, which contain facts concerning each Fund’s objective and policies, management fees, expenses, and other information.
Proxy Voting
A description of the policies and procedures that the Funds use to determine how to vote proxies relating to portfolio securities is available without charge, upon request, by calling toll free, 1-800-236-FUND (3863) and by accessing the Funds’ Statement of Additional Information, which is available on the Funds’ website at http://www.bmofunds.com and on the SEC’s website at http://www.sec.gov.
Each Fund’s proxy voting record for the most recent 12-month period ended June 30 is available without charge, upon request, by calling toll free,1-800-236-FUND (3863) and by accessing the SEC’s website at http://www.sec.gov.
Disclosure of Portfolio Holdings
The Funds file their complete schedules of portfolio holdings with the SEC for the first and third quarters of each fiscal year on Form N-Q. Each Fund’s Form N-Q is available on the SEC’s website at http://www.sec.gov and may be reviewed and copied at the SEC’s Public Reference Room in Washington, D.C. Information on the operation of the Public Reference Room may be obtained by calling 1-800-SEC-0330.
Shares of the BMO Funds are not bank deposits or other obligations of, or issued, endorsed or guaranteed by, BMO Harris Bank, NA, or any of its affiliates. Shares of the BMO Funds, like shares of all mutual funds, are not insured or guaranteed by the U.S. government, the Federal Deposit Insurance Corporation, the Federal Reserve Board, or any other government agency. Investment in mutual funds involves investment risk, including the possible loss of principal.
| | |
| | PRSRT STD U.S. POSTAGE PAID LANCASTER, PA PERMIT NO. 1793 |
| | |
| | BMO Funds U.S. Services P.O. Box 55931 Boston, MA 02205-5931 |
| | |
| | Contact us 1-800-236-FUND (3863) 414-287-8555 |
| | |
| | Learn more bmofunds.com |
BMO Investment Distributors, LLC, Distributor
BMO Asset Management Corp., Investment Adviser
Investment products are:NOT FDIC INSURED — NO BANK GUARANTEE — MAY LOSE VALUE.
© 2018 BMO Financial Corp. (9/18)
Item 2. Code of Ethics.
The Registrant has a code of ethics (the “Code”) that applies to the Registrant’s principal executive officer and principal financial officer. During the period covered by this report, there were no amendments to the provisions of the Code, nor were there any implicit or explicit waivers to the provisions of the Code. The Code is filed herewith.
Item 3. Audit Committee Financial Expert.
The Registrant’s Board of Directors has determined that the Registrant has four audit committee financial experts serving on its audit committee, each of whom is “independent” within the meaning of FormN-CSR: Ridge A. Braunschweig, Barbara J. Pope, John A. Lubs, and Benjamin M. Cutler. Under applicable securities laws, a person who is determined to be an audit committee financial expert will not be deemed an “expert” for any purpose, including without limitation for purposes of Section 11 of the Securities Act of 1933, as amended, as a result of being designated or identified as an audit committee financial expert. The designation or identification of a person as an audit committee financial expert does not impose on such person any duties, obligations, or liabilities that are greater than the duties, obligations, and liabilities imposed on such person as a member of the audit committee and Board of Directors in the absence of such designation or identification.
Item 4. Principal Accountant Fees and Services.
The aggregate fees for professional services by KPMG LLP during the fiscal year 2018 and 2017 were as follows:
| (a) | Audit Fees for Registrant. |
| | | | | | |
Fiscal year ended August 31, 2018 | | $ | 631,150 | | | |
Fiscal year ended August 31, 2017 | | $ | 650,555 | | | |
| (b) | Audit-Related Fees for Registrant. These are fees by the Registrant’s independent auditors for assurance and related services that were reasonably related to the performance of the audit of the Registrant’s financial statements that are not reported under “Audit Fees”. These fees include amounts related to FormN-17f-2 filings. |
| | | | | | |
Fiscal year ended August 31, 2018 | | $ | 16,500 | | | |
Fiscal year ended August 31, 2017 | | $ | 76,755 | | | |
| (c) | Tax Fees for Registrant. These are fees for professional services rendered by the Registrant’s independent auditors for tax compliance, tax advice, and tax planning. These fees include federal, excise and state tax reviews; performed by KPMG LLP. |
| | | | | | |
Fiscal year ended August 31, 2018 | | $ | 169,840 | | | |
Fiscal year ended August 31, 2017 | | $ | 170,210 | | | |
| | | | | | |
Fiscal year ended August 31, 2018 | | | None | | | |
Fiscal year ended August 31, 2017 | | | None | | | |
| (e) | Audit Committee’spre-approval policies and procedures. |
| | (1) | The Audit Committee has adoptedpre-approval policies and procedures that require the Audit Committee topre-approve all audit andnon-audit services of the Registrant, including services provided to the Registrant’s investment adviser or any entity controlling, controlled by or under common control with the Registrant’s investment adviser that provides ongoing services to the Registrant with respect to any engagement that directly relates to the operations and financial reporting of the Registrant. |
| | (2) | None of the services described in paragraphs (b) through (d) of this Item 4 were approved by the audit committee pursuant to paragraph (c)(7)(i)(C) of Rule2-01 of RegulationS-X. |
| (g) | During the last two fiscal years, othernon-audit services rendered by the Registrant’s independent auditors to the Registrant, its investment adviser or any entity controlling, controlled by or under the common control with the investment adviser that provides ongoing services to the Registrant included the following: |
Statement on Standards for Attestation Engagements No. 16 (SSAE No. 16) examinations for BMO Harris Bank N.A.
| | | | | | |
Fiscal year ended August 31, 2018 | | $ | 220,000 | | | |
Fiscal year ended August 31, 2017 | | $ | 220,000 | | | |
Item 5. Audit Committee of Listed Registrants.
Not applicable.
Item 6. Investments.
Except as noted below, the schedules of investments are included as part of the report to shareholders filed under Item 1 of this Form. The schedules of investments for BMO Ultra ShortTax-Free Fund, BMO ShortTax-Free Fund, and BMO IntermediateTax-Free Fund, are filed under this Item.
Ultra Short Tax-Free Fund
| | | | | | | | |
Description | | Shares or
Principal
Amount | | | Value | |
| | |
Municipals — 97.3% | | | | | | | | |
| | |
Alabama — 7.1% | | | | | | | | |
Albertville Municipal Utilities Board - Water System, AGM: | | | | | | | | |
2.000%, 8/15/2019 | | $ | 735,000 | | | $ | 735,610 | |
2.000%, 8/15/2020 | | | 355,000 | | | | 355,000 | |
Black Belt Energy Gas District, 2.295%, 12/1/2048, Call 9/1/2023 (7) | | | 4,500,000 | | | | 4,500,000 | |
Chatom Industrial Development Board, 1.650%, 8/1/2037, Call 2/1/2019 (7) | | | 4,800,000 | | | | 4,797,456 | |
City of Brundidge Utility Revenue, AGM, 2.000%, 12/1/2018 | | | 385,000 | | | | 385,185 | |
County of Jefferson, 5.000%, 9/15/2019 | | | 1,000,000 | | | | 1,034,200 | |
Eutaw Industrial Development Board, 1.600%, 6/1/2028, Call 9/19/2018 (7) | | | 300,000 | | | | 300,000 | |
Health Care Authority for Baptist Health, 2.130%, 11/1/2042 (7) | | | 11,125,000 | | | | 11,125,000 | |
Industrial Development Board of the City of Mobile, 1.550%, 6/1/2034, Call 9/19/2018 (7) | | | 1,500,000 | | | | 1,500,000 | |
Limestone County Water & Sewer Authority, BAM, 2.000%, 12/1/2019 | | | 160,000 | | | | 160,389 | |
Southeast Alabama Gas Supply District, 2.282%, 4/1/2049, Call 1/1/2024 (7) | | | 5,000,000 | | | | 4,995,900 | |
Tender Option Bond Trust Receipts/Certificates: | | | | | | | | |
1.660%, 5/1/2026 (5) (7) | | | 3,000,000 | | | | 3,000,000 | |
1.660%, 7/1/2026 (5) (7) | | | 4,500,000 | | | | 4,500,000 | |
1.710%, 10/5/2020 (5) (7) | | | 5,000,000 | | | | 5,000,000 | |
| | | | | | | | |
| | | | | | | 42,388,740 | |
| | |
Arizona — 0.7% | | | | | | | | |
Arizona Health Facilities Authority: | | | | | | | | |
3.410%, 2/1/2048, Call 8/9/2019 (7) | | | 3,250,000 | | | | 3,289,422 | |
3.410%, 2/1/2048, Call 8/9/2019 (7) | | | 750,000 | | | | 759,098 | |
| | | | | | | | |
| | | | | | | 4,048,520 | |
| | |
Arkansas — 2.2% | | | | | | | | |
Arkansas Development Finance Authority: | | | | | | | | |
2.110%, 9/1/2044, Call 9/4/2018 (7) | | | 7,000,000 | | | | 7,000,000 | |
2.660%, 9/1/2044, Call 3/1/2019 (7) | | | 3,000,000 | | | | 3,006,360 | |
City of Cabot, 2.550%, 6/1/2043, Call 6/1/2023 | | | 195,000 | | | | 194,536 | |
Little Rock School District, SAW, 3.000%, 2/1/2019 | | | 3,000,000 | | | | 3,016,380 | |
| | | | | | | | |
| | | | | | | 13,217,276 | |
| | |
California — 3.1% | | | | | | | | |
Bay Area Toll Authority: | | | | | | | | |
1.875%, 4/1/2047, Call 10/1/2018 (7) | | | 525,000 | | | | 525,179 | |
2.660%, 4/1/2045, Call 10/1/2023 (7) | | | 1,750,000 | | | | 1,807,155 | |
California Health Facilities Financing Authority, NATL-RE, 2.756%, 7/1/2022, Call 9/19/2018 (7) (8) | | | 500,000 | | | | 486,025 | |
California Municipal Finance Authority, 1.650%, 9/1/2021 (7) | | | 1,500,000 | | | | 1,499,895 | |
Northern California Gas Authority No. 1, 2.196%, 7/1/2019 (7) | | | 3,935,000 | | | | 3,936,023 | |
Palomar Health: | | | | | | | | |
4.000%, 11/1/2018 | | | 125,000 | | | | 125,321 | |
4.000%, 11/1/2019 | | | 505,000 | | | | 513,969 | |
Rib Floater Trust Various States, 1.710%, 8/15/2051 (5) (7) | | | 3,000,000 | | | | 3,000,000 | |
State of California: | | | | | | | | |
1.850%, 12/1/2028, Call 12/1/2019 (7) | | | 750,000 | | | | 750,720 | |
2.287%, 12/1/2029, Call 10/1/2018 (7) | | | 950,000 | | | | 950,380 | |
Tender Option Bond Trust Receipts/Certificates, 1.710%, 8/1/2024 (5) (7) | | | 4,760,000 | | | | 4,760,000 | |
| | | | | | | | |
| | | | | | | 18,354,667 | |
| | |
Colorado — 1.6% | | | | | | | | |
City & County of Denver Airport System Revenue, AGC, 1.900%, 11/15/2025, Call 9/19/2018 (7) (8) | | | 525,000 | | | | 525,000 | |
Colorado Health Facilities Authority: | | | | | | | | |
| | | | | | | | |
2.200%, 7/1/2034, Call 7/1/2019 (5) (7) | | | 4,300,000 | | | | 4,300,000 | |
5.000%, 6/1/2019 | | | 450,000 | | | | 459,135 | |
Colorado School of Mines, 1.895%, 2/1/2023, Call 8/1/2022 (7) | | | 1,200,000 | | | | 1,199,700 | |
E-470 Public Highway Authority, 2.291%, 9/1/2039, Call 3/1/2019 (7) | | | 3,445,000 | | | | 3,453,888 | |
| | | | | | | | |
| | | | | | | 9,937,723 | |
Connecticut — 0.1% | | | | | | | | |
Connecticut State Health & Educational Facilities Authority, 5.000%, 7/1/2020 | | | 400,000 | | | | 422,464 | |
| | |
District of Columbia — 0.5% | | | | | | | | |
District of Columbia Housing Finance Agency, AGM, 5.000%, 7/1/2021, Call 10/1/2018 | | | 360,000 | | | | 360,846 | |
Washington Convention & Sports Authority, 5.000%, 10/1/2020 | | | 2,500,000 | | | | 2,658,300 | |
| | | | | | | | |
| | | | | | | 3,019,146 | |
Florida — 6.0% | | | | | | | | |
Citizens Property Insurance Corp.: | | | | | | | | |
5.000%, 6/1/2019 | | | 2,640,000 | | | | 2,701,274 | |
5.000%, 6/1/2020 | | | 3,870,000 | | | | 4,079,599 | |
City of Cape Coral Water & Sewer Revenue, AGM, 1.400%, 9/1/2018 | | | 645,000 | | | | 645,000 | |
City of Jacksonville, 1.590%, 5/1/2029, Call 9/19/2018 (7) | | | 2,100,000 | | | | 2,100,000 | |
City of Orlando, AGM: | | | | | | | | |
3.000%, 11/1/2019 | | | 850,000 | | | | 861,994 | |
4.000%, 11/1/2018 | | | 650,000 | | | | 652,360 | |
County of Escambia, 1.550%, 4/1/2039, Call 9/19/2018 (7) | | | 1,000,000 | | | | 1,000,000 | |
County of Martin, 1.540%, 7/15/2022, Call 9/19/2018 (7) | | | 1,900,000 | | | | 1,900,000 | |
Escambia County Health Facilities Authority, AGC, 1.650%, 11/15/2029, Call 9/4/2018 (7) | | | 3,080,000 | | | | 3,080,000 | |
Florida Municipal Power Agency, AMBAC: | | | | | | | | |
2.730%, 10/1/2021 (7) (8) | | | 325,000 | | | | 325,000 | |
2.765%, 10/1/2021, Call 9/6/2018 (7) (8) | | | 250,000 | | | | 250,000 | |
JEA Electric System Revenue, 5.000%, 10/1/2018 | | | 600,000 | | | | 601,446 | |
Manatee County School District, AGM, 4.000%, 10/1/2018 | | | 670,000 | | | | 671,139 | |
North Broward Hospital District: | | | | | | | | |
5.000%, 1/1/2019 | | | 630,000 | | | | 635,790 | |
5.000%, 1/1/2020 | | | 875,000 | | | | 907,077 | |
Palm Beach County School District, 5.000%, 8/1/2019 | | | 1,600,000 | | | | 1,647,664 | |
RBC Municipal Products, Inc. Trust, 1.760%, 3/1/2026 (5) (7) | | | 5,000,000 | | | | 5,000,000 | |
Sarasota County Health Facilities Authority, 4.000%, 1/1/2019 | | | 500,000 | | | | 502,870 | |
| | |
School Board of Miami-Dade County, FGIC, 1.790%, 5/1/2037, Call 9/1/2018 (5) (7) | | | 8,000,000 | | | | 8,000,000 | |
Sumter County Industrial Development Authority, 4.000%, 7/1/2019 | | | 620,000 | | | | 630,918 | |
| | | | | | | | |
| | | | | | | 36,192,131 | |
Georgia — 4.0% | | | | | | | | |
Atkinson/Coffee Counties Joint Development Authority, 1.650%, 12/1/2019, Call 6/1/2019 | | | 3,000,000 | | | | 2,987,760 | |
City of Atlanta Water & Wastewater Revenue, 2.891%, 11/1/2038, Call 10/1/2018 (7) | | | 2,750,000 | | | | 2,751,815 | |
Georgia State Road & Tollway Authority, 5.000%, 6/1/2019 | | | 1,750,000 | | | | 1,792,962 | |
Main Street Natural Gas, Inc.: | | | | | | | | |
2.130%, 8/1/2048, Call 9/1/2023 (7) | | | 5,000,000 | | | | 4,992,400 | |
2.225%, 8/1/2048, Call 9/1/2023 (7) | | | 5,000,000 | | | | 4,982,500 | |
Morgan County Hospital Authority, 2.750%, 9/1/2019, Call 3/1/2019 | | | 3,750,000 | | | | 3,760,200 | |
Peach County Development Authority, 1.200%, 10/1/2018, Call 9/21/2018 | | | 1,000,000 | | | | 999,590 | |
Waleska Downtown Development Authority, 2.000%, 8/1/2019, Call 2/1/2019 | | | 1,690,000 | | | | 1,687,871 | |
| | | | | | | | |
| | | | | | | 23,955,098 | |
Guam — 0.0% | | | | | | | | |
Territory of Guam, 5.000%, 12/1/2018 | | | 250,000 | | | | 251,743 | |
| | |
Hawaii — 0.5% | | | | | | | | |
City & County of Honolulu, 1.860%, 9/1/2023, Call 9/17/2018 (7) | | | 2,800,000 | | | | 2,797,060 | |
| | |
Idaho — 0.7% | | | | | | | | |
Idaho Housing & Finance Association, 1.740%, 1/1/2038, Call 9/4/2018 (7) | | | 4,015,000 | | | | 4,015,000 | |
| | |
Illinois — 6.9% | | | | | | | | |
City of Chicago Waterworks Revenue: | | | | | | | | |
5.000%, 11/1/2018 | | | 1,000,000 | | | | 1,005,070 | |
| | | | | | | | |
5.000%, 11/1/2018 | | | 1,155,000 | | | | 1,160,856 | |
5.000%, 11/1/2019 | | | 250,000 | | | | 258,518 | |
City of Chicago Waterworks Revenue, AGM, 4.250%, 11/1/2018 | | | 150,000 | | | | 150,539 | |
Cook County School District No. 130 Blue Island, 2.350%, 12/1/2028, Call 9/10/2018 (5) (7) (9) | | | 3,750,000 | | | | 3,750,000 | |
County of Cook, 5.000%, 11/15/2018 | | | 1,300,000 | | | | 1,308,255 | |
County of Peoria, 1.760%, 12/15/2018 (5) (7) | | | 3,250,000 | | | | 3,250,000 | |
Illinois Educational Facilities Authority, 1.800%, 7/1/2036 (7) | | | 2,000,000 | | | | 1,998,580 | |
Illinois Finance Authority: | | | | | | | | |
3.000%, 12/1/2018 | | | 125,000 | | | | 125,200 | |
3.000%, 12/1/2019 | | | 200,000 | | | | 201,110 | |
4.000%, 11/15/2018 | | | 200,000 | | | | 200,848 | |
5.000%, 11/15/2018 | | | 350,000 | | | | 352,117 | |
5.000%, 11/15/2019 | | | 605,000 | | | | 626,520 | |
5.000%, 11/15/2019 | | | 250,000 | | | | 259,072 | |
Illinois State University, 5.000%, 4/1/2020 | | | 200,000 | | | | 206,968 | |
Kankakee River Metropolitan Agency, AGM, 3.000%, 5/1/2019 | | | 300,000 | | | | 301,392 | |
Lake County Forest Preserve District, 2.048%, 12/15/2020 (7) | | | 370,000 | | | | 370,240 | |
Northern Illinois Municipal Power Agency, 5.000%, 12/1/2018 | | | 500,000 | | | | 503,620 | |
Ogle Lee & De Kalb Counties Township High School District No. 212 Rochelle, 4.000%, 12/1/2018 | | | 925,000 | | | | 930,134 | |
Rib Floater Trust Various States, 1.740%, 8/15/2030, Call 10/1/2018 (5) (7) | | | 5,000,000 | | | | 5,000,000 | |
State of Illinois: | | | | | | | | |
5.000%, 10/1/2021 (9) | | | 1,500,000 | | | | 1,577,925 | |
5.000%, 2/1/2022 | | | 6,040,000 | | | | 6,346,107 | |
Tender Option Bond Trust Receipts/Certificates: | | | | | | | | |
1.710%, 6/15/2020 (5) (7) | | | 2,000,000 | | | | 2,000,000 | |
1.710%, 6/15/2031, Call 6/15/2026 (5) (7) | | | 4,355,000 | | | | 4,355,000 | |
1.710%, 1/1/2035, Call 1/1/2026 (5) (7) | | | 2,605,000 | | | | 2,605,000 | |
Town of Normal, 4.000%, 6/1/2019 | | | 230,000 | | | | 233,896 | |
Village of Bolingbrook: | | | | | | | | |
4.000%, 3/1/2019 | | | 1,700,000 | | | | 1,716,626 | |
4.000%, 3/1/2020 | | | 345,000 | | | | 354,608 | |
Village of Rantoul, AGM, 2.000%, 1/1/2019 | | | 150,000 | | | | 149,996 | |
| | | | | | | | |
| | | | | | | 41,298,197 | |
Indiana — 2.4% | | | | | | | | |
Indiana Housing & Community Development Authority, GNMA/FNMA/FHLMC, 1.780%, 7/1/2047, Call 9/19/2018 (7) | | | 6,000,000 | | | | 6,000,000 | |
Tender Option Bond Trust Receipts/Certificates, 1.830%, 10/15/2019 (5) (7) | | | 8,500,000 | | | | 8,500,000 | |
| | | | | | | | |
| | | | | | | 14,500,000 | |
Iowa — 1.5% | | | | | | | | |
Iowa Finance Authority, 2.135%, 2/15/2035 (5) (7) | | | 3,700,000 | | | | 3,700,037 | |
Iowa Finance Authority, GNMA/FNMA/FHLMC, 1.860%, 7/1/2047, Call 11/2/2020 (7) | | | 1,500,000 | | | | 1,502,940 | |
Iowa Higher Education Loan Authority, 2.000%, 12/1/2018, Call 10/1/2018 | | | 3,500,000 | | | | 3,500,105 | |
| | |
People’s Memorial Hospital of Buchanan County, 1.500%, 12/1/2018, Call 10/1/2018 | | | 405,000 | | | | 404,154 | |
Xenia Rural Water District, 2.000%, 12/1/2018 | | | 225,000 | | | | 225,101 | |
| | | | | | | | |
| | | | | | | 9,332,337 | |
Kansas — 0.1% | | | | | | | | |
State of Kansas Department of Transportation, 1.757%, 9/1/2021 (7) | | | 400,000 | | | | 400,348 | |
| | |
Kentucky — 1.8% | | | | | | | | |
Kentucky Rural Water Finance Corp., 3.000%, 11/1/2018 | | | 3,000,000 | | | | 3,006,210 | |
Kentucky State Property & Building Commission, NATL-RE, 5.000%, 8/1/2019 | | | 2,500,000 | | | | 2,569,450 | |
Laurel County Judicial Center Public Properties Corp., 4.000%, 3/1/2020 | | | 530,000 | | | | 545,948 | |
Louisville/Jefferson County Metropolitan Government: | | | | | | | | |
1.250%, 6/1/2033 (7) | | | 1,000,000 | | | | 994,990 | |
1.250%, 6/1/2033 (7) | | | 1,000,000 | | | | 994,990 | |
Northern Kentucky Water Service District, 3.000%, 4/1/2019, Call 10/1/2018 | | | 2,500,000 | | | | 2,501,550 | |
| | | | | | | | |
| | | | | | | 10,613,138 | |
Louisiana — 1.9% | | | | | | | | |
Louisiana Housing Corp., FHA, 2.500%, 12/1/2031, Call 6/1/2020 | | | 410,000 | | | | 390,312 | |
Louisiana Public Facilities Authority: | | | | | | | | |
| | | | | | | | |
1.780%, 7/1/2021, Call 9/6/2018 (7) | | | 885,000 | | | | 885,000 | |
2.210%, 9/1/2057, Call 3/1/2023 (7) | | | 5,000,000 | | | | 5,002,100 | |
4.000%, 5/15/2019 | | | 225,000 | | | | 228,224 | |
Parish of St. James, 1.730%, 11/1/2040, Call 9/19/2018 (7) | | | 5,000,000 | | | | 5,000,000 | |
| | | | | | | | |
| | | | | | | 11,505,636 | |
Maine — 0.0% | | | | | | | | |
City of Portland General Airport Revenue, 5.000%, 1/1/2019 | | | 305,000 | | | | 308,132 | |
| | |
Maryland — 1.4% | | | | | | | | |
City of Baltimore: | | | | | | | | |
3.000%, 9/1/2018 | | | 250,000 | | | | 250,000 | |
4.000%, 9/1/2019 | | | 350,000 | | | | 356,853 | |
Maryland Industrial Development Financing Authority, 1.720%, 3/1/2030, Call 9/19/2018 (7) | | | 5,000,000 | | | | 5,000,000 | |
RBC Municipal Products, Inc. Trust, 1.760%, 1/1/2025 (5) (7) | | | 3,000,000 | | | | 3,000,000 | |
| | | | | | | | |
| | | | | | | 8,606,853 | |
Massachusetts — 0.2% | | | | | | | | |
Commonwealth of Massachusetts, 2.030%, 11/1/2018, Call 10/1/2018 (7) | | | 750,000 | | | | 750,030 | |
Massachusetts Development Finance Agency, 2.040%, 7/1/2050, Call 8/1/2019 (7) | | | 500,000 | | | | 500,670 | |
| | | | | | | | |
| | | | | | | 1,250,700 | |
Michigan — 1.1% | | | | | | | | |
Boyne City Public School District, 1.500%, 5/1/2019 | | | 1,265,000 | | | | 1,262,356 | |
City of Detroit Water Supply System Revenue, BHAC FGIC, 5.750%, 7/1/2024, Call 10/1/2018 | | | 100,000 | | | | 100,305 | |
Michigan Finance Authority: | | | | | | | | |
1.930%, 12/1/2039, Call 6/1/2020 (7) | | | 200,000 | | | | 200,840 | |
5.000%, 11/15/2018 | | | 500,000 | | | | 503,085 | |
5.000%, 11/15/2019 | | | 400,000 | | | | 414,516 | |
Michigan State Hospital Finance Authority, 1.500%, 11/1/2027 (7) | | | 850,000 | | | | 842,418 | |
Taylor Tax Increment Finance Authority, AGM: | | | | | | | | |
4.000%, 5/1/2020, Call 10/1/2018 | | | 785,000 | | | | 786,248 | |
4.000%, 5/1/2021, Call 10/1/2018 | | | 600,000 | | | | 600,918 | |
Tender Option Bond Trust Receipts/Certificates, Q-SBLF, 1.660%, 5/1/2026 (5) (7) | | | 2,000,000 | | | | 2,000,000 | |
White Cloud Public Schools, Q-SBLF, 4.000%, 5/1/2019 | | | 175,000 | | | | 177,484 | |
| | | | | | | | |
| | | | | | | 6,888,170 | |
Minnesota — 0.5% | | | | | | | | |
Housing & Redevelopment Authority of the City of St. Paul: | | | | | | | | |
2.000%, 11/15/2018 | | | 805,000 | | | | 805,547 | |
3.000%, 11/15/2019 | | | 600,000 | | | | 608,748 | |
Minnesota Rural Water Finance Authority, Inc., 1.050%, 3/1/2019 | | | 1,350,000 | | | | 1,343,291 | |
| | | | | | | | |
| | | | | | | 2,757,586 | |
Mississippi — 1.2% | | | | | | | | |
Mississippi Business Finance Corp., 1.560%, 12/1/2030, Call 9/4/2018 (7) | | | 700,000 | | | | 700,000 | |
Mississippi Development Bank, 2.500%, 1/1/2020 | | | 4,600,000 | | | | 4,635,788 | |
Mississippi Hospital Equipment & Facilities Authority, 2.125%, 9/1/2022 (7) | | | 925,000 | | | | 924,473 | |
Southwest Mississippi Regional Medical Center, 2.100%, 6/1/2019, Call 12/1/2018 | | | 1,000,000 | | | | 998,540 | |
| | | | | | | | |
| | | | | | | 7,258,801 | |
Missouri — 1.4% | | | | | | | | |
Cape Girardeau County Industrial Development Authority, 5.000%, 3/1/2019 | | | 220,000 | | | | 222,924 | |
City of St. Louis, 3.000%, 5/30/2019 | | | 5,000,000 | | | | 5,036,400 | |
Missouri Housing Development Commission, GNMA/FNMA/FHLMC, 4.700%, 3/1/2035, Call 9/1/2019 | | | 200,000 | | | | 203,660 | |
Missouri State Environmental Improvement & Energy Resources Authority, NATL-RE, 2.538%, 12/1/2022, Call 9/19/2018 (7) (8) | | | 1,750,000 | | | | 1,750,000 | |
St. Louis County Industrial Development Authority, 2.850%, 9/1/2018 | | | 1,000,000 | | | | 1,000,000 | |
| | | | | | | | |
| | | | | | | 8,212,984 | |
Nevada — 0.1% | | | | | | | | |
City of Carson City, 5.000%, 9/1/2019 | | | 345,000 | | | | 354,877 | |
| | |
New Jersey — 7.2% | | | | | | | | |
City of Union City, SAW, 4.000%, 11/1/2019 | | | 1,000,000 | | | | 1,020,520 | |
Lyndhurst Township School District, School Bond Gty, 2.750%, 9/14/2018 | | | 5,500,000 | | | | 5,501,485 | |
New Jersey Economic Development Authority: | | | | | | | | |
| | | | | | | | |
1.850%, 11/1/2040, Call 9/19/2018 (7) | | | 4,600,000 | | | | 4,600,000 | |
1.850%, 11/1/2040, Call 9/19/2018 (7) | | | 5,665,000 | | | | 5,665,000 | |
1.910%, 11/1/2031, Call 9/19/2018 (7) | | | 4,995,000 | | | | 4,995,000 | |
New Jersey Health Care Facilities Financing Authority: | | | | | | | | |
1.840%, 7/1/2028, Call 9/5/2018 (7) | | | 300,000 | | | | 300,000 | |
1.850%, 7/1/2038, Call 9/19/2018 (7) | | | 3,175,000 | | | | 3,175,000 | |
New Jersey Transportation Trust Fund Authority: | | | | | | | | |
2.560%, 6/15/2034, Call 6/15/2019 (7) | | | 5,000,000 | | | | 5,004,100 | |
4.000%, 6/15/2019 | | | 500,000 | | | | 508,095 | |
4.000%, 6/15/2020 | | | 200,000 | | | | 206,840 | |
5.000%, 6/15/2019 | | | 4,500,000 | | | | 4,607,415 | |
New Jersey Transportation Trust Fund Authority, AGM, 5.500%, 12/15/2018 | | | 250,000 | | | | 252,570 | |
New Jersey Turnpike Authority: | | | | | | | | |
1.797%, 1/1/2021 (7) | | | 1,750,000 | | | | 1,752,380 | |
1.937%, 1/1/2022 (7) | | | 750,000 | | | | 752,647 | |
Tender Option Bond Trust Receipts/Certificates, 1.710%, 7/1/2025 (5) (7) | | | 2,175,000 | | | | 2,175,000 | |
Tobacco Settlement Financing Corp., 5.000%, 6/1/2020 | | | 2,400,000 | | | | 2,521,104 | |
| | | | | | | | |
| | | | | | | 43,037,156 | |
New Mexico — 1.4% | | | | | | | | |
County of Bernalillo, 1.400%, 3/1/2020 (7) | | | 2,875,000 | | | | 2,869,422 | |
New Mexico Municipal Energy Acquisition Authority, 2.145%, 11/1/2039, Call 2/1/2019 (7) | | | 5,500,000 | | | | 5,505,830 | |
| | | | | | | | |
| | | | | | | 8,375,252 | |
New York — 10.4% | | | | | | | | |
Albany Industrial Development Agency, 1.780%, 7/1/2032, Call 9/6/2018 (7) | | | 1,175,000 | | | | 1,175,000 | |
Chautauqua County Capital Resource Corp., 1.300%, 11/1/2031 (7) | | | 775,000 | | | | 774,736 | |
City of New York, 1.560%, 8/1/2035, Call 9/19/2018 (7) | | | 6,300,000 | | | | 6,300,000 | |
City of New York, AGC, 1.590%, 10/1/2021, Call 9/4/2018 (7) (8) | | | 100,000 | | | | 100,000 | |
Long Island Power Authority, 2.107%, 5/1/2033, Call 10/1/2018 (7) | | | 1,600,000 | | | | 1,600,272 | |
Metropolitan Transportation Authority: | | | | | | | | |
1.945%, 11/1/2030 (7) | | | 3,000,000 | | | | 3,001,530 | |
2.010%, 11/15/2044 (7) | | | 3,000,000 | | | | 2,995,350 | |
2.095%, 11/1/2031 (7) | | | 3,500,000 | | | | 3,510,395 | |
2.140%, 11/15/2041 (7) | | | 500,000 | | | | 500,660 | |
5.000%, 11/15/2030, Call 11/15/2019 (7) | | | 600,000 | | | | 622,212 | |
New York City Transitional Finance Authority Future Tax Secured Revenue: | | | | | | | | |
1.520%, 8/1/2022, Call 9/19/2018 (7) | | | 4,320,000 | | | | 4,320,000 | |
1.520%, 8/1/2023, Call 9/19/2018 (7) | | | 6,550,000 | | | | 6,550,000 | |
1.560%, 11/1/2029, Call 9/19/2018 (7) | | | 3,700,000 | | | | 3,700,000 | |
1.560%, 5/1/2034, Call 9/19/2018 (7) | | | 3,800,000 | | | | 3,800,000 | |
New York City Water & Sewer System: | | | | | | | | |
1.570%, 6/15/2039, Call 9/19/2018 (7) | | | 250,000 | | | | 250,000 | |
1.580%, 6/15/2039, Call 9/19/2018 (7) | | | 1,550,000 | | | | 1,550,000 | |
New York State Dormitory Authority, 4.000%, 12/1/2018 (5) | | | 1,000,000 | | | | 1,004,030 | |
Nuveen New York AMT-Free Quality Municipal Income Fund, 1.860%, 5/1/2047, Call 9/19/2018 (5) (7) | | | 5,000,000 | | | | 5,000,000 | |
RBC Municipal Products, Inc. Trust, 1.530%, 3/1/2022, Call 9/19/2018 (5) (7) | | | 6,000,000 | | | | 6,000,000 | |
South Glens Falls Central School District, SAW, 3.000%, 7/26/2019 | | | 4,500,000 | | | | 4,540,455 | |
Triborough Bridge & Tunnel Authority, 2.095%, 1/1/2032 (7) | | | 4,935,000 | | | | 4,982,376 | |
| | | | | | | | |
| | | | | | | 62,277,016 | |
North Carolina — 0.2% | | | | | | | | |
North Carolina Medical Care Commission, 1.880%, 6/1/2029, Call 6/1/2020 (5) (7) | | | 1,000,000 | | | | 1,000,000 | |
| | |
North Dakota — 0.2% | | | | | | | | |
Barnes County North Public School District Building Authority, 4.000%, 5/1/2019 | | | 590,000 | | | | 597,983 | |
City of Williston, AGM, 2.650%, 11/1/2020, Call 10/1/2018 | | | 655,000 | | | | 655,458 | |
| | | | | | | | |
| | | | | | | 1,253,441 | |
Ohio — 9.1% | | | | | | | | |
City of Akron, 3.000%, 12/12/2018 | | | 4,000,000 | | | | 4,012,840 | |
City of Avon, 3.000%, 9/5/2019 (9) | | | 1,250,000 | | | | 1,263,313 | |
City of Fairborn, 2.250%, 3/21/2019 | | | 2,887,000 | | | | 2,893,553 | |
City of Grove City, 2.500%, 3/7/2019 | | | 4,000,000 | | | | 4,011,680 | |
City of Lakewood, 2.500%, 3/28/2019 | | | 4,000,000 | | | | 4,013,880 | |
City of Seven Hills, 2.875%, 4/10/2019 | | | 750,000 | | | | 753,128 | |
| | | | | | | | |
County of Belmont, 3.000%, 8/29/2019 | | | 3,800,000 | | | | 3,831,350 | |
County of Richland, 3.250%, 2/1/2019 | | | 695,000 | | | | 698,419 | |
County of Trumbull: | | | | | | | | |
2.000%, 8/29/2019 | | | 2,800,000 | | | | 2,795,100 | |
3.125%, 8/29/2019 | | | 2,000,000 | | | | 2,018,720 | |
Dublin City School District, 2.500%, 4/18/2019 | | | 4,500,000 | | | | 4,514,625 | |
FHLMC Multifamily VRD Certificates, 1.860%, 9/15/2033 (7) | | | 3,490,000 | | | | 3,490,000 | |
Lancaster Port Authority, 2.115%, 5/1/2038, Call 2/1/2019 (7) | | | 5,000,000 | | | | 5,004,700 | |
Ohio Higher Educational Facility Commission: | | | | | | | | |
2.250%, 9/1/2033, Call 9/1/2018 (7) | | | 460,000 | | | | 460,000 | |
5.000%, 12/1/2018 | | | 500,000 | | | | 504,070 | |
Rib Floater Trust Various States, 1.810%, 11/15/2048, Call 10/1/2018 (5) (7) | | | 4,000,000 | | | | 4,000,000 | |
State of Ohio, 1.450%, 11/1/2035 (7) | | | 2,000,000 | | | | 2,000,000 | |
Tender Option Bond Trust Receipts/Certificates, 1.710%, 8/1/2024 (5) (7) | | | 5,580,000 | | | | 5,580,000 | |
Village of Orange, 3.000%, 8/29/2019 | | | 2,500,000 | | | | 2,521,100 | |
| | | | | | | | |
| | | | | | | 54,366,478 | |
Oklahoma — 0.2% | | | | | | | | |
Oklahoma County Finance Authority, 5.000%, 10/1/2019 | | | 510,000 | | | | 527,355 | |
Tulsa County Independent School District No. 4 Bixby, 2.000%, 7/1/2019 | | | 1,000,000 | | | | 1,002,510 | |
| | | | | | | | |
| | | | | | | 1,529,865 | |
Oregon — 0.7% | | | | | | | | |
County of Gilliam, 1.500%, 10/1/2018 | | | 1,000,000 | | | | 999,620 | |
Port of Morrow, 1.600%, 2/1/2027, Call 9/19/2018 (7) | | | 3,210,000 | | | | 3,210,000 | |
| | | | | | | | |
| | | | | | | 4,209,620 | |
Pennsylvania — 4.5% | | | | | | | | |
Allentown City School District, SAW, 2.200%, 1/2/2019, Call 10/2/2018 | | | 1,500,000 | | | | 1,499,220 | |
Bethlehem Area School District, SAW, 1.932%, 7/1/2031, Call 11/2/2020 (7) | | | 2,995,000 | | | | 2,996,138 | |
Commonwealth Financing Authority, 5.000%, 6/1/2020 | | | 1,000,000 | | | | 1,048,530 | |
Indiana County Industrial Development Authority, 1.550%, 4/1/2019, Call 10/1/2018 | | | 1,850,000 | | | | 1,846,947 | |
Manheim Township School District, 1.885%, 5/1/2025, Call 5/1/2021 (7) | | | 2,000,000 | | | | 2,015,240 | |
Montgomery County Higher Education & Health Authority: | | | | | | | | |
1.820%, 9/1/2050, Call 9/4/2018 (7) | | | 3,000,000 | | | | 3,000,000 | |
2.280%, 9/1/2051, Call 9/1/2019 (7) | | | 2,500,000 | | | | 2,500,025 | |
Montgomery County Industrial Development Authority, AGC, 1.650%, 11/15/2029, Call 9/1/2018 (7) | | | 1,500,000 | | | | 1,500,000 | |
North Penn Water Authority, 1.895%, 11/1/2024, Call 5/1/2019 (7) | | | 2,000,000 | | | | 2,000,240 | |
Northampton County General Purpose Authority, 2.497%, 8/15/2048, Call 2/15/2023 (7) | | | 1,000,000 | | | | 1,002,750 | |
Old Forge School District, BAM SAW, 2.000%, 5/1/2019 | | | 500,000 | | | | 500,090 | |
Pennsylvania Economic Development Financing Authority, 2.125%, 11/1/2021 (7) | | | 3,000,000 | | | | 2,998,320 | |
Pennsylvania Turnpike Commission: | | | | | | | | |
2.440%, 12/1/2020, Call 6/1/2020 (7) | | | 1,800,000 | | | | 1,816,686 | |
2.710%, 12/1/2019, Call 6/1/2019 (7) | | | 2,225,000 | | | | 2,243,935 | |
| | | | | | | | |
| | | | | | | 26,968,121 | |
South Carolina — 1.5% | | | | | | | | |
Lexington County Health Services District, Inc., 5.000%, 11/1/2019 | | | 250,000 | | | | 258,840 | |
Patriots Energy Group Financing Agency, 2.243%, 10/1/2048, Call 11/1/2023 (7) | | | 6,000,000 | | | | 6,000,000 | |
South Carolina Jobs-Economic Development Authority, 2.250%, 5/1/2019, Call 11/1/2018 (5) | | | 3,000,000 | | | | 2,988,540 | |
| | | | | | | | |
| | | | | | | 9,247,380 | |
Tennessee — 1.0% | | | | | | | | |
County of Monroe, 1.200%, 6/15/2019, Call 12/15/2018 | | | 1,250,000 | | | | 1,245,262 | |
Metropolitan Government Nashville & Davidson County Health & Educational Facility Board, 1.875%, 7/1/2021 (7) | | | 1,400,000 | | | | 1,398,110 | |
Tender Option Bond Trust Receipts/Certificates, 1.760%, 7/1/2046, Call 9/6/2018 (5) (7) | | | 3,100,000 | | | | 3,100,000 | |
Tennessee Housing Development Agency, 4.500%, 7/1/2028, Call 1/1/2020 | | | 60,000 | | | | 60,228 | |
| | | | | | | | |
| | | | | | | 5,803,600 | |
Texas — 7.9% | | | | | | | | |
Austin Convention Enterprises, Inc., 5.000%, 1/1/2019 | | | 400,000 | | | | 403,752 | |
Bexar County Health Facilities Development Corp.: | | | | | | | | |
5.000%, 7/15/2019 | | | 125,000 | | | | 127,880 | |
5.000%, 7/15/2020 | | | 175,000 | | | | 182,870 | |
| | | | | | | | |
City of Lewisville, AGM, 4.000%, 9/1/2018 | | | 340,000 | | | | 340,000 | |
Crane County Water District, 4.000%, 2/15/2019 | | | 1,000,000 | | | | 1,009,820 | |
Deer Park Independent School District, PSF, 3.000%, 10/1/2042 (7) | | | 2,000,000 | | | | 2,024,920 | |
Denton County Fresh Water Supply District No. 7, AGM, 2.000%, 2/15/2019 | | | 240,000 | | | | 240,295 | |
Georgetown Independent School District, 2.500%, 8/1/2034 (7) | | | 1,500,000 | | | | 1,509,240 | |
Goose Creek Consolidated Independent School District, PSF, 1.180%, 2/15/2035 (7) | | | 1,800,000 | | | | 1,789,416 | |
Harris County Municipal Utility District No. 371,BAM: | | | | | | | | |
2.000%, 9/1/2018 | | | 290,000 | | | | 290,000 | |
2.000%, 9/1/2019 | | | 295,000 | | | | 295,230 | |
Irving Hospital Authority, 2.660%, 10/15/2044, Call 4/15/2023 (7) | | | 1,000,000 | | | | 1,002,500 | |
Midlothian Independent School District, PSF, 2.500%, 8/1/2052 (7) | | | 1,500,000 | | | | 1,514,505 | |
Northside Independent School District, PSF: | | | | | | | | |
2.000%, 8/1/2044 (7) | | | 4,000,000 | | | | 4,006,400 | |
2.125%, 8/1/2040, Call 2/1/2019 (7) | | | 1,850,000 | | | | 1,851,868 | |
Rib Floater Trust Various States: | | | | | | | | |
1.740%, 6/1/2032, Call 4/1/2020 (5) (7) | | | 6,000,000 | | | | 6,000,000 | |
1.740%, 11/1/2042, Call 11/1/2020 (5) (7) | | | 5,000,000 | | | | 5,000,000 | |
Spring Branch Independent School District, PSF, 3.000%, 6/15/2041 (7) | | | 4,000,000 | | | | 4,036,920 | |
Tarrant County Cultural Education Facilities Finance Corp., 2.500%, 12/1/2018, Call 9/21/2018 | | | 975,000 | | | | 975,205 | |
Tender Option Bond Trust Receipts/Certificates, 1.760%, 7/1/2021 (5) (7) | | | 11,000,000 | | | | 11,000,000 | |
Trail of the Lakes Municipal Utility District, BAM, 5.000%, 4/1/2019 | | | 120,000 | | | | 122,147 | |
Travis County Health Facilities Development Corp., 5.250%, 1/1/2047, Call 1/1/2020 (7) | | | 3,400,000 | | | | 3,588,632 | |
| | | | | | | | |
| | | | | | | 47,311,600 | |
Utah — 0.4% | | | | | | | | |
Tender Option Bond Trust Receipts/Certificates, 1.740%, 1/1/2025 (5) (7) | | | 2,500,000 | | | | 2,500,000 | |
| | |
Virginia — 1.6% | | | | | | | | |
Newport News Redevelopment & Housing Authority, FHA/GNMA, 1.200%, 4/1/2019 | | | 3,500,000 | | | | 3,487,295 | |
Peninsula Ports Authority, 1.550%, 10/1/2033 (7) | | | 1,000,000 | | | | 997,990 | |
Tender Option Bond Trust Receipts/Certificates, 1.710%, 1/1/2025 (5) (7) | | | 5,400,000 | | | | 5,400,000 | |
| | | | | | | | |
| | | | | | | 9,885,285 | |
Washington — 2.0% | | | | | | | | |
City of Bellingham Water & Sewer Revenue, 1.760%, 8/1/2019 (5) (7) | | | 500,000 | | | | 500,000 | |
County of Skagit, 2.000%, 12/1/2018 | | | 485,000 | | | | 485,543 | |
Tender Option Bond Trust Receipts/Certificates: | | | | | | | | |
1.710%, 6/15/2033, Call 6/1/2019 (5) (7) | | | 5,050,000 | | | | 5,050,000 | |
1.730%, 1/1/2035 (5) (7) | | | 5,000,000 | | | | 5,000,000 | |
Washington Health Care Facilities Authority, 2.490%, 1/1/2042, Call 1/1/2022 (7) | | | 450,000 | | | | 455,549 | |
WBRP 3.2, 5.000%, 1/1/2019 | | | 500,000 | | | | 505,560 | |
| | | | | | | | |
| | | | | | | 11,996,652 | |
West Virginia — 0.9% | | | | | | | | |
West Virginia Hospital Finance Authority: | | | | | | | | |
1.840%, 6/1/2033, Call 9/4/2018 (7) | | | 5,000,000 | | | | 5,000,000 | |
5.000%, 1/1/2020 (9) | | | 300,000 | | | | 311,667 | |
5.000%, 1/1/2021 (9) | | | 360,000 | | | | 383,170 | |
| | | | | | | | |
| | | | | | | 5,694,837 | |
Wisconsin — 1.1% | | | | | | | | |
Chippewa Falls Area Unified School District, 3.000%, 1/10/2019, Call 10/10/2018 | | | 1,225,000 | | | | 1,226,752 | |
County of Langlade, 2.000%, 10/1/2018 | | | 100,000 | | | | 100,040 | |
Hilbert School District, 2.100%, 4/1/2019, Call 10/1/2018 | | | 1,580,000 | | | | 1,580,190 | |
Public Finance Authority: | | | | | | | | |
2.300%, 10/1/2019, Call 4/1/2019 | | | 1,500,000 | | | | 1,494,255 | |
5.000%, 11/15/2018 | | | 565,000 | | | | 568,898 | |
5.000%, 11/15/2019 | | | 440,000 | | | | 457,301 | |
Wisconsin Health & Educational Facilities Authority: | | | | | | | | |
1.910%, 8/15/2054, Call 1/28/2021 (7) | | | 500,000 | | | | 500,120 | |
| | | | | | | | |
5.000%, 2/15/2019 | | | 455,000 | | | | 461,511 | |
| | | | | | | | |
| | | | | | | 6,389,067 | |
| | | | | | | | |
Total Municipals
(identified cost $583,645,965) | | | | | | | 583,732,697 | |
| | | | | | | | |
| | |
Short-Term Investments — 3.7% | | | | | | | | |
| | |
Mutual Funds — 0.0% | | | | | | | | |
BMO Government Money Market Fund — Premier Class, 1.773% (4) | | | 159,901 | | | | 159,901 | |
| | |
Short-Term Municipals — 3.7% | | | | | | | | |
| | |
Florida — 0.4% | | | | | | | | |
City of Jacksonville, 0.010%, 10/9/2018 | | | 2,500,000 | | | | 2,500,000 | |
| | |
Illinois — 0.1% | | | | | | | | |
Kendall Kane & Will Counties Community Unit School District No. 308, 3.000%, 10/1/2018 | | | 360,000 | | | | 360,349 | |
| | |
Indiana — 0.5% | | | | | | | | |
Union Township School Corp., 2.500%, 12/31/2018 | | | 2,900,000 | | | | 2,904,495 | |
| | |
Kentucky — 0.3% | | | | | | | | |
Louisville/Jefferson County Metropolitan Government, 1.550%, 9/7/2018 | | | 2,000,000 | | | | 2,000,000 | |
| | |
Massachusetts — 0.4% | | | | | | | | |
City of Pittsfield, 2.500%, 2/1/2019 | | | 2,264,752 | | | | 2,270,957 | |
| | |
Nevada — 0.1% | | | | | | | | |
City of Carson City, 5.000%, 9/1/2018 | | | 460,000 | | | | 460,000 | |
| | |
New York — 0.1% | | | | | | | | |
County of Nassau, 3.000%, 9/18/2018 | | | 500,000 | | | | 500,280 | |
| | |
Ohio — 0.4% | | | | | | | | |
Township of Union, 2.000%, 9/6/2018 | | | 2,350,000 | | | | 2,350,024 | |
| | |
Oregon — 0.3% | | | | | | | | |
State of Oregon, 5.000%, 9/28/2018 | | | 2,000,000 | | | | 2,004,440 | |
| | |
South Carolina — 0.1% | | | | | | | | |
Lexington County Health Services District, Inc., 5.000%, 11/1/2018 | | | 500,000 | | | | 502,560 | |
| | |
Texas — 0.8% | | | | | | | | |
City of Dallas, 1.300%, 9/26/2018 | | | 5,000,000 | | | | 5,000,000 | |
| | |
Wisconsin — 0.2% | | | | | | | | |
Two Rivers Public School District, 1.500%, 9/28/2018 | | | 1,470,000 | | | | 1,469,824 | |
| | | | | | | | |
| | |
Total Short-Term Municipals | | | | | | | 22,322,929 | |
| | | | | | | | |
Total Short-Term Investments
(identified cost $22,491,574) | | | | | | | 22,482,830 | |
| | | | | | | | |
| | |
Total Investments — 101.0%
(identified cost $606,137,539) | | | | | | | 606,215,527 | |
| | |
Other Assets and Liabilities — (1.0)% | | | | | | | (6,112,050 | ) |
| | | | | | | | |
| | |
Total Net Assets — 100.0% | | | | | | $ | 600,103,477 | |
| | | | | | | | |
| (4) | Denotes an investment in an affiliated entity. Please refer to Note 6, subsectionInvestments in Affiliated Issuers, in the Notes to Financial Statements. |
| (5) | Denotes a restricted security which is subject to restrictions on resale under federal securities laws. These securities have been deemed liquid based on criteria approved by the Board of Directors of the BMO Funds. At August 31, 2018 these securities amounted to: |
| | | | | | | | |
| Fund | | Amount | | | % of Total
Net Assets | |
Ultra Short Tax-Free Fund | | | $ 147,017,607 | | | | 24.50 | % |
| (7) | Denotes a variable rate security. The rate shown is the current interest rate as of August 31, 2018. Rate fluctuations are based underlying positions and/or other variables. For securities whose yields vary with a designated market index or market rate, the reference rate and spread are indicated in the description. |
| (8) | Issue represents an Auction Rate Security. An Auction Rate Security is a corporate or municipal bond debt instrument with a long nominal maturity for which the interest rate is regularly reset through a Dutch auction. The rate presented is either the rate set through the auction or the maximum interest rate provided for in the security issuance provision. |
| (9) | Purchased on a when-issued or delayed delivery basis. |
Short Tax-Free Fund
| | | | | | | | |
Description | | Shares or
Principal
Amount | | | Value | |
| | |
Municipals — 100.6% | | | | | | | | |
| | |
Alabama — 3.8% | | | | | | | | |
Alabama Federal Aid Highway Finance Authority, 5.000%, 9/1/2018 | | $ | 1,000,000 | | | $ | 1,000,000 | |
Black Belt Energy Gas District: | | | | | | | | |
2.295%, 12/1/2048, Call 9/1/2023 (7) | | | 1,000,000 | | | | 1,000,000 | |
4.000%, 7/1/2046, Call 3/1/2021 (7) | | | 1,000,000 | | | | 1,045,390 | |
County of Jefferson, 5.000%, 9/15/2021 | | | 1,000,000 | | | | 1,083,410 | |
Health Care Authority for Baptist Health, 2.130%, 11/1/2042 (7) | | | 595,000 | | | | 595,000 | |
Industrial Development Board of the City of Mobile, 1.680%, 6/1/2034, Call 9/19/2018 (7) | | | 1,000,000 | | | | 1,000,000 | |
Southeast Alabama Gas Supply District, 2.282%, 4/1/2049, Call 1/1/2024 (7) | | | 1,000,000 | | | | 999,180 | |
Tuscaloosa City Board of Education: | | | | | | | | |
5.000%, 8/1/2020 | | | 200,000 | | | | 212,010 | |
5.000%, 8/1/2021 | | | 175,000 | | | | 189,952 | |
| | | | | | | | |
| | | | | | | 7,124,942 | |
Alaska — 0.8% | | | | | | | | |
Alaska Industrial Development & Export Authority, 3.500%, 12/1/2020, Call 12/1/2019 | | | 1,000,000 | | | | 1,013,200 | |
City of Valdez, 5.000%, 1/1/2021 | | | 500,000 | | | | 533,035 | |
| | | | | | | | |
| | | | | | | 1,546,235 | |
Arizona — 1.8% | | | | | | | | |
Arizona Health Facilities Authority: | | | | | | | | |
3.410%, 2/1/2048, Call 8/9/2019 (7) | | | 250,000 | | | | 253,033 | |
3.410%, 2/1/2048, Call 8/9/2019 (7) | | | 250,000 | | | | 253,033 | |
City of El Mirage, 5.000%, 7/1/2022, Call 7/1/2020 | | | 465,000 | | | | 490,598 | |
City of Phoenix Civic Improvement Corp., NATL-RE, 5.500%, 7/1/2019 | | | 100,000 | | | | 103,162 | |
Coconino County Pollution Control Corp., 1.600%, 3/1/2039 (7) | | | 750,000 | | | | 743,595 | |
Industrial Development Authority of the City of Phoenix, 3.000%, 7/1/2020 (5) | | | 55,000 | | | | 54,546 | |
La Paz County Industrial Development Authority, 5.000%, 2/15/2021 (5) | | | 750,000 | | | | 774,757 | |
Maricopa County Industrial Development Authority: | | | | | | | | |
2.550%, 7/1/2021 | | | 330,000 | | | | 326,796 | |
2.875%, 7/1/2021 (5) | | | 200,000 | | | | 199,056 | |
Pinal County School District No. 1 Florence, BAM, 4.000%, 7/1/2020 | | | 250,000 | | | | 260,177 | |
| | | | | | | | |
| | | | | | | 3,458,753 | |
Arkansas — 0.7% | | | | | | | | |
Arkansas Development Finance Authority, 2.110%, 9/1/2044, Call 9/4/2018 (7) | | | 863,000 | | | | 863,000 | |
City of Cabot, 2.550%, 6/1/2043, Call 6/1/2023 | | | 70,000 | | | | 69,834 | |
City of Hot Springs Wastewater Revenue, 5.000%, 12/1/2020 | | | 245,000 | | | | 260,175 | |
City of Rogers, 2.125%, 11/1/2029, Call 11/1/2021 | | | 75,000 | | | | 74,849 | |
| | | | | | | | |
| | | | | | | 1,267,858 | |
California — 9.0% | | | | | | | | |
Abag Finance Authority for Nonprofit Corps., 5.000%, 7/1/2020 | | | 500,000 | | | | 531,425 | |
Bay Area Toll Authority, 2.660%, 4/1/2045, Call 10/1/2023 (7) | | | 500,000 | | | | 516,330 | |
California Health Facilities Financing Authority, NATL-RE, 2.756%, 7/1/2022, Call 9/19/2018 (7) (8) | | | 400,000 | | | | 388,820 | |
California Housing Finance Agency, AGM, 4.893%, 2/1/2037, Call 9/6/2018 (7) (8) | | | 5,000 | | | | 5,000 | |
California Municipal Finance Authority: | | | | | | | | |
1.650%, 9/1/2021 (7) | | | 500,000 | | | | 499,965 | |
5.000%, 2/1/2022 | | | 1,000,000 | | | | 1,091,370 | |
California Public Finance Authority: | | | | | | | | |
5.000%, 10/15/2021 | | | 350,000 | | | | 375,263 | |
5.000%, 10/15/2022 | | | 300,000 | | | | 327,036 | |
California State Public Works Board: | | | | | | | | |
| | | | | | | | |
5.000%, 4/1/2020 | | | 320,000 | | | | 336,822 | |
5.000%, 11/1/2020, Call 11/1/2019 | | | 35,000 | | | | 36,356 | |
5.125%, 10/1/2022, Call 10/1/2019 | | | 245,000 | | | | 254,702 | |
California Statewide Communities Development Authority, 5.000%, 12/1/2025 (5) | | | 200,000 | | | | 222,542 | |
California Statewide Communities Development Authority, CMI, 3.500%, 11/1/2021, Call 11/1/2019 | | | 750,000 | | | | 763,462 | |
California Statewide Communities Development Authority, NATL-RE, 5.374%, 4/1/2028 (7) (8) | | | 75,000 | | | | 75,000 | |
Carson Redevelopment Agency Successor Agency, AGM, 5.000%, 10/1/2020 | | | 675,000 | | | | 719,158 | |
Chino Redevelopment Agency Successor Agency, AMBAC, 4.000%, 9/1/2019, Call 10/1/2018 | | | 250,000 | | | | 250,388 | |
City of Redding Electric System Revenue, NATL-RE, 3.150%, 7/1/2022 (7) (8) | | | 100,000 | | | | 98,138 | |
County of San Joaquin, 4.000%, 4/1/2019 | | | 225,000 | | | | 228,177 | |
Florin Resource Conservation District, NATL-RE, 4.000%, 9/1/2018 | | | 500,000 | | | | 500,000 | |
Fresno Joint Powers Financing Authority, AGM, 5.000%, 4/1/2022 | | | 875,000 | | | | 965,370 | |
Golden State Tobacco Securitization Corp., 5.000%, 6/1/2022 | | | 1,000,000 | | | | 1,110,200 | |
Northern California Gas Authority No. 1, 2.196%, 7/1/2019 (7) | | | 545,000 | | | | 545,142 | |
Palomar Health, 5.000%, 11/1/2022 | | | 375,000 | | | | 408,060 | |
Rib Floater Trust Various States, 1.710%, 3/1/2042, Call 10/1/2018 (5) (7) | | | 2,000,000 | | | | 2,000,000 | |
Sacramento Redevelopment Agency Successor Agency, BAM, 5.000%, 12/1/2022 | | | 385,000 | | | | 432,875 | |
State of California, 2.287%, 12/1/2029, Call 10/1/2018 (7) | | | 610,000 | | | | 610,244 | |
Tender Option Bond Trust Receipts/Certificates: | | | | | | | | |
1.660%, 11/1/2023 (5) (7) | | | 1,500,000 | | | | 1,500,000 | |
1.710%, 8/1/2022 (5) (7) | | | 2,000,000 | | | | 2,000,000 | |
Twin Rivers Unified School District, AGM, 3.200%, 6/1/2041, Call 10/1/2018 (7) | | | 220,000 | | | | 220,548 | |
| | | | | | | | |
| | | | | | | 17,012,393 | |
Colorado — 4.5% | | | | | | | | |
Auraria Higher Education Center, 6.000%, 5/1/2019 | | | 178,000 | | | | 183,071 | |
City of Burlington Water & Sewer Revenue, AGM, 3.000%, 11/1/2019 | | | 100,000 | | | | 100,655 | |
Colorado Educational & Cultural Facilities Authority: | | | | | | | | |
2.500%, 12/15/2019 | | | 590,000 | | | | 590,655 | |
5.000%, 10/1/2021 | | | 1,000,000 | | | | 1,077,160 | |
Colorado Health Facilities Authority: | | | | | | | | |
2.200%, 7/1/2034, Call 7/1/2019 (5) (7) | | | 1,000,000 | | | | 1,000,000 | |
3.125%, 5/15/2027, Call 5/15/2020 | | | 1,000,000 | | | | 1,000,710 | |
4.000%, 12/1/2018 | | | 250,000 | | | | 251,280 | |
4.500%, 2/1/2019 | | | 250,000 | | | | 252,383 | |
5.000%, 5/15/2021 | | | 325,000 | | | | 345,072 | |
5.000%, 6/1/2021 | | | 250,000 | | | | 268,155 | |
5.000%, 5/15/2022 | | | 250,000 | | | | 269,440 | |
5.000%, 6/1/2022 | | | 250,000 | | | | 273,010 | |
County of Montrose: | | | | | | | | |
4.000%, 12/1/2018 | | | 175,000 | | | | 175,831 | |
4.000%, 12/1/2019 | | | 200,000 | | | | 205,288 | |
E-470 Public Highway Authority, 2.440%, 9/1/2039, Call 3/1/2021 (7) | | | 575,000 | | | | 580,819 | |
Regional Transportation District, 5.000%, 6/1/2025, Call 6/1/2020 | | | 500,000 | | | | 527,875 | |
Tender Option Bond Trust Receipts/Certificates, 1.670%, 12/1/2032, Call 12/1/2022 (5) (7) | | | 500,000 | | | | 500,000 | |
University of Colorado Hospital Authority, 5.000%, 11/15/2038, Call 9/1/2021 (7) | | | 750,000 | | | | 810,877 | |
Wheatlands Metropolitan District, BAM, 4.000%, 12/1/2020 | | | 125,000 | | | | 129,719 | |
| | | | | | | | |
| | | | | | | 8,542,000 | |
Connecticut — 0.3% | | | | | | | | |
State of Connecticut: | | | | | | | | |
2.480%, 9/15/2019 (7) | | | 115,000 | | | | 115,936 | |
5.000%, 3/15/2021 | | | 500,000 | | | | 532,965 | |
| | | | | | | | |
| | | | | | | 648,901 | |
Florida — 6.7% | | | | | | | | |
Brevard County Health Facilities Authority: | | | | | | | | |
5.000%, 4/1/2020 | | | 500,000 | | | | 524,290 | |
5.000%, 4/1/2021 | | | 400,000 | | | | 428,684 | |
City of Jacksonville, 1.590%, 5/1/2029, Call 9/19/2018 (7) | | | 200,000 | | | | 200,000 | |
City of Orlando, AGM: | | | | | | | | |
4.000%, 11/1/2021 | | | 460,000 | | | | 487,264 | |
5.000%, 11/1/2022 | | | 350,000 | | | | 389,294 | |
| | | | | | | | |
City of Port St. Lucie, 5.000%, 7/1/2020 | | | 295,000 | | | | 311,405 | |
City of Tampa, 5.000%, 11/15/2020, Call 5/15/2020 | | | 25,000 | | | | 26,303 | |
Columbia County School Board, 5.000%, 7/1/2019 | | | 920,000 | | | | 944,205 | |
Columbia County School Board, BAM, 5.000%, 7/1/2021 | | | 400,000 | | | | 431,612 | |
County of Broward Half-Cent Sales Tax Revenue, 5.000%, 10/1/2020 | | | 100,000 | | | | 106,121 | |
County of Okeechobee, 1.550%, 7/1/2039 (7) | | | 915,000 | | | | 891,686 | |
Emerald Coast Utilities Authority, BAM, 5.000%, 1/1/2021 | | | 300,000 | | | | 320,457 | |
Escambia County Health Facilities Authority, AGC, 1.650%, 11/15/2029, Call 9/4/2018 (7) | | | 1,700,000 | | | | 1,700,000 | |
Florida Housing Finance Corp., GNMA/FNMA/FHLMC, 4.600%, 1/1/2029, Call 1/1/2020 | | | 50,000 | | | | 51,041 | |
Halifax Hospital Medical Center: | | | | | | | | |
5.000%, 6/1/2020 | | | 325,000 | | | | 341,227 | |
5.000%, 6/1/2021 | | | 300,000 | | | | 323,112 | |
Miami-Dade County Educational Facilities Authority, AMBAC, 5.250%, 4/1/2020 | | | 40,000 | | | | 42,136 | |
Pinellas County Health Facilities Authority, 1.530%, 11/1/2038, Call 9/19/2018 (7) | | | 900,000 | | | | 900,000 | |
Pinellas County Health Facilities Authority, NATL-RE, 2.936%, 11/15/2023, Call 9/19/2018 (7) (8) | | | 150,000 | | | | 150,000 | |
Sarasota County Health Facilities Authority, 5.000%, 1/1/2022 | | | 500,000 | | | | 534,645 | |
School Board of Miami-Dade County: | | | | | | | | |
1.790%, 8/1/2027, Call 2/1/2019 (5) (7) | | | 1,515,000 | | | | 1,515,000 | |
5.000%, 5/1/2019 | | | 225,000 | | | | 229,860 | |
School District of Broward County, 5.000%, 7/1/2019 | | | 1,000,000 | | | | 1,026,720 | |
Southeast Overtown Park West Community Redevelopment Agency, 5.000%, 3/1/2019 (5) | | | 250,000 | | | | 253,900 | |
Sumter County Industrial Development Authority: | | | | | | | | |
5.000%, 7/1/2020 | | | 235,000 | | | | 247,894 | |
5.000%, 7/1/2020 | | | 300,000 | | | | 316,461 | |
| | | | | | | | |
| | | | | | | 12,693,317 | |
Georgia — 5.0% | | | | | | | | |
Atlanta Development Authority, 4.000%, 9/1/2020 | | | 500,000 | | | | 520,695 | |
City of Atlanta: | | | | | | | | |
5.000%, 1/1/2021 | | | 250,000 | | | | 266,283 | |
5.000%, 1/1/2022 | | | 700,000 | | | | 761,502 | |
City of Atlanta Water & Wastewater Revenue: | | | | | | | | |
2.891%, 11/1/2038, Call 10/1/2018 (7) | | | 250,000 | | | | 250,165 | |
6.000%, 11/1/2029, Call 11/1/2019 | | | 290,000 | | | | 304,407 | |
County of DeKalb Water & Sewerage Revenue, 5.000%, 10/1/2020 | | | 150,000 | | | | 159,909 | |
DeKalb Private Hospital Authority, 5.000%, 11/15/2021, Call 11/15/2019 | | | 420,000 | | | | 436,716 | |
Gainesville & Hall County Hospital Authority: | | | | | | | | |
2.510%, 8/15/2035, Call 8/22/2019 (7) | | | 350,000 | | | | 351,431 | |
5.000%, 2/15/2021 | | | 700,000 | | | | 749,847 | |
Georgia State Road & Tollway Authority, 5.000%, 6/1/2021 | | | 1,250,000 | | | | 1,355,000 | |
Main Street Natural Gas, Inc.: | | | | | | | | |
2.145%, 4/1/2048, Call 6/1/2023 (7) | | | 1,000,000 | | | | 995,490 | |
2.225%, 8/1/2048, Call 9/1/2023 (7) | | | 500,000 | | | | 498,250 | |
5.000%, 3/15/2019 | | | 1,000,000 | | | | 1,016,040 | |
5.250%, 9/15/2018 | | | 100,000 | | | | 100,092 | |
Tender Option Bond Trust Receipts/Certificates, 1.710%, 4/1/2025 (5) (7) | | | 1,250,000 | | | | 1,250,000 | |
Tender Option Bond Trust Receipts/Certificates, County Guarantee, 1.690%, 8/15/2049, Call 2/1/2025 (5) (7) | | | 500,000 | | | | 500,000 | |
| | | | | | | | |
| | | | | | | 9,515,827 | |
| | |
Guam — 0.3% | | | | | | | | |
Territory of Guam, 5.000%, 12/1/2022 | | | 500,000 | | | | 549,540 | |
| | |
Idaho — 0.1% | | | | | | | | |
Idaho Health Facilities Authority, 6.500%, 11/1/2023, Call 11/1/2018 | | | 150,000 | | | | 151,154 | |
Idaho Housing & Finance Association, 5.000%, 7/15/2022, Call 7/15/2019 | | | 75,000 | | | | 77,138 | |
| | | | | | | | |
| | | | | | | 228,292 | |
Illinois — 13.6% | | | | | | | | |
Bureau & Putnam Counties High School District No. 500 Princeton Township, BAM, 2.000%, 12/1/2018 | | | 400,000 | | | | 400,296 | |
Chicago O’Hare International Airport: | | | | | | | | |
5.000%, 1/1/2019 | | | 200,000 | | | | 202,178 | |
| | | | | | | | |
5.000%, 1/1/2022 | | | 100,000 | | | | 109,695 | |
5.000%, 1/1/2022 | | | 200,000 | | | | 219,390 | |
Chicago Park District: | | | | | | | | |
5.000%, 1/1/2022 | | | 250,000 | | | | 269,880 | |
5.000%, 1/1/2022 | | | 500,000 | | | | 539,760 | |
Chicago Transit Authority: | | | | | | | | |
5.000%, 6/1/2021 | | | 750,000 | | | | 804,045 | |
5.500%, 6/1/2019, Call 12/1/2018 | | | 105,000 | | | | 105,996 | |
City of Chicago Wastewater Transmission Revenue: | | | | | | | | |
5.000%, 1/1/2021 | | | 840,000 | | | | 891,954 | |
5.000%, 1/1/2022 | | | 500,000 | | | | 541,590 | |
City of Chicago Waterworks Revenue, 5.000%, 11/1/2021 | | | 1,000,000 | | | | 1,080,110 | |
City of Peoria, 3.000%, 1/1/2019 | | | 300,000 | | | | 301,134 | |
City of Waukegan, 5.000%, 12/30/2020 | | | 250,000 | | | | 266,380 | |
Clyde Park District, AGM, 4.250%, 2/1/2019 | | | 170,000 | | | | 171,139 | |
Cook County School District No. 130 Blue Island, 2.350%, 12/1/2028, Call 9/10/2018 (5) (7) (9) | | | 1,000,000 | | | | 1,000,000 | |
Cook County Township High School District No. 201 J Sterling Morton, AMBAC: | | | | | | | | |
0.000%, 12/1/2018 | | | 170,000 | | | | 169,075 | |
0.000%, 12/1/2019 | | | 100,000 | | | | 97,111 | |
Cook Kane Lake & McHenry Counties Community College District No. 512, 5.000%, 12/1/2019 | | | 1,000,000 | | | | 1,039,880 | |
County of Cook: | | | | | | | | |
5.000%, 11/15/2020, Call 11/15/2019 | | | 250,000 | | | | 258,893 | |
5.000%, 11/15/2021 | | | 720,000 | | | | 784,397 | |
Illinois Finance Authority: | | | | | | | | |
2.807%, 5/1/2036, Call 11/1/2020 (7) | | | 1,000,000 | | | | 1,005,820 | |
4.000%, 10/1/2018 | | | 275,000 | | | | 275,382 | |
5.000%, 1/1/2021 | | | 200,000 | | | | 211,392 | |
5.000%, 11/15/2021 | | | 400,000 | | | | 434,224 | |
5.000%, 1/1/2022 | | | 150,000 | | | | 161,333 | |
5.000%, 7/15/2022 | | | 750,000 | | | | 830,243 | |
5.000%, 11/15/2022 | | | 555,000 | | | | 613,636 | |
5.000%, 12/1/2022 | | | 290,000 | | | | 310,523 | |
Illinois Housing Development Authority, AGM, 4.400%, 9/1/2020, Call 10/1/2018 | | | 100,000 | | | | 100,165 | |
Kane McHenry Cook & De Kalb Counties Unit School District No. 300, 5.000%, 1/1/2023 | | | 1,000,000 | | | | 1,110,020 | |
Lake County Forest Preserve District, 2.048%, 12/15/2020 (7) | | | 205,000 | | | | 205,133 | |
Marion-Clinton Etc Counties High School District No. 200-Centralia, BAM, 3.000%, 12/1/2019 | | | 185,000 | | | | 184,839 | |
Metropolitan Pier & Exposition Authority, NATL-RE, 0.000%, 6/15/2020 | | | 30,000 | | | | 28,483 | |
Quad Cities Regional Economic Development Authority, 4.000%, 10/1/2019 | | | 400,000 | | | | 407,884 | |
Railsplitter Tobacco Settlement Authority, 5.000%, 6/1/2023 | | | 1,000,000 | | | | 1,112,450 | |
Rib Floater Trust Various States, 1.740%, 8/15/2030, Call 10/1/2018 (5) (7) | | | 2,000,000 | | | | 2,000,000 | |
Rock Island County Public Building Commission, 3.700%, 12/1/2018 | | | 75,000 | | | | 75,206 | |
State of Illinois: | | | | | | | | |
5.000%, 4/1/2020 | | | 100,000 | | | | 103,594 | |
5.000%, 2/1/2021 | | | 240,000 | | | | 250,315 | |
5.000%, 11/1/2022 | | | 2,000,000 | | | | 2,116,580 | |
Tender Option Bond Trust Receipts/Certificates, 1.710%, 6/15/2020 (5) (7) | | | 955,000 | | | | 955,000 | |
Town of Cicero, AGM, 5.000%, 1/1/2020 | | | 500,000 | | | | 517,135 | |
Village of Bolingbrook, AGM: | | | | | | | | |
4.000%, 3/1/2022 | | | 630,000 | | | | 663,755 | |
4.000%, 3/1/2023 | | | 510,000 | | | | 541,625 | |
Will & Kankakee Counties School District No. 255, 4.000%, 6/1/2019 | | | 1,110,000 | | | | 1,128,482 | |
Will County Community High School District No. 210 Lincoln-Way, 4.000%, 1/1/2022, Call 1/1/2019 | | | 1,000,000 | | | | 1,000,360 | |
Will County School District No. 159 Mokena, 2.000%, 12/1/2018 | | | 110,000 | | | | 110,089 | |
| | | | | | | | |
| | | | | | | 25,706,571 | |
Indiana — 2.6% | | | | | | | | |
City of Whiting, 1.850%, 6/1/2044 (7) | | | 1,000,000 | | | | 997,880 | |
Indiana Finance Authority: | | | | | | | | |
1.450%, 5/1/2028 (7) | | | 1,000,000 | | | | 1,000,000 | |
5.000%, 5/1/2020 | | | 100,000 | | | | 105,261 | |
| | | | | | | | |
5.000%, 8/15/2020 | | | 250,000 | | | | 259,222 | |
5.250%, 10/1/2022, Call 10/1/2021 | | | 150,000 | | | | 165,209 | |
Indiana Housing & Community Development Authority, GNMA/FNMA/FHLMC, 1.780%, 7/1/2047, Call 9/19/2018 (7) | | | 2,000,000 | | | | 2,000,000 | |
Indianapolis Local Public Improvement Bond Bank, 5.000%, 6/1/2020 | | | 100,000 | | | | 105,345 | |
Jasper Hospital Authority, 5.000%, 11/1/2020 | | | 250,000 | | | | 264,325 | |
| | | | | | | | |
| | | | | | | 4,897,242 | |
Iowa — 1.1% | | | | | | | | |
Iowa Higher Education Loan Authority, 2.000%, 12/1/2018, Call 10/1/2018 | | | 1,000,000 | | | | 1,000,030 | |
People’s Memorial Hospital of Buchanan County, 1.500%, 12/1/2018, Call 10/1/2018 | | | 1,000,000 | | | | 997,910 | |
| | | | | | | | |
| | | | | | | 1,997,940 | |
Kansas — 0.4% | | | | | | | | |
Bourbon County Unified School District No. 234-Fort Scott, 5.000%, 9/1/2020 | | | 420,000 | | | | 444,108 | |
Kansas Development Finance Authority, AMBAC, 0.000%, 7/1/2019 | | | 100,000 | | | | 98,553 | |
Kansas Development Finance Authority, BAM TCRs, 5.000%, 12/1/2019 | | | 200,000 | | | | 206,920 | |
| | | | | | | | |
| | | | | | | 749,581 | |
Kentucky — 1.7% | | | | | | | | |
Kentucky Asset Liability Commission, 5.000%, 9/1/2023 | | | 500,000 | | | | 561,530 | |
Kentucky Interlocal School Transportation Association, 2.000%, 3/1/2019 | | | 495,000 | | | | 495,406 | |
Kentucky Rural Water Finance Corp., 2.250%, 3/1/2020, Call 9/1/2019 (9) | | | 1,200,000 | | | | 1,203,144 | |
Kentucky State Property & Building Commission: | | | | | | | | |
5.375%, 11/1/2023, Call 11/1/2018 | | | 20,000 | | | | 20,121 | |
5.375%, 11/1/2023, Call 11/1/2018 | | | 5,000 | | | | 5,030 | |
Lexington Center Corp., AGC, 4.100%, 10/1/2020, Call 9/3/2018 | | | 265,000 | | | | 265,450 | |
Louisville/Jefferson County Metropolitan Government, 5.000%, 10/1/2020 | | | 550,000 | | | | 582,516 | |
| | | | | | | | |
| | | | | | | 3,133,197 | |
Louisiana — 0.3% | | | | | | | | |
Evangeline Parish Road & Drain Sales Tax District No. 1, AGM, 5.000%, 12/1/2020 | | | 400,000 | | | | 426,224 | |
Louisiana Housing Corp., FHA, 2.500%, 12/1/2031, Call 6/1/2020 | | | 5,000 | | | | 4,760 | |
Louisiana Public Facilities Authority, AMBAC, 2.756%, 9/1/2027, Call 9/11/2018 (7) (8) | | | 50,000 | | | | 49,256 | |
State of Louisiana, 5.000%, 11/15/2020, Call 5/15/2020 | | | 110,000 | | | | 116,092 | |
| | | | | | | | |
| | | | | | | 596,332 | |
Maine — 0.1% | | | | | | | | |
City of Portland General Airport Revenue: | | | | | | | | |
4.000%, 7/1/2019 | | | 130,000 | | | | 132,182 | |
4.000%, 7/1/2020 | | | 110,000 | | | | 113,875 | |
| | | | | | | | |
| | | | | | | 246,057 | |
Maryland — 1.2% | | | | | | | | |
City of Baltimore: | | | | | | | | |
2.852%, 7/1/2037, Call 9/5/2018 (7) (8) | | | 25,000 | | | | 23,136 | |
5.000%, 9/1/2022 | | | 500,000 | | | | 547,175 | |
City of Baltimore, NATL-RE, 3.062%, 7/1/2020 (7) (8) | | | 50,000 | | | | 50,000 | |
City of Rockville, 5.000%, 11/1/2022 | | | 500,000 | | | | 543,670 | |
Maryland Community Development Administration, GNMA/FNMA/FHLMC, 4.500%, 3/1/2027, Call 3/1/2021 | | | 20,000 | | | | 20,608 | |
Maryland Industrial Development Financing Authority, 1.720%, 3/1/2030, Call 9/19/2018 (7) | | | 1,000,000 | | | | 1,000,000 | |
| | | | | | | | |
| | | | | | | 2,184,589 | |
Massachusetts — 1.0% | | | | | | | | |
Commonwealth of Massachusetts, 1.700%, 8/1/2043 (7) | | | 1,000,000 | | | | 982,480 | |
Massachusetts Development Finance Agency: | | | | | | | | |
4.000%, 4/15/2020 | | | 225,000 | | | | 229,613 | |
5.000%, 7/1/2021 | | | 280,000 | | | | 300,535 | |
5.000%, 7/1/2022 | | | 315,000 | | | | 343,526 | |
| | | | | | | | |
| | | | | | | 1,856,154 | |
Michigan — 3.3% | | | | | | | | |
Avondale School District, Q-SBLF, 5.000%, 11/1/2018 | | | 300,000 | | | | 301,617 | |
City of Detroit Water Supply System Revenue, BHAC FGIC, 5.750%, 7/1/2024, Call 10/1/2018 | | | 200,000 | | | | 200,610 | |
City of Wyandotte Electric System Revenue, BAM: | | | | | | | | |
| | | | | | | | |
5.000%, 10/1/2018 | | | 200,000 | | | | 200,430 | |
5.000%, 10/1/2019 | | | 250,000 | | | | 256,835 | |
Grosse Ile Township School District, Q-SBLF, 5.000%, 5/1/2020 | | | 595,000 | | | | 625,208 | |
Lake St. Claire Clean Water Initiative, County Guarantee, 5.000%, 10/1/2020 | | | 150,000 | | | | 159,339 | |
Marquette Board of Light & Power, 5.000%, 7/1/2020 | | | 150,000 | | | | 158,175 | |
Michigan State Hospital Finance Authority, 5.000%, 11/15/2020, Call 11/15/2019 | | | 520,000 | | | | 539,942 | |
Muskegon Public Schools, Q-SBLF, 4.250%, 5/1/2021, Call 5/1/2019 | | | 200,000 | | | | 203,202 | |
State of Michigan, 5.500%, 11/1/2021, Call 5/1/2019 | | | 300,000 | | | | 307,572 | |
Taylor Tax Increment Finance Authority, AGM, 4.000%, 5/1/2021, Call 10/1/2018 | | | 270,000 | | | | 270,413 | |
Tender Option Bond Trust Receipts/Certificates,Q-SBLF: | | | | | | | | |
1.660%, 5/1/2026 (5) (7) | | | 1,000,000 | | | | 1,000,000 | |
1.660%, 5/1/2026 (5) (7) | | | 2,000,000 | | | | 2,000,000 | |
| | | | | | | | |
| | | | | | | 6,223,343 | |
Minnesota — 0.3% | | | | | | | | |
Housing & Redevelopment Authority of The City of St. Paul, 5.000%, 11/15/2021 | | | 500,000 | | | | 545,530 | |
| | |
Mississippi — 1.1% | | | | | | | | |
Mississippi Business Finance Corp., 1.560%, 11/1/2035, Call 9/4/2018 (7) | | | 1,450,000 | | | | 1,450,000 | |
Mississippi Development Bank, 5.000%, 8/1/2019 | | | 155,000 | | | | 159,518 | |
Southwest Mississippi Regional Medical Center, 2.100%, 6/1/2019, Call 12/1/2018 | | | 500,000 | | | | 499,270 | |
| | | | | | | | |
| | | | | | | 2,108,788 | |
Missouri — 2.5% | | | | | | | | |
Health & Educational Facilities Authority of the State of Missouri: | | | | | | | | |
5.000%, 2/1/2022 | | | 250,000 | | | | 269,342 | |
5.000%, 2/1/2024, Call 2/1/2021 | | | 250,000 | | | | 262,880 | |
Kansas City Planned Industrial Expansion Authority, 1.500%, 12/1/2018, Call 9/21/2018 | | | 1,000,000 | | | | 999,460 | |
Missouri Housing Development Commission, GNMA/FNMA/FHLMC, 4.700%, 3/1/2035, Call 9/1/2019 | | | 200,000 | | | | 203,660 | |
Missouri State Environmental Improvement & Energy Resources Authority, NATL-RE, 2.538%, 12/1/2022, Call 9/19/2018 (7) (8) | | | 805,000 | | | | 805,000 | |
Southeast Missouri State University, 5.000%, 4/1/2019 | | | 1,000,000 | | | | 1,018,470 | |
St. Louis County Industrial Development Authority, 2.850%, 9/1/2018 | | | 600,000 | | | | 600,000 | |
St. Louis Municipal Finance Corp., 5.000%, 2/15/2021 | | | 500,000 | | | | 532,640 | |
| | | | | | | | |
| | | | | | | 4,691,452 | |
Nevada — 0.3% | | | | | | | | |
City of Carson City, 5.000%, 9/1/2022 | | | 500,000 | | | | 549,170 | |
| | |
New Jersey — 3.9% | | | | | | | | |
City of Jersey City, AGM, 4.000%, 2/15/2019 | | | 620,000 | | | | 626,305 | |
Lyndhurst Township School District, School Bond Gty, 2.750%, 9/14/2018 | | | 1,500,000 | | | | 1,500,405 | |
New Jersey Economic Development Authority, 5.000%, 11/1/2021 | | | 400,000 | | | | 430,024 | |
New Jersey Health Care Facilities Financing Authority, 5.000%, 7/1/2022 | | | 790,000 | | | | 874,925 | |
New Jersey Higher Education Student Assistance Authority, 4.875%, 12/1/2024, Call 12/1/2019 | | | 330,000 | | | | 339,900 | |
New Jersey Transportation Trust Fund Authority: | | | | | | | | |
2.560%, 6/15/2034, Call 6/15/2019 (7) | | | 475,000 | | | | 475,389 | |
4.000%, 12/15/2019 | | | 75,000 | | | | 76,862 | |
5.000%, 6/15/2019 | | | 150,000 | | | | 153,498 | |
New Jersey Transportation Trust Fund Authority, AGM, 5.250%, 12/15/2019 | | | 250,000 | | | | 260,613 | |
New Jersey Transportation Trust Fund Authority, NATL-RE: | | | | | | | | |
5.500%, 12/15/2019 | | | 135,000 | | | | 140,893 | |
5.500%, 12/15/2020 | | | 10,000 | | | | 10,736 | |
South Jersey Port Corp., 5.000%, 1/1/2019 | | | 340,000 | | | | 342,805 | |
Tender Option Bond Trust Receipts/Certificates, 1.690%, 7/1/2025 (5) (7) | | | 1,000,000 | | | | 1,000,000 | |
Tobacco Settlement Financing Corp., 5.000%, 6/1/2022 | | | 1,000,000 | | | | 1,096,170 | |
| | | | | | | | |
| | | | | | | 7,328,525 | |
New Mexico — 0.4% | | | | | | | | |
New Mexico Mortgage Finance Authority, GNMA/FNMA/FHLMC, 5.300%, 9/1/2040, Call 9/1/2019 | | | 15,000 | | | | 15,571 | |
New Mexico Municipal Energy Acquisition Authority, 2.145%, 11/1/2039, Call 2/1/2019 (7) | | | 650,000 | | | | 650,689 | |
| | | | | | | | |
| | | | | | | 666,260 | |
New York — 7.3% | | | | | | | | |
| | | | | | | | |
BB&T Municipal Trust, 2.360%, 11/15/2019 (5) (7) | | | 88,474 | | | | 88,484 | |
County of Nassau, 5.000%, 10/1/2018 | | | 1,000,000 | | | | 1,002,540 | |
Erie County Industrial Development Agency, SAW, 5.250%, 5/1/2025, Call 5/1/2019 | | | 400,000 | | | | 409,820 | |
Long Island Power Authority, 2.107%, 5/1/2033, Call 10/1/2018 (7) | | | 1,000,000 | | | | 1,000,170 | |
New York City Transitional Finance Authority Future Tax Secured Revenue, 1.520%, 8/1/2022, Call 9/19/2018 (7) | | | 600,000 | | | | 600,000 | |
New York State Dormitory Authority: | | | | | | | | |
5.000%, 12/15/2019 | | | 495,000 | | | | 515,998 | |
5.000%, 12/1/2022 (5) | | | 600,000 | | | | 657,168 | |
5.250%, 2/15/2024, Call 2/15/2019 | | | 380,000 | | | | 386,320 | |
5.250%, 2/15/2024, Call 2/15/2019 | | | 20,000 | | | | 20,320 | |
New York State Dormitory Authority, NATL-RE, 3.700%, 7/1/2029, Call 9/4/2018 (7) (8) | | | 525,000 | | | | 525,000 | |
New York State Energy Research & Development Authority, 2.000%, 6/1/2029 (7) | | | 350,000 | | | | 349,601 | |
New York State Thruway Authority, 5.000%, 5/1/2019 | | | 1,000,000 | | | | 1,021,530 | |
Nuveen New York AMT-Free Quality Municipal Income Fund, 1.860%, 5/1/2047, Call 9/19/2018 (5) (7) | | | 1,500,000 | | | | 1,500,000 | |
RBC Municipal Products, Inc. Trust, 1.530%, 3/1/2022, Call 9/19/2018 (5) (7) | | | 1,700,000 | | | | 1,700,000 | |
State of New York Mortgage Agency, 5.000%, 10/1/2019 | | | 600,000 | | | | 620,874 | |
Triborough Bridge & Tunnel Authority, 2.095%, 1/1/2032 (7) | | | 1,000,000 | | | | 1,009,600 | |
TSASC, Inc., 5.000%, 6/1/2021 | | | 1,000,000 | | | | 1,072,060 | |
Westchester Tobacco Asset Securitization, 5.000%, 6/1/2020 | | | 1,155,000 | | | | 1,212,265 | |
| | | | | | | | |
| | | | | | | 13,691,750 | |
North Carolina — 0.5% | | | | | | | | |
North Carolina Eastern Municipal Power Agency, AGC, 6.000%, 1/1/2019 | | | 50,000 | | | | 50,721 | |
North Carolina Eastern Municipal Power Agency, FGIC, 3.144%, 1/1/2025 (7) (8) | | | 600,000 | | | | 542,472 | |
North Carolina Medical Care Commission, 5.000%, 10/1/2022 | | | 350,000 | | | | 387,103 | |
| | | | | | | | |
| | | | | | | 980,296 | |
North Dakota — 0.2% | | | | | | | | |
City of Williston, 5.000%, 5/1/2020 | | | 240,000 | | | | 251,782 | |
North Dakota Housing Finance Agency, 3.750%, 7/1/2042, Call 7/1/2022 | | | 90,000 | | | | 92,498 | |
| | | | | | | | |
| | | | | | | 344,280 | |
Ohio — 3.6% | | | | | | | | |
Akron Bath Copley Joint Township Hospital District, 5.000%, 11/15/2021 | | | 805,000 | | | | 867,677 | |
City of Akron, 3.000%, 12/12/2018 | | | 1,000,000 | | | | 1,003,210 | |
City of Cleveland Airport System Revenue, AGM, 5.000%, 1/1/2019 | | | 600,000 | | | | 605,922 | |
City of Harrison, 2.000%, 10/1/2018 | | | 60,000 | | | | 60,014 | |
County of Hamilton: | | | | | | | | |
1.560%, 9/1/2033, Call 9/19/2018 (7) | | | 300,000 | | | | 300,000 | |
4.000%, 1/1/2021 | | | 445,000 | | | | 460,264 | |
5.000%, 1/1/2022 | | | 465,000 | | | | 499,977 | |
FHLMC Multifamily VRD Certificates, 1.860%, 9/15/2033 (7) | | | 1,345,000 | | | | 1,345,000 | |
Lancaster Port Authority, 2.015%, 8/1/2019, Call 2/1/2019 (7) | | | 195,000 | | | | 195,033 | |
Ohio Housing Finance Agency, GNMA/FNMA/FHLMC, 4.000%, 5/1/2022, Call 5/1/2021 | | | 70,000 | | | | 71,704 | |
Rib Floater Trust Various States, 1.810%, 11/15/2048, Call 10/1/2018 (5) (7) | | | 1,000,000 | | | | 1,000,000 | |
University of Toledo, 5.000%, 6/1/2020 | | | 375,000 | | | | 395,243 | |
| | | | | | | | |
| | | | | | | 6,804,044 | |
Oregon — 0.5% | | | | | | | | |
Port of Morrow, 1.600%, 2/1/2027, Call 9/19/2018 (7) | | | 1,000,000 | | | | 1,000,000 | |
| | |
Pennsylvania — 4.4% | | | | | | | | |
Allegheny County Hospital Development Authority: | | | | | | | | |
2.290%, 2/1/2021, Call 11/1/2018 (7) | | | 80,000 | | | | 80,397 | |
5.375%, 8/15/2029, Call 8/15/2019 | | | 225,000 | | | | 231,831 | |
Berks County Industrial Development Authority, 5.000%, 11/1/2022 | | | 250,000 | | | | 275,762 | |
Berks County Municipal Authority, 3.060%, 11/1/2039, Call 9/17/2018 (7) | | | 350,000 | | | | 355,330 | |
City of Philadelphia, AGC: | | | | | | | | |
5.125%, 8/1/2025, Call 8/1/2019 | | | 10,000 | | | | 10,314 | |
5.125%, 8/1/2025, Call 8/1/2019 | | | 90,000 | | | | 92,699 | |
Commonwealth Financing Authority, 5.000%, 6/1/2022 | | | 1,000,000 | | | | 1,091,660 | |
Commonwealth of Pennsylvania, 5.000%, 4/15/2020, Call 4/15/2019 | | | 600,000 | | | | 612,570 | |
| | |
Delaware County Vocational & Technical School Authority, BAM, 3.000%, 11/1/2018 | | | 120,000 | | | | 120,262 | |
| | | | | | | | |
Lancaster County Solid Waste Management Authority, 5.000%, 12/15/2020 | | | 200,000 | | | | 213,242 | |
Lancaster Industrial Development Authority, 5.000%, 5/1/2020 | | | 285,000 | | | | 297,326 | |
Montgomery County Higher Education & Health Authority, 1.820%, 9/1/2050, Call 9/4/2018 (7) | | | 1,000,000 | | | | 1,000,000 | |
North Penn Water Authority, 1.895%, 11/1/2024, Call 5/1/2019 (7) | | | 800,000 | | | | 800,096 | |
Northampton County General Purpose Authority: | | | | | | | | |
2.497%, 8/15/2048, Call 2/15/2023 (7) | | | 1,000,000 | | | | 1,002,750 | |
2.960%, 8/15/2043, Call 2/15/2020 (7) | | | 150,000 | | | | 151,660 | |
Pennsylvania Economic Development Financing Authority: | | | | | | | | |
2.125%, 11/1/2021 (7) | | | 500,000 | | | | 499,720 | |
5.000%, 3/1/2020 | | | 200,000 | | | | 209,240 | |
Pennsylvania Turnpike Commission: | | | | | | | | |
2.440%, 12/1/2020, Call 6/1/2020 (7) | | | 325,000 | | | | 328,013 | |
2.540%, 12/1/2021, Call 6/1/2021 (7) | | | 80,000 | | | | 81,192 | |
2.710%, 12/1/2019, Call 6/1/2019 (7) | | | 600,000 | | | | 605,106 | |
School District of Philadelphia, BHAC SAW, 5.000%, 9/1/2018 | | | 65,000 | | | | 65,000 | |
State Public School Building Authority, AGM, 5.375%, 10/1/2023, Call 10/1/2018 | | | 160,000 | | | | 160,442 | |
| | | | | | | | |
| | | | | | | 8,284,612 | |
Rhode Island — 0.1% | | | | | | | | |
Rhode Island Turnpike & Bridge Authority, 3.000%, 10/1/2018 | | | 275,000 | | | | 275,267 | |
| | |
South Carolina — 1.1% | | | | | | | | |
Newberry Investing in Children’s Education, 5.000%, 12/1/2019 | | | 1,000,000 | | | | 1,040,760 | |
Patriots Energy Group Financing Agency, 2.243%, 10/1/2048, Call 11/1/2023 (7) | | | 1,000,000 | | | | 1,000,000 | |
| | | | | | | | |
| | | | | | | 2,040,760 | |
Tennessee — 1.7% | | | | | | | | |
Clarksville Natural Gas Acquisition Corp., 5.000%, 12/15/2019 | | | 125,000 | | | | 129,543 | |
Metropolitan Government Nashville & Davidson County Health & Educational Facility Board, 2.000%, 1/1/2022 (7) | | | 1,000,000 | | | | 999,990 | |
Tender Option Bond Trust Receipts/Certificates, 1.760%, 7/1/2046, Call 9/6/2018 (5) (7) | | | 900,000 | | | | 900,000 | |
Tennessee Energy Acquisition Corp.: | | | | | | | | |
4.000%, 5/1/2048, Call 2/1/2023 (7) | | | 1,000,000 | | | | 1,059,640 | |
5.250%, 9/1/2020 | | | 10,000 | | | | 10,610 | |
5.250%, 9/1/2021 | | | 55,000 | | | | 59,710 | |
| | | | | | | | |
| | | | | | | 3,159,493 | |
Texas — 7.6% | | | | | | | | |
City of The Colony, 6.000%, 2/15/2019 | | | 795,000 | | | | 810,630 | |
Clifton Higher Education Finance Corp., PSF, 5.000%, 8/15/2020 | | | 160,000 | | | | 169,360 | |
County of Cameron, BAM, 5.000%, 2/15/2020 | | | 240,000 | | | | 251,426 | |
Crane County Water District, 3.000%, 2/15/2021 | | | 605,000 | | | | 619,357 | |
Harris County Cultural Education Facilities Finance Corp., 2.390%, 6/1/2021 (7) | | | 350,000 | | | | 354,588 | |
Irving Hospital Authority, 5.000%, 10/15/2022 | | | 215,000 | | | | 236,223 | |
Lower Colorado River Authority, 5.000%, 5/15/2019 | | | 1,000,000 | | | | 1,023,150 | |
New Hope Cultural Education Facilities Finance Corp.: | | | | | | | | |
3.375%, 8/15/2021 (5) | | | 405,000 | | | | 402,772 | |
4.000%, 11/15/2021 | | | 615,000 | | | | 631,150 | |
New Hope Cultural Education Facilities Finance Corp., AGM, 4.000%, 4/1/2020 | | | 250,000 | | | | 256,483 | |
North Texas Higher Education Authority, Inc., 3.237%, 7/1/2030 (7) | | | 105,000 | | | | 105,125 | |
North Texas Tollway Authority: | | | | | | | | |
2.230%, 1/1/2038, Call 7/1/2019 (7) | | | 350,000 | | | | 350,343 | |
2.360%, 1/1/2050, Call 10/1/2018 (7) | | | 250,000 | | | | 250,025 | |
5.000%, 1/1/2022 | | | 250,000 | | | | 274,068 | |
Northside Independent School District, PSF, 2.125%, 8/1/2040, Call 2/1/2019 (7) | | | 675,000 | | | | 675,682 | |
Panhandle-Plains Higher Education Authority, Inc., 3.587%, 4/1/2035 (7) | | | 250,000 | | | | 254,115 | |
Rib Floater Trust Various States: | | | | | | | | |
1.740%, 6/1/2032, Call 4/1/2020 (5) (7) | | | 2,000,000 | | | | 2,000,000 | |
1.740%, 11/1/2042, Call 11/1/2020 (5) (7) | | | 2,000,000 | | | | 2,000,000 | |
Tarrant County Cultural Education Facilities Finance Corp.: | | | | | | | | |
2.500%, 12/1/2018, Call 9/21/2018 | | | 140,000 | | | | 140,029 | |
5.000%, 5/15/2021 | | | 500,000 | | | | 525,945 | |
5.000%, 11/15/2022 | | | 1,000,000 | | | | 1,093,090 | |
Tender Option Bond Trust Receipts/Certificates, 1.760%, 7/1/2021 (5) (7) | | | 1,500,000 | | | | 1,500,000 | |
| | | | | | | | |
Texas State University System, 5.000%, 3/15/2022 | | | 350,000 | | | | 386,095 | |
| | | | | | | | |
| | | | | | | 14,309,656 | |
| | |
Utah — 0.2% | | | | | | | | |
Salt Lake City Corp., AMBAC, 2.321%, 5/15/2020, Call 9/19/2018 (7) (8) | | | 400,000 | | | | 400,000 | |
| | |
Vermont — 0.1% | | | | | | | | |
City of Burlington Airport Revenue, AGM, 5.000%, 7/1/2019 | | | 100,000 | | | | 102,515 | |
| | |
Virginia — 0.6% | | | | | | | | |
Henrico County Economic Development Authority, AGM, 3.616%, 8/23/2027, Call 9/19/2018 (7) (8) | | | 1,100,000 | | | | 1,100,000 | |
| | |
Washington — 1.2% | | | | | | | | |
Eclipse Funding Trust, 1.560%, 7/1/2042, Call 7/1/2027 (5) (7) | | | 500,000 | | | | 500,000 | |
FYI Properties, 5.000%, 6/1/2020, Call 6/1/2019 | | | 360,000 | | | | 368,139 | |
Marysville Local Improvement District, 3.350%, 6/1/2036, Call 6/1/2024 | | | 15,000 | | | | 15,014 | |
State of Washington, 5.000%, 2/1/2022 | | | 1,000,000 | | | | 1,100,700 | |
| | |
Washington State Housing Finance Commission, GNMA/FNMA/FHLMC, 5.000%, 10/1/2020 | | | 320,000 | | | | 341,341 | |
| | | | | | | | |
| | | | | | | 2,325,194 | |
West Virginia — 2.4% | | | | | | | | |
West Virginia Commissioner of Highways, 5.000%, 9/1/2018 | | | 1,250,000 | | | | 1,250,000 | |
West Virginia Hospital Finance Authority: | | | | | | | | |
1.840%, 6/1/2033, Call 9/4/2018 (7) | | | 2,000,000 | | | | 2,000,000 | |
5.000%, 1/1/2022 (9) | | | 520,000 | | | | 564,392 | |
5.000%, 1/1/2023 (9) | | | 555,000 | | | | 612,443 | |
| | | | | | | | |
| | | | | | | 4,426,835 | |
Wisconsin — 2.3% | | | | | | | | |
Hilbert School District, 2.100%, 4/1/2019, Call 10/1/2018 | | | 1,000,000 | | | | 1,000,120 | |
Public Finance Authority: | | | | | | | | |
3.500%, 11/15/2023, Call 5/15/2019 (5) | | | 500,000 | | | | 502,445 | |
5.000%, 11/15/2021 | | | 610,000 | | | | 663,967 | |
5.000%, 11/15/2022 | | | 500,000 | | | | 552,825 | |
State of Wisconsin: | | | | | | | | |
5.000%, 9/1/2020 | | | 175,000 | | | | 186,459 | |
5.000%, 3/1/2021 | | | 300,000 | | | | 323,874 | |
Wisconsin Health & Educational Facilities Authority: | | | | | | | | |
3.000%, 8/15/2019 | | | 105,000 | | | | 106,203 | |
5.000%, 3/1/2020 | | | 200,000 | | | | 205,282 | |
5.000%, 8/15/2020 | | | 260,000 | | | | 275,722 | |
5.000%, 8/15/2022 | | | 200,000 | | | | 222,004 | |
5.000%, 8/15/2023 | | | 205,000 | | | | 231,443 | |
5.500%, 12/15/2020, Call 12/15/2019 | | | 80,000 | | | | 83,575 | |
| | | | | | | | |
| | | | | | | 4,353,919 | |
| | | | | | | | |
Total Municipals
(identified cost $189,575,417) | | | | | | | 189,667,410 | |
| | | | | | | | |
Mutual Funds — 0.5% | | | | | | | | |
BMO Ultra Short Tax-Free Fund - Institutional Class (4) | | | 87,008 | | | | 875,303 | |
| | | | | | | | |
Total Mutual Funds
(identified cost $877,821) | | | | | | | 875,303 | |
| | | | | | | | |
| | |
Short-Term Investments — 0.0% | | | | | | | | |
| | |
Mutual Funds — 0.0% | | | | | | | | |
BMO Government Money Market Fund — Premier Class, 1.773% (4) | | | 121,200 | | | | 121,200 | |
| | | | | | | | |
Total Short-Term Investments
(identified cost $121,200) | | | | | | | 121,200 | |
| | | | | | | | |
| | |
Total Investments — 101.1%
(identified cost $190,574,438) | | | | | | | 190,663,913 | |
| | | | | | | | |
Other Assets and Liabilities — (1.1)% | | | | | | | (2,139,917 | ) |
| | | | | | | | |
| | |
Total Net Assets — 100.0% | | | | | | $ | 188,523,996 | |
| | | | | | | | |
| (4) | Denotes an investment in an affiliated entity. Please refer to Note 6, subsectionInvestments in Affiliated Issuers, in the Notes to Financial Statements. |
| (5) | Denotes a restricted security which is subject to restrictions on resale under federal securities laws. These securities have been deemed liquid based on criteria approved by the Board of Directors of the BMO Funds. At August 31, 2018 these securities amounted to: |
| | | | | | | | |
| Fund | | Amount | | | % of Total Net Assets | |
Short Tax-Free Fund | | | $ 32,475,671 | | | | 17.23 | % |
| (6) | All or a portion of this security is segregated as collateral for securities sold short. |
| (7) | Denotes a variable rate security. The rate shown is the current interest rate as of August 31, 2018. Rate fluctuations are based underlying positions and/or other variables. For securities whose yields vary with a designated market index or market rate, the reference rate and spread are indicated in the description. |
| (8) | Issue represents an Auction Rate Security. An Auction Rate Security is a corporate or municipal bond debt instrument with a long nominal maturity for which the interest rate is regularly reset through a Dutch auction. The rate presented is either the rate set through the auction or the maximum interest rate provided for in the security issuance provision. |
| (9) | Purchased on a when-issued or delayed delivery basis. |
Intermediate Tax-Free Fund
| | | | | | | | |
Description | | Shares or
Principal
Amount | | | Value | |
| | |
Municipals — 98.8% | | | | | | | | |
| | |
Alabama — 2.6% | | | | | | | | |
Alabama Board of Education: | | | | | | | | |
3.000%, 6/1/2021 | | $ | 305,000 | | | $ | 311,609 | |
4.000%, 7/1/2021 | | | 1,895,000 | | | | 1,993,654 | |
5.000%, 10/1/2020, Call 10/1/2018 | | | 230,000 | | | | 230,538 | |
Birmingham-Jefferson Civic Center Authority, 5.000%, 7/1/2048, Call 7/1/2028 | | | 3,000,000 | | | | 3,368,520 | |
Black Belt Energy Gas District, 2.295%, 12/1/2048, Call 9/1/2023 (7) | | �� | 4,000,000 | | | | 4,000,000 | |
Butler County Board of Education, AGM, 4.000%, 7/1/2020 | | | 585,000 | | | | 607,745 | |
City of Birmingham, 4.000%, 3/1/2022 (13) | | | 1,945,000 | | | | 2,029,938 | |
Health Care Authority for Baptist Health, 2.130%, 11/1/2042 (7) | | | 3,485,000 | | | | 3,485,000 | |
Mobile County Board of School Commissioners, 5.000%, 3/1/2027, Call 3/1/2026 | | | 4,015,000 | | | | 4,532,775 | |
Southeast Alabama Gas Supply District, 2.245%, 6/1/2049, Call 3/1/2024 (7) | | | 7,000,000 | | | | 6,968,220 | |
Special Care Facilities Financing Authority of the City of Pell City Alabama, 5.000%, 12/1/2025, Call 12/1/2021 | | | 4,000,000 | | | | 4,323,360 | |
Tender Option Bond Trust Receipts/Certificates: | | | | | | | | |
1.660%, 7/1/2026 (5) (7) | | | 4,590,000 | | | | 4,590,000 | |
1.710%, 10/5/2020 (5) (7) | | | 3,000,000 | | | | 3,000,000 | |
UAB Medicine Finance Authority: | | | | | | | | |
5.000%, 9/1/2036, Call 3/1/2027 | | | 2,340,000 | | | | 2,650,939 | |
5.000%, 9/1/2037, Call 3/1/2027 | | | 2,030,000 | | | | 2,294,915 | |
5.000%, 9/1/2041, Call 3/1/2027 | | | 1,020,000 | | | | 1,149,071 | |
| | | | | | | | |
| | | | | | | 45,536,284 | |
Alaska — 0.5% | | | | | | | | |
Alaska Housing Finance Corp.: | | | | | | | | |
5.000%, 12/1/2027, Call 6/1/2022 | | | 1,065,000 | | | | 1,181,138 | |
5.000%, 12/1/2027, Call 6/1/2022 | | | 310,000 | | | | 337,835 | |
5.000%, 12/1/2028, Call 12/1/2024 | | | 2,500,000 | | | | 2,828,025 | |
5.000%, 6/1/2029, Call 12/1/2024 | | | 1,000,000 | | | | 1,129,370 | |
Borough of Matanuska-Susitna: | | | | | | | | |
5.000%, 11/1/2022 | | | 500,000 | | | | 557,820 | |
5.000%, 4/1/2031, Call 4/1/2021 | | | 150,000 | | | | 162,129 | |
Borough of North Slope, 5.000%, 6/30/2024, Call 6/1/2021 | | | 1,020,000 | | | | 1,106,823 | |
City of Anchorage Electric Revenue, NATL-RE, 5.000%, 12/1/2024, Call 10/1/2018 | | | 305,000 | | | | 305,753 | |
City of Valdez, 5.000%, 1/1/2021 | | | 1,190,000 | | | | 1,268,623 | |
| | | | | | | | |
| | | | | | | 8,877,516 | |
Arizona — 2.4% | | | | | | | | |
Arizona Department of Transportation State Highway Fund Revenue, 5.250%, 7/1/2029, Call 7/1/2021 | | | 3,000,000 | | | | 3,278,280 | |
Arizona Health Facilities Authority: | | | | | | | | |
3.410%, 2/1/2048, Call 8/9/2019 (7) | | | 4,500,000 | | | | 4,554,585 | |
5.000%, 2/1/2022 | | | 1,000,000 | | | | 1,086,220 | |
Arizona Industrial Development Authority: | | | | | | | | |
5.000%, 3/1/2037, Call 9/1/2027 (5) | | | 1,250,000 | | | | 1,263,525 | |
5.000%, 3/1/2042, Call 9/1/2027 (5) | | | 1,000,000 | | | | 1,004,310 | |
Arizona Transportation Board: | | | | | | | | |
5.000%, 7/1/2022, Call 7/1/2020 | | | 1,260,000 | | | | 1,334,264 | |
5.000%, 7/1/2023, Call 7/1/2020 | | | 1,405,000 | | | | 1,487,811 | |
City of Goodyear Water & Sewer Revenue, 5.125%, 7/1/2025, Call 7/1/2020 | | | 345,000 | | | | 364,506 | |
City of Peoria Water & Wastewater Revenue, 4.000%, 7/1/2019 | | | 515,000 | | | | 524,790 | |
City of Phoenix Civic Improvement Corp.: | | | | | | | | |
5.000%, 7/1/2019 | | | 615,000 | | | | 631,949 | |
5.000%, 7/1/2026, Call 7/1/2020 | | | 1,050,000 | | | | 1,111,887 | |
City of Phoenix Civic Improvement Corp., BHAC FGIC, 5.500%, 7/1/2027 (13) | | | 500,000 | | | | 605,735 | |
| | | | | | | | |
City of Phoenix Civic Improvement Corp., NATL-RE: | | | | | | | | |
5.500%, 7/1/2021 (13) | | | 555,000 | | | | 604,994 | |
5.500%, 7/1/2036 (13) | | | 530,000 | | | | 688,650 | |
City of Tucson, AGM, 5.000%, 7/1/2020 | | | 500,000 | | | | 527,895 | |
County of Pima Sewer System Revenue, 5.000%, 7/1/2027, Call 7/1/2022 | | | 1,450,000 | | | | 1,598,016 | |
Gilbert Public Facilities Municipal Property Corp., 5.500%, 7/1/2026, Call 7/1/2019 | | | 825,000 | | | | 851,161 | |
Glendale Industrial Development Authority, 5.000%, 5/15/2023, Call 5/15/2020 | | | 500,000 | | | | 525,540 | |
Greater Arizona Development Authority, BHAC NATL-RE, 5.000%, 8/1/2027, Call 10/1/2018 | | | 155,000 | | | | 155,389 | |
Industrial Development Authority of the City of Phoenix: | | | | | | | | |
3.000%, 7/1/2020 (5) | | | 290,000 | | | | 287,605 | |
5.000%, 7/1/2031, Call 7/1/2026 (5) | | | 3,000,000 | | | | 3,181,620 | |
Industrial Development Authority of the County of Pima, 4.950%, 10/1/2020 | | | 2,000,000 | | | | 2,118,320 | |
La Paz County Industrial Development Authority: | | | | | | | | |
5.000%, 2/15/2046, Call 2/15/2026 (5) | | | 1,000,000 | | | | 1,053,940 | |
5.000%, 2/15/2048, Call 2/15/2028 | | | 1,185,000 | | | | 1,261,101 | |
Maricopa County Industrial Development Authority: | | | | | | | | |
4.000%, 1/1/2019 | | | 200,000 | | | | 201,778 | |
5.000%, 7/1/2036, Call 7/1/2026 (5) | | | 1,225,000 | | | | 1,281,374 | |
5.000%, 7/1/2036, Call 7/1/2026 | | | 750,000 | | | | 790,628 | |
Maricopa County Unified School District No. 60 Higley, AGM: | | | | | | | | |
5.000%, 7/1/2023 | | | 1,000,000 | | | | 1,130,350 | |
5.000%, 7/1/2024 | | | 575,000 | | | | 660,819 | |
Salt Verde Financial Corp., 5.250%, 12/1/2022 | | | 110,000 | | | | 122,185 | |
Scottsdale Industrial Development Authority, 5.000%, 9/1/2018 | | | 250,000 | | | | 250,000 | |
State of Arizona, AGM: | | | | | | | | |
5.000%, 10/1/2023, Call 4/1/2020 | | | 1,000,000 | | | | 1,047,140 | |
5.250%, 10/1/2024, Call 10/1/2019 | | | 5,000,000 | | | | 5,177,950 | |
Town of Marana, 5.000%, 7/1/2023 | | | 450,000 | | | | 507,555 | |
University Medical Center Corp., 5.000%, 7/1/2021 | | | 425,000 | | | | 460,292 | |
University of Arizona, 5.000%, 8/1/2026, Call 8/1/2021 | | | 455,000 | | | | 491,860 | |
| | | | | | | | |
| | | | | | | 42,224,024 | |
Arkansas — 1.2% | | | | | | | | |
Arkansas Development Finance Authority: | | | | | | | | |
2.110%, 9/1/2044, Call 9/4/2018 (7) | | | 3,650,000 | | | | 3,650,000 | |
5.000%, 2/1/2020 | | | 255,000 | | | | 265,654 | |
5.000%, 2/1/2021 | | | 315,000 | | | | 336,392 | |
5.000%, 2/1/2022 | | | 150,000 | | | | 163,190 | |
Arkansas Development Finance Authority, GNMA/FNMA/FHLMC: | | | | | | | | |
4.000%, 1/1/2025, Call 7/1/2021 | | | 200,000 | | | | 207,898 | |
4.000%, 7/1/2025, Call 7/1/2021 | | | 430,000 | | | | 446,147 | |
Arkansas State University: | | | | | | | | |
4.000%, 3/1/2021 | | | 390,000 | | | | 407,975 | |
4.000%, 3/1/2022 | | | 1,140,000 | | | | 1,205,789 | |
4.000%, 3/1/2023 | | | 985,000 | | | | 1,053,418 | |
City of Fayetteville, 3.300%, 11/1/2023 | | | 2,510,000 | | | | 2,631,308 | |
City of Maumelle, 2.600%, 3/1/2030, Call 3/1/2022 | | | 735,000 | | | | 731,928 | |
City of Springdale Sales & Use Tax Revenue: | | | | | | | | |
3.000%, 11/1/2021 | | | 1,000,000 | | | | 1,027,630 | |
5.000%, 11/1/2028, Call 11/1/2022 | | | 1,000,000 | | | | 1,103,880 | |
City of Stuttgart, AGM, 3.800%, 6/1/2042, Call 6/1/2020 | | | 905,000 | | | | 902,149 | |
Conway Health Facilities Board, 4.250%, 8/1/2021 | | | 605,000 | | | | 616,707 | |
County of Greene, AGM: | | | | | | | | |
4.000%, 3/1/2019, Call 10/1/2018 | | | 840,000 | | | | 841,310 | |
4.000%, 3/1/2020, Call 10/1/2018 | | | 1,430,000 | | | | 1,432,388 | |
Henderson State University, BAM: | | | | | | | | |
5.000%, 11/1/2022 | | | 905,000 | | | | 1,000,152 | |
5.000%, 11/1/2023, Call 11/1/2022 | | | 860,000 | | | | 949,698 | |
University of Arkansas: | | | | | | | | |
5.000%, 12/1/2021 | | | 300,000 | | | | 328,872 | |
5.000%, 12/1/2022 | | | 520,000 | | | | 581,734 | |
5.000%, 12/1/2023, Call 12/1/2022 | | | 500,000 | | | | 560,225 | |
5.000%, 11/1/2030, Call 11/1/2024 | | | 1,000,000 | | | | 1,146,080 | |
| | | | | | | | |
| | | | | | | 21,590,524 | |
California — 6.9% | | | | | | | | |
| | | | | | | | |
Abag Finance Authority for Nonprofit Corps., 5.000%, 7/1/2020 | | | 515,000 | | | | 547,368 | |
Abag Finance Authority for Nonprofit Corps., CMI, 5.000%, 4/1/2020 | | | 1,000,000 | | | | 1,055,460 | |
ABC Unified School District, NATL-RE, 5.000%, 2/1/2021 | | | 1,250,000 | | | | 1,342,200 | |
Alvord Unified School District, AGM, 0.000%, 8/1/2046, Call 8/1/2036 | | | 1,150,000 | | | | 1,124,654 | |
Anaheim Public Financing Authority, 5.000%, 10/1/2030, Call 4/1/2019 | | | 225,000 | | | | 229,730 | |
Bay Area Toll Authority, 2.810%, 4/1/2036, Call 10/1/2026 (7) | | | 5,000,000 | | | | 5,199,400 | |
Bellevue Union School District, AGM: | | | | | | | | |
0.000%, 8/1/2030 | | | 585,000 | | | | 390,681 | |
0.000%, 8/1/2031 | | | 615,000 | | | | 391,023 | |
Bonita Unified School District, 5.500%, 8/1/2035, Call 8/1/2021 | | | 940,000 | | | | 1,042,526 | |
Burbank Unified School District, 0.000%, 8/1/2031, Call 2/1/2025 (13) | | | 1,325,000 | | | | 1,176,785 | |
California County Tobacco Securitization Agency, 4.000%, 6/1/2029, Call 10/1/2018 | | | 3,660,000 | | | | 3,660,988 | |
California Health Facilities Financing Authority: | | | | | | | | |
5.000%, 7/1/2037, Call 7/1/2023 | | | 2,000,000 | | | | 2,223,820 | |
5.000%, 8/15/2042, Call 8/15/2027 | | | 1,000,000 | | | | 1,120,030 | |
California Health Facilities Financing Authority, NATL-RE, 2.756%, 7/1/2022, Call 9/19/2018 (7) (8) | | | 1,300,000 | | | | 1,263,665 | |
California Infrastructure & Economic Development Bank, 1.832%, 8/1/2047, Call 2/1/2021 (7) | | | 2,500,000 | | | | 2,497,550 | |
California Municipal Finance Authority: | | | | | | | | |
1.650%, 9/1/2021 (7) | | | 1,300,000 | | | | 1,299,909 | |
5.000%, 2/1/2042, Call 2/1/2027 | | | 1,500,000 | | | | 1,661,415 | |
California State Public Works Board, 5.000%, 4/1/2037, Call 4/1/2022 | | | 1,000,000 | | | | 1,092,790 | |
California Statewide Communities Development Authority: | | | | | | | | |
5.000%, 12/1/2031, Call 6/1/2026 (5) | | | 1,000,000 | | | | 1,105,150 | |
5.000%, 12/1/2046, Call 6/1/2026 (5) | | | 1,000,000 | | | | 1,077,660 | |
Carson Redevelopment Agency Successor Agency, AGM, 5.000%, 10/1/2021 | | | 850,000 | | | | 927,996 | |
City of Fairfield, XLCA, 0.000%, 4/1/2022 | | | 1,205,000 | | | | 1,113,613 | |
City of Madera Water Revenue: | | | | | | | | |
5.750%, 1/1/2026, Call 1/1/2020 | | | 1,550,000 | | | | 1,635,684 | |
6.500%, 1/1/2040, Call 1/1/2020 | | | 1,280,000 | | | | 1,363,264 | |
County of Los Angeles, 0.000%, 9/1/2018 | | | 750,000 | | | | 750,000 | |
County of Los Angeles, AMBAC TCRs, 0.000%, 9/1/2020 | | | 600,000 | | | | 579,906 | |
County of San Joaquin, 5.000%, 4/1/2022 | | | 350,000 | | | | 385,511 | |
Delhi Unified School District, AMBAC, 0.000%, 8/1/2019 | | | 125,000 | | | | 123,165 | |
Duarte Unified School District, 5.125%, 8/1/2026 (13) | | | 585,000 | | | | 700,087 | |
El Centro Financing Authority, AGM: | | | | | | | | |
4.000%, 10/1/2021 | | | 460,000 | | | | 489,684 | |
5.000%, 10/1/2022 | | | 580,000 | | | | 648,440 | |
5.000%, 10/1/2023 | | | 800,000 | | | | 911,472 | |
Encinitas Union School District, 0.000%, 8/1/2035, Call 8/1/2032 | | | 500,000 | | | | 559,335 | |
Escondido Union High School District, 0.000%, 8/1/2032, Call 8/1/2025 (13) | | | 1,250,000 | | | | 1,299,687 | |
Escondido Union High School District, AGC, 0.000%, 8/1/2031 | | | 480,000 | | | | 313,032 | |
Fresno Joint Powers Financing Authority, AGM, 5.000%, 4/1/2033, Call 4/1/2027 | | | 1,000,000 | | | | 1,142,850 | |
Fresno Unified School District, 0.000%, 8/1/2034, Call 8/1/2021 | | | 1,045,000 | | | | 401,970 | |
Fresno Unified School District, NATL-RE, 6.000%, 8/1/2026 | | | 2,890,000 | | | | 3,398,669 | |
Golden State Tobacco Securitization Corp.: | | | | | | | | |
5.000%, 6/1/2028, Call 6/1/2027 | | | 1,000,000 | | | | 1,153,530 | |
5.000%, 6/1/2029, Call 6/1/2027 | | | 1,000,000 | | | | 1,148,550 | |
Hacienda La Puente Unified School District, AGM: | | | | | | | | |
5.000%, 6/1/2022 | | | 400,000 | | | | 444,540 | |
5.000%, 6/1/2023 | | | 400,000 | | | | 454,180 | |
5.000%, 6/1/2024 | | | 775,000 | | | | 894,079 | |
5.000%, 6/1/2025 | | | 425,000 | | | | 495,665 | |
Imperial Community College District, AGC, 0.000%, 8/1/2028 | | | 330,000 | | | | 240,488 | |
Imperial County Local Transportation Authority, 5.000%, 6/1/2032, Call 6/1/2022 | | | 2,000,000 | | | | 2,175,840 | |
Jefferson School District/San Joaquin County, 0.000%, 8/1/2029, Call 8/1/2024 | | | 170,000 | | | | 112,533 | |
Jurupa Community Services District, 5.000%, 9/1/2029, Call 9/1/2020 | | | 375,000 | | | | 398,036 | |
Lakeside Union School District/Kern County, AGC, 0.000%, 9/1/2027 | | | 295,000 | | | | 225,525 | |
Long Beach Bond Finance Authority: | | | | | | | | |
5.000%, 11/1/2025, Call 11/1/2021 | | | 1,000,000 | | | | 1,093,520 | |
5.000%, 11/1/2030, Call 11/1/2021 | | | 1,750,000 | | | | 1,906,922 | |
Lynwood Unified School District, AGM: | | | | | | | | |
5.000%, 8/1/2024, Call 8/1/2023 | | | 620,000 | | | | 700,606 | |
5.000%, 8/1/2025, Call 8/1/2023 | | | 760,000 | | | | 861,072 | |
| | | | | | | | |
McKinleyville Union School District, AGM, 0.000%, 8/1/2041, Call 8/1/2026 (13) | | | 165,000 | | | | 174,268 | |
McKinleyville Union School District, BAM: | | | | | | | | |
0.000%, 8/1/2036, Call 8/1/2021 | | | 1,200,000 | | | | 524,736 | |
0.000%, 8/1/2037, Call 8/1/2021 | | | 1,980,000 | | | | 814,671 | |
Mendocino-Lake Community College District, AGM, 5.600%, 8/1/2031, Call 8/1/2026 (13) | | | 300,000 | | | | 361,080 | |
Midpeninsula Regional Open Space District, 5.000%, 9/1/2029, Call 9/1/2022 | | | 2,000,000 | | | | 2,253,500 | |
Modesto Irrigation District, 5.000%, 7/1/2021 | | | 500,000 | | | | 546,135 | |
Mount Diablo Unified School District, AGM, 0.000%, 8/1/2035, Call 8/1/2025 | | | 2,125,000 | | | | 2,061,590 | |
Murrieta Valley Unified School District, NATL-RE, 0.000%, 9/1/2020 | | | 500,000 | | | | 481,925 | |
Norman Y Mineta San Jose International Airport SJC: | | | | | | | | |
5.000%, 3/1/2041, Call 3/1/2027 (14) | | | 1,000,000 | | | | 1,124,960 | |
5.000%, 3/1/2042, Call 3/1/2027 | | | 1,665,000 | | | | 1,894,204 | |
Northern California Gas Authority No. 1: | | | | | | | | |
2.196%, 7/1/2019 (7) | | | 1,575,000 | | | | 1,575,409 | |
2.286%, 7/1/2027 (7) | | | 1,915,000 | | | | 1,874,421 | |
Northern California Power Agency: | | | | | | | | |
5.000%, 7/1/2031, Call 7/1/2022 | | | 500,000 | | | | 553,170 | |
5.000%, 7/1/2032, Call 7/1/2022 | | | 700,000 | | | | 773,619 | |
Orchard School District, NATL-RE, 0.000%, 8/1/2023 | | | 590,000 | | | | 526,369 | |
Pasadena Public Financing Authority, 0.000%, 3/1/2029 | | | 2,000,000 | | | | 1,452,940 | |
Porterville Unified School District Facilities Improvement District, AGM, 0.000%, 8/1/2034, Call 10/1/2018 | | | 1,500,000 | | | | 702,990 | |
Roseville Joint Union High School District, 0.000%, 8/1/2022 | | | 305,000 | | | | 281,430 | |
Sacramento Redevelopment Agency Successor Agency, BAM: | | | | | | | | |
5.000%, 12/1/2027, Call 12/1/2025 | | | 235,000 | | | | 271,820 | |
5.000%, 12/1/2028, Call 12/1/2025 | | | 425,000 | | | | 490,378 | |
5.000%, 12/1/2030, Call 12/1/2025 | | | 1,000,000 | | | | 1,148,150 | |
5.000%, 12/1/2031, Call 12/1/2025 | | | 2,000,000 | | | | 2,289,240 | |
San Francisco City & County Airport Comm-San Francisco International Airport: | | | | | | | | |
5.000%, 5/1/2024, Call 5/1/2021 | | | 745,000 | | | | 809,904 | |
5.000%, 5/1/2024, Call 5/1/2021 | | | 295,000 | | | | 320,087 | |
San Jose Financing Authority, 5.000%, 6/1/2039, Call 6/1/2023 | | | 1,435,000 | | | | 1,595,002 | |
San Jose Unified School District, NATL-RE, 0.000%, 8/1/2027 | | | 1,495,000 | | | | 1,179,450 | |
San Miguel Joint Union School District, AGM: | | | | | | | | |
0.000%, 6/15/2020 | | | 415,000 | | | | 402,554 | |
0.000%, 6/15/2021 | | | 490,000 | | | | 464,672 | |
0.000%, 6/15/2022 | | | 505,000 | | | | 464,418 | |
Santa Ana Unified School District, 0.000%, 8/1/2021 | | | 500,000 | | | | 473,130 | |
Santa Barbara County College School District: | | | | | | | | |
0.000%, 8/1/2027 | | | 365,000 | | | | 282,944 | |
0.000%, 8/1/2031 | | | 470,000 | | | | 300,349 | |
State of California: | | | | | | | | |
5.250%, 9/1/2025, Call 9/1/2021 | | | 2,045,000 | | | | 2,260,093 | |
6.000%, 3/1/2033, Call 3/1/2020 | | | 1,550,000 | | | | 1,650,889 | |
Tender Option Bond Trust Receipts/Certificates: | | | | | | | | |
1.660%, 2/1/2023 (5) (7) | | | 2,410,000 | | | | 2,410,000 | |
1.660%, 11/1/2023 (5) (7) | | | 6,000,000 | | | | 6,000,000 | |
1.660%, 8/15/2042, Call 8/15/2020 (5) (7) | | | 5,000,000 | | | | 5,000,000 | |
1.660%, 10/1/2054 (5) (7) | | | 800,000 | | | | 800,000 | |
Tender Option Bond Trust Receipts/Certificates, AGM, 1.640%, 11/15/2049, Call 11/15/2024 (5) (7) | | | 5,760,000 | | | | 5,760,000 | |
Twin Rivers Unified School District, AGM, 3.200%, 6/1/2041, Call 10/1/2018 (7) | | | 1,365,000 | | | | 1,368,399 | |
Vallejo City Unified School District, NATL-RE, 5.900%, 8/1/2025 | | | 1,225,000 | | | | 1,416,345 | |
Walnut Creek Elementary School District Contra Costa County, 0.000%, 9/1/2023 | | | 1,560,000 | | | | 1,391,114 | |
Watereuse Finance Authority, BAM TCRs, 5.500%, 5/1/2036, Call 5/1/2024 | | | 2,635,000 | | | | 3,035,889 | |
| | |
West Contra Costa Unified School District, AGM NATL-RE FGIC, 0.000%, 8/1/2025 | | | 310,000 | | | | 259,176 | |
West Kern Water District, 5.000%, 6/1/2028, Call 6/1/2021 | | | 2,000,000 | | | | 2,160,200 | |
Westminster School District, BAM, 0.000%, 8/1/2048, Call 8/1/2023 | | | 7,045,000 | | | | 1,111,278 | |
Whittier Union High School District, 0.000%, 8/1/2034, Call 8/1/2019 | | | 500,000 | | | | 190,345 | |
Windsor Unified School District, AGM: | | | | | | | | |
0.000%, 8/1/2020 | | | 105,000 | | | | 101,744 | |
0.000%, 8/1/2023 | | | 240,000 | | | | 214,428 | |
0.000%, 8/1/2024, Call 8/1/2023 | | | 330,000 | | | | 280,229 | |
| | | | | | | | |
0.000%, 8/1/2025, Call 8/1/2023 | | | 270,000 | | | | 217,704 | |
0.000%, 8/1/2026, Call 8/1/2023 | | | 330,000 | | | | 251,906 | |
0.000%, 8/1/2028, Call 8/1/2023 | | | 420,000 | | | | 287,078 | |
| | | | | | | | |
| | | | | | | 123,188,587 | |
Colorado — 2.7% | | | | | | | | |
Adams & Arapahoe Joint School District 28J Aurora, SAW, 5.000%, 12/1/2031, Call 12/1/2026 | | | 5,000,000 | | | | 5,832,150 | |
Adams County School District No. 14, SAW: | | | | | | | | |
5.000%, 12/1/2024 | | | 500,000 | | | | 576,455 | |
5.000%, 12/1/2026, Call 12/1/2024 | | | 355,000 | | | | 411,292 | |
5.000%, 12/1/2027, Call 12/1/2024 | | | 500,000 | | | | 578,025 | |
Arkansas River Power Authority, 5.000%, 10/1/2043, Call 10/1/2028 | | | 2,250,000 | | | | 2,472,165 | |
City & County of Denver, 5.000%, 8/1/2048, Call 8/1/2026 | | | 4,000,000 | | | | 4,481,480 | |
City & County of Denver Airport System Revenue: | | | | | | | | |
5.000%, 11/15/2021 | | | 500,000 | | | | 549,115 | |
5.000%, 12/1/2048, Call 12/1/2028 | | | 3,000,000 | | | | 3,354,150 | |
Colorado Educational & Cultural Facilities Authority: | | | | | | | | |
4.000%, 12/15/2025 | | | 535,000 | | | | 554,035 | |
5.000%, 9/1/2020 (13) | | | 1,060,000 | | | | 1,122,985 | |
5.000%, 9/1/2021 (13) | | | 865,000 | | | | 937,037 | |
5.000%, 10/1/2030, Call 10/1/2025 | | | 1,250,000 | | | | 1,376,400 | |
Colorado Health Facilities Authority: | | | | | | | | |
2.200%, 7/1/2034, Call 7/1/2019 (5) (7) | | | 3,325,000 | | | | 3,325,000 | |
3.125%, 5/15/2027, Call 5/15/2020 | | | 250,000 | | | | 250,178 | |
4.500%, 2/1/2020 | | | 455,000 | | | | 468,568 | |
5.000%, 9/1/2018 | | | 530,000 | | | | 530,000 | |
5.000%, 9/1/2019 | | | 560,000 | | | | 577,147 | |
5.000%, 2/1/2021 | | | 475,000 | | | | 501,975 | |
5.000%, 9/1/2022 | | | 750,000 | | | | 827,362 | |
5.000%, 12/1/2023 | | | 215,000 | | | | 237,670 | |
5.000%, 2/1/2024 | | | 420,000 | | | | 462,277 | |
5.000%, 6/1/2047, Call 6/1/2027 | | | 1,000,000 | | | | 1,090,800 | |
5.250%, 1/1/2025, Call 1/1/2020 | | | 460,000 | | | | 480,139 | |
5.250%, 5/15/2037, Call 5/15/2027 | | | 1,000,000 | | | | 1,092,510 | |
Commerce City Northern Infrastructure General Improvement District, AGM: | | | | | | | | |
5.000%, 12/1/2020 | | | 785,000 | | | | 838,788 | |
5.000%, 12/1/2021 | | | 725,000 | | | | 792,381 | |
5.000%, 12/1/2022 | | | 1,185,000 | | | | 1,317,021 | |
County of Boulder, 5.000%, 12/1/2025, Call 12/1/2020 | | | 475,000 | | | | 506,141 | |
| | |
Denver City & County School District No. 1, SAW, 5.000%, 12/1/2032, Call 12/1/2022 | | | 1,500,000 | | | | 1,684,575 | |
Denver Convention Center Hotel Authority: | | | | | | | | |
5.000%, 12/1/2033, Call 12/1/2026 | | | 1,000,000 | | | | 1,121,990 | |
5.000%, 12/1/2034, Call 12/1/2026 | | | 1,000,000 | | | | 1,116,360 | |
Denver Health & Hospital Authority, 5.500%, 12/1/2019 | | | 1,195,000 | | | | 1,223,071 | |
Park Creek Metropolitan District, 5.000%, 12/1/2030, Call 12/1/2025 | | | 1,895,000 | | | | 2,159,713 | |
Public Authority for Colorado Energy, 5.750%, 11/15/2018 | | | 195,000 | | | | 196,453 | |
Rangely Hospital District, 6.000%, 11/1/2026, Call 11/1/2021 | | | 2,000,000 | | | | 2,186,220 | |
Tender Option Bond Trust Receipts/Certificates, 1.670%, 12/1/2032, Call 12/1/2022 (5) (7) | | | 1,685,000 | | | | 1,685,000 | |
Weld County School District No. RE-7 Platte Valley, SAW, 4.000%, 12/1/2023, Call 12/1/2020 | | | 1,140,000 | | | | 1,194,253 | |
| | | | | | | | |
| | | | | | | 48,110,881 | |
Connecticut — 0.9% | | | | | | | | |
City of New Haven, AGM, 5.000%, 8/1/2023 | | | 2,060,000 | | | | 2,318,613 | |
Connecticut Housing Finance Authority, 3.600%, 11/15/2030, Call 11/15/2024 | | | 305,000 | | | | 306,650 | |
Connecticut State Health & Educational Facilities Authority: | | | | | | | | |
3.250%, 9/1/2021, Call 10/1/2018 (5) | | | 350,000 | | | | 350,105 | |
5.000%, 7/1/2029, Call 7/1/2028 | | | 1,000,000 | | | | 1,167,160 | |
State of Connecticut: | | | | | | | | |
5.000%, 3/15/2027, Call 3/15/2026 | | | 2,155,000 | | | | 2,426,465 | |
5.000%, 4/15/2034, Call 4/15/2027 | | | 3,000,000 | | | | 3,315,510 | |
University of Connecticut: | | | | | | | | |
5.000%, 3/15/2032, Call 3/15/2026 | | | 2,000,000 | | | | 2,206,740 | |
| | | | | | | | |
5.000%, 1/15/2033, Call 1/15/2027 | | | 4,000,000 | | | | 4,428,440 | |
| | | | | | | | |
| | | | | | | 16,519,683 | |
Delaware — 0.4% | | | | | | | | |
City of Wilmington, 5.000%, 10/1/2025, Call 10/1/2023 | | | 3,715,000 | | | | 4,209,689 | |
Delaware State Economic Development Authority, 5.000%, 6/1/2036, Call 6/1/2026 | | | 1,500,000 | | | | 1,520,055 | |
Delaware State Housing Authority, GNMA/FNMA/FHLMC, 5.000%, 1/1/2026, Call 7/1/2019 | | | 195,000 | | | | 198,264 | |
Sustainable Energy Utility, Inc., 5.000%, 9/15/2034, Call 9/15/2021 | | | 1,580,000 | | | | 1,707,443 | |
| | | | | | | | |
| | | | | | | 7,635,451 | |
District of Columbia — 0.4% | | | | | | | | |
District of Columbia: | | | | | | | | |
5.000%, 10/1/2025, Call 10/1/2021 | | | 1,865,000 | | | | 1,992,324 | |
5.000%, 6/1/2036, Call 6/1/2026 | | | 2,500,000 | | | | 2,729,150 | |
5.000%, 12/1/2036, Call 12/1/2021 | | | 500,000 | | | | 542,215 | |
Washington Convention & Sports Authority, 5.000%, 10/1/2030, Call 10/1/2027 | | | 1,500,000 | | | | 1,758,810 | |
| | | | | | | | |
| | | | | | | 7,022,499 | |
Florida — 6.0% | | | | | | | | |
Central Florida Expressway Authority: | | | | | | | | |
4.000%, 7/1/2041, Call 7/1/2027 | | | 4,000,000 | | | | 4,098,560 | |
5.000%, 7/1/2039, Call 7/1/2027 | | | 1,000,000 | | | | 1,134,070 | |
Citizens Property Insurance Corp., 5.000%, 6/1/2019 | | | 2,615,000 | | | | 2,675,694 | |
City of Boynton Beach Utility System Revenue, AGM, 5.000%, 11/1/2027, Call 11/1/2021 | | | 1,000,000 | | | | 1,088,390 | |
City of Fort Pierce, AGC, 5.875%, 9/1/2028, Call 9/1/2018 | | | 1,000,000 | | | | 1,000,000 | |
City of Gulf Breeze, 5.000%, 12/1/2023, Call 12/1/2020 | | | 2,000,000 | | | | 2,132,480 | |
City of Lakeland Department of Electric Utilities, AGM, 5.250%, 10/1/2028 | | | 1,250,000 | | | | 1,545,600 | |
City of North Port, BAM, 5.000%, 7/1/2022 | | | 200,000 | | | | 220,030 | |
City of Orlando, AGM: | | | | | | | | |
5.000%, 11/1/2034, Call 11/1/2027 | | | 1,000,000 | | | | 1,133,350 | |
5.000%, 11/1/2035, Call 11/1/2027 | | | 1,000,000 | | | | 1,129,970 | |
5.000%, 11/1/2036, Call 11/1/2027 | | | 1,000,000 | | | | 1,126,610 | |
City of Port St. Lucie, AGC, 6.250%, 9/1/2027, Call 9/1/2018 | | | 500,000 | | | | 500,000 | |
City of Sunrise, NATL-RE: | | | | | | | | |
0.000%, 10/1/2019 | | | 905,000 | | | | 888,158 | |
0.000%, 10/1/2020 | | | 975,000 | | | | 936,761 | |
0.000%, 10/1/2021 | | | 175,000 | | | | 163,923 | |
City of Sunrise Utility System Revenue, 4.000%, 10/1/2019 | | | 540,000 | | | | 553,370 | |
City of Tallahassee: | | | | | | | | |
5.000%, 12/1/2026, Call 12/1/2025 | | | 450,000 | | | | 506,592 | |
5.000%, 12/1/2027, Call 12/1/2025 | | | 400,000 | | | | 448,372 | |
City of Tampa, 5.250%, 11/15/2026, Call 5/15/2020 | | | 2,000,000 | | | | 2,119,080 | |
City of Tampa, AMBAC, 0.000%, 4/1/2021 | | | 460,000 | | | | 434,051 | |
Columbia County School Board, BAM, 5.000%, 7/1/2026, Call 7/1/2025 | | | 495,000 | | | | 568,809 | |
County of Broward, AGM, 5.000%, 4/1/2033, Call 4/1/2023 | | | 740,000 | | | | 797,202 | |
County of Broward Airport System Revenue: | | | | | | | | |
5.000%, 10/1/2026, Call 10/1/2025 (14) | | | 750,000 | | | | 857,250 | |
5.000%, 10/1/2031, Call 10/1/2025 (14) | | | 1,000,000 | | | | 1,121,160 | |
County of Lee County Water & Sewer Revenue, 5.000%, 10/1/2029, Call 10/1/2022 | | | 2,000,000 | | | | 2,208,740 | |
County of Miami-Dade, AGC, 0.000%, 10/1/2021 | | | 610,000 | | | | 567,062 | |
County of Miami-Dade Aviation Revenue: | | | | | | | | |
5.000%, 10/1/2025, Call 10/1/2024 | | | 800,000 | | | | 917,840 | |
5.000%, 10/1/2040, Call 10/1/2027 (14) | | | 1,500,000 | | | | 1,683,480 | |
5.500%, 10/1/2026, Call 10/1/2020 | | | 450,000 | | | | 483,998 | |
5.500%, 10/1/2026, Call 10/1/2020 | | | 1,450,000 | | | | 1,559,547 | |
County of Miami-Dade Aviation Revenue, AGC, 5.000%, 10/1/2029, Call 10/1/2019 | | | 400,000 | | | | 414,048 | |
County of Miami-Dade Water & Sewer System Revenue: | | | | | | | | |
4.000%, 10/1/2035, Call 10/1/2027 | | | 2,500,000 | | | | 2,628,175 | |
5.000%, 10/1/2033, Call 10/1/2025 | | | 2,000,000 | | | | 2,275,000 | |
5.250%, 10/1/2029, Call 10/1/2023 | | | 100,000 | | | | 113,022 | |
County of Miami-Dade Water & Sewer System Revenue, BHAC, 6.000%, 10/1/2023, Call 10/1/2018 | | | 1,000,000 | | | | 1,003,290 | |
County of Orange Sales Tax Revenue, 5.000%, 1/1/2027, Call 1/1/2022 | | | 5,810,000 | | | | 6,338,013 | |
County of St. Johns, AGM: | | | | | | | | |
5.000%, 10/1/2020 | | | 1,625,000 | | | | 1,725,490 | |
| | | | | | | | |
5.000%, 10/1/2021 | | | 1,110,000 | | | | 1,206,648 | |
Dupree Lakes Community Development District, BAM, 3.000%, 5/1/2019 | | | 190,000 | | | | 191,378 | |
Emerald Coast Utilities Authority, BAM, 5.000%, 1/1/2032, Call 1/1/2025 | | | 1,445,000 | | | | 1,619,079 | |
Escambia County Health Facilities Authority, AGC, 1.650%, 11/15/2029, Call 9/4/2018 (7) | | | 4,000,000 | | | | 4,000,000 | |
Florida Housing Finance Corp., GNMA/FNMA/FHLMC: | | | | | | | | |
4.450%, 1/1/2030, Call 7/1/2021 | | | 300,000 | | | | 306,870 | |
5.000%, 7/1/2028, Call 1/1/2020 | | | 95,000 | | | | 96,493 | |
Halifax Hospital Medical Center: | | | | | | | | |
5.000%, 6/1/2026 | | | 1,525,000 | | | | 1,755,778 | |
5.000%, 6/1/2027, Call 6/1/2026 | | | 1,295,000 | | | | 1,472,635 | |
Lee County Industrial Development Authority, 5.000%, 11/1/2025, Call 11/1/2020 | | | 2,000,000 | | | | 2,133,800 | |
Lee County School Board, 5.000%, 8/1/2028, Call 8/1/2024 | | | 2,500,000 | | | | 2,836,700 | |
| | |
Miami-Dade County Educational Facilities Authority, 5.000%, 4/1/2031, Call 4/1/2025 | | | 2,000,000 | | | | 2,257,300 | |
Monroe County School District, 5.000%, 6/1/2034, Call 6/1/2027 | | | 1,000,000 | | | | 1,141,140 | |
Orange County Health Facilities Authority, 5.250%, 10/1/2035, Call 10/1/2018 | | | 440,000 | | | | 441,192 | |
Palm Beach County Health Facilities Authority: | | | | | | | | |
5.000%, 5/15/2036, Call 5/15/2027 | | | 1,000,000 | | | | 1,079,630 | |
5.000%, 5/15/2037, Call 5/15/2027 | | | 1,000,000 | | | | 1,077,340 | |
5.000%, 11/15/2045, Call 11/15/2025 | | | 2,500,000 | | | | 2,762,800 | |
Polk County Housing Finance Authority, GNMA COLL, 5.000%, 9/1/2029, Call 8/1/2020 | | | 150,000 | | | | 157,917 | |
Putnam County Development Authority, 1.480%, 9/1/2024, Call 9/19/2018 (7) | | | 3,600,000 | | | | 3,600,000 | |
Sarasota County Health Facilities Authority: | | | | | | | | |
5.000%, 1/1/2030, Call 1/1/2025 | | | 750,000 | | | | 817,710 | |
5.000%, 1/1/2031, Call 1/1/2025 | | | 935,000 | | | | 1,017,196 | |
5.000%, 1/1/2037, Call 1/1/2024 | | | 1,000,000 | | | | 1,075,770 | |
School Board of Miami-Dade County, 1.790%, 8/1/2027, Call 2/1/2019 (5) (7) | | | 6,305,000 | | | | 6,305,000 | |
| | |
School Board of Miami-Dade County, FGIC, 1.790%, 5/1/2037, Call 9/1/2018 (5) (7) | | | 6,500,000 | | | | 6,500,000 | |
St. Lucie County School Board, AGM, 5.000%, 7/1/2022, Call 7/1/2021 | | | 2,500,000 | | | | 2,678,375 | |
Sumter County Industrial Development Authority: | | | | | | | | |
4.000%, 7/1/2019 | | | 1,000,000 | | | | 1,017,610 | |
5.000%, 7/1/2020 | | | 500,000 | | | | 527,435 | |
Tender Option Bond Trust Receipts/Certificates, 1.660%, 10/1/2042, Call 4/1/2022 (5) (7) | | | 7,500,000 | | | | 7,500,000 | |
Town of Davie: | | | | | | | | |
5.000%, 4/1/2019 | | | 75,000 | | | | 76,407 | |
5.000%, 4/1/2021 | | | 615,000 | | | | 661,506 | |
5.000%, 4/1/2022 | | | 830,000 | | | | 912,104 | |
Volusia County Educational Facility Authority, AGM, 5.000%, 10/15/2029, Call 10/15/2021 | | | 730,000 | | | | 798,270 | |
| | | | | | | | |
| | | | | | | 107,121,270 | |
Georgia — 4.4% | | | | | | | | |
Carroll City-County Hospital Authority, County Guarantee: | | | | | | | | |
5.000%, 7/1/2023, Call 7/1/2020 | | | 1,185,000 | | | | 1,252,652 | |
5.000%, 7/1/2023, Call 7/1/2020 | | | 1,605,000 | | | | 1,696,918 | |
5.000%, 7/1/2024, Call 7/1/2020 | | | 695,000 | | | | 734,678 | |
5.000%, 7/1/2024, Call 7/1/2020 | | | 945,000 | | | | 998,600 | |
City of Atlanta Department of Aviation: | | | | | | | | |
5.000%, 1/1/2031, Call 1/1/2024 | | | 1,000,000 | | | | 1,127,010 | |
5.000%, 1/1/2032, Call 1/1/2024 | | | 2,500,000 | | | | 2,808,250 | |
5.000%, 1/1/2033, Call 1/1/2024 | | | 1,000,000 | | | | 1,121,710 | |
5.000%, 1/1/2034, Call 1/1/2024 | | | 1,000,000 | | | | 1,121,180 | |
City of Atlanta Water & Wastewater Revenue: | | | | | | | | |
5.000%, 11/1/2040, Call 11/1/2027 | | | 1,000,000 | | | | 1,152,990 | |
5.000%, 11/1/2047, Call 11/1/2027 | | | 3,000,000 | | | | 3,438,330 | |
City of Atlanta Water & Wastewater Revenue, NATL-RE, 5.500%, 11/1/2022 | | | 1,000,000 | | | | 1,107,010 | |
Cobb County Kennestone Hospital Authority, 5.000%, 4/1/2031, Call 4/1/2021 | | | 3,000,000 | | | | 3,187,200 | |
Floyd County Hospital Authority, County Guarantee: | | | | | | | | |
5.000%, 7/1/2020 | | | 1,335,000 | | | | 1,408,986 | |
5.000%, 7/1/2021 | | | 1,155,000 | | | | 1,246,280 | |
5.000%, 7/1/2027, Call 7/1/2022 | | | 1,250,000 | | �� | | 1,360,813 | |
| | | | | | | | |
Fulton County Development Authority, 5.250%, 3/15/2024, Call 3/15/2019 | | | 1,120,000 | | | | 1,140,138 | |
Gainesville & Hall County Development Authority: | | | | | | | | |
5.000%, 3/1/2027 | | | 750,000 | | | | 823,335 | |
5.000%, 3/1/2037, Call 3/1/2027 | | | 500,000 | | | | 528,680 | |
5.000%, 3/1/2047, Call 3/1/2027 | | | 3,000,000 | | | | 3,141,510 | |
Gainesville & Hall County Hospital Authority: | | | | | | | | |
5.000%, 2/15/2036, Call 2/15/2027 | | | 1,500,000 | | | | 1,667,880 | |
5.000%, 2/15/2037, Call 2/15/2027 | | | 2,000,000 | | | | 2,219,200 | |
5.000%, 2/15/2042, Call 2/15/2027 | | | 3,000,000 | | | | 3,310,320 | |
Glynn-Brunswick Memorial Hospital Authority, 5.000%, 8/1/2043, Call 8/1/2027 | | | 1,000,000 | | | | 1,094,660 | |
Jefferson City School District, SAW, 5.250%, 2/1/2029, Call 2/1/2021 | | | 1,350,000 | | | | 1,459,471 | |
Main Street Natural Gas, Inc.: | | | | | | | | |
2.130%, 8/1/2048, Call 9/1/2023 (7) | | | 5,000,000 | | | | 4,992,400 | |
2.145%, 4/1/2048, Call 6/1/2023 (7) | | | 7,000,000 | | | | 6,968,430 | |
2.225%, 8/1/2048, Call 9/1/2023 (7) | | | 5,000,000 | | | | 4,982,500 | |
5.250%, 9/15/2018 | | | 250,000 | | | | 250,230 | |
Private Colleges & Universities Authority, 5.000%, 10/1/2020 | | | 575,000 | | | | 605,515 | |
RBC Municipal Products, Inc. Trust, 1.620%, 10/1/2021, Call 9/19/2018 (5) (7) | | | 4,000,000 | | | | 4,000,000 | |
Richmond County Hospital Authority: | | | | | | | | |
5.250%, 1/1/2029, Call 1/1/2019 | | | 1,150,000 | | | | 1,163,547 | |
5.375%, 1/1/2029, Call 1/1/2019 | | | 940,000 | | | | 951,449 | |
South Fulton Municipal Regional Water & Sewer Authority, BAM: | | | | | | | | |
5.000%, 1/1/2023 | | | 800,000 | | | | 889,408 | |
5.000%, 1/1/2024 | | | 1,000,000 | | | | 1,129,680 | |
5.000%, 1/1/2025, Call 1/1/2024 | | | 700,000 | | | | 795,648 | |
South Regional Joint Development Authority, 5.250%, 8/1/2023 | | | 25,000 | | | | 28,315 | |
| | |
Spalding County Water & Sewer Facilities Authority, 6.125%, 9/1/2028, Call 9/1/2018 | | | 700,000 | | | | 700,000 | |
Tender Option Bond Trust Receipts/Certificates, 1.710%, 4/1/2025 (5) (7) | | | 4,000,000 | | | | 4,000,000 | |
Tender Option Bond Trust Receipts/Certificates, County Guarantee, 1.690%, 8/15/2049, Call 2/1/2025 (5) (7) | | | 2,520,000 | | | | 2,520,000 | |
Valdosta & Lowndes County Hospital Authority, County Guarantee, 5.000%, 10/1/2025, Call 10/1/2021 | | | 2,940,000 | | | | 3,194,163 | |
Winder-Barrow Industrial Building Authority, AGM, 5.000%, 12/1/2029, Call 12/1/2021 | | | 1,000,000 | | | | 1,083,450 | |
| | | | | | | | |
| | | | | | | 77,402,536 | |
Guam — 0.1% | | | | | | | | |
Territory of Guam: | | | | | | | | |
5.000%, 12/1/2032, Call 12/1/2026 | | | 1,310,000 | | | | 1,456,458 | |
5.000%, 12/1/2033, Call 12/1/2026 | | | 1,000,000 | | | | 1,108,010 | |
| | | | | | | | |
| | | | | | | 2,564,468 | |
Hawaii — 0.1% | | | | | | | | |
City & County of Honolulu: | | | | | | | | |
5.000%, 10/1/2022 | | | 500,000 | | | | 559,000 | |
5.000%, 10/1/2023 | | | 500,000 | | | | 570,190 | |
| | | | | | | | |
| | | | | | | 1,129,190 | |
Idaho — 0.1% | | | | | | | | |
| | |
Canyon County School District No. 131 Nampa, School Bond Gty, 5.000%, 9/15/2023 | | | 1,000,000 | | | | 1,133,590 | |
Idaho Health Facilities Authority, 6.500%, 11/1/2023, Call 11/1/2018 | | | 515,000 | | | | 518,960 | |
| | | | | | | | |
| | | | | | | 1,652,550 | |
Illinois — 14.5% | | | | | | | | |
Bureau County Township High School District No. 502, BAM, 6.625%, 10/1/2043, Call 12/1/2023 | | | 3,400,000 | | | | 4,155,548 | |
Chicago Board of Education, 6.000%, 4/1/2046, Call 4/1/2027 | | | 1,500,000 | | | | 1,754,415 | |
Chicago Board of Education, NATL-RE: | | | | | | | | |
0.000%, 12/1/2022 | | | 365,000 | | | | 318,112 | |
5.000%, 12/1/2019 | | | 70,000 | | | | 71,705 | |
5.250%, 12/1/2021 | | | 1,000,000 | | | | 1,069,540 | |
Chicago O’Hare International Airport: | | | | | | | | |
5.000%, 1/1/2026, Call 1/1/2025 (14) | | | 1,500,000 | | | | 1,673,370 | |
5.000%, 1/1/2031, Call 1/1/2025 (14) | | | 1,000,000 | | | | 1,097,440 | |
5.000%, 1/1/2039, Call 1/1/2027 | | | 2,000,000 | | | | 2,233,240 | |
| | | | | | | | |
Chicago O’Hare International Airport, AGC, 5.250%, 1/1/2026, Call 1/1/2020 | | | 775,000 | | | | 807,271 | |
Chicago Park District: | | | | | | | | |
5.000%, 1/1/2023, Call 1/1/2022 | | | 1,060,000 | | | | 1,140,783 | |
5.000%, 1/1/2025, Call 7/1/2020 | | | 230,000 | | | | 239,628 | |
5.000%, 1/1/2026, Call 1/1/2021 | | | 730,000 | | | | 766,004 | |
5.000%, 1/1/2028, Call 1/1/2024 | | | 2,500,000 | | | | 2,742,875 | |
5.000%, 11/15/2029, Call 11/15/2018 | | | 130,000 | | | | 130,887 | |
5.000%, 1/1/2031, Call 1/1/2026 | | | 1,790,000 | | | | 1,974,173 | |
5.000%, 1/1/2040, Call 1/1/2026 | | | 1,000,000 | | | | 1,076,690 | |
Chicago Transit Authority, 5.000%, 12/1/2046, Call 12/1/2026 | | | 3,000,000 | | | | 3,221,700 | |
City of Chicago, 6.000%, 1/1/2038, Call 1/1/2027 | | | 10,000,000 | | | | 11,335,100 | |
City of Chicago Wastewater Transmission Revenue: | | | | | | | | |
5.000%, 1/1/2031, Call 1/1/2025 | | | 3,715,000 | | | | 4,043,815 | |
5.000%, 1/1/2032, Call 1/1/2027 | | | 2,000,000 | | | | 2,196,700 | |
5.000%, 1/1/2033, Call 1/1/2027 | | | 3,000,000 | | | | 3,283,770 | |
5.000%, 1/1/2039, Call 1/1/2025 | | | 500,000 | | | | 536,320 | |
City of Chicago Waterworks Revenue: | | | | | | | | |
5.000%, 11/1/2025 | | | 2,000,000 | | | | 2,262,660 | |
5.000%, 11/1/2027, Call 11/1/2026 | | | 2,500,000 | | | | 2,837,950 | |
5.000%, 11/1/2027, Call 11/1/2026 | | | 1,000,000 | | | | 1,135,180 | |
5.000%, 11/1/2028, Call 11/1/2026 | | | 1,000,000 | | | | 1,129,030 | |
5.000%, 11/1/2029, Call 11/1/2026 | | | 1,000,000 | | | | 1,122,930 | |
City of Chicago Waterworks Revenue, AGM: | | | | | | | | |
5.000%, 11/1/2027, Call 11/1/2018 | | | 140,000 | | | | 140,753 | |
5.000%, 11/1/2027, Call 11/1/2018 | | | 60,000 | | | | 60,311 | |
City of Springfield, 5.000%, 12/1/2022 | | | 905,000 | | | | 988,568 | |
City of Springfield Electric Revenue: | | | | | | | | |
5.000%, 3/1/2028, Call 3/1/2025 | | | 1,000,000 | | | | 1,118,380 | |
5.000%, 3/1/2029, Call 3/1/2025 | | | 1,000,000 | | | | 1,114,010 | |
Cook County Community Consolidated School District No. 65 Evanston: | | | | | | | | |
0.000%, 12/1/2027, Call 12/1/2024 | | | 300,000 | | | | 213,948 | |
0.000%, 12/1/2029, Call 12/1/2024 | | | 400,000 | | | | 257,316 | |
0.000%, 12/1/2030, Call 12/1/2024 | | | 1,130,000 | | | | 691,210 | |
0.000%, 12/1/2031, Call 12/1/2024 | | | 1,500,000 | | | | 868,965 | |
Cook County School District No. 103 Lyons, AGM, 0.000%, 12/1/2021 | | | 850,000 | | | | 788,808 | |
Cook County School District No. 124 Evergreen Park, BAM, 4.000%, 12/1/2020 | | | 450,000 | | | | 465,489 | |
Cook County School District No. 130 Blue Island, 2.350%, 12/1/2028, Call 9/10/2018 (5) (7) (9) | | | 5,000,000 | | | | 5,000,000 | |
Cook County School District No. 144 Prairie Hills, AGM: | | | | | | | | |
0.000%, 12/1/2028 | | | 2,830,000 | | | | 1,901,788 | |
0.000%, 12/1/2029 | | | 2,580,000 | | | | 1,651,303 | |
Cook County School District No. 83 Mannheim, 5.625%, 6/1/2033 | | | 2,980,000 | | | | 3,425,570 | |
Cook County Township High School District No. 201 J Sterling Morton, AMBAC, 0.000%, 12/1/2019 | | | 675,000 | | | | 655,499 | |
Cook County Township High School District No. 220 Reavis, 6.000%, 12/1/2030, Call 12/1/2023 | | | 1,000,000 | | | | 1,169,750 | |
Cook County Township High School District No. 220 Reavis, BAM: | | | | | | | | |
6.000%, 12/1/2031, Call 12/1/2023 | | | 2,035,000 | | | | 2,379,342 | |
6.000%, 12/1/2032, Call 12/1/2023 | | | 2,160,000 | | | | 2,540,570 | |
6.000%, 6/1/2033, Call 12/1/2023 | | | 2,235,000 | | | | 2,621,566 | |
County of Cook: | | | | | | | | |
5.000%, 11/15/2029, Call 11/15/2026 | | | 3,270,000 | | | | 3,696,212 | |
5.000%, 11/15/2030, Call 11/15/2026 | | | 2,750,000 | | | | 3,095,757 | |
5.250%, 11/15/2023, Call 11/15/2020 | | | 350,000 | | | | 372,425 | |
County of Cook, BAM TCRs, 5.000%, 11/15/2023 | | | 1,000,000 | | | | 1,120,520 | |
County of Cook Sales Tax Revenue: | | | | | | | | |
5.250%, 11/15/2035, Call 11/15/2027 | | | 1,520,000 | | | | 1,774,342 | |
5.250%, 11/15/2036, Call 11/15/2027 | | | 3,000,000 | | | | 3,491,580 | |
County of St. Clair: | | | | | | | | |
5.250%, 10/1/2024, Call 10/1/2019 | | | 485,000 | | | | 503,052 | |
5.250%, 10/1/2024, Call 10/1/2019 | | | 215,000 | | | | 222,979 | |
5.250%, 10/1/2027, Call 10/1/2019 | | | 835,000 | | | | 866,079 | |
5.250%, 10/1/2027, Call 10/1/2019 | | | 315,000 | | | | 326,690 | |
County of St. Clair Highway Revenue, 5.500%, 1/1/2038, Call 1/1/2023 | | | 825,000 | | | | 924,693 | |
| | | | | | | | |
DeKalb County Community Unit School District No. 424 Genoa-Kingston, AMBAC, 0.000%, 1/1/2020 | | | 600,000 | | | | 582,510 | |
DeKalb County Community Unit School District No. 428 DeKalb: | | | | | | | | |
0.000%, 1/1/2025, Call 7/1/2020 | | | 400,000 | | | | 299,652 | |
0.000%, 1/1/2028, Call 7/1/2020 | | | 1,000,000 | | | | 619,170 | |
DeKalb Kane & LaSalle Counties Community College District No. 523 Kishwaukee, 0.000%, 2/1/2035, Call 2/1/2021 | | | 470,000 | | | | 167,931 | |
DuPage County School District No. 16 Queen Bee, NATL-RE FGIC, 0.000%, 11/1/2019 | | | 530,000 | | | | 515,176 | |
Frankfort Square Park District, AMBAC, 0.000%, 1/1/2022 | | | 670,000 | | | | 587,972 | |
Illinois Development Finance Authority, AGM: | | | | | | | | |
0.000%, 1/1/2020 | | | 450,000 | | | | 439,061 | |
0.000%, 1/1/2020 | | | 500,000 | | | | 485,550 | |
0.000%, 1/1/2021 | | | 95,000 | | | | 90,731 | |
0.000%, 1/1/2021 | | | 160,000 | | | | 152,283 | |
5.150%, 1/1/2019 | | | 420,000 | | | | 424,347 | |
Illinois Finance Authority: | | | | | | | | |
5.000%, 11/15/2023, Call 11/15/2022 | | | 215,000 | | | | 237,534 | |
5.000%, 8/15/2024 | | | 250,000 | | | | 278,330 | |
5.000%, 5/15/2025 | | | 1,000,000 | | | | 1,085,670 | |
5.000%, 11/15/2026, Call 11/15/2025 | | | 1,000,000 | | | | 1,129,200 | |
5.000%, 11/15/2027, Call 11/15/2025 | | | 500,000 | | | | 561,850 | |
5.000%, 11/1/2029, Call 11/1/2026 | | | 2,000,000 | | | | 2,218,640 | |
5.000%, 5/15/2030, Call 5/15/2025 | | | 1,000,000 | | | | 1,046,200 | |
5.000%, 11/1/2030, Call 11/1/2026 | | | 1,200,000 | | | | 1,324,008 | |
5.000%, 1/1/2036, Call 1/1/2027 | | | 2,000,000 | | | | 2,162,340 | |
5.000%, 12/1/2037, Call 12/1/2027 | | | 1,000,000 | | | | 1,051,280 | |
5.000%, 8/1/2042, Call 8/1/2027 | | | 580,000 | | | | 628,952 | |
5.000%, 8/1/2046, Call 8/1/2027 | | | 515,000 | | | | 556,854 | |
5.000%, 8/1/2047, Call 8/1/2027 | | | 750,000 | | | | 809,782 | |
5.000%, 12/1/2047, Call 12/1/2027 | | | 1,000,000 | | | | 1,041,230 | |
5.250%, 2/15/2030, Call 2/15/2020 | | | 250,000 | | | | 262,425 | |
6.000%, 10/1/2024, Call 10/1/2021 | | | 1,010,000 | | | | 1,073,226 | |
6.000%, 8/15/2041, Call 8/15/2021 | | | 2,665,000 | | | | 2,923,372 | |
6.875%, 10/1/2043, Call 10/1/2021 | | | 3,000,000 | | | | 3,237,900 | |
Illinois Finance Authority, AGC, 5.250%, 8/15/2019 (13) | | | 250,000 | | | | 258,230 | |
Illinois Housing Development Authority, GNMA/FNMA/FHLMC, 2.450%, 6/1/2043, Call 1/1/2023 | | | 566,509 | | | | 537,968 | |
Illinois State Toll Highway Authority: | | | | | | | | |
5.000%, 1/1/2028, Call 1/1/2023 | | | 1,000,000 | | | | 1,110,450 | |
5.000%, 1/1/2029, Call 1/1/2023 | | | 1,000,000 | | | | 1,108,280 | |
5.000%, 1/1/2030, Call 1/1/2026 | | | 1,000,000 | | | | 1,143,990 | |
5.000%, 12/1/2032, Call 1/1/2026 | | | 7,790,000 | | | | 8,790,703 | |
5.000%, 1/1/2042, Call 1/1/2028 | | | 2,000,000 | | | | 2,260,560 | |
Kane & DeKalb Counties Community Unit School District No. 302 Kaneland, NATL-RE, 0.000%, 2/1/2023 | | | 5,450,000 | | | | 4,861,618 | |
Kane Cook & DuPage Counties School District No. U-46 Elgin, AMBAC: | | | | | | | | |
0.000%, 1/1/2023 | | | 350,000 | | | | 317,331 | |
0.000%, 1/1/2023 | | | 650,000 | | | | 577,870 | |
Kane McHenry Cook & De Kalb Counties Unit School District No. 300: | | | | | | | | |
5.000%, 1/1/2023 | | | 1,000,000 | | | | 1,110,020 | |
5.000%, 1/1/2024 | | | 1,000,000 | | | | 1,124,360 | |
5.000%, 1/1/2026, Call 1/1/2025 | | | 4,000,000 | | | | 4,548,720 | |
5.250%, 1/1/2033, Call 1/1/2023 | | | 900,000 | | | | 1,001,547 | |
Knox & Warren Counties Community Unit School District No. 205 Galesburg, 6.125%, 1/1/2036, Call 1/1/2021 | | | 1,435,000 | | | | 1,542,496 | |
Lake County School District No. 33 Emmons, XLCA: | | | | | | | | |
0.000%, 12/1/2026 | | | 525,000 | | | | 380,368 | |
0.000%, 12/1/2028 | | | 335,000 | | | | 218,886 | |
Lake County School District No. 38 Big Hollow, AMBAC, 0.000%, 2/1/2019 | | | 200,000 | | | | 197,810 | |
Lake County School District No. 56 Gurnee, 5.000%, 1/1/2024 | | | 440,000 | | | | 494,718 | |
McHenry & Kane Counties Community Consolidated School District No. 158 Huntley, AGM FGIC, 0.000%, 1/1/2024 | | | 500,000 | | | | 425,600 | |
McHenry & Kane Counties Community Consolidated School District No. 158 Huntley, NATL-RE: | | | | | | | | |
| | | | | | | | |
0.000%, 1/1/2021 | | | 1,070,000 | | | | 1,021,914 | |
0.000%, 1/1/2021 | | | 830,000 | | | | 783,105 | |
McHenry County Community Unit School District No. 12 Johnsburg, AGM: | | | | | | | | |
4.000%, 1/1/2019 | | | 265,000 | | | | 266,685 | |
5.000%, 1/1/2020 | | | 550,000 | | | | 570,163 | |
5.000%, 1/1/2021 | | | 810,000 | | | | 854,631 | |
5.000%, 1/1/2022 | | | 895,000 | | | | 960,845 | |
Metropolitan Pier & Exposition Authority, NATL-RE: | | | | | | | | |
0.000%, 6/15/2020 | | | 440,000 | | | | 417,754 | |
0.000%, 12/15/2023 | | | 20,000 | | | | 17,661 | |
0.000%, 12/15/2023 | | | 835,000 | | | | 693,476 | |
0.000%, 6/15/2024 | | | 1,000,000 | | | | 810,030 | |
5.700%, 6/15/2023 | | | 1,710,000 | | | | 1,986,712 | |
5.700%, 6/15/2023 | | | 1,820,000 | | | | 2,046,608 | |
Metropolitan Water Reclamation District of Greater Chicago, 5.000%, 12/1/2031, Call 12/1/2026 | | | 3,500,000 | | | | 3,963,750 | |
Peoria Public Building Commission, AGC, 0.000%, 12/1/2019, Call 12/1/2018 | | | 1,000,000 | | | | 947,780 | |
Railsplitter Tobacco Settlement Authority: | | | | | | | | |
5.000%, 6/1/2027, Call 6/1/2026 | | | 2,000,000 | | | | 2,277,300 | |
5.250%, 6/1/2021 | | | 1,120,000 | | | | 1,209,040 | |
Rib Floater Trust Various States, 1.740%, 8/15/2030, Call 10/1/2018 (5) (7) | | | 5,000,000 | | | | 5,000,000 | |
Sales Tax Securitization Corp.: | | | | | | | | |
5.000%, 1/1/2029, Call 1/1/2028 | | | 1,000,000 | | | | 1,149,270 | |
5.000%, 1/1/2030, Call 1/1/2028 | | | 2,450,000 | | | | 2,792,338 | |
South Suburban College Community School District No. 510, AGC, 0.000%, 12/1/2025 | | | 1,000,000 | | | | 802,650 | |
Southern Illinois University, BAM, 5.000%, 4/1/2026, Call 4/1/2025 | | | 1,175,000 | | | | 1,318,679 | |
Southwestern Illinois Development Authority: | | | | | | | | |
5.000%, 10/15/2029, Call 10/15/2025 | | | 1,780,000 | | | | 1,953,781 | |
5.000%, 10/15/2032, Call 10/15/2025 | | | 1,335,000 | | | | 1,453,908 | |
| | |
Southwestern Illinois Development Authority, AGC, 5.750%, 2/1/2029, Call 2/1/2019 | | | 1,025,000 | | | | 1,042,230 | |
St. Clair County Community Unit School District No. 187 Cahokia, AGM, 5.000%, 1/1/2020 | | | 630,000 | | | | 654,778 | |
St. Louis Regional Airport Authority, 6.000%, 12/1/2024, Call 12/1/2018 | | | 745,000 | | | | 751,683 | |
State of Illinois: | | | | | | | | |
5.000%, 3/1/2020 | | | 500,000 | | | | 517,115 | |
5.000%, 4/1/2024, Call 4/1/2023 | | | 500,000 | | | | 526,670 | |
5.000%, 11/1/2025 | | | 7,000,000 | | | | 7,462,910 | |
5.000%, 2/1/2027 | | | 1,000,000 | | | | 1,067,070 | |
5.000%, 10/1/2028 (9) | | | 2,000,000 | | | | 2,140,420 | |
5.000%, 2/1/2029, Call 2/1/2027 | | | 1,000,000 | | | | 1,058,310 | |
5.250%, 6/15/2034, Call 6/15/2019 | | | 3,715,000 | | | | 3,818,723 | |
6.500%, 6/15/2022 | | | 250,000 | | | | 264,510 | |
State of Illinois, AGM, 5.000%, 4/1/2028, Call 4/1/2023 | | | 3,205,000 | | | | 3,448,484 | |
Tazewell County School District No. 51 Washington Central, NATL-RE, 9.000%, 12/1/2025 | | | 165,000 | | | | 225,108 | |
Tender Option Bond Trust Receipts/Certificates: | | | | | | | | |
1.660%, 11/15/2037, Call 11/15/2027 (5) (7) | | | 4,075,000 | | | | 4,075,000 | |
1.660%, 11/1/2039, Call 5/1/2019 (5) (7) | | | 1,000,000 | | | | 1,000,000 | |
1.710%, 6/15/2020 (5) (7) | | | 3,705,000 | | | | 3,705,000 | |
1.740%, 4/1/2046, Call 4/1/2027 (5) (7) | | | 2,500,000 | | | | 2,500,000 | |
Town of Cicero, AGM: | | | | | | | | |
5.000%, 1/1/2020 | | | 1,000,000 | | | | 1,034,270 | |
5.000%, 1/1/2021 | | | 1,000,000 | | | | 1,059,050 | |
Village of Bolingbrook, AGM, 5.000%, 1/1/2025, Call 1/1/2020 | | | 1,425,000 | | | | 1,472,695 | |
Village of Elwood, AGC: | | | | | | | | |
0.000%, 3/1/2024, Call 3/1/2019 | | | 250,000 | | | | 188,535 | |
0.000%, 3/1/2026, Call 3/1/2019 | | | 1,280,000 | | | | 862,502 | |
Village of Franklin Park, BAM: | | | | | | | | |
4.000%, 10/1/2018 | | | 425,000 | | | | 425,706 | |
4.000%, 10/1/2019 | | | 420,000 | | | | 429,811 | |
4.000%, 10/1/2020 | | | 615,000 | | | | 634,766 | |
5.000%, 10/1/2022, Call 10/1/2021 | | | 730,000 | | | | 789,035 | |
5.000%, 10/1/2023, Call 10/1/2021 | | | 685,000 | | | | 739,547 | |
| | | | | | | | |
5.000%, 10/1/2024, Call 10/1/2021 | | | 425,000 | | | | 458,579 | |
5.000%, 10/1/2025, Call 10/1/2021 | | | 920,000 | | | | 992,689 | |
Village of Justice, AMBAC, 0.000%, 1/1/2021 | | | 635,000 | | | | 580,130 | |
Will & Kankakee Counties School District No. 255: | | | | | | | | |
5.000%, 6/1/2026, Call 6/1/2025 | | | 500,000 | | | | 551,910 | |
5.000%, 6/1/2029, Call 6/1/2025 | | | 600,000 | | | | 653,208 | |
Will County Community High School District No. 210 Lincoln-Way: | | | | | | | | |
5.000%, 1/1/2027, Call 1/1/2023 | | | 1,250,000 | | | | 1,252,800 | |
5.000%, 1/1/2028, Call 1/1/2023 | | | 3,500,000 | | | | 3,501,085 | |
5.000%, 1/1/2030, Call 1/1/2023 | | | 2,000,000 | | | | 1,977,740 | |
Will County Community School District No. 161 Summit Hill, NATL-RE, 0.000%, 1/1/2019 | | | 695,000 | | | | 689,537 | |
Will County Community Unit School District No. 201-U Crete-Monee, NATL-RE: | | | | | | | | |
0.000%, 11/1/2020 | | | 245,000 | | | | 235,014 | |
0.000%, 11/1/2020 | | | 1,755,000 | | | | 1,668,092 | |
0.000%, 11/1/2021 | | | 55,000 | | | | 51,427 | |
0.000%, 11/1/2021 | | | 245,000 | | | | 225,892 | |
0.000%, 11/1/2022 | | | 60,000 | | | | 54,493 | |
0.000%, 11/1/2022 | | | 190,000 | | | | 169,267 | |
Will County Community Unit School District No. 209-U Wilmington, NATL-RE, 5.750%, 1/1/2023, Call 10/16/2018 | | | 545,000 | | | | 546,673 | |
Will County School District No. 114 Manhattan, NATL-RE: | | | | | | | | |
0.000%, 12/1/2020 | | | 630,000 | | | | 603,080 | |
0.000%, 12/1/2020 | | | 550,000 | | | | 517,605 | |
Will County School District No. 114 Manhattan, NATL-RE, 0.000%, 12/1/2023 | | | 1,600,000 | | | | 1,348,576 | |
Will County Township High School District No. 204 Joliet, 6.250%, 1/1/2031, Call 1/1/2021 | | | 500,000 | | | | 547,730 | |
Will Grundy Counties Community College District No. 525, 5.250%, 6/1/2036, Call 12/1/2023 | | | 3,400,000 | | | | 3,813,712 | |
Williamson County Community Unit School District No. 5 Carterville, AGC: | | | | | | | | |
0.000%, 1/1/2029, Call 1/1/2019 | | | 300,000 | | | | 167,628 | |
0.000%, 1/1/2033, Call 1/1/2019 | | | 1,000,000 | | | | 420,190 | |
0.000%, 1/1/2034, Call 1/1/2019 | | | 1,000,000 | | | | 389,410 | |
Winnebago & Boone Counties School District No. 205 Rockford: | | | | | | | | |
0.000%, 2/1/2020 | | | 500,000 | | | | 483,375 | |
4.000%, 2/1/2027, Call 2/1/2023 | | | 4,680,000 | | | | 4,897,292 | |
| | | | | | | | |
| | | | | | | 258,798,154 | |
Indiana — 2.1% | | | | | | | | |
Carmel Redevelopment Authority, 5.000%, 7/1/2023, Call 7/1/2020 | | | 350,000 | | | | 370,304 | |
City of Greenwood Sewage Works Revenue: | | | | | | | | |
4.250%, 10/1/2020, Call 10/1/2018 | | | 820,000 | | | | 829,824 | |
4.625%, 10/1/2024, Call 10/1/2018 | | | 520,000 | | | | 526,370 | |
City of Rockport, 3.050%, 6/1/2025 | | | 2,100,000 | | | | 2,111,403 | |
Fishers Redevelopment District: | | | | | | | | |
5.125%, 7/15/2026, Call 1/15/2020 | | | 1,875,000 | | | | 1,962,300 | |
5.250%, 7/15/2023, Call 1/15/2020 | | | 1,605,000 | | | | 1,682,425 | |
Frankfort High School Elementary School Building Corp., 5.000%, 7/15/2025 | | | 115,000 | | | | 132,785 | |
Franklin Township-Marion County Multiple School Building Corp., SAW: | | | | | | | | |
5.000%, 7/10/2021 | | | 580,000 | | | | 630,767 | |
5.000%, 7/15/2029, Call 1/15/2023 | | | 2,565,000 | | | | 2,841,738 | |
Indiana Bond Bank, 2.220%, 10/15/2022 (7) | | | 1,650,000 | | | | 1,636,354 | |
Indiana Finance Authority: | | | | | | | | |
1.450%, 5/1/2028 (7) | | | 1,500,000 | | | | 1,500,000 | |
3.000%, 7/1/2019 | | | 250,000 | | | | 252,578 | |
5.000%, 8/15/2020 | | | 700,000 | | | | 725,823 | |
5.000%, 10/1/2022 | | | 300,000 | | | | 327,525 | |
5.000%, 10/1/2023 | | | 400,000 | | | | 441,732 | |
5.000%, 10/1/2024, Call 10/1/2023 | | | 275,000 | | | | 303,281 | |
5.000%, 5/1/2029, Call 5/1/2022 | | | 85,000 | | | | 93,912 | |
5.000%, 5/1/2029, Call 5/1/2022 | | | 3,985,000 | | | | 4,338,111 | |
5.250%, 10/1/2024, Call 10/1/2021 | | | 710,000 | | | | 780,645 | |
5.250%, 10/1/2031, Call 10/1/2021 | | | 2,190,000 | | | | 2,387,341 | |
5.250%, 11/15/2046, Call 11/15/2026 | | | 2,500,000 | | | | 2,740,150 | |
5.500%, 5/1/2024, Call 5/1/2019 | | | 820,000 | | | | 840,697 | |
5.500%, 5/1/2024, Call 5/1/2019 | | | 180,000 | | | | 184,448 | |
| | | | | | | | |
Indiana Health Facility Financing Authority, AMBAC, 1.029%, 5/1/2031, Call 9/4/2018 (7) (8) | | | 425,000 | | | | 416,542 | |
Indiana Housing & Community Development Authority, GNMA/FNMA/FHLMC, 1.780%, 7/1/2047, Call 9/19/2018 (7) | | | 2,550,000 | | | | 2,550,000 | |
Indiana Municipal Power Agency, 5.250%, 1/1/2024, Call 1/1/2019 | | | 500,000 | | | | 505,975 | |
Indianapolis Local Public Improvement Bond Bank: | | | | | | | | |
5.000%, 1/1/2021 | | | 175,000 | | | | 187,511 | |
5.000%, 1/1/2022, Call 1/1/2021 | | | 200,000 | | | | 213,120 | |
5.750%, 1/1/2038, Call 1/1/2019 | | | 345,000 | | | | 349,675 | |
Indianapolis Local Public Improvement Bond Bank, NATL-RE, 5.250%, 7/1/2022 | | | 500,000 | | | | 557,930 | |
Marion High School Building Corp., SAW: | | | | | | | | |
4.000%, 7/15/2019 | | | 455,000 | | | | 463,863 | |
4.000%, 7/15/2020, Call 1/15/2020 | | | 935,000 | | | | 960,348 | |
4.000%, 7/15/2021, Call 1/15/2020 | | | 375,000 | | | | 384,503 | |
Portage Redevelopment District: | | | | | | | | |
5.000%, 1/15/2023 | | | 280,000 | | | | 307,406 | |
5.000%, 1/15/2024 | | | 215,000 | | | | 239,181 | |
Porter County Jail Building Corp., AGM, 5.500%, 7/10/2021 | | | 160,000 | | | | 167,629 | |
Rush County Elementary School Building Corp., SAW, 5.250%, 7/15/2021, Call 1/15/2019 | | | 565,000 | | | | 572,565 | |
Steuben Lakes Regional Waste District, 5.000%, 9/1/2024, Call 9/1/2023 | | | 1,225,000 | | | | 1,369,623 | |
| | | | | | | | |
| | | | | | | 36,886,384 | |
Iowa — 0.4% | | | | | | | | |
Iowa Finance Authority: | | | | | | | | |
5.000%, 5/15/2036, Call 5/15/2026 | | | 4,000,000 | | | | 4,287,080 | |
5.000%, 5/15/2043, Call 5/15/2027 | | | 1,000,000 | | | | 1,072,010 | |
Johnston Community School District, AGM, 5.000%, 7/1/2027, Call 7/1/2022 | | | 1,455,000 | | | | 1,583,986 | |
| | | | | | | | |
| | | | | | | 6,943,076 | |
Kansas — 0.2% | | | | | | | | |
Kansas Development Finance Authority: | | | | | | | | |
5.000%, 11/15/2020, Call 11/15/2019 | | | 35,000 | | | | 36,279 | |
5.000%, 11/15/2020, Call 11/15/2019 | | | 765,000 | | | | 793,779 | |
5.000%, 3/1/2031, Call 3/1/2020 | | | 1,000,000 | | | | 1,044,540 | |
Kansas Development Finance Authority, AGM, 5.250%, 11/1/2028, Call 11/1/2018 | | | 475,000 | | | | 477,774 | |
| | |
Wyandotte County-Kansas City Unified Government Utility System Revenue, 5.000%, 9/1/2032, Call 9/1/2022 | | | 1,000,000 | | | | 1,096,740 | |
| | | | | | | | |
| | | | | | | 3,449,112 | |
Kentucky — 1.0% | | | | | | | | |
Kentucky Asset Liability Commission: | | | | | | | | |
5.000%, 9/1/2024 | | | 1,000,000 | | | | 1,139,440 | |
5.000%, 9/1/2025 | | | 1,250,000 | | | | 1,442,313 | |
Kentucky Economic Development Finance Authority: | | | | | | | | |
5.000%, 8/15/2041, Call 8/15/2027 | | | 1,500,000 | | | | 1,615,335 | |
5.000%, 8/15/2046, Call 8/15/2027 | | | 1,500,000 | | | | 1,611,825 | |
Louisville/Jefferson County Metropolitan Government: | | | | | | | | |
5.000%, 10/1/2030, Call 10/1/2026 | | | 1,300,000 | | | | 1,478,152 | |
5.000%, 10/1/2031, Call 10/1/2026 | | | 3,500,000 | | | | 3,963,610 | |
Paducah Electric Plant Board, AGC, 5.000%, 10/1/2023, Call 4/1/2019 | | | 100,000 | | | | 101,905 | |
Paducah Electric Plant Board, AGM: | | | | | | | | |
5.000%, 10/1/2027, Call 10/1/2026 | | | 2,000,000 | | | | 2,267,960 | |
5.000%, 10/1/2028, Call 10/1/2026 | | | 1,850,000 | | | | 2,086,596 | |
5.000%, 10/1/2030, Call 10/1/2026 | | | 1,500,000 | | | | 1,677,120 | |
Pulaski County Public Properties Corp., 5.500%, 12/1/2024, Call 12/1/2018 | | | 260,000 | | | | 262,405 | |
| | | | | | | | |
| | | | | | | 17,646,661 | |
Louisiana — 2.0% | | | | | | | | |
City of Bossier City Utilities Revenue, 5.000%, 10/1/2031, Call 10/1/2024 | | | 1,160,000 | | | | 1,328,049 | |
City of New Orleans Sewerage Service Revenue: | | | | | | | | |
5.000%, 6/1/2021 | | | 800,000 | | | | 860,744 | |
5.000%, 6/1/2022 | | | 450,000 | | | | 493,614 | |
5.000%, 6/1/2023 | | | 500,000 | | | | 558,835 | |
5.000%, 6/1/2026, Call 6/1/2025 | | | 150,000 | | | | 171,120 | |
5.000%, 6/1/2027, Call 6/1/2025 | | | 200,000 | | | | 227,896 | |
5.000%, 6/1/2029, Call 6/1/2025 | | | 200,000 | | | | 226,712 | |
City of New Orleans Water System Revenue: | | | | | | | | |
| | | | | | | | |
5.000%, 12/1/2021 | | | 500,000 | | | | 542,540 | |
5.000%, 12/1/2022 | | | 725,000 | | | | 800,211 | |
5.000%, 12/1/2024 | | | 765,000 | | | | 875,290 | |
5.000%, 12/1/2026, Call 12/1/2025 | | | 240,000 | | | | 274,032 | |
5.000%, 12/1/2029, Call 12/1/2025 | | | 350,000 | | | | 396,935 | |
| | |
City of Shreveport Water & Sewer Revenue, BAM, 4.000%, 12/1/2025, Call 12/1/2024 | | | 2,210,000 | | | | 2,375,197 | |
Lafayette Public Trust Financing Authority, AGM: | | | | | | | | |
4.000%, 10/1/2020 | | | 690,000 | | | | 719,442 | |
4.000%, 10/1/2021 | | | 675,000 | | | | 713,988 | |
Louisiana Housing Corp., GNMA COLL, 4.750%, 6/1/2027, Call 6/1/2020 | | | 610,000 | | | | 628,825 | |
Louisiana Public Facilities Authority: | | | | | | | | |
3.375%, 9/1/2028, Call 3/1/2021 | | | 2,440,000 | | | | 2,455,958 | |
5.000%, 5/15/2042, Call 5/15/2027 | | | 2,500,000 | | | | 2,753,275 | |
Louisiana Stadium & Exposition District, 5.000%, 7/1/2023 | | | 800,000 | | | | 902,320 | |
New Orleans Aviation Board: | | | | | | | | |
5.000%, 1/1/2043, Call 1/1/2027 | | | 1,500,000 | | | | 1,678,395 | |
5.000%, 1/1/2048, Call 1/1/2027 | | | 1,855,000 | | | | 2,067,064 | |
Parish of St. Bernard: | | | | | | | | |
4.000%, 3/1/2020 | | | 3,470,000 | | | | 3,576,980 | |
4.000%, 3/1/2021 | | | 3,585,000 | | | | 3,727,181 | |
Parish of St. James, 1.730%, 11/1/2040, Call 9/19/2018 (7) | | | 6,000,000 | | | | 6,000,000 | |
Port New Orleans Board of Commissioners, 5.000%, 4/1/2032, Call 4/1/2023 | | | 725,000 | | | | 777,845 | |
Regional Transit Authority, NATL-RE, 0.000%, 12/1/2021 | | | 210,000 | | | | 178,448 | |
Terrebonne Parish Consolidated Government, 5.875%, 3/1/2024, Call 3/1/2019 | | | 495,000 | | | | 505,435 | |
| | | | | | | | |
| | | | | | | 35,816,331 | |
Maine — 0.7% | | | | | | | | |
City of Portland General Airport Revenue, 5.000%, 7/1/2022 | | | 300,000 | | | | 328,314 | |
Maine Health & Higher Educational Facilities Authority: | | | | | | | | |
5.000%, 7/1/2043, Call 7/1/2028 | | | 1,500,000 | | | | 1,680,285 | |
5.000%, 7/1/2048, Call 7/1/2028 | | | 2,000,000 | | | | 2,238,620 | |
Maine State Housing Authority, 3.850%, 11/15/2029, Call 11/15/2021 | | | 7,025,000 | | | | 7,140,983 | |
Maine Turnpike Authority, 5.000%, 7/1/2029, Call 7/1/2022 | | | 1,500,000 | | | | 1,651,380 | |
| | | | | | | | |
| | | | | | | 13,039,582 | |
Maryland — 1.0% | | | | | | | | |
City of Rockville: | | | | | | | | |
5.000%, 11/1/2030, Call 11/1/2024 | | | 765,000 | | | | 841,600 | |
5.000%, 11/1/2037, Call 11/1/2024 | | | 1,000,000 | | | | 1,085,590 | |
5.000%, 11/1/2042, Call 11/1/2024 | | | 1,000,000 | | | | 1,082,710 | |
Maryland Health & Higher Educational Facilities Authority: | | | | | | | | |
5.000%, 5/15/2042, Call 5/15/2027 | | | 4,750,000 | | | | 5,302,520 | |
5.750%, 7/1/2034, Call 7/1/2021 | | | 775,000 | | | | 854,112 | |
Maryland Industrial Development Financing Authority, 1.720%, 3/1/2030, Call 9/19/2018 (7) | | | 5,000,000 | | | | 5,000,000 | |
Montgomery County Housing Opportunities Commission: | | | | | | | | |
5.000%, 7/1/2031, Call 7/1/2020 | | | 655,000 | | | | 679,215 | |
5.125%, 7/1/2037, Call 7/1/2020 | | | 3,110,000 | | | | 3,218,912 | |
| | | | | | | | |
| | | | | | | 18,064,659 | |
Massachusetts — 1.5% | | | | | | | | |
Commonwealth of Massachusetts, 5.250%, 9/1/2043, Call 9/1/2028 (9) | | | 5,000,000 | | | | 5,903,250 | |
Massachusetts Development Finance Agency: | | | | | | | | |
5.000%, 7/1/2025, Call 7/1/2021 | | | 1,425,000 | | | | 1,540,482 | |
5.000%, 7/1/2027, Call 7/1/2025 | | | 125,000 | | | | 144,654 | |
5.000%, 7/1/2037, Call 7/1/2027 | | | 1,400,000 | | | | 1,505,294 | |
5.000%, 10/1/2037, Call 10/1/2022 (5) | | | 500,000 | | | | 538,900 | |
5.000%, 10/1/2047, Call 10/1/2022 (5) | | | 500,000 | | | | 534,965 | |
Massachusetts Educational Financing Authority: | | | | | | | | |
5.000%, 7/1/2025, Call 7/1/2022 (14) | | | 500,000 | | | | 531,560 | |
5.250%, 1/1/2019 | | | 445,000 | | | | 449,882 | |
5.250%, 1/1/2019 (14) | | | 1,150,000 | | | | 1,161,293 | |
Massachusetts Health & Educational Facilities Authority, 5.000%, 7/1/2024, Call 7/1/2019 | | | 3,105,000 | | | | 3,185,140 | |
Massachusetts Housing Finance Agency, 3.700%, 12/1/2027, Call 6/1/2022 (14) | | | 635,000 | | | | 635,355 | |
Massachusetts School Building Authority, 5.000%, 8/15/2030, Call 8/15/2022 | | | 815,000 | | | | 896,867 | |
| | | | | | | | |
Massachusetts Water Resources Authority, 5.000%, 8/1/2043, Call 8/1/2028 | | | 8,600,000 | | | | 9,984,256 | |
| | | | | | | | |
| | | | | | | 27,011,898 | |
Michigan — 3.4% | | | | | | | | |
Alma Public Schools, Q-SBLF, 5.000%, 5/1/2021 | | | 890,000 | | | | 960,132 | |
Bay City School District, Q-SBLF: | | | | | | | | |
5.000%, 11/1/2027, Call 5/1/2024 | | | 645,000 | | | | 729,527 | |
5.000%, 11/1/2028, Call 5/1/2024 | | | 1,305,000 | | | | 1,473,084 | |
Caledonia Community Schools, Q-SBLF: | | | | | | | | |
5.000%, 5/1/2025 | | | 600,000 | | | | 691,824 | |
5.000%, 5/1/2026 | | | 500,000 | | | | 579,790 | |
Carman-Ainsworth Community School District, BAM, 5.000%, 5/1/2020 | | | 375,000 | | | | 394,039 | |
Charter Township of Northville: | | | | | | | | |
4.000%, 4/1/2021 | | | 400,000 | | | | 419,032 | |
4.000%, 4/1/2022 | | | 240,000 | | | | 254,251 | |
Chippewa Valley Schools, Q-SBLF, 5.000%, 5/1/2027, Call 11/1/2025 | | | 20,000 | | | | 23,172 | |
City of Detroit Sewage Disposal System Revenue, AGC NATL-RE, 5.250%, 7/1/2023, Call 10/1/2018 | | | 95,000 | | | | 95,256 | |
City of Detroit Sewage Disposal System Revenue, NATL-RE, 0.000%, 7/1/2020 | | | 110,000 | | | | 105,321 | |
City of Wyandotte Electric System Revenue, BAM: | | | | | | | | |
5.000%, 10/1/2020 | | | 200,000 | | | | 210,448 | |
5.000%, 10/1/2021 | | | 290,000 | | | | 310,863 | |
5.000%, 10/1/2022 | | | 290,000 | | | | 316,373 | |
5.000%, 10/1/2023 | | | 250,000 | | | | 277,080 | |
5.000%, 10/1/2024 | | | 300,000 | | | | 336,258 | |
Coloma Community School District, Q-SBLF, 3.000%, 5/1/2021 | | | 905,000 | | | | 929,462 | |
Comstock Park Public Schools, Q-SBLF, 5.000%, 5/1/2028, Call 5/1/2021 | | | 400,000 | | | | 429,368 | |
Detroit City School District, AGM Q-SBLF, 5.250%, 5/1/2026 | | | 300,000 | | | | 348,525 | |
Dundee Community Schools, Q-SBLF: | | | | | | | | |
5.000%, 5/1/2022 | | | 1,200,000 | | | | 1,323,144 | |
5.000%, 5/1/2025 | | | 1,000,000 | | | | 1,153,040 | |
Fitzgerald Public School District, BAM, 4.000%, 5/1/2019 | | | 2,065,000 | | | | 2,089,016 | |
Fraser Public School District, Q-SBLF: | | | | | | | | |
5.000%, 5/1/2021 | | | 1,000,000 | | | | 1,080,430 | |
5.000%, 5/1/2022 | | | 1,000,000 | | | | 1,102,620 | |
5.000%, 5/1/2025 | | | 1,700,000 | | | | 1,960,168 | |
Grosse Ile Township School District, Q-SBLF: | | | | | | | | |
5.000%, 5/1/2026, Call 5/1/2025 | | | 200,000 | | | | 230,342 | |
5.000%, 5/1/2027, Call 5/1/2025 | | | 230,000 | | | | 263,074 | |
Hartland Consolidated Schools, AGM Q-SBLF: | | | | | | | | |
5.250%, 5/1/2026, Call 5/1/2021 | | | 1,625,000 | | | | 1,756,934 | |
5.250%, 5/1/2027, Call 5/1/2021 | | | 600,000 | | | | 648,228 | |
5.250%, 5/1/2028, Call 5/1/2021 | | | 1,575,000 | | | | 1,700,323 | |
Howell Public Schools, Q-SBLF, 4.250%, 5/1/2024, Call 5/1/2022 | | | 1,000,000 | | | | 1,066,880 | |
Jackson County Hospital Finance Authority, AGC, 4.500%, 6/1/2026, Call 6/1/2020 | | | 415,000 | | | | 434,596 | |
Jenison Public Schools: | | | | | | | | |
5.000%, 5/1/2021 | | | 500,000 | | | | 538,325 | |
5.000%, 5/1/2022, Call 5/1/2021 | | | 560,000 | | | | 606,553 | |
Kent Hospital Finance Authority, 5.000%, 11/15/2029, Call 11/15/2021 | | | 1,000,000 | | | | 1,081,380 | |
Lansing Board of Water & Light, 5.000%, 7/1/2037, Call 7/1/2021 | | | 1,000,000 | | | | 1,067,680 | |
Lansing School District, Q-SBLF: | | | | | | | | |
5.000%, 5/1/2019 | | | 1,000,000 | | | | 1,021,860 | |
5.000%, 5/1/2020 | | | 1,825,000 | | | | 1,922,254 | |
Livonia Public Schools School District, BAM, 5.000%, 5/1/2021 | | | 1,600,000 | | | | 1,716,192 | |
Marshall Public Schools, Q-SBLF: | | | | | | | | |
4.000%, 11/1/2028, Call 5/1/2025 | | | 1,380,000 | | | | 1,467,796 | |
4.000%, 11/1/2029, Call 5/1/2025 | | | 940,000 | | | | 993,392 | |
Mattawan Consolidated School District, Q-SBLF, 5.000%, 5/1/2019 | | | 215,000 | | | | 219,586 | |
Michigan Finance Authority: | | | | | | | | |
5.000%, 11/1/2020 | | | 2,000,000 | | | | 2,130,280 | |
5.000%, 7/1/2026, Call 7/1/2025 | | | 175,000 | | | | 197,130 | |
5.000%, 7/1/2027, Call 7/1/2025 | | | 600,000 | | | | 673,116 | |
5.000%, 7/1/2029, Call 7/1/2025 | | | 950,000 | | | | 1,062,660 | |
5.000%, 7/1/2032, Call 7/1/2025 | | | 1,500,000 | | | | 1,662,300 | |
5.000%, 7/1/2034, Call 7/1/2025 | | | 500,000 | | | | 547,685 | |
5.000%, 12/1/2037, Call 12/1/2027 | | | 1,000,000 | | | | 1,137,800 | |
| | | | | | | | |
5.000%, 11/15/2041, Call 11/15/2026 | | | 1,000,000 | | | | 1,103,760 | |
Michigan Finance Authority, AGM: | | | | | | | | |
5.000%, 7/1/2029, Call 7/1/2024 | | | 1,500,000 | | | | 1,677,810 | |
5.000%, 7/1/2030, Call 7/1/2024 | | | 1,500,000 | | | | 1,674,390 | |
Michigan State Housing Development Authority, 5.625%, 10/1/2031, Call 10/1/2020 | | | 850,000 | | | | 900,464 | |
North Branch Area Schools, Q-SBLF, 5.000%, 5/1/2024 | | | 200,000 | | | | 228,136 | |
Plymouth-Canton Community School District, Q-SBLF, 5.000%, 5/1/2021 | | | 450,000 | | | | 485,460 | |
Redford Union School District No. 1, AMBAC Q-SBLF, 5.000%, 5/1/2022 | | | 250,000 | | | | 266,145 | |
River Rouge School District, Q-SBLF: | | | | | | | | |
5.000%, 5/1/2020 | | | 1,700,000 | | | | 1,789,165 | |
5.000%, 5/1/2021 | | | 1,155,000 | | | | 1,246,014 | |
Taylor Tax Increment Finance Authority, AGM: | | | | | | | | |
3.000%, 5/1/2019 | | | 340,000 | | | | 342,288 | |
3.250%, 5/1/2020 | | | 90,000 | | | | 91,748 | |
Tender Option Bond Trust Receipts/Certificates, Q-SBLF, 1.660%, 5/1/2026 (5) (7) | | | 3,000,000 | | | | 3,000,000 | |
Wayne County Airport Authority: | | | | | | | | |
5.000%, 12/1/2026, Call 12/1/2025 (14) | | | 3,000,000 | | | | 3,427,500 | |
5.000%, 12/1/2030, Call 12/1/2025 | | | 1,250,000 | | | | 1,422,862 | |
Wayne State University, AGM: | | | | | | | | |
5.000%, 11/15/2025, Call 11/15/2018 | | | 230,000 | | | | 231,569 | |
5.000%, 11/15/2025, Call 11/15/2018 | | | 285,000 | | | | 286,944 | |
Western Township Utilities Authority, 4.000%, 1/1/2021 | | | 1,200,000 | | | | 1,253,052 | |
| | | | | | | | |
| | | | | | | 61,165,896 | |
Minnesota — 0.3% | | | | | | | | |
City of Minneapolis, AGC: | | | | | | | | |
6.500%, 11/15/2038, Call 11/15/2018 | | | 165,000 | | | | 166,604 | |
6.500%, 11/15/2038, Call 11/15/2018 | | | 905,000 | | | | 913,724 | |
City of Minneapolis St. Paul Housing & Redevelopment Authority: | | | | | | | | |
4.000%, 8/15/2019 | | | 445,000 | | | | 453,366 | |
5.250%, 8/15/2025, Call 8/15/2020 | | | 275,000 | | | | 291,742 | |
City of Minneapolis St. Paul Housing & Redevelopment Authority, AGM, 5.000%, 8/15/2025, Call 8/15/2020 | | | 215,000 | | | | 226,733 | |
Minnesota Higher Education Facilities Authority, 5.000%, 10/1/2019 | | | 400,000 | | | | 413,396 | |
| | |
Minnesota Housing Finance Agency, GNMA COLL, 2.600%, 9/1/2042, Call 7/1/2022 | | | 783,540 | | | | 755,787 | |
Minnesota Housing Finance Agency, GNMA/FNMA/FHLMC: | | | | | | | | |
2.250%, 12/1/2042, Call 1/1/2022 | | | 512,993 | | | | 485,579 | |
3.900%, 7/1/2030, Call 1/1/2022 | | | 530,000 | | | | 541,252 | |
5.000%, 1/1/2031, Call 7/1/2021 | | | 585,000 | | | | 611,968 | |
| | | | | | | | |
| | | | | | | 4,860,151 | |
Mississippi — 0.8% | | | | | | | | |
Mississippi Business Finance Corp.: | | | | | | | | |
1.560%, 12/1/2030, Call 9/4/2018 (7) | | | 1,000,000 | | | | 1,000,000 | |
1.560%, 11/1/2035, Call 9/4/2018 (7) | | | 6,600,000 | | | | 6,600,000 | |
Mississippi Development Bank: | | | | | | | | |
3.125%, 10/1/2023 | | | 180,000 | | | | 181,024 | |
5.000%, 10/1/2023 | | | 2,505,000 | | | | 2,706,402 | |
5.000%, 1/1/2027, Call 1/1/2022 | | | 1,200,000 | | | | 1,317,960 | |
Mississippi State University Educational Building Corp., 5.000%, 11/1/2022 | | | 135,000 | | | | 150,157 | |
West Rankin Utility Authority, AGM, 5.000%, 1/1/2048, Call 1/1/2028 | | | 2,000,000 | | | | 2,241,840 | |
| | | | | | | | |
| | | | | | | 14,197,383 | |
Missouri — 1.7% | | | | | | | | |
Bi-State Development Agency of the Missouri-Illinois Metropolitan District, 5.000%, 10/1/2033, Call 10/1/2022 | | | 4,000,000 | | | | 4,414,200 | |
Chesterfield Valley Transportation Development District: | | | | | | | | |
4.000%, 5/15/2019 | | | 475,000 | | | | 482,134 | |
5.000%, 5/15/2020 | | | 125,000 | | | | 131,427 | |
5.000%, 5/15/2021 | | | 490,000 | | | | 522,502 | |
City of Kansas City: | | | | | | | | |
5.000%, 9/1/2021, Call 9/1/2019 | | | 500,000 | | | | 515,160 | |
5.000%, 9/1/2023, Call 9/1/2019 | | | 300,000 | | | | 309,096 | |
5.000%, 10/1/2026, Call 10/1/2025 | | | 120,000 | | | | 138,326 | |
5.000%, 10/1/2028, Call 10/1/2025 | | | 115,000 | | | | 131,843 | |
5.000%, 9/1/2032, Call 9/1/2019 | | | 1,000,000 | | | | 1,029,730 | |
| | | | | | | | |
City of St. Louis, 3.000%, 5/30/2019 | | | 1,000,000 | | | | 1,007,280 | |
Health & Educational Facilities Authority of the State of Missouri: | | | | | | | | |
5.000%, 2/1/2024, Call 2/1/2021 | | | 1,050,000 | | | | 1,104,096 | |
5.000%, 2/1/2032, Call 2/1/2026 | | | 1,000,000 | | | | 1,090,270 | |
5.000%, 11/15/2034, Call 5/15/2026 | | | 3,000,000 | | | | 3,359,070 | |
5.250%, 10/1/2031, Call 10/1/2021 | | | 1,000,000 | | | | 1,085,760 | |
Independence School District, SAW, 5.250%, 3/1/2030, Call 3/1/2021 | | | 2,000,000 | | | | 2,157,040 | |
Joplin Industrial Development Authority, 5.000%, 2/15/2020 | | | 330,000 | | | | 344,794 | |
Lees Summit Industrial Development Authority: | | | | | | | | |
5.000%, 8/15/2036, Call 8/15/2024 | | | 1,000,000 | | | | 1,052,850 | |
5.000%, 8/15/2046, Call 8/15/2024 | | | 2,000,000 | | | | 2,085,120 | |
Missouri Housing Development Commission, GNMA/FNMA/FHLMC: | | | | | | | | |
3.800%, 5/1/2025, Call 5/1/2021 | | | 595,000 | | | | 610,262 | |
4.000%, 5/1/2027, Call 5/1/2021 | | | 580,000 | | | | 592,743 | |
5.000%, 11/1/2027, Call 11/1/2019 | | | 170,000 | | | | 174,094 | |
Missouri State Environmental Improvement & Energy Resources Authority: | | | | | | | | |
5.750%, 1/1/2029, Call 1/1/2019 | | | 685,000 | | | | 694,056 | |
5.750%, 1/1/2029, Call 1/1/2019 | | | 65,000 | | | | 65,851 | |
St. Louis County Industrial Development Authority: | | | | | | | | |
2.850%, 9/1/2018 | | | 2,900,000 | | | | 2,900,000 | |
5.000%, 9/1/2048, Call 9/1/2027 | | | 1,000,000 | | | | 1,079,580 | |
Stone County Reorganized School District No. 4 Reeds Spring, SAW: | | | | | | | | |
5.000%, 3/1/2030, Call 3/1/2020 | | | 1,000,000 | | | | 1,045,290 | |
5.000%, 3/1/2031, Call 3/1/2020 | | | 750,000 | | | | 783,967 | |
5.000%, 3/1/2032, Call 3/1/2020 | | | 1,000,000 | | | | 1,045,290 | |
| | | | | | | | |
| | | | | | | 29,951,831 | |
Nebraska — 0.6% | | | | | | | | |
Central Plains Energy Project: | | | | | | | | |
5.000%, 9/1/2034 | | | 1,000,000 | | | | 1,173,070 | |
5.000%, 8/1/2039, Call 12/1/2019 (7) | | | 1,000,000 | | | | 1,036,250 | |
Hospital Authority No. 1 of Lancaster County, 5.500%, 1/1/2030, Call 1/1/2020 | | | 1,000,000 | | | | 1,041,540 | |
Nebraska Public Power District, 5.000%, 1/1/2032, Call 1/1/2022 | | | 1,000,000 | | | | 1,082,850 | |
Omaha Public Power District: | | | | | | | | |
5.000%, 2/1/2036, Call 12/1/2027 | | | 1,000,000 | | | | 1,158,540 | |
5.000%, 2/1/2037, Call 12/1/2027 | | | 500,000 | | | | 577,965 | |
Omaha-Douglas Public Building Commission: | | | | | | | | |
5.000%, 5/1/2026, Call 5/1/2022 | | | 825,000 | | | | 906,906 | |
5.000%, 5/1/2027, Call 5/1/2022 | | | 585,000 | | | | 642,429 | |
5.000%, 5/1/2028, Call 5/1/2022 | | | 550,000 | | | | 603,586 | |
5.000%, 5/1/2029, Call 5/1/2022 | | | 660,000 | | | | 723,334 | |
Tender Option Bond Trust Receipts/Certificates, 1.630%, 11/1/2048, Call 11/1/2025 (5) (7) | | | 1,200,000 | | | | 1,200,000 | |
| | | | | | | | |
| | | | | | | 10,146,470 | |
Nevada — 1.1% | | | | | | | | |
County of Clark, 5.000%, 7/1/2028, Call 7/1/2019 | | | 2,180,000 | | | | 2,240,255 | |
County of Clark Department of Aviation: | | | | | | | | |
5.000%, 7/1/2029, Call 7/1/2024 | | | 1,200,000 | | | | 1,344,300 | |
5.000%, 7/1/2030, Call 7/1/2024 | | | 1,000,000 | | | | 1,116,830 | |
5.000%, 7/1/2040, Call 7/1/2027 | | | 4,000,000 | | | | 4,536,280 | |
County of Washoe: | | | | | | | | |
5.000%, 2/1/2033, Call 2/1/2019 | | | 3,920,000 | | | | 3,966,530 | |
5.500%, 2/1/2028, Call 2/1/2019 | | | 1,000,000 | | | | 1,014,940 | |
Las Vegas Valley Water District, 5.000%, 6/1/2028, Call 6/1/2022 | | | 5,115,000 | | | | 5,624,250 | |
| | | | | | | | |
| | | | | | | 19,843,385 | |
New Hampshire — 0.0% | | | | | | | | |
New Hampshire Housing Finance Authority, 4.800%, 7/1/2028, Call 1/1/2022 | | | 730,000 | | | | 738,132 | |
| | |
New Jersey — 3.9% | | | | | | | | |
Lyndhurst Township School District, School Bond Gty, 2.750%, 9/14/2018 | | | 2,000,000 | | | | 2,000,540 | |
New Jersey Economic Development Authority: | | | | | | | | |
5.000%, 6/15/2019 | | | 3,000,000 | | | | 3,066,660 | |
5.000%, 6/15/2020 | | | 1,500,000 | | | | 1,570,365 | |
5.000%, 11/1/2021 | | | 4,600,000 | | | | 4,945,276 | |
5.500%, 6/15/2030, Call 12/15/2026 | | | 2,500,000 | | | | 2,856,500 | |
| | | | | | | | |
New Jersey Higher Education Student Assistance Authority, 4.875%, 12/1/2024, Call 12/1/2019 | | | 5,520,000 | | | | 5,685,600 | |
| | |
New Jersey Housing & Mortgage Finance Agency, 4.250%, 10/1/2032, Call 10/1/2021 | | | 260,000 | | | | 264,953 | |
New Jersey Transportation Trust Fund Authority: | | | | | | | | |
2.560%, 6/15/2034, Call 6/15/2019 (7) | | | 5,000,000 | | | | 5,004,100 | |
5.000%, 6/15/2022 | | | 500,000 | | | | 541,205 | |
5.000%, 6/15/2030, Call 6/15/2026 | | | 1,000,000 | | | | 1,112,110 | |
5.000%, 6/15/2031, Call 6/15/2026 | | | 1,000,000 | | | | 1,107,770 | |
5.000%, 6/15/2032, Call 12/15/2024 | | | 5,000,000 | | | | 5,389,950 | |
5.250%, 12/15/2023 | | | 240,000 | | | | 267,655 | |
New Jersey Transportation Trust Fund Authority, BAM TCRs: | | | | | | | | |
5.000%, 6/15/2028, Call 6/15/2022 | | | 5,000,000 | | | | 5,352,550 | |
5.000%, 6/15/2033, Call 6/15/2022 | | | 3,000,000 | | | | 3,182,880 | |
5.250%, 6/15/2033, Call 6/15/2023 | | | 5,635,000 | | | | 6,132,345 | |
New Jersey Transportation Trust Fund Authority, BHAC AMBAC, 0.000%, 12/15/2024 | | | 440,000 | | | | 367,928 | |
New Jersey Turnpike Authority: | | | | | | | | |
5.000%, 1/1/2031, Call 1/1/2025 | | | 500,000 | | | | 563,930 | |
5.000%, 1/1/2032, Call 7/1/2022 | | | 3,440,000 | | | | 3,827,241 | |
5.000%, 1/1/2035, Call 1/1/2022 | | | 1,685,000 | | | | 1,853,500 | |
Tender Option Bond Trust Receipts/Certificates, 1.690%, 7/1/2025 (5) (7) | | | 4,035,000 | | | | 4,035,000 | |
Tobacco Settlement Financing Corp.: | | | | | | | | |
5.000%, 6/1/2031, Call 6/1/2028 | | | 2,750,000 | | | | 3,126,723 | |
5.000%, 6/1/2032, Call 6/1/2028 | | | 2,000,000 | | | | 2,266,860 | |
5.000%, 6/1/2033, Call 6/1/2028 | | | 1,500,000 | | | | 1,693,500 | |
5.000%, 6/1/2046, Call 6/1/2028 | | | 2,500,000 | | | | 2,731,500 | |
| | | | | | | | |
| | | | | | | 68,946,641 | |
New Mexico — 0.8% | | | | | | | | |
City of Santa Fe, 4.000%, 6/1/2025, Call 6/1/2022 | | | 655,000 | | | | 694,176 | |
New Mexico Mortgage Finance Authority, GNMA COLL, 2.600%, 2/1/2043, Call 1/1/2023 | | | 800,594 | | | | 768,570 | |
New Mexico Mortgage Finance Authority, GNMA/FNMA/FHLMC: | | | | | | | | |
4.500%, 9/1/2024, Call 9/1/2019 | | | 175,000 | | | | 176,948 | |
4.625%, 3/1/2028, Call 9/1/2021 | | | 510,000 | | | | 524,907 | |
5.350%, 3/1/2030, Call 9/1/2020 | | | 1,270,000 | | | | 1,331,265 | |
5.650%, 9/1/2039, Call 3/1/2019 | | | 90,000 | | | | 91,165 | |
| | |
New Mexico Municipal Energy Acquisition Authority, 2.145%, 11/1/2039, Call 2/1/2019 (7) | | | 10,000,000 | | | | 10,010,600 | |
| | | | | | | | |
| | | | | | | 13,597,631 | |
New York — 5.8% | | | | | | | | |
Albany Capital Resource Corp.: | | | | | | | | |
5.000%, 12/1/2023 | | | 150,000 | | | | 168,615 | |
5.000%, 12/1/2024 | | | 200,000 | | | | 227,596 | |
BB&T Municipal Trust, 2.360%, 11/15/2019 (5) (7) | | | 265,421 | | | | 265,453 | |
Buffalo & Erie County Industrial Land Development Corp.: | | | | | | | | |
5.000%, 6/1/2035, Call 6/1/2024 | | | 1,000,000 | | | | 1,087,100 | |
5.000%, 8/1/2037, Call 8/1/2027 | | | 1,300,000 | | | | 1,382,511 | |
5.000%, 8/1/2047, Call 8/1/2027 | | | 1,000,000 | | | | 1,053,030 | |
City of New York: | | | | | | | | |
1.560%, 8/1/2024, Call 9/19/2018 (7) | | | 1,015,000 | | | | 1,015,000 | |
1.560%, 8/1/2035, Call 9/19/2018 (7) | | | 2,550,000 | | | | 2,550,000 | |
5.000%, 8/1/2032, Call 2/1/2028 | | | 1,000,000 | | | | 1,169,970 | |
5.250%, 3/1/2034, Call 3/1/2028 | | | 3,000,000 | | | | 3,572,910 | |
5.250%, 3/1/2035, Call 3/1/2028 | | | 2,500,000 | | | | 2,968,325 | |
City of New York, AGC, 1.590%, 10/1/2021, Call 9/4/2018 (7) (8) | | | 400,000 | | | | 400,000 | |
Long Island Power Authority: | | | | | | | | |
2.107%, 5/1/2033, Call 10/1/2018 (7) | | | 2,500,000 | | | | 2,500,425 | |
5.000%, 9/1/2042, Call 9/1/2027 | | | 1,000,000 | | | | 1,132,960 | |
Metropolitan Transportation Authority: | | | | | | | | |
2.010%, 11/15/2044 (7) | | | 1,000,000 | | | | 998,450 | |
5.000%, 11/15/2033, Call 5/15/2028 | | | 1,620,000 | | | | 1,868,621 | |
5.000%, 11/15/2036, Call 11/15/2026 | | | 2,325,000 | | | | 2,622,670 | |
New York City Transitional Finance Authority Future Tax Secured Revenue: | | | | | | | | |
| | | | | | | | |
1.520%, 8/1/2023, Call 9/19/2018 (7) | | | 4,600,000 | | | | 4,600,000 | |
1.560%, 11/1/2029, Call 9/19/2018 (7) | | | 5,000,000 | | | | 5,000,000 | |
1.560%, 5/1/2034, Call 9/19/2018 (7) | | | 6,700,000 | | | | 6,700,000 | |
5.000%, 11/1/2024, Call 11/1/2022 | | | 5,715,000 | | | | 6,380,740 | |
5.000%, 11/1/2026, Call 5/1/2025 | | | 1,000,000 | | | | 1,161,690 | |
5.000%, 11/1/2026, Call 5/1/2025 | | | 2,000,000 | | | | 2,323,380 | |
5.000%, 2/1/2038, Call 2/1/2027 | | | 4,000,000 | | | | 4,552,120 | |
5.000%, 2/1/2039, Call 2/1/2027 | | | 4,000,000 | | | | 4,545,800 | |
New York City Water & Sewer System: | | | | | | | | |
5.000%, 6/15/2028, Call 6/15/2024 | | | 500,000 | | | | 571,180 | |
5.000%, 6/15/2029, Call 6/15/2024 | | | 600,000 | | | | 683,676 | |
New York Convention Center Development Corp., 0.000%, 11/15/2032 | | | 1,250,000 | | | | 750,137 | |
New York State Dormitory Authority: | | | | | | | | |
5.000%, 3/15/2027, Call 3/15/2022 | | | 7,555,000 | | | | 8,279,978 | |
5.000%, 3/15/2028, Call 3/15/2019 | | | 625,000 | | | | 636,488 | |
5.000%, 12/1/2035, Call 6/1/2027 (5) | | | 500,000 | | | | 550,875 | |
5.000%, 12/1/2037, Call 6/1/2027 (5) | | | 500,000 | | | | 548,130 | |
6.000%, 7/1/2038, Call 7/1/2020 | | | 1,000,000 | | | | 1,054,590 | |
New York State Dormitory Authority, NATL-RE, 3.700%, 7/1/2029, Call 9/4/2018 (7) (8) | | | 2,600,000 | | | | 2,600,000 | |
New York State Urban Development Corp., 5.000%, 3/15/2028, Call 3/15/2023 | | | 1,000,000 | | | | 1,120,950 | |
New York Transportation Development Corp., AGM, 4.000%, 7/1/2032, Call 7/1/2024 (14) | | | 2,500,000 | | | | 2,569,200 | |
Nuveen New York AMT-Free Quality Municipal Income Fund, 1.860%, 5/1/2047, Call 9/19/2018 (5) (7) | | | 5,000,000 | | | | 5,000,000 | |
RBC Municipal Products, Inc. Trust, 1.530%, 3/1/2022, Call 9/19/2018 (5) (7) | | | 6,000,000 | | | | 6,000,000 | |
State of New York Mortgage Agency, 5.000%, 10/1/2019 | | | 500,000 | | | | 517,395 | |
Tender Option Bond Trust Receipts/Certificates, 1.660%, 11/15/2044, Call 11/15/2021 (5) (7) | | | 6,000,000 | | | | 6,000,000 | |
Triborough Bridge & Tunnel Authority: | | | | | | | | |
5.000%, 11/15/2037, Call 11/15/2028 | | | 1,500,000 | | | | 1,751,700 | |
5.000%, 11/15/2038, Call 11/15/2028 | | | 1,565,000 | | | | 1,824,618 | |
TSASC, Inc.: | | | | | | | | |
5.000%, 6/1/2036, Call 6/1/2027 | | | 1,000,000 | | | | 1,097,040 | |
5.000%, 6/1/2041, Call 6/1/2027 | | | 1,000,000 | | | | 1,079,970 | |
Westchester Tobacco Asset Securitization, 5.000%, 6/1/2021 | | | 500,000 | | | | 536,030 | |
| | | | | | | | |
| | | | | | | 103,419,323 | |
North Carolina — 0.7% | | | | | | | | |
County of Catawba: | | | | | | | | |
4.000%, 10/1/2025, Call 10/1/2021 | | | 585,000 | | | | 610,254 | |
5.000%, 10/1/2023, Call 10/1/2021 | | | 1,000,000 | | | | 1,088,010 | |
5.000%, 10/1/2024, Call 10/1/2021 | | | 835,000 | | | | 907,971 | |
County of Cumberland, 5.125%, 12/1/2028, Call 12/1/2019 | | | 250,000 | | | | 260,668 | |
County of Union: | | | | | | | | |
5.000%, 12/1/2026, Call 6/1/2023 | | | 1,390,000 | | | | 1,550,920 | |
5.000%, 12/1/2027, Call 6/1/2023 | | | 1,645,000 | | | | 1,833,106 | |
North Carolina Eastern Municipal Power Agency, AGC, 6.000%, 1/1/2019 | | | 95,000 | | | | 96,369 | |
North Carolina Housing Finance Agency, 4.250%, 1/1/2028, Call 7/1/2021 | | | 220,000 | | | | 224,974 | |
North Carolina Medical Care Commission: | | | | | | | | |
1.580%, 11/1/2034, Call 9/19/2018 (7) | | | 600,000 | | | | 600,000 | |
4.000%, 6/1/2020 | | | 470,000 | | | | 487,122 | |
5.000%, 6/1/2027, Call 6/1/2022 | | | 500,000 | | | | 548,650 | |
North Carolina Turnpike Authority, 5.000%, 7/1/2047, Call 7/1/2026 | | | 750,000 | | | | 814,598 | |
Orange County Public Facilities Co., 5.000%, 10/1/2026, Call 10/1/2022 | | | 1,130,000 | | | | 1,264,741 | |
Raleigh Durham Airport Authority, 5.000%, 5/1/2036, Call 5/1/2020 | | | 1,690,000 | | | | 1,769,565 | |
| | | | | | | | |
| | | | | | | 12,056,948 | |
North Dakota — 1.5% | | | | | | | | |
Barnes County North Public School District Building Authority: | | | | | | | | |
4.000%, 5/1/2021 | | | 635,000 | | | | 664,813 | |
4.500%, 5/1/2030, Call 5/1/2021 | | | 1,515,000 | | | | 1,548,785 | |
4.500%, 5/1/2033, Call 5/1/2021 | | | 1,850,000 | | | | 1,879,989 | |
City of Dickinson, 5.000%, 10/1/2025, Call 10/1/2021 | | | 2,240,000 | | | | 2,371,174 | |
City of Grand Forks: | | | | | | | | |
4.000%, 12/1/2019 | | | 535,000 | | | | 548,081 | |
| | | | | | | | |
5.000%, 12/1/2032, Call 12/1/2021 | | | 1,000,000 | | | | 1,054,600 | |
City of West Fargo, 3.000%, 5/1/2023, Call 10/1/2018 | | | 185,000 | | | | 185,078 | |
County of Ward: | | | | | | | | |
5.000%, 6/1/2034, Call 6/1/2028 | | | 2,500,000 | | | | 2,770,075 | |
5.000%, 6/1/2038, Call 6/1/2028 | | | 2,500,000 | | | | 2,742,150 | |
North Dakota Housing Finance Agency, 5.250%, 1/1/2029, Call 7/1/2019 | | | 110,000 | | | | 112,115 | |
North Dakota Public Finance Authority: | | | | | | | | |
4.000%, 6/1/2023 | | | 2,440,000 | | | | 2,617,217 | |
4.000%, 6/1/2024, Call 6/1/2023 | | | 2,190,000 | | | | 2,343,979 | |
4.000%, 6/1/2025, Call 6/1/2023 | | | 1,145,000 | | | | 1,219,688 | |
Williston Parks & Recreation District: | | | | | | | | |
4.500%, 3/1/2020 | | | 1,205,000 | | | | 1,219,014 | |
4.500%, 3/1/2025, Call 3/1/2021 | | | 2,525,000 | | | | 2,530,277 | |
4.625%, 3/1/2026, Call 3/1/2021 | | | 2,620,000 | | | | 2,620,891 | |
| | | | | | | | |
| | | | | | | 26,427,926 | |
Ohio — 3.9% | | | | | | | | |
Akron Bath Copley Joint Township Hospital District, 5.000%, 11/15/2021 | | | 1,000,000 | | | | 1,077,860 | |
City of Chillicothe, 5.000%, 12/1/2037, Call 12/1/2027 | | | 2,000,000 | | | | 2,205,080 | |
City of Cleveland Airport System Revenue, AGM: | | | | | | | | |
5.000%, 1/1/2030, Call 1/1/2022 | | | 3,900,000 | | | | 4,208,841 | |
5.000%, 1/1/2031, Call 1/1/2022 | | | 1,000,000 | | | | 1,078,530 | |
City of Cleveland Airport System Revenue, MAC: | | | | | | | | |
5.000%, 1/1/2022, Call 1/1/2021 | | | 2,320,000 | | | | 2,475,997 | |
5.000%, 1/1/2031, Call 1/1/2022 | | | 1,270,000 | | | | 1,369,733 | |
City of Cleveland Income Tax Revenue: | | | | | | | | |
5.000%, 10/1/2024, Call 10/1/2022 | | | 460,000 | | | | 513,705 | |
5.000%, 10/1/2028, Call 10/1/2022 | | | 1,075,000 | | | | 1,200,506 | |
5.000%, 10/1/2029, Call 10/1/2022 | | | 1,130,000 | | | | 1,261,927 | |
5.000%, 10/1/2029, Call 10/1/2022 | | | 2,290,000 | | | | 2,557,357 | |
City of Middleburg Heights, 5.125%, 8/1/2031, Call 8/1/2021 | | | 1,000,000 | | | | 1,083,050 | |
Cleveland Department of Public Utilities Division of Water: | | | | | | | | |
4.000%, 1/1/2028, Call 1/1/2024 | | | 500,000 | | | | 532,010 | |
4.000%, 1/1/2029, Call 1/1/2024 | | | 1,000,000 | | | | 1,059,940 | |
4.000%, 1/1/2030, Call 1/1/2024 | | | 1,000,000 | | | | 1,055,880 | |
Cleveland Heights & University Heights City School District: | | | | | | | | |
0.000%, 12/1/2024 | | | 400,000 | | | | 350,040 | |
0.000%, 12/1/2025 | | | 600,000 | | | | 503,394 | |
Cleveland-Cuyahoga County Port Authority, 5.000%, 10/1/2022, Call 10/1/2020 | | | 1,000,000 | | | | 1,064,580 | |
County of Franklin: | | | | | | | | |
5.000%, 5/15/2028, Call 5/15/2023 | | | 2,000,000 | | | | 2,228,560 | |
5.000%, 7/1/2029, Call 7/1/2026 | | | 2,000,000 | | | | 2,179,340 | |
5.000%, 5/15/2031, Call 5/15/2023 | | | 405,000 | | | | 447,869 | |
County of Franklin Sales Tax Revenue, 5.000%, 6/1/2048, Call 6/1/2028 | | | 3,000,000 | | | | 3,475,860 | |
County of Hamilton, 5.000%, 1/1/2031, Call 1/1/2026 | | | 1,350,000 | | | | 1,475,185 | |
County of Hamilton Sales Tax Revenue, 5.000%, 12/1/2029, Call 12/1/2021 | | | 975,000 | | | | 1,056,364 | |
County of Hancock, 5.750%, 12/1/2026, Call 6/1/2021 | | | 1,120,000 | | | | 1,234,509 | |
County of Lucas, 5.000%, 11/15/2022, Call 11/15/2021 | | | 925,000 | | | | 994,653 | |
Delaware City School District, 5.250%, 12/1/2038, Call 6/1/2023 | | | 1,240,000 | | | | 1,386,742 | |
Elyria City School District, School District Credit Program, 4.000%, 12/1/2028, Call 12/1/2022 | | | 1,130,000 | | | | 1,189,822 | |
FHLMC Multifamily VRD Certificates, 1.860%, 9/15/2033 (7) | | | 3,495,000 | | | | 3,495,000 | |
Johnstown-Monroe Local School District, 5.000%, 12/1/2030, Call 12/1/2021 | | | 715,000 | | | | 784,519 | |
Lake County Community College District: | | | | | | | | |
4.000%, 12/1/2022, Call 12/1/2019 | | | 695,000 | | | | 713,202 | |
4.000%, 12/1/2024, Call 12/1/2019 | | | 835,000 | | | | 856,451 | |
4.000%, 12/1/2025, Call 12/1/2019 | | | 855,000 | | | | 876,965 | |
Lake Local School District/Stark County, School District Credit Program: | | | | | | | | |
4.000%, 12/1/2023, Call 12/1/2021 | | | 1,550,000 | | | | 1,649,231 | |
4.000%, 12/1/2025, Call 12/1/2021 | | | 1,660,000 | | | | 1,754,471 | |
Liberty Local School District, AGM, 4.500%, 12/1/2018 | | | 885,000 | | | | 890,921 | |
New Albany Community Authority: | | | | | | | | |
4.000%, 10/1/2020 | | | 590,000 | | | | 614,928 | |
5.000%, 10/1/2022 | | | 1,000,000 | | | | 1,108,890 | |
5.000%, 10/1/2023, Call 10/1/2022 | | | 1,105,000 | | | | 1,219,423 | |
North Olmsted City School District: | | | | | | | | |
| | | | | | | | |
5.000%, 12/1/2027, Call 12/1/2023 | | | 220,000 | | | | 251,957 | |
5.000%, 12/1/2028, Call 12/1/2023 | | | 365,000 | | | | 418,020 | |
5.000%, 12/1/2029, Call 12/1/2023 | | | 500,000 | | | | 572,630 | |
Ohio Higher Educational Facility Commission: | | | | | | | | |
4.000%, 12/1/2020 | | | 1,050,000 | | | | 1,091,506 | |
4.000%, 12/1/2021 | | | 795,000 | | | | 836,674 | |
4.000%, 12/1/2022 | | | 845,000 | | | | 897,407 | |
Ohio Housing Finance Agency, GNMA/FNMA/FHLMC, 5.200%, 9/1/2029, Call 10/1/2018 | | | 1,000,000 | | | | 1,002,040 | |
Ohio Turnpike & Infrastructure Commission, 5.250%, 2/15/2033, Call 2/15/2023 | | | 1,330,000 | | | | 1,479,971 | |
Ohio University, 5.000%, 12/1/2028, Call 6/1/2022 | | | 225,000 | | | | 246,807 | |
Ohio Water Development Authority, 5.000%, 6/1/2022 | | | 1,100,000 | | | | 1,221,638 | |
Rib Floater Trust Various States, 1.810%, 11/15/2048, Call 10/1/2018 (5) (7) | | | 5,000,000 | | | | 5,000,000 | |
State of Ohio, 1.450%, 11/1/2035 (7) | | | 500,000 | | | | 500,000 | |
Tender Option Bond Trust Receipts/Certificates, 1.660%, 4/1/2026 (5) (7) | | | 2,000,000 | | | | 2,000,000 | |
University of Toledo, 5.000%, 6/1/2030, Call 6/1/2021 | | | 250,000 | | | | 271,280 | |
| | | | | | | | |
| | | | | | | 69,021,265 | |
Oklahoma — 0.7% | | | | | | | | |
Cushing Educational Facilities Authority, 5.000%, 9/1/2022 | | | 2,000,000 | | | | 2,210,320 | |
Delaware County Justice Authority: | | | | | | | | |
3.750%, 9/1/2029, Call 10/1/2018 | | | 1,830,000 | | | | 1,830,037 | |
4.000%, 9/1/2018 | | | 415,000 | | | | 415,000 | |
4.000%, 9/1/2019 | | | 740,000 | | | | 755,888 | |
4.000%, 9/1/2020 | | | 700,000 | | | | 723,415 | |
4.000%, 9/1/2021 | | | 805,000 | | | | 841,458 | |
Oklahoma Housing Finance Agency, GNMA COLL: | | | | | | | | |
2.500%, 3/1/2022 | | | 270,000 | | | | 273,796 | |
3.300%, 3/1/2031, Call 3/1/2022 | | | 650,000 | | | | 654,407 | |
Oklahoma Housing Finance Agency, GNMA/FNMA/FHLMC, 6.500%, 9/1/2038, Call 9/1/2018 | | | 10,000 | | | | 10,000 | |
Tulsa Airports Improvement Trust, BAM, 5.000%, 6/1/2028, Call 6/1/2023 (14) | | | 1,405,000 | | | | 1,526,266 | |
Tulsa County Industrial Authority: | | | | | | | | |
5.250%, 11/15/2037, Call 11/15/2025 | | | 1,500,000 | | | | 1,658,595 | |
5.250%, 11/15/2045, Call 11/15/2025 | | | 1,500,000 | | | | 1,650,600 | |
| | | | | | | | |
| | | | | | | 12,549,782 | |
Oregon — 0.6% | | | | | | | | |
City of Portland, 5.000%, 6/15/2027, Call 6/15/2022 | | | 1,000,000 | | | | 1,095,610 | |
City of Tigard Water Revenue, 5.000%, 8/1/2029, Call 8/1/2022 | | | 690,000 | | | | 761,367 | |
City of Woodburn Wastewater Revenue: | | | | | | | | |
0.000%, 3/1/2020 | | | 1,380,000 | | | | 1,339,911 | |
0.000%, 3/1/2021 | | | 1,215,000 | | | | 1,152,306 | |
Clackamas & Washington Counties School District No. 3, NATL-RE School Bond Gty, 0.000%, 6/15/2023 | | | 2,000,000 | | | | 1,798,080 | |
Klamath Falls Intercommunity Hospital Authority: | | | | | | | | |
5.000%, 9/1/2021 | | | 250,000 | | | | 270,972 | |
5.000%, 9/1/2022 | | | 505,000 | | | | 557,904 | |
Port of Morrow: | | | | | | | | |
3.500%, 6/1/2020, Call 6/1/2019 | | | 210,000 | | | | 212,434 | |
3.750%, 6/1/2021, Call 6/1/2019 | | | 220,000 | | | | 222,869 | |
4.000%, 6/1/2022, Call 6/1/2019 | | | 235,000 | | | | 238,321 | |
Port of Portland Airport Revenue, 5.500%, 7/1/2031, Call 7/1/2021 | | | 3,000,000 | | | | 3,275,400 | |
| | |
State of Oregon Housing & Community Services Department, 4.450%, 7/1/2023, Call 1/1/2020 (14) | | | 585,000 | | | | 597,115 | |
| | | | | | | | |
| | | | | | | 11,522,289 | |
Pennsylvania — 2.8% | | | | | | | | |
Berks County Industrial Development Authority: | | | | | | | | |
5.000%, 5/15/2032, Call 5/15/2027 | | | 750,000 | | | | 824,812 | |
5.000%, 11/1/2037, Call 11/1/2027 | | | 1,000,000 | | | | 1,109,150 | |
5.000%, 5/15/2038, Call 5/15/2025 | | | 255,000 | | | | 277,522 | |
5.000%, 5/15/2042, Call 5/15/2024 | | | 1,655,000 | | | | 1,803,867 | |
5.000%, 5/15/2043, Call 5/15/2025 | | | 350,000 | | | | 379,607 | |
5.000%, 5/15/2047, Call 5/15/2027 | | | 1,630,000 | | | | 1,759,797 | |
Bucks County Industrial Development Authority, 5.000%, 10/1/2037, Call 10/1/2024 | | | 1,250,000 | | | | 1,375,575 | |
Central Bradford Progress Authority, 5.375%, 12/1/2041, Call 12/1/2021 | | | 500,000 | | | | 545,740 | |
| | | | | | | | |
City of Pittsburgh, 4.000%, 9/1/2021 | | | 750,000 | | | | 790,177 | |
Commonwealth Financing Authority: | | | | | | | | |
5.000%, 6/1/2032, Call 6/1/2028 | | | 1,000,000 | | | | 1,135,210 | |
5.000%, 6/1/2033, Call 6/1/2028 | | | 1,250,000 | | | | 1,414,575 | |
5.000%, 6/1/2034, Call 6/1/2028 | | | 1,000,000 | | | | 1,127,240 | |
5.000%, 6/1/2035, Call 6/1/2028 | | | 1,000,000 | | | | 1,123,710 | |
Geisinger Authority, 5.000%, 2/15/2039, Call 2/15/2027 | | | 2,500,000 | | | | 2,820,775 | |
Kiski Area School District, AGM SAW, 4.000%, 3/1/2021 | | | 1,450,000 | | | | 1,518,266 | |
Lancaster Industrial Development Authority: | | | | | | | | |
5.000%, 5/1/2021 | | | 360,000 | | | | 382,781 | |
5.000%, 5/1/2022 | | | 430,000 | | | | 464,658 | |
Lehigh County General Purpose Authority, 4.000%, 11/1/2019 | | | 555,000 | | | | 568,764 | |
Montgomery County Higher Education & Health Authority, 1.820%, 9/1/2050, Call 9/4/2018 (7) | | | 8,000,000 | | | | 8,000,000 | |
Montgomery County Industrial Development Authority, 6.250%, 11/15/2029, Call 11/15/2019 | | | 715,000 | | | | 753,810 | |
Montgomery County Industrial Development Authority, FHA, 5.000%, 8/1/2024, Call 8/1/2020 | | | 1,350,000 | | | | 1,426,626 | |
Pennsylvania Economic Development Financing Authority, 2.125%, 11/1/2021 (7) | | | 1,500,000 | | | | 1,499,160 | |
Pennsylvania Economic Development Financing Authority, AGM: | | | | | | | | |
0.000%, 1/1/2020 | | | 600,000 | | | | 576,762 | |
0.000%, 1/1/2021 | | | 600,000 | | | | 558,252 | |
5.000%, 1/1/2022 | | | 305,000 | | | | 327,137 | |
Pennsylvania Housing Finance Agency, 4.200%, 10/1/2033, Call 10/1/2018 (14) | | | 1,370,000 | | | | 1,372,534 | |
Pennsylvania Turnpike Commission: | | | | | | | | |
2.540%, 12/1/2021, Call 6/1/2021 (7) | | | 5,000,000 | | | | 5,074,500 | |
4.000%, 12/1/2023, Call 12/1/2019 | | | 105,000 | | | | 108,011 | |
4.000%, 12/1/2023, Call 12/1/2019 | | | 95,000 | | | | 97,053 | |
5.000%, 6/1/2021, Call 6/1/2019 | | | 715,000 | | | | 732,932 | |
5.000%, 12/1/2030, Call 12/1/2020 (13) | | | 215,000 | | | | 230,074 | |
5.000%, 12/1/2030, Call 12/1/2020 (13) | | | 120,000 | | | | 128,004 | |
5.000%, 12/1/2030, Call 12/1/2020 (13) | | | 250,000 | | | | 267,528 | |
5.500%, 12/1/2042, Call 12/1/2026 | | | 3,000,000 | | | | 3,439,920 | |
6.000%, 12/1/2034, Call 12/1/2020 (13) | | | 55,000 | | | | 60,058 | |
6.000%, 12/1/2034, Call 12/1/2020 (13) | | | 70,000 | | | | 76,437 | |
6.000%, 12/1/2034, Call 12/1/2020 (13) | | | 270,000 | | | | 294,206 | |
6.000%, 12/1/2036, Call 12/1/2020 | | | 975,000 | | | | 1,065,782 | |
Pittsburgh School District, BAM SAW, 5.000%, 9/1/2024, Call 9/1/2022 | | | 1,000,000 | | | | 1,107,170 | |
Pittsburgh Water & Sewer Authority, AGM, 2.097%, 9/1/2040, Call 6/1/2020 (7) | | | 2,055,000 | | | | 2,059,131 | |
Sayre Health Care Facilities Authority, 2.321%, 12/1/2024, Call 10/1/2018 (7) | | | 225,000 | | | | 226,377 | |
Scranton School District, BAM SAW, 5.000%, 12/1/2034, Call 12/1/2027 | | | 1,500,000 | | | | 1,680,000 | |
| | | | | | | | |
| | | | | | | 50,583,690 | |
Rhode Island — 0.6% | | | | | | | | |
| | |
Rhode Island Housing & Mortgage Finance Corp., 3.625%, 10/1/2029, Call 10/1/2021 | | | 760,000 | | | | 769,143 | |
Rhode Island Student Loan Authority: | | | | | | | | |
3.375%, 12/1/2023, Call 12/1/2020 (14) | | | 185,000 | | | | 187,449 | |
4.000%, 12/1/2022, Call 12/1/2021 (14) | | | 2,885,000 | | | | 3,001,381 | |
4.200%, 12/1/2018, Call 10/1/2018 | | | 600,000 | | | | 601,428 | |
4.250%, 12/1/2020, Call 10/1/2018 | | | 500,000 | | | | 501,125 | |
4.250%, 12/1/2025, Call 12/1/2021 (14) | | | 2,205,000 | | | | 2,279,044 | |
4.500%, 12/1/2021, Call 10/1/2018 | | | 585,000 | | | | 586,421 | |
4.750%, 12/1/2028, Call 12/1/2021 (14) | | | 545,000 | | | | 566,849 | |
Town of Cumberland, SAW: | | | | | | | | |
4.000%, 3/15/2024 | | | 795,000 | | | | 866,065 | |
4.000%, 3/15/2026, Call 3/15/2024 | | | 460,000 | | | | 494,675 | |
| | | | | | | | |
| | | | | | | 9,853,580 | |
South Carolina — 1.6% | | | | | | | | |
City of Rock Hill Combined Utility System Revenue, AGM: | | | | | | | | |
5.250%, 1/1/2026, Call 1/1/2022 | | | 730,000 | | | | 799,211 | |
5.250%, 1/1/2028, Call 1/1/2022 | | | 475,000 | | | | 517,964 | |
County of Dorchester Waterworks & Sewer System Revenue: | | | | | | | | |
5.000%, 10/1/2022 | | | 480,000 | | | | 532,070 | |
5.000%, 10/1/2026, Call 10/1/2022 | | | 400,000 | | | | 441,584 | |
| | | | | | | | |
County of Florence: | | | | | | | | |
5.000%, 11/1/2025, Call 11/1/2020 | | | 2,000,000 | | | | 2,124,600 | |
5.000%, 11/1/2030, Call 11/1/2020 | | | 500,000 | | | | 529,300 | |
5.000%, 11/1/2031, Call 11/1/2024 | | | 360,000 | | | | 402,541 | |
Patriots Energy Group Financing Agency, 2.243%, 10/1/2048, Call 11/1/2023 (7) | | | 8,000,000 | | | | 8,000,000 | |
Piedmont Municipal Power Agency, AGC: | | | | | | | | |
5.000%, 1/1/2030, Call 7/1/2021 | | | 450,000 | | | | 481,216 | |
5.750%, 1/1/2034, Call 7/1/2021 | | | 1,000,000 | | | | 1,093,140 | |
South Carolina Jobs-Economic Development Authority: | | | | | | | | |
5.000%, 7/1/2022 | | | 1,735,000 | | | | 1,888,808 | |
5.000%, 11/15/2047, Call 11/15/2025 | | | 1,500,000 | | | | 1,658,685 | |
South Carolina Public Service Authority: | | | | | | | | |
5.000%, 12/1/2032, Call 12/1/2026 | | | 3,265,000 | | | | 3,610,274 | |
5.500%, 1/1/2038, Call 1/1/2019 | | | 920,000 | | | | 931,730 | |
South Carolina State Housing Finance & Development Authority, GNMA COLL, 5.000%, 1/1/2028, Call 1/1/2020 | | | 45,000 | | | | 45,961 | |
Spartanburg Sanitation Sewer District, 5.000%, 3/1/2030, Call 3/1/2023 (13) | | | 1,500,000 | | | | 1,655,610 | |
St. Peters Parish-Jasper County Public Facilities Corp., AGM, 5.000%, 4/1/2031, Call 4/1/2021 | | | 900,000 | | | | 952,011 | |
Tender Option Bond Trust Receipts/Certificates, 1.710%, 1/1/2020 (5) (7) | | | 2,390,000 | | | | 2,390,000 | |
| | | | | | | | |
| | | | | | | 28,054,705 | |
South Dakota — 0.8% | | | | | | | | |
City of Rapid City Airport Revenue: | | | | | | | | |
5.500%, 12/1/2022, Call 12/1/2019 | | | 225,000 | | | | 235,319 | |
6.750%, 12/1/2031, Call 12/1/2019 | | | 500,000 | | | | 528,200 | |
7.000%, 12/1/2035, Call 12/1/2019 | | | 750,000 | | | | 794,677 | |
South Dakota Health & Educational Facilities Authority: | | | | | | | | |
4.250%, 9/1/2023 | | | 740,000 | | | | 788,566 | |
4.500%, 9/1/2018 | | | 500,000 | | | | 500,000 | |
4.500%, 9/1/2020 | | | 900,000 | | | | 949,437 | |
4.500%, 9/1/2021, Call 9/1/2020 | | | 1,080,000 | | | | 1,134,335 | |
4.500%, 9/1/2022, Call 9/1/2020 | | | 1,005,000 | | | | 1,051,542 | |
5.000%, 9/1/2019 | | | 200,000 | | | | 206,504 | |
5.000%, 11/1/2022 | | | 715,000 | | | | 795,273 | |
5.000%, 8/1/2023 | | | 375,000 | | | | 422,636 | |
5.000%, 11/1/2023 | | | 625,000 | | | | 707,231 | |
5.000%, 8/1/2024 | | | 195,000 | | | | 222,641 | |
5.000%, 11/1/2024 | | | 650,000 | | | | 745,355 | |
5.000%, 11/1/2024, Call 11/1/2019 | | | 1,000,000 | | | | 1,035,120 | |
5.000%, 11/1/2025, Call 11/1/2024 | | | 600,000 | | | | 685,434 | |
5.000%, 9/1/2027, Call 9/1/2024 | | | 720,000 | | | | 800,899 | |
South Dakota Housing Development Authority, 3.550%, 11/1/2033, Call 11/1/2022 | | | 2,250,000 | | | | 2,261,160 | |
| | | | | | | | |
| | | | | | | 13,864,329 | |
Tennessee — 1.3% | | | | | | | | |
Knox County Health Educational & Housing Facility Board, 5.000%, 1/1/2042, Call 1/1/2027 | | | 5,815,000 | | | | 6,312,880 | |
Metropolitan Government Nashville & Davidson County Health & Educational Facility Board: | | | | | | | | |
2.000%, 1/1/2022 (7) | | | 3,000,000 | | | | 2,999,970 | |
5.000%, 11/1/2027, Call 11/1/2021 | | | 500,000 | | | | 540,055 | |
5.000%, 7/1/2031, Call 7/1/2026 | | | 1,000,000 | | | | 1,129,550 | |
Tennessee Energy Acquisition Corp.: | | | | | | | | |
5.000%, 2/1/2023 | | | 5,310,000 | | | | 5,853,426 | |
5.250%, 9/1/2021 | | | 3,810,000 | | | | 4,136,288 | |
5.250%, 9/1/2022 | | | 250,000 | | | | 276,345 | |
Tennessee Housing Development Agency: | | | | | | | | |
4.000%, 7/1/2025, Call 1/1/2021 | | | 890,000 | | | | 914,021 | |
4.125%, 1/1/2025, Call 1/1/2021 | | | 615,000 | | | | 630,111 | |
5.000%, 1/1/2027, Call 7/1/2019 | | | 45,000 | | | | 45,559 | |
| | | | | | | | |
| | | | | | | 22,838,205 | |
Texas — 6.7% | | | | | | | | |
Bexar County Health Facilities Development Corp., 5.000%, 7/15/2033, Call 7/15/2023 | | | 1,000,000 | | | | 1,092,510 | |
| | | | | | | | |
Brazoria-Fort Bend County Municipal Utility District No. 1, MAC, 3.000%, 9/1/2020 | | | 700,000 | | | | 710,017 | |
Capital Area Cultural Education Facilities Finance Corp.: | | | | | | | | |
5.000%, 4/1/2019 | | | 1,000,000 | | | | 1,016,340 | |
5.250%, 4/1/2021, Call 4/1/2020 | | | 400,000 | | | | 418,364 | |
Central Texas Regional Mobility Authority, 0.000%, 1/1/2025 | | | 1,000,000 | | | | 817,130 | |
City of Beaumont Waterworks & Sewer System Revenue, BAM: | | | | | | | | |
5.000%, 9/1/2026, Call 9/1/2025 | | | 1,000,000 | | | | 1,150,400 | |
5.000%, 9/1/2027, Call 9/1/2025 | | | 600,000 | | | | 688,182 | |
5.000%, 9/1/2030, Call 9/1/2025 | | | 1,000,000 | | | | 1,136,730 | |
City of Galveston Wharves & Terminal Revenue, 4.625%, 2/1/2024, Call 2/1/2021 | | | 1,130,000 | | | | 1,182,726 | |
City of Houston, 5.000%, 9/1/2026, Call 9/1/2024 | | | 250,000 | | | | 282,043 | |
City of Houston, AMBAC, 0.000%, 9/1/2019 | | | 400,000 | | | | 392,396 | |
City of Houston Airport System Revenue: | | | | | | | | |
5.000%, 7/1/2030, Call 7/1/2028 | | | 1,375,000 | | | | 1,621,496 | |
5.000%, 7/1/2038, Call 7/1/2028 | | | 5,000,000 | | | | 5,716,950 | |
City of Houston Airport System Revenue, XLCA, 4.152%, 7/1/2032, Call 9/6/2018 (7) (8) | | | 425,000 | | | | 425,000 | |
City of Laredo International Toll Bridge System Revenue, AGM: | | | | | | | | |
5.000%, 10/1/2026, Call 10/1/2024 | | | 225,000 | | | | 255,418 | |
5.000%, 10/1/2027, Call 10/1/2024 | | | 240,000 | | | | 271,006 | |
City of San Marcos Electric Utility System Revenue, BAM: | | | | | | | | |
4.500%, 11/1/2028, Call 11/1/2022 | | | 600,000 | | | | 641,190 | |
5.000%, 11/1/2033, Call 11/1/2022 | | | 1,215,000 | | | | 1,326,112 | |
Clifton Higher Education Finance Corp., PSF: | | | | | | | | |
5.000%, 8/15/2026, Call 8/15/2025 | | | 675,000 | | | | 777,776 | |
5.000%, 8/15/2027, Call 8/15/2025 | | | 545,000 | | | | 625,371 | |
5.000%, 8/15/2028, Call 8/15/2025 | | | 835,000 | | | | 954,155 | |
5.000%, 8/15/2029, Call 8/15/2025 | | | 335,000 | | | | 381,213 | |
5.000%, 8/15/2030, Call 8/15/2025 | | | 1,250,000 | | | | 1,417,375 | |
Corpus Christi Business & Job Development Corp., 5.000%, 9/1/2022 | | | 1,000,000 | | | | 1,104,350 | |
County of Bexar, AGM, 5.000%, 8/15/2031, Call 8/15/2024 | | | 1,280,000 | | | | 1,427,264 | |
County of Wise, 8.000%, 8/15/2034, Call 8/15/2021 | | | 4,000,000 | | | | 4,426,080 | |
Crane County Water District: | | | | | | | | |
5.000%, 2/15/2026, Call 2/15/2025 | | | 915,000 | | | | 1,039,861 | |
5.000%, 2/15/2030, Call 2/15/2025 | | | 1,000,000 | | | | 1,117,010 | |
Cypress-Fairbanks Independent School District, PSF, 5.000%, 2/15/2034, Call 2/15/2021 | | | 675,000 | | | | 721,062 | |
Dallas/Fort Worth International Airport: | | | | | | | | |
5.000%, 11/1/2024, Call 11/1/2022 | | | 1,000,000 | | | | 1,111,430 | |
5.000%, 11/1/2032, Call 11/1/2020 | | | 5,000,000 | | | | 5,302,800 | |
5.000%, 11/1/2033, Call 11/1/2023 | | | 2,000,000 | | | | 2,218,920 | |
5.250%, 11/1/2033, Call 11/1/2023 | | | 1,200,000 | | | | 1,351,848 | |
Georgetown Independent School District, PSF, 5.000%, 8/15/2025, Call 8/15/2020 | | | 645,000 | | | | 684,642 | |
Grand Parkway Transportation Corp.: | | | | | | | | |
0.000%, 10/1/2030, Call 10/1/2028 (13) | | | 1,000,000 | | | | 950,920 | |
5.000%, 10/1/2043, Call 4/1/2028 | | | 5,000,000 | | | | 5,719,150 | |
Gulf Coast Authority, AGM: | | | | | | | | |
5.000%, 10/1/2029, Call 10/1/2022 | | | 1,430,000 | | | | 1,576,904 | |
5.000%, 10/1/2030, Call 10/1/2022 | | | 1,505,000 | | | | 1,658,375 | |
Harris County Cultural Education Facilities Finance Corp.: | | | | | | | | |
2.310%, 6/1/2020 (7) | | | 2,000,000 | | | | 2,016,860 | |
2.390%, 6/1/2021 (7) | | | 2,400,000 | | | | 2,431,464 | |
5.250%, 10/1/2029, Call 10/1/2019 | | | 1,550,000 | | | | 1,598,964 | |
Harris County Flood Control District, 5.000%, 10/1/2030, Call 10/1/2027 | | | 1,900,000 | | | | 2,241,145 | |
Harris County Municipal Utility District No. 165, BAM, 5.000%, 3/1/2025 | | | 400,000 | | | | 458,008 | |
Harris County Municipal Utility District No. 374, AGM, 5.000%, 9/1/2036, Call 9/1/2019 | | | 550,000 | | | | 567,886 | |
Irving Hospital Authority, 5.000%, 10/15/2044, Call 6/30/2026 | | | 1,500,000 | | | | 1,621,755 | |
Katy Independent School District, PSF, 5.000%, 2/15/2043, Call 2/15/2028 | | | 1,500,000 | | | | 1,722,510 | |
Lancaster Independent School District, BAM, 4.000%, 2/15/2029, Call 2/15/2025 | | | 3,000,000 | | | | 3,187,230 | |
Lower Colorado River Authority: | | | | | | | | |
5.000%, 5/15/2026, Call 5/15/2025 | | | 695,000 | | | | 795,476 | |
5.000%, 5/15/2027, Call 5/15/2025 | | | 1,355,000 | | | | 1,544,646 | |
Mesquite Independent School District, PSF, 0.000%, 8/15/2021 | | | 635,000 | | | | 597,814 | |
| | | | | | | | |
Nacogdoches County Hospital District, AGM, 3.000%, 5/15/2019 | | | 510,000 | | | | 511,872 | |
New Hope Cultural Education Facilities Finance Corp.: | | | | | | | | |
5.000%, 11/15/2031, Call 11/15/2024 | | | 850,000 | | | | 900,915 | |
5.000%, 8/15/2036, Call 8/15/2021 (5) | | | 1,700,000 | | | | 1,711,968 | |
5.000%, 8/15/2037, Call 8/15/2021 (5) | | | 1,260,000 | | | | 1,267,837 | |
5.500%, 8/15/2036, Call 8/15/2021 | | | 1,000,000 | | | | 1,020,900 | |
New Hope Cultural Education Facilities Finance Corp., AGM, 4.000%, 4/1/2024 | | | 440,000 | | | | 464,961 | |
North Texas Tollway Authority: | | | | | | | | |
2.360%, 1/1/2050, Call 10/1/2018 (7) | | | 1,750,000 | | | | 1,750,175 | |
5.000%, 1/1/2027, Call 1/1/2025 | | | 2,090,000 | | | | 2,392,423 | |
North Texas Tollway Authority, AGC, 5.750%, 1/1/2038, Call 1/1/2019 | | | 1,725,000 | | | | 1,747,804 | |
Northside Independent School District, PSF, 2.125%, 8/1/2040, Call 2/1/2019 (7) | | | 2,030,000 | | | | 2,032,050 | |
Pleasanton Independent School District, PSF, 5.000%, 8/15/2029, Call 8/15/2024 | | | 1,000,000 | | | | 1,136,690 | |
Rib Floater Trust Various States: | | | | | | | | |
1.740%, 6/1/2032, Call 4/1/2020 (5) (7) | | | 7,000,000 | | | | 7,000,000 | |
1.740%, 11/1/2042, Call 11/1/2020 (5) (7) | | | 3,165,000 | | | | 3,165,000 | |
San Antonio Municipal Facilities Corp., 5.000%, 8/15/2036, Call 8/15/2021 | | | 500,000 | | | | 538,215 | |
Sienna Plantation Levee Improvement District, BAM, 4.000%, 9/1/2020 | | | 400,000 | | | | 416,160 | |
Tarrant County Cultural Education Facilities Finance Corp.: | | | | | | | | |
2.500%, 12/1/2018, Call 9/21/2018 | | | 235,000 | | | | 235,049 | |
5.000%, 10/1/2028, Call 10/1/2023 | | | 2,030,000 | | | | 2,251,920 | |
5.000%, 5/15/2037, Call 5/15/2024 | | | 1,895,000 | | | | 1,983,534 | |
5.000%, 11/15/2037, Call 11/15/2027 | | | 2,175,000 | | | | 2,363,507 | |
5.000%, 11/15/2040, Call 11/15/2026 | | | 3,250,000 | | | | 3,496,155 | |
5.000%, 5/15/2045, Call 5/15/2024 | | | 3,250,000 | | | | 3,386,695 | |
Tender Option Bond Trust Receipts/Certificates, 1.630%, 8/15/2027, Call 8/15/2022 (5) (7) | | | 300,000 | | | | 300,000 | |
Texas Municipal Gas Acquisition & Supply Corp. III, 5.000%, 12/15/2021 | | | 2,000,000 | | | | 2,172,120 | |
Waco Independent School District, PSF: | | | | | | | | |
4.000%, 8/15/2028, Call 8/15/2024 | | | 1,000,000 | | | | 1,074,920 | |
4.000%, 8/15/2029, Call 8/15/2024 | | | 2,380,000 | | | | 2,544,791 | |
| | | | | | | | |
| | | | | | | 118,359,935 | |
U. S. Virgin Islands — 0.2% | | | | | | | | |
Virgin Islands Public Finance Authority: | | | | | | | | |
5.000%, 9/1/2030, Call 9/1/2025 (5) | | | 2,320,000 | | | | 2,457,321 | |
5.000%, 9/1/2033, Call 9/1/2025 (5) | | | 1,000,000 | | | | 1,050,490 | |
| | | | | | | | |
| | | | | | | 3,507,811 | |
Utah — 0.6% | | | | | | | | |
Central Utah Water Conservancy District: | | | | | | | | |
5.000%, 10/1/2026, Call 10/1/2019 | | | 850,000 | | | | 880,311 | |
5.000%, 10/1/2028, Call 10/1/2019 | | | 1,000,000 | | | | 1,035,660 | |
City of Draper, 5.000%, 5/1/2032, Call 5/1/2022 | | | 325,000 | | | | 356,428 | |
City of Riverton: | | | | | | | | |
5.250%, 12/1/2034, Call 6/1/2023 | | | 1,455,000 | | | | 1,632,015 | |
5.250%, 12/1/2036, Call 6/1/2023 | | | 2,150,000 | | | | 2,410,559 | |
Jordan Valley Water Conservancy District, 5.000%, 10/1/2035, Call 4/1/2021 | | | 920,000 | | | | 994,391 | |
Utah Charter School Finance Authority, UT, 5.250%, 10/15/2028, Call 10/15/2023 | | | 480,000 | | | | 532,248 | |
Utah Infrastructure Agency, AGM: | | | | | | | | |
5.400%, 10/15/2036, Call 10/15/2021 | | | 1,000,000 | | | | 1,107,150 | |
5.500%, 10/15/2030, Call 10/15/2021 | | | 1,300,000 | | | | 1,443,208 | |
Utah State Board of Regents, 5.000%, 8/1/2031, Call 8/1/2020 | | | 1,030,000 | | | | 1,092,047 | |
| | | | | | | | |
| | | | | | | 11,484,017 | |
Vermont — 0.1% | | | | | | | | |
Vermont Housing Finance Agency, GNMA/FNMA/FHLMC, 4.000%, 11/1/2043, Call 5/1/2023 | | | 890,000 | | | | 925,128 | |
Vermont Student Assistance Corp.: | | | | | | | | |
5.000%, 6/15/2019 (14) | | | 130,000 | | | | 132,787 | |
5.000%, 6/15/2020 (14) | | | 125,000 | | | | 130,730 | |
| | | | | | | | |
| | | | | | | 1,188,645 | |
Virginia — 0.3% | | | | | | | | |
City of Chesapeake Chesapeake Expressway Toll Road Revenue, 5.000%, 7/15/2022 | | | 500,000 | | | | 547,070 | |
Henrico County Economic Development Authority, AGM, 3.616%, 8/23/2027, Call 9/19/2018 (7) (8) | | | 50,000 | | | | 50,000 | |
Stafford County Economic Development Authority: | | | | | | | | |
| | | | | | | | |
5.000%, 6/15/2028, Call 6/15/2026 | | | 1,000,000 | | | | 1,130,370 | |
5.000%, 6/15/2030, Call 6/15/2026 | | | 700,000 | | | | 785,092 | |
Virginia College Building Authority: | | | | | | | | |
5.000%, 3/1/2023, Call 3/1/2020 | | | 745,000 | | | | 779,978 | |
5.000%, 3/1/2024, Call 3/1/2020 | | | 1,755,000 | | | | 1,837,397 | |
Virginia Small Business Financing Authority, 4.250%, 11/1/2021, Call 5/1/2020 | | | 1,000,000 | | | | 1,040,930 | |
| | | | | | | | |
| | | | | | | 6,170,837 | |
Washington — 1.5% | | | | | | | | |
Chelan County Public Utility District No. 1, NATL-RE, 0.000%, 6/1/2024 | | | 210,000 | | | | 180,348 | |
King County Housing Authority, County Guarantee: | | | | | | | | |
5.200%, 5/1/2028, Call 11/1/2018 | | | 660,000 | | | | 662,798 | |
5.500%, 12/1/2028, Call 12/1/2018 | | | 1,000,000 | | | | 1,009,490 | |
King County Public Hospital District No. 1, 5.000%, 12/1/2031, Call 12/1/2026 | | | 4,000,000 | | | | 4,539,320 | |
King County Public Hospital District No. 2, 5.250%, 12/1/2028, Call 12/1/2020 | | | 200,000 | | | | 213,928 | |
Marysville Local Improvement District, 3.350%, 6/1/2036, Call 6/1/2024 | | | 30,000 | | | | 30,028 | |
Mason & Kitsap Counties School District No. 403 North Mason, School Bond Gty, 5.000%, 12/1/2035, Call 12/1/2023 | | | 2,025,000 | | | | 2,276,302 | |
Port of Bellingham, 5.250%, 12/1/2022, Call 12/1/2020 | | | 1,060,000 | | | | 1,134,062 | |
Spokane County School District No. 81 Spokane, School Bond Gty, 5.000%, 12/1/2030, Call 12/1/2021 | | | 650,000 | | | | 714,279 | |
State of Washington, 4.100%, 7/1/2022, Call 1/1/2019 | | | 440,000 | | | | 443,208 | |
Tender Option Bond Trust Receipts/Certificates: | | | | | | | | |
1.710%, 6/15/2033, Call 6/1/2019 (5) (7) | | | 2,900,000 | | | | 2,900,000 | |
1.710%, 8/15/2042, Call 8/15/2022 (5) (7) | | | 3,375,000 | | | | 3,375,000 | |
Washington Health Care Facilities Authority, 5.000%, 10/1/2030, Call 10/1/2022 | | | 750,000 | | | | 824,288 | |
Washington State Housing Finance Commission: | | | | | | | | |
5.000%, 1/1/2029, Call 1/1/2026 (5) | | | 840,000 | | | | 940,724 | |
5.000%, 1/1/2036, Call 1/1/2025 (5) | | | 2,125,000 | | | | 2,277,150 | |
5.000%, 1/1/2038, Call 1/1/2026 (5) | | | 2,000,000 | | | | 2,195,920 | |
Washington State Housing Finance Commission, GNMA/FNMA/FHLMC, 3.050%, 6/1/2022 | | | 750,000 | | | | 770,025 | |
WBRP 3.2: | | | | | | | | |
5.000%, 1/1/2026, Call 7/1/2025 | | | 750,000 | | | | 870,480 | |
5.000%, 1/1/2031, Call 7/1/2025 | | | 940,000 | | | | 1,071,337 | |
Whidbey Island Public Hospital District: | | | | | | | | |
5.000%, 12/1/2021 | | | 520,000 | | | | 563,732 | |
5.000%, 12/1/2022 | | | 510,000 | | | | 561,821 | |
| | | | | | | | |
| | | | | | | 27,554,240 | |
West Virginia — 0.7% | | | | | | | | |
West Virginia Hospital Finance Authority: | | | | | | | | |
1.840%, 6/1/2033, Call 9/4/2018 (7) | | | 8,000,000 | | | | 8,000,000 | |
5.000%, 1/1/2043, Call 1/1/2029 (9) | | | 1,750,000 | | | | 1,941,747 | |
5.750%, 1/1/2044, Call 1/1/2019 | | | 2,500,000 | | | | 2,533,050 | |
| | | | | | | | |
| | | | | | | 12,474,797 | |
Wisconsin — 3.6% | | | | | | | | |
City of Oak Creek, 3.000%, 6/1/2027, Call 6/1/2025 | | | 100,000 | | | | 101,341 | |
Monroe Redevelopment Authority, 5.500%, 2/15/2029, Call 2/15/2019 | | | 500,000 | | | | 508,660 | |
Public Finance Authority: | | | | | | | | |
3.500%, 11/15/2023, Call 5/15/2019 (5) | | | 750,000 | | | | 753,668 | |
3.950%, 11/15/2024, Call 11/15/2019 (5) | | | 1,000,000 | | | | 1,012,210 | |
4.750%, 12/1/2035, Call 12/1/2020 | | | 2,000,000 | | | | 2,066,660 | |
5.000%, 11/15/2029 | | | 1,900,000 | | | | 2,182,891 | |
5.000%, 11/15/2030 | | | 1,230,000 | | | | 1,418,411 | |
5.000%, 7/1/2037, Call 7/1/2024 | | | 820,000 | | | | 853,997 | |
5.000%, 9/30/2037, Call 9/30/2027 | | | 250,000 | | | | 275,853 | |
5.000%, 7/1/2047, Call 7/1/2024 | | | 1,000,000 | | | | 1,035,140 | |
5.125%, 7/15/2037, Call 7/15/2027 (5) | | | 2,500,000 | | | | 2,559,750 | |
State of Wisconsin: | | | | | | | | |
4.000%, 5/1/2027, Call 5/1/2022 | | | 800,000 | | | | 857,288 | |
5.000%, 3/1/2023, Call 9/1/2021 | | | 2,000,000 | | | | 2,183,580 | |
5.000%, 5/1/2027, Call 5/1/2022 | | | 25,000 | | | | 27,668 | |
5.000%, 5/1/2027, Call 5/1/2022 | | | 1,580,000 | | | | 1,739,785 | |
5.750%, 5/1/2029, Call 5/1/2019 | | | 105,000 | | | | 107,856 | |
5.750%, 5/1/2029, Call 5/1/2019 | | | 1,050,000 | | | | 1,077,373 | |
| | | | | | | | |
6.000%, 5/1/2033, Call 5/1/2019 | | | 135,000 | | | | 138,891 | |
6.000%, 5/1/2033, Call 5/1/2019 | | | 1,280,000 | | | | 1,316,890 | |
6.000%, 5/1/2036, Call 5/1/2019 | | | 1,965,000 | | | | 2,021,631 | |
Tender Option Bond Trust Receipts/Certificates, 1.630%, 11/15/2044 (5) (7) | | | 4,320,000 | | | | 4,320,000 | |
Wisconsin Center District: | | | | | | | | |
0.000%, 12/15/2033, Call 6/15/2026 | | | 2,200,000 | | | | 1,217,568 | |
0.000%, 12/15/2034, Call 6/15/2026 | | | 6,665,000 | | | | 3,514,788 | |
Wisconsin Center District, AGM: | | | | | | | | |
5.250%, 12/15/2023 | | | 520,000 | | | | 574,569 | |
5.250%, 12/15/2027 | | | 1,930,000 | | | | 2,216,817 | |
Wisconsin Health & Educational Facilities Authority: | | | | | | | | |
4.000%, 2/15/2042, Call 2/15/2027 | | | 1,000,000 | | | | 1,001,400 | |
4.750%, 10/15/2029, Call 10/15/2021 | | | 605,000 | | | | 641,385 | |
5.000%, 6/1/2019 | | | 105,000 | | | | 107,381 | |
5.000%, 7/1/2019 | | | 340,000 | | | | 349,115 | |
5.000%, 7/1/2019 | | | 650,000 | | | | 667,427 | |
5.000%, 8/15/2019 | | | 250,000 | | | | 257,765 | |
5.000%, 8/15/2019 | | | 955,000 | | | | 983,755 | |
5.000%, 8/15/2020 | | | 1,060,000 | | | | 1,123,049 | |
5.000%, 3/1/2021 | | | 240,000 | | | | 249,847 | |
5.000%, 8/15/2021 | | | 1,160,000 | | | | 1,259,714 | |
5.000%, 3/1/2022 | | | 205,000 | | | | 215,705 | |
5.000%, 10/1/2022 | | | 750,000 | | | | 832,282 | |
5.000%, 12/15/2022 | | | 500,000 | | | | 553,610 | |
5.000%, 12/15/2023 | | | 500,000 | | | | 562,480 | |
5.000%, 12/15/2024 | | | 500,000 | | | | 569,075 | |
5.000%, 3/1/2025, Call 3/1/2024 | | | 315,000 | | | | 335,173 | |
5.000%, 6/1/2026, Call 6/1/2020 | | | 135,000 | | | | 142,407 | |
5.000%, 8/15/2027, Call 8/15/2022 | | | 500,000 | | | | 554,610 | |
5.000%, 12/15/2028, Call 12/15/2024 | | | 100,000 | | | | 111,605 | |
5.000%, 8/15/2029, Call 8/15/2022 | | | 1,700,000 | | | | 1,882,274 | |
5.000%, 4/1/2032, Call 10/1/2022 | | | 4,560,000 | | | | 4,948,968 | |
5.000%, 6/1/2032, Call 6/1/2022 | | | 1,000,000 | | | | 1,069,830 | |
5.000%, 8/15/2032, Call 8/15/2022 | | | 5,000,000 | | | | 5,536,100 | |
5.125%, 4/15/2031, Call 4/15/2023 | | | 250,000 | | | | 283,655 | |
5.250%, 6/1/2034, Call 6/1/2020 | | | 300,000 | | | | 316,941 | |
5.375%, 8/15/2024, Call 2/15/2020 | | | 1,625,000 | | | | 1,711,027 | |
Wisconsin Health & Educational Facilities Authority, AGM, 5.000%, 7/15/2027, Call 7/15/2021 | | | 3,655,000 | | | | 3,973,241 | |
| | | | | | | | |
| | | | | | | 64,323,106 | |
Wyoming — 0.1% | | | | | | | | |
County of Laramie, 5.000%, 5/1/2027, Call 5/1/2021 | | | 1,000,000 | | | | 1,074,500 | |
| | | | | | | | |
Total Municipals
(identified cost $1,722,346,529) | | | | | | | 1,758,008,770 | |
| | | | | | | | |
Mutual Funds — 0.9% | | | | | | | | |
BlackRock Long-Term Municipal Advantage Trust | | | 121,500 | | | | 1,402,110 | |
BlackRock Muni Intermediate Duration Fund, Inc. | | | 110,000 | | | | 1,450,900 | |
BlackRock Municipal Bond Trust | | | 93,400 | | | | 1,340,290 | |
BlackRock Municipal Income Quality Trust | | | 107,800 | | | | 1,411,102 | |
BlackRock Municipal Income Trust | | | 107,000 | | | | 1,392,070 | |
BlackRock MuniHoldings Quality Fund, Inc. | | | 93,400 | | | | 1,116,130 | |
BlackRock MuniYield Quality Fund, Inc. | | | 105,000 | | | | 1,439,550 | |
BMO Ultra Short Tax-Free Fund - Institutional Class (4) | | | 513,162 | | | | 5,162,410 | |
Eaton Vance Municipal Income 2028 Term Trust | | | 42,000 | | | | 811,440 | |
| | | | | | | | |
Total Mutual Funds
(identified cost $15,779,501) | | | | | | | 15,526,002 | |
| | | | | | | | |
| | |
Short-Term Investments — 0.0% | | | | | | | | |
| | |
Mutual Funds — 0.0% | | | | | | | | |
BMO Government Money Market Fund — Premier Class, 1.773% (4) | | | 85,922 | | | | 85,922 | |
| | | | | | | | |
Total Short-Term Investments
(identified cost $85,922) | | | | | | | 85,922 | |
| | | | | | | | |
| | | | | | | | |
Total Investments — 99.7%
(identified cost $1,738,211,952) | | | | | | | 1,773,620,694 | |
| | |
Other Assets and Liabilities — 0.3% | | | | | | | 5,738,089 | |
| | | | | | | | |
| | |
Total Net Assets — 100.0% | | | | | | $ | 1,779,358,783 | |
| | | | | | | | |
| (4) | Denotes an investment in an affiliated entity. Please refer to Note 6, subsectionInvestments in Affiliated Issuers, in the Notes to Financial Statements. |
| (5) | Denotes a restricted security which is subject to restrictions on resale under federal securities laws. These securities have been deemed liquid based on criteria approved by the Board of Directors of the BMO Funds. At August 31, 2018 these securities amounted to: |
| | | | | | | | |
| Fund | | Amount | | | % of Total Net Assets | |
Intermediate Tax-Free Fund | | | $ 169,630,650 | | | | 9.53% | |
| (7) | Denotes a variable rate security. The rate shown is the current interest rate as of August 31, 2018. Rate fluctuations are based underlying positions and/or other variables. For securities whose yields vary with a designated market index or market rate, the reference rate and spread are indicated in the description. |
| (8) | Issue represents an Auction Rate Security. An Auction Rate Security is a corporate or municipal bond debt instrument with a long nominal maturity for which the interest rate is regularly reset through a Dutch auction. The rate presented is either the rate set through the auction or the maximum interest rate provided for in the security issuance provision. |
| (9) | Purchased on a when-issued or delayed delivery basis. |
| (13) | Issue represents a convertible capital appreciation bond. These securities are tax-exempt bonds that originate as capital appreciation bonds with zero coupon features at time of issuance and convert to an interest paying bond at a pre-specified rate determined at time of issuance. |
| (14) | Securities that are subject to alternative minimum tax of the Intermediate Tax-Free Fund portfolio represents 1.45%, as calculated based upon total portfolio market value. |
Report of Independent Registered Public Accounting Firm
To the Board of Directors and Shareholders of BMO Funds, Inc.:
Opinion on the Financial Statements
We have audited the accompanying statements of assets and liabilities of BMO Ultra ShortTax-Free Fund, BMO ShortTax-Free Fund, and BMO IntermediateTax-Free Fund (each a series of BMO Funds, Inc., collectively referred to as the Funds), including the summary schedules of investments as of August 31, 2018, and the related statements of operations for the year then ended, the statements of changes in net assets for each of the years in thetwo-year period then ended, and the related notes to financial statements (collectively, the financial statements), and the financial highlights for each of the years or periods in thefive-year period then ended (the financial statements and financial highlights are included in Item 1 of thisForm N-CSR), and the schedules of investments as of August 31, 2018 (included in Item 6 of thisForm N-CSR). In our opinion, the financial statements and financial highlights present fairly, in all material respects, the financial position of the Funds as of August 31, 2018, the results of their operations for the year then ended, the changes in their net assets for each of the years in the two-year period then ended, and the financial highlights for each of the years or periods in the five-year period then ended, in conformity with U.S. generally accepted accounting principles.
Basis for Opinion
These financial statements and financial highlights are the responsibility of the Funds’ management. Our responsibility is to express an opinion on these financial statements and financial highlights based on our audits. We are a public accounting firm registered with the Public Company Accounting Oversight Board (United States) (PCAOB) and are required to be independent with respect to the Funds in accordance with the U.S. federal securities laws and the applicable rules and regulations of the Securities and Exchange Commission and the PCAOB.
We conducted our audits in accordance with the standards of the PCAOB. Those standards require that we plan and perform the audit to obtain reasonable assurance about whether the financial statements and financial highlights are free of material misstatement, whether due to error or fraud. Our audits included performing procedures to assess the risks of material misstatement of the financial statements and financial highlights, whether due to error or fraud, and performing procedures that respond to those risks. Such procedures included examining, on a test basis, evidence regarding the amounts and disclosures in the financial statements and financial highlights. Such procedures also included confirmation of securities owned as of August 31, 2018 by correspondence with custodians and brokers or by other appropriate auditing procedures. Our audits also included evaluating the accounting principles used and significant estimates made by management as well as evaluating the overall presentation of the financial statements and financial highlights. We believe that our audits provide a reasonable basis for our opinion.
/s/KPMG LLP
We have served as the auditor of one or more BMO Funds, Inc. investment companies since 2011.
Columbus, Ohio
October 26, 2018
Item 7. Disclosure of Proxy Voting Policies and Procedures forClosed-End Management Investment Companies.
Not applicable toopen-end management investment companies.
Item 8. Portfolio Managers ofClosed-End Management Investment Companies.
Not applicable toopen-end management investment companies.
Item 9. Purchases of Equity Securities byClosed-End Management Investment Company and Affiliated Purchasers.
Not applicable toopen-end management investment companies.
Item 10. Submission of Matters to a Vote of Security Holders.
Not applicable.
Item 11. Controls and Procedures.
| (a) | The Registrant’s principal executive officer and principal financial officer have reviewed the Registrant’s disclosure controls and procedures (as defined in Rule30a-3(c) under the Investment Company Act of 1940, as amended, (the “Act”)) as of a date within 90 days of the filing of this report, as required by Rule30a-3(b) under the Act. Based on their review, such officers have concluded that the disclosure controls and procedures were effective in ensuring that information required to be disclosed in this report was appropriately recorded, processed, summarized and reported and made known to them by others within the Registrant and by the Registrant’s service providers. |
| (b) | There were no changes in the Registrant’s internal control over financial reporting (as defined in Rule30a-3(d) under the Act (17 CFR270.30a-3(d)) that occurred during the Registrant’s second fiscal quarter of the period covered by this report that materially affected, or were reasonably likely to materially affect, the Registrant’s internal control over financial reporting. |
Item 12. Disclosure of Securities Lending Activities forClosed-End Management Investment Companies
Not applicable toopen-end management investment companies.
Item 13. Exhibits.
(a) (1) Code of Ethics. Filed herewith.
(a) (2) Certifications required pursuant to Section 302 of the Sarbanes-Oxley Act of 2002. Filed herewith.
(a) (3) Not applicable.
(a)(4) Not applicable.
| (b) | Certification pursuant to Section 906 of the Sarbanes-Oxley Act of 2002. Filed herewith. |
SIGNATURES
Pursuant to the requirements of the Securities Exchange Act of 1934 and the Investment Company Act of 1940, the Registrant has duly caused this report to be signed on its behalf by the undersigned, thereunto duly authorized.
|
| BMO Funds, Inc. |
|
| By: /s/ John M. Blaser |
| John M. Blaser |
| President |
March 27, 2019
Pursuant to the requirements of the Securities Exchange Act of 1934 and the Investment Company Act of 1940, this report has been signed below by the following persons on behalf of the Registrant and in the capacities and on the dates indicated.
|
| By: /s/ John M. Blaser |
| John M. Blaser |
| President |
| (Principal Executive Officer) |
March 27, 2019
|
| By: /s/ Timothy M. Bonin |
| Timothy M. Bonin |
| Treasurer |
| (Principal Financial Officer) |
March 27, 2019