UNITED STATES
SECURITIES AND EXCHANGE COMMISSION
Washington, D.C. 20549
FORM N-CSR
CERTIFIED SHAREHOLDER REPORT OF REGISTERED MANAGEMENT
INVESTMENT COMPANIES
Investment Company Act File Number 811-58433
BMO Funds, Inc.
(Exact name of registrant as specified in charter)
790 N. Water Street
Milwaukee, WI 53202
(Address of principal executive offices) (Zip code)
John M. Blaser
BMO Asset Management Corp.
790 N. Water Street
Milwaukee, WI 53202
(Name and address of agent for service)
Copies to:
Michael P. O’Hare, Esq.
Stradley, Ronon, Stevens & Young, LLP
2005 Market Street, Suite 2600
Philadelphia, PA 19103
Registrant’s telephone number, including area code: (800) 236-3863
Date of fiscal year end: August 31
Date of reporting period: August 31, 2020
Item 1. Reports to Stockholders.
The following is a copy of the report transmitted to shareholders pursuant to Rule 30e-1 under the Investment Company Act of 1940, as amended (the “Act”).
Annual report
Equity Funds
International & Global Funds
Fixed Income Funds
Money Market Funds
Notification of electronic delivery of shareholder materials
Beginning on January 1, 2021, as permitted by regulations adopted by the Securities and Exchange Commission, paper copies of the Funds’ shareholder reports will no longer be sent by mail, unless you specifically request paper copies of the reports from the Funds or from your broker/dealer, investment professional, or financial institution. Instead, the reports will be made available online at bmofunds.com/documents, and you will be notified by mail each time a report is posted and provided with a website link to access the report.
If you already elected to receive shareholder reports electronically, you will not be affected by this change and you need not take any action. You may elect to receive shareholder reports and other communications from the Funds electronically by calling 1-800-236-FUND (3863), by sending an email request to bmofundsus.services@bmo.com, or by asking your broker/dealer, investment professional, or financial institution.
You may elect to receive all future reports in paper free of charge. If you invest through a financial intermediary, you can contact your financial intermediary to request that you continue to receive paper copies of your shareholder reports. If you invest directly with the Funds, you can call the Funds toll-free at 1-800-236-FUND (3863) or send an email request to bmofundsus.services@bmo.com. Your election to receive reports in paper will apply to all funds held in your account if you invest through your financial intermediary or all funds held with the fund complex if you invest directly with the Funds.

Table of Contents
| | | | |
Not FDIC Insured | | No Bank Guarantee | | May Lose Value |
| | |
| | |
| Annual Report | | BMO Low Volatility Equity Fund |
| | | | | | | | | | | | |
Average annual total returns (%) | |
| | | 1-Year | | | 5-Years | | | Since
Inception | |
| Advisor Class (A) NAV | | | (1.25 | ) | | | 8.57 | | | | 8.34 | |
| Advisor Class (A) OFFER | | | (6.18 | ) | | | 7.47 | | | | 7.46 | |
| Institutional Class (I) | | | (1.06 | ) | | | 8.85 | | | | 10.43 | |
| Russell 1000® Index | | | 22.50 | | | | 14.31 | | | | 14.26 | |
| Lipper Multi-Cap Value Funds Index | | | (0.97 | ) | | | 5.12 | | | | 9.44 | |
| * | Benchmarks since inception reflect the inception date of the Institutional Class. |
The performance data quoted represents past performance which is no guarantee of future results. Investment return and principal value will fluctuate so that an investor’s shares, when redeemed, may be worth more or less than their original costs. Mutual fund performance changes over time and current performance may be lower or higher than what is stated. To receive current performance to the most recent month-end, please call 1-800-236-3863 or visit www.bmofunds.com.
Commentary
The BMO Low Volatility Equity Fund (the Fund) returned -1.06% for the fiscal year ended August 31, 2020 versus the Russell 1000® Index and the Lipper Multi-Cap Value Funds Index, which returned 22.50% and -0.97%, respectively.
Global equities experienced a year unlike any other as COVID-19 exploded into a worldwide pandemic during the first quarter of 2020, leading to an unprecedented economic shutdown as governments and businesses took dramatic steps to contain the virus. Investors responded to sudden expectations of a global recession, straining the liquidity of financial markets while sending equities into a steep decline in the first quarter. As financial conditions worsened in March, forced liquidations and hedge-fund deleveraging exaggerated the market selloff, driving volatility to record highs. Global stocks rebounded strongly, however, in the months following the March lows as countries began to reopen their economies and policymakers announced unprecedented fiscal and monetary support. Investors returned to risk assets relatively quickly and helped global equities finish the trailing 12-month period with double-digit returns.
Despite the U.S. taking over the global lead in COVID-19 cases during the summer of 2020, U.S. equities rallied dramatically following March lows. As they had prior to the virus, large technology firms helped drive U.S. markets higher, signaling the continuation of concentrated leadership in U.S equities. While U.S. equities delivered strong 12-month returns across asset classes, value remained a weak spot in terms of style, continuing a long stretch in which growth stocks have consistently outperformed value names.
The Fund underperformed the Russell 1000® Index in the fiscal period; both sector allocation and stock selection were negative for the period. The Fund’s underweight positions in Energy and Industrials added to performance, while an underweight position in Information Technology and an overweight position in Utilities detracted from performance. Stock selection was strongest in Materials and Energy and weakest in Consumer Discretionary and Health Care. Newmont Corp. (NEM) (71% return, 3% of the Fund) and Kroger Co. (54% return, 2% of the Fund) added to the portfolio’s performance, while US Foods Holding Corp. (USFD) (-56% return, <1% of the Fund) and Public Storage (PSA) (-17% return, 2% of the Fund) detracted from returns.
As we look ahead, the potential for heightened market volatility remains as investors continue to grapple with the lasting economic effects of COVID-19 in addition to the impact of the upcoming election cycle. Repositioning has focused on upgrading quality and reducing exposure to companies with balance sheet risk, without sacrificing valuation exposure. Furthermore, valuation spreads remain near historical levels, suggesting an opportunity for long-term alpha generation by emphasizing company valuations as a part of our mufti-faceted process. At the same time, we continue to emphasize risk management during periods of heightened market volatility.
Fund Managers; Investment Experience
David A. Corris, CFA; since 1999
Jason C. Hans, CFA; since 1999
Jay Kaufman, CFA; since 2006
Ernesto Ramos, Ph.D.; since 1988
| | | | | | | | | | | | | | | | | | | | |
| | | | | | | | | Inception
date | | | Expenses (%) | |
| Share class | | Ticker | | | CUSIP | | | Gross | | | Net | |
| Advisor (A) | | | BAEGX | | | | 09658W105 | | | | 5/27/2014 | | | | 0.93 | | | | 0.90 | |
| Institutional (I) | | | MLVEX | | | | 09658L208 | | | | 9/28/2012 | | | | 0.68 | | | | 0.65 | |
The above expense ratios are from the Funds’ Prospectus dated December 27, 2019, and are inclusive of Acquired Fund Fees and Expenses. See Note 6 in the Notes to Financial Statements for additional information. Net expense ratios reflect contractual fee waivers and/or expense reimbursements if applicable, made by BMO Asset Management Corp., the investment adviser (Adviser). The Adviser may not terminate these fee waivers and/or expense reimbursements prior to December 31, 2021 without the consent of the Board of Directors, unless the investment advisory agreement is terminated. Without these contractual waivers, the Fund’s returns would have been lower.
| | | | |
Portfolio sector allocation | |
| Sector | | Fund (%) | |
| Communication Services | | | 6.5 | |
| Consumer Discretionary | | | 9.6 | |
| Consumer Staples | | | 21.8 | |
| Energy | | | 1.7 | |
| Financials | | | 7.6 | |
| Healthcare | | | 16.7 | |
| Industrials | | | 7.0 | |
| Information Technology | | | 6.1 | |
| Materials | | | 2.9 | |
| Real Estate | | | 5.7 | |
| Utilities | | | 12.5 | |
| Other Assets & Liabilities, Net | | | 1.9 | |
| Total | | | 100.0 | |
Portfolio composition will change due to the ongoing management of the Fund. The percentages are based on net assets as of August 31, 2020 and may not necessarily reflect adjustments that are routinely made when presenting net assets for formal financial statement processes.
Growth of an assumed $10,000 investment
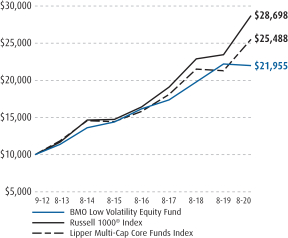
See Explanation of the Indices and Notes in the Commentary for additional information. The above graph relates to the Institutional Class shares of the Fund. Performance for the Advisor Class shares will vary from the performance of the Institutional Class shares shown above due to differences in charges and expenses. This graph illustrates the hypothetical investment of $10,000 in the Institutional Class shares of the Fund from the lesser of the Fund’s inception date or August 31, 2010 to August 31, 2020.
2
| | |
| | |
| Annual Report | | BMO Dividend Income Fund |
| | | | | | | | | | | | |
Average annual total returns (%) | |
| | | 1-Year | | | 5-Years | | | Since
Inception | |
| Advisor Class (A) NAV | | | (0.01 | ) | | | 8.60 | | | | 7.15 | |
| Advisor Class (A) OFFER | | | (5.02 | ) | | | 7.50 | | | | 6.28 | |
| Institutional Class (I) | | | 0.28 | | | | 8.87 | | | | 10.30 | |
| Russell 1000® Value Index | | | 0.84 | | | | 7.53 | | | | 10.50 | |
| Standard & Poor’s 500® Index | | | 21.94 | | | | 14.46 | | | | 14.85 | |
| Lipper Equity Income Funds Index | | | 4.12 | | | | 8.87 | | | | 10.31 | |
| * | Benchmarks since inception reflect the inception date of the Institutional Class. |
The performance data quoted represents past performance which is no guarantee of future results. Investment return and principal value will fluctuate so that an investor’s shares, when redeemed, may be worth more or less than their original costs. Mutual fund performance changes over time and current performance may be lower or higher than what is stated. To receive current performance to the most recent month-end, please call 1-800-236-3863 or visit www.bmofunds.com.
Commentary
The BMO Dividend Income Fund (the Fund) returned 0.28% for the fiscal year ended August 31, 2020 versus the Russell 1000® Value Index, the Standard & Poor’s 500® Index and the Lipper Equity Income Funds Index, which returned 0.84%, 21.94% and 4.12%, respectively.
Global equities experienced a year unlike any other as COVID-19 exploded into a worldwide pandemic during the first quarter of 2020, leading to an unprecedented economic shutdown as governments and businesses took dramatic steps to contain the virus. Investors responded to sudden expectations of a global recession, straining the liquidity of financial markets while sending equities into a steep decline in the first quarter. As financial conditions worsened in March, forced liquidations and hedge-fund deleveraging exaggerated the market selloff, driving volatility to record highs. Global stocks rebounded strongly, however, in the months following the March lows as countries began to reopen their economies and policymakers announced unprecedented fiscal and monetary support. Investors returned to risk assets relatively quickly and helped global equities finish the trailing 12-month period with double-digit returns.
The Fund’s performance was aided by our sector allocation as we were overweight sectors like Information Technology and Consumer Discretionary, while we were underweight Financials. Investors focused on sectors that would be less negatively impacted, or thrive, in an environment impacted by social distancing measures. Work from home mandates led to corporations and consumers investing in technology and spending on home improvement. Meanwhile, the low interest rate environment along with concerns about future credit risk hampered bank performance.
The Fund exposure to higher yielding consumer focused companies detracted from performance. Stock selection was weak within the Industrial and Consumer Staples sectors. Boeing ( -73% return, <1% of the Fund) continued to struggle with the launch of its next generation plane and the global travel shutdown. The position was sold as the company eliminated its dividend. The limitation placed on dining out negatively impacted protein company Tyson Foods (-25% return, 1% of the Fund) and food distributor Sysco (-17% return, 1% of the Fund).
As we look ahead, the potential for heightened market volatility remains as investors grapple with the lasting economic effects of COVID-19 and the upcoming election cycle. Repositioning has focused on upgrading quality and reducing exposure to companies with balance sheet risk, without sacrificing valuation exposure. Furthermore, valuation spreads remain near historical levels, suggesting an opportunity for long-term alpha generation by emphasizing company valuations as a part of our mufti-faceted process. At the same time, we continue to emphasize risk management during periods of heightened market volatility.
Fund Managers; Investment Experience
Kenneth M. Conrad, Ph.D., CFA; since 2000
Casey J. Sambs, CFA; since 2004
| | | | | | | | | | | | | | | | | | | | |
| | | | | | | | | Inception
date | | | Expenses (%) | |
| Share class | | Ticker | | | CUSIP | | | Gross | | | Net | |
| Advisor (A) | | | BADIX | | | | 09658W204 | | | | 5/27/2014 | | | | 1.03 | | | | 0.90 | |
| Institutional (I) | | | MDIVX | | | | 09658L604 | | | | 12/29/2011 | | | | 0.78 | | | | 0.65 | |
The above expense ratios are from the Funds’ Prospectus dated December 27, 2019, and are inclusive of Acquired Fund Fees and Expenses. See Note 6 in the Notes to Financial Statements for additional information. Net expense ratios reflect contractual fee waivers and/or expense reimbursements if applicable, made by BMO Asset Management Corp., the investment adviser (Adviser). The Adviser may not terminate these fee waivers and/or expense reimbursements prior to December 31, 2021 without the consent of the Board of Directors, unless the investment advisory agreement is terminated. Without these contractual waivers, the Fund’s returns would have been lower.
| | | | |
Portfolio sector allocation | |
| Sector | | Fund (%) | |
| Communication Services | | | 6.8 | |
| Consumer Discretionary | | | 8.0 | |
| Consumer Staples | | | 8.0 | |
| Energy | | | 2.9 | |
| Financials | | | 12.1 | |
| Healthcare | | | 15.0 | |
| Industrials | | | 9.7 | |
| Information Technology | | | 22.4 | |
| Materials | | | 3.4 | |
| Real Estate | | | 4.2 | |
| Utilities | | | 5.2 | |
| Other Assets & Liabilities, Net | | | 2.3 | |
| Total | | | 100.0 | |
Portfolio composition will change due to the ongoing management of the Fund. The percentages are based on net assets as of August 31, 2020 and may not necessarily reflect adjustments that are routinely made when presenting net assets for formal financial statement processes.
Growth of an assumed $10,000 investment
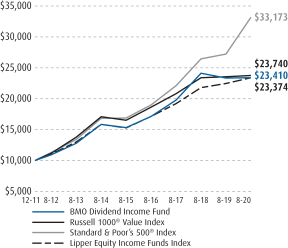
See Explanation of the Indices and Notes in the Commentary for additional information. The above graph relates to the Institutional Class shares of the Fund. Performance for the Advisor Class shares will vary from the performance of the Institutional Class shares shown above due to differences in charges and expenses. This graph illustrates the hypothetical investment of $10,000 in the Institutional Class shares of the Fund from the lesser of the Fund’s inception date or August 31, 2010 to August 31, 2020.
3
| | |
| | |
| Annual Report | | BMO Large-Cap Value Fund |
| | | | | | | | | | | | | | | | |
Average annual total returns (%) | |
| | | 1-Year | | | 5-Years | | | 10-Years | | | Since
Inception | |
| Advisor Class (A) NAV | | | 0.43 | | | | 5.35 | | | | — | | | | 5.00 | |
| Advisor Class (A) OFFER | | | (4.57 | ) | | | 4.28 | | | | | | | | 4.14 | |
| Institutional Class (I) | | | 0.70 | | | | 5.61 | | | | 10.41 | | | | 5.68 | |
| Retirement Class (R-6) | | | 0.82 | | | | — | | | | — | | | | 5.75 | |
| Russell 1000® Value Index | | | 0.84 | | | | 7.53 | | | | 11.05 | | | | 11.05 | |
| Lipper Multi-Cap Value Funds Index | | | (0.97 | ) | | | 5.12 | | | | 9.44 | | | | 9.44 | |
| * | Benchmarks since inception reflect the inception date of the Institutional Class. |
The performance data quoted represents past performance which is no guarantee of future results. Investment return and principal value will fluctuate so that an investor’s shares, when redeemed, may be worth more or less than their original costs. Mutual fund performance changes over time and current performance may be lower or higher than what is stated. To receive current performance to the most recent month-end, please call 1-800-236-3863 or visit www.bmofunds.com.
Commentary
The BMO Large-Cap Value Fund (the Fund) returned 0.70% for the fiscal year ended August 31, 2020 versus the Russell 1000® Value Index and the Lipper Multi-Cap Value Funds Index, which returned 0.84% and -0.97%, respectively.
Global equities experienced a year unlike any other as COVID-19 exploded into a worldwide pandemic during the first quarter of 2020, leading to an unprecedented economic shutdown as governments and businesses took dramatic steps to contain the virus. Investors responded to sudden expectations of a global recession, straining the liquidity of financial markets while sending equities into a steep decline in the first quarter. As financial conditions worsened in March, forced liquidations and hedge-fund deleveraging exaggerated the market selloff, driving volatility to record highs. Global stocks rebounded strongly, however, in the months following the March lows as countries began to reopen their economies and policymakers announced unprecedented fiscal and monetary support. Investors returned to risk assets relatively quickly and helped global equities finish the trailing 12-month period with double-digit returns.
Despite the U.S. taking over the global lead in COVID-19 cases during the summer of 2020, U.S. equities also rallied dramatically following March lows. As they had prior to the virus, large technology firms helped drive U.S. markets higher, signaling the continuation of concentrated leadership in U.S equities. While U.S. equities delivered strong 12-month returns across asset classes, value remained a weak spot in terms of style, continuing a long stretch in which growth stocks have consistently outperformed value names.
The Fund underperformed the Russell 1000® Value Index in the fiscal period: sector allocation was positive for the period, while stock selection was negative. The Fund’s overweight positions in Information Technology and Health Care added to performance, while an underweight position in Materials and an overweight position in Financials detracted from performance. Stock selection was strongest in Energy and Information Technology and weakest in Consumer Staples and Communication Services. Microsoft Corp. (MSFT) (66% return, 2% of the Fund) and Morgan Stanley (MS) (30% return, 3% of the Fund) added to the portfolio’s performance, while United Airlines Holdings Inc. (UAL) (-69% return, <1% of the Fund) and US Foods Holding Corp. (USFD) (-51% return, <1% of the Fund) detracted from returns.
As we look ahead, the potential for heightened market volatility remains as investors continue to grapple with the lasting economic effects of COVID-19 in addition to the impact of the upcoming election cycle. Repositioning has focused on upgrading quality and reducing exposure to companies with balance sheet risk, without sacrificing valuation exposure. Furthermore, valuation spreads remain near historical levels, suggesting an opportunity for long-term alpha generation by emphasizing company valuations as a part of our mufti-faceted process. At the same time, we continue to emphasize risk management during periods of heightened market volatility.
Fund Managers; Investment Experience
David A. Corris, CFA; since 1999
Jason C. Hans, CFA; since 1999
Ernesto Ramos, Ph.D.; since 1988
| | | | | | | | | | | | | | | | | | | | |
| | | | | | | | | Inception
date | | | Expenses (%) | |
| Share class | | Ticker | | | CUSIP | | | Gross | | | Net | |
| Advisor (A) | | | BALVX | | | | 09658W303 | | | | 5/27/2014 | | | | 0.85 | | | | 0.79 | |
| Institutional (I) | | | MLVIX | | | | 09658L844 | | | | 1/31/2008 | | | | 0.60 | | | | 0.54 | |
| Retirement (R-6) | | | BLCRX | | | | 09658W568 | | | | 12/28/2015 | | | | 0.45 | | | | 0.39 | |
The above expense ratios are from the Funds’ Prospectus dated December 27, 2019, and are inclusive of Acquired Fund Fees and Expenses. See Note 6 in the Notes to Financial Statements for additional information. Net expense ratios reflect contractual fee waivers and/or expense reimbursements if applicable, made by BMO Asset Management Corp., the investment adviser (Adviser). The Adviser may not terminate these fee waivers and/or expense reimbursements prior to December 31, 2021 without the consent of the Board of Directors, unless the investment advisory agreement is terminated. Without these contractual waivers, the Fund’s returns would have been lower.
| | | | |
Portfolio sector allocation | |
| Sector | | Fund (%) | |
| Communication Services | | | 7.1 | |
| Consumer Discretionary | | | 7.2 | |
| Consumer Staples | | | 11.5 | |
| Energy | | | 3.0 | |
| Financials | | | 20.2 | |
| Healthcare | | | 16.6 | |
| Industrials | | | 12.3 | |
| Information Technology | | | 10.2 | |
| Materials | | | 1.2 | |
| Real Estate | | | 3.7 | |
| Utilities | | | 5.5 | |
| Other Assets & Liabilities, Net | | | 1.5 | |
| Total | | | 100.0 | |
Portfolio composition will change due to the ongoing management of the Fund. The percentages are based on net assets as of August 31, 2020 and may not necessarily reflect adjustments that are routinely made when presenting net assets for formal financial statement processes.
Growth of an assumed $10,000 investment
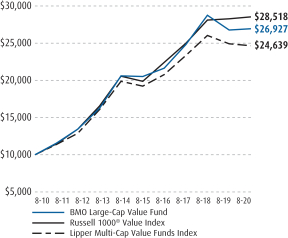
See Explanation of the Indices and Notes in the Commentary for additional information. The above graph relates to the Institutional Class shares of the Fund. Performance for the Advisor Class and Retirement R-6 shares will vary from the performance of the Institutional Class shares shown above due to differences in charges and expenses. This graph illustrates the hypothetical investment of $10,000 in the Institutional Class shares of the Fund from the lesser of the Fund’s inception date or August 31, 2010 to August 31, 2020.
4
| | |
| | |
| Annual Report | | BMO Large-Cap Growth Fund |
| | | | | | | | | | | | | | | | |
Average annual total returns (%) | |
| | | 1-Year | | | 5-Years | | | 10-Years | | | Since
Inception | |
| Investor Class (Y) | | | 29.88 | | | | 16.83 | | | | 17.31 | | | | 8.83 | |
| Advisor Class (A) NAV | | | 29.85 | | | | 16.84 | | | | — | | | | 15.41 | |
| Advisor Class (A) OFFER | | | 23.39 | | | | 15.64 | | | | — | | | | 14.47 | |
| Institutional Class (I) | | | 30.19 | | | | 17.13 | | | | 17.60 | | | | 12.13 | |
| Retirement Class (R-6) | | | 30.40 | | | | — | | | | — | | | | 17.43 | |
| Russell 1000® Growth Index | | | 44.34 | | | | 20.66 | | | | 19.02 | | | | 19.02 | |
| Lipper Multi-Cap Growth Funds Index | | | 39.20 | | | | 17.32 | | | | 16.93 | | | | 16.93 | |
| * | Benchmarks since inception reflect the inception date of the Institutional Class. |
The performance data quoted represents past performance which is no guarantee of future results. Investment return and principal value will fluctuate so that an investor’s shares, when redeemed, may be worth more or less than their original costs. Mutual fund performance changes over time and current performance may be lower or higher than what is stated. To receive current performance to the most recent month-end, please call 1-800-236-3863 or visit www.bmofunds.com.
Commentary
The BMO Large-Cap Growth Fund (the Fund) returned 30.19% for the fiscal year ended August 31, 2020 versus the Russell 1000® Growth Index and the Lipper Multi-Cap Growth Funds Index, which returned 44.34% and 39.20%, respectively.
Global equities experienced a year unlike any other as COVID-19 exploded into a worldwide pandemic during the first quarter of 2020, leading to an unprecedented economic shutdown as governments and businesses took dramatic steps to contain the virus. Investors responded to sudden expectations of a global recession, straining the liquidity of financial markets while sending equities into a steep decline in the first quarter. As financial conditions worsened in March, forced liquidations and hedge-fund deleveraging exaggerated the market selloff, driving volatility to record highs. Global stocks rebounded strongly, however, in the months following the March lows as countries began to reopen their economies and policymakers announced unprecedented fiscal and monetary support. Investors returned to risk assets relatively quickly and helped global equities finish the trailing 12-month period with double-digit returns.
Despite the U.S. taking over the global lead in COVID-19 cases during the summer of 2020, U.S. equities also rallied dramatically following March lows. As they had prior to the virus, large technology firms helped drive U.S. markets higher, signaling the continuation of concentrated leadership in U.S equities. While U.S. equities delivered strong 12-month returns across asset classes, value remained a weak spot in terms of style, continuing a long stretch in which growth stocks have consistently outperformed value names.
The Fund underperformed the Russell 1000® Growth Index in the fiscal period; both sector allocation and stock selection were negative. The Fund’s underweight position in Materials and overweight position in Energy added to performance, while an underweight position in Consumer Discretionary and an overweight position in Industrials detracted from performance. Stock selection was strongest in Health Care and Energy and weakest in Consumer Discretionary and Information Technology. Horizon Therapeutics Public Ltd. (HZNP) (149% return, 1% of the Fund) and Fortinet Inc. (FTNT) (67% return, 2% of the Fund) added to the portfolio’s performance, while MGM Resorts International (MGM) (-49% return, <1% of the Fund) and Expedia Group Inc. (EXPE) (-40% return, <1% of the Fund) detracted from returns.
As we look ahead, the potential for heightened market volatility remains as investors continue to grapple with the lasting economic effects of COVID-19 in addition to the impact of the upcoming election cycle. Repositioning has focused on upgrading quality and reducing exposure to companies with balance sheet risk, without sacrificing valuation exposure. Furthermore, valuation spreads remain near historical levels, suggesting an opportunity for long-term alpha generation by emphasizing company valuations as a part of our multi-faceted process. At the same time, we continue to emphasize risk management during periods of heightened market volatility.
Fund Managers; Investment Experience
David A. Corris, CFA; since 1999
Jason C. Hans, CFA; since 1999
Ernesto Ramos, Ph.D.; since 1988
| | | | | | | | | | | | | | | | | | | | |
| | | | | | | | | Inception
date | | | Expenses (%) | |
| Share class | | Ticker | | | CUSIP | | | Gross | | | Net | |
| Investor (Y) | | | MASTX | | | | 09658L745 | | | | 11/20/1992 | | | | 0.84 | | | | 0.79 | |
| Advisor (A) | | | BALGX | | | | 09658W402 | | | | 5/27/2014 | | | | 0.84 | | | | 0.79 | |
| Institutional (I) | | | MLCIX | | | | 09658L752 | | | | 1/31/2008 | | | | 0.59 | | | | 0.54 | |
| Retirement (R-6) | | | BLGRX | | | | 09658W576 | | | | 12/28/2015 | | | | 0.44 | | | | 0.39 | |
The above expense ratios are from the Funds’ Prospectus dated December 27, 2019, and are inclusive of Acquired Fund Fees and Expenses. See Note 6 in the Notes to Financial Statements for additional information. Net expense ratios reflect contractual fee waivers and/or expense reimbursements if applicable, made by BMO Asset Management Corp., the investment adviser (Adviser). The Adviser may not terminate these fee waivers and/or expense reimbursements prior to December 31, 2021 without the consent of the Board of Directors, unless the investment advisory agreement is terminated. Without these contractual waivers, the Fund’s returns would have been lower.
| | | | |
Portfolio sector allocation | |
| Sector | | Fund (%) | |
| Communication Services | | | 13.3 | |
| Consumer Discretionary | | | 11.5 | |
| Consumer Staples | | | 4.4 | |
| Financials | | | 2.4 | |
| Healthcare | | | 13.8 | |
| Industrials | | | 5.9 | |
| Information Technology | | | 46.5 | |
| Materials | | | 0.5 | |
| Real Estate | | | 1.2 | |
| Other Assets & Liabilities, Net | | | 0.5 | |
| Total | | | 100.0 | |
Portfolio composition will change due to the ongoing management of the Fund. The percentages are based on net assets as of August 31, 2020 and may not necessarily reflect adjustments that are routinely made when presenting net assets for formal financial statement processes.
Growth of an assumed $10,000 investment
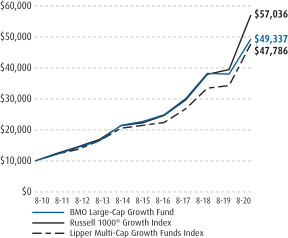
See Explanation of the Indices and Notes in the Commentary for additional information. The above graph relates to the Investor Class shares of the Fund. Performance for the Institutional Class, Advisor Class and Retirement R-6 shares will vary from the performance of the Investor Class shares shown above due to differences in charges and expenses. This graph illustrates the hypothetical investment of $10,000 in the Investor Class shares of the Fund from the lesser of the Fund’s inception date or August 31, 2010 to August 31, 2020.
5
| | |
| | |
| Annual Report | | BMO Mid-Cap Value Fund |
| | | | | | | | | | | | | | | | |
Average annual total returns (%) | |
| | | 1-Year | | | 5-Years | | | 10-Years | | | Since
Inception | |
| Advisor Class (A) NAV | | | (8.10 | ) | | | 2.20 | | | | — | | | | 2.17 | |
| Advisor Class (A) OFFER | | | (12.73 | ) | | | 1.16 | | | | — | | | | 1.34 | |
| Institutional Class (I) | | | (7.79 | ) | | | 2.46 | | | | 8.71 | | | | 5.91 | |
| Retirement Class (R-6) | | | (7.66 | ) | | | 2.61 | | | | — | | | | 2.57 | |
| Russell Midcap® Value Index | | | (1.30 | ) | | | 6.15 | | | | 10.94 | | | | 10.94 | |
| Lipper Mid-Cap Value Funds Index | | | (3.66 | ) | | | 3.51 | | | | 9.12 | | | | 9.12 | |
| * | Benchmarks since inception reflect the inception date of the Institutional Class. |
The performance data quoted represents past performance which is no guarantee of future results. Investment return and principal value will fluctuate so that an investor’s shares, when redeemed, may be worth more or less than their original costs. Mutual fund performance changes over time and current performance may be lower or higher than what is stated. To receive current performance to the most recent month-end, please call 1-800-236-3863 or visit www.bmofunds.com.
Commentary
The BMO Mid-Cap Value Fund (the Fund) returned -7.79% for the fiscal year ended August 31, 2020 versus the Russell Midcap® Value Index and the Lipper Mid-Cap Value Funds Index, which returned -1.30% and -3.66%, respectively.
Global equities experienced a year unlike any other as COVID-19 exploded into a worldwide pandemic during the first quarter of 2020, leading to an unprecedented economic shutdown as governments and businesses took dramatic steps to contain the virus. Investors responded to sudden expectations of a global recession, straining the liquidity of financial markets while sending equities into a steep decline in the first quarter. As financial conditions worsened in March, forced liquidations and hedge-fund deleveraging exaggerated the market selloff, driving volatility to record highs. Global stocks rebounded strongly, however, in the months following the March lows as countries began to reopen their economies and policymakers announced unprecedented fiscal and monetary support. Investors returned to risk assets relatively quickly and helped global equities finish the trailing 12-month period with double-digit returns.
Despite the U.S. taking over the global lead in COVID-19 cases during the summer of 2020, U.S. equities also rallied dramatically following March lows. As they had prior to the virus, large technology firms helped drive U.S. markets higher, signaling the continuation of concentrated leadership in U.S equities. While U.S. equities delivered strong 12-month returns across asset classes, value remained a weak spot in terms of style, continuing a long stretch in which growth stocks have consistently outperformed value names.
The Fund underperformed the Russell Midcap® Value Index in the fiscal period; sector allocation was positive for the period, while stock selection was negative. The Fund’s overweight position in Health Care and underweight position in Energy added to performance, while an overweight position in Real Estate and an underweight position in Materials detracted from performance. Stock selection was strongest in Energy and weakest in Consumer Discretionary and Financials. Charles River Laboratories International Inc. (CRL) (67% return, 1% of the Fund) and Akamai Technologies Inc. (AKAM) (31% return, 1% of the Fund) added to the portfolio’s performance, while EPR Properties (EPR) (-62% return, <1% of the Fund) and Sabre Corp. (SABR) (-73% return, <1% Fund) detracted from returns.
As we look ahead, the potential for heightened market volatility remains as investors continue to grapple with the lasting economic effects of COVID-19 in addition to the impact of the upcoming election cycle. Repositioning has focused on upgrading quality and reducing exposure to companies with balance sheet risk, without sacrificing valuation exposure. Furthermore, valuation spreads remain near historical levels, suggesting an opportunity for long-term alpha generation by emphasizing company valuations as a part of our mufti-faceted process. At the same time, we continue to emphasize risk management during periods of heightened market volatility.
Fund Managers; Investment Experience
David A. Corris, CFA; since 1999
Thomas Lettenberger, CFA; Since 1994
| | | | | | | | | | | | | | | | | | | | |
| | | | | | | | | Inception
date | | | Expenses (%) | |
| Share class | | Ticker | | | CUSIP | | | Gross | | | Net | |
| Advisor (A) | | | BAMCX | | | | 09658W501 | | | | 5/27/2014 | | | | 1.26 | | | | 1.24 | |
| Institutional (I) | | | MRVIX | | | | 09658L711 | | | | 1/31/2008 | | | | 1.01 | | | | 0.99 | |
| Retirement (R-6) | | | BMVGX | | | | 09658V438 | | | | 5/27/2014 | | | | 0.86 | | | | 0.84 | |
The above expense ratios are from the Funds’ Prospectus dated December 27, 2019, and are inclusive of Acquired Fund Fees and Expenses. See Note 6 in the Notes to Financial Statements for additional information. Net expense ratios reflect contractual fee waivers and/or expense reimbursements if applicable, made by BMO Asset Management Corp., the investment adviser (Adviser). The Adviser may not terminate these fee waivers and/or expense reimbursements prior to December 31, 2021 without the consent of the Board of Directors, unless the investment advisory agreement is terminated. Without these contractual waivers, the Fund’s returns would have been lower.
| | | | |
Portfolio sector allocation | |
| Sector | | Fund (%) | |
| Communication Services | | | 4.4 | |
| Consumer Discretionary | | | 9.4 | |
| Consumer Staples | | | 6.3 | |
| Energy | | | 1.8 | |
| Financials | | | 12.6 | |
| Healthcare | | | 11.5 | |
| Industrials | | | 16.4 | |
| Information Technology | | | 10.6 | |
| Materials | | | 6.3 | |
| Real Estate | | | 9.8 | |
| Utilities | | | 9.4 | |
| Other Assets & Liabilities, Net | | | 1.5 | |
| Total | | | 100.0 | |
Portfolio composition will change due to the ongoing management of the Fund. The percentages are based on net assets as of August 31, 2020 and may not necessarily reflect adjustments that are routinely made when presenting net assets for formal financial statement processes.
Growth of an assumed $10,000 investment
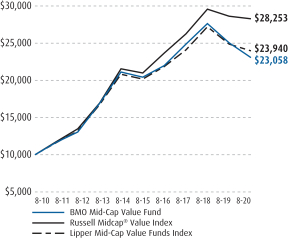
See Explanation of the Indices and Notes in the Commentary for additional information. The above graph relates to the Institutional Class shares of the Fund. Performance for the Advisor Class and Retirement R-6 shares will vary from the performance of the Institutional Class shares shown above due to differences in charges and expenses. This graph illustrates the hypothetical investment of $10,000 in the Institutional Class shares of the Fund from the lesser of the Fund’s inception date or August 31, 2010 to August 31, 2020.
6
| | |
| | |
| Annual Report | | BMO Mid-Cap Growth Fund |
| | | | | | | | | | | | | | | | |
Average annual total returns (%) | |
| | | 1-Year | | | 5-Years | | | 10-Years | | | Since
Inception | |
| Advisor Class (A) NAV | | | 19.05 | | | | 10.82 | | | | — | | | | 8.81 | |
| Advisor Class (A) OFFER | | | 13.08 | | | | 9.69 | | | | — | | | | 7.93 | |
| Institutional Class (I) | | | 19.41 | | | | 11.10 | | | | 12.88 | | | | 9.17 | |
| Retirement Class (R-6) | | | 19.49 | | | | 11.26 | | | | — | | | | 9.25 | |
| Russell Midcap® Growth Index | | | 23.56 | | | | 14.94 | | | | 16.03 | | | | 16.03 | |
| Lipper Mid-Cap Growth Funds Index | | | 25.06 | | | | 15.03 | | | | 15.09 | | | | 15.09 | |
| * | Benchmarks since inception reflect the inception date of the Institutional Class. |
The performance data quoted represents past performance which is no guarantee of future results. Investment return and principal value will fluctuate so that an investor’s shares, when redeemed, may be worth more or less than their original costs. Mutual fund performance changes over time and current performance may be lower or higher than what is stated. To receive current performance to the most recent month-end, please call 1-800-236-3863 or visit www.bmofunds.com.
Commentary
The BMO Mid-Cap Growth Fund (the Fund) returned 19.41% for the fiscal year ended August 31, 2020 versus the Russell Midcap® Growth Index and the Lipper Mid-Cap Growth Funds Index, which returned 23.56% and 25.06%, respectively.
Global equities experienced a year unlike any other as COVID-19 exploded into a worldwide pandemic during the first quarter of 2020, leading to an unprecedented economic shutdown as governments and businesses took dramatic steps to contain the virus. Investors responded to sudden expectations of a global recession, straining the liquidity of financial markets while sending equities into a steep decline in the first quarter. As financial conditions worsened in March, forced liquidations and hedge-fund deleveraging exaggerated the market selloff, driving volatility to record highs. Global stocks rebounded strongly, however, in the months following the March lows as countries began to reopen their economies and policymakers announced unprecedented fiscal and monetary support. Investors returned to risk assets relatively quickly and helped global equities finish the trailing 12-month period with double-digit returns.
Despite the U.S. taking over the global lead in COVID-19 cases during the summer of 2020, U.S. equities also rallied dramatically following March lows. As they had prior to the virus, large technology firms helped drive U.S. markets higher, signaling the continuation of concentrated leadership in U.S equities. While U.S. equities delivered strong 12-month returns across asset classes, value remained a weak spot in terms of style, continuing a long stretch in which growth stocks have consistently outperformed value names.
The Fund underperformed the Russell Midcap® Growth Index in the fiscal period; sector allocation was positive for the period, while stock selection was negative. The Fund’s overweight position in Health Care and underweight position in Communication Services added to performance, while overweight positions in Real Estate and Financials detracted from performance. Stock selection was strongest in Health Care and Energy and weakest in Real Estate and Industrials. Tempur Sealy International Inc. (TPX) (105% return, 1% of the Fund) and DexCom Inc. (DXCM) (148% return, 1% of the Fund) added to the portfolio’s performance, while US Foods Holding Corp. (USFD) (-42% return, <1% of the Fund) and Euronet Worldwide Inc. (EEFT) (-33% return, 1% of the Fund) detracted from returns.
As we look ahead, the potential for heightened market volatility remains as investors continue to grapple with the lasting economic effects of COVID-19 in addition to the impact of the upcoming election cycle. Repositioning has focused on upgrading quality and reducing exposure to companies with balance sheet risk, without sacrificing valuation exposure. Furthermore, valuation spreads remain near historical levels, suggesting an opportunity for long-term alpha generation by emphasizing company valuations as a part of our mufti-faceted process. At the same time, we continue to emphasize risk management during periods of heightened market volatility.
Fund Managers; Investment Experience
David A. Corris, CFA; since 1999
Thomas Lettenberger, CFA; since 1994
| | | | | | | | | | | | | | | | | | | | |
| | | | | | | | | Inception
date | | | Expenses (%) | |
| Share class | | Ticker | | | CUSIP | | | Gross | | | Net | |
| Advisor (A) | | | BGMAX | | | | 09658W600 | | | | 5/27/2014 | | | | 1.32 | | | | 1.24 | |
| Institutional (I) | | | MRMIX | | | | 09658L737 | | | | 1/31/2008 | | | | 1.07 | | | | 0.99 | |
| Retirement (R-6) | | | BMGGX | | | | 09658V412 | | | | 5/27/2014 | | | | 0.92 | | | | 0.84 | |
The above expense ratios are from the Funds’ Prospectus dated December 27, 2019, and are inclusive of Acquired Fund Fees and Expenses. See Note 6 in the Notes to Financial Statements for additional information. Net expense ratios reflect contractual fee waivers and/or expense reimbursements if applicable, made by BMO Asset Management Corp., the investment adviser (Adviser). The Adviser may not terminate these fee waivers and/or expense reimbursements prior to December 31, 2021 without the consent of the Board of Directors, unless the investment advisory agreement is terminated. Without these contractual waivers, the Fund’s returns would have been lower.
| | | | |
Portfolio sector allocation | |
| Sector | | Fund (%) | |
| Communication Services | | | 4.0 | |
| Consumer Discretionary | | | 7.6 | |
| Consumer Staples | | | 1.2 | |
| Financials | | | 4.5 | |
| Healthcare | | | 22.9 | |
| Industrials | | | 13.4 | |
| Information Technology | | | 39.5 | |
| Materials | | | 2.9 | |
| Real Estate | | | 2.5 | |
| Other Assets & Liabilities, Net | | | 1.5 | |
| Total | | | 100.0 | |
Portfolio composition will change due to the ongoing management of the Fund. The percentages are based on net assets as of August 31, 2020 and may not necessarily reflect adjustments that are routinely made when presenting net assets for formal financial statement processes.
Growth of an assumed $10,000 investment
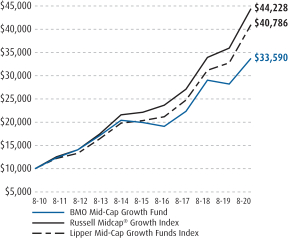
See Explanation of the Indices and Notes in the Commentary for additional information. The above graph relates to the Institutional Class shares of the Fund. Performance for the Advisor Class and Retirement R-6 shares will vary from the performance of the Institutional Class shares shown above due to differences in charges and expenses. This graph illustrates the hypothetical investment of $10,000 in the Institutional Class shares of the Fund from the lesser of the Fund’s inception date or August 31, 2010 to August 31, 2020.
7
| | |
| | |
| Annual Report | | BMO Small-Cap Value Fund |
| | | | | | | | | | | | |
Average annual total returns (%) | |
| | | 1-Year | | | 5-Years | | | Since
Inception | |
| Advisor Class (A) NAV | | | (8.63 | ) | | | 2.16 | | | | 1.15 | |
| Advisor Class (A) OFFER | | | (13.2 | ) | | | 1.11 | | | | 0.32 | |
| Institutional Class (I) | | | (8.40 | ) | | | 2.43 | | | | 6.07 | |
| Retirement Class (R-6) | | | (8.24 | ) | | | 2.59 | | | | 1.59 | |
| Russell 2000® Value Index | | | (6.14 | ) | | | 4.37 | | | | 5.86 | |
| Lipper Small-Cap Core Funds Index | | | (1.01 | ) | | | 6.36 | | | | 7.53 | |
| * | Benchmarks since inception reflect the inception date of the Institutional Class. |
The performance data quoted represents past performance which is no guarantee of future results. Investment return and principal value will fluctuate so that an investor’s shares, when redeemed, may be worth more or less than their original costs. Mutual fund performance changes over time and current performance may be lower or higher than what is stated. To receive current performance to the most recent month-end, please call 1-800-236-3863 or visit www.bmofunds.com.
Commentary
The BMO Small-Cap Value Fund (the Fund) returned -8.40% for the fiscal year ended August 31, 2020 versus the Russell 2000® Value Index and the Lipper Small-Cap Core Funds, which returned -6.14% and -1.01%, respectively.
Global equities experienced a year unlike any other as COVID-19 exploded into a worldwide pandemic during the first quarter of 2020, leading to an unprecedented economic shutdown as governments and businesses took dramatic steps to contain the virus. Investors responded to sudden expectations of a global recession, straining the liquidity of financial markets while sending equities into a steep decline in the first quarter. As financial conditions worsened in March, forced liquidations and hedge-fund deleveraging exaggerated the market selloff, driving volatility to record highs. Global stocks rebounded strongly, however, in the months following the March lows as countries began to reopen their economies and policymakers announced unprecedented fiscal and monetary support. Investors returned to risk assets relatively quickly and helped global equities finish the trailing 12-month period with double-digit returns.
Despite the U.S. taking over the global lead in COVID-19 cases during the summer of 2020, U.S. equities also rallied dramatically following March lows. As they had prior to the virus, large technology firms helped drive U.S. markets higher, signaling the continuation of concentrated leadership in U.S equities. While U.S. equities delivered strong 12-month returns across asset classes, value remained a weak spot in terms of style, continuing a long stretch in which growth stocks have consistently outperformed value names.
The Fund underperformed the Russell 2000® Value Index in the fiscal period ending; sector allocation was positive for the period, while stock selection was negative. The Fund’s overweight positions in Health Care and Information Technology added to performance, while underweight positions in Consumer Staples and Materials detracted from performance. Stock selection was strongest in Industrials and Consumer Discretionary and weakest in Health Care and Information Technology. K12 Inc. (LRN) (73% return, 1% of the Fund) and National General Holdings Corp. (NGHC) (44% return, <1% of the Fund) added to the portfolio’s performance, while Great Western Bancorp Inc. (GWB) (-52% return, 1% of the Fund) and Kraton Corp. (KRA) (-73% return, <1% of the Fund) detracted from returns.
As we look ahead, the potential for heightened market volatility remains as investors continue to grapple with the lasting economic effects of COVID-19 in addition to the impact of the upcoming election cycle. Repositioning has focused on upgrading quality and reducing exposure to companies with balance sheet risk, without sacrificing valuation exposure. Furthermore, valuation spreads remain near historical levels, suggesting an opportunity for long-term alpha generation by emphasizing company valuations as a part of our mufti-faceted process. At the same time, we continue to emphasize risk management during periods of heightened market volatility.
Fund Managers; Investment Experience
David A. Corris, CFA; since 1999
Thomas Lettenberger, CFA; Since 1994
| | | | | | | | | | | | | | | | | | | | |
| | | | | | | | | Inception
date | | | Expenses (%) | |
| Share class | | Ticker | | | CUSIP | | | Gross | | | Net | |
| Advisor (A) | | | BACVX | | | | 09658W709 | | | | 5/27/2014 | | | | 1.40 | | | | 1.24 | |
| Institutional (I) | | | MRSNX | | | | 09658L596 | | | | 2/28/2011 | | | | 1.15 | | | | 0.99 | |
| Retirement (R-6) | | | BSVGX | | | | 09658V388 | | | | 5/27/2014 | | | | 1.00 | | | | 0.84 | |
The above expense ratios are from the Funds’ Prospectus dated December 27, 2019, and are inclusive of Acquired Fund Fees and Expenses. See Note 6 in the Notes to Financial Statements for additional information. Net expense ratios reflect contractual fee waivers and/or expense reimbursements if applicable, made by BMO Asset Management Corp., the investment adviser (Adviser). The Adviser may not terminate these fee waivers and/or expense reimbursements prior to December 31, 2021 without the consent of the Board of Directors, unless the investment advisory agreement is terminated. Without these contractual waivers, the Fund’s returns would have been lower.
| | | | |
Portfolio sector allocation | |
| Sector | | Fund (%) | |
| Consumer Discretionary | | | 13.1 | |
| Consumer Staples | | | 2.2 | |
| Energy | | | 2.0 | |
| Financials | | | 25.3 | |
| Healthcare | | | 7.8 | |
| Industrials | | | 18.2 | |
| Information Technology | | | 9.9 | |
| Materials | | | 6.4 | |
| Real Estate | | | 8.2 | |
| Utilities | | | 4.1 | |
| Other Assets & Liabilities, Net | | | 2.8 | |
| Total | | | 100.0 | |
Portfolio composition will change due to the ongoing management of the Fund. The percentages are based on net assets as of August 31, 2020 and may not necessarily reflect adjustments that are routinely made when presenting net assets for formal financial statement processes.
Growth of an assumed $10,000 investment
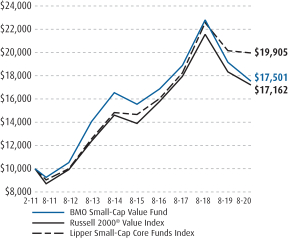
See Explanation of the Indices and Notes in the Commentary for additional information. The above graph relates to the Institutional Class shares of the Fund. Performance for the Advisor Class and Retirement R-6 shares will vary from the performance of the Institutional Class shares shown above due to differences in charges and expenses. This graph illustrates the hypothetical investment of $10,000 in the Institutional Class shares of the Fund from the lesser of the Fund’s inception date or August 31, 2010 to August 31, 2020.
8
| | |
| | |
| Annual Report | | BMO Small-Cap Growth Fund |
| | | | | | | | | | | | | | | | |
Average annual total returns (%) | |
| | | 1-Year | | | 5-Years | | | 10-Years | | | Since
Inception | |
| Advisor Class (A) NAV | | | 10.60 | | | | — | | | | — | | | | 7.37 | |
| Advisor Class (A) OFFER | | | 5.04 | | | | — | | | | — | | | | 5.68 | |
| Institutional Class (I) | | | 10.89 | | | | 6.23 | | | | 10.83 | | | | 8.15 | |
| Russell 2000® Growth Index | | | 17.28 | | | | 10.45 | | | | 14.08 | | | | 14.08 | |
| Lipper Small-Cap Growth Funds Index | | | 20.55 | | | | 13.39 | | | | 14.67 | | | | 14.67 | |
| * | Benchmarks since inception reflect the inception date of the Institutional Class. |
The performance data quoted represents past performance which is no guarantee of future results. Investment return and principal value will fluctuate so that an investor’s shares, when redeemed, may be worth more or less than their original costs. Mutual fund performance changes over time and current performance may be lower or higher than what is stated. To receive current performance to the most recent month-end, please call 1-800-236-3863 or visit www.bmofunds.com.
Commentary
The BMO Small-Cap Growth Fund (the Fund) returned 10.89% for the fiscal year ended August 31, 2020 versus the Russell 2000® Growth Index and the Lipper Small-Cap Growth Funds Index, which returned 17.28% and 20.55%, respectively.
Global equities experienced a year unlike any other as COVID-19 exploded into a worldwide pandemic during the first quarter of 2020, leading to an unprecedented economic shutdown as governments and businesses took dramatic steps to contain the virus. Investors responded to sudden expectations of a global recession, straining the liquidity of financial markets while sending equities into a steep decline in the first quarter. As financial conditions worsened in March, forced liquidations and hedge-fund deleveraging exaggerated the market selloff, driving volatility to record highs. Global stocks rebounded strongly, however, in the months following the March lows as countries began to reopen their economies and policymakers announced unprecedented fiscal and monetary support. Investors returned to risk assets relatively quickly and helped global equities finish the trailing 12-month period with double-digit returns.
Despite the U.S. taking over the global lead in COVID-19 cases during the summer of 2020, U.S. equities also rallied dramatically following March lows. As they had prior to the virus, large technology firms helped drive U.S. markets higher, signaling the continuation of concentrated leadership in U.S equities. While U.S. equities delivered strong 12-month returns across asset classes, value remained a weak spot in terms of style, continuing a long stretch in which growth stocks have consistently outperformed value names.
The Fund underperformed the Russell 2000® Growth Index in the fiscal period ending; sector allocation was positive for the period, while stock selection was negative. The Fund’s underweight positions in Consumer Discretionary and Financials added to performance, while an overweight position in Consumer Staples and an underweight position in Utilities detracted from performance. Stock selection was strongest in Consumer Staples and Communication Services and weakest in Health Care and Industrials. Teladoc Health Inc. (TDOC) (232% return, <1% of the Fund) and K12 Inc. (LRN) (82% return, 1% of the Fund) added to the portfolio’s performance, while Everi Holdings Inc. (EVRI) (-67% return, <1% of the Fund) and Radius Health Inc. (RDUS) (-56% return, 1% of the Fund) detracted from returns.
As we look ahead, the potential for heightened market volatility remains as investors continue to grapple with the lasting economic effects of COVID-19 in addition to the impact of the upcoming election cycle. Repositioning has focused on upgrading quality and reducing exposure to companies with balance sheet risk, without sacrificing valuation exposure. Furthermore, valuation spreads remain near historical levels, suggesting an opportunity for long-term alpha generation by emphasizing company valuations as a part of our mufti-faceted process. At the same time, we continue to emphasize risk management during periods of heightened market volatility.
Fund Managers; Investment Experience
David A. Corris, CFA; since 1999
Thomas Lettenberger, CFA; Since 1994
| | | | | | | | | | | | | | | | | | | | |
| | | | | | | | | Inception
date | | | Expenses (%) | |
| Share class | | Ticker | | | CUSIP | | | Gross | | | Net | |
| Advisor (A) | | | BSLAX | | | | 09658V339 | | | | 5/31/2017 | | | | 1.31 | | | | 1.24 | |
| Institutional (I) | | | MSGIX | | | | 09658L620 | | | | 1/31/2008 | | | | 1.06 | | | | 0.99 | |
The above expense ratios are from the Funds’ Prospectus dated December 27, 2019, and are inclusive of Acquired Fund Fees and Expenses. See Note 6 in the Notes to Financial Statements for additional information. Net expense ratios reflect contractual fee waivers and/or expense reimbursements if applicable, made by BMO Asset Management Corp., the investment adviser (Adviser). The Adviser may not terminate these fee waivers and/or expense reimbursements prior to December 31, 2021 without the consent of the Board of Directors, unless the investment advisory agreement is terminated. Without these contractual waivers, the Fund’s returns would have been lower.
| | | | |
Portfolio sector allocation | |
| Sector | | Fund (%) | |
| Communication Services | | | 1.8 | |
| Consumer Discretionary | | | 11.6 | |
| Consumer Staples | | | 4.2 | |
| Financials | | | 1.7 | |
| Healthcare | | | 35.3 | |
| Industrials | | | 14.3 | |
| Information Technology | | | 23.9 | |
| Materials | | | 2.7 | |
| Real Estate | | | 2.0 | |
| Utilities | | | 0.6 | |
| Other Assets & Liabilities, Net | | | 1.9 | |
| Total | | | 100.0 | |
Portfolio composition will change due to the ongoing management of the Fund. The percentages are based on net assets as of August 31, 2020 and may not necessarily reflect adjustments that are routinely made when presenting net assets for formal financial statement processes.
Growth of an assumed $10,000 investment
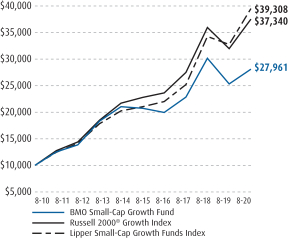
See Explanation of the Indices and Notes in the Commentary for additional information. The above graph relates to the Institutional Class shares of the Fund. Performance for the Advisor Class shares will vary from the performance of the Institutional Class shares shown above due to differences in charges and expenses. This graph illustrates the hypothetical investment of $10,000 in the Institutional Class shares of the Fund from the lesser of the Fund’s inception date or August 31, 2010 to August 31, 2020.
9
| | |
| | |
| Annual Report | | BMO Global Low Volatility Equity Fund |
| | | | | | | | | | | | |
Average annual total returns (%) | |
| | | 1-Year | | | 5-Years | | | Since
Inception | |
| Advisor Class (A) NAV | | | (5.51 | ) | | | 4.93 | | | | 4.38 | |
| Advisor Class (A) OFFER | | | (10.22 | ) | | | 3.85 | | | | 3.52 | |
| Institutional Class (I) | | | (5.29 | ) | | | 5.17 | | | | 5.82 | |
| Morgan Stanley Capital International All Country World Index | | | 16.52 | | | | 10.21 | | | | 8.47 | |
| Lipper Global Multi-Cap Value Funds Index | | | 0.59 | | | | 4.17 | | | | 3.73 | |
| * | Benchmarks since inception reflect the inception date of the Institutional Class. |
The performance data quoted represents past performance which is no guarantee of future results. Investment return and principal value will fluctuate so that an investor’s shares, when redeemed, may be worth more or less than their original costs. Mutual fund performance changes over time and current performance may be lower or higher than what is stated. To receive current performance to the most recent month-end, please call 1-800-236-3863 or visit www.bmofunds.com.
Commentary
The BMO Global Low Volatility Equity Fund (the Fund) returned -5.29% for the fiscal year ended August 31, 2020 versus MSCI All Country World Index Net and the Lipper Global Multi-Cap Value Funds Index, which returned 16.52% and 0.59%, respectively.
Global equities experienced a year unlike any other as COVID-19 exploded into a worldwide pandemic during the first quarter of 2020, leading to an unprecedented economic shutdown as governments and businesses took dramatic steps to contain the virus. Investors responded to sudden expectations of a global recession, straining the liquidity of financial markets while sending equities into a steep decline in the first quarter. As financial conditions worsened in March, forced liquidations and hedge-fund deleveraging exaggerated the market selloff, driving volatility to record highs. Global stocks rebounded strongly, however, in the months following the March lows as countries began to reopen their economies and policymakers announced unprecedented fiscal and monetary support. Investors returned to risk assets relatively quickly and helped global equities finish the trailing 12-month period with double-digit returns.
Despite the U.S. taking over the global lead in COVID-19 cases during the summer of 2020, U.S. equities also rallied dramatically following March lows. As they had prior to the virus, large technology firms helped drive U.S. markets higher, signaling the continuation of concentrated leadership in U.S equities. While U.S. equities delivered strong 12-month returns across asset classes, value remained a weak spot in terms of style, continuing a long stretch in which growth stocks have consistently outperformed value names.
The Fund underperformed the MSCI ACWI Net in the fiscal period; both sector allocation and stock selection were negative for the period. The Fund’s underweight positions in Energy and Industrials added to performance, while an underweight position in Information Technology and an overweight position in Real Estate detracted from performance. Stock selection was strongest in Materials and weakest in Communication Services and Consumer Discretionary. Fisher & Paykel Healthcare Corp. (FPH-NZ) (140% return, 2% of the Fund) and Flow Traders NV (FLOW-NL) (69% return, 2% of the Fund) added to the portfolio’s performance, while American Assets Trust Inc. (AAT-US) (-44% return, <1% of the Fund) and Portland General Electric Co. (POR-US) (-30% return, 1% of the Fund) detracted from returns.
As we look ahead, the potential for heightened market volatility remains as investors continue to grapple with the lasting economic effects of COVID-19 in addition to the impact of the upcoming election cycle. Repositioning has focused on upgrading quality and reducing exposure to companies with balance sheet risk, without sacrificing valuation exposure. Furthermore, valuation spreads remain near historical levels, suggesting an opportunity for long-term alpha generation by emphasizing company valuations as a part of our mufti-faceted process. At the same time, we continue to emphasize risk management during periods of heightened market volatility.
Fund Managers; Investment Experience
Jay Kaufman, CFA; since 2006
Ernesto Ramos, Ph.D.; since 1988
David Rosenblatt, CFA; since 2007
| | | | | | | | | | | | | | | | | | | | |
| | | | | | | | | Inception
date | | | Expenses (%) | |
| Share class | | Ticker | | | CUSIP | | | Gross | | | Net | |
| Advisor (A) | | | BAEGX | | | | 09658W873 | | | | 5/27/2014 | | | | 1.47 | | | | 1.10 | |
| Institutional (I) | | | BGLBX | | | | 09658V768 | | | | 9/30/2013 | | | | 1.22 | | | | 0.85 | |
The above expense ratios are from the Funds’ Prospectus dated December 27, 2019, and are inclusive of Acquired Fund Fees and Expenses. See Note 6 in the Notes to Financial Statements for additional information. Net expense ratios reflect contractual fee waivers and/or expense reimbursements if applicable, made by BMO Asset Management Corp., the investment adviser (Adviser). The Adviser may not terminate these fee waivers and/or expense reimbursements prior to December 31, 2021 without the consent of the Board of Directors, unless the investment advisory agreement is terminated. Without these contractual waivers, the Fund’s returns would have been lower.
| | | | |
Portfolio sector allocation | |
| Sector | | Fund (%) | |
| Communication Services | | | 20.8 | |
| Consumer Discretionary | | | 3.3 | |
| Consumer Staples | | | 17.5 | |
| Financials | | | 11.0 | |
| Healthcare | | | 16.5 | |
| Industrials | | | 1.8 | |
| Information Technology | | | 1.0 | |
| Materials | | | 2.7 | |
| Real Estate | | | 8.9 | |
| Utilities | | | 14.8 | |
| Other Assets & Liabilities, Net | | | 1.7 | |
| Total | | | 100.0 | |
Portfolio composition will change due to the ongoing management of the Fund. The percentages are based on net assets as of August 31, 2020 and may not necessarily reflect adjustments that are routinely made when presenting net assets for formal financial statement processes.
Growth of an assumed $10,000 investment
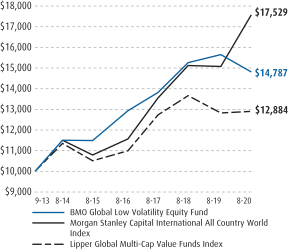
See Explanation of the Indices and Notes in the Commentary for additional information. The above graph relates to the Institutional Class shares of the Fund. Performance for the Advisor Class shares will vary from the performance of the Institutional Class shares shown above due to differences in charges and expenses. This graph illustrates the hypothetical investment of $10,000 in the Institutional Class shares of the Fund from the lesser of the Fund’s inception date or August 31, 2010 to August 31, 2020.
10
| | |
| | |
| Annual Report | | BMO Disciplined International Equity Fund |
| | | | | | | | |
Average annual total returns (%) | |
| | | 1-Year | | | Since
Inception | |
| Advisor Class (A) NAV | | | 0.92 | | | | 1.49 | |
| Advisor Class (A) OFFER | | | (4.15 | ) | | | 0.44 | |
| Institutional Class (I) | | | 1.30 | | | | 1.76 | |
| Morgan Stanley Capital International Europe, Australasia, Far East Index | | | 6.13 | | | | 5.04 | |
| Lipper International Multi-Cap Core Funds Index | | | 4.75 | | | | 8.28 | |
| * | Benchmarks since inception reflect the inception date of the Institutional Class. |
The performance data quoted represents past performance which is no guarantee of future results. Investment return and principal value will fluctuate so that an investor’s shares, when redeemed, may be worth more or less than their original costs. Mutual fund performance changes over time and current performance may be lower or higher than what is stated. To receive current performance to the most recent month-end, please call 1-800-236-3863 or visit www.bmofunds.com.
Commentary
The BMO Disciplined International Equity Fund (the Fund) returned 1.30% for the fiscal year ended August 31, 2020 versus the MSCI EAFE Index and the Lipper International Multi-Cap Core Funds Index, which returned 6.13% and 4.75%, respectively.
Global equities experienced a year unlike any other as COVID-19 exploded into a worldwide pandemic during the first quarter of 2020, leading to an unprecedented economic shutdown as governments and businesses took dramatic steps to contain the virus. Investors responded to sudden expectations of a global recession, straining the liquidity of financial markets while sending equities into a steep decline in the first quarter. As financial conditions worsened in March, forced liquidations and hedge-fund deleveraging exaggerated the market selloff, driving volatility to record highs. Global stocks rebounded strongly, however, in the months following the March lows as countries began to reopen their economies and policymakers announced unprecedented fiscal and monetary support. Investors returned to risk assets relatively quickly and helped global equities finish the trailing 12-month period with double-digit returns.
Despite the U.S. taking over the global lead in COVID-19 cases during the summer of 2020, U.S. equities also rallied dramatically following March lows. As they had prior to the virus, large technology firms helped drive U.S. markets higher, signaling the continuation of concentrated leadership in U.S equities. While U.S. equities delivered strong 12-month returns across asset classes, value remained a weak spot in terms of style, continuing a long stretch in which growth stocks have consistently outperformed value names.
The Fund underperformed the MSCI EAFE Index in the fiscal period ending; sector allocation was positive for the period, while stock selection was negative. The Fund’s overweight positions in Health Care and Information Technology added to performance, while overweight positions in Real Estate and Utilities detracted from performance. Stock selection was strongest in Energy and Financials and weakest in Industrials and Information Technology. Roche Holding AG (ROG-CH) (32% return, 3% of the Fund) and Sartorius Stedim Biotech SA (DIM-FR) (142% return, 2% of the Fund) added to the portfolio’s performance, while AerCap Holdings NV (AER-US) (-45% return, 1% of the Fund) and Eni SpA. (ENI-IT) (-33% return, 1% of the Fund) detracted from returns.
As we look ahead, the potential for heightened market volatility remains as investors continue to grapple with the lasting economic effects of COVID-19 in addition to the impact of the upcoming election cycle. Repositioning has focused on upgrading quality and reducing exposure to companies with balance sheet risk, without sacrificing valuation exposure. Furthermore, valuation spreads remain near historical levels, suggesting an opportunity for long-term alpha generation by emphasizing company valuations as a part of our mufti-faceted process. At the same time, we continue to emphasize risk management during periods of heightened market volatility.
Fund Managers; Investment Experience
Jay Kaufman, CFA; since 2006
Ernesto Ramos, Ph.D.; since 1988
David Rosenblatt, CFA; since 2007
| | | | | | | | | | | | | | | | | | | | |
| | | | | | | | | Inception
date | | | Expenses (%) | |
| Share class | | Ticker | | | CUSIP | | | Gross | | | Net | |
| Advisor (A) | | | BDAQX | | | | 09658W667 | | | | 9/17/2015 | | | | 1.28 | | | | 1.15 | |
| Institutional (I) | | | BDIQX | | | | 09658W659 | | | | 9/17/2015 | | | | 1.03 | | | | 0.90 | |
The above expense ratios are from the Funds’ Prospectus dated December 27, 2019, and are inclusive of Acquired Fund Fees and Expenses. See Note 6 in the Notes to Financial Statements for additional information. Net expense ratios reflect contractual fee waivers and/or expense reimbursements if applicable, made by BMO Asset Management Corp., the investment adviser (Adviser). The Adviser may not terminate these fee waivers and/or expense reimbursements prior to December 31, 2021 without the consent of the Board of Directors, unless the investment advisory agreement is terminated. Without these contractual waivers, the Fund’s returns would have been lower.
| | | | |
Portfolio sector allocation | |
| Sector | | Fund (%) | |
| Communication Services | | | 6.8 | |
| Consumer Discretionary | | | 6.5 | |
| Consumer Staples | | | 10.6 | |
| Energy | | | 1.8 | |
| Financials | | | 13.1 | |
| Healthcare | | | 17.9 | |
| Industrials | | | 9.8 | |
| Information Technology | | | 11.2 | |
| Materials | | | 8.3 | |
| Real Estate | | | 4.1 | |
| Utilities | | | 6.8 | |
| Other Assets & Liabilities, Net | | | 3.1 | |
| Total | | | 100.0 | |
Portfolio composition will change due to the ongoing management of the Fund. The percentages are based on net assets as of August 31, 2020 and may not necessarily reflect adjustments that are routinely made when presenting net assets for formal financial statement processes.
Growth of an assumed $10,000 investment
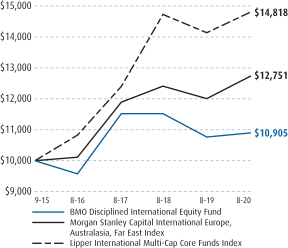
See Explanation of the Indices and Notes in the Commentary for additional information. The above graph relates to the Institutional Class shares of the Fund. Performance for the Advisor Class shares will vary from the performance of the Institutional Class shares shown above due to differences in charges and expenses. This graph illustrates the hypothetical investment of $10,000 in the Institutional Class shares of the Fund from the lesser of the Fund’s inception date or August 31, 2010 to August 31, 2020.
11
| | |
| | |
| Annual Report | | BMO Pyrford International Stock Fund |
| | | | | | | | | | | | |
Average annual total returns (%) | |
| | | 1-Year | | | 5-Years | | | Since
Inception | |
| Advisor Class (A) NAV | | | 6.11 | | | | 4.85 | | | | 2.12 | |
| Advisor Class (A) OFFER | | | 0.79 | | | | 3.77 | | | | 1.29 | |
| Institutional Class (I) | | | 6.38 | | | | 5.11 | | | | 5.89 | |
| Retirement Class (R-6) | | | 6.54 | | | | 5.28 | | | | 2.54 | |
| Morgan Stanley Capital International Europe, Australasia, Far East Index | | | 6.13 | | | | 4.72 | | | | 5.79 | |
| Lipper International Multi-Cap Core Funds Index | | | 4.75 | | | | 4.52 | | | | 6.35 | |
| * | Benchmarks since inception reflect the inception date of the Institutional Class. |
The performance data quoted represents past performance which is no guarantee of future results. Investment return and principal value will fluctuate so that an investor’s shares, when redeemed, may be worth more or less than their original costs. Mutual fund performance changes over time and current performance may be lower or higher than what is stated. To receive current performance to the most recent month-end, please call 1-800-236-3863 or visit www.bmofunds.com.
Commentary
The BMO Pyrford International Stock Fund (the Fund) returned 6.38% for the fiscal year ended August 31, 2020 versus the Morgan Stanley Capital International (MSCI) Europe, Australasia, Far East Index (EAFE) and the Lipper International Multi-Cap Core Funds Index, which returned 6.13% and 4.75%, respectively.
Following outperformance during the selloff in Q1 2020, the Fund lagged the subsequent rebound. The bounce occurred in risk assets and it had nothing to do with investment fundamentals. Stimulus measures and targeted relief packages alongside an easing of lockdown restrictions continue to dominate market returns despite the headlines of concentrated spikes in coronavirus cases. The easing of lockdown restrictions is a crucial lifeline to many sectors but optimism around a rebound in earnings is running far ahead of a rebound in sales and earnings
Relative performance was predominantly driven by positive stock selection contribution from Europe and a negative country allocation from Asia Pacific. Positive Eurozone stock selection has been driven by not owning the low-quality Eurozone banks while also benefitting from the recovery in German industrial stocks such as Fuchs Petrolub (38% return, 2% of the Fund) and GEA Group (38% return, 1% of the Fund).
In Asia Pacific, the overweight to Malaysia and underweight to Japan detracted. The underweight to Japan is based on elevated valuations, the burdensome debt level in Japan combined with soft economic growth. The Fund did benefit from being underweight the Japanese Yen which has lagged other currency returns. Singapore stock selection weighed on relative returns, led by Comfortdelgro (-37% return, 1% of the Fund), the land transport company which has seen revenues negatively impacted by lockdown restrictions. We remain holders given the strong balance sheet, with strong cash flow generation ability enabling them to acquire growth overseas given the limited growth outlook within Singapore.
Valuations reflect the view that earnings growth will recover over 2021 despite continued uncertainty on the duration of a recovery and the impact of unprecedented government borrowing. As we have mentioned before, such swift and sizeable rescue packages were a necessity, but they come at a price. A legacy of greater debt and challenging demographics suggests global growth will remain subdued for many years.
Investment Adviser:
BMO Asset Management Corp.
Sub-adviser:
Pyrford International Ltd.
Fund Managers; Investment Experience
Tony Cousins, CFA; since 1985
Daniel McDonagh, CFA; since 1997
Paul Simons, CFA; since 1996
| | | | | | | | | | | | | | | | | | | | |
| | | | | | | | | Inception
date | | | Expenses (%) | |
| Share class | | Ticker | | | CUSIP | | | Gross | | | Net | |
| Advisor (A) | | | BPIAX | | | | 09658W840 | | | | 5/27/2014 | | | | 1.21 | | | | 1.19 | |
| Institutional (I) | | | MISNX | | | | 09658L513 | | | | 12/29/2011 | | | | 0.96 | | | | 0.94 | |
| Retirement (R-6) | | | BISGX | | | | 09658V362 | | | | 5/27/2014 | | | | 0.81 | | | | 0.79 | |
The above expense ratios are from the Funds’ Prospectus dated December 27, 2019, and are inclusive of Acquired Fund Fees and Expenses. See Note 6 in the Notes to Financial Statements for additional information. Net expense ratios reflect contractual fee waivers and/or expense reimbursements if applicable, made by BMO Asset Management Corp., the investment adviser (Adviser). The Adviser may not terminate these fee waivers and/or expense reimbursements prior to December 31, 2021 without the consent of the Board of Directors, unless the investment advisory agreement is terminated. Without these contractual waivers, the Fund’s returns would have been lower.
| | | | |
Portfolio sector allocation | |
| Sector | | Fund (%) | |
| Communication Services | | | 10.4 | |
| Consumer Discretionary | | | 3.9 | |
| Consumer Staples | | | 15.1 | |
| Energy | | | 6.4 | |
| Financials | | | 10.9 | |
| Healthcare | | | 10.1 | |
| Industrials | | | 20.8 | |
| Information Technology | | | 6.9 | |
| Materials | | | 4.3 | |
| Utilities | | | 3.9 | |
| Materials | | | 1.7 | |
| Other Assets & Liabilities, Net | | | 5.6 | |
| Total | | | 100.0 | |
Portfolio composition will change due to the ongoing management of the Fund. The percentages are based on net assets as of August 31, 2020 and may not necessarily reflect adjustments that are routinely made when presenting net assets for formal financial statement processes.
Growth of an assumed $10,000 investment
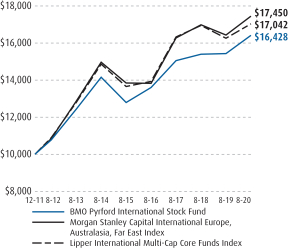
See Explanation of the Indices and Notes in the Commentary for additional information. The above graph relates to the Institutional Class shares of the Fund. Performance for the Advisor Class and Retirement R-6 shares will vary from the performance of the Institutional Class shares shown above due to differences in charges and expenses. This graph illustrates the hypothetical investment of $10,000 in the Institutional Class shares of the Fund from the lesser of the Fund’s inception date or August 31, 2010 to August 31, 2020.
12
| | |
| | |
| Annual Report | | BMO LGM Emerging Markets Equity Fund |
| | | | | | | | | | | | | | | | |
Average annual total returns (%) | |
| | | 1-Year | | | 5-Years | | | 10-Years | | | Since
Inception | |
| Advisor Class (A) NAV | | | 4.30 | | | | 6.29 | | | | — | | | | 3.18 | |
| Advisor Class (A) OFFER | | | (0.89 | ) | | | 5.21 | | | | — | | | | 2.34 | |
| Institutional Class (I) | | | 4.60 | | | | 6.57 | | | | 3.11 | | | | 7.38 | |
| Morgan Stanley Capital International Emerging Markets Index | | | 14.49 | | | | 8.66 | | | | 3.76 | | | | 3.76 | |
| Lipper Emerging Markets Funds Index | | | 14.17 | | | | 8.98 | | | | 4.18 | | | | 4.18 | |
| * | Benchmarks since inception reflect the inception date of the Institutional Class. |
The performance data quoted represents past performance which is no guarantee of future results. Investment return and principal value will fluctuate so that an investor’s shares, when redeemed, may be worth more or less than their original costs. Mutual fund performance changes over time and current performance may be lower or higher than what is stated. To receive current performance to the most recent month-end, please call 1-800-236-3863 or visit www.bmofunds.com.
Commentary
The BMO LGM Emerging Markets Equity Fund (the Fund) returned 4.60% for the fiscal year ended August 31, 2020 versus the Morgan Stanley Capital International Emerging Markets Index and the Lipper Emerging Markets Funds Index, which returned 14.49% and 14.17%, respectively.
Returns were materially impacted (and continue to be impacted) by the outbreak of COVID-19 (as well as a major correction in the oil market). This instability however has not been equally distributed across underlying markets. On aggregate, the index has been propped up by the strength and resilience of China and Taiwan, while many other large emerging markets (including India, Mexico, Indonesia, South Africa and Brazil) sold heavily as the virus spread globally and countries went into lock down. In the past twelve months, China has actually gained 39% while Taiwan is up 38% while South Korea has gained 23%. Collectively these three markets account for approximately 65% of the MSCI EM Index. In general, all other markets have materially underperformed; India is up only 3%, Mexico down 19%, Indonesia is down 17% and Brazil down 26%. Currency, where often fear is first realized, played a material role in the weakness, though we have seen the U.S. dollar weaken in the past number of weeks.
Security selections in China and Russia and avoidance of exposures to the Brazilian market contributed most to relative performance. While security selections in China added material value, the overall underweight in the Chinese market hurt relative performance from an allocation perspective. Exposures in India, South Africa and Mexico (all markets where the portfolio has invested more relative to the index) detracted from relative performance. From a sector perspective, positions in Consumer Staples cost the most value as volumes in the majority of businesses dried up during the global lockdown. An underweight to some of the mega cap Technology names also hurt relative returns, while positions in Financials lost ground as the market moved to discount the potential impacts that may occur on the back of the sharp economic correction. A good deal of relative underperformance arose from companies not held in the portfolio. In particular, not owning Alibaba and Meituan Dianping detracted materially with returns of 64% and 250% respectively.
On the positive side, Ping An Healthcare and Technology (China) (140% return, <1% of the Fund) delivered a stellar return for the portfolio. The company, which provides an online/App based doctor’s service, has seen a huge increase in demand for its service since the onset of COVID. Daily consultations were up nine-fold during the January-February COVID-19 pandemic, driving a phenomenal share-price performance year to date (in excess of 100%). This move is great for the fund, but everything comes at a price and this one just became too rich. Recent management changes also have given cause for concern, so we felt it was prudent to take our profits in this stock.
Investment Adviser:
BMO Asset Management Corp.
Sub-adviser:
LGM Investments Limited
Fund Managers; Investment Experience
Irina Hunter; since 1994
Rishikesh Patel; since 2003
| | | | | | | | | | | | | | | | | | | | |
| | | | | | | | | Inception
date | | | Expenses (%) | |
| Share class | | Ticker | | | CUSIP | | | Gross | | | Net | |
| Advisor (A) | | | BAEMX | | | | 09658W824 | | | | 5/27/2014 | | | | 1.50 | | | | 1.40 | |
| Institutional (I) | | | MIEMX | | | | 09658L489 | | | | 12/22/2008 | | | | 1.25 | | | | 1.15 | |
The above expense ratios are from the Funds’ Prospectus dated December 27, 2019, and are inclusive of Acquired Fund Fees and Expenses. See Note 6 in the Notes to Financial Statements for additional information. Net expense ratios reflect contractual fee waivers and/or expense reimbursements if applicable, made by BMO Asset Management Corp., the investment adviser (Adviser). The Adviser may not terminate these fee waivers and/or expense reimbursements prior to December 31, 2021 without the consent of the Board of Directors, unless the investment advisory agreement is terminated. Without these contractual waivers, the Fund’s returns would have been lower.
| | | | |
Portfolio sector allocation | |
| Sector | | Fund (%) | |
| Communication Services | | | 4.3 | |
| Consumer Discretionary | | | 9.4 | |
| Consumer Staples | | | 32.1 | |
| Energy | | | 2.4 | |
| Financials | | | 25.8 | |
| Healthcare | | | 1.0 | |
| Industrials | | | 2.9 | |
| Information Technology | | | 15.7 | |
| Consumer Staples | | | 2.2 | |
| Other Assets & Liabilities, Net | | | 4.2 | |
| Total | | | 100.0 | |
Portfolio composition will change due to the ongoing management of the Fund. The percentages are based on net assets as of August 31, 2020 and may not necessarily reflect adjustments that are routinely made when presenting net assets for formal financial statement processes.
Growth of an assumed $10,000 investment
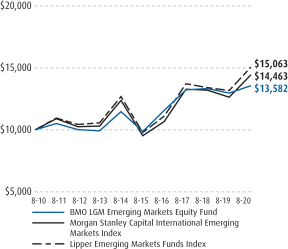
See Explanation of the Indices and Notes in the Commentary for additional information. The above graph relates to the Institutional Class shares of the Fund. Performance for the Advisor Class shares will vary from the performance of the Institutional Class shares shown above due to differences in charges and expenses. This graph illustrates the hypothetical investment of $10,000 in the Institutional Class shares of the Fund from the lesser of the Fund’s inception date or August 31, 2010 to August 31, 2020.
13
| | |
| | |
| Annual Report | | BMO Ultra Short Tax-Free Fund |
| | | | | | | | | | | | | | | | |
Average annual total returns (%) | |
| | | 1-Year | | | 5-Years | | | 10-Years | | | Since
Inception | |
| Advisor Class (A) NAV | | | 1.06 | | | | 0.99 | | | | — | | | | 0.85 | |
| Advisor Class (A) OFFER | | | (1.00 | ) | | | 0.57 | | | | — | | | | 0.52 | |
| Institutional Class (I) | | | 1.21 | | | | 1.22 | | | | 1.17 | | | | 1.26 | |
| Blended Index (50% Bloomberg Barclays 1 Year Municipal Bond Index and 50% iMoneyNet, Inc. Money Market Fund Tax-Free National Retail Index) | | | 1.29 | | | | 0.99 | | | | 0.71 | | | | 0.74 | |
| Lipper Short Municipal Debt Funds Index | | | 1.49 | | | | 1.36 | | | | 1.21 | | | | 1.21 | |
| * | Benchmarks since inception reflect the inception date of the Institutional Class. |
The performance data quoted represents past performance which is no guarantee of future results. Investment return and principal value will fluctuate so that an investor’s shares, when redeemed, may be worth more or less than their original costs. Mutual fund performance changes over time and current performance may be lower or higher than what is stated. To receive current performance to the most recent month-end, please call 1-800-236-3863 or visit www.bmofunds.com.
Commentary
The BMO Ultra Short Tax-Free Fund returned 1.21% for the fiscal year ended August 31, 2020 versus the blended (50% Bloomberg Barclays 1 Year Muni Bond Index and 50% iMoneyNet Money Fund Tax Free National Retail Index) and the Lipper Short Municipal Debt Funds Index, which returned 1.29% and 1.49%, respectively.
The fiscal year began with the U.S. in a slow but steady economic expansion with municipal bonds performing solidly in an environment of limited supply and historically strong industry inflows. Everything was turned on its head starting in Q1 2020 with the arrival of the global pandemic, resulting in personal tragedies and economic fallout across the U.S. In March, municipal bond volatility reached levels not seen since the early 1980’s as investors rushed to the exits seeking the safety of cash. Fortunately, the U.S. Federal Reserve (the Fed) and the Treasury Department reinstituted programs used during the Global Financial Crisis and created some new ones, such as the Municipal Liquidity Facility (MLF), to help the financial markets stabilize and ultimately recover in late spring.
Sadly, the pandemic continues, but swift and massive monetary and fiscal interventions allowed the municipal market to rally into fiscal year-end. Despite the negative returns seen in the first quarter of 2020, municipal bond returns ended the fiscal year up 3% for the trailing one-year period (Bloomberg Barclays Municipal Bond Index). We believe the Fed, and to some extent Congress, will continue to support the U.S. economy until more effective treatments to combat the virus emerge.
The Fund was defensively positioned for most of the fiscal year, maintaining both overall credit quality and a slightly shorter duration relative to the benchmark. This conservative stance hindered performance during the non-pandemic portion of the fiscal year, but aided performance during the March liquidity crunch. The Fund’s floating rate exposure also helped relative performance during the fiscal year, along with security selection in the 2-4 year portion of the yield curve.
The Fund has gradually added a bit of duration since the spring with the front end of the yield curve remaining extremely flat and the Fed likely to remain accommodative for the foreseeable future, while the U.S. economy rebounds from the pandemic-led recession in the months ahead.
Fund Managers; Investment Experience
Thomas Byron; since 1981
Brian Sipich, CFA; since 1998
Robert Wimmel; since 1992
| | | | | | | | | | | | | | | | | | | | |
| | | | | | | | | Inception
date | | | Expenses (%) | |
| Share class | | Ticker | | | CUSIP | | | Gross | | | Net | |
| Advisor | | | BAUSX | | | | 09658W790 | | | | 5/27/2014 | | | | 0.62 | | | | 0.55 | |
| Institutional | | | MUISX | | | | 09658L539 | | | | 9/30/2009 | | | | 0.37 | | | | 0.30 | |
The above expense ratios are from the Funds’ Prospectus dated December 27, 2019, and are inclusive of Acquired Fund Fees and Expenses. See Note 6 in the Notes to Financial Statements for additional information. Net expense ratios reflect contractual fee waivers and/or expense reimbursements if applicable, made by BMO Asset Management Corp., the investment adviser (Adviser). The Adviser may not terminate these fee waivers and/or expense reimbursements prior to December 31, 2021 without the consent of the Board of Directors, unless the investment advisory agreement is terminated. Without these contractual waivers, the Fund’s returns would have been lower.
| | | | |
Municipal Issuance/Industry Type | |
| Issuance/Industry | | Fund (%) | |
| General Obligation — 16.0% | | | | |
School District | | | 5.8 | |
State or Local | | | 10.2 | |
| Revenue Bonds — 78.4% | | | | |
Appropriation | | | 16.2 | |
Education | | | 4.9 | |
General Revenue | | | 2.3 | |
Health Care | | | 15.1 | |
Housing | | | 5.8 | |
Industrial Revenue | | | 7.0 | |
Power | | | 5.0 | |
Special Tax | | | 6.1 | |
State or Local | | | 0.4 | |
Student Loan | | | 0.2 | |
Tobacco | | | 0.1 | |
Transportation | | | 10.4 | |
Water & Sewer | | | 4.9 | |
| Other Assets & Liabilities, Net | | | 5.6 | |
| Total | | | 100.0 | |
Portfolio composition will change due to the ongoing management of the Fund. The percentages are based on net assets as of August 31, 2020 and may not necessarily reflect adjustments that are routinely made when presenting net assets for formal financial statement processes.
Growth of an assumed $10,000 investment
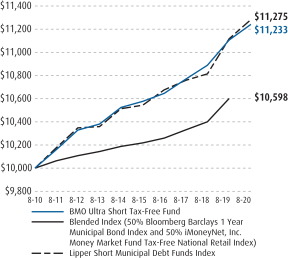
See Explanation of the Indices and Notes in the Commentary for additional information. The above graph relates to the Institutional Class shares of the Fund. Performance for the Advisor Class shares will vary from the performance of the Institutional Class shares shown above due to differences in charges and expenses. This graph illustrates the hypothetical investment of $10,000 in the Institutional Class shares of the Fund from the lesser of the Fund’s inception date or August 31, 2010 to August 31, 20120
14
| | |
| | |
| Annual Report | | BMO Short Tax-Free Fund |
| | | | | | | | | | | | |
Average annual total returns (%) | |
| | | 1-Year | | | 5-Years | | | Since
Inception | |
| Advisor Class (A) NAV | | | 1.73 | | | | 1.64 | | | | 1.61 | |
| Advisor Class (A) OFFER | | | (0.30 | ) | | | 1.23 | | | | 1.28 | |
| Institutional Class (I) | | | 1.88 | | | | 1.81 | | | | 1.92 | |
| Bloomberg Barclays Short (1-5 Year) Municipal Index | | | 2.72 | | | | 1.97 | | | | 1.69 | |
| Lipper Short Municipal Debt Funds Index | | | 1.49 | | | | 1.36 | | | | 1.07 | |
| * | Benchmarks since inception reflect the inception date of the Institutional Class. |
The performance data quoted represents past performance which is no guarantee of future results. Investment return and principal value will fluctuate so that an investor’s shares, when redeemed, may be worth more or less than their original costs. Mutual fund performance changes over time and current performance may be lower or higher than what is stated. To receive current performance to the most recent month-end, please call 1-800-236-3863 or visit www.bmofunds.com.
Commentary
The BMO Short Tax-Free Fund returned 1.88% for the fiscal year ended August 31, 2020 versus the Bloomberg Barclays Muni Short 1-5 Year Index and the Lipper Short Municipal Debt Funds Index, which returned 2.72% and 1.49%, respectively.
The fiscal year began with the U.S. in a slow but steady economic expansion with municipal bonds performing solidly in an environment of limited supply and historically strong industry inflows. Everything was turned on its head starting in Q1 2020 with the arrival of the global pandemic resulting in personal tragedies and economic fallout across the U.S. In March, municipal bond volatility reached levels not seen since the early 1980’s as investors rushed to the exits seeking the safety of cash. Fortunately, the U.S. Federal Reserve (the Fed) and the Treasury Department reinstituted programs used during the Global Financial Crisis and created some new ones, such as the Municipal Liquidity Facility (MLF), to help the financial markets stabilize and ultimately recover in late spring.
Sadly, the pandemic continues, but swift and massive monetary and fiscal interventions allowed the municipal market to rally into fiscal year-end. Despite the negative returns seen in the first quarter of 2020, municipal bond returns ended the fiscal year up 3% for the trailing one-year period (Bloomberg Barclays Municipal Bond Index). We believe the Fed, and to some extent Congress, will continue to support the U.S. economy until more effective treatments to combat the virus emerge.
The Fund was positioned for a continued economic expansion when the pandemic hit, including an overweight of the lower investment grade credit tiers relative to the benchmark as well as a preference for bonds in higher income sectors such as Health Care and Transportation. While the Fund’s duration was just slightly shorter than neutral for much of the fiscal year, which helped relative performance somewhat during the Covid-sparked selloff, the Fund’s exposure to Hospital credits and the 4-6 year portion the yield curve served as performance headwinds during the fiscal year. Fortunately, the Fund took advantage of the temporary price dislocations in March and April, adding to the portfolio’s yield. The additional yield, plus price appreciation of many securities over the final quarter of the fiscal year, had relative performance on a positive trajectory as the year concluded.
We continue to believe maintaining more credit exposure relative to the benchmark will reward shareholders as the Fed is likely to remain accommodative for the foreseeable future, while the U.S. economy rebounds from the pandemic-led recession in the months ahead.
Fund Managers; Investment Experience
Thomas Byron; since 1981
Brian Sipich, CFA; since 1998
Robert Wimmel; since 1992
| | | | | | | | | | | | | | | | | | | | |
| | | | | | | | | Inception
date | | | Expenses (%) | |
| Share class | | Ticker | | | CUSIP | | | Gross | | | Net | |
| Advisor (A) | | | BAUSX | | | | 09658W782 | | | | 5/27/2014 | | | | 0.72 | | | | 0.55 | |
| Institutional (I) | | | MUISX | | | | 09658L646 | | | | 11/29/2012 | | | | 0.47 | | | | 0.40 | |
The above expense ratios are from the Funds’ Prospectus dated April 1, 2019, and are inclusive of Acquired Fund Fees and Expenses. See Note 6 in the Notes to Financial Statements for additional information. Net expense ratios reflect contractual fee waivers and/or expense reimbursements if applicable, made by BMO Asset Management Corp., the investment adviser (Adviser). The Adviser may not terminate these fee waivers and/or expense reimbursements prior to December 31, 2020 without the consent of the Board of Directors, unless the investment advisory agreement is terminated. Without these contractual waivers, the Fund’s returns would have been lower.
| | | | |
Municipal Issuance/Industry Type | |
| Issuance/Industry | | Fund (%) | |
| General Obligation — 12.8% | | | | |
School District | | | 3.0 | |
State or Local | | | 9.8 | |
| Revenue Bonds — 86.5% | | | | |
Appropriation | | | 22.5 | |
Education | | | 4.5 | |
Health Care | | | 27.2 | |
Housing | | | 4.9 | |
Industrial Revenue | | | 1.2 | |
Power | | | 4.0 | |
Special Tax | | | 4.8 | |
Tobacco | | | 4.3 | |
Transportation | | | 7.1 | |
Water & Sewer | | | 6.0 | |
| Other Assets & Liabilities, Net | | | 0.7 | |
| Total | | | 100.0 | |
Portfolio composition will change due to the ongoing management of the Fund. The percentages are based on net assets as of August 31, 2020 and may not necessarily reflect adjustments that are routinely made when presenting net assets for formal financial statement processes.
Growth of an assumed $10,000 investment
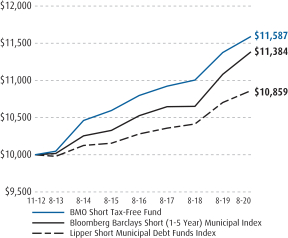
See Explanation of the Indices and Notes in the Commentary for additional information. The above graph relates to the Institutional Class shares of the Fund. Performance for the Advisor Class shares will vary from the performance of the Institutional Class shares shown above due to differences in charges and expenses. This graph illustrates the hypothetical investment of $10,000 in the Institutional Class shares of the Fund from the lesser of the Fund’s inception date or August 31, 2010 to August 31, 2020
15
| | |
| | |
| Annual Report | | BMO Short-Term Income Fund |
| | | | | | | | | | | | | | | | |
Average annual total returns (%) | |
| | | 1-Year | | | 5-Years | | | 10-Years | | | Since
Inception | |
| Advisor Class (A) NAV | | | 3.09 | | | | 2.26 | | | | — | | | | 1.88 | |
| Advisor Class (A) OFFER | | | 1.06 | | | | 1.84 | | | | — | | | | 1.56 | |
| Institutional Class (I) | | | 3.35 | | | | 2.51 | | | | 2.26 | | | | 2.97 | |
| Lipper Short Investment-Grade Debt Funds Index | | | 3.80 | | | | 2.50 | | | | 2.06 | | | | 2.06 | |
| Bank of America Merrill Lynch 1-3 Year U.S. Government/Corporate Index | | | 3.67 | | | | 2.17 | | | | 1.63 | | | | 1.63 | |
| * | Benchmarks since inception reflect the inception date of the Institutional Class. |
The performance data quoted represents past performance which is no guarantee of future results. Investment return and principal value will fluctuate so that an investor’s shares, when redeemed, may be worth more or less than their original costs. Mutual fund performance changes over time and current performance may be lower or higher than what is stated. To receive current performance to the most recent month-end, please call 1-800-236-3863 or visit www.bmofunds.com.
Commentary
The BMO Short-Term Income Fund (the Fund) returned 3.35% for the fiscal year ended August 31, 2020 versus the Bank of America Merrill Lynch 1-3 Year U.S. Government/Corporate Index and the Lipper Short Investment-Grade Debt Funds Index, which returned 3.67% and 3.80%, respectively.
The most significant episode affecting the marketplace over the past twelve months was an exogenous shock that brought the global economy to a near full-stop in March and April of this year. As uncertainty about the depth of economic disruption from Covid-19 rose in early 2020, liquidity and access to credit were frozen, leaving markets largely non-functional. By May, the combination of lower interest rates and a gradual return of confidence sent investors in search of incremental yield. Thanks to this surge in demand, by the end of July, bond spreads had tightened nearly all the way back to “pre-COVID” levels.
Over the last 12 months, the Federal Reserve (the Fed) lowered the overnight interest rate four times, including 25 basis point declines at meetings in September and October 2019, in what the Fed termed as a “mid-cycle adjustment”. Further, the Fed responded to heightened market concerns in early 2020 by slashing the overnight rate 150 basis points to a range of 0-0.25%; a rate last seen in the wake of the 2008/2009 financial crisis. A direct result of the Fed’s action was that interest rates in the front-end of the curve declined dramatically and the shape of the curve steepened.
Regarding Fund attribution, sector selection/allocation was the dominant factor affecting performance, both positively and negatively. For three of the four most recent quarters, an overweight exposure to the spread sectors (Corporate and Asset-Backed (ABS)), as compared to the benchmark index, was extremely positive as high demand and spread tightening resulted in outperformance. Amid the extreme market unease resulting from “pandemic” concerns, the U.S. Government sector far outperformed all others in the first three months of 2020 as investors poured into “safe haven” assets and the associated spreads on Corporate/ABS securities widened exponentially.
Despite the general acceptance that interest rates will remain exceptionally low for the near term; projections for the front-end, fixed income markets will be dynamic and subject to fluctuations. With the belief that demand will remain strong, we continue to favor an overweight, but tempered, bias to the spread sectors, particularly in corporate and securitized issues. Thanks to looming uncertainties (COVID, election results, etc.); immediate access to liquidity will remain a focal point.
Fund Managers; Investment Experience
Peter J. Arts; since 1992
Boyd R. Eager; since 1997
Don McConnell; since 1995
| | | | | | | | | | | | | | | | | | | | |
| | | | | | | | | Inception
date | | | Expenses (%) | |
| Share class | | Ticker | | | CUSIP | | | Gross | | | Net | |
| Advisor (A) | | | BTMAX | | | | 09658W774 | | | | 5/27/2014 | | | | 0.70 | | | | 0.60 | |
| Institutional (I) | | | MSIFX | | | | 09658L570 | | | | 5/31/2007 | | | | 0.45 | | | | 0.35 | |
The above expense ratios are from the Funds’ Prospectus dated December 27, 2019, and are inclusive of Acquired Fund Fees and Expenses. See Note 6 in the Notes to Financial Statements for additional information. Net expense ratios reflect contractual fee waivers and/or expense reimbursements if applicable, made by BMO Asset Management Corp., the investment adviser (Adviser). The Adviser may not terminate these fee waivers and/or expense reimbursements prior to December 31, 2021 without the consent of the Board of Directors, unless the investment advisory agreement is terminated. Without these contractual waivers, the Fund’s returns would have been lower.
| | | | |
Portfolio sector allocation | |
| Sector | | Fund (%) | |
| Asset-Backed Securities | | | 15.2 | |
| Collateralized Mortgage Obligations | | | 3.8 | |
| Commercial Mortgage Securities | | | 4.5 | |
| Corporate Bonds & Notes | | | 51.3 | |
| U.S. Government & U.S. Government Agency Obligations | | | 17.7 | |
| U.S. Government Agency-Mortgage Securities | | | 2.2 | |
| Other Assets & Liabilities, Net | | | 5.3 | |
| Total | | | 100.0 | |
Portfolio composition will change due to the ongoing management of the Fund. The percentages are based on net assets as of August 31, 2020 and may not necessarily reflect adjustments that are routinely made when presenting net assets for formal financial statement processes.
Growth of an assumed $10,000 investment
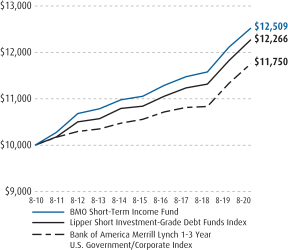
See Explanation of the Indices and Notes in the Commentary for additional information. The above graph relates to the Institutional Class shares of the Fund. Performance for the Advisor Class shares will vary from the performance of the Institutional Class shares shown above due to differences in charges and expenses. This graph illustrates the hypothetical investment of $10,000 in the Institutional Class shares of the Fund from the lesser of the Fund’s inception date or August 31, 2010 to August 31, 20120
16
| | |
| | |
| Annual Report | | BMO Intermediate Tax-Free Fund |
| | | | | | | | | | | | | | | | |
Average annual total returns (%) | |
| | | 1-Year | | | 5-Years | | | 10-Years | | | Since
Inception | |
| Investor Class (Y) | | | 1.78 | | | | 3.11 | | | | 3.42 | | | | 4.29 | |
| Advisor Class (A) NAV | | | 1.78 | | | | 3.11 | | | | — | | | | 3.10 | |
| Advisor Class (A) OFFER | | | (1.77 | ) | | | 2.37 | | | | — | | | | 2.52 | |
| Institutional Class (I) | | | 2.02 | | | | 3.35 | | | | — | | | | 4.10 | |
| Bloomberg Barclays 1-15 Year Blend Municipal Bond Index | | | 3.26 | | | | 3.48 | | | | 3.37 | | | | 3.37 | |
| Lipper Intermediate Municipal Debt Funds Index | | | 2.50 | | | | 3.27 | | | | 3.17 | | | | 3.17 | |
| * | Benchmarks since inception reflect the inception date of the Institutional Class. |
The performance data quoted represents past performance which is no guarantee of future results. Investment return and principal value will fluctuate so that an investor’s shares, when redeemed, may be worth more or less than their original costs. Mutual fund performance changes over time and current performance may be lower or higher than what is stated. To receive current performance to the most recent month-end, please call 1-800-236-3863 or visit www.bmofunds.com.
Commentary
The BMO Intermediate Tax-Free Fund (the Fund) returned 2.02% for the fiscal year ended August 31, 2020 versus the Bloomberg Barclays 1-15 Year Muni Blend Index and the Lipper Intermediate Municipal Debt Funds Index, which returned 3.26% and 2.50%, respectively.
The fiscal year began with the U.S. in a slow but steady economic expansion with municipal bonds performing solidly in an environment of limited supply and historically strong industry inflows. Everything was turned on its head starting in Q1 2020 with the arrival of the global pandemic resulting in personal tragedies and economic fallout across the U.S. In March, municipal bond volatility reached levels not seen since the early 1980’s as investors rushed to the exits seeking the safety of cash. Fortunately, the U.S. Federal Reserve (the Fed) and the Treasury Department reinstituted programs used during the Global Financial Crisis and created some new ones, such as the Municipal Liquidity Facility (MLF), to help the financial markets stabilize and ultimately recover in late spring.
Sadly, the pandemic continues, but swift and massive monetary and fiscal interventions allowed the municipal market to rally into fiscal year-end. Despite the negative returns seen in the first quarter of 2020, municipal bond returns ended the fiscal year up 3% for the trailing one-year period (Bloomberg Barclays Municipal Bond Index). We believe the Fed, and to some extent Congress, will continue to support the U.S. economy until more effective treatments to combat the virus emerge.
The Fund was positioned for a continued economic expansion when the pandemic hit, including an overweight of the lower investment grade credit tiers relative to the benchmark as well as a preference for bonds in higher income sectors such as Health Care and Transportation. While the Fund’s duration was just slightly longer than neutral for much of the fiscal year, exposure to the long end of the yield curve hindered performance during the selloff. Fortunately, the Fund took advantage of the temporary price dislocations in March and April, adding to the portfolio’s yield. The additional yield, plus price appreciation of many securities over the final quarter of the fiscal year, including many longer maturities, had relative performance on a positive trajectory as the year concluded.
Looking ahead, we believe maintaining credit exposure and a slightly longer duration relative to the benchmark will reward shareholders, as the Fed is likely to remain accommodative for the foreseeable future, while the U.S. economy rebounds from the pandemic-led recession in the months ahead.
Fund Managers; Investment Experience
Thomas Byron; since 1981
Brian Sipich, CFA; since 1998
Robert Wimmel; since 1992
| | | | | | | | | | | | | | | | | | | | |
| | | | | | | | | Inception
date | | | Expenses (%) | |
| Share class | | Ticker | | | CUSIP | | | Gross | | | Net | |
| Investor (Y) | | | MITFX | | | | 09658L760 | | | | 2/01/1994 | | | | 0.55 | | | | 0.54 | |
| Advisor (A) | | | BITAX | | | | 09658W766 | | | | 5/27/2014 | | | | 0.55 | | | | 0.54 | |
| Institutional (I) | | | MIITX | | | | 09658L778 | | | | 12/27/2010 | | | | 0.30 | | | | 0.30 | |
The above expense ratios are from the Funds’ Prospectus dated December 27, 2019, and are inclusive of Acquired Fund Fees and Expenses. See Note 6 in the Notes to Financial Statements for additional information. Net expense ratios reflect contractual fee waivers and/or expense reimbursements if applicable, made by BMO Asset Management Corp., the investment adviser (Adviser). The Adviser may not terminate these fee waivers and/or expense reimbursements prior to December 31, 2021 without the consent of the Board of Directors, unless the investment advisory agreement is terminated. Without these contractual waivers, the Fund’s returns would have been lower.
| | | | |
Municipal Issuance/ Industry Type | |
| Issuance/Industry | | Fund (%) | |
| General Obligation — 19.5% | | | | |
School District | | | 8.9 | |
State or Local | | | 10.6 | |
| Revenue Bonds — 79.1% | | | | |
Appropriation | | | 20.7 | |
Education | | | 8.4 | |
General Revenue | | | 0.6 | |
Health Care | | | 19.4 | |
Housing | | | 4.1 | |
Industrial Revenue | | | 0.2 | |
Power | | | 1.8 | |
Special Tax | | | 2.5 | |
Student Loan | | | 0.3 | |
Tobacco | | | 1.4 | |
Transportation | | | 13.5 | |
Water & Sewer | | | 6.2 | |
| Other Assets & Liabilities, Net | | | 1.4 | |
| Total | | | 100.0 | |
Portfolio composition will change due to the ongoing management of the Fund. The percentages are based on net assets as of August 31, 2020 and may not necessarily reflect adjustments that are routinely made when presenting net assets for formal financial statement processes.
Growth of an assumed $10,000 investment
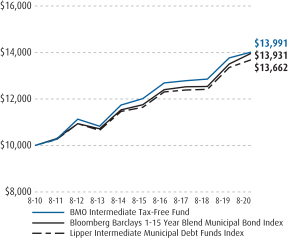
See Explanation of the Indices and Notes in the Commentary for additional information. The above graph relates to the Investor Class shares of the Fund. Performance for the Advisor Class and Institutional Class shares will vary from the performance of the Investor Class shares shown above due to differences in charges and expenses. This graph illustrates the hypothetical investment of $10,000 in the Investor Class shares of the Fund from the lesser of the Fund’s inception date or August 31, 2010 to August 31, 2020.
17
| | |
| | |
| Annual Report | | BMO Strategic Income Fund |
| | | | | | | | | | | | | | | | |
Average annual total returns (%) | |
| | | 1-Year | | | 5-Years | | | 10-Years | | | Since
Inception | |
| Investor Class (Y) | | | 7.24 | | | | 4.79 | | | | 3.70 | | | | 5.02 | |
| Advisor Class (A) NAV | | | 7.24 | | | | 4.79 | | | | — | | | | 4.33 | |
| Advisor Class (A) OFFER | | | 3.52 | | | | 4.04 | | | | — | | | | 3.74 | |
| Institutional Class (I) | | | 7.51 | | | | 5.03 | | | | 3.96 | | | | 4.86 | |
| Bloomberg Barclays U.S. Aggregate Bond Index* | | | 6.47 | | | | 4.33 | | | | 3.65 | | | | 3.65 | |
| Lipper Multi-Sector Funds Index | | | 4.19 | | | | 4.48 | | | | 4.59 | | | | 4.59 | |
| * | Benchmarks since inception reflect the inception date of the Institutional Class. |
The performance data quoted represents past performance which is no guarantee of future results. Investment return and principal value will fluctuate so that an investor’s shares, when redeemed, may be worth more or less than their original costs. Mutual fund performance changes over time and current performance may be lower or higher than what is stated. To receive current performance to the most recent month-end, please call 1-800-236-3863 or visit www.bmofunds.com.
Commentary
The BMO Strategic Income Fund (the Fund) returned 7.51% for the fiscal year ended August 31, 2020 versus the Bloomberg Barclays U.S. Aggregate Bond Index and the Lipper Multi-Sector Income Funds Index, which returned 6.47% and 4.19%, respectively.
The Fund delivered strong absolute returns and outperformed its benchmark and peer group in the period. The Fund benefited from receipt of litigation settlement proceeds which added to performance. The sharp decline in interest rates on the U.S. Treasury, which fell from 2% at the end of August 2019, to 1% at the end of August 2020, drove the higher than expected returns in the bond market. In this environment, Treasuries returned 7% for the period. The Fund’s below benchmark duration reduced relative returns given the magnitude of decline in rates during the period.
Individual security selection within corporate credit was a positive factor for performance in the period; in particular, selection within the Pharmaceuticals, Communications and Other Financials sectors added to returns, while selection within the Energy, REIT and Airline sectors detracted from returns.
The Fund’s significant yield advantage versus the benchmark contributed additional income during the period, increasing overall returns. Sector allocations to investment grade credit (-67 basis points of excess return) and emerging market debt (-152 bps) detracted from returns. Within investment grade, the overweight to lower quality investment grade (BBB -123 bps) reduced returns. High yield securities (-15 bps) outperformed investment grade, credit securities. High quality, high yield securities (BB +340 bps) were the top performing high yield quality segment. Allocations to securitized products reduced relative returns from underweight positioning in MBS (+52 bps) and overweight positioning in CMBS (-128 bps).
Looking forward, our view is U.S. fixed income sectors, particularly non-governmental sectors, appear attractive, even noting the recompression of spreads since the first quarter in a landscape of improved risk sentiment and strong demand for yield. While U.S. corporates have retraced a significant portion of their year to date widening, other sectors and asset classes have gone further, leaving corporates relatively well positioned. With global government yields as low as they are, demand for income is strong. Furthermore, we expect recent U.S. monetary policy to remain accommodating for a prolonged period. While some economic data such as economic growth is expected to improve, other data such as employment figures remain challenged, highlighting the remaining uncertainty. On balance, these factors suggest a favorable outlook for the sector, but one with potential for volatility.
Fund Managers; Investment Experience
Scott M. Kimball, CFA; since 2004
Frank J. Reda, CMT; since 2001
| | | | | | | | | | | | | | | | | | | | |
| | | | | | | | | Inception
date | | | Expenses (%) | |
| Share class | | Ticker | | | CUSIP | | | Gross | | | Net | |
| Investor (Y) | | | MRGIX | | | | 09658L810 | | | | 12/13/1992 | | | | 0.96 | | | | 0.80 | |
| Advisor (A) | | | BMTAX | | | | 09658W758 | | | | 5/27/2014 | | | | 0.96 | | | | 0.80 | |
| Institutional (I) | | | MGIIX | | | | 09658L828 | | | | 5/31/2007 | | | | 0.71 | | | | 0.55 | |
The above expense ratios are from the Funds’ Prospectus dated December 27, 2019, and are inclusive of Acquired Fund Fees and Expenses. See Note 6 in the Notes to Financial Statements for additional information. Net expense ratios reflect contractual fee waivers and/or expense reimbursements if applicable, made by BMO Asset Management Corp., the investment adviser (Adviser). The Adviser may not terminate these fee waivers and/or expense reimbursements prior to December 31, 2021 without the consent of the Board of Directors, unless the investment advisory agreement is terminated. Without these contractual waivers, the Fund’s returns would have been lower.
| | | | |
Portfolio sector allocation | |
| Sector | | Fund (%) | |
| Asset-Backed Securities | | | 0.2 | |
| Collateralized Mortgage Obligations | | | 10.9 | |
| Commercial Mortgage Securities | | | 4.3 | |
| Corporate Bonds & Notes | | | 79.9 | |
| U.S. Government Agency-Mortgage Securities | | | 2.3 | |
| Other Assets & Liabilities, Net | | | 2.4 | |
| Total | | | 100.0 | |
Portfolio composition will change due to the ongoing management of the Fund. The percentages are based on net assets as of August 31, 2020 and may not necessarily reflect adjustments that are routinely made when presenting net assets for formal financial statement processes.
Growth of an assumed $10,000 investment
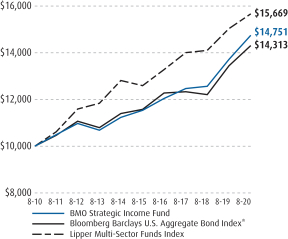
See Explanation of the Indices and Notes in the Commentary for additional information. The above graph relates to the Institutional Class shares of the Fund. Performance for the Investor Class and Advisor Class shares will vary from the performance of the Institutional Class shares shown above due to differences in charges and expenses. This graph illustrates the hypothetical investment of $10,000 in the Institutional Class shares of the Fund from the lesser of the Fund’s inception date or August 31, 2010 to August 31, 2020.
18
| | |
| | |
| Annual Report | | BMO Corporate Income Fund |
| | | | | | | | | | | | | | | | |
Average annual total returns (%) | |
| | | 1-Year | | | 5-Years | | | 10-Years | | | Since
Inception | |
| Investor Class (Y) | | | 7.86 | | | | 6.69 | | | | 5.80 | | | | 7.69 | |
| Advisor Class (A) NAV | | | 7.86 | | | | 6.69 | | | | — | | | | 5.18 | |
| Advisor Class (A) OFFER | | | 4.04 | | | | 5.93 | | | | — | | | | 4.58 | |
| Institutional Class (I) | | | 7.98 | | | | 6.83 | | | | 5.95 | | | | 7.86 | |
| Bloomberg Barclays U.S. Credit Index | | | 7.10 | | | | 5.91 | | | | 5.01 | | | | 5.01 | |
| Lipper Corporate Debt Funds BBB-Rated Index | | | 5.63 | | | | 5.81 | | | | 5.19 | | | | 5.19 | |
| * | Benchmarks since inception reflect the inception date of the Institutional Class. |
The performance data quoted represents past performance which is no guarantee of future results. Investment return and principal value will fluctuate so that an investor’s shares, when redeemed, may be worth more or less than their original costs. Mutual fund performance changes over time and current performance may be lower or higher than what is stated. To receive current performance to the most recent month-end, please call 1-800-236-3863 or visit www.bmofunds.com.
Commentary
The BMO Corporate Income Fund (the Fund) returned 7.98% for the fiscal year ended August 31, 2020 versus the Bloomberg Barclays U.S. Credit Index and the Lipper Corporate Debt Funds BBB-Rated Index, which returned 7.10% and 5.63%, respectively.
The Fund delivered strong absolute returns and outperformed its benchmark and peer group in the period. The sharp decline in interest rates on the U.S. Treasury, which fell from 2% at the end of August 2019, to 1% at the end of August 2020, drove the higher than expected returns in the bond market. In this environment, Treasuries returned 7% for the period.
Yield curve management was overall positive as the Fund entered the period with below benchmark duration, but converged to above benchmark duration prior to the March volatility, which added to relative performance as U.S. Treasury rates declined sharply during the period.
Individual security selection within corporate credit was a positive factor for performance in the period; in particular, selection within the Pharmaceuticals, Consumer Non-cyclicals and Diversified Manufacturing sectors added to returns, while selection within Energy and Insurance sectors detracted from returns.
Sector and quality selection was additive. For the majority of the time period, the Fund was underweight lower quality investment grade securities, which underperformed higher quality securities with BBB rated bonds underperforming overall credit by 56 basis points of excess return. The portfolio also had an allocation to high yield, which outperformed investment grade by 52 basis points of excess returns. During the significant spread widening in March, the Fund increased exposure to lower quality and high yield allocations to take advantage of the attractive spreads. The overweight to financial issuers (+85 bps excess returns) and underweight to utilities (-120 bps excess returns) contributed positively to returns.
Looking forward, our view is U.S. fixed income sectors, particularly non-governmental sectors, appear attractive, even noting the recompression of spreads since the first quarter in a landscape of improved risk sentiment and strong demand for yield. While U.S. corporates have retraced a significant portion of their year to date widening, other sectors and asset classes have gone further, leaving corporates relatively well positioned. With global government yields as low as they are, demand for income is strong. Furthermore, we expect recent U.S. monetary policy to remain accommodating for a prolonged period. While some economic data such as economic growth is expected to improve, other data such as employment figures remain challenged, highlighting the remaining uncertainty. On balance, these factors suggest a favorable outlook for the sector, but one with potential for volatility.
Investment Adviser:
BMO Asset Management Corp.
Fund Managers; Investment Experience
Scott M. Kimball, CFA; since 2004
Frank J. Reda, CMT; since 2001
| | | | | | | | | | | | | | | | | | | | |
| | | | | | | | | Inception
date | | | Expenses (%) | |
| Share class | | Ticker | | | CUSIP | | | Gross | | | Net | |
| Investor (Y) | | | MCIYX | | | | 09658L851 | | | | 12/22/2008 | | | | 0.67 | | | | 0.59 | |
| Advisor (A) | | | BATIX | | | | 09658W733 | | | | 5/27/2014 | | | | 0.67 | | | | 0.59 | |
| Institutional (I) | | | MCIIX | | | | 09658L869 | | | | 12/22/2008 | | | | 0.42 | | | | 0.42 | |
The above expense ratios are from the Funds’ Prospectus dated December 27, 2019, and are inclusive of Acquired Fund Fees and Expenses. See Note 6 in the Notes to Financial Statements for additional information. Net expense ratios reflect contractual fee waivers and/or expense reimbursements if applicable, made by BMO Asset Management Corp., the investment adviser (Adviser). The Adviser may not terminate these fee waivers and/or expense reimbursements prior to December 31, 2021 without the consent of the Board of Directors, unless the investment advisory agreement is terminated. Without these contractual waivers, the Fund’s returns would have been lower.
| | | | |
Portfolio sector allocation | |
| Sector | | Fund (%) | |
| Corporate Bonds & Notes | | | 95.3 | |
| Other Assets & Liabilities, Net | | | 4.7 | |
| Total | | | 100.0 | |
Portfolio composition will change due to the ongoing management of the
Fund. The percentages are based on net assets as of August 31, 2020 and
may not necessarily reflect adjustments that are routinely made when
presenting net assets for formal financial statement processes.
Growth of an assumed $10,000 investment
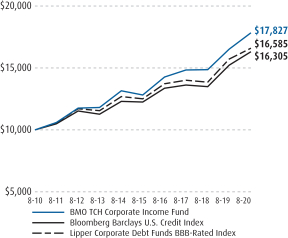
See Explanation of the Indices and Notes in the Commentary for additional information. The above graph relates to the Institutional Class shares of the Fund. Performance for the Investor Class and Advisor Class shares will vary from the performance of the Institutional Class shares shown above due to differences in charges and expenses. This graph illustrates the hypothetical investment of $10,000 in the Institutional Class shares of the Fund from the lesser of the Fund’s inception date or August 31, 2010 to August 31, 2020.
19
| | |
| | |
| Annual Report | | BMO Core Plus Bond Fund |
| | | | | | | | | | | | | | | | |
Average annual total returns (%) | |
| | | 1-Year | | | 5-Years | | | 10-Years | | | Since
Inception | |
| Investor Class (Y) | | | 6.49 | | | | 4.73 | | | | 4.58 | | | | 5.70 | |
| Advisor Class (A) NAV | | | 6.49 | | | | 4.73 | | | | — | | | | 3.85 | |
| Advisor Class (A) OFFER | | | 2.72 | | | | 4.00 | | | | — | | | | 3.26 | |
| Institutional Class (I) | | | 6.67 | | | | 4.98 | | | | 4.82 | | | | 5.95 | |
| Bloomberg Barclays U.S. Aggregate Bond Index | | | 6.47 | | | | 4.33 | | | | 3.65 | | | | 3.65 | |
| Lipper Core Plus Bond Funds Index | | | 6.38 | | | | 4.65 | | | | 4.26 | | | | 4.26 | |
| * | Benchmarks since inception reflect the inception date of the Institutional Class. |
The performance data quoted represents past performance which is no guarantee of future results. Investment return and principal value will fluctuate so that an investor’s shares, when redeemed, may be worth more or less than their original costs. Mutual fund performance changes over time and current performance may be lower or higher than what is stated. To receive current performance to the most recent month-end, please call 1-800-236-3863 or visit www.bmofunds.com.
Commentary
The BMO Core Plus Bond Fund (the Fund) returned 6.67% for the fiscal year ended August 31, 2020 versus the Bloomberg Barclays U.S. Aggregate Bond Index and the Lipper Core Plus Bond Funds Index, which returned 6.47% and 6.38%, respectively.
The Fund delivered strong absolute returns and outperformed its benchmark and peer group in the period. The sharp decline in interest rates on the U.S. Treasury, which fell from 2% at the end of August 2019, to 1% at the end of August 2020, drove the higher than expected returns in the bond market. In this environment, Treasuries returned 7% for the period.
Yield curve management was overall positive as the Fund entered the period with modestly below benchmark duration, but converged to benchmark prior to the March volatility, which added to relative performance as U.S. Treasury rates rose during the initial period before sharply declining during the first quarter of this year.
Individual security selection within corporate credit was a positive factor for performance in the period; in particular, selection within the Services, Brokerage, and Electronics sectors added to returns, while selection within Energy and Communications sectors detracted from returns.
Sector and quality selection was negative. The portfolio was overweight credit, which underperformed duration-matched Treasuries by 67 basis points as credit spreads widened during the period. Within credit, the Fund was overweight lower quality investment grade securities, which underperformed higher quality securities with BBB rated bonds underperforming overall credit by 56 basis points of excess return, though the portfolio also had an allocation to high yield, which outperformed investment grade by 52 basis points of excess returns. During the significant spread widening in March, the Fund increased exposure to credit and lower quality allocations to take advantage of the attractive spreads. The overweight to financial issuers (+85 bps excess returns) was additive to returns.
Looking forward, our view is U.S. fixed income sectors, particularly non-governmental sectors, appear attractive, even noting the recompression of spreads since the first quarter in a landscape of improved risk sentiment and strong demand for yield. While U.S. corporates have retraced a significant portion of their year to date widening, other sectors and asset classes have gone further, leaving corporates relatively well positioned. With global government yields as low as they are, demand for income is strong. Furthermore, we expect recent U.S. monetary policy to remain accommodating for a prolonged period. While some economic data such as economic growth is expected to improve, other data such as employment figures remain challenged, highlighting the remaining uncertainty. On balance, these factors suggest a favorable outlook for the sector, but one with potential for volatility.
Investment Adviser:
BMO Asset Management Corp.
Fund Managers; Investment Experience
Scott M. Kimball, CFA; since 2004
Frank J. Reda, CMT; since 2001
| | | | | | | | | | | | | | | | | | | | |
| | | | | | | | | Inception
date | | | Expenses (%) | |
| Share class | | Ticker | | | CUSIP | | | Gross | | | Net | |
| Investor (Y) | | | MCYBX | | | | 09658L877 | | | | 12/22/2008 | | | | 0.58 | | | | 0.58 | |
| Advisor (A) | | | BATCX | | | | 09658W725 | | | | 5/27/2014 | | | | 0.58 | | | | 0.58 | |
| Institutional (I) | | | MCBIX | | | | 09658L885 | | | | 2/22/2008 | | | | 0.33 | | | | 0.33 | |
The above expense ratios are from the Funds’ Prospectus dated December 27, 2019, and are inclusive of Acquired Fund Fees and Expenses. See Note 6 in the Notes to Financial Statements for additional information. Net expense ratios reflect contractual fee waivers and/or expense reimbursements if applicable, made by BMO Asset Management Corp., the investment adviser (Adviser). The Adviser may not terminate these fee waivers and/or expense reimbursements prior to December 31, 2021 without the consent of the Board of Directors, unless the investment advisory agreement is terminated. Without these contractual waivers, the Fund’s returns would have been lower.
| | | | |
Portfolio sector allocation | |
| Sector | | Fund (%) | |
| Asset-Backed Securities | | | 1.2 | |
| Collateralized Mortgage Obligations | | | 4.0 | |
| Commercial Mortgage Securities | | | 5.5 | |
| Corporate Bonds & Notes | | | 39.9 | |
| U.S. Government & U.S. Government Agency Obligations | | | 21.4 | |
| U.S. Government Agency-Mortgage Securities | | | 25.6 | |
| Other Assets & Liabilities, Net | | | 2.4 | |
| Total | | | 100.0 | |
Portfolio composition will change due to the ongoing management of the Fund. The percentages are based on net assets as of August 31, 2020 and may not necessarily reflect adjustments that are routinely made when presenting net assets for formal financial statement processes.
Growth of an assumed $10,000 investment
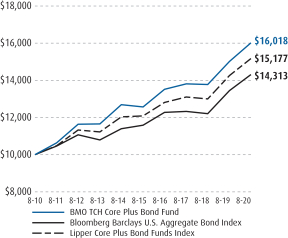
See Explanation of the Indices and Notes in the Commentary for additional information. The above graph relates to the Institutional Class shares of the Fund. Performance for the Investor Class and Advisor Class shares will vary from the performance of the Institutional Class shares shown above due to differences in charges and expenses. This graph illustrates the hypothetical investment of $10,000 in the Institutional Class shares of the Fund from the lesser of the Fund’s inception date or August 31, 2010 to August 31, 2020.
20
| | |
| | |
| Annual Report | | BMO Government Money Market Fund |
| | | | | | | | | | | | |
Average annual total returns (%) | |
| | | 1-Year | | | 5-Years | | | 10-Years | |
| Investor Class (Y) | | | 0.71 | | | | 0.78 | | | | 0.39 | |
| Premier Class | | | 0.86 | | | | 0.97 | | | | 0.49 | |
| iMoneyNet, Inc. Government Money Market Index | | | 0.78 | | | | 0.81 | | | | 0.41 | |
| Lipper U.S. Government Money Market Funds Index | | | 0.71 | | | | 0.75 | | | | 0.38 | |
The performance data quoted represents past performance which is no guarantee of future results. Investment return and principal value will fluctuate so that an investor’s shares, when redeemed, may be worth more or less than their original costs. Mutual fund performance changes over time and current performance may be lower or higher than what is stated. To receive current performance to the most recent month-end, please call 1-800-236-3863 or visit www.bmofunds.com.
An investment in the Fund is neither insured nor guaranteed by the Federal Deposit Insurance Corporation or any other government agency. Although the Fund seeks to preserve the value of your investment at $1.00 per share, it is possible to lose money by investing in the Fund.
Commentary
The BMO Government Money Market Fund (the Fund) returned 0.86% for the fiscal year-ended August 31, 2020 versus the iMoneyNet, Inc. Government Money Market Index and the Lipper Institutional U.S. Government Money Market Funds Index, which returned 0.78% and 0.71%, respectively.
The most significant event affecting the marketplace over the past twelve months was the exogenous shock of the COVID-19 pandemic. In March and April of 2020, in an effort to contain the spread of the virus, domestic and foreign economies were strategically shut down with exceptions made for businesses that were deemed “essential.” Market uncertainty about the depth of economic and societal disruption contributed to a large-scale liquidity freeze across the financial markets.
In response to the market upheaval, a heavy premium was placed on short dated, government securities. As investors fled riskier assets, a large influx of cash transitioned into Government money market funds. Floating rate securities indexed to Secured Overnight Financing Rate (SOFR) suffered increased liquidity pressure; consequently, spreads in these securities widened dramatically. Thanks to this “flight to quality”, significant supply and demand pressures in the U.S. Government markets began to take shape. At the peak of the unrest, negative yields in the Treasury bill market extended as far as December 2020. However, by May, large scale issuance in the Treasury bill market helped meet investor demand, and supported a normalizing of short-dated yields.
Over the last 12 months, the Federal Reserve (the Fed) lowered the overnight interest rate four times, including 25 basis point declines at meetings in September and October 2019, in what the Fed termed as a “mid-cycle adjustment”. Further, the Fed responded to heightened market concerns in early 2020 by slashing the overnight rate 150 basis points to a range of 0-0.25%; a rate last seen in the wake of the 2008/2009 financial crisis. The front-end of the yield curve has since flattened as all indications point to a near-zero interest rate environment remaining through 2021.
Thanks to the increase in issuance, the Fund was able to capture higher yields in Treasury bills, as compared to similarly dated Agency securities. Opportunistic investing in SOFR indexed Agency securities, was additive to performance and will remain a strategic focus moving forward. Over the course of the last year, the Fund provided a high level of daily liquidity, primarily through the use of government collateralized, overnight repurchase agreements and short-dated Treasury Bills, which is expected to continue.
Fund Managers; Investment Experience
Peter J. Arts; since 1992
Boyd R. Eager; since 1997
Robert Stapleton; since 2010
| | | | | | | | | | | | | | | | | | | | |
| | | | | | | | | Inception
date | | | Expenses (%) | |
| Share class | | Ticker | | | CUSIP | | | Gross | | | Net | |
| Investor (Y) | | | MGYXX | | | | 09658L786 | | | | 5/17/2004 | | | | 0.51 | | | | 0.46 | |
| Premier | | | MGNXX | | | | 09658L794 | | | | 5/28/2004 | | | | 0.26 | | | | 0.21 | |
The above expense ratios are from the Funds’ Prospectus dated December 27, 2019, and are inclusive of Acquired Fund Fees and Expenses. See Note 6 in the Notes to Financial Statements for additional information. Net expense ratios reflect contractual fee waivers and/or expense reimbursements if applicable, made by BMO Asset Management Corp., the investment adviser (Adviser). The Adviser may not terminate these fee waivers and/or expense reimbursements prior to December 31, 2021 without the consent of the Board of Directors, unless the investment advisory agreement is terminated. Without these contractual waivers, the Fund’s returns would have been lower.
| | | | |
Portfolio sector allocation | |
| Sector | | Fund (%) | |
| Mutual Funds | | | 4.4 | |
| Repurchase Agreements | | | 32.9 | |
| U.S. Government & U.S. Government Agency Obligations | | | 49.6 | |
| U.S. Treasury Bills | | | 14.4 | |
| Other Assets & Liabilities, Net | | | (1.3 | ) |
| Total | | | 100.0 | |
Portfolio composition will change due to the ongoing management of the Fund. The percentages are based on net assets as of August 31, 2020 and may not necessarily reflect adjustments that are routinely made when presenting net assets for formal financial statement processes.
Growth of an assumed $10,000 investment
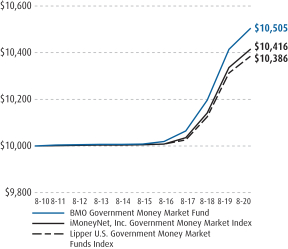
See Explanation of the Indices and Notes in the Commentary for additional information. The above graph relates to the Premier Class shares of the Fund. Performance for the Investor Class shares will vary from the performance of the Premier Class shares shown above due to differences in charges and expenses. This graph illustrates the hypothetical investment of $10,000 in the Premier Class shares of the Fund from the lesser of the Fund’s inception date or August 31, 2010 to August 31, 2020.
21
| | |
| | |
| Annual Report | | BMO Tax-Free Money Market Fund |
| | | | | | | | | | | | |
Average annual total returns (%) | |
| | | 1-Year | | | 5-Years | | | 10-Years | |
| Investor Class (Y) | | | 0.66 | | | | 0.62 | | | | 0.33 | |
| Premier Class | | | 0.91 | | | | 0.84 | | | | 0.50 | |
| iMoneyNet, Inc. Fund Report/Tax-Free National Retail Index | | | 0.70 | | | | 0.59 | | | | 0.30 | |
| Lipper Tax-Exempt Money Market Funds Index | | | 0.76 | | | | 0.66 | | | | 0.34 | |
The performance data quoted represents past performance which is no guarantee of future results. Investment return and principal value will fluctuate so that an investor’s shares, when redeemed, may be worth more or less than their original costs. Mutual fund performance changes over time and current performance may be lower or higher than what is stated. To receive current performance to the most recent month-end, please call 1-800-236-3863 or visit www.bmofunds.com.
An investment in the Fund is neither insured nor guaranteed by the Federal Deposit Insurance Corporation or any other government agency. Although the Fund seeks to preserve the value of your investment at $1.00 per share, it is possible to lose money by investing in the Fund.
Commentary
The BMO Tax-Free Money Market Fund returned 0.91% for the fiscal year ended August 31, 2020 versus the iMoneyNet Money Fund Report/Tax-Free National Index and the Lipper Tax-Exempt Money Market Index, which returned 0.70% and 0.76%, respectively.
The fiscal year began with the U.S. in a slow but steady economic expansion with municipal bonds performing solidly in an environment of limited supply and historically strong industry inflows. Everything was turned on its head starting in Q1 2020 with the arrival of the global pandemic resulting in personal tragedies and economic fallout across the U.S. In March, municipal bond volatility reached levels not seen since the early 1980s as investors rushed to the exits seeking the safety of cash. Fortunately, the U.S. Federal Reserve (the Fed) and the Treasury Department reinstituted programs used during the Global Financial Crisis and created some new ones, such as the Municipal Liquidity Facility (MLF), to help the financial markets stabilize and ultimately recover in late spring.
Sadly, the pandemic continues, but swift and massive monetary and fiscal interventions allowed the municipal market to rally into fiscal year-end. Despite the negative returns seen in the first quarter of 2020, municipal bond returns ended the fiscal year up 3% for the trailing one-year period (Bloomberg Barclays Municipal Bond Index). The Fund maintained a shorter duration than its peers and invested opportunistically in fixed rate bonds as short rates began to decline. Floating rate exposure decreased slightly over the course of the fiscal year.
We believe the Fed, and to some extent Congress, will continue to support the U.S. economy until more effective treatments to combat the virus emerge.
Fund Managers; Investment Experience
Thomas Byron; since 1981
Brian Sipich, CFA; since 1998
Robert Wimmel; since 1992
Michael Montgomery; since 2012
| | | | | | | | | | | | | | | | | | | | |
| | | | | | | | | Inception
date | | | Expenses (%) | |
| Share class | | Ticker | | | CUSIP | | | Gross | | | Net | |
| Investor (Y) | | | MTFXX | | | | 09658L547 | | | | 9/22/2004 | | | | 0.55 | | | | 0.45 | |
| Premier | | | MFIXX | | | | 09658L554 | | | | 6/29/2005 | | | | 0.30 | | | | 0.20 | |
The above expense ratios are from the Funds’ Prospectus dated December 27, 2019, and are inclusive of Acquired Fund Fees and Expenses. See Note 6 in the Notes to Financial Statements for additional information. Net expense ratios reflect contractual fee waivers and/or expense reimbursements if applicable, made by BMO Asset Management Corp., the investment adviser (Adviser). The Adviser may not terminate these fee waivers and/or expense reimbursements prior to December 31, 2021 without the consent of the Board of Directors, unless the investment advisory agreement is terminated. Without these contractual waivers, the Fund’s returns would have been lower.
| | | | |
Municipal Issuance/Industry Type | |
| Issuance/Industry | | Fund (%) | |
| General Obligation — 15.9% | |
School District | | | 0.8 | |
State or Local | | | 15.1 | |
| Revenue Bonds — 79.1% | |
Appropriation | | | 12.4 | |
Education | | | 7.4 | |
General Revenue | | | 2.0 | |
Health Care | | | 20.2 | |
Housing | | | 7.9 | |
Industrial Revenue | | | 2.8 | |
Special Tax | | | 11.2 | |
Transportation | | | 8.1 | |
Water & Sewer | | | 7.1 | |
| Other Assets & Liabilities, Net | | | 5.0 | |
| Total | | | 100.0 | |
Portfolio composition will change due to the ongoing management of the Fund. The percentages are based on net assets as of August 31, 2020 and may not necessarily reflect adjustments that are routinely made when presenting net assets for formal financial statement processes.
Growth of an assumed $10,000 investment
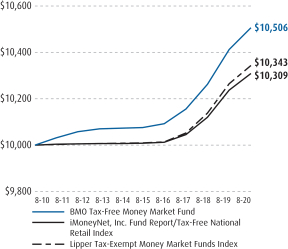
See Explanation of the Indices and Notes in the Commentary for additional information. The above graph relates to the Premier Class shares of the Fund. Performance for the Investor Class shares will vary from the performance of the Premier Class shares shown above due to differences in charges and expenses. This graph illustrates the hypothetical investment of $10,000 in the Premier Class shares of the Fund from the lesser of the Fund’s inception date or August 31, 2010 to August 31, 2020.
22
| | |
| | |
| Annual Report | | BMO Prime Money Market Fund |
| | | | | | | | | | | | |
Average annual total returns (%) | |
| | | 1-Year | | | 5-Years | | | 10-Years | |
| Investor Class (Y) | | | 0.83 | | | | 0.91 | | | | 0.46 | |
| Premier Class | | | 1.02 | | | | 1.14 | | | | 0.62 | |
| iMoneyNet, Inc. Money Fund Report Averages | | | 0.81 | | | | 0.86 | | | | 0.44 | |
| Lipper Money Market Instrument Funds Index | | | 0.94 | | | | 0.95 | | | | 0.48 | |
The performance data quoted represents past performance which is no guarantee of future results. Investment return and principal value will fluctuate so that an investor’s shares, when redeemed, may be worth more or less than their original costs. Mutual fund performance changes over time and current performance may be lower or higher than what is stated. To receive current performance to the most recent month-end, please call 1-800-236-3863 or visit www.bmofunds.com.
An investment in the Fund is neither insured nor guaranteed by the Federal Deposit Insurance Corporation or any other government agency. Although the Fund seeks to preserve the value of your investment at $1.00 per share, it is possible to lose money by investing in the Fund.
Commentary
The BMO Prime Money Market Fund (the Fund) returned 1.02% for the fiscal year-ended August 31, 2020 versus the iMoneyNet, Inc. Money Market Index and the Lipper Prime Money Market Funds Index, which returned 0.81% and 0.94%, respectively.
The most significant event affecting the marketplace over the past twelve months was the exogenous shock of the COVID-19 pandemic. In March and April of 2020, in an effort to contain the spread of the virus, domestic and foreign economies were strategically shut down with exceptions made for businesses that were deemed “essential.” Market uncertainty about the depth of the economic disruption contributed to a large-scale liquidity freeze across the financial markets. Fixed income markets responded by placing a premium on short dated, highly rated, credit and government securities. By May, as market confidence began to return, yields on securities declined and began to better reflect the new, low interest rate environment. By mid-July, front-end fixed income yields across all asset classes aligned with the Federal Funds Rate.
Over the last 12 months, the Federal Reserve (the Fed) lowered the overnight interest rate four times, including 25 basis point declines at meetings in September and October 2019, in what the Fed termed as a “mid-cycle adjustment”. Further, the Fed responded to heightened market concerns in early 2020 by slashing the overnight rate 150 basis points to a range of 0-0.25%; a rate last seen in the wake of the 2008/2009 financial crisis. In an effort to ensure proper market functionality and aid in liquidity, the Fed also reintroduced several “great recession” era programs. The front-end of the yield curve has since flattened as all indications point to a near-zero interest rate environment remaining through 2021.
After the two 25 basis point interest rate reductions in the fall of 2019, a relatively stable interest rate outlook into early-2020 provided opportunities to purchase longer-dated, higher yielding, fixed rate securities. The longer duration purchases provided additional return relative to shorter maturities, as yields showed signs of plateauing, then eventually falling. The decline in interest rates, and the resulting longer-dated purchases, led to the Fund’s Weighted Average Maturity (WAM) lengthening relative to prior years. An exposure to LIBOR based floaters also contributed positively to performance as those indices remained elevated through mid-May.
Moving forward, a strategic focus on fixed and floating rate, asset-backed commercial paper (ABCP) and select certificates of deposit (CD’s) will aid in providing high levels of liquidity, and assist in achieving higher yields.
Fund Managers; Investment Experience
Peter J. Arts; since 1992
Boyd R. Eager; since 1997
Robert Stapleton; since 2010
| | | | | | | | | | | | | | | | | | | | |
| | | | | | | | | Inception
date | | | Expenses (%) | |
| Share class | | Ticker | | | CUSIP | | | Gross | | | Net | |
| Investor (Y) | | | BYFXX | | | | 09658V354 | | | | 11/23/1992 | | | | 0.51 | | | | 0.45 | |
| Premier | | | BPFXX | | | | 09658V347 | | | | 4/03/2000 | | | | 0.26 | | | | 0.20 | |
The above expense ratios are from the Funds’ Prospectus dated December 27, 2019, and are inclusive of Acquired Fund Fees and Expenses. See Note 6 in the Notes to Financial Statements for additional information. Net expense ratios reflect contractual fee waivers and/or expense reimbursements if applicable, made by BMO Asset Management Corp., the investment adviser (Adviser). The Adviser may not terminate these fee waivers and/or expense reimbursements prior to December 31, 2021 without the consent of the Board of Directors, unless the investment advisory agreement is terminated. Without these contractual waivers, the Fund’s returns would have been lower.
| | | | |
Portfolio sector allocation | |
| Sector | | Fund (%) | |
| Certificates of Deposit | | | 13.9 | |
| Commercial Paper | | | 70.5 | |
| Mutual Funds | | | 6.1 | |
| Repurchase Agreements | | | 7.7 | |
| U.S Government & U.S Government Agency Obligation | | | 1.8 | |
| Other Assets & Liabilities, Net | | | 0.0 | |
| Total | | | 100.0 | |
Portfolio composition will change due to the ongoing management of the Fund. The percentages are based on net assets as of August 31, 2020 and may not necessarily reflect adjustments that are routinely made when presenting net assets for formal financial statement processes.
Growth of an assumed $10,000 investment
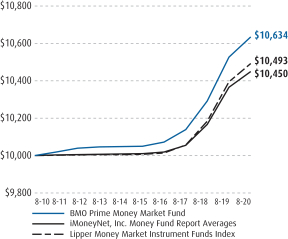
See Explanation of the Indices and Notes in the Commentary for additional information. The above graph relates to the Premier Class shares of the Fund. Performance for the Investor Class shares will vary from the performance of the Premier Class shares shown above due to differences in charges and expenses. This graph illustrates the hypothetical investment of $10,000 in the Premier Class shares of the Fund from the lesser of the Fund’s inception date or August 31, 2010 to August 31, 2020.
23
| | |
| | |
| Annual Report | | BMO Institutional Prime Money Market Fund |
| | | | | | | | |
Average annual total returns (%) | |
| | | 1-Year | | | Since
Inception | |
| Investor Class (Y) | | | 0.84 | | | | 1.11 | |
| Premier Class | | | 1.04 | | | | 1.35 | |
| iMoneyNet, Inc. Money Fund Report Averages | | | 0.81 | | | | 1.01 | |
| Lipper Institutional Money Market Funds Index | | | 1.20 | | | | 1.46 | |
The performance data quoted represents past performance which is no guarantee of future results. Investment return and principal value will fluctuate so that an investor’s shares, when redeemed, may be worth more or less than their original costs. Mutual fund performance changes over time and current performance may be lower or higher than what is stated. To receive current performance to the most recent month-end, please call 1-800-236-3863 or visit www.bmofunds.com.
An investment in the Fund is neither insured nor guaranteed by the Federal Deposit Insurance Corporation or any other government agency. Although the Fund seeks to preserve the value of your investment at $1.00 per share, it is possible to lose money by investing in the Fund.
Commentary
The BMO Institutional Prime Money Market Fund (the Fund) returned 1.04% for the fiscal year-ended August 31, 2020 versus the iMoneyNet, Inc. Money Market Index and the Lipper Institutional Prime Money Market Funds Index, which returned 0.81% and 1.20%, respectively.
The most significant event affecting the marketplace over the past twelve months was the exogenous shock of the COVID-19 pandemic. In March and April of 2020, in an effort to contain the spread of the virus, domestic and foreign economies were strategically shut down with exceptions made for businesses that were deemed “essential.” Market uncertainty about the depth of the economic disruption contributed to a large-scale liquidity freeze across the financial markets. Fixed income markets responded by placing a premium on short dated, highly rated, credit and government securities. By May, as market confidence began to return, yields on securities declined and began to better reflect the new, low interest rate environment. By mid-July, front-end fixed income yields across all asset classes aligned with the Federal Funds Rate.
Over the last 12 months, the Federal Reserve (the Fed) lowered the overnight interest rate four times, including 25 basis point declines at meetings in September and October 2019, in what the Fed termed as a “mid-cycle adjustment”. Further, the Fed responded to heightened market concerns in early 2020 by slashing the overnight rate 150 basis points to a range of 0-0.25%; a rate last seen in the wake of the 2008/2009 financial crisis. In an effort to ensure proper market functionality and aid in liquidity, the Fed also reintroduced several “great recession” era programs. The front-end of the yield curve has since flattened as all indications point to a near-zero interest rate environment remaining through 2021.
After the two 25 basis point interest rate reductions in the fall of 2019, a relatively stable interest rate outlook into early-2020 provided opportunities to purchase longer-dated, higher yielding, fixed rate securities. The longer duration purchases provided additional return relative to shorter maturities, as yields showed signs of plateauing, then eventually falling. The subsequent decline in interest rates and the resulting longer-dated purchases led to the Fund’s Weighted Average Maturity (WAM) lengthening relative to prior years. An exposure to LIBOR based floaters also contributed positively to performance as those indices remained elevated through mid-May.
Moving forward, a strategic focus on fixed and floating rate, asset-backed commercial paper and select certificates of deposit (CD’s) will aid in providing high levels of liquidity, and assist in achieving higher yields.
Fund Managers; Investment Experience
Peter J. Arts; since 1992
Boyd R. Eager; since 1997
Robert Stapleton; since 2010
| | | | | | | | | | | | | | | | | | | | |
| | | | | | | | | Inception
date | | | Expenses (%) | |
| Share class | | Ticker | | | CUSIP | | | Gross | | | Net | |
| Investor (Y) | | | BYFXX | | | | 09658V354 | | | | 6/03/2016 | | | | 0.52 | | | | 0.45 | |
| Premier | | | BPFXX | | | | 09658V347 | | | | 6/03/2016 | | | | 0.27 | | | | 0.20 | |
The above expense ratios are from the Funds’ Prospectus dated December 27, 2019, and are inclusive of Acquired Fund Fees and Expenses. See Note 6 in the Notes to Financial Statements for additional information. Net expense ratios reflect contractual fee waivers and/or expense reimbursements if applicable, made by BMO Asset Management Corp., the investment adviser (Adviser). The Adviser may not terminate these fee waivers and/or expense Reimbursements prior to December 31, 2021 without the consent of the Board of Directors, unless the investment advisory agreement is terminated. Without these contractual waivers, the Fund’s returns would have been lower
| | | | |
Portfolio sector allocation | |
| Sector | | Fund (%) | |
| Certificates of Deposit | | | 22.1 | |
| Commercial Paper | | | 63.7 | |
| Mutual Funds | | | 6.0 | |
| Repurchase Agreements | | | 6.7 | |
| U.S Government & U.S Government Agency Obligation | | | 1.5 | |
| Other Assets & Liabilities, Net | | | 0.0 | |
| Total | | | 100.0 | |
Portfolio composition will change due to the ongoing management of the Fund. The percentages are based on net assets as of August 31, 2020 and may not necessarily reflect adjustments that are routinely made when presenting net assets for formal financial statement processes.
Growth of an assumed $10,000 investment
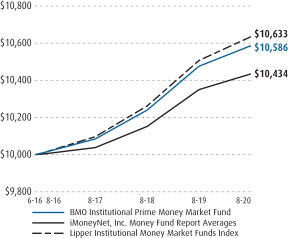
See Explanation of the Indices and Notes in the Commentary for additional information. The above graph relates to the Premier Class shares of the Fund. Performance for the Investor Class shares will vary from the performance of the Premier Class shares shown above due to differences in charges and expenses. This graph illustrates the hypothetical investment of $10,000 in the Premier Class shares of the Fund from the lesser of the Fund’s inception date or August 31, 2010 to August 31, 2020.
24
| | |
| |
| Explanation of the Indices and Notes in the Commentary |
The views expressed in the commentary are as of August 31, 2020 and are those of the Funds’ investment adviser and/or portfolio manager(s). The views are subject to change at any time in response to changing circumstances in the market and are not intended to predict or guarantee the future performance of the Funds or any individual security, industry, market sector or the markets generally. Statements involving predictions, assessments, analyses or outlook for individual securities, industries, market sectors and/or markets involve risks and uncertainties. In addition to the general risks described for the Funds in their current Prospectuses, other factors bearing on these commentaries include the accuracy of the investment adviser’s or portfolio manager’s forecasts and predictions and the appropriateness of the investment programs designed by the investment adviser or portfolio managers to implement their strategies efficiently and effectively. Any one, or more, of these factors, as well as other risks affecting the securities markets and investment instruments generally, could cause the actual results of a Fund to differ materially as compared to benchmarks associated with that Fund. The line graphs and tables do not reflect the deduction of taxes that a shareholder would pay on Fund distributions or the redemption of Fund shares. The gross and net expense ratios are based on expenses incurred by a Fund as disclosed in the Funds’ Prospectus dated December 27, 2019. Each Fund’s performance assumes the reinvestment of all dividends and distributions. Performance returns for all benchmark comparisons assume dividends and distributions were reinvested for the entire period. All indices are unmanaged and are not available for direct investment.
| | | | |
| Fund/Benchmark Comparison per Fund | | Explanation |
| Low Volatility Equity Fund | | Russell 1000® Index | | The Russell 1000® Index consists of approximately 1,000 of the largest companies in the U.S. equity markets.(4) |
| | Lipper Multi-Cap Value Funds Index | | Lipper indices are comprised of a certain number of eligible mutual funds designated by Lipper, Inc. as falling into the respective categories indicated.(5) |
| Dividend Income Fund | | Russell 1000® Value Index | | The Russell 1000® Value Index measures the performance of those Russell 1000 companies with lower price-to-book ratios and lower forecasted growth values.(4) |
| | Standard & Poor’S 500® Index | | The S&P 500® is an unmanaged index of large-cap common stocks. |
| | Lipper Equity Income Funds Index | | Lipper indices are comprised of a certain number of eligible mutual funds designated by Lipper, Inc. as falling into the respective categories indicated.(5) |
Large-Cap Value Fund | | Russell 1000® Value Index | | The Russell 1000® Value Index measures the performance of those Russell 1000 companies with lower price-to-book ratios and lower forecasted growth values.(4) |
| | Lipper Multi-Cap Value Funds Index | | Lipper indices are comprised of a certain number of eligible mutual funds designated by Lipper, Inc. as falling into the respective categories indicated.(5) |
| Large-Cap Growth Fund | | Russell 1000® Growth Index | | The Russell 1000® Growth Index measures the performance of those Russell 1000 companies with higher price-to-book ratios and higher forecasted growth values.(4) |
| | Lipper Multi-Cap Growth Funds | | Lipper indices are comprised of a certain number of eligible mutual funds designated by Lipper, Inc. as falling into the respective categories indicated.(5) |
| Mid-Cap Value Fund | | Russell Midcap® Value Index | | This index measures the performance of those Russell Midcap companies with lower price-to-book ratios and lower forecasted growth values. The stocks are also members of the Russell 1000® Value Index.(4) |
| | Lipper Mid-Cap Value Funds Index | | Lipper indices are comprised of a certain number of eligible mutual funds designated by Lipper, Inc. as falling into the respective categories indicated.(5) |
| Mid-Cap Growth Fund | | Russell Midcap® Growth Index | | This index measures the performance of those Russell Midcap companies with higher price-to-book ratios and higher forecasted growth values. The stocks are also members of the Russell 1000® Growth Index.(4) |
| | Lipper Mid-Cap Growth Funds Index | | Lipper indices are comprised of a certain number of eligible mutual funds designated by Lipper, Inc. as falling into the respective categories indicated.(5) |
Small-Cap Value Fund(1) | | Russell 2000® Value Index | | The Russell 2000® Value Index measures the performance of those Russell 2000 companies with lower price-to-book ratios and lower forecasted growth values.(4) |
| | Lipper Small-Cap Core Funds Index | | Lipper indices are comprised of a certain number of eligible mutual funds designated by Lipper, Inc. as falling into the respective categories indicated.(5) |
| Small-Cap Growth Fund(1) | | Russell 2000® Growth Index | | The Russell 2000® Growth Index measures the performance of those Russell 2000 companies with higher price-to-book ratios and higher forecasted growth values.(4) |
| | Lipper Small-Cap Growth Funds Index | | Lipper indices are comprised of a certain number of eligible mutual funds designated by Lipper, Inc. as falling into the respective categories indicated.(5) |
25
| | |
| |
| Explanation of the Indices and Notes in the Commentary (continued) |
| | | | |
| Fund/Benchmark Comparison per Fund | | Explanation |
| Global Low Volatility Equity Fund(1) | | Morgan Stanley Capital International All Country World Index | | The MSCI All Country World Index is a free float-adjusted market capitalization weighted index that is designed to measure the equity market performance of developed and emerging markets.(4) |
| | Lipper Global Multi-Cap Value Funds Index | | Lipper indices are comprised of a certain number of eligible mutual funds designated by Lipper, Inc. as falling into the respective categories indicated.(5) |
| Disciplined International Equity Fund(3) | | Morgan Stanley Capital International Europe, Australasia, Far East Index | | The MSCI Europe, Australasia and Far East Index is a standard unmanaged foreign securities index representing major non-U.S. stock markets, as monitored by Morgan Stanley Capital International.(4) |
| | Lipper International Multi-Cap Core Funds Index | | Lipper indices are comprised of a certain number of eligible mutual funds designated by Lipper, Inc. as falling into the respective categories indicated.(5) |
| Pyrford International Stock Fund(3) | | Morgan Stanley Capital International Europe, Australasia, Far East Index | | The MSCI Europe, Australasia and Far East Index is a standard unmanaged foreign securities index representing major non-U.S. stock markets, as monitored by Morgan Stanley Capital International.(4) |
| | Lipper International Multi-Cap Core Funds Index | | Lipper indices are comprised of a certain number of eligible mutual funds designated by Lipper, Inc. as falling into the respective categories indicated.(5) |
| LGM Emerging Markets Equity Fund(3) | | Morgan Stanley Capital International Emerging Markets Index | | The MSCI Emerging Markets Index is a market capitalization weighted index comprised of over 800 companies representative of the market structure of the emerging countries in Europe, Latin America, Africa, Middle East and Asia, as monitored by Morgan Stanley Capital International.(4) |
| | Lipper Emerging Markets Funds Index | | Lipper indices are comprised of a certain number of eligible mutual funds designated by Lipper, Inc. as falling into the respective categories indicated.(5) |
| Ultra Short Tax-Free Fund(2)(6) | | Blended Index (50% Bloomberg Barclays 1 Year Municipal Bond Index And 50% Imoneynet, Inc. Money Market Fund Tax-Free National Retail Index) | | The blended index consists of 50% Bloomberg Barclays 1 Year Municipal Bond Index and 50% iMoneyNet Money Market Fund Tax-Free National Retail Index. The Bloomberg Barclays 1 Year Municipal Bond Index is the 1 year component of the Bloomberg Barclays Capital Municipal Bond Index, which is an unmanaged index composed of longterm tax-exempt bonds with a minimum credit rating of Baa. The iMoneyNet Money Market Fund Tax-Free National Retail Index is an average of money funds with investment objectives similar to that of the Fund.(4) |
| | Lipper Short Municipal Debt Funds Index | | Lipper indices are comprised of a certain number of eligible mutual funds designated by Lipper, Inc. as falling into the respective categories indicated.(5) |
| Short Tax-Free Fund(2)(6) | | Bloomberg Barclays Short (1-5 Year) Municipal Index | | The Bloomberg Barclays Short (1-5 Year) Municipal Index includes invetment-grade tax-exempt bonds that are issued by state and local governments and have maturities of 1 to 5 years.(4) |
| | Lipper Short Municipal Debt Funds Index | | Lipper indices are comprised of a certain number of eligible mutual funds designated by Lipper, Inc. as falling into the respective categories indicated.(5) |
| Short-Term Income Fund(6) | | Bank of America Merrill Lynch 1-3 Year U.S. Government/ Corporate Index | | This is an index tracking short-term U.S. government and corporate securities with maturities between 1 and 2.99 years. The index is produced by Merrill Lynch, Pierce, Fenner & Smith.(4) |
| | Lipper Short Investment-Grade Debt Funds Index | | Lipper indices are comprised of a certain number of eligible mutual funds designated by Lipper, Inc. as falling into the respective categories indicated.(5) |
| Intermediate Tax-Free Fund(2)(6) | | Bloomberg Barclays 1-15 Year Blend Municipal Bond Index | | This index is the 1-15 year Blend component of the Bloomberg Barclays Municipal Bond Index, which is an unmanaged index composed of long-term tax-exempt bonds with a minimum credit rating of Baa and a range of maturities between 1-17 years. To qualify for inclusion, a bond or security must have outstanding par value of at least $7 million, issued as part of a transaction of at least $75 million, fixed rate, dated-date after December 31, 1990 and must have at least one year from final maturity.(4) |
| | Lipper Intermediate Municipal Debt Funds Index | | Lipper indices are comprised of a certain number of eligible mutual funds designated by Lipper, Inc. as falling into the respective categories indicated.(5) |
| Strategic Income Fund(6) | | Bloomberg Barclays U.S. Aggregate Bond Index | | Bloomberg Barclays U.S. Aggregate Bond Index is an unmanaged index that covers the U.S. investment-grade fixed-rate bond market, including government and credit securities, agency mortgage pass-through securities, asset-backed securities and commercial mortgage-based securities.(4) |
| | Lipper Multi-Sector Funds Index | | Lipper indices are comprised of a certain number of eligible mutual funds designated by Lipper, Inc. as falling into the respective categories indicated.(5) |
26
| | |
| |
| Explanation of the Indices and Notes in the Commentary (continued) |
| | | | |
| Fund/Benchmark Comparison per Fund | | Explanation |
| Corporate Income Fund(6) | | Bloomberg Barclays U.S. Credit Index | | Bloomberg Barclays U.S. Credit Index represents securities that are SEC registered, taxable and U.S. dollar denominated. The index covers U.S. corporate and specified foreign debentures and secured notes that meet the specified maturity, liquidity and quality requirements.(4) |
| | Lipper Corporate Debt Funds BBB-Rated Index | | Lipper indices are comprised of a certain number of eligible mutual funds designated by Lipper, Inc. as falling into the respective categories indicated.(5) |
| Core Plus Bond Fund(6) | | Bloomberg Barclays U.S. Aggregate Bond Index | | Bloomberg Barclays U.S. Aggregate Bond Index is an unmanaged index that covers the U.S. investment-grade fixed-rate bond market, including government and credit securities, agency mortgage pass-through securities, asset-backed securities and commercial mortgage-based securities. To qualify for inclusion, a bond or security must have at least one year to final maturity, rated investment grade Baa3 or better, dollar denominated, non-convertible, fixed rate and be publicly issued.(4) |
| | Lipper Core Plus Bond Funds Index | | Lipper indices are comprised of a certain number of eligible mutual funds designated by Lipper, Inc. as falling into the respective categories indicated.(5) |
| Government Money Market Fund | | iMoneyNet, Inc. Government Money Market Index | | This index is an average of money funds with investment objectives similar to that of the Fund. |
| | Lipper U.S. Government Money Market Funds Index | | Lipper indices are comprised of a certain number of eligible mutual funds designated by Lipper, Inc. as falling into the respective categories indicated.(5) |
| Tax-Free Money Market Fund | | iMoneyNet, Inc. Fund Report/ Tax-Free National Retail Index | | This index is an average of money funds with investment objectives similar to that of the Fund. |
| | Lipper Tax-Exempt Money Market Funds Index | | Lipper indices are comprised of a certain number of eligible mutual funds designated by Lipper, Inc. as falling into the respective categories indicated.(5) |
| Prime Money Market Fund | | iMoneyNet, Inc. Money Fund Report Averages | | This index is an average of money funds with investment objectives similar to that of the Fund. |
| | Lipper Money Market Instrument Funds Index | | Lipper indices are comprised of a certain number of eligible mutual funds designated by Lipper, Inc. as falling into the respective categories indicated.(5) |
| Institutional Prime Money Market Fund | | iMoneyNet, Inc. Money Fund Report Averages | | This index is an average of money funds with investment objectives similar to that of the Fund. |
| | Lipper Institutional Money Market Funds Index | | Lipper indices are comprised of a certain number of eligible mutual funds designated by Lipper, Inc. as falling into the respective categories indicated.(5) |
| (1) | Small-Cap stocks are less liquid and more volatile than large-cap stocks. |
| (2) | Income generated by the Fund may be subject to the federal alternative minimum tax. |
| (3) | International investing involves special risks including currency risk, political risk, increased volatility of foreign securities, and differences in auditing and other financial standards. |
| (4) | Performance returns do not reflect the deduction of sales charges, expenses, or other fees that the Securities and Exchange Commission requires to be reflected in a mutual fund’s performance. |
| (5) | Performance returns do not reflect the deduction of sales charges of component funds, or taxes, but do reflect the deduction of fund expenses. |
| (6) | Investors should be aware that in an environment of rising interest rates, they may expect to see declining bond prices. |
27
| | |
| |
| Expense Example (Unaudited) |
For the Six Months Ended August 31, 2020
As a shareholder of the Fund, you may incur two types of costs: (1) transaction costs, which may include sales charges (loads) on purchase payments, reinvested dividends, or other distributions; redemption fees; and exchange fees; and (2) ongoing costs, including management fees; distribution and/or service (12b-1) fees; and other Fund expenses. This Example is intended to help you understand your ongoing costs (in dollars) of investing in the Funds and to compare these costs with the ongoing costs of investing in other mutual funds.
The Example is based on an investment of $1,000 invested at the beginning of the period and held for the entire six month period ended August 31, 2020 (3/1/20-8/31/20).
Actual Expenses
The information in the table under the heading “Actual Expenses” provides information about actual account values and actual expenses. You may use the information in this line, together with the amount you invested, to estimate the expenses that you paid over the period. Simply divide your account value by $1,000 (for example, an $8,600 account value divided by $1,000 = 8.6), then multiply the result by the number in the first line under the heading entitled “Expenses Paid During Period” to estimate the expenses you paid on your account during this period.
Hypothetical Example for Comparison Purposes
The information in the table under the heading “Hypothetical Expenses” provides information about hypothetical account values and hypothetical expenses based on a Fund’s actual expense ratio and an assumed rate of return of 5% per year before expenses, which is not the Fund’s actual return. The hypothetical account values and expenses may not be used to estimate the actual ending account balance or expenses you paid for the period. You may use this information to compare the ongoing costs of investing in a Fund and other funds. To do so, compare this 5% hypothetical example with the 5% hypothetical examples that appear in the shareholder reports of the other funds.
Please note that the expenses shown in the table are meant to highlight your ongoing costs only and do not reflect any transaction costs, such as sales charges (loads), redemption fees, or exchange fees. Therefore, the information under the heading “Hypothetical Expenses” is useful in comparing ongoing costs only, and will not help you determine the relative total costs of owning different funds. In addition, if these transaction costs were included, your costs would have been higher.
| | | | | | | | | | | | | | | | | | | | | | | | |
| | | Actual Expenses | | | Hypothetical Expenses | |
Fund | | Beginning
account
value
3/1/20 | | | Ending
account
value
8/31/20 | | | Expenses
paid during
period
3/1/20-
8/31/20(1) | | | Ending
account
value
8/31/20 | | | Expenses
paid during
period
3/1/20-
8/31/20(1) | | | Annualized
Expense
Ratio(1) | |
Low Volatility Equity Fund | | | | | | | | | | | | | | | | | | | | | | | | |
| Advisor | | $ | 1,000.00 | | | $ | 1,035.80 | | | $ | 4.61 | | | $ | 1,020.61 | | | $ | 4.57 | | | | 0.90 | % |
| Institutional | | | 1,000.00 | | | | 1,036.40 | | | | 3.33 | | | | 1,021.87 | | | | 3.30 | | | | 0.65 | |
Dividend Income Fund | | | | | | | | | | | | | | | | | | | | | | | | |
| Advisor | | | 1,000.00 | | | | 1,028.60 | | | | 4.59 | | | | 1,020.61 | | | | 4.57 | | | | 0.90 | |
| Institutional | | | 1,000.00 | | | | 1,030.30 | | | | 3.32 | | | | 1,021.87 | | | | 3.30 | | | | 0.65 | |
Large-Cap Value Fund | | | | | | | | | | | | | | | | | | | | | | | | |
| Advisor | | | 1,000.00 | | | | 1,044.60 | | | | 4.06 | | | | 1,021.17 | | | | 4.01 | | | | 0.79 | |
| Institutional | | | 1,000.00 | | | | 1,045.20 | | | | 2.78 | | | | 1,022.42 | | | | 2.75 | | | | 0.54 | |
| Retirement class R-6 | | | 1,000.00 | | | | 1,046.50 | | | | 2.01 | | | | 1,023.18 | | | | 1.98 | | | | 0.39 | |
28
| | |
| |
| Expense Example (Unaudited) (continued) |
| | | | | | | | | | | | | | | | | | | | | | | | |
| | | Actual Expenses | | | Hypothetical Expenses | |
Fund | | Beginning
account
value
3/1/20 | | | Ending
account
value
8/31/20 | | | Expenses
paid during
period
3/1/20-
8/31/20(1) | | | Ending
account
value
8/31/20 | | | Expenses
paid during
period
3/1/20-
8/31/20(1) | | | Annualized
Expense
Ratio(1) | |
Large-Cap Growth Fund | | | | | | | | | | | | | | | | | | | | | | | | |
| Investor | | $ | 1,000.00 | | | $ | 1,288.50 | | | $ | 4.54 | | | $ | 1,021.17 | | | $ | 4.01 | | | | 0.79 | % |
| Advisor | | | 1,000.00 | | | | 1,288.90 | | | | 4.55 | | | | 1,021.17 | | | | 4.01 | | | | 0.79 | |
| Institutional | | | 1,000.00 | | | | 1,290.30 | | | | 3.11 | | | | 1,022.42 | | | | 2.75 | | | | 0.54 | |
| Retirement class R-6 | | | 1,000.00 | | | | 1,292.10 | | | | 2.25 | | | | 1,023.18 | | | | 1.98 | | | | 0.39 | |
Mid-Cap Value Fund | | | | | | | | | | | | | | | | | | | | | | | | |
| Advisor | | | 1,000.00 | | | | 951.70 | | | | 6.08 | | | | 1,018.90 | | | | 6.29 | | | | 1.24 | |
| Institutional | | | 1,000.00 | | | | 953.40 | | | | 4.86 | | | | 1,020.16 | | | | 5.03 | | | | 0.99 | |
| Retirement class R-6 | | | 1,000.00 | | | | 954.50 | | | | 4.13 | | | | 1,020.91 | | | | 4.27 | | | | 0.84 | |
Mid-Cap Growth Fund | | | | | | | | | | | | | | | | | | | | | | | | |
| Advisor | | | 1,000.00 | | | | 1,210.90 | | | | 6.89 | | | | 1,018.90 | | | | 6.29 | | | | 1.24 | |
| Institutional | | | 1,000.00 | | | | 1,212.50 | | | | 5.51 | | | | 1,020.16 | | | | 5.03 | | | | 0.99 | |
| Retirement class R-6 | | | 1,000.00 | | | | 1,213.10 | | | | 4.67 | | | | 1,020.91 | | | | 4.27 | | | | 0.84 | |
Small-Cap Value Fund | | | | | | | | | | | | | | | | | | | | | | | | |
| Advisor | | | 1,000.00 | | | | 979.10 | | | | 6.17 | | | | 1,018.90 | | | | 6.29 | | | | 1.24 | |
| Institutional | | | 1,000.00 | | | | 981.30 | | | | 4.93 | | | | 1,020.16 | | | | 5.03 | | | | 0.99 | |
| Retirement class R-6 | | | 1,000.00 | | | | 981.50 | | | | 4.18 | | | | 1,020.91 | | | | 4.27 | | | | 0.84 | |
Small-Cap Growth Fund | | | | | | | | | | | | | | | | | | | | | | | | |
| Advisor | | | 1,000.00 | | | | 1,097.00 | | | | 6.54 | | | | 1,018.90 | | | | 6.29 | | | | 1.24 | |
| Institutional | | | 1,000.00 | | | | 1,098.30 | | | | 5.22 | | | | 1,020.16 | | | | 5.03 | | | | 0.99 | |
Global Low Volatility Equity Fund | | | | | | | | | | | | | | | | | | | | | | | | |
| Advisor | | | 1,000.00 | | | | 987.50 | | | | 5.50 | | | | 1,019.61 | | | | 5.58 | | | | 1.10 | |
| Institutional | | | 1,000.00 | | | | 989.50 | | | | 4.25 | | | | 1,020.86 | | | | 4.32 | | | | 0.85 | |
Disciplined International Equity Fund | | | | | | | | | | | | | | | | | | | | | | | | |
| Advisor | | | 1,000.00 | | | | 1,018.90 | | | | 5.84 | | | | 1,019.36 | | | | 5.84 | | | | 1.15 | |
| Institutional | | | 1,000.00 | | | | 1,021.00 | | | | 4.57 | | | | 1,020.61 | | | | 4.57 | | | | 0.90 | |
Pyrford International Stock Fund | | | | | | | | | | | | | | | | | | | | | | | | |
| Advisor | | | 1,000.00 | | | | 1,064.40 | | | | 6.18 | | | | 1,019.15 | | | | 6.04 | | | | 1.19 | |
| Institutional | | | 1,000.00 | | | | 1,064.90 | | | | 4.88 | | | | 1,020.41 | | | | 4.77 | | | | 0.94 | |
| Retirement class R-6 | | | 1,000.00 | | | | 1,066.50 | | | | 4.10 | | | | 1,021.17 | | | | 4.01 | | | | 0.79 | |
LGM Emerging Markets Equity Fund | | | | | | | | | | | | | | | | | | | | | | | | |
| Advisor | | | 1,000.00 | | | | 1,063.60 | | | | 7.26 | | | | 1,018.10 | | | | 7.10 | | | | 1.40 | |
| Institutional | | | 1,000.00 | | | | 1,066.10 | | | | 5.97 | | | | 1,019.36 | | | | 5.84 | | | | 1.15 | |
Ultra Short Tax-Free Fund | | | | | | | | | | | | | | | | | | | | | | | | |
| Advisor | | | 1,000.00 | | | | 1,002.60 | | | | 2.77 | | | | 1,022.37 | | | | 2.80 | | | �� | 0.55 | |
| Institutional | | | 1,000.00 | | | | 1,003.80 | | | | 1.51 | | | | 1,023.63 | | | | 1.53 | | | | 0.30 | |
Short Tax-Free Fund | | | | | | | | | | | | | | | | | | | | | | | | |
| Advisor | | | 1,000.00 | | | | 1,004.90 | | | | 2.77 | | | | 1,022.37 | | | | 2.80 | | | | 0.55 | |
| Institutional | | | 1,000.00 | | | | 1,006.70 | | | | 2.02 | | | | 1,023.13 | | | | 2.03 | | | | 0.40 | |
Short-Term Income Fund | | | | | | | | | | | | | | | | | | | | | | | | |
| Advisor | | | 1,000.00 | | | | 1,013.30 | | | | 3.04 | | | | 1,022.12 | | | | 3.05 | | | | 0.60 | |
| Institutional | | | 1,000.00 | | | | 1,014.60 | | | | 1.77 | | | | 1,023.38 | | | | 1.78 | | | | 0.35 | |
Intermediate Tax-Free Fund | | | | | | | | | | | | | | | | | | | | | | | | |
| Investor | | | 1,000.00 | | | | 990.10 | | | | 2.70 | | | | 1,022.42 | | | | 2.75 | | | | 0.54 | |
| Advisor | | | 1,000.00 | | | | 990.10 | | | | 2.70 | | | | 1,022.42 | | | | 2.75 | | | | 0.54 | |
| Institutional | | | 1,000.00 | | | | 991.30 | | | | 1.55 | | | | 1,023.58 | | | | 1.58 | | | | 0.31 | |
29
| | |
| |
| Expense Example (Unaudited) (continued) |
| | | | | | | | | | | | | | | | | | | | | | | | |
| | | Actual Expenses | | | Hypothetical Expenses | |
Fund | | Beginning
account
value
3/1/20 | | | Ending
account
value
8/31/20 | | | Expenses
paid during
period
3/1/20-
8/31/20(1) | | | Ending
account
value
8/31/20 | | | Expenses
paid during
period
3/1/20-
8/31/20(1) | | | Annualized
Expense
Ratio(1) | |
Strategic Income Fund | | | | | | | | | | | | | | | | | | | | | | | | |
| Investor | | $ | 1,000.00 | | | $ | 1,049.40 | | | $ | 4.12 | | | $ | 1,021.11 | | | $ | 4.06 | | | | 0.80 | % |
| Advisor | | | 1,000.00 | | | | 1,049.40 | | | | 4.12 | | | | 1,021.11 | | | | 4.06 | | | | 0.80 | |
| Institutional | | | 1,000.00 | | | | 1,049.60 | | | | 2.83 | | | | 1,022.37 | | | | 2.80 | | | | 0.55 | |
Corporate Income Fund | | | | | | | | | | | | | | | | | | | | | | | | |
| Investor | | | 1,000.00 | | | | 1,036.80 | | | | 3.02 | | | | 1,022.17 | | | | 3.00 | | | | 0.59 | |
| Advisor | | | 1,000.00 | | | | 1,036.70 | | | | 3.02 | | | | 1,022.17 | | | | 3.00 | | | | 0.59 | |
| Institutional | | | 1,000.00 | | | | 1,036.90 | | | | 2.10 | | | | 1,023.08 | | | | 2.08 | | | | 0.41 | |
Core Plus Bond Fund | | | | | | | | | | | | | | | | | | | | | | | | |
| Investor | | | 1,000.00 | | | | 1,035.00 | | | | 2.86 | | | | 1,022.32 | | | | 2.85 | | | | 0.56 | |
| Advisor | | | 1,000.00 | | | | 1,035.00 | | | | 2.86 | | | | 1,022.32 | | | | 2.85 | | | | 0.56 | |
| Institutional | | | 1,000.00 | | | | 1,035.50 | | | | 1.59 | | | | 1,023.58 | | | | 1.58 | | | | 0.31 | |
Government Money Market Fund | | | | | | | | | | | | | | | | | | | | | | | | |
| Investor | | | 1,000.00 | | | | 1,000.40 | | | | 2.26 | | | | 1,022.87 | | | | 2.29 | | | | 0.45 | |
| Premier | | | 1,000.00 | | | | 1,000.70 | | | | 1.01 | | | | 1,024.13 | | | | 1.02 | | | | 0.20 | |
Tax-Free Money Market Fund | | | | | | | | | | | | | | | | | | | | | | | | |
| Investor | | | 1,000.00 | | | | 1,002.40 | | | | 2.27 | | | | 1,022.87 | | | | 2.29 | | | | 0.45 | |
| Premier | | | 1,000.00 | | | | 1,003.60 | | | | 1.01 | | | | 1,024.13 | | | | 1.02 | | | | 0.20 | |
Prime Money Market Fund | | | | | | | | | | | | | | | | | | | | | | | | |
| Investor | | | 1,000.00 | | | | 1,000.90 | | | | 2.26 | | | | 1,022.87 | | | | 2.29 | | | | 0.45 | |
| Premier | | | 1,000.00 | | | | 1,001.50 | | | | 1.01 | | | | 1,024.13 | | | | 1.02 | | | | 0.20 | |
Institutional Prime Money Market Fund | | | | | | | | | | | | | | | | | | | | | | | | |
| Investor | | | 1,000.00 | | | | 1,000.90 | | | | 2.26 | | | | 1,022.87 | | | | 2.29 | | | | 0.45 | |
| Premier | | | 1,000.00 | | | | 1,001.70 | | | | 1.01 | | | | 1,024.13 | | | | 1.02 | | | | 0.20 | |
| (1) | Expenses are equal to the Funds’ annualized expense ratios for the period March 1, 2020 through August 31, 2020, multiplied by the average account value over the period, multiplied by 184/366 (to reflect the one-half year period). These expenses and ratios are exclusive of acquired fund fees and expenses. |
30
August 31, 2020
| | |
| | |
| Schedules of Investments | | BMO Funds |
Low Volatility Equity Fund
| | | | | | | | |
| Description | | Shares | | | Value | |
| Common Stocks — 98.1% | | | | | | |
| | |
| Communication Services — 6.5% | | | | | | |
| | |
Advertising — 0.5% | | | | | | | | |
Omnicom Group, Inc. | | | 24,471 | | | $ | 1,323,636 | |
| | |
Broadcasting — 0.2% | | | | | | | | |
Discovery, Inc., Class A (1)(2) | | | 22,933 | | | | 506,017 | |
| | |
Cable & Satellite — 0.9% | | | | | | | | |
Charter Communications, Inc., Class A (1)(2) | | | 3,797 | | | | 2,337,471 | |
|
Integrated Telecommunication Services — 2.8% | |
AT&T, Inc. | | | 61,619 | | | | 1,836,863 | |
Verizon Communications, Inc. | | | 91,727 | | | | 5,436,659 | |
| | | | | | | | |
| | | | | | | 7,273,522 | |
|
Interactive Home Entertainment — 1.0% | |
Electronic Arts, Inc. (1) | | | 18,116 | | | | 2,526,638 | |
|
Interactive Media & Services — 1.0% | |
Alphabet, Inc., Class C (1) | | | 1,566 | | | | 2,559,126 | |
| | |
Publishing — 0.1% | | | | | | | | |
John Wiley & Sons, Inc., Class A | | | 10,374 | | | | 328,337 | |
| | | | | | | | |
Total Communication Services | | | | | | | 16,854,747 | |
| | |
| Consumer Discretionary — 9.6% | | | | | | |
| | |
Automotive Retail — 2.2% | | | | | | | | |
AutoZone, Inc. (1) | | | 4,780 | | | | 5,718,362 | |
| | |
Education Services — 1.4% | | | | | | | | |
Bright Horizons Family Solutions, Inc. (1) | | | 22,134 | | | | 2,944,043 | |
Graham Holdings Co., Class B (2) | | | 1,563 | | | | 668,886 | |
| | | | | | | | |
| | | | | | | 3,612,929 | |
|
General Merchandise Stores — 3.1% | |
Dollar General Corp. | | | 16,344 | | | | 3,299,527 | |
Target Corp. | | | 31,797 | | | | 4,808,024 | |
| | | | | | | | |
| | | | | | | 8,107,551 | |
|
Internet & Direct Marketing Retail — 2.0% | |
Amazon.com, Inc. (1) | | | 1,527 | | | | 5,269,616 | |
|
Internet Software & Services — 0.4% | |
eBay, Inc. (2) | | | 17,579 | | | | 962,978 | |
|
Specialized Consumer Services — 0.5% | |
ServiceMaster Global Holdings, Inc. (1) | | | 28,655 | | | | 1,143,334 | |
| | | | | | | | |
Total Consumer Discretionary | | | | | | | 24,814,770 | |
| | |
| Consumer Staples — 21.8% | | | | | | |
| | |
Agricultural Products — 1.6% | | | | | | | | |
Ingredion, Inc. | | | 51,824 | | | | 4,168,723 | |
| | |
Food Retail — 5.2% | | | | | | | | |
Casey’s General Stores, Inc. (2) | | | 9,439 | | | | 1,678,726 | |
Kroger Co. (2) | | | 174,011 | | | | 6,208,713 | |
Sprouts Farmers Market, Inc. (1) | | | 242,015 | | | | 5,651,050 | |
| | | | | | | | |
| | | | | | | 13,538,489 | |
|
Household Products — 0.7% | |
Church & Dwight Co., Inc. (2) | | | 10,462 | | | | 1,002,573 | |
Procter & Gamble Co. | | | 5,751 | | | | 795,536 | |
| | | | | | | | |
| | | | | | | 1,798,109 | |
|
Hypermarkets & Super Centers — 4.9% | |
Costco Wholesale Corp. | | | 18,610 | | | | 6,469,953 | |
Walmart, Inc. | | | 45,038 | | | | 6,253,526 | |
| | | | | | | | |
| | | | | | | 12,723,479 | |
| | | | | | | | |
| Description | | Shares | | | Value | |
| Common Stocks (continued) | | | | | | |
| | |
| Consumer Staples (continued) | | | | | | |
|
Packaged Foods & Meats — 7.1% | |
Campbell Soup Co. (2) | | | 43,489 | | | $ | 2,287,956 | |
Flowers Foods, Inc. | | | 127,435 | | | | 3,117,060 | |
General Mills, Inc. | | | 78,722 | | | | 5,034,272 | |
Hershey Co. | | | 30,120 | | | | 4,477,037 | |
J.M. Smucker Co. (2) | | | 4,652 | | | | 559,078 | |
Kellogg Co. (2) | | | 10,634 | | | | 754,057 | |
Lamb Weston Holdings, Inc. | | | 14,485 | | | | 910,382 | |
Tyson Foods, Inc., Class A | | | 20,425 | | | | 1,282,690 | |
| | | | | | | | |
| | | | | | | 18,422,532 | |
|
Soft Drinks — 2.3% | |
PepsiCo, Inc. | | | 41,854 | | | | 5,862,071 | |
| | | | | | | | |
Total Consumer Staples | | | | | | | 56,513,403 | |
| | |
| Energy — 1.7% | | | | | | |
|
Integrated Oil & Gas — 1.6% | |
Chevron Corp. (2) | | | 38,675 | | | | 3,245,992 | |
Exxon Mobil Corp. | | | 20,204 | | | | 806,948 | |
| | | | | | | | |
| | | | | | | 4,052,940 | |
|
Oil & Gas-Exploration & Production — 0.1% | |
ConocoPhillips | | | 9,167 | | | | 347,338 | |
| | | | | | | | |
Total Energy | | | | | | | 4,400,278 | |
| | |
| Financials — 7.6% | | | | | | |
|
Asset Management & Custody Banks — 0.2% | |
Bank of New York Mellon Corp. | | | 15,434 | | | | 570,749 | |
|
Financial Exchanges & Data — 1.2% | |
Morningstar, Inc. | | | 20,568 | | | | 3,293,965 | |
|
Property & Casualty Insurance — 3.3% | |
Allstate Corp. | | | 51,330 | | | | 4,773,691 | |
Axis Capital Holdings, Ltd. (2) | | | 41,749 | | | | 1,993,933 | |
Travelers Cos., Inc. | | | 14,856 | | | | 1,723,890 | |
| | | | | | | | |
| | | | | | | 8,491,514 | |
| | |
Reinsurance — 2.9% | | | | | | | | |
Everest Re Group, Ltd. | | | 22,122 | | | | 4,868,610 | |
RenaissanceRe Holdings, Ltd. | | | 14,190 | | | | 2,607,270 | |
| | | | | | | | |
| | | | | | | 7,475,880 | |
| | | | | | | | |
Total Financials | | | | | | | 19,832,108 | |
| | |
| Healthcare — 16.7% | | | | | | |
| | |
Biotechnology — 3.7% | | | | | | | | |
Amgen, Inc. (2) | | | 21,468 | | | | 5,438,274 | |
Gilead Sciences, Inc. | | | 63,765 | | | | 4,256,313 | |
| | | | | | | | |
| | | | | | | 9,694,587 | |
|
Healthcare Equipment — 3.0% | |
Baxter International, Inc. | | | 48,035 | | | | 4,182,408 | |
Medtronic PLC | | | 33,435 | | | | 3,593,259 | |
| | | | | | | | |
| | | | | | | 7,775,667 | |
| | |
Pharmaceuticals — 10.0% | | | | | | | | |
Bristol-Myers Squibb Co. | | | 78,492 | | | | 4,882,202 | |
Eli Lilly and Co. | | | 35,782 | | | | 5,309,691 | |
Johnson & Johnson | | | 32,500 | | | | 4,985,825 | |
Merck & Co., Inc. | | | 62,176 | | | | 5,301,748 | |
Pfizer, Inc. | | | 144,329 | | | | 5,454,193 | |
| | | | | | | | |
| | | | | | | 25,933,659 | |
| | | | | | | | |
Total Healthcare | | | | | | | 43,403,913 | |
| | |
| Industrials — 7.0% | | | | | | |
| | |
Aerospace & Defense — 3.0% | | | | | | | | |
Lockheed Martin Corp. (2) | | | 14,692 | | | | 5,733,700 | |
(See Notes to Schedules of Investments and Notes to Financial Statements, which are an integral part of the Financial Statements)
31
August 31, 2020
Low Volatility Equity Fund (continued)
| | | | | | | | |
| Description | | Shares | | | Value | |
| Common Stocks (continued) | | | | | | |
| | |
| Industrials (continued) | | | | | | |
| | |
Aerospace & Defense (continued) | | | | | | | | |
Northrop Grumman Corp. | | | 6,049 | | | $ | 2,072,448 | |
| | | | | | | | |
| | | | | | | 7,806,148 | |
|
Environmental & Facilities Services — 3.7% | |
Republic Services, Inc. | | | 35,598 | | | | 3,300,646 | |
Waste Management, Inc. | | | 55,293 | | | | 6,303,402 | |
| | | | | | | | |
| | | | | | | 9,604,048 | |
|
Industrial Conglomerates — 0.3% | |
Carlisle Cos., Inc. | | | 4,921 | | | | 644,405 | |
| | | | | | | | |
Total Industrials | | | | | | | 18,054,601 | |
| | |
| Information Technology — 6.1% | | | | | | |
| | |
Application Software — 1.3% | | | | | | | | |
Citrix Systems, Inc. (2) | | | 23,197 | | | | 3,368,205 | |
|
Communications Equipment — 1.9% | |
Motorola Solutions, Inc. (2) | | | 31,515 | | | | 4,876,946 | |
|
Data Processing & Outsourced Services — 1.5% | |
Genpact, Ltd. (2) | | | 90,241 | | | | 3,806,365 | |
|
Internet Services & Infrastructure — 0.3% | |
Palo Alto Networks, Inc. (1) | | | 2,953 | | | | 760,132 | |
| | |
Systems Software — 1.1% | | | | | | | | |
Microsoft Corp. | | | 12,758 | | | | 2,877,312 | |
| | | | | | | | |
Total Information Technology | | | | 15,688,960 | |
| | |
| Materials — 2.9% | | | | | | |
| | |
Gold — 2.9% | | | | | | | | |
Newmont Corp. | | | 113,312 | | | | 7,623,631 | |
| | |
| Real Estate — 5.7% | | | | | | |
| | |
Office REIT’s — 1.8% | | | | | | | | |
Equity Commonwealth | | | 151,656 | | | | 4,760,482 | |
| | |
Residential REIT’s — 1.3% | | | | | | | | |
Equity LifeStyle Properties, Inc. (2) | | | 36,343 | | | | 2,409,177 | |
Essex Property Trust, Inc. | | | 3,958 | | | | 856,947 | |
| | | | | | | | |
| | | | | | | 3,266,124 | |
| | |
Specialized REIT’s — 2.6% | | | | | | | | |
CubeSmart | | | 20,354 | | | | 643,594 | |
Extra Space Storage, Inc. (2) | | | 10,608 | | | | 1,130,282 | |
Public Storage | | | 23,202 | | | | 4,928,105 | |
| | | | | | | | |
| | | | | | | 6,701,981 | |
| | | | | | | | |
Total Real Estate | | | | | | | 14,728,587 | |
| | |
| Utilities — 12.5% | | | | | | |
| | |
Electric Utilities — 8.2% | | | | | | | | |
American Electric Power Co., Inc. (2) | | | 67,765 | | | | 5,341,915 | |
Avangrid, Inc. | | | 43,203 | | | | 2,075,472 | |
Duke Energy Corp. (2) | | | 41,229 | | | | 3,312,338 | |
Entergy Corp. | | | 51,608 | | | | 5,116,417 | |
Xcel Energy, Inc. | | | 75,605 | | | | 5,252,657 | |
| | | | | | | | |
| | | | | | | 21,098,799 | |
| | |
Multi-Utilities — 2.4% | | | | | | | | |
Ameren Corp. | | | 47,968 | | | | 3,794,748 | |
CMS Energy Corp. | | | 17,755 | | | | 1,074,000 | |
Public Service Enterprise Group, Inc. (2) | | | 26,290 | | | | 1,373,390 | |
| | | | | | | | |
| | | | | | | 6,242,138 | |
| | | | | | | | |
| Description | | Shares | | | Value | |
| Common Stocks (continued) | | | | | | |
| | |
| Utilities (continued) | | | | | | |
| | |
Water Utilities — 1.9% | | | | | | | | |
American Water Works Co., Inc. | | | 35,308 | | | $ | 4,990,433 | |
| | | | | | | | |
Total Utilities | | | | | | | 32,331,370 | |
| | | | | | | | |
Total Common Stocks
(identified cost $214,032,913) | | | | | | | 254,246,368 | |
| | | | | | | | |
| Short-Term Investments — 10.1% | |
|
| Collateral Pool Investments for Securities on Loan — 8.5% | |
| | |
Collateral pool allocation (3) | | | | | | | 21,952,763 | |
| | |
| Mutual Funds — 1.6% | | | | | | |
BMO Institutional Prime Money Market Fund — Premier Class, 0.130% (4) | | | 4,254,885 | | | | 4,254,460 | |
| | | | | | | | |
Total Short-Term Investments
(identified cost $26,208,074) | | | | | | | 26,207,223 | |
| | | | | | | | |
Total Investments — 108.2%
(identified cost $240,240,987) | | | | | | | 280,453,591 | |
| Other Assets and Liabilities — (8.2)% | | | | (21,318,220 | ) |
| | | | | | | | |
| Total Net Assets — 100.0% | | | | | | $ | 259,135,371 | |
| | | | | | | | |
Dividend Income Fund
| | | | | | | | |
| Description | | Shares | | | Value | |
| Common Stocks — 97.7% | |
|
| Communication Services — 6.8% | |
|
Broadcasting — 0.5% | |
Nexstar Media Group, Inc., Class A (2) | | | 12,175 | | | $ | 1,168,922 | |
|
Cable & Satellite — 2.6% | |
Comcast Corp., Class A (2) | | | 143,241 | | | | 6,418,629 | |
|
Integrated Telecommunication Services — 3.7% | |
AT&T, Inc. | | | 75,995 | | | | 2,265,411 | |
Verizon Communications, Inc. | | | 114,559 | | | | 6,789,912 | |
| | | | | | | | |
| | | | | | | 9,055,323 | |
| | | | | | | | |
Total Communication Services | | | | | | | 16,642,874 | |
|
| Consumer Discretionary — 8.0% | |
|
Computer & Electronics Retail — 1.9% | |
Best Buy Co., Inc. (2) | | | 42,636 | | | | 4,728,759 | |
|
General Merchandise Stores — 2.7% | |
Target Corp. | | | 43,472 | | | | 6,573,401 | |
|
Home Improvement Retail — 2.7% | |
Lowe’s Cos., Inc. | | | 39,799 | | | | 6,554,497 | |
|
Hotels, Resorts & Cruise Lines — 0.7% | |
Wyndham Destinations, Inc. | | | 58,046 | | | | 1,682,754 | |
| | | | | | | | |
Total Consumer Discretionary | | | | | | | 19,539,411 | |
|
| Consumer Staples — 8.0% | |
|
Food Distributors — 1.0% | |
Sysco Corp. (2) | | | 42,534 | | | | 2,557,995 | |
|
Household Products — 1.1% | |
Procter & Gamble Co. | | | 19,742 | | | | 2,730,911 | |
|
Hypermarkets & Super Centers — 1.0% | |
Walmart, Inc. | | | 17,898 | | | | 2,485,137 | |
|
Packaged Foods & Meats — 1.3% | |
Tyson Foods, Inc., Class A | | | 49,145 | | | | 3,086,306 | |
(See Notes to Schedules of Investments and Notes to Financial Statements, which are an integral part of the Financial Statements)
32
Dividend Income Fund (continued)
| | | | | | | | |
| Description | | Shares | | | Value | |
| Common Stocks (continued) | |
|
| Consumer Staples (continued) | |
|
Soft Drinks — 2.0% | |
PepsiCo, Inc. (2) | | | 34,969 | | | $ | 4,897,758 | |
|
Tobacco — 1.6% | |
Philip Morris International, Inc. (2) | | | 49,072 | | | | 3,915,455 | |
| | | | | | | | |
Total Consumer Staples | | | | | | | 19,673,562 | |
|
| Energy — 2.9% | |
|
Integrated Oil & Gas — 0.8% | |
Chevron Corp. (2) | | | 23,263 | | | | 1,952,464 | |
|
Oil & Gas-Exploration & Production — 1.4% | |
ConocoPhillips | | | 88,664 | | | | 3,359,479 | |
|
Oil & Gas-Refining & Marketing — 0.7% | |
Valero Energy Corp. | | | 33,112 | | | | 1,741,360 | |
| | | | | | | | |
Total Energy | | | | | | | 7,053,303 | |
|
| Financials — 12.1% | |
|
Asset Management & Custody Banks — 2.3% | |
Ameriprise Financial, Inc. | | | 22,909 | | | | 3,592,131 | |
Bank of New York Mellon Corp. | | | 57,003 | | | | 2,107,971 | |
| | | | | | | | |
| | | | | | | 5,700,102 | |
|
Consumer Finance — 0.4% | |
Discover Financial Services (2) | | | 19,293 | | | | 1,024,072 | |
|
Diversified Banks — 2.5% | |
Bank of America Corp. | | | 44,719 | | | | 1,151,067 | |
Citigroup, Inc. | | | 98,072 | | | | 5,013,441 | |
| | | | | | | | |
| | | | | | | 6,164,508 | |
|
Investment Banking & Brokerage — 3.7% | |
Goldman Sachs Group, Inc. | | | 13,306 | | | | 2,726,000 | |
Morgan Stanley | | | 118,456 | | | | 6,190,511 | |
| | | | | | | | |
| | | | | | | 8,916,511 | |
|
Property & Casualty Insurance — 1.6% | |
Allstate Corp. | | | 41,136 | | | | 3,825,648 | |
|
Regional Banks — 1.6% | |
Citizens Financial Group, Inc. | | | 116,232 | | | | 3,006,922 | |
KeyCorp | | | 71,844 | | | | 885,118 | |
| | | | | | | | |
| | | | | | | 3,892,040 | |
| | | | | | | | |
Total Financials | | | | | | | 29,522,881 | |
|
| Healthcare — 15.0% | |
|
Biotechnology — 1.8% | |
AbbVie, Inc. (2) | | | 45,217 | | | | 4,330,432 | |
|
Healthcare Equipment — 1.5% | |
Medtronic PLC | | | 35,302 | | | | 3,793,906 | |
|
Healthcare Services — 1.2% | |
CVS Health Corp. | | | 48,342 | | | | 3,003,005 | |
|
Managed Healthcare — 0.7% | |
UnitedHealth Group, Inc. (2) | | | 5,250 | | | | 1,640,887 | |
|
Pharmaceuticals — 9.8% | |
Bristol-Myers Squibb Co. (2) | | | 60,385 | | | | 3,755,947 | |
Eli Lilly and Co. | | | 14,655 | | | | 2,174,655 | |
Johnson & Johnson | | | 53,744 | | | | 8,244,867 | |
Merck & Co., Inc. | | | 66,218 | | | | 5,646,409 | |
Pfizer, Inc. | | | 109,755 | | | | 4,147,642 | |
| | | | | | | | |
| | | | | | | 23,969,520 | |
| | | | | | | | |
Total Healthcare | | | | | | | 36,737,750 | |
| | | | | | | | |
| Description | | Shares | | | Value | |
| Common Stocks (continued) | |
|
| Industrials — 9.7% | |
|
Aerospace & Defense — 2.4% | |
Lockheed Martin Corp. (2) | | | 4,554 | | | $ | 1,777,244 | |
Northrop Grumman Corp. | | | 6,428 | | | | 2,202,297 | |
Raytheon Technologies Corp. | | | 30,045 | | | | 1,832,745 | |
| | | | | | | | |
| | | | | | | 5,812,286 | |
|
Building Products — 0.7% | |
Trane Technologies PLC | | | 13,599 | | | | 1,609,986 | |
|
Construction Machinery & Heavy Trucks — 1.4% | |
Caterpillar, Inc. (2) | | | 24,436 | | | | 3,477,487 | |
|
Electrical Components & Equipment — 2.5% | |
Eaton Corp. PLC (2) | | | 33,646 | | | | 3,435,256 | |
Hubbell, Inc. | | | 18,842 | | | | 2,730,583 | |
| | | | | | | | |
| | | | | | | 6,165,839 | |
|
Industrial Conglomerates — 0.5% | |
Carlisle Cos., Inc. (2) | | | 9,343 | | | | 1,223,466 | |
|
Industrial Machinery — 1.6% | |
Crane Co. | | | 19,266 | | | | 1,089,300 | |
Parker-Hannifin Corp. | | | 7,361 | | | | 1,516,439 | |
Timken Co. | | | 25,362 | | | | 1,374,367 | |
| | | | | | | | |
| | | | | | | 3,980,106 | |
| | |
Railroads — 0.6% | | | | | | | | |
Union Pacific Corp. (2) | | | 6,942 | | | | 1,335,918 | |
| | | | | | | | |
Total Industrials | | | | | | | 23,605,088 | |
| | |
| Information Technology — 22.4% | | | | | | |
|
Communications Equipment — 4.1% | |
Cisco Systems, Inc. | | | 132,575 | | | | 5,597,316 | |
Motorola Solutions, Inc. (2) | | | 27,449 | | | | 4,247,733 | |
| | | | | | | | |
| | | | | | | 9,845,049 | |
|
IT Consulting & Other Services — 0.8% | |
Amdocs, Ltd. (2) | | | 31,445 | | | | 1,925,378 | |
|
Semiconductor Equipment — 2.7% | |
Applied Materials, Inc. | | | 30,002 | | | | 1,848,123 | |
KLA Corp. | | | 12,386 | | | | 2,540,864 | |
Lam Research Corp. (2) | | | 6,683 | | | | 2,247,761 | |
| | | | | | | | |
| | | | | | | 6,636,748 | |
| | |
Semiconductors — 8.3% | | | | | | | | |
Broadcom, Inc. (2) | | | 17,205 | | | | 5,972,716 | |
Intel Corp. (2) | | | 66,126 | | | | 3,369,120 | |
QUALCOMM, Inc. | | | 54,396 | | | | 6,478,563 | |
Texas Instruments, Inc. (2) | | | 31,688 | | | | 4,504,449 | |
| | | | | | | | |
| | | | | | | 20,324,848 | |
| | |
Systems Software — 6.1% | | | | | | | | |
Microsoft Corp. | | | 43,528 | | | | 9,816,870 | |
Oracle Corp. (2) | | | 89,679 | | | | 5,131,432 | |
| | | | | | | | |
| | | | | | | 14,948,302 | |
|
Technology Hardware, Storage & Peripherals — 0.4% | |
Seagate Technology PLC | | | 21,089 | | | | 1,012,061 | |
| | | | | | | | |
Total Information Technology | | | | | | | 54,692,386 | |
| | |
| Materials — 3.4% | | | | | | |
|
Diversified Chemicals — 1.6% | |
Huntsman Corp. | | | 177,969 | | | | 3,847,690 | |
|
Fertilizers & Agricultural Chemicals — 0.8% | |
CF Industries Holdings, Inc. | | | 60,879 | | | | 1,986,482 | |
| | |
Specialty Chemicals — 1.0% | | | | | | | | |
PPG Industries, Inc. | | | 21,304 | | | | 2,565,001 | |
| | | | | | | | |
Total Materials | | | | | | | 8,399,173 | |
(See Notes to Schedules of Investments and Notes to Financial Statements, which are an integral part of the Financial Statements)
33
August 31, 2020
Dividend Income Fund (continued)
| | | | | | | | |
| Description | | Shares | | | Value | |
| Common Stocks (continued) | |
| | |
| Real Estate — 4.2% | | | | | | |
| | |
Residential REIT’s — 0.8% | | | | | | | | |
Camden Property Trust | | | 20,753 | | | $ | 1,887,278 | |
|
Specialized REIT’s — 3.4% | |
CyrusOne, Inc. (2) | | | 21,231 | | | | 1,773,425 | |
Gaming and Leisure Properties, Inc. | | | 51,431 | | | | 1,869,517 | |
Lamar Advertising Co., Class A | | | 53,890 | | | | 3,730,804 | |
Life Storage, Inc. | | | 10,181 | | | | 1,073,383 | |
| | | | | | | | |
| | | | | | | 8,447,129 | |
| | | | | | | | |
Total Real Estate | | | | | | | 10,334,407 | |
| | |
| Utilities — 5.2% | | | | | | |
|
Electric Utilities — 2.5% | |
Entergy Corp. | | | 47,948 | | | | 4,753,565 | |
NRG Energy, Inc. | | | 42,310 | | | | 1,455,887 | |
| | | | | | | | |
| | | | | | | 6,209,452 | |
|
Independent Power Producers & Energy Traders — 2.3% | |
AES Corp. | | | 311,599 | | | | 5,530,882 | |
|
Multi-Utilities — 0.4% | |
CMS Energy Corp. | | | 17,689 | | | | 1,070,008 | |
| | | | | | | | |
Total Utilities | | | | | | | 12,810,342 | |
| | | | | | | | |
Total Common Stocks
(identified cost $195,066,638) | | | | | | | 239,011,177 | |
| | | | | | | | |
| Short-Term Investments — 20.5% | |
|
| Collateral Pool Investments for Securities on Loan — 18.4% | |
| | |
Collateral pool allocation (3) | | | | | | | 45,096,198 | |
|
| Mutual Funds — 2.1% | |
BMO Institutional Prime Money Market Fund — Premier Class, 0.130% (4) | | | 5,160,647 | | | | 5,160,131 | |
| | | | | | | | |
Total Short-Term Investments (identified cost $50,257,042) | | | | | | | 50,256,329 | |
| | | | | | | | |
Total Investments — 118.2% (identified cost $245,323,680) | | | | | | | 289,267,506 | |
| Other Assets and Liabilities — (18.2)% | | | | (44,550,200 | ) |
| | | | | | | | |
| Total Net Assets — 100.0% | | | | | | $ | 244,717,306 | |
| | | | | | | | |
Large-Cap Value Fund
| | | | | | | | |
| Description | | Shares | | | Value | |
| Common Stocks — 98.5% | | | | | | |
| | |
| Communication Services — 7.1% | | | | | | |
| | |
Broadcasting — 1.4% | | | | | | | | |
Discovery, Inc., Class A (1)(2) | | | 162,460 | | | $ | 3,584,680 | |
| | |
Cable & Satellite — 2.5% | | | | | | | | |
Comcast Corp., Class A (2) | | | 146,422 | | | | 6,561,170 | |
|
Integrated Telecommunication Services — 2.1% | |
Verizon Communications, Inc. (2) | | | 92,401 | | | | 5,476,607 | |
|
Interactive Home Entertainment — 1.1% | |
Electronic Arts, Inc. (1) | | | 21,300 | | | | 2,970,711 | |
| | | | | | | | |
Total Communication Services | | | | | | | 18,593,168 | |
| | | | | | | | |
| Description | | Shares | | | Value | |
| Common Stocks (continued) | | | | | | |
| | |
| Consumer Discretionary — 7.2% | | | | | | |
|
Apparel, Accessories & Luxury Goods — 0.3% | |
Ralph Lauren Corp. | | | 13,160 | | | $ | 905,803 | |
| | |
Footwear — 1.1% | | | | | | | | |
Deckers Outdoor Corp. (1)(2) | | | 13,882 | | | | 2,830,123 | |
|
General Merchandise Stores — 2.1% | |
Target Corp. | | | 36,636 | | | | 5,539,730 | |
|
Home Improvement Retail — 1.5% | |
Lowe’s Cos., Inc. | | | 23,227 | | | | 3,825,255 | |
|
Homefurnishing Retail — 1.1% | |
Williams-Sonoma, Inc. (2) | | | 33,175 | | | | 2,911,438 | |
| | |
Leisure Products — 1.1% | | | | | | | | |
Polaris, Inc. | | | 28,135 | | | | 2,842,760 | |
| | | | | | | | |
Total Consumer Discretionary | | | | | | | 18,855,109 | |
| | |
| Consumer Staples — 11.5% | | | | | | |
| | |
Food Distributors — 1.1% | | | | | | | | |
Sysco Corp. (2) | | | 48,441 | | | | 2,913,242 | |
| | |
Food Retail — 0.8% | | | | | | | | |
Kroger Co. (2) | | | 61,169 | | | | 2,182,510 | |
| | |
Household Products — 2.3% | | | | | | | | |
Procter & Gamble Co. | | | 44,067 | | | | 6,095,788 | |
|
Hypermarkets & Super Centers — 3.2% | |
Walmart, Inc. | | | 59,097 | | | | 8,205,618 | |
| | |
Packaged Foods & Meats — 3.0% | | | | | | | | |
General Mills, Inc. | | | 36,336 | | | | 2,323,687 | |
Hershey Co. | | | 16,329 | | | | 2,427,143 | |
Tyson Foods, Inc., Class A | | | 48,984 | | | | 3,076,195 | |
| | | | | | | | |
| | | | | | | 7,827,025 | |
|
Soft Drinks — 1.1% | |
PepsiCo, Inc. (2) | | | 20,025 | | | | 2,804,702 | |
| | | | | | | | |
Total Consumer Staples | | | | | | | 30,028,885 | |
|
| Energy — 3.0% | |
|
Oil & Gas-Drilling — 0.4% | |
Helmerich & Payne, Inc. (2) | | | 55,763 | | | | 918,974 | |
|
Oil & Gas-Exploration & Production — 2.6% | |
Cabot Oil & Gas Corp. (2) | | | 152,850 | | | | 2,899,564 | |
ConocoPhillips | | | 104,477 | | | | 3,958,634 | |
| | | | | | | | |
| | | | | | | 6,858,198 | |
| | | | | | | | |
Total Energy | | | | | | | 7,777,172 | |
|
| Financials — 20.2% | |
|
Asset Management & Custody Banks — 1.2% | |
Ameriprise Financial, Inc. (2) | | | 20,151 | | | | 3,159,677 | |
| | |
Consumer Finance — 1.7% | | | | | | | | |
American Express Co. (2) | | | 20,217 | | | | 2,053,845 | |
Capital One Financial Corp. (2) | | | 34,101 | | | | 2,353,992 | |
| | | | | | | | |
| | | | | | | 4,407,837 | |
|
Diversified Banks — 2.2% | |
Citigroup, Inc. (2) | | | 114,505 | | | | 5,853,496 | |
|
Investment Banking & Brokerage — 4.4% | |
Goldman Sachs Group, Inc. (2) | | | 12,222 | | | | 2,503,921 | |
Morgan Stanley (2) | | | 136,579 | | | | 7,137,619 | |
Raymond James Financial, Inc. (2) | | | 25,070 | | | | 1,898,300 | |
| | | | | | | | |
| | | | | | | 11,539,840 | |
|
Other Diversified Financial Services — 0.6% | |
Voya Financial, Inc. (2) | | | 27,889 | | | | 1,447,718 | |
(See Notes to Schedules of Investments and Notes to Financial Statements, which are an integral part of the Financial Statements)
34
Large-Cap Value Fund (continued)
| | | | | | | | |
| Description | | Shares | | | Value | |
| Common Stocks (continued) | | | | | | |
|
| Financials (continued) | |
|
Property & Casualty Insurance — 4.1% | |
Allstate Corp. | | | 56,219 | | | $ | 5,228,367 | |
Travelers Cos., Inc. (2) | | | 47,271 | | | | 5,485,327 | |
| | | | | | | | |
| | | | | | | 10,713,694 | |
|
Regional Banks — 4.3% | |
Citizens Financial Group, Inc. (2) | | | 146,953 | | | | 3,801,674 | |
KeyCorp | | | 248,535 | | | | 3,061,951 | |
Regions Financial Corp. (2) | | | 235,842 | | | | 2,726,333 | |
Zions Bancorp NA (2) | | | 50,879 | | | | 1,636,269 | |
| | | | | | | | |
| | | | | | | 11,226,227 | |
|
Reinsurance — 1.7% | |
Everest Re Group, Ltd. | | | 19,509 | | | | 4,293,541 | |
| | | | | | | | |
Total Financials | | | | | | | 52,642,030 | |
|
| Healthcare — 16.6% | |
|
Biotechnology — 2.0% | |
Alexion Pharmaceuticals, Inc. (1) | | | 26,437 | | | | 3,019,634 | |
Exelixis, Inc. (1) | | | 98,247 | | | | 2,183,048 | |
| | | | | | | | |
| | | | | | | 5,202,682 | |
|
Healthcare Equipment — 4.8% | |
Baxter International, Inc. (2) | | | 47,129 | | | | 4,103,522 | |
Hologic, Inc. (1) | | | 45,051 | | | | 2,690,446 | |
Medtronic PLC | | | 52,621 | | | | 5,655,179 | |
| | | | | | | | |
| | | | | | | 12,449,147 | |
|
Healthcare Services — 0.8% | |
Cigna Corp. (1) | | | 12,235 | | | | 2,170,122 | |
|
Healthcare Supplies — 0.8% | |
Dentsply Sirona, Inc. | | | 44,522 | | | | 1,997,702 | |
|
Healthcare Technology — 0.7% | |
Cerner Corp. (2) | | | 24,991 | | | | 1,833,590 | |
|
Pharmaceuticals — 7.5% | |
Eli Lilly and Co. | | | 22,659 | | | | 3,362,369 | |
Jazz Pharmaceuticals PLC (1) | | | 19,143 | | | | 2,572,628 | |
Johnson & Johnson (2) | | | 36,689 | | | | 5,628,459 | |
Merck & Co., Inc. (2) | | | 39,907 | | | | 3,402,870 | |
Pfizer, Inc. | | | 125,535 | | | | 4,743,968 | |
| | | | | | | | |
| | | | | | | 19,710,294 | |
| | | | | | | | |
Total Healthcare | | | | | | | 43,363,537 | |
|
| Industrials — 12.3% | |
|
Aerospace & Defense — 1.1% | |
Northrop Grumman Corp. (2) | | | 8,471 | | | | 2,902,249 | |
|
Agricultural & Farm Machinery — 1.2% | |
AGCO Corp. | | | 44,226 | | | | 3,144,469 | |
|
Airlines — 0.7% | |
Southwest Airlines Co. | | | 51,365 | | | | 1,930,297 | |
|
Building Products — 2.7% | |
Fortune Brands Home & Security, Inc. (2) | | | 29,519 | | | | 2,481,958 | |
Masco Corp. (2) | | | 75,718 | | | | 4,414,359 | |
| | | | | | | | |
| | | | | | | 6,896,317 | |
|
Construction & Engineering — 1.0% | |
Quanta Services, Inc. | | | 50,767 | | | | 2,601,809 | |
|
Construction Machinery & Heavy Trucks — 1.1% | |
Allison Transmission Holdings, Inc. | | | 78,790 | | | | 2,826,197 | |
| | | | | | | | |
| Description | | Shares | | | Value | |
| Common Stocks (continued) | | | | | | |
|
| Industrials (continued) | |
|
Electrical Components & Equipment — 0.5% | |
Hubbell, Inc. (2) | | | 9,352 | | | $ | 1,355,292 | |
|
Environmental & Facilities Services — 0.6% | |
Clean Harbors, Inc. (1) | | | 25,005 | | | | 1,527,805 | |
|
Railroads — 1.6% | |
Kansas City Southern (2) | | | 22,439 | | | | 4,084,795 | |
|
Trading Companies & Distributors — 1.8% | |
United Rentals, Inc. (1) (2) | | | 15,103 | | | | 2,673,986 | |
WW Grainger, Inc. (2) | | | 5,639 | | | | 2,060,660 | |
| | | | | | | | |
| | | | | | | 4,734,646 | |
| | | | | | | | |
Total Industrials | | | | | | | 32,003,876 | |
|
| Information Technology — 10.2% | |
|
Communications Equipment — 2.0% | |
Cisco Systems, Inc. | | | 51,324 | | | | 2,166,899 | |
F5 Networks, Inc. (1) | | | 22,358 | | | | 2,958,634 | |
| | | | | | | | |
| | | | | | | 5,125,533 | |
|
Data Processing & Outsourced Services — 0.8% | |
Euronet Worldwide, Inc. (1) | | | 21,238 | | | | 2,195,585 | |
|
Electronic Components — 0.5% | |
Dolby Laboratories, Inc., Class A (2) | | | 18,822 | | | | 1,314,717 | |
|
Electronic Equipment & Instruments — 0.6% | |
Zebra Technologies Corp., Class A (1) | | | 5,123 | | | | 1,467,893 | |
|
IT Consulting & Other Services — 0.7% | |
CACI International, Inc., Class A (1) | | | 7,544 | | | | 1,766,729 | |
|
Semiconductors — 2.3% | |
Intel Corp. (2) | | | 118,322 | | | | 6,028,506 | |
|
Systems Software — 3.3% | |
Microsoft Corp. | | | 19,815 | | | | 4,468,877 | |
Oracle Corp. (2) | | | 74,765 | | | | 4,278,053 | |
| | | | | | | | |
| | | | | | | 8,746,930 | |
| | | | | | | | |
Total Information Technology | | | | 26,645,893 | |
|
| Materials — 1.2% | |
|
Diversified Chemicals — 0.6% | |
Huntsman Corp. (2) | | | 75,277 | | | | 1,627,489 | |
|
Steel — 0.6% | |
Steel Dynamics, Inc. (2) | | | 46,630 | | | | 1,376,517 | |
| | | | | | | | |
Total Materials | | | | | | | 3,004,006 | |
|
| Real Estate — 3.7% | |
|
Residential REIT’s — 1.0% | |
Camden Property Trust (2) | | | 29,629 | | | | 2,694,461 | |
|
Retail REIT’s — 0.7% | |
Brixmor Property Group, Inc. | | | 163,660 | | | | 1,931,188 | |
|
Specialized REIT’s — 2.0% | |
Gaming and Leisure Properties, Inc. | | | 52,434 | | | | 1,905,976 | |
Lamar Advertising Co., Class A | | | 45,940 | | | | 3,180,426 | |
| | | | | | | | |
| | | | | | | 5,086,402 | |
| | | | | | | | |
Total Real Estate | | | | | | | 9,712,051 | |
|
| Utilities — 5.5% | |
|
Electric Utilities — 3.3% | |
Avangrid, Inc. (2) | | | 42,381 | | | | 2,035,983 | |
Entergy Corp. (2) | | | 40,988 | | | | 4,063,550 | |
NRG Energy, Inc. (2) | | | 69,009 | | | | 2,374,600 | |
| | | | | | | | |
| | | | | | | 8,474,133 | |
(See Notes to Schedules of Investments and Notes to Financial Statements, which are an integral part of the Financial Statements)
35
August 31, 2020
Large-Cap Value Fund (continued)
| | | | | | | | |
| Description | | Shares | | | Value | |
| Common Stocks (continued) | | | | | | |
|
| Utilities (continued) | |
|
Independent Power Producers & Energy Traders — 2.2% | |
AES Corp. (2) | | | 321,890 | | | $ | 5,713,548 | |
| | | | | | | | |
Total Utilities | | | | | | | 14,187,681 | |
| | | | | | | | |
Total Common Stocks
(identified cost $229,443,467) | | | | | | | 256,813,408 | |
| | | | | | | | |
| Short-Term Investments — 23.2% | |
|
| Collateral Pool Investments for Securities on Loan — 21.9% | |
| | |
Collateral pool allocation (3) | | | | | | | 57,069,363 | |
| | |
| Mutual Funds — 1.3% | | | | | | |
BMO Institutional Prime Money Market Fund — Premier Class, 0.130% (4) | | | 3,590,241 | | | | 3,589,882 | |
| | | | | | | | |
Total Short-Term Investments
(identified cost $60,659,408) | | | | 60,659,245 | |
| | | | | | | | |
Total Investments — 121.7%
(identified cost $290,102,875) | | | | 317,472,653 | |
| Other Assets and Liabilities — (21.7)% | | | | (56,641,717 | ) |
| | | | | | | | |
| Total Net Assets — 100.0% | | | | | | $ | 260,830,936 | |
| | | | | | | | |
Large-Cap Growth Fund
| | | | | | | | |
| Description | | Shares | | | Value | |
| Common Stocks — 99.5% | |
|
| Communication Services — 13.3% | |
| | |
Cable & Satellite — 0.7% | | | | | | | | |
Charter Communications, Inc., Class A (1)(2) | | | 5,598 | | | $ | 3,446,185 | |
|
Interactive Home Entertainment — 2.1% | |
Electronic Arts, Inc. (1) | | | 34,489 | | | | 4,810,181 | |
Take-Two Interactive Software, Inc. (1) | | | 28,559 | | | | 4,889,015 | |
| | | | | | | | |
| | | | | | | 9,699,196 | |
|
Interactive Media & Services — 10.5% | |
Alphabet, Inc., Class A (1) | | | 3,215 | | | | 5,238,939 | |
Alphabet, Inc., Class C (1) | | | 11,495 | | | | 18,784,899 | |
Facebook, Inc., Class A (1) | | | 81,478 | | | | 23,889,350 | |
| | | | | | | | |
| | | | | | | 47,913,188 | |
| | | | | | | | |
Total Communication Services | | | | | | | 61,058,569 | |
|
| Consumer Discretionary — 11.5% | |
|
Apparel Retail — 0.6% | |
Burlington Stores, Inc. (1)(2) | | | 14,640 | | | | 2,883,055 | |
|
Education Services — 0.8% | |
Chegg, Inc. (1)(2) | | | 50,585 | | | | 3,730,138 | |
|
Footwear — 0.8% | |
Deckers Outdoor Corp. (1) | | | 16,452 | | | | 3,354,070 | |
|
General Merchandise Stores — 1.2% | |
Target Corp. | | | 36,563 | | | | 5,528,691 | |
|
Home Improvement Retail — 1.4% | |
Lowe’s Cos., Inc. | | | 39,126 | | | | 6,443,661 | |
|
Internet & Direct Marketing Retail — 6.7% | |
Amazon.com, Inc. (1) | | | 8,167 | | | | 28,183,990 | |
| | | | | | | | |
| Description | | Shares | | | Value | |
| Common Stocks (continued) | |
|
| Consumer Discretionary (continued) | |
|
Internet & Direct Marketing Retail (continued) | |
eBay, Inc. (2) | | | 45,611 | | | $ | 2,498,571 | |
| | | | | | | | |
| | | | | | | 30,682,561 | |
| | | | | | | | |
Total Consumer Discretionary | | | | | | | 52,622,176 | |
|
| Consumer Staples — 4.4% | |
|
Household Products — 0.8% | |
Procter & Gamble Co. | | | 25,509 | | | | 3,528,660 | |
|
Hypermarkets & Super Centers — 1.1% | |
Walmart, Inc. | | | 35,004 | | | | 4,860,305 | |
|
Packaged Foods & Meats — 1.7% | |
Hershey Co. | | | 52,188 | | | | 7,757,224 | |
|
Personal Products — 0.8% | |
Estee Lauder Cos., Inc., Class A (2) | | | 17,169 | | | | 3,806,711 | |
| | | | | | | | |
Total Consumer Staples | | | | | | | 19,952,900 | |
|
| Financials — 2.4% | |
|
Consumer Finance — 0.8% | |
American Express Co. (2) | | | 35,780 | | | | 3,634,890 | |
|
Diversified Banks — 0.6% | |
U.S. Bancorp | | | 81,195 | | | | 2,955,498 | |
|
Property & Casualty Insurance — 1.0% | |
Allstate Corp. | | | 48,840 | | | | 4,542,120 | |
| | | | | | | | |
Total Financials | | | | | | | 11,132,508 | |
|
| Healthcare — 13.8% | |
|
Biotechnology — 4.3% | |
Alexion Pharmaceuticals, Inc. (1) | | | 34,666 | | | | 3,959,551 | |
Amgen, Inc. | | | 21,210 | | | | 5,372,917 | |
Exelixis, Inc. (1) | | | 72,845 | | | | 1,618,616 | |
Neurocrine Biosciences, Inc. (1)(2) | | | 15,067 | | | | 1,754,100 | |
Sarepta Therapeutics, Inc. (1)(2) | | | 11,425 | | | | 1,672,848 | |
Vertex Pharmaceuticals, Inc. (1) | | | 19,674 | | | | 5,491,407 | |
| | | | | | | | |
| | | | | | | 19,869,439 | |
|
Healthcare Equipment — 1.3% | |
Baxter International, Inc. | | | 36,316 | | | | 3,162,034 | |
Masimo Corp. (1) | | | 11,756 | | | | 2,633,344 | |
| | | | | | | | |
| | | | | | | 5,795,378 | |
|
Healthcare Supplies — 1.3% | |
Align Technology, Inc. (1) | | | 20,521 | | | | 6,094,326 | |
|
Healthcare Technology — 0.9% | |
Veeva Systems, Inc., Class A (1) | | | 14,047 | | | | 3,965,047 | |
|
Managed Healthcare — 1.4% | |
Humana, Inc. | | | 11,324 | | | | 4,701,385 | |
UnitedHealth Group, Inc. | | | 6,185 | | | | 1,933,122 | |
| | | | | | | | |
| | | | | | | 6,634,507 | |
|
Pharmaceuticals — 4.6% | |
Bristol-Myers Squibb Co. | | | 58,594 | | | | 3,644,547 | |
Eli Lilly and Co. | | | 21,469 | | | | 3,185,785 | |
Horizon Therapeutics PLC (1) | | | 72,958 | | | | 5,480,605 | |
Jazz Pharmaceuticals PLC (1) | | | 21,578 | | | | 2,899,867 | |
Merck & Co., Inc. | | | 67,307 | | | | 5,739,268 | |
| | | | | | | | |
| | | | | | | 20,950,072 | |
| | | | | | | | |
Total Healthcare | | | | | | | 63,308,769 | |
|
| Industrials — 5.9% | |
|
Construction Machinery & Heavy Trucks — 0.9% | |
Allison Transmission Holdings, Inc. | | | 109,316 | | | | 3,921,165 | |
(See Notes to Schedules of Investments and Notes to Financial Statements, which are an integral part of the Financial Statements)
36
Large-Cap Growth Fund (continued)
| | | | | | | | |
| Description | | Shares | | | Value | |
| Common Stocks (continued) | |
|
| Industrials (continued) | |
|
Electrical Components & Equipment — 0.8% | |
Sensata Technologies Holding PLC (1) | | | 85,518 | | | $ | 3,560,970 | |
|
Industrial Conglomerates — 0.7% | |
Carlisle Cos., Inc. | | | 24,494 | | | | 3,207,489 | |
|
Railroads — 1.4% | |
Kansas City Southern (2) | | | 35,311 | | | | 6,428,014 | |
|
Research & Consulting Services — 0.8% | |
TransUnion | | | 41,963 | | | | 3,639,031 | |
|
Trading Companies & Distributors — 1.3% | |
WW Grainger, Inc. (2) | | | 16,615 | | | | 6,071,620 | |
| | | | | | | | |
Total Industrials | | | | | | | 26,828,289 | |
|
| Information Technology — 46.5% | |
|
Application Software — 6.1% | |
Adobe, Inc. (1) | | | 25,794 | | | | 13,242,382 | |
Five9, Inc. (1)(2) | | | 17,982 | | | | 2,291,626 | |
salesforce.com, Inc. (1) | | | 45,291 | | | | 12,348,591 | |
| | | | | | | | |
| | | | | | | 27,882,599 | |
|
Communications Equipment — 2.3% | |
F5 Networks, Inc. (1) | | | 41,003 | | | | 5,425,927 | |
Motorola Solutions, Inc. | | | 33,093 | | | | 5,121,142 | |
| | | | | | | | |
| | | | | | | 10,547,069 | |
|
Data Processing & Outsourced Services — 8.9% | |
Euronet Worldwide, Inc. (1) | | | 16,904 | | | | 1,747,535 | |
Mastercard, Inc., Class A | | | 43,300 | | | | 15,509,627 | |
PayPal Holdings, Inc. (1) | | | 52,537 | | | | 10,724,903 | |
Visa, Inc., Class A (2) | | | 60,936 | | | | 12,917,823 | |
| | | | | | | | |
| | | | | | | 40,899,888 | |
|
Internet Services & Infrastructure — 1.2% | |
Okta, Inc. (1) | | | 9,710 | | | | 2,091,242 | |
Palo Alto Networks, Inc. (1) | | | 13,953 | | | | 3,591,642 | |
| | | | | | | | |
| | | | | | | 5,682,884 | |
|
Semiconductor Equipment — 1.9% | |
Entegris, Inc. | | | 39,032 | | | | 2,610,850 | |
Lam Research Corp. (2) | | | 18,846 | | | | 6,338,664 | |
| | | | | | | | |
| | | | | | | 8,949,514 | |
|
Semiconductors — 4.1% | |
Broadcom, Inc. | | | 15,118 | | | | 5,248,214 | |
NVIDIA Corp. | | | 20,915 | | | | 11,189,107 | |
Texas Instruments, Inc. | | | 15,829 | | | | 2,250,092 | |
| | | | | | | | |
| | | | | | | 18,687,413 | |
|
Systems Software — 12.9% | |
Fortinet, Inc. (1)(2) | | | 52,885 | | | | 6,981,084 | |
Microsoft Corp. | | | 166,289 | | | | 37,503,158 | |
Oracle Corp. | | | 110,989 | | | | 6,350,791 | |
ServiceNow, Inc. (1)(2) | | | 16,882 | | | | 8,137,462 | |
| | | | | | | | |
| | | | | | | 58,972,495 | |
|
Technology Hardware, Storage & Peripherals — 9.1% | |
Apple, Inc. (2) | | | 321,652 | | | | 41,505,974 | |
| | | | | | | | |
Total Information Technology | | | | 213,127,836 | |
|
| Materials — 0.5% | |
|
Specialty Chemicals — 0.5% | |
PPG Industries, Inc. | | | 18,061 | | | | 2,174,544 | |
| | | | | | | | |
| Description | | Shares | | | Value | |
| Common Stocks (continued) | |
|
| Real Estate — 1.2% | |
|
Specialized REIT’s — 1.2% | |
CyrusOne, Inc. | | | 25,500 | | | $ | 2,130,015 | |
Lamar Advertising Co., Class A | | | 47,852 | | | | 3,312,794 | |
| | | | | | | | |
Total Real Estate | | | | | | | 5,442,809 | |
| | | | | | | | |
Total Common Stocks
(identified cost $254,043,060) | | | | 455,648,400 | |
| | | | | | | | |
| Short-Term Investments — 10.8% | |
|
| Collateral Pool Investments for Securities on Loan — 10.2% | |
| | |
Collateral pool allocation (3) | | | | | | | 46,454,500 | |
| | |
| Mutual Funds — 0.6% | | | | | | |
BMO Institutional Prime Money Market Fund — Premier Class, 0.130% (4) | | | 2,952,021 | | | | 2,951,726 | |
| | | | | | | | |
Total Short-Term Investments
(identified cost $49,406,817) | | | | | | | 49,406,226 | |
| | | | | | | | |
Total Investments — 110.3%
(identified cost $303,449,877) | | | | | | | 505,054,626 | |
| Other Assets and Liabilities — (10.3)% | | | | (47,257,973 | ) |
| | | | | | | | |
| Total Net Assets — 100.0% | | | | | | $ | 457,796,653 | |
| | | | | | | | |
Mid-Cap Value Fund
| | | | | | | | |
| Description | | Shares | | | Value | |
| Common Stocks — 98.5% | |
|
| Communication Services — 4.4% | |
|
Advertising — 1.2% | |
Interpublic Group of Cos., Inc. (2) | | | 72,499 | | | $ | 1,287,582 | |
|
Broadcasting — 1.0% | |
Discovery, Inc., Class A (1)(2) | | | 49,424 | | | | 1,090,541 | |
|
Cable & Satellite — 1.1% | |
DISH Network Corp., Class A (1) | | | 34,062 | | | | 1,209,882 | |
|
Interactive Media & Services — 1.1% | |
Twitter, Inc. (1)(2) | | | 28,185 | | | | 1,143,747 | |
| | | | | | | | |
Total Communication Services | | | | | | | 4,731,752 | |
|
| Consumer Discretionary — 9.4% | |
|
Apparel, Accessories & Luxury Goods — 1.8% | |
PVH Corp. (2) | | | 16,663 | | | | 929,129 | |
Ralph Lauren Corp. | | | 13,544 | | | | 932,233 | |
| | | | | | | | |
| | | | | | | 1,861,362 | |
|
Auto Parts & Equipment — 1.0% | |
Lear Corp. | | | 9,636 | | | | 1,097,830 | |
|
Automotive Retail — 1.1% | |
AutoZone, Inc. (1) | | | 959 | | | | 1,147,261 | |
|
Consumer Electronics — 1.1% | |
Garmin, Ltd. (2) | | | 10,786 | | | | 1,117,538 | |
|
Education Services — 1.4% | |
Graham Holdings Co., Class B | | | 3,486 | | | | 1,491,834 | |
|
Homebuilding — 1.1% | |
PulteGroup, Inc. | | | 27,058 | | | | 1,206,516 | |
|
Internet & Direct Marketing Retail — 1.0% | |
Expedia Group, Inc. | | | 11,198 | | | | 1,099,084 | |
|
Restaurants — 0.9% | |
Aramark | | | 36,561 | | | | 1,007,621 | |
| | | | | | | | |
Total Consumer Discretionary | | | | | | | 10,029,046 | |
(See Notes to Schedules of Investments and Notes to Financial Statements, which are an integral part of the Financial Statements)
37
August 31, 2020
Mid-Cap Value Fund (continued)
| | | | | | | | |
| Description | | Shares | | | Value | |
| Common Stocks (continued) | |
|
| Consumer Staples — 6.3% | |
|
Agricultural Products — 1.5% | |
Ingredion, Inc. | | | 20,298 | | | $ | 1,632,771 | |
|
Brewers — 1.2% | |
Molson Coors Beverage Co., Class B | | | 32,182 | | | | 1,211,331 | |
|
Food Distributors — 1.1% | |
Sysco Corp. | | | 19,267 | | | | 1,158,717 | |
|
Packaged Foods & Meats — 2.5% | |
Hershey Co. | | | 10,357 | | | | 1,539,465 | |
J.M. Smucker Co. | | | 9,374 | | | | 1,126,567 | |
| | | | | | | | |
| | | | | | | 2,666,032 | |
| | | | | | | | |
Total Consumer Staples | | | | | | | 6,668,851 | |
|
| Energy — 1.8% | |
|
Oil & Gas-Exploration & Production — 1.8% | |
Cimarex Energy Co. (2) | | | 38,215 | | | | 1,061,613 | |
Pioneer Natural Resources Co. | | | 8,166 | | | | 848,692 | |
| | | | | | | | |
Total Energy | | | | | | | 1,910,305 | |
|
| Financials — 12.6% | |
|
Asset Management & Custody Banks — 2.0% | |
Ameriprise Financial, Inc. (2) | | | 13,335 | | | | 2,090,928 | |
|
Investment Banking & Brokerage — 3.0% | |
Evercore, Inc., Class A (2) | | | 28,737 | | | | 1,778,246 | |
Raymond James Financial, Inc. (2) | | | 18,732 | | | | 1,418,387 | |
| | | | | | | | |
| | | | | | | 3,196,633 | |
|
Life & Health Insurance — 2.0% | |
Globe Life, Inc. | | | 13,089 | | | | 1,079,580 | |
Principal Financial Group, Inc. (2) | | | 24,289 | | | | 1,022,810 | |
| | | | | | | | |
| | | | | | | 2,102,390 | |
|
Multi-Line Insurance — 2.8% | |
American Financial Group, Inc. | | | 15,002 | | | | 1,002,883 | |
Hartford Financial Services Group, Inc. | | | 50,093 | | | | 2,026,262 | |
| | | | | | | | |
| | | | | | | 3,029,145 | |
|
Regional Banks — 2.8% | |
Comerica, Inc. | | | 17,199 | | | | 679,877 | |
Regions Financial Corp. | | | 99,430 | | | | 1,149,411 | |
Signature Bank | | | 11,346 | | | | 1,100,902 | |
| | | | | | | | |
| | | | | | | 2,930,190 | |
| | | | | | | | |
Total Financials | | | | | | | 13,349,286 | |
|
| Healthcare — 11.5% | |
|
Biotechnology — 1.8% | |
Alexion Pharmaceuticals, Inc. (1) | | | 9,084 | | | | 1,037,574 | |
Exelixis, Inc. (1) | | | 38,522 | | | | 855,959 | |
| | | | | | | | |
| | | | | | | 1,893,533 | |
|
Healthcare Equipment — 4.6% | |
Hologic, Inc. (1) | | | 19,461 | | | | 1,162,211 | |
Steris PLC (2) | | | 10,843 | | | | 1,730,976 | |
Zimmer Biomet Holdings, Inc. | | | 14,287 | | | | 2,012,753 | |
| | | | | | | | |
| | | | | | | 4,905,940 | |
|
Healthcare Facilities — 1.5% | |
Encompass Health Corp. | | | 24,227 | | | | 1,580,570 | |
|
Healthcare Supplies — 1.2% | |
Dentsply Sirona, Inc. (2) | | | 27,488 | | | | 1,233,387 | |
| | | | | | | | |
| Description | | Shares | | | Value | |
| Common Stocks (continued) | |
|
| Healthcare (continued) | |
|
Life Sciences Tools & Services — 0.9% | |
Charles River Laboratories International, Inc. (1) | | | 4,257 | | | $ | 932,070 | |
|
Pharmaceuticals — 1.5% | |
Jazz Pharmaceuticals PLC (1) | | | 12,324 | | | | 1,656,222 | |
| | | | | | | | |
Total Healthcare | | | | | | | 12,201,722 | |
|
| Industrials — 16.4% | |
|
Agricultural & Farm Machinery — 1.2% | |
AGCO Corp. | | | 18,388 | | | | 1,307,387 | |
|
Airlines — 0.7% | |
JetBlue Airways Corp. (1)(2) | | | 66,699 | | | | 768,373 | |
|
Construction & Engineering — 3.0% | |
Quanta Services, Inc. | | | 26,856 | | | | 1,376,370 | |
Valmont Industries, Inc. | | | 14,007 | | | | 1,779,589 | |
| | | | | | | | |
| | | | | | | 3,155,959 | |
|
Construction Machinery & Heavy Trucks — 2.5% | |
Allison Transmission Holdings, Inc. | | | 32,351 | | | | 1,160,430 | |
Cummins, Inc. | | | 7,227 | | | | 1,497,796 | |
| | | | | | | | |
| | | | | | | 2,658,226 | |
|
Electrical Components & Equipment — 3.4% | |
Hubbell, Inc. | | | 11,886 | | | | 1,722,519 | |
Regal Beloit Corp. (2) | | | 19,275 | | | | 1,905,527 | |
| | | | | | | | |
| | | | | | | 3,628,046 | |
|
Environmental & Facilities Services — 1.8% | |
Clean Harbors, Inc. (1) | | | 12,470 | | | | 761,917 | |
Republic Services, Inc. (2) | | | 12,064 | | | | 1,118,574 | |
| | | | | | | | |
| | | | | | | 1,880,491 | |
|
Industrial Conglomerates — 1.0% | |
Carlisle Cos., Inc. | | | 7,960 | | | | 1,042,362 | |
|
Industrial Machinery — 0.9% | |
Crane Co. | | | 16,282 | | | | 920,584 | |
|
Research & Consulting Services — 1.0% | |
TransUnion | | | 11,764 | | | | 1,020,174 | |
|
Trucking — 0.9% | |
Ryder System, Inc. (2) | | | 24,526 | | | | 1,003,113 | |
| | | | | | | | |
Total Industrials | | | | | | | 17,384,715 | |
|
| Information Technology — 10.6% | |
|
Application Software — 1.3% | |
SS&C Technologies Holdings, Inc. (2) | | | 21,408 | | | | 1,364,118 | |
|
Data Processing & Outsourced Services — 1.1% | |
Maximus, Inc. | | | 14,884 | | | | 1,154,254 | |
|
Electronic Components — 1.4% | |
Dolby Laboratories, Inc., Class A | | | 22,233 | | | | 1,552,975 | |
|
Electronic Equipment & Instruments — 1.4% | |
National Instruments Corp. | | | 40,570 | | | | 1,456,057 | |
|
Electronic Manufacturing Services — 1.7% | |
Jabil, Inc. | | | 51,806 | | | | 1,769,175 | |
|
Internet Services & Infrastructure — 1.0% | |
Akamai Technologies, Inc. (1)(2) | | | 9,085 | | | | 1,057,767 | |
| | |
Semiconductors — 1.8% | | | | | | | | |
ON Semiconductor Corp. (1)(2) | | | 90,340 | | | | 1,930,566 | |
| | |
Systems Software — 0.9% | | | | | | | | |
NortonLifeLock, Inc. (2) | | | 42,031 | | | | 988,569 | |
| | | | | | | | |
Total Information Technology | | | | | | | 11,273,481 | |
(See Notes to Schedules of Investments and Notes to Financial Statements, which are an integral part of the Financial Statements)
38
Mid-Cap Value Fund (continued)
| | | | | | | | |
| Description | | Shares | | | Value | |
| Common Stocks (continued) | |
|
| Materials — 6.3% | |
|
Commodity Chemicals — 1.4% | |
Valvoline, Inc. | | | 71,986 | | | $ | 1,468,514 | |
|
Metal & Glass Containers — 1.2% | |
Crown Holdings, Inc. (1) | | | 16,510 | | | | 1,268,794 | |
|
Paper Packaging — 1.0% | |
WestRock Co. | | | 35,156 | | | | 1,066,281 | |
|
Specialty Chemicals — 1.0% | |
Celanese Corp. | | | 10,423 | | | | 1,054,286 | |
|
Steel — 1.7% | |
Steel Dynamics, Inc. | | | 62,928 | | | | 1,857,635 | |
| | | | | | | | |
Total Materials | | | | | | | 6,715,510 | |
|
| Real Estate — 9.8% | |
|
Office REIT’s — 1.1% | |
Boston Properties, Inc. | | | 13,368 | | | | 1,161,278 | |
|
Residential REIT’s — 3.8% | |
Camden Property Trust | | | 19,468 | | | | 1,770,420 | |
Essex Property Trust, Inc. | | | 6,223 | | | | 1,347,342 | |
Mid-America Apartment Communities, Inc. | | | 8,092 | | | | 947,735 | |
| | | | | | | | |
| | | | | | | 4,065,497 | |
|
Retail REIT’s — 1.3% | |
Realty Income Corp. | | | 22,121 | | | | 1,372,166 | |
|
Specialized REIT’s — 3.6% | |
Gaming and Leisure Properties, Inc. | | | 36,333 | | | | 1,320,704 | |
Lamar Advertising Co., Class A | | | 22,586 | | | | 1,563,629 | |
Life Storage, Inc. | | | 9,233 | | | | 973,435 | |
| | | | | | | | |
| | | | | | | 3,857,768 | |
| | | | | | | | |
Total Real Estate | | | | | | | 10,456,709 | |
|
| Utilities — 9.4% | |
|
Electric Utilities — 5.6% | |
Entergy Corp. | | | 17,998 | | | | 1,784,322 | |
IDACORP, Inc. | | | 17,545 | | | | 1,577,295 | |
NRG Energy, Inc. | | | 43,116 | | | | 1,483,622 | |
Portland General Electric Co. | | | 27,730 | | | | 1,057,900 | |
| | | | | | | | |
| | | | | | | 5,903,139 | |
|
Gas Utilities — 1.2% | |
UGI Corp. | | | 37,836 | | | | 1,306,477 | |
|
Independent Power Producers & Energy Traders — 1.2% | |
AES Corp. | | | 71,643 | | | | 1,271,663 | |
| | |
Multi-Utilities — 1.4% | | | | | | | | |
MDU Resources Group, Inc. (2) | | | 65,344 | | | | 1,543,425 | |
| | | | | | | | |
Total Utilities | | | | | | | 10,024,704 | |
| | | | | | | | |
Total Common Stocks
(identified cost $102,805,248) | | | | | | | 104,746,081 | |
| | | | | | | | |
| Short-Term Investments — 10.3% | |
|
| Collateral Pool Investments for Securities on Loan — 9.0% | |
| | |
Collateral pool allocation (3) | | | | | | | 9,514,603 | |
| | | | | | | | |
| Description | | Shares | | | Value | |
| Short-Term Investments (continued) | |
| | |
| Mutual Funds — 1.3% | | | | | | |
BMO Institutional Prime Money Market Fund — Premier Class, 0.130% (4) | | | 1,403,725 | | | $ | 1,403,585 | |
| | | | | | | | |
Total Short-Term Investments
(identified cost $10,918,468) | | | | | | | 10,918,188 | |
| | | | | | | | |
Total Investments — 108.8%
(identified cost $113,723,716) | | | | | | | 115,664,269 | |
| Other Assets and Liabilities — (8.8)% | | | | (9,362,853 | ) |
| | | | | | | | |
| Total Net Assets — 100.0% | | | | | | $ | 106,301,416 | |
| | | | | | | | |
Mid-Cap Growth Fund
| | | | | | | | |
| Description | | Shares | | | Value | |
| Common Stocks — 98.5% | |
|
| Communication Services — 4.0% | |
|
Interactive Home Entertainment — 4.0% | |
Spotify Technology SA (1) | | | 3,635 | | | $ | 1,025,651 | |
Take-Two Interactive Software, Inc. (1) | | | 10,094 | | | | 1,727,992 | |
Zynga, Inc., Class A (1)(2) | | | 137,147 | | | | 1,242,552 | |
| | | | | | | | |
Total Communication Services | | | | | | | 3,996,195 | |
|
| Consumer Discretionary — 7.6% | |
|
Apparel Retail — 1.3% | |
Burlington Stores, Inc. (1)(2) | | | 6,818 | | | | 1,342,669 | |
|
Automotive Retail — 1.6% | |
O’Reilly Automotive, Inc. (1) | | | 3,423 | | | | 1,593,852 | |
|
Education Services — 0.7% | |
Chegg, Inc. (1)(2) | | | 9,496 | | | | 700,235 | |
|
Footwear — 1.6% | |
Deckers Outdoor Corp. (1) | | | 8,020 | | | | 1,635,037 | |
|
Home Furnishings — 1.1% | |
Tempur Sealy International, Inc. (1) | | | 12,608 | | | | 1,078,488 | |
|
Leisure Products — 1.3% | |
Polaris, Inc. | | | 12,347 | | | | 1,247,541 | |
| | | | | | | | |
Total Consumer Discretionary | | | | | | | 7,597,822 | |
|
| Consumer Staples — 1.2% | |
|
Food Retail — 1.2% | |
Sprouts Farmers Market, Inc. (1) | | | 51,208 | | | | 1,195,707 | |
|
| Financials — 4.5% | |
|
Financial Exchanges & Data — 1.0% | |
MSCI, Inc. (2) | | | 2,744 | | | | 1,024,253 | |
|
Investment Banking & Brokerage — 1.3% | |
LPL Financial Holdings, Inc. (2) | | | 15,673 | | | | 1,287,693 | |
|
Property & Casualty Insurance — 0.9% | |
Hanover Insurance Group, Inc. | | | 9,145 | | | | 937,271 | |
|
Reinsurance — 1.3% | |
Everest Re Group, Ltd. | | | 5,785 | | | | 1,273,163 | |
| | | | | | | | |
Total Financials | | | | | | | 4,522,380 | |
|
| Healthcare — 22.9% | |
|
Biotechnology — 6.3% | |
Alexion Pharmaceuticals, Inc. (1) | | | 7,786 | | | | 889,317 | |
BioMarin Pharmaceutical, Inc. (1) | | | 15,911 | | | | 1,241,535 | |
Exelixis, Inc. (1) | | | 48,076 | | | | 1,068,249 | |
Incyte Corp. (1)(2) | | | 9,339 | | | | 899,813 | |
(See Notes to Schedules of Investments and Notes to Financial Statements, which are an integral part of the Financial Statements)
39
August 31, 2020
Mid-Cap Growth Fund (continued)
| | | | | | | | |
| Description | | Shares | | | Value | |
| Common Stocks (continued) | |
|
| Healthcare (continued) | |
|
Biotechnology (continued) | |
Ionis Pharmaceuticals, Inc. (1) | | | 16,867 | | | $ | 919,251 | |
Neurocrine Biosciences, Inc. (1)(2) | | | 10,731 | | | | 1,249,303 | |
| | | | | | | | |
| | | | | | | 6,267,468 | |
|
Healthcare Equipment — 6.1% | |
ABIOMED, Inc. (1)(2) | | | 3,639 | | | | 1,119,429 | |
DexCom, Inc. (1) | | | 2,991 | | | | 1,272,401 | |
IDEXX Laboratories, Inc. (1) | | | 4,256 | | | | 1,664,352 | |
Masimo Corp. (1) | | | 3,104 | | | | 695,296 | |
Teleflex, Inc. | | | 3,440 | | | | 1,351,748 | |
| | | | | | | | |
| | | | | | | 6,103,226 | |
|
Healthcare Services — 1.1% | |
Chemed Corp. | | | 2,012 | | | | 1,040,425 | |
|
Healthcare Supplies — 1.8% | |
Haemonetics Corp. (1) | | | 8,267 | | | | 741,219 | |
ICU Medical, Inc. (1) | | | 5,446 | | | | 1,090,507 | |
| | | | | | | | |
| | | | | | | 1,831,726 | |
|
Healthcare Technology — 1.9% | |
Veeva Systems, Inc., Class A (1) | | | 6,679 | | | | 1,885,281 | |
|
Life Sciences Tools & Services — 4.8% | |
Bio-Rad Laboratories, Inc., Class A (1) | | | 2,760 | | | | 1,403,709 | |
Bio-Techne Corp. (2) | | | 8,328 | | | | 2,127,471 | |
PRA Health Sciences, Inc. (1) | | | 11,707 | | | | 1,251,595 | |
| | | | | | | | |
| | | | | | | 4,782,775 | |
|
Pharmaceuticals — 0.9% | |
Jazz Pharmaceuticals PLC (1) | | | 6,978 | | | | 937,774 | |
| | | | | | | | |
Total Healthcare | | | | | | | 22,848,675 | |
|
| Industrials — 13.4% | |
|
Building Products — 1.5% | |
Fortune Brands Home & Security, Inc. | | | 17,764 | | | | 1,493,597 | |
|
Construction & Engineering — 0.9% | |
Valmont Industries, Inc. | | | 7,522 | | | | 955,670 | |
|
Construction Machinery & Heavy Trucks — 1.3% | |
Cummins, Inc. | | | 6,281 | | | | 1,301,737 | |
|
Electrical Components & Equipment — 2.8% | |
Hubbell, Inc. | | | 9,793 | | | | 1,419,201 | |
Sensata Technologies Holding PLC (1) | | | 32,395 | | | | 1,348,928 | |
| | | | | | | | |
| | | | | | | 2,768,129 | |
|
Environmental & Facilities Services — 1.3% | |
Clean Harbors, Inc. (1) | | | 21,332 | | | | 1,303,385 | |
|
Industrial Machinery — 1.5% | |
ITT, Inc. | | | 24,231 | | | | 1,521,949 | |
|
Research & Consulting Services — 2.8% | |
CoStar Group, Inc. (1) | | | 1,798 | | | | 1,525,783 | |
TransUnion | | | 14,650 | | | | 1,270,448 | |
| | | | | | | | |
| | | | | | | 2,796,231 | |
|
Trucking — 1.3% | |
Old Dominion Freight Line, Inc. (1) | | | 6,241 | | | | 1,261,806 | |
| | | | | | | | |
Total Industrials | | | | | | | 13,402,504 | |
|
| Information Technology — 39.5% | |
|
Application Software — 11.8% | |
2U, Inc. (1)(2) | | | 30,907 | | | | 1,279,241 | |
Cadence Design Systems, Inc. (1) | | | 8,907 | | | | 987,875 | |
| | | | | | | | |
| Description | | Shares | | | Value | |
| Common Stocks (continued) | |
|
| Information Technology (continued) | |
|
Application Software (continued) | |
Dropbox, Inc. (1) | | | 43,557 | | | $ | 922,102 | |
Guidewire Software, Inc. (1)(2) | | | 12,890 | | | | 1,447,676 | |
HubSpot, Inc. (1)(2) | | | 6,584 | | | | 1,973,093 | |
New Relic, Inc. (1)(2) | | | 23,486 | | | | 1,442,745 | |
PTC, Inc. (1) | | | 17,975 | | | | 1,643,095 | |
Synopsys, Inc. (1) | | | 9,490 | | | | 2,100,137 | |
| | | | | | | | |
| | | | | | | 11,795,964 | |
|
Communications Equipment — 3.5% | |
Ciena Corp. (1) | | | 26,131 | | | | 1,483,457 | |
F5 Networks, Inc. (1) | | | 8,951 | | | | 1,184,486 | |
Motorola Solutions, Inc. | | | 5,278 | | | | 816,770 | |
| | | | | | | | |
| | | | | | | 3,484,713 | |
|
Consulting & Other Services — 1.1% | |
LiveRamp Holdings, Inc. (1) | | | 19,403 | | | | 1,083,464 | |
|
Data Processing & Outsourced Services — 3.3% | |
Euronet Worldwide, Inc. (1) | | | 13,688 | | | | 1,415,065 | |
Genpact, Ltd. | | | 43,636 | | | | 1,840,567 | |
| | | | | | | | |
| | | | | | | 3,255,632 | |
|
Electronic Components — 1.2% | |
Dolby Laboratories, Inc., Class A | | | 17,220 | | | | 1,202,817 | |
|
Electronic Equipment & Instruments — 1.5% | |
Keysight Technologies, Inc. (1) | | | 14,794 | | | | 1,457,505 | |
|
Internet Services & Infrastructure — 3.7% | |
GoDaddy, Inc., Class A (1)(2) | | | 21,977 | | | | 1,839,036 | |
Palo Alto Networks, Inc. (1) | | | 7,374 | | | | 1,898,141 | |
| | | | | | | | |
| | | | | | | 3,737,177 | |
|
IT Consulting & Other Services — 2.9% | |
CACI International, Inc., Class A (1) | | | 3,182 | | | | 745,192 | |
EPAM Systems, Inc. (1) | | | 6,576 | | | | 2,151,010 | |
| | | | | | | | |
| | | | | | | 2,896,202 | |
|
Semiconductor Equipment — 4.6% | |
KLA Corp. | | | 7,969 | | | | 1,634,760 | |
SolarEdge Technologies, Inc. (1) | | | 5,079 | | | | 1,123,221 | |
Teradyne, Inc. (2) | | | 21,838 | | | | 1,855,575 | |
| | | | | | | | |
| | | | | | | 4,613,556 | |
|
Semiconductors — 2.4% | |
Inphi Corp. (1) | | | 8,570 | | | | 976,809 | |
ON Semiconductor Corp. (1) | | | 67,479 | | | | 1,442,026 | |
| | | | | | | | |
| | | | | | | 2,418,835 | |
|
Systems Software — 2.2% | |
FireEye, Inc. (1)(2) | | | 88,267 | | | | 1,295,759 | |
Proofpoint, Inc. (1) | | | 8,304 | | | | 910,700 | |
| | | | | | | | |
| | | | | | | 2,206,459 | |
|
Technology Hardware, Storage & Peripherals — 1.3% | |
Pure Storage, Inc., Class A (1)(2) | | | 83,159 | | | | 1,269,006 | |
| | | | | | | | |
Total Information Technology | | | | | | | 39,421,330 | |
|
| Materials — 2.9% | |
|
Commodity Chemicals — 1.1% | |
Valvoline, Inc. | | | 55,429 | | | | 1,130,752 | |
|
Specialty Chemicals — 1.2% | |
Axalta Coating Systems, Ltd. (1) | | | 48,295 | | | | 1,151,836 | |
| | |
Steel — 0.6% | | | | | | | | |
Steel Dynamics, Inc. | | | 21,937 | | | | 647,580 | |
| | | | | | | | |
Total Materials | | | | | | | 2,930,168 | |
(See Notes to Schedules of Investments and Notes to Financial Statements, which are an integral part of the Financial Statements)
40
Mid-Cap Growth Fund (continued)
| | | | | | | | |
| Description | | Shares | | | Value | |
| Common Stocks (continued) | |
|
| Real Estate — 2.5% | |
|
Real Estate Services — 1.3% | |
CBRE Group, Inc., Class A (1)(2) | | | 26,654 | | | $ | 1,253,538 | |
|
Residential REIT’s — 1.2% | |
Equity LifeStyle Properties, Inc. | | | 18,435 | | | | 1,222,056 | |
| | | | | | | | |
Total Real Estate | | | | | | | 2,475,594 | |
| | | | | | | | |
Total Common Stocks
(identified cost $78,118,803) | | | | | | | 98,390,375 | |
| | | | | | | | |
| Short-Term Investments — 15.2% | |
|
| Collateral Pool Investments for Securities on Loan — 13.6% | |
| | |
Collateral pool allocation (3) | | | | | | | 13,636,803 | |
| | |
| Mutual Funds — 1.6% | | | | | | |
BMO Institutional Prime Money Market Fund — Premier Class, 0.130% (4) | | | 1,583,068 | | | | 1,582,909 | |
| | | | | | | | |
Total Short-Term Investments
(identified cost $15,220,029) | | | | | | | 15,219,712 | |
| | | | | | | | |
Total Investments — 113.7%
(identified cost $93,338,832) | | | | | | | 113,610,087 | |
| Other Assets and Liabilities — (13.7)% | | | | (13,684,342 | ) |
| | | | | | | | |
| Total Net Assets — 100.0% | | | | | | $ | 99,925,745 | |
| | | | | | | | |
Small-Cap Value Fund
| | | | | | | | |
| Description | | Shares | | | Value | |
| Common Stocks — 97.2% | |
|
| Consumer Discretionary — 13.1% | |
|
Apparel Retail — 0.3% | |
Zumiez, Inc. (1)(2) | | | 5,881 | | | $ | 151,024 | |
|
Auto Parts & Equipment — 1.8% | |
American Axle & Manufacturing Holdings, Inc. | | | 22,549 | | | | 175,431 | |
Dana, Inc. | | | 33,545 | | | | 467,953 | |
Stoneridge, Inc. (1) | | | 12,774 | | | | 258,035 | |
| | | | | | | | |
| | | | | | | 901,419 | |
|
Automotive Retail — 0.7% | |
Murphy USA, Inc. (1) | | | 2,707 | | | | 365,066 | |
|
Broadcasting — 0.4% | |
Gray Television, Inc. | | | 14,010 | | | | 217,435 | |
|
Casinos & Gaming — 0.7% | |
Boyd Gaming Corp. (2) | | | 8,182 | | | | 219,114 | |
Red Rock Resorts, Inc. (2) | | | 7,605 | | | | 129,855 | |
| | | | | | | | |
| | | | | | | 348,969 | |
|
Consumer Electronics — 0.5% | |
Universal Electronics, Inc. (1) | | | 6,075 | | | | 249,561 | |
|
Education Services — 1.7% | |
Graham Holdings Co., Class B | | | 948 | | | | 405,697 | |
K12, Inc. (1) | | | 12,582 | | | | 468,176 | |
| | | | | | | | |
| | | | | | | 873,873 | |
|
Home Furnishings — 1.0% | |
La-Z-Boy, Inc. (2) | | | 14,989 | | | | 487,143 | |
|
Homebuilding — 3.2% | |
KB Home (2) | | | 14,310 | | | | 511,726 | |
| | | | | | | | |
| Description | | Shares | | | Value | |
| Common Stocks (continued) | |
|
| Consumer Discretionary (continued) | |
|
Homebuilding (continued) | |
M/I Homes, Inc. (1) | | | 4,317 | | | $ | 183,731 | |
Meritage Homes Corp. (1)(2) | | | 5,961 | | | | 572,435 | |
TRI Pointe Group, Inc. (1)(2) | | | 19,648 | | | | 331,658 | |
| | | | | | | | |
| | | | | | | 1,599,550 | |
|
Homefurnishing Retail — 0.5% | |
Sleep Number Corp. (1) | | | 4,722 | | | | 226,656 | |
|
Leisure Products — 0.4% | |
Johnson Outdoors, Inc., Class A | | | 2,449 | | | | 209,904 | |
|
Restaurants — 0.5% | |
Dine Brands Global, Inc. (2) | | | 4,463 | | | | 265,816 | |
|
Specialty Stores — 1.4% | |
Hibbett Sports, Inc. (1)(2) | | | 14,063 | | | | 469,282 | |
Sally Beauty Holdings, Inc. (1) | | | 21,221 | | | | 236,827 | |
| | | | | | | | |
| | | | | | | 706,109 | |
| | | | | | | | |
Total Consumer Discretionary | | | | | | | 6,602,525 | |
|
| Consumer Staples — 2.2% | |
|
Food Distributors — 0.3% | |
SpartanNash Co. | | | 9,042 | | | | 180,659 | |
| | |
Food Retail — 0.2% | | | | | | | | |
Sprouts Farmers Market, Inc. (1) | | | 3,479 | | | | 81,235 | |
| | |
Household Products — 1.6% | | | | | | | | |
Central Garden & Pet Co., Class A (1) | | | 13,410 | | | | 498,315 | |
Spectrum Brands Holdings, Inc. | | | 5,008 | | | | 298,477 | |
| | | | | | | | |
| | | | | | | 796,792 | |
| | |
Personal Products — 0.1% | | | | | | | | |
Inter Parfums, Inc. (2) | | | 1,250 | | | | 55,838 | |
| | | | | | | | |
Total Consumer Staples | | | | | | | 1,114,524 | |
| | |
| Energy — 2.0% | | | | | | |
|
Oil & Gas-Equipment & Services — 1.2% | |
Liberty Oilfield Services, Inc., Class A | | | 24,249 | | | | 156,406 | |
Matrix Service Co. (1)(2) | | | 15,738 | | | | 145,419 | |
ProPetro Holding Corp. | | | 10,668 | | | | 66,995 | |
Select Energy Services, Inc., Class A (1)(2) | | | 35,153 | | | | 167,680 | |
Solaris Oilfield Infrastructure, Inc., Class A | | | 11,169 | | | | 86,895 | |
| | | | | | | | |
| | | | | | | 623,395 | |
|
Oil & Gas-Refining & Marketing — 0.8% | |
World Fuel Services Corp. | | | 15,227 | | | | 401,993 | |
| | | | | | | | |
Total Energy | | | | | | | 1,025,388 | |
| | |
| Financials — 25.3% | | | | | | |
|
Asset Management & Custody Banks — 0.2% | |
Waddell & Reed Financial, Inc., Class A (2) | | | 6,987 | | | | 110,045 | |
| | |
Consumer Finance — 0.9% | | | | | | | | |
Encore Capital Group, Inc. | | | 2,047 | | | | 94,039 | |
Nelnet, Inc., Class A (2) | | | 5,761 | | | | 377,288 | |
| | | | | | | | |
| | | | | | | 471,327 | |
|
Investment Banking & Brokerage — 2.9% | |
Cowen, Inc., Class A | | | 5,171 | | | | 93,543 | |
Evercore, Inc., Class A | | | 6,180 | | | | 382,418 | |
Oppenheimer Holdings, Inc., Class A | | | 5,263 | | | | 128,575 | |
Stifel Financial Corp. (2) | | | 11,821 | | | | 599,443 | |
StoneX Group, Inc. (1) | | | 4,238 | | | | 240,295 | |
| | | | | | | | |
| | | | | | | 1,444,274 | |
(See Notes to Schedules of Investments and Notes to Financial Statements, which are an integral part of the Financial Statements)
41
August 31, 2020
Small-Cap Value Fund (continued)
| | | | | | | | |
| Description | | Shares | | | Value | |
| Common Stocks (continued) | |
| | |
| Financials (continued) | | | | | | |
|
Life & Health Insurance — 0.4% | |
American Equity Investment Life Holding Co. (2) | | | 7,413 | | | $ | 177,245 | |
|
Property & Casualty Insurance — 2.2% | |
AMERISAFE, Inc. (2) | | | 6,312 | | | | 421,200 | |
Employers Holdings, Inc. (2) | | | 10,931 | | | | 356,132 | |
HCI Group, Inc. (2) | | | 3,589 | | | | 196,390 | |
Heritage Insurance Holdings, Inc. | | | 8,525 | | | | 111,251 | |
| | | | | | | | |
| | | | | | | 1,084,973 | |
|
Regional Banks — 13.5% | |
1st Source Corp. | | | 5,392 | | | | 185,754 | |
Associated Banc-Corp (2) | | | 20,482 | | | | 275,278 | |
Atlantic Capital Bancshares, Inc. (1) | | | 11,231 | | | | 129,550 | |
Bancorp, Inc. (1)(2) | | | 29,043 | | | | 275,908 | |
Banner Corp. (2) | | | 9,044 | | | | 326,669 | |
Boston Private Financial Holdings, Inc. (2) | | | 28,514 | | | | 169,373 | |
Bryn Mawr Bank Corp. (2) | | | 4,420 | | | | 119,959 | |
Cathay General Bancorp | | | 21,348 | | | | 527,082 | |
Central Pacific Financial Corp. (2) | | | 18,396 | | | | 284,954 | |
Community Trust Bancorp, Inc. | | | 4,273 | | | | 137,890 | |
Financial Institutions, Inc. (2) | | | 5,338 | | | | 91,974 | |
First Bancorp/Southern Pines NC | | | 7,730 | | | | 158,079 | |
First Commonwealth Financial Corp. | | | 28,042 | | | | 229,944 | |
First Merchants Corp. | | | 7,644 | | | | 195,534 | |
Great Southern Bancorp, Inc. (2) | | | 2,261 | | | | 87,139 | |
Great Western Bancorp, Inc. | | | 18,929 | | | | 263,681 | |
Hancock Whitney Corp. | | | 14,069 | | | | 281,521 | |
Heartland Financial USA, Inc. (2) | | | 8,255 | | | | 284,220 | |
Hilltop Holdings, Inc. | | | 22,029 | | | | 453,797 | |
Independent Bank Corp. | | | 10,485 | | | | 156,331 | |
International Bancshares Corp. (2) | | | 16,129 | | | | 509,354 | |
Lakeland Bancorp, Inc. | | | 8,566 | | | | 91,057 | |
Peapack Gladstone Financial Corp. | | | 5,774 | | | | 98,158 | |
Preferred Bank (2) | | | 6,862 | | | | 256,639 | |
QCR Holdings, Inc. (2) | | | 3,393 | | | | 101,688 | |
Sandy Spring Bancorp, Inc. (2) | | | 938 | | | | 22,437 | |
TriCo Bancshares | | | 3,731 | | | | 103,311 | |
Umpqua Holdings Corp. | | | 2,117 | | | | 23,880 | |
Univest Financial Corp. (2) | | | 7,167 | | | | 115,317 | |
Webster Financial Corp. | | | 9,177 | | | | 252,367 | |
Wintrust Financial Corp. (2) | | | 9,030 | | | | 392,986 | |
Zions Bancorp NA (2) | | | 6,731 | | | | 216,469 | |
| | | | | | | | |
| | | | | | | 6,818,300 | |
|
Thrifts & Mortgage Finance — 5.2% | |
Axos Financial, Inc. (1) | | | 12,834 | | | | 318,027 | |
Essent Group, Ltd. | | | 11,867 | | | | 423,652 | |
Flagstar Bancorp, Inc. (2) | | | 13,106 | | | | 411,791 | |
HomeStreet, Inc. | | | 10,011 | | | | 274,001 | |
NMI Holdings, Inc., Class A (1) | | | 17,042 | | | | 292,270 | |
TrustCo Bank Corp. | | | 31,545 | | | | 188,008 | |
Walker & Dunlop, Inc. | | | 6,476 | | | | 354,755 | |
WSFS Financial Corp. (2) | | | 12,413 | | | | 363,701 | |
| | | | | | | | |
| | | | | | | 2,626,205 | |
| | | | | | | | |
Total Financials | | | | | | | 12,732,369 | |
|
| Healthcare — 7.8% | |
|
Biotechnology — 2.4% | |
Alkermes PLC (1) | | | 14,386 | | | | 237,944 | |
Castle Biosciences, Inc. (1)(2) | | | 3,894 | | | | 178,073 | |
Coherus Biosciences, Inc. (1) | | | 12,108 | | | | 229,689 | |
| | | | | | | | |
| Description | | Shares | | | Value | |
| Common Stocks (continued) | |
|
| Healthcare (continued) | |
|
Biotechnology (continued) | |
Emergent BioSolutions, Inc. (1) | | | 3,660 | | | $ | 417,423 | |
Vericel Corp. (1)(2) | | | 9,259 | | | | 146,755 | |
| | | | | | | | |
| | | | | | | 1,209,884 | |
|
Healthcare Equipment — 2.3% | |
AngioDynamics, Inc. (1)(2) | | | 17,473 | | | | 163,635 | |
CONMED Corp. | | | 4,438 | | | | 383,044 | |
Integer Holdings Corp. (1)(2) | | | 5,116 | | | | 354,334 | |
Orthofix Medical, Inc. (1) | | | 8,266 | | | | 250,790 | |
| | | | | | | | |
| | | | | | | 1,151,803 | |
|
Healthcare Facilities — 0.8% | |
Surgery Partners, Inc. (1) | | | 19,861 | | | | 379,146 | |
|
Healthcare Supplies — 0.4% | |
OraSure Technologies, Inc. (1)(2) | | | 17,272 | | | | 202,428 | |
|
Healthcare Technology — 1.4% | |
Computer Programs & Systems, Inc. (2) | | | 7,520 | | | | 205,747 | |
HealthStream, Inc. (1) | | | 9,882 | | | | 204,706 | |
HMS Holdings Corp. (1) | | | 10,898 | | | | 303,945 | |
| | | | | | | | |
| | | | | | | 714,398 | |
|
Life Sciences Tools & Services — 0.5% | |
Luminex Corp. (2) | | | 10,120 | | | | 270,103 | |
| | | | | | | | |
Total Healthcare | | | | | | | 3,927,762 | |
|
| Industrials — 18.2% | |
|
Air Freight & Logistics — 1.5% | |
Echo Global Logistics, Inc. (1) | | | 16,633 | | | | 454,413 | |
Hub Group, Inc., Class A (1)(2) | | | 5,825 | | | | 313,618 | |
| | | | | | | | |
| | | | | | | 768,031 | |
|
Building Products — 3.0% | |
Builders FirstSource, Inc. (1) | | | 17,409 | | | | 533,063 | |
Masonite International Corp. (1) | | | 3,609 | | | | 329,466 | |
Patrick Industries, Inc. | | | 6,584 | | | | 370,087 | |
Quanex Building Products Corp. | | | 16,666 | | | | 280,155 | |
| | | | | | | | |
| | | | | | | 1,512,771 | |
|
Construction & Engineering — 2.9% | |
EMCOR Group, Inc. | | | 7,771 | | | | 582,903 | |
MYR Group, Inc. (1)(2) | | | 4,275 | | | | 165,913 | |
Northwest Pipe Co. (1)(2) | | | 6,052 | | | | 171,453 | |
Primoris Services Corp. | | | 9,609 | | | | 183,147 | |
Valmont Industries, Inc. | | | 2,995 | | | | 380,515 | |
| | | | | | | | |
| | | | | | | 1,483,931 | |
|
Construction Machinery & Heavy Trucks — 0.3% | |
Miller Industries, Inc. | | | 4,191 | | | | 131,472 | |
|
Diversified Support Services — 0.7% | |
UniFirst Corp. | | | 1,702 | | | | 327,839 | |
|
Electrical Components & Equipment — 0.9% | |
Regal Beloit Corp. | | | 4,653 | | | | 459,996 | |
|
Environmental & Facilities Services — 0.6% | |
Clean Harbors, Inc. (1) | | | 5,269 | | | | 321,936 | |
|
Human Resource & Employment Services — 1.5% | |
Heidrick & Struggles International, Inc. | | | 9,950 | | | | 215,218 | |
Korn Ferry | | | 7,426 | | | | 226,493 | |
TrueBlue, Inc. (1)(2) | | | 18,656 | | | | 315,660 | |
| | | | | | | | |
| | | | | | | 757,371 | |
|
Industrial Machinery — 1.8% | |
Columbus McKinnon Corp. | | | 9,568 | | | | 348,036 | |
EnPro Industries, Inc. (2) | | | 259 | | | | 15,157 | |
Lydall, Inc. (1)(2) | | | 12,177 | | | | 228,684 | |
(See Notes to Schedules of Investments and Notes to Financial Statements, which are an integral part of the Financial Statements)
42
Small-Cap Value Fund (continued)
| | | | | | | | |
| Description | | Shares | | | Value | |
| Common Stocks (continued) | |
|
| Industrials (continued) | |
|
Industrial Machinery (continued) | |
Mueller Industries, Inc. | | | 10,422 | | | $ | 309,533 | |
| | | | | | | | |
| | | | | | | 901,410 | |
|
Office Services & Supplies — 0.8% | |
Kimball International, Inc., Class B | | | 11,074 | | | | 124,140 | |
Steelcase, Inc., Class A | | | 26,838 | | | | 280,457 | |
| | | | | | | | |
| | | | | | | 404,597 | |
|
Research & Consulting Services — 1.5% | |
CBIZ, Inc. (1) | | | 17,301 | | | | 420,760 | |
Huron Consulting Group, Inc. (1) | | | 8,115 | | | | 352,029 | |
| | | | | | | | |
| | | | | | | 772,789 | |
|
Trading Companies & Distributors — 1.6% | |
BMC Stock Holdings, Inc. (1) | | | 1,882 | | | | 75,129 | |
DXP Enterprises, Inc. | | | 1,780 | | | | 34,247 | |
Foundation Building Materials, Inc. (1)(2) | | | 18,529 | | | | 300,726 | |
H&E Equipment Services, Inc. | | | 9,788 | | | | 198,305 | |
Herc Holdings, Inc. (1)(2) | | | 4,400 | | | | 180,180 | |
| | | | | | | | |
| | | | | | | 788,587 | |
|
Trucking — 1.1% | |
ArcBest Corp. (2) | | | 11,383 | | | | 384,973 | |
Covenant Logistics Group, Inc., Class A (1)(2) | | | 8,492 | | | | 155,658 | |
| | | | | | | | |
| | | | | | | 540,631 | |
| | | | | | | | |
Total Industrials | | | | | | | 9,171,361 | |
| | |
| Information Technology — 9.9% | | | | | | |
|
Application Software — 0.5% | |
Verint Systems, Inc. (1) | | | 5,644 | | | | 268,429 | |
|
Communications Equipment — 0.5% | |
NetScout Systems, Inc. (1)(2) | | | 10,135 | | | | 234,524 | |
|
Data Processing & Outsourced Services — 1.1% | |
Sykes Enterprises, Inc. (1) | | | 16,832 | | | | 557,224 | |
|
Electronic Components — 1.6% | |
Knowles Corp. (1) | | | 20,077 | | | | 302,359 | |
Vishay Intertechnology, Inc. | | | 31,529 | | | | 504,149 | |
| | | | | | | | |
| | | | | | | 806,508 | |
|
Electronic Equipment & Instruments — 0.7% | |
MTS Systems Corp. (2) | | | 9,757 | | | | 238,071 | |
Vishay Precision Group, Inc. (1) | | | 4,896 | | | | 121,959 | |
| | | | | | | | |
| | | | | | | 360,030 | |
|
Electronic Manufacturing Services — 2.6% | |
CTS Corp. | | | 8,502 | | | | 177,692 | |
Fabrinet (1) | | | 6,282 | | | | 438,358 | |
Plexus Corp. (1) | | | 5,537 | | | | 421,199 | |
Sanmina Corp. (1) | | | 9,990 | | | | 282,717 | |
| | | | | | | | |
| | | | | | | 1,319,966 | |
|
IT Consulting & Other Services — 0.2% | |
KBR, Inc. (2) | | | 2,966 | | | | 74,120 | |
|
Semiconductor Equipment — 1.8% | |
Amkor Technology, Inc. (1)(2) | | | 31,189 | | | | 380,350 | |
Onto Innovation, Inc. (1) | | | 1 | | | | 31 | |
Photronics, Inc. (1) | | | 31,084 | | | | 311,772 | |
Ultra Clean Holdings, Inc. (1) | | | 9,678 | | | | 237,305 | |
| | | | | | | | |
| | | | | | | 929,458 | |
| | | | | | | | |
| Description | | Shares | | | Value | |
| Common Stocks (continued) | |
| | |
| Information Technology (continued) | | | | | | |
|
Semiconductors — 0.9% | |
Diodes, Inc. (1)(2) | | | 8,915 | | | $ | 435,587 | |
| | | | | | | | |
Total Information Technology | | | | | | | 4,985,846 | |
| | |
| Materials — 6.4% | | | | | | |
|
Commodity Chemicals — 1.9% | |
Koppers Holdings, Inc. (1)(2) | | | 14,843 | | | | 357,123 | |
Orion Engineered Carbons SA | | | 31,984 | | | | 388,606 | |
Tronox Holdings PLC | | | 20,739 | | | | 185,821 | |
| | | | | | | | |
| | | | | | | 931,550 | |
|
Construction Materials — 0.4% | |
US Concrete, Inc. | | | 8,461 | | | | 225,824 | |
|
Forest Products — 1.1% | |
Boise Cascade Co. | | | 12,557 | | | | 575,110 | |
|
Specialty Chemicals — 1.1% | |
Stepan Co. | | | 4,898 | | | | 564,690 | |
|
Steel — 1.9% | |
Carpenter Technology Corp. | | | 10,424 | | | | 219,217 | |
Commercial Metals Co. (2) | | | 21,574 | | | | 450,249 | |
Schnitzer Steel Industries, Inc., Class A | | | 13,790 | | | | 272,215 | |
| | | | | | | | |
| | | | | | | 941,681 | |
| | | | | | | | |
Total Materials | | | | | | | 3,238,855 | |
| | |
| Real Estate — 8.2% | | | | | | |
|
Diversified REIT’s — 2.3% | |
Alexander & Baldwin, Inc. (2) | | | 33,545 | | | | 406,230 | |
Gladstone Commercial Corp. | | | 8,678 | | | | 170,175 | |
Lexington Realty Trust | | | 51,219 | | | | 582,360 | |
| | | | | | | | |
| | | | | | | 1,158,765 | |
|
Healthcare REIT’s — 1.0% | |
Healthcare Realty Trust, Inc. (2) | | | 8,055 | | | | 232,387 | |
Physicians Realty Trust (2) | | | 15,262 | | | | 277,005 | |
| | | | | | | | |
| | | | | | | 509,392 | |
|
Hotel & Resort REIT’s — 0.1% | |
Xenia Hotels & Resorts, Inc. (2) | | | 5,518 | | | | 49,552 | |
|
Industrial REIT’s — 1.7% | |
First Industrial Realty Trust, Inc. | | | 8,725 | | | | 372,121 | |
STAG Industrial, Inc. (2) | | | 14,309 | | | | 462,181 | |
| | | | | | | | |
| | | | | | | 834,302 | |
|
Office REIT’s — 1.4% | |
City Office REIT, Inc. | | | 11,055 | | | | 88,882 | |
Easterly Government Properties, Inc. | | | 5,747 | | | | 139,020 | |
Piedmont Office Realty Trust, Inc., Class A (2) | | | 30,171 | | | | 461,918 | |
| | | | | | | | |
| | | | | | | 689,820 | |
|
Retail REIT’s — 1.1% | |
Getty Realty Corp. | | | 11,826 | | | | 346,384 | |
SITE Centers Corp. | | | 15,035 | | | | 112,913 | |
Spirit Realty Capital, Inc. | | | 2,889 | | | | 102,588 | |
| | | | | | | | |
| | | | | | | 561,885 | |
|
Specialized REIT’s — 0.6% | |
National Storage Affiliates Trust | | | 9,288 | | | | 318,671 | |
| | | | | | | | |
Total Real Estate | | | | | | | 4,122,387 | |
|
| Utilities — 4.1% | |
|
Electric Utilities — 1.7% | |
IDACORP, Inc. | | | 4,374 | | | | 393,223 | |
Portland General Electric Co. | | | 11,930 | | | | 455,129 | |
| | | | | | | | |
| | | | | | | 848,352 | |
(See Notes to Schedules of Investments and Notes to Financial Statements, which are an integral part of the Financial Statements)
43
August 31, 2020
Small-Cap Value Fund (continued)
| | | | | | | | |
| Description | | Shares | | | Value | |
| Common Stocks (continued) | |
|
| Utilities (continued) | |
| | |
Gas Utilities — 1.2% | | | | | | | | |
One Gas, Inc. (2) | | | 3,108 | | | $ | 230,365 | |
Southwest Gas Holdings, Inc. | | | 5,903 | | | | 371,122 | |
| | | | | | | | |
| | | | | | | 601,487 | |
| | |
Multi-Utilities — 1.2% | | | | | | | | |
Black Hills Corp. (2) | | | 7,397 | | | | 414,825 | |
Unitil Corp. (2) | | | 4,687 | | | | 197,791 | |
| | | | | | | | |
| | | | | | | 612,616 | |
| | | | | | | | |
Total Utilities | | | | | | | 2,062,455 | |
| | | | | | | | |
Total Common Stocks
(identified cost $48,737,732) | | | | 48,983,472 | |
| | | | | | | | |
| Short-Term Investments — 16.9% | |
|
| Collateral Pool Investments for Securities on Loan — 13.6% | |
| | |
Collateral pool allocation (3) | | | | | | | 6,858,721 | |
| | |
| Mutual Funds — 3.3% | | | | | | |
BMO Institutional Prime Money Market Fund — Premier Class, 0.130% (4) | | | 1,651,874 | | | | 1,651,709 | |
| | | | | | | | |
Total Short-Term Investments
(identified cost $8,510,701) | | | | 8,510,430 | |
| | | | | | | | |
Total Investments — 114.1%
(identified cost $57,248,433) | | | | | | | 57,493,902 | |
| Other Assets and Liabilities — (14.1)% | | | | (7,125,833 | ) |
| | | | | | | | |
| Total Net Assets — 100.0% | | | $ | 50,368,069 | |
| | | | | | | | |
Small-Cap Growth Fund
| | | | | | | | |
| Description | | Shares | | | Value | |
| Common Stocks — 98.1% | |
|
| Communication Services — 1.8% | |
|
Advertising — 1.1% | |
TechTarget, Inc. (1) | | | 26,235 | | | $ | 1,041,005 | |
|
Alternative Carriers — 0.7% | |
Cogent Communications Holdings, Inc. (2) | | | 10,788 | | | | 725,601 | |
| | | | | | | | |
Total Communication Services | | | | | | | 1,766,606 | |
|
| Consumer Discretionary — 11.6% | |
|
Consumer Electronics — 1.7% | |
Sonos, Inc. (1) | | | 69,872 | | | | 983,099 | |
Universal Electronics, Inc. (1) | | | 15,523 | | | | 637,685 | |
| | | | | | | | |
| | | | | | | 1,620,784 | |
|
Education Services — 0.9% | |
K12, Inc. (1)(2) | | | 22,458 | | | | 835,662 | |
|
Footwear — 2.6% | |
Crocs, Inc. (1)(2) | | | 25,458 | | | | 1,016,029 | |
Deckers Outdoor Corp. (1) | | | 5,096 | | | | 1,038,921 | |
Steven Madden, Ltd. | | | 24,917 | | | | 527,244 | |
| | | | | | | | |
| | | | | | | 2,582,194 | |
|
Homebuilding — 1.0% | |
Skyline Champion Corp. (1)(2) | | | 33,944 | | | | 968,762 | |
| | | | | | | | |
| Description | | Shares | | | Value | |
| Common Stocks (continued) | |
|
| Consumer Discretionary (continued) | |
|
Homefurnishing Retail — 1.1% | |
Sleep Number Corp. (1)(2) | | | 21,841 | | | $ | 1,048,368 | |
|
Internet & Direct Marketing Retail — 2.2% | |
1-800-Flowers.com, Inc., Class A (1)(2) | | | 38,888 | | | | 1,163,918 | |
Shutterstock, Inc. (2) | | | 19,696 | | | | 991,102 | |
| | | | | | | | |
| | | | | | | 2,155,020 | |
|
Leisure Products — 1.0% | |
YETI Holdings, Inc. (1) | | | 18,565 | | | | 953,870 | |
|
Restaurants — 1.1% | |
Wingstop, Inc. (2) | | | 6,554 | | | | 1,070,924 | |
| | | | | | | | |
Total Consumer Discretionary | | | | | | | 11,235,584 | |
|
| Consumer Staples — 4.2% | |
|
Food Retail — 1.0% | |
Sprouts Farmers Market, Inc. (1) | | | 41,673 | | | | 973,064 | |
|
Household Products — 1.0% | |
Central Garden & Pet Co., Class A (1) | | | 26,508 | | | | 985,037 | |
|
Packaged Foods & Meats — 2.2% | |
Freshpet, Inc. (1)(2) | | | 12,873 | | | | 1,462,373 | |
Hostess Brands, Inc. (1) | | | 55,476 | | | | 712,312 | |
| | | | | | | | |
| | | | | | | 2,174,685 | |
| | | | | | | | |
Total Consumer Staples | | | | | | | 4,132,786 | |
|
| Financials — 1.7% | |
|
Life & Health Insurance — 0.9% | |
Primerica, Inc. | | | 6,763 | | | | 844,361 | |
|
Property & Casualty Insurance — 0.8% | |
AMERISAFE, Inc. (2) | | | 12,165 | | | | 811,770 | |
| | | | | | | | |
Total Financials | | | | | | | 1,656,131 | |
|
| Healthcare — 35.3% | |
|
Biotechnology — 15.9% | |
ACADIA Pharmaceuticals, Inc. (1) | | | 17,138 | | | | 678,493 | |
Akebia Therapeutics, Inc. (1)(2) | | | 56,171 | | | | 584,740 | |
BioSpecifics Technologies Corp. (1) | | | 8,569 | | | | 552,701 | |
Castle Biosciences, Inc. (1)(2) | | | 15,755 | | | | 720,476 | |
Coherus Biosciences, Inc. (1)(2) | | | 41,444 | | | | 786,193 | |
Deciphera Pharmaceuticals, Inc. (1)(2) | | | 11,421 | | | | 514,059 | |
Dicerna Pharmaceuticals, Inc. (1) | | | 36,517 | | | | 676,295 | |
Halozyme Therapeutics, Inc. (1)(2) | | | 45,101 | | | | 1,307,703 | |
Natera, Inc. (1)(2) | | | 22,009 | | | | 1,402,193 | |
PTC Therapeutics, Inc. (1)(2) | | | 19,380 | | | | 957,857 | |
Puma Biotechnology, Inc. (1)(2) | | | 67,764 | | | | 697,292 | |
Radius Health, Inc. (1) | | | 40,346 | | | | 499,483 | |
REGENXBIO, Inc. (1)(2) | | | 12,142 | | | | 370,574 | |
Repligen Corp. (1) | | | 7,921 | | | | 1,227,042 | |
Retrophin, Inc. (1)(2) | | | 39,652 | | | | 776,783 | |
Vanda Pharmaceuticals, Inc. (1)(2) | | | 38,620 | | | | 397,400 | |
Veracyte, Inc. (1)(2) | | | 32,498 | | | | 1,082,508 | |
Vericel Corp. (1)(2) | | | 49,598 | | | | 786,128 | |
Voyager Therapeutics, Inc. (1) | | | 54,976 | | | | 648,167 | |
Xencor, Inc. (1) | | | 21,730 | | | | 776,848 | |
| | | | | | | | |
| | | | | | | 15,442,935 | |
|
Healthcare Equipment — 8.4% | |
AtriCure, Inc. (1)(2) | | | 20,494 | | | | 916,697 | |
Axogen, Inc. (1)(2) | | | 69,266 | | | | 822,187 | |
Cardiovascular Systems, Inc. (1) | | | 19,886 | | | | 649,676 | |
CONMED Corp. | | | 11,710 | | | | 1,010,690 | |
Globus Medical, Inc., Class A (1)(2) | | | 11,971 | | | | 676,601 | |
(See Notes to Schedules of Investments and Notes to Financial Statements, which are an integral part of the Financial Statements)
44
Small-Cap Growth Fund (continued)
| | | | | | | | |
| Description | | Shares | | | Value | |
| Common Stocks (continued) | |
|
| Healthcare (continued) | |
|
Healthcare Equipment (continued) | |
iRhythm Technologies, Inc. (1) | | | 6,903 | | | $ | 1,519,903 | |
Novocure, Ltd. (1)(2) | | | 10,557 | | | | 873,592 | |
Orthofix Medical, Inc. (1) | | | 19,122 | | | | 580,161 | |
Tandem Diabetes Care, Inc. (1)(2) | | | 9,331 | | | | 1,051,790 | |
| | | | | | | | |
| | | | | | | 8,101,297 | |
|
Healthcare Facilities — 0.8% | |
Select Medical Holdings Corp. (1) | | | 39,976 | | | | 802,318 | |
|
Healthcare Services — 2.2% | |
Amedisys, Inc. (1) | | | 4,327 | | | | 1,046,701 | |
R1 RCM, Inc. (1)(2) | | | 77,371 | | | | 1,121,880 | |
| | | | | | | | |
| | | | | | | 2,168,581 | |
|
Healthcare Supplies — 1.6% | |
Haemonetics Corp. (1)(2) | | | 7,978 | | | | 715,308 | |
Neogen Corp. (1)(2) | | | 10,387 | | | | 791,489 | |
| | | | | | | | |
| | | | | | | 1,506,797 | |
|
Healthcare Technology — 2.3% | |
HMS Holdings Corp. (1) | | | 22,781 | | | | 635,362 | |
Inovalon Holdings, Inc. (1) | | | 42,336 | | | | 1,047,604 | |
Omnicell, Inc. (1) | | | 8,592 | | | | 572,915 | |
| | | | | | | | |
| | | | | | | 2,255,881 | |
|
Life Sciences Tools & Services — 2.5% | |
Medpace Holdings, Inc. (1)(2) | | | 10,703 | | | | 1,389,143 | |
NeoGenomics, Inc. (1)(2) | | | 27,494 | | | | 1,070,891 | |
| | | | | | | | |
| | | | | | | 2,460,034 | |
|
Pharmaceuticals — 1.6% | |
Amphastar Pharmaceuticals, Inc. (1) (2) | | | 34,427 | | | | 701,622 | |
Collegium Pharmaceutical, Inc. (1)(2) | | | 41,500 | | | | 790,990 | |
| | | | | | | | |
| | | | | | | 1,492,612 | |
| | | | | | | | |
Total Healthcare | | | | | | | 34,230,455 | |
|
| Industrials — 14.3% | |
|
Air Freight & Logistics — 1.6% | |
Echo Global Logistics, Inc. (1) | | | 23,606 | | | | 644,916 | |
Hub Group, Inc., Class A (1) | | | 17,699 | | | | 952,914 | |
| | | | | | | | |
| | | | | | | 1,597,830 | |
|
Building Products — 2.9% | |
Builders FirstSource, Inc. (1)(2) | | | 48,778 | | | | 1,493,582 | |
CSW Industrials, Inc. | | | 9,419 | | | | 680,523 | |
Gibraltar Industries, Inc. (1) | | | 10,833 | | | | 676,467 | |
| | | | | | | | |
| | | | | | | 2,850,572 | |
|
Construction & Engineering — 0.9% | |
EMCOR Group, Inc. | | | 11,072 | | | | 830,511 | |
|
Construction Machinery & Heavy Trucks — 0.8% | |
Astec Industries, Inc. | | | 14,025 | | | | 739,398 | |
|
Electrical Components & Equipment — 0.7% | |
Atkore International Group, Inc. (1) | | | 25,576 | | | | 683,646 | |
|
Human Resource & Employment Services — 0.7% | |
Korn Ferry | | | 23,934 | | | | 729,987 | |
|
Industrial Machinery — 3.7% | |
Mueller Industries, Inc. | | | 26,327 | | | | 781,912 | |
Mueller Water Products, Inc., Class A (2) | | | 77,398 | | | | 835,898 | |
Tennant Co. (2) | | | 14,113 | | | | 938,091 | |
| | | | | | | | |
| Description | | Shares | | | Value | |
| Common Stocks (continued) | |
|
| Industrials (continued) | |
|
Industrial Machinery (continued) | |
Watts Water Technologies, Inc., Class A (2) | | | 10,506 | | | $ | 1,005,950 | |
| | | | | | | | |
| | | | | | | 3,561,851 | |
|
Office Services & Supplies — 0.6% | |
Herman Miller, Inc. | | | 22,542 | | | | 537,176 | |
|
Research & Consulting Services — 0.9% | |
Huron Consulting Group, Inc. (1) | | | 19,753 | | | | 856,885 | |
|
Trading Companies & Distributors — 1.5% | |
Applied Industrial Technologies, Inc. | | | 12,859 | | | | 774,240 | |
Foundation Building Materials, Inc. (1) | | | 44,529 | | | | 722,706 | |
| | | | | | | | |
| | | | | | | 1,496,946 | |
| | | | | | | | |
Total Industrials | | | | | | | 13,884,802 | |
|
| Information Technology — 23.9% | |
|
Application Software — 8.9% | |
Blackline, Inc. (1)(2) | | | 9,898 | | | | 864,788 | |
Bottomline Technologies DE, Inc. (1) | | | 16,711 | | | | 795,945 | |
Box, Inc., Class A (1) | | | 43,858 | | | | 860,932 | |
ChannelAdvisor Corp. (1)(2) | | | 48,858 | | | | 821,792 | |
Cornerstone OnDemand, Inc. (1) | | | 16,353 | | | | 576,770 | |
Domo, Inc. (1) | | | 21,680 | | | | 882,810 | |
Envestnet, Inc. (1) | | | 9,691 | | | | 804,256 | |
SPS Commerce, Inc. (1) | | | 15,409 | | | | 1,230,871 | |
Verint Systems, Inc. (1) | | | 15,691 | | | | 746,264 | |
Workiva, Inc. (1) | | | 17,410 | | | | 1,027,190 | |
| | | | | | | | |
| | | | | | | 8,611,618 | |
|
Communications Equipment — 1.4% | |
NetScout Systems, Inc. (1) | | | 29,051 | | | | 672,240 | |
Viavi Solutions, Inc. (1) | | | 54,446 | | | | 726,038 | |
| | | | | | | | |
| | | | | | | 1,398,278 | |
|
Data Processing & Outsourced Services — 1.8% | |
ExlService Holdings, Inc. (1) | | | 11,219 | | | | 714,538 | |
TTEC Holdings, Inc. (2) | | | 17,743 | | | | 1,005,851 | |
| | | | | | | | |
| | | | | | | 1,720,389 | |
|
Electronic Equipment & Instruments — 0.7% | |
Itron, Inc. (1)(2) | | | 11,100 | | | | 661,227 | |
|
Electronic Manufacturing Services — 0.9% | |
Plexus Corp. (1) | | | 11,923 | | | | 906,983 | |
|
IT Consulting & Other Services — 1.1% | |
LiveRamp Holdings, Inc. (1)(2) | | | 18,835 | | | | 1,051,746 | |
|
Semiconductor Equipment — 3.5% | |
Advanced Energy Industries, Inc. (1)(2) | | | 11,544 | | | | 855,641 | |
Brooks Automation, Inc. (2) | | | 18,299 | | | | 944,777 | |
FormFactor, Inc. (1)(2) | | | 36,567 | | | | 955,496 | |
Photronics, Inc. (1) | | | 69,573 | | | | 697,817 | |
| | | | | | | | |
| | | | | | | 3,453,731 | |
|
Semiconductors — 2.0% | |
Silicon Laboratories, Inc. (1)(2) | | | 9,005 | | | | 922,202 | |
Synaptics, Inc. (1)(2) | | | 11,827 | | | | 1,009,198 | |
| | | | | | | | |
| | | | | | | 1,931,400 | |
| | |
Systems Software — 3.6% | | | | | | | | |
CommVault Systems, Inc. (1) | | | 20,587 | | | | 889,976 | |
OneSpan, Inc. (1)(2) | | | 37,407 | | | | 806,121 | |
Tenable Holdings, Inc. (1)(2) | | | 27,167 | | | | 1,022,566 | |
Zuora, Inc. (1) | | | 55,069 | | | | 748,387 | |
| | | | | | | | |
| | | | | | | 3,467,050 | |
| | | | | | | | |
Total Information Technology | | | | | | | 23,202,422 | |
(See Notes to Schedules of Investments and Notes to Financial Statements, which are an integral part of the Financial Statements)
45
August 31, 2020
Small-Cap Growth Fund (continued)
| | | | | | | | |
| Description | | Shares | | | Value | |
| Common Stocks (continued) | |
|
| Materials — 2.7% | |
|
Construction Materials — 0.8% | |
Summit Materials, Inc.,
Class A (1)(2) | | | 54,079 | | | $ | 805,236 | |
|
Diversified Metals & Mining — 1.1% | |
Materion Corp. (2) | | | 19,264 | | | | 1,051,622 | |
| | |
Specialty Chemicals — 0.8% | | | | | | | | |
Innospec, Inc. | | | 9,759 | | | | 728,900 | |
| | | | | | | | |
Total Materials | | | | | | | 2,585,758 | |
|
| Real Estate — 2.0% | |
|
Industrial REIT’s — 1.0% | |
EastGroup Properties, Inc. (2) | | | 7,147 | | | | 951,694 | |
|
Specialized REIT’s — 1.0% | |
QTS Realty Trust, Inc., Class A (2) | | | 14,091 | | | | 955,652 | |
| | | | | | | | |
Total Real Estate | | | | | | | 1,907,346 | |
|
| Utilities — 0.6% | |
|
Renewable Electricity — 0.6% | |
Ormat Technologies, Inc. (2) | | | 10,269 | | | | 625,074 | |
| | | | | | | | |
Total Common Stocks
(identified cost $79,755,653) | | | | | | | 95,226,964 | |
| | | | | | | | |
| Short-Term Investments — 23.9% | |
|
| Collateral Pool Investments for Securities on Loan — 21.9% | |
| | |
Collateral pool allocation (3) | | | | | | | 21,305,052 | |
| | |
| Mutual Funds — 2.0% | | | | | | |
BMO Institutional Prime Money Market Fund — Premier Class, 0.130% (4) | | | 1,915,290 | | | | 1,915,098 | |
| | | | | | | | |
Total Short-Term Investments
(identified cost $23,220,441) | | | | 23,220,150 | |
| | | | | | | | |
Total Investments — 122.0%
(identified cost $102,976,094) | | | | 118,447,114 | |
| Other Assets and Liabilities — (22.0)% | | | | (21,369,914 | ) |
| | | | | | | | |
| Total Net Assets — 100.0% | | | | | | $ | 97,077,200 | |
| | | | | | | | |
Global Low Volatility Equity Fund
| | | | | | | | |
| Description | | Shares | | | Value | |
| Common Stocks — 98.3% | |
|
Belgium — 0.8% | |
Telenet Group Holding NV | | | 1,343 | | | $ | 52,215 | |
UCB SA | | | 484 | | | | 57,481 | |
| | | | | | | | |
| | | | | | | 109,696 | |
|
Bermuda — 0.5% | |
Enstar Group, Ltd. (1) | | | 415 | | | | 74,281 | |
|
Canada — 9.1% | |
Atco, Ltd., Class I | | | 4,617 | | | | 140,667 | |
BCE, Inc. (2) | | | 3,797 | | | | 163,192 | |
Cogeco Communications, Inc. | | | 1,512 | | | | 113,346 | |
Emera, Inc. (2) | | | 1,563 | | | | 63,809 | |
George Weston, Ltd. | | | 1,942 | | | | 140,296 | |
Granite Real Estate Investment Trust | | | 2,405 | | | | 143,063 | |
Kirkland Lake Gold, Ltd. | | | 1,924 | | | | 102,517 | |
Loblaw Cos., Ltd. | | | 2,004 | | | | 103,569 | |
Quebecor, Inc., Class B | | | 9,649 | | | | 239,237 | |
| | | | | | | | |
| Description | | Shares | | | Value | |
| Common Stocks (continued) | |
|
Canada (continued) | |
Rogers Communications, Inc., Class B | | | 1,155 | | | $ | 48,047 | |
| | | | | | | | |
| | | | | | | 1,257,743 | |
|
Cayman Islands — 1.8% | |
Tencent Holdings, Ltd. | | | 3,600 | | | | 246,419 | |
|
China — 0.7% | |
Agricultural Bank of China, Ltd., Class H | | | 172,000 | | | | 57,480 | |
China Minsheng Banking Corp., Ltd., Class H | | | 69,100 | | | | 42,083 | |
| | | | | | | | |
| | | | | | | 99,563 | |
|
Czech Republic — 1.7% | |
CEZ AS | | | 5,519 | | | | 113,709 | |
Komercni banka AS (1) | | | 2,333 | | | | 56,176 | |
Moneta Money Bank AS (5) | | | 26,337 | | | | 66,407 | |
| | | | | | | | |
| | | | | | | 236,292 | |
|
France — 0.7% | |
Sanofi | | | 1,001 | | | | 101,381 | |
|
Germany — 0.3% | |
Talanx AG (1) | | | 955 | | | | 35,489 | |
|
Hong Kong — 4.0% | |
CLP Holdings, Ltd. | | | 15,000 | | | | 147,383 | |
HK Electric Investments & HK Electric Investments, Ltd. | | | 132,000 | | | | 134,381 | |
HKT Trust & HKT, Ltd. | | | 96,000 | | | | 137,245 | |
Sun Art Retail Group, Ltd. | | | 104,500 | | | | 136,184 | |
| | | | | | | | |
| | | | | | | 555,193 | |
|
Hungary — 0.2% | |
Magyar Telekom Telecommunications PLC | | | 28,565 | | | | 35,089 | |
|
Israel — 1.4% | |
Bank Leumi Le-Israel BM | | | 19,178 | | | | 98,336 | |
Reit 1, Ltd. | | | 7,964 | | | | 32,051 | |
Strauss Group, Ltd. | | | 2,098 | | | | 61,293 | |
| | | | | | | | |
| | | | | | | 191,680 | |
|
Italy — 4.2% | |
A2A SpA | | | 49,876 | | | | 72,792 | |
Enel SpA | | | 38,008 | | | | 344,213 | |
Iren SpA | | | 62,275 | | | | 162,901 | |
| | | | | | | | |
| | | | | | | 579,906 | |
|
Japan — 15.5% | |
Bridgestone Corp. | | | 800 | | | | 25,386 | |
Chubu Electric Power Co., Inc. | | | 14,600 | | | | 180,510 | |
Daiwa Securities Living Investments Corp. | | | 181 | | | | 180,803 | |
DCM Holdings Co., Ltd. | | | 4,900 | | | | 60,050 | |
Doutor Nichires Holdings Co., Ltd. | | | 2,500 | | | | 38,781 | |
Frontier Real Estate Investment Corp. | | | 55 | | | | 183,827 | |
Geo Holdings Corp. | | | 6,100 | | | | 99,003 | |
Hogy Medical Co., Ltd. | | | 800 | | | | 25,379 | |
KDDI Corp. | | | 10,200 | | | | 296,423 | |
Mitsui Sugar Co., Ltd. | | | 1,600 | | | | 29,216 | |
Morinaga Milk Industry Co., Ltd. | | | 1,300 | | | | 63,211 | |
Nihon Kohden Corp. | | | 1,500 | | | | 51,338 | |
Nippon Telegraph & Telephone Corp. | | | 11,800 | | | | 268,665 | |
NTT DoCoMo, Inc. | | | 9,400 | | | | 262,612 | |
Paramount Bed Holdings Co., Ltd. | | | 1,000 | | | | 39,891 | |
Suzuken Co., Ltd. | | | 1,000 | | | | 37,200 | |
TIS, Inc. | | | 2,300 | | | | 46,037 | |
Towa Pharmaceutical Co., Ltd. | | | 2,300 | | | | 45,646 | |
Tsumura & Co. | | | 2,300 | | | | 65,364 | |
(See Notes to Schedules of Investments and Notes to Financial Statements, which are an integral part of the Financial Statements)
46
Global Low Volatility Equity Fund (continued)
| | | | | | | | |
| Description | | Shares | | | Value | |
| Common Stocks (continued) | |
|
Japan (continued) | |
United Arrows, Ltd. | | | 1,700 | | | $ | 26,082 | |
Valor Holdings Co., Ltd. | | | 2,100 | | | | 53,752 | |
Vital KSK Holdings, Inc. | | | 3,400 | | | | 34,380 | |
Yaoko Co., Ltd. | | | 500 | | | | 39,135 | |
| | | | | | | | |
| | | | | | | 2,152,691 | |
|
Mexico — 1.1% | |
Arca Continental SAB de C.V. | | | 20,200 | | | | 91,824 | |
Qualitas Controladora SAB de C.V. (2) | | | 14,400 | | | | 56,726 | |
| | | | | | | | |
| | | | | | | 148,550 | |
|
Netherlands — 3.6% | |
Flow Traders (5) | | | 6,174 | | | | 243,136 | |
Intertrust NV (5) | | | 2,457 | | | | 44,098 | |
Koninklijke Ahold Delhaize NV | | | 4,296 | | | | 129,294 | |
Pharming Group NV (1)(2) | | | 61,696 | | | | 78,042 | |
| | | | | | | | |
| | | | | | | 494,570 | |
|
New Zealand — 3.3% | |
Fisher & Paykel Healthcare Corp., Ltd. | | | 10,072 | | | | 250,009 | |
Infratil, Ltd. | | | 21,692 | | | | 72,474 | |
Spark New Zealand, Ltd. | | | 42,720 | | | | 138,989 | |
| | | | | | | | |
| | | | | | | 461,472 | |
|
Philippines — 2.6% | |
Globe Telecom, Inc. | | | 1,430 | | | | 61,583 | |
International Container Terminal Services, Inc. | | | 40,630 | | | | 87,989 | |
Manila Electric Co. | | | 18,160 | | | | 100,754 | |
PLDT, Inc. | | | 3,675 | | | | 112,103 | |
| | | | | | | | |
| | | | | | | 362,429 | |
|
Portugal — 0.3% | |
REN — Redes Energeticas Nacionais SGPS SA | | | 16,092 | | | | 46,664 | |
|
Singapore — 3.2% | |
Mapletree Industrial Trust | | | 20,800 | | | | 46,628 | |
NetLink NBN Trust | | | 352,900 | | | | 251,599 | |
SATS, Ltd. | | | 36,200 | | | | 79,821 | |
Sheng Siong Group, Ltd. | | | 48,400 | | | | 62,254 | |
| | | | | | | | |
| | | | | | | 440,302 | |
|
South Africa — 2.0% | |
AngloGold Ashanti, Ltd. | | | 4,125 | | | | 120,373 | |
Gold Fields, Ltd. | | | 11,892 | | | | 153,687 | |
| | | | | | | | |
| | | | | | | 274,060 | |
|
Spain — 0.8% | |
Red Electrica Corp. SA | | | 5,603 | | | | 107,149 | |
|
Switzerland — 4.9% | |
Nestle SA | | | 2,392 | | | | 287,268 | |
Novartis AG | | | 1,157 | | | | 99,886 | |
Roche Holding AG | | | 536 | | | | 187,195 | |
Sonova Holding AG (1) | | | 463 | | | | 108,125 | |
| | | | | | | | |
| | | | | | | 682,474 | |
|
Taiwan — 4.4% | |
Coretronic Corp. | | | 41,000 | | | | 48,977 | |
Far EasTone Telecommunications Co., Ltd. | | | 91,000 | | | | 190,116 | |
Fubon Financial Holding Co., Ltd. | | | 93,000 | | | | 135,658 | |
Great Wall Enterprise Co., Ltd. | | | 39,200 | | | | 60,453 | |
Taichung Commercial Bank Co., Ltd. | | | 156,196 | | | | 59,356 | |
Taiwan Secom Co., Ltd. | | | 11,075 | | | | 32,083 | |
| | | | | | | | |
| Description | | Shares | | | Value | |
| Common Stocks (continued) | |
|
Taiwan (continued) | |
Tripod Technology Corp. | | | 9,000 | | | $ | 35,581 | |
Uni-President Enterprises Corp. | | | 18,000 | | | | 40,857 | |
| | | | | | | | |
| | | | | | | 603,081 | |
|
United Kingdom — 1.6% | |
Assura PLC | | | 123,156 | | | | 133,349 | |
AstraZeneca PLC | | | 759 | | | | 84,617 | |
| | | | | | | | |
| | | | | | | 217,966 | |
|
United States — 29.6% | |
ALLETE, Inc. | | | 866 | | | | 46,729 | |
Allstate Corp. | | | 2,955 | | | | 274,815 | |
Atrion Corp. | | | 99 | | | | 62,540 | |
AutoZone, Inc. (1) | | | 87 | | | | 104,079 | |
CMS Energy Corp. | | | 1,116 | | | | 67,507 | |
Danaher Corp. | | | 437 | | | | 90,227 | |
Eli Lilly and Co. | | | 837 | | | | 124,202 | |
Equity LifeStyle Properties, Inc. | | | 4,197 | | | | 278,219 | |
Essex Property Trust, Inc. | | | 246 | | | | 53,262 | |
Evergy, Inc. | | | 1,059 | | | | 56,360 | |
Extra Space Storage, Inc. | | | 768 | | | | 81,830 | |
Getty Realty Corp. | | | 3,545 | | | | 103,833 | |
Globus Medical, Inc., Class A (1) | | | 1,094 | | | | 61,833 | |
Hershey Co. | | | 494 | | | | 73,428 | |
Home Depot, Inc. | | | 192 | | | | 54,728 | |
Kroger Co. | | | 5,333 | | | | 190,281 | |
Lamb Weston Holdings, Inc. | | | 520 | | | | 32,682 | |
MDU Resources Group, Inc. | | | 1,611 | | | | 38,052 | |
Merck & Co., Inc. | | | 3,841 | | | | 327,522 | |
Moody’s Corp. | | | 332 | | | | 97,821 | |
OraSure Technologies, Inc. (1) | | | 4,818 | | | | 56,467 | |
PepsiCo, Inc. | | | 1,790 | | | | 250,707 | |
Pfizer, Inc. | | | 6,218 | | | | 234,978 | |
Portland General Electric Co. | | | 3,330 | | | | 127,040 | |
Progressive Corp. | | | 737 | | | | 70,045 | |
S&P Global, Inc. | | | 230 | | | | 84,277 | |
Safety Insurance Group, Inc. | | | 999 | | | | 72,328 | |
Sprouts Farmers Market, Inc. (1) | | | 7,761 | | | | 181,219 | |
Target Corp. | | | 357 | | | | 53,982 | |
Unitil Corp. | | | 731 | | | | 30,848 | |
Verizon Communications, Inc. | | | 4,413 | | | | 261,559 | |
Walmart, Inc. | | | 2,277 | | | | 316,161 | |
Weis Markets, Inc. (2) | | | 1,640 | | | | 80,737 | |
Zoetis, Inc. | | | 326 | | | | 52,193 | |
| | | | | | | | |
| | | | | | | 4,092,491 | |
| | | | | | | | |
Total Common Stocks
(identified cost $11,849,747) | | | | | | | 13,606,631 | |
| | | | | | | | |
| Short-Term Investments — 4.4% | |
|
| Collateral Investment for Securities on Loan — 3.1% | |
| | |
BMO Institutional Prime Money Market Fund — Premier Class, 0.130% (3)(4) | | | 430,414 | | | | 430,413 | |
|
| Mutual Funds — 1.3% | |
BMO Institutional Prime Money Market Fund — Premier Class, 0.130% (4) | | | 172,081 | | | | 172,064 | |
| | | | | | | | |
Total Short-Term Investments
(identified cost $602,511) | | | | | | | 602,477 | |
| | | | | | | | |
Total Investments — 102.7%
(identified cost $12,452,258) | | | | | | | 14,209,108 | |
| Other Assets and Liabilities — (2.7)% | | | | (369,011 | ) |
| | | | | | | | |
| Total Net Assets — 100.0% | | | | | | $ | 13,840,097 | |
| | | | | | | | |
(See Notes to Schedules of Investments and Notes to Financial Statements, which are an integral part of the Financial Statements)
47
August 31, 2020
Global Low Volatility Equity Fund (continued)
| | | | | | | | |
| Industry | | Value | | | % of
Total
Net Assets | |
Agriculture | | $ | 60,453 | | | | 0.4 | % |
Auto Parts & Equipment | | | 25,386 | | | | 0.2 | |
Banks | | | 379,838 | | | | 2.7 | |
Beverages | | | 342,531 | | | | 2.5 | |
Biotechnology | | | 78,042 | | | | 0.6 | |
Building Materials | | | 38,052 | | | | 0.3 | |
Commercial Services | | | 401,173 | | | | 2.8 | |
Diversified Financial Services | | | 422,892 | | | | 3.1 | |
Electric | | | 2,015,890 | | | | 14.5 | |
Electronics | | | 84,558 | | | | 0.7 | |
Engineering & Construction | | | 79,821 | | | | 0.6 | |
Food | | | 1,452,486 | | | | 10.6 | |
Healthcare-Products | | | 745,809 | | | | 5.5 | |
Insurance | | | 583,684 | | | | 4.2 | |
Internet | | | 246,419 | | | | 1.8 | |
Media | | | 404,798 | | | | 2.9 | |
Mining | | | 376,577 | | | | 2.7 | |
Pharmaceuticals | | | 1,452,045 | | | | 10.4 | |
Real Estate Investment Trusts | | | 1,236,865 | | | | 8.8 | |
Retail | | | 906,053 | | | | 6.6 | |
Software | | | 46,037 | | | | 0.3 | |
Telecommunications | | | 2,227,222 | | | | 16.1 | |
| | | | | | | | |
Total Common Stocks | | | 13,606,631 | | | | 98.3 | |
Collateral Investment for Securities on Loan | | | 430,413 | | | | 3.1 | |
Mutual Funds | | | 172,064 | | | | 1.3 | |
| | | | | | | | |
Total Investments | | | 14,209,108 | | | | 102.7 | |
Other Assets and Liabilities | | | (369,011 | ) | | | (2.7 | ) |
| | | | | | | | |
Net Assets | | $ | 13,840,097 | | | | 100.0 | % |
| | | | | | | | |
Disciplined International Equity Fund
| | | | | | | | |
| Description | | Shares | | | Value | |
| Common Stocks — 96.9% | |
|
Australia — 9.2% | |
AGL Energy, Ltd. | | | 18,779 | | | $ | 204,987 | |
BHP Group, Ltd. | | | 39,941 | | | | 1,116,771 | |
CSL, Ltd. | | | 3,000 | | | | 632,840 | |
Qantas Airways, Ltd. | | | 123,246 | | | | 358,147 | |
Rio Tinto PLC | | | 15,353 | | | | 951,247 | |
Santos, Ltd. | | | 75,126 | | | | 314,170 | |
| | | | | | | | |
| | | | | | | 3,578,162 | |
|
China — 1.5% | |
UBS Group AG | | | 49,159 | | | | 597,391 | |
|
Denmark — 2.8% | |
Carlsberg A/S, Class B | | | 2,612 | | | | 367,074 | |
Novo Nordisk A/S, Class B | | | 6,413 | | | | 424,764 | |
Pandora A/S | | | 4,088 | | | | 298,589 | |
| | | | | | | | |
| | | | | | | 1,090,427 | |
|
Finland — 1.7% | |
UPM-Kymmene OYJ | | | 18,321 | | | | 555,548 | |
Valmet OYJ | | | 3,935 | | | | 107,629 | |
| | | | | | | | |
| | | | | | | 663,177 | |
|
France — 7.7% | |
Arkema SA | | | 1,176 | | | | 130,374 | |
Cie de Saint-Gobain (1) | | | 12,228 | | | | 495,846 | |
Eiffage SA (1) | | | 4,805 | | | | 442,783 | |
Peugeot SA (1) | | | 32,443 | | | | 556,347 | |
| | | | | | | | |
| Description | | Shares | | | Value | |
| Common Stocks (continued) | |
|
France (continued) | |
Sanofi | | | 2,693 | | | $ | 272,746 | |
Sartorius Stedim Biotech | | | 1,647 | | | | 589,241 | |
Vinci SA | | | 5,341 | | | | 500,844 | |
| | | | | | | | |
| | | | | | | 2,988,181 | |
|
Germany — 3.6% | |
Allianz SE | | | 4,158 | | | | 900,693 | |
Deutsche Boerse AG | | | 1,111 | | | | 210,009 | |
Siltronic AG | | | 3,193 | | | | 296,980 | |
| | | | | | | | |
| | | | | | | 1,407,682 | |
|
Hong Kong — 2.1% | |
CK Asset Holdings, Ltd. | | | 112,000 | | | | 608,397 | |
WH Group, Ltd. (5) | | | 251,000 | | | | 216,664 | |
| | | | | | | | |
| | | | | | | 825,061 | |
|
Israel — 0.4% | |
Bank Leumi Le-Israel BM | | | 33,034 | | | | 169,382 | |
|
Italy — 5.1% | |
A2A SpA | | | 246,315 | | | | 359,489 | |
Azimut Holding SpA | | | 5,309 | | | | 102,667 | |
Enel SpA | | | 124,081 | | | | 1,123,719 | |
Eni SpA | | | 43,385 | | | | 403,833 | |
| | | | | | | | |
| | | | | | | 1,989,708 | |
|
Japan — 25.4% | |
AGC, Inc. | | | 7,100 | | | | 201,440 | |
Alfresa Holdings Corp. | | | 11,800 | | | | 237,304 | |
Astellas Pharma, Inc. | | | 13,700 | | | | 215,301 | |
Brother Industries, Ltd. | | | 11,500 | | | | 190,554 | |
Chubu Electric Power Co., Inc. | | | 36,000 | | | | 445,093 | |
Daito Trust Construction Co., Ltd. | | | 2,500 | | | | 221,900 | |
Daiwa House Industry Co., Ltd. | | | 26,800 | | | | 718,740 | |
Fujitsu, Ltd. | | | 3,600 | | | | 469,735 | |
Hitachi, Ltd. | | | 26,000 | | | | 866,544 | |
JVC Kenwood Corp. | | | 48,400 | | | | 71,744 | |
KDDI Corp. | | | 19,200 | | | | 557,972 | |
K’s Holdings Corp. | | | 15,100 | | | | 214,278 | |
MEIJI Holdings Co., Ltd. | | | 3,000 | | | | 242,459 | |
Nichias Corp. | | | 5,300 | | | | 125,851 | |
Nippon Telegraph & Telephone Corp. | | | 36,700 | | | | 835,595 | |
NTT DoCoMo, Inc. | | | 29,700 | | | | 829,744 | |
Obayashi Corp. | | | 55,800 | | | | 546,331 | |
ORIX Corp. | | | 23,400 | | | | 292,072 | |
Sekisui Chemical Co., Ltd. | | | 16,000 | | | | 256,357 | |
Sekisui House, Ltd. | | | 8,400 | | | | 166,231 | |
Seven & i Holdings Co., Ltd. (2) | | | 4,300 | | | | 139,375 | |
Showa Denko KK | | | 7,200 | | | | 140,513 | |
Sumitomo Electric Industries, Ltd. | | | 6,200 | | | | 73,113 | |
Sumitomo Mitsui Financial Group, Inc. (2) | | | 12,800 | | | | 376,815 | |
Suntory Beverage & Food, Ltd. | | | 7,000 | | | | 270,311 | |
Taiheiyo Cement Corp. | | | 6,500 | | | | 165,453 | |
TIS, Inc. | | | 12,200 | | | | 244,196 | |
USS Co., Ltd. | | | 28,900 | | | | 488,693 | |
West Japan Railway Co. | | | 6,200 | | | | 326,112 | |
| | | | | | | | |
| | | | | | | 9,929,826 | |
|
Netherlands — 5.5% | |
AerCap Holdings NV (1) | | | 8,214 | | | | 242,888 | |
ASM International NV | | | 2,792 | | | | 420,144 | |
ING Groep NV (1) | | | 54,065 | | | | 438,984 | |
Koninklijke Ahold Delhaize NV | | | 34,908 | | | | 1,050,601 | |
| | | | | | | | |
| | | | | | | 2,152,617 | |
|
New Zealand — 0.9% | |
Fisher & Paykel Healthcare Corp., Ltd. | | | 13,985 | | | | 347,138 | |
(See Notes to Schedules of Investments and Notes to Financial Statements, which are an integral part of the Financial Statements)
48
Disciplined International Equity Fund (continued)
| | | | | | | | |
| Description | | Shares | | | Value | |
| Common Stocks (continued) | |
| | |
Norway — 1.1% | | | | | | | | |
Telenor ASA | | | 26,019 | | | $ | 423,240 | |
| | |
Singapore — 3.6% | | | | | | | | |
DBS Group Holdings, Ltd. | | | 45,200 | | | | 693,340 | |
Singapore Exchange, Ltd. | | | 40,400 | | | | 255,664 | |
United Overseas Bank, Ltd. | | | 31,300 | | | | 449,986 | |
| | | | | | | | |
| | | | | | | 1,398,990 | |
|
Spain — 1.9% | |
Amadeus IT Group SA | | | 3,394 | | | | 189,996 | |
Endesa SA | | | 9,847 | | | | 272,974 | |
Industria de Diseno Textil SA | | | 7,467 | | | | 209,848 | |
Merlin Properties Socimi SA | | | 7,775 | | | | 69,773 | |
| | | | | | | | |
| | | | | | | 742,591 | |
|
Sweden — 1.7% | |
Boliden AB | | | 5,601 | | | | 166,998 | |
SKF AB, Class B | | | 24,191 | | | | 482,712 | |
| | | | | | | | |
| | | | | | | 649,710 | |
|
Switzerland — 13.3% | |
Credit Suisse Group AG | | | 40,803 | | | | 448,406 | |
Nestle SA | | | 8,078 | | | | 970,129 | |
Novartis AG | | | 11,584 | | | | 1,000,072 | |
Roche Holding AG | | | 3,842 | | | | 1,341,799 | |
Sonova Holding AG (1) | | | 2,677 | | | | 625,162 | |
TE Connectivity, Ltd. | | | 8,420 | | | | 813,372 | |
| | | | | | | | |
| | | | | | | 5,198,940 | |
|
United Kingdom — 9.4% | |
AstraZeneca PLC | | | 2,638 | | | | 294,097 | |
Avast PLC (5) | | | 81,542 | | | | 584,247 | |
Diageo PLC | | | 4,860 | | | | 163,032 | |
Dialog Semiconductor PLC (1) | | | 6,579 | | | | 284,915 | |
GlaxoSmithKline PLC | | | 50,662 | | | | 996,874 | |
Legal & General Group PLC | | | 62,862 | | | | 182,599 | |
Persimmon PLC | | | 5,257 | | | | 184,115 | |
Tate & Lyle PLC | | | 27,425 | | | | 249,950 | |
Unilever PLC | | | 8,139 | | | | 485,240 | |
United Utilities Group PLC | | | 22,921 | | | | 254,677 | |
| | | | | | | | |
| | | | | | | 3,679,746 | |
| | | | | | | | |
Total Common Stocks
(identified cost $33,520,676) | | | | 37,831,969 | |
| | | | | | | | |
| Short-Term Investments — 3.6% | |
|
| Collateral Investment for Securities on Loan — 1.3% | |
BMO Institutional Prime Money Market Fund — Premier Class, 0.130% (3)(4) | | | 532,390 | | | | 532,390 | |
| | |
| Mutual Funds — 2.3% | | | | | | |
BMO Institutional Prime Money Market Fund — Premier Class, 0.130% (4) | | | 885,091 | | | | 885,003 | |
| | | | | | | | |
Total Short-Term Investments
(identified cost $1,417,570) | | | | 1,417,393 | |
| | | | | | | | |
Total Investments — 100.5%
(identified cost $34,938,246) | | | | 39,249,362 | |
| Other Assets and Liabilities — (0.5)% | | | | (210,763 | ) |
| | | | | | | | |
| Total Net Assets — 100.0% | | | | | | $ | 39,038,599 | |
| | | | | | | | |
| | | | | | | | |
| Industry | | Value | | | % of
Total
Net Assets | |
Airlines | | $ | 358,147 | | | | 0.9 | % |
Auto Manufacturers | | | 556,347 | | | | 1.4 | |
Auto Parts & Equipment | | | 73,113 | | | | 0.2 | |
Banks | | | 3,174,304 | | | | 8.0 | |
Beverages | | | 800,417 | | | | 2.0 | |
Biotechnology | | | 632,840 | | | | 1.6 | |
Building Materials | | | 988,590 | | | | 2.5 | |
Chemicals | | | 270,887 | | | | 0.7 | |
Commercial Services | | | 189,996 | | | | 0.5 | |
Computers | | | 1,053,982 | | | | 2.7 | |
Cosmetics/Personal Care | | | 485,240 | | | | 1.2 | |
Diversified Financial Services | | | 860,412 | | | | 2.2 | |
Electric | | | 2,406,262 | | | | 6.1 | |
Electrical Components & Equipment | | | 190,554 | | | | 0.5 | |
Electronics | | | 813,372 | | | | 2.1 | |
Engineering & Construction | | | 1,489,958 | | | | 3.9 | |
Food | | | 2,869,178 | | | | 7.3 | |
Forest Products & Paper | | | 555,548 | | | | 1.4 | |
Healthcare-Products | | | 1,561,541 | | | | 4.0 | |
Healthcare-Services | | | 237,304 | | | | 0.6 | |
Home Builders | | | 606,703 | | | | 1.6 | |
Home Furnishings | | | 71,744 | | | | 0.2 | |
Insurance | | | 1,083,292 | | | | 2.8 | |
Machinery-Construction & Mining | | | 866,544 | | | | 2.2 | |
Machinery-Diversified | | | 107,629 | | | | 0.3 | |
Metal Fabricate/Hardware | | | 482,712 | | | | 1.3 | |
Mining | | | 2,235,016 | | | | 5.8 | |
Oil & Gas | | | 718,003 | | | | 1.8 | |
Pharmaceuticals | | | 4,545,653 | | | | 11.8 | |
Real Estate | | | 1,549,037 | | | | 4.0 | |
Real Estate Investment Trusts | | | 69,773 | | | | 0.2 | |
Retail | | | 1,211,408 | | | | 3.2 | |
Semiconductors | | | 1,002,039 | | | | 2.6 | |
Software | | | 244,196 | | | | 0.6 | |
Telecommunications | | | 2,646,551 | | | | 6.7 | |
Transportation | | | 326,112 | | | | 0.8 | |
Trucking & Leasing | | | 242,888 | | | | 0.6 | |
Water | | | 254,677 | | | | 0.6 | |
| | | | | | | | |
Total Common Stocks | | | 37,831,969 | | | | 96.9 | |
Collateral Investment for Securities on Loan | | | 532,390 | | | | 1.3 | |
Mutual Funds | | | 885,003 | | | | 2.3 | |
| | | | | | | | |
Total Investments | | | 39,249,362 | | | | 100.5 | |
Other Assets and Liabilities | | | (210,763 | ) | | | (0.5 | ) |
| | | | | | | | |
Net Assets | | $ | 39,038,599 | | | | 100.0 | % |
| | | | | | | | |
Pyrford International Stock Fund
| | | | | | | | |
| Description | | Shares | | | Value | |
| Common Stocks — 92.7% | | | | | | |
| | |
Australia — 11.3% | | | | | | | | |
Brambles, Ltd. | | | 1,846,257 | | | $ | 15,101,332 | |
Computershare, Ltd. (2) | | | 1,212,171 | | | | 11,881,750 | |
Newcrest Mining, Ltd. | | | 251,437 | | | | 5,926,899 | |
QBE Insurance Group, Ltd. | | | 1,402,107 | | | | 10,972,058 | |
Rio Tinto, Ltd. | | | 93,503 | | | | 6,758,389 | |
Woodside Petroleum, Ltd. | | | 809,796 | | | | 11,694,452 | |
Woolworths Group, Ltd. | | | 542,936 | | | | 15,965,644 | |
| | | | | | | | |
| | | | | | | 78,300,524 | |
| | |
Finland — 3.0% | | | | | | | | |
Kone OYJ, Class B | | | 123,122 | | | | 10,555,283 | |
Sampo OYJ, A Shares | | | 249,923 | | | | 10,059,826 | |
| | | | | | | | |
| | | | | | | 20,615,109 | |
(See Notes to Schedules of Investments and Notes to Financial Statements, which are an integral part of the Financial Statements)
49
August 31, 2020
Pyrford International Stock Fund (continued)
| | | | | | | | |
| Description | | Shares | | | Value | |
| Common Stocks (continued) | | | | | | |
| | |
France — 7.3% | | | | | | | | |
Air Liquide SA | | | 78,681 | | | $ | 13,055,959 | |
Bureau Veritas SA (1) | | | 412,922 | | | | 9,359,986 | |
Legrand SA | | | 91,430 | | | | 7,626,650 | |
Rubis SCA | | | 166,007 | | | | 7,840,975 | |
Sanofi | | | 128,531 | | | | 13,017,572 | |
| | | | | | | | |
| | | | | | | 50,901,142 | |
| | |
Germany — 7.4% | | | | | | | | |
Brenntag AG | | | 183,987 | | | | 11,518,166 | |
Deutsche Post AG | | | 240,450 | | | | 10,938,193 | |
Fielmann AG (1) | | | 108,564 | | | | 7,896,369 | |
GEA Group AG | | | 214,589 | | | | 7,825,799 | |
SAP SE | | | 81,898 | | | | 13,491,062 | |
| | | | | | | | |
| | | | | | | 51,669,589 | |
| | |
Hong Kong — 4.2% | | | | | | | | |
AIA Group, Ltd. | | | 712,800 | | | | 7,339,351 | |
China Mobile, Ltd. | | | 1,267,500 | | | | 8,855,917 | |
Power Assets Holdings, Ltd. | | | 1,217,569 | | | | 6,975,312 | |
VTech Holdings, Ltd. | | | 1,073,100 | | | | 6,258,435 | |
| | | | | | | | |
| | | | | | | 29,429,015 | |
| | |
Indonesia — 1.0% | | | | | | | | |
Bank Rakyat Indonesia Persero Tbk PT | | | 14,525,200 | | | | 3,501,010 | |
Telekomunikasi Indonesia Persero Tbk PT | | | 15,651,400 | | | | 3,073,854 | |
| | | | | | | | |
| | | | | | | 6,574,864 | |
| | |
Japan — 13.0% | | | | | | | | |
ABC-Mart, Inc. | | | 171,400 | | | | 9,029,996 | |
Japan Tobacco, Inc. | | | 1,134,568 | | | | 21,236,662 | |
KDDI Corp. | | | 476,800 | | | | 13,856,304 | |
Mitsubishi Electric Corp. | | | 1,070,800 | | | | 14,790,921 | |
Nabtesco Corp. | | | 181,100 | | | | 5,736,586 | |
Nihon Kohden Corp. | | | 338,500 | | | | 11,585,351 | |
Sumitomo Rubber Industries, Ltd. | | | 964,000 | | | | 9,292,772 | |
Toyota Tsusho Corp. | | | 162,500 | | | | 4,740,830 | |
| | | | | | | | |
| | | | | | | 90,269,422 | |
| | |
Malaysia — 2.5% | | | | | | | | |
Axiata Group Bhd | | | 7,240,267 | | | | 5,231,834 | |
Malayan Banking Bhd | | | 6,750,277 | | | | 11,878,413 | |
| | | | | | | | |
| | | | | | | 17,110,247 | |
| | |
Netherlands — 3.4% | | | | | | | | |
Koninklijke Vopak NV | | | 178,849 | | | | 9,822,025 | |
Unilever NV | | | 235,740 | | | | 13,646,851 | |
| | | | | | | | |
| | | | | | | 23,468,876 | |
| | |
Norway — 1.8% | | | | | | | | |
Telenor ASA | | | 787,898 | | | | 12,816,409 | |
| | |
Singapore — 4.7% | | | | | | | | |
ComfortDelGro Corp., Ltd. | | | 8,450,900 | | | | 9,192,850 | |
Singapore Technologies Engineering, Ltd. | | | 1,903,500 | | | | 4,756,826 | |
Singapore Telecommunications, Ltd. | | | 5,555,200 | | | | 9,391,026 | |
United Overseas Bank, Ltd. | | | 662,202 | | | | 9,520,173 | |
| | | | | | | | |
| | | | | | | 32,860,875 | |
| | |
Sweden — 1.4% | | | | | | | | |
Assa Abloy AB, Class B | | | 129,878 | | | | 3,003,029 | |
Atlas Copco AB, A Shares (2) | | | 64,330 | | | | 2,974,123 | |
Essity AB, Class B (1) | | | 117,155 | | | | 4,030,767 | |
| | | | | | | | |
| | | | | | | 10,007,919 | |
| | | | | | | | |
| Description | | Shares | | | Value | |
| Common Stocks (continued) | | | | | | |
| | |
Switzerland — 11.0% | | | | | | | | |
Geberit AG | | | 6,636 | | | $ | 3,821,784 | |
Givaudan SA | | | 1,048 | | | | 4,393,960 | |
Nestle SA | | | 160,136 | | | | 19,231,555 | |
Novartis AG | | | 183,406 | | | | 15,833,845 | |
Roche Holding AG | | | 48,734 | | | | 17,020,105 | |
Schindler Holding AG | | | 14,958 | | | | 3,989,572 | |
SGS SA | | | 1,599 | | | | 4,135,695 | |
Zurich Insurance Group AG | | | 21,862 | | | | 8,077,779 | |
| | | | | | | | |
| | | | | | | 76,504,295 | |
| | |
Taiwan — 3.8% | | | | | | | | |
Advantech Co., Ltd. | | | 564,359 | | | | 5,837,567 | |
Chunghwa Telecom Co., Ltd. | | | 2,353,000 | | | | 8,701,004 | |
Merida Industry Co., Ltd. | | | 149,000 | | | | 1,244,142 | |
Taiwan Semiconductor Manufacturing Co., Ltd. | | | 725,000 | | | | 10,538,401 | |
| | | | | | | | |
| | | | | | | 26,321,114 | |
|
United Kingdom — 16.9% | |
BP PLC | | | 2,091,990 | | | | 7,388,268 | |
British American Tobacco PLC | | | 352,952 | | | | 11,948,553 | |
Bunzl PLC | | | 238,511 | | | | 7,722,053 | |
GlaxoSmithKline PLC | | | 659,447 | | | | 12,975,913 | |
IMI PLC | | | 465,431 | | | | 6,563,840 | |
Imperial Brands PLC | | | 492,171 | | | | 8,243,608 | |
Legal & General Group PLC | | | 4,844,768 | | | | 14,072,878 | |
National Grid PLC | | | 1,089,063 | | | | 12,275,348 | |
Reckitt Benckiser Group PLC | | | 104,832 | | | | 10,524,077 | |
Royal Dutch Shell PLC, A Shares | | | 541,097 | | | | 8,058,563 | |
Royal Dutch Shell PLC, B Shares | | | 506,099 | | | | 7,191,491 | |
Vodafone Group PLC | | | 6,823,203 | | | | 10,164,350 | |
| | | | | | | | |
| | | | | | | 117,128,942 | |
| | | | | | | | |
Total Common Stocks
(identified cost $578,880,258) | | | | 643,978,342 | |
| | | | | | | | |
| Preferred Stocks — 1.7% | |
| | |
Germany — 1.7% | | | | | | | | |
Fuchs Petrolub SE | | | 255,305 | | | | 12,070,957 | |
| | | | | | | | |
Total Preferred Stocks
(identified cost $9,273,334) | | | | | | | 12,070,957 | |
| | | | | | | | |
| Short-Term Investments — 7.0% | |
|
| Collateral Investment for Securities on Loan — 2.6% | |
| | |
BMO Institutional Prime Money Market Fund — Premier Class,
0.130% (3)(4) | | | 17,734,286 | | | | 17,734,286 | |
| | |
| Mutual Funds — 4.4% | | | | | | |
BMO Institutional Prime Money Market Fund — Premier Class, 0.130% (4) | | | 30,798,044 | | | | 30,794,964 | |
| | | | | | | | |
Total Short-Term Investments
(identified cost $48,527,639) | | | | | | | 48,529,250 | |
| | | | | | | | |
Total Investments — 101.4%
(identified cost $636,681,231) | | | | | | | 704,578,549 | |
| Other Assets and Liabilities — (1.4)% | | | | (9,591,209 | ) |
| | | | | | | | |
| Total Net Assets — 100.0% | | | | | | $ | 694,987,340 | |
| | | | | | | | |
(See Notes to Schedules of Investments and Notes to Financial Statements, which are an integral part of the Financial Statements)
50
Pyrford International Stock Fund (continued)
| | | | | | | | |
| Industry | | Value | | | % of
Total
Net Assets | |
Agriculture | | $ | 41,428,823 | | | | 6.0 | % |
Auto Parts & Equipment | | | 9,292,772 | | | | 1.3 | |
Banks | | | 24,899,596 | | | | 3.6 | |
Building Materials | | | 3,821,784 | | | | 0.5 | |
Chemicals | | | 28,968,085 | | | | 4.2 | |
Commercial Services | | | 28,597,013 | | | | 4.1 | |
Computers | | | 17,719,317 | | | | 2.5 | |
Cosmetics/Personal Care | | | 17,677,618 | | | | 2.6 | |
Distribution/Wholesale | | | 12,462,883 | | | | 1.8 | |
Electric | | | 6,975,312 | | | | 1.0 | |
Electrical Components & Equipment | | | 7,626,650 | | | | 1.1 | |
Electronics | | | 3,003,029 | | | | 0.4 | |
Engineering & Construction | | | 4,756,826 | | | | 0.7 | |
Food | | | 35,197,199 | | | | 5.1 | |
Gas | | | 20,116,323 | | | | 2.9 | |
Hand/Machine Tools | | | 3,989,572 | | | | 0.6 | |
Healthcare-Products | | | 11,585,351 | | | | 1.7 | |
Home Furnishings | | | 6,258,435 | | | | 0.9 | |
Household Products/Wares | | | 10,524,077 | | | | 1.5 | |
Insurance | | �� | 50,521,892 | | | | 7.3 | |
Leisure Time | | | 1,244,142 | | | | 0.2 | |
Machinery-Construction & Mining | | | 17,765,044 | | | | 2.5 | |
Machinery-Diversified | | | 24,117,668 | | | | 3.4 | |
Mining | | | 12,685,288 | | | | 1.8 | |
Miscellaneous Manufacturing | | | 6,563,840 | | | | 0.9 | |
Oil & Gas | | | 34,332,774 | | | | 5.0 | |
Pharmaceuticals | | | 58,847,435 | | | | 8.5 | |
Pipelines | | | 9,822,025 | | | | 1.4 | |
Retail | | | 16,926,365 | | | | 2.4 | |
Semiconductors | | | 10,538,401 | | | | 1.5 | |
Software | | | 13,491,062 | | | | 1.9 | |
Telecommunications | | | 72,090,698 | | | | 10.5 | |
Transportation | | | 20,131,043 | | | | 2.9 | |
| | | | | | | | |
Total Common Stocks | | | 643,978,342 | | | | 92.7 | |
Preferred Stocks | | | 12,070,957 | | | | 1.7 | |
Collateral Investment for Securities on Loan | | | 17,734,286 | | | | 2.6 | |
Mutual Funds | | | 30,794,964 | | | | 4.4 | |
| | | | | | | | |
Total Investments | | | 704,578,549 | | | | 101.4 | |
Other Assets and Liabilities | | | (9,591,209 | ) | | | (1.4 | ) |
| | | | | | | | |
Net Assets | | $ | 694,987,340 | | | | 100.0 | % |
| | | | | | | | |
LGM Emerging Markets Equity Fund
| | | | | | | | |
| Description | | Shares | | | Value | |
| Common Stocks — 93.6% | |
|
Brazil — 2.4% | |
Raia Drogasil SA | | | 315,400 | | | $ | 6,206,100 | |
|
Cayman Islands — 4.4% | |
Tencent Holdings, Ltd. | | | 165,500 | | | | 11,328,450 | |
|
China — 12.8% | |
ANTA Sports Products, Ltd. | | | 841,000 | | | | 8,306,695 | |
Inner Mongolia Yili Industrial Group Co., Ltd., Class A | | | 2,149,852 | | | | 13,153,527 | |
Sinopharm Group Co., Ltd., Class H | | | 1,017,600 | | | | 2,505,201 | |
Tingyi Cayman Islands Holding Corp. | | | 2,618,000 | | | | 4,918,335 | |
Zhejiang Supor Co., Ltd., Class A | | | 364,200 | | | | 4,502,823 | |
| | | | | | | | |
| | | | | | | 33,386,581 | |
| | | | | | | | |
| Description | | Shares | | | Value | |
| Common Stocks (continued) | |
|
Egypt — 1.6% | |
Commercial International Bank Egypt SAE, GDR | | | 962,627 | | | $ | 4,110,417 | |
|
Hong Kong — 9.0% | |
AIA Group, Ltd. | | | 986,200 | | | | 10,154,417 | |
Hong Kong Exchanges & Clearing, Ltd. | | | 207,000 | | | | 10,448,556 | |
Vitasoy International Holdings, Ltd. | | | 780,000 | | | | 2,777,735 | |
| | | | | | | | |
| | | | | | | 23,380,708 | |
|
India — 22.2% | |
Colgate-Palmolive India, Ltd. | | | 421,044 | | | | 7,793,096 | |
HDFC Bank, Ltd. | | | 921,137 | | | | 13,911,381 | |
Infosys, Ltd. | | | 668,044 | | | | 8,346,976 | |
Marico, Ltd. | | | 550,240 | | | | 2,752,789 | |
Maruti Suzuki India, Ltd. | | | 52,413 | | | | 4,853,013 | |
Nestle India, Ltd. | | | 17,624 | | | | 3,829,717 | |
Reliance Industries, Ltd. | | | 219,426 | | | | 6,170,728 | |
Tata Consultancy Services, Ltd. | | | 325,745 | | | | 9,939,299 | |
| | | | | | | | |
| | | | | | | 57,596,999 | |
|
Indonesia — 3.7% | |
Bank Mandiri Persero Tbk PT | | | 23,843,308 | | | | 9,741,987 | |
|
Jersey — 3.0% | |
Wizz Air Holdings PLC (1)(5) | | | 147,836 | | | | 7,683,457 | |
|
Mexico — 3.8% | |
Wal-Mart de Mexico SAB de C.V. | | | 4,120,089 | | | | 9,866,222 | |
|
Netherlands — 2.6% | |
Prosus NV (1) | | | 66,655 | | | | 6,668,865 | |
|
Nigeria — 1.2% | |
Guaranty Trust Bank PLC | | | 48,352,103 | | | | 3,198,388 | |
|
Portugal — 1.8% | |
Jeronimo Martins SGPS SA | | | 292,644 | | | | 4,803,614 | |
|
Russia — 5.1% | |
Magnit PJSC, GDR | | | 369,885 | | | | 5,426,213 | |
Moscow Exchange MICEX-RTS PJSC | | | 4,229,600 | | | | 7,814,246 | |
| | | | | | | | |
| | | | | | | 13,240,459 | |
|
South Africa — 6.0% | |
Clicks Group, Ltd. | | | 573,712 | | | | 7,784,308 | |
Discovery, Ltd. | | | 1,085,987 | | | | 7,753,824 | |
| | | | | | | | |
| | | | | | | 15,538,132 | |
|
Taiwan — 6.5% | |
Taiwan Semiconductor Manufacturing Co., Ltd. | | | 1,155,000 | | | | 16,788,763 | |
|
United Kingdom — 2.6% | |
Unilever PLC | | | 115,632 | | | | 6,893,870 | |
|
United States — 2.2% | |
Western Union Co. | | | 237,525 | | | | 5,603,215 | |
|
Vietnam — 2.7% | |
Vietnam Dairy Products JSC | | | 1,368,611 | | | | 7,145,714 | |
| | | | | | | | |
Total Common Stocks
(identified cost $197,055,278) | | | | | | | 243,181,941 | |
| | | | | | | | |
| Common Stock Units — 2.2% | |
|
Mexico — 2.2% | |
Fomento Economico Mexicano SAB de C.V., | | | 971,600 | | | | 5,650,572 | |
| | | | | | | | |
Total Common Stock Units
(identified cost $8,477,861) | | | | | | | 5,650,572 | |
| | | | | | | | |
(See Notes to Schedules of Investments and Notes to Financial Statements, which are an integral part of the Financial Statements)
51
August 31, 2020
LGM Emerging Markets Equity Fund (continued)
| | | | | | | | |
| Description | | Shares | | | Value | |
| Short-Term Investments — 2.3% | |
|
| Mutual Funds — 2.3% | |
BMO Institutional Prime Money Market Fund — Premier Class, 0.130% (4) | | | 5,951,160 | | | $ | 5,950,565 | |
| | | | | | | | |
Total Short-Term Investments
(identified cost $5,951,755) | | | | | | | 5,950,565 | |
| | | | | | | | |
Total Investments — 98.1%
(identified cost $211,484,894) | | | | | | | 254,783,078 | |
| Other Assets and Liabilities — 1.9% | | | | 4,908,778 | |
| | | | | | | | |
| Total Net Assets — 100.0% | | | | | | $ | 259,691,856 | |
| | | | | | | | |
| | | | | | | | |
| Industry | | Value | | | % of
Total
Net Assets | |
Airlines | | $ | 7,683,457 | | | | 3.0 | % |
Auto Manufacturers | | | 4,853,013 | | | | 1.9 | |
Banks | | | 30,962,173 | | | | 11.8 | |
Beverages | | | 2,777,735 | | | | 1.1 | |
Computers | | | 18,286,275 | | | | 7.0 | |
Cosmetics/Personal Care | | | 14,686,966 | | | | 5.6 | |
Diversified Financial Services | | | 23,866,017 | | | | 9.2 | |
Food | | | 42,029,909 | | | | 16.2 | |
Housewares | | | 4,502,823 | | | | 1.7 | |
Insurance | | | 17,908,241 | | | | 6.9 | |
Internet | | | 17,997,315 | | | | 7.0 | |
Oil & Gas | | | 6,170,728 | | | | 2.4 | |
Pharmaceuticals | | | 2,505,201 | | | | 0.9 | |
Retail | | | 32,163,325 | | | | 12.4 | |
Semiconductors | | | 16,788,763 | | | | 6.5 | |
| | | | | | | | |
Total Common Stocks | | | 243,181,941 | | | | 93.6 | |
Common Stock Units | | | 5,650,572 | | | | 2.2 | |
Mutual Funds | | | 5,950,565 | | | | 2.3 | |
| | | | | | | | |
Total Investments | | | 254,783,078 | | | | 98.1 | |
Other Assets and Liabilities | | | 4,908,778 | | | | 1.9 | |
| | | | | | | | |
Net Assets | | $ | 259,691,856 | | | | 100.0 | % |
| | | | | | | | |
Ultra Short Tax–Free Fund*
| | | | | | | | |
| Description | | Principal
Amount | | | Value | |
| Municipals — 94.4% | |
|
Alabama — 2.0% | |
Black Belt Energy Gas District, 1.015%, (LIBOR 1 Month),
12/01/2048, Call 9/1/2023 (6) | | $ | 4,500,000 | | | $ | 4,483,260 | |
Other Securities | | | 5,950,000 | | | | 6,159,127 | |
| | | | | | | | |
| | | | | | | 10,642,387 | |
|
Arizona — 1.0% | |
Other Securities | | | 5,175,000 | | | | 5,181,165 | |
|
California — 3.4% | |
California Pollution Control Financing Authority,
0.600%, 8/01/2040 | | | 3,700,000 | | | | 3,691,897 | |
Tender Option Bond Trust Receipts/Certificates | | | | | | | | |
0.190%, 11/15/2049,
Call 11/15/2026 (5)(6) | | | 3,750,000 | | | | 3,750,000 | |
0.240%, 12/01/2030 (5)(6) | | | 3,855,000 | | | | 3,855,000 | |
| | | | | | | | |
| Description | | Principal
Amount | | | Value | |
| Municipals (continued) | |
|
California (continued) | |
Other Securities | | $ | 7,050,000 | | | $ | 7,083,470 | |
| | | | | | | | |
| | | | | | | 18,380,367 | |
|
Colorado — 1.7% | |
Tender Option Bond Trust Receipts/Certificates,
0.530%, 2/01/2021 (5)(6) | | | 5,000,000 | | | | 5,000,000 | |
Other Securities | | | 4,010,000 | | | | 4,066,998 | |
| | | | | | | | |
| | | | | | | 9,066,998 | |
|
Connecticut — 1.4% | |
Town of Windham,
3.000%, 10/01/2020 | | | 4,000,000 | | | | 4,007,480 | |
Other Securities | | | 3,035,000 | | | | 3,292,944 | |
| | | | | | | | |
| | | | | | | 7,300,424 | |
|
District of Columbia — 0.5% | |
Other Securities | | | 2,860,000 | | | | 2,866,047 | |
|
Florida — 6.5% | |
County of Escambia,
0.220%, 4/01/2039, Call 8/31/2020 (6) | | | 5,900,000 | | | | 5,900,000 | |
Florida Development Finance Corp., 0.550%, 1/01/2049, Call 10/1/2020 (6) | | | 10,000,000 | | | | 9,999,600 | |
Tender Option Bond Trust Receipts/Certificates,
0.390%, 4/01/2053, Call 4/1/2028 (5)(6) | | | 8,000,000 | | | | 8,000,000 | |
Other Securities | | | 10,815,000 | | | | 10,835,734 | |
| | | | | | | | |
| | | | | | | 34,735,334 | |
|
Georgia — 4.7% | |
Burke County Development Authority,
2.250%, 10/01/2032 (6) | | | 4,000,000 | | | | 4,119,520 | |
Main Street Natural Gas, Inc. | | | | | | | | |
0.730%, (SIFMA Municipal Swap Index Yield), 8/01/2048, Call 9/1/2023 (6) | | | 5,000,000 | | | | 4,990,200 | |
0.865%, (LIBOR 1 Month), 4/01/2048, Call 6/1/2023 (6) | | | 5,000,000 | | | | 4,994,250 | |
Other Securities | | | 10,805,000 | | | | 10,989,873 | |
| | | | | | | | |
| | | | | | | 25,093,843 | |
|
Idaho — 0.8% | |
Idaho Housing & Finance Association,
0.280%, 1/01/2038, Call 9/1/2020 (6) | | | 4,490,000 | | | | 4,490,000 | |
Other Securities | | | | | | | | |
|
Illinois — 10.1% | |
Chicago Park District,
5.000%, 1/01/2023 | | | 4,780,000 | | | | 5,152,219 | |
Illinois Development Finance Authority,
1.600%, 11/01/2044, Call 10/1/2020 (6) | | | 5,000,000 | | | | 5,008,800 | |
State of Illinois | | | | | | | | |
5.000%, 11/01/2021 | | | 7,000,000 | | | | 7,259,980 | |
5.000%, 2/01/2022 | | | 6,040,000 | | | | 6,328,470 | |
Other Securities | | | 29,455,000 | | | | 30,445,533 | |
| | | | | | | | |
| | | | | | | 54,195,002 | |
(See Notes to Schedules of Investments and Notes to Financial Statements, which are an integral part of the Financial Statements)
52
Ultra Short Tax–Free Fund* (continued)
| | | | | | | | |
| Description | | Principal
Amount | | | Value | |
| Municipals (continued) | |
|
Indiana — 3.4% | |
Indianapolis Local Public Improvement Bond Bank,
1.450%, 6/01/2021, Call 10/1/2020 | | $ | 3,750,000 | | | $ | 3,750,150 | |
Other Securities | | | 14,055,000 | | | | 14,276,884 | |
| | | | | | | | |
| | | | | | | 18,027,034 | |
|
Iowa — 1.9% | |
Iowa Finance Authority, 0.735%, (SIFMA Municipal Swap Index Yield), 2/15/2035, Call 3/20/2021 (5)(6) | | | 3,995,000 | | | | 3,968,313 | |
Other Securities | | | 6,000,000 | | | | 6,082,470 | |
| | | | | | | | |
| | | | | | | 10,050,783 | |
|
Kansas — 1.5% | |
Other Securities | | | 7,835,000 | | | | 7,855,343 | |
|
Kentucky — 7.8% | |
County of Carroll,
1.200%, 10/01/2034 (6) | | | 5,000,000 | | | | 5,000,550 | |
Kentucky Economic Development Finance Authority,
0.250%, 5/01/2034, Call 8/31/2020 | | | 9,735,000 | | | | 9,735,000 | |
Kentucky Public Energy Authority, 1.235%, (LIBOR 1 Month), 12/01/2049, Call 3/1/2025 (6) | | | 5,000,000 | | | | 5,009,850 | |
Kentucky Rural Water Finance Corp. | | | | | | | | |
1.250%, 2/01/2022, Call 2/1/2021 | | | 6,770,000 | | | | 6,783,405 | |
1.450%, 6/01/2021, Call 12/1/2020 | | | 5,500,000 | | | | 5,514,630 | |
Other Securities | | | 9,560,000 | | | | 9,634,768 | |
| | | | | | | | |
| | | | | | | 41,678,203 | |
|
Louisiana — 1.2% | |
Louisiana Public Facilities Authority, 0.810%, (SIFMA Municipal Swap Index Yield), 9/01/2057, Call 3/1/2023 (6) | | | 5,000,000 | | | | 4,960,600 | |
Other Securities | | | 1,400,000 | | | | 1,447,264 | |
| | | | | | | | |
| | | | | | | 6,407,864 | |
|
Maryland — 0.8% | |
Maryland Economic Development Corp.,
1.700%, 9/01/2022 | | | 4,000,000 | | | | 4,087,240 | |
Other Securities | | | | | | | | |
|
Massachusetts — 0.1% | |
Other Securities | | | 550,000 | | | | 562,788 | |
|
Michigan — 3.0% | |
Tender Option Bond Trust Receipts/Certificates, Q-SBLF,
0.190%, 5/01/2028 (5)(6) | | | 11,335,000 | | | | 11,335,000 | |
Other Securities | | | 4,475,000 | | | | 4,671,681 | |
| | | | | | | | |
| | | | | | | 16,006,681 | |
|
Mississippi — 2.2% | |
Other Securities | | | 11,085,000 | | | | 11,794,556 | |
| | | | | | | | |
| Description | | Principal
Amount | | | Value | |
| Municipals (continued) | |
|
Missouri — 1.3% | |
Other Securities | | $ | 7,040,000 | | | $ | 7,070,318 | |
|
Nebraska — 0.4% | |
Other Securities | | | 2,000,000 | | | | 2,100,850 | |
|
New Jersey — 1.6% | |
Other Securities | | | 8,530,000 | | | | 8,804,843 | |
|
New Mexico — 0.6% | |
Other Securities | | | 3,275,000 | | | | 3,226,590 | |
|
New York — 9.1% | |
County of Suffolk,
2.000%, 9/25/2020 | | | 4,000,000 | | | | 4,003,000 | |
Hempstead Union Free School District, SAW,
1.500%, 6/30/2021 | | | 4,000,000 | | | | 4,022,440 | |
Long Island Power Authority,
0.870%, (LIBOR 1 Month), 5/01/2033, Call 10/1/2022 (6) | | | 4,000,000 | | | | 3,988,280 | |
Metropolitan Transportation Authority, 5.000%, 9/01/2022 | | | 6,000,000 | | | | 6,266,160 | |
Tender Option Bond Trust Receipts/Certificates,
0.240%, 8/01/2021 (5)(6) | | | 5,335,000 | | | | 5,335,000 | |
Triborough Bridge & Tunnel Authority, 0.815%, (LIBOR 1 Month), 1/01/2032 (6) | | | 4,845,000 | | | | 4,848,052 | |
Other Securities | | | 20,415,000 | | | | 20,587,705 | |
| | | | | | | | |
| | | | | | | 49,050,637 | |
|
North Dakota — 0.1% | |
Other Security | | | 750,000 | | | | 777,495 | |
|
Ohio — 3.2% | |
Port of Greater Cincinnati Development Authority,
3.000%, 5/01/2023, Call 5/1/2022 | | | 6,000,000 | | | | 6,013,080 | |
Other Securities | | | 10,965,000 | | | | 11,280,680 | |
| | | | | | | | |
| | | | | | | 17,293,760 | |
|
Oklahoma — 1.4% | |
Oklahoma Development Finance Authority, 1.625%, 7/06/2023, Call 6/30/2022 | | | 4,400,000 | | | | 4,393,400 | |
Other Securities | | | 2,900,000 | | | | 2,926,898 | |
| | | | | | | | |
| | | | | | | 7,320,298 | |
|
Pennsylvania — 5.3% | |
Pennsylvania Economic Development Financing Authority,
1.700%, 8/01/2037 (6) | | | 5,000,000 | | | | 5,004,100 | |
Tender Option Bond Trust Receipts/Certificates,
0.420%, 12/01/2024 (5)(6) | | | 6,910,000 | | | | 6,910,000 | |
Other Securities | | | 16,685,000 | | | | 16,798,938 | |
| | | | | | | | |
| | | | | | | 28,713,038 | |
|
South Carolina — 1.4% | |
Patriots Energy Group Financing Agency, 0.975%, (LIBOR 1 Month), 10/01/2048, Call 11/1/2023 (6) | | | 6,000,000 | | | | 6,006,960 | |
Other Security | | | 1,500,000 | | | | 1,500,000 | |
| | | | | | | | |
| | | | | | | 7,506,960 | |
(See Notes to Schedules of Investments and Notes to Financial Statements, which are an integral part of the Financial Statements)
53
August 31, 2020
Ultra Short Tax–Free Fund* (continued)
| | | | | | | | |
| Description | | Shares or
Principal
Amount | | | Value | |
| Municipals (continued) | |
|
Tennessee — 1.1% | |
Tennessee Energy Acquisition Corp., 5.250%, 9/01/2020 | | $ | 4,720,000 | | | $ | 4,720,000 | |
Other Security | | | 1,195,000 | | | | 1,195,000 | |
| | | | | | | | |
| | | | | | | 5,915,000 | |
|
Texas — 3.8% | |
Mission Economic Development Corp.,
1.500%, 5/01/2050 (6) | | | 10,000,000 | | | | 9,999,300 | |
Other Securities | | | 10,600,000 | | | | 10,675,306 | |
| | | | | | | | |
| | | | | | | 20,674,606 | |
|
Virginia — 2.1% | |
Hampton Redevelopment & Housing Authority,
1.460%, 12/01/2022, Call 12/1/2021 (6) | | | 4,000,000 | | | | 4,050,520 | |
Westmoreland County Industrial Development Authority, 2.000%, 6/01/2022, Call 12/1/2021 | | | 4,300,000 | | | | 4,393,654 | |
Other Securities | | | 2,900,000 | | | | 2,901,894 | |
| | | | | | | | |
| | | | | | | 11,346,068 | |
|
Washington — 1.8% | |
Tender Option Bond Trust Receipts/Certificates,
0.560%, 7/01/2026 (5)(6) | | | 7,500,000 | | | | 7,500,000 | |
Other Securities | | | 2,345,000 | | | | 2,363,344 | |
| | | | | | | | |
| | | | | | | 9,863,344 | |
|
West Virginia — 2.8% | |
County of Harrison,
3.000%, 10/15/2037 (6) | | | 5,000,000 | | | | 5,110,850 | |
West Virginia Hospital Finance Authority, 0.560%, 6/01/2033, Call 9/1/2020 (6) | | | 8,495,000 | | | | 8,495,000 | |
Other Securities | | | 1,360,000 | | | | 1,389,765 | |
| | | | | | | | |
| | | | | | | 14,995,615 | |
|
Wisconsin — 4.4% | |
Wisconsin Health & Educational Facilities Authority, 0.750%, 2/15/2053, Call 9/1/2020 (6) | | | 12,750,000 | | | | 12,750,000 | |
Other Securities | | | 10,800,000 | | | | 10,912,060 | |
| | | | | | | | |
| | | | | | | 23,662,060 | |
| | | | | | | | |
Total Municipals
(identified cost $504,771,865) | | | | 506,743,541 | |
| | | | | | | | |
|
| Mutual Funds — 3.8% | |
Nuveen New York AMT-Free Municipal Credit Income Fund | | | | | | | | |
0.920%, Call 8/31/2020 | | | 40,000 | | | | 4,000,000 | |
0.920%, 3/01/2029 | | | 11,320,000 | | | | 11,320,000 | |
Nuveen New York AMT-Free Quality Municipal Income Fund, 0.920% | | | 5,000,000 | | | | 5,000,000 | |
| | | | | | | | |
Total Mutual Funds
(identified cost $20,320,000) | | | | | | | 20,320,000 | |
| | | | | | | | |
| | | | | | | | |
| Description | | Principal
Amount | | | Value | |
| Short-Term Investments — 1.3% | |
|
| Repurchase Agreements — 1.3% | |
Agreement with Fixed Income Clearing Corp., 0.080%, dated 8/31/2020, to be repurchased at $6,725,364 on 9/1/2020, collateralized by U.S. Government Treasury Obligation with a maturity of 8/31/2022, with a fair value of $6,859,927 | | $ | 6,725,349 | | | $ | 6,725,349 | |
| | | | | | | | |
Total Short-Term Investments
(identified cost $6,725,349) | | | | | | | 6,725,349 | |
| | | | | | | | |
Total Investments — 99.5%
(identified cost $531,817,214) | | | | | | | 533,788,890 | |
| Other Assets — 0.5% | | | | | | | 2,814,144 | |
| | | | | | | | |
| Net Assets — 100.0% | | | | | | $ | 536,603,034 | |
| | | | | | | | |
Short Tax-Free Fund*
| | | | | | | | |
| Description | | Principal
Amount | | | Value | |
| Municipals — 99.3% | |
|
Alabama — 3.5% | |
Black Belt Energy Gas District | | | | | | | | |
4.000%, 6/01/2023 | | $ | 1,000,000 | | | $ | 1,091,750 | |
4.000%, 7/01/2046, Call 3/1/2021 (6) | | | 1,000,000 | | | | 1,023,250 | |
Other Securities | | | 2,275,000 | | | | 2,368,780 | |
| | | | | | | | |
| | | | | | | 4,483,780 | |
|
Alaska — 1.6% | |
Alaska Housing Finance Corp., 3.250%, 12/01/2044, Call 6/1/2029 | | | 1,000,000 | | | | 1,106,970 | |
Alaska Industrial Development & Export Authority, 3.500%, 12/01/2020, Call 10/1/2020 | | | 1,000,000 | | | | 1,002,700 | |
| | | | | | | | |
| | | | | | | 2,109,670 | |
|
Arizona — 0.3% | |
Other Securities | | | 435,000 | | | | 440,725 | |
|
Arkansas — 0.2% | |
Other Security | | | 245,000 | | | | 247,886 | |
|
California — 5.9% | |
California Municipal Finance Authority, 5.000%, 2/01/2022 | | | 1,000,000 | | | | 1,059,650 | |
Golden State Tobacco Securitization Corp., 5.000%, 6/01/2022 | | | 1,000,000 | | | | 1,077,810 | |
Tender Option Bond Trust Receipts/Certificates, 0.240%, 12/01/2030 | | | 1,500,000 | | | | 1,500,000 | |
Other Securities | | | 3,660,000 | | | | 3,848,924 | |
| | | | | | | | |
| | | | | | | 7,486,384 | |
|
Colorado — 3.3% | |
Colorado Educational & Cultural Facilities Authority, 5.000%, 10/01/2021 | | | 1,000,000 | | | | 1,032,550 | |
Colorado Health Facilities Authority, 5.000%, 8/01/2049, Call 2/1/2025 (6) | | | 1,000,000 | | | | 1,154,060 | |
(See Notes to Schedules of Investments and Notes to Financial Statements, which are an integral part of the Financial Statements)
54
Short Tax-Free Fund* (continued)
| | | | | | | | |
| Description | | Principal
Amount | | | Value | |
| Municipals (continued) | |
|
Colorado (continued) | |
Other Securities | | $ | 1,950,000 | | | $ | 2,011,380 | |
| | | | | | | | |
| | | | | | | 4,197,990 | |
|
Connecticut — 2.2% | |
City of New Haven, AGM, 5.000%, 8/01/2024 | | | 1,000,000 | | | | 1,146,430 | |
State of Connecticut, 5.000%, 4/15/2023 | | | 1,000,000 | | | | 1,122,480 | |
Other Security | | | 500,000 | | | | 512,745 | |
| | | | | | | | |
| | | | | | | 2,781,655 | |
|
District of Columbia — 0.9% | |
Metropolitan Washington Airports Authority, 5.000%, 10/01/2024 | | | 1,000,000 | | | | 1,169,990 | |
|
Florida — 6.3% | |
City of Atlantic Beach, 3.250%, 11/15/2024, Call 11/15/2020 | | | 1,155,000 | | | | 1,157,183 | |
County of Okeechobee, 1.550%, 7/01/2039 (6) | | | 1,000,000 | | | | 1,010,110 | |
JEA Water & Sewer System Revenue, 0.030%, 10/01/2038, Call 8/31/2020 | | | 1,300,000 | | | | 1,300,000 | |
JPMorgan Chase Putters/Drivers Trust, 0.420%, 2/16/2022, Call 8/18/2021 (5)(6) | | | 1,000,000 | | | | 1,000,000 | |
Other Securities | | | 3,460,000 | | | | 3,534,002 | |
| | | | | | | | |
| | | | | | | 8,001,295 | |
|
Georgia — 6.8% | |
Burke County Development Authority, 2.925%, 11/01/2048 (6) | | | 1,250,000 | | | | 1,333,200 | |
Main Street Natural Gas, Inc. | | | | | | | | |
0.865%, (LIBOR 1 Month), 4/01/2048, Call 6/1/2023 (6) | | | 1,500,000 | | | | 1,498,275 | |
5.000%, 5/15/2024 | | | 1,250,000 | | | | 1,418,812 | |
Other Securities | | | 4,275,000 | | | | 4,434,183 | |
| | | | | | | | |
| | | | | | | 8,684,470 | |
|
Guam — 0.4% | |
Other Security | | | 500,000 | | | | 533,355 | |
|
Illinois — 17.4% | |
Chicago Housing Authority, HUD SEC 8, 5.000%, 1/01/2023 | | | 1,000,000 | | | | 1,092,810 | |
City of Chicago Waterworks Revenue, 5.000%, 11/01/2021 | | | 1,445,000 | | | | 1,518,276 | |
Illinois Finance Authority, 1.470%, (LIBOR 1 Month), 5/01/2036, Call 11/1/2020 (6) | | | 1,000,000 | | | | 1,000,290 | |
Kane McHenry Cook & De Kalb Counties Unit School District No. 300, 5.000%, 1/01/2023 | | | 1,000,000 | | | | 1,106,780 | |
Railsplitter Tobacco Settlement Authority, 5.000%, 6/01/2023 | | | 1,165,000 | | | | 1,302,552 | |
Sales Tax Securitization Corp., 5.000%, 1/01/2023 | | | 1,000,000 | | | | 1,084,100 | |
State of Illinois, 5.000%, 11/01/2022 | | | 2,000,000 | | | | 2,107,220 | |
University of Illinois, 5.000%, 3/15/2022 | | | 1,000,000 | | | | 1,063,040 | |
| | | | | | | | |
| Description | | Principal
Amount | | | Value | |
| Municipals (continued) | |
|
Illinois (continued) | |
Other Securities | | $ | 11,250,000 | | | $ | 11,965,560 | |
| | | | | | | | |
| | | | | | | 22,240,628 | |
|
Indiana — 1.7% | |
City of Whiting, 5.000%, 12/01/2044 (6) | | | 1,000,000 | | | | 1,226,410 | |
Other Securities | | | 900,000 | | | | 911,305 | |
| | | | | | | | |
| | | | | | | 2,137,715 | |
|
Iowa — 0.4% | |
Other Security | | | 500,000 | | | | 511,155 | |
|
Kansas — 0.6% | |
Other Securities | | | 795,000 | | | | 796,560 | |
|
Kentucky — 3.0% | |
City of Berea, 0.160%, 6/01/2032, Call 9/1/2020 (6) | | | 1,000,000 | | | | 1,000,000 | |
Kentucky Public Energy Authority, 1.235%, (LIBOR 1 Month), 12/01/2049, Call 3/1/2025 (6) | | | 1,000,000 | | | | 1,001,970 | |
Other Securities | | | 1,750,000 | | | | 1,881,512 | |
| | | | | | | | |
| | | | | | | 3,883,482 | |
|
Louisiana — 0.3% | |
Other Securities | | | 405,000 | | | | 409,692 | |
|
Maryland — 0.4% | |
Other Securities | | | 505,000 | | | | 520,567 | |
|
Massachusetts — 2.6% | |
Commonwealth of Massachusetts, 1.700%, 8/01/2043 (6) | | | 1,000,000 | | | | 1,025,530 | |
Massachusetts Transportation Trust Fund Metropolitan Highway System Revenue, 5.000%, 1/01/2039, Call 1/1/2023 (6) | | | 1,200,000 | | | | 1,323,996 | |
Other Securities | | | 855,000 | | | | 921,461 | |
| | | | | | | | |
| | | | | | | 3,270,987 | |
|
Michigan — 2.0% | |
Michigan Finance Authority, 3.500%, 11/15/2044 (6) | | | 1,000,000 | | | | 1,060,440 | |
Other Securities | | | 1,420,000 | | | | 1,514,722 | |
| | | | | | | | |
| | | | | | | 2,575,162 | |
|
Mississippi — 2.5% | |
Mississippi Business Finance Corp., 2.200%, 3/01/2027 (6) | | | 1,250,000 | | | | 1,288,737 | |
Other Securities | | | 1,750,000 | | | | 1,874,268 | |
| | | | | | | | |
| | | | | | | 3,163,005 | |
|
Missouri — 0.9% | |
Other Securities | | | 1,100,000 | | | | 1,110,081 | |
|
Nebraska — 0.9% | |
Central Plains Energy Project, 5.000%, 3/01/2050, Call 10/1/2023 (6) | | | 1,000,000 | | | | 1,129,950 | |
Other Securities | | | | | | | | |
|
Nevada — 1.6% | |
City of North Las Vegas NV, AGM, 5.000%, 6/01/2023 | | | 1,000,000 | | | | 1,117,490 | |
Other Securities | | | 950,000 | | | | 985,178 | |
| | | | | | | | |
| | | | | | | 2,102,668 | |
(See Notes to Schedules of Investments and Notes to Financial Statements, which are an integral part of the Financial Statements)
55
August 31, 2020
Short Tax-Free Fund* (continued)
| | | | | | | | |
| Description | | Principal
Amount | | | Value | |
| Municipals (continued) | |
|
New Jersey — 2.6% | |
Tobacco Settlement Financing Corp., 5.000%, 6/01/2022 | | $ | 1,000,000 | | | $ | 1,076,940 | |
Other Securities | | | 2,100,000 | | | | 2,301,708 | |
| | | | | | | | |
| | | | | | | 3,378,648 | |
|
New Mexico — 0.9% | |
Other Securities | | | 1,200,000 | | | | 1,165,900 | |
|
New York — 5.9% | |
Metropolitan Transportation Authority | | | | | | | | |
5.000%, 9/01/2022 | | | 1,000,000 | | | | 1,044,360 | |
5.000%, 11/15/2048 (6) | | | 1,000,000 | | | | 1,079,200 | |
TSASC, Inc.,
5.000%, 6/01/2021 | | | 1,000,000 | | | | 1,029,760 | |
Other Securities | | | 4,355,000 | | | | 4,402,789 | |
| | | | | | | | |
| | | | | | | 7,556,109 | |
|
North Carolina — 0.7% | |
Other Securities | | | 950,000 | | | | 947,014 | |
|
North Dakota — 0.0% | |
Other Security | | | 40,000 | | | | 41,389 | |
|
Ohio — 4.2% | |
American Municipal Power, Inc., 2.300%, 2/15/2038, Call 8/15/2021 (6) | | | 1,000,000 | | | | 1,013,770 | |
Eclipse Funding Trust, 0.190%, 10/01/2040, Call 10/1/2026 (5) (6) | | | 1,500,000 | | | | 1,500,000 | |
Port of Greater Cincinnati Development Authority, 3.000%, 5/01/2023, Call 5/1/2022 | | | 1,000,000 | | | | 1,002,180 | |
Other Securities | | | 1,775,000 | | | | 1,831,095 | |
| | | | | | | | |
| | | | | | | 5,347,045 | |
|
Oklahoma — 0.5% | |
Other Security | | | 600,000 | | | | 599,100 | |
|
Pennsylvania — 2.9% | |
Commonwealth Financing Authority, 5.000%, 6/01/2022 | | | 1,000,000 | | | | 1,075,820 | |
Other Securities | | | 2,630,000 | | | | 2,666,411 | |
| | | | | | | | |
| | | | | | | 3,742,231 | |
|
South Carolina — 1.0% | |
Patriots Energy Group Financing Agency, 0.975%, (LIBOR 1 Month), 10/01/2048, Call 11/1/2023 (6) | | | 1,000,000 | | | | 1,001,160 | |
Other Security | | | 300,000 | | | | 300,000 | |
| | | | | | | | |
| | | | | | | 1,301,160 | |
|
Tennessee — 2.4% | |
Metropolitan Government Nashville & Davidson County Health & Educational Facility Board, 2.000%, 1/01/2022 (6) | | | 1,000,000 | | | | 1,005,130 | |
Tennessee Energy Acquisition Corp., 4.000%, 5/01/2048, Call 2/1/2023 (6) | | | 1,000,000 | | | | 1,080,690 | |
Other Securities | | | 855,000 | | | | 940,021 | |
| | | | | | | | |
| | | | | | | 3,025,841 | |
| | | | | | | | |
| Description | | Principal
Amount | | | Value | |
| Municipals (continued) | |
|
Texas — 5.1% | |
Tarrant County Cultural Education Facilities Finance Corp., 5.000%, 11/15/2022 | | $ | 1,000,000 | | | $ | 1,073,280 | |
Other Securities | | | 5,270,000 | | | | 5,397,635 | |
| | | | | | | | |
| | | | | | | 6,470,915 | |
|
Virginia — 1.7% | |
Other Securities | | | 2,075,000 | | | | 2,124,663 | |
|
Washington — 1.8% | |
State of Washington, 5.000%, 2/01/2022 | | | 1,000,000 | | | | 1,068,470 | |
Other Securities | | | 1,320,000 | | | | 1,255,776 | |
| | | | | | | | |
| | | | | | | 2,324,246 | |
|
West Virginia — 1.7% | |
West Virginia Economic Development Authority, 2.550%, 3/01/2040 (6) | | | 1,000,000 | | | | 1,055,280 | |
Other Securities | | | 1,075,000 | | | | 1,153,440 | |
| | | | | | | | |
| | | | | | | 2,208,720 | |
|
Wisconsin — 2.2% | |
Other Securities | | | 2,740,000 | | | | 2,839,701 | |
| | | | | | | | |
Total Municipals
(identified cost $124,927,263) | | | | | | | 127,061,534 | |
| | | | | | | | |
| Short-Term Investments — 0.7% | |
|
| Repurchase Agreements — 0.7% | |
Other Security | | | 902,979 | | | | 902,979 | |
| | | | | | | | |
Total Short-Term Investments
(identified cost $902,978) | | | | | | | 902,979 | |
| | | | | | | | |
Total Investments — 100.0%
(identified cost $125,830,241) | | | | | | | 127,964,513 | |
| Other Assets — (0.0)% | | | | | | | (14,934 | ) |
| | | | | | | | |
| Net Assets — 100.0% | | | | | | $ | 127,949,579 | |
| | | | | | | | |
Short-Term Income Fund
| | | | | | | | |
| Description | | Principal
Amount | | | Value | |
| Asset-Backed Securities — 15.2% | |
|
Automobiles — 7.7% | |
AmeriCredit Automobile Receivables Trust: | | | | | | | | |
Class A3, (Series 2018-2), 3.150%, 3/20/2023 | | $ | 739,866 | | | $ | 748,790 | |
Class A3, (Series 2018-3), 3.380%, 7/18/2023 | | | 131,487 | | | | 133,861 | |
Class C, (Series 2017-1), 2.710%, 8/18/2022 | | | 1,000,000 | | | | 1,009,071 | |
Class C, (Series 2017-3), 2.690%, 6/19/2023 | | | 1,755,000 | | | | 1,786,617 | |
Class D, (Series 2016-1), 3.590%, 2/8/2022 | | | 1,609,415 | | | | 1,610,438 | |
Class D, (Series 2016-3), 2.710%, 9/8/2022 | | | 2,000,000 | | | | 2,023,314 | |
Class D, (Series 2017-1), 3.130%, 1/18/2023 | | | 1,500,000 | | | | 1,537,841 | |
Avis Budget Rental Car Funding AESOP LLC: | | | | | | | | |
Class A, (Series 2015-2A), 2.630%, 12/20/2021 (5) | | | 666,667 | | | | 668,490 | |
(See Notes to Schedules of Investments and Notes to Financial Statements, which are an integral part of the Financial Statements)
56
Short-Term Income Fund (continued)
| | | | | | | | |
| Description | | Principal
Amount | | | Value | |
| Asset-Backed Securities (continued) | |
|
Automobiles (continued) | |
Class A, (Series 2016-1A), 2.990%, 6/20/2022 (5) | | $ | 400,000 | | | $ | 403,432 | |
Chesapeake Funding II LLC, Class A1, (Series 2019-2A), 1.950%, 9/15/2031 (5) | | | 727,138 | | | | 742,310 | |
Drive Auto Receivables Trust: | | | | | | | | |
Class B, (Series 2020-1), 2.080%, 7/15/2024 | | | 1,000,000 | | | | 1,020,010 | |
Class C, (Series 2018-5), 3.990%, 1/15/2025 | | | 988,000 | | | | 1,016,846 | |
Class C, (Series 2019-4), 2.510%, 11/17/2025 | | | 2,000,000 | | | | 2,041,076 | |
Ford Credit Auto Lease Trust, Class A3, (Series 2020-B), 0.620%, 8/15/2023 | | | 1,000,000 | | | | 1,004,518 | |
GM Financial Consumer Automobile, Class C, (Series 2017-1A), 2.450%, 7/17/2023 (5) | | | 1,000,000 | | | | 1,005,485 | |
Mercedes-Benz Master Owner Trust, Class A, (Series 2019-BA), 2.610%, 5/15/2024 (5) | | | 1,275,000 | | | | 1,324,142 | |
Nissan Auto Receivables Owner Trust, Class A2A, (Series 2018-C), 3.070%, 10/15/2021 | | | 76,107 | | | | 76,220 | |
World Omni Auto Receivables Trust, Class A3, (Series 2017-B), 1.950%, 2/15/2023 | | | 208,884 | | | | 210,650 | |
| | | | | | | | |
| | | | | | | 18,363,111 | |
|
Credit Cards — 0.9% | |
Synchrony Card Funding LLC, Class A, (Series 2019-A1), 2.950%, 3/15/2025 | | | 297,000 | | | | 307,754 | |
World Financial Network Credit Card Master Trust, Class A, (Series 2019-B), 2.490%, 4/15/2026 | | | 1,775,000 | | | | 1,828,677 | |
| | | | | | | | |
| | | | | | | 2,136,431 | |
|
Other Financial — 6.6% | |
Ally Master Owner Trust: | | | | | | | | |
Class A, (Series 2018-2), 3.290%, 5/15/2023 | | | 1,500,000 | | | | 1,533,760 | |
Class A2, (Series 2018-1), 2.700%, 1/17/2023 | | | 1,300,000 | | | | 1,312,613 | |
Daimler Trucks Retail Trust, Class A3, (Series 2018-1), 2.850%, 7/15/2021 (5) | | | 53,434 | | | | 53,481 | |
Ford Credit Floorplan Master Owner Trust: | | | | | | | | |
Class A1, (Series 2018-3), 3.520%, 10/15/2023 | | | 1,000,000 | | | | 1,034,479 | |
Class A2, (Series 2019-3), 0.762% (LIBOR 1 Month + 60 basis points), 9/15/2024 (6) | | | 1,300,000 | | | | 1,307,115 | |
Marlin Receivables LLC, Class B, (Series 2018-1A), 3.540%, 5/22/2023 (5) | | | 1,000,000 | | | | 1,008,178 | |
MMAF Equipment Finance LLC, Class A4, (Series 2017-B), 2.410%, 11/15/2024 (5) | | | 2,000,000 | | | | 2,049,965 | |
| | | | | | | | |
| Description | | Principal
Amount | | | Value | |
| Asset-Backed Securities (continued) | |
|
Other Financial (continued) | |
Navistar Financial Dealer Note Master Owner Trust II, Class A, (Series 2019-1), 0.815% (LIBOR 1 Month + 64 basis points), 5/25/2024 (5)(6) | | $ | 1,000,000 | | | $ | 999,311 | |
Pawnee Equipment Receivables LLC, Class A2, (Series 2019-1), 2.290%, 10/15/2024 (5) | | | 1,883,866 | | | | 1,900,279 | |
Sierra Timeshare Conduit Receivables Funding LLC, Class B, (Series 2017-1A), 3.200%, 3/20/2034 (5) | | | 689,521 | | | | 693,532 | |
Volvo Financial Equipment LLC, Class A4, (Series 2017-1A), 2.210%, 11/15/2021 (5) | | | 479,408 | | | | 481,215 | |
Westgate Resorts, Class B, (Series 2020-1A), 3.963%, 3/20/2034 (5) | | | 1,226,199 | | | | 1,256,223 | |
Westgate Resorts LLC: | | | | | | | | |
Class B, (Series 2017-1A), 4.050%, 12/20/2030 (5) | | | 1,312,995 | | | | 1,292,547 | |
Class B, (Series 2018-1A), 3.580%, 12/20/2031 (5) | | | 679,923 | | | | 671,128 | |
| | | | | | | | |
| | | | | | | 15,593,826 | |
| | | | | | | | |
Total Asset-Backed Securities
(identified cost $35,646,807) | | | | | | | 36,093,368 | |
| | | | | | | | |
| Collateralized Mortgage Obligations — 3.8% | |
|
Federal Home Loan Mortgage Corporation — 0.7% | |
2.000%, 1/15/2024, (Series 4295) | | | 267,972 | | | | 271,214 | |
3.000%, 2/15/2031, (Series 4013) | | | 587,013 | | | | 608,208 | |
4.000%, 12/15/2038, (Series 3738) | | | 288,273 | | | | 291,308 | |
4.500%, 8/15/2039, (Series 3778) | | | 362,828 | | | | 379,430 | |
| | | | | | | | |
| | | | | | | 1,550,160 | |
|
Federal National Mortgage Association — 0.2% | |
3.000%, 8/25/2040, (Series 2015-15) | | | 541,656 | | | | 550,051 | |
|
Federal National Mortgage Association — 0.5% | |
2.500%, 6/25/2029, (Series 2014-34) | | | 609,742 | | | | 637,728 | |
3.643%, 7/25/2021, (Series 2011-M3) | | | 621,076 | | | | 624,369 | |
| | | | | | | | |
| | | | | | | 1,262,097 | |
|
Private Sponsor — 2.4% | |
Banc of America Funding Trust: | | | | | | | | |
Class 1A3, (Series 2007-C), 3.970%, 5/20/2036 (6) | | | 91,258 | | | | 88,650 | |
Class 2A1, (Series 2005-5), 5.500%, 9/25/2035 | | | 186,188 | | | | 207,846 | |
Chase Mortgage Finance Trust: | | | | | | | | |
Class A1, (Series 2005-S2), 5.500%, 10/25/2035 | | | 110,380 | | | | 108,813 | |
Class A3, (Series 2006-S4), 6.000%, 12/25/2036 | | | 175,424 | | | | 125,117 | |
FREMF Mortgage Trust: | | | | | | | | |
Class B, (Series 2013-K26), 3.720%, 12/25/2045 (5)(6) | | | 1,250,000 | | | | 1,311,069 | |
Class B, (Series 2014-K716), 4.081%, 8/25/2047 (5)(6) | | | 1,500,000 | | | | 1,523,836 | |
Class C, (Series 2012-K21), 4.068%, 7/25/2045 (5)(6) | | | 1,000,000 | | | | 1,036,532 | |
JP Morgan Mortgage Trust: | | | | | | | | |
Class 1A5, (Series 2017-3), 3.500%, 8/25/2047 (5)(6) | | | 307,542 | | | | 309,488 | |
Class 2A2, (Series 2005-S3), 5.500%, 1/25/2021 | | | 22,962 | | | | 22,819 | |
(See Notes to Schedules of Investments and Notes to Financial Statements, which are an integral part of the Financial Statements)
57
August 31, 2020
Short-Term Income Fund (continued)
| | | | | | | | |
| Description | | Principal
Amount | | | Value | |
| Collateralized Mortgage Obligations (continued) | |
|
Private Sponsor (continued) | |
Class 3A1, (Series 2007-A2), 3.509%, 4/25/2037 (6) | | $ | 9,112 | | | $ | 7,729 | |
Class A4, (Series 2019-6), 3.500%, 12/25/2049 (5)(6) | | | 251,800 | | | | 255,501 | |
Morgan Stanley Mortgage Loan Trust, Class 2A2, (Series 2004-10AR), 3.671%, 11/25/2034 (6) | | | 131,021 | | | | 130,479 | |
OBX Trust, Class A8, (Series 2019-INV1), 4.000%, 11/25/2048 (5)(6) | | | 358,884 | | | | 361,175 | |
Wells Fargo Mortgage Backed Securities Trust, Class A1, (Series 2006-AR19), 4.300%, 12/25/2036 (6) | | | 138,566 | | | | 126,136 | |
| | | | | | | | |
| | | | | | | 5,615,190 | |
| | | | | | | | |
Total Collateralized Mortgage Obligations
(identified cost $8,971,600) | | | | 8,977,498 | |
| | | | | | | | |
| Commercial Mortgage Securities — 4.5% | |
|
Government National Mortgage Association — 0.8% | |
1.800%, 7/16/2037, (Series 2013-179) | | | 543,611 | | | | 546,702 | |
2.100%, 4/16/2050, (Series 2016-92) | | | 755,590 | | | | 769,398 | |
2.650%, 2/16/2045, (Series 2015-33) | | | 586,011 | | | | 591,192 | |
| | | | | | | | |
| | | | | | | 1,907,292 | |
|
Private Sponsor — 3.7% | |
Cantor Commercial Real Estate Lending, Class A1, (Series 2019-CF2), 2.047%, 11/15/2052 | | | 1,359,388 | | | | 1,392,998 | |
Citigroup Commercial Mortgage Trust, Class A1, (Series 2017-P7), 2.008%, 4/14/2050 | | | 341,590 | | | | 342,503 | |
GS Mortgage Securities Corp. Trust 2020-DUNE, Class A, (Series 2020-DUNE), 1.262% (LIBOR 1 Month + 110 basis points), 12/15/2036 (5)(6) | | | 2,000,000 | | | | 1,883,997 | |
GS Mortgage Securities Trust, Class A4, (Series 2011-GC3), 4.753%, 3/10/2044 (5) | | | 395,619 | | | | 396,588 | |
Morgan Stanley BAML Trust, Class A1, (Series 2016-C30), 1.389%, 9/15/2049 | | | 580,524 | | | | 580,906 | |
SLIDE 2018-FUN, Class B, (Series 2018-FUN), 1.412% (LIBOR 1 Month + 125 basis points), 6/15/2031 (5)(6) | | | 948,545 | | | | 885,317 | |
UBS Commercial Mortgage Trust, Class A1, (Series 2017-C3), 1.935%, 8/15/2050 | | | 810,094 | | | | 815,057 | |
WFRBS Commercial Mortgage Trust, Class ASB, (Series 2013-C18), 3.676%, 12/15/2046 | | | 1,355,161 | | | | 1,413,813 | |
WF-RBS Commercial Mortgage Trust, Class A4, (Series 2011-C2), 4.869%, 2/15/2044 (5)(6) | | | 912,708 | | | | 920,852 | |
| | | | | | | | |
| | | | | | | 8,632,031 | |
| | | | | | | | |
Total Commercial Mortgage Securities
(identified cost $10,631,093) | | | | 10,539,323 | |
| | | | | | | | |
| | | | | | | | |
| Description | | Principal
Amount | | | Value | |
| Corporate Bonds & Notes — 51.3% | |
|
Auto Manufacturers — 4.8% | |
American Honda Finance Corp.: | | | | | | | | |
1.950%, 5/10/2023 | | $ | 650,000 | | | $ | 674,595 | |
2.900%, 2/16/2024 (2) | | | 1,000,000 | | | | 1,072,254 | |
3.450%, 7/14/2023 (2) | | | 1,555,000 | | | | 1,679,205 | |
Ford Motor Credit Co. LLC, 1.576% (LIBOR 3 Month + 127 basis points), 3/28/2022 (6) | | | 1,000,000 | | | | 962,962 | |
General Motors Financial Co., Inc.: | | | | | | | | |
1.700%, 8/18/2023 (2) | | | 1,200,000 | | | | 1,208,213 | |
1.818% (LIBOR 3 Month + 155 basis points), 1/14/2022 (6) | | | 750,000 | | | | 753,003 | |
2.450%, 11/6/2020 | | | 1,000,000 | | | | 1,002,956 | |
3.450%, 1/14/2022 (2) | | | 750,000 | | | | 769,602 | |
PACCAR Financial Corp.: | | | | | | | | |
2.650%, 5/10/2022 (2) | | | 600,000 | | | | 624,100 | |
2.650%, 4/6/2023 | | | 675,000 | | | | 714,137 | |
Toyota Motor Credit Corp.: | | | | | | | | |
0.956% (LIBOR 3 Month + 69 basis points), 1/11/2022 (6) | | | 1,000,000 | | | | 1,007,513 | |
3.350%, 1/8/2024 | | | 850,000 | | | | 927,129 | |
| | | | | | | | |
| | | | | | | 11,395,669 | |
|
Banks — 20.7% | |
BancorpSouth Bank, 4.125% (LIBOR 3 Month + 247 basis points), 11/20/2029 (2)(6) | | | 1,750,000 | | | | 1,742,442 | |
Bank of America Corp.: | | | | | | | | |
1.263% (LIBOR 3 Month + 100 basis points), 4/24/2023 (2)(6) | | | 2,000,000 | | | | 2,020,782 | |
3.499% (LIBOR 3 Month + 63 basis points), 5/17/2022 (2)(6) | | | 1,000,000 | | | | 1,022,288 | |
Bank of New York Mellon Corp.: | | | | | | | | |
1.600%, 4/24/2025 | | | 1,000,000 | | | | 1,044,487 | |
3.450%, 8/11/2023 | | | 1,000,000 | | | | 1,091,221 | |
Canadian Imperial Bank of Commerce, 3.500%, 9/13/2023 (2) | | | 650,000 | | | | 711,941 | |
Citigroup, Inc.: | | | | | | | | |
2.350%, 8/2/2021 | | | 520,000 | | | | 529,567 | |
2.700%, 10/27/2022 (2) | | | 1,000,000 | | | | 1,046,551 | |
1.205% (LIBOR 3 Month + 96 basis points), 4/25/2022 (6) | | | 1,500,000 | | | | 1,517,190 | |
Customers Bancorp, Inc., 3.950%, 6/30/2022 | | | 1,000,000 | | | | 1,011,014 | |
Fifth Third Bancorp: | | | | | | | | |
1.625%, 5/5/2023 (2) | | | 1,000,000 | | | | 1,027,248 | |
3.650%, 1/25/2024 | | | 1,750,000 | | | | 1,915,652 | |
First Citizens BancShares, Inc., 3.375% (SOFR + 247 basis points), 3/15/2030 (6) | | | 1,500,000 | | | | 1,485,563 | |
Flagstar Bancorp, Inc., 6.125%, 7/15/2021 | | | 1,375,000 | | | | 1,400,713 | |
Goldman Sachs Group, Inc.: | | | | | | | | |
2.350%, 11/15/2021 | | | 1,000,000 | | | | 1,003,939 | |
3.625%, 1/22/2023 (2) | | | 1,650,000 | | | | 1,771,930 | |
3.625%, 2/20/2024 | | | 1,000,000 | | | | 1,091,789 | |
Home BancShares, Inc., 5.625% (LIBOR 3 Month + 358 basis points), 4/15/2027 (6) | | | 1,000,000 | | | | 1,023,172 | |
Huntington Bancshares, Inc., 2.300%, 1/14/2022 (2) | | | 1,144,000 | | | | 1,171,691 | |
Independent Bank Group, Inc., 5.875%, 8/1/2024 | | | 1,680,000 | | | | 1,745,786 | |
JPMorgan Chase & Co., 3.200%, 1/25/2023 (2) | | | 1,000,000 | | | | 1,066,416 | |
(See Notes to Schedules of Investments and Notes to Financial Statements, which are an integral part of the Financial Statements)
58
Short-Term Income Fund (continued)
| | | | | | | | |
| Description | | Principal
Amount | | | Value | |
| Corporate Bonds & Notes (continued) | |
|
Banks (continued) | |
KeyBank NA: | | | | | | | | |
3.300%, 2/1/2022 (2) | | $ | 1,000,000 | | | $ | 1,041,174 | |
3.375%, 3/7/2023 | | | 1,000,000 | | | | 1,070,729 | |
Mitsubishi UFJ Financial Group, Inc.: | | | | | | | | |
3.535%, 7/26/2021 | | | 850,000 | | | | 874,471 | |
3.761%, 7/26/2023 (2) | | | 1,000,000 | | | | 1,090,235 | |
Morgan Stanley: | | | | | | | | |
1.452% (LIBOR 3 Month + 118 basis points), 1/20/2022 (6) | | | 645,000 | | | | 647,620 | |
2.625%, 11/17/2021 | | | 1,250,000 | | | | 1,283,624 | |
3.125%, 1/23/2023 | | | 1,000,000 | | | | 1,060,751 | |
Peapack-Gladstone Financial Corp., 6.000% (LIBOR 3 Month + 485 basis points), 6/30/2026 (6) | | | 500,000 | | | | 504,194 | |
PNC Bank NA, 3.500%, 6/8/2023 | | | 1,000,000 | | | | 1,081,157 | |
Royal Bank of Canada, 2.750%, 2/1/2022 (2) | | | 400,000 | | | | 414,232 | |
State Street Corp., 1.950%, 5/19/2021 (2) | | | 1,000,000 | | | | 1,012,345 | |
Toronto-Dominion Bank: | | | | | | | | |
2.125%, 4/7/2021 | | | 1,000,000 | | | | 1,011,481 | |
3.250%, 3/11/2024 | | | 1,000,000 | | | | 1,092,326 | |
Truist Bank: | | | | | | | | |
3.502% (LIBOR 3 Month + 59 basis points), 8/2/2022 (2)(6) | | | 750,000 | | | | 770,857 | |
3.689% (LIBOR 3 Month + 74 basis points), 8/2/2024 (2)(6) | | | 700,000 | | | | 762,932 | |
Truist Financial Corp., 2.200%, 3/16/2023 | | | 1,000,000 | | | | 1,043,170 | |
U.S. Bancorp, 1.450%, 5/12/2025 | | | 1,000,000 | | | | 1,037,780 | |
United Community Banks, Inc., 4.500% (LIBOR 3 Month + 212 basis points), 1/30/2028 (6) | | | 1,000,000 | | | | 981,328 | |
Wells Fargo & Co.: | | | | | | | | |
1.373% (LIBOR 3 Month + 111 basis points), 1/24/2023 (6) | | | 1,000,000 | | | | 1,008,947 | |
2.625%, 7/22/2022 (2) | | | 1,500,000 | | | | 1,561,088 | |
West Loop BC, 4.000% (LIBOR 3 Month + 187 basis points), 12/1/2027 (6) | | | 2,000,000 | | | | 2,061,742 | |
Westpac Banking Corp.: | | | | | | | | |
2.500%, 6/28/2022 (2) | | | 500,000 | | | | 520,480 | |
2.800%, 1/11/2022 (2) | | | 500,000 | | | | 518,073 | |
| | | | | | | | |
| | | | | | | 48,892,118 | |
| | |
Beverages — 0.5% | | | | | | | | |
Coca-Cola Co., 3.200%, 11/1/2023 (2) | | | 1,000,000 | | | | 1,090,910 | |
| | |
Computers — 2.3% | | | | | | | | |
Apple, Inc.: | | | | | | | | |
0.750%, 5/11/2023 (2) | | | 1,250,000 | | | | 1,266,845 | |
1.700%, 9/11/2022 (2) | | | 725,000 | | | | 746,915 | |
2.400%, 5/3/2023 (2) | | | 1,500,000 | | | | 1,584,138 | |
Dell International LLC, 4.420%, 6/15/2021 (5) | | | 719,000 | | | | 737,666 | |
International Business Machines Corp., 3.375%, 8/1/2023 | | | 1,000,000 | | | | 1,086,485 | |
| | | | | | | | |
| | | | | | | 5,422,049 | |
|
Cosmetics/Personal Care — 0.9% | |
Colgate-Palmolive Co., 2.250%, 11/15/2022 (2) | | | 1,300,000 | | | | 1,358,592 | |
| | | | | | | | |
| Description | | Principal
Amount | | | Value | |
| Corporate Bonds & Notes (continued) | |
|
Cosmetics/Personal Care (continued) | |
Procter & Gamble Co., 2.150%, 8/11/2022 | | $ | 775,000 | | | $ | 804,233 | |
| | | | | | | | |
| | | | | | | 2,162,825 | |
|
Diversified Financial Services — 2.0% | |
American Express Co.: | | | | | | | | |
3.400%, 2/22/2024 (2) | | | 1,000,000 | | | | 1,096,540 | |
3.700%, 8/3/2023 (2) | | | 1,500,000 | | | | 1,634,741 | |
American Express Credit Corp., 2.700%, 3/3/2022 (2) | | | 1,000,000 | | | | 1,033,845 | |
Capital One Financial Corp.: | | | | | | | | |
3.050%, 3/9/2022 | | | 500,000 | | | | 518,515 | |
3.200%, 1/30/2023 (2) | | | 500,000 | | | | 528,400 | |
| | | | | | | | |
| | | | | | | 4,812,041 | |
| | |
Electric — 0.3% | | | | | | | | |
NextEra Energy Capital Holdings, Inc., 3.150%, 4/1/2024 | | | 650,000 | | | | 705,859 | |
| | |
Healthcare-Services — 0.7% | | | | | | | | |
UnitedHealth Group, Inc., 2.875%, 3/15/2023 (2) | | | 1,500,000 | | | | 1,596,379 | |
| | |
Insurance — 0.3% | | | | | | | | |
Aon Corp., 2.200%, 11/15/2022 | | | 650,000 | | | | 675,204 | |
| | |
Internet — 0.6% | | | | | | | | |
Amazon.com, Inc., 0.800%, 6/3/2025 | | | 1,500,000 | | | | 1,521,503 | |
|
Machinery-Construction & Mining — 1.3% | |
Caterpillar Financial Services Corp.: | | | | | | | | |
0.650%, 7/7/2023 | | | 1,250,000 | | | | 1,259,267 | |
1.950%, 11/18/2022 (2) | | | 775,000 | | | | 801,960 | |
3.450%, 5/15/2023 | | | 1,000,000 | | | | 1,082,363 | |
| | | | | | | | |
| | | | | | | 3,143,590 | |
|
Machinery-Diversified — 1.3% | |
John Deere Capital Corp.: | | | | | | | | |
2.800%, 1/27/2023 | | | 1,250,000 | | | | 1,321,934 | |
2.800%, 3/6/2023 | | | 750,000 | | | | 797,689 | |
3.200%, 1/10/2022 | | | 1,000,000 | | | | 1,040,349 | |
| | | | | | | | |
| | | | | | | 3,159,972 | |
|
Media — 1.4% | |
Comcast Corp.: | | | | | | | | |
2.750%, 3/1/2023 (2) | | | 1,000,000 | | | | 1,058,118 | |
3.700%, 4/15/2024 | | | 1,000,000 | | | | 1,111,140 | |
Walt Disney Co., 1.650%, 9/1/2022 (2) | | | 1,000,000 | | | | 1,025,493 | |
| | | | | | | | |
| | | | | | | 3,194,751 | |
| | |
Oil & Gas — 4.3% | | | | | | | | |
BP Capital Markets PLC, 2.500%, 11/6/2022 (2) | | | 1,250,000 | | | | 1,305,088 | |
Chevron Corp.: | | | | | | | | |
1.141%, 5/11/2023 | | | 1,000,000 | | | | 1,021,435 | |
1.554%, 5/11/2025 (2) | | | 1,000,000 | | | | 1,041,957 | |
Chevron USA, Inc., 1.018%, 8/12/2027 | | | 425,000 | | | | 424,665 | |
Equinor ASA, 2.450%, 1/17/2023 | | | 1,000,000 | | | | 1,048,488 | |
Exxon Mobil Corp.: | | | | | | | | |
2.019%, 8/16/2024 | | | 1,000,000 | | | | 1,060,104 | |
2.397%, 3/6/2022 (2) | | | 850,000 | | | | 875,351 | |
Phillips 66: | | | | | | | | |
0.834% (LIBOR 3 Month + 60 basis points), 2/26/2021 (6) | | | 1,200,000 | | | | 1,199,322 | |
3.700%, 4/6/2023 | | | 1,000,000 | | | | 1,077,212 | |
(See Notes to Schedules of Investments and Notes to Financial Statements, which are an integral part of the Financial Statements)
59
August 31, 2020
Short-Term Income Fund (continued)
| | | | | | | | |
| Description | | Principal
Amount | | | Value | |
| Corporate Bonds & Notes (continued) | |
| | |
Oil & Gas (continued) | | | | | | | | |
Shell International Finance BV, 3.500%, 11/13/2023 | | $ | 1,000,000 | | | $ | 1,095,657 | |
| | | | | | | | |
| | | | | | | 10,149,279 | |
| | |
Pharmaceuticals — 1.4% | | | | | | | | |
AbbVie, Inc., 3.750%, 11/14/2023 (2) | | | 500,000 | | | | 548,649 | |
CVS Health Corp.: | | | | | | | | |
3.350%, 3/9/2021 | | | 1,000,000 | | | | 1,015,650 | |
3.700%, 3/9/2023 (2) | | | 1,000,000 | | | | 1,077,039 | |
Johnson & Johnson, 2.625%, 1/15/2025 | | | 700,000 | | | | 763,279 | |
| | | | | | | | |
| | | | | | | 3,404,617 | |
| | |
Pipelines — 1.3% | | | | | | | | |
Energy Transfer Operating LP, 3.600%, 2/1/2023 | | | 1,000,000 | | | | 1,035,928 | |
Kinder Morgan Energy Partners LP, 3.500%, 9/1/2023 (2) | | | 1,903,000 | | | | 2,044,209 | |
| | | | | | | | |
| | | | | | | 3,080,137 | |
| | |
Retail — 1.6% | | | | | | | | |
McDonald’s Corp., 3.350%, 4/1/2023 | | | 1,000,000 | | | | 1,071,888 | |
Walmart, Inc.: | | | | | | | | |
3.300%, 4/22/2024 | | | 1,500,000 | | | | 1,641,384 | |
3.400%, 6/26/2023 (2) | | | 1,000,000 | | | | 1,084,595 | |
| | | | | | | | |
| | | | | | | 3,797,867 | |
| | |
Savings & Loans — 0.9% | | | | | | | | |
New York Community Bancorp, Inc., 5.900% (LIBOR 3 Month + 278 basis points), 11/6/2028 (2)(6) | | | 1,000,000 | | | | 1,022,797 | |
Sterling Bancorp, 4.000% (SOFR + 253 basis points), 12/30/2029 (6) | | | 1,000,000 | | | | 975,811 | |
| | | | | | | | |
| | | | | | | 1,998,608 | |
| | |
Software — 2.0% | | | | | | | | |
Microsoft Corp., 2.875%, 2/6/2024 (2) | | | 1,500,000 | | | | 1,620,174 | |
Oracle Corp.: | | | | | | | | |
1.900%, 9/15/2021 | | | 525,000 | | | | 533,379 | |
2.400%, 9/15/2023 | | | 1,500,000 | | | | 1,585,913 | |
2.500%, 5/15/2022 | | | 1,000,000 | | | | 1,034,066 | |
| | | | | | | | |
| | | | | | | 4,773,532 | |
|
Telecommunications — 1.6% | |
AT&T, Inc., 3.900%, 3/11/2024 | | | 1,000,000 | | | | 1,106,916 | |
Verizon Communications, Inc.: | | | | | | | | |
1.321% (LIBOR 3 Month + 100 basis points), 3/16/2022 (6) | | | 750,000 | | | | 760,973 | |
4.150%, 3/15/2024 | | | 1,250,000 | | | | 1,396,932 | |
5.150%, 9/15/2023 | | | 500,000 | | | | 569,136 | |
| | | | | | | | |
| | | | | | | 3,833,957 | |
|
Transportation — 1.1% | |
Union Pacific Corp.: | | | | | | | | |
2.950%, 3/1/2022 | | | 1,000,000 | | | | 1,039,908 | |
3.500%, 6/8/2023 | | | 1,500,000 | | | | 1,624,842 | |
| | | | | | | | |
| | | | | | | 2,664,750 | |
| | | | | | | | |
Total Corporate Bonds & Notes
(identified cost $117,576,138) | | | | 121,475,617 | |
| | | | | | | | |
| | | | | | | | |
| Description | | Principal
Amount | | | Value | |
| U.S. Government & U.S. Government Agency Obligations — 17.7% | |
|
Federal Farm Credit Bank — 0.8% | |
1.480%, 3/10/2026 | | $ | 2,000,000 | | | $ | 2,002,050 | |
|
Federal Home Loan Mortgage Corporation — 0.4% | |
2.375%, 2/16/2021 | | | 1,000,000 | | | | 1,010,267 | |
|
Federal National Mortgage Association — 1.3% | |
0.625%, 4/22/2025 | | | 2,000,000 | | | | 2,019,053 | |
2.500%, 4/13/2021 | | | 1,000,000 | | | | 1,014,548 | |
| | | | | | | | |
| | | | | | | 3,033,601 | |
|
Sovereign — 2.9% | |
0.250%, 6/26/2023 | | | 1,250,000 | | | | 1,250,311 | |
0.250%, 8/24/2023 | | | 1,125,000 | | | | 1,125,114 | |
0.420%, 7/27/2023 | | | 1,550,000 | | | | 1,549,845 | |
0.500%, 6/17/2025 | | | 1,000,000 | | | | 1,003,354 | |
0.800%, 6/2/2025 | | | 2,000,000 | | | | 2,000,020 | |
| | | | | | | | |
| | | | | | | 6,928,644 | |
|
U.S. Treasury Bonds & Notes — 12.3% | |
1.500%, 2/28/2023 | | | 2,500,000 | | | | 2,584,961 | |
1.500%, 9/30/2024 | | | 2,500,000 | | | | 2,631,396 | |
1.625%, 4/30/2023 | | | 2,000,000 | | | | 2,078,984 | |
1.750%, 7/31/2024 | | | 2,000,000 | | | | 2,120,977 | |
1.875%, 4/30/2022 | | | 2,000,000 | | | | 2,057,656 | |
2.000%, 5/31/2021 | | | 1,500,000 | | | | 1,520,504 | |
2.000%, 11/30/2022 | | | 1,000,000 | | | | 1,041,836 | |
2.125%, 12/31/2022 | | | 2,000,000 | | | | 2,092,422 | |
2.125%, 2/29/2024 | | | 1,000,000 | | | | 1,068,008 | |
2.250%, 1/31/2024 | | | 1,000,000 | | | | 1,070,859 | |
2.375%, 4/15/2021 | | | 2,000,000 | | | | 2,027,626 | |
2.625%, 7/15/2021 | | | 1,000,000 | | | | 1,021,456 | |
2.750%, 8/15/2021 | | | 2,000,000 | | | | 2,049,413 | |
2.750%, 7/31/2023 | | | 2,000,000 | | | | 2,151,562 | |
2.750%, 8/31/2023 | | | 1,750,000 | | | | 1,886,172 | |
2.750%, 11/15/2023 | | | 1,500,000 | | | | 1,624,219 | |
| | | | | | | | |
| | | | | | | 29,028,051 | |
| | | | | | | | |
Total U.S. Government & U.S. Government Agency Obligations
(identified cost $40,934,531) | | | | 42,002,613 | |
| | | | | | | | |
| U.S. Government Agency-Mortgage Securities — 2.2% | |
|
Federal Home Loan Mortgage Corporation — 0.9% | |
3.000%, 12/9/2022 | | | 2,000,000 | | | | 2,127,073 | |
|
Federal Home Loan Mortgage Corporation — 1.0% | |
1.370%, 3/11/2025 | | | 2,300,000 | | | | 2,310,155 | |
|
Federal National Mortgage Association — 0.3% | |
3.500%, 4/1/2026, (AH9345) | | | 56,054 | | | | 59,296 | |
4.000%, 11/1/2031, (MA0908) | | | 268,074 | | | | 290,259 | |
5.500%, 11/1/2033, (555880) | | | 77,737 | | | | 91,440 | |
5.500%, 2/1/2034 | | | 57,552 | | | | 67,785 | |
5.500%, 8/1/2037 | | | 128,025 | | | | 150,829 | |
| | | | | | | | |
| | | | | | | 659,609 | |
|
Government National Mortgage Association — 0.0% | |
7.500%, 8/15/2037, (668905) | | | 12,332 | | | | 12,731 | |
| | | | | | | | |
| Total U.S. Government Agency-Mortgage Securities | |
(identified cost $4,946,038) | | | | 5,109,568 | |
| | | | | | | | |
| Short-Term Investments — 15.3% | |
|
Certificates of Deposit — 1.1% | |
MUFG Bank, Ltd., 0.709%
(LIBOR 3 Month + 46 basis points), 2/4/2021 (6) | | | 1,500,000 | | | | 1,500,000 | |
(See Notes to Schedules of Investments and Notes to Financial Statements, which are an integral part of the Financial Statements)
60
Short-Term Income Fund (continued)
| | | | | | | | |
| Description | | Shares or
Principal
Amount | | | Value | |
| Short-Term Investments (continued) | |
|
Certificates of Deposit (continued) | |
Sumitomo Mitsui Banking Corp., 0.659% (LIBOR 3 Month + 36 basis points), 4/6/2021 (6) | | $ | 1,000,000 | | | $ | 1,000,742 | |
| | | | | | | | |
| | | | | | | 2,500,742 | |
|
| Collateral Pool Investments for Securities on Loan — 11.2% | |
| | |
Collateral pool allocation (3) | | | | | | | 26,622,189 | |
|
| Mutual Funds — 3.0% | |
BMO Institutional Prime Money Market Fund — Premier Class, 0.130% (4) | | | 7,070,063 | | | | 7,069,356 | |
| | | | | | | | |
Total Short-Term Investments
(identified cost $36,193,702) | | | | | | | 36,192,287 | |
| | | | | | | | |
Total Investments — 110.0%
(identified cost $254,899,909) | | | | | | | 260,390,274 | |
| Other Assets and Liabilities — (10.0)% | | | | (23,703,125 | ) |
| | | | | | | | |
| Total Net Assets — 100.0% | | | | | | $ | 236,687,149 | |
| | | | | | | | |
Intermediate Tax-Free Fund*
| | | | | | | | |
| Description | | Principal
Amount | | | Value | |
| Municipals — 98.6% | | | | | | |
| | |
Alabama — 2.3% | | | | | | | | |
Black Belt Energy Gas District, 4.000%, 10/01/2049,
Call 7/1/2026 (6) | | $ | 11,500,000 | | | $ | 13,383,700 | |
Other Securities | | | 27,330,000 | | | | 30,248,726 | |
| | | | | | | | |
| | | | | | | 43,632,426 | |
| | |
Alaska — 0.4% | | | | | | | | |
Other Securities | | | 6,850,000 | | | | 7,617,288 | |
|
Arizona — 2.6% | |
Chandler Industrial Development Authority, 5.000%, 6/01/2049 (6) | | | 5,000,000 | | | | 5,779,400 | |
Other Securities | | | 39,675,000 | | | | 42,410,374 | |
| | | | | | | | |
| | | | | | | 48,189,774 | |
|
Arkansas — 0.6% | |
Other Securities | | | 10,175,000 | | | | 10,895,168 | |
|
California — 6.1% | |
San Francisco City & County Airport Comm-San Francisco International Airport,
5.000%, 5/01/2045,
Call 5/1/2029 | | | 13,500,000 | | | | 16,367,670 | |
Other Securities | | | 99,635,000 | | | | 97,695,993 | |
| | | | | | | | |
| | | | | | | 114,063,663 | |
| | |
Colorado — 3.1% | | | | | | | | |
City & County of Denver,
5.000%, 8/01/2041,
Call 8/1/2026 | | | 8,000,000 | | | | 9,557,120 | |
City & County of Denver Airport System Revenue,
5.000%, 11/15/2030,
Call 11/15/2027 | | | 5,010,000 | | | | 6,175,126 | |
Other Securities | | | 37,180,000 | | | | 41,686,295 | |
| | | | | | | | |
| | | | | | | 57,418,541 | |
| | | | | | | | |
| Description | | Principal
Amount | | | Value | |
| Municipals (continued) | | | | | | |
| | |
Connecticut — 2.2% | | | | | | | | |
Connecticut State Health & Educational Facilities Authority, 4.000%, 7/01/2038,
Call 7/1/2029 | | $ | 5,430,000 | | | $ | 5,998,195 | |
Other Securities | | | 29,555,000 | | | | 35,744,291 | |
| | | | | | | | |
| | | | | | | 41,742,486 | |
| | |
Delaware — 0.4% | | | | | | | | |
Other Securities | | | 6,795,000 | | | | 7,463,739 | |
|
District of Columbia — 1.0% | |
Washington Metropolitan Area Transit Authority,
4.000%, 7/15/2040,
Call 7/15/2030 | | | 6,370,000 | | | | 7,588,454 | |
Other Securities | | | 10,845,000 | | | | 11,752,202 | |
| | | | | | | | |
| | | | | | | 19,340,656 | |
| | |
Florida — 5.0% | | | | | | | | |
County of Orange Sales Tax Revenue, 5.000%, 1/01/2027,
Call 1/1/2022 | | | 5,810,000 | | | | 6,181,956 | |
Sarasota County Public Hospital District, 5.000%, 7/01/2041,
Call 7/1/2028 | | | 5,000,000 | | | | 6,050,000 | |
Volusia County Educational Facility Authority, 5.000%, 10/15/2044, Call 10/15/2029 | | | 5,850,000 | | | | 7,178,886 | |
Other Securities | | | 67,150,000 | | | | 74,203,168 | |
| | | | | | | | |
| | | | | | | 93,614,010 | |
| | |
Georgia — 5.4% | | | | | | | | |
Gainesville & Hall County Hospital Authority, 4.000%, 2/15/2040, Call 2/15/2030 | | | 7,000,000 | | | | 8,041,880 | |
Main Street Natural Gas, Inc. | | | | | | | | |
0.730%, (SIFMA Municipal Swap Index Yield),
8/01/2048, Call 9/1/2023 (6) | | | 10,000,000 | | | | 9,980,400 | |
0.865%, (LIBOR 1 Month), 4/01/2048, Call 6/1/2023 (6) | | | 11,500,000 | | | | 11,486,775 | |
4.000%, 8/01/2049, Call 9/1/2024 (6) | | | 6,000,000 | | | | 6,817,140 | |
Other Securities | | | 58,690,000 | | | | 64,219,533 | |
| | | | | | | | |
| | | | | | | 100,545,728 | |
| | |
Guam — 0.1% | | | | | | | | |
Other Securities | | | 2,310,000 | | | | 2,606,939 | |
|
Hawaii — 0.1% | |
Other Securities | | | 1,000,000 | | | | 1,123,145 | |
|
Idaho — 0.1% | |
Other Security | | | 1,000,000 | | | | 1,140,470 | |
|
Illinois — 18.0% | |
City of Chicago | | | | | | | | |
5.000%, 1/01/2028 | | | 6,000,000 | | | | 6,838,560 | |
5.000%, 1/01/2040, Call 1/1/2029 | | | 9,400,000 | | | | 10,361,150 | |
5.000%, 1/01/2044, Call 1/1/2029 | | | 11,750,000 | | | | 12,875,650 | |
6.000%, 1/01/2038, Call 1/1/2027 | | | 10,000,000 | | | | 11,543,000 | |
Illinois Finance Authority | | | | | | | | |
5.000%, 5/15/2043, Call 11/15/2028 | | | 5,000,000 | | | | 5,986,800 | |
5.000%, 1/01/2044, Call 1/1/2028 | | | 5,000,000 | | | | 5,865,150 | |
(See Notes to Schedules of Investments and Notes to Financial Statements, which are an integral part of the Financial Statements)
61
August 31, 2020
Intermediate Tax-Free Fund* (continued)
| | | | | | | | |
| Description | | Principal
Amount | | | Value | |
| Municipals (continued) | | | | | | |
|
Illinois (continued) | |
Illinois Housing Development Authority, GNMA/FNMA/FHLMC, 3.750%, 4/01/2050, Call 4/1/2029 | | $ | 4,960,000 | | | $ | 5,565,219 | |
Illinois State Toll Highway Authority, 5.000%, 12/01/2032, Call 1/1/2026 | | | 7,790,000 | | | | 9,302,117 | |
Sales Tax Securitization Corp., 5.250%, 1/01/2043, Call 1/1/2029 | | | 5,000,000 | | | | 5,864,050 | |
State of Illinois | | | | | | | | |
5.000%, 2/01/2026 | | | 7,000,000 | | | | 7,869,890 | |
5.000%, 6/01/2026 | | | 5,000,000 | | | | 5,644,600 | |
5.000%, 10/01/2029, Call 10/1/2028 | | | 5,000,000 | | | | 5,749,400 | |
5.000%, 6/15/2034, Call 6/15/2028 | | | 5,000,000 | | | | 5,823,550 | |
Other Securities | | | 214,433,792 | | | | 236,821,194 | |
| | | | | | | | |
| | | | | | | 336,110,330 | |
| | |
Indiana — 1.9% | | | | | | | | |
Other Securities | | | 32,805,000 | | | | 34,532,913 | |
|
Iowa — 0.5% | |
Other Securities | | | 8,983,000 | | | | 9,516,241 | |
|
Kansas — 0.3% | |
Other Securities | | | 5,495,000 | | | | 5,608,479 | |
|
Kentucky — 1.9% | |
Kentucky Public Energy Authority, 1.235%, (LIBOR 1 Month), 12/01/2049,
Call 3/1/2025 (6) | | | 7,000,000 | | | | 7,013,790 | |
Other Securities | | | 23,200,000 | | | | 27,465,911 | |
| | | | | | | | |
| | | | | | | 34,479,701 | |
| | |
Louisiana — 1.2% | | | | | | | | |
Other Securities | | | 21,140,000 | | | | 22,419,521 | |
|
Maine — 0.4% | |
Other Securities | | | 6,415,000 | | | | 7,170,873 | |
|
Maryland — 0.4% | |
Other Securities | | | 7,305,000 | | | | 7,405,129 | |
|
Massachusetts — 1.5% | |
Massachusetts Bay Transportation Authority,
5.000%, 7/01/2046, Call 7/1/2027 | | | 4,465,000 | | | | 5,435,200 | |
Massachusetts Transportation Trust Fund Metropolitan Highway System Revenue, 5.000%, 1/01/2039, Call 1/1/2023 (6) | | | 5,000,000 | | | | 5,516,650 | |
Other Securities | | | 14,180,000 | | | | 16,441,627 | |
| | | | | | | | |
| | | | | | | 27,393,477 | |
|
Michigan — 3.5% | |
Other Securities | | | 58,260,000 | | | | 65,604,869 | |
|
Minnesota — 0.3% | |
Other Securities | | | 5,348,694 | | | | 5,842,077 | |
|
Mississippi — 0.8% | |
Other Securities | | | 13,765,000 | | | | 15,297,919 | |
| | | | | | | | |
| Description | | Principal
Amount | | | Value | |
| Municipals (continued) | | | | | | |
|
Missouri — 1.9% | |
Other Securities | | $ | 32,130,000 | | | $ | 34,661,150 | |
|
Nebraska — 0.2% | |
Other Securities | | | 3,620,000 | | | | 3,884,795 | |
|
Nevada — 0.8% | |
Las Vegas Valley Water District, 5.000%, 6/01/2028, Call 6/1/2022 | | | 5,115,000 | | | | 5,507,525 | |
Other Securities | | | 7,830,000 | | | | 9,060,604 | |
| | | | | | | | |
| | | | | | | 14,568,129 | |
|
New Hampshire — 0.2% | |
Other Securities | | | 4,475,000 | | | | 4,590,963 | |
|
New Jersey — 3.2% | |
New Jersey Transportation Trust Fund Authority | | | | | | | | |
New Jersey Transportation Trust Fund Authority, 5.000%, 6/15/2032, Call 12/15/2024 | | | 5,000,000 | | | | 5,536,850 | |
New Jersey Transportation Trust Fund Authority, BAM TCRs, 5.250%, 6/15/2033, Call 6/15/2023 | | | 5,635,000 | | | | 6,127,781 | |
Other Securities | | | 42,625,000 | | | | 47,605,148 | |
| | | | | | | | |
| | | | | | | 59,269,779 | |
|
New Mexico — 0.6% | |
New Mexico Hospital Equipment Loan Council, 5.000%, 7/01/2049, Call 7/1/2026 | | | 5,225,000 | | | | 5,405,942 | |
Other Securities | | | 5,222,276 | | | | 5,324,166 | |
| | | | | | | | |
| | | | | | | 10,730,108 | |
|
New York — 5.2% | |
Metropolitan Transportation Authority, 5.000%, 9/01/2022 | | | 8,390,000 | | | | 8,762,180 | |
New York City Transitional Finance Authority Future Tax Secured Revenue | | | | | | | | |
5.000%, 11/01/2024, Call 11/1/2022 | | | 5,715,000 | | | | 6,298,159 | |
5.000%, 8/01/2036, Call 8/1/2028 | | | 5,555,000 | | | | 6,930,640 | |
New York State Dormitory Authority, 5.000%, 3/15/2027, Call 3/15/2022 | | | 7,555,000 | | | | 8,073,802 | |
Other Securities | | | 58,345,000 | | | | 66,384,016 | |
| | | | | | | | |
| | | | | | | 96,448,797 | |
|
North Carolina — 1.0% | |
Other Securities | | | 21,755,000 | | | | 19,255,316 | |
|
North Dakota — 0.9% | |
Other Securities | | | 15,775,000 | | | | 17,072,475 | |
|
Ohio — 3.4% | |
Eclipse Funding Trust,
0.190%, 10/01/2040, Call 10/1/2026 (5)(6) | | | 6,200,000 | | | | 6,200,000 | |
Other Securities | | | 53,760,000 | | | | 57,413,995 | |
| | | | | | | | |
| | | | | | | 63,613,995 | |
|
Oklahoma — 0.6% | |
Other Securities | | | 10,760,000 | | | | 11,397,085 | |
(See Notes to Schedules of Investments and Notes to Financial Statements, which are an integral part of the Financial Statements)
62
Intermediate Tax-Free Fund* (continued)
| | | | | | | | |
| Description | | Principal
Amount | | | Value | |
| Municipals (continued) | | | | | | |
|
Oregon — 0.6% | |
Other Securities | | $ | 10,245,000 | | | $ | 10,580,259 | |
|
Pennsylvania — 3.6% | |
Pennsylvania Turnpike Commission, 5.000%, 6/01/2042, Call 6/1/2027 | | | 5,450,000 | | | | 6,375,355 | |
Other Securities | | | 54,400,000 | | | | 60,501,661 | |
| | | | | | | | |
| | | | | | | 66,877,016 | |
|
Rhode Island — 0.4% | |
Other Securities | | | 7,105,000 | | | | 7,414,624 | |
|
South Carolina — 1.5% | |
Patriots Energy Group Financing Agency, 0.975%, (LIBOR 1 Month), 10/01/2048, Call 11/1/2023 (6) | | | 8,000,000 | | | | 8,009,280 | |
Other Securities | | | 18,295,000 | | | | 20,022,246 | |
| | | | | | | | |
| | | | | | | 28,031,526 | |
|
South Dakota — 0.6% | |
Other Securities | | | 9,855,000 | | | | 10,538,142 | |
|
Tennessee — 1.9% | |
Knox County Health Educational & Housing Facility Board, 5.000%, 1/01/2042, Call 1/1/2027 | | | 5,815,000 | | | | 6,773,021 | |
Tennessee Energy Acquisition Corp., 5.000%, 2/01/2023 | | | 5,310,000 | | | | 5,864,258 | |
Tennessee Housing Development Agency, 3.500%, 7/01/2050, Call 7/1/2029 | | | 5,880,000 | | | | 6,587,717 | |
Other Securities | | | 15,255,000 | | | | 16,268,460 | |
| | | | | | | | |
| | | | | | | 35,493,456 | |
|
Texas — 5.7% | |
City of Houston Airport System Revenue, 5.000%, 7/01/2038, Call 7/1/2028 | | | 5,000,000 | | | | 6,105,550 | |
North Texas Tollway Authority,
5.000%, 1/01/2048, Call 1/1/2028 | | | 5,000,000 | | | | 6,043,250 | |
Tarrant County Cultural Education Facilities Finance Corp.,
5.000%, 5/15/2045, Call 5/15/2024 | | | 5,145,000 | | | | 5,415,473 | |
Other Securities | | | 78,905,000 | | | | 88,712,340 | |
| | | | | | | | |
| | | | | | | 106,276,613 | |
|
U. S. Virgin Islands — 0.2% | |
Other Securities | | | 3,320,000 | | | | 3,746,156 | |
|
Utah — 0.5% | |
Other Securities | | | 7,630,000 | | | | 8,371,361 | |
|
Vermont — 0.0% | |
Other Security | | | 515,000 | | | | 545,776 | |
|
Virginia — 0.5% | |
Other Securities | | | 8,650,000 | | | | 9,728,763 | |
|
Washington — 1.7% | |
FYI Properties,
5.000%, 6/01/2031, Call 6/1/2028 | | | 5,000,000 | | | | 6,256,650 | |
| | | | | | | | |
| Description | | Principal
Amount | | | Value | |
| Municipals (continued) | | | | | | |
|
Washington (continued) | |
Other Securities | | $ | 22,690,000 | | | $ | 24,773,261 | |
| | | | | | | | |
| | | | | | | 31,029,911 | |
|
West Virginia — 0.5% | |
Other Securities | | | 8,435,000 | | | | 10,034,433 | |
|
Wisconsin — 2.7% | |
Wisconsin Health & Educational Facilities Authority, 5.000%, 8/15/2032, Call 8/15/2022 | | | 5,000,000 | | | | 5,463,400 | |
Other Securities | | | 44,845,000 | | | | 44,346,301 | |
| | | | | | | | |
| | | | | | | 49,809,701 | |
|
Wyoming — 0.1% | |
Other Security | | | 1,000,000 | | | | 1,025,700 | |
| | | | | | | | |
Total Municipals
(identified cost $1,725,091,411) | | | | 1,835,771,591 | |
| | | | | | | | |
| Mutual Funds — 0.5% | |
Nuveen New York AMT-Free Municipal Credit Income Fund,
0.920%, 3/01/2029 (6) | | | 10,000,000 | | | | 10,000,000 | |
| | | | | | | | |
Total Mutual Funds
(identified cost $10,000,000) | | | | | | | 10,000,000 | |
| | | | | | | | |
| Short-Term Investments — 0.1% | |
|
| Repurchase Agreements — 0.1% | |
Other Security | | | 2,334,710 | | | | 2,334,710 | |
| | | | | | | | |
Total Short-Term Investments
(identified cost $2,334,710) | | | | | | | 2,334,710 | |
| | | | | | | | |
Total Investments — 99.2%
(identified cost $1,737,426,121) | | | | 1,848,106,301 | |
| Other Assets — 0.8% | | | | | | | 14,930,924 | |
| | | | | | | | |
| Net Assets — 100.0% | | | | | | $ | 1,863,037,225 | |
| | | | | | | | |
Strategic Income Fund
| | | | | | | | |
| Description | | Principal
Amount | | | Value | |
| Asset-Backed Securities — 0.2% | |
|
Federal Home Loan Mortgage Corporation — 0.2% | |
0.301% (LIBOR 1 Month + 13 basis points), 8/25/2031, (Series T-32) (6) | | $ | 152,005 | | | $ | 151,531 | |
| | | | | | | | |
Total Asset-Backed Securities (identified cost $152,005) | | | | | | | 151,531 | |
| | | | | | | | |
| Collateralized Mortgage Obligations — 10.9% | |
|
Federal National Mortgage Association — 0.4% | |
0.571% (LIBOR 1 Month + 40 basis points), 4/25/2034, (Series 2004-25) (6) | | | 90,768 | | | | 90,997 | |
4.000%, 3/25/2041, (Series 2012-21) | | | 158,125 | | | | 168,202 | |
| | | | | | | | |
| | | | | | | 259,199 | |
|
Private Sponsor — 9.8% | |
Alternative Loan Trust, Class 1A1, (Series 2004-24CB), 6.000%, 11/25/2034 | | | 519,596 | | | | 528,503 | |
Banc of America Funding Trust, Class 2A1, (Series 2005-5), 5.500%, 9/25/2035 | | | 186,188 | | | | 207,846 | |
(See Notes to Schedules of Investments and Notes to Financial Statements, which are an integral part of the Financial Statements)
63
August 31, 2020
Strategic Income Fund (continued)
| | | | | | | | |
| Description | | Principal
Amount | | | Value | |
| Collateralized Mortgage Obligations (continued) | |
|
Private Sponsor (continued) | |
Chase Mortgage Finance Trust: | | | | | | | | |
Class 7A1, (Series 2007-A2), 3.105%, 7/25/2037 (6) | | $ | 302,730 | | | $ | 268,690 | |
Class A1, (Series 2005-S2), 5.500%, 10/25/2035 | | | 331,141 | | | | 326,439 | |
ChaseFlex Trust , Class 4A3, (Series 2005-2), 6.000%, 5/25/2020 | | | 15,059 | | | | 10,529 | |
FREMF Mortgage Trust: | | | | | | | | |
Class B, (Series 2019-K91), 4.252%, 4/25/2051 (5)(6) | | | 1,000,000 | | | | 1,161,492 | |
Class B, (Series 2019-K95), 3.919%, 8/25/2052 (5)(6) | | | 1,000,000 | | | | 1,128,518 | |
Class C, (Series 2018-K77), 4.160%, 5/25/2051 (5)(6) | | | 1,000,000 | | | | 1,076,634 | |
GSR Mortgage Loan Trust, Class 2A4, (Series 2007-1F), 5.500%, 1/25/2037 | | | 70,115 | | | | 79,093 | |
Morgan Stanley Mortgage Loan Trust, Class 2A2, (Series 2004-10AR), 3.671%, 11/25/2034 (6) | | | 241,730 | | | | 240,731 | |
Residential Asset Securitization Trust, Class A4, (Series 2005-A8CB), 5.500%, 7/25/2035 | | | 570,104 | | | | 500,591 | |
RFMSI Trust, Class A2, (Series 2006-S4), 6.000%, 4/25/2036 | | | 337,937 | | | | 327,335 | |
Structured Adjustable Rate Mortgage Loan Trust, Class 1A2, (Series 2004-18), 3.425%, 12/25/2034 (6) | | | 329,668 | | | | 316,048 | |
Wells Fargo Mortgage Backed Securities Trust: | | | | | | | | |
Class A1, (Series 2006-AR19), 4.300%, 12/25/2036 (6) | | | 366,369 | | | | 333,504 | |
Class A1, (Series 2007-15), 6.000%, 11/25/2037 | | | 303,854 | | | | 284,034 | |
Class A6, (Series 2007-7), 6.000%, 6/25/2037 | | | 179,565 | | | | 168,807 | |
| | | | | | | | |
| | | | | | | 6,958,794 | |
|
WL Collateral CMO — 0.7% | |
Federal National Mortgage Association, Class 2M2, (Series 2016-C07), 4.522% (LIBOR 1 Month + 435 basis points), 5/25/2029 (6) | | | 508,173 | | | | 527,572 | |
| | | | | | | | |
Total Collateralized Mortgage Obligations
(identified cost $7,389,264) | | | | 7,745,565 | |
| | | | | | | | |
| Commercial Mortgage Securities — 4.3% | |
|
Private Sponsor — 4.3% | |
BANK, Class A4, (Series 2018-BN15), 4.407%, 11/15/2061 (6) | | | 750,000 | | | | 907,993 | |
Commercial Mortgage Trust, Class D, (Series 2013-CR12), 5.071%, 10/10/2046 (5)(6) | | | 500,000 | | | | 276,496 | |
GS Mortgage Securities Trust, Class D, (Series 2013-GC16), 5.311%, 11/10/2046 (5)(6) | | | 300,000 | | | | 270,317 | |
| | | | | | | | |
| Description | | Principal
Amount | | | Value | |
| Commercial Mortgage Securities (continued) | |
|
Private Sponsor (continued) | |
Wells Fargo Commercial Mortgage Trust: | | | | | | | | |
Class B, (Series 2015-C26), 3.783%, 2/15/2048 | | $ | 750,000 | | | $ | 759,062 | |
Class D, (Series 2015-C26), 3.586%, 2/15/2048 (5) | | | 720,000 | | | | 573,489 | |
WFRBS Commercial Mortgage Trust, Class D, (Series 2013-C16), 5.021%, 9/15/2046 (5)(6) | | | 485,000 | | | | 285,742 | |
| | | | | | | | |
Total Commercial Mortgage Securities
(identified cost $2,985,264) | | | | 3,073,099 | |
| | | | | | | | |
| Corporate Bonds & Notes — 79.9% | |
|
Aerospace/Defense — 1.3% | |
Boeing Co., 4.875%, 5/1/2025 | | | 350,000 | | | | 381,240 | |
Howmet Aerospace, Inc., 6.875%, 5/1/2025 | | | 250,000 | | | | 284,451 | |
Spirit AeroSystems, Inc., 7.500%, 4/15/2025 (2)(5) | | | 250,000 | | | | 252,812 | |
| | | | | | | | |
| | | | | | | 918,503 | |
|
Agriculture — 2.5% | |
Altria Group, Inc., 5.950%, 2/14/2049 | | | 500,000 | | | | 680,784 | |
Bunge, Ltd. Finance Corp., 4.350%, 3/15/2024 | | | 500,000 | | | | 549,939 | |
Imperial Brands Finance PLC, 3.500%, 7/26/2026 (5) | | | 500,000 | | | �� | 545,464 | |
| | | | | | | | |
| | | | | | | 1,776,187 | |
|
Airlines — 1.5% | |
American Airlines, Inc., 11.750%, 7/15/2025 (5) | | | 500,000 | | | | 481,003 | |
Delta Air Lines, Inc.: | | | | | | | | |
2.900%, 10/28/2024 (2) | | | 500,000 | | | | 459,415 | |
3.750%, 10/28/2029 | | | 150,000 | | | | 134,018 | |
| | | | | | | | |
| | | | | | | 1,074,436 | |
|
Auto Manufacturers — 1.8% | |
Ford Motor Co., 4.750%, 1/15/2043 (2) | | | 500,000 | | | | 464,062 | |
General Motors Financial Co., Inc., 1.618% (LIBOR 3 Month + 131 basis points), 6/30/2022 (6) | | | 500,000 | | | | 499,181 | |
Navistar International Corp., 9.500%, 5/1/2025 (5) | | | 250,000 | | | | 285,625 | |
| | | | | | | | |
| | | | | | | 1,248,868 | |
|
Banks — 2.2% | |
Banco Nacional de Costa Rica, 6.250%, 11/1/2023 (5) | | | 1,000,000 | | | | 1,023,000 | |
CIT Group, Inc., 3.929% (SOFR + 383 basis points), 6/19/2024 | | | 500,000 | | | | 516,775 | |
| | | | | | | | |
| | | | | | | 1,539,775 | |
|
Beverages — 1.1% | |
Molson Coors Beverage Co., 4.200%, 7/15/2046 | | | 750,000 | | | | 779,946 | |
|
Biotechnology — 0.5% | |
Regeneron Pharmaceuticals, Inc., 1.750%, 9/15/2030 | | | 350,000 | | | | 343,610 | |
|
Building Materials — 0.5% | |
Cemex SAB de C.V., 7.375%, 6/5/2027 (5) | | | 350,000 | | | | 379,969 | |
(See Notes to Schedules of Investments and Notes to Financial Statements, which are an integral part of the Financial Statements)
64
Strategic Income Fund (continued)
| | | | | | | | |
| Description | | Principal
Amount | | | Value | |
| Corporate Bonds & Notes (continued) | |
|
Chemicals — 3.3% | |
Braskem Netherlands Finance BV, 4.500%, 1/10/2028 (5) | | $ | 500,000 | | | $ | 489,063 | |
Nouryon Holding BV, 8.000%, 10/1/2026 (2)(5) | | | 500,000 | | | | 537,172 | |
OCP SA, 4.500%, 10/22/2025 (5) | | | 750,000 | | | | 795,112 | |
Syngenta Finance NV, 4.892%, 4/24/2025 (5) | | | 500,000 | | | | 541,300 | |
| | | | | | | | |
| | | | | | | 2,362,647 | |
|
Commercial Services — 3.9% | |
Element Fleet Management Corp., 3.850%, 6/15/2025 (5) | | | 350,000 | | | | 369,909 | |
Howard University, 2.801%, 10/1/2023 | | | 250,000 | | | | 256,822 | |
Refinitiv US Holdings, Inc., 8.250%, 11/15/2026 (5) | | | 750,000 | | | | 827,812 | |
United Rentals North America, Inc., 5.500%, 5/15/2027 | | | 750,000 | | | | 804,731 | |
WW International, Inc., 8.625%, 12/1/2025 (5) | | | 500,000 | | | | 527,813 | |
| | | | | | | | |
| | | | | | | 2,787,087 | |
|
Computers — 2.0% | |
Dell International LLC, 5.300%, 10/1/2029 (2)(5) | | | 750,000 | | | | 856,997 | |
Seagate HDD Cayman: | | | | | | | | |
4.091%, 6/1/2029 (5) | | | 270,000 | | | | 289,989 | |
4.875%, 6/1/2027 | | | 253,000 | | | | 283,396 | |
| | | | | | | | |
| | | | | | | 1,430,382 | |
|
Diversified Financial Services — 3.6% | |
Ally Financial, Inc., 5.750%, 11/20/2025 | | | 400,000 | | | | 448,908 | |
Cantor Fitzgerald LP, 4.875%, 5/1/2024 (2)(5) | | | 500,000 | | | | 548,907 | |
Jefferies Finance LLC, 7.250%, 8/15/2024 (5) | | | 1,000,000 | | | | 973,645 | |
Raymond James Financial, Inc., 4.650%, 4/1/2030 (2) | | | 500,000 | | | | 609,857 | |
| | | | | | | | |
| | | | | | | 2,581,317 | |
|
Electric — 1.1% | |
Abu Dhabi National Energy Co. PJSC, 4.375%, 4/23/2025 (5) | | | 500,000 | | | | 566,920 | |
Talen Energy Supply LLC, 6.500%, 6/1/2025 | | | 300,000 | | | | 209,969 | |
| | | | | | | | |
| | | | | | | 776,889 | |
|
Electrical Components & Equipment — 0.7% | |
Energizer Holdings, Inc., 4.750%, 6/15/2028 | | | 500,000 | | | | 522,400 | |
|
Electronics — 0.4% | |
Jabil, Inc., 3.000%, 1/15/2031 | | | 250,000 | | | | 254,933 | |
|
Food — 2.8% | |
Albertsons Cos. LLC, 5.750%, 3/15/2025 | | | 500,000 | | | | 515,573 | |
Minerva Luxembourg SA, 6.500%, 9/20/2026 (5) | | | 500,000 | | | | 530,317 | |
Post Holdings, Inc., 5.000%, 8/15/2026 (5) | | | 500,000 | | | | 519,767 | |
Sysco Corp., 5.650%, 4/1/2025 (2) | | | 350,000 | | | | 414,545 | |
| | | | | | | | |
| | | | | | | 1,980,202 | |
| | | | | | | | |
| Description | | Principal
Amount | | | Value | |
| Corporate Bonds & Notes (continued) | |
|
Forest Products & Paper — 1.2% | |
Suzano Austria GmbH, 7.000%, 3/16/2047 (5) | | $ | 750,000 | | | $ | 874,219 | |
|
Healthcare-Services — 0.9% | |
Catalent Pharma Solutions, Inc., 4.875%, 1/15/2026 (2)(5) | | | 634,000 | | | | 648,937 | |
|
Home Furnishings — 1.1% | |
Whirlpool Corp., 4.750%, 2/26/2029 | | | 650,000 | | | | 797,451 | |
|
Insurance — 0.8% | |
Brighthouse Financial, Inc., 5.625%, 5/15/2030 | | | 500,000 | | | | 581,808 | |
|
Internet — 0.4% | |
Expedia Group, Inc., 6.250%, 5/1/2025 (5) | | | 250,000 | | | | 274,973 | |
|
Investment Companies — 2.6% | |
Goldman Sachs BDC, Inc., 3.750%, 2/10/2025 | | | 750,000 | | | | 788,075 | |
Icahn Enterprises LP, 4.750%, 9/15/2024 (2) | | | 500,000 | | | | 517,033 | |
Owl Rock Capital Corp., 5.250%, 4/15/2024 | | | 500,000 | | | | 528,558 | |
| | | | | | | | |
| | | | | | | 1,833,666 | |
|
Iron/Steel — 2.4% | |
ArcelorMittal, 4.550%, 3/11/2026 (2) | | | 750,000 | | | | 822,434 | |
GUSAP III LP, 4.250%, 1/21/2030 (5) | | | 500,000 | | | | 525,155 | |
United States Steel Corp., 6.875%, 8/15/2025 (2) | | | 250,000 | | | | 183,751 | |
Vale Overseas, Ltd., 3.750%, 7/8/2030 | | | 150,000 | | | | 157,725 | |
| | | | | | | | |
| | | | | | | 1,689,065 | |
|
Leisure Time — 0.7% | |
NCL Corp., Ltd., 10.250%, 2/1/2026 | | | 300,000 | | | | 301,500 | |
Royal Caribbean Cruises, Ltd., 5.250%, 11/15/2022 | | | 250,000 | | | | 224,219 | |
| | | | | | | | |
| | | | | | | 525,719 | |
|
Lodging — 0.3% | |
MGM Resorts International, 6.750%, 5/1/2025 | | | 200,000 | | | | 214,315 | |
|
Media — 3.7% | |
AMC Networks, Inc., 5.000%, 4/1/2024 (2) | | | 500,000 | | | | 510,313 | |
Discovery Communications LLC, 3.950%, 3/20/2028 | | | 700,000 | | | | 793,174 | |
Sirius XM Radio, Inc., 5.375%, 7/15/2026 (5) | | | 750,000 | | | | 786,979 | |
Time Warner Cable LLC, 4.500%, 9/15/2042 | | | 500,000 | | | | 561,086 | |
| | | | | | | | |
| | | | | | | 2,651,552 | |
|
Mining — 4.6% | |
Glencore Funding LLC, 4.625%, 4/29/2024 (5) | | | 500,000 | | | | 559,628 | |
Hudbay Minerals, Inc., 7.250%, 1/15/2023 (5) | | | 750,000 | | | | 762,109 | |
Kinross Gold Corp.: | | | | | | | | |
4.500%, 7/15/2027 | | | 825,000 | | | | 944,249 | |
6.875%, 9/1/2041 | | | 750,000 | | | | 985,252 | |
| | | | | | | | |
| | | | | | | 3,251,238 | |
(See Notes to Schedules of Investments and Notes to Financial Statements, which are an integral part of the Financial Statements)
65
August 31, 2020
Strategic Income Fund (continued)
| | | | | | | | |
| Description | | Principal
Amount | | | Value | |
| Corporate Bonds & Notes (continued) | |
|
Miscellaneous Manufacturing — 0.7% | |
Trinity Industries, Inc., 4.550%, 10/1/2024 (2) | | $ | 500,000 | | | $ | 504,000 | |
|
Oil & Gas — 3.6% | |
Aker BP ASA, 6.000%, 7/1/2022 (5) | | | 250,000 | | | | 255,138 | |
Comstock Resources, Inc., 9.750%, 8/15/2026 | | | 500,000 | | | | 533,755 | |
Diamond Offshore Drilling, Inc., 7.875%, 8/15/2025 (7) | | | 750,000 | | | | 77,344 | |
Gulfport Energy Corp., 6.000%, 10/15/2024 (2) | | | 350,000 | | | | 209,344 | |
Oasis Petroleum, Inc., 6.875%, 3/15/2022 | | | 300,000 | | | | 59,250 | |
PBF Holding Co. LLC, 7.250%, 6/15/2025 | | | 750,000 | | | | 714,071 | |
W&T Offshore, Inc., 9.750%, 11/1/2023 (5) | | | 700,000 | | | | 511,525 | |
Whiting Petroleum Corp., 6.625%, 1/15/2026 (7) | | | 750,000 | | | | 177,581 | |
| | | | | | | | |
| | | | | | | 2,538,008 | |
|
Oil & Gas Services — 0.2% | |
Nine Energy Service, Inc., 8.750%, 11/1/2023 (5) | | | 400,000 | | | | 146,626 | |
|
Pharmaceuticals — 3.6% | |
Bausch Health Cos., Inc., 5.000%, 1/30/2028 (5) | | | 500,000 | | | | 494,375 | |
Mylan, Inc., 5.200%, 4/15/2048 | | | 700,000 | | | | 886,715 | |
Teva Pharmaceutical Finance Netherlands III BV: | | | | | | | | |
4.100%, 10/1/2046 (2) | | | 800,000 | | | | 686,600 | |
6.000%, 4/15/2024 (2) | | | 500,000 | | | | 526,162 | |
| | | | | | | | |
| | | | | | | 2,593,852 | |
|
Pipelines — 4.4% | |
Buckeye Partners LP, 4.500%, 3/1/2028 (2) | | | 500,000 | | | | 511,670 | |
Enable Midstream Partners LP, 4.950%, 5/15/2028 | | | 500,000 | | | | 493,046 | |
Energy Transfer Operating LP, 5.150%, 2/1/2043 | | | 750,000 | | | | 702,530 | |
EQM Midstream Partners LP, 4.000%, 8/1/2024 | | | 500,000 | | | | 503,283 | |
Sunoco Logistics Partners Operations LP, 5.400%, 10/1/2047 | | | 900,000 | | | | 894,918 | |
| | | | | | | | |
| | | | | | | 3,105,447 | |
|
Real Estate Investment Trusts — 4.3% | |
Diversified Healthcare Trust, 4.750%, 2/15/2028 (2) | | | 500,000 | | | | 466,981 | |
Host Hotels & Resorts LP, 3.500%, 9/15/2030 | | | 500,000 | | | | 495,193 | |
iStar, Inc., 4.750%, 10/1/2024 | | | 600,000 | | | | 599,565 | |
MPT Operating Partnership LP, 4.625%, 8/1/2029 | | | 500,000 | | | | 534,590 | |
SBA Communications Corp., 4.875%, 9/1/2024 | | | 500,000 | | | | 514,225 | |
Service Properties Trust, 4.950%, 10/1/2029 | | | 500,000 | | | | 448,125 | |
| | | | | | | | |
| | | | | | | 3,058,679 | |
|
Retail — 3.0% | |
Beacon Roofing Supply, Inc., 4.875%, 11/1/2025 (2)(5) | | | 450,000 | | | | 446,933 | |
| | | | | | | | |
| Description | | Principal
Amount | | | Value | |
| Corporate Bonds & Notes (continued) | |
|
Retail (continued) | |
L Brands, Inc., 6.950%, 3/1/2033 (2) | | $ | 500,000 | | | $ | 456,780 | |
New Red Finance, Inc., 4.250%, 5/15/2024 (2)(5) | | | 250,000 | | | | 254,938 | |
QVC, Inc., 4.750%, 2/15/2027 (2) | | | 500,000 | | | | 534,222 | |
Ross Stores, Inc., 4.600%, 4/15/2025 (2) | | | 350,000 | | | | 403,732 | |
| | | | | | | | |
| | | | | | | 2,096,605 | |
|
Semiconductors — 1.8% | |
Broadcom, Inc., 4.750%, 4/15/2029 (5) | | | 600,000 | | | | 704,697 | |
Marvell Technology Group, Ltd., 4.875%, 6/22/2028 | | | 500,000 | | | | 603,366 | |
| | | | | | | | |
| | | | | | | 1,308,063 | |
|
Software — 1.9% | |
Citrix Systems, Inc., 3.300%, 3/1/2030 | | | 500,000 | | | | 533,552 | |
VMware, Inc., 3.900%, 8/21/2027 (2) | | | 750,000 | | | | 833,239 | |
| | | | | | | | |
| | | | | | | 1,366,791 | |
|
Sovereign — 3.9% | |
Argentine Government International Bond: | | | | | | | | |
1.000%, 7/9/2029 | | | 9,405 | | | | 5,185 | |
1.000%, 7/9/2030 | | | 85,626 | | | | 44,526 | |
1.000%, 7/9/2035 | | | 156,873 | | | | 73,338 | |
Costa Rica Government International Bond, 5.625%, 4/30/2043 (5) | | | 800,000 | | | | 678,400 | |
Ivory Coast Government International Bond, 6.125%, 6/15/2033 (5) | | | 750,000 | | | | 758,691 | |
Oman Sovereign Sukuk Co., 4.397%, 6/1/2024 (5) | | | 500,000 | | | | 504,487 | |
Turkiye Ihracat Kredi Bankasi AS, 5.000%, 9/23/2021 (5) | | | 450,000 | | | | 447,271 | |
Zambia Government International Bond, 8.970%, 7/30/2027 (5) | | | 500,000 | | | | 267,111 | |
| | | | | | | | |
| | | | | | | 2,779,009 | |
|
Telecommunications — 2.7% | |
Sprint Communications, Inc., 6.000%, 11/15/2022 | | | 500,000 | | | | 543,125 | |
Telecom Italia SpA, 5.303%, 5/30/2024 (5) | | | 600,000 | | | | 663,291 | |
Turk Telekomunikasyon AS, 4.875%, 6/19/2024 (2)(5) | | | 750,000 | | | | 738,563 | |
| | | | | | | | |
| | | | | | | 1,944,979 | |
| | |
Transportation — 0.9% | | | | | | | | |
Empresa de Transporte de Pasajeros Metro SA, 3.650%, 5/7/2030 (5) | | | 350,000 | | | | 390,031 | |
Pacific National Finance Pty, Ltd., 4.625%, 9/23/2020 (5) | | | 250,000 | | | | 250,400 | |
| | | | | | | | |
| | | | | | | 640,431 | |
| | |
Trucking & Leasing — 1.0% | | | | | | | | |
Fly Leasing, Ltd., 6.375%, 10/15/2021 (2) | | | 750,000 | | | | 705,116 | |
| | | | | | | | |
Total Corporate Bonds & Notes
(identified cost $55,651,751) | | | | 56,887,700 | |
| | | | | | | | |
(See Notes to Schedules of Investments and Notes to Financial Statements, which are an integral part of the Financial Statements)
66
Strategic Income Fund (continued)
| | | | | | | | |
| Description | | Shares or
Principal
Amount | | | Value | |
| U.S. Government Agency-Mortgage Securities — 2.3% | |
|
Federal Home Loan Mortgage Corporation — 0.5% | |
3.500%, 4/1/2042 | | $ | 51,621 | | | $ | 56,697 | |
4.500%, 7/1/2040 | | | 17,704 | | | | 19,807 | |
5.000%, 12/1/2022 | | | 21,891 | | | | 23,088 | |
5.000%, 1/1/2040 | | | 158,076 | | | | 182,126 | |
5.500%, 10/1/2021 | | | 9,787 | | | | 9,882 | |
5.500%, 7/1/2035 | | | 30,733 | | | | 36,021 | |
6.000%, 12/1/2036 | | | 14,069 | | | | 16,553 | |
6.000%, 12/1/2037 | | | 4,614 | | | | 5,150 | |
7.500%, 4/1/2024 | | | 11,228 | | | | 12,127 | |
7.500%, 4/1/2027 | | | 9,500 | | | | 10,768 | |
8.000%, 8/1/2030 | | | 12,470 | | | | 14,943 | |
8.500%, 9/1/2024 | | | 5,283 | | | | 5,734 | |
9.500%, 2/1/2025 | | | 129 | | | | 130 | |
| | | | | | | | |
| | | | | | | 393,026 | |
|
Federal National Mortgage Association — 1.5% | |
3.000%, 8/1/2032 | | | 140,842 | | | | 151,379 | |
4.000%, 3/1/2041 | | | 202,007 | | | | 224,303 | |
5.500%, 1/1/2023 | | | 32,272 | | | | 35,710 | |
5.500%, 2/1/2036 | | | 90,427 | | | | 106,521 | |
6.000%, 9/1/2021 | | | 23,842 | | | | 24,238 | |
6.500%, 8/1/2030 | | | 200,923 | | | | 226,573 | |
6.500%, 12/1/2031 | | | 12,411 | | | | 14,117 | |
6.500%, 11/1/2037 | | | 26,516 | | | | 30,165 | |
7.000%, 3/1/2029 | | | 24,533 | | | | 28,800 | |
7.000%, 7/1/2029 | | | 68,158 | | | | 76,980 | |
7.000%, 2/1/2030 | | | 49,936 | | | | 56,165 | |
7.500%, 10/1/2030 | | | 6,337 | | | | 6,843 | |
8.000%, 10/1/2028 | | | 74,056 | | | | 83,255 | |
8.000%, 4/1/2030 | | | 20,122 | | | | 24,640 | |
| | | | | | | | |
| | | | | | | 1,089,689 | |
|
Government National Mortgage Association — 0.3% | |
5.000%, 4/15/2034 | | | 146,755 | | | | 166,542 | |
7.000%, 8/15/2031 | | | 24,814 | | | | 29,169 | |
9.500%, 10/15/2024 | | | 12 | | | | 11 | |
| | | | | | | | |
| | | | | | | 195,722 | |
| | | | | | | | |
Total U.S. Government Agency-Mortgage Securities
| |
(identified cost $1,531,864) | | | | | | | 1,678,437 | |
| | | | | | | | |
| Short-Term Investments — 12.2% | | | | |
|
| Collateral Pool Investments for Securities on Loan — 11.2% | |
| | |
Collateral pool allocation (3) | | | | | | | 7,990,849 | |
|
| Mutual Funds — 1.0% | |
BMO Institutional Prime Money Market Fund — Premier Class, 0.130% (4) | | | 702,990 | | | | 702,920 | |
| | | | | | | | |
Total Short-Term Investments
(identified cost $8,693,872) | | | | | | | 8,693,769 | |
| | | | | | | | |
Total Investments — 109.8%
(identified cost $76,404,020) | | | | | | | 78,230,101 | |
| Other Assets and Liabilities — (9.8)% | | | | (7,004,985 | ) |
| | | | | | | | |
| Total Net Assets — 100.0% | | | | | | $ | 71,225,116 | |
| | | | | | | | |
Corporate Income Fund
| | | | | | | | |
| Description | | Principal
Amount | | | Value | |
| Corporate Bonds & Notes — 95.3% | |
|
Aerospace/Defense — 2.1% | |
BAE Systems PLC, 3.400%, 4/15/2030 (5) | | $ | 1,800,000 | | | $ | 2,024,656 | |
Boeing Co.: | | | | | | | | |
2.800%, 3/1/2024 | | | 2,000,000 | | | | 2,039,079 | |
4.875%, 5/1/2025 | | | 2,000,000 | | | | 2,178,512 | |
Spirit AeroSystems, Inc., 7.500%, 4/15/2025 (5) | | | 2,000,000 | | | | 2,022,500 | |
| | | | | | | | |
| | | | | | | 8,264,747 | |
|
Agriculture — 2.2% | |
BAT Capital Corp., 4.540%, 8/15/2047 | | | 2,750,000 | | | | 2,996,065 | |
Bunge, Ltd. Finance Corp.: | | | | | | | | |
3.250%, 8/15/2026 (2) | | | 1,000,000 | | | | 1,074,006 | |
3.750%, 9/25/2027 | | | 1,800,000 | | | | 1,958,775 | |
Imperial Brands Finance PLC, 3.500%, 7/26/2026 (2) (5) | | | 1,750,000 | | | | 1,909,124 | |
Philip Morris International, Inc., 2.900%, 11/15/2021 | | | 1,000,000 | | | | 1,031,288 | |
| | | | | | | | |
| | | | | | | 8,969,258 | |
| | |
Airlines — 0.7% | | | | | | | | |
Delta Air Lines, Inc.: | | | | | | | | |
2.900%, 10/28/2024 (2) | | | 1,960,000 | | | | 1,800,907 | |
3.750%, 10/28/2029 | | | 1,000,000 | | | | 893,453 | |
| | | | | | | | |
| | | | | | | 2,694,360 | |
| | |
Auto Manufacturers — 4.6% | | | | | | | | |
Cummins, Inc., 1.500%, 9/1/2030 (2) | | | 3,000,000 | | | | 2,989,454 | |
Daimler Finance North America LLC: | | | | | | | | |
2.000%, 7/6/2021 (5) | | | 2,500,000 | | | | 2,528,886 | |
3.700%, 5/4/2023 (5) | | | 750,000 | | | | 805,379 | |
Ford Motor Co., 5.291%, 12/8/2046 | | | 2,000,000 | | | | 1,893,750 | |
Ford Motor Credit Co. LLC: | | | | | | | | |
1.576% (LIBOR 3 Month + 127 basis points), 3/28/2022 (6) | | | 750,000 | | | | 722,222 | |
4.134%, 8/4/2025 | | | 1,500,000 | | | | 1,507,650 | |
General Motors Financial Co., Inc.: | | | | | | | | |
4.000%, 1/15/2025 | | | 1,000,000 | | | | 1,077,325 | |
4.350%, 1/17/2027 (2) | | | 1,500,000 | | | | 1,628,038 | |
Hyundai Capital America, 2.650%, 2/10/2025 (5) | | | 2,000,000 | | | | 2,082,235 | |
Navistar International Corp., 9.500%, 5/1/2025 (5) | | | 800,000 | | | | 914,000 | |
Toyota Motor Credit Corp., 3.400%, 4/14/2025 (2) | | | 2,000,000 | | | | 2,235,756 | |
| | | | | | | | |
| | | | | | | 18,384,695 | |
| | |
Banks — 12.8% | | | | | | | | |
Banco Santander SA, 1.826% (LIBOR 3 Month + 156 basis points), 4/11/2022 (6) | | | 2,000,000 | | | | 2,021,060 | |
Bank of America Corp.: | | | | | | | | |
0.947% (LIBOR 3 Month + 65 basis points), 6/25/2022 (6) | | | 1,000,000 | | | | 1,004,550 | |
2.592% (SOFR + 215 basis points), 4/29/2031 (6) | | | 3,500,000 | | | | 3,736,895 | |
3.458% (LIBOR 3 Month + 97 basis points), 3/15/2025 (2) (6) | | | 1,000,000 | | | | 1,094,717 | |
(See Notes to Schedules of Investments and Notes to Financial Statements, which are an integral part of the Financial Statements)
67
August 31, 2020
Corporate Income Fund (continued)
| | | | | | | | |
| Description | | Principal
Amount | | | Value | |
| Corporate Bonds & Notes (continued) | |
| | |
Banks (continued) | | | | | | | | |
Capital One Financial Corp.: | | | | | | | | |
1.263% (LIBOR 3 Month + 95 basis points), 3/9/2022 (6) | | $ | 1,500,000 | | | $ | 1,512,367 | |
3.300%, 10/30/2024 (2) | | | 1,250,000 | | | | 1,361,475 | |
Citigroup, Inc., 1.780% (LIBOR 3 Month + 143 basis points), 9/1/2023 (6) | | | 2,000,000 | | | | 2,033,580 | |
Deutsche Bank AG, 4.250%, 2/4/2021 | | | 2,000,000 | | | | 2,028,247 | |
Goldman Sachs Group, Inc.: | | | | | | | | |
1.354% (LIBOR 3 Month + 111 basis points), 4/26/2022 (6) | | | 1,000,000 | | | | 1,005,312 | |
4.223% (LIBOR 3 Month + 130 basis points), 5/1/2029 (6) | | | 1,250,000 | | | | 1,470,944 | |
HSBC Holdings PLC: | | | | | | | | |
2.020% (LIBOR 3 Month + 166 basis points), 5/25/2021 (6) | | | 1,500,000 | | | | 1,516,356 | |
3.973% (LIBOR 3 Month + 161 basis points), 5/22/2030 (6) | | | 2,150,000 | | | | 2,441,294 | |
JPMorgan Chase & Co.: | | | | | | | | |
2.739% (SOFR + 151 basis points), 10/15/2030 (2) (6) | | | 3,000,000 | | | | 3,258,895 | |
3.509% (LIBOR 3 Month + 95 basis points), 1/23/2029 (2) (6) | | | 1,500,000 | | | | 1,695,761 | |
Lloyds Banking Group PLC, 2.907% (LIBOR 3 Month + 81 basis points), 11/7/2023 (6) | | | 2,000,000 | | | | 2,092,403 | |
Mizuho Financial Group, Inc., 2.953%, 2/28/2022 (2) | | | 2,500,000 | | | | 2,592,969 | |
Morgan Stanley: | | | | | | | | |
2.699% (SOFR + 114 basis points), 1/22/2031 (2) (6) | | | 2,000,000 | | | | 2,160,873 | |
3.737% (LIBOR 3 Month + 85 basis points), 4/24/2024 (2) (6) | | | 2,750,000 | | | | 2,972,662 | |
PNC Financial Services Group, Inc., 2.200%, 11/1/2024 (2) | | | 2,000,000 | | | | 2,133,184 | |
Royal Bank of Canada: | | | | | | | | |
0.964% (LIBOR 3 Month + 66 basis points), 10/5/2023 (6) | | | 2,500,000 | | | | 2,520,157 | |
2.250%, 11/1/2024 (2) | | | 2,000,000 | | | | 2,134,083 | |
Skandinaviska Enskilda Banken AB, 2.800%, 3/11/2022 (2) | | | 2,000,000 | | | | 2,075,089 | |
Wells Fargo & Co.: | | | | | | | | |
1.378% (LIBOR 3 Month + 93 basis points), 2/11/2022 (6) | | | 1,640,000 | | | | 1,645,624 | |
2.572% (LIBOR 3 Month + 100 basis points), 2/11/2031 (2) (6) | | | 2,500,000 | | | | 2,642,376 | |
3.584% (LIBOR 3 Month + 131 basis points), 5/22/2028 (2) (6) | | | 2,000,000 | | | | 2,246,016 | |
| | | | | | | | |
| | | | | | | 51,396,889 | |
| | |
Beverages — 2.4% | | | | | | | | |
Anheuser-Busch Cos. LLC, 4.900%, 2/1/2046 (2) | | | 2,000,000 | | | | 2,477,365 | |
Coca-Cola Co., 1.750%, 9/6/2024 | | | 1,800,000 | | | | 1,890,638 | |
Constellation Brands, Inc., 2.875%, 5/1/2030 (2) | | | 500,000 | | | | 537,866 | |
Fomento Economico Mexicano SAB de C.V., 3.500%, 1/16/2050 | | | 2,500,000 | | | | 2,686,852 | |
| | | | | | | | |
| Description | | Principal
Amount | | | Value | |
| Corporate Bonds & Notes (continued) | |
| | |
Beverages (continued) | | | | | | | | |
Molson Coors Beverage Co., 4.200%, 7/15/2046 (2) | | $ | 2,000,000 | | | $ | 2,079,857 | |
| | | | | | | | |
| | | | | | | 9,672,578 | |
| | |
Biotechnology — 1.3% | | | | | | | | |
Amgen, Inc., 3.150%, 2/21/2040 (2) | | | 1,500,000 | | | | 1,601,688 | |
Biogen, Inc., 2.250%, 5/1/2030 (2) | | | 1,500,000 | | | | 1,544,922 | |
Regeneron Pharmaceuticals, Inc., 2.800%, 9/15/2050 | | | 2,000,000 | | | | 1,922,466 | |
| | | | | | | | |
| | | | | | | 5,069,076 | |
| | |
Building Materials — 0.7% | | | | | | | | |
Carrier Global Corp., 2.242%, 2/15/2025 (5) | | | 2,500,000 | | | | 2,624,654 | |
| | |
Chemicals — 3.7% | | | | | | | | |
Braskem Netherlands Finance BV, 4.500%, 1/10/2028 (2) (5) | | | 1,000,000 | | | | 978,125 | |
Mosaic Co., 4.050%, 11/15/2027 (2) | | | 2,500,000 | | | | 2,775,799 | |
Nouryon Holding BV, 8.000%, 10/1/2026 (2) (5) | | | 1,000,000 | | | | 1,074,345 | |
Nutrien, Ltd., 4.125%, 3/15/2035 | | | 1,000,000 | | | | 1,161,409 | |
OCP SA, 4.500%, 10/22/2025 (5) | | | 2,000,000 | | | | 2,120,298 | |
Orbia Advance Corp SAB de C.V.: | | | | | | | | |
5.875%, 9/17/2044 (5) | | | 500,000 | | | | 585,648 | |
6.750%, 9/19/2042 (5) | | | 1,500,000 | | | | 1,913,318 | |
Sherwin-Williams Co., 3.300%, 5/15/2050 (2) | | | 2,000,000 | | | | 2,153,190 | |
Syngenta Finance NV, 4.892%, 4/24/2025 (5) | | | 2,000,000 | | | | 2,165,199 | |
| | | | | | | | |
| | | | | | | 14,927,331 | |
| | |
Commercial Services — 0.5% | | | | | | | | |
ADT Security Corp., 4.125%, 6/15/2023 | | | 500,000 | | | | 523,445 | |
Element Fleet Management Corp., 3.850%, 6/15/2025 (5) | | | 1,500,000 | | | | 1,585,323 | |
| | | | | | | | |
| | | | | | | 2,108,768 | |
| | |
Computers — 2.0% | | | | | | | | |
Apple, Inc., 3.750%, 11/13/2047 | | | 2,000,000 | | | | 2,432,038 | |
Dell International LLC, 8.350%, 7/15/2046 (5) | | | 2,000,000 | | | | 2,706,399 | |
Hewlett Packard Enterprise Co.: | | | | | | | | |
1.024% (LIBOR 3 Month + 72 basis points), 10/5/2021 (6) | | | 1,700,000 | | | | 1,700,329 | |
4.900%, 10/15/2025 | | | 1,000,000 | | | | 1,156,787 | |
| | | | | | | | |
| | | | | | | 7,995,553 | |
|
Diversified Financial Services — 5.4% | |
Ally Financial, Inc., 4.250%, 4/15/2021 | | | 2,500,000 | | | | 2,542,828 | |
BlackRock, Inc., 2.400%, 4/30/2030 (2) | | | 2,000,000 | | | | 2,189,027 | |
Cantor Fitzgerald LP, 4.875%, 5/1/2024 (5) | | | 2,000,000 | | | | 2,195,626 | |
E*TRADE Financial Corp., 3.800%, 8/24/2027 (2) | | | 1,500,000 | | | | 1,679,537 | |
GE Capital International Funding Co. Unlimited Co., 4.418%, 11/15/2035 (2) | | | 2,500,000 | | | | 2,585,582 | |
Jefferies Finance LLC, 7.250%, 8/15/2024 (5) | | | 1,875,000 | | | | 1,825,585 | |
Jefferies Financial Group, Inc., 6.625%, 10/23/2043 | | | 500,000 | | | | 616,587 | |
(See Notes to Schedules of Investments and Notes to Financial Statements, which are an integral part of the Financial Statements)
68
Corporate Income Fund (continued)
| | | | | | | | |
| Description | | Principal
Amount | | | Value | |
| Corporate Bonds & Notes (continued) | |
|
Diversified Financial Services (continued) | |
Jefferies Group LLC, 6.500%, 1/20/2043 | | $ | 500,000 | | | $ | 635,405 | |
Legg Mason, Inc., 4.750%, 3/15/2026 | | | 500,000 | | | | 595,537 | |
Nasdaq, Inc., 3.250%, 4/28/2050 | | | 1,000,000 | | | | 1,076,513 | |
Nomura Holdings, Inc., 2.648%, 1/16/2025 (2) | | | 850,000 | | | | 896,824 | |
Private Export Funding Corp., 1.750%, 11/15/2024 | | | 2,000,000 | | | | 2,111,959 | |
Synchrony Financial, 3.950%, 12/1/2027 | | | 2,750,000 | | | | 2,902,749 | |
| | | | | | | | |
| | | | | | | 21,853,759 | |
|
Electric — 3.9% | |
Abu Dhabi National Energy Co. PJSC, 4.375%, 4/23/2025 (2) (5) | | | 750,000 | | | | 850,380 | |
AEP Transmission Co. LLC, 3.800%, 6/15/2049 | | | 2,000,000 | | | | 2,414,363 | |
Alabama Power Co.: | | | | | | | | |
3.750%, 3/1/2045 | | | 2,000,000 | | | | 2,358,983 | |
1.450%, 9/15/2030 | | | 2,500,000 | | | | 2,500,165 | |
CenterPoint Energy, Inc., 3.600%, 11/1/2021 | | | 3,000,000 | | | | 3,108,435 | |
Duke Energy Florida LLC, 2.500%, 12/1/2029 (2) | | | 2,000,000 | | | | 2,194,467 | |
Public Service Electric and Gas Co., 3.200%, 8/1/2049 | | | 1,000,000 | | | | 1,127,403 | |
San Diego Gas & Electric Co., 4.100%, 6/15/2049 | | | 1,000,000 | | | | 1,234,020 | |
| | | | | | | | |
| | | | | | | 15,788,216 | |
|
Electronics — 0.8% | |
FLIR Systems, Inc., 2.500%, 8/1/2030 | | | 1,000,000 | | | | 1,027,426 | |
Jabil, Inc., 3.000%, 1/15/2031 (2) | | | 2,000,000 | | | | 2,039,465 | |
| | | | | | | | |
| | | | | | | 3,066,891 | |
|
Engineering & Construction — 0.3% | |
Fluor Corp., 4.250%, 9/15/2028 (2) | | | 1,500,000 | | | | 1,202,520 | |
|
Environmental Control — 0.4% | |
Republic Services, Inc., 1.450%, 2/15/2031 | | | 1,750,000 | | | | 1,729,358 | |
|
Food — 2.6% | |
Conagra Brands, Inc., 3.800%, 10/22/2021 | | | 2,500,000 | | | | 2,594,463 | |
JM Smucker Co., 3.550%, 3/15/2050 | | | 1,500,000 | | | | 1,630,302 | |
Kraft Heinz Foods Co., 4.375%, 6/1/2046 | | | 1,950,000 | | | | 2,003,436 | |
Kroger Co., 4.450%, 2/1/2047 | | | 1,000,000 | | | | 1,233,988 | |
Mars, Inc., 2.375%, 7/16/2040 (5) | | | 2,000,000 | | | | 1,972,502 | |
Sysco Corp., 5.650%, 4/1/2025 (2) | | | 700,000 | | | | 829,090 | |
| | | | | | | | |
| | | | | | | 10,263,781 | |
|
Hand/Machine Tools — 0.3% | |
Snap-on, Inc., 3.100%, 5/1/2050 | | | 1,000,000 | | | | 1,057,708 | |
|
Healthcare-Products — 0.7% | |
Thermo Fisher Scientific, Inc., 3.000%, 4/15/2023 (2) | | | 1,000,000 | | | | 1,062,313 | |
| | | | | | | | |
| Description | | Principal
Amount | | | Value | |
| Corporate Bonds & Notes (continued) | |
|
Healthcare-Products (continued) | |
Zimmer Biomet Holdings, Inc., 3.550%, 4/1/2025 (2) | | $ | 1,500,000 | | | $ | 1,668,182 | |
| | | | | | | | |
| | | | | | | 2,730,495 | |
|
Healthcare-Services — 1.4% | |
Anthem, Inc., 2.250%, 5/15/2030 (2) | | | 3,300,000 | | | | 3,428,293 | |
Laboratory Corp. of America Holdings, 3.250%, 9/1/2024 | | | 2,000,000 | | | | 2,192,003 | |
| | | | | | | | |
| | | | | | | 5,620,296 | |
|
Insurance — 7.0% | |
Allstate Corp., 0.736% (LIBOR 3 Month + 43 basis points), 3/29/2021 (6) | | | 1,445,000 | | | | 1,448,243 | |
Brighthouse Financial, Inc., 5.625%, 5/15/2030 | | | 1,000,000 | | | | 1,163,616 | |
Fidelity National Financial, Inc., 3.400%, 6/15/2030 (2) | | | 1,000,000 | | | | 1,081,788 | |
Five Corners Funding Trust II, 2.850%, 5/15/2030 (5) | | | 1,250,000 | | | | 1,339,012 | |
High Street Funding Trust II, 4.682%, 2/15/2048 (5) | | | 2,500,000 | | | | 2,925,327 | |
Lincoln National Corp., 3.625%, 12/12/2026 (2) | | | 2,000,000 | | | | 2,247,161 | |
Metropolitan Life Global Funding I, 3.450%, 10/9/2021 (2) (5) | | | 3,000,000 | | | | 3,104,999 | |
Nationwide Financial Services, Inc., 3.900%, 11/30/2049 (5) | | | 2,500,000 | | | | 2,579,942 | |
New York Life Insurance Co., 3.750%, 5/15/2050 (2) (5) | | | 1,000,000 | | | | 1,141,771 | |
Prudential Financial, Inc.: | | | | | | | | |
3.700%, 3/13/2051 | | | 2,000,000 | | | | 2,258,663 | |
3.935%, 12/7/2049 | | | 3,000,000 | | | | 3,433,740 | |
Teachers Insurance & Annuity Association of America, 3.300%, 5/15/2050 (5) | | | 2,000,000 | | | | 2,079,938 | |
Unum Group: | | | | | | | | |
4.000%, 3/15/2024 (2) | | | 2,000,000 | | | | 2,170,866 | |
4.000%, 6/15/2029 (2) | | | 1,000,000 | | | | 1,096,198 | |
| | | | | | | | |
| | | | | | | 28,071,264 | |
|
Internet — 2.6% | |
Alibaba Group Holding, Ltd., 2.800%, 6/6/2023 (2) | | | 2,000,000 | | | | 2,117,877 | |
Alphabet, Inc., 2.050%, 8/15/2050 | | | 3,000,000 | | | | 2,869,382 | |
Amazon.com, Inc., 4.050%, 8/22/2047 (2) | | | 1,500,000 | | | | 1,953,031 | |
eBay, Inc., 4.000%, 7/15/2042 (2) | | | 1,500,000 | | | | 1,680,086 | |
Expedia Group, Inc., 6.250%, 5/1/2025 (5) | | | 1,500,000 | | | | 1,649,838 | |
| | | | | | | | |
| | | | | | | 10,270,214 | |
|
Investment Companies — 0.4% | |
Ares Capital Corp., 3.625%, 1/19/2022 (2) | | | 1,500,000 | | | | 1,538,679 | |
|
Iron/Steel — 1.0% | |
Nucor Corp., 4.400%, 5/1/2048 | | | 2,000,000 | | | | 2,559,288 | |
Vale Overseas, Ltd., 3.750%, 7/8/2030 | | | 1,350,000 | | | | 1,419,525 | |
| | | | | | | | |
| | | | | | | 3,978,813 | |
|
Leisure Time — 0.2% | |
Royal Caribbean Cruises, Ltd., 5.250%, 11/15/2022 | | | 1,000,000 | | | | 896,875 | |
(See Notes to Schedules of Investments and Notes to Financial Statements, which are an integral part of the Financial Statements)
69
August 31, 2020
Corporate Income Fund (continued)
| | | | | | | | |
| Description | | Principal
Amount | | | Value | |
| Corporate Bonds & Notes (continued) | |
|
Lodging — 1.1% | |
Hyatt Hotels Corp., 5.375%, 8/15/2021 | | $ | 1,000,000 | | | $ | 1,029,990 | |
MGM Resorts International, 6.750%, 5/1/2025 | | | 1,375,000 | | | | 1,473,416 | |
Wyndham Destinations, Inc., 5.750%, 4/1/2027 (2) | | | 2,000,000 | | | | 2,057,120 | |
| | | | | | | | |
| | | | | | | 4,560,526 | |
|
Machinery-Construction & Mining — 0.6% | |
Caterpillar, Inc., 3.803%, 8/15/2042 (2) | | | 2,000,000 | | | | 2,468,370 | |
|
Machinery-Diversified — 0.4% | |
Westinghouse Air Brake Technologies Corp., 4.400%, 3/15/2024 (2) | | | 1,500,000 | | | | 1,632,122 | |
|
Media — 2.6% | |
Charter Communications Operating LLC, 5.375%, 5/1/2047 | | | 2,000,000 | | | | 2,396,469 | |
Comcast Corp., 4.600%, 10/15/2038 (2) | | | 1,750,000 | | | | 2,254,466 | |
Cox Communications, Inc., 4.600%, 8/15/2047 (5) | | | 1,500,000 | | | | 1,882,750 | |
Discovery Communications LLC, 3.950%, 3/20/2028 (2) | | | 2,000,000 | | | | 2,266,211 | |
ViacomCBS, Inc., 4.375%, 3/15/2043 | | | 1,500,000 | | | | 1,601,585 | |
| | | | | | | | |
| | | | | | | 10,401,481 | |
|
Mining — 1.1% | |
Corp Nacional del Cobre de Chile, 3.750%, 1/15/2031 (5) | | | 600,000 | | | | 668,250 | |
Glencore Funding LLC: | | | | | | | | |
4.125%, 5/30/2023 (2) (5) | | | 2,500,000 | | | | 2,691,174 | |
4.625%, 4/29/2024 (5) | | | 1,000,000 | | | | 1,119,257 | |
| | | | | | | | |
| | | | | | | 4,478,681 | |
|
Miscellaneous Manufacturing — 0.6% | |
Siemens Financieringsmaatschappij NV, 3.300%, 9/15/2046 (5) | | | 2,000,000 | | | | 2,284,051 | |
|
Oil & Gas — 2.7% | |
BP Capital Markets PLC, 1.191% (LIBOR 3 Month + 87 basis points), 9/16/2021 (6) | | | 2,500,000 | | | | 2,517,058 | |
Ecopetrol SA, 7.375%, 9/18/2043 (2) | | | 1,500,000 | | | | 1,941,375 | |
EQT Corp., 3.900%, 10/1/2027 (2) | | | 500,000 | | | | 484,840 | |
Exxon Mobil Corp., 3.095%, 8/16/2049 (2) | | | 1,000,000 | | | | 1,051,307 | |
Occidental Petroleum Corp., 4.300%, 8/15/2039 (2) | | | 1,250,000 | | | | 967,969 | |
Petroleos Mexicanos, 6.875%, 8/4/2026 | | | 1,500,000 | | | | 1,533,517 | |
Shell International Finance BV, 3.750%, 9/12/2046 | | | 1,000,000 | | | | 1,150,890 | |
Valero Energy Corp., 4.000%, 4/1/2029 (2) | | | 1,000,000 | | | | 1,126,893 | |
| | | | | | | | |
| | | | | | | 10,773,849 | |
| | | | | | | | |
| Description | | Principal
Amount | | | Value | |
| Corporate Bonds & Notes (continued) | |
|
Oil & Gas Services — 0.5% | |
Baker Hughes a GE Co. LLC / Baker Hughes Co-Obligor, Inc., 4.080%, 12/15/2047 | | $ | 2,000,000 | | | $ | 2,120,638 | |
|
Pharmaceuticals — 6.6% | |
AbbVie, Inc., 1.024% (LIBOR 3 Month + 65 basis points), 11/21/2022 (5) (6) | | | 550,000 | | | | 552,890 | |
AstraZeneca PLC, 3.500%, 8/17/2023 | | | 2,000,000 | | | | 2,170,263 | |
Bayer US Finance II LLC, 4.875%, 6/25/2048 (5) | | | 2,350,000 | | | | 2,916,698 | |
Bristol-Myers Squibb Co., 2.000%, 8/1/2022 | | | 2,500,000 | | | | 2,578,549 | |
Cigna Corp., 0.949% (LIBOR 3 Month + 65 basis points), 9/17/2021 (6) | | | 1,500,000 | | | | 1,500,338 | |
CVS Health Corp.: | | | | | | | | |
3.250%, 8/15/2029 | | | 2,000,000 | | | | 2,225,442 | |
4.300%, 3/25/2028 | | | 2,500,000 | | | | 2,945,009 | |
Eli Lilly and Co., 3.700%, 3/1/2045 | | | 1,000,000 | | | | 1,223,515 | |
Express Scripts Holding Co., 4.800%, 7/15/2046 | | | 1,500,000 | | | | 1,762,032 | |
Johnson & Johnson, 1.300%, 9/1/2030 (2) | | | 2,200,000 | | | | 2,233,444 | |
Mylan, Inc., 5.200%, 4/15/2048 | | | 1,500,000 | | | | 1,900,103 | |
Shire Acquisitions Investments Ireland DAC: | | | | | | | | |
2.400%, 9/23/2021 | | | 273,000 | | | | 278,543 | |
2.875%, 9/23/2023 | | | 2,000,000 | | | | 2,130,001 | |
Teva Pharmaceutical Finance Netherlands III BV, 4.100%, 10/1/2046 (2) | | | 2,500,000 | | | | 2,145,625 | |
| | | | | | | | |
| | | | | | | 26,562,452 | |
|
Pipelines — 1.8% | |
Enable Midstream Partners LP, 4.950%, 5/15/2028 (2) | | | 3,000,000 | | | | 2,958,276 | |
EQM Midstream Partners LP, 4.000%, 8/1/2024 (2) | | | 1,500,000 | | | | 1,509,848 | |
MPLX LP, 4.800%, 2/15/2029 (2) | | | 1,250,000 | | | | 1,450,813 | |
Sunoco Logistics Partners Operations LP, 5.300%, 4/1/2044 | | | 1,500,000 | | | | 1,427,581 | |
| | | | | | | | |
| | | | | | | 7,346,518 | |
|
Real Estate Investment Trusts — 2.9% | |
EPR Properties, 5.250%, 7/15/2023 | | | 1,000,000 | | | | 1,004,536 | |
Host Hotels & Resorts LP, 3.500%, 9/15/2030 | | | 1,400,000 | | | | 1,386,540 | |
iStar, Inc., 5.500%, 2/15/2026 | | | 2,500,000 | | | | 2,478,650 | |
Kimco Realty Corp., 3.300%, 2/1/2025 | | | 1,250,000 | | | | 1,343,118 | |
Mid-America Apartments LP, 3.600%, 6/1/2027 | | | 2,275,000 | | | | 2,559,869 | |
Prologis LP, 2.250%, 4/15/2030 | | | 1,500,000 | | | | 1,601,348 | |
Service Properties Trust, 4.500%, 3/15/2025 (2) | | | 1,500,000 | | | | 1,402,500 | |
| | | | | | | | |
| | | | | | | 11,776,561 | |
|
Retail — 4.3% | |
Gap, Inc., 8.625%, 5/15/2025 (5) | | | 1,300,000 | | | | 1,454,245 | |
Home Depot, Inc., 4.250%, 4/1/2046 (2) | | | 2,000,000 | | | | 2,569,101 | |
(See Notes to Schedules of Investments and Notes to Financial Statements, which are an integral part of the Financial Statements)
70
Corporate Income Fund (continued)
| | | | | | | | |
| Description | | Principal
Amount | | | Value | |
| Corporate Bonds & Notes (continued) | |
|
Retail (continued) | |
L Brands, Inc., 6.950%, 3/1/2033 (2) | | $ | 1,350,000 | | | $ | 1,233,306 | |
Ross Stores, Inc., 4.600%, 4/15/2025 (2) | | | 2,000,000 | | | | 2,307,038 | |
Starbucks Corp.: | | | | | | | | |
2.550%, 11/15/2030 | | | 1,000,000 | | | | 1,063,076 | |
3.750%, 12/1/2047 | | | 2,000,000 | | | | 2,193,741 | |
Target Corp., 3.625%, 4/15/2046 | | | 2,500,000 | | | | 3,098,242 | |
Walgreens Boots Alliance, Inc., 4.100%, 4/15/2050 (2) | | | 2,000,000 | | | | 2,020,592 | |
Walmart, Inc., 3.700%, 6/26/2028 | | | 1,000,000 | | | | 1,185,076 | |
| | | | | | | | |
| | | | | | | 17,124,417 | |
|
Semiconductors — 1.4% | |
Broadcom, Inc., 4.750%, 4/15/2029 (5) | | | 2,000,000 | | | | 2,348,989 | |
KLA Corp., 3.300%, 3/1/2050 | | | 1,750,000 | | | | 1,875,025 | |
Marvell Technology Group, Ltd., 4.875%, 6/22/2028 | | | 1,000,000 | | | | 1,206,732 | |
| | | | | | | | |
| | | | | | | 5,430,746 | |
|
Software — 2.4% | |
CA, Inc., 4.700%, 3/15/2027 (2) | | | 2,500,000 | | | | 2,770,564 | |
Citrix Systems, Inc., 3.300%, 3/1/2030 (2) | | | 1,000,000 | | | | 1,067,103 | |
Fiserv, Inc., 4.400%, 7/1/2049 (2) | | | 2,000,000 | | | | 2,523,468 | |
Oracle Corp., 4.000%, 11/15/2047 (2) | | | 1,000,000 | | | | 1,186,994 | |
VMware, Inc., 3.900%, 8/21/2027 (2) | | | 2,000,000 | | | | 2,221,973 | |
| | | | | | | | |
| | | | | | | 9,770,102 | |
|
Sovereign — 1.2% | |
Bermuda Government International Bond, 2.375%, 8/20/2030 | | | 2,500,000 | | | | 2,556,250 | |
Export-Import Bank of Korea, 3.000%, 11/1/2022 (2) | | | 2,250,000 | | | | 2,365,357 | |
| | | | | | | | |
| | | | | | | 4,921,607 | |
|
Telecommunications — 2.7% | |
AT&T, Inc.: | | | | | | | | |
4.350%, 6/15/2045 | | | 1,000,000 | | | | 1,148,397 | |
4.500%, 5/15/2035 | | | 2,000,000 | | | | 2,398,975 | |
Colombia Telecomunicaciones SA ESP, 5.375%, 9/27/2022 | | | 450,000 | | | | 452,182 | |
Motorola Solutions, Inc.: | | | | | | | | |
4.600%, 2/23/2028 (2) | | | 1,000,000 | | | | 1,157,886 | |
5.500%, 9/1/2044 (2) | | | 1,000,000 | | | | 1,167,988 | |
Telecom Italia Capital SA, 7.200%, 7/18/2036 | | | 1,500,000 | | | | 1,977,225 | |
Verizon Communications, Inc., 4.522%, 9/15/2048 | | | 2,000,000 | | | | 2,634,695 | |
| | | | | | | | |
| | | | | | | 10,937,348 | |
|
Transportation — 2.1% | |
CSX Corp., 3.800%, 4/15/2050 (2) | | | 1,500,000 | | | | 1,815,453 | |
FedEx Corp., 4.050%, 2/15/2048 (2) | | | 2,500,000 | | | | 2,807,680 | |
Union Pacific Corp., 3.250%, 2/5/2050 (2) | | | 2,000,000 | | | | 2,224,259 | |
| | | | | | | | |
| Description | | Shares or
Principal
Amount | | | Value | |
| Corporate Bonds & Notes (continued) | |
|
Transportation (continued) | |
United Parcel Service, Inc., 5.200%, 4/1/2040 | | $ | 1,000,000 | | | $ | 1,390,182 | |
| | | | | | | | |
| | | | | | | 8,237,574 | |
|
Water — 0.3% | |
American Water Capital Corp., 2.800%, 5/1/2030 | | | 1,000,000 | | | | 1,104,849 | |
| | | | | | | | |
Total Corporate Bonds & Notes
(identified cost $349,443,303) | | | | 382,108,670 | |
| | | | | | | | |
| Short-Term Investments — 19.9% | |
|
| Collateral Pool Investments for Securities on Loan — 15.4% | |
| | |
Collateral pool allocation (3) | | | | | | | 61,602,281 | |
| | |
| Mutual Funds — 4.5% | | | | | | |
BMO Institutional Prime Money Market Fund — Premier Class, 0.130% (4) | | | 18,018,808 | | | | 18,017,006 | |
| | | | | | | | |
Total Short-Term Investments
(identified cost $79,621,127) | | | | 79,619,287 | |
| | | | | | | | |
Total Investments — 115.2%
(identified cost $429,064,430) | | | | 461,727,957 | |
| Other Assets and Liabilities — (15.2)% | | | | (60,946,757 | ) |
| | | | | | | | |
| Total Net Assets — 100.0% | | | | | | $ | 400,781,200 | |
| | | | | | | | |
Core Plus Bond Fund
| | | | | | | | |
| Description | | Principal
Amount | | | Value | |
| Asset-Backed Securities — 1.2% | |
|
Automobiles — 0.1% | |
Nissan Auto Receivables Owner Trust, Class A4, (Series 2016-B), 1.540%, 10/17/2022 | | $ | 1,324,767 | | | $ | 1,326,494 | |
|
Credit Cards — 1.1% | |
Discover Card Execution Note Trust, Class A5, (Series 2018-A5), 3.320%, 3/15/2024 | | | 11,815,000 | | | | 12,196,282 | |
| | | | | | | | |
Total Asset-Backed Securities
(identified cost $13,250,889) | | | | 13,522,776 | |
| | | | | | | | |
| Collateralized Mortgage Obligations — 4.0% | |
|
Federal Home Loan Mortgage Corporation — 2.3% | |
3.244%, 8/25/2027, (Series K068) | | | 6,000,000 | | | | 6,921,602 | |
3.310%, 5/25/2023, (Series K032) (6) | | | 19,000,000 | | | | 20,374,198 | |
| | | | | | | | |
| | | | | | | 27,295,800 | |
|
Federal National Mortgage Association — 1.0% | |
3.370%, 7/25/2028, (Series 2018-M10) (6) | | | 10,000,000 | | | | 11,511,212 | |
|
Private Sponsor — 0.5% | |
FREMF Mortgage Trust: | | | | | | | | |
Class B, (Series 2019-K91), 4.252%, 4/25/2051 (5) (6) | | | 3,500,000 | | | | 4,065,223 | |
Class B, (Series 2019-K95), 3.919%, 8/25/2052 (5) (6) | | | 1,500,000 | | | | 1,692,777 | |
| | | | | | | | |
| | | | | | | 5,758,000 | |
(See Notes to Schedules of Investments and Notes to Financial Statements, which are an integral part of the Financial Statements)
71
August 31, 2020
Core Plus Bond Fund (continued)
| | | | | | | | |
| Description | | Principal
Amount | | | Value | |
| Collateralized Mortgage Obligations (continued) | |
|
WL Collateral CMO — 0.2% | |
Federal National Mortgage Association, Class 2M2, (Series 2016-C07), 4.522% (LIBOR 1 Month + 435 basis points), 5/25/2029 (6) | | $ | 2,117,387 | | | $ | 2,198,216 | |
| | | | | | | | |
Total Collateralized Mortgage Obligations
(identified cost $43,204,621) | | | | 46,763,228 | |
| | | | | | | | |
| Commercial Mortgage Securities — 5.5% | |
|
Private Sponsor — 5.5% | |
BANK: | | | | | | | | |
Class A4, (Series 2018-BN12), 4.255%, 5/15/2061 (6) | | | 7,500,000 | | | | 8,941,512 | |
Class A5, (Series 2017-BNK7), 3.435%, 9/15/2060 | | | 10,000,000 | | | | 11,294,054 | |
Commercial Mortgage Trust, Class D, (Series 2013-CR12), 5.071%, 10/10/2046 (5) (6) | | | 4,500,000 | | | | 2,488,464 | |
GS Mortgage Securities Trust: | | | | | | | | |
Class B, (Series 2020-GC45), 3.405%, 2/13/2053 (6) | | | 3,500,000 | | | | 3,728,096 | |
Class D, (Series 2013-GC16), 5.311%, 11/10/2046 (5) (6) | | | 2,000,000 | | | | 1,802,110 | |
UBS-Barclays Commercial Mortgage Trust, Class A5, (Series 2012-C4), 2.850%, 12/10/2045 | | | 9,888,381 | | | | 10,251,775 | |
Wells Fargo Commercial Mortgage Trust: | | | | | | | | |
Class A4, (Series 2017-C41), 3.472%, 11/15/2050 | | | 7,000,000 | | | | 7,914,005 | |
Class B, (Series 2015-C26), 3.783%, 2/15/2048 | | | 7,000,000 | | | | 7,084,580 | |
Class D, (Series 2015-C26), 3.586%, 2/15/2048 (5) | | | 8,300,000 | | | | 6,611,055 | |
WFRBS Commercial Mortgage Trust, Class D, (Series 2013-C16), 5.021%, 9/15/2046 (5) (6) | | | 6,609,000 | | | | 3,893,757 | |
| | | | | | | | |
Total Commercial Mortgage Securities
(identified cost $61,617,008) | | | | 64,009,408 | |
| | | | | | | | |
| Corporate Bonds & Notes — 39.9% | |
|
Aerospace/Defense — 1.0% | |
BAE Systems PLC, 3.400%, 4/15/2030 (5) | | | 4,000,000 | | | | 4,499,237 | |
Boeing Co., 4.875%, 5/1/2025 | | | 3,750,000 | | | | 4,084,709 | |
Spirit AeroSystems, Inc., 7.500%, 4/15/2025 (5) | | | 3,500,000 | | | | 3,539,375 | |
| | | | | | | | |
| | | | | | | 12,123,321 | |
|
Agriculture — 1.4% | |
Altria Group, Inc., 5.950%, 2/14/2049 (2) | | | 5,000,000 | | | | 6,807,845 | |
BAT Capital Corp., 4.540%, 8/15/2047 | | | 5,000,000 | | | | 5,447,391 | |
Bunge, Ltd. Finance Corp., 3.750%, 9/25/2027 | | | 4,000,000 | | | | 4,352,834 | |
| | | | | | | | |
| | | | | | | 16,608,070 | |
|
Airlines — 0.5% | |
Delta Air Lines, Inc.: | | | | | | | | |
2.900%, 10/28/2024 (2) | | | 2,000,000 | | | | 1,837,660 | |
3.750%, 10/28/2029 (2) | | | 5,000,000 | | | | 4,467,263 | |
| | | | | | | | |
| | | | | | | 6,304,923 | |
| | | | | | | | |
| Description | | Principal
Amount | | | Value | |
| Corporate Bonds & Notes (continued) | |
|
Apparel — 0.5% | |
Tapestry, Inc., 4.125%, 7/15/2027 (2) | | $ | 5,500,000 | | | $ | 5,377,950 | |
|
Auto Manufacturers — 2.0% | |
Cummins, Inc., 1.500%, 9/1/2030 | | | 2,000,000 | | | | 1,992,969 | |
Ford Motor Co.: | | | | | | | | |
4.750%, 1/15/2043 (2) | | | 5,000,000 | | | | 4,640,625 | |
5.291%, 12/8/2046 | | | 1,500,000 | | | | 1,420,312 | |
General Motors Co., 5.000%, 10/1/2028 | | | 2,000,000 | | | | 2,226,849 | |
General Motors Financial Co., Inc., 4.000%, 1/15/2025 | | | 4,000,000 | | | | 4,309,302 | |
Hyundai Capital America, 3.750%, 7/8/2021 (5) | | | 6,500,000 | | | | 6,647,739 | |
Navistar International Corp., 9.500%, 5/1/2025 (5) | | | 1,850,000 | | | | 2,113,625 | |
| | | | | | | | |
| | | | | | | 23,351,421 | |
|
Banks — 7.7% | |
Banco Santander SA, 1.826% (LIBOR 3 Month + 156 basis points), 4/11/2022 (6) | | | 4,000,000 | | | | 4,042,120 | |
Bank of America Corp., 4.183%, 11/25/2027 | | | 7,500,000 | | | | 8,659,897 | |
Barclays PLC, 5.200%, 5/12/2026 | | | 5,000,000 | | | | 5,706,050 | |
Capital One Financial Corp., 1.263% (LIBOR 3 Month + 95 basis points), 3/9/2022 (6) | | | 1,500,000 | | | | 1,512,367 | |
Citigroup, Inc.: | | | | | | | | |
1.388% (LIBOR 3 Month + 107 basis points), 12/8/2021 (6) | | | 1,250,000 | | | | 1,263,726 | |
1.780% (LIBOR 3 Month + 143 basis points), 9/1/2023 (6) | | | 5,000,000 | | | | 5,083,950 | |
Goldman Sachs Group, Inc.: | | | | | | | | |
1.354% (LIBOR 3 Month + 111 basis points), 4/26/2022 (6) | | | 5,000,000 | | | | 5,026,560 | |
4.223% (LIBOR 3 Month + 130 basis points), 5/1/2029 (2) (6) | | | 5,000,000 | | | | 5,883,774 | |
HSBC Holdings PLC, 3.973% (LIBOR 3 Month + 161 basis points), 5/22/2030 (6) | | | 4,000,000 | | | | 4,541,941 | |
ING Groep NV, 4.100%, 10/2/2023 (2) | | | 5,000,000 | | | | 5,522,824 | |
JPMorgan Chase & Co.: | | | | | | | | |
1.275% (LIBOR 3 Month + 100 basis points), 1/15/2023 (2) (6) | | | 4,000,000 | | | | 4,041,712 | |
1.418% (LIBOR 3 Month + 110 basis points), 6/7/2021 (6) | | | 5,000,000 | | | | 5,036,434 | |
3.625%, 12/1/2027 (2) | | | 5,000,000 | | | | 5,631,349 | |
Lloyds Banking Group PLC, 2.907% (LIBOR 3 Month + 81 basis points), 11/7/2023 (6) | | | 7,500,000 | | | | 7,846,513 | |
Mizuho Financial Group, Inc., 0.989% (LIBOR 3 Month + 63 basis points), 5/25/2024 (6) | | | 3,860,000 | | | | 3,837,903 | |
Morgan Stanley,
3.950%, 4/23/2027 | | | 5,000,000 | | | | 5,687,676 | |
PNC Financial Services Group, Inc., 2.200%, 11/1/2024 | | | 5,750,000 | | | | 6,132,905 | |
Regions Financial Corp., 2.250%, 5/18/2025 (2) | | | 3,500,000 | | | | 3,721,232 | |
| | | | | | | | |
| | | | | | | 89,178,933 | |
|
Beverages — 0.8% | |
Fomento Economico Mexicano SAB de C.V., 3.500%, 1/16/2050 | | | 3,000,000 | | | | 3,224,222 | |
(See Notes to Schedules of Investments and Notes to Financial Statements, which are an integral part of the Financial Statements)
72
Core Plus Bond Fund (continued)
| | | | | | | | |
| Description | | Principal
Amount | | | Value | |
| Corporate Bonds & Notes (continued) | |
|
Beverages (continued) | |
PepsiCo, Inc., 2.875%, 10/15/2049 | | $ | 5,500,000 | | | $ | 5,903,136 | |
| | | | | | | | |
| | | | | | | 9,127,358 | |
|
Chemicals — 1.5% | |
Braskem Netherlands Finance BV, 4.500%, 1/31/2030 (5) | | | 1,500,000 | | | | 1,429,875 | |
Nouryon Holding BV, 8.000%, 10/1/2026 (2) (5) | | | 4,500,000 | | | | 4,834,552 | |
Orbia Advance Corp SAB de C.V., 6.750%, 9/19/2042 (5) | | | 4,400,000 | | | | 5,612,398 | |
Syngenta Finance NV, 4.892%, 4/24/2025 (5) | | | 5,250,000 | | | | 5,683,649 | |
| | | | | | | | |
| | | | | | | 17,560,474 | |
|
Commercial Services — 0.8% | |
Element Fleet Management Corp., 3.850%, 6/15/2025 (5) | | | 3,850,000 | | | | 4,068,996 | |
Refinitiv US Holdings, Inc., 8.250%, 11/15/2026 (5) | | | 4,500,000 | | | | 4,966,875 | |
| | | | | | | | |
| | | | | | | 9,035,871 | |
|
Computers — 0.9% | |
Dell International LLC: | | | | | | | | |
5.300%, 10/1/2029 (5) | | | 2,500,000 | | | | 2,856,656 | |
8.350%, 7/15/2046 (5) | | | 2,000,000 | | | | 2,706,399 | |
Hewlett Packard Enterprise Co., 4.900%, 10/15/2025 (2) | | | 2,000,000 | | | | 2,313,575 | |
Seagate HDD Cayman: | | | | | | | | |
4.091%, 6/1/2029 (5) | | | 1,091,000 | | | | 1,171,772 | |
4.875%, 6/1/2027 (2) | | | 1,006,000 | | | | 1,126,861 | |
| | | | | | | | |
| | | | | | | 10,175,263 | |
|
Diversified Financial Services — 2.1% | |
Cantor Fitzgerald LP, 4.875%, 5/1/2024 (2)(5) | | | 5,000,000 | | | | 5,489,066 | |
GE Capital International Funding Co. Unlimited Co., 4.418%, 11/15/2035 | | | 1,500,000 | | | | 1,551,349 | |
Jefferies Financial Group, Inc., 6.625%, 10/23/2043 | | | 500,000 | | | | 616,587 | |
Jefferies Group LLC: | | | | | | | | |
4.150%, 1/23/2030 | | | 5,000,000 | | | | 5,656,971 | |
6.500%, 1/20/2043 (2) | | | 1,000,000 | | | | 1,270,810 | |
Legg Mason, Inc., 4.750%, 3/15/2026 (2) | | | 1,950,000 | | | | 2,322,595 | |
Synchrony Financial, 3.950%, 12/1/2027 | | | 6,500,000 | | | | 6,861,043 | |
| | | | | | | | |
| | | | | | | 23,768,421 | |
|
Electric — 1.0% | |
Berkshire Hathaway Energy Co., 4.050%, 4/15/2025 (2)(5) | | | 3,500,000 | | | | 4,010,800 | |
Consumers Energy Co., 2.500%, 5/1/2060 (2) | | | 2,000,000 | | | | 1,949,497 | |
Duke Energy Florida LLC, 2.500%, 12/1/2029 | | | 5,000,000 | | | | 5,486,166 | |
| | | | | | | | |
| | | | | | | 11,446,463 | |
|
Electrical Components & Equipment — 0.2% | |
Energizer Holdings, Inc., 4.750%, 6/15/2028 (5) | | | 2,500,000 | | | | 2,612,000 | |
| | | | | | | | |
| Description | | Principal
Amount | | | Value | |
| Corporate Bonds & Notes (continued) | |
|
Food — 2.7% | |
Albertsons Cos. LLC, 5.750%, 3/15/2025 | | $ | 1,375,000 | | | $ | 1,417,824 | |
Conagra Brands, Inc., 5.400%, 11/1/2048 (2) | | | 5,000,000 | | | | 6,907,497 | |
General Mills, Inc., 0.811% (LIBOR 3 Month + 54 basis points), 4/16/2021 (6) | | | 1,725,000 | | | | 1,729,661 | |
JM Smucker Co., 2.375%, 3/15/2030 (2) | | | 3,700,000 | | | | 3,862,162 | |
Kraft Heinz Foods Co., 4.375%, 6/1/2046 | | | 5,000,000 | | | | 5,137,014 | |
Kroger Co., 4.450%, 2/1/2047 | | | 5,000,000 | | | | 6,169,941 | |
Pilgrim’s Pride Corp., 5.750%, 3/15/2025 (2)(5) | | | 5,500,000 | | | | 5,658,125 | |
| | | | | | | | |
| | | | | | | 30,882,224 | |
|
Healthcare-Services — 0.7% | |
Anthem, Inc., 2.375%, 1/15/2025 (2) | | | 5,000,000 | | | | 5,339,284 | |
Molina Healthcare, Inc., 4.375%, 6/15/2028 (5) | | | 2,500,000 | | | | 2,615,000 | |
| | | | | | | | |
| | | | | | | 7,954,284 | |
|
Insurance — 2.4% | |
Brighthouse Financial, Inc., 5.625%, 5/15/2030 (2) | | | 2,750,000 | | | | 3,199,943 | |
Five Corners Funding Trust II, 2.850%, 5/15/2030 (2)(5) | | | 5,000,000 | | | | 5,356,050 | |
Manulife Financial Corp., 2.484%, 5/19/2027 | | | 3,500,000 | | | | 3,777,197 | |
Reinsurance Group of America, Inc., 3.150%, 6/15/2030 (2) | | | 3,750,000 | | | | 4,077,039 | |
Teachers Insurance & Annuity Association of America, 3.300%, 5/15/2050 (5) | | | 4,300,000 | | | | 4,471,866 | |
Unum Group, 5.750%, 8/15/2042 | | | 5,930,000 | | | | 6,795,057 | |
| | | | | | | | |
| | | | | | | 27,677,152 | |
|
Internet — 1.1% | |
eBay, Inc.: | |
1.138% (LIBOR 3 Month + 87 basis points), 1/30/2023 (6) | | | 5,000,000 | | | | 5,049,497 | |
4.000%, 7/15/2042 (2) | | | 3,500,000 | | | | 3,920,201 | |
Expedia Group, Inc., 6.250%, 5/1/2025 (5) | | | 3,500,000 | | | | 3,849,621 | |
| | | | | | | | |
| | | | | | | 12,819,319 | |
|
Leisure Time — 0.3% | |
Royal Caribbean Cruises, Ltd., 5.250%, 11/15/2022 (2) | | | 3,500,000 | | | | 3,139,062 | |
|
Lodging — 0.4% | |
MGM Resorts International, 6.750%, 5/1/2025 (2) | | | 2,375,000 | | | | 2,544,991 | |
Wyndham Destinations Inc., 5.400%, 4/1/2024 (2) | | | 2,250,000 | | | | 2,295,000 | |
| | | | | | | | |
| | | | | | | 4,839,991 | |
|
Machinery-Construction & Mining — 0.5% | |
Caterpillar Financial Services Corp., 2.850%, 5/17/2024 (2) | | | 5,000,000 | | | | 5,407,374 | |
|
Media — 1.6% | |
Charter Communications Operating LLC, 5.375%, 5/1/2047 | | | 6,500,000 | | | | 7,788,525 | |
(See Notes to Schedules of Investments and Notes to Financial Statements, which are an integral part of the Financial Statements)
73
August 31, 2020
Core Plus Bond Fund (continued)
| | | | | | | | |
| Description | | Principal
Amount | | | Value | |
| Corporate Bonds & Notes (continued) | |
|
Media (continued) | |
Discovery Communications LLC, 5.300%, 5/15/2049 (2) | | $ | 5,000,000 | | | $ | 6,156,254 | |
Univision Communications, Inc., 6.625%, 6/1/2027 (5) | | | 1,350,000 | | | | 1,356,858 | |
ViacomCBS, Inc., 4.375%, 3/15/2043 | | | 3,500,000 | | | | 3,737,033 | |
| | | | | | | | |
| | | | | | | 19,038,670 | |
|
Mining — 0.7% | |
Corp Nacional del Cobre de Chile, 3.750%, 1/15/2031 (2) (5) | | | 1,200,000 | | | | 1,336,500 | |
Glencore Funding LLC: | | | | | | | | |
4.000%, 3/27/2027 (5) | | | 5,000,000 | | | | 5,498,101 | |
4.625%, 4/29/2024 (2) (5) | | | 1,000,000 | | | | 1,119,257 | |
| | | | | | | | |
| | | | | | | 7,953,858 | |
|
Oil & Gas — 1.8% | |
Diamond Offshore Drilling, Inc., 3.450%, 11/1/2023 (7) | | | 5,000,000 | | | | 518,225 | |
EQT Corp., 3.900%, 10/1/2027 (2) | | | 1,900,000 | | | | 1,842,392 | |
Exxon Mobil Corp., 3.095%, 8/16/2049 (2) | | | 6,000,000 | | | | 6,307,840 | |
Gulfport Energy Corp., 6.000%, 10/15/2024 (2) | | | 5,500,000 | | | | 3,289,687 | |
Occidental Petroleum Corp., 4.400%, 8/15/2049 (2) | | | 2,250,000 | | | | 1,738,564 | |
Petroleos Mexicanos, 6.875%, 8/4/2026 | | | 2,611,000 | | | | 2,669,343 | |
Valaris PLC, 5.750%, 10/1/2044 (7) | | | 1,668,000 | | | | 126,009 | |
W&T Offshore, Inc., 9.750%, 11/1/2023 (5) | | | 5,500,000 | | | | 4,019,125 | |
| | | | | | | | |
| | | | | | | 20,511,185 | |
|
Pharmaceuticals — 1.4% | |
Bayer US Finance II LLC, 4.250%, 12/15/2025 (2) (5) | | | 5,000,000 | | | | 5,756,683 | |
Mylan, Inc., 5.200%, 4/15/2048 | | | 5,000,000 | | | | 6,333,676 | |
Teva Pharmaceutical Finance Netherlands III BV, 4.100%, 10/1/2046 (2) | | | 5,000,000 | | | | 4,291,250 | |
| | | | | | | | |
| | | | | | | 16,381,609 | |
|
Pipelines — 0.5% | |
Energy Transfer Operating LP, 5.150%, 3/15/2045 | | | 4,000,000 | | | | 3,751,334 | |
Sunoco Logistics Partners Operations LP, 5.300%, 4/1/2044 | | | 2,000,000 | | | | 1,903,442 | |
| | | | | | | | |
| | | | | | | 5,654,776 | |
|
Real Estate Investment Trusts — 1.5% | |
EPR Properties, 5.250%, 7/15/2023 | | | 910,000 | | | | 914,128 | |
iStar, Inc., 5.500%, 2/15/2026 | | | 7,000,000 | | | | 6,940,220 | |
Service Properties Trust, 4.500%, 3/15/2025 | | | 2,500,000 | | | | 2,337,500 | |
Simon Property Group LP, 3.250%, 9/13/2049 (2) | | | 5,000,000 | | | | 4,762,486 | |
Welltower, Inc., 4.500%, 1/15/2024 (2) | | | 2,500,000 | | | | 2,743,800 | |
| | | | | | | | |
| | | | | | | 17,698,134 | |
|
Retail — 1.2% | |
Gap, Inc., 8.625%, 5/15/2025 (2) (5) | | | 2,500,000 | | | | 2,796,625 | |
L Brands, Inc., 6.950%, 3/1/2033 (2) | | | 1,500,000 | | | | 1,370,340 | |
| | | | | | | | |
| Description | | Principal
Amount | | | Value | |
| Corporate Bonds & Notes (continued) | |
|
Retail (continued) | |
Ross Stores, Inc., 4.600%, 4/15/2025 (2) | | $ | 3,250,000 | | | $ | 3,748,936 | |
Starbucks Corp., 2.550%, 11/15/2030 | | | 2,650,000 | | | | 2,817,150 | |
Walgreens Boots Alliance, Inc., 3.200%, 4/15/2030 | | | 3,500,000 | | | | 3,721,738 | |
| | | | | | | | |
| | | | | | | 14,454,789 | |
|
Semiconductors — 0.8% | |
Broadcom, Inc., 4.110%, 9/15/2028 (5) | | | 3,000,000 | | | | 3,363,151 | |
Marvell Technology Group, Ltd., 4.875%, 6/22/2028 (2) | | | 5,000,000 | | | | 6,033,662 | |
| | | | | | | | |
| | | | | | | 9,396,813 | |
|
Software — 0.6% | |
CA, Inc., 4.700%, 3/15/2027 (2) | | | 4,000,000 | | | | 4,432,903 | |
Oracle Corp., 2.400%, 9/15/2023 (2) | | | 2,000,000 | | | | 2,114,550 | |
| | | | | | | | |
| | | | | | | 6,547,453 | |
|
Telecommunications — 1.3% | |
CenturyLink, Inc., 7.600%, 9/15/2039 (2) | | | 4,000,000 | | | | 4,608,880 | |
Motorola Solutions, Inc., 5.500%, 9/1/2044 | | | 3,000,000 | | | | 3,503,963 | |
Telecom Italia SpA, 5.303%, 5/30/2024 (5) | | | 6,000,000 | | | | 6,632,910 | |
| | | | | | | | |
| | | | | | | 14,745,753 | |
|
Water — 0.0% | |
American Water Capital Corp., 2.800%, 5/1/2030 | | | 250,000 | | | | 276,212 | |
| | | | | | | | |
Total Corporate Bonds & Notes
(identified cost $429,930,671) | | | | | | | 462,049,126 | |
| | | | | | | | |
| U.S. Government & U.S. Government Agency Obligations — 21.4% | |
|
U.S. Treasury Bonds & Notes — 21.4% | |
0.375%, 4/30/2025 (2) | | | 25,000,000 | | | | 25,149,414 | |
1.500%, 10/31/2024 | | | 40,000,000 | | | | 42,132,812 | |
2.000%, 2/15/2025 | | | 25,000,000 | | | | 26,960,938 | |
2.000%, 8/15/2025 | | | 25,000,000 | | | | 27,131,836 | |
2.000%, 2/15/2050 (2) | | | 9,830,000 | | | | 11,129,403 | |
2.250%, 8/15/2049 | | | 10,000,000 | | | | 11,901,953 | |
2.375%, 5/15/2029 | | | 5,000,000 | | | | 5,748,633 | |
2.750%, 6/30/2025 | | | 40,000,000 | | | | 44,790,625 | |
2.875%, 5/15/2049 | | | 20,150,000 | | | | 26,991,555 | |
3.000%, 8/15/2048 (2) | | | 10,000,000 | | | | 13,630,078 | |
3.000%, 2/15/2049 | | | 5,000,000 | | | | 6,838,672 | |
3.375%, 11/15/2048 | | | 4,000,000 | | | | 5,819,531 | |
| | | | | | | | |
| Total U.S. Government & U.S. Government Agency Obligations | |
(identified cost $220,693,934) | | | | 248,225,450 | |
| | | | | | | | |
| U.S. Government Agency-Mortgage Securities — 25.6% | |
|
Federal Home Loan Mortgage Corporation — 4.4% | |
3.000%, 11/1/2042 | | | 859,611 | | | | 922,171 | |
3.000%, 4/1/2043 | | | 1,068,679 | | | | 1,168,278 | |
3.000%, 4/1/2043 | | | 1,725,184 | | | | 1,863,126 | |
3.000%, 5/1/2043 | | | 1,766,309 | | | | 1,893,552 | |
3.000%, 7/1/2043 | | | 6,973,287 | | | | 7,476,277 | |
3.000%, 9/1/2043 | | | 7,118,027 | | | | 7,627,457 | |
3.000%, 4/1/2045 | | | 5,792,281 | | | | 6,153,985 | |
3.500%, 12/1/2040 | | | 652,012 | | | | 716,262 | |
3.500%, 12/1/2041 | | | 476,501 | | | | 520,633 | |
3.500%, 3/1/2042 | | | 167,483 | | | | 181,531 | |
(See Notes to Schedules of Investments and Notes to Financial Statements, which are an integral part of the Financial Statements)
74
Core Plus Bond Fund (continued)
| | | | | | | | |
| Description | | Principal
Amount | | | Value | |
| U.S. Government Agency-Mortgage Securities (continued) | |
|
Federal Home Loan Mortgage Corporation (continued) | |
3.500%, 12/1/2042 | | $ | 414,392 | | | $ | 445,656 | |
3.500%, 11/1/2043 | | | 4,123,929 | | | | 4,457,957 | |
3.500%, 1/1/2044 | | | 4,179,522 | | | | 4,500,690 | |
3.500%, 2/1/2044 | | | 4,420,702 | | | | 4,758,785 | |
3.500%, 11/1/2044 | | | 2,936,965 | | | | 3,139,053 | |
4.000%, 4/1/2026 | | | 198,894 | | | | 211,290 | |
4.000%, 12/1/2039 | | | 357,293 | | | | 394,261 | |
4.000%, 12/1/2040 | | | 1,865,389 | | | | 2,054,405 | |
4.000%, 3/1/2041 | | | 159,127 | | | | 175,486 | |
4.000%, 8/1/2041 | | | 102,405 | | | | 113,128 | |
4.000%, 11/1/2041 | | | 394,837 | | | | 435,370 | |
4.500%, 3/1/2039 | | | 79,686 | | | | 89,042 | |
4.500%, 5/1/2039 | | | 304,311 | | | | 340,338 | |
4.500%, 2/1/2040 | | | 77,376 | | | | 86,523 | |
4.500%, 2/1/2041 | | | 642,369 | | | | 718,972 | |
5.000%, 12/1/2035 | | | 42,526 | | | | 48,920 | |
5.000%, 1/1/2038 | | | 20,592 | | | | 23,547 | |
5.000%, 3/1/2038 | | | 72,216 | | | | 83,171 | |
5.000%, 3/1/2038 | | | 20,872 | | | | 23,954 | |
5.000%, 2/1/2039 | | | 135,849 | | | | 148,756 | |
5.000%, 1/1/2040 | | | 113,402 | | | | 130,656 | |
6.000%, 6/1/2037 | | | 33,579 | | | | 38,678 | |
6.000%, 1/1/2038 | | | 46,167 | | | | 53,871 | |
| | | | | | | | |
| | | | | | | 50,995,781 | |
|
Federal National Mortgage Association — 21.1% | |
2.000%, 7/1/2050 | | | 7,454,373 | | | | 7,689,803 | |
2.000%, 7/1/2050 | | | 19,889,460 | | | | 20,517,620 | |
2.000%, 8/1/2050 | | | 9,976,390 | | | | 10,291,472 | |
2.500%, 4/1/2050 | | | 19,974,531 | | | | 20,990,155 | |
2.500%, 9/1/2050 | | | 5,000,000 | | | | 5,260,449 | |
3.000%, 3/1/2043 | | | 2,260,104 | | | | 2,440,338 | |
3.000%, 7/1/2043 | | | 4,462,780 | | | | 4,779,928 | |
3.000%, 7/1/2043 | | | 9,227,289 | | | | 9,921,532 | |
3.000%, 9/1/2044 | | | 5,253,086 | | | | 5,582,561 | |
3.000%, 1/1/2045 | | | 6,131,321 | | | | 6,534,975 | |
3.000%, 6/1/2045 | | | 4,700,240 | | | | 4,992,391 | |
3.000%, 3/1/2046 | | | 9,568,651 | | | | 10,128,387 | |
3.000%, 7/1/2046 | | | 11,517,695 | | | | 12,192,694 | |
3.000%, 4/1/2049 | | | 15,916,651 | | | | 16,790,455 | |
3.000%, 9/1/2049 | | | 17,878,561 | | | | 18,860,071 | |
3.000%, 9/1/2049 | | | 17,769,996 | | | | 18,745,546 | |
3.000%, 11/1/2049 | | | 3,984,208 | | | | 4,202,936 | |
3.500%, 5/1/2042 | | | 779,423 | | | | 846,048 | |
3.500%, 10/1/2042 | | | 557,815 | | | | 613,183 | |
3.500%, 10/1/2042 | | | 555,177 | | | | 602,593 | |
3.500%, 10/1/2042 | | | 651,858 | | | | 700,554 | |
3.500%, 11/1/2042 | | | 354,437 | | | | 384,283 | |
3.500%, 12/1/2042 | | | 777,458 | | | | 844,130 | |
3.500%, 12/1/2047 | | | 3,130,633 | | | | 3,314,717 | |
3.500%, 3/1/2049 | | | 16,309,540 | | | | 17,205,025 | |
3.500%, 4/1/2049 | | | 8,419,393 | | | | 8,889,554 | |
3.500%, 6/1/2049 | | | 13,344,999 | | | | 14,065,728 | |
3.500%, 10/1/2049 | | | 7,871,454 | | | | 8,297,157 | |
4.000%, 11/1/2040 | | | 210,430 | | | | 232,315 | |
4.000%, 1/1/2041 | | | 251,442 | | | | 274,121 | |
4.000%, 2/1/2041 | | | 1,507,568 | | | | 1,662,820 | |
4.000%, 2/1/2041 | | | 308,180 | | | | 339,738 | |
4.000%, 3/1/2041 | | | 139,638 | | | | 155,050 | |
4.000%, 11/1/2041 | | | 226,665 | | | | 249,111 | |
4.000%, 9/1/2048 | | | 4,091,687 | | | | 4,355,909 | |
4.500%, 6/1/2039 | | | 453,958 | | | | 507,273 | |
4.500%, 8/1/2041 | | | 256,925 | | | | 283,920 | |
| | | | | | | | |
| Description | | Shares or
Principal
Amount | | | Value | |
| U.S. Government Agency-Mortgage Securities (continued) | |
|
Federal National Mortgage Association (continued) | |
5.000%, 7/1/2022 | | $ | 35,772 | | | $ | 37,722 | |
5.000%, 3/1/2035 | | | 153,831 | | | | 176,201 | |
5.000%, 5/1/2042 | | | 338,844 | | | | 386,174 | |
5.500%, 2/1/2034 | | | 26,358 | | | | 31,044 | |
5.500%, 8/1/2037 | | | 261,275 | | | | 307,814 | |
5.500%, 6/1/2038 | | | 36,555 | | | | 42,394 | |
6.000%, 12/1/2038 | | | 13,535 | | | | 15,408 | |
6.500%, 10/1/2037 | | | 25,944 | | | | 30,454 | |
6.500%, 11/1/2037 | | | 13,258 | | | | 15,083 | |
| | | | | | | | |
| | | | | | | 244,786,836 | |
|
Government National Mortgage Association — 0.1% | |
4.000%, 10/15/2040 | | | 246,506 | | | | 264,896 | |
4.000%, 12/15/2040 | | | 342,166 | | | | 370,844 | |
4.000%, 4/15/2041 | | | 312,010 | | | | 338,847 | |
5.500%, 8/20/2038 | | | 49,873 | | | | 55,318 | |
5.500%, 2/15/2039 | | | 31,884 | | | | 36,898 | |
6.000%, 12/15/2038 | | | 36,760 | | | | 41,865 | |
6.000%, 1/15/2039 | | | 17,273 | | | | 20,160 | |
| | | | | | | | |
| | | | | | | 1,128,828 | |
| | | | | | | | |
| Total U.S. Government Agency-Mortgage Securities | |
(identified cost $284,231,514) | | | | 296,911,445 | |
| | | | | | | | |
| Short-Term Investments — 7.9% | |
|
| Collateral Pool Investments for Securities on Loan — 5.8% | |
| | |
Collateral pool allocation (3) | | | | | | | 66,878,566 | |
|
| Mutual Funds — 2.1% | |
BMO Institutional Prime Money Market Fund — Premier Class, 0.130% (4) | | | 24,131,550 | | | | 24,129,137 | |
| | | | | | | | |
Total Short-Term Investments
(identified cost $91,011,842) | | | | | | | 91,007,703 | |
| | | | | | | | |
Total Investments — 105.5%
(identified cost $1,143,940,479) | | | | 1,222,489,136 | |
| Other Assets and Liabilities — (5.5)% | | | | (63,516,915 | ) |
| | | | | | | | |
| Total Net Assets — 100.0% | | | | | | $ | 1,158,972,221 | |
| | | | | | | | |
Government Money Market Fund
| | | | | | | | |
| Description | | Shares or
Principal
Amount | | | Value | |
| Mutual Funds — 4.4% | |
Goldman Sachs Money Market Fund — Premier Class, 0.020% | | | 85,888,423 | | | $ | 85,888,423 | |
State Street Institutional U.S. Government Money Market Fund — Premier Class, 0.034% | | | 86,223,792 | | | | 86,223,792 | |
| | | | | | | | |
| Total Mutual Funds | | | | | | | 172,112,215 | |
| | | | | | | | |
| Repurchase Agreements — 32.9% | |
Agreement with Canadian Imperial Bank of Commerce, 0.090%, dated 8/31/2020, to be repurchased at $200,000,500 on 9/1/2020, collateralized by U.S. Government Agency Obligations with various maturities to 8/20/2069, with a fair value of $204,000,076 | | $ | 200,000,000 | | | | 200,000,000 | |
(See Notes to Schedules of Investments and Notes to Financial Statements, which are an integral part of the Financial Statements)
75
August 31, 2020
Government Money Market Fund (continued)
| | | | | | | | |
| Description | | Principal
Amount | | | Value | |
| Repurchase Agreements (continued) | |
Agreement with Canadian Imperial Bank of Commerce, 0.100%, dated 8/3/2020, to be repurchased at $100,008,611 on 9/3/2020, collateralized by U.S. Government Agency Obligations with various maturities to 7/1/2050, with a fair value of $ 102,000,000 | | $ | 100,000,000 | | | $ | 100,000,000 | |
Agreement with Fixed Income Clearing Corp., 0.000%, dated 8/31/2020, to be repurchased at $11,581,267 on 9/1/2020, collateralized by U.S. Government Treasury Obligation with a maturity of 4/15/2021, with a fair value of $11,812,945 | | | 11,581,267 | | | | 11,581,267 | |
Agreement with Fixed Income Clearing Corp., 0.080%, dated 8/31/2020, to be repurchased at $492,501,094 on 9/1/2020, collateralized by U.S. Government Treasury Obligation with various maturities to 8/31/2025, with a fair value of $502,350,005 | | | 492,500,000 | | | | 492,500,000 | |
Agreement with Goldman Sachs Group, Inc., 0.080%, dated 8/31/2020, to be repurchased at $175,000,389 on 9/1/2020, collateralized by U.S. Government Agency Obligations with various maturities to 1/1/2050, with a fair value of $178,500,000 | | | 175,000,000 | | | | 175,000,000 | |
Agreement with Merrill Lynch Pierce Fenner & Smith, Inc., 0.090%, dated 8/31/2020, to be repurchased at $130,000,325 on 9/1/2020, collateralized by U.S. Government Agency Obligation with various maturities to 9/1/2050, with a fair value of $132,600,000 | | | 130,000,000 | | | | 130,000,000 | |
Agreement with TD Securities USA LLC, 0.090%, dated 8/27/2020, to be repurchased at $185,003,238 on 9/3/2020, collateralized by U.S. Government Agency Obligation with various maturities to 11/15/2049, with a fair value of $188,703,402 | | | 185,000,000 | | | | 185,000,000 | |
| | | | | | | | |
| Total Repurchase Agreements | | | | | | | 1,294,081,267 | |
| | | | | | | | |
| U.S. Government & U.S. Government Agency Obligations — 49.6% | |
|
Federal Farm Credit Bank — 9.5% | |
0.101% 11/4/2020 (8) | | | 5,000,000 | | | | 4,999,111 | |
0.122% 3/10/2021 (8) | | | 5,000,000 | | | | 4,996,833 | |
| | | | | | | | |
| Description | | Principal
Amount | | | Value | |
| U.S. Government & U.S. Government Agency Obligations (continued) | |
|
Federal Farm Credit Bank (continued) | |
0.150% (SOFR + 8 basis points) 11/27/2020 (6) | | $ | 7,000,000 | | | $ | 7,000,000 | |
0.150% (SOFR + 8 basis points) 1/14/2021 (6) | | | 7,000,000 | | | | 7,000,000 | |
0.162% (LIBOR 1 Month) 3/17/2021 (6) | | | 15,000,000 | | | | 14,999,488 | |
0.173% (LIBOR 1 Month + 1 basis points) 12/11/2020 (6) | | | 4,150,000 | | | | 4,149,106 | |
0.173% (LIBOR 1 Month + 1 basis points) 1/12/2021 (6) | | | 7,000,000 | | | | 6,998,883 | |
0.175% (LIBOR 1 Month + 2 basis points) 9/9/2020 (6) | | | 23,500,000 | | | | 23,499,829 | |
0.175% (U.S. Federal Funds Effective Rate (continuous series) + 9 basis points) 3/10/2021 (6) | | | 15,000,000 | | | | 14,999,611 | |
0.177% (LIBOR 1 Month + 2 basis points) 3/17/2021 (6) | | | 14,485,000 | | | | 14,480,586 | |
0.180% 7/13/2021 | | | 12,500,000 | | | | 12,498,382 | |
0.180% (SOFR + 11 basis points) 5/18/2021 (6) | | | 15,000,000 | | | | 15,000,000 | |
0.187% (LIBOR 1 Month + 4 basis points) 9/18/2020 (6) | | | 10,000,000 | | | | 10,000,375 | |
0.190% (SOFR + 12 basis points) 3/18/2021 (6) | | | 10,000,000 | | | | 10,000,792 | |
0.200% (FCPR DLY - 305 basis points) 12/11/2020 (6) | | | 15,000,000 | | | | 14,999,585 | |
0.203% 11/6/2020 (8) | | | 15,000,000 | | | | 14,994,500 | |
0.215% 9/4/2020 | | | 25,000,000 | | | | 25,000,102 | |
0.230% (LIBOR 1 Month + 8 basis points) 2/1/2021 (6) | | | 20,000,000 | | | | 20,000,000 | |
0.230% (SOFR + 16 basis points) 5/7/2021 (6) | | | 9,000,000 | | | | 9,001,863 | |
0.244% (LIBOR 1 Month + 8 basis points) 8/13/2021 (6) | | | 20,000,000 | | | | 20,000,000 | |
0.250% (FCPR DLY - 300 basis points) 3/22/2021 (6) | | | 10,000,000 | | | | 9,999,441 | |
0.255% (LIBOR 1 Month + 10 basis points) 9/9/2021 (6) | | | 4,000,000 | | | | 4,000,000 | |
0.255% (LIBOR 1 Month + 8 basis points) 8/25/2021 (6) | | | 12,000,000 | | | | 12,000,000 | |
0.261% (LIBOR 1 Month + 11 basis points) 11/2/2021 (6) | | | 10,000,000 | | | | 10,000,000 | |
0.310% (SOFR + 24 basis points) 7/7/2021 (6) | | | 10,000,000 | | | | 10,000,000 | |
0.315% (LIBOR 1 Month + 16 basis points) 7/1/2021 (6) | | | 14,000,000 | | | | 14,000,000 | |
0.320% (FCPR DLY - 293 basis points) 9/24/2020 (6) | | | 20,000,000 | | | | 20,001,996 | |
0.340% (FCPR DLY - 291 basis points) 1/25/2021 (6) | | | 24,000,000 | | | | 24,014,229 | |
0.350% (SOFR + 28 basis points) 4/1/2021 (6) | | | 15,000,000 | | | | 15,000,000 | |
| | | | | | | | |
| | | | | | | 373,634,712 | |
|
Federal Home Loan Bank — 31.6% | |
0.091% 10/23/2020 (8) | | | 15,000,000 | | | | 14,998,050 | |
0.091% 11/20/2020 (8) | | | 25,000,000 | | | | 24,995,000 | |
0.093% (LIBOR 3 Month - 17 basis points) 1/22/2021 (6) | | | 12,500,000 | | | | 12,500,000 | |
0.095% 11/6/2020 (8) | | | 19,000,000 | | | | 18,996,726 | |
0.099% 11/27/2020 (8) | | | 20,000,000 | | | | 19,995,263 | |
0.100% 11/19/2020 (8) | | | 20,000,000 | | | | 19,999,794 | |
0.100% (SOFR + 3 basis points) 9/4/2020 (6) | | | 25,000,000 | | | | 25,000,000 | |
0.100% (SOFR + 3 basis points) 11/6/2020 (6) | | | 12,000,000 | | | | 12,000,000 | |
(See Notes to Schedules of Investments and Notes to Financial Statements, which are an integral part of the Financial Statements)
76
Government Money Market Fund (continued)
| | | | | | | | |
| Description | | Principal
Amount | | | Value | |
| U.S. Government & U.S. Government Agency Obligations (continued) | |
|
Federal Home Loan Bank (continued) | |
0.101% 9/18/2020 (8) | | $ | 1,600,000 | | | $ | 1,599,924 | |
0.101% 10/9/2020 (8) | | | 7,250,000 | | | | 7,249,235 | |
0.101% 12/11/2020 (8) | | | 20,000,000 | | | | 19,994,389 | |
0.102% 11/18/2020 (8) | | | 20,000,000 | | | | 19,995,623 | |
0.105% (SOFR + 4 basis points) 2/25/2021 (6) | | | 15,000,000 | | | | 15,000,000 | |
0.107% (LIBOR 3 Month - 17 basis points) 1/8/2021 (6) | | | 15,000,000 | | | | 15,000,000 | |
0.110% 11/13/2020 (8) | | | 20,000,000 | | | | 19,995,620 | |
0.110% (SOFR + 4 basis points) 2/9/2021 (6) | | | 12,000,000 | | | | 12,000,000 | |
0.110% (SOFR + 4 basis points) 2/26/2021 (6) | | | 20,000,000 | | | | 20,000,000 | |
0.110% (SOFR + 4 basis points) 3/19/2021 (6) | | | 20,000,000 | | | | 20,000,000 | |
0.110% (SOFR + 4 basis points) 4/23/2021 (6) | | | 20,000,000 | | | | 20,000,000 | |
0.112% 12/2/2020 (8) | | | 20,000,000 | | | | 19,994,378 | |
0.113% 11/12/2020 (8) | | | 25,000,000 | | | | 24,994,450 | |
0.115% (SOFR + 5 basis points) 9/28/2020 (6) | | | 29,000,000 | | | | 28,999,438 | |
0.119% 2/26/2021 (8) | | | 15,000,000 | | | | 14,991,323 | |
0.120% (SOFR + 5 basis points) 1/22/2021 (6) | | | 5,700,000 | | | | 5,700,000 | |
0.120% (SOFR + 5 basis points) 5/26/2021 (6) | | | 20,000,000 | | | | 20,000,000 | |
0.122% 2/17/2021 (8) | | | 15,000,000 | | | | 14,991,550 | |
0.125% 7/2/2021 | | | 10,000,000 | | | | 9,997,322 | |
0.125% (SOFR + 6 basis points) 5/14/2021 (6) | | | 31,350,000 | | | | 31,340,955 | |
0.126% 2/10/2021 (8) | | | 10,000,000 | | | | 9,994,420 | |
0.136% 1/20/2021 (8) | | | 15,000,000 | | | | 14,992,128 | |
0.142% 10/2/2020 (8) | | | 10,000,000 | | | | 9,998,794 | |
0.142% 10/14/2020 (8) | | | 17,500,000 | | | | 17,497,074 | |
0.142% 11/30/2020 (8) | | | 17,600,000 | | | | 17,593,840 | |
0.145% (SOFR + 8 basis points) 7/8/2021 (6) | | | 29,500,000 | | | | 29,493,074 | |
0.145% (SOFR + 8 basis points) 7/23/2021 (6) | | | 10,000,000 | | | | 10,000,000 | |
0.146% 9/25/2020 (8) | | | 17,500,000 | | | | 17,498,320 | |
0.147% (LIBOR 1 Month - 1 basis points) 4/5/2021 (6) | | | 15,000,000 | | | | 15,000,000 | |
0.150% (LIBOR 1 Month - 2 basis points) 4/27/2021 (6) | | | 15,000,000 | | | | 15,000,138 | |
0.150% (SOFR + 8 basis points) 3/4/2021 (6) | | | 20,000,000 | | | | 20,000,000 | |
0.150% (SOFR + 8 basis points) 2/18/2022 (6) | | | 10,000,000 | | | | 10,000,000 | |
0.155% (SOFR + 9 basis points) 9/11/2020 (6) | | | 22,250,000 | | | | 22,250,000 | |
0.160% 11/20/2020 | | | 15,800,000 | | | | 15,799,794 | |
0.160% 2/16/2021 | | | 15,000,000 | | | | 14,999,742 | |
0.160% 4/5/2021 | | | 15,000,000 | | | | 14,998,889 | |
0.160% (SOFR + 9 basis points) 12/4/2020 (6) | | | 20,000,000 | | | | 20,000,000 | |
0.162% 11/23/2020 (8) | | | 16,500,000 | | | | 16,493,913 | |
0.162% 1/6/2021 (8) | | | 17,500,000 | | | | 17,490,122 | |
0.167% (LIBOR 1 Month + 1 basis points) 8/16/2021 (6) | | | 25,000,000 | | | | 25,003,671 | |
0.170% 12/28/2020 (8) | | | 11,000,000 | | | | 10,993,943 | |
0.170% (SOFR + 10 basis points) 12/23/2020 (6) | | | 12,000,000 | | | | 12,000,000 | |
| | | | | | | | |
| Description | | Principal
Amount | | | Value | |
| U.S. Government & U.S. Government Agency Obligations (continued) | |
|
Federal Home Loan Bank (continued) | |
0.170% (SOFR + 10 basis points) 2/22/2021 (6) | | $ | 16,000,000 | | | $ | 16,000,000 | |
0.173% (LIBOR 3 Month - 14 basis points) 12/18/2020 (6) | | | 15,000,000 | | | | 15,000,209 | |
0.175% (SOFR + 11 basis points) 10/1/2020 (6) | | | 13,000,000 | | | | 13,000,000 | |
0.177% 12/23/2020 (8) | | | 12,000,000 | | | | 11,993,446 | |
0.178% 12/18/2020 (8) | | | 2,089,000 | | | | 2,087,903 | |
0.178% 3/9/2021 (8) | | | 8,621,000 | | | | 8,613,079 | |
0.181% (LIBOR 1 Month + 2 basis points) 3/19/2021 (6) | | | 20,000,000 | | | | 20,000,000 | |
0.183% 10/23/2020 | | | 14,750,000 | | | | 14,750,000 | |
0.185% (SOFR + 12 basis points) 3/12/2021 (6) | | | 11,000,000 | | | | 11,000,000 | |
0.188% 5/27/2021 (8) | | | 12,000,000 | | | | 11,983,473 | |
0.190% (SOFR + 12 basis points) 10/7/2020 (6) | | | 12,000,000 | | | | 12,000,000 | |
0.190% (SOFR + 12 basis points) 2/28/2022 (6) | | | 15,000,000 | | | | 15,000,000 | |
0.200% (SOFR + 13 basis points) 10/16/2020 (6) | | | 21,000,000 | | | | 21,000,000 | |
0.200% (SOFR + 13 basis points) 3/11/2021 (6) | | | 20,000,000 | | | | 20,000,000 | |
0.205% (SOFR + 14 basis points) 3/10/2021 (6) | | | 20,000,000 | | | | 19,999,470 | |
0.208% (LIBOR 1 Month + 5 basis points) 5/20/2021 (6) | | | 20,000,000 | | | | 20,000,000 | |
0.210% (SOFR + 14 basis points) 8/18/2021 (6) | | | 15,000,000 | | | | 15,000,000 | |
0.230% (SOFR + 16 basis points) 1/7/2021 (6) | | | 15,000,000 | | | | 15,000,000 | |
0.230% (SOFR + 16 basis points) 5/7/2021 (6) | | | 15,000,000 | | | | 15,005,693 | |
0.230% (SOFR + 16 basis points) 11/26/2021 (6) | | | 15,000,000 | | | | 15,000,000 | |
0.240% (SOFR + 17 basis points) 4/9/2021 (6) | | | 10,000,000 | | | | 10,000,000 | |
0.300% (SOFR + 23 basis points) 4/13/2021 (6) | | | 15,000,000 | | | | 15,000,000 | |
0.305% 10/26/2020 (8) | | | 15,000,000 | | | | 14,993,125 | |
0.325% 10/26/2020 (8) | | | 15,000,000 | | | | 14,992,667 | |
0.407% 3/18/2021 (8) | | | 10,000,000 | | | | 9,978,000 | |
0.417% 3/19/2021 (8) | | | 10,000,000 | | | | 9,977,336 | |
1.375% 9/28/2020 | | | 24,700,000 | | | | 24,722,536 | |
1.875% 7/7/2021 | | | 4,920,000 | | | | 4,991,832 | |
| | | | | | | | |
| | | | | | | 1,244,515,671 | |
|
Federal Home Loan Mortgage Corporation — 1.9% | |
0.110% (SOFR + 4 basis points) 9/10/2020 (6) | | | 20,000,000 | | | | 20,000,000 | |
0.210% (SOFR + 14 basis points) 12/10/2021 (6) | | | 10,000,000 | | | | 9,972,975 | |
0.230% (SOFR + 16 basis points) 12/8/2021 (6) | | | 10,000,000 | | | | 10,000,000 | |
0.260% (SOFR + 19 basis points) 6/2/2022 (6) | | | 10,000,000 | | | | 10,000,000 | |
0.325% 10/19/2020 (8) | | | 16,400,000 | | | | 16,393,003 | |
0.470% (SOFR + 40 basis points) 10/21/2021 (6) | | | 10,500,000 | | | | 10,500,000 | |
| | | | | | | | |
| | | | | | | 76,865,978 | |
|
Federal National Mortgage Association — 3.0% | |
0.095% (SOFR + 3 basis points) 9/4/2020 (6) | | | 20,000,000 | | | | 20,000,000 | |
0.145% (SOFR + 8 basis points) 10/30/2020 (6) | | | 9,000,000 | | | | 9,000,000 | |
(See Notes to Schedules of Investments and Notes to Financial Statements, which are an integral part of the Financial Statements)
77
August 31, 2020
Government Money Market Fund (continued)
| | | | | | | | |
| Description | | Principal
Amount | | | Value | |
| U.S. Government & U.S. Government Agency Obligations (continued) | |
|
Federal National Mortgage Association (continued) | |
0.200% (SOFR + 13 basis points) 6/11/2021 (6) | | $ | 20,000,000 | | | $ | 20,000,733 | |
0.260% (SOFR + 19 basis points) 4/5/2021 (6) | | | 17,500,000 | | | | 17,500,000 | |
0.350% (SOFR + 28 basis points) 7/6/2021 (6) | | | 10,000,000 | | | | 10,000,000 | |
0.410% (SOFR + 34 basis points) 12/30/2021 (6) | | | 15,000,000 | | | | 15,000,000 | |
1.375% 2/26/2021 | | | 25,447,000 | | | | 25,601,345 | |
| | | | | | | | |
| | | | | | | 117,102,078 | |
|
Sovereign — 3.6% | |
0.140% (3-Month T-Bill Index) 6/20/2027 (6) | | | 13,997,561 | | | | 13,997,561 | |
0.140% (3-Month T-Bill Index) 6/20/2027 (6) | | | 4,666,666 | | | | 4,666,666 | |
0.140% (3-Month T-Bill Index) 9/20/2027 (6) | | | 14,000,000 | | | | 14,000,000 | |
0.170% (3-Month T-Bill Index) 1/20/2027 (6) | | | 15,000,000 | | | | 15,000,000 | |
0.170% (3-Month T-Bill Index) 2/15/2028 (6) | | | 9,788,880 | | | | 9,788,880 | |
0.170% (3-Month T-Bill Index) 1/15/2030 (6) | | | 17,064,153 | | | | 17,064,153 | |
0.170% (3-Month T-Bill Index) 1/20/2035 (6) | | | 13,000,000 | | | | 13,000,000 | |
0.170% (3-Month T-Bill Index) 1/20/2035 (6) | | | 5,000,000 | | | | 5,000,000 | |
0.170% (3-Month T-Bill Index) 4/20/2035 (6) | | | 5,000,000 | | | | 5,000,000 | |
0.170% (3-Month T-Bill Index) 4/20/2035 (6) | | | 15,000,000 | | | | 15,000,000 | |
0.180% (3-Month T-Bill Index) 9/15/2026 (6) | | | 9,000,000 | | | | 9,000,000 | |
0.180% (3-Month T-Bill Index) 8/13/2027 (6) | | | 10,000,000 | | | | 10,000,000 | |
0.180% (3-Month T-Bill Index) 10/15/2030 (6) | | | 10,000,000 | | | | 10,000,000 | |
| | | | | | | | |
| | | | | | | 141,517,260 | |
| | | | | | | | |
| Total U.S. Government & U.S. Government Agency Obligations | | | | 1,953,635,699 | |
| | | | | | | | |
| U.S. Treasury Bills — 14.4% | |
|
U.S. Treasury Bonds & Notes — 14.4% | |
United States Treasury Bill: | | | | | | | | |
0.071% 9/3/2020 (8) | | | 25,000,000 | | | | 24,999,903 | |
0.073% 9/8/2020 (8) | | | 25,000,000 | | | | 24,999,648 | |
0.076% 9/10/2020 (8) | | | 25,000,000 | | | | 24,999,531 | |
0.081% 9/15/2020 (8) | | | 25,000,000 | | | | 24,999,227 | |
0.099% 10/27/2020 (8) | | | 25,000,000 | | | | 24,996,208 | |
0.101% 10/6/2020 (8) | | | 25,000,000 | | | | 24,997,569 | |
0.101% 12/17/2020 (8) | | | 20,000,000 | | | | 19,994,056 | |
0.102% 9/22/2020 (8) | | | 45,000,000 | | | | 44,997,349 | |
0.104% 12/3/2020 (8) | | | 45,000,000 | | | | 44,988,043 | |
0.105% 11/19/2020 (8) | | | 20,000,000 | | | | 19,995,458 | |
0.120% 11/19/2020 (8) | | | 20,000,000 | | | | 19,994,799 | |
0.132% 9/17/2020 (8) | | | 15,000,000 | | | | 14,999,133 | |
0.136% 9/8/2020 (8) | | | 20,000,000 | | | | 19,999,477 | |
0.142% 10/13/2020 (8) | | | 20,000,000 | | | | 19,996,733 | |
0.146% 11/12/2020 (8) | | | 15,000,000 | | | | 14,995,680 | |
0.147% 10/8/2020 (8) | | | 20,000,000 | | | | 19,997,019 | |
0.149% 11/19/2020 (8) | | | 17,500,000 | | | | 17,494,374 | |
0.152% 10/15/2020 (8) | | | 15,000,000 | | | | 14,997,245 | |
| | | | | | | | |
| Description | | Principal
Amount | | | Value | |
| U.S. Treasury Bills (continued) | |
|
U.S. Treasury Bonds & Notes (continued) | |
0.168% 9/24/2020 (8) | | $ | 20,000,000 | | | $ | 19,997,879 | |
0.175% 10/15/2020 (8) | | | 15,000,000 | | | | 14,996,838 | |
United States Treasury Cash Management Bill: | | | | | | | | |
0.099% 11/17/2020 (8) | | | 20,000,000 | | | | 19,995,829 | |
0.104% 11/24/2020 (8) | | | 20,000,000 | | | | 19,995,217 | |
0.105% 11/17/2020 (8) | | | 20,000,000 | | | | 19,995,572 | |
0.108% 11/24/2020 (8) | | | 20,000,000 | | | | 19,995,053 | |
0.132% 12/29/2020 (8) | | | 15,000,000 | | | | 14,993,554 | |
United States Treasury Note, 0.244% (Treasury Money Market Yield 3 Month + 14 basis points), 4/30/2021 (6) | | | 15,935,000 | | | | 15,938,050 | |
| | | | | | | | |
| | | | | | | 568,349,444 | |
| | | | | | | | |
Total Investments — 101.3%
(at amortized cost) | | | | 3,988,178,625 | |
| Other Assets and Liabilities — (1.3)% | | | | (50,817,947 | ) |
| | | | | | | | |
| Total Net Assets — 100.0% | | | $ | 3,937,360,678 | |
| | | | | | | | |
Tax-Free Money Market Fund
| | | | | | | | |
| Description | | Principal
Amount | | | Value | |
| Municipals — 95.0% | |
|
Alabama — 8.1% | |
Chatom Industrial Development Board, 0.375%, 8/1/2037 (6) | | $ | 5,600,000 | | | $ | 5,600,000 | |
City of Oxford, 0.160%, 9/1/2041 (6) | | | 12,745,000 | | | | 12,745,000 | |
Columbia Industrial Development Board, 0.080%, 12/1/2037 (6) | | | 2,900,000 | | | | 2,900,000 | |
Industrial Development Board of the City of Mobile Alabama, 0.200%, 6/1/2034 (6) | | | 10,000,000 | | | | 10,000,000 | |
| | | | | | | | |
| | | | | | | 31,245,000 | |
| | |
California — 2.8% | | | | | | | | |
Tender Option Bond Trust Receipts/Certificates: | | | | | | | | |
0.190% 11/1/2023 (5)(6) | | | 2,070,000 | | | | 2,070,000 | |
0.240% 9/1/2042 (5)(6) | | | 8,945,000 | | | | 8,945,000 | |
| | | | | | | | |
| | | | | | | 11,015,000 | |
| | |
Connecticut — 2.9% | | | | | | | | |
State of Connecticut, 0.160%, 5/15/2034 (6) | | | 11,400,000 | | | | 11,400,000 | |
| | |
Delaware — 1.6% | | | | | | | | |
Tender Option Bond Trust Receipts/Certificates, 0.250%, 1/1/2027 (5)(6) | | | 6,200,000 | | | | 6,200,000 | |
| | |
Florida — 11.4% | | | | | | | | |
City of Jacksonville: | | | | | | | | |
0.080% 8/1/2036 (6) | | | 11,400,000 | | | | 11,400,000 | |
0.150% 9/8/2020 (6) | | | 8,000,000 | | | | 8,000,000 | |
County of St. Lucie, 0.050%, 9/1/2028 (6) | | | 3,000,000 | | | | 3,000,000 | |
Highlands County Health Facilities Authority: | | | | | | | | |
0.090% 11/15/2035 (6) | | | 4,950,000 | | | | 4,950,000 | |
0.090% 11/15/2037 (6) | | | 10,500,000 | | | | 10,500,000 | |
JEA Water & Sewer System Revenue, 0.030%, 10/1/2038 (6) | | | 6,230,000 | | | | 6,230,000 | |
| | | | | | | | |
| | | | | | | 44,080,000 | |
(See Notes to Schedules of Investments and Notes to Financial Statements, which are an integral part of the Financial Statements)
78
Tax-Free Money Market Fund (continued)
| | | | | | | | |
| Description | | Principal
Amount | | | Value | |
| Municipals (continued) | |
| | |
Illinois — 7.9% | | | | | | | | |
Illinois Educational Facilities Authority, 0.090%, 7/1/2033 (6) | | $ | 1,046,000 | | | $ | 1,046,000 | |
Illinois Finance Authority, 0.080%, 7/1/2038 (6) | | | 504,000 | | | | 504,000 | |
Phoenix Realty Special Account-U LP, 0.160%, 7/1/2025 (6) | | | 8,075,000 | | | | 8,075,000 | |
Tender Option Bond Trust Receipts/Certificates: | | | | | | | | |
0.170% 2/15/2025 (5)(6) | | | 2,640,000 | | | | 2,640,000 | |
0.240% 1/1/2048 (5)(6) | | | 4,500,000 | | | | 4,500,000 | |
0.290% 11/15/2025 (5)(6) | | | 6,670,000 | | | | 6,670,000 | |
0.350% 1/1/2026 (5)(6) | | | 7,000,000 | | | | 7,000,000 | |
| | | | | | | | |
| | | | | | | 30,435,000 | |
| | |
Indiana — 2.0% | | | | | | | | |
Tender Option Bond Trust Receipts/Certificates, 0.240%, 5/14/2026 (5)(6) | | | 7,770,000 | | | | 7,770,000 | |
| | |
Iowa — 3.4% | | | | | | | | |
Iowa Finance Authority: | | | | | | | | |
0.130% 9/1/2036 (6) | | | 6,200,000 | | | | 6,200,000 | |
0.130% 12/1/2042 (6) | | | 7,000,000 | | | | 7,000,000 | |
| | | | | | | | |
| | | | | | | 13,200,000 | |
| | |
Kentucky — 0.4% | | | | | | | | |
Louisville and Jefferson County Metropolitan Sewer District, 3.000%, 10/23/2020 | | | 1,500,000 | | | | 1,503,223 | |
| | |
Maryland — 1.2% | | | | | | | | |
Washington Suburban Sanitary Commission, 0.180%, County Guarantee, 6/1/2023 (6) | | | 4,710,000 | | | | 4,710,000 | |
| | |
Michigan — 0.8% | | | | | | | | |
Michigan Finance Authority, 0.590%, (SIFMA Municipal Swap Index Yield), 10/15/2038 (6) | | | 3,000,000 | | | | 3,000,000 | |
| | |
Minnesota — 3.4% | | | | | | | | |
City of Minneapolis St. Paul Housing & Redevelopment Authority, 0.020%, AGM, 8/15/2037 (6) | | | 8,305,000 | | | | 8,305,000 | |
City of Ramsey, 0.290%, 12/1/2023 (6) | | | 1,300,000 | | | | 1,300,000 | |
Minnesota Higher Education Facilities Authority, 0.200%, 3/1/2033 (6) | | | 3,400,000 | | | | 3,400,000 | |
| | | | | | | | |
| | | | | | | 13,005,000 | |
| | |
Mississippi — 1.5% | | | | | | | | |
County of Jackson, 0.030%, 6/1/2023 (6) | | | 920,000 | | | | 920,000 | |
Mississippi Business Finance Corp., 1.500%, 5/1/2037 (6) | | | 5,000,000 | | | | 5,000,000 | |
| | | | | | | | |
| | | | | | | 5,920,000 | |
| | |
Missouri — 3.4% | | | | | | | | |
Tender Option Bond Trust Receipts/Certificates, 0.340%, 5/15/2041 (5)(6) | | | 13,000,000 | | | | 13,000,000 | |
| | |
Nebraska — 0.2% | | | | | | | | |
Nebraska Investment Finance Authority, 0.600%, 9/1/2031 (6) | | | 600,000 | | | | 600,000 | |
| | | | | | | | |
| Description | | Principal
Amount | | | Value | |
| Municipals (continued) | |
| | |
New Hampshire — 2.6% | | | | | | | | |
New Hampshire Business Finance Authority, 0.150%, 9/1/2030 (6) | | $ | 10,000,000 | | | $ | 10,000,000 | |
| | |
New Jersey — 1.2% | | | | | | | | |
Hudson County Improvement Authority, 2.000%, County Guarantee, 2/19/2021 | | | 2,800,000 | | | | 2,813,078 | |
Lyndhurst Township School District, 1.875%, 9/10/2020 | | | 2,000,000 | | | | 2,000,289 | |
| | | | | | | | |
| | | | | | | 4,813,367 | |
| | |
New York — 10.7% | | | | | | | | |
City of New York: | | | | | | | | |
0.040% 8/1/2024 (6) | | | 3,120,000 | | | | 3,120,000 | |
0.040% 8/1/2044 (6) | | | 12,300,000 | | | | 12,300,000 | |
Metropolitan Transportation Authority, 4.000%, 9/1/2020 | | | 5,000,000 | | | | 5,000,000 | |
New York City Housing Development Corp., 0.200%, 5/1/2052 (6) | | | 9,500,000 | | | | 9,500,000 | |
New York City Transitional Finance Authority Future Tax Secured Revenue, 0.040%, 8/1/2043 (6) | | | 5,500,000 | | | | 5,500,000 | |
New York City Water & Sewer System: | | | | | | | | |
0.020% 6/15/2048 (6) | | | 1,475,000 | | | | 1,475,000 | |
0.040% 6/15/2039 (6) | | | 300,000 | | | | 300,000 | |
0.070% 6/15/2035 (6) | | | 1,095,000 | | | | 1,095,000 | |
New York State Dormitory Authority, 5.000%, 3/31/2021 | | | 3,000,000 | | | | 3,077,089 | |
| | | | | | | | |
| | | | | | | 41,367,089 | |
| | |
Ohio — 7.6% | | | | | | | | |
American Municipal Power, Inc., 1.500%, 6/24/2021 | | | 2,000,000 | | | | 2,017,174 | |
County of Lake, 2.250%, 1/14/2021 | | | 2,975,000 | | | | 2,987,148 | |
Ohio State University, 0.070%, 12/1/2039 (6) | | | 1,325,000 | | | | 1,325,000 | |
Port of Greater Cincinnati Development Authority: | | | | | | | | |
0.170% 11/1/2023 (6) | | | 1,000,000 | | | | 1,000,000 | |
0.170% 11/1/2025 (6) | | | 210,000 | | | | 210,000 | |
State of Ohio: | | | | | | | | |
0.070% 8/1/2021 (6) | | | 700,000 | | | | 700,000 | |
5.000% 9/15/2020 | | | 5,000,000 | | | | 5,005,159 | |
Tender Option Bond Trust Receipts/Certificates: | | | | | | | | |
0.270% 8/15/2025 (5)(6) | | | 8,000,000 | | | | 8,000,000 | |
0.270% 6/1/2026 (5)(6) | | | 4,000,000 | | | | 4,000,000 | |
0.290% 6/1/2026 (5)(6) | | | 4,000,000 | | | | 4,000,000 | |
| | | | | | | | |
| | | | | | | 29,244,481 | |
| | |
South Carolina — 1.7% | | | | | | | | |
Charleston County School District, 5.000%, SCSDE, 5/12/2021 | | | 3,000,000 | | | | 3,083,406 | |
South Carolina Educational Facilities Authority, 0.080%, 10/1/2039 (6) | | | 3,615,000 | | | | 3,615,000 | |
| | | | | | | | |
| | | | | | | 6,698,406 | |
| | |
South Dakota — 3.2% | | | | | | | | |
South Dakota Housing Development Authority: | | | | | | | | |
0.210% 11/1/2048 (6) | | | 6,030,000 | | | | 6,030,000 | |
0.260% 5/1/2048 (6) | | | 6,350,000 | | | | 6,350,000 | |
| | | | | | | | |
| | | | | | | 12,380,000 | |
(See Notes to Schedules of Investments and Notes to Financial Statements, which are an integral part of the Financial Statements)
79
August 31, 2020
Tax-Free Money Market Fund (continued)
| | | | | | | | |
| Description | | Shares or
Principal
Amount | | | Value | |
| Municipals (continued) | |
|
Tennessee — 0.8% | |
Shelby County Health Educational & Housing Facilities Board,
0.030%, AGM, 6/1/2042 (6) | | $ | 3,000,000 | | | $ | 3,000,000 | |
| | |
Texas — 10.0% | | | | | | | | |
University of North Texas System: | | | | | | | | |
0.170% 9/17/2020 | | | 8,280,000 | | | | 8,280,000 | |
0.170% 9/16/2020 | | | 4,950,000 | | | | 4,950,000 | |
City of Houston Combined Utility System Revenue, 0.090%, 5/15/2034 (6) | | | 1,625,000 | | | | 1,625,000 | |
City of San Antonio, 0.180%, 1/6/2021 | | | 4,000,000 | | | | 4,000,000 | |
Harris County Health Facilities Development Corp., 0.020%, 12/1/2041 (6) | | | 7,010,000 | | | | 7,010,000 | |
Tarrant County Cultural Education Facilities Finance Corp., 0.200%, 11/15/2033 (6) | | | 600,000 | | | | 600,000 | |
Tender Option Bond Trust Receipts/Certificates, 0.290%, 7/1/2021 (5) (6) | | | 12,100,000 | | | | 12,100,000 | |
| | | | | | | | |
| | | | | | | 38,565,000 | |
|
Utah — 1.4% | |
City of Murray, 0.020%, 5/15/2037 (6) | | | 3,425,000 | | | | 3,425,000 | |
County of Weber, 0.090%, 2/15/2032 | | | 2,000,000 | | | | 2,000,000 | |
| | | | | | | | |
| | | | | | | 5,425,000 | |
|
Virginia — 0.9% | |
Loudoun County Economic Development Authority, 0.080%, 6/1/2043 (6) | | | 3,510,000 | | | | 3,510,000 | |
| | |
Washington — 2.4% | | | | | | | | |
Washington Health Care Facilities Authority, 5.625%, 1/1/2035 | | | 9,000,000 | | | | 9,159,289 | |
Washington State Housing Finance Commission, 0.110%, 7/1/2028 (6) | | | 30,000 | | | | 30,000 | |
| | | | | | | | |
| | | | | | | 9,189,289 | |
|
Wisconsin — 1.5% | |
PMA Levy & Aid Anticipation Notes Program, 3.000%, 10/23/2020 | | | 2,500,000 | | | | 2,506,067 | |
Sauk Prairie School District, 2.000%, 12/9/2020 | | | 3,000,000 | | | | 3,000,780 | |
Wisconsin Health & Educational Facilities Authority, 0.120%, 5/1/2030 (6) | | | 135,000 | | | | 135,000 | |
| | | | | | | | |
| | | | | | | 5,641,847 | |
| | | | | | | | |
| Total Municipals | | | | | | | 366,917,702 | |
| | | | | | | | |
| Mutual Funds — 4.8% | | | | | | |
Blackrock Liquidity Funds Tempfund Portfolio — Institutional Class, 0.050% | | | 2,017,805 | | | | 2,017,805 | |
| | | | | | | | |
| Description | | Shares | | | Value | |
| Mutual Funds (continued) | |
Federated Institutional Tax-Free Cash Trust — Institutional Class, 0.010% | | | 16,472,400 | | | $ | 16,472,400 | |
| | | | | | | | |
| Total Mutual Funds | | | | | | | 18,490,205 | |
| | | | | | | | |
Total Investments — 99.8%
(at amortized cost) | | | | 385,407,907 | |
| Other Assets and Liabilities — 0.2% | | | | 719,952 | |
| | | | | | | | |
| Total Net Assets — 100.0% | | | | | | $ | 386,127,859 | |
| | | | | | | | |
Prime Money Market Fund
| | | | | | | | |
| Description | | Principal
Amount | | | Value | |
| Certificates of Deposit — 13.9% | |
|
Banks — 13.9% | |
Bank of Nova Scotia, 0.450% (U.S. Federal Funds Effective Rate (continuous series) + 36 basis points), 9/3/2020 (6) | | $ | 2,500,000 | | | $ | 2,500,000 | |
Canadian Imperial Bank of Commerce: | | | | | | | | |
0.100% 9/2/2020 | | | 17,500,000 | | | | 17,500,000 | |
0.320% (SOFR + 25 basis points), 3/2/2021 (6) | | | 2,500,000 | | | | 2,500,000 | |
0.490% (U.S. Federal Funds Effective Rate (continuous series) + 40 basis points), 10/9/2020 (6) | | | 2,500,000 | | | | 2,500,000 | |
Credit Agricole Corporate and Investment Bank: | | | | | | | | |
0.317% (LIBOR 3 Month + 6 basis points), 2/12/2021 (6) | | | 2,650,000 | | | | 2,650,000 | |
0.321% (LIBOR 3 Month + 7 basis points), 2/3/2021 (6) | | | 3,000,000 | | | | 3,000,038 | |
Mizuho Bank, Ltd.: | | | | | | | | |
0.255% (LIBOR 1 Month + 10 basis points), 9/8/2020 (6) | | | 3,000,000 | | | | 3,000,000 | |
0.310% 9/8/2020 | | | 2,000,000 | | | | 2,000,074 | |
MUFG Bank, Ltd.: | | | | | | | | |
0.291% 1/28/2021 | | | 3,000,000 | | | | 3,000,000 | |
0.709% (LIBOR 3 Month + 46 basis points), 2/4/2021 (6) | | | 2,500,000 | | | | 2,504,177 | |
1.980% 10/15/2020 | | | 3,000,000 | | | | 3,000,869 | |
Nordea Bank AB, 0.347% (LIBOR 3 Month + 10 basis points), 5/21/2021 (6) | | | 3,000,000 | | | | 3,000,000 | |
Norinchukin Bank, 1.250% 9/3/2020 | | | 3,000,000 | | | | 3,000,000 | |
Royal Bank of Canada: | | | | | | | | |
0.270% (SOFR + 20 basis points), 8/6/2021 | | | 3,000,000 | | | | 3,000,000 | |
0.320% (SOFR + 25 basis points), 2/26/2021 (6) | | | 3,250,000 | | | | 3,248,394 | |
0.428% (LIBOR 3 Month + 12 basis points), 6/18/2021 (6) | | | 3,250,000 | | | | 3,250,000 | |
Skandinaviska Enskilda Banken AB: | | | | | | | | |
0.338% (LIBOR 3 Month + 7 basis points), 10/9/2020 (6) | | | 2,750,000 | | | | 2,750,029 | |
0.414% (LIBOR 3 Month + 11 basis points), 1/4/2021 (6) | | | 2,500,000 | | | | 2,500,210 | |
0.452% (LIBOR 3 Month + 15 basis points), 10/2/2020 (6) | | | 2,500,000 | | | | 2,500,000 | |
(See Notes to Schedules of Investments and Notes to Financial Statements, which are an integral part of the Financial Statements)
80
Prime Money Market Fund (continued)
| | | | | | | | |
| Description | | Principal
Amount | | | Value | |
| Certificates of Deposit (continued) | |
|
Banks (continued) | |
Sumitomo Mitsui Banking Corp.: | | | | | | | | |
0.265% (LIBOR 1 Month + 11 basis points), 9/4/2020 (6) | | $ | 3,000,000 | | | $ | 3,000,000 | |
0.293% (LIBOR 3 Month + 4 basis points), 11/13/2020 (6) | | | 2,500,000 | | | | 2,500,347 | |
0.313% (LIBOR 1 Month + 13 basis points), 11/23/2020 (6) | | | 3,150,000 | | | | 3,150,000 | |
0.384% (LIBOR 3 Month + 10 basis points), 1/6/2021 (6) | | | 3,500,000 | | | | 3,500,000 | |
Toronto-Dominion Bank: | | | | | | | | |
0.428% (LIBOR 3 Month + 11 basis points), 6/10/2021 (6) | | | 3,250,000 | | | | 3,250,000 | |
0.490% (SOFR + 42 basis points), 9/30/2020 (6) | | | 2,500,000 | | | | 2,500,000 | |
| | | | | | | | |
Total Certificates of Deposit | | | | | | | 85,304,138 | |
| | | | | | | | |
| Commercial Paper — 70.5% | |
|
Asset-Backed Securities — 27.7% | |
CAFCO LLC: | | | | | | | | |
0.213% 10/22/2020 (8) | | | 3,500,000 | | | | 3,498,959 | |
0.233% 2/2/2021 (8) | | | 2,500,000 | | | | 2,497,540 | |
0.335% 11/18/2020 (8) | | | 3,500,000 | | | | 3,497,497 | |
Chesh LLC, 0.101% 9/1/2020 (8) | | | 23,999,999 | | | | 24,000,000 | |
CRC Funding LLC, 0.193% 11/19/2020 (8) | | | 3,000,000 | | | | 2,998,749 | |
Crown Point Capital Co. LLC: | | | | | | | | |
0.284% 9/23/2020 (8) | | | 3,000,000 | | | | 2,999,487 | |
0.304% 11/5/2020 (8) | | | 3,000,000 | | | | 2,998,375 | |
0.315% 10/22/2020 (8) | | | 3,000,000 | | | | 2,998,682 | |
0.325% 1/19/2021 (8) | | | 2,500,000 | | | | 2,496,889 | |
0.406% 1/21/2021 (8) | | | 3,000,000 | | | | 2,995,267 | |
1.321% 12/2/2020 (8) | | | 2,500,000 | | | | 2,491,758 | |
Glencove Funding LLC: | | | | | | | | |
0.205% (US0001W + 10 basis points), 2/19/2021 (5)(6) | | | 5,000,000 | | | | 5,000,000 | |
0.213% (US0001W + 10 basis points), 2/1/2021 (5)(6) | | | 7,500,000 | | | | 7,500,000 | |
LMA Americas LLC: | | | | | | | | |
0.112% 9/3/2020 (8) | | | 11,000,000 | | | | 10,999,933 | |
0.243% 10/9/2020 (8) | | | 3,500,000 | | | | 3,499,113 | |
0.304% 9/14/2020 (8) | | | 2,280,000 | | | | 2,279,753 | |
0.315% 11/17/2020 (8) | | | 3,000,000 | | | | 2,998,011 | |
0.406% 11/4/2020 (8) | | | 2,500,000 | | | | 2,498,222 | |
Longship Funding LLC: | | | | | | | | |
0.101% 9/1/2020 (8) | | | 20,000,000 | | | | 20,000,000 | |
0.142% 9/30/2020 (8) | | | 3,500,000 | | | | 3,499,605 | |
Old Line Funding LLC: | | | | | | | | |
0.315% 10/30/2020 (8) | | | 4,000,000 | | | | 3,997,968 | |
0.335% 3/22/2021 (8) | | | 4,000,000 | | | | 3,992,593 | |
Ridgefield Funding Co.: | | | | | | | | |
0.122% 9/3/2020 (8) | | | 15,000,000 | | | | 14,999,900 | |
0.203% 11/4/2020 (8) | | | 3,000,000 | | | | 2,998,933 | |
0.213% 11/4/2020 (8) | | | 4,000,000 | | | | 3,998,507 | |
Sheffield Receivables Co. LLC: | | | | | | | | |
0.274% 12/21/2020 (8) | | | 2,000,000 | | | | 1,998,335 | |
0.294% 11/9/2020 (8) | | | 3,500,000 | | | | 3,498,055 | |
0.325% 1/12/2021 (8) | | | 3,000,000 | | | | 2,996,453 | |
0.406% 11/2/2020 (8) | | | 2,500,000 | | | | 2,498,278 | |
0.417% 11/17/2020 (8) | | | 3,500,000 | | | | 3,496,931 | |
0.427% 11/5/2020 (8) | | | 3,000,000 | | | | 2,997,725 | |
Thunder Bay Funding LLC: | | | | | | | | |
0.254% 11/20/2020 (8) | | | 1,275,000 | | | | 1,274,292 | |
| | | | | | | | |
| Description | | Principal
Amount | | | Value | |
| Commercial Paper (continued) | | | | | | |
|
Asset-Backed Securities (continued) | |
0.264% 3/11/2021 (8) | | $ | 2,750,000 | | | $ | 2,746,207 | |
0.274% 11/20/2020 (8) | | | 4,000,000 | | | | 3,997,600 | |
0.447% 10/20/2020 (8) | | | 2,500,000 | | | | 2,498,503 | |
| | | | | | | | |
| | | | | | | 169,738,120 | |
|
Auto Manufacturers — 0.9% | |
Toyota Motor Credit Corp.: | | | | | | | | |
0.300% (LIBOR 1 Month + 13 basis points), 11/23/2020 (6) | | | 3,000,000 | | | | 3,000,000 | |
0.303% (LIBOR 3 Month + 5 basis points), 11/13/2020 (6) | | | 2,500,000 | | | | 2,500,000 | |
| | | | | | | | |
| | | | | | | 5,500,000 | |
|
Banks — 14.1% | |
Bank of Nova Scotia: | | | | | | | | |
0.370% (LIBOR 3 Month + 9 basis points), 2/16/2021 (6) | | | 2,500,000 | | | | 2,500,011 | |
0.649% (LIBOR 3 Month + 40 basis points), 5/4/2021 (6) | | | 3,500,000 | | | | 3,508,366 | |
Credit Suisse AG, 0.501% (LIBOR 3 Month + 25 basis points), 11/2/2020 (6) | | | 2,500,000 | | | | 2,500,000 | |
Manhattan Asset Funding Co. LLC: | | | | | |
0.152% 9/18/2020 (8) | | | 3,500,000 | | | | 3,499,752 | |
0.183% 11/19/2020 (8) | | | 2,571,000 | | | | 2,569,984 | |
0.243% 10/6/2020 (8) | | | 3,500,000 | | | | 3,499,183 | |
0.243% 10/7/2020 (8) | | | 3,500,000 | | | | 3,499,160 | |
0.304% 9/21/2020 (8) | | | 3,750,000 | | | | 3,749,375 | |
0.345% 11/20/2020 (8) | | | 3,500,000 | | | | 3,497,356 | |
National Australia Bank, Ltd., 0.256% (LIBOR 1 Month + 10 basis points), 4/30/2021 (5)(6) | | | 3,000,000 | | | | 3,000,051 | |
Nationwide Building Society, 0.162% 9/11/2020 (8) | | | 3,500,000 | | | | 3,499,844 | |
Skandinaviska Enskilda Banken AB, 0.233% 11/12/2020 (8) | | | 3,000,000 | | | | 2,998,620 | |
Societe Generale, 0.101% 9/3/2020 (8) | | | 10,000,000 | | | | 9,999,944 | |
Sumitomo Mitsui Banking Corp., 0.213% 11/25/2020 (8) | | | 3,000,000 | | | | 2,998,513 | |
Swedbank AB, 0.101% 9/4/2020 (8) | | | 15,000,000 | | | | 14,999,875 | |
Swedish Export Credit Corp.: | | | | | | | | |
0.274% 12/1/2020 (8) | | | 3,500,000 | | | | 3,497,611 | |
0.274% 12/1/2020 (8) | | | 1,000,000 | | | | 999,318 | |
Toronto-Dominion Bank: | | | | | | | | |
0.101% 9/3/2020 (8) | | | 8,000,000 | | | | 7,999,956 | |
0.112% 9/8/2020 (8) | | | 7,500,000 | | | | 7,499,840 | |
| | | | | | | | |
| | | | | | | 86,316,759 | |
|
Diversified Financial Services — 23.4% | |
Atlantic Asset Securitization LLC: | | | | | |
0.223% 11/18/2020 (8) | | | 4,000,000 | | | | 3,998,093 | |
0.233% 2/3/2021 (8) | | | 3,000,000 | | | | 2,997,029 | |
0.335% 12/8/2020 (8) | | | 2,000,000 | | | | 1,998,203 | |
Collateralized Commercial Paper Co. LLC: | | | | | | | | |
0.254% 2/8/2021 (8) | | | 4,000,000 | | | | 3,995,556 | |
0.266% (LIBOR 1 Month + 11 basis points), 9/1/2020 (6) | | | 10,000,000 | | | | 10,000,000 | |
(See Notes to Schedules of Investments and Notes to Financial Statements, which are an integral part of the Financial Statements)
81
August 31, 2020
Prime Money Market Fund (continued)
| | | | | | | | |
| Description | | Shares or
Principal
Amount | | | Value | |
| Commercial Paper (continued) | | | | | | |
|
Diversified Financial Services (continued) | |
0.274% 2/2/2021 (8) | | $ | 3,000,000 | | | $ | 2,996,535 | |
0.305% (LIBOR 3 Month + 5 basis points), 10/23/2020 (6) | | | 2,500,000 | | | | 2,500,000 | |
0.386% 2/9/2021 (8) | | | 3,000,000 | | | | 2,994,902 | |
Columbia Funding Co. LLC: | | | | | | | | |
0.112% 9/8/2020 (8) | | | 5,000,000 | | | | 4,999,893 | |
0.193% 10/16/2020 (8) | | | 4,000,000 | | | | 3,999,050 | |
0.203% 11/17/2020 (8) | | | 3,000,000 | | | | 2,998,717 | |
0.325% 12/2/2020 (8) | | | 3,500,000 | | | | 3,497,138 | |
Erste Abwicklungsanstalt, 0.213% 9/8/2020 (8) | | | 2,000,000 | | | | 1,999,918 | |
Natixis S.A., 0.320% (SOFR + 25 basis points), 2/12/2021 (6) | | | 2,500,000 | | | | 2,500,000 | |
Regency Markets No. 1 LLC: | | | | | | | | |
0.162% 9/8/2020 (8) | | | 7,500,000 | | | | 7,499,767 | |
0.162% 9/15/2020 (8) | | | 3,500,000 | | | | 3,499,782 | |
0.162% 9/25/2020 (8) | | | 5,000,000 | | | | 4,999,467 | |
0.172% 9/3/2020 (8) | | | 8,000,000 | | | | 7,999,924 | |
Sheffield Receivables Co. LLC, 0.450% 12/2/2020 (8) | | | 3,500,000 | | | | 3,500,000 | |
Starbird Funding Corp.: | | | | | | | | |
0.101% 9/1/2020 (8) | | | 2,200,000 | | | | 2,200,000 | |
0.213% 12/14/2020 (8) | | | 3,500,000 | | | | 3,497,877 | |
0.233% 2/10/2021 (8) | | | 2,500,000 | | | | 2,497,412 | |
0.264% 11/9/2020 (8) | | | 3,500,000 | | | | 3,498,256 | |
0.274% 9/16/2020 (8) | | | 3,500,000 | | | | 3,499,606 | |
0.386% 11/9/2020 (8) | | | 2,500,000 | | | | 2,498,179 | |
0.427% 9/22/2020 (8) | | | 2,500,000 | | | | 2,499,387 | |
Versailles CDS LLC: | | | | | | | | |
0.101% 9/2/2020 (8) | | | 5,000,000 | | | | 4,999,986 | |
0.152% 9/1/2020 (8) | | | 5,000,000 | | | | 5,000,000 | |
0.203% 11/3/2020 (8) | | | 3,500,000 | | | | 3,498,775 | |
0.233% 11/5/2020 (8) | | | 3,000,000 | | | | 2,998,754 | |
0.284% 9/2/2020 (8) | | | 3,750,000 | | | | 3,749,971 | |
Victory Receivables Corp.: | | | | | | | | |
0.091% 9/1/2020 (8) | | | 10,000,000 | | | | 10,000,000 | |
0.122% 9/1/2020 (8) | | | 5,000,000 | | | | 5,000,000 | |
0.203% 9/8/2020 (8) | | | 3,500,000 | | | | 3,499,864 | |
0.223% 10/21/2020 (8) | | | 2,500,000 | | | | 2,499,236 | |
0.264% 10/1/2020 (8) | | | 3,000,000 | | | | 2,999,350 | |
| | | | | | | | |
| | | | | | | 143,410,627 | |
|
Integrated Oil — 4.4% | |
Equinor ASA, 0.101% 9/1/2020 (8) | | | 23,500,000 | | | | 23,500,000 | |
Exxon Mobil Corp., 0.294% 9/25/2020 (8) | | | 3,500,000 | | | | 3,499,323 | |
| | | | | | | | |
| | | | | | | 26,999,323 | |
| | | | | | | | |
Total Commercial Paper | | | | | | | 431,964,829 | |
| | | | | | | | |
| Mutual Funds — 6.1% | | | | | | |
Goldman Sachs Money Market Fund — Premier Class, 0.020% | | | 20,054,009 | | | | 20,054,009 | |
State Street Institutional U.S. Government Money Market Fund — Premier Class, 0.034% | | | 17,053,173 | | | | 17,053,173 | |
| | | | | | | | |
Total Mutual Funds | | | | | | | 37,107,182 | |
| | | | | | | | |
| | | | | | | | |
| Description | | Principal
Amount | | | Value | |
| Repurchase Agreements — 7.7% | |
Agreement with Fixed Income Clearing Corp., 0.000%, dated 8/31/2020, to be repurchased at $9,599,699 on 9/1/2020, collateralized by U.S. Government Treasury Obligation with a maturity of 4/15/2021, with a fair value of $9,791,750 | | $ | 9,599,699 | | | $ | 9,599,699 | |
Agreement with Fixed Income Clearing Corp., 0.080%, dated 8/31/2020, to be repurchased at $2,500,006 on 9/1/2020, collateralized by U.S. Government Treasury Obligation with a maturity of 6/15/2023, with a fair value of $2,550,089 | | | 2,500,000 | | | | 2,500,000 | |
Agreement with Merrill Lynch Pierce Fenner & Smith, Inc., 0.090%, dated 8/31/2020, to be repurchased at $25,000,063 on 9/1/2020, collateralized by U.S. Government Agency Obligation with a maturity of 6/20/2050, with a fair value of $25,500,001 | | | 25,000,000 | | | | 25,000,000 | |
Agreement with TD Securities USA LLC, 0.090%, dated 8/27/2020, to be repurchased at $10,000,175 on 9/3/2020, collateralized by U.S. Government Agency Obligation with a maturity of 8/15/2028, with a fair value of $10,200,213 | | | 10,000,000 | | | | 10,000,000 | |
| | | | | | | | |
Total Repurchase Agreements | | | | 47,099,699 | |
| | | | | | | | |
| U.S. Government & U.S. Government Agency Obligations — 1.8% | |
|
Federal Home Loan Mortgage Corporation — 0.9% | |
Federal Home Loan Mortgage Corporation, 0.470%, (SOFR + 40 basis points), 10/21/2021 (6) | | | 5,250,000 | | | | 5,250,000 | |
|
Sovereign — 0.9% | |
Federal National Mortgage Association , 0.430%, (SOFR + 36 basis points), 1/20/2022 (6) | | | 5,500,000 | | | | 5,500,000 | |
| | | | | | | | |
| Total U.S. Government & U.S. Government Agency Obligations | | | | 10,750,000 | |
| | | | | | | | |
Total Investments — 100.0%
(at amortized cost) | | | | 612,225,848 | |
| Other Assets and Liabilities — 0.0% | | | | 125,347 | |
| | | | | | | | |
| Total Net Assets — 100.0% | | | $ | 612,351,195 | |
| | | | | | | | |
(See Notes to Schedules of Investments and Notes to Financial Statements, which are an integral part of the Financial Statements)
82
Institutional Prime Money Market Fund
| | | | | | | | |
| Description | | Principal
Amount | | | Value | |
| Certificates of Deposit — 22.1% | |
|
Banks — 22.1% | |
Bank of Nova Scotia, 0.450% (U.S. Federal Funds Effective Rate (continuous series) + 36 basis points), 9/3/2020 (6) | | $ | 2,800,000 | | | $ | 2,800,019 | |
Canadian Imperial Bank of Commerce: | | | | | | | | |
0.100% 9/2/2020 | | | 10,000,000 | | | | 10,000,003 | |
0.320% (SOFR + 25 basis points), 3/2/2021 (6) | | | 3,500,000 | | | | 3,502,027 | |
0.490% (U.S. Federal Funds Effective Rate (continuous series) + 40 basis points), 10/9/2020 (6) | | | 3,000,000 | | | | 3,000,848 | |
Credit Agricole Corporate and Investment Bank: | | | | | | | | |
0.317% (LIBOR 3 Month + 6 basis points), 2/12/2021 (6) | | | 3,000,000 | | | | 3,001,408 | |
0.321% (LIBOR 3 Month + 7 basis points), 2/3/2021 (6) | | | 3,250,000 | | | | 3,251,577 | |
Mizuho Bank, Ltd.: | | | | | | | | |
0.255% (LIBOR 1 Month + 10 basis points), 9/8/2020 (6) | | | 3,000,000 | | | | 3,000,078 | |
0.310% 9/8/2020 | | | 2,000,000 | | | | 2,000,090 | |
MUFG Bank, Ltd.: | | | | | | | | |
0.290% 1/28/2021 | | | 2,500,000 | | | | 2,500,572 | |
0.709% (LIBOR 3 Month + 46 basis points), 2/4/2021 (6) | | | 3,000,000 | | | | 3,004,999 | |
1.980% 10/15/2020 (6) | | | 3,000,000 | | | | 3,006,947 | |
Nordea Bank AB, 0.347% (LIBOR 3 Month + 10 basis points), 5/21/2021 (6) | | | 3,000,000 | | | | 3,002,695 | |
Norinchukin Bank, 1.250% 9/3/2020 | | | 4,000,000 | | | | 4,000,390 | |
Royal Bank of Canada: | | | | | | | | |
0.270% (SOFR + 20 basis points), 8/6/2021 (6) | | | 2,500,000 | | | | 2,499,622 | |
0.320% (SOFR + 25 basis points), 2/26/2021 (6) | | | 2,750,000 | | | | 2,751,653 | |
0.428% (LIBOR 3 Month + 12 basis points), 6/18/2021 (6) | | | 2,750,000 | | | | 2,752,291 | |
Skandinaviska Enskilda Banken AB: | | | | | | | | |
0.338% (LIBOR 3 Month + 7 basis points), 10/9/2020 (6) | | | 2,750,000 | | | | 2,750,325 | |
0.414% (LIBOR 3 Month + 11 basis points), 1/4/2021 (6) | | | 2,500,000 | | | | 2,501,075 | |
0.452% (LIBOR 3 Month + 15 basis points), 10/2/2020 (6) | | | 3,500,000 | | | | 3,500,539 | |
Sumitomo Mitsui Banking Corp.: | | | | | | | | |
0.265% (LIBOR 1 Month + 11 basis points), 9/4/2020 (6) | | | 3,000,000 | | | | 3,000,049 | |
0.294% (LIBOR 3 Month + 4 basis points), 11/13/2020 (6) | | | 2,500,000 | | | | 2,500,325 | |
0.313% (LIBOR 1 Month + 13 basis points), 11/23/2020 (6) | | | 2,750,000 | | | | 2,750,701 | |
0.384% (LIBOR 3 Month + 10 basis points), 1/6/2021 (6) | | | 3,000,000 | | | | 3,001,093 | |
0.647% (LIBOR 3 Month + 39 basis points), 2/12/2021 (6) | | | 3,000,000 | | | | 3,005,127 | |
Toronto-Dominion Bank: | | | | | | | | |
0.428% (LIBOR 3 Month + 11 basis points), 6/10/2021 (6) | | | 2,500,000 | | | | 2,501,253 | |
| | | | | | | | |
| Description | | Principal
Amount | | | Value | |
| Certificates of Deposit (continued) | |
|
Banks (continued) | |
0.490% (SOFR + 42 basis points), 9/30/2020 (6) | | $ | 2,750,000 | | | $ | 2,750,825 | |
| | | | | | | | |
Total Certificates of Deposit
(identified cost $82,309,020) | | | | | | | 82,336,531 | |
| | | | | | | | |
| Commercial Paper — 63.7% | |
|
Asset-Backed Securities — 25.7% | |
CAFCO LLC, 0.335% 11/18/2020 (8) | | | 2,500,000 | | | | 2,499,265 | |
Chesh LLC, 0.101% 9/1/2020 (8) | | | 14,000,000 | | | | 13,950,895 | |
Crown Point Capital Co. LLC: | | | | | | | | |
0.284% 9/23/2020 (8) | | | 2,500,000 | | | | 2,499,441 | |
0.304% 11/5/2020 (8) | | | 2,500,000 | | | | 2,499,216 | |
0.315% 10/22/2020 (8) | | | 2,500,000 | | | | 2,499,220 | |
0.325% 1/19/2021 (8) | | | 2,500,000 | | | | 2,497,924 | |
0.406% 1/21/2021 (8) | | | 2,500,000 | | | | 2,497,885 | |
1.321% 12/2/2020 (8) | | | 2,500,000 | | | | 2,498,734 | |
LMA Americas LLC: | | | | | | | | |
0.112% 9/3/2020 (8) | | | 3,100,000 | | | | 3,099,968 | |
0.284% 9/14/2020 (8) | | | 2,600,000 | | | | 2,599,858 | |
0.304% 9/14/2020 (8) | | | 2,000,000 | | | | 1,999,891 | |
0.315% 11/17/2020 (8) | | | 2,500,000 | | | | 2,499,009 | |
0.356% 12/7/2020 (8) | | | 2,500,000 | | | | 2,498,653 | |
0.406% 11/4/2020 (8) | | | 2,500,000 | | | | 2,499,233 | |
Longship Funding LLC, 0.101% 9/1/2020 (8) | | | 7,500,000 | | | | 7,499,972 | |
Old Line Funding LLC: | | | | | | | | |
0.315% 10/30/2020 (8) | | | 3,000,000 | | | | 2,999,275 | |
0.335% 3/22/2021 (8) | | | 3,000,000 | | | | 2,996,786 | |
Ridgefield Funding Co., 0.122% 9/3/2020 (8) | | | 15,000,000 | | | | 14,999,842 | |
Sheffield Receivables Co. LLC: | | | | | | | | |
0.294% 11/9/2020 (8) | | | 2,500,000 | | | | 2,499,149 | |
0.325% 1/12/2021 (8) | | | 2,500,000 | | | | 2,498,046 | |
0.406% 11/2/2020 (8) | | | 2,500,000 | | | | 2,499,265 | |
0.417% 11/17/2020 (8) | | | 2,500,000 | | | | 2,499,009 | |
0.427% 11/5/2020 (8) | | | 2,000,000 | | | | 1,999,373 | |
Thunder Bay Funding LLC: | | | | | | | | |
0.264% 3/11/2021 (8) | | | 3,000,000 | | | | 2,996,272 | |
0.274% 11/20/2020 (8) | | | 3,000,000 | | | | 2,999,149 | |
0.447% 10/20/2020 (8) | | | 2,500,000 | | | | 2,499,601 | |
| | | | | | | | |
| | | | | | | 95,624,931 | |
|
Auto Manufacturers — 0.8% | |
Toyota Motor Credit Corp., 0.303% (LIBOR 3 Month + 5 basis points), 11/13/2020 (6) | | | 3,000,000 | | | | 3,000,000 | |
|
Banks — 13.6% | |
Bank of Nova Scotia: | | | | | | | | |
0.370% (LIBOR 3 Month + 9 basis points), 2/16/2021 (6) | | | 2,500,000 | | | | 2,501,431 | |
0.649% (LIBOR 3 Month + 40 basis points), 5/4/2021 (6) | | | 3,000,000 | | | | 3,008,067 | |
Credit Suisse AG, 0.501% (LIBOR 3 Month + 25 basis points), 11/2/2020 (6) | | | 3,000,000 | | | | 3,001,346 | |
Manhattan Asset Funding Co. LLC: | | | | | | | | |
0.304% 9/21/2020 (8) | | | 2,250,000 | | | | 2,249,844 | |
0.345% 11/20/2020 (8) | | | 2,500,000 | | | | 2,499,241 | |
National Australia Bank, Ltd., 0.256% (LIBOR 1 Month + 10 basis points), 4/30/2021 (5)(6) | | | 2,500,000 | | | | 2,500,818 | |
(See Notes to Schedules of Investments and Notes to Financial Statements, which are an integral part of the Financial Statements)
83
August 31, 2020
Institutional Prime Money Market Fund (continued)
| | | | | | | | |
| Description | | Principal
Amount | | | Value | |
| Commercial Paper (continued) | |
|
Banks (continued) | |
Nationwide Building Society, 0.162% 9/11/2020 (8) | | $ | 3,000,000 | | | $ | 2,999,876 | |
Societe Generale, 0.101% 9/3/2020 (8) | | | 10,000,000 | | | | 9,999,913 | |
Swedbank AB: | | | | | | | | |
0.101% 9/1/2020 (8) | | | 5,000,000 | | | | 4,999,988 | |
0.101% 9/4/2020 (8) | | | 7,500,000 | | | | 7,499,924 | |
Toronto-Dominion Bank: | | | | | | | | |
0.101% 9/3/2020 (8) | | | 5,000,000 | | | | 4,999,965 | |
0.112% 9/8/2020 (8) | | | 4,500,000 | | | | 4,499,914 | |
| | | | | | | | |
| | | | | | | 50,760,327 | |
|
Diversified Financial Services — 18.4% | |
Atlantic Asset Securitization LLC, 0.335% 12/8/2020 (8) | | | 2,000,000 | | | | 1,999,296 | |
Collateralized Commercial Paper Co. LLC: | | | | | | | | |
0.266% (LIBOR 1 Month + 11 basis points), 9/1/2020 (6) | | | 5,000,000 | | | | 5,000,000 | |
0.274% 2/2/2021 (8) | | | 2,500,000 | | | | 2,497,664 | |
0.305% (LIBOR 3 Month + 5 basis points), 10/23/2020 (6) | | | 3,000,000 | | | | 3,000,276 | |
0.386% 2/9/2021 (8) | | | 2,500,000 | | | | 2,497,536 | |
Columbia Funding Co. LLC: | | | | | | | | |
0.112% 9/8/2020 (8) | | | 5,000,000 | | | | 4,999,868 | |
0.325% 12/2/2020 (8) | | | 3,000,000 | | | | 2,998,094 | |
Natixis S.A., 0.320% (SOFR + 25 basis points), 2/12/2021 (6) | | | 3,000,000 | | | | 3,001,786 | |
Regency Markets No. 1 LLC: | | | | | | | | |
0.162% 9/8/2020 (8) | | | 5,000,000 | | | | 4,999,849 | |
0.172% 9/3/2020 (8) | | | 5,500,000 | | | | 5,499,938 | |
Sheffield Receivables Co. LLC, 0.450% 12/2/2020 | | | 2,500,000 | | | | 2,501,955 | |
Starbird Funding Corp.: | | | | | | | | |
0.101% 9/1/2020 (8) | | | 2,265,000 | | | | 2,264,992 | |
0.274% 9/16/2020 (8) | | | 2,750,000 | | | | 2,749,822 | |
0.386% 11/9/2020 (8) | | | 2,000,000 | | | | 1,999,320 | |
0.427% 9/22/2020 (8) | | | 2,500,000 | | | | 2,499,771 | |
Versailles CDS LLC: | | | | | | | | |
0.101% 9/2/2020 (8) | | | 5,000,000 | | | | 4,999,956 | |
0.284% 9/2/2020 (8) | | | 2,500,000 | | | | 2,499,978 | |
Victory Receivables Corp.: | | | | | | | | |
0.091% 9/1/2020 (8) | | | 10,000,000 | | | | 9,999,963 | |
0.264% 10/1/2020 (8) | | | 2,500,000 | | | | 2,499,666 | |
| | | | | | | | |
| | | | | | | 68,509,730 | |
|
Integrated Oil — 5.2% | |
Equinor ASA, 0.101% 9/1/2020 (8) | | | 14,000,000 | | | | 13,999,957 | |
Exxon Mobil Corp.: | | | | | | | | |
0.294% 9/25/2020 (8) | | | 2,500,000 | | | | 2,499,875 | |
0.416% 9/22/2020 (8) | | | 3,000,000 | | | | 2,999,872 | |
| | | | | | | | |
| | | | | | | 19,499,704 | |
| | | | | | | | |
Total Commercial Paper
(identified cost $237,403,083) | | | | 237,394,692 | |
| | | | | | | | |
| | | | | | | | |
| Description | | Shares or
Principal
Amount | | | Value | |
| Mutual Funds — 6.0% | |
Goldman Sachs Money Market Fund — Premier Class, 0.018% | | | 10,647,885 | | | $ | 10,647,885 | |
State Street Institutional U.S. Government Money Market Fund — Premier Class, 0.034% | | | 11,523,155 | | | | 11,523,155 | |
| | | | | | | | |
Total Mutual Funds
(identified cost $22,171,040) | | | | 22,171,040 | |
| | | | | | | | |
| Repurchase Agreements — 6.7% | |
Agreement with Merrill Lynch Pierce Fenner & Smith, Inc., 0.090%, dated 8/31/2020, to be repurchased at $20,000,050 on 9/1/2020, collateralized by U.S. Government Agency Obligation with a maturity of 6/20/2050, with a fair value of $20,400,000 | | $ | 20,000,000 | | | | 20,000,000 | |
Agreement with TD Securities USA LLC, 0.090%, dated 8/27/2020, to be repurchased at $5,000,088 on 9/3/2020, collateralized by U.S. Government Agency Obligation with a maturity of 8/15/2028, with a fair value of $5,100,107 | | | 5,000,000 | | | | 5,000,000 | |
| | | | | | | | |
Total Repurchase Agreements
(identified cost $25,000,000) | | | | 25,000,000 | |
| | | | | | | | |
| U.S. Government & U.S. Government Agency Obligations — 1.5% | |
|
Federal Home Loan Mortgage Corporation — 0.7% | |
Federal Home Loan Mortgage Corporation, 0.470%, (SOFR + 40 basis points), 10/21/2021 (6) | | | 2,750,000 | | | | 2,751,012 | |
| | |
Sovereign — 0.8% | | | | | | | | |
Federal National Mortgage Association , 0.430%, (SOFR + 36 basis points), 1/20/2022 (6) | | | 2,750,000 | | | | 2,758,297 | |
| | | | | | | | |
| Total U.S. Government & U.S. Government Agency Obligations | | | | 5,509,309 | |
| | | | | | | | |
Total Investments — 100.0% (identified cost $372,383,143) | | | | 372,411,572 | |
| Other Assets and Liabilities — (0.0)% | | | | (2,597 | ) |
| | | | | |
| Total Net Assets — 100.0% | | | $ | 372,408,975 | |
| | | | | | | | |
(See Notes to Schedules of Investments and Notes to Financial Statements, which are an integral part of the Financial Statements)
84
| | |
| | |
| Notes to Schedules of Investments | | |
The categories of investments are shown as a percentage of total net assets for each Fund as of August 31, 2020. Call dates contained within the Schedules of Investments represent the next possible date the security can be redeemed, at the option of the issuer, determined as of August 31, 2020. Maturity dates contained within the Schedules of Investments represent the stated legal maturity date or mandatory put date. Certain securities may be subject to demand features which allow the security to be redeemed prior to final maturity date. In accordance with Rule 2a-7, securities held in the money market funds provide for the return of principal and interest within 397 days due to a scheduled final maturity date or through specific demand features. Demand features entitle a Fund to receive the principal amount of the instrument from the issuer or a third party (1) on no more than 30 calendar days’ notice or (2) at specified intervals not exceeding 397 calendar days.
| * | A Summary Schedule of Investments is presented for this portfolio. A complete Schedule of Investments is available by accessing the SEC’s website, www.sec.gov. For all items listed as “Other securities” in this summary Schedule of Investments, this represents issues not identified as top-fifty unaffiliated holdings in terms of value and issues or issuers not exceeding one percent individually or in aggregate, respectively, as of August 31, 2020. In certain instances, securities for which footnotes listed below may otherwise apply are included in the “Other securities” caption. |
| (2) | Certain shares or principal amounts are temporarily on loan to unaffiliated brokers-dealers. |
| (3) | Please refer to Note 2, subsection Securities Lending, in the Notes to Financial Statements. |
| (4) | Denotes an investment in an affiliated entity. Please refer to Note 5, subsection Investments in Affiliated Issuers, in the Notes to Financial Statements. |
| (5) | Denotes a restricted security which is subject to restrictions on resale under federal securities laws. These securities have been deemed liquid based on criteria approved by the Board of Directors of the BMO Funds. At August 31, 2020 these securities amounted to: |
| | | | | | | | |
| | | Amount | | | % of Total
Net Assets | |
Global Low Volatility Equity Fund | | $ | 353,641 | | | | 2.56 | % |
| | |
Disciplined International Equity Fund | | | 800,911 | | | | 2.05 | |
| | |
LGM Emerging Markets Equity Fund | | | 7,683,457 | | | | 2.96 | |
| | |
Ultra Short Tax-Free Fund | | | 67,046,481 | | | | 12.49 | |
| | |
Short Tax-Free Fund | | | 4,995,782 | | | | 3.90 | |
| | |
Short-Term Income Fund | | | 24,171,739 | | | | 10.21 | |
| | |
Intermediate Tax-Free Fund | | | 54,471,142 | | | | 2.92 | |
| | | | | | | | |
| | | Amount | | | % of Total
Net Assets | |
Strategic Income Fund | | $ | 28,059,761 | | | | 39.40 | % |
| | |
Corporate Income Fund | | | 65,623,313 | | | | 16.37 | |
| | |
Core Plus Bond Fund | | | 136,626,272 | | | | 11.79 | |
| | |
Tax-Free Money Market Fund | | | 86,895,000 | | | | 22.50 | |
| | |
Prime Money Market Fund | | | 15,500,051 | | | | 2.53 | |
| | |
Institutional Prime Money Market Fund | | | 2,500,818 | | | | 0.67 | |
| (6) | Denotes a variable rate security. The rate shown is the current interest rate as of August 31, 2020. Rate fluctuations are based on underlying positions and/or other variables. For securities whose yields vary with a designated market index or market rate, the reference rate and spread are indicated in the description. |
| (7) | Issue is in default or bankruptcy. |
| (8) | Each issue shows the rate of the discount at the time of purchase. |
The following acronyms may be referenced throughout this report:
| | |
ACA — American Capital Access Corporation ADED — Arkansas Department of Economic Development ADR — American Depository Receipt AGC — Assured Guaranty Corporation AGM — Assured Guaranty Municipal AMBAC — American Municipal Bond Assurance Corporation AMT — Alternative Minimum Tax BAM — Build America Mutual Assurance Company BHAC — Berkshire Hathaway Assurance Corporation BMA — Bond Market Association CFC — Cooperative Finance Corporation CIFG — CDC IXIS Financial Guaranty CMI — California Mortgage Insurance COLL — Collateralized ETF — Exchange Traded Fund FCPR DLY — Federal Reserve Bank Prime Loan Rate FDIC — Federal Depository Insurance Corporation FGIC — Financial Guaranty Insurance Corporation FHA — Federal Housing Administration FHLB — Federal Home Loan Bank FHLMC — Federal Home Loan Mortgage Corporation FNMA — Federal National Mortgage Association FRN — Floating Rate Note FSA — Financial Security Assurance Corporation GDR — Global Depository Receipt GNMA — Government National Mortgage Association GO — Government Obligation HFDC — Health Facility Development Corporation HUD — Department of Housing and Urban Development IDC — Industrial Development Corporation | | IMI — Investors Mortgage Insurance Company INS — Insured LIBOR — London Interbank Offered Rate LIQ — Liquidity Agreement LLC — Limited Liability Corporation LOC — Letter of Credit LP — Limited Partnership LT — Limited Tax MAC — Municipal Assurance Corporation MBIA — Municipal Bond Insurance Association MHF — Maryland Housing Fund MTN — Medium Term Note NATL — National Public Finance Guarantee PCA — Pollution Control Authority PLC — Public Limited Company PSF — Permanent School Fund Guaranteed PUFG — Permanent University Fund Guarantee Q-SBLF — Qualified School Bond Loan Fund RADIAN — Radian Asset Assurance REITs — Real Estate Investment Trusts REMIC — Real Estate Mortgage Investment Conduit SAW — State Aid Withholding SIFMA — Securities Industry and Financial Markets Association SOFR — Secured Overnight Financing Rate TCRs — Transferable Custody Receipts TLGP — Temporary Liquidity Guarantee Program TRANs — Tax and Revenue Anticipation Notes UT — Unlimited Tax VRNs — Variable Rate Notes XLCA — XL Capital Assurance |
85
August 31, 2020
| | |
| | |
| Statements of Assets and Liabilities | | BMO Funds |
| | | | | | | | | | | | | | | | | | | | |
| | | | | | | | | | | | | | | | |
| | | Low Volatility
Equity Fund | | | Dividend
Income Fund | | | Large-Cap
Value Fund | | | Large-Cap
Growth Fund | | | Mid-Cap
Value Fund | |
Assets: | | | | | | | | | | | | | | | | | | | | |
Investments in unaffiliated issuers, at value | | $ | 276,199,131 | (1) | | $ | 284,107,375 | (1) | | $ | 313,882,771 | (1) | | $ | 502,102,900 | (1) | | $ | 114,260,684 | (1) |
Cash sweep investments in affiliated issuers, at value | | | 4,254,460 | | | | 5,160,131 | | | | 3,589,882 | | | | 2,951,726 | | | | 1,403,585 | |
Dividends and interest receivable | | | 633,177 | | | | 605,121 | | | | 553,299 | | | | 341,138 | | | | 223,252 | |
Receivable for investments sold | | | — | | | | 324,017 | | | | — | | | | — | | | | — | |
Receivable for capital stock sold | | | 353,196 | | | | 175,549 | | | | 142,432 | | | | 255,736 | | | | 50,796 | |
Prepaid expenses and other receivables | | | 43,325 | | | | 25,890 | | | | 30,044 | | | | 41,580 | | | | 29,973 | |
| | | | | | | | | | | | | | | | | | | | |
Total assets | | | 281,483,289 | | | | 290,398,083 | | | | 318,198,428 | | | | 505,693,080 | | | | 115,968,290 | |
| | | | | |
Liabilities: | | | | | | | | | | | | | | | | | | | | |
Payable for return of securities lending collateral | | | 21,952,763 | | | | 45,096,198 | | | | 57,069,363 | | | | 46,454,500 | | | | 9,514,603 | |
Payable for capital stock redeemed | | | 249,069 | | | | 112,326 | | | | 150,725 | | | | 1,233,191 | | | | 34,859 | |
Payable to affiliates, net (Note 5) | | | 110,605 | | | | 106,471 | | | | 84,330 | | | | 140,961 | | | | 67,453 | |
Payable to custodian | | | — | | | | 324,017 | | | | — | | | | — | | | | — | |
Other liabilities | | | 35,481 | | | | 41,765 | | | | 63,074 | | | | 67,775 | | | | 49,959 | |
| | | | | | | | | | | | | | | | | | | | |
Total liabilities | | | 22,347,918 | | | | 45,680,777 | | | | 57,367,492 | | | | 47,896,427 | | | | 9,666,874 | |
| | | | | | | | | | | | | | | | | | | | |
Total net assets | | $ | 259,135,371 | | | $ | 244,717,306 | | | $ | 260,830,936 | | | $ | 457,796,653 | | | $ | 106,301,416 | |
| | | | | | | | | | | | | | | | | | | | |
Net assets consist of: | | | | | | | | | | | | | | | | | | | | |
Paid-in capital | | $ | 234,638,969 | | | $ | 226,415,625 | | | $ | 243,798,328 | | | $ | 236,506,397 | | | $ | 110,544,955 | |
Distributable earnings (accumulated loss) | | | 24,496,402 | | | | 18,301,681 | | | | 17,032,608 | | | | 221,290,256 | | | | (4,243,539 | ) |
| | | | | | | | | | | | | | | | | | | | |
Total net assets | | $ | 259,135,371 | | | $ | 244,717,306 | | | $ | 260,830,936 | | | $ | 457,796,653 | | | $ | 106,301,416 | |
| | | | | | | | | | | | | | | | | | | | |
Net asset value, offering price and redemption proceeds per share (unlimited shares authorized, no par value) | | | | | | | | | | | | | | | | | | | | |
Investor class of shares: | | | | | | | | | | | | | | | | | | | | |
Net asset value, offering price and redemption proceeds per share | | $ | — | | | $ | — | | | $ | — | | | $ | 22.24 | | | $ | — | |
Advisor class of shares: | | | | | | | | | | | | | | | | | | | | |
Net asset value, offering price and redemption proceeds per share | | | 15.06 | | | | 13.66 | | | | 13.52 | | | | 22.22 | | | | 9.07 | |
Offering price per share(2) | | | 15.85 | | | | 14.38 | | | | 14.23 | | | | 23.39 | | | | 9.55 | |
Institutional class of shares: | | | | | | | | | | | | | | | | | | | | |
Net asset value, offering price and redemption proceeds per share | | | 15.12 | | | | 13.62 | | | | 13.53 | | | | 22.49 | | | | 9.01 | |
Retirement class R-6 of shares: | | | | | | | | | | | | | | | | | | | | |
Net asset value, offering price and redemption proceeds per share | | | — | | | | — | | | | 13.55 | | | | 22.56 | | | | 9.02 | |
| | | | | |
Net assets: | | | | | | | | | | | | | | | | | | | | |
Investor class of shares | | $ | — | | | $ | — | | | $ | — | | | $ | 66,446,570 | | | $ | — | |
Advisor class of shares | | | 41,687,574 | | | | 8,789,488 | | | | 14,046,639 | | | | 686,838 | | | | 28,113,536 | |
Institutional class of shares | | | 217,447,797 | | | | 235,927,818 | | | | 213,465,960 | | | | 121,957,677 | | | | 65,344,594 | |
Retirement class R-6 of shares | | | — | | | | — | | | | 33,318,337 | | | | 268,705,568 | | | | 12,843,286 | |
| | | | | | | | | | | | | | | | | | | | |
Total net assets | | $ | 259,135,371 | | | $ | 244,717,306 | | | $ | 260,830,936 | | | $ | 457,796,653 | | | $ | 106,301,416 | |
| | | | | | | | | | | | | | | | | | | | |
Shares outstanding: | | | | | | | | | | | | | | | | | | | | |
Investor class of shares | | | — | | | | — | | | | — | | | | 2,987,089 | | | | — | |
Advisor class of shares | | | 2,768,292 | | | | 643,337 | | | | 1,039,183 | | | | 30,905 | | | | 3,099,332 | |
Institutional class of shares | | | 14,380,726 | | | | 17,327,379 | | | | 15,775,462 | | | | 5,421,575 | | | | 7,255,028 | |
Retirement class R-6 of shares | | | — | | | | — | | | | 2,459,232 | | | | 11,913,081 | | | | 1,423,732 | |
| | | | | | | | | | | | | | | | | | | | |
Total shares outstanding | | | 17,149,018 | | | | 17,970,716 | | | | 19,273,877 | | | | 20,352,650 | | | | 11,778,092 | |
| | | | | | | | | | | | | | | | | | | | |
Investments, at cost: | | | | | | | | | | | | | | | | | | | | |
Investments in unaffiliated issuers | | $ | 235,985,676 | | | $ | 240,162,836 | | | $ | 286,512,831 | | | $ | 300,497,561 | | | $ | 112,319,850 | |
Cash sweep investments in affiliated issuers | | | 4,255,311 | | | | 5,160,844 | | | | 3,590,044 | | | | 2,952,316 | | | | 1,403,866 | |
| | | | | | | | | | | | | | | | | | | | |
Total investments, at cost | | $ | 240,240,987 | | | $ | 245,323,680 | | | $ | 290,102,875 | | | $ | 303,449,877 | | | $ | 113,723,716 | |
| | | | | | | | | | | | | | | | | | | | |
| (1) | Including $21,314,548, $43,785,153, $55,410,232, $45,103,966 and $9,237,992 respectively, of securities on loan. A security on loan value represents both fair value and accrued interest. |
| (2) | Computation of offering price per share 100/95 of net asset value. |
(See Notes which are an integral part of the Financial Statements)
86
August 31, 2020
| | |
| | |
| Statements of Assets and Liabilities | | BMO Funds |
| | | | | | | | | | | | | | | | | | | | |
| | | | | | | | | | | | | | | | |
| | | Mid-Cap
Growth Fund | | | Small-Cap
Value Fund | | | Small-Cap
Growth Fund | | | Global Low
Volatility
Equity Fund | | | Disciplined
International
Equity Fund | |
Assets: | | | | | | | | | | | | | | | | | | | | |
Investments in unaffiliated issuers, at value | | $ | 112,027,178 | (1) | | $ | 55,842,193 | (1) | | $ | 116,532,016 | (1) | | $ | 13,606,631 | (1) | | $ | 37,831,969 | (1) |
Cash sweep investments in affiliated issuers, at value | | | 1,582,909 | | | | 1,651,709 | | | | 1,915,098 | | | | 602,477 | | | | 1,417,393 | |
Cash denominated in foreign currencies | | | — | | | | — | | | | — | | | | 13,543 | (2) | | | 15,554 | (2) |
Dividends and interest receivable | | | 45,502 | | | | 57,040 | | | | 21,254 | | | | 62,189 | | | | 321,319 | |
Receivable for investments sold | | | — | | | | 1,491,165 | | | | — | | | | — | | | | — | |
Receivable for capital stock sold | | | 49,400 | | | | 28,053 | | | | 34,949 | | | | 35 | | | | — | |
Receivable from affiliates, net (Note 5) | | | — | | | | — | | | | — | | | | 11,529 | | | | 10,884 | |
Prepaid expenses and other receivables | | | 29,653 | | | | 26,362 | | | | 23,550 | | | | 26,033 | | | | 30,472 | |
| | | | | | | | | | | | | | | | | | | | |
Total assets | | | 113,734,642 | | | | 59,096,522 | | | | 118,526,867 | | | | 14,322,437 | | | | 39,627,591 | |
| | | | | |
Liabilities: | | | | | | | | | | | | | | | | | | | | |
Payable for return of securities lending collateral | | | 13,636,803 | | | | 6,858,721 | | | | 21,305,052 | | | | 430,413 | | | | 532,390 | |
Payable for investments purchased | | | — | | | | 1,814,100 | | | | — | | | | — | | | | — | |
Payable for capital stock redeemed | | | 66,929 | | | | 15,070 | | | | 35,196 | | | | — | | | | 943 | |
Payable for foreign tax expense | | | — | | | | — | | | | — | | | | 3,898 | | | | 1,149 | |
Payable to affiliates, net (Note 5) | | | 59,663 | | | | 13,293 | | | | 58,018 | | | | — | | | | — | |
Other liabilities | | | 45,502 | | | | 27,269 | | | | 51,401 | | | | 48,029 | | | | 54,510 | |
| | | | | | | | | | | | | | | | | | | | |
Total liabilities | | | 13,808,897 | | | | 8,728,453 | | | | 21,449,667 | | | | 482,340 | | | | 588,992 | |
| | | | | | | | | | | | | | | | | | | | |
Total net assets | | $ | 99,925,745 | | | $ | 50,368,069 | | | $ | 97,077,200 | | | $ | 13,840,097 | | | $ | 39,038,599 | |
| | | | | | | | | | | | | | | | | | | | |
Net assets consist of: | | | | | | | | | | | | | | | | | | | | |
Paid-in capital | | $ | 72,317,226 | | | $ | 55,234,010 | | | $ | 78,808,782 | | | $ | 15,486,541 | | | $ | 41,958,631 | |
Distributable earnings (accumulated loss) | | | 27,608,519 | | | | (4,865,941 | ) | | | 18,268,418 | | | | (1,646,444 | ) | | | (2,920,032 | ) |
| | | | | | | | | | | | | | | | | | | | |
Total net assets | | $ | 99,925,745 | | | $ | 50,368,069 | | | $ | 97,077,200 | | | $ | 13,840,097 | | | $ | 39,038,599 | |
| | | | | | | | | | | | | | | | | | | | |
Net asset value, offering price and redemption proceeds per share (unlimited shares authorized, no par value) | | | | | | | | | | | | | | | | | | | | |
Advisor class of shares: | | | | | | | | | | | | | | | | | | | | |
Net asset value, offering price and redemption proceeds per share | | $ | 14.87 | | | $ | 10.30 | | | $ | 16.64 | | | $ | 10.27 | | | $ | 9.71 | |
Offering price per share(3) | | | 15.65 | | | | 10.84 | | | | 17.52 | | | | 10.81 | | | | 10.22 | |
Institutional class of shares: | | | | | | | | | | | | | | | | | | | | |
Net asset value, offering price and redemption proceeds per share | | | 15.92 | | | | 10.48 | | | | 17.55 | | | | 10.36 | | | | 9.74 | |
Retirement class R-6 of shares: | | | | | | | | | | | | | | | | | | | | |
Net asset value, offering price and redemption proceeds per share | | | 16.11 | | | | 10.59 | | | | — | | | | — | | | | — | |
| | | | | |
Net assets: | | | | | | | | | | | | | | | | | | | | |
Advisor class of shares | | $ | 14,016,036 | | | $ | 1,575,122 | | | $ | 27,151,606 | | | $ | 100,889 | | | $ | 139,330 | |
Institutional class of shares | | | 78,142,593 | | | | 41,135,223 | | | | 69,925,594 | | | | 13,739,208 | | | | 38,899,269 | |
Retirement class R-6 of shares | | | 7,767,116 | | | | 7,657,724 | | | | — | | | | — | | | | — | |
| | | | | | | | | | | | | | | | | | | | |
Total net assets | | $ | 99,925,745 | | | $ | 50,368,069 | | | $ | 97,077,200 | | | $ | 13,840,097 | | | $ | 39,038,599 | |
| | | | | | | | | | | | | | | | | | | | |
Shares outstanding: | | | | | | | | | | | | | | | | | | | | |
Advisor class of shares | | | 942,577 | | | | 152,934 | | | | 1,632,172 | | | | 9,821 | | | | 14,347 | |
Institutional class of shares | | | 4,909,331 | | | | 3,923,396 | | | | 3,984,421 | | | | 1,325,775 | | | | 3,995,704 | |
Retirement class R-6 of shares | | | 482,063 | | | | 722,809 | | | | — | | | | — | | | | — | |
| | | | | | | | | | | | | | | | | | | | |
Total shares outstanding | | | 6,333,971 | | | | 4,799,139 | | | | 5,616,593 | | | | 1,335,596 | | | | 4,010,051 | |
| | | | | | | | | | | | | | | | | | | | |
Investments, at cost: | | | | | | | | | | | | | | | | | | | | |
Investments in unaffiliated issuers | | $ | 91,755,606 | | | $ | 55,596,453 | | | $ | 101,060,705 | | | $ | 11,849,747 | | | $ | 33,520,676 | |
Cash sweep investments in affiliated issuers | | | 1,583,226 | | | | 1,651,980 | | | | 1,915,389 | | | | 602,511 | | | | 1,417,570 | |
| | | | | | | | | | | | | | | | | | | | |
Total investments, at cost | | $ | 93,338,832 | | | $ | 57,248,433 | | | $ | 102,976,094 | | | $ | 12,452,258 | | | $ | 34,938,246 | |
| | | | | | | | | | | | | | | | | | | | |
| (1) | Including $13,240,351, $6,659,323, $20,685,668, $407,443 and $504,303 respectively, of securities on loan. A security on loan value represents both fair value and accrued interest. |
| (2) | Identified cost of cash denominated in foreign currencies is $13,326 and $15,271, respectively. |
| (3) | Computation of offering price per share 100/95 of net asset value. |
(See Notes which are an integral part of the Financial Statements)
87
August 31, 2020
| | |
| | |
| Statements of Assets and Liabilities | | BMO Funds |
| | | | | | | | | | | | | | | | | | | | |
| | | | | | | | | | | | | | | | |
| | | Pyrford
International
Stock Fund | | | LGM
Emerging
Markets
Equity Fund | | | Ultra Short
Tax-Free Fund | | | Short
Tax-Free Fund | | | Short-Term
Income Fund | |
Assets: | | | | | | | | | | | | | | | | | | | | |
Investments in unaffiliated issuers, at value | | $ | 656,049,299 | (1) | | $ | 248,832,513 | | | $ | 527,063,541 | | | $ | 127,061,534 | | | $ | 253,320,918 | (1) |
Cash sweep investments in affiliated issuers, at value | | | 48,529,250 | | | | 5,950,565 | | | | — | | | | — | | | | 7,069,356 | |
Investments in repurchase agreements | | | — | | | | — | | | | 6,725,349 | | | | 902,979 | | | | — | |
Cash | | | — | | | | — | | | | 206,889 | | | | 14,778 | | | | — | |
Cash denominated in foreign currencies | | | 228,473 | (2) | | | 365,832 | (2) | | | — | | | | — | | | | — | |
Dividends and interest receivable | | | 5,912,233 | | | | 147,572 | | | | 2,576,260 | | | | 1,114,660 | | | | 1,113,917 | |
Receivable for investments sold | | | 1,367,248 | | | | 5,493,499 | | | | — | | | | — | | | | — | |
Receivable for capital stock sold | | | 2,673,614 | | | | 360,143 | | | | 7,295,365 | | | | 159,448 | | | | 2,327,025 | |
Prepaid expenses and other receivables | | | 42,620 | | | | 19,920 | | | | 39,834 | | | | 27,812 | | | | 28,845 | |
| | | | | | | | | | | | | | | | | | | | |
Total assets | | | 714,802,737 | | | | 261,170,044 | | | | 543,907,238 | | | | 129,281,211 | | | | 263,860,061 | |
| | | | | |
Liabilities: | | | | | | | | | | | | | | | | | | | | |
Payable for return of securities lending collateral | | | 17,734,286 | | | | — | | | | — | | | | — | | | | 26,622,189 | |
Payable for investments purchased | | | 882,854 | | | | — | | | | 6,091,685 | | | | 1,103,060 | | | | — | |
Payable for capital stock redeemed | | | 409,230 | | | | 261,910 | | | | 853,045 | | | | 36,227 | | | | 330,305 | |
Payable for foreign tax expense | | | 211,973 | | | | 892,334 | | | | — | | | | — | | | | — | |
Payable to affiliates, net (Note 5) | | | 440,793 | | | | 127,502 | | | | 103,642 | | | | 34,191 | | | | 31,384 | |
Payable for capital gains distribution | | | — | | | | — | | | | 43,420 | | | | — | | | | — | |
Payable for income distribution | | | — | | | | — | | | | 148,294 | | | | 114,014 | | | | 138,552 | |
Other liabilities | | | 136,261 | | | | 196,442 | | | | 64,118 | | | | 44,140 | | | | 50,482 | |
| | | | | | | | | | | | | | | | | | | | |
Total liabilities | | | 19,815,397 | | | | 1,478,188 | | | | 7,304,204 | | | | 1,331,632 | | | | 27,172,912 | |
| | | | | | | | | | | | | | | | | | | | |
Total net assets | | $ | 694,987,340 | | | $ | 259,691,856 | | | $ | 536,603,034 | | | $ | 127,949,579 | | | $ | 236,687,149 | |
| | | | | | | | | | | | | | | | | | | | |
Net assets consist of: | | | | | | | | | | | | | | | | | | | | |
Paid-in capital | | $ | 646,467,891 | | | $ | 242,674,929 | | | $ | 535,402,012 | | | $ | 126,007,021 | | | $ | 232,941,788 | |
Distributable earnings | | | 48,519,449 | | | | 17,016,927 | | | | 1,201,022 | | | | 1,942,558 | | | | 3,745,361 | |
| | | | | | | | | | | | | | | | | | | | |
Total net assets | | $ | 694,987,340 | | | $ | 259,691,856 | | | $ | 536,603,034 | | | $ | 127,949,579 | | | $ | 236,687,149 | |
| | | | | | | | | | | | | | | | | | | | |
Net asset value, offering price and redemption proceeds per share (unlimited shares authorized, no par value) | | | | | | | | | | | | | | | | | | | | |
Advisor class of shares: | | | | | | | | | | | | | | | | | | | | |
Net asset value, offering price and redemption proceeds per share | | $ | 13.56 | | | $ | 15.22 | | | $ | 10.09 | | | $ | 10.29 | | | $ | 9.55 | |
Offering price per share | | | 14.27 | (3) | | | 16.02 | (3) | | | 10.30 | (4) | | | 10.50 | (4) | | | — | |
Institutional class of shares: | | | | | | | | | | | | | | | | | | | | |
Net asset value, offering price and redemption proceeds per share | | | 13.29 | | | | 15.16 | | | | 10.08 | | | | 10.30 | | | | 9.57 | |
Retirement class R-6 of shares: | | | | | | | | | | | | | | | | | | | | |
Net asset value, offering price and redemption proceeds per share | | | 13.31 | | | | — | | | | — | | | | — | | | | — | |
| | | | | |
Net assets: | | | | | | | | | | | | | | | | | | | | |
Advisor class of shares | | $ | 1,815,592 | | | $ | 3,895,509 | | | $ | 12,997,957 | | | $ | 3,464,722 | | | $ | 20,404,083 | |
Institutional class of shares | | | 463,023,344 | | | | 255,796,347 | | | | 523,605,077 | | | | 124,484,857 | | | | 216,283,066 | |
Retirement class R-6 of shares | | | 230,148,404 | | | | — | | | | — | | | | — | | | | — | |
| | | | | | | | | | | | | | | | | | | | |
Total net assets | | $ | 694,987,340 | | | $ | 259,691,856 | | | $ | 536,603,034 | | | $ | 127,949,579 | | | $ | 236,687,149 | |
| | | | | | | | | | | | | | | | | | | | |
Shares outstanding: | | | | | | | | | | | | | | | | | | | | |
Advisor class of shares | | | 133,930 | | | | 255,889 | | | | 1,287,685 | | | | 336,571 | | | | 2,136,164 | |
Institutional class of shares | | | 34,834,590 | | | | 16,876,080 | | | | 51,920,748 | | | | 12,085,962 | | | | 22,599,947 | |
Retirement class R-6 of shares | | | 17,295,248 | | | | — | | | | — | | | | — | | | | — | |
| | | | | | | | | | | | | | | | | | | | |
Total shares outstanding | | | 52,263,768 | | | | 17,131,969 | | | | 53,208,433 | | | | 12,422,533 | | | | 24,736,111 | |
| | | | | | | | | | | | | | | | | | | | |
Investments, at cost: | | | | | | | | | | | | | | | | | | | | |
Investments in unaffiliated issuers | | $ | 588,153,592 | | | $ | 205,533,139 | | | $ | 531,817,214 | | | $ | 125,830,241 | | | $ | 247,829,138 | |
Cash sweep investments in affiliated issuers | | | 48,527,639 | | | | 5,951,755 | | | | — | | | | — | | | | 7,070,770 | |
| | | | | | | | | | | | | | | | | | | | |
Total investments, at cost | | $ | 636,681,231 | | | $ | 211,484,894 | | | $ | 531,817,214 | | | $ | 125,830,241 | | | $ | 254,899,908 | |
| | | | | | | | | | | | | | | | | | | | |
| (1) | Including $16,830,531 and $25,848,223 respectively, of securities on loan. A security on loan value represents both fair value and accrued interest. |
| (2) | Identified cost of cash denominated in foreign currencies is $228,398 and $369,252. |
| (3) | Computation of offering price per share 100/95 of net asset value. |
| (4) | Computation of offering price per share 100/98 of net asset value. |
(See Notes which are an integral part of the Financial Statements)
88
August 31, 2020
| | |
| | |
| Statements of Assets and Liabilities | | BMO Funds |
| | | | | | | | | | | | | | | | |
| | | | | | | | | | | | | |
| | | Intermediate
Tax-Free Fund | | | Strategic
Income Fund | | | Corporate
Income Fund | | | Core Plus
Bond Fund | |
Assets: | | | | | | | | | | | | | | | | |
Investments in unaffiliated issuers, at value | | $ | 1,845,771,591 | | | $ | 77,527,181 | (1) | | $ | 443,710,951 | (1) | | $ | 1,198,359,999 | (1) |
Cash sweep investments in affiliated issuers, at value | | | — | | | | 702,920 | | | | 18,017,006 | | | | 24,129,137 | |
Investments in repurchase agreements | | | 2,334,710 | | | | — | | | | — | | | | — | |
Dividends and interest receivable | | | 18,144,527 | | | | 931,059 | | | | 3,504,588 | | | | 7,141,825 | |
Receivable for investments sold | | | 2,508,325 | | | | 117,864 | | | | — | | | | — | |
Receivable for capital stock sold | | | 3,704,342 | | | | 479,446 | | | | 430,812 | | | | 4,660,272 | |
Prepaid expenses and other receivables | | | 64,476 | | | | 35,527 | | | | 28,239 | | | | 35,952 | |
| | | | | | | | | | | | | | | | |
Total assets | | | 1,872,527,971 | | | | 79,793,997 | | | | 465,691,596 | | | | 1,234,327,185 | |
| | | | |
Liabilities: | | | | | | | | | | | | | | | | |
Payable for return of securities lending collateral | | | — | | | | 7,990,849 | | | | 61,602,281 | | | | 66,878,566 | |
Payable for investments purchased | | | 5,735,470 | | | | 430,301 | | | | 2,500,000 | | | | 6,999,930 | |
Payable for capital stock redeemed | | | 2,048,096 | | | | 63,859 | | | | 338,769 | | | | 879,877 | |
Payable for foreign tax expense | | | — | | | | 162 | | | | 288 | | | | 575 | |
Payable to affiliates, net (Note 5) | | | 450,244 | | | | 15,219 | | | | 119,100 | | | | 276,038 | |
Payable for income distribution | | | 1,046,263 | | | | 29,509 | | | | 297,008 | | | | 210,549 | |
Other liabilities | | | 210,673 | | | | 38,982 | | | | 52,950 | | | | 109,429 | |
| | | | | | | | | | | | | | | | |
Total liabilities | | | 9,490,746 | | | | 8,568,881 | | | | 64,910,396 | | | | 75,354,964 | |
| | | | | | | | | | | | | | | | |
Total net assets | | $ | 1,863,037,225 | | | $ | 71,225,116 | | | $ | 400,781,200 | | | $ | 1,158,972,221 | |
| | | | | | | | | | | | | | | | |
Net assets consist of: | | | | | | | | | | | | | | | | |
Paid-in capital | | $ | 1,786,061,240 | | | $ | 71,907,914 | | | $ | 367,272,233 | | | $ | 1,089,178,837 | |
Distributable earnings (accumulated loss) | | | 76,975,985 | | | | (682,798 | ) | | | 33,508,967 | | | | 69,793,384 | |
| | | | | | | | | | | | | | | | |
Total net assets | | $ | 1,863,037,225 | | | $ | 71,225,116 | | | $ | 400,781,200 | | | $ | 1,158,972,221 | |
| | | | | | | | | | | | | | | | |
Net asset value, offering price and redemption proceeds per share (unlimited shares authorized, no par value) | | | | | | | | | | | | | | | | |
Investor class of shares: | | | | | | | | | | | | | | | | |
Net asset value, offering price and redemption proceeds per share | | $ | 11.50 | | | $ | 9.44 | | | $ | 14.28 | | | $ | 12.42 | |
Advisor class of shares: | | | | | | | | | | | | | | | | |
Net asset value, offering price and redemption proceeds per share | | | 11.50 | | | | 9.44 | | | | 14.28 | | | | 12.41 | |
Offering price per share(2) | | | 11.92 | | | | 9.78 | | | | 14.80 | | | | 12.86 | |
Institutional class of shares: | | | | | | | | | | | | | | | | |
Net asset value, offering price and redemption proceeds per share | | | 11.49 | | | | 9.43 | | | | 14.26 | | | | 12.41 | |
| | | | |
Net assets: | | | | | | | | | | | | | | | | |
Investor class of shares | | $ | 440,188,974 | | | $ | 52,054,386 | | | $ | 98,766,156 | | | $ | 92,258,536 | |
Advisor class of shares | | | 5,015,749 | | | | 12,857,867 | | | | 3,719,273 | | | | 4,437,657 | |
Institutional class of shares | | | 1,417,832,502 | | | | 6,312,863 | | | | 298,295,771 | | | | 1,062,276,028 | |
| | | | | | | | | | | | | | | | |
Total net assets | | $ | 1,863,037,225 | | | $ | 71,225,116 | | | $ | 400,781,200 | | | $ | 1,158,972,221 | |
| | | | | | | | | | | | | | | | |
Shares outstanding: | | | | | | | | | | | | | | | | |
Investor class of shares | | | 38,267,338 | | | | 5,515,505 | | | | 6,916,744 | | | | 7,430,928 | |
Advisor class of shares | | | 436,090 | | | | 1,362,441 | | | | 260,502 | | | | 357,465 | |
Institutional class of shares | | | 123,390,260 | | | | 669,278 | | | | 20,912,743 | | | | 85,587,262 | |
| | | | | | | | | | | | | | | | |
Total shares outstanding | | | 162,093,688 | | | | 7,547,224 | | | | 28,089,989 | | | | 93,375,655 | |
| | | | | | | | | | | | | | | | |
Investments, at cost: | | | | | | | | | | | | | | | | |
Investments in unaffiliated issuers | | $ | 1,737,426,121 | | | $ | 75,700,996 | | | $ | 411,045,585 | | | $ | 1,119,807,203 | |
Cash sweep investments in affiliated issuers | | | — | | | | 703,024 | | | | 18,018,845 | | | | 24,133,276 | |
| | | | | | | | | | | | | | | | |
Total investments, at cost | | $ | 1,737,426,121 | | | $ | 76,404,020 | | | $ | 429,064,430 | | | $ | 1,143,940,479 | |
| | | | | | | | | | | | | | | | |
| (1) | Including $7,758,537, $59,811,368 and $64,934,259 respectively, of securities on loan. A security on loan value represents both fair value and accrued interest. |
| (2) | Computation of offering price per share 100/96.5 of net asset value. |
(See Notes which are an integral part of the Financial Statements)
89
August 31, 2020
| | |
| | |
| Statements of Assets and Liabilities | | BMO Funds |
| | | | | | | | | | | | | | | | |
| | | | | | | | | | | | | |
| | | Government
Money
Market Fund | | | Tax-Free
Money
Market Fund | | | Prime
Money
Market Fund | | | Institutional
Prime Money
Market Fund | |
Assets: | | | | | | | | | | | | | | | | |
Investments in unaffiliated issuers, at value | | $ | 2,694,097,358 | | | $ | 385,407,907 | | | $ | 565,126,149 | | | $ | 347,411,572 | |
Investments in repurchase agreements | | | 1,294,081,267 | | | | — | | | | 47,099,699 | | | | 25,000,000 | |
Cash | | | — | | | | 1,000 | | | | 95,904 | | | | — | |
Dividends and interest receivable | | | 578,022 | | | | 855,098 | | | | 122,901 | | | | 123,072 | |
Receivable for capital stock sold | | | 4,442 | | | | — | | | | — | | | | — | |
Prepaid expenses and other receivables | | | 22,914 | | | | 23,252 | | | | 38,927 | | | | 21,198 | |
| | | | | | | | | | | | | | | | |
Total assets | | | 3,988,784,003 | | | | 386,287,257 | | | | 612,483,580 | | | | 372,555,842 | |
| | | | | | | | | | | | | | | | |
Liabilities: | | | | | | | | | | | | | | | | |
Payable for investments purchased | | | 49,989,573 | | | | — | | | | — | | | | — | |
Payable for capital stock redeemed | | | 954,314 | | | | — | | | | 29,403 | | | | — | |
Payable to affiliates, net (Note 5) | | | 243,022 | | | | 46,372 | | | | 17,891 | | | | 19,644 | |
Payable for income distribution | | | 29,248 | | | | 51,918 | | | | 8,215 | | | | 11,718 | |
Other liabilities | | | 207,168 | | | | 61,108 | | | | 76,876 | | | | 115,505 | |
| | | | | | | | | | | | | | | | |
Total liabilities | | | 51,423,325 | | | | 159,398 | | | | 132,385 | | | | 146,867 | |
| | | | | | | | | | | | | | | | |
Total net assets | | $ | 3,937,360,678 | | | $ | 386,127,859 | | | $ | 612,351,195 | | | $ | 372,408,975 | |
| | | | | | | | | | | | | | | | |
Net assets consist of: | | | | | | | | | | | | | | | | |
Paid-in capital | | $ | 3,937,362,653 | | | $ | 386,127,181 | | | $ | 612,359,410 | | | $ | 372,364,177 | |
Distributable earnings (accumulated loss) | | | (1,975 | ) | | | 678 | | | | (8,215 | ) | | | 44,798 | |
| | | | | | | | | | | | | | | | |
Total net assets | | $ | 3,937,360,678 | | | $ | 386,127,859 | | | $ | 612,351,195 | | | $ | 372,408,975 | |
| | | | | | | | | | | | | | | | |
Net asset value, offering price and redemption proceeds per share (unlimited shares authorized, no par value) | | | | | | | | | | | | | | | | |
Investor class of shares: | | | | | | | | | | | | | | | | |
Net asset value, offering price and redemption proceeds per share | | $ | 1.00 | | | $ | 1.00 | | | $ | 1.00 | | | $ | 0.9999 | |
Premier class of shares: | | | | | | | | | | | | | | | | |
Net asset value, offering price and redemption proceeds per share | | | 1.00 | | | | 1.00 | | | | 1.00 | | | | 0.9999 | |
| | | | |
Net assets: | | | | | | | | | | | | | | | | |
Investor class of shares | | $ | 600,042,990 | | | $ | 61,100,263 | | | $ | 268,054,114 | | | $ | 2,823,976 | |
Premier class of shares | | | 3,337,317,688 | | | | 325,027,596 | | | | 344,297,081 | | | | 369,584,999 | |
| | | | | | | | | | | | | | | | |
Total net assets | | $ | 3,937,360,678 | | | $ | 386,127,859 | | | $ | 612,351,195 | | | $ | 372,408,975 | |
| | | | | | | | | | | | | | | | |
Shares outstanding: | | | | | | | | | | | | | | | | |
Investor class of shares | | | 600,044,566 | | | | 61,096,332 | | | | 268,116,040 | | | | 2,824,240 | |
Premier class of shares | | | 3,337,318,087 | | | | 325,058,518 | | | | 344,259,210 | | | | 369,606,154 | |
| | | | | | | | | | | | | | | | |
Total shares outstanding | | | 3,937,362,653 | | | | 386,154,850 | | | | 612,375,250 | | | | 372,430,394 | |
| | | | | | | | | | | | | | | | |
Investments, at cost: | | | | | | | | | | | | | | | | |
Investments in unaffiliated issuers | | $ | 3,988,178,625 | | | $ | 385,407,907 | | | $ | 612,225,848 | | | $ | 372,383,143 | |
| | | | | | | | | | | | | | | | |
Total investments, at cost | | $ | 3,988,178,625 | | | $ | 385,407,907 | | | $ | 612,225,848 | | | $ | 372,383,143 | |
| | | | | | | | | | | | | | | | |
(See Notes which are an integral part of the Financial Statements)
90
Year Ended August 31, 2020
| | |
| | |
| Statements of Operations | | BMO Funds |
| | | | | | | | | | | | | | | | | | | | |
| | | | | | | | | | | | | | | | |
| | | Low Volatility
Equity Fund | | | Dividend
Income Fund | | | Large-Cap
Value Fund | | | Large-Cap
Growth Fund | | | Mid-Cap
Value Fund | |
Investment Income: | | | | | | | | | | | | | | | | | | | | |
Dividend income from: | | | | | | | | | | | | | | | | | | | | |
Unaffiliated issuers | | $ | 5,860,534 | (1) | | $ | 8,929,809 | | | $ | 7,237,498 | | | $ | 4,446,790 | | | $ | 3,087,817 | |
Affiliated issuers | | | 54,748 | | | | 63,471 | | | | 54,782 | | | | 72,019 | | | | 19,251 | |
Net securities lending income from: | | | | | | | | | | | | | | | | | | | | |
Unaffiliated issuers | | | 34,530 | | | | 40,310 | | | | 51,885 | | | | 58,765 | | | | 25,803 | |
Affiliated issuers (Note 5) | | | 20,767 | | | | 23,982 | | | | 30,638 | | | | 35,123 | | | | 15,590 | |
| | | | | | | | | | | | | | | | | | | | |
Total income | | | 5,970,579 | | | | 9,057,572 | | | | 7,374,803 | | | | 4,612,697 | | | | 3,148,461 | |
| | | | | |
Expenses: | | | | | | | | | | | | | | | | | | | | |
Investment advisory fees (Note 5) | | | 1,065,888 | | | | 1,452,423 | | | | 1,060,655 | | | | 1,595,765 | | | | 829,844 | |
Shareholder servicing fees (Note 5) | | | — | | | | — | | | | — | | | | 146,013 | | | | — | |
Administration fees (Note 5) | | | 371,688 | | | | 435,727 | | | | 388,882 | | | | 316,434 | | | | 162,781 | |
Portfolio accounting fees | | | 51,398 | | | | 57,779 | | | | 61,439 | | | | 76,463 | | | | 35,330 | |
Recordkeeping fees | | | 44,039 | | | | 73,809 | | | | 74,141 | | | | 97,004 | | | | 80,677 | |
Custodian fees | | | 8,156 | | | | 9,982 | | | | 9,628 | | | | 6,758 | | | | 4,943 | |
Registration fees | | | 70,898 | | | | 67,881 | | | | 56,775 | | | | 69,009 | | | | 51,833 | |
Professional fees | | | 25,819 | | | | 25,819 | | | | 26,219 | | | | 26,219 | | | | 26,219 | |
Printing and postage | | | 23,141 | | | | 54,081 | | | | 30,010 | | | | 36,461 | | | | 34,561 | |
Directors’ fees | | | 24,375 | | | | 24,375 | | | | 24,375 | | | | 24,375 | | | | 24,375 | |
Distribution services fees—Advisor Class (Note 5) | | | 97,755 | | | | 33,216 | | | | 42,755 | | | | 1,634 | | | | 81,712 | |
Miscellaneous | | | 7,626 | | | | 9,995 | | | | 19,379 | | | | 22,746 | | | | 7,245 | |
| | | | | | | | | | | | | | | | | | | | |
Total expenses | | | 1,790,783 | | | | 2,245,087 | | | | 1,794,258 | | | | 2,418,881 | | | | 1,339,520 | |
| | | | | |
Deduct: | | | | | | | | | | | | | | | | | | | | |
Expense waivers (Note 5) | | | (80,926 | ) | | | (323,231 | ) | | | (172,256 | ) | | | (168,971 | ) | | | (77,133 | ) |
| | | | | | | | | | | | | | | | | | | | |
Net expenses | | | 1,709,857 | | | | 1,921,856 | | | | 1,622,002 | | | | 2,249,910 | | | | 1,262,387 | |
| | | | | | | | | | | | | | | | | | | | |
Net investment income (loss) | | | 4,260,722 | | | | 7,135,716 | | | | 5,752,801 | | | | 2,362,787 | | | | 1,886,074 | |
| | | | | |
Realized and unrealized gain (loss) on Investments: | | | | | | | | | | | | | | | | | | | | |
Net realized gain (loss) on transactions from: | | | | | | | | | | | | | | | | | | | | |
Investments in unaffiliated issuers | | | (13,674,786 | ) | | | (23,462,640 | ) | | | (5,542,864 | ) | | | 22,270,471 | | | | (4,358,314 | ) |
Investments in affiliated issuers | | | 1,120 | | | | 644 | | | | (809 | ) | | | 2,590 | | | | 78 | |
| | | | | | | | | | | | | | | | | | | | |
Total net realized gain (loss) | | | (13,673,666 | ) | | | (23,461,996 | ) | | | (5,543,673 | ) | | | 22,273,061 | | | | (4,358,236 | ) |
Net change in unrealized appreciation/depreciation on: | | | | | | | | | | | | | | | | | | | | |
Investments in unaffiliated issuers | | | 623,666 | | | | 13,611,413 | | | | (1,401,632 | ) | | | 99,110,770 | | | | (6,975,219 | ) |
Investments in affiliated issuers | | | (988 | ) | | | (1,219 | ) | | | (424 | ) | | | (590 | ) | | | (282 | ) |
| | | | | | | | | | | | | | | | | | | | |
Total net change in unrealized appreciation/ depreciation | | | 622,678 | | | | 13,610,194 | | | | (1,402,056 | ) | | | 99,110,180 | | | | (6,975,501 | ) |
| | | | | | | | | | | | | | | | | | | | |
Net realized and unrealized gain (loss) | | | (13,050,988 | ) | | | (9,851,802 | ) | | | (6,945,729 | ) | | | 121,383,241 | | | | (11,333,737 | ) |
| | | | | | | | | | | | | | | | | | | | |
Change in net assets resulting from operations | | $ | (8,790,266 | ) | | $ | (2,716,086 | ) | | $ | (1,192,928 | ) | | $ | 123,746,028 | | | $ | (9,447,663 | ) |
| | | | | | | | | | | | | | | | | | | | |
| (1) | Net of foreign taxes withheld of $1,089. |
(See Notes which are an integral part of the Financial Statements)
91
Year Ended August 31, 2020
| | |
| | |
| Statements of Operations | | BMO Funds |
| | | | | | | | | | | | | | | | | | | | |
| | | | | | | | | | | | | | | | |
| | | Mid-Cap
Growth Fund | | | Small-Cap
Value Fund | | | Small-Cap
Growth Fund | | | Global Low
Volatility
Equity Fund | | | Disciplined
International
Equity Fund | |
Investment Income: | | | | | | | | | | | | | | | | | | | | |
Dividend income from: | | | | | | | | | | | | | | | | | | | | |
Unaffiliated issuers | | $ | 785,163 | | | $ | 869,523 | | | $ | 678,165 | | | $ | 732,679 | (1) | | $ | 1,532,448 | (1) |
Affiliated issuers | | | 14,428 | | | | 7,580 | | | | 12,378 | | | | 6,856 | | | | 6,081 | |
Net securities lending income from: | | | | | | | | | | | | | | | | | | | | |
Unaffiliated issuers | | | 19,880 | | | | 11,555 | | | | 21,984 | | | | 2,710 | | | | 8,939 | |
Affiliated issuers (Note 5) | | | 11,911 | | | | 7,278 | | | | 13,454 | | | | — | | | | — | |
| | | | | | | | | | | | | | | | | | | | |
Total income | | | 831,382 | | | | 895,936 | | | | 725,981 | | | | 742,245 | | | | 1,547,468 | |
| | | | | |
Expenses: | | | | | | | | | | | | | | | | | | | | |
Investment advisory fees (Note 5) | | | 652,553 | | | | 347,783 | | | | 641,396 | | | | 150,205 | | | | 299,917 | |
Administration fees (Note 5) | | | 131,474 | | | | 64,845 | | | | 140,452 | | | | 39,760 | | | | 74,979 | |
Portfolio accounting fees | | | 31,307 | | | | 28,517 | | | | 32,123 | | | | 4,295 | | | | 3,089 | |
Recordkeeping fees | | | 68,635 | | | | 36,090 | | | | 67,808 | | | | 22,992 | | | | 22,071 | |
Custodian fees | | | 4,212 | | | | 10,241 | | | | 11,376 | | | | 86,019 | | | | 76,536 | |
Registration fees | | | 51,930 | | | | 52,033 | | | | 38,596 | | | | 37,427 | | | | 51,290 | |
Professional fees | | | 26,219 | | | | 25,819 | | | | 26,219 | | | | 32,635 | | | | 29,405 | |
Printing and postage | | | 28,709 | | | | 20,739 | | | | 30,945 | | | | 5,756 | | | | 5,697 | |
Directors’ fees | | | 24,375 | | | | 24,375 | | | | 24,375 | | | | 24,375 | | | | 24,375 | |
Distribution services fees—Advisor Class (Note 5) | | | 33,443 | | | | 6,353 | | | | 69,681 | | | | 834 | | | | 349 | |
Miscellaneous | | | 5,397 | | | | 5,140 | | | | 5,175 | | | | 1,614 | | | | 2,780 | |
| | | | | | | | | | | | | | | | | | | | |
Total expenses | | | 1,058,254 | | | | 621,935 | | | | 1,088,146 | | | | 405,912 | | | | 590,488 | |
| | | | | |
Deduct: | | | | | | | | | | | | | | | | | | | | |
Expense waivers (Note 5) | | | (93,065 | ) | | | (124,247 | ) | | | (91,484 | ) | | | (178,516 | ) | | | (138,108 | ) |
| | | | | | | | | | | | | | | | | | | | |
Net expenses | | | 965,189 | | | | 497,688 | | | | 996,662 | | | | 227,396 | | | | 452,380 | |
| | | | | | | | | | | | | | | | | | | | |
Net investment income (loss) | | | (133,807 | ) | | | 398,248 | | | | (270,681 | ) | | | 514,849 | | | | 1,095,088 | |
| | | | | |
Realized and unrealized gain (loss) on Investments: | | | | | | | | | | | | | | | | | | | | |
Net realized gain (loss) on transactions from: | | | | | | | | | | | | | | | | | | | | |
Investments in unaffiliated issuers | | | 9,318,157 | | | | (5,096,892 | ) | | | 3,604,379 | | | | (3,148,669 | ) | | | (4,161,160 | ) |
Investments in affiliated issuers | | | (64 | ) | | | (7 | ) | | | (78 | ) | | | (7 | ) | | | 211 | |
Foreign currency transactions | | | — | | | | — | | | | — | | | | 7 | | | | (16,797 | ) |
| | | | | | | | | | | | | | | | | | | | |
Total net realized gain (loss) | | | 9,318,093 | | | | (5,096,899 | ) | | | 3,604,301 | | | | (3,148,669 | ) | | | (4,177,746 | ) |
Net change in unrealized appreciation/depreciation on: | | | | | | | | | | | | | | | | | | | | |
Investments in unaffiliated issuers | | | 7,073,656 | | | | 294,389 | | | | 6,114,055 | | | | (1,863,748 | ) | | | 3,973,403 | |
Investments in affiliated issuers | | | (320 | ) | | | (293 | ) | | | (293 | ) | | | (97 | ) | | | (180 | ) |
Foreign currency transactions | | | — | | | | — | | | | — | | | | 3,656 | | | | 22,024 | |
| | | | | | | | | | | | | | | | | | | | |
Total net change in unrealized appreciation/depreciation | | | 7,073,336 | | | | 294,096 | | | | 6,113,762 | | | | (1,860,189 | ) | | | 3,995,247 | |
| | | | | | | | | | | | | | | | | | | | |
Net realized and unrealized gain (loss) | | | 16,391,429 | | | | (4,802,803 | ) | | | 9,718,063 | | | | (5,008,858 | ) | | | (182,499 | ) |
| | | | | | | | | | | | | | | | | | | | |
Change in net assets resulting from operations | | $ | 16,257,622 | | | $ | (4,404,555 | ) | | $ | 9,447,382 | | | $ | (4,494,009 | ) | | $ | 912,589 | |
| | | | | | | | | | | | | | | | | | | | |
| (1) | Net of foreign taxes withheld of $70,604 and $141,454, respectively. |
(See Notes which are an integral part of the Financial Statements)
92
Year Ended August 31, 2020
| | |
| | |
| Statements of Operations | | BMO Funds |
| | | | | | | | | | | | | | | | | | | | |
| | | | | | | | | | | | | | | | |
| | | Pyrford
International
Stock Fund | | | LGM
Emerging
Markets
Equity Fund | | | Ultra Short
Tax-Free Fund | | | Short
Tax-Free Fund | | | Short-Term
Income Fund | |
Investment Income: | | | | | | | | | | | | | | | | | | | | |
Dividend income from: | | | | | | | | | | | | | | | | | | | | |
Unaffiliated issuers | | $ | 21,290,576 | (1) | | $ | 8,458,447 | (1) | | $ | 151,378 | | | $ | 7,884 | | | $ | 9,871 | |
Affiliated issuers | | | 227,260 | | | | 99,229 | | | | — | | | | — | | | | 82,365 | |
Interest income | | | — | | | | — | | | | 8,555,911 | | | | 3,089,565 | | | | 6,279,237 | |
Net securities lending income from: | | | | | | | | | | | | | | | | | | | | |
Unaffiliated issuers | | | 190,738 | | | | 120,034 | | | | — | | | | — | | | | 32,540 | |
Affiliated issuers (Note 5) | | | — | | | | — | | | | — | | | | — | | | | 18,592 | |
| | | | | | | | | | | | | | | | | | | | |
Total income | | | 21,708,574 | | | | 8,677,710 | | | | 8,707,289 | | | | 3,097,449 | | | | 6,422,605 | |
| | | | | |
Expenses: | | | | | | | | | | | | | | | | | | | | |
Investment advisory fees (Note 5) | | | 4,713,849 | | | | 2,434,152 | | | | 958,955 | | | | 280,500 | | | | 490,948 | |
Administration fees (Note 5) | | | 660,013 | | | | 405,692 | | | | 824,571 | | | | 213,552 | | | | 380,875 | |
Portfolio accounting fees | | | 21,146 | | | | 12,410 | | | | 111,610 | | | | 67,136 | | | | 75,333 | |
Recordkeeping fees | | | 46,210 | | | | 47,841 | | | | 38,858 | | | | 24,527 | | | | 62,826 | |
Custodian fees | | | 197,207 | | | | 363,546 | | | | 10,868 | | | | 3,094 | | | | 8,827 | |
Registration fees | | | 60,327 | | | | 50,187 | | | | 53,825 | | | | 38,640 | | | | 41,246 | |
Professional fees | | | 36,180 | | | | 49,717 | | | | 30,819 | | | | 30,819 | | | | 30,819 | |
Printing and postage | | | 24,550 | | | | 31,715 | | | | 11,573 | | | | 9,579 | | | | 26,533 | |
Directors’ fees | | | 24,375 | | | | 24,375 | | | | 24,375 | | | | 24,375 | | | | 24,375 | |
Distribution services fees—Advisor Class (Note 5) | | | 8,855 | | | | 10,563 | | | | 35,062 | | | | 9,905 | | | | 56,464 | |
Miscellaneous | | | 6,670 | | | | 3,300 | | | | 19,154 | | | | 6,268 | | | | 8,200 | |
| | | | | | | | | | | | | | | | | | | | |
Total expenses | | | 5,799,382 | | | | 3,433,498 | | | | 2,119,670 | | | | 708,395 | | | | 1,206,446 | |
| | | | | |
Deduct: | | | | | | | | | | | | | | | | | | | | |
Expense waivers (Note 5) | | | (40,585 | ) | | | (307,589 | ) | | | (433,082 | ) | | | (132,972 | ) | | | (261,272 | ) |
| | | | | | | | | | | | | | | | | | | | |
Net expenses | | | 5,758,797 | | | | 3,125,909 | | | | 1,686,588 | | | | 575,423 | | | | 945,174 | |
| | | | | | | | | | | | | | | | | | | | |
Net investment income (loss) | | | 15,949,777 | | | | 5,551,801 | | | | 7,020,701 | | | | 2,522,026 | | | | 5,477,431 | |
| | | | | |
Realized and unrealized gain (loss) on Investments: | | | | | | | | | | | | | | | | | | | | |
Net realized gain (loss) on transactions from: | | | | | | | | | | | | | | | | | | | | |
Investments in unaffiliated issuers | | | 10,049,766 | | | | (28,879,528 | )(2) | | | (721,719 | ) | | | (23,092 | ) | | | 566,567 | |
Investments in affiliated issuers | | | (7,821 | ) | | | 4,390 | | | | — | | | | — | | | | 1,558 | |
Foreign currency transactions | | | (328,671 | ) | | | (389,372 | ) | | | — | | | | — | | | | — | |
| | | | | | | | | | | | | | | | | | | | |
Total net realized gain (loss) | | | 9,713,274 | | | | (29,264,510 | ) | | | (721,719 | ) | | | (23,092 | ) | | | 568,125 | |
Net change in unrealized appreciation/depreciation on: | | | | | | | | | | | | | | | | | | | | |
Investments in unaffiliated issuers | | | 17,624,077 | | | | 31,988,243 | | | | 706,598 | | | | (245,132 | ) | | | 1,744,707 | |
Investments in affiliated issuers | | | 356 | | | | (1,583 | ) | | | — | | | | — | | | | (1,428 | ) |
Foreign currency transactions | | | 223,665 | | | | 136 | | | | — | | | | — | | | | — | |
| | | | | | | | | | | | | | | | | | | | |
Total net change in unrealized appreciation/ depreciation | | | 17,848,098 | | | | 31,986,796 | | | | 706,598 | | | | (245,132 | ) | | | 1,743,279 | |
| | | | | | | | | | | | | | | | | | | | |
Net realized and unrealized gain (loss) | | | 27,561,372 | | | | 2,722,286 | | | | (15,121 | ) | | | (268,224 | ) | | | 2,311,404 | |
| | | | | | | | | | | | | | | | | | | | |
Change in net assets resulting from operations | | $ | 43,511,149 | | | $ | 8,274,087 | | | $ | 7,005,580 | | | $ | 2,253,802 | | | $ | 7,788,835 | |
| | | | | | | | | | | | | | | | | | | | |
| (1) | Net of foreign taxes withheld of $1,689,342 and $697,491 respectively. |
| (2) | Net of foreign taxes withheld of $889,164, $890,033 of which is related to appreciated investments held at period end. |
(See Notes which are an integral part of the Financial Statements)
93
Year Ended August 31, 2020
| | |
| | |
| Statements of Operations | | BMO Funds |
| | | | | | | | | | | | | | | | |
| | | | | | | | | | | | | |
| | | Intermediate
Tax-Free Fund | | | Strategic
Income Fund | | | Corporate
Income Fund | | | Core Plus
Bond Fund | |
Investment Income: | | | | | | | | | | | | | | | | |
Dividend income from: | | | | | | | | | | | | | | | | |
Unaffiliated issuers | | $ | 90,509 | | | $ | 3,349 | | | $ | — | | | $ | 8,464 | |
Affiliated issuers | | | — | | | | 24,853 | | | | 152,863 | | | | 322,466 | |
Interest income | | | 60,298,728 | | | | 3,642,431 | | | | 12,446,288 | | | | 34,914,293 | |
Net securities lending income from: | | | | | | | | | | | | | | | | |
Unaffiliated issuers | | | — | | | | 16,335 | | | | 62,687 | | | | 160,825 | |
Affiliated issuers (Note 5) | | | — | | | | 10,494 | | | | 39,065 | | | | 91,722 | |
| | | | | | | | | | | | | | | | |
Total income | | | 60,389,237 | | | | 3,697,462 | | | | 12,700,903 | | | | 35,497,770 | |
| | | | |
Expenses: | | | | | | | | | | | | | | | | |
Investment advisory fees (Note 5) | | | 2,197,271 | | | | 178,870 | | | | 638,717 | | | | 1,380,588 | |
Shareholder servicing fees (Note 5) | | | 1,210,251 | | | | 130,388 | | | | 243,111 | | | | 205,015 | |
Administration fees (Note 5) | | | 2,860,906 | | | | 107,322 | | | | 528,717 | | | | 1,635,883 | |
Portfolio accounting fees | | | 387,100 | | | | 46,115 | | | | 80,722 | | | | 164,474 | |
Recordkeeping fees | | | 49,873 | | | | 67,531 | | | | 38,027 | | | | 43,347 | |
Custodian fees | | | 14,387 | | | | 6,676 | | | | 7,415 | | | | — | |
Registration fees | | | 165,114 | | | | 50,625 | | | | 58,426 | | | | 80,494 | |
Professional fees | | | 30,819 | | | | 33,119 | | | | 33,019 | | | | 33,019 | |
Printing and postage | | | 41,325 | | | | 21,973 | | | | 15,737 | | | | 33,655 | |
Directors’ fees | | | 24,375 | | | | 24,375 | | | | 24,375 | | | | 24,375 | |
Distribution services fees—Advisor Class (Note 5) | | | 12,313 | | | | 30,781 | | | | 17,531 | | | | 9,915 | |
Miscellaneous | | | 51,524 | | | | 4,690 | | | | 11,357 | | | | 28,773 | |
| | | | | | | | | | | | | | | | |
Total expenses | | | 7,045,258 | | | | 702,465 | | | | 1,697,154 | | | | 3,639,538 | |
| | | | |
Deduct: | | | | | | | | | | | | | | | | |
Expense waivers (Note 5) | | | (103,984 | ) | | | (147,776 | ) | | | (70,131 | ) | | | — | |
| | | | | | | | | | | | | | | | |
Net expenses | | | 6,941,274 | | | | 554,689 | | | | 1,627,023 | | | | 3,639,538 | |
| | | | | | | | | | | | | | | | |
Net investment income (loss) | | | 53,447,963 | | | | 3,142,773 | | | | 11,073,880 | | | | 31,858,232 | |
| | | | |
Realized and unrealized gain (loss) on Investments: | | | | | | | | | | | | | | | | |
Net realized gain (loss) on transactions from: | | | | | | | | | | | | | | | | |
Investments in unaffiliated issuers | | | (17,644,029 | ) | | | 1,679,155 | (1) | | | 2,421,772 | | | | 1,612,861 | |
Investments in affiliated issuers | | | — | | | | 1,276 | | | | (133 | ) | | | 12,605 | |
| | | | | | | | | | | | | | | | |
Total net realized gain (loss) | | | (17,644,029 | ) | | | 1,680,431 | | | | 2,421,639 | | | | 1,625,466 | |
Net change in unrealized appreciation/ depreciation on: | | | | | | | | | | | | | | | | |
Investments in unaffiliated issuers | | | (5,091,491 | ) | | | (36,002 | ) | | | 11,844,105 | | | | 37,054,941 | |
Investments in affiliated issuers | | | — | | | | (112 | ) | | | (3,207 | ) | | | (4,910 | ) |
| | | | | | | | | | | | | | | | |
Total net change in unrealized appreciation/ depreciation | | | (5,091,491 | ) | | | (36,114 | ) | | | 11,840,898 | | | | 37,050,031 | |
| | | | | | | | | | | | | | | | |
Net realized and unrealized gain (loss) | | | (22,735,520 | ) | | | 1,644,317 | | | | 14,262,537 | | | | 38,675,497 | |
| | | | | | | | | | | | | | | | |
Change in net assets resulting from operations | | $ | 30,712,443 | | | $ | 4,787,090 | | | $ | 25,336,417 | | | $ | 70,533,729 | |
| | | | | | | | | | | | | | | | |
| (1) | Amount includes $1,872,689 related to litigation settlements received during the year. |
(See Notes which are an integral part of the Financial Statements)
94
Year Ended August 31, 2020
| | |
| | |
| Statements of Operations | | BMO Funds |
| | | | | | | | | | | | | | | | |
| | | | | | | | | | | | | |
| | | Government
Money
Market Fund | | | Tax-Free
Money
Market Fund | | | Prime
Money
Market Fund | | | Institutional
Prime Money
Market Fund | |
Investment Income: | | | | | | | | | | | | | | | | |
Dividend income from: | | | | | | | | | | | | | | | | |
Unaffiliated issuers | | $ | 9,887 | | | $ | — | | | $ | — | | | $ | — | |
Interest income | | | 34,181,159 | (1) | | | 4,136,003 | | | | 6,193,628 | | | | 6,824,240 | |
Excess expense reimbursement from investment adviser (Note 5) | | | 1,090,818 | | | | 5,532 | | | | 164,127 | | | | 1,309 | |
| | | | | | | | | | | | | | | | |
Total income | | | 35,281,864 | | | | 4,141,535 | | | | 6,357,755 | | | | 6,825,549 | |
| | | | |
Expenses: | | | | | | | | | | | | | | | | |
Investment advisory fees (Note 5) | | | 6,793,328 | | | | 749,481 | | | | 830,561 | | | | 784,673 | |
Shareholder servicing fees (Note 5) | | | 1,661,608 | | | | 159,697 | | | | 609,648 | | | | 4,947 | |
Administration fees (Note 5) | | | 1,160,022 | | | | 144,039 | | | | 182,943 | | | | 173,423 | |
Portfolio accounting fees | | | 404,178 | | | | 85,285 | | | | 115,972 | | | | 131,413 | |
Recordkeeping fees | | | 30,745 | | | | 29,763 | | | | 74,557 | | | | 232,174 | |
Custodian fees | | | 35,918 | | | | 18,458 | | | | 19,946 | | | | 28,684 | |
Registration fees | | | 43,570 | | | | 52,379 | | | | 65,033 | | | | 54,520 | |
Professional fees | | | 29,719 | | | | 34,019 | | | | 34,219 | | | | 34,019 | |
Printing and postage | | | 22,825 | | | | 14,968 | | | | 43,749 | | | | 9,704 | |
Directors’ fees | | | 24,375 | | | | 24,375 | | | | 24,375 | | | | 24,375 | |
Miscellaneous | | | 83,060 | | | | 11,713 | | | | 14,331 | | | | 16,148 | |
| | | | | | | | | | | | | | | | |
Total expenses | | | 10,289,348 | | | | 1,324,177 | | | | 2,015,334 | | | | 1,494,080 | |
| | | | |
Deduct: | | | | | | | | | | | | | | | | |
Expense waivers (Note 5) | | | (1,607,270 | ) | | | (414,999 | ) | | | (298,271 | ) | | | (442,902 | ) |
| | | | | | | | | | | | | | | | |
Net expenses | | | 8,682,078 | | | | 909,178 | | | | 1,717,063 | | | | 1,051,178 | |
| | | | | | | | | | | | | | | | |
Net investment income (loss) | | | 26,599,786 | | | | 3,232,357 | | | | 4,640,692 | | | | 5,774,371 | |
| | | | |
Realized and unrealized gain (loss) on Investments: | | | | | | | | | | | | | | | | |
Net realized gain (loss) on transactions from: | | | | | | | | | | | | | | | | |
Investments in unaffiliated issuers | | | (1,834 | ) | | | 3,940 | | | | 616 | | | | 3,962 | |
| | | | | | | | | | | | | | | | |
Total net realized gain (loss) | | | (1,834 | ) | | | 3,940 | | | | 616 | | | | 3,962 | |
Net change in unrealized depreciation on: | | | | | | | | | | | | | | | | |
Investments in unaffiliated issuers | | | — | | | | — | | | | — | | | | (30,643 | ) |
| | | | | | | | | | | | | | | | |
Total net change in unrealized depreciation | | | — | | | | — | | | | — | | | | (30,643 | ) |
| | | | | | | | | | | | | | | | |
Net realized and unrealized gain (loss) | | | (1,834 | ) | | | 3,940 | | | | 616 | | | | (26,681 | ) |
| | | | | | | | | | | | | | | | |
Change in net assets resulting from operations | | $ | 26,597,952 | | | $ | 3,236,297 | | | $ | 4,641,308 | | | $ | 5,747,690 | |
| | | | | | | | | | | | | | | | |
| (1) | Income earned from the interfund lending program is $25,433. |
(See Notes which are an integral part of the Financial Statements)
95
| | |
| | |
| Statements of Changes in Net Assets | | |
| | | | | | | | | | | | | | | | | | | | | | | | |
| | | | | | | | | | |
| | | Low Volatility
Equity Fund | | | Dividend
Income Fund | | | Large-Cap
Value Fund | |
| | | Year Ended
August 31,
2020 | | | Year Ended
August 31,
2019 | | | Year Ended
August 31,
2020 | | | Year Ended
August 31,
2019 | | | Year Ended
August 31,
2020 | | | Year Ended
August 31,
2019 | |
Change in net assets resulting from: | | | | | | | | | | | | | | | | | | | | | | | | |
| | | | | | |
Operations: | | | | | | | | | | | | | | | | | | | | | | | | |
Net investment income (loss) | | $ | 4,260,722 | | | $ | 2,572,907 | | | $ | 7,135,716 | | | $ | 5,295,723 | | | $ | 5,752,801 | | | $ | 6,703,231 | |
Net realized gain (loss) on investments | | | (13,673,366 | ) | | | 2,908,962 | | | | (23,461,996 | ) | | | (1,812,626 | ) | | | (5,543,673 | ) | | | (3,260,425 | ) |
Net change in unrealized appreciation / depreciation on investments | | | 622,678 | | | | 15,017,580 | | | | 13,610,194 | | | | (6,514,456 | ) | | | (1,402,056 | ) | | | (34,813,659 | ) |
| | | | | | | | | | | | | | | | | | | | | | | | |
Change in net assets resulting from operations | | | (8,790,266 | ) | | | 20,499,449 | | | | (2,716,086 | ) | | | (3,031,359 | ) | | | (1,192,928 | ) | | | (31,370,853 | ) |
| | | | | | |
Distributions to shareholders: | | | | | | | | | | | | | | | | | | | | | | | | |
Investor class of shares | | | — | | | | — | | | | — | | | | — | | | | — | | | | — | |
Advisor class of shares | | | (1,450,854 | ) | | | (2,539,428 | ) | | | (330,362 | ) | | | (553,901 | ) | | | (314,895 | ) | | | (2,255,004 | ) |
Institutional class of shares | | | (7,550,078 | ) | | | (10,688,056 | ) | | | (7,471,748 | ) | | | (11,571,620 | ) | | | (4,781,801 | ) | | | (29,608,063 | ) |
Retirement class R-6 of shares | | | — | | | | — | | | | — | | | | — | | | | (940,489 | ) | | | (8,385,293 | ) |
| | | | | | | | | | | | | | | | | | | | | | | | |
Change in net assets resulting from distributions to shareholders | | | (9,000,932 | ) | | | (13,227,484 | ) | | | (7,802,110 | ) | | | (12,125,521 | ) | | | (6,037,185 | ) | | | (40,248,360 | ) |
| | | | | | |
Capital stock transactions: | | | | | | | | | | | | | | | | | | | | | | | | |
Proceeds from sale of shares | | | 223,207,848 | | | | 124,692,065 | | | | 69,941,306 | | | | 235,092,837 | | | | 129,149,913 | | | | 66,947,372 | |
Net asset value of shares issued to shareholders in payment of distributions declared | | | 8,728,824 | | | | 12,448,685 | | | | 6,514,980 | | | | 11,734,440 | | | | 5,726,579 | | | | 39,419,230 | |
Cost of shares redeemed | | | (168,174,482 | ) | | | (59,633,706 | ) | | | (134,207,951 | ) | | | (73,784,496 | ) | | | (163,878,784 | ) | | | (129,756,728 | ) |
| | | | | | | | | | | | | | | | | | | | | | | | |
Change in net assets resulting from capital stock transactions | | | 63,762,190 | | | | 77,507,044 | | | | (57,751,665 | ) | | | 173,042,781 | | | | (29,002,292 | ) | | | (23,390,126 | ) |
| | | | | | | | | | | | | | | | | | | | | | | | |
Change in net assets | | | 45,970,992 | | | | 84,779,009 | | | | (68,269,861 | ) | | | 157,885,901 | | | | (36,232,405 | ) | | | (95,009,339 | ) |
| | | | | | |
Net assets: | | | | | | | | | | | | | | | | | | | | | | | | |
Beginning of period | | | 213,164,379 | | | | 128,385,370 | | | | 312,987,167 | | | | 155,101,266 | | | | 297,063,341 | | | | 392,072,680 | |
| | | | | | | | | | | | | | | | | | | | | | | | |
End of period | | $ | 259,135,371 | | | $ | 213,164,379 | | | $ | 244,717,306 | | | $ | 312,987,167 | | | $ | 260,830,936 | | | $ | 297,063,341 | |
| | | | | | | | | | | | | | | | | | | | | | | | |
(See Notes which are an integral part of the Financial Statements)
96
| | | | | | | | | | | | | | | | | | | | | | | | | | | | | | |
| | | | | | | | | | |
Large-Cap
Growth Fund | | | Mid-Cap
Value Fund | | | Mid-Cap
Growth Fund | | | Small-Cap
Value Fund | |
Year Ended
August 31,
2020 | | | Year Ended
August 31,
2019 | | | Year Ended
August 31,
2020 | | | Year Ended
August 31,
2019 | | | Year Ended
August 31,
2020 | | | Year Ended
August 31,
2019 | | | Year Ended
August 31,
2020 | | | Year Ended
August 31,
2019 | |
| | | | | | | | | | | | | | | | | | | | | | | | | | | | | | |
| | | | | | | |
| | | | | | | | | | | | | | | | | | | | | | | | | | | | | | |
| $ | 2,362,787 | | | $ | 3,328,031 | | | $ | 1,886,074 | | | $ | 1,996,306 | | | $ | (133,807) | | | $ | (177,420) | | | $ | 398,248 | | | $ | 496,308 | |
| | 22,273,061 | | | | 22,623,039 | | | | (4,358,236 | ) | | | (2,371,492 | ) | | | 9,318,093 | | | | 12,560,287 | | | | (5,096,899 | ) | | | 289,402 | |
| | | | | | | |
| | 99,110,180 | | | | (26,450,235 | ) | | | (6,975,501 | ) | | | (18,095,442 | ) | | | 7,073,336 | | | | (16,369,576 | ) | | | 294,096 | | | | (12,392,721 | ) |
| | | | | | | | | | | | | | | | | | | | | | | | | | | | | | |
| | | | | | | |
| | 123,746,028 | | | | (499,165 | ) | | | (9,447,663 | ) | | | (18,470,628 | ) | | | 16,257,622 | | | | (3,986,709 | ) | | | (4,404,555 | ) | | | (11,607,011 | ) |
| | | | | | | |
| | | | | | | | | | | | | | | | | | | | | | | | | | | | | | |
| | (2,778,048 | ) | | | (8,151,650 | ) | | | — | | | | — | | | | — | | | | — | | | | — | | | | — | |
| | (31,524 | ) | | | (122,745 | ) | | | (460,109 | ) | | | (5,989,408 | ) | | | (1,752,862 | ) | | | (2,613,372 | ) | | | (32,711 | ) | | | (313,516 | ) |
| | (8,547,857 | ) | | | (36,189,535 | ) | | | (1,340,958 | ) | | | (12,798,593 | ) | | | (9,076,065 | ) | | | (12,980,336 | ) | | | (599,407 | ) | | | (3,915,187 | ) |
| | (11,957,598 | ) | | | (9,011,688 | ) | | | (215,944 | ) | | | (3,943,242 | ) | | | (919,723 | ) | | | (3,595,774 | ) | | | (103,017 | ) | | | (1,032,489 | ) |
| | | | | | | | | | | | | | | | | | | | | | | | | | | | | | |
| | | | | | | |
| | (23,315,027 | ) | | | (53,475,618 | ) | | | (2,017,011 | ) | | | (22,731,243 | ) | | | (11,748,650 | ) | | | (19,189,482 | ) | | | (735,135 | ) | | | (5,261,192 | ) |
| | | | | | | |
| | | | | | | | | | | | | | | | | | | | | | | | | | | | | | |
| | 102,603,302 | | | | 288,967,578 | | | | 17,595,463 | | | | 20,727,668 | | | | 12,255,066 | | | | 16,077,740 | | | | 12,141,600 | | | | 12,512,229 | |
| | | | | | | |
| | 21,673,096 | | | | 48,947,018 | | | | 1,946,452 | | | | 22,534,196 | | | | 11,701,291 | | | | 19,124,023 | | | | 726,039 | | | | 5,218,811 | |
| | (221,999,713 | ) | | | (235,274,441 | ) | | | (42,658,213 | ) | | | (61,287,176 | ) | | | (25,323,401 | ) | | | (43,674,135 | ) | | | (13,193,789 | ) | | | (20,877,358 | ) |
| | | | | | | | | | | | | | | | | | | | | | | | | | | | | | |
| | | | | | | |
| | (97,723,315 | ) | | | 102,640,155 | | | | (23,116,298 | ) | | | (18,025,312 | ) | | | (1,367,044 | ) | | | (8,472,372 | ) | | | (326,150 | ) | | | (3,146,318 | ) |
| | | | | | | | | | | | | | | | | | | | | | | | | | | | | | |
| | 2,707,686 | | | | 48,665,372 | | | | (34,580,972 | ) | | | (59,227,183 | ) | | | 3,141,928 | | | | (31,648,563 | ) | | | (5,465,840 | ) | | | (20,014,521 | ) |
| | | | | | | |
| | | | | | | | | | | | | | | | | | | | | | | | | | | | | | |
| | 455,088,967 | | | | 406,423,595 | | | | 140,882,388 | | | | 200,109,571 | | | | 96,783,817 | | | | 128,432,380 | | | | 55,833,909 | | | | 75,848,430 | |
| | | | | | | | | | | | | | | | | | | | | | | | | | | | | | |
| $ | 457,796,653 | | | $ | 455,088,967 | | | $ | 106,301,416 | | | $ | 140,882,388 | | | $ | 99,925,745 | | | $ | 96,783,817 | | | $ | 50,368,069 | | | $ | 55,833,909 | |
| | | | | | | | | | | | | | | | | | | | | | | | | | | | | | |
97
| | |
| | |
| Statements of Changes in Net Assets | | |
| | | | | | | | | | | | | | | | | | | | | | | | |
| | | | | | | | | | |
| | | Small-Cap
Growth Fund | | | Global Low Volatility
Equity Fund | | | Disciplined International
Equity Fund | |
| | | Year Ended
August 31,
2020 | | | Year Ended
August 31,
2019 | | | Year Ended
August 31,
2020 | | | Year Ended
August 31,
2019 | | | Year Ended
August 31,
2020 | | | Year Ended
August 31,
2019 | |
Change in net assets resulting from: | | | | | | | | | | | | | | | | | | | | | | | | |
| | | | | | |
Operations: | | | | | | | | | | | | | | | | | | | | | | | | |
Net investment income (loss) | | $ | (270,681 | ) | | $ | (450,978 | ) | | $ | 514,849 | | | $ | 860,280 | | | $ | 1,095,088 | | | $ | 2,268,048 | |
Net realized gain (loss) on investments | | | 3,604,301 | | | | 1,931,571 | | | | (3,148,669 | ) | | | 1,037,717 | | | | (4,177,746 | ) | | | (3,342,402 | ) |
Net change in unrealized appreciation / depreciation on investments | | | 6,113,762 | | | | (25,089,308 | ) | | | (1,860,189 | ) | | | (1,041,799 | ) | | | 3,995,247 | | | | (4,175,960 | ) |
| | | | | | | | | | | | | | | | | | | | | | | | |
Change in net assets resulting from operations | | | 9,447,382 | | | | (23,608,715 | ) | | | (4,494,009 | ) | | | 856,198 | | | | 912,589 | | | | (5,250,314 | ) |
| | | | | | |
Distributions to shareholders: | | | | | | | | | | | | | | | | | | | | | | | | |
Advisor class of shares | | | (554,817 | ) | | | (6,575,826 | ) | | | (33,392 | ) | | | (54,278 | ) | | | (5,904 | ) | | | (2,852 | ) |
Institutional class of shares | | | (1,223,257 | ) | | | (11,821,590 | ) | | | (1,780,680 | ) | | | (5,908,175 | ) | | | (2,443,021 | ) | | | (1,525,583 | ) |
Retirement class R-6 of shares | | | — | | | | — | | | | — | | | | — | | | | — | | | | — | |
Class F-3 of shares | | | — | | | | — | | | | — | | | | — | | | | — | | | | — | |
| | | | | | | | | | | | | | | | | | | | | | | | |
Change in net assets resulting from distributions to shareholders | | | (1,778,074 | ) | | | (18,397,416 | ) | | | (1,814,072 | ) | | | (5,962,453 | ) | | | (2,448,925 | ) | | | (1,528,435 | ) |
| | | | | | |
Capital stock transactions: | | | | | | | | | | | | | | | | | | | | | | | | |
Proceeds from sale of shares | | | 12,655,691 | | | | 21,977,695 | | | | 2,590,741 | | | | 8,165,404 | | | | 8,917,345 | | | | 21,711,420 | |
Net asset value of shares issued to shareholders in payment of distributions declared | | | 1,758,649 | | | | 18,153,178 | | | | 1,783,822 | | | | 5,947,142 | | | | 1,333,781 | | | | 1,341,526 | |
Cost of shares redeemed | | | (24,610,432 | ) | | | (51,603,896 | ) | | | (19,220,780 | ) | | | (4,555,760 | ) | | | (30,683,683 | ) | | | (32,830,709 | ) |
Redemption fees | | | — | | | | — | | | | 25 | | | | 4 | | | | 38,332 | | | | — | |
| | | | | | | | | | | | | | | | | | | | | | | | |
Change in net assets resulting from capital stock transactions | | | (10,196,092 | ) | | | (11,473,023 | ) | | | (14,846,192 | ) | | | 9,556,790 | | | | (20,394,225 | ) | | | (9,777,763 | ) |
| | | | | | | | | | | | | | | | | | | | | | | | |
Change in net assets | | | (2,526,784 | ) | | | (53,479,154 | ) | | | (21,154,273 | ) | | | 4,450,535 | | | | (21,930,561 | ) | | | (16,556,512 | ) |
| | | | | | |
Net assets: | | | | | | | | | | | | | | | | | | | | | | | | |
Beginning of period | | | 99,603,984 | | | | 153,083,138 | | | | 34,994,370 | | | | 30,543,835 | | | | 60,969,160 | | | | 77,525,672 | |
| | | | | | | | | | | | | | | | | | | | | | | | |
End of period | | $ | 97,077,200 | | | $ | 99,603,984 | | | $ | 13,840,097 | | | $ | 34,994,370 | | | $ | 39,038,599 | | | $ | 60,969,160 | |
| | | | | | | | | | | | | | | | | | | | | | | | |
(See Notes which are an integral part of the Financial Statements)
98
| | | | | | | | | | | | | | | | | | | | | | | | | | | | | | |
| | | | | | | | | | |
Pyrford International
Stock Fund | | | LGM Emerging
Markets Equity Fund | | | Ultra Short
Tax-Free Fund | | | Short
Tax-Free Fund | |
Year Ended
August 31,
2020 | | | Year Ended
August 31,
2019 | | | Year Ended
August 31,
2020 | | | Year Ended
August 31,
2019 | | | Year Ended
August 31,
2020 | | | Year Ended
August 31,
2019 | | | Year Ended
August 31,
2020 | | | Year Ended
August 31,
2019 | |
| | | | | | | | | | | | | | | | | | | | | | | | | | | | | | |
| | | | | | | |
| | | | | | | | | | | | | | | | | | | | | | | | | | | | | | |
| $ | 15,949,777 | | | $ | 17,811,533 | | | $ | 5,551,801 | | | $ | 3,948,730 | | | $ | 7,020,701 | | | $ | 9,617,390 | | | $ | 2,522,026 | | | $ | 3,194,229 | |
| | 9,713,274 | | | | (1,140,950 | ) | | | (29,264,510 | ) | | | 1,293,783 | | | | (721,719 | ) | | | 77,396 | | | | (23,092 | ) | | | 33,823 | |
| | | | | | | |
| | 17,848,098 | | | | (16,291,181 | ) | | | 31,986,796 | | | | (14,443,017 | ) | | | 706,598 | | | | 1,187,090 | | | | (245,132 | ) | | | 2,289,929 | |
| | | | | | | | | | | | | | | | | | | | | | | | | | | | | | |
| | | | | | | |
| | 43,511,149 | | | | 379,402 | | | | 8,274,087 | | | | (9,200,504 | ) | | | 7,005,580 | | | | 10,881,876 | | | | 2,253,802 | | | | 5,517,981 | |
| | | | | | | |
| | | | | | | | | | | | | | | | | | | | | | | | | | | | | | |
| | (85,227 | ) | | | (142,355 | ) | | | (89,598 | ) | | | (177,483 | ) | | | (149,493 | ) | | | (287,653 | ) | | | (64,292 | ) | | | (90,361 | ) |
| | (12,028,172 | ) | | | (12,873,242 | ) | | | (6,410,628 | ) | | | (8,498,978 | ) | | | (6,977,967 | ) | | | (9,329,653 | ) | | | (2,457,915 | ) | | | (3,103,824 | ) |
| | (5,677,054 | ) | | | (4,754,416 | ) | | | — | | | | — | | | | — | | | | — | | | | — | | | | — | |
| | — | | | | (1,250 | ) | | | — | | | | — | | | | — | | | | — | | | | — | | | | — | |
| | | | | | | | | | | | | | | | | | | | | | | | | | | | | | |
| | | | | | | |
| | (17,790,453 | ) | | | (17,771,263 | ) | | | (6,500,226 | ) | | | (8,676,461 | ) | | | (7,127,460 | ) | | | (9,617,306 | ) | | | (2,522,207 | ) | | | (3,194,185 | ) |
| | | | | | | |
| | | | | | | | | | | | | | | | | | | | | | | | | | | | | | |
| | 181,212,542 | | | | 179,398,812 | | | | 47,544,896 | | | | 184,565,106 | | | | 476,314,728 | | | | 455,013,834 | | | | 35,315,846 | | | | 38,924,406 | |
| | | | | | | |
| | 15,873,905 | | | | 15,571,565 | | | | 5,797,498 | | | | 8,184,014 | | | | 3,610,205 | | | | 5,246,595 | | | | 790,798 | | | | 1,039,378 | |
| | (182,384,945 | ) | | | (177,474,748 | ) | | | (86,812,335 | ) | | | (90,308,302 | ) | | | (501,557,114 | ) | | | (503,271,381 | ) | | | (67,684,713 | ) | | | (71,015,523 | ) |
| | 1,686 | | | | 7,393 | | | | 4,949 | | | | 1,285 | | | | — | | | | — | | | | — | | | | — | |
| | | | | | | | | | | | | | | | | | | | | | | | | | | | | | |
| | | | | | | |
| | 14,703,188 | | | | 17,503,022 | | | | (33,464,992 | ) | | | 102,442,103 | | | | (21,632,181 | ) | | | (43,010,952 | ) | | | (31,578,069 | ) | | | (31,051,739 | ) |
| | | | | | | | | | | | | | | | | | | | | | | | | | | | | | |
| | 40,423,884 | | | | 111,161 | | | | (31,691,131 | ) | | | 84,565,138 | | | | (21,754,061 | ) | | | (41,746,382 | ) | | | (31,846,474 | ) | | | (28,727,943 | ) |
| | | | | | | |
| | | | | | | | | | | | | | | | | | | | | | | | | | | | | | |
| | 654,563,456 | | | | 654,452,295 | | | | 291,382,987 | | | | 206,817,849 | | | | 558,357,095 | | | | 600,103,477 | | | | 159,796,053 | | | | 188,523,996 | |
| | | | | | | | | | | | | | | | | | | | | | | | | | | | | | |
| $ | 694,987,340 | | | $ | 654,563,456 | | | $ | 259,691,856 | | | $ | 291,382,987 | | | $ | 536,603,034 | | | $ | 558,357,095 | | | $ | 127,949,579 | | | $ | 159,796,053 | |
| | | | | | | | | | | | | | | | | | | | | | | | | | | | | | |
99
| | |
| | |
| Statements of Changes in Net Assets | | |
| | | | | | | | | | | | | | | | | | | | | | | | |
| | | | | | | | | | |
| | | Short-Term
Income Fund | | | Intermediate
Tax-Free Fund | | | Strategic
Income Fund | |
| | | Year Ended
August 31,
2020 | | | Year Ended
August 31,
2019 | | | Year Ended
August 31,
2020 | | | Year Ended
August 31,
2019 | | | Year Ended
August 31,
2020 | | | Year Ended
August 31,
2019 | |
Change in net assets resulting from: | | | | | | | | | | | | | | | | | |
| | | | | | |
Operations: | | | | | | | | | | | | | | | | | | | | | | | | |
Net investment income (loss) | | $ | 5,477,431 | | | $ | 6,317,075 | | | $ | 53,447,963 | | | $ | 51,208,942 | | | $ | 3,142,773 | | | $ | 3,548,002 | |
Net realized gain (loss) on investments | | | 568,125 | | | | (60,896 | ) | | | (17,644,029 | ) | | | (4,368,827 | ) | | | 1,680,431 | | | | (844,954 | ) |
Net change in unrealized appreciation/ depreciation on investments | | | 1,743,279 | | | | 5,247,967 | | | | (5,091,491 | ) | | | 80,362,929 | | | | (36,114 | ) | | | 3,982,634 | |
| | | | | | | | | | | | | | | | | | | | | | | | |
Change in net assets resulting from operations | | | 7,788,835 | | | | 11,504,146 | | | | 30,712,443 | | | | 127,203,044 | | | | 4,787,090 | | | | 6,685,682 | |
| | | | | | |
Distributions to shareholders: | | | | | | | | | | | | | | | | | | | | | | | | |
Investor class of shares | | | — | | | | — | | | | (12,734,809 | ) | | | (18,177,993 | ) | | | (3,719,817 | )(1) | | | (2,623,768 | ) |
Advisor class of shares | | | (454,483 | ) | | | (572,105 | ) | | | (129,659 | ) | | | (224,682 | ) | | | (888,510 | )(1) | | | (588,494 | ) |
Institutional class of shares | | | (5,207,303 | ) | | | (5,821,595 | ) | | | (40,734,694 | ) | | | (33,427,811 | ) | | | (486,118 | )(1) | | | (501,610 | ) |
Premier class of shares | | | — | | | | — | | | | — | | | | — | | | | — | | | | — | |
| | | | | | | | | | | | | | | | | | | | | | | | |
Change in net assets resulting from distributions to shareholders | | | (5,661,786 | ) | | | (6,393,700 | ) | | | (53,599,162 | ) | | | (51,830,486 | ) | | | (5,094,445 | ) | | | (3,713,872 | ) |
| | | | | | |
Capital stock transactions: | | | | | | | | | | | | | | | | | | | | | | | | |
Proceeds from sale of shares | | | 138,349,252 | | | | 113,830,655 | | | | 450,168,017 | | | | 934,039,993 | | | | 3,342,872 | | | | 2,591,998 | |
Net asset value of shares issued to shareholders in payment of distributions declared | | | 3,040,307 | | | | 3,753,375 | | | | 41,032,175 | | | | 40,306,879 | | | | 4,868,408 | | | | 3,529,210 | |
Cost of shares redeemed | | | (165,176,785 | ) | | | (104,426,395 | ) | | | (522,940,100 | ) | | | (911,414,361 | ) | | | (14,894,741 | ) | | | (16,904,030 | ) |
| | | | | | | | | | | | | | | | | | | | | | | | |
Change in net assets resulting from capital stock transactions | | | (23,787,226 | ) | | | 13,157,635 | | | | (31,739,908 | ) | | | 62,932,511 | | | | (6,683,461 | ) | | | (10,782,822 | ) |
| | | | | | | | | | | | | | | | | | | | | | | | |
Change in net assets | | | (21,660,177 | ) | | | 18,268,081 | | | | (54,626,627 | ) | | | 138,305,069 | | | | (6,990,816 | ) | | | (7,811,012 | ) |
| | | | | | |
Net assets: | | | | | | | | | | | | | | | | | | | | | | | | |
Beginning of period | | | 258,347,326 | | | | 240,079,245 | | | | 1,917,663,852 | | | | 1,779,358,783 | | | | 78,215,932 | | | | 86,026,944 | |
| | | | | | | | | | | | | | | | | | | | | | | | |
End of period | | $ | 236,687,149 | | | $ | 258,347,326 | | | $ | 1,863,037,225 | | | $ | 1,917,663,852 | | | $ | 71,225,116 | | | $ | 78,215,932 | |
| | | | | | | | | | | | | | | | | | | | | | | | |
| (1) | Includes distribution to shareholders for return of capital in the amount of $1,354,943, $323,640 and $177,068, respectively. |
| (2) | Includes distribution to shareholders for return of capital in the amount of $64,782, $3,135 and $863,470 respectively. |
(See Notes which are an integral part of the Financial Statements)
100
| | | | | | | | | | | | | | | | | | | | | | | | | | | | | | |
| | | | | | | | | | |
Corporate
Income Fund | | | Core Plus
Bond Fund | | | Government Money
Market Fund | | | Tax-Free Money
Market Fund | |
Year Ended
August 31,
2020 | | | Year Ended
August 31,
2019 | | | Year Ended
August 31,
2020 | | | Year Ended
August 31,
2019 | | | Year Ended
August 31,
2020 | | | Year Ended
August 31,
2019 | | | Year Ended
August 31,
2020 | | | Year Ended
August 31,
2019 | |
| | | | | | | | | | | | | | | | | | | | | | | | | | | | | | |
| | | | | | | |
| | | | | | | | | | | | | | | | | | | | | | | | | | | | | | |
| $ | 11,073,880 | | | $ | 10,457,073 | | | $ | 31,858,232 | | | $ | 34,323,060 | | | $ | 26,599,786 | | | $ | 63,208,008 | | | $ | 3,232,357 | | | $ | 5,921,671 | |
| | 2,421,639 | | | | (1,423,451 | ) | | | 1,625,466 | | | | (1,998,213 | ) | | | (1,834 | ) | | | 4,655 | | | | 3,940 | | | | 19,607 | |
| | | | | | | |
| | 11,840,898 | | | | 23,115,389 | | | | 37,050,031 | | | | 50,833,044 | | | | — | | | | — | | | | — | | | | — | |
| | | | | | | | | | | | | | | | | | | | | | | | | | | | | | |
| | | | | | | |
| | 25,336,417 | | | | 32,149,011 | | | | 70,533,729 | | | | 83,157,891 | | | | 26,597,952 | | | | 63,212,663 | | | | 3,236,297 | | | | 5,941,278 | |
| | | | | | | |
| | | | | | | | | | | | | | | | | | | | | | | | | | | | | | |
| | (2,982,524 | ) | | | (3,608,172 | ) | | | (2,340,943 | )(2) | | | (2,203,494 | ) | | | (5,118,095 | ) | | | (12,256,532 | ) | | | (412,550 | ) | | | (919,719 | ) |
| | (217,334 | ) | | | (141,929 | ) | | | (113,298 | )(2) | | | (102,886 | ) | | | — | | | | — | | | | — | | | | — | |
| | (8,024,711 | ) | | | (7,573,720 | ) | | | (31,201,850 | )(2) | | | (32,251,533 | ) | | | — | | | | — | | | | — | | | | — | |
| | — | | | | — | | | | — | | | | — | | | | (21,481,691 | ) | | | (50,956,131 | ) | | | (2,823,409 | ) | | | (5,021,273 | ) |
| | | | | | | | | | | | | | | | | | | | | | | | | | | | | | |
| | | | | | | |
| | (11,224,569 | ) | | | (11,323,821 | ) | | | (33,656,091 | ) | | | (34,557,913 | ) | | | (26,599,786 | ) | | | (63,212,663 | ) | | | (3,235,959 | ) | | | (5,940,992 | ) |
| | | | | | | |
| | | | | | | | | | | | | | | | | | | | | | | | | | | | | | |
| | 156,171,648 | | | | 166,374,912 | | | | 332,718,205 | | | | 264,740,954 | | | | 15,252,856,276 | | | | 16,062,057,054 | | | | 663,592,810 | | | | 828,334,151 | |
| | | | | | | |
| | 7,193,564 | | | | 7,341,969 | | | | 30,921,744 | | | | 31,159,017 | | | | 3,415,176 | | | | 8,714,362 | | | | 419,717 | | | | 919,257 | |
| | (121,984,007 | ) | | | (94,036,984 | ) | | | (265,662,007 | ) | | | (366,234,660 | ) | | | (14,508,723,483 | ) | | | (16,270,006,965 | ) | | | (685,960,999 | ) | | | (802,490,834 | ) |
| | | | | | | | | | | | | | | | | | | | | | | | | | | | | | |
| | | | | | | |
| | 41,381,205 | | | | 79,679,897 | | | | 97,977,942 | | | | (70,334,689 | ) | | | 747,547,969 | | | | (199,235,549 | ) | | | (21,948,472 | ) | | | 26,762,574 | |
| | | | | | | | | | | | | | | | | | | | | | | | | | | | | | |
| | 55,493,053 | | | | 100,505,087 | | | | 134,855,580 | | | | (21,734,711 | ) | | | 747,546,135 | | | | (199,235,549 | ) | | | (21,948,134 | ) | | | 26,762,860 | |
| | | | | | | |
| | | | | | | | | | | | | | | | | | | | | | | | | | | | | | |
| | 345,288,147 | | | | 244,783,060 | | | | 1,024,116,641 | | | | 1,045,851,352 | | | | 3,189,814,543 | | | | 3,389,050,092 | | | | 408,075,993 | | | | 381,313,133 | |
| | | | | | | | | | | | | | | | | | | | | | | | | | | | | | |
| $ | 400,781,200 | | | $ | 345,288,147 | | | $ | 1,158,972,221 | | | $ | 1,024,116,641 | | | $ | 3,937,360,678 | | | $ | 3,189,814,543 | | | $ | 386,127,859 | | | $ | 408,075,993 | |
| | | | | | | | | | | | | | | | | | | | | | | | | | | | | | |
101
| | |
| | |
| Statements of Changes in Net Assets | | |
| | | | | | | | | | | | | | | | |
| | | | | | | |
| | | Prime Money
Market Fund | | | Institutional Prime
Money
Market Fund | |
| | | Year Ended
August 31,
2020 | | | Year Ended
August 31,
2019 | | | Year Ended
August 31,
2020 | | | Year Ended
August 31,
2019 | |
Change in net assets resulting from: | | | | | | | | | | | | | | | | |
| | | | |
Operations: | | | | | | | | | | | | | | | | |
Net investment income (loss) | | $ | 4,640,692 | | | $ | 10,005,716 | | | $ | 5,774,371 | | | $ | 12,721,627 | |
Net realized gain (loss) on investments | | | 616 | | | | 536 | | | | 3,962 | | | | 1,072 | |
Net change in unrealized appreciation/depreciation on investments | | | — | | | | — | | | | (30,643 | ) | | | 2,973 | |
| | | | | | | | | | | | | | | | |
Change in net assets resulting from operations | | | 4,641,308 | | | | 10,006,252 | | | | 5,747,690 | | | | 12,725,672 | |
| | | | |
Distributions to shareholders: | | | | | | | | | | | | | | | | |
Investor class of shares | | | (1,773,854 | ) | | | (4,275,427 | ) | | | (12,653 | ) | | | (42,124 | ) |
Premier class of shares | | | (2,867,506 | ) | | | (5,730,825 | ) | | | (5,765,731 | ) | | | (12,680,593 | ) |
| | | | | | | | | | | | | | | | |
Change in net assets resulting from distributions to shareholders | | | (4,641,360 | ) | | | (10,006,252 | ) | | | (5,778,384 | ) | | | (12,722,717 | ) |
| | | | |
Capital stock transactions: | | | | | | | | | | | | | | | | |
Proceeds from sale of shares | | | 844,500,735 | | | | 775,417,901 | | | | 2,747,935,050 | | | | 2,739,102,472 | |
Net asset value of shares issued to shareholders in payment of distributions declared | | | 1,685,304 | | | | 4,030,461 | | | | 2,017,518 | | | | 4,242,411 | |
Cost of shares redeemed | | | (730,358,154 | ) | | | (744,417,480 | ) | | | (2,938,948,138 | ) | | | (2,663,727,009 | ) |
| | | | | | | | | | | | | | | | |
Change in net assets resulting from capital stock transactions | | | 115,827,885 | | | | 35,030,882 | | | | (188,995,570 | ) | | | 79,617,874 | |
| | | | | | | | | | | | | | | | |
Change in net assets | | | 115,827,833 | | | | 35,030,882 | | | | (189,026,264 | ) | | | 79,620,829 | |
| | | | |
Net assets: | | | | | | | | | | | | | | | | |
Beginning of period | | | 496,523,362 | | | | 461,492,480 | | | | 561,435,239 | | | | 481,814,410 | |
| | | | | | | | | | | | | | | | |
End of period | | $ | 612,351,195 | | | $ | 496,523,362 | | | $ | 372,408,975 | | | $ | 561,435,239 | |
| | | | | | | | | | | | | | | | |
(See Notes which are an integral part of the Financial Statements)
102
| | |
| |
| Financial Highlights—Investor Class of Shares (For a share outstanding throughout each period) |
| | | | | | | | | | | | | | | | | | | | | | | | | | | | | | | | | | | | | | | | | | | | | | | | | | | | | | | | | | | | | | | | | | | | | | |
Period
Ended
August 31, | | Net asset
value,
beginning
of period | | Net
investment
income
(loss) | | Net realized
and unrealized
gain (loss) | | Total from
investment
operations | | Distributions to
shareholders
from net
investment
income | | Distributions to
shareholders from
net realized gain | | Total
distributions | | Net asset
value, end
of period | | Total
return (2)(3) | | Ratios to Average Net Assets (1) | | Net assets,
end of period
(000 omitted) | | Portfolio
turnover
rate (3) |
| | Gross
Expenses | | Net
Expenses (4) | | Net
investment
income
(loss) (4) |
Large-Cap Growth Fund | | | | | | | | | | | | | | | | | | | | | | | | | | | | | | | | | | | | | | | | | | | | | | | | | | | | | | | | | | | | | |
| 2020(5) | | | $ | 17.96 | | | | $ | 0.05 | | | | $ | 5.11 | | | | $ | 5.16 | | | | $ | (0.09 | ) | | | $ | (0.79 | ) | | | $ | (0.88 | ) | | | $ | 22.24 | | | | | 29.88 | % | | | | 0.83 | % | | | | 0.79 | % | | | | 0.22 | % | | | $ | 66,447 | | | | | 71 | % |
| 2019 | | | | 20.95 | | | | | 0.09 | | | | | (0.47 | ) | | | | (0.38 | ) | | | | (0.06 | ) | | | | (2.55 | ) | | | | (2.61 | ) | | | | 17.96 | | | | | (0.62 | ) | | | | 0.84 | | | | | 0.79 | | | | | 0.50 | | | | | 58,562 | | | | | 89 | |
| 2018 | | | | 17.46 | | | | | 0.07 | | | | | 4.42 | | | | | 4.49 | | | | | — | | | | | (1.00 | ) | | | | (1.00 | ) | | | | 20.95 | | | | | 26.78 | | | | | 0.92 | | | | | 0.91 | | | | | 0.28 | | | | | 65,365 | | | | | 57 | |
| 2017 | | | | 15.34 | | | | | 0.06 | | | | | 3.03 | | | | | 3.09 | | | | | (0.07 | ) | | | | (0.90 | ) | | | | (0.97 | ) | | | | 17.46 | | | | | 21.30 | | | | | 1.03 | | | | | 1.00 | | | | | 0.34 | | | | | 74,359 | | | | | 75 | |
| 2016 | | | | 16.26 | | | | | 0.03 | | | | | 1.44 | | | | | 1.47 | | | | | (0.02 | ) | | | | (2.37 | ) | | | | (2.39 | ) | | | | 15.34 | | | | | 9.68 | | | | | 1.13 | | | | | 1.07 | | | | | 0.23 | | | | | 163,712 | | | | | 70 | |
Intermediate Tax-Free Fund | | | | | | | | | | | | | | | | | | | | | | | | | | | | | | | | | | | | | | | | | | | | | | |
| 2020 | | | | 11.60 | | | | | 0.30 | | | | | (0.10 | ) | | | | 0.20 | | | | | (0.30 | ) | | | | — | | | | | (0.30 | ) | | | | 11.50 | | | | | 1.78 | | | | | 0.56 | | | | | 0.54 | | | | | 2.63 | | | | | 440,189 | | | | | 52 | |
| 2019 | | | | 11.13 | | | | | 0.31 | | | | | 0.46 | | | | | 0.77 | | | | | (0.30 | ) | | | | — | | | | | (0.30 | ) | | | | 11.60 | | | | | 7.05 | | | | | 0.56 | | | | | 0.55 | | | | | 2.69 | | | | | 528,980 | | | | | 64 | |
| 2018 | | | | 11.37 | | | | | 0.30 | | | | | (0.24 | ) | | | | 0.06 | | | | | (0.30 | ) | | | | (0.00 | ) | | | | (0.30 | ) | | | | 11.13 | | | | | 0.53 | | | | | 0.55 | | | | | 0.55 | | | | | 2.65 | | | | | 870,195 | | | | | 45 | |
| 2017 | | | | 11.61 | | | | | 0.29 | | | | | (0.21 | ) | | | | 0.08 | | | | | (0.29 | ) | | | | (0.03 | ) | | | | (0.32 | ) | | | | 11.37 | | | | | 0.78 | | | | | 0.57 | | | | | 0.55 | | | | | 2.55 | | | | | 975,664 | | | | | 44 | |
| 2016 | | | | 11.26 | | | | | 0.25 | | | | | 0.37 | | | | | 0.62 | | | | | (0.25 | ) | | | | (0.02 | ) | | | | (0.27 | ) | | | | 11.61 | | | | | 5.56 | | | | | 0.57 | | | | | 0.55 | | | | | 2.19 | | | | | 1,241,387 | | | | | 42 | |
Strategic Income Fund | | | | | | | | | | | | | | | | | | | | | | | | | | | | | | | | | | | | | | | | | | | | | | | | | | | | | | | | | | | | | |
| 2020 | | | | 9.46 | | | | | 0.40 | | | | | 0.24 | | | | | 0.64 | | | | | (0.66 | )(8) | | | | — | | | | | (0.66 | ) | | | | 9.44 | | | | | 7.24 | (10) | | | | 1.01 | | | | | 0.80 | | | | | 4.37 | | | | | 52,054 | | | | | 31 | |
| 2019 | | | | 9.08 | | | | | 0.42 | | | | | 0.38 | | | | | 0.80 | | | | | (0.42 | ) | | | | — | | | | | (0.42 | ) | | | | 9.46 | | | | | 9.08 | | | | | 0.96 | | | | | 0.80 | | | | | 4.41 | | | | | 56,576 | | | | | 39 | |
| 2018 | | | | 9.45 | | | | | 0.41 | | | | | (0.37 | ) | | | | 0.04 | | | | | (0.41 | ) | | | | — | | | | | (0.41 | ) | | | | 9.08 | | | | | 0.37 | | | | | 0.91 | | | | | 0.80 | | | | | 4.09 | | | | | 59,724 | | | | | 33 | |
| 2017 | | | | 9.43 | | | | | 0.23 | | | | | 0.08 | | | | | 0.31 | | | | | (0.29 | ) | | | | — | | | | | (0.29 | ) | | | | 9.45 | | | | | 3.32 | | | | | 0.90 | | | | | 0.80 | | | | | 2.46 | | | | | 73,488 | | | | | 65 | |
| 2016 | | | | 9.31 | | | | | 0.21 | | | | | 0.17 | | | | | 0.38 | | | | | (0.26 | ) | | | | — | | | | | (0.26 | ) | | | | 9.43 | | | | | 4.17 | | | | | 0.86 | | | | | 0.80 | | | | | 2.28 | | | | | 85,665 | | | | | 13 | |
Corporate Income Fund | | | | | | | | | | | | | | | | | | | | | | | | | | | | | | | | | | | | | | | | | | | | | | | | | | | | | | | | | | | | | |
| 2020 | | | | 13.65 | | | | | 0.42 | | | | | 0.63 | | | | | 1.05 | | | | | (0.42 | ) | | | | — | | | | | (0.42 | ) | | | | 14.28 | | | | | 7.86 | (11) | | | | 0.66 | | | | | 0.59 | | | | | 3.02 | | | | | 98,766 | | | | | 31 | |
| 2019 | | | | 12.79 | | | | | 0.45 | | | | | 0.90 | | | | | 1.35 | | | | | (0.45 | ) | | | | (0.04 | ) | | | | (0.49 | ) | | | | 13.65 | | | | | 10.88 | | | | | 0.67 | | | | | 0.59 | | | | | 3.52 | | | | | 101,125 | | | | | 37 | |
| 2018 | | | | 13.20 | | | | | 0.40 | | | | | (0.39 | ) | | | | 0.01 | | | | | (0.40 | ) | | | | (0.02 | ) | | | | (0.42 | ) | | | | 12.79 | | | | | 0.05 | | | | | 0.63 | | | | | 0.59 | | | | | 3.08 | | | | | 102,523 | | | | | 31 | |
| 2017 | | | | 13.17 | | | | | 0.35 | | | | | 0.14 | | | | | 0.49 | | | | | (0.35 | ) | | | | (0.11 | ) | | | | (0.46 | ) | | | | 13.20 | | | | | 3.86 | | | | | 0.71 | | | | | 0.59 | | | | | 2.70 | | | | | 120,745 | | | | | 44 | |
| 2016 | | | | 12.33 | | | | | 0.45 | | | | | 0.89 | | | | | 1.34 | | | | | (0.45 | ) | | | | (0.05 | ) | | | | (0.50 | ) | | | | 13.17 | | | | | 11.23 | | | | | 0.72 | | | | | 0.59 | | | | | 3.65 | | | | | 82,643 | | | | | 62 | |
Core Plus Bond Fund | | | | | | | | | | | | | | | | | | | | | | | | | | | | | | | | | | | | | | | | | | | | | | | | | | | | | | | | | | | | | |
| 2020 | | | | 12.00 | | | | | 0.32 | | | | | 0.44 | | | | | 0.76 | | | | | (0.34 | )(9) | | | | — | | | | | (0.34 | ) | | | | 12.42 | | | | | 6.49 | (12) | | | | 0.56 | | | | | 0.56 | | | | | 2.69 | | | | | 92,259 | | | | | 28 | |
| 2019 | | | | 11.41 | | | | | 0.37 | | | | | 0.59 | | | | | 0.96 | | | | | (0.37 | ) | | | | — | | | | | (0.37 | ) | | | | 12.00 | | | | | 8.63 | | | | | 0.58 | | | | | 0.58 | | | | | 3.24 | | | | | 74,970 | | | | | 51 | |
| 2018 | | | | 11.79 | | | | | 0.32 | | | | | (0.37 | ) | | | | (0.05 | ) | | | | (0.32 | ) | | | | (0.01 | ) | | | | (0.33 | ) | | | | 11.41 | | | | | (0.45 | ) | | | | 0.58 | | | | | 0.58 | | | | | 2.70 | | | | | 61,251 | | | | | 45 | |
| 2017 | | | | 11.89 | | | | | 0.24 | | | | | (0.02 | ) | | | | 0.22 | | | | | (0.28 | ) | | | | (0.04 | ) | | | | (0.32 | ) | | | | 11.79 | | | | | 1.91 | | | | | 0.59 | | | | | 0.59 | | | | | 2.37 | | | | | 68,946 | | | | | 34 | |
| 2016 | | | | 11.42 | | | | | 0.34 | | | | | 0.48 | | | | | 0.82 | | | | | (0.35 | ) | | | | (0.00 | ) | | | | (0.35 | ) | | | | 11.89 | | | | | 7.36 | | | | | 0.59 | | | | | 0.59 | | | | | 3.00 | | | | | 508,030 | | | | | 39 | |
Government Money Market Fund | | | | | | | | | | | | | | | | | | | | | | | | | | | | | | | | | | | | | | | | | | | | | | |
| 2020 | | | | 1.00 | | | | | 0.01 | | | | | (0.00 | ) | | | | 0.01 | | | | | (0.01 | ) | | | | — | | | | | (0.01 | ) | | | | 1.00 | | | | | 0.71 | | | | | 0.50 | | | | | 0.45 | | | | | 0.77 | | | | | 600,043 | | | | | — | |
| 2019 | | | | 1.00 | | | | | 0.02 | | | | | 0.00 | | | | | 0.02 | | | | | (0.02 | ) | | | | (0.00 | ) | | | | (0.02 | ) | | | | 1.00 | | | | | 1.89 | | | | | 0.50 | | | | | 0.45 | | | | | 1.89 | | | | | 805,270 | | | | | — | |
| 2018 | | | | 1.00 | | | | | 0.01 | | | | | 0.00 | | | | | 0.01 | | | | | (0.01 | ) | | | | (0.00 | ) | | | | (0.01 | ) | | | | 1.00 | | | | | 1.05 | | | | | 0.50 | | | | | 0.45 | | | | | 1.03 | | | | | 747,981 | | | | | — | |
| 2017 | | | | 1.00 | | | | | 0.00 | | | | | 0.00 | | | | | 0.00 | | | | | (0.00 | ) | | | | (0.00 | ) | | | | (0.00 | ) | | | | 1.00 | | | | | 0.24 | | | | | 0.50 | | | | | 0.42 | | | | | 0.24 | | | | | 814,242 | | | | | — | |
| 2016 | | | | 1.00 | | | | | 0.00 | | | | | 0.00 | | | | | 0.00 | | | | | (0.00 | ) | | | | (0.00 | ) | | | | (0.00 | ) | | | | 1.00 | | | | | 0.01 | | | | | 0.53 | | | | | 0.29 | | | | | 0.01 | | | | | 268,417 | | | | | — | |
Tax-Free Money Market Fund | | | | | | | | | | | | | | | | | | | | | | | | | | | | | | | | | | | | | | | | | | | | | | |
| 2020 | | | | 1.00 | | | | | 0.00 | | | | | 0.01 | | | | | 0.01 | | | | | (0.01 | ) | | | | — | | | | | (0.01 | ) | | | | 1.00 | | | | | 0.66 | | | | | 0.56 | | | | | 0.45 | | | | | 0.65 | | | | | 61,100 | | | | | — | |
| 2019 | | | | 1.00 | | | | | 0.01 | | | | | 0.00 | | | | | 0.01 | | | | | (0.01 | ) | | | | (0.00 | ) | | | | (0.01 | ) | | | | 1.00 | | | | | 1.20 | | | | | 0.55 | | | | | 0.45 | | | | | 1.20 | | | | | 71,794 | | | | | — | |
| 2018 | | | | 1.00 | | | | | 0.01 | | | | | 0.00 | | | | | 0.01 | | | | | (0.01 | ) | | | | (0.00 | ) | | | | (0.01 | ) | | | | 1.00 | | | | | 0.80 | | | | | 0.56 | | | | | 0.45 | | | | | 0.79 | | | | | 75,889 | | | | | — | |
| 2017 | | | | 1.00 | | | | | 0.00 | | | | | 0.00 | | | | | 0.00 | | | | | (0.00 | ) | | | | (0.00 | ) | | | | (0.00 | ) | | | | 1.00 | | | | | 0.37 | | | | | 0.57 | | | | | 0.45 | | | | | 0.33 | | | | | 76,029 | | | | | — | |
| 2016 | | | | 1.00 | | | | | 0.00 | | | | | 0.00 | | | | | 0.00 | | | | | (0.00 | ) | | | | (0.00 | ) | | | | (0.00 | ) | | | | 1.00 | | | | | 0.06 | | | | | 0.53 | | | | | 0.26 | | | | | 0.03 | | | | | 90,098 | | | | | — | |
Prime Money Market Fund | | | | | | | | | | | | | | | | | | | | | | | | | | | | | | | | | | | | | | | | | | | | | | |
| 2020 | | | | 1.00 | | | | | 0.01 | | | | | — | | | | | 0.01 | | | | | (0.01 | ) | | | | — | | | | | (0.01 | ) | | | | 1.00 | | | | | 0.83 | | | | | 0.50 | | | | | 0.45 | | | | | 0.73 | | | | | 268,054 | | | | | — | |
| 2019 | | | | 1.00 | | | | | 0.02 | | | | | 0.00 | | | | | 0.02 | | | | | (0.02 | ) | | | | (0.00 | ) | | | | (0.02 | ) | | | | 1.00 | | | | | 2.03 | | | | | 0.51 | | | | | 0.45 | | | | | 2.03 | | | | | 247,742 | | | | | — | |
| 2018 | | | | 1.00 | | | | | 0.01 | | | | | 0.00 | | | | | 0.01 | | | | | (0.01 | ) | | | | (0.00 | ) | | | | (0.01 | ) | | | | 1.00 | | | | | 1.25 | | | | | 0.52 | | | | | 0.45 | | | | | 1.24 | | | | | 193,006 | | | | | — | |
| 2017 | | | | 1.00 | | | | | 0.00 | | | | | 0.00 | | | | | 0.00 | | | | | (0.00 | ) | | | | (0.00 | ) | | | | (0.00 | ) | | | | 1.00 | | | | | 0.42 | | | | | 0.53 | | | | | 0.45 | | | | | 0.36 | | | | | 202,251 | | | | | — | |
| 2016 | | | | 1.00 | | | | | 0.00 | | | | | 0.00 | | | | | 0.00 | | | | | (0.00 | ) | | | | (0.00 | ) | | | | (0.00 | ) | | | | 1.00 | | | | | 0.03 | | | | | 0.45 | | | | | 0.38 | | | | | 0.03 | | | | | 903,864 | | | | | — | |
(See Notes which are an integral part of the Financial Statements)
103
| | |
| |
| Financial Highlights—Investor Class of Shares (For a share outstanding throughout each period) |
| | | | | | | | | | | | | | | | | | | | | | | | | | | | | | | | | | | | | | | | | | | | | | | | | | | | | | | | | | | | | | | | | | | | | | |
Period
Ended
August 31, | | Net asset
value,
beginning
of period | | Net
investment
income
(loss) | | Net realized
and unrealized
gain (loss) | | Total from
investment
operations | | Distributions to
shareholders
from net
investment
income | | Distributions to
shareholders from
net realized gain | | Total
distributions | | Net asset
value, end
of period | | Total
return (2)(3) | | Ratios to Average Net Assets (1) | | Net assets,
end of period
(000 omitted) | | Portfolio
turnover
rate (3) |
| | Gross
Expenses | | Net
Expenses (4) | | Net
investment
income
(loss) (4) |
Institutional Prime Money Market Fund | |
| 2020 | | | $ | 1.0001 | | | | $ | 0.0086 | | | | $ | (0.0002 | ) | | | $ | 0.0084 | | | | $ | (0.0086 | ) | | | $ | — | | | | $ | (0.0086 | ) | | | $ | 0.9999 | | | | | 0.84 | % | | | | 0.54 | % | | | | 0.45 | % | | | | 0.64 | % | | | $ | 2,824 | | | | | — | % |
| 2019 | | | | 1.0001 | | | | | 0.0204 | | | | | — | | | | | 0.0204 | | | | | (0.0204 | ) | | | | — | | | | | (0.0204 | ) | | | | 1.0001 | | | | | 2.06 | | | | | 0.52 | | | | | 0.45 | | | | | 2.04 | | | | | 1,218 | | | | | — | |
| 2018 | | | | 1.0001 | | | | | 0.0128 | | | | | 0.0000 | | | | | 0.0128 | | | | | (0.0128 | ) | | | | (0.0000 | ) | | | | (0.0128 | ) | | | | 1.0001 | | | | | 1.29 | | | | | 0.55 | | | | | 0.45 | | | | | 1.31 | | | | | 2,401 | | | | | — | |
| 2017(6) | | | | 1.00 | | | | | 0.0049 | | | | | 0.0001 | | | | | 0.0050 | | | | | (0.0049 | ) | | | | (0.0000 | ) | | | | (0.0049 | ) | | | | 1.0001 | | | | | 0.50 | | | | | 0.55 | | | | | 0.45 | | | | | 0.50 | | | | | 1,421 | | | | | — | |
| 2016(7) | | | | 1.00 | | | | | 0.00 | | | | | 0.00 | | | | | 0.00 | | | | | (0.00 | ) | | | | (0.00 | ) | | | | (0.00 | ) | | | | 1.00 | | | | | 0.03 | | | | | 0.54 | | | | | 0.45 | | | | | 0.14 | | | | | 992 | | | | | — | |
| (1) | Annualized for periods less than one year. |
| (2) | Based on net asset value as of end of period date. |
| (3) | Not annualized for periods less than one year. |
| (4) | The contractual and voluntary expense waivers pursuant to Note 5 of the financial statements are reflected in both the net expense and net investment income ratios. |
| (5) | Calculated using the average shares method. |
| (6) | Effective October 3, 2016, the BMO Institutional Prime Money Market Fund switched the valuation method of its securities from amortized cost to reflecting changes in market values, thus allowing the Fund’s NAV to “float”. In connection with this change, the Fund’s per share NAV is now calculated to four decimals (e.g., $1.0000). |
| (7) | Reflects operations for the period from June 3, 2016 (inception date) to August 31, 2016. |
| (8) | Includes distribution to shareholders for return of capital in the amount of $0.24 per share. |
| (9) | Includes distribution to shareholders for return of capital in the amount of $0.01 per share. |
| (10) | Total return includes litigation proceeds received during the year. Excluding these litigation proceeds, the total return would have been 4.31% |
| (11) | Total return includes litigation proceeds received during the year. Excluding these litigation proceeds, the total return would have been 7.82% |
| (12) | Total return includes litigation proceeds received during the year. Excluding these litigation proceeds, the total return would have been 6.40% |
(See Notes which are an integral part of the Financial Statements)
104
| | |
| |
| Financial Highlights—Advisor Class of Shares (For a share outstanding throughout each period) |
| | | | | | | | | | | | | | | | | | | | | | | | | | | | | | | | | | | | | | | | | | | | | | | | | | | | | | | | | | | | | | | | | | | | | | |
Period
Ended
August 31, | | Net asset
value,
beginning
of period | | Net
investment
income
(loss) | | Net realized
and unrealized
gain (loss) | | Total from
investment
operations | | Distributions to
shareholders
from net
investment
income | | Distributions to
shareholders from
net realized gain | | Total
distributions | | Net asset
value, end
of period | | Total
return (2)(3) | | Ratios to Average Net Assets (1) | | Net assets,
end of period
(000 omitted) | | Portfolio
turnover
rate (3) |
| | Gross
Expenses | | Net
Expenses (4) | | Net
investment
income
(loss) (4) |
Low Volatility Equity Fund | | | | | | | | | | | | | | | | | | | | | | | | | | | | | | | | | | | | | | | | | | | | | | | | | | | | | | | | |
| 2020 | | | $ | 15.81 | | | | $ | 0.22 | | | | $ | (0.42 | ) | | | $ | (0.20 | ) | | | $ | (0.24 | ) | | | $ | (0.31 | ) | | | $ | (0.55 | ) | | | $ | 15.06 | | | | | (1.25 | )% | | | | 0.93 | % | | | | 0.90 | % | | | | 1.50 | % | | | $ | 41,688 | | | | | 51 | % |
| 2019 | | | | 15.72 | | | | | 0.22 | | | | | 1.43 | | | | | 1.65 | | | | | (0.22 | ) | | | | (1.34 | ) | | | | (1.56 | ) | | | | 15.81 | | | | | 11.80 | | | | | 1.03 | | | | | 0.90 | | | | | 1.48 | | | | | 29,006 | | | | | 32 | |
| 2018 | | | | 14.36 | | | | | 0.19 | | | | | 1.76 | | | | | 1.95 | | | | | (0.20 | ) | | | | (0.39 | ) | | | | (0.59 | ) | | | | 15.72 | | | | | 13.96 | | | | | 1.03 | | | | | 0.90 | | | | | 1.25 | | | | | 25,571 | | | | | 43 | |
| 2017 | | | | 13.79 | | | | | 0.20 | | | | | 0.74 | | | | | 0.94 | | | | | (0.20 | ) | | | | (0.17 | ) | | | | (0.37 | ) | | | | 14.36 | | | | | 6.94 | | | | | 1.03 | | | | | 0.90 | | | | | 1.47 | | | | | 31,624 | | | | | 56 | |
| 2016 | | | | 12.81 | | | | | 0.16 | | | | | 1.35 | | | | | 1.51 | | | | | (0.17 | ) | | | | (0.36 | ) | | | | (0.53 | ) | | | | 13.79 | | | | | 12.13 | | | | | 1.05 | | | | | 0.90 | | | | | 1.40 | | | | | 15,064 | | | | | 40 | |
Dividend Income Fund | | | | | | | | | | | | | | | | | | | | | | | | | | | | | | | | | | | | | | | | | | | | | | | | | | | | | | | | |
| 2020 | | | | 14.02 | | | | | 0.32 | | | | | (0.35 | ) | | | | (0.03 | ) | | | | (0.31 | ) | | | | (0.02 | ) | | | | (0.33 | ) | | | | 13.66 | | | | | (0.01 | ) | | | | 1.01 | | | | | 0.90 | | | | | 2.20 | | | | | 8,789 | | | | | 46 | |
| 2019 | | | | 15.46 | | | | | 0.30 | | | | | (0.85 | ) | | | | (0.55 | ) | | | | (0.31 | ) | | | | (0.58 | ) | | | | (0.89 | ) | | | | 14.02 | | | | | (3.51 | ) | | | | 1.02 | | | | | 0.90 | | | | | 2.32 | | | | | 15,365 | | | | | 43 | |
| 2018 | | | | 14.51 | | | | | 0.28 | | | | | 2.67 | | | | | 2.95 | | | | | (0.30 | ) | | | | (1.70 | ) | | | | (2.00 | ) | | | | 15.46 | | | | | 21.90 | | | | | 1.04 | | | | | 0.90 | | | | | 2.07 | | | | | 6,092 | | | | | 39 | |
| 2017(5) | | | | 12.94 | | | | | 0.28 | | | | | 1.61 | | | | | 1.89 | | | | | (0.21 | ) | | | | (0.11 | ) | | | | (0.32 | ) | | | | 14.51 | | | | | 14.80 | | | | | 1.08 | | | | | 0.90 | | | | | 2.06 | | | | | 3,205 | | | | | 43 | |
| 2016 | | | | 12.59 | | | | | 0.30 | | | | | 1.11 | | | | | 1.41 | | | | | (0.30 | ) | | | | (0.76 | ) | | | | (1.06 | ) | | | | 12.94 | | | | | 11.89 | | | | | 1.08 | | | | | 0.90 | | | | | 2.44 | | | | | 78,531 | | | | | 51 | |
Large-Cap Value Fund | | | | | | | | | | | | | | | | | | | | | | | | | | | | | | | | | | | | | | | | | | | | | | | | | | | | | | | | |
| 2020 | | | | 13.72 | | | | | 0.22 | | | | | (0.18 | ) | | | | 0.04 | | | | | (0.24 | ) | | | | — | | | | | (0.24 | ) | | | | 13.52 | | | | | 0.43 | | | | | 0.85 | | | | | 0.79 | | | | | 1.62 | | | | | 14,047 | | | | | 76 | |
| 2019 | | | | 16.59 | | | | | 0.26 | | | | | (1.46 | ) | | | | (1.20 | ) | | | | (0.27 | ) | | | | (1.40 | ) | | | | (1.67 | ) | | | | 13.72 | | | | | (7.15 | ) | | | | 0.85 | | | | | 0.79 | | | | | 1.78 | | | | | 18,621 | | | | | 67 | |
| 2018 | | | | 15.85 | | | | | 0.16 | | | | | 2.22 | | | | | 2.38 | | | | | (0.19 | ) | | | | (1.45 | ) | | | | (1.64 | ) | | | | 16.59 | | | | | 15.57 | | | | | 0.91 | | | | | 0.89 | | | | | 0.82 | | | | | 22,602 | | | | | 54 | |
| 2017(5) | | | | 14.14 | | | | | 0.08 | | | | | 1.93 | | | | | 2.01 | | | | | (0.18 | ) | | | | (0.12 | ) | | | | (0.30 | ) | | | | 15.85 | | | | | 14.33 | | | | | 1.02 | | | | | 1.00 | | | | | 0.49 | | | | | 25,061 | | | | | 62 | |
| 2016 | | | | 15.23 | | | | | 0.21 | | | | | 0.53 | | | | | 0.74 | | | | | (0.22 | ) | | | | (1.61 | ) | | | | (1.83 | ) | | | | 14.14 | | | | | 5.31 | | | | | 1.10 | | | | | 1.07 | | | | | 1.61 | | | | | 37 | | | | | 60 | |
Large-Cap Growth Fund | | | | | | | | | | | | | | | | | | | | | | | | | | | | | | | | | | | | | | | | | | | | | | | | | | | | | | | | |
| 2020(5) | | | | 17.94 | | | | | 0.04 | | | | | 5.12 | | | | | 5.16 | | | | | (0.09 | ) | | | | (0.79 | ) | | | | (0.88 | ) | | | | 22.22 | | | | | 29.85 | | | | | 0.83 | | | | | 0.79 | | | | | 0.22 | | | | | 687 | | | | | 71 | |
| 2019 | | | | 20.96 | | | | | 0.09 | | | | | (0.48 | ) | | | | (0.39 | ) | | | | (0.08 | ) | | | | (2.55 | ) | | | | (2.63 | ) | | | | 17.94 | | | | | (0.63 | ) | | | | 0.84 | | | | | 0.79 | | | | | 0.49 | | | | | 712 | | | | | 89 | |
| 2018 | | | | 17.46 | | | | | 0.05 | | | | | 4.45 | | | | | 4.50 | | | | | — | | | | | (1.00 | ) | | | | (1.00 | ) | | | | 20.96 | | | | | 26.84 | | | | | 0.91 | | | | | 0.88 | | | | | 0.32 | | | | | 860 | | | | | 57 | |
| 2017 | | | | 15.34 | | | | | 0.03 | | | | | 3.06 | | | | | 3.09 | | | | | (0.07 | ) | | | | (0.90 | ) | | | | (0.97 | ) | | | | 17.46 | | | | | 21.30 | | | | | 1.03 | | | | | 1.00 | | | | | 0.39 | | | | | 808 | | | | | 75 | |
| 2016 | | | | 16.26 | | | | | 0.02 | | | | | 1.45 | | | | | 1.47 | | | | | (0.02 | ) | | | | (2.37 | ) | | | | (2.39 | ) | | | | 15.34 | | | | | 9.68 | | | | | 1.13 | | | | | 1.07 | | | | | 0.29 | | | | | 405 | | | | | 70 | |
Mid-Cap Value Fund | | | | | | | | | | | | | | | | | | | | | | | | | | | | | | | | | | | | | | | | | | | | | | | | | | | | | | | | |
| 2020 | | | | 9.99 | | | | | 0.16 | | | | | (0.95 | ) | | | | (0.79 | ) | | | | (0.13 | ) | | | | — | | | | | (0.13 | ) | | | | 9.07 | | | | | (8.10 | ) | | | | 1.30 | | | | | 1.24 | | | | | 1.36 | | | | | 28,114 | | | | | 47 | |
| 2019 | | | | 12.64 | | | | | 0.13 | | | | | (1.34 | ) | | | | (1.21 | ) | | | | (0.11 | ) | | | | (1.33 | ) | | | | (1.44 | ) | | | | 9.99 | | | | | (9.63 | ) | | | | 1.26 | | | | | 1.24 | | | | | 0.98 | | | | | 39,032 | | | | | 50 | |
| 2018 | | | | 11.91 | | | | | 0.11 | | | | | 1.17 | | | | | 1.28 | | | | | (0.05 | ) | | | | (0.50 | ) | | | | (0.55 | ) | | | | 12.64 | | | | | 10.89 | | | | | 1.25 | | | | | 1.24 | | | | | 0.79 | | | | | 55,151 | | | | | 64 | |
| 2017 | | | | 14.40 | | | | | 0.05 | | | | | 1.28 | | | | | 1.33 | | | | | (0.05 | ) | | | | (3.77 | ) | | | | (3.82 | ) | | | | 11.91 | | | | | 12.88 | | | | | 1.26 | | | | | 1.24 | | | | | 0.74 | | | | | 64,462 | | | | | 139 | |
| 2016 | | | | 15.02 | | | | | 0.11 | | | | | 0.86 | | | | | 0.97 | | | | | (0.12 | ) | | | | (1.47 | ) | | | | (1.59 | ) | | | | 14.40 | | | | | 7.27 | | | | | 1.23 | | | | | 1.23 | | | | | 0.90 | | | | | 39 | | | | | 24 | |
Mid-Cap Growth Fund | | | | | | | | | | | | | | | | | | | | | | | | | | | | | | | | | | | | | | | | | | | | | | | | | | | | | | | | |
| 2020 | | | | 14.20 | | | | | (0.06 | ) | | | | 2.55 | | | | | 2.49 | | | | | — | | | | | (1.82 | ) | | | | (1.82 | ) | | | | 14.87 | | | | | 19.05 | | | | | 1.34 | | | | | 1.24 | | | | | (0.37 | ) | | | | 14,016 | | | | | 56 | |
| 2019 | | | | 17.96 | | | | | (0.06 | ) | | | | (0.75 | ) | | | | (0.81 | ) | | | | — | | | | | (2.95 | ) | | | | (2.95 | ) | | | | 14.20 | | | | | (2.95 | ) | | | | 1.32 | | | | | 1.24 | | | | | (0.41 | ) | | | | 14,229 | | | | | 61 | |
| 2018 | | | | 14.79 | | | | | (0.08 | ) | | | | 4.24 | | | | | 4.16 | | | | | — | | | | | (0.99 | ) | | | | (0.99 | ) | | | | 17.96 | | | | | 29.40 | | | | | 1.31 | | | | | 1.24 | | | | | (0.43 | ) | | | | 16,399 | | | | | 63 | |
| 2017 | | | | 16.26 | | | | | (0.02 | ) | | | | 2.11 | | | | | 2.09 | | | | | (0.02 | ) | | | | (3.54 | ) | | | | (3.56 | ) | | | | 14.79 | | | | | 16.73 | | | | | 1.37 | | | | | 1.24 | | | | | (0.47 | ) | | | | 17,945 | | | | | 157 | |
| 2016 | | | | 20.02 | | | | | 0.03 | | | | | (0.91 | ) | | | | (0.88 | ) | | | | — | | | | | (2.88 | ) | | | | (2.88 | ) | | | | 16.26 | | | | | (4.23 | ) | | | | 1.29 | | | | | 1.24 | | | | | 0.09 | | | | | 31 | | | | | 59 | |
Small-Cap Value Fund | | | | | | | | | | | | | | | | | | | | | | | | | | | | | | | | | | | | | | | | | | | | | | | | | | | | | | | | |
| 2020(5) | | | | 11.39 | | | | | 0.06 | | | | | (1.03 | ) | | | | (0.97 | ) | | | | (0.07 | ) | | | | (0.05 | ) | | | | (0.12 | ) | | | | 10.30 | | | | | (8.63 | ) | | | | 1.48 | | | | | 1.24 | | | | | 0.52 | | | | | 1,575 | | | | | 82 | |
| 2019 | | | | 14.78 | | | | | 0.08 | | | | | (2.45 | ) | | | | (2.37 | ) | | | | (0.06 | ) | | | | (0.96 | ) | | | | (1.02 | ) | | | | 11.39 | | | | | (16.19 | ) | | | | 1.39 | | | | | 1.24 | | | | | 0.53 | | | | | 3,140 | | | | | 67 | |
| 2018 | | | | 13.30 | | | | | 0.03 | | | | | 2.57 | | | | | 2.60 | | | | | — | | | | | (1.12 | ) | | | | (1.12 | ) | | | | 14.78 | | | | | 20.32 | | | | | 1.41 | | | | | 1.24 | | | | | 0.25 | | | | | 4,741 | | | | | 70 | |
| 2017(5) | | | | 13.21 | | | | | 0.03 | | | | | 1.36 | | | | | 1.39 | | | | | (0.04 | ) | | | | (1.26 | ) | | | | (1.30 | ) | | | | 13.30 | | | | | 11.58 | | | | | 1.49 | | | | | 1.24 | | | | | 0.22 | | | | | 4,931 | | | | | 148 | |
| 2016 | | | | 12.72 | | | | | 0.03 | | | | | 0.98 | | | | | 1.01 | | | | | — | | | | | (0.52 | ) | | | | (0.52 | ) | | | | 13.21 | | | | | 8.23 | | | | | 1.39 | | | | | 1.24 | | | | | 0.17 | | | | | 42,615 | | | | | 39 | |
Small-Cap Growth Fund | | | | | | | | | | | | | | | | | | | | | | | | | | | | | | | | | | | | | | | | | | | | | | | | | | | | | | | | |
| 2020 | | | | 15.32 | | | | | (0.07 | ) | | | | 1.69 | | | | | 1.62 | | | | | — | | | | | (0.30 | ) | | | | (0.30 | ) | | | | 16.64 | | | | | 10.60 | | | | | 1.34 | | | | | 1.24 | | | | | (0.46 | ) | | | | 27,152 | | | | | 70 | |
| 2019 | | | | 21.60 | | | | | (0.02 | ) | | | | (3.51 | ) | | | | (3.53 | ) | | | | — | | | | | (2.75 | ) | | | | (2.75 | ) | | | | 15.32 | | | | | (16.12 | ) | | | | 1.30 | | | | | 1.24 | | | | | (0.54 | ) | | | | 31,378 | | | | | 61 | |
| 2018 | | | | 18.37 | | | | | (0.12 | ) | | | | 5.43 | | | | | 5.31 | | | | | — | | | | | (2.08 | ) | | | | (2.08 | ) | | | | 21.60 | | | | | 31.55 | | | | | 1.28 | | | | | 1.24 | | | | | (0.47 | ) | | | | 53,772 | | | | | 80 | |
| 2017(6) | | | | 17.79 | | | | | (0.06 | ) | | | | 0.64 | | | | | 0.58 | | | | | — | | | | | — | | | | | — | | | | | 18.37 | | | | | 3.26 | | | | | 1.24 | | | | | 1.24 | | | | | (0.97 | ) | | | | 57,737 | | | | | 197 | |
(See Notes which are an integral part of the Financial Statements)
105
| | |
| |
| Financial Highlights—Advisor Class of Shares (For a share outstanding throughout each period) |
| | | | | | | | | | | | | | | | | | | | | | | | | | | | | | | | | | | | | | | | | | | | | | | | | | | | | | | | | | | | | | | | | | | | | | |
Period
Ended
August 31, | | Net asset
value,
beginning
of period | | Net
investment
income
(loss) | | Net realized
and unrealized
gain (loss) | | Total from
investment
operations | | Distributions to
shareholders
from net
investment
income | | Distributions to
shareholders from
net realized gain | | Total
distributions | | Net asset
value, end
of period | | Total
return (2)(3) | | Ratios to Average Net Assets (1) | | Net assets,
end of period
(000 omitted) | | Portfolio
turnover
rate (3) |
| | Gross
Expenses | | Net
Expenses (4) | | Net
investment
income
(loss) (4) |
Global Low Volatility Equity Fund | | | | | | | | | | | | | | | | | | | | | | | | | | | | | | | | | | | | | | | | | | | | | | | | | | | | | | | | |
| 2020(5) | | | $ | 11.42 | | | | $ | 0.16 | | | | $ | (0.74 | ) | | | $ | (0.58 | ) | | | $ | (0.36 | ) | | | $ | (0.21 | ) | | | $ | (0.57 | ) | | | $ | 10.27 | | | | | (5.51 | )% | | | | 1.77 | % | | | | 1.10 | % | | | | 1.44 | % | | | $ | 101 | | | | | 49 | % |
| 2019(7) | | | | 14.00 | | | | | 0.52 | | | | | (0.37 | ) | | | | 0.15 | | | | | (0.38 | ) | | | | (2.35 | ) | | | | (2.73 | ) | | | | 11.42 | | | | | 2.21 | | | | | 1.62 | | | | | 1.10 | | | | | 2.50 | | | | | 660 | | | | | 44 | |
| 2018 | | | | 13.16 | | | | | (0.15 | ) | | | | 1.46 | | | | | 1.31 | | | | | (0.34 | ) | | | | (0.13 | ) | | | | (0.47 | ) | | | | 14.00 | | | | | 10.21 | | | | | 1.46 | | | | | 1.10 | | | | | 1.50 | | | | | 339 | | | | | 34 | |
| 2017(7) | | | | 12.61 | | | | | 0.14 | | | | | 0.66 | | | | | 0.80 | | | | | (0.17 | ) | | | | (0.08 | ) | | | | (0.25 | ) | | | | 13.16 | | | | | 6.59 | | | | | 1.52 | | | | | 1.10 | | | | | 1.96 | | | | | 997 | | | | | 74 | |
| 2016(7) | | | | 11.31 | | | | | 0.11 | | | | | 1.25 | | | | | 1.36 | | | | | (0.06 | ) | | | | (0.00 | ) | | | | (0.06 | ) | | | | 12.61 | | | | | 12.11 | | | | | 1.63 | | | | | 1.10 | | | | | 2.04 | | | | | 266 | | | | | 36 | |
Disciplined International Equity Fund | | | | | | | | | | | | | | | | | | | | | | | | | | | | | | | | | | | | | | | | | | | | | | | | | | | | | | | | |
| 2020(5) | | | | 10.01 | | | | | 0.19 | | | | | (0.07 | ) | | | | 0.12 | | | | | (0.42 | ) | | | | — | | | | | (0.42 | ) | | | | 9.71 | | | | | 0.92 | | | | | 1.44 | | | | | 1.15 | | | | | 1.99 | | | | | 139 | | | | | 55 | |
| 2019 | | | | 10.94 | | | | | 0.33 | | | | | (1.09 | ) | | | | (0.76 | ) | | | | (0.17 | ) | | | | — | | | | | (0.17 | ) | | | | 10.01 | | | | | (6.91 | ) | | | | 1.28 | | | | | 1.15 | | | | | 2.79 | | | | | 141 | | | | | 59 | |
| 2018(7) | | | | 11.17 | | | | | 0.21 | | | | | (0.22 | ) | | | | (0.01 | ) | | | | (0.22 | ) | | | | — | | | | | (0.22 | ) | | | | 10.94 | | | | | (0.15 | ) | | | | 1.27 | | | | | 1.15 | | | | | 2.11 | | | | | 186 | | | | | 52 | |
| 2017(7) | | | | 9.56 | | | | | 0.20 | | | | | 1.66 | | | | | 1.86 | | | | | (0.25 | ) | | | | — | | | | | (0.25 | ) | | | | 11.17 | | | | | 19.97 | | | | | 1.39 | | | | | 1.15 | | | | | 1.98 | | | | | 149 | | | | | 77 | |
| 2016(7)(8) | | | | 10.00 | | | | | 0.23 | | | | | (0.67 | ) | | | | (0.44 | ) | | | | — | | | | | — | | | | | — | | | | | 9.56 | | | | | (4.40 | ) | | | | 1.45 | | | | | 1.15 | | | | | 2.53 | | | | | 125 | | | | | 64 | |
Pyrford International Stock Fund | | | | | | | | | | | | | | | | | | | | | | | | | | | | | | | | | | | | | | | | | | | | | | | | | | | | | | | | |
| 2020(5)(7) | | | | 13.08 | | | | | 0.26 | | | | | 0.54 | | | | | 0.80 | | | | | (0.32 | ) | | | | — | | | | | (0.32 | ) | | | | 13.56 | | | | | 6.11 | | | | | 1.20 | | | | | 1.19 | | | | | 1.95 | | | | | 1,816 | | | | | 28 | |
| 2019(7) | | | | 13.43 | | | | | 0.32 | | | | | (0.34 | ) | | | | (0.02 | ) | | | | (0.33 | ) | | | | — | | | | | (0.33 | ) | | | | 13.08 | | | | | 0.04 | | | | | 1.21 | | | | | 1.19 | | | | | 2.32 | | | | | 4,621 | | | | | 16 | |
| 2018(7) | | | | 13.16 | | | | | (0.09 | ) | | | | 0.36 | | | | | 0.27 | | | | | — | | | | | — | | | | | — | | | | | 13.43 | | | | | 2.05 | | | | | 1.20 | | | | | 1.18 | | | | | 2.88 | | | | | 6,037 | | | | | 20 | |
| 2017(5)(7) | | | | 12.18 | | | | | 0.40 | | | | | 0.83 | | | | | 1.23 | | | | | (0.25 | ) | | | | — | | | | | (0.25 | ) | | | | 13.16 | | | | | 10.38 | | | | | 1.30 | | | | | 1.21 | | | | | 3.11 | | | | | 891 | | | | | 33 | |
| 2016(7) | | | | 11.74 | | | | | 0.33 | | | | | 0.35 | | | | | 0.68 | | | | | (0.24 | ) | | | | — | | | | | (0.24 | ) | | | | 12.18 | | | | | 5.96 | | | | | 1.31 | | | | | 1.24 | | | | | 0.92 | | | | | 88 | | | | | 12 | |
LGM Emerging Markets Equity Fund | | | | | | | | | | | | | | | | | | | | | | | | | | | | | | | | | | | | | | | | | | | | | | | | | | | | | | | | |
| 2020(5)(7) | | | | 14.89 | | | | | 0.28 | | | | | 0.36 | | | | | 0.64 | | | | | (0.23 | ) | | | | (0.08 | ) | | | | (0.31 | ) | | | | 15.22 | | | | | 4.30 | | | | | 1.51 | | | | | 1.40 | | | | | 1.90 | | | | | 3,896 | | | | | 45 | |
| 2019(7) | | | | 16.04 | | | | | (0.02 | ) | | | | (0.49 | ) | | | | (0.51 | ) | | | | (0.13 | ) | | | | (0.51 | ) | | | | (0.64 | ) | | | | 14.89 | | | | | (3.05 | ) | | | | 1.51 | | | | | 1.40 | | | | | 1.30 | | | | | 5,224 | | | | | 24 | |
| 2018(7) | | | | 15.93 | | | | | 0.14 | | | | | (0.03 | ) | | | | 0.11 | | | | | — | | | | | — | | | | | — | | | | | 16.04 | | | | | 0.69 | | | | | 1.55 | | | | | 1.40 | | | | | 0.84 | | | | | 4,983 | | | | | 22 | |
| 2017(5)(7) | | | | 14.04 | | | | | 0.13 | | | | | 1.82 | | | | | 1.95 | | | | | (0.06 | ) | | | | — | | | | | (0.06 | ) | | | | 15.93 | | | | | 14.03 | | | | | 1.63 | | | | | 1.40 | | | | | 0.96 | | | | | 4,776 | | | | | 40 | |
| 2016(7) | | | | 12.12 | | | | | 0.16 | | | | | 1.86 | | | | | 2.02 | | | | | (0.10 | ) | | | | — | | | | | (0.10 | ) | | | | 14.04 | | | | | 16.88 | | | | | 1.64 | | | | | 1.40 | | | | | 0.92 | | | | | 51,879 | | | | | 24 | |
Ultra Short Tax-Free Fund | | | | | | | | | | | | | | | | | | | | | | | | | | | | | | | | | | | | | | | | | | | | | | | | | | | | | | | | |
| 2020 | | | | 10.09 | | | | | 0.09 | | | | | 0.01 | | | | | 0.10 | | | | | (0.10 | ) | | | | — | | | | | (0.10 | ) | | | | 10.09 | | | | | 1.06 | | | | | 0.63 | | | | | 0.55 | | | | | 1.05 | | | | | 12,998 | | | | | 267 | |
| 2019 | | | | 10.07 | | | | | 0.13 | | | | | 0.03 | | | | | 0.16 | | | | | (0.14 | ) | | | | — | | | | | (0.14 | ) | | | | 10.09 | | | | | 1.62 | | | | | 0.62 | | | | | 0.55 | | | | | 1.41 | | | | | 16,498 | | | | | 155 | |
| 2018 | | | | 10.08 | | | | | 0.10 | | | | | 0.00 | | | | | 0.10 | | | | | (0.10 | ) | | | | (0.01 | ) | | | | (0.11 | ) | | | | 10.07 | | | | | 0.95 | | | | | 0.62 | | | | | 0.55 | | | | | 0.99 | | | | | 27,434 | | | | | 156 | |
| 2017 | | | | 10.08 | | | | | 0.07 | | | | | 0.01 | | | | | 0.08 | | | | | (0.07 | ) | | | | (0.01 | ) | | | | (0.08 | ) | | | | 10.08 | | | | | 0.80 | | | | | 0.64 | | | | | 0.55 | | | | | 0.74 | | | | | 34,696 | | | | | 126 | |
| 2016 | | | | 10.08 | | | | | 0.04 | | | | | 0.01 | | | | | 0.05 | | | | | (0.04 | ) | | | | (0.01 | ) | | | | (0.05 | ) | | | | 10.08 | | | | | 0.50 | | | | | 0.64 | | | | | 0.55 | | | | | 0.39 | | | | | 25 | | | | | 56 | |
Short Tax-Free Fund | | | | | | | | | | | | | | | | | | | | | | | | | | | | | | | | | | | | | | | | | | | | | | | | | | | | | | | | |
| 2020 | | | | 10.28 | | | | | 0.17 | | | | | 0.01 | | | | | 0.18 | | | | | (0.17 | ) | | | | — | | | | | (0.17 | ) | | | | 10.29 | | | | | 1.73 | | | | | 0.74 | | | | | 0.55 | | | | | 1.62 | | | | | 3,465 | | | | | 62 | |
| 2019 | | | | 10.14 | | | | | 0.17 | | | | | 0.14 | | | | | 0.31 | | | | | (0.17 | ) | | | | — | | | | | (0.17 | ) | | | | 10.28 | | | | | 3.10 | | | | | 0.72 | | | | | 0.55 | | | | | 1.68 | | | | | 3,668 | | | | | 94 | |
| 2018 | | | | 10.22 | | | | | 0.14 | | | | | (0.08 | ) | | | | 0.06 | | | | | (0.14 | ) | | | | — | | | | | (0.14 | ) | | | | 10.14 | | | | | 0.62 | | | | | 0.67 | | | | | 0.55 | | | | | 1.40 | | | | | 6,502 | | | | | 95 | |
| 2017 | | | | 10.24 | | | | | 0.13 | | | | | (0.02 | ) | | | | 0.11 | | | | | (0.13 | ) | | | | (0.00 | ) | | | | (0.13 | ) | | | | 10.22 | | | | | 1.08 | | | | | 0.76 | | | | | 0.55 | | | | | 1.27 | | | | | 7,166 | | | | | 93 | |
| 2016 | | | | 10.20 | | | | | 0.11 | | | | | 0.06 | | | | | 0.17 | | | | | (0.11 | ) | | | | (0.02 | ) | | | | (0.13 | ) | | | | 10.24 | | | | | 1.69 | | | | | 0.77 | | | | | 0.55 | | | | | 1.04 | | | | | 1,151 | | | | | 39 | |
Short-Term Income Fund | | | | | | | | | | | | | | | | | | | | | | | | | | | | | | | | | | | | | | | | | | | | | | | | | | | | | | | | |
| 2020 | | | | 9.45 | | | | | 0.18 | | | | | 0.11 | | | | | 0.29 | | | | | (0.19 | ) | | | | — | | | | | (0.19 | ) | | | | 9.55 | | | | | 3.09 | | | | | 0.70 | | | | | 0.60 | | | | | 1.94 | | | | | 20,404 | | | | | 48 | |
| 2019 | | | | 9.27 | | | | | 0.22 | | | | | 0.18 | | | | | 0.40 | | | | | (0.22 | ) | | | | — | | | | | (0.22 | ) | | | | 9.45 | | | | | 4.34 | | | | | 0.70 | | | | | 0.60 | | | | | 2.30 | | | | | 24,531 | | | | | 53 | |
| 2018 | | | | 9.39 | | | | | 0.17 | | | | | (0.12 | ) | | | | 0.05 | | | | | (0.17 | ) | | | | — | | | | | (0.17 | ) | | | | 9.27 | | | | | 0.56 | | | | | 0.71 | | | | | 0.60 | | | | | 1.80 | | | | | 26,011 | | | | | 48 | |
| 2017 | | | | 9.40 | | | | | 0.15 | | | | | (0.01 | ) | | | | 0.14 | | | | | (0.15 | ) | | | | — | | | | | (0.15 | ) | | | | 9.39 | | | | | 1.46 | | | | | 0.72 | | | | | 0.60 | | | | | 1.61 | | | | | 33,311 | | | | | 53 | |
| 2016 | | | | 9.33 | | | | | 0.10 | | | | | 0.07 | | | | | 0.17 | | | | | (0.10 | ) | | | | — | | | | | (0.10 | ) | | | | 9.40 | | | | | 1.87 | | | | | 0.70 | | | | | 0.60 | | | | | 0.98 | | | | | 157 | | | | | 64 | |
Intermediate Tax-Free Fund | | | | | | | | | | | | | | | | | | | | | | | | | | | | | | | | | | | | | | | | | | | | | | | | | | | | | | | | |
| 2020 | | | | 11.60 | | | | | 0.29 | | | | | (0.09 | ) | | | | 0.20 | | | | | (0.30 | ) | | | | — | | | | | (0.30 | ) | | | | 11.50 | | | | | 1.78 | | | | | 0.56 | | | | | 0.54 | | | | | 2.63 | | | | | 5,016 | | | | | 52 | |
| 2019 | | | | 11.13 | | | | | 0.30 | | | | | 0.47 | | | | | 0.77 | | | | | (0.30 | ) | | | | — | | | | | (0.30 | ) | | | | 11.60 | | | | | 7.05 | | | | | 0.56 | | | | | 0.55 | | | | | 2.69 | | | | | 4,505 | | | | | 64 | |
| 2018 | | | | 11.37 | | | | | 0.30 | | | | | (0.24 | ) | | | | 0.06 | | | | | (0.30 | ) | | | | — | | | | | (0.30 | ) | | | | 11.13 | | | | | 0.53 | | | | | 0.55 | | | | | 0.55 | | | | | 2.65 | | | | | 14,701 | | | | | 45 | |
| 2017 | | | | 11.61 | | | | | 0.29 | | | | | (0.21 | ) | | | | 0.08 | | | | | (0.29 | ) | | | | (0.03 | ) | | | | (0.32 | ) | | | | 11.37 | | | | | 0.79 | | | | | 0.57 | | | | | 0.55 | | | | | 2.57 | | | | | 10,842 | | | | | 44 | |
| 2016 | | | | 11.26 | | | | | 0.25 | | | | | 0.37 | | | | | 0.62 | | | | | (0.25 | ) | | | | (0.02 | ) | | | | (0.27 | ) | | | | 11.61 | | | | | 5.56 | | | | | 0.57 | | | | | 0.55 | | | | | 2.18 | | | | | 1,693 | | | | | 42 | |
(See Notes which are an integral part of the Financial Statements)
106
| | |
| |
| Financial Highlights—Advisor Class of Shares (For a share outstanding throughout each period) |
| | | | | | | | | | | | | | | | | | | | | | | | | | | | | | | | | | | | | | | | | | | | | | | | | | | | | | | | | | | | | | | | | | | | | | |
Period
Ended
August 31, | | Net asset
value,
beginning
of period | | Net
investment
income
(loss) | | Net realized
and unrealized
gain (loss) | | Total from
investment
operations | | Distributions to
shareholders
from net
investment
income | | Distributions to
shareholders from
net realized gain | | Total
distributions | | Net asset
value, end
of period | | Total
return (2)(3) | | Ratios to Average Net Assets (1) | | Net assets,
end of period
(000 omitted) | | Portfolio
turnover
rate (3) |
| | Gross
Expenses | | Net
Expenses (4) | | Net
investment
income
(loss) (4) |
Strategic Income Fund | | | | | | | | | | | | | | | | | | | | | | | | | | | | | | | | | | | | | | | | | | | | | | | | | | | | | | | | |
| 2020 | | | $ | 9.46 | | | | $ | 0.40 | | | | $ | 0.24 | | | | $ | 0.64 | | | | $ | (0.66 | )(9) | | | $ | — | | | | $ | (0.66 | ) | | | $ | 9.44 | | | | | 7.24 | (11)% | | | | 1.01 | % | | | | 0.80 | % | | | | 4.39 | % | | | $ | 12,858 | | | | | 31 | % |
| 2019 | | | | 9.08 | | | | | 0.42 | | | | | 0.38 | | | | | 0.80 | | | | | (0.42 | ) | | | | — | | | | | (0.42 | ) | | | | 9.46 | | | | | 9.08 | | | | | 0.96 | | | | | 0.80 | | | | | 4.41 | | | | | 12,523 | | | | | 39 | |
| 2018 | | | | 9.45 | | | | | 0.37 | | | | | (0.37 | ) | | | | 0.00 | | | | | (0.40 | ) | | | | — | | | | | (0.40 | ) | | | | 9.08 | | | | | 0.37 | | | | | 0.92 | | | | | 0.80 | | | | | 4.09 | | | | | 13,602 | | | | | 33 | |
| 2017 | | | | 9.43 | | | | | 0.28 | | | | | 0.03 | | | | | 0.31 | | | | | (0.29 | ) | | | | — | | | | | (0.29 | ) | | | | 9.45 | | | | | 3.32 | | | | | 0.90 | | | | | 0.80 | | | | | 3.14 | | | | | 18,354 | | | | | 65 | |
| 2016 | | | | 9.31 | | | | | 0.22 | | | | | 0.16 | | | | | 0.38 | | | | | (0.26 | ) | | | | — | | | | | (0.26 | ) | | | | 9.43 | | | | | 4.17 | | | | | 0.86 | | | | | 0.80 | | | | | 2.27 | | | | | 32 | | | | | 13 | |
Corporate Income Fund | | | | | | | | | | | | | | | | | | | | | | | | | | | | | | | | | | | | | | | | | | | | | | | | | | | | | | | | |
| 2020 | | | | 13.65 | | | | | 0.42 | | | | | 0.63 | | | | | 1.05 | | | | | (0.42 | ) | | | | — | | | | | (0.42 | ) | | | | 14.28 | | | | | 7.86 | (12) | | | | 0.66 | | | | | 0.59 | | | | | 3.05 | | | | | 3,719 | | | | | 31 | |
| 2019 | | | | 12.79 | | | | | 0.45 | | | | | 0.90 | | | | | 1.35 | | | | | (0.45 | ) | | | | (0.04 | ) | | | | (0.49 | ) | | | | 13.65 | | | | | 10.89 | | | | | 0.67 | | | | | 0.59 | | | | | 3.48 | | | | | 7,208 | | | | | 37 | |
| 2018 | | | | 13.20 | | | | | 0.40 | | | | | (0.39 | ) | | | | 0.01 | | | | | (0.40 | ) | | | | (0.02 | ) | | | | (0.42 | ) | | | | 12.79 | | | | | 0.06 | | | | | 0.63 | | | | | 0.59 | | | | | 3.15 | | | | | 1,864 | | | | | 31 | |
| 2017 | | | | 13.17 | | | | | 0.35 | | | | | 0.14 | | | | | 0.49 | | | | | (0.35 | ) | | | | (0.11 | ) | | | | (0.46 | ) | | | | 13.20 | | | | | 3.86 | | | | | 0.71 | | | | | 0.59 | | | | | 2.63 | | | | | 1,384 | | | | | 44 | |
| 2016 | | | | 12.33 | | | | | 0.45 | | | | | 0.89 | | | | | 1.34 | | | | | (0.45 | ) | | | | (0.05 | ) | | | | (0.50 | ) | | | | 13.17 | | | | | 11.23 | | | | | 0.72 | | | | | 0.59 | | | | | 3.77 | | | | | 66 | | | | | 62 | |
Core Plus Bond Fund | | | | | | | | | | | | | | | | | | | | | | | | | | | | | | | | | | | | | | | | | | | | | | | | | | | | | | | | |
| 2020 | | | | 12.00 | | | | | 0.32 | | | | | 0.43 | | | | | 0.75 | | | | | (0.34 | )(10) | | | | — | | | | | (0.34 | ) | | | | 12.41 | | | | | 6.49 | (13) | | | | 0.56 | | | | | 0.56 | | | | | 2.69 | | | | | 4,438 | | | | | 28 | |
| 2019 | | | | 11.41 | | | | | 0.37 | | | | | 0.59 | | | | | 0.96 | | | | | (0.37 | ) | | | | — | | | | | (0.37 | ) | | | | 12.00 | | | | | 8.63 | | | | | 0.58 | | | | | 0.58 | | | | | 3.23 | | | | | 3,727 | | | | | 51 | |
| 2018 | | | | 11.79 | | | | | 0.31 | | | | | (0.37 | ) | | | | (0.06 | ) | | | | (0.32 | ) | | | | (0.01 | ) | | | | (0.33 | ) | | | | 11.41 | | | | | (0.45 | ) | | | | 0.58 | | | | | 0.58 | | | | | 2.69 | | | | | 3,032 | | | | | 45 | |
| 2017 | | | | 11.89 | | | | | 0.28 | | | | | (0.06 | ) | | | | 0.22 | | | | | (0.28 | ) | | | | (0.04 | ) | | | | (0.32 | ) | | | | 11.79 | | | | | 1.91 | | | | | 0.59 | | | | | 0.59 | | | | | 2.36 | | | | | 3,337 | | | | | 34 | |
| 2016 | | | | 11.42 | | | | | 0.34 | | | | | 0.48 | | | | | 0.82 | | | | | (0.35 | ) | | | | (0.00 | ) | | | | (0.35 | ) | | | | 11.89 | | | | | 7.36 | | | | | 0.59 | | | | | 0.59 | | | | | 2.99 | | | | | 1,434 | | | | | 39 | |
| (1) | Annualized for periods less than one year. |
| (2) | Based on net asset value as of end of period date. |
| (3) | Not annualized for periods less than one year. |
| (4) | The contractual and voluntary expense waivers pursuant to Note 5 of the financial statements are reflected in both the net expense and net investment income ratios. |
| (5) | Calculated using the average shares method. |
| (6) | Reflects operations for the period from May 31, 2017 (inception date) to August 31, 2017. |
| (7) | Redemption fees consisted of per share amounts less than $0.01. |
| (8) | Reflects operations for the period from September 17, 2015 (inception date) to August 31, 2016. |
| (9) | Includes distribution to shareholders for return of capital in the amount of $0.24 per share. |
| (10) | Includes distribution to shareholders for return of capital in the amount of $0.01 per share. |
| (11) | Total return includes litigation proceeds received during the year. Excluding these litigation proceeds, the total return would have been 4.31% |
| (12) | Total return includes litigation proceeds received during the year. Excluding these litigation proceeds, the total return would have been 7.82% |
| (13) | Total return includes litigation proceeds received during the year. Excluding these litigation proceeds, the total return would have been 6.40% |
(See Notes which are an integral part of the Financial Statements)
107
| | |
| |
| Financial Highlights—Institutional Class of Shares (For a share outstanding throughout each period) |
| | | | | | | | | | | | | | | | | | | | | | | | | | | | | | | | | | | | | | | | | | | | | | | | | | | | | | | | | | | | | | | | | | | | | | |
Period
Ended
August 31, | | Net asset
value,
beginning
of period | | Net
investment
income
(loss) | | Net realized
and unrealized
gain (loss) | | Total from
investment
operations | | Distributions to
shareholders
from net
investment
income | | Distributions to
shareholders from
net realized gain | | Total
distributions | | Net asset
value, end
of period | | Total
return (2)(3) | | Ratios to Average Net Assets (1) | | Net assets,
end of period
(000 omitted) | | Portfolio
turnover
rate (3) |
| | Gross
Expenses | | Net
Expenses (4) | | Net
investment
income
(loss) (4) |
Low Volatility Equity Fund | | | | | | | | | | | | | | | | | | | | | | | | | | | | | | | | | | | | | | | | | | | | | | | | | | | |
| 2020 | | | $ | 15.88 | | | | $ | 0.28 | | | | $ | (0.45 | ) | | | $ | (0.17 | ) | | | $ | (0.28 | ) | | | $ | (0.31 | ) | | | $ | (0.59 | ) | | | $ | 15.12 | | | | | (1.06 | )% | | | | 0.68 | % | | | | 0.65 | % | | | | 1.76 | % | | | $ | 217,448 | | | | | 51 | % |
| 2019 | | | | 15.77 | | | | | 0.25 | | | | | 1.46 | | | | | 1.71 | | | | | (0.26 | ) | | | | (1.34 | ) | | | | (1.60 | ) | | | | 15.88 | | | | | 12.18 | | | | | 0.78 | | | | | 0.65 | | | | | 1.71 | | | | | 184,158 | | | | | 32 | |
| 2018 | | | | 14.42 | | | | | 0.24 | | | | | 1.74 | | | | | 1.98 | | | | | (0.24 | ) | | | | (0.39 | ) | | | | (0.63 | ) | | | | 15.77 | | | | | 14.12 | | | | | 0.78 | | | | | 0.65 | | | | | 1.52 | | | | | 102,815 | | | | | 43 | |
| 2017 | | | | 13.84 | | | | | 0.24 | | | | | 0.74 | | | | | 0.98 | | | | | (0.23 | ) | | | | (0.17 | ) | | | | (0.40 | ) | | | | 14.42 | | | | | 7.24 | | | | | 0.78 | | | | | 0.65 | | | | | 1.69 | | | | | 127,837 | | | | | 56 | |
| 2016 | | | | 12.84 | | | | | 0.20 | | | | | 1.35 | | | | | 1.55 | | | | | (0.19 | ) | | | | (0.36 | ) | | | | (0.55 | ) | | | | 13.84 | | | | | 12.47 | | | | | 0.80 | | | | | 0.65 | | | | | 1.62 | | | | | 135,413 | | | | | 40 | |
Dividend Income Fund | | | | | | | | | | | | | | | | | | | | | | | | | | | | | | | | | | | | | | | | | | | | | | | | | | | |
| 2020 | | | | 13.98 | | | | | 0.34 | | | | | (0.34 | ) | | | | 0.00 | | | | | (0.34 | ) | | | | (0.02 | ) | | | | (0.36 | ) | | | | 13.62 | | | | | 0.28 | | | | | 0.76 | | | | | 0.65 | | | | | 2.47 | | | | | 235,928 | | | | | 46 | |
| 2019 | | | | 15.41 | | | | | 0.34 | | | | | (0.85 | ) | | | | (0.51 | ) | | | | (0.34 | ) | | | | (0.58 | ) | | | | (0.92 | ) | | | | 13.98 | | | | | (3.24 | ) | | | | 0.78 | | | | | 0.65 | | | | | 2.56 | | | | | 297,622 | | | | | 43 | |
| 2018 | | | | 14.47 | | | | | 0.34 | | | | | 2.64 | | | | | 2.98 | | | | | (0.34 | ) | | | | (1.70 | ) | | | | (2.04 | ) | | | | 15.41 | | | | | 22.17 | | | | | 0.79 | | | | | 0.65 | | | | | 2.31 | | | | | 149,009 | | | | | 39 | |
| 2017(5) | | | | 12.96 | | | | | 0.33 | | | | | 1.60 | | | | | 1.93 | | | | | (0.31 | ) | | | | (0.11 | ) | | | | (0.42 | ) | | | | 14.47 | | | | | 15.15 | | | | | 0.83 | | | | | 0.65 | | | | | 2.37 | | | | | 112,377 | | | | | 43 | |
| 2016 | | | | 12.62 | | | | | 0.35 | | | | | 1.08 | | | | | 1.43 | | | | | (0.33 | ) | | | | (0.76 | ) | | | | (1.09 | ) | | | | 12.96 | | | | | 12.07 | | | | | 0.83 | | | | | 0.65 | | | | | 2.68 | | | | | 38,719 | | | | | 51 | |
Large-Cap Value Fund | | | | | | | | | | | | | | | | | | | | | | | | | | | | | | | | | | | | | | | | | | | | | | | | | | | |
| 2020 | | | | 13.74 | | | | | 0.27 | | | | | (0.20 | ) | | | | 0.07 | | | | | (0.28 | ) | | | | — | | | | | (0.28 | ) | | | | 13.53 | | | | | 0.70 | | | | | 0.60 | | | | | 0.54 | | | | | 1.90 | | | | | 213,466 | | | | | 76 | |
| 2019 | | | | 16.61 | | | | | 0.30 | | | | | (1.46 | ) | | | | (1.16 | ) | | | | (0.31 | ) | | | | (1.40 | ) | | | | (1.71 | ) | | | | 13.74 | | | | | (6.97 | ) | | | | 0.59 | | | | | 0.54 | | | | | 2.01 | | | | | 224,930 | | | | | 67 | |
| 2018 | | | | 15.88 | | | | | 0.28 | | | | | 2.14 | | | | | 2.42 | | | | | (0.24 | ) | | | | (1.45 | ) | | | | (1.69 | ) | | | | 16.61 | | | | | 15.83 | | | | | 0.67 | | | | | 0.64 | | | | | 1.64 | | | | | 287,685 | | | | | 54 | |
| 2017(5) | | | | 14.16 | | | | | 0.22 | | | | | 1.83 | | | | | 2.05 | | | | | (0.21 | ) | | | | (0.12 | ) | | | | (0.33 | ) | | | | 15.88 | | | | | 14.66 | | | | | 0.77 | | | | | 0.75 | | | | | 1.47 | | | | | 307,156 | | | | | 62 | |
| 2016 | | | | 15.26 | | | | | 0.24 | | | | | 0.53 | | | | | 0.77 | | | | | (0.26 | ) | | | | (1.61 | ) | | | | (1.87 | ) | | | | 14.16 | | | | | 5.57 | | | | | 0.85 | | | | | 0.82 | | | | | 1.83 | | | | | 136,813 | | | | | 60 | |
Large-Cap Growth Fund | | | | | | | | | | | | | | | | | | | | | | | | | | | | | | | | | | | | | | | | | | | | | | | | | | | |
| 2020(5) | | | | 18.15 | | | | | 0.09 | | | | | 5.18 | | | | | 5.27 | | | | | (0.14 | ) | | | | (0.79 | ) | | | | (0.93 | ) | | | | 22.49 | | | | | 30.19 | | | | | 0.58 | | | | | 0.54 | | | | | 0.48 | | | | | 121,958 | | | | | 71 | |
| 2019 | | | | 21.17 | | | | | 0.18 | | | | | (0.53 | ) | | | | (0.35 | ) | | | | (0.12 | ) | | | | (2.55 | ) | | | | (2.67 | ) | | | | 18.15 | | | | | (0.40 | ) | | | | 0.59 | | | | | 0.54 | | | | | 0.75 | | | | | 168,838 | | | | | 89 | |
| 2018 | | | | 17.60 | | | | | 0.11 | | | | | 4.48 | | | | | 4.59 | | | | | (0.02 | ) | | | | (1.00 | ) | | | | (1.02 | ) | | | | 21.17 | | | | | 27.19 | | | | | 0.67 | | | | | 0.64 | | | | | 0.56 | | | | | 279,227 | | | | | 57 | |
| 2017 | | | | 15.47 | | | | | 0.10 | | | | | 3.06 | | | | | 3.16 | | | | | (0.13 | ) | | | | (0.90 | ) | | | | (1.03 | ) | | | | 17.60 | | | | | 21.63 | | | | | 0.78 | | | | | 0.75 | | | | | 0.65 | | | | | 278,436 | | | | | 75 | |
| 2016 | | | | 16.39 | | | | | 0.07 | | | | | 1.44 | | | | | 1.51 | | | | | (0.06 | ) | | | | (2.37 | ) | | | | (2.43 | ) | | | | 15.47 | | | | | 9.88 | | | | | 0.88 | | | | | 0.82 | | | | | 0.50 | | | | | 95,438 | | | | | 70 | |
Mid-Cap Value Fund | | | | | | | | | | | | | | | | | | | | | | | | | | | | | | | | | | | | | | | | | | | | | | | | | | | |
| 2020 | | | | 9.92 | | | | | 0.16 | | | | | (0.91 | ) | | | | (0.75 | ) | | | | (0.16 | ) | | | | — | | | | | (0.16 | ) | | | | 9.01 | | | | | (7.79 | ) | | | | 1.05 | | | | | 0.99 | | | | | 1.62 | | | | | 65,345 | | | | | 47 | |
| 2019 | | | | 12.58 | | | | | 0.13 | | | | | (1.32 | ) | | | | (1.19 | ) | | | | (0.14 | ) | | | | (1.33 | ) | | | | (1.47 | ) | | | | 9.92 | | | | | (9.47 | ) | | | | 1.01 | | | | | 0.99 | | | | | 1.23 | | | | | 87,893 | | | | | 50 | |
| 2018 | | | | 11.89 | | | | | 0.13 | | | | | 1.18 | | | | | 1.31 | | | | | (0.12 | ) | | | | (0.50 | ) | | | | (0.62 | ) | | | | 12.58 | | | | | 11.21 | | | | | 1.00 | | | | | 0.99 | | | | | 1.04 | | | | | 113,786 | | | | | 64 | |
| 2017 | | | | 14.38 | | | | | 0.08 | | | | | 1.27 | | | | | 1.35 | | | | | (0.07 | ) | | | | (3.77 | ) | | | | (3.84 | ) | | | | 11.89 | | | | | 13.10 | | | | | 1.01 | | | | | 0.99 | | | | | 0.91 | | | | | 127,304 | | | | | 139 | |
| 2016 | | | | 15.01 | | | | | 0.16 | | | | | 0.85 | | | | | 1.01 | | | | | (0.17 | ) | | | | (1.47 | ) | | | | (1.64 | ) | | | | 14.38 | | | | | 7.55 | | | | | 0.98 | | | | | 0.98 | | | | | 1.09 | | | | | 75,608 | | | | | 24 | |
Mid-Cap Growth Fund | | | | | | | | | | | | | | | | | | | | | | | | | | | | | | | | | | | | | | | | | | | | | | | | | | | |
| 2020 | | �� | | 15.04 | | | | | (0.01 | ) | | | | 2.71 | | | | | 2.70 | | | | | — | | | | | (1.82 | ) | | | | (1.82 | ) | | | | 15.92 | | | | | 19.41 | | | | | 1.09 | | | | | 0.99 | | | | | (0.12 | ) | | | | 78,143 | | | | | 56 | |
| 2019 | | | | 18.79 | | | | | (0.02 | ) | | | | (0.78 | ) | | | | (0.80 | ) | | | | — | | | | | (2.95 | ) | | | | (2.95 | ) | | | | 15.04 | | | | | (2.75 | ) | | | | 1.07 | | | | | 0.99 | | | | | (0.16 | ) | | | | 74,575 | | | | | 61 | |
| 2018 | | | | 15.39 | | | | | (0.03 | ) | | | | 4.42 | | | | | 4.39 | | | | | — | | | | | (0.99 | ) | | | | (0.99 | ) | | | | 18.79 | | | | | 29.76 | | | | | 1.06 | | | | | 0.99 | | | | | (0.18 | ) | | | | 89,028 | | | | | 63 | |
| 2017 | | | | 16.76 | | | | | 0.03 | | | | | 2.19 | | | | | 2.22 | | | | | (0.05 | ) | | | | (3.54 | ) | | | | (3.59 | ) | | | | 15.39 | | | | | 17.07 | | | | | 1.12 | | | | | 0.99 | | | | | (0.07 | ) | | | | 94,464 | | | | | 157 | |
| 2016 | | | | 20.51 | | | | | 0.04 | | | | | (0.91 | ) | | | | (0.87 | ) | | | | — | | | | | (2.88 | ) | | | | (2.88 | ) | | | | 16.76 | | | | | (4.06 | ) | | | | 1.04 | | | | | 0.99 | | | | | 0.33 | | | | | 39,569 | | | | | 59 | |
Small-Cap Value Fund | | | | | | | | | | | | | | | | | | | | | | | | | | | | | | | | | | | | | | | | | | | | | | | | | | | |
| 2020(5) | | | | 11.60 | | | | | 0.09 | | | | | (1.05 | ) | | | | (0.96 | ) | | | | (0.11 | ) | | | | (0.05 | ) | | | | (0.16 | ) | | | | 10.48 | | | | | (8.40 | ) | | | | 1.24 | | | | | 0.99 | | | | | 0.78 | | | | | 41,135 | | | | | 82 | |
| 2019 | | | | 15.03 | | | | | 0.09 | | | | | (2.47 | ) | | | | (2.38 | ) | | | | (0.09 | ) | | | | (0.96 | ) | | | | (1.05 | ) | | | | 11.60 | | | | | (15.93 | ) | | | | 1.14 | | | | | 0.99 | | | | | 0.78 | | | | | 44,586 | | | | | 67 | |
| 2018 | | | | 13.47 | | | | | 0.07 | | | | | 2.61 | | | | | 2.68 | | | | | — | | | | | (1.12 | ) | | | | (1.12 | ) | | | | 15.03 | | | | | 20.67 | | | | | 1.16 | | | | | 0.99 | | | | | 0.49 | | | | | 56,848 | | | | | 70 | |
| 2017(5) | | | | 13.37 | | | | | 0.04 | | | | | 1.41 | | | | | 1.45 | | | | | (0.09 | ) | | | | (1.26 | ) | | | | (1.35 | ) | | | | 13.47 | | | | | 11.87 | | | | | 1.24 | | | | | 0.99 | | | | | 0.33 | | | | | 56,585 | | | | | 148 | |
| 2016 | | | | 12.84 | | | | | 0.05 | | | | | 1.00 | | | | | 1.05 | | | | | — | | | | | (0.52 | ) | | | | (0.52 | ) | | | | 13.37 | | | | | 8.47 | | | | | 1.14 | | | | | 0.99 | | | | | 0.40 | | | | | 25,522 | | | | | 39 | |
Small-Cap Growth Fund | | | | | | | | | | | | | | | | | | | | | | | | | | | | | | | | | | | | | | | | | | | | | | | | | | | |
| 2020 | | | | 16.10 | | | | | (0.03 | ) | | | | 1.78 | | | | | 1.75 | | | | | — | | | | | (0.30 | ) | | | | (0.30 | ) | | | | 17.55 | | | | | 10.89 | | | | | 1.09 | | | | | 0.99 | | | | | (0.22 | ) | | | | 69,926 | | | | | 70 | |
| 2019 | | | | 22.48 | | | | | 0.01 | | | | | (3.64 | ) | | | | (3.63 | ) | | | | — | | | | | (2.75 | ) | | | | (2.75 | ) | | | | 16.10 | | | | | (15.92 | ) | | | | 1.05 | | | | | 0.99 | | | | | (0.29 | ) | | | | 68,226 | | | | | 61 | |
| 2018 | | | | 19.00 | | | | | (0.03 | ) | | | | 5.59 | | | | | 5.56 | | | | | — | | | | | (2.08 | ) | | | | (2.08 | ) | | | | 22.48 | | | | | 31.83 | | | | | 1.02 | | | | | 0.99 | | | | | (0.21 | ) | | | | 99,311 | | | | | 80 | |
| 2017 | | | | 16.62 | | | | | (0.14 | ) | | | | 2.52 | | | | | 2.38 | | | | | — | | | | | — | | | | | — | | | | | 19.00 | | | | | 14.32 | | | | | 1.02 | | | | | 1.02 | | | | | (0.37 | ) | | | | 81,259 | | | | | 197 | |
| 2016 | | | | 18.60 | | | | | (0.10 | ) | | | | (0.64 | ) | | | | (0.74 | ) | | | | — | | | | | (1.24 | ) | | | | (1.24 | ) | | | | 16.62 | | | | | (3.72 | ) | | | | 1.18 | | | | | 1.18 | | | | | (0.21 | ) | | | | 179,726 | | | | | 63 | |
(See Notes which are an integral part of the Financial Statements)
108
| | |
| |
| Financial Highlights—Institutional Class of Shares (For a share outstanding throughout each period) |
| | | | | | | | | | | | | | | | | | | | | | | | | | | | | | | | | | | | | | | | | | | | | | | | | | | | | | | | | | | | | | | | | | | | | | |
Period
Ended
August 31, | | Net asset
value,
beginning
of period | | Net
investment
income
(loss) | | Net realized
and unrealized
gain (loss) | | Total from
investment
operations | | Distributions to
shareholders
from net
investment
income | | Distributions to
shareholders from
net realized gain | | Total
distributions | | Net asset
value, end
of period | | Total
return (2)(3) | | Ratios to Average Net Assets (1) | | Net assets,
end of period
(000 omitted) | | Portfolio
turnover
rate (3) |
| | Gross
Expenses | | Net
Expenses (4) | | Net
investment
income
(loss) (4) |
Global Low Volatility Equity Fund | | | | | | | | | | | | | | | | | | | | | | | | | | | | | | | | | | | | | | | | | | | | | | | | | | | | | | | | | | | | | |
| 2020(5)(6) | | | $ | 11.49 | | | | $ | 0.21 | | | | $ | (0.77 | ) | | | $ | (0.56 | ) | | | $ | (0.36 | ) | | | $ | (0.21 | ) | | | $ | (0.57 | ) | | | $ | 10.36 | | | | | (5.29 | )% | | | | 1.53 | % | | | | 0.85 | % | | | | 1.95 | % | | | $ | 13,739 | | | | | 49 | % |
| 2019(6) | | | | 14.05 | | | | | 0.38 | | | | | (0.19 | ) | | | | 0.19 | | | | | (0.40 | ) | | | | (2.35 | ) | | | | (2.75 | ) | | | | 11.49 | | | | | 2.48 | | | | | 1.37 | | | | | 0.85 | | | | | 2.67 | | | | | 34,335 | | | | | 44 | |
| 2018 | | | | 13.20 | | | | | 0.30 | | | | | 1.05 | | | | | 1.35 | | | | | (0.37 | ) | | | | (0.13 | ) | | | | (0.50 | ) | | | | 14.05 | | | | | 10.44 | | | | | 1.19 | | | | | 0.85 | | | | | 1.94 | | | | | 30,205 | | | | | 34 | |
| 2017(6) | | | | 12.65 | | | | | 0.19 | | | | | 0.64 | | | | | 0.83 | | | | | (0.20 | ) | | | | (0.08 | ) | | | | (0.28 | ) | | | | 13.20 | | | | | 6.76 | | | | | 1.27 | | | | | 0.85 | | | | | 1.98 | | | | | 48,221 | | | | | 74 | |
| 2016(6) | | | | 11.34 | | | | | 0.07 | | | | | 1.33 | | | | | 1.40 | | | | | (0.09 | ) | | | | (0.00 | ) | | | | (0.09 | ) | | | | 12.65 | | | | | 12.44 | | | | | 1.38 | | | | | 0.85 | | | | | 2.26 | | | | | 38,909 | | | | | 36 | |
Disciplined International Equity Fund | | | | | | | | | | | | | | | | | | | | | | | | | | | | | | | | | | | | | | | | | | | | | | | | | | | | | | | | |
| 2020(5) | | | | 10.03 | | | | | 0.22 | | | | | (0.06 | ) | | | | 0.16 | | | | | (0.45 | ) | | | | — | | | | | (0.45 | ) | | | | 9.74 | | | | | 1.30 | | | | | 1.18 | | | | | 0.90 | | | | | 2.19 | | | | | 38,899 | | | | | 55 | |
| 2019 | | | | 10.96 | | | | | 0.34 | | | | | (1.08 | ) | | | | (0.74 | ) | | | | (0.19 | ) | | | | — | | | | | (0.19 | ) | | | | 10.03 | | | | | (6.64 | ) | | | | 1.03 | | | | | 0.90 | | | | | 3.00 | | | | | 60,828 | | | | | 59 | |
| 2018(6) | | | | 11.19 | | | | | 0.26 | | | | | (0.25 | ) | | | | 0.01 | | | | | (0.24 | ) | | | | — | | | | | (0.24 | ) | | | | 10.96 | | | | | 0.05 | | | | | 1.03 | | | | | 0.90 | | | | | 2.33 | | | | | 77,339 | | | | | 52 | |
| 2017(6) | | | | 9.58 | | | | | 0.25 | | | | | 1.64 | | | | | 1.89 | | | | | (0.28 | ) | | | | — | | | | | (0.28 | ) | | | | 11.19 | | | | | 20.30 | | | | | 1.14 | | | | | 0.90 | | | | | 2.13 | | | | | 72,239 | | | | | 77 | |
| 2016(6)(7) | | | | 10.00 | | | | | 0.23 | | | | | (0.65 | ) | | | | (0.42 | ) | | | | — | | | | | — | | | | | — | | | | | 9.58 | | | | | (4.20 | ) | | | | 1.20 | | | | | 0.90 | | | | | 2.51 | | | | | 67,434 | | | | | 64 | |
Pyrford International Stock Fund | | | | | | | | | | | | | | | | | | | | | | | | | | | | | | | | | | | | | | | | | | | | | | | | | | | | | | | | | | | | | |
| 2020(5)(6) | | | | 12.84 | | | | | 0.31 | | | | | 0.51 | | | | | 0.82 | | | | | (0.37 | ) | | | | — | | | | | (0.37 | ) | | | | 13.29 | | | | | 6.38 | | | | | 0.95 | | | | | 0.94 | | | | | 2.40 | | | | | 463,023 | | | | | 28 | |
| 2019(6) | | | | 13.18 | | | | | 0.33 | | | | | (0.33 | ) | | | | — | | | | | (0.34 | ) | | | | — | | | | | (0.34 | ) | | | | 12.84 | | | | | 0.25 | | | | | 0.96 | | | | | 0.94 | | | | | 2.71 | | | | | 486,114 | | | | | 16 | |
| 2018(6) | | | | 13.21 | | | | | 0.37 | | | | | (0.06 | ) | | | | 0.31 | | | | | (0.34 | ) | | | | — | | | | | (0.34 | ) | | | | 13.18 | | | | | 2.34 | | | | | 0.96 | | | | | 0.94 | | | | | 2.41 | | | | | 485,053 | | | | | 20 | |
| 2017(5)(6) | | | | 12.22 | | | | | 0.32 | | | | | 0.94 | | | | | 1.26 | | | | | (0.27 | ) | | | | — | | | | | (0.27 | ) | | | | 13.21 | | | | | 10.68 | | | | | 1.05 | | | | | 0.96 | | | | | 2.59 | | | | | 593,746 | | | | | 33 | |
| 2016(6) | | | | 11.78 | | | | | 0.35 | | | | | 0.36 | | | | | 0.71 | | | | | (0.27 | ) | | | | — | | | | | (0.27 | ) | | | | 12.22 | | | | | 6.21 | | | | | 1.06 | | | | | 0.99 | | | | | 2.44 | | | | | 485,787 | | | | | 12 | |
LGM Emerging Markets Equity Fund | | | | | | | | | | | | | | | | | | | | | | | | | | | | | | | | | | | | | | | | | | | | | | | | | | | | | | | | |
| 2020(5)(6) | | | | 14.82 | | | | | 0.29 | | | | | 0.39 | | | | | 0.68 | | | | | (0.26 | ) | | | | (0.08 | ) | | | | (0.34 | ) | | | | 15.16 | | | | | 4.60 | | | | | 1.27 | | | | | 1.15 | | | | | 2.06 | | | | | 255,796 | | | | | 45 | |
| 2019(6) | | | | 15.99 | | | | | 0.22 | | | | | (0.69 | ) | | | | (0.47 | ) | | | | (0.19 | ) | | | | (0.51 | ) | | | | (0.70 | ) | | | | 14.82 | | | | | (2.76 | ) | | | | 1.25 | | | | | 1.15 | | | | | 1.65 | | | | | 286,159 | | | | | 24 | |
| 2018(6) | | | | 15.97 | | | | | 0.19 | | | | | (0.04 | ) | | | | 0.15 | | | | | (0.13 | ) | | | | — | | | | | (0.13 | ) | | | | 15.99 | | | | | 0.92 | | | | | 1.29 | | | | | 1.15 | | | | | 1.20 | | | | | 201,835 | | | | | 22 | |
| 2017(5)(6) | | | | 14.08 | | | | | 0.15 | | | | | 1.84 | | | | | 1.99 | | | | | (0.10 | ) | | | | — | | | | | (0.10 | ) | | | | 15.97 | | | | | 14.36 | | | | | 1.38 | | | | | 1.15 | | | | | 1.04 | | | | | 157,581 | | | | | 40 | |
| 2016(6) | | | | 12.16 | | | | | 0.15 | | | | | 1.90 | | | | | 2.05 | | | | | (0.13 | ) | | | | — | | | | | (0.13 | ) | | | | 14.08 | | | | | 17.12 | | | | | 1.39 | | | | | 1.15 | | | | | 1.07 | | | | | 78,851 | | | | | 24 | |
Ultra Short Tax-Free Fund | | | | | | | | | | | | | | | | | | | | | | | | | | | | | | | | | | | | | | | | | | | | | | | | | | | | | | | | | | | | | |
| 2020 | | | | 10.09 | | | | | 0.13 | | | | | (0.01 | ) | | | | 0.12 | | | | | (0.13 | ) | | | | — | | | | | (0.13 | ) | | | | 10.08 | | | | | 1.21 | | | | | 0.38 | | | | | 0.30 | | | | | 1.28 | | | | | 523,605 | | | | | 267 | |
| 2019 | | | | 10.06 | | | | | 0.17 | | | | | 0.03 | | | | | 0.20 | | | | | (0.17 | ) | | | | — | | | | | (0.17 | ) | | | | 10.09 | | | | | 1.98 | | | | | 0.37 | | | | | 0.30 | | | | | 1.66 | | | | | 541,859 | | | | | 155 | |
| 2018 | | | | 10.08 | | | | | 0.13 | | | | | (0.01 | ) | | | | 0.12 | | | | | (0.13 | ) | | | | (0.01 | ) | | | | (0.14 | ) | | | | 10.06 | | | | | 1.10 | | | | | 0.37 | | | | | 0.30 | | | | | 1.25 | | | | | 572,669 | | | | | 156 | |
| 2017 | | | | 10.07 | | | | | 0.10 | | | | | 0.02 | | | | | 0.12 | | | | | (0.10 | ) | | | | (0.01 | ) | | | | (0.11 | ) | | | | 10.08 | | | | | 1.15 | | | | | 0.39 | | | | | 0.30 | | | | | 0.94 | | | | | 625,691 | | | | | 126 | |
| 2016 | | | | 10.08 | | | | | 0.07 | | | | | 0.00 | | | | | 0.07 | | | | | (0.07 | ) | | | | (0.01 | ) | | | | (0.08 | ) | | | | 10.07 | | | | | 0.65 | | | | | 0.39 | | | | | 0.30 | | | | | 0.65 | | | | | 548,641 | | | | | 56 | |
Short Tax-Free Fund | | | | | | | | | | | | | | | | | | | | | | | | | | | | | | | | | | | | | | | | | | | | | | | | | | | | | | | | | | | | | |
| 2020 | | | | 10.29 | | | | | 0.18 | | | | | 0.01 | | | | | 0.19 | | | | | (0.18 | ) | | | | — | | | | | (0.18 | ) | | | | 10.30 | | | | | 1.88 | | | | | 0.49 | | | | | 0.40 | | | | | 1.78 | | | | | 124,485 | | | | | 62 | |
| 2019 | | | | 10.14 | | | | | 0.19 | | | | | 0.15 | | | | | 0.34 | | | | | (0.19 | ) | | | | — | | | | | (0.19 | ) | | | | 10.29 | | | | | 3.35 | | | | | 0.47 | | | | | 0.40 | | | | | 1.83 | | | | | 156,128 | | | | | 94 | |
| 2018 | | | | 10.22 | | | | | 0.16 | | | | | (0.08 | ) | | | | 0.08 | | | | | (0.16 | ) | | | | — | | | | | (0.16 | ) | | | | 10.14 | | | | | 0.77 | | | | | 0.48 | | | | | 0.40 | | | | | 1.56 | | | | | 182,022 | | | | | 95 | |
| 2017 | | | | 10.25 | | | | | 0.14 | | | | | (0.03 | ) | | | | 0.11 | | | | | (0.14 | ) | | | | (0.00 | ) | | | | (0.14 | ) | | | | 10.22 | | | | | 1.14 | | | | | 0.51 | | | | | 0.40 | | | | | 1.39 | | | | | 175,454 | | | | | 93 | |
| 2016 | | | | 10.20 | | | | | 0.13 | | | | | 0.07 | | | | | 0.20 | | | | | (0.13 | ) | | | | (0.02 | ) | | | | (0.15 | ) | | | | 10.25 | | | | | 1.94 | | | | | 0.52 | | | | | 0.40 | | | | | 1.18 | | | | | 168,592 | | | | | 39 | |
Short-Term Income Fund | | | | | | | | | | | | | | | | | | | | | | | | | | | | | | | | | | | | | | | | | | | | | | | | | | | | | | | | | | | | | |
| 2020 | | | | 9.47 | | | | | 0.20 | | | | | 0.11 | | | | | 0.31 | | | | | (0.21 | ) | | | | — | | | | | (0.21 | ) | | | | 9.57 | | | | | 3.35 | | | | | 0.45 | | | | | 0.35 | | | | | 2.18 | | | | | 216,283 | | | | | 48 | |
| 2019 | | | | 9.29 | | | | | 0.24 | | | | | 0.18 | | | | | 0.42 | | | | | (0.24 | ) | | | | — | | | | | (0.24 | ) | | | | 9.47 | | | | | 4.59 | | | | | 0.45 | | | | | 0.35 | | | | | 2.56 | | | | | 233,816 | | | | | 53 | |
| 2018 | | | | 9.40 | | | | | 0.20 | | | | | (0.11 | ) | | | | 0.09 | | | | | (0.20 | ) | | | | — | | | | | (0.20 | ) | | | | 9.29 | | | | | 0.92 | | | | | 0.46 | | | | | 0.35 | | | | | 2.06 | | | | | 214,068 | | | | | 48 | |
| 2017 | | | | 9.42 | | | | | 0.17 | | | | | (0.02 | ) | | | | 0.15 | | | | | (0.17 | ) | | | | — | | | | | (0.17 | ) | | | | 9.40 | | | | | 1.60 | | | | | 0.47 | | | | | 0.35 | | | | | 1.76 | | | | | 209,278 | | | | | 53 | |
| 2016 | | | | 9.35 | | | | | 0.11 | | | | | 0.09 | | | | | 0.20 | | | | | (0.13 | ) | | | | — | | | | | (0.13 | ) | | | | 9.42 | | | | | 2.12 | | | | | 0.45 | | | | | 0.35 | | | | | 1.16 | | | | | 234,507 | | | | | 64 | |
Intermediate Tax-Free Fund | | | | | | | | | | | | | | | | | | | | | | | | | | | | | | | | | | | | | | | | | | | | | | | | | | | | | | | | |
| 2020 | | | | 11.59 | | | | | 0.33 | | | | | (0.10 | ) | | | | 0.23 | | | | | (0.33 | ) | | | | — | | | | | (0.33 | ) | | | | 11.49 | | | | | 2.02 | | | | | 0.31 | | | | | 0.31 | | | | | 2.86 | | | | | 1,417,833 | | | | | 52 | |
| 2019 | | | | 11.12 | | | | | 0.33 | | | | | 0.47 | | | | | 0.80 | | | | | (0.33 | ) | | | | — | | | | | (0.33 | ) | | | | 11.59 | | | | | 7.40 | | | | | 0.30 | | | | | 0.30 | | | | | 2.95 | | | | | 1,384,178 | | | | | 64 | |
| 2018 | | | | 11.37 | | | | | 0.32 | | | | | (0.25 | ) | | | | 0.07 | | | | | (0.32 | ) | | | | — | | | | | (0.32 | ) | | | | 11.12 | | | | | 0.68 | | | | | 0.31 | | | | | 0.31 | | | | | 2.88 | | | | | 894,463 | | | | | 45 | |
| 2017 | | | | 11.60 | | | | | 0.31 | | | | | (0.20 | ) | | | | 0.11 | | | | | (0.31 | ) | | | | (0.03 | ) | | | | (0.34 | ) | | | | 11.37 | | | | | 1.11 | | | | | 0.32 | | | | | 0.32 | | | | | 2.79 | | | | | 631,658 | | | | | 44 | |
| 2016 | | | | 11.26 | | | | | 0.28 | | | | | 0.36 | | | | | 0.64 | | | | | (0.28 | ) | | | | (0.02 | ) | | | | (0.30 | ) | | | | 11.60 | | | | | 5.71 | | | | | 0.32 | | | | | 0.32 | | | | | 2.43 | | | | | 601,873 | | | | | 42 | |
(See Notes which are an integral part of the Financial Statements)
109
| | |
| |
| Financial Highlights—Institutional Class of Shares (For a share outstanding throughout each period) |
| | | | | | | | | | | | | | | | | | | | | | | | | | | | | | | | | | | | | | | | | | | | | | | | | | | | | | | | | | | | | | | | | | | | | | |
Period
Ended
August 31, | | Net asset
value,
beginning
of period | | Net
investment
income
(loss) | | Net realized
and unrealized
gain (loss) | | Total from
investment
operations | | Distributions to
shareholders
from net
investment
income | | Distributions to
shareholders from
net realized gain | | Total
distributions | | Net asset
value, end
of period | | Total
return (2)(3) | �� | Ratios to Average Net Assets (1) | | Net assets,
end of period
(000 omitted) | | Portfolio
turnover
rate (3) |
| | Gross
Expenses | | Net
Expenses (4) | | Net
investment
income
(loss) (4) |
Strategic Income Fund | | | | | | | | | | | | | | | | | | | | | | | | | | | | | | | | | | | | | | | | | | | | | | | | | | | | | | | | | | | | | |
| 2020 | | | $ | 9.45 | | | | $ | 0.44 | | | | $ | 0.23 | | | | $ | 0.67 | | | | $ | (0.69 | )(8) | | | $ | — | | | | $ | (0.69 | ) | | | $ | 9.43 | | | | | 7.51 | (10)% | | | | 0.75 | % | | | | 0.55 | % | | | | 4.52 | % | | | $ | 6,313 | | | | | 31 | % |
| 2019 | | | | 9.08 | | | | | 0.43 | | | | | 0.38 | | | | | 0.81 | | | | | (0.44 | ) | | | | — | | | | | (0.44 | ) | | | | 9.45 | | | | | 9.23 | | | | | 0.70 | | | | | 0.55 | | | | | 4.65 | | | | | 9,117 | | | | | 39 | |
| 2018 | | | | 9.44 | | | | | 0.40 | | | | | (0.36 | ) | | | | 0.07 | | | | | (0.43 | ) | | | | — | | | | | (0.43 | ) | | | | 9.08 | | | | | 0.72 | | | | | 0.67 | | | | | 0.55 | | | | | 4.31 | | | | | 12,701 | | | | | 33 | |
| 2017 | | | | 9.42 | | | | | 0.27 | | | | | 0.06 | | | | | 0.33 | | | | | (0.31 | ) | | | | — | | | | | (0.31 | ) | | | | 9.44 | | | | | 3.58 | | | | | 0.65 | | | | | 0.55 | | | | | 2.68 | | | | | 21,550 | | | | | 65 | |
| 2016 | | | | 9.31 | | | | | 0.23 | | | | | 0.17 | | | | | 0.40 | | | | | (0.29 | ) | | | | — | | | | | (0.29 | ) | | | | 9.42 | | | | | 4.32 | | | | | 0.61 | | | | | 0.55 | | | | | 2.53 | | | | | 21,663 | | | | | 13 | |
Corporate Income Fund | | | | | | | | | | | | | | | | | | | | | | | | | | | | | | | | | | | | | | | | | | | | | | | | | | | | | | | | | | | | | |
| 2020 | | | | 13.64 | | | | | 0.44 | | | | | 0.62 | | | | | 1.06 | | | | | (0.44 | ) | | | | — | | | | | (0.44 | ) | | | | 14.26 | | | | | 7.98 | (11) | | | | 0.41 | | | | | 0.41 | | | | | 3.19 | | | | | 298,296 | | | | | 31 | |
| 2019 | | | | 12.78 | | | | | 0.47 | | | | | 0.90 | | | | | 1.37 | | | | | (0.47 | ) | | | | (0.04 | ) | | | | (0.51 | ) | | | | 13.64 | | | | | 11.07 | | | | | 0.42 | | | | | 0.42 | | | | | 3.68 | | | | | 236,955 | | | | | 37 | |
| 2018 | | | | 13.19 | | | | | 0.42 | | | | | (0.39 | ) | | | | 0.03 | | | | | (0.42 | ) | | | | (0.02 | ) | | | | (0.44 | ) | | | | 12.78 | | | | | 0.19 | | | | | 0.45 | | | | | 0.45 | | | | | 3.24 | | | | | 140,395 | | | | | 31 | |
| 2017 | | | | 13.15 | | | | | 0.37 | | | | | 0.15 | | | | | 0.52 | | | | | (0.37 | ) | | | | (0.11 | ) | | | | (0.48 | ) | | | | 13.19 | | | | | 4.07 | | | | | 0.46 | | | | | 0.46 | | | | | 2.84 | | | | | 134,293 | | | | | 44 | |
| 2016 | | | | 12.32 | | | | | 0.46 | | | | | 0.88 | | | | | 1.34 | | | | | (0.46 | ) | | | | (0.05 | ) | | | | (0.51 | ) | | | | 13.15 | | | | | 11.28 | | | | | 0.47 | | | | | 0.47 | | | | | 3.77 | | | | | 129,429 | | | | | 62 | |
Core Plus Bond Fund | | | | | | | | | | | | | | | | | | | | | | | | | | | | | | | | | | | | | | | | | | | | | | | | | | | | | | | | | | | | | |
| 2020 | | | | 12.00 | | | | | 0.35 | | | | | 0.43 | | | | | 0.78 | | | | | (0.37 | )(9) | | | | — | | | | | (0.37 | ) | | | | 12.41 | | | | | 6.67 | (12) | | | | 0.31 | | | | | 0.31 | | | | | 2.94 | | | | | 1,062,276 | | | | | 28 | |
| 2019 | | | | 11.40 | | | | | 0.40 | | | | | 0.60 | | | | | 1.00 | | | | | (0.40 | ) | | | | — | | | | | (0.40 | ) | | | | 12.00 | | | | | 8.99 | | | | | 0.33 | | | | | 0.33 | | | | | 3.48 | | | | | 945,420 | | | | | 51 | |
| 2018 | | | | 11.78 | | | | | 0.34 | | | | | (0.37 | ) | | | | (0.03 | ) | | | | (0.34 | ) | | | | (0.01 | ) | | | | (0.35 | ) | | | | 11.40 | | | | | (0.20 | ) | | | | 0.33 | | | | | 0.33 | | | | | 2.95 | | | | | 981,569 | | | | | 45 | |
| 2017 | | | | 11.89 | | | | | 0.31 | | | | | (0.07 | ) | | | | 0.24 | | | | | (0.31 | ) | | | | (0.04 | ) | | | | (0.35 | ) | | | | 11.78 | | | | | 2.08 | | | | | 0.34 | | | | | 0.34 | | | | | 2.62 | | | | | 975,051 | | | | | 34 | |
| 2016 | | | | 11.42 | | | | | 0.37 | | | | | 0.48 | | | | | 0.85 | | | | | (0.38 | ) | | | | (0.00 | ) | | | | (0.38 | ) | | | | 11.89 | | | | | 7.63 | | | | | 0.34 | | | | | 0.34 | | | | | 3.25 | | | | | 459,228 | | | | | 39 | |
| (1) | Annualized for periods less than one year. |
| (2) | Based on net asset value as of end of period date. |
| (3) | Not annualized for periods less than one year. |
| (4) | The contractual and voluntary expense waivers pursuant to Note 5 of the financial statements are reflected in both the net expense and net investment income ratios. |
| (5) | Calculated using the average shares method. |
| (6) | Redemption fees consisted of per share amounts less than $0.01. |
| (7) | Reflects operations for the period from September 17, 2015 (inception date) to August 31, 2016. |
| (8) | Includes distribution to shareholders for return of capital in the amount of $0.23 per share. |
| (9) | Includes distribution to shareholders for return of capital in the amount of $0.01 per share. |
| (10) | Total return includes litigation proceeds received during the year. Excluding these litigation proceeds, the total return would have been 4.58% |
| (11) | Total return includes litigation proceeds received during the year. Excluding these litigation proceeds, the total return would have been 7.94% |
| (12) | Total return includes litigation proceeds received during the year. Excluding these litigation proceeds, the total return would have been 6.58% |
(See Notes which are an integral part of the Financial Statements)
110
| | |
| |
| Financial Highlights—Premier Class of Shares (For a share outstanding throughout each period) |
| | | | | | | | | | | | | | | | | | | | | | | | | | | | | | | | | | | | | | | | | | | | | | | | | | | | | | | | | | | | | | | | | | | | | | |
Period
Ended
August 31, | | Net asset
value,
beginning
of period | | Net
investment
income
(loss) | | Net realized
and unrealized
gain (loss) | | Total from
investment
operations | | Distributions to
shareholders
from net
investment
income | | Distributions to
shareholders
from net
realized gain | | Total
distributions | | Net asset
value, end
of period | | Total
return (2)(3) | | Ratios to Average Net Assets (1) | | Net assets,
end
of period
(000
omitted) | | Portfolio
turnover
rate (3) |
| | Gross
Expenses | | Net
Expenses (4) | | Net
investment
income
(loss) (4) |
Government Money Market Fund | | | | | | | | | | | | | | | | | | | | | | | | | | | | | | | | | | | | | | | | | | | | | | | | | | | | | | | | | | | | | |
| 2020 | | | $ | 1.00 | | | | $ | 0.01 | | | | $ | (0.00 | ) | | | $ | 0.01 | | | | $ | (0.01 | ) | | | $ | — | | | | $ | (0.01 | ) | | | $ | 1.00 | | | | | 0.86 | % | | | | 0.25 | % | | | | 0.20 | % | | | | 0.75 | % | | | $ | 3,337,318 | | | | | — | % |
| 2019 | | | | 1.00 | | | | | 0.02 | | | | | 0.00 | | | | | 0.02 | | | | | (0.02 | ) | | | | (0.00 | ) | | | | (0.02 | ) | | | | 1.00 | | | | | 2.14 | | | | | 0.25 | | | | | 0.20 | | | | | 2.13 | | | | | 2,384,545 | | | | | — | |
| 2018 | | | | 1.00 | | | | | 0.01 | | | | | 0.00 | | | | | 0.01 | | | | | (0.01 | ) | | | | — | | | | | (0.01 | ) | | | | 1.00 | | | | | 1.30 | | | | | 0.25 | | | | | 0.20 | | | | | 1.30 | | | | | 2,641,069 | | | | | — | |
| 2017 | | | | 1.00 | | | | | 0.00 | | | | | 0.00 | | | | | 0.00 | | | | | (0.00 | ) | | | | (0.00 | ) | | | | (0.00 | ) | | | | 1.00 | | | | | 0.45 | | | | | 0.25 | | | | | 0.20 | | | | | 0.45 | | | | | 2,269,361 | | | | | — | |
| 2016 | | | | 1.00 | | | | | 0.00 | | | | | 0.00 | | | | | 0.00 | | | | | (0.00 | ) | | | | (0.00 | ) | | | | (0.00 | ) | | | | 1.00 | | | | | 0.11 | | | | | 0.28 | | | | | 0.18 | | | | | 0.12 | | | | | 1,967,459 | | | | | — | |
Tax-Free Money Market Fund | | | | | | | | | | | | | | | | | | | | | | | | | | | | | | | | | | | | | | | | | | | | | | | | | | | | | | | | | | | | | |
| 2020 | | | | 1.00 | | | | | 0.01 | | | | | 0.00 | | | | | 0.01 | | | | | (0.01 | ) | | | | — | | | | | (0.01 | ) | | | | 1.00 | | | | | 0.91 | | | | | 0.31 | | | | | 0.20 | | | | | 0.91 | | | | | 325,028 | | | | | — | |
| 2019 | | | | 1.00 | | | | | 0.01 | | | | | 0.00 | | | | | 0.01 | | | | | (0.01 | ) | | | | (0.00 | ) | | | | (0.01 | ) | | | | 1.00 | | | | | 1.46 | | | | | 0.30 | | | | | 0.20 | | | | | 1.44 | | | | | 336,282 | | | | | — | |
| 2018 | | | | 1.00 | | | | | 0.01 | | | | | 0.00 | | | | | 0.01 | | | | | (0.01 | ) | | | | (0.00 | ) | | | | (0.01 | ) | | | | 1.00 | | | | | 1.05 | | | | | 0.31 | | | | | 0.20 | | | | | 1.07 | | | | | 305,424 | | | | | — | |
| 2017 | | | | 1.00 | | | | | 0.01 | | | | | 0.00 | | | | | 0.01 | | | | | (0.01 | ) | | | | (0.00 | ) | | | | (0.01 | ) | | | | 1.00 | | | | | 0.62 | | | | | 0.32 | | | | | 0.20 | | | | | 0.57 | | | | | 238,772 | | | | | — | |
| 2016 | | | | 1.00 | | | | | 0.00 | | | | | 0.00 | | | | | 0.00 | | | | | (0.00 | ) | | | | (0.00 | ) | | | | (0.00 | ) | | | | 1.00 | | | | | 0.17 | | | | | 0.28 | | | | | 0.16 | | | | | 0.13 | | | | | 313,954 | | | | | — | |
Prime Money Market Fund | | | | | | | | | | | | | | | | | | | | | | | | | | | | | | | | | | | | | | | | | | | | | | | | | | | | | | | | | | | | | |
| 2020 | | | | 1.00 | | | | | 0.01 | | | | | — | | | | | 0.01 | | | | | (0.01 | ) | | | | — | | | | | (0.01 | ) | | | | 1.00 | | | | | 1.02 | | | | | 0.25 | | | | | 0.20 | | | | | 0.93 | | | | | 344,297 | | | | | — | |
| 2019 | | | | 1.00 | | | | | 0.02 | | | | | 0.00 | | | | | 0.02 | | | | | (0.02 | ) | | | | (0.00 | ) | | | | (0.02 | ) | | | | 1.00 | | | | | 2.28 | | | | | 0.26 | | | | | 0.20 | | | | | 2.27 | | | | | 248,781 | | | | | — | |
| 2018 | | | | 1.00 | | | | | 0.01 | | | | | 0.00 | | | | | 0.01 | | | | | (0.01 | ) | | | | (0.00 | ) | | | | (0.01 | ) | | | | 1.00 | | | | | 1.50 | | | | | 0.27 | | | | | 0.20 | | | | | 1.52 | | | | | 268,487 | | | | | — | |
| 2017 | | | | 1.00 | | | | | 0.01 | | | | | 0.00 | | | | | 0.01 | | | | | (0.01 | ) | | | | (0.00 | ) | | | | (0.01 | ) | | | | 1.00 | | | | | 0.67 | | | | | 0.28 | | | | | 0.20 | | | | | 0.61 | | | | | 166,338 | | | | | — | |
| 2016 | | | | 1.00 | | | | | 0.00 | | | | | 0.00 | | | | | 0.00 | | | | | (0.00 | ) | | | | (0.00 | ) | | | | (0.00 | ) | | | | 1.00 | | | | | 0.22 | | | | | 0.20 | | | | | 0.20 | | | | | 0.21 | | | | | 668,609 | | | | | — | |
Institutional Prime Money Market Fund | | | | | | | | | | | | | | | | | | | | | | | | | | | | | | | | | | | | | | | | | | | | | | | | | | | | | | | | |
| 2020 | | | | 1.0001 | | | | | 0.0106 | | | | | (0.0002 | ) | | | | 0.0104 | | | | | (0.0106 | ) | | | | — | | | | | (0.0106 | ) | | | | 0.9999 | | | | | 1.04 | | | | | 0.28 | | | | | 0.20 | | | | | 1.11 | | | | | 369,585 | | | | | — | |
| 2019 | | | | 1.0001 | | | | | 0.0229 | | | | | — | | | | | 0.0229 | | | | | (0.0229 | ) | | | | — | | | | | (0.0229 | ) | | | | 1.0001 | | | | | 2.31 | | | | | 0.27 | | | | | 0.20 | | | | | 2.30 | | | | | 560,217 | | | | | — | |
| 2018 | | | | 1.0001 | | | | | 0.0153 | | | | | 0.00 | | | | | 0.0153 | | | | | (0.0153 | ) | | | | (0.00 | ) | | | | (0.0153 | ) | | | | 1.0001 | | | | | 1.54 | | | | | 0.29 | | | | | 0.20 | | | | | 1.55 | | | | | 479,413 | | | | | — | |
| 2017(5) | | | | 1.00 | | | | | 0.0074 | | | | | 0.0001 | | | | | 0.0075 | | | | | (0.0074 | ) | | | | (0.00 | ) | | | | (0.0074 | ) | | | | 1.0001 | | | | | 0.75 | | | | | 0.30 | | | | | 0.20 | | | | | 0.74 | | | | | 400,203 | | | | | — | |
| 2016(6) | | | | 1.00 | | | | | 0.00 | | | | | 0.00 | | | | | 0.00 | | | | | (0.00 | ) | | | | (0.00 | ) | | | | (0.00 | ) | | | | 1.00 | | | | | 0.00 | | | | | 0.29 | | | | | 0.20 | | | | | 0.37 | | | | | 415,218 | | | | | — | |
| (1) | Annualized for periods less than one year. |
| (2) | Based on net asset value as of end of period date. |
| (3) | Not annualized for periods less than one year. |
| (4) | The contractual and voluntary expense waivers pursuant to Note 5 of the financial statements are reflected in both the net expense and net investment income ratios. |
| (5) | Effective October 3, 2016, the BMO Institutional Prime Money Market Fund switched the valuation method of its securities from amortized cost to reflecting changes in market values, thus allowing the Fund’s NAV to “float”. In connection with this change, the Fund’s per share NAV is now calculated to four decimals (e.g., $1.0000). |
| (6) | Reflects operations for the period from June 3, 2016 (inception date) to August 31, 2016. |
(See Notes which are an integral part of the Financial Statements)
111
| | |
| |
| Financial Highlights—Retirement Class R-6 of Shares (For a share outstanding throughout each period) |
| | | | | | | | | | | | | | | | | | | | | | | | | | | | | | | | | | | | | | | | | | | | | | | | | | | | | | | | | | | | | | | | | | | | | | |
Period
Ended
August 31, | | Net asset
value,
beginning
of period | | Net
investment
income
(loss) | | Net realized
and unrealized
gain (loss) | | Total from
investment
operations | | Distributions to
shareholders
from net
investment
income | | Distributions to
shareholders
from net
realized gain | | Total
distributions | | Net asset
value, end
of period | | Total
return (2)(3) | | Ratios to Average Net Assets (1) | | Net assets,
end of period
(000 omitted) | | Portfolio
turnover
rate (3) |
| | Gross
Expenses | | Net
Expenses (4) | | Net
investment
income
(loss) (4) |
Large-Cap Value Fund | | | | | | | | | | | | | | | | | | | | | | | | | | | | | | | | | | | | | | | | | | | | | | | | | | | | | | | | | | | | | |
| 2020 | | | $ | 13.75 | | | | $ | 0.28 | | | | $ | (0.19 | ) | | | $ | 0.09 | | | | $ | (0.29 | ) | | | $ | — | | | | $ | (0.29 | ) | | | $ | 13.55 | | | | | 0.82 | % | | | | 0.45 | % | | | | 0.39 | % | | | | 2.00 | % | | | $ | 33,318 | | | | | 76 | % |
| 2019 | | | | 16.62 | | | | | 0.31 | | | | | (1.46 | ) | | | | (1.15 | ) | | | | (0.32 | ) | | | | (1.40 | ) | | | | (1.72 | ) | | | | 13.75 | | | | | (6.80 | ) | | | | 0.45 | | | | | 0.39 | | | | | 2.15 | | | | | 53,513 | | | | | 67 | |
| 2018 | | | | 15.88 | | | | | (0.48 | ) | | | | 2.94 | | | | | 2.46 | | | | | (0.27 | ) | | | | (1.45 | ) | | | | (1.72 | ) | | | | 16.62 | | | | | 16.07 | | | | | 0.42 | | | | | 0.39 | | | | | 1.97 | | | | | 81,786 | | | | | 54 | |
| 2017(5) | | | | 14.17 | | | | | 0.26 | | | | | 1.81 | | | | | 2.07 | | | | | (0.24 | ) | | | | (0.12 | ) | | | | (0.36 | ) | | | | 15.88 | | | | | 14.75 | | | | | 0.62 | | | | | 0.60 | | | | | 1.64 | | | | | 1,479 | | | | | 62 | |
| 2016(6) | | | | 13.81 | | | | | 0.21 | | | | | 0.30 | | | | | 0.51 | | | | | (0.15 | ) | | | | — | | | | | (0.15 | ) | | | | 14.17 | | | | | 3.77 | | | | | 0.63 | | | | | 0.60 | | | | | 2.27 | | | | | 52 | | | | | 60 | |
Large-Cap Growth Fund | | | | | | | | | | | | | | | | | | | | | | | | | | | | | | | | | | | | | | | | | | | | | | | | | | | | | | | | | | | | | |
| 2020(5) | | | | 18.20 | | | | | 0.12 | | | | | 5.19 | | | | | 5.31 | | | | | (0.16 | ) | | | | (0.79 | ) | | | | (0.95 | ) | | | | 22.56 | | | | | 30.40 | | | | | 0.43 | | | | | 0.39 | | | | | 0.62 | | | | | 268,706 | | | | | 71 | |
| 2019 | | | | 21.21 | | | | | 0.13 | | | | | (0.44 | ) | | | | (0.31 | ) | | | | (0.15 | ) | | | | (2.55 | ) | | | | (2.70 | ) | | | | 18.20 | | | | | (0.22 | ) | | | | 0.43 | | | | | 0.39 | | | | | 0.94 | | | | | 226,978 | | | | | 89 | |
| 2018 | | | | 17.62 | | | | | 0.11 | | | | | 4.52 | | | | | 4.63 | | | | | (0.04 | ) | | | | (1.00 | ) | | | | (1.04 | ) | | | | 21.21 | | | | | 27.36 | | | | | 0.43 | | | | | 0.40 | | | | | 0.87 | | | | | 60,971 | | | | | 57 | |
| 2017 | | | | 15.49 | | | | | 0.09 | | | | | 3.10 | | | | | 3.19 | | | | | (0.16 | ) | | | | (0.90 | ) | | | | (1.06 | ) | | | | 17.62 | | | | | 21.83 | | | | | 0.63 | | | | | 0.60 | | | | | 0.75 | | | | | 2,852 | | | | | 75 | |
| 2016(6) | | | | 14.75 | | | | | 0.07 | | | | | 0.67 | | | | | 0.74 | | | | | — | | | | | — | | | | | — | | | | | 15.49 | | | | | 5.02 | | | | | 0.66 | | | | | 0.60 | | | | | 0.72 | | | | | 53 | | | | | 70 | |
Mid-Cap Value Fund | | | | | | | | | | | | | | | | | | | | | | | | | | | | | | | | | | | | | | | | | | | | | | | | | | | | | | | | | | | | | |
| 2020 | | | | 9.93 | | | | | 0.17 | | | | | (0.91 | ) | | | | (0.74 | ) | | | | (0.17 | ) | | | | — | | | | | (0.17 | ) | | | | 9.02 | | | | | (7.66 | ) | | | | 0.91 | | | | | 0.84 | | | | | 1.72 | | | | | 12,843 | | | | | 47 | |
| 2019 | | | | 12.60 | | | | | 0.17 | | | | | (1.35 | ) | | | | (1.18 | ) | | | | (0.16 | ) | | | | (1.33 | ) | | | | (1.49 | ) | | | | 9.93 | | | | | (9.37 | ) | | | | 0.86 | | | | | 0.84 | | | | | 1.37 | | | | | 13,957 | | | | | 50 | |
| 2018 | | | | 11.90 | | | | | 0.14 | | | | | 1.19 | | | | | 1.33 | | | | | (0.13 | ) | | | | (0.50 | ) | | | | (0.63 | ) | | | | 12.60 | | | | | 11.41 | | | | | 0.83 | | | | | 0.83 | | | | | 1.24 | | | | | 31,173 | | | | | 64 | |
| 2017 | | | | 14.38 | | | | | 0.11 | | | | | 1.26 | | | | | 1.37 | | | | | (0.08 | ) | | | | (3.77 | ) | | | | (3.85 | ) | | | | 11.90 | | | | | 13.31 | | | | | 0.86 | | | | | 0.84 | | | | | 1.05 | | | | | 14,714 | | | | | 139 | |
| 2016 | | | | 15.03 | | | | | 0.18 | | | | | 0.84 | | | | | 1.02 | | | | | (0.20 | ) | | | | (1.47 | ) | | | | (1.67 | ) | | | | 14.38 | | | | | 7.65 | | | | | 0.83 | | | | | 0.83 | | | | | 1.28 | | | | | 11,332 | | | | | 24 | |
Mid-Cap Growth Fund | | | | | | | | | | | | | | | | | | | | | | | | | | | | | | | | | | | | | | | | | | | | | | | | | | | | | | | | | | | | | |
| 2020 | | | | 15.19 | | | | | 0.01 | | | | | 2.73 | | | | | 2.74 | | | | | — | | | | | (1.82 | ) | | | | (1.82 | ) | | | | 16.11 | | | | | 19.49 | | | | | 0.94 | | | | | 0.84 | | | | | 0.03 | | | | | 7,767 | | | | | 56 | |
| 2019 | | | | 18.91 | | | | | 0.02 | | | | | (0.79 | ) | | | | (0.77 | ) | | | | — | | | | | (2.95 | ) | | | | (2.95 | ) | | | | 15.19 | | | | | (2.54 | ) | | | | 0.92 | | | | | 0.84 | | | | | 0.01 | | | | | 7,980 | | | | | 61 | |
| 2018 | | | | 15.46 | | | | | 0.00 | | | | | 4.44 | | | | | 4.44 | | | | | — | | | | | (0.99 | ) | | | | (0.99 | ) | | | | 18.91 | | | | | 29.96 | | | | | 0.88 | | | | | 0.84 | | | | | — | | | | | 23,005 | | | | | 63 | |
| 2017 | | | | 16.83 | | | | | 0.07 | | | | | 2.18 | | | | | 2.25 | | | | | (0.08 | ) | | | | (3.54 | ) | | | | (3.62 | ) | | | | 15.46 | | | | | 17.22 | | | | | 0.97 | | | | | 0.84 | | | | | (0.13 | ) | | | | 592 | | | | | 157 | |
| 2016 | | | | 20.55 | | | | | 0.09 | | | | | (0.93 | ) | | | | (0.84 | ) | | | | — | | | | | (2.88 | ) | | | | (2.88 | ) | | | | 16.83 | | | | | (3.89 | ) | | | | 0.89 | | | | | 0.84 | | | | | 0.49 | | | | | 25 | | | | | 59 | |
Small-Cap Value Fund | | | | | | | | | | | | | | | | | | | | | | | | | | | | | | | | | | | | | | | | | | | | | | | | | | | | | | | | | | | | | |
| 2020(5) | | | | 11.70 | | | | | 0.11 | | | | | (1.06 | ) | | | | (0.95 | ) | | | | (0.11 | ) | | | | (0.05 | ) | | | | (0.16 | ) | | | | 10.59 | | | | | (8.24 | ) | | | | 1.08 | | | | | 0.84 | | | | | 0.92 | | | | | 7,658 | | | | | 82 | |
| 2019 | | | | 15.13 | | | | | 0.12 | | | | | (2.50 | ) | | | | (2.38 | ) | | | | (0.09 | ) | | | | (0.96 | ) | | | | (1.05 | ) | | | | 11.70 | | | | | (15.81 | ) | | | | 1.00 | | | | | 0.84 | | | | | 0.91 | | | | | 8,108 | | | | | 67 | |
| 2018 | | | | 13.53 | | | | | 0.04 | | | | | 2.68 | | | | | 2.72 | | | | | — | | | | | (1.12 | ) | | | | (1.12 | ) | | | | 15.13 | | | | | 20.89 | | | | | 0.97 | | | | | 0.84 | | | | | 0.69 | | | | | 14,260 | | | | | 70 | |
| 2017(5) | | | | 13.42 | | | | | 0.05 | | | | | 1.42 | | | | | 1.47 | | | | | (0.10 | ) | | | | (1.26 | ) | | | | (1.36 | ) | | | | 13.53 | | | | | 12.05 | | | | | 1.09 | | | | | 0.84 | | | | | 0.37 | | | | | 2,653 | | | | | 148 | |
| 2016 | | | | 12.87 | | | | | 0.07 | | | | | 1.00 | | | | | 1.07 | | | | | — | | | | | (0.52 | ) | | | | (0.52 | ) | | | | 13.42 | | | | | 8.61 | | | | | 0.99 | | | | | 0.84 | | | | | 0.60 | | | | | 926 | | | | | 39 | |
Pyrford International Stock Fund | | | | | | | | | | | | | | | | | | | | | | | | | | | | | | | | | | | | | | | | | | | | | | | | | | | |
| 2020(5)(7) | | | | 12.86 | | | | | 0.34 | | | | | 0.50 | | | | | 0.84 | | | | | (0.39 | ) | | | | — | | | | | (0.39 | ) | | | | 13.31 | | | | | 6.54 | | | | | 0.80 | | | | | 0.79 | | | | | 2.65 | | | | | 230,148 | | | | | 28 | |
| 2019(7) | | | | 13.20 | | | | | 0.34 | | | | | (0.31 | ) | | | | 0.03 | | | | | (0.37 | ) | | | | — | | | | | (0.37 | ) | | | | 12.86 | | | | | 0.44 | | | | | 0.81 | | | | | 0.79 | | | | | 2.86 | | | | | 163,829 | | | | | 16 | |
| 2018(7) | | | | 13.22 | | | | | 0.35 | | | | | (0.01 | ) | | | | 0.34 | | | | | (0.36 | ) | | | | — | | | | | (0.36 | ) | | | | 13.20 | | | | | 2.55 | | | | | 0.81 | | | | | 0.79 | | | | | 3.32 | | | | | 155,368 | | | | | 20 | |
| 2017(5)(7) | | | | 12.23 | | | | | 0.40 | | | | | 0.88 | | | | | 1.28 | | | | | (0.29 | ) | | | | — | | | | | (0.29 | ) | | | | 13.22 | | | | | 10.85 | | | | | 0.90 | | | | | 0.81 | | | | | 3.21 | | | | | 48,889 | | | | | 33 | |
| 2016(7) | | | | 11.79 | | | | | 0.20 | | | | | 0.53 | | | | | 0.73 | | | | | (0.29 | ) | | | | — | | | | | (0.29 | ) | | | | 12.23 | | | | | 6.35 | | | | | 0.91 | | | | | 0.84 | | | | | 2.85 | | | | | 16,100 | | | | | 12 | |
| (1) | Annualized for periods less than one year. |
| (2) | Based on net asset value as of end of period date. |
| (3) | Not annualized for periods less than one year. |
| (4) | The contractual and voluntary expense waivers pursuant to Note 5 of the financial statements are reflected in both the net expense and net investment income ratios. |
| (5) | Calculated using the average shares method. |
| (6) | Reflects operations for the period from December 28, 2015 (inception date) to August 31, 2016. |
| (7) | Redemption fees consisted of per share amounts less than $0.01. |
(See Notes which are an integral part of the Financial Statements)
112
August 31, 2020
| | |
| | |
| Notes to Financial Statements | | |
BMO Funds, Inc. (the “Corporation”) is registered under the Investment Company Act of 1940 (the “Act”), as amended, as an open-end management investment company. As of August 31, 2020, the Corporation consisted of 28 portfolios, including 23 diversified portfolios within this annual report (individually referred to as the “Fund,” or collectively as the “Funds”) each with differing share class offerings, and 5 target risk portfolios whose annual report is available under a separate cover. BMO Asset Management Corp. serves as the Funds’ investment adviser (the “Adviser”), a Delaware corporation headquartered in Chicago, Illinois that is a wholly-owned subsidiary of BMO Financial Corp.
| | | | |
| Funds | | Fund Inception
Date | | Investment Objective |
Low Volatility Equity Fund | | September 28, 2012 | | To provide capital appreciation. |
Dividend Income Fund | | December 29, 2011 | | To provide capital appreciation and current income. |
Large-Cap Value Fund | | September 30, 1993 | | To provide capital appreciation. |
Large-Cap Growth Fund | | November 20, 1992 | | To provide capital appreciation. |
Mid-Cap Value Fund | | September 30, 1993 | | To provide capital appreciation. |
Mid-Cap Growth Fund | | September 30, 1993 | | To provide capital appreciation. |
Small-Cap Value Fund | | February 28, 2011 | | To provide capital appreciation. |
Small-Cap Growth Fund | | October 31, 1995 | | To provide capital appreciation. |
Global Low Volatility Equity Fund (1) | | September 30, 2013 | | To provide capital appreciation. |
Disciplined International Equity Fund (1) | | September 17, 2015 | | To provide capital appreciation. |
Pyrford International Stock Fund (1) | | December 29, 2011 | | To provide capital appreciation. |
LGM Emerging Markets Equity Fund (1) | | December 22, 2008 | | To provide capital appreciation. |
Ultra Short Tax-Free Fund | | September 30, 2009 | | To provide current income exempt from federal income tax consistent with preservation of capital. |
Short Tax-Free Fund | | November 29, 2012 | | To provide current income exempt from federal income tax consistent with preservation of capital. |
Short-Term Income Fund | | November 1, 1992 | | To maximize total return consistent with current income. |
Intermediate Tax-Free Fund | | February 1, 1994 | | To provide a high level of current income exempt from federal income tax consistent with preservation of capital. |
Strategic Income Fund | | December 13, 1992 | | To maximize total return consistent with current income. |
Corporate Income Fund (2) | | December 22, 2008 | | To maximize total return consistent with current income. |
Core Plus Bond Fund (3) | | December 22, 2008 | | To maximize total return consistent with current income. |
Government Money Market Fund | | May 17, 2004 | | To provide current income consistent with stability of principal. |
Tax-Free Money Market Fund | | September 22, 2004 | | To provide current income that is exempt from federal income tax and is consistent with stability of principal. |
Prime Money Market Fund | | November 23, 1992 | | To provide current income consistent with stability of principal. |
Institutional Prime Money Market Fund | | June 3, 2016 | | To provide current income consistent with preservation of capital. |
| (1) | Collectively referred to as the “International Funds”. |
| (2) | Formerly BMO TCH Corporate Income Fund. |
| (3) | Formerly BMO TCH Core Plus Bond Fund. |
| 2. | | Significant Accounting Policies |
The Funds are investment companies and follow the accounting and reporting guidance under Financial Accounting Standards Board (“FASB”) Accounting Standards Codification (“ASC”) Topic 946, Financial Services—Investment Companies. The following is a summary of significant accounting policies consistently followed by the Funds in the preparation of their financial statements.
Use of Estimates—The preparation of financial statements in conformity with accounting principles generally accepted in the United States of America (“GAAP”) requires management to make estimates and assumptions that affect the reported amounts of assets and liabilities at the date of the financial statements and the reported amounts of increases and decreases in net assets from operations during the reporting period. Actual results may differ from those estimates.
Investment Valuations—Listed equity securities are valued each trading day at the last sale price or official closing price reported on a national securities exchange. Securities listed on a foreign exchange are valued each trading day at the last closing price on the principal exchange on which they are traded immediately prior to the time for determination of Net Asset Value (“NAV”) or at fair value as discussed below. Equity securities without a reported trade, U.S. government securities, listed corporate bonds, other fixed income and asset-backed securities with maturities of 60 days or more, unlisted securities, and private placement securities are generally valued at the mean of the latest bid and asked price as furnished by an independent pricing service. Fixed income securities that are not exchange traded are valued by an independent pricing service, taking into consideration yield, liquidity, risk, credit quality, coupon, maturity, type of issue, and any other factors or market data the pricing service deems relevant. Fixed income securities with remaining maturities of 60 days or less at the time of purchase, and of sufficient credit quality, are valued at amortized cost, which approximates fair value. Investments in open-end registered investment companies are valued at net asset value.
113
| | |
| | |
| Notes to Financial Statements (continued) | | |
Securities or other assets for which market valuations are not readily available, or are deemed to be inaccurate, are valued at fair value as determined in good faith using methods approved by the Board of Directors (the “Directors”). The Directors have established a Pricing Committee, which is responsible for determinations of fair value, subject to the supervision of the Directors. In determining fair value, the Pricing Committee takes into account all information available and any factors it deems appropriate. Consequently, the price of securities used by a Fund to calculate its NAV may differ from quoted or published prices for the same securities. Fair value pricing involves subjective judgments; it is possible that the fair value determined for a security is materially different than the value that would be realized upon the sale of that security and the differences may be material to the NAV of the Fund or the financial statements presented.
Securities held in certain funds may be listed on foreign exchanges that do not value their listed securities at the same time each Fund calculates its NAV. Most foreign markets close well before each Fund values its securities, generally 3:00 p.m. (Central Time). The earlier close of these foreign markets gives rise to the possibility that significant events, including broad market moves, may have occurred in the interim.
The Pricing Committee may determine that a security needs to be fair valued if, among other things, it believes the value of the security might have been materially affected by events occurring after the close of the market in which the security was principally traded, but before the time for determination of the NAV (“a subsequent event”). A subsequent event might include a company-specific development (for example, announcement of a merger that is made after the close of the foreign market), a development that might affect an entire market or region (for example, weather related events) or a potentially global development (such as a terrorist attack that may be expected to have an effect on investor expectations worldwide). The Funds have retained an independent fair value pricing service to assist in fair valuing foreign securities. The service utilizes statistical data based on historical performance of securities, markets, and other data in developing factors used to estimate a fair value.
Investment Income, Expenses, and Distributions—Interest income and expenses are accrued daily. Dividend income, realized gain distributions from underlying funds, and distributions to shareholders are recorded on the ex-dividend date except in the case of certain foreign securities, for which dividends are recorded as soon after the ex-dividend date as the Funds’ information agents become aware of such dividends. Non-cash dividends included in dividend income, if any, are recorded at fair value. Paid-in-kind interest included in interest income, if any, is accrued daily.
The Funds offer multiple classes of shares which differ in their respective distribution, administration, and service fees. All shareholders bear the common expenses of the Funds. Dividends are declared separately for each class. No class has preferential dividend rights; differences in per share dividend rates are generally due to differences in class-specific expenses. Income, non-class specific expenses, and realized and unrealized gains and losses are allocated daily to each class of shares based on the value of total shares outstanding of each class without distinction between share classes.
Expenses attributable to a particular class of shares, such as shareholder servicing fees, are allocated directly to that class.
Foreign Currency Translation—The accounting records of the Funds are maintained in U.S. dollars. All assets and liabilities denominated in foreign currencies are translated into U.S. dollars based on the rate of exchange of such currencies against U.S. dollars on the date of valuation. Purchases and sales of securities, income, and expenses are translated at the rate of exchange quoted on the respective date that such transactions are recorded. The effect of changes in foreign exchange rates on realized and unrealized gains or losses on securities is reflected as a component of such gains or losses.
Reported net realized foreign exchange gains or losses arise from sales of portfolio securities, sales and maturities of short-term securities, sales of foreign currencies, currency gains or losses realized between the trade and settlement dates on securities transactions, and the difference between the amounts of dividends, interest, and foreign withholding taxes recorded on the Funds’ books and the U.S. dollar equivalent of the amounts actually received or paid. Net unrealized foreign exchange gains and losses arise from changes in the value of assets and liabilities other than investments in securities at each reporting period, resulting from changes in the exchange rate.
Premium and Discount Amortization/Paydown Gains and Losses—Premiums and discounts on fixed income securities are amortized/accreted for tax and financial statement purposes. Gains and losses realized on principal payments of mortgage-backed and asset-backed securities (paydown gains and losses) are classified as part of interest income.
Repurchase Agreements—The Funds’ policy requires the custodian bank to take possession, to have legally segregated in the Federal Reserve Book Entry System, or to have segregated within the custodian bank’s vault, all securities held as collateral under repurchase agreement transactions. Additionally, procedures have been established by the Funds to monitor, on a daily basis, the market value of each repurchase agreement’s collateral to ensure that the value of collateral at least equals the repurchase price to be paid under the repurchase agreement, including accrued interest.
The Funds will enter into repurchase agreements only with banks and other recognized financial institutions, such as broker-dealers, which are deemed by the Adviser (or sub-advisers, as applicable) to be creditworthy pursuant to the guidelines and/ or standards reviewed or established by the Directors. Risks may arise from the potential inability of counterparties to honor the terms of the repurchase agreement. Accordingly, the Funds could receive less than the repurchase price on the sale of collateral securities.
Restricted Securities—Restricted securities are securities that may be resold only upon registration under federal securities laws or in transactions exempt from such registration. In some cases, the issuer of restricted securities has agreed to register such securities for resale at the issuer’s expense either upon demand by the Funds or in connection with another registered offering of the securities. Many restricted securities may be resold in the secondary market in transactions exempt from registration. Such restricted securities may be determined to be liquid under criteria established by the Directors.
114
When-Issued and Delayed Delivery Transactions—The Funds may engage in when-issued or delayed delivery transactions. The Funds record when-issued securities on the trade date and maintain security positions such that sufficient liquid assets will be available to make payment for the commitment to purchase securities. Securities purchased on a when-issued or delayed delivery basis are marked-to-market daily and begin earning interest on the settlement date. Losses may occur on these transactions due to changes in market conditions or the failure of counterparties to perform under the contract.
Money Market Funds—Rule 2a-7 under the Act effectively includes three categories of money market funds: “Government,” “Retail,” and “Institutional.” The BMO Government Money Market Fund operates as a Government money market fund. The BMO Tax-Free Money Market Fund and BMO Prime Money Market Fund operate as Retail money market funds. The BMO Institutional Prime Money Market Fund operates as an Institutional money market fund. Each money market fund is operated to comply with the various requirements of Rule 2a-7.
As a Government money market fund, the BMO Government Money Market Fund invests at least 99.5% of its total assets in U.S. government securities, cash, and/or repurchase agreements that are collateralized fully (as defined in Rule 2a-7 under the Act). As Retail money market funds, BMO Tax-Free Money Market Fund and BMO Prime Money Market Fund have adopted policies and procedures reasonably designed to limit investments in the Fund to accounts beneficially owned by natural persons. Each Government and Retail money market fund uses the amortized cost method of valuing portfolio instruments, which approximates fair value, and seeks to transact shares at a stable $1.00 NAV per share.
As an Institutional money market fund, BMO Institutional Prime Money Market Fund operates with a floating NAV reflecting the current market-based values of its portfolio securities, except as otherwise generally permitted for securities with remaining maturities of 60 days or less, which generally are valued at amortized cost. BMO Institutional Prime Money Market Fund also is required to round its NAV to four decimal places (e.g., $1.0000).
The Institutional and Retail money market funds have adopted policies and procedures imposing a fee upon the sale of shares (“Liquidity Fee”) or temporarily suspending the ability to sell shares if the Fund’s liquidity falls below designated thresholds (“Redemption Gate”). The Board of Directors has chosen not to subject the BMO Government Money Market Fund to a Liquidity Fee or a Redemption Gate, and may do so in the future only with advance notice to shareholders.
Redemption Fees—The International Funds impose a 2% redemption fee on shares held for 30 days or less. All redemption fees are recorded by the International Funds as paid-in-capital.
Securities Lending—Certain Funds participate in one of two securities lending programs, providing for the lending of corporate bonds, equity, and government securities to qualified brokers, in exchange for the opportunity to earn additional income for participating. State Street Bank & Trust Company and BMO Harris Bank N.A. serve as the securities lending agents for the International Funds and non-International Funds participating in the programs, respectively. The Funds receive cash as collateral in return for the securities and record a corresponding payable for collateral due to the respective broker. The amount of cash collateral received is maintained at a minimum level of 100% of the prior day’s market value on securities and accrued interest loaned. Collateral is reinvested in short-term securities including overnight repurchase agreements, commercial paper, master notes, floating rate corporate notes (with at least quarterly reset rates), and money market funds. The valuation of these collateral securities is discussed in “Investment Valuations” above. When a Fund lends its portfolio securities, it is subject to the risk that it may not be able to get the portfolio securities back from the borrower on a timely basis, in which case the Fund may lose certain investment opportunities. A Fund also is subject to the risks associated with the investments of cash collateral received from the borrower.
115
| | |
| | |
| Notes to Financial Statements (continued) | | |
Cash collateral received as part of the International Funds’ securities lending program was invested in the following security as of August 31, 2020:
| | | | |
Description | | Value | |
BMO Institutional Prime Money Market Fund – Premier Class, 0.130% | | $ | 18,697,090 | |
Cash collateral received as part of the non-International Funds’ securities lending program was jointly pooled and invested in the following securities as of August 31, 2020 (1):
| | | | |
Description | | Value | |
Atlantic Asset Securitization LLC, 0.150%, 9/23/2020 (2) | | $ | 4,999,542 | |
Atlantic Asset Securitization LLC, 0.330%, 12/08/2020 (2) | | | 2,997,305 | |
Bank of Nova Scotia, 0.297% (LIBOR 3 Month + 40 Basis point), 5/04/2021 (3) | | | 3,509,165 | |
Bank of Nova Scotia, 0.450%, 9/03/2020 (2) | | | 3,750,024 | |
Bank of Nova Scotia, 0.475% (LIBOR 3 Month + 9 Basis point), 2/16/2021 (3) | | | 3,601,813 | |
BlackRock Liquidity Funds FedFund Portfolio, 0.130%, 9/01/2020 (2) | | | 60,888,143 | |
BMO Government Money Market Fund—Premier Class, 0.010%, 9/01/2020 (4) | | | 9,000,000 | |
BMO Institutional Prime Money Market Fund—Premier Class, 0.130%, 9/01/2020 (4) | | | 140,033,000 | |
Canadian Imperial Bank of Commerce, 0.320%, 3/02/2021 (2) | | | 3,151,663 | |
Canadian Imperial Bank of Commerce/New York NY, 0.490%, 10/09/2020 (2) | | | 3,500,935 | |
Collateralized Commercial Paper Co. LLC, 0.250%, 2/08/2021 (2) | | | 3,246,389 | |
Collateralized Commercial Paper Co. LLC, 0.306% (LIBOR 3 Month + 5 Basis point), 10/23/2020 (3) | | | 3,500,000 | |
Collateralized Commercial Paper Co. LLC, 0.381%, 2/09/2021 (2) | | | 3,494,052 | |
Collateralized Commercial Paper Co. LLC, 0.401%, 12/01/2020 (2) | | | 3,496,461 | |
Credit Suisse AG-New York Branch, 0.501% (LIBOR 3 Month + 25 Basis point), 11/02/2020 (3) | | | 3,751,587 | |
Credit Suisse AG-New York Branch, 0.623% (LIBOR 3 Month + 7 Basis point), 2/03/2021 (3) | | | 3,751,582 | |
Exxon Corp., 0.410%, 9/22/2020 (2) | | | 3,499,163 | |
Glencove Funding DAC, 0.213% (LIBOR 1 Week + 10 Basis point), 2/19/2021 (3) | | | 5,750,000 | |
Gotham Funding Corp, 0.170%, 11/23/2020 (2) | | | 2,598,981 | |
LMA Americas LLC, 0.320%, 9/10/2020 (2) | | | 3,499,720 | |
LMA Americas LLC, 0.350%, 12/07/2020 (2) | | | 3,496,699 | |
LMA Americas LLC, 0.401%, 1/15/2021 (2) | | | 3,494,711 | |
Manhattan Asset FDG Co LLC, 0.140%, 9/24/2020 (2) | | | 2,654,763 | |
Manhattan Asset FDG Co LLC, 0.160%, 9/25/2020 (2) | | | 1,999,787 | |
Manhattan Asset FDG Co LLC, 0.200%, 9/10/2020 (2) | | | 3,499,825 | |
| | | | |
Description | | Value | |
Mizuho Bank Ltd., 0.255% (LIBOR 1 Month + 10 Basis point), 9/08/2020 (3) | | $ | 3,500,088 | |
Nordea Bank, 0.347% (LIBOR 3 Month + 10 Basis point), 5/21/2021 (3) | | | 3,402,688 | |
Old Line Funding LLC, 0.200%, 2/09/2021 (2) | | | 2,497,764 | |
Old Line Funding LLC, 0.310%, 10/30/2020 (2) | | | 4,397,765 | |
Old Line Funding LLC, 0.331%, 3/22/2021 (2) | | | 2,495,371 | |
Regency Markets No 1 LLC, 0.150%, 9/15/2020 (2) | | | 2,849,834 | |
Regency Markets No 1 LLC, 0.160%, 9/09/2020 (2) | | | 1,999,929 | |
Regency Markets No 1 LLC, 0.160%, 9/25/2020 (2) | | | 2,999,680 | |
Royal Bank of Canada, 0.428% (LIBOR 3 Month + 12 Basis point), 6/18/2021 (3) | | | 3,402,427 | |
Sheffield Receivables Co. LLC, 0.400%, 11/02/2020 (2) | | | 3,497,589 | |
Sheffield Receivables Co. LLC, 0.400%, 11/20/2020 (2) | | | 3,496,889 | |
Sheffield Receivables Co. LLC, 0.410%, 11/17/2020 (2) | | | 3,496,931 | |
Sheffield Receivables Co. LLC, 0.450%, 12/02/2020 (2) | | | 3,750,000 | |
Skandinaviska Enskilda Banken AB, 0.329% (LIBOR 3 Month + 7 Basis point), 10/09/2020 (3) | | | 5,000,513 | |
Skandinaviska Enskilda Banken AB, 0.390% (LIBOR 3 Month + 11 Basis point), 1/04/2021 (3) | | | 3,501,325 | |
Skandinaviska Enskilda Banken AB, 0.452% (LIBOR 3 Month + 15 Basis point), 10/02/2020 (3) | | | 4,750,672 | |
Starbird Funding Corp., 0.260%, 11/09/2020 (2) | | | 3,498,256 | |
Sumitomo Mitsui Banking Corp., 0.384% (LIBOR 3 Month + 10 Basis point), 1/06/2021 (3) | | | 3,501,093 | |
Svenska Handelsbanken AB, 0.356% (LIBOR 1 Month + 25 Basis point), 1/04/2021 (3) | | | 3,502,604 | |
Swedish Export Credit Corp., 0.270%, 12/01/2020 (2) | | | 3,997,270 | |
Thunder Bay Funding LLC, 0.270%, 11/20/2020 (2) | | | 3,298,020 | |
Toronto-Dominion Bank, 0.428% (LIBOR 3 Month + 11 Basis point), 6/10/2021 (3) | | | 3,501,349 | |
Toronto-Dominion Bank, 0.490%, 9/30/2020 (2) | | | 3,751,095 | |
Toyota Motor Credit Corp., 0.303% (LIBOR 3 Month + 5 Basis point), 11/13/2020 (3) | | | 3,750,000 | |
Versailles Commercial Paper LLC, 0.280%, 9/02/2020 (2) | | | 3,499,973 | |
Victory Receivables Corp., 0.200%, 9/08/2020 (2) | | | 3,499,864 | |
Victory Receivables Corp., 0.210%, 9/10/2020 (2) | | | 3,499,816 | |
Victory Receivables Corp., 0.350%, 11/04/2020 (2) | | | 3,497,822 | |
Other | | | (20,049 | ) |
| | | | |
Total | | $ | 384,981,888 | |
| | | | |
| | (1) | The collateral pool is managed by the fixed income group within the Adviser. Each Fund owns a pro-rata interest in the collateral pool determined by the value of securities on loan for such Fund. |
| | (2) | Each issue shows the rate of the discount at the time of purchase. |
| | (3) | Denotes a floating rate security. Floating rate securities are securities whose yields vary with a designated market index or market rate. These securities are shown at their current rates as of August 31, 2020. |
| | (4) | Denotes an investment in an affiliated entity. Please refer to Note 5, subsection Investments in Affiliated Issuers, in the Notes to Financial Statements. |
Federal Income Taxes—The policies and procedures of the Funds require compliance with Subchapter M of the Internal Revenue Code of 1986 (the “Code”), as amended, and distribution to shareholders each year of substantially all of their income. Accordingly, no provision for federal tax are necessary. Withholding taxes on foreign dividends and unrealized appreciation on investments have been provided for in accordance with the applicable country’s tax rules and rates.
Commitments and Contingencies—In the normal course of business, the Corporation enters into contracts that provide general indemnifications to other parties. The Corporation’s maximum exposure under these arrangements is unknown as this would involve future claims that may be made against the Corporation that have not yet occurred. However, the Corporation has not had prior claims or losses pursuant to these contracts and expects the risk of loss to be remote.
116
Other—Investment transactions are accounted for on a trade date basis. Net realized gains and losses on securities are computed on the basis of specific security lot identification.
| 3. | | Fair Value Measurement |
Fair Valuation Measurement defines fair value, establishes a framework for measuring fair value in accordance with GAAP, and requires disclosure about fair value measurements. It establishes a fair value hierarchy that distinguishes between (1) market participant assumptions developed based on market data obtained from sources independent of the reporting issuer (observable inputs), and (2) the reporting issuer’s own assumptions about market participant assumptions developed based on the best information available in the circumstances (unobservable inputs). It also provides guidance on determining when a significant decrease occurs in the trade volume and/or frequency for an asset, when a transaction is not orderly, and how that information must be incorporated into fair value measurement.
In August 2018, the FASB issued Accounting Standards Update 2018-13, Fair Value Measurement (Topic 820) — Disclosures Framework — Changes to Disclosure Requirements of Fair Value Measurement (“ASU 2018-13”) which introduces new fair value disclosure requirements as well as eliminates and modifies certain existing fair value disclosure requirements. ASU 2018-13 would be effective for fiscal years beginning after December 15, 2019 and for interim periods within those fiscal years; however, management has elected to early adopt ASU 2018-13 effective with the current reporting period as permitted by the standard. The impact of the Funds’ adoption was limited to changes in the Funds’ financial statement disclosures regarding fair value, primarily those disclosures related to transfers between levels of the fair value hierarchy and disclosure of the range and weighted average used to develop significant unobservable inputs for Level 3 fair value measurements, when applicable.
Various inputs are used in determining the value of the Funds’ investments. The inputs or methodology used for valuing securities are not necessarily an indication of the risk associated with investing in those securities. These inputs are summarized in the three broad levels listed below:
Level 1—quoted prices in active markets for identical securities. An active market for the security is a market in which transactions occur with sufficient frequency and volume to provide pricing information on an ongoing basis. Common and preferred stocks, options and futures contracts, and U.S. registered mutual funds are generally categorized as Level 1.
Level 2—other significant observable inputs (including quoted prices for similar securities, interest rates, prepayment speeds, credit risk, etc.). Fixed income securities, repurchase agreements and securities valued by an independent fair value pricing service are generally categorized as Level 2.
Level 3—significant unobservable inputs, including management’s own assumptions in determining the fair value of investments.
For the period ended August 31, 2020 the Funds had no investments in private investment funds, and there were no investments excluded from the fair value hierarchy. The Funds did not hold any Level 3 securities as of August 31, 2020.
The following is a summary of the inputs used, as of August 31, 2020, in valuing the Funds’ assets:
| | | | | | | | | | | | | | | | |
| | | Low Volatility Equity Fund | | | | |
| | | Level 1 | | | Level 2 | | | Level 3 | | | Total | |
Common Stocks(1) | | $ | 254,246,368 | | | $ | — | | | $ | — | | | $ | 254,246,368 | |
Short-Term Investments | | | 4,254,460 | | | | 21,952,763 | | | | — | | | | 26,207,223 | |
| | | | | | | | | | | | | | | | |
Total | | $ | 258,500,828 | | | $ | 21,952,763 | | | $ | — | | | $ | 280,453,591 | |
| | | | | | | | | | | | | | | | |
| | |
| | | Dividend Income Fund | | | | |
| | | Level 1 | | | Level 2 | | | Level 3 | | | Total | |
Common Stocks(1) | | $ | 239,011,177 | | | $ | — | | | $ | — | | | $ | 239,011,177 | |
Short-Term Investments | | | 5,160,131 | | | | 45,096,198 | | | | — | | | | 50,256,329 | |
| | | | | | | | | | | | | | | | |
Total | | $ | 244,171,308 | | | $ | 45,096,198 | | | $ | — | | | $ | 289,267,506 | |
| | | | | | | | | | | | | | | | |
| | |
| | | Large-Cap Value Fund | | | | |
| | | Level 1 | | | Level 2 | | | Level 3 | | | Total | |
Common Stocks(1) | | $ | 256,813,408 | | | $ | — | | | $ | — | | | $ | 256,813,408 | |
Short-Term Investments | | | 3,589,882 | | | | 57,069,363 | | | | — | | | | 60,659,245 | |
| | | | | | | | | | | | | | | | |
Total | | $ | 260,403,290 | | | $ | 57,069,363 | | | $ | — | | | $ | 317,472,653 | |
| | | | | | | | | | | | | | | | |
| | |
| | | Large-Cap Growth Fund | | | | |
| | | Level 1 | | | Level 2 | | | Level 3 | | | Total | |
Common Stocks(1) | | $ | 455,648,400 | | | $ | — | | | $ | — | | | $ | 455,648,400 | |
Short-Term Investments | | | 2,951,726 | | | | 46,454,500 | | | | — | | | | 49,406,226 | |
| | | | | | | | | | | | | | | | |
Total | | $ | 458,600,126 | | | $ | 46,454,500 | | | $ | — | | | $ | 505,054,626 | |
| | | | | | | | | | | | | | | | |
| | | | | | | | | | | | | | | | |
| | | Mid-Cap Value Fund | | | | |
| | | Level 1 | | | Level 2 | | | Level 3 | | | Total | |
Common Stocks(1) | | $ | 104,746,081 | | | $ | — | | | $ | — | | | $ | 104,746,081 | |
Short-Term Investments | | | 1,403,585 | | | | 9,514,603 | | | | — | | | | 10,918,188 | |
| | | | | | | | | | | | | | | | |
Total | | $ | 106,149,666 | | | $ | 9,514,603 | | | $ | — | | | $ | 115,664,269 | |
| | | | | | | | | | | | | | | | |
| | |
| | | Mid-Cap Growth Fund | | | | |
| | | Level 1 | | | Level 2 | | | Level 3 | | | Total | |
Common Stocks(1) | | $ | 98,390,375 | | | $ | — | | | $ | — | | | $ | 98,390,375 | |
Short-Term Investments | | | 1,582,909 | | | | 13,636,803 | | | | — | | | | 15,219,712 | |
| | | | | | | | | | | | | | | | |
Total | | $ | 99,973,284 | | | $ | 13,636,803 | | | $ | — | | | $ | 113,610,087 | |
| | | | | | | | | | | | | | | | |
| | |
| | | Small-Cap Value Fund | | | | |
| | | Level 1 | | | Level 2 | | | Level 3 | | | Total | |
Common Stocks(1) | | $ | 48,983,472 | | | $ | — | | | $ | — | | | $ | 48,983,472 | |
Short-Term Investments | | | 1,651,709 | | | | 6,858,721 | | | | — | | | | 8,510,430 | |
| | | | | | | | | | | | | | | | |
Total | | $ | 50,635,181 | | | $ | 6,858,721 | | | $ | — | | | $ | 57,493,902 | |
| | | | | | | | | | | | | | | | |
| | |
| | | Small-Cap Growth Fund | | | | |
| | | Level 1 | | | Level 2 | | | Level 3 | | | Total | |
Common Stocks(1) | | $ | 95,226,964 | | | $ | — | | | $ | — | | | $ | 95,226,964 | |
Short-Term Investments | | | 1,915,098 | | | | 21,305,052 | | | | — | | | | 23,220,150 | |
| | | | | | | | | | | | | | | | |
Total | | $ | 97,142,062 | | | $ | 21,305,052 | | | $ | — | | | $ | 118,447,114 | |
| | | | | | | | | | | | | | | | |
117
| | |
| | |
| Notes to Financial Statements (continued) | | |
| | | | | | | | | | | | | | | | |
| | | Global Low Volatility
Equity Fund | | | | |
| | | Level 1 | | | Level 2 | | | Level 3 | | | Total | |
Common Stocks | | | | | | | | | | | | | | | | |
Belgium | | $ | 109,696 | | | $ | — | | | $ | — | | | $ | 109,696 | |
Bermuda | | | 74,281 | | | | — | | | | — | | | | 74,281 | |
Canada | | | 1,257,743 | | | | — | | | | — | | | | 1,257,743 | |
Cayman Islands | | | 246,419 | | | | — | | | | — | | | | 246,419 | |
China | | | 99,563 | | | | — | | | | — | | | | 99,563 | |
Czech Republic | | | 236,292 | | | | — | | | | — | | | | 236,292 | |
France | | | 101,381 | | | | — | | | | — | | | | 101,381 | |
Germany | | | 35,489 | | | | — | | | | — | | | | 35,489 | |
Hong Kong | | | 555,193 | | | | — | | | | — | | | | 555,193 | |
Hungary | | | 35,089 | | | | — | | | | — | | | | 35,089 | |
Israel | | | 191,680 | | | | — | | | | — | | | | 191,680 | |
Italy | | | 579,906 | | | | — | | | | — | | | | 579,906 | |
Japan | | | 2,152,691 | | | | — | | | | — | | | | 2,152,691 | |
Mexico | | | 148,550 | | | | — | | | | — | | | | 148,550 | |
Netherlands | | | 494,570 | | | | — | | | | — | | | | 494,570 | |
New Zealand | | | 461,472 | | | | — | | | | — | | | | 461,472 | |
Philippines | | | 362,429 | | | | — | | | | — | | | | 362,429 | |
Portugal | | | 46,664 | | | | — | | | | — | | | | 46,664 | |
Singapore | | | 440,302 | | | | — | | | | — | | | | 440,302 | |
South Africa | | | 274,060 | | | | — | | | | — | | | | 274,060 | |
Spain | | | 107,149 | | | | — | | | | — | | | | 107,149 | |
Switzerland | | | 682,474 | | | | — | | | | — | | | | 682,474 | |
Taiwan | | | 603,081 | | | | — | | | | — | | | | 603,081 | |
United Kingdom | | | 217,966 | | | | — | | | | — | | | | 217,966 | |
United States | | | 4,092,491 | | | | — | | | | — | | | | 4,092,491 | |
Short-Term Investments | | | 602,477 | | | | — | | | | — | | | | 602,477 | |
| | | | | | | | | | | | | | | | |
Total | | $ | 14,209,108 | | | $ | — | | | $ | — | | | $ | 14,209,108 | |
| | | | | | | | | | | | | | | | |
| | |
| | | Disciplined International
Equity Fund | | | | |
| | | Level 1 | | | Level 2 | | | Level 3 | | | Total | |
Common Stocks | | | | | | | | | | | | | | | | |
Australia | | $ | 3,578,162 | | | $ | — | | | $ | — | | | $ | 3,578,162 | |
China | | | 597,391 | | | | — | | | | — | | | | 597,391 | |
Denmark | | | 1,090,427 | | | | — | | | | — | | | | 1,090,427 | |
Finland | | | 663,177 | | | | — | | | | — | | | | 663,177 | |
France | | | 2,988,181 | | | | — | | | | — | | | | 2,988,181 | |
Germany | | | 1,407,682 | | | | — | | | | — | | | | 1,407,682 | |
Hong Kong | | | 825,061 | | | | — | | | | — | | | | 825,061 | |
Israel | | | 169,382 | | | | — | | | | — | | | | 169,382 | |
Italy | | | 1,989,708 | | | | — | | | | — | | | | 1,989,708 | |
Japan | | | 9,929,826 | | | | — | | | | — | | | | 9,929,826 | |
Netherlands | | | 2,152,617 | | | | — | | | | — | | | | 2,152,617 | |
New Zealand | | | 347,138 | | | | — | | | | — | | | | 347,138 | |
Norway | | | 423,240 | | | | — | | | | — | | | | 423,240 | |
Singapore | | | 1,398,990 | | | | — | | | | — | | | | 1,398,990 | |
Spain | | | 742,591 | | | | — | | | | — | | | | 742,591 | |
Sweden | | | 649,710 | | | | — | | | | — | | | | 649,710 | |
Switzerland | | | 5,198,940 | | | | — | | | | — | | | | 5,198,940 | |
United Kingdom | | | 3,679,746 | | | | — | | | | — | | | | 3,679,746 | |
Short-Term Investments | | | 1,417,393 | | | | — | | | | — | | | | 1,417,393 | |
| | | | | | | | | | | | | | | | |
Total | | $ | 39,249,362 | | | $ | — | | | $ | — | | | $ | 39,249,362 | |
| | | | | | | | | | | | | | | | |
| | | | | | | | | | | | | | | | |
| | | Pyrford International Stock Fund | | | | |
| | | Level 1 | | | Level 2 | | | Level 3 | | | Total | |
Common Stocks | | | | | | | | | | | | | | | | |
Australia | | $ | 78,300,524 | | | $ | — | | | $ | — | | | $ | 78,300,524 | |
Finland | | | 20,615,109 | | | | — | | | | — | | | | 20,615,109 | |
France | | | 50,901,142 | | | | — | | | | — | | | | 50,901,142 | |
Germany | | | 51,669,589 | | | | — | | | | — | | | | 51,669,589 | |
Hong Kong | | | 29,429,015 | | | | — | | | | — | | | | 29,429,015 | |
Indonesia | | | 6,574,864 | | | | — | | | | — | | | | 6,574,864 | |
Japan | | | 90,269,422 | | | | — | | | | — | | | | 90,269,422 | |
Malaysia | | | 17,110,247 | | | | — | | | | — | | | | 17,110,247 | |
Netherlands | | | 23,468,876 | | | | — | | | | — | | | | 23,468,876 | |
Norway | | | 12,816,409 | | | | — | | | | — | | | | 12,816,409 | |
Singapore | | | 32,860,875 | | | | — | | | | — | | | | 32,860,875 | |
Sweden | | | 10,007,919 | | | | — | | | | — | | | | 10,007,919 | |
Switzerland | | | 76,504,295 | | | | — | | | | — | | | | 76,504,295 | |
Taiwan | | | 26,321,114 | | | | — | | | | — | | | | 26,321,114 | |
United Kingdom | | | 117,128,942 | | | | — | | | | — | | | | 117,128,942 | |
Preferred Stocks | | | | | | | | | | | | | | | | |
Germany | | | 12,070,957 | | | | — | | | | — | | | | 12,070,957 | |
Short-Term Investments | | | 48,529,250 | | | | — | | | | — | | | | 48,529,250 | |
| | | | | | | | | | | | | | | | |
Total | | $ | 704,578,549 | | | $ | — | | | $ | — | | | $ | 704,578,549 | |
| | | | | | | | | | | | | | | | |
| | |
| | | LGM Emerging Markets Equity Fund | | | | |
| | | Level 1 | | | Level 2 | | | Level 3 | | | Total | |
Common Stocks | | | | | | | | | | | | | | | | |
Brazil | | $ | 6,206,100 | | | $ | — | | | $ | — | | | $ | 6,206,100 | |
Cayman Islands | | | 11,328,450 | | | | — | | | | — | | | | 11,328,450 | |
China | | | 33,386,581 | | | | — | | | | — | | | | 33,386,581 | |
Egypt | | | 4,110,417 | | | | — | | | | — | | | | 4,110,417 | |
Hong Kong | | | 23,380,708 | | | | — | | | | — | | | | 23,380,708 | |
India | | | 57,596,999 | | | | — | | | | — | | | | 57,596,999 | |
Indonesia | | | 9,741,987 | | | | — | | | | — | | | | 9,741,987 | |
Jersey | | | 7,683,457 | | | | — | | | | — | | | | 7,683,457 | |
Mexico | | | 9,866,222 | | | | — | | | | — | | | | 9,866,222 | |
Netherlands | | | 6,668,865 | | | | — | | | | — | | | | 6,668,865 | |
Nigeria | | | 3,198,388 | | | | — | | | | — | | | | 3,198,388 | |
Portugal | | | 4,803,614 | | | | — | | | | — | | | | 4,803,614 | |
Russia | | | 13,240,459 | | | | — | | | | — | | | | 13,240,459 | |
South Africa | | | 15,538,132 | | | | — | | | | — | | | | 15,538,132 | |
Taiwan | | | 16,788,763 | | | | — | | | | — | | | | 16,788,763 | |
United Kingdom | | | 6,893,870 | | | | — | | | | — | | | | 6,893,870 | |
United States | | | 5,603,215 | | | | — | | | | — | | | | 5,603,215 | |
Vietnam | | | 7,145,714 | | | | — | | | | — | | | | 7,145,714 | |
Common Stock Units | | | 5,650,572 | | | | — | | | | — | | | | 5,650,572 | |
Short-Term Investments | | | 5,950,565 | | | | — | | | | — | | | | 5,950,565 | |
| | | | | | | | | | | | | | | | |
Total | | $ | 254,783,078 | | | $ | — | | | $ | — | | | $ | 254,783,078 | |
| | | | | | | | | | | | | | | | |
| | |
| | | Ultra Short Tax-Free Fund | | | | |
| | | Level 1 | | | Level 2 | | | Level 3 | | | Total | |
Municipals | | $ | — | | | $ | 506,743,541 | | | $ | — | | | $ | 506,743,541 | |
Mutual Funds | | | 20,320,000 | | | | — | | | | — | | | | 20,320,000 | |
Repurchase Agreements | | | — | | | | 6,725,349 | | | | — | | | | 6,725,349 | |
| | | | | | | | | | | | | | | | |
Total | | $ | 20,320,000 | | | $ | 513,468,890 | | | $ | — | | | $ | 533,788,890 | |
| | | | | | | | | | | | | | | | |
| | |
| | | Short Tax-Free Fund | | | | |
| | | Level 1 | | | Level 2 | | | Level 3 | | | Total | |
Municipals | | $ | — | | | $ | 127,061,534 | | | $ | — | | | $ | 127,061,534 | |
Repurchase Agreements | | | — | | | | 902,979 | | | | — | | | | 902,979 | |
| | | | | | | | | | | | | | | | |
Total | | $ | — | | | $ | 127,964,513 | | | $ | — | | | $ | 127,964,513 | |
| | | | | | | | | | | | | | | | |
118
| | | | | | | | | | | | | | | | |
| | | Short-Term Income Fund | | | | |
| | | Level 1 | | | Level 2 | | | Level 3 | | | Total | |
Asset-Backed Securities | | $ | — | | | $ | 36,093,368 | | | $ | — | | | $ | 36,093,368 | |
Collateralized Mortgage Obligations | | | — | | | | 8,977,498 | | | | — | | | | 8,977,498 | |
Commercial Mortgage Securities | | | — | | | | 10,539,323 | | | | — | | | | 10,539,323 | |
Corporate Bonds & Notes | | | — | | | | 121,475,617 | | | | — | | | | 121,475,617 | |
U.S. Government & U.S. Government Agency Obligations | | | — | | | | 42,002,613 | | | | — | | | | 42,002,613 | |
U.S. Government Agency-Mortgage Securities | | | — | | | | 5,109,568 | | | | — | | | | 5,109,568 | |
Short-Term Investments | | | 7,069,356 | | | | 29,122,931 | | | | — | | | | 36,192,287 | |
| | | | | | | | | | | | | | | | |
Total | | $ | 7,069,356 | | | $ | 253,320,918 | | | $ | — | | | $ | 260,390,274 | |
| | | | | | | | | | | | | | | | |
| | |
| | | Intermediate Tax-Free Fund | | | | |
| | | Level 1 | | | Level 2 | | | Level 3 | | | Total | |
Municipals | | $ | — | | | $ | 1,835,771,591 | | | $ | — | | | $ | 1,835,771,591 | |
Mutual Funds | | | 10,000,000 | | | | — | | | | — | | | | 10,000,000 | |
Repurchase Agreements | | | — | | | | 2,334,710 | | | | — | | | | 2,334,710 | |
| | | | | | | | | | | | | | | | |
Total | | $ | 10,000,000 | | | $ | 1,838,106,301 | | | $ | — | | | $ | 1,848,106,301 | |
| | | | | | | | | | | | | | | | |
| | |
| | | Strategic Income Fund | | | | |
| | | Level 1 | | | Level 2 | | | Level 3 | | | Total | |
Asset-Backed Securities | | $ | — | | | $ | 151,531 | | | $ | — | | | $ | 151,531 | |
Collateralized Mortgage Obligations | | | — | | | | 7,745,565 | | | | — | | | | 7,745,565 | |
Commercial Mortgage Securities | | | — | | | | 3,073,099 | | | | — | | | | 3,073,099 | |
Corporate Bonds & Notes | | | — | | | | 56,887,700 | | | | — | | | | 56,887,700 | |
U.S. Government Agency-Mortgage Securities | | | — | | | | 1,678,437 | | | | — | | | | 1,678,437 | |
Short-Term Investments | | | 702,920 | | | | 7,990,849 | | | | — | | | | 8,693,769 | |
| | | | | | | | | | | | | | | | |
Total | | $ | 702,920 | | | $ | 77,527,181 | | | $ | — | | | $ | 78,230,101 | |
| | | | | | | | | | | | | | | | |
| | |
| | | Corporate Income Fund | | | | |
| | | Level 1 | | | Level 2 | | | Level 3 | | | Total | |
Corporate Bonds & Notes | | $ | — | | | $ | 382,108,670 | | | $ | — | | | $ | 382,108,670 | |
Short-Term Investments | | | 18,017,006 | | | | 61,602,281 | | | | — | | | | 79,619,287 | |
| | | | | | | | | | | | | | | | |
Total | | $ | 18,017,006 | | | $ | 443,710,951 | | | $ | — | | | $ | 461,727,957 | |
| | | | | | | | | | | | | | | | |
| | | | | | | | | | | | | | | | |
| | | Core Plus Bond Fund | | | | |
| | | Level 1 | | | Level 2 | | | Level 3 | | | Total | |
Asset-Backed Securities | | $ | — | | | $ | 13,522,776 | | | $ | — | | | $ | 13,522,776 | |
Collateralized Mortgage Obligations | | | — | | | | 46,763,228 | | | | — | | | | 46,763,228 | |
Commercial Mortgage Securities | | | — | | | | 64,009,408 | | | | — | | | | 64,009,408 | |
Corporate Bonds & Notes | | | — | | | | 462,049,126 | | | | — | | | | 462,049,126 | |
U.S. Government & U.S. Government Agency Obligations | | | — | | | | 248,225,450 | | | | — | | | | 248,225,450 | |
U.S. Government Agency-Mortgage Securities | | | — | | | | 296,911,445 | | | | — | | | | 296,911,445 | |
Short-Term Investments | | | 24,129,137 | | | | 66,878,566 | | | | — | | | | 91,007,703 | |
| | | | | | | | | | | | | | | | |
Total | | $ | 24,129,137 | | | $ | 1,198,359,999 | | | $ | — | | | $ | 1,222,489,136 | |
| | | | | | | | | | | | | | | | |
| | |
| | | Government Money Market Fund | | | | |
| | | Level 1 | | | Level 2 | | | Level 3 | | | Total | |
Mutual Funds | | $ | 172,112,215 | | | $ | — | | | $ | — | | | $ | 172,112,215 | |
Repurchase Agreements | | | — | | | | 1,294,081,267 | | | | — | | | | 1,294,081,267 | |
U.S. Government & U.S. Government Agency Obligations | | | — | | | | 1,953,635,699 | | | | — | | | | 1,953,635,699 | |
U.S. Treasury Bills | | | — | | | | 568,349,444 | | | | — | | | | 568,349,444 | |
| | | | | | | | | | | | | | | | |
Total | | $ | 172,112,215 | | | $ | 3,816,066,410 | | | $ | — | | | $ | 3,988,178,625 | |
| | | | | | | | | | | | | | | | |
| | |
| | | Tax-Free Money Market Fund | | | | |
| | | Level 1 | | | Level 2 | | | Level 3 | | | Total | |
Municipals | | $ | — | | | $ | 366,917,702 | | | $ | — | | | $ | 366,917,702 | |
Mutual Funds | | | 18,490,205 | | | | — | | | | — | | | | 18,490,205 | |
| | | | | | | | | | | | | | | | |
Total | | $ | 18,490,205 | | | $ | 366,917,702 | | | $ | — | | | $ | 385,407,907 | |
| | | | | | | | | | | | | | | | |
| | |
| | | Prime Money Market Fund | | | | |
| | | Level 1 | | | Level 2 | | | Level 3 | | | Total | |
Certificates of Deposit | | $ | — | | | $ | 85,304,138 | | | $ | — | | | $ | 85,304,138 | |
Commercial Paper | | | — | | | | 431,964,829 | | | | — | | | | 431,964,829 | |
Mutual Funds | | | 37,107,182 | | | | — | | | | — | | | | 37,107,182 | |
Repurchase Agreements | | | — | | | | 47,099,699 | | | | — | | | | 47,099,699 | |
U.S. Government & U.S. Government Agency Obligations | | | — | | | | 10,750,000 | | | | — | | | | 10,750,000 | |
| | | | | | | | | | | | | | | | |
Total | | $ | 37,107,182 | | | $ | 575,118,666 | | | $ | — | | | $ | 612,225,848 | |
| | | | | | | | | | | | | | | | |
| | |
| | | Institutional Prime Money Market Fund | | | | |
| | | Level 1 | | | Level 2 | | | Level 3 | | | Total | |
Certificates of Deposit | | $ | — | | | $ | 82,336,531 | | | $ | — | | | $ | 82,336,531 | |
Commercial Paper | | | — | | | | 237,394,692 | | | | — | | | | 237,394,692 | |
Mutual Funds | | | 22,171,040 | | | | — | | | | — | | | | 22,171,040 | |
Repurchase Agreements | | | — | | | | 25,000,000 | | | | — | | | | 25,000,000 | |
U.S. Government & U.S. Government Agency Obligations | | | — | | | | 5,509,309 | | | | — | | | | 5,509,309 | |
| | | | | | | | | | | | | | | | |
Total | | $ | 22,171,040 | | | $ | 350,240,532 | | | $ | — | | | $ | 372,411,572 | |
| | | | | | | | | | | | | | | | |
| (1) | All sub-categories within Common Stocks and Preferred Stocks represent either entire Level 1 or Level 2 evaluation status. |
119
| | |
| | |
| Notes to Financial Statements (continued) | | |
The Articles of Incorporation permit the Directors to issue an indefinite number of full and fractional shares of common stock, par value $0.0001 per share. Transactions in capital stock were as follows:
| | | | | | | | | | | | | | | | |
| | | | | | | |
| | | Low Volatility
Equity Fund | | | Dividend
Income Fund | |
| | | Year Ended
August 31,
2020 | | | Year Ended
August 31,
2019 | | | Year Ended
August 31,
2020 | | | Year Ended
August 31,
2019 | |
Capital stock transactions in dollars: | | | | | | | | | | | | | | | | |
Proceeds from sale of shares: | | | | | | | | | | | | | | | | |
Investor class of shares | | $ | — | | | $ | — | | | $ | — | | | $ | — | |
Advisor class of shares | | | 32,120,308 | | | | 9,668,503 | | | | 2,358,690 | | | | 12,698,198 | |
Institutional class of shares | | | 191,087,540 | | | | 115,023,562 | | | | 67,582,616 | | | | 222,394,639 | |
Retirement class R-6 of shares | | | — | | | | — | | | | — | | | | — | |
| | | | | | | | | | | | | | | | |
Net proceeds from sale of shares | | | 223,207,848 | | | | 124,692,065 | | | | 69,941,306 | | | | 235,092,837 | |
Net asset value of shares issued to shareholders in payment of distributions declared: | | | | | | | | | | | | | | | | |
Investor class of shares | | | — | | | | — | | | | — | | | | — | |
Advisor class of shares | | | 1,409,734 | | | | 2,438,172 | | | | 326,623 | | | | 543,537 | |
Institutional class of shares | | | 7,319,090 | | | | 10,010,513 | | | | 6,188,357 | | | | 11,190,903 | |
Retirement class R-6 of shares | | | — | | | | — | | | | — | | | | — | |
| | | | | | | | | | | | | | | | |
Net proceeds from shares issued: | | | 8,728,824 | | | | 12,448,685 | | | | 6,514,980 | | | | 11,734,440 | |
Cost of shares redeemed: | | | | | | | | | | | | | | | | |
Investor class of shares | | | — | | | | — | | | | — | | | | — | |
Advisor class of shares | | | (19,107,101 | ) | | | (9,069,238 | ) | | | (8,587,418 | ) | | | (3,157,993 | ) |
Institutional class of shares | | | (149,067,381 | ) | | | (50,564,468 | ) | | | (125,620,533 | ) | | | (70,626,503 | ) |
Retirement class R-6 of shares | | | — | | | | — | | | | — | | | | — | |
| | | | | | | | | | | | | | | | |
Net cost of shares redeemed | | | (168,174,482 | ) | | | (59,633,706 | ) | | | (134,207,951 | ) | | | (73,784,496 | ) |
| | | | | | | | | | | | | | | | |
Net change resulting from fund share transactions in dollars | | $ | 63,762,190 | | | $ | 77,507,044 | | | $ | (57,751,665 | ) | | $ | 173,042,781 | |
| | | | | | | | | | | | | | | | |
Capital stock transactions in shares: | | | | | | | | | | | | | | | | |
Sale of shares: | | | | | | | | | | | | | | | | |
Investor class of shares | | | — | | | | — | | | | — | | | | — | |
Advisor class of shares | | | 2,111,328 | | | | 641,978 | | | | 183,644 | | | | 890,265 | |
Institutional class of shares | | | 12,619,398 | | | | 7,766,860 | | | | 5,069,501 | | | | 15,839,792 | |
Retirement class R-6 of shares | | | — | | | | — | | | | — | | | | — | |
| | | | | | | | | | | | | | | | |
Net sale of shares | | | 14,730,726 | | | | 8,408,838 | | | | 5,253,145 | | | | 16,730,057 | |
Shares issued to shareholders in payment of distributions declared: | | | | | | | | | | | | | | | | |
Investor class of shares | | | — | | | | — | | | | — | | | | — | |
Advisor class of shares | | | 93,665 | | | | 171,813 | | | | 25,598 | | | | 38,845 | |
Institutional class of shares | | | 489,176 | | | | 700,704 | | | | 487,143 | | | | 803,639 | |
Retirement class R-6 of shares | | | — | | | | — | | | | — | | | | — | |
| | | | | | | | | | | | | | | | |
Net shares issued | | | 582,841 | | | | 872,517 | | | | 512,741 | | | | 842,484 | |
Shares redeemed: | | | | | | | | | | | | | | | | |
Investor class of shares | | | — | | | | — | | | | — | | | | — | |
Advisor class of shares | | | (1,270,951 | ) | | | (606,674 | ) | | | (661,704 | ) | | | (227,462 | ) |
Institutional class of shares | | | (10,326,579 | ) | | | (3,387,527 | ) | | | (9,518,623 | ) | | | (5,024,544 | ) |
Retirement class R-6 of shares | | | — | | | | — | | | | — | | | | — | |
| | | | | | | | | | | | | | | | |
Net shares redeemed | | | (11,597,530 | ) | | | (3,994,201 | ) | | | (10,180,327 | ) | | | (5,252,006 | ) |
| | | | | | | | | | | | | | | | |
Net change resulting from fund share transactions in shares | | | 3,716,037 | | | | 5,287,154 | | | | (4,414,441 | ) | | | 12,320,535 | |
| | | | | | | | | | | | | | | | |
120
| | | | | | | | | | | | | | | | | | | | | | | | | | | | | | |
| | | | | | | | | | |
Large-Cap
Value Fund | | | Large-Cap
Growth Fund | | | Mid-Cap
Value Fund | | | Mid-Cap
Growth Fund | |
Year Ended
August 31,
2020 | | | Year Ended
August 31,
2019 | | | Year Ended
August 31,
2020 | | | Year Ended
August 31,
2019 | | | Year Ended
August 31,
2020 | | | Year Ended
August 31,
2019 | | | Year Ended
August 31,
2020 | | | Year Ended
August 31,
2019 | |
| | | | | | | | | | | | | | | | | | | | | | | | | | | | | | |
| | | | | | | | | | | | | | | | | | | | | | | | | | | | | | |
| $ | — | | | $ | — | | | $ | 3,175,158 | | | $ | 5,143,147 | | | $ | — | | | $ | — | | | $ | — | | | $ | — | |
| | 691,833 | | | | 702,179 | | | | 56,188 | | | | 754,845 | | | | 1,216,861 | | | | 1,384,665 | | | | 722,620 | | | | 805,182 | |
| | 114,779,390 | | | | 44,351,441 | | | | 26,765,540 | | | | 66,582,901 | | | | 11,206,657 | | | | 11,581,825 | | | | 10,815,063 | | | | 8,697,238 | |
| | 13,678,690 | | | | 21,893,752 | | | | 72,606,416 | | | | 216,486,685 | | | | 5,171,945 | | | | 7,761,178 | | | | 717,383 | | | | 6,575,320 | |
| | | | | | | | | | | | | | | | | | | | | | | | | | | | | | |
| | 129,149,913 | | | | 66,947,372 | | | | 102,603,302 | | | | 288,967,578 | | | | 17,595,463 | | | | 20,727,668 | | | | 12,255,066 | | | | 16,077,740 | |
|
|
| | | | | | | | | | | | | | | | | | | | | | | | | | | | |
| | — | | | | — | | | | 2,703,872 | | | | 7,903,690 | | | | — | | | | — | | | | — | | | | — | |
| | 304,418 | | | | 2,194,121 | | | | 29,377 | | | | 116,339 | | | | 445,269 | | | | 5,843,113 | | | | 1,745,071 | | | | 2,598,569 | |
| | 4,481,673 | | | | 28,839,817 | | | | 6,990,904 | | | | 31,915,301 | | | | 1,285,239 | | | | 12,747,841 | | | | 9,036,497 | | | | 12,929,680 | |
| | 940,488 | | | | 8,385,292 | | | | 11,948,943 | | | | 9,011,688 | | | | 215,944 | | | | 3,943,242 | | | | 919,723 | | | | 3,595,774 | |
| | | | | | | | | | | | | | | | | | | | | | | | | | | | | | |
| | 5,726,579 | | | | 39,419,230 | | | | 21,673,096 | | | | 48,947,018 | | | | 1,946,452 | | | | 22,534,196 | | | | 11,701,291 | | | | 19,124,023 | |
| | | | | | | | | | | | | | | | | | | | | | | | | | | | | | |
| | — | | | | — | | | | (10,871,342 | ) | | | (10,901,192 | ) | | | — | | | | — | | | | — | | | | — | |
| | (5,290,805 | ) | | | (3,014,034 | ) | | | (255,095 | ) | | | (859,315 | ) | | | (9,502,592 | ) | | | (12,282,708 | ) | | | (3,268,291 | ) | | | (2,413,973 | ) |
| | (122,157,202 | ) | | | (81,627,562 | ) | | | (106,408,111 | ) | | | (169,560,029 | ) | | | (26,896,038 | ) | | | (26,636,484 | ) | | | (19,729,078 | ) | | | (20,445,365 | ) |
| | (36,430,777 | ) | | | (45,115,132 | ) | | | (104,465,165 | ) | | | (53,953,905 | ) | | | (6,259,583 | ) | | | (22,367,984 | ) | | | (2,326,032 | ) | | | (20,814,797 | ) |
| | | | | | | | | | | | | | | | | | | | | | | | | | | | | | |
| | (163,878,784 | ) | | | (129,756,728 | ) | | | (221,999,713 | ) | | | (235,274,441 | ) | | | (42,658,213 | ) | | | (61,287,176 | ) | | | (25,323,401 | ) | | | (43,674,135 | ) |
| | | | | | | | | | | | | | | | | | | | | | | | | | | | | | |
| $ | (29,002,292 | ) | | $ | (23,390,126 | ) | | $ | (97,723,315 | ) | | $ | 102,640,155 | | | $ | (23,116,298 | ) | | $ | (18,025,312 | ) | | $ | (1,367,044 | ) | | $ | (8,472,372 | ) |
| | | | | | | | | | | | | | | | | | | | | | | | | | | | | | |
| | | | | | | | | | | | | | | | | | | | | | | | | | | | | | |
| | | | | | | | | | | | | | | | | | | | | | | | | | | | | | |
| | — | | | | — | | | | 177,230 | | | | 285,200 | | | | — | | | | — | | | | — | | | | — | |
| | 52,253 | | | | 48,101 | | | | 3,152 | | | | 39,698 | | | | 135,941 | | | | 130,653 | | | | 55,974 | | | | 54,552 | |
| | 8,186,602 | | | | 3,087,120 | | | | 1,466,854 | | | | 3,686,092 | | | | 1,203,845 | | | | 1,120,182 | | | | 759,578 | | | | 568,485 | |
| | 1,031,995 | | | | 1,551,696 | | | | 4,175,985 | | | | 12,113,349 | | | | 655,855 | | | | 720,902 | | | | 57,779 | | | | 440,599 | |
| | | | | | | | | | | | | | | | | | | | | | | | | | | | | | |
| | 9,270,850 | | | | 4,686,917 | | | | 5,823,221 | | | | 16,124,339 | | | | 1,995,641 | | | | 1,971,737 | | | | 873,331 | | | | 1,063,636 | |
| | | | | | | | | | | | | | | | | | | | | | | | | | | | | | |
| | — | | | | — | | | | 149,965 | | | | 481,932 | | | | — | | | | — | | | | — | | | | — | |
| | 24,549 | | | | 158,402 | | | | 1,631 | | | | 7,102 | | | | 41,809 | | | | 581,404 | | | | 131,406 | | | | 200,507 | |
| | 357,432 | | | | 2,079,204 | | | | 384,116 | | | | 1,928,417 | | | | 121,709 | | | | 1,278,620 | | | | 636,821 | | | | 943,084 | |
| | 74,135 | | | | 603,955 | | | | 655,455 | | | | 543,856 | | | | 20,449 | | | | 395,511 | | | | 64,092 | | | | 260,186 | |
| | | | | | | | | | | | | | | | | | | | | | | | | | | | | | |
| | 456,116 | | | | 2,841,561 | | | | 1,191,167 | | | | 2,961,307 | | | | 183,967 | | | | 2,255,535 | | | | 832,319 | | | | 1,403,777 | |
| | | | | | | | | | | | | | | | | | | | | | | | | | | | | | |
| | — | | | | — | | | | (600,217 | ) | | | (626,865 | ) | | | — | | | | — | | | | — | | | | — | |
| | (394,329 | ) | | | (211,798 | ) | | | (13,541 | ) | | | (48,183 | ) | | | (986,657 | ) | | | (1,165,342 | ) | | | (247,002 | ) | | | (165,917 | ) |
| | (9,136,269 | ) | | | (6,116,012 | ) | | | (5,729,694 | ) | | | (9,504,674 | ) | | | (2,929,775 | ) | | | (2,584,495 | ) | | | (1,444,717 | ) | | | (1,291,903 | ) |
| | (2,537,399 | ) | | | (3,186,393 | ) | | | (5,391,655 | ) | | | (3,058,871 | ) | | | (657,555 | ) | | | (2,186,144 | ) | | | (165,332 | ) | | | (1,391,659 | ) |
| | | | | | | | | | | | | | | | | | | | | | | | | | | | | | |
| | (12,067,997 | ) | | | (9,514,203 | ) | | | (11,735,107 | ) | | | (13,238,593 | ) | | | (4,573,987 | ) | | | (5,935,981 | ) | | | (1,857,051 | ) | | | (2,849,479 | ) |
| | | | | | | | | | | | | | | | | | | | | | | | | | | | | | |
| | (2,341,031 | ) | | | (1,985,725 | ) | | | (4,720,719 | ) | | | 5,847,053 | | | | (2,394,379 | ) | | | (1,708,709 | ) | | | (151,401 | ) | | | (382,066 | ) |
| | | | | | | | | | | | | | | | | | | | | | | | | | | | | | |
121
| | |
| | |
| Notes to Financial Statements (continued) | | |
| | | | | | | | | | | | | | | | |
| | | | | | | |
| | | Small-Cap
Value Fund | | | Small-Cap
Growth Fund | |
| | | Year Ended
August 31,
2020 | | | Year Ended
August 31,
2019 | | | Year Ended
August 31,
2020 | | | Year Ended
August 31,
2019 | |
Capital stock transactions in dollars: | | | | | | | | | | | | | | | | |
Proceeds from sale of shares: | | | | | | | | | | | | | | | | |
Advisor class of shares | | $ | 155,290 | | | $ | 305,655 | | | $ | 953,307 | | | $ | 2,309,900 | |
Institutional class of shares | | | 9,707,579 | | | | 7,431,075 | | | | 11,702,384 | | | | 19,667,795 | |
Retirement class R-6 of shares | | | 2,278,731 | | | | 4,775,499 | | | | — | | | | — | |
Class F-3 of shares | | | — | | | | — | | | | — | | | | — | |
| | | | | | | | | | | | | | | | |
Net proceeds from sale of shares | | | 12,141,600 | | | | 12,512,229 | | | | 12,655,691 | | | | 21,977,695 | |
Net asset value of shares issued to shareholders in payment of distributions declared: | | | | | | | | | | | | | | | | |
Advisor class of shares | | | 32,323 | | | | 310,252 | | | | 541,680 | | | | 6,414,028 | |
Institutional class of shares | | | 590,699 | | | | 3,876,070 | | | | 1,216,969 | | | | 11,739,150 | |
Retirement class R-6 of shares | | | 103,017 | | | | 1,032,489 | | | | — | | | | — | |
Class F-3 of shares | | | — | | | | — | | | | — | | | | — | |
| | | | | | | | | | | | | | | | |
Net proceeds from shares issued: | | | 726,039 | | | | 5,218,811 | | | | 1,758,649 | | | | 18,153,178 | |
Cost of shares redeemed: | | | | | | | | | | | | | | | | |
Advisor class of shares | | | (1,472,641 | ) | | | (1,168,307 | ) | | | (7,876,028 | ) | | | (16,029,451 | ) |
Institutional class of shares | | | (9,349,615 | ) | | | (10,640,892 | ) | | | (16,734,404 | ) | | | (35,574,445 | ) |
Retirement class R-6 of shares | | | (2,371,533 | ) | | | (9,068,159 | ) | | | — | | | | — | |
Class F-3 of shares | | | — | | | | — | | | | — | | | | — | |
| | | | | | | | | | | | | | | | |
Net cost of shares redeemed | | | (13,193,789 | ) | | | (20,877,358 | ) | | | (24,610,432 | ) | | | (51,603,896 | ) |
Redemption fees | | | — | | | | — | | | | — | | | | — | |
| | | | | | | | | | | | | | | | |
Net change resulting from fund share transactions in dollars | | $ | (326,150) | | | $ | (3,146,318 | ) | | $ | (10,196,092) | | | $ | (11,473,023 | ) |
| | | | | | | | | | | | | | | | |
| | | | |
Capital stock transactions in shares: | | | | | | | | | | | | | | | | |
Sale of shares: | | | | | | | | | | | | | | | | |
Advisor class of shares | | | 17,727 | | | | 24,728 | | | | 63,428 | | | | 132,193 | |
Institutional class of shares | | | 933,645 | | | | 604,137 | | | | 733,207 | | | | 1,153,609 | |
Retirement class R-6 of shares | | | 235,799 | | | | 384,484 | | | | — | | | | — | |
Class F-3 of shares | | | — | | | | — | | | | — | | | | — | |
| | | | | | | | | | | | | | | | |
Net sale of shares | | | 1,187,171 | | | | 1,013,349 | | | | 796,635 | | | | 1,285,802 | |
Shares issued to shareholders in payment of distributions declared: | | | | | | | | | | | | | | | | |
Advisor class of shares | | | 2,639 | | | | 26,815 | | | | 33,160 | | | | 425,898 | |
Institutional class of shares | | | 47,483 | | | | 329,598 | | | | 70,735 | | | | 742,514 | |
Retirement class R-6 of shares | | | 8,202 | | | | 87,130 | | | | — | | | | — | |
Class F-3 of shares | | | — | | | | — | | | | — | | | | — | |
| | | | | | | | | | | | | | | | |
Net shares issued | | | 58,324 | | | | 443,543 | | | | 103,895 | | | | 1,168,412 | |
Shares redeemed: | | | | | | | | | | | | | | | | |
Advisor class of shares | | | (143,070 | ) | | | (96,723 | ) | | | (512,950 | ) | | | (999,522 | ) |
Institutional class of shares | | | (902,350 | ) | | | (871,408 | ) | | | (1,055,893 | ) | | | (2,077,157 | ) |
Retirement class R-6 of shares | | | (214,190 | ) | | | (720,951 | ) | | | — | | | | — | |
Class F-3 of shares | | | — | | | | — | | | | — | | | | — | |
| | | | | | | | | | | | | | | | |
Net shares redeemed | | | (1,259,610 | ) | | | (1,689,082 | ) | | | (1,568,843 | ) | | | (3,076,679 | ) |
| | | | | | | | | | | | | | | | |
Net change resulting from fund share transactions in shares | | | (14,115 | ) | | | (232,190 | ) | | | (668,313 | ) | | | (622,465 | ) |
| | | | | | | | | | | | | | | | |
| (1)Reflects | operations for the period from September 1, 2018, to December 28, 2018 (termination of Retirement class F-3 of shares). |
122
| | | | | | | | | | | | | | | | | | | | | | | | | | | | | | |
| | | | | | | | | | |
Global Low
Volatility
Equity Fund | | | Disciplined
International
Equity Fund | | | Pyrford
International
Stock Fund | | | LGM
Emerging
Markets
Equity Fund | |
Year Ended
August 31,
2020 | | | Year Ended
August 31,
2019 | | | Year Ended
August 31,
2020 | | | Year Ended
August 31,
2019 | | | Year Ended
August 31,
2020 | | | Year Ended
August 31,
2019 | | | Year Ended
August 31,
2020 | | | Year Ended
August 31,
2019 | |
| | | | | | | | | | | | | | | | | | | | | | | | | | | | | | |
| | | | | | | | | | | | | | | | | | | | | | | | | | | | | | |
| $ | 116,082 | | | $ | 497,821 | | | $ | 5,905 | | | $ | 2,561 | | | $ | 430,593 | | | $ | 109,625 | | | $ | 484,183 | | | $ | 1,942,673 | |
| | 2,474,659 | | | | 7,667,583 | | | | 8,911,440 | | | | 21,708,859 | | | | 79,554,019 | | | | 114,884,836 | | | | 47,060,713 | | | | 182,622,433 | |
| | — | | | | — | | | | — | | | | — | | | | 101,227,930 | | | | 64,243,843 | | | | — | | | | — | |
| | — | | | | — | | | | — | | | | — | | | | — | | | | 160,508 | (1) | | | — | | | | — | |
| | | | | | | | | | | | | | | | | | | | | | | | | | | | | | |
| | 2,590,741 | | | | 8,165,404 | | | | 8,917,345 | | | | 21,711,420 | | | | 181,212,542 | | | | 179,398,812 | | | | 47,544,896 | | | | 184,565,106 | |
| | | | | | | |
| | | | | | | | | | | | | | | | | | | | | | | | | | | | | | |
| | 32,275 | | | | 48,910 | | | | 1,704 | | | | 1,185 | | | | 65,462 | | | | 113,890 | | | | 88,930 | | | | 171,004 | |
| | 1,751,547 | | | | 5,898,232 | | | | 1,332,077 | | | | 1,340,341 | | | | 10,131,885 | | | | 10,702,009 | | | | 5,708,568 | | | | 8,013,010 | |
| | — | | | | — | | | | — | | | | — | | | | 5,676,558 | | | | 4,754,416 | | | | — | | | | — | |
| | — | | | | — | | | | — | | | | — | | | | — | | | | 1,250 | (1) | | | — | | | | — | |
| | | | | | | | | | | | | | | | | | | | | | | | | | | | | | |
| | 1,783,822 | | | | 5,947,142 | | | | 1,333,781 | | | | 1,341,526 | | | | 15,873,905 | | | | 15,571,565 | | | | 5,797,498 | | | | 8,184,014 | |
| | | | | | | | | | | | | | | | | | | | | | | | | | | | | | |
| | (693,070 | ) | | | (177,171 | ) | | | (4,672 | ) | | | (33,953 | ) | | | (3,395,729 | ) | | | (1,449,652 | ) | | | (1,954,509 | ) | | | (1,548,285 | ) |
| | (18,527,710 | ) | | | (4,378,589 | ) | | | (30,679,011 | ) | | | (32,796,756 | ) | | | (131,364,725 | ) | | | (111,399,473 | ) | | | (84,857,826 | ) | | | (88,760,017 | ) |
| | — | | | | — | | | | — | | | | — | | | | (47,624,491 | ) | | | (56,842,037 | ) | | | — | | | | — | |
| | — | | | | — | | | | — | | | | — | | | | — | | | | (7,783,586 | )(1) | | | — | | | | — | |
| | | | | | | | | | | | | | | | | | | | | | | | | | | | | | |
| | (19,220,780 | ) | | | (4,555,760 | ) | | | (30,683,683 | ) | | | (32,830,709 | ) | | | (182,384,945 | ) | | | (177,474,748 | ) | | | (86,812,335 | ) | | | (90,308,302 | ) |
| | 25 | | | | 4 | | | | 38,332 | | | | — | | | | 1,686 | | | | 7,393 | | | | 4,949 | | | | 1,285 | |
| | | | | | | | | | | | | | | | | | | | | | | | | | | | | | |
| $ | (14,846,192 | ) | | $ | 9,556,790 | | | $ | (20,394,225 | ) | | $ | (9,777,763 | ) | | $ | 14,703,188 | | | $ | 17,503,022 | | | $ | (33,464,992 | ) | | $ | 102,442,103 | |
| | | | | | | | | | | | | | | | | | | | | | | | | | | | | | |
| | | | | | | |
| | | | | | | | | | | | | | | | | | | | | | | | | | | | | | |
| | | | | | | | | | | | | | | | | | | | | | | | | | | | | | |
| | 10,104 | | | | 43,760 | | | | 582 | | | | 251 | | | | 32,611 | | | | 8,503 | | | | 34,675 | | | | 130,398 | |
| | 216,765 | | | | 689,325 | | | | 869,738 | | | | 2,078,327 | | | | 6,441,429 | | | | 9,063,446 | | | | 3,471,923 | | | | 12,069,702 | |
| | — | | | | — | | | | — | | | | — | | | | 7,811,908 | | | | 5,014,709 | | | | — | | | | — | |
| | — | | | | — | | | | — | | | | — | | | | — | | | | 12,198 | (1) | | | — | | | | — | |
| | | | | | | | | | | | | | | | | | | | | | | | | | | | | | |
| | 226,869 | | | | 733,085 | | | | 870,320 | | | | 2,078,578 | | | | 14,285,948 | | | | 14,098,856 | | | | 3,506,598 | | | | 12,200,100 | |
| | | | | | | | | | | | | | | | | | | | | | | | | | | | | | |
| | 2,887 | | | | 4,533 | | | | 164 | | | | 123 | | | | 4,803 | | | | 9,435 | | | | 5,897 | | | | 11,917 | |
| | 155,555 | | | | 544,117 | | | | 128,208 | | | | 139,474 | | | | 760,081 | | | | 904,650 | | | | 381,079 | | | | 561,636 | |
| | — | | | | — | | | | — | | | | — | | | | 425,848 | | | | 401,895 | | | | — | | | | — | |
| | — | | | | — | | | | — | | | | — | | | | — | | | | 106 | (1) | | | — | | | | — | |
| | | | | | | | | | | | | | | | | | | | | | | | | | | | | | |
| | 158,442 | | | | 548,650 | | | | 128,372 | | | | 139,597 | | | | 1,190,732 | | | | 1,316,086 | | | | 386,976 | | | | 573,553 | |
| | | | | | | | | | | | | | | | | | | | | | | | | | | | | | |
| | (60,958 | ) | | | (14,712 | ) | | | (465 | ) | | | (3,338 | ) | | | (256,802 | ) | | | (113,979 | ) | | | (135,602 | ) | | | (102,088 | ) |
| | (2,035,559 | ) | | | (394,255 | ) | | | (3,064,886 | ) | | | (3,208,824 | ) | | | (10,222,850 | ) | | | (8,909,877 | ) | | | (6,292,131 | ) | | | (5,935,508 | ) |
| | — | | | | — | | | | — | | | | — | | | | (3,686,312 | ) | | | (4,442,295 | ) | | | — | | | | — | |
| | — | | | | — | | | | — | | | | — | | | | — | | | | (617,942 | )(1) | | | — | | | | — | |
| | | | | | | | | | | | | | | | | | | | | | | | | | | | | | |
| | (2,096,517 | ) | | | (408,967 | ) | | | (3,065,351 | ) | | | (3,212,162 | ) | | | (14,165,964 | ) | | | (14,084,093 | ) | | | (6,427,733 | ) | | | (6,037,596 | ) |
| | | | | | | | | | | | | | | | | | | | | | | | | | | | | | |
| | (1,711,206 | ) | | | 872,768 | | | | (2,066,659 | ) | | | (993,987 | ) | | | 1,310,716 | | | | 1,330,849 | | | | (2,534,159 | ) | | | 6,736,057 | |
| | | | | | | | | | | | | | | | | | | | | | | | | | | | | | |
123
| | |
| | |
| Notes to Financial Statements (continued) | | |
| | | | | | | | | | | | | | | | |
| | | | | | | |
| | | Ultra Short
Tax-Free Fund | | | Short
Tax-Free Fund | |
| | | Year Ended
August 31,
2020 | | | Year Ended
August 31,
2019 | | | Year Ended
August 31,
2020 | | | Year Ended
August 31,
2019 | |
Capital stock transactions in dollars: | | | | | | | | | | | | | | | | |
Proceeds from sale of shares: | | | | | | | | | | | | | | | | |
Investor class of shares | | $ | — | | | $ | — | | | $ | — | | | $ | — | |
Advisor class of shares | | | 1,936,853 | | | | 4,379,161 | | | | 1,568,044 | | | | 818,333 | |
Institutional class of shares | | | 474,377,875 | | | | 450,634,673 | | | | 33,747,802 | | | | 38,106,073 | |
| | | | | | | | | | | | | | | | |
Net proceeds from sale of shares | | | 476,314,728 | | | | 455,013,834 | | | | 35,315,846 | | | | 38,924,406 | |
Net asset value of shares issued to shareholders in payment of distributions declared: | | | | | | | | | | | | | | | | |
Investor class of shares | | | — | | | | — | | | | — | | | | — | |
Advisor class of shares | | | 142,124 | | | | 270,051 | | | | 46,765 | | | | 72,771 | |
Institutional class of shares | | | 3,468,081 | | | | 4,976,544 | | | | 744,033 | | | | 966,607 | |
| | | | | | | | | | | | | | | | |
Net proceeds from shares issued: | | | 3,610,205 | | | | 5,246,595 | | | | 790,798 | | | | 1,039,378 | |
Cost of shares redeemed: | | | | | | | | | | | | | | | | |
Investor class of shares | | | — | | | | — | | | | — | | | | — | |
Advisor class of shares | | | (5,565,487 | ) | | | (15,620,257 | ) | | | (1,819,799 | ) | | | (3,792,675 | ) |
Institutional class of shares | | | (495,991,627 | ) | | | (487,651,124 | ) | | | (65,864,914 | ) | | | (67,222,848 | ) |
| | | | | | | | | | | | | | | | |
Net cost of shares redeemed | | | (501,557,114 | ) | | | (503,271,381 | ) | | | (67,684,713 | ) | | | (71,015,523 | ) |
| | | | | | | | | | | | | | | | |
Net change resulting from fund share transactions in dollars | | $ | (21,632,181 | ) | | $ | (43,010,952 | ) | | $ | (31,578,069 | ) | | $ | (31,051,739 | ) |
| | | | | | | | | | | | | | | | |
| | | | |
Capital stock transactions in shares: | | | | | | | | | | | | | | | | |
Sale of shares: | | | | | | | | | | | | | | | | |
Investor class of shares | | | — | | | | — | | | | — | | | | — | |
Advisor class of shares | | | 192,388 | | | | 434,741 | | | | 153,038 | | | | 80,413 | |
Institutional class of shares | | | 47,128,522 | | | | 44,771,183 | | | | 3,297,297 | | | | 3,745,703 | |
| | | | | | | | | | | | | | | | |
Net sale of shares | | | 47,320,910 | | | | 45,205,924 | | | | 3,450,335 | | | | 3,826,116 | |
Shares issued to shareholders in payment of distributions declared: | | | | | | | | | | | | | | | | |
Investor class of shares | | | — | | | | — | | | | — | | | | — | |
Advisor class of shares | | | 14,103 | | | | 26,801 | | | | 4,572 | | | | 7,159 | |
Institutional class of shares | | | 344,437 | | | | 494,260 | | | | 72,667 | | | | 94,908 | |
| | | | | | | | | | | | | | | | |
Net shares issued | | | 358,540 | | | | 521,061 | | | | 77,239 | | | | 102,067 | |
Shares redeemed: | | | | | | | | | | | | | | | | |
Investor class of shares | | | — | | | | — | | | | — | | | | — | |
Advisor class of shares | | | (553,199 | ) | | | (1,551,260 | ) | | | (177,891 | ) | | | (372,079 | ) |
Institutional class of shares | | | (49,280,153 | ) | | | (48,442,329 | ) | | | (6,462,912 | ) | | | (6,606,010 | ) |
| | | | | | | | | | | | | | | | |
Net shares redeemed | | | (49,833,352 | ) | | | (49,993,589 | ) | | | (6,640,803 | ) | | | (6,978,089 | ) |
| | | | | | | | | | | | | | | | |
Net change resulting from fund share transactions in shares | | | (2,153,902 | ) | | | (4,266,604 | ) | | | (3,113,229 | ) | | | (3,049,906 | ) |
| | | | | | | | | | | | | | | | |
124
| | | | | | | | | | | | | | | | | | | | | | | | | | | | | | |
| | | | | | | | | | |
Short-Term
Income Fund | | | Intermediate
Tax-Free Fund | | | Strategic
Income Fund | | | Corporate
Income Fund | |
Year Ended
August 31,
2020 | | | Year Ended
August 31,
2019 | | | Year Ended
August 31,
2020 | | | Year Ended
August 31,
2019 | | | Year Ended
August 31,
2020 | | | Year Ended
August 31,
2019 | | | Year Ended
August 31,
2020 | | | Year Ended
August 31,
2019 | |
| | | | | | | | | | | | | | | | | | | | | | | | | | | | | | |
| | | | | | | | | | | | | | | | | | | | | | | | | | | | | | |
| $ | — | | | $ | — | | | $ | 74,637,725 | | | $ | 216,805,372 | | | $ | 949,227 | | | $ | 992,911 | | | $ | 21,858,490 | | | $ | 20,311,265 | |
| | 4,070,227 | | | | 4,131,141 | | | | 2,872,891 | | | | 5,193,016 | | | | 1,273,157 | | | | 277,237 | | | | 3,230,923 | | | | 5,361,083 | |
| | 134,279,025 | | | | 109,699,514 | | | | 372,657,401 | | | | 712,041,605 | | | | 1,120,488 | | | | 1,321,850 | | | | 131,082,235 | | | | 140,702,564 | |
| | | | | �� | | | | | | | | | | | | | | | | | | | | | | | | | |
| | 138,349,252 | | | | 113,830,655 | | | | 450,168,017 | | | | 934,039,993 | | | | 3,342,872 | | | | 2,591,998 | | | | 156,171,648 | | | | 166,374,912 | |
| | | | | | | |
| | | | | | | | | | | | | | | | | | | | | | | | | | | | | | |
| | — | | | | — | | | | 12,469,066 | | | | 17,880,753 | | | | 3,659,919 | | | | 2,584,595 | | | | 2,959,675 | | | | 3,586,826 | |
| | 382,780 | | | | 499,349 | | | | 129,411 | | | | 219,608 | | | | 867,078 | | | | 572,728 | | | | 217,463 | | | | 141,683 | |
| | 2,657,527 | | | | 3,254,026 | | | | 28,433,698 | | | | 22,206,518 | | | | 341,411 | | | | 371,887 | | | | 4,016,426 | | | | 3,613,460 | |
| | | | | | | | | | | | | | | | | | | | | | | | | | | | | | |
| | 3,040,307 | | | | 3,753,375 | | | | 41,032,175 | | | | 40,306,879 | | | | 4,868,408 | | | | 3,529,210 | | | | 7,193,564 | | | | 7,341,969 | |
| | | | | | | | | | | | | | | | | | | | | | | | | | | | | | |
| | — | | | | — | | | | (169,172,197 | ) | | | (598,428,311 | ) | | | (8,907,781 | ) | | | (8,927,747 | ) | | | (30,657,413 | ) | | | (31,034,788 | ) |
| | (8,796,687 | ) | | | (6,587,838 | ) | | | (2,436,241 | ) | | | (15,779,341 | ) | | | (1,769,963 | ) | | | (2,424,528 | ) | | | (6,813,290 | ) | | | (608,000 | ) |
| | (156,380,098 | ) | | | (97,838,557 | ) | | | (351,331,662 | ) | | | (297,206,709 | ) | | | (4,216,997 | ) | | | (5,551,755 | ) | | | (84,513,304 | ) | | | (62,394,196 | ) |
| | | | | | | | | | | | | | | | | | | | | | | | | | | | | | |
| | (165,176,785 | ) | | | (104,426,395 | ) | | | (522,940,100 | ) | | | (911,414,361 | ) | | | (14,894,741 | ) | | | (16,904,030 | ) | | | (121,984,007 | ) | | | (94,036,984 | ) |
| | | | | | | | | | | | | | | | | | | | | | | | | | | | | | |
| $ | (23,787,226 | ) | | $ | 13,157,635 | | | $ | (31,739,908 | ) | | $ | 62,932,511 | | | $ | (6,683,461 | ) | | $ | (10,782,822 | ) | | $ | 41,381,205 | | | $ | 79,679,897 | |
| | | | | | | | | | | | | | | | | | | | | | | | | | | | | | |
| | | | | | | |
| | | | | | | | | | | | | | | | | | | | | | | | | | | | | | |
| | | | | | | | | | | | | | | | | | | | | | | | | | | | | | |
| | — | | | | — | | | | 6,555,552 | | | | 19,477,473 | | | | 102,989 | | | | 107,030 | | | | 1,578,690 | | | | 1,556,211 | |
| | 430,903 | | | | 443,854 | | | | 250,687 | | | | 465,275 | | | | 137,193 | | | | 30,251 | | | | 237,000 | | | | 417,871 | |
| | 14,178,308 | | | | 11,770,026 | | | | 32,659,798 | | | | 63,694,084 | | | | 120,817 | | | | 146,666 | | | | 9,537,053 | | | | 11,033,820 | |
| | | | | | | | | | | | | | | | | | | | | | | | | | | | | | |
| | 14,609,211 | | | | 12,213,880 | | | | 39,466,037 | | | | 83,636,832 | | | | 360,999 | | | | 283,947 | | | | 11,352,743 | | | | 13,007,902 | |
| | | | | | | | | | | | | | | | | | | | | | | | | | | | | | |
| | — | | | | — | | | | 1,090,900 | | | | 1,596,327 | | | | 398,286 | | | | 283,183 | | | | 215,523 | | | | 280,292 | |
| | 40,444 | | | | 53,561 | | | | 11,324 | | | | 19,628 | | | | 94,375 | | | | 62,763 | | | | 15,900 | | | | 10,894 | |
| | 280,207 | | | | 348,309 | | | | 2,491,419 | | | | 1,970,954 | | | | 37,049 | | | | 40,885 | | | | 291,832 | | | | 281,658 | |
| | | | | | | | | | | | | | | | | | | | | | | | | | | | | | |
| | 320,651 | | | | 401,870 | | | | 3,593,643 | | | | 3,586,909 | | | | 529,710 | | | | 386,831 | | | | 523,255 | | | | 572,844 | |
| | | | | | | | | | | | | | | | | | | | | | | | | | | | | | |
| | — | | | | — | | | | (14,981,722 | ) | | | (53,682,031 | ) | | | (969,104 | ) | | | (982,294 | ) | | | (2,284,300 | ) | | | (2,442,676 | ) |
| | (930,304 | ) | | | (708,704 | ) | | | (214,322 | ) | | | (1,417,837 | ) | | | (193,570 | ) | | | (266,152 | ) | | | (520,331 | ) | | | (46,572 | ) |
| | (16,547,806 | ) | | | (10,482,728 | ) | | | (31,203,613 | ) | | | (26,636,202 | ) | | | (453,457 | ) | | | (622,082 | ) | | | (6,290,520 | ) | | | (4,926,377 | ) |
| | | | | | | | | | | | | | | | | | | | | | | | | | | | | | |
| | (17,478,110 | ) | | | (11,191,432 | ) | | | (46,399,657 | ) | | | (81,736,070 | ) | | | (1,616,131 | ) | | | (1,870,528 | ) | | | (9,095,151 | ) | | | (7,415,625 | ) |
| | | | | | | | | | | | | | | | | | | | | | | | | | | | | | |
| | (2,548,248 | ) | | | 1,424,318 | | | | (3,339,977 | ) | | | 5,487,671 | | | | (725,422 | ) | | | (1,199,750 | ) | | | 2,780,847 | | | | 6,165,121 | |
| | | | | | | | | | | | | | | | | | | | | | | | | | | | | | |
125
| | |
| | |
| Notes to Financial Statements (continued) | | |
| | | | | | | | | | | | | | | | |
| | | | | | | |
| | | Core Plus
Bond Fund | | | Government
Money
Market Fund | |
| | | Year Ended
August 31,
2020 | | | Year Ended
August 31,
2019 | | | Year Ended
August 31,
2020 | | | Year Ended
August 31,
2019 | |
Capital stock transactions in dollars: | | | | | | | | | | | | | | | | |
Proceeds from sale of shares: | | | | | | | | | | | | | | | | |
Investor class of shares | | $ | 35,968,047 | | | $ | 32,098,000 | | | $ | 2,578,764,198 | | | $ | 3,185,455,821 | |
Advisor class of shares | | | 1,171,193 | | | | 905,069 | | | | — | | | | — | |
Institutional class of shares | | | 295,578,965 | | | | 231,737,885 | | | | — | | | | — | |
Premier class of shares | | | — | | | | — | | | | 12,674,092,078 | | | | 12,876,601,233 | |
| | | | | | | | | | | | | | | | |
Net proceeds from sale of shares | | | 332,718,205 | | | | 264,740,954 | | | | 15,252,856,276 | | | | 16,062,057,054 | |
Net asset value of shares issued to shareholders in payment of distributions declared: | | | | | | | | | | | | | | | | |
Investor class of shares | | | 2,330,523 | | | | 2,187,496 | | | | 767,390 | | | | 2,297,317 | |
Advisor class of shares | | | 113,313 | | | | 102,848 | | | | — | | | | — | |
Institutional class of shares | | | 28,477,908 | | | | 28,868,673 | | | | — | | | | — | |
Premier class of shares | | | — | | | | — | | | | 2,647,786 | | | | 6,417,045 | |
| | | | | | | | | | | | | | | | |
Net proceeds from shares issued: | | | 30,921,744 | | | | 31,159,017 | | | | 3,415,176 | | | | 8,714,362 | |
Cost of shares redeemed: | | | | | | | | | | | | | | | | |
Investor class of shares | | | (23,869,582 | ) | | | (24,315,803 | ) | | | (2,784,757,727 | ) | | | (3,130,464,509 | ) |
Advisor class of shares | | | (704,373 | ) | | | (484,940 | ) | | | — | | | | — | |
Institutional class of shares | | | (241,088,052 | ) | | | (341,433,917 | ) | | | — | | | | — | |
Premier class of shares | | | — | | | | — | | | | (11,723,965,756 | ) | | | (13,139,542,456 | ) |
| | | | | | | | | | | | | | | | |
Net cost of shares redeemed | | | (265,662,007 | ) | | | (366,234,660 | ) | | | (14,508,723,483 | ) | | | (16,270,006,965 | ) |
| | | | | | | | | | | | | | | | |
Net change resulting from fund share transactions in dollars | | $ | 97,977,942 | | | $ | (70,334,689 | ) | | $ | 747,547,969 | | | $ | (199,235,549 | ) |
| | | | | | | | | | | | | | | | |
Capital stock transactions in shares: | | | | | | | | | | | | | | | | |
Sale of shares: | | | | | | | | | | | | | | | | |
Investor class of shares | | | 2,977,900 | | | | 2,807,800 | | | | 2,578,764,198 | | | | 3,185,455,821 | |
Advisor class of shares | | | 96,429 | | | | 77,989 | | | | — | | | | — | |
Institutional class of shares | | | 24,547,106 | | | | 20,143,950 | | | | — | | | | — | |
Premier class of shares | | | — | | | | — | | | | 12,674,092,078 | | | | 12,876,601,233 | |
| | | | | | | | | | | | | | | | |
Net sale of shares | | | 27,621,435 | | | | 23,029,739 | | | | 15,252,856,276 | | | | 16,062,057,054 | |
Shares issued to shareholders in payment of distributions declared: | | | | | | | | | | | | | | | | |
Investor class of shares | | | 192,692 | | | | 190,146 | | | | 767,390 | | | | 2,297,317 | |
Advisor class of shares | | | 9,372 | | | | 8,937 | | | | — | | | | — | |
Institutional class of shares | | | 2,355,842 | | | | 2,515,292 | | | | — | | | | — | |
Premier class of shares | | | — | | | | — | | | | 2,647,786 | | | | 6,417,045 | |
| | | | | | | | | | | | | | | | |
Net shares issued | | | 2,557,906 | | | | 2,714,375 | | | | 3,415,176 | | | | 8,714,362 | |
Shares redeemed: | | | | | | | | | | | | | | | | |
Investor class of shares | | | (1,985,930 | ) | | | (2,120,689 | ) | | | (2,784,757,727 | ) | | | (3,130,464,509 | ) |
Advisor class of shares | | | (58,845 | ) | | | (42,173 | ) | | | — | | | | — | |
Institutional class of shares | | | (20,110,009 | ) | | | (29,932,723 | ) | | | — | | | | — | |
Premier class of shares | | | — | | | | — | | | | (11,723,965,756 | ) | | | (13,139,542,456 | ) |
| | | | | | | | | | | | | | | | |
Net shares redeemed | | | (22,154,784 | ) | | | (32,095,585 | ) | | | (14,508,723,483 | ) | | | (16,270,006,965 | ) |
| | | | | | | | | | | | | | | | |
Net change resulting from fund share transactions in shares | | | 8,024,557 | | | | (6,351,471 | ) | | | 747,547,969 | | | | (199,235,549 | ) |
| | | | | | | | | | | | | | | | |
126
| | | | | | | | | | | | | | | | | | | | | | |
| | | | | | | |
Tax-Free
Money
Market Fund | | | Prime
Money
Market Fund | | | Institutional
Prime Money
Market Fund | |
Year Ended
August 31,
2020 | | | Year Ended
August 31,
2019 | | | Year Ended
August 31,
2020 | | | Year Ended
August 31,
2019 | | | Year Ended
August 31,
2020 | | | Year Ended
August 31,
2019 | |
| | | | | | | | | | | | | | | | | | | | | | |
| | | | | | | | | | | | | | | | | | | | | | |
| $ | 98,378,590 | | | $ | 76,238,873 | | | $ | 306,452,583 | | | $ | 289,687,624 | | | $ | 1,802,371 | | | $ | 94,325 | |
| | — | | | | — | | | | — | | | | — | | | | — | | | | — | |
| | — | | | | — | | | | — | | | | — | | | | — | | | | — | |
| | 565,214,220 | | | | 752,095,278 | | | | 538,048,152 | | | | 485,730,277 | | | | 2,746,132,679 | | | | 2,739,008,147 | |
| | | | | | | | | | | | | | | | | | | | | | |
| | 663,592,810 | | | | 828,334,151 | | | | 844,500,735 | | | | 775,417,901 | | | | 2,747,935,050 | | | | 2,739,102,472 | |
| | | | | | | | | | | | | | | | | | | | | | |
| | 407,224 | | | | 900,019 | | | | 1,612,812 | | | | 3,862,824 | | | | 12,641 | | | | 42,122 | |
| | — | | | | — | | | | — | | | | — | | | | — | | | | — | |
| | — | | | | — | | | | — | | | | — | | | | — | | | | — | |
| | 12,493 | | | | 19,238 | | | | 72,492 | | | | 167,637 | | | | 2,004,877 | | | | 4,200,289 | |
| | | | | | | | | | | | | | | | | | | | | | |
| | 419,717 | | | | 919,257 | | | | 1,685,304 | | | | 4,030,461 | | | | 2,017,518 | | | | 4,242,411 | |
| | | | | | | | | | | | | | | | | | | | | | |
| | (109,479,869 | ) | | | (81,235,290 | ) | | | (287,753,703 | ) | | | (238,814,009 | ) | | | (208,888 | ) | | | (1,319,323 | ) |
| | — | | | | — | | | | — | | | | — | | | | — | | | | — | |
| | — | | | | — | | | | — | | | | — | | | | — | | | | — | |
| | (576,481,130 | ) | | | (721,255,544 | ) | | | (442,604,451 | ) | | | (505,603,471 | ) | | | (2,938,739,250 | ) | | | (2,662,407,686 | ) |
| | | | | | | | | | | | | | | | | | | | | | |
| | (685,960,999 | ) | | | (802,490,834 | ) | | | (730,358,154 | ) | | | (744,417,480 | ) | | | (2,938,948,138 | ) | | | (2,663,727,009 | ) |
| | | | | | | | | | | | | | | | | | | | | | |
| $ | (21,948,472 | ) | | $ | 26,762,574 | | | $ | 115,827,885 | | | $ | 35,030,882 | | | $ | (188,995,570 | ) | | $ | 79,617,874 | |
| | | | | | | | | | | | | | | | | | | | | | |
| | | | | | | | | | | | | | | | | | | | | | |
| | | | | | | | | | | | | | | | | | | | | | |
| | 98,378,590 | | | | 76,238,873 | | | | 306,452,583 | | | | 289,687,624 | | | | 1,802,531 | | | | 94,320 | |
| | — | | | | — | | | | — | | | | — | | | | — | | | | — | |
| | — | | | | — | | | | — | | | | — | | | | — | | | | — | |
| | 565,214,220 | | | | 752,095,278 | | | | 538,048,152 | | | | 485,730,277 | | | | 2,746,146,569 | | | | 2,738,976,101 | |
| | | | | | | | | | | | | | | | | | | | | | |
| | 663,592,810 | | | | 828,334,151 | | | | 844,500,735 | | | | 775,417,901 | | | | 2,747,949,100 | | | | 2,739,070,421 | |
| | | | | | | | | | | | | | | | | | | | | | |
| | 407,224 | | | | 900,019 | | | | 1,612,812 | | | | 3,862,824 | | | | 12,641 | | | | 42,122 | |
| | — | | | | — | | | | — | | | | — | | | | — | | | | — | |
| | — | | | | — | | | | — | | | | — | | | | — | | | | — | |
| | 12,493 | | | | 19,238 | | | | 72,492 | | | | 167,637 | | | | 2,004,917 | | | | 4,200,220 | |
| | | | | | | | | | | | | | | | | | | | | | |
| | 419,717 | | | | 919,257 | | | | 1,685,304 | | | | 4,030,461 | | | | 2,017,558 | | | | 4,242,342 | |
| | | | | | | | | | | | | | | | | | | | | | |
| | (109,479,869 | ) | | | (81,235,290 | ) | | | (287,753,703 | ) | | | (238,814,024 | ) | | | (208,876 | ) | | | (1,319,283 | ) |
| | — | | | | — | | | | — | | | | — | | | | — | | | | — | |
| | — | | | | — | | | | — | | | | — | | | | — | | | | — | |
| | (576,481,130 | ) | | | (721,255,544 | ) | | | (442,604,451 | ) | | | (505,603,471 | ) | | | (2,938,722,858 | ) | | | (2,662,374,872 | ) |
| | | | | | | | | | | | | | | | | | | | | | |
| | (685,960,999 | ) | | | (802,490,834 | ) | | | (730,358,154 | ) | | | (744,417,495 | ) | | | (2,938,931,734 | ) | | | (2,663,694,155 | ) |
| | | | | | | | | | | | | | | | | | | | | | |
| | (21,948,472 | ) | | | 26,762,574 | | | | 115,827,885 | | | | 35,030,867 | | | | (188,965,076 | ) | | | 79,618,608 | |
| | | | | | | | | | | | | | | | | | | | | | |
127
| | |
| | |
| Notes to Financial Statements (continued) | | |
| 5. | | Investment Adviser Fee and Other Transactions with Affiliates |
General—Certain of the Officers and Directors of the Corporation are also Officers and Directors/Trustees of one or more portfolios within the Fund complex, which are affiliates of the Corporation. None of the Fund Officers or interested Directors receives any compensation from the Funds. Certain Officers and Directors are also employees of the Adviser.
Investment Advisory Fees—The Adviser receives for its services an investment adviser fee based on a percentage of each Fund’s average daily net assets (“ADNA”) as listed below.
| | | | | | | | | | | | | | | | | | | | |
| | | Fund’s ADNA | | | | |
Fund | | on the
first
$500
million | | | on the
next
$200
million | | | on the
next
$100
million | | | in
excess
of $800
million | | | | |
Low Volatility Equity Fund | | | 0.400 | (1)% | | | 0.390 | (1)% | | | 0.350 | (1)% | | | 0.300 | (1)% | | | | |
Dividend Income Fund | | | 0.500 | | | | 0.490 | | | | 0.450 | | | | 0.400 | | | | | |
Mid-Cap Value Fund | | | 0.685 | | | | 0.670 | | | | 0.570 | | | | 0.510 | | | | | |
Mid-Cap Growth Fund | | | 0.685 | | | | 0.670 | | | | 0.570 | | | | 0.510 | | | | | |
Small-Cap Value Fund | | | 0.685 | | | | 0.680 | | | | 0.620 | | | | 0.610 | | | | | |
Small-Cap Growth Fund | | | 0.685 | | | | 0.680 | | | | 0.620 | | | | 0.610 | | | | | |
Global Low Volatility Equity Fund | | | 0.500 | (2) | | | 0.490 | (2) | | | 0.450 | (2) | | | 0.400 | (2) | | | | |
Pyrford International Stock Fund | | | 0.735 | | | | 0.720 | | | | 0.620 | | | | 0.560 | | | | | |
LGM Emerging Markets Equity Fund | | | 0.900 | | | | 0.890 | | | | 0.850 | | | | 0.800 | | | | | |
| | |
| | | Fund’s ADNA | | | | |
Fund | | on the
first
$100
million | | | on the
next
$150
million | | | on the
next
$250
million | | | in
excess
of $500
million | | | | |
Ultra Short Tax-Free Fund | | | 0.200 | % | | | 0.190 | % | | | 0.170 | % | | | 0.100 | % | | | | |
Short Tax-Free Fund | | | 0.200 | | | | 0.190 | | | | 0.170 | | | | 0.150 | | | | | |
Short-Term Income Fund | | | 0.200 | | | | 0.190 | | | | 0.170 | | | | 0.100 | | | | | |
Intermediate Tax-Free Fund | | | 0.250 | | | | 0.160 | | | | 0.120 | | | | 0.100 | | | | | |
Strategic Income Fund | | | 0.250 | | | | 0.200 | | | | 0.200 | | | | 0.200 | | | | | |
Corporate Income Fund | | | 0.200 | | | | 0.190 | | | | 0.150 | | | | 0.100 | | | | | |
Core Plus Bond Fund | | | 0.250 | | | | 0.160 | | | | 0.120 | | | | 0.100 | | | | | |
| | | |
| | | Fund’s ADNA | | | | | | | |
Fund | | on the
first
$1
billion | | | on the
next
$1
billion | | | on the
next
$2
billion | | | | | | | |
Large-Cap Value Fund | | | 0.350 | % | | | 0.325 | % | | | 0.300 | % | | | | | | | | |
Large-Cap Growth Fund | | | 0.350 | | | | 0.325 | | | | 0.300 | | | | | | | | | |
Disciplined International Equity Fund | | | 0.600 | | | | 0.575 | | | | 0.550 | | | | | | | | | |
| |
| | | Fund’s ADNA | |
Fund | | on the
first
$2
billion | | | on the
next
$2
billion | | | on the
next
$2
billion | | | on the
next
$2
billion | | | in
excess
of $8
billion | |
Government Money Market Fund | | | 0.200 | % | | | 0.185 | % | | | 0.170 | % | | | 0.155 | % | | | 0.140 | % |
Tax-Free Money Market Fund | | | 0.200 | | | | 0.185 | | | | 0.170 | | | | 0.155 | | | | 0.140 | |
Prime Money Market Fund | | | 0.150 | | | | 0.135 | | | | 0.120 | | | | 0.105 | | | | 0.090 | |
Institutional Prime Money Market Fund | | | 0.150 | | | | 0.135 | | | | 0.120 | | | | 0.105 | | | | 0.090 | |
| | (1) | Effective December 27, 2019 the Advisory Rate was changed from 0.500% to 0.400% on the first $500 million, the next $200 million rate was lowered from 0.490% to 0.390%, the next $100 million the rate was lowered from 0.450% to 0.350%, and thereafter the rate was lowered from 0.400% to 0.300%. |
| | (2) | Effective December 27, 2019 the Advisory Rate was changed from 0.650% to 0.500% on the first $500 million, the next $200 million rate was lowered from 0.640% to 0.490%, the next $100 million the rate was lowered from 0.600% to 0.450%, and thereafter the rate was lowered from 0.550% to 0.400%. |
The Pyrford International Stock Fund’s sub-adviser is Pyrford International Ltd., an affiliate of the Adviser. The LGM Emerging Markets Equity Fund’s sub-adviser is LGM Investments Limited, an affiliate of the Adviser. The Adviser compensates each sub-adviser based on the level of average daily net assets of each respective Fund managed by each sub-adviser.
128
Contractual Expense Limitation—The Adviser has agreed to waive or reduce its investment advisory fee or reimburse expenses to the extent necessary to prevent class specific total annual operating expenses (excluding taxes, dividend and interest expense, brokerage commissions, other investment related costs, Acquired Fund Fees and Expenses and extraordinary expenses, such as litigation and other expenses not incurred in the ordinary course of a Fund’s business) from exceeding the amounts for the periods set forth below. The Adviser may not terminate this arrangement prior to December 31, 2021, without the consent of the Directors, unless the investment advisory agreement is terminated. The Adviser may voluntarily choose to waive any portion of its fee beyond its contractual agreement. The Adviser can modify or terminate this voluntary waiver at any time at its sole discretion. Additionally, the agreement does not provide for recoupment by the Adviser of waived fees or reimbursed expenses.
| | | | | | | | | | | | | | | | | | | | |
| | | Annualized Contractual Expense Limitation | |
Fund | | Investor
Class | | | Advisor
Class | | | Institutional
Class | | | Premier
Class | | | Retirement
Class R-6 | |
Low Volatility Equity Fund | | | | | | | 0.90 | % | | | 0.65 | % | | | | | | | | |
Dividend Income Fund | | | | | | | 0.90 | | | | 0.65 | | | | | | | | | |
Large-Cap Value Fund | | | | | | | 0.79 | | | | 0.54 | | | | | | | | 0.39 | % |
Large-Cap Growth Fund | | | 0.79 | % | | | 0.79 | | | | 0.54 | | | | | | | | 0.39 | |
Mid-Cap Value Fund | | | | | | | 1.24 | | | | 0.99 | | | | | | | | 0.84 | |
Mid-Cap Growth Fund | | | | | | | 1.24 | | | | 0.99 | | | | | | | | 0.84 | |
Small-Cap Value Fund | | | | | | | 1.24 | | | | 0.99 | | | | | | | | 0.84 | |
Small-Cap Growth Fund | | | | | | | 1.24 | | | | 0.99 | | | | | | | | | |
Global Low Volatility Equity Fund | | | | | | | 1.10 | | | | 0.85 | | | | | | | | | |
Disciplined International Equity Fund | | | | | | | 1.15 | | | | 0.90 | | | | | | | | | |
Pyrford International Stock Fund | | | | | | | 1.19 | | | | 0.94 | | | | | | | | 0.79 | |
LGM Emerging Markets Equity Fund | | | | | | | 1.40 | | | | 1.15 | | | | | | | | | |
Ultra Short Tax-Free Fund | | | | | | | 0.55 | | | | 0.30 | | | | | | | | | |
Short Tax-Free Fund | | | | | | | 0.55 | | | | 0.40 | | | | | | | | | |
Short-Term Income Fund | | | | | | | 0.60 | | | | 0.35 | | | | | | | | | |
Intermediate Tax-Free Fund | | | 0.54 | | | | 0.54 | | | | 0.50 | | | | | | | | | |
Strategic Income Fund | | | 0.80 | | | | 0.80 | | | | 0.55 | | | | | | | | | |
Corporate Income Fund | | | 0.59 | | | | 0.59 | | | | 0.55 | | | | | | | | | |
Core Plus Bond Fund | | | 0.59 | | | | 0.59 | | | | 0.55 | | | | | | | | | |
Government Money Market Fund | | | 0.45 | | | | | | | | | | | | 0.20 | % | | | | |
Tax-Free Money Market Fund | | | 0.45 | | | | | | | | | | | | 0.20 | | | | | |
Prime Money Market Fund | | | 0.45 | | | | | | | | | | | | 0.20 | | | | | |
Institutional Prime Money Market Fund | | | 0.45 | | | | | | | | | | | | 0.20 | | | | | |
Shareholder Servicing Fees—Under the terms of a Shareholder Services Agreement with the Adviser, each Fund pays the Adviser at the annual rate of 0.25% of average daily net assets of the Fund’s Investor Class shares for the period. The fee paid to the Adviser is used to finance certain services for shareholders and to maintain shareholder accounts.
Distribution Services Fees—Certain Funds are subject to a Distribution Plan (the “Plan”) pursuant to Rule 12b-1 under the Act. The Plan authorizes payments by the Fund to finance activities intended to result in the sale of its Advisor Class shares. The Plan provides that the Fund may incur distribution expenses of 0.25% of the average daily net assets of the Fund’s Advisor Class shares.
129
| | |
| | |
| Notes to Financial Statements (continued) | | |
Administration Fees—The fee paid to the Adviser is based on each Fund’s average daily net assets with respect to Administration Fee Schedule A and the aggregate average daily net assets of all Funds representing Administration Fee Schedule B as listed below.
| | | | | | | | | | |
| Administration Fee Schedule A | | | | Administration Fee Schedule B |
Annual Rate | | | | | | | | Annual Rate | | ADNA |
| 0.1500% | | | | | | | | 0.0400% | | on the first $2 billion |
| | | | | | | | 0.0300 | | on the next $2 billion |
| | | | | | | | 0.0250 | | on the next $2 billion |
| | | | | | | | 0.0200 | | on the next $2 billion |
| | | | | | | | 0.0100 | | in excess of $8 billion |
| | | | | | | | | | |
| | |
| Fund | | | | Fund |
| Low Volatility Equity Fund(1) | | Ultra Short Tax-Free Fund(1) | | | | Government Money Market Fund(1) |
| Dividend Income Fund(1) | | Short Tax-Free Fund(1) | | | | Tax-Free Money Market Fund(1) |
| Large-Cap Value Fund(1) | | Short-Term Income Fund(1) | | | | Prime Money Market Fund(1) |
| Large-Cap Growth Fund(1) | | Intermediate Tax-Free Fund(1) | | | | Institutional Prime Money Market Fund(1) |
| Mid-Cap Value Fund(1) | | Strategic Income Fund(1) | | | | |
| Mid-Cap Growth Fund(1) | | Corporate Income Fund(1) | | | | |
| Small-Cap Value Fund(1) | | Core Plus Bond Fund(1) | | | | |
| Small-Cap Growth Fund(1) | | | | | | |
| Global Low Volatility Equity Fund | | | | | | |
| Disciplined International Equity(1) | | | | | | |
| Pyrford International Stock Fund(1) | | | | | | |
| LGM Emerging Markets Equity Fund | | | | | | |
| | (1) | For the year ended August 31, 2020, the Funds with class-specific Administration Fees were as follows: |
| | | | | | | | | | | | | | | | |
Fund | | Investor
Class | | | Advisor
Class | | | Institutional
Class | | | Premier
Class | |
Low Volatility Equity Fund | | $ | — | | | $ | 58,653 | | | $ | 313,035 | | | $ | — | |
Dividend Income Fund | | | — | | | | 19,930 | | | | 415,797 | | | | — | |
Large-Cap Value Fund | | | — | | | | 25,653 | | | | 363,229 | | | | — | |
Large-Cap Growth Fund | | | 87,608 | | | | 980 | | | | 227,846 | | | | — | |
Mid-Cap Value Fund | | | — | | | | 49,027 | | | | 113,754 | | | | — | |
Mid-Cap Growth Fund | | | — | | | | 20,066 | | | | 111,408 | | | | — | |
Small-Cap Value Fund | | | — | | | | 3,812 | | | | 61,033 | | | | — | |
Small-Cap Growth Fund | | | — | | | | 41,809 | | | | 98,643 | | | | — | |
Disciplined International Equity Fund | | | — | | | | 209 | | | | 74,770 | | | | — | |
Pyrford International Stock Fund | | | — | | | | 5,313 | | | | 654,700 | | | | — | |
Ultra Short Tax-Free Fund | | | — | | | | 21,037 | | | | 803,534 | | | | — | |
Short Tax-Free Fund | | | — | | | | 5,943 | | | | 207,609 | | | | — | |
Short-Term Income Fund | | | — | | | | 33,879 | | | | 346,996 | | | | — | |
Intermediate Tax-Free Fund | | | 726,150 | | | | 7,388 | | | | 2,127,368 | | | | — | |
Strategic Income Fund | | | 78,233 | | | | 18,469 | | | | 10,620 | | | | — | |
Corporate Income Fund | | | 145,867 | | | | 10,518 | | | | 372,332 | | | | — | |
Core Plus Bond Fund | | | 123,009 | | | | 5,949 | | | | 1,506,925 | | | | — | |
Government Money Market Fund | | | 220,398 | | | | — | | | | — | | | | 939,624 | |
Tax-Free Money Market Fund | | | 24,577 | | | | — | | | | — | | | | 119,462 | |
Prime Money Market Fund | | | 80,562 | | | | — | | | | — | | | | 102,381 | |
Institutional Prime Money Market Fund | | | 652 | | | | — | | | | — | | | | 172,771 | |
Securities Lending—Certain Funds pay a fee to BMO Harris for its services as the securities lending agent. The securities lending income as shown in the Statements of Operations is net of these fees. The following amounts were paid for the year ended August 31, 2020:
| | | | |
Fund | | Fees Paid | |
Low Volatility Equity Fund | | $ | 23,742 | |
Dividend Income Fund | | | 27,576 | |
Large-Cap Value Fund | | | 35,393 | |
Large-Cap Growth Fund | | | 40,253 | |
Mid-Cap Value Fund | | | 17,762 | |
Mid-Cap Growth Fund | | | 13,643 | |
| | | | |
Fund | | Fees Paid | |
Small-Cap Value Fund | | $ | 8,131 | |
Small-Cap Growth Fund | | | 15,242 | |
Short-Term Income Fund | | | 21,933 | |
Strategic Income Fund | | | 11,510 | |
Corporate Income Fund | | | 43,639 | |
Core Plus Bond Fund | | | 108,258 | |
130
Investments in Affiliated Issuers—An affiliated issuer is an entity in which a Fund has ownership of at least 5% of the voting securities or any investment in a BMO Fund. Issuers that are affiliates of the Funds at year-end are noted in the Funds’ Schedules of Investments. Additional security purchases and the reduction of certain securities shares outstanding of existing portfolio holdings that were not considered affiliated in prior periods may result in the Funds owning in excess of 5% of the outstanding shares at year-end. The table below reflects transactions during the period with entities that are affiliates as of August 31, 2020 and may include acquisitions of new investments, prior period holdings that became affiliated during the period and prior period affiliated holdings that are no longer affiliated as of year-end.
| | | | | | | | | | | | | | | | | | | | | | | | | | | | | | | | |
Security/Fund Description | | Value,
Beginning
of Period | | | Purchases(1) | | | Sales
Proceeds(1) | | | Change in
Unrealized
Appreciation
(Depreciation) | | | Net
Realized
Gain(Loss) | | | Value,
End
of Period | | | Dividends
Credited
to
Income | | | Net Realized
Gain on
Capital Gain
Distributions | |
Cash Sweep Investments in BMO Institutional Prime Money Market Fund, Premier Class, 0.130% | |
Low Volatility Equity Fund | | $ | 5,840,436 | | | $ | 165,616,252 | | | $ | 167,202,360 | | | $ | (988 | ) | | $ | 1,120 | | | $ | 4,254,460 | | | $ | 54,748 | | | $ | — | |
Dividend Income Fund | | | 28,264,217 | | | | 66,353,593 | | | | 89,457,104 | | | | (1,219 | ) | | | 644 | | | | 5,160,131 | | | | 63,471 | | | | — | |
Large-Cap Value Fund | | | 5,888,195 | | | | 155,204,938 | | | | 157,502,018 | | | | (424 | ) | | | (809 | ) | | | 3,589,882 | | | | 54,782 | | | | — | |
Large-Cap Growth Fund | | | 5 | | | | 116,940,022 | | | | 113,990,301 | | | | (590 | ) | | | 2,590 | | | | 2,951,726 | | | | 72,019 | | | | — | |
Mid-Cap Value Fund | | | 1,259,074 | | | | 26,630,088 | | | | 26,485,373 | | | | (282 | ) | | | 78 | | | | 1,403,585 | | | | 19,251 | | | | — | |
Mid-Cap Growth Fund | | | 687,000 | | | | 19,613,481 | | | | 18,717,188 | | | | (320 | ) | | | (64 | ) | | | 1,582,909 | | | | 14,428 | | | | — | |
Small-Cap Value Fund | | | 511,829 | | | | 12,299,769 | | | | 11,159,589 | | | | (293 | ) | | | (7 | ) | | | 1,651,709 | | | | 7,580 | | | | — | |
Small-Cap Growth Fund | | | 1,221,390 | | | | 24,564,809 | | | | 23,870,730 | | | | (293 | ) | | | (78 | ) | | | 1,915,098 | | | | 12,378 | | | | — | |
Global Low Volatility Equity Fund | | | 621,645 | | | | 6,361,589 | | | | 6,811,066 | | | | (97 | ) | | | (7 | ) | | | 172,064 | | | | 6,856 | | | | — | |
Disciplined International Equity Fund | | | 182,205 | | | | 16,159,309 | | | | 15,456,542 | | | | (180 | ) | | | 211 | | | | 885,003 | | | | 6,081 | | | | — | |
Pyrford International Stock Fund | | | 26,959,715 | | | | 192,891,398 | | | | 189,048,684 | | | | 356 | | | | (7,821 | ) | | | 30,794,964 | | | | 227,260 | | | | — | |
LGM Emerging Markets Equity Fund | | | 16,712,847 | | | | 88,910,435 | | | | 99,675,524 | | | | (1,583 | ) | | | 4,390 | | | | 5,950,565 | | | | 99,229 | | | | — | |
Short-Term Income Fund | | | 3,541,770 | | | | 194,741,107 | | | | 191,213,651 | | | | (1,428 | ) | | | 1,558 | | | | 7,069,356 | | | | 82,365 | | | | — | |
Strategic Income Fund | | | 1,992,682 | | | | 25,223,407 | | | | 26,514,333 | | | | (112 | ) | | | 1,276 | | | | 702,920 | | | | 24,853 | | | | — | |
Corporate Income Fund | | | 19,020,393 | | | | 174,334,222 | | | | 175,334,269 | | | | (3,207 | ) | | | (133 | ) | | | 18,017,006 | | | | 152,863 | | | | — | |
Core Plus Bond Fund | | | 40,249,132 | | | | 468,820,428 | | | | 484,948,118 | | | | (4,910 | ) | | | 12,605 | | | | 24,129,137 | | | | 322,466 | | | | — | |
|
Collateral Investment for Securities on Loan in BMO Institutional Prime Money Market Fund, Premier Class, 0.130% | |
Global Low Volatility Equity Fund | | | 743,529 | | | | 8,940,816 | | | | 9,253,955 | | | | — | | | | 23 | | | | 430,413 | | | | — | | | | — | |
Disciplined International Equity Fund | | | 6,280,673 | | | | 15,166,050 | | | | 20,914,333 | | | | — | | | | — | | | | 532,390 | | | | — | | | | — | |
Pyrford International Stock Fund | | | 12,915,868 | | | | 318,951,576 | | | | 314,132,948 | | | | — | | | | (210 | ) | | | 17,734,286 | | | | — | | | | — | |
LGM Emerging Markets Equity Fund | | | 1,884,447 | | | | 124,361,059 | | | | 126,241,457 | | | | — | | | | (4,049 | ) | | | — | | | | — | | | | — | |
|
Collateral Pool Pro Rata Allocation for Securities on Loan in BMO Government Money Market Fund, Premier Class, 0.010% | |
Low Volatility Equity Fund | | | 4,368,527 | | | | 50,887,761 | | | | 54,743,082 | | | | — | | | | — | | | | 513,206 | | | | 486 | | | | — | |
Dividend Income Fund | | | 5,582,475 | | | | 82,006,195 | | | | 86,534,424 | | | | — | | | | — | | | | 1,054,246 | | | | 561 | | | | — | |
Large-Cap Value Fund | | | 5,905,804 | | | | 96,081,105 | | | | 100,652,757 | | | | — | | | | — | | | | 1,334,152 | | | | 717 | | | | — | |
Large-Cap Growth Fund | | | 7,435,061 | | | | 95,665,730 | | | | 102,014,791 | | | | — | | | | — | | | | 1,086,000 | | | | 822 | | | | — | |
Mid-Cap Value Fund | | | 2,845,282 | | | | 28,378,777 | | | | 31,001,629 | | | | — | | | | — | | | | 222,430 | | | | 365 | | | | — | |
Mid-Cap Growth Fund | | | 1,522,380 | | | | 23,697,261 | | | | 24,900,844 | | | | — | | | | — | | | | 318,797 | | | | 279 | | | | — | |
Small-Cap Value Fund | | | 1,317,481 | | | | 15,584,160 | | | | 16,741,300 | | | | — | | | | — | | | | 160,341 | | | | 170 | | | | — | |
Small-Cap Growth Fund | | | 2,341,531 | | | | 36,777,505 | | | | 38,620,972 | | | | — | | | | — | | | | 498,064 | | | | 315 | | | | — | |
Short-Term Income Fund | | | 2,183,963 | | | | 41,027,465 | | | | 42,589,062 | | | | — | | | | — | | | | 622,366 | | | | 435 | | | | — | |
Strategic Income Fund | | | 1,365,485 | | | | 17,030,810 | | | | 18,209,487 | | | | — | | | | — | | | | 186,808 | | | | 246 | | | | — | |
Corporate Income Fund | | | 5,389,867 | | | | 97,169,278 | | | | 101,119,024 | | | | — | | | | — | | | | 1,440,121 | | | | 914 | | | | — | |
Core Plus Bond Fund | | | 8,259,006 | | | | 121,484,536 | | | | 128,180,073 | | | | — | | | | — | | | | 1,563,469 | | | | 2,146 | | | | — | |
|
Collateral Pool Pro Rata Allocation for Securities on Loan in BMO Institutional Prime Money Market Fund, Premier Class, 0.130% | |
Low Volatility Equity Fund | | | 27,640,382 | | | | — | | | | 19,655,302 | | | | — | | | | — | | | | 7,985,080 | | | | 7,553 | | | | — | |
Dividend Income Fund | | | 35,321,230 | | | | — | | | | 18,917,975 | | | | — | | | | — | | | | 16,403,255 | | | | 8,722 | | | | — | |
Large-Cap Value Fund | | | 37,366,988 | | | | — | | | | 16,608,624 | | | | — | | | | — | | | | 20,758,364 | | | | 11,143 | | | | — | |
Large-Cap Growth Fund | | | 47,042,842 | | | | — | | | | 30,145,520 | | | | — | | | | — | | | | 16,897,322 | | | | 12,774 | | | | — | |
Mid-Cap Value Fund | | | 18,002,561 | | | | — | | | | 14,541,727 | | | | — | | | | — | | | | 3,460,834 | | | | 5,670 | | | | — | |
Mid-Cap Growth Fund | | | 9,632,344 | | | | — | | | | 4,672,104 | | | | — | | | | — | | | | 4,960,240 | | | | 4,332 | | | | — | |
Small-Cap Value Fund | | | 8,335,920 | | | | — | | | | 5,841,135 | | | | — | | | | — | | | | 2,494,785 | | | | 2,647 | | | | — | |
Small-Cap Growth Fund | | | 14,815,253 | | | | — | | | | 7,065,770 | | | | — | | | | — | | | | 7,749,483 | | | | 4,893 | | | | — | |
Short-Term Income Fund | | | 13,818,288 | | | | — | | | | 4,134,755 | | | | — | | | | — | | | | 9,683,533 | | | | 6,762 | | | | — | |
Strategic Income Fund | | | 8,639,645 | | | | — | | | | 5,733,060 | | | | — | | | | — | | | | 2,906,585 | | | | 3,817 | | | | — | |
Corporate Income Fund | | | 34,102,571 | | | | — | | | | 11,695,407 | | | | — | | | | — | | | | 22,407,164 | | | | 14,208 | | | | — | |
Core Plus Bond Fund | | | 52,256,083 | | | | — | | | | 27,929,728 | | | | — | | | | — | | | | 24,326,355 | | | | 33,359 | | | | — | |
| (1) | Includes adjustment for net change in Collateral Pool Pro Rata Allocation of value, at end of period. |
131
| | |
| | |
| Notes to Financial Statements (continued) | | |
Interfund Borrowing and Lending—The Funds participate in an interfund lending program. This program allows the Funds to borrow cash from any of the BMO Money Market Funds for temporary purposes. The program is subject to a number of conditions, including the requirement that the interfund loan rate to be charged to the Funds under the program is (i) more favorable to the lending Fund than the rate it could otherwise obtain from investing cash in repurchase agreements or purchasing shares of the BMO Money Market Funds and (ii) more favorable to the borrowing Fund than the lowest interest rate at which bank short-term loans would be available to the Funds. In addition, a Fund may participate in the program only if its participation is consistent with the Fund’s investment policies and limitations. The Directors are responsible for the oversight of the interfund lending program.
Funds utilizing the interfund lending program, borrowing from the BMO Government Money Market Fund during the year ended August 31, 2020, were as follows:
| | | | | | | | |
Fund | | Average Daily
Loan Balance
Outstanding | | | Weighted Average
Interest Rate | |
Low Volatility Equity Fund | | $ | 64,316 | | | | 1.234 | % |
Dividend Income Fund | | | 63,704 | | | | 0.755 | |
Large-Cap Value Fund | | | 401,360 | | | | 2.081 | |
Large-Cap Growth Fund | | | 504,504 | | | | 1.219 | |
Mid-Cap Value Fund | | | 24,340 | | | | 1.109 | |
Mid-Cap Growth Fund | | | 3,052 | | | | 2.005 | |
Small-Cap Value Fund | | | 1,579 | | | | 0.753 | |
Global Low Volatility Equity Fund | | | 115,695 | | | | 1.132 | |
Disciplined International Equity Fund | | | 107,569 | | | | 1.897 | |
| | | | | | | | |
Fund | | Average Daily
Loan Balance
Outstanding | | | Weighted Average
Interest Rate | |
LGM Emerging Markets Equity Fund | | $ | 38,061 | | | | 0.762 | % |
Ultra Short Tax-Free Fund | | | 166,897 | | | | 1.405 | |
Short Tax-Free Fund | | | 781 | | | | 0.741 | |
Short-Term Income Fund | | | 149 | | | | 0.739 | |
Intermediate Tax-Free Fund | | | 39,740 | | | | 1.055 | |
Strategic Income Fund | | | 340 | | | | 1.104 | |
Corporate Income Fund | | | 12,905 | | | | 2.098 | |
The Corporation, on behalf of the respective Funds, participated in a $25 million unsecured, committed revolving line of credit (“LOC”) agreement with State Street Bank, expiring on October 15, 2020 and renewing on that same day with a new expiration date of October 14, 2021. The LOC was made available for extraordinary or emergency purposes, primarily for financing redemption payments. Borrowings currently are charged interest at a rate of the London Interbank Offering Rate (“LIBOR”) plus 1.25% and a commitment fee of 0.20% per annum on the daily unused portion with no administrative fee. No borrowings were outstanding under the LOC during the year ended August 31, 2020.
| 7. | | Investment Transactions |
Purchases and sales of investments, excluding short-term U.S. government securities, short-term obligations, and in-kind contributions, for the year ended August 31, 2020 were as follows:
| | | | | | | | | | | | | | | | |
| | | Other than
U.S Government
Securities | | | U.S Government
Securities | |
Fund | | Purchases | | | Sales | | | Purchases | | | Sales | |
Low Volatility Equity Fund | | $ | 186,746,716 | | | $ | 123,498,326 | | | $ | — | | | $ | — | |
Dividend Income Fund | | | 128,360,416 | | | | 175,253,596 | | | | — | | | | — | |
Large-Cap Value Fund | | | 225,363,647 | | | | 252,692,913 | | | | — | | | | — | |
Large-Cap Growth Fund | | | 318,033,380 | | | | 431,104,536 | | | | — | | | | — | |
Mid-Cap Value Fund | | | 56,428,328 | | | | 77,931,678 | | | | — | | | | — | |
Mid-Cap Growth Fund | | | 52,581,762 | | | | 65,690,035 | | | | — | | | | — | |
Small-Cap Value Fund | | | 41,166,586 | | | | 42,422,819 | | | | — | | | | — | |
Small-Cap Growth Fund | | | 64,586,012 | | | | 77,280,955 | | | | — | | | | — | |
Global Low Volatility Equity Fund | | | 12,661,767 | | | | 28,196,205 | | | | — | | | | — | |
Disciplined International Equity Fund | | | 26,967,206 | | | | 49,124,887 | | | | — | | | | — | |
Pyrford International Stock Fund | | | 184,591,848 | | | | 175,448,757 | | | | — | | | | — | |
LGM Emerging Markets Equity Fund | | | 116,091,571 | | | | 146,392,556 | | | | — | | | | — | |
Ultra Short Tax-Free Fund | | | 1,318,540,515 | | | | 1,324,050,266 | | | | — | | | | 6,420,000 | |
Short Tax-Free Fund | | | 87,244,130 | | | | 116,320,740 | | | | — | | | | — | |
Short-Term Income Fund | | | 75,021,676 | | | | 107,810,684 | | | | 36,837,092 | | | | 27,891,889 | |
Intermediate Tax-Free Fund | | | 993,335,414 | | | | 1,032,743,840 | | | | — | | | | — | |
Strategic Income Fund | | | 21,226,339 | | | | 22,374,950 | | | | 539,561 | | | | 4,893,475 | |
Corporate Income Fund | | | 151,534,810 | | | | 106,486,200 | | | | — | | | | — | |
Core Plus Bond Fund | | | 179,698,479 | | | | 88,150,730 | | | | 215,693,560 | | | | 207,489,510 | |
132
| 8. | | Federal Tax Information |
The timing and character of income and capital gain distributions are determined in accordance with income tax regulations, which may differ from GAAP. These differences are due in part to differing treatments for net operating loss, foreign currency transactions, paydown gain or loss, market discount accretion and premium amortization.
To the extent that differences arise that are permanent in nature, such amounts are reclassified within the capital accounts on the Statements of Assets and Liabilities based on their Federal tax basis treatment; temporary differences do not require reclassification and had no impact on the NAV of the Funds.
The Funds complied with FASB interpretation Accounting for Uncertainty in Income Taxes which provides guidance for how uncertain tax provisions should be recognized, measured, presented and disclosed in the financial statements. Accounting for Uncertainty in Income Taxes requires the affirmative evaluation of tax positions taken, or expected to be taken, in the course of preparing the Funds’ tax returns to determine whether it is “more-likely-than-not,” (i.e., greater than 50 percent) of being sustained by the applicable tax authority. Tax positions not deemed to meet the more-likely-than-not threshold may result in a tax benefit or expense in the current year.
Accounting for Uncertainty in Income Taxes requires management of the Funds to analyze all open tax years, as defined by the statutes of limitations, for all major jurisdictions, which includes federal and certain states. Open tax years are those that are open for exam by the taxing authorities (i.e., the last four tax years and the interim tax period since then). There are no examinations in progress. For all open tax years and all major taxing jurisdictions through the end of the reporting period, management of the Fund reviewed all tax positions taken or expected to be taken in the preparation of the Funds’ tax returns and concluded that Accounting for Uncertainty in Income Taxes resulted in no effect on the Funds’ reported net assets or results of operations as of and during the year ended August 31, 2020. Management of the Funds also is not aware of any tax positions for which it is reasonably possible that the total amounts of recognized tax benefits will significantly change in the next twelve months.
The difference between book basis and tax basis unrealized appreciation/depreciation is attributable in part to the tax deferral of losses on wash sales, the realization for tax purposes of unrealized gains on investments in passive foreign investment companies, foreign unrealized capital gains tax, foreign currency and the discount accretion/premium amortization of debt securities.
| | | | | | | | | | | | | | | | |
Fund | | Cost of
Investments
for Federal
Tax Purposes | | | Gross
Unrealized
Appreciation
for Federal
Tax Purposes | | | Gross
Unrealized
(Depreciation)
for Federal
Tax Purposes | | | Net
Unrealized
Appreciation
(Depreciation)
for Federal
Tax Purposes | |
Low Volatility Equity Fund | | $ | 244,993,761 | | | $ | 40,775,193 | | | $ | (5,315,360 | ) | | $ | 35,459,833 | |
Dividend Income Fund | | | 248,951,203 | | | | 47,383,977 | | | | (7,067,674 | ) | | | 40,316,303 | |
Large-Cap Value Fund | | | 292,336,277 | | | | 38,281,174 | | | | (13,144,798 | ) | | | 25,136,376 | |
Large-Cap Growth Fund | | | 304,586,452 | | | | 202,777,833 | | | | (2,309,659 | ) | | | 200,468,174 | |
Mid-Cap Value Fund | | | 114,490,200 | | | | 13,438,194 | | | | (12,264,125 | ) | | | 1,174,069 | |
Mid-Cap Growth Fund | | | 93,451,684 | | | | 22,886,737 | | | | (2,728,334 | ) | | | 20,158,403 | |
Small-Cap Value Fund | | | 57,557,827 | | | | 5,885,693 | | | | (5,949,618 | ) | | | (63,925 | ) |
Small-Cap Growth Fund | | | 103,261,508 | | | | 19,301,273 | | | | (4,115,667 | ) | | | 15,185,606 | |
Global Low Volatility Equity Fund | | | 12,600,204 | | | | 2,183,628 | | | | (574,724 | ) | | | 1,608,904 | |
Disciplined International Equity Fund | | | 35,230,865 | | | | 6,045,144 | | | | (2,026,647 | ) | | | 4,018,497 | |
Pyrford International Stock Fund | | | 651,389,670 | | | | 115,620,749 | | | | (62,431,870 | ) | | | 53,188,879 | |
LGM Emerging Markets Equity Fund | | | 216,348,745 | | | | 46,712,434 | | | | (8,278,101 | ) | | | 38,434,333 | |
Ultra Short Tax-Free Fund | | | 531,817,214 | | | | 2,706,338 | | | | (734,662 | ) | | | 1,971,676 | |
Short Tax-Free Fund | | | 125,830,240 | | | | 2,374,716 | | | | (240,443 | ) | | | 2,134,273 | |
Short-Term Income Fund | | | 254,903,269 | | | | 5,947,748 | | | | (460,743 | ) | | | 5,487,005 | |
Intermediate Tax-Free Fund | | | 1,737,952,045 | | | | 113,229,341 | | | | (3,075,085 | ) | | | 110,154,256 | |
Strategic Income Fund | | | 76,405,741 | | | | 4,771,253 | | | | (2,946,893 | ) | | | 1,824,360 | |
Corporate Income Fund | | | 429,067,886 | | | | 34,237,865 | | | | (1,577,794 | ) | | | 32,660,071 | |
Core Plus Bond Fund | | | 1,143,943,581 | | | | 92,504,105 | | | | (13,958,551 | ) | | | 78,545,554 | |
Government Money Market Fund | | | 3,988,178,625 | | | | — | | | | — | | | | — | |
Tax-Free Money Market Fund | | | 385,407,907 | | | | — | | | | — | | | | — | |
Prime Money Market Fund | | | 612,225,848 | | | | — | | | | — | | | | — | |
Institutional Prime Money Market Fund | | | 372,383,143 | | | | 78,397 | | | | (49,967 | ) | | | 28,430 | |
133
| | |
| | |
| Notes to Financial Statements (continued) | | |
The tax character of distributions reported on the Statements of Changes in Net Assets for the years ended August 31, 2020 and August 31, 2019, were as follows:
| | | | | | | | | | | | | | | | | | | | | | | | | | | | |
| | | 2020 | | | 2019 | |
Fund | | Ordinary
Income | | | Tax-Exempt
Income | | | Long-Term
Capital Gains | | | Return of
Capital | | | Ordinary
Income | | | Tax-Exempt
Income | | | Long-Term
Capital Gains | |
Low Volatility Equity Fund | | $ | 5,195,768 | | | $ | — | | | $ | 3,805,164 | | | $ | — | | | $ | 3,779,573 | | | $ | — | | | $ | 9,447,911 | |
Dividend Income Fund | | | 7,319,856 | | | | — | | | | 482,254 | | | | — | | | | 4,756,191 | | | | — | | | | 7,369,330 | |
Large-Cap Value Fund | | | 6,030,748 | | | | — | | | | 6,437 | | | | — | | | | 9,866,179 | | | | — | | | | 30,382,182 | |
Large-Cap Growth Fund | | | 4,362,889 | | | | — | | | | 18,952,138 | | | | — | | | | 13,206,950 | | | | — | | | | 40,268,668 | |
Mid-Cap Value Fund | | | 2,007,610 | | | | — | | | | 9,401 | | | | — | | | | 3,044,221 | | | | — | | | | 19,687,022 | |
Mid-Cap Growth Fund | | | — | | | | — | | | | 11,748,650 | | | | — | | | | 8,149,700 | | | | — | | | | 11,039,782 | |
Small-Cap Value Fund | | | 491,203 | | | | — | | | | 243,932 | | | | — | | | | 1,961,119 | | | | — | | | | 3,300,073 | |
Small-Cap Growth Fund | | | — | | | | — | | | | 1,778,074 | | | | — | | | | 5,123,756 | | | | — | | | | 13,273,660 | |
Global Low Volatility Equity Fund | | | 1,147,472 | | | | — | | | | 666,600 | | | | — | | | | 1,231,016 | | | | — | | | | 4,731,437 | |
Disciplined International Equity Fund | | | 2,448,925 | | | | — | | | | — | | | | — | | | | 1,528,435 | | | | — | | | | — | |
Pyrford International Stock Fund | | | 17,790,453 | | | | — | | | | — | | | | — | | | | 17,771,263 | | | | — | | | | — | |
LGM Emerging Markets Equity Fund | | | 4,915,995 | | | | — | | | | 1,584,231 | | | | — | | | | 4,193,042 | | | | — | | | | 4,483,419 | |
Ultra Short Tax-Free Fund | | | 35,723 | | | | 7,022,596 | | | | 69,141 | | | | — | | | | 16,759 | | | | 9,600,547 | | | | — | |
Short Tax-Free Fund | | | 3,176 | | | | 2,519,031 | | | | — | | | | — | | | | 9,597 | | | | 3,184,588 | | | | — | |
Short-Term Income Fund | | | 5,661,786 | | | | — | | | | — | | | | — | | | | 6,393,700 | | | | — | | | | — | |
Intermediate Tax-Free Fund | | | 150,239 | | | | 53,448,923 | | | | — | | | | — | | | | 620,457 | | | | 51,210,030 | | | | — | |
Strategic Income Fund | | | 3,238,794 | | | | — | | | | — | | | | 1,855,651 | | | | 3,713,872 | | | | — | | | | — | |
Corporate Income Fund | | | 11,224,569 | | | | — | | | | — | | | | — | | | | 10,884,025 | | | | — | | | | 439,797 | |
Core Plus Bond Fund | | | 32,724,704 | | | | — | | | | — | | | | 931,387 | | | | 34,557,913 | | | | — | | | | — | |
Government Money Market Fund | | | 26,599,786 | | | | — | | | | — | | | | — | | | | 63,212,461 | | | | — | | | | 200 | |
Tax-Free Money Market Fund | | | — | | | | 3,232,019 | | | | 3,940 | | | | — | | | | 12,023 | | | | 5,921,385 | | | | 7,584 | |
Prime Money Market Fund | | | 4,641,360 | | | | — | | | | — | | | | — | | | | 10,006,252 | | | | — | | | | — | |
Institutional Prime Money Market Fund | | | 5,778,384 | | | | — | | | | — | | | | — | | | | 12,722,718 | | | | — | | | | — | |
As of August 31, 2020, the components of distributable earnings on a tax basis are as follows:
| | | | | | | | | | | | | | | | | | | | |
Fund | | Undistributed
Ordinary
Income | | | Undistributed
Tax-Exempt
Income | | | Undistributed
Long-Term
Capital Gains | | | Accumulated
Capital and
Other Losses | | | Unrealized
Appreciation
(Depreciation) | |
Low Volatility Equity Fund | | $ | 438,026 | | | $ | — | | | $ | 129,459 | | | $ | — | | | $ | 35,459,833 | |
Dividend Income Fund | | | 1,017,860 | | | | — | | | | 7,695 | | | | — | | | | 40,316,303 | |
Large-Cap Value Fund | | | 703,713 | | | | — | | | | — | | | | (8,807,481 | ) | | | 25,136,376 | |
Large-Cap Growth Fund | | | 1,698,143 | | | | — | | | | 19,123,939 | | | | — | | | | 200,468,174 | |
Mid-Cap Value Fund | | | 908,652 | | | | — | | | | — | | | | (6,326,260 | ) | | | 1,174,069 | |
Mid-Cap Growth Fund | | | 1,454,323 | | | | — | | | | 5,995,793 | | | | — | | | | 20,158,403 | |
Small-Cap Value Fund | | | 243,819 | | | | — | | | | — | | | | — | | | | (63,925 | ) |
Small-Cap Growth Fund | | | — | | | | — | | | | 3,773,842 | | | | — | | | | 15,185,606 | |
Global Low Volatility Equity Fund | | | 265,483 | | | | — | | | | — | | | | — | | | | 1,609,121 | |
Disciplined International Equity Fund | | | 655,732 | | | | — | | | | — | | | | (7,609,856 | ) | | | 4,034,092 | |
Pyrford International Stock Fund | | | 12,931,800 | | | | — | | | | — | | | | (17,792,371 | ) | | | 53,380,020 | |
LGM Emerging Markets Equity Fund | | | 7,430,831 | | | | — | | | | — | | | | (28,841,642 | ) | | | 38,427,738 | |
Ultra Short Tax-Free Fund | | | — | | | | 126,827 | | | | — | | | | — | | | | 1,971,676 | |
Short Tax-Free Fund | | | — | | | | 115,889 | | | | — | | | | (193,590 | ) | | | 2,134,273 | |
Short-Term Income Fund | | | 148,953 | | | | — | | | | — | | | | (1,752,045 | ) | | | 5,487,005 | |
Intermediate Tax-Free Fund | | | 40,471 | | | | 1,277,024 | | | | — | | | | (33,449,503 | ) | | | 110,154,256 | |
Strategic Income Fund | | | — | | | | — | | | | — | | | | (2,477,649 | ) | | | 1,824,360 | |
Corporate Income Fund | | | 144,480 | | | | — | | | | 1,001,424 | | | | — | | | | 32,660,071 | |
Core Plus Bond Fund | | | — | | | | — | | | | — | | | | (8,541,621 | ) | | | 78,545,554 | |
Government Money Market Fund | | | 29,107 | | | | — | | | | — | | | | (1,834 | ) | | | — | |
Tax-Free Money Market Fund | | | — | | | | 52,596 | | | | — | | | | — | | | | — | |
Prime Money Market Fund | | | — | | | | — | | | | — | | | | — | | | | — | |
Institutional Prime Money Market Fund | | | 28,086 | | | | — | | | | — | | | | — | | | | 28,430 | |
134
At August 31, 2020, the Funds had capital loss carryforwards, which reduce the Funds’ taxable income arising from future net realized gains on investments, if any, to the extent permitted by the Code, and thus will reduce the amount of distributions to shareholders which would otherwise be necessary to relieve the Funds of any liability for federal tax. Pursuant to the Code, such capital loss carryforwards are not subject to expiration and are as follows:
| | | | | | | | | | | | | | | | |
| | | Capital Loss Carryforwards | |
Fund | | Short-Term | | | Long-Term | | | Total | | | Utilized in Current Year | |
Large-Cap Value Fund | | $ | 8,807,481 | | | $ | — | | | $ | 8,807,481 | | | $ | — | |
Mid-Cap Value Fund | | | 6,326,260 | | | | — | | | | 6,326,260 | | | | — | |
Disciplined International Equity Fund | | | 2,629,685 | | | | 4,980,171 | | | | 7,609,856 | | | | — | |
Pyrford International Stock Fund | | | — | | | | 17,792,371 | | | | 17,792,371 | | | | 11,745,116 | |
LGM Emerging Markets Equity Fund | | | 9,126,454 | | | | 19,715,188 | | | | 28,841,642 | | | | — | |
Short Tax-Free Fund | | | 174,478 | | | | 19,112 | | | | 193,590 | | | | — | |
Short-Term Income Fund | | | 640,694 | | | | 1,111,351 | | | | 1,752,045 | | | | 378,962 | |
Intermediate Tax-Free Fund | | | 25,520,582 | | | | 7,928,921 | | | | 33,449,503 | | | | — | |
Strategic Income Fund | | | — | | | | 2,477,649 | | | | 2,477,649 | | | | 1,601,972 | |
Corporate Income Fund | | | — | | | | — | | | | — | | | | 1,422,345 | |
Core Plus Bond Fund | | | — | | | | 8,541,621 | | | | 8,541,621 | | | | 952,402 | |
Government Money Market Fund | | | 1,834 | | | | — | | | | 1,834 | | | | — | |
As of August 31, 2020, the following funds had post-October losses, which are deferred until fiscal year 2021 for tax purposes, of:
| | | | | | | | |
| | | Post-October Losses | |
Fund | | Short-Term | | | Long-Term | |
Low Volatility Equity Fund | | $ | 8,084,105 | | | $ | 3,446,811 | |
Dividend Income Fund | | | 12,610,502 | | | | 10,429,675 | |
Small-Cap Value Fund | | | 3,318,536 | | | | 1,727,299 | |
Global Low Volatility Equity Fund | | | 2,055,186 | | | | 1,465,862 | |
Ultra-Short Tax Free Fund | | | 283,202 | | | | 465,985 | |
Net capital losses incurred after October 31, and within the taxable year, are deemed to arise on the first day of the Fund’s next taxable year.
As of August 31, 2020, the Small-Cap Growth Fund had a late-year ordinary loss of $691,030, which is deferred until fiscal year 2021 for tax purposes. Net late-year losses incurred within the taxable year are deemed to arise on the first day of the Fund’s next taxable year.
The COVID-19 outbreak, first detected in December 2019 and declared a pandemic by the World Health Organization in March 2020, has resulted in significant disruptions to global business activity and the global economy. The ultimate economic fallout from the pandemic, and the long-term impact on economies, markets, industries and individual issuers, are not known. The COVID-19 pandemic has caused substantial market volatility and may adversely affect the value and liquidity of the Fund’s investments, negatively impact the Fund’s performance, and cause disruptions to the Funds’ service providers.
| 10. | | Recently Issued Accounting Pronouncements |
In March 2017, FASB issued an Accounting Standard Update, ASU 2017-08, Receivables Nonrefundable Fees and Other Costs (Subtopic 310-20), Premium Amortization on Purchased Callable Debt Securities (the “ASU”) which amends the amortization period for certain purchased callable debt securities held at a premium, shortening such period to the earliest call date. The ASU does not require any accounting change for debt securities held at a discount; the discount continues to be accreted to maturity. The ASU is effective for fiscal years, and interim periods within those fiscal years, beginning after December 15, 2018. The Funds have adopted ASU 2017-08 and it did not have an impact on the Funds’ financial statements.
| 11. | | Reference Rate Reform |
In March 2020, FASB issued ASU 2020-04, Reference Rate Reform: Facilitation of the Effects of Reference Rate Reform on Financial Reporting. The main objective of the new guidance is to provide relief to companies that will be impacted by the expected change in benchmark interest rates at the end of 2021, when participating banks will no longer be required to submit London Interbank Offered Rate (LIBOR) quotes by the UK Financial Conduct Authority (FCA). The new guidance allows companies to, provided the only change to existing contracts are a change to an approved benchmark interest rate, account for modifications as a continuance of the existing contract without additional analysis. For new and existing contracts, the Funds may elect to apply the amendments as of March 12, 2020 through December 31, 2022. Management is currently assessing the impact of the ASU’s adoption to the Funds’ financial statements and various filings.
135
| | |
| | |
| Notes to Financial Statements (continued) | | |
| 12. | | Shareholder Tax Information (unaudited) |
Of the ordinary income (including short-term capital gain) distributions made by the Funds during the year ended August 31, 2020, the percentages that qualify for the dividend received deduction available to corporate shareholders were as follows:
| | | | |
Low Volatility Equity Fund | | | 60.88 | % |
Dividend Income Fund | | | 73.59 | |
Large-Cap Value Fund | | | 71.87 | |
Large-Cap Growth Fund | | | 57.67 | |
| | | | |
Mid-Cap Value Fund | | | 77.48 | % |
Small-Cap Value Fund | | | 88.46 | |
Global Low Volatility Equity Fund | | | 26.23 | |
LGM Emerging Markets Equity Fund | | | 3.08 | |
Of the ordinary income (including short-term capital gain) distributions made by the Funds during the year ended August 31, 2020, the percentages that are designated as qualified dividend income were as follows:
| | | | |
Low Volatility Equity Fund | | | 66.21 | % |
Dividend Income Fund | | | 74.66 | |
Large-Cap Value Fund | | | 72.86 | |
Large-Cap Growth Fund | | | 57.57 | |
Mid-Cap Value Fund | | | 77.86 | |
| | | | |
Small-Cap Value Fund | | | 93.85 | % |
Global Low Volatility Equity Fund | | | 64.61 | |
Disciplined International Equity Fund | | | 93.05 | |
Pyrford International Stock Fund | | | 82.66 | |
LGM Emerging Markets Equity Fund | | | 80.91 | |
For Federal tax purposes, for the year ended August 31, 2020, the following Funds designate long-term capital gains, or the amounts determined to be necessary, of:
| | | | |
Low Volatility Equity Fund | | $ | 3,805,164 | |
Dividend Income Fund | | | 482,254 | |
Large-Cap Value Fund | | | 6,437 | |
Large-Cap Growth Fund | | | 18,952,138 | |
Mid-Cap Value Fund | | | 9,401 | |
Mid-Cap Growth Fund | | | 11,748,650 | |
| | | | |
Small-Cap Value Fund | | $ | 243,932 | |
Small-Cap Growth Fund | | | 1,778,074 | |
Global Low Volatility Equity Fund | | | 666,600 | |
LGM Emerging Markets Equity Fund | | | 1,584,231 | |
Ultra Short Tax-Free Fund | | | 69,141 | |
Tax-Free Money Market Fund | | | 3,940 | |
For Federal tax purposes, for the year ended August 31, 2020, the following Funds designate qualified short-term capital gains, or the amounts determined to be necessary, of:
| | | | |
Low Volatility Equity Fund | | $ | 923,201 | |
Large-Cap Growth Fund | | | 770,159 | |
Ultra Short Tax-Free Fund | | | 35,723 | |
Prime Money Market Fund | | | 616 | |
Institutional Prime Money Market Fund | | | 3,961 | |
For Federal tax purposes, for the year ended August 31, 2020, the following Funds designate qualified tax-exempt dividends, or the amounts determined to be necessary, of:
| | | | |
Ultra Short Tax-Free Fund | | $ | 8,707,289 | |
Short Tax-Free Fund | | | 3,093,548 | |
Intermediate Tax-Free Fund | | | 60,389,237 | |
Tax-Free Money Market Fund | | | 4,136,003 | |
For the year ended August 31, 2020, Pursuant to Section 853 of the Code, the following Funds designate income derived from foreign sources and foreign taxes paid, or the amounts determined to be necessary, of:
| | | | | | | | | | | | | | | | |
Fund | | Income
Derived from
Foreign Sources | | | Foreign
Source Income
Distributed
per Share | | | Foreign Taxes
Paid | | | Foreign
Taxes Paid
per share | |
Global Low Volatility Equity Fund | | $ | 603,093 | | | $ | 0.45 | | | $ | 51,498 | | | $ | 0.04 | |
Disciplined International Equity Fund | | | 1,675,909 | | | | 0.42 | | | | 104,132 | | | | 0.03 | |
Pyrford International Stock Fund | | | 22,978,794 | | | | 0.44 | | | | 1,004,227 | | | | 0.02 | |
LGM Emerging Markets Equity Fund | | | 8,819,215 | | | | 0.51 | | | | 599,368 | | | | 0.03 | |
For the year ended August 31, 2020, Pursuant to Section 871 of the Code, the Government Money Market Fund designated interest related dividends for non-resident alien shareholders of $26,599,786.
136
| | |
| | |
| | | Report of Independent Registered Public Accounting Firm |
To the Shareholders and Board of Directors BMO Funds, Inc.:
Opinion on the Financial Statements
We have audited the accompanying statements of assets and liabilities of BMO Low Volatility Equity Fund, BMO Dividend Income Fund, BMO Large-Cap Value Fund, BMO Large-Cap Growth Fund, BMO Mid-Cap Value Fund, BMO Mid-Cap Growth Fund, BMO Small-Cap Value Fund, BMO Small-Cap Growth Fund, BMO Global Low Volatility Equity Fund, BMO Disciplined International Equity Fund, BMO Pyrford International Stock Fund, BMO LGM Emerging Markets Equity Fund, BMO Ultra Short Tax-Free Fund, BMO Short Tax-Free Fund, BMO Short-Term Income Fund, BMO Intermediate Tax-Free Fund, BMO Strategic Income Fund, BMO Corporate Income Fund (formerly BMO TCH Corporate Income Fund), BMO Core Plus Bond Fund (formerly BMO TCH Core Plus Bond Fund), BMO Government Money Market Fund, BMO Tax-Free Money Market Fund, BMO Prime Money Market Fund, and BMO Institutional Prime Money Market Fund (each a series of BMO Funds, Inc., collectively referred to as the Funds), including the schedules of investments, as of August 31, 2020, the related statements of operations for the year then ended, the statements of changes in net assets for each of the years in the two-year period then ended, and the related notes (collectively, the financial statements) and the financial highlights for each of the years or periods in the five-year period then ended. In our opinion, the financial statements and financial highlights present fairly, in all material respects, the financial position of the Funds as of August 31, 2020, the results of their operations for the year then ended, the changes in their net assets for each of the years in the two-year period then ended, and the financial highlights for each of the years or periods in the five-year period then ended, in conformity with U.S. generally accepted accounting principles.
Basis for Opinion
These financial statements and financial highlights are the responsibility of the Funds’ management. Our responsibility is to express an opinion on these financial statements and financial highlights based on our audits. We are a public accounting firm registered with the Public Company Accounting Oversight Board (United States) (PCAOB) and are required to be independent with respect to the Funds in accordance with the U.S. federal securities laws and the applicable rules and regulations of the Securities and Exchange Commission and the PCAOB.
We conducted our audits in accordance with the standards of the PCAOB. Those standards require that we plan and perform the audit to obtain reasonable assurance about whether the financial statements and financial highlights are free of material misstatement, whether due to error or fraud. Our audits included performing procedures to assess the risks of material misstatement of the financial statements and financial highlights, whether due to error or fraud, and performing procedures that respond to those risks. Such procedures included examining, on a test basis, evidence regarding the amounts and disclosures in the financial statements and financial highlights. Such procedures also included confirmation of securities owned as of August 31, 2020, by correspondence with the custodians and brokers or by other appropriate auditing procedures. Our audits also included evaluating the accounting principles used and significant estimates made by management, as well as evaluating the overall presentation of the financial statements and financial highlights. We believe that our audits provide a reasonable basis for our opinion.
/s/ KPMG LLP
We have served as the auditor of one or more BMO Funds, Inc. investment companies since 2011.
Columbus, Ohio
October 27, 2020
137
| | |
| | |
| Results of Special Meeting of Shareholders (Unaudited) | | |
A special meeting of shareholders of BMO Funds, Inc. was held on July 10, 2020. The matter voted on by the shareholders of record as of May 14, 2020 and the results of the vote at the shareholder meeting were as follows:
| | | | | | | | |
To elect eight directors to the Corporation’s Board of Directors | | Votes For | | | Votes Withheld | |
Marie-Renée Bakker | | | 3,599,681,878.098 | | | | 4,624,523.218 | |
John M. Blaser | | | 3,592,855,038.019 | | | | 11,451,363.297 | |
Ridge A. Braunschweig | | | 3,582,755,431.607 | | | | 21,550,969.709 | |
Teresa V. Jankovic | | | 3,600,647,931.143 | | | | 3,658,470.173 | |
John A. Lubs | | | 3,571,368,532.405 | | | | 32,937,868.911 | |
Vincent P. Lyles | | | 3,582,955,899.533 | | | | 21,350,501.783 | |
Daniela O’Leary-Gill | | | 3,591,151,091.170 | | | | 13,155,310.146 | |
Barbara J. Pope | | | 3,502,276,106.928 | | | | 102,030,294.388 | |
The approval by shareholders of the proposal resulted in the election to the Board of Directors of Ms. Bakker and Ms. Jankovic effective September 1, 2020. Each other Director continued in office following the meeting.
138
| | |
| |
| Directors and Officers of the Funds (continued) |
The following tables provide information about each Director and Officer of the Funds as of September 1, 2020. The address of each Director is c/o BMO Funds, 790 North Water Street, 11th Floor, Milwaukee, Wisconsin 53202. There are currently 29 separate portfolios or funds in the BMO Funds complex, of which 28 are registered as BMO Funds, Inc. and one is registered as BMO LGM Frontier Markets Equity Fund with the Securities and Exchange Commission. The Funds’ Statement of Additional Information includes additional information about the Directors and is available, without charge and upon request, by calling 1-800-236-FUND (3863).
| | | | | | | | | | |
| INDEPENDENT DIRECTORS | | | | | | |
| Name and Age | | Position(s) Held
with the Corporation | | Term of
Office and
Length of
Time Served* | | Principal Occupation(s)
During Past 5 Years | | Number of
Portfolios in
Fund
Complex
Overseen by
Director | | Other
Directorships
Held by
Director |
| | | | | |
Marie-Renée Bakker Age: 63 | | Independent Director | | Since
September
2020 | | Director, National Green Fund (a Dutch “green” investment fund) since 2016; previously, Senior Finance Manager at the World Bank Group (financial institution), 2005-2019. | | 29 | | None |
| | | | | |
Ridge A. Braunschweig Age: 67 | | Independent Director | | Since
October
2009 | | President and Chief Executive Officer, CPL Industries, Inc. (a manufacturing holding company prior to May 2009 and a family office since May 2009), since January 2012. | | 29 | | None |
| | | | | |
Teresa V. Jankovic Age: 65 | | Independent Director | | Since
September
2020 | | Founder and Independent Consultant, The Independent Consultant, LLC (a financial services consulting firm), since 2016; Managing Director, Bank of New York Mellon, from 2011 to 2016. | | 29 | | None |
| | | | | |
John A. Lubs Age: 72 | | Independent Director | | Since July
2004 | | Retired; formerly, Vice Chairman, Mason Companies, Inc. (a footwear distributor), from 2004 to 2010 and Chief Operating Officer, from 2003 to 2010. | | 29 | | None |
| | | | | |
Vincent P. Lyles Age: 59 | | Independent Director | | Since
September
2017 | | Vice President of Community Relations, Advocate Aurora Health Care, since 2019; President and Chief Executive Officer, Boys & Girls Clubs of Greater Milwaukee, from 2012 to 2018. | | 29 | | None |
| | | | | |
Barbara J. Pope
Age: 72 | | Independent Director | | Since
March
1999 | | Retired; formerly, President of Barbara J. Pope, P.C. (a financial consulting firm), 1992-2015; President of Sedgwick Street Fund LLC (a private investment partnership), 1996-2015; Tax Partner, Price Waterhouse. | | 29 | | None |
* Each Director serves an indefinite term until he or she retires or otherwise resigns, is removed, dies or until his or her successor is duly elected. Retirement
for a Director occurs no later than August 31 following his or her 75th birthday. |
139
| | |
| |
| Directors and Officers of the Funds (Unaudited) (continued) |
| | | | | | | | | | |
| INTERESTED DIRECTORS |
| Name and Age | | Position(s) Held with
the Corporation | | Term of
Office and
Length of
Time Served* | | Principal Occupation(s)
During Past 5 Years | | Number of
Portfolios in
Fund
Complex
Overseen by
Director | | Other
Directorships
Held by
Director |
| | | | | |
John M. Blaser** Age: 63 | | Director and President | | Since
May
1999 | | Managing Director of the Adviser, since June 2012. | | 29 | | None |
| | | | | |
Daniela O’Leary - Gill** Age: 55 | | Director | | Since
August
2018 | | Retired; formerly, Chief Operating Officer of BMO Financial Group, from 2018 to 2020; Director of the Adviser from 2018 to 2020; Head, Communications, Government & Investor Relations from 2016 to 2018; Head, AML Program Oversight from 2014 to 2016. | | 29 | | None |
* Each Director serves an indefinite term until he or she retires or otherwise resigns, is removed, dies or until his or her successor is duly elected. Retirement
for a Director occurs no later than August 31 following his or her 75th birthday. |
** Mr. Blaser is an “interested person” of the Corporation (as defined in the 1940 Act) due to the positions that he holds with the Corporation, and the
Adviser. Ms. O’Leary - Gill is an “interested person” of the Corporation due to the positions that she held with the Adviser and BMO. |
| | | | | | |
| PRINCIPAL OFFICERS |
| Name and Age | | Position(s) Held with
the Corporation | | Term of Office and Length of
Time Served | | Principal Occupation(s) During Past 5
Years |
| | | |
Brett Black Age: 48 | | Chief Compliance Officer and Anti-Money Laundering Compliance Officer | | Elected by the Board annually; since November 2017 | | Vice President and Chief Compliance Officer of BMO Harris Bank, since 2017; Assistant Vice President, Deputy Chief Compliance Officer, since 2014; Senior Compliance Officer of BMO Harris Bank, since 2012. |
| | | |
Timothy M. Bonin Age: 47 | | Vice President, Chief Financial Officer and Treasurer | | Elected by the Board annually; since February 2006 | | Vice President of the Adviser, since February 2006. |
| | | |
Michael J. Murphy Age: 41 | | Secretary | | Elected by the Board annually; since May 2016 | | Senior Counsel and Vice President of BMO Harris Bank N.A., since 2014; Associate, Vedder Price P.C., 2010 to 2014. |
140
| | |
| |
| Discussion of the Operation and Effectiveness of the Funds’ Liquidity Risk Management Program (Unaudited) |
As required by Rule 22e-4 (the “Liquidity Rule”) adopted by the Securities and Exchange Commission (the “SEC”) under the Investment Company Act of 1940 (the “1940 Act”), the Board of Directors (the “Board”) of BMO Funds, Inc., (the “Company”), approved the Liquidity Risk Management Program (the “Program”) with respect to the Funds to facilitate compliance with all requirements of the Liquidity Rule and to protect shareholders from dilution of their interests.
The Program is administered by the Liquidity Risk Management Committee (the “Committee”), which is comprised of the Chief Compliance Officer, the Chief Financial Officer, and the Secretary of the Funds. At least annually, as required by the Liquidity Rule, the Board reviews a report prepared by the Committee on the adequacy and effectiveness of the Program and, if applicable, any material changes to the Program.
On May 13, 2020, during a regularly scheduled meeting of the Board, the Committee provided the Board with a written report addressing the Program’s adequacy and effectiveness for the period December 1, 2018 to December 31, 2019 (the “Review Period”). The Committee concluded that the Program, as adopted and implemented, is reasonably designed to assess and manage each Fund’s liquidity risk.
The Committee assesses, manages, and at least monthly reviews each Fund’s liquidity risk. In assessing, managing, and reviewing a Fund’s liquidity risk, the Committee considers, as applicable, the following factors: (i) a Fund’s investment strategy, (ii) the liquidity of a Fund’s portfolio investments, (iii) a Fund’s holdings of cash and cash equivalents and borrowing arrangements, and (iv) a Fund’s short-term and long-term cash flow projections.
The Committee classifies each Fund’s portfolio investments as highly liquid, moderately liquid, less liquid, or illiquid. The classification is based on a determination of how long it is reasonably expected to take to convert the investment into cash, or sell or dispose of the investment, in current market conditions without significantly changing the market value of the investment. The Committee makes its determination by considering relevant market and trading data provided by a third-party vendor, investment-specific considerations, and, when appropriate, input from the Funds’ portfolio managers. During the Review Period, the Committee concluded that each Fund primarily held assets that are highly liquid. Accordingly, the Committee concluded that each Fund was able to rely on the exclusion in the Liquidity Rule from the requirements related to highly liquid investment minimums.
The Committee also monitors each Fund’s compliance with the Liquidity Rule’s limit on a Fund’s investments in illiquid investments of no more than 15% of its net assets. The Committee reported that, during the Review Period, no Fund exceeded the 15% limit on illiquid investments, and as such, the Committee indicated no events occurred that would require the filing of Form N-LIQUID with the SEC.
141
| | |
| |
| Shareholder Report Disclosure of Directors’ Approval of Continuation of Contracts (Unaudited) |
Approval of Continuation of Advisory and Subadvisory Agreements
During the reporting period, the Board of Directors (the “Board”) of BMO Funds, Inc. (the “Corporation”), including the Directors who are not “interested persons” of the Corporation as defined in the Investment Company Act of 1940, as amended (the “Independent Directors”), met to discuss the advisory and subadvisory agreements, as applicable, of each portfolio of the Corporation included in this shareholder report (each, a “Fund” and collectively, the “Funds”). The Board approved the continuation of the following agreements, all for an additional year ending August 31, 2021 (except as noted): (1) the investment advisory agreement (the “Advisory Agreement”) between the Corporation and BMO Asset Management Corp. (the “Adviser”) on behalf of each Fund (for an additional year ending August 26, 2020 for BMO Disciplined Equity Fund); (2) an investment subadvisory agreement with each of the following subadvisers that are affiliates of the Adviser: (i) LGM Investments Limited on behalf of BMO LGM Emerging Markets Equity Fund; and (ii) Pyrford International Ltd. on behalf of BMO Pyrford International Stock Fund. The subadvisers listed above are referred to herein each as a “Subadviser” and collectively as the “Subadvisers.” The subadvisory agreements listed above are referred to herein each as a “Subadvisory Agreement” and collectively as the “Subadvisory Agreements.”
At Board meetings held on July 8, 2020 (“July Meeting”) and August 12, 2020 (“August Meeting”), the Board met with management of the Adviser regarding the annual approval of the continuation of the Funds’ Advisory and Subadvisory Agreements. In connection with its consideration of the Advisory and Subadvisory Agreements, the Board considered the information furnished and discussed throughout the year at regularly scheduled Board and Committee meetings, as applicable, and the information provided specifically in relation to the annual consideration of the approval of the Advisory Agreement and Subadvisory Agreements in response to requests of the Independent Directors and their independent legal counsel. Information furnished in connection with Board or Committee meetings throughout the year included, among other things, presentations given by the portfolio managers of the Funds on each Fund’s investment strategies, risks, absolute performance, and comparative performance of each Fund against its benchmark indices; reports regarding each Fund’s asset levels including sales and redemption activities; and various reports on the monitoring of the Funds’ compliance with the securities laws, regulations, policies, and procedures.
In preparation for the Board’s annual consideration of the approval of the Advisory and Subadvisory Agreements, the Board requested and received a wide variety of information and reports concerning the Adviser (and its affiliates) and the Subadvisers, including information on: (1) the nature, extent and quality of services provided to each Fund by the Adviser (and its affiliates) and the Subadvisers, as applicable; (2) the investment performance of each Fund as compared to a group of comparable funds; (3) the level of the advisory and subadvisory fees charged to each Fund as compared to: (a) other clients of the Adviser and the Subadvisers and (b) a group of comparable funds; (4) the expense ratios of each Fund as compared to a group of comparable funds; (5) profitability information for the Adviser and, to the extent made available, profitability information for the Subadvisers; and (6) the Adviser’s and each Subadviser’s compliance program. The Board also considered information related to potential “fall out” or ancillary benefits enjoyed by the Adviser (and its affiliates) and each Subadviser as a result of their relationships with the Funds.
In addition to evaluating, among other things, the written information provided by the Adviser, the Board also considered the answers to questions posed by the Board to representatives of the Adviser at various meetings and took into account their accumulated experience in working with the Adviser on matters related to the Funds. The Independent Directors also met separately in executive sessions with their independent legal counsel to review and consider the information provided regarding the Advisory Agreement and the Subadvisory Agreements.
Based on their review, the Independent Directors and the full Board concluded that it was in the best interests of each Fund to approve the continuation of each Advisory and Subadvisory Agreement, as applicable. Although the Advisory Agreement and the Subadvisory Agreements for all of the Funds were considered at the same Board meeting, the Board considered each Fund separately. In their deliberations, the Board did not identify any single factor or group of factors as all-important or controlling, but considered all factors together. The material factors and conclusions that formed the basis for the Board’s determinations are discussed below.
Nature, Extent and Quality of Services
In evaluating the nature, extent, and quality of the services provided by the Adviser and each Subadviser to the Funds, the Board reviewed information describing the financial strength, experience, resources and key personnel of the Adviser and each Subadviser, including the personnel who provide investment management services to the Funds. With respect to the Adviser, the Board considered the administrative services that are provided to each Fund, as well as other services performed by the Adviser, including the selection and monitoring of the Subadvisers, as applicable; monitoring of the execution of portfolio transactions; monitoring adherence to the Funds’ investment restrictions; monitoring the Funds’ compliance with their compliance policies and procedures and with applicable securities laws and regulations; producing shareholder reports; providing support services for the Board and Board committees; communicating with shareholders; and overseeing the activities of other service providers. The Board also considered the Adviser’s experience in providing investment advisory services to funds and the differentiation of the advisory services provided by the management team versus the portfolio management services provided by the Subadvisers, as applicable. With respect to each Subadviser, the Board noted each Subadviser’s experience in managing the strategies of its respective Fund and each Subadviser’s compliance program as it relates to the Fund. The Board considered the other services provided by the Subadvisers under the Subadvisory Agreements, including selecting broker-dealers for execution of portfolio transactions; monitoring adherence to the Fund’s investment restrictions; and assisting with portfolio compliance with securities laws, regulations, policies and procedures.
142
Based upon this review, the Board concluded that the nature, quality and extent of the services to be provided to each Fund by the Adviser and each Subadviser, as applicable, are expected to be satisfactory.
Review of Fund Performance
The Board reviewed the investment performance of each of the Funds. While consideration was given to performance reports provided in connection with, and discussions held at, regular Board meetings throughout the year, particular attention was given to the performance reports provided specifically in connection with the July and August Meetings. In particular, the Board noted the performance of each Fund relative to its Lipper Inc. (“Lipper”) peer universe. The Directors also considered performance information for each Fund relative to its benchmark and, as applicable, its Morningstar, Inc. (“Morningstar”) ratings.
With respect to each Fund’s performance as compared to its Lipper peer universe (“peer group”), the Board reviewed each Fund’s performance percentile rankings over the year-to-date and one-, three-, five-, and ten-year trailing periods (as applicable) through May 31, 2020, as provided by the Adviser. The Board also reviewed each Fund’s performance relative to its respective benchmark over various trailing periods ended May 31, 2020. The Board considered that each Fund ranked in one of the top two quartiles for performance as compared to its peer group in at least half of the periods reviewed, except for the following Funds.
With respect to the BMO Large-Cap Growth Fund, the Board considered that its year-to-date and one- and three-year performance was in the third quartile of its peer group, while its five- and ten-year performance was in the second quartile. The Board observed that the Fund underperformed its benchmark for the one-, three-, five-, and ten-year periods. The Board noted that the Fund was ranked three stars by Morningstar. The Board considered the Adviser’s explanation that the Fund’s recent underperformance could be attributed, in part, to technology company concentration within the large-capitalization universe, as well as to the Fund’s sector positioning.
With respect to the BMO Mid-Cap Value Fund, the Board considered that its year-to-date and one-, three-, five- and ten-year performance was in the fourth quartile of its peer group. The Board observed that the Fund underperformed its benchmark for the one-, three-, five- and ten-year periods. The Board noted that the Fund was ranked two stars by Morningstar. The Board considered the Adviser’s explanation that the Fund’s recent underperformance could be attributed, in part, to stocks with energy and consumer travel exposure selling off, as well as to the management team’s incorporation of stock valuation factors into the investment selection process. The Board also noted the Adviser’s representation that the Fund remains positioned in line with strategic mandates and considered that Fund management is closely monitoring the Fund.
With respect to the BMO Mid-Cap Growth Fund, the Board considered that its year-to-date and five- and ten-year performance was in the fourth quartile of its peer group, while its one- and three-year performance was in the third quartile. The Board observed that the Fund underperformed its benchmark for the one-, three-, five- and ten-year periods. The Board noted that the Fund was ranked two stars by Morningstar. The Board considered the Adviser’s explanation that the Fund’s recent underperformance could be attributed, in part, to the management team’s incorporation of stock valuation factors into the investment selection process, as well as to the Fund’s smaller market-capitalization positioning compared to its peer group and benchmark.
With respect to the BMO Small-Cap Value Fund, the Board considered that its year-to-date and one-, three-, and five-year performance was in the fourth quartile of its peer group. The Board observed that the Fund underperformed its benchmark for the one-, three- and five-year periods. The Board noted that the Fund was ranked three stars by Morningstar. The Board considered the Adviser’s explanation that the Fund’s recent underperformance could be attributed, in significant part, to the management team’s incorporation of stock valuation factors into the investment selection process.
With respect to the BMO Small-Cap Growth Fund, the Board considered that its year-to-date and one-, three-, five- and ten-year performance was in the fourth quartile of its peer group. The Board observed that the Fund underperformed its benchmark for the one-, three-, five- and ten-year periods. The Board noted that the Fund was ranked one star by Morningstar. The Board considered the Adviser’s explanation that the Fund’s recent underperformance could be attributed, in significant part, to the management team’s incorporation of stock valuation factors into the investment selection process.
With respect to the BMO Disciplined International Equity Fund, the Board considered its limited performance history and noted that its year-to-date and one-year performance was in the third quartile of its peer group, while its three-year performance was in the fourth quartile. The Board observed that the Fund underperformed its benchmark for the one- and three-year periods. The Board considered the Adviser’s explanation that the Fund’s recent underperformance could be attributed, in significant part, to the management team’s incorporation of stock valuation factors into the investment selection process. The Board also noted the Adviser’s representation that the Fund remains positioned in line with strategic mandates and considered that Fund management is closely monitoring the Fund.
With respect to the BMO LGM Emerging Markets Equity Fund, the Board considered that its year-to-date and ten-year performance was in the third quartile of its peer group, its one- and three-year performance was in the fourth quartile, and its five-year performance was in the second quartile. The Board observed that the Fund underperformed its benchmark for the one-, three- and ten-year periods, while its five-year performance was within two basis points of its benchmark. The Board noted that the Fund was ranked three stars by Morningstar. The Board considered the Adviser’s explanation that the
143
| | |
| |
| Shareholder Report Disclosure of Directors’ Approval of Continuation of Contracts (Unaudited) (continued) |
Fund invests in stable businesses with strong cash flows and balance sheets and that the Fund’s recent underperformance could be attributed, in part, to the recent stay-at-home consumer behavior associated with the COVID-19 pandemic, as well as to country allocation. The Board also noted the Adviser’s representation that the Fund plans to continue investing in companies with strong balance sheets, earning potential, and solid management teams and considered that Fund management is closely monitoring the Fund.
With respect to the BMO Ultra Short Tax-Free Fund, the Board considered that its year-to-date and one-, three-, five-, and ten-year performance was in the third quartile of its peer group. The Board observed that the Fund underperformed its benchmark for the one-, three-, and five-year periods. The Board noted that the Fund was ranked two stars by Morningstar. The Board considered the Adviser’s explanation that the Fund’s recent underperformance with respect to ultra-short municipal fund peers could be attributed, in part, to the Fund’s lower duration, higher floating rate exposure, and higher average credit quality. The Board also noted the Adviser’s explanation that the Fund’s longer-term performance compared favorably with respect to such peers and considered that Fund management is closely monitoring the Fund.
With respect to the BMO Intermediate Tax-Free Fund, the Board considered that its year-to-date and one-year performance was in the fourth quartile of its peer group, its three-year performance was in the third quartile, and its five-year performance was in the second quartile. The Board observed that the Fund underperformed its benchmark for the one-, three-, and five-year periods. The Board noted that the Fund was ranked three stars by Morningstar. The Board considered the Adviser’s explanation that the Fund’s recent underperformance could be attributed, in part, to the Fund’s “barbell” positioning with respect to the yield curve (i.e., less exposure to the two to ten-year portion of the curve), as well as to the Fund’s underweight allocation to higher quality holdings. The Board also considered that Fund management is closely monitoring the Fund.
The Board determined that it was generally satisfied with each Fund’s performance and would continue to closely monitor each Fund’s performance results.
Costs of Services Provided and Profits Realized by the Adviser and Subadvisers
The Board considered the fees payable by each Fund under the Advisory Agreement and each Subadvisory Agreement. The Board first reviewed the management fees charged to comparable accounts managed by the Adviser and the Subadvisers of each Fund, if any, taking into consideration differences in style, size and services provided to such other accounts. The Board noted that, in some cases, the fees for certain accounts or average fees for certain investment strategies were lower than the fees charged to certain Funds with similar investment strategies. The Board considered the Adviser’s explanation that registered investment companies generally require additional advisory and administrative services than other clients due to the enhanced regulatory structure and legal requirements with which investment companies must comply. With respect to the Subadvisers, the Board also considered the affiliation of each Subadviser with the Adviser.
The Board next reviewed information provided by the Adviser comparing each Fund’s contractual (gross) advisory fee to the median fee of its Morningstar peer category (“Morningstar peers”) or Strategic Insight’s Simfund peer category (“Simfund peers”). In addition, the Board reviewed information provided by the Adviser comparing each Fund’s net expense ratio to the median net expense ratio of the comparable Morningstar peer group and Lipper peer group (“Lipper peers”). With respect to the Subadvisers, the Board considered the fees payable under the Subadvisory Agreements, noting that the fees would be paid by the Adviser (not the Fund). The Board also considered the division of services provided and fee split between the Adviser and each Subadviser.
The Board considered that all of the equity and fixed income Funds’ contractual advisory fees were lower than their Morningstar peers and all of the money market Funds’ contractual advisory fees were equal to or within six basis points of their Simfund peers.
The Board considered and viewed favorably that the Adviser has agreed to contractual expense limitations for the Funds (the “Expense Limitations”), and that the net expense ratios for the Funds take into account the effect of the Expense Limitations.
The Board considered the methodology used by the Adviser and each Subadviser in determining compensation payable to its portfolio managers and the competitive environment for investment management talent. The Board also considered the financial condition of the Adviser and certain of its affiliates and each Subadviser, and particularly focused on the financial strength of the ultimate parent company of the Adviser, and the parent company’s commitment, financial and otherwise, to the global asset management business and the Funds.
The Board reviewed profitability information it received from the Adviser in connection with the services provided to each Fund and the Corporation as a whole. The materials provided in this regard showed, and the Directors acknowledged, that the Adviser experienced positive net margins with respect to certain Funds and did not experience positive net margins with respect to other Funds. The Board also reviewed the comparative profitability information provided by the Adviser from Strategic Insight regarding other public investment advisory firms. The Board also reviewed and considered profitability information it received from each Subadviser, if provided, in connection with the services provided to each Fund.
Economies of Scale
The Board considered the extent to which economies of scale would be realized as the Funds grow and whether the Funds’ fee levels reflect these economies of scale for the benefit of Fund shareholders. The Board considered each Fund’s fee structure,
144
asset size and net expense ratio giving effect to each Fund’s Expense Limitation. The Board was satisfied with the fee structures and also considered the Adviser’s commitment to continue to evaluate advisory fee breakpoints in the future.
Other Benefits to the Adviser and Subadvisers
The Board considered benefits that accrue to the Adviser and its affiliates from their relationships with the Funds, including revenue in the form of administration fees, shareholder service fees and securities lending revenue. In addition, the Board considered information relating to any soft dollar arrangements in connection with equity security brokerage transactions for the Funds (particularly with respect to the Funds only investing in U.S. equity securities). The Board noted that, other than the services provided by the Adviser and Subadvisers pursuant to the Advisory and Subadvisory Agreements and the related fees to be paid by each Fund, the Adviser and Subadvisers may potentially benefit from their relationship with each Fund in other ways. The Board also considered that the success of any Fund could attract other business to the Adviser and that the success of the Adviser could enhance the Adviser’s ability to serve the Funds.
The Board concluded that, taking into account all of the information reviewed, each Fund’s advisory and subadvisory fee was reasonable.
Overall Conclusions
Based on all of the information considered and the conclusions reached, the Board determined that the terms of the Advisory and Subadvisory Agreements are fair and reasonable and that the approval of the continuation of the Advisory Agreement and each Subadvisory Agreement is in the best interests of each applicable Fund.
145
146
147
148
This report is authorized for distribution to prospective investors only when preceded or accompanied by the Funds’ prospectuses, which contain facts concerning each Fund’s objective and policies, management fees, expenses, and other information.
Proxy Voting
A description of the policies and procedures that the Funds use to determine how to vote proxies relating to portfolio securities is available without charge, upon request, by calling toll free, 1-800-236-FUND (3863) and by accessing the Funds’ Statement of Additional Information, which is available on the Funds’ website at http://www.bmofunds.com and on the SEC’s website at http://www.sec.gov.
Each Fund’s proxy voting record for the most recent 12-month period ended June 30 is available without charge, upon request, by calling toll free, 1-800-236-FUND (3863) and by accessing the SEC’s website at http://www.sec.gov.
Disclosure of Portfolio Holdings
The Funds file their complete schedules of portfolio holdings with the SEC periodically. The schedule of portfolio holdings for the first and third quarter of the fiscal year for each Fund (other than the money market funds) is included as an exhibit on Form N-PORT. The schedule of portfolio holdings for the money market funds is filed monthly on Form N-MFP. Each Fund’s Form N-PORT or N-MFP is available on the SEC’s website at http://www.sec.gov and may be reviewed and copied at the SEC’s Public Reference Room in Washington, D.C. Information on the operation of the Public Reference Room may be obtained by calling 1-800-SEC-0330.
Shares of the BMO Funds are not bank deposits or other obligations of, or issued, endorsed or guaranteed by, BMO Harris Bank, NA, or any of its affiliates. Shares of the BMO Funds, like shares of all mutual funds, are not insured or guaranteed by the U.S. government, the Federal Deposit Insurance Corporation, the Federal Reserve Board, or any other government agency. Investment in mutual funds involves investment risk, including the possible loss of principal.
| | |
| | PRSRT STD U.S. POSTAGE PAID LANCASTER, PA PERMIT NO. 1793 |
| | |
 | | BMO Funds U.S. Services P.O. Box 55931 Boston, MA 02205-5931 |
| | |
 | | Contact us 1-800-236-FUND (3863) 414-287-8555 |
| | |
 | | Learn more bmofunds.com |
DISTRIBUTOR
Foreside Financial Services, LLC
Three Canal Plaza, Suite 100
Portland, Maine 04101
www.foreside.com
INVESTMENT ADVISER
BMO Asset Management Corp.
Investment products are: NOT FDIC INSURED — NO BANK GUARANTEE — MAY LOSE VALUE.
© 2020 BMO Financial Corp. (9/20)
Annual report
Conservative Allocation Fund
Moderate Allocation Fund
Balanced Allocation Fund
Growth Allocation Fund
Aggressive Allocation Fund
Notification of electronic delivery of shareholder materials
Beginning on January 1, 2021, as permitted by regulations adopted by the Securities and Exchange Commission, paper copies of the Funds’ shareholder reports will no longer be sent by mail, unless you specifically request paper copies of the reports from the Funds or from your broker/dealer, investment professional, or financial institution. Instead, the reports will be made available online at bmofunds.com/documents, and you will be notified by mail each time a report is posted and provided with a website link to access the report.
If you already elected to receive shareholder reports electronically, you will not be affected by this change and you need not take any action. You may elect to receive shareholder reports and other communications from the Funds electronically by calling 1-800-236-FUND (3863), by sending an email request to bmofundsus.services@bmo.com, or by asking your broker/dealer, investment professional, or financial institution.
You may elect to receive all future reports in paper free of charge. If you invest through a financial intermediary, you can contact your financial intermediary to request that you continue to receive paper copies of your shareholder reports. If you invest directly with the Funds, you can call the Funds toll-free at 1-800-236-FUND (3863) or send an email request to bmofundsus.services@bmo.com. Your election to receive reports in paper will apply to all funds held in your account if you invest through your financial intermediary or all funds held with the fund complex if you invest directly with the Funds.

Table of Contents
| | | | |
Not FDIC Insured | | No Bank Guarantee | | May Lose Value |
| | |
| | |
| Annual Report — Commentary | | BMO Funds |
Performance for the One-Year Period Ending August 31, 2020 (%)
| | | | | | | | | | | | | | | | |
| | | Retirement Class (R-6) | | | Bloomberg Barclays
U.S. Aggregate Bond Index | | | S&P 500 Index | | | Lipper Mixed Asset | |
| BMO Conservative Allocation | | | 6.99 | | | | 6.47 | | | | | | | | 6.61 | |
| BMO Moderate Allocation | | | 9.42 | | | | 6.47 | | | | | | | | 10.12 | |
| BMO Balanced Allocation | | | 10.73 | | | | | | | | 21.94 | | | | 14.06 | |
| BMO Growth Allocation | | | 11.63 | | | | | | | | 21.94 | | | | 14.62 | |
| BMO Aggressive Allocation | | | 13.29 | | | | | | | | 21.94 | | | | 19.73 | |
The BMO Target Risk Funds returns ranged from 7.0% for the BMO Conservative Allocation Fund to 13.3% for the Aggressive Allocation Fund. Performance versus Lipper peer group medians was mixed.
After a rate cut by the U.S. Federal Reserve (the Fed) in 2019, hopes were for a secular uptick in global growth. The emergence of the COVID-19 pandemic, however, defined fiscal year 2020 as economic shutdowns reeled financial markets, forcing governments across the globe to embark on sweeping monetary and fiscal stimulus. This unprecedented action allowed markets to rebound strongly from lows with all major asset classes finishing positive for the one year period. U.S. large cap equities led the way as the S&P 500 returned 21.9%, beating U.S. small caps at 6.7%. International markets were positive as well as international developed equities were up 7.0%, but trailed the 11.7% return of emerging market equities. In fixed income markets, Fed interest rate cuts, expansive quantitative easing, and outright asset purchases pushed yields downward. The 10-year treasury yield fell from 1.46% at the beginning of the fiscal year to 0.71% at the end. The Bloomberg U.S. Aggregate Bond Index returned 8.6%, while high yield and emerging market debt finished up 6.4% and 7.8%, respectively.
Fixed income managers outperformed their benchmarks on aggregate for the year. Both BMO Core Plus Bond and Metropolitan West Total Return Bond outperformed their core bond benchmark. TCW Emerging Markets Bond slightly outperformed its emerging market debt benchmark, while Federated High Yield matched its high yield benchmark. The alternatives allocation detracted value during the year as BMO Alternative Strategies lagged bonds and equities.
Domestic equity strategies broadly underperformed benchmarks. Large and mid-cap managers struggled with BMO Large-Cap Growth, BMO Low Volatility Equity and Dodge & Cox Stock the largest detractors for the period. On the positive side, Harbor Capital Appreciation and T. Rowe Price Growth Stock were able to surpass their benchmarks. Domestic small cap managers struggled in choppy markets as BMO Small-Cap Growth, BMO Small-Cap Value and Goldman Sachs Small Cap Value all underperformed benchmarks for the year.
International equity fund performance was largely positive for the year. MFS International Value and T. Rowe International Discovery added the most value. BMO Disciplined International Equity, Dodge & Cox International and BMO Pyrford International were the main laggards. On the emerging markets side, BMO LGM Emerging Markets Equity underperformed the benchmark.
Our portfolios are positioned slightly positive risk with an overweight in U.S. large cap equities and a commensurate underweight to core bonds. Within equities we are overweight U.S. equities versus international developed equities. We believe U.S. equities remain attractive due to strong government stimulus and greater exposure to growth-heavy corporations. Within fixed income we have a bias towards U.S. investment grade corporate credit due to highly supportive central bank policy.
Moving into fiscal 2021, the hopeful resolution of the COVID-19 pandemic and the aftermath will be at the forefront of global markets. Additionally, in the near term we will be keeping a close eye on the 2020 U.S. elections as there is a good possibility that Democrats take complete control of government, with significant implications for markets and sectors. Additionally, we will continue to monitor government and central bank responses to the COVID aftermath as businesses fight to survive and millions look for work.
2
| | | | | | | | | | | | | | | | | | | | | | | | | | | | |
| |
| BMO Conservative Allocation Fund | |
Average annual total returns (%) | | | | | Ticker | | Cusip | | Inception
date | | Expenses (%)* | |
| | | 1-year | | | 5-year | | | Since inception | | | |
| | | | | Gross | | | Net | |
| Investor Class (Y) | | | 6.49 | | | | 4.63 | | | | 3.69 | | | | | BDVYX | | 09658L299 | | 5/30/2014 | | | 1.36 | | | | 0.84 | |
| Institutional Class (I) | | | 6.86 | | | | 4.92 | | | | 3.96 | | | | | BDVIX | | 09658L331 | | 5/30/2014 | | | 1.11 | | | | 0.59 | |
| Retirement Class (R-3) | | | 6.29 | | | | 4.39 | | | | 3.43 | | | | | BDVRX | | 09658L323 | | 5/30/2014 | | | 1.61 | | | | 1.09 | |
| Retirement Class (R-6) | | | 6.99 | | | | 5.06 | | | | 4.11 | | | | | BDVSX | | 09658L315 | | 5/30/2014 | | | 0.96 | | | | 0.44 | |
| Bloomberg Barclays U.S. Aggregate Bond Index | | | 6.47 | | | | 4.33 | | | | 3.86 | | | | | | | | | | | | | | | | | |
Lipper Mixed-Asset Target Allocation
Conservative Funds Index | | | 6.61 | | | | 5.39 | | | | 4.15 | | | | | | | | | | | | | | | | | |
| | | | | | | | | | | | | | | | | | | | |
| Growth of an assumed $10,000 investment | | | | Portfolio sector allocation** | |
| | | | | Sector | | | | | Fund (%) | |
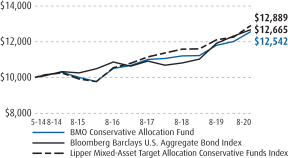 | | | | Large-Cap Funds | | | | | | | 11.7 | |
| | | | Mid-Cap Funds | | | | | | | 1.3 | |
| | | | Small-Cap Funds | | | | | | | 1.1 | |
| | | | International Funds | | | | | | | 5.6 | |
| | | | Fixed Income Funds | | | | | | | 72.0 | |
| | | | Alternative Funds | | | | | | | 6.8 | |
| | | | Other Assets & Liabilities, Net | | | | | | | 1.5 | |
| | | | Total | | | | | | | 100.0 | |
| | | | | | | | | | | | | | | | |
| | | | | | | | | | | | | | | | |
| | | | | | | | | | | | | | | | |
| | | | | | | | | | | | | | | | |
| | | | | | | | | | | | | | | | | | | | | | | | | | |
| |
| BMO Moderate Allocation Fund | |
Average annual total returns (%) | | | | Ticker | | Cusip | | Inception
date | | Expenses (%)* | |
| | | 1-year | | | 5-year | | | Since inception | | |
| | | | | Gross | | | Net | |
| Investor Class (Y) | | | 9.03 | | | | 5.95 | | | 4.74 | | | | BMBYX | | 09658L166 | | 5/30/2014 | | | 1.16 | | | | 0.82 | |
| Institutional Class (I) | | | 9.20 | | | | 6.24 | | | 5.01 | | | | BMBHX | | 09658L190 | | 5/30/2014 | | | 0.91 | | | | 0.57 | |
| Retirement Class (R-3) | | | 8.76 | | | | 5.70 | | | 4.49 | | | | BMBQX | | 09658L182 | | 5/30/2014 | | | 1.41 | | | | 1.07 | |
| Retirement Class (R-6) | | | 9.42 | | | | 6.39 | | | 5.16 | | | | BMBTX | | 09658L174 | | 5/30/2014 | | | 0.76 | | | | 0.42 | |
| Bloomberg Barclays U.S. Aggregate Bond Index | | | 6.47 | | | | 4.33 | | | 3.86 | | | | | | | | | | | | | | | | |
Lipper Mixed-Asset Target Allocation
Moderate Funds Index | | | 10.12 | | | | 7.43 | | | 5.88 | | | | | | | | | | | | | | | | |
| | | | | | | | | | | | | | | | | | | | |
| Growth of an assumed $10,000 investment | | | | Portfolio sector allocation** | |
| | | | | Sector | | | | | Fund (%) | |
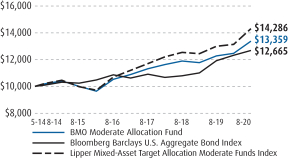 | | | | Large-Cap Funds | | | | | | | 24.9 | |
| | | | Mid-Cap Funds | | | | | | | 2.5 | |
| | | | Small-Cap Funds | | | | | | | 2.2 | |
| | | | International Funds | | | | | | | 11.0 | |
| | | | Fixed Income Funds | | | | | | | 52.9 | |
| | | | Alternative Funds | | | | | | | 4.7 | |
| | | | Other Assets & Liabilities, Net | | | | | | | 1.8 | |
| | | | Total | | | | | | | 100.0 | |
| | | | | | | | | | | | | | | | |
| | | | | | | | | | | | | | | | |
| | | | | | | | | | | | | | | | |
| | | | | | | | | | | | | | | | |
The above graphs relate to the Investor Class shares of the Fund. Performance for the Institutional, Retirement R-3 and Retirement R-6 will vary from the performance of the Investor Class shares shown above due to differences in charges and expenses. These graphs illustrate the hypothetical investment of $10,000 in the Investor Class shares of the Fund from each Fund’s inception date to August 31, 2020.
The performance data quoted represents past performance which is no guarantee of future results. Investment return and principal value will fluctuate so that an investor’s shares, when redeemed, may be worth more or less than their original costs. Mutual fund performance changes over time and current performance may be lower or higher than what is stated. To receive current performance to the most recent month-end, please call 1-800-236-3863 or visit www.bmofunds.com.
| * | The above expense ratios are from the Funds’ Prospectus dated December 27, 2019, and are inclusive of Acquired Fund Fees and Expenses. See Note 5, subsection Contractual Expense Limitation, in the Notes to Financial Statements for additional information. Net expense ratios reflect contractual fee waivers and/or expense reimbursements if applicable, made by BMO Asset Management Corp., the investment adviser (Adviser). The Adviser may not terminate these fee waivers and/or expense reimbursements prior to December 31, 2021 without the consent of the Board of Directors, unless the investment advisory agreement is terminated. Without these contractual waivers, the Fund’s returns would have been lower. |
| ** | Portfolio composition will change due to ongoing management of the Fund. The percentages are based on net assets as of August 31, 2020 and may not necessarily reflect adjustments that are routinely made when presenting net assets for formal financial statement processes. |
The Standard & Poor’s 500 Index is an unmanaged index of large-cap common stocks.
Lipper indices measure the performance of the 30 largest mutual funds in each respective fund category.
3
| | | | | | | | | | | | | | | | | | | | | | | | | | |
| |
| BMO Balanced Allocation Fund | |
Average annual total returns (%) | | | | Ticker | | Cusip | | Inception
date | | Expenses (%)* | |
| | | 1-year | | | 5-year | | | Since inception | | |
| | | | | Gross | | | Net | |
| Investor Class (Y) | | | 10.40 | | | | 6.93 | | | 5.52 | | | | BGRYX | | 09658L216 | | 5/30/2014 | | | 1.01 | | | | 0.87 | |
| Institutional Class (I) | | | 10.75 | | | | 7.23 | | | 5.81 | | | | BGRHX | | 09658L240 | | 5/30/2014 | | | 0.76 | | | | 0.62 | |
| Retirement Class (R-3) | | | 10.14 | | | | 6.68 | | | 5.27 | | | | BGRRX | | 09658L232 | | 5/30/2014 | | | 1.26 | | | | 1.12 | |
| Retirement Class (R-6) | | | 10.73 | | | | 7.37 | | | 5.95 | | | | BGRQX | | 09658L224 | | 5/30/2014 | | | 0.61 | | | | 0.47 | |
| Standard & Poor’s 500 Index | | | 21.94 | | | | 14.46 | | | 12.32 | | | | | | | | | | | | | | | | |
Lipper Mixed-Asset Target Allocation Growth
Funds Index | | | 14.06 | | | | 8.98 | | | 6.72 | | | | | | | | | | | | | | | | |
| | | | | | | | | | | | | | | | | | | | |
| Growth of an assumed $10,000 investment | | | | Portfolio sector allocation** | |
| | | | | Sector | | | | | Fund (%) | |
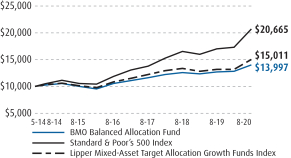 | | | | Large-Cap Funds | | | | | | | 38.7 | |
| | | | Mid-Cap Funds | | | | | | | 3.7 | |
| | | | Small-Cap Funds | | | | | | | 3.3 | |
| | | | International Funds | | | | | | | 16.3 | |
| | | | Fixed Income Funds | | | | | | | 33.6 | |
| | | | Alternative Funds | | | | | | | 3.3 | |
| | | | Other Assets & Liabilities, Net | | | | | | | 1.1 | |
| | | | Total | | | | | | | 100.0 | |
| | | | | | | | | | | | | | | | |
| | | | | | | | | | | | | | | | |
| | | | | | | | | | | | | | | | |
| | | | | | | | | | | | | | | | |
| | | | | | | | | | | | | | | | | | | | | | | | | | |
| |
| BMO Growth Allocation Fund | |
Average annual total returns (%) | | | | Ticker | | Cusip | | Inception
date | | Expenses (%)* | |
| | | 1-year | | | 5-year | | | Since inception | | |
| | | | | Gross | | | Net | |
| Investor Class (Y) | | | 11.13 | | | | 7.84 | | | 6.23 | | | | BABYX | | 09658L380 | | 5/30/2014 | | | 1.12 | | | | 0.86 | |
| Institutional Class (I) | | | 11.55 | | | | 8.12 | | | 6.51 | | | | BABHX | | 09658L422 | | 5/30/2014 | | | 0.87 | | | | 0.61 | |
| Retirement Class (R-3) | | | 10.86 | | | | 7.57 | | | 5.97 | | | | BABRX | | 09658L414 | | 5/30/2014 | | | 1.37 | | | | 1.11 | |
| Retirement Class (R-6) | | | 11.63 | | | | 8.26 | | | 6.65 | | | | BABQX | | 09658L398 | | 5/30/2014 | | | 0.72 | | | | 0.46 | |
| Standard & Poor’s 500 Index | | | 21.94 | | | | 14.46 | | | 12.32 | | | | | | | | | | | | | | | | |
Lipper Mixed-Asset Target Allocation
Aggressive Funds Index | | | 14.62 | | | | 9.06 | | | 7.85 | | | | | | | | | | | | | | | | |
| | | | | | | | | | | | | | | | | | | | |
| Growth of an assumed $10,000 investment | | | | Portfolio sector allocation** | |
| | | | | Sector | | | | | Fund (%) | |
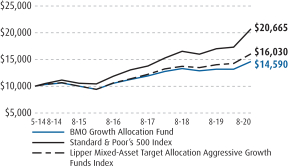
| | | | Large-Cap Funds | | | | | | | 50.8 | |
| | | | Mid-Cap Funds | | | | | | | 4.9 | |
| | | | Small-Cap Funds | | | | | | | 4.4 | |
| | | | International Funds | | | | | | | 21.2 | |
| | | | Fixed Income Funds | | | | | | | 15.3 | |
| | | | Alternative Funds | | | | | | | 2.2 | |
| | | | Other Assets & Liabilities, Net | | | | | | | 1.2 | |
| | | | Total | | | | | | | 100.0 | |
| | | | | | | | | | | | | | | | |
| | | | | | | | | | | | | | | | |
| | | | | | | | | | | | | | | | |
| | | | | | | | | | | | | | | | |
| | | | | | | | | | | | | | | | |
The above graphs relate to the Investor Class shares of the Fund. Performance for the Institutional, Retirement R-3 and Retirement R-6 will vary from the performance of the Investor Class shares shown above due to differences in charges and expenses. These graphs illustrate the hypothetical investment of $10,000 in the Investor Class shares of the Fund from each Fund’s inception date to August 31, 2020.
The performance data quoted represents past performance which is no guarantee of future results. Investment return and principal value will fluctuate so that an investor’s shares, when redeemed, may be worth more or less than their original costs. Mutual fund performance changes over time and current performance may be lower or higher than what is stated. To receive current performance to the most recent month-end, please call 1-800-236-3863 or visit www.bmofunds.com.
| * | The above expense ratios are from the Funds’ Prospectus dated December 27, 2019, and are inclusive of Acquired Fund Fees and Expenses. See Note 5, subsection Contractual Expense Limitation, in the Notes to Financial Statements for additional information. Net expense ratios reflect contractual fee waivers and/or expense reimbursements if applicable, made by BMO Asset Management Corp., the investment adviser (Adviser). The Adviser may not terminate these fee waivers and/or expense reimbursements prior to December 31, 2021 without the consent of the Board of Directors, unless the investment advisory agreement is terminated. Without these contractual waivers, the Fund’s returns would have been lower. |
| ** | Portfolio composition will change due to ongoing management of the Fund. The percentages are based on net assets as of August 31, 2020 and may not necessarily reflect adjustments that are routinely made when presenting net assets for formal financial statement processes. |
The Standard & Poor’s 500 Index is an unmanaged index of large-cap common stocks.
Lipper indices measure the performance of the 30 largest mutual funds in each respective fund category.
4
| | | | | | | | | | | | | | | | | | | | | | | | | | | | |
| |
| BMO Aggressive Allocation Fund | |
Average annual total returns (%) | | | | | Ticker | | Cusip | | Inception
date | | Expenses (%)* | |
| | | 1-year | | | 5-year | | | Since inception | | | |
| | | | | Gross | | | Net | |
| Investor Class (Y) | | | 12.79 | | | | 8.86 | | | | 7.14 | | | | | BDSYX | | 09658L257 | | 5/30/2014 | | | 1.04 | | | | 0.85 | |
| Institutional Class (I) | | | 13.06 | | | | 9.14 | | | | 7.42 | | | | | BDSHX | | 09658L281 | | 5/30/2014 | | | 0.79 | | | | 0.60 | |
| Retirement Class (R-3) | | | 12.59 | | | | 8.57 | | | | 6.87 | | | | | BDSRX | | 09658L273 | | 5/30/2014 | | | 1.29 | | | | 1.10 | |
| Retirement Class (R-6) | | | 13.29 | | | | 9.31 | | | | 7.59 | | | | | BDSQX | | 09658L265 | | 5/30/2014 | | | 0.64 | | | | 0.45 | |
| Standard & Poor’s 500 Index | | | 21.94 | | | | 14.46 | | | | 12.32 | | | | | | | | | | | | | | | | | |
| Lipper Multi-Cap Core Funds Index | | | 19.73 | | | | 12.04 | | | | 10.11 | | | | | | | | | | | | | | | | | |
| | | | | | | | | |
| | | | | | | | | | | | | | | | | | | | | | | | | | | | |
| | | | | | | | | | | | | | | | | | | | |
| Growth of an assumed $10,000 investment | | | | Portfolio sector allocation** | |
| | | | | Sector | | | | | Fund (%) | |
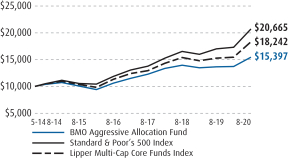 | | | | Large-Cap Funds | | | | | | | 61.5 | |
| | | | Mid-Cap Funds | | | | | | | 6.0 | |
| | | | Small-Cap Funds | | | | | | | 5.2 | |
| | | | International Funds | | | | | | | 26.5 | |
| | | | Other Assets & Liabilities, Net | | | | | | | 0.8 | |
| | | | Total | | | | | | | 100.0 | |
| | | | | | | | | | | | | | | | |
| | | | | | | | | | | | | | | | |
| | | | | | | | | | | | | | | | |
| | | | | | | | | | | | | | | | |
| | | | | | | | | | | | | | | | |
| | | | | | | | | | | | | | | | |
The above graphs relate to the Investor Class shares of the Fund. Performance for the Institutional, Retirement R-3 and Retirement R-6 will vary from the performance of the Investor Class shares shown above due to differences in charges and expenses. These graphs illustrate the hypothetical investment of $10,000 in the Investor Class shares of the Fund from each Fund’s inception date to August 31, 2020.
The performance data quoted represents past performance which is no guarantee of future results. Investment return and principal value will fluctuate so that an investor’s shares, when redeemed, may be worth more or less than their original costs. Mutual fund performance changes over time and current performance may be lower or higher than what is stated. To receive current performance to the most recent month-end, please call 1-800-236-3863 or visit www.bmofunds.com.
| * | The above expense ratios are from the Funds’ Prospectus dated December 27, 2019, and are inclusive of Acquired Fund Fees and Expenses. See Note 5, subsection Contractual Expense Limitation, in the Notes to Financial Statements for additional information. Net expense ratios reflect contractual fee waivers and/or expense reimbursements if applicable, made by BMO Asset Management Corp., the investment adviser (Adviser). The Adviser may not terminate these fee waivers and/or expense reimbursements prior to December 31, 2021 without the consent of the Board of Directors, unless the investment advisory agreement is terminated. Without these contractual waivers, the Fund’s returns would have been lower. |
| ** | Portfolio composition will change due to ongoing management of the Fund. The percentages are based on net assets as of August 31, 2020 and may not necessarily reflect adjustments that are routinely made when presenting net assets for formal financial statement processes. |
The Standard & Poor’s 500 Index is an unmanaged index of large-cap common stocks.
Lipper indices measure the performance of the 30 largest mutual funds in each respective fund category.
5
| | |
| | |
| Expense Example (Unaudited) | | |
For the Six Months Ended August 31, 2020
As a shareholder of the Fund, you may incur two types of costs: (1) transaction costs, which may include sales charges (loads) on purchase payments, reinvested dividends, or other distributions; redemption fees; and exchange fees; and (2) ongoing costs, including management fees; distribution and/or service (12b-1) fees; and other Fund expenses. This Example is intended to help you understand your ongoing costs (in dollars) of investing in the Funds and to compare these costs with the ongoing costs of investing in other mutual funds.
The Example is based on an investment of $1,000 invested at the beginning of the period and held for the entire six month period ended August 31, 2020 (3/1/20-8/31/20).
Actual Expenses
The information in the table under the heading “Actual Expenses” provides information about actual account values and actual expenses. You may use the information in these columns, together with the amount you invested, to estimate the expenses that you paid over the period. Simply divide your account value by $1,000 (for example, an $8,600 account value divided by $1,000 = 8.6), then multiply the result by the number in the first line under the heading entitled “Expenses Paid During Period” to estimate the expenses you paid on your account during this period.
Hypothetical Example for Comparison Purposes
The information in the table under the heading “Hypothetical Expenses” provides information about hypothetical account values and hypothetical expenses based on a Fund’s actual expense ratio and an assumed rate of return of 5% per year before expenses, which is not the Fund’s actual return. The hypothetical account values and expenses may not be used to estimate the actual ending account balance or expenses you paid for the period. You may use this information to compare the ongoing costs of investing in a Fund and other funds. To do so, compare this 5% hypothetical example with the 5% hypothetical examples that appear in the shareholder reports of the other funds.
Please note that the expenses shown in the table are meant to highlight your ongoing costs only and do not reflect any transaction costs, such as sales charges (loads), redemption fees, or exchange fees. Therefore, the information under the heading “Hypothetical Expenses” is useful in comparing ongoing costs only, and will not help you determine the relative total costs of owning different funds. In addition, if these transaction costs were included, your costs would have been higher.
| | | | | | | | | | | | | | | | | | | | | | | | |
| | | Actual Expenses | | | Hypothetical Expenses | |
Fund | | Beginning
account
value
3/1/20 | | | Ending
account
value
8/31/20 | | | Expenses
paid during
period
3/1/20-
8/31/20(1) | | | Ending
account
value
8/31/20 | | | Expenses
paid during
period
3/1/20-
8/31/20(1) | | | Annualized
Expense
Ratio(1) | |
Conservative Allocation Fund | | | | | | | | | | | | | | | | | | | | | | | | |
| Investor | | $ | 1,000.00 | | | $ | 1,045.80 | | | $ | 1.70 | | | $ | 1,023.48 | | | $ | 1.68 | | | | 0.33 | % |
| Institutional | | | 1,000.00 | | | | 1,047.60 | | | | 0.41 | | | | 1,024.73 | | | | 0.41 | | | | 0.08 | |
| Retirement class R-3 | | | 1,000.00 | | | | 1,044.80 | | | | 2.98 | | | | 1,022.22 | | | | 2.95 | | | | 0.58 | |
| Retirement class R-6 | | | 1,000.00 | | | | 1,048.10 | | | | 0.00 | | | | 1,025.14 | | | | 0.00 | | | | 0.00 | |
Moderate Allocation Fund | | | | | | | | | | | | | | | | | | | | | | | | |
| Investor | | | 1,000.00 | | | | 1,073.30 | | | | 1.56 | | | | 1,023.63 | | | | 1.53 | | | | 0.30 | |
| Institutional | | | 1,000.00 | | | | 1,075.40 | | | | 0.26 | | | | 1,024.89 | | | | 0.25 | | | | 0.05 | |
| Retirement class R-3 | | | 1,000.00 | | | | 1,072.00 | | | | 2.86 | | | | 1,022.37 | | | | 2.80 | | | | 0.55 | |
| Retirement class R-6 | | | 1,000.00 | | | | 1,075.30 | | | | 0.00 | | | | 1,025.14 | | | | 0.00 | | | | 0.00 | |
Balanced Allocation Fund | | | | | | | | | | | | | | | | | | | | | | | | |
| Investor | | | 1,000.00 | | | | 1,093.00 | | | | 1.74 | | | | 1,023.48 | | | | 1.68 | | | | 0.33 | |
| Institutional | | | 1,000.00 | | | | 1,095.70 | | | | 0.42 | | | | 1,024.73 | | | | 0.41 | | | | 0.08 | |
| Retirement class R-3 | | | 1,000.00 | | | | 1,092.90 | | | | 3.05 | | | | 1,022.22 | | | | 2.95 | | | | 0.58 | |
| Retirement class R-6 | | | 1,000.00 | | | | 1,095.50 | | | | 0.00 | | | | 1,025.14 | | | | 0.00 | | | | 0.00 | |
Growth Allocation Fund | | | | | | | | | | | | | | | | | | | | | | | | |
| Investor | | | 1,000.00 | | | | 1,107.30 | | | | 1.59 | | | | 1,023.63 | | | | 1.53 | | | | 0.30 | |
| Institutional | | | 1,000.00 | | | | 1,109.70 | | | | 0.27 | | | | 1,024.89 | | | | 0.25 | | | | 0.05 | |
| Retirement class R-3 | | | 1,000.00 | | | | 1,105.90 | | | | 2.91 | | | | 1,022.37 | | | | 2.80 | | | | 0.55 | |
| Retirement class R-6 | | | 1,000.00 | | | | 1,109.30 | | | | 0.00 | | | | 1,025.14 | | | | 0.00 | | | | 0.00 | |
Aggressive Allocation Fund | | | | | | | | | | | | | | | | | | | | | | | | |
| Investor | | | 1,000.00 | | | | 1,127.20 | | | | 1.76 | | | | 1,023.48 | | | | 1.68 | | | | 0.33 | |
| Institutional | | | 1,000.00 | | | | 1,128.70 | | | | 0.43 | | | | 1,024.73 | | | | 0.41 | | | | 0.08 | |
| Retirement class R-3 | | | 1,000.00 | | | | 1,126.30 | | | | 3.10 | | | | 1,022.22 | | | | 2.95 | | | | 0.58 | |
| Retirement class R-6 | | | 1,000.00 | | | | 1,129.70 | | | | 0.00 | | | | 1,025.14 | | | | 0.00 | | | | 0.00 | |
| (1) | Expenses are equal to the Funds’ annualized expense ratios for the period March 1, 2020 through August 31, 2020, multiplied by the average account value over the period, multiplied by 184/366 (to reflect the one-half year period). These expenses and ratios are exclusive of acquired fund fees and expenses. |
6
August 31, 2020
| | |
| | |
| Schedules of Investments | | BMO Funds |
Conservative Allocation Fund
| | | | | | | | |
| Description | | Shares | | | Value | |
| Exchange Traded Funds — 5.6% | | | | | | |
| | |
| Large-Cap Funds — 3.7% | | | | | | |
Vanguard S&P 500 ETF | | | 5,273 | | | $ | 1,692,738 | |
| | | | | | | | |
| | |
| Fixed Income Funds — 1.9% | | | | | | |
Vanguard Long-Term Treasury ETF | | | 8,928 | | | | 883,872 | |
| | | | | | | | |
Total Exchange Traded Funds
(identified cost $2,280,637) | | | | | | | 2,576,610 | |
| | |
| Mutual Funds — 92.9% | | | | | | |
| | |
| Large-Cap Funds — 8.0% | | | | | | |
BMO Dividend Income Fund — Institutional Class (1) | | | 26,776 | | | | 364,683 | |
BMO Large-Cap Growth Fund — Class R6 (1) | | | 29,668 | | | | 669,309 | |
BMO Large-Cap Value Fund — Class R6 (1) | | | 55,753 | | | | 755,456 | |
BMO Low Volatility Equity Fund — Institutional Class (1) | | | 38,687 | | | | 584,953 | |
Dodge & Cox Stock Fund — Retail Class | | | 3,465 | | | | 600,019 | |
Harbor Capital Appreciation Fund — Retirement Class | | | 3,448 | | | | 379,106 | |
T. Rowe Price Growth Stock Fund — Institutional Class | | | 3,646 | | | | 342,792 | |
| | | | | | | | |
Total Large-Cap Funds | | | | | | | 3,696,318 | |
| | |
| Mid-Cap Funds — 1.3% | | | | | | |
BMO Mid-Cap Growth Fund — Class R6 (1) | | | 10,522 | | | | 169,508 | |
BMO Mid-Cap Value Fund — Class R6 (1) | | | 19,280 | | | | 173,902 | |
Vanguard Mid-Cap Index Fund — Institutional Class | | | 5,018 | | | | 247,093 | |
| | | | | | | | |
Total Mid-Cap Funds | | | | | | | 590,503 | |
| | |
| Small-Cap Funds — 1.1% | | | | | | |
BMO Small-Cap Growth Fund — Institutional Class (1) | | | 14,787 | | | | 259,516 | |
BMO Small-Cap Value Fund — Class R6 (1) | | | 14,163 | | | | 150,134 | |
Goldman Sachs Small Cap Value Fund — Institutional Class | | | 2,467 | | | | 109,814 | |
| | | | | | | | |
Total Small-Cap Funds | | | | | | | 519,464 | |
| | |
| International Funds — 5.6% | | | | | | |
BMO Disciplined International Equity Fund — Institutional Class (1) | | | 33,556 | | | | 326,832 | |
BMO LGM Emerging Markets Equity Fund — Institutional Class (1) | | | 19,019 | | | | 288,334 | |
BMO Pyrford International Stock Fund — Class R6 (1) | | | 37,527 | | | | 499,482 | |
Dodge & Cox International Stock Fund — Retail Class | | | 11,675 | | | | 440,736 | |
MFS International Value Fund — Class R6 | | | 12,573 | | | | 628,636 | |
T. Rowe Price International Discovery Fund — Institutional Class | | | 3,316 | | | | 270,511 | |
Vanguard Emerging Markets Stock Index Fund — Admiral Class | | | 3,413 | | | | 125,705 | |
| | | | | | | | |
Total International Funds | | | | | | | 2,580,236 | |
| | |
| Fixed Income Funds — 70.1% | | | | | | |
BMO Core Plus Bond Fund — Institutional Class (1) | | | 800,754 | | | | 9,937,362 | |
BMO Corporate Income Fund — Institutional Class (1) | | | 63,556 | | | | 906,301 | |
| | | | | | | | |
| Description | | Shares | | | Value | |
| Mutual Funds (continued) | | | | | | |
| | |
| Fixed Income Funds (continued) | | | | | | |
Federated Hermes Institutional High-Yield Bond Fund — Class R6 | | | 258,772 | | | $ | 2,512,679 | |
Metropolitan West Total Return Bond Fund — Plan Class | | | 911,020 | | | | 9,966,552 | |
TCW Emerging Markets Income Fund — Institutional Class | | | 531,055 | | | | 4,333,406 | |
Vanguard Total Bond Market Index Fund — Institutional Class | | | 397,989 | | | | 4,628,616 | |
| | | | | | | | |
Total Fixed Income Funds | | | | | | | 32,284,916 | |
| | |
| Alternative Funds — 6.8% | | | | | | |
BNY Mellon Global Real Return Fund — Institutional Class | | | 195,646 | | | | 3,134,249 | |
| | | | | | | | |
Total Mutual Funds
(identified cost $36,947,926) | | | | | | | 42,805,686 | |
| | |
| Short-Term Investments — 1.0% | | | | | | |
| | |
| Mutual Funds — 1.0% | | | | | | |
BMO Institutional Prime Money Market Fund — Premier Class, 0.130% (1) | | | 440,793 | | | | 440,749 | |
| | | | | | | | |
Total Short-Term Investments — 1.0%
(identified cost $440,816) | | | | 440,749 | |
| | | | | | | | |
Total Investments — 99.5%
(identified cost $39,669,379) | | | | | | | 45,823,045 | |
| Other Assets and Liabilities — 0.5% | | | | | | | 230,270 | |
| | | | | | | | |
| Total Net Assets — 100.0% | | | | | | $ | 46,053,315 | |
| | | | | | | | |
Moderate Allocation Fund
| | | | | | | | |
| Description | | Shares | | | Value | |
| Exchange Traded Funds — 8.1% | | | | | | |
| | |
| Large-Cap Funds — 6.2% | | | | | | |
Vanguard S&P 500 ETF | | | 15,189 | | | $ | 4,875,973 | |
| | | | | | | | |
| | |
| Fixed Income Funds — 1.9% | | | | | | |
Vanguard Long-Term Treasury ETF | | | 14,667 | | | | 1,452,033 | |
| | | | | | | | |
Total Exchange Traded Funds
(identified cost $5,646,300) | | | | | | | 6,328,006 | |
| | |
| Mutual Funds — 90.1% | | | | | | |
| | |
| Large-Cap Funds — 18.7% | | | | | | |
BMO Dividend Income Fund — Institutional Class (1) | | | 88,655 | | | | 1,207,479 | |
BMO Large-Cap Growth Fund — Class R6 (1) | | | 99,755 | | | | 2,250,479 | |
BMO Large-Cap Value Fund — Class R6 (1) | | | 188,537 | | | | 2,554,673 | |
BMO Low Volatility Equity Fund — Institutional Class (1) | | | 126,929 | | | | 1,919,171 | |
Dodge & Cox Stock Fund — Retail Class | | | 11,423 | | | | 1,977,825 | |
Harbor Capital Appreciation Fund — Retirement Class | | | 11,989 | | | | 1,318,142 | |
T. Rowe Price Growth Stock Fund — Institutional Class | | | 12,242 | | | | 1,151,072 | |
Vanguard Institutional Index Fund — Institutional Class | | | 7,083 | | | | 2,217,638 | |
| | | | | | | | |
Total Large-Cap Funds | | | | | | | 14,596,479 | |
| | |
| Mid-Cap Funds — 2.5% | | | | | | |
BMO Mid-Cap Growth Fund — Class R6 (1) | | | 35,166 | | | | 566,517 | |
(See Notes which are an integral part of the Financial Statements)
7
August 31, 2020
Moderate Allocation Fund (continued)
| | | | | | | | |
| Description | | Shares | | | Value | |
| Mutual Funds (continued) | | | | | | |
| | |
| Mid-Cap Funds (continued) | | | | | | |
BMO Mid-Cap Value Fund — Class R6 (1) | | | 63,610 | | | $ | 573,766 | |
Vanguard Mid-Cap Index Fund — Institutional Class | | | 16,329 | | | | 804,030 | |
| | | | | | | | |
Total Mid-Cap Funds | | | | | | | 1,944,313 | |
| | |
| Small-Cap Funds — 2.2% | | | | | | |
BMO Small-Cap Growth Fund — Institutional Class (1) | | | 48,447 | | | | 850,254 | |
BMO Small-Cap Value Fund — Class R6 (1) | | | 45,681 | | | | 484,218 | |
Goldman Sachs Small Cap Value Fund — Institutional Class | | | 8,331 | | | | 370,893 | |
| | | | | | | | |
Total Small-Cap Funds | | | | | | | 1,705,365 | |
| | |
| International Funds — 11.0% | | | | | | |
BMO Disciplined International Equity Fund — Institutional Class (1) | | | 112,258 | | | | 1,093,389 | |
BMO LGM Emerging Markets Equity Fund — Institutional Class (1) | | | 61,415 | | | | 931,054 | |
BMO Pyrford International Stock Fund — Class R6 (1) | | | 124,877 | | | | 1,662,113 | |
Dodge & Cox International Stock Fund — Retail Class | | | 38,857 | | | | 1,466,835 | |
MFS International Value Fund — Class R6 | | | 41,279 | | | | 2,063,975 | |
T. Rowe Price International Discovery Fund — Institutional Class | | | 11,517 | | | | 939,548 | |
Vanguard Emerging Markets Stock Index Fund — Admiral Class | | | 11,459 | | | | 422,050 | |
| | | | | | | | |
Total International Funds | | | | | | | 8,578,964 | |
| | |
| Fixed Income Funds — 51.0% | | | | | | |
BMO Core Plus Bond Fund — Institutional Class (1) | | | 1,122,610 | | | | 13,931,592 | |
BMO Corporate Income Fund — Institutional Class (1) | | | 105,871 | | | | 1,509,716 | |
Federated Hermes Institutional High-Yield Bond Fund — Class R6 | | | 318,340 | | | | 3,091,085 | |
Metropolitan West Total Return Bond Fund — Plan Class | | | 1,214,540 | | | | 13,287,066 | |
TCW Emerging Markets Income Fund — Institutional Class | | | 686,889 | | | | 5,605,015 | |
Vanguard Total Bond Market Index Fund — Institutional Class | | | 203,584 | | | | 2,367,679 | |
| | | | | | | | |
Total Fixed Income Funds | | | | | | | 39,792,153 | |
| | |
| Alternative Funds — 4.7% | | | | | | |
BNY Mellon Global Real Return Fund — Institutional Class | | | 229,134 | | | | 3,670,732 | |
| | | | | | | | |
Total Mutual Funds
(identified cost $56,601,698) | | | | | | | 70,288,006 | |
| | | | | | | | |
| Description | | Shares | | | Value | |
| Short-Term Investments — 0.8% | | | | | | |
| | |
| Mutual Funds — 0.8% | | | | | | |
BMO Institutional Prime Money Market Fund — Premier Class, 0.130% (1) | | | 647,704 | | | $ | 647,639 | |
| | | | | | | | |
Total Short-Term Investments — 0.8%
(identified cost $647,763) 647,639 | |
| | | | | | | | |
Total Investments — 99.0%
(identified cost $62,895,761) | | | | | | | 77,263,651 | |
| Other Assets and Liabilities — 1.0% | | | | | | | 805,832 | |
| | | | | | | | |
| Total Net Assets — 100.0% | | | | | | $ | 78,069,483 | |
| | | | | | | | |
Balanced Allocation Fund
| | | | | | | | |
| Description | | Shares | | | Value | |
| Exchange Traded Funds — 9.8% | | | | | | |
| | |
| Large-Cap Funds — 7.4% | | | | | | |
Vanguard S&P 500 ETF | | | 56,562 | | | $ | 18,157,533 | |
| | |
| Fixed Income Funds — 2.4% | | | | | | |
Vanguard Long-Term Treasury ETF | | | 60,135 | | | | 5,953,365 | |
| | | | | | | | |
Total Exchange Traded Funds
(identified cost $21,702,420) | | | | | | | 24,110,898 | |
| | |
| Mutual Funds — 89.1% | | | | | | |
| | |
| Large-Cap Funds — 31.3% | | | | | | |
BMO Dividend Income Fund — Institutional Class (1) | | | 414,985 | | | | 5,652,090 | |
BMO Large-Cap Growth Fund — Class R6 (1) | | | 478,030 | | | | 10,784,362 | |
BMO Large-Cap Value Fund — Class R6 (1) | | | 876,158 | | | | 11,871,940 | |
BMO Low Volatility Equity Fund — Institutional Class (1) | | | 603,396 | | | | 9,123,354 | |
Dodge & Cox Stock Fund — Retail Class | | | 53,034 | | | | 9,182,357 | |
Harbor Capital Appreciation Fund — Retirement Class | | | 56,518 | | | | 6,214,125 | |
T. Rowe Price Growth Stock Fund — Institutional Class | | | 58,440 | | | | 5,495,098 | |
Vanguard Institutional Index Fund — Institutional Class | | | 60,916 | | | | 19,071,680 | |
| | | | | | | | |
Total Large-Cap Funds | | | | | | | 77,395,006 | |
| | |
| Mid-Cap Funds — 3.7% | | | | | | |
BMO Mid-Cap Growth Fund — Class R6 (1) | | | 166,766 | | | | 2,686,603 | |
BMO Mid-Cap Value Fund — Class R6 (1) | | | 295,884 | | | | 2,668,873 | |
Vanguard Mid-Cap Index Fund — Institutional Class | | | 79,251 | | | | 3,902,317 | |
| | | | | | | | |
Total Mid-Cap Funds | | | | | | | 9,257,793 | |
| | |
| Small-Cap Funds — 3.3% | | | | | | |
BMO Small-Cap Growth Fund — Institutional Class (1) | | | 233,942 | | | | 4,105,674 | |
BMO Small-Cap Value Fund — Class R6 (1) | | | 218,965 | | | | 2,321,025 | |
Goldman Sachs Small Cap Value Fund — Institutional Class | | | 38,895 | | | | 1,731,626 | |
| | | | | | | | |
Total Small-Cap Funds | | | | | | | 8,158,325 | |
(See Notes which are an integral part of the Financial Statements)
8
Balanced Allocation Fund (continued)
| | | | | | | | |
| Description | | Shares | | | Value | |
| Mutual Funds (continued) | | | | | | |
| | |
| International Funds — 16.3% | | | | | | |
BMO Disciplined International Equity Fund — Institutional Class (1) | | | 521,381 | | | $ | 5,078,247 | |
BMO LGM Emerging Markets Equity Fund — Institutional Class (1) | | | 286,291 | | | | 4,340,167 | |
BMO Pyrford International Stock Fund — Class R6 (1) | | | 534,408 | | | | 7,112,972 | |
Dodge & Cox International Stock Fund — Retail Class | | | 179,847 | | | | 6,789,233 | |
MFS International Value Fund — Class R6 | | | 178,978 | | | | 8,948,899 | |
T. Rowe Price International Discovery Fund — Institutional Class | | | 55,658 | | | | 4,540,607 | |
Vanguard Developed Markets Index Fund — Admiral Class | | | 99,920 | | | | 1,346,921 | |
Vanguard Emerging Markets Stock Index Fund — Admiral Class | | | 55,922 | | | | 2,059,605 | |
| | | | | | | | |
Total International Funds | | | | | | | 40,216,651 | |
| | |
| Fixed Income Funds — 31.2% | | | | | | |
BMO Core Plus Bond Fund — Institutional Class (1) | | | 1,854,198 | | | | 23,010,598 | |
BMO Corporate Income Fund — Institutional Class (1) | | | 675,886 | | | | 9,638,140 | |
Federated Hermes Institutional High-Yield Bond Fund — Class R6 | | | 504,217 | | | | 4,895,943 | |
Metropolitan West Total Return Bond Fund — Plan Class | | | 2,287,539 | | | | 25,025,678 | |
TCW Emerging Markets Income Fund — Institutional Class | | | 1,196,486 | | | | 9,763,326 | |
Vanguard Total Bond Market Index Fund — Institutional Class | | | 412,647 | | | | 4,799,087 | |
| | | | | | | | |
Total Fixed Income Funds | | | | | | | 77,132,772 | |
| | |
| Alternative Funds — 3.3% | | | | | | |
BNY Mellon Global Real Return Fund — Institutional Class | | | 515,791 | | | | 8,262,972 | |
| | | | | | | | |
Total Mutual Funds
(identified cost $154,326,209) | | | | | | | 220,423,519 | |
| | |
| Short-Term Investments — 0.6% | | | | | | |
| | |
| Mutual Funds — 0.6% | | | | | | |
BMO Institutional Prime Money Market Fund — Premier Class, 0.130% (1) | | | 1,506,003 | | | | 1,505,852 | |
| | | | | | | | |
Total Short-Term Investments — 0.6%
(identified cost $1,506,054) | | | | 1,505,852 | |
| | | | | | | | |
Total Investments — 99.5%
(identified cost $177,534,683) | | | | | | | 246,040,269 | |
| Other Assets and Liabilities — 0.5% | | | | 1,265,957 | |
| | | | | | | | |
| Total Net Assets — 100.0% | | | | | | $ | 247,306,226 | |
| | | | | | | | |
Growth Allocation Fund
| | | | | | | | |
| Description | | Shares | | | Value | |
| Exchange Traded Funds — 9.7% | | | | | | |
| | |
| Large-Cap Funds — 7.1% | | | | | | |
Vanguard S&P 500 ETF | | | 23,295 | | | $ | 7,478,161 | |
| | |
| Fixed Income Funds — 2.6% | | | | | | |
Vanguard Long-Term Treasury ETF | | | 28,175 | | | | 2,789,325 | |
| | | | | | | | |
Total Exchange Traded Funds
(identified cost $9,548,984) | | | | | | | 10,267,486 | |
| | |
| Mutual Funds — 89.1% | | | | | | |
| | |
| Large-Cap Funds — 43.7% | | | | | | |
BMO Dividend Income Fund — Institutional Class (1) | | | 233,974 | | | | 3,186,724 | |
BMO Large-Cap Growth Fund — Class R6 (1) | | | 274,310 | | | | 6,188,434 | |
BMO Large-Cap Value Fund — Class R6 (1) | | | 494,851 | | | | 6,705,232 | |
BMO Low Volatility Equity Fund — Institutional Class (1) | | | 338,536 | | | | 5,118,665 | |
Dodge & Cox Stock Fund — Retail Class | | | 30,123 | | | | 5,215,499 | |
Harbor Capital Appreciation Fund — Retirement Class | | | 31,479 | | | | 3,461,172 | |
T. Rowe Price Growth Stock Fund — Institutional Class | | | 31,859 | | | | 2,995,697 | |
Vanguard Institutional Index Fund — Institutional Class | | | 43,315 | | | | 13,560,919 | |
| | | | | | | | |
Total Large-Cap Funds | | | | | | | 46,432,342 | |
| | |
| Mid-Cap Funds — 4.9% | | | | | | |
BMO Mid-Cap Growth Fund — Class R6 (1) | | | 96,679 | | | | 1,557,505 | |
BMO Mid-Cap Value Fund — Class R6 (1) | | | 163,788 | | | | 1,477,367 | |
Vanguard Mid-Cap Index Fund — Institutional Class | | | 44,207 | | | | 2,176,731 | |
| | | | | | | | |
Total Mid-Cap Funds | | | | | | | 5,211,603 | |
| | |
| Small-Cap Funds — 4.4% | | | | | | |
BMO Small-Cap Growth Fund — Institutional Class (1) | | | 130,977 | | | | 2,298,638 | |
BMO Small-Cap Value Fund — Class R6 (1) | | | 127,414 | | | | 1,350,588 | |
Goldman Sachs Small Cap Value Fund — Institutional Class | | | 22,513 | | | | 1,002,301 | |
| | | | | | | | |
Total Small-Cap Funds | | | | | | | 4,651,527 | |
| | |
| International Funds — 21.2% | | | | | | |
BMO Disciplined International Equity Fund — Institutional Class (1) | | | 286,776 | | | | 2,793,202 | |
BMO LGM Emerging Markets Equity Fund — Institutional Class (1) | | | 162,739 | | | | 2,467,115 | |
BMO Pyrford International Stock Fund — Class R6 (1) | | | 300,332 | | | | 3,997,413 | |
Dodge & Cox International Stock Fund — Retail Class | | | 102,249 | | | | 3,859,909 | |
MFS International Value Fund — Class R6 | | | 85,476 | | | | 4,273,777 | |
T. Rowe Price International Discovery Fund — Institutional Class | | | 30,340 | | | | 2,475,164 | |
Vanguard Developed Markets Index Fund — Admiral Class | | | 112,713 | | | | 1,519,374 | |
Vanguard Emerging Markets Stock Index Fund — Admiral Class | | | 30,750 | | | | 1,132,521 | |
| | | | | | | | |
Total International Funds | | | | | | | 22,518,475 | |
(See Notes which are an integral part of the Financial Statements)
9
August 31, 2020
Growth Allocation Fund (continued)
| | | | | | | | |
| Description | | Shares | | | Value | |
| Mutual Funds (continued) | | | | | | |
| | |
| Fixed Income Funds — 12.7% | | | | | | |
BMO Core Plus Bond Fund — Institutional Class (1) | | | 228,943 | | | $ | 2,841,180 | |
BMO Corporate Income Fund — Institutional Class (1) | | | 347,765 | | | | 4,959,139 | |
Federated Hermes Institutional High-Yield Bond Fund — Class R6 | | | 104,640 | | | | 1,016,053 | |
Metropolitan West Total Return Bond Fund — Plan Class | | | 235,197 | | | | 2,573,054 | |
TCW Emerging Markets Income Fund — Institutional Class | | | 264,082 | | | | 2,154,911 | |
| | | | | | | | |
Total Fixed Income Funds | | | | | | | 13,544,337 | |
| | |
| Alternative Funds — 2.2% | | | | | | |
BNY Mellon Global Real Return Fund — Institutional Class | | | 143,156 | | | | 2,293,360 | |
| | | | | | | | |
Total Mutual Funds
(identified cost $61,880,502) | | | | | | | 94,651,644 | |
| | |
| Short-Term Investments — 0.7% | | | | | | |
| | |
| Mutual Funds — 0.7% | | | | | | |
BMO Institutional Prime Money Market Fund — Premier Class, 0.130% (1) | | | 755,260 | | | | 755,185 | |
| | | | | | | | |
Total Short-Term Investments — 0.7%
(identified cost $755,336) | | | | 755,185 | |
| | | | | | | | |
Total Investments — 99.5%
(identified cost $72,184,822) | | | | | | | 105,674,315 | |
| Other Assets and Liabilities — 0.5% | | | | | | | 488,013 | |
| | | | | | | | |
| Total Net Assets — 100.0% | | | | | | $ | 106,162,328 | |
| | | | | | | | |
Aggressive Allocation Fund
| | | | | | | | |
| Description | | Shares | | | Value | |
| Exchange Traded Funds — 9.5% | | | | | | |
| | |
| Large-Cap Funds — 9.5% | | | | | | |
Vanguard S&P 500 ETF
(identified cost $13,677,027) | | | 45,426 | | | $ | 14,582,654 | |
| Mutual Funds — 89.7% | | | | | | |
| | |
| Large-Cap Funds — 52.0% | | | | | | |
BMO Dividend Income Fund — Institutional Class (1) | | | 399,925 | | | | 5,446,972 | |
BMO Large-Cap Growth Fund — Class R6 (1) | | | 467,119 | | | | 10,538,209 | |
BMO Large-Cap Value Fund — Class R6 (1) | | | 843,933 | | | | 11,435,298 | |
BMO Low Volatility Equity Fund — Institutional Class (1) | | | 541,710 | | | | 8,190,658 | |
Dodge & Cox Stock Fund — Retail Class | | | 51,475 | | | | 8,912,303 | |
Harbor Capital Appreciation Fund — Retirement Class | | | 55,522 | | | | 6,104,672 | |
T. Rowe Price Growth Stock Fund — Institutional Class | | | 58,174 | | | | 5,470,077 | |
Vanguard Institutional Index Fund — Institutional Class | | | 76,446 | | | | 23,933,693 | |
| | | | | | | | |
Total Large-Cap Funds | | | | | | | 80,031,882 | |
| | | | | | | | |
| Description | | Shares | | | Value | |
| Mutual Funds (continued) | | | | | | |
| | |
| Mid-Cap Funds — 6.0% | | | | | | |
BMO Mid-Cap Growth Fund — Class R6 (1) | | | 171,364 | | | $ | 2,760,667 | |
BMO Mid-Cap Value Fund — Class R6 (1) | | | 291,596 | | | | 2,630,193 | |
Vanguard Mid-Cap Index Fund — Institutional Class | | | 77,248 | | | | 3,803,707 | |
| | | | | | | | |
Total Mid-Cap Funds | | | | | | | 9,194,567 | |
| | |
| Small-Cap Funds — 5.2% | | | | | | |
BMO Small-Cap Growth Fund — Institutional Class (1) | | | 229,322 | | | | 4,024,606 | |
BMO Small-Cap Value Fund — Class R6 (1) | | | 215,162 | | | | 2,280,714 | |
Goldman Sachs Small Cap Value Fund — Institutional Class | | | 37,781 | | | | 1,682,025 | |
| | | | | | | | |
Total Small-Cap Funds | | | | | | | 7,987,345 | |
| | |
| International Funds — 26.5% | | | | | | |
BMO Disciplined International Equity Fund — Institutional Class (1) | | | 517,139 | | | | 5,036,930 | |
BMO LGM Emerging Markets Equity Fund — Institutional Class (1) | | | 294,321 | | | | 4,461,904 | |
BMO Pyrford International Stock Fund — Class R6 (1) | | | 493,603 | | | | 6,569,863 | |
Dodge & Cox International Stock Fund — Retail Class | | | 174,343 | | | | 6,581,454 | |
MFS International Value Fund — Class R6 | | | 174,218 | | | | 8,710,883 | |
T. Rowe Price International Discovery Fund — Institutional Class | | | 51,389 | | | | 4,192,351 | |
Vanguard Developed Markets Index Fund — Admiral Class | | | 237,415 | | | | 3,200,362 | |
Vanguard Emerging Markets Stock Index Fund — Admiral Class | | | 56,149 | | | | 2,067,957 | |
| | | | | | | | |
Total International Funds | | | | | | | 40,821,704 | |
| | | | | | | | |
Total Mutual Funds
(identified cost $81,886,280) | | | | | | | 138,035,498 | |
| | |
| Short-Term Investments — 0.7% | | | | | | |
| | |
| Mutual Funds — 0.7% | | | | | | |
BMO Institutional Prime Money Market Fund — Premier Class, 0.130% (1) | | | 1,048,151 | | | | 1,048,046 | |
| | | | | | | | |
Total Short-Term Investments — 0.7%
(identified cost $1,047,960) | | | | 1,048,046 | |
| | | | | | | | |
Total Investments — 99.9%
(identified cost $96,611,267) | | | | | | | 153,666,198 | |
| Other Assets and Liabilities — 0.1% | | | | 122,484 | |
| | | | | | | | |
| Total Net Assets — 100.0% | | | | | | $ | 153,788,682 | |
| | | | | | | | |
| | |
| Notes to Schedules of Investments | | |
The categories of investments are shown as a percentage of total net assets for each Fund as of August 31, 2020.
| (1) | Denotes an investment in an affiliated entity. Please refer to Note 5, Investments in Affiliated Issuers, in the Additional Information Associated with the Schedule of Investments. |
(See Notes which are an integral part of the Financial Statements)
10
August 31, 2020
| | |
| | |
| Statements of Assets and Liabilities | | BMO Funds |
| | | | | | | | | | | | | | | | | | | | |
| | | | | | | | | | | | | | | | |
| | | Conservative
Allocation
Fund | | | Moderate
Allocation
Fund | | | Balanced
Allocation
Fund | | | Growth
Allocation
Fund | | | Aggressive
Allocation
Fund | |
Assets: | | | | | | | | | | | | | | | | | | | | |
Investments in unaffiliated issuers, at value | | $ | 30,296,524 | | | $ | 47,081,591 | | | $ | 146,140,372 | | | $ | 59,977,928 | | | $ | 89,242,138 | |
Cash sweep investments in affiliated issuers, at value | | | 440,749 | | | | 647,639 | | | | 1,505,852 | | | | 755,185 | | | | 1,048,046 | |
Investments in other affiliated issuers, at value | | | 15,085,772 | | | | 29,534,421 | | | | 98,394,045 | | | | 44,941,202 | | | | 63,376,014 | |
Dividends and interest receivable | | | 73,403 | | | | 91,634 | | | | 175,810 | | | | 33,607 | | | | 46 | |
Receivable for investments sold | | | 345,413 | | | | 404,536 | | | | 910,629 | | | | 252,742 | | | | — | |
Receivable for capital stock sold | | | 8,604 | | | | 280,780 | | | | 211,840 | | | | 171,600 | | | | 109,106 | |
Receivable from affiliates, net (Note 5) | | | 16,609 | | | | 21,061 | | | | 6,516 | | | | 22,566 | | | | 10,968 | |
Prepaid expenses and other receivables | | | 37,837 | | | | 38,437 | | | | 38,814 | | | | 38,319 | | | | 38,327 | |
| | | | | | | | | | | | | | | | | | | | |
Total assets | | | 46,304,911 | | | | 78,100,099 | | | | 247,383,878 | | | | 106,193,149 | | | | 153,824,645 | |
| | | | | |
Liabilities: | | | | | | | | | | | | | | | | | | | | |
Payable for capital stock redeemed | | | 226,596 | | | | — | | | | 35,820 | | | | — | | | | — | |
Other liabilities | | | 25,000 | | | | 30,616 | | | | 41,832 | | | | 30,821 | | | | 35,963 | |
| | | | | | | | | | | | | | | | | | | | |
Total liabilities | | | 251,596 | | | | 30,616 | | | | 77,652 | | | | 30,821 | | | | 35,963 | |
| | | | | | | | | | | | | | | | | | | | |
Total net assets | | $ | 46,053,315 | | | $ | 78,069,483 | | | $ | 247,306,226 | | | $ | 106,162,328 | | | $ | 153,788,682 | |
| | | | | | | | | | | | | | | | | | | | |
| | | | | |
Net assets consist of: | | | | | | | | | | | | | | | | | | | | |
Paid-in capital | | $ | 39,179,904 | | | $ | 61,074,899 | | | $ | 163,065,402 | | | $ | 68,065,731 | | | $ | 86,837,063 | |
Distributable earnings | | | 6,873,411 | | | | 16,994,584 | | | | 84,240,824 | | | | 38,096,597 | | | | 66,951,619 | |
| | | | | | | | | | | | | | | | | | | | |
Total net assets | | $ | 46,053,315 | | | $ | 78,069,483 | | | $ | 247,306,226 | | | $ | 106,162,328 | | | $ | 153,788,682 | |
| | | | | | | | | | | | | | | | | | | | |
| | | | | |
Net asset value, offering price and redemption proceeds per share (unlimited shares authorized, no par value) | | | | | | | | | | | | | | | | | | | | |
Investor class of shares | | $ | 7.76 | | | $ | 9.37 | | | $ | 8.46 | | | $ | 9.60 | | | $ | 8.77 | |
Institutional class of shares | | | 8.14 | | | | 9.41 | | | | 8.47 | | | | 9.61 | | | | 8.77 | |
Retirement class R-3 of shares | | | 7.93 | | | | 9.38 | | | | 8.47 | | | | 9.61 | | | | 8.74 | |
Retirement class R-6 of shares | | | 7.84 | | | | 9.43 | | | | 8.49 | | | | 9.64 | | | | 8.80 | |
| | | | | |
Net assets: | | | | | | | | | | | | | | | | | | | | |
Investor class of shares | | $ | 10,749,776 | | | $ | 3,486,349 | | | $ | 47,468,633 | | | $ | 2,316,374 | | | $ | 18,158,956 | |
Institutional class of shares | | | 414,865 | | | | 6,377,577 | | | | 37,233,009 | | | | 5,171,941 | | | | 9,549,153 | |
Retirement class R-3 of shares | | | 548,893 | | | | 7,704,564 | | | | 14,550,491 | | | | 9,436,668 | | | | 18,170,779 | |
Retirement class R-6 of shares | | | 34,339,781 | | | | 60,500,993 | | | | 148,054,093 | | | | 89,237,345 | | | | 107,909,794 | |
| | | | | | | | | | | | | | | | | | | | |
Total net assets | | $ | 46,053,315 | | | $ | 78,069,483 | | | $ | 247,306,226 | | | $ | 106,162,328 | | | $ | 153,788,682 | |
| | | | | | | | | | | | | | | | | | | | |
| | | | | |
Shares outstanding: | | | | | | | | | | | | | | | | | | | | |
Investor class of shares | | | 1,384,521 | | | | 372,032 | | | | 5,609,167 | | | | 241,167 | | | | 2,070,480 | |
Institutional class of shares | | | 50,943 | | | | 677,684 | | | | 4,398,211 | | | | 538,352 | | | | 1,088,518 | |
Retirement class R-3 of shares | | | 69,192 | | | | 821,577 | | | | 1,718,559 | | | | 981,834 | | | | 2,078,377 | |
Retirement class R-6 of shares | | | 4,380,251 | | | | 6,413,860 | | | | 17,431,253 | | | | 9,252,736 | | | | 12,268,245 | |
| | | | | | | | | | | | | | | | | | | | |
Total shares outstanding | | | 5,884,907 | | | | 8,285,153 | | | | 29,157,190 | | | | 11,014,089 | | | | 17,505,620 | |
| | | | | | | | | | | | | | | | | | | | |
| | | | | |
Investments, at cost: | | | | | | | | | | | | | | | | | | | | |
Investments in unaffiliated issuers | | $ | 26,810,584 | | | $ | 38,113,985 | | | $ | 100,260,459 | | | $ | 35,953,336 | | | $ | 48,019,317 | |
Cash sweep investments in affiliated issuers | | | 440,816 | | | | 647,763 | | | | 1,506,054 | | | | 755,336 | | | | 1,047,960 | |
Investments in other affiliated issuers | | | 12,417,979 | | | | 24,134,013 | | | | 75,768,170 | | | | 35,476,150 | | | | 47,543,990 | |
| | | | | | | | | | | | | | | | | | | | |
Total investments, at cost | | $ | 39,669,379 | | | $ | 62,895,761 | | | $ | 177,534,683 | | | $ | 72,184,822 | | | $ | 96,611,267 | |
| | | | | | | | | | | | | | | | | | | | |
(See Notes which are an integral part of the Financial Statements)
11
August 31, 2020
| | |
| | |
| Statements of Operations | | BMO Funds |
| | | | | | | | | | | | | | | | | | | | |
| | | | | | | | | | | | | | | | |
| | | Conservative
Allocation
Fund | | | Moderate
Allocation
Fund | | | Balanced
Allocation
Fund | | | Growth
Allocation
Fund | | | Aggressive
Allocation
Fund | |
Investment Income: | | | | | | | | | | | | | | | | | | | | |
Dividend income from: | | | | | | | | | | | | | | | | | | | | |
Unaffiliated issuers | | $ | 612,125 | | | $ | 1,005,004 | | | $ | 3,233,401 | | | $ | 1,271,270 | | | $ | 1,667,488 | |
Affiliated issuers | | | 360,763 | | | | 685,927 | | | | 2,304,566 | | | | 989,946 | | | | 1,340,347 | |
Excess expense reimbursement from investment adviser (Note 5) | | | 20,360 | | | | 57,045 | | | | 105,095 | | | | 87,159 | | | | 73,668 | |
| | | | | | | | | | | | | | | | | | | | |
Total income | | | 993,248 | | | | 1,747,976 | | | | 5,643,062 | | | | 2,348,375 | | | | 3,081,503 | |
| | | | | |
Expenses: | | | | | | | | | | | | | | | | | | | | |
Shareholder servicing fees (Note 5) | | | 26,263 | | | | 8,462 | | | | 132,483 | | | | 9,565 | | | | 50,141 | |
Administration fees (Note 5) | | | 17,351 | | | | 25,507 | | | | 155,268 | | | | 33,363 | | | | 70,115 | |
Portfolio accounting fees | | | 21,489 | | | | 25,698 | | | | 46,373 | | | | 30,709 | | | | 34,730 | |
Recordkeeping fees | | | 43,163 | | | | 40,625 | | | | 43,049 | | | | 41,203 | | | | 42,927 | |
Custodian fees | | | 396 | | | | 815 | | | | 1,601 | | | | 960 | | | | 1,147 | |
Registration fees | | | 63,518 | | | | 64,086 | | | | 64,785 | | | | 63,973 | | | | 63,980 | |
Professional fees | | | 23,358 | | | | 23,358 | | | | 23,358 | | | | 23,358 | | | | 23,358 | |
Printing and postage | | | 10,859 | | | | 9,945 | | | | 11,428 | | | | 9,478 | | | | 10,547 | |
Directors’ fees | | | 24,375 | | | | 24,375 | | | | 24,375 | | | | 24,375 | | | | 24,375 | |
Distribution services fees (Note 5) | | | 2,951 | | | | 35,976 | | | | 69,447 | | | | 42,883 | | | | 83,959 | |
Miscellaneous | | | 4,662 | | | | 5,629 | | | | 12,185 | | | | 6,864 | | | | 8,610 | |
| | | | | | | | | | | | | | | | | | | | |
Total expense | | | 238,385 | | | | 264,476 | | | | 584,352 | | | | 286,731 | | | | 413,889 | |
| | | | | |
Deduct: | | | | | | | | | | | | | | | | | | | | |
Expense waivers (Note 5) | | | (199,611 | ) | | | (211,268 | ) | | | (298,815 | ) | | | (222,737 | ) | | | (241,560 | ) |
| | | | | | | | | | | | | | | | | | | | |
Net expenses | | | 38,774 | | | | 53,208 | | | | 285,537 | | | | 63,994 | | | | 172,329 | |
| | | | | | | | | | | | | | | | | | | | |
Net investment income | | | 954,474 | | | | 1,694,768 | | | | 5,357,525 | | | | 2,284,381 | | | | 2,909,174 | |
| | | | | |
Realized and unrealized gain (loss) on investments: | | | | | | | | | | | | | | | | | | | | |
Net realized gain (loss) on transactions from: | | | | | | | | | | | | | | | | | | | | |
Investments in unaffiliated issuers | | | 1,076,990 | | | | 2,930,604 | | | | 14,823,528 | | | | 4,043,528 | | | | 6,579,718 | |
Investments in affiliated issuers | | | (572,438 | ) | | | (631,116 | ) | | | 1,402,061 | | | | 12,101 | | | | 2,700,540 | |
Net realized gain (loss) on capital gains distributions from: | | | | | | | | | | | | | | | | | | | | |
Investments in unaffiliated issuers | | | 167,784 | | | | 451,244 | | | | 2,055,116 | | | | 1,078,764 | | | | 1,720,653 | |
Investments in affiliated issuers | | | 65,845 | | | | 244,683 | | | | 1,324,645 | | | | 768,614 | | | | 1,288,753 | |
| | | | | | | | | | | | | | | | | | | | |
Total net realized gain | | | 738,181 | | | | 2,995,415 | | | | 19,605,350 | | | | 5,903,007 | | | | 12,289,664 | |
Net change in unrealized gain (loss) appreciation/depreciation on: | | | | | | | | | | | | | | | | | | | | |
Investments in unaffiliated issuers | | | 483,666 | | | | 537,491 | | | | (2,014,598 | ) | | | 1,373,393 | | | | 3,195,731 | |
Investments in affiliated issuers | | | 548,392 | | | | 1,107,867 | | | | 1,076,979 | | | | 1,285,187 | | | | 373,475 | |
| | | | | | | | | | | | | | | | | | | | |
Total net change in unrealized appreciation/depreciation | | | 1,032,058 | | | | 1,645,358 | | | | (937,619 | ) | | | 2,658,580 | | | | 3,569,206 | |
| | | | | | | | | | | | | | | | | | | | |
Net realized and unrealized gain | | | 1,770,239 | | | | 4,640,773 | | | | 18,667,731 | | | | 8,561,587 | | | | 15,858,870 | |
| | | | | | | | | | | | | | | | | | | | |
Change in net assets resulting from operations | | $ | 2,724,713 | | | $ | 6,335,541 | | | $ | 24,025,256 | | | $ | 10,845,968 | | | $ | 18,768,044 | |
| | | | | | | | | | | | | | | | | | | | |
(See Notes which are an integral part of the Financial Statements)
12
| | |
| | |
| Statements of Changes in Net Assets | | BMO Funds |
| | | | | | | | | | | | | | | | |
| | | | | | | |
| | | Conservative
Allocation
Fund | | | Moderate
Allocation
Fund | |
| | | Year Ended
August 31,
2020 | | | Year Ended
August 31,
2019 | | | Year Ended
August 31,
2020 | | | Year Ended
August 31,
2019 | |
Change in net assets resulting from: | | | | | | | | | | | | | | | | |
| | | | |
Operations: | | | | | | | | | | | | | | | | |
Net investment income (loss) | | $ | 954,474 | | | $ | 981,460 | | | $ | 1,694,768 | | | $ | 1,837,031 | |
Net realized gain (loss) on investments | | | 738,181 | | | | 976,446 | | | | 2,995,415 | | | | 2,627,602 | |
Net change in unrealized appreciation/depreciation on investments | | | 1,032,058 | | | | 94,897 | | | | 1,645,358 | | | | (3,037,226 | ) |
| | | | | | | | | | | | | | | | |
Change in net assets resulting from operations | | | 2,724,713 | | | | 2,052,803 | | | | 6,335,541 | | | | 1,427,407 | |
| | | | |
Distributions to shareholders: | | | | | | | | | | | | | | | | |
Investor class of shares | | | (588,913 | ) | | | (1,832,308 | ) | | | (210,809 | ) | | | (498,960 | ) |
Institutional class of shares | | | (29,294 | ) | | | (80,131 | ) | | | (370,646 | ) | | | (652,823 | ) |
Retirement class R-3 of shares | | | (34,543 | ) | | | (138,410 | ) | | | (410,410 | ) | | | (807,355 | ) |
Retirement class R-6 of shares | | | (1,456,744 | ) | | | (3,516,104 | ) | | | (3,427,730 | ) | | | (6,601,234 | ) |
| | | | | | | | | | | | | | | | |
Change in net assets resulting from distributions to shareholders | | | (2,109,494 | ) | | | (5,566,953 | ) | | | (4,419,595 | ) | | | (8,560,372 | ) |
| | | | |
Capital stock transactions: | | | | | | | | | | | | | | | | |
Proceeds from sale of shares | | | 18,667,073 | | | | 12,833,774 | | | | 20,165,300 | | | | 21,406,373 | |
Net asset value of shares issued to shareholders in payment of distributions declared | | | 2,109,494 | | | | 5,566,953 | | | | 4,393,582 | | | | 8,560,371 | |
Cost of shares redeemed | | | (13,129,292 | ) | | | (14,610,744 | ) | | | (20,226,156 | ) | | | (32,977,344 | ) |
| | | | | | | | | | | | | | | | |
Change in net assets resulting from capital stock transactions | | | 7,647,275 | | | | 3,789,983 | | | | 4,332,726 | | | | (3,010,600 | ) |
| | | | | | | | | | | | | | | | |
Change in net assets | | | 8,262,494 | | | | 275,833 | | | | 6,248,672 | | | | (10,143,565 | ) |
| | | | |
Net assets: | | | | | | | | | | | | | | | | |
Beginning of period | | | 37,790,821 | | | | 37,514,988 | | | | 71,820,811 | | | | 81,964,376 | |
| | | | | | | | | | | | | | | | |
End of period | | $ | 46,053,315 | | | $ | 37,790,821 | | | $ | 78,069,483 | | | $ | 71,820,811 | |
| | | | | | | | | | | | | | | | |
(See Notes which are an integral part of the Financial Statements)
13
| | |
| | |
| Statements of Changes in Net Assets | | BMO Funds |
| | | | | | | | | | | | | | | | | | | | | | | | |
| | | | | | | | | | |
| | | Balanced
Allocation
Fund | | | Growth
Allocation
Fund | | | Aggressive
Allocation
Fund | |
| | | Year Ended
August 31,
2020 | | | Year Ended
August 31,
2019 | | | Year Ended
August 31,
2020 | | | Year Ended
August 31,
2019 | | | Year Ended
August 31,
2020 | | | Year Ended
August 31,
2019 | |
Change in net assets resulting from: | | | | | | | | | | | | | | | | | | | | | | | | |
| | | | | | |
Operations: | | | | | | | | | | | | | | | | | | | | | | | | |
Net investment income (loss) | | $ | 5,357,525 | | | $ | 6,479,257 | | | $ | 2,284,381 | | | $ | 2,202,510 | | | $ | 2,909,174 | | | $ | 3,044,980 | |
Net realized gain (loss) on investments | | | 19,605,350 | | | | 21,400,763 | | | | 5,903,007 | | | | 7,003,942 | | | | 12,289,664 | | | | 12,682,620 | |
Net change in unrealized appreciation/depreciation on investments | | | (937,619 | ) | | | (24,330,313 | ) | | | 2,658,580 | | | | (10,039,095 | ) | | | 3,569,206 | | | | (19,115,380 | ) |
| | | | | | | | | | | | | | | | | | | | | | | | |
Change in net assets resulting from operations | | | 24,025,256 | | | | 3,549,707 | | | | 10,845,968 | | | | (832,643 | ) | | | 18,768,044 | | | | (3,387,780 | ) |
| | | | | | |
Distributions to shareholders: | | | | | | | | | | | | | | | | | | | | | | | | |
Investor class of shares | | | (6,302,490 | ) | | | (8,967,196 | ) | | | (472,835 | ) | | | (690,676 | ) | | | (2,248,354 | ) | | | (3,116,691 | ) |
Institutional class of shares | | | (3,952,087 | ) | | | (3,335,219 | ) | | | (1,063,122 | ) | | | (1,735,406 | ) | | | (1,042,965 | ) | | | (1,541,577 | ) |
Retirement class R-3 of shares | | | (1,386,719 | ) | | | (1,767,800 | ) | | | (642,787 | ) | | | (976,684 | ) | | | (1,537,576 | ) | | | (1,805,967 | ) |
Retirement class R-6 of shares | | | (15,963,209 | ) | | | (17,482,928 | ) | | | (7,071,756 | ) | | | (8,566,608 | ) | | | (10,584,450 | ) | | | (13,423,510 | ) |
| | | | | | | | | | | | | | | | | | | | | | | | |
Change in net assets resulting from distributions to shareholders | | | (27,604,505 | ) | | | (31,553,143 | ) | | | (9,250,500 | ) | | | (11,969,374 | ) | | | (15,413,345 | ) | | | (19,887,745 | ) |
| | | | | | |
Capital stock transactions: | | | | | | | | | | | | | | | | | | | | | | | | |
Proceeds from sale of shares | | | 37,752,942 | | | | 54,213,225 | | | | 23,414,834 | | | | 26,450,385 | | | | 26,172,980 | | | | 26,760,381 | |
Net asset value of shares issued to shareholders in payment of distributions declared | | | 27,551,532 | | | | 31,544,597 | | | | 9,250,500 | | | | 11,969,373 | | | | 15,406,632 | | | | 19,878,744 | |
Cost of shares redeemed | | | (88,109,720 | ) | | | (129,776,859 | ) | | | (41,982,333 | ) | | | (34,353,214 | ) | | | (53,420,625 | ) | | | (40,818,080 | ) |
| | | | | | | | | | | | | | | | | | | | | | | | |
Change in net assets resulting from capital stock transactions | | | (22,805,246 | ) | | | (44,019,037 | ) | | | (9,316,999 | ) | | | 4,066,544 | | | | (11,841,013 | ) | | | 5,821,045 | |
| | | | | | | | | | | | | | | | | | | | | | | | |
Change in net assets | | | (26,384,495 | ) | | | (72,022,473 | ) | | | (7,721,531 | ) | | | (8,735,473 | ) | | | (8,486,314 | ) | | | (17,454,480 | ) |
| | | | | | |
Net assets: | | | | | | | | | | | | | | | | | | | | | | | | |
Beginning of period | | | 273,690,721 | | | | 345,713,194 | | | | 113,883,859 | | | | 122,619,332 | | | | 162,274,996 | | | | 179,729,476 | |
| | | | | | | | | | | | | | | | | | | | | | | | |
End of period | | $ | 247,306,226 | | | $ | 273,690,721 | | | $ | 106,162,328 | | | $ | 113,883,859 | | | $ | 153,788,682 | | | $ | 162,274,996 | |
| | | | | | | | | | | | | | | | | | | | | | | | |
(See Notes which are an integral part of the Financial Statements)
14
| | |
| |
| Financial Highlights—Investor Class of Shares (For a share outstanding throughout each period) |
| | | | | | | | | | | | | | | | | | | | | | | | | | | | | | | | | | | | | | | | | | | | | | | | | | | | | | | | | | | | | | | | | | | | | | |
| | | | | | | | | | | | |
Period
Ended
August 31, | | Net asset
value,
beginning
of period | | Net
investment
income (loss) | | Net realized
and unrealized
gain (loss) | | Total from
investment
operations | | Distributionsto
shareholders
from net
investment
income | | Distributionsto
shareholders
from net
realized gain | | Total
distributions | | Net asset
value,end
of period | | Total
return (1) | | Ratios to Average Net Assets | | | | |
| | Gross
Expenses | | Net
Expenses (2) | | Net
investment
income
(loss) (2) | | Net assets,
end of period
(000 omitted) | | Portfolio
turnover
rate |
Conservative Allocation Fund | | | | | | | | | | | | | | | | | | | | | | | | | | | | | | | | | | | | |
| 2020 | | | $ | 7.72 | | | | $ | 0.16 | (3) | | | $ | 0.32 | | | | $ | 0.48 | | | | $ | (0.22 | ) | | | $ | (0.22 | ) | | | $ | (0.44 | ) | | | $ | 7.76 | | | | | 6.49 | % | | | | 0.87 | % | | | | 0.33 | % | | | | 2.08 | % | | | $ | 10,750 | | | | | 77 | % |
| 2019 | | | | 8.67 | | | | | 0.18 | (3) | | | | 0.14 | | | | | 0.32 | | | | | (0.22 | ) | | | | (1.05 | ) | | | | (1.27 | ) | | | | 7.72 | | | | | 5.13 | | | | | 0.85 | | | | | 0.33 | | | | | 2.36 | | | | | 10,526 | | | | | 50 | |
| 2018 | | | | 10.02 | | | | | 0.21 | | | | | (0.03 | ) | | | | 0.18 | | | | | (0.40 | ) | | | | (1.13 | ) | | | | (1.53 | ) | | | | 8.67 | | | | | 1.79 | | | | | 0.79 | | | | | 0.33 | | | | | 1.99 | | | | | 13,395 | | | | | 29 | |
| 2017 | | | | 9.80 | | | | | 0.18 | | | | | 0.28 | | | | | 0.46 | | | | | (0.24 | ) | | | | (0.00 | ) | | | | (0.24 | ) | | | | 10.02 | | | | | 4.83 | | | | | 0.58 | | | | | 0.33 | | | | | 1.55 | | | | | 15,531 | | | | | 40 | |
| 2016 | | | | 9.76 | | | | | 0.25 | | | | | 0.21 | | | | | 0.46 | | | | | (0.23 | ) | | | | (0.19 | ) | | | | (0.42 | ) | | | | 9.80 | | | | | 4.98 | | | | | 0.56 | | | | | 0.33 | | | | | 2.23 | | | | | 17,919 | | | | | 31 | |
Moderate Allocation Fund | | | | | | | | | | | | | | | | | | | | | | | | | | | | | | | | | | | | |
| 2020 | | | | 9.13 | | | | | 0.19 | | | | | 0.60 | | | | | 0.79 | | | | | (0.23 | ) | | | | (0.32 | ) | | | | (0.55 | ) | | | | 9.37 | | | | | 9.03 | | | | | 0.66 | | | | | 0.30 | | | | | 2.00 | | | | | 3,486 | | | | | 82 | |
| 2019 | | | | 9.92 | | | | | 0.19 | (3) | | | | 0.02 | | | | | 0.21 | | | | | (0.26 | ) | | | | (0.74 | ) | | | | (1.00 | ) | | | | 9.13 | | | | | 3.15 | | | | | 0.64 | | | | | 0.30 | | | | | 2.05 | | | | | 3,486 | | | | | 57 | |
| 2018 | | | | 10.08 | | | | | 0.18 | | | | | 0.31 | | | | | 0.49 | | | | | (0.19 | ) | | | | (0.46 | ) | | | | (0.65 | ) | | | | 9.92 | | | | | 4.94 | | | | | 0.60 | | | | | 0.30 | | | | | 1.69 | | | | | 7,126 | | | | | 31 | |
| 2017 | | | | 9.72 | | | | | 0.17 | | | | | 0.55 | | | | | 0.72 | | | | | (0.22 | ) | | | | (0.14 | ) | | | | (0.36 | ) | | | | 10.08 | | | | | 7.59 | | | | | 0.58 | | | | | 0.30 | | | | | 1.43 | | | | | 7,777 | | | | | 39 | |
| 2016 | | | | 9.78 | | | | | 0.24 | | | | | 0.23 | | | | | 0.47 | | | | | (0.20 | ) | | | | (0.33 | ) | | | | (0.53 | ) | | | | 9.72 | | | | | 5.13 | | | | | 0.56 | | | | | 0.30 | | | | | 1.92 | | | | | 13,119 | | | | | 38 | |
Balanced Allocation Fund | | | | | | | | | | | | | | | | | | | | | | | | | | | | | | | | | | | | |
| 2020 | | | | 8.49 | | | | | 0.16 | | | | | 0.68 | | | | | 0.84 | | | | | (0.19 | ) | | | | (0.68 | ) | | | | (0.87 | ) | | | | 8.46 | | | | | 10.40 | | | | | 0.49 | | | | | 0.33 | | | | | 1.91 | | | | | 47,469 | | | | | 60 | |
| 2019 | | | | 9.41 | | | | | 0.23 | | | | | (0.25 | ) | | | | (0.02 | ) | | | | (0.21 | ) | | | | (0.69 | ) | | | | (0.90 | ) | | | | 8.49 | | | | | 0.94 | | | | | 0.47 | | | | | 0.33 | | | | | 1.87 | | | | | 62,662 | | | | | 52 | |
| 2018 | | | | 9.65 | | | | | 0.15 | | | | | 0.60 | | | | | 0.75 | | | | | (0.18 | ) | | | | (0.81 | ) | | | | (0.99 | ) | | | | 9.41 | | | | | 8.06 | | | | | 0.48 | | | | | 0.33 | | | | | 1.39 | | | | | 98,453 | | | | | 29 | |
| 2017 | | | | 9.42 | | | | | 0.13 | | | | | 0.79 | | | | | 0.92 | | | | | (0.18 | ) | | | | (0.51 | ) | | | | (0.69 | ) | | | | 9.65 | | | | | 10.33 | | | | | 0.48 | | | | | 0.33 | | | | | 1.19 | | | | | 101,517 | | | | | 35 | |
| 2016 | | | | 9.78 | | | | | 0.15 | | | | | 0.32 | | | | | 0.47 | | | | | (0.17 | ) | | | | (0.66 | ) | | | | (0.83 | ) | | | | 9.42 | | | | | 5.23 | | | | | 0.47 | | | | | 0.33 | | | | | 1.54 | | | | | 110,814 | | | | | 33 | |
Growth Allocation Fund | | | | | | | | | | | | | | | | | | | | | | | | | | | | | | | | | | | | |
| 2020 | | | | 9.33 | | | | | 0.20 | (3) | | | | 0.81 | | | | | 1.01 | | | | | (0.19 | ) | | | | (0.55 | ) | | | | (0.74 | ) | | | | 9.60 | | | | | 11.13 | | | | | 0.58 | | | | | 0.30 | | | | | 2.13 | | | | | 2,316 | | | | | 58 | |
| 2019 | | | | 10.58 | | | | | 0.15 | (3) | | | | (0.39 | ) | | | | (0.24 | ) | | | | (0.22 | ) | | | | (0.79 | ) | | | | (1.01 | ) | | | | 9.33 | | | | | (1.00 | ) | | | | 0.56 | | | | | 0.30 | | | | | 1.63 | | | | | 5,883 | | | | | 44 | |
| 2018 | | | | 10.23 | | | | | 0.13 | | | | | 0.98 | | | | | 1.11 | | | | | (0.18 | ) | | | | (0.58 | ) | | | | (0.76 | ) | | | | 10.58 | | | | | 11.15 | | | | | 0.56 | | | | | 0.30 | | | | | 1.18 | | | | | 13,887 | | | | | 32 | |
| 2017 | | | | 9.57 | | | | | 0.10 | | | | | 1.11 | | | | | 1.21 | | | | | (0.12 | ) | | | | (0.43 | ) | | | | (0.55 | ) | | | | 10.23 | | | | | 13.27 | | | | | 0.57 | | | | | 0.30 | | | | | 1.10 | | | | | 16,758 | | | | | 42 | |
| 2016 | | | | 9.82 | | | | | 0.12 | | | | | 0.37 | | | | | 0.49 | | | | | (0.16 | ) | | | | (0.58 | ) | | | | (0.74 | ) | | | | 9.57 | | | | | 5.28 | | | | | 0.56 | | | | | 0.30 | | | | | 1.22 | | | | | 24,691 | | | | | 38 | |
Aggressive Allocation Fund | | | | | | | | | | | | | | | | | | | | | | | | | | | | | | | | | | | | |
| 2020 | | | | 8.53 | | | | | 0.15 | (3) | | | | 0.91 | | | | | 1.06 | | | | | (0.16 | ) | | | | (0.66 | ) | | | | (0.82 | ) | | | | 8.77 | | | | | 12.79 | | | | | 0.54 | | | | | 0.33 | | | | | 1.77 | | | | | 18,159 | | | | | 37 | |
| 2019 | | | | 10.01 | | | | | 0.24 | | | | | (0.61 | ) | | | | (0.37 | ) | | | | (0.21 | ) | | | | (0.90 | ) | | | | (1.11 | ) | | | | 8.53 | | | | | (2.10 | ) | | | | 0.52 | | | | | 0.33 | | | | | 1.59 | | | | | 23,715 | | | | | 47 | |
| 2018 | | | | 10.01 | | | | | 0.12 | | | | | 1.20 | | | | | 1.32 | | | | | (0.19 | ) | | | | (1.13 | ) | | | | (1.32 | ) | | | | 10.01 | | | | | 13.90 | | | | | 0.53 | | | | | 0.33 | | | | | 1.06 | | | | | 34,898 | | | | | 27 | |
| 2017 | | | | 9.56 | | | | | 0.11 | | | | | 1.27 | | | | | 1.38 | | | | | (0.10 | ) | | | | (0.83 | ) | | | | (0.93 | ) | | | | 10.01 | | | | | 15.60 | | | | | 0.53 | | | | | 0.33 | | | | | 1.03 | | | | | 37,632 | | | | | 33 | |
| 2016 | | | | 9.85 | | | | | 0.10 | | | | | 0.38 | | | | | 0.48 | | | | | (0.13 | ) | | | | (0.64 | ) | | | | (0.77 | ) | | | | 9.56 | | | | | 5.14 | | | | | 0.52 | | | | | 0.33 | | | | | 1.04 | | | | | 52,260 | | | | | 33 | |
| (1) | Based on net asset value as of end of period date. |
| (2) | The contractual and voluntary expense waivers pursuant to Note 5 of the financial statements are reflected in both the net expense and net investment income ratios. |
| (3) | Calculated using the average shares method. |
(See Notes which are an integral part of the Financial Statements)
15
| | |
| |
| Financial Highlights—Institutional Class of Shares (For a share outstanding throughout each period) |
| | | | | | | | | | | | | | | | | | | | | | | | | | | | | | | | | | | | | | | | | | | | | | | | | | | | | | | | | | | | | | | | | | | | | | |
| | | | | | | | | | | | |
Period
Ended
August 31, | | Net asset
value,
beginning
of period | | Net
investment
income
(loss) | | Net realized
and unrealized
gain (loss) | | Total from
investment
operations | | Distributionsto
shareholders
from net
investment
income | | Distributionsto
shareholders
from net
realized gain | | Total
distributions | | Net asset
value,end
of period | | Total
return (1) | | Ratios to Average Net Assets | | | | |
| | Gross
Expenses | | Net
Expenses (2) | | Net
investment
income
(loss) (2) | | Net assets,
end of period
(000 omitted) | | Portfolio
turnover
rate |
Conservative Allocation Fund | | | | | | | | | | | | | | | | | | | | | | | | | | | | | | | | | | | | |
| 2020 | | | $ | 8.05 | | | | $ | 0.18 | (3) | | | $ | 0.35 | | | | $ | 0.53 | | | | $ | (0.22 | ) | | | $ | (0.22 | ) | | | $ | (0.44 | ) | | | $ | 8.14 | | | | | 6.86 | % | | | | 0.62 | % | | | | 0.08 | % | | | | 2.29 | % | | | $ | 415 | | | | | 77 | % |
| 2019 | | | | 8.97 | | | | | 0.21 | (3) | | | | 0.14 | | | | | 0.35 | | | | | (0.22 | ) | | | | (1.05 | ) | | | | (1.27 | ) | | | | 8.05 | | | | | 5.32 | | | | | 0.60 | | | | | 0.08 | | | | | 2.57 | | | | | 564 | | | | | 50 | |
| 2018 | | | | 10.02 | | | | | 3.41 | | | | | (3.20 | ) | | | | 0.21 | | | | | (0.13 | ) | | | | (1.13 | ) | | | | (1.26 | ) | | | | 8.97 | | | | | 2.11 | | | | | 0.52 | | | | | 0.08 | | | | | 1.10 | | | | | 1,416 | | | | | 29 | |
| 2017 | | | | 9.81 | | | | | 0.18 | | | | | 0.30 | | | | | 0.48 | | | | | (0.27 | ) | | | | (0.00 | ) | | | | (0.27 | ) | | | | 10.02 | | | | | 5.07 | | | | | 0.33 | | | | | 0.08 | | | | | 1.78 | | | | | 26,464 | | | | | 40 | |
| 2016 | | | | 9.77 | | | | | 0.24 | | | | | 0.25 | | | | | 0.49 | | | | | (0.26 | ) | | | | (0.19 | ) | | | | (0.45 | ) | | | | 9.81 | | | | | 5.29 | | | | | 0.31 | | | | | 0.08 | | | | | 2.46 | | | | | 29,479 | | | | | 31 | |
Moderate Allocation Fund | | | | | | | | | | | | | | | | | | | | | | | | | | | | | | | | | | | | |
| 2020 | | | | 9.16 | | | | | 0.24 | | | | | 0.57 | | | | | 0.81 | | | | | (0.24 | ) | | | | (0.32 | ) | | | | (0.56 | ) | | | | 9.41 | | | | | 9.20 | | | | | 0.41 | | | | | 0.05 | | | | | 2.33 | | | | | 6,378 | | | | | 82 | |
| 2019 | | | | 9.94 | | | | | 0.21 | (3) | | | | 0.02 | | | | | 0.23 | | | | | (0.27 | ) | | | | (0.74 | ) | | | | (1.01 | ) | | | | 9.16 | | | | | 3.42 | | | | | 0.39 | | | | | 0.05 | | | | | 2.27 | | | | | 6,997 | | | | | 57 | |
| 2018 | | | | 10.08 | | | | | 0.28 | | | | | 0.25 | | | | | 0.53 | | | | | (0.21 | ) | | | | (0.46 | ) | | | | (0.67 | ) | | | | 9.94 | | | | | 5.33 | | | | | 0.36 | | | | | 0.05 | | | | | 1.68 | | | | | 5,888 | | | | | 31 | |
| 2017 | | | | 9.73 | | | | | 0.17 | | | | | 0.57 | | | | | 0.74 | | | | | (0.25 | ) | | | | (0.14 | ) | | | | (0.39 | ) | | | | 10.08 | | | | | 7.82 | | | | | 0.33 | | | | | 0.05 | | | | | 1.66 | | | | | 9,375 | | | | | 39 | |
| 2016 | | | | 9.79 | | | | | 0.23 | | | | | 0.28 | | | | | 0.51 | | | | | (0.24 | ) | | | | (0.33 | ) | | | | (0.57 | ) | | | | 9.73 | | | | | 5.50 | | | | | 0.31 | | | | | 0.05 | | | | | 2.15 | | | | | 11,990 | | | | | 38 | |
Balanced Allocation Fund | | | | | | | | | | | | | | | | | | | | | | | | | | | | | | | | | | | | |
| 2020 | | | | 8.50 | | | | | 0.18 | | | | | 0.69 | | | | | 0.87 | | | | | (0.22 | ) | | | | (0.68 | ) | | | | (0.90 | ) | | | | 8.47 | | | | | 10.75 | | | | | 0.24 | | | | | 0.08 | | | | | 2.11 | | | | | 37,233 | | | | | 60 | |
| 2019 | | | | 9.42 | | | | | 0.26 | | | | | (0.26 | ) | | | | — | | | | | (0.23 | ) | | | | (0.69 | ) | | | | (0.92 | ) | | | | 8.50 | | | | | 1.23 | | | | | 0.22 | | | | | 0.08 | | | | | 1.99 | | | | | 37,232 | | | | | 52 | |
| 2018 | | | | 9.66 | | | | | 0.19 | | | | | 0.58 | | | | | 0.77 | | | | | (0.20 | ) | | | | (0.81 | ) | | | | (1.01 | ) | | | | 9.42 | | | | | 8.27 | | | | | 0.23 | | | | | 0.08 | | | | | 1.61 | | | | | 47,597 | | | | | 29 | |
| 2017 | | | | 9.43 | | | | | 0.13 | | | | | 0.81 | | | | | 0.94 | | | | | (0.20 | ) | | | | (0.51 | ) | | | | (0.71 | ) | | | | 9.66 | | | | | 10.67 | | | | | 0.23 | | | | | 0.08 | | | | | 1.42 | | | | | 52,821 | | | | | 35 | |
| 2016 | | | | 9.79 | | | | | 0.17 | | | | | 0.33 | | | | | 0.50 | | | | | (0.20 | ) | | | | (0.66 | ) | | | | (0.86 | ) | | | | 9.43 | | | | | 5.54 | | | | | 0.22 | | | | | 0.08 | | | | | 1.73 | | | | | 74,515 | | | | | 33 | |
Growth Allocation Fund | | | | | | | | | | | | | | | | | | | | | | | | | | | | | | | | | | | | |
| 2020 | | | | 9.32 | | | | | 0.22 | (3) | | | | 0.82 | | | | | 1.04 | | | | | (0.20 | ) | | | | (0.55 | ) | | | | (0.75 | ) | | | | 9.61 | | | | | 11.55 | | | | | 0.33 | | | | | 0.05 | | | | | 2.37 | | | | | 5,172 | | | | | 58 | |
| 2019 | | | | 10.59 | | | | | 0.18 | (3) | | | | (0.42 | ) | | | | (0.24 | ) | | | | (0.24 | ) | | | | (0.79 | ) | | | | (1.03 | ) | | | | 9.32 | | | | | (0.88 | ) | | | | 0.31 | | | | | 0.05 | | | | | 1.96 | | | | | 13,390 | | | | | 44 | |
| 2018 | | | | 10.23 | | | | | 0.15 | | | | | 1.00 | | | | | 1.15 | | | | | (0.21 | ) | | | | (0.58 | ) | | | | (0.79 | ) | | | | 10.59 | | | | | 11.59 | | | | | 0.31 | | | | | 0.05 | | | | | 1.42 | | | | | 11,441 | | | | | 32 | |
| 2017 | | | | 9.58 | | | | | 0.09 | | | | | 1.14 | | | | | 1.23 | | | | | (0.15 | ) | | | | (0.43 | ) | | | | (0.58 | ) | | | | 10.23 | | | | | 13.51 | | | | | 0.32 | | | | | 0.05 | | | | | 1.15 | | | | | 8,969 | | | | | 42 | |
| 2016 | | | | 9.84 | | | | | 0.14 | | | | | 0.37 | | | | | 0.51 | | | | | (0.19 | ) | | | | (0.58 | ) | | | | (0.77 | ) | | | | 9.58 | | | | | 5.50 | | | | | 0.31 | | | | | 0.05 | | | | | 1.48 | | | | | 9,696 | | | | | 38 | |
Aggressive Allocation Fund | | | | | | | | | | | | | | | | | | | | | | | | | | | | | | | | | | | | |
| 2020 | | | | 8.53 | | | | | 0.16 | (3) | | | | 0.92 | | | | | 1.08 | | | | | (0.18 | ) | | | | (0.66 | ) | | | | (0.84 | ) | | | | 8.77 | | | | | 13.06 | | | | | 0.29 | | | | | 0.08 | | | | | 1.99 | | | | | 9,549 | | | | | 37 | |
| 2019 | | | | 10.01 | | | | | 0.26 | | | | | (0.61 | ) | | | | (0.35 | ) | | | | (0.23 | ) | | | | (0.90 | ) | | | | (1.13 | ) | | | | 8.53 | | | | | (1.79 | ) | | | | 0.27 | | | | | 0.08 | | | | | 1.79 | | | | | 12,095 | | | | | 47 | |
| 2018 | | | | 10.00 | | | | | 0.15 | | | | | 1.20 | | | | | 1.35 | | | | | (0.21 | ) | | | | (1.13 | ) | | | | (1.34 | ) | | | | 10.01 | | | | | 14.26 | | | | | 0.28 | | | | | 0.08 | | | | | 1.23 | | | | | 15,878 | | | | | 27 | |
| 2017 | | | | 9.57 | | | | | 0.14 | | | | | 1.25 | | | | | 1.39 | | | | | (0.13 | ) | | | | (0.83 | ) | | | | (0.96 | ) | | | | 10.00 | | | | | 15.79 | | | | | 0.28 | | | | | 0.08 | | | | | 1.29 | | | | | 14,685 | | | | | 33 | |
| 2016 | | | | 9.87 | | | | | 0.11 | | | | | 0.39 | | | | | 0.50 | | | | | (0.16 | ) | | | | (0.64 | ) | | | | (0.80 | ) | | | | 9.57 | | | | | 5.41 | | | | | 0.27 | | | | | 0.08 | | | | | 1.31 | | | | | 24,026 | | | | | 33 | |
| (1) | Based on net asset value as of end of period date. |
| (2) | The contractual and voluntary expense waivers pursuant to Note 5 of the financial statements are reflected in both the net expense and net investment income ratios. |
| (3) | Calculated using the average shares method. |
(See Notes which are an integral part of the Financial Statements)
16
| | |
| |
| Financial Highlights—Retirement Class R-3 of Shares (For a share outstanding throughout each period) |
| | | | | | | | | | | | | | | | | | | | | | | | | | | | | | | | | | | | | | | | | | | | | | | | | | | | | | | | | | | | | | | | | | | | | | |
| | | | | | | | | | | | |
Period
Ended
August 31, | | Net asset
value,
beginning
of period | | Net
investment
income
(loss) | | Net realized
and unrealized
gain (loss) | | Total from
investment
operations | | Distributions to
shareholders
from net
investment
income | | Distributions to
shareholders
from net
realized gain | | Total
distributions | | Net asset
value,end
of period | | Total
return (1) | | Ratios to Average Net Assets | | | | |
| | Gross
Expenses | | Net
Expenses (2) | | Net
investment
income
(loss) (2) | | Net assets,
end of period
(000 omitted) | | Portfolio
turnover
rate |
Conservative Allocation Fund | | | | | | | | | | | | | | | | | | | | | | | | | | | | | | | | | | | | |
| 2020 | | | $ | 7.88 | | | | $ | 0.14 | (3) | | | $ | 0.34 | | | | $ | 0.48 | | | | $ | (0.21 | ) | | | $ | (0.22 | ) | | | $ | (0.43 | ) | | | $ | 7.93 | | | | | 6.29 | % | | | | 1.12 | % | | | | 0.58 | % | | | | 1.86 | % | | | $ | 549 | | | | | 77 | % |
| 2019 | | | | 8.84 | | | | | 0.17 | (3) | | | | 0.13 | | | | | 0.30 | | | | | (0.21 | ) | | | | (1.05 | ) | | | | (1.26 | ) | | | | 7.88 | | | | | 4.78 | | | | | 1.10 | | | | | 0.58 | | | | | 2.14 | | | | | 633 | | | | | 50 | |
| 2018 | | | | 10.01 | | | | | 0.52 | | | | | (0.36 | ) | | | | 0.16 | | | | | (0.20 | ) | | | | (1.13 | ) | | | | (1.33 | ) | | | | 8.84 | | | | | 1.58 | | | | | 1.04 | | | | | 0.58 | | | | | 1.41 | | | | | 956 | | | | | 29 | |
| 2017 | | | | 9.80 | | | | | 0.13 | | | | | 0.30 | | | | | 0.43 | | | | | (0.22 | ) | | | | (0.00 | ) | | | | (0.22 | ) | | | | 10.01 | | | | | 4.52 | | | | | 0.83 | | | | | 0.58 | | | | | 1.34 | | | | | 3,012 | | | | | 40 | |
| 2016 | | | | 9.74 | | | | | 0.21 | | | | | 0.24 | | | | | 0.45 | | | | | (0.20 | ) | | | | (0.19 | ) | | | | (0.39 | ) | | | | 9.80 | | | | | 4.82 | | | | | 0.81 | | | | | 0.58 | | | | | 1.97 | | | | | 6,802 | | | | | 31 | |
Moderate Allocation Fund | | | | | | | | | | | | | | | | | | | | | | | | | | | | | | | | | | | | |
| 2020 | | | | 9.14 | | | | | 0.15 | | | | | 0.62 | | | | | 0.77 | | | | | (0.21 | ) | | | | (0.32 | ) | | | | (0.53 | ) | | | | 9.38 | | | | | 8.76 | | | | | 0.91 | | | | | 0.55 | | | | | 1.73 | | | | | 7,705 | | | | | 82 | |
| 2019 | | | | 9.91 | | | | | 0.17 | (3) | | | | 0.02 | | | | | 0.19 | | | | | (0.22 | ) | | | | (0.74 | ) | | | | (0.96 | ) | | | | 9.14 | | | | | 2.94 | | | | | 0.89 | | | | | 0.55 | | | | | 1.89 | | | | | 6,975 | | | | | 57 | |
| 2018 | | | | 10.08 | | | | | 0.20 | | | | | 0.26 | | | | | 0.46 | | | | | (0.17 | ) | | | | (0.46 | ) | | | | (0.63 | ) | | | | 9.91 | | | | | 4.65 | | | | | 0.85 | | | | | 0.55 | | | | | 1.43 | | | | | 8,095 | | | | | 31 | |
| 2017 | | | | 9.72 | | | | | 0.11 | | | | | 0.58 | | | | | 0.69 | | | | | (0.19 | ) | | | | (0.14 | ) | | | | (0.33 | ) | | | | 10.08 | | | | | 7.37 | | | | | 0.83 | | | | | 0.55 | | | | | 1.10 | | | | | 13,725 | | | | | 39 | |
| 2016 | | | | 9.76 | | | | | 0.26 | | | | | 0.19 | | | | | 0.45 | | | | | (0.16 | ) | | | | (0.33 | ) | | | | (0.49 | ) | | | | 9.72 | | | | | 4.90 | | | | | 0.81 | | | | | 0.55 | | | | | 1.65 | | | | | 12,695 | | | | | 38 | |
Balanced Allocation Fund | | | | | | | | | | | | | | | | | | | | | | | | | | | | | | | | | | | | |
| 2020 | | | | 8.50 | | | | | 0.13 | | | | | 0.69 | | | | | 0.82 | | | | | (0.17 | ) | | | | (0.68 | ) | | | | (0.85 | ) | | | | 8.47 | | | | | 10.14 | | | | | 0.74 | | | | | 0.58 | | | | | 1.57 | | | | | 14,550 | | | | | 60 | |
| 2019 | | | | 9.41 | | | | | 0.21 | | | | | (0.24 | ) | | | | (0.03 | ) | | | | (0.19 | ) | | | | (0.69 | ) | | | | (0.88 | ) | | | | 8.50 | | | | | 0.75 | | | | | 0.72 | | | | | 0.58 | | | | | 1.73 | | | | | 13,632 | | | | | 52 | |
| 2018 | | | | 9.64 | | | | | 0.13 | | | | | 0.59 | | | | | 0.72 | | | | | (0.14 | ) | | | | (0.81 | ) | | | | (0.95 | ) | | | | 9.41 | | | | | 7.77 | | | | | 0.73 | | | | | 0.58 | | | | | 1.16 | | | | | 19,213 | | | | | 29 | |
| 2017 | | | | 9.40 | | | | | 0.09 | | | | | 0.80 | | | | | 0.89 | | | | | (0.14 | ) | | | | (0.51 | ) | | | | (0.65 | ) | | | | 9.64 | | | | | 10.11 | | | | | 0.73 | | | | | 0.58 | | | | | 0.92 | | | | | 23,649 | | | | | 35 | |
| 2016 | | | | 9.76 | | | | | 0.13 | | | | | 0.31 | | | | | 0.44 | | | | | (0.14 | ) | | | | (0.66 | ) | | | | (0.80 | ) | | | | 9.40 | | | | | 4.94 | | | | | 0.72 | | | | | 0.58 | | | | | 1.28 | | | | | 29,095 | | | | | 33 | |
Growth Allocation Fund | | | | | | | | | | | | | | | | | | | | | | | | | | | | | | | | | | | | |
| 2020 | | | | 9.34 | | | | | 0.13 | (3) | | | | 0.86 | | | | | 0.99 | | | | | (0.17 | ) | | | | (0.55 | ) | | | | (0.72 | ) | | | | 9.61 | | | | | 10.86 | | | | | 0.83 | | | | | 0.55 | | | | | 1.46 | | | | | 9,437 | | | | | 58 | |
| 2019 | | | | 10.58 | | | | | 0.15 | (3) | | | | (0.42 | ) | | | | (0.27 | ) | | | | (0.18 | ) | | | | (0.79 | ) | | | | (0.97 | ) | | | | 9.34 | | | | | (1.29 | ) | | | | 0.81 | | | | | 0.55 | | | | | 1.59 | | | | | 8,220 | | | | | 44 | |
| 2018 | | | | 10.22 | | | | | 0.10 | | | | | 0.99 | | | | | 1.09 | | | | | (0.15 | ) | | | | (0.58 | ) | | | | (0.73 | ) | | | | 10.58 | | | | | 11.00 | | | | | 0.81 | | | | | 0.55 | | | | | 0.91 | | | | | 15,107 | | | | | 32 | |
| 2017 | | | | 9.55 | | | | | 0.10 | | | | | 1.08 | | | | | 1.18 | | | | | (0.08 | ) | | | | (0.43 | ) | | | | (0.51 | ) | | | | 10.22 | | | | | 12.96 | | | | | 0.82 | | | | | 0.55 | | | | | 0.85 | | | | | 18,846 | | | | | 42 | |
| 2016 | | | | 9.81 | | | | | 0.09 | | | | | 0.37 | | | | | 0.46 | | | | | (0.14 | ) | | | | (0.58 | ) | | | | (0.72 | ) | | | | 9.55 | | | | | 4.95 | | | | | 0.81 | | | | | 0.55 | | | | | 0.91 | | | | | 25,876 | | | | | 38 | |
Aggressive Allocation Fund | | | | | | | | | | | | | | | | | | | | | | | | | | | | | | | | | | | | |
| 2020 | | | | 8.50 | | | | | 0.11 | (3) | | | | 0.93 | | | | | 1.04 | | | | | (0.14 | ) | | | | (0.66 | ) | | | | (0.80 | ) | | | | 8.74 | | | | | 12.59 | | | | | 0.79 | | | | | 0.58 | | | | | 1.33 | | | | | 18,171 | | | | | 37 | |
| 2019 | | | | 9.99 | | | | | 0.20 | | | | | (0.60 | ) | | | | (0.40 | ) | | | | (0.19 | ) | | | | (0.90 | ) | | | | (1.09 | ) | | | | 8.50 | | | | | (2.47 | ) | | | | 0.77 | | | | | 0.58 | | | | | 1.29 | | | | | 16,079 | | | | | 47 | |
| 2018 | | | | 9.98 | | | | | 0.10 | | | | | 1.20 | | | | | 1.30 | | | | | (0.16 | ) | | | | (1.13 | ) | | | | (1.29 | ) | | | | 9.99 | | | | | 13.70 | | | | | 0.78 | | | | | 0.58 | | | | | 0.79 | | | | | 16,950 | | | | | 27 | |
| 2017 | | | | 9.55 | | | | | 0.06 | | | | | 1.29 | | | | | 1.35 | | | | | (0.09 | ) | | | | (0.83 | ) | | | | (0.92 | ) | | | | 9.98 | | | | | 15.24 | | | | | 0.78 | | | | | 0.58 | | | | | 0.63 | | | | | 17,152 | | | | | 33 | |
| 2016 | | | | 9.84 | | | | | 0.07 | | | | | 0.38 | | | | | 0.45 | | | | | (0.10 | ) | | | | (0.64 | ) | | | | (0.74 | ) | | | | 9.55 | | | | | 4.87 | | | | | 0.77 | | | | | 0.58 | | | | | 0.77 | | | | | 19,395 | | | | | 33 | |
| (1) | Based on net asset value as of end of period date. |
| (2) | The contractual and voluntary expense waivers pursuant to Note 5 of the financial statements are reflected in both the net expense and net investment income ratios. |
| (3) | Calculated using the average shares method. |
(See Notes which are an integral part of the Financial Statements)
17
| | |
| |
| Financial Highlights—Retirement Class R-6 of Shares (For a share outstanding throughout each period) |
| | | | | | | | | | | | | | | | | | | | | | | | | | | | | | | | | | | | | | | | | | | | | | | | | | | | | | | | | | | | | | | | | | | | | | |
| | | | | | | | | | | | |
Period
Ended
August 31, | | Net asset
value,
beginning
of period | | Net
investment
income
(loss) | | Net realized
and unrealized
gain (loss) | | Total from
investment
operations | | Distributions to
shareholders
from net
investment
income | | Distributions to
shareholders
from net
realized gain | | Total
distributions | | Net asset
value,end
of period | | Total
return(1) | | Ratios to Average Net Assets | | | | |
| | Gross
Expenses | | Net
Expenses (2)(3) | | Net
investment
income
(loss) (2) | | Net assets,
end of period
(000 omitted) | | Portfolio
turnover
rate |
Conservative Allocation Fund | | | | | | | | | | | | | | | | | | | | | | | | | | | | | | | | | | | | |
| 2020 | | | $ | 7.76 | | | | $ | 0.19 | (4) | | | $ | 0.33 | | | | $ | 0.52 | | | | $ | (0.22 | ) | | | $ | (0.22 | ) | | | $ | (0.44 | ) | | | $ | 7.84 | | | | | 6.99 | % | | | | 0.47 | % | | | | 0.00 | % | | | | 2.46 | % | | | $ | 34,340 | | | | | 77 | % |
| 2019 | | | | 8.68 | | | | | 0.21 | (4) | | | | 0.14 | | | | | 0.35 | | | | | (0.22 | ) | | | | (1.05 | ) | | | | (1.27 | ) | | | | 7.76 | | | | | 5.51 | | | | | 0.45 | | | | | 0.00 | | | | | 2.72 | | | | | 26,067 | | | | | 50 | |
| 2018 | | | | 10.03 | | | | | 0.21 | | | | | 0.01 | | | | | 0.22 | | | | | (0.44 | ) | | | | (1.13 | ) | | | | (1.57 | ) | | | | 8.68 | | | | | 2.28 | | | | | 0.39 | | | | | 0.00 | | | | | 2.42 | | | | | 21,748 | | | | | 29 | |
| 2017 | | | | 9.82 | | | | | 0.27 | | | | | 0.23 | | | | | 0.50 | | | | | (0.29 | ) | | | | (0.00 | ) | | | | (0.29 | ) | | | | 10.03 | | | | | 5.22 | | | | | 0.18 | | | | | 0.00 | | | | | 1.96 | | | | | 28,927 | | | | | 40 | |
| 2016 | | | | 9.79 | | | | | 0.25 | | | | | 0.24 | | | | | 0.49 | | | | | (0.27 | ) | | | | (0.19 | ) | | | | (0.46 | ) | | | | 9.82 | | | | | 5.34 | | | | | 0.16 | | | | | 0.00 | | | | | 2.61 | | | | | 88,818 | | | | | 31 | |
Moderate Allocation Fund | | | | | | | | | | | | | | | | | | | | | | | | | | | | | | | | | | | | |
| 2020 | | | | 9.16 | | | | | 0.22 | | | | | 0.61 | | | | | 0.83 | | | | | (0.24 | ) | | | | (0.32 | ) | | | | (0.56 | ) | | | | 9.43 | | | | | 9.42 | | | | | 0.26 | | | | | 0.00 | | | | | 2.37 | | | | | 60,501 | | | | | 82 | |
| 2019 | | | | 9.92 | | | | | 0.23 | (4) | | | | 0.02 | | | | | 0.25 | | | | | (0.27 | ) | | | | (0.74 | ) | | | | (1.01 | ) | | | | 9.16 | | | | | 3.63 | | | | | 0.24 | | | | | 0.00 | | | | | 2.58 | | | | | 54,363 | | | | | 57 | |
| 2018 | | | | 10.09 | | | | | 0.22 | | | | | 0.31 | | | | | 0.53 | | | | | (0.24 | ) | | | | (0.46 | ) | | | | (0.70 | ) | | | | 9.92 | | | | | 5.33 | | | | | 0.20 | | | | | 0.00 | | | | | 2.12 | | | | | 60,855 | | | | | 31 | |
| 2017 | | | | 9.74 | | | | | 0.21 | | | | | 0.54 | | | | | 0.75 | | | | | (0.26 | ) | | | | (0.14 | ) | | | | (0.40 | ) | | | | 10.09 | | | | | 8.02 | | | | | 0.18 | | | | | 0.00 | | | | | 1.83 | | | | | 80,283 | | | | | 39 | |
| 2016 | | | | 9.80 | | | | | 0.22 | | | | | 0.30 | | | | | 0.52 | | | | | (0.25 | ) | | | | (0.33 | ) | | | | (0.58 | ) | | | | 9.74 | | | | | 5.67 | | | | | 0.16 | | | | | 0.00 | | | | | 2.27 | | | | | 101,327 | | | | | 38 | |
Balanced Allocation Fund | | | | | | | | | | | | | | | | | | | | | | | | | | | | | | | | | | | | |
| 2020 | | | | 8.52 | | | | | 0.19 | | | | | 0.68 | | | | | 0.87 | | | | | (0.22 | ) | | | | (0.68 | ) | | | | (0.90 | ) | | | | 8.49 | | | | | 10.73 | | | | | 0.09 | | | | | 0.00 | | | | | 2.23 | | | | | 148,054 | | | | | 60 | |
| 2019 | | | | 9.42 | | | | | 0.25 | | | | | (0.23 | ) | | | | 0.02 | | | | | (0.23 | ) | | | | (0.69 | ) | | | | (0.92 | ) | | | | 8.52 | | | | | 1.48 | | | | | 0.07 | | | | | 0.00 | | | | | 2.23 | | | | | 160,166 | | | | | 52 | |
| 2018 | | | | 9.66 | | | | | 0.18 | | | | | 0.61 | | | | | 0.79 | | | | | (0.22 | ) | | | | (0.81 | ) | | | | (1.03 | ) | | | | 9.42 | | | | | 8.51 | | | | | 0.08 | | | | | 0.00 | | | | | 1.82 | | | | | 180,451 | | | | | 29 | |
| 2017 | | | | 9.44 | | | | | 0.19 | | | | | 0.76 | | | | | 0.95 | | | | | (0.22 | ) | | | | (0.51 | ) | | | | (0.73 | ) | | | | 9.66 | | | | | 10.73 | | | | | 0.08 | | | | | 0.00 | | | | | 1.67 | | | | | 193,690 | | | | | 35 | |
| 2016 | | | | 9.80 | | | | | 0.18 | | | | | 0.33 | | | | | 0.51 | | | | | (0.21 | ) | | | | (0.66 | ) | | | | (0.87 | ) | | | | 9.44 | | | | | 5.70 | | | | | 0.07 | | | | | 0.00 | | | | | 1.87 | | | | | 252,982 | | | | | 33 | |
Growth Allocation Fund | | | | | | | | | | | | | | | | | | | | | | | | | | | | | | | | | | | | |
| 2020 | | | | 9.34 | | | | | 0.19 | (4) | | | | 0.86 | | | | | 1.05 | | | | | (0.20 | ) | | | | (0.55 | ) | | | | (0.75 | ) | | | | 9.64 | | | | | 11.63 | | | | | 0.18 | | | | | 0.00 | | | | | 2.12 | | | | | 89,237 | | | | | 58 | |
| 2019 | | | | 10.59 | | | | | 0.18 | (4) | | | | (0.40 | ) | | | | (0.22 | ) | | | | (0.24 | ) | | | | (0.79 | ) | | | | (1.03 | ) | | | | 9.34 | | | | | (0.68 | ) | | | | 0.16 | | | | | 0.00 | | | | | 1.94 | | | | | 86,392 | | | | | 44 | |
| 2018 | | | | 10.24 | | | | | 0.17 | | | | | 0.99 | | | | | 1.16 | | | | | (0.23 | ) | | | | (0.58 | ) | | | | (0.81 | ) | | | | 10.59 | | | | | 11.66 | | | | | 0.17 | | | | | 0.00 | | | | | 1.59 | | | | | 82,185 | | | | | 32 | |
| 2017 | | | | 9.59 | | | | | 0.16 | | | | | 1.09 | | | | | 1.25 | | | | | (0.17 | ) | | | | (0.43 | ) | | | | (0.60 | ) | | | | 10.24 | | | | | 13.69 | | | | | 0.17 | | | | | 0.00 | | | | | 1.49 | | | | | 84,417 | | | | | 42 | |
| 2016 | | | | 9.85 | | | | | 0.15 | | | | | 0.37 | | | | | 0.52 | | | | | (0.20 | ) | | | | (0.58 | ) | | | | (0.78 | ) | | | | 9.59 | | | | | 5.67 | | | | | 0.16 | | | | | 0.00 | | | | | 1.51 | | | | | 79,852 | | | | | 38 | |
Aggressive Allocation Fund | | | | | | | | | | | | | | | | | | | | | | | | | | | | | | | | | | | | |
| 2020 | | | | 8.54 | | | | | 0.17 | (4) | | | | 0.93 | | | | | 1.10 | | | | | (0.18 | ) | | | | (0.66 | ) | | | | (0.84 | ) | | | | 8.80 | | | | | 13.29 | | | | | 0.14 | | | | | 0.00 | | | | | 2.03 | | | | | 107,910 | | | | | 37 | |
| 2019 | | | | 10.02 | | | | | 0.25 | | | | | (0.60 | ) | | | | (0.35 | ) | | | | (0.23 | ) | | | | (0.90 | ) | | | | (1.13 | ) | | | | 8.54 | | | | | (1.77 | ) | | | | 0.12 | | | | | 0.00 | | | | | 1.94 | | | | | 110,386 | | | | | 47 | |
| 2018 | | | | 10.01 | | | | | 0.16 | | | | | 1.21 | | | | | 1.37 | | | | | (0.23 | ) | | | | (1.13 | ) | | | | (1.36 | ) | | | | 10.02 | | | | | 14.51 | | | | | 0.13 | | | | | 0.00 | | | | | 1.47 | | | | | 112,003 | | | | | 27 | |
| 2017 | | | | 9.58 | | | | | 0.15 | | | | | 1.26 | | | | | 1.41 | | | | | (0.15 | ) | | | | (0.83 | ) | | | | (0.98 | ) | | | | 10.01 | | | | | 16.00 | | | | | 0.13 | | | | | 0.00 | | | | | 1.43 | | | | | 105,925 | | | | | 33 | |
| 2016 | | | | 9.88 | | | | | 0.14 | | | | | 0.38 | | | | | 0.52 | | | | | (0.18 | ) | | | | (0.64 | ) | | | | (0.82 | ) | | | | 9.58 | | | | | 5.58 | | | | | 0.12 | | | | | 0.00 | | | | | 1.38 | | | | | 123,203 | | | | | 33 | |
| (1) | Based on net asset value as of end of period date. |
| (2) | The contractual and voluntary expense waivers pursuant to Note 5 of the financial statements are reflected in both the net expense and net investment income ratios. |
| (3) | Please refer to Note 5, subsection Investment Adviser Fee and Other Transactions with Affiliates, in the Notes to Financial Statements. |
| (4) | Calculated using the average shares method. |
(See Notes which are an integral part of the Financial Statements)
18
August 31, 2020
| | |
| | |
| Notes to Financial Statements | | |
BMO Funds, Inc. (the “Corporation”) is registered under the Investment Company Act of 1940 (the “Act”), as amended as an open-end management investment company. As of August 31, 2020, the Corporation consisted of 28 portfolios, including 5 target risk diversified portfolios within this annual report (individually referred to as the “Fund,” or collectively as the “Funds”), each with differing share class offerings as well as 23 other portfolios whose annual report is available under a separate cover. BMO Asset Management Corp. serves as the Funds’ investment adviser (the “Adviser”), a Delaware corporation headquartered in Chicago, Illinois that is a wholly-owned subsidiary of BMO Financial Corp.
| | | | |
| Fund | | Inception Date | | Investment Objective |
Conservative Allocation Fund | | May 30, 2014 | | To provide total return primarily from income, secondarily from appreciation. |
Moderate Allocation Fund | | May 30, 2014 | | To provide total investment return from income and appreciation. |
Balanced Allocation Fund | | May 30, 2014 | | To provide total investment return from income and appreciation. |
Growth Allocation Fund | | May 30, 2014 | | To provide total investment return from income and appreciation. |
Aggressive Allocation Fund | | May 30, 2014 | | To provide total investment return primarily from appreciation, secondarily from income. |
The target investment allocation for each of the Funds, based on each Fund’s total assets, is set forth below.
| | | | | | | | | | | | | | | | |
Fund | | Equity | | | Fixed Income | | | Alternatives | | | Money Market Funds | |
Conservative Allocation Fund | | | 10%–30% | | | | 60%–80% | | | | 0%–15% | | | | 0%–10% | |
Moderate Allocation Fund | | | 30%–50% | | | | 40%–60% | | | | 0%–15% | | | | 0%–10% | |
Balanced Allocation Fund | | | 50%–70% | | | | 25%–45% | | | | 0%–15% | | | | 0%–10% | |
Growth Allocation Fund | | | 70%–90% | | | | 5%–25% | | | | 0%–15% | | | | 0%–10% | |
Aggressive Allocation Fund | | | 90%–100% | | | | 0% | | | | 0%–10% | | | | 0%–10% | |
Each Fund seeks to achieve its investment objectives by investing in a mix (without limitation) of BMO Funds and unaffiliated mutual funds. The Funds are designed to provide investors with investment management, asset allocation, and ongoing reallocation over time. Each Fund is considered a “fund of funds” because it invests in other mutual funds. A fund of funds bears its own direct expenses in addition to bearing a proportionate share of expenses charged to the underlying funds in which it invests.
| 2. | | Significant Accounting Policies |
The Funds are investment companies and follow the accounting and reporting guidance under Financial Accounting Standards Board (“FASB”) Accounting Standards Codification (“ASC”) Topic 946, Financial Services—Investment Companies. The following is a summary of significant accounting policies consistently followed by the Funds in the preparation of their financial statements.
Use of Estimates—The preparation of financial statements in conformity with accounting principles generally accepted in the United States of America (“GAAP”) requires management to make estimates and assumptions that affect the reported amounts of assets and liabilities at the date of the financial statements and the reported amounts of increases and decreases in net assets from operations during the reporting period. Actual results may differ from those estimates.
Investment Valuations—Investments in other open-end registered investment companies are valued at net asset value.
Securities or other assets for which market valuations are not readily available, or are deemed to be inaccurate, are valued at fair value as determined in good faith using methods approved by the Board of Directors (the “Directors”). The Directors have established a Pricing Committee, which is responsible for determinations of fair value, subject to the supervision of the Directors. In determining fair value, the Pricing Committee takes into account all information available and any factors it deems appropriate. Consequently, the price of securities used by a Fund to calculate its NAV may differ from quoted or published prices for the same securities. Fair value pricing involves subjective judgments; it is possible that the fair value determined for a security is materially different than the value that would be realized upon the sale of that security and the differences may be material to the NAV of the Fund or the financial statements presented.
In valuing underlying fund investments, the Funds use the NAVs reported by the underlying funds. An underlying fund may need to fair value one or more of its investments, which may, in turn, require a Fund to do the same because of delays in obtaining the underlying fund’s NAV.
Investment Income, Expenses, and Distributions—Investment income and expenses are accrued daily. The Funds distribute net investment income, if any, and net realized gains (net of any capital loss carryovers) annually. Dividend income, realized gain distributions from underlying funds, and distributions to shareholders are recorded on the ex-dividend date except in the case of certain foreign securities, for which dividends are recorded as soon after the ex-dividend date as the Funds’ information agents become aware of such dividends. Non-cash dividends included in dividend income, if any, are recorded at fair value. Paid-in-kind interest included in interest income, if any, is accrued daily.
The Funds offer multiple classes of shares which differ in their respective distribution, administration, and service fees. All shareholders bear the common expenses of the Funds. Dividends are declared separately for each class. No class has preferential dividend rights; differences in per share dividend rates are generally due to differences in class-specific expenses. Income, non-class specific expenses, and realized and unrealized gains and losses are allocated daily to each class of shares based on the value of total shares outstanding of each class without distinction between share classes. Expenses attributable to a particular class of shares, such as shareholder servicing fees, are allocated directly to that class.
19
Federal Income Taxes—The policies and procedures of the Funds require compliance with Subchapter M of the Internal Revenue Code of 1986 (the “Code”), as amended, and distribution to shareholders each year of substantially all of their income. Accordingly, no provision for federal tax are necessary. Withholding taxes on foreign dividends have been provided for in accordance with the applicable country’s tax rules and rates.
Securities of Other Investment Companies & Underlying Fund Investment Risk—The Funds invest in the securities of other investment companies, including exchange-traded funds, within the limits prescribed by the 1940 Act and the rules promulgated thereunder. Investments in the securities of other investment companies may involve duplication of advisory fees and certain other expenses. By investing in another investment company, a Fund becomes a shareholder of that investment company. As a result, Fund shareholders indirectly will bear the Fund’s proportionate share of the fees and expenses paid by shareholders of the other investment company, in addition to the fees and expenses Fund shareholders directly bear in connection with the Fund’s own operations. The Funds also may invest in investment companies that are not organized under the laws of the United States. The Funds’ risks are directly related to the risks of the underlying funds. It is important to understand the risks associated with investing in the underlying funds.
Commitments and Contingencies—In the normal course of business, the Corporation enters into contracts that provide general indemnifications to other parties. The Corporation’s maximum exposure under these arrangements is unknown as this would involve future claims that may be made against the Corporation that have not yet occurred. However, the Corporation has not had prior claims or losses pursuant to these contracts and expects the risk of loss to be remote.
Other—Investment transactions are accounted for on a trade date basis. Net realized gains and losses on securities are computed on the basis of specific security lot identification.
| 3. | | Fair Value Measurement |
Fair Valuation Measurement defines fair value, establishes a framework for measuring fair value in accordance with GAAP, and requires disclosure about fair value measurements. It establishes a fair value hierarchy that distinguishes between (1) market participant assumptions developed based on market data obtained from sources independent of the reporting issuer (observable inputs), and (2) the reporting issuer’s own assumptions about market participant assumptions developed based on the best information available in the circumstances (unobservable inputs). It also provides guidance on determining when a significant decrease occurs in the trade volume and/or frequency for an asset, when a transaction is not orderly, and how that information must be incorporated into fair value measurement.
Various inputs are used in determining the value of the Funds’ investments. The inputs or methodology used for valuing securities are not necessarily an indication of the risk associated with investing in those securities. These inputs are summarized in the three broad levels listed below:
Level 1—quoted prices in active markets for identical securities. An active market for the security is a market in which transactions occur with sufficient frequency and volume to provide pricing information on an ongoing basis. Common and preferred stocks, options and futures contracts, and U.S. registered mutual funds are generally categorized as Level 1.
Level 2—other significant observable inputs (including quoted prices for similar securities, interest rates, prepayment speeds, credit risk, etc.). Fixed income securities, repurchase agreements and securities valued by an independent fair value pricing service are generally categorized as Level 2.
Level 3—significant unobservable inputs, including management’s own assumptions in determining the fair value of investments.
For the period ended August 31, 2020, the Funds had no investments in private investment funds, and there were no investments excluded from the fair value hierarchy. The Funds did not hold any Level 2 or Level 3 securities as of August 31, 2020.
20
| | |
| | |
| Notes to Financial Statements (continued) | | |
The following is a summary of the inputs used, as of August 31, 2020, in valuing the Funds’ assets:
| | | | | | | | | | | | | | | | |
| | | Conservative Allocation Fund | |
| | | Level 1 | | | Level 2 | | | Level 3 | | | Total | |
Exchange Traded Funds | | $ | 2,576,610 | | | $ | — | | | $ | — | | | $ | 2,576,610 | |
Mutual Funds | | | 42,805,686 | | | | — | | | | — | | | | 42,805,686 | |
Short-Term Investments | | | 440,749 | | | | — | | | | — | | | | 440,749 | |
| | | | | | | | | | | | | | | | |
Total | | $ | 45,823,045 | | | $ | — | | | $ | — | | | $ | 45,823,045 | |
| | | | | | | | | | | | | | | | |
| |
| | | Moderate Allocation Fund | |
| | | Level 1 | | | Level 2 | | | Level 3 | | | Total | |
Exchange Traded Funds | | $ | 6,328,006 | | | $ | — | | | $ | — | | | $ | 6,328,006 | |
Mutual Funds | | | 70,288,006 | | | | — | | | | — | | | | 70,288,006 | |
Short-Term Investments | | | 647,639 | | | | — | | | | — | | | | 647,639 | |
| | | | | | | | | | | | | | | | |
Total | | $ | 77,263,651 | | | $ | — | | | $ | — | | | $ | 77,263,651 | |
| | | | | | | | | | | | | | | | |
| |
| | | Balanced Allocation Fund | |
| | | Level 1 | | | Level 2 | | | Level 3 | | | Total | |
Exchange Traded Funds | | $ | 24,110,898 | | | $ | — | | | $ | — | | | $ | 24,110,898 | |
Mutual Funds | | | 220,423,519 | | | | — | | | | — | | | | 220,423,519 | |
Short-Term Investments | | | 1,505,852 | | | | — | | | | — | | | | 1,505,852 | |
| | | | | | | | | | | | | | | | |
Total | | $ | 246,040,269 | | | $ | — | | | $ | — | | | $ | 246,040,269 | |
| | | | | | | | | | | | | | | | |
| | | | | | | | | | | | | | | | |
| | | Growth Allocation Fund | |
| | | Level 1 | | | Level 2 | | | Level 3 | | | Total | |
Exchange Traded Funds | | $ | 10,267,486 | | | $ | — | | | $ | — | | | $ | 10,267,486 | |
Mutual Funds | | | 94,651,644 | | | | — | | | | — | | | | 94,651,644 | |
Short-Term Investments | | | 755,185 | | | | — | | | | — | | | | 755,185 | |
| | | | | | | | | | | | | | | | |
Total | | $ | 105,674,315 | | | $ | — | | | $ | — | | | $ | 105,674,315 | |
| | | | | | | | | | | | | | | | |
| |
| | | Aggressive Allocation Fund | |
| | | Level 1 | | | Level 2 | | | Level 3 | | | Total | |
Exchange Traded Funds | | $ | 14,582,654 | | | $ | — | | | $ | — | | | $ | 14,582,654 | |
Mutual Funds | | | 138,035,498 | | | | — | | | | — | | | | 138,035,498 | |
Short-Term Investments | | | 1,048,046 | | | | — | | | | — | | | | 1,048,046 | |
| | | | | | | | | | | | | | | | |
Total | | $ | 153,666,198 | | | $ | — | | | $ | — | | | $ | 153,666,198 | |
| | | | | | | | | | | | | | | | |
The Articles of Incorporation permit the Directors to issue an indefinite number of full and fractional shares of common stock, par value $0.0001 per share. Transactions in capital stock were as follows:
| | | | | | | | | | | | | | | | |
| | | | | | | |
| | | Conservative
Allocation
Fund | | | Moderate
Allocation
Fund | |
| | | Year Ended
August 31,
2020 | | | Year Ended
August 31,
2019 | | | Year Ended
August 31,
2020 | | | Year Ended
August 31,
2019 | |
Capital stock transactions in dollars: | | | | | | | | | | | | | | | | |
Proceeds from sale of shares: | | | | | | | | | | | | | | | | |
Investor class of shares | | $ | 3,691,990 | | | $ | 2,465,164 | | | $ | 500,150 | | | $ | 950,509 | |
Institutional class of shares | | | 187,230 | | | | 117,705 | | | | 4,065,438 | | | | 3,116,147 | |
Retirement class R-3 of shares | | | 35,092 | | | | 121,181 | | | | 1,524,501 | | | | 1,154,804 | |
Retirement class R-6 of shares | | | 14,752,761 | | | | 10,129,724 | | | | 14,075,211 | | | | 16,184,913 | |
| | | | | | | | | | | | | | | | |
Net proceeds from sale of shares | | | 18,667,073 | | | | 12,833,774 | | | | 20,165,300 | | | | 21,406,373 | |
Net asset value of shares issued to shareholders in payment of distributions declared: | | | | | | | | | | | | | | | | |
Investor class of shares | | | 588,913 | | | | 1,832,308 | | | | 210,809 | | | | 498,960 | |
Institutional class of shares | | | 29,294 | | | | 80,131 | | | | 344,633 | | | | 652,822 | |
Retirement class R-3 of shares | | | 34,543 | | | | 138,410 | | | | 410,410 | | | | 807,355 | |
Retirement class R-6 of shares | | | 1,456,744 | | | | 3,516,104 | | | | 3,427,730 | | | | 6,601,234 | |
| | | | | | | | | | | | | | | | |
Net proceeds from shares issued: | | | 2,109,494 | | | | 5,566,953 | | | | 4,393,582 | | | | 8,560,371 | |
Cost of shares redeemed: | | | | | | | | | | | | | | | | |
Investor class of shares | | | (3,925,708 | ) | | | (5,875,859 | ) | | | (797,952 | ) | | | (4,670,009 | ) |
Institutional class of shares | | | (370,331 | ) | | | (995,816 | ) | | | (5,029,742 | ) | | | (2,215,134 | ) |
Retirement class R-3 of shares | | | (154,787 | ) | | | (478,752 | ) | | | (1,414,577 | ) | | | (2,437,709 | ) |
Retirement class R-6 of shares | | | (8,678,466 | ) | | | (7,260,317 | ) | | | (12,983,885 | ) | | | (23,654,492 | ) |
| | | | | | | | | | | | | | | | |
Net cost of shares redeemed | | | (13,129,292 | ) | | | (14,610,744 | ) | | | (20,226,156 | ) | | | (32,977,344 | ) |
| | | | | | | | | | | | | | | | |
Net change resulting from fund share transactions in dollars | | $ | 7,647,275 | | | $ | 3,789,983 | | | $ | 4,332,726 | | | $ | (3,010,600 | ) |
| | | | | | | | | | | | | | | | |
| | | | |
Capital stock transactions in shares: | | | | | | | | | | | | | | | | |
Sale of shares: | | | | | | | | | | | | | | | | |
Investor class of shares | | | 494,712 | | | | 324,199 | | | | 55,712 | | | | 105,457 | |
Institutional class of shares | | | 24,097 | | | | 15,097 | | | | 448,767 | | | | 335,532 | |
Retirement class R-3 of shares | | | 4,565 | | | | 15,349 | | | | 170,674 | | | | 125,926 | |
Retirement class R-6 of shares | | | 1,976,871 | | | | 1,296,852 | | | | 1,569,198 | | | | 1,750,383 | |
| | | | | | | | | | | | | | | | |
Net sale of shares | | | 2,500,245 | | | | 1,651,497 | | | | 2,244,351 | | | | 2,317,298 | |
Shares issued to shareholders in payment of distributions declared: | | | | | | | | | | | | | | | | |
Investor class of shares | | | 79,475 | | | | 260,642 | | | | 23,687 | | | | 60,701 | |
Institutional class of shares | | | 3,780 | | | | 10,947 | | | | 38,636 | | | | 79,419 | |
Retirement class R-3 of shares | | | 4,557 | | | | 19,250 | | | | 46,010 | | | | 97,980 | |
Retirement class R-6 of shares | | | 195,274 | | | | 498,738 | | | | 383,844 | | | | 803,070 | |
| | | | | | | | | | | | | | | | |
Net shares issued | | | 283,086 | | | | 789,577 | | | | 492,177 | | | | 1,041,170 | |
Shares redeemed: | | | | | | | | | | | | | | | | |
Investor class of shares | | | (553,198 | ) | | | (765,774 | ) | | | (89,073 | ) | | | (502,486 | ) |
Institutional class of shares | | | (46,996 | ) | | | (113,856 | ) | | | (573,983 | ) | | | (243,374 | ) |
Retirement class R-3 of shares | | | (20,273 | ) | | | (62,442 | ) | | | (158,332 | ) | | | (277,395 | ) |
Retirement class R-6 of shares | | | (1,151,052 | ) | | | (942,390 | ) | | | (1,473,977 | ) | | | (2,750,279 | ) |
| | | | | | | | | | | | | | | | |
Net shares redeemed | | | (1,771,519 | ) | | | (1,884,462 | ) | | | (2,295,365 | ) | | | (3,773,534 | ) |
| | | | | | | | | | | | | | | | |
Net change resulting from fund share transactions in shares | | | 1,011,812 | | | | 556,612 | | | | 441,163 | | | | (415,066 | ) |
| | | | | | | | | | | | | | | | |
21
| | | | | | | | | | | | | | | | | | | | | | | | |
| | | | | | | | | | |
| | | Balanced
Allocation
Fund | | | Growth
Allocation
Fund | | | Aggressive
Allocation
Fund | |
| | | Year Ended
August 31,
2020 | | | Year Ended
August 31,
2019 | | | Year Ended
August 31,
2020 | | | Year Ended
August 31,
2019 | | | Year Ended
August 31,
2020 | | | Year Ended
August 31,
2019 | |
Capital stock transactions in dollars: | | | | | | | | | | | | | | | | | | | | | | | | |
Proceeds from sale of shares: | | | | | | | | | | | | | | | | | | | | | | | | |
Investor class of shares | | $ | 2,681,563 | | | $ | 6,856,544 | | | $ | 587,449 | | | $ | 1,098,046 | | | $ | 1,171,984 | | | $ | 2,496,835 | |
Institutional class of shares | | | 4,954,522 | | | | 15,613,631 | | | | 608,146 | | | | 7,043,334 | | | | 1,530,717 | | | | 1,002,999 | |
Retirement class R-3 of shares | | | 958,720 | | | | 933,516 | | | | 1,104,359 | | | | 1,187,845 | | | | 2,223,695 | | | | 1,551,068 | |
Retirement class R-6 of shares | | | 29,158,137 | | | | 30,809,534 | | | | 21,114,880 | | | | 17,121,160 | | | | 21,246,584 | | | | 21,709,479 | |
| | | | | | | | | | | | | | | | | | | | | | | | |
Net proceeds from sale of shares | | | 37,752,942 | | | | 54,213,225 | | | | 23,414,834 | | | | 26,450,385 | | | | 26,172,980 | | | | 26,760,381 | |
Net asset value of shares issued to shareholders in payment of distributions declared: | | | | | | | | | | | | | | | | | | | | | | | | |
Investor class of shares | | | 6,302,490 | | | | 8,958,651 | | | | 472,835 | | | | 690,675 | | | | 2,241,641 | | | | 3,107,692 | |
Institutional class of shares | | | 3,899,114 | | | | 3,335,219 | | | | 1,063,122 | | | | 1,735,406 | | | | 1,042,965 | | | | 1,541,575 | |
Retirement class R-3 of shares | | | 1,386,719 | | | | 1,767,800 | | | | 642,787 | | | | 976,684 | | | | 1,537,576 | | | | 1,805,967 | |
Retirement class R-6 of shares | | | 15,963,209 | | | | 17,482,927 | | | | 7,071,756 | | | | 8,566,608 | | | | 10,584,450 | | | | 13,423,510 | |
| | | | | | | | | | | | | | | | | | | | | | | | |
Net proceeds from shares issued: | | | 27,551,532 | | | | 31,544,597 | | | | 9,250,500 | | | | 11,969,373 | | | | 15,406,632 | | | | 19,878,744 | |
Cost of shares redeemed: | | | | | | | | | | | | | | | | | | | | | | | | |
Investor class of shares | | | (23,266,254 | ) | | | (43,512,389 | ) | | | (4,646,220 | ) | | | (8,973,691 | ) | | | (9,445,777 | ) | | | (12,956,666 | ) |
Institutional class of shares | | | (8,696,477 | ) | | | (26,307,153 | ) | | | (9,321,898 | ) | | | (4,945,775 | ) | | | (5,357,121 | ) | | | (4,555,850 | ) |
Retirement class R-3 of shares | | | (1,378,077 | ) | | | (6,503,889 | ) | | | (800,060 | ) | | | (7,834,425 | ) | | | (2,199,831 | ) | | | (2,002,966 | ) |
Retirement class R-6 of shares | | | (54,768,912 | ) | | | (53,453,428 | ) | | | (27,214,155 | ) | | | (12,599,323 | ) | | | (36,417,896 | ) | | | (21,302,598 | ) |
| | | | | | | | | | | | | | | | | | | | | | | | |
Net cost of shares redeemed | | | (88,109,720 | ) | | | (129,776,859 | ) | | | (41,982,333 | ) | | | (34,353,214 | ) | | | (53,420,625 | ) | | | (40,818,080 | ) |
| | | | | | | | | | | | | | | | | | | | | | | | |
Net change resulting from fund share transactions in dollars | | $ | (22,805,246 | ) | | $ | (44,019,037 | ) | | $ | (9,316,999 | ) | | $ | 4,066,544 | | | $ | (11,841,013 | ) | | $ | 5,821,045 | |
| | | | | | | | | | | | | | | | | | | | | | | | |
| | | | | | |
Capital stock transactions in shares: | | | | | | | | | | | | | | | | | | | | | | | | |
Sale of shares: | | | | | | | | | | | | | | | | | | | | | | | | |
Investor class of shares | | | 334,855 | | | | 817,103 | | | | 63,136 | | | | 116,942 | | | | 151,410 | | | | 300,242 | |
Institutional class of shares | | | 619,828 | | | | 1,817,532 | | | | 69,008 | | | | 676,329 | | | | 194,372 | | | | 118,215 | |
Retirement class R-3 of shares | | | 117,220 | | | | 109,123 | | | | 122,202 | | | | 126,403 | | | | 270,061 | | | | 179,397 | |
Retirement class R-6 of shares | | | 3,578,601 | | | | 3,504,426 | | | | 2,308,626 | | | | 1,785,288 | | | | 2,551,538 | | | | 2,442,138 | |
| | | | | | | | | | | | | | | | | | | | | | | | |
Net sale of shares | | | 4,650,504 | | | | 6,248,184 | | | | 2,562,972 | | | | 2,704,962 | | | | 3,167,381 | | | | 3,039,992 | |
Shares issued to shareholders in payment of distributions declared: | | | | | | | | | | | | | | | | | | | | | | | | |
Investor class of shares | | | 780,011 | | | | 1,185,007 | | | | 50,952 | | | | 84,023 | | | | 264,033 | | | | 418,826 | |
Institutional class of shares | | | 483,162 | | | | 441,166 | | | | 114,808 | | | | 211,635 | | | | 123,137 | | | | 208,040 | |
Retirement class R-3 of shares | | | 171,199 | | | | 233,219 | | | | 69,117 | | | | 118,530 | | | | 181,532 | | | | 243,720 | |
Retirement class R-6 of shares | | | 1,973,203 | | | | 2,312,557 | | | | 761,222 | | | | 1,043,437 | | | | 1,246,696 | | | | 1,811,540 | |
| | | | | | | | | | | | | | | | | | | | | | | | |
Net shares issued | | | 3,407,575 | | | | 4,171,949 | | | | 996,099 | | | | 1,457,625 | | | | 1,815,398 | | | | 2,682,126 | |
Shares redeemed: | | | | | | | | | | | | | | | | | | | | | | | | |
Investor class of shares | | | (2,882,169 | ) | | | (5,090,096 | ) | | | (503,576 | ) | | | (882,257 | ) | | | (1,126,053 | ) | | | (1,422,575 | ) |
Institutional class of shares | | | (1,083,302 | ) | | | (2,932,262 | ) | | | (1,081,783 | ) | | | (532,221 | ) | | | (647,510 | ) | | | (493,342 | ) |
Retirement class R-3 of shares | | | (173,567 | ) | | | (780,552 | ) | | | (89,998 | ) | | | (792,576 | ) | | | (263,860 | ) | | | (229,147 | ) |
Retirement class R-6 of shares | | | (6,926,412 | ) | | | (6,163,445 | ) | | | (3,064,220 | ) | | | (1,340,347 | ) | | | (4,462,259 | ) | | | (2,502,659 | ) |
| | | | | | | | | | | | | | | | | | | | | | | | |
Net shares redeemed | | | (11,065,450 | ) | | | (14,966,355 | ) | | | (4,739,577 | ) | | | (3,547,401 | ) | | | (6,499,682 | ) | | | (4,647,723 | ) |
| | | | | | | | | | | | | | | | | | | | | | | | |
Net change resulting from fund share transactions in shares | | | (3,007,371 | ) | | | (4,546,222 | ) | | | (1,180,506 | ) | | | 615,186 | | | | (1,516,903 | ) | | | 1,074,395 | |
| | | | | | | | | | | | | | | | | | | | | | | | |
22
| | |
| | |
| Notes to Financial Statements (continued) | | |
| 5. | | Investment Adviser Fee and Other Transactions with Affiliates |
General—Certain of the Officers and Directors of the Corporation are also Officers and Directors/Trustees of one or more portfolios within the Fund complex, which are affiliates of the Corporation. None of the Fund Officers or interested Directors receives any compensation from the funds. Certain Officers and Directors are also employees of the Adviser.
Investment Advisory Fees—The Adviser does not receive an investment advisory fee for the services it performs for the Funds. However, the Adviser is entitled to receive an investment advisory fee from each of the BMO Funds that serve as underlying funds.
Contractual Expense Limitation—The Adviser has contractually agreed to waive or reduce fees and reimburse expenses to the extent necessary to prevent class total annual operating expenses (excluding acquired fund fees and expenses, interest, taxes, brokerage commissions, other investment-related costs and extraordinary expenses, such as litigation and other expenses not incurred in the ordinary course of a Fund’s business) from exceeding the levels set out in the table below through December 31, 2021. This agreement may not be terminated prior to December 31, 2021 without the consent of the Funds’ Board of Directors, unless terminated due to the termination of the investment advisory agreement. Additionally, the agreement does not provide for recoupment by the Adviser of waived fees or reimbursed expenses.
| | | | | | | | | | | | | | | | |
| | | Annualized Contractual Expense Limitation
Exclusive of Acquired Fund Fees and Expenses | |
Fund | | Investor
Class | | | Institutional
Class | | | Retirement
Class R-3 | | | Retirement
Class R-6(1) | |
Conservative Allocation Fund | | | 0.33 | % | | | 0.08 | % | | | 0.58 | % | | | (0.07 | )% |
Moderate Allocation Fund | | | 0.30 | | | | 0.05 | | | | 0.55 | | | | (0.10 | ) |
Balanced Allocation Fund | | | 0.33 | | | | 0.08 | | | | 0.58 | | | | (0.07 | ) |
Growth Allocation Fund | | | 0.30 | | | | 0.05 | | | | 0.55 | | | | (0.10 | ) |
Aggressive Allocation Fund | | | 0.33 | | | | 0.08 | | | | 0.58 | | | | (0.07 | ) |
| | (1) | As a result of reimbursing expenses including acquired fund expenses, the Adviser reimbursed amounts in excess of the respective share classes operating expenses. The aggregate excess reimbursement is accounted for as “Excess expense reimbursement from investment adviser” included in investment income on the Statements of Operations. |
Shareholder Servicing Fees—Under the terms of a Shareholder Services Agreement with the Adviser, each Fund pays the Adviser at the annual rate of 0.25% of average daily net assets of the Fund’s Investor Class shares for the period. The fee paid to the Adviser is used to finance certain services for shareholders and to maintain shareholder accounts.
Distribution Services Fees—The Funds are subject to a Distribution Plan (the “Plan”) pursuant to Rule 12b-1 under the Act. The Plan authorizes payments by the Fund to finance activities intended to result in the sale of its Retirement Class R-3 shares. The Plan provides that the Fund may incur distribution expenses of 0.50% of the average daily net assets of the Fund’s Retirement Class R-3 shares.
Administration Fees—Each Fund pays the Adviser at the annual rate of 0.15% of average daily net assets per class (except the Retirement class R-6, which does not pay an Administration Fee).
For the period ended August 31, 2020, the Funds were charged the following Administration Fees per class:
| | | | | | | | | | | | |
Fund | | Investor
Class | | | Institutional
Class | | | Retirement
Class R-3 | |
Conservative Allocation Fund | | $ | 15,758 | | | $ | 708 | | | $ | 885 | |
Moderate Allocation Fund | | | 5,077 | | | | 9,637 | | | | 10,793 | |
Balanced Allocation Fund | | | 79,490 | | | | 54,945 | | | | 20,834 | |
Growth Allocation Fund | | | 5,739 | | | | 14,759 | | | | 12,865 | |
Aggressive Allocation Fund | | | 30,084 | | | | 14,843 | | | | 25,188 | |
Custodian Fees—BMO Harris Bank N.A. (“BMO”) was the Funds’ custodian through October 10, 2019. BMO received fees of 0.0050% on the first $10 billion average daily net assets, based on the collective net assets of the Corporation custodied by BMO, and 0.0025% on all assets in excess of $10 billion. On October 10, 2019 custody services transferred to State Street Bank and Trust.
23
Investments in Affiliated Issuers—An affiliated issuer is an entity in which a Fund has ownership of at least 5% of the voting securities or any investment in a BMO Fund. Issuers that are affiliates of the Funds at year-end are noted in the Funds’ Schedules of Investments. Additional security purchases and the reduction of certain securities shares outstanding of existing portfolio holdings that were not considered affiliated in prior years may result in the Funds owning in excess of 5% of the outstanding shares at year-end. The table below reflects transactions during the period with entities that are affiliates as of August 31, 2020 and may include acquisitions of new investments, prior period holdings that became affiliated during the period and prior period affiliated holdings that are no longer affiliated as of year-end. Please refer to the Schedules of Investments for which class each Fund’s underlying affiliated issuer represents.
| | | | | | | | | | | | | | | | | | | | | | | | | | | | | | | | |
Fund/Security Description | | Value,
Beginning
of Period | | | Purchases | | | Sales
Proceeds | | | Change In
Unrealized
Appreciation
(Depreciation) | | | Net
Realized
Gain(Loss) | | | Value, End
of Period | | | Dividends
Credited
to
Income | | | Net Realized
Gain on
Capital Gain
Distributions | |
Conservative Allocation Fund | | | | | | | | | | | | | | | | | | | | | | | | | | | | | | | | |
Large-Cap Funds — 5.2% | | | | | | | | | | | | | | | | | | | | | | | | | | | | | | | | |
BMO Low Volatility Equity Fund | | $ | 475,209 | | | $ | 223,962 | | | $ | 87,678 | | | $ | (23,541 | ) | | $ | (2,999 | ) | | $ | 584,953 | | | $ | 9,220 | | | $ | 9,490 | |
BMO Dividend Income Fund | | | 292,539 | | | | 193,130 | | | | 116,678 | | | | 3,841 | | | | (8,149 | ) | | | 364,683 | | | | 7,775 | | | | 430 | |
BMO Large-Cap Value Fund | | | 872,627 | | | | 577,706 | | | | 731,185 | | | | (12,420 | ) | | | 48,728 | | | | 755,456 | | | | 17,081 | | | | — | |
BMO Large-Cap Growth Fund | | | 743,735 | | | | 395,561 | | | | 636,720 | | | | 88,722 | | | | 78,011 | | | | 669,309 | | | | 7,039 | | | | 34,336 | |
| | | | | | | | | | | | | | | | | | | | | | | | | | | | | | | | |
| | | | | | | | | | | | | | | | | | | | | | | 2,374,401 | | | | | | | | | |
Mid-Cap Funds — 0.7% | | | | | | | | | | | | | | | | | | | | | | | | | | | | | | | | |
BMO Mid-Cap Growth Fund | | | 137,532 | | | | 81,222 | | | | 61,326 | | | | 13,974 | | | | (1,894 | ) | | | 169,508 | | | | — | | | | 16,056 | |
BMO Mid-Cap Value Fund | | | 138,801 | | | | 92,346 | | | | 45,307 | | | | (7,979 | ) | | | (3,959 | ) | | | 173,902 | | | | 2,310 | | | | 11 | |
| | | | | | | | | | | | | | | | | | | | | | | | | | | | | | | | |
| | | | | | | | | | | | | | | | | | | | | | | 343,410 | | | | | | | | | |
Small-Cap Funds — 0.9% | | | | | | | | | | | | | | | | | | | | | | | | | | | | | | | | |
BMO Small-Cap Growth Fund | | | 209,043 | | | | 118,669 | | | | 88,955 | | | | 24,373 | | | | (3,614 | ) | | | 259,516 | | | | — | | | | 3,740 | |
BMO Small-Cap Value Fund | | | 119,570 | | | | 89,051 | | | | 49,234 | | | | (1,233 | ) | | | (8,020 | ) | | | 150,134 | | | | 1,045 | | | | 508 | |
| | | | | | | | | | | | | | | | | | | | | | | | | | | | | | | | |
| | | | | | | | | | | | | | | | | | | | | | | 409,650 | | | | | | | | | |
International Funds — 2.4% | | | | | | | | | | | | | | | | | | | | | | | | | | | | | | | | |
BMO LGM Emerging Markets Equity Fund | | | 234,221 | | | | 124,391 | | | | 79,312 | | | | 13,794 | | | | (4,760 | ) | | | 288,334 | | | | 3,957 | | | | 1,274 | |
BMO Pyrford International Stock Fund | | | 364,133 | | | | 330,938 | | | | 223,455 | | | | 20,644 | | | | 7,222 | | | | 499,482 | | | | 8,707 | | | | — | |
BMO Disciplined International Equity Fund | | | 397,559 | | | | 283,978 | | | | 335,710 | | | | (8,170 | ) | | | (10,825 | ) | | | 326,832 | | | | 13,987 | | | | — | |
| | | | | | | | | | | | | | | | | | | | | | | | | | | | | | | | |
| | | | | | | | | | | | | | | | | | | | | | | 1,114,648 | | | | | | | | | |
Fixed Income Funds — 23.5% | | | | | | | | | | | | | | | | | | | | | | | | | | | | | | | | |
BMO Core Plus Bond Fund | | | 7,645,843 | | | | 6,016,720 | | | | 4,015,704 | | | | 221,815 | | | | 68,688 | | | | 9,937,362 | | | | 257,761 | | | | — | |
BMO Corporate Income Fund | | | — | | | | 892,609 | | | | 3,461 | | | | 17,083 | | | | 70 | | | | 906,301 | | | | 4,763 | | | | — | |
| | | | | | | | | | | | | | | | | | | | | | | | | | | | | | | | |
| | | | | | | | | | | | | | | | | | | | | | | 10,843,663 | | | | | | | | | |
| | | | | | | | |
Alternative Funds — 0.0% | | | | | | | | | | | | | | | | | | | | | | | | | | | | | | | | |
BMO Alternative Strategies Fund | | | 3,922,099 | | | | 1,865,501 | | | | 5,254,213 | | | | 197,614 | | | | (731,001 | ) | | | — | | | | 22,237 | | | | — | |
| | | | | | | | |
Short-Term Investment — 1.0% | | | | | | | | | | | | | | | | | | | | | | | | | | | | | | | | |
BMO Institutional Prime Money Market Fund | | | 290,913 | | | | 19,725,652 | | | | 19,575,755 | | | | (125 | ) | | | 64 | | | | 440,749 | | | | 4,881 | | | | — | |
| | | | | | | | | | | | | | | | | | | | | | | | | | | | | | | | |
Totals | | $ | 15,843,824 | | | $ | 31,011,436 | | | $ | 31,304,693 | | | $ | 548,392 | | | $ | (572,438 | ) | | $ | 15,526,521 | | | $ | 360,763 | | | $ | 65,845 | |
| | | | | | | | | | | | | | | | | | | | | | | | | | | | | | | | |
24
| | |
| | |
| Notes to Financial Statements (continued) | | |
| | | | | | | | | | | | | | | | | | | | | | | | | | | | | | | | |
Fund/Security Description | | Value,
Beginning
of Period | | | Purchases | | | Sales
Proceeds | | | Change In
Unrealized
Appreciation
(Depreciation) | | | Net
Realized
Gain(Loss) | | | Value, End
of Period | | | Dividends
Credited
to
Income | | | Net Realized
Gain on
Capital Gain
Distributions | |
Moderate Allocation Fund | | | | | | | | | | | | | | | | | | | | | | | | | | | | | | | | |
Large-Cap Funds — 10.2% | | | | | | | | | | | | | | | | | | | | | | | | | | | | | | | | |
BMO Low Volatility Equity Fund | | $ | 1,762,692 | | | $ | 1,724,570 | | | $ | 1,504,374 | | | $ | (170,626 | ) | | $ | 106,909 | | | $ | 1,919,171 | | | $ | 33,145 | | | $ | 35,152 | |
BMO Dividend Income Fund | | | 1,085,928 | | | | 521,318 | | | | 399,218 | | | | 13,518 | | | | (14,067 | ) | | | 1,207,479 | | | | 28,450 | | | | 1,593 | |
BMO Large-Cap Value Fund | | | 3,248,906 | | | | 1,951,654 | | | | 2,746,447 | | | | 17,813 | | | | 82,747 | | | | 2,554,673 | | | | 63,992 | | | | — | |
BMO Large-Cap Growth Fund | | | 2,775,255 | | | | 2,348,216 | | | | 3,447,382 | | | | 242,058 | | | | 332,332 | | | | 2,250,479 | | | | 26,167 | | | | 127,639 | |
| | | | | | | | | | | | | | | | | | | | | | | | | | | | | | | | |
| | | | | | | | | | | | | | | | | | | | | | | 7,931,802 | | | | | | | | | |
Mid-Cap Funds — 1.5% | | | | | | | | | | | | | | | | | | | | | | | | | | | | | | | | |
BMO Mid-Cap Growth Fund | | | 513,703 | | | | 265,414 | | | | 256,351 | | | | 44,707 | | | | (956 | ) | | | 566,517 | | | | — | | | | 59,767 | |
BMO Mid-Cap Value Fund | | | 516,503 | | | | 269,085 | | | | 180,591 | | | | (16,103 | ) | | | (15,128 | ) | | | 573,766 | | | | 8,597 | | | | 40 | |
| | | | | | | | | | | | | | | | | | | | | | | | | | | | | | | | |
| | | | | | | | | | | | | | | | | | | | | | | 1,140,283 | | | | | | | | | |
Small-Cap Funds — 1.7% | | | | | | | | | | | | | | | | | | | | | | | | | | | | | | | | |
BMO Small-Cap Growth Fund | | | 791,550 | | | | 380,657 | | | | 428,559 | | | | 96,833 | | | | 9,773 | | | | 850,254 | | | | — | | | | 13,925 | |
BMO Small-Cap Value Fund | | | 442,812 | | | | 305,078 | | | | 237,882 | | | | 3,500 | | | | (29,290 | ) | | | 484,218 | | | | 3,856 | | | | 1,875 | |
| | | | | | | | | | | | | | | | | | | | | | | | | | | | | | | | |
| | | | | | | | | | | | | | | | | | | | | | | 1,334,472 | | | | | | | | | |
International Funds — 4.7% | | | | | | | | | | | | | | | | | | | | | | | | | | | | | | | | |
BMO LGM Emerging Markets Equity Fund | | | 861,314 | | | | 211,683 | | | | 170,118 | | | | 43,126 | | | | (14,951 | ) | | | 931,054 | | | | 14,571 | | | | 4,692 | |
BMO Pyrford International Stock Fund | | | 1,348,953 | | | | 981,108 | | | | 774,334 | | | | 54,710 | | | | 51,676 | | | | 1,662,113 | | | | 32,127 | | | | — | |
BMO Disciplined International Equity Fund | | | 1,470,274 | | | | 518,862 | | | | 835,640 | | | | (28,535 | ) | | | (31,572 | ) | | | 1,093,389 | | | | 51,624 | | | | — | |
| | | | | | | | | | | | | | | | | | | | | | | | | | | | | | | | |
| | | | | | | | | | | | | | | | | | | | | | | 3,686,556 | | | | | | | | | |
Fixed Income Funds — 19.8% | | | | | | | | | | | | | | | | | | | | | | | | | | | | | | | | |
BMO Core Plus Bond Fund | | | 10,686,927 | | | | 6,336,566 | | | | 3,529,885 | | | | 434,629 | | | | 3,355 | | | | 13,931,592 | | | | 371,243 | | | | — | |
BMO Corporate Income Fund | | | — | | | | 1,513,952 | | | | 33,774 | | | | 28,463 | | | | 1,075 | | | | 1,509,716 | | | | 8,033 | | | | — | |
| | | | | | | | | | | | | | | | | | | | | | | | | | | | | | | | |
| | | | | | | | | | | | | | | | | | | | | | | 15,441,308 | | | | | | | | | |
| | | | | | | | |
Alternative Funds — 0.0% | | | | | | | | | | | | | | | | | | | | | | | | | | | | | | | | |
BMO Alternative Strategies Fund | | | 6,006,630 | | | | 2,128,794 | | | | 7,366,772 | | | | 344,002 | | | | (1,112,654 | ) | | | — | | | | 34,711 | | | | — | |
| | | | | | | | |
Short-Term Investment — 0.8% | | | | | | | | | | | | | | | | | | | | | | | | | | | | | | | | |
BMO Institutional Prime Money Market Fund | | | 696,506 | | | | 34,818,549 | | | | 34,866,823 | | | | (228 | ) | | | (365 | ) | | | 647,639 | | | | 9,411 | | | | — | |
| | | | | | | | | | | | | | | | | | | | | | | | | | | | | | | | |
Totals | | $ | 32,207,953 | | | $ | 54,275,506 | | | $ | 56,778,150 | | | $ | 1,107,867 | | | $ | (631,116 | ) | | $ | 30,182,060 | | | $ | 685,927 | | | $ | 244,683 | |
| | | | | | | | | | | | | | | | | | | | | | | | | | | | | | | | |
25
| | | | | | | | | | | | | | | | | | | | | | | | | | | | | | | | |
Fund/Security Description | | Value,
Beginning
of Period | | | Purchases | | | Sales
Proceeds | | | Change In
Unrealized
Appreciation
(Depreciation) | | | Net
Realized
Gain(Loss) | | | Value, End
of Period | | | Dividends
Credited
to
Income | | | Net Realized
Gain on
Capital Gain
Distributions | |
Balanced Allocation Fund | | | | | | | | | | | | | | | | | | | | | | | | | | | | | | | | |
Large-Cap Funds — 15.1% | | | | | | | | | | | | | | | | | | | | | | | | | | | | | | | | |
BMO Low Volatility Equity Fund | | $ | 9,840,258 | | | $ | 2,773,603 | | | $ | 3,109,040 | | | $ | (634,241 | ) | | $ | 252,774 | | | $ | 9,123,354 | | | $ | 168,722 | | | $ | 190,301 | |
BMO Dividend Income Fund | | | 6,050,960 | | | | 913,164 | | | | 1,317,329 | | | | (169,186 | ) | | | 174,481 | | | | 5,652,090 | | | | 143,703 | | | | 8,621 | |
BMO Large-Cap Value Fund | | | 18,143,713 | | | | 4,929,089 | | | | 11,845,667 | | | | (227,563 | ) | | | 872,368 | | | | 11,871,940 | | | | 323,609 | | | | — | |
BMO Large-Cap Growth Fund | | | 15,513,513 | | | | 4,754,449 | | | | 12,240,051 | | | | 640,774 | | | | 2,115,677 | | | | 10,784,362 | | | | 141,661 | | | | 690,994 | |
| | | | | | | | | | | | | | | | | | | | | | | | | | | | | | | | |
| | | | | | | | | | | | | | | | | | | | | | | 37,431,746 | | | | | | | | | |
Mid-Cap Funds — 2.2% | | | | | | | | | | | | | | | | | | | | | | | | | | | | | | | | |
BMO Mid-Cap Growth Fund | | | 2,886,233 | | | | 561,067 | | | | 941,520 | | | | 55,825 | | | | 124,998 | | | | 2,686,603 | | | | — | | | | 323,763 | |
BMO Mid-Cap Value Fund | | | 2,901,971 | | | | 762,859 | | | | 885,222 | | | | (235,866 | ) | | | 125,131 | | | | 2,668,873 | | | | 46,563 | | | | 214 | |
| | | | | | | | | | | | | | | | | | | | | | | | | | | | | | | | |
| | | | | | | | | | | | | | | | | | | | | | | 5,355,476 | | | | | | | | | |
Small-Cap Funds — 2.6% | | | | | | | | | | | | | | | | | | | | | | | | | | | | | | | | |
BMO Small-Cap Growth Fund | | | 4,414,268 | | | | 778,363 | | | | 1,547,728 | | | | 352,476 | | | | 108,295 | | | | 4,105,674 | | | | — | | | | 75,226 | |
BMO Small-Cap Value Fund | | | 2,482,108 | | | | 825,200 | | | | 861,784 | | | | 13,546 | | | | (138,045 | ) | | | 2,321,025 | | | | 20,790 | | | | 10,107 | |
| | | | | | | | | | | | | | | | | | | | | | | | | | | | | | | | |
| | | | | | | | | | | | | | | | | | | | | | | 6,426,699 | | | | | | | | | |
International Funds — 6.7% | | | | | | | | | | | | | | | | | | | | | | | | | | | | | | | | |
BMO LGM Emerging Markets Equity Fund | | | 4,812,244 | | | | 489,259 | | | | 1,070,236 | | | | 34,324 | | | | 74,576 | | | | 4,340,167 | | | | 78,945 | | | | 25,419 | |
BMO Pyrford International Stock Fund | | | 7,536,704 | | | | 4,038,191 | | | | 4,844,647 | | | | (218,789 | ) | | | 601,513 | | | | 7,112,972 | | | | 174,341 | | | | — | |
BMO Disciplined International Equity Fund | | | 8,214,534 | | | | 2,577,043 | | | | 5,450,290 | | | | (43,266 | ) | | | (219,774 | ) | | | 5,078,247 | | | | 280,378 | | | | — | |
| | | | | | | | | | | | | | | | | | | | | | | | | | | | | | | | |
| | | | | | | | | | | | | | | | | | | | | | | 16,531,386 | | | | | | | | | |
Fixed Income Funds — 13.2% | | | | | | | | | | | | | | | | | | | | | | | | | | | | | | | | |
BMO Core Plus Bond Fund | | | 23,835,921 | | | | 12,840,265 | | | | 14,460,454 | | | | 274,545 | | | | 520,321 | | | | 23,010,598 | | | | 737,109 | | | | — | |
BMO Corporate Income Fund | | | — | | | | 9,456,414 | | | | — | | | | 181,726 | | | | — | | | | 9,638,140 | | | | 50,619 | | | | — | |
| | | | | | | | | | | | | | | | | | | | | | | | | | | | | | | | |
| | | | | | | | | | | | | | | | | | | | | | | 32,648,738 | | | | | | | | | |
| | | | | | | | |
Alternative Funds — 0.0% | | | | | | | | | | | | | | | | | | | | | | | | | | | | | | | | |
BMO Alternative Strategies Fund | | | 19,017,134 | | | | 3,061,313 | | | | 19,922,927 | | | | 1,053,399 | | | | (3,208,919 | ) | | | — | | | | 107,438 | | | | — | |
| | | | | | | | |
Short-Term Investment — 0.6% | | | | | | | | | | | | | | | | | | | | | | | | | | | | | | | | |
BMO Institutional Prime Money Market Fund | | | 2,721,496 | | | | 76,697,375 | | | | 77,910,959 | | | | (725 | ) | | | (1,335 | ) | | | 1,505,852 | | | | 30,688 | | | | — | |
| | | | | | | | | | | | | | | | | | | | | | | | | | | | | | | | |
Totals | | $ | 128,371,057 | | | $ | 125,457,654 | | | $ | 156,407,854 | | | $ | 1,076,979 | | | $ | 1,402,061 | | | $ | 99,899,897 | | | $ | 2,304,566 | | | $ | 1,324,645 | |
| | | | | | | | | | | | | | | | | | | | | | | | | | | | | | | | |
26
| | |
| | |
| Notes to Financial Statements (continued) | | |
| | | | | | | | | | | | | | | | | | | | | | | | | | | | | | | | |
Fund/Security Description | | Value,
Beginning
of Period | | | Purchases | | | Sales
Proceeds | | | Change In
Unrealized
Appreciation
(Depreciation) | | | Net
Realized
Gain (Loss) | | | Value, End
of Period | | | Dividends
Credited
to
Income | | | Net Realized
Gain on
Capital Gain
Distributions | |
Growth Allocation Fund | | | | | | | | | | | | | | | | | | | | | | | | | | | | | | | | |
Large-Cap Funds — 20.0% | | | | | | | | | | | | | | | | | | | | | | | | | | | | | | | | |
BMO Low Volatility Equity Fund | | $ | 5,418,771 | | | $ | 2,193,210 | | | $ | 2,227,366 | | | $ | (270,724 | ) | | $ | 4,774 | | | $ | 5,118,665 | | | $ | 95,287 | | | $ | 110,393 | |
BMO Dividend Income Fund | | | 3,330,821 | | | | 634,670 | | | | 761,483 | | | | 5,120 | | | | (22,404 | ) | | | 3,186,724 | | | | 80,888 | | | | 5,003 | |
BMO Large-Cap Value Fund | | | 9,987,271 | | | | 3,013,980 | | | | 6,574,623 | | | | 117,635 | | | | 160,969 | | | | 6,705,232 | | | | 181,722 | | | | — | |
BMO Large-Cap Growth Fund | | | 8,540,272 | | | | 2,509,299 | | | | 6,364,777 | | | | 597,852 | | | | 905,788 | | | | 6,188,434 | | | | 82,160 | | | | 400,758 | |
| | | | | | | | | | | | | | | | | | | | | | | | | | | | | | | | |
| | | | | | | | | | | | | | | | | | | | | | | 21,199,055 | | | | | | | | | |
Mid-Cap Funds — 2.9% | | | | | | | | | | | | | | | | | | | | | | | | | | | | | | | | |
BMO Mid-Cap Growth Fund | | | 1,584,650 | | | | 282,698 | | | | 390,877 | | | | 60,719 | | | | 20,315 | | | | 1,557,505 | | | | — | | | | 188,035 | |
BMO Mid-Cap Value Fund | | | 1,593,287 | | | | 376,251 | | | | 394,520 | | | | (99,244 | ) | | | 1,593 | | | | 1,477,367 | | | | 27,043 | | | | 124 | |
| | | | | | | | | | | | | | | | | | | | | | | | | | | | | | | | |
| | | | | | | | | | | | | | | | | | | | | | | 3,034,872 | | | | | | | | | |
Small-Cap Funds — 3.4% | | | | | | | | | | | | | | | | | | | | | | | | | | | | | | | | |
BMO Small-Cap Growth Fund | | | 2,425,688 | | | | 332,862 | | | | 692,979 | | | | 232,211 | | | | 856 | | | | 2,298,638 | | | | — | | | | 43,717 | |
BMO Small-Cap Value Fund | | | 1,372,534 | | | | 379,759 | | | | 328,839 | | | | 20,794 | | | | (93,660 | ) | | | 1,350,588 | | | | 12,060 | | | | 5,863 | |
| | | | | | | | | | | | | | | | | | | | | | | | | | | | | | | | |
| | | | | | | | | | | | | | | | | | | | | | | 3,649,226 | | | | | | | | | |
International Funds — 8.7% | | | | | | | | | | | | | | | | | | | | | | | | | | | | | | | | |
BMO LGM Emerging Markets Equity Fund | | | 2,668,786 | | | | 296,689 | | | | 545,509 | | | | 96,556 | | | | (49,407 | ) | | | 2,467,115 | | | | 45,718 | | | | 14,721 | |
BMO Pyrford International Stock Fund | | | 4,148,947 | | | | 2,408,086 | | | | 2,758,864 | | | | (85,689 | ) | | | 284,933 | | | | 3,997,413 | | | | 101,303 | | | | — | |
BMO Disciplined International Equity Fund | | | 4,519,910 | | | | 1,139,822 | | | | 2,678,571 | | | | (82,500 | ) | | | (105,459 | ) | | | 2,793,202 | | | | 162,863 | | | | — | |
| | | | | | | | | | | | | | | | | | | | | | | | | | | | | | | | |
| | | | | | | | | | | | | | | | | | | | | | | 9,257,730 | | | | | | | | | |
Fixed Income Funds — 7.3% | | | | | | | | | | | | | | | | | | | | | | | | | | | | | | | | |
BMO Core Plus Bond Fund | | | 3,201,664 | | | | 660,155 | | | | 1,112,475 | | | | 59,914 | | | | 31,922 | | | | 2,841,180 | | | | 96,625 | | | | — | |
BMO Corporate Income Fund | | | — | | | | 4,929,501 | | | | 236,900 | | | | 269,750 | | | | (3,212 | ) | | | 4,959,139 | | | | 53,407 | | | | — | |
| | | | | | | | | | | | | | | | | | | | | | | | | | | | | | | | |
| | | | | | | | | | | | | | | | | | | | | | | 7,800,319 | | | | | | | | | |
| | | | | | | | |
Alternative Funds — 0.0% | | | | | | | | | | | | | | | | | | | | | | | | | | | | | | | | |
BMO Alternative Strategies Fund | | | 6,309,807 | | | | 1,214,185 | | | | 6,762,366 | | | | 363,149 | | | | (1,124,775 | ) | | | — | | | | 37,708 | | | | — | |
| | | | | | | | |
Short-Term Investment — 0.7% | | | | | | | | | | | | | | | | | | | | | | | | | | | | | | | | |
BMO Institutional Prime Money Market Fund | | | 1,152,517 | | | | 36,003,224 | | | | 36,400,068 | | | | (356 | ) | | | (132 | ) | | | 755,185 | | | | 13,162 | | | | — | |
| | | | | | | | | | | | | | | | | | | | | | | | | | | | | | | | |
Totals | | $ | 56,254,925 | | | $ | 56,374,391 | | | $ | 68,230,217 | | | $ | 1,285,187 | | | $ | 12,101 | | | $ | 45,696,387 | | | $ | 989,946 | | | $ | 768,614 | |
| | | | | | | | | | | | | | | | | | | | | | | | | | | | | | | | |
Aggressive Allocation Fund | | | | | | | | | | | | | | | | | | | | | | | | | | | | | | | | |
Large-Cap Funds — 23.2% | | | | | | | | | | | | | | | | | | | | | | | | | | | | | | | | |
BMO Low Volatility Equity Fund | | $ | 9,429,318 | | | $ | 1,260,456 | | | $ | 2,090,879 | | | $ | (640,766 | ) | | $ | 232,529 | | | $ | 8,190,658 | | | $ | 158,330 | | | $ | 184,978 | |
BMO Dividend Income Fund | | | 5,764,728 | | | | 713,552 | | | | 1,024,377 | | | | (16,130 | ) | | | 9,199 | | | | 5,446,972 | | | | 135,272 | | | | 8,333 | |
BMO Large-Cap Value Fund | | | 17,286,092 | | | | 3,970,761 | | | | 10,366,314 | | | | 49,790 | | | | 494,969 | | | | 11,435,298 | | | | 304,902 | | | | — | |
BMO Large-Cap Growth Fund | | | 14,758,236 | | | | 3,219,311 | | | | 10,068,267 | | | | 907,534 | | | | 1,721,395 | | | | 10,538,209 | | | | 137,533 | | | | 670,856 | |
| | | | | | | | | | | | | | | | | | | | | | | | | | | | | | | | |
| | | | | | | | | | | | | | | | | | | | | | | 35,611,137 | | | | | | | | | |
Mid-Cap Funds — 3.5% | | | | | | | | | | | | | | | | | | | | | | | | | | | | | | | | |
BMO Mid-Cap Growth Fund | | | 2,736,158 | | | | 460,789 | | | | 593,678 | | | | 112,375 | | | | 45,023 | | | | 2,760,667 | | | | — | | | | 317,000 | |
BMO Mid-Cap Value Fund | | | 2,761,184 | | | | 385,884 | | | | 332,006 | | | | (203,411 | ) | | | 18,542 | | | | 2,630,193 | | | | 45,436 | | | | 209 | |
| | | | | | | | | | | | | | | | | | | | | | | | | | | | | | | | |
| | | | | | | | | | | | | | | | | | | | | | | 5,390,860 | | | | | | | | | |
Small-Cap Funds — 4.1% | | | | | | | | | | | | | | | | | | | | | | | | | | | | | | | | |
BMO Small-Cap Growth Fund | | | 4,170,031 | | | | 370,611 | | | | 890,771 | | | | 344,067 | | | | 30,668 | | | | 4,024,606 | | | | — | | | | 72,934 | |
BMO Small-Cap Value Fund | | | 2,345,901 | | | | 571,661 | | | | 500,193 | | | | (35,059 | ) | | | (101,596 | ) | | | 2,280,714 | | | | 20,373 | | | | 9,904 | |
| | | | | | | | | | | | | | | | | | | | | | | | | | | | | | | | |
| | | | | | | | | | | | | | | | | | | | | | | 6,305,320 | | | | | | | | | |
International Funds — 10.4% | | | | | | | | | | | | | | | | | | | | | | | | | | | | | | | | |
BMO LGM Emerging Markets Equity Fund | | | 4,612,374 | | | | 510,585 | | | | 776,789 | | | | 167,905 | | | | (52,171 | ) | | | 4,461,904 | | | | 76,212 | | | | 24,539 | |
BMO Pyrford International Stock Fund | | | 7,216,629 | | | | 3,574,730 | | | | 4,546,239 | | | | (213,278 | ) | | | 538,021 | | | | 6,569,863 | | | | 168,466 | | | | — | |
BMO Disciplined International Equity Fund | | | 7,859,748 | | | | 2,065,984 | | | | 4,641,213 | | | | (144,176 | ) | | | (103,413 | ) | | | 5,036,930 | | | | 270,523 | | | | — | |
| | | | | | | | | | | | | | | | | | | | | | | | | | | | | | | | |
| | | | | | | | | | | | | | | | | | | | | | | 16,068,697 | | | | | | | | | |
| | | | | | | | |
Alternative Funds — 0.0% | | | | | | | | | | | | | | | | | | | | | | | | | | | | | | | | |
BMO Alternative Strategies Fund | | | 808,700 | | | | 75,318 | | | | 796,008 | | | | 44,545 | | | | (132,555 | ) | | | — | | | | 4,683 | | | | — | |
| | | | | | | | |
Short-Term Investment — 0.7% | | | | | | | | | | | | | | | | | | | | | | | | | | | | | | | | |
BMO Institutional Prime Money Market Fund | | | 1,351,802 | | | | 54,108,213 | | | | 54,411,977 | | | | 79 | | | | (71 | ) | | | 1,048,046 | | | | 18,617 | | | | — | |
| | | | | | | | | | | | | | | | | | | | | | | | | | | | | | | | |
Totals | | $ | 81,100,901 | | | $ | 71,287,855 | | | $ | 91,038,711 | | | $ | 373,475 | | | $ | 2,700,540 | | | $ | 64,424,060 | | | $ | 1,340,347 | | | $ | 1,288,753 | |
| | | | | | | | | | | | | | | | | | | | | | | | | | | | | | | | |
27
Interfund Borrowing and Lending—The Funds participate in an interfund lending program. This program allows the Funds to borrow cash from any of the BMO Money Market Funds for temporary purposes. The program is subject to a number of conditions, including the requirement that the interfund loan rate to be charged to the Funds under the program is (i) more favorable to the lending Fund than the rate it could otherwise obtain from investing cash in repurchase agreements or purchasing shares of the BMO Money Market Funds and (ii) more favorable to the borrowing Fund than the lowest interest rate at which bank short-term loans would be available to the Funds. In addition, a Fund may participate in the program only if its participation is consistent with the Fund’s investment policies and limitations. The Directors are responsible for the oversight of the interfund lending program.
Funds utilizing the interfund lending program, borrowing from the BMO Government Money Market Fund during the year ended August 31, 2020, were as follows:
| | | | | | | | |
Fund | | Average Daily Loan
Balance Outstanding | | | Weighted Average
Interest Rate | |
Conservative Allocation Fund | | $ | 5,995 | | | | 1.329 | % |
Moderate Allocation Fund | | | 12,828 | | | | 2.049 | |
Balanced Allocation Fund | | | 39,339 | | | | 1.996 | |
Growth Allocation Fund | | | 21,255 | | | | 1.968 | |
Aggressive Allocation Fund | | | 35,555 | | | | 2.241 | |
The Corporation, on behalf of the respective Funds, participated in a $25 million unsecured, committed revolving line of credit (“LOC”) agreement with State Street Bank, expiring on October 15, 2020 and renewing on that same day with a new expiraton date of October 14, 2021. The LOC was made available for extraordinary or emergency purposes, primarily for financing redemption payments. Borrowings currently are charged interest at a rate of the London Interbank Offering Rate (“LIBOR”) plus 1.25% and a commitment fee of 0.20% per annum on the daily unused portion with no administrative fee. No borrowings were outstanding under the LOC during the year ended August 31, 2020.
| 7. | | Investment Transactions |
Purchases and sales of investments, excluding short-term U.S. government securities, short-term obligations, and in-kind contributions, for the year ended August 31, 2020 were as follows:
| | | | | | | | | | | | | | | | |
| | | Other than
U.S Government
Securities | | | U.S Government
Securities | |
Fund | | Purchases | | | Sales | | | Purchases | | | Sales | |
Conservative Allocation Fund | | $ | 37,304,283 | | | $ | 30,498,857 | | | $ | — | | | $ | — | |
Moderate Allocation Fund | | | 60,951,718 | | | | 59,307,221 | | | | — | | | | — | |
Balanced Allocation Fund | | | 149,853,332 | | | | 191,202,112 | | | | — | | | | — | |
Growth Allocation Fund | | | 62,165,355 | | | | 76,503,172 | | | | — | | | | — | |
Aggressive Allocation Fund | | | 55,267,790 | | | | 76,115,211 | | | | — | | | | — | |
| 8. | | Federal Tax Information |
The timing and character of income and capital gain distributions are determined in accordance with income tax regulations, which may differ from GAAP. These differences are due in part to differing treatments for net operating loss, foreign currency transactions, paydown gain or loss, market discount accretion, and premium amortization.
To the extent that differences arise that are permanent in nature, such amounts are reclassified within the capital accounts on the Statements of Assets and Liabilities based on their Federal tax basis treatment; temporary differences do not require reclassification and had no impact on the NAV of the Funds.
The Funds complied with FASB interpretation Accounting for Uncertainty in Income Taxes which provides guidance for how uncertain tax provisions should be recognized, measured, presented and disclosed in the financial statements. Accounting for Uncertainty in Income Taxes requires the affirmative evaluation of tax positions taken, or expected to be taken, in the course of preparing the Funds’ tax returns to determine whether it is “more-likely-than-not,” (i.e., greater than 50 percent) of being sustained by the applicable tax authority. Tax positions not deemed to meet the more-likely-than-not threshold may result in a tax benefit or expense in the current year.
28
| | |
| | |
| Notes to Financial Statements (continued) | | |
Accounting for Uncertainty in Income Taxes requires management of the Funds to analyze all open tax years, as defined by the statutes of limitations, for all major jurisdictions, which includes federal and certain states. Open tax years are those that are open for exam by the taxing authorities (i.e., the last four tax years and the interim tax period since then). The Funds has no examinations in progress. For all open tax years and all major taxing jurisdictions through the end of the reporting period, management of the Fund reviewed all tax positions taken or expected to be taken in the preparation of the Funds’ tax returns and concluded that Accounting for Uncertainty in Income Taxes resulted in no effect on the Funds’ reported net assets or results of operations as of and during the period ended August 31, 2020. Management of the Funds also is not aware of any tax positions for which it is reasonably possible that the total amounts of recognized tax benefits will significantly change in the next twelve months.
| | | | | | | | | | | | | | | | |
Fund | | Cost of
Investments
for Federal
Tax Purposes | | | Gross
Unrealized
Appreciation
for Federal
Tax Purposes | | | Gross
Unrealized
(Depreciation)
for Federal
Tax Purposes | | | Net
Unrealized
Appreciation
for Federal
Tax Purposes | |
Conservative Allocation Fund | | $ | 40,186,959 | | | $ | 5,639,353 | | | $ | (3,267 | ) | | $ | 5,636,086 | |
Moderate Allocation Fund | | | 63,910,257 | | | | 13,366,259 | | | | (12,866 | ) | | | 13,353,393 | |
Balanced Allocation Fund | | | 180,456,040 | | | | 65,685,731 | | | | (101,502 | ) | | | 65,584,229 | |
Growth Allocation Fund | | | 73,441,714 | | | | 32,328,160 | | | | (95,559 | ) | | | 32,232,601 | |
Aggressive Allocation Fund | | | 98,227,339 | | | | 55,692,057 | | | | (253,198 | ) | | | 55,438,859 | |
The difference between book basis and tax basis unrealized appreciation/depreciation is attributable in part to the tax deferral of losses on wash sales.
The tax character of distributions reported on the Statements of Changes in Net Assets for the years ended August 31, 2020 and August 31, 2019, were as follows:
| | | | | | | | | | | | | | | | |
| | | 2020 | | | 2019 | |
Fund | | Ordinary
Income(1) | | | Long-Term
Capital Gains | | | Ordinary
Income(1) | | | Long-Term
Capital Gains | |
Conservative Allocation Fund | | $ | 1,163,821 | | | $ | 945,673 | | | $ | 1,102,589 | | | $ | 4,464,364 | |
Moderate Allocation Fund | | | 1,916,162 | | | | 2,503,433 | | | | 2,532,120 | | | | 6,028,252 | |
Balanced Allocation Fund | | | 7,623,682 | | | | 19,980,823 | | | | 8,637,637 | | | | 22,915,506 | |
Growth Allocation Fund | | | 2,699,575 | | | | 6,550,925 | | | | 3,086,814 | | | | 8,882,560 | |
Aggressive Allocation Fund | | | 3,521,173 | | | | 11,892,172 | | | | 4,733,699 | | | | 15,154,046 | |
| | (1) | For tax purposes, short-term capital gain distributions are considered ordinary income. |
As of August 31, 2020, the components of distributable earnings on a tax basis are as follows:
| | | | | | | | | | | | | | | | | | | | | | | | |
Fund | | Undistributed
Ordinary
Income | | | Undistributed
Tax-Exempt
Income | | | Undistributed
Long-Term
Capital Gains | | | Accumulated
Capital and
Other Losses | | | Other
Adjustments | | | Unrealized
Appreciation | |
Conservative Allocation Fund | | $ | 609,056 | | | $ | — | | | $ | 628,269 | | | $ | — | | | $ | — | | | $ | 5,636,086 | |
Moderate Allocation Fund | | | 887,677 | | | | — | | | | 2,753,514 | | | | — | | | | — | | | | 13,353,393 | |
Balanced Allocation Fund | | | 2,167,036 | | | | — | | | | 16,489,559 | | | | — | | | | — | | | | 65,584,229 | |
Growth Allocation Fund | | | 706,232 | | | | — | | | | 6,004,648 | | | | — | | | | — | | | | 32,232,601 | |
Aggressive Allocation Fund | | | 620,249 | | | | — | | | | 11,681,098 | | | | — | | | | — | | | | 55,438,859 | |
As of August 31, 2020, the following funds had post-October losses, which are deferred until fiscal year 2021 for tax purposes, of:
| | | | | | | | |
Fund | | Short-Term | | | Long-Term | |
Aggressive Allocation Fund | | $ | 788,587 | | | $ | — | |
Growth Allocation Fund | | | 846,884 | | | | — | |
Net capital losses incurred after October 31, and within the taxable year, are deemed to arise on the first day of the Fund’s next taxable year.
The COVID-19 outbreak, first detected in December 2019 and declared a pandemic by the World Health Organization in March 2020, has resulted in significant disruptions to global business activity and the global economy. The ultimate economic fallout from the pandemic, and the long-term impact on economies, markets, industries and individual issuers, are not known. The COVID-19 pandemic has caused substantial market volatility and may adversely affect the value and liquidity of the Funds’ investments, negatively impact the Funds’ performance, and cause disruptions to the Funds’ service providers.
29
| 10. | | Shareholder Tax Information (unaudited) |
Of the ordinary income (including short-term capital gain) distributions made by the Funds during the year ended August 31, 2020, the percentages that qualify for the dividend received deduction available to corporate shareholders were as follows:
| | | | |
Conservative Allocation Fund | | | 8.23 | % |
Moderate Allocation Fund | | | 16.83 | |
Balanced Allocation Fund | | | 25.27 | |
Growth Allocation Fund | | | 35.84 | |
Aggressive Allocation Fund | | | 43.67 | |
Of the ordinary income (including short-term capital gain) distributions made by the Funds during the year ended August 31, 2020, the percentages that are designated as qualified dividend income were as follows:
| | | | |
Conservative Allocation Fund | | | 10.56 | % |
Moderate Allocation Fund | | | 22.13 | |
Balanced Allocation Fund | | | 34.98 | |
Growth Allocation Fund | | | 49.09 | |
Aggressive Allocation Fund | | | 62.28 | |
For Federal tax purposes, for the year ended August 31, 2020, the following Funds designate long-term capital gains, or the amounts determined to be necessary, of:
| | | | |
Conservative Allocation Fund | | $ | 945,673 | |
Moderate Allocation Fund | | | 2,503,433 | |
Balanced Allocation Fund | | | 19,980,823 | |
Growth Allocation Fund | | | 6,550,925 | |
Aggressive Allocation Fund | | | 11,892,172 | |
For Federal tax purposes, for the year ended August 31, 2020, the following Funds designate qualified short-term capital gains, or the amounts determined to be necessary, of:
| | | | |
Conservative Allocation Fund | | $ | 105,555 | |
Moderate Allocation Fund | | | 56,195 | |
Balanced Allocation Fund | | | 1,072,338 | |
Growth Allocation Fund | | | 253,845 | |
Aggressive Allocation Fund | | | 329,724 | |
30
| | |
| |
| Report of Independent Registered Public Accounting Firm |
To the Shareholders and Board of Directors
BMO Funds, Inc.:
Opinion on the Financial Statements
We have audited the accompanying statements of assets and liabilities of BMO Conservative Allocation Fund, BMO Moderate Allocation Fund, BMO Balanced Allocation Fund, BMO Growth Allocation Fund, and BMO Aggressive Allocation Fund (each a series of BMO Funds, Inc., collectively referred to as the Funds), including the schedules of investments, as of August 31, 2020, the related statements of operations for the year then ended, the statements of changes in net assets for each of the years in the two-year period then ended, and the related notes (collectively, the financial statements) and the financial highlights for each of the years in the five-year period then ended. In our opinion, the financial statements and financial highlights present fairly, in all material respects, the financial position of the Funds as of August 31, 2020, the results of their operations for the year then ended, the changes in their net assets for each of the years in the two-year period then ended, and the financial highlights for each of the years in the five-year period then ended, in conformity with U.S. generally accepted accounting principles.
Basis for Opinion
These financial statements and financial highlights are the responsibility of the Funds’ management. Our responsibility is to express an opinion on these financial statements and financial highlights based on our audits. We are a public accounting firm registered with the Public Company Accounting Oversight Board (United States) (PCAOB) and are required to be independent with respect to the Funds in accordance with the U.S. federal securities laws and the applicable rules and regulations of the Securities and Exchange Commission and the PCAOB.
We conducted our audits in accordance with the standards of the PCAOB. Those standards require that we plan and perform the audit to obtain reasonable assurance about whether the financial statements and financial highlights are free of material misstatement, whether due to error or fraud. Our audits included performing procedures to assess the risks of material misstatement of the financial statements and financial highlights, whether due to error or fraud, and performing procedures that respond to those risks. Such procedures included examining, on a test basis, evidence regarding the amounts and disclosures in the financial statements and financial highlights. Such procedures also included confirmation of securities owned as of August 31, 2020, by correspondence with the custodian and transfer agents or by other appropriate auditing procedures. Our audits also included evaluating the accounting principles used and significant estimates made by management, as well as evaluating the overall presentation of the financial statements and financial highlights. We believe that our audits provide a reasonable basis for our opinion.
/s/ KPMG LLP
We have served as the auditor of one or more BMO Funds, Inc. investment companies since 2011.
Columbus, Ohio
October 27, 2020
31
| | |
| |
| Directors and Officers of the Funds (Unaudited) |
The following tables provide information about each Director and Officer of the Funds as of September 1, 2020. The address of each Director is c/o BMO Funds, 790 North Water Street, 11th Floor, Milwaukee, Wisconsin 53202. There are currently 29 separate portfolios or funds in the BMO Funds complex, of which 28 are registered as BMO Funds, Inc. and one is registered as BMO LGM Frontier Markets Equity Fund with the Securities and Exchange Commission. The Funds’ Statement of Additional Information includes additional information about the Directors and is available, without charge and upon request, by calling 1-800-236-FUND (3863).
| | | | | | | | | | |
| INDEPENDENT DIRECTORS |
| Name and Age | | Position(s) Held with
the Corporation | | Term of
Office and
Length of
Time Served* | | Principal Occupation(s)
During Past 5 Years | | Number of
Portfolios in
Fund
Complex
Overseen by
Director | | Other
Directorships
Held by
Director |
| | | | | |
Marie-Renée Bakker
Age: 63 | | Independent Director | | Since September 2020 | | Director, National Green Fund (a Dutch “green” investment fund) since 2016; previously, Senior Finance Manager at the World Bank Group (financial institution), 2005–2019. | | 29 | | None |
| | | | | |
Ridge A. Braunschweig
Age: 67 | | Independent Director | | Since October 2009 | | President and Chief Executive Officer, CPL Industries, Inc. (a manufacturing holding company prior to May 2009 and a family office since May 2009), since January 2012. | | 29 | | None |
| | | | | |
Teresa V. Jankovic
Age: 65 | | Independent Director | | Since September 2020 | | Founder and Independent Consultant, The Independent Consultant, LLC (a financial services consulting firm), since 2016; Managing Director, Bank of New York Mellon, from 2011 to 2016. | | 29 | | None |
| | | | | |
John A. Lubs
Age: 72 | | Independent Director | | Since July 2004 | | Retired; formerly, Vice Chairman, Mason Companies, Inc. (a footwear distributor), from 2004 to 2010 and Chief Operating Officer, from 2003 to 2010. | | 29 | | None |
| | | | | |
Vincent P. Lyles
Age: 59 | | Independent Director | | Since September 2017 | | Vice President of Community Relations, Advocate Aurora Health Care, since 2019; President and Chief Executive Officer, Boys & Girls Clubs of Greater Milwaukee, from 2012 to 2018. | | 29 | | None |
| | | | | |
Barbara J. Pope
Age: 72 | | Independent Director | | Since March 1999 | | Retired; formerly, President of Barbara J. Pope, P.C. (a financial consulting firm), 1992-2015; President of Sedgwick Street Fund LLC (a private investment partnership), 1996-2015; Tax Partner, Price Waterhouse. | | 29 | | None |
|
| * Each Director serves an indefinite term until he or she retires or otherwise resigns, is removed, dies or until his or her successor is duly elected. Retirement for a Director occurs no later than August 31 following his or her 75th birthday. |
32
| | |
| |
| Directors and Officers of the Funds (Unaudited) (continued) |
| | | | | | | | | | |
| INTERESTED DIRECTORS | | | | | | | | |
| Name and Age | | Position(s) Held with
the Corporation | | Term of
Office and
Length of
Time Served* | | Principal Occupation(s)
During Past 5 Years | | Number of
Portfolios in
Fund
Complex
Overseen by
Director | | Other
Directorships
Held by
Director |
| | | | | |
John M. Blaser**
Age: 63 | | Director and President | | Since May 1999 | | Managing Director of the Adviser, since June 2012. | | 29 | | None |
| | | | | |
Daniela O’Leary-Gill**
Age: 55 | | Director | | Since August 2018 | | Retired; formerly, Chief Operating Officer of BMO Financial Group, from 2018 to 2020; Director of the Adviser from 2018 to 2020; Head, Communications, Government & Investor Relations from 2016 to 2018; Head, AML Program Oversight from 2014 to 2016. | | 29 | | None |
|
| * Each Director serves an indefinite term until he or she retires or otherwise resigns, is removed, dies or until his or her successor is duly elected. Retirement for a Director occurs no later than August 31 following his or her 75th birthday. |
|
| ** Mr. Blaser is an “interested person” of the Corporation (as defined in the 1940 Act) due to the positions that he holds with the Corporation, and the Adviser. Ms. O’Leary-Gill is an “interested person” of the Corporation due to the positions that she held with the Adviser and BMO. |
| | | | | | |
| PRINCIPAL OFFICERS | | | | |
| Name and Age | | Position(s) Held with
the Corporation | | Term of Office and Length of
Time Served | | Principal Occupation(s) During Past 5
Years |
| | | |
Brett Black
Age: 48 | | Chief Compliance Officer and Anti-Money Laundering Compliance Officer | | Elected by the Board annually; since November 2017 | | Vice President and Chief Compliance Officer of BMO Harris Bank, since 2017; Assistant Vice President, Deputy Chief Compliance Officer, since 2014; Senior Compliance Officer of BMO Harris Bank, since 2012. |
| | | |
Timothy M. Bonin
Age: 47 | | Vice President, Chief Financial Officer and Treasurer | | Elected by the Board annually; since February 2006 | | Vice President of the Adviser, since February 2006. |
| | | |
Michael J. Murphy
Age: 41 | | Secretary | | Elected by the Board annually; since May 2016 | | Senior Counsel and Vice President of BMO Harris Bank N.A., since 2014; Associate, Vedder Price P.C., 2010 to 2014. |
33
| | |
| |
| Results of Special Meeting of Shareholders (Unaudited) |
A special meeting of shareholders of BMO Funds, Inc. was held on July 10, 2020. The matter voted on by the shareholders of record as of May 14, 2020 and the results of the vote at the shareholder meeting were as follows:
| | | | | | | | |
To elect eight directors to the Corporation’s Board of Directors | | Votes For | | | Votes Withheld | |
Marie-Renée Bakker | | | 3,599,681,878.098 | | | | 4,624,523.218 | |
John M. Blaser | | | 3,592,855,038.019 | | | | 11,451,363.297 | |
Ridge A. Braunschweig | | | 3,582,755,431.607 | | | | 21,550,969.709 | |
Teresa V. Jankovic | | | 3,600,647,931.143 | | | | 3,658,470.173 | |
John A. Lubs | | | 3,571,368,532.405 | | | | 32,937,868.911 | |
Vincent P. Lyles | | | 3,582,955,899.533 | | | | 21,350,501.783 | |
Daniela O’Leary-Gill | | | 3,591,151,091.170 | | | | 13,155,310.146 | |
Barbara J. Pope | | | 3,502,276,106.928 | | | | 102,030,294.388 | |
The approval by shareholders of the proposal resulted in the election to the Board of Directors of Ms. Bakker and Ms. Jankovic effective September 1, 2020. Each other Director continued in office following the meeting.
34
| | |
| |
| Discussion of the Operation and Effectiveness of the Funds’ Liquidity Risk Management Program (Unaudited) |
As required by Rule 22e-4 (the “Liquidity Rule”) adopted by the Securities and Exchange Commission (the “SEC”) under the Investment Company Act of 1940 (the “1940 Act”), the Board of Directors (the “Board”) of BMO Funds, Inc., (the “Company”), approved the Liquidity Risk Management Program (the “Program”) with respect to the Funds to facilitate compliance with all requirements of the Liquidity Rule and to protect shareholders from dilution of their interests.
The Program is administered by the Liquidity Risk Management Committee (the “Committee”), which is comprised of the Chief Compliance Officer, the Chief Financial Officer, and the Secretary of the Funds. At least annually, as required by the Liquidity Rule, the Board reviews a report prepared by the Committee on the adequacy and effectiveness of the Program and, if applicable, any material changes to the Program.
On May 13, 2020, during a regularly scheduled meeting of the Board, the Committee provided the Board with a written report addressing the Program’s adequacy and effectiveness for the period December 1, 2018 to December 31, 2019 (the “Review Period”). The Committee concluded that the Program, as adopted and implemented, is reasonably designed to assess and manage each Fund’s liquidity risk.
The Committee assesses, manages, and at least monthly reviews each Fund’s liquidity risk. In assessing, managing, and reviewing a Fund’s liquidity risk, the Committee considers, as applicable, the following factors: (i) a Fund’s investment strategy, (ii) the liquidity of a Fund’s portfolio investments, (iii) a Fund’s holdings of cash and cash equivalents and borrowing arrangements, and (iv) a Fund’s short-term and long-term cash flow projections.
The Committee classifies each Fund’s portfolio investments as highly liquid, moderately liquid, less liquid, or illiquid. The classification is based on a determination of how long it is reasonably expected to take to convert the investment into cash, or sell or dispose of the investment, in current market conditions without significantly changing the market value of the investment. The Committee makes its determination by considering relevant market and trading data provided by a third-party vendor, investment-specific considerations, and, when appropriate, input from the Funds’ portfolio managers. During the Review Period, the Committee concluded that each Fund primarily held assets that are highly liquid. Accordingly, the Committee concluded that each Fund was able to rely on the exclusion in the Liquidity Rule from the requirements related to highly liquid investment minimums.
The Committee also monitors each Fund’s compliance with the Liquidity Rule’s limit on a Fund’s investments in illiquid investments of no more than 15% of its net assets. The Committee reported that, during the Review Period, no Fund exceeded the 15% limit on illiquid investments, and as such, the Committee indicated no events occurred that would require the filing of Form N-LIQUID with the SEC.
35
| | |
| |
| Shareholder Report Disclosure of Directors’ Approval of Continuation of Contracts (Unaudited) |
Approval of Continuation of Advisory Agreement
During the reporting period, the Board of Directors (the “Board”) of BMO Funds, Inc. (the “Corporation”), including the Directors who are not “interested persons” of the Corporation as defined in the Investment Company Act of 1940, as amended (the “Independent Directors”), met to discuss the advisory agreement of each portfolio of the Corporation included in this shareholder report (each, a “Fund” and collectively, the “Funds”). The Board approved the continuation of the investment advisory agreement (the “Advisory Agreement”) between the Corporation and BMO Asset Management Corp. (the “Adviser”) on behalf of each Fund for an additional year ending August 31, 2021.
At Board meetings held on July 8, 2020 (“July Meeting”) and August 12, 2020 (“August Meeting”), the Board met with management of the Adviser regarding the annual approval of the continuation of the Funds’ Advisory Agreement. In connection with its consideration of the Advisory Agreement, the Board considered the information furnished and discussed throughout the year at regularly scheduled Board and Committee meetings, as applicable, and the information provided specifically in relation to the annual consideration of the approval of the Advisory Agreement in response to requests of the Independent Directors and their independent legal counsel. Information furnished in connection with Board or Committee meetings throughout the year included, among other things, presentations given by the portfolio managers of the Funds on each Fund’s investment strategies, risks, absolute performance, and comparative performance of each Fund against its benchmark indices; reports regarding each Fund’s asset levels including sales and redemption activities; and various reports on the monitoring of the Funds’ compliance with the securities laws, regulations, policies and procedures.
In preparation for the Board’s annual consideration of the approval of the Advisory Agreement, the Board requested and received a wide variety of information and reports concerning the Adviser (and its affiliates), including information on: (1) the nature, extent, and quality of services provided to each Fund by the Adviser (and its affiliates); (2) the investment performance of each Fund as compared to a group of comparable funds; (3) the expense ratios of each Fund as compared to a group of comparable funds; (4) profitability information for the Adviser; and (5) the Adviser’s compliance program. The Board also considered information related to potential “fall out” or ancillary benefits enjoyed by the Adviser and its affiliates as a result of their relationships with the Funds.
In addition to evaluating, among other things, the written information provided by the Adviser, the Board also considered the answers to questions posed by the Board to representatives of the Adviser at various meetings and took into account their accumulated experience in working with the Adviser on matters related to the Funds. The Independent Directors also met separately in executive sessions with their independent legal counsel to review and consider the information provided regarding the Advisory Agreement.
Based on their review, the Independent Directors and the full Board concluded that it was in the best interests of each Fund to approve the continuation of the Advisory Agreement. Although the Advisory Agreement for all of the Funds was considered at the same Board meeting, the Board considered each Fund separately. In their deliberations, the Board did not identify any single factor or group of factors as all-important or controlling but considered all factors together. The material factors and conclusions that formed the basis for the Board’s determinations are discussed below.
Nature, Extent and Quality of Services
In evaluating the nature, extent, and quality of the services provided by the Adviser to the Funds, the Board reviewed information describing the financial strength, experience, resources and key personnel of the Adviser, including the personnel who provide investment management services to the Funds. The Board considered the administrative services that are provided to each Fund, as well as other services performed by the Adviser, including the selection and monitoring of the underlying funds; monitoring adherence to the Funds’ investment restrictions; monitoring the Funds’ compliance with their compliance policies and procedures and with applicable securities laws and regulations; producing shareholder reports; providing support services for the Board and Board committees; communicating with shareholders; and overseeing the activities of other service providers. The Board also considered the Adviser’s experience in providing investment advisory services to funds.
Based upon this review, the Board concluded that the nature, quality, and extent of the services to be provided to each Fund by the Adviser are expected to be satisfactory.
Review of Fund Performance
The Board reviewed the investment performance of each of the Funds. While consideration was given to performance reports provided in connection with, and discussions held at, regular Board meetings throughout the year, particular attention was given to the performance reports provided specifically in connection with the July and August Meetings. In particular, the Board noted the performance of each Fund relative to its Lipper Inc. (“Lipper”) peer universe. The Directors also considered performance information for each Fund relative to its benchmark and its Morningstar, Inc. (“Morningstar”) ratings.
With respect to each Fund’s performance as compared to its Lipper peer universe (“peer group”), the Board reviewed each Fund’s performance percentile rankings over the year-to-date and one-, three-, and five-year trailing periods through May 31, 2020, as provided by the Adviser. The Board also reviewed each Fund’s performance relative to its respective benchmark over various trailing periods ended May 31, 2020. The Board considered that each Fund ranked in one of the top two quartiles for performance as compared to its peer group in at least half of the periods reviewed, except for the following Funds.
36
| | |
| |
| Shareholder Report Disclosure of Directors’ Approval of Continuation of Contracts (Unaudited) (continued) |
With respect to the BMO Balanced Allocation Fund, the Board considered that the Fund’s year-to-date performance was in the second quartile of its peer group, while its one-, three-, and five-year performance was in the third quartile. The Board observed that the Fund underperformed its benchmark for the one-, three-, and five-year periods. The Board noted that the Fund was ranked three stars by Morningstar (except for Class R3 shares of the Fund which were ranked two stars). The Board considered the Adviser’s explanation that the Fund’s recent underperformance could be attributed, in part, to due to higher international stock exposure as compared to its peer group.
With respect to the BMO Growth Allocation Fund, the Board considered that the Fund’s year-to-date performance was in the second quartile of its peer group, while its one-, three-, and five-year performance was in the third quartile. The Board observed that the Fund underperformed its benchmark for the one-, three-, and five-year periods. The Board noted that the Fund was ranked three stars by Morningstar. The Board considered the Adviser’s explanation that the Fund’s recent underperformance could be attributed, in part, to a slight overweight allocation to U.S. equities and an underweight allocation to fixed income.
With respect to the BMO Aggressive Allocation Fund, the Board considered that the Fund’s year-to-date performance was in the third quartile of its peer group, while its one-, three-, and five-year performance was in the fourth quartile. The Board observed that the Fund underperformed its benchmark for the one-, three-, and five-year periods. The Board noted that the Fund was ranked three stars by Morningstar. The Board considered the Adviser’s explanation that the Fund’s recent underperformance could be attributed, in part, to a slight overweight allocation to U.S. equities and an underweight allocation to fixed income.
The Board determined that it was generally satisfied with each Fund’s performance and would continue to closely monitor each Fund’s performance results.
Costs of Services Provided and Profits Realized by the Adviser
The Board considered the fees payable by each Fund under the Advisory Agreement, noting that the Funds do not pay a management fee to the Adviser.
The Board reviewed information provided by the Adviser comparing each Fund’s net expense ratio to the median net expense ratio of the comparable Lipper peer group (“Lipper peers”). The Board considered that each Fund’s net expense ratio was lower than the median of its Lipper peers for Class I, Class R3, and Class R6 shares. The Board noted that, with the exception of the BMO Growth Allocation Fund, the net expense ratios for Class Y shares of the Funds were higher than the median of its Lipper peers. The Board considered that the net expense ratios included the fees and expenses of the underlying funds in which the Funds invest. The Board also considered the size of the Funds and that economies of scale with respect to certain other expenses may not have been realized.
The Board considered and viewed favorably that the Adviser has agreed to contractual expense limitations for the Funds (the “Expense Limitations”), and that the net expense ratios for the Funds take into account the effect of the Expense Limitations.
The Board considered the methodology used by the Adviser in determining compensation payable to its portfolio managers and the competitive environment for investment management talent. The Board also considered the financial condition of the Adviser and certain of its affiliates and particularly focused on the financial strength of the ultimate parent company of the Adviser, and the parent company’s commitment, financial and otherwise, to the global asset management business and the BMO Fund complex.
The Board reviewed profitability information it received from the Adviser in connection with the services provided to each Fund and the Corporation as a whole. The materials provided in this regard showed, and the Directors acknowledged, that the Adviser would not have a profit with respect to the Funds because the Funds do not pay management fees to the Adviser.
Economies of Scale
With respect to the management fee levels for the Funds, the Board did not consider the extent to which economies of scale would be realized as the Funds grow because the Funds do not pay management fees to the Adviser.
Other Benefits to the Adviser
The Board considered benefits that accrue to the Adviser and its affiliates from their relationships with the Funds, including revenue in the form of administration fees, custody fees, and shareholder service fees. In addition, the Board considered information relating to any soft dollar arrangements in connection with equity security brokerage transactions for the underlying funds, as applicable. The Board noted that the Adviser may potentially benefit from its relationship with each Fund in other ways. The Board also considered that the success of any Fund could attract other business to the Adviser and that the success of the Adviser could enhance the Adviser’s ability to serve the Funds.
The Board concluded that, taking into account all of the information reviewed, each Fund’s advisory fee was reasonable.
37
| | |
| |
| Shareholder Report Disclosure of Directors’ Approval of Continuation of Contracts (Unaudited) (continued) |
Overall Conclusions
Based on all of the information considered and the conclusions reached, the Board determined that the terms of the Advisory Agreement are fair and reasonable and that the approval of the continuation of the Advisory Agreement is in the best interests of each Fund.
38
39
40
This report is authorized for distribution to prospective investors only when preceded or accompanied by the Funds’ prospectuses, which contain facts concerning each Fund’s objective and policies, management fees, expenses, and other information.
Proxy Voting
A description of the policies and procedures that the Funds use to determine how to vote proxies relating to portfolio securities is available without charge, upon request, by calling toll free, 1-800-236-FUND (3863) and by accessing the Funds’ Statement of Additional Information, which is available on the Funds’ website at http://www.bmofunds.com and on the SEC’s website at http://www.sec.gov.
Each Fund’s proxy voting record for the most recent 12-month period ended June 30 is available without charge, upon request, by calling toll free, 1-800-236-FUND (3863) and by accessing the SEC’s website at http://www.sec.gov.
Disclosure of Portfolio Holdings
The Funds file their complete schedules of portfolio holdings with the SEC for the first and third quarters of each fiscal year on as an attachment to Form N-PORT. Each Fund’s Form N-PORT is available on the SEC’s website at http://www.sec.gov and may be reviewed and copied at the SEC’s Public Reference Room in Washington, D.C. Information on the operation of the Public Reference Room may be obtained by calling 1-800-SEC-0330.
Shares of the BMO Funds are not bank deposits or other obligations of, or issued, endorsed or guaranteed by, BMO Harris Bank, NA, or any of its affiliates. Shares of the BMO Funds, like shares of all mutual funds, are not insured or guaranteed by the U.S. government, the Federal Deposit Insurance Corporation, the Federal Reserve Board, or any other government agency. Investment in mutual funds involves investment risk, including the possible loss of principal.
| | |
| | PRSRT STD U.S. POSTAGE PAID LANCASTER, PA PERMIT NO. 1793 |
| | |
 | | BMO Funds U.S. Services P.O. Box 55931 Boston, MA 02205-5931 |
| | |
 | | Contact us 1-800-236-FUND (3863) 414-287-8555 |
| | |
 | | Learn more bmofunds.com |
DISTRIBUTOR
Foreside Financial Services, LLC
Three Canal Plaza, Suite 100
Portland, Maine 04101
www.foreside.com
INVESTMENT ADVISER
BMO Asset Management Corp.
Investment products are: NOT FDIC INSURED — NO BANK GUARANTEE — MAY LOSE VALUE.
© 2020 BMO Financial Corp. (9/20)
Item 2. Code of Ethics.
The Registrant has a code of ethics (the “Code”) that applies to the Registrant’s principal executive officer and principal financial officer. During the period covered by this report, there were no amendments to the provisions of the Code, nor were there any implicit or explicit waivers to the provisions of the Code. The Code is filed herewith.
Item 3. Audit Committee Financial Expert.
The Registrant’s Board of Directors has determined that the Registrant has four audit committee financial experts serving on its audit committee, each of whom is “independent” within the meaning of Form N-CSR: Ridge A. Braunschweig, Teresa V. Jankovic, John A. Lubs, and Barbara J. Pope. Under applicable securities laws, a person who is determined to be an audit committee financial expert will not be deemed an “expert” for any purpose, including without limitation for purposes of Section 11 of the Securities Act of 1933, as amended, as a result of being designated or identified as an audit committee financial expert. The designation or identification of a person as an audit committee financial expert does not impose on such person any duties, obligations, or liabilities that are greater than the duties, obligations, and liabilities imposed on such person as a member of the audit committee and Board of Directors in the absence of such designation or identification.
Item 4. Principal Accountant Fees and Services.
The aggregate fees for professional services by KPMG LLP during the fiscal year 2020 and 2019 were as follows:
| (a) | Audit Fees for Registrant. |
| | | | |
| Fiscal year ended August 31, 2020 | | $550,100 | | |
| Fiscal year ended August 31, 2019 | | $544,100 | | |
| (b) | Audit-Related Fees for Registrant. These are fees by the Registrant’s independent auditors for assurance and related services that were reasonably related to the performance of the audit of the Registrant’s financial statements that are not reported under “Audit Fees”. These fees include amounts related to Form N-17f-2 filings. |
| | | | |
| Fiscal year ended August 31, 2020 | | $0 | | |
| Fiscal year ended August 31, 2019 | | $5,500 | | |
| (c) | Tax Fees for Registrant. These are fees for professional services rendered by the Registrant’s independent auditors for tax compliance, tax advice, and tax planning. These fees include federal, excise and state tax reviews; performed by KPMG LLP. |
| | | | |
| Fiscal year ended August 31, 2020 | | $138,000 | | |
| Fiscal year ended August 31, 2019 | | $184,080 | | |
| | | | |
| Fiscal year ended August 31, 2020 | | None | | |
| Fiscal year ended August 31, 2019 | | None | | |
| (e) | Audit Committee’s pre-approval policies and procedures. |
| | (1) | The Audit Committee has adopted pre-approval policies and procedures that require the Audit Committee to pre-approve all audit and non-audit services of the Registrant, including services provided to the Registrant’s investment adviser or any entity controlling, controlled by or under common control with the Registrant’s investment adviser that provides ongoing services to the Registrant with respect to any engagement that directly relates to the operations and financial reporting of the Registrant. |
| | (2) | None of the services described in paragraphs (b) through (d) of this Item 4 were approved by the audit committee pursuant to paragraph (c)(7)(i)(C) of Rule 2-01 of Regulation S-X. |
| (g) | During the last two fiscal years, other non-audit services rendered by the Registrant’s independent auditors to the Registrant, its investment adviser or any entity controlling, controlled by or under the common control with the investment adviser that provides ongoing services to the Registrant included the following: |
Statement on Standards for Attestation Engagements No. 16 (SSAE No. 16) examinations for BMO Harris Bank N.A.
| | | | |
| Fiscal year ended August 31, 2020 | | $255,000 | | |
| Fiscal year ended August 31, 2019 | | $220,000 | | |
Item 5. Audit Committee of Listed Registrants.
Not applicable.
Item 6. Investments.
| (a) | Except as noted below, the schedules of investments are included as part of the report to shareholders filed under Item 1 of this Form. The schedules of investments for BMO Intermediate Tax-Free Fund, BMO Short Tax-Free Fund and BMO Ultra Short Tax-Free Fund are filed under this Item. |
Intermediate Tax-Free Fund
| | | | | | | | |
Description | |
| Shares or
Principal
Amount |
| | | Value | |
| | |
Municipals — 98.6% | | | | | | | | |
| | |
Alabama — 2.3% | | | | | | | | |
Alabama Board of Education: | | | | | | | | |
3.000%, 6/1/2021 | | $ | 305,000 | | | $ | 309,895 | |
4.000%, 7/1/2021 | | | 1,895,000 | | | | 1,946,051 | |
5.000%, 10/1/2020, Call 9/1/2020 | | | 230,000 | | | | 230,810 | |
Black Belt Energy Gas District: | | | | | | | | |
1.015%, (LIBOR 1 Month), 12/1/2048, Call 9/1/2023 (1) | | | 4,000,000 | | | | 3,985,120 | |
4.000%, 10/1/2049, Call 7/1/2026 (1) | | | 11,500,000 | | | | 13,383,700 | |
City of Birmingham, 4.000%, 3/1/2022 (2) | | | 1,225,000 | | | | 1,240,888 | |
Columbia Industrial Development Board, 0.200%, 12/1/2037, Call 9/1/2020 (1) | | | 1,400,000 | | | | 1,400,000 | |
Lower Alabama Gas District, 4.000%, 12/1/2050, Call 9/1/2025 (1) | | | 1,400,000 | | | | 1,609,496 | |
Mobile County Board of School Commissioners, 5.000%, 3/1/2027, Call 3/1/2026 | | | 4,015,000 | | | | 4,891,715 | |
Special Care Facilities Financing Authority of the City of Pell City Alabama, 5.000%, 12/1/2025, Call 12/1/2021 | | | 4,000,000 | | | | 4,201,040 | |
UAB Medicine Finance Authority: | | | | | | | | |
4.000%, 9/1/2038, Call 9/1/2029 | | | 1,000,000 | | | | 1,168,520 | |
4.000%, 9/1/2044, Call 9/1/2029 | | | 2,470,000 | | | | 2,828,866 | |
5.000%, 9/1/2036, Call 3/1/2027 | | | 2,340,000 | | | | 2,802,946 | |
5.000%, 9/1/2037, Call 3/1/2027 | | | 2,030,000 | | | | 2,425,546 | |
5.000%, 9/1/2041, Call 3/1/2027 | | | 1,020,000 | | | | 1,207,833 | |
| | | | | | | | |
| | | | | | | 43,632,426 | |
| | |
Alaska — 0.4% | | | | | | | | |
Alaska Housing Finance Corp.: | | | | | | | | |
5.000%, 12/1/2027, Call 6/1/2022 | | | 1,065,000 | | | | 1,153,523 | |
5.000%, 12/1/2027, Call 6/1/2022 | | | 310,000 | | | | 332,490 | |
5.000%, 12/1/2028, Call 12/1/2024 | | | 2,500,000 | | | | 2,903,000 | |
5.000%, 6/1/2029, Call 12/1/2024 | | | 1,000,000 | | | | 1,159,840 | |
Borough of Matanuska-Susitna: | | | | | | | | |
5.000%, 11/1/2022 | | | 500,000 | | | | 551,135 | |
5.000%, 4/1/2031, Call 4/1/2021 | | | 150,000 | | | | 154,229 | |
Borough of North Slope, 5.000%, 6/30/2024, Call 6/1/2021 | | | 1,020,000 | | | | 1,056,924 | |
City of Anchorage Electric Revenue, NATL-RE, 5.000%, 12/1/2024, Call 9/1/2020 | | | 305,000 | | | | 306,147 | |
| | | | | | | | |
| | | | | | | 7,617,288 | |
| | |
Arizona — 2.6% | | | | | | | | |
Arizona Health Facilities Authority, 5.000%, 2/1/2022 | | | 1,000,000 | | | | 1,064,790 | |
Arizona Industrial Development Authority: | | | | | | | | |
3.550%, 7/15/2029, Call 7/15/2027 (3) | | | 1,350,000 | | | | 1,345,882 | |
3.750%, 12/15/2029, Call 12/15/2027 (3) | | | 570,000 | | | | 562,966 | |
4.000%, 7/15/2030, Call 7/15/2028 (3) | | | 625,000 | | | | 646,650 | |
4.000%, 7/15/2040, Call 7/15/2028 (3) | | | 925,000 | | | | 902,643 | |
4.000%, 11/1/2045, Call 11/1/2030 | | | 1,870,000 | | | | 2,146,928 | |
4.000%, 7/15/2050, Call 7/15/2028 (3) | | | 1,600,000 | | | | 1,500,944 | |
4.000%, 11/1/2050, Call 11/1/2030 | | | 2,000,000 | | | | 2,286,660 | |
5.000%, 3/1/2037, Call 9/1/2027 (3) | | | 1,250,000 | | | | 1,316,275 | |
5.000%, 7/1/2039, Call 7/1/2029 (3) | | | 780,000 | | | | 824,421 | |
5.000%, 12/15/2039, Call 12/15/2027 (3) | | | 400,000 | | | | 409,816 | |
5.000%, 3/1/2042, Call 9/1/2027 (3) | | | 1,000,000 | | | | 1,040,690 | |
5.000%, 7/1/2049, Call 7/1/2029 (3) | | | 1,400,000 | | | | 1,455,636 | |
5.000%, 7/15/2049, Call 7/15/2027 (3) | | | 3,350,000 | | | | 3,485,775 | |
5.000%, 12/15/2049, Call 12/15/2027 (3) | | | 700,000 | | | | 708,946 | |
5.750%, 7/15/2038, Call 7/15/2026 (3) | | | 1,750,000 | | | | 1,940,557 | |
Chandler Industrial Development Authority, 5.000%, 6/1/2049 (1) | | | 5,000,000 | | | | 5,779,400 | |
City of Phoenix Civic Improvement Corp., BHAC FGIC, 5.500%, 7/1/2027 (2) | | | 500,000 | | | | 642,610 | |
| | | | | | | | |
City of Phoenix Civic Improvement Corp., NATL-RE: | | | | | | | | |
5.500%, 7/1/2021 (2) | | | 555,000 | | | | 576,828 | |
5.500%, 7/1/2036 (2) | | | 530,000 | | | | 796,791 | |
County of Pima Sewer System Revenue, 5.000%, 7/1/2027, Call 7/1/2022 | | | 1,450,000 | | | | 1,569,291 | |
Greater Arizona Development Authority, BHAC NATL-RE, 5.000%, 8/1/2027, Call 9/1/2020 | | | 70,000 | | | | 70,263 | |
Industrial Development Authority of the City of Phoenix: | | | | | | | | |
0.480%, 12/1/2035 | | | 2,500,000 | | | | 2,499,800 | |
5.000%, 7/1/2031, Call 7/1/2026 (3) | | | 3,000,000 | | | | 3,246,840 | |
La Paz County Industrial Development Authority: | | | | | | | | |
5.000%, 2/15/2046, Call 2/15/2026 (3) | | | 1,000,000 | | | | 1,078,040 | |
5.000%, 2/15/2048, Call 2/15/2028 | | | 1,185,000 | | | | 1,306,060 | |
Maricopa County Industrial Development Authority: | | | | | | | | |
5.000%, 7/1/2035, Call 7/1/2026 | | | 2,325,000 | | | | 2,422,603 | |
5.000%, 7/1/2036, Call 7/1/2026 | | | 750,000 | | | | 838,403 | |
5.000%, 7/1/2039, Call 7/1/2029 (3) | | | 1,000,000 | | | | 1,082,780 | |
5.000%, 7/1/2047, Call 7/1/2026 (3) | | | 1,225,000 | | | | 1,290,685 | |
Maricopa County Unified School District No. 60 Higley, AGM: | | | | | | | | |
5.000%, 7/1/2023 | | | 1,000,000 | | | | 1,129,990 | |
5.000%, 7/1/2024 | | | 575,000 | | | | 674,021 | |
Salt Verde Financial Corp., 5.250%, 12/1/2022 | | | 110,000 | | | | 120,387 | |
Town of Marana, 5.000%, 7/1/2023 | | | 450,000 | | | | 508,496 | |
University Medical Center Corp., 5.000%, 7/1/2021 | | | 425,000 | | | | 442,064 | |
University of Arizona, 5.000%, 8/1/2026, Call 8/1/2021 | | | 455,000 | | | | 474,843 | |
| | | | | | | | |
| | | | | | | 48,189,774 | |
| | |
Arkansas — 0.6% | | | | | | | | |
Arkansas Development Finance Authority: | | | | | | | | |
5.000%, 2/1/2021 | | | 315,000 | | | | 320,399 | |
5.000%, 2/1/2022 | | | 150,000 | | | | 158,631 | |
Arkansas Development Finance Authority, GNMA/FNMA/FHLMC: | | | | | | | | |
4.000%, 1/1/2025, Call 7/1/2021 | | | 150,000 | | | | 153,723 | |
4.000%, 7/1/2025, Call 7/1/2021 | | | 335,000 | | | | 343,204 | |
Arkansas State University: | | | | | | | | |
4.000%, 3/1/2021 | | | 390,000 | | | | 395,905 | |
4.000%, 3/1/2022 | | | 1,140,000 | | | | 1,191,574 | |
4.000%, 3/1/2023 | | | 985,000 | | | | 1,059,781 | |
City of Maumelle, 2.600%, 3/1/2030, Call 3/1/2022 | | | 415,000 | | | | 418,905 | |
City of Springdale Sales & Use Tax Revenue: | | | | | | | | |
3.000%, 11/1/2021 | | | 1,000,000 | | | | 1,031,460 | |
5.000%, 11/1/2028, Call 11/1/2022 | | | 1,000,000 | | | | 1,101,290 | |
Conway Health Facilities Board, 4.250%, 8/1/2021 | | | 210,000 | | | | 216,367 | |
Henderson State University, BAM: | | | | | | | | |
5.000%, 11/1/2022 | | | 905,000 | | | | 975,047 | |
5.000%, 11/1/2023, Call 11/1/2022 | | | 860,000 | | | | 925,953 | |
University of Arkansas: | | | | | | | | |
5.000%, 12/1/2021 | | | 300,000 | | | | 318,162 | |
5.000%, 12/1/2022 | | | 520,000 | | | | 575,562 | |
5.000%, 12/1/2023, Call 12/1/2022 | | | 500,000 | | | | 549,975 | |
5.000%, 11/1/2030, Call 11/1/2024 | | | 1,000,000 | | | | 1,159,230 | |
| | | | | | | | |
| | | | | | | 10,895,168 | |
| | |
California — 6.1% | | | | | | | | |
ABC Unified School District, NATL-RE, 5.000%, 2/1/2021 | | | 1,250,000 | | | | 1,275,125 | |
Alvord Unified School District, AGM, 7.350%, 8/1/2046, Call 8/1/2036 | | | 1,150,000 | | | | 1,489,836 | |
Bay Area Toll Authority, 1.410%, (SIFMA Municipal Swap Index Yield), 4/1/2036, Call 10/1/2026 (1) | | | 5,000,000 | | | | 4,993,750 | |
Bellevue Union School District, AGM: | | | | | | | | |
0.000%, 8/1/2030 | | | 585,000 | | | | 498,613 | |
0.000%, 8/1/2031 | | | 615,000 | | | | 509,694 | |
Bonita Unified School District, 5.500%, 8/1/2035, Call 8/1/2021 | | | 940,000 | | | | 986,088 | |
Burbank Unified School District, 4.340%, 8/1/2031, Call 2/1/2025 (2) | | | 1,325,000 | | | | 1,358,854 | |
California Health Facilities Financing Authority: | | | | | | | | |
5.000%, 7/1/2037, Call 7/1/2023 | | | 2,000,000 | | | | 2,197,880 | |
5.000%, 8/15/2042, Call 8/15/2027 | | | 1,000,000 | | | | 1,138,930 | |
| | | | | | | | |
California Infrastructure & Economic Development Bank, 0.496%, (LIBOR 1 Month), 8/1/2047, Call 2/1/2021 (1) | | | 2,500,000 | | | | 2,490,950 | |
California Municipal Finance Authority, 5.000%, 2/1/2042, Call 2/1/2027 | | | 1,500,000 | | | | 1,735,335 | |
California State Public Works Board, 5.000%, 4/1/2037, Call 4/1/2022 | | | 1,000,000 | | | | 1,066,530 | |
Carson Redevelopment Agency Successor Agency, AGM, 5.000%, 10/1/2021 | | | 850,000 | | | | 892,687 | |
City of Fairfield, XLCA, 0.000%, 4/1/2022 | | | 1,205,000 | | | | 1,196,902 | |
City of Los Angeles Department of Airports, 4.000%, 5/15/2050, Call 5/15/2030 | | | 2,000,000 | | | | 2,242,800 | |
County of Los Angeles, AMBAC TCRs, 0.000%, 9/1/2020 | | | 600,000 | | | | 600,000 | |
County of San Joaquin, 5.000%, 4/1/2022 | | | 350,000 | | | | 375,225 | |
Duarte Unified School District, 5.125%, 8/1/2026 (2) | | | 585,000 | | | | 736,117 | |
El Centro Financing Authority, AGM: | | | | | | | | |
4.000%, 10/1/2021 | | | 460,000 | | | | 479,164 | |
5.000%, 10/1/2022 | | | 580,000 | | | | 638,481 | |
5.000%, 10/1/2023 | | | 800,000 | | | | 918,768 | |
Encinitas Union School District, 6.750%, 8/1/2035, Call 8/1/2032 | | | 500,000 | | | | 703,025 | |
Escondido Union High School District, 5.450%, 8/1/2032, Call 8/1/2025 (2) | | | 1,250,000 | | | | 1,478,900 | |
Escondido Union High School District, AGC, 0.000%, 8/1/2031 | | | 480,000 | | | | 400,402 | |
Fresno Joint Powers Financing Authority, AGM, 5.000%, 4/1/2033, Call 4/1/2027 | | | 1,000,000 | | | | 1,207,880 | |
Fresno Unified School District, 0.000%, 8/1/2034, Call 8/1/2021 | | | 1,045,000 | | | | 427,321 | |
Fresno Unified School District, NATL-RE, 6.000%, 8/1/2026 | | | 2,890,000 | | | | 3,358,440 | |
Golden State Tobacco Securitization Corp.: | | | | | | | | |
5.000%, 6/1/2028, Call 6/1/2027 | | | 1,000,000 | | | | 1,236,790 | |
5.000%, 6/1/2029, Call 6/1/2027 | | | 1,000,000 | | | | 1,222,340 | |
Hacienda La Puente Unified School District, AGM: | | | | | | | | |
5.000%, 6/1/2022 | | | 400,000 | | | | 432,224 | |
5.000%, 6/1/2023 | | | 400,000 | | | | 449,916 | |
5.000%, 6/1/2024 | | | 775,000 | | | | 905,665 | |
5.000%, 6/1/2025 | | | 425,000 | | | | 514,089 | |
Imperial Community College District, AGC, 0.000%, 8/1/2028 | | | 330,000 | | | | 294,664 | |
Imperial County Local Transportation Authority, 5.000%, 6/1/2032, Call 6/1/2022 | | | 2,000,000 | | | | 2,133,600 | |
Jefferson School District/San Joaquin County, 0.000%, 8/1/2029, Call 8/1/2024 | | | 170,000 | | | | 129,722 | |
Jurupa Community Services District, 5.000%, 9/1/2029, Call 9/1/2020 | | | 375,000 | | | | 375,000 | |
Lakeside Union School District/Kern County, AGC, 0.000%, 9/1/2027 | | | 295,000 | | | | 272,046 | |
Long Beach Bond Finance Authority: | | | | | | | | |
5.000%, 11/1/2025, Call 11/1/2021 | | | 1,000,000 | | | | 1,055,830 | |
5.000%, 11/1/2030, Call 11/1/2021 | | | 1,750,000 | | | | 1,839,810 | |
Lynwood Unified School District, AGM: | | | | | | | | |
5.000%, 8/1/2024, Call 8/1/2023 | | | 620,000 | | | | 700,581 | |
5.000%, 8/1/2025, Call 8/1/2023 | | | 760,000 | | | | 858,070 | |
McKinleyville Union School District, AGM, 7.050%, 8/1/2041, Call 8/1/2026 (2) | | | 165,000 | | | | 215,929 | |
McKinleyville Union School District, BAM: | | | | | | | | |
0.000%, 8/1/2036, Call 8/1/2021 | | | 1,200,000 | | | | 557,124 | |
0.000%, 8/1/2037, Call 8/1/2021 | | | 1,980,000 | | | | 865,458 | |
Mendocino-Lake Community College District, AGM, 5.600%, 8/1/2031, Call 8/1/2026 (2) | | | 300,000 | | | | 380,958 | |
Midpeninsula Regional Open Space District, 5.000%, 9/1/2029, Call 9/1/2022 | | | 2,000,000 | | | | 2,193,360 | |
Modesto Irrigation District, 5.000%, 7/1/2021 | | | 500,000 | | | | 519,435 | |
Mount Diablo Unified School District, AGM, 5.750%, 8/1/2035, Call 8/1/2025 | | | 2,125,000 | | | | 2,322,455 | |
Murrieta Valley Unified School District, NATL-RE, 0.000%, 9/1/2020 | | | 500,000 | | | | 500,000 | |
Norman Y Mineta San Jose International Airport SJC: | | | | | | | | |
5.000%, 3/1/2041, Call 3/1/2027 (4) | | | 1,000,000 | | | | 1,170,310 | |
5.000%, 3/1/2042, Call 3/1/2027 | | | 1,665,000 | | | | 1,987,727 | |
Northern California Gas Authority No. 1, 0.918%, (LIBOR 3 Month), 7/1/2027 (1) | | | 1,755,000 | | | | 1,728,973 | |
Northern California Power Agency: | | | | | | | | |
5.000%, 7/1/2031, Call 7/1/2022 | | | 500,000 | | | | 539,895 | |
5.000%, 7/1/2032, Call 7/1/2022 | | | 700,000 | | | | 746,557 | |
Orchard School District, NATL-RE, 0.000%, 8/1/2023 | | | 590,000 | | | | 581,457 | |
Pasadena Public Financing Authority, 0.000%, 3/1/2029 | | | 2,000,000 | | | | 1,781,520 | |
Roseville Joint Union High School District, 0.000%, 8/1/2022 | | | 305,000 | | | | 302,554 | |
Sacramento Redevelopment Agency Successor Agency, BAM: | | | | | | | | |
5.000%, 12/1/2027, Call 12/1/2025 | | | 235,000 | | | | 283,105 | |
5.000%, 12/1/2028, Call 12/1/2025 | | | 425,000 | | | | 509,630 | |
5.000%, 12/1/2030, Call 12/1/2025 | | | 1,000,000 | | | | 1,186,770 | |
5.000%, 12/1/2031, Call 12/1/2025 | | | 2,000,000 | | | | 2,358,640 | |
| | | | | | | | |
San Francisco City & County Airport Comm-San Francisco International Airport: | | | | | | | | |
4.000%, 5/1/2050, Call 5/1/2029 | | | 2,700,000 | | | | 3,023,244 | |
5.000%, 5/1/2024, Call 5/1/2021 | | | 745,000 | | | | 768,654 | |
5.000%, 5/1/2024, Call 5/1/2021 | | | 295,000 | | | | 303,685 | |
5.000%, 5/1/2045, Call 5/1/2029 | | | 13,500,000 | | | | 16,367,670 | |
San Jose Financing Authority, 5.000%, 6/1/2039, Call 6/1/2023 | | | 1,435,000 | | | | 1,570,966 | |
San Jose Unified School District, NATL-RE, 0.000%, 8/1/2027 | | | 1,495,000 | | | | 1,397,885 | |
San Miguel Joint Union School District, AGM: | | | | | | | | |
0.000%, 6/15/2021 | | | 490,000 | | | | 488,197 | |
0.000%, 6/15/2022 | | | 505,000 | | | | 500,076 | |
Santa Ana Unified School District, 0.000%, 8/1/2021 | | | 500,000 | | | | 497,725 | |
Santa Barbara County College School District: | | | | | | | | |
0.000%, 8/1/2027 | | | 365,000 | | | | 341,998 | |
0.000%, 8/1/2031 | | | 470,000 | | | | 399,345 | |
State of California: | | | | | | | | |
5.250%, 9/1/2025, Call 9/1/2021 | | | 2,045,000 | | | | 2,146,350 | |
6.000%, 3/1/2033, Call 9/1/2020 | | | 520,000 | | | | 523,104 | |
Vallejo City Unified School District, NATL-RE, 5.900%, 8/1/2025 | | | 1,225,000 | | | | 1,388,758 | |
Walnut Creek Elementary School District Contra Costa County, 0.000%, 9/1/2023 | | | 1,560,000 | | | | 1,536,179 | |
Watereuse Finance Authority, BAM TCRs, 5.500%, 5/1/2036, Call 5/1/2024 | | | 2,635,000 | | | | 3,104,900 | |
West Contra Costa Unified School District, AGM NATL-RE FGIC, 0.000%, 8/1/2025 | | | 310,000 | | | | 298,273 | |
West Kern Water District, 5.000%, 6/1/2028, Call 6/1/2021 | �� | | 2,000,000 | | | | 2,069,800 | |
Western Placer Unified School District: | | | | | | | | |
2.000%, 6/1/2025, Call 6/1/2023 | | | 1,000,000 | | | | 1,032,170 | |
2.000%, 6/1/2025, Call 6/1/2023 | | | 5,000,000 | | | | 5,138,800 | |
Westminster School District, BAM, 0.000%, 8/1/2048, Call 8/1/2023 | | | 7,045,000 | | | | 1,239,215 | |
Windsor Unified School District, AGM: | | | | | | | | |
0.000%, 8/1/2023 | | | 240,000 | | | | 235,154 | |
0.000%, 8/1/2024, Call 8/1/2023 | | | 330,000 | | | | 308,065 | |
0.000%, 8/1/2025, Call 8/1/2023 | | | 270,000 | | | | 239,698 | |
0.000%, 8/1/2026, Call 8/1/2023 | | | 330,000 | | | | 277,520 | |
0.000%, 8/1/2028, Call 8/1/2023 | | | 420,000 | | | | 316,331 | |
| | | | | | | | |
| | | | | | | 114,063,663 | |
Colorado — 3.1% | | | | | | | | |
Adams County School District No. 14, SAW: | | | | | | | | |
5.000%, 12/1/2024 | | | 500,000 | | | | 597,135 | |
5.000%, 12/1/2026, Call 12/1/2024 | | | 355,000 | | | | 424,793 | |
5.000%, 12/1/2027, Call 12/1/2024 | | | 500,000 | | | | 597,365 | |
Arkansas River Power Authority, 5.000%, 10/1/2038, Call 10/1/2028 | | | 2,250,000 | | | | 2,510,505 | |
City & County of Denver, 5.000%, 8/1/2041, Call 8/1/2026 | | | 8,000,000 | | | | 9,557,120 | |
City & County of Denver Airport System Revenue: | | | | | | | | |
5.000%, 11/15/2021 | | | 500,000 | | | | 528,190 | |
5.000%, 11/15/2030, Call 11/15/2027 | | | 5,010,000 | | | | 6,175,126 | |
5.000%, 12/1/2048, Call 12/1/2028 | | | 3,000,000 | | | | 3,581,550 | |
Colorado Bridge Enterprise: | | | | | | | | |
4.000%, 12/31/2028, Call 12/31/2027 | | | 2,760,000 | | | | 3,249,348 | |
4.000%, 6/30/2029, Call 12/31/2027 | | | 4,525,000 | | | | 5,313,119 | |
Colorado Educational & Cultural Facilities Authority: | | | | | | | | |
4.000%, 12/15/2025 | | | 535,000 | | | | 561,268 | |
5.000%, 9/1/2020 (2) | | | 1,060,000 | | | | 1,060,000 | |
5.000%, 9/1/2021 (2) | | | 865,000 | | | | 899,773 | |
Colorado Health Facilities Authority: | | | | | | | | |
4.000%, 11/15/2043, Call 11/15/2029 | | | 1,000,000 | | | | 1,144,130 | |
4.000%, 8/1/2044, Call 8/1/2029 | | | 2,000,000 | | | | 2,218,460 | |
4.000%, 9/1/2045, Call 9/1/2030 | | | 1,000,000 | | | | 1,098,530 | |
4.000%, 8/1/2049, Call 8/1/2029 | | | 2,265,000 | | | | 2,497,027 | |
4.000%, 9/1/2050, Call 9/1/2030 | | | 1,500,000 | | | | 1,636,830 | |
5.000%, 2/1/2021 | | | 475,000 | | | | 479,783 | |
5.000%, 9/1/2022 | | | 750,000 | | | | 808,057 | |
5.000%, 12/1/2023 | | | 215,000 | | | | 233,056 | |
5.000%, 2/1/2024 | | | 420,000 | | | | 450,866 | |
5.000%, 6/1/2047, Call 6/1/2027 | | | 1,000,000 | | | | 1,296,650 | |
Commerce City Northern Infrastructure General Improvement District, AGM: | | | | | | | | |
5.000%, 12/1/2020 | | | 785,000 | | | | 794,444 | |
5.000%, 12/1/2021 | | | 725,000 | | | | 768,891 | |
| | | | | | | | |
5.000%, 12/1/2022 | | | 1,185,000 | | | | 1,309,354 | |
County of Boulder, 5.000%, 12/1/2025, Call 12/1/2020 | | | 475,000 | | | | 480,510 | |
Denver City & County School District No. 1, SAW, 5.000%, 12/1/2032, Call 12/1/2022 | | | 1,500,000 | | | | 1,661,355 | |
Park Creek Metropolitan District, 5.000%, 12/1/2030, Call 12/1/2025 | | | 1,895,000 | | | | 2,259,484 | |
Rangely Hospital District, 6.000%, 11/1/2026, Call 11/1/2021 | | | 2,000,000 | | | | 2,075,060 | |
Weld County School District No. RE-7 Platte Valley, SAW, 4.000%, 12/1/2023, Call 12/1/2020 | | | 1,140,000 | | | | 1,150,762 | |
| | | | | | | | |
| | | | | | | 57,418,541 | |
Connecticut — 2.2% | | | | | | | | |
City of New Haven, AGM: | | | | | | | | |
5.000%, 8/1/2023 | | | 295,000 | | | | 335,566 | |
5.000%, 8/1/2023 | | | 1,765,000 | | | | 1,962,857 | |
5.000%, 2/1/2024 | | | 650,000 | | | | 733,616 | |
5.000%, 8/1/2024 | | | 1,000,000 | | | | 1,146,430 | |
5.000%, 8/1/2039, Call 8/1/2029 | | | 3,000,000 | | | | 3,675,420 | |
Connecticut Housing Finance Authority: | | | | | | | | |
3.500%, 11/15/2045, Call 5/15/2029 | | | 2,500,000 | | | | 2,796,850 | |
3.600%, 11/15/2030, Call 11/15/2024 | | | 305,000 | | | | 328,378 | |
Connecticut State Health & Educational Facilities Authority: | | | | | | | | |
4.000%, 7/1/2038, Call 7/1/2029 | | | 5,430,000 | | | | 5,998,195 | |
5.000%, 7/1/2029, Call 7/1/2028 | | | 1,000,000 | | | | 1,265,800 | |
State of Connecticut: | | | | | | | | |
5.000%, 3/15/2027, Call 3/15/2026 | | | 2,155,000 | | | | 2,634,875 | |
5.000%, 4/15/2028 | | | 1,250,000 | | | | 1,613,175 | |
5.000%, 4/15/2030, Call 4/15/2029 | | | 1,150,000 | | | | 1,498,887 | |
5.000%, 4/15/2034, Call 4/15/2027 | | | 3,000,000 | | | | 3,658,200 | |
5.000%, 1/15/2040, Call 1/15/2030 | | | 4,000,000 | | | | 5,051,560 | |
University of Connecticut: | | | | | | | | |
5.000%, 3/15/2032, Call 3/15/2026 | | | 2,000,000 | | | | 2,369,700 | |
5.000%, 1/15/2033, Call 1/15/2027 | | | 4,000,000 | | | | 4,826,320 | |
5.000%, 11/1/2036, Call 11/1/2028 | | | 1,485,000 | | | | 1,846,657 | |
| | | | | | | | |
| | | | | | | 41,742,486 | |
Delaware — 0.4% | | | | | | | | |
City of Wilmington, 5.000%, 10/1/2025, Call 10/1/2023 | | | 3,715,000 | | | | 4,251,669 | |
Delaware State Economic Development Authority: | | | | | | | | |
5.000%, 6/1/2036, Call 6/1/2026 | | | 500,000 | | | | 523,845 | |
5.000%, 6/1/2046, Call 6/1/2026 | | | 1,000,000 | | | | 1,030,110 | |
Sustainable Energy Utility, Inc., 5.000%, 9/15/2034, Call 9/15/2021 | | | 1,580,000 | | | | 1,658,115 | |
| | | | | | | | |
| | | | | | | 7,463,739 | |
District of Columbia — 1.0% | | | | | | | | |
District of Columbia: | | | | | | | | |
4.000%, 7/1/2044, Call 7/1/2029 | | | 3,480,000 | | | | 3,738,216 | |
5.000%, 10/1/2025, Call 10/1/2021 | | | 1,865,000 | | | | 1,962,204 | |
5.000%, 6/1/2036, Call 6/1/2026 | | | 1,115,000 | | | | 1,247,507 | |
5.000%, 12/1/2036, Call 12/1/2021 | | | 165,000 | | | | 174,796 | |
5.000%, 12/1/2036, Call 12/1/2021 | | | 335,000 | | | | 352,453 | |
5.000%, 6/1/2046, Call 6/1/2026 | | | 1,385,000 | | | | 1,517,586 | |
Metropolitan Washington Airports Authority Dulles Toll Road Revenue, 4.000%, 10/1/2049, Call 10/1/2029 | | | 1,000,000 | | | | 1,098,850 | |
Washington Convention & Sports Authority, 5.000%, 10/1/2030, Call 10/1/2027 | | | 1,500,000 | | | | 1,660,590 | |
Washington Metropolitan Area Transit Authority, 4.000%, 7/15/2040, Call 7/15/2030 | | | 6,370,000 | | | | 7,588,454 | |
| | | | | | | | |
| | | | | | | 19,340,656 | |
Florida — 5.0% | | | | | | | | |
Central Florida Expressway Authority, 4.000%, 7/1/2041, Call 7/1/2027 | | | 4,000,000 | | | | 4,435,600 | |
City of Atlantic Beach: | | | | | | | | |
5.000%, 11/15/2043, Call 11/15/2025 | | | 1,085,000 | | | | 1,171,561 | |
5.000%, 11/15/2048, Call 11/15/2025 | | | 1,750,000 | | | | 1,882,702 | |
City of Boynton Beach Utility System Revenue, AGM, 5.000%, 11/1/2027, Call 11/1/2021 | | | 1,000,000 | | | | 1,053,690 | |
City of Gulf Breeze, 5.000%, 12/1/2023, Call 12/1/2020 | | | 2,000,000 | | | | 2,023,360 | |
City of Lakeland Department of Electric Utilities, AGM, 5.250%, 10/1/2028 | | | 1,250,000 | | | | 1,698,200 | |
City of North Port, BAM, 5.000%, 7/1/2022 | | | 200,000 | | | | 217,146 | |
City of Orlando, AGM, 5.000%, 11/1/2035, Call 11/1/2027 | | | 2,270,000 | | | | 2,712,922 | |
| | | | | | | | |
City of Sunrise, NATL-RE: | | | | | | | | |
0.000%, 10/1/2020 | | | 975,000 | | | | 974,756 | |
0.000%, 10/1/2021 | | | 175,000 | | | | 174,190 | |
City of Tallahassee: | | | | | | | | |
5.000%, 12/1/2026, Call 12/1/2025 | | | 450,000 | | | | 528,039 | |
5.000%, 12/1/2027, Call 12/1/2025 | | | 400,000 | | | | 467,364 | |
City of Tampa, AMBAC, 0.000%, 4/1/2021 | | | 460,000 | | | | 459,200 | |
Columbia County School Board, BAM, 5.000%, 7/1/2026, Call 7/1/2025 | | | 495,000 | | | | 594,881 | |
County of Broward, AGM, 5.000%, 4/1/2033, Call 4/1/2023 | | | 740,000 | | | | 817,204 | |
County of Broward Airport System Revenue: | | | | | | | | |
5.000%, 10/1/2026, Call 10/1/2025 (4) | | | 750,000 | | | | 890,707 | |
5.000%, 10/1/2031, Call 10/1/2025 (4) | | | 1,000,000 | | | | 1,164,520 | |
County of Lee County Water & Sewer Revenue, 5.000%, 10/1/2029, Call 10/1/2022 | | | 2,000,000 | | | | 2,199,220 | |
County of Miami-Dade, AGC, 0.000%, 10/1/2021 | | | 610,000 | | | | 604,492 | |
County of Miami-Dade Aviation Revenue: | | | | | | | | |
4.000%, 10/1/2044, Call 10/1/2029 | | | 1,000,000 | | | | 1,102,190 | |
5.000%, 10/1/2025, Call 10/1/2024 | | | 800,000 | | | | 932,480 | |
5.000%, 10/1/2044, Call 10/1/2029 | | | 3,000,000 | | | | 3,629,700 | |
5.500%, 10/1/2026, Call 10/1/2020 | | | 450,000 | | | | 451,931 | |
5.500%, 10/1/2026, Call 10/1/2020 | | | 1,450,000 | | | | 1,456,278 | |
County of Miami-Dade Water & Sewer System Revenue: | | | | | | | | |
5.000%, 10/1/2033, Call 10/1/2025 | | | 2,000,000 | | | | 2,394,880 | |
5.250%, 10/1/2029, Call 10/1/2023 | | | 100,000 | | | | 115,434 | |
County of Orange Sales Tax Revenue, 5.000%, 1/1/2027, Call 1/1/2022 | | | 5,810,000 | | | | 6,181,956 | |
County of St. Johns, AGM: | | | | | | | | |
5.000%, 10/1/2020 | | | 1,625,000 | | | | 1,631,175 | |
5.000%, 10/1/2021 | | | 1,110,000 | | | | 1,166,366 | |
Emerald Coast Utilities Authority, BAM, 5.000%, 1/1/2032, Call 1/1/2025 | | | 1,445,000 | | | | 1,703,438 | |
Florida Housing Finance Corp., GNMA/FNMA/FHLMC, 4.450%, 1/1/2030, Call 7/1/2021 | | | 210,000 | | | | 214,832 | |
Florida Housing Finance Corp., GNMA/FNMA/FHLMC COLL, 3.500%, 7/1/2051, Call 7/1/2029 | | | 1,250,000 | | | | 1,396,075 | |
Halifax Hospital Medical Center: | | | | | | | | |
5.000%, 6/1/2026 | | | 1,525,000 | | | | 1,837,259 | |
5.000%, 6/1/2027, Call 6/1/2026 | | | 1,295,000 | | | | 1,546,075 | |
JPMorgan Chase Putters/Drivers Trust, 0.420%, 2/16/2022, Call 8/18/2021 (1)(3) | | | 5,000,000 | | | | 5,000,000 | |
Lee County Industrial Development Authority, 5.000%, 11/1/2025, Call 11/1/2020 | | | 2,000,000 | | | | 2,015,580 | |
Lee County School Board, 5.000%, 8/1/2028, Call 8/1/2024 | | | 2,500,000 | | | | 2,907,800 | |
Miami-Dade County Educational Facilities Authority, 5.000%, 4/1/2031, Call 4/1/2025 | | | 2,000,000 | | | | 2,279,980 | |
Miami-Dade County Industrial Development Authority, 1.600%, 11/1/2041 (1) | | | 1,000,000 | | | | 1,001,760 | |
Monroe County School District, 5.000%, 6/1/2034, Call 6/1/2027 | | | 1,000,000 | | | | 1,233,200 | |
North Sumter County Utility Dependent District, 5.000%, 10/1/2049, Call 10/1/2029 | | | 1,350,000 | | | | 1,648,188 | |
Palm Beach County Health Facilities Authority: | | | | | | | | |
5.000%, 5/15/2036, Call 5/15/2027 | | | 1,000,000 | | | | 1,079,570 | |
5.000%, 5/15/2037, Call 5/15/2027 | | | 1,000,000 | | | | 1,077,730 | |
5.000%, 11/15/2042, Call 11/15/2027 | | | 250,000 | | | | 296,675 | |
Polk County Housing Finance Authority, GNMA COLL, 5.000%, 9/1/2029, Call 9/1/2020 | | | 145,000 | | | | 145,255 | |
Polk County Industrial Development Authority: | | | | | | | | |
5.000%, 1/1/2029, Call 1/1/2025 | | | 390,000 | | | | 421,719 | |
5.000%, 1/1/2039, Call 1/1/2025 | | | 300,000 | | | | 314,799 | |
5.000%, 1/1/2049, Call 1/1/2025 | | | 1,000,000 | | | | 1,034,650 | |
Putnam County Development Authority, 0.180%, 9/1/2024, Call 9/1/2020 (1) | | | 300,000 | | | | 300,000 | |
Sarasota County Health Facilities Authority: | | | | | | | | |
5.000%, 1/1/2030, Call 1/1/2025 | | | 750,000 | | | | 816,593 | |
5.000%, 1/1/2031, Call 1/1/2025 | | | 935,000 | | | | 1,014,447 | |
5.000%, 1/1/2032, Call 1/1/2025 | | | 1,100,000 | | | | 1,190,673 | |
Sarasota County Public Hospital District, 5.000%, 7/1/2041, Call 7/1/2028 | | | 5,000,000 | | | | 6,050,000 | |
St. Lucie County School Board, AGM, 5.000%, 7/1/2022, Call 7/1/2021 | | | 2,500,000 | | | | 2,593,525 | |
Town of Davie: | | | | | | | | |
5.000%, 4/1/2021 | | | 615,000 | | | | 631,790 | |
5.000%, 4/1/2022 | | | 830,000 | | | | 891,055 | |
Volusia County Educational Facility Authority: | | | | | | | | |
4.000%, 10/15/2038, Call 10/15/2029 | | | 585,000 | | | | 671,896 | |
| | | | | | | | |
5.000%, 10/15/2044, Call 10/15/2029 | | | 5,850,000 | | | | 7,178,886 | |
5.000%, 10/15/2049, Call 10/15/2029 | | | 1,000,000 | | | | 1,219,850 | |
Volusia County Educational Facility Authority, AGM, 5.000%, 10/15/2029, Call 10/15/2021 | | | 730,000 | | | | 768,566 | |
| | | | | | | | |
| | | | | | | 93,614,010 | |
Georgia — 5.4% | | | | | | | | |
Bartow County Development Authority, 1.550%, 8/1/2043 (1) | | | 2,000,000 | | | | 2,017,020 | |
Burke County Development Authority: | | | | | | | | |
0.230%, 11/1/2052, Call 9/1/2020 (1) | | | 1,800,000 | | | | 1,800,000 | |
2.250%, 10/1/2032 (1) | | | 3,000,000 | | | | 3,089,640 | |
2.925%, 11/1/2048 (1) | | | 4,250,000 | | | | 4,532,880 | |
City of Atlanta Airport Passenger Facility Charge: | | | | | | | | |
5.000%, 1/1/2031, Call 1/1/2024 | | | 1,000,000 | | | | 1,129,850 | |
5.000%, 1/1/2032, Call 1/1/2024 | | | 2,500,000 | | | | 2,816,725 | |
5.000%, 1/1/2033, Call 1/1/2024 | | | 1,000,000 | | | | 1,123,540 | |
5.000%, 1/1/2034, Call 1/1/2024 | | | 1,000,000 | | | | 1,121,450 | |
City of Atlanta Water & Wastewater Revenue: | | | | | | | | |
5.000%, 11/1/2040, Call 11/1/2027 | | | 1,000,000 | | | | 1,248,390 | |
5.000%, 11/1/2043, Call 11/1/2027 | | | 3,000,000 | | | | 3,720,930 | |
City of Atlanta Water & Wastewater Revenue, NATL-RE, 5.500%, 11/1/2022 | | | 1,000,000 | | | | 1,063,520 | |
Cobb County Kennestone Hospital Authority, 5.000%, 4/1/2031, Call 4/1/2021 | | | 3,000,000 | | | | 3,066,240 | |
Development Authority of Appling County, 1.500%, 1/1/2038 | | | 1,000,000 | | | | 1,005,650 | |
Development Authority of Burke County, 1.500%, 1/1/2040 | | | 1,500,000 | | | | 1,508,475 | |
Floyd County Hospital Authority, County Guarantee: | | | | | | | | |
5.000%, 7/1/2021 | | | 1,155,000 | | | | 1,198,313 | |
5.000%, 7/1/2027, Call 7/1/2022 | | | 1,250,000 | | | | 1,339,588 | |
Gainesville & Hall County Development Authority: | | | | | | | | |
5.000%, 3/1/2027 | | | 670,000 | | | | 680,606 | |
5.000%, 3/1/2037, Call 3/1/2027 | | | 500,000 | | | | 475,935 | |
5.125%, 3/1/2052, Call 3/1/2027 | | | 2,925,000 | | | | 2,654,379 | |
Gainesville & Hall County Hospital Authority: | | | | | | | | |
4.000%, 2/15/2040, Call 2/15/2030 | | | 7,000,000 | | | | 8,041,880 | |
5.000%, 2/15/2036, Call 2/15/2027 | | | 1,500,000 | | | | 1,783,815 | |
5.000%, 2/15/2037, Call 2/15/2027 | | | 2,000,000 | | | | 2,371,600 | |
5.000%, 2/15/2042, Call 2/15/2027 | | | 3,000,000 | | | | 3,518,130 | |
Jefferson City School District, SAW, 5.250%, 2/1/2029, Call 2/1/2021 | | | 1,350,000 | | | | 1,378,242 | |
Main Street Natural Gas, Inc.: | | | | | | | | |
0.730%, (SIFMA Municipal Swap Index Yield), 8/1/2048, Call 9/1/2023 (1) | | | 10,000,000 | | | | 9,980,400 | |
0.865%, (LIBOR 1 Month), 4/1/2048, Call 6/1/2023 (1) | | | 11,500,000 | | | | 11,486,775 | |
0.945%, (LIBOR 1 Month), 8/1/2048, Call 9/1/2023 (1) | | | 500,000 | | | | 500,340 | |
4.000%, 8/1/2049, Call 9/1/2024 (1) | | | 6,000,000 | | | | 6,817,140 | |
5.000%, 5/15/2030, Call 5/15/2029 | | | 2,750,000 | | | | 3,433,347 | |
5.000%, 5/15/2031, Call 5/15/2029 | | | 4,000,000 | | | | 4,960,640 | |
Monroe County Development Authority, 2.250%, 7/1/2025, Call 6/13/2024 | | | 3,000,000 | | | | 3,090,210 | |
Private Colleges & Universities Authority, 5.000%, 10/1/2020 | | | 575,000 | | | | 576,305 | |
South Fulton Municipal Regional Water & Sewer Authority, BAM: | | | | | | | | |
5.000%, 1/1/2023 | | | 800,000 | | | | 885,024 | |
5.000%, 1/1/2024 | | | 1,000,000 | | | | 1,150,450 | |
5.000%, 1/1/2025, Call 1/1/2024 | | | 700,000 | | | | 804,146 | |
South Regional Joint Development Authority, 5.250%, 8/1/2023 | | | 25,000 | | | | 27,897 | |
Valdosta & Lowndes County Hospital Authority, County Guarantee, 5.000%, 10/1/2025, Call 10/1/2021 | | | 2,940,000 | | | | 3,091,586 | |
Winder-Barrow Industrial Building Authority, AGM, 5.000%, 12/1/2029, Call 12/1/2021 | | | 1,000,000 | | | | 1,054,670 | |
| | | | | | | | |
| | | | | | | 100,545,728 | |
Guam — 0.1% | | | | | | | | |
Territory of Guam: | | | | | | | | |
5.000%, 12/1/2032, Call 12/1/2026 | | | 1,310,000 | | | | 1,480,549 | |
5.000%, 12/1/2033, Call 12/1/2026 | | | 1,000,000 | | | | 1,126,390 | |
| | | | | | | | |
| | | | | | | 2,606,939 | |
Hawaii — 0.1% | | | | | | | | |
City & County of Honolulu: | | | | | | | | |
5.000%, 10/1/2022 | | | 500,000 | | | | 550,085 | |
| | | | | | | | |
5.000%, 10/1/2023 | | | 500,000 | | | | 573,060 | |
| | | | | | | | |
| | | | | | | 1,123,145 | |
Idaho — 0.1% | | | | | | | | |
Canyon County School District No. 131 Nampa, School Bond Gty, 5.000%, 9/15/2023 | | | 1,000,000 | | | | 1,140,470 | |
| | |
Illinois — 18.0% | | | | | | | | |
Bureau County Township High School District No. 502, BAM, 6.625%, 10/1/2043, Call 12/1/2023 | | | 3,400,000 | | | | 4,088,262 | |
Chicago Board of Education: | | | | | | | | |
5.000%, 4/1/2042, Call 4/1/2028 | | | 1,500,000 | | | | 1,657,755 | |
5.000%, 4/1/2046, Call 4/1/2028 | | | 1,250,000 | | | | 1,372,550 | |
6.000%, 4/1/2046, Call 4/1/2027 | | | 1,500,000 | | | | 1,752,690 | |
Chicago Board of Education, NATL-RE: | | | | | | | | |
0.000%, 12/1/2022 | | | 365,000 | | | | 347,721 | |
5.250%, 12/1/2021 | | | 1,000,000 | | | | 1,054,070 | |
Chicago Housing Authority, HUD SEC 8: | | | | | | | | |
5.000%, 1/1/2023 | | | 710,000 | | | | 775,895 | |
5.000%, 1/1/2037, Call 1/1/2028 | | | 2,500,000 | | | | 3,009,250 | |
Chicago O’Hare International Airport: | | | | | | | | |
5.000%, 1/1/2026, Call 1/1/2025 (4) | | | 1,500,000 | | | | 1,750,830 | |
5.000%, 1/1/2031, Call 1/1/2025 (4) | | | 1,000,000 | | | | 1,153,440 | |
5.000%, 1/1/2037, Call 1/1/2029 | | | 1,200,000 | | | | 1,455,612 | |
5.000%, 1/1/2038, Call 1/1/2027 | | | 2,290,000 | | | | 2,685,895 | |
5.000%, 1/1/2038, Call 1/1/2029 | | | 4,250,000 | | | | 5,139,822 | |
5.000%, 1/1/2039, Call 1/1/2029 | | | 1,250,000 | | | | 1,507,475 | |
5.250%, 1/1/2030, Call 9/1/2020 | | | 2,595,000 | | | | 2,605,120 | |
Chicago O’Hare International Airport, AGC, 5.250%, 1/1/2026, Call 9/1/2020 | | | 775,000 | | | | 778,085 | |
Chicago Park District: | | | | | | | | |
5.000%, 1/1/2023, Call 1/1/2022 | | | 1,060,000 | | | | 1,107,488 | |
5.000%, 1/1/2026, Call 1/1/2021 | | | 730,000 | | | | 737,745 | |
5.000%, 1/1/2028, Call 1/1/2024 | | | 2,500,000 | | | | 2,725,600 | |
5.000%, 1/1/2031, Call 1/1/2026 | | | 1,790,000 | | | | 2,006,089 | |
5.000%, 1/1/2040, Call 1/1/2026 | | | 1,000,000 | | | | 1,094,240 | |
Chicago Transit Authority: | | | | | | | | |
4.000%, 12/1/2050 | | | 3,000,000 | | | | 3,303,450 | |
5.000%, 12/1/2046, Call 12/1/2026 | | | 3,000,000 | | | | 3,429,030 | |
City of Chicago: | | | | | | | | |
5.000%, 1/1/2028 | | | 6,000,000 | | | | 6,838,560 | |
5.000%, 1/1/2040, Call 1/1/2029 | | | 9,400,000 | | | | 10,361,150 | |
5.000%, 1/1/2044, Call 1/1/2029 | | | 11,750,000 | | | | 12,875,650 | |
5.500%, 1/1/2035, Call 1/1/2029 | | | 2,000,000 | | | | 2,344,260 | |
6.000%, 1/1/2038, Call 1/1/2027 | | | 10,000,000 | | | | 11,543,000 | |
City of Chicago Wastewater Transmission Revenue: | | | | | | | | |
5.000%, 1/1/2031, Call 1/1/2025 | | | 3,715,000 | | | | 4,291,828 | |
5.000%, 1/1/2032, Call 1/1/2027 | | | 2,000,000 | | | | 2,371,100 | |
5.000%, 1/1/2035, Call 1/1/2027 | | | 3,310,000 | | | | 3,878,691 | |
5.000%, 1/1/2039, Call 1/1/2025 | | | 500,000 | | | | 566,790 | |
City of Chicago Waterworks Revenue: | | | | | | | | |
5.000%, 11/1/2025 | | | 2,000,000 | | | | 2,348,180 | |
5.000%, 11/1/2027, Call 11/1/2026 | | | 2,500,000 | | | | 3,025,000 | |
5.000%, 11/1/2027, Call 11/1/2026 | | | 1,000,000 | | | | 1,210,000 | |
5.000%, 11/1/2028, Call 11/1/2026 | | | 1,000,000 | | | | 1,203,440 | |
5.000%, 11/1/2029, Call 11/1/2026 | | | 1,000,000 | | | | 1,198,020 | |
City of Chicago Waterworks Revenue, AGM, 5.000%, 11/1/2027, Call 9/1/2020 | | | 60,000 | | | | 60,178 | |
City of Springfield, 5.000%, 12/1/2022 | | | 905,000 | | | | 988,197 | |
City of Springfield Electric Revenue: | | | | | | | | |
5.000%, 3/1/2028, Call 3/1/2025 | | | 1,000,000 | | | | 1,184,010 | |
5.000%, 3/1/2029, Call 3/1/2025 | | | 1,000,000 | | | | 1,181,580 | |
Cook County Community Consolidated School District No. 65 Evanston: | | | | | | | | |
0.000%, 12/1/2027, Call 12/1/2024 | | | 300,000 | | | | 248,835 | |
0.000%, 12/1/2029, Call 12/1/2024 | | | 400,000 | | | | 299,992 | |
0.000%, 12/1/2030, Call 12/1/2024 | | | 1,130,000 | | | | 806,797 | |
0.000%, 12/1/2031, Call 12/1/2024 | | | 1,500,000 | | | | 1,015,500 | |
Cook County School District No. 103 Lyons, AGM, 0.000%, 12/1/2021 | | | 850,000 | | | | 843,854 | |
| | | | | | | | |
Cook County School District No. 124 Evergreen Park, BAM, 4.000%, 12/1/2020 | | | 450,000 | | | | 453,965 | |
Cook County School District No. 144 Prairie Hills, AGM: | | | | | | | | |
0.000%, 12/1/2028 | | | 2,830,000 | | | | 2,462,157 | |
0.000%, 12/1/2029 | | | 2,580,000 | | | | 2,180,152 | |
Cook County School District No. 83 Mannheim, 5.625%, 6/1/2033 | | | 2,980,000 | | | | 3,954,728 | |
Cook County Township High School District No. 220 Reavis, 6.000%, 12/1/2030, Call 12/1/2023 | | | 1,000,000 | | | | 1,148,200 | |
Cook County Township High School District No. 220 Reavis, BAM: | | | | | | | | |
6.000%, 12/1/2031, Call 12/1/2023 | | | 2,035,000 | | | | 2,344,320 | |
6.000%, 12/1/2032, Call 12/1/2023 | | | 2,160,000 | | | | 2,466,763 | |
6.000%, 6/1/2033, Call 12/1/2023 | | | 2,235,000 | | | | 2,549,375 | |
County of Cook: | | | | | | | | |
5.000%, 11/15/2028, Call 11/15/2026 | | | 3,150,000 | | | | 3,783,654 | |
5.000%, 11/15/2031, Call 11/15/2026 | | | 2,750,000 | | | | 3,249,152 | |
5.250%, 11/15/2023, Call 11/15/2020 | | | 350,000 | | | | 352,972 | |
County of Cook, BAM TCRs, 5.000%, 11/15/2023 | | | 1,000,000 | | | | 1,136,270 | |
County of Cook Sales Tax Revenue: | | | | | | | | |
5.250%, 11/15/2035, Call 11/15/2027 | | | 1,520,000 | | | | 1,845,386 | |
5.250%, 11/15/2036, Call 11/15/2027 | | | 3,000,000 | | | | 3,630,090 | |
County of St. Clair Highway Revenue, 5.500%, 1/1/2038, Call 1/1/2023 | | | 825,000 | | | | 925,584 | |
DeKalb Kane & LaSalle Counties Community College District No. 523 Kishwaukee, 0.000%, 2/1/2035, Call 2/1/2021 | | | 470,000 | | | | 179,155 | |
Frankfort Square Park District, AMBAC, 0.000%, 1/1/2022 | | | 670,000 | | | | 656,084 | |
Illinois Development Finance Authority, AGM: | | | | | | | | |
0.000%, 1/1/2021 | | | 95,000 | | | | 94,890 | |
0.000%, 1/1/2021 | | | 160,000 | | | | 159,773 | |
Illinois Finance Authority: | | | | | | | | |
4.000%, 10/1/2040, Call 10/1/2030 | | | 500,000 | | | | 562,815 | |
4.000%, 10/1/2050, Call 10/1/2030 | | | 1,500,000 | | | | 1,647,285 | |
5.000%, 5/15/2023 | | | 445,000 | | | | 471,967 | |
5.000%, 11/15/2023, Call 11/15/2022 | | | 215,000 | | | | 235,717 | |
5.000%, 8/15/2024 | | | 250,000 | | | | 289,578 | |
5.000%, 5/15/2025 | | | 1,000,000 | | | | 1,039,630 | |
5.000%, 11/15/2026, Call 11/15/2025 | | | 1,000,000 | | | | 1,193,750 | |
5.000%, 11/15/2027, Call 11/15/2025 | | | 500,000 | | | | 594,355 | |
5.000%, 11/1/2029, Call 11/1/2026 | | | 2,000,000 | | | | 2,302,420 | |
5.000%, 5/15/2030, Call 5/15/2025 | | | 1,000,000 | | | | 1,047,670 | |
5.000%, 1/1/2036, Call 1/1/2027 | | | 2,000,000 | | | | 2,349,080 | |
5.000%, 12/1/2037, Call 12/1/2027 | | | 1,000,000 | | | | 1,098,710 | |
5.000%, 5/15/2043, Call 11/15/2028 | | | 5,000,000 | | | | 5,986,800 | |
5.000%, 1/1/2044, Call 1/1/2028 | | | 5,000,000 | | | | 5,865,150 | |
5.000%, 10/1/2044, Call 10/1/2029 | | | 1,000,000 | | | | 1,199,070 | |
5.000%, 12/1/2047, Call 12/1/2027 | | | 1,000,000 | | | | 1,079,140 | |
5.000%, 10/1/2049, Call 10/1/2029 | | | 1,250,000 | | | | 1,489,937 | |
6.000%, 10/1/2024, Call 10/1/2021 | | | 1,010,000 | | | | 1,038,027 | |
6.000%, 8/15/2041, Call 8/15/2021 | | | 2,665,000 | | | | 2,775,544 | |
6.875%, 10/1/2043, Call 10/1/2021 | | | 3,000,000 | | | | 3,072,240 | |
Illinois Housing Development Authority, GNMA/FNMA/FHLMC: | | | | | | | | |
2.450%, 6/1/2043, Call 1/1/2023 | | | 413,792 | | | | 422,957 | |
3.750%, 4/1/2050, Call 4/1/2029 | | | 4,960,000 | | | | 5,565,219 | |
Illinois State Toll Highway Authority: | | | | | | | | |
5.000%, 1/1/2028, Call 1/1/2023 | | | 1,000,000 | | | | 1,095,980 | |
5.000%, 1/1/2029, Call 1/1/2023 | | | 1,000,000 | | | | 1,095,980 | |
5.000%, 1/1/2030, Call 1/1/2026 | | | 1,000,000 | | | | 1,210,200 | |
5.000%, 1/1/2031, Call 1/1/2029 | | | 500,000 | | | | 642,785 | |
5.000%, 12/1/2032, Call 1/1/2026 | | | 7,790,000 | | | | 9,302,117 | |
Kane & DeKalb Counties Community Unit School District No. 302 Kaneland, NATL-RE, 0.000%, 2/1/2023 | | | 5,450,000 | | | | 5,300,561 | |
Kane Cook & DuPage Counties School District No. U-46 Elgin, AMBAC: | | | | | | | | |
0.000%, 1/1/2023 | | | 350,000 | | | | 346,917 | |
0.000%, 1/1/2023 | | | 650,000 | | | | 641,095 | |
Kane McHenry Cook & De Kalb Counties Unit School District No. 300: | | | | | | | | |
5.000%, 1/1/2023 | | | 1,000,000 | | | | 1,106,780 | |
5.000%, 1/1/2024 | | | 1,000,000 | | | | 1,151,170 | |
5.000%, 1/1/2026, Call 1/1/2025 | | | 4,000,000 | | | | 4,768,120 | |
| | | | | | | | |
5.250%, 1/1/2033, Call 1/1/2023 | | | 900,000 | | | | 991,998 | |
Knox & Warren Counties Community Unit School District No. 205 Galesburg, 6.125%, 1/1/2036, Call 1/1/2021 | | | 1,435,000 | | | | 1,461,949 | |
Lake County School District No. 33 Emmons, XLCA: | | | | | | | | |
0.000%, 12/1/2026 | | | 525,000 | | | | 470,972 | |
0.000%, 12/1/2028 | | | 335,000 | | | | 281,169 | |
Lake County School District No. 56 Gurnee, 5.000%, 1/1/2024 | | | 440,000 | | | | 503,518 | |
McHenry & Kane Counties Community Consolidated School District No. 158 Huntley, AGM FGIC, 0.000%, 1/1/2024 | | | 500,000 | | | | 483,115 | |
McHenry & Kane Counties Community Consolidated School District No. 158 Huntley, NATL-RE: | | | | | | | | |
0.000%, 1/1/2021 | | | 1,070,000 | | | | 1,068,941 | |
0.000%, 1/1/2021 | | | 830,000 | | | | 827,593 | |
McHenry County Community Unit School District No. 12 Johnsburg, AGM: | | | | | | | | |
5.000%, 1/1/2021 | | | 810,000 | | | | 821,089 | |
5.000%, 1/1/2022 | | | 895,000 | | | | 947,223 | |
Metropolitan Pier & Exposition Authority, NATL-RE: | | | | | | | | |
0.000%, 12/15/2023 | | | 20,000 | | | | 19,642 | |
0.000%, 12/15/2023 | | | 835,000 | | | | 778,771 | |
0.000%, 6/15/2024 | | | 1,000,000 | | | | 921,950 | |
5.700%, 6/15/2023 | | | 1,710,000 | | | | 1,960,327 | |
5.700%, 6/15/2023 | | | 1,820,000 | | | | 2,007,933 | |
Railsplitter Tobacco Settlement Authority: | | | | | | | | |
5.000%, 6/1/2027, Call 6/1/2026 | | | 2,000,000 | | | | 2,438,280 | |
5.250%, 6/1/2021 | | | 1,120,000 | | | | 1,159,446 | |
Sales Tax Securitization Corp.: | | | | | | | | |
5.000%, 1/1/2029 | | | 2,500,000 | | | | 3,072,325 | |
5.000%, 1/1/2029, Call 1/1/2028 | | | 1,000,000 | | | | 1,205,680 | |
5.000%, 1/1/2030 | | | 2,000,000 | | | | 2,491,640 | |
5.000%, 1/1/2030, Call 1/1/2028 | | | 1,450,000 | | | | 1,737,912 | |
5.000%, 1/1/2031, Call 1/1/2028 | | | 2,000,000 | | | | 2,378,340 | |
5.250%, 1/1/2043, Call 1/1/2029 | | | 5,000,000 | | | | 5,864,050 | |
South Suburban College Community School District No. 510, AGC, 0.000%, 12/1/2025 | | | 1,000,000 | | | | 922,380 | |
Southern Illinois University, BAM, 5.000%, 4/1/2026, Call 4/1/2025 | | | 1,175,000 | | | | 1,308,386 | |
Southwestern Illinois Development Authority: | | | | | | | | |
5.000%, 10/15/2029, Call 10/15/2025 | | | 1,780,000 | | | | 2,130,589 | |
5.000%, 10/15/2032, Call 10/15/2025 | | | 1,335,000 | | | | 1,591,320 | |
State of Illinois: | | | | | | | | |
4.000%, 11/1/2034, Call 11/1/2029 | | | 5,000,000 | | | | 5,202,550 | |
5.000%, 4/1/2024, Call 4/1/2023 | | | 500,000 | | | | 534,110 | |
5.000%, 2/1/2026 | | | 7,000,000 | | | | 7,869,890 | |
5.000%, 6/1/2026 | | | 5,000,000 | | | | 5,644,600 | |
5.000%, 10/1/2027 | | | 2,300,000 | | | | 2,637,249 | |
5.000%, 10/1/2029, Call 10/1/2028 | | | 2,400,000 | | | | 2,759,712 | |
5.000%, 10/1/2029, Call 10/1/2028 | | | 5,000,000 | | | | 5,749,400 | |
5.000%, 11/1/2030, Call 11/1/2026 | | | 1,000,000 | | | | 1,111,780 | |
5.000%, 6/15/2034, Call 6/15/2028 | | | 5,000,000 | | | | 5,823,550 | |
5.500%, 5/1/2039, Call 5/1/2030 | | | 4,000,000 | | | | 4,677,840 | |
5.750%, 5/1/2045, Call 5/1/2030 | | | 2,000,000 | | | | 2,349,760 | |
6.500%, 6/15/2022 | | | 135,000 | | | | 137,051 | |
State of Illinois, AGM, 5.000%, 4/1/2028, Call 4/1/2023 | | | 3,205,000 | | | | 3,459,285 | |
Tazewell County School District No. 51 Washington Central, NATL-RE, 9.000%, 12/1/2025 | | | 165,000 | | | | 232,663 | |
Town of Cicero, AGM, 5.000%, 1/1/2021 | | | 1,000,000 | | | | 1,013,860 | |
Village of Elwood, AGC: | | | | | | | | |
0.000%, 3/1/2024, Call 9/1/2020 | | | 250,000 | | | | 211,625 | |
0.000%, 3/1/2026, Call 9/1/2020 | | | 1,280,000 | | | | 969,165 | |
Village of Franklin Park, BAM: | | | | | | | | |
4.000%, 10/1/2020 | | | 615,000 | | | | 616,790 | |
5.000%, 10/1/2022, Call 10/1/2021 | | | 730,000 | | | | 766,566 | |
5.000%, 10/1/2023, Call 10/1/2021 | | | 685,000 | | | | 719,161 | |
5.000%, 10/1/2024, Call 10/1/2021 | | | 425,000 | | | | 445,957 | |
5.000%, 10/1/2025, Call 10/1/2021 | | | 920,000 | | | | 965,062 | |
Village of Justice, AMBAC, 0.000%, 1/1/2021 | | | 635,000 | | | | 633,679 | |
| | | | | | | | |
Will & Kankakee Counties School District No. 255: | | | | | | | | |
5.000%, 6/1/2026, Call 6/1/2025 | | | 500,000 | | | | 598,315 | |
5.000%, 6/1/2029, Call 6/1/2025 | | | 600,000 | | | | 713,040 | |
Will County Community High School District No. 210 Lincoln-Way: | | | | | | | | |
5.000%, 1/1/2027, Call 1/1/2023 | | | 1,250,000 | | | | 1,335,437 | |
5.000%, 1/1/2028, Call 1/1/2023 | | | 3,500,000 | | | | 3,731,595 | |
5.000%, 1/1/2030, Call 1/1/2023 | | | 2,000,000 | | | | 2,137,480 | |
Will County Community High School District No. 210 Lincoln-Way, AGM, 4.000%, 1/1/2034, Call 1/1/2029 | | | 650,000 | | | | 719,063 | |
Will County Community Unit School District No. 201-U Crete-Monee, NATL-RE: | | | | | | | | |
0.000%, 11/1/2020 | | | 245,000 | | | | 244,875 | |
0.000%, 11/1/2020 | | | 1,755,000 | | | | 1,753,561 | |
0.000%, 11/1/2021 | | | 55,000 | | | | 54,726 | |
0.000%, 11/1/2021 | | | 245,000 | | | | 243,292 | |
0.000%, 11/1/2022 | | | 60,000 | | | | 59,330 | |
0.000%, 11/1/2022 | | | 190,000 | | | | 187,078 | |
Will County School District No. 114 Manhattan, NATL-RE: | | | | | | | | |
0.000%, 12/1/2020 | | | 630,000 | | | | 629,502 | |
0.000%, 12/1/2020 | | | 550,000 | | | | 548,669 | |
0.000%, 12/1/2023 | | | 1,600,000 | | | | 1,532,016 | |
Will County Township High School District No. 204 Joliet, 6.250%, 1/1/2031, Call 1/1/2021 | | | 500,000 | | | | 509,735 | |
Will Grundy Counties Community College District No. 525, 5.250%, 6/1/2036, Call 12/1/2023 | | | 3,400,000 | | | | 3,909,830 | |
Winnebago & Boone Counties School District No. 205 Rockford, 4.000%, 2/1/2027, Call 2/1/2023 | | | 4,680,000 | | | | 5,040,781 | |
| | | | | | | | |
| | | | | | | 336,110,330 | |
Indiana — 1.9% | | | | | | | | |
City of Boonville, 2.600%, 1/1/2023, Call 9/1/2020 | | | 2,500,000 | | | | 2,507,800 | |
City of Rockport, 3.050%, 6/1/2025 | | | 2,100,000 | | | | 2,303,868 | |
City of Whiting, 5.000%, 12/1/2044 (1) | | | 2,200,000 | | | | 2,698,102 | |
Frankfort High School Elementary School Building Corp., 5.000%, 7/15/2025 | | | 115,000 | | | | 139,351 | |
Franklin Township-Marion County Multiple School Building Corp., SAW: | | | | | | | | |
5.000%, 7/10/2021 | | | 580,000 | | | | 603,989 | |
5.000%, 7/15/2029, Call 1/15/2023 | | | 2,565,000 | | | | 2,852,639 | |
Indiana Bond Bank: | | | | | | | | |
0.000%, 1/15/2031, Call 1/15/2029 | | | 1,500,000 | | | | 1,251,660 | |
0.000%, 1/15/2032, Call 1/15/2029 | | | 1,500,000 | | | | 1,202,535 | |
0.820%, (SIFMA Municipal Swap Index Yield), 10/15/2022 (1) | | | 1,650,000 | | | | 1,646,271 | |
Indiana Finance Authority: | | | | | | | | |
3.000%, 11/1/2030 | | | 1,000,000 | | | | 1,032,910 | |
3.000%, 11/1/2030 | | | 2,000,000 | | | | 2,065,820 | |
5.000%, 10/1/2022 | | | 300,000 | | | | 321,204 | |
5.000%, 10/1/2023 | | | 400,000 | | | | 441,144 | |
5.000%, 10/1/2024, Call 10/1/2023 | | | 275,000 | | | | 302,984 | |
5.000%, 5/1/2029, Call 5/1/2022 | | | 130,000 | | | | 140,065 | |
5.000%, 5/1/2029, Call 5/1/2022 | | | 3,940,000 | | | | 4,198,031 | |
5.000%, 11/15/2038, Call 11/15/2025 | | | 2,000,000 | | | | 2,168,500 | |
5.250%, 10/1/2024, Call 10/1/2021 | | | 710,000 | | | | 747,879 | |
5.250%, 10/1/2031, Call 10/1/2021 | | | 2,190,000 | | | | 2,303,398 | |
5.250%, 11/15/2046, Call 11/15/2026 | | | 2,500,000 | | | | 2,674,250 | |
Indianapolis Local Public Improvement Bond Bank: | | | | | | | | |
5.000%, 1/1/2021 | | | 175,000 | | | | 177,791 | |
5.000%, 1/1/2022, Call 1/1/2021 | | | 200,000 | | | | 203,190 | |
Indianapolis Local Public Improvement Bond Bank, NATL-RE, 5.250%, 7/1/2022 | | | 500,000 | | | | 546,305 | |
Portage Redevelopment District: | | | | | | | | |
5.000%, 1/15/2023 | | | 280,000 | | | | 309,333 | |
5.000%, 1/15/2024 | | | 215,000 | | | | 246,700 | |
Porter County Jail Building Corp., AGM, 5.500%, 7/10/2021 | | | 55,000 | | | | 56,599 | |
Steuben Lakes Regional Waste District, 5.000%, 9/1/2024, Call 9/1/2023 | | | 1,225,000 | | | | 1,390,595 | |
| | | | | | | | |
| | | | | | | 34,532,913 | |
Iowa — 0.5% | | | | | | | | |
City of Waverly, 2.500%, 12/31/2022, Call 7/1/2022 | | | 1,213,000 | | | | 1,240,062 | |
| | | | | | | | |
Iowa Finance Authority: | | | | | | | | |
5.000%, 5/15/2036, Call 5/15/2026 | | | 4,065,000 | | | | 4,344,997 | |
5.000%, 5/15/2043, Call 5/15/2027 | | | 1,000,000 | | | | 1,063,670 | |
5.000%, 3/1/2048, Call 3/1/2024 | | | 1,250,000 | | | | 1,297,713 | |
Johnston Community School District, AGM, 5.000%, 7/1/2027, Call 7/1/2022 | | | 1,455,000 | | | | 1,569,799 | |
| | | | | | | | |
| | | | | | | 9,516,241 | |
Kansas — 0.3% | | | | | | | | |
City of Holton, 2.500%, 7/1/2021, Call 1/1/2021 | | | 4,495,000 | | | | 4,513,699 | |
Wyandotte County-Kansas City Unified Government Utility System Revenue, 5.000%, 9/1/2032, Call 9/1/2022 | | | 1,000,000 | | | | 1,094,780 | |
| | | | | | | | |
| | | | | | | 5,608,479 | |
Kentucky — 1.9% | | | | | | | | |
City of Berea, 0.160%, 6/1/2032, Call 9/1/2020 (1) | | | 800,000 | | | | 800,000 | |
Kentucky Asset Liability Commission: | | | | | | | | |
5.000%, 9/1/2024 | | | 1,000,000 | | | | 1,151,910 | |
5.000%, 9/1/2025 | | | 1,250,000 | | | | 1,480,862 | |
Kentucky Economic Development Finance Authority, 5.000%, 8/15/2041, Call 8/15/2027 | | | 3,500,000 | | | | 4,070,990 | |
Kentucky Public Energy Authority: | | | | | | | | |
1.235%, (LIBOR 1 Month), 12/1/2049, Call 3/1/2025 (1) | | | 7,000,000 | | | | 7,013,790 | |
4.000%, 12/1/2050, Call 3/1/2026 (1) | | | 4,000,000 | | | | 4,647,360 | |
Louisville/Jefferson County Metropolitan Government: | | | | | | | | |
5.000%, 10/1/2030, Call 10/1/2026 | | | 1,300,000 | | | | 1,559,948 | |
5.000%, 10/1/2031, Call 10/1/2026 | | | 3,500,000 | | | | 4,181,695 | |
5.000%, 10/1/2047, Call 7/1/2029 (1) | | | 4,000,000 | | | | 4,853,200 | |
Paducah Electric Plant Board, AGM: | | | | | | | | |
5.000%, 10/1/2027, Call 10/1/2026 | | | 2,000,000 | | | | 2,461,540 | |
5.000%, 10/1/2028, Call 10/1/2026 | | | 1,850,000 | | | | 2,258,406 | |
| | | | | | | | |
| | | | | | | 34,479,701 | |
Louisiana — 1.2% | | | | | | | | |
City of Bossier City Utilities Revenue, 5.000%, 10/1/2031, Call 10/1/2024 | | | 1,160,000 | | | | 1,347,943 | |
City of Shreveport Water & Sewer Revenue, BAM, 4.000%, 12/1/2025, Call 12/1/2024 | | | 2,210,000 | | | | 2,516,063 | |
Lafayette Public Trust Financing Authority, AGM: | | | | | | | | |
4.000%, 10/1/2020 | | | 690,000 | | | | 691,359 | |
4.000%, 10/1/2021 | | | 675,000 | | | | 692,719 | |
Louisiana Public Facilities Authority: | | | | | | | | |
3.375%, 9/1/2028, Call 3/1/2021 | | | 2,440,000 | | | | 2,474,233 | |
4.000%, 6/1/2050, Call 6/1/2030 (5) | | | 750,000 | | | | 842,768 | |
5.000%, 5/15/2042, Call 5/15/2027 | | | 2,500,000 | | | | 2,883,475 | |
Louisiana Stadium & Exposition District, 5.000%, 7/1/2023 | | | 800,000 | | | | 857,504 | |
Parish of St. Bernard, 4.000%, 3/1/2021 | | | 3,585,000 | | | | 3,649,781 | |
Parish of St. John the Baptist: | | | | | | | | |
2.125%, 6/1/2037 | | | 3,000,000 | | | | 3,019,260 | |
2.375%, 6/1/2037 | | | 2,500,000 | | | | 2,536,125 | |
Port New Orleans Board of Commissioners, 5.000%, 4/1/2032, Call 4/1/2023 | | | 725,000 | | | | 807,549 | |
Regional Transit Authority, NATL-RE, 0.000%, 12/1/2021 | | | 105,000 | | | | 100,742 | |
| | | | | | | | |
| | | | | | | 22,419,521 | |
Maine — 0.4% | | | | | | | | |
City of Portland General Airport Revenue, 5.000%, 7/1/2022 | | | 300,000 | | | | 322,791 | |
Maine Health & Higher Educational Facilities Authority, 5.000%, 7/1/2043, Call 7/1/2028 | | | 3,500,000 | | | | 4,216,660 | |
Maine State Housing Authority, 3.850%, 11/15/2029, Call 11/15/2021 | | | 2,615,000 | | | | 2,631,422 | |
| | | | | | | | |
| | | | | | | 7,170,873 | |
Maryland — 0.4% | | | | | | | | |
City of Rockville: | | | | | | | | |
5.000%, 11/1/2030, Call 11/1/2024 | | | 765,000 | | | | 796,717 | |
5.000%, 11/1/2037, Call 11/1/2024 | | | 1,000,000 | | | | 1,010,730 | |
5.000%, 11/1/2042, Call 11/1/2024 | | | 1,000,000 | | | | 990,680 | |
Maryland Health & Higher Educational Facilities Authority, 5.750%, 7/1/2034, Call 7/1/2021 | | | 775,000 | | | | 809,937 | |
Montgomery County Housing Opportunities Commission: | | | | | | | | |
5.000%, 7/1/2031, Call 9/1/2020 | | | 655,000 | | | | 660,568 | |
5.125%, 7/1/2037, Call 9/1/2020 | | | 3,110,000 | | | | 3,136,497 | |
| | | | | | | | |
| | | | | | | 7,405,129 | |
| | | | | | | | |
Massachusetts — 1.5% | | | | | | | | |
Commonwealth of Massachusetts, 5.000%, 1/1/2037, Call 1/1/2029 | | | 850,000 | | | | 1,094,545 | |
Massachusetts Bay Transportation Authority, 5.000%, 7/1/2046, Call 7/1/2027 | | | 4,465,000 | | | | 5,435,200 | |
Massachusetts Development Finance Agency: | | | | | | | | |
4.000%, 6/1/2049, Call 6/1/2029 | | | 1,000,000 | | | | 1,079,950 | |
5.000%, 7/1/2025, Call 7/1/2021 | | | 1,425,000 | | | | 1,481,615 | |
5.000%, 7/1/2027, Call 7/1/2025 | | | 125,000 | | | | 149,849 | |
5.000%, 7/1/2029, Call 1/1/2029 | | | 750,000 | | | | 927,457 | |
5.000%, 7/1/2031, Call 1/1/2029 | | | 2,000,000 | | | | 2,418,720 | |
5.000%, 7/1/2037, Call 7/1/2027 | | | 1,400,000 | | | | 1,578,122 | |
5.000%, 10/1/2037, Call 10/1/2022 (3) | | | 500,000 | | | | 537,745 | |
5.000%, 6/1/2039, Call 6/1/2029 | | | 750,000 | | | | 893,377 | |
5.000%, 10/1/2047, Call 10/1/2022 (3) | | | 500,000 | | | | 534,575 | |
Massachusetts Educational Financing Authority, 5.000%, 7/1/2025, Call 7/1/2022 (4) | | | 330,000 | | | | 348,741 | |
Massachusetts Housing Finance Agency, 3.700%, 12/1/2027, Call 6/1/2022 (4) | | | 635,000 | | | | 645,065 | |
Massachusetts Port Authority, 5.000%, 7/1/2037, Call 7/1/2029 | | | 3,100,000 | | | | 3,860,492 | |
Massachusetts School Building Authority, 5.000%, 8/15/2030, Call 8/15/2022 | | | 815,000 | | | | 891,374 | |
Massachusetts Transportation Trust Fund Metropolitan Highway System Revenue, 5.000%, 1/1/2039, Call 1/1/2023 (1) | | | 5,000,000 | | | | 5,516,650 | |
| | | | | | | | |
| | | | | | | 27,393,477 | |
Michigan — 3.5% | | | | | | | | |
Alma Public Schools, Q-SBLF, 5.000%, 5/1/2021 | | | 890,000 | | | | 917,777 | |
Bay City School District, Q-SBLF: | | | | | | | | |
5.000%, 11/1/2027, Call 5/1/2024 | | | 645,000 | | | | 752,186 | |
5.000%, 11/1/2028, Call 5/1/2024 | | | 1,305,000 | | | | 1,519,268 | |
Caledonia Community Schools, Q-SBLF: | | | | | | | | |
5.000%, 5/1/2025 | | | 600,000 | | | | 724,410 | |
5.000%, 5/1/2026 | | | 500,000 | | | | 621,995 | |
Charter Township of Northville: | | | | | | | | |
4.000%, 4/1/2021 | | | 400,000 | | | | 408,908 | |
4.000%, 4/1/2022 | | | 240,000 | | | | 254,503 | |
Chippewa Valley Schools, Q-SBLF, 5.000%, 5/1/2027, Call 11/1/2025 | | | 20,000 | | | | 24,565 | |
City of Wyandotte Electric System Revenue, BAM: | | | | | | | | |
5.000%, 10/1/2020 | | | 200,000 | | | | 200,668 | |
5.000%, 10/1/2021 | | | 290,000 | | | | 303,239 | |
5.000%, 10/1/2022 | | | 290,000 | | | | 315,491 | |
5.000%, 10/1/2023 | | | 250,000 | | | | 282,405 | |
5.000%, 10/1/2024 | | | 300,000 | | | | 349,680 | |
Coloma Community School District, Q-SBLF, 3.000%, 5/1/2021 | | | 905,000 | | | | 922,168 | |
Comstock Park Public Schools, Q-SBLF, 5.000%, 5/1/2028, Call 5/1/2021 | | | 400,000 | | | | 412,896 | |
Detroit City School District, AGM Q-SBLF, 5.250%, 5/1/2026 | | | 300,000 | | | | 372,078 | |
Dundee Community Schools, Q-SBLF: | | | | | | | | |
5.000%, 5/1/2022 | | | 1,200,000 | | | | 1,292,484 | |
5.000%, 5/1/2025 | | | 1,000,000 | | | | 1,210,440 | |
Fraser Public School District, Q-SBLF: | | | | | | | | |
5.000%, 5/1/2021 | | | 1,000,000 | | | | 1,030,870 | |
5.000%, 5/1/2022 | | | 1,000,000 | | | | 1,077,070 | |
5.000%, 5/1/2025 | | | 1,700,000 | | | | 2,049,010 | |
Great Lakes Water Authority Sewage Disposal System Revenue, 5.000%, 7/1/2029 | | | 3,600,000 | | | | 4,724,064 | |
Grosse Ile Township School District, Q-SBLF: | | | | | | | | |
5.000%, 5/1/2026, Call 5/1/2025 | | | 200,000 | | | | 240,958 | |
5.000%, 5/1/2027, Call 5/1/2025 | | | 230,000 | | | | 276,630 | |
Hartland Consolidated Schools, AGM Q-SBLF: | | | | | | | | |
5.250%, 5/1/2026, Call 5/1/2021 | | | 1,625,000 | | | | 1,678,966 | |
5.250%, 5/1/2027, Call 5/1/2021 | | | 600,000 | | | | 619,926 | |
5.250%, 5/1/2028, Call 5/1/2021 | | | 1,575,000 | | | | 1,627,306 | |
Howell Public Schools, Q-SBLF, 4.250%, 5/1/2024, Call 5/1/2022 | | | 1,000,000 | | | | 1,066,720 | |
Jenison Public Schools: | | | | | | | | |
5.000%, 5/1/2021 | | | 500,000 | | | | 515,950 | |
5.000%, 5/1/2022, Call 5/1/2021 | | | 560,000 | | | | 578,054 | |
Kent Hospital Finance Authority, 5.000%, 11/15/2029, Call 11/15/2021 | | | 1,000,000 | | | | 1,057,380 | |
Lansing Board of Water & Light, 5.000%, 7/1/2037, Call 7/1/2021 | | | 1,000,000 | | | | 1,040,150 | |
Livonia Public Schools, BAM, 5.000%, 5/1/2021 | | | 1,600,000 | | | | 1,649,392 | |
| | | | | | | | |
Marshall Public Schools, Q-SBLF: | | | | | | | | |
4.000%, 11/1/2028, Call 5/1/2025 | | | 1,380,000 | | | | 1,583,219 | |
4.000%, 11/1/2029, Call 5/1/2025 | | | 940,000 | | | | 1,074,552 | |
Michigan Finance Authority: | | | | | | | | |
4.000%, 2/15/2044, Call 8/15/2029 | | | 4,000,000 | | | | 4,542,440 | |
5.000%, 11/1/2020 | | | 2,000,000 | | | | 2,014,600 | |
5.000%, 7/1/2026, Call 7/1/2025 | | | 175,000 | | | | 210,221 | |
5.000%, 7/1/2027, Call 7/1/2025 | | | 600,000 | | | | 718,542 | |
5.000%, 7/1/2029, Call 7/1/2025 | | | 950,000 | | | | 1,130,737 | |
5.000%, 7/1/2032, Call 7/1/2025 | | | 1,500,000 | | | | 1,761,330 | |
5.000%, 7/1/2034, Call 7/1/2025 | | | 500,000 | | | | 587,625 | |
5.000%, 12/1/2035, Call 12/1/2027 | | | 1,000,000 | | | | 1,228,590 | |
5.000%, 11/15/2041, Call 11/15/2026 | | | 1,000,000 | | | | 1,169,480 | |
Michigan Finance Authority, AGM: | | | | | | | | |
5.000%, 7/1/2029, Call 7/1/2024 | | | 1,500,000 | | | | 1,729,860 | |
5.000%, 7/1/2030, Call 7/1/2024 | | | 1,500,000 | | | | 1,724,355 | |
Michigan State Housing Development Authority, 3.500%, 12/1/2050, Call 6/1/2029 | | | 3,500,000 | | | | 3,905,195 | |
Michigan Strategic Fund, 5.000%, 12/31/2043, Call 12/31/2028 | | | 3,400,000 | | | | 3,815,140 | |
North Branch Area Schools, Q-SBLF, 5.000%, 5/1/2024 | | | 200,000 | | | | 233,314 | |
Plymouth-Canton Community School District, Q-SBLF, 5.000%, 5/1/2021 | | | 450,000 | | | | 464,445 | |
Redford Union School District No. 1, AMBAC Q-SBLF, 5.000%, 5/1/2022 | | | 135,000 | | | | 142,487 | |
River Rouge School District, Q-SBLF, 5.000%, 5/1/2021 | | | 1,155,000 | | | | 1,191,844 | |
Wayne County Airport Authority: | | | | | | | | |
5.000%, 12/1/2026, Call 12/1/2025 (4) | | | 3,000,000 | | | | 3,566,940 | |
5.000%, 12/1/2030, Call 12/1/2025 | | | 1,250,000 | | | | 1,477,850 | |
Western Township Utilities Authority, 4.000%, 1/1/2021 | | | 1,200,000 | | | | 1,214,496 | |
| | | | | | | | |
| | | | | | | 65,604,869 | |
Minnesota — 0.3% | | | | | | | | |
Duluth Economic Development Authority, 5.000%, 2/15/2043, Call 2/15/2028 | | | 1,000,000 | | | | 1,157,720 | |
Minnesota Housing Finance Agency, GNMA COLL, 2.600%, 9/1/2042, Call 7/1/2022 | | | 530,166 | | | | 545,297 | |
Minnesota Housing Finance Agency, GNMA/FNMA/FHLMC: | | | | | | | | |
2.250%, 12/1/2042, Call 1/1/2022 | | | 368,528 | | | | 375,707 | |
3.500%, 7/1/2050, Call 7/1/2029 | | | 2,465,000 | | | | 2,749,954 | |
3.900%, 7/1/2030, Call 1/1/2022 | | | 430,000 | | | | 443,708 | |
5.000%, 1/1/2031, Call 7/1/2021 | | | 555,000 | | | | 569,691 | |
| | | | | | | | |
| | | | | | | 5,842,077 | |
Mississippi — 0.8% | | | | | | | | |
Mississippi Business Finance Corp., 3.200%, 9/1/2028, Call 3/13/2024 | | | 4,000,000 | | | | 4,198,440 | |
Mississippi Development Bank: | | | | | | | | |
3.125%, 10/1/2023 | | | 165,000 | | | | 171,823 | |
5.000%, 10/1/2023 | | | 2,270,000 | | | | 2,464,425 | |
5.000%, 1/1/2027, Call 1/1/2022 | | | 1,200,000 | | | | 1,276,824 | |
Mississippi Hospital Equipment & Facilities Authority: | | | | | | | | |
4.000%, 1/1/2039, Call 1/1/2030 | | | 1,500,000 | | | | 1,722,270 | |
4.000%, 1/1/2040, Call 1/1/2030 | | | 1,100,000 | | | | 1,259,269 | |
Mississippi State University Educational Building Corp., 5.000%, 11/1/2022 | | | 135,000 | | | | 148,250 | |
State of Mississippi, 5.000%, 10/15/2036, Call 10/15/2028 | | | 3,395,000 | | | | 4,056,618 | |
| | | | | | | | |
| | | | | | | 15,297,919 | |
Missouri — 1.9% | | | | | | | | |
Bi-State Development Agency of the Missouri-Illinois Metropolitan District, 5.000%, 10/1/2033, Call 10/1/2022 | | | 4,000,000 | | | | 4,398,440 | |
Chesterfield Valley Transportation Development District, 5.000%, 5/15/2021 | | | 490,000 | | | | 505,837 | |
City of Kansas City: | | | | | | | | |
5.000%, 9/1/2021, Call 9/1/2020 | | | 500,000 | | | | 501,830 | |
5.000%, 9/1/2023, Call 9/1/2020 | | | 300,000 | | | | 301,122 | |
5.000%, 10/1/2026, Call 10/1/2025 | | | 120,000 | | | | 144,038 | |
5.000%, 10/1/2028, Call 10/1/2025 | | | 115,000 | | | | 137,154 | |
5.000%, 9/1/2032, Call 9/1/2020 | | | 1,000,000 | | | | 1,003,520 | |
Health & Educational Facilities Authority of the State of Missouri: | | | | | | | | |
4.000%, 2/15/2044, Call 2/15/2029 | | | 2,000,000 | | | | 2,257,500 | |
4.000%, 2/1/2048, Call 2/1/2029 | | | 2,750,000 | | | | 2,803,130 | |
4.000%, 2/15/2049, Call 2/15/2029 | | | 2,500,000 | | | | 2,804,425 | |
5.000%, 2/1/2024, Call 2/1/2021 | | | 1,050,000 | | | | 1,061,886 | |
| | | | | | | | |
5.000%, 11/15/2034, Call 5/15/2026 | | | 3,000,000 | | | | 3,557,220 | |
5.000%, 2/1/2042, Call 2/1/2024 | | | 3,000,000 | | | | 3,253,200 | |
5.250%, 10/1/2031, Call 10/1/2021 | | | 1,000,000 | | | | 1,054,820 | |
Independence School District, SAW, 5.250%, 3/1/2030, Call 3/1/2021 | | | 2,000,000 | | | | 2,049,160 | |
Kansas City Industrial Development Authority, 5.000%, 3/1/2046, Call 3/1/2029 | | | 2,000,000 | | | | 2,372,320 | |
Lees Summit Industrial Development Authority: | | | | | | | | |
5.000%, 8/15/2036, Call 8/15/2024 | | | 1,100,000 | | | | 1,139,457 | |
5.000%, 8/15/2051, Call 8/15/2024 | | | 2,405,000 | | | | 2,440,786 | |
Missouri Housing Development Commission, GNMA/FNMA/FHLMC: | | | | | | | | |
3.800%, 5/1/2025, Call 5/1/2021 | | | 465,000 | | | | 475,597 | |
4.000%, 5/1/2027, Call 5/1/2021 | | | 470,000 | | | | 481,398 | |
Missouri State Environmental Improvement & Energy Resources Authority, 5.750%, 1/1/2029, Call 9/1/2020 | | | 65,000 | | | | 65,290 | |
St. Louis County Industrial Development Authority: | | | | | | | | |
0.000%, 6/15/2024, Call 9/1/2020 (1) | | | 800,000 | | | | 800,000 | |
5.000%, 9/1/2048, Call 9/1/2027 | | | 1,000,000 | | | | 1,053,020 | |
| | | | | | | | |
| | | | | | | 34,661,150 | |
Nebraska — 0.2% | | | | | | | | |
Nebraska Public Power District, 5.000%, 1/1/2032, Call 1/1/2022 | | | 1,000,000 | | | | 1,055,090 | |
Omaha-Douglas Public Building Commission: | | | | | | | | |
5.000%, 5/1/2026, Call 5/1/2022 | | | 825,000 | | | | 891,033 | |
5.000%, 5/1/2027, Call 5/1/2022 | | | 585,000 | | | | 631,823 | |
5.000%, 5/1/2028, Call 5/1/2022 | | | 550,000 | | | | 594,022 | |
5.000%, 5/1/2029, Call 5/1/2022 | | | 660,000 | | | | 712,827 | |
| | | | | | | | |
| | | | | | | 3,884,795 | |
Nevada — 0.8% | | | | | | | | |
City of North Las Vegas NV, AGM, 5.000%, 6/1/2023 | | | 1,000,000 | | | | 1,117,490 | |
City of Sparks NV, 2.500%, 6/15/2024 (3) | | | 630,000 | | | | 625,930 | |
County of Clark Department of Aviation: | | | | | | | | |
5.000%, 7/1/2029, Call 7/1/2024 | | | 1,200,000 | | | | 1,376,064 | |
5.000%, 7/1/2030, Call 7/1/2024 | | | 1,000,000 | | | | 1,143,880 | |
5.000%, 7/1/2040, Call 7/1/2027 | | | 4,000,000 | | | | 4,797,240 | |
Las Vegas Valley Water District, 5.000%, 6/1/2028, Call 6/1/2022 | | | 5,115,000 | | | | 5,507,525 | |
| | | | | | | | |
| | | | | | | 14,568,129 | |
New Hampshire — 0.2% | | | | | | | | |
New Hampshire Business Finance Authority, 2.150%, 7/1/2027, Call 4/2/2024 (1) | | | 4,000,000 | | | | 4,111,560 | |
New Hampshire Housing Finance Authority, 4.800%, 7/1/2028, Call 1/1/2022 | | | 475,000 | | | | 479,403 | |
| | | | | | | | |
| | | | | | | 4,590,963 | |
New Jersey — 3.2% | | | | | | | | |
New Jersey Economic Development Authority: | | | | | | | | |
5.000%, 11/1/2021 | | | 4,600,000 | | | | 4,815,602 | |
5.500%, 6/15/2030, Call 12/15/2026 | | | 2,500,000 | | | | 2,979,125 | |
New Jersey Housing & Mortgage Finance Agency, 4.250%, 10/1/2032, Call 10/1/2021 | | | 30,000 | | | | 30,083 | |
New Jersey Transportation Trust Fund Authority: | | | | | | | | |
4.000%, 6/15/2036, Call 12/15/2028 | | | 1,000,000 | | | | 1,074,980 | |
4.000%, 6/15/2044, Call 12/15/2028 | | | 2,500,000 | | | | 2,646,825 | |
4.000%, 6/15/2050, Call 12/15/2028 | | | 3,500,000 | | | | 3,679,270 | |
5.000%, 6/15/2022 | | | 500,000 | | | | 535,400 | |
5.000%, 6/15/2030, Call 6/15/2026 | | | 1,000,000 | | | | 1,156,190 | |
5.000%, 6/15/2031, Call 6/15/2026 | | | 1,000,000 | | | | 1,150,230 | |
5.000%, 6/15/2032, Call 12/15/2024 | | | 5,000,000 | | | | 5,536,850 | |
5.000%, 12/15/2033, Call 12/15/2029 | | | 3,000,000 | | | | 3,588,330 | |
5.250%, 12/15/2023 | | | 240,000 | | | | 270,525 | |
New Jersey Transportation Trust Fund Authority, BAM TCRs: | | | | | | | | |
5.000%, 6/15/2028, Call 6/15/2022 | | | 5,000,000 | | | | 5,299,450 | |
5.000%, 6/15/2033, Call 6/15/2022 | | | 3,000,000 | | | | 3,156,750 | |
5.250%, 6/15/2033, Call 6/15/2023 | | | 5,635,000 | | | | 6,127,781 | |
New Jersey Transportation Trust Fund Authority, BHAC AMBAC, 0.000%, 12/15/2024 | | | 440,000 | | | | 414,511 | |
New Jersey Turnpike Authority: | | | | | | | | |
5.000%, 1/1/2031, Call 1/1/2025 | | | 500,000 | | | | 576,950 | |
5.000%, 1/1/2032, Call 7/1/2022 | | | 3,440,000 | | | | 3,742,892 | |
5.000%, 1/1/2035, Call 1/1/2022 | | | 1,685,000 | | | | 1,792,874 | |
| | | | | | | | |
Tobacco Settlement Financing Corp.: | | | | | | | | |
5.000%, 6/1/2031, Call 6/1/2028 | | | 2,750,000 | | | | 3,451,360 | |
5.000%, 6/1/2032, Call 6/1/2028 | | | 2,000,000 | | | | 2,493,080 | |
5.000%, 6/1/2033, Call 6/1/2028 | | | 1,500,000 | | | | 1,859,760 | |
5.250%, 6/1/2046, Call 6/1/2028 | | | 2,440,000 | | | | 2,890,961 | |
| | | | | | | | |
| | | | | | | 59,269,779 | |
New Mexico — 0.6% | | | | | | | | |
City of Santa Fe: | | | | | | | | |
2.625%, 5/15/2025, Call 11/15/2021 | | | 750,000 | | | | 732,893 | |
4.000%, 6/1/2025, Call 6/1/2022 | | | 655,000 | | | | 695,852 | |
5.000%, 5/15/2044, Call 5/15/2026 | | | 1,350,000 | | | | 1,420,929 | |
New Mexico Hospital Equipment Loan Council: | | | | | | | | |
2.375%, 7/1/2024, Call 1/1/2021 | | | 550,000 | | | | 531,245 | |
5.000%, 7/1/2049, Call 7/1/2026 | | | 5,225,000 | | | | 5,405,942 | |
New Mexico Mortgage Finance Authority, GNMA COLL, 2.600%, 2/1/2043, Call 1/1/2023 | | | 557,276 | | | | 574,011 | |
New Mexico Mortgage Finance Authority, GNMA/FNMA/FHLMC: | | | | | | | | |
4.625%, 3/1/2028, Call 9/1/2021 | | | 385,000 | | | | 391,272 | |
5.350%, 3/1/2030, Call 9/1/2020 | | | 975,000 | | | | 977,964 | |
| | | | | | | | |
| | | | | | | 10,730,108 | |
New York — 5.2% | | | | | | | | |
Albany Capital Resource Corp.: | | | | | | | | |
5.000%, 12/1/2023 | | | 150,000 | | | | 163,278 | |
5.000%, 12/1/2024 | | | 200,000 | | | | 222,032 | |
Buffalo & Erie County Industrial Land Development Corp.: | | | | | | | | |
5.000%, 6/1/2035, Call 6/1/2024 | | | 1,000,000 | | | | 1,090,710 | |
5.000%, 8/1/2037, Call 8/1/2027 | | | 1,300,000 | | | | 1,377,805 | |
5.000%, 8/1/2047, Call 8/1/2027 | | | 1,000,000 | | | | 1,042,660 | |
City of New York: | | | | | | | | |
5.000%, 8/1/2032, Call 2/1/2022 | | | 3,000,000 | | | | 3,185,340 | |
5.000%, 3/1/2037, Call 3/1/2028 | | | 1,120,000 | | | | 1,371,552 | |
5.250%, 3/1/2034, Call 3/1/2028 | | | 3,000,000 | | | | 3,763,410 | |
5.250%, 3/1/2035, Call 3/1/2028 | | | 2,500,000 | | | | 3,126,675 | |
City of New York, AGC, 0.790%, 10/1/2021, Call 9/1/2020 (1)(6) | | | 400,000 | | | | 400,000 | |
Long Island Power Authority, 0.870%, (LIBOR 1 Month), 5/1/2033, Call 10/1/2022 (1) | | | 5,000,000 | | | | 4,985,300 | |
Metropolitan Transportation Authority: | | | | | | | | |
0.610%, (SIFMA Municipal Swap Index Yield), 11/15/2044 (1) | | | 1,000,000 | | | | 952,450 | |
5.000%, 5/15/2022 | | | 3,040,000 | | | | 3,155,490 | |
5.000%, 9/1/2022 | | | 8,390,000 | | | | 8,762,180 | |
5.000%, 11/15/2034, Call 5/15/2028 | | | 1,815,000 | | | | 2,016,755 | |
5.000%, 11/15/2036, Call 11/15/2026 | | | 2,325,000 | | | | 2,537,854 | |
New York City Transitional Finance Authority Future Tax Secured Revenue: | | | | | | | | |
5.000%, 11/1/2024, Call 11/1/2022 | | | 5,715,000 | | | | 6,298,159 | |
5.000%, 11/1/2026, Call 5/1/2025 | | | 1,000,000 | | | | 1,204,270 | |
5.000%, 11/1/2026, Call 5/1/2025 | | | 2,000,000 | | | | 2,408,540 | |
5.000%, 8/1/2034, Call 8/1/2026 | | | 4,000,000 | | | | 4,884,800 | |
5.000%, 8/1/2036, Call 8/1/2028 | | | 5,555,000 | | | | 6,930,640 | |
5.000%, 5/1/2038, Call 5/1/2027 | | | 4,000,000 | | | | 4,840,760 | |
5.250%, 8/1/2037, Call 8/1/2028 | | | 3,500,000 | | | | 4,432,855 | |
New York City Water & Sewer System: | | | | | | | | |
5.000%, 6/15/2028, Call 6/15/2024 | | | 500,000 | | | | 584,115 | |
5.000%, 6/15/2029, Call 6/15/2024 | | | 600,000 | | | | 699,708 | |
5.000%, 6/15/2048, Call 12/15/2027 | | | 1,000,000 | | | | 1,236,970 | |
New York Liberty Development Corp., 2.800%, 9/15/2069, Call 3/15/2029 | | | 1,000,000 | | | | 961,940 | |
New York State Dormitory Authority: | | | | | | | | |
5.000%, 3/15/2027, Call 3/15/2022 | | | 7,555,000 | | | | 8,073,802 | |
5.000%, 12/1/2035, Call 6/1/2027 (3) | | | 500,000 | | | | 579,800 | |
5.000%, 12/1/2037, Call 6/1/2027 (3) | | | 500,000 | | | | 575,870 | |
5.250%, 3/15/2037, Call 9/15/2028 | | | 1,695,000 | | | | 2,149,887 | |
New York State Dormitory Authority, NATL-RE, 0.180%, 7/1/2029, Call 9/1/2020 (1)(6) | | | 2,200,000 | | | | 2,200,000 | |
New York State Urban Development Corp.: | | | | | | | | |
4.000%, 3/15/2049, Call 9/15/2030 | | | 1,500,000 | | | | 1,740,300 | |
| | | | | | | | |
5.000%, 3/15/2028, Call 3/15/2023 | | | 1,000,000 | | | | 1,113,550 | |
New York Transportation Development Corp., AGM, 4.000%, 7/1/2032, Call 7/1/2024 (4) | | | 2,500,000 | | | | 2,679,100 | |
Triborough Bridge & Tunnel Authority, 5.000%, 11/15/2037, Call 11/15/2028 | | | 1,500,000 | | | | 1,880,535 | |
TSASC, Inc.: | | | | | | | | |
5.000%, 6/1/2036, Call 6/1/2027 | | | 1,000,000 | | | | 1,176,060 | |
5.000%, 6/1/2041, Call 6/1/2027 | | | 1,000,000 | | | | 1,128,460 | |
Westchester Tobacco Asset Securitization, 5.000%, 6/1/2021 | | | 500,000 | | | | 515,185 | |
| | | | | | | | |
| | | | | | | 96,448,797 | |
North Carolina — 1.0% | | | | | | | | |
County of Catawba: | | | | | | | | |
4.000%, 10/1/2025, Call 10/1/2021 | | | 585,000 | | | | 607,335 | |
5.000%, 10/1/2023, Call 10/1/2021 | | | 1,000,000 | | | | 1,051,880 | |
5.000%, 10/1/2024, Call 10/1/2021 | | | 835,000 | | | | 878,320 | |
County of Union: | | | | | | | | |
5.000%, 12/1/2026, Call 6/1/2023 | | | 1,390,000 | | | | 1,569,991 | |
5.000%, 12/1/2027, Call 6/1/2023 | | | 1,645,000 | | | | 1,856,564 | |
North Carolina Housing Finance Agency, 4.250%, 1/1/2028, Call 7/1/2021 | | | 20,000 | | | | 20,214 | |
North Carolina Medical Care Commission: | | | | | | | | |
5.000%, 6/1/2027, Call 6/1/2022 | | | 500,000 | | | | 541,105 | |
5.000%, 1/1/2038, Call 1/1/2026 | | | 1,000,000 | | | | 1,085,470 | |
5.000%, 1/1/2044, Call 1/1/2026 | | | 1,000,000 | | | | 1,075,330 | |
North Carolina Turnpike Authority: | | | | | | | | |
0.010%, 1/1/2040, Call 1/1/2030 | | | 2,000,000 | | | | 1,195,060 | |
0.010%, 1/1/2041, Call 1/1/2030 | | | 2,000,000 | | | | 1,147,180 | |
0.010%, 1/1/2042, Call 1/1/2030 | | | 1,500,000 | | | | 828,255 | |
0.010%, 1/1/2043, Call 1/1/2030 | | | 1,500,000 | | | | 797,595 | |
0.010%, 1/1/2044, Call 1/1/2030 | | | 2,000,000 | | | | 1,024,980 | |
5.000%, 1/1/2043, Call 1/1/2030 | | | 1,400,000 | | | | 1,692,278 | |
5.000%, 7/1/2047, Call 7/1/2026 | | | 750,000 | | | | 844,275 | |
5.000%, 1/1/2049, Call 1/1/2030 | | | 1,500,000 | | | | 1,796,925 | |
Orange County Public Facilities Co., 5.000%, 10/1/2026, Call 10/1/2022 | | | 1,130,000 | | | | 1,242,559 | |
| | | | | | | | |
| | | | | | | 19,255,316 | |
North Dakota — 0.9% | | | | | | | | |
Barnes County North Public School District Building Authority: | | | | | | | | |
4.000%, 5/1/2021 | | | 635,000 | | | | 651,040 | |
4.500%, 5/1/2030, Call 5/1/2021 | | | 1,515,000 | | | | 1,558,299 | |
4.500%, 5/1/2033, Call 5/1/2021 | | | 1,850,000 | | | | 1,902,873 | |
City of Grand Forks, 5.000%, 12/1/2032, Call 12/1/2021 | | | 1,000,000 | | | | 1,027,740 | |
County of Ward: | | | | | | | | |
5.000%, 6/1/2034, Call 6/1/2028 | | | 2,500,000 | | | | 2,843,350 | |
5.000%, 6/1/2043, Call 6/1/2028 | | | 2,500,000 | | | | 2,755,550 | |
North Dakota Public Finance Authority: | | | | | | | | |
4.000%, 6/1/2023 | | | 2,440,000 | | | | 2,679,315 | |
4.000%, 6/1/2024, Call 6/1/2023 | | | 2,190,000 | | | | 2,402,846 | |
4.000%, 6/1/2025, Call 6/1/2023 | | | 1,145,000 | | | | 1,251,462 | |
| | | | | | | | |
| | | | | | | 17,072,475 | |
Ohio — 3.4% | | | | | | | | |
Akron Bath Copley Joint Township Hospital District, 5.000%, 11/15/2021 | | | 1,000,000 | | | | 1,052,150 | |
Buckeye Tobacco Settlement Financing Authority, 4.000%, 6/1/2048, Call 6/1/2030 | | | 2,000,000 | | | | 2,212,420 | |
City of Cleveland Airport System Revenue, AGM: | | | | | | | | |
5.000%, 1/1/2030, Call 1/1/2022 | | | 3,900,000 | | | | 4,149,678 | |
5.000%, 1/1/2031, Call 1/1/2022 | | | 1,000,000 | | | | 1,064,020 | |
City of Cleveland Airport System Revenue, MAC: | | | | | | | | |
5.000%, 1/1/2022, Call 1/1/2021 | | | 2,320,000 | | | | 2,351,366 | |
5.000%, 1/1/2031, Call 1/1/2022 | | | 1,270,000 | | | | 1,351,305 | |
City of Cleveland Income Tax Revenue: | | | | | | | | |
5.000%, 10/1/2024, Call 10/1/2022 | | | 460,000 | | | | 505,821 | |
5.000%, 10/1/2028, Call 10/1/2022 | | | 1,075,000 | | | | 1,182,081 | |
5.000%, 10/1/2029, Call 10/1/2022 | | | 1,130,000 | | | | 1,242,559 | |
5.000%, 10/1/2029, Call 10/1/2022 | | | 2,290,000 | | | | 2,515,588 | |
City of Middleburg Heights, 5.125%, 8/1/2031, Call 8/1/2021 | | | 1,000,000 | | | | 1,041,460 | |
| | | | | | | | |
Cleveland Department of Public Utilities Division of Water: | | | | | | | | |
4.000%, 1/1/2028, Call 1/1/2024 | | | 500,000 | | | | 556,045 | |
4.000%, 1/1/2029, Call 1/1/2024 | | | 1,000,000 | | | | 1,125,010 | |
4.000%, 1/1/2030, Call 1/1/2024 | | | 1,000,000 | | | | 1,125,010 | |
Cleveland Heights & University Heights City School District: | | | | | | | | |
0.000%, 12/1/2024 | | | 400,000 | | | | 385,944 | |
0.000%, 12/1/2025 | | | 600,000 | | | | 568,338 | |
Cleveland-Cuyahoga County Port Authority, 5.000%, 10/1/2022, Call 10/1/2020 | | | 1,000,000 | | | | 1,003,020 | |
County of Franklin: | | | | | | | | |
5.000%, 5/15/2028, Call 5/15/2023 | | | 2,000,000 | | | | 2,216,480 | |
5.000%, 7/1/2029, Call 7/1/2026 | | | 2,000,000 | | | | 2,198,940 | |
5.000%, 5/15/2031, Call 5/15/2023 | | | 405,000 | | | | 445,897 | |
County of Hamilton Sales Tax Revenue, 5.000%, 12/1/2029, Call 12/1/2021 | | | 975,000 | | | | 1,020,425 | |
County of Hancock, 5.750%, 12/1/2026, Call 6/1/2021 | | | 1,120,000 | | | | 1,165,954 | |
County of Lucas, 5.000%, 11/15/2022, Call 11/15/2021 | | | 925,000 | | | | 961,297 | |
County of Miami, 5.000%, 8/1/2045, Call 8/1/2028 | | | 2,220,000 | | | | 2,669,506 | |
Delaware City School District, 5.250%, 12/1/2038, Call 6/1/2023 | | | 1,240,000 | | | | 1,411,108 | |
Eclipse Funding Trust, 0.190%, 10/1/2040, Call 10/1/2026 (1)(3) | | | 6,200,000 | | | | 6,200,000 | |
Elyria City School District, School District Credit Program, 4.000%, 12/1/2028, Call 12/1/2022 | | | 1,130,000 | | | | 1,208,128 | |
Franklin County Convention Facilities Authority, 5.000%, 12/1/2044, Call 12/1/2029 | | | 1,500,000 | | | | 1,441,785 | |
Johnstown-Monroe Local School District, 5.000%, 12/1/2030, Call 12/1/2021 | | | 715,000 | | | | 757,914 | |
Lake Local School District/Stark County, School District Credit Program: | | | | | | | | |
4.000%, 12/1/2023, Call 12/1/2021 | | | 1,550,000 | | | | 1,623,733 | |
4.000%, 12/1/2025, Call 12/1/2021 | | | 1,660,000 | | | | 1,738,966 | |
New Albany Community Authority: | | | | | | | | |
4.000%, 10/1/2020 | | | 590,000 | | | | 591,823 | |
5.000%, 10/1/2022 | | | 1,000,000 | | | | 1,097,300 | |
5.000%, 10/1/2023, Call 10/1/2022 | | | 1,105,000 | | | | 1,210,583 | |
North Olmsted City School District: | | | | | | | | |
5.000%, 12/1/2027, Call 12/1/2023 | | | 220,000 | | | | 254,008 | |
5.000%, 12/1/2028, Call 12/1/2023 | | | 365,000 | | | | 421,422 | |
5.000%, 12/1/2029, Call 12/1/2023 | | | 500,000 | | | | 577,290 | |
Ohio Higher Educational Facility Commission: | | | | | | | | |
4.000%, 12/1/2020 | | | 1,050,000 | | | | 1,059,408 | |
4.000%, 12/1/2021 | | | 795,000 | | | | 830,775 | |
4.000%, 12/1/2022 | | | 845,000 | | | | 912,980 | |
Ohio Turnpike & Infrastructure Commission, 5.250%, 2/15/2033, Call 2/15/2023 | | | 1,330,000 | | | | 1,459,236 | |
Ohio University, 5.000%, 12/1/2028, Call 6/1/2022 | | | 225,000 | | | | 243,702 | |
Ohio Water Development Authority, 5.000%, 6/1/2022 | | | 1,100,000 | | | | 1,193,665 | |
Port of Greater Cincinnati Development Authority, 3.000%, 5/1/2023, Call 5/1/2022 | | | 5,000,000 | | | | 5,010,900 | |
University of Toledo, 5.000%, 6/1/2030, Call 6/1/2021 | | | 250,000 | | | | 258,955 | |
| | | | | | | | |
| | | | | | | 63,613,995 | |
Oklahoma — 0.6% | | | | | | | | |
Cushing Educational Facilities Authority, 5.000%, 9/1/2022 | | | 2,000,000 | | | | 2,176,960 | |
Delaware County Justice Authority: | | | | | | | | |
3.750%, 9/1/2029, Call 9/1/2020 | | | 975,000 | | | | 976,502 | |
4.000%, 9/1/2020 | | | 700,000 | | | | 700,000 | |
4.000%, 9/1/2021 | | | 805,000 | | | | 831,106 | |
Norman Regional Hospital Authority, 4.000%, 9/1/2045, Call 9/1/2029 | | | 1,500,000 | | | | 1,587,165 | |
Oklahoma Housing Finance Agency, GNMA COLL: | | | | | | | | |
2.500%, 3/1/2022 | | | 115,000 | | | | 118,434 | |
3.300%, 3/1/2031, Call 3/1/2022 | | | 260,000 | | | | 260,681 | |
Tulsa Airports Improvement Trust, BAM, 5.000%, 6/1/2028, Call 6/1/2023 (4) | | | 1,405,000 | | | | 1,544,587 | |
Tulsa County Industrial Authority: | | | | | | | | |
5.250%, 11/15/2037, Call 11/15/2025 | | | 2,750,000 | | | | 2,938,512 | |
5.250%, 11/15/2045, Call 11/15/2025 | | | 250,000 | | | | 263,138 | |
| | | | | | | | |
| | | | | | | 11,397,085 | |
Oregon — 0.6% | | | | | | | | |
City of Portland, 5.000%, 6/15/2027, Call 6/15/2022 | | | 1,000,000 | | | | 1,080,480 | |
City of Tigard Water Revenue, 5.000%, 8/1/2029, Call 8/1/2022 | | | 690,000 | | | | 749,471 | |
City of Woodburn Wastewater Revenue, 0.000%, 3/1/2021 | | | 1,215,000 | | | | 1,212,886 | |
Clackamas & Washington Counties School District No. 3, NATL-RE School Bond Gty, 0.000%, 6/15/2023 | | | 2,000,000 | | | | 1,969,240 | |
| | | | | | | | |
Klamath Falls Intercommunity Hospital Authority: | | | | | | | | |
5.000%, 9/1/2021 | | | 250,000 | | | | 260,562 | |
5.000%, 9/1/2022 | | | 505,000 | | | | 545,471 | |
Oregon State Business Development Commission, 5.000%, 3/1/2049 (1) | | | 1,000,000 | | | | 1,061,920 | |
Port of Morrow: | | | | | | | | |
3.750%, 6/1/2021, Call 9/1/2020 | | | 220,000 | | | | 220,578 | |
4.000%, 6/1/2022, Call 9/1/2020 | | | 235,000 | | | | 235,651 | |
Port of Portland Airport Revenue, 5.500%, 7/1/2031, Call 7/1/2021 | | | 3,000,000 | | | | 3,113,880 | |
State of Oregon Housing & Community Services Department, 4.450%, 7/1/2023, Call 9/1/2020 (4) | | | 130,000 | | | | 130,120 | |
| | | | | | | | |
| | | | | | | 10,580,259 | |
Pennsylvania — 3.6% | | | | | | | | |
Allegheny County Hospital Development Authority: | | | | | | | | |
4.000%, 7/15/2038, Call 7/15/2029 | | | 500,000 | | | | 571,990 | |
4.000%, 7/15/2039, Call 7/15/2029 | | | 500,000 | | | | 570,320 | |
Berks County Industrial Development Authority: | | | | | | | | |
5.000%, 5/15/2032, Call 5/15/2027 | | | 1,050,000 | | | | 1,147,261 | |
5.000%, 5/15/2038, Call 5/15/2025 | | | 255,000 | | | | 272,552 | |
5.000%, 5/15/2042, Call 5/15/2024 | | | 1,655,000 | | | | 1,758,355 | |
5.000%, 5/15/2043, Call 5/15/2025 | | | 350,000 | | | | 371,224 | |
5.000%, 5/15/2047, Call 5/15/2027 | | | 1,630,000 | | | | 1,721,965 | |
Berks County Municipal Authority: | | | | | | | | |
5.000%, 2/1/2040, Call 8/1/2026 (1) | | | 4,000,000 | | | | 4,431,000 | |
5.000%, 2/1/2040, Call 8/1/2029 (1) | | | 2,000,000 | | | | 2,267,600 | |
Bucks County Industrial Development Authority, 5.000%, 10/1/2037, Call 10/1/2024 | | | 1,250,000 | | | | 1,347,250 | |
Central Bradford Progress Authority, 5.375%, 12/1/2041, Call 12/1/2021 | | | 500,000 | | | | 531,370 | |
City of Pittsburgh, 4.000%, 9/1/2021 | | | 750,000 | | | | 777,532 | |
Commonwealth Financing Authority: | | | | | | | | |
5.000%, 6/1/2032, Call 6/1/2028 | | | 1,000,000 | | | | 1,252,790 | |
5.000%, 6/1/2033, Call 6/1/2028 | | | 1,250,000 | | | | 1,556,975 | |
5.000%, 6/1/2034, Call 6/1/2028 | | | 1,000,000 | | | | 1,241,070 | |
5.000%, 6/1/2035, Call 6/1/2028 | | | 1,000,000 | | | | 1,237,550 | |
Doylestown Hospital Authority, 4.000%, 7/1/2045, Call 7/1/2029 | | | 1,250,000 | | | | 1,318,812 | |
Geisinger Authority, 5.000%, 2/15/2039, Call 2/15/2027 | | | 2,500,000 | | | | 2,987,550 | |
Kiski Area School District, AGM SAW, 4.000%, 3/1/2021 | | | 1,450,000 | | | | 1,476,346 | |
Lancaster County Hospital Authority: | | | | | | | | |
2.875%, 12/15/2023, Call 9/1/2020 | | | 500,000 | | | | 492,655 | |
5.000%, 6/15/2044, Call 6/15/2026 | | | 1,000,000 | | | | 1,027,850 | |
Lancaster Industrial Development Authority: | | | | | | | | |
5.000%, 5/1/2021 | | | 360,000 | | | | 371,484 | |
5.000%, 5/1/2022 | | | 430,000 | | | | 464,043 | |
Montgomery County Higher Education & Health Authority: | | | | | | | | |
4.000%, 9/1/2044, Call 9/1/2029 | | | 1,000,000 | | | | 1,100,680 | |
5.000%, 9/1/2033, Call 9/1/2029 | | | 1,500,000 | | | | 1,879,755 | |
Montgomery County Industrial Development Authority: | | | | | | | | |
5.000%, 11/15/2036, Call 11/15/2026 | | | 4,315,000 | | | | 4,995,562 | |
5.000%, 12/1/2038, Call 12/1/2025 | | | 1,000,000 | | | | 1,076,440 | |
Pennsylvania Economic Development Financing Authority, AGM: | | | | | | | | |
0.000%, 1/1/2021 | | | 600,000 | | | | 597,336 | |
5.000%, 1/1/2022 | | | 305,000 | | | | 321,958 | |
Pennsylvania Turnpike Commission: | | | | | | | | |
1.140%, (SIFMA Municipal Swap Index Yield), 12/1/2021, Call 6/1/2021 (1) | | | 5,000,000 | | | | 5,020,100 | |
4.000%, 12/1/2023, Call 9/1/2020 | | | 95,000 | | | | 95,215 | |
4.000%, 12/1/2037, Call 12/1/2027 | | | 2,975,000 | | | | 3,273,571 | |
5.000%, 12/1/2030, Call 12/1/2020 (2) | | | 215,000 | | | | 217,561 | |
5.000%, 12/1/2030, Call 12/1/2020 (2) | | | 120,000 | | | | 121,429 | |
5.000%, 12/1/2030, Call 12/1/2020 (2) | | | 250,000 | | | | 253,008 | |
5.000%, 12/1/2037, Call 12/1/2027 | | | 1,250,000 | | | | 1,513,225 | |
5.000%, 12/1/2037, Call 12/1/2029 | | | 1,000,000 | | | | 1,263,840 | |
5.000%, 12/1/2039, Call 12/1/2029 | | | 1,000,000 | | | | 1,256,310 | |
5.000%, 6/1/2042, Call 6/1/2027 | | | 5,450,000 | | | | 6,375,355 | |
5.500%, 12/1/2042, Call 12/1/2026 | | | 3,000,000 | | | | 3,612,300 | |
6.000%, 12/1/2034, Call 12/1/2020 (2) | | | 55,000 | | | | 55,788 | |
6.000%, 12/1/2034, Call 12/1/2020 (2) | | | 70,000 | | | | 71,002 | |
6.000%, 12/1/2034, Call 12/1/2020 (2) | | | 270,000 | | | | 273,902 | |
6.000%, 12/1/2036, Call 12/1/2020 | | | 975,000 | | | | 989,089 | |
| | | | | | | | |
Pittsburgh School District, BAM SAW, 5.000%, 9/1/2024, Call 9/1/2022 | | | 1,000,000 | | | | 1,094,110 | |
Pittsburgh Water & Sewer Authority, AGM, 0.760%, (LIBOR 1 Month), 9/1/2040, Call 9/1/2020 (1) | | | 2,055,000 | | | | 2,055,021 | |
Sayre Health Care Facilities Authority, 1.015%, (LIBOR 3 Month), 12/1/2024, Call 9/1/2020 (1) | | | 170,000 | | | | 168,915 | |
| | | | | | | | |
| | | | | | | 66,877,016 | |
Rhode Island — 0.4% | | | | | | | | |
Rhode Island Housing & Mortgage Finance Corp., 3.625%, 10/1/2029, Call 10/1/2021 | | | 760,000 | | | | 777,199 | |
Rhode Island Student Loan Authority: | | | | | | | | |
4.000%, 12/1/2022, Call 12/1/2021 (4) | | | 2,885,000 | | | | 2,960,703 | |
4.250%, 12/1/2025, Call 12/1/2021 (4) | | | 2,205,000 | | | | 2,266,431 | |
Town of Cumberland, SAW: | | | | | | | | |
4.000%, 3/15/2024 | | | 795,000 | | | | 896,577 | |
4.000%, 3/15/2026, Call 3/15/2024 | | | 460,000 | | | | 513,714 | |
| | | | | | | | |
| | | | | | | 7,414,624 | |
South Carolina — 1.5% | | | | | | | | |
City of Rock Hill Combined Utility System Revenue, AGM: | | | | | | | | |
5.250%, 1/1/2026, Call 1/1/2022 | | | 730,000 | | | | 778,311 | |
5.250%, 1/1/2028, Call 1/1/2022 | | | 475,000 | | | | 505,576 | |
County of Dorchester Waterworks & Sewer System Revenue: | | | | | | | | |
5.000%, 10/1/2022 | | | 480,000 | | | | 526,704 | |
5.000%, 10/1/2026, Call 10/1/2022 | | | 400,000 | | | | 439,404 | |
County of Florence: | | | | | | | | |
5.000%, 11/1/2025, Call 11/1/2020 | | | 2,000,000 | | | | 2,015,820 | |
5.000%, 11/1/2030, Call 11/1/2020 | | | 500,000 | | | | 503,955 | |
5.000%, 11/1/2031, Call 11/1/2024 | | | 360,000 | | | | 412,535 | |
Patriots Energy Group Financing Agency: | | | | | | | | |
0.975%, (LIBOR 1 Month), 10/1/2048, Call 11/1/2023 (1) | | | 8,000,000 | | | | 8,009,280 | |
4.000%, 10/1/2048, Call 11/1/2023 (1) | | | 2,500,000 | | | | 2,773,150 | |
Piedmont Municipal Power Agency, AGC: | | | | | | | | |
5.000%, 1/1/2030, Call 7/1/2021 | | | 450,000 | | | | 464,171 | |
5.750%, 1/1/2034, Call 7/1/2021 | | | 1,000,000 | | | | 1,034,970 | |
South Carolina Jobs-Economic Development Authority: | | | | | | | | |
5.000%, 7/1/2022 | | | 1,735,000 | | | | 1,886,084 | |
5.000%, 4/1/2038, Call 4/1/2024 | | | 2,000,000 | | | | 2,135,500 | |
South Carolina Public Service Authority, 5.000%, 12/1/2032, Call 12/1/2026 | | | 3,265,000 | | | | 3,948,462 | |
Spartanburg Sanitation Sewer District, 5.000%, 3/1/2030, Call 3/1/2023 (2) | | | 1,500,000 | | | | 1,677,255 | |
St. Peters Parish-Jasper County Public Facilities Corp., AGM, 5.000%, 4/1/2031, Call 4/1/2021 | | | 900,000 | | | | 920,349 | |
| | | | | | | | |
| | | | | | | 28,031,526 | |
South Dakota — 0.6% | | | | | | | | |
South Dakota Health & Educational Facilities Authority: | | | | | | | | |
4.250%, 9/1/2023 | | | 740,000 | | | | 797,306 | |
4.500%, 9/1/2020 | | | 900,000 | | | | 900,000 | |
4.500%, 9/1/2021, Call 9/1/2020 | | | 1,080,000 | | | | 1,083,164 | |
4.500%, 9/1/2022, Call 9/1/2020 | | | 1,005,000 | | | | 1,007,874 | |
5.000%, 11/1/2022 | | | 715,000 | | | | 783,225 | |
5.000%, 8/1/2023 | | | 375,000 | | | | 426,315 | |
5.000%, 11/1/2023 | | | 625,000 | | | | 711,288 | |
5.000%, 8/1/2024 | | | 195,000 | | | | 230,535 | |
5.000%, 11/1/2024 | | | 650,000 | | | | 763,692 | |
5.000%, 11/1/2025, Call 11/1/2024 | | | 600,000 | | | | 702,864 | |
5.000%, 9/1/2027, Call 9/1/2024 | | | 720,000 | | | | 807,854 | |
South Dakota Housing Development Authority, 3.550%, 11/1/2033, Call 11/1/2022 | | | 2,250,000 | | | | 2,324,025 | |
| | | | | | | | |
| | | | | | | 10,538,142 | |
Tennessee — 1.9% | | | | | | | | |
Knox County Health Educational & Housing Facility Board, 5.000%, 1/1/2042, Call 1/1/2027 | | | 5,815,000 | | | | 6,773,021 | |
Metropolitan Government Nashville & Davidson County Health & Educational Facility Board: | | | | | | | | |
2.000%, 1/1/2022 (1) | | | 3,000,000 | | | | 3,015,390 | |
5.000%, 11/1/2027, Call 11/1/2021 | | | 1,500,000 | | | | 1,556,100 | |
5.000%, 7/1/2031, Call 7/1/2026 | | | 1,000,000 | | | | 1,182,320 | |
| | | | | | | | |
Metropolitan Nashville Airport Authority: | | | | | | | | |
4.000%, 7/1/2049, Call 7/1/2030 | | | 1,250,000 | | | | 1,384,050 | |
5.000%, 7/1/2044, Call 7/1/2030 | | | 500,000 | | | | 614,435 | |
Tennessee Energy Acquisition Corp.: | | | | | | | | |
5.000%, 2/1/2023 | | | 5,310,000 | | | | 5,864,258 | |
5.250%, 9/1/2021 | | | 3,810,000 | | | | 3,987,431 | |
5.250%, 9/1/2022 | | | 250,000 | | | | 273,140 | |
Tennessee Housing Development Agency: | | | | | | | | |
3.500%, 7/1/2050, Call 7/1/2029 | | | 5,880,000 | | | | 6,587,717 | |
3.500%, 7/1/2050, Call 7/1/2029 | | | 2,500,000 | | | | 2,792,275 | |
4.000%, 7/1/2025, Call 1/1/2021 | | | 890,000 | | | | 901,143 | |
4.125%, 1/1/2025, Call 1/1/2021 | | | 555,000 | | | | 562,176 | |
| | | | | | | | |
| | | | | | | 35,493,456 | |
Texas — 5.7% | | | | | | | | |
Bexar County Health Facilities Development Corp., 5.000%, 7/15/2033, Call 7/15/2023 | | | 1,000,000 | | | | 1,073,880 | |
Bexar County Hospital District: | | | | | | | | |
5.000%, 2/15/2034, Call 2/15/2028 | | | 1,000,000 | | | | 1,260,460 | |
5.000%, 2/15/2038, Call 2/15/2028 | | | 1,250,000 | | | | 1,555,725 | |
Brazoria-Fort Bend County Municipal Utility District No. 1, MAC, 3.000%, 9/1/2020 | | | 700,000 | | | | 700,000 | |
Central Texas Regional Mobility Authority, 0.000%, 1/1/2025 | | | 1,000,000 | | | | 942,160 | |
City of Beaumont Waterworks & Sewer System Revenue, BAM: | | | | | | | | |
5.000%, 9/1/2026, Call 9/1/2025 | | | 1,000,000 | | | | 1,207,360 | |
5.000%, 9/1/2027, Call 9/1/2025 | | | 600,000 | | | | 724,416 | |
5.000%, 9/1/2030, Call 9/1/2025 | | | 1,000,000 | | | | 1,200,290 | |
City of Houston Airport System Revenue: | | | | | | | | |
5.000%, 7/1/2030, Call 7/1/2028 | | | 1,375,000 | | | | 1,734,975 | |
5.000%, 7/1/2038, Call 7/1/2028 | | | 5,000,000 | | | | 6,105,550 | |
City of Houston Hotel Occupancy Tax & Special Revenue, 5.000%, 9/1/2026, Call 9/1/2024 | | | 250,000 | | | | 270,425 | |
City of Laredo International Toll Bridge System Revenue, AGM: | | | | | | | | |
5.000%, 10/1/2026, Call 10/1/2024 | | | 225,000 | | | | 264,240 | |
5.000%, 10/1/2027, Call 10/1/2024 | | | 240,000 | | | | 281,537 | |
City of San Marcos Electric Utility System Revenue, BAM: | | | | | | | | |
4.500%, 11/1/2028, Call 11/1/2022 | | | 600,000 | | | | 649,182 | |
5.000%, 11/1/2033, Call 11/1/2022 | | | 1,215,000 | | | | 1,328,724 | |
Clifton Higher Education Finance Corp., PSF: | | | | | | | | |
5.000%, 8/15/2026, Call 8/15/2025 | | | 675,000 | | | | 822,319 | |
5.000%, 8/15/2027, Call 8/15/2025 | | | 545,000 | | | | 663,347 | |
5.000%, 8/15/2028, Call 8/15/2025 | | | 835,000 | | | | 1,013,590 | |
5.000%, 8/15/2029, Call 8/15/2025 | | | 335,000 | | | | 405,189 | |
5.000%, 8/15/2030, Call 8/15/2025 | | | 1,250,000 | | | | 1,505,812 | |
Corpus Christi Business & Job Development Corp., 5.000%, 9/1/2022 | | | 1,000,000 | | | | 1,075,800 | |
County of Bexar, AGM, 5.000%, 8/15/2031, Call 8/15/2024 | | | 1,280,000 | | | | 1,486,426 | |
County of Wise, 8.000%, 8/15/2034, Call 8/15/2021 | | | 4,000,000 | | | | 4,134,680 | |
Crane County Water District: | | | | | | | | |
5.000%, 2/15/2026, Call 2/15/2025 | | | 915,000 | | | | 1,083,497 | |
5.000%, 2/15/2030, Call 2/15/2025 | | | 1,000,000 | | | | 1,161,070 | |
Cypress-Fairbanks Independent School District, PSF, 5.000%, 2/15/2034, Call 2/15/2021 | | | 675,000 | | | | 688,561 | |
Dallas/Fort Worth International Airport: | | | | | | | | |
4.000%, 11/1/2034, Call 11/1/2030 (5) | | | 1,250,000 | | | | 1,498,163 | |
4.000%, 11/1/2035, Call 11/1/2030 (5) | | | 1,000,000 | | | | 1,192,590 | |
5.000%, 11/1/2024, Call 11/1/2022 | | | 1,000,000 | | | | 1,096,560 | |
5.000%, 11/1/2032, Call 11/1/2020 | | | 5,000,000 | | | | 5,039,950 | |
5.000%, 11/1/2033, Call 11/1/2023 | | | 2,000,000 | | | | 2,229,340 | |
5.250%, 11/1/2033, Call 11/1/2023 | | | 1,200,000 | | | | 1,346,880 | |
Georgetown Independent School District, PSF: | | | | | | | | |
5.000%, 8/15/2027 | | | 1,000,000 | | | | 1,298,610 | |
5.000%, 8/15/2028 | | | 1,000,000 | | | | 1,331,110 | |
Grand Parkway Transportation Corp., 5.050%, 10/1/2030, Call 10/1/2028 (2) | | | 1,000,000 | | | | 1,165,040 | |
Gulf Coast Authority, AGM: | | | | | | | | |
5.000%, 10/1/2029, Call 10/1/2022 | | | 1,430,000 | | | | 1,566,322 | |
| | | | | | | | |
5.000%, 10/1/2030, Call 10/1/2022 | | | 1,505,000 | | | | 1,647,809 | |
Harris County Cultural Education Facilities Finance Corp., 0.990%, (SIFMA Municipal Swap Index Yield), 6/1/2021 (1) | | | 2,400,000 | | | | 2,403,744 | |
Harris County Municipal Utility District No. 165, BAM, 5.000%, 3/1/2025 | | | 400,000 | | | | 475,748 | |
Lancaster Independent School District, BAM, 4.000%, 2/15/2029, Call 2/15/2025 | | | 3,000,000 | | | | 3,396,510 | |
Lower Colorado River Authority: | | | | | | | | |
5.000%, 5/15/2026, Call 5/15/2025 | | | 695,000 | | | | 837,308 | |
5.000%, 5/15/2027, Call 5/15/2025 | | | 1,355,000 | | | | 1,629,658 | |
5.000%, 5/15/2036, Call 5/15/2029 | | | 1,500,000 | | | | 1,901,985 | |
Matagorda County Navigation District No. 1, 2.600%, 11/1/2029 | | | 1,000,000 | | | | 1,035,380 | |
Mesquite Independent School District, PSF, 0.000%, 8/15/2021 | | | 635,000 | | | | 633,609 | |
New Hope Cultural Education Facilities Finance Corp.: | | | | | | | | |
4.000%, 11/15/2021 | | | 615,000 | | | | 618,708 | |
5.000%, 11/15/2031, Call 11/15/2024 | | | 850,000 | | | | 901,689 | |
5.000%, 8/15/2036, Call 8/15/2021 (3) | | | 1,700,000 | | | | 1,711,747 | |
5.125%, 8/15/2047, Call 8/15/2021 (3) | | | 1,260,000 | | | | 1,266,073 | |
5.500%, 8/15/2036, Call 8/15/2021 | | | 1,000,000 | | | | 1,016,210 | |
New Hope Cultural Education Facilities Finance Corp., AGM, 4.000%, 4/1/2024 | | | 440,000 | | | | 479,142 | |
North Texas Tollway Authority: | | | | | | | | |
4.000%, 1/1/2036, Call 1/1/2029 | | | 1,000,000 | | | | 1,180,830 | |
5.000%, 1/1/2027, Call 1/1/2025 | | | 2,090,000 | | | | 2,475,563 | |
5.000%, 1/1/2048, Call 1/1/2028 | | | 5,000,000 | | | | 6,043,250 | |
Pleasanton Independent School District, PSF, 5.000%, 8/15/2029, Call 8/15/2024 | | | 1,000,000 | | | | 1,172,770 | |
Prosper Independent School District, PSF, 5.000%, 2/15/2044, Call 2/15/2029 | | | 2,880,000 | | | | 3,665,866 | |
San Antonio Municipal Facilities Corp., 5.000%, 8/15/2036, Call 8/15/2021 | | | 500,000 | | | | 520,770 | |
Sienna Plantation Levee Improvement District, BAM, 4.000%, 9/1/2020 | | | 400,000 | | | | 400,000 | |
Tarrant County Cultural Education Facilities Finance Corp.: | | | | | | | | |
5.000%, 10/1/2028, Call 10/1/2023 | | | 2,030,000 | | | | 2,265,744 | |
5.000%, 11/15/2037, Call 11/15/2027 | | | 2,175,000 | | | | 2,508,058 | |
5.000%, 5/15/2045, Call 5/15/2024 | | | 5,145,000 | | | | 5,415,473 | |
5.000%, 11/15/2046, Call 11/15/2026 | | | 2,000,000 | | | | 2,231,960 | |
5.000%, 11/15/2046, Call 11/15/2027 | | | 1,250,000 | | | | 1,416,000 | |
Texas Municipal Gas Acquisition & Supply Corp. III, 5.000%, 12/15/2021 | | | 2,000,000 | | | | 2,100,260 | |
Waco Independent School District, PSF: | | | | | | | | |
4.000%, 8/15/2028, Call 8/15/2024 | | | 1,000,000 | | | | 1,131,640 | |
4.000%, 8/15/2029, Call 8/15/2024 | | | 2,380,000 | | | | 2,689,329 | |
| | | | | | | | |
| | | | | | | 106,276,613 | |
U. S. Virgin Islands — 0.2% | | | | | | | | |
Virgin Islands Public Finance Authority: | | | | | | | | |
5.000%, 9/1/2030, Call 9/1/2025 (3) | | | 2,320,000 | | | | 2,627,516 | |
5.000%, 9/1/2033, Call 9/1/2025 (3) | | | 1,000,000 | | | | 1,118,640 | |
| | | | | | | | |
| | | | | | | 3,746,156 | |
Utah — 0.5% | | | | | | | | |
City of Draper, 5.000%, 5/1/2032, Call 5/1/2022 | | | 325,000 | | | | 349,609 | |
City of Riverton: | | | | | | | | |
5.250%, 12/1/2034, Call 6/1/2023 | | | 1,455,000 | | | | 1,653,622 | |
5.250%, 12/1/2036, Call 6/1/2023 | | | 2,150,000 | | | | 2,443,497 | |
Jordan Valley Water Conservancy District, 5.000%, 10/1/2035, Call 4/1/2021 | | | 920,000 | | | | 945,935 | |
Utah Charter School Finance Authority, UT, 5.250%, 10/15/2028, Call 10/15/2023 | | | 480,000 | | | | 544,118 | |
Utah Infrastructure Agency, AGM: | | | | | | | | |
5.400%, 10/15/2036, Call 10/15/2021 | | | 1,000,000 | | | | 1,057,880 | |
5.500%, 10/15/2030, Call 10/15/2021 | | | 1,300,000 | | | | 1,376,700 | |
| | | | | | | | |
| | | | | | | 8,371,361 | |
Vermont — 0.0% | | | | | | | | |
Vermont Housing Finance Agency, GNMA/FNMA/FHLMC, 4.000%, 11/1/2043, Call 5/1/2023 | | | 515,000 | | | | 545,776 | |
| | |
Virginia — 0.5% | | | | | | | | |
Albermarle County Economic Development Authority, 0.180%, 10/1/2048, Call 9/1/2020 (1) | | | 700,000 | | | | 700,000 | |
City of Chesapeake Chesapeake Expressway Toll Road Revenue, 5.000%, 7/15/2022 | | | 500,000 | | | | 523,615 | |
Henrico County Economic Development Authority, 5.000%, 10/1/2037, Call 10/1/2024 | | | 1,000,000 | | | | 1,098,740 | |
| | | | | | | | |
Henrico County Economic Development Authority, AGM, 0.308%, 8/23/2027, Call 9/1/2020 (1)(6) | | | 50,000 | | | | 50,000 | |
Stafford County Economic Development Authority: | | | | | | | | |
5.000%, 6/15/2028, Call 6/15/2026 | | | 1,000,000 | | | | 1,188,180 | |
5.000%, 6/15/2030, Call 6/15/2026 | | | 700,000 | | | | 825,195 | |
Virginia College Building Authority, 5.000%, 2/1/2031, Call 2/1/2027 | | | 2,200,000 | | | | 2,758,008 | |
Virginia Small Business Financing Authority, 5.000%, 7/1/2049, Call 1/1/2022 | | | 2,500,000 | | | | 2,585,025 | |
| | | | | | | | |
| | | | | | | 9,728,763 | |
Washington — 1.7% | | | | | | | | |
Chelan County Public Utility District No. 1, NATL-RE, 0.000%, 6/1/2024 | | | 210,000 | | | | 204,368 | |
FYI Properties, 5.000%, 6/1/2031, Call 6/1/2028 | | | 5,000,000 | | | | 6,256,650 | |
King County Housing Authority, County Guarantee: | | | | | | | | |
5.200%, 5/1/2028, Call 9/1/2020 | | | 390,000 | | | | 395,756 | |
5.500%, 12/1/2028, Call 9/1/2020 | | | 1,000,000 | | | | 1,004,590 | |
King County Public Hospital District No. 1, 5.000%, 12/1/2031, Call 12/1/2026 | | | 4,000,000 | | | | 4,678,480 | |
King County Public Hospital District No. 2, 5.250%, 12/1/2028, Call 12/1/2020 | | | 200,000 | | | | 202,530 | |
Mason & Kitsap Counties School District No. 403 North Mason, School Bond Gty, 5.000%, 12/1/2035, Call 12/1/2023 | | | 2,025,000 | | | | 2,312,388 | |
Port of Bellingham, 5.250%, 12/1/2022, Call 12/1/2020 | | | 1,060,000 | | | | 1,072,741 | |
Port of Seattle, 4.000%, 4/1/2044, Call 4/1/2029 | | | 1,000,000 | | | | 1,077,670 | |
Snohomish County Housing Authority, 5.000%, 4/1/2031, Call 4/1/2029 | | | 1,000,000 | | | | 1,268,650 | |
Spokane County School District No. 81 Spokane, School Bond Gty, 5.000%, 12/1/2030, Call 12/1/2021 | | | 650,000 | | | | 689,013 | |
Washington Health Care Facilities Authority, 5.000%, 10/1/2030, Call 10/1/2022 | | | 750,000 | | | | 807,218 | |
Washington State Housing Finance Commission: | | | | | | | | |
2.375%, 1/1/2026, Call 7/1/2021 (3) | | | 1,000,000 | | | | 934,560 | |
5.000%, 1/1/2029, Call 1/1/2026 (3) | | | 840,000 | | | | 933,408 | |
5.000%, 1/1/2036, Call 1/1/2025 (3) | | | 2,125,000 | | | | 2,181,652 | |
5.000%, 1/1/2038, Call 1/1/2026 (3) | | | 2,000,000 | | | | 2,161,600 | |
5.000%, 1/1/2044, Call 7/1/2026 (3) | | | 1,000,000 | | | | 1,014,910 | |
5.000%, 1/1/2049, Call 7/1/2026 (3) | | | 1,000,000 | | | | 1,009,170 | |
Washington State Housing Finance Commission, GNMA/FNMA/FHLMC, 3.050%, 6/1/2022 | | | 750,000 | | | | 781,898 | |
WBRP 3.2: | | | | | | | | |
5.000%, 1/1/2026, Call 7/1/2025 | | | 750,000 | | | | 912,488 | |
5.000%, 1/1/2031, Call 7/1/2025 | | | 940,000 | | | | 1,130,171 | |
| | | | | | | | |
| | | | | | | 31,029,911 | |
West Virginia — 0.5% | | | | | | | | |
West Virginia Hospital Finance Authority: | | | | | | | | |
5.000%, 9/1/2031, Call 9/1/2029 | | | 2,020,000 | | | | 2,458,239 | |
5.000%, 9/1/2032, Call 9/1/2029 | | | 1,000,000 | | | | 1,208,240 | |
5.000%, 6/1/2042, Call 6/1/2027 | | | 3,665,000 | | | | 4,302,307 | |
5.000%, 1/1/2043, Call 1/1/2029 | | | 1,750,000 | | | | 2,065,647 | |
| | | | | | | | |
| | | | | | | 10,034,433 | |
Wisconsin — 2.7% | | | | | | | | |
City of Oak Creek, 3.000%, 6/1/2027, Call 6/1/2025 | | | 100,000 | | | | 110,132 | |
Public Finance Authority: | | | | | | | | |
4.000%, 1/1/2046, Call 1/1/2027 | | | 2,000,000 | | | | 1,890,140 | |
4.750%, 12/1/2035, Call 12/1/2020 | | | 525,000 | | | | 556,815 | |
4.750%, 12/1/2035, Call 12/1/2020 | | | 1,475,000 | | | | 1,564,385 | |
5.000%, 11/15/2029 | | | 2,500,000 | | | | 2,912,500 | |
5.000%, 11/15/2030 | | | 1,620,000 | | | | 1,893,569 | |
5.000%, 7/1/2037, Call 7/1/2024 | | | 820,000 | | | | 881,648 | |
5.000%, 11/15/2041, Call 11/15/2027 | | | 250,000 | | | | 296,310 | |
5.000%, 7/1/2047, Call 7/1/2024 | | | 1,000,000 | | | | 1,063,700 | |
5.125%, 7/15/2037, Call 7/15/2027 (3) | | | 2,500,000 | | | | 2,618,400 | |
State of Wisconsin: | | | | | | | | |
4.000%, 5/1/2027, Call 5/1/2022 | | | 800,000 | | | | 850,752 | |
5.000%, 3/1/2023, Call 9/1/2021 | | | 2,000,000 | | | | 2,091,460 | |
5.000%, 5/1/2027, Call 5/1/2022 | | | 25,000 | | | | 26,979 | |
5.000%, 5/1/2027, Call 5/1/2022 | | | 1,580,000 | | | | 1,706,463 | |
Wisconsin Center District: | | | | | | | | |
0.000%, 12/15/2033, Call 6/15/2026 | | | 2,200,000 | | | | 1,389,080 | |
0.000%, 12/15/2034, Call 6/15/2026 | | | 6,665,000 | | | | 4,015,196 | |
| | | | | | | | |
Wisconsin Center District, AGM: | | | | | | | | |
5.250%, 12/15/2023 | | | 375,000 | | | | 404,059 | |
5.250%, 12/15/2023 | | | 145,000 | | | | 164,015 | |
5.250%, 12/15/2027 | | | 420,000 | | | | 530,204 | |
5.250%, 12/15/2027 | | | 1,510,000 | | | | 1,889,886 | |
Wisconsin Health & Educational Facilities Authority: | | | | | | | | |
4.750%, 10/15/2029, Call 10/15/2021 | | | 605,000 | | | | 627,712 | |
5.000%, 3/1/2021 | | | 240,000 | | | | 243,641 | |
5.000%, 8/15/2021 | | | 1,160,000 | | | | 1,212,745 | |
5.000%, 10/1/2022 | | | 750,000 | | | | 810,727 | |
5.000%, 12/15/2022 | | | 500,000 | | | | 550,340 | |
5.000%, 12/15/2023 | | | 500,000 | | | | 571,605 | |
5.000%, 12/15/2024 | | | 500,000 | | | | 589,755 | |
5.000%, 3/1/2025, Call 3/1/2024 | | | 315,000 | | | | 345,829 | |
5.000%, 8/15/2027, Call 8/15/2022 | | | 500,000 | | | | 546,340 | |
5.000%, 12/15/2028, Call 12/15/2024 | | | 100,000 | | | | 115,561 | |
5.000%, 8/15/2029, Call 8/15/2022 | | | 1,700,000 | | | | 1,857,556 | |
5.000%, 4/1/2032, Call 10/1/2022 | | | 4,560,000 | | | | 4,878,744 | |
5.000%, 6/1/2032, Call 6/1/2022 | | | 1,000,000 | | | | 1,051,980 | |
5.000%, 8/15/2032, Call 8/15/2022 | | | 5,000,000 | | | | 5,463,400 | |
5.125%, 4/15/2031, Call 4/15/2023 | | | 250,000 | | | | 281,098 | |
Wisconsin Health & Educational Facilities Authority, AGM, 5.000%, 7/15/2027, Call 7/15/2021 | | | 3,655,000 | | | | 3,806,975 | |
| | | | | | | | |
| | | | | | | 49,809,701 | |
Wyoming — 0.1% | | | | | | | | |
County of Laramie, 5.000%, 5/1/2027, Call 5/1/2021 | | | 1,000,000 | | | | 1,025,700 | |
| | | | | | | | |
| | |
Total Municipals
(identified cost $1,735,091,411) | | | | | | | 1,845,771,591 | |
| | | | | | | | |
Mutual Funds — 0.5% | | | | | | | | |
Nuveen New York AMT-Free Municipal Credit Income Fund, 0.920%, 3/1/2029 (1) | | | 10,000,000 | | | | 10,000,000 | |
| | | | | | | | |
| | |
Total Mutual Funds
(identified cost $10,000,000) | | | | | | | 10,000,000 | |
| | | | | | | | |
| | |
Short-Term Investments — 0.1% | | | | | | | | |
| | |
Repurchase Agreements — 0.1% | | | | | | | | |
Agreement with Fixed Income Clearing Corp., 0.080%, dated 8/31/2020, to be repurchased at $2,334,716 on 9/1/2020, collateralized by U.S. Government Treasury Obligation with a maturity of 6/30/2022, with a fair value of $2,381,414 | | | 2,334,710 | | | | 2,334,710 | |
| | | | | | | | |
| | |
Total Short-Term Investments
(identified cost $2,334,710) | | | | | | | 2,334,710 | |
| | | | | | | | |
| | |
Total Investments — 99.2%
(identified cost $1,737,426,121) | | | | | | | 1,848,106,301 | |
| | |
Other Assets and Liabilities — 0.8% | | | | | | | 14,930,924 | |
| | | | | | | | |
Total Net Assets — 100.0% | | | | | | $ | 1,863,037,225 | |
| | | | | | | | |
| (1) | Denotes a variable rate security. The rate shown is the current interest rate as of August 31, 2020. Rate fluctuations are based underlying positions and/or other variables. For securities whose yields vary with a designated market index or market rate, the reference rate and spread are indicated in the description. |
| (2) | Issue represents a convertible capital appreciation bond. These securities are tax-exempt bonds that originate as capital appreciation bonds with zero coupon features at time of issuance and convert to an interest paying bond at a pre-specified rate determined at time of issuance. |
| (3) | Denotes a restricted security which is subject to restrictions on resale under federal securities laws. These securities have been deemed liquid based on criteria approved by the Board of Directors of the BMO Funds. At August 31, 2020 these securities amounted to: |
| | | | | | | | |
| Fund | | Amount | | | % of Total Net Assets | |
Intermediate Tax-Free Fund | |
| 54,471,142
|
| |
| 2.92
|
|
| (4) | Securities that are subject to alternative minimum tax of the Intermediate Tax-Free Fund portfolio represents 2.34%, as calculated based upon total portfolio market value. |
| (5) | Purchased on a when-issued or delayed delivery basis. |
| (6) | Issue represents an Auction Rate Security. An Auction Rate Security is a corporate or municipal bond debt instrument with a long nominal maturity for which the interest rate is regularly reset through a Dutch auction. The rate presented is either the rate set through the auction or the maximum interest rate provided for in the security issuance provision. |
Short Tax-Free Fund
| | | | | | | | |
Description | |
| Shares or
Principal Amount |
| | | Value | |
| | |
Municipals — 99.3% | | | | | | | | |
| | |
Alabama — 3.5% | | | | | | | | |
Black Belt Energy Gas District: | | | | | | | | |
1.015%, (LIBOR 1 Month), 12/1/2048, Call 9/1/2023 (1) | | $ | 1,000,000 | | | $ | 996,280 | |
4.000%, 6/1/2023 | | | 1,000,000 | | | | 1,091,750 | |
4.000%, 7/1/2046, Call 3/1/2021 (1) | | | 1,000,000 | | | | 1,023,250 | |
Columbia Industrial Development Board, 0.200%, 12/1/2037, Call 9/1/2020 (1) | | | 500,000 | | | | 500,000 | |
Lower Alabama Gas District, 4.000%, 12/1/2050, Call 9/1/2025 (1) | | | 600,000 | | | | 689,784 | |
Tuscaloosa City Board of Education, 5.000%, 8/1/2021 | | | 175,000 | | | | 182,716 | |
| | | | | | | | |
| | | | | | | 4,483,780 | |
| | |
Alaska — 1.6% | | | | | | | | |
Alaska Housing Finance Corp., 3.250%, 12/1/2044, Call 6/1/2029 | | | 1,000,000 | | | | 1,106,970 | |
Alaska Industrial Development & Export Authority, 3.500%, 12/1/2020, Call 10/1/2020 | | | 1,000,000 | | | | 1,002,700 | |
| | | | | | | | |
| | | | | | | 2,109,670 | |
| | |
Arizona — 0.3% | | | | | | | | |
La Paz County Industrial Development Authority, 5.000%, 2/15/2021 (2) | | | 250,000 | | | | 254,333 | |
Maricopa County Industrial Development Authority: | | | | | | | | |
2.550%, 7/1/2021 | | | 115,000 | | | | 116,259 | |
2.875%, 7/1/2021 (2) | | | 70,000 | | | | 70,133 | |
| | | | | | | | |
| | | | | | | 440,725 | |
| | |
Arkansas — 0.2% | | | | | | | | |
City of Hot Springs Wastewater Revenue, 5.000%, 12/1/2020 | | | 245,000 | | | | 247,886 | |
| | |
California — 5.9% | | | | | | | | |
Bay Area Toll Authority, 1.260%, (SIFMA Municipal Swap Index Yield), 4/1/2045, Call 10/1/2023 (1) | | | 500,000 | | | | 503,170 | |
California Housing Finance Agency, AGM, 0.450%, 2/1/2037, Call 9/3/2020 (1)(3) | | | 5,000 | | | | 5,000 | |
California Municipal Finance Authority, 5.000%, 2/1/2022 | | | 1,000,000 | | | | 1,059,650 | |
California Public Finance Authority: | | | | | | | | |
5.000%, 10/15/2021 | | | 350,000 | | | | 364,574 | |
5.000%, 10/15/2022 | | | 300,000 | | | | 323,415 | |
California Statewide Communities Development Authority, CMI, 3.500%, 11/1/2021, Call 11/1/2020 (1)(3) | | | 195,000 | | | | 201,686 | |
Carson Redevelopment Agency Successor Agency, AGM, 5.000%, 10/1/2020 | | | 675,000 | | | | 677,538 | |
Fresno Joint Powers Financing Authority, AGM, 5.000%, 4/1/2022 | | | 875,000 | | | | 941,246 | |
Golden State Tobacco Securitization Corp., 5.000%, 6/1/2022 | | | 1,000,000 | | | | 1,077,810 | |
Palomar Health, 5.000%, 11/1/2022 | | | 375,000 | | | | 407,809 | |
Sacramento Redevelopment Agency Successor Agency, BAM, 5.000%, 12/1/2022 | | | 385,000 | | | | 424,486 | |
Tender Option Bond Trust Receipts/Certificates, 0.240%, 12/1/2030 | | | 1,500,000 | | | | 1,500,000 | |
| | | | | | | | |
| | | | | | | 7,486,384 | |
| | |
Colorado — 3.3% | | | | | | | | |
Colorado Educational & Cultural Facilities Authority, 5.000%, 10/1/2021 | | | 1,000,000 | | | | 1,032,550 | |
Colorado Health Facilities Authority: | | | | | | | | |
5.000%, 6/1/2021 | | | 250,000 | | | | 258,763 | |
5.000%, 6/1/2022 | | | 250,000 | | | | 270,322 | |
5.000%, 8/1/2049, Call 2/1/2025 (1) | | | 1,000,000 | | | | 1,154,060 | |
E-470 Public Highway Authority, 1.162%, (LIBOR 1 Month), 9/1/2039, Call 3/1/2021 (1) | | | 575,000 | | | | 575,213 | |
University of Colorado Hospital Authority, 5.000%, 11/15/2038, Call 9/1/2021 (1) | | | 750,000 | | | | 780,997 | |
Wheatlands Metropolitan District, BAM, 4.000%, 12/1/2020 | | | 125,000 | | | | 126,085 | |
| | | | | | | | |
| | | | | | | 4,197,990 | |
| | | | | | | | |
| | |
Connecticut — 2.2% | | | | | | | | |
City of New Haven, AGM, 5.000%, 8/1/2024 | | | 1,000,000 | | | | 1,146,430 | |
State of Connecticut: | | | | | | | | |
5.000%, 3/15/2021 | | | 500,000 | �� | | | 512,745 | |
5.000%, 4/15/2023 | | | 1,000,000 | | | | 1,122,480 | |
| | | | | | | | |
| | | | | | | 2,781,655 | |
| | |
District of Columbia — 0.9% | | | | | | | | |
Metropolitan Washington Airports Authority, 5.000%, 10/1/2024 | | | 1,000,000 | | | | 1,169,990 | |
| | |
Florida — 6.3% | | | | | | | | |
Brevard County Health Facilities Authority, 5.000%, 4/1/2021 | | | 400,000 | | | | 410,088 | |
City of Atlantic Beach, 3.250%, 11/15/2024, Call 11/15/2020 | | | 1,155,000 | | | | 1,157,183 | |
City of Orlando, AGM, 4.000%, 11/1/2021 | | | 460,000 | | | | 477,779 | |
Columbia County School Board, BAM, 5.000%, 7/1/2021 | | | 400,000 | | | | 415,172 | |
County of Broward Half-Cent Sales Tax Revenue, 5.000%, 10/1/2020 | | | 100,000 | | | | 100,392 | |
County of Escambia, 0.220%, 4/1/2039, Call 8/31/2020 (1) | | | 100,000 | | | | 100,000 | |
County of Okeechobee, 1.550%, 7/1/2039 (1) | | | 1,000,000 | | | | 1,010,110 | |
County of St. Lucie, 0.190%, 9/1/2028, Call 8/31/2020 (1) | | | 300,000 | | | | 300,000 | |
Emerald Coast Utilities Authority, BAM, 5.000%, 1/1/2021 | | | 300,000 | | | | 304,815 | |
Halifax Hospital Medical Center, 5.000%, 6/1/2021 | | | 300,000 | | | | 309,501 | |
JEA Electric System Revenue, 0.190%, 10/1/2038, Call 8/31/2020 (1) | | | 100,000 | | | | 100,000 | |
JEA Water & Sewer System Revenue, 0.030%, 10/1/2038, Call 8/31/2020 | | | 1,300,000 | | | | 1,300,000 | |
JPMorgan Chase Putters/Drivers Trust, 0.420%, 2/16/2022, Call 8/18/2021 (1)(2) | | | 1,000,000 | | | | 1,000,000 | |
Miami-Dade County Industrial Development Authority, 1.600%, 11/1/2041 | | | 500,000 | | | | 500,880 | |
Sarasota County Health Facilities Authority, 5.000%, 1/1/2022 | | | 500,000 | | | | 515,375 | |
| | | | | | | | |
| | | | | | | 8,001,295 | |
| | |
Georgia — 6.8% | | | | | | | | |
Atlanta Development Authority, 4.000%, 9/1/2020 | | | 500,000 | | | | 500,000 | |
Bartow County Development Authority: | | | | | | | | |
1.550%, 8/1/2043 (1) | | | 500,000 | | | | 504,255 | |
2.050%, 9/1/2029 (1) | | | 500,000 | | | | 508,815 | |
Burke County Development Authority: | | | | | | | | |
0.230%, 11/1/2052, Call 9/1/2020 (1) | | | 100,000 | | | | 100,000 | |
2.925%, 11/1/2048 (1) | | | 1,250,000 | | | | 1,333,200 | |
City of Atlanta: | | | | | | | | |
5.000%, 1/1/2021 | | | 250,000 | | | | 253,970 | |
5.000%, 1/1/2022 | | | 700,000 | | | | 738,444 | |
County of DeKalb Water & Sewerage Revenue, 5.000%, 10/1/2020 | | | 150,000 | | | | 150,585 | |
Gainesville & Hall County Hospital Authority, 5.000%, 2/15/2021 | | | 700,000 | | | | 713,776 | |
Main Street Natural Gas, Inc.: | | | | | | | | |
0.865%, (LIBOR 1 Month), 4/1/2048, Call 6/1/2023 (1) | | | 1,500,000 | | | | 1,498,275 | |
5.000%, 5/15/2024 | | | 1,250,000 | | | | 1,418,812 | |
Municipal Electric Authority of Georgia, 5.000%, 1/1/2023 | | | 875,000 | | | | 964,338 | |
| | | | | | | | |
| | | | | | | 8,684,470 | |
| | |
Guam — 0.4% | | | | | | | | |
Territory of Guam, 5.000%, 12/1/2022 | | | 500,000 | | | | 533,355 | |
| | |
Illinois — 17.4% | | | | | | | | |
Chicago Housing Authority, HUD SEC 8, 5.000%, 1/1/2023 | | | 1,000,000 | | | | 1,092,810 | |
Chicago O’Hare International Airport: | | | | | | | | |
5.000%, 1/1/2022 | | | 100,000 | | | | 105,656 | |
5.000%, 1/1/2022 | | | 200,000 | | | | 211,312 | |
Chicago Park District: | | | | | | | | |
5.000%, 1/1/2022 | | | 250,000 | | | | 261,750 | |
5.000%, 1/1/2022 | | | 500,000 | | | | 523,500 | |
Chicago Transit Authority, 5.000%, 6/1/2021 | | | 750,000 | | | | 772,155 | |
City of Chicago, 5.000%, 1/1/2024 | | | 340,000 | | | | 369,444 | |
City of Chicago Wastewater Transmission Revenue: | | | | | | | | |
5.000%, 1/1/2021 | | | 840,000 | | | | 852,121 | |
5.000%, 1/1/2022 | | | 500,000 | | | | 528,970 | |
City of Chicago Waterworks Revenue, 5.000%, 11/1/2021 | | | 1,445,000 | | | | 1,518,276 | |
City of Waukegan, 5.000%, 12/30/2020 | | | 250,000 | | | | 253,778 | |
Cook County School District No 99 Cicero, 5.000%, 12/1/2023 | | | 575,000 | | | | 653,614 | |
County of Cook, 5.000%, 11/15/2021 | | | 720,000 | | | | 757,008 | |
County of Cook Sales Tax Revenue, 5.000%, 11/15/2024, Call 11/15/2022 | | | 810,000 | | | | 889,582 | |
| | | | | | | | |
Illinois Finance Authority: | | | | | | | | |
1.470%, (LIBOR 1 Month), 5/1/2036, Call 11/1/2020 (1) | | | 1,000,000 | | | | 1,000,290 | |
5.000%, 1/1/2021 | | | 200,000 | | | | 202,872 | |
5.000%, 11/15/2021 | | | 400,000 | | | | 421,356 | |
5.000%, 1/1/2022 | | | 150,000 | | | | 158,651 | |
5.000%, 7/15/2022 | | | 750,000 | | | | 812,572 | |
5.000%, 11/15/2022 | | | 555,000 | | | | 604,401 | |
5.000%, 12/1/2022 | | | 290,000 | | | | 307,304 | |
5.000%, 5/15/2023 | | | 250,000 | | | | 265,150 | |
5.000%, 5/15/2024 | | | 450,000 | | | | 485,726 | |
Illinois Housing Development Authority, 1.900%, 10/1/2022 (1) | | | 500,000 | | | | 508,400 | |
Illinois Housing Development Authority, AGM, 4.400%, 9/1/2020, Call 10/1/2020 | | | 20,000 | | | | 20,000 | |
Kane McHenry Cook & De Kalb Counties Unit School District No. 300, 5.000%, 1/1/2023 | | | 1,000,000 | | | | 1,106,780 | |
Lake County Forest Preserve District, 0.690%, (LIBOR 3 Month), 12/15/2020 (1) | | | 70,000 | | | | 69,936 | |
Northern Illinois University, BAM, 5.000%, 4/1/2025 | | | 400,000 | | | | 467,152 | |
Railsplitter Tobacco Settlement Authority, 5.000%, 6/1/2023 | | | 1,165,000 | | | | 1,302,552 | |
Sales Tax Securitization Corp., 5.000%, 1/1/2023 | | | 1,000,000 | | | | 1,084,100 | |
State of Illinois: | | | | | | | | |
5.000%, 2/1/2021 | | | 240,000 | | | | 243,458 | |
5.000%, 11/1/2022 | | | 2,000,000 | | | | 2,107,220 | |
University of Illinois, 5.000%, 3/15/2022 | | | 1,000,000 | | | | 1,063,040 | |
Village of Bolingbrook, AGM: | | | | | | | | |
4.000%, 3/1/2022 | | | 630,000 | | | | 665,286 | |
4.000%, 3/1/2023 | | | 510,000 | | | | 554,406 | |
| | | | | | | | |
| | | | | | | 22,240,628 | |
Indiana — 1.7% | | | | | | | | |
City of Boonville, 2.600%, 1/1/2023, Call 9/1/2020 | | | 500,000 | | | | 501,560 | |
City of Whiting, 5.000%, 12/1/2044 (1) | | | 1,000,000 | | | | 1,226,410 | |
Indiana Finance Authority, 5.250%, 10/1/2022, Call 10/1/2021 | | | 150,000 | | | | 158,003 | |
Jasper Hospital Authority, 5.000%, 11/1/2020 | | | 250,000 | | | | 251,742 | |
| | | | | | | | |
| | | | | | | 2,137,715 | |
Iowa — 0.4% | | | | | | | | |
City of Waverly, 2.500%, 12/31/2022, Call 7/1/2022 | | | 500,000 | | | | 511,155 | |
Kansas — 0.6% | | | | | | | | |
Bourbon County Unified School District No. 234-Fort Scott, 5.000%, 9/1/2020 | | | 420,000 | | | | 420,000 | |
City of Holton, 2.500%, 7/1/2021, Call 1/1/2021 | | | 375,000 | | | | 376,560 | |
| | | | | | | | |
| | | | | | | 796,560 | |
Kentucky — 3.0% | | | | | | | | |
City of Berea, 0.160%, 6/1/2032, Call 9/1/2020 (1) | | | 1,000,000 | | | | 1,000,000 | |
Kentucky Asset Liability Commission, 5.000%, 9/1/2023 | | | 500,000 | | | | 560,110 | |
Kentucky Public Energy Authority: | | | | | | | | |
1.235%, (LIBOR 1 Month), 12/1/2049, Call 3/1/2025 (1) | | | 1,000,000 | | | | 1,001,970 | |
4.000%, 7/1/2023 | | | 750,000 | | | | 818,167 | |
Louisville/Jefferson County Metropolitan Government, 1.850%, 10/1/2033 (1) | | | 500,000 | | | | 503,235 | |
| | | | | | | | |
| | | | | | | 3,883,482 | |
Louisiana — 0.3% | | | | | | | | |
Evangeline Parish Road & Drain Sales Tax District No. 1, AGM, 5.000%, 12/1/2020 | | | 400,000 | | | | 404,612 | |
Louisiana Housing Corp., FHA, 2.500%, 12/1/2031, Call 10/1/2020 | | | 5,000 | | | | 5,080 | |
| | | | | | | | |
| | | | | | | 409,692 | |
Maryland — 0.4% | | | | | | | | |
City of Rockville, 5.000%, 11/1/2022 | | | 500,000 | | | | 515,475 | |
Maryland Community Development Administration, GNMA/FNMA/FHLMC, 4.500%, 3/1/2027, Call 3/1/2021 | | | 5,000 | | | | 5,092 | |
| | | | | | | | |
| | | | | | | 520,567 | |
Massachusetts — 2.6% | | | | | | | | |
Commonwealth of Massachusetts, 1.700%, 8/1/2043 (1) | | | 1,000,000 | | | | 1,025,530 | |
Massachusetts Development Finance Agency: | | | | | | | | |
5.000%, 7/1/2021 | | | 280,000 | | | | 288,856 | |
5.000%, 7/1/2022 | | | 315,000 | | | | 336,663 | |
5.000%, 7/1/2024 | | | 260,000 | | | | 295,942 | |
| | | | | | | | |
Massachusetts Transportation Trust Fund Metropolitan Highway System Revenue, 5.000%, 1/1/2039, Call 1/1/2023 (1) | | | 1,200,000 | | | | 1,323,996 | |
| | | | | | | | |
| | | | | | | 3,270,987 | |
Michigan — 2.0% | | | | | | | | |
Great Lakes Water Authority Water Supply System Revenue, 5.000%, 7/1/2023 | | | 800,000 | | | | 892,680 | |
Lake St. Claire Clean Water Initiative, County Guarantee, 5.000%, 10/1/2020 | | | 150,000 | | | | 150,585 | |
Michigan Finance Authority, 3.500%, 11/15/2044 (1) | | | 1,000,000 | | | | 1,060,440 | |
Muskegon Public Schools, Q-SBLF, 4.250%, 5/1/2021, Call 10/1/2020 | | | 200,000 | | | | 200,634 | |
Taylor Tax Increment Finance Authority, AGM, 4.000%, 5/1/2021, Call 10/1/2020 | | | 270,000 | | | | 270,823 | |
| | | | | | | | |
| | | | | | | 2,575,162 | |
Mississippi — 2.5% | | | | | | | | |
Mississippi Business Finance Corp.: | | | | | | | | |
0.030%, 11/1/2035, Call 9/1/2020 (1) | | | 1,000,000 | | | | 1,000,000 | |
2.200%, 3/1/2027 (1) | | | 1,250,000 | | | | 1,288,737 | |
State of Mississippi, 5.000%, 10/15/2024 | | | 750,000 | | | | 874,268 | |
| | | | | | | | |
| | | | | | | 3,163,005 | |
Missouri — 0.9% | | | | | | | | |
Health & Educational Facilities Authority of the State of Missouri: | | | | | | | | |
2.875%, 2/1/2034, Call 9/21/2020 | | | 600,000 | | | | 597,564 | |
5.000%, 2/1/2022 | | | 250,000 | | | | 259,687 | |
5.000%, 2/1/2024, Call 2/1/2021 | | | 250,000 | | | | 252,830 | |
| | | | | | | | |
| | | | | | | 1,110,081 | |
Nebraska — 0.9% | | | | | | | | |
Central Plains Energy Project, 5.000%, 3/1/2050, Call 10/1/2023 (1) | | | 1,000,000 | | | | 1,129,950 | |
Nevada — 1.6% | | | | | | | | |
City of Carson City, 5.000%, 9/1/2022 | | | 500,000 | | | | 538,085 | |
City of North Las Vegas NV, AGM, 5.000%, 6/1/2023 | | | 1,000,000 | | | | 1,117,490 | |
City of Sparks NV, 2.500%, 6/15/2024 (2) | | | 450,000 | | | | 447,093 | |
| | | | | | | | |
| | | | | | | 2,102,668 | |
New Jersey — 2.6% | | | | | | | | |
New Jersey Economic Development Authority, 5.000%, 11/1/2021 | | | 400,000 | | | | 418,748 | |
New Jersey Health Care Facilities Financing Authority: | | | | | | | | |
5.000%, 7/1/2022 | | | 790,000 | | | | 851,217 | |
5.000%, 10/1/2026 | | | 650,000 | | | | 741,819 | |
New Jersey Transportation Trust Fund Authority, 5.000%, 12/15/2023 | | | 250,000 | | | | 279,792 | |
New Jersey Transportation Trust Fund Authority, NATL-RE, 5.500%, 12/15/2020 | | | 10,000 | | | | 10,132 | |
Tobacco Settlement Financing Corp., 5.000%, 6/1/2022 | | | 1,000,000 | | | | 1,076,940 | |
| | | | | | | | |
| | | | | | | 3,378,648 | |
New Mexico — 0.9% | | | | | | | | |
New Mexico Hospital Equipment Loan Council: | | | | | | | | |
0.020%, 8/1/2034, Call 8/31/2020 | | | 200,000 | | | | 200,000 | |
2.375%, 7/1/2024, Call 1/1/2021 | | | 1,000,000 | | | | 965,900 | |
| | | | | | | | |
| | | | | | | 1,165,900 | |
New York — 5.9% | | | | | | | | |
Long Island Power Authority, 0.870%, (LIBOR 1 Month), 5/1/2033, Call 10/1/2022 (1) | | | 1,000,000 | | | | 997,070 | |
Metropolitan Transportation Authority: | | | | | | | | |
0.060%, 11/1/2035, Call 8/31/2020 (1) | | | 400,000 | | | | 400,000 | |
5.000%, 9/1/2022 | | | 1,000,000 | | | | 1,044,360 | |
5.000%, 11/15/2048 (1) | | | 1,000,000 | | | | 1,079,200 | |
New York City Water & Sewer System, 0.020%, 6/15/2049, Call 8/31/2020 | | | 200,000 | | | | 200,000 | |
New York State Dormitory Authority, 5.000%, 12/1/2022 (2) | | | 600,000 | | | | 649,554 | |
New York State Dormitory Authority, NATL-RE, 0.180%, 7/1/2029, Call 9/1/2020 (1)(3) | | | 425,000 | | | | 425,000 | |
New York State Housing Finance Agency, SONYMA, 1.875%, 5/1/2050, Call 9/21/2020 (1) | | | 750,000 | | | | 750,548 | |
Triborough Bridge & Tunnel Authority, 0.815%, (LIBOR 1 Month), 1/1/2032 (1) | | | 980,000 | | | | 980,617 | |
TSASC, Inc., 5.000%, 6/1/2021 | | | 1,000,000 | | | | 1,029,760 | |
| | | | | | | | |
| | | | | | | 7,556,109 | |
North Carolina — 0.7% | | | | | | | | |
North Carolina Eastern Municipal Power Agency, FGIC, 3.144%, 1/1/2025 (1)(3) | | | 600,000 | | | | 580,116 | |
| | | | | | | | |
North Carolina Medical Care Commission, 5.000%, 10/1/2022 | | | 350,000 | | | | 366,898 | |
| | | | | | | | |
| | | | | | | 947,014 | |
North Dakota — 0.0% | | | | | | | | |
North Dakota Housing Finance Agency, 3.750%, 7/1/2042, Call 7/1/2022 | | | 40,000 | | | | 41,389 | |
Ohio — 4.2% | | | | | | | | |
Akron Bath Copley Joint Township Hospital District, 5.000%, 11/15/2021 | | | 805,000 | | | | 846,981 | |
American Municipal Power, Inc., 2.300%, 2/15/2038, Call 8/15/2021 (1) | | | 1,000,000 | | | | 1,013,770 | |
County of Hamilton: | | | | | | | | |
4.000%, 1/1/2021 | | | 445,000 | | | | 446,442 | |
5.000%, 1/1/2022 | | | 465,000 | | | | 476,471 | |
Eclipse Funding Trust, 0.190%, 10/1/2040, Call 10/1/2026 (1)(2) | | | 1,500,000 | | | | 1,500,000 | |
Ohio Housing Finance Agency, GNMA/FNMA/FHLMC, 4.000%, 5/1/2022, Call 5/1/2021 | | | 60,000 | | | | 61,201 | |
Port of Greater Cincinnati Development Authority, 3.000%, 5/1/2023, Call 5/1/2022 | | | 1,000,000 | | | | 1,002,180 | |
| | | | | | | | |
| | | | | | | 5,347,045 | |
Oklahoma — 0.5% | | | | | | | | |
Oklahoma Development Finance Authority, 1.625%, 7/6/2023, Call 6/30/2022 | | | 600,000 | | | | 599,100 | |
Pennsylvania — 2.9% | | | | | | | | |
Allegheny County Hospital Development Authority, 1.180%, (LIBOR 3 Month), 2/1/2021, Call 11/1/2020 (1) | | | 30,000 | | | | 29,964 | |
Berks County Industrial Development Authority, 5.000%, 11/1/2022 | | | 250,000 | | | | 264,175 | |
Commonwealth Financing Authority, 5.000%, 6/1/2022 | | | 1,000,000 | | | | 1,075,820 | |
Lancaster County Hospital Authority, 2.875%, 12/15/2023, Call 9/1/2020 | | | 500,000 | | | | 492,655 | |
Lancaster County Solid Waste Management Authority, 5.000%, 12/15/2020 | | | 200,000 | | | | 202,644 | |
Montgomery County Industrial Development Authority: | | | | | | | | |
4.000%, 12/1/2022 | | | 250,000 | | | | 257,585 | |
5.000%, 12/1/2023 | | | 320,000 | | | | 343,136 | |
Northampton County General Purpose Authority, 1.160%, (LIBOR 1 Month), 8/15/2048, Call 2/15/2023 (1) | | | 1,000,000 | | | | 995,930 | |
Pennsylvania Turnpike Commission, 1.140%, (SIFMA Municipal Swap Index Yield), 12/1/2021, Call 6/1/2021 (1) | | | 80,000 | | | | 80,322 | |
| | | | | | | | |
| | | | | | | 3,742,231 | |
South Carolina — 1.0% | | | | | | | | |
Patriots Energy Group Financing Agency, 0.975%, (LIBOR 1 Month), 10/1/2048, Call 11/1/2023 (1) | | | 1,000,000 | | | | 1,001,160 | |
South Carolina Educational Facilities Authority, 0.190%, 10/1/2039, Call 9/22/2020 (1) | | | 300,000 | | | | 300,000 | |
| | | | | | | | |
| | | | | | | 1,301,160 | |
Tennessee — 2.4% | | | | | | | | |
Metropolitan Government Nashville & Davidson County Health & Educational Facility Board, 2.000%, 1/1/2022 (1) | | | 1,000,000 | | | | 1,005,130 | |
Tennessee Energy Acquisition Corp.: | | | | | | | | |
4.000%, 5/1/2048, Call 2/1/2023 (1) | | | 1,000,000 | | | | 1,080,690 | |
5.000%, 2/1/2023 | | | 790,000 | | | | 872,460 | |
5.250%, 9/1/2020 | | | 10,000 | | | | 10,000 | |
5.250%, 9/1/2021 | | | 55,000 | | | | 57,561 | |
| | | | | | | | |
| | | | | | | 3,025,841 | |
Texas — 5.1% | | | | | | | | |
City of Dallas Housing Finance Corp., 1.500%, 4/1/2023 (1) | | | 900,000 | | | | 918,351 | |
Crane County Water District, 3.000%, 2/15/2021 | | | 605,000 | | | | 612,133 | |
Fort Bend Independent School District, PSF: | | | | | | | | |
0.875%, 8/1/2050 (1) | | | 500,000 | | | | 504,065 | |
1.950%, 8/1/2049 (1) | | | 845,000 | | | | 869,125 | |
Harris County Cultural Education Facilities Finance Corp., 0.990%, (SIFMA Municipal Swap Index Yield), 6/1/2021 (1) | | | 350,000 | | | | 350,546 | |
Irving Hospital Authority, 5.000%, 10/15/2022 | | | 215,000 | | | | 235,103 | |
New Hope Cultural Education Facilities Finance Corp.: | | | | | | | | |
3.375%, 8/15/2021 (2) | | | 140,000 | | | | 140,109 | |
4.000%, 11/15/2021 | | | 615,000 | | | | 618,708 | |
North Texas Tollway Authority, 5.000%, 1/1/2022 | | | 250,000 | | | | 265,590 | |
| | | | | | | | |
Tarrant County Cultural Education Facilities Finance Corp.: | | | | | | | | |
5.000%, 5/15/2021 | | | 500,000 | | | | 508,320 | |
5.000%, 11/15/2022 | | | 1,000,000 | | | | 1,073,280 | |
Texas State University System, 5.000%, 3/15/2022 | | | 350,000 | | | | 375,585 | |
| | | | | | | | |
| | | | | | | 6,470,915 | |
Virginia — 1.7% | | | | | | | | |
Albermarle County Economic Development Authority, 0.180%, 10/1/2048, Call 9/1/2020 | | | 500,000 | | | | 500,000 | |
Henrico County Economic Development Authority, 5.000%, 10/1/2023 | | | 575,000 | | | | 624,663 | |
Henrico County Economic Development Authority, AGM, 0.308%, 8/23/2027, Call 9/1/2020 (1)(3) | | | 1,000,000 | | | | 1,000,000 | |
| | | | | | | | |
| | | | | | | 2,124,663 | |
Washington — 1.8% | | | | | | | | |
State of Washington, 5.000%, 2/1/2022 | | | 1,000,000 | | | | 1,068,470 | |
Washington State Housing Finance Commission, 2.375%, 1/1/2026, Call 7/1/2021 (2) | | | 1,000,000 | | | | 934,560 | |
Washington State Housing Finance Commission, GNMA/FNMA/FHLMC, 5.000%, 10/1/2020 | | | 320,000 | | | | 321,216 | |
| | | | | | | | |
| | | | | | | 2,324,246 | |
West Virginia — 1.7% | | | | | | | | |
West Virginia Economic Development Authority, 2.550%, 3/1/2040 (1) | | | 1,000,000 | | | | 1,055,280 | |
West Virginia Hospital Finance Authority: | | | | | | | | |
5.000%, 1/1/2022 | | | 520,000 | | | | 547,602 | |
5.000%, 1/1/2023 | | | 555,000 | | | | 605,838 | |
| | | | | | | | |
| | | | | | | 2,208,720 | |
Wisconsin — 2.2% | | | | | | | | |
Public Finance Authority: | | | | | | | | |
5.000%, 11/15/2021 | | | 610,000 | | | | 630,142 | |
5.000%, 11/15/2022 | | | 500,000 | | | | 528,595 | |
State of Wisconsin: | | | | | | | | |
5.000%, 9/1/2020 | | | 175,000 | | | | 175,000 | |
5.000%, 3/1/2021 | | | 300,000 | | | | 307,230 | |
Wisconsin Health & Educational Facilities Authority: | | | | | | | | |
0.750%, 2/15/2053, Call 9/1/2020 (1) | | | 750,000 | | | | 750,000 | |
5.000%, 8/15/2022 | | | 200,000 | | | | 217,262 | |
5.000%, 8/15/2023 | | | 205,000 | | | | 231,472 | |
| | | | | | | | |
| | | | | | | 2,839,701 | |
| | | | | | | | |
Total Municipals
(identified cost $124,927,263) | | | | | | | 127,061,534 | |
| | | | | | | | |
| | |
Short-Term Investments — 0.7% | | | | | | | | |
| | |
Repurchase Agreements — 0.7% | | | | | | | | |
Agreement with Fixed Income Clearing Corp., 0.080%, dated 8/31/2020, to be repurchased at $902,981 on 9/1/2020, collateralized by U.S. Government Treasury Obligation with a maturity of 8/31/2022, with a fair value of $921,048 | | | 902,979 | | | | 902,979 | |
| | | | | | | | |
Total Short-Term Investments
(identified cost $902,978) | | | | | | | 902,979 | |
| | | | | | | | |
| | |
Total Investments — 100.0%
(identified cost $125,830,241) | | | | | | | 127,964,513 | |
| | |
Other Assets and Liabilities — (0.0)% | | | | | | | (14,934 | ) |
| | | | | | | | |
Total Net Assets — 100.0% | | | | | | $ | 127,949,579 | |
| | | | | | | | |
| (1) | Denotes a variable rate security. The rate shown is the current interest rate as of August 31, 2020. Rate fluctuations are based underlying positions and/or other variables. For securities whose yields vary with a designated market index or market rate, the reference rate and spread are indicated in the description. |
| (2) | Denotes a restricted security which is subject to restrictions on resale under federal securities laws. These securities have been deemed liquid based on criteria approved by the Board of Directors of the BMO Funds. At August 31, 2020 these securities amounted to: |
| | | | | | | | |
| Fund | | Amount | | | % of Total
Net Assets | |
Short Tax-Free Fund | | | 4,995,782 | | | | 3.90 | |
| (3) | Issue represents an Auction Rate Security. An Auction Rate Security is a corporate or municipal bond debt instrument with a long nominal maturity for which the interest rate is regularly reset through a Dutch auction. The rate presented is either the rate set through the auction or the maximum interest rate provided for in the security issuance provision. |
Ultra Short Tax-Free Fund
| | | | | | | | |
Description | |
| Shares or
Principal
Amount |
| | | Value | |
| | |
Municipals — 94.4% | | | | | | | | |
| | |
Alabama — 2.0% | | | | | | | | |
Alabama Housing Finance Authority, 1.500%, 11/1/2022 (1) | | $ | 3,000,000 | | | $ | 3,047,220 | |
Birmingham Airport Authority, BAM: | | | | | | | | |
5.000%, 7/1/2023 | | | 225,000 | | | | 251,201 | |
5.000%, 7/1/2024 | | | 325,000 | | | | 375,466 | |
Black Belt Energy Gas District: | | | | | | | | |
1.015%, (LIBOR 1 Month), 12/1/2048, Call 9/1/2023 (1) | | | 4,500,000 | | | | 4,483,260 | |
4.000%, 6/1/2021 | | | 1,000,000 | | | | 1,025,680 | |
4.000%, 6/1/2022 | | | 1,000,000 | | | | 1,059,560 | |
Columbia Industrial Development Board, 0.200%, 12/1/2037, Call 9/1/2020 (1) | | | 400,000 | | | | 400,000 | |
| | | | | | | | |
| | | | | | | 10,642,387 | |
Arizona — 1.0% | | | | | | | | |
Arizona Industrial Development Authority, 0.020%, 2/1/2048, Call 8/31/2020 | | | 2,925,000 | | | | 2,925,000 | |
Maricopa County Pollution Control Corp., 1.050%, 1/1/2038 (1) | | | 2,250,000 | | | | 2,256,165 | |
| | | | | | | | |
| | | | | | | 5,181,165 | |
California — 3.4% | | | | | | | | |
Bay Area Toll Authority, 1.260%, (SIFMA Municipal Swap Index Yield), 4/1/2045, Call 10/1/2023 (1) | | | 1,750,000 | | | | 1,761,095 | |
California County Tobacco Securitization Agency: | | | | | | | | |
3.000%, 6/1/2021 | | | 300,000 | | | | 306,108 | |
4.000%, 6/1/2022 | | | 250,000 | | | | 265,967 | |
California Pollution Control Financing Authority: | | | | | | | | |
0.600%, 8/1/2040 | | | 3,700,000 | | | | 3,691,897 | |
0.600%, 11/1/2042 (1)(2) | | | 2,000,000 | | | | 2,000,100 | |
Metropolitan Water District of Southern California, 0.020%, 7/1/2035, Call 9/1/2020 | | | 1,500,000 | | | | 1,500,000 | |
State of California: | | | | | | | | |
0.450%, (SIFMA Municipal Swap Index Yield), 12/1/2028, Call 9/21/2020 (1) | | | 750,000 | | | | 750,030 | |
0.874%, (LIBOR 1 Month), 12/1/2031, Call 6/1/2021 (1) | | | 500,000 | | | | 500,170 | |
Tender Option Bond Trust Receipts/Certificates: | | | | | | | | |
0.190%, 11/15/2049, Call 11/15/2026 (1)(2) | | | 3,750,000 | | | | 3,750,000 | |
0.240%, 12/1/2030 (1)(2) | | | 3,855,000 | | | | 3,855,000 | |
| | | | | | | | |
| | | | | | | 18,380,367 | |
Colorado — 1.7% | | | | | | | | |
City & County of Denver Airport System Revenue, AGC, 0.990%, 11/15/2025, Call 8/31/2020 (1)(3) | | | 475,000 | | | | 475,000 | |
Colorado Health Facilities Authority, 5.000%, 6/1/2022 | | | 1,000,000 | | | | 1,081,290 | |
Colorado School of Mines, 0.615%, (LIBOR 1 Month), 2/1/2023, Call 8/1/2022 (1) | | | 1,165,000 | | | | 1,148,352 | |
E-470 Public Highway Authority, 0.524%, (LIBOR 1 Month), 9/1/2039, Call 9/21/2020 (1) | | | 1,370,000 | | | | 1,362,356 | |
Tender Option Bond Trust Receipts/Certificates, 0.530%, 2/1/2021 (1)(2) | | | 5,000,000 | | | | 5,000,000 | |
| | | | | | | | |
| | | | | | | 9,066,998 | |
Connecticut — 1.4% | | | | | | | | |
City of New Haven: | | | | | | | | |
5.000%, 2/1/2022 | | | 350,000 | | | | 367,829 | |
5.000%, 8/1/2022 | | | 1,025,000 | | | | 1,089,811 | |
City of New Haven, AGM: | | | | | | | | |
5.000%, 2/1/2023 | | | 580,000 | | | | 634,236 | |
5.000%, 8/1/2023 | | | 1,080,000 | | | | 1,201,068 | |
Town of Windham, 3.000%, 10/1/2020 | | | 4,000,000 | | | | 4,007,480 | |
| | | | | | | | |
| | | | | | | 7,300,424 | |
| | | | | | | | |
District of Columbia — 0.5% | | | | | | | | |
District of Columbia Housing Finance Agency, AGM, 5.000%, 7/1/2021, Call 10/1/2020 | | | 360,000 | | | | 361,397 | |
Washington Convention & Sports Authority, 5.000%, 10/1/2020 | | | 2,500,000 | | | | 2,504,650 | |
| | | | | | | | |
| | | | | | | 2,866,047 | |
Florida — 6.5% | | | | | | | | |
Broward County Housing Finance Authority, 1.400%, 5/1/2022 (1) | | | 2,500,000 | | | | 2,515,900 | |
City of Atlantic Beach, 3.000%, 11/15/2023, Call 10/1/2020 | | | 2,000,000 | | | | 2,001,200 | |
City of Jacksonville, 0.180%, 5/1/2029, Call 8/31/2020 (1) | | | 290,000 | | | | 290,000 | |
County of Escambia, 0.220%, 4/1/2039, Call 8/31/2020 (1) | | | 5,900,000 | | | | 5,900,000 | |
County of St. Lucie, 0.190%, 9/1/2028, Call 8/31/2020 (1) | | | 1,000,000 | | | | 1,000,000 | |
Florida Development Finance Corp., 0.550%, 1/1/2049, Call 10/1/2020 (1) | | | 10,000,000 | | | | 9,999,600 | |
JEA Electric System Revenue, 0.190%, 10/1/2038, Call 8/31/2020 (1) | | | 1,025,000 | | | | 1,025,000 | |
JEA Water & Sewer System Revenue, 0.030%, 10/1/2038, Call 8/31/2020 (1) | | | 1,600,000 | | | | 1,600,000 | |
Miami-Dade County Housing Finance Authority, 0.600%, 12/1/2022, Call 6/1/2021 (1) | | | 1,000,000 | | | | 1,001,170 | |
Miami-Dade County Industrial Development Authority, 1.600%, 11/1/2041 (1) | | | 1,400,000 | | | | 1,402,464 | |
Tender Option Bond Trust Receipts/Certificates, 0.390%, 4/1/2053, Call 4/1/2028 (1)(2) | | | 8,000,000 | | | | 8,000,000 | |
| | | | | | | | |
| | | | | | | 34,735,334 | |
Georgia — 4.7% | | | | | | | | |
Bartow County Development Authority, 2.050%, 9/1/2029 (1) | | | 1,400,000 | | | | 1,424,682 | |
Burke County Development Authority: | | | | | | | | |
0.230%, 11/1/2052, Call 9/1/2020 (1) | | | 1,220,000 | | | | 1,220,000 | |
1.550%, 12/1/2049 (1) | | | 3,000,000 | | | | 3,025,530 | |
2.250%, 10/1/2032 (1) | | | 4,000,000 | | | | 4,119,520 | |
Development Authority of Appling County, 0.240%, 9/1/2029, Call 8/31/2020 (1) | | | 1,300,000 | | | | 1,300,000 | |
Development Authority of Monroe County, 1.500%, 1/1/2039 (1) | | | 2,000,000 | | | | 2,011,300 | |
Main Street Natural Gas, Inc.: | | | | | | | | |
0.730%, (SIFMA Municipal Swap Index Yield), 8/1/2048, Call 9/1/2023 (1) | | | 5,000,000 | | | | 4,990,200 | |
0.865%, (LIBOR 1 Month), 4/1/2048, Call 6/1/2023 (1) | | | 5,000,000 | | | | 4,994,250 | |
5.000%, 5/15/2021 | | | 700,000 | | | | 719,250 | |
Municipal Electric Authority of Georgia: | | | | | | | | |
5.000%, 1/1/2022 | | | 380,000 | | | | 402,910 | |
5.000%, 1/1/2023 | | | 805,000 | | | | 886,201 | |
| | | | | | | | |
| | | | | | | 25,093,843 | |
Idaho — 0.8% | | | | | | | | |
Idaho Housing & Finance Association, 0.280%, 1/1/2038, Call 9/1/2020 (1) | | | 4,490,000 | | | | 4,490,000 | |
| | |
Illinois — 10.1% | | | | | | | | |
Chicago Housing Authority, HUD SEC 8, 5.000%, 1/1/2021 | | | 1,400,000 | | | | 1,418,228 | |
Chicago O’Hare International Airport: | | | | | | | | |
5.000%, 1/1/2023 | | | 1,000,000 | | | | 1,094,760 | |
5.000%, 1/1/2023 | | | 825,000 | | | | 903,177 | |
Chicago Park District: | | | | | | | | |
5.000%, 1/1/2023 | | | 4,780,000 | | | | 5,152,219 | |
5.000%, 1/1/2023, Call 1/1/2022 | | | 285,000 | | | | 297,768 | |
City of Chicago: | | | | | | | | |
5.000%, 1/1/2021 | | | 200,000 | | | | 201,532 | |
5.000%, 1/1/2022 | | | 300,000 | | | | 309,186 | |
5.000%, 1/1/2023 | | | 400,000 | | | | 425,236 | |
City of Chicago Waterworks Revenue, 5.000%, 11/1/2021 | | | 1,000,000 | | | | 1,050,710 | |
City of Granite, 2.450%, 5/1/2027 (1) | | | 3,000,000 | | | | 3,036,810 | |
Cook County School District No 99 Cicero: | | | | | | | | |
5.000%, 12/1/2020 | | | 555,000 | | | | 561,493 | |
5.000%, 12/1/2021 | | | 575,000 | | | | 608,465 | |
Illinois Development Finance Authority, 1.600%, 11/1/2044, Call 10/1/2020 (1) | | | 5,000,000 | | | | 5,008,800 | |
Illinois Finance Authority: | | | | | | | | |
0.700%, 5/1/2040 | | | 2,800,000 | | | | 2,795,548 | |
0.910%, (SIFMA Municipal Swap Index Yield), 1/1/2046, Call 7/1/2022 (1) | | | 2,000,000 | | | | 1,990,700 | |
5.000%, 10/1/2023 | | | 250,000 | | | | 279,803 | |
5.000%, 10/1/2024 | | | 250,000 | | | | 288,462 | |
Illinois Housing Development Authority, 1.900%, 10/1/2022 (1) | | | 1,790,000 | | | | 1,820,072 | |
Lake County Forest Preserve District, 0.690%, (LIBOR 3 Month), 12/15/2020 (1) | | | 130,000 | | | | 129,882 | |
Northern Illinois University, BAM, 5.000%, 4/1/2024 | | | 500,000 | | | | 568,055 | |
| | | | | | | | |
Rockford Park District, 3.000%, 12/15/2020 | | | 1,165,000 | | | | 1,172,468 | |
Sales Tax Securitization Corp., 5.000%, 1/1/2025 | | | 500,000 | | | | 574,445 | |
Sangamon County School District No 186 Springfield, AGM: | | | | | | | | |
4.000%, 6/1/2022 | | | 750,000 | | | | 789,622 | |
4.000%, 6/1/2023 | | | 1,000,000 | | | | 1,081,660 | |
State of Illinois: | | | | | | | | |
4.000%, 6/15/2021 | | | 355,000 | | | | 362,242 | |
4.875%, 5/1/2021 | | | 250,000 | | | | 255,448 | |
5.000%, 10/1/2021 | | | 1,500,000 | | | | 1,555,050 | |
5.000%, 11/1/2021 | | | 7,000,000 | | | | 7,259,980 | |
5.000%, 2/1/2022 | | | 6,040,000 | | | | 6,328,470 | |
5.000%, 12/1/2022 | | | 1,000,000 | | | | 1,068,080 | |
5.125%, 5/1/2022 | | | 500,000 | | | | 528,985 | |
5.375%, 5/1/2023 | | | 250,000 | | | | 271,165 | |
5.500%, 5/1/2024 | | | 500,000 | | | | 555,595 | |
Tender Option Bond Trust Receipts/Certificates, AGM, 0.190%, 12/1/2020 (1)(2) | | | 3,015,000 | | | | 3,015,000 | |
Will County Community High School District No 210 Lincoln-Way, AGM, 4.000%, 1/1/2022 | | | 975,000 | | | | 1,003,918 | |
Will County Community Unit School District No. 201-U Crete-Monee, NATL-RE, 0.000%, 11/1/2021 | | | 435,000 | | | | 431,968 | |
| | | | | | | | |
| | | | | | | 54,195,002 | |
Indiana — 3.4% | | | | | | | | |
Center Grove Multi-Facility School Building Corp., 2.500%, 12/15/2020, Call 10/1/2020 | | | 3,000,000 | | | | 3,004,890 | |
City of Rockport: | | | | | | | | |
1.350%, 7/1/2025 (1) | | | 1,000,000 | | | | 1,009,280 | |
1.350%, 7/1/2025 (1) | | | 1,000,000 | | | | 1,009,370 | |
City of Whiting, 5.000%, 11/1/2045 (1) | | | 1,345,000 | | | | 1,471,726 | |
Indiana Finance Authority, 0.650%, 12/1/2037 (1) | | | 3,000,000 | | | | 3,000,000 | |
Indianapolis Local Public Improvement Bond Bank, 1.450%, 6/1/2021, Call 10/1/2020 | | | 3,750,000 | | | | 3,750,150 | |
Lafayette School Corp., 4.000%, 1/15/2021 | | | 425,000 | | | | 430,176 | |
Noblesville Multi School Building Corp., 5.000%, 7/15/2021 | | | 2,160,000 | | | | 2,226,442 | |
Tender Option Bond Trust Receipts/Certificates, 0.470%, 10/1/2020 (1)(2) | | | 2,125,000 | | | | 2,125,000 | |
| | | | | | | | |
| | | | | | | 18,027,034 | |
Iowa — 1.9% | | | | | | | | |
City of Waverly, 2.500%, 12/31/2022, Call 7/1/2022 | | | 3,500,000 | | | | 3,578,085 | |
Iowa Finance Authority: | | | | | | | | |
0.735%, (SIFMA Municipal Swap Index Yield), 2/15/2035, Call 3/20/2021 (1)(2) | | | 3,995,000 | | | | 3,968,313 | |
2.875%, 5/15/2049, Call 11/15/2020 | | | 1,000,000 | | | | 1,004,310 | |
Iowa Finance Authority, GNMA/FNMA/FHLMC, 0.460%, (SIFMA Municipal Swap Index Yield), 7/1/2047, Call 11/2/2020 (1) | | | 1,500,000 | | | | 1,500,075 | |
| | | | | | | | |
| | | | | | | 10,050,783 | |
Kansas — 1.5% | | | | | | | | |
City of Andover, 1.625%, 10/1/2022, Call 10/1/2020 | | | 2,190,000 | | | | 2,192,300 | |
City of Holton, 2.500%, 7/1/2021, Call 1/1/2021 | | | 1,245,000 | | | | 1,250,179 | |
City of Lenexa, 1.625%, 9/1/2021, Call 10/1/2020 | | | 1,000,000 | | | | 1,000,770 | |
City of Washington, 2.000%, 12/1/2022, Call 12/1/2020 | | | 3,000,000 | | | | 3,012,210 | |
State of Kansas Department of Transportation, 0.420%, (LIBOR 1 Month), 9/1/2021 (1) | | | 400,000 | | | | 399,884 | |
| | | | | | | | |
| | | | | | | 7,855,343 | |
Kentucky — 7.8% | | | | | | | | |
City of Ashland: | | | | | | | | |
5.000%, 2/1/2021 | | | 385,000 | | | | 390,517 | |
5.000%, 2/1/2022 | | | 475,000 | | | | 497,586 | |
County of Carroll, 1.200%, 10/1/2034 (1) | | | 5,000,000 | | | | 5,000,550 | |
County of Owen, 0.700%, 6/1/2040 | | | 2,300,000 | | | | 2,294,963 | |
Kentucky Economic Development Finance Authority: | | | | | | | | |
0.250%, 5/1/2034, Call 8/31/2020 | | | 9,735,000 | | | | 9,735,000 | |
0.650%, 4/1/2031 (1) | | | 2,000,000 | | | | 2,000,000 | |
Kentucky Higher Education Student Loan Corp., 5.000%, 6/1/2021 | | | 1,000,000 | | | | 1,025,210 | |
Kentucky Housing Corp., 2.000%, 4/1/2022 (1) | | | 1,400,000 | | | | 1,413,552 | |
| | | | | | | | |
Kentucky Public Energy Authority, 1.235%, (LIBOR 1 Month), 12/1/2049, Call 3/1/2025 (1) | | | 5,000,000 | | | | 5,009,850 | |
Kentucky Rural Water Finance Corp.: | | | | | | | | |
1.250%, 2/1/2022, Call 2/1/2021 | | | 6,770,000 | | | | 6,783,405 | |
1.450%, 6/1/2021, Call 12/1/2020 | | | 5,500,000 | | | | 5,514,630 | |
Louisville/Jefferson County Metropolitan Government, 1.850%, 10/1/2033 (1) | | | 2,000,000 | | | | 2,012,940 | |
| | | | | | | | |
| | | | | | | 41,678,203 | |
Louisiana — 1.2% | | | | | | | | |
Consolidated Government of the City of Baton Rouge & Parish of East Baton Rouge, 5.000%, 8/1/2021 (4) | | | 1,050,000 | | | | 1,091,685 | |
Louisiana Housing Corp., FHA, 2.500%, 12/1/2031, Call 10/1/2020 | | | 350,000 | | | | 355,579 | |
Louisiana Public Facilities Authority, 0.810%, (SIFMA Municipal Swap Index Yield), 9/1/2057, Call 3/1/2023 (1) | | | 5,000,000 | | | | 4,960,600 | |
| | | | | | | | |
| | | | | | | 6,407,864 | |
Maryland — 0.8% | | | | | | | | |
Maryland Economic Development Corp., 1.700%, 9/1/2022 | | | 4,000,000 | | | | 4,087,240 | |
Massachusetts — 0.1% | | | | | | | | |
Massachusetts Development Finance Agency: | | | | | | | | |
2.450%, 5/1/2027 (1)(2) | | | 250,000 | | | | 253,068 | |
5.000%, 7/1/2021 | | | 300,000 | | | | 309,720 | |
| | | | | | | | |
| | | | | | | 562,788 | |
Michigan — 3.0% | | | | | | | | |
Michigan Finance Authority: | | | | | | | | |
0.652%, (LIBOR 1 Month), 12/1/2039, Call 10/1/2020 (1) | | | 200,000 | | | | 199,934 | |
3.500%, 11/15/2044 (1) | | | 3,175,000 | | | | 3,366,897 | |
Taylor Tax Increment Finance Authority, AGM, 4.000%, 5/1/2021, Call 10/1/2020 | | | 600,000 | | | | 601,830 | |
Tender Option Bond Trust Receipts/Certificates, Q-SBLF, 0.190%, 5/1/2028 (1)(2) | | | 11,335,000 | | | | 11,335,000 | |
Wayne-Westland Community Schools, Q-SBLF, 4.000%, 11/1/2020 | | | 500,000 | | | | 503,020 | |
| | | | | | | | |
| | | | | | | 16,006,681 | |
Mississippi — 2.2% | | | | | | | | |
Mississippi Business Finance Corp.: | | | | | | | | |
0.410%, 7/1/2025, Call 8/31/2020 (1) | | | 3,000,000 | | | | 3,000,000 | |
0.410%, 5/1/2028, Call 8/31/2020 (1) | | | 3,000,000 | | | | 3,000,000 | |
Mississippi Development Bank: | | | | | | | | |
5.000%, 9/1/2022 | | | 250,000 | | | | 271,387 | |
5.000%, 9/1/2023 | | | 700,000 | | | | 787,703 | |
5.000%, 9/1/2025 | | | 400,000 | | | | 478,168 | |
State of Mississippi: | | | | | | | | |
5.000%, 10/15/2022 | | | 1,000,000 | | | | 1,088,390 | |
5.000%, 10/15/2024 | | | 2,735,000 | | | | 3,168,908 | |
| | | | | | | | |
| | | | | | | 11,794,556 | |
Missouri — 1.3% | | | | | | | | |
City of St. Louis, 2.000%, 6/1/2021 | | | 3,000,000 | | | | 3,031,590 | |
Health & Educational Facilities Authority of the State of Missouri, 2.875%, 2/1/2034, Call 9/21/2020 | | | 765,000 | | | | 761,894 | |
Missouri Public Utilities Commission, 1.500%, 3/1/2021, Call 9/21/2020 | | | 3,275,000 | | | | 3,276,834 | |
| | | | | | | | |
| | | | | | | 7,070,318 | |
Nebraska — 0.4% | | | | | | | | |
Central Plains Energy Project: | | | | | | | | |
4.000%, 8/1/2021 | | | 1,000,000 | | | | 1,032,900 | |
4.000%, 8/1/2022 | | | 1,000,000 | | | | 1,067,950 | |
| | | | | | | | |
| | | | | | | 2,100,850 | |
New Jersey — 1.6% | | | | | | | | |
City of Newark, AGM SAW, 5.000%, 10/1/2023 | | | 630,000 | | | | 713,311 | |
City of Newark, AGM School Bond Gty, 5.000%, 10/1/2023 | | | 350,000 | | | | 396,284 | |
City of Newark, SAW: | | | | | | | | |
5.000%, 10/1/2021 | | | 100,000 | | | | 104,498 | |
5.000%, 10/1/2022 | | | 700,000 | | | | 760,165 | |
City of Newark, School Bond Gty: | | | | | | | | |
5.000%, 10/1/2021 | | | 250,000 | | | | 261,468 | |
5.000%, 10/1/2022 | | | 400,000 | | | | 434,812 | |
Lyndhurst Township School District, 1.875%, 9/10/2020 | | | 1,100,000 | | | | 1,100,440 | |
| | | | | | | | |
New Jersey Economic Development Authority, 1.200%, 11/1/2034 (1) | | | 2,500,000 | | | | 2,536,975 | |
New Jersey Turnpike Authority: | | | | | | | | |
0.460%, (LIBOR 1 Month), 1/1/2021 (1) | | | 1,750,000 | | | | 1,749,020 | |
0.600%, (LIBOR 1 Month), 1/1/2022 (1) | | | 750,000 | | | | 747,870 | |
| | | | | | | | |
| | | | | | | 8,804,843 | |
New Mexico — 0.6% | | | | | | | | |
City of Farmington, 1.200%, 6/1/2040 (1) | | | 1,250,000 | | | | 1,256,400 | |
City of Santa Fe, 2.250%, 5/15/2024, Call 11/15/2021 | | | 500,000 | | | | 485,740 | |
New Mexico Hospital Equipment Loan Council, 2.250%, 7/1/2023, Call 1/1/2021 | | | 1,525,000 | | | | 1,484,450 | |
| | | | | | | | |
| | | | | | | 3,226,590 | |
New York — 9.1% | | | | | | | | |
City of New York, AGC, 0.790%, 10/1/2021, Call 9/1/2020 (1)(3) | | | 100,000 | | | | 100,000 | |
County of Suffolk, 2.000%, 9/25/2020 | | | 4,000,000 | | | | 4,003,000 | |
Hempstead Union Free School District, SAW: | | | | | | | | |
1.500%, 6/30/2021 | | | 4,000,000 | | | | 4,022,440 | |
1.750%, 12/15/2020, Call 10/1/2020 | | | 1,200,000 | | | | 1,203,348 | |
Long Island Power Authority, 0.870%, (LIBOR 1 Month), 5/1/2033, Call 10/1/2022 (1) | | | 4,000,000 | | | | 3,988,280 | |
Metropolitan Transportation Authority: | | | | | | | | |
0.610%, (SIFMA Municipal Swap Index Yield), 11/15/2044 (1) | | | 3,000,000 | | | | 2,857,350 | |
0.665%, (LIBOR 1 Month), 11/1/2030 (1) | | | 2,970,000 | | | | 2,820,163 | |
5.000%, 5/15/2021 | | | 2,500,000 | | | | 2,542,825 | |
5.000%, 9/1/2022 | | | 6,000,000 | | | | 6,266,160 | |
5.000%, 2/1/2023 | | | 2,645,000 | | | | 2,780,689 | |
New York State Dormitory Authority, 5.000%, 3/31/2021 | | | 3,000,000 | | | | 3,084,630 | |
Oyster Bay, 2.000%, 3/12/2021 | | | 2,000,000 | | | | 2,017,360 | |
Tender Option Bond Trust Receipts/Certificates, 0.240%, 8/1/2021 (1)(2) | | | 5,335,000 | | | | 5,335,000 | |
Town of Oyster Bay, 4.000%, 8/27/2021 | | | 2,000,000 | | | | 2,070,580 | |
Town of Oyster Bay, BAM, 4.000%, 11/1/2023 (4) | | | 1,000,000 | �� | | | 1,110,760 | |
Triborough Bridge & Tunnel Authority, 0.815%, (LIBOR 1 Month), 1/1/2032 (1) | | | 4,845,000 | | | | 4,848,052 | |
| | | | | | | | |
| | | | | | | 49,050,637 | |
North Dakota — 0.1% | | | | | | | | |
City of Williston, 5.000%, 7/15/2021 | | | 750,000 | | | | 777,495 | |
| | |
Ohio — 3.2% | | | | | | | | |
American Municipal Power, Inc., 2.250%, 12/3/2020 | | | 765,000 | | | | 768,787 | |
City of Cleveland Airport System Revenue, 5.000%, 1/1/2023 | | | 3,100,000 | | | | 3,371,932 | |
City of North Olmsted, 2.000%, 3/10/2021 | | | 1,020,000 | | | | 1,026,181 | |
County of Lorain, 1.300%, 2/6/2021, Call 10/1/2020 | | | 805,000 | | | | 805,403 | |
County of Union, 2.000%, 9/9/2020 | | | 1,500,000 | | | | 1,500,585 | |
Ohio Housing Finance Agency, 1.750%, 6/1/2022, Call 6/1/2021 (1) | | | 2,775,000 | | | | 2,806,912 | |
Port of Greater Cincinnati Development Authority, 3.000%, 5/1/2023, Call 5/1/2022 | | | 6,000,000 | | | | 6,013,080 | |
Village of Oakwood, 2.250%, 9/17/2020 | | | 1,000,000 | | | | 1,000,880 | |
| | | | | | | | |
| | | | | | | 17,293,760 | |
Oklahoma — 1.4% | | | | | | | | |
Canadian County Educational Facilities Authority, 5.000%, 12/1/2020 | | | 1,900,000 | | | | 1,916,378 | |
Oklahoma Development Finance Authority, 1.625%, 7/6/2023, Call 6/30/2022 | | | 4,400,000 | | | | 4,393,400 | |
Oklahoma Housing Finance Agency, 1.600%, 7/1/2022 (1) | | | 1,000,000 | | | | 1,010,520 | |
| | | | | | | | |
| | | | | | | 7,320,298 | |
Pennsylvania — 5.3% | | | | | | | | |
Berks County Municipal Authority: | | | | | | | | |
5.000%, 2/1/2022 | | | 500,000 | | | | 518,770 | |
5.000%, 2/1/2023 | | | 1,300,000 | | | | 1,378,624 | |
Bethlehem Area School District, SAW, 0.597%, (LIBOR 1 Month), 7/1/2031, Call 11/2/2020 (1) | | | 2,985,000 | | | | 2,962,374 | |
Delaware County Industrial Development Authority, 0.300%, 9/1/2045, Call 8/31/2020 (1) | | | 2,300,000 | | | | 2,300,000 | |
Manheim Township School District, 0.586%, (LIBOR 1 Month), 5/1/2025, Call 5/1/2021 (1) | | | 2,000,000 | | | | 1,989,060 | |
| | | | | | | | |
Montgomery County Higher Education & Health Authority, 0.880%, (SIFMA Municipal Swap Index Yield), 9/1/2051, Call 9/21/2020 (1) | | | 2,500,000 | | | | 2,500,075 | |
Northampton County General Purpose Authority, 1.160%, (LIBOR 1 Month), 8/15/2048, Call 2/15/2023 (1) | | | 1,000,000 | | | | 995,930 | |
Pennsylvania Economic Development Financing Authority: | | | | | | | | |
0.600%, 4/1/2034 (1) | | | 1,100,000 | | | | 1,100,055 | |
1.700%, 8/1/2037 (1)(4) | | | 5,000,000 | | | | 5,004,100 | |
2.150%, 11/1/2021 (1) | | | 2,000,000 | | | | 2,033,780 | |
2.625%, 11/1/2021 | | | 1,000,000 | | | | 1,020,270 | |
Tender Option Bond Trust Receipts/Certificates, 0.420%, 12/1/2024 (1)(2) | | | 6,910,000 | | | | 6,910,000 | |
| | | | | | | | |
| | | | | | | 28,713,038 | |
South Carolina — 1.4% | | | | | | | | |
Patriots Energy Group Financing Agency, 0.975%, (LIBOR 1 Month), 10/1/2048, Call 11/1/2023 (1) | | | 6,000,000 | | | | 6,006,960 | |
South Carolina Jobs-Economic Development Authority, 0.670%, 5/1/2048, Call 8/31/2020 (1) | | | 1,500,000 | | | | 1,500,000 | |
| | | | | | | | |
| | | | | | | 7,506,960 | |
Tennessee — 1.1% | | | | | | | | |
Shelby County Health Educational & Housing Facilities Board, AGM, 0.030%, 6/1/2042, Call 8/31/2020 (1) | | | 1,195,000 | | | | 1,195,000 | |
Tennessee Energy Acquisition Corp., 5.250%, 9/1/2020 | | | 4,720,000 | | | | 4,720,000 | |
| | | | | | | | |
| | | | | | | 5,915,000 | |
Texas — 3.8% | | | | | | | | |
City of Dallas Housing Finance Corp., 1.500%, 4/1/2023 (1) | | | 3,400,000 | | | | 3,469,326 | |
Gulf Coast Authority, 2.450%, 5/1/2028 (1) | | | 250,000 | | | | 253,068 | |
Irving Hospital Authority, 1.260%, (SIFMA Municipal Swap Index Yield), 10/15/2044, Call 4/15/2023 (1) | | | 1,000,000 | | | | 977,050 | |
Matagorda County Navigation District No. 1, 0.900%, 5/1/2030 (4) | | | 3,000,000 | | | | 2,992,380 | |
Mission Economic Development Corp., 1.500%, 5/1/2050 (1)(4) | | | 10,000,000 | | | | 9,999,300 | |
Texas Municipal Gas Acquisition & Supply Corp., 5.000%, 12/15/2020 | | | 2,950,000 | | | | 2,983,482 | |
| | | | | | | | |
| | | | | | | 20,674,606 | |
Virginia — 2.1% | | | | | | | | |
Halifax County Industrial Development Authority, 0.450%, 12/1/2041 (4) | | | 2,000,000 | | | | 1,999,680 | |
Hampton Redevelopment & Housing Authority, 1.460%, 12/1/2022, Call 12/1/2021 (1) | | | 4,000,000 | | | | 4,050,520 | |
Henrico County Economic development Authority, 5.000%, 10/1/2020 | | | 900,000 | | | | 902,214 | |
Westmoreland County Industrial Development Authority, 2.000%, 6/1/2022, Call 12/1/2021 | | | 4,300,000 | | | | 4,393,654 | |
| | | | | | | | |
| | | | | | | 11,346,068 | |
Washington — 1.8% | | | | | | | | |
Tender Option Bond Trust Receipts/Certificates, 0.560%, 7/1/2026 (1)(2) | | | 7,500,000 | | | | 7,500,000 | |
Vancouver Housing Authority, 1.530%, 12/1/2022, Call 12/1/2021 | | | 1,795,000 | | | | 1,813,471 | |
Washington Health Care Facilities Authority, 1.212%, (LIBOR 1 Month), 1/1/2042, Call 1/1/2022 (1) | | | 550,000 | | | | 549,873 | |
| | | | | | | | |
| | | | | | | 9,863,344 | |
West Virginia — 2.8% | | | | | | | | |
County of Harrison, 3.000%, 10/15/2037 (1) | | | 5,000,000 | | | | 5,110,850 | |
West Virginia Economic Development Authority, 3.000%, 6/1/2037 (1) | | | 1,000,000 | | | | 1,024,970 | |
West Virginia Hospital Finance Authority: | | | | | | | | |
0.560%, 6/1/2033, Call 9/1/2020 (1) | | | 8,495,000 | | | | 8,495,000 | |
5.000%, 1/1/2021 | | | 360,000 | | | | 364,795 | |
| | | | | | | | |
| | | | | | | 14,995,615 | |
Wisconsin — 4.4% | | | | | | | | |
Burlington Area School District, 2.000%, 9/24/2020 | | | 1,000,000 | | | | 1,001,030 | |
City of Lancaster, 4.000%, 5/1/2021, Call 10/1/2020 | | | 1,010,000 | | | | 1,012,505 | |
D C Everest Area School District, 2.000%, 4/1/2022, Call 10/1/2020 | | | 1,290,000 | | | | 1,291,728 | |
Edgar School District, 2.000%, 10/6/2020 | | | 1,800,000 | | | | 1,802,844 | |
Oconto Falls Public School District, 2.000%, 10/1/2020 | | | 2,450,000 | | | | 2,453,528 | |
Two Rivers Public School District, 2.000%, 9/30/2020 | | | 1,750,000 | | | | 1,752,275 | |
Wisconsin Health & Educational Facilities Authority: | | | | | | | | |
0.510%, (SIFMA Municipal Swap Index Yield), 8/15/2054, Call 1/28/2021 (1) | | | 500,000 | | | | 499,150 | |
0.750%, 2/15/2053, Call 9/1/2020 (1) | | | 12,750,000 | | | | 12,750,000 | |
| | | | | | | | |
5.000%, 12/1/2022 | | | 1,000,000 | | | | 1,099,000 | |
| | | | | | | | |
| | | | | | | 23,662,060 | |
| | | | | | | | |
Total Municipals
(identified cost $504,771,865) | | | | | | | 506,743,541 | |
| | | | | | | | |
Mutual Funds — 3.8% | | | | | | | | |
Nuveen New York AMT-Free Municipal Credit Income Fund: | | | | | | | | |
0.920%, Call 8/31/2020 | | | 40,000 | | | | 4,000,000 | |
0.920%, 3/1/2029 | | | 11,320,000 | | | | 11,320,000 | |
Nuveen New York AMT-Free Quality Municipal Fund, 0.920% | | | ,5,000,000 | | | | 5,000,000 | |
| | | | | | | | |
Total Mutual Funds
(identified cost $20,320,000) | | | | | | | 20,320,000 | |
| | | | | | | | |
Short-Term Investments — 1.3% | | | | | | | | |
| | |
Repurchase Agreements — 1.3% | | | | | | | | |
Agreement with Fixed Income Clearing Corp., 0.080%, dated 8/31/2020, to be repurchased at $6,725,364 on 9/1/2020, collateralized by U.S. Government Treasury Obligation with a maturity of 8/31/2022, with a fair value of $6,859,927 | | | 6,725,349 | | | | 6,725,349 | |
| | | | | | | | |
Total Short-Term Investments
(identified cost $6,725,349) | | | | | | | 6,725,349 | |
| | | | | | | | |
| | |
Total Investments — 99.5%
(identified cost $531,817,214) | | | | | | | 533,788,890 | |
| | |
Other Assets and Liabilities — 0.5% | | | | | | | 2,814,144 | |
| | | | | | | | |
Total Net Assets — 100.0% | | | | | | $ | 536,603,034 | |
| | | | | | | | |
| (1) | Denotes a variable rate security. The rate shown is the current interest rate as of August 31, 2020. Rate fluctuations are based underlying positions and/or other variables. For securities whose yields vary with a designated market index or market rate, the reference rate and spread are indicated in the description. |
| (2) | Denotes a restricted security which is subject to restrictions on resale under federal securities laws. These securities have been deemed liquid based on criteria approved by the Board of Directors of the BMO Funds. At August 31, 2020 these securities amounted to: |
| | | | | | | | |
Fund | | Amount | | | % of Total
Net Assets | |
Ultra Short Tax-Free Fund | | | 67,046,481 | | | | 12.49 | |
| (3) | Issue represents an Auction Rate Security. An Auction Rate Security is a corporate or municipal bond debt instrument with a long nominal maturity for which the interest rate is regularly reset through a Dutch auction. The rate presented is either the rate set through the auction or the maximum interest rate provided for in the security issuance provision. |
| (4) | Purchased on a when-issued or delayed delivery basis. |
Item 7. Disclosure of Proxy Voting Policies and Procedures for Closed-End Management Investment Companies.
Not applicable to open-end management investment companies.
Item 8. Portfolio Managers of Closed-End Management Investment Companies.
Not applicable to open-end management investment companies.
Item 9. Purchases of Equity Securities by Closed-End Management Investment Company and Affiliated Purchasers.
Not applicable to open-end management investment companies.
Item 10. Submission of Matters to a Vote of Security Holders.
Not applicable.
Item 11. Controls and Procedures.
| (a) | The Registrant’s principal executive officer and principal financial officer have reviewed the Registrant’s disclosure controls and procedures (as defined in Rule 30a-3(c) under the Investment Company Act of 1940, as amended, (the “Act”)) as of a date within 90 days of the filing of this report, as required by Rule 30a-3(b) under the Act. Based on their review, such officers have concluded that the disclosure controls and procedures were effective in ensuring that information required to be disclosed in this report was appropriately recorded, processed, summarized and reported and made known to them by others within the Registrant and by the Registrant’s service providers. |
| (b) | There were no changes in the Registrant’s internal control over financial reporting (as defined in Rule 30a-3(d) under the Act (17 CFR 270.30a-3(d)) that occurred during the period covered by this report that materially affected, or were reasonably likely to materially affect, the Registrant’s internal control over financial reporting. |
Item 12. Disclosure of Securities Lending Activities for Closed-End Management Investment Companies
Not applicable to open-end management investment companies.
Item 13. Exhibits.
(a) (1) Code of Ethics. Filed herewith.
(a) (2) Certifications required pursuant to Section 302 of the Sarbanes-Oxley Act of 2002. Filed herewith.
(a) (3) Not applicable.
(a) (4) Not applicable.
(b) Certification pursuant to Section 906 of the Sarbanes-Oxley Act of 2002. Filed herewith.
SIGNATURES
Pursuant to the requirements of the Securities Exchange Act of 1934 and the Investment Company Act of 1940, the Registrant has duly caused this report to be signed on its behalf by the undersigned, thereunto duly authorized.
BMO Funds, Inc.
| | |
By: | | /s/ John M. Blaser |
| | John M. Blaser |
| | President |
Date: November 6, 2020
Pursuant to the requirements of the Securities Exchange Act of 1934 and the Investment Company Act of 1940, this report has been signed below by the following persons on behalf of the Registrant and in the capacities and on the dates indicated.
| | |
By: | | /s/ John M. Blaser |
| | John M. Blaser |
| | President |
| | (Principal Executive Officer) |
Date: November 6, 2020
| | |
| By: | | /s/ Timothy M. Bonin |
| | Timothy M. Bonin |
| | Treasurer |
| | (Principal Financial Officer) |
Date: November 6, 2020