UNITED STATES
SECURITIES AND EXCHANGE COMMISSION
Washington, D.C. 20549
FORM N-CSR
CERTIFIED SHAREHOLDER REPORT OF REGISTERED
MANAGEMENT INVESTMENT COMPANIES
Investment Company Act file number 811-7064
The Target Portfolio Trust
(Exact name of registrant as specified in charter)
| | |
Gateway Center 3 100 Mulberry Street Newark, New Jersey 07102 |
| (Address of principal executive offices) |
Lori E. Bostrom
Gateway Center 3
100 Mulberry Street
Newark, New Jersey 07102
(Name and address of agent for service)
Registrant’s telephone number, including area code: 973-367-1495
Date of fiscal year end: 12/31/03
Date of reporting period: 12/31/03
Item 1 – Reports to Stockholders – [INSERT REPORT]

The TARGETPortfolio Trust®
Annual Report
December 31, 2003
TARGET
A STRUCTURED AND PERSONALIZED INVESTMENT PROGRAM

Dear TARGET Shareholder:
February 23, 2004
As you may know, the mutual fund industry recently has been the subject of much media attention. As president of The TARGET Portfolio Trust, I’d like to provide you with an update on the issues as they pertain to your Portfolio.
Regulators and government authorities have requested information regarding trading practices from many mutual fund companies across the nation. Our fund family has been cooperating with inquiries it has received, and at the same time, Prudential Financial, Inc. has been conducting its own internal review. This review encompasses the policies, systems, and procedures of our fund family, Prudential Financial’s investment units and its proprietary distribution channels. The review also includes mutual fund trading activity by investment professionals who manage our funds.
Market timing
The frequent trading of shares in response to short-term fluctuations in the market is known as “market timing”. When market timing occurs in violation of a fund’s prospectus, in certain circumstances, a fund may have to sell portfolio securities to have the cash necessary to redeem the market timer’s shares. The redemption may happen when it is not advantageous to sell securities and result in harming the fund’s performance and/or subject the fund to additional transaction costs.
Prudential Investments LLC, the Fund’s investment manager, has actively discouraged market timing and for years our mutual fund prospectuses have identified and addressed this issue. Prudential Investments has established operating policies and procedures that are designed to detect and deter frequent trading activities that would be disruptive to the management of our mutual fund portfolios, and has rejected numerous orders placed by market timers in the past.
Late trading
The Securities and Exchange Commission requires that orders to purchase or redeem mutual fund shares be received either by the fund or by an intermediary (such as a broker, financial adviser, or 401(k) record keeper) before the time at which the fund calculates its net asset value (normally 4:00 p.m., Eastern time) if they are to receive that day’s price. The policies of our mutual funds do not make and have not made allowances for the practice known as “late trading”.
For more than 40 years we have offered investors quality investment products, financial guidance, and responsive customer service. Today we remain committed to this heritage and to the highest ethical principles in our investment practices.
Sincerely,

Judy A. Rice, President
The TARGET Portfolio Trust
| | |
| THE TARGET PORTFOLIO TRUST | | 1 |
| | | | | | | | | | | |
| Equity Portfolios as of 12/31/03 | | | | | | | | | | | |
| | | Total Returns1
(Without
TARGET
Program Fee)
One Year | | | Average Annual Total Returns1
(With TARGET Program Fee) |
| | | | One Year | | | Five Years | | | Ten Years2 |
Large Capitalization Growth Portfolio | | 39.53 | % | | 37.45 | % | | –1.55 | % | | 8.50% |
|
S&P 500 Index4 | | 28.67 | | | 28.67 | | | –0.57 | | | 11.06 |
|
Russell 1000 Growth Index4 | | 29.75 | | | 29.75 | | | –5.11 | | | 9.21 |
|
Lipper Large-Cap Core Funds Avg.5 | | 25.59 | | | 25.59 | | | –1.75 | | | 8.78 |
|
| | | | | | | | | | | | |
Large Capitalization Value Portfolio | | 36.38 | % | | 34.35 | % | | 2.75 | % | | 9.35% |
|
S&P 500 Index4 | | 28.67 | | | 28.67 | | | –0.57 | | | 11.06 |
|
Russell 1000 Value Index4 | | 30.03 | | | 30.03 | | | 3.56 | | | 11.88 |
|
Lipper Multi-Cap Value Funds Avg.5 | | 30.80 | | | 30.80 | | | 4.95 | | | 11.00 |
|
| | | | | | | | | | | | |
Small Capitalization Growth Portfolio | | 33.05 | % | | 31.07 | % | | –2.65 | % | | 3.83% |
|
Russell 2000 Index4 | | 47.25 | | | 47.25 | | | 7.13 | | | 9.47 |
|
Russell 2000 Growth Index4 | | 48.54 | | | 48.54 | | | 0.86 | | | 5.43 |
|
Lipper Small-Cap Growth Funds Avg.5 | | 44.36 | | | 44.36 | | | 4.88 | | | 8.53 |
|
| | | | | | | | | | | | |
Small Capitalization Value Portfolio | | 47.10 | % | | 44.91 | % | | 12.96 | % | | 10.34% |
|
Russell 2000 Index4 | | 47.25 | | | 47.25 | | | 7.13 | | | 9.47 |
|
Russell 2000 Value Index4 | | 46.03 | | | 46.03 | | | 12.28 | | | 12.70 |
|
Lipper Small-Cap Core Funds Avg.5 | | 44.24 | | | 44.24 | | | 10.07 | | | 10.04 |
|
| | | | | | | | | | | | |
International Equity Portfolio | | 28.76 | % | | 26.84 | % | | –2.00 | % | | 3.62% |
|
MSCI EAFE Index4 | | 38.59 | | | 38.59 | | | –0.05 | | | 4.47 |
|
Lipper International Funds Avg.5 | | 34.74 | | | 34.74 | | | 1.28 | | | 4.65 |
|
| | | | | | | | | | | | |
| | | | |
| Fixed Income Portfolios as of 12/31/03 | | | | | | | | | | | |
International Bond Portfolio | | 5.31 | % | | 4.26 | % | | 1.05 | % | | 2.28% (2.24)2,3 |
|
Citigroup Non-U.S. WGBI–Hedged4 | | 1.88 | | | 1.88 | | | 5.44 | | | 8.272 |
|
Citigroup Non-U.S. WGBI–Unhedged4 | | 18.52 | | | 18.52 | | | 5.21 | | | 6.892 |
|
Lipper International Income Funds Avg.5 | | 15.75 | | | 15.75 | | | 5.89 | | | 7.202 |
|
| | | | | | | | | | | | |
Total Return Bond Portfolio | | 6.22 | % | | 5.17 | % | | 5.75 | % | | 6.07% |
|
Lehman Brothers Aggregate Bond Index4 | | 4.10 | | | 4.10 | | | 6.62 | | | 6.95 |
|
Lehman Brothers Govt/Credit Bond Index4 | | 4.67 | | | 4.67 | | | 6.66 | | | 6.98 |
|
Lipper Corporate Debt BBB-Rated Funds Avg.5 | | 8.23 | | | 8.23 | | | 6.11 | | | 6.49 |
|
| | | | | | | | | | | | |
Intermediate-Term Bond Portfolio | | 4.58 | % | | 3.54 | % | | 5.44 | % | | 5.65% |
|
Lehman Brothers Int. Govt/Credit Bond Index4 | | 4.31 | | | 4.31 | | | 6.65 | | | 6.63 |
|
Lipper Int. Inv.-Grade Debt Funds Avg.5 | | 4.55 | | | 4.55 | | | 5.82 | | | 6.17 |
|
| | | | | | | | | | | | |
Mortgage Backed Securities Portfolio | | 2.20 | % | | 1.18 | % | | 4.89 | % | | 5.48% (5.47)3 |
|
Lehman Brothers Mortgage-Backed Securities Index4 | | 3.07 | | | 3.07 | | | 6.55 | | | 6.89 |
|
Citigroup Mortgage-Backed Securities Index4 | | 3.07 | | | 3.07 | | | 6.59 | | | 6.91 |
|
Lipper U.S. Mortgage Funds Avg.5 | | 2.48 | | | 2.48 | | | 5.68 | | | 5.88 |
|
| | |
| 2 | | THE TARGET PORTFOLIO TRUST |
| | | | | | | | | |
| Money Market Portfolio as of 12/31/03 | | | | | | | | |
| | | Total Returns1
(Without
TARGET Program
Fee) One Year | | | Net Asset Value
(NAV) | | 7-Day Current
Yield | |
U.S. Government Money Market Portfolio7 | | 0.70 | % | | $ | 1.00 | | 0.55 | % |
| |
Lipper U.S. Government Money Market Funds Avg.5 | | 0.46 | | | | N/A | | N/A | |
| |
iMoneyNet, Inc. All Taxable Money Market Fund Avg.6 | | N/A | | | | N/A | | 0.53 | |
| |
Past performance is not indicative of future results. Principal value and investment return will fluctuate so that an investor’s shares, when redeemed, may be worth more or less than their original cost. 1Source: Prudential Investments LLC, Lipper Inc., and iMoneyNet, Inc. Total returns assume the reinvestment of all dividends and distributions, and take into account all charges and expenses applicable to an investment in each portfolio. The one-year total returns (without advisory fee) do not reflect a deduction for the annual TARGET program fee. Returns would be lower if the fee were deducted. The average annual total returns for the TARGET portfolios assume the imposition of the maximum TARGET annual advisory fee of 1.50% for stock portfolios and 1% for bond portfolios for retail investors. Returns for retirement accounts will differ. The maximum advisory fees for these accounts are 1.25% and 1.35% of equity portfolio and bond portfolio assets respectively. The returns in the table do not reflect the deduction of taxes that a shareholder would pay on fund distributions or following the redemption of fund shares. 2The inception date for the International Bond Portfolio is 5/17/94, and therefore the performance is for the since-inception period. 3Without waiver of fees and/or expense subsidization, the portfolios’ returns would have been lower, as indicated in parentheses. 4Investors cannot invest directly in an index. The returns for the benchmark indexes would be lower if they included the effects of sales charges, operating expenses of a mutual fund, or taxes. The Standard & Poor’s Composite Stock Price Index (S&P 500 Index) is an unmanaged index of 500 stocks of large U.S. companies. It gives a broad look at how stock prices have performed. The Russell 1000 Growth Index contains those securities in the Russell 1000 Index with an above-average growth orientation. Companies in this index tend to exhibit higher price-to-book and price-to-earnings ratios, lower dividend yields, and higher forecasted growth rates. The Russell 1000 Value Index contains those securities in the Russell 1000 Index with a below-average growth orientation. Companies in this index generally have low price-to-book and price-to-earnings ratios, higher dividend yields, and lower forecasted growth values. The Russell 2000 Index is an unmanaged index of the stocks of the 2,000 smallest U.S. companies included in the Russell 3000 Index. It gives a broad look at how the stock prices of smaller companies have performed. The Russell 2000 Growth Index contains those securities in the Russell 2000 Index with an above-average growth orientation. Companies in this index generally have higher price-to-book and price-to-earnings ratios. The Russell 2000 Value Index contains those securities in the Russell 2000 Index with a below-average growth orientation. Companies in this index generally have low price-to-earnings ratios, higher dividend yields, and lower forecasted growth values. The Morgan Stanley Capital International Europe, Australasia, and Far East Index (MSCI EAFE Index) is an unmanaged, weighted index that reflects stock price movements in Europe, Australasia, and the Far East. It gives a broad look at how foreign stocks have performed. The Citigroup Non-U.S. World Government Bond Index (WGBI)–Hedged is an unmanaged index of approximately 600 high-quality bonds with foreign currency exposure hedged to the U.S. dollar. The Citigroup Non-U.S. World Government Bond Index (WGBI)–Unhedged is an unmanaged index of approximately 600 high-quality bonds issued in several different currencies. It gives a broad look at how foreign bonds have performed. The Lehman Brothers Aggregate Bond Index is an unmanaged index of investment-grade securities issued by the U.S. government and its agencies and by corporations with between 1 and 10 years remaining to maturity. It gives a broad look at how bond prices of short- and intermediate-term bonds have performed. The Lehman Brothers Government/Credit Bond Index (formerly Lehman Brothers Government/Corporate Bond Index) is an unmanaged index of publicly traded intermediate- and long-term government and corporate debt with an average maturity of 10 years. It gives a broad look at how bonds have performed. The Lehman Brothers Intermediate Government/Credit Bond Index (formerly Lehman Brothers Intermediate Government/Corporate Bond Index) is an unmanaged index of publicly traded U.S. government bonds and investment-grade corporate bonds with maturities of up to 10 years. It gives a broad look at how intermediate-term bonds have performed. The Lehman Brothers Mortgage-Backed Securities Index is a market capitalization-weighted index of 15- and
| | |
| THE TARGET PORTFOLIO TRUST | | 3 |
30-year fixed-rate securities backed by GNMA, FNMA, and FHLMC mortgage pools, and balloon mortgages with fixed-rate coupons. The Citigroup Mortgage-Backed Securities Index is an unmanaged index of 15- and 30-year mortgage-related securities issued by U.S. government agencies. Each of them gives a broad look at how mortgage-backed securities have performed. 5The Lipper averages represent returns based on an average of all funds in the respective Lipper categories for the periods noted. The returns for the Lipper averages would be lower if they included the effects of sales charges or taxes. Large-Cap Core funds invest at least 75% of their equity assets in companies with market capitalizations (on a three-year weighted basis) greater than 300% of the dollar-weighted median market capitalization of the middle 1,000 securities of the S&P SuperComposite 1500 Index. Large-cap core funds have an above-average price-to-earnings ratio, price-to-book ratio, and three-year sales-per-share growth value compared with the S&P 500 Index. Multi-Cap Value funds invest in a variety of market capitalization ranges without concentrating 75% of their equity assets in any one market capitalization range over an extended period of time. Multi-cap funds typically have between 25% and 75% of their assets invested in companies with market capitalizations (on a three-year weighted basis) above 300% of the dollar-weighted median market capitalization of the middle 1,000 securities of the S&P SuperComposite 1500 Index. Multi-cap value funds typically have a below-average price-to-earnings ratio and three-year sales-per-share growth value compared with the S&P 500 Index. Small-Cap Growth funds invest at least 75% of their equity assets in companies with market capitalizations (on a three-year weighted basis) less than 250% of the dollar-weighted median of the smallest 500 of the middle 1,000 securities of the S&P SuperComposite 1500 Index. Small-cap growth funds typically have an above-average price-to-earnings ratio, price-to-book ratio, and three-year sales-per-share growth value compared with the S&P SmallCap 600 Index. Small-Cap Core funds invest at least 75% of their equity assets in companies with market capitalizations (on a three-year weighted basis) less than 250% of the dollar-weighted median of the smallest 500 of the middle 1,000 securities of the S&P SuperComposite 1500 Index. Small-cap core funds have more latitude in the companies in which they invest. These funds typically have an average price-to-earnings ratio and three-year sales-per-share growth value compared with the S&P SmallCap 600 Index. International funds invest their assets in securities with primary trading markets outside of the United States. International Income funds invest primarily in U.S. dollar and non-U.S. dollar debt securities of issuers located in at least three countries, excluding the United States, except in periods of market weakness. Corporate Debt BBB-Rated funds invest primarily in corporate and government debt issues rated in the top four grades. Intermediate Investment-Grade Debt funds invest primarily in investment-grade debt issues (rated in the top four grades) with dollar-weighted average maturities of 5 to 10 years. U.S. Mortgage funds invest primarily in mortgages/securities issued or guaranteed as to principal and interest by the U.S. government and certain federal agencies. U.S. Government Money Market funds invest principally in financial instruments issued or guaranteed by the U.S. government, its agencies or instrumentalities with dollar-weighted average maturities of less than 90 days. These funds intend to keep a constant net asset value. 6The iMoneyNet, Inc. Average is based upon the average yield of all mutual funds in the iMoneyNet, Inc. All Taxable Money Market Fund category. 7An investment in the U.S. Government Money Market Portfolio is not insured or guaranteed by the Federal Deposit Insurance Corporation or any other government agency. Although this Portfolio seeks to preserve the value of your investment at $1 per share, it is possible to lose money by investing in this Portfolio.
| | |
| 4 | | THE TARGET PORTFOLIO TRUST |
Investment Advisers’ Report
| | |
|
| DECEMBER 31, 2003 | | ANNUAL REPORT |
The TARGET Portfolio Trust
Investment Advisers’ Report
Large Capitalization Growth Portfolio
The total return of the Large Capitalization Growth Portfolio, subadvised by Oak Associates, Ltd. and Columbus Circle Investors LLC, was 39.53% during the one-year period ended December 31, 2003. During the same period, the S&P 500 Index returned 28.67%, the Russell 1000 Growth Index returned 29.75%, and the Lipper Large-Cap Core Funds Average returned 25.59%.
Oak Associates, Ltd.
The year 2003 was a good one for the equity markets in general, and Oak Associates’ portion of the Portfolio significantly outperformed the S&P 500 Index. This was due to a variety of factors, including strong top-down economic analysis, a concentration in the stocks in which Oak had the highest confidence, low turnover, and Oak’s maintaining the Portfolio’s top performers as they continued to appreciate during the year.
Oak Associates takes a top-down approach to determine the sectors that it believes will provide the Portfolio with optimal long-term growth. It then concentrates the number of sectors in which to invest, as well as the number of securities to hold. During the year, Oak felt that technology, healthcare, and financial services would be the driving forces of productivity and economic growth. These sectors have also tended to outperform on a longer-term basis following an economic recovery.
This stance proved beneficial as all three sectors positively impacted the Portfolio during the year. Oak’s technology holdings generated the greatest relative results, highlighted by its semiconductors and networking stocks, many of which more than doubled in price. These securities performed well as investors anticipated an increase in demand due to stronger business spending. Examples of technology holdings that generated strong results were Veritas Software, Juniper Networks, EMC Corp., Cisco Systems, and Xilinx Inc. The Portfolio’s financial stocks also did well after starting the year slowly. Examples of winning holdings in this area were Morgan Stanley and Citigroup. Oak’s healthcare positions tended to lag the overall market until the fourth quarter, consistent with what one would expect in the earlier stages of an economic recovery. As the economic recovery evolved, healthcare began to reverse its underperformance. The sector has also experienced a relief rally after passage of the Medicare reform bill. An example of a healthcare stock that performed well toward the end of the year was Pfizer, Inc.
| | |
| 6 | | THE TARGET PORTFOLIO TRUST |
Columbus Circle Investors LLC
Columbus Circle Investors’ (CCI) portion of the Portfolio outperformed the S&P 500 Index during 2003. For the most part, smaller and less established growth stocks generated the best results during the year. The factors that hindered stock performance in 2002 reversed course in 2003 as investors became less risk averse and increasingly more willing to pay higher multiples for future results, especially in the technology and cyclical sectors. The market’s rally gained momentum during the year as corporate earnings continued to show positive signs, inflation and interest rates remained stable, and the employment picture began to improve.
The greatest lift to CCI’s portion of the portfolio during the reporting period came from its exposure to technology, financials, and consumer discretionary stocks. These sectors benefited as consumers continued to show the strong spending patterns they had shown through most of the previous decade. Although CCI’s portion of the Portfolio was underweight in healthcare, the stocks selected in this area outperformed the healthcare component of the Index. For example, CCI identified opportunities in medical technology (Boston Scientific), biotechnology (Amgen), and healthcare services (Aetna). In the technology sector, portfolio holdings Cisco Systems, Veritas Software, and Intel Corp. benefited from signs of increased capital spending and effective cost-cutting measures that were implemented in 2002. A favorable interest-rate environment and a stronger economy enabled CCI’s financial stocks, such as Capital One Financial, to make meaningful contributions to the Portfolio as well. The Portfolio was negatively affected by the poor performance of holdings Lockheed Martin and AT&T Corp. and by its underweight in the industrial sector.
| | |
| THE TARGET PORTFOLIO TRUST | | 7 |
The Portfolio of Investments following this report shows the size of the Portfolio’s positions at period-end.
Large Capitalization Value Portfolio
The total return of the Large Capitalization Value Portfolio, subadvised by Hotchkis and Wiley Capital Management, LLC and J.P. Morgan Investment Management Inc., was 36.38% during the one-year period ended December 31, 2003. During the same period, the S&P 500 Index returned 28.67%, the Russell 1000 Value Index returned 30.03%, and the Lipper Multi-Cap Value Funds Average returned 30.80%.
Hotchkis and Wiley Capital Management, LLC
Hotchkis and Wiley’s portion of the Portfolio strongly outperformed the S&P 500 Index in 2003, driven largely by strong security selection. Positive contributions to returns in the Portfolio were broad-based, with positive returns recorded in 9 of the 10 economic sectors.
Hotchkis and Wiley follows a bottom-up approach to stock selection based on a highly disciplined investment process that emphasizes rigorous, internally generated research in order to identify out-of-favor stocks that represent solid fundamental value. The largest contributor to absolute performance was the Portfolio’s overweight in the consumer discretionary sector. Within this sector, retail stocks did particularly well, with Sears Roebuck and J.C. Penney leading the way. Sears Roebuck & Co. gained as the sale of its credit card business was finalized in November and as news of management’s plans to repurchase nearly one-third of its outstanding shares was announced. J.C. Penney benefited as the sale of its troubled Eckerd drugstore division appeared imminent. Strong results were also generated by financial stocks as insurance industry holdings Metlife, Allmerica Financial, St. Paul, and Allstate all posted double-digit gains during the year. Also making a significant contribution was the Portfolio’s exposure to Computer Associates as the stock made considerable gains along with the rest of the technology sector.
Conversely, a larger technology weighting would have boosted the Portfolio’s performance, as relatively expensive industries such as semiconductors, which were not held in the Portfolio, performed very well. The Portfolio’s holding in Eastman Kodak also detracted from results. The company’s share price fell due to investor skepticism regarding its restructuring efforts. In addition, shares of DTE Energy declined on news that its third-quarter profits fell.
| | |
| 8 | | THE TARGET PORTFOLIO TRUST |
J.P. Morgan Investment Management Inc.
J.P. Morgan’s portion of the Portfolio outperformed the S&P 500 Index during the one-year period ended December 31, 2003. Throughout much of the year, investors were drawn to lower-quality, higher-risk investments, driving up price/earnings multiples for the stocks that had underperformed in recent years. In particular, stocks in the technology, financial, and industrial sectors generated superior results, while dividend-paying stocks and high-quality stable growers did not perform as well. During the year, J.P. Morgan carefully analyzed whether corporate capital spending would accelerate to help reduce the economy’s dependence on consumer spending. Toward the end of the reporting period, this appeared to be the case.
Looking at the Portfolio’s performance, it generated exceptional results from its stocks in the finance and capital markets sectors. Examples of winning holdings in these areas included Countrywide Financial, which returned 97%; FleetBoston Financial, which returned 88%; and E-Trade Financial Corp., which soared 160%. The Portfolio’s performance was also enhanced by the success of holding United States Steel Corp., as its stock returned 170% in 2003. Conversely, the poor performance of the Portfolio’s energy stocks, in particular Anadarko Petroleum Corp. (which returned only 8%) and the defense manufacturer Raytheon Co. (whose total return was close to zero), detracted from relative results.
| | |
| THE TARGET PORTFOLIO TRUST | | 9 |
The Portfolio of Investments following this report shows the size of the Portfolio’s positions at period-end.
Small Capitalization Growth Portfolio
The total return of the Small Capitalization Growth Portfolio was 33.05% during the one-year period ended December 31, 2003. During the same period, the Russell 2000 Index returned 47.25%, the Russell 2000 Growth Index returned 48.54%, and the Lipper Small-Cap Growth Funds Average returned 44.36%.
The Portfolio is subadvised by Westcap Investors, LLC (which replaced Sawgrass Asset Management L.L.C. as a subadvisor during the third quarter of 2003) and RS Investment Management, L.P. (which replaced J.P. Morgan Fleming Asset Management (USA) Inc. during the fourth quarter of 2003).
Sawgrass Asset Management, L.L.C.
While Sawgrass Asset Management produced positive results during the period it served as a Portfolio subadvisor, it underperformed its indexes. This was largely the result of stock selection. In particular, Sawgrass’s performance was adversely affected due to its bias toward higher-quality stocks. During the reporting period, more speculative stocks generated the best investment results.
Westcap Investors, LLC
From its inception as a Portfolio subadvisor through the end of 2003, Westcap generated solid absolute results, but lagged the return of the Russell 2000 Growth Index over the same period. Because of its expectations for the aftermath of the war in Iraq, Westcap maintained a more conservative posture for the Portfolio than it normally would have, considering the signs of impending economic expansion. However, for much of the year, investors embraced lower-quality stocks, leaving managers of higher-quality portfolios disadvantaged from a relative performance standpoint. Many of these lower-quality companies quickly became very expensive. Given their valuations, many of these firms will have to execute their business plans to perfection in order to produce the revenue and earnings expected. Westcap believes the market has started to refocus on higher-quality companies that exhibit less risk and are selling at more reasonable price multiples. As such, it feels that, going forward, this investor focus will benefit shares of higher-quality, earnings- and cash-flow-driven companies.
| | |
| 10 | | THE TARGET PORTFOLIO TRUST |
From a stock selection standpoint, Westcap’s top performing sector versus the benchmark was financials. Portfolio returns were also enhanced by an overweight in information technology. Conversely, its worst performing sector allocations were an underweight in healthcare and an overweight in energy. Westcap’s stock selection was the poorest in the industrials sector.
In the information technology sector, Avocent Corporation, Semtech Corporation, Benchmark Electronics, and Rogers Corporation were examples of companies that contributed to overall performance. In the financial sector, Investors Financial Services and Jeffries Group boosted performance. On the other hand, in the healthcare sector, ICU Medical, Zoll Medical, and Charles River Laboratories detracted from results. In the industrials sector, slowing growth rates at Coinstar and RMH Teleservices caused their stock prices to decline. Given their lower growth prospects, both of these positions have been eliminated so that Westcap can invest in companies with stronger prospects for growth over a full market cycle.
J.P. Morgan Fleming Asset Management (USA) Inc.
Although J.P. Morgan generated positive investment results during its tenure as a Portfolio subadvisor this period, it underperformed its indexes. During 2003, higher-risk, more speculative stocks generated the best results. However, J.P. Morgan generally held less risky stocks, which did not perform as well during the reporting period. J.P. Morgan’s portion of the Portfolio was also hurt due to the performance of its holding in Medcath, an owner and operator of cardiac hospitals. Medcath’s stock price fell due to disappointing earnings results.
RS Investment Management, L.P.
During the short period since its inception as a subadvisor for the Portfolio, RS Investments (RS) produced positive absolute results but underperformed its benchmark. Throughout this period, RS continued to harvest gains from many of its technology positions. While it redeployed some of the gains into other technology-related companies, RS remained valuation sensitive, and stuck to its discipline of purchasing companies selling at a discount to their growth rate. While the firm’s overall technology exposure was underweight compared with that of the benchmark, stock selection in this sector continued to be very strong and contributed the largest source of returns during the reporting period. Holdings such as Lionbridge Technologies Inc., Tumbleweed Communications Corporation, and Opnet Technologies, Inc. all enhanced results.
| | |
| THE TARGET PORTFOLIO TRUST | | 11 |
The Portfolio held an overweight exposure to the consumer sector during the period. Throughout most of 2003, specialty retailers and numerous Internet-related companies generated significant gains. However, investors somewhat retreated from both of these groups late in the year, and several Portfolio positions underperformed. We view stock price weakness in certain Internet-related companies as an opportunity to expand our positions with the purchase of additional shares in companies that we believe have the best fundamentals.
Healthcare, at approximately 21% of the Portfolio, proved to be one of the weakest sectors relative to the benchmark over the period. Examples of stocks that detracted from results included a number of pharmaceutical-related stocks, including Pozen, Inc. and AtheroGenics, Inc. RS was also hurt by price weakness in several medical device and biotech positions. However, RS continues to have conviction in its research premise, and has added to these positions on price weakness.
The Portfolio of Investments following this report shows the size of the Portfolio’s positions at period-end.
| | |
| 12 | | THE TARGET PORTFOLIO TRUST |
Small Capitalization Value Portfolio
The total return of the Small Capitalization Value Portfolio was 47.10% during the one-year period ended December 31, 2003. During the same period, the Russell 2000 Index returned 47.25%, the Russell 2000 Value Index returned 46.03%, and the Lipper Small-Cap Core Funds Average returned 44.24%.
The Portfolio is subadvised by EARNEST Partners, LLC and NFJ Investment Group L. P. (which replaced National City Investment Management Company as a subadvisor to the Portfolio in October 2003).
National City Investment Management Company
While National City Investment Management produced positive results during the period it served as a Portfolio subadvisor, it underperformed the Portfolio’s indexes. Two factors detracted from performance. National City’s portion of the Portfolio included fewer speculative stocks than the overall indexes, which detracted from results as more speculative stocks led the market. In addition, the Portfolio’s market capitalization was somewhat larger than the indexes, which hurt relative results as the smallest-cap stocks generally outperformed stocks of firms at the larger end of the small-cap range. Aside from these considerations, National City benefited from favorable stock selection during the period when it served as a subadvisor for the Portfolio.
EARNEST Partners, LLC
Equity investors were rewarded with strong results in 2003. A resilient consumer, increasing productivity, and improving corporate profitability all resulted in a solid year for equities. The year proved to be especially good for small-cap stocks, with small-cap growth stocks outperforming their value stock counterparts.
During the year, EARNEST Partners significantly outperformed its indexes. As a bottom-up manager, EARNEST focuses on identifying and investing in high-quality, attractively valued securities. The lion’s share of performance was created by individual stock selection across a variety of industries. The Portfolio’s consumer discretionary stocks enhanced results as home builders like Hovnanian (+174%) and D.R. Horton (+150%) rose sharply due to historically low mortgage rates and record home purchases. Consumer electronics manufacturer Harman International appreciated by over 148% as the company experienced strong sales of its automotive entertainment and information systems. Financial holdings, such as Americredit (+105%) and Jefferies (+58%), also boosted returns as both companies benefited from
| | |
| THE TARGET PORTFOLIO TRUST | | 13 |
improvements in the overall credit and brokerage markets. EARNEST believes that equity markets will continue to benefit from low inflation coupled with a favorable fiscal and monetary policy. This combination should continue to drive consumer spending and improve corporate profitability over the long term. EARNEST also feels that the equity markets may remain volatile and that stock selection will remain the primary driver for Portfolio performance.
NFJ Investment Group L.P.
During the short period since its inception as a Portfolio subadvisor, NFJ Investment Group (NFJ) generated strong absolute results but underperformed the Russell 2000 Value Index. NFJ employs a conservative investment discipline that calls for the purchase of higher-quality companies that pay dividends. As such, NFJ typically holds lower risk stocks than those in the benchmark indexes. However, during the reporting period, riskier, more speculative stocks generated better results than their less risky counterparts.
While NFJ’s investment decisions are based on bottom-up fundamental analysis, and it looks to remain diversified across industries, its Portfolio sector exposures aided performance for the period. In particular, slight overweight positions in basic materials and energy, and an underweight position in technology boosted relative returns. During the period, NFJ’s stock selection was neutral, neither aiding nor hurting relative performance.
The Portfolio of Investments following this report shows the size of the Portfolio’s positions at period-end.
| | |
| 14 | | THE TARGET PORTFOLIO TRUST |
International Equity Portfolio
Lazard Asset Management LLC
The total return of the International Equity Portfolio, subadvised by Lazard Asset Management LLC, was 28.76% during the one-year period ended December 31, 2003. During the same period, the MSCI EAFE Index rose 38.59% and the Lipper International Funds Average returned 34.74%.
The early part of 2003, which saw a continuation of the previous year’s bear market, proved an anomaly in an otherwise bull market year. In mid-March, just before the start of the war in Iraq, sentiment swung abruptly from very negative to very positive. Investors rotated into stocks that stood to gain from an improving economy. The stocks that benefited most from this change in sentiment included highly leveraged and economically sensitive companies. In fact, many of the greatest beneficiaries were those same lower-quality companies whose business models had been most questioned during the bear market. The technology sector, which led 2002’s decline, proved to be 2003’s strongest performer. However, late in the year, there were signs that the rebound in lower-quality stocks had begun to fade as investors started focusing once again on individual company fundamentals.
For the one-year period ended December 31, 2003, the Portfolio generated strong absolute results but lagged its benchmark indexes. During the year, the Portfolio’s performance was helped by stock selection in the consumer discretionary sector. An example of a strong performing stock was Nissan Motor Co., which benefited from new model introductions and strong U.S. demand. With the leadership of CEO Carlos Ghosn, Nissan has steadily gained market share, improved its marketing efforts, rolled out new models, and implemented good capital discipline. Luxury goods manufacturer Richemont also performed well as the improving economy led to a rebound in demand for luxury items. Conversely, the Portfolio was hurt by stock selection in the financial sector. Lazard avoided unprofitable Japanese financial stocks such as Sumitomo Mitsui, Mizuho, UFJ Holdings, and Resona. However, these stocks significantly outperformed the sector and the market. Stock selection in the technology sector posed a similar problem, with unprofitable companies such as Ericsson and Alcatel significantly outperforming their peers and the overall market, while Portfolio holdings in companies with consistently high return on capital, such as Nokia, failed to fully participate in the rally.
The Portfolio of Investments following this report shows the size of the Portfolio’s positions at period-end.
| | |
| THE TARGET PORTFOLIO TRUST | | 15 |
International Bond Portfolio
Fischer Francis Trees & Watts, Inc.
The total return of the International Bond Portfolio, subadvised by Fischer Francis Trees & Watts, Inc. (FFTW), was 5.31% during the one-year period ended December 31, 2003. During the same period, the Citigroup Non-U.S. World Government Bond Index–Hedged Index returned 1.88%, the Citigroup Non-U.S. World Government Bond Index–Unhedged Index returned 18.52%, and the Lipper International Income Funds Average returned 15.75%.
In May 2003, the Portfolio adopted a U.S. dollar hedged mandate instead of an unhedged mandate. This means that the Portfolio now includes contracts intended to buffer the impact of currency changes on the value of its holdings. However, bond portfolios that were hedged underperformed their unhedged counterparts in 2003 due to the sharp decline in the U.S. dollar. As a result, the Portfolio outperformed the Hedged Index and underperformed the Unhedged Index.
During the year, FFTW enhanced results through its exposure to corporate bonds. FFTW increased the Portfolio’s exposure to these securities on price weakness in 2002. This proved beneficial as corporate bonds performed well throughout much of 2003. From a country standpoint, the Portfolio’s European government bonds added to returns over the year. However, poor performance in the first and third quarters, combined with fourth-quarter Japanese government bond losses, countered these gains.
Despite strong positioning in the second and fourth quarters, FFTW’s interest-rate stance was fairly neutral for the year. This was largely due to increased interest-rate volatility in the first and third quarters. In terms of currency positioning, during the first half of 2003, currency exposures were primarily focused on a euro overweight versus the yen. For the second half of the year, the Portfolio’s positions focused more on the U.S. dollar’s weakness versus other major currencies.
The Portfolio of Investments following this report shows the size of the Portfolio’s positions at period-end.
| | |
| 16 | | THE TARGET PORTFOLIO TRUST |
Total Return Bond Portfolio
Pacific Investment Management Company LLC
The total return of the Total Return Bond Portfolio, subadvised by Pacific Investment Management Company LLC (PIMCO), was 6.22% in 2003 versus 4.10% for the Lehman Brothers Aggregate Bond Index, 4.67% for the Lehman Brothers Government/Credit Bond Index, and 8.23% for the Lipper Corporate Debt BBB-Rated Funds Average.
Bonds gained ground in 2003, despite volatile interest rates, led by higher-yielding corporate bonds and emerging market securities. Interest rates fell in the first half of the year as the markets were anxious about deflation, but then reversed course as the mood swung toward optimism about faster economic growth. Inflation was not a factor even in the face of surging commodity prices and a falling U.S. dollar. As such, it helped to mitigate the rise in interest rates.
For the year, the Portfolio outperformed its benchmark index, driven by favorable security selection. An allocation to Treasury inflation-protected securities (TIPS) helped returns as less volatile assets outperformed amid rising rates. Emerging market bonds strongly boosted returns as credit fundamentals within the asset class continued to improve. Asset-backed bonds added to returns due to their relatively high yields. The Portfolio’s select mortgages added value as well. Modest currency exposure to the euro and yen helped returns as the U.S. dollar fell amid concern about the U.S. trade deficit. Interest-rate strategies were neutral to slightly positive as a near index duration and curve position had little impact on returns. Non-U.S. exposure, mainly to Eurozone issues, had minimal impact as rates rose in major developed markets.
Conversely, an underweight in corporate bonds had a negative impact as profits and margins improved. However, positive security selection helped to mitigate this impact. A mortgage underweight in the fourth quarter detracted from returns as lower volatility caused this area of the market to perform well.
| | |
| THE TARGET PORTFOLIO TRUST | | 17 |
The Portfolio of Investments following this report shows the size of the Portfolio’s positions at period-end.
Intermediate-Term Bond Portfolio
Pacific Investment Management Company LLC
The total return of the Intermediate-Term Bond Portfolio, subadvised by Pacific Investment Management Company LLC (PIMCO), was 4.58% in 2003 versus 4.31% for the Lehman Brothers Intermediate Government/Credit Bond Index (formerly the Lehman Brothers Intermediate Government/Corporate Bond Index) and 4.55% for the Lipper Intermediate Investment-Grade Debt Funds Average.
Bonds gained ground in 2003, despite volatile interest rates, led by higher-yielding corporate bonds and emerging market securities. Interest rates fell in the first half of the year as the markets were anxious about deflation, but then reversed course as the mood swung toward optimism about faster economic growth. Inflation was not a factor even in the face of surging commodity prices and a falling U.S. dollar. As such, it helped to mitigate the rise in interest rates.
For the year, the Portfolio outperformed its index, driven largely by active security selection. Our exposure to select mortgages was positive as attractive yields provided adequate compensation for the assumption of prepayment risk. A small allocation to Treasury inflation-protected securities (TIPS) helped returns as TIPS were less volatile amid rising rates. Emerging market bonds strongly boosted returns as credit fundamentals within the asset class continued to improve. A modest currency exposure to the euro and yen helped returns as the dollar fell amid concern about the U.S. trade deficit. Non-U.S. exposure, mainly to Eurozone issues, had minimal impact as rates rose in major developed markets. Interest-rate strategies were neutral to slightly positive. A strategy that kept the Portfolio’s duration profile near that of the Index had little impact on returns.
Conversely, an underweight in corporate securities had a strong negative impact as profits and margins improved. However, positive security selection helped mitigate some of this.
During the year, the Portfolio experienced significant portfolio turnover, which was attributable mainly to the use of certain types of mortgage securities and derivatives. We do not frequently trade holdings that generate significant transaction costs to the Portfolio, such as less liquid corporate bonds and emerging market securities. However, we often purchase mortgage pass-through securities on a to-be-announced (TBA) basis. Provided that pricing is to our advantage, we may sell a mortgage TBA
| | |
| 18 | | THE TARGET PORTFOLIO TRUST |
prior to settlement date and buy or “roll” the same position forward, moving the settlement date to the next month. Although frequently rolling mortgage TBAs generates a large number of transactions, we believe that this technique can contribute to the Portfolio’s investment returns without contributing additional risk.
In the U.S. Treasury market, we frequently use futures contracts and options as substitutes for physical Treasury securities. Derivative contracts with short maturities need to be rolled forward frequently, which typically results in more trades. The cash-equivalent securities that back the mortgage and derivatives contracts also generate additional trades, but can also earn attractive returns. We believe that the benefits of these trading strategies outweigh the costs associated with them.
| | |
| THE TARGET PORTFOLIO TRUST | | 19 |
The Portfolio of Investments following this report shows the size of the Portfolio’s positions at period-end.
Mortgage Backed Securities Portfolio
Wellington Management Company, LLP
The total return of the Mortgage Backed Securities Portfolio, subadvised by Wellington Management Company, LLP, was 2.20% in 2003 versus 3.07% for both the Lehman Brothers Mortgage-Backed Securities Index and the Citigroup Mortgage-Backed Securities Index, and 2.48% for the Lipper U.S. Mortgage Funds Average.
In 2003, the mortgage-backed securities market rose modestly, with the asset class experiencing significant volatility during the course of the year. During the first half of 2003, Treasury yields fell to their lowest rates in decades. The market rally (bond yields and prices move in the opposite direction) was precipitated by a weak economy and the possibility that the Federal Reserve Board (the Fed) may use “unconventional policy,” such as targeting interest rates through outright Treasury bond purchases. These low rates triggered the largest refinancing wave the mortgage-backed securities market has ever experienced. As the market became more confident in an economic recovery and the Fed removed the prospect of “unconventional policy,” yields rose sharply. Although the Fed did not raise interest rates in 2003, the reaction in the bond market resembled the last Fed tightening cycle back in 1994.
For the first half of the year, the Portfolio outperformed its Indexes due to its superior prepayment protection and security selection. In particular, the Portfolio was aided by its exposure to commercial mortgage-backed securities and Federal National Mortgage Association (FNMA) Delegated Underwriting and Servicing issues. An overweight in seasoned Government National Mortgage Association (GNMA) securities also boosted results.
In the second half of the year, the Portfolio’s longer-than-benchmark duration stance was the major detractor from performance. Interest rates rose significantly on the belief that the Fed would not use unconventional policy, such as purchasing longer Treasurys or targeting interest rates, to stimulate an economic recovery and ward off deflation.
The Portfolio of Investments following this report shows the size of the Portfolio’s positions at period-end.
| | |
| 20 | | THE TARGET PORTFOLIO TRUST |
U.S. Government Money Market Portfolio
Wellington Management Company, LLP
The total return of the U.S. Government Money Market Portfolio, subadvised by Wellington Management Company, LLP, was 0.70% in 2003 versus 0.46% for the Lipper U.S. Government Money Market Funds Average.
During 2003, money market securities produced fairly minimal returns. To further stimulate the economy, in June 2003, the Federal Reserve Board (the Fed) cut interest rates 0.25% to a 45-year low of 1%. This created an atmosphere that favored riskier assets, such as equities.
The primary driver of performance for the Portfolio was Wellington’s duration posture during the year compared to the 90-day Treasury Bill. When interest rates are flat or declining, portfolios with longer maturities fare comparatively better. The Portfolio’s performance was aided as its average maturity was lengthened gradually over the first half of the year in anticipation of the Fed easing.
Also enhancing results was the Portfolio’s exposure to securities issued by government-sponsored agencies. Wellington’s agency exposure remained fairly constant through the first half of 2003. However, it began to increase the Portfolio’s exposure to agencies as they became more attractive relative to repurchase agreements later in the year.
| | |
| THE TARGET PORTFOLIO TRUST | | 21 |
The Portfolio of Investments following this report shows the size of the Portfolio’s positions at period-end.
| | |
Large Capitalization Growth Portfolio | | Portfolio of Investments
December 31, 2003 |
| | | | | |
| SHARES | | DESCRIPTION | | VALUE (NOTE 1) |
|
| | | | | | |
| | | LONG-TERM INVESTMENTS—96.6% | | | |
| | |
| | | Common Stocks | | | |
| | |
| | | Aluminum—1.2% | | | |
| 114,000 | | Alcoa, Inc. | | $ | 4,332,000 |
| | | | |
|
|
| | |
| | | Apparel—1.0% | | | |
| 52,500 | | Nike, Inc. (Class B shares) | | | 3,594,150 |
| | | | |
|
|
| | |
| | | Computer Software & Services—13.7% | | | |
| 180,000 | | Advent Software, Inc.(a) | | | 3,137,400 |
| 300,000 | | Brocade Communications Systems, Inc.(a) | | | 1,734,000 |
| 701,500 | | EMC Corp.(a) | | | 9,063,380 |
| 454,500 | | Microsoft Corp. | | | 12,516,930 |
| 277,000 | | Oracle Corp.(a) | | | 3,656,400 |
| 130,500 | | PeopleSoft, Inc.(a) | | | 2,975,400 |
| 393,000 | | VERITAS Software Corp.(a) | | | 14,603,880 |
| | | | |
|
|
| | | | | | 47,687,390 |
| | | | |
|
|
| | |
| | | Computers & Business Equipment—10.6% | | | |
| 1,320,900 | | Cisco Systems, Inc.(a) | | | 32,084,661 |
| 139,000 | | Dell, Inc.(a) | | | 4,720,440 |
| | | | |
|
|
| | | | | | 36,805,101 |
| | | | |
|
|
| | |
| | | Cosmetics & Toiletries—1.4% | | | |
| 36,500 | | Avon Products, Inc. | | | 2,463,385 |
| 66,500 | | Estee Lauder Cos., Inc. (Class A shares) | | | 2,610,790 |
| | | | |
|
|
| | | | | | 5,074,175 |
| | | | |
|
|
| | |
| | | Drugs & Healthcare—12.9% | | | |
| 59,000 | | Amgen, Inc.(a) | | | 3,646,200 |
| 71,000 | | Boston Scientific Corp.(a) | | | 2,609,960 |
| 81,000 | | Bristol-Myers Squibb Co. | | | 2,316,600 |
| 106,000 | | Cardinal Health, Inc. | | | 6,482,960 |
| 117,000 | | Caremark Rx, Inc.(a) | | | 2,963,610 |
| 38,000 | | Gilead Sciences, Inc.(a) | | | 2,209,320 |
| 32,500 | | Invitrogen Corp.(a) | | | 2,275,000 |
| 162,700 | | Medtronic, Inc. | | | 7,908,847 |
| 348,500 | | Pfizer, Inc. | | | 12,312,505 |
| 45,000 | | Watson Pharmaceuticals, Inc.(a) | | | 2,070,000 |
| | | | |
|
|
| | | | | | 44,795,002 |
| | | | |
|
|
| | |
| | | Education—0.8% | | | |
| 39,000 | | Apollo Group, Inc. (Class A shares)(a) | | | 2,652,000 |
| | | | |
|
|
See Notes to Financial Statements
| | |
| 22 | | THE TARGET PORTFOLIO TRUST |
| | | | | |
| SHARES | | DESCRIPTION | | VALUE (NOTE 1) |
|
| | | | | | |
| | | Electronic Components—9.7% | | | |
| 729,000 | | Applied Materials, Inc.(a) | | $ | 16,366,050 |
| 453,000 | | Xilinx, Inc.(a) | | | 17,549,220 |
| | | | |
|
|
| | | | | | 33,915,270 |
| | | | |
|
|
| | | Financial Services—15.1% | | | |
| 83,000 | | Capital One Financial Corp. | | | 5,087,070 |
| 72,500 | | CIT Group, Inc. | | | 2,606,375 |
| 304,000 | | Citigroup, Inc. | | | 14,756,160 |
| 97,000 | | J.P. Morgan Chase & Co. | | | 3,562,810 |
| 468,150 | | MBNA Corp. | | | 11,633,528 |
| 154,400 | | Morgan Stanley | | | 8,935,128 |
| 53,000 | | Radian Group, Inc. | | | 2,583,750 |
| 90,000 | | SLM Corp. | | | 3,391,200 |
| | | | |
|
|
| | | | | | 52,556,021 |
| | | | |
|
|
| | |
| | | Hotels & Restaurants—1.6% | | | |
| 227,000 | | McDonald’s Corp. | | | 5,636,410 |
| | | | |
|
|
| | |
| | | Household Products—0.6% | | | |
| 53,000 | | Energizer Holdings, Inc.(a) | | | 1,990,680 |
| | | | |
|
|
| | |
| | | Insurance—2.4% | | | |
| 126,000 | | American International Group, Inc. | | | 8,351,280 |
| | | | |
|
|
| | |
| | | Internet—2.1% | | | |
| 79,500 | | Amazon.com, Inc.(a) | | | 4,184,880 |
| 163,300 | | Juniper Networks, Inc.(a) | | | 3,050,444 |
| | | | |
|
|
| | | | | | 7,235,324 |
| | | | |
|
|
| | |
| | | Machinery—1.1% | | | |
| 61,000 | | Deere & Co. | | | 3,968,050 |
| | | | |
|
|
| | |
| | | Media—2.5% | | | |
| 36,000 | | Clear Channel Communications, Inc. | | | 1,685,880 |
| 99,999 | | Comcast Corp. (Class A shares)(a) | | | 3,286,967 |
| 209,500 | | Time Warner Cos., Inc.(a) | | | 3,768,905 |
| | | | |
|
|
| | | | | | 8,741,752 |
| | | | |
|
|
| | |
| | | Oil Field/Equipment & Services—1.9% | | | |
| 48,500 | | Apache Corp. | | | 3,933,350 |
| 77,000 | | BJ Services Co.(a) | | | 2,764,300 |
| | | | |
|
|
| | | | | | 6,697,650 |
| | | | |
|
|
| | |
| | | Retail Trade—6.1% | | | |
| 211,000 | | GAP, Inc. (The) | | | 4,897,310 |
| 137,000 | | Home Depot, Inc. (The) | | | 4,862,130 |
| 94,500 | | Nordstrom, Inc. | | | 3,241,350 |
| 190,500 | | Staples, Inc.(a) | | | 5,200,650 |
| 55,000 | | Wal-Mart Stores, Inc. | | | 2,917,750 |
| | | | |
|
|
| | | | | | 21,119,190 |
| | | | |
|
|
See Notes to Financial Statements
| | |
| THE TARGET PORTFOLIO TRUST | | 23 |
| | |
Large Capitalization Growth Portfolio (cont’d) | | Portfolio of Investments
December 31, 2003 |
| | | | | | |
| SHARES | | DESCRIPTION | | VALUE (NOTE 1) | |
| |
| | | | | | | |
| | |
| | | Semiconductor & Semiconductor Equipment—10.5% | | | | |
| 54,500 | | Analog Devices, Inc. | | $ | 2,487,925 | |
| 166,000 | | Intel Corp. | | | 5,345,200 | |
| 325,000 | | Linear Technology Corp. | | | 13,672,750 | |
| 300,000 | | Maxim Integrated Products, Inc. | | | 14,940,000 | |
| | | | |
|
|
|
| | | | | | 36,445,875 | |
| | | | |
|
|
|
| | |
| | | Telecommunications—1.4% | | | | |
| 250,000 | | Corning, Inc.(a) | | | 2,607,500 | |
| 167,000 | | Motorola, Inc. | | | 2,349,690 | |
| | | | |
|
|
|
| | | | | | 4,957,190 | |
| | | | |
|
|
|
| | | Total long-term investments
(cost $226,774,040) | | | 336,554,510 | |
| | | | |
|
|
|
| | |
| | | SHORT-TERM INVESTMENT—3.6% | | | | |
| | |
| | | Mutual Fund | | | | |
| 12,375,527 | | Dryden Core Investment Fund—Taxable Money Market Series
(cost $12,375,527; Note 3) | | | 12,375,527 | |
| | | | |
|
|
|
| | | Total Investments—100.2%
(cost $239,149,567; Note 5) | | | 348,930,037 | |
| | | Liabilities in excess of other assets—(0.2%) | | | (544,987 | ) |
| | | | |
|
|
|
| | | Net Assets—100% | | $ | 348,385,050 | |
| | | | |
|
|
|
| (a) | Non-income producing security. |
See Notes to Financial Statements
| | |
| 24 | | THE TARGET PORTFOLIO TRUST |
| | | | | |
| SHARES | | DESCRIPTION | | VALUE (NOTE 1) |
|
| | | | | | |
| | | LONG-TERM INVESTMENTS—98.0% | | | |
| | |
| | | Common Stocks | | | |
| | |
| | | Aerospace/Defense—2.3% | | | |
| 19,400 | | Honeywell International, Inc. | | $ | 648,542 |
| 23,500 | | Lockheed Martin Corp. | | | 1,207,900 |
| 11,300 | | Northrop Grumman Corp. | | | 1,080,280 |
| 102,700 | | Raytheon Co. | | | 3,085,108 |
| 12,500 | | United Technologies Corp. | | | 1,184,625 |
| | | | |
|
|
| | | | | | 7,206,455 |
| | | | |
|
|
| | |
| | | Automobiles—0.7% | | | |
| 49,700 | | Ford Motor Co. | | | 795,200 |
| 16,200 | | General Motors Corp. | | | 865,080 |
| 13,400 | | Harley-Davidson, Inc. | | | 636,902 |
| | | | |
|
|
| | | | | | 2,297,182 |
| | | | |
|
|
| | |
| | | Automotive Components—0.9% | | | |
| 2,900 | | Dana Corp. | | | 53,215 |
| 141,862 | | Delphi Corp. | | | 1,448,411 |
| 7,800 | | Johnson Controls, Inc. | | | 905,736 |
| 6,900 | | Lear Corp. | | | 423,177 |
| | | | |
|
|
| | | | | | 2,830,539 |
| | | | |
|
|
| | |
| | | Chemicals—1.5% | | | |
| 10,400 | | Air Products & Chemicals, Inc. | | | 549,432 |
| 3,000 | | Dow Chemical Co. | | | 124,710 |
| 31,700 | | Eastman Chemical Co. | | | 1,253,101 |
| 7,500 | | EI du Pont de Nemours & Co. | | | 344,175 |
| 8,500 | | Monsanto Co. | | | 244,630 |
| 7,600 | | PPG Industries, Inc. | | | 486,552 |
| 33,800 | | Praxair, Inc. | | | 1,291,160 |
| 13,100 | | Rohm & Haas Co. | | | 559,501 |
| | | | |
|
|
| | | | | | 4,853,261 |
| | | | |
|
|
| | |
| | | Commercial Banks—7.5% | | | |
| 35,300 | | Bank of America Corp. | | | 2,839,179 |
| 20,400 | | Bank One Corp. | | | 930,036 |
| 5,100 | | City National Corp. | | | 316,812 |
| 5,000 | | Compass Bancshares, Inc. | | | 196,550 |
| 14,300 | | First Tennessee National Corp. | | | 630,630 |
| 41,100 | | FleetBoston Financial Corp. | | | 1,794,015 |
| 21,800 | | GreenPoint Financial Corp. | | | 769,976 |
| 13,800 | | Hibernia Corp. (Class A shares) | | | 324,438 |
| 108,100 | | KeyCorp | | | 3,169,492 |
| 9,100 | | Marshall & Ilsley Corp. | | | 348,075 |
| 20,400 | | Mellon Financial Corp. | | | 655,044 |
See Notes to Financial Statements
| | |
| THE TARGET PORTFOLIO TRUST | | 25 |
| | |
Large Capitalization Value Portfolio (cont’d) | | Portfolio of Investments
December 31, 2003 |
| | | | | |
| SHARES | | DESCRIPTION | | VALUE (NOTE 1) |
|
| | | | | | |
| | |
| | | Commercial Banks (cont’d) | | | |
| 16,300 | | North Fork Bancorporation, Inc. | | $ | 659,661 |
| 22,700 | | SouthTrust Corp. | | | 742,971 |
| 20,800 | | SunTrust Banks, Inc. | | | 1,487,200 |
| 96,700 | | U.S. Bancorp | | | 2,879,726 |
| 38,200 | | UnionBanCal Corp. | | | 2,198,028 |
| 53,500 | | Wachovia Corp. | | | 2,492,565 |
| 23,800 | | Wells Fargo & Co. | | | 1,401,582 |
| | | | |
|
|
| | | | | | 23,835,980 |
| | | | |
|
|
| | | Commercial Services & Supplies—3.0% | | | |
| 1,700 | | BearingPoint, Inc.(a) | | | 17,153 |
| 162,500 | | Cendant Corp.(a) | | | 3,618,875 |
| 194,600 | | Waste Management, Inc. | | | 5,760,160 |
| | | | |
|
|
| | | | | | 9,396,188 |
| | | | |
|
|
| | |
| | | Computers & Peripherals—1.7% | | | |
| 49,100 | | Cisco Systems, Inc.(a) | | | 1,192,639 |
| 85,100 | | Gateway, Inc.(a) | | | 391,460 |
| 93,200 | | Hewlett-Packard Co. | | | 2,140,804 |
| 10,500 | | International Business Machines Corp. | | | 973,140 |
| 1,900 | | Lexmark International, Inc.(a) | | | 149,416 |
| 12,500 | | NCR Corp.(a) | | | 485,000 |
| 7,400 | | Oracle Corp. | | | 93,610 |
| | | | |
|
|
| | | | | | 5,426,069 |
| | | | |
|
|
| | |
| | | Consumer Products—0.7% | | | |
| 3,600 | | Fortune Brands, Inc. | | | 257,364 |
| 18,500 | | Procter & Gamble Co. | | | 1,847,780 |
| | | | |
|
|
| | | | | | 2,105,144 |
| | | | |
|
|
| | |
| | | Cosmetics & Toiletries—0.3% | | | |
| 24,400 | | Gillette Co. | | | 896,212 |
| | | | |
|
|
| | |
| | | Data Processing Systems—0.1% | | | |
| 6,100 | | First Data Corp. | | | 250,649 |
| | | | |
|
|
| | |
| | | Diversified Manufacturing—0.1% | | | |
| 4,300 | | SPX Corp.(a) | | | 252,883 |
| | | | |
|
|
| | |
| | | Electric Utilities—7.3% | | | |
| 76,700 | | Alliant Energy Corp. | | | 1,909,830 |
| 4,600 | | Ameren Corp. | | | 211,600 |
| 157,920 | | American Electric Power Co., Inc. | | | 4,818,139 |
| 23,700 | | Consolidated Edison, Inc. | | | 1,019,337 |
| 7,900 | | Constellation Energy Group, Inc. | | | 309,364 |
| 22,000 | | DTE Energy Co. | | | 866,800 |
| 30,300 | | Edison International | | | 664,479 |
See Notes to Financial Statements
| | |
| 26 | | THE TARGET PORTFOLIO TRUST |
| | | | | |
| SHARES | | DESCRIPTION | | VALUE (NOTE 1) |
|
| | | | | | |
| | | Electric Utilities (cont’d) | | | |
| 75,900 | | Entergy Corp. | | $ | 4,336,167 |
| 149,996 | | FirstEnergy Corp. | | | 5,279,860 |
| 8,700 | | General Electric Co. | | | 269,526 |
| 9,000 | | NiSource, Inc. | | | 197,460 |
| 22,300 | | PG&E Corp.(a) | | | 619,271 |
| 16,900 | | Pinnacle West Capital Corp. | | | 676,338 |
| 19,600 | | PPL Corp. | | | 857,500 |
| 14,000 | | TXU Corp. | | | 332,080 |
| 6,200 | | Wisconsin Energy Corp. | | | 207,390 |
| 38,300 | | Xcel Energy, Inc. | | | 650,334 |
| | | | |
|
|
| | | | | | 23,225,475 |
| | | | |
|
|
| | |
| | | Electrical Equipment—0.1% | | | |
| 1,100 | | Agilent Technologies, Inc.(a) | | | 32,164 |
| 7,000 | | Cooper Industries, Ltd. (Class A shares) | | | 405,510 |
| | | | |
|
|
| | | | | | 437,674 |
| | | | |
|
|
| | |
| | | Electronics—0.2% | | | |
| 22,500 | | Altera Corp.(a) | | | 510,750 |
| 2,600 | | QLogic Corp.(a) | | | 134,160 |
| 1,300 | | Xilinx, Inc.(a) | | | 50,362 |
| | | | |
|
|
| | | | | | 695,272 |
| | | | |
|
|
| | |
| | | Energy Equipment & Services—0.1% | | | |
| 14,800 | | Pride International, Inc.(a) | | | 275,872 |
| | | | |
|
|
| | |
| | | Exchange Traded Funds—0.1% | | | |
| 6,280 | | Ishares Russell 1000 Value Index Fund | | | 366,564 |
| | | | |
|
|
| | |
| | | Financial Services—9.2% | | | |
| 1,700 | | Bear Stearns Cos., Inc. (The) | | | 135,915 |
| 10,600 | | Capital One Financial Corp. | | | 649,674 |
| 7,300 | | Charles Schwab Corp. (The) | | | 86,432 |
| 165,600 | | CIT Group, Inc. | | | 5,953,320 |
| 142,300 | | Citigroup, Inc. | | | 6,907,242 |
| 18,900 | | Countrywide Credit Industries, Inc. | | | 1,433,590 |
| 25,300 | | Freddie Mac | | | 1,475,496 |
| 19,600 | | Goldman Sachs Group, Inc. | | | 1,935,108 |
| 20,700 | | Janus Capital Group, Inc. | | | 339,687 |
| 2,400 | | Legg Mason, Inc. | | | 185,232 |
| 10,100 | | MBIA, Inc. | | | 598,223 |
| 16,700 | | MBNA Corp. | | | 414,995 |
| 17,700 | | Merrill Lynch & Co., Inc. | | | 1,038,105 |
| 42,600 | | Morgan Stanley | | | 2,465,262 |
| 161,700 | | Principal Financial Group, Inc. (The) | | | 5,347,419 |
| | | | |
|
|
| | | | | | 28,965,700 |
| | | | |
|
|
| | |
| | | Food Products—1.8% | | | |
| 13,600 | | Archer-Daniels-Midland Co. | | | 206,992 |
| 33,800 | | Coca-Cola Co. | | | 1,715,350 |
See Notes to Financial Statements
| | |
| THE TARGET PORTFOLIO TRUST | | 27 |
| | |
Large Capitalization Value Portfolio (cont’d) | | Portfolio of Investments
December 31, 2003 |
| | | | | |
| SHARES | | DESCRIPTION | | VALUE (NOTE 1) |
|
| | | | | | |
| | | Food Products (cont’d) | | | |
| 1,100 | | General Mills, Inc. | | $ | 49,830 |
| 800 | | H.J. Heinz Co. | | | 29,144 |
| 200 | | Hershey Foods Corp. | | | 15,398 |
| 9,300 | | Kellogg Co. | | | 354,144 |
| 54,700 | | Kraft Foods, Inc. (Class A shares) | | | 1,762,434 |
| 69,300 | | Sara Lee Corp. | | | 1,504,503 |
| | | | |
|
|
| | | | | | 5,637,795 |
| | | | |
|
|
| | |
| | | Gas & Pipeline Utilities—0.2% | | | |
| 19,300 | | El Paso Corp. | | | 158,067 |
| 7,100 | | Valero Energy Corp. | | | 329,014 |
| | | | |
|
|
| | | | | | 487,081 |
| | | | |
|
|
| | |
| | | Healthcare Equipment & Supplies—1.5% | | | |
| 6,600 | | Amgen, Inc.(a) | | | 407,880 |
| 16,300 | | Bausch & Lomb, Inc. | | | 845,970 |
| 400 | | Baxter International, Inc. | | | 12,208 |
| 4,200 | | Bristol-Myers Squibb Co. | | | 120,120 |
| 2,300 | | Eli Lilly & Co. | | | 161,759 |
| 5,100 | | Gilead Sciences, Inc.(a) | | | 296,514 |
| 11,500 | | Guidant Corp. | | | 692,300 |
| 6,300 | | Human Genome Sciences, Inc.(a) | | | 83,475 |
| 4,900 | | MedImmune, Inc.(a) | | | 124,460 |
| 13,800 | | Merck & Co., Inc. | | | 637,560 |
| 5,800 | | Pfizer, Inc. | | | 204,914 |
| 8,700 | | Sepracor, Inc. | | | 208,191 |
| 3,300 | | Watson Pharmaceuticals, Inc.(a) | | | 151,800 |
| 16,800 | | Wyeth | | | 713,160 |
| | | | |
|
|
| | | | | | 4,660,311 |
| | | | |
|
|
| | |
| | | Healthcare Providers & Services—4.1% | | | |
| 97,700 | | Aetna, Inc. | | | 6,602,566 |
| 4,300 | | Anthem, Inc.(a) | | | 322,500 |
| 366,600 | | Tenet Healthcare Corp.(a) | | | 5,883,930 |
| | | | |
|
|
| | | | | | 12,808,996 |
| | | | |
|
|
| | |
| | | Homebuilding—0.1% | | | |
| 1,200 | | D.R. Horton, Inc. | | | 51,912 |
| 3,600 | | KB Home | | | 261,072 |
| 700 | | Pulte Homes, Inc. | | | 65,534 |
| | | | |
|
|
| | | | | | 378,518 |
| | | | |
|
|
| | |
| | | Hotels, Restaurants & Leisure—3.9% | | | |
| 1,800 | | Carnival Corp. | | | 71,514 |
| 80,400 | | Mandalay Resort Group(a) | | | 3,595,488 |
| 300 | | Marriott International, Inc. | | | 13,860 |
See Notes to Financial Statements
| | |
| 28 | | THE TARGET PORTFOLIO TRUST |
| | | | | |
| SHARES | | DESCRIPTION | | VALUE (NOTE 1) |
|
| | | | | | |
| | |
| | | Hotels, Restaurants & Leisure (cont’d) | | | |
| 38,300 | | McDonald’s Corp. | | $ | 950,989 |
| 156,900 | | Park Place Entertainment Corp. | | | 1,699,227 |
| 171,800 | | Yum! Brands, Inc.(a) | | | 5,909,920 |
| | | | |
|
|
| | | | | | 12,240,998 |
| | | | |
|
|
| | | Household Durables—1.8% | | | |
| 1,600 | | Black & Decker Corp. | | | 78,912 |
| 3,900 | | Centex Corp. | | | 419,835 |
| 46,600 | | Lennar Corp. (Class A Shares) | | | 4,473,600 |
| 4,590 | | Lennar Corp. (Class B shares) | | | 419,526 |
| 15,600 | | Masco Corp. | | | 427,596 |
| | | | |
|
|
| | | | | | 5,819,469 |
| | | | |
|
|
| | |
| | | Industrial Conglomerates—1.8% | | | |
| 1,800 | | 3M Co. | | | 153,054 |
| 3,900 | | ITT Industries, Inc. | | | 289,419 |
| 200,300 | | Tyco International Ltd. (Bermuda) | | | 5,307,950 |
| | | | |
|
|
| | | | | | 5,750,423 |
| | | | |
|
|
| | |
| | | Industrial Machinery—0.4% | | | |
| 5,500 | | Deere & Co. | | | 357,775 |
| 4,500 | | Eaton Corp. | | | 485,910 |
| 5,300 | | Ingersoll-Rand Co. (Class A shares) | | | 359,764 |
| | | | |
|
|
| | | | | | 1,203,449 |
| | | | |
|
|
| | |
| | | Insurance—10.6% | | | |
| 89,800 | | Allmerica Financial Corp.(a) | | | 2,763,146 |
| 191,100 | | Allstate Corp. (The) | | | 8,221,122 |
| 15,300 | | Ambac Financial Group, Inc. | | | 1,061,667 |
| 7,300 | | American International Group, Inc. | | | 483,844 |
| 600 | | Chubb Corp. (The) | | | 40,860 |
| 15,400 | | CIGNA Corp. | | | 885,500 |
| 26,900 | | Hartford Financial Services Group, Inc. (The) | | | 1,587,907 |
| 4,100 | | John Hancock Financial Services, Inc. | | | 153,750 |
| 19,300 | | Lincoln National Corp. | | | 779,141 |
| 260,770 | | MetLife, Inc. | | | 8,780,126 |
| 7,400 | | Protective Life Corp. | | | 250,416 |
| 1,000 | | SAFECO Corp. | | | 38,930 |
| 173,100 | | St. Paul Cos., Inc. | | | 6,863,415 |
| 7,300 | | Torchmark Corp. | | | 332,442 |
| 44,000 | | Travelers Property Casualty Corp., (Class A shares) | | | 738,320 |
| 7,900 | | Travelers Property Casualty Corp., (Class B shares) | | | 134,063 |
| 29,300 | | UnumProvident Corp. | | | 462,061 |
| | | | |
|
|
| | | | | | 33,576,710 |
| | | | |
|
|
| | | IT Services—3.0% | | | |
| 14,800 | | Computer Sciences Corp.(a) | | | 654,604 |
| 334,600 | | Electronic Data Systems Corp. | | | 8,211,084 |
| 6,100 | | EMC Corp.(a) | | | 78,812 |
See Notes to Financial Statements
| | |
| THE TARGET PORTFOLIO TRUST | | 29 |
| | |
Large Capitalization Value Portfolio (cont’d) | | Portfolio of Investments
December 31, 2003 |
| | | | | |
| SHARES | | DESCRIPTION | | VALUE (NOTE 1) |
|
| | | IT Services (cont’d) | | | |
| | | | | | |
| 18,500 | | SunGard Data Systems, Inc.(a) | | $ | 512,635 |
| 39,400 | | Sun Microsystems, Inc.(a) | | | 176,906 |
| | | | |
|
|
| | | | | | 9,634,041 |
| | | | |
|
|
| | |
| | | Leisure Equipment & Products—0.9% | | | |
| 113,800 | | Eastman Kodak Co. | | | 2,921,246 |
| | | | |
|
|
| | |
| | | Manufacturing | | | |
| 900 | | Illinois Tool Works, Inc. | | | 75,519 |
| | | | |
|
|
| | |
| | | Media—2.7% | | | |
| 4,400 | | E.W. Scripps Co. (Class A shares) | | | 414,216 |
| 30,400 | | Fox Entertainment Group, Inc. (Class A shares)(a) | | | 886,160 |
| 16,300 | | Gannett Co., Inc. | | | 1,453,308 |
| 1,300 | | Knight-Ridder, Inc. | | | 100,581 |
| 49,800 | | Liberty Media Corp. (Class A shares)(a) | | | 592,122 |
| 400 | | McGraw-Hill Companies, Inc. (The) | | | 27,968 |
| 63,400 | | Time Warner Cos., Inc. | | | 1,140,566 |
| 11,500 | | Tribune Co. | | | 593,400 |
| 41,000 | | Viacom, Inc. (Class B shares) | | | 1,819,580 |
| 61,700 | | Walt Disney Co. | | | 1,439,461 |
| | | | |
|
|
| | | | | | 8,467,362 |
| | | | |
|
|
| | |
| | | Metals & Mining—1.8% | | | |
| 129,976 | | Alcoa, Inc. | | | 4,939,088 |
| 24,100 | | United States Steel Corp. | | | 843,982 |
| | | | |
|
|
| | | | | | 5,783,070 |
| | | | |
|
|
| | |
| | | Multi-Utilities—0.1% | | | |
| 12,001 | | SCANA Corp. | | | 411,034 |
| | | | |
|
|
| | |
| | | Networking Equipment—0.1% | | | |
| 16,500 | | Juniper Networks, Inc.(a) | | | 308,220 |
| | | | |
|
|
| | |
| | | Oil & Gas—4.9% | | | |
| 16,200 | | Anadarko Petroleum Corp. | | | 826,362 |
| 1,300 | | Baker Hughes, Inc. | | | 41,808 |
| 29,400 | | ChevronTexaco Corp. | | | 2,539,866 |
| 139,200 | | Exxon Mobil Corp. | | | 5,707,200 |
| 78,128 | | Sunoco, Inc. | | | 3,996,247 |
| 37,100 | | Teekay Shipping Corp. | | | 2,115,813 |
| 9,700 | | Unocal Corp. | | | 357,251 |
| | | | |
|
|
| | | | | | 15,584,547 |
| | | | |
|
|
| | |
| | | Oil Field/Equipment & Services—1.4% | | | |
| 34,800 | | ConocoPhillips | | | 2,281,836 |
| 4,800 | | Cooper Cameron Corp.(a) | | | 223,680 |
See Notes to Financial Statements
| | |
| 30 | | THE TARGET PORTFOLIO TRUST |
| | | | | |
| SHARES | | DESCRIPTION | | VALUE (NOTE 1) |
|
| | | | | | |
| | | Oil Field/Equipment & Services (cont’d) | | | |
| 30,700 | | Devon Energy Corp. | | $ | 1,757,882 |
| 15,600 | | Dynegy, Inc. | | | 66,768 |
| 1,300 | | ENSCO International, Inc. | | | 35,321 |
| 8,800 | | Rowan Cos., Inc.(a) | | | 203,896 |
| | | | |
|
|
| | | | | | 4,569,383 |
| | | | |
|
|
| | |
| | | Paper & Forest Products—1.1% | | | |
| 9,500 | | Bowater, Inc. | | | 439,945 |
| 15,100 | | Georgia-Pacific Group | | | 463,117 |
| 3,200 | | Smurfit-Stone Container Corp.(a) | | | 59,424 |
| 3,100 | | Temple-Inland, Inc. | | | 194,277 |
| 35,720 | | Weyerhaeuser Co. | | | 2,286,080 |
| | | | |
|
|
| | | | | | 3,442,843 |
| | | | |
|
|
| | |
| | | Railroads & Equipment—0.2% | | | |
| 1,800 | | CSX Corp. | | | 64,692 |
| 400 | | FedEx Corp. | | | 27,000 |
| 10,800 | | Norfolk Southern Corp. | | | 255,420 |
| 1,700 | | Union Pacific Corp. | | | 118,116 |
| | | | |
|
|
| | | | | | 465,228 |
| | | | |
|
|
| | |
| | | Real Estate Investment Trust—1.4% | | | |
| 1,700 | | Apartment Investment & Management Co. | | | 58,650 |
| 4,300 | | Archstone-Smith Trust | | | 120,314 |
| 2,100 | | Camden Property Trust | | | 93,030 |
| 5,000 | | CarrAmerica Realty Corp. | | | 148,900 |
| 9,100 | | Duke Realty Corp. | | | 282,100 |
| 31,800 | | Equity Office Properties Trust | | | 911,070 |
| 12,000 | | Equity Residential | | | 354,120 |
| 11,700 | | General Growth Properties, Inc. | | | 324,675 |
| 2,500 | | Highwoods Properties, Inc. | | | 63,500 |
| 5,700 | | Hospitality Properties Trust | | | 235,296 |
| 2,900 | | Mack-Cali Realty Corp. | | | 120,698 |
| 25,585 | | Plum Creek Timber Co., Inc. | | | 779,063 |
| 12,700 | | ProLogis Trust | | | 407,543 |
| 6,500 | | Rouse Co. (The) | | | 305,500 |
| 6,500 | | United Dominion Realty Trust, Inc. | | | 124,800 |
| | | | |
|
|
| | | | | | 4,329,259 |
| | | | |
|
|
| | |
| | | Retailing—6.9% | | | |
| 8,900 | | Abercrombie & Fitch Co. (Class A shares)(a) | | | 219,919 |
| 107,400 | | Albertson’s, Inc. | | | 2,432,610 |
| 31,100 | | CVS Corp. | | | 1,123,332 |
| 16,300 | | Federated Department Stores, Inc.(a) | | | 768,219 |
| 19,900 | | Home Depot, Inc. (The) | | | 706,251 |
| 274,700 | | J. C. Penney Co., Inc. | | | 7,219,116 |
| 10,200 | | Kohl’s Corp.(a) | | | 458,388 |
See Notes to Financial Statements
| | |
| THE TARGET PORTFOLIO TRUST | | 31 |
| | |
Large Capitalization Value Portfolio (cont’d) | | Portfolio of Investments
December 31, 2003 |
| | | | | |
| SHARES | | DESCRIPTION | | VALUE (NOTE 1) |
|
| | | | | | |
| | |
| | | Retailing (cont’d) | | | |
| 6,600 | | May Department Stores Co. (The) | | $ | 191,862 |
| 192,000 | | Sears, Roebuck & Co. | | | 8,734,080 |
| | | | |
|
|
| | | | | | 21,853,777 |
| | | | |
|
|
| | |
| | | Semiconductors & Semiconductor Equipment—0.1% | | | |
| 800 | | Intersil Corp. (Class A shares)(a) | | | 19,880 |
| 5,800 | | Micron Technology, Inc.(a) | | | 78,126 |
| 1,400 | | Novellus Systems, Inc.(a) | | | 58,870 |
| | | | |
|
|
| | | | | | 156,876 |
| | | | |
|
|
| | |
| | | Software—2.2% | | | |
| 9,600 | | BMC Software, Inc.(a) | | | 179,040 |
| 229,200 | | Computer Associates International, Inc. | | | 6,266,328 |
| 8,500 | | Mercury Interactive Corp.(a) | | | 413,440 |
| 2,700 | | Take-Two Interactive Software, Inc. | | | 77,787 |
| | | | |
|
|
| | | | | | 6,936,595 |
| | | | |
|
|
| | |
| | | Supplier & Networking Equipment—0.1% | | | |
| 21,100 | | Lucent Technologies, Inc.(a) | | | 59,924 |
| 43,000 | | Tellabs, Inc.(a) | | | 362,490 |
| | | | |
|
|
| | | | | | 422,414 |
| | | | |
|
|
| | |
| | | Telecommunications Services—2.8% | | | |
| 18,820 | | AT&T Corp. | | | 382,046 |
| 24,000 | | AT&T Wireless Services, Inc.(a) | | | 191,760 |
| 35,100 | | BellSouth Corp. | | | 993,330 |
| 13,700 | | Corning, Inc.(a) | | | 142,891 |
| 9,796 | | Hughes Electronics Corp(a) | | | 162,125 |
| 26,400 | | Qwest Communications International, Inc.(a) | | | 114,048 |
| 109,300 | | SBC Communications, Inc. | | | 2,849,451 |
| 51,300 | | Sprint Corp. (PCS Group)(a) | | | 288,306 |
| 112,400 | | Verizon Communications, Inc. | | | 3,942,992 |
| | | | |
|
|
| | | | | | 9,066,949 |
| | | | |
|
|
| | |
| | | Textiles, Apparel & Luxury Goods—0.9% | | | |
| 67,900 | | Jones Apparel Group, Inc. | | | 2,392,117 |
| 6,000 | | Nike, Inc. (Class B shares) | | | 410,760 |
| | | | |
|
|
| | | | | | 2,802,877 |
| | | | |
|
|
| | |
| | | Thrifts & Mortgage Finance—1.3% | | | |
| 100,000 | | Washington Mutual, Inc. | | | 4,012,000 |
| | | | |
|
|
| | |
| | | Tobacco—3.6% | | | |
| 210,200 | | Altria Group, Inc. | | | 11,439,084 |
| | | | |
|
|
See Notes to Financial Statements
| | |
| 32 | | THE TARGET PORTFOLIO TRUST |
| | | | | | |
| SHARES | | DESCRIPTION | | VALUE (NOTE 1) | |
| |
| | | | | | | |
| | |
| | | Toys & Amusements—0.4% | | | | |
| 19,500 | | Hasbro, Inc. | | $ | 414,960 | |
| 40,900 | | Mattel, Inc. | | | 788,143 | |
| | | | |
|
|
|
| | | | | | 1,203,103 | |
| | | | |
|
|
|
| | |
| | | Trading Companies & Distributors—0.1% | | | | |
| 3,500 | | W.W. Grainger, Inc. | | | 165,865 | |
| | | | |
|
|
|
| | | Total common stocks
(cost $242,207,954) | | | 309,932,161 | |
| | | | |
|
|
|
| | |
| | | Preferred Stock | | | | |
| | |
| | | Media | | | | |
| 1 | | News Corp. Ltd.
(cost $29) | | | 30 | |
| | | | |
|
|
|
| | | Total long-term investments
(cost $242,207,983) | | | 309,932,191 | |
| | | | |
|
|
|
| | |
| | | SHORT-TERM INVESTMENT—3.3% | | | | |
| | |
| | | Mutual Fund | | | | |
| 10,363,339 | | Dryden Core Investment Fund—Taxable Money Market Series
(cost $10,363,339; Note 3) | | | 10,363,339 | |
| | | | |
|
|
|
| | | Total Investments—101.3%
(cost $252,571,322; Note 5) | | | 320,295,530 | |
| | | Liabilities in excess of other assets—(1.3%) | | | (4,164,907 | ) |
| | �� | | |
|
|
|
| | | Net Assets—100% | | $ | 316,130,623 | |
| | | | |
|
|
|
| (a) | Non-income producing security. |
See Notes to Financial Statements
| | |
| THE TARGET PORTFOLIO TRUST | | 33 |
| | |
| Small Capitalization Growth Portfolio | | Portfolio of Investments
December 31, 2003 |
| | | | | |
| SHARES | | DESCRIPTION | | VALUE (NOTE 1) |
|
| | | | | | |
| | | LONG-TERM INVESTMENTS—93.8% | | | |
| | |
| | | Common Stocks | | | |
| | |
| | | Air Freight & Logistics—1.4% | | | |
| 47,838 | | Forward Air Corp.(a) | | $ | 1,315,545 |
| 41,947 | | Vitran Corporation, Inc. | | | 593,550 |
| | | | |
|
|
| | | | | | 1,909,095 |
| | | | |
|
|
| | |
| | | Airlines—0.5% | | | |
| 49,550 | | Pinnacle Airlines Corp. | | | 688,250 |
| | | | |
|
|
| | |
| | | Automobiles—0.9% | | | |
| 18,036 | | Monaco Coach Corp. | | | 429,257 |
| 11,270 | | Winnebago Industries, Inc. | | | 774,812 |
| | | | |
|
|
| | | | | | 1,204,069 |
| | | | |
|
|
| | |
| | | Banking & Finance—1.2% | | | |
| 24,150 | | Franklin Bank Corp., Houston TX | | | 458,850 |
| 13,050 | | PrivateBancorp, Inc. | | | 594,036 |
| 30,100 | | World Acceptance Corp.(a) | | | 599,291 |
| | | | |
|
|
| | | | | | 1,652,177 |
| | | | |
|
|
| | |
| | | Biotechnology—0.9% | | | |
| 13,132 | | Connetics Corp. | | | 238,477 |
| 28,800 | | Discovery Laboratories, Inc. | | | 302,112 |
| 15,048 | | IDEXX Laboratories, Inc.(a) | | | 696,422 |
| | | | |
|
|
| | | | | | 1,237,011 |
| | | | |
|
|
| | |
| | | Business Services—0.9% | | | |
| 3,104 | | Digital Insight Corp.(a) | | | 77,290 |
| 60,050 | | Lionbridge Technologies | | | 577,081 |
| 35,250 | | Marlin Business Services, Inc.(a) | | | 613,349 |
| | | | |
|
|
| | | | | | 1,267,720 |
| | | | |
|
|
| | |
| | | Capital Markets—2.9% | | | |
| 40,161 | | Investors Financial Services Corp. | | | 1,542,584 |
| 75,018 | | Jefferies Group, Inc. | | | 2,477,094 |
| | | | |
|
|
| | | | | | 4,019,678 |
| | | | |
|
|
| | |
| | | Commercial Banks—1.2% | | | |
| 15,950 | | First Community Bancorp/CA | | | 576,433 |
| 15,050 | | Nara Bancorp, Inc. | | | 410,865 |
| 17,000 | | Southwest Bancorporation of Texas, Inc.(a) | | | 660,450 |
| | | | |
|
|
| | | | | | 1,647,748 |
| | | | |
|
|
See Notes to Financial Statements
| | |
| 34 | | THE TARGET PORTFOLIO TRUST |
| | | | | |
| SHARES | | DESCRIPTION | | VALUE (NOTE 1) |
|
| | | | | | |
| | | Commercial Services & Supplies—4.0% | | | |
| 13,950 | | Bright Horizons Family Solutions, Inc. | | $ | 585,900 |
| 28,074 | | ChoicePoint, Inc.(a) | | | 1,069,339 |
| 13,220 | | Hewitt Associates, Inc. | | | 395,278 |
| 49,912 | | Kroll, Inc.(a) | | | 1,297,712 |
| 39,200 | | Netbank, Inc. | | | 523,320 |
| 27,400 | | Sylvan Learning Systems, Inc.(a) | | | 788,846 |
| 18,400 | | Telik, Inc. | | | 423,384 |
| 66,950 | | Tripath Imaging, Inc. | | | 522,210 |
| | | | |
|
|
| | | | | | 5,605,989 |
| | | | |
|
|
| | |
| | | Communications Equipment—4.1% | | | |
| 172,600 | | Adaptec, Inc. | | | 1,524,058 |
| 21,700 | | Alvarion Ltd. | | | 250,635 |
| 83,550 | | Andrew Corp.(a) | | | 961,661 |
| 60,832 | | Avocent Corp. | | | 2,221,585 |
| 15,778 | | Black Box Corp. | | | 726,892 |
| | | | |
|
|
| | | | | | 5,684,831 |
| | | | |
|
|
| | |
| | | Computer Services—0.7% | | | |
| 29,800 | | Citadel Security Software, Inc. | | | 113,240 |
| 19,750 | | Equinix, Inc. | | | 556,950 |
| 14,850 | | eSpeed, Inc.(a) | | | 347,639 |
| | | | |
|
|
| | | | | | 1,017,829 |
| | | | |
|
|
| | |
| | | Computers & Peripherals—4.0% | | | |
| 43,400 | | Dynamex, Inc. | | | 520,800 |
| 80,600 | | Emulex Corp. | | | 2,150,408 |
| 22,750 | | Kintera, Inc. | | | 282,100 |
| 50,700 | | Phoenix Technologies Ltd.(a) | | | 409,656 |
| 50,671 | | Planar Systems, Inc. | | | 1,232,319 |
| 99,700 | | Sapient Corp.(a) | | | 558,320 |
| 58,900 | | Synplicity, Inc. | | | 461,187 |
| | | | |
|
|
| | | | | | 5,614,790 |
| | | | |
|
|
| | |
| | | Construction & Engineering—1.0% | | | |
| 37,950 | | Essex Corp. | | | 356,351 |
| 20,687 | | Jacobs Engineering Group, Inc. | | | 993,182 |
| | | | |
|
|
| | | | | | 1,349,533 |
| | | | |
|
|
| | |
| | | Diversified Financial Services—4.0% | | | |
| 28,620 | | Affiliated Managers Group, Inc.(a) | | | 1,991,666 |
| 57,122 | | Financial Federal Corp. | | | 1,745,077 |
| 32,834 | | Gabelli Asset Management, Inc. (Class A shares) | | | 1,306,793 |
| 38,550 | | Per-Se Technologies, Inc. | | | 588,273 |
| | | | |
|
|
| | | | | | 5,631,809 |
| | | | |
|
|
See Notes to Financial Statements
| | |
| THE TARGET PORTFOLIO TRUST | | 35 |
| | |
Small Capitalization Growth Portfolio (cont’d) | | Portfolio of Investments
December 31, 2003 |
| | | | | |
| SHARES | | DESCRIPTION | | VALUE (NOTE 1) |
|
| | | | | | |
| | | Drugs & Healthcare—0.7% | | | |
| 18,011 | | Enzon Pharmaceuticals, Inc.(a) | | $ | 216,132 |
| 35,700 | | Province Healthcare Co.(a) | | | 571,200 |
| 9,200 | | Serologicals Corp.(a) | | | 171,120 |
| | | | |
|
|
| | | | | | 958,452 |
| | | | |
|
|
| | |
| | | Electronic Equipment & Instruments—5.4% | | | |
| 42,300 | | Asyst Technologies, Inc.(a) | | | 733,905 |
| 69,375 | | Benchmark Electronics, Inc.(a) | | | 2,414,943 |
| 23,429 | | Fisher Scientific International, Inc.(a) | | | 969,258 |
| 781 | | Global Imaging Systems, Inc.(a) | | | 24,797 |
| 52,350 | | GrafTech International, Ltd.(a) | | | 706,725 |
| 66,100 | | Innovex, Inc. | | | 557,223 |
| 36,050 | | Rogers Corp. | | | 1,590,526 |
| 21,200 | | Veeco Instruments, Inc. | | | 597,840 |
| | | | |
|
|
| | | | | | 7,595,217 |
| | | | |
|
|
| | |
| | | Energy Equipment & Services—2.4% | | | |
| 49,500 | | Cal Dive International, Inc.(a) | | | 1,193,445 |
| 27,900 | | Dril-Quip, Inc. | | | 454,770 |
| 150,150 | | Grey Wolf, Inc.(a) | | | 561,561 |
| 29,850 | | Hydril Co. | | | 714,311 |
| 25,000 | | Maverick Tube Corp.(a) | | | 481,250 |
| | | | |
|
|
| | | | | | 3,405,337 |
| | | | |
|
|
| | |
| | | Food & Staples Retailing—1.6% | | | |
| 22,700 | | Buffalo Wild Wings, Inc.(a) | | | 589,065 |
| 28,635 | | Performance Food Group Co.(a) | | | 1,035,728 |
| 53,300 | | Wild Oats Markets, Inc.(a) | | | 689,169 |
| | | | |
|
|
| | | | | | 2,313,962 |
| | | | |
|
|
| | |
| | | Healthcare Equipment & Supplies—4.5% | | | |
| 45,542 | | American Medical Systems Holdings, Inc.(a) | | | 992,815 |
| 6,870 | | Beckman Coulter, Inc. | | | 349,202 |
| 11,538 | | Edwards Lifesciences Corp.(a) | | | 347,063 |
| 32,100 | | I-Flow Corp.(a) | | | 446,511 |
| 32,775 | | Inamed Corp.(a) | | | 1,575,166 |
| 36,000 | | Intuitive Surgical, Inc.(a) | | | 615,239 |
| 26,150 | | Laserscope(a) | | | 407,679 |
| 58,750 | | Orthologic Corp.(a) | | | 360,138 |
| 8,700 | | Ventana Medical Systems, Inc.(a) | | | 342,780 |
| 24,950 | | Vicuron Pharmaceuticals, Inc.(a) | | | 465,318 |
| 12,424 | | Zoll Medical Corp.(a) | | | 440,804 |
| | | | |
|
|
| | | | | | 6,342,715 |
| | | | |
|
|
| | |
| | | Healthcare Providers & Services—1.5% | | | |
| 13,700 | | Kindred Healthcare, Inc.(a) | | | 712,126 |
See Notes to Financial Statements
| | |
| 36 | | THE TARGET PORTFOLIO TRUST |
| | | | | |
| SHARES | | DESCRIPTION | | VALUE (NOTE 1) |
|
| | | | | | |
| | |
| | | Healthcare Providers & Services (cont’d) | | | |
| 30,814 | | Priority Healthcare Corp. (Class B shares)(a) | | $ | 742,926 |
| 35,950 | | Providence Service Corp. (The)(a) | | | 581,671 |
| | | | |
|
|
| | | | | | 2,036,723 |
| | | | |
|
|
| | | Hotels, Restaurants & Leisure—2.9% | | | |
| 38,602 | | Alliance Gaming Corp.(a) | | | 951,539 |
| 20,013 | | Chicago Pizza & Brewery, Inc.(a) | | | 298,594 |
| 24,389 | | Mandalay Resort Group(a) | | | 1,090,676 |
| 70,920 | | Rare Hospitality International, Inc.(a) | | | 1,733,285 |
| | | | |
|
|
| | | | | | 4,074,094 |
| | | | |
|
|
| | |
| | | Household Durables—0.7% | | | |
| 25,065 | | Toll Brothers, lnc.(a) | | | 996,584 |
| | | | |
|
|
| | |
| | | Insurance—3.0% | | | |
| 43,266 | | American Medical Security Group, Inc. | | | 970,024 |
| 30,606 | | Infinity Property & Casualty Corp. | | | 1,011,528 |
| 27,560 | | LabOne, Inc. | | | 894,873 |
| 18,500 | | ProAssurance Corp.(a) | | | 594,775 |
| 33,350 | | Scottish Annuity & Life Holdings, Ltd. | | | 693,013 |
| | | | |
|
|
| | | | | | 4,164,213 |
| | | | |
|
|
| | |
| | | Internet Software & Services—3.0% | | | |
| 24,100 | | InfoSpace, Inc.(a) | | | 555,505 |
| 42,900 | | United Online, Inc.(a) | | | 720,291 |
| 172,162 | | ValueVision Media, Inc. | | | 2,875,105 |
| | | | |
|
|
| | | | | | 4,150,901 |
| | | | |
|
|
| | |
| | | IT Services—1.8% | | | |
| 111,751 | | Ciber, Inc.(a)2 | | | 967,764 |
| 74,359 | | Keane, Inc.(a) | | | 1,088,615 |
| 18,650 | | Radware Ltd.(a) | | | 508,213 |
| | | | |
|
|
| | | | | | 2,564,592 |
| | | | |
|
|
| | |
| | | Leisure Equipment & Products—1.2% | | | |
| 78,900 | | Image Entertainment, Inc.(a) | | | 325,857 |
| 42,950 | | K2, Inc. | | | 653,270 |
| 16,530 | | Multimedia Games, Inc.(a) | | | 679,383 |
| | | | |
|
|
| | | | | | 1,658,510 |
| | | | |
|
|
| | |
| | | Machinery—0.6% | | | |
| 11,190 | | Applied Films Corp.(a) | | | 369,494 |
| 34,800 | | Intevac, Inc. | | | 491,028 |
| | | | |
|
|
| | | | | | 860,522 |
| | | | |
|
|
| | |
| | | Media—7.7% | | | |
| 74,200 | | CNET Networks, Inc.(a) | | | 506,044 |
| 45,889 | | Cox Radio, Inc.(a) | | | 1,157,779 |
| 66,100 | | Digitas, Inc.(a) | | | 616,052 |
See Notes to Financial Statements
| | |
| THE TARGET PORTFOLIO TRUST | | 37 |
| | |
Small Capitalization Growth Portfolio (cont’d) | | Portfolio of Investments
December 31, 2003 |
| | | | | |
| SHARES | | DESCRIPTION | | VALUE (NOTE 1) |
|
| | | | | | |
| | | Media (cont’d) | | | |
| 59,260 | | Emmis Communications Corp.(Class A shares)(a) | | $ | 1,602,982 |
| 81,000 | | Entravision Communications Corp.(a) | | | 899,100 |
| 31,865 | | Forrester Research, Inc.(a) | | | 569,428 |
| 23,300 | | Getty Images, Inc.(a) | | | 1,168,029 |
| 56,400 | | ICT Group, Inc.(a) | | | 662,700 |
| 67,267 | | Insight Communications Co., Inc.(a) | | | 693,523 |
| 43,750 | | Modem Media, Inc. | | | 357,438 |
| 42,854 | | SBS Broadcasting SA(a) | | | 1,397,040 |
| 149,243 | | Valueclick, Inc.(a) | | | 1,355,126 |
| | | | |
|
|
| | | | | | 10,985,241 |
| | | | |
|
|
| | |
| | | Multiline Retail—0.8% | | | |
| 40,004 | | 99 Cents Only Stores, Inc.(a) | | | 1,089,309 |
| | | | |
|
|
| | |
| | | Office Equipment & Supplies—0.9% | | | |
| 70,500 | | Scientific Games Corp.(a) | | | 1,199,205 |
| | | | |
|
|
| | |
| | | Oil & Gas—2.9% | | | |
| 41,508 | | Newfield Exploration Co.(a) | | | 1,848,766 |
| 40,200 | | Oil States Intl., Inc.(a) | | | 560,388 |
| 64,150 | | Superior Energy Services, Inc.(a) | | | 603,010 |
| 25,450 | | Unit Corp.(a) | | | 599,348 |
| 8,540 | | Western Gas Resources, Inc. | | | 403,515 |
| | | | |
|
|
| | | | | | 4,015,027 |
| | | | |
|
|
| | |
| | | Patent Owners & Lessors—0.1% | | | |
| 21,800 | | SRS Labs, Inc.(a) | | | 203,394 |
| | | | |
|
|
| | |
| | | Pharmaceuticals—4.4% | | | |
| 28,350 | | Alexion Pharmaceuticals, Inc.(a) | | | 482,517 |
| 35,550 | | Atherogenics, Inc.(a) | | | 531,473 |
| 22,700 | | Bradley Pharmaceuticals, Inc.(a) | | | 577,261 |
| 19,150 | | Dade Behring Holdings, Inc.(a) | | | 684,421 |
| 162,050 | | Durect Corp.(a) | | | 418,089 |
| 29,200 | | EPIX Medical, Inc.(a) | | | 475,376 |
| 3,700 | | Icon PLC(a) | | | 161,320 |
| 28,400 | | Inspire Pharmaceuticals, Inc.(a) | | | 402,144 |
| 29,500 | | Inveresk Research Group, Inc.(a) | | | 729,535 |
| 35,000 | | North American Scientific, Inc.(a) | | | 367,500 |
| 25,700 | | Penwest Pharmaceuticals Co.(a) | | | 444,096 |
| 34,000 | | Pozen, Inc.(a) | | | 346,800 |
| 27,300 | | Salix Pharmaceuticals, Ltd.(a) | | | 618,891 |
| | | | |
|
|
| | | | | | 6,239,423 |
| | | | |
|
|
| | |
| | | Semiconductors & Semiconductor Equipment—6.8% | | | |
| 24,633 | | Cabot Microelectronics Corp.(a) | | | 1,207,016 |
| 77,500 | | ChipPAC, Inc. (Class A shares)(a) | | | 588,225 |
See Notes to Financial Statements
| | |
| 38 | | THE TARGET PORTFOLIO TRUST |
| | | | | |
| SHARES | | DESCRIPTION | | VALUE (NOTE 1) |
|
| | | | | | |
| | | Semiconductors & Semiconductor Equipment (cont’d) | | | |
| 29,800 | | Exar Corp. | | $ | 508,984 |
| 37,500 | | FSI International, Inc.(a) | | | 276,750 |
| 83,386 | | Genus, Inc. | | | 500,316 |
| 26,270 | | Intersil Corp. (Class A)(a) | | | 652,810 |
| 127,647 | | Kopin Corp.(a) | | | 856,511 |
| 29,950 | | Mykrolis Corp.(a) | | | 481,596 |
| 23,800 | | O2Micro International, Ltd.(a) | | | 533,120 |
| 71,784 | | PLX Technology, Inc.(a) | | | 635,288 |
| 15,750 | | Power Integrations, Inc.(a) | | | 526,995 |
| 46,560 | | Semtech Corp.(a) | | | 1,058,308 |
| 14,150 | | Ultratech, Inc.(a) | | | 415,586 |
| 53,800 | | Xicor, Inc.(a) | | | 610,092 |
| 40,650 | | Zoran Corp.(a) | | | 706,904 |
| | | | |
|
|
| | | | | | 9,558,501 |
| | | | |
|
|
| | |
| | | Software—6.0% | | | |
| 12,400 | | Altiris, Inc.(a) | | | 452,352 |
| 57,700 | | Catapult Communications Corp.(a) | | | 836,650 |
| 147,720 | | Clicksoftware Technologies, Ltd(a) | | | 602,698 |
| 32,242 | | Embarcadero Technologies, Inc.(a) | | | 514,260 |
| 13,376 | | Factset Research Systems, Inc. | | | 511,097 |
| 27,305 | | Fair Isaac Corp. | | | 1,342,313 |
| 11,281 | | Hyperion Solutions Corp.(a) | | | 340,009 |
| 81,369 | | Jack Henry & Associates, Inc. | | | 1,674,573 |
| 119,059 | | Logicvision, Inc.(a) | | | 535,766 |
| 24,500 | | Merge Technologies, Inc.(a) | | | 432,180 |
| 30,636 | | Opnet Technologies, Inc.(a) | | | 504,269 |
| 11,565 | | Serena Software, Inc.(a) | | | 212,218 |
| 59,700 | | Tumbleweed Communications Corp.(a) | | | 500,286 |
| | | | |
|
|
| | | | | | 8,458,671 |
| | | | |
|
|
| | |
| | | Specialty Retail—5.5% | | | |
| 37,350 | | Aaron Rents, Inc. (Class B shares) | | | 751,856 |
| 115,300 | | Casual Male Retail Group, Inc. | | | 800,182 |
| 45,400 | | Charlotte Russe Holding, Inc.(a) | | | 629,244 |
| 10,200 | | Cost Plus, Inc.(a) | | | 418,200 |
| 31,800 | | Ezcorp, Inc. | | | 270,300 |
| 26,700 | | Guitar Center, Inc.(a) | | | 869,886 |
| 17,750 | | HOT Topic, Inc.(a) | | | 522,915 |
| 41,881 | | Kirkland’s, Inc.(a) | | | 739,618 |
| 12,338 | | Linens ‘n Things, Inc.(a) | | | 371,127 |
| 32,550 | | Movie Gallery, Inc. | | | 608,034 |
| 31,400 | | Peet’s Coffee & Tea, Inc.(a) | | | 546,674 |
| 12,040 | | Regis Corp. | | | 475,821 |
| 19,900 | | TBC Corp. | | | 513,619 |
| 5,266 | | Tractor Supply Co.(a) | | | 204,795 |
| | | | |
|
|
| | | | | | 7,722,271 |
| | | | |
|
|
See Notes to Financial Statements
| | |
| THE TARGET PORTFOLIO TRUST | | 39 |
| | |
Small Capitalization Growth Portfolio (cont’d) | | Portfolio of Investments
December 31, 2003 |
| | | | | | |
| SHARES | | DESCRIPTION | | VALUE (NOTE 1) | |
| |
| | | | | | | |
| | | Textiles, Apparel & Luxury Goods—1.2% | | | | |
| 72,265 | | Ashworth, Inc.(a) | | $ | 583,179 | |
| 40,643 | | Guess?, Inc.(a) | | | 490,561 | |
| 19,400 | | Oxford Industries, Inc. | | | 657,272 | |
| | | | |
|
|
|
| | | | | | 1,731,012 | |
| | | | |
|
|
|
| | |
| | | Thrifts & Mortgage Finance—0.5% | | | | |
| 33,600 | | Saxon Capital, Inc.(a) | | | 703,920 | |
| | | | |
|
|
|
| | | Total long-term investments
(cost $119,588,635) | | | 131,558,325 | |
| | | | |
|
|
|
| | |
| | | SHORT-TERM INVESTMENT—8.3% | | | | |
| | |
| | | Mutual Fund | | | | |
| 11,602,177 | | Dryden Core Investment Fund—Taxable Money Market Series
(cost $11,602,177; Note 3) | | | 11,602,177 | |
| | | | |
|
|
|
| | | Total Investments—102.1%
(cost $131,190,812; Note 5) | | | 143,160,502 | |
| | | Liabilities in excess of other assets—(2.1%) | | | (2,909,190 | ) |
| | | | |
|
|
|
| | | Net Assets—100% | | $ | 140,251,312 | |
| | | | |
|
|
|
| (a) | Non-income producing security. |
See Notes to Financial Statements
| | |
| 40 | | THE TARGET PORTFOLIO TRUST |
| | |
Portfolio of Investments
December 31, 2003 | | Small Capitalization Value Portfolio |
| | | | | |
| SHARES | | DESCRIPTION | | VALUE (NOTE 1) |
|
| | | | | | |
| | | LONG-TERM INVESTMENTS—96.2% | | | |
| | |
| | | Common Stocks | | | |
| | |
| | | Aerospace/Defense—1.6% | | | |
| 21,400 | | Curtiss-Wright Corp. | | $ | 963,214 |
| 28,700 | | Moog, Inc. (Class A shares)(a) | | | 1,417,780 |
| 20,400 | | Precision Castparts Corp. | | | 926,364 |
| | | | |
|
|
| | | | | | 3,307,358 |
| | | | |
|
|
| | |
| | | Auto Related—2.7% | | | |
| 43,600 | | ArvinMeritor, Inc. | | | 1,051,632 |
| 90,800 | | CSK Auto Corp.(a) | | | 1,704,316 |
| 15,200 | | Snap-On, Inc. | | | 490,048 |
| 31,800 | | United Auto Group, Inc. | | | 995,340 |
| 18,300 | | Winnebago Industries, Inc. | | | 1,258,125 |
| | | | |
|
|
| | | | | | 5,499,461 |
| | | | |
|
|
| | |
| | | Banks—6.2% | | | |
| 30,000 | | Astoria Financial Corp. | | | 1,116,000 |
| 34,100 | | BancorpSouth, Inc. | | | 808,852 |
| 96,800 | | BankUnited Financial Corp. (Class A shares)(a) | | | 2,496,472 |
| 12,700 | | Chittenden Corp. | | | 427,228 |
| 15,500 | | Commerce Bancorp, Inc. | | | 816,540 |
| 31,100 | | Commercial Federal Corp. | | | 830,681 |
| 57,500 | | Fremont General Corp. | | | 972,325 |
| 21,200 | | Hibernia Corp. (Class A shares) | | | 498,412 |
| 44,500 | | Old National Bancorp / IN | | | 1,016,825 |
| 26,500 | | Provident Financial Group, Inc. | | | 846,675 |
| 34,600 | | Seacoast Financial Services Corp. | | | 948,386 |
| 35,000 | | Susquehanna Bancshares, Inc. | | | 875,350 |
| 5,900 | | UMB Financial Corp. | | | 280,486 |
| 29,400 | | Washington Federal, Inc. | | | 834,960 |
| | | | |
|
|
| | | | | | 12,769,192 |
| | | | |
|
|
| | |
| | | Beverages—0.8% | | | |
| 14,200 | | Adolph Coors Co. | | | 796,620 |
| 52,200 | | PepsiAmericas, Inc. | | | 893,664 |
| | | | |
|
|
| | | | | | 1,690,284 |
| | | | |
|
|
| | |
| | | Business Services—4.7% | | | |
| 211,300 | | Administaff, Inc.(a) | | | 3,672,394 |
| 142,000 | | Allied Waste Industries, Inc.(a) | | | 1,970,960 |
| 20,800 | | Banta Corp. | | | 842,400 |
| 31,000 | | Harland John H. Co. | | | 846,300 |
| 44,600 | | Kelly Services, Inc. (Class A shares) | | | 1,272,884 |
| 43,000 | | Republic Services, Inc.(a) | | | 1,102,090 |
| | | | |
|
|
| | | | | | 9,707,028 |
| | | | |
|
|
See Notes to Financial Statements
| | |
| THE TARGET PORTFOLIO TRUST | | 41 |
| | |
Small Capitalization Value Portfolio (cont’d) | | Portfolio of Investments
December 31, 2003 |
| | | | | |
| SHARES | | DESCRIPTION | | VALUE (NOTE 1) |
|
| | | | | | |
| | | Chemicals—2.8% | | | |
| 29,000 | | Lubrizol Corp. (The) | | $ | 943,080 |
| 81,400 | | Methanex Corp. | | | 914,122 |
| 5,500 | | RPM International, Inc. | | | 90,530 |
| 30,700 | | Scotts Co. (The) (Class A shares)(a) | | | 1,816,212 |
| 50,000 | | Sensient Technologies Corp. | | | 988,500 |
| 19,200 | | Valspar Corp. (The) | | | 948,864 |
| | | | |
|
|
| | | | | | 5,701,308 |
| | | | |
|
|
| | |
| | | Computers & Peripherals—0.4% | | | |
| 22,300 | | Imation Corp. | | | 783,845 |
| | | | |
|
|
| | |
| | | Containers & Packaging—0.4% | | | |
| 53,000 | | Rock-Tenn Co. (Class A shares) | | | 914,780 |
| | | | |
|
|
| | |
| | | Cosmetics & Toiletries—0.6% | | | |
| 72,700 | | Chattem, Inc.(a) | | | 1,301,330 |
| | | | |
|
|
| | |
| | | Diversified Financial Services—0.4% | | | |
| 35,400 | | GATX Corp. | | | 990,492 |
| | | | |
|
|
| | |
| | | Drugs & Healthcare—9.8% | | | |
| 32,800 | | Arrow International, Inc. | | | 819,344 |
| 23,550 | | Barr Pharmaceuticals, Inc.(a) | | | 1,812,173 |
| 79,300 | | Cooper Companies, Inc. (The) | | | 3,737,408 |
| 70,400 | | Covance, Inc.(a) | | | 1,886,720 |
| 91,050 | | K-V Pharmaceutical Co. (Class B shares)(a) | | | 2,359,106 |
| 38,500 | | Lincare Holdings, Inc.(a) | | | 1,156,155 |
| 59,200 | | NDCHealth Corp. | | | 1,516,704 |
| 54,400 | | Pediatrix Medical Group, Inc.(a) | | | 2,996,895 |
| 85,800 | | Pharmaceutical Product Development, Inc.(a) | | | 2,314,026 |
| 84,700 | | Serologicals Corp.(a) | | | 1,575,420 |
| | | | |
|
|
| | | | | | 20,173,951 |
| | | | |
|
|
| | |
| | | Electric Utilities—2.4% | | | |
| 46,700 | | Cleco Corp. | | | 839,666 |
| 41,000 | | OGE Energy Corp. | | | 991,790 |
| 78,600 | | PNM Resources, Inc. | | | 2,208,660 |
| 41,400 | | Westar Energy, Inc | | | 838,350 |
| | | | |
|
|
| | | | | | 4,878,466 |
| | | | |
|
|
| | |
| | | Electrical Equipment—0.5% | | | |
| 36,900 | | Acuity Brands, Inc. | | | 952,020 |
| | | | |
|
|
| | |
| | | Electronics—2.5% | | | |
| 77,600 | | FLIR Systems, Inc.(a) | | | 2,832,400 |
| 177,600 | | Sanmina-SCI Corp.(a) | | | 2,239,536 |
| | | | |
|
|
| | | | | | 5,071,936 |
| | | | |
|
|
See Notes to Financial Statements
| | |
| 42 | | THE TARGET PORTFOLIO TRUST |
| | | | | |
| SHARES | | DESCRIPTION | | VALUE (NOTE 1) |
|
| | | | | | |
| | | Financial Services—5.2% | | | |
| 154,700 | | AmeriCredit Corp.(a) | | $ | 2,464,371 |
| 36,200 | | Eaton Vance Corp. | | | 1,326,368 |
| 39,800 | | Global Payments, Inc. | | | 1,875,376 |
| 74,600 | | Jefferies, Group, Inc. | | | 2,463,292 |
| 40,700 | | Raymond James Financial, Inc. | | | 1,534,390 |
| 7,600 | | Student Loan Corp. (The) | | | 1,109,600 |
| | | | |
|
|
| | | | | | 10,773,397 |
| | | | |
|
|
| | |
| | | Food & Staples Retailing—0.9% | | | |
| 52,700 | | Casey’s General Stores, Inc. | | | 930,682 |
| 48,700 | | Ruddick Corp. | | | 871,730 |
| | | | |
|
|
| | | | | | 1,802,412 |
| | | | |
|
|
| | |
| | | Food Products—1.2% | | | |
| 23,600 | | Corn Products International, Inc. | | | 813,020 |
| 32,400 | | Fresh Del Monte Produce, Inc. | | | 772,092 |
| 19,100 | | Lancaster Colony Corp. | | | 862,556 |
| | | | |
|
|
| | | | | | 2,447,668 |
| | | | |
|
|
| | |
| | | Gas & Pipeline Utilities—3.8% | | | |
| 38,400 | | Atmos Energy Corp. | | | 933,120 |
| 44,200 | | Cascade Natural Gas Corp. | | | 932,178 |
| 26,200 | | Northwest Natural Gas Co. | | | 805,650 |
| 62,300 | | ONEOK, Inc. | | | 1,375,584 |
| 25,000 | | Peoples Energy Corp. | | | 1,051,000 |
| 25,100 | | UGI Corp. | | | 850,890 |
| 39,400 | | Vectren Corp. | | | 971,210 |
| 34,000 | | WGL Holdings, Inc. | | | 944,860 |
| | | | |
|
|
| | | | | | 7,864,492 |
| | | | |
|
|
| | |
| | | Healthcare Equipment & Supplies—0.9% | | | |
| 24,700 | | Analogic Corp. | | | 1,012,700 |
| 19,800 | | Invacare Corp. | | | 799,326 |
| | | | |
|
|
| | | | | | 1,812,026 |
| | | | |
|
|
| | |
| | | Home Builder—3.7% | | | |
| 12,500 | | M.D.C. Holdings, Inc. | | | 806,250 |
| 57,900 | | D.R. Horton, Inc. | �� | | 2,504,754 |
| 50,600 | | Hovnanian Enterprises, Inc. (Class A shares)(a) | | | 4,405,236 |
| | | | |
|
|
| | | | | | 7,716,240 |
| | | | |
|
|
| | |
| | | Hotels & Restaurants—2.9% | | | |
| 27,700 | | Bob Evans Farms, Inc. | | | 899,142 |
| 42,500 | | Brinker International, Inc.(a) | | | 1,409,300 |
| 23,000 | | IHOP Corp. | | | 885,040 |
| 35,500 | | Landry’s Restaurants, Inc. | | | 913,060 |
| 35,400 | | Lone Star Steakhouse & Saloon, Inc. | | | 820,572 |
| 35,300 | | Sonic Corp.(a) | | | 1,080,886 |
| | | | |
|
|
| | | | | | 6,008,000 |
| | | | |
|
|
See Notes to Financial Statements
| | |
| THE TARGET PORTFOLIO TRUST | | 43 |
| | |
Small Capitalization Value Portfolio (cont’d) | | Portfolio of Investments
December 31, 2003 |
| | | | | |
| SHARES | | DESCRIPTION | | VALUE (NOTE 1) |
|
| | | | | | |
| | | Household Durables—1.3% | | | |
| 38,000 | | Maytag Corp. | | $ | 1,058,300 |
| 21,400 | | Russ Berrie & Co., Inc. | | | 725,460 |
| 54,600 | | Tupperware Corp. | | | 946,764 |
| | | | |
|
|
| | | | | | 2,730,524 |
| | | | |
|
|
| | |
| | | Industrial Conglomerates—0.4% | | | |
| 17,300 | | Teleflex, Inc. | | | 836,109 |
| | | | |
|
|
| | |
| | | Insurance—3.7% | | | |
| 22,000 | | AmerUs Group Co. | | | 769,340 |
| 39,500 | | Commerce Group, Inc. (The) | | | 1,560,250 |
| 31,050 | | Delphi Financial Group, Inc. (Class A shares) | | | 1,117,800 |
| 16,900 | | LandAmerica Financial Group, Inc. | | | 883,194 |
| 50,500 | | Philadelphia Consolidated Holding Corp.(a) | | | 2,465,915 |
| 23,000 | | Protective Life Corp. | | | 778,320 |
| | | | |
|
|
| | | | | | 7,574,819 |
| | | | |
|
|
| | |
| | | Leisure Related—2.0% | | | |
| 50,000 | | Callaway Golf Co. | | | 842,500 |
| 27,800 | | CEC Entertainment, Inc.(a) | | | 1,317,442 |
| 74,900 | | WMS Industries, Inc.(a) | | | 1,962,380 |
| | | | |
|
|
| | | | | | 4,122,322 |
| | | | |
|
|
| | |
| | | Machinery—3.6% | | | |
| 24,200 | | Albany International Corp. (Class A shares) | | | 820,380 |
| 18,000 | | Barnes Group, Inc. | | | 581,580 |
| 31,200 | | Crane Co. | | | 959,088 |
| 19,900 | | Harsco Corp. | | | 872,018 |
| 33,000 | | Lincoln Electric Holdings, Inc. | | | 816,420 |
| 37,000 | | Regal-Beloit Corp. | | | 814,000 |
| 20,000 | | Tecumseh Products Co. (Class A shares) | | | 968,600 |
| 34,100 | | Valmont Industries, Inc. | | | 789,415 |
| 20,700 | | York International Corp. | | | 761,760 |
| | | | |
|
|
| | | | | | 7,383,261 |
| | | | |
|
|
| | |
| | | Marine—0.4% | | | |
| 25,800 | | Alexander & Baldwin, Inc. | | | 869,202 |
| | | | |
|
|
| | |
| | | Medical & Dental Supplies—0.4% | | | |
| 41,500 | | Owens & Minor, Inc. | | | 909,265 |
| | | | |
|
|
| | |
| | | Metals & Mining—1.7% | | | |
| 30,600 | | Arch Coal, Inc. | | | 953,802 |
| 24,100 | | Commercial Metals Co. | | | 732,640 |
| 58,000 | | Massey Energy Co. | | | 1,206,400 |
| 11,400 | | Quanex Corp. | | | 525,540 |
| | | | |
|
|
| | | | | | 3,418,382 |
| | | | |
|
|
See Notes to Financial Statements
| | |
| 44 | | THE TARGET PORTFOLIO TRUST |
| | | | | |
| SHARES | | DESCRIPTION | | VALUE (NOTE 1) |
|
| | | | | | |
| | | Multi-Utilities & Unregulated Power—0.5% | | | |
| 40,200 | | National Fuel Gas Co. | | $ | 982,488 |
| | | | |
|
|
| | |
| | | Multimedia—5.1% | | | |
| 44,900 | | Handleman Co. | | | 921,797 |
| 75,000 | | Harman International Industries, Inc. | | | 5,548,500 |
| 41,700 | | Scholastic Corp.(a) | | | 1,419,468 |
| 172,500 | | Sinclair Broadcast Group, Inc. (Class A shares)(a) | | | 2,573,700 |
| | | | |
|
|
| | | | | | 10,463,465 |
| | | | |
|
|
| | |
| | | Oil & Gas Exploration/Production—9.0% | | | |
| 50,000 | | Cabot Oil & Gas Corp. | | | 1,467,500 |
| 132,800 | | Chesapeake Energy Corp. | | | 1,803,424 |
| 25,000 | | Energen Corp. | | | 1,025,750 |
| 45,400 | | Frontline Ltd. | | | 1,156,338 |
| 47,000 | | Helmerich & Payne, Inc. | | | 1,312,710 |
| 27,000 | | Nicor, Inc. | | | 919,080 |
| 60,000 | | St. Mary Land & Exploration Co. | | | 1,710,000 |
| 59,100 | | Swift Energy Co. (a) | | | 995,835 |
| 18,200 | | Teekay Shipping Corp. | | | 1,037,946 |
| 45,000 | | Tidewater, Inc. | | | 1,344,600 |
| 113,000 | | Vintage Petroleum, Inc. | | | 1,359,390 |
| 60,700 | | Westport Resources Corp.(a) | | | 1,812,502 |
| 92,933 | | XTO Energy, Inc. | | | 2,630,004 |
| | | | |
|
|
| | | | | | 18,575,079 |
| | | | |
|
|
| | |
| | | Real Estate Investment Trusts—4.8% | | | |
| 22,100 | | Alexandria Real Estate Equities, Inc. | | | 1,279,590 |
| 47,400 | | Annaly Mortgage Management, Inc. | | | 872,160 |
| 41,000 | | Entertainment Properties Trust | | | 1,423,110 |
| 23,900 | | First Industrial Realty Trust, Inc. | | | 806,625 |
| 16,300 | | Health Care Property Investors, Inc. | | | 828,040 |
| 23,400 | | Healthcare Realty Trust, Inc. | | | 836,550 |
| 82,500 | | HRPT Properties Trust | | | 832,425 |
| 6,200 | | Nationwide Health Properties, Inc. | | | 121,210 |
| 32,900 | | New Plan Excel Realty Trust | | | 811,643 |
| 21,400 | | Shurgard Storage Centers, Inc. | | | 805,710 |
| 30,500 | | SL Green Realty Corp. | | | 1,252,025 |
| | | | |
|
|
| | | | | | 9,869,088 |
| | | | |
|
|
| | |
| | | Retail Apparel—2.6% | | | |
| 23,300 | | Brown Shoe Co., Inc. | | | 883,769 |
| 39,000 | | Burlington Coat Factory Warehouse Corp. | | | 825,240 |
| 116,850 | | Fred’s, Inc. | | | 3,620,013 |
| | | | |
|
|
| | | | | | 5,329,022 |
| | | | |
|
|
| | |
| | | Road & Rail—0.4% | | | |
| 22,900 | | USF Corp. | | | 782,951 |
| | | | |
|
|
See Notes to Financial Statements
| | |
| THE TARGET PORTFOLIO TRUST | | 45 |
| | |
Small Capitalization Value Portfolio (cont’d) | | Portfolio of Investments
December 31, 2003 |
| | | | | |
| SHARES | | DESCRIPTION | | VALUE (NOTE 1) |
|
| | | | | | |
| | | Specialty Retail—0.4% | | | |
| 48,500 | | Movie Gallery, Inc.(a) | | $ | 905,980 |
| | | | |
|
|
| | |
| | | Telecommunications—1.7% | | | |
| 315,500 | | American Tower Corp. (Class A shares)(a) | | | 3,413,710 |
| | | | |
|
|
| | |
| | | Textiles & Apparel—1.7% | | | |
| 22,100 | | Kellwood Co. | | | 906,100 |
| 97,600 | | Phillips-Van Heusen Corp. | | | 1,731,424 |
| 47,900 | | Russell Corp. | | | 841,124 |
| | | | |
|
|
| | | | | | 3,478,648 |
| | | | |
|
|
| | |
| | | Tobacco—0.8% | | | |
| 37,000 | | Loews Corp.—Carolina Group | | | 933,880 |
| 17,900 | | Universal Corp. | | | 790,643 |
| | | | |
|
|
| | | | | | 1,724,523 |
| | | | |
|
|
| | |
| | | Trading Companies & Distributors—1.3% | | | |
| 22,500 | | Hughes Supply, Inc. | | | 1,116,450 |
| 69,000 | | Watsco, Inc. | | | 1,568,370 |
| | | | |
|
|
| | | | | | 2,684,820 |
| | | | |
|
|
| | | Total common stocks
(cost $154,407,513) | | | 198,219,344 |
| | | | |
|
|
| | | SHORT-TERM INVESTMENT—3.1% | | | |
| | |
| | | Mutual Fund | | | |
| 6,310,814 | | Dryden Core Investment Fund—Taxable Money Market Series
(cost $6,310,814; Note 3) | | | 6,310,814 |
| | | | |
|
|
| | | Total Investments—99.3%
(cost $160,718,327; Note 5) | | | 204,530,158 |
| | | Other assets in excess of liabilities—0.7% | | | 1,459,096 |
| | | | |
|
|
| | | Net Assets—100% | | $ | 205,989,254 |
| | | | |
|
|
| (a) | Non-income producing security. |
See Notes to Financial Statements
| | |
| 46 | | THE TARGET PORTFOLIO TRUST |
| | |
Portfolio of Investments
December 31, 2003 | | International Equity Portfolio |
| | | | | |
| SHARES | | DESCRIPTION | | VALUE (NOTE 1) |
|
| | | | | | |
| | | LONG-TERM INVESTMENTS—96.2% | | | |
| | |
| | | Common Stocks—95.6% | | | |
| | |
| | | Australia—1.5% | | | |
| 308,181 | | BHP Billiton, Ltd. | | $ | 2,830,501 |
| | | | |
|
|
| | |
| | | Belgium—1.5% | | | |
| 140,900 | | Fortis | | | 2,832,929 |
| | | | |
|
|
| | |
| | | Denmark—0.5% | | | |
| 23,200 | | Novo Nordisk A/S (Class B shares) | | | 945,190 |
| | | | |
|
|
| | |
| | | Finland—2.8% | | | |
| 314,400 | | Nokia OYJ | | | 5,436,963 |
| | | | |
|
|
| | |
| | | France—10.5% | | | |
| 43,900 | | Aventis SA | | | 2,901,564 |
| 47,120 | | BNP Paribas SA | | | 2,966,991 |
| 19,900 | | Carrefour SA | | | 1,092,392 |
| 125,127 | | Credit Agricole SA | | | 2,987,707 |
| 42,500 | | Lagardere SCA | | | 2,453,614 |
| 22,800 | | Schneider Electric SA | | | 1,492,583 |
| 33,085 | | Total SA | | | 6,151,272 |
| | | | |
|
|
| | | | | | 20,046,123 |
| | | | |
|
|
| | |
| | | Germany—4.2% | | | |
| 23,200 | | Bayerische Motoren Werke (BMW) AG | | | 1,081,282 |
| 210,000 | | Deutsche Telekom AG (a) | | | 3,851,413 |
| 8,000 | | Muenchener Rueckversicherungs—Gesellschaft AG | | | 976,993 |
| 25,600 | | Siemens AG | | | 2,060,141 |
| | | | |
|
|
| | | | | | 7,969,829 |
| | | | |
|
|
| | |
| | | Hong Kong—1.3% | | | |
| 335,500 | | CLP Holdings Ltd. | | | 1,598,936 |
| 537,000 | | Hong Kong & China Gas, Ltd. | | | 819,652 |
| | | | |
|
|
| | | | | | 2,418,588 |
| | | | |
|
|
| | |
| | | Ireland—3.8% | | | |
| 113,226 | | Allied Irish Banks PLC | | | 1,806,646 |
| 219,200 | | Bank of Ireland | | | 2,989,755 |
| 125,051 | | CRH PLC | | | 2,567,899 |
| | | | |
|
|
| | | | | | 7,364,300 |
| | | | |
|
|
| | |
| | | Italy—3.0% | | | |
| 214,800 | | ENI-Entre Nazionale Idrocarburi SpA | | | 4,053,239 |
| 400,500 | | Snam Rete Gas SpA | | | 1,697,376 |
| | | | |
|
|
| | | | | | 5,750,615 |
| | | | |
|
|
See Notes to Financial Statements
| | |
| THE TARGET PORTFOLIO TRUST | | 47 |
| | |
International Equity Portfolio (cont’d) | | Portfolio of Investments
December 31, 2003 |
| | | | | |
| SHARES | | DESCRIPTION | | VALUE (NOTE 1) |
|
| | | | | | |
| | | Japan—16.9% | | | |
| 59,480 | | Acom Co., Ltd. | | $ | 2,697,329 |
| 81,000 | | Canon Inc. | | | 3,771,485 |
| 478 | | East Japan Railway Co. | | | 2,252,403 |
| 31,500 | | Fanuc, Ltd. | | | 1,887,002 |
| 3,700 | | Funai Electric Co., Ltd. | | | 507,857 |
| 58,100 | | Honda Motor Co., Ltd. | | | 2,580,536 |
| 75 | | Japan Tobacco, Inc. | | | 549,361 |
| 53,000 | | Kao Corp. | | | 1,078,100 |
| 12,400 | | NEC Electronics Corp. | | | 907,120 |
| 298,000 | | Nissan Motor Co., Ltd. | | | 3,403,490 |
| 217,000 | | Nomura Holdings, Inc. | | | 3,695,297 |
| 1,078 | | NTT DoCoMo, Inc. | | | 2,444,285 |
| 7,800 | | Rohm Co., Ltd. | | | 914,136 |
| 22,400 | | Shin-Etsu Chemical Co., Ltd. | | | 915,480 |
| 83,300 | | Takeda Chemical Industries, Ltd. | | | 3,303,396 |
| 444,000 | | Tokyo Gas Co., Ltd. | | | 1,582,607 |
| | | | |
|
|
| | | | | | 32,489,884 |
| | | | |
|
|
| | |
| | | Netherlands—7.6% | | | |
| 56,700 | | ABN AMRO Holding NV | | | 1,326,671 |
| 66,617 | | Heineken NV | | | 2,536,790 |
| 468,700 | | Koninklijke KPN NV | | | 3,618,118 |
| 140,919 | | Philips Electronics NV | | | 4,114,877 |
| 58,200 | | Royal Dutch Petroleum Co. | | | 3,068,567 |
| | | | |
|
|
| | | | | | 14,665,023 |
| | | | |
|
|
| | |
| | | Norway—0.5% | | | |
| 92,600 | | Statoil ASA | | | 1,040,442 |
| | | | |
|
|
| | |
| | | Singapore—2.0% | | | |
| 313,850 | | Oversea-Chinese Banking Corp., Ltd. | | | 2,236,110 |
| 199,328 | | United Overseas Bank, Ltd. | | | 1,549,273 |
| | | | |
|
|
| | | | | | 3,785,383 |
| | | | |
|
|
| | |
| | | Spain—2.5% | | | |
| 63,800 | | Altadis SA | | | 1,810,671 |
| 158,700 | | Endesa SA | | | 3,052,693 |
| | | | |
|
|
| | | | | | 4,863,364 |
| | | | |
|
|
| | |
| | | Sweden—0.5% | | | |
| 28,100 | | Sandvik AB | | | 968,521 |
| | | | |
|
|
| | |
| | | Switzerland—8.8% | | | |
| 100,800 | | Compagnie Financiere Richemont AG | | | 2,420,667 |
| 113,600 | | Credit Suisse Group | | | 4,156,378 |
| 32,000 | | Roche Holding AG-Genusshein | | | 3,227,815 |
See Notes to Financial Statements
| | |
| 48 | | THE TARGET PORTFOLIO TRUST |
| | | | | |
| SHARES | | DESCRIPTION | | VALUE (NOTE 1) |
|
| | | | | | |
| | |
| | | Switzerland (cont’d) | | | |
| 50,800 | | Swiss Reinsurance(a) | | $ | 3,429,796 |
| 54,300 | | UBS AG(a) | | | 3,718,787 |
| | | | |
|
|
| | | | | | 16,953,443 |
| | | | |
|
|
| | | United Kingdom—27.7% | | | |
| 514,400 | | Barclays PLC | | | 4,588,171 |
| 198,600 | | Boots Group PLC | | | 2,456,680 |
| 465,300 | | BP PLC | | | 3,773,311 |
| 363,012 | | Cadbury Schweppes PLC | | | 2,666,004 |
| 237,099 | | Diageo PLC | | | 3,119,668 |
| 258,500 | | GlaxoSmithKline PLC | | | 5,923,274 |
| 438,948 | | HSBC Holdings PLC(a) | | | 6,899,202 |
| 62,060 | | Imperial Tobacco Group PLC | | | 1,222,069 |
| 123,240 | | Kesa Electricals PLC | | | 567,542 |
| 727,100 | | Rentokil Initial PLC | | | 2,473,085 |
| 84,500 | | Rio Tinto PLC | | | 2,334,070 |
| 139,300 | | Royal Bank of Scotland Group PLC | | | 4,104,613 |
| 132,200 | | Smiths Group PLC | | | 1,564,315 |
| 484,100 | | Tesco PLC | | | 2,233,701 |
| 193,300 | | Unilever PLC | | | 1,801,990 |
| 3,008,000 | | Vodafone Group PLC | | | 7,457,940 |
| | | | |
|
|
| | | | | | 53,185,635 |
| | | | |
|
|
| | | Total common stocks
(cost $145,798,260) | | | 183,546,733 |
| | | | |
|
|
| | |
| | | Preferred Stock—0.6% | | | |
| | | Germany | | | |
| 1,780 | | Porsche AG
(cost $839,859) | | | 1,053,002 |
| | | | |
|
|
| | | Total long-term investments
(cost $146,638,119) | | | 184,599,735 |
| | | | |
|
|
PRINCIPAL
AMOUNT (000)
| | SHORT-TERM INVESTMENT—3.7% | | |
| | |
| | | U.S. Government Obligations | | | |
| | | U.S. Treasury Bills | | | |
| $7,185 | | 0.78%, 2/5/04(b) | | | |
| | | (cost $7,178,807) | | | 7,179,353 |
| | | | |
|
|
| | | Total Investments—99.9%
(cost $153,816,926; Note 5) | | | 191,779,088 |
| | | Other assets in excess of liabilities—0.1% | | | 129,613 |
| | | | |
|
|
| | | Net Assets—100% | | $ | 191,908,701 |
| | | | |
|
|
| (a) | Non-income producing security |
| (b) | Rate quoted represents yield-to-maturity as of purchase date. |
See Notes to Financial Statements
| | |
| THE TARGET PORTFOLIO TRUST | | 49 |
| | |
International Equity Portfolio (cont’d) | | Portfolio of Investments
December 31, 2003 |
The industry classification of portfolio holdings and other assets in excess of liabilities shown as a percentage of net assets as of December 31, 2003 were as follows:
| | | |
Banks | | 20.5 | % |
Telecommunications | | 11.9 | |
Energy Integrated | | 9.4 | |
Drugs | | 8.5 | |
Producer Manufacturing | | 6.3 | |
Alcohol & Tobacco | | 4.8 | |
Financial Services | | 4.8 | |
Automotive | | 4.2 | |
U. S. Government Obligations | | 3.7 | |
Retail & Apparel | | 3.3 | |
Components & Semiconductors | | 2.9 | |
Food & Beverage | | 2.9 | |
Metals | | 2.7 | |
Utilities—Electric | | 2.4 | |
Insurance | | 2.3 | |
Other Consumer Discretionary | | 1.5 | |
Housing | | 1.3 | |
Commercial Services | | 1.3 | |
Leisure & Entertainment | | 1.3 | |
Utilities—Gas | | 1.3 | |
Transportation | | 1.2 | |
Energy Services | | 0.9 | |
Chemicals | | 0.5 | |
| | |
|
|
| | | 99.9 | |
Other assets in excess of liabilities | | 0.1 | |
| | |
|
|
| | | 100.0 | % |
| | |
|
|
See Notes to Financial Statements
| | |
| 50 | | THE TARGET PORTFOLIO TRUST |
| | |
Portfolio of Investments
December 31, 2003 | | International Bond Portfolio |
| | | | | | | |
PRINCIPAL
AMOUNT (000) | | DESCRIPTION | | VALUE (NOTE 1) |
|
| | | | | | | | |
| | | | | LONG-TERM INVESTMENTS—99.3% | | | |
| | | |
| | | | | Denmark—10.0% | | | |
| | | | | Danish Gov’t. Bonds, | | | |
| DKK | | 1,100 | | 6.00%, 11/15/11 | | $ | 208,162 |
| | | | | Nordea Kredit Realkreditaktieselskab, | | | |
| | | 7,300 | | 5.00%, 10/1/35 | | | 1,267,296 |
| | | | | Nykredit A/S, Series AB, | | | |
| | | 7,400 | | 5.00%, 10/1/35 | | | 1,206,935 |
| | | | | TOTALKREDIT A/S, Series C, | | | |
| | | 7,280 | | 5.00%, 10/1/35 | | | 1,187,610 |
| | | | | | |
|
|
| | | | | | | | 3,870,003 |
| | | | | | |
|
|
| | | |
| | | | | Eurobonds—44.0% | | | |
| | | | | Allied Irish Banks PLC, | | | |
| EUR | | 30 | | 7.50%, 2/28/11(b) | | | 43,874 |
| | | | | Arena BV, Series 2003-I, Class A2, | | | |
| | | 500 | | 4.30%, 5/19/11(c) | | | 618,882 |
| | | | | Argo Mortgage Ser. L, Series 1, Class A, | | | |
| | | 371 | | 2.411%, 1/28/09(c) | | | 469,223 |
| | | | | Atlantes Mortgage PLC, Series 1, Class A, | | | |
| | | 282 | | 2.412%, 1/17/36 | | | 355,326 |
| | | | | Austrian Gov’t. Bonds, | | | |
| | | 511 | | 3.707%, 5/3/07 | | | 723,870 |
| | | | | Bayerische Hypo-und Vereinsbank AG, | | | |
| | | 400 | | 4.75%, 9/19/07 | | | 528,078 |
| | | | | Belgian Gov’t. Bonds, | | | |
| | | 740 | | 5.50%, 3/28/28 | | | 1,000,290 |
| | | | | Chase CCMT, Series 1998-4, Class A, | | | |
| | | 300 | | 5.00%, 8/15/08 | | | 397,683 |
| | | | | Chester Asset Receivables, | | | |
| | | 500 | | 6.125%, 10/15/10 | | | 702,038 |
| | | | | Citibank Credit Card Issuance Trust, Series 2001-A4, | | | |
| | | 300 | | 5.375%, 4/11/11 | | | 402,529 |
| | | | | Credit Suisse Group Capital Guernsey V Ltd., | | | |
| | | 80 | | 6.905%, 11/7/11(b) | | | 113,148 |
| | | | | DePfa Deutsche Pfandbriefbank AG, | | | |
| | | 200 | | 5.00%, 2/3/05 | | | 258,993 |
| | | | | Deutsche Genossenschaft Hypothekebank, | | | |
| | | 300 | | 5.75%, 1/22/07 | | | 406,332 |
| | | | | Deutsche Telekom International Finance BV, | | | |
| | | 70 | | 7.50%, 1/24/33 | | | 107,808 |
| | | | | Dutch MBS BV, Series X, Class A, | | | |
| | | 500 | | 2.408%, 4/2/10(c) | | | 631,685 |
See Notes to Financial Statements
| | |
| THE TARGET PORTFOLIO TRUST | | 51 |
| | |
International Bond Portfolio (cont’d) | | Portfolio of Investments
December 31, 2003 |
| | | | | | | |
PRINCIPAL
AMOUNT (000) | | DESCRIPTION | | VALUE (NOTE 1) |
|
| | | | | | | | |
| | | | | Eurobonds (cont’d) | | | |
| | | | | Eurohypo AG, | | | |
| EUR | | 400 | | 5.75%, 7/5/10 | | $ | 553,380 |
| | | | | Finnish Gov’t. Bonds, | | | |
| | | 1,250 | | 2.75%, 7/4/06 | | | 1,573,430 |
| | | | | Ford Motor Credit Co., | | | |
| | | 100 | | 6.75%, 1/14/08 | | | 133,584 |
| | | | | French Gov’t. Bonds, | | | |
| | | 1,300 | | 5.75%, 10/25/32 | | | 1,838,999 |
| | | | | France Telecom S.A., | | | |
| | | 50 | | 8.125%, 1/28/33 | | | 81,029 |
| | | | | General Motors Corp., | | | |
| | | 140 | | 8.375%, 7/5/33 | | | 207,033 |
| | | | | German Gov’t. Bonds, | | | |
| | | 1,460 | | 4.50%, 8/17/07 | | | 1,919,812 |
| | | | | Goldman Sachs Group, Inc., | | | |
| | | 80 | | 5.125%, 4/24/13 | | | 104,197 |
| | | | | Hellenic Republic Gov’t. Bonds, | | | |
| | | 460 | | 5.90%, 10/22/22 | | | 643,033 |
| | | | | Hilton Group Finance PLC, | | | |
| | | 80 | | 6.50%, 7/17/09 | | | 110,625 |
| | | | | HSBC Capital Funding L.P. (Channel Islands), | | | |
| | | 30 | | 8.03%, 6/30/12(b) | | | 45,920 |
| | | | | Inter-American Development Bank, | | | |
| | | 900 | | 5.50%, 3/30/10 | | | 1,231,427 |
| | | | | Italy Buoni Poliennali de Tesoro, | | | |
| | | 120 | | 5.75%, 2/1/33 | | | 166,141 |
| | | | | MDP Acquisitions PLC, | | | |
| | | 25 | | 10.125%, 10/1/12 | | | 35,476 |
| | | | | Permanent Financing PLC, | | | |
| | | 500 | | 5.10%, 6/11/07 | | | 662,854 |
| | | | | Petronas Capital Ltd., | | | |
| | | 100 | | 6.375%, 5/22/09 | | | 137,979 |
| | | | | RBS Capital Trust II, Class A, | | | |
| | | 50 | | 6.467%, 6/30/12(b) | | | 69,650 |
| | | | | Royal Bank of Scotland PLC (The), | | | |
| | | 40 | | 6.125%, 2/5/13 | | | 56,102 |
| | | | | SLM Student Loan Trust (The), | | | |
| | | 250 | | 3.80%, 6/17/10 | | | 309,284 |
| | | | | Tyco International Group S.A., | | | |
| | | 150 | | 4.375%, 11/19/04 | | | 191,095 |
| | | | | Zurich Finance (USA), Inc., | | | |
| | | 100 | | 5.75%, 10/2/13(c) | | | 129,599 |
| | | | | | |
|
|
| | | | | | | | 16,960,408 |
| | | | | | |
|
|
See Notes to Financial Statements
| | |
| 52 | | THE TARGET PORTFOLIO TRUST |
| | | | | | | |
PRINCIPAL
AMOUNT (000) | | DESCRIPTION | | VALUE (NOTE 1) |
|
| | | | | | | | |
| | | | | Japan—13.0% | | | |
| | | | | Japanese Gov’t. Bonds, | | | |
| JPY | | 156,000 | | 1.50%, 12/20/11 | | $ | 1,496,927 |
| | | 222,000 | | 1.50%, 3/20/12 | | | 2,126,498 |
| | | 110,000 | | 1.20%, 9/20/12 | | | 1,025,075 |
| | | 37,000 | | 1.90%, 9/20/23 | | | 349,334 |
| | | | | | |
|
|
| | | | | | | | 4,997,834 |
| | | | | | |
|
|
| | | |
| | | | | New Zealand—7.5% | | | |
| | | | | New Zealand Gov’t. Bonds, | | | |
| NZD | | 2,600 | | 8.00%, 11/15/06 | | | 1,808,886 |
| | | 1,570 | | 7.00%, 7/15/09 | | | 1,085,913 |
| | | | | | |
|
|
| | | | | | | | 2,894,799 |
| | | | | | |
|
|
| | | |
| | | | | Sweden—6.3% | | | |
| | | | | Swedish Gov’t. Bonds, | | | |
| SEK | | 16,710 | | 5.00%, 1/28/09 | | | 2,411,760 |
| | | | | | |
|
|
| | | |
| | | | | United Kingdom—16.6% | | | |
| | | | | European Investment Bank, | | | |
| GBP | | 465 | | 7.625%, 12/7/06 | | | 897,394 |
| | | | | United Kingdom Treasury Stocks, | | | |
| | | 1,450 | | 8.50%, 12/7/05 | | | 2,797,263 |
| | | 1,100 | | 5.75%, 12/7/09 | | | 2,078,660 |
| | | 370 | | 4.25%, 6/7/32 | | | 616,921 |
| | | | | | |
|
|
| | | | | | | | 6,390,238 |
| | | | | | |
|
|
| | | |
| | | | | United States—1.9% | | | |
| | | | | MBNA Credit Card Master Trust, | | | |
| | | | | Series 2002-A2, Class A, | | | |
| USD | | 280 | | 5.60%, 7/17/14 | | | 380,656 |
| | | | | United States Treasury Bonds, TIPS, | | | |
| | | 302 | | 3.375%, 4/15/32 | | | 371,948 |
| | | | | | |
|
|
| | | | | | | | 752,604 |
| | | | | | |
|
|
| | | | | Total long-term investments
(cost US$34,341,795) | | | 38,277,646 |
| | | | | | |
|
|
| | | |
| | | | | SHORT-TERM INVESTMENTS—2.6% | | | |
| | | |
| | | | | United States Government Obligations—0.4% | | | |
| | | | | United States Treasury Bill, | | | |
| USD | | 150 | | 0.93%, 1/15/04(a)(d) | | | 149,950 |
| | | | | | |
|
|
See Notes to Financial Statements
| | |
| THE TARGET PORTFOLIO TRUST | | 53 |
| | |
International Bond Portfolio (cont’d) | | Portfolio of Investments
December 31, 2003 |
| | | | | | | | |
| SHARES | | DESCRIPTION | | VALUE (NOTE 1) | |
| |
| | | | | | | | | |
| | | |
| | | | | Mutual Fund—2.2% | | | | |
| | | 851,854 | | Dryden Core Investment Fund-Taxable Money Market Series (Note 3) | | $ | 851,854 | |
| | | | | | |
|
|
|
| | | | | Total short-term investments
(cost US$1,001,800) | | | 1,001,804 | |
| | | | | | |
|
|
|
| | | | | Total Investments—101.9%
(cost US$35,343,595; Note 5) | | | 39,279,450 | |
| | | | | Liabilities in excess of other assets—(1.9%) | | | (726,373 | ) |
| | | | | | |
|
|
|
| | | | | Net Assets—100% | | $ | 38,553,077 | |
| | | | | | |
|
|
|
Portfolio securities are classified according to the securities’ currency denomination.
DKK—Danish Krone.
EUR—Euro.
GBP—British Pound.
JPY—Japanese Yen.
NZD—New Zealand Dollar.
SEK—Swedish Krona.
USD—United States Dollar.
TIPS—Treasury Inflation Protection Security
| (a) | Rate quoted represents yield-to-maturity as of purchase date. |
| (b) | Variable Rate instruments without fixed maturity date. Maturity date shown is the next callable date for the instrument. |
| (c) | Variable Rate instruments. The maturity date presented for these instruments is the later of the next date on which the security can be redeemed or of the next date on which the rate of interest is adjusted. |
| (d) | Segregated as collateral for financial futures contracts. |
The industry classification of portfolio holdings and liabilities in excess of other assets shown as a percentage of net assets as of December 31, 2003 were as follows:
| | | |
Foreign Government Securities | | 61.9 | % |
Collaterized Mortgage Loan Securities | | 20.2 | |
Other Supranationals | | 5.5 | |
Collaterized Credit Cards | | 4.9 | |
Money Market Fund | | 2.2 | |
U.S. Government Obligations | | 1.4 | |
Banking | | 1.1 | |
Other | | 0.9 | |
Automotive | | 0.9 | |
Collaterized Student Loan Obligations | | 0.8 | |
Goods Conglomerates | | 0.5 | |
Telecommunications | | 0.5 | |
Energy | | 0.4 | |
Insurance Property & Casualty | | 0.3 | |
Gaming | | 0.3 | |
Paper & Packaging | | 0.1 | |
| | |
|
|
| | | 101.9 | |
Liabilities in excess of other assets | | (1.9 | ) |
| | |
|
|
| | | 100.0 | % |
| | |
|
|
See Notes to Financial Statements
| | |
| 54 | | THE TARGET PORTFOLIO TRUST |
| | |
Portfolio of Investments
December 31, 2003 | | Total Return Bond Portfolio |
| | | | | | | | |
MOODY’S
RATING
(UNAUDITED) | | PRINCIPAL
AMOUNT (000) | | DESCRIPTION | | VALUE (NOTE 1) |
|
| | | | | | | | | |
| | | | | | LONG-TERM INVESTMENTS—47.4% | | | |
| | | |
| | | | | | CORPORATE BONDS—5.8% | | | |
| | | |
| | | | | | Airlines—0.2% | | | |
| | | | | | Embarcadero Aircraft Securitization Trust, Class A-1, | | | |
| Ba2 | | $ | 100 | | 1.64%, 8/15/25(b) | | $ | 45,914 |
| | | | | | United Airlines, Inc., Equipment Trust, | | | |
| Ca | | | 1,000 | | 10.85%, 2/19/15 (d) | | | 316,250 |
| | | | | | | |
|
|
| | | | | | | | | 362,164 |
| | | | | | | |
|
|
| | | |
| | | | | | Financial Services—3.3% | | | |
| | | | | | CIT Group, Inc., Sr. Notes, | | | |
| A2 | | | 500 | | 2.67%, 3/1/04, MTN(b) | | | 501,118 |
| | | | | | Ford Motor Credit Co., | | | |
| A3 | | | 1,200 | | Sr. Notes, 5.75%, 2/23/04 | | | 1,207,190 |
| A3 | | | 400 | | Notes, 6.70%, 7/16/04 | | | 410,277 |
| | | | | | General Motors Acceptance Corp., Notes, | | | |
| A3 | | | 1,500 | | 6.875%, 9/15/11 | | | 1,615,691 |
| | | | | | PEMEX Project Funding Master Trust, Gtd. Notes, | | | |
| Baa1 | | | 500 | | 8.00%, 11/15/11 | | | 558,750 |
| Baa1 | | | 250 | | 9.125%, 10/13/10 | | | 296,875 |
| | | | | | PP&L Capital Funding, Inc., Sr. Notes, | | | |
| Baa3 | | | 600 | | 7.75%, 4/15/05 | | | 642,620 |
| | | | | | | |
|
|
| | | | | | | | | 5,232,521 |
| | | | | | | |
|
|
| | | |
| | | | | | Oil & Gas-Production/Pipeline—1.0% | | | |
| | | | | | El Paso Corp., Sr. Notes, | | | |
| Caa1 | | | 750 | | 7.75%, 1/15/32, MTN | | | 639,375 |
| Caa1 | | | 500 | | 7.80%, 8/1/31, MTN | | | 425,625 |
| | | | | | Williams Companies, Inc., Debs., | | | |
| B3 | | | 500 | | 7.50%, 1/15/31 | | | 506,250 |
| | | | | | | |
|
|
| | | | | | | | | 1,571,250 |
| | | | | | | |
|
|
| | | |
| | | | | | Telecommunications—0.8% | | | |
| | | | | | AT&T Corp., Sr. Notes, | | | |
| Baa2 | | | 300 | | 7.30%, 11/15/11 | | | 345,294 |
| | | | | | Qwest Corp., | | | |
| Ba3 | | | 250 | | Debs., 7.50%, 6/15/23 | | | 250,000 |
| Ba3 | | | 550 | | Notes, 8.875%, 3/15/12 | | | 631,125 |
| | | | | | | |
|
|
| | | | | | | | | 1,226,419 |
| | | | | | | |
|
|
See Notes to Financial Statements
| | |
| THE TARGET PORTFOLIO TRUST | | 55 |
| | |
Total Return Bond Portfolio (cont’d) | | Portfolio of Investments
December 31, 2003 |
| | | | | | | | |
MOODY’S
RATING
(UNAUDITED) | | PRINCIPAL
AMOUNT (000) | | DESCRIPTION | | VALUE (NOTE 1) |
|
| | | | | | | | | |
| | | | | | Utility-Gas and Electric—0.5% | | | |
| | | | | | Entergy Gulf States, First Mtge., | | | |
| Baa3 | | $ | 800 | | 2.07%, 6/18/07(b) | | $ | 801,802 |
| | | | | | | |
|
|
| | | | | | Total corporate bonds
(cost $9,487,101) | | | 9,194,156 |
| | | | | | | |
|
|
| | | | | | U.S. Government Agency Mortgage Backed Securities—11.0% |
| | | | | | Federal Home Loan Mortgage Corp., | | | |
| | | | 126 | | 3.88%, 1/1/24(b) | | | 128,272 |
| | | | 279 | | 5.50%, 4/1/29 - 6/1/29 | | | 283,975 |
| | | | 255 | | 6.00%, 9/1/22 | | | 264,537 |
| | | | 191 | | 7.50%, 9/1/16 - 7/1/17 | | | 206,186 |
| | | | 2 | | 9.25%, 1/1/10 | | | 2,664 |
| | | | | | Federal National Mortgage Association, | | | |
| | | | 346 | | 3.66%, 1/1/20(b) | | | 352,139 |
| | | | 11,637 | | 4.00%, 8/1/18 - 9/1/18 | | | 11,354,609 |
| | | | 242 | | 4.07%, 5/1/36(b) | | | 245,570 |
| | | | 670 | | 4.50%, 8/1/33 | | | 641,794 |
| | | | 891 | | 5.00%, 4/1/14 | | | 909,481 |
| | | | 441 | | 6.00%, 11/1/16 - 7/25/28 | | | 454,092 |
| | | | 737 | | 6.50%, 4/1/21 - 9/1/21 | | | 773,071 |
| | | | | | Government National Mortgage Association, | | | |
| | | | 442 | | 4.375%, 2/20/17 - 2/20/26(b) | | | 450,297 |
| | | | 250 | | 4.75%, 7/20/22 - 7/20/27(b) | | | 254,411 |
| | | | 198 | | 5.00%, 11/20/29(b) | | | 202,553 |
| | | | 328 | | 5.625%, 10/20/26 - 10/20/27(b) | | | 333,424 |
| | | | 411 | | 8.50%, 6/15/30 - 8/20/30 | | | 446,295 |
| | | | | | | |
|
|
| | | | | | Total U.S. Government agency mortgage backed securities
(cost $17,363,988) | | | 17,303,370 |
| | | | | | | |
|
|
| | | |
| | | | | | Foreign Corporate Bonds—0.5% | | | |
| | | | | | Alcan, Inc., | | | |
| Baa1 | | | 800 | | 1.43%, 12/8/04 (b) (cost $800,225) | | | 797,907 |
| | | | | | | |
|
|
| | | |
| | | | | | Collateralized Mortgage Obligations—2.3% | | | |
| | | | | | American Housing Trust 1, Series 1-5, Class A, | | | |
| Aaa | | | 5 | | 8.625%, 8/25/18 | | | 5,703 |
| | | | | | Bear Stearns ARM Trust, Series 2001-9, | | | |
| Aaa | | | 361 | | 5.656%, 2/25/33(b) | | | 363,172 |
| | | | | | Federal Home Loan Mortgage Corp., | | | |
| Aaa | | | 20 | | 1.29%, 9/15/26(b) | | | 19,604 |
| Aaa | | | 899 | | 5.00%, 9/15/16 | | | 925,231 |
| Aaa | | | 1,263 | | 8.00%, 9/15/29 | | | 1,404,299 |
| | | | | | Federal National Mortgage Association, | | | |
| Aaa | | | 199 | | 5.50%, 7/25/29 | | | 200,027 |
See Notes to Financial Statements
| | |
| 56 | | THE TARGET PORTFOLIO TRUST |
| | | | | | | | |
MOODY’S
RATING
(UNAUDITED) | | PRINCIPAL
AMOUNT (000) | | DESCRIPTION | | VALUE (NOTE 1) |
|
| | | | | | | | | |
| | | | | | Collateralized Mortgage Obligations (cont’d) | | | |
| | | | | | Indymac ARM Trust, Series 2001, Class A, | | | |
| Aaa | | $ | 63 | | 6.678%, 1/25/32(b) | | $ | 64,314 |
| | | | | | J.P. Morgan Commercial Mortgage Finance Corp., | | | |
| | | | | | Series 2000, Class A, | | | |
| Aaa | | | 34 | | 1.443%, 4/15/10(b) | | | 34,064 |
| | | | | | | | | |
| | | | | | Residential Asset Securitization Trust, | | | |
| | | | | | Series 1999-A6, Class NB, | | | |
| AAA(c) | | | 82 | | 6.50%, 9/25/14 | | | 84,142 |
| | | | | | Series 1999-A8, Class NB1, | | | |
| AAA(c) | | | 48 | | 7.875%, 1/25/30 | | | 48,681 |
| | | | | | Residential Funding Mortgage Securities I, Inc., | | | |
| | | | | | Series 2003-S9, Class A1, | | | |
| Aaa | | | 361 | | 6.50%, 3/25/32 | | | 371,950 |
| | | | | | Washington Mutual Mortgage Loan, Trust 2001, | | | |
| | | | | | Class A, | | | |
| Aaa | | | 86 | | 3.67%, 1/25/41(b) | | | 87,398 |
| | | | | | | |
|
|
| | | | | | Total collateralized mortgage obligations
(cost $3,434,559) | | | 3,608,585 |
| | | | | | | |
|
|
| | | |
| | | | | | Municipals—6.4% | | | |
| | | | | | California State Rev., Antic. Wts., | | | |
| MIG1 | | | 1,300 | | 2.00%, 6/16/04 | | | 1,302,639 |
| | | | | | Du Page County Illinois, Limited Tax, | | | |
| Aaa | | | 500 | | 5.00%, 1/1/31 | | | 506,250 |
| | | | | | Georgia State Road & Thruway Authority Rev.,
Governors Transportation Choices, | | | |
| Aaa | | | 500 | | 5.00%, 3/1/21 | | | 524,255 |
| | | | | | Golden State Tob. Securitization Corp., California State Tob. Settlement, Rev., Series 2003, Class A-1, | | | |
| Baa2 | | | 500 | | 6.25%, 6/1/33 | | | 479,875 |
| Baa2 | | | 400 | | 6.75%, 6/1/39 | | | 394,164 |
| | | | | | Massachusetts State Water Resources Authority, | | | |
| | | | | | Series J, | | | |
| Aaa | | | 750 | | 5.00%, 8/1/32 | | | 763,695 |
| | | | | | Minnesota State Rev., | | | |
| Aa1 | | | 600 | | 5.00%, 8/1/13 | | | 677,094 |
| | | | | | Missouri Higher Education, Loan Authority, Student Loan Rev., | | | |
| Aaa | | | 1,500 | | 1.22%, 1/1/31(b) | | | 1,500,000 |
| | | | | | New York City Trust Cultural Resources, Museum of
Modern Art, Series 2001, Class D, | | | |
| Aaa | | | 1,500 | | 5.125%, 7/1/31 | | | 1,550,625 |
| | | | | | South Carolina State Highway, Series B, | | | |
| Aaa | | | 1,100 | | 5.00%, 4/1/17 | | | 1,183,028 |
| | | | | | Tobacco Settlement Financing Corp., New Jersey State, | | | |
| Baa2 | | | 800 | | 6.00%, 6/1/37 | | | 714,904 |
| Baa2 | | | 500 | | 6.375%, 6/1/32 | | | 484,985 |
| | | | | | | |
|
|
| | | | | | Total municipals
(cost $9,728,377) | | | 10,081,514 |
| | | | | | | |
|
|
See Notes to Financial Statements
| | |
| THE TARGET PORTFOLIO TRUST | | 57 |
| | |
Total Return Bond Portfolio (cont’d) | | Portfolio of Investments
December 31, 2003 |
| | | | | | | | |
MOODY’S
RATING
(UNAUDITED) | | PRINCIPAL
AMOUNT (000) | | DESCRIPTION | | VALUE (NOTE 1) |
|
| | | | | | | | | |
| | | | | | U.S. Government Securities—16.4% | | | |
| | | | | | United States Treasury Bonds, | | | |
| | | $ | 200 | | 5.375%, 2/15/31 | | $ | 208,570 |
| | | | 100 | | 5.50%, 8/15/28 | | | 104,160 |
| | | | 4,450 | | 7.50%, 11/15/16 | | | 5,665,406 |
| | | | 60 | | 8.125%, 8/15/19 | | | 81,047 |
| | | | | | United States Treasury Notes, | | | |
| | | | 5,500 | | 1.625%, 10/31/05 | | | 5,491,410 |
| | | | 3,737 | | 3.375%, 1/15/07, TIPS | | | 4,048,004 |
| | | | 6,299 | | 3.625%, 1/15/08, TIPS | | | 6,965,860 |
| | | | 200 | | 4.25%, 11/15/13 | | | 199,781 |
| | | | | | United States Treasury Strips, P/O, | | | |
| | | | 8,400 | | Zero Coupon, 11/15/16 - 2/15/22 | | | 3,313,550 |
| | | | | | | |
|
|
| | | | | | Total U.S. Government securities
(cost $25,666,458) | | | 26,077,788 |
| | | | | | | |
|
|
| | | |
| | | | | | Foreign Government Securities—5.0% | | | |
| | | | | | Federal Republic of Brazil, | | | |
| B1 | | | 1,478 | | 8.00%, 4/15/14 | | | 1,448,138 |
| | | | | | Federal Republic of Germany, | | | |
| Aaa | | | 1,606 | | 4.25%, 3/12/04 | | | 2,033,938 |
| Aaa | | | 1,000 | | 6.50%, 10/14/05 - 6/1/08 | | | 1,346,292 |
| | | | | | Republic of Panama, | | | |
| Ba1 | | | 300 | | 8.875%, 9/30/27 | | | 315,000 |
| BB(c) | | | 450 | | 9.375%, 7/23/12 | | | 513,000 |
| | | | | | Republic of Peru, | | | |
| Ba3 | | | 500 | | 9.125%, 1/15/08 | | | 587,500 |
| | | | | | Russian Government Bond, | | | |
| Baa3 | | | 700 | | 5.00% (until 3/31/07), 7.50%, 3/31/30(b) | | | 671,125 |
| | | | | | United Mexican States, | | | |
| Baa2 | | | 1,000 | | 6.375%, 1/16/13 | | | 1,037,500 |
| | | | | | | |
|
|
| | | | | | Total foreign government securities
(cost $6,873,745) | | | 7,952,493 |
| | | | | | | |
|
|
| | | | | | Total long-term investments
(cost $73,354,453) | | | 75,015,813 |
| | | | | | | |
|
|
| | | |
| | | | | | SHORT-TERM INVESTMENTS—50.4% | | | |
| | | |
| | | | | | Commercial Paper—27.7% | | | |
| | | | | | ABN AMRO, | | | |
| P-1 | | | 400 | | 1.07%, 1/26/04(e) | | | 399,703 |
| P-1 | | | 1,200 | | 1.08%, 2/19/04(e) | | | 1,198,244 |
| | | | | | Anz (Delaware), Inc. | | | |
| P-1 | | | 1,000 | | 1.07%, 2/17/04(e) | | | 998,603 |
| P-1 | | | 600 | | 1.08%, 2/19/04(e) | | | 599,122 |
See Notes to Financial Statements
| | |
| 58 | | THE TARGET PORTFOLIO TRUST |
| | | | | | | | |
MOODY’S
RATING
(UNAUDITED) | | PRINCIPAL
AMOUNT (000) | | DESCRIPTION | | VALUE (NOTE 1) |
|
| | | | | | | | | |
| | | |
| | | | | | Commercial Paper (cont’d) | | | |
| P-1 | | $ | 2,500 | | 1.08%, 2/26/04(e) | | $ | 2,495,819 |
| | | | | | Barclays U.S. Funding, | | | |
| P-1 | | | 4,000 | | 1.07%, 1/20/04(e) | | | 3,997,751 |
| | | | | | BP Capital Markets PLC, | | | |
| P-1 | | | 700 | | 1.08%, 3/2/04(e) | | | 698,719 |
| | | | | | Danske Corp., | | | |
| P-1 | | | 1,400 | | 1.08%, 2/9/04(e) | | | 1,398,370 |
| P-1 | | | 1,900 | | 1.08%, 2/24/04(e) | | | 1,896,936 |
| | | | | | E.I. Dupont de Nemours, | | | |
| P-1 | | | 1,300 | | 1.07%, 1/16/04(e) | | | 1,299,420 |
| | | | | | European Investment Bank, | | | |
| P-1 | | | 600 | | 1.06%, 2/10/04(e) | | | 599,293 |
| | | | | | General Electric Capital Corp., | | | |
| P-1 | | | 3,000 | | 1.12%, 3/4/04(e) | | | 2,994,120 |
| P-1 | | | 1,500 | | 1.12%, 2/17/04(e) | | | 1,497,807 |
| | | | | | HBOS Treasury Services PLC, | | | |
| P-1 | | | 600 | | 1.11%, 3/12/04(e) | | | 598,687 |
| P-1 | | | 3,000 | | 1.10%, 2/25/04(e) | | | 2,994,958 |
| P-1 | | | 800 | | 1.11%, 2/10/04(e) | | | 799,013 |
| | | | | | Kraft Foods, Inc., | | | |
| P-1 | | | 1,100 | | 1.97%, 2/27/04(e) | | | 1,100,117 |
| | | | | | Lloyds TSB Bank PLC, | | | |
| P-1 | | | 4,400 | | 1.07%, 2/26/04(e) | | | 4,392,710 |
| | | | | | Rabobank Nederland, | | | |
| P-1 | | | 2,000 | | 1.07%, 1/20/04(e) | | | 1,998,871 |
| | | | | | Royal Bank of Scotland PLC, | | | |
| P-1 | | | 900 | | 1.08%, 1/27/04(e) | | | 899,298 |
| P-1 | | | 500 | | 1.08%, 2/3/04(e) | | | 499,505 |
| | | | | | Shell Finance UK PLC, | | | |
| P-1 | | | 2,000 | | 1.06%, 3/17/04(e) | | | 1,995,524 |
| | | | | | UBS Finance LLC, | | | |
| P-1 | | | 3,000 | | 1.06%, 1/20/04(e) | | | 2,998,322 |
| P-1 | | | 1,500 | | 1.08%, 2/17/04(e) | | | 1,497,875 |
| | | | | | Westpac Capital, | | | |
| P-1 | | | 600 | | 1.09%, 1/28/04(e) | | | 599,512 |
| P-1 | | | 3,000 | | 1.10%, 2/12/04(e) | | | 2,996,150 |
| P-1 | | | 300 | | 1.10%, 4/8/04(e) | | | 299,102 |
| | | | | | | |
|
|
| | | | | | Total commercial paper
(cost $43,743,435) | | | 43,743,551 |
| | | | | | | |
|
|
| | | | | | U.S. Government Agency Mortgage Backed Securities—0.1% |
| | | | | | Federal National Mortgage Association, | | | |
| | | | | | 1.02%, 2/3/04 | | | |
| | | | 200 | | (cost $199,815) | | | 199,815 |
| | | | | | | |
|
|
See Notes to Financial Statements
| | |
| THE TARGET PORTFOLIO TRUST | | 59 |
| | |
Total Return Bond Portfolio (cont’d) | | Portfolio of Investments
December 31, 2003 |
| | | | | | | | | |
| | | PRINCIPAL
AMOUNT (000) | | DESCRIPTION | | VALUE (NOTE 1) | |
| |
| | | | | | | | | | |
| | | |
| | | | | | U.S. Government Securities—22.6% | | | | |
| | | | | | United States Treasury Bills, | | | | |
| | | $ | 720 | | 0.89%, 3/18/04(e) | | $ | 718,688 | |
| | | | 15,000 | | 0.92%, 4/8/04(e) | | | 14,959,372 | |
| | | | 5,200 | | 1.03%, 6/3/04(e) | | | 5,179,070 | |
| | | | 5,700 | | 1.00%, 6/10/04(e) | | | 5,675,729 | |
| | | | 9,200 | | 0.98%, 6/17/04(e) | | | 9,159,032 | |
| | | | | | | |
|
|
|
| | | | | | Total U.S. Government securities
(cost $35,689,192) | | | 35,691,891 | |
| | | | | | | |
|
|
|
| | | CONTRACTS
| | Options Purchased(a) | | | |
| | | | | | Put Options | | | | |
| | | | | | EURO, expiring | | | | |
| | | | 60 | | 3/15/04 @$96.25 | | | 375 | |
| | | | | | EURO, expiring | | | | |
| | | | 90 | | 9/13/04 @$93.75 | | | 563 | |
| | | | | | Euribor Future, expiring | | | | |
| | | | 68 | | 3/15/04 @$96.625 | | | 1,072 | |
| | | | | | | |
|
|
|
| | | | | | Total options purchased
(cost $2,063) | | | 2,010 | |
| | | | | | | |
|
|
|
| | | | | | Total short-term investments
(cost $79,634,505) | | | 79,637,267 | |
| | | | | | | |
|
|
|
| | | |
| | | | | | Total Investments, Before Outstanding Options Written and Securities Sold Short—97.8%
(cost $152,988,958; Note 5) | | | 154,653,080 | |
| | | | | | | |
|
|
|
| | | NOTIONAL
AMOUNT (000)
| | OUTSTANDING OPTIONS WRITTEN(a)—
(0.3%) | | | |
| | | | | | Call Options | | | | |
| | | | | | Interest Rate Swaps, | | | | |
| | | | | | 3 month LIBOR over 6.0%, | | | | |
| | | $ | 1,200 | | expiring 10/07/04 | | | (16,030 | ) |
| | | | | | 3 month LIBOR over 4.0%, | | | | |
| | | | 15,100 | | expiring 9/23/04 | | | (173,997 | ) |
| | | | | | 3 month LIBOR over 7.0%, | | | | |
| | | | 15,100 | | expiring 9/23/04 | | | (194,594 | ) |
| | | | | | 3 month LIBOR over 3.8%, | | | | |
| | | | 2,200 | | expiring 10/7/04 | | | (17,959 | ) |
| | | | | | 3 month LIBOR over 6.0%, | | | | |
| | | | 2,200 | | expiring 10/7/04 | | | (16,797 | ) |
| | | | | | 3 month LIBOR over 4.0%, | | | | |
| | | | 1,000 | | expiring 10/31/05 | | | (11,467 | ) |
| | | | | | 3 month LIBOR over 7.0%, | | | | |
| | | | 1,000 | | expiring 10/31/05 | | | (14,047 | ) |
See Notes to Financial Statements
| | |
| 60 | | THE TARGET PORTFOLIO TRUST |
| | | | | | | | | |
| | | NOTIONAL
AMOUNT (000) | | DESCRIPTION | | VALUE (NOTE 1) | |
| |
| | | | | | | | | | |
| | | | | | Call Options (cont’d) | | | | |
| | | | | | 3 month LIBOR over 4.0%, | | | | |
| | | $ | 1,200 | | expiring 10/31/05 | | $ | (7,756 | ) |
| | | | | | | |
|
|
|
| | | | | | Total outstanding options written
(premiums received $584,954) | | | (452,647 | ) |
| | | | | | | |
|
|
|
| | | PRINCIPAL
AMOUNT (000)
| | INVESTMENTS SOLD SHORT—(11.4)% | | | |
| | | | | | United States Treasury Notes, | | | | |
| | | $ | 10,600 | | 3.625%, 5/15/13 | | | (10,188,837 | ) |
| | | | 2,700 | | 4.25%, 8/15/13 | | | (2,703,375 | ) |
| | | | 1,750 | | 4.375%, 5/15/07 | | | (1,853,153 | ) |
| | | | 3,000 | | 5.50%, 5/15/09 | | | (3,336,210 | ) |
| | | | | | | |
|
|
|
| | | | | | Total investments sold short
(proceeds received $17,905,332) | | | (18,081,575 | ) |
| | | | | | | |
|
|
|
| | | |
| | | | | | Total Investments, Net of Outstanding Options Written and Investments Sold Short—86.1%
(cost $134,498,672) | | | 136,118,858 | |
| | | | | | Other assets in excess of liabilities—13.9% | | | 22,029,327 | |
| | | | | | | |
|
|
|
| | | | | | Net Assets—100.0% | | $ | 158,148,185 | |
| | | | | | | |
|
|
|
| (a) | Non-income producing security. |
| (b) | Variable rate instrument. |
| (c) | Standard & Poor’s rating. |
| (e) | Rate quoted represents yield-to-maturity as of purchase date. |
| (f) | Discount rate at time of purchase for United States Government Agencies and Obligations. |
ARM—Adjustable Rate Mortgage.
MTN—Medium Term Note.
P/O—Principal Only.
TIPS—Treasury Inflation Protection Security.
The Fund’s current Prospectus contains a description of Moody’s and Standard & Poor’s ratings.
See Notes to Financial Statements
| | |
| THE TARGET PORTFOLIO TRUST | | 61 |
| | |
Intermediate-Term Bond Portfolio | | Portfolio of Investments
December 31, 2003 |
| | | | | | | | |
MOODY’S
RATING (UNAUDITED) | | PRINCIPAL
AMOUNT (000) | | DESCRIPTION | | VALUE (NOTE 1) |
|
| | | | | | | | | |
| | | | | | LONG-TERM INVESTMENTS—44.6% | | | |
| | | |
| | | | | | Asset Backed Securities—1.6% | | | |
| | | | | | BRAZOS Student Loan Finance Co., | | | |
| Aaa | | $ | 700 | | 1.21%, 10/1/35(a) | | $ | 699,467 |
| | | | | | Conseco Finance Securitization, | | | |
| A3 | | | 902 | | 7.47%, 5/1/32 | | | 910,820 |
| | | | | | Credit-Based Asset Servicing and Securitization, | | | |
| Aaa | | | 819 | | 1.48%, 8/25/29(a) | | | 819,428 |
| | | | | | First Franklin Mortgage Loan, | | | |
| Aaa | | | 550 | | 2.82%, 3/25/34(a) | | | 550,000 |
| | | | | | Metropolitan Asset Funding, Inc., | | | |
| AAA(d) | | | 166 | | 1.60%, 4/25/29(a) | | | 165,917 |
| | | | | | Premium Asset Trust, | | | |
| A2 | | | 1,500 | | 1.50%, 11/27/04(a) | | | 1,503,391 |
| | | | | | Residential Asset Mortgage Products, Inc., | | | |
| AAA(d) | | | 800 | | 1.47%, 12/25/33(a) | | | 799,359 |
| | | | | | | |
|
|
| | | | | | Total asset backed securities
(cost $5,435,189) | | | 5,448,382 |
| | | | | | | |
|
|
| | | |
| | | | | | Corporate Bonds—13.0% | | | |
| | | |
| | | | | | Airlines—0.7% | | | |
| | | | | | American Airlines, Inc., | | | |
| Baa2 | | | 1,500 | | 7.86%, 4/1/13 | | | 1,522,169 |
| | | | | | United Air Lines, Inc., | | | |
| Ca | | | 1,700 | | 6.83%, 3/1/10(f) | | | 292,096 |
| Ca | | | 1,500 | | 10.85%, 2/19/15(b)(c)(f) | | | 474,375 |
| | | | | | | |
|
|
| | | | | | | | | 2,288,640 |
| | | | | | | |
|
|
| | | |
| | | | | | Banking—0.1% | | | |
| | | | | | Export-Import Bank Korea, | | | |
| A3 | | | 300 | | 6.50%, 11/15/06 | | | 323,829 |
| | | | | | | |
|
|
| | | |
| | | | | | Cable—0.5% | | | |
| | | | | | Cox Communications, Inc., | | | |
| Baa2 | | | 1,500 | | 7.50%, 8/15/04 | | | 1,550,153 |
| | | | | | | |
|
|
| | | |
| | | | | | Electrical Power—3.3% | | | |
| | | | | | AEP Texas Central Co., | | | |
| Baa2 | | | 3,000 | | 2.43%, 2/15/05(a) | | | 3,002,976 |
| | | | | | Edison International, Inc., | | | |
| Ba2 | | | 1,000 | | 6.88%, 9/15/04 | | | 1,027,500 |
| | | | | | Indianapolis Power & Light, | | | |
| Baa2 | | | 1,500 | | 6.30%, 7/1/13 | | | 1,547,493 |
| | | | | | Pacific Gas & Electric Co., | | | |
| Ba2 | | | 2,500 | | 8.33%, 10/31/49(a)(c) | | | 2,515,625 |
See Notes to Financial Statements
| | |
| 62 | | THE TARGET PORTFOLIO TRUST |
| | | | | | | | |
MOODY’S
RATING (UNAUDITED) | | PRINCIPAL
AMOUNT (000) | | DESCRIPTION | | VALUE (NOTE 1) |
|
| | | | | | | | | |
| | | | | | Electrical Power (cont’d) | | | |
| | | | | | Progress Energy, Inc., | | | |
| Baa2 | | $ | 2,000 | | 7.00%, 10/30/31 | | $ | 2,140,574 |
| | | | | | TXU Energy Co., | | | |
| Baa2 | | | 850 | | 6.125%, 3/15/08 | | | 909,700 |
| | | | | | | |
|
|
| | | | | | | | | 11,143,868 |
| | | | | | | |
|
|
| | | |
| | | | | | Entertainment—0.1% | | | |
| | | | | | International Game Technology, | | | |
| Baa3 | | | 200 | | 7.875%, 5/15/04 | | | 204,166 |
| | | | | | | |
|
|
| | | |
| | | | | | Financial Services—4.2% | | | |
| | | | | | Bear Stearns & Co., Inc., | | | |
| A1 | | | 1,200 | | 1.70%, 11/30/04(a) | | | 1,204,480 |
| | | | | | Ford Motor Credit Co., | | | |
| A3 | | | 2,600 | | 7.60%, 8/1/05 | | | 2,778,915 |
| | | | | | General Motors Acceptance Corp., | | | |
| A3 | | | 700 | | 1.88%, 1/20/04(a) | | | 700,176 |
| A3 | | | 2,500 | | 6.88%, 8/28/12 | | | 2,689,564 |
| A3 | | | 1,200 | | 7.63%, 6/15/04 | | | 1,232,032 |
| A3 | | | 700 | | 8.00%, 11/1/31 | | | 786,077 |
| | | | | | Golden West Financial Corp., | | | |
| A1 | | | 1,500 | | 5.50%, 8/8/06 | | | 1,618,743 |
| | | | | | Heller Financial, Inc., | | | |
| Aaa | | | 500 | | 6.375%, 3/15/06 | | | 545,421 |
| | | | | | Household Finance Co., | | | |
| A1 | | | 730 | | 6.70%, 11/13/13 | | | 788,502 |
| | | | | | Unilever Capital Corp., | | | |
| A1 | | | 1,750 | | 6.875%, 11/1/05 | | | 1,897,646 |
| | | | | | | |
|
|
| | | | | | | | | 14,241,556 |
| | | | | | | |
|
|
| | | |
| | | | | | Healthcare Services—0.1% | | | |
| | | | | | HCA, Inc., | | | |
| Ba1 | | | 300 | | 6.91%, 6/15/05 | | | 316,011 |
| | | | | | | |
|
|
| | | |
| | | | | | Media—0.6% | | | |
| | | | | | Time Warner, Inc., | | | |
| Baa1 | | | 2,000 | | 7.75%, 6/15/05 | | | 2,158,082 |
| | | | | | | |
|
|
| | | |
| | | | | | Oil And Gas Exploration Services—0.3% | | | |
| | | | | | Parker & Parsley Petroleum Co., | | | |
| Ba1 | | | 800 | | 8.88%, 4/15/05 | | | 856,199 |
| | | | | | | |
|
|
| | | |
| | | | | | Restaurants—0.3% | | | |
| | | | | | Yum! Brands, Inc., | | | |
| Ba1 | | | 800 | | 7.45%, 5/15/05 | | | 853,000 |
| | | | | | | |
|
|
See Notes to Financial Statements
| | |
| THE TARGET PORTFOLIO TRUST | | 63 |
| | |
Intermediate-Term Bond Portfolio (cont’d) | | Portfolio of Investments
December 31, 2003 |
| | | | | | | | |
MOODY’S
RATING (UNAUDITED) | | PRINCIPAL
AMOUNT (000) | | DESCRIPTION | | VALUE (NOTE 1) |
|
| | | | | | | | | |
| | | | | | Telecommunications—2.8% | | | |
| | | | | | Deutsche Telekom International Finance BV, | | | |
| Baa3 | | $ | 2,300 | | 8.25%, 6/15/05 | | $ | 2,494,937 |
| | | | | | France Telecom SA, | | | |
| Baa3 | | | 2,000 | | 9.75%, 3/1/31 | | | 2,657,349 |
| | | | | | Sprint Capital Corp., | | | |
| Baa1 | | | 2,000 | | 6.00%, 1/15/07 | | | 2,136,094 |
| Baa3 | | | 350 | | 7.90%, 3/15/05 | | | 372,844 |
| | | | | | Verizon Wireless Capital LLC, | | | |
| A3 | | | 1,500 | | 1.24%, 5/23/05(a) | | | 1,498,200 |
| | | | | | WorldCom, Inc., | | | |
| NR | | | 1,000 | | 7.375%, 1/15/11(b)(c)(f) | | | 335,000 |
| | | | | | | |
|
|
| | | | | | | | | 9,494,424 |
| | | | | | | |
|
|
| | | | | | Total corporate bonds
(cost $45,066,316) | | | 43,429,928 |
| | | | | | | |
|
|
| | |
| | | | | | U.S. Government Agency Mortgage Pass-Through
Obligations—9.6% |
| | | | | | Federal Farm Credit Bank, | | | |
| | | | 2,300 | | 5.45%, 1/19/05 | | | 2,399,023 |
| | | | | | Federal Home Loan Mortgage Corp., | | | |
| | | | 821 | | 6.00%, 3/15/30 | | | 826,843 |
| | | | 420 | | 6.50%, 9/25/22 | | | 420,445 |
| | | | 12 | | 9.25%, 1/1/10 | | | 13,452 |
| | | | | | Federal National Mortgage Association, | | | |
| | | | 264 | | 3.518%, 7/1/25(a) | | | 267,171 |
| | | | 230 | | 3.875%, 8/1/24(a) | | | 233,785 |
| | | | 9,331 | | 5.00%, 10/1/17 - 9/1/18 | | | 9,526,660 |
| | | | 31 | | 5.234%, 12/1/30(a) | | | 31,292 |
| | | | 5,991 | | 6.00%, 11/1/12 - 9/1/17 | | | 6,293,217 |
| | | | 114 | | 6.50%, 9/1/05 | | | 116,746 |
| | | | | | Government National Mortgage Association, | | | |
| | | | 1,000 | | 3.55%, 7/20/30(a) | | | 997,878 |
| | | | 1,720 | | 4.25%, 3/20/30(a) | | | 1,749,258 |
| | | | 991 | | 4.375%, 5/20/23 - 2/20/26(a) | | | 1,010,886 |
| | | | 539 | | 4.44%, 6/20/27(a) | | | 549,535 |
| | | | 454 | | 4.75%, 8/20/26(a) | | | 461,731 |
| | | | 134 | | 5.625%, 10/20/24(a) | | | 136,293 |
| | | | 116 | | 5.70%, 12/20/26(a) | | | 119,729 |
| | | | 1,856 | | 6.00%, 1/15/29 - 7/15/29 | | | 1,931,816 |
| | | | 4,374 | | 6.50%, 10/15/25 - 6/15/32 | | | 4,614,851 |
| | | | 482 | | 8.00%, 9/20/30 - 7/20/31 | | | 520,973 |
| | | | | | | |
|
|
| | | | | | Total U.S. Government agency mortgage pass-through obligations
(cost $31,893,688) | | | 32,221,584 |
| | | | | | | |
|
|
See Notes to Financial Statements
| | |
| 64 | | THE TARGET PORTFOLIO TRUST |
| | | | | | | | |
MOODY’S
RATING (UNAUDITED) | | PRINCIPAL
AMOUNT (000) | | DESCRIPTION | | VALUE (NOTE 1) |
|
| | | | | | | | | |
| | | | | | Collateralized Mortgage Obligations—7.7% | | | |
| | | | | | Bank of America Mortgage Securities, Inc., | | | |
| AAA(d) | | $ | 1,412 | | 5.74%, 10/20/32(a) | | $ | 1,460,380 |
| | | | | | Bear Stearns ALT-A Trust, | | | |
| Aaa | | | 1,200 | | 1.421%, 2/25/34(a) | | | 1,199,929 |
| | | | | | Countrywide Home Loans, | | | |
| Aaa | | | 1,127 | | 5.00%, 9/19/32(a) | | | 1,140,381 |
| Aaa | | | 513 | | 5.75%, 3/19/32(a) | | | 526,864 |
| AAA(d) | | | 1,252 | | 6.25%, 12/25/33 | | | 1,284,989 |
| AAA(d) | | | 698 | | 6.50%, 8/25/29 | | | 727,073 |
| Aaa | | | 655 | | 6.50%, 1/25/34 | | | 693,284 |
| | | | | | G-Wing Limited, | | | |
| BBB(d) | | | 732 | | 3.82%, 11/6/11(a) | | | 724,748 |
| | | | | | Government National Mortgage Association, | | | |
| | | | 570 | | 1.65%, 2/16/30(a) | | | 574,029 |
| | | | 458 | | 1.75%, 2/16/30(a) | | | 462,411 |
| | | | 1,999 | | 7.50%, 2/20/30 | | | 2,114,493 |
| | | | 316 | | 8.50%, 3/20/25 | | | 341,640 |
| | | | | | GS Mortgage Securities Corp. II, | | | |
| Aa1 | | | 827 | | 6.04%, 8/15/18 | | | 880,615 |
| | | | | | Norwest Asset Securities Corp., | | | |
| AAA(d) | | | 171 | | 6.50%, 1/25/29 | | | 171,493 |
| | | | | | Salomon Brothers Mortgage Securities VII, | | | |
| Aaa | | | 5,000 | | 7.174%, 3/25/25 | | | 5,307,969 |
| | | | | | Sequoia Mortgage Trust, | | | |
| Aaa | | | 5,273 | | 1.53%, 10/20/27(a) | | | 5,284,339 |
| | | | | | Structured Asset Securities Corp., | | | |
| Aaa | | | 1,337 | | 6.25%, 1/25/32 | | | 1,381,387 |
| | | | | | Superannuation Members Home Loans Global Fund, | | | |
| Aaa | | | 407 | | 1.43%, 6/15/26(a) | | | 407,688 |
| | | | | | United Mortgage Securities Corp., | | | |
| Aaa | | | 940 | | 3.91%, 6/25/32(a) | | | 944,291 |
| | | | | | | |
|
|
| | | | | | Total collateralized mortgage obligations
(cost $25,555,110) | | | 25,628,003 |
| | | | | | | |
|
|
| | | |
| | | | | | Municipal Bonds—0.6% | | | |
| | | | | | Honolulu Hawaii City & County, | | | |
| Aaa | | | 1,000 | | 4.75%, 7/1/28 | | | 1,005,000 |
| | | | | | Missouri Higher Education Loan Authority, | | | |
| Aaa | | | 1,000 | | 1.19%, 9/1/43(a) | | | 1,000,000 |
| | | | | | | |
|
|
| | | | | | Total municipal bonds
(cost $1,836,732) | | | 2,005,000 |
| | | | | | | |
|
|
| | | |
| | | | | | Foreign Bonds—5.5% | | | |
| | | | | | Federal Republic of Brazil, | | | |
| B2 | | | 1,231 | | 8.00%, 4/15/14 (Brady Bond) | | | 1,206,782 |
| B2 | | | 2,000 | | 11.50%, 3/12/08 | | | 2,320,000 |
| | | | | | Republic of Panama, | | | |
| Ba1 | | | 1,500 | | 9.375%, 4/1/29 | | | 1,680,000 |
See Notes to Financial Statements
| | |
| THE TARGET PORTFOLIO TRUST | | 65 |
| | |
Intermediate-Term Bond Portfolio (cont’d) | | Portfolio of Investments
December 31, 2003 |
| | | | | | | | |
MOODY’S
RATING (UNAUDITED) | | PRINCIPAL
AMOUNT (000) | | DESCRIPTION | | VALUE (NOTE 1) |
|
| | | | | | | | | |
| | | |
| | | | | | Foreign Bonds (cont’d) | | | |
| | | | | | Republic of Peru, | | | |
| BA3 | | $ | 3,750 | | 9.125%, 1/15/08 - 2/21/12 | | $ | 4,226,250 |
| | | | | | Republic of South Africa, | | | |
| Baa2 | | | 750 | | 9.125%, 5/19/09 | | | 901,875 |
| | | | | | United Mexican States, | | | |
| Baa2 | | | 1,500 | | 6.375%, 1/16/13 | | | 1,556,250 |
| Baa2 | | | 3,000 | | 8.00%, 9/24/22 | | | 3,282,000 |
| Baa2 | | | 3,000 | | 8.30%, 8/15/31 | | | 3,382,500 |
| | | | | | | |
|
|
| | | | | | Total foreign bonds
(cost $16,437,355) | | | 18,555,657 |
| | | | | | | |
|
|
| | | |
| | | | | | U.S. Government Securities—6.6% | | | |
| | | | | | United States Treasury Notes, TIPS, | | | |
| | | | 5,408 | | 3.375%, 1/15/07-1/15/12(g) | | | 5,950,816 |
| | | | 3,665 | | 3.625%, 1/15/08 | | | 4,052,865 |
| | | | 10,717 | | 3.875%, 1/15/09 | | | 12,102,106 |
| | | | | | | |
|
|
| | | | | | Total U.S. Government Securities
(cost $20,802,596) | | | 22,105,787 |
| | | | | | | |
|
|
| | | SHARES
| | | | |
| | | |
| | | | | | Warrants(b) | | | |
| | | | | | Mexico Value, Ser. B, expiring | | | |
| | | | 2,500,000 | | 6/30/04 | | | 18,750 |
| | | | | | Mexico Value, Ser. C, expiring | | | |
| | | | 2,500,000 | | 6/30/05 | | | 2,500 |
| | | | | | Mexico Value, Ser. D, expiring | | | |
| | | | 2,500,000 | | 6/30/06 | | | 2,500 |
| | | | | | Mexico Value, Ser. E, expiring | | | |
| | | | 2,500,000 | | 6/30/07 | | | 1,500 |
| | | | | | | |
|
|
| | | | | | Total warrants
(cost $6,814) | | | 25,250 |
| | | | | | | |
|
|
| | | | | | Total long-term investments
(cost $147,033,800) | | | 149,419,591 |
| | | | | | | |
|
|
See Notes to Financial Statements
| | |
| 66 | | THE TARGET PORTFOLIO TRUST |
| | | | | | | | |
MOODY’S
RATING (UNAUDITED) | | PRINCIPAL
AMOUNT (000) | | DESCRIPTION | | VALUE (NOTE 1) |
|
| | | | | | | | | |
| | | | | | SHORT-TERM INVESTMENTS—44.9% | | | |
| | | |
| | | | | | U.S. Government and Agency Securities—27.3% | | | |
| | | | | | Federal Home Loan Mortgage Corp., | | | |
| | | $ | 3,300 | | 1.06%, 1/8/2004(e) | | $ | 3,299,320 |
| | | | 10,000 | | 1.06%, 1/15/2004(e) | | | 9,995,878 |
| | | | 200 | | 1.08%, 1/29/04(e) | | | 199,832 |
| | | | | | Federal National Mortgage Association, | | | |
| | | | 2,900 | | 1.03%, 3/31/04(e) | | | 2,892,750 |
| | | | 5,600 | | 1.05%, 3/17/04(e) | | | 5,587,587 |
| | | | 900 | | 1.06%, 3/10/04(e) | | | 898,172 |
| | | | 10,100 | | 1.07%, 2/18/04(e) | | | 10,085,591 |
| | | | 7,600 | | 1.08%, 4/1/04(e) | | | 7,579,348 |
| | | | | | United States Treasury Bills, | | | |
| | | | 3,550 | | 0.90%, 3/4/04(e)(g) | | | 3,544,803 |
| | | | 16,000 | | 0.99%, 4/15/04(e) | | | 15,957,936 |
| | | | 14,900 | | 1.02%, 4/22/04(e) | | | 14,857,833 |
| | | | 4,800 | | 1.03%, 5/6/04(e) | | | 4,784,669 |
| | | | 11,600 | | 1.04%, 5/13/04(e) | | | 11,561,036 |
| | | | | | | |
|
|
| | | | | | Total U.S. Government and agency securities
(cost $91,227,584) | | | 91,244,755 |
| | | | | | | |
|
|
| | | |
| | | | | | Commercial Paper—17.6% | | | |
| | | | | | ABN Amro, | | | |
| P-1 | | | 4,600 | | 1.07%, 1/14/04 | | | 4,598,223 |
| P-1 | | | 1,500 | | 1.08%, 2/19/04 | | | 1,497,805 |
| | | | | | Anz (Delaware) Inc., | | | |
| P-1 | | | 2,500 | | 1.08%, 2/26/04 | | | 2,495,819 |
| | | | | | Barclays US Funding, | | | |
| P-1 | | | 300 | | 1.07%, 1/20/04 | | | 299,831 |
| | | | | | BP Capital Markets PLC, | | | |
| P-1 | | | 600 | | 1.08%, 3/2/04 | | | 598,902 |
| | | | | | Danske Corp., | | | |
| P-1 | | | 3,600 | | 1.08%, 1/12/04 | | | 3,598,818 |
| P-1 | | | 5,000 | | 1.08%, 1/21/04 | | | 4,997,000 |
| | | | | | European Investment Bank, | | | |
| P-1 | | | 700 | | 1.06%, 2/10/04 | | | 699,176 |
| | | | | | General Electric Capital Corp., | | | |
| P-1 | | | 5,200 | | 1.09%, 2/9/04 | | | 5,193,860 |
| P-1 | | | 700 | | 1.09%, 4/13/04 | | | 697,817 |
| P-1 | | | 2,400 | | 1.12%, 3/4/04 | | | 2,395,296 |
| | | | | | HBOS Treasury Services, | | | |
| P-1 | | | 600 | | 1.09%, 1/29/04 | | | 599,491 |
| P-1 | | | 900 | | 1.09%, 2/5/04 | | | 899,046 |
| P-1 | | | 600 | | 1.11%, 1/23/04 | | | 599,595 |
| P-1 | | | 6,000 | | 1.12%, 2/18/04 | | | 5,991,040 |
| | | | | | Lloyds Bank PLC, | | | |
| P-1 | | | 500 | | 1.06%, 1/22/04 | | | 499,691 |
| P-1 | | | 1,600 | | 1.07%, 2/26/04 | | | 1,597,349 |
See Notes to Financial Statements
| | |
| THE TARGET PORTFOLIO TRUST | | 67 |
| | |
Intermediate-Term Bond Portfolio (cont’d) | | Portfolio of Investments
December 31, 2003 |
| | | | | | | | | |
MOODY’S
RATING (UNAUDITED) | | PRINCIPAL
AMOUNT (000) | | DESCRIPTION | | VALUE (NOTE 1) | |
| |
| | | | | | | | | | |
| | | | | | Commercial Paper (cont’d) | | | | |
| | | | | | Rabobank USA, | | | | |
| P-1 | | $ | 10,000 | | 1.08%, 2/24/04 | | $ | 9,983,876 | |
| | | | | | UBS Finance (DE) LLC, | | | | |
| P-1 | | | 1,600 | | 1.08%, 2/17/04 | | | 1,597,733 | |
| P-1 | | | 6,600 | | 1.09%, 2/25/04 | | | 6,589,160 | |
| | | | | | Westpac Trust, | | | | |
| P-1 | | | 1,100 | | 1.08%, 2/5/04 | | | 1,098,850 | |
| P-1 | | | 600 | | 1.09%, 3/24/04 | | | 598,492 | |
| P-1 | | | 1,900 | | 1.11%, 3/11/04 | | | 1,895,899 | |
| | | | | | | |
|
|
|
| | | | | | Total commercial paper
(cost $59,022,769) | | | 59,022,769 | |
| | | | | | | |
|
|
|
| | | | | | Total short-term investments
(cost $150,250,353) | | | 150,267,524 | |
| | | | | | | |
|
|
|
| | | | | | Total Investments, Before Outstanding Options
Written—89.5%
(cost $297,284,153; Note 5) | | | 299,687,115 | |
| | | | | | | |
|
|
|
| | | NOTIONAL
AMOUNT (000)
| | | | | |
| | | | | | OUTSTANDING OPTIONS WRITTEN(b)—(0.1)% | |
| | | |
| | | | | | Call Options—(0.1)% | | | | |
| | | | | | Interest Rate Swaps, | | | | |
| | | | | | 3 month LIBOR over 4.00%, | | | | |
| | | $ | 16,900 | | expiring 1/7/05 | | | (197,645 | ) |
| | | |
| | | | | | Put Options | | | | |
| | | | | | Interest Rate Swaps, | | | | |
| | | | | | 3 month LIBOR over 7.00%, | | | | |
| | | | 16,900 | | expiring 1/7/05 | | | (79,802 | ) |
| | | | | | | |
|
|
|
| | | | | | Total outstanding options written
(premiums received $309,693) | | | (277,447 | ) |
| | | | | | | |
|
|
|
| | | |
| | | | | | Total Investments, Net of Outstanding Options
Written—89.4% | | | 299,409,668 | |
| | | | | | Other assets in excess of other liabilities—10.6% | | | 35,396,439 | |
| | | | | | | |
|
|
|
| | | | | | Net Assets—100% | | $ | 334,806,107 | |
| | | | | | | |
|
|
|
| (a) | Rate shown reflects current rate on variable rate instruments. |
| (b) | Non-income producing security. |
| (c) | Represents issuer in default on interest payments. |
| (d) | Standard & Poor’s rating. |
| (e) | Rate shown reflects yield to maturity on date of purchase. |
| (g) | Portion of security pledged as initial margin for financial futures contracts. |
NR—Not Rated by Moody’s or Standard & Poor’s.
TIPS—Treasury Inflation Protection Security.
See Notes to Financial Statements
| | |
| 68 | | THE TARGET PORTFOLIO TRUST |
| | |
Portfolio of Investments
December 31, 2003 | | Mortgage Backed Securities Portfolio |
| | | | | | |
PRINCIPAL
AMOUNT (000) | | DESCRIPTION | | VALUE (NOTE 1) |
|
| | | | | | | |
| | | | LONG-TERM INVESTMENTS—103.9% | | | |
| | |
| | | | Collateralized Mortgage Obligations—10.1% | | | |
| | | | Bear Stearns Commercial Mortgage Securities Corp., | | | |
| $ | 750 | | 7.32%, 10/15/32 | | $ | 873,456 |
| | | | Chase Commercial Mortgage Securities Corp., | | | |
| | 300 | | 6.56%, 5/18/30 | | | 333,301 |
| | | | CS First Boston Mortgage Securities Corp., | | | |
| | 5 | | 7.15%, 6/20/29 | | | 4,895 |
| | 146 | | Zero Coupon, 4/25/17, P/O | | | 124,912 |
| | 146 | | 8.985%, 4/25/17, I/O | | | 32,298 |
| | | | Federal Home Loan Mortgage Corp., | | | |
| | 35 | | 5.50%, 8/15/21, PAC | | | 34,743 |
| | 1,185 | | 6.00%, 10/15/20 - 5/15/23 | | | 1,230,403 |
| | 494 | | 6.50%, 11/15/22, PAC | | | 500,043 |
| | 359 | | 7.00%, 3/15/23, PAC | | | 369,232 |
| | 691 | | 8.00%, 12/15/06 - 7/15/21, PAC | | | 696,343 |
| | 18 | | 9.00%, 10/15/20 | | | 17,883 |
| | | | Federal National Mortgage Assn., | | | |
| | 584 | | 6.00%, 5/25/10 PAC | | | 607,415 |
| | 473 | | 6.50%, 4/25/22 - 12/25/23 PAC | | | 488,452 |
| | 315 | | 6.527%, 5/25/30 | | | 342,982 |
| | 118 | | 7.00%, 9/25/20 PAC | | | 123,884 |
| | 281 | | 7.50%, 5/25/07 - 7/25/22 | | | 299,310 |
| | 389 | | 8.00%, 12/25/21 - 5/25/24 PAC | | | 427,460 |
| | 131 | | 8.50%, 7/25/18 - 6/25/21 PAC | | | 142,204 |
| | 753 | | 7.00%, 3/25/23 PAC, I/O | | | 65,562 |
| | | | Morgan Stanley Dean Witter Commercial Mortgage, | | | |
| | 1,000 | | 6.39%, 7/15/33 | | | 1,114,020 |
| | 807 | | 6.66%, 2/15/33 | | | 911,290 |
| | 750 | | 7.20%, 10/15/33 | | | 868,988 |
| | | | Nomura Asset Commercial Mortgage, | | | |
| | 1,000 | | 6.69%, 3/15/30 | | | 1,141,046 |
| | | | Salomon Brothers Mortgage Securities, | | | |
| | 70 | | 6.00%, 12/25/11 | | | 70,244 |
| | | | | |
|
|
| | | | Total collateralized mortgage obligations | | | |
| | | | (cost $10,012,131) | | | 10,820,366 |
| | | | | |
|
|
| |
| | | | U.S. Government Agency Mortgage Pass-Through Obligations—92.6% |
| | | | Federal Home Loan Mortgage Corp., | | | |
| | 3,440 | | 5.00%, 10/1/33 | | | 3,397,625 |
| | 68 | | 6.00%, 5/1/11 | | | 71,881 |
| | 688 | | 6.50%, 2/1/04 - 6/1/22 | | | 722,135 |
| | 166 | | 7.50%, 3/1/08 - 6/1/28 | | | 177,858 |
| | 10 | | 8.25%, 12/1/05 - 5/1/08 | | | 9,901 |
| | 48 | | 8.50%, 12/1/07 - 7/1/21 | | | 52,226 |
| | 37 | | 8.75%, 12/1/08 | | | 39,833 |
See Notes to Financial Statements
| | |
| THE TARGET PORTFOLIO TRUST | | 69 |
| | |
Mortgage Backed Securities Portfolio (cont’d) | | Portfolio of Investments
December 31, 2003 |
| | | | | | | |
PRINCIPAL
AMOUNT (000) | | | DESCRIPTION | | VALUE (NOTE 1) |
|
| | | | | | | | |
| | | | | U.S. Government Agency Mortgage Pass-Through Obligations (cont’d) |
| $ | 129 | | | 9.00%, 10/1/05 - 3/1/11 | | $ | 138,031 |
| | — | (b) | | 10.00%, 1/1/04 | | | 36 |
| | 31 | | | 11.50%, 3/1/16 | | | 34,586 |
| | 16 | | | 13.25%, 5/1/13 | | | 17,819 |
| | 4 | | | 14.00%, 6/1/11 | | | 4,093 |
| | | | | Federal National Mortgage Assn., | | | |
| | 1,000 | | | 4.625%, 10/15/13 | | | 992,958 |
| | 19,566 | | | 5.00%, 10/1/17 - 12/1/33 | | | 19,709,969 |
| | 8,507 | | | 5.50%, 12/1/13 - 10/1/33 | | | 8,639,399 |
| | 685 | | | 5.78%, 11/1/11(a) | | | 740,239 |
| | 4,933 | | | 6.00%, 8/1/11 - 1/1/34 | | | 5,111,961 |
| | 5,000 | | | 6.00%, 1/15/16, TBA | | | 5,242,190 |
| | 1,467 | | | 6.009%, 11/1/11 | | | 1,607,955 |
| | 79 | | | 6.048%, 3/1/12(a) | | | 86,319 |
| | 2,400 | | | 6.125%, 3/15/12 | | | 2,673,060 |
| | 84 | | | 6.18%, 7/1/08 | | | 91,645 |
| | 74 | | | 6.30%, 1/1/08 | | | 81,191 |
| | 67 | | | 6.34%, 1/1/08 | | | 73,238 |
| | 74 | | | 6.43%, 1/1/08 | | | 81,485 |
| | 469 | | | 6.447%, 1/1/08 | | | 514,748 |
| | 28 | | | 6.50%, 2/1/11 | | | 29,653 |
| | 631 | | | 6.55%, 9/1/07 | | | 691,555 |
| | 45 | | | 6.837%, 10/1/07 | | | 48,990 |
| | 419 | | | 7.00%, 9/1/11 - 7/1/12 | | | 448,275 |
| | 580 | | | 7.04%, 3/1/07 | | | 638,220 |
| | 8 | | | 7.50%, 2/1/20 | | | 8,306 |
| | 4 | | | 7.75%, 10/1/19 | | | 3,906 |
| | 153 | | | 8.00%, 3/1/07 - 12/1/22 | | | 168,664 |
| | 93 | | | 8.50%, 1/1/07 | | | 94,483 |
| | 46 | | | 9.75%, 8/1/10 - 11/1/16 | | | 51,360 |
| | | | | Government National Mortgage Assn., | | | |
| | 8,717 | | | 6.00%, 10/15/08 - 6/15/33 | | | 9,088,354 |
| | 13,830 | | | 6.00%, 1/1/34, TBA | | | 14,370,226 |
| | 9,468 | | | 6.50%, 5/15/23 - 5/15/32 | | | 9,993,486 |
| | 6,594 | | | 7.00%, 7/15/16 - 1/15/30 | | | 7,052,317 |
| | 3,970 | | | 7.50%, 3/15/07 - 10/15/29 | | | 4,277,106 |
| | 962 | | | 8.00%, 1/15/08 - 11/15/30 | | | 1,050,964 |
| | 115 | | | 8.25%, 6/20/17 - 7/20/17 | | | 125,477 |
| | 70 | | | 8.50%, 3/15/05 - 4/20/17 | | | 76,663 |
| | 264 | | | 9.00%, 7/20/04 - 1/15/20 | | | 292,518 |
| | 186 | | | 9.50%, 4/15/06 - 1/15/21 | | | 205,949 |
| | 13 | | | 13.50%, 5/15/11 | | | 14,872 |
| | 28 | | | 14.00%, 6/15/11 | | | 32,911 |
| | 18 | | | 16.00%, 5/15/12 | | | 22,175 |
| | | | | | |
|
|
| | | | | Total U.S. Government agency mortgage pass-through obligations (cost $97,918,679) | | | 99,098,811 |
| | | | | | |
|
|
See Notes to Financial Statements
| | |
| 70 | | THE TARGET PORTFOLIO TRUST |
| | | | | | | |
PRINCIPAL
AMOUNT (000) | | DESCRIPTION | | VALUE (NOTE 1) | |
| |
| | | | | | | | |
| | | | U.S. Treasury Securities—1.2% | | | | |
| | | | United States Treasury Bond, | | | | |
| $ | 900 | | 8.875%, 2/15/19
(cost $1,292,873) | | $ | 1,286,719 | |
| | | | | |
|
|
|
| | | | Total long-term investments
(cost $109,223,683) | | | 111,205,896 | |
| | | | | |
|
|
|
| | |
| | | | SHORT-TERM INVESTMENTS—13.5% | | | | |
| | |
| | | | Repurchase Agreements | | | | |
| | 4,700 | | ABN AMRO, 0.98%, dated 12/31/03, due 1/02/04 in the amount of $4,700,256 (cost $4,700,000; collateralized by $4,781,000 United States Treasury Note, 4.25%, 11/15/2013; value of the collateral including accrued interest was $4,794,355) | | | 4,700,000 | |
| | 9,800 | | Goldman Sachs Group, Inc., 1.01%, dated 12/31/03, due 1/02/04 in the amount of $9,800,550 (cost $9,800,000; collateralized by $9,536,168 and $798,136 Federal Home Loan Mortgage Corp. Notes, 5.00%, 7/01/33 and 9/01/33; value of the collateral including accrued interest was $9,996,000) | | | 9,800,000 | |
| | | | | |
|
|
|
| | | | Total repurchase agreements
(cost $14,500,000) | | | 14,500,000 | |
| | | | | |
|
|
|
| | | | Total Investments, Before Securities Sold Short—117.4%
(cost $123,723,683; Note 5) | | | 125,705,896 | |
| | | | | |
|
|
|
| | |
| | | | SECURITIES SOLD SHORT—(4.4)% | | | | |
| | | | Government National Mortgage Assn., | | | | |
| | 4,500 | | 6.50%, 1/22/33, TBA
(proceeds received $4,729,219) | | | (4,741,875 | ) |
| | | | | |
|
|
|
| | | | Total Investments, Net of Investments Sold Short—113.0%
(cost $118,994,464) | | | 120,964,021 | |
| | | | Liabilities in excess of other assets—(13.0%) | | | (13,892,021 | ) |
| | | | | |
|
|
|
| | | | Net Assets—100% | | $ | 107,072,000 | |
| | | | | |
|
|
|
| (a) | Variable rate instrument. The maturity date presented for these instruments is the later of the next date on which the security can be redeemed at par or the next date on which the rate of interest is adjusted. |
| (b) | Less than $500 principal amount held. |
I/O—Interest Only Security.
PAC—Planned Amortization Class.
P/O—Principal Only Security.
TBA—To be announced. Such securities are purchased on a forward commitment basis.
See Notes to Financial Statements
| | |
| THE TARGET PORTFOLIO TRUST | | 71 |
| | |
U.S. Government Money Market Portfolio | | Portfolio of Investments
December 31, 2003 |
| | | | | | |
PRINCIPAL
AMOUNT (000) | | DESCRIPTION | | VALUE (NOTE 1) |
|
| | | | | | | |
| | |
| | | | Federal Home Loan Bank—16.2% | | | |
| $ | 800 | | 1.05%, 1/28/04(a) | | $ | 799,370 |
| | 3,000 | | 3.75%, 2/13/04 | | | 3,008,235 |
| | 1,000 | | 1.07%, 2/27/04(a) | | | 998,306 |
| | 900 | | 1.15.%, 3/12/04(a) | | | 897,976 |
| | 5,000 | | 1.12%, 3/19/04(a) | | | 4,987,975 |
| | 1,500 | | 3.75%, 4/15/04 | | | 1,510,617 |
| | 3,742 | | 1.15%, 5/26/04(a) | | | 3,724,624 |
| | | | | |
|
|
| | | | | | | 15,927,103 |
| | | | | |
|
|
| | |
| | | | Federal Home Loan Mortgage Corp.—25.7% | | | |
| | 1,300 | | 1.10%, 1/15/04(a) | | | 1,299,444 |
| | 2,000 | | 1.35%, 1/29/04(a) | | | 1,997,931 |
| | 2,160 | | 5.25%, 2/15/04 | | | 2,170,397 |
| | 3,000 | | 1.18%, 2/17/04(a) | | | 2,995,417 |
| | 750 | | 0.94%, 2/26/04(a) | | | 748,695 |
| | 500 | | 1.09%, 2/26/04(a) | | | 499,152 |
| | 1,000 | | 1.28%, 2/26/04(a) | | | 998,260 |
| | 2,000 | | 1.15%, 4/22/04(a) | | | 1,992,907 |
| | 980 | | 1.10%, 5/13/04(a) | | | 976,017 |
| | 750 | | 5.00%, 5/15/04 | | | 760,397 |
| | 4,000 | | 1.14%, 5/20/04(a) | | | 3,982,344 |
| | 500 | | 1.19%, 6/16/04(a) | | | 497,263 |
| | 1,430 | | 1.27%, 6/17/04(a) | | | 1,421,592 |
| | 2,000 | | 1.40%, 8/11/04 | | | 2,001,598 |
| | 3,000 | | 1.17%, 8/18/04(a) | | | 2,977,767 |
| | | | | |
|
|
| | | | | | | 25,319,181 |
| | | | | |
|
|
| | |
| | | | Federal National Mortgage Association—29.0% | | | |
| | 260 | | 1.07%, 1/28/04(a) | | | 259,791 |
| | 1,000 | | 1.08%, 2/6/04(a) | | | 998,782 |
| | 1,500 | | 1.25%, 2/6/04(a) | | | 1,498,173 |
| | 1,699 | | 1.29%, 2/6/04(a) | | | 1,696,930 |
| | 1,630 | | 1.10%, 2/11/04(a) | | | 1,627,958 |
| | 8,000 | | 1.07%, 2/13/04(a) | | | 7,989,776 |
| | 2,000 | | 1.05%, 2/17/04(a) | | | 1,997,273 |
| | 800 | | 1.10%, 3/17/04(a) | | | 798,124 |
| | 960 | | 1.12%, 3/17/04(a) | | | 957,748 |
| | 950 | | 1.02%, 4/30/04(a) | | | 946,802 |
| | 1,000 | | 1.13%, 4/30/04(a) | | | 996,267 |
| | 500 | | 1.10%, 5/5/04(a) | | | 498,090 |
| | 700 | | 1.08%, 5/28/04(a) | | | 696,921 |
| | 2,000 | | 1.11%, 6/25/04(a) | | | 1,988,593 |
| | 4,000 | | 1.21%, 6/25/04(a) | | | 3,977,185 |
| | 1,675 | | 1.15%, 7/23/04(a) | | | 1,664,132 |
| | | | | |
|
|
| | | | | | | 28,592,545 |
| | | | | |
|
|
See Notes to Financial Statements
| | |
| 72 | | THE TARGET PORTFOLIO TRUST |
| | | | | | | |
PRINCIPAL
AMOUNT (000) | | DESCRIPTION | | VALUE (NOTE 1) | |
| |
| | | | | | | | |
| | | | Repurchase Agreements—29.1% | | | | |
| $ | 9,300 | | ABN AMRO, Inc., .98%, dated 12/31/03, due 1/02/04 in the amount of $9,300,506 (cost $9,300,000; collateralized by $9,460,000 United States Treasury Note, 4.25%, 11/15/2013; value of the collateral including accrued interest was $9,486,425) | | $ | 9,300,000 | |
| | 7,000 | | Credit Suisse First Boston Corp., .99%, dated 12/31/03, due 1/02/04 in the amount of 7,000,385 (cost 7,000,000; collateralized by $7,375,000, Federal Home Loan Bank, 3.501%, 3/16/2010; value of the collateral including accrued interest was $7,144,607) | | | 7,000,000 | |
| | 12,400 | | Goldman, Sachs & Co., 1.01%, dated 12/31/03, due 1/02/04 in the amount of $12,400,696 (cost $12,400,000; collateralized by $20,939,764 Freddie Mac, 6.50%, 8/01/2032; value of the collateral including accrued interest was 12,648,000) | | | 12,400,000 | |
| | | | | |
|
|
|
| | | | | | | 28,700,000 | |
| | | | | |
|
|
|
| | | | Total Investments—100.0%
(amortized cost $98,538,829)(b) | | | 98,538,829 | |
| | | | Liabilities in excess of other assets | | | (75,240 | ) |
| | | | | |
|
|
|
| | | | Net Assets—100% | | $ | 98,463,589 | |
| | | | | |
|
|
|
| (a) | Rate quoted represents yield-to-maturity as of purchase date. |
| (b) | Federal income tax basis of portfolio securities is the same as for financial reporting purposes. |
See Notes to Financial Statements
| | |
| THE TARGET PORTFOLIO TRUST | | 73 |
Statements of Assets and Liabilities December 31,2003
| | | | | | | | | | | | |
| | | LARGE
CAPITALIZATION
GROWTH
PORTFOLIO | | | LARGE
CAPITALIZATION
VALUE
PORTFOLIO | | | SMALL
CAPITALIZATION
GROWTH
PORTFOLIO | |
| |
| | | |
| ASSETS | | | | | | | | | | | | |
| |
Investments, at value* | | $ | 348,930,037 | | | $ | 320,295,530 | | | $ | 143,160,502 | |
| |
Repurchase Agreement* | | | — | | | | — | | | | — | |
| |
Cash | | | — | | | | 206,353 | | | | — | |
| |
Foreign currency, at value** | | | — | | | | — | | | | — | |
| |
Receivable for Fund shares sold | | | 861,507 | | | | 791,225 | | | | 322,819 | |
| |
Dividends and interest receivable | | | 151,876 | | | | 528,942 | | | | 7,409 | |
| |
Prepaid expenses and other assets | | | 8,672 | | | | 5,379 | | | | 989 | |
| |
Receivable for investments sold | | | — | | | | 1,097,585 | | | | 231,102 | |
| |
Receivable for foreign tax reclaim | | | — | | | | — | | | | — | |
| |
Due from broker for variation margin | | | — | | | | — | | | | — | |
| |
Premium for swaps purchased | | | — | | | | — | | | | — | |
| |
Unrealized appreciation on swaps | | | — | | | | — | | | | — | |
| |
Unrealized appreciation on forward currency contracts | | | — | | | | — | | | | — | |
| |
Total assets | | | 349,952,092 | | | | 322,925,014 | | | | 143,722,821 | |
| | | |
| LIABILITIES | | | | | | | | | | | | |
| |
Payable for Fund shares reacquired | | | 1,197,462 | | | | 1,243,646 | | | | 442,069 | |
| |
Payable for investments purchased | | | — | | | | 5,256,720 | | | | 2,758,740 | |
| |
Accrued expenses and other liabilities | | | 181,963 | | | | 124,434 | | | | 182,672 | |
| |
Management fee payable | | | 174,145 | | | | 155,528 | | | | 70,301 | |
| |
Deferred Trustees' fees | | | 12,271 | | �� | | 14,063 | | | | 12,560 | |
| |
Payable to custodian | | | 1,201 | | | | — | | | | 5,167 | |
| |
Dividends payable | | | — | | | | — | | | | — | |
| |
Due to broker for variation margin | | | — | | | | — | | | | — | |
| |
Outstanding options written*** | | | — | | | | — | | | | — | |
| |
Premium for swaps written | | | — | | | | — | | | | — | |
| |
Unrealized depreciation on swaps | | | — | | | | — | | | | — | |
| |
Unrealized depreciation on forward currency contracts | | | — | | | | — | | | | — | |
| |
Investments sold short, at value**** | | | — | | | | — | | | | — | |
| |
Total liabilities | | | 1,567,042 | | | | 6,794,391 | | | | 3,471,509 | |
| |
| | | |
| NET ASSETS | | $ | 348,385,050 | | | $ | 316,130,623 | | | $ | 140,251,312 | |
| |
Net assets were comprised of: | | | | | | | | | | | | |
Shares of beneficial interest, at par | | $ | 22,640 | | | $ | 22,370 | | | $ | 14,957 | |
| |
Paid-in capital, in excess of par | | | 298,581,548 | | | | 257,964,840 | | | | 183,184,130 | |
| |
| | | | 298,604,188 | | | | 257,987,210 | | | | 183,199,087 | |
Undistributed net investment income | | | — | | | | 103,948 | | | | — | |
| |
Accumulated net realized gain (loss) | | | (59,999,608 | ) | | | (9,684,743 | ) | | | (54,917,465 | ) |
| |
Net unrealized appreciation (depreciation) | | | 109,780,470 | | | | 67,724,208 | | | | 11,969,690 | |
| |
Net assets, December 31, 2003 | | $ | 348,385,050 | | | $ | 316,130,623 | | | $ | 140,251,312 | |
| |
Shares of beneficial interest issued and outstanding | | | 22,640,478 | | | | 22,370,410 | | | | 14,956,953 | |
| |
Net asset value, offering price and redemption
price per share | | $ | 15.39 | | | $ | 14.13 | | | $ | 9.38 | |
| |
* Identified cost of total investments | | $ | 239,149,567 | | | $ | 252,571,322 | | | $ | 131,190,812 | |
| |
** Identified cost of currency | | | — | | | | — | | | | — | |
| |
*** Premiums received from options written | | | — | | | | — | | | | — | |
| |
**** Proceeds received from short sales | | | — | | | | — | | | | — | |
| |
See Notes to Financial Statements
| | |
| 74 | | THE TARGET PORTFOLIO TRUST |
Statements of Assets and Liabilities December 31,2003 (cont’d)
| | | | | | | | | | | | | | | |
| | | SMALL
CAPITALIZATION
VALUE
PORTFOLIO | | INTERNATIONAL
EQUITY
PORTFOLIO | | | INTERNATIONAL
BOND
PORTFOLIO | | | TOTAL RETURN
BOND
PORTFOLIO | |
| |
| | | | |
| ASSETS | | | | | | | | | | | | | | | |
| |
Investments, at value* | | $ | 204,530,158 | | $ | 191,779,088 | | | $ | 39,279,450 | | | $ | 154,653,080 | |
| |
Repurchase Agreement* | | | — | | | — | | | | — | | | | — | |
| |
Cash | | | — | | | — | | | | — | | | | 1,703,338 | |
| |
Foreign currency, at value** | | | — | | | — | | | | 62,508 | | | | 630,540 | |
| |
Receivable for Fund shares sold | | | 1,719,866 | | | 429,959 | | | | 351,661 | | | | 855,096 | |
| |
Dividends and interest receivable | | | 241,930 | | | 249,223 | | | | 667,988 | | | | 859,213 | |
| |
Prepaid expenses and other assets | | | 2,495 | | | 4,007 | | | | 365,468 | | | | 2,050 | |
| |
Receivable for investments sold | | | 744,702 | | | — | | | | 281,136 | | | | 20,940,239 | |
| |
Receivable for foreign tax reclaim | | | — | | | 442,860 | | | | — | | | | — | |
| |
Due from broker for variation margin | | | — | | | — | | | | — | | | | 8,590 | |
| |
Premium for swaps purchased | | | — | | | — | | | | — | | | | 138,648 | |
| |
Unrealized appreciation on swaps | | | — | | | — | | | | — | | | | 241,625 | |
| |
Unrealized appreciation on forward currency contracts | | | — | | | — | | | | 1,512,449 | | | | 24,368 | |
| |
Total assets | | | 207,239,151 | | | 192,905,137 | | | | 42,520,660 | | | | 180,056,787 | |
| | | | |
| LIABILITIES | | | | | | | | | | | | | | | |
| |
Payable for Fund shares reacquired | | | 853,084 | | | 723,079 | | | | 181,327 | | | | 399,415 | |
| |
Payable for investments purchased | | | — | | | 13,943 | | | | — | | | | 2,278,990 | |
| |
Accrued expenses and other liabilities | | | 214,946 | | | 118,572 | | | | 72,876 | | | | 43,535 | |
| |
Management fee payable | | | 101,861 | | | 109,652 | | | | 15,939 | | | | 60,048 | |
| |
Deferred Trustees' fees | | | 12,469 | | | 12,936 | | | | 8,957 | | | | 11,454 | |
| |
Payable to custodian | | | 67,537 | | | 18,254 | | | | 13,310 | | | | — | |
| |
Dividends payable | | | — | | | — | | | | — | | | | — | |
| |
Unrealized loss on futures | | | — | | | — | | | | 36,498 | | | | — | |
| |
Outstanding options written*** | | | — | | | — | | | | — | | | | 452,647 | |
| |
Premium for swaps written | | | — | | | — | | | | — | | | | 278,422 | |
| |
Unrealized depreciation on swaps | | | — | | | — | | | | — | | | | 216,603 | |
| |
Unrealized depreciation on forward currency contracts | | | — | | | — | | | | 3,638,676 | | | | 85,913 | |
| |
Investments sold short, at value**** | | | — | | | — | | | | — | | | | 18,081,575 | |
| |
Total liabilities | | | 1,249,897 | | | 996,436 | | | | 3,967,583 | | | | 21,908,602 | |
| |
| | | | |
| NET ASSETS | | $ | 205,989,254 | | $ | 191,908,701 | | | $ | 38,553,077 | | | $ | 158,148,185 | |
| |
Net assets were comprised of: | | | | | | | | | | | | | | | |
Shares of beneficial interest, at par | | $ | 10,970 | | $ | 16,651 | | | $ | 4,562 | | | $ | 14,833 | |
| |
Paid-in capital, in excess of par | | | 160,982,826 | | | 204,922,117 | | | | 38,565,297 | | | | 155,962,449 | |
| |
| | | | 160,993,796 | | | 204,938,768 | | | | 38,569,859 | | | | 155,977,282 | |
Undistributed net investment income (loss) | | | — | | | 911,418 | | | | (1,842,579 | ) | | | (232,077 | ) |
| |
Accumulated net realized gain (loss) | | | 1,183,627 | | | (51,968,349 | ) | | | 14,290 | | | | (229,844 | ) |
| |
Net unrealized appreciation (depreciation) | | | 43,811,831 | | | 38,026,864 | | | | 1,811,507 | | | | 2,632,824 | |
| |
Net assets, December 31, 2003 | | $ | 205,989,254 | | $ | 191,908,701 | | | $ | 38,553,077 | | | $ | 158,148,185 | |
| |
Shares of beneficial interest issued and outstanding | | | 10,970,003 | | | 16,651,445 | | | | 4,562,324 | | | | 14,832,930 | |
| |
Net asset value, offering price and redemption price per share | | $ | 18.78 | | $ | 11.53 | | | $ | 8.45 | | | $ | 10.66 | |
| |
* Identified cost of total investments | | $ | 160,718,327 | | $ | 153,816,926 | | | $ | 35,343,595 | | | $ | 152,988,958 | |
| |
** Identified cost of currency | | | — | | | — | | | $ | 61,516 | | | $ | 596,059 | |
| |
*** Premiums received from options written | | | — | | | — | | | | — | | | $ | 584,954 | |
| |
**** Proceeds received from short sales | | | — | | | — | | | | — | | | $ | 17,905,332 | |
| |
See Notes to Financial Statements
| | |
| THE TARGET PORTFOLIO TRUST | | 75 |
Statements of Assets and Liabilities December 31,2003 (cont’d)
| | | | | | | | | | | |
| | | INTERMEDIATE-TERM
BOND
PORTFOLIO | | | MORTGAGE BACKED
SECURITIES
PORTFOLIO | | | U.S. GOVERNMENT
MONEY MARKET
PORTFOLIO |
|
| | | |
| ASSETS | | | | | | | | | | | |
|
Investments, at value* | | $ | 299,687,115 | | | $ | 111,205,896 | | | $ | 69,838,829 |
|
Repurchase Agreement* | | | — | | | | 14,500,000 | | | | 28,700,000 |
|
Cash | | | 4,659,627 | | | | 165,772 | | | | 70,472 |
|
Foreign currency, at value** | | | 2,354,578 | | | | — | | | | — |
|
Receivable for Fund shares sold | | | 1,576,549 | | | | 632,493 | | | | 1,083,833 |
|
Dividends and interest receivable | | | 1,907,457 | | | | 509,144 | | | | 113,832 |
|
Prepaid expenses and other assets | | | 4,798 | | | | 3,446 | | | | 14,907 |
|
Receivable for investments sold | | | 33,599,100 | | | | 4,731,883 | | | | — |
|
Receivable for foreign tax reclaim | | | — | | | | — | | | | — |
|
Due from broker for variation margin | | | 45,842 | | | | — | | | | — |
|
Premium for swaps purchased | | | 129,987 | | | | — | | | | — |
|
Unrealized appreciation on swaps | | | 196,724 | | | | — | | | | |
|
Unrealized appreciation on forward currency contracts | | | — | | | | — | | | | — |
|
Total assets | | | 344,161,777 | | | | 131,748,634 | | | | 99,821,873 |
| | | |
| LIABILITIES | | | | | | | | | | | |
|
Payable for Fund shares reacquired | | | 753,528 | | | | 263,285 | | | | 1,266,464 |
|
Payable for investments purchased | | | 7,521,438 | | | | 19,556,016 | | | | — |
|
Accrued expenses and other liabilities | | | 135,501 | | | | 52,549 | | | | 56,293 |
|
Management fee payable | | | 127,610 | | | | 41,410 | | | | 21,339 |
|
Deferred Trustees' fees | | | 12,476 | | | | 11,513 | | | | 12,815 |
|
Payable to custodian | | | — | | | | — | | | | — |
|
Dividends payable | | | 21,937 | | | | 9,986 | | | | 1,373 |
|
Due to broker for variation margin | | | — | | | | — | | | | — |
|
Outstanding options written*** | | | 277,447 | | | | — | | | | — |
|
Premium for swaps written | | | 232,800 | | | | — | | | | — |
|
Unrealized depreciation on swaps | | | 238,216 | | | | — | | | | — |
|
Unrealized depreciation on forward currency contracts | | | 34,717 | | | | — | | | | — |
|
Investments sold short, at value**** | | | — | | | | 4,741,875 | | | | — |
|
Total liabilities | | | 9,355,670 | | | | 24,676,634 | | | | 1,358,284 |
|
| | | |
| NET ASSETS | | $ | 334,806,107 | | | $ | 107,072,000 | | | $ | 98,463,589 |
|
Net assets were comprised of: Shares of beneficial | | | | | | | | | | | |
interest, at par | | $ | 32,013 | | | $ | 10,249 | | | $ | 98,464 |
|
Paid-in capital, in excess of par | | | 331,347,034 | | | | 106,731,498 | | | | 98,365,125 |
|
| | | | 331,379,047 | | | | 106,741,747 | | | | 98,463,589 |
Undistributed net investment income (loss) | | | (48,999 | ) | | | (9,986 | ) | | | — |
|
Accumulated net realized gain (loss) | | | (32,526 | ) | | | (1,629,318 | ) | | | — |
|
Net unrealized appreciation (depreciation) | | | 3,508,585 | | | | 1,969,557 | | | | — |
|
Net assets, December 31, 2003 | | $ | 334,806,107 | | | $ | 107,072,000 | | | $ | 98,463,589 |
|
Shares of beneficial interest issued and outstanding | | | 32,013,317 | | | | 10,248,940 | | | | 98,463,589 |
|
Net asset value, offering price and redemption
price per share | | $ | 10.46 | | | $ | 10.45 | | | $ | 1.00 |
|
* Identified cost of total investments | | $ | 297,284,153 | | | $ | 123,723,683 | | | $ | 98,538,829 |
|
** Identified cost of currency | | | 2,318,817 | | | | — | | | | — |
|
*** Premiums received from options written | | | 309,693 | | | | — | | | | — |
|
**** Proceeds received from short sales | | | — | | | | 4,729,219 | | | | — |
|
See Notes to Financial Statements
| | |
| 76 | | THE TARGET PORTFOLIO TRUST |
Statements of Operations
For The Year Ended December 31, 2003
| | | | | | | | | | | | |
| | | LARGE
CAPITALIZATION
GROWTH
PORTFOLIO | | | LARGE
CAPITALIZATION
VALUE
PORTFOLIO | | | SMALL
CAPITALIZATION
GROWTH
PORTFOLIO | |
| |
| | | |
| NET INVESTMENT INCOME (LOSS) | | | | | | | | | | | | |
| |
Income | | | | | | | | | | | | |
Interest | | $ | — | | | $ | — | | | $ | 6,693 | |
| |
Dividends | | | 2,185,420 | | | | 5,824,235 | | | | 270,015 | |
| |
Less: Foreign withholding taxes | | | (7,998 | ) | | | (44 | ) | | | (461 | ) |
| |
Total income | | | 2,177,422 | | | | 5,824,191 | | | | 276,247 | |
| |
Expenses | | | | | | | | | | | | |
Management fee | | | 1,745,909 | | | | 1,521,918 | | | | 699,792 | |
| |
Transfer agent’s fees and expenses | | | 351,000 | | | | 245,000 | | | | 232,000 | |
| |
Custodian’s fees and expenses | | | 94,000 | | | | 98,000 | | | | 95,000 | |
| |
Reports to shareholders | | | 149,000 | | | | 61,000 | | | | 70,000 | |
| |
Registration fees | | | 30,000 | | | | 21,000 | | | | 25,000 | |
| |
Legal fees and expenses | | | 30,000 | | | | 40,000 | | | | 48,000 | |
| |
Trustees’ fees | | | 10,000 | | | | 13,000 | | | | 12,000 | |
| |
Audit fees | | | 17,000 | | | | 17,000 | | | | 17,000 | |
| |
Miscellaneous | | | 16,928 | | | | 2,503 | | | | 6,453 | |
| |
Total expenses | | | 2,443,837 | | | | 2,019,421 | | | | 1,205,245 | |
| |
| Net investment income (loss) | | | (266,415 | ) | | | 3,804,770 | | | | (928,998 | ) |
| |
| | | |
| REALIZED AND UNREALIZED GAIN (LOSS) ON INVESTMENTS AND FOREIGN CURRENCY TRANSACTIONS | | | | | | | | | | | | |
| |
Net realized gain (loss) on: | | | | | | | | | | | | |
Investment transactions | | | 147,403 | | | | 3,331,117 | | | | 2,695,947 | |
| |
Financial futures contracts | | | — | | | | — | | | | — | |
| |
Foreign currency transactions | | | — | | | | — | | | | — | |
| |
Options written | | | — | | | | — | | | | — | |
| |
Swaps | | | — | | | | — | | | | — | |
| |
Short sales | | | — | | | | — | | | | — | |
| |
| Total net realized gain (loss) | | | 147,403 | | | | 3,331,117 | | | | 2,695,947 | |
| |
Net change in unrealized appreciation (depreciation) on: | | | | | | | | | | | | |
Investments | | | 96,800,137 | | | | 74,996,919 | | | | 32,138,123 | |
| |
Financial futures contracts | | | — | | | | — | | | | — | |
| |
Foreign currencies | | | — | | | | — | | | | — | |
| |
Options written | | | — | | | | — | | | | — | |
| |
Swaps | | | — | | | | — | | | | — | |
| |
Short sales | | | — | | | | — | | | | — | |
| |
| Net change in unrealized appreciation (depreciation) | | | 96,800,137 | | | | 74,996,919 | | | | 32,138,123 | |
| |
| Net gain (loss) | | | 96,947,540 | | | | 78,328,036 | | | | 34,834,070 | |
| |
| | | |
| NET INCREASE IN NET ASSETS RESULTING FROM OPERATIONS | | $ | 96,681,125 | | | $ | 82,132,806 | | | $ | 33,905,072 | |
| |
See Notes to Financial Statements
| | |
| THE TARGET PORTFOLIO TRUST | | 77 |
Statements of Operations
For The Year Ended December 31, 2003 (cont’d)
| | | | | | | | | | | | | | | | |
| | | SMALL
CAPITALIZATION
VALUE
PORTFOLIO | | | INTERNATIONAL
EQUITY
PORTFOLIO | | | INTERNATIONAL
BOND
PORTFOLIO | | | TOTAL RETURN
BOND
PORTFOLIO | |
| |
| | | | |
| NET INVESTMENT INCOME (LOSS) | | | | | | | | | | | | | | | | |
| |
Income | | | | | | | | | | | | | | | | |
Interest | | $ | — | | | $ | 24,614 | | | $ | 1,132,887 | | | $ | 5,682,056 | |
| |
Dividends | | | 1,744,575 | | | | 4,596,582 | | | | 24,110 | | | | 8,219 | |
| |
Less: Foreign withholding taxes | | | (1,562 | ) | | | (376,100 | ) | | | (37,124 | ) | | | (1,336 | ) |
| |
Total income | | | 1,743,013 | | | | 4,245,096 | | | | 1,119,873 | | | | 5,688,939 | |
| |
Expenses | | | | | | | | | | | | | | | | |
Management fee | | | 966,152 | | | | 1,074,042 | | | | 164,959 | | | | 683,996 | |
| |
Transfer agent’s fees and expenses | | | 246,000 | | | | 209,000 | | | | 76,000 | | | | 184,000 | |
| |
Custodian’s fees and expenses | | | 94,000 | | | | 220,000 | | | | 167,000 | | | | 148,000 | |
| |
Reports to shareholders | | | 92,000 | | | | 48,000 | | | | 17,000 | | | | 49,000 | |
| |
Registration fees | | | 20,000 | | | | 14,000 | | | | 17,000 | | | | 18,000 | |
| |
Legal fees and expenses | | | 33,000 | | | | 35,000 | | | | 27,000 | | | | 31,000 | |
| |
Trustees’ fees | | | 13,000 | | | | 12,000 | | | | 12,000 | | | | 14,000 | |
| |
Audit fees | | | 17,000 | | | | 25,000 | | | | 17,000 | | | | 17,000 | |
| |
Miscellaneous | | | 12,768 | | | | 9,016 | | | | 1,142 | | | | 5,429 | |
| |
Total expenses | | | 1,493,920 | | | | 1,646,058 | | | | 499,101 | | | | 1,150,425 | |
| |
| Net investment income (loss) | | | 249,093 | | | | 2,599,038 | | | | 620,772 | | | | 4,538,514 | |
| |
| | | | |
| REALIZED AND UNREALIZED GAIN (LOSS) ON INVESTMENTS AND FOREIGN CURRENCY TRANSACTIONS | | | | | | | | | | | | | | | | |
| |
Net realized gain (loss) on: | | | | | | | | | | | | | | | | |
Investment transactions | | | 12,342,371 | | | | 282,608 | | | | 3,417,173 | | | | 4,423,468 | |
| |
Financial futures contracts | | | — | | | | — | | | | (105,503 | ) | | | 1,213,652 | |
| |
Foreign currency transactions | | | — | | | | (387,682 | ) | | | (2,003,927 | ) | | | (2,059,191 | ) |
| |
Options written | | | — | | | | — | | | | — | | | | 465,462 | |
| |
Swaps | | | — | | | | — | | | | — | | | | 1,180,029 | |
| |
Short sales | | | — | | | | — | | | | — | | | | (134,474 | ) |
| |
| Total net realized gain (loss) | | | 12,342,371 | | | | (105,074 | ) | | | 1,307,743 | | | | 5,088,946 | |
| |
Net change in unrealized appreciation (depreciation) on: | | | | | | | | | | | | | | | | |
Investments | | | 51,963,048 | | | | 39,026,201 | | | | 1,952,932 | | | | (2,324,911 | ) |
| |
Financial futures contracts | | | — | | | | — | | | | (38,773 | ) | | | (64,664 | ) |
| |
Foreign currencies | | | — | | | | 25,998 | | | | (2,239,300 | ) | | | 961,283 | |
| |
Options written | | | — | | | | — | | | | — | | | | 158,099 | |
| |
Swaps | | | — | | | | — | | | | — | | | | 879,984 | |
| |
Short sales | | | — | | | | — | | | | — | | | | (54,817 | ) |
| |
Net change in unrealized
appreciation (depreciation) | | | 51,963,048 | | | | 39,052,199 | | | | (325,141 | ) | | | (445,026 | ) |
| |
| Net gain (loss) | | | 64,305,419 | | | | 38,947,125 | | | | 982,602 | | | | 4,643,920 | |
| |
| | | | |
| NET INCREASE IN NET ASSETS RESULTING FROM OPERATIONS | | $ | 64,554,512 | | | $ | 41,546,163 | | | $ | 1,603,374 | | | $ | 9,182,434 | |
| |
See Notes to Financial Statements
| | |
| 78 | | THE TARGET PORTFOLIO TRUST |
Statements of Operations
For The Year Ended December 31, 2003 (cont’d)
| | | | | | | | | | | |
| | | INTERMEDIATE-
TERM BOND
PORTFOLIO | | | MORTGAGE
BACKED
SECURITIES
PORTFOLIO | | | U.S.
GOVERNMENT
MONEY
MARKET
PORTFOLIO |
|
| | | |
| NET INVESTMENT INCOME (LOSS) | | | | | | | | | | | |
|
Income | | | | | | | | | | | |
Interest | | $ | 11,400,500 | | | $ | 6,036,187 | | | $ | 1,418,747 |
|
Dividends | | | 4,537 | | | | — | | | | — |
|
Less: Foreign withholding taxes | | | — | | | | — | | | | — |
|
Total income | | | 11,405,037 | | | | 6,036,187 | | | | 1,418,747 |
|
Expenses | | | | | | | | | | | |
Management fee | | | 1,545,597 | | | | 515,368 | | | | 287,077 |
|
Transfer agent’s fees and expenses | | | 322,000 | | | | 156,000 | | | | 124,000 |
|
Custodian’s fees and expenses | | | 181,000 | | | | 148,000 | | | | 65,000 |
|
Reports to shareholders | | | 126,000 | | | | 38,000 | | | | 47,000 |
|
Registration fees | | | 51,000 | | | | 43,000 | | | | 22,000 |
|
Legal fees and expenses | | | 48,000 | | | | 28,000 | | | | 29,000 |
|
Trustees’ fees | | | 17,000 | | | | 14,000 | | | | 12,000 |
|
Audit fees | | | 17,000 | | | | 17,000 | | | | 15,000 |
|
Miscellaneous | | | 17,088 | | | | 4,249 | | | | 714 |
|
Total expenses | | | 2,324,685 | | | | 963,617 | | | | 601,791 |
|
| Net investment income (loss) | | | 9,080,352 | | | | 5,072,570 | | | | 816,956 |
|
| | | |
| REALIZED AND UNREALIZED GAIN (LOSS) ON INVESTMENTS AND FOREIGN CURRENCY TRANSACTIONS | | | | | | | | | | | |
|
Net realized gain (loss) on: | | | | | | | | | | | |
Investment transactions | | | 4,577,051 | | | | (1,161,530 | ) | | | 3,401 |
|
Financial futures contracts | | | 2,329,651 | | | | (18,905 | ) | | | — |
|
Foreign currency transactions | | | (486,672 | ) | | | — | | | | — |
|
Options written | | | 20,465 | | | | — | | | | — |
|
Swaps | | | (6,879 | ) | | | — | | | | — |
|
Short sales | | | — | | | | — | | | | — |
|
| Total net realized gain (loss) | | | 6,433,616 | | | | (1,180,435 | ) | | | 3,401 |
|
Net change in unrealized appreciation (depreciation) on: | | | | | | | | | | | |
Investments | | | 780,679 | | | | (1,580,051 | ) | | | — |
|
Financial futures contracts | | | (1,103,424 | ) | | | 63,004 | | | | — |
|
Foreign currencies | | | 28,002 | | | | — | | | | — |
|
Options written | | | 42,179 | | | | — | | | | — |
|
Swaps | | | (41,492 | ) | | | — | | | | — |
|
Short sales | | | — | | | | (12,656 | ) | | | — |
|
| Net change in unrealized appreciation (depreciation) | | | (294,056 | ) | | | (1,529,703 | ) | | | — |
|
| Net gain (loss) | | | 6,139,560 | | | | (2,710,138 | ) | | | 3,401 |
|
| | | |
| NET INCREASE IN NET ASSETS RESULTING FROM OPERATIONS | | $ | 15,219,912 | | | $ | 2,362,432 | | | $ | 820,357 |
|
See Notes to Financial Statements
| | |
| THE TARGET PORTFOLIO TRUST | | 79 |
Statements of Changes in Net Assets
| | | | | | | | | | | | | | | | |
| | | LARGE CAPITALIZATION GROWTH PORTFOLIO
| | | LARGE CAPITALIZATION VALUE PORTFOLIO
| |
| | | Year Ended December 31,
| | | Year Ended December 31,
| |
| | | 2003 | | | 2002 | | | 2003 | | | 2002 | |
| |
| | | | |
INCREASE (DECREASE) IN NET ASSETS | | | | | | | | | | | | | | | | |
| |
| Operations | | | | | | | | | | | | | | | | |
| | | | |
Net investment income (loss) | | $ | (266,415 | ) | | $ | (324,006 | ) | | $ | 3,804,770 | | | $ | 3,778,751 | |
| |
| | | | |
Net realized gain(loss) on investment and foreign currency transactions | | | 147,403 | | | | (45,534,696 | ) | | | 3,331,117 | | | | (11,726,166 | ) |
| |
| | | | |
Net change in unrealized appreciation (depreciation) of investments | | | 96,800,137 | | | | (69,124,607 | ) | | | 74,996,919 | | | | (29,385,081 | ) |
| |
| | | | |
Net increase (decrease) in net assets resulting from operations | | | 96,681,125 | | | | (114,983,309 | ) | | | 82,132,806 | | | | (37,332,496 | ) |
| |
| Dividends and Distributions | | | | | | | | | | | | | | | | |
| | | | |
Dividends from net investment income | | | — | | | | — | | | | (3,731,879 | ) | | | (3,747,694 | ) |
| |
| | | | |
Distributions from net realized gains | | | — | | | | — | | | | — | | | | (2,566,849 | ) |
| |
| | | | |
Tax return of capital distributions | | | — | | | | — | | | | — | | | | — | |
| |
| | | | |
Total distributions | | | — | | | | — | | | | (3,731,879 | ) | | | (6,314,543 | ) |
| |
| Fund share transactions | | | | | | | | | | | | | | | | |
| | | | |
Net proceeds from shares sold | | | 90,568,160 | | | | 111,519,886 | | | | 68,404,898 | | | | 67,172,023 | |
| |
| | | | |
Net asset value of shares issued in reinvestment of dividends and distributions | | | — | | | | — | | | | 3,647,047 | | | | 6,162,451 | |
| |
| | | | |
Cost of shares reacquired | | | (82,611,933 | ) | | | (111,218,343 | ) | | | (63,948,228 | ) | | | (75,269,496 | ) |
| |
| | | | |
Net increase (decrease) in net assets from Fund share transactions | | | 7,956,227 | | | | 301,543 | | | | 8,103,717 | | | | (1,935,022 | ) |
| |
| | | | |
Total increase (decrease) | | | 104,637,352 | | | | (114,681,766 | ) | | | 86,504,644 | | | | (45,582,061 | ) |
| | | | |
| NET ASSETS | | | | | | | | | | | | | | | | |
| |
| | | | |
Beginning of year | | | 243,747,698 | | | | 358,429,464 | | | | 229,625,979 | | | | 275,208,040 | |
| |
| | | | |
End of year(a) | | $ | 348,385,050 | | | $ | 243,747,698 | | | $ | 316,130,623 | | | $ | 229,625,979 | |
| |
| | | | |
(a) Includes undistributed net investment income of | | $ | — | | | $ | — | | | $ | 103,948 | | | $ | 31,057 | |
| |
See Notes to Financial Statements
| | |
| 80 | | THE TARGET PORTFOLIO TRUST |
Statements of Changes in Net Assets (cont’d)
| | | | | | | | | | | | | | | | |
| | | SMALL CAPITALIZATION GROWTH PORTFOLIO
| | | SMALL CAPITALIZATION VALUE PORTFOLIO
| |
| | | Year Ended December 31,
| | | Year Ended December 31,
| |
| | | 2003 | | | 2002 | | | 2003 | | | 2002 | |
| |
| | | | |
INCREASE (DECREASE) IN NET ASSETS | | | | | | | | | | | | | | | | |
| |
| Operations | | | | | | | | | | | | | | | | |
| | | | |
Net investment income (loss) | | $ | (928,998 | ) | | $ | (904,314 | ) | | $ | 249,093 | | | $ | 393,004 | |
| |
| | | | |
Net realized gain (loss) on investment and foreign currency transactions | | | 2,695,947 | | | | (34,839,123 | ) | | | 12,342,371 | | | | 17,971,053 | |
| |
| | | | |
Net change in unrealized appreciation (depreciation) of investments | | | 32,138,123 | | | | (14,331,239 | ) | | | 51,963,048 | | | | (34,165,684 | ) |
| |
| | | | |
Net increase (decrease) in net assets resulting from operations | | | 33,905,072 | | | | (50,074,676 | ) | | | 64,554,512 | | | | (15,801,627 | ) |
| |
| Dividends and Distributions | | | | | | | | | | | | | | | | |
| | | | |
Dividends from net investment income | | | — | | | | — | | | | (297,792 | ) | | | (364,476 | ) |
| |
| | | | |
Distributions from net realized gains | | | — | | | | — | | | | (6,670,354 | ) | | | (29,829,985 | ) |
| |
| | | | |
Tax return of capital distributions | | | — | | | | — | | | | — | | | | — | |
| |
| | | | |
Total distributions | | | — | | | | — | | | | (6,968,146 | ) | | | (30,194,461 | ) |
| |
| Fund share transactions | | | | | | | | | | | | | | | | |
| | | | |
Net proceeds from shares sold | | | 36,726,416 | | | | 40,755,309 | | | | 43,122,655 | | | | 56,996,830 | |
| |
| | | | |
Net asset value of shares issued in reinvestment of dividends and distributions | | | — | | | | — | | | | 6,775,452 | | | | 29,148,512 | |
| |
| | | | |
Cost of shares reacquired | | | (31,248,031 | ) | | | (35,366,709 | ) | | | (49,425,658 | ) | | | (69,306,479 | ) |
| |
| | | | |
Net increase (decrease) in net assets from Fund share transactions | | | 5,478,385 | | | | 5,388,600 | | | | 472,449 | | | | 16,838,863 | |
| |
| | | | |
Total increase (decrease) | | | 39,383,457 | | | | (44,686,076 | ) | | | 58,058,815 | | | | (29,157,225 | ) |
| | | | |
| NET ASSETS | | | | | | | | | | | | | | | | |
| |
| | | | |
Beginning of year | | | 100,867,855 | | | | 145,553,931 | | | | 147,930,439 | | | | 177,087,664 | |
| |
| | | | |
End of year | | $ | 140,251,312 | | | $ | 100,867,855 | | | $ | 205,989,254 | | | $ | 147,930,439 | |
| |
See Notes to Financial Statements
| | |
| THE TARGET PORTFOLIO TRUST | | 81 |
Statements of Changes in Net Assets (cont’d)
| | | | | | | | | | | | | | | | |
| | | INTERNATIONAL EQUITY PORTFOLIO
| | | INTERNATIONAL BOND PORTFOLIO
| |
| | | Year Ended December 31,
| | | Year Ended December 31,
| |
| | | 2003 | | | 2002 | | | 2003 | | | 2002 | |
| |
| | | | |
INCREASE (DECREASE) IN NET ASSETS | | | | | | | | | | | | | | | | |
| |
| Operations | | | | | | | | | | | | | | | | |
| | | | |
Net investment income (loss) | | $ | 2,599,038 | | | $ | 1,756,973 | | | $ | 620,772 | | | $ | 415,099 | |
| |
| | | | |
Net realized gain (loss) on investment and foreign currency transactions | | | (105,074 | ) | | | (20,325,523 | ) | | | 1,307,743 | | | | 321,688 | |
| |
| | | | |
Net change in unrealized appreciation (depreciation) of investments | | | 39,052,199 | | | | 3,003,254 | | | | (325,141 | ) | | | 3,453,514 | |
| |
| | | | |
Net increase (decrease) in net assets resulting from operations | | | 41,546,163 | | | | (15,565,296 | ) | | | 1,603,374 | | | | 4,190,301 | |
| |
| Dividends and Distributions | | | | | | | | | | | | | | | | |
| | | | |
Dividends from net investment income | | | (2,118,075 | ) | | | (54,411 | ) | | | (3,416,812 | ) | | | (318,534 | ) |
| |
| | | | |
Distributions from net realized gains | | | — | | | | — | | | | (24,731 | ) | | | — | |
| |
| | | | |
Tax return of capital distributions | | | — | | | | — | | | | — | | | | — | |
| |
| | | | |
Total distributions | | | (2,118,075 | ) | | | (54,411 | ) | | | (3,441,543 | ) | | | (318,534 | ) |
| |
| Fund share transactions | | | | | | | | | | | | | | | | |
| | | | |
Net proceeds from shares sold | | | 90,795,763 | | | | 83,819,786 | | | | 34,299,415 | | | | 17,136,555 | |
| |
| | | | |
Net asset value of shares issued in reinvestment of dividends and distributions | | | 2,078,838 | | | | 53,115 | | | | 3,241,777 | | | | 300,517 | |
| |
| | | | |
Cost of shares reacquired | | | (80,785,501 | ) | | | (86,168,186 | ) | | | (24,797,728 | ) | | | (12,298,060 | ) |
| |
| | | | |
Net increase (decrease) in net assets from
Fund share transactions | | | 12,089,100 | | | | (2,295,285 | ) | | | 12,743,464 | | | | 5,139,012 | |
| |
| | | | |
Total increase (decrease) | | | 51,517,188 | | | | (17,914,992 | ) | | | 10,905,295 | | | | 9,010,779 | |
| | | | |
| NET ASSETS | | | | | | | | | | | | | | | | |
| |
| | | | |
Beginning of year | | | 140,391,513 | | | | 158,306,505 | | | | 27,647,782 | | | | 18,637,003 | |
| |
| | | | |
End of year(a) | | $ | 191,908,701 | | | $ | 140,391,513 | | | $ | 38,553,077 | | | $ | 27,647,782 | |
| |
| | | | |
(a) Includes undistributed net investment
income of | | $ | 911,418 | | | $ | 832,395 | | | $ | — | | | $ | 163,303 | |
| |
See Notes to Financial Statements
| | |
| 82 | | THE TARGET PORTFOLIO TRUST |
Statements of Changes in Net Assets (cont’d)
| | | | | | | | | | | | | | | | |
| | | TOTAL RETURN BOND PORTFOLIO
| | | INTERMEDIATE-TERM BOND PORTFOLIO
| |
| | | Year Ended December 31,
| | | Year Ended December 31,
| |
| | | 2003 | | | 2002 | | | 2003 | | | 2002 | |
| |
| | | | |
INCREASE (DECREASE) IN NET ASSETS | | | | | | | | | | | | | | | | |
| |
| Operations | | | | | | | | | | | | | | | | |
| | | | |
Net investment income (loss) | | $ | 4,538,514 | | | $ | 4,776,954 | | | $ | 9,080,352 | | | $ | 9,236,024 | |
| |
| | | | |
Net realized gain (loss) on investment and foreign currency transactions | | | 5,088,946 | | | | 3,631,105 | | | | 6,433,616 | | | | 9,388,877 | |
| |
| | | | |
Net change in unrealized appreciation (depreciation) of investments | | | (445,026 | ) | | | 3,204,260 | | | | (294,056 | ) | | | 3,668,411 | |
| |
| | | | |
Net increase (decrease) in net assets resulting from operations | | | 9,182,434 | | | | 11,612,319 | | | | 15,219,912 | | | | 22,293,312 | |
| |
| Dividends and Distributions | | | | | | | | | | | | | | | | |
| | | | |
Dividends from net investment income | | | (4,978,895 | ) | | | (5,208,229 | ) | | | (11,106,479 | ) | | | (9,656,660 | ) |
| |
| | | | |
Distributions from net realized gains | | | (5,176,715 | ) | | | (2,779,487 | ) | | | (5,519,023 | ) | | | (5,735,921 | ) |
| |
| | | | |
Tax return of capital distributions | | | — | | | | — | | | | — | | | | — | |
| |
| | | | |
Total distributions | | | (10,155,610 | ) | | | (7,987,716 | ) | | | (16,625,502 | ) | | | (15,392,581 | ) |
| |
| Fund share transactions | | | | | | | | | | | | | | | | |
| | | | |
Net proceeds from shares sold | | | 75,598,373 | | | | 79,064,222 | | | | 144,146,258 | | | | 208,541,648 | |
| |
| | | | |
Net asset value of shares issued in reinvestment of dividends and distributions | | | 9,845,648 | | | | 7,595,223 | | | | 15,775,559 | | | | 14,664,203 | |
| |
| | | | |
Cost of shares reacquired | | | (65,811,034 | ) | | | (56,881,456 | ) | | | (156,779,293 | ) | | | (92,270,589 | ) |
| |
| | | | |
Net increase (decrease) in net assets from
Fund share transactions | | | 19,632,987 | | | | 29,777,989 | | | | 3,142,524 | | | | 130,935,262 | |
| |
| | | | |
Total increase (decrease) | | | 18,659,811 | | | | 33,402,592 | | | | 1,736,934 | | | | 137,835,993 | |
| | | | |
| NET ASSETS | | | | | | | | | | | | | | | | |
| |
| | | | |
Beginning of year | | | 139,488,374 | | | | 106,085,782 | | | | 333,069,173 | | | | 195,233,180 | |
| |
| | | | |
End of year(a) | | $ | 158,148,185 | | | $ | 139,488,374 | | | $ | 334,806,107 | | | $ | 333,069,173 | |
| |
| | | | |
(a) Includes undistributed net investment
income of | | $ | — | | | $ | 104,150 | | | $ | — | | | $ | — | |
| |
See Notes to Financial Statements
| | |
| THE TARGET PORTFOLIO TRUST | | 83 |
Statements of Changes in Net Assets (cont’d)
| | | | | | | | | | | | | | | | |
| | | MORTGAGE BACKED SECURITIES PORTFOLIO
| | | U.S. GOVERNMENT MONEY MARKET PORTFOLIO
| |
| | | Year Ended December 31,
| | | Year Ended December 31,
| |
| | | 2003 | | | 2002 | | | 2003 | | | 2002 | |
| |
| | | | |
INCREASE (DECREASE) IN NET ASSETS | | | | | | | | | | | | | | | | |
| |
| Operations | | | | | | | | | | | | | | | | |
| | | | |
Net investment income (loss) | | $ | 5,072,570 | | | $ | 4,202,089 | | | $ | 816,956 | | | $ | 1,678,296 | |
| |
| | | | |
Net realized gain(loss) on investment and foreign currency transactions | | | (1,180,435 | ) | | | 1,127,459 | | | | 3,401 | | | | (1,180 | ) |
| |
| | | | |
Net change in unrealized appreciation (depreciation) of investments | | | (1,529,703 | ) | | | 2,014,430 | | | | — | | | | — | |
| |
| | | | |
Net increase (decrease) in net assets resulting from operations | | | 2,362,432 | | | | 7,343,978 | | | | 820,357 | | | | 1,677,116 | |
| |
| Dividends and Distributions | | | | | | | | | | | | | | | | |
| | | | |
Dividends from net investment income | | | (5,247,606 | ) | | | (5,052,128 | ) | | | (820,357 | ) | | | (1,677,116 | ) |
| |
| | | | |
Distributions from net realized gains | | | — | | | | — | | | | — | | | | — | |
| |
| | | | |
Tax return of capital distributions | | | — | | | | — | | | | — | | | | — | |
| |
| | | | |
Total distributions | | | (5,247,606 | ) | | | (5,052,128 | ) | | | (820,357 | ) | | | (1,677,116 | ) |
| |
| Fund share transactions(a) | | | | | | | | | | | | | | | | |
| | | | |
Net proceeds from shares sold | | | 50,238,355 | | | | 72,556,734 | | | | 236,126,066 | | | | 574,524,433 | |
| |
| | | | |
Net asset value of shares issued in reinvestment of dividends and distributions | | | 4,676,518 | | | | 4,443,190 | | | | 771,336 | | | | 1,417,564 | |
| |
| | | | |
Cost of shares reacquired | | | (60,503,405 | ) | | | (39,247,945 | ) | | | (265,575,191 | ) | | | (603,782,502 | ) |
| |
| | | | |
Net increase (decrease) in net assets from Fund share transactions | | | (5,588,532 | ) | | | 37,751,979 | | | | (28,677,789 | ) | | | (27,840,505 | ) |
| |
| | | | |
Total increase (decrease) | | | (8,473,706 | ) | | | 40,043,829 | | | | (28,677,789 | ) | | | (27,840,505 | ) |
| | | | |
| NET ASSETS | | | | | | | | | | | | | | | | |
| |
| | | | |
Beginning of year | | | 115,545,706 | | | | 75,501,877 | | | | 127,141,378 | | | | 154,981,883 | |
| |
| | | | |
End of year(b) | | $ | 107,072,000 | | | $ | 115,545,706 | | | $ | 98,463,589 | | | $ | 127,141,378 | |
| |
| | | | |
(a) Fund share transactions are at $1 per share for the U.S. Government Money Market Portfolio. | | | | | | | | | | | | | | | | |
| |
| | | | |
(b) Includes undistributed net investment
income of | | $ | — | | | $ | 120,842 | | | $ | — | | | $ | — | |
| |
See Notes to Financial Statements
| | |
| 84 | | THE TARGET PORTFOLIO TRUST |
Financial Highlights
| | | | | | | | | | | | | | | | | | | | |
| | | LARGE CAPITALIZATION GROWTH PORTFOLIO
| |
| | | Year Ended December 31,
| |
| | | 2003 | | | 2002 | | | 2001 | | | 2000 | | | 1999 | |
| |
| | | | | |
PER SHARE OPERATING PERFORMANCE: | | | | | | | | | | | | | | | | | | | | |
| |
| | | | | |
Net asset value, beginning of year | | $ | 11.03 | | | $ | 16.15 | | | $ | 23.20 | | | $ | 25.68 | | | $ | 18.29 | |
| |
| | | | | |
Income from investment operations | | | | | | | | | | | | | | | | | | | | |
| | | | | |
Net investment income (loss) | | | (.01 | ) | | | (.01 | ) | | | .02 | | | | (.06 | ) | | | (.03 | ) |
| |
| | | | | |
Net realized and unrealized gain (loss)
on investment transactions | | | 4.37 | | | | (5.11 | ) | | | (7.05 | ) | | | (.68 | ) | | | 9.79 | |
| |
Total from investment operations | | | 4.36 | | | | (5.12 | ) | | | (7.03 | ) | | | (.74 | ) | | | 9.76 | |
| |
| | | | | |
Less distributions | | | | | | | | | | | | | | | | | | | | |
| | | | | |
Dividends from net investment income | | | — | | | | — | | | | (.02 | ) | | | — | | | | — | |
| |
| | | | | |
Distributions from net realized gains | | | — | | | | — | | | | — | | | | (1.74 | ) | | | (2.37 | ) |
| |
| | | | | |
Tax return of capital distributions | | | — | | | | — | | | | — | | | | — | | | | — | |
| |
Total distributions | | | — | | | | — | | | | (.02 | ) | | | (1.74 | ) | | | (2.37 | ) |
| |
| | | | | |
Net asset value, end of year | | $ | 15.39 | | | $ | 11.03 | | | $ | 16.15 | | | $ | 23.20 | | | $ | 25.68 | |
| |
| | | | | |
| TOTAL RETURN(a) | | | 39.53 | % | | | (31.70 | )% | | | (30.32 | )% | | | (3.37 | )% | | | 55.37 | % |
| |
| | | | |
| RATIOS/SUPPLEMENTAL DATA: | | | | | | | | | | | | | | | | | |
| |
| | | | | |
Net assets, end of year (000) | | $ | 348,385 | | | $ | 243,748 | | | $ | 358,429 | | | $ | 512,778 | | | $ | 515,470 | |
| |
| | | | | |
Average net assets (000) | | $ | 290,985 | | | $ | 297,189 | | | $ | 397,492 | | | $ | 581,198 | | | $ | 385,995 | |
| |
| | | | | |
Ratios to average net assets
Expenses | | | .84 | % | | | .81 | % | | | .75 | % | | | .69 | % | | | .68 | % |
| |
| | | | | |
Net investment income (loss) | | | (.09 | )% | | | (.11 | )% | | | .08 | % | | | (.25 | )% | | | (.16 | )% |
| |
| | | | | |
Portfolio turnover rate | | | 49 | % | | | 66 | % | | | 68 | % | | | 48 | % | | | 50 | % |
| |
| (a) | Total return is calculated assuming a purchase of shares on the first day and a sale on the last day of each year reported and includes reinvestments of dividends and distributions. |
See Notes to Financial Statements
| | |
| THE TARGET PORTFOLIO TRUST | | 85 |
Financial Highlights (cont’d)
| | | | | | | | | | | | | | | | | | | | |
| | | LARGE CAPITALIZATION VALUE PORTFOLIO
| |
| | | Year Ended December 31,
| |
| | | 2003 | | | 2002 | | | 2001 | | | 2000 | | | 1999 | |
| |
| | | | | |
PER SHARE OPERATING PERFORMANCE: | | | | | | | | | | | | | | | | | | | | |
| |
| | | | | |
Net asset value, beginning of year | | $ | 10.49 | | | $ | 12.45 | | | $ | 12.64 | | | $ | 13.01 | | | $ | 15.87 | |
| |
| | | | | |
Income from investment operations | | | | | | | | | | | | | | | | | | | | |
| | | | | |
Net investment income (loss) | | | .17 | | | | .18 | | | | .19 | | | | .25 | | | | .27 | |
| |
| | | | | |
Net realized and unrealized gain (loss)
on investment transactions | | | 3.64 | | | | (1.85 | ) | | | (.03 | ) | | | .72 | | | | (1.00 | ) |
| |
Total from investment operations | | | 3.81 | | | | (1.67 | ) | | | .16 | | | | .97 | | | | (.73 | ) |
| |
| | | | | |
Less distributions | | | | | | | | | | | | | | | | | | | | |
| | | | | |
Dividends from net investment income | | | (.17 | ) | | | (.17 | ) | | | (.19 | ) | | | (.25 | ) | | | (.29 | ) |
| |
| | | | | |
Distributions from net realized gains | | | — | | | | (.12 | ) | | | (.16 | ) | | | (1.09 | ) | | | (1.84 | ) |
| |
| | | | | |
Tax return of capital distributions | | | — | | | | — | | | | — | | | | — | | | | — | |
| |
Total distributions | | | (.17 | ) | | | (.29 | ) | | | (.35 | ) | | | (1.34 | ) | | | (2.13 | ) |
| |
| | | | | |
Net asset value, end of year | | $ | 14.13 | | | $ | 10.49 | | | $ | 12.45 | | | $ | 12.64 | | | $ | 13.01 | |
| |
| | | | | |
| TOTAL RETURN(a) | | | 36.38 | % | | | (13.57 | )% | | | 1.21 | % | | | 8.22 | % | | | (4.37 | )% |
| |
| | | | |
| RATIOS/SUPPLEMENTAL DATA: | | | | | | | | | | | | | | | | | |
| |
| | | | | |
Net assets, end of year (000) | | $ | 316,131 | | | $ | 229,626 | | | $ | 275,208 | | | $ | 268,802 | | | $ | 262,156 | |
| |
| | | | | |
Average net assets (000) | | $ | 253,653 | | | $ | 253,096 | | | $ | 275,773 | | | $ | 243,008 | | | $ | 279,900 | |
| |
| | | | | |
Ratios to average net assets
Expenses | | | .80 | % | | | .80 | % | | | .76 | % | | | .80 | % | | | .73 | % |
| |
| | | | | |
Net investment income (loss) | | | 1.50 | % | | | 1.49 | % | | | 1.51 | % | | | 2.01 | % | | | 1.74 | % |
| |
| | | | | |
Portfolio turnover rate | | | 56 | % | | | 56 | % | | | 50 | % | | | 80 | % | | | 36 | % |
| |
| (a) | Total return is calculated assuming a purchase of shares on the first day and a sale on the last day of each year reported and includes reinvestments of dividends and distributions. |
See Notes to Financial Statements
| | |
| 86 | | THE TARGET PORTFOLIO TRUST |
Financial Highlights (cont’d)
| | | | | | | | | | | | | | | | | | | | |
| | | SMALL CAPITALIZATION GROWTH PORTFOLIO
| |
| | | Year Ended December 31,
| |
| | | 2003 | | | 2002 | | | 2001 | | | 2000 | | | 1999 | |
| |
| | | | | |
PER SHARE OPERATING PERFORMANCE: | | | | | | | | | | | | | | | | | | | | |
| |
| | | | | |
Net asset value, beginning of year | | $ | 7.05 | | | $ | 10.56 | | | $ | 13.09 | | | $ | 17.47 | | | $ | 15.35 | |
| |
| | | | | |
Income from investment operations | | | | | | | | | | | | | | | | | | | | |
| | | | | |
Net investment income (loss) | | | (.06 | ) | | | (.06 | ) | | | (.07 | ) | | | (.07 | ) | | | (.06 | ) |
| |
| | | | | |
Net realized and unrealized gain (loss)
on investment transactions | | | 2.39 | | | | (3.45 | ) | | | (2.46 | ) | | | 0.36 | | | | 4.35 | |
| |
Total from investment operations | | | 2.33 | | | | (3.51 | ) | | | (2.53 | ) | | | 0.29 | | | | 4.29 | |
| |
| | | | | |
Less distributions | | | | | | | | | | | | | | | | | | | | |
| | | | | |
Dividends from net investment income | | | — | | | | — | | | | — | | | | — | | | | — | |
| |
| | | | | |
Distributions from net realized gains | | | — | | | | — | | | | — | | | | (4.67 | ) | | | (2.17 | ) |
| |
| | | | | |
Tax return of capital distributions | | | — | | | | — | | | | — | | | | — | | | | — | |
| |
Total distributions | | | — | | | | — | | | | — | | | | (4.67 | ) | | | (2.17 | ) |
| |
| | | | | |
Net asset value, end of year | | $ | 9.38 | | | $ | 7.05 | | | $ | 10.56 | | | $ | 13.09 | | | $ | 17.47 | |
| |
| | | | | |
| TOTAL RETURN(a) | | | 33.05 | % | | | (33.24 | )% | | | (19.33 | )% | | | 1.83 | % | | | 29.20 | % |
| |
| | | | |
| RATIOS/SUPPLEMENTAL DATA: | | | | | | | | | | | | | | | | | |
| |
| | | | | |
Net assets, end of year (000) | | $ | 140,251 | | | $ | 100,868 | | | $ | 145,554 | | | $ | 182,515 | | | $ | 186,603 | |
| |
| | | | | |
Average net assets (000) | | $ | 116,632 | | | $ | 122,299 | | | $ | 156,654 | | | $ | 197,168 | | | $ | 150,593 | |
| |
| | | | | |
Ratios to average net assets
Expenses | | | 1.03 | % | | | .99 | % | | | .88 | % | | | .79 | % | | | .80 | % |
| |
| | | | | |
Net investment income (loss) | | | (.80 | )% | | | (.74 | )% | | | (.59 | )% | | | (.49 | )% | | | (.45 | )% |
| |
| | | | | |
Portfolio turnover rate | | | 235 | % | | | 153 | % | | | 167 | % | | | 165 | % | | | 207 | % |
| |
| (a) | Total return is calculated assuming a purchase of shares on the first day and a sale on the last day of each year reported and includes reinvestment of dividends and distributions. |
See Notes to Financial Statements
| | |
| THE TARGET PORTFOLIO TRUST | | 87 |
Financial Highlights (cont’d)
| | | | | | | | | | | | | | | | | | | | |
| | | SMALL CAPITALIZATION VALUE PORTFOLIO
| |
| | | Year Ended December 31,
| |
| | | 2003 | | | 2002 | | | 2001 | | | 2000 | | | 1999 | |
| |
| | | | | |
PER SHARE OPERATING PERFORMANCE: | | | | | | | | | | | | | | | | | | | | |
| |
| | | | | |
Net asset value, beginning of year | | $ | 13.23 | | | $ | 17.54 | | | $ | 16.88 | | | $ | 14.97 | | | $ | 14.98 | |
| |
| | | | | |
Income from investment operations | | | | | | | | | | | | | | | | | | | | |
| | | | | |
Net investment income (loss) | | | .03 | | | | .04 | | | | .09 | | | | .11 | | | | .11 | |
| |
| | | | | |
Net realized and unrealized gain (loss)
on investment transactions | | | 6.18 | | | | (1.41 | ) | | | 2.67 | | | | 3.34 | | | | .10 | |
| |
Total from investment operations | | | 6.21 | | | | (1.37 | ) | | | 2.76 | | | | 3.45 | | | | .21 | |
| |
| | | | | |
Less distributions | | | | | | | | | | | | | | | | | | | | |
| | | | | |
Dividends from net investment income | | | (.03 | ) | | | (.04 | ) | | | (.19 | ) | | | (.02 | ) | | | (.12 | ) |
| |
| | | | | |
Distributions in excess of net investment income | | | — | | | | — | | | | — | | | | — | | | | — | |
| |
| | | | | |
Distributions from net realized gains | | | (.63 | ) | | | (2.90 | ) | | | (1.91 | ) | | | (1.52 | ) | | | (.10 | ) |
| |
| | | | | |
Tax return of capital distributions | | | — | | | | — | | | | — | | | | — | | | | — | |
| |
Total distributions | | | (.66 | ) | | | (2.94 | ) | | | (2.10 | ) | | | (1.54 | ) | | | (.22 | ) |
| |
| | | | | |
Net asset value, end of year | | $ | 18.78 | | | $ | 13.23 | | | $ | 17.54 | | | $ | 16.88 | | | $ | 14.97 | |
| |
| | | | | |
| TOTAL RETURN(a) | | | 47.10 | % | | | (8.48 | )% | | | 17.23 | % | | | 23.91 | % | | | 1.39 | % |
| |
| | | | |
| RATIOS/SUPPLEMENTAL DATA: | | | | | | | | | | | | | | | | | |
| |
| | | | | |
Net assets, end of year (000) | | $ | 205,989 | | | $ | 147,930 | | | $ | 177,088 | | | $ | 152,672 | | | $ | 127,010 | |
| |
| | | | | |
Average net assets (000) | | $ | 161,025 | | | $ | 167,945 | | | $ | 161,663 | | | $ | 130,303 | | | $ | 129,077 | |
| |
| | | | | |
Ratios to average net assets
Expenses | | | .93 | % | | | .88 | % | | | .87 | % | | | .85 | % | | | .87 | % |
| |
| | | | | |
Net investment income (loss) | | | .15 | % | | | .23 | % | | | .59 | % | | | .75 | % | | | .75 | % |
| |
| | | | | |
Portfolio turnover rate | | | 89 | % | | | 95 | % | | | 114 | % | | | 55 | % | | | 42 | % |
| |
| (a) | Total return is calculated assuming a purchase of shares on the first day and a sale on the last day of each year reported and includes reinvestments of dividends and distributions. |
See Notes to Financial Statements
| | |
| 88 | | THE TARGET PORTFOLIO TRUST |
Financial Highlights (cont’d)
| | | | | | | | | | | | | | | | | | | | |
| | | INTERNATIONAL EQUITY PORTFOLIO
| |
| | | Year Ended December 31,
| |
| | | 2003 | | | 2002 | | | 2001 | | | 2000 | | | 1999 | |
| |
| | | | | |
PER SHARE OPERATING PERFORMANCE: | | | | | | | | | | | | | | | | | | | | |
| |
| | | | | |
Net asset value, beginning of year | | $ | 9.07 | | | $ | 10.10 | | | $ | 13.52 | | | $ | 17.37 | | | $ | 15.54 | |
| |
| | | | | |
Income from investment operations | | | | | | | | | | | | | | | | | | | | |
| | | | | |
Net investment income | | | .16 | | | | .11 | | | | .09 | | | | .17 | | | | .23 | |
| |
| | | | | |
Net realized and unrealized gain (loss)
on investment transactions | | | 2.43 | | | | (1.14 | ) | | | (3.39 | ) | | | (1.87 | ) | | | 3.29 | |
| |
Total from investment operations | | | 2.59 | | | | (1.03 | ) | | | (3.30 | ) | | | (1.70 | ) | | | 3.52 | |
| |
| | | | | |
Less distributions | | | | | | | | | | | | | | | | | | | | |
| | | | | |
Dividends from net investment income | | | (.13 | ) | | | — | (b) | | | — | | | | (.17 | ) | | | (.23 | ) |
| |
| | | | | |
Distributions in excess of net investment income | | | — | | | | — | | | | — | | | | (.17 | ) | | | (.17 | ) |
| |
| | | | | |
Distributions from net realized gains | | | — | | | | — | | | | (.12 | ) | | | (1.81 | ) | | | (1.29 | ) |
| |
| | | | | |
Tax return of capital distributions | | | — | | | | — | | | | — | | | | — | | | | — | |
| |
Total distributions | | | (.13 | ) | | | — | | | | (.12 | ) | | | (2.15 | ) | | | (1.69 | ) |
| |
| | | | | |
Net asset value, end of year | | $ | 11.53 | | | $ | 9.07 | | | $ | 10.10 | | | $ | 13.52 | | | $ | 17.37 | |
| |
| | | | | |
| TOTAL RETURN(a) | | | 28.76 | % | | | (10.17 | )% | | | (24.56 | )% | | | (9.42 | )% | | | 23.30 | % |
| |
| | | | |
| RATIOS/SUPPLEMENTAL DATA: | | | | | | | | | | | | | | | | | |
| |
| | | | | |
Net assets, end of year (000) | | $ | 191,909 | | | $ | 140,392 | | | $ | 158,307 | | | $ | 227,028 | | | $ | 274,997 | |
| |
| | | | | |
Average net assets (000) | | $ | 153,435 | | | $ | 150,249 | | | $ | 190,106 | | | $ | 246,420 | | | $ | 246,148 | |
| |
| | | | | |
Ratios to average net assets
Expenses | | | 1.07 | % | | | 1.09 | % | | | 1.01 | % | | | .93 | % | | | .93 | % |
| |
| | | | | |
Net investment income (loss) | | | 1.69 | % | | | 1.17 | % | | | .82 | % | | | .85 | % | | | 1.25 | % |
| |
| | | | | |
Portfolio turnover rate | | | 47 | % | | | 55 | % | | | 65 | % | | | 44 | % | | | 35 | % |
| |
| (a) | Total return is calculated assuming a purchase of shares on the first day and a sale on the last day of each year reported and includes reinvestments of dividends and distributions. |
| (b) | Less than $.005 per share. |
See Notes to Financial Statements
| | |
| THE TARGET PORTFOLIO TRUST | | 89 |
Financial Highlights (cont’d)
| | | | | | | | | | | | | | | | | | | | |
| | | INTERNATIONAL BOND PORTFOLIO
| |
| | | Year Ended December 31,
| |
| | | 2003 | | | 2002 | | | 2001 | | | 2000 | | | 1999 | |
| |
| | | | | |
PER SHARE OPERATING PERFORMANCE: | | | | | | | | | | | | | | | | | | | | |
| |
| | | | | |
Net asset value, beginning of year | | $ | 8.83 | | | $ | 7.46 | | | $ | 8.08 | | | $ | 8.48 | | | $ | 9.52 | |
| |
| | | | | |
Income from investment operations | | | | | | | | | | | | | | | | | | | | |
| | | | | |
Net investment income (loss) | | | .21 | | | | .15 | | | | .18 | | | | .32 | | | | .30 | |
| |
| | | | | |
Net realized and unrealized gain (loss)
on investment transactions | | | .26 | | | | 1.33 | | | | (.64 | ) | | | (.45 | ) | | | (.84 | ) |
| |
Total from investment operations | | | .47 | | | | 1.48 | | | | (.46 | ) | | | (.13 | ) | | | (.54 | ) |
| |
| | | | | |
Less distributions | | | | | | | | | | | | | | | | | | | | |
| | | | | |
Dividends from net investment income | | | (.84 | ) | | | (.11 | ) | | | — | | | | — | | | | (.23 | ) |
| |
| | | | | |
Distributions in excess of net investment income | | | — | | | | — | | | | — | | | | — | | | | — | |
| |
| | | | | |
Distributions from net realized gains | | | (.01 | ) | | | — | | | | — | | | | — | | | | (.16 | ) |
| |
| | | | | |
Tax return of capital distributions | | | — | | | | — | | | | (.16 | ) | | | (.27 | ) | | | (.11 | ) |
| |
Total distributions | | | (.85 | ) | | | (.11 | ) | | | (.16 | ) | | | (.27 | ) | | | (.50 | ) |
| |
| | | | | |
Net asset value, end of year | | $ | 8.45 | | | $ | 8.83 | | | $ | 7.46 | | | $ | 8.08 | | | $ | 8.48 | |
| |
| | | | | |
| TOTAL RETURN(a) | | | 5.31 | % | | | 20.14 | % | | | (5.73 | )% | | | (1.34 | )% | | | (5.88 | )% |
| |
| | | | |
| RATIOS/SUPPLEMENTAL DATA: | | | | | | | | | | | | | | | | | |
| |
| | | | | |
Net assets, end of year (000) | | $ | 38,553 | | | $ | 27,648 | | | $ | 18,637 | | | $ | 19,548 | | | $ | 26,492 | |
| |
| | | | | |
Average net assets (000) | | $ | 32,992 | | | $ | 22,022 | | | $ | 19,235 | | | $ | 20,809 | | | $ | 29,300 | |
| |
| | | | | |
Ratios to average net assets
Expenses | | | 1.51 | % | | | 1.69 | % | | | 1.83 | % | | | 1.47 | % | | | 1.25 | % |
| |
| | | | | |
Net investment income (loss) | | | 1.88 | % | | | 1.88 | % | | | 2.31 | % | | | 4.16 | % | | | 3.36 | % |
| |
| | | | | |
Portfolio turnover rate | | | 235 | % | | | 238 | % | | | 251 | % | | | 52 | % | | | 132 | % |
| |
| (a) | Total return is calculated assuming a purchase of shares on the first day and a sale on the last day of each year reported and includes reinvestment of dividends and distributions. |
See Notes to Financial Statements
| | |
| 90 | | THE TARGET PORTFOLIO TRUST |
Financial Highlights (cont’d)
| | | | | | | | | | | | | | | | | | | | |
| | | TOTAL RETURN BOND PORTFOLIO
| |
| | | Year Ended December 31,
| |
| | | 2003 | | | 2002 | | | 2001 | | | 2000 | | | 1999 | |
| |
| | | | | |
PER SHARE OPERATING PERFORMANCE: | | | | | | | | | | | | | | | | | | | | |
| |
| | | | | |
Net asset value, beginning of year | | $ | 10.73 | | | $ | 10.42 | | | $ | 10.27 | | | $ | 9.86 | | | $ | 10.49 | |
| |
| | | | | |
Income from investment operations | | | | | | | | | | | | | | | | | | | | |
| | | | | |
Net investment income (loss) | | | .33 | | | | .41 | | | | .52 | | | | .66 | | | | .56 | |
| |
| | | | | |
Net realized and unrealized gain (loss)
on Investment transactions | | | .33 | | | | .57 | | | | .28 | | | | .42 | | | | (.63 | ) |
| |
Total from investment operations | | | .66 | | | | .98 | | | | .80 | | | | 1.08 | | | | (.07 | ) |
| |
| | | | | |
Less distributions | | | | | | | | | | | | | | | | | | | | |
| | | | | |
Dividends from net investment income | | | (.36 | ) | | | (.45 | ) | | | (.54 | ) | | | (.67 | ) | | | (.56 | ) |
| |
| | | | | |
Distributions in excess of net Investment income | | | — | | | | — | | | | — | | | | — | | | | — | |
| |
| | | | | |
Distributions from net realized gains | | | (.37 | ) | | | (.22 | ) | | | (.11 | ) | | | — | | | | — | |
| |
| | | | | |
Tax return of capital distributions | | | — | | | | — | | | | — | | | | — | | | | — | |
| |
Total distributions | | | (.73 | ) | | | (.67 | ) | | | (.65 | ) | | | (.67 | ) | | | (.56 | ) |
| |
| | | | | |
Net asset value, end of year | | $ | 10.66 | | | $ | 10.73 | | | $ | 10.42 | | | $ | 10.27 | | | $ | 9.86 | |
| |
| | | | | |
| TOTAL RETURN(a) | | | 6.22 | % | | | 9.65 | % | | | 7.97 | % | | | 11.30 | % | | | (.67 | )% |
| |
| | | | |
| RATIOS/SUPPLEMENTAL DATA: | | | | | | | | | | | | | | | | | |
| |
| | | | | |
Net assets, end of year (000) | | $ | 158,148 | | | $ | 139,488 | | | $ | 106,086 | | | $ | 74,003 | | | $ | 67,269 | |
| |
| | | | | |
Average net assets (000) | | $ | 151,999 | | | $ | 122,888 | | | $ | 90,698 | | | $ | 67,151 | | | $ | 65,911 | |
| |
| | | | | |
Ratios to average net assets
Expenses | | | .76 | % | | | .75 | % | | | .78 | % | | | .79 | % | | | .82 | % |
| |
| | | | | |
Net investment income (loss) | | | 2.99 | % | | | 3.89 | % | | | 4.83 | % | | | 6.23 | % | | | 5.54 | % |
| |
| | | | | |
Portfolio turnover rate | | | 445 | % | | | 429 | % | | | 472 | % | | | 483 | % | | | 368 | % |
| |
| (a) | Total return is calculated assuming a purchase of shares on the first day and a sale on the last day of each year reported and includes reinvestment of dividends and distributions. |
See Notes to Financial Statements
| | |
| THE TARGET PORTFOLIO TRUST | | 91 |
Financial Highlights (cont’d)
| | | | | | | | | | | | | | | | | | | | |
| | | INTERMEDIATE-TERM BOND PORTFOLIO
| |
| | | Year Ended December 31,
| |
| | | 2003 | | | 2002 | | | 2001 | | | 2000 | | | 1999 | |
| |
| | | | | |
PER SHARE OPERATING PERFORMANCE: | | | | | | | | | | | | | | | | | | | | |
| |
| | | | | |
Net asset value, beginning of year | | $ | 10.50 | | | $ | 10.23 | | | $ | 10.23 | | | $ | 9.92 | | | $ | 10.36 | |
| |
| | | | | |
Income from investment operations | | | | | | | | | | | | | | | | | | | | |
| | | | | |
Net investment income (loss) | | | .28 | | | | .38 | | | | .52 | | | | .63 | | | | .56 | |
| |
| | | | | |
Net realized and unrealized gain (loss)
on investment transactions | | | .19 | | | | .47 | | | | .29 | | | | .34 | | | | (.43 | ) |
| |
Total from investment operations | | | .47 | | | | .85 | | | | .81 | | | | .97 | | | | .13 | |
| |
| | | | | |
Less distributions | | | | | | | | | | | | | | | | | | | | |
| | | | | |
Dividends from net investment income | | | (.34 | ) | | | (.39 | ) | | | (.54 | ) | | | (.63 | ) | | | (.57 | ) |
| |
| | | | | |
Distributions in excess of net investment income | | | — | | | | — | | | | — | | | | (.03 | ) | | | — | |
| |
| | | | | |
Distributions from net realized gains | | | (.17 | ) | | | (.19 | ) | | | (.27 | ) | | | — | | | | — | |
| |
| | | | | |
Tax return of capital distributions | | | — | | | | — | | | | — | | | | — | | | | — | |
| |
Total distributions | | | (.51 | ) | | | (.58 | ) | | | (.81 | ) | | | (.66 | ) | | | (.57 | ) |
| |
| | | | | |
Net asset value, end of year | | $ | 10.46 | | | $ | 10.50 | | | $ | 10.23 | | | $ | 10.23 | | | $ | 9.92 | |
| |
| | | | | |
| TOTAL RETURN(a) | | | 4.58 | % | | | 8.56 | % | | | 8.19 | % | | | 10.10 | % | | | 1.30 | % |
| |
| | | | |
| RATIOS/SUPPLEMENTAL DATA: | | | | | | | | | | | | | | | | | |
| |
| | | | | |
Net assets, end of year (000) | | $ | 334,806 | | | $ | 333,069 | | | $ | 195,233 | | | $ | 130,715 | | | $ | 112,991 | |
| |
| | | | | |
Average net assets (000) | | $ | 343,466 | | | $ | 258,072 | | | $ | 167,039 | | | $ | 116,330 | | | $ | 108,243 | |
| |
| | | | | |
Ratios to average net assets
Expenses | | | .68 | % | | | .66 | % | | | .66 | % | | | .71 | % | | | .67 | % |
| |
| | | | | |
Net investment income (loss) | | | 2.64 | % | | | 3.58 | % | | | 4.91 | % | | | 6.35 | % | | | 5.63 | % |
| |
| | | | | |
Portfolio turnover rate | | | 422 | % | | | 377 | % | | | 560 | % | | | 423 | % | | | 253 | % |
| |
| (a) | Total return is calculated assuming a purchase of shares on the first day and a sale on the last day of each year reported and includes reinvestment of dividends and distributions. |
See Notes to Financial Statements
| | |
| 92 | | THE TARGET PORTFOLIO TRUST |
Financial Highlights (cont’d)
| | | | | | | | | | | | | | | | | | | | |
| | | MORTGAGE BACKED SECURITIES PORTFOLIO
| |
| | | Year Ended December 31,
| |
| | | 2003 | | | 2002 | | | 2001 | | | 2000 | | | 1999 | |
| |
| | | | | |
PER SHARE OPERATING PERFORMANCE: | | | | | | | | | | | | | | | | | | | | |
| |
| | | | | |
Net asset value, beginning of year | | $ | 10.70 | | | $ | 10.44 | | | $ | 10.31 | | | $ | 9.97 | | | $ | 10.47 | |
| |
| | | | | |
Income from investment operations | | | | | | | | | | | | | | | | | | | | |
| | | | | |
Net investment income (loss) | | | .47 | | | | .56 | | | | .61 | | | | .65 | | | | .66 | |
| |
| | | | | |
Net realized and unrealized gain (loss)
on Investment transactions | | | (.24 | ) | | | .27 | | | | .17 | | | | .33 | | | | (.50 | ) |
| |
Total from investment operations | | | .23 | | | | .83 | | | | .78 | | | | .98 | | | | .16 | |
| |
| | | | | |
Less distributions | | | | | | | | | | | | | | | | | | | | |
| | | | | |
Dividends from net investment income | | | (.48 | ) | | | (.57 | ) | | | (.65 | ) | | | (.64 | ) | | | (.66 | ) |
| |
| | | | | |
Distributions in excess of net Investment income | | | — | | | | — | | | | — | | | | — | | | | — | |
| |
| | | | | |
Distributions from net realized gains | | | — | | | | — | | | | — | | | | — | | | | — | |
| |
| | | | | |
Tax return of capital distributions | | | — | | | | — | | | | — | | | | — | | | | — | |
| |
Total distributions | | | (.48 | ) | | | (.57 | ) | | | (.65 | ) | | | (.64 | ) | | | (.66 | ) |
| |
| | | | | |
Net asset value, end of year | | $ | 10.45 | | | $ | 10.70 | | | $ | 10.44 | | | $ | 10.31 | | | $ | 9.97 | |
| |
| | | | | |
| TOTAL RETURN(a) | | | 2.20 | % | | | 8.13 | % | | | 7.79 | % | | | 10.35 | % | | | 1.54 | % |
| |
| | | | |
| RATIOS/SUPPLEMENTAL DATA: | | | | | | | | | | | | | | | | | |
| |
| | | | | |
Net assets, end of year (000) | | $ | 107,072 | | | $ | 115,546 | | | $ | 75,502 | | | $ | 63,234 | | | $ | 67,372 | |
| |
| | | | | |
Average net assets (000) | | $ | 114,526 | | | $ | 94,893 | | | $ | 69,767 | | | $ | 61,771 | | | $ | 70,244 | |
| |
| | | | | |
Ratios to average net assets
Expenses | | | .84 | % | | | .80 | % | | | .84 | % | | | .83 | % | | | .80 | % |
| |
| | | | | |
Net investment income (loss) | | | 4.43 | % | | | 4.43 | % | | | 5.74 | % | | | 6.60 | % | | | 6.31 | % |
| |
| | | | | |
Portfolio turnover rate | | | 282 | % | | | 184 | % | | | 72 | % | | | 74 | % | | | 14 | % |
| |
| (a) | Total return is calculated assuming a purchase of shares on the first day and a sale on the last day of each year reported and includes reinvestment of dividends and distributions. |
See Notes to Financial Statements
| | |
| THE TARGET PORTFOLIO TRUST | | 93 |
Financial Highlights (cont’d)
| | | | | | | | | | | | | | | | | | | | |
| | | U.S. GOVERNMENT
MONEY MARKET PORTFOLIO
| |
| | | Year Ended December 31,
| |
| | | 2003 | | | 2002 | | | 2001 | | | 2000 | | | 1999 | |
| |
| | | | | |
PER SHARE OPERATING PERFORMANCE: | | | | | | | | | | | | | | | | | | | | |
| |
| | | | | |
Net asset value, beginning of year | | $ | 1.00 | | | $ | 1.00 | | | $ | 1.00 | | | $ | 1.00 | | | $ | 1.00 | |
| |
| | | | | |
Net investment income and net realized gain on investment transactions | | | .007 | | | | .013 | | | | .037 | | | | .058 | | | | .045 | |
| |
| | | | | |
Dividends and distributions | | | (.007 | ) | | | (.013 | ) | | | (.037 | ) | | | (.058 | ) | | | (.045 | ) |
| |
| | | | | |
Net asset value, end of year | | $ | 1.00 | | | $ | 1.00 | | | $ | 1.00 | | | $ | 1.00 | | | $ | 1.00 | |
| |
| | | | | |
| TOTAL RETURN(a) | | | .70 | % | | | 1.31 | % | | | 3.77 | % | | | 5.87 | % | | | 4.67 | % |
| |
| | | | | |
| RATIOS/SUPPLEMENTAL DATA: | | | | | | | | | | | | | | | | | | | | |
| |
| | | | | |
Net assets, end of year (000) | | $ | 98,464 | | | $ | 127,141 | | | $ | 154,982 | | | $ | 122,226 | | | $ | 85,722 | |
| |
| | | | | |
Average net assets (000) | | $ | 114,831 | | | $ | 128,550 | | | $ | 132,704 | | | $ | 93,985 | | | $ | 196,853 | |
| |
| | | | | |
Ratios to average net assets
Expenses | | | .52 | % | | | .45 | % | | | .51 | % | | | .56 | % | | | .43 | % |
| |
| | | | | |
Net investment income | | | .71 | % | | | 1.31 | % | | | 3.52 | % | | | 5.76 | % | | | 4.64 | % |
| |
| (a) | Total return is calculated by assuming a purchase of shares on the first day and a sale on the last day of each year reported and includes reinvestments of dividends and distributions. |
See Notes to Financial Statements
| | |
| 94 | | THE TARGET PORTFOLIO TRUST |
Notes to Financial Statements
The Target Portfolio Trust (the ‘Fund’) is an open-end management investment company. The Fund was established as a Delaware business trust on July 29, 1992 and consists of ten separate portfolios (the “Portfolio” or “Portfolios”). All the Portfolios are diversified, as defined under the Investment Company Act of 1940, except for the International Bond Portfolio. Investment operations commenced on January 5, 1993, with the exception of the International Bond Portfolio, which commenced on May 17, 1994.
The Portfolios and their investment objectives are as follows:
| • | Large Capitalization Growth Portfolio—long-term capital appreciation through investment primarily in stocks of large corporations that, in the investment adviser’s opinion, should have earnings growth faster than that of the S&P 500; |
| • | Large Capitalization Value Portfolio—total return consisting of capital appreciation and dividend income through investment primarily in stocks of large corporations that, in the adviser’s opinion, are undervalued; |
| • | Small Capitalization Growth Portfolio—maximum capital appreciation through investment primarily in small company common stocks that, in the investment adviser’s opinion, should have earnings growth faster than that of the U.S. economy in general; |
| • | Small Capitalization Value Portfolio—above average capital appreciation through investment in small company common stocks that, in the adviser’s opinion, are undervalued or overlooked in the marketplace; |
| • | International Equity Portfolio—capital appreciation through investment primarily in stocks of companies domiciled outside the United States; |
| • | International Bond Portfolio—high total return through investment primarily in high-quality, foreign debt securities; |
| • | Total Return Bond Portfolio—total return of current income and capital appreciation through investment primarily in fixed-income securities of varying maturities with a dollar-weighted average portfolio maturity of more than four years but not more than fifteen years; |
| • | Intermediate-Term Bond Portfolio—current income and reasonable stability of principal through investment primarily in high quality fixed-income securities of varying maturities with a dollar-weighted average portfolio maturity of more than three years but not more than ten years; |
| • | Mortgage Backed Securities Portfolio—high current income primarily and capital appreciation secondarily, each consistent with the protection of capital through investment primarily in mortgage-related securities; |
| • | U.S. Government Money Market Portfolio—maximum current income consistent with maintenance of liquidity and preservation of capital through investment exclusively in short-term securities issued or guaranteed by the U.S. Government, its agencies or instrumentalities. |
The ability of issuers of debt securities (other than those issued or guaranteed by the U.S. Government) held by the Portfolios to meet their obligations may be affected by economic or political developments in a specific industry, region or country.
| | |
| THE TARGET PORTFOLIO TRUST | | 95 |
Note 1. Accounting Policies
The following is a summary of significant accounting policies followed by the Fund and the Portfolios in the preparation of its financial statements.
Securities Valuations: Securities listed on a securities exchange are valued at the last sale price on such exchange on the day of valuation or, if there was no sale on such day, at the mean between the last reported bid and ask prices, or at the last bid price on such day in the absence of an asked price. Securities traded via Nasdaq are valued at the official closing price provided by Nasdaq. Securities that are actively traded in the over-the-counter market, including listed securities for which the primary market is believed by Prudential Investments LLC (“PI” or “Manager”), in consultation with the subadviser(s); to be over-the-counter, are valued by an independent pricing agent or principal market maker. Options on securities and indices traded on an exchange are valued at the mean between the most recently quoted bid and asked prices on such exchange. Futures contracts and options thereon traded on a commodities exchange or board of trade are valued at the last sale price at the close of trading on such exchange or board of trade or, if there was no sale on the applicable commodities exchange or board of trade on such day, at the mean between the most recently quoted bid and asked prices on such exchange or board of trade or at the last bid price in the absence of an asked price. Prices may be obtained from independent pricing services which use information provided by market makers or estimates of market values obtained from yield data relating to investments or securities with similar characteristics. Securities for which reliable market quotations are not readily available, or whose values have been affected by events occurring after the close of the security’s foreign market and before the portfolio’s normal pricing time, are valued at fair value in accordance with the Board of Trustees’ approved fair valuation procedures.
Investments in mutual funds are valued at their net asset value as of the close of the New York Stock Exchange on the date of the valuation.
U.S. Government securities for which market quotations are available are valued at a price provided by an independent pricing agent or primary dealer (a dealer that trades in U.S. Government securities with the Federal Reserve System).
Securities held by the U.S. Government Money Market Portfolio are valued at amortized cost, which approximates market value. The amortized cost method involves valuing a security at its cost on the date of purchase and thereafter assuming a constant amortization to maturity of the difference between the principal amount due at maturity and cost.
Short-term securities held by the other portfolios which mature in 60 days or less are valued at amortized cost, which approximates market value. Short-term securities held by the other portfolios which mature in more than 60 days are valued at current market quotations.
Repurchase Agreements: In connection with transactions in repurchase agreements with United States financial institutions, it is the Fund’s policy that its custodian or designated subcustodians under triparty repurchase agreements, as the case may be, take possession of the underlying collateral securities, the value of which exceeds the principal amount of the repurchase transaction, including accrued interest. To the extent that any repurchase transaction exceeds one business day, the value of the collateral is marked-to-market on a daily basis to ensure the adequacy of the collateral. If the seller defaults, and the value of the collateral declines or if bankruptcy proceedings are commenced with respect to the seller of the security, realization of the collateral by the Fund may be delayed or limited.
| | |
| 96 | | THE TARGET PORTFOLIO TRUST |
Financial Futures Contracts: A financial futures contract is an agreement to purchase (long) or sell (short) an agreed amount of securities at a set price for delivery on a future date. Upon entering into a financial futures contract, the Portfolio is required to pledge to the broker an amount of cash and/or other assets equal to a certain percentage of the contract amount. This amount is known as the “initial margin.” Subsequent payments, known as “variation margin,” are made or received by the Portfolio each day, depending on the daily fluctuations in the value of the underlying security. Such variation margin is recorded for financial statement purposes on a daily basis as unrealized gain or loss. When the contract expires or is closed, the gain or loss is realized and is presented in the Statements of Operations as net realized gain or loss on financial futures contracts.
The Portfolio invests in financial futures contracts in order to hedge its existing portfolio securities, or securities the Portfolio intends to purchase, against fluctuations in value caused by changes in prevailing interest rates or market conditions. Should interest rates move unexpectedly, the Portfolio may not achieve the anticipated benefits of the financial futures contracts and may realize a loss. The use of futures transactions involves the risk of imperfect correlation in movements in the price of futures contracts, interest rates and the underlying hedged assets. The International Equity Portfolio, International Bond Portfolio, Intermediate-Term Bond Portfolio, Mortgage-Backed Securities Portfolio and Total Return Bond Portfolio are the only portfolios that may invest in financial futures contracts.
Foreign Currency Translation: The books and records of the Portfolios are maintained in U.S. dollars. Foreign currency amounts are translated into U.S. dollars on the following basis:
(i) market value of investment securities, other assets and liabilities—at the current daily rates of exchange;
(ii) purchases and sales of investment securities, income and expenses—at the rates of exchange prevailing on the respective dates of such transactions.
Although the net assets of the Portfolios are presented at the foreign exchange rates and market values at the close of the fiscal year, the Portfolios do not isolate that portion of the results of operations arising as a result of changes in the foreign exchange rates from the fluctuations arising from changes in the market prices of long-term portfolio securities held at the end of the fiscal year. Similarly, the Portfolios do not isolate the effect of changes in foreign exchange rates from the fluctuations arising from changes in the market prices of long-term portfolio securities sold during the fiscal year. Accordingly, realized foreign currency gains or losses are included in the reported net realized gains or losses on investment transactions.
Net realized gains or losses on foreign currency transactions represent net foreign exchange gains or losses from the holding of foreign currencies, currency gains or losses realized between the trade date and settlement date on securities transactions, and the difference between the amounts of dividends, interest and foreign withholding taxes recorded on the Portfolios’ books and the U.S. dollar equivalent amounts actually received or paid. Net unrealized currency gains or losses from valuing foreign currency denominated assets and liabilities (other than investments) at year end exchange rates are reflected as a component of net unrealized appreciation (depreciation) on foreign currencies.
Foreign security and currency transactions may involve certain considerations and risks not typically associated with those of domestic origin as a result of, among other factors, the possibility of political and economic instability or the level of governmental supervision and regulation of foreign securities markets.
Foreign Currency Forward Contracts: A foreign currency forward contract is a commitment to purchase or sell a foreign currency at a future date at a negotiated forward rate. The Portfolio enters into foreign currency forward contracts in order to hedge its exposure to changes in foreign currency exchange
| | |
| THE TARGET PORTFOLIO TRUST | | 97 |
rates on its foreign portfolio holdings or on specific receivables and payables denominated in a foreign currency. The contracts are valued daily at current forward exchange rates and any unrealized gain or loss is included in net unrealized appreciation or depreciation on foreign currency transactions. Gain or loss is realized on the settlement date of the contract equal to the difference between the settlement value of the original and renegotiated forward contracts. This gain or loss, if any, is included in net realized gain or loss on foreign currency transactions. Risks may arise upon entering into these contracts from the potential inability of the counterparties to meet the terms of their contracts. The International Equity Portfolio, International Bond Portfolio, Intermediate-Term Bond Portfolio and Total Return Bond Portfolio may enter into foreign currency forward contracts in order to hedge their exposure to changes in foreign currency exchange rates on their foreign portfolio holdings.
Options: The Portfolio may either purchase or write options in order to hedge against adverse market movements or fluctuations in value caused by changes in prevailing interest rates with respect to securities which the Portfolio currently owns or intends to purchase. The Portfolio’s principal reason for writing options is to realize, through receipt of premiums, a greater current return than would be realized on the underlying security alone. When the Portfolio purchases an option, it pays a premium and an amount equal to that premium is recorded as an asset. When the Portfolio writes an option, it receives a premium and an amount equal to that premium is recorded as a liability. The asset or liability is adjusted daily to reflect the current market value of the option.
If an option expires unexercised, the Portfolio realizes a gain or loss to the extent of the premium received or paid. If an option is exercised, the premium received or paid is recorded as an adjustment to the proceeds from the sale or the cost of the purchase in determining whether the Portfolio has realized a gain or loss. The difference between the premium and the amount received or paid on effecting a closing purchase or sale transaction is also treated as a realized gain or loss. Gain or loss on purchased options is included in net realized gain or loss on investment transactions. Gain or loss on written options is presented separately as net realized gain or loss on options written.
The Portfolio, as writer of an option, may have no control over whether the underlying securities may be sold (called) or purchased (put). As a result, the Portfolio bears the market risk of an unfavorable change in the price of the security underlying the written option. The Portfolio, as purchaser of an option, bears the risk of the potential inability of the counterparties to meet the terms of their contracts. The International Equity Portfolio, the International Bond Portfolio, the Intermediate-Term Bond Portfolio, the Total Return Bond Portfolio and the Mortgage-Backed Securities Portfolio may either purchase or write options.
Short Sales: Certain portfolios of the Fund may make short sales of securities as a method of hedging potential price declines in similar securities owned. The Portfolio may sell a security it does not own in anticipation of a decline in the market value of that security (short sale). When the Portfolio makes a short sale, it will borrow the security sold short and deliver it to the broker-dealer through which it made the short sale as collateral for its obligation to deliver the security upon conclusion of the sale. The Portfolio may have to pay a fee to borrow the particular security and may be obligated to return any interest or dividends received on such borrowed securities. The fee may be referred to as the “initial margin.” Subsequent payments known as “variation margin,” are made or received by the Portfolio each day, depending on the daily fluctuations in the value of the security sold short. Such variation margin is recorded for financial statement purposes on a daily basis as unrealized gain (loss). A gain, limited to the price at which the Portfolio sold the security short, or a loss, unlimited as to dollar amount, will be recognized upon the termination of a short sale if the market price at termination is less than or greater than the proceeds originally received, respectively, and is presented in the Statement of Operations as net realized gain or loss on short sales. The Total Return Bond Portfolio, Intermediate-Term Bond Portfolio and Mortgage Backed Securities Portfolio may enter into short sales.
| | |
| 98 | | THE TARGET PORTFOLIO TRUST |
Swaps: A swap is an agreement to exchange the return generated by one instrument for the return generated by another instrument. The Portfolios enter into interest rate, forward swap spread lock and credit default swap agreements to manage its exposure to interest rates and credit risk. Interest rate swap agreements involve the exchange by the Portfolios with another party of their respective commitments to pay or receive interest. Forward spread lock swap agreements involve commitments to pay or receive a settlement amount calculated as the difference between the swap spread and a fixed spread, multiplied by the notional amount times the duration of the swap. The swap spread is the difference between the benchmark swap rate (market rate) and the specific Treasury rate. In a credit default swap, one party makes a stream of payments to another party in exchange for the right to receive a specified return in the event of a default by a third party, typically corporate issues or sovereign issues of an emerging country, on its obligation. Dividends and interest on the securities in the swap are included in the value of the exchange. The swaps are valued daily at current market value and any unrealized gain or loss is included in the Statement of Assets and Liabilities. Gain or loss is realized on the termination date of the swap and is equal to the difference between the Portfolio’s basis in the swap and the proceeds of the closing transaction, including any fees. During the period that the swap agreement is open, the Portfolios may be subject to risk from the potential inability of the counterparty to meet the terms of the agreement. The Total Return Bond Portfolio, International Bond Portfolio, Mortgage Backed Securities Portfolio and the Intermediate-Term Bond Portfolio may enter into swaps.
The use of derivative transactions may involve elements of both market and credit risk in excess of the amounts reported in the Statements of Assets and Liabilities.
When-Issued/Delayed Delivery Securities: Securities purchased or sold on a when-issued or delayed-delivery basis may be settled a month or more after trade date; interest income is not accrued until settlement date. At the time a Portfolio enters into such transactions, it instructs the custodian to segregate assets with a current value at least equal to the amount of its when-issued or delayed-delivery purchase commitments.
Securities Transactions and Net Investment Income: Securities transactions are recorded on the trade date. Realized gains or losses on sales of securities are calculated on the identified cost basis. Dividend income is recorded on the ex-dividend date and interest income, including amortization of premium and accretion of discount on debt securities, as required, is recorded on an accrual basis.
Dividends and Distributions: The Total Return Bond Portfolio, Intermediate-Term Bond Portfolio and Mortgage Backed Securities Portfolio declare dividends of their net investment income daily and pay such dividends monthly. The U.S. Government Money Market Portfolio declares net investment income and any net capital gain or loss daily and pays such dividends monthly. Each other Portfolio declares and pays a dividend of its net investment income, if any, at least annually. The International Bond Portfolio changed its dividend policy from declaring daily to annually. Each Portfolio except for the U.S. Government Money Market Portfolio declares and pays its net realized capital gains, if any, at least annually. Dividends and distributions to shareholders, which are determined in accordance with federal income tax regulations and which may differ from generally accepted accounting principles, are recorded on ex-dividend date. Permanent book/tax differences relating to income and gains are reclassified amongst undistributed net investment income, accumulated net realized gain or loss and paid-in capital in excess of par, as appropriate.
Taxes: For federal income tax purposes, each Portfolio in the Fund is treated as a separate tax-paying entity. It is each Portfolio’s policy to continue to meet the requirements of the Internal Revenue Code applicable to regulated investment companies and to distribute all of its taxable net income and capital gains, if any, to shareholders. Therefore, no federal income tax provision is required.
Withholding taxes on foreign interest and dividends are recorded net of reclaimable amounts, at the time the related income is earned.
| | |
| THE TARGET PORTFOLIO TRUST | | 99 |
Estimates: The preparation of the financial statements requires management to make estimates and assumptions that affect the reported amounts and disclosures in the financial statements. Actual results could differ from those estimates.
Note 2. Agreements
The Fund’s manager is Prudential Investments LLC (“PI”). PI manages the investment operations of the Fund, administers the Fund’s affairs and is responsible for the selection, subject to review and approval of the Trustees, of the advisers. PI supervises the advisers’ performance of advisory services and makes recommendations to the Trustees as to whether the advisers’ contracts should be renewed, modified or terminated. PI pays for the costs pursuant to the advisory agreements, the cost of compensation of officers of the Fund, occupancy and certain clerical and accounting costs of the Fund. The Fund bears all other costs and expenses.
The advisers noted below each furnished investment advisory services in connection with the management of the Portfolios. Each of the two advisers of the domestic equity Portfolios—the Large Capitalization Growth Portfolio, Large Capitalization Value Portfolio, Small Capitalization Growth Portfolio and Small Capitalization Value Portfolio—manages approximately 50% of the assets of the respective Portfolio. In general, in order to maintain an approximately equal division of assets between the two advisers, all daily cash inflows (i.e., subscriptions and reinvested distributions) and outflows (i.e., redemptions and expenses items) are divided between the two advisers as PI deems it appropriate. In order to maintain an approximately equal allocation between the two subadvisers, a periodic rebalancing of each subadviser’s share of Portfolio assets may occur to account for market fluctuations.
| | |
Portfolio
| | Adviser
|
Large Capitalization Growth | | Oak Associates, Ltd. and Columbus Circle Investors |
Large Capitalization Value | | J.P. Morgan Investment Management, Inc. and Hotchkis & Wiley Capital Management Inc. |
Small Capitalization Growth | | Westcap Investors, LLC* and RS Investment Management, L.P.** |
Small Capitalization Value | | NFJ Investment Group L.P.*** and EARNEST Partners, LLC |
International Equity | | Lazard Asset Management |
International Bond | | Fischer, Francis, Trees & Watts, Inc. |
Total Return Bond and
Intermediate-Term Bond | | Pacific Investment Management Company |
Mortgage Backed Securities and
U.S. Government Money Market | | Wellington Management Company, LLP |
| * | Effective at the close of business on July 23, 2003, Westcap Investments, LLC replaced Sawgrass Asset Management LLC. |
| ** | Effective at the close of business on October 3, 2003, RS Investment Management L.P. replaced JPMorgan Fleming Asset Management USA, Inc. |
| *** | Effective at the close of business on October 8, 2003, NFJ Investment Group replaced National City Investment Company. |
| | |
| 100 | | THE TARGET PORTFOLIO TRUST |
The management fee payable to PI is computed daily and paid monthly, at an annual rate of the average daily net assets of the Portfolios specified below and PI, in turn, pays each adviser a fee for its services.
| | | |
Portfolio
| | Total
Management Fee
| |
Large Capitalization Growth | | 0.60 | % |
Large Capitalization Value | | 0.60 | % |
Small Capitalization Growth | | 0.60 | % |
Small Capitalization Value | | 0.60 | % |
International Equity | | 0.70 | % |
International Bond | | 0.50 | % |
Total Return Bond | | 0.45 | % |
Intermediate-Term Bond | | 0.45 | % |
Mortgage Backed Securities | | 0.45 | % |
U.S. Government Money Market | | 0.25 | % |
The Fund has a distribution agreement with Prudential Investment Management Services LLC (“PIMS”). PIMS serves the Fund without compensation.
PI and PIMS are indirect, wholly-owned subsidiaries of Prudential Financial, Inc. (“Prudential”).
The Fund (excluding the U.S. Government Money Market Portfolio), along with other affiliated registered investment companies (the “Funds”), is party to a syndicate credit agreement (“SCA”) with a group of banks. The SCA provides for a commitment of $800 million and allows the Funds to increase the commitment to $1 billion, if necessary. Interest on any borrowings will be incurred at market rates. The Funds pay a commitment fee of .08 of 1% of the unused portion of the SCA. The commitment fee is accrued daily, paid quarterly and is allocated to the Funds pro rata based on net assets. The purpose of the SCA is to serve as an alternative source of funding for capital share redemptions. The expiration date of the SCA was May 2, 2003. On May 2, 2003, the SCA was renewed under the same terms and conditions (“May 2003 renewal”). The expiration date of the May 2003 renewal is April 30, 2004. The Fund did not borrow any amounts pursuant to the SCA during the year ended December 31, 2003.
Note 3. Other Transactions with Affiliates
Prudential Mutual Fund Services LLC (“PMFS”), an affiliate of PI and an indirect, wholly-owned subsidiary of Prudential, serves as the Fund’s transfer agent. The following approximate amounts represent the fees PMFS charged for the year ended December 31, 2003, as well as the fees due to PMFS as of December 31, 2003. Transfer agent fees and expenses in the Statement of Operations also includes certain out-of-pocket expenses paid to nonaffiliates, where applicable.
| | | | | | |
Portfolio
| | Amount incurred for the year ended December 31, 2003
| | Amount due as of December 31, 2003
|
Large Capitalization Growth | | $ | 275,800 | | $ | 23,000 |
Large Capitalization Value | | | 192,400 | | | 16,400 |
Small Capitalization Growth | | | 185,600 | | | 15,800 |
Small Capitalization Value | | | 199,000 | | | 17,400 |
International Equity | | | 164,200 | | | 14,000 |
International Bond | | | 60,800 | | | 5,700 |
| | |
| THE TARGET PORTFOLIO TRUST | | 101 |
| | | | | | |
Portfolio
| | Amount incurred for the year ended December 31, 2003
| | Amount due as of December 31, 2003
|
Total Return Bond | | $ | 146,500 | | $ | 12,900 |
Intermediate-Term Bond | | | 252,100 | | | 20,700 |
Mortgage Backed Securities | | | 111,400 | | | 9,300 |
U.S. Government Money Market | | | 97,200 | | | 7,500 |
Effective July 1, 2003, Prudential and Wachovia Corp. formed a joint venture, Wachovia Securities, LLC (“Wachovia”), whereby Prudential and Wachovia Corp. combined their brokerage businesses with Prudential holding a minority interest. Prior to July 1, 2003, Prudential Securities, Inc. (“PSI”), was an indirect, wholly-owned subsidiary of Prudential. For the year ended December 31, 2003, the amount of brokerage commissions earned by PSI and Wachovia from transactions executed on behalf of the Fund was as follows:
| | | | | | |
Portfolio
| | PSI
| | Wachovia*
|
Large Capitalization Growth | | $ | — | | $ | 4,350 |
Large Capitalization Value | | | 7,436 | | | 5,806 |
Small Capitalization Growth | | | 90 | | | 5,400 |
Small Capitalization Value | | | 177 | | | 255 |
| * | The amount earned by Wachovia for the period of July 1, 2003 to December 31, 2003. |
The Fund pays networking fees to affiliated broker/dealers. These networking fees are payments made to broker/dealers that clear mutual fund transactions through a national clearing system. These amounts are included in transfer agent’s fees and expenses in the Statement of Operations. The Fund paid networking fees, as follows:
| | | |
Portfolio
| | Paid to PSI and
Wachovia
|
Large Capitalization Growth | | $ | 69,000 |
Large Capitalization Value | | | 48,000 |
Small Capitalization Growth | | | 46,300 |
Small Capitalization Value | | | 45,000 |
International Equity | | | 40,900 |
International Bond | | | 14,600 |
Total Return Bond | | | 34,200 |
Intermediate-Term Bond | | | 63,200 |
Mortgage Backed Securities | | | 27,700 |
U.S. Government Money Market | | | 24,300 |
Certain Portfolios invest in the Taxable Money Market Series (the “Series”), a portfolio of Dryden Core Investment Fund, formerly Prudential Core Investment Fund, pursuant to an exemptive order received from the Securities and Exchange Commission. The Series is a money market mutual fund registered under the Investment Company Act of 1940, as amended, and managed by PI. During the year ended December 31, 2003, the following Portfolios earned income from the Series by investing their excess cash:
| | |
| 102 | | THE TARGET PORTFOLIO TRUST |
| | | |
Portfolio
| | Excess Cash
Investment
|
Large Capitalization Growth | | $ | 108,152 |
Large Capitalization Value | | | 58,690 |
Small Capitalization Growth | | | 64,387 |
Small Capitalization Value | | | 50,615 |
International Bond | | | 24,110 |
Total Return Bond | | | 8,219 |
Intermediate-Term Bond | | | 4,537 |
Note 4. Portfolio Securities
Purchases and sales of portfolio securities, excluding short-term investments, government securities, short sales and written options, for the year ended December 31, 2003, were as follows:
| | | | | | |
Portfolio
| | Purchases
| | Sales
|
Large Capitalization Growth | | $ | 141,402,471 | | $ | 138,542,133 |
Large Capitalization Value | | | 140,017,012 | | | 139,001,363 |
Small Capitalization Growth | | | 262,669,000 | | | 262,680,229 |
Small Capitalization Value | | | 139,775,917 | | | 147,967,863 |
International Equity | | | 78,108,017 | | | 70,139,820 |
International Bond | | | 77,590,409 | | | 67,680,762 |
Total Return Bond | | | 490,440,982 | | | 558,885,920 |
Intermediate-Term Bond | | | 997,381,461 | | | 1,153,521,102 |
Mortgage Backed Securities | | | 314,649,508 | | | 314,210,115 |
At December 31, 2003, the International Bond, Total Return Bond and the Intermediate-Term Bond Portfolios had open financial futures contracts. The unrealized appreciation (depreciation) on such contracts as of December 31, 2003 were as follows:
International Bond Portfolio:
| | | | | | | | | | | | | | |
Number of Contracts
| | Type
| | Expiration
Date
| | Value at
December 31, 2003
| | Value at
Trade Date
| | Unrealized
Appreciation
(Depreciation)
| |
| | | Long Positions: | | | | | | | | | | | | |
| 2 | | Gilt | | Mar. 2004 | | $ | 388,392 | | $ | 381,013 | | $ | 7,379 | |
| 1 | | Japanese 10yr Bond | | Mar. 2004 | | | 1,286,274 | | | 1,279,312 | | | 6,962 | |
| | | | | | | | | | | | |
|
|
|
| | | | | | | | | | | | | | 14,341 | |
| | | | | | | | | | | | |
|
|
|
| | | | | |
| | | Short Positions: | | | | | | | | | | | | |
| 42 | | Euro-BOBL | | Mar. 2004 | | | 5,855,525 | | | 5,807,691 | | | (47,834 | ) |
| 5 | | Ruix Index | | Mar. 2004 | | | 713,421 | | | 710,900 | | | (2,521 | ) |
| 3 | | Euro-Schatz | | Mar. 2004 | | | 400,164 | | | 399,680 | | | (484 | ) |
| | | | | | | | | | | | |
|
|
|
| | | | | | | | | | | | | | (50,839 | ) |
| | | | | | | | | | | | |
|
|
|
| | | | | | | | | | | | | $ | (36,498 | ) |
| | | | | | | | | | | | |
|
|
|
| | |
| THE TARGET PORTFOLIO TRUST | | 103 |
Total Return Bond Portfolio:
| | | | | | | | | | | | | | |
Number of Contracts
| | Type
| | Expiration
Date
| | Value at
December 31, 2003
| | Value at
Trade Date
| | Unrealized
Appreciation
(Depreciation)
| |
| | | Long Positions: | | | | | | | | | | | | |
| 488 | | 10yr T-Note | | Mar. 2004 | | $ | 54,785,625 | | $ | 53,986,351 | | $ | 799,274 | |
| 142 | | Ruix Index | | Mar. 2004 | | | 20,261,150 | | | 20,000,597 | | | 260,553 | |
| 32 | | 90 Day Libor | | Dec. 2004 | | | 6,819,069 | | | 6,833,812 | | | (14,743 | ) |
| 25 | | 90 Day Eurodollar | | Mar. 2007 | | | 5,954,375 | | | 5,936,250 | | | 18,125 | |
| 20 | | 90 Day Euribor | | Dec. 2004 | | | 6,136,478 | | | 6,125,091 | | | 11,387 | |
| 13 | | 90 Day Libor | | Sept. 2004 | | | 2,775,483 | | | 2,773,548 | | | 1,935 | |
| 12 | | 90 Day Libor | | Mar. 2005 | | | 2,553,660 | | | 2,583,556 | | | (29,896 | ) |
| 4 | | 90 Day Libor | | Mar. 2004 | | | 857,486 | | | 862,233 | | | (4,747 | ) |
| 4 | | 90 Day Libor | | Jun. 2004 | | | 855,964 | | | 860,585 | | | (4,621 | ) |
| | | | | | | | | | | | |
|
|
|
| | | | | | | | | | | | | | 1,037,267 | |
| | | | | | | | | | | | |
|
|
|
| | | Short Positions: | | | | | | | | | | | | |
| 60 | | 15yr T-Bond | | Mar. 2004 | | | 6,558,750 | | | 6,511,031 | | | (47,719 | ) |
| 59 | | 5yr T-Note | | Mar. 2004 | | | 6,585,875 | | | 6,600,625 | | | 14,750 | |
| | | | | | | | | | | | |
|
|
|
| | | | | | | | | | | | | | (32,969 | ) |
| | | | | | | | | | | | |
|
|
|
| | | | | | | | | | | | | $ | 1,004,298 | |
| | | | | | | | | | | | |
|
|
|
Intermediate-Term Bond Portfolio:
| | | | | | | | | | | | | |
| | | | | |
Number of
Contracts
| | Type
| | Expiration
Date
| | Value at
December 31, 2003
| | Value at Trade Date
| | Unrealized
Appreciation
|
| | | Long Positions: | | | | | | | | | | | |
| 665 | | 90 Day Euro | | Sept. 2004 | | $ | 163,332,313 | | $ | 162,800,313 | | $ | 532,000 |
| 195 | | 10Yr U.S. T-Bond | | Mar. 2004 | | | 21,891,797 | | | 21,685,656 | | | 206,141 |
| 87 | | 90 Day Euro | | Mar. 2004 | | | 21,483,563 | | | 21,340,013 | | | 143,550 |
| 87 | | 90 Day Euro | | Jun. 2004 | | | 21,438,975 | | | 21,256,275 | | | 182,700 |
| 65 | | 90 Day Euribor | | Mar. 2005 | | | 19,863,939 | | | 19,846,730 | | | 17,209 |
| 65 | | 90 Day Euribor | | Jun. 2005 | | | 19,812,752 | | | 19,798,632 | | | 14,120 |
| 65 | | 90 Day Euribor | | Sept. 2005 | | | 19,767,778 | | | 19,758,720 | | | 9,058 |
| 65 | | 90 Day Euribor | | Dec. 2005 | | | 19,728,882 | | | 19,719,835 | | | 9,047 |
| | | | | | | | | | | | |
|
|
| | | | | | | | | | | | | $ | 1,113,825 |
| | | | | | | | | | | | |
|
|
| | |
| 104 | | THE TARGET PORTFOLIO TRUST |
At December 31, 2003, the International Bond Portfolio had outstanding forward currency contracts to sell and purchase foreign currencies, as follows:
| | | | | | | | | | |
Foreign Currency Purchase Contracts
| | Value at Settlement
Date Payable
| | Current Value
| | Unrealized
Appreciation
| |
Australian Dollars,
Expiring 2/24/04 | | $ | 1,112,952 | | $ | 1,175,206 | | $ | 62,254 | |
Canadian Dollars,
Expiring 2/24/04 | | | 6,136,679 | | | 6,263,156 | | | 126,477 | |
Euros,
Expiring 2/24/04 | | | 18,649,160 | | | 19,675,462 | | | 1,026,302 | |
Pound Sterling,
Expiring 2/24/04 | | | 2,553,326 | | | 2,701,297 | | | 147,971 | |
Japanese Yen,
Expiring 2/24/04 | | | 7,055,479 | | | 7,129,728 | | | 74,249 | |
Norwegian Krones,
Expiring 2/24/04 | | | 657,526 | | | 663,166 | | | 5,640 | |
Swiss Francs,
Expiring 2/24/04 | | | 1,045,932 | | | 1,115,488 | | | 69,556 | |
| | |
|
| |
|
| |
|
|
|
| | | $ | 37,211,054 | | $ | 38,723,503 | | $ | 1,512,449 | |
| | |
|
| |
|
| |
|
|
|
| | | |
Foreign Currency Sale Contracts
| | Value at Settlement
Date Receivable
| | Current Value
| | Unrealized
Depreciation
| |
Australian Dollars,
Expiring 2/24/04 | | $ | 1,073,149 | | $ | 1,152,750 | | $ | (79,601 | ) |
Canadian Dollars,
Expiring 2/24/04 | | | 5,837,861 | | | 5,949,131 | | | (111,270 | ) |
Canadian Dollars for Australian Dollars,
Expiring 2/24/04 | | | 292,279 | | | 299,415 | | | (7,136 | ) |
Danish Krones,
Expiring 2/24/04 | | | 2,454,555 | | | 2,585,870 | | | (131,315 | ) |
Euros,
Expiring 2/24/04 | | | 29,550,451 | | | 31,839,639 | | | (2,289,188 | ) |
Pound Sterling,
Expiring 2/24/04 | | | 7,850,955 | | | 8,162,093 | | | (311,138 | ) |
Pound Sterling for Euros
Expiring 2/24/04 | | | 943,875 | | | 1,022,034 | | | (78,159 | ) |
Japanese Yen,
Expiring 2/24/04 | | | 10,990,777 | | | 11,119,367 | | | (128,590 | ) |
Norwegian Krones for Euros
Expiring 2/24/04 | | | 657,526 | | | 687,389 | | | (29,863 | ) |
New Zealand Dollar,
Expiring 2/24/04 | | | 2,854,879 | | | 2,910,260 | | | (55,381 | ) |
Swedish Krona,
Expiring 2/24/04 | | | 2,415,964 | | | 2,581,856 | | | (165,892 | ) |
Swiss Francs,
Expiring 2/24/04 | | | 1,060,000 | | | 1,181,671 | | | (121,671 | ) |
Swiss Francs for Euros,
Expiring 2/24/04 | | | 1,045,932 | | | 1,120,900 | | | (74,968 | ) |
Euros for Japanese Yen,
Expiring 2/24/04 | | | 1,378,440 | | | 1,402,105 | | | (23,665 | ) |
Euros for Norwegian Krones,
Expiring 2/24/04 | | | 655,264 | | | 660,165 | | | (4,901 | ) |
Euros for Pound Sterling,
Expiring 2/24/04 | | | 899,225 | | | 925,163 | | | (25,938 | ) |
| | |
|
| |
|
| |
|
|
|
| | | $ | 69,961,132 | | $ | 73,599,808 | | $ | (3,638,676 | ) |
| | |
|
| |
|
| |
|
|
|
| | |
| THE TARGET PORTFOLIO TRUST | | 105 |
As December 31, 2003, the Total Return Bond Portfolio had outstanding forward currency contracts to sell currency, as follows:
| | | | | | | | | | |
Foreign Currency Purchase Contracts
| | Value at Settlement
Date Payable
| | Current Value
| | Unrealized
Appreciation
| |
Euros,
Expiring 1/07/04 | | $ | 735,373 | | $ | 759,182 | | $ | 23,809 | |
Japanese Yen,
Expiring 1/15/04 | | | 91,713 | | | 92,272 | | | 559 | |
| | |
|
| |
|
| |
|
|
|
| | | $ | 827,086 | | $ | 851,454 | | $ | 24,368 | |
| | |
|
| |
|
| |
|
|
|
| | | |
Foreign Currency Sale Contracts
| | Value at Settlement
Date Payable
| | Current Value
| | Unrealized
Depreciation
| |
Euros,
Expiring 1/07/04 | | $ | 2,946,109 | | $ | 3,027,901 | | $ | (81,792 | ) |
Pound Sterling,
Expiring 1/23/04 | | | 119,178 | | | 123,299 | | | (4,121 | ) |
| | |
|
| |
|
| |
|
|
|
| | | $ | 3,065,287 | | $ | 3,151,200 | | $ | (85,913 | ) |
| | |
|
| |
|
| |
|
|
|
As December 31, 2003, the Intermediate-Term Bond Portfolio had outstanding forward contracts to sell foreign currency, as follows:
| | | | | | | | | | |
Foreign Currency Sale Contracts
| | Value at Settlement
Date Receivable
| | Current Value
| | Unrealized
Depreciation
| |
Euros,
Expiring 1/07/04 | | $ | 2,261,746 | | $ | 2,296,463 | | $ | (34,717 | ) |
| | |
|
| |
|
| |
|
|
|
Transactions in options written during the year ended December 31, 2003 were as follows:
| | | | | | | | |
Total Return Bond Portfolio
| | Number of Contracts/
Notional Amount (000)
| | | Premiums
Received
| |
Options outstanding at December 31, 2002 | | | 14,468 | | | $ | 206,623 | |
Options written | | | 54,021 | | | | 972,376 | |
Options closed | | | (15,344 | ) | | | (181,035 | ) |
Options expired | | | (14,145 | ) | | | (413,010 | ) |
| | |
|
|
| |
|
|
|
Options outstanding at December 31, 2003 | | | 39,000 | | | $ | 584,954 | |
| | |
|
|
| |
|
|
|
| | |
Intermediate-Term Bond Portfolio
| | Number of Contracts/
Notional Amount (000)
| | | Premiums
Received
| |
Options outstanding at December 31, 2002 | | | 61 | | | $ | 10,543 | |
Options written | | $ | 33,800 | | | | 309,693 | |
Options expired | | | (61 | ) | | | (10,543 | ) |
| | |
|
|
| |
|
|
|
Options outstanding at December 31, 2003 | | $ | 33,800 | | | $ | 309,693 | |
| | |
|
|
| |
|
|
|
| | |
| 106 | | THE TARGET PORTFOLIO TRUST |
The Total Return Bond Portfolio entered into interest rate swap agreements during the year ended December 31, 2003. Details of the swap agreements outstanding as of December 31, 2003 were as follows:
| | | | | | | | | | | | | | |
Counterparty
| | Termination
Date
| | Notional Amount
| | Fixed
Rate
| | | Floating Rate
| | Unrealized
Appreciation (Depreciation)
| |
Morgan Stanley(a) | | 6/2/2012 | | | JPY190,000,000 | | 1.07 | % | | 6 month LIBOR | | $ | 42,933 | |
Goldman Sachs(a) | | 6/2/2012 | | | JPY200,000,000 | | 1.07 | % | | 6 month LIBOR | | | 63,018 | |
Merrill Lynch(b) | | 3/29/2005 | | | CHF5,600,000 | | 1.50 | % | | 3 month LIBOR | | | 22,211 | |
JP Morgan(b) | | 3/29/2005 | | | CHF1,800,000 | | 1.50 | % | | 3 month LIBOR | | | 5,169 | |
Merrill Lynch(b) | | 3/29/2005 | | | CHF6,800,000 | | 1.50 | % | | 3 month LIBOR | | | 82 | |
UBS Warburg LLC(b) | | 9/15/2005 | | $ | 7,500,000 | | 3.25 | % | | 3 month LIBOR | | | 13,410 | |
Goldman Sachs(b) | | 9/15/2005 | | | EUR16,600,000 | | 3.50 | % | | 6 month Euribor | | | 56,103 | |
Barclay’s Bank PLC(b) | | 9/15/2005 | | | EUR2,100,000 | | 3.50 | % | | 6 month Euribor | | | 1,678 | |
Morgan Stanley(b) | | 3/16/2005 | | | GBP1,400,000 | | 4.25 | % | | 6 month LIBOR | | | (3,369 | ) |
Goldman Sachs(a) | | 6/16/2014 | | $ | 500,000 | | 5.00 | % | | 3 month LIBOR | | | (6,555 | ) |
JP Morgan(b) | | 3/17/2005 | | | GBP2,000,000 | | 4.00 | % | | 6 month LIBOR | | | (7,036 | ) |
Bank of America Securities LLC(b) | | 6/16/2009 | | $ | 3,000,000 | | 4.00 | % | | 3 month LIBOR | | | 12,456 | |
UBS Warburg LLC(a) | | 6/16/2014 | | | EUR9,200,000 | | 5.00 | % | | 6 month Euribor | | | (178,356 | ) |
JP Morgan(b) | | 9/27/2012 | | $ | 3,000,000 | | 4.00 | % | | 3 month LIBOR | | | 12,096 | |
| | | | | | | | | | | | |
|
|
|
| | | | | | | | | | | | | $ | 33,840 | |
| | | | | | | | | | | | |
|
|
|
| (a) | Portfolio pays the fixed rate and receives the floating rate. |
| (b) | Portfolio pays the floating rate and receives the fixed rate. |
The Total Return Bond Portfolio entered into a forward swap spread lock agreement during the year ended December 31, 2003. Details of the swap agreement outstanding as of December 31, 2003, were as follows:
| | | | | | | | | | | | |
Counterparty
| | Maturity
Date
| | Notional
Amount
| | Spread
Lock
| | Underlying
Bond
| | Unrealized
Appreciation
|
Bank of America
Securities LLC(a) | | 1/15/2004 | | $ | 2,500,000 | | 0.18% | | U.S. T-Note,
6.25%, 8/15/23 | | $ | 4,882 |
| | | | | | | | | | | |
|
|
| (a) | Portfolio pays the floating rate and receives the fixed rate. |
| | |
| THE TARGET PORTFOLIO TRUST | | 107 |
The Total Return Bond Portfolio entered into credit default swap agreements during the year ended December 31, 2003. Details of the swap agreements outstanding as of December 31, 2003 were as follows:
| | | | | | | | | | | | | |
Counterparty
| | Termination Date
| | Notional
Amount
| | Fixed
Rate
| | Underlying Bond
| | Unrealized
Appreciation (Depreciation)
| |
Morgan Stanley(a) | | 12/20/2008 | | $ | 500,000 | | 0.26% | | Allstate Corp.,
6.125%, due 2/15/12 | | $ | (244 | ) |
Merrill Lynch & Co(a) | | 12/20/2008 | | | 300,000 | | 0.32% | | Ingersoll-Rand Co.,
6.48%, due 6/1/25 | | | 138 | |
Morgan Stanley(a) | | 12/20/2008 | | | 300,000 | | 0.21% | | Emerson Electric Co.,
4.625%, due 10/15/12 | | | 557 | |
Barclays Bank PLC(a) | | 12/20/2008 | | | 500,000 | | 0.16% | | Eli Lilly & Co., Inc.,
6.00%, due 3/15/12 | | | 701 | |
Bank of America
Securities LLC(a) | | 12/20/2008 | | | 300,000 | | 0.13% | | E.I. DuPont,
6.875%, due 10/15/09 | | | — | |
Bear Stearns & Co(a) | | 12/20/2008 | | | 400,000 | | 0.32% | | Hewlett Packard Co.,
6.50%, due 7/1/12 | | | (1,307 | ) |
Lehman Brothers(a) | | 12/20/2008 | | | 400,000 | | 0.11% | | Johnson & Johnson,
3.80%, due 5/15/13 | | | (187 | ) |
Lehman Brothers(a) | | 12/20/2008 | | | 400,000 | | 0.12% | | Home Depot, Inc.,
5.375%, due 4/1/06 | | | 186 | |
Citigroup(a) | | 12/20/2008 | | | 300,000 | | 0.29% | | FedEx Corp.,
7.25%, due 2/15/11 | | | (1,135 | ) |
Lehman Brothers(a) | | 12/20/2008 | | | 200,000 | | 0.29% | | Whirlpool Corp.,
8.60%, due 5/1/10 | | | 370 | |
Citigroup(a) | | 12/20/2008 | | | 400,000 | | 0.28% | | Eaton Corp.,
5.75%, due 7/15/12 | | | (372 | ) |
Merrill Lynch & Co(a) | | 12/20/2008 | | | 100,000 | | 0.22% | | Gannett Co., Inc.,
6.375%, due 4/1/12 | | | — | |
Citigroup(a) | | 12/20/2008 | | | 800,000 | | 0.14% | | Wal-Mart Stores, Inc.,
6.875%, due 8/10/09 | | | 372 | |
UBS Warburg LLC(a) | | 12/20/2008 | | | 600,000 | | 0.35% | | AutoZone, Inc.,
5.875%, due 10/15/12 | | | 2,739 | |
Lehman Brothers(a) | | 12/20/2008 | | | 100,000 | | 0.24% | | Costco Wholesale
Corp.,
5.50%, due 3/15/07 | | | 273 | |
Lehman Brothers(a) | | 12/20/2008 | | | 300,000 | | 0.30% | | Masco Corp.,
5.875%, due 7/15/12 | | | (699 | ) |
Lehman Brothers(a) | | 12/20/2008 | | | 300,000 | | 0.35% | | RadioShack Corp.,
7.375%, due 5/15/11 | | | 677 | |
Barclays Bank PLC(a) | | 12/20/2008 | | | 200,000 | | 0.67% | | The Walt Disney Co.,
6.375%, due 3/1/12 | | | (2,699 | ) |
Bear Stearns & Co(a) | | 12/20/2008 | | | 100,000 | | 1.09% | | Capital One Bank,
4.875%, due 5/15/08 | | | (419 | ) |
Lehman Brothers(a) | | 12/20/2008 | | | 200,000 | | 0.48% | | Northrop Grmman
Corp.,
7.125%, due 2/15/11 | | | (566 | ) |
Lehman Brothers(a) | | 12/20/2008 | | | 200,000 | | 0.53% | | Lockheed Martin Corp.,
8.20%, due 12/1/09 | | | (749 | ) |
Lehman Brothers(a) | | 12/20/2008 | | | 200,000 | | 0.97% | | Goodrich Corp.,
7.625%, due 12/15/12 | | | (4,326 | ) |
UBS Warburg LLC(a) | | 12/20/2008 | | | 200,000 | | 0.98% | | SunMicrosystems, Inc.,
7.65%, due 8/15/09 | | | (2,569 | ) |
| | |
| 108 | | THE TARGET PORTFOLIO TRUST |
| | | | | | | | | | | | |
Counterparty
| | Termination Date
| | Notional
Amount
| | Fixed
Rate
| | Underlying Bond
| | Unrealized
Appreciation (Depreciation)
| |
Barclays Bank PLC(a) | | 12/20/2008 | | 200,000 | | 0.67% | | Clear Channel
Communications, Inc.,
7.65%, due 9/15/10 | | | (1,601 | ) |
Bear Stearns & Co(a) | | 12/20/2008 | | 200,000 | | 0.24% | | Deere & Co.,
7.85%, due 5/15/10 | | | 278 | |
UBS Warburg LLC(a) | | 12/20/2008 | | 200,000 | | 0.37% | | RadioShack Corp.,
7.375%, due 5/15/11 | | | 266 | |
Bear Stearns & Co(a) | | 12/20/2008 | | 200,000 | | 0.19% | | Caterpillar, Inc.,
7.25%, due 9/15/09 | | | 93 | |
Morgan Stanley & Co(a) | | 12/20/2008 | | 200,000 | | 0.22% | | Emerson Electric Co.,
7.125%, due 8/15/10 | | | 279 | |
Merrill Lynch & Co(a) | | 12/20/2008 | | 300,000 | | 0.35% | | Devon Energy Corp.,
6.875%, due 9/30/11 | | | 122 | |
Bear Stearns & Co(a) | | 12/20/2008 | | 200,000 | | 0.60% | | International Paper Co.,
6.75%, due 9/1/11 | | | 172 | |
Merrill Lynch & Co(a) | | 12/20/2008 | | 200,000 | | 0.27% | | Anadarko Petroleum Corp.,
5.00%, due 10/1/12 | | | 92 | |
UBS Warburg LLC(a) | | 12/20/2008 | | 200,000 | | 0.44% | | Carnival Corp.,
6.15%, due 4/15/08 | | | 272 | |
Morgan Stanley(a) | | 12/20/2008 | | 200,000 | | 0.42% | | Countrywide Home
Loans, Inc.,
5.625%, due 7/15/09 | | | (196 | ) |
Merrill Lynch & Co(a) | | 12/20/2008 | | 200,000 | | 0.28% | | Occidental Petroleum Corp.,
6.75%, due 1/15/12 | | | (280 | ) |
Goldman Sachs(a) | | 12/20/2008 | | 200,000 | | 0.60% | | Clear Channel
Communications, Inc.,
7.65%, due 9/15/10 | | | (954 | ) |
Lehman Brothers(a) | | 12/20/2008 | | 200,000 | | 0.45% | | Cox Communications, Inc.,
7.75%, due 11/1/10 | | | (474 | ) |
UBS Warburg LLC(a) | | 12/20/2008 | | 200,000 | | 0.44% | | Simon Property Group, L.P.,
5.45%, due 3/15/13 | | | (753 | ) |
Morgan Stanley(a) | | 12/20/2008 | | 200,000 | | 0.53% | | The Kroger Co.,
4.75%, due 4/15/12 | | | (196 | ) |
Bear Stearns & Co(a) | | 12/20/2008 | | 200,000 | | 0.15% | | Wal-Mart Stores, Inc.,
6.875%, due 8/10/09 | | | — | |
Merrill Lynch & Co(a) | | 12/20/2008 | | 200,000 | | 0.85% | | Motorola, Inc.,
7.625%, due 11/15/10 | | | (1,561 | ) |
| | | | | | | | | | |
|
|
|
| | | | | | | | | | | $ | (13,700 | ) |
| | | | | | | | | | |
|
|
|
| (a) | Portfolio pays the fixed rate and receives the floating rate. |
The Intermediate-Term Bond Portfolio entered into interest rate swap agreements during the year ended December 31, 2003. Details of the swap agreements outstanding as of December 31, 2003 were as follows:
| | | | | | | | | | | | | | |
Counterparty
| | Termination
Date
| | Notional Amount
| | Fixed
Rate
| | | Floating Rate
| | Unrealized
Appreciation
(Depreciation)
| |
Goldman Sachs Group LP(a) | | 6/16/2009 | | $ | 38,800,000 | | 4.00 | % | | 3 month LIBOR | | $ | 156,442 | |
UBS Warburg LLC(a) | | 3/15/2007 | | EUR | 8,900,000 | | 4.00 | % | | 6 month Euribor | | | 40,282 | |
Morgan Stanley & Co., Inc.(a) | | 3/17/2004 | | GBP | 26,800,000 | | 4.25 | % | | 6 month LIBOR | | | (238,216 | ) |
| | | | | | | | | | | | |
|
|
|
| | | | | | | | | | | | | $ | (41,492 | ) |
| | | | | | | | | | | | |
|
|
|
| (a) | Portfolio pays the floating rate and receives the fixed rate. |
| | |
| THE TARGET PORTFOLIO TRUST | | 109 |
Note 5. Tax and Distribution Information
In order to present undistributed net investment income or loss and accumulated net realized gains or losses on the Statement of Assets and Liabilities that more closely represent their tax character, certain adjustments have been made to paid-in capital in excess of par, undistributed net investment income or loss and accumulated net realized gain or loss on investments. For the year ended December 31, 2003, the adjustments were as follows:
| | | | | | | | | | | | |
Portfolio
| | Paid-In Capital in
Excess of Par
| | | Undistributed Net Investment
Income
| | | Accumulated
Net Realized Gain or Loss
| |
Large Capitalization Growth Portfolio(b) | | $ | (266,415 | ) | | $ | 266,415 | | | | — | |
Small Capitalization Growth Portfolio(b) | | | (928,998 | ) | | | 928,998 | | | | — | |
Small Capitalization Value Portfolio(d) | | | — | | | | 48,699 | | | $ | (48,699 | ) |
International Equity Portfolio(a)(c) | | | 20,089 | | | | (401,940 | ) | | | 381,851 | |
International Bond Portfolio(a) | | | — | | | | 790,158 | | | | (790,158 | ) |
Total Return Bond Portfolio(a)(d)(f) | | | 473,554 | | | | 104,154 | | | | (577,708 | ) |
Intermediate-Term Bond Portfolio(a)(d)(e) | | | (76,904 | ) | | | 2,054,083 | | | | (1,977,179 | ) |
Mortgage Backed Securities Portfolio(d) | | | (44,208 | ) | | | 44,208 | | | | — | |
U.S. Government Money Market Portfolio(d) | | | — | | | | 3,401 | | | | (3,401 | ) |
| (a) | Reclassification of net foreign currency gain (loss). |
| (b) | Reclassification of tax operating loss. |
| (c) | Reclassification of book to tax differences due to the sale of passive foreign investment companies. |
| (d) | Reclassification of overdistribution of ordinary income. |
| (e) | Reclassification of market discount accretion and premium amortization. |
| (f) | Reclassification for redemptions utilized as distributions for federal income tax purposes. |
Net investment income, net realized gains and net assets were not affected by these reclassifications.
For federal income tax purposes, the following portfolios had post-October losses deferred and capital loss carryforward as of December 31, 2003.
| | | | | | |
| | | Post-October Losses
Deferred at
December 31, 2003
|
Portfolio
| | Currency
| | Capital
|
Small Capitalization Growth Portfolio | | | — | | $ | 34,099 |
International Equity Portfolio | | $ | 58,323 | | | — |
Intermediate-Term Bond Portfolio | | | 32,523 | | | — |
Mortgage Backed Securities Portfolio | | | — | | | 275,509 |
| | | | |
Portfolio
| | Approximate Capital Loss Carryforward *
At December 31, 2003
| | |
Large Capitalization Growth Portfolio | | $58,279,000 | | ($11,752,000 expiring in 2009; $39,797,000 expiring in 2010; $6,730,000 expiring in 2011) |
Large Capitalization Value Portfolio | | 6,675,000(a) | | (expiring in 2010) |
Small Capitalization Growth Portfolio | | 54,440,000 | | ($19,057,000 expiring in 2009; $28,653,000 expiring in 2010; $6,730,000 expiring in 2011) |
| | |
| 110 | | THE TARGET PORTFOLIO TRUST |
| | | | |
Portfolio
| | Approximate Capital Loss Carryforward *
At December 31, 2003
| | |
International Equity Portfolio | | $50,185,000 | | ($23,151,000 expiring in 2009; $24,235,000 expiring in 2010; $2,799,000 in 2011) |
International Bond Portfolio | | —(b) | | — |
Mortgage Backed Securities Portfolio | | 1,354,000 | | ($384,000 expiring in 2008; $970,000 expiring in 2011) |
| * | Accordingly, no capital distribution is expected to be paid to shareholders until net gains have been realized in excess of such carryforwards. |
| (a) | Approximately $2,003,000 of its capital loss carryforward was used to offset net taxable gains realized in the fiscal year ended December 31, 2003. |
| (b) | Approximately $349,000 of its capital loss carryforward was used to offset net taxable gains realized in the fiscal year ended December 31, 2003. |
For the year ended December 31, 2003, the tax character of the distributions paid, as reflected in the Statements of Changes in Net Assets were:
| | | | | | | | | |
Portfolio
| | Ordinary Income
| | Long-Term Capital Gain
| | Total
Distributions
|
Large Capitalization Value Portfolio | | $ | 3,731,879 | | | — | | $ | 3,731,879 |
Small Capitalization Value Portfolio | | | 3,591,404 | | $ | 3,376,742 | | | 6,968,146 |
International Equity Portfolio | | | 2,118,075 | | | — | | | 2,118,075 |
International Bond Portfolio | | | 3,416,812 | | | 24,731 | | | 3,441,543 |
Total Return Bond Portfolio | | | 8,556,130 | | | 1,599,480 | | | 10,155,610 |
Intermediate-Term Bond Portfolio | | | 15,975,002 | | | 650,500 | | | 16,625,502 |
Mortgage Backed Securities Portfolio | | | 5,247,606 | | | — | | | 5,247,606 |
U.S. Government Money Market Portfolio | | | 820,357 | | | — | | | 820,357 |
For the year ended December 31, 2002, the tax character of the distributions paid, as reflected in the Statements of Changes in Net Assets were:
| | | | | | | | | |
Portfolio
| | Ordinary Income
| | Long-Term Capital Gain
| | Total
Distributions
|
Large Capitalization Value Portfolio | | $ | 3,747,694 | | $ | 2,566,849 | | $ | 6,314,543 |
Small Capitalization Value Portfolio | | | 5,396,672 | | | 24,797,789 | | | 30,194,461 |
International Equity Portfolio | | | 54,411 | | | — | | | 54,411 |
International Bond Portfolio | | | 318,534 | | | — | | | 318,534 |
Total Return Bond Portfolio | | | 7,311,187 | | | 676,529 | | | 7,987,716 |
Intermediate-Term Bond Portfolio | | | 13,996,377 | | | 1,396,204 | | | 15,392,581 |
Mortgage Backed Securities Portfolio | | | 5,052,128 | | | — | | | 5,052,128 |
U.S. Government Money Market Portfolio | | | 1,677,116 | | | — | | | 1,677,116 |
The tax character of distributable earnings at December 31, 2003 was:
| | | | | | |
Portfolio
| | Ordinary Income
| | Long-Term Capital Gain
|
Large Capitalization Value Portfolio | | $ | 103,948 | | | — |
Small Capitalization Value Portfolio | | | 324,655 | | $ | 1,071,450 |
International Equity Portfolio | | | 1,279,664 | | | — |
| | |
| THE TARGET PORTFOLIO TRUST | | 111 |
| | | | | | |
Portfolio
| | Ordinary Income
| | Long-Term Capital Gain
|
International Bond Portfolio | | $ | 228,072 | | $ | 5,347 |
Total Return Bond Portfolio | | | 202,040 | | | 353,329 |
Intermediate-Term Bond Portfolio | | | 227,291 | | | 813,296 |
As of December 31, 2003, the Large Capitalization Growth, Small Capitalization Growth, Mortgage Backed Securities and U.S. Government Money Market Portfolios had no distributable earnings on a tax basis.
The United States federal income tax basis and unrealized appreciation (depreciation) of the Portfolios’ investments and the total net unrealized appreciation (depreciation) as of December 31, 2003, were as follows:
| | | | | | | | | | | | | | | | | | | |
Portfolio
| | Tax Basis
| | Appreciation
| | Depreciation
| | Net Unrealized
of Investments
| | Other
Cost Basis Adjustments
| | | Total Net
Unrealized
|
Large Capitalization Growth Portfolio | | $ | 240,870,374 | | $ | 133,676,065 | | $ | 25,616,402 | | $ | 108,059,663 | | | — | | | $ | 108,059,663 |
Large Capitalization Value Portfolio | | | 255,581,083 | | | 70,616,408 | | | 5,901,961 | | | 64,714,447 | | | — | | | | 64,714,447 |
Small Capitalization Growth Portfolio | | | 131,634,045 | | | 15,089,368 | | | 3,562,911 | | | 11,526,457 | | | — | | | | 11,526,457 |
Small Capitalization Value Portfolio | | | 160,930,805 | | | 44,756,926 | | | 1,157,573 | | | 43,599,353 | | | — | | | | 43,599,353 |
International Equity Portfolio | | | 155,909,712 | | | 37,274,326 | | | 1,404,950 | | | 35,869,376 | | $ | 64,702 | | | | 35,934,078 |
International Bond Portfolio | | | 35,668,198 | | | 3,769,201 | | | 157,949 | | | 3,611,252 | | | (129,437 | ) | | | 3,481,815 |
Total Return Bond Portfolio | | | 152,990,868 | | | 3,265,301 | | | 1,603,089 | | | 1,662,212 | | | 247,150 | | | | 1,909,362 |
Intermediate-Term Bond Portfolio | | | 297,292,874 | | | 6,082,013 | | | 3,687,772 | | | 2,394,241 | | | 75,949 | | | | 2,470,190 |
Mortgage Backed Securities Portfolio | | | 123,723,683 | | | 2,215,215 | | | 233,002 | | | 1,982,213 | | | (12,656 | ) | | | 1,969,557 |
The differences between book basis and tax basis are primarily attributable to deferred losses on wash sales, mark to market on purchased options and mark to market on passive foreign investment companies. The other cost basis adjustments are primarily attributable to appreciation (depreciation) on written options, futures, swaps, short sales, forward currency contracts and mark to market of receivables and payables.
| | |
| 112 | | THE TARGET PORTFOLIO TRUST |
Note 6. Capital
The Fund has authorized an unlimited number of shares of beneficial interest at $.001 par value per share.
Transactions in shares of beneficial interest during year ended December 31, 2003 were as follows:
| | | | | | | | | | |
Portfolio
| | Shares
Sold
| | Shares
Issued in
Reinvestment
of Dividends
and
Distributions
| | Shares
Reacquired
| | | Increase/
(Decrease)
in Shares
Outstanding
| |
Large Capitalization Growth Portfolio | | 6,953,016 | | — | | (6,417,696 | ) | | 535,320 | |
Large Capitalization Value Portfolio | | 5,785,901 | | 268,646 | | (5,571,034 | ) | | 483,513 | |
Small Capitalization Growth Portfolio | | 4,591,873 | | — | | (3,951,697 | ) | | 640,176 | |
Small Capitalization Value Portfolio | | 2,731,257 | | 371,473 | | (3,313,238 | ) | | (210,508 | ) |
International Equity Portfolio | | 9,427,039 | | 200,739 | | (8,456,409 | ) | | 1,171,369 | |
International Bond Portfolio | | 3,767,332 | | 385,003 | | (2,719,639 | ) | | 1,432,696 | |
Total Return Bond Portfolio | | 6,974,878 | | 915,221 | | (6,059,658 | ) | | 1,830,441 | |
Intermediate-Term Bond Portfolio | | 13,623,787 | | 1,495,398 | | (14,835,948 | ) | | 283,237 | |
Mortgage Backed Securities Portfolio | | 4,746,277 | | 443,657 | | (5,735,443 | ) | | (545,509 | ) |
Transactions in shares of beneficial interest during the fiscal year ended December 31, 2002, were as follows:
| | | | | | | | | | |
Portfolio
| | Shares Sold
| | Shares Issued in
Reinvestment
of Dividends
and
Distributions
| | Shares
Reacquired
| | | Increase/
(Decrease)
in Shares
Outstanding
| |
Large Capitalization Growth Portfolio | | 8,398,367 | | — | | (8,482,157 | ) | | (83,790 | ) |
Large Capitalization Value Portfolio | | 5,841,891 | | 543,508 | | (6,595,311 | ) | | (209,912 | ) |
Small Capitalization Growth Portfolio | | 4,742,296 | | — | | (4,214,900 | ) | | 527,396 | |
Small Capitalization Value Portfolio | | 3,492,647 | | 2,033,553 | | (4,442,760 | ) | | 1,083,440 | |
International Equity Portfolio | | 8,916,721 | | 5,001 | | (9,117,137 | ) | | (195,415 | ) |
International Bond Portfolio | | 2,122,894 | | 37,026 | | (1,528,675 | ) | | 631,245 | |
Total Return Bond Portfolio | | 7,462,420 | | 717,545 | | (5,362,611 | ) | | 2,817,354 | |
Intermediate-Term Bond Portfolio | | 20,128,098 | | 1,417,532 | | (8,907,875 | ) | | 12,637,755 | |
Mortgage Backed Securities Portfolio | | 6,840,775 | | 419,877 | | (3,698,849 | ) | | 3,561,803 | |
| | |
| THE TARGET PORTFOLIO TRUST | | 113 |
Report of Independent Auditors
To the Trustees and Shareholders of The Target Portfolio Trust
In our opinion, the accompanying statements of assets and liabilities, including the portfolios of investments, and the related statements of operations and of changes in net assets and the financial highlights present fairly, in all material respects, the financial position of Large Capitalization Growth Portfolio, Large Capitalization Value Portfolio, Small Capitalization Growth Portfolio, Small Capitalization Value Portfolio, International Equity Portfolio, International Bond Portfolio, Total Return Bond Portfolio, Intermediate-Term Bond Portfolio, Mortgage Backed Securities Portfolio and U.S. Government Money Market Portfolio (constituting The Target Portfolio Trust, hereafter referred to as the “Trust”) at December 31, 2003, the results of each of their operations for the year then ended, the changes in each of their net assets for each of the two years in the period then ended and financial highlights for each of the five years in the period then ended, in conformity with accounting principles generally accepted in the United States of America. These financial statements and financial highlights (hereafter referred to as “financial statements”) are the responsibility of the Trust’s management; our responsibility is to express an opinion on these financial statements based on our audits. We conducted our audits of these financial statements in accordance with auditing standards generally accepted in the United States of America, which require that we plan and perform the audit to obtain reasonable assurance about whether the financial statements are free of material misstatement. An audit includes examining, on a test basis, evidence supporting the amounts and disclosures in the financial statements, assessing the accounting principles used and significant estimates made by management, and evaluating the overall financial statement presentation. We believe that our audits, which included confirmation of securities at December 31, 2003 by correspondence with the custodian and brokers, provide a reasonable basis for our opinion.
PricewaterhouseCoopers, LLP
New York, New York
February 24, 2004
| | |
| 114 | | THE TARGET PORTFOLIO TRUST |
Federal Income Tax Information (Unaudited)
As required by the Internal Revenue Code, we wish to advise you as to the federal tax status of dividends and distributions paid by the Fund during its fiscal year ended December 31, 2003. Further, we wish to advise you of the percentage of the ordinary income dividends (excluding long-term capital gains distributions) paid in 2003 that qualify for the corporate dividends received deduction available to corporate taxpayers.
Detailed below, please find the aggregate dividends and distributions, per share, paid by each portfolio during the year ended December 31, 2003 as well as the corporate dividend received deduction percentage:
| | | | | | | | | | | | | | | |
| | | Ordinary Dividends*
| | | | | | | |
Portfolio
| | Income
| | Short-Term
Capital Gains
| | Long-Term
Capital Gains
Distributions
| | Total Dividends
and Distributions
| | Corporate
Dividend
Received
Deduction
| |
Large Capitalization Value Portfolio | | $ | 0.1698 | | $ | — | | $ | — | | $ | 0.1698 | | 100.00 | % |
Small Capitalization Value Portfolio | | | 0.0283 | | | 0.3130 | | | 0.3209 | | | 0.6622 | | 44.24 | % |
International Equity Portfolio | | | 0.1327 | | | — | | | — | | | 0.1327 | | 8.57 | % |
International Bond Portfolio | | | 0.8440 | | | — | | | 0.0060 | | | 0.8500 | | — | |
Total Return Bond Portfolio | | | 0.3606 | | | 0.2537 | | | 0.1130 | | | 0.7273 | | — | |
Intermediate-Term Bond Portfolio | | | 0.3400 | | | — | | | 0.1700 | | | 0.5100 | | — | |
Mortgage Backed Securities Portfolio | | | 0.4792 | | | — | | | — | | | 0.4792 | | — | |
U.S. Government Money Market Portfolio | | | 0.0070 | | | — | | | — | | | 0.0070 | | — | |
| * | For federal income tax purposes, ordinary income dividends and short-term capital gains distributions are taxable as ordinary income. Long-term capital gains distributions are taxable as capital gains income. |
The International Equity Portfolio has elected to give the benefit tax credit to its shareholders. Accordingly, shareholders who must report their gross income dividends and distributions in a federal income tax return will be entitled to a foreign tax credit, or an itemized deduction in computing their U.S. income tax liability. It is generally more advantageous to claim rather than take a deduction. For the fiscal year ended December 31, 2003 the International Equity Portfolio intends on passing through $396,189 of ordinary income distributions as a foreign tax credit.
The Large Capitalization Value Portfolio, Small Capitalization Value Portfolio, and International Equity Portfolio will designate 100%, 8.29% and 100% of ordinary income dividends, respectively, as qualified for the reduced tax rate under The Jobs and Growth Tax Relief Reconciliation Act of 2003.
| | |
| THE TARGET PORTFOLIO TRUST | | 115 |
Important Notice For Certain Shareholders (Unaudited)
Many states do not tax the portion of mutual fund dividends attributed to interest from U.S. Government obligations. Listed below is the percentage of interest earned by the following Target portfolios from U.S. Government obligations for the calendar year 2003.
To determine the amount of your dividends which may be exempt from state and local tax, simply multiply the amount in Box 1 of your 1099-Div (Ordinary Dividends) by the percentage listed below. These percentages do not apply to taxable capital gain distributions paid by the portfolios.
| | | |
Portfolio*
| | Percentage of Interest from
U.S. Government obligations
| |
Total Return Bond Portfolio | | 12.42 | % |
Intermediate-Term Bond Portfolio | | 4.21 | |
U.S. Government Money Market Portfolio | | 15.98 | |
| * | Due to certain minimum portfolio holding requirements in California, Connecticut and New York, residents of those states will not be able to exclude 2003 interest income from state and local taxes. |
Please consult your tax adviser or state/local authorities to properly report this information on your tax return. If you have any questions concerning the amounts listed above, please call your Prudential Securities Financial Adviser.
| | |
| 116 | | THE TARGET PORTFOLIO TRUST |
The Target Portfolio Trust
Supplemental Proxy Information
(Unaudited)
A Special Meeting of Shareholders was held on July 17, 2003, and adjourned to August 21, 2003, to September 12, 2003 and further adjourned to October 10, 2003. At such meetings the shareholders approved the following proposals:
| | 1)* | To approve the election of ten (10) directors to the Board of Directors, as follows: |
The result of the proxy solicitation on the preceding matter was:
| | | | | | | | |
Matter
| | Votes For
| | Votes Against
| | Votes Withheld
| | Abstentions
|
David E.A. Carson | | 199,987,760 | | — | | 2,195,005 | | — |
Robert E. La Blanc | | 197,858,619 | | — | | 2,324,146 | | — |
Robert F. Gunia | | 200,013,667 | | — | | 2,169,098 | | — |
Douglas H.
McCorkindale | | 199,992,981 | | — | | 2,189,820 | | — |
Stephen P. Munn† | | 199,983,194 | | — | | 2,199,571 | | — |
Richard A. Redeker | | 200,041,826 | | — | | 1,885,443 | | — |
Judy A. Rice | | 200,027,519 | | — | | 2,155,246 | | — |
Robin B. Smith | | 199,943,906 | | — | | 2,238,859 | | — |
Stephen Stoneburn | | 200,089,822 | | — | | 2,092,943 | | — |
Clay T. Whitehead | | 200,003,830 | | — | | 1,922,092 | | — |
| †Mr. | Munn ceased being a director effective November 30, 2003. |
| | |
| THE TARGET PORTFOLIO TRUST | | 117 |
| | 4a)** | To approve changes to fundamental investment restrictions or policies, relating to: fund diversification. |
| | | | |
For
| | Against
| | Abstain
|
| 18,360,347 | | 716,131 | | 689,698 |
| | 4b)** | To approve changes to fundamental investment restrictions or policies, relating to: issuing senior securities, borrowing money or pledging assets. |
| | | | |
For
| | Against
| | Abstain
|
| 18,189,639 | | 881,391 | | 695,146 |
| | 4c)** | To approve changes to fundamental investment restrictions or policies, relating to: buying and selling real estate. |
| | | | |
For
| | Against
| | Abstain
|
| 18,228,993 | | 818,140 | | 719,043 |
| | 4d)** | To approve changes to fundamental investment restrictions or policies, relating to: buying and selling commodities and commodity contracts. |
| | | | |
For
| | Against
| | Abstain
|
| 18,142,918 | | 923,145 | | 700,113 |
| | 4e)** | To approve changes to fundamental investment restrictions or policies, relating to: fund concentration. |
| | | | |
For
| | Against
| | Abstain
|
| 18,236,858 | | 815,037 | | 738,241 |
| | 4f)** | To approve changes to fundamental investment restrictions or policies, relating to: making loans. |
| | | | |
For
| | Against
| | Abstain
|
| 18,115,126 | | 659,450 | | 744,557 |
| | 4g)** | To approve changes to fundamental investment restrictions and policies, relating to: other investment restrictions, including investing in securities of other investment companies. |
| | | | |
For
| | Against
| | Abstain
|
| 18,238,951 | | 797,706 | | 729,519 |
| | 5)** | To approve amendments to the Company’s Declaration of Trust. |
| | | | |
For
| | Against
| | Abstain
|
| 18,261,527 | | 762,923 | | 741,726 |
| * | Approved at the July 17, 2003 meeting. |
| ** | Approved at the September 12, 2003 meeting. The totals represent approvals for the following Portfolios of the Trust only: Intermediate Term Bond Portfolio, International Bond Portfolio, and Total Return Bond Portfolio. The remaining portfolios have not approved the proposals. |
| | |
| 118 | | THE TARGET PORTFOLIO TRUST |
Management of the Trust (Unaudited)
Information pertaining to the Trustees of the Trust is set forth below. Trustees who are not deemed to be “interested persons” of the Trust, as defined in the 1940 Act are referred to as “Independent Trustees.” Trustees who are deemed to be “interested persons” of the Trust are referred to as “Interested Trustees.” “Fund Complex”† consists of the Trust and any other investment companies managed by PI.
Independent Trustees(2)
David E.A. Carson (69), Trustee since 2003(3 ) Oversees 89 portfolios in Fund complex
Principal occupations (last 5 years): Director (January 2000 to May 2000), Chairman (January 1999 to December 1999), Chairman and Chief Executive Officer (January 1998 to December 1998) and President, Chairman and Chief Executive Officer (1983-1997) of People’s Bank.
Other Directorships held:(4) Director of United Illuminating and UIL Holdings (utility company), since 1993.
Robert E. La Blanc (69), Trustee since 2003(3 ) Oversees 98 portfolios in Fund complex
Principal occupations (last 5 years): President (since 1981) of Robert E. La Blanc Associates, Inc. (telecommunications); formerly General Partner at Salomon Brothers and Vice-Chairman of Continental Telecom; Trustee of Manhattan College.
Other Directorships held:(4) Director of Storage Technology Corporation (since 1979) (technology), Chartered Semiconductor Manufacturing, Ltd. (since 1998); Titan Corporation (electronics) (since 1995), Computer Associates International, Inc. (since 2002) (software company); FiberNet Telecom Group, Inc. (since 2003) (telecom company); Director (since April 1999) of the High Yield Plus Fund, Inc.
Douglas H. McCorkindale (64), Trustee since 1996(3 ) Oversees 91 portfolios in Fund complex
Principal occupations (last 5 years): Chairman (since February 2001), Chief Executive Officer (since June 2000) and President (since September 1997) of Gannett Co. Inc. (publishing and media); formerly Vice Chairman (March 1984-May 2000) of Gannett Co., Inc.
Other Directorships held:(4) Director of Gannett Co. Inc., Director of Continental Airlines, Inc. (since May 1993); Director of Lockheed Martin Corp. (aerospace and defense) (since May 2001); Director of The High Yield Plus Fund, Inc. (since 1996).
Richard A. Redeker (60), Trustee since 1993(3) Oversees 92 portfolios in Fund complex
Principal occupations (last 5 years): Management Consultant; formerly employee of Prudential Investments (October 1996-December 1998); Director of Invesmart, Inc. (since 2001) and Director of Penn Tank Lines, Inc. (since 1999).
Other Directorships held:(4) None.
| | |
| THE TARGET PORTFOLIO TRUST | | 119 |
Robin B. Smith (64), Trustee since 1996(3) Oversees 99 portfolios in Fund complex
Principal occupations (last 5 years): Chairman of the Board (since January 2003) of Publishers Clearing House (direct marketing), formerly Chairman and Chief Executive Officer (August 1996-January 2003) of Publishers Clearing House.
Other Directorships held:(4) Director of BellSouth Corporation (since 1992).
Stephen Stoneburn (60), Trustee since 2003(3) Oversees 97 portfolios in Fund complex
Principal occupations (last 5 years): President and Chief Executive Officer (since June 1996) of Quadrant Media Corp. (a publishing company); formerly President (June 1995-June 1996) of Argus Integrated Media, Inc.; Senior Vice President and Managing Director (January 1993-1995) of Cowles Business Media and Senior Vice President of Fairchild Publications, Inc. (1975-1989).
Other Directorships held:(4) None
Clay T. Whitehead (65), Trustee since 1996(3) Oversees 96 portfolios in Fund complex
Principal occupations (last 5 years): President (since 1983) of National Exchange Inc. (new business development firm).
Other Directorships held:(4) Director (since 2000) of the High Yield Plus Fund, Inc.
Interested Trustees(1)
Judy A. Rice (56), President since 2003 and Director since 2000(3) Oversees 95 portfolios in Fund complex
Principal occupations (last 5 years): President, Chief Executive Officer, Chief Operating Officer and Officer-in-Charge (since 2003) of PI; Director, Officer-in-Charge, President, Chief Executive Officer and Chief Operating Officer (since May 2003) of American Skandia Advisory Services, Inc. and American Skandia Investment Services, Inc.; Director, Officer-in-Charge, President, Chief Executive Officer (since May 2003) of American Skandia Fund Services, Inc.; Vice President (since February 1999) of Prudential Investment Management Services LLC; President, Chief Executive Officer and Officer-in-Charge (since April 2003) of Prudential Mutual Fund Services LLC; formerly various positions to Senior Vice President (1992-1999) of Prudential Securities; and various positions to Managing Director (1975-1992) of Salomon Smith Barney; Member of Board of Governors of the Money Management Institute.
Other Directorships held:(4) None
Robert F. Gunia (57), Vice President and Director since 1996(3 )Oversees 179 portfolios in Fund complex
Principal occupations (last 5 years): Chief Administrative Officer (since June 1999) of PI; Executive Vice President and Treasurer (since January 1996) of PI; President (since April 1999) of Prudential Investment Management Services LLC (PIMS); Corporate Vice President (since September 1997) of The Prudential Insurance Company of America (Prudential); Director, Executive Vice President and Chief Administrative Officer (since May 2003) of American Skandia Investment Services, Inc., American Skandia Advisory Services, Inc. and American Skandia Fund Services, Inc.; President (since April 1999) of Prudential Investment Management Services LLC; Executive Vice President (since March 1999) and Treasurer (since May 2000) of Prudential Mutual Fund Services LLC; formerly Senior Vice President (March 1987-May 1999) of Prudential Securities.
Other Directorships held:(4) Vice President and Director (since May 1989) and Treasurer (since 1999) of The Asia Pacific Fund, Inc.
| | |
| 120 | | THE TARGET PORTFOLIO TRUST |
Information pertaining to the Officers of the Trust is set forth below.
Officers(2)
Marguerite E.H. Morrison (47), Chief Legal Officer since 2003 and Assistant Secretary since 2002(3)
Principal occupations (last 5 years): Vice President and Chief Legal Officer—Mutual Funds and Unit Investment Trust (since August 2000) of Prudential; Senior Vice President and Secretary (since April 2003) of PI; Senior Vice President and Secretary (since May 2003) of American Skandia Investment Services, Inc., American Skandia Advisory Services, Inc. and American Skandia Fund Services, Inc.; Vice President and Assistant Secretary of PIMS (since October 2001), previously Senior Vice President and Assistant Secretary (February 2001-April 2003) of PI, Vice President and Associate General Counsel (December 1996-February 2001) of PI.
Maryanne Ryan (39), Anti-Money Laundering Compliance Officer since 2002(3)
Principal occupations (last 5 years): Vice President, Prudential (since November 1998), First Vice President, Prudential Securities (March 1997-May 1998); Anti-Money Laundering Compliance Officer (since 2003) of American Skandia Investment Services, Inc., American Skandia Advisory Services, Inc. and American Skandia Marketing, Inc.
Grace C. Torres (44), Treasurer and Principal Financial and Accounting Officer since 1998(3)
Principal occupations (last 5 years): Senior Vice President (since January 2000) of PI, Senior Vice President and Assistant Treasurer (since May 2003) of American Skandia Investment Services, Inc. and American Skandia Advisory Services, Inc.; formerly First Vice President (December 1996-January 2000) of PI and First Vice President (March 1993-1999) of Prudential Securities.
Lori E. Bostrom (41), Secretary since 2002(3)
Principal occupations (last 5 years): Vice President and Corporate Counsel (since October 2002) of Prudential; formerly Senior Counsel of The Guardian Life Insurance Company of America (February 1996-October 2002).
| | (1) | “Interested” Trustee, as defined in the 1940 Act, by reason of employment with the Manager, (Prudential Investments LLC or PI), the Subadviser (Prudential Investment Management, Inc. or PIM) or the Distributor (Prudential Investment Management Services LLC or PIMS). |
| | (2) | Unless otherwise noted, the address of the Trustees and Officers is c/o: Prudential Investments LLC, Gateway Center Three, 100 Mulberry Street, Newark, NJ 07102. |
| | (3) | There is no set term of office for Trustees and Officers. The Independent Trustees have adopted a retirement policy, which calls for the retirement of Trustees on December 31 of the year in which they reach the age of 75. The table shows the individuals length of service as Trustee and/or Officer. |
| | (4) | This includes only directorships of companies requested to register, or file reports with the SEC under the Securities and Exchange Act of 1934 (that is, “public companies”) or other investment companies registered under the 1940 Act. |
| | † | The Fund Complex consists of all investment companies managed by PI. The Funds for which PI serves as manager include JennisonDryden Mutual Funds, Strategic Partners Funds, American Skandia Advisor Funds, Inc., The Prudential Variable Contract Accounts 2, 10, 11, The Target Portfolio Trust, The Prudential Series Fund, Inc., American Skandia Trust, and Prudential’s Gibraltar Fund. |
Additional information about the Fund’s Trustees is included in the Fund’s Statement of Additional Information which is available without charge, upon request, by calling (800) 521-7466 or (732) 482-7555 (Calling from outside the U.S.)
| | |
| THE TARGET PORTFOLIO TRUST | | 121 |
Growth of a $10,000 Investment
Large Capitalization Growth Portfolio
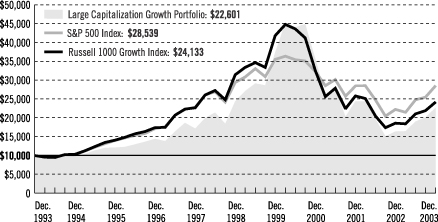
| | | | | | | | | |
|
| Average Annual Total Returns as of 12/31/03 | |
| | | One Year | | | Five Years | | | Ten Years | |
With TARGET Program Fee | | 37.45 | % | | –1.55 | % | | 8.50 | % |
| |
| | | |
| | | One Year | | | Five Years | | | Ten Years | |
Without TARGET Program Fee | | 39.53 | % | | –0.06 | % | | 10.14 | % |
| |
Past performance is not indicative of future results. Principal and investment return will fluctuate so that an investor’s shares, when redeemed, may be worth more or less than their original cost.
The graph compares a $10,000 investment in the TARGET Large Capitalization Growth Portfolio with a similar investment in the S&P 500 Index and the Russell 1000 Growth Index by portraying the initial account values at the beginning of the 10-year period (December 31, 1993) and the account values at the end of the current fiscal year (December 31, 2003), as measured on a quarterly basis. The graph takes into account the maximum quarterly TARGET program fee of 1.50% annually for retail investors. For individual retirement plans and qualified employee benefit plans, taking into account the maximum TARGET program fee of 1.25%, the average annual total return for the 10-year period would have been 7.78% and the growth of a $10,000 investment would have been $23,175. The average annual total returns in the table and the returns on investment in the graph do not reflect the deduction of taxes that a shareholder would pay on Portfolio distributions or following the redemption of Portfolio shares.
The S&P 500 Index is an index of 500 stocks of large U.S. companies. It gives a broad look at how U.S. stock prices have performed. The Russell 1000 Growth Index contains those securities in the Russell 1000 Index with a greater-than-average growth orientation. Companies in this index tend to exhibit higher price-to-book and price-to-earnings ratios, lower dividend yields, and higher forecasted growth rates. These indexes are unmanaged, and the total returns include the reinvestment of all dividends, but do not include the effect of sales charges, operating expenses, or taxes. These returns would be lower if they included the effect of sales charges, operating expenses, or taxes. The securities in these indexes may differ substantially from the securities in the Portfolio. These indexes are not the only ones that may be used to characterize performance of large-capitalization equity funds, and other indexes may portray different comparative performance. Investors cannot invest directly in an index.
| | |
| | | THE TARGET PORTFOLIO TRUST |
Growth of a $10,000 Investment
Large Capitalization Value Portfolio
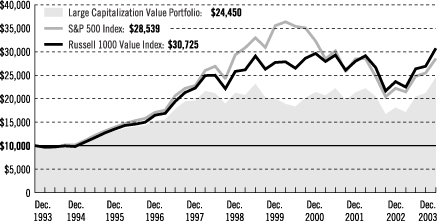
| | | | | | | | | |
| | | |
| Average Annual Total Returns as of 12/31/03 | | | | | | | | | |
| | | One Year | | | Five Years | | | Ten Years | |
With TARGET Program Fee | | 34.35 | % | | 2.75 | % | | 9.35 | % |
| |
| | | |
| | | One Year | | | Five Years | | | Ten Years | |
Without TARGET Program Fee | | 36.38 | % | | 4.31 | % | | 11.01 | % |
| |
Past performance is not indicative of future results. Principal and investment return will fluctuate so that an investor’s shares, when redeemed, may be worth more or less than their original cost.
The graph compares a $10,000 investment in the TARGET Large Capitalization Value Portfolio with a similar investment in the S&P 500 Index and the Russell 1000 Value Index by portraying the initial account values at the beginning of the 10-year period (December 31, 1993) and the account values at the end of the current fiscal year (December 31, 2003), as measured on a quarterly basis. The graph takes into account the maximum quarterly TARGET program fee of 1.50% annually for retail investors. For individual retirement plans and qualified employee benefit plans, taking into account the maximum TARGET program fee of 1.25%, the average annual total return for the 10-year period would have been 9.63% and the growth of a $10,000 investment would have been $25,071. The average annual total returns in the table and the returns on investment in the graph do not reflect the deduction of taxes that a shareholder would pay on Portfolio distributions or following the redemption of Portfolio shares.
The S&P 500 Index is an index of 500 stocks of large U.S. companies. It gives a broad look at how U.S. stock prices have performed. The Russell 1000 Value Index contains those securities in the Russell 1000 Index with a lesser-than-average growth orientation. Companies in this index generally have low price-to-book and price-to-earnings ratios, higher dividend yields, and lower forecasted growth values. These indexes are unmanaged, and the total returns include the reinvestment of all dividends, but do not include the effect of sales charges, operating expenses, or taxes. These returns would be lower if they included the effect of sales charges, operating expenses, or taxes. The securities in these indexes may differ substantially from the securities in the Portfolio. These indexes are not the only ones that may be used to characterize performance of large-capitalization equity funds, and other indexes may portray different comparative performance. Investors cannot invest directly in an index.
| | |
| THE TARGET PORTFOLIO TRUST | | |
Growth of a $10,000 Investment
Small Capitalization Growth Portfolio
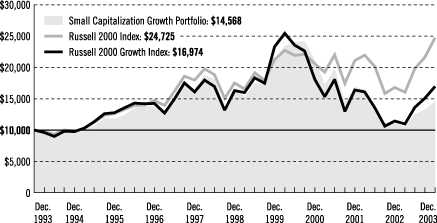
| | | | | | | | | |
| | | |
| Average Annual Total Returns as of 12/31/03 | | | | | | | | | |
| | | One Year | | | Five Years | | | Ten Years | |
With TARGET Program Fee | | 31.07 | % | | –2.65 | % | | 3.83 | % |
| |
| | | |
| | | One Year | | | Five Years | | | Ten Years | |
Without TARGET Program Fee | | 33.05 | % | | –1.17 | % | | 5.41 | % |
| |
Past performance is not indicative of future results. Principal and investment return will fluctuate so that an investor’s shares, when redeemed, may be worth more or less than their original cost.
The graph compares a $10,000 investment in the TARGET Small Capitalization Growth Portfolio with a similar investment in the Russell 2000 Index and the Russell 2000 Growth Index by portraying the initial account values at the beginning of the 10-year period (December 31, 1993) and the account values at the end of the current fiscal year (December 31, 2003), as measured on a quarterly basis. The graph takes into account the maximum quarterly TARGET program fee of 1.50% annually for retail investors. For individual retirement plans and qualified employee benefit plans, taking into account the maximum TARGET program fee of 1.25%, the average annual total return for the 10-year period would have been 4.10% and the growth of a $10,000 investment would have been $14,938. The average annual total returns in the table and the returns on investment in the graph do not reflect the deduction of taxes that a shareholder would pay on Portfolio distributions or following the redemption of Portfolio shares.
The Russell 2000 Index is a weighted index that comprises the smallest 2,000 stocks among the largest 3,000 equity-capitalized U.S. corporations and represents approximately 10% of their aggregate market value. The Russell 2000 Growth Index comprises securities in the Russell 2000 Index with a greater-than-average growth orientation. Companies in this index tend to exhibit higher price-to-book ratios and higher forecasted growth values. These indexes are unmanaged, and the total returns include the reinvestment of all dividends, but do not include the effect of sales charges, operating expenses, or taxes. These returns would be lower if they included the effect of sales charges, operating expenses, or taxes. The securities in these indexes may differ substantially from the securities in the Portfolio. These indexes are not the only ones that may be used to characterize performance of small-capitalization equity funds, and other indexes may portray different comparative performance. Investors cannot invest directly in an index.
| | |
| | | THE TARGET PORTFOLIO TRUST |
Growth of a $10,000 Investment
Small Capitalization Value Portfolio
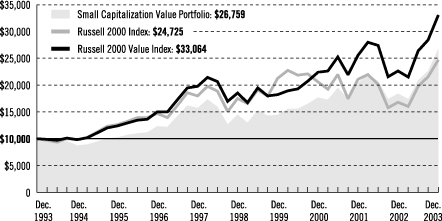
| | | | | | | | | |
| | | |
| Average Annual Total Returns as of 12/31/03 | | | | | | | | | |
| | | One Year | | | Five Years | | | Ten Years | |
With TARGET Program Fee | | 44.91 | % | | 12.96 | % | | 10.34 | % |
| |
| | | |
| | | One Year | | | Five Years | | | Ten Years | |
Without TARGET Program Fee | | 47.10 | % | | 14.67 | % | | 12.01 | % |
| |
Past performance is not indicative of future results. Principal and investment return will fluctuate so that an investor’s shares, when redeemed, may be worth more or less than their original cost.
The graph compares a $10,000 investment in the TARGET Small Capitalization Value Portfolio with a similar investment in the Russell 2000 Index and the Russell 2000 Value Index by portraying the initial account values at the beginning of the 10-year period (December 31, 1993) and the account values at the end of the current fiscal year (December 31, 2003), as measured on a quarterly basis. The graph takes into account the maximum quarterly TARGET program fee of 1.50% annually for retail investors. For individual retirement plans and qualified employee benefit plans, taking into account the maximum TARGET program fee of 1.25%, the average annual total return for the 10-year period would have been 10.62% and the growth of a $10,000 investment would have been $27,439. The average annual total returns in the table and the returns on investment in the graph do not reflect the deduction of taxes that a shareholder would pay on Portfolio distributions or following the redemption of Portfolio shares.
The Russell 2000 Index is a weighted index that comprises the smallest 2,000 stocks among the largest 3,000 equity-capitalized U.S. corporations and represents approximately 10% of their aggregate market value. The Russell 2000 Value Index comprises securities in the Russell 2000 Index with a lesser-than-average growth orientation. Companies in this index tend to exhibit lower price-to-book ratios and lower forecasted growth values. These indexes are unmanaged, and the total returns include the reinvestment of all dividends, but do not include the effect of sales charges, operating expenses, or taxes. These returns would be lower if they included the effect of sales charges, operating expenses, or taxes. The securities in these indexes may differ substantially from the securities in the Portfolio. These indexes are not the only ones that may be used to characterize performance of small-capitalization equity funds, and other indexes may portray different comparative performance. Investors cannot invest directly in an index.
| | |
THE TARGET PORTFOLIO TRUST | | |
Growth of a $10,000 Investment
International Equity Portfolio
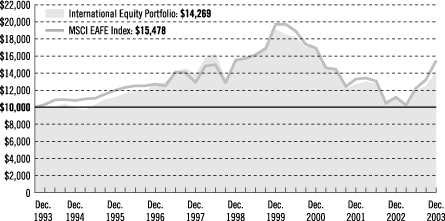
| | | | | | | | | |
| | | |
| Average Annual Total Returns as of 12/31/03 | | | | | | | | | |
| | | One Year | | | Five Years | | | Ten Years | |
With TARGET Program Fee | | 26.84 | % | | –2.00 | % | | 3.62 | % |
| |
| | | |
| | | One Year | | | Five Years | | | Ten Years | |
Without TARGET Program Fee | | 28.76 | % | | –0.51 | % | | 5.19 | % |
| |
Past performance is not indicative of future results. Principal and investment return will fluctuate so that an investor’s shares, when redeemed, may be worth more or less than their original cost.
The graph compares a $10,000 investment in the TARGET International Equity Portfolio with a similar investment in the Morgan Stanley Capital International Europe, Australasia, Far East Index (MSCI EAFE Index) by portraying the initial account values at the beginning of the 10-year period (December 31, 1993) and the account values at the end of the current fiscal year (December 31, 2003), as measured on a quarterly basis. The graph takes into account the maximum quarterly TARGET program fee of 1.50% annually for retail investors. For individual retirement plans and qualified employee benefit plans, taking into account the maximum TARGET program fee of 1.25%, the average annual total return for the 10-year period would have been 3.88% and the growth of a $10,000 investment would have been $14,632. The average annual total returns in the table and the returns on investment in the graph do not reflect the deduction of taxes that a shareholder would pay on Portfolio distributions or following the redemption of Portfolio shares.
The MSCI EAFE Index is a weighted index of performance that reflects stock price movements in Europe, Australasia, and the Far East. The MSCI EAFE Index is unmanaged, and the total returns include the reinvestment of all dividends, but do not include the effect of sales charges, operating expenses, or taxes. These returns would be lower if they included the effect of sales charges, operating expenses, or taxes. The securities in the MSCI EAFE Index may differ substantially from the securities in the Portfolio. The MSCI EAFE Index is not the only one that may be used to characterize performance of international equity funds, and other indexes may portray different comparative performance. Investors cannot invest directly in an index.
| | |
| | | THE TARGET PORTFOLIO TRUST |
Growth of a $10,000 Investment
International Bond Portfolio
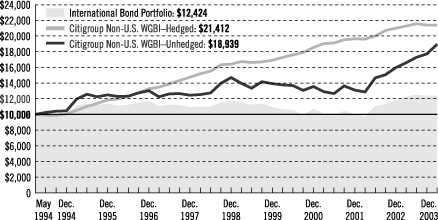
| | | | | | | | | |
|
| Average Annual Total Returns as of 12/31/03 | |
| | | One Year | | | Five Years | | | Since Inception | |
With TARGET Program Fee | | 4.26 | % | | 1.05 | % | | 2.28 | %(2.24) |
| |
| | | |
| | | One Year | | | Five Years | | | Since Inception | |
Without TARGET Program Fee | | 5.31 | % | | 2.06 | % | | 3.31 | %(3.27) |
| |
Past performance is not indicative of future results. Principal and investment return will fluctuate so that an investor’s shares, when redeemed, may be worth more or less than their original cost.
The graph compares a $10,000 investment in the TARGET International Bond Portfolio with a similar investment in the Citigroup Non-U.S. World Government Bond Index–Hedged (Citigroup Non-U.S. WGBI–Hedged) and the Citigroup Non-U.S. World Government Bond Index–Unhedged (Citigroup Non-U.S. WGBI–Unhedged) by portraying the initial account values at the commencement of operations (May 17, 1994) and the account values at the end of the current fiscal year (December 31, 2003), as measured on a quarterly basis. The graph takes into account the maximum quarterly TARGET program fee of 1% annually for retail investors. For individual retirement plans and qualified employee benefit plans, taking into account the maximum TARGET program fee of 1.35%, the average annual total return since inception would have been 1.92% and the growth of a $10,000 investment would have been $12,011. The average annual total returns in the table and the returns on investment in the graph do not reflect the deduction of taxes that a shareholder would pay on Portfolio distributions or following the redemption of Portfolio shares. Without waiver of fees and/or expense subsidization, the Portfolio’s returns would have been lower, as indicated in parentheses.
The Citigroup Non-U.S. WGBI–Hedged is an unmanaged index of approximately 600 high-quality bonds with foreign currency exposure translated to the U.S. dollar. The Citigroup Non-U.S. WGBI–Unhedged is an unmanaged index of approximately 600 high-quality bonds issued in several different currencies. It gives a broad look at how foreign bonds have performed. The indexes’ total returns include the reinvestment of all dividends, but do not include the effect of sales charges, operating expenses, or taxes. These returns would be lower if they included the effect of sales charges, operating expenses, or taxes. The securities in the indexes may differ substantially from the securities in the Portfolio. These indexes are not the only ones that may be used to characterize performance of international bond funds, and other indexes may portray different comparative performance. Investors cannot invest directly in an index.
| | |
| THE TARGET PORTFOLIO TRUST | | |
Growth of a $10,000 Investment
Total Return Bond Portfolio
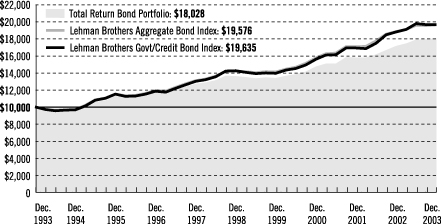
| | | | | | | | | |
|
| Average Annual Total Returns as of 12/31/03 | |
| | | One Year | | | Five Years | | | Ten Years | |
With TARGET Program Fee | | 5.17 | % | | 5.75 | % | | 6.07 | % |
| |
| | | |
| | | One Year | | | Five Years | | | Ten Years | |
Without TARGET Program Fee | | 6.22 | % | | 6.81 | % | | 7.14 | % |
| |
Past performance is not indicative of future results. Principal and investment return will fluctuate so that an investor’s shares, when redeemed, may be worth more or less than their original cost.
The graph compares a $10,000 investment in the TARGET Total Return Bond Portfolio with a similar investment in the Lehman Brothers Aggregate Bond Index and the Lehman Brothers Government/Credit (Govt/Credit Bond) Index by portraying the initial account values at the beginning of the 10-year period (December 31, 1993) and the account values at the end of the current fiscal year (December 31, 2003), as measured on a quarterly basis. The graph takes into account the maximum quarterly TARGET program fee of 1% annually for retail investors. For individual retirement plans and qualified employee benefit plans, taking into account the maximum TARGET program fee of 1.35%, the average annual total return for the 10-year period would have been 5.98% and the growth of a $10,000 investment would have been $18,935. The average annual total returns in the table and the returns on investment in the graph do not reflect the deduction of taxes that a shareholder would pay on Portfolio distributions or following the redemption of Portfolio shares.
The Lehman Brothers Aggregate Bond Index is a market value-weighted index that tracks the daily price, coupon pay-downs, and total return performance of fixed-rate, publicly placed, dollar-denominated, and nonconvertible investment-grade debt issues without at least $100 million par amount outstanding and with at least one year to final maturity. The Lehman Brothers Govt/Credit Bond Index is an index of publicly traded intermediate- and long-term government and corporate debt with an average maturity of 10 years. It gives a broad look at how bonds have performed. .These indexes are unmanaged, and the total returns include the reinvestment of all dividends, but do not include the effect of sales charges, operating expenses, or taxes. These returns would be lower if they included the effect of sales charges, operating expenses, or taxes. The securities in these indexes may differ substantially from the securities in the Portfolio. These indexes are not the only ones that may be used to characterize performance of bond funds, and other indexes may portray different comparative performance. Investors cannot invest directly in an index.
| | |
| | | THE TARGET PORTFOLIO TRUST |
Growth of a $10,000 Investment
Intermediate-Term Bond Portfolio
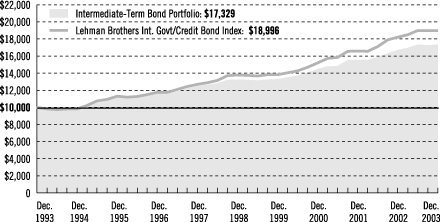
| | | | | | | | | |
| | | |
| Average Annual Total Returns as of 12/31/03 | | | | | | | | | |
| | | One Year | | | Five Years | | | Ten Years | |
With TARGET Program Fee | | 3.54 | % | | 5.44 | % | | 5.65 | % |
| |
| | | |
| | | One Year | | | Five Years | | | Ten Years | |
Without TARGET Program Fee | | 4.58 | % | | 6.50 | % | | 6.71 | % |
| |
Past performance is not indicative of future results. Principal and investment return will fluctuate so that an investor’s shares, when redeemed, may be worth more or less than their original cost.
The graph compares a $10,000 investment in the TARGET Intermediate-Term Bond Portfolio with a similar investment in the Lehman Brothers Intermediate Government/Credit Bond Index (formerly Lehman Brothers Int. Govt/Credit Bond Index) by portraying the initial account values at the beginning of the 10-year period (December 31, 1993) and the account values at the end of the current fiscal year (December 31, 2003), as measured on a quarterly basis. The graph takes into account the maximum quarterly TARGET program fee of 1% annually for retail investors. For individual retirement plans and qualified employee benefit plans, taking into account the maximum TARGET program fee of 1.35%, the average annual total return for the 10-year period would have been 5.28% and the growth of a $10,000 investment would have been $16,731. The average annual total returns in the table and the returns on investment in the graph do not reflect the deduction of taxes that a shareholder would pay on Portfolio distributions or following the redemption of Portfolio shares.
The Lehman Brothers Int. Govt/Credit Bond Index is a weighted index comprising securities issued by the U.S. government and its agencies, and securities publicly issued by corporations, with 1 to 10 years remaining to maturity and rated investment grade. The Lehman Brothers Int. Govt/Credit Bond Index is unmanaged, and the total returns include the reinvestment of all dividends, but do not include the effect of sales charges, operating expenses, or taxes. These returns would be lower if they included the effect of sales charges, operating expenses, or taxes. The securities in the Lehman Brothers Int. Govt/Credit Bond Index may differ substantially from the securities in the Portfolio. The Lehman Brothers Int. Govt/Credit Bond Index is not the only one that may be used to characterize performance of bond funds, and other indexes may portray different comparative performance. Investors cannot invest directly in an index.
| | |
| | | THE TARGET PORTFOLIO TRUST |
Growth of a $10,000 Investment
Mortgage Backed Securities Portfolio
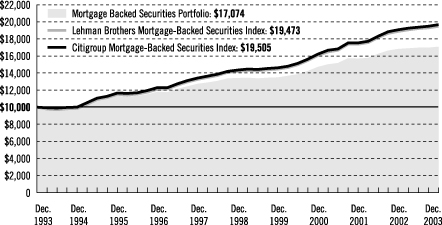
| | | | | | | | |
|
| Average Annual Total Returns as of 12/31/03 |
| | | One Year | | | Five Years | | | Ten Years |
With TARGET Program Fee | | 1.18 | % | | 4.89 | % | | 5.48% (5.47) |
|
| | | |
| | | One Year | | | Five Years | | | Ten Years |
Without TARGET Program Fee | | 2.20 | % | | 5.94 | % | | 6.54% (6.53) |
|
Past performance is not indicative of future results. Principal and investment return will fluctuate so that an investor’s shares, when redeemed, may be worth more or less than their original cost.
The graph compares a $10,000 investment in the TARGET Mortgage Backed Securities Portfolio with a similar investment in the Lehman Brothers Mortgage-Backed Securities Index and the Citigroup Mortgage-Backed Securities Index by portraying the initial account values at the beginning of the 10-year period (December 31, 1993) and the account values at the end of the current fiscal year (December 31, 2003), as measured on a quarterly basis. The graph takes into account the maximum quarterly TARGET program fee of 1% annually for retail investors. For individual retirement plans and qualified employee benefit plans, taking into account the maximum TARGET program fee of 1.35%, the average annual total return for the 10-year period would have been 5.11% and the growth of a $10,000 investment would have been $16,485. The average annual total returns in the table and the returns on investment in the graph do not reflect the deduction of taxes that a shareholder would pay on Portfolio distributions or following the redemption of Portfolio shares. Without waiver of management fees and/or expense subsidizations, the Portfolio’s average annual total returns would have been lower, as indicated in parentheses.
The Lehman Brothers Mortgage-Backed Securities Index is a market capitalization-weighted index of 15-year and 30-year fixed-rate securities backed by the mortgage pools of the GNMA, the FNMA, and the FHLMC, and balloon mortgages with fixed-rate coupons. The Citigroup Mortgage-Backed Securities Index is an index of 30- and 15-year mortgage-related securities issued by U.S. government agencies. It gives a broad look at how mortgage-backed securities have performed. These indexes are unmanaged, and the total returns include the reinvestment of all dividends, but do not include the effect of sales charges, operating expenses, or taxes. These returns would be lower if they included the effect of sales charges, operating expenses, or taxes. The securities in these indexes may differ substantially from the securities in the Portfolio. These indexes are not the only ones that may be used to characterize performance of bond funds, and other indexes may portray different comparative performance. Investors cannot invest directly in an index.
| | |
| | | THE TARGET PORTFOLIO TRUST |
| | |
| |
| n MAIL | | n TELEPHONE |
Gateway Center Three 100 Mulberry Street Newark, NJ 07102 | | (800) 225-1852 |
|
| TRUSTEES |
| David E.A. Carson•Robert F. Gunia•Robert E. La Blanc•Douglas H. McCorkindale•Richard A. Redeker•Judy A. Rice•Robin B. Smith•Stephen D. Stoneburn•Clay T. Whitehead |
|
| OFFICERS |
| Judy A. Rice, President•Robert F. Gunia, Vice President•Grace C. Torres, Treasurer and Principal Financial and Accounting Officer•Marguerite E.H. Morrison, Chief Legal Officer and Assistant Secretary•Lori E. Bostrom, Secretary•Maryanne Ryan, Anti-Money Laundering Compliance Officer |
| | | | |
| MANAGER | | Prudential Investments LLC | | Gateway Center Three
100 Mulberry Street
Newark, NJ 07102 |
|
| INVESTMENT ADVISERS | | Columbus Circle
Investors LLC | | Metro Center
One Station Plaza
Stamford, CT 06902 |
|
| | | EARNEST Partners, LLC | | 75 14th Street, Suite 2300
Atlanta, GA 30309 |
|
| | | Fischer Francis Trees &
Watts, Inc. | | 200 Park Avenue
New York, NY 10166 |
|
| | | Hotchkis and Wiley Capital
Management, LLC | | 725 S. Figueroa Street
Suite 3900
Los Angeles, CA 90017 |
|
| | | J.P. Morgan Investment
Management Inc. | | 522 Fifth Avenue
New York, NY 10036 |
|
| | | Lazard Asset Management
LLC | | 30 Rockefeller Plaza
New York, NY 10112 |
|
| | | NFJ Investment Group L.P. | | 2121 San Jacinto
Suite 1840
Dallas, TX 75201 |
|
| | | Oak Associates, Ltd. | | 3875 Embassy Parkway
Suite 250
Akron, OH 44333 |
|
| | | Pacific Investment
Management Company LLC | | 840 Newport Center Drive
Newport Beach, CA 92660 |
|
| | | RS Investment
Management, L.P. | | 388 Market Street
Suite 1700
San Francisco, CA 94111 |
| | | | |
| | | Wellington Management
Company, LLP | | 75 State Street
Boston, MA 02109 |
|
| | | Westcap Investors, LLC | | 11111 Santa Monica
Boulevard
Suite 820
Los Angeles, CA 90025 |
|
| DISTRIBUTOR | | Prudential Investment
Management Services LLC | | Gateway Center Three
14th Floor
100 Mulberry Street
Newark, NJ 07102 |
|
| CUSTODIAN | | The Bank of New York | | One Wall Street
New York, NY 10286 |
|
| TRANSFER AGENT | | Prudential Mutual Fund
Services LLC | | PO Box 8098
Philadelphia, PA 19101 |
|
| INDEPENDENT AUDITORS | | PricewaterhouseCoopers LLP | | 1177 Avenue of the
Americas
New York, NY 10036 |
|
| FUND COUNSEL | | Shearman & Sterling LLP | | 599 Lexington Avenue
New York, NY 10022 |
This report is not authorized for distribution to prospective investors unless preceded or accompanied by a current prospectus. The views expressed in this report and information about the portfolios’ holdings are for the period covered by this report and are subject to change thereafter.
Prudential Financial and the Rock logo are registered service marks of The Prudential Insurance Company of America, Newark, NJ, and its affiliates.
| | | | | | | | | | | | | | |
|
| The TARGET Portfolio Trust |
| | | | | Nasdaq | | CUSIP | | | | Nasdaq | | CUSIP | | |
| | | | | | | |
| | | Large Capitalization Growth | | TALGX | | 875921207 | | Large Capitalization Value | | TAXVX | | 875921108 | | |
| | | Small Capitalization Growth | | TASGX | | 875921405 | | Small Capitalization Value | | TASVX | | 875921306 | | |
| | | | | | | |
| | | International Equity | | TAIEX | | 875921504 | | International Bond | | TIBPX | | 875921876 | | |
| | | Total Return Bond | | TATBX | | 875921884 | | Intermediate-Term Bond | | TAIBX | | 875921801 | | |
| | | | | | | |
| | | Mortgage Backed Securities | | TGMBX | | 875921702 | | U.S. Government Money Market | | PUGXX | | 875921603 | | |
| | | | | | | | | | | | | | | |
Mutual Funds:
| | | | |
| ARE NOT INSURED BY THE FDIC OR ANY FEDERAL GOVERNMENT AGENCY | | MAY LOSE VALUE | | ARE NOT A DEPOSIT OF OR GUARANTEED BY ANY BANK OR ANY BANK AFFILIATE |

| | | | | | | | | | | | | | |
| | |
| | | The TARGET Portfolio Trust | | |
| | | | | Nasdaq | | CUSIP | | | | Nasdaq | | CUSIP | | |
| | | | | | | |
| | | Large Capitalization Growth | | TALGX | | 875921207 | | Large Capitalization Value | | TAXVX | | 875921108 | | |
| | | Small Capitalization Growth | | TASGX | | 875921405 | | Small Capitalization Value | | TASVX | | 875921306 | | |
| | | | | | | |
| | | International Equity | | TAIEX | | 875921504 | | International Bond | | TIBPX | | 875921876 | | |
| | | Total Return Bond | | TATBX | | 875921884 | | Intermediate-Term Bond | | TAIBX | | 875921801 | | |
| | | | | | | |
| | | Mortgage Backed Securities | | TGMBX | | 875921702 | | U.S. Government Money Market | | PUGXX | | 875921603 | | |
| | | | | | | | | | | | | | | |
TMF158E IFS-A088432
Item 2 – Code of Ethics – – See Exhibit (a)
As of the end of the period covered by this report, the registrant has adopted a code of ethics (the “Section 406 Standards for Investment Companies – Ethical Standards for Principal Executive and Financial Officers”) that applies to the registrant’s Principal Executive Officer and Principal Financial Officer; the registrant’s Principal Financial Officer also serves as the Principal Accounting Officer.
The registrant hereby undertakes to provide any person, without charge, upon request, a copy of the code of ethics. To request a copy of the code of ethics, contact the registrant 973-367-1495, and ask for a copy of the Section 406 Standards for Investment Companies – Ethical Standards for Principal Executive and Financial Officers.
Item 3 – Audit Committee Financial Expert –
The registrant’s Board has determined that Mr. David Carson, member of the Board’s Audit Committee is an “audit committee financial expert,” and that he is “independent,” for purposes of this Item.
Item 4 – Principal Accountant Fees and Services –
Form N-CSR, Item 4. Principal Accountant Fees and Services
For each of the fiscal years ended December 31, 2003 and December 31, 2002 PricewaterhouseCoopers LLP (“PwC”), the Registrant’s principal accountant, billed the Registrant $176,000 (for ten portfolios in the series) for professional services rendered for the audit of the Registrant’s annual financial statements or services that are normally provided in connection with statutory and regulatory filings.
None.
None.
None.
| (e) (1) | Audit Committee Pre-Approval Policies and Procedures |
THE PRUDENTIAL MUTUAL FUNDS
AUDIT COMMITTEE POLICY
on
Pre-Approval of Services Provided by the Independent Accountants
The Audit Committee of each Prudential Mutual Fund is charged with the responsibility to monitor the independence of the Fund’s independent accountants. As part of this responsibility, the Audit Committee must pre-approve any independent accounting firm’s engagement to render audit and/or permissible non-audit services, as required by law. In evaluating a proposed engagement of the independent accountants, the Audit Committee will assess the effect that the engagement might reasonably be expected to have on the accountant’s independence. The Committee’s evaluation will be based on:
| | • | a review of the nature of the professional services expected to be provided, |
| | • | a review of the safeguards put into place by the accounting firm to safeguard independence, and |
| | • | periodic meetings with the accounting firm. |
Policy for Audit and Non-Audit Services Provided to the Funds
On an annual basis, the scope of audits for each Fund, audit fees and expenses, and audit-related and non-audit services (and fees proposed in respect thereof) proposed to be performed by the Fund’s independent accountants will be presented by the Treasurer and the independent accountants to the Audit Committee for review and, as appropriate, approval prior to the initiation of such services. Such presentation shall be accompanied by confirmation by both the Treasurer and the independent accountants that the proposed services will not adversely affect the independence of the independent accountants. Proposed services shall be described in sufficient detail to enable the Audit Committee to assess the appropriateness of such services and fees, and the compatibility of the provision of such services with the auditor’s independence. The Committee shall receive periodic reports on the progress of the audit and other services which are approved by the Committee or by the Committee Chair pursuant to authority delegated in this Policy.
The categories of services enumerated under “Audit Services”, “Audit-related Services”, and “Tax Services” are intended to provide guidance to the Treasurer and the independent accountants as to those categories of services which the Committee believes are generally consistent with the independence of the independent accountants and which the Committee (or the Committee Chair) would expect upon the presentation of specific proposals to pre-approve.
The enumerated categories are not intended as an exclusive list of audit, audit-related or tax services which the Committee (or the Committee Chair) would consider for pre-approval.
Audit Services
The following categories of audit services are considered to be consistent with the role of the Fund’s independent accountants
| | Ø | Annual Fund financial statement audits |
| | Ø | Seed audits (related to new product filings, as required) |
| | Ø | SEC and regulatory filings and consents |
Audit-related Services
The following categories of audit-related services are considered to be consistent with the role of the Fund’s independent accountants:
| | Ø | Accounting consultations |
| | Ø | Fund merger support services |
| | Ø | Agreed Upon Procedure Reports |
| | Ø | Other Internal Control Reports |
Individual audit-related services that fall within one of these categories and are not presented to the Audit Committee as part of the annual pre-approval process will be subject to pre-approval by the Committee Chair (or any other Committee member on whom this responsibility has been delegated) so long as the estimated fee for those services does not exceed $50,000.
Tax Services
The following categories of tax services are considered to be consistent with the role of the Fund’s independent accountants:
| | Ø | Tax compliance services related to the filing or amendment of the following: |
| | n | Federal, state and local income tax compliance; and, |
| | n | Sales and use tax compliance |
| | Ø | Timely RIC qualification reviews |
| | Ø | Tax distribution analysis and planning |
| | Ø | Tax authority examination services |
| | Ø | Tax appeals support services |
| | Ø | Accounting methods studies |
| | Ø | Fund merger support services |
| | Ø | Tax consulting services and related projects |
Individual tax services that fall within one of these categories and are not presented to the Audit Committee as part of the annual pre-approval process will be subject to pre-approval by the
Committee Chair (or any other Committee member on whom this responsibility has been delegated) so long as the estimated fee for those services does not exceed $50,000.
Other Non-audit Services
Certain non-audit services that the independent accountants are legally permitted to render will be subject to pre-approval by the Committee or by one or more Committee members to whom the Committee has delegated this authority and who will report to the full Committee any pre-approval decisions made pursuant to this Policy. Non-audit services presented for pre-approval pursuant to this paragraph will be accompanied by a confirmation from both the Treasurer and the independent accountants that the proposed services will not adversely affect the independence of the independent accountants.
Proscribed Services
The Fund’s independent accountants will not render services in the following categories of non-audit services:
| | Ø | Bookkeeping or other services related to the accounting records or financial statements of the Fund |
| | Ø | Financial information systems design and implementation |
| | Ø | Appraisal or valuation services, fairness opinions, or contribution-in-kind reports |
| | Ø | Internal audit outsourcing services |
| | Ø | Management functions or human resources |
| | Ø | Broker or dealer, investment adviser, or investment banking services |
| | Ø | Legal services and expert services unrelated to the audit |
| | Ø | Any other service that the Public Company Accounting Oversight Board determines, by regulation, is impermissible. |
Pre-approval of Non-Audit Services Provided to Other Entities Within the Prudential Fund Complex
Certain non-audit services provided to Prudential Investments LLC or any of its affiliates that also provide ongoing services to the Prudential Mutual Funds will be subject to pre-approval by the Audit Committee. The only non-audit services provided to these entities that will require pre-approval are those related directly to the operations and financial reporting of the Funds. Individual projects that are not presented to the Audit Committee as part of the annual pre-approval process, will be subject to pre-approval by the Committee Chair (or any other Committee member on whom this responsibility has been delegated) so long as the estimated fee for those services does not exceed $50,000. Services presented for pre-approval pursuant to this paragraph will be accompanied by a confirmation from both the Treasurer and the independent accountants that the proposed services will not adversely affect the independence of the independent accountants.
Although the Audit Committee will not pre-approve all services provided to Prudential Investments LLC and its affiliates, the Committee will receive an annual report from the Fund’s independent accounting firm showing the aggregate fees for all services provided to Prudential Investments and its affiliates.
(e)-(2) Percentage of services referred to in 4(b)- (4)(d) that were approved by the audit committee –Not applicable.
| (f) | Percentage of hours expended attributable to work performed by other than full time employees of principal accountant if greater than 50%. |
Not applicable.
N/A to Registrant. The aggregate non-audit fees billed by PwC for services rendered to the registrant’s investment adviser and any entity controlling, controlled by, or under common control with the investment adviser that provides ongoing services to the registrant for each of the last two fiscal years 2003 and 2002 were $1,715,979 and $1,601,295 respectively.
(h) Principal Accountants Independence
The Registrant’s Audit Committee has considered whether the provision of non-audit services that were rendered to the registrant’s investment adviser and any entity controlling, controlled by, or under common control with the investment adviser that provides ongoing services to the registrant that were not pre-approved pursuant to Rule 2-01(c)(7)(ii) of Regulation S-X is compatible with maintaining PwC’s independence.
Item 5 – Reserved
Item 6 – Reserved
Item 7 – Disclosure of Proxy Voting Policies and Procedures for Closed-End Management Investment Companies – Not required in this filing
Item 8 – Reserved
Item 9 – Controls and Procedures
| | (a) | It is the conclusion of the registrant’s principal executive officer and principal financial officer that the effectiveness of the registrant’s current disclosure controls and procedures (such disclosure controls and procedures having been evaluated within 90 days of the date of this filing) provide reasonable assurance that the information required to be disclosed by the registrant has been recorded, processed, summarized and reported within the time period specified in the Commission’s rules and forms and that the information required to be disclosed by the registrant has been accumulated and communicated to the registrant’s principal executive officer and principal financial officer in order to allow timely decisions regarding required disclosure. |
| | (b) | There have been no significant changes in the registrant’s internal controls or in other factors that could significantly affect these controls subsequent to the date of their evaluation, including any corrective actions with regard to significant deficiencies and material weaknesses. |
Item 10 – Exhibits
| | (a) | Code of Ethics – attached hereto |
| | (b) | Certifications pursuant to Section 302 and 906 of the Sarbanes-Oxley Act – Attached hereto |
SIGNATURES
Pursuant to the requirements of the Securities Exchange Act of 1934 and the Investment Company Act of 1940, the registrant has duly caused this report to be signed on its behalf by the undersigned, thereunto duly authorized.
| | | | |
(Registrant) | | The Target Portfolio Trust
|
| |
| By (Signature and Title)* | | /s/ Lori E. Bostrom |
| |
|
| | Lori E. Bostrom |
| | Secretary |
| |
Date | | February 23, 2004
|
Pursuant to the requirements of the Securities Exchange Act of 1934 and the Investment Company Act of 1940, this report has been signed below by the following persons on behalf of the registrant and in the capacities and on the dates indicated.
| | | | |
| |
| By (Signature and Title)* | | /s/ Judy A. Rice |
| |
|
| | Judy A. Rice |
| | President and Principal Executive Officer |
| |
Date | | February 23, 2004
|
| | | | |
| |
| By (Signature and Title)* | | /s/ Grace C. Torres
|
| | Grace C. Torres |
| | Treasurer and Principal Financial Officer |
| |
Date | | February 23, 2004
|
| * | Print the name and title of each signing officer under his or her signature. |