UNITED STATES
SECURITIES AND EXCHANGE COMMISSION
Washington, D.C. 20549
FORM N-CSR
CERTIFIED SHAREHOLDER REPORT OF REGISTERED MANAGEMENT
INVESTMENT COMPANIES
| | |
Investment Company Act file number: | | 811-07064 |
| |
Exact name of registrant as specified in charter: | | The Target Portfolio Trust |
| |
Address of principal executive offices: | | Gateway Center 3, 100 Mulberry Street, Newark, New Jersey 07102 |
| |
Name and address of agent for service: | | Deborah A. Docs Gateway Center 3, 100 Mulberry Street, Newark, New Jersey 07102 |
| |
Registrant’s telephone number, including area code: | | 973-367-7521 |
| |
Date of fiscal year end: | | 12/31/2004 |
| |
Date of reporting period: | | 12/31/2004 |
Item 1 – Reports to Stockholders – [ INSERT REPORT ]


The TARGETPortfolio Trust®
Annual Report
December 31, 2004
TARGET
A STRUCTURED AND PERSONALIZED INVESTMENT PROGRAM
This report is not authorized for distribution to prospective investors unless preceded or accompanied by a current prospectus.
The views expressed in this report and information about the Trust’s portfolios’ securities are for the period covered by this report and are subject to change thereafter.

| | |
| Dear TARGET Shareholder: | | February 14, 2005 |
We hope that you find the Annual report for The TARGET Portfolio Trust informative and useful. Today many investors may be asking where they can find new growth opportunities. As a TARGET shareholder, we believe that you are uniquely positioned for domestic and global growth opportunities because you already have a strategic investment plan in place.
The TARGET program’s structured and professional approach to investing helps you “tune out” the noise of current market developments and allows you to concentrate on what’s really important—your long-term goals. It started with a personal plan that you and your financial professional constructed based on your reasons for investing, the time you have to reach your goals, and the level of risk you were willing to assume. Your financial professional worked closely with you to develop an appropriate asset allocation, and then the rest was relatively simple because there is a corresponding TARGET portfolio for each asset class. The managers for each portfolio are carefully chosen and are monitored by our team of experienced investment management analysts. These firms are among the leading institutional money managers available whose typical clients include pension funds, Fortune 500 companies, and very wealthy individuals.
Your TARGET program also evolves with your changing needs. Your financial professional should help you track your plan’s progress, stay informed of important developments, and assist you in determining whether you need to modify your portfolio. In these ways and more, the TARGET program seeks to make your investment goals a reality.
Thank you for your continued confidence.
Sincerely,

Judy A. Rice, President
The TARGET Portfolio Trust
| | |
| THE TARGET PORTFOLIO TRUST | | 1 |
Equity Portfolios Performance
Performance data quoted represent past performance. Past performance does not guarantee future results. The investment return and principal value of an investment will fluctuate so that an investor’s shares, when redeemed, may be worth more or less than their original cost. Current performance may be lower or higher than the past performance data quoted. An investor may obtain performance data current to the most recent month-end by visiting our website at www.prudential.com or by calling (800) 225-1852. The maximum TARGET program fee for retail investors is 1.50%.
| | | | | | | | | | | |
| Equity Portfolios for years ended 12/31/04 | | | | | | | | | |
| | | Total Returns1
(Without
TARGET
Program Fee) | | | Average Annual Total Returns1
(With TARGET Program Fee) |
| | | One Year | | | One Year | | | Five Years | | | Ten Years |
Large Capitalization Growth Portfolio | | 3.78 | % | | 2.23 | % | | –9.19 | % | | 8.97% |
S&P 500 Index2 | | 10.87 | | | 10.87 | | | –2.30 | | | 12.07 |
Russell 1000 Growth Index2 | | 6.30 | | | 6.30 | | | –9.29 | | | 9.59 |
Lipper Large-Cap Core Funds Avg.3 | | 7.79 | | | 7.79 | | | –3.45 | | | 9.98 |
| | | | | | | | | | | | |
Large Capitalization Value Portfolio | | 18.87 | % | | 17.10 | % | | 7.32 | % | | 11.02% |
S&P 500 Index2 | | 10.87 | | | 10.87 | | | –2.30 | | | 12.07 |
Russell 1000 Value Index2 | | 16.49 | | | 16.49 | | | 5.27 | | | 13.83 |
Lipper Multi-Cap Value Funds Avg.3 | | 14.39 | | | 14.39 | | | 5.36 | | | 11.86 |
| | | | | | | | | | | | |
Small Capitalization Growth Portfolio | | 15.03 | % | | 13.32 | % | | –4.88 | % | | 5.53% |
Russell 2000 Index2 | | 18.33 | | | 18.33 | | | 6.61 | | | 11.54 |
Russell 2000 Growth Index2 | | 14.31 | | | 14.31 | | | –3.57 | | | 7.12 |
Lipper Small-Cap Growth Funds Avg.3 | | 10.65 | | | 10.65 | | | –1.82 | | | 9.44 |
| | | | | | | | | | | | |
Small Capitalization Value Portfolio | | 24.02 | % | | 22.17 | % | | 17.60 | % | | 14.07% |
Russell 2000 Index2 | | 18.33 | | | 18.33 | | | 6.61 | | | 11.54 |
Russell 2000 Value Index2 | | 22.25 | | | 22.25 | | | 17.23 | | | 15.17 |
Lipper Small-Cap Core Funds Avg.3 | | 18.38 | | | 18.38 | | | 10.33 | | | 12.96 |
| | | | | | | | | | | | |
International Equity Portfolio | | 15.23 | % | | 13.51 | % | | –3.31 | % | | 5.08% |
MSCI EAFE Index2 | | 20.25 | | | 20.25 | | | –1.13 | | | 5.62 |
Lipper International Funds Avg.3 | | 20.14 | | | 20.14 | | | –0.44 | | | 6.10 |
1Source: Prudential Investments LLC and Lipper Inc. Total returns assume the reinvestment of all dividends and distributions, and take into account all charges and expenses applicable to an investment in each portfolio. The one-year total returns do not reflect a deduction for the annual TARGET program fee. Returns would be lower if the fee were deducted. The average annual total returns for the TARGET portfolios assume the imposition of the
| | |
| 2 | | THE TARGET PORTFOLIO TRUST |
maximum TARGET annual advisory fee of 1.50% for equity portfolios for retail investors. The maximum advisory fee for retirement accounts is 1.25% of equity portfolio assets. Returns in the table do not reflect the deduction of taxes that a shareholder would pay on portfolio distributions or following the redemption of portfolio shares.
2Investors cannot invest directly in an index. The returns for the benchmark indexes would be lower if they reflected deductions for TARGET program fees, portfolio operating expenses, sales charges, or taxes. The Standard & Poor’s 500 Composite Stock Price Index (S&P 500 Index) is an unmanaged index of 500 stocks of large U.S. companies. It gives a broad look at how stock prices have performed. The Russell 1000 Growth Index contains those securities in the Russell 1000 Index with an above-average growth orientation. Companies in this index tend to exhibit higher price-to-book and price-to-earnings ratios, lower dividend yields, and higher forecasted growth rates. The Russell 1000 Value Index contains those securities in the Russell 1000 Index with a below-average growth orientation. Companies in this index generally have low price-to-book and price-to-earnings ratios, higher dividend yields, and lower forecasted growth values. The Russell 2000 Index is an unmanaged index of the stocks of the 2,000 smallest U.S. companies included in the Russell 3000 Index. It gives a broad look at how the stock prices of smaller companies have performed. The Russell 2000 Growth Index contains those securities in the Russell 2000 Index with an above-average growth orientation. Companies in this index generally have higher price-to-book and price-to-earnings ratios. The Russell 2000 Value Index contains those securities in the Russell 2000 Index with a below-average growth orientation. Companies in this index generally have low price-to-earnings ratios, higher dividend yields, and lower forecasted growth values. The Morgan Stanley Capital International Europe, Australasia, and Far East Index (MSCI EAFE Index) is an unmanaged, weighted index that reflects stock price movements in Europe, Australasia, and the Far East. It gives a broad look at how foreign stocks have performed.
3The Lipper averages represent returns based on an average of all funds in the respective Lipper categories for the periods noted. The returns for the Lipper averages would be lower if they reflected deductions for TARGET program fees, portfolio operating expenses, sales charges, or taxes. Large-Cap Core funds invest at least 75% of their equity assets in companies with market capitalizations (on a three-year weighted basis) greater than 300% of the dollar-weighted median market capitalization of the middle 1,000 securities of the S&P SuperComposite 1500 Index. Large-cap core funds have an above-average price-to-earnings ratio, price-to-book ratio, and three-year sales-per-share growth value compared with the S&P 500 Index. Multi-Cap Value funds invest in a variety of market capitalization ranges without concentrating 75% of their equity assets in any one market capitalization range over an extended period of time. Multi-cap funds typically have between 25% and 75% of their assets invested in companies with market capitalizations (on a three-year weighted basis) above 300% of the dollar-weighted median market capitalization of the middle 1,000 securities of the S&P SuperComposite 1500 Index. Multi-cap value funds typically have a below-average price-to-earnings ratio and three-year sales-per-share growth value compared with the S&P 500 Index. Small-Cap Growth funds invest at least 75% of their equity assets in companies with market capitalizations (on a three-year weighted basis) less than 250% of the dollar-weighted median of the smallest 500 of the middle 1,000 securities of the S&P SuperComposite 1500 Index. Small-cap growth funds typically have an above-average price-to-earnings ratio, price-to-book ratio, and three-year sales-per-share growth value compared with the S&P SmallCap 600 Index. Small-Cap Core funds invest at least 75% of their equity assets in companies with market capitalizations (on a three-year weighted basis) less than 250% of the dollar-weighted median of the smallest 500 of the middle 1,000 securities of the S&P SuperComposite 1500 Index. Small-cap core funds have more latitude in the companies in which they invest. These funds typically have an average price-to-earnings ratio and three-year sales-per-share growth value compared with the S&P SmallCap 600 Index. International funds invest their assets in securities with primary trading markets outside of the United States.
| | |
| THE TARGET PORTFOLIO TRUST | | 3 |
Fixed Income Portfolios Performance
Performance data quoted represent past performance. Past performance does not guarantee future results. The investment return and principal value of an investment will fluctuate so that an investor’s shares, when redeemed, may be worth more or less than their original cost. Current performance may be lower or higher than the past performance data quoted. An investor may obtain performance data current to the most recent month-end by visiting our website at www.prudential.com or by calling (800) 225-1852. The maximum TARGET program fee for retirement accounts is 1.35%.
| | | | | | | | | | | |
| Fixed Income Portfolios for years ended 12/31/04 | | | | | | | | | |
| | | Total Returns1
(Without TARGET Program Fee) | | | Average Annual Total Returns1
(with TARGET Program Fee) |
| | | One Year | | | One Year | | | Five Years | | | Ten Years |
International Bond Portfolio | | 3.71 | % | | 2.67 | % | | 3.03 | % | | 2.45% (2.43)2 |
Citigroup Non-U.S. WGBI-Hedged3 | | 5.17 | | | 5.17 | | | 5.90 | | | 8.39 |
Lipper International Income Funds Avg.4 | | 10.47 | | | 10.47 | | | 8.62 | | | 7.50 |
| | | | | | | | | | | | |
Total Return Bond Portfolio | | 4.73 | % | | 3.69 | % | | 6.87 | % | | 6.95% |
Lehman Brothers U.S. Aggregate Bond Index3 | | 4.34 | | | 4.34 | | | 7.71 | | | 7.72 |
Lipper Corporate Debt BBB-Rated Funds Avg.4 | | 5.11 | | | 5.11 | | | 7.53 | | | 7.75 |
| | | | | | | | | | | | |
Intermediate-Term Bond Portfolio | | 3.19 | % | | 2.16 | % | | 5.83 | % | | 6.22% |
Lehman Brothers Int. Govt./Credit Bond Index3 | | 3.04 | | | 3.04 | | | 7.21 | | | 7.16 |
Lipper Int. Inv.-Grade Debt Funds Avg.4 | | 3.85 | | | 3.85 | | | 6.85 | | | 6.89 |
| | | | | | | | | | | | |
Mortgage Backed Securities Portfolio | | 3.68 | % | | 2.64 | % | | 5.33 | % | | 5.92% (5.91)2 |
Lehman Brothers Mortgage-Backed Securities Index3 | | 4.70 | | | 4.70 | | | 7.14 | | | 7.56 |
Citigroup Mortgage-Backed Securities Index3 | | 4.83 | | | 4.83 | | | 7.21 | | | 7.57 |
Lipper U.S. Mortgage Funds Avg.4 | | 3.68 | | | 3.68 | | | 6.33 | | | 6.57 |
1Source: Prudential Investments LLC and Lipper Inc. Total returns assume the reinvestment of all dividends and distributions, and take into account all charges and expenses applicable to an investment in each portfolio. The one-year total returns do not reflect a deduction for the annual TARGET program fee. Returns would be lower if the fee were deducted. The average annual total returns for the TARGET portfolios assume the imposition of the maximum TARGET annual advisory fee of 1.00% for bond portfolios for retail investors. The maximum advisory fee for retirement accounts is 1.35% of bond portfolio assets. Returns in the table do not reflect the deduction of taxes that a shareholder would pay on Portfolio distributions or following the redemption of Portfolio shares.
2Without waiver of fees and/or expense subsidization, the portfolios’ returns would have been lower, as indicated in parentheses.
3Investors cannot invest directly in an index. The returns for the benchmark indexes would be lower if they reflected deductions for TARGET program fees, portfolio operating expenses, sales charges, or taxes. The Citigroup
| | |
| 4 | | THE TARGET PORTFOLIO TRUST |
Non-U.S. World Government Bond Index Hedged (WGBI-Hedged) is an unmanaged index of approximately 600 high-quality bonds with foreign currency exposure translated to the U.S. dollar. It gives a broad look at how foreign bonds have performed. The Lehman Brothers U.S. Aggregate Bond Index (LABI) is an unmanaged index of investment-grade securities issued by the U.S. government and its agencies and by corporations with between 1 and 10 years remaining to maturity. It gives a broad look at how bond prices of short- and intermediate-term bonds have performed. The Lehman Brothers Intermediate Government/Credit Bond Index is an unmanaged index of publicly traded U.S. government bonds and investment-grade corporate bonds with maturities of up to 10 years. It gives a broad look at how intermediate-term bonds have performed. The Lehman Brothers Mortgage-Backed Securities Index is a market capitalization-weighted index of 15- and 30-year fixed-rate securities backed by GNMA, FNMA, and FHLMC mortgage pools, and balloon mortgages with fixed-rate coupons. The Citigroup Mortgage-Backed Securities Index is an unmanaged index of 15- and 30-year mortgage-related securities issued by U.S. government agencies. Each of them gives a broad look at how mortgage-backed securities have performed.
4The Lipper averages represent returns based on an average of all funds in the respective Lipper categories for the periods noted. The returns for the Lipper averages would be lower if they reflected deductions for TARGET program fees, portfolio operating expenses, sales charges, or taxes. International Income funds invest primarily in U.S. dollar and non-U.S. dollar debt securities of issuers located in at least three countries, excluding the United States, except in periods of market weakness. Corporate Debt BBB-Rated funds invest primarily in corporate and government debt issues rated in the top four grades. Intermediate Investment-Grade Debt funds invest primarily in investment-grade debt issues (rated in the top four grades) with dollar-weighted average maturities of 5 to 10 years. U.S. Mortgage funds invest primarily in mortgages/securities issued or guaranteed as to principal and interest by the U.S. government and certain federal agencies.
| | |
| THE TARGET PORTFOLIO TRUST | | 5 |
Money Market Portfolio Performance
Yields will fluctuate from time to time, and past performance does not guarantee future results. Current performance may be lower or higher than the past performance data quoted. The investment return and principal value will fluctuate, and shares, when sold, may be worth more or less than the original cost. For the most recent month-end performance update, call (800) 225-1852.
| | | | | | | | | |
| Money Market Portfolio as of 12/31/04 | | | | | | | | |
| | | Total Returns1
(Without
TARGET Program
Fee) One Year | | | Net Asset Value
(NAV) | | 7-Day Current
Yield | |
U.S. Government Money Market Portfolio | | 0.76 | % | | $ | 1.00 | | 0.49 | % |
Lipper U.S. Government Money Market Funds Avg.2 | | 0.63 | | | | N/A | | N/A | |
iMoneyNet, Inc. All Taxable Money Market Funds Avg.3 | | N/A | | | | N/A | | 1.60 | % |
1Source: Prudential Investments LLC and Lipper Inc. Total returns assume the reinvestment of all dividends and distributions, and take into account all charges and expenses applicable to an investment in each portfolio. The one-year total returns do not reflect a deduction for the annual TARGET program fee. Returns would be lower if the fee were deducted. The returns in the table do not reflect the deduction of taxes that a shareholder would pay on Portfolio distributions or following the redemption of Portfolio shares.
2The Lipper average represents returns based on an average of all funds in the respective Lipper categories for the periods noted. The returns for the Lipper average would be lower if it reflected deductions for TARGET program fees, portfolio operating expenses, sales charges, or taxes. U.S. Government Money Market funds invest principally in financial instruments issued or guaranteed by the U.S. government, its agencies, or instrumentalities with dollar-weighted average maturities of less than 90 days. These funds intend to keep a constant net asset value.
3iMoneyNet, Inc. regularly reports a 7-day current yield on Tuesdays for taxable money market funds. This is the data of all funds in the iMoneyNet, Inc. All Taxable Money Market Funds Average category as of December 28, 2004, the closest date to the end of our reporting period.
An investment in the U.S. Government Money Market Portfolio (the Portfolio) is not insured or guaranteed by the Federal Deposit Insurance Corporation or any other government agency. Although the Portfolio seeks to preserve the value of your investment at $1 per share, it is possible to lose money by investing in the Portfolio.
| | |
| 6 | | THE TARGET PORTFOLIO TRUST |
Investment Advisers’ Report
Large Capitalization Growth Portfolio
The total return of the Large Capitalization Growth Portfolio, subadvised by Oak Associates, Ltd. and Columbus Circle Investors, was 3.78% without taking into account the TARGET program fee for the year ended December 31, 2004. During the same period, the S&P 500 Index returned 10.87%, the Russell 1000 Growth Index returned 6.30%, and the Lipper Large-Cap Core Funds Average returned 7.79%.
Oak Associates, Ltd.
The Oak segment of the Portfolio substantially underperformed the Russell 1000 Growth Index primarily due to its exposure to the technology sector. Within technology, the greatest detractors from performance were Cisco Systems, Veritas Software, and Applied Materials. Despite posting strong earnings results throughout 2004, Cisco Systems was weak due to concerns about slowing growth in its end-markets. Storage software vendor Veritas Software hampered performance after it reported weak second-quarter sales. Oak sold its Veritas Software position in the fourth quarter to fund new ideas. Shares of semiconductor equipment maker Applied Materials were also weak as the semiconductor industry suffered from inventory concerns.
Although Oak’s exposure to the healthcare sector positively contributed to performance, stock selection within the sector detracted from performance. Drug distributor Cardinal Health hurt performance as it struggled to meet earnings forecasts and transitioned to a fee-for-service business model. Oak sold its Cardinal position in the fourth quarter to fund a new idea. Pfizer shares suffered with those of other large-cap pharmaceutical companies after concerns about increased cardiovascular risk of a popular class of drugs.
Relative performance was also hurt by Oak’s lack of exposure to the industrials, energy, and telecom service sectors, which performed quite well in 2004. These sectors benefited from the sharp rise in commodity prices that typically occurs in the early stages of an economic recovery.
On a positive note, on-line auctioneer eBay helped offset the segment’s weaknesses in technology and healthcare by propelling its consumer discretionary sector performance significantly higher than the benchmark Russell 1000 Growth Index.
Columbus Circle Investors LLC
The Columbus Circle segment of the Portfolio substantially outperformed the Russell 1000 Growth Index as the latter half of 2004 proved to be favorable to its positive
| | |
| THE TARGET PORTFOLIO TRUST | | 7 |
momentum and positive surprise investment discipline. Columbus Circle focuses on companies that are increasing earnings at a much faster rate than the overall market. These companies stood out when economic expansion and profit momentum moderated in 2004 to sustainable levels. As the year progressed, Columbus Circle responded to evidence that consumer spending was weakening by selectively trimming the segment’s technology holdings and reducing its weight in consumer discretionary stocks. It increased exposure to energy, utilities, telecommunications, and basic materials as commodity prices remained high and long-term interest rates remained unusually low.
Energy stocks and consumer discretionary stocks led the segment’s outperformance. Potash Corp, McDonalds, and TXU were the largest contributors. As emerging markets such as China increased their demand for fertilizer, Potash’s sales and profits soared and the stock rose swiftly. McDonalds rose as same-store sales continued to rise faster than had been expected when the company rolled out a leaner, healthier menu. TXU continued to beat earnings expectations, benefiting from its efforts to reduce its debt and its costs. The segment remains focused on energy and exploration stocks to benefit from increased capital spending by oil companies. Its healthcare stocks detracted slightly from its return as litigation issues hurt pharmaceutical holdings. The Medicare Modernization Act, repatriation of foreign profits at a lower tax rate, a weak dollar, and consolidations within the big pharmaceutical group may present better opportunities in 2005.
The Portfolio of Investments following this report shows the size of the Portfolio’s positions at period-end.
| | |
| 8 | | THE TARGET PORTFOLIO TRUST |
Large Capitalization Value Portfolio
The total return of the Large Capitalization Value Portfolio, subadvised by Hotchkis and Wiley Capital Management, LLC and J.P. Morgan Investment Management Inc., was 18.87% without taking into account the TARGET program fee for the year ended December 31, 2004. During the same period, the S&P 500 Index returned 10.87%, the Russell 1000 Value Index returned 16.49%, and the Lipper Multi-Cap Value Funds Average returned 14.39%.
Hotchkis and Wiley Capital Management, LLC
Hotchkis and Wiley’s segment of the Portfolio strongly outperformed the Russell 1000 Value Index, primarily because of security selection. Positive contributions were broad-based, with gains recorded in 8 of the 10 economic sectors. The largest contributor to return was the segment’s large weight in the well-performing consumer discretionary sector. Within this sector, positions in J.C. Penney and Mandalay Resort Group were the strongest performers, posting double-digit gains. J.C. Penney gained on news that the sale of the company’s troubled Eckerd division was finalized. Mandalay Resort Group benefited from a buyout offer from one of its rivals as well as from an overall increase in travel. Stock selection within the financials sector also helped performance as Metlife, UnumProvident, and Principal Financial Group made solid gains. The segment’s return was weakened by stock selection in the information technology sector. Electronic Data Systems led the decline as delays in the company’s turnaround efforts dragged its stock price downward throughout 2004. Other detractors from return included Tenet Healthcare, Alcoa, and Delphi. Alcoa was the largest detractor as analysts reduced their forecasts of the company’s earnings. At the same time, investors appeared concerned about the impact of slower Chinese demand for commodities in general.
J.P. Morgan Investment Management Inc.
The J.P. Morgan segment of the Portfolio performed essentially in line with the Russell 1000 Value Index. Robust stock selection within the pharmaceutical/medical technology, finance, and telecommunications sectors helped its performance. A position in Sepracor rocketed as a result of optimism about its new insomnia medication Lunesta. The stock received an incremental boost as a result of favorable FDA labeling for Lunesta. The insomnia market is estimated to be a $2 billion opportunity with strong growth potential. Performance also benefited from an underweight in Merck when it pulled its pain reliever Vioxx from the market. However, stock selection within the consumer stable, media, and network technology industries weakened relative performance. An underweight in Apple Computer hurt
| | |
| THE TARGET PORTFOLIO TRUST | | 9 |
because Apple had significant gains due to robust iPod sales. J.P. Morgan does not believe Apple’s 8% operating margin is sustainable if iPods continue to be an increasingly large percentage of Apple’s business. In addition, an overweight in Forest Labs affected performance negatively on news that orders were down and that its once-promising drug Neramexane did not pass its first trials. However, the segment remains overweight in the company because Forest Labs generates substantial cash flow, is inexpensive relative to forecasts for earnings growth, may buy back a substantial amount of shares, and should be able to find new in-licensing candidates.
The Portfolio of Investments following this report shows the size of the Portfolio’s positions at period-end.
| | |
| 10 | | THE TARGET PORTFOLIO TRUST |
Small Capitalization Growth Portfolio
The total return of the Small Capitalization Growth Portfolio was 15.03% without taking into account the TARGET program fee for the year ended December 31, 2004. During the same period, the Russell 2000 Index returned 18.33%, the Russell 2000 Growth Index returned 14.31%, and the Lipper Small-Cap Growth Funds Average returned 10.65%. The Portfolio is subadvised by RS Investment Management, L.P. and Westcap Investors, LLC.
RS Investment Management, L.P.
RS Investments’ segment of the Portfolio outperformed the Russell 2000 Growth Index. Small-cap growth stocks typically perform best coming out of recession, but also perform well during periods of strong economic growth and high productivity as long as interest rates remain stable. The year 2004 presented such a backdrop with a third year of higher gross domestic product, stable interest rates, and productivity that translated into good profit growth. Moreover, many small firms went through downsizing and restructuring during the recession, which helped position them for significant operating leverage with any slight improvement in the economy. As a result of this improvement, a number of the segment’s holdings experienced rapid earnings and revenue growth.
The segment’s top four industries were oil well equipment and services, consumer electronics (which includes many Internet holdings), semiconductors, and medical systems. RS Investment sold some semiconductor positions early in the year to lock in gains. A number of long-term holdings, such as Aaron Rents, Scientific Games, Guitar Center, Superior Energy Services, and Unit, were among the top contributors. The top Internet contributors to return were InfoSpace, ValueClick, Jupitermedia, and CNET Networks. However, an underweight in the materials and processing sector hurt relative performance, as did poor stock selection in producer durables and technology. Computer services, software, & systems was the worst-performing industry group with disappointing results from Tumbleweed Communications and ClickSoftware Technologies.
Westcap Investors, LLC
Westcap’s segment of the Portfolio trailed the Russell 2000 Growth Index slightly. It emphasized growth cyclicals, such as retailers and technology, and de-emphasized pure cyclicals, such as steel and machinery. This contributed to underperformance during the first three quarters of the year, but to outperformance in the fourth quarter. Looking forward to 2005, Westcap intends to continue focusing on companies that exhibit growth despite a maturation of the economic cycle.
| | |
| THE TARGET PORTFOLIO TRUST | | 11 |
The segment’s strongest sectors were healthcare, financial services, and technology. The largest contributions in healthcare came from American Medical Systems and Connetics. Strong performance in financial services came from Affiliated Managers Group and Factset Research Systems. In technology, Catapult Communications, Hyperion Solutions, and Avocent Corporation contributed to relative performance. Underperforming sectors of the segment included consumer discretionary, materials & processing, and consumer staples. The weakest consumer discretionary positions were 99 Cents Only Stores, Valuevision Media, and Emmis Communications. In materials & processing, Cabot Microelectronics hindered relative performance. Underperformance by Performance Food Group contributed to relative weakness in the consumer staples sector.
Westcap looks for attractively priced, high-quality companies in all parts of the economy that possess strong fundamentals and that it expects to provide superior returns over a full economic cycle. Its segment is focused on growth sectors such as technology, financial services, consumer discretionary, and healthcare.
The Portfolio of Investments following this report shows the size of the Portfolio’s positions at period-end.
| | |
| 12 | | THE TARGET PORTFOLIO TRUST |
Small Capitalization Value Portfolio
The total return of the Small Capitalization Value Portfolio was 24.02% without taking into account the TARGET program fee for the year ended December 31, 2004. During the same period, the Russell 2000 Index returned 18.33%, the Russell 2000 Value Index returned 22.25%, and the Lipper Small-Cap Core Funds Average returned 18.38%. The Portfolio is subadvised by EARNEST Partners, LLC and NFJ Investment Group L.P.
EARNEST Partners, LLC
EARNEST Partners’ segment of the Portfolio outperformed the Russell 2000 Value Index primarily because of its stock selection in many sectors. Financial holdings, such as AmeriCredit, Philadelphia Consolidated, and Commerce Group, saw improved business due to low interest rates and good underwriting growth. Information technology holdings such as Flir Systems and Global Payments also added to performance. Consumer discretionary holdings benefited from a significant position in Harman International and a smaller position in Meritage. Stock selection also had a positive impact in the telecommunications services sector with strong performance from American Tower. The segment’s selection in the materials sector was positive, but its underweight in the sector relative to the Russell 2000 Value Index hurt relative performance.
NFJ Investment Group L.P.
NFJ Investment Group’s segment of the Portfolio outperformed the Russell 2000 Value Index primarily because of its overweighting in energy and underweighting in technology. Even though the energy sector’s strength relative to the rest of the market abated in the fourth quarter of the year, it was the strongest sector for the year overall, up 62% in the Russell 2000 Value Index. The segment’s energy stock selection added to its return, rising an average of 65.8% for the year. One position, Frontline, more than doubled in value. Conversely, even though the technology sector rocketed in the fourth quarter, it was the only sector to register a decline for the full year. The segment held only five technology stocks—an average 5% weighting. The segment normally underweights the financial sector because NFJ believes that matching that sector’s 34% weight in the Russell 2000 Value Index would not be prudent diversification. As interest rates generally declined over the past 10 years, this strategy has hurt performance. However, in 2004 the sector’s return was close to the Index average, making the impact on relative performance small.
The Portfolio of Investments following this report shows the size of the Portfolio’s positions at period-end.
| | |
| THE TARGET PORTFOLIO TRUST | | 13 |
International Equity Portfolio
Lazard Asset Management LLC
The total return of the International Equity Portfolio, subadvised by Lazard Asset Management LLC, was 15.23% without taking into account the TARGET program fee for the year ended December 31, 2004. During the same period, the MSCI EAFE Index rose 20.25% and the Lipper International Funds Average returned 20.14%.
International stocks spent most of 2004 in a narrow trading range as strong earnings growth was offset by concerns about rising interest rates, rising oil prices, and the sustainability of the global economic rebound. However, they moved higher in the fourth quarter as oil prices crested, easing concerns that higher energy costs would restrain earnings and economic growth. Energy stocks were strong during the year since oil prices rose sharply, and utilities also performed well as investors sought out yield in a low-interest-rate environment. In contrast, technology stocks lagged as corporate spending on information technology products has yet to rebound significantly. Healthcare stocks were hurt by concerns over drug safety following Merck’s high-profile recall of Vioxx. On a regional basis, European markets generally outperformed, helped by the rising euro, while the Japanese market lagged the broad index on concerns about the sustainability of its economic rebound.
Stock selection in the financials sector negatively impacted performance when reinsurers Swiss Re and Munich Re were hurt by the hurricanes hitting Florida. Although the hurricanes caused near-term costs as payments were made to their reinsurance clients, Lazard believes that the longer-term outlook for reinsurance companies’ earnings is positive because the costs remove insuring capacity from the industry and improve pricing discipline. Stock selection in the consumer discretionary sector also detracted from returns as Nissan declined due to concerns regarding the steel shortage caused by increased demand from China. However, Nissan stated that the shortage should have a relatively small impact on sales in the United States, its biggest market. In contrast, stock selection in healthcare helped the Portfolio. It did not hold AstraZeneca, which declined, but did hold Schering, which appreciated significantly due to internal restructuring and the recent approval of its birth control pill. The Portfolio also held Aventis, which gained on expectations of revenue and cost synergism from its proposed acquisition by Sanofi-Synthelabo.
| | |
| 14 | | THE TARGET PORTFOLIO TRUST |
The Portfolio also was hurt by overweighting larger stocks while small and midcap stocks continued to outperform. However, Lazard believes that the performance of large stocks may improve, since the relative valuation of large caps versus small caps is very attractive compared to historical norms. In addition, smaller-cap stocks have been outperforming larger-cap stocks for nearly five years. The duration and magnitude of this period of outperformance has been similar to historical peaks in the large-cap/small-cap cycle.
The Portfolio of Investments following this report shows the size of the Portfolio’s positions at period-end.
| | |
| THE TARGET PORTFOLIO TRUST | | 15 |
International Bond Portfolio
The total return of the International Bond Portfolio was 3.71% without taking into account the TARGET program fee for the year ended December 31, 2004. During the same 12-month period, the Citigroup non-U.S. World Government Bond Index (Hedged) returned 5.17%, and the Lipper International Income Funds Average returned 10.47%. From January 1, 2004, through October 20, 2004, the Portfolio was subadvised by Fischer Francis Trees & Watts, Inc., which was replaced by Pacific Investment Management Company LLC (PIMCO) as of October 21, 2004.
Fischer Francis Trees & Watts, Inc.
From January 1, 2004, through October 20, 2004, interest-rate positioning made a meaningful contribution to the Portfolio’s return. Early in the year, positions focused on an underperformance of Japanese bonds, both on an outright basis and relative to European bonds. As Japanese yields rose consistently through much of 2004, these positions benefited the Portfolio. The third quarter, however, was difficult for bond investors. United States employment statistics reversed course, raising concerns about a summer “soft patch” leading to the resumption of a recession, and oil prices continued to climb. Though neutral overall in Europe, the Portfolio was overweight in the United Kingdom versus the euro area.
While 2004 began with a continuation of the two-year weakening trend in the U.S. dollar, comments from European Central Bank policymakers regarding the strength of the euro raised the possibility of further cuts in European short-term interest rates. This helped push the U.S. dollar more than 2% higher versus the euro during the first quarter of 2004. The Portfolio began the year focused on a stronger Japanese yen and weaker euro, but quickly changed its focus to U.S. dollar weakness versus the other major currencies. However, currency positioning had a negative impact on the Portfolio’s performance for most of the year, but the Portfolio’s small position in corporate bonds had a slightly positive impact on its performance.
Pacific Investment Management Company LLC
From October 21, 2004, through the remainder of the year, global bonds performed well as investors welcomed a reversal in crude oil prices while navigating an unexpectedly sharp fall in the U.S. dollar. Muted growth prospects and benign inflation underpinned returns. Bonds of the Euroland, the United Kingdom, and Canada strongly outperformed U.S. Treasury securities and Japanese government bonds during the fourth quarter. The Portfolio’s U.S. duration and curve strategies detracted from its performance, and while U.S. yields rose, PIMCO’s curve-steepening posture, designed to capture roll-down, was negatively affected by a flatter
| | |
| 16 | | THE TARGET PORTFOLIO TRUST |
yield curve as near maturity yields rose the most. However, the Portfolio’s overweight exposure to Euroland duration relative to its benchmark was a strong positive as yields fell in response to continued growth concerns and a surging euro. An underweight to Japanese government bonds relative to its benchmark benefited the Portfolio’s performance as Japanese government bond yields barely shifted during the quarter, lagging other bond markets. Exposure to emerging-market bonds was another positive for the Portfolio as was a tactical allocation to Treasury inflation protected securities (TIPS).
The Portfolio of Investments following this report shows the size of the Portfolio’s positions at period-end.
| | |
| THE TARGET PORTFOLIO TRUST | | 17 |
Total Return Bond Portfolio
Pacific Investment Management Company LLC
The total return of the Total Return Bond Portfolio, subadvised by Pacific Investment Management Company LLC (PIMCO), was 4.73% without taking into account the TARGET program fee for the year ended December 31, 2004. During the same period, the Lehman Brothers U.S. Aggregate Bond Index (the Index) returned 4.34% and the Lipper Corporate Debt BBB-Rated Funds Average returned 5.11%.
During the early part of the year, concern about the durability of the U.S. economic recovery pushed interest rates lower, and demand for relatively safe assets rose amid renewed fears of terrorist attacks after the Madrid bombing. However, from April through June, employment reports showed strength, which convinced markets that the Federal Reserve (the Fed) would soon begin a long-anticipated tightening campaign. On June 30, 2004, the Fed met market expectations with a 25-basis-point increase in the federal funds rate, which is the rate banks charge each other on overnight loans. It raised the key short-term rate a total of five times in 2004, lifting the federal funds rate from 1.00% to 2.25%.
Signs of rising inflation fueled anxiety that central banks may need to move aggressively to combat it. Inflation concerns were driven by higher oil prices as well as slower productivity growth. The Fed helped calm markets by commenting that it would raise rates gradually. Economic data suggested moderate economic growth as job numbers, inflation, and consumer confidence all fell short of analysts’ expectations.
The Portfolio outperformed its benchmark, the Index, during 2004. Diversifying beyond core sectors in the Index helped protect the Portfolio during difficult market periods and also added to returns in sectors where interest rates actually fell. Overall, a below-Index U.S. duration was positive for the Portfolio’s return as short- and intermediate-term rates rose in the United States. Additionally, Euroland duration contributed to the Portfolio’s return as intermediate- and long-term rates fell. Active management across a variety of strategies, including “rolling down” a steep yield curve, active security selection of mortgage-backed securities and corporate bonds, exposure to Treasury inflation protected securities (TIPS), Euroland exposure, and emerging-market exposure, all contributed to the Portfolio’s performance during the year.
The Portfolio of Investments following this report shows the size of the Portfolio’s positions at period-end.
| | |
| 18 | | THE TARGET PORTFOLIO TRUST |
Intermediate-Term Bond Portfolio
Pacific Investment Management Company LLC
The total return of the Intermediate-Term Bond Portfolio, subadvised by Pacific Investment Management Company LLC (PIMCO), was 3.19% without taking into account the TARGET program fee for the year ended December 31, 2004. During the same period, the Lehman Brothers Intermediate Government/Credit Bond Index (the Index) returned 3.04% and the Lipper Intermediate Investment-Grade Debt Funds Average returned 3.85%.
During the early part of the year, concern about the durability of the U.S. economic recovery pushed interest rates lower, and demand for relatively safe assets rose amid renewed fears of terrorist attacks after the Madrid bombing. However, from April through June, employment reports showed strength, which convinced markets that the Federal Reserve (the Fed) would soon begin a long-anticipated tightening campaign. On June 30, 2004, the Fed met market expectations with a 25-basis-point increase in the federal funds rate, which is the rate banks charge each other on overnight loans. It raised the key short-term rate a total of five times in 2004, lifting the federal funds rate from 1.00% to 2.25%.
Signs of rising inflation fueled anxiety that central banks may need to move aggressively to combat it. Inflation concerns were driven by higher oil prices as well as slower productivity growth. The Fed helped calm markets by commenting that it would raise rates gradually. Economic data suggested moderate economic growth as job numbers, inflation, and consumer confidence all fell short of analysts’ expectations.
The Portfolio outperformed its benchmark, the Index, in 2004. Diversifying beyond core sectors in the Index helped protect the Portfolio during difficult market periods and also added to returns in sectors where interest rates actually fell. Overall, a below-Index U.S. duration was positive for the Portfolio’s return as short- and intermediate-term rates rose in the United States. Additionally, Euroland duration contributed to the Portfolio’s return as intermediate- and long-term rates fell. Active management across a variety of strategies, including “rolling down” a steep yield curve, active security selection of mortgage-backed securities and corporate bonds, exposure to Treasury inflation protected securities (TIPS), Euroland exposure, and emerging-market exposure, all contributed to the Portfolio’s performance during the year.
The Portfolio of Investments following this report shows the size of the Portfolio’s positions at period-end.
| | |
| THE TARGET PORTFOLIO TRUST | | 19 |
Mortgage Backed Securities Portfolio
Wellington Management Company, LLP
The total return of the Mortgage Backed Securities Portfolio, subadvised by Wellington Management Company, LLP, was 3.68% without taking into account the TARGET program fee for the year ended December 31, 2004. During the same period, the Citigroup Mortgage-Backed Securities Index returned 4.83%, the Lehman Brothers Mortgage-Backed Securities Index returned 4.70%, and the Lipper U.S. Mortgage Funds Average returned 3.68%.
In the first half of 2004, gross domestic product and employment in the United States were strong, raising fears in financial markets that higher inflationary pressures were around the corner. These concerns caused rates to move higher as market participants expected the Federal Reserve (the Fed) to aggressively tighten monetary policy. Mortgage-backed securities underperformed as yields rose.
As we came into the third quarter of 2004, the economy began to show signs of weakness and interest rates began to fall. Over the remainder of 2004, interest rates retraced their steps. The yield on the benchmark 10-year U.S. Treasury note ended the year close to 4.20%, which was almost identical to where it began the year. Mortgage-backed securities outperformed during the third and fourth quarters of 2004. The end of the refinancing wave decreased the supply of mortgages and strong foreign demand led prices of mortgage-backed securities higher.
The Portfolio’s return was driven by the decline in yield spread between mortgage-backed securities and U.S. Treasurys as well as by coupon payments on mortgage-backed securities. The Portfolio’s underperformance reflected its lower risk exposure to mortgage-backed securities in the face of a strong economy and a Fed that increased short-term interest rates five times in 2004.
The Portfolio of Investments following this report shows the size of the Portfolio’s positions at period-end.
| | |
| 20 | | THE TARGET PORTFOLIO TRUST |
U.S. Government Money Market Portfolio
Wellington Management Company, LLP
The total return of the U.S. Government Money Market Portfolio, subadvised by Wellington Management Company, LLP, was 0.76% without taking into account the TARGET program fee for the year ended December 31, 2004. During the same period, the Lipper U.S. Government Money Market Portfolio Funds Average returned 0.63%.
The U.S. economy gained momentum over the course of 2004 and showed significant acceleration during the latter half of the year. Gross domestic product data released during the fourth quarter showed that the economy expanded at a rate of 4% during the third quarter, faster than previously estimated. This suggested a strong finish to 2004. In light of the improving economic data, policymakers at the Federal Reserve (the Fed) continued a tightening campaign that began in June. At their most recent meeting on December 14, the Fed raised short-term rates another 25 basis points for a fifth time in 2004. The combined moves lifted the federal funds rate—the rate banks charge each other on overnight loans—from 1.00% to the current target rate of 2.25%. Fed policymakers reiterated their plan to continue raising rates at a “measured” pace.
As it became apparent that the Fed would systematically bring the federal funds rate to a neutral level, the Portfolio’s weighted average maturity shortened in order to position the Portfolio to take advantage of future rate increases. Often when the Fed tightens monetary policy, the slope of the money market yield curve will steepen as the market prices in additional rate increases in the future.
The Portfolio of Investments following this report shows the size of the Portfolio’s positions at period-end.
| | |
| THE TARGET PORTFOLIO TRUST | | 21 |
Fees and Expenses (Unaudited)
As a shareholder of the Fund, you incur two types of costs: (1) transaction costs, including sales charges (loads) on purchase payments and redemptions, as applicable, and (2) ongoing costs, including management fees, Target program fees and other Fund expenses, as applicable. This example is intended to help you understand your ongoing costs (in dollars) of investing in the Fund and to compare these costs with the ongoing costs of investing in other mutual funds. This example does not reflect Target program fees. If Target program fees were included, the costs would be higher.
The example is based on an investment of $1,000 invested on July 1, 2004, at the beginning of the period, and held through the six-month period ended December 31, 2004.
The Fund may charge additional fees to holders of certain accounts that are not included in the expenses shown in the table. These fees apply to Individual Retirement Accounts (IRAs), 403(b) accounts, and Section 529 plan accounts. As of the close of the six months covered by the table, IRA fees included a setup fee of $5, a maintenance fee of up to $36 annually ($18 for the six-month period), and a termination fee of $10. 403(b) accounts and Section 529 plan accounts are each charged an annual $25 fiduciary maintenance fee ($12.50 for the six-month period). Some of the fees vary in amount, or are waived, based on your total account balance or the number of JennisonDryden or Strategic Partners funds, including the Fund, that you own. You should consider the additional fees that were charged to your Fund account over the six-month period when you estimate the total ongoing expenses paid over the period and the impact of these fees on your ending account value, as these additional expenses are not reflected in the information provided in the expense table. Additional fees have the effect of reducing investment returns.
Actual Expenses
The first line for each share class in the following table provides information about actual account values and actual expenses. You may use the information in this line, together with the amount you invested, to estimate the expenses that you paid over the period. Simply divide your account value by $1,000 (for example, an $8,600 account value ÷ $1,000 = 8.6), then multiply the result by the number in the first line under the heading “Expenses Paid During the Six-Month Period” to estimate the expenses you paid on your account during this period.
Hypothetical Example for Comparison Purposes
The second line for each share class in the following table provides information about hypothetical account values and hypothetical expenses based on the Fund’s actual expense ratio and an assumed rate of return of 5% per year before expenses, which is not the Fund’s actual return. The hypothetical account values and expenses may not
| | |
| 22 | | THE TARGET PORTFOLIO TRUST |
be used to estimate the actual ending account balance or expenses you paid for the period. You may use this information to compare the ongoing costs of investing in the Fund and other funds. To do so, compare this 5% hypothetical example with the 5% hypothetical examples that appear in the shareholder reports of the other funds.
Please note that the expenses shown in the table are meant to highlight your ongoing costs only, and do not reflect any transactional costs such as sales charges (loads). Therefore the second line for each share class in the table is useful in comparing ongoing costs only, and will not help you determine the relative total costs of owning different funds. In addition, if these transactional costs were included, your costs would have been higher.
| | | | | | | | | | | | | | |
Large Capitalization
Growth Portfolio | | Beginning Account
Value
July 1, 2004 | | Ending Account
Value December 31, 2004 | | Annualized
Expense Ratio
Based on the
Six-Month Period | | | Expenses Paid
During the Six-
Month Period* |
| | | | | | | | | | | | | | | |
| | | Actual | | $ | 1,000 | | $ | 1,036 | | 0.79 | % | | $ | 4.04 |
| | | Hypothetical | | $ | 1,000 | | $ | 1,021 | | 0.79 | % | | $ | 4.01 |
| | | | | | | | | | | | | | | |
| | | | | | | | | | | | | | |
Large Capitalization
Value Portfolio | | Beginning Account
Value
July 1, 2004 | | Ending Account
Value December 31, 2004 | | Annualized
Expense Ratio
Based on the
Six-Month Period | | | Expenses Paid
During the Six-
Month Period* |
| | | | | | | | | | | | | | | |
| | | Actual | | $ | 1,000 | | $ | 1,130 | | 0.75 | % | | $ | 4.02 |
| | | Hypothetical | | $ | 1,000 | | $ | 1,021 | | 0.75 | % | | $ | 3.81 |
| | | | | | | | | | | | | | | |
| | | | | | | | | | | | | | |
Small Capitalization
Growth Portfolio | | Beginning Account
Value
July 1, 2004 | | Ending Account
Value December 31, 2004 | | Annualized
Expense Ratio
Based on the
Six-Month Period | | | Expenses Paid
During the Six-
Month Period* |
| | | | | | | | | | | | | | | |
| | | Actual | | $ | 1,000 | | $ | 1,098 | | 0.90 | % | | $ | 4.75 |
| | | Hypothetical | | $ | 1,000 | | $ | 1,021 | | 0.90 | % | | $ | 4.57 |
| | | | | | | | | | | | | | | |
| | | | | | | | | | | | | | |
Small Capitalization
Value Portfolio | | Beginning Account
Value
July 1, 2004 | | Ending Account
Value December 31, 2004 | | Annualized
Expense Ratio
Based on the
Six-Month Period | | | Expenses Paid
During the Six-
Month Period* |
| | | | | | | | | | | | | | | |
| | | Actual | | $ | 1,000 | | $ | 1,142 | | 0.81 | % | | $ | 4.36 |
| | | Hypothetical | | $ | 1,000 | | $ | 1,021 | | 0.81 | % | | $ | 4.11 |
| | | | | | | | | | | | | | |
International
Equity Portfolio | | Beginning Account
Value
July 1, 2004 | | Ending Account
Value December 31, 2004 | | Annualized
Expense Ratio
Based on the
Six-Month Period | | | Expenses Paid
During the Six-
Month Period* |
| | | | | | | | | | | | | | | |
| | | Actual | | $ | 1,000 | | $ | 1,144 | | 0.98 | % | | $ | 5.28 |
| | | Hypothetical | | $ | 1,000 | | $ | 1,020 | | 0.98 | % | | $ | 4.98 |
| | | | | | | | | | | | | | | |
| | |
| THE TARGET PORTFOLIO TRUST | | 23 |
| | | | | | | | | | | | | | |
International
Bond Portfolio | | Beginning Account
Value
July 1, 2004 | | Ending Account
Value December 31, 2004 | | Annualized
Expense Ratio
Based on the
Six-Month Period | | | Expenses Paid
During the Six-
Month Period* |
| | | | | | | | | | | | | | | |
| | | Actual | | $ | 1,000 | | $ | 1,037 | | 1.59 | % | | $ | 8.14 |
| | | Hypothetical | | $ | 1,000 | | $ | 1,017 | | 1.59 | % | | $ | 8.06 |
| | | | | | | | | | | | | | |
Total Return
Bond Portfolio | | Beginning Account
Value
July 1, 2004 | | Ending Account
Value December 31, 2004 | | Annualized
Expense Ratio
Based on the
Six-Month Period | | | Expenses Paid
During the Six-
Month Period* |
| | | | | | | | | | | | | | | |
| | | Actual | | $ | 1,000 | | $ | 1,043 | | 0.76 | % | | $ | 3.90 |
| | | Hypothetical | | $ | 1,000 | | $ | 1,021 | | 0.76 | % | | $ | 3.86 |
| | | | | | | | | | | | | | |
Intermediate-Term
Bond Portfolio | | Beginning Account
Value
July 1, 2004 | | Ending Account
Value December 31, 2004 | | Annualized
Expense Ratio
Based on the
Six-Month Period | | | Expenses Paid
During the Six-
Month Period* |
| | | | | | | | | | | | | | | |
| | | Actual | | $ | 1,000 | | $ | 1,032 | | 0.64 | % | | $ | 3.27 |
| | | Hypothetical | | $ | 1,000 | | $ | 1,022 | | 0.64 | % | | $ | 3.25 |
| | | | | | | | | | | | | | |
Mortgage Backed
Securities Portfolio | | Beginning Account
Value
July 1, 2004 | | Ending Account
Value December 31, 2004 | | Annualized
Expense Ratio
Based on the
Six-Month Period | | | Expenses Paid
During the Six-
Month Period* |
| | | | | | | | | | | | | | | |
| | | Actual | | $ | 1,000 | | $ | 1,034 | | 0.91 | % | | $ | 4.65 |
| | | Hypothetical | | $ | 1,000 | | $ | 1,021 | | 0.91 | % | | $ | 4.62 |
| | | | | | | | | | | | | | |
U.S. Government
Money Market Portfolio | | Beginning Account
Value
July 1, 2004 | | Ending Account
Value December 31, 2004 | | Annualized
Expense Ratio
Based on the
Six-Month Period | | | Expenses Paid
During the Six-
Month Period* |
| | | | | | | | | | | | | | | |
| | | Actual | | $ | 1,000 | | $ | 1,005 | | 0.64 | % | | $ | 3.23 |
| | | Hypothetical | | $ | 1,000 | | $ | 1,022 | | 0.64 | % | | $ | 3.25 |
* Fund expenses for each share class are equal to the annualized expense ratio for each share class (provided in the table), multiplied by the average account value over the period, multiplied by the 184 days in the six-month period ended December 31, 2004, and divided by the 366 days in the Fund’s fiscal year ended December 31, 2004 (to reflect the six-month period).
| | |
| 24 | | THE TARGET PORTFOLIO TRUST |
| | |
Portfolio of Investments
As of December 31, 2004 | | Large Capitalization Growth Portfolio |
| | | | | |
| SHARES | | DESCRIPTION | | VALUE (NOTE 1) |
| | | | | | |
| | | LONG-TERM INVESTMENTS—98.8% | | | |
| | |
| | | Common Stocks | | | |
| | |
| | | Air Freight & Couriers—2.8% | | | |
| 28,000 | | FedEx Corp. | | $ | 2,757,720 |
| 80,000 | | United Parcel Service, Inc., (Class B shares) | | | 6,836,800 |
| | | | |
|
|
| | | | | | 9,594,520 |
| | | | |
|
|
| | |
| | | Apparel—1.1% | | | |
| 42,500 | | Nike, Inc. (Class B shares) | | | 3,854,325 |
| | | | |
|
|
| | |
| | | Beverages—0.8% | | | |
| 56,000 | | Constellation Brands, Inc. (Class A shares)(a) | | | 2,604,560 |
| | | | |
|
|
| | |
| | | Biotechnology—3.2% | | | |
| 90,000 | | Affymetrix, Inc.(a) | | | 3,289,500 |
| 43,500 | | Biogen Idec, Inc.(a) | | | 2,897,535 |
| 90,500 | | Genentech, Inc.(a) | | | 4,926,820 |
| | | | |
|
|
| | | | | | 11,113,855 |
| | | | |
|
|
| | |
| | | Capital Markets—1.0% | | | |
| 300,000 | | Charles Schwab Corp. (The) | | | 3,588,000 |
| | | | |
|
|
| | |
| | | Chemicals—1.9% | | | |
| 47,500 | | Potash Corp. of Saskatchewan (Canada) | | | 3,945,350 |
| 55,000 | | Praxair, Inc. | | | 2,428,250 |
| | | | |
|
|
| | | | | | 6,373,600 |
| | | | |
|
|
| | |
| | | Communications Equipment—4.1% | | | |
| 162,500 | | Comverse Technology, Inc.(a) | | | 3,973,125 |
| 234,500 | | QUALCOMM, Inc. | | | 9,942,800 |
| | | | |
|
|
| | | | | | 13,915,925 |
| | | | |
|
|
| | |
| | | Computer Software & Services—5.0% | | | |
| 425,000 | | EMC Corp.(a) | | | 6,319,750 |
| 406,500 | | Microsoft Corp. | | | 10,857,615 |
| | | | |
|
|
| | | | | | 17,177,365 |
| | | | |
|
|
| | |
| | | Computers & Business Equipment—4.3% | | | |
| 759,500 | | Cisco Systems, Inc.(a) | | | 14,658,350 |
| | | | |
|
|
| | |
| | | Computers & Peripherals—4.0% | | | |
| 62,000 | | Apple Computer, Inc.(a) | | | 3,992,800 |
| 45,000 | | Avid Technology, Inc.(a) | | | 2,778,750 |
| 165,000 | | Dell, Inc.(a) | | | 6,953,100 |
| | | | |
|
|
| | | | | | 13,724,650 |
| | | | |
|
|
| | |
| | | Cosmetics & Toiletries—1.0% | | | |
| 77,000 | | Estee Lauder Cos., Inc. (Class A shares) | | | 3,524,290 |
| | | | |
|
|
See Notes to Financial Statements
| | |
| THE TARGET PORTFOLIO TRUST | | 25 |
| | |
Large Capitalization Growth Portfolio (cont’d) | | Portfolio of Investments
As of December 31, 2004 |
| | | | | |
| SHARES | | DESCRIPTION | | VALUE (NOTE 1) |
| | | | | | |
| | | Diversified Telecommunication Services—1.3% | | | |
| 175,500 | | Sprint Corp. | | $ | 4,361,175 |
| | | | |
|
|
| | |
| | | Drugs & Healthcare—6.8% | | | |
| 80,000 | | Amgen, Inc.(a) | | | 5,132,000 |
| 108,000 | | Caremark Rx, Inc.(a) | | | 4,258,440 |
| 177,700 | | Medtronic, Inc. | | | 8,826,359 |
| 190,000 | | Pfizer, Inc. | | | 5,109,100 |
| | | | |
|
|
| | | | | | 23,325,899 |
| | | | |
|
|
| | |
| | | Electric Utilities—1.1% | | | |
| 55,500 | | TXU Corp. | | | 3,583,080 |
| | | | |
|
|
| | |
| | | Electrical Equipment—1.1% | | | |
| 75,000 | | Rockwell Automation, Inc. | | | 3,716,250 |
| | | | |
|
|
| | |
| | | Electronic Components—3.2% | | | |
| 410,000 | | Applied Materials, Inc.(a) | | | 7,011,000 |
| 61,000 | | Fisher Scientific International, Inc.(a) | | | 3,805,180 |
| | | | |
|
|
| | | | | | 10,816,180 |
| | | | |
|
|
| | |
| | | Electronic Equipment & Instruments—1.0% | | | |
| 200,000 | | Symbol Technologies, Inc. | | | 3,460,000 |
| | | | |
|
|
| | |
| | | Financial Services—9.3% | | | |
| 65,500 | | Capital One Financial Corp. | | | 5,515,755 |
| 6,700 | | Chicago Mercantile Exchange Holdings, Inc. | | | 1,532,290 |
| 84,500 | | CIT Group, Inc. | | | 3,871,790 |
| 168,000 | | Citigroup, Inc. | | | 8,094,240 |
| 53,000 | | Goldman Sachs Group, Inc. (The) | | | 5,514,120 |
| 263,000 | | MBNA Corp. | | | 7,413,970 |
| | | | |
|
|
| | | | | | 31,942,165 |
| | | | |
|
|
| | |
| | | Food & Staples Retailing—1.0% | | | |
| 73,500 | | CVS Corp. | | | 3,312,645 |
| | | | |
|
|
| | |
| | | Health Care Equipment & Supplies—1.1% | | | |
| 59,500 | | C. R. Bard, Inc. | | | 3,806,810 |
| | | | |
|
|
| | |
| | | Health Care Providers & Services—1.1% | | | |
| 46,000 | | CIGNA Corp. | | | 3,752,220 |
| | | | |
|
|
| | |
| | | Hotels, Restaurants & Leisure—4.4% | | | |
| 56,500 | | Carnival Corp. | | | 3,256,095 |
| 211,500 | | McDonald’s Corp. | | | 6,780,690 |
| 43,000 | | Starwood Hotels & Resorts Worldwide, Inc. | | | 2,511,200 |
| 49,500 | | Station Casinos, Inc. | | | 2,706,660 |
| | | | |
|
|
| | | | | | 15,254,645 |
| | | | |
|
|
See Notes to Financial Statements
| | |
| 26 | | THE TARGET PORTFOLIO TRUST |
| | | | | |
| SHARES | | DESCRIPTION | | VALUE (NOTE 1) |
| | | | | | |
| | | Household Durables—1.0% | | | |
| 28,000 | | Harman International Industries, Inc. | | $ | 3,556,000 |
| | | | |
|
|
| | |
| | | Household Products—1.5% | | | |
| 59,000 | | Clorox Co. (The) | | | 3,476,870 |
| 36,000 | | Colgate-Palmolive Co. | | | 1,841,760 |
| | | | |
|
|
| | | | | | 5,318,630 |
| | | | |
|
|
| | |
| | | Industrial Conglomerates—0.5% | | | |
| 25,000 | | Textron, Inc. | | | 1,845,000 |
| | | | |
|
|
| | |
| | | Internet—3.4% | | | |
| 18,000 | | Google Inc. (Class A shares)(a) | | | 3,475,800 |
| 299,800 | | Juniper Networks, Inc.(a) | | | 8,151,562 |
| | | | |
|
|
| | | | | | 11,627,362 |
| | | | |
|
|
| | |
| | | Internet & Catalog Retail—3.6% | | | |
| 107,000 | | eBay, Inc.(a) | | | 12,441,960 |
| | | | |
|
|
| | |
| | | IT Services—2.2% | | | |
| 180,000 | | Cognizant Technology Solutions Corp. (Class A shares)(a) | | | 7,619,400 |
| | | | |
|
|
| | |
| | | Machinery—1.9% | | | |
| 37,100 | | Deere & Co. | | | 2,760,240 |
| 47,500 | | Ingersoll-Rand Co. (Bermuda) | | | 3,814,250 |
| | | | |
|
|
| | | | | | 6,574,490 |
| | | | |
|
|
| | |
| | | Media—3.0% | | | |
| 63,500 | | EchoStar Communications Corp. (Class A shares)(a) | | | 2,110,740 |
| 226,000 | | Time Warner Cos., Inc.(a) | | | 4,393,440 |
| 99,000 | | XM Satellite Radio Holdings, Inc. (Class A shares)(a) | | | 3,724,380 |
| | | | |
|
|
| | | | | | 10,228,560 |
| | | | |
|
|
| | |
| | | Oil & Gas—1.0% | | | |
| 40,000 | | ConocoPhillips | | | 3,473,200 |
| | | | |
|
|
| | |
| | | Oil Field/Equipment & Services—1.9% | | | |
| 67,500 | | Apache Corp. | | | 3,413,475 |
| 82,000 | | Devon Energy Corp. | | | 3,191,440 |
| | | | |
|
|
| | | | | | 6,604,915 |
| | | | |
|
|
| | |
| | | Retail Trade—4.3% | | | |
| 124,500 | | Home Depot, Inc. (The) | | | 5,321,130 |
| 84,000 | | Nordstrom, Inc. | | | 3,925,320 |
| 162,000 | | Staples, Inc. | | | 5,461,020 |
| | | | |
|
|
| | | | | | 14,707,470 |
| | | | |
|
|
| | |
| | | Semiconductors & Semiconductor Equipment—6.7% | | | |
| 1 | | Freescale Semiconductor, Inc.(a) | | | 10 |
| 228,000 | | Linear Technology Corp. | | | 8,837,280 |
| 80,000 | | Marvell Technology Group Ltd. (Bermuda)(a) | | | 2,837,600 |
| 205,000 | | Maxim Integrated Products, Inc. | | | 8,689,950 |
| 109,500 | | Texas Instruments, Inc. | | | 2,695,890 |
| | | | |
|
|
| | | | | | 23,060,730 |
| | | | |
|
|
See Notes to Financial Statements
| | |
| THE TARGET PORTFOLIO TRUST | | 27 |
| | |
Large Capitalization Growth Portfolio (cont’d) | | Portfolio of Investments
As of December 31, 2004 |
| | | | | |
| SHARES | | DESCRIPTION | | VALUE (NOTE 1) |
| | | | | | |
| | | Software—5.1% | | | |
| 47,000 | | Adobe Systems, Inc. | | $ | 2,948,780 |
| 130,000 | | Electronic Arts, Inc.(a) | | | 8,018,400 |
| 260,000 | | Symantec Corp.(a) | | | 6,697,600 |
| | | | |
|
|
| | | | | | 17,664,780 |
| | | | |
|
|
| | |
| | | Telecommunications—2.1% | | | |
| 213,500 | | Motorola, Inc. | | | 3,672,200 |
| 233,500 | | Nokia Oyj Corp. ADR (Finland) | | | 3,658,945 |
| | | | |
|
|
| | | | | | 7,331,145 |
| | | | |
|
|
| | | Total long-term investments
(cost $264,234,599) | | | 339,514,151 |
| | | | |
|
|
| | |
| | | SHORT-TERM INVESTMENTS | | | |
| | |
| | | Money Market Mutual Fund | | | |
| 2 | | Dryden Core Investment Fund—Taxable Money Market Series
(cost $2; Note 3) | | | 2 |
| | | | |
|
|
| | | Total Investments—98.8%
(cost $264,234,601; Note 5) | | | 339,514,153 |
| | | Other assets in excess of liabilities—1.2% | | | 4,245,464 |
| | | | |
|
|
| | | Net Assets—100% | | $ | 343,759,617 |
| | | | |
|
|
| (a) | Non-income producing security. |
ADR—American Depositary Receipt
See Notes to Financial Statements
| | |
| 28 | | THE TARGET PORTFOLIO TRUST |
The industry classification of portfolio holdings and other assets in excess of liabilities shown as a percentage of net assets as of December 31, 2004 were as follows:
| | | |
Financial Services | | 9.3 | % |
Drugs & Healthcare | | 6.8 | |
Semiconductors & Semiconductor Equipment | | 6.7 | |
Software | | 5.1 | |
Computer Software & Services | | 5.0 | |
Hotels, Restaurants & Leisure | | 4.4 | |
Computers & Business Equipment | | 4.3 | |
Retail Trade | | 4.3 | |
Communications Equipment | | 4.1 | |
Computers & Peripherals | | 4.0 | |
Internet & Catalog Retail | | 3.6 | |
Internet | | 3.4 | |
Biotechnology | | 3.2 | |
Electronic Components | | 3.2 | |
Media | | 3.0 | |
Air Freight & Couriers | | 2.8 | |
IT Services | | 2.2 | |
Telecommunications | | 2.1 | |
Chemicals | | 1.9 | |
Machinery | | 1.9 | |
Oil Field/Equipment & Services | | 1.9 | |
Household Products | | 1.5 | |
Diversified Telecommunications Services | | 1.3 | |
Apparel | | 1.1 | |
Electric Utilities | | 1.1 | |
Electrical Equipment | | 1.1 | |
Health Care Equipment & Supplies | | 1.1 | |
Health Care Providers & Services | | 1.1 | |
Capital Markets | | 1.0 | |
Cosmetics & Toiletries | | 1.0 | |
Electronic Equipment & Instruments | | 1.0 | |
Food & Staples Retailing | | 1.0 | |
Household Durables | | 1.0 | |
Oil & Gas | | 1.0 | |
Beverages | | 0.8 | |
Industrial Conglomerates | | 0.5 | |
| | |
|
|
| | | 98.8 | |
Other assets in excess of liabilities | | 1.2 | |
| | |
|
|
| | | 100.0 | % |
| | |
|
|
See Notes to Financial Statements
| | |
| THE TARGET PORTFOLIO TRUST | | 29 |
| | |
| Large Capitalization Value Portfolio | | Portfolio of Investments
As of December 31, 2004 |
| | | | | |
| SHARES | | DESCRIPTION | | VALUE (NOTE 1) |
| | | | | | |
| | | LONG-TERM INVESTMENTS—99.6% | | | |
| | |
| | | Common Stock | | | |
| | |
| | | Aerospace/Defense—3.6% | | | |
| 109,300 | | Lockheed Martin Corp. | | $ | 6,071,615 |
| 31,800 | | Northrop Grumman Corp. | | | 1,728,648 |
| 117,700 | | Raytheon Co. | | | 4,570,291 |
| 13,700 | | United Technologies Corp. | | | 1,415,895 |
| | | | |
|
|
| | | | | | 13,786,449 |
| | | | |
|
|
| | |
| | | Automobiles—0.6% | | | |
| 80,600 | | Ford Motor Co. | | | 1,179,984 |
| 27,100 | | General Motors Corp. | | | 1,085,626 |
| | | | |
|
|
| | | | | | 2,265,610 |
| | | | |
|
|
| | |
| | | Automotive Components—1.2% | | | |
| 2,900 | | Dana Corp. | | | 50,257 |
| 232,262 | | Delphi Corp. | | | 2,095,003 |
| 42,800 | | Lear Corp. | | | 2,611,228 |
| | | | |
|
|
| | | | | | 4,756,488 |
| | | | |
|
|
| | |
| | | Beverages—0.6% | | | |
| 600 | | Anheuser-Busch Cos., Inc. | | | 30,438 |
| 46,700 | | Coca-Cola Co. | | | 1,944,121 |
| 8,400 | | PepsiCo, Inc. | | | 438,480 |
| | | | |
|
|
| | | | | | 2,413,039 |
| | | | |
|
|
| | |
| | | Capital Markets—0.2% | | | |
| 23,000 | | Bank of New York Co., Inc. (The) | | | 768,660 |
| 2,900 | | E*Trade Financial Corp.(a) | | | 43,355 |
| | | | |
|
|
| | | | | | 812,015 |
| | | | |
|
|
| | |
| | | Chemicals—1.6% | | | |
| 25,400 | | Air Products & Chemicals, Inc. | | | 1,472,438 |
| 20,000 | | Dow Chemical Co. | | | 990,200 |
| 100 | | Eastman Chemical Co. | | | 5,773 |
| 35,400 | | Nalco Holdings Co.(a) | | | 691,008 |
| 7,600 | | PPG Industries, Inc. | | | 518,016 |
| 35,300 | | Praxair, Inc. | | | 1,558,495 |
| 18,900 | | Rohm & Haas Co. | | | 835,947 |
| | | | |
|
|
| | | | | | 6,071,877 |
| | | | |
|
|
| | |
| | | Commercial Banks—6.2% | | | |
| 127,600 | | Bank of America Corp. | | | 5,995,924 |
| 8,100 | | BB&T Corp. | | | 340,605 |
| 14,300 | | First Horizon National Corp. | | | 616,473 |
| 7,100 | | FirstMerit Corp. | | | 202,279 |
See Notes to Financial Statements
| | |
| 30 | | THE TARGET PORTFOLIO TRUST |
| | | | | |
| SHARES | | DESCRIPTION | | VALUE (NOTE 1) |
| | | | | | |
| | | Commercial Banks (cont’d.) | | | |
| 90,600 | | KeyCorp | | $ | 3,071,340 |
| 10,400 | | Marshall & Ilsley Corp. | | | 459,680 |
| 10,800 | | Mellon Financial Corp. | | | 335,988 |
| 69,700 | | North Fork Bancorporation, Inc. | | | 2,010,845 |
| 3,000 | | PNC Financial Services Group | | | 172,320 |
| 26,500 | | State Street Corp. | | | 1,301,680 |
| 49,500 | | U.S. Bancorp | | | 1,550,340 |
| 40,700 | | UnionBanCal Corp. | | | 2,624,336 |
| 26,600 | | Wachovia Corp. | | | 1,399,160 |
| 53,500 | | Wells Fargo & Co. | | | 3,325,025 |
| 8,200 | | Zions Bancorp | | | 557,846 |
| | | | |
|
|
| | | | | | 23,963,841 |
| | | | |
|
|
| | |
| | | Commercial Services & Supplies—2.4% | | | |
| 194,500 | | Cendant Corp. | | | 4,547,410 |
| 155,200 | | Waste Management, Inc. | | | 4,646,688 |
| | | | |
|
|
| | | | | | 9,194,098 |
| | | | |
|
|
| | |
| | | Communications Equipment—0.1% | | | |
| 4,600 | | QUALCOMM, Inc. | | | 195,040 |
| | | | |
|
|
| | |
| | | Computers & Peripherals—1.1% | | | |
| 22,500 | | Dell, Inc.(a) | | | 948,150 |
| 19,100 | | EMC Corp.(a) | | | 284,017 |
| 64,000 | | Hewlett-Packard Co. | | | 1,342,080 |
| 13,100 | | International Business Machines Corp. | | | 1,291,398 |
| 1,500 | | Lexmark International, Inc.(a) | | | 127,500 |
| 1,800 | | NCR Corp.(a) | | | 124,614 |
| | | | |
|
|
| | | | | | 4,117,759 |
| | | | |
|
|
| | |
| | | Consumer Products—0.3% | | | |
| 20,000 | | Procter & Gamble Co. | | | 1,101,600 |
| | | | |
|
|
| | |
| | | Cosmetics & Toiletries | | | |
| 3,700 | | Gillette Co. | | | 165,686 |
| | | | |
|
|
| | |
| | | Diversified Financial Services—7.5% | | | |
| 71,700 | | Charles Schwab Corp. (The) | | | 857,532 |
| 126,900 | | CIT Group, Inc. | | | 5,814,558 |
| 172,800 | | Citigroup, Inc. | | | 8,325,504 |
| 17,300 | | Countrywide Credit Industries, Inc. | | | 640,273 |
| 17,100 | | Goldman Sachs Group, Inc. | | | 1,779,084 |
| 2,000 | | Legg Mason, Inc. | | | 146,520 |
| 7,500 | | MBIA, Inc. | | | 474,600 |
| 39,800 | | MBNA Corp. | | | 1,121,962 |
| 57,800 | | Morgan Stanley | | | 3,209,056 |
| 161,700 | | Principal Financial Group, Inc. (The) | | | 6,619,998 |
| | | | |
|
|
| | | | | | 28,989,087 |
| | | | |
|
|
| | |
| | | Diversified Telecommunication Services—0.1% | | | |
| 19,000 | | Sprint Corp. | | | 472,150 |
| | | | |
|
|
See Notes to Financial Statements
| | |
| THE TARGET PORTFOLIO TRUST | | 31 |
| | |
Large Capitalization Value Portfolio (cont’d) | | Portfolio of Investments
As of December 31, 2004 |
| | | | | |
| SHARES | | DESCRIPTION | | VALUE (NOTE 1) |
| | | | | | |
| | | Electric Utilities—6.8% | | | |
| 76,700 | | Alliant Energy Corp. | | $ | 2,193,620 |
| 24,200 | | Consolidated Edison, Inc. | | | 1,058,750 |
| 9,700 | | Constellation Energy Group, Inc. | | | 423,987 |
| 19,600 | | Edison International | | | 627,788 |
| 47,200 | | Entergy Corp. | | | 3,190,248 |
| 149,996 | | FirstEnergy Corp. | | | 5,926,342 |
| 119,100 | | FPL Group, Inc. | | | 8,902,725 |
| 25,100 | | NiSource, Inc. | | | 571,778 |
| 14,200 | | PG&E Corp.(a) | | | 472,576 |
| 16,900 | | Pinnacle West Capital Corp. | | | 750,529 |
| 19,600 | | PPL Corp. | | | 1,044,288 |
| 10,500 | | Wisconsin Energy Corp. | | | 353,955 |
| 38,300 | | Xcel Energy, Inc. | | | 697,060 |
| | | | |
|
|
| | | | | | 26,213,646 |
| | | | |
|
|
| | |
| | | Electrical Equipment | | | |
| 100 | | Cooper Industries, Ltd. (Class A shares) | | | 6,789 |
| | | | |
|
|
| | |
| | | Exchange Traded Funds—0.2% | | | |
| 12,950 | | iShares Russell 1000 Value Index Fund | | | 859,492 |
| | | | |
|
|
| | |
| | | Food & Staples Retailing—1.5% | | | |
| 232,800 | | Albertson’s, Inc. | | | 5,559,264 |
| 4,300 | | Costco Wholesale Corp. | | | 208,163 |
| | | | |
|
|
| | | | | | 5,767,427 |
| | | | |
|
|
| | |
| | | Food Products—1.9% | | | |
| 800 | | H.J. Heinz Co. | | | 31,192 |
| 59,900 | | Kraft Foods, Inc. (Class A shares) | | | 2,133,039 |
| 88,400 | | Sara Lee Corp. | | | 2,133,976 |
| 4,800 | | Sysco Corp. | | | 183,216 |
| 69,900 | | Unilever Plc—ADR | | | 2,762,448 |
| | | | |
|
|
| | | | | | 7,243,871 |
| | | | |
|
|
| | |
| | | Gas & Pipeline Utilities—0.2% | | | |
| 17,900 | | Northeast Utilities | | | 337,415 |
| 9,400 | | Valero Energy Corp. | | | 426,760 |
| | | | |
|
|
| | | | | | 764,175 |
| | | | |
|
|
| | |
| | | Healthcare Equipment & Supplies—0.5% | | | |
| 3,600 | | Eli Lilly & Co. | | | 204,300 |
| 9,100 | | Gilead Sciences, Inc.(a) | | | 318,409 |
| 5,800 | | Guidant Corp. | | | 418,180 |
| 5,500 | | Sepracor, Inc.(a) | | | 326,535 |
| 14,200 | | Watson Pharmaceuticals, Inc.(a) | | | 465,902 |
| 6,300 | | Wyeth | | | 268,317 |
| | | | |
|
|
| | | | | | 2,001,643 |
| | | | |
|
|
See Notes to Financial Statements
| | |
| 32 | | THE TARGET PORTFOLIO TRUST |
| | | | | |
| SHARES | | DESCRIPTION | | VALUE (NOTE 1) |
| | | | | | |
| | | Healthcare Providers & Services—3.8% | | | |
| 48,400 | | Aetna, Inc. | | $ | 6,037,900 |
| 66,600 | | HCA, Inc. | | | 2,661,336 |
| 411,600 | | Tenet Healthcare Corp.(a) | | | 4,519,368 |
| 11,000 | | WellPoint, Inc.(a) | | | 1,265,000 |
| | | | |
|
|
| | | | | | 14,483,604 |
| | | | |
|
|
| | |
| | | Homebuilding—0.2% | | | |
| 8,300 | | D.R. Horton, Inc. | | | 334,573 |
| 4,200 | | Pulte Homes, Inc. | | | 267,960 |
| | | | |
|
|
| | | | | | 602,533 |
| | | | |
|
|
| | |
| | | Hotels, Restaurants & Leisure—3.5% | | | |
| 227,000 | | Caesars Entertainment, Inc.(a) | | | 4,571,780 |
| 700 | | Carnival Corp. | | | 40,341 |
| 22,700 | | Hilton Hotels Corp. | | | 516,198 |
| 19,100 | | International Game Technology | | | 656,658 |
| 7,000 | | Mandalay Resort Group | | | 493,010 |
| 3,000 | | Marriott International, Inc. | | | 188,940 |
| 63,200 | | McDonald’s Corp. | | | 2,026,192 |
| 8,500 | | Starwood Hotels & Resorts Worldwide, Inc. | | | 496,400 |
| 2,500 | | Wendy’s International, Inc. | | | 98,150 |
| 95,900 | | Yum! Brands, Inc. | | | 4,524,562 |
| | | | |
|
|
| | | | | | 13,612,231 |
| | | | |
|
|
| | |
| | | Household Durables—2.5% | | | |
| 1,500 | | Centex Corp. | | | 89,370 |
| 160,600 | | Lennar Corp. (Class A shares) | | | 9,102,808 |
| 9,180 | | Lennar Corp. (Class B shares) | | | 479,288 |
| | | | |
|
|
| | | | | | 9,671,466 |
| | | | |
|
|
| | |
| | | Industrial Conglomerates—4.3% | | | |
| 2,000 | | 3M Co. | | | 164,140 |
| 266,100 | | General Electric Co. | | | 9,712,650 |
| 3,900 | | ITT Industries, Inc. | | | 329,355 |
| 173,800 | | Tyco International Ltd. (Bermuda) | | | 6,211,612 |
| | | | |
|
|
| | | | | | 16,417,757 |
| | | | |
|
|
| | |
| | | Industrial Machinery—0.5% | | | |
| 1,000 | | Caterpillar, Inc. | | | 97,510 |
| 12,000 | | Deere & Co. | | | 892,800 |
| 14,600 | | Eaton Corp. | | | 1,056,456 |
| | | | |
|
|
| | | | | | 2,046,766 |
| | | | |
|
|
| | |
| | | Insurance—10.7% | | | |
| 29,000 | | AFLAC, Inc. | | | 1,155,360 |
| 82,900 | | Allmerica Financial Corp.(a) | | | 2,721,607 |
| 107,800 | | Allstate Corp. (The) | | | 5,575,416 |
| 13,100 | | Ambac Financial Group, Inc. | | | 1,075,903 |
| 800 | | Chubb Corp. (The) | | | 61,520 |
See Notes to Financial Statements
| | |
| THE TARGET PORTFOLIO TRUST | | 33 |
| | |
Large Capitalization Value Portfolio (cont’d) | | Portfolio of Investments
As of December 31, 2004 |
| | | | | |
| SHARES | | DESCRIPTION | | VALUE (NOTE 1) |
| | | | | | |
| | | Insurance (cont’d.) | | | |
| 34,100 | | Genworth Financial, Inc. | | $ | 920,700 |
| 20,500 | | Hartford Financial Services Group, Inc. (The) | | | 1,420,855 |
| 275,070 | | MetLife, Inc. | | | 11,143,085 |
| 4,600 | | Progressive Corp. (The) | | | 390,264 |
| 7,400 | | Protective Life Corp. | | | 315,906 |
| 218,200 | | St. Paul Travelers Cos., Inc. (The) | | | 8,088,674 |
| 12,000 | | Torchmark Corp. | | | 685,680 |
| 422,100 | | UnumProvident Corp. | | | 7,572,474 |
| 3,000 | | W.R. Berkley Corp. | | | 141,510 |
| | | | |
|
|
| | | | | | 41,268,954 |
| | | | |
|
|
| | |
| | | IT Services—3.0% | | | |
| 3,700 | | Automatic Data Processing, Inc. | | | 164,095 |
| 5,000 | | Computer Sciences Corp.(a) | | | 281,850 |
| 466,400 | | Electronic Data Systems Corp. | | | 10,773,840 |
| 24,000 | | Sun Microsystems, Inc.(a) | | | 129,120 |
| 600 | | SunGard Data Systems, Inc.(a) | | | 16,998 |
| | | | |
|
|
| | | | | | 11,365,903 |
| | | | |
|
|
| | |
| | | Leisure Equipment & Products—1.1% | | | |
| 115,400 | | Eastman Kodak Co. | | | 3,721,650 |
| 35,100 | | Mattel, Inc. | | | 684,099 |
| | | | |
|
|
| | | | | | 4,405,749 |
| | | | |
|
|
| | |
| | | Machinery—0.6% | | | |
| 58,000 | | SPX Corp. | | | 2,323,480 |
| | | | |
|
|
| | |
| | | Media—2.3% | | | |
| 2,200 | | Comcast Corp. (Class A shares)(a) | | | 72,248 |
| 8,800 | | E.W. Scripps Co. (Class A shares) | | | 424,864 |
| 11,200 | | EchoStar Communications Corp. (Class A shares)(a) | | | 372,288 |
| 32,100 | | Fox Entertainment Group, Inc. (Class A shares)(a) | | | 1,003,446 |
| 22,900 | | Gannett Co., Inc. | | | 1,870,930 |
| 1,300 | | Knight-Ridder, Inc. | | | 87,022 |
| 33,000 | | Liberty Media Corp. (Class A shares)(a) | | | 362,340 |
| 4,800 | | News Corp. (Class A shares) | | | 89,568 |
| 92,400 | | Time Warner Cos., Inc.(a) | | | 1,796,256 |
| 75,700 | | Viacom, Inc. (Class B shares) | | | 2,754,723 |
| 2,300 | | Walt Disney Co. | | | 63,940 |
| | | | |
|
|
| | | | | | 8,897,625 |
| | | | |
|
|
| | |
| | | Metals & Mining—1.2% | | | |
| 131,976 | | Alcoa, Inc. | | | 4,146,686 |
| 9,800 | | United States Steel Corp. | | | 502,250 |
| | | | |
|
|
| | | | | | 4,648,936 |
| | | | |
|
|
See Notes to Financial Statements
| | |
| 34 | | THE TARGET PORTFOLIO TRUST |
| | | | | |
| SHARES | | DESCRIPTION | | VALUE (NOTE 1) |
| | | | | | |
| | | Multi-Utilities & Unregulated Power—0.7% | | | |
| 31,300 | | Dominion Resources, Inc. | | $ | 2,120,262 |
| 13,100 | | SCANA Corp. | | | 516,140 |
| | | | |
|
|
| | | | | | 2,636,402 |
| | | | |
|
|
| | |
| | | Multiline Retail—3.5% | | | |
| 6,700 | | Abercrombie & Fitch Co. (Class A shares) | | | 314,565 |
| 14,300 | | Federated Department Stores, Inc. | | | 826,397 |
| 11,600 | | Home Depot, Inc. (The) | | | 495,784 |
| 8,600 | | Kohl’s Corp.(a) | | | 422,862 |
| 9,000 | | May Department Stores Co. (The) | | | 264,600 |
| 215,300 | | Sears, Roebuck & Co. | | | 10,986,759 |
| | | | |
|
|
| | | | | | 13,310,967 |
| | | | |
|
|
| | |
| | | Networking Equipment—0.1% | | | |
| 9,500 | | Juniper Networks, Inc.(a) | | | 258,305 |
| | | | |
|
|
| | |
| | | Oil & Gas—5.3% | | | |
| 6,000 | | Anadarko Petroleum Corp. | | | 388,860 |
| 11,900 | | Baker Hughes, Inc. | | | 507,773 |
| 12,100 | | Chesapeake Energy Corp. | | | 199,650 |
| 56,100 | | ChevronTexaco Corp. | | | 2,945,811 |
| 191,700 | | Exxon Mobil Corp. | | | 9,826,542 |
| 5,000 | | Occidental Petroleum Corp. | | | 291,800 |
| 52,028 | | Sunoco, Inc. | | | 4,251,208 |
| 18,600 | | Teekay Shipping Corp. | | | 783,246 |
| 24,900 | | Unocal Corp. | | | 1,076,676 |
| 3,400 | | Williams Cos., Inc. (The) | | | 55,386 |
| | | | |
|
|
| | | | | | 20,326,952 |
| | | | |
|
|
| | |
| | | Oil Field/Equipment & Services—1.0% | | | |
| 33,600 | | ConocoPhillips | | | 2,917,488 |
| 21,100 | | Devon Energy Corp. | | | 821,212 |
| 7,500 | | Dynegy, Inc.(a) | | | 34,650 |
| | | | |
|
|
| | | | | | 3,773,350 |
| | | | |
|
|
| | |
| | | Paper & Forest Products—0.9% | | | |
| 4,100 | | Bowater, Inc. | | | 180,277 |
| 10,000 | | Georgia-Pacific Group | | | 374,800 |
| 15,000 | | International Paper Co. | | | 630,000 |
| 3,200 | | Smurfit-Stone Container Corp.(a) | | | 59,776 |
| 1,200 | | Temple-Inland, Inc. | | | 82,080 |
| 33,520 | | Weyerhaeuser Co. | | | 2,253,214 |
| | | | |
|
|
| | | | | | 3,580,147 |
| | | | |
|
|
| | |
| | | Pharmaceuticals—0.4% | | | |
| 20,800 | | Forest Laboratories, Inc.(a) | | | 933,088 |
| 1,800 | | Medicis Pharmaceutical Corp. (Class A shares) | | | 63,198 |
| 7,800 | | OSI Pharmaceuticals, Inc.(a) | | | 583,830 |
| | | | |
|
|
| | | | | | 1,580,116 |
| | | | |
|
|
See Notes to Financial Statements
| | |
| THE TARGET PORTFOLIO TRUST | | 35 |
| | |
Large Capitalization Value Portfolio (cont’d) | | Portfolio of Investments
As of December 31, 2004 |
| | | | | |
| SHARES | | DESCRIPTION | | VALUE (NOTE 1) |
| | | | | | |
| | | Railroads & Equipment—0.4% | | | |
| 3,600 | | CSX Corp. | | $ | 144,288 |
| 2,100 | | FedEx Corp. | | | 206,829 |
| 32,900 | | Norfolk Southern Corp. | | | 1,190,651 |
| | | | |
|
|
| | | | | | 1,541,768 |
| | | | |
|
|
| | |
| | | Real Estate Investment Trust—3.0% | | | |
| 73,500 | | Apartment Investment & Management Co. | | | 2,832,690 |
| 4,200 | | Camden Property Trust | | | 214,200 |
| 5,700 | | CarrAmerica Realty Corp. | | | 188,100 |
| 2,200 | | CenterPoint Properties Trust | | | 105,358 |
| 10,400 | | Duke Realty Corp. | | | 355,056 |
| 50,100 | | Equity Office Properties Trust | | | 1,458,912 |
| 1,800 | | Equity Residential | | | 65,124 |
| 5,060 | | General Growth Properties, Inc. | | | 182,970 |
| 7,100 | | Kimco Realty Corp. | | | 411,729 |
| 3,800 | | Liberty Property Trust | | | 164,160 |
| 5,800 | | Mack-Cali Realty Corp. | | | 266,974 |
| 41,100 | | New Century Financial Corp. | | | 2,626,701 |
| 54,285 | | Plum Creek Timber Co., Inc. | | | 2,086,715 |
| 17,000 | | ProLogis Trust | | | 736,610 |
| | | | |
|
|
| | | | | | 11,695,299 |
| | | | |
|
|
| | |
| | | Road & Rail—0.6% | | | |
| 34,000 | | Union Pacific Corp. | | | 2,286,500 |
| | | | |
|
|
| | |
| | | Semiconductors & Semiconductor Equipment—0.1% | | | |
| 4,000 | | Analog Devices, Inc. | | | 147,680 |
| 9,600 | | Intersil Corp. (Class A shares) | | | 160,704 |
| | | | |
|
|
| | | | | | 308,384 |
| | | | |
|
|
| | |
| | | Software—3.0% | | | |
| 277,600 | | Computer Associates International, Inc. | | | 8,622,256 |
| 66,600 | | Microsoft Corp. | | | 1,778,886 |
| 76,000 | | Oracle Corp.(a) | | | 1,042,720 |
| 2,700 | | Take-Two Interactive Software, Inc.(a) | | | 93,933 |
| | | | |
|
|
| | | | | | 11,537,795 |
| | | | |
|
|
| | |
| | | Specialty Retail—0.2% | | | |
| 10,300 | | Lowe’s Cos., Inc. | | | 593,177 |
| 1,900 | | Ross Stores, Inc. | | | 54,853 |
| 5,200 | | Staples, Inc. | | | 175,292 |
| | | | |
|
|
| | | | | | 823,322 |
| | | | |
|
|
| | |
| | | Supplier & Networking Equipment—0.1% | | | |
| 93,200 | | Lucent Technologies, Inc.(a) | | | 350,432 |
| | | | |
|
|
See Notes to Financial Statements
| | |
| 36 | | THE TARGET PORTFOLIO TRUST |
| | | | | | |
| SHARES | | DESCRIPTION | | VALUE (NOTE 1) | |
| | | | | | | |
| | | Telecommunications Services—2.0% | | | | |
| 31,200 | | BellSouth Corp. | | $ | 867,048 | |
| 37,900 | | Corning, Inc.(a) | | | 446,083 | |
| 92,000 | | SBC Communications, Inc. | | | 2,370,840 | |
| 103,900 | | Verizon Communications, Inc. | | | 4,208,989 | |
| | | | |
|
|
|
| | | | | | 7,892,960 | |
| | | | |
|
|
|
| | |
| | | Textiles, Apparel & Luxury Goods—0.9% | | | | |
| 71,600 | | Jones Apparel Group, Inc. | | | 2,618,412 | |
| 11,000 | | Nike, Inc. (Class B shares) | | | 997,590 | |
| | | | |
|
|
|
| | | | | | 3,616,002 | |
| | | | |
|
|
|
| | |
| | | Thrifts & Mortgage Finance—3.1% | | | | |
| 5,200 | | Astoria Financial Corp. | | | 207,844 | |
| 5,400 | | Doral Financial Corp. | | | 265,950 | |
| 76,800 | | Freddie Mac | | | 5,660,160 | |
| 138,300 | | Washington Mutual, Inc. | | | 5,847,324 | |
| | | | |
|
|
|
| | | | | | 11,981,278 | |
| | | | |
|
|
|
| | |
| | | Tobacco—3.6% | | | | |
| 230,200 | | Altria Group, Inc. | | | 14,065,220 | |
| | | | |
|
|
|
| | |
| | | Toys & Amusement—0.1% | | | | |
| 21,200 | | Hasbro, Inc. | | | 410,856 | |
| | | | |
|
|
|
| | |
| | | Trading Companies & Distributors | | | | |
| 1,100 | | W.W. Grainger, Inc. | | | 73,282 | |
| | | | |
|
|
|
| | |
| | | Wireless Telecommunication Services—0.3% | | | | |
| 35,800 | | Nextel Communications, Inc. (Class A shares)(a) | | | 1,074,000 | |
| | | | |
|
|
|
| | | Total long-term investments
(cost $292,453,934) | | | 384,030,123 | |
| | | | |
|
|
|
| | |
| | | SHORT-TERM INVESTMENT—0.4% | | | | |
| | |
| | | Money Market Mutual Fund | | | | |
| 1,471,639 | | Dryden Core Investment Fund—Taxable Money Market Series
(cost $1,471,639; Note 3) | | | 1,471,639 | |
| | | | |
|
|
|
| | | Total Investments—100.0%
(cost $293,925,573; Note 5) | | | 385,501,762 | |
| | | Liabilities in excess of other assets | | | (88,261 | ) |
| | | | |
|
|
|
| | | Net Assets—100% | | $ | 385,413,501 | |
| | | | |
|
|
|
| (a) | Non-income producing security. |
ADR—American Depositary Receipt.
See Notes to Financial Statements
| | |
| THE TARGET PORTFOLIO TRUST | | 37 |
| | |
Large Capitalization Value Portfolio (cont’d) | | Portfolio of Investments
As of December 31, 2004 |
The industry classification of portfolio holdings and liabilities in excess of other assets shown as a percentage of net assets as of December 31, 2004 were as follows:
| | | |
Insurance | | 10.7 | % |
Diversified Financial Services | | 7.5 | |
Electric Utilities | | 6.8 | |
Commercial Banks | | 6.2 | |
Oil & Gas | | 5.3 | |
Industrial Conglomerates | | 4.3 | |
Healthcare Providers & Services | | 3.8 | |
Aerospace | | 3.6 | |
Tobacco | | 3.6 | |
Hotels, Restaurants & Leisure | | 3.5 | |
Multiline Retail | | 3.5 | |
Thrifts & Mortgage Finance | | 3.1 | |
IT Services | | 3.0 | |
Real Estate Investment Trust | | 3.0 | |
Software | | 3.0 | |
Household Durables | | 2.5 | |
Commercial Services & Supplies | | 2.4 | |
Media | | 2.3 | |
Telecommunications Services | | 2.0 | |
Food Products | | 1.9 | |
Chemicals | | 1.6 | |
Food & Staples Retailing | | 1.5 | |
Automotive Component | | 1.2 | |
Metals & Mining | | 1.2 | |
Computers & Peripherals | | 1.1 | |
Leisure Equipment & Products | | 1.1 | |
Oil Fueld/Equipment & Services | | 1.0 | |
Paper & Forest Products | | 0.9 | |
Textiles, Apparel & Luxury Goods | | 0.9 | |
Multi-Utilities & Unregulated Power | | 0.7 | |
Automobiles | | 0.6 | |
Beverages | | 0.6 | |
Machinery | | 0.6 | |
Road & Rail | | 0.6 | |
Healthcare Equipment & Supplies | | 0.5 | |
Industrial Machinery | | 0.5 | |
Pharmaceuticals | | 0.4 | |
Railroads & Equipment | | 0.4 | |
Money Market Mutual Fund | | 0.4 | |
Consumer Products | | 0.3 | |
Wireless Telecommunication Services | | 0.3 | |
Capital Markets | | 0.2 | |
Exchange Traded Funds | | 0.2 | |
Gas & Pipeline Utilities | | 0.2 | |
Homebuilding | | 0.2 | |
Specialty Retail | | 0.2 | |
Communications Equipment | | 0.1 | |
Diversified Telecommunications Services | | 0.1 | |
Networking Equipment | | 0.1 | |
Semiconductors & Semiconductors Equipment | | 0.1 | |
Supplier & Networking Equipment | | 0.1 | |
Toys & Amusement | | 0.1 | |
| | |
|
|
| | | 100.0 | % |
| | |
|
|
See Notes to Financial Statements
| | |
| 38 | | THE TARGET PORTFOLIO TRUST |
| | |
Portfolio of Investments
As of December 31, 2004 | | Small Capitalization Growth Portfolio |
| | | | | |
| SHARES | | DESCRIPTION | | VALUE (NOTE 1) |
| | | | | | |
| | | LONG-TERM INVESTMENTS—96.4% | | | |
| | |
| | | Common Stocks | | | |
| | |
| | | Aerospace & Defense—1.5% | | | |
| 2,000 | | Argon ST, Inc.(a) | | $ | 70,900 |
| 17,830 | | DRS Technologies, Inc.(a) | | | 761,519 |
| 13,460 | | Engineered Support Systems, Inc. | | | 797,102 |
| 24,580 | | Mercury Computer Systems, Inc.(a) | | | 729,534 |
| | | | |
|
|
| | | | | | 2,359,055 |
| | | | |
|
|
| | |
| | | Air Freight & Logistics—1.3% | | | |
| 28,028 | | Forward Air Corp.(a) | | | 1,252,851 |
| 51,447 | | Vitran Corp.(a) | | | 879,744 |
| | | | |
|
|
| | | | | | 2,132,595 |
| | | | |
|
|
| | |
| | | Auto Components—0.3% | | | |
| 11,510 | | Gentex Corp. | | | 426,100 |
| | | | |
|
|
| | |
| | | Automobiles—1.1% | | | |
| 5,000 | | IMPCO Technologies, Inc.(a) | | | 37,750 |
| 28,765 | | Monaco Coach Corp. | | | 591,696 |
| 29,362 | | Winnebago Industries, Inc. | | | 1,146,880 |
| | | | |
|
|
| | | | | | 1,776,326 |
| | | �� | |
|
|
| | |
| | | Banking & Finance—0.7% | | | |
| 15,530 | | PrivateBancorp, Inc. | | | 500,532 |
| 20,400 | | Signature Bank, Inc.(a) | | | 660,144 |
| | | | |
|
|
| | | | | | 1,160,676 |
| | | | |
|
|
| | |
| | | Biotechnology—2.5% | | | |
| 65,357 | | Connetics Corp.(a) | | | 1,587,522 |
| 15,048 | | IDEXX Laboratories, Inc.(a) | | | 821,470 |
| 102,640 | | Nabi Biopharmaceuticals(a) | | | 1,503,676 |
| | | | |
|
|
| | | | | | 3,912,668 |
| | | | |
|
|
| | |
| | | Business Services—1.4% | | | |
| 92,951 | | Digital Insight Corp.(a) | | | 1,710,298 |
| 30,880 | | Marlin Business Services, Inc.(a) | | | 586,720 |
| | | | |
|
|
| | | | | | 2,297,018 |
| | | | |
|
|
| | |
| | | Capital Markets—1.2% | | | |
| 24,797 | | Jefferies Group, Inc. | | | 998,823 |
| 17,477 | | Piper Jaffray Companies, Inc.(a) | | | 838,022 |
| | | | |
|
|
| | | | | | 1,836,845 |
| | | | |
|
|
| | |
| | | Commercial Banks—1.7% | | | |
| 35,800 | | Nara Bancorp, Inc. | | | 761,466 |
| 61,520 | | Southwest Bancorporation of Texas, Inc. | | | 1,432,801 |
| 10,151 | | Wintrust Financial Corp. | | | 578,201 |
| | | | |
|
|
| | | | | | 2,772,468 |
| | | | |
|
|
See Notes to Financial Statements
| | |
| THE TARGET PORTFOLIO TRUST | | 39 |
| | |
Small Capitalization Growth Portfolio (cont’d) | | Portfolio of Investments
As of December 31, 2004 |
| | | | | |
| SHARES | | DESCRIPTION | | VALUE (NOTE 1) |
| | | | | | |
| | | Commercial Services & Supplies—4.3% | | | |
| 38,516 | | Education Management Corp.(a) | | $ | 1,271,413 |
| 86,883 | | FTI Consulting, Inc.(a) | | | 1,830,626 |
| 83,290 | | Kforce, Inc.(a) | | | 924,519 |
| 18,080 | | Laureate Education, Inc.(a) | | | 797,147 |
| 30,140 | | Navigant Consulting, Inc.(a) | | | 801,724 |
| 26,633 | | Stericycle, Inc.(a) | | | 1,223,786 |
| | | | |
|
|
| | | | | | 6,849,215 |
| | | | |
|
|
| | |
| | | Communications Equipment—3.5% | | | |
| 50,396 | | Andrew Corp.(a) | | | 686,897 |
| 19,380 | | Applied Signal Technology, Inc. | | | 683,145 |
| 72,072 | | Avocent Corp.(a) | | | 2,920,358 |
| 76,770 | | Harmonic, Inc.(a) | | | 640,262 |
| 63,640 | | Symmetricom, Inc.(a) | | | 617,944 |
| | | | |
|
|
| | | | | | 5,548,606 |
| | | | |
|
|
| | |
| | | Computers & Peripherals—0.8% | | | |
| 33,840 | | M-Systems Flash Disk Pioneers, Ltd. (Israel)(a) | | | 667,325 |
| 108,550 | | Synplicity, Inc.(a) | | | 642,616 |
| | | | |
|
|
| | | | | | 1,309,941 |
| | | | |
|
|
| | |
| | | Construction & Engineering—1.4% | | | |
| 47,181 | | Jacobs Engineering Group, Inc.(a) | | | 2,254,780 |
| | | | |
|
|
| | |
| | | Diversified Financial Services—2.5% | | | |
| 28,167 | | Affiliated Managers Group, Inc.(a) | | | 1,908,032 |
| 29,420 | | Financial Federal Corp. | | | 1,153,264 |
| 18,607 | | Gabelli Asset Management, Inc. (Class A shares) | | | 902,812 |
| | | | |
|
|
| | | | | | 3,964,108 |
| | | | |
|
|
| | |
| | | Diversified Telecommunication Services—1.0% | | | |
| 26,130 | | Novatel Wireless, Inc.(a) | | | 506,399 |
| 30,580 | | SafeNet, Inc.(a) | | | 1,123,510 |
| | | | |
|
|
| | | | | | 1,629,909 |
| | | | |
|
|
| | |
| | | Drugs & Healthcare—0.3% | | | |
| 32,675 | | Enzon Pharmaceuticals, Inc.(a) | | | 448,301 |
| | | | |
|
|
| | |
| | | Electrical Equipment—0.5% | | | |
| 75,200 | | Artesyn Technologies, Inc.(a) | | | 849,760 |
| | | | |
|
|
| | |
| | | Electronic Equipment & Instruments—5.2% | | | |
| 22,270 | | BEI Technologies, Inc. | | | 687,698 |
| 53,674 | | Benchmark Electronics, Inc.(a) | | | 1,830,282 |
| 7,350 | | Ceradyne, Inc.(a) | | | 420,494 |
| 15,700 | | Faro Technologies, Inc.(a) | | | 489,526 |
See Notes to Financial Statements
| | |
| 40 | | THE TARGET PORTFOLIO TRUST |
| | | | | |
| SHARES | | DESCRIPTION | | VALUE (NOTE 1) |
| | | | | | |
| | | Electronic Equipment & Instruments (cont’d.) | | | |
| 23,178 | | Global Imaging Systems, Inc.(a) | | $ | 915,531 |
| 36,150 | | Littelfuse, Inc.(a) | | | 1,234,884 |
| 60,859 | | Photon Dynamics, Inc.(a) | | | 1,477,657 |
| 27,508 | | Rogers Corp.(a) | | | 1,185,595 |
| | | | |
|
|
| | | | | | 8,241,667 |
| | | | |
|
|
| | |
| | | Energy Equipment & Services—3.6% | | | |
| 40,174 | | Cal Dive International, Inc.(a) | | | 1,637,091 |
| 17,525 | | Cooper Cameron Corp.(a) | | | 943,020 |
| 138,220 | | Grey Wolf, Inc.(a) | | | 728,419 |
| 17,048 | | Hydril Co.(a) | | | 775,854 |
| 20,080 | | Maverick Tube Corp.(a) | | | 608,424 |
| 51,210 | | Patterson-UTI Energy, Inc. | | | 996,035 |
| | | | |
|
|
| | | | | | 5,688,843 |
| | | | |
|
|
| | |
| | | Food & Staples Retailing—1.4% | | | |
| 44,419 | | Performance Food Group Co.(a) | | | 1,195,315 |
| 153,287 | | SunOpta, Inc. (Canada)(a) | | | 1,100,601 |
| | | | |
|
|
| | | | | | 2,295,916 |
| | | | |
|
|
| | |
| | | Healthcare Equipment & Supplies—7.6% | | | |
| 47,950 | | Abaxis, Inc.(a) | | | 694,796 |
| 42,478 | | Advanced Neuromodulation Systems, Inc.(a) | | | 1,676,181 |
| 17,327 | | American Medical Systems Holdings, Inc.(a) | | | 724,442 |
| 40,550 | | Closure Medical Corp.(a) | | | 790,725 |
| 28,423 | | Edwards Lifesciences Corp.(a) | | | 1,172,733 |
| 118,050 | | Encore Medical Corp.(a) | | | 801,560 |
| 20,745 | | Inamed Corp.(a) | | | 1,312,120 |
| 9,160 | | Intuitive Surgical, Inc.(a) | | | 366,583 |
| 15,320 | | Laserscope (a) | | | 550,141 |
| 144,950 | | Orthovita, Inc.(a) | | | 607,341 |
| 22,570 | | PolyMedica Corp. | | | 841,635 |
| 56,520 | | PSS World Medical, Inc.(a) | | | 707,348 |
| 134,800 | | Spectranetics Corp. (The)(a) | | | 757,711 |
| 20,761 | | Varian, Inc.(a) | | | 851,409 |
| | | | |
|
|
| | | | | | 11,854,725 |
| | | | |
|
|
| | |
| | | Healthcare Providers & Services—3.7% | | | |
| 32,685 | | America Service Group, Inc.(a) | | | 874,977 |
| 29,036 | | AmSurg Corp. (Class A shares)(a) | | | 857,723 |
| 16,510 | | Chemed Corp. | | | 1,107,987 |
| 24,600 | | Kindred Healthcare, Inc.(a) | | | 736,770 |
| 32,600 | | Lifeline Systems, Inc.(a) | | | 839,776 |
| 18,527 | | LifePoint Hospitals, Inc.(a) | | | 645,110 |
| 36,560 | | Providence Service Corp. (The)(a) | | | 766,663 |
| | | | |
|
|
| | | | | | 5,829,006 |
| | | | |
|
|
| | |
| | | Hotels, Restaurants & Leisure—2.2% | | | |
| 82,800 | | Cosi, Inc.(a) | | | 500,940 |
| 6,300 | | Mikohn Gaming Corp.(a) | | | 64,386 |
See Notes to Financial Statements
| | |
| THE TARGET PORTFOLIO TRUST | | 41 |
| | |
Small Capitalization Growth Portfolio (cont’d) | | Portfolio of Investments
As of December 31, 2004 |
| | | | | |
| SHARES | | DESCRIPTION | | VALUE (NOTE 1) |
| | | | | | |
| | | Hotels, Restaurants & Leisure (cont’d.) | | | |
| 66,072 | | RARE Hospitality International, Inc.(a) | | $ | 2,105,054 |
| 32,748 | | Ruby Tuesday, Inc. | | | 854,068 |
| | | | |
|
|
| | | | | | 3,524,448 |
| | | | |
|
|
| | |
| | | Household Durables—0.5% | | | |
| 11,795 | | Toll Brothers, lnc.(a) | | | 809,255 |
| | | | |
|
|
| | |
| | | Insurance—2.4% | | | |
| 44,950 | | Affirmative Insurance Holdings, Inc. | | | 756,958 |
| 28,716 | | Infinity Property & Casualty Corp. | | | 1,010,803 |
| 33,200 | | LabOne, Inc. | | | 1,063,728 |
| 82,850 | | Tower Group, Inc. | | | 994,200 |
| | | | |
|
|
| | | | | | 3,825,689 |
| | | | |
|
|
| | |
| | | Internet Software & Services—4.4% | | | |
| 30,490 | | Ask Jeeves, Inc.(a) | | | 815,608 |
| 17,030 | | Equinix, Inc.(a) | | | 727,862 |
| 17,540 | | InfoSpace, Inc.(a) | | | 834,027 |
| 27,940 | | J2 Global Communications, Inc.(a) | | | 963,930 |
| 17,630 | | Jupitermedia Corp.(a) | | | 419,241 |
| 79,880 | | Keynote Systems, Inc.(a) | | | 1,111,930 |
| 155,937 | | ValueVision Media, Inc. (Class A shares)(a) | | | 2,169,083 |
| | | | |
|
|
| | | | | | 7,041,681 |
| | | | |
|
|
| | |
| | | IT Services—2.3% | | | |
| 111,751 | | Ciber, Inc.(a) | | | 1,077,280 |
| 37,057 | | Keane, Inc.(a) | | | 544,738 |
| 44,630 | | Radvision, Ltd.(a) | | | 602,505 |
| 22,370 | | Radware, Ltd.(a) | | | 584,528 |
| 34,421 | | UNOVA, Inc.(a) | | | 870,507 |
| | | | |
|
|
| | | | | | 3,679,558 |
| | | | |
|
|
| | |
| | | Leisure Equipment & Products—0.8% | | | |
| 54,510 | | Image Entertainment, Inc.(a) | | | 323,789 |
| 59,110 | | K2, Inc. | | | 938,667 |
| | | | |
|
|
| | | | | | 1,262,456 |
| | | | |
|
|
| | |
| | | Media—4.6% | | | |
| 60,550 | | CNET Networks, Inc.(a) | | | 679,977 |
| 45,889 | | Cox Radio, Inc.(a) | | | 756,251 |
| 112,250 | | Digitas, Inc.(a) | | | 1,071,988 |
| 45,811 | | Emmis Communications Corp.(Class A shares)(a) | | | 879,113 |
| 81,000 | | Entravision Communications Corp.(a) | | | 676,350 |
| 12,484 | | Getty Images, Inc.(a) | | | 859,523 |
| 175,463 | | Valueclick, Inc.(a) | | | 2,338,921 |
| | | | |
|
|
| | | | | | 7,262,123 |
| | | | |
|
|
See Notes to Financial Statements
| | |
| 42 | | THE TARGET PORTFOLIO TRUST |
| | | | | |
| SHARES | | DESCRIPTION | | VALUE (NOTE 1) |
| | | | | | |
| | | Multiline Retail—1.1% | | | |
| 34,401 | | 99 Cents Only Stores, Inc.(a) | | $ | 555,920 |
| 65,673 | | Fred’s, Inc. | | | 1,142,710 |
| | | | |
|
|
| | | | | | 1,698,630 |
| | | | |
|
|
| | |
| | | Office Equipment & Supplies—1.0% | | | |
| 64,080 | | Scientific Games Corp.(a) | | | 1,527,667 |
| | | | |
|
|
| | |
| | | Oil & Gas—2.5% | | | |
| 12,892 | | Forest Oil Corp.(a) | | | 408,934 |
| 51,950 | | Key Energy Services, Inc.(a) | | | 613,010 |
| 36,830 | | Oil States International, Inc.(a) | | | 710,451 |
| 47,650 | | Superior Energy Services, Inc.(a) | | | 734,287 |
| 17,850 | | Unit Corp.(a) | | | 682,049 |
| 29,881 | | Western Gas Resoures, Inc. | | | 874,018 |
| | | | |
|
|
| | | | | | 4,022,749 |
| | | | |
|
|
| | |
| | | Patent Owners & Lessors—0.4% | | | |
| 113,840 | | SRS Labs, Inc.(a) | | | 711,614 |
| | | | |
|
|
| | |
| | | Pharmaceuticals—3.7% | | | |
| 31,480 | | Alexion Pharmaceuticals, Inc.(a) | | | 793,296 |
| 19,450 | | Atherogenics, Inc.(a) | | | 458,242 |
| 46,560 | | Cypress Bioscience, Inc.(a) | | | 654,634 |
| 52,828 | | HealthExtras, Inc.(a) | | | 861,096 |
| 38,760 | | Inspire Pharmaceuticals, Inc.(a) | | | 650,005 |
| 52,790 | | QLT, Inc. (Canada)(a) | | | 848,863 |
| 23,550 | | Rigel Pharmaceuticals, Inc.(a) | | | 575,091 |
| 39,600 | | Salix Pharmaceuticals, Ltd.(a) | | | 696,564 |
| 23,250 | | Vaxgen, Inc.(a) | | | 394,669 |
| | | | |
|
|
| | | | | | 5,932,460 |
| | | | |
|
|
| | |
| | | Road & Rail—0.5% | | | |
| 21,650 | | Old Dominion Freight Line, Inc.(a) | | | 753,420 |
| | | | |
|
|
| | |
| | | Semiconductors & Semiconductor Equipment—3.5% | | | |
| 55,738 | | Intersil Corp. (Class A shares) | | | 933,054 |
| 26,500 | | Microsemi Corp.(a) | | | 460,040 |
| 86,980 | | O2Micro International, Ltd.(a) | | | 995,052 |
| 35,377 | | Semtech Corp.(a) | | | 773,695 |
| 11,420 | | Sigmatel, Inc.(a) | | | 405,753 |
| 19,459 | | Silicon Laboratories, Inc.(a) | | | 687,097 |
| 53,170 | | SiRF Technology Holdings, Inc.(a) | | | 676,322 |
| 35,780 | | Ultratech, Inc.(a) | | | 674,453 |
| | | | |
|
|
| | | | | | 5,605,466 |
| | | | |
|
|
| | |
| | | Software—11.3% | | | |
| 46,878 | | Altiris, Inc.(a) | | | 1,660,888 |
| 27,942 | | Catapult Communications Corp.(a) | | | 675,079 |
| 79,542 | | Embarcadero Technologies, Inc.(a) | | | 748,490 |
| 53,790 | | Epicor Software Corp.(a) | | | 757,901 |
| 10,408 | | Factset Research Systems, Inc. | | | 608,244 |
| 54,383 | | Fair Isaac Corp. | | | 1,994,768 |
| 53,253 | | Filenet Corp.(a) | | | 1,371,797 |
See Notes to Financial Statements
| | |
| THE TARGET PORTFOLIO TRUST | | 43 |
| | |
Small Capitalization Growth Portfolio (cont’d) | | Portfolio of Investments
As of December 31, 2004 |
| | | | | | |
| SHARES | | DESCRIPTION | | VALUE (NOTE 1) | |
| | | | | | | |
| | | Software (cont’d.) | | | | |
| 32,994 | | Hyperion Solutions Corp.(a) | | $ | 1,538,180 | |
| 39,640 | | Infocrossing, Inc.(a) | | | 671,105 | |
| 129,039 | | Informatica Corp.(a) | | | 1,047,797 | |
| 32,259 | | Jack Henry & Associates, Inc. | | | 642,277 | |
| 18,262 | | Kronos, Inc.(a) | | | 933,736 | |
| 18,853 | | Macrovision Corp.(a) | | | 484,899 | |
| 28,040 | | Merge Technologies, Inc.(a) | | | 623,890 | |
| 19,940 | | Open Solutions, Inc.(a) | | | 517,642 | |
| 64,220 | | Serena Software, Inc.(a) | | | 1,389,721 | |
| 56,230 | | Smith Micro Software, Inc.(a) | | | 503,259 | |
| 36,700 | | Sonic Solutions, Inc.(a) | | | 823,548 | |
| 33,900 | | THQ, Inc.(a) | | | 777,666 | |
| | | | |
|
|
|
| | | | | | 17,770,887 | |
| | | | |
|
|
|
| | |
| | | Specialty Retail—5.9% | | | | |
| 22,415 | | Aaron Rents, Inc. (Class B shares) | | | 560,375 | |
| 37,800 | | Beacon Roofing Supply, Inc.(a) | | | 750,708 | |
| 60,050 | | Charlotte Russe Holding, Inc.(a) | | | 606,505 | |
| 21,500 | | Cost Plus, Inc.(a) | | | 690,795 | |
| 45,030 | | Ezcorp, Inc. | | | 693,912 | |
| 19,130 | | Guitar Center, Inc.(a) | | | 1,007,960 | |
| 36,495 | | Jos. A. Bank Clothiers, Inc.(a) | | | 1,032,809 | |
| 28,100 | | Knoll, Inc.(a) | | | 491,750 | |
| 36,650 | | Linens ‘n Things, Inc.(a) | | | 908,920 | |
| 30,538 | | PETCO Animal Supplies, Inc.(a) | | | 1,205,640 | |
| 34,315 | | Tractor Supply Co.(a) | | | 1,276,861 | |
| | | | |
|
|
|
| | | | | | 9,226,235 | |
| | | | |
|
|
|
| | |
| | | Textiles, Apparel & Luxury Goods—1.2% | | | | |
| 87,665 | | Ashworth, Inc.(a) | | | 954,672 | |
| 23,980 | | Oxford Industries, Inc. | | | 990,374 | |
| | | | |
|
|
|
| | | | | | 1,945,046 | |
| | | | |
|
|
|
| | |
| | | Thrifts & Mortgage Finance—0.6% | | | | |
| 42,350 | | Saxon Capital, Inc. | | | 1,015,977 | |
| | | | |
|
|
|
| | | Total long-term investments
(cost $128,021,757) | | | 153,053,889 | |
| | | | |
|
|
|
| | |
| | | SHORT-TERM INVESTMENT—3.8% | | | | |
| | |
| | | Money Market Mutual Fund | | | | |
| 6,051,025 | | Dryden Core Investment Fund—Taxable Money Market Series
(cost $6,051,025; Note 3) | | | 6,051,025 | |
| | | | |
|
|
|
| | | Total Investments—100.2%
(cost $134,072,782; Note 5) | | | 159,104,914 | |
| | | Liabilities in excess of other assets—(0.2%) | | | (347,659 | ) |
| | | | |
|
|
|
| | | Net Assets—100% | | $ | 158,757,255 | |
| | | | |
|
|
|
| (a) | Non-income producing security. |
See Notes to Financial Statements
| | |
| 44 | | THE TARGET PORTFOLIO TRUST |
The industry classification of portfolio holdings and liabilities in excess of other assets shown as a percentage of net assets as of December 31, 2004 were as follows:
| | | |
Software | | 11.3 | % |
Healthcare Equipment & Supplies | | 7.6 | |
Specialty Retail | | 5.9 | |
Electronic Equipment & Instruments | | 5.2 | |
Media | | 4.6 | |
Internet Software & Services | | 4.4 | |
Commercal Services & Supplies | | 4.3 | |
Money Market Mutual Fund | | 3.8 | |
Healthcare Providers & Services | | 3.7 | |
Pharmaceuticals | | 3.7 | |
Energy Equipment & Services | | 3.6 | |
Communications Equipment | | 3.5 | |
Semiconductors & Semiconductor Equipment | | 3.5 | |
Biotechnology | | 2.5 | |
Diversified Financial Services | | 2.5 | |
Oil & Gas | | 2.5 | |
Insurance | | 2.4 | |
IT Services | | 2.3 | |
Hotels, Restaurants & Leisure | | 2.2 | |
Commercial Banks | | 1.7 | |
Aerospace & Defense | | 1.5 | |
Business Services | | 1.4 | |
Construction & Engineering | | 1.4 | |
Food & Staples Retailing | | 1.4 | |
Air Freight & Logistics | | 1.3 | |
Capital Markets | | 1.2 | |
Textiles, Appareal & Luxury Goods | | 1.2 | |
Automobiles | | 1.1 | |
Multiline Retail | | 1.1 | |
Diversified Telecommunications Services | | 1.0 | |
Office Equipment & Supplies | | 1.0 | |
Computers & Peripherals | | 0.8 | |
Leisure Equipment & Products | | 0.8 | |
Banking & Finance | | 0.7 | |
Thrifts & Mortgage Finance | | 0.6 | |
Electrical Equipment | | 0.5 | |
Household Durables | | 0.5 | |
Road & Rail | | 0.5 | |
Patent Owners & Lessors | | 0.4 | |
Auto Components | | 0.3 | |
Drugs & Healthcare | | 0.3 | |
| | |
|
|
| | | 100.2 | |
Liabilities in excess of other assets | | (0.2 | ) |
| | |
|
|
| | | 100.0 | % |
| | |
|
|
See Notes to Financial Statements
| | |
| THE TARGET PORTFOLIO TRUST | | 45 |
| | |
| Small Capitalization Value Portfolio | | Portfolio of Investments
As of December 31, 2004 |
| | | | | |
| SHARES | | DESCRIPTION | | VALUE (NOTE 1) |
| | | | | | |
| | | LONG-TERM INVESTMENTS—97.4% | | | |
| | |
| | | Common Stocks | | | |
| | |
| | | Aerospace/Defense—1.9% | | | |
| 21,400 | | Curtiss-Wright Corp. | | $ | 1,228,574 |
| 45,050 | | Moog, Inc. (Class A shares)(a) | | | 2,043,018 |
| 20,400 | | Precision Castparts Corp. | | | 1,339,872 |
| | | | |
|
|
| | | | | | 4,611,464 |
| | | | |
|
|
| | |
| | | Airlines—0.5% | | | |
| 65,000 | | SkyWest, Inc. | | | 1,303,900 |
| | | | |
|
|
| | |
| | | Auto Related—2.6% | | | |
| 48,500 | | ArvinMeritor, Inc. | | | 1,084,945 |
| 90,800 | | CSK Auto Corp.(a) | | | 1,519,992 |
| 33,100 | | Snap-On, Inc. | | | 1,137,316 |
| 37,800 | | United Auto Group, Inc. | | | 1,118,502 |
| 36,600 | | Winnebago Industries, Inc. | | | 1,429,596 |
| | | | |
|
|
| | | | | | 6,290,351 |
| | | | |
|
|
| | |
| | | Banks—4.4% | | | |
| 31,100 | | BancorpSouth, Inc. | | | 757,907 |
| 96,800 | | BankUnited Financial Corp. (Class A shares)(a) | | | 3,092,760 |
| 34,500 | | Commercial Federal Corp. | | | 1,024,995 |
| 50,000 | | Fremont General Corp. | | | 1,259,000 |
| 21,200 | | Hibernia Corp. (Class A shares) | | | 625,612 |
| 25,900 | | Hudson United Bancorp | | | 1,019,942 |
| 40,530 | | Old National Bancorp / IN | | | 1,048,106 |
| 37,400 | | Susquehanna Bancshares, Inc. | | | 933,130 |
| 40,400 | | Washington Federal, Inc. | | | 1,072,216 |
| | | | |
|
|
| | | | | | 10,833,668 |
| | | | |
|
|
| | |
| | | Beverages—0.9% | | | |
| 14,200 | | Coors Adolph Co. (Class B shares) | | | 1,074,514 |
| 52,200 | | PepsiAmericas, Inc. | | | 1,108,728 |
| | | | |
|
|
| | | | | | 2,183,242 |
| | | | |
|
|
| | |
| | | Building Products—0.4% | | | |
| 49,900 | | Lennox International, Inc. | | | 1,015,465 |
| | | | |
|
|
| | |
| | | Business Services—3.0% | | | |
| 80,600 | | Administaff, Inc.(a) | | | 1,016,366 |
| 142,000 | | Allied Waste Industries, Inc.(a) | | | 1,317,760 |
| 26,000 | | Banta Corp. | | | 1,163,760 |
| 31,000 | | John H. Harland Co. | | | 1,119,100 |
| 44,600 | | Kelly Services, Inc. (Class A shares) | | | 1,346,028 |
| 43,000 | | Republic Services, Inc. | | | 1,442,220 |
| | | | |
|
|
| | | | | | 7,405,234 |
| | | | |
|
|
See Notes to Financial Statements
| | |
| 46 | | THE TARGET PORTFOLIO TRUST |
| | | | | |
| SHARES | | DESCRIPTION | | VALUE (NOTE 1) |
| | | | | | |
| | | Chemicals—3.2% | | | |
| 29,000 | | Lubrizol Corp. (The) | | $ | 1,068,940 |
| 69,000 | | Methanex Corp. | | | 1,259,940 |
| 61,000 | | RPM International, Inc. | | | 1,199,260 |
| 30,700 | | Scotts Co. (The) (Class A shares)(a) | | | 2,257,064 |
| 50,000 | | Sensient Technologies Corp. | | | 1,199,500 |
| 19,200 | | Valspar Corp. (The) | | | 960,192 |
| | | | |
|
|
| | | | | | 7,944,896 |
| | | | |
|
|
| | |
| | | Commercial Services & Supplies—0.5% | | | |
| 30,700 | | School Specialty, Inc.(a) | | | 1,183,792 |
| | | | |
|
|
| | |
| | | Construction & Engineering—1.0% | | | |
| 60,000 | | Chicago Bridge & Iron Co. (Netherlands) | | | 2,400,000 |
| | | | |
|
|
| | |
| | | Containers & Packaging—0.4% | | | |
| 65,000 | | Rock-Tenn Co. (Class A shares) | | | 985,400 |
| | | | |
|
|
| | |
| | | Cosmetics & Toiletries—1.0% | | | |
| 72,700 | | Chattem, Inc.(a) | | | 2,406,370 |
| | | | |
|
|
| | |
| | | Diversified Financial Services—0.4% | | | |
| 35,400 | | GATX Corp. | | | 1,046,424 |
| | | | |
|
|
| | |
| | | Drugs & Healthcare—6.1% | | | |
| 32,800 | | Arrow International, Inc. | | | 1,016,472 |
| 35,325 | | Barr Pharmaceuticals, Inc.(a) | | | 1,608,701 |
| 59,700 | | Cooper Cos., Inc. | | | 4,214,222 |
| 70,400 | | Covance, Inc.(a) | | | 2,728,000 |
| 85,800 | | Pharmaceutical Product Development, Inc.(a) | | | 3,542,682 |
| 84,700 | | Serologicals Corp.(a) | | | 1,873,564 |
| | | | |
|
|
| | | | | | 14,983,641 |
| | | | |
|
|
| | |
| | | Electric Utilities—1.8% | | | |
| 52,000 | | Cleco Corp. | | | 1,053,520 |
| 32,800 | | Duquesne Light Holdings, Inc. | | | 618,280 |
| 68,850 | | PNM Resources, Inc. | | | 1,741,217 |
| 41,400 | | Westar Energy, Inc. | | | 946,818 |
| | | | |
|
|
| | | | | | 4,359,835 |
| | | | |
|
|
| | |
| | | Electrical Equipment—0.5% | | | |
| 36,900 | | Acuity Brands, Inc. | | | 1,173,420 |
| | | | |
|
|
| | |
| | | Electronic Equipment & Instruments—0.9% | | | |
| 126,700 | | Checkpoint Systems, Inc.(a) | | | 2,286,935 |
| | | | |
|
|
| | |
| | | Electronics—2.6% | | | |
| 77,600 | | FLIR Systems, Inc.(a) | | | 4,950,104 |
| 177,600 | | Sanmina-SCI Corp.(a) | | | 1,504,272 |
| | | | |
|
|
| | | | | | 6,454,376 |
| | | | |
|
|
| | |
| | | Financial Services—5.8% | | | |
| 154,700 | | AmeriCredit Corp.(a) | | | 3,782,414 |
| 36,200 | | Eaton Vance Corp. | | | 1,887,830 |
See Notes to Financial Statements
| | |
| THE TARGET PORTFOLIO TRUST | | 47 |
| | |
Small Capitalization Value Portfolio (cont’d) | | Portfolio of Investments
As of December 31, 2004 |
| | | | | |
| SHARES | | DESCRIPTION | | VALUE (NOTE 1) |
| | | | | | |
| | | Financial Services (cont’d.) | | | |
| 39,800 | | Global Payments, Inc. | | $ | 2,329,892 |
| 74,600 | | Jefferies, Group, Inc. | | | 3,004,888 |
| 61,050 | | Raymond James Financial, Inc. | | | 1,891,329 |
| 7,600 | | Student Loan Corp. (The) | | | 1,398,400 |
| | | | |
|
|
| | | | | | 14,294,753 |
| | | | |
|
|
| | |
| | | Food & Staples Retailing—0.8% | | | |
| 52,700 | | Casey’s General Stores, Inc. | | | 956,505 |
| 48,700 | | Ruddick Corp. | | | 1,056,303 |
| | | | |
|
|
| | | | | | 2,012,808 |
| | | | |
|
|
| | |
| | | Food Products—1.2% | | | |
| 23,100 | | Corn Products International, Inc. | | | 1,237,236 |
| 32,400 | | Fresh Del Monte Produce, Inc. | | | 959,364 |
| 19,100 | | Lancaster Colony Corp. | | | 818,817 |
| | | | |
|
|
| | | | | | 3,015,417 |
| | | | |
|
|
| | |
| | | Gas & Pipeline Utilities—3.8% | | | |
| 38,400 | | Atmos Energy Corp. | | | 1,050,240 |
| 57,400 | | Cascade Natural Gas Corp. | | | 1,216,880 |
| 32,500 | | Northwest Natural Gas Co. | | | 1,096,550 |
| 62,300 | | ONEOK, Inc. | | | 1,770,566 |
| 25,000 | | Peoples Energy Corp. | | | 1,098,750 |
| 25,100 | | UGI Corp. | | | 1,026,841 |
| 39,400 | | Vectren Corp. | | | 1,055,920 |
| 34,000 | | WGL Holdings, Inc. | | | 1,048,560 |
| | | | |
|
|
| | | | | | 9,364,307 |
| | | | |
|
|
| | |
| | | Health Care Equipment & Supplies—0.4% | | | |
| 19,800 | | Invacare Corp. | | | 915,948 |
| | | | |
|
|
| | |
| | | Health Care Providers & Services—2.2% | | | |
| 71,000 | | Accredo Health, Inc.(a) | | | 1,968,120 |
| 67,500 | | American Healthways, Inc.(a) | | | 2,230,200 |
| 70,000 | | Select Medical Corp. | | | 1,232,000 |
| | | | |
|
|
| | | | | | 5,430,320 |
| | | | |
|
|
| | |
| | | Home Builder—3.6% | | | |
| 101,200 | | Hovnanian Enterprises, Inc. (Class A shares)(a) | | | 5,011,424 |
| 13,750 | | M.D.C. Holdings, Inc. | | | 1,188,550 |
| 25,100 | | Meritage Homes Corp.(a) | | | 2,828,770 |
| | | | |
|
|
| | | | | | 9,028,744 |
| | | | |
|
|
| | |
| | | Hotels, Restaurants & Leisure—2.6% | | | |
| 35,000 | | Bob Evans Farms, Inc. | | | 914,900 |
| 42,500 | | Brinker International, Inc.(a) | | | 1,490,475 |
| 53,200 | | Intrawest Corp. (Canada) | | | 1,223,068 |
See Notes to Financial Statements
| | |
| 48 | | THE TARGET PORTFOLIO TRUST |
| | | | | |
| SHARES | | DESCRIPTION | | VALUE (NOTE 1) |
| | | | | | |
| | | Hotels, Restaurants & Leisure (cont’d.) | | | |
| 35,500 | | Landry’s Restaurants, Inc. | | $ | 1,031,630 |
| 52,950 | | Sonic Corp.(a) | | | 1,614,975 |
| | | | |
|
|
| | | | | | 6,275,048 |
| | | | |
|
|
| | |
| | | Household Durables—1.0% | | | |
| 25,000 | | M/I Homes Inc. | | | 1,377,750 |
| 47,500 | | Maytag Corp. | | | 1,002,250 |
| | | | |
|
|
| | | | | | 2,380,000 |
| | | | |
|
|
| | |
| | | Industrial Conglomerates—0.5% | | | |
| 21,500 | | Teleflex, Inc. | | | 1,116,710 |
| | | | |
|
|
| | |
| | | Insurance—5.6% | | | |
| 33,900 | | American Financial Group, Inc. | | | 1,061,409 |
| 22,000 | | AmerUs Group Co. | | | 996,600 |
| 39,500 | | Commerce Group, Inc. (The) | | | 2,411,080 |
| 60,150 | | Delphi Financial Group, Inc. (Class A shares) | | | 2,775,923 |
| 20,000 | | Hilb, Rogal & Hobbs Co. | | | 724,800 |
| 25,000 | | LandAmerica Financial Group, Inc. | | | 1,348,250 |
| 50,500 | | Philadelphia Consolidated Holding Corp.(a) | | | 3,340,070 |
| 23,000 | | Protective Life Corp. | | | 981,870 |
| | | | |
|
|
| | | | | | 13,640,002 |
| | | | |
|
|
| | |
| | | Leisure Related—1.7% | | | |
| 41,700 | | CEC Entertainment, Inc.(a) | | | 1,666,749 |
| 74,900 | | WMS Industries, Inc.(a) | | | 2,512,146 |
| | | | |
|
|
| | | | | | 4,178,895 |
| | | | |
|
|
| | |
| | | Machinery—4.3% | | | |
| 29,800 | | Albany International Corp. (Class A shares) | | | 1,047,768 |
| 36,000 | | Barnes Group, Inc. | | | 954,360 |
| 34,500 | | Crane Co. | | | 994,980 |
| 19,900 | | Harsco Corp. | | | 1,109,226 |
| 33,000 | | Lincoln Electric Holdings, Inc. | | | 1,139,820 |
| 30,700 | | Mueller Industries, Inc. | | | 988,540 |
| 37,000 | | Regal-Beloit Corp. | | | 1,058,200 |
| 22,000 | | Tecumseh Products Co. (Class A shares) | | | 1,051,600 |
| 49,000 | | Valmont Industries, Inc. | | | 1,230,390 |
| 26,000 | | York International Corp. | | | 898,040 |
| | | | |
|
|
| | | | | | 10,472,924 |
| | | | |
|
|
| | |
| | | Medical & Dental Supplies—0.5% | | | |
| 41,500 | | Owens & Minor, Inc. | | | 1,169,055 |
| | | | |
|
|
| | |
| | | Metals & Mining—2.3% | | | |
| 70,300 | | Agnico-Eagle Mines Ltd. (Canada) | | | 966,625 |
| 30,600 | | Arch Coal, Inc. | | | 1,087,524 |
| 88,500 | | Goldcorp, Inc. (Canada) | | | 1,331,040 |
| 45,000 | | Massey Energy Co. | | | 1,572,750 |
| 11,400 | | Quanex Corp. | | | 781,698 |
| | | | |
|
|
| | | | | | 5,739,637 |
| | | | |
|
|
See Notes to Financial Statements
| | |
| THE TARGET PORTFOLIO TRUST | | 49 |
| | |
Small Capitalization Value Portfolio (cont’d) | | Portfolio of Investments
As of December 31, 2004 |
| | | | | |
| SHARES | | DESCRIPTION | | VALUE (NOTE 1) |
| | | | | | |
| | | Multi-Utilities & Unregulated Power—0.5% | | | |
| 40,200 | | National Fuel Gas Co. | | $ | 1,139,268 |
| | | | |
|
|
| | |
| | | Multimedia—4.0% | | | |
| 44,900 | | Handleman Co. | | | 964,452 |
| 50,200 | | Harman International Industries, Inc. | | | 6,375,400 |
| 41,700 | | Scholastic Corp.(a) | | | 1,541,232 |
| 108,600 | | Sinclair Broadcast Group, Inc. (Class A shares) | | | 1,000,206 |
| | | | |
|
|
| | | | | | 9,881,290 |
| | | | |
|
|
| | |
| | | Oil & Gas—1.3% | | | |
| 22,500 | | Frontier Oil Corp. | | | 599,850 |
| 2,200 | | Holly Corp. | | | 61,314 |
| 76,400 | | Range Resources Corp. | | | 1,563,144 |
| 31,000 | | Western Gas Resources, Inc. | | | 906,750 |
| | | | |
|
|
| | | | | | 3,131,058 |
| | | | |
|
|
| | |
| | | Oil & Gas Exploration/Production—6.7% | | | |
| 107,500 | | Cabot Oil & Gas Corp. | | | 4,756,874 |
| 132,800 | | Chesapeake Energy Corp. | | | 2,191,200 |
| 20,000 | | Energen Corp. | | | 1,179,000 |
| 20,000 | | Frontline Ltd. | | | 887,200 |
| 1 | | Ship Finance International Ltd. | | | 14 |
| 30,000 | | St. Mary Land & Exploration Co. | | | 1,252,200 |
| 83,400 | | Swift Energy Co.(a) | | | 2,413,596 |
| 25,000 | | Teekay Shipping Corp. | | | 1,052,750 |
| 40,000 | | Tidewater, Inc. | | | 1,424,400 |
| 60,000 | | Vintage Petroleum, Inc. | | | 1,361,400 |
| | | | |
|
|
| | | | | | 16,518,634 |
| | | | |
|
|
| | |
| | | Paper & Forest Products—0.5% | | | |
| 24,000 | | Potlatch Corp. | | | 1,213,920 |
| | | | |
|
|
| | |
| | | Pharmaceuticals—1.4% | | | |
| 91,050 | | KV Pharmaceutical Co. (Class A shares)(a) | | | 2,007,652 |
| 103,564 | | Nabi Biopharmaceuticals(a) | | | 1,517,213 |
| | | | |
|
|
| | | | | | 3,524,865 |
| | | | |
|
|
| | |
| | | Real Estate Investment Trust—4.7% | | | |
| 52,500 | | Annaly Mortgage Management, Inc. | | | 1,030,050 |
| 41,000 | | Entertainment Properties Trust | | | 1,826,550 |
| 29,200 | | Equity One, Inc. | | | 692,916 |
| 23,900 | | First Industrial Realty Trust, Inc. | | | 973,447 |
| 23,400 | | Healthcare Realty Trust, Inc. | | | 952,380 |
| 82,500 | | HRPT Properties Trust | | | 1,058,475 |
| 46,800 | | Nationwide Health Properties, Inc. | | | 1,111,500 |
| 41,000 | | New Plan Excel Realty Trust | | | 1,110,280 |
| 21,400 | | Shurgard Storage Centers, Inc. | | | 941,814 |
| 30,500 | | SL Green Realty Corp. | | | 1,846,775 |
| | | | |
|
|
| | | | | | 11,544,187 |
| | | | |
|
|
See Notes to Financial Statements
| | |
| 50 | | THE TARGET PORTFOLIO TRUST |
| | | | | | |
| SHARES | | DESCRIPTION | | VALUE (NOTE 1) | |
| | | | | | | |
| | | Retail Apparel—0.8% | | | | |
| 36,000 | | Brown Shoe Co., Inc. | | $ | 1,073,880 | |
| 39,000 | | Burlington Coat Factory Warehouse Corp. | | | 885,300 | |
| | | | |
|
|
|
| | | | | | 1,959,180 | |
| | | | |
|
|
|
| | |
| | | Road & Rail—0.9% | | | | |
| 28,000 | | Arkansas Best Corp. | | | 1,256,920 | |
| 22,900 | | USF Corp. | | | 869,055 | |
| | | | |
|
|
|
| | | | | | 2,125,975 | |
| | | | |
|
|
|
| | |
| | | Specialty Retail—0.6% | | | | |
| 42,400 | | Borders Group, Inc. | | | 1,076,960 | |
| 30,700 | | Stein Mart Inc.(a) | | | 523,742 | |
| | | | |
|
|
|
| | | | | | 1,600,702 | |
| | | | |
|
|
|
| | |
| | | Telecommunications—2.4% | | | | |
| 315,500 | | American Tower Corp. (Class A shares)(a) | | | 5,805,200 | |
| | | | |
|
|
|
| | |
| | | Textiles & Apparel—1.8% | | | | |
| 22,100 | | Kellwood Co. | | | 762,450 | |
| 97,600 | | Phillips-Van Heusen Corp. | | | 2,635,200 | |
| 53,000 | | Russell Corp. | | | 1,032,440 | |
| | | | |
|
|
|
| | | | | | 4,430,090 | |
| | | | |
|
|
|
| | |
| | | Thrifts & Mortgage Finance—1.5% | | | | |
| 51,300 | | Accredited Home Lenders Holding Co.(a) | | | 2,548,584 | |
| 30,000 | | Astoria Financial Corp. | | | 1,199,100 | |
| | | | |
|
|
|
| | | | | | 3,747,684 | |
| | | | |
|
|
|
| | |
| | | Tobacco—0.9% | | | | |
| 41,000 | | Loews Corp.—Carolina Group | | | 1,186,950 | |
| 20,000 | | Universal Corp. | | | 956,800 | |
| | | | |
|
|
|
| | | | | | 2,143,750 | |
| | | | |
|
|
|
| | |
| | | Trading Companies & Distributors—1.0% | | | | |
| 69,000 | | Watsco, Inc. | | | 2,430,180 | |
| | | | |
|
|
|
| | | Total long-term investments
(cost $163,179,518) | | | 239,098,964 | |
| | | | |
|
|
|
| | |
| | | SHORT-TERM INVESTMENT—2.7% | | | | |
| | |
| | | Money Market Mutual Fund | | | | |
| 6,685,092 | | Dryden Core Investment Fund—Taxable Money Market Series
(cost $6,685,092, Note 3) | | | 6,685,092 | |
| | | | |
|
|
|
| | | Total Investments—100.1%
(cost $169,864,610; Note 5) | | | 245,784,056 | |
| | | Liabilities in excess of other assets—(0.1%) | | | (207,806 | ) |
| | | | |
|
|
|
| | | Net Assets—100% | | $ | 245,576,250 | |
| | | | |
|
|
|
| (a) | Non-income producing security. |
See Notes to Financial Statements
| | |
| THE TARGET PORTFOLIO TRUST | | 51 |
| | |
Small Capitalization Value Portfolio (cont’d) | | Portfolio of Investments
As of December 31, 2004 |
The industry classification of portfolio holdings and liabilities in excess of other assets shown as a percentage of net assets as of December 31, 2004 were as follows:
| | | |
Oil & Gas Exploration/Production | | 6.7 | % |
Drugs & Healthcare | | 6.1 | |
Financial Services | | 5.8 | |
Insurance | | 5.6 | |
Real Estate Investment Trust | | 4.7 | |
Banks | | 4.4 | |
Machinery | | 4.3 | |
Multimedia | | 4.0 | |
Gas & Pipeline Utilities | | 3.8 | |
Home Builders | | 3.6 | |
Chemicals | | 3.2 | |
Business Services | | 3.0 | |
Money Market Mutual Fund | | 2.7 | |
Auto Related | | 2.6 | |
Electronics | | 2.6 | |
Hotels, Restaurants & Leisure | | 2.6 | |
Telecommunications | | 2.4 | |
Metals & Mining | | 2.3 | |
Health Care Providers | | 2.2 | |
Aerospace & Defense | | 1.9 | |
Electric Utilities | | 1.8 | |
Textiles & Apparel | | 1.8 | |
Leisure Related | | 1.7 | |
Thrifts & Mortgage Finance | | 1.5 | |
Pharmaceuticals | | 1.4 | |
Oil & Gas | | 1.3 | |
Food Products | | 1.2 | |
Construction & Engineering | | 1.0 | |
Cosmetics & Toiletries | | 1.0 | |
Household Durables | | 1.0 | |
Trading Companies & Distributors | | 1.0 | |
Beverages | | 0.9 | |
Electronic Equipment & Instruments | | 0.9 | |
Road & Rail | | 0.9 | |
Tobacco | | 0.9 | |
Food & Staples Retailing | | 0.8 | |
Retail Apparel | | 0.8 | |
Specialty Retail | | 0.6 | |
Airlines | | 0.5 | |
Commercal Services & Supplies | | 0.5 | |
Electrical Equipment | | 0.5 | |
Industrial Conglomerates | | 0.5 | |
Medical & Dental Supplies | | 0.5 | |
Multi-Utilities & Unregulated Power | | 0.5 | |
Paper & Forest Products | | 0.5 | |
Building Products | | 0.4 | |
Containers & Packaging | | 0.4 | |
Diversified Financial Services | | 0.4 | |
Health Care Equipment & Supplies | | 0.4 | |
| | |
|
|
| | | 100.1 | |
Liabilities in excess of other assets | | (0.1 | ) |
| | |
|
|
| | | 100.0 | % |
| | |
|
|
See Notes to Financial Statements
| | |
| 52 | | THE TARGET PORTFOLIO TRUST |
| | |
Portfolio of Investments
As of December 31, 2004 | | International Equity Portfolio |
| | | | | |
| SHARES | | DESCRIPTION | | VALUE (NOTE 1) |
| | | | | | |
| | | LONG-TERM INVESTMENTS—98.4% | | | |
| | |
| | | Common Stocks—97.9% | | | |
| | |
| | | Finland—4.6% | | | |
| 484,500 | | Nokia OYJ | | $ | 7,652,426 |
| 196,000 | | Stora Enso Oyj (Class R shares) | | | 3,002,474 |
| | | | |
|
|
| | | | | | 10,654,900 |
| | | | |
|
|
| | |
| | | France—11.7% | | | |
| 73,600 | | Carrefour SA | | | 3,505,429 |
| 140,827 | | Credit Agricole SA | | | 4,249,503 |
| 30,800 | | Lagardere SCA | | | 2,223,026 |
| 68,775 | | Sanofi-Aventis | | | 5,496,765 |
| 16,500 | | Schneider Electric SA | | | 1,148,294 |
| 30,285 | | Total SA | | | 6,615,196 |
| 117,600 | | Vivendi Universal SA | | | 3,754,824 |
| | | | |
|
|
| | | | | | 26,993,037 |
| | | | |
|
|
| | |
| | | Germany—11.0% | | | |
| 283,400 | | Deutsche Telekom AG(a) | | | 6,409,917 |
| 58,000 | | E.ON AG | | | 5,296,234 |
| 69,300 | | Schering AG | | | 5,178,896 |
| 47,300 | | Siemens AG | | | 4,009,281 |
| 99,800 | | Volkswagen AG | | | 4,524,031 |
| | | | |
|
|
| | | | | | 25,418,359 |
| | | | |
|
|
| | |
| | | Ireland—2.9% | | | |
| 252,700 | | Bank of Ireland | | | 4,195,948 |
| 92,551 | | CRH PLC | | | 2,478,242 |
| | | | |
|
|
| | | | | | 6,674,190 |
| | | | |
|
|
| | |
| | | Italy—4.2% | | | |
| 260,100 | | Enel SpA | | | 2,556,100 |
| 231,200 | | ENI-Entre Nazionale Idrocarburi SpA | | | 5,788,642 |
| 483,300 | | Terna SpA | | | 1,386,113 |
| | | | |
|
|
| | | | | | 9,730,855 |
| | | | |
|
|
| | |
| | | Japan—19.1% | | | |
| 28,530 | | Acom Co., Ltd. | | | 2,135,504 |
| 10,700 | | Aiful Corp. | | | 1,176,822 |
| 386 | | East Japan Railway Co. | | | 2,147,165 |
| 53,800 | | Fanuc, Ltd. | | | 3,517,713 |
| 461,000 | | Fujitsu Ltd. | | | 3,000,751 |
| 286,000 | | Mitsubishi Estate Co., Ltd. | | | 3,349,273 |
| 68,500 | | Murata Manufacturing Co. Ltd. | | | 3,830,439 |
| 32,000 | | NEC Electronics Corp. | | | 1,561,433 |
See Notes to Financial Statements
| | |
| THE TARGET PORTFOLIO TRUST | | 53 |
| | |
International Equity Portfolio (cont’d) | | Portfolio of Investments
As of December 31, 2004 |
| | | | | |
| SHARES | | DESCRIPTION | | VALUE (NOTE 1) |
| | | | | | |
| | | Japan (cont’d.) | | | |
| 406,100 | | Nissan Motor Co., Ltd. | | $ | 4,414,906 |
| 316,000 | | Nomura Holdings, Inc. | | | 4,607,242 |
| 1,552 | | NTT DoCoMo, Inc. | | | 2,862,574 |
| 88,200 | | Shin-Etsu Chemical Co., Ltd. | | | 3,615,107 |
| 312,000 | | Sumitomo Trust & Banking Co., Ltd. | | | 2,256,192 |
| 40,500 | | Takeda Chemical Industries, Ltd. | | | 2,039,426 |
| 853,000 | | Tokyo Gas Co., Ltd. | | | 3,496,243 |
| | | | |
|
|
| | | | | | 44,010,790 |
| | | | |
|
|
| | |
| | | Netherlands—6.4% | | | |
| 65,036 | | Heineken NV | | | 2,168,456 |
| 147,719 | | Philips Electronics NV | | | 3,917,354 |
| 148,800 | | Royal Dutch Petroleum Co. | | | 8,565,556 |
| | | | |
|
|
| | | | | | 14,651,366 |
| | | | |
|
|
| | |
| | | Norway—1.8% | | | |
| 146,900 | | DBN NOR ASA | | | 1,449,196 |
| 172,900 | | Statoil ASA | | | 2,711,978 |
| | | | |
|
|
| | | | | | 4,161,174 |
| | | | |
|
|
| | |
| | | Singapore—1.2% | | | |
| 331,850 | | Oversea-Chinese Banking Corp., Ltd. | | | 2,744,410 |
| | | | |
|
|
| | |
| | | Switzerland—6.9% | | | |
| 71,700 | | Compagnie Financiere Richemont AG | | | 2,386,637 |
| 141,900 | | Credit Suisse Group | | | 5,965,016 |
| 12,900 | | Nestle SA | | | 3,375,033 |
| 58,800 | | Swiss Reinsurance(a) | | | 4,193,721 |
| | | | |
|
|
| | | | | | 15,920,407 |
| | | | |
|
|
| | |
| | | United Kingdom—28.1% | | | |
| 481,400 | | Barclays PLC | | | 5,416,050 |
| 338,800 | | BP PLC | | | 3,304,351 |
| 256,612 | | Cadbury Schweppes PLC | | | 2,389,449 |
| 344,499 | | Diageo PLC | | | 4,914,233 |
| 93,700 | | Emap PLC | | | 1,467,042 |
| 301,900 | | GlaxoSmithKline PLC | | | 7,082,936 |
| 403,648 | | HSBC Holdings PLC(a) | | | 6,811,939 |
| 112,860 | | Imperial Tobacco Group PLC | | | 3,092,025 |
| 196,640 | | Kesa Electricals PLC | | | 1,066,521 |
| 314,100 | | Marks & Spencer Group PLC | | | 2,068,431 |
| 436,450 | | Prudential PLC | | | 3,795,873 |
| 830,900 | | Rentokil Initial PLC | | | 2,356,976 |
| 71,300 | | Rio Tinto PLC | | | 2,098,508 |
| 201,200 | | Royal Bank of Scotland Group PLC | | | 6,767,700 |
| 500,400 | | Unilever PLC | | | 4,914,076 |
See Notes to Financial Statements
| | |
| 54 | | THE TARGET PORTFOLIO TRUST |
| | | | | | |
| SHARES | | DESCRIPTION | | VALUE (NOTE 1) |
| | | | | | | |
| | | | United Kingdom (cont’d.) | | | |
| | 2,588,800 | | Vodafone Group PLC | | $ | 7,020,467 |
| | | | | |
|
|
| | | | | | | 64,566,577 |
| | | | | |
|
|
| | | | Total common stocks
(cost $180,033,988) | | | 225,526,065 |
| | | | | |
|
|
| | |
| | | | Preferred Stock—0.5% | | | |
| | 1,780 | | Porsche AG
(cost $839,859) | | | 1,129,164 |
| | | | | |
|
|
| | | | Total long-term investments
(cost $180,873,847) | | $ | 226,655,229 |
| | | | | |
|
|
Principal
Amount
(000)
| | SHORT-TERM INVESTMENT—0.4% | | |
| | |
| | | | U.S. Government Obligations | | | |
| | | | U.S. Treasury Bills | | | |
| $ | 946 | | Various, 2/10/05(b)
(cost $943,919) | | | 943,886 |
| | | | | |
|
|
| | | | Total Investments—98.8%
(cost $181,817,766; Note 5) | | | 227,599,115 |
| | | | Other assets in excess of liabilities—1.2% | | | 2,700,719 |
| | | | | |
|
|
| | | | Net Assets—100% | | $ | 230,299,834 |
| | | | | |
|
|
| (a) | Non-income producing security. |
| (b) | Yields range from 1.95% to 2.11% and represent yield-to-maturity as of respective purchase date. |
See Notes to Financial Statements
| | |
| THE TARGET PORTFOLIO TRUST | | 55 |
| | |
International Equity Portfolio (cont’d) | | Portfolio of Investments
As of December 31, 2004 |
The industry classification of portfolio holdings and other assets in excess of liabilities shown as a percentage of net assets as of December 31, 2004 were as follows:
| | | |
Banks | | 17.2 | % |
Energy-Integrated | | 8.8 | |
Telecommunications | | 7.7 | |
Drugs | | 7.7 | |
Diversified Manufacturing | | 6.3 | |
Food & Beverage | | 5.6 | |
Automotive | | 4.4 | |
Utilities-Electric | | 4.0 | |
Alcohol & Tobacco | | 3.5 | |
Insurance | | 3.5 | |
Financial Services | | 3.4 | |
Technology Hardware | | 3.3 | |
Retail & Apparel | | 2.9 | |
Oil & Gas | | 2.9 | |
Chemicals | | 2.5 | |
Electronics | | 1.7 | |
Media | | 1.6 | |
Utilities-Gas | | 1.5 | |
Real estate | | 1.5 | |
Computers & Peripherals | | 1.3 | |
Housing | | 1.1 | |
Consumer Discretionary | | 1.0 | |
Commercial Services | | 1.0 | |
Leisure & Entertainment | | 1.0 | |
Railroads | | 0.9 | |
Metals | | 0.9 | |
Semiconductor Components | | 0.7 | |
Electrical Equipment | | 0.5 | |
U.S. Government Obligations | | 0.4 | |
| | |
|
|
| | | 98.8 | |
Other assets in excess of liabilities | | 1.2 | |
| | |
|
|
| | | 100.0 | % |
| | |
|
|
See Notes to Financial Statements
| | |
| 56 | | THE TARGET PORTFOLIO TRUST |
| | |
Portfolio of Investments
As of December 31, 2004 | | International Bond Portfolio |
| | | | | | | |
PRINCIPAL
AMOUNT (000) | | DESCRIPTION | | VALUE (NOTE 1) |
| | | | | | | | |
| | | | | LONG-TERM INVESTMENTS—96.6% | | | |
| | | |
| | | | | Denmark—0.5% | | | |
| | | | | Danish Gov’t. Bonds, | | | |
| DKK | | 1,100 | | 6.00%, 11/15/11 | | $ | 232,520 |
| | | | | | |
|
|
| | | |
| | | | | Eurobonds—63.3% | | | |
| | | | | Arena BV, Series 2003-I, Class A2, | | | |
| EUR | | 500 | | 4.30%, 5/19/55(c) | | | 709,551 |
| | | | | Argo Mortgage Ser. L, Series 1, CLass A, | | | |
| | | 306 | | 2.41%, 10/28/36(c) | | | 416,649 |
| | | | | Atlantes Mortgage PLC, Series 1, Class A, | | | |
| | | 251 | | 2.42%, 1/17/36(c) | | | 341,740 |
| | | | | Austrian Gov’t. Bonds, | | | |
| | | 511 | | 7.25%, 5/3/07 | | | 764,987 |
| | | 560 | | 4.00%, 7/15/09 | | | 792,805 |
| | | | | Bayerische Hypo-und Vereinsbank AG, | | | |
| | | 400 | | 4.75%, 9/19/07 | | | 571,021 |
| | | | | Belgian Gov’t. Bonds, | | | |
| | | 1,100 | | 4.25%, 9/28/14 | | | 1,563,087 |
| | | | | Chase CCMT, Series 1998-4, Class A, | | | |
| | | 300 | | 5.00%, 8/15/08 | | | 434,607 |
| | | | | Chester Asset Receivables, | | | |
| | | 500 | | 6.125%, 10/15/10 | | | 772,937 |
| | | | | Citibank Credit Card Issuance Trust, Series 2001-A4, | | | |
| | | 650 | | 5.375%, 4/11/11 | | | 973,016 |
| | | | | Credit Suisse Group Capital Guernsey V Ltd., | | | |
| | | 80 | | 6.905%, 11/29/49(b) | | | 126,932 |
| | | | | DePfa Deutsche Pfandbriefbank AG, | | | |
| | | 200 | | 5.00%, 2/3/05 | | | 272,517 |
| | | | | Deutsche Bundesrepublik, Series 03 | | | |
| | | 100 | | 4.50%, 1/4/13 | | | 145,254 |
| | | | | Deutsche Bundesrepublik, Series 98 | | | |
| | | 560 | | 5.63%, 1/4/28 | | | 915,369 |
| | | | | Deutsche Bundesrepublik, Series 99 | | | |
| | | 300 | | 4.00%, 7/4/09 | | | 424,775 |
| | | | | Deutsche Genossenschaft Hypothekebank, | | | |
| | | 300 | | 5.75%, 1/22/07 | | | 432,955 |
| | | | | Deutsche Telekom International Finance BV, | | | |
| | | 70 | | 7.50%, 1/24/33 | | | 127,878 |
| | | | | Dutch MBS BV, Series-X, Class A, | | | |
| | | 500 | | 2.43%, 10/2/79(c) | | | 682,955 |
| | | | | Finnish Gov’t. Bonds, | | | |
| | | 1,590 | | 2.75%, 7/4/06 | | | 2,173,675 |
| | | 1,450 | | 5.375%, 7/4/13 | | | 2,237,868 |
| | | 2,010 | | 4.25%, 7/4/15 | | | 2,859,034 |
See Notes to Financial Statements
| | |
| THE TARGET PORTFOLIO TRUST | | 57 |
| | |
International Bond Portfolio (cont’d) | | Portfolio of Investments
As of December 31, 2004 |
| | | | | | | |
PRINCIPAL
AMOUNT (000) | | DESCRIPTION | | VALUE (NOTE 1) |
| | | | | | | | |
| | | | | Eurobonds (cont’d.) | | | |
| | | | | French Gov’t. Bonds, | | | |
| USD | | 580 | | 5.75%, 10/25/32 | | $ | 974,814 |
| | | | | Goldman Sachs Group, Inc. (The), | | | |
| | | 80 | | 5.125%, 4/24/13 | | | 117,338 |
| | | | | Hilton Group Finance PLC, | | | |
| | | 60 | | 6.50%, 7/17/09 | | | 91,782 |
| | | | | Inter-American Development Bank, | | | |
| | | 900 | | 5.50%, 3/30/10 | | | 1,360,959 |
| | | | | Linde Finance BV, | | | |
| | | 60 | | 6.00%, 7/29/49(b) | | | 89,817 |
| | | | | MBNA Credit Card Master Trust, Series 2002-A2, Class A, | | | |
| | | 550 | | 5.60%, 7/17/14 | | | 838,494 |
| | | | | Mizuho Finance Group Cayman Ltd., | | | |
| | | 100 | | 4.75%, 4/15/14(b) | | | 142,282 |
| | | | | Netherlands Gov’t. Bonds, | | | |
| | | 600 | | 3.75%, 7/15/09 | | | 841,979 |
| | | 400 | | 7.50%, 1/15/23 | | | 777,687 |
| | | | | Permanent Financing PLC, | | | |
| | | 500 | | 5.10%, 6/11/07 | | | 715,645 |
| | | | | Portuguese Obrigacoes do Tesouro OT, | | | |
| | | 1,320 | | 3.00%, 7/17/06 | | | 1,809,509 |
| | | | | RBS Capital Trust II, Class A, | | | |
| | | 50 | | 6.467%, 12/29/49(b) | | | 78,639 |
| | | | | Royal Bank of Scotland PLC (The), | | | |
| | | 40 | | 6.125%, 2/5/13 | | | 62,691 |
| | | | | SLM Student Loan Trust (The), | | | |
| | | 250 | | 3.80%, 6/17/10 | | | 347,019 |
| | | | | Spanish Gov’t. Bonds, | | | |
| | | 1,600 | | 4.40%, 1/31/15 | | | 2,300,085 |
| | | | | Zurich Finance (USA), Inc., | | | |
| | | 100 | | 5.75%, 10/2/23 | | | 148,067 |
| | | | | | |
|
|
| | | | | | | | 28,436,419 |
| | | | | | |
|
|
| | | |
| | | | | Japan—15.2% | | | |
| | | | | Japanese Gov’t. Bonds, | | | |
| JPY | | 246,000 | | 0.60%, 9/20/08 | | | 2,419,555 |
| | | 187,000 | | 0.60%, 3/20/09 | | | 1,834,261 |
| | | 9,000 | | 1.50%, 12/20/11 | | | 91,065 |
| | | 14,000 | | 1.50%, 3/20/12 | | | 141,283 |
| | | 94,000 | | 1.20%, 9/20/12 | | | 924,638 |
| | | 145,000 | | 1.40%, 12/20/13 | | | 1,426,967 |
| | | | | | |
|
|
| | | | | | | | 6,837,769 |
| | | | | | |
|
|
See Notes to Financial Statements
| | |
| 58 | | THE TARGET PORTFOLIO TRUST |
| | | | | | | |
PRINCIPAL
AMOUNT (000) | | DESCRIPTION | | VALUE (NOTE 1) |
| | | | | | | | |
| | | | | United Kingdom—10.0% | | | |
| | | | | European Investment Bank, | | | |
| GBP | | 5 | | 7.625%, 12/7/06 | | $ | 10,106 |
| | | | | United Kingdom Treasury Stocks, | | | |
| | | 2,200 | | 5.75%, 12/7/09 | | | 4,455,247 |
| | | | | | |
|
|
| | | | | | | | 4,465,353 |
| | | | | | |
|
|
| | | |
| | | | | United States—7.6% | | | |
| | | | | Chase Funding Loan Acquisition Trust, | | | |
| USD | | 80 | | 2.75%, 1/25/33(c) | | | 79,808 |
| | | | | CIT Group Home Equity Loan Trust, | | | |
| | | 17 | | 2.71%, 3/25/33(c) | | | 17,116 |
| | | | | Federal National Mortgage Association, | | | |
| | | 71 | | 3.50%, 3/25/09 | | | 70,854 |
| | | | | Federal Republic of Brazil, | | | |
| | | 100 | | 8.30%, 6/29/09(c) | | | 117,750 |
| | | 1,000 | | 10.50%, 7/14/14 | | | 1,185,000 |
| | | | | France Telecom S.A., | | | |
| | | 70 | | 9.25%, 3/1/31 | | | 94,891 |
| | | | | Long Beach Mortgage Loan Trust, | | | |
| | | 37 | | 2.74%, 7/25/33(c) | | | 36,760 |
| | | | | Morgan Stanley Capital, Series 2004-HE9, Class A-3A | | | |
| | | 99 | | 2.61%, 11/25/34(c) | | | 98,510 |
| | | | | Republic of Peru, | | | |
| | | 100 | | 9.125%, 2/21/12 | | | 117,000 |
| | | | | Russian Gov’t. Bonds, | | | |
| | | 600 | | 5.00%, 3/31/30 | | | 620,640 |
| | | | | South Africa Gov’t. Bonds, | | | |
| | | 200 | | 7.375%, 4/25/12 | | | 229,000 |
| | | | | United Mexican States, | | | |
| | | 100 | | 6.75%, 9/27/34 | | | 98,750 |
| | | | | United States Treasury Notes, TIPS, | | | |
| | | 549 | | 3.50%, 1/15/11 | | | 623,950 |
| | | | | | |
|
|
| | | | | | | | 3,390,029 |
| | | | | | |
|
|
| | | | | Total long-term investments
(cost U.S.$37,941,078) | | | 43,362,090 |
| | | | | | |
|
|
| | | |
| | | | | SHORT-TERM INVESTMENTS—14.1% | | | |
| | | |
| | | | | Commercial Paper—7.8% | | | |
| | | | | BP Capital Markets PLC, | | | |
| | | 1,100 | | 2.10%, 1/3/05(a) | | | 1,099,872 |
| | | | | Danske Corp., | | | |
| | | 1,200 | | 2.44%, 3/23/05(a) | | | 1,193,664 |
| | | | | UBS Finance LLC, | | | |
| | | 1,200 | | 2.51%, 4/27/05(a) | | | 1,190,568 |
| | | | | | |
|
|
| | | | | | | | 3,484,104 |
| | | | | | |
|
|
| | | |
| | | | | Foreign Government Securities—0.5% | | | |
| | | | | Canada Treasury Bills, | | | |
| CAD | | 300 | | 2.34%, 2/10/05(a) | | | 249,701 |
| | | | | | |
|
|
See Notes to Financial Statements
| | |
| THE TARGET PORTFOLIO TRUST | | 59 |
| | |
International Bond Portfolio (cont’d) | | Portfolio of Investments
As of December 31, 2004 |
| | | | | | | | |
PRINCIPAL
AMOUNT (000) | | DESCRIPTION | | VALUE (NOTE 1) | |
| | | | | | | | | |
| | | | | U.S. Government and Agency Securities—5.8% | | | | |
| | | | | Federal National Mortgage Association, | | | | |
| USD | | 200 | | 2.35%, 3/9/05 (a)(d) | | $ | 199,250 | |
| | | 300 | | 2.38%, 3/15/05(a)(d) | | | 298,500 | |
| | | 200 | | 2.42%, 3/16/05(a)(d) | | | 199,000 | |
| | | 800 | | 2.44%, 3/23/05(a(d) | | | 795,892 | |
| | | 1,000 | | 2.47%, 3/30/05(a)(d) | | | 994,410 | |
| | | | | United States Treasury Bills, | | | | |
| | | 130 | | 2.16%, 3/17/05(a)(d) | | | 129,448 | |
| | | | | | |
|
|
|
| | | | | | | | 2,616,500 | |
| | | | | | |
|
|
|
| | | | | Total short-term investments
(cost U.S.$6,329,758) | | | 6,350,305 | |
| | | | | | |
|
|
|
| | | |
| | | | | Total Investments, Before Outstanding Options Written—110.7%
(cost US$44,270,836; Note 5) | | | 49,712,395 | |
| | | | | | |
|
|
|
| | | |
| | | | | OUTSTANDING OPTIONS WRITTEN(e) | | | | |
Contracts
| | | | | |
| | | | | Call Options | | | | |
| | | 32 | | United States Treasury Notes,
expiring 2/18/05 @ $115 | | | (3,500 | ) |
| | | | | | |
|
|
|
| | | |
| | | | | Put Options | | | | |
| | | 14 | | United States Treasury Notes,
expiring 2/18/05 @ $109 | | | (2,406 | ) |
| | | | | | |
|
|
|
| | | | | Total outstanding options written
(premiums received $29,965) | | | (5,906 | ) |
| | | | | | |
|
|
|
| | | | | Total Investments; Net of Outstanding Options Written—110.7% | | | 49,706,489 | |
| | | | | Liabilities in excess of other assets—(10.7%) | | | (4,801,488 | ) |
| | | | | | |
|
|
|
| | | | | Net Assets—100% | | $ | 44,905,001 | |
| | | | | | |
|
|
|
Portfolio securities are classified according to the securities currency denomination.
CAD—Canadian Dollar.
DKK—Danish Krone.
EUR—Euro.
GBP—British Pound.
JPY—Japanese Yen.
USD—United States Dollar.
| (a) | Rate quoted represents yield-to-maturity as of purchase date. |
| (b) | Variable Rate instruments without fixed maturity date. Maturity date shown is the next callable date for the instrument. |
| (c) | Variable Rate instruments. The maturity date presented for these instruments is the later of the next date on which the security can be redeemed at par or the next date on which the rate of interest is adjusted. |
| (d) | Segregated as collateral for financial futures contracts. |
| (e) | Non-income producing security. |
See Notes to Financial Statements
| | |
| 60 | | THE TARGET PORTFOLIO TRUST |
The industry classification of portfolio holdings and liabilities in excess of other assets shown as a percentage of net assets as of December 31, 2004 were as follows:
| | | |
Foreign Government Securities | | 72.7 | % |
Commercial Paper | | 7.8 | |
Banking | | 6.8 | |
U.S. Government and Agency Securities | | 5.7 | |
Collateralized Mortgage Loan Securities | | 4.9 | |
Collateralized Credit Cards | | 4.0 | |
Asset Backed Securities | | 3.2 | |
Diversified Financial Services | | 1.9 | |
U.S. Government Obligations | | 1.7 | |
Collateralized Student Loan Obligations | | 0.8 | |
Telecommunications | | 0.5 | |
Insurance | | 0.3 | |
Lodging | | 0.2 | |
Engineering & Construction | | 0.2 | |
| | |
|
|
| | | 110.7 | |
Liabilities in excess of other assets | | (10.7 | ) |
| | |
|
|
| | | 100.0 | % |
| | |
|
|
See Notes to Financial Statements
| | |
| THE TARGET PORTFOLIO TRUST | | 61 |
| | |
| Total Return Bond Portfolio | | Portfolio of Investments
As of December 31, 2004 |
| | | | | | | | |
MOODY’S RATING
(UNAUDITED) | | PRINCIPAL
AMOUNT (000)# | | DESCRIPTION | | VALUE (NOTE 1) |
| | | | | | | | | |
| | | | | | LONG-TERM INVESTMENTS—75.7% | | | |
| | | |
| | | | | | Corporate Bonds—8.6% | | | |
| | | |
| | | | | | Airlines—0.3% | | | |
| | | | | | Embarcadero Aircraft Securitization Trust, Class A-1, | | | |
| B3 | | $ | 100 | | 2.88%, 8/15/25(b) | | $ | 52,033 |
| | | | | | United Airlines, Inc., Equipment Trust, | | | |
| NR | | | 1,000 | | 10.85%, 2/19/15(a)(d) | | | 390,000 |
| | | | | | | |
|
|
| | | | | | | | | 442,033 |
| | | | | | | |
|
|
| | | |
| | | | | | Automotive—1.0% | | | |
| | | | | | DaimlerChrysler NA Holding Corp., Gtd., | | | |
| A3 | | | 1,700 | | 7.40%, 1/20/05 | | | 1,704,157 |
| | | | | | | |
|
|
| | | |
| | | | | | Financial Services—3.8% | | | |
| | | | | | Ford Motor Credit Co., Notes, | | | |
| A3 | | | 1,700 | | 7.50%, 3/15/05 | | | 1,714,519 |
| | | | | | General Motors Acceptance Corp., Notes, | | | |
| Baa1 | | | 900 | | 4.30%, 5/19/05, MTN(b) | | | 904,224 |
| Baa1 | | | 100 | | 5.25%, 5/16/05, MTN | | | 100,929 |
| Baa1 | | | 1,500 | | 6.875%, 9/15/11 | | | 1,537,189 |
| Baa1 | | | 100 | | 7.50%, 7/15/05 | | | 102,060 |
| | | | | | HSBC Bank, Sr. Notes, | | | |
| Aa2 | | | 800 | | 2.59%, 9/21/07(b) | | | 800,339 |
| | | | | | PEMEX Project Funding Master Trust, Gtd. Notes, | | | |
| Baa1 | | | 500 | | 8.00%, 11/15/11 | | | 575,500 |
| Baa1 | | | 250 | | 9.125%, 10/13/10 | | | 299,750 |
| | | | | | PP&L Capital Funding, Inc., Gtd. Notes, | | | |
| Ba1 | | | 200 | | 7.29%, 5/18/06 | | | 208,644 |
| | | | | | Sr. Notes, | | | |
| Baa3 | | | 600 | | 7.75%, 4/15/05, MTN | | | 607,180 |
| | | | | | | |
|
|
| | | | | | | | | 6,850,334 |
| | | | | | | |
|
|
| | | |
| | | | | | Insurance—0.9% | | | |
| | | | | | AIG Sunamerica, Sec’d., MTN, (Cayman Islands), | | | |
| Aaa | | JPY | 170,000 | | 1.20%, 1/26/05 | | | 1,660,173 |
| | | | | | | |
|
|
| | | |
| | | | | | Telecommunications—1.3% | | | |
| | | | | | AT&T Corp., Sr. Notes, | | | |
| Ba1 | | | 300 | | 9.05%, 11/15/11 | | | 345,375 |
| | | | | | Qwest Corp., Debs., | | | |
| Ba3 | | | 250 | | 7.50%, 6/15/23 | | | 248,750 |
| | | | | | SBC Communications, Inc., Notes, | | | |
| A2 | | | 1,700 | | 4.21%, 6/5/21 | | | 1,709,775 |
| | | | | | | |
|
|
| | | | | | | | | 2,303,900 |
| | | | | | | |
|
|
See Notes to Financial Statements
| | |
| 62 | | THE TARGET PORTFOLIO TRUST |
| | | | | | | | |
MOODY’S RATING (UNAUDITED) | | PRINCIPAL
AMOUNT (000)# | | DESCRIPTION | | VALUE (NOTE 1) |
| | | | | | | | | |
| | | | | | Utilities—Gas and Electric—1.3% | | | |
| | | | | | CenterPoint Energy Resources Corp., Notes, | | | |
| Ba1 | | $ | 400 | | 8.125%, 7/15/05 | | $ | 410,536 |
| | | | | | El Paso Corp., Sr. Notes, MTN, | | | |
| Caa1 | | | 750 | | 7.75%, 1/15/32 | | | 718,124 |
| Caa1 | | | 500 | | 7.80%, 8/1/31 | | | 480,000 |
| | | | | | Pacific Gas & Electric Co., First Mtge., | | | |
| Baa2 | | | 560 | | 2.72%, 4/3/06(b) | | | 560,460 |
| | | | | | TXU Energy Co. LLC, | | | |
| Baa2 | | | 201 | | 2.84%, 1/17/06(b) | | | 201,551 |
| | | | | | | |
|
|
| | | | | | | | | 2,370,671 |
| | | | | | | |
|
|
| | | | | | Total corporate bonds
(cost $15,901,329) | | | 15,331,268 |
| | | | | | | |
|
|
| | |
| | | | | | U.S. Government Agency Mortgage-Backed Securities—7.9% |
| | | | | | Federal Home Loan Mortgage Corp., | | | |
| | | | 11 | | 2.66%, 9/15/26(b) | | | 11,094 |
| | | | 101 | | 3.79%, 1/1/24(b) | | | 103,017 |
| | | | 70 | | 5.50%, 4/1/29 - 6/1/29 | | | 71,518 |
| | | | 166 | | 6.00%, 9/1/22 | | | 172,697 |
| | | | 134 | | 7.50%, 9/1/16 - 7/1/17 | | | 143,828 |
| | | | 1,368 | | 8.00%, 9/15/29 | | | 1,492,714 |
| | | | 1 | | 9.25%, 1/1/10 | | | 1,385 |
| | | | | | Federal National Mortgage Association, | | | |
| | | | 288 | | 3.66%, 1/1/20(b) | | | 293,597 |
| | | | 183 | | 3.97%, 5/1/36(b) | | | 185,374 |
| | | | 622 | | 4.50%, 8/1/33 | | | 602,586 |
| | | | 9,500 | | 4.50%, 1/15/35, TBA | | | 9,179,375 |
| | | | 79 | | 5.00%, 1/1/19 | | | 80,134 |
| | | | 203 | | 6.00%, 11/1/16 - 1/1/23 | | | 211,019 |
| | | | 422 | | 6.50%, 4/1/21 - 9/1/21 | | | 444,883 |
| | | | | | Government National Mortgage Association, | | | |
| | | | 304 | | 3.375%, 2/20/17 - 2/20/26(b) | | | 301,609 |
| | | | 174 | | 3.75%, 7/20/22 - 7/20/27(b) | | | 176,083 |
| | | | 133 | | 4.00%, 11/20/29(b) | | | 134,232 |
| | | | 213 | | 4.625%, 10/20/26 - 10/20/27(b) | | | 217,851 |
| | | | 190 | | 8.50%, 6/15/30 - 8/20/30 | | | 207,314 |
| | | | | | | |
|
|
| | | | | | Total U.S. Government agency mortgage-backed securities
(cost $13,852,566) | | | 14,030,310 |
| | | | | | | |
|
|
| | | |
| | | | | | Collateralized Mortgage Obligations—3.0% | | | |
| | | | | | American Housing Trust 1, Series 1-5, Class A, | | | |
| Aaa | | | 4 | | 8.625%, 8/25/18 | | | 4,021 |
| | | | | | Bear Stearns ARM Trust, Series 2001-9, | | | |
| Aaa | | | 206 | | 5.64%, 2/25/33(b) | | | 206,234 |
| | | | | | CS First Boston Mortgage Securities, Series 2002-HE16 A2, | | | |
| Aaa | | | 801 | | 2.75%, 10/25/32(b) | | | 801,372 |
| | | | | | Honda Auto Receivables Owner Trust, Series 2004-3 A1, | | | |
| A1+(c) | | | 670 | | 2.09%, 11/18/05 | | | 670,004 |
See Notes to Financial Statements
| | |
| THE TARGET PORTFOLIO TRUST | | 63 |
| | |
Total Return Bond Portfolio (cont’d) | | Portfolio of Investments
As of December 31, 2004 |
| | | | | | | | |
MOODY’S RATING (UNAUDITED) | | PRINCIPAL
AMOUNT (000)# | | DESCRIPTION | | VALUE (NOTE 1) |
| | | | | | | | | |
| | | | | | Collateralized Mortgage Obligations (cont’d.) | | | |
| | | | | | Indymac ARM Trust, Series 2001, Class A, | | | |
| Aaa | | $ | 26 | | 3.87%, 1/25/32(b) | | $ | 25,940 |
| | | | | | Residential Funding Mortgage Securities I, Inc.,
Series 2003-S9, Class A1, | | | |
| Aaa | | | 192 | | 6.50%, 3/25/32 | | | 197,219 |
| | | | | | Washington Mutual Mortgage Loan, Trust 2003, Class R1 A1, | | | |
| Aaa | | | 3,351 | | 2.69%, 12/25/27(b) | | | 3,347,140 |
| | | | | | Trust 2001, Class A, | | | |
| Aaa | | | 43 | | 3.56%, 1/25/41(b) | | | 42,787 |
| | | | | | | |
|
|
| | | | | | Total collateralized mortgage obligations (cost $5,300,383) | | | 5,294,717 |
| | | | | | | |
|
|
| | | |
| | | | | | Municipals—4.9% | | | |
| | | | | | Du Page County Illinois, Limited Tax, | | | |
| Aaa | | | 500 | | 5.00%, 1/1/31 | | | 510,625 |
| | | | | | Georgia State Road & Thruway Authority Rev., Governors Transportation Choices, | | | |
| Aaa | | | 500 | | 5.00%, 3/1/21 | | | 530,180 |
| | | | | | Golden State Tob. Securitization Corp., California State Tob. Settlement, Rev., Series 2003, Class A-1, | | | |
| Baa3 | | | 500 | | 6.25%, 6/1/33 | | | 500,635 |
| Baa3 | | | 400 | | 6.75%, 6/1/39 | | | 401,244 |
| | | | | | Massachusetts State Water Resources Authority, Series J, | | | |
| Aaa | | | 750 | | 5.00%, 8/1/32 | | | 768,975 |
| | | | | | Minnesota State Rev., | | | |
| Aa1 | | | 600 | | 5.00%, 8/1/13 | | | 671,328 |
| | | | | | New York City Trust Cultural Resources, Museum of Modern Art, Series 2001, Class D, | | | |
| Aaa | | | 1,500 | | 5.125%, 7/1/31 | | | 1,561,875 |
| | | | | | South Carolina State Highway, Series B, | | | |
| Aaa | | | 1,100 | | 5.00%, 4/1/17 | | | 1,183,248 |
| | | | | | South Central Connecticut, Regional Water Authority, | | | |
| Aaa | | | 1,300 | | 5.00%, 8/1/26 | | | 1,362,426 |
| | | | | | Tobacco Settlement Financing Corp., New Jersey State, | | | |
| Baa2 | | | 800 | | 6.00%, 6/1/37 | | | 730,128 |
| Baa2 | | | 500 | | 6.375%, 6/1/32 | | | 483,325 |
| | | | | | | |
|
|
| | | | | | Total municipals (cost $8,278,056) | | | 8,703,989 |
| | | | | | | |
|
|
| | | |
| | | | | | U.S. Government Securities—41.1% | | | |
| | | | | | United States Treasury Bonds, TIPS, | | | |
| | | | 2,713 | | 0.875%, 4/15/10 | | | 2,686,999 |
| | | | 3,709 | | 2.00%, 1/15/14 | | | 3,839,121 |
| | | | 808 | | 2.375%, 1/15/25 | | | 864,023 |
| | | | 1,382 | | 3.375%, 1/15/07(g) | | | 1,463,570 |
| | | | 3,182 | | 3.625%, 1/15/08 | | | 3,465,817 |
See Notes to Financial Statements
| | |
| 64 | | THE TARGET PORTFOLIO TRUST |
| | | | | | | | |
MOODY’S RATING (UNAUDITED) | | PRINCIPAL
AMOUNT (000)# | | DESCRIPTION | | VALUE (NOTE 1) |
| | | | | | | | | |
| | | | | | U.S. Government Securities (cont’d.) | | | |
| | | | | | United States Treasury Bonds, | | | |
| | | $ | 600 | | 6.00%, 2/15/26 | | $ | 687,305 |
| | | | 60 | | 8.125%, 8/15/19 | | | 81,895 |
| | | | 3,550 | | 8.875%, 8/15/17(f) | | | 5,030,737 |
| | | | | | United States Treasury Notes, | | | |
| | | | 6,800 | | 1.625%, 4/30/05(f) | | | 6,783,265 |
| | | | 2,000 | | 2.50%, 10/31/06 | | | 1,981,328 |
| | | | 2,100 | | 3.375%, 10/15/09 | | | 2,079,328 |
| | | | 1,000 | | 3.875%, 5/15/09 | | | 1,014,727 |
| | | | 2,500 | | 4.00%, 2/15/14 | | | 2,465,528 |
| | | | 15,600 | | 4.88%, 2/15/12 | | | 16,488,467 |
| | | | 3,000 | | 5.00%, 2/15/11 | | | 3,191,367 |
| | | | 17,700 | | 5.00%, 8/15/11 | | | 18,842,889 |
| | | | | | United States Treasury Strips, P/O, | | | |
| | | | 500 | | Zero Coupon, 11/15/16 | | | 287,772 |
| | | | 2,400 | | Zero Coupon, 5/15/20 | | | 1,121,966 |
| | | | 2,500 | | Zero Coupon, 2/15/22 | | | 1,055,785 |
| | | | | | | |
|
|
| | | | | | Total U.S. Government securities
(cost $73,007,961) | | | 73,431,889 |
| | | | | | | |
|
|
| | | |
| | | | | | Foreign Government Securities—10.2% | | | |
| | | | | | Federal Republic of Brazil, | | | |
| B2 | | | 72 | | 3.06%, 4/15/06(b) | | | 72,086 |
| B1 | | | 44 | | 3.125%, 4/15/12(b) | | | 42,022 |
| B1 | | | 2,395 | | 8.00%, 4/15/14 | | | 2,450,718 |
| | | | | | Federal Republic of Germany, | | | |
| Aaa | | EUR | 1,000 | | 3.75%, 1/4/09 | | | 1,403,212 |
| Aaa | | EUR | 900 | | 5.25%, 7/4/10 | | | 1,352,071 |
| Aaa | | EUR | 1,400 | | 5.625%, 1/4/28 | | | 2,288,422 |
| Aaa | | EUR | 1,100 | | 6.50%, 10/14/05 - 7/4/27 | | | 1,584,047 |
| | | | | | Italy Government Bond, | | | |
| Aa2 | | JPY | 58,000 | | 3.75%, 6/8/05 | | | 574,865 |
| | | | | | Republic of Panama, | | | |
| Ba1 | | | 300 | | 8.875%, 9/30/27 | | | 330,000 |
| Ba1 | | | 450 | | 9.375%, 7/23/12 | | | 530,708 |
| | | | | | Republic of Peru, | | | |
| Ba3 | | | 500 | | 9.125%, 1/15/08 | | | 568,750 |
| | | | | | Russian Gov’t. Bond, | | | |
| Baa3 | | | 2,950 | | 5.00%, 3/31/30 | | | 3,051,481 |
| | | | | | United Kingdom Treasury, | | | |
| Aaa | | GBP | 1,700 | | 5.00%, 9/7/14 | | | 3,381,005 |
| | | | | | United Mexican States, MTN, | | | |
| Baa1 | | | 700 | | 5.875%, 1/15/14 | | | 717,150 |
| | | | | | | |
|
|
| | | | | | Total foreign government securities
(cost $16,967,187) | | | 18,346,537 |
| | | | | | | |
|
|
| | | | | | Total long-term investments
(cost $133,307,482) | | | 135,138,710 |
| | | | | | | |
|
|
See Notes to Financial Statements
| | |
| THE TARGET PORTFOLIO TRUST | | 65 |
| | |
Total Return Bond Portfolio (cont’d) | | Portfolio of Investments
As of December 31, 2004 |
| | | | | | | | |
MOODY’S RATING (UNAUDITED) | | PRINCIPAL
AMOUNT (000)# | | DESCRIPTION | | VALUE (NOTE 1) |
| | | | | | | | | |
| | | | | | SHORT-TERM INVESTMENTS—32.3% | | | |
| | | |
| | | | | | Commercial Paper—30.7% | | | |
| | | | | | ANZ Inc., (Delaware) | | | |
| P-1 | | $ | 300 | | 2.02%, 2/2/05(e) | | $ | 299,409 |
| | | | | | ASB Bank, Ltd., | | | |
| P-1 | | | 800 | | 2.43%, 3/14/05(e) | | | 796,288 |
| | | | | | Barclays U.S. Funding, | | | |
| P-1 | | | 3,100 | | 2.43%, 3/15/05(e) | | | 3,085,399 |
| | | | | | BP Capital Markets, PLC, | | | |
| P-1 | | | 1,400 | | 2.10%, 1/3/05(a) | | | 1,399,837 |
| | | | | | CBA (DE) Finance, | | | |
| P-1 | | | 4,500 | | 2.43%, 3/15/05(e) | | | 4,478,805 |
| | | | | | CDC Corp., | | | |
| P-1 | | | 2,100 | | 2.04%, 2/16/05(e) | | | 2,093,900 |
| P-1 | | | 900 | | 2.04%, 2/22/05(e) | | | 897,099 |
| | | | | | Danske Corp., | | | |
| P-1 | | | 1,700 | | 2.38%, 4/1/05(e) | | | 1,689,902 |
| P-1 | | | 3,700 | | 2.44%, 3/23/05(e) | | | 3,680,464 |
| | | | | | Dexia Delaware LLC, | | | |
| P-1 | | | 200 | | 2.06%, 1/26/05(e) | | | 199,714 |
| P-1 | | | 3,100 | | 2.41%, 3/14/05(e) | | | 3,085,616 |
| | | | | | Fortis Funding LLC, | | | |
| P-1 | | | 4,800 | | 2.00%, 1/21/05(e) | | | 4,793,902 |
| | | | | | General Electric Capital Corp., | | | |
| P-1 | | | 100 | | 2.28%, 2/23/05(e) | | | 99,666 |
| P-1 | | | 700 | | 2.32%, 2/24/05(e) | | | 697,576 |
| | | | | | General Motors Acceptance Corp., | | | |
| P-2 | | | 300 | | 2.36%, 3/21/05(e) | | | 298,445 |
| P-2 | | | 600 | | 2.50%, 4/5/05(e) | | | 596,091 |
| | | | | | HBOS Treasury Services, | | | |
| P-1 | | | 4,900 | | 2.41%, 3/14/05(e) | | | 4,877,265 |
| P-1 | | | 500 | | 2.42%, 3/15/05(e) | | | 497,645 |
| | | | | | ING US Funding LLC, | | | |
| P-1 | | | 3,500 | | 2.40%, 3/14/05(e) | | | 3,483,760 |
| | | | | | Nestle Capital Corp., | | | |
| P-1 | | | 1,600 | | 2.22%, 2/15/05(e) | | | 1,595,282 |
| | | | | | Nordea North America, Inc., | | | |
| P-1 | | | 800 | | 2.45%, 4/4/05(e) | | | 795,016 |
| | | | | | Pfizer, Inc., | | | |
| P-1 | | | 2,800 | | 2.24%, 3/18/05(e) | | | 2,786,196 |
| P-1 | | | 2,600 | | 2.33%, 3/3/05(e) | | | 2,589,938 |
| | | | | | Royal Bank of Scotland PLC, | | | |
| P-1 | | | 700 | | 2.03%, 1/21/05(e) | | | 699,111 |
| | | | | | Shell Finance UK PLC, | | | |
| P-1 | | | 3,500 | | 2.10%, 1/7/05(e) | | | 3,498,775 |
See Notes to Financial Statements
| | |
| 66 | | THE TARGET PORTFOLIO TRUST |
| | | | | | | | | |
MOODY’S RATING (UNAUDITED) | | PRINCIPAL
AMOUNT (000)# | | DESCRIPTION | | VALUE (NOTE 1) | |
| | | | | | | | | | |
| | | | | | Commercial Paper (cont’d.) | | | | |
| | | | | | Spintab AB, | | | | |
| P-1 | | $ | 1,200 | | 2.07%, 1/7/05(e) | | $ | 1,199,519 | |
| | | | | | UBS Finance (DE) LLC, | | | | |
| P-1 | | | 4,600 | | 2.37%, 3/10/05(e) | | | 4,579,944 | |
| | | | | | | |
|
|
|
| | | | | | Total commercial paper
(cost $54,791,814) | | | 54,794,564 | |
| | | | | | | |
|
|
|
| | | |
| | | | | | U.S. Government Securities—1.4% | | | | |
| | | | | | United States Treasury Bills, | | | | |
| | | | 1,500 | | 2.13%, 5/5/05(e) | | | 1,487,877 | |
| | | | 500 | | 2.20%, 3/3/05(e) | | | 498,304 | |
| | | | 500 | | 2.21%, 3/17/05(e)(g) | | | 497,878 | |
| | | | | | | |
|
|
|
| | | | | | (cost $2,484,842) | | | 2,484,059 | |
| | | | | | | |
|
|
|
| | | Contracts
| | OUTSTANDING OPTIONS PURCHASED(a)—0.2% | |
| | | | 60 | | Euro Futures,
expiring 9/19/05 @$93.25 | | | 750 | |
| | | | | | | |
|
|
|
| | | Notional
Amount (000)
| | | | | |
| | | | | | Call Options | | | | |
| | | $ | 2,100 | | Interest Rate Swaps,
3 month LIBOR over 5.75%,
expiring 4/27/09 | | | 183,274 | |
| | | |
| | | | | | Put Options | | | | |
| | | | 2,100 | | Interest Rate Swaps,
3 month LIBOR over 6.25%,
expiring 4/27/09 | | | 110,086 | |
| | | | | | | |
|
|
|
| | | | | | | | | 293,360 | |
| | | | | | | |
|
|
|
| | | | | | Total options purchased
(cost $259,320) | | | 294,110 | |
| | | | | | | |
|
|
|
| | | | | | Total short-term investments
(cost $57,535,976) | | | 57,572,733 | |
| | | | | | | |
|
|
|
| | | |
| | | | | | Total Investments, Before Outstanding Options Written and Securities Sold Short—108.0%
(cost $190,843,458; Note 5) | | | 192,711,443 | |
| | | | | | | |
|
|
|
| | | Contracts
| | OUTSTANDING OPTIONS WRITTEN(a)—(0.1%) | |
| | | | | | Call Options | | | | |
| | | | 29 | | United States Treasury Notes,
expiring 2/18/05 @$113 | | | (14,500 | ) |
| | | | 77 | | United States Treasury Notes,
expiring 2/18/05 @$114 | | | (18,047 | ) |
| | | | | | | |
|
|
|
| | | | | | | | | (32,547 | ) |
| | | | | | | |
|
|
|
See Notes to Financial Statements
| | |
| THE TARGET PORTFOLIO TRUST | | 67 |
| | |
Total Return Bond Portfolio (cont’d) | | Portfolio of Investments
As of December 31, 2004 |
| | | | | | | | | | |
| | | CONTRACTS | | | DESCRIPTION | | VALUE (NOTE 1) | |
| | | | | | | | | | | |
| | | |
| | | | | | | Put Options | | | | |
| | | | 6 | | | 90 Day GBP LIBOR expiring,
12/21/2005 @$94.25 | | $ | (432 | ) |
| | | | 106 | | | United States Treasury Notes,
expiring 2/18/05 @$108 | | | (9,937 | ) |
| | | | | | | | |
|
|
|
| | | | | | | | | | (10,369 | ) |
| | | | | | | | |
|
|
|
| | | Notional
Amount (000)
| | | | | | |
| | | | | | | Call Options | | | | |
| | | | | | | Interest Rate Swaps, | | | | |
| | | $ | (15,100 | ) | | 3 month LIBOR over 4.0%,
expiring 9/23/05 | | | (106,546 | ) |
| | | | (15,100 | ) | | 3 month LIBOR over 7.0%,
expiring 9/23/05 | | | (4,983 | ) |
| | | |
| | | | | | | Put Options | | | | |
| | | | | | | Interest Rate Swaps, | | | | |
| | | | (1,000 | ) | | 3 month LIBOR over 4.0%,
expiring 10/31/05 | | | (7,625 | ) |
| | | | (1,000 | ) | | 3 month LIBOR over 7.0%,
expiring 10/31/05 | | | (551 | ) |
| | | | | | | | |
|
|
|
| | | | | | | | | | (119,705 | ) |
| | | | | | | | |
|
|
|
| | | | | | | Total outstanding options written
(premiums received $545,289) | | | (162,621 | ) |
| | | | | | | | |
|
|
|
| | | Principal
Amount (000)#
| | | INVESTMENTS SOLD SHORT—(19.6%) | | | |
| | | | | | | Federal National Mortgage Association, | | | | |
| | | | (500 | ) | | 5.00%, 1/1/35, TBA | | | (495,937 | ) |
| | | | (800 | ) | | 6.00%, 1/1/35, TBA | | | (827,000 | ) |
| | | | | | | United States Treasury Notes, | | | | |
| | | | (10,600 | ) | | 3.625%, 5/15/13 | | | (10,271,644 | ) |
| | | | (11,200 | ) | | 3.875%, 2/15/13 | | | (11,050,379 | ) |
| | | | (4,500 | ) | | 4.00%, 11/15/12 | | | (4,492,440 | ) |
| | | | (750 | ) | | 4.375%, 5/15/07 | | | (770,830 | ) |
| | | | (4,850 | ) | | 4.375%, 8/15/12 | | | (4,965,755 | ) |
| | | | (1,900 | ) | | 4.875%, 2/15/12 | | | (2,008,211 | ) |
| | | | | | | | |
|
|
|
| | | | | | | Total investments sold short
(proceeds received $34,755,801) | | | (34,882,196 | ) |
| | | | | | | | |
|
|
|
| | | |
| | | | | | | Total Investments, Net of Outstanding Options Written and
Investments Sold Short—88.3%
(cost $155,542,368) | | $ | 157,666,626 | |
| | | | | | | Other assets in excess of other liabilities—11.7% | | | 20,821,547 | |
| | | | | | | | |
|
|
|
| | | | | | | Net Assets—100% | | $ | 178,488,173 | |
| | | | | | | | |
|
|
|
See Notes to Financial Statements
| | |
| 68 | | THE TARGET PORTFOLIO TRUST |
The following abbreviations are used in the portfolio descriptions:
ARM—Adjustable Rate Mortgage.
EUR—Euro.
GBP—British Pound.
JPY—Japanese Yen.
MTN—Medium Term Note
P/O—Principal Only.
TBA—To be announced. Such securities are purchased on a forward commitment basis.
TIPS—Treasury Inflation Protection Security.
| # | Principal amount is denoted in U.S. dollars unless otherwise indicated. |
| (a) | Non-income producing security. |
| (b) | Variable rate instrument. |
| (c) | Standard and Poor’s rating. |
| (e) | Rate quoted represents yield-to-maturity as of purchase date. |
(f) Security pledged as collateral for TBA’s.
(g) All or portion of security pledged as initial margin for financial futures.
The Fund’s current prospectus contains a description of Moody’s and Standard & Poor’s ratings.
See Notes to Financial Statements
| | |
| THE TARGET PORTFOLIO TRUST | | 69 |
| | |
Total Return Bond Portfolio (cont’d) | | Portfolio of Investments
As of December 31, 2004 |
The major asset group classification of portfolio holdings and other assets in excess of other liabilities shown as a percentage of net assets as of December 31, 2004 were as follows:
| | | |
U.S. Government Securities | | 42.5 | % |
Commercial Paper | | 30.7 | |
Foreign Government Securities | | 10.2 | |
Corporate Bonds | | 8.6 | |
U.S. Government Agency Mortgage-Backed Securities | | 7.9 | |
Municipals | | 4.9 | |
Collateralized Mortgage Obligations | | 3.0 | |
Options Purchased | | 0.2 | |
| | |
|
|
| | | 108.0 | |
Outstanding Options Written | | (0.1 | ) |
Securities Sold Short | | (19.6 | ) |
Other assets in excess of other liabilities | | 11.7 | |
| | |
|
|
| | | 100.0 | % |
| | |
|
|
See Notes to Financial Statements
| | |
| 70 | | THE TARGET PORTFOLIO TRUST |
| | |
Portfolio of Investments
As of December 31, 2004 | | Intermediate Term-Bond Portfolio |
| | | | | | | | |
MOODY’S
RATINGS
(UNAUDITED) | | PRINCIPAL
AMOUNT (000) | | DESCRIPTION | | VALUE (NOTE 1) |
| | | | | | | | | |
| | | | | | LONG-TERM INVESTMENTS—59.9% | | | |
| | | | | | Asset Backed Securities—0.9% | | | |
| | | | | | Countrywide Asset-Backed Certificates, | | | |
| | | | | | Ser. 2004-12, | | | |
| Aaa | | $ | 1,448 | | 2.38%, 1/25/24(a) | | $ | 1,449,370 |
| | | | | | Credit-Based Asset Servicing and Securitization, | | | |
| | | | | | Ser. 2002-CB1, Class A2, | | | |
| AAA(d) | | | 271 | | 2.69%, 8/25/29(a) | | | 271,393 |
| | | | | | First Franklin Mortgage Loan, | | | |
| | | | | | Ser. 2003-FF5, Class A2, | | | |
| Aaa | | | 386 | | 2.82%, 3/25/34(a) | | | 384,167 |
| | | | | | Metropolitan Asset Funding, Inc., | | | |
| | | | | | Ser. 1999-D, Class A1, | | | |
| AAA(d) | | | 47 | | 2.88%, 4/25/29(a)(h) (cost $47,248; purchased 6/28/01) | | | 47,194 |
| | | | | | Residential Asset Mortgage Products, Inc., | | | |
| | | | | | Ser. 2003-RS11, Class AIIB, | | | |
| Aaa | | | 512 | | 2.75%, 12/25/33(a) | | | 512,413 |
| | | | | | Residential Asset Securities Corp., | | | |
| | | | | | Ser. 2001-KS3, Class AII, | | | |
| Aaa | | | 120 | | 2.65%, 9/25/31(a) | | | 119,691 |
| | | | | | | |
|
|
| | | | | | Total asset backed securities
(cost $2,784,147) | | | 2,784,228 |
| | | | | | | |
|
|
| | | |
| | | | | | Corporate Bonds—19.5% | | | |
| | | |
| | | | | | Airlines—0.8% | | | |
| | | | | | American Airlines, Inc., | | | |
| Baa2 | | | 1,500 | | 7.86%, 10/1/11 | | | 1,550,282 |
| | | | | | United Airlines, Inc., | | | |
| NR | | | 1,700 | | 6.83%, 9/1/08(f) | | | 78,328 |
| NR | | | 1,500 | | 10.85%, 2/19/15(c)(f) | | | 585,000 |
| | | | | | | |
|
|
| | | | | | | | | 2,213,610 |
| | | | | | | |
|
|
| | | |
| | | | | | Automobile Manufacturers—1.4% | | | |
| | | | | | DaimlerChrysler NA Holding Corp., | | | |
| A3 | | | 1,500 | | 2.34%, 9/10/07(a) | | | 1,504,914 |
| A3 | | | 2,191 | | 7.40%, 1/20/05 | | | 2,195,355 |
| | | | | | Lear Corp., | | | |
| Baa3 | | | 500 | | 7.96%, 5/15/05 | | | 507,985 |
| | | | | | | |
|
|
| | | | | | | | | 4,208,254 |
| | | | | | | |
|
|
| | | |
| | | | | | Banking—2.0% | | | |
| | | | | | Bank of America NA, | | | |
| Aa1 | | | 3,000 | | 2.05%, 2/16/05(a) | | | 3,000,063 |
| | | | | | Export-Import Bank of Korea (The), | | | |
| A3 | | | 300 | | 6.50%, 11/15/06 | | | 315,376 |
| | | | | | Korea Development Bank (The), | | | |
| A3 | | | 2,670 | | 4.75%, 7/20/09 | | | 2,720,476 |
| | | | | | | |
|
|
| | | | | | | | | 6,035,915 |
| | | | | | | |
|
|
See Notes to Financial Statements
| | |
| THE TARGET PORTFOLIO TRUST | | 71 |
| | |
Intermediate Term-Bond Portfolio (cont’d) | | Portfolio of Investments
As of December 31, 2004 |
| | | | | | | | |
MOODY’S
RATINGS
(UNAUDITED) | | PRINCIPAL
AMOUNT (000) | | DESCRIPTION | | VALUE (NOTE 1) |
| | | | | | | | | |
| | | | | | Electric Power—3.0% | | | |
| | | | | | AEP Texas Central Co., | | | |
| Baa2 | | $ | 3,000 | | 2.96%, 2/15/05(a) | | $ | 3,000,068 |
| | | | | | Dayton Power & Light Co., | | | |
| Baa3 | | | 500 | | 5.13%, 10/1/13(h) | | | 510,841 |
| | | | | | (cost $511,741; purchased 3/19/04) | | | |
| | | | | | Dominion Resources, Inc., | | | |
| Baa1 | | | 1,200 | | 7.63%, 7/15/05 | | | 1,228,490 |
| | | | | | Duke Energy Corp., | | | |
| Baa1 | | | 300 | | 2.89%, 12/8/05(a) | | | 300,569 |
| | | | | | GPU, Inc., | | | |
| Baa3 | | | 900 | | 7.70%, 12/1/05 | | | 932,345 |
| | | | | | Nisource Finance Corp., | | | |
| Baa3 | | | 1,500 | | 2.92%, 11/23/09(a) | | | 1,497,917 |
| | | | | | Pacific Gas & Electric Co., | | | |
| Baa2 | | | 1,524 | | 2.72%, 4/3/06(a) | | | 1,525,253 |
| | | | | | | |
|
|
| | | | | | | | | 8,995,483 |
| | | | | | | |
|
|
| | | |
| | | | | | Financial Services—4.4% | | | |
| | | | | | Duke Capital LLC, | | | |
| Baa3 | | | 600 | | 6.25%, 7/15/05 | | | 609,941 |
| | | | | | Ford Motor Credit Co., | | | �� |
| A3 | | | 2,795 | | 6.75%, 5/15/05 | | | 2,831,096 |
| A3 | | | 900 | | 7.60%, 8/1/05 | | | 921,004 |
| | | | | | General Motors Acceptance Corp., | | | |
| A3 | | | 2,160 | | 3.18%, 5/18/06(a) | | | 2,150,007 |
| A3 | | | 1,240 | | 6.88%, 8/28/12 | | | 1,266,015 |
| A3 | | | 700 | | 8.00%, 11/1/31 | | | 719,520 |
| | | | | | Golden West Financial Corp., | | | |
| A1 | | | 1,500 | | 5.50%, 8/8/06 | | | 1,553,451 |
| | | | | | Heller Financial, Inc., | | | |
| Aaa | | | 500 | | 6.38%, 3/15/06 | | | 517,494 |
| | | | | | Household Finance Co., | | | |
| A1 | | | 730 | | 6.70%, 11/13/05 | | | 750,785 |
| | | | | | Unilever Capital Corp., | | | |
| A1 | | | 1,750 | | 6.88%, 11/1/05 | | | 1,804,119 |
| | | | | | | |
|
|
| | | | | | | | | 13,123,432 |
| | | | | | | |
|
|
| | | |
| | | | | | Food & Staples Retailing—0.1% | | | |
| | | | | | Delhaize America, Inc., | | | |
| Ba1 | | | 300 | | 7.38%, 4/15/06 | | | 314,993 |
| | | | | | | |
|
|
| | | |
| | | | | | Gaming—0.8% | | | |
| | | | | | Caesars Entertainment, Inc., | | | |
| Ba2 | | | 1,200 | | 7.88%, 12/15/05 | | | 1,245,000 |
| Ba1 | | | 1,070 | | 8.50%, 11/15/06 | | | 1,158,275 |
| | | | | | | |
|
|
| | | | | | | | | 2,403,275 |
| | | | | | | |
|
|
See Notes to Financial Statements
| | |
| 72 | | THE TARGET PORTFOLIO TRUST |
| | | | | | | | |
MOODY’S
RATINGS
(UNAUDITED) | | PRINCIPAL
AMOUNT (000) | | DESCRIPTION | | VALUE (NOTE 1) |
| | | | | | | | | |
| | | | | | Healthcare Services—0.2% | | | |
| | | | | | HCA, Inc., | | | |
| Ba1 | | $ | 700 | | 6.91%, 6/15/05 | | $ | 710,258 |
| | | | | | | |
|
|
| | | |
| | | | | | Industrial Conglomerates—0.6% | | | |
| | | | | | Tyco International Group SA, | | | |
| Baa3 | | | 1,640 | | 6.38%, 6/15/05 | | | 1,663,928 |
| | | | | | | |
|
|
| | | |
| | | | | | Media—1.8% | | | |
| | | | | | Comcast MO of Delaware LLC, | | | |
| Baa3 | | | 2,300 | | 8.88%, 9/15/05 | | | 2,389,838 |
| | | | | | Time Warner, Inc. | | | |
| Baa1 | | | 1,000 | | 5.63%, 5/1/05 | | | 1,009,209 |
| Baa1 | | | 2,000 | | 7.75%, 6/15/05 | | | 2,037,658 |
| | | | | | | |
|
|
| | | | | | | | | 5,436,705 |
| | | | | | | |
|
|
| | | |
| | | | | | Oil & Gas Exploration Services—0.3% | | | |
| | | | | | Parker & Parsley Petroleum Co., | | | |
| Baa3 | | | 800 | | 8.88%, 4/15/05 | | | 812,301 |
| | | | | | | |
|
|
| | | |
| | | | | | Paper & Packaging—0.4% | | | |
| | | | | | Georgia-Pacific Co., | | | |
| Ba3 | | | 980 | | 7.50%, 5/15/06 | | | 1,026,550 |
| | | | | | | |
|
|
| | | |
| | | | | | Telecommunications—3.3% | | | |
| | | | | | Deutsche Telekom International Finance BV, | | | |
| Baa2 | | | 2,300 | | 8.25%, 6/15/05 | | | 2,353,599 |
| | | | | | France Telecom SA, | | | |
| Baa2 | | | 2,000 | | 9.25%, 3/1/31 | | | 2,711,183 |
| | | | | | MCI, Inc., | | | |
| B2 | | | 61 | | 6.91%, 5/1/07 | | | 62,449 |
| B2 | | | 61 | | 7.69%, 5/1/09 | | | 63,135 |
| B2 | | | 52 | | 8.74%, 5/1/14 | | | 55,900 |
| | | | | | U.S. West Communications, | | | |
| Ba3 | | | 300 | | 6.63%, 9/15/05 | | | 306,000 |
| | | | | | SBC Communications, Inc., | | | |
| A1 | | | 2,550 | | 4.21%, 6/5/21(h) | | | |
| | | | | | (cost $2,581,119; purchased 6/15/04 - 10/14/04) | | | 2,564,663 |
| | | | | | Sprint Capital Corp., | | | |
| Baa3 | | | 350 | | 7.90%, 3/15/05 | | | 353,787 |
| | | | | | Verizon Wireless Capital LLC, | | | |
| A3 | | | 1,500 | | 2.42%, 5/23/05(a)(h) | | | |
| | | | | | (cost $1,498,855; purchased 11/20/03) | | | 1,499,600 |
| | | | | | | |
|
|
| | | | | | | | | 9,970,316 |
| | | | | | | |
|
|
| | | |
| | | | | | Tobacco—0.4% | | | |
| | | | | | Altria Group, Inc., | | | |
| Baa2 | | | 1,050 | | 7.00%, 7/15/05 | | | 1,066,262 |
| | | | | | | |
|
|
| | | | | | Total corporate bonds
(cost $60,792,379) | | | 57,981,282 |
| | | | | | | |
|
|
See Notes to Financial Statements
| | |
| THE TARGET PORTFOLIO TRUST | | 73 |
| | |
Intermediate Term-Bond Portfolio (cont’d) | | Portfolio of Investments
As of December 31, 2004 |
| | | | | | | | |
MOODY’S
RATINGS
(UNAUDITED) | | PRINCIPAL
AMOUNT (000) | | DESCRIPTION | | VALUE (NOTE 1) |
| | | | | | | | | |
| | | |
| | | | | | Collateralized Mortgage Obligations—6.8% | | | |
| | | | | | Bank of America Mortgage Securities, Inc., | | | |
| | | | | | Ser. 2002-K, Class A1, | | | |
| AAA(d) | | $ | 663 | | 5.60%, 10/20/32(a) | | $ | 672,222 |
| | | | | | Bear Stearns Adjustable Rate Mortgage Trust, | | | |
| | | | | | Ser. 2003-7, Class A2, | | | |
| AAA | | | 2,598 | | 3.75%, 11/25/34(a) | | | 2,587,429 |
| | | | | | Bear Stearns Alternative Loans Trust, | | | |
| | | | | | Ser. 2004-8, Class A2, | | | |
| Aaa | | | 432 | | 2.46%, 2/25/34(a) | | | 431,923 |
| | | | | | Countrywide Alternative Loans Trust, | | | |
| | | | | | Ser. 2003-J3, Class A1, | | | |
| AAA(d) | | | 559 | | 6.25%, 12/25/33 | | | 572,792 |
| | | | | | Countrywide Home Loans, | | | |
| | | | | | Ser. 2004-25, Class A1, | | | |
| Aaa | | | 4,393 | | 2.75%, 2/25/35(a) | | | 4,396,435 |
| | | | | | Ser. 2002-HYB2, Class A1, | | | |
| Aaa | | | 272 | | 4.95%, 9/19/32(a) | | | 273,004 |
| | | | | | Ser. 2002-1, Class A1, | | | |
| Aaa | | | 290 | | 5.70%, 3/19/32(a) | | | 294,336 |
| | | | | | Ser. 2003-R4, Class 2A, | | | |
| Aaa | | | 463 | | 6.50%, 1/25/34(h) | | | |
| | | | | | (cost $485,698; purchased 12/1/03) | | | 480,547 |
| | | | | | CS First Boston Mortgage Securities Corp., | | | |
| | | | | | Ser. 2003-8, Class A1, | | | |
| Aaa | | | 258 | | 6.50%, 4/25/33 | | | 262,937 |
| | | | | | Federal Home Loan Mortgage Corp., | | | |
| | | | 893 | | 7.00%, 10/25/43 | | | 944,981 |
| | | | | | Federal National Mortgage Association., | | | |
| | | | 690 | | 3.50%, 4/25/17 | | | 688,853 |
| | | | 241 | | 5.00%, 8/25/22 | | | 241,139 |
| | | | | | Government National Mortgage Association, | | | |
| | | | 391 | | 2.91%, 2/16/30(a) | | | 393,956 |
| | | | 275 | | 3.00%, 2/16/30(a) | | | 277,735 |
| | | | 1,020 | | 7.50%, 2/20/30 | | | 1,072,112 |
| | | | 211 | | 8.50%, 3/20/25 | | | 221,750 |
| | | | | | GS Mortgage Securities Corp. II, | | | |
| | | | | | Ser. 2001-1285, Class A1, | | | |
| Aaa | | | 745 | | 6.04%, 8/15/18(h) | | | |
| | | | | | (cost $803,816; purchased 10/9/02) | | | 794,917 |
| | | | | | Sequoia Mortgage Trust, | | | |
| | | | | | Ser. 10, Class 2A, | | | |
| Aaa | | | 4,318 | | 2.52%, 10/20/27(a) | | | 4,328,793 |
See Notes to Financial Statements
| | |
| 74 | | THE TARGET PORTFOLIO TRUST |
| | | | | | | |
MOODY’S
RATINGS
(UNAUDITED) | | PRINCIPAL
AMOUNT (000) | | DESCRIPTION | | VALUE (NOTE 1) |
| | | | | | | | |
| | | |
| | | | | Collateralized Mortgage Obligations (cont’d) | | | |
| | | | | Structured Asset Securities Corp., | | | |
| | | | | Ser. 2001-21A, Class A1, | | | |
| Aaa | | $ 618 | | 6.25%, 1/25/32 | | $ | 641,010 |
| | | | | Superannuation Members Home Loans Global Fund, | | | |
| | | | | Ser. 1A, Class A2, | | | |
| AAA(d) | | 196 | | 2.14%, 6/15/26(a)(h) | | | |
| | | | | (cost $195,922; purchased 5/30/01 - 1/22/04) | | | 195,800 |
| | | | | Washington Mutual, | | | |
| | | | | Ser. 2002-AR6, Class A, | | | |
| Aaa | | 548 | | 2.86%, 6/25/42 - 8/25/42(a) | | | 552,520 |
| | | | | | |
|
|
| | | | | Total collateralized mortgage obligations
(cost $20,357,488) | | | 20,325,191 |
| | | | | | |
|
|
| | | |
| | | | | Municipal Bond—0.3% | | | |
| | | | | Honolulu, Hawaii, City & County, | | | |
| Aaa | | 1,000 | | 4.75%, 7/1/28 | | | |
| | | | | (cost $839,820) | | | 1,007,500 |
| | | | | | |
|
|
| | | |
| | | | | Foreign Government Bonds—5.0% | | | |
| | | | | Federal Republic of Brazil, | | | |
| B2 | | 1,203 | | 8.00%, 4/15/14 (Brady Bond) | | | 1,231,058 |
| B2 | | 2,000 | | 11.50%, 3/12/08 | | | 2,347,000 |
| | | | | Republic of Panama, | | | |
| Ba1 | | 1,500 | | 9.375%, 4/1/29 | | | 1,746,300 |
| | | | | Republic of Peru, | | | |
| Ba3 | | 3,750 | | 9.125%, 1/15/08 - 2/21/12 | | | 4,348,125 |
| | | | | Republic of South Africa, | | | |
| Baa2 | | 750 | | 9.125%, 5/19/09 | | | 888,750 |
| | | | | Swedish Government, | | | |
| Aaa | | SEK 16,000 | | 8.00%, 8/15/07 | | | 2,721,883 |
| | | | | United Mexican States, | | | |
| Baa2 | | $ 1,500 | | 6.375%, 1/16/13 | | | 1,597,500 |
| | | | | | |
|
|
| | | | | Total foreign government bonds
(cost $12,999,089) | | | 14,880,616 |
| | | | | | |
|
|
| | | | | U.S. Government Agency Mortgage Pass-Through Obligations—9.4% | | | |
| | | | | Federal Farm Credit Bank, | | | |
| | | 2,301 | | 5.45%, 1/19/05 | | | 2,303,663 |
| | | | | Federal Home Loan Mortgage Corp., | | | |
| | | 7 | | 9.25%, 1/1/10 | | | 6,994 |
| | | | | Federal National Mortgage Association | | | |
| | | 232 | | 3.52%, 7/1/25(a) | | | 230,076 |
| | | 218 | | 4.75%, 8/1/24(a) | | | 222,878 |
| | | 7,525 | | 5.00%, 10/1/17 - 9/1/18 | | | 7,652,927 |
| | | 9,000 | | 5.00%, 1/1/20 TBA | | | 9,140,626 |
| | | 19 | | 5.23%, 12/1/30(a) | | | 18,967 |
| | | 13 | | 6.50%, 9/1/05 | | | 12,993 |
| | | 2,826 | | 6.00%, 11/1/12 - 9/1/17 | | | 2,964,427 |
See Notes to Financial Statements
| | |
| THE TARGET PORTFOLIO TRUST | | 75 |
| | |
Intermediate Term-Bond Portfolio (cont’d) | | Portfolio of Investments
As of December 31, 2004 |
| | | | | | | |
MOODY’S
RATINGS
(UNAUDITED) | | PRINCIPAL
AMOUNT (000) | | DESCRIPTION | | VALUE (NOTE 1) |
| | | | | | | | |
| | | | | U.S. Government Agency Mortgage Pass-Through Obligations (cont’d) | | | |
| | | | | Government National Mortgage Association, | | | |
| | | $ 1,247 | | 3.32%, 3/20/30(a) | | $ | 1,239,519 |
| | | 1,039 | | 3.38%, 5/20/23 - 6/20/27(a) | | | 1,033,729 |
| | | 653 | | 3.50%, 7/20/30(a) | | | 649,845 |
| | | 92 | | 4.63%, 10/20/24(a) | | | 94,123 |
| | | 72 | | 4.64%, 12/20/26(a) | | | 73,689 |
| | | 287 | | 4.75%, 8/20/26(a) | | | 290,360 |
| | | 1,354 | | 6.00%, 1/15/29 - 7/15/29 | | | 1,407,791 |
| | | 441 | | 6.50%, 10/15/25 - 6/15/29 | | | 465,054 |
| | | 214 | | 8.00%, 9/20/30 - 7/20/31 | | | 231,216 |
| | | | | | |
|
|
| | | | | Total U.S. Government agency mortgage pass-through obligations
(cost $28,030,642) | | | 28,038,877 |
| | | | | | |
|
|
| | | | | U.S. Government Securities—17.0% | | | |
| | | | | United States Treasury Notes, | | | |
| | | 33,300 | | 3.50%, 12/15/09 | | | 33,138,695 |
| | | 5,565 | | 3.375%, 1/15/07 - 1/15/12(g), TIPS, RRB | | | 6,105,570 |
| | | 3,771 | | 3.625%, 1/15/08, TIPS, RRB | | | 4,107,635 |
| | | 6,501 | | 3.875%, 1/15/09, TIPS, RRB | | | 7,286,370 |
| | | | | | |
|
|
| | | | | Total U.S. Government securities
(cost $49,002,006) | | | 50,638,270 |
| | | | | | |
|
|
| | | Shares
| | | | |
| | | |
| | | | | Preferred Stock—0.9% | | | |
| | | 46,100 | | Fannie Mae, 7.00%(a)
(cost $2,305,000) | | | 2,613,294 |
| | | | | | |
|
|
| | | | | Warrants—0.1% | | |
| | | 2,500,000 | | Mexico Value, Ser. C,
expiring 6/30/05(b) | | | 33,750 |
| | | 2,500,000 | | Mexico Value, Ser. D,
expiring 6/30/06(b) | | | 63,750 |
| | | 2,500,000 | | Mexico Value, Ser. E,
expiring 6/30/07(b) | | | 56,250 |
| | | | | | |
|
|
| | | | | Total warrants
(cost $719) | | | 153,750 |
| | | | | | |
|
|
| | | | | Total long-term investments
(cost $177,111,290) | | | 178,423,008 |
| | | | | | |
|
|
See Notes to Financial Statements
| | |
| 76 | | THE TARGET PORTFOLIO TRUST |
| | | | | | | |
MOODY’S
RATINGS
(UNAUDITED) | | PRINCIPAL
AMOUNT (000) | | DESCRIPTION | | VALUE (NOTE 1) |
| | | | | SHORT-TERM INVESTMENTS—52.9% | | |
| | | |
| | | | | | Certificates of Deposit—3.8% | | |
| | | | | | Citibank, | | |
| P-1 | | $ | 6,000 | | 2.38%, 3/7/05 | | 6,000,000 |
| | | | | | HSBC Bank, | | |
| P-1 | | | 5,300 | | 2.41%, 4/1/05 | | 5,298,186 |
| | | | | | | |
|
| | | | | | Total certificates of deposit
(cost $11,300,000) | | 11,298,186 |
| | | | | | | |
|
| | | |
| | | | | | Commercial Paper—20.5%(e) | | |
| | | | | | Anz (Delaware) Inc., | | |
| P-1 | | | 4,000 | | 2.04%, 1/27/05 | | 3,994,107 |
| | | | | | Bank of Ireland, | | |
| P-1 | | | 6,000 | | 2.18%, 2/11/05 | | 5,983,806 |
| | | | | | Barclays US Funding Corp., | | |
| P-1 | | | 8,300 | | 2.48%, 4/18/05 | | 8,240,406 |
| | | | | | CDC Corp., | | |
| P-1 | | | 600 | | 2.07%, 2/23/05 | | 597,998 |
| | | | | | Dexia (Delaware) LLC, | | |
| P-1 | | | 9,100 | | 2.42%, 3/14/05 | | 9,057,776 |
| | | | | | General Electric Capital Corp., | | |
| P-1 | | | 5,500 | | 2.28%, 2/23/05 | | 5,481,644 |
| P-1 | | | 300 | | 2.32%, 2/24/05 | | 298,961 |
| | | | | | General Motors Acceptance Corp., | | |
| P-1 | | | 3,120 | | 2.50%, 4/5/05 | | 3,099,674 |
| | | | | | HBOS Treasury Services PLC, | | |
| P-1 | | | 500 | | 2.42%, 3/14/05 | | 497,680 |
| P-1 | | | 300 | | 2.44%, 3/22/05 | | 298,437 |
| P-1 | | | 8,298 | | 2.47%, 4/12/05 | | 8,244,058 |
| | | | | | Rabobank USA Finance Corp., | | |
| P-1 | | | 1,800 | | 2.17%, 1/3/05 | | 1,799,783 |
| | | | | | Royal Bank of Scotland (The), | | |
| P-1 | | | 4,400 | | 2.41%, 3/15/05 | | 4,379,276 |
| | | | | | UBS Finance (DE) LLC, | | |
| P-1 | | | 8,300 | | 2.30%, 2/28/05 | | 8,268,049 |
| P-1 | | | 800 | | 2.41%, 3/15/05 | | 796,232 |
| | | | | | | |
|
| | | | | | Total commercial paper
(cost $61,033,863) | | 61,037,887 |
| | | | | | | |
|
| | | |
| | | | | | U.S. Government and Agency Securities—28.6%(e) | | |
| | | | | | Federal Home Loan Bank, | | |
| | | | 3,100 | | 1.94%, 1/4/05 | | 3,099,238 |
| | | | 11,500 | | 1.96%, 1/14/05 - 1/19/05 | | 11,489,553 |
| | | | 2,200 | | 2.00%, 1/21/05 | | 2,197,566 |
| | | | 900 | | 2.06%, 2/1/05 | | 898,253 |
| | | | 3,000 | | 2.10%, 1/12/05 | | 2,998,008 |
| | | | 3,000 | | 2.26%, 3/2/05 | | 2,988,750 |
See Notes to Financial Statements
| | |
| THE TARGET PORTFOLIO TRUST | | 77 |
| | |
Intermediate Term-Bond Portfolio (cont’d) | | Portfolio of Investments
As of December 31, 2004 |
| | | | | | | | | |
| | | PRINCIPAL
AMOUNT (000) | | DESCRIPTION | | VALUE (NOTE 1) | |
| | | | | | | | | | |
| | | |
| | | | | | U.S. Government and Agency Securities (cont’d) | | | | |
| | | $ | 3,000 | | 2.30%, 3/4/05 | | $ | 2,988,300 | |
| | | | 6,100 | | 2.35%, 3/11/05 | | | 6,077,125 | |
| | | | | | Federal Home Loan Mortgage Corp., | | | | |
| | | | 11,400 | | 1.96%, 1/11/05 | | | 11,393,784 | |
| | | | 8,400 | | 1.98%, 1/18/05 - 1/25/05 | | | 8,388,956 | |
| | | | 1,400 | | 2.19%, 2/15/05 | | | 1,396,041 | |
| | | | | | Federal National Mortgage Association, | | | | |
| | | | 3,100 | | 1.99%, 1/19/05 | | | 3,096,916 | |
| | | | 10,000 | | 2.06%, 1/26/05 | | | 9,984,963 | |
| | | | 2,300 | | 2.08%, 2/2/05 | | | 2,295,529 | |
| | | | 2,900 | | 2.18%, 2/9/05 | | | 2,892,869 | |
| | | | 800 | | 2.23%, 2/4/05 | | | 798,294 | |
| | | | 2,000 | | 2.26%, 2/23/05 | | | 1,993,354 | |
| | | | 5,900 | | 2.30%, 3/2/05 | | | 5,877,875 | |
| | | | 500 | | 2.34%, 3/9/05 | | | 498,125 | |
| | | | 3,000 | | 2.39%, 4/15/05 | | | 2,977,500 | |
| | | | | | United States Treasury Bill, | | | | |
| | | | 1,035 | | 2.20%, 3/17/05(g) | | | 1,030,607 | |
| | | | | | | |
|
|
|
| | | | | | Total U.S. Government and agency securities
(cost $85,360,232) | | | 85,361,606 | |
| | | | | | | |
|
|
|
| | | CONTRACTS/
NOTIONAL
AMOUNT (000)
| | | | | |
| | |
| | | | Outstanding Options Purchased(b) | | | | |
| | | | | | Put Options | | | | |
| | | | 135 | | Eurodollar Futures,
expiring 3/14/05 @ $94.00
(cost $1,350) | | | 1,688 | |
| | | | | | | |
|
|
|
| | | | | | Total short-term investments
(cost $157,695,445) | | | 157,699,367 | |
| | | | | | | |
|
|
|
| | | |
| | | | | | Total Investments, Before Outstanding Options
Written—112.8%
(cost $334,806,735; Note 5) | | | 336,122,375 | |
| | | | | | | |
|
|
|
| | |
| | | | Outstanding Options Written(b) | | | | |
| | | | | | Call Options | | | | |
| | | | 200 | | United States Treasury Notes Futures,
expiring 2/18/05 @ $114 | | | (46,875 | ) |
| | | $ | 16,900 | | Interest Rate Swaps, 3 month LIBOR over 4.00%,
expiring 1/7/05 | | | (253 | ) |
| | | | | | | |
|
|
|
| | | | | | | | | (47,128 | ) |
| | | | | | | |
|
|
|
See Notes to Financial Statements
| | |
| 78 | | THE TARGET PORTFOLIO TRUST |
| | | | | | | | | |
| | | CONTRACTS/
NOTIONAL
AMOUNT (000) | | DESCRIPTION | | VALUE (NOTE 1) | |
| | | | | | | | | | |
| | | | | | Put Options | | | | |
| | | $ | 16,900 | | Interest Rate Swaps, 3 month LIBOR over 7.00%,
expiring 1/7/05 | | $ | (1 | ) |
| | | | | | | |
|
|
|
| | | | | | Total outstanding options written
(premiums received $346,443) | | | (47,129 | ) |
| | | | | | | |
|
|
|
| | | |
| | | | | | Total Investments, Net of Outstanding Options
Written—112.8% | | | 336,075,246 | |
| | | | | | Other liabilities in excess of other assets—(12.8%) | | | (38,092,940 | ) |
| | | | | | | |
|
|
|
| | | | | | Net Assets—100% | | $ | 297,982,306 | |
| | | | | | | |
|
|
|
The following abbreviations are used in the portfolio descriptions:
NR—Not rated by Moody’s or Standard & Poor’s.
RRB—Real Return Bond.
SEK—Swedish Krona
TBA—Securities purchased on a forward commitment basis.
TIPS—Treasury Inflation Protection Security.
The Fund’s current prospectus contains a description of Moody’s and Standard & Poor’s Ratings.
| (a) | Rate shown reflects current rate on variable rate instruments. |
| (b) | Non-Income producing security. |
| (c) | Represents issues in default on interest payments; non-income producing security. |
| (d) | Standard & Poor’s rating. |
| (e) | Rate shown reflects yield to maturity on date of purchase. |
| (g) | All or portion of security pledged as initial margin for financial futures contracts. |
| (h) | Private placement, restricted as to resale and does not have a readily available market. The aggregate cost of such securities is $6,124,399. The aggregate value of $6,093,562 is approximately 2.05% of net assets. |
The major asset category classification of portfolio holdings and other liabilities in excess of other assets shown as a percentage of net assets as of December 31, 2004 were as follows:
| | | |
U.S. Government and Agency Securities | | 45.6 | % |
Commercial Paper | | 20.5 | |
Corporate Bonds | | 19.5 | |
U.S. Government Agency Mortgage Pass-Through Obligations | | 9.4 | |
Collateralized Mortgage Obligations | | 6.8 | |
Foreign Government Bonds | | 5.0 | |
Certificates of Deposit | | 3.8 | |
Preferred Stock | | 0.9 | |
Asset Backed Securities | | 0.9 | |
Municipal Bond | | 0.3 | |
Warrants | | 0.1 | |
| | |
|
|
| | | 112.8 | |
Other liabilities in excess of other assets | | (12.8 | ) |
| | |
|
|
| | | 100.0 | % |
| | |
|
|
See Notes to Financial Statements
| | |
| THE TARGET PORTFOLIO TRUST | | 79 |
| | |
| Mortgage Backed Securities Portfolio | | Portfolio of Investments
As of December 31, 2004 |
| | | | | | |
PRINCIPAL AMOUNT (000) | | DESCRIPTION | | VALUE (NOTE 1) |
| | | | LONG-TERM INVESTMENTS—113.1% | | | |
| | |
| | | | Collateralized Mortgage Obligations—10.7% | | | |
| | | | Bear Stearns Commercial Mortgage Securities Corp., | | | |
| $ | 750 | | 7.32%, 10/15/32 | | $ | 855,875 |
| | | | Chase Commercial Mortgage Securities Corp., | | | |
| | 264 | | 6.56%, 5/18/30 | | | 283,720 |
| | | | CS First Boston Mortgage Securities Corp., | | | |
| | 92 | | Zero Coupon, 4/25/17, P/O | | | 80,427 |
| | 95 | | 8.985%, 4/25/17, I/O | | | 22,689 |
| | | | Federal Home Loan Mortgage Corp., | | | |
| | 22 | | 5.50%, 8/15/21, PAC | | | 21,638 |
| | 1,088 | | 6.00%, 10/15/20 - 5/15/23, PAC | | | 1,114,983 |
| | 133 | | 7.00%, 3/15/23, PAC | | | 134,985 |
| | 24 | | 8.00%, 4/15/21 | | | 23,975 |
| | 348 | | 8.00%, 12/15/06 - 7/15/21, PAC | | | 349,193 |
| | 12 | | 9.00%, 10/15/20 | | | 12,293 |
| | | | Federal National Mortgage Assn., | | | |
| | 610 | | 4.50%, 5/25/33, PAC | | | 608,162 |
| | 31 | | 6.00%, 4/1/19, I/O | | | 32,725 |
| | 230 | | 6.00%, 10/25/22, PAC | | | 239,682 |
| | 45 | | 6.50%, 4/25/22 | | | 47,158 |
| | 397 | | 6.50%, 12/25/23, PAC | | | 416,440 |
| | 234 | | 6.527%, 5/25/30(a) | | | 245,270 |
| | 521 | | 7.00%, 9/25/20 - 3/25/23, PAC | | | 105,183 |
| | 160 | | 7.50%, 5/25/07 - 7/25/22 | | | 168,000 |
| | 349 | | 8.00%, 12/25/21 - 5/25/24, PAC | | | 378,603 |
| | 44 | | 8.50%, 7/25/18 - 2/25/20, PAC | | | 47,150 |
| | 45 | | 8.50%, 6/25/21 | | | 46,901 |
| | | | Morgan Stanley Dean Witter Commercial Mortgage, | | | |
| | 1,000 | | 6.39%, 7/15/33 | | | 1,106,495 |
| | 807 | | 6.66%, 2/15/33 | | | 896,395 |
| | 750 | | 7.20%, 10/15/33 | | | 851,228 |
| | | | Nomura Asset Commercial Mortgage, | | | |
| | 1,000 | | 6.69%, 3/15/30 | | | 1,133,211 |
| | | | Salomon Brothers Mortgage Securities, | | | |
| | 51 | | 6.00%, 12/25/11 | | | 50,711 |
| | | | Wells Fargo Mortgage Backed Securities | | | |
| | 1,000 | | 4.586%, 1/25/35 | | | 1,004,062 |
| | | | | |
|
|
| | | | Total collateralized mortgage obligations
(cost $9,648,898) | | | 10,277,154 |
| | | | | |
|
|
| |
| | | | U.S. Government Agency Mortgage Pass-Through Obligations—99.8% |
| | | | Federal Home Loan Mortgage Corp., | | | |
| | 527 | | 5.00%, 10/1/33 | | | 524,260 |
| | 1,000 | | 5.50%, 8/1/19 - 9/1/19 | | | 1,033,417 |
See Notes to Financial Statements
| | |
| 80 | | THE TARGET PORTFOLIO TRUST |
| | | | | | |
PRINCIPAL AMOUNT (000) | | DESCRIPTION | | VALUE (NOTE 1) |
| | | | U.S. Government Agency Mortgage Pass-Through Obligations (cont’d.) |
| $ | 1,454 | | 6.00%, 5/1/11 - 10/1/31 | | $ | 1,503,211 |
| | 411 | | 6.50%, 12/1/14 - 6/1/22 | | | 433,919 |
| | 106 | | 7.50%, 3/1/08 - 6/1/28 | | | 113,416 |
| | 7 | | 8.25%, 12/1/05 - 5/1/08 | | | 6,435 |
| | 35 | | 8.50%, 12/1/07 - 7/1/21 | | | 37,919 |
| | 15 | | 8.75%, 12/1/08 | | | 15,923 |
| | 80 | | 9.00%, 10/1/05 - 3/1/11 | | | 83,904 |
| | 30 | | 11.50%, 3/1/16 | | | 32,767 |
| | 13 | | 13.25%, 5/1/13 | | | 14,112 |
| | 3 | | 14.00%, 6/1/11 | | | 3,589 |
| | | | Federal National Mortgage Assn., | | | |
| | 22,928 | | 5.00%, 9/1/17 - 3/1/34 | | | 23,182,269 |
| | 5,000 | | 5.00%, 1/1/35, TBA | | | 4,959,375 |
| | 9,545 | | 5.50%, 7/1/33 - 11/1/34 | | | 9,695,653 |
| | 677 | | 5.78%, 11/1/11(a) | | | 725,310 |
| | 2,700 | | 6.00%, 2/13/33 | | | 2,785,217 |
| | 8,079 | | 6.00%, 8/1/34 - 1/1/34 | | | 8,367,319 |
| | 1,094 | | 6.009%, 11/1/11 | | | 1,194,455 |
| | 75 | | 6.048%, 3/1/12 | | | 81,328 |
| | 83 | | 6.18%, 7/1/08 | | | 87,671 |
| | 65 | | 6.34%, 1/1/08 | | | 69,006 |
| | 73 | | 6.43%, 1/1/08 | | | 77,449 |
| | 462 | | 6.447%, 1/1/08 | | | 489,213 |
| | 3,533 | | 6.50%, 11/1/08 - 9/1/34 | | | 3,734,363 |
| | 620 | | 6.55%, 9/1/07 | | | 654,882 |
| | 38 | | 6.858%, 10/1/07 | | | 40,480 |
| | 207 | | 7.00%, 9/1/11 - 7/1/12 | | | 219,362 |
| | 571 | | 7.04%, 3/1/07 | | | 601,317 |
| | 1 | | 7.75%, 10/1/19 | | | 831 |
| | 104 | | 8.00%, 3/1/07 - 12/1/22 | | | 114,450 |
| | 45 | | 8.50%, 1/1/07 | | | 45,155 |
| | 30 | | 9.75%, 8/1/10 - 11/1/16 | | | 33,487 |
| | | | Government National Mortgage Assn., | | | |
| | 10,925 | | 5.00%, 3/15/33 - 12/15/34 | | | 10,942,634 |
| | 3,447 | | 6.00%, 10/15/08 - 7/15/34 | | | 3,598,300 |
| | 5,000 | | 6.00%, 1/1/35, TBA | | | 5,179,690 |
| | 4,403 | | 6.50%, 5/15/23 - 10/15/34 | | | 4,643,681 |
| | 3,976 | | 7.00%, 7/15/16 - 1/15/30 | | | 4,239,152 |
| | 3,927 | | 7.50%, 3/15/07 - 10/15/29 | | | 4,231,678 |
| | 1,139 | | 8.00%, 1/15/08 - 11/15/30 | | | 1,239,068 |
| | 77 | | 8.25%, 6/20/17 - 7/20/17 | | | 83,465 |
| | 62 | | 8.50%, 3/15/05 - 4/20/17 | | | 68,810 |
| | 175 | | 9.00%, 5/20/05 - 1/15/20 | | | 194,932 |
| | 143 | | 9.50%, 4/15/06 - 1/15/21 | | | 157,014 |
| | 12 | | 13.50%, 5/15/11 | | | 13,332 |
| | 25 | | 14.00%, 6/15/11 | | | 29,151 |
| | 17 | | 16.00%, 5/15/12 | | | 20,192 |
| | | | | |
|
|
| | | | Total U.S. Government agency mortgage pass-through obligations
(cost $94,816,579) | | | 95,602,563 |
| | | | | |
|
|
See Notes to Financial Statements
| | |
| THE TARGET PORTFOLIO TRUST | | 81 |
| | |
Mortgage Backed Securities Portfolio (cont’d) | | Portfolio of Investments
As of December 31, 2004 |
| | | | | | | |
PRINCIPAL AMOUNT (000) | | DESCRIPTION | | VALUE (NOTE 1) | |
| | |
| | | | United States Treasury Securities—2.6% | | | | |
| | | | United States Treasury Bond, | | | | |
| $ | 1,750 | | 8.875%, 2/15/19
(cost $2,517,939) | | $ | 2,517,608 | |
| | | | | |
|
|
|
| | | | Total Investments, Before Securities Sold Short—113.1% (cost $106,983,416; Note 5) | | | 108,397,325 | |
| | | | | |
|
|
|
| | |
| | | | SECURITIES SOLD SHORT—(13.9)% | | | | |
| | | | Federal National Mortgage Assn., TBA | | | | |
| | 5,000 | | 5.00%, 1/1/20 | | | (5,078,125 | ) |
| | 3,000 | | 5.50%, 2/20/19 | | | (3,092,814 | ) |
| | 5,000 | | 6.00%, 1/1/35 | | | (5,168,750 | ) |
| | | | | |
|
|
|
| | | | Total securities sold short
(proceeds received $13,310,156) | | | (13,339,689 | ) |
| | | | | |
|
|
|
| | | | Total Investments, Net of Securities Sold Short—99.2%
(cost $93,673,260) | | | 95,057,636 | |
| | | | Other assets in excess of other liabilities—0.8% | | | 737,996 | |
| | | | | |
|
|
|
| | | | Net Assets—100% | | $ | 95,795,632 | |
| | | | | |
|
|
|
The following abbreviations are used in the portfolio descriptions.
I/O—Interest Only Security.
PAC—Planned Amortization Class.
P/O—Principal Only Security.
TBA—To be announced. Such securities are purchased on a forward commitment basis.
| (a) | Variable Rate instrument. The maturity date presented for these instruments is the later of the next date on which the security can be redeemed at par or the next date on which the rate of interest is adjusted. |
The major asset category classification of portfolio holdings and other assets in excess of other liabilities shown as a percentage of net assets as of December 31, 2004 were as follows:
| | | |
U.S. Government Agency Mortgage Pass-Through Obligations | | 99.8 | % |
Collateralized Mortgage Obligations | | 10.7 | |
United States Treasury Securities | | 2.6 | |
| | |
|
|
| | | 113.1 | |
Securities Sold Short | | (13.9 | ) |
Other assets in excess of other liabilities | | 0.8 | |
| | |
|
|
| | | 100.0 | % |
| | |
|
|
See Notes to Financial Statements
| | |
| 82 | | THE TARGET PORTFOLIO TRUST |
| | |
Portfolio of Investments
As of December 31, 2004 | | U.S. Government Money Market Portfolio |
| | | | | | | |
PRINCIPAL
AMOUNT (000) | | DESCRIPTION | | VALUE (NOTE 1) | |
| | | | | | | | |
| |
| | | | Federal Home Loan Bank—8.4% | |
| $ | 1,200 | | 2.22%, 2/4/05(a) | | $ | 1,197,484 | |
| | 1,420 | | 2.23%, 2/18/05(a) | | | 1,415,778 | |
| | 1,000 | | 1.50%, 3/1/05 | | | 1,000,000 | |
| | 1,198 | | 2.36%, 3/21/05(a) | | | 1,191,796 | |
| | 1,000 | | 1.625%, 4/15/05 | | | 1,003,108 | |
| | 400 | | 1.66%, 5/16/05 | | | 400,000 | |
| | | | | |
|
|
|
| | | | | | | 6,208,166 | |
| | | | | |
|
|
|
| | |
| | | | Federal Home Loan Mortgage Corp.—31.0% | | | | |
| | 4,000 | | 1.97%, 1/11/05(a) | | | 3,997,811 | |
| | 5,000 | | 2.03%, 1/18/05(a) | | | 4,995,207 | |
| | 4,022 | | 2.05%, 1/24/05(a) | | | 4,016,732 | |
| | 1,100 | | 2.15%, 1/25/05(a) | | | 1,098,424 | |
| | 5,939 | | 2.14% - 2.28%, 2/1/05(a) | | | 5,927,513 | |
| | 3,000 | | 1.16%, 3/8/05(a) | | | 2,993,620 | |
| | | | | |
|
|
|
| | | | | | | 23,029,307 | |
| | | | | |
|
|
|
| |
| | | | Federal National Mortgage Association—25.2% | |
| | 11,250 | | 2.24%, 2/2/05(a) | | | 11,227,600 | |
| | 3,000 | | 1.14%, 2/4/05(a) | | | 2,996,770 | |
| | 1,000 | | 2.23%, 2/10/05(a) | | | 997,522 | |
| | 2,000 | | 1.375%, 2/11/05 | | | 1,997,992 | |
| | 750 | | 1.375%, 2/14/05 | | | 749,978 | |
| | 200 | | 1.61%, 5/13/05 | | | 200,000 | |
| | 500 | | 1.75%, 5/23/05 | | | 500,000 | |
| | | | | |
|
|
|
| | | | | | | 18,669,862 | |
| | | | | |
|
|
|
| | |
| | | | Repurchase Agreements—36.0% | | | | |
| | 8,800 | | Deutsche Bank Securities, 2.17%, dated 12/31/04, due 1/03/05 in the amount of $8,801,591 (cost $8,800,000; collateralized by $8,938,722 Government National Mortgage Association, 5.00%, 12/15/34, value of the collateral including accrued interest was $8,976,001) | | | 8,800,000 | |
| | 17,900 | | Goldman, Sachs & Co., 2.29%, dated 12/31/04, due 1/03/05 in the amount of $17,903,416 (cost $17,900,000; collateralized by $18,188,304 Federal Home Loan Mortgage Corp., 4.50%, 5/01/24, value of the collateral including accrued interest was $18,258,001) | | | 17,900,000 | |
| | | | | |
|
|
|
| | | | | | | 26,700,000 | |
| | | | | |
|
|
|
| | | | Total Investments—100.6%
(amortized cost $74,607,335)(b) | | | 74,607,335 | |
| | | | Liabilities in excess of other assets—(0.6%) | | | (417,521 | ) |
| | | | | |
|
|
|
| | | | Net Assets—100% | | $ | 74,189,814 | |
| | | | | |
|
|
|
| (a) | Rate quoted represents yield-to-maturity as of purchase date. |
| (b) | Federal income tax basis of portfolio securities is the same as for financial reporting purposes. |
See Notes to Financial Statements
| | |
| THE TARGET PORTFOLIO TRUST | | 83 |
| | |
U.S. Government Money Market Portfolio (cont’d) | | Portfolio of Investments
As of December 31, 2004 |
The major asset category classification of portfolio holdings and liabilities in excess of other assets shown as a percentage of net assets as of December 31, 2004 were as follows:
| | | |
Repurchase Agreements | | 36.0 | % |
Federal Home Loan Mortgage Corp. | | 31.0 | |
Federal National Mortgage Association | | 25.2 | |
Federal Home Loan Bank | | 8.4 | |
| | |
|
|
| | | 100.6 | |
Liabilities in excess of other assets | | (0.6 | ) |
| | |
|
|
| | | 100.0 | % |
| | |
|
|
See Notes to Financial Statements
| | |
| 84 | | THE TARGET PORTFOLIO TRUST |
Statements of Assets and Liabilities December 31, 2004
| | | | | | | | | | | | | | |
| | | LARGE
CAPITALIZATION
GROWTH
PORTFOLIO | | | LARGE
CAPITALIZATION
VALUE
PORTFOLIO | | SMALL
CAPITALIZATION
GROWTH
PORTFOLIO | | | SMALL
CAPITALIZATION
VALUE
PORTFOLIO |
| | | | |
| ASSETS | | | | | | | | | | | | | | |
Investments, at value* | | $ | 339,514,153 | | | $ | 385,501,762 | | $ | 159,104,914 | | | $ | 245,784,056 |
Repurchase Agreement* | | | — | | | | — | | | — | | | | — |
Cash | | | — | | | | — | | | — | | | | 22,268 |
Foreign currency, at value** | | | — | | | | — | | | — | | | | — |
Receivable for Fund shares sold | | | 212,614 | | | | 209,993 | | | 70,584 | | | | 521,756 |
Dividends and interest receivable | | | 171,062 | | | | 593,757 | | | 44,855 | | | | 285,945 |
Prepaid expenses and other assets | | | 13,339 | | | | 12,180 | | | 6,094 | | | | 13,767 |
Receivable for investments sold | | | 6,008,684 | | | | 1,025,081 | | | 468,301 | | | | 505,505 |
Receivable for foreign tax reclaim | | | — | | | | — | | | — | | | | — |
Due from broker for variation margin | | | — | | | | — | | | — | | | | — |
Premium for swaps purchased | | | — | | | | — | | | — | | | | — |
Unrealized appreciation on swaps | | | — | | | | — | | | — | | | | — |
Unrealized appreciation on forward currency contracts | | | — | | | | — | | | — | | | | — |
Total assets | | | 345,919,852 | | | | 387,342,773 | | | 159,694,748 | | | | 247,133,297 |
| | | | |
| LIABILITIES | | | | | | | | | | | | | | |
Payable for Fund shares reacquired | | | 828,079 | | | | 688,412 | | | 323,454 | | | | 1,030,487 |
Payable for investments purchased | | | — | | | | 899,158 | | | 31,299 | | | | 165,444 |
Accrued expenses and other liabilities | | | 198,543 | | | | 132,568 | | | 169,664 | | | | 224,502 |
Management fee payable | | | 175,660 | | | | 195,396 | | | 79,578 | | | | 123,805 |
Deferred Trustees’ fees | | | 11,976 | | | | 13,738 | | | 12,075 | | | | 12,809 |
Payable to custodian | | | 945,977 | | | | — | | | 321,423 | | | | — |
Dividends payable | | | — | | | | — | | | — | | | | — |
Due to broker for variation margin | | | — | | | | — | | | — | | | | — |
Outstanding options written*** | | | — | | | | — | | | — | | | | — |
Premium for swaps written | | | — | | | | — | | | — | | | | — |
Unrealized depreciation on swaps | | | — | | | | — | | | — | | | | — |
Unrealized depreciation on forward currency contracts | | | — | | | | — | | | — | | | | — |
Investments sold short, at value**** | | | — | | | | — | | | — | | | | — |
Total liabilities | | | 2,160,235 | | | | 1,929,272 | | | 937,493 | | | | 1,557,047 |
| | | | |
| NET ASSETS | | $ | 343,759,617 | | | $ | 385,413,501 | | $ | 158,757,255 | | | $ | 245,576,250 |
Net assets were comprised of:
Shares of beneficial interest, at par | | $ | 21,614 | | | $ | 23,230 | | $ | 14,714 | | | $ | 11,242 |
Paid-in capital, in excess of par | | | 283,580,507 | | | | 282,294,924 | | | 180,012,142 | | | | 167,159,077 |
| | | | 283,602,121 | | | | 282,318,154 | | | 180,026,856 | | | | 167,170,319 |
Undistributed net investment income (loss) | | | 19,269 | | | | 390,569 | | | (12,075 | ) | | | 35,568 |
Accumulated net realized gains (losses) | | | (15,141,325 | ) | | | 11,128,589 | | | (46,289,658 | ) | | | 2,450,917 |
Net unrealized appreciation (depreciation) | | | 75,279,552 | | | | 91,576,189 | | | 25,032,132 | | | | 75,919,446 |
Net assets, December 31, 2004 | | $ | 343,759,617 | | | $ | 385,413,501 | | $ | 158,757,255 | | | $ | 245,576,250 |
Shares of beneficial interest issued and outstanding | | | 21,613,694 | | | | 23,230,228 | | | 14,714,348 | | | | 11,241,974 |
Net asset value, offering price and redemption price per share | | $ | 15.90 | | | $ | 16.59 | | $ | 10.79 | | | $ | 21.84 |
* Identified cost of total investments | | $ | 264,234,601 | | | $ | 293,925,573 | | $ | 134,072,782 | | | $ | 169,864,610 |
** Identified cost of currency | | $ | — | | | $ | — | | $ | — | | | $ | — |
*** Premiums received from options written | | $ | — | | | $ | — | | $ | — | | | $ | — |
**** Proceeds received from short sales | | $ | — | | | $ | — | | $ | — | | | $ | — |
See Notes to Financial Statements
| | |
| THE TARGET PORTFOLIO TRUST | | 85 |
Statements of Assets and Liabilities December 31, 2004 (cont’d)
| | | | | | | | | | | | | | | | |
| | |
INTERNATIONAL
EQUITY
PORTFOLIO | | | INTERNATIONAL
BOND
PORTFOLIO | | | TOTAL RETURN
BOND
PORTFOLIO | | | INTERMEDIATE-
TERM BOND
PORTFOLIO | |
| | | | |
| ASSETS | | | | | | | | | | | | | | | | |
Investments, at value* | | $ | 227,599,115 | | | $ | 49,712,395 | | | $ | 192,711,443 | | | $ | 336,122,375 | |
Repurchase Agreement* | | | — | | | | — | | | | — | | | | — | |
Cash | | | 957 | | | | 126,842 | | | | 2,082,433 | | | | 4,789,468 | |
Foreign currency, at value** | | | — | | | | 534,397 | | | | 983,067 | | | | 728,853 | |
Receivable for Fund shares sold | | | 158,943 | | | | 49,153 | | | | 324,051 | | | | 361,305 | |
Dividends and interest receivable | | | 344,626 | | | | 752,380 | | | | 1,395,547 | | | | 1,675,847 | |
Prepaid expenses and other assets | | | 4,921 | | | | 1,283 | | | | 4,900 | | | | 10,096 | |
Receivable for investments sold | | | 2,494,536 | | | | — | | | | 54,965,320 | | | | 198 | |
Receivable for foreign tax reclaim | | | 514,998 | | | | — | | | | — | | | | — | |
Due from broker for variation margin | | | — | | | | 3,984 | | | | 136,559 | | | | 201,191 | |
Premium for swaps purchased | | | — | | | | 15,804 | | | | 246,430 | | | | 118,899 | |
Unrealized appreciation on swaps | | | — | | | | 32,204 | | | | 371,718 | | | | 355,085 | |
Unrealized appreciation on forward currency contracts | | | — | | | | 44,527 | | | | 20,275 | | | | — | |
Total assets | | | 231,118,096 | | | | 51,272,969 | | | | 253,241,743 | | | | 344,363,317 | |
| | | | |
| LIABILITIES | | | | | | | | | | | | | | | | |
Payable for Fund shares reacquired | | | 512,743 | | | | 105,996 | | | | 630,813 | | | | 536,547 | |
Payable for investments purchased | | | — | | | | 5,506,618 | | | | 36,259,138 | | | | 45,035,747 | |
Accrued expenses and other liabilities | | | 144,616 | | | | 105,660 | | | | 99,264 | | | | 158,894 | |
Management fee payable | | | 135,537 | | | | 19,139 | | | | 67,292 | | | | 114,657 | |
Deferred Trustees’ fees | | | 12,668 | | | | 8,953 | | | | 11,523 | | | | 12,729 | |
Payable to custodian | | | — | | | | — | | | | — | | | | — | |
Dividends payable | | | — | | | | — | | | | 17,015 | | | | 21,574 | |
Due to broker for variation margin | | | — | | | | — | | | | — | | | | — | |
Outstanding options written*** | | | — | | | | 5,906 | | | | 162,621 | | | | 47,129 | |
Premium for swaps written | | | — | | | | 149,268 | | | | 1,266,774 | | | | 129,570 | |
Unrealized depreciation on swaps | | | — | | | | 15,176 | | | | 1,289,790 | | | | 324,164 | |
Unrealized depreciation on forward currency contracts | | | 12,698 | | | | 451,252 | | | | 67,144 | | | | — | |
Investments sold short, at value**** | | | — | | | | — | | | | 34,882,196 | | | | — | |
Total liabilities | | | 818,262 | | | | 6,367,968 | | | | 74,753,570 | | | | 46,381,011 | |
| | | | |
| NET ASSETS | | $ | 230,299,834 | | | $ | 44,905,001 | | | $ | 178,488,173 | | | $ | 297,982,306 | |
Net assets were comprised of:
Shares of beneficial interest, at par | | $ | 17,543 | | | $ | 5,482 | | | $ | 16,783 | | | $ | 28,762 | |
Paid-in capital, in excess of par | | | 214,914,759 | | | | 46,245,651 | | | | 176,920,161 | | | | 297,450,866 | |
| | | | 214,932,302 | | | | 46,251,133 | | | | 176,936,944 | | | | 297,479,628 | |
Undistributed net investment income (loss) | | | 436,240 | | | | (6,485,912 | ) | | | (290,951 | ) | | | 176,503 | |
Accumulated net realized gains (losses) | | | (30,939,110 | ) | | | 2,972 | | | | 910,526 | | | | (1,313,670 | ) |
Net unrealized appreciation (depreciation) | | | 45,870,402 | | | | 5,136,808 | | | | 931,654 | | | | 1,639,845 | |
Net assets, December 31, 2004 | | $ | 230,299,834 | | | $ | 44,905,001 | | | $ | 178,488,173 | | | $ | 297,982,306 | |
Shares of beneficial interest issued and outstanding | | | 17,542,780 | | | | 5,481,607 | | | | 16,782,672 | | | | 28,762,079 | |
Net asset value, offering price and redemption price per share | | $ | 13.13 | | | $ | 8.19 | | | $ | 10.64 | | | $ | 10.36 | |
* Identified cost of total investments | | $ | 181,817,766 | | | $ | 44,270,836 | | | $ | 190,843,458 | | | $ | 334,806,735 | |
** Identified cost of currency | | $ | — | | | $ | 531,532 | | | $ | 972,493 | | | $ | 711,187 | |
*** Premiums received from options written | | $ | — | | | $ | 29,965 | | | $ | 545,289 | | | $ | 346,443 | |
**** Proceeds received from short sales | | $ | — | | | $ | — | | | $ | 34,755,801 | | | $ | — | |
See Notes to Financial Statements
| | |
| 86 | | THE TARGET PORTFOLIO TRUST |
Statements of Assets and Liabilities December 31, 2004 (cont’d)
| | | | | | | | |
| | | MORTGAGE
BACKED
SECURITIES
PORTFOLIO | | | U.S. GOVERNMENT
MONEY MARKET
PORTFOLIO | |
| | |
| ASSETS | | | | | | | | |
Investments, at value* | | $ | 108,397,325 | | | $ | 47,907,335 | |
Repurchase Agreement* | | | — | | | | 26,700,000 | |
Cash | | | 84,423 | | | | 9,280 | |
Foreign currency, at value** | | | — | | | | — | |
Receivable for Fund shares sold | | | 69,274 | | | | 263,596 | |
Dividends and interest receivable | | | 495,225 | | | | 31,627 | |
Prepaid expenses and other assets | | | 5,143 | | | | 3,405 | |
Receivable for investments sold | | | 13,312,386 | | | | — | |
Receivable for foreign tax reclaim | | | — | | | | — | |
Due from broker for variation margin | | | — | | | | — | |
Premium for swaps purchased | | | — | | | | — | |
Unrealized appreciation on swaps | | | 1,339 | | | | — | |
Unrealized appreciation on forward currency contracts | | | — | | | | — | |
Total assets | | | 122,365,115 | | | | 74,915,243 | |
| | |
| LIABILITIES | | | | | | | | |
Payable for Fund shares reacquired | | | 143,523 | | | | 600,565 | |
Payable for investments purchased | | | 12,884,844 | | | | — | |
Accrued expenses and other liabilities | | | 136,589 | | | | 100,854 | |
Management fee payable | | | 37,092 | | | | 7,754 | |
Deferred Trustees’ fees | | | 11,547 | | | | 13,490 | |
Payable to custodian | | | — | | | | — | |
Dividends payable | | | 11,840 | | | | 2,766 | |
Due to broker for variation margin | | | 4,359 | | | | — | |
Outstanding options written*** | | | — | | | | — | |
Premium for swaps written | | | — | | | | — | |
Unrealized depreciation on swaps | | | — | | | | — | |
Unrealized depreciation on forward currency contracts | | | — | | | | — | |
Investments sold short, at value**** | | | 13,339,689 | | | | — | |
Total liabilities | | | 26,569,483 | | | | 725,429 | |
| | |
| NET ASSETS | | $ | 95,795,632 | | | $ | 74,189,814 | |
Net assets were comprised of:
Shares of beneficial interest, at par | | $ | 9,216 | | | $ | 74,190 | |
Paid-in capital, in excess of par | | | 96,128,896 | | | | 74,116,030 | |
| | | | 96,138,112 | | | | 74,190,220 | |
Undistributed net investment income (loss) | | | (15,711 | ) | | | — | |
Accumulated net realized gains (losses) | | | (1,718,822 | ) | | | (406 | ) |
Net unrealized appreciation (depreciation) | | | 1,392,053 | | | | — | |
Net assets, December 31, 2004 | | $ | 95,795,632 | | | $ | 74,189,814 | |
Shares of beneficial interest issued and outstanding | | | 9,215,956 | | | | 74,190,220 | |
Net asset value, offering price and redemption price per share | | $ | 10.39 | | | $ | 1.00 | |
* Identified cost of total investments | | $ | 106,983,416 | | | $ | 74,607,335 | |
** Identified cost of currency | | $ | — | | | $ | — | |
*** Premiums received from options written | | $ | — | | | $ | — | |
**** Proceeds received from short sales | | $ | 13,310,156 | | | $ | — | |
See Notes to Financial Statements
| | |
| THE TARGET PORTFOLIO TRUST | | 87 |
Statements of Operations
For The Year Ended December 31, 2004
| | | | | | | | | | | | | | | | |
| | | LARGE
CAPITALIZATION
GROWTH
PORTFOLIO | | | LARGE
CAPITALIZATION
VALUE
PORTFOLIO | | | SMALL
CAPITALIZATION
GROWTH
PORTFOLIO | | | SMALL
CAPITALIZATION
VALUE
PORTFOLIO | |
| | | |
| NET INVESTMENT INCOME (LOSS) | | | | | | | | | | | | | |
Income | | | | | | | | | | | | | | | | |
Interest | | $ | — | | | $ | — | | | $ | — | | | $ | — | |
Dividends | | | 4,209,913 | | | | 7,542,849 | | | | 456,227 | | | | 3,671,808 | |
Less: Foreign withholding taxes | | | (1,148 | ) | | | (97 | ) | | | — | | | | (6,667 | ) |
Total income | | | 4,208,765 | | | | 7,542,752 | | | | 456,227 | | | | 3,665,141 | |
Expenses | | | | | | | | | | | | | | | | |
Management fee | | | 2,072,476 | | | | 2,077,916 | | | | 880,299 | | | | 1,310,922 | |
Transfer agent’s fees and expenses | | | 339,000 | | | | 260,000 | | | | 243,000 | | | | 286,000 | |
Custodian’s fees and expenses | | | 105,000 | | | | 110,000 | | | | 96,000 | | | | 98,000 | |
Reports to shareholders | | | 45,000 | | | | 33,000 | | | | 13,000 | | | | 10,000 | |
Registration fees | | | 31,000 | | | | 39,000 | | | | 21,000 | | | | 15,000 | |
Legal fees and expenses | | | 30,000 | | | | 21,000 | | | | 26,000 | | | | 29,000 | |
Trustees’ fees | | | 10,000 | | | | 8,000 | | | | 10,000 | | | | 11,000 | |
Audit fees | | | 18,000 | | | | 18,000 | | | | 17,000 | | | | 18,000 | |
Miscellaneous | | | 14,013 | | | | 9,516 | | | | 8,300 | | | | 12,986 | |
Total expenses | | | 2,664,489 | | | | 2,576,432 | | | | 1,314,599 | | | | 1,790,908 | |
| Net investment income (loss) | | | 1,544,276 | | | | 4,966,320 | | | | (858,372 | ) | | | 1,874,233 | |
| | | |
REALIZED AND UNREALIZED GAIN (LOSS) ON INVESTMENTS AND FOREIGN
CURRENCY TRANSACTIONS | | | | | | | | | | | | | |
Net realized gain on: | | | | | | | | | | | | | | | | |
Investment transactions | | | 44,858,283 | | | | 33,363,731 | | | | 8,627,807 | | | | 14,363,197 | |
Financial futures contracts | | | — | | | | — | | | | — | | | | — | |
Foreign currency transactions | | | — | | | | — | | | | — | | | | — | |
Options written | | | — | | | | — | | | | — | | | | — | |
Swaps | | | — | | | | — | | | | — | | | | — | |
Short sales | | | — | | | | — | | | | — | | | | — | |
| Total net realized gain | | | 44,858,283 | | | | 33,363,731 | | | | 8,627,807 | | | | 14,363,197 | |
Net change in unrealized appreciation (depreciation) on:
Investments | | | (34,500,918 | ) | | | 23,851,981 | | | | 13,062,442 | | | | 32,107,615 | |
Financial futures contracts | | | — | | | | — | | | | — | | | | — | |
Foreign currencies | | | — | | | | — | | | | — | | | | — | |
Options written | | | — | | | | — | | | | — | | | | — | |
Swaps | | | — | | | | — | | | | — | | | | — | |
Short sales | | | — | | | | — | | | | — | | | | — | |
| Net change in unrealized appreciation (depreciation) | | | (34,500,918 | ) | | | 23,851,981 | | | | 13,062,442 | | | | 32,107,615 | |
| Net gain | | | 10,357,365 | | | | 57,215,712 | | | | 21,690,249 | | | | 46,470,812 | |
| | | | |
| NET INCREASE IN NET ASSETS RESULTING FROM OPERATIONS | | $ | 11,901,641 | | | $ | 62,182,032 | | | $ | 20,831,877 | | | $ | 48,345,045 | |
See Notes to Financial Statements
| | |
| 88 | | THE TARGET PORTFOLIO TRUST |
Statements of Operations
For The Year Ended December 31, 2004 (cont’d)
| | | | | | | | | | | | | | | | |
| | | INTERNATIONAL
EQUITY
PORTFOLIO | | | INTERNATIONAL
BOND
PORTFOLIO | | | TOTAL RETURN
BOND
PORTFOLIO | | | INTERMEDIATE-
TERM BOND
PORTFOLIO | |
| | | | |
| NET INVESTMENT INCOME | | | | | | | | | | | | | | | | |
Income | | | | | | | | | | | | | | | | |
Interest | | $ | 50,617 | | | $ | 1,556,574 | | | $ | 4,370,114 | | | $ | 7,975,066 | |
Dividends | | | 5,405,984 | | | | 34,310 | | | | — | | | | — | |
Less: Foreign withholding taxes | | | (706,817 | ) | | | (19,418 | ) | | | (4,349 | ) | | | (16 | ) |
Total income | | | 4,749,784 | | | | 1,571,466 | | | | 4,365,765 | | | | 7,975,050 | |
Expenses | | | | | | | | | | | | | | | | |
Management fee | | | 1,465,645 | | | | 215,993 | | | | 765,329 | | | | 1,434,021 | |
Transfer agent’s fees and expenses | | | 221,000 | | | | 95,000 | | | | 212,000 | | | | 286,000 | |
Custodian’s fees and expenses | | | 289,000 | | | | 240,000 | | | | 194,000 | | | | 176,000 | |
Reports to shareholders | | | 25,000 | | | | 9,000 | | | | 17,000 | | | | 40,000 | |
Registration fees | | | 25,000 | | | | 18,000 | | | | 32,000 | | | | 42,000 | |
Legal fees and expenses | | | 19,000 | | | | 23,000 | | | | 15,000 | | | | 23,000 | |
Trustees’ fees | | | 10,000 | | | | 9,000 | | | | 9,000 | | | | 13,000 | |
Audit fees | | | 22,000 | | | | 27,000 | | | | 22,000 | | | | 23,000 | |
Miscellaneous | | | 22,698 | | | | 4,544 | | | | 12,192 | | | | 14,376 | |
Total expenses | | | 2,099,343 | | | | 641,537 | | | | 1,278,521 | | | | 2,051,397 | |
| Net investment income | | | 2,650,441 | | | | 929,929 | | | | 3,087,244 | | | | 5,923,653 | |
| | | | |
| REALIZED AND UNREALIZED GAIN (LOSS) ON INVESTMENTS AND FOREIGN CURRENCY TRANSACTIONS | | | | | | | | | | | | | | | | |
Net realized gain (loss) on: | | | | | | | | | | | | | | �� | | |
Investment transactions | | | 21,298,529 | | | | 2,848,501 | | | | 3,046,481 | | | | 2,198,476 | |
Financial futures contracts | | | — | | | | 16,735 | | | | 3,358,662 | | | | 2,994,118 | |
Foreign currency transactions | | | (900,424 | ) | | | (5,431,230 | ) | | | (205,106 | ) | | | (304,587 | ) |
Options written | | | — | | | | (93,049 | ) | | | 345,653 | | | | 289,078 | |
Swaps | | | — | | | | 15,686 | | | | 925,097 | | | | 562,426 | |
Short sales | | | — | | | | — | | | | (940,732 | ) | | | — | |
| Total net realized gain (loss) | | | 20,398,105 | | | | (2,643,357 | ) | | | 6,530,055 | | | | 5,739,511 | |
Net change in unrealized appreciation (depreciation) on:
Investments | | | 7,819,187 | | | | 1,505,704 | | | | 206,050 | | | | (1,087,322 | ) |
Financial futures contracts | | | — | | | | 40,709 | | | | (1,175,454 | ) | | | (996,613 | ) |
Foreign currencies | | | 24,351 | | | | 1,737,801 | | | | (89,603 | ) | | | (124,286 | ) |
Options written | | | — | | | | 24,059 | | | | 250,351 | | | | 267,068 | |
Swaps | | | — | | | | 17,028 | | | | (942,362 | ) | | | 72,413 | |
Short sales | | | — | | | | — | | | | 49,848 | | | | — | |
| Net change in unrealized appreciation (depreciation) | | | 7,843,538 | | | | 3,325,301 | | | | (1,701,170 | ) | | | (1,868,740 | ) |
| Net gain | | | 28,241,643 | | | | 681,944 | | | | 4,828,885 | | | | 3,870,771 | |
| | | | |
| NET INCREASE IN NET ASSETS RESULTING FROM OPERATIONS | | $ | 30,892,084 | | | $ | 1,611,873 | | | $ | 7,916,129 | | | $ | 9,794,424 | |
See Notes to Financial Statements
| | |
| THE TARGET PORTFOLIO TRUST | | 89 |
Statements of Operations
For The Year Ended December 31, 2004 (cont’d)
| | | | | | | | |
| | | MORTGAGE
BACKED
SECURITIES
PORTFOLIO | | | U.S. GOVERNMENT
MONEY MARKET
PORTFOLIO | |
| | |
| NET INVESTMENT INCOME | | | | | | | | |
Income | | | | | | | | |
Interest | | $ | 4,510,312 | | | $ | 1,294,903 | |
Dividends | | | — | | | | — | |
Less: Foreign withholding taxes | | | — | | | | — | |
Total income | | | 4,510,312 | | | | 1,294,903 | |
Expenses | | | | | | | | |
Management fee | | | 463,747 | | | | 237,137 | |
Transfer agent’s fees and expenses | | | 154,000 | | | | 109,000 | |
Custodian’s fees and expenses | | | 150,000 | | | | 97,000 | |
Reports to shareholders | | | 35,000 | | | | 41,000 | |
Registration fees | | | 40,000 | | | | 31,000 | |
Legal fees and expenses | | | 37,000 | | | | 35,000 | |
Trustees’ fees | | | 11,000 | | | | 10,000 | |
Audit fees | | | 23,000 | | | | 17,000 | |
Miscellaneous | | | 9,462 | | | | 8,646 | |
Total expenses | | | 923,209 | | | | 585,783 | |
| Net investment income | | | 3,587,103 | | | | 709,120 | |
| | |
REALIZED AND UNREALIZED GAIN (LOSS) ON INVESTMENTS
AND FOREIGN CURRENCY TRANSACTIONS | | | | | | | | |
Net realized gain (loss) on: | | | | | | | | |
Investment transactions | | | 827,139 | | | | (406 | ) |
Financial futures contracts | | | (119,321 | ) | | | — | |
Foreign currency transactions | | | — | | | | — | |
Options written | | | — | | | | — | |
Swaps | | | 13,426 | | | | — | |
Short sales | | | (84,258 | ) | | | — | |
| Total net realized loss | | | 636,986 | | | | (406 | ) |
Net change in unrealized appreciation (depreciation) on:
Investments | | | (568,304 | ) | | | — | |
Financial futures contracts | | | 6,338 | | | | — | |
Foreign currencies | | | — | | | | — | |
Options written | | | — | | | | — | |
Swaps | | | 1,339 | | | | — | |
Short sales | | | (16,877 | ) | | | — | |
| Net change in unrealized appreciation (depreciation) | | | (577,504 | ) | | | — | |
| Net loss | | | 59,482 | | | | (406 | ) |
| | |
| NET INCREASE IN NET ASSETS RESULTING FROM OPERATIONS | | $ | 3,646,585 | | | $ | 708,714 | |
See Notes to Financial Statements
| | |
| 90 | | THE TARGET PORTFOLIO TRUST |
Statements of Changes in Net Assets
| | | | | | | | | | | | | | | | |
| | | LARGE CAPITALIZATION
GROWTH PORTFOLIO
| | | LARGE CAPITALIZATION
VALUE PORTFOLIO
| |
| | | Year
Ended
December 31,
2004 | | | Year
Ended
December 31,
2003 | | | Year
Ended
December 31,
2004 | | | Year
Ended
December 31,
2003 | |
| | | | |
INCREASE (DECREASE)
IN NET ASSETS | | | | | | | | | | | | | | | | |
| Operations | | | | | | | | | | | | | | | | |
Net investment income (loss) | | $ | 1,544,276 | | | $ | (266,415 | ) | | $ | 4,966,320 | | | $ | 3,804,770 | |
Net realized gain on investment and foreign currency transactions | | | 44,858,283 | | | | 147,403 | | | | 33,363,731 | | | | 3,331,117 | |
Net change in unrealized appreciation (depreciation) of investments | | | (34,500,918 | ) | | | 96,800,137 | | | | 23,851,981 | | | | 74,996,919 | |
Net increase in net assets resulting from operations | | | 11,901,641 | | | | 96,681,125 | | | | 62,182,032 | | | | 82,132,806 | |
| Distributions (Note 1) | | | | | | | | | | | | | | | | |
Dividends from net investment income | | | (1,525,007 | ) | | | — | | | | (4,679,699 | ) | | | (3,731,879 | ) |
Distributions from net realized gains | | | — | | | | — | | | | — | | | | — | |
Tax return of capital distributions | | | — | | | | — | | | | — | | | | — | |
Total distributions | | | (1,525,007 | ) | | | — | | | | (4,679,699 | ) | | | (3,731,879 | ) |
| Fund share transactions (Note 6) | | | | | | | | | | | | | | | | |
Net proceeds from shares sold | | | 75,709,022 | | | | 90,568,160 | | | | 79,263,751 | | | | 68,404,898 | |
Net asset value of shares issued in
reinvestment of dividends and
distributions | | | 1,524,328 | | | | — | | | | 4,674,589 | | | | 3,647,047 | |
Cost of shares reacquired | | | (92,235,417 | ) | | | (82,611,933 | ) | | | (72,157,795 | ) | | | (63,948,228 | ) |
Net increase (decrease) in net assets from
Fund share transactions | | | (15,002,067 | ) | | | 7,956,227 | | | | 11,780,545 | | | | 8,103,717 | |
Total increase (decrease) | | | (4,625,433 | ) | | | 104,637,352 | | | | 69,282,878 | | | | 86,504,644 | |
| | | | |
| NET ASSETS | | | | | | | | | | | | | | | | |
Beginning of year | | | 348,385,050 | | | | 243,747,698 | | | | 316,130,623 | | | | 229,625,979 | |
End of year(a) | | $ | 343,759,617 | | | $ | 348,385,050 | | | $ | 385,413,501 | | | $ | 316,130,623 | |
(a) Includes undistributed net investment
income of | | $ | 19,269 | | | $ | — | | | $ | 390,569 | | | $ | 103,948 | |
See Notes to Financial Statements
| | |
| THE TARGET PORTFOLIO TRUST | | 91 |
Statements of Changes in Net Assets (cont’d)
| | | | | | | | | | | | | | | | |
| | | SMALL CAPITALIZATION
GROWTH PORTFOLIO
| | | SMALL CAPITALIZATION
VALUE PORTFOLIO
| |
| | | Year
Ended
December 31,
2004 | | | Year
Ended
December 31,
2003 | | | Year
Ended
December 31,
2004 | | | Year
Ended
December 31,
2003 | |
| | | | |
INCREASE (DECREASE)
IN NET ASSETS | | | | | | | | | | | | | | | | |
| Operations | | | | | | | | | | | | | | | | |
Net investment income (loss) | | $ | (858,372 | ) | | $ | (928,998 | ) | | $ | 1,874,233 | | | $ | 249,093 | |
Net realized gain on investment and foreign currency transactions | | | 8,627,807 | | | | 2,695,947 | | | | 14,363,197 | | | | 12,342,371 | |
Net change in unrealized appreciation (depreciation) of investments | | | 13,062,442 | | | | 32,138,123 | | | | 32,107,615 | | | | 51,963,048 | |
Net increase in net assets resulting from operations | | | 20,831,877 | | | | 33,905,072 | | | | 48,345,045 | | | | 64,554,512 | |
| Distributions (Note 1) | | | | | | | | | | | | | | | | |
Dividends from net investment income | | | — | | | | — | | | | (1,838,665 | ) | | | (297,792 | ) |
Distributions from net realized gains | | | — | | | | — | | | | (13,095,907 | ) | | | (6,670,354 | ) |
Tax return of capital distributions | | | — | | | | — | | | | — | | | | — | |
Total distributions | | | — | | | | — | | | | (14,934,572 | ) | | | (6,968,146 | ) |
| Fund share transactions (Note 6) | | | | | | | | | | | | | | | | |
Net proceeds from shares sold | | | 32,372,700 | | | | 36,726,416 | | | | 55,190,474 | | | | 43,122,655 | |
Net asset value of shares issued in
reinvestment of dividends and distributions | | | — | | | | — | | | | 14,826,689 | | | | 6,775,452 | |
Cost of shares reacquired | | | (34,698,634 | ) | | | (31,248,031 | ) | | | (63,840,640 | ) | | | (49,425,658 | ) |
Net increase (decrease) in net assets from
Fund share transactions | | | (2,325,934 | ) | | | 5,478,385 | | | | 6,176,523 | | | | 472,449 | |
Total increase | | | 18,505,943 | | | | 39,383,457 | | | | 39,586,996 | | | | 58,058,815 | |
| | | | |
| NET ASSETS | | | | | | | | | | | | | | | | |
Beginning of year | | | 140,251,312 | | | | 100,867,855 | | | | 205,989,254 | | | | 147,930,439 | |
End of year(a) | | $ | 158,757,255 | | | $ | 140,251,312 | | | $ | 245,576,250 | | | $ | 205,989,254 | |
(a) Includes undistributed net investment
income of | | $ | — | | | $ | — | | | $ | 35,568 | | | $ | — | |
See Notes to Financial Statements
| | |
| 92 | | THE TARGET PORTFOLIO TRUST |
Statements of Changes in Net Assets (cont’d)
| | | | | | | | | | | | | | | | |
| | | INTERNATIONAL EQUITY
PORTFOLIO
| | | INTERNATIONAL BOND
PORTFOLIO
| |
| | | Year
Ended
December 31,
2004 | | | Year
Ended
December 31,
2003 | | | Year
Ended
December 31,
2004 | | | Year
Ended
December 31,
2003 | |
| | | | |
INCREASE (DECREASE)
IN NET ASSETS | | | | | | | | | | | | | | | | |
| Operations | | | | | | | | | | | | | | | | |
Net investment income | | $ | 2,650,441 | | | $ | 2,599,038 | | | $ | 929,929 | | | $ | 620,772 | |
Net realized gain (loss) on investment and foreign currency transactions | | | 20,398,105 | | | | (105,074 | ) | | | (2,643,357 | ) | | | 1,307,743 | |
Net change in unrealized appreciation (depreciation) of investments | | | 7,843,538 | | | | 39,052,199 | | | | 3,325,301 | | | | (325,141 | ) |
Net increase in net assets resulting from operations | | | 30,892,084 | | | | 41,546,163 | | | | 1,611,873 | | | | 1,603,374 | |
| Distributions (Note 1) | | | | | | | | | | | | | | | | |
Dividends from net investment income | | | (2,494,485 | ) | | | (2,118,075 | ) | | | (2,484,946 | ) | | | (3,416,812 | ) |
Distributions from net realized gains | | | — | | | | — | | | | (456,277 | ) | | | (24,731 | ) |
Tax return of capital distributions | | | — | | | | — | | | | — | | | | — | |
Total distributions | | | (2,494,485 | ) | | | (2,118,075 | ) | | | (2,941,223 | ) | | | (3,441,543 | ) |
| Fund share transactions (Note 6) | | | | | | | | | | | | | | | | |
Net proceeds from shares sold | | | 56,273,516 | | | | 90,795,763 | | | | 20,311,661 | | | | 34,299,415 | |
Net asset value of shares issued in
reinvestment of dividends and distributions | | | 2,472,659 | | | | 2,078,838 | | | | 2,925,531 | | | | 3,241,777 | |
Cost of shares reacquired | | | (48,752,641 | ) | | | (80,785,501 | ) | | | (15,555,918 | ) | | | (24,797,728 | ) |
Net increase in net assets from
Fund share transactions | | | 9,993,534 | | | | 12,089,100 | | | | 7,681,274 | | | | 12,743,464 | |
Total increase | | | 38,391,133 | | | | 51,517,188 | | | | 6,351,924 | | | | 10,905,295 | |
| | | | |
| NET ASSETS | | | | | | | | | | | | | | | | |
Beginning of year | | | 191,908,701 | | | | 140,391,513 | | | | 38,553,077 | | | | 27,647,782 | |
End of year(a) | | $ | 230,299,834 | | | $ | 191,908,701 | | | $ | 44,905,001 | | | $ | 38,553,077 | |
(a) Includes undistributed net investment
income of | | $ | 436,240 | | | $ | 911,418 | | | $ | — | | | $ | — | |
See Notes to Financial Statements
| | |
| THE TARGET PORTFOLIO TRUST | | 93 |
Statements of Changes in Net Assets (cont’d)
| | | | | | | | | | | | | | | | |
| | | TOTAL RETURN BOND
PORTFOLIO
| | | INTERMEDIATE-TERM BOND
PORTFOLIO
| |
| | | Year
Ended
December 31,
2004 | | | Year
Ended
December 31,
2003 | | | Year
Ended
December 31,
2004 | | | Year
Ended
December 31,
2003 | |
| | | | |
INCREASE (DECREASE)
IN NET ASSETS | | | | | | | | | | | | | | | | |
| Operations | | | | | | | | | | | | | | | | |
Net investment income | | $ | 3,087,244 | | | $ | 4,538,514 | | | $ | 5,923,653 | | | $ | 9,080,352 | |
Net realized gain on investment and foreign currency transactions | | | 6,530,055 | | | | 5,088,946 | | | | 5,739,511 | | | | 6,433,616 | |
Net change in unrealized appreciation (depreciation) of investments | | | (1,701,170 | ) | | | (445,026 | ) | | | (1,868,740 | ) | | | (294,056 | ) |
Net increase in net assets resulting from operations | | | 7,916,129 | | | | 9,182,434 | | | | 9,794,424 | | | | 15,219,912 | |
| Distributions (Note 1) | | | | | | | | | | | | | | | | |
Dividends from net investment income | | | (7,979,590 | ) | | | (4,978,895 | ) | | | (7,098,116 | ) | | | (11,106,479 | ) |
Distributions from net realized gains | | | (556,213 | ) | | | (5,176,715 | ) | | | (5,620,690 | ) | | | (5,519,023 | ) |
Tax return of capital distributions | | | — | | | | — | | | | — | | | | — | |
Total distributions | | | (8,535,803 | ) | | | (10,155,610 | ) | | | (12,718,806 | ) | | | (16,625,502 | ) |
| Fund share transactions (Note 6) | | | | | | | | | | | | | | | | |
Net proceeds from shares sold | | | 68,049,223 | | | | 75,598,373 | | | | 77,193,471 | | | | 144,146,258 | |
Net asset value of shares issued in
reinvestment of dividends and distributions | | | 8,280,441 | | | | 9,845,648 | | | | 12,177,841 | | | | 15,775,559 | |
Cost of shares reacquired | | | (55,370,002 | ) | | | (65,811,034 | ) | | | (123,270,731 | ) | | | (156,779,293 | ) |
Net increase (decrease) in net assets from
Fund share transactions | | | 20,959,662 | | | | 19,632,987 | | | | (33,899,419 | ) | | | 3,142,524 | |
Total increase (decrease) | | | 20,339,988 | | | | 18,659,811 | | | | (36,823,801 | ) | | | 1,736,934 | |
| | | | |
| NET ASSETS | | | | | | | | | | | | | | | | |
Beginning of year | | | 158,148,185 | | | | 139,488,374 | | | | 334,806,107 | | | | 333,069,173 | |
End of year(a) | | $ | 178,488,173 | | | $ | 158,148,185 | | | $ | 297,982,306 | | | $ | 334,806,107 | |
(a) Includes undistributed net investment
income of | | $ | — | | | $ | — | | | $ | 176,503 | | | $ | — | |
See Notes to Financial Statements
| | |
| 94 | | THE TARGET PORTFOLIO TRUST |
Statements of Changes in Net Assets (cont’d)
| | | | | | | | | | | | | | | | |
| | | MORTGAGE BACKED
SECURITIES PORTFOLIO
| | | U.S. GOVERNMENT MONEY
MARKET PORTFOLIO
| |
| | | Year
Ended
December 31,
2004 | | | Year
Ended
December 31,
2003 | | | Year
Ended
December 31,
2004 | | | Year
Ended
December 31,
2003 | |
| | | | |
INCREASE (DECREASE)
IN NET ASSETS | | | | | | | | | | | | | | | | |
| Operations | | | | | | | | | | | | | | | | |
Net investment income | | $ | 3,587,103 | | | $ | 5,072,570 | | | $ | 709,120 | | | $ | 816,956 | |
Net realized gain (loss) on investment and foreign currency transactions | | | 636,986 | | | | (1,180,435 | ) | | | (406 | ) | | | 3,401 | |
Net change in unrealized appreciation (depreciation) of investments | | | (577,504 | ) | | | (1,529,703 | ) | | | — | | | | — | |
Net increase in net assets resulting from operations | | | 3,646,585 | | | | 2,362,432 | | | | 708,714 | | | | 820,357 | |
| Distributions (Note 1) | | | | | | | | | | | | | | | | |
Dividends from net investment income | | | (4,319,318 | ) | | | (5,247,606 | ) | | | (709,120 | ) | | | (820,357 | ) |
Distributions from net realized gains | | | — | | | | — | | | | — | | | | — | |
Tax return of capital distributions | | | — | | | | — | | | | — | | | | — | |
Total distributions | | | (4,319,318 | ) | | | (5,247,606 | ) | | | (709,120 | ) | | | (820,357 | ) |
| Fund share transactions (Note6)(a) | | | | | | | | | | | | | | | | |
Net proceeds from shares sold | | | 23,936,870 | | | | 50,238,355 | | | | 131,542,846 | | | | 236,126,066 | |
Net asset value of shares issued in
reinvestment of dividends and
distributions | | | 3,838,750 | | | | 4,676,518 | | | | 661,498 | | | | 771,336 | |
Cost of shares reacquired | | | (38,379,255 | ) | | | (60,503,405 | ) | | | (156,477,713 | ) | | | (265,575,191 | ) |
Net decrease in net assets from
Fund share transactions | | | (10,603,635 | ) | | | (5,588,532 | ) | | | (24,273,369 | ) | | | (28,677,789 | ) |
Total decrease | | | (11,276,368 | ) | | | (8,473,706 | ) | | | (24,273,775 | ) | | | (28,677,789 | ) |
| | | | |
| NET ASSETS | | | | | | | | | | | | | | | | |
Beginning of year | | | 107,072,000 | | | | 115,545,706 | | | | 98,463,589 | | | | 127,141,378 | |
End of year(b) | | $ | 95,795,632 | | | $ | 107,072,000 | | | $ | 74,189,814 | | | $ | 98,463,589 | |
(a) Fund share transactions are at $1 per share
for the U.S. Government Money Market
Portfolio. | | | | | | | | | | | | | | | | |
(b) Includes undistributed net investment
income of | | $ | — | | | $ | — | | | $ | — | | | $ | — | |
See Notes to Financial Statements
| | |
| THE TARGET PORTFOLIO TRUST | | 95 |
Financial Highlights
| | | | | | | | | | | | | | | | | | | | |
| | | LARGE CAPITALIZATION
GROWTH PORTFOLIO
| |
| | | Year Ended December 31,
| |
| | | 2004 | | | 2003 | | | 2002 | | | 2001 | | | 2000 | |
| | | | | |
| PER SHARE OPERATING PERFORMANCE: | | | | | | | | | | | | | | | | | | | | |
Net asset value, beginning of year | | | $15.39 | | | | $11.03 | | | | $16.15 | | | | $23.20 | | | | $25.68 | |
Income (loss) from investment operations | | | | | | | | | | | | | | | | | | | | |
Net investment income (loss) | | | .07 | | | | (.01 | ) | | | (.01 | ) | | | .02 | | | | (.06 | ) |
Net realized and unrealized gain (loss) on
investment transactions | | | .51 | | | | 4.37 | | | | (5.11 | ) | | | (7.05 | ) | | | (.68 | ) |
Total from investment operations | | | .58 | | | | 4.36 | | | | (5.12 | ) | | | (7.03 | ) | | | (.74 | ) |
Less distributions | | | | | | | | | | | | | | | | | | | | |
Dividends from net investment income | | | (.07 | ) | | | — | | | | — | | | | (.02 | ) | | | — | |
Distributions from net realized gains | | | — | | | | — | | | | — | | | | — | | | | (1.74 | ) |
Total distributions | | | (.07 | ) | | | — | | | | — | | | | (.02 | ) | | | (1.74 | ) |
Net asset value, end of year | | | $15.90 | | | | $15.39 | | | | $11.03 | | | | $16.15 | | | | $23.20 | |
| | | | | |
| TOTAL RETURN(a) | | | 3.78 | % | | | 39.53 | % | | | (31.70 | )% | | | (30.32 | )% | | | (3.37 | )% |
| | | | |
| RATIOS/SUPPLEMENTAL DATA: | | | | | | | | | | | | | | | | | |
Net assets, end of year (000) | | $ | 343,760 | | | $ | 348,385 | | | $ | 243,748 | | | $ | 358,429 | | | $ | 512,778 | |
Average net assets (000) | | $ | 345,413 | | | $ | 290,985 | | | $ | 297,189 | | | $ | 397,492 | | | $ | 581,198 | |
Ratios to average net assets | | | | | | | | | | | | | | | | | | | | |
Expenses | | | .77 | % | | | .84 | % | | | .81 | % | | | .75 | % | | | .69 | % |
Net investment income (loss) | | | .45 | % | | | (.09 | )% | | | (.11 | )% | | | .08 | % | | | (.25 | )% |
Portfolio turnover rate | | | 76 | % | | | 49 | % | | | 66 | % | | | 68 | % | | | 48 | % |
| (a) | Total return is calculated assuming a purchase of shares on the first day and a sale on the last day of each year reported and includes reinvestment of dividends and distributions. |
See Notes to Financial Statements
| | |
| 96 | | THE TARGET PORTFOLIO TRUST |
Financial Highlights (cont’d)
| | | | | | | | | | | | | | | | | | | | |
| | | LARGE CAPITALIZATION
VALUE PORTFOLIO
| |
| | | Year Ended December 31,
| |
| | | 2004 | | | 2003 | | | 2002 | | | 2001 | | | 2000 | |
| | | | | |
| PER SHARE OPERATING PERFORMANCE: | | | | | | | | | | | | | | | | | | | | |
Net asset value, beginning of year | | | $14.13 | | | | $10.49 | | | | $12.45 | | | | $12.64 | | | | $13.01 | |
Income (loss) from investment operations | | | | | | | | | | | | | | | | | | | | |
Net investment income | | | .21 | | | | .17 | | | | .18 | | | | .19 | | | | .25 | |
Net realized and unrealized gain (loss) on
investment transactions | | | 2.45 | | | | 3.64 | | | | (1.85 | ) | | | (.03 | ) | | | .72 | |
Total from investment operations | | | 2.66 | | | | 3.81 | | | | (1.67 | ) | | | .16 | | | | .97 | |
Less distributions | | | | | | | | | | | | | | | | | | | | |
Dividends from net investment income | | | (.20 | ) | | | (.17 | ) | | | (.17 | ) | | | (.19 | ) | | | (.25 | ) |
Distributions from net realized gains | | | — | | | | — | | | | (.12 | ) | | | (.16 | ) | | | (1.09 | ) |
Total distributions | | | (.20 | ) | | | (.17 | ) | | | (.29 | ) | | | (.35 | ) | | | (1.34 | ) |
Net asset value, end of year | | | $16.59 | | | | $14.13 | | | | $10.49 | | | | $12.45 | | | | $12.64 | |
| | | | | |
| TOTAL RETURN(a) | | | 18.87 | % | | | 36.38 | % | | | (13.57 | )% | | | 1.21 | % | | | 8.22 | % |
| | | | |
| RATIOS/SUPPLEMENTAL DATA: | | | | | | | | | | | | | | | | | |
Net assets, end of year (000) | | $ | 385,414 | | | $ | 316,131 | | | $ | 229,626 | | | $ | 275,208 | | | $ | 268,802 | |
Average net assets (000) | | $ | 346,319 | | | $ | 253,653 | | | $ | 253,096 | | | $ | 275,773 | | | $ | 243,008 | |
Ratios to average net assets | | | | | | | | | | | | | | | | | | | | |
Expenses | | | .74 | % | | | .80 | % | | | .80 | % | | | .76 | % | | | .80 | % |
Net investment income | | | 1.43 | % | | | 1.50 | % | | | 1.49 | % | | | 1.51 | % | | | 2.01 | % |
Portfolio turnover rate | | | 47 | % | | | 56 | % | | | 56 | % | | | 50 | % | | | 80 | % |
| (a) | Total return is calculated assuming a purchase of shares on the first day and a sale on the last day of each year reported and includes reinvestment of dividends and distributions. |
See Notes to Financial Statements
| | |
| THE TARGET PORTFOLIO TRUST | | 97 |
Financial Highlights (cont’d)
| | | | | | | | | | | | | | | | | | | | |
| | | SMALL CAPITALIZATION
GROWTH PORTFOLIO
| |
| | | Year Ended December 31,
| |
| | | 2004 | | | 2003 | | | 2002 | | | 2001 | | | 2000 | |
| | | | | |
| PER SHARE OPERATING PERFORMANCE: | | | | | | | | | | | | | | | | | | | | |
Net asset value, beginning of year | | | $9.38 | | | | $7.05 | | | | $10.56 | | | | $13.09 | | | | $17.47 | |
Income (loss) from investment operations | | | | | | | | | | | | | | | | | | | | |
Net investment loss | | | (.06 | ) | | | (.06 | ) | | | (.06 | ) | | | (.07 | ) | | | (.07 | ) |
Net realized and unrealized gain (loss) on
investment transactions | | | 1.47 | | | | 2.39 | | | | (3.45 | ) | | | (2.46 | ) | | | .36 | |
Total from investment operations | | | 1.41 | | | | 2.33 | | | | (3.51 | ) | | | (2.53 | ) | | | .29 | |
Less distributions | | | | | | | | | | | | | | | | | | | | |
Distributions from net realized gains | | | — | | | | — | | | | — | | | | — | | | | (4.67 | ) |
Net asset value, end of year | | | $10.79 | | | | $9.38 | | | | $7.05 | | | | $10.56 | | | | $13.09 | |
| | | | | |
| TOTAL RETURN(a) | | | 15.03 | % | | | 33.05 | % | | | (33.24 | )% | | | (19.33 | )% | | | 1.83 | % |
| | | | |
| RATIOS/SUPPLEMENTAL DATA: | | | | | | | | | | | | | | | | | |
Net assets, end of year (000) | | $ | 158,757 | | | $ | 140,251 | | | $ | 100,868 | | | $ | 145,554 | | | $ | 182,515 | |
Average net assets (000) | | $ | 146,717 | | | $ | 116,632 | | | $ | 122,299 | | | $ | 156,654 | | | $ | 197,168 | |
Ratios to average net assets | | | | | | | | | | | | | | | | | | | | |
Expenses | | | .90 | % | | | 1.03 | % | | | .99 | % | | | .88 | % | | | .79 | % |
Net investment loss | | | (.58 | )% | | | (.80 | )% | | | (.74 | )% | | | (.59 | )% | | | (.49 | )% |
Portfolio turnover rate | | | 107 | % | | | 235 | % | | | 153 | % | | | 167 | % | | | 165 | % |
| (a) | Total return is calculated assuming a purchase of shares on the first day and a sale on the last day of each year reported and includes reinvestment of dividends and distributions. |
See Notes to Financial Statements
| | |
| 98 | | THE TARGET PORTFOLIO TRUST |
Financial Highlights (cont’d)
| | | | | | | | | | | | | | | | | | | | |
| | | SMALL CAPITALIZATION
VALUE PORTFOLIO
| |
| | | Year Ended December 31,
| |
| | | 2004 | | | 2003 | | | 2002 | | | 2001 | | | 2000 | |
| | | | | |
| PER SHARE OPERATING PERFORMANCE: | | | | | | | | | | | | | | | | | | | | |
Net asset value, beginning of year | | | $18.78 | | | | $13.23 | | | | $17.54 | | | | $16.88 | | | | $14.97 | |
Income (loss) from investment operations | | | | | | | | | | | | | | | | | | | | |
Net investment income | | | .17 | | | | .03 | | | | .04 | | | | .09 | | | | .11 | |
Net realized and unrealized gain (loss) on
investment transactions | | | 4.27 | | | | 6.18 | | | | (1.41 | ) | | | 2.67 | | | | 3.34 | |
Total from investment operations | | | 4.44 | | | | 6.21 | | | | (1.37 | ) | | | 2.76 | | | | 3.45 | |
Less distributions | | | | | | | | | | | | | | | | | | | | |
Dividends from net investment income | | | (.17 | ) | | | (.03 | ) | | | (.04 | ) | | | (.19 | ) | | | (.02 | ) |
Distributions from net realized gains | | | (1.21 | ) | | | (.63 | ) | | | (2.90 | ) | | | (1.91 | ) | | | (1.52 | ) |
Total distributions | | | (1.38 | ) | | | (.66 | ) | | | (2.94 | ) | | | (2.10 | ) | | | (1.54 | ) |
Net asset value, end of year | | | $21.84 | | | | $18.78 | | | | $13.23 | | | | $17.54 | | | | $16.88 | |
| | | | | |
| TOTAL RETURN(a) | | | 24.02 | % | | | 47.10 | % | | | (8.48 | )% | | | 17.23 | % | | | 23.91 | % |
| | | | |
| RATIOS/SUPPLEMENTAL DATA: | | | | | | | | | | | | | | | | | |
Net assets, end of year (000) | | $ | 245,576 | | | $ | 205,989 | | | $ | 147,930 | | | $ | 177,088 | | | $ | 152,672 | |
Average net assets (000) | | $ | 218,487 | | | $ | 161,025 | | | $ | 167,945 | | | $ | 161,663 | | | $ | 130,303 | |
Ratios to average net assets | | | | | | | | | | | | | | | | | | | | |
Expenses | | | .82 | % | | | .93 | % | | | .88 | % | | | .87 | % | | | .85 | % |
Net investment income | | | .86 | % | | | .15 | % | | | .23 | % | | | .59 | % | | | .75 | % |
Portfolio turnover rate | | | 22 | % | | | 89 | % | | | 95 | % | | | 114 | % | | | 55 | % |
| (a) | Total return is calculated assuming a purchase of shares on the first day and a sale on the last day of each year reported and includes reinvestment of dividends and distributions. |
See Notes to Financial Statements
| | |
| THE TARGET PORTFOLIO TRUST | | 99 |
Financial Highlights (cont’d)
| | | | | | | | | | | | | | | | | | | | |
| | | INTERNATIONAL
EQUITY PORTFOLIO
| |
| | | Year Ended December 31,
| |
| | | 2004 | | | 2003 | | | 2002 | | | 2001 | | | 2000 | |
| | | | | |
| PER SHARE OPERATING PERFORMANCE: | | | | | | | | | | | | | | | | | | | | |
Net asset value, beginning of year | | | $11.53 | | | | $9.07 | | | | $10.10 | | | | $13.52 | | | | $17.37 | |
Income (loss) from investment operations | | | | | | | | | | | | | | | | | | | | |
Net investment income | | | .15 | | | | .16 | | | | .11 | | | | .09 | | | | .17 | |
Net realized and unrealized gain (loss) on
investment transactions | | | 1.59 | | | | 2.43 | | | | (1.14 | ) | | | (3.39 | ) | | | (1.87 | ) |
Total from investment operations | | | 1.74 | | | | 2.59 | | | | (1.03 | ) | | | (3.30 | ) | | | (1.70 | ) |
Less distributions | | | | | | | | | | | | | | | | | | | | |
Dividends from net investment income | | | (.14 | ) | | | (.13 | ) | | | — | (b) | | | — | | | | (.17 | ) |
Distributions in excess of net investment income | | | — | | | | — | | | | — | | | | — | | | | (.17 | ) |
Distributions from net realized gains | | | — | | | | — | | | | — | | | | (.12 | ) | | | (1.81 | ) |
Total distributions | | | (.14 | ) | | | (.13 | ) | | | — | | | | (.12 | ) | | | (2.15 | ) |
Net asset value, end of year | | | $13.13 | | | | $11.53 | | | | $9.07 | | | | $10.10 | | | | $13.52 | |
| | | | | |
| TOTAL RETURN(a) | | | 15.23 | % | | | 28.76 | % | | | (10.17 | )% | | | (24.56 | )% | | | (9.42 | )% |
| | | | |
| RATIOS/SUPPLEMENTAL DATA: | | | | | | | | | | | | | | | | | |
Net assets, end of year (000) | | $ | 230,300 | | | $ | 191,909 | | | $ | 140,392 | | | $ | 158,307 | | | $ | 227,028 | |
Average net assets (000) | | $ | 209,378 | | | $ | 153,435 | | | $ | 150,249 | | | $ | 190,106 | | | $ | 246,420 | |
Ratios to average net assets | | | | | | | | | | | | | | | | | | | | |
Expenses | | | 1.00 | % | | | 1.07 | % | | | 1.09 | % | | | 1.01 | % | | | .93 | % |
Net investment income | | | 1.27 | % | | | 1.69 | % | | | 1.17 | % | | | .82 | % | | | .85 | % |
Portfolio turnover rate | | | 59 | % | | | 47 | % | | | 55 | % | | | 65 | % | | | 44 | % |
| (a) | Total return is calculated assuming a purchase of shares on the first day and a sale on the last day of each year reported and includes reinvestment of dividends and distributions. |
| (b) | Less than $.005 per share. |
See Notes to Financial Statements
| | |
| 100 | | THE TARGET PORTFOLIO TRUST |
Financial Highlights (cont’d)
| | | | | | | | | | | | | | | | | | | | |
| | | INTERNATIONAL
BOND PORTFOLIO
| |
| | | Year Ended December 31,
| |
| | | 2004 | | | 2003 | | | 2002 | | | 2001 | | | 2000 | |
| | | | | |
PER SHARE OPERATING
PERFORMANCE: | | | | | | | | | | | | | | | | | | | | |
Net asset value, beginning of year | | | $8.45 | | | | $8.83 | | | | $7.46 | | | | $8.08 | | | | $8.48 | |
Income (loss) from investment operations | | | | | | | | | | | | | | | | | | | | |
Net investment income | | | .26 | | | | .21 | | | | .15 | | | | .18 | | | | .32 | |
Net realized and unrealized gain (loss) on
investment transactions | | | .05 | | | | .26 | | | | 1.33 | | | | (.64 | ) | | | (.45 | ) |
Total from investment operations | | | .31 | | | | .47 | | | | 1.48 | | | | (.46 | ) | | | (.13 | ) |
Less distributions | | | | | | | | | | | | | | | | | | | | |
Dividends from net investment income | | | (.48 | ) | | | (.84 | ) | | | (.11 | ) | | | — | | | | — | |
Distributions from net realized gains | | | (.09 | ) | | | (.01 | ) | | | — | | | | — | | | | — | |
Tax return of capital distributions | | | — | | | | — | | | | — | | | | (.16 | ) | | | (.27 | ) |
Total distributions | | | (.57 | ) | | | (.85 | ) | | | (.11 | ) | | | (.16 | ) | | | (.27 | ) |
Net asset value, end of year | | | $8.19 | | | | $8.45 | | | | $8.83 | | | | $7.46 | | | | $8.08 | |
| | | | | |
| TOTAL RETURN(a) | | | 3.71 | % | | | 5.31 | % | | | 20.14 | % | | | (5.73 | )% | | | (1.34 | )% |
| | | | |
| RATIOS/SUPPLEMENTAL DATA: | | | | | | | | | | | | | | | | | |
Net assets, end of year (000) | | $ | 44,905 | | | $ | 38,553 | | | $ | 27,648 | | | $ | 18,637 | | | $ | 19,548 | |
Average net assets (000) | | $ | 43,199 | | | $ | 32,992 | | | $ | 22,022 | | | $ | 19,235 | | | $ | 20,809 | |
Ratios to average net assets | | | | | | | | | | | | | | | | | | | | |
Expenses | | | 1.49 | % | | | 1.51 | % | | | 1.69 | % | | | 1.83 | % | | | 1.47 | % |
Net investment income | | | 2.15 | % | | | 1.88 | % | | | 1.88 | % | | | 2.31 | % | | | 4.16 | % |
Portfolio turnover rate | | | 169 | % | | | 235 | % | | | 238 | % | | | 251 | % | | | 52 | % |
| (a) | Total return is calculated assuming a purchase of shares on the first day and a sale on the last day of each year reported and includes reinvestment of dividends and distributions. |
See Notes to Financial Statements
| | |
| THE TARGET PORTFOLIO TRUST | | 101 |
Financial Highlights (cont’d)
| | | | | | | | | | | | | | | | | | | | |
| | | TOTAL RETURN
BOND PORTFOLIO
| |
| | | Year Ended December 31,
| |
| | | 2004 | | | 2003 | | | 2002 | | | 2001 | | | 2000 | |
| | | | | |
PER SHARE OPERATING PERFORMANCE: | | | | | | | | | | | | | | | | | | | | |
Net asset value, beginning of year | | | $10.66 | | | | $10.73 | | | | $10.42 | | | | $10.27 | | | | $9.86 | |
Income from investment operations | | | | | | | | | | | | | | | | | | | | |
Net investment income | | | .20 | | | | .33 | | | | .41 | | | | .52 | | | | .66 | |
Net realized and unrealized gain on
investment transactions | | | .31 | | | | .33 | | | | .57 | | | | .28 | | | | .42 | |
Total from investment Operations | | | .51 | | | | .66 | | | | .98 | | | | .80 | | | | 1.08 | |
Less distributions | | | | | | | | | | | | | | | | | | | | |
Dividends from net investment income | | | (.44 | ) | | | (.36 | ) | | | (.45 | ) | | | (.54 | ) | | | (.67 | ) |
Distributions from net realized gains | | | (.09 | ) | | | (.37 | ) | | | (.22 | ) | | | (.11 | ) | | | — | |
Total distributions | | | (.53 | ) | | | (.73 | ) | | | (.67 | ) | | | (.65 | ) | | | (.67 | ) |
Net asset value, end of year | | | $10.64 | | | | $10.66 | | | | $10.73 | | | | $10.42 | | | | $10.27 | |
| | | | | |
| TOTAL RETURN(a) | | | 4.73 | % | | | 6.22 | % | | | 9.65 | % | | | 7.97 | % | | | 11.30 | % |
| | | | | |
| RATIOS/SUPPLEMENTAL DATA: | | | | | | | | | | | | | | | | | | | | |
Net assets, end of year (000) | | $ | 178,488 | | | $ | 158,148 | | | $ | 139,488 | | | $ | 106,086 | | | $ | 74,003 | |
Average net assets (000) | | $ | 170,073 | | | $ | 151,999 | | | $ | 122,888 | | | $ | 90,698 | | | $ | 67,151 | |
Ratios to average net assets | | | | | | | | | | | | | | | | | | | | |
Expenses | | | .75 | % | | | .76 | % | | | .75 | % | | | .78 | % | | | .79 | % |
Net investment income | | | 1.82 | % | | | 2.99 | % | | | 3.89 | % | | | 4.83 | % | | | 6.23 | % |
Portfolio turnover rate | | | 587 | % | | | 445 | % | | | 429 | % | | | 472 | % | | | 483 | % |
| (a) | Total return is calculated assuming a purchase of shares on the first day and a sale on the last day of each year reported and includes reinvestment of dividends and distributions. |
See Notes to Financial Statements
| | |
| 102 | | THE TARGET PORTFOLIO TRUST |
Financial Highlights (cont’d)
| | | | | | | | | | | | | | | | | | | | |
| | | INTERMEDIATE-TERM
BOND PORTFOLIO
| |
| | | Year Ended December 31,
| |
| | | 2004 | | | 2003 | | | 2002 | | | 2001 | | | 2000 | |
| | | | | |
| PER SHARE OPERATING PERFORMANCE: | | | | | | | | | | | | | | | | | | | | |
Net asset value, beginning of year | | | $10.46 | | | | $10.50 | | | | $10.23 | | | | $10.23 | | | | $9.92 | |
Income from investment operations | | | | | | | | | | | | | | | | | | | | |
Net investment income | | | .19 | | | | .28 | | | | .38 | | | | .52 | | | | .63 | |
Net realized and unrealized gain on
investment transactions | | | .14 | | | | .19 | | | | .47 | | | | .29 | | | | .34 | |
Total from investment operations | | | .33 | | | | .47 | | | | .85 | | | | .81 | | | | .97 | |
Less distributions | | | | | | | | | | | | | | | | | | | | |
Dividends from net investment income | | | (.24 | ) | | | (.34 | ) | | | (.39 | ) | | | (.54 | ) | | | (.63 | ) |
Distributions in excess of net investment income | | | — | | | | — | | | | — | | | | — | | | | (.03 | ) |
Distributions from net realized gains | | | (.19 | ) | | | (.17 | ) | | | (.19 | ) | | | (.27 | ) | | | — | |
Total distributions | | | (.43 | ) | | | (.51 | ) | | | (.58 | ) | | | (.81 | ) | | | (.66 | ) |
Net asset value, end of year | | | $10.36 | | | | $10.46 | | | | $10.50 | | | | $10.23 | | | | $10.23 | |
| | | | | |
| TOTAL RETURN(a) | | | 3.19 | % | | | 4.58 | % | | | 8.56 | % | | | 8.19 | % | | | 10.10 | % |
| | | | | |
| RATIOS/SUPPLEMENTAL DATA: | | | | | | | | | | | | | | | | | | | | |
Net assets, end of year (000) | | $ | 297,982 | | | $ | 334,806 | | | $ | 333,069 | | | $ | 195,233 | | | $ | 130,715 | |
Average net assets (000) | | $ | 318,671 | | | $ | 343,466 | | | $ | 258,072 | | | $ | 167,039 | | | $ | 116,330 | |
Ratios to average net assets | | | | | | | | | | | | | | | | | | | | |
Expenses | | | .64 | % | | | .68 | % | | | .66 | % | | | .66 | % | | | .71 | % |
Net investment income | | | 1.86 | % | | | 2.64 | % | | | 3.58 | % | | | 4.91 | % | | | 6.35 | % |
Portfolio turnover rate | | | 133 | % | | | 422 | % | | | 377 | % | | | 560 | % | | | 423 | % |
| (a) | Total return is calculated assuming a purchase of shares on the first day and a sale on the last day of each year reported and includes reinvestment of dividends and distributions. |
See Notes to Financial Statements
| | |
| THE TARGET PORTFOLIO TRUST | | 103 |
Financial Highlights (cont’d)
| | | | | | | | | | | | | | | | | | | | |
| | | MORTGAGE BACKED
SECURITIES PORTFOLIO
| |
| | | Year Ended December 31,
| |
| | | 2004 | | | 2003 | | | 2002 | | | 2001 | | | 2000 | |
| | | | | |
PER SHARE OPERATING PERFORMANCE: | | | | | | | | | | | | | | | | | | | | |
Net asset value, beginning of year | | | $10.45 | | | | $10.70 | | | | $10.44 | | | | $10.31 | | | | $9.97 | |
Income (loss) from investment operations | | | | | | | | | | | | | | | | | | | | |
Net investment income | | | .36 | | | | .47 | | | | .56 | | | | .61 | | | | .65 | |
Net realized and unrealized gain (loss) on
investment transactions | | | .02 | | | | (.24 | ) | | | .27 | | | | .17 | | | | .33 | |
Total from investment operations | | | .38 | | | | .23 | | | | .83 | | | | .78 | | | | .98 | |
Less distributions | | | | | | | | | | | | | | | | | | | | |
Dividends from net investment income | | | (.44 | ) | | | (.48 | ) | | | (.57 | ) | | | (.65 | ) | | | (.64 | ) |
Net asset value, end of year | | | $10.39 | | | | $10.45 | | | | $10.70 | | | | $10.44 | | | | $10.31 | |
| | | | | |
| TOTAL RETURN(a) | | | 3.68 | % | | | 2.20 | % | | | 8.13 | % | | | 7.79 | % | | | 10.35 | % |
| | | | | |
| RATIOS/SUPPLEMENTAL DATA: | | | | | | | | | | | | | | | | | | | | |
Net assets, end of year (000) | | $ | 95,796 | | | $ | 107,072 | | | $ | 115,546 | | | $ | 75,502 | | | $ | 63,234 | |
Average net assets (000) | | $ | 103,055 | | | $ | 114,526 | | | $ | 94,893 | | | $ | 69,767 | | | $ | 61,771 | |
Ratios to average net assets | | | | | | | | | | | | | | | | | | | | |
Expenses | | | .90 | % | | | .84 | % | | | .80 | % | | | .84 | % | | | .83 | % |
Net investment income | | | 3.48 | % | | | 4.43 | % | | | 4.43 | % | | | 5.74 | % | | | 6.60 | % |
Portfolio turnover rate | | | 279 | % | | | 282 | % | | | 184 | % | | | 72 | % | | | 74 | % |
| (a) | Total return is calculated assuming a purchase of shares on the first day and a sale on the last day of each year reported and includes reinvestment of dividends and distributions. |
See Notes to Financial Statements
| | |
| 104 | | THE TARGET PORTFOLIO TRUST |
Financial Highlights (cont’d)
| | | | | | | | | | | | | | | | | | | | |
| | | U.S. GOVERNMENT
MONEY MARKET PORTFOLIO
| |
| | | Year Ended December 31,
| |
| | | 2004 | | | 2003 | | | 2002 | | | 2001 | | | 2000 | |
| | | | | |
PER SHARE OPERATING
PERFORMANCE: | | | | | | | | | | | | | | | | | | | | |
Net asset value, beginning of year | | | $1.00 | | | | $1.00 | | | | $1.00 | | | | $1.00 | | | | $1.00 | |
Net investment income and net realized gain on investment transactions | | | .008 | | | | .007 | | | | .013 | | | | .037 | | | | .058 | |
Dividends and distributions | | | (.008 | ) | | | (.007 | ) | | | (.013 | ) | | | (.037 | ) | | | (.058 | ) |
Net asset value, end of year | | | $1.00 | | | | $1.00 | | | | $1.00 | | | | $1.00 | | | | $1.00 | |
| | | | | |
| TOTAL RETURN(a) | | | 0.76 | % | | | 0.70 | % | | | 1.31 | % | | | 3.77 | % | | | 5.87 | % |
| | | | |
| RATIOS/SUPPLEMENTAL DATA: | | | | | | | | | | | | | | | | | |
Net assets, end of year (000) | | $ | 74,190 | | | $ | 98,464 | | | $ | 127,141 | | | $ | 154,982 | | | $ | 122,226 | |
Average net assets (000) | | $ | 94,854 | | | $ | 114,831 | | | $ | 128,550 | | | $ | 132,704 | | | $ | 93,985 | |
Ratios to average net assets | | | | | | | | | | | | | | | | | | | | |
Expenses | | | .59 | % | | | .52 | % | | | .45 | % | | | .51 | % | | | .56 | % |
Net investment income | | | .72 | % | | | .71 | % | | | 1.31 | % | | | 3.52 | % | | | 5.76 | % |
| (a) | Total return is calculated assuming a purchase of shares on the first day and a sale on the last day of each year reported and includes reinvestment of dividends and distributions. |
See Notes to Financial Statements
| | |
| THE TARGET PORTFOLIO TRUST | | 105 |
Notes to Financial Statements
The TARGET Portfolio Trust (the ‘Fund’) is an open-end management investment company. The Fund was established as a Delaware business trust on July 29, 1992 and consists of ten separate portfolios (the “Portfolio” or “Portfolios”). All the Portfolios are diversified, as defined under the Investment Company Act of 1940, except for the International Bond Portfolio. Investment operations commenced on January 5, 1993, with the exception of the International Bond Portfolio, which commenced on May 17, 1994.
The Portfolios and their investment objectives are as follows:
| • | | Large Capitalization Growth Portfolio—long-term capital appreciation through investment primarily in stocks of large corporations that, in the investment adviser’s opinion, should have earnings growth faster than that of the S&P 500; |
| • | | Large Capitalization Value Portfolio—total return consisting of capital appreciation and dividend income through investment primarily in stocks of large corporations that, in the adviser’s opinion, are undervalued; |
| • | | Small Capitalization Growth Portfolio—maximum capital appreciation through investment primarily in small company common stocks that, in the investment adviser’s opinion, should have earnings growth faster than that of the U.S. economy in general; |
| • | | Small Capitalization Value Portfolio—above average capital appreciation through investment in small company common stocks that, in the adviser’s opinion, are undervalued or overlooked in the marketplace; |
| • | | International Equity Portfolio—capital appreciation through investment primarily in stocks of companies domiciled outside the United States; |
| • | | International Bond Portfolio—high total return through investment primarily in high-quality, foreign debt securities; |
| • | | Total Return Bond Portfolio—total return of current income and capital appreciation through investment primarily in fixed-income securities of varying maturities with a dollar-weighted average portfolio maturity of more than four years but not more than fifteen years; |
| • | | Intermediate-Term Bond Portfolio—current income and reasonable stability of principal through investment primarily in high quality fixed-income securities of varying maturities with a dollar-weighted average portfolio maturity of more than three years but not more than ten years; |
| • | | Mortgage Backed Securities Portfolio—high current income primarily and capital appreciation secondarily, each consistent with the protection of capital through investment primarily in mortgage related securities; |
| • | | U.S. Government Money Market Portfolio—maximum current income consistent with maintenance of liquidity and preservation of capital through investment exclusively in short-term securities issued or guaranteed by the U.S. Government, its agencies or instrumentalities. |
The ability of issuers of debt securities (other than those issued or guaranteed by the U.S. Government) held by the Portfolios to meet their obligations may be affected by economic or political developments in a specific industry, region or country.
| | |
| 106 | | THE TARGET PORTFOLIO TRUST |
Note 1. Accounting Policies
The following is a summary of significant accounting policies followed by the Fund and the Portfolios in the preparation of its financial statements.
Securities Valuations: Securities listed on a securities exchange (other than options on securities and indices) are valued at the last sale price on such exchange on the day of valuation or, if there was no sale on such day, at the mean between the last reported bid and ask prices, or at the last bid price on such day in the absence of an asked price. Securities traded via Nasdaq are valued at the NASDAQ official closing price (NOCP) on the day of valuation, or if there was no NOCP, at the last sale price. Securities that are actively traded in the over-the-counter market, including listed securities for which the primary market is believed by Prudential Investments LLC (“PI” or “Manager”), in consultation with the subadviser(s); to be over-the-counter, are valued at market value using prices provided by an independent pricing agent or principal market maker. Options on securities and indices traded on an exchange are valued at the last sale price as of the close of trading on the applicable exchange or, if there was no sale, at the mean between the most recently quoted bid and asked prices on such exchange or at the last bid price in the absence of an asked price. Futures contracts and options thereon traded on a commodities exchange or board of trade are valued at the last sale price at the close of trading on such exchange or board of trade or, if there was no sale on the applicable commodities exchange or board of trade on such day, at the mean between the most recently quoted bid and asked prices on such exchange or board of trade or at the last bid price in the absence of an asked price. Securities for which reliable market quotations are not readily available, or whose values have been affected by events occurring after the close of the security’s foreign market and before the Portfolio’s pricing time, are valued at fair value in accordance with the Board of Trustees’ approved fair valuation procedures. As of December 31, 2004 there were no foreign securities whose value required adjustment in accordance with procedures approved by the Board of Trustees. Using fair value to price securities may result in a value that is different from a security’s most recent closing price and from the price used by other mutual funds to calculate their net asset values.
Certain Portfolios held illiquid securities, including those which are restricted as to disposition under securities law (“restricted securities”). Restricted securities, sometimes referred to as private placements, are valued pursuant to the valuation procedures noted above. Each Portfolio may hold up to 15% of its net assets in illiquid securities, except for the U.S. Government Money Market Portfolio, which may hold up to 10% of its net assets in illiquid securities.
Investments in mutual funds are valued at their net asset value as of the close of the New York Stock Exchange on the date of the valuation.
U.S. Government securities for which market quotations are available are valued at a price provided by an independent pricing agent or primary dealer (a dealer that trades in U.S. Government securities with the Federal Reserve System).
Securities held by the U.S. Government Money Market Portfolio are valued at amortized cost in accordance with Rule 2a-7 of the Investment Company Act, which approximates market value. The amortized cost method involves valuing a security at its cost on the date of purchase and thereafter assuming a constant amortization to maturity of the difference between the principal amount due at maturity and the cost.
Short-term securities held by the other Portfolios which mature in 60 days or less are valued at amortized cost, which approximates market value. Short-term securities held by the other Portfolios which mature in more than 60 days are valued at current market quotations.
| | |
| THE TARGET PORTFOLIO TRUST | | 107 |
Repurchase Agreements: In connection with transactions in repurchase agreements with United States financial institutions, it is the Fund’s policy that its custodian or designated subcustodians under triparty repurchase agreements, as the case may be, take possession of the underlying collateral securities, the value of which exceeds the principal amount of the repurchase transaction, including accrued interest. To the extent that any repurchase transaction exceeds one business day, the value of the collateral is marked-to-market on a daily basis to ensure the adequacy of the collateral. If the seller defaults, and the value of the collateral declines or, if bankruptcy proceedings are commenced with respect to the seller of the security, realization of the collateral by the Fund may be delayed or limited.
Financial Futures Contracts: A financial futures contract is an agreement to purchase (long) or sell (short) an agreed amount of securities at a set price for delivery on a future date. Upon entering into a financial futures contract, the Portfolio is required to pledge to the broker an amount of cash and/or other assets equal to a certain percentage of the contract amount. This amount is known as the “initial margin.” Subsequent payments, known as “variation margin,” are made or received by the Portfolio each day, depending on the daily fluctuations in the value of the underlying security. Such variation margin is recorded for financial statement purposes on a daily basis as an unrealized gain or loss. When the contract expires or is closed, the gain or loss is realized and is presented in the Statements of Operations as a net realized gain or loss on financial futures contracts.
The Portfolio invests in financial futures contracts in order to hedge its existing portfolio securities, or securities the Portfolio intends to purchase, against fluctuations in value caused by changes in prevailing interest rates or market conditions. Should interest rates move unexpectedly, the Portfolio may not achieve the anticipated benefits of the financial futures contracts and may realize a loss. The use of futures transactions involves the risk of imperfect correlation in movements in the price of futures contracts, interest rates and the underlying hedged assets. The Portfolio maintains a segregated account of Securities or other liquid assets, the dollar value of which is at least equal to its obligation with respect to financial futures contracts. The International Equity Portfolio, International Bond Portfolio, Intermediate-Term Bond Portfolio, Mortgage-Backed Securities Portfolio and Total Return Bond Portfolio are the only portfolios that may invest in financial futures contracts.
Foreign Currency Translation: The books and records of the Portfolios are maintained in U.S. dollars. Foreign currency amounts are translated into U.S. dollars on the following basis:
(i) market value of investment securities, other assets and liabilities—at the current daily rates of exchange;
(ii) purchases and sales of investment securities, income and expenses—at the rates of exchange prevailing on the respective dates of such transactions.
Although the net assets of the Portfolios are presented at the foreign exchange rates and market values at the close of the year, the Portfolios do not isolate that portion of the results of operations arising as a result of changes in the foreign exchange rates from the fluctuations arising from changes in the market prices of long-term securities held at year end. Similarly, the Portfolios do not isolate the effect of changes in foreign exchange rates from the fluctuations arising from changes in the market prices of long-term portfolio securities sold during the year. Accordingly, realized foreign currency gains or losses are included in the reported net realized gains or losses on investment transactions.
Net realized gains or losses on foreign currency transactions represent net foreign exchange gains or losses from the holding of foreign currencies, currency gains or losses realized between the trade date and settlement date on securities transactions, and the difference between the amounts of dividends, interest and
| | |
| 108 | | THE TARGET PORTFOLIO TRUST |
foreign withholding taxes recorded on the Portfolios’ books and the U.S. dollar equivalent amounts actually received or paid. Net unrealized currency gains or losses from valuing foreign currency denominated assets and liabilities (other than investments) at year end exchange rates are reflected as a component of net unrealized appreciation (depreciation) on investments and foreign currencies.
Foreign security and currency transactions may involve certain considerations and risks not typically associated with those of domestic origin as a result of, among other factors, the possibility of political and economic instability or the level of governmental supervision and regulation of foreign securities markets.
Forward Foreign Currency Contracts: A forward foreign currency contract is a commitment to purchase or sell a foreign currency at a future date at a negotiated forward rate. The Portfolio enters into forward foreign currency contracts in order to hedge its exposure to changes in foreign currency exchange rates on its foreign portfolio holdings or on specific receivables and payables denominated in a foreign currency. The contracts are valued daily at current forward exchange rates and any unrealized gain or loss is included in net unrealized appreciation or depreciation on foreign currency transactions. Gains or losses are realized on the settlement date of the contract equal to the difference between the settlement value of the original and negotiated forward contracts. This gain or loss, if any, is included in net realized gain or loss on foreign currency transactions. Risks may arise upon entering into these contracts from the potential inability of the counterparties to meet the terms of their contracts. The International Equity Portfolio, International Bond Portfolio, Intermediate-Term Bond Portfolio and Total Return Bond Portfolio may enter into forward foreign currency contracts in order to hedge their exposure to changes in foreign currency exchange rates on their foreign portfolio holdings.
Options: The Portfolio may either purchase or write options in order to hedge against adverse market movements or fluctuations in value caused by changes in prevailing interest rates or foreign currency exchange rates with respect to securities or currencies which the Portfolio currently owns or intends to purchase. The Portfolio’s principal reason for writing options is to realize, through receipt of premiums, a greater current return than would be realized on the underlying security alone. When the Portfolio purchases an option, it pays a premium and an amount equal to that premium is recorded as an asset. When the Portfolio writes an option, it receives a premium and an amount equal to that premium is recorded as a liability. The asset or liability is adjusted daily to reflect the current market value of the option.
If an option expires unexercised, the Portfolio realizes a gain or loss to the extent of the premium received or paid. If an option is exercised, the premium received or paid is recorded as an adjustment to the proceeds from the sale or the cost basis of the purchase in determining whether the Portfolio has realized a gain or loss. The difference between the premium and the amount received or paid on effecting a closing purchase or sale transaction is also treated as a realized gain or loss. Gains or losses on purchased options are included in net realized gains or losses on investment transactions. Gains or losses on written options are presented separately as net realized gains or losses on options written.
The Portfolio, as writer of an option, may have no control over whether the contract may be exercised. As a result, the Portfolio bears the market risk of an unfavorable change in the price of the security or currencies underlying the written option. The Portfolio, as purchaser of an option, bears the risk of the potential inability of the counterparties to meet the terms of their contracts. The Portfolio maintains a segregated account of securities or other liquid assets, the dollar value of which is at least equal to its obligation with respect to options. The International Equity Portfolio, the International Bond Portfolio, the Intermediate-Term Bond Portfolio, the Total Return Bond Portfolio and the Mortgage-Backed Securities Portfolio may either purchase or write options.
| | |
| THE TARGET PORTFOLIO TRUST | | 109 |
Short Sales: Certain portfolios of the Fund may make short sales of securities as a method of hedging potential price declines in similar securities owned. The Portfolio may sell a security, it does not own in anticipation of a decline in the market value of that security (short sale). When the Portfolio makes a short sale, it will borrow the security sold short and deliver it to the broker-dealer through which it made the short sale as collateral for its obligation to deliver the security upon conclusion of the sale. The Portfolio may have to pay a fee to borrow the particular security and may be obligated to return any interest or dividends received on such borrowed securities. A gain, limited to the price at which the Portfolio sold the security short, or a loss, unlimited as to dollar amount, will be recognized upon the termination of a short sale if the market price at termination is less than or greater than the proceeds originally received, respectively, and is presented in the Statement of Operations as net realized gain or loss on short sales. The Portfolio maintains a segregated account of securities or other liquid assets, the dollar value of which is at least equal to its obligation with respect to short sales. The Total Return Bond Portfolio, Intermediate-Term Bond Portfolio and Mortgage-Backed Securities Portfolio may enter into short sales.
Swaps: A swap is an agreement to exchange the return generated by one instrument for the return generated by another instrument. The Portfolio may enter into interest rate, forward swap spread lock and credit default swap agreements to manage its exposure to interest rates and credit risk. Interest rate swap agreements involve the exchange by the Portfolio with another party of their respective commitments to pay or receive interest. Forward spread lock swap agreements involve commitments to pay or receive a settlement amount calculated as the difference between the swap spread and a fixed spread, multiplied by the notional amount times the duration of the swap. The swap spread is the difference between the benchmark swap rate (market rate) and the specific Treasury rate. In a credit default swap, one party makes a stream of payments to another party in exchange for the right to receive a specified return in the event of a default by a third party, typically corporate issues or sovereign issues of an emerging country, on its obligation. Dividends and interest on the securities in the swap are included in the value of the exchange. The swaps are valued daily at current market value and any unrealized gain or loss is included in the Statement of Assets and Liabilities. Gain or loss is realized on the termination date of the swap and is equal to the difference between the Portfolio’s basis in the swap and the proceeds of the closing transaction, including any fees. During the period that the swap agreement is open, the Portfolio may be subject to risk from the potential inability of the counterparty to meet the terms of the agreement. The Total Return Bond Portfolio, International Bond Portfolio, Mortgage Backed Securities Portfolio and the Intermediate-Term Bond Portfolio may enter into swaps.
The use of derivative transactions may involve elements of both market and credit risk in excess of the amounts reported in the Statements of Assets and Liabilities.
When-Issued/Delayed Delivery Securities: Certain Portfolios may purchase or sell securities on a when-issued or delayed delivery basis. These transactions involve a commitment by the Portfolio to purchase or sell securities for a predetermined price or yield, with payment and delivery taking place beyond the customary settlement period. When delayed delivery purchases are outstanding, the Portfolio will set aside and maintain until the settlement date in a segregated account, liquid assets in an amount sufficient to meet the purchase price. When purchasing a security on a delayed delivery basis, the Portfolio assumes the rights and risks of ownership of the security, including the risk of price and yield fluctuations, and takes such fluctuations into account when determining its net asset value. The Portfolio may dispose of or renegotiate a delayed delivery transaction after it is entered into, and may sell when-issued securities before they are delivered, which may result in a capital gain or loss. When the Portfolio has sold a security on a delayed delivery basis, the Portfolio does not participate in future gains and losses with respect to the security.
Securities Transactions and Net Investment Income: Securities transactions are recorded on the trade date. Realized and unrealized gains and losses from security and currency transactions are calculated
| | |
| 110 | | THE TARGET PORTFOLIO TRUST |
on the identified cost basis. Dividend income is recorded on the ex-dividend date and interest income, including amortization of premium and accretion of discount of debt securities, as required, is recorded on the accrual basis. Expenses are recorded on the accrual basis. The Fund’s expenses are allocated to the respective Portfolios on the basis of relative net assets except for expenses that are charged directly at the Portfolio or class level.
Dividends and Distributions: The Total Return Bond Portfolio, Intermediate-Term Bond Portfolio and Mortgage Backed Securities Portfolio declare dividends of their net investment income daily and pay such dividends monthly. The U.S. Government Money Market Portfolio declares net investment income and any net capital gain (loss) daily and pays such dividends monthly. Each other Portfolio declares and pays a dividend of its net investment income, if any, at least annually. Each Portfolio except for the U.S. Government Money Market Portfolio declares and pays its net realized capital gains, if any, at least annually. Dividends and distributions to shareholders, which are determined in accordance with federal income tax regulations and which may differ from generally accepted accounting principles, are recorded on exdividend date. Permanent book/ tax differences relating to income and gains are reclassified amongst undistributed net investment income, accumulated net realized gain or loss and paid-in capital, in excess of par, as appropriate.
Taxes: For federal income tax purposes, each Portfolio in the Fund is treated as a separate tax-paying entity. It is each Portfolio’s policy to continue to meet the requirements of the Internal Revenue Code applicable to regulated investment companies and to distribute all of its taxable net investment income and capital gains, if any, to its shareholders. Therefore, no federal income tax provision is required.
Withholding taxes on foreign interest and dividends are recorded net of reclaimable amounts, at the time the related income is earned.
Estimates: The preparation of the financial statements requires management to make estimates and assumptions that affect the reported amounts and disclosures in the financial statements. Actual results could differ from those estimates.
Note 2. Agreements
The Fund’s manager is Prudential Investments LLC (“PI”). PI manages the investment operations of the Fund, administers the Fund’s affairs and is responsible for the selection, subject to review and approval of the Trustees, of the advisers. PI supervises the advisers’ performance of advisory services and makes recommendations to the Trustees as to whether the advisers’ contracts should be renewed, modified or terminated. PI pays for the costs pursuant to the advisory agreements, the cost of compensation of officers of the Fund, occupancy and certain clerical and accounting costs of the Fund. The Fund bears all other costs and expenses.
The advisers noted below each furnished investment advisory services in connection with the management of the Portfolios. Each of the two advisers of the domestic equity Portfolios—the Large Capitalization Growth Portfolio, Large Capitalization Value Portfolio, Small Capitalization Growth Portfolio and Small Capitalization Value Portfolio—manages approximately 50% of the assets of the respective Portfolio. In general, in order to maintain an approximately equal division of assets between the two advisers, all daily cash inflows (i.e., subscriptions and reinvested distributions) and outflows (i.e., redemptions and expenses items) are divided between the two advisers as PI deems appropriate. In order to maintain an approximately equal allocation between the two subadvisers, a periodic rebalancing of each subadviser’s share of Portfolio assets may occur to account for market fluctuations.
| | |
| THE TARGET PORTFOLIO TRUST | | 111 |
| | |
Portfolio
| | Adviser
|
Large Capitalization Growth | | Oak Associates, Ltd. and Columbus Circle Investors |
Large Capitalization Value | | J.P. Morgan Investment Management, Inc. and Hotchkis & Wiley Capital Management, LLC |
Small Capitalization Growth | | Westcap Investors, LLC and RS Investment Management, L.P. |
Small Capitalization Value | | NFJ Investment Group L.P. and EARNEST Partners, LLC |
International Equity | | Lazard Asset Management |
International Bond*, Total Return Bond and Intermediate-Term Bond | | Pacific Investment Management Company LLC |
Mortgage Backed Securities and
U.S. Government Money Market | | Wellington Management Company, LLP |
| * | Effective at the close of business on October 20, 2004, Pacific Investment Management Company LLC replaced Fischer, Francis, Trees & Watts, Inc. |
The management fee payable to PI is computed daily and paid monthly, at an annual rate of the average daily net assets of the Portfolios specified below and PI, in turn, pays each adviser a fee for its services.
| | | |
Portfolio
| | Contracted & Effective
Management Fee
| |
Large Capitalization Growth | | 0.60 | % |
Large Capitalization Value | | 0.60 | % |
Small Capitalization Growth | | 0.60 | % |
Small Capitalization Value | | 0.60 | % |
International Equity | | 0.70 | % |
International Bond | | 0.50 | % |
Total Return Bond | | 0.45 | % |
Intermediate-Term Bond | | 0.45 | % |
Mortgage Backed Securities | | 0.45 | % |
U.S. Government Money Market | | 0.25 | % |
The Fund has a distribution agreement with Prudential Investment Management Services LLC (“PIMS”). PIMS serves the Fund without compensation.
PI and PIMS are indirect, wholly-owned subsidiaries of Prudential Financial, Inc. (“Prudential”).
The Fund, along with other affiliated registered investment companies (the “Funds”), is a party to a syndicated credit agreement (“SCA”) with a group of banks. For the period from January 1, 2004 through April 30, 2004 the SCA provided for a commitment of $800 million and allowed the Funds to increase the commitment to $1 billion if necessary. Effective May 1, 2004, the SCA provided for a commitment of $500 million. Interest on any borrowings under the SCA would be incurred at market rates. The Funds paid a commitment fee of .08 of 1% of the unused portion of the SCA. The commitment fee is accrued daily and paid quarterly and is allocated to the Funds pro rata, based on net assets. The purpose of the SCA is to serve as an alternative source of funding for capital share redemptions. The expiration date of the SCA was October 29, 2004. Effective October 29, 2004, the Funds entered into a revised credit agreement with two banks. The commitment under the revised credit agreement continues to be $500 million. The Funds pay a commitment fee of .075 of 1% of the unused portion of the revised credit agreement. The expiration date of the revised credit agreement is October 28, 2005. The Fund did not borrow any amounts pursuant to the SCA during the year ended December 31, 2004.
| | |
| 112 | | THE TARGET PORTFOLIO TRUST |
Note 3. Other Transactions with Affiliates
Prudential Mutual Fund Services LLC (“PMFS”), an affiliate of PI and an indirect, wholly-owned subsidiary of Prudential, serves as the Fund’s transfer agent. The following approximate amounts represent the fees PMFS charged for the year ended December 31, 2004, as well as the fees due to PMFS as of December 31, 2004. Transfer agent fees and expenses in the Statement of Operations also include certain out-of-pocket expenses paid to non-affiliates where applicable.
| | | | | | |
Portfolio
| | Amount incurred for the
year ended
December 31, 2004
| | Amounts due as of
December 31, 2004
|
Large Capitalization Growth | | $ | 263,500 | | $ | 20,100 |
Large Capitalization Value | | | 203,200 | | | 16,800 |
Small Capitalization Growth | | | 190,800 | | | 15,400 |
Small Capitalization Value | | | 228,600 | | | 19,300 |
International Equity | | | 173,100 | | | 14,000 |
International Bond | | | 73,900 | | | 6,100 |
Total Return Bond | | | 166,300 | | | 14,100 |
Intermediate-Term Bond | | | 225,300 | | | 17,100 |
Mortgage Backed Securities | | | 108,000 | | | 8,400 |
U.S. Government Money Market | | | 85,900 | | | 6,600 |
The Portfolios pay networking fees to affiliated and unaffiliated broker/dealers, including fees relating to the services of Wachovia Securities, LLC (“Wachovia”), an affiliate of PI. These networking fees are payments made to broker/dealers that clear mutual fund transactions through a national clearing system. These amounts are included in transfer agent’s fees and expenses in the Statement of Operations. For the year ended December 31, 2004, the Portfolios paid networking fees as follows:
| | | | | | | | | |
Portfolio
| | Total
Networking
Fees Incurred
| | Wachovia
Fees Incurred
| | Due to
Wachovia as of
December 31, 2004
|
Large Capitalization Growth | | $ | 54,700 | | $ | 54,400 | | $ | 2,200 |
Large Capitalization Value | | | 39,600 | | | 39,400 | | | 600 |
Small Capitalization Growth | | | 37,800 | | | 37,500 | | | 500 |
Small Capitalization Value | | | 40,700 | | | 40,400 | | | 1,200 |
International Equity | | | 33,800 | | | 33,800 | | | 400 |
International Bond | | | 15,000 | | | 15,000 | | | 1,100 |
Total Return Bond | | | 33,000 | | | 32,800 | | | 4,100 |
Intermediate-Term Bond | | | 48,900 | | | 48,600 | | | 3,800 |
Mortgage Backed Securities | | | 21,400 | | | 21,400 | | | 300 |
U.S. Government Money Market | | | 18,500 | | | 18,400 | | | 1,900 |
| | |
| THE TARGET PORTFOLIO TRUST | | 113 |
For the year ended December 31, 2004, the amount of brokerage commissions earned by Wachovia and Prudential Equity Group, LLC, (“PEG”), an indirect, wholly-owned subsidiary of Prudential, from portfolio transactions executed on behalf of the Portfolios were as follows:
| | | | | | |
Portfolio
| | Wachovia
| | PEG
|
Large Capitalization Growth | | $ | 1,385 | | | — |
Large Capitalization Value | | | 72 | | $ | 2,345 |
Small Capitalization Growth | | | 80 | | | — |
Certain Portfolios invest in the Taxable Money Market Series (the “Series”), a portfolio of Dryden Core Investment Fund, pursuant to an exemptive order received from the Securities and Exchange Commission. The Series is a money market mutual fund registered under the Investment Company Act of 1940, as amended, and managed by PI. During the year ended December 31, 2004, the following Portfolios earned income from the Series by investing their excess cash:
| | | |
Portfolio
| | Excess Cash
Investment
|
Large Capitalization Growth | | $ | 129,718 |
Large Capitalization Value | | | 81,912 |
Small Capitalization Growth | | | 106,839 |
Small Capitalization Value | | | 101,886 |
International Bond | | | 34,310 |
Note 4. Portfolio Securities
Purchases and sales of portfolio securities, excluding short-term investments and U.S. Government securities, for the year ended December 31, 2004, were as follows:
| | | | | | |
Portfolio
| | Purchases
| | Sales
|
Large Capitalization Growth | | $ | 253,179,954 | | $ | 260,577,677 |
Large Capitalization Value | | | 178,674,610 | | | 161,587,111 |
Small Capitalization Growth | | | 149,119,380 | | | 149,303,161 |
Small Capitalization Value | | | 46,231,075 | | | 51,754,680 |
International Equity | | | 133,060,791 | | | 120,110,220 |
International Bond | | | 67,157,123 | | | 66,364,902 |
Total Return Bond | | | 445,808,215 | | | 439,278,472 |
Intermediate-Term Bond | | | 119,865,164 | | | 130,027,141 |
Mortgage Backed Securities | | | 289,213,353 | | | 292,606,065 |
| | |
| 114 | | THE TARGET PORTFOLIO TRUST |
At December 31, 2004, the International Bond, Total Return Bond, Intermediate-Term Bond and the Mortgage Backed Securities Portfolios had open financial futures contracts. The unrealized appreciation (depreciation) on such contracts as of December 31, 2004 were as follows:
International Bond:
| | | | | | | | | | | | | | |
Number of
Contracts
| | Type
| | Expiration
Date
| | Value at
December 31, 2004
| | Value at
Trade Date
| | Unrealized
Appreciation
(Depreciation)
| |
| | | Long Positions: | | | | | | | | | | | | |
| 15 | | 10yr T-Note | | Mar. 2005 | | $ | 1,679,063 | | $ | 1,686,328 | | $ | (7,265 | ) |
| 8 | | Euro-BUND | | Mar. 2005 | | | 1,289,547 | | | 1,291,180 | | | (1,633 | ) |
| 3 | | Japanese 10yr Bond | | Mar. 2005 | | | 4,050,747 | | | 4,037,121 | | | 13,626 | |
| 2 | | Euro-BOBL | | Mar. 2005 | | | 306,919 | | | 307,436 | | | (517 | ) |
| | | | | | | | | | | | |
|
|
|
| | | | | | | | | | | | | $ | 4,211 | |
| | | | | | | | | | | | |
|
|
|
| | | | |
| Total Return Bond: | | | | | | | | | |
Number of
Contracts
| | Type
| | Expiration
Date
| | Value at
December 31, 2004
| | Value at
Trade Date
| | Unrealized
Appreciation
(Depreciation)
| |
| | | Long Positions: | | | | | | | | | | | | |
| 408 | | 10yr T-Note | | Mar. 2005 | | $ | 45,670,500 | | $ | 45,752,578 | | $ | (82,078 | ) |
| 131 | | Euro-BOBL | | Mar. 2005 | | | 20,103,167 | | | 20,143,930 | | | (40,763 | ) |
| 67 | | 90 Day Euro | | Jun. 2005 | | | 16,218,188 | | | 16,283,188 | | | (65,000 | ) |
| 62 | | 90 Day Euro | | Dec. 2005 | | | 14,948,200 | | | 14,864,350 | | | 83,850 | |
| 49 | | 5yr T-Note | | Mar. 2005 | | | 5,367,031 | | | 5,387,406 | | | (20,375 | ) |
| 31 | | 90 Day Euro | | Sep. 2005 | | | 7,487,275 | | | 7,517,500 | | | (30,225 | ) |
| 27 | | 90 Day Euro | | Mar. 2005 | | | 6,553,913 | | | 6,556,275 | | | (2,362 | ) |
| 17 | | 15yr T-Bond | | Mar. 2005 | | | 1,912,500 | | | 1,918,875 | | | (6,375 | ) |
| 13 | | 90 Day Euribor | | Dec. 2005 | | | 2,971,648 | | | 2,957,513 | | | 14,135 | |
| 12 | | 90 Day Euribor | | Mar. 2005 | | | 2,739,892 | | | 2,768,349 | | | (28,457 | ) |
| 2 | | Japanese 10yr Bond | | Mar. 2005 | | | 2,700,498 | | | 2,694,004 | | | 6,494 | |
| | | | | | | | | | | | |
|
|
|
| | | | | | | | | | | | | $ | (171,156 | ) |
| | | | | | | | | | | | |
|
|
|
| | | | |
| Intermediate-Term Bond: | | | | | | | | | |
Number of
Contracts
| | Type
| | Expiration
Date
| | Value at
December 31, 2004
| | Value at
Trade Date
| | Unrealized
Appreciation
(Depreciation)
| |
| | | Long Positions: | | | | | | | | | | | | |
| 507 | | 90 Day Euro | | Sep. 2005 | | $ | 122,453,175 | | $ | 122,956,612 | | $ | (503,437 | ) |
| 405 | | 5yr T-Note | | Mar. 2005 | | | 44,360,156 | | | 44,278,945 | | | 81,211 | |
| 376 | | 10yr T-Note | | Mar. 2005 | | | 42,088,500 | | | 41,541,594 | | | 546,906 | |
| 24 | | Euro-BOBL | | Mar. 2005 | | | 3,683,023 | | | 3,690,491 | | | (7,468 | ) |
| | | | | | | | | | | | |
|
|
|
| | | | | | | | | | | | | $ | 117,212 | |
| | | | | | | | | | | | |
|
|
|
| | |
| THE TARGET PORTFOLIO TRUST | | 115 |
| | | | | | | | | | | | | |
| | | | |
| Mortgage Backed Securities: | | | | | | | | |
Number of
Contracts
| | Type
| | Expiration
Date
| | Value at
December 31, 2004
| | Value at
Trade Date
| | Unrealized
Appreciation
|
| | | Short Positions: | | | | | | | | | | | |
| 26 | | 2yr T-Note | | Mar. 2005 | | $ | 5,449,437 | | $ | 5,453,803 | | $ | 4,366 |
| 5 | | 5yr T-Note | | Mar. 2005 | | | 547,656 | | | 549,628 | | | 1,972 |
| | | | | | | | | | | | |
|
|
| | | | | | | | | | | | | $ | 6,338 |
| | | | | | | | | | | | |
|
|
At December 31, 2004, the International Bond Portfolio had outstanding forward currency contracts to purchase and sell foreign currencies, as follows:
| | | | | | | | | | |
Foreign Currency Purchase Contracts
| | Value at Settlement
Date Payable
| | Current
Value
| | Unrealized
Appreciation
(Depreciation)
| |
Euros,
expiring 01/10/05 | | $ | 3,061,983 | | $ | 3,100,662 | | $ | 38,679 | |
Japanese Yen,
expiring 1/12/05 | | | 122,186 | | | 124,593 | | | 2,407 | |
expiring 1/27/05 | | | 71,002 | | | 73,062 | | | 2,060 | |
New Zealand Dollars,
expiring 2/11/05 | | | 1,411 | | | 1,438 | | | 27 | |
Pound Sterlings,
expiring 1/13/05 | | | 4,451,443 | | | 4,411,617 | | | (39,826 | ) |
Swedish Kronas,
expiring 3/09/05 | | | 62,359 | | | 63,703 | | | 1,344 | |
| | |
|
| |
|
| |
|
|
|
| | | $ | 7,770,384 | | $ | 7,775,075 | | $ | 4,691 | |
| | |
|
| |
|
| |
|
|
|
| | | |
Foreign Currency Sale Contracts
| | Value at Settlement
Date Receivable
| | Current
Value
| | Unrealized
Appreciation
(Depreciation)
| |
Canadian Dollars,
expiring 1/13/05 | | $ | 208,123 | | $ | 212,810 | | $ | (4,687 | ) |
Danish Krones,
expiring 1/03/05 | | | 12,048 | | | 12,060 | | | (12 | ) |
expiring 3/09/05 | | | 249,600 | | | 252,319 | | | (2,719 | ) |
Euros,
expiring 1/10/05 | | | 30,789,320 | | | 31,176,538 | | | (387,218 | ) |
expiring 1/10/05 | | | 237,895 | | | 237,885 | | | 10 | |
expiring 1/12/05 | | | 122,379 | | | 125,061 | | | (2,682 | ) |
Japanese Yen,
expiring 1/27/05 | | | 6,144,695 | | | 6,154,380 | | | (9,685 | ) |
Pound Sterlings,
expiring 1/13/05 | | | 4,597,396 | | | 4,601,509 | | | (4,113 | ) |
Swedish Kronas,
expiring 1/12/05 | | | 60,491 | | | 60,801 | | | (310 | ) |
| | |
|
| |
|
| |
|
|
|
| | | $ | 42,421,947 | | $ | 42,833,363 | | $ | (411,416 | ) |
| | |
|
| |
|
| |
|
|
|
| | |
| 116 | | THE TARGET PORTFOLIO TRUST |
| | | | | | | | | | |
|
At December 31, 2004, the Total Return Bond Portfolio had outstanding forward currency contracts to
purchase and sell foreign currencies, as follows: | |
Foreign Currency Purchase Contracts
| | Value at Settlement
Date Payable
| | Current
Value
| | Unrealized
Appreciation
(Depreciation)
| |
Euros,
expiring 1/10/05 | | $ | 780,062 | | $ | 796,600 | | $ | 16,538 | |
Pound Sterling,
expiring 1/13/05 | | | 284,442 | | | 283,878 | | | (564 | ) |
Japanese Yen,
expiring 1/27/05 | | | 181,978 | | | 185,420 | | | 3,442 | |
| | |
|
| |
|
| |
|
|
|
| | | $ | 1,246,482 | | $ | 1,265,898 | | $ | 19,416 | |
| | |
|
| |
|
| |
|
|
|
| | | |
Foreign Currency Sale Contracts
| | Value at Settlement
Date Receivable
| | Current
Value
| | Unrealized
Depreciation
| |
Euros,
expiring 1/10/05 | | $ | 3,247,749 | | $ | 3,297,540 | | $ | (49,791 | ) |
Pound Sterling,
expiring 1/13/05 | | | 272,276 | | | 272,626 | | | (350 | ) |
Japanese Yen,
expiring 1/27/05 | | | 373,853 | | | 389,997 | | | (16,144 | ) |
| | |
|
| |
|
| |
|
|
|
| | | $ | 3,893,878 | | $ | 3,960,163 | | $ | (66,285 | ) |
| | |
|
| |
|
| |
|
|
|
Transactions in options written during the year ended December 31, 2004, were as follows:
| | | | | | | |
| | |
International Bond
| | Number of Contracts
| | | Premiums
Received
| |
Options outstanding at December 31, 2003 | | — | | | | — | |
Options written | | 553 | | | $ | 122,843 | |
Options closed | | (413 | ) | | | (78,319 | ) |
Options expired | | (94 | ) | | | (14,559 | ) |
| | |
|
| |
|
|
|
Options outstanding at December 31, 2004 | | 46 | | | $ | 29,965 | |
| | |
|
| |
|
|
|
| | |
Total Return Bond
| | Number of Contracts/
Notional Amount (000)
| | | Premiums
Received
| |
Options outstanding at December 31, 2003 | | 39,000 | | | $ | 584,954 | |
Options written | | 3,609 | | | | 306,725 | |
Options closed | | (9 | ) | | | (6,935 | ) |
Options expired | | (10,182 | ) | | | (339,455 | ) |
| | |
|
| |
|
|
|
Options outstanding at December 31, 2004 | | 32,418 | | | $ | 545,289 | |
| | |
|
| |
|
|
|
| | |
Intermediate-Term Bond
| | Number of Contracts/
Notional Amount (000)
| | | Premiums
Received
| |
Options outstanding at December 31, 2003 | | 33,800 | | | $ | 309,693 | |
Options written | | 555 | | | | 329,677 | |
Options closed | | (47 | ) | | | (34,105 | ) |
Options expired | | (308 | ) | | | (258,822 | ) |
| | |
|
| |
|
|
|
Options outstanding at December 31, 2004 | | 34,000 | | | $ | 346,443 | |
| | |
|
| |
|
|
|
| | |
| THE TARGET PORTFOLIO TRUST | | 117 |
The Total Return Bond Portfolio entered into interest rate swap agreements during the year ended December 31, 2004. Details of the swap agreements outstanding as of December 31, 2004 were as follows:
| | | | | | | | | | | | | | |
Counterparty
| | Termination
Date
| | Notional
Amount
| | Fixed
Rate
| | | Floating
Rate
| | Unrealized
Appreciation
(Depreciation)
| |
UBS AG(a) | | 6/17/10 | | EUR | 200,000 | | 4.00 | % | | 6 month LIBOR | | $ | 6,859 | |
UBS AG(b) | | 12/15/14 | | EUR | 9,200,000 | | 5.00 | | | 6 month LIBOR | | | (1,044,292 | ) |
UBS AG(a) | | 6/15/12 | | JPY | 130,000,000 | | 2.00 | | | 6 month LIBOR | | | (55,936 | ) |
UBS AG(a) | | 9/15/05 | | $ | 7,500,000 | | 3.25 | | | 3 month LIBOR | | | 86 | |
UBS AG(b) | | 12/16/14 | | $ | 5,100,000 | | 5.00 | | | 3 month LIBOR | | | 2,954 | |
UBS AG(a) | | 12/16/19 | | $ | 6,400,000 | | 6.00 | | | 3 month LIBOR | | | 9,577 | |
Lehman Brothers(a) | | 6/15/10 | | $ | 3,000,000 | | 4.00 | | | 3 month LIBOR | | | 16,977 | |
Lehman Brothers(b) | | 6/15/05 | | $ | 9,300,000 | | 5.00 | | | 3 month LIBOR | | | 46,100 | |
Lehman Brothers(b) | | 6/15/25 | | $ | 5,200,000 | | 6.00 | | | 3 month LIBOR | | | 21,502 | |
Goldman Sachs Capital Markets, L.P.(a) | | 6/15/10 | | $ | 4,500,000 | | 4.00 | | | 3 month LIBOR | | | 2,021 | |
JPMorgan Chase Bank(a) | | 3/17/05 | | GBP | 2,000,000 | | 4.00 | | | 6 month LIBOR | | | (9,628 | ) |
JPMorgan Chase Bank(a) | | 6/17/10 | | EUR | 1,000,000 | | 4.00 | | | 6 month LIBOR | | | 34,294 | |
JPMorgan Chase Bank(a) | | 3/15/32 | | EUR | 1,600,000 | | 6.00 | | | 6 month LIBOR | | | 79,794 | |
JPMorgan Chase Bank(a) | | 6/18/34 | | EUR | 1,500,000 | | 6.00 | | | 6 month LIBOR | | | 130,060 | |
RBS Greenwich Capital(a) | | 6/15/10 | | $ | 2,700,000 | | 4.00 | | | 3 month LIBOR | | | 14,983 | |
Barclays Bank PLC(b) | | 3/15/32 | | GBP | 1,300,000 | | 5.00 | | | 6 month LIBOR | | | (35,839 | ) |
Barclays Bank PLC(b) | | 6/18/34 | | GBP | 900,000 | | 5.00 | | | 6 month LIBOR | | | (42,312 | ) |
Barclays Bank PLC(a) | | 6/15/07 | | $ | 1,700,000 | | 4.00 | | | 3 month LIBOR | | | 2,869 | |
Morgan Stanley Capital Services(b) | | 6/15/12 | | JPY | 130,000,000 | | 2.00 | | | 6 month LIBOR | | | (45,885 | ) |
Morgan Stanley Capital Services(a) | | 3/16/05 | | GBP | 1,200,000 | | 4.25 | | | 6 month LIBOR | | | (7,225 | ) |
| | | | | | | | | | | | |
|
|
|
| | | | | | | | | | | | | $ | (873,041 | ) |
| | | | | | | | | | | | |
|
|
|
| (a) | Portfolio pays the floating rate and receives the fixed rate. |
| (b) | Portfolio pays the fixed rate and receives the floating rate. |
The Total Return Bond Portfolio entered into credit default swap agreements during the year ended December 31, 2004. Details of the swap agreements outstanding as of December 31, 2004 were as follows:
| | | | | | | | | | | | | | |
Counterparty
| | Termination
Date
| | Notional
Amount
| | Fixed
Rate
| | | Underlying
Bond
| | Unrealized
Appreciation
(Depreciation)
| |
Morgan Stanley Capital Services(a) | | 12/20/2008 | | $ | 500,000 | | 0.26 | % | | Allstate Corp.,
6.125%, due 2/15/12 | | $ | (1,919 | ) |
Merrill Lynch Capital Services(a) | | 12/20/2008 | | | 200,000 | | 0.27 | | | Anadarko Petroleum
Corp.,
5.00%, due 10/1/12 | | | (548 | ) |
UBS AG(a) | | 12/20/2008 | | | 600,000 | | 0.35 | | | AutoZone, Inc.,
5.875%, due 10/15/12 | | | 6,478 | |
Bear Stearns International Ltd.(a) | | 12/20/2008 | | | 100,000 | | 1.09 | | | Capital One Bank,
4.875%, due 5/15/08 | | | (2,153 | ) |
UBS AG(a) | | 12/20/2008 | | | 200,000 | | 0.44 | | | Carnival Corp.,
6.15%, due 4/15/08 | | | (1,981 | ) |
| | |
| 118 | | THE TARGET PORTFOLIO TRUST |
| | | | | | | | | | | | | | |
Counterparty
| | Termination
Date
| | Notional
Amount
| | Fixed
Rate
| | | Underlying
Bond
| | Unrealized
Appreciation
(Depreciation)
| |
Bear Stearns International Ltd.(a) | | 12/20/2008 | | $ | 200,000 | | 0.19 | % | | Caterpillar, Inc.,
7.25%, due 9/15/09 | | $ | (241 | ) |
Lehman Brothers(a) | | 12/20/2008 | | | 100,000 | | 0.24 | | | Costco Wholesale Corp.,
5.50%, due 3/15/07 | | | (420 | ) |
Morgan Stanley(a) | | 12/20/2008 | | | 200,000 | | 0.42 | | | Countrywide Home Loans, Inc.,
5.625%, due 7/15/09 | | | (335 | ) |
Bear Stearns International Ltd.(a) | | 12/20/2008 | | | 200,000 | | 0.24 | | | Deere & Co.,
7.85%, due 5/15/10 | | | (617 | ) |
Merrill Lynch Capital Services(a) | | 12/20/2008 | | | 300,000 | | 0.35 | | | Devon Energy Corp.,
6.875%, due 9/30/11 | | | (1,161 | ) |
Bank of America Securities LLC(a) | | 12/20/2008 | | | 300,000 | | 0.13 | | | E.I. DuPont,
6.875%, due 10/15/09 | | | (576 | ) |
Citigroup(a) | | 12/20/2008 | | | 400,000 | | 0.28 | | | Eaton Corp.,
5.75%, due 7/15/12 | | | (2,139 | ) |
Barclays Bank PLC(a) | | 12/20/2008 | | | 500,000 | | 0.16 | | | Eli Lilly & Co., Inc.,
6.00%, due 3/15/12 | | | (595 | ) |
Morgan Stanley Capital Services(a) | | 12/20/2008 | | | 300,000 | | 0.21 | | | Emerson Electric Co,.
6.48%, due 10/15/12 | | | (590 | ) |
Morgan Stanley Capital Services(a) | | 12/20/2008 | | | 200,000 | | 0.22 | | | Emerson Electric Co,.
7.125%, due 8/15/10 | | | (468 | ) |
Citigroup(a) | | 12/20/2008 | | | 300,000 | | 0.29 | | | FedEx Corp.,
7.25%, due 2/15/11 | | | (1,266 | ) |
Merrill Lynch Capital Services(a) | | 12/20/2008 | | | 100,000 | | 0.22 | | | Gannett Co., Inc.,
6.375%, due 8/10/09 | | | (123 | ) |
Bear Stearns International Ltd.(a) | | 6/20/2005 | | | 4,800,000 | | 0.55 | | | General Motors,
6.875%, due 8/28/12 | | | 2,200 | |
Bear Stearns International Ltd.(b) | | 6/20/2005 | | | 4,800,000 | | 0.69 | | | General Motors,
7.125%, due 7/15/13 | | | 2,108 | |
Leham Brothers(a) | | 12/20/2008 | | | 200,000 | | 0.97 | | | Goodrich Corp.,
7.625%, due 12/15/12 | | | (5,000 | ) |
Bear Stearns International Ltd.(a) | | 12/20/2008 | | | 400,000 | | 0.32 | | | Hewlett Packard Co.,
6.50%, due 7/1/12 | | | (2,740 | ) |
Lehman Brothers(a) | | 12/20/2008 | | | 400,000 | | 0.12 | | | Home Depot, Inc.,
5.375%, due 4/1/06 | | | (471 | ) |
Merrill Lynch Capital Services(a) | | 12/20/2008 | | | 300,000 | | 0.32 | | | Ingersoll-Rand Co.,
6.48%, due 6/1/25 | | | (1,500 | ) |
Bear Stearns International Ltd.(a) | | 12/20/2008 | | | 200,000 | | 0.60 | | | International Paper Co.,
6.75%, due 9/1/11 | | | (2,220 | ) |
Lehman Brothers(a) | | 12/20/2008 | | | 400,000 | | 0.11 | | | Johnson & Johnson,
3.80%, due 5/15/13 | | | (317 | ) |
Lehman Brothers(a) | | 12/20/2008 | | | 200,000 | | 0.53 | | | Lockheed Martin Corp.,
8.20%, due 12/1/09 | | | (2,437 | ) |
Lehman Brothers(a) | | 12/20/2008 | | | 300,000 | | 0.35 | | | Masco Corp.,
5.875%, due 7/15/12 | | | (944 | ) |
Morgan Stanley Capital Services(b) | | 5/20/2005 | | | 1,000,000 | | 0.63 | | | Mexico Gov't,
11.50%, due 11/15/26 | | | 2,570 | |
Merrill Lynch Capital Services(a) | | 12/20/2008 | | | 200,000 | | 0.85 | | | Motorola, Inc.,
7.625%, due 11/15/10 | | | (4,019 | ) |
| | |
| THE TARGET PORTFOLIO TRUST | | 119 |
| | | | | | | | | | | | | | |
Counterparty
| | Termination
Date
| | Notional
Amount
| | Fixed
Rate
| | | Underlying
Bond
| | Unrealized
Appreciation
(Depreciation)
| |
Lehman Brothers(a) | | 12/20/2008 | | $ | 200,000 | | 0.48 | % | | Northrop Grmman
Corp.,
7.125%, due 2/15/11 | | $ | (1,904 | ) |
Merrill Lynch Capital Services(a) | | 12/20/2008 | | | 200,000 | | 0.28 | | | Occidental Petroleum
Corp.,
6.75%, due 1/15/12 | | | (404 | ) |
Lehman Brothers(a) | | 12/20/2008 | | | 300,000 | | 0.35 | | | Radioshack Corp.,
7.375%, due 5/15/11 | | | (1,500 | ) |
UBS AG(a) | | 12/20/2008 | | | 200,000 | | 0.37 | | | Radioshack Corp.,
7.375%, due 5/15/11 | | | (1,150 | ) |
Lehman Brothers(a) | | 6/20/2009 | | | 1,200,000 | | 0.40 | | | Republic of China,
6.80%, due 05/23/11 | | | (8,361 | ) |
Morgan Stanley Capital Services | | 12/20/2008 | | | 200,000 | | 0.44 | | | Simon Property
Group, L.P.,
5.45%, due 3/15/13 | | | (1,161 | ) |
UBS AG(a) | | 12/20/2008 | | | 200,000 | | 0.53 | | | The Kroger Co.,
4.75%, due 4/15/12 | | | (1,753 | ) |
Barclays Bank PLC(a) | | 12/20/2008 | | | 200,000 | | 0.67 | | | The Walt Disney Co.,
6.375%, due 3/1/12 | | | (3,632 | ) |
Citigroup(a) | | 12/20/2008 | | | 800,000 | | 0.14 | | | Wal-Mart Stores, Inc.,
6.875%, due 8/10/09 | | | (2,427 | ) |
Bear Stearns International Ltd.(a) | | 12/20/2008 | | | 200,000 | | 0.15 | | | Wal-Mart Stores, Inc.,
6.875%, due 8/10/09 | | | (682 | ) |
Lehman Brothers(a) | | 12/20/2008 | | | 200,000 | | 0.29 | | | Whirlpool Corp.,
8.60%, due 5/1/10 | | | (633 | ) |
| | | | | | | | | | | | |
|
|
|
| | | | | | | | | | | | | $ | (45,031 | ) |
| | | | | | | | | | | | |
|
|
|
| (a) | Portfolio pays the fixed rate and receives from the counterparty, par in the event that the underlying bond defaults. |
| (b) | Portfolio pays the counterparty, par in the event that the underlying bond defaults and receives the fixed rate. |
The Intermediate-Term Bond Portfolio entered into interest rate swap agreements during the year ended December 31, 2004. Details of the swap agreements outstanding as of December 31, 2004 were as follows:
| | | | | | | | | | | | | | |
Counterparty
| | Termination
Date
| | Notional
Amount
| | Fixed
Rate
| | | Floating
Rate
| | Unrealized
Appreciation
(Depreciation)
| |
Merrill Lynch Capital Services(a) | | 6/17/2008 | | SEK | 56,000,000 | | 4.50 | % | | SEK - STIBOR - SIDE | | $ | 316,759 | |
Morgan Stanley Capital Services(a) | | 3/17/2005 | | GBP | 26,800,000 | | 4.25 | | | 6 month GBP LIBOR | | | (324,164 | ) |
RBS Greenwich Capital (a) | | 6/15/2010 | | $ | 6,000,000 | | 4.00 | | | 3 month LIBOR | | | 33,295 | |
| | | | | | | | | | | | |
|
|
|
| | | | | | | | | | | | | $ | 25,890 | |
| | | | | | | | | | | | |
|
|
|
| (a) | Portfolio pays the floating rate and receives the fixed rate. |
| | |
| 120 | | THE TARGET PORTFOLIO TRUST |
The Intermediate-Term Bond Portfolio entered into credit default swap agreements during the year ended December 31, 2004. Details of the swap agreements outstanding as of December 31, 2004 were as follows:
| | | | | | | | | | | | | |
Counterparty
| | Termination
Date
| | Notional
Amount
| | Fixed
Rate
| | | Underlying
Bond
| | Unrealized
Appreciation
|
JP Morgan Chase Bank(a) | | 3/11/2005 | | $ | 1,200,000 | | 1.00 | % | | Russian Federation,
5.00% 3/31/30 | | $ | 4,333 |
Bear Stearns International Ltd.(a) | | 3/17/2005 | | | 200,000 | | 1.00 | | | Russian Federation,
5.00% 3/31/30 | | | 698 |
| | | | | | | | | | | | |
|
|
| | | | | | | | | | | | | $ | 5,031 |
| | | | | | | | | | | | |
|
|
| (a) | Portfolio pays the counterparty, par in the event that the underlying bond defaults and receives the fixed rate. |
The International Bond Portfolio entered into interest rate swap agreements during the year ended December 31, 2004. Details of the swap agreements outstanding as of December 31, 2004 were as follows:
| | | | | | | | | | | | | | |
Counterparty
| | Termination
Date
| | Notional
Amount
| | Fixed
Rate
| | | Floating
Rate
| | Unrealized
Appreciation
(Depreciation)
| |
Bank of America, N.A.(a) | | 6/15/2015 | | $ | 5,000,000 | | 5.00 | % | | 3 month LIBOR | | $ | 22,836 | |
Goldman Sachs Capital Markets, L.P.(a) | | 6/15/2015 | | $ | 2,200,000 | | 5.00 | | | 3 month LIBOR | | | (12,643 | ) |
UBS AG(a) | | 6/18/2034 | | GBP | 200,000 | | 5.00 | | | 6 month LIBOR | | | (2,533 | ) |
UBS AG(a) | | 12/18/2034 | | EUR | 200,000 | | 6.00 | | | 6 month EURIBOR | | | 9,368 | |
| | | | | | | | | | | | |
|
|
|
| | | | | | | | | | | | | $ | 17,028 | |
| | | | | | | | | | | | |
|
|
|
| (a) | Portfolio pays the fixed rate and receives the floating rate. |
The Mortgage Backed Securities Portfolio entered into a total return swap agreement during the year ended December 31, 2004. Details of the swap agreement outstanding as of December 31, 2004 were as follows:
| | | | | | | | | | | | |
Counterparty
| | Termination
Date
| | Notional
Amount
(000)
| | Return
Received
| | Return
Paid
| | Unrealized
Appreciation
|
Goldman Sachs Capital Markets, L.P. | | 5/1/05 | | $ | 3,000 | | Lehman Bros.
CMBS Index | | spread change*
((notional
amount/10,000)*
Mod Adj Durat) | | $ | 1,339 |
| | | | | | | | | | | |
|
|
| | |
| THE TARGET PORTFOLIO TRUST | | 121 |
Note 5. Tax and Distribution Information
In order to present undistributed net investment income or loss and accumulated net realized gains or losses on the Statement of Assets and Liabilities that more closely represent their tax character, certain adjustments have been made to paid-in-capital in excess of par, undistributed net investment income or loss and accumulated net realized gain or loss on investment. For the year ended December 31, 2004, the adjustments were as follows:
| | | | | | | | | | | | |
Portfolio
| | Paid-In
Capital In
Excess of Par
| | | Undistributed
Net investment
Income
| | | Accumulated
Net Realized
Gain or Loss
| |
Large Capitalization Value Portfolio(e) | | $ | 12,550,399 | | | | — | | | $ | (12,550,399 | ) |
Small Capitalization Growth Portfolio(b) | | | (846,297 | ) | | $ | 846,297 | | | | — | |
International Equity Portfolio(a)(c) | | | — | | | | (631,134 | ) | | | 631,134 | |
International Bond Portfolio(a)(d)(h) | | | — | | | | (3,088,316 | ) | | | 3,088,316 | |
Total Return Bond Portfolio(a)(d)(g) | | | — | | | | 4,833,472 | | | | (4,833,472 | ) |
Intermediate-Term Bond Portfolio(a)(d)(f)(h) | | | — | | | | 1,399,965 | | | | (1,399,965 | ) |
Mortgage Backed Securities Portfolio(d)(h) | | | — | | | | 726,490 | | | | (726,490 | ) |
| (a) | Reclassification of net foreign currency gain (loss). |
| (b) | Reclassification of tax operating loss. |
| (c) | Reclassification of book to tax differences due to the sale of passive foreign investment companies. |
| (d) | Reclassification of swap income. |
| (e) | Reclassification for redemptions utilized as distributions for federal income tax purposes. |
| (f) | Reclassification of income from defaulted securities. |
| (g) | Reclassification of overdistribution of ordinary income. |
| (h) | Reclassification of paydowns. |
Net investment income, net realized gains and net assets were not affected by these reclassifications.
For federal income tax purposes the following Portfolios had post-October losses incurred in the period November 1, 2004 through December 31, 2004 that they have elected to be incurred in the following fiscal year and capital loss carryforwards as of December 31, 2004. Accordingly, no capital gain distributions are expected to be paid to shareholders until future net gains have been realized in excess of such carryforwards. The approximate amounts were as follows:
| | | | | | | | | | |
| | | Post-October Losses
| | Capital Loss
Carryforward
| |
Portfolio
| | Currency
| | Capital
| |
Large Capitalization Growth Portfolio | | | — | | | — | | $ | 13,646,000 | (a) |
Large Capitalization Value Portfolio | | | — | | | — | | | — | (b) |
Small Capitalization Growth Portfolio | | | — | | | — | | | 45,743,000 | (c) |
International Equity Portfolio | | $ | 102,000 | | | — | | | 30,095,000 | (d) |
International Bond Portfolio | | | 3,614,000 | | | — | | | — | |
Total Return Bond Portfolio | | | — | | $ | 251,000 | | | — | |
Intermediate-Term Bond Portfolio | | | — | | | 1,314,000 | | | — | |
Mortgage Backed Securities Portfolio | | | — | | | — | | | 1,609,000 | (e) |
U.S. Government Money Market Portfolio | | | — | | | 400 | | | — | |
| (a) | Approximately $6,916,000 expiring in 2010 and $6,730,000 expiring in 2011. Approximately $44,633,000 was used to offset net taxable gains realized in the fiscal year ended December 31, 2004. |
| (b) | Approximately $6,675,000 was used to offset net taxable gains realized in the fiscal year ended December 31, 2004. |
| | |
| 122 | | THE TARGET PORTFOLIO TRUST |
| (c) | Approximately $10,360,000 expiring in 2009, $28,653,000 expiring in 2010 and $6,730,000 expiring in 2011. Approximately $8,697,000 was used to offset net taxable gains realized in the fiscal year ended December 31, 2004. |
| (d) | Approximately $3,060,000 expiring in 2009, $24,235,000 expiring in 2010 and $2,800,000 expiring in 2011. Approximately $20,091,000 was used to offset net taxable gains realized in the fiscal year ended December 31, 2004. |
| (e) | Approximately $384,000 expiring in 2008, $970,000 expiring in 2011 and $255,000 expiring in 2012. |
For the year ended December 31, 2004, the tax character of distributions paid, as reflected in the Statement of Changes in Net Assets were:
| | | | | | | | | |
Portfolio
| | Ordinary
Income
| | Long-Term
Capital Gain
| | Total
Distributions
|
Large Capitalization Growth Portfolio | | $ | 1,525,007 | | | — | | $ | 1,525,007 |
Large Capitalization Value Portfolio | | | 4,679,699 | | | — | | | 4,679,699 |
Small Capitalization Value Portfolio | | | 5,807,652 | | $ | 9,126,920 | | | 14,934,572 |
International Equity Portfolio | | | 2,494,485 | | | — | | | 2,494,485 |
International Bond Portfolio | | | 2,800,864 | | | 140,359 | | | 2,941,223 |
Total Return Bond Portfolio | | | 7,451,540 | | | 1,084,263 | | | 8,535,803 |
Intermediate-Term Bond Portfolio | | | 9,177,935 | | | 3,540,871 | | | 12,718,806 |
Mortgage Backed Securities Portfolio | | | 4,319,318 | | | — | | | 4,319,318 |
U.S. Government Money Market Portfolio | | | 709,120 | | | — | | | 709,120 |
For the year ended December 31, 2003, the tax character of the distributions paid, as reflected in the Statements of Changes in Net Assets were:
| | | | | | | | | |
Portfolio
| | Ordinary Income
| | Long-Term Capital Gain
| | Total
Distributions
|
Large Capitalization Value Portfolio | | $ | 3,731,879 | | | — | | $ | 3,731,879 |
Small Capitalization Value Portfolio | | | 3,591,404 | | $ | 3,376,742 | | | 6,968,146 |
International Equity Portfolio | | | 2,118,075 | | | — | | | 2,118,075 |
International Bond Portfolio | | | 3,416,812 | | | 24,731 | | | 3,441,543 |
Total Return Bond Portfolio | | | 8,556,130 | | | 1,599,480 | | | 10,155,610 |
Intermediate-Term Bond Portfolio | | | 15,975,002 | | | 650,500 | | | 16,625,502 |
Mortgage Backed Securities Portfolio | | | 5,247,606 | | | — | | | 5,247,606 |
U.S. Government Money Market Portfolio | | | 820,357 | | | — | | | 820,357 |
The tax character of distributable earnings at December 31, 2004 was:
| | | | | | |
Portfolio
| | Ordinary
Income
| | Long-Term
Capital Gain
|
Large Capitalization Growth Portfolio | | $ | 31,245 | | | — |
Large Capitalization Value Portfolio | | | 1,012,777 | | $ | 12,968,246 |
Small Capitalization Growth Portfolio | | | — | | | — |
Small Capitalization Value Portfolio | | | 235,301 | | | 2,384,848 |
International Equity Portfolio | | | 1,735,093 | | | — |
International Bond Portfolio | | | 832,554 | | | 22,759 |
Total Return Bond Portfolio | | | — | | | 1,295,871 |
Intermediate-Term Bond Portfolio | | | 334,382 | | | 100,626 |
Mortgage Backed Securities Portfolio | | | 1,561 | | | — |
U.S. Government Money Market Portfolio | | | 13,490 | | | — |
| | |
| THE TARGET PORTFOLIO TRUST | | 123 |
The United States federal income tax basis and unrealized appreciation (depreciation) of the Portfolios' investments and the total net unrealized appreciation (depreciation) as of December 31, 2004, were as follows:
| | | | | | | | | | | | | | | | | | | | |
Portfolio
| | Tax Basis
| | Appreciation
| | Depreciation
| | | Net Unrealized
Appreciation
of Investments
| | Other
Cost Basis
Adjustments
| | | Total net
Unrealized
|
Large Capitalization Growth Portfolio | | $ | 265,729,856 | | $ | 87,550,761 | | $ | (13,766,464 | ) | | $ | 73,784,297 | | | — | | | $ | 73,784,297 |
Large Capitalization Value Portfolio | | | 296,373,700 | | | 94,056,225 | | | (4,928,163 | ) | | | 89,128,062 | | | — | | | | 89,128,062 |
Small Capitalization Growth Portfolio | | | 134,619,761 | | | 28,492,055 | | | (4,006,902 | ) | | | 24,485,153 | | | — | | | | 24,485,153 |
Small Capitalization Value Portfolio | | | 169,985,466 | | | 77,333,244 | | | (1,534,654 | ) | | | 75,798,590 | | | — | | | | 75,798,590 |
International Equity Portfolio | | | 183,858,811 | | | 45,088,978 | | | (1,348,674 | ) | | | 43,740,304 | | $ | 101,225 | | | | 43,841,529 |
International Bond Portfolio | | | 48,377,950 | | | 1,373,728 | | | (39,283 | ) | | | 1,334,445 | | | 86,615 | | | | 1,421,060 |
Total Return Bond Portfolio | | | 191,423,949 | | | 2,883,631 | | | (1,596,137 | ) | | | 1,287,494 | | | (798,507 | ) | | | 488,987 |
Intermediate-Term Bond Portfolio | | | 335,006,954 | | | 5,098,716 | | | (3,983,295 | ) | | | 1,115,421 | | | 209,311 | | | | 1,324,732 |
Mortgage Backed Securities Portfolio | | | 107,087,088 | | | 1,612,939 | | | (302,702 | ) | | | 1,310,237 | | | (28,194 | ) | | | 1,282,043 |
The difference between book basis and tax basis are primarily attributable to deferred losses on wash sales, mark to market on purchased options and mark to market on passive foreign investment companies. The other cost basis adjustments are primarily attributable to appreciation (depreciation) on written options, futures, swaps, short sales, forward currency contracts and mark to market of receivable and payables.
| | |
| 124 | | THE TARGET PORTFOLIO TRUST |
Note 6. Capital
The Fund has authorized an unlimited number of shares of beneficial interest at $.001 par value per share. Transactions in shares of beneficial interest during the year ended December 31, 2004 were as follows:
| | | | | | | | | | |
Portfolio
| | Shares
Sold
| | Shares Issued in
Reinvestment of
Dividends and
Distributions
| | Shares
Reacquired
| | | Increase/
(Decrease)
in Shares
Outstanding
| |
Large Capitalization Growth Portfolio | | 4,993,871 | | 99,111 | | (6,119,766 | ) | | (1,026,784 | ) |
Large Capitalization Value Portfolio | | 5,414,647 | | 290,776 | | (4,845,605 | ) | | 859,818 | |
Small Capitalization Growth Portfolio | | 3,359,377 | | — | | (3,601,982 | ) | | (242,605 | ) |
Small Capitalization Value Portfolio | | 2,777,541 | | 706,764 | | (3,212,334 | ) | | 271,971 | |
International Equity Portfolio | | 4,804,787 | | 210,635 | | (4,124,087 | ) | | 891,335 | |
International Bond Portfolio | | 2,404,390 | | 358,888 | | (1,843,995 | ) | | 919,283 | |
Total Return Bond Portfolio | | 6,346,880 | | 778,446 | | (5,175,584 | ) | | 1,949,742 | |
Intermediate-Term Bond Portfolio | | 7,378,419 | | 1,172,608 | | (11,802,265 | ) | | (3,251,238 | ) |
Mortgage Backed Securities Portfolio | | 2,296,659 | | 369,469 | | (3,699,112 | ) | | (1,032,984 | ) |
Transactions in shares of beneficial interest during the year ended December 31, 2003 were as follows:
| | | | | | | | | | |
Portfolio
| | Shares
Sold
| | Shares Issued in
Reinvestment of
Dividends and
Distributions
| | Shares
Reacquired
| | | Increase/
(Decrease)
in Shares
Outstanding
| |
Large Capitalization Growth Portfolio | | 6,953,016 | | — | | (6,417,696 | ) | | 535,320 | |
Large Capitalization Value Portfolio | | 5,785,901 | | 268,646 | | (5,571,034 | ) | | 483,513 | |
Small Capitalization Growth Portfolio | | 4,591,873 | | — | | (3,951,697 | ) | | 640,176 | |
Small Capitalization Value Portfolio | | 2,731,257 | | 371,473 | | (3,313,238 | ) | | (210,508 | ) |
International Equity Portfolio | | 9,427,039 | | 200,739 | | (8,456,409 | ) | | 1,171,369 | |
International Bond Portfolio | | 3,767,332 | | 385,003 | | (2,719,639 | ) | | 1,432,696 | |
Total Return Bond Portfolio | | 6,974,878 | | 915,221 | | (6,059,658 | ) | | 1,830,441 | |
Intermediate-Term Bond Portfolio | | 13,623,787 | | 1,495,398 | | (14,835,948 | ) | | 283,237 | |
Mortgage Backed Securities Portfolio | | 4,746,277 | | 443,657 | | (5,735,443 | ) | | (545,509 | ) |
| | |
| THE TARGET PORTFOLIO TRUST | | 125 |
Report of Independent Registered Public Accounting Firm
The Board of Trustees and Shareholders of
The Target Portfolio Trust
We have audited the accompanying statements of assets and liabilities of The Target Portfolio Trust (comprised of Large Capitalization Growth Portfolio, Large Capitalization Value Portfolio, Small Capitalization Growth Portfolio, Small Capitalization Value Portfolio, International Equity Portfolio, International Bond Portfolio, Total Return Bond Portfolio, Intermediate-Term Bond Portfolio, Mortgage Backed Securities Portfolio, and U.S. Government Money Market Portfolio) hereafter referred to as the “Trust”, including the portfolios of investments, as of December 31, 2004, and the related statements of operations, the statements of changes in net assets, and the financial highlights for the year then ended. These financial statements and financial highlights are the responsibility of the Trust’s management. Our responsibility is to express an opinion on these financial statements and financial highlights based on our audit. The statements of changes in net assets for the year ended December 31, 2003 and the financial highlights for the periods presented through December 31, 2003, were audited by another independent registered public accounting firm, whose report dated, February 24, 2004, expressed an unqualified opinion thereon.
We conducted our audit in accordance with the standards of the Public Company Accounting Oversight Board (United States). Those standards require that we plan and perform the audit to obtain reasonable assurance about whether the financial statements and financial highlights are free of material misstatement. An audit includes examining, on a test basis, evidence supporting the amounts and disclosures in the financial statements. Our procedures included confirmation of securities owned as of December 31, 2004, by correspondence with the custodian and brokers or by other appropriate auditing procedures where replies from brokers were not received. An audit also includes assessing the accounting principles used and significant estimates made by management, as well as evaluating the overall financial statement presentation. We believe that our audit provides a reasonable basis for our opinion.
In our opinion, the financial statements and financial highlights referred to above present fairly, in all material respects, the financial position of the Trust as of December 31, 2004, and the results of its operations, the changes in its net assets, and the financial highlights for the year then ended, in conformity with U.S. generally accepted accounting principles.

KPMG LLP
New York, New York
February 24, 2005
| | |
| 126 | | THE TARGET PORTFOLIO TRUST |
Federal Income Tax Information (Unaudited)
As required by the Internal Revenue Code, we wish to advise you as to the federal tax status of dividends and distributions paid by the Fund during its fiscal year ended December 31, 2004. Further, we wish to advise you of the percentage of the ordinary income dividends (excluding long-term capital gains distributions) paid in 2004 that qualify for the corporate dividends received deduction available to corporate taxpayers.
Detailed below, please find the aggregate dividends and distributions, per share, paid by each portfolio during the year ended December 31, 2004 as well as the corporate dividend received deduction percentage:
| | | | | | | | | | | | | | | |
| | | Ordinary Dividends*
| | | | | | | |
Portfolio
| | Income
| | Short-Term
Capital Gains
| | Long-Term
Capital Gains
Distributions
| | Total Dividends
and Distributions
| | Corporate
Dividend
Received
Deduction
| |
Large Capitalization Growth Portfolio | | $ | 0.0688 | | | — | | | — | | $ | 0.0688 | | 100.00 | % |
Large Capitalization Value Portfolio | | | 0.2000 | | | — | | | — | | | 0.2000 | | 100.00 | % |
Small Capitalization Value Portfolio | | | 0.1708 | | $ | 0.3681 | | $ | 0.8459 | | | 1.3848 | | 55.94 | % |
International Equity Portfolio | | | 0.1393 | | | — | | | — | | | 0.1393 | | — | |
International Bond Portfolio | | | 0.4798 | | | 0.0610 | | | 0.0271 | | | 0.5679 | | — | |
Total Return Bond Portfolio | | | 0.4921 | | | 0.0128 | | | 0.0225 | | | 0.5274 | | — | |
Intermediate-Term Bond Portfolio | | | 0.2344 | | | 0.0720 | | | 0.1214 | | | 0.4278 | | — | |
Mortgage Backed Securities Portfolio | | | 0.4357 | | | — | | | — | | | 0.4357 | | — | |
U.S. Government Money Market Portfolio | | | 0.0076 | | | — | | | — | | | 0.0076 | | — | |
| * | For federal income tax purposes, ordinary income dividends and short-term capital gains distributions are taxable as ordinary income. Long-term capital gains distributions are taxable as capital gains income. |
The International Equity Portfolio has elected to give the benefit tax credit to its shareholders. Accordingly, shareholders who must report their gross income dividends and distributions in a federal income tax return will be entitled to a foreign tax credit, or an itemized deduction in computing their U.S. income tax liability. It is generally more advantageous to claim rather than take a deduction. For the fiscal year ended December 31, 2004 the International Equity Portfolio intends on passing through $706,817 of ordinary income distributions as a foreign tax credit from recognized foreign source income of $5,405,984.
The Large Capitalization Growth Portfolio, Large Capitalization Value Portfolio, Small Capitalization Value Portfolio, and International Equity Portfolio will designate 100%, 100%, 56% and 100% of ordinary income dividends, respectively, as qualified for the reduced tax rate under The Jobs and Growth Tax Relief Reconciliation Act of 2003.
The Large Capitalization Value Portfolio utilized redemptions as distributions in the amount of $12,550,399 as long-term capital gain.
| | |
| THE TARGET PORTFOLIO TRUST | | 127 |
Important Notice For Certain Shareholders (Unaudited)
Many states do not tax the portion of mutual fund dividends attributed to interest from U.S. Government obligations. Listed below is the percentage of interest earned by the following Target portfolios from U.S. Government obligations for the calendar year 2004.
To determine the amount of your dividends which may be exempt from state and local tax, simply multiply the amount in Box 1 of your 1099-Div (Ordinary Dividends) by the percentage listed below. These percentages do not apply to taxable capital gain distributions paid by the portfolios.
| | | |
Portfolio*
| | Percentage of Interest from
U.S. Government obligations
| |
Total Return Bond Portfolio | | 23.87 | % |
Intermediate-Term Bond Portfolio | | 2.87 | |
Mortgage Backed Securities Portfolio | | 2.06 | |
U.S. Government Money Market Portfolio | | 16.61 | |
| * | Due to certain minimum portfolio holding requirements in California, Connecticut and New York, residents of those states will not be able to exclude 2004 interest income from state and local taxes. |
Please consult your tax adviser or state/local authorities to properly report this information on your tax return. If you have any questions concerning the amounts listed above, please call your Wachovia Securities Financial Adviser.
| | |
| 128 | | THE TARGET PORTFOLIO TRUST |
Management of the Trust (Unaudited)
Information pertaining to the Trustees of the Trust is set forth below. Trustees who are not deemed to be “interested persons” of the Trust, as defined in the Investment Company Act of 1940 (the 1940 Act), are referred to as “Independent Trustees.” Trustees who are deemed to be “Interested persons” of the Trust are referred to as “Interested Trustees.” “Fund Complex”† consists of the Trust and any other investment companies managed by PI.
Independent Trustees2
David E.A. Carson (70), Trustee since 20033
Oversees 92 portfolios in Fund complex
Principal occupations (last 5 years): Director (January 2000 to May 2000), Chairman (January 1999 to December 1999), Chairman and Chief Executive Officer (January 1998 to December 1998) and President, Chairman and Chief Executive Officer (1983-1997) of People’s Bank.
Other Directorships held:4 Director of United Illuminating and UIL Holdings (utility company), since 1993.
Robert E. La Blanc (70), Trustee since 19993
Oversees 92 portfolios in Fund complex
Principal occupations (last 5 years): President (since 1981) of Robert E. La Blanc Associates, Inc. (telecommunications); formerly General Partner at Salomon Brothers and Vice-Chairman of Continental Telecom; Trustee of Manhattan College.
Other Directorships held:4 Director of Chartered Semiconductor Manufacturing, Ltd. (since 1998); Titan Corporation (electronics) (since 1995), Computer Associates International, Inc. (since 2002) (software company); FiberNet Telecom Group, Inc. (since 2003) (telecom company); Director (since April 1999) of the High Yield Plus Fund, Inc.
Douglas H. McCorkindale (65), Trustee since 19963
Oversees 92 portfolios in Fund complex
Principal occupations (last 5 years): Chairman (since February 2001), Chief Executive Officer (since June 2000) and President (since September 1997) of Gannett Co. Inc. (publishing and media); formerly Vice Chairman (March 1984-May 2000) of Gannett Co., Inc.
Other Directorships held:4 Director of Gannett Co. Inc., Director of Continental Airlines, Inc. (since May 1993); Director of Lockheed Martin Corp. (aerospace and defense) (since May 2001); Director of The High Yield Plus Fund, Inc. (since 1996).
Richard A. Redeker (61), Trustee since 20033
Oversees 91 portfolios in Fund complex
Principal occupations (last 5 years): Management Consultant; Director of Investmart, Inc. (since 2001) and Director of Penn Tank Lines, Inc. (since 1999).
Other Directorships held:4 None.
| | |
| THE TARGET PORTFOLIO TRUST | | 129 |
Robin B. Smith (65), Trustee since 20033
Oversees 91 portfolios in Fund complex
Principal occupations (last 5 years): Chairman of the Board (since January 2003) of Publishers Clearing House (direct marketing), formerly Chairman and Chief Executive Officer (August 1996-January 2003) of Publishers Clearing House.
Other Directorships held:4 Director of BellSouth Corporation (since 1992).
Stephen D. Stoneburn (61), Trustee since 20033
Oversees 91 portfolios in Fund complex
Principal occupations (last 5 years): President and Chief Executive Officer (since June 1996) of Quadrant Media Corp. (a publishing company); formerly President (June 1995-June 1996) of Argus Integrated Media, Inc.; Senior Vice President and Managing Director (January 1993-1995) of Cowles Business Media and Senior Vice President of Fairchild Publications, Inc. (1975-1989).
Other Directorships held:4 None
Clay T. Whitehead (66), Trustee since 19993
Oversees 92 portfolios in Fund complex
Principal occupations (last 5 years): President (since 1983) of National Exchange Inc. (new business development firm).
Other Directorships held:4 Director (since 2000) of the High Yield Plus Fund, Inc.
Interested Trustees1
Judy A. Rice (57), President since 2003 and Trustee since 20003
Oversees 92 portfolios in Fund complex
Principal occupations (last 5 years): President, Chief Executive Officer, Chief Operating Officer and Officer-in-Charge (since 2003) of PI; Director, Officer-in-Charge, President, Chief Executive Officer and Chief Operating Officer (since May 2003) of American Skandia Advisory Services, Inc. and American Skandia Investment Services, Inc.; Director, Officer-in-Charge, President, Chief Executive Officer (since May 2003) of American Skandia Fund Services, Inc.; Vice President (since February 1999) of Prudential Investment Management Services LLC; President, Chief Executive Officer and Officer-in-Charge (since April 2003) of Prudential Mutual Fund Services LLC; formerly various positions to Senior Vice President (1992-1999) of Prudential Securities; and various positions to Managing Director (1975-1992) of Salomon Smith Barney; Member of Board of Governors of the Money Management Institute.
Other Directorships held:4 None
Robert F. Gunia (58), Vice President and Trustee since 19993
Oversees 166 portfolios in Fund complex
Principal occupations (last 5 years): Chief Administrative Officer (since June 1999) of PI; Executive Vice President and Treasurer (since January 1996) of PI; President (since April 1999) of Prudential Investment Management Services LLC (PIMS); Corporate Vice President (since September 1997) of The Prudential Insurance Company of America (Prudential); Director, Executive Vice President and Chief Administrative Officer (since May 2003) of American Skandia Investment Services, Inc., American Skandia Advisory Services, Inc. and American Skandia Fund Services, Inc.; formerly Senior Vice President (March 1987-May 1999) of Prudential Securities.
| | |
| 130 | | THE TARGET PORTFOLIO TRUST |
Other Directorships held:4 Vice President and Director (since May 1989) and Treasurer (since 1999) of The Asia Pacific Fund, Inc.
Information pertaining to the Officers of the Fund is set forth below.
Officers2
William V. Healey (51), Chief Legal Officer since 20043
Principal occupations (last 5 years): Vice President and Associate General Counsel (since 1998) of Prudential; Executive Vice President and Chief Legal Officer (since February 1999) of Prudential Investments LLC; Senior Vice President, Chief Legal Officer and Secretary (since December 1998) of Prudential Investment Management Services LLC; Executive Vice President and Chief Legal Officer (since February 1999) of Prudential Mutual Fund Services LLC; Vice President and Secretary (since October 1998) of Prudential Investment Management, Inc., Executive Vice President and Chief Legal Officer (since May 2003) of American Skandia Investment Services, Inc., American Skandia Fund Services, Inc. and American Skandia Advisory Services, Inc.; Director (June 1999-June 2002 and June 2003-present) of ICI Mutual Insurance Company; prior to August 1998, Associate General Counsel of the Dreyfus Corporation (Dreyfus), a subsidiary of Mellon Bank, N.A. (Mellon Bank), and an officer and/or director of various affiliates of Mellon Bank and Dreyfus; Assistant Secretary (since June 2004) of The Asia Pacific Fund, Inc.
Deborah A. Docs (47), Secretary since 20043
Vice President and Corporate Counsel (since January 2001) of Prudential, Vice President and Assistant Secretary (since December 1996) of PI; Vice President and Assistant Secretary (since May 2003) of American Skandia Investment Services, Inc.
Lee D. Augsburger (45), Chief Compliance Officer since 20043
Principal occupations (last 5 years): Vice President and Chief Compliance Officer (since May 2003) of PI; Vice President and Chief Compliance Officer (since October 2000) of Prudential Investment Management, Inc.; formerly Vice President and Chief Legal Officer—Annuities (August 1999-October 2000) of Prudential Insurance Company of America; Vice President and Corporate Counsel (November 1997-August 1999) of Prudential Insurance Company of America.
Maryanne Ryan (40), Anti-Money Laundering Compliance Officer since 20023
Principal occupations (last 5 years): Vice President, Prudential (since November 1998), First Vice President, Prudential Securities (March 1997-May 1998); Anti-Money Laundering Compliance Officer (since 2003) of American Skandia Investment Services, Inc., American Skandia Advisory Services, Inc. and American Skandia Marketing, Inc.
Helene Gurian (51), Acting Anti-Money Laundering Compliance Officer since 20043
Principal occupations (last 5 years): Vice President, Prudential (since July 1997). Vice President, Compliance (July 1997-January 2001); Vice President, Compliance and Risk Officer, Retail Distribution (January 2001-May 2002); Vice President, Corporate Investigations (May 2002-present) responsible for supervision of Prudential’s fraud investigations, anti-money laundering program and high technology investigation unit.
Grace C. Torres (45), Treasurer and Principal Financial and Accounting Officer since 19983
Principal occupations (last 5 years): Senior Vice President (since January 2000) of PI, Senior Vice President and Assistant Treasurer (since May 2003) of American Skandia Investment Services, Inc. and American Skandia Advisory Services, Inc.; formerly First Vice President (December 1996-January 2000) of PI and First Vice President (March 1993-1999) of Prudential Securities.
| | 1 | “Interested” Trustee, as defined in the 1940 Act, by reason of employment with the Manager, (Prudential Investments LLC or PI), the Subadviser (Quantative Management Associates LLC or QMA) or the Distributor (Prudential Investment Management Services LLC or PIMS). |
| | 2 | Unless otherwise noted, the address of the Trustees and Officers is c/o: Prudential Investments LLC, Gateway Center Three, 100 Mulberry Street, Newark, NJ 07102. |
| | |
| THE TARGET PORTFOLIO TRUST | | 131 |
| | 3 | There is no set term of office for Trustees and Officers. The Independent Trustees have adopted a retirement policy, which calls for the retirement of Trustees on December 31 of the year in which they reach the age of 75. The table shows the individuals length of service as Trustee and/or Officer. |
| | 4 | This includes only directorships of companies requested to register, or file reports with the SEC under the Securities and Exchange Act of 1934 (that is, “public companies”) or other investment companies registered under the 1940 Act. |
| | † | The Fund Complex consists of all investment companies managed by PI. The Funds for which PI serves as manager include JennisonDryden Mutual Funds, Strategic Partners Funds, American Skandia Advisor Funds, Inc., The Prudential Variable Contract Accounts 2, 10, 11, The Target Portfolio Trust, The Prudential Series Fund, Inc., American Skandia Trust, and Prudential’s Gibraltar Fund. |
Additional information about the Trust’s Trustees is included in the Trust’s Statement of Additional Information which is available without charge, upon request, by calling (800) 521-7466 or (732) 482-7555 (Calling from outside the U.S.)
| | |
| 132 | | THE TARGET PORTFOLIO TRUST |
Growth of a $10,000 Investment
Large Capitalization Growth Portfolio
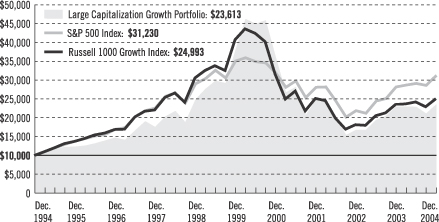
| | | | | | | | | |
| Average Annual Total Returns as of 12/31/04 | |
| | | One Year | | | Five Years | | | Ten Years | |
With TARGET Program Fee | | 2.23 | % | | –9.19 | % | | 8.97 | % |
| | | |
| | | One Year | | | Five Years | | | Ten Years | |
Without TARGET Program Fee | | 3.78 | % | | –7.81 | % | | 10.62 | % |
Performance data quoted represent past performance. Past performance does not guarantee future results. The investment return and principal value of an investment will fluctuate so that an investor’s shares, when redeemed, may be worth more or less than their original cost. Current performance may be lower or higher than the past performance data quoted. The returns in the graph and the tables do not reflect the deduction of taxes that a shareholder would pay on Fund distributions or following the redemption of Fund shares. An investor may obtain performance data current to the most recent month-end by visiting our website at www.prudential.com or by calling (800) 225-1852. The maximum TARGET program fee for retail investors is 1.50%.
The graph compares a $10,000 investment in the TARGET Large Capitalization Growth Portfolio with a similar investment in the S&P 500 Index and the Russell 1000 Growth Index by portraying the initial account values at the beginning of the 10-year period (December 31, 1994) and the account values at the end of the current fiscal year (December 31, 2004), as measured on a quarterly basis. The graph takes into account the maximum quarterly TARGET program fee of 1.50% annually for retail investors. For individual retirement plans and qualified employee benefit plans, taking into account the maximum TARGET program fee of 1.25%, the average annual total return for the 10-year period would have been 9.25% and the growth of a $10,000 investment would have been $24,240. The average annual total returns in the table and the returns on investment in the graph do not reflect the deduction of taxes that a shareholder would pay on Portfolio distributions or following the redemption of Portfolio shares.
| | |
| | | THE TARGET PORTFOLIO TRUST |
The S&P 500 Index is an index of 500 stocks of large U.S. companies. It gives a broad look at how U.S. stock prices have performed. The Russell 1000 Growth Index contains those securities in the Russell 1000 Index with a greater-than-average growth orientation. Companies in this index tend to exhibit higher price-to-book and price-to-earnings ratios, lower dividend yields, and higher forecasted growth rates. These indexes are unmanaged, and the total returns include the reinvestment of all dividends, but do not include the effect of sales charges, operating expenses, or taxes. These returns would be lower if they included the effect of sales charges, operating expenses, or taxes. The securities in these indexes may differ substantially from the securities in the Portfolio. These indexes are not the only ones that may be used to characterize performance of large-capitalization equity funds, and other indexes may portray different comparative performance. Investors cannot invest directly in an index.
| | |
| THE TARGET PORTFOLIO TRUST | | |
Growth of a $10,000 Investment
Large Capitalization Value Portfolio
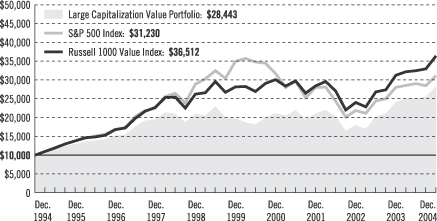
| | | | | | | | | |
| Average Annual Total Returns as of 12/31/04 | | | | | | | | | |
| | | One Year | | | Five Years | | | Ten Years | |
With TARGET Program Fee | | 17.10 | % | | 7.32 | % | | 11.02 | % |
| | | |
| | | One Year | | | Five Years | | | Ten Years | |
Without TARGET Program Fee | | 18.87 | % | | 8.94 | % | | 12.70 | % |
Performance data quoted represent past performance. Past performance does not guarantee future results. The investment return and principal value of an investment will fluctuate so that an investor’s shares, when redeemed, may be worth more or less than their original cost. Current performance may be lower or higher than the past performance data quoted. The returns in the graph and the tables do not reflect the deduction of taxes that a shareholder would pay on Fund distributions or following the redemption of Fund shares. An investor may obtain performance data current to the most recent month-end by visiting our website at www.prudential.com or by calling (800) 225-1852. The maximum TARGET program fee for retail investors is 1.50%.
The graph compares a $10,000 investment in the TARGET Large Capitalization Value Portfolio with a similar investment in the S&P 500 Index and the Russell 1000 Value Index by portraying the initial account values at the beginning of the 10-year period (December 31, 1994) and the account values at the end of the current fiscal year (December 31, 2004), as measured on a quarterly basis. The graph takes into account the maximum quarterly TARGET program fee of 1.50% annually for retail investors. For individual retirement plans and qualified employee benefit plans, taking into account the maximum TARGET program fee of 1.25%, the average annual total return for the 10-year period would have been 11.30% and the growth of a $10,000 investment would have been $29,197. The average annual total returns in the table and the returns on investment in the graph do not reflect the deduction of taxes that a shareholder would pay on Portfolio distributions or following the redemption of Portfolio shares.
| | |
| | | THE TARGET PORTFOLIO TRUST |
The S&P 500 Index is an index of 500 stocks of large U.S. companies. It gives a broad look at how U.S. stock prices have performed. The Russell 1000 Value Index contains those securities in the Russell 1000 Index with a lesser-than-average growth orientation. Companies in this index generally have low price-to-book and price-to-earnings ratios, higher dividend yields, and lower forecasted growth values. These indexes are unmanaged, and the total returns include the reinvestment of all dividends, but do not include the effect of sales charges, operating expenses, or taxes. These returns would be lower if they included the effect of sales charges, operating expenses, or taxes. The securities in these indexes may differ substantially from the securities in the Portfolio. These indexes are not the only ones that may be used to characterize performance of large-capitalization equity funds, and other indexes may portray different comparative performance. Investors cannot invest directly in an index.
| | |
| THE TARGET PORTFOLIO TRUST | | |
Growth of a $10,000 Investment
Small Capitalization Growth Portfolio
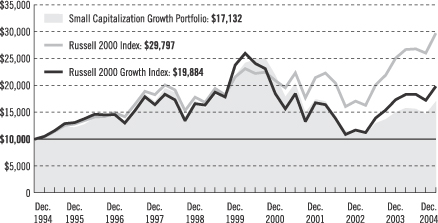
| | | | | | | | | |
| Average Annual Total Returns as of 12/31/04 | | | | | | | | | |
| | | One Year | | | Five Years | | | Ten Years | |
With TARGET Program Fee | | 13.32 | % | | –4.88 | % | | 5.53 | % |
| | | |
| | | One Year | | | Five Years | | | Ten Years | |
Without TARGET Program Fee | | 15.03 | % | | –3.44 | % | | 7.13 | % |
Performance data quoted represent past performance. Past performance does not guarantee future results. The investment return and principal value of an investment will fluctuate so that an investor’s shares, when redeemed, may be worth more or less than their original cost. Current performance may be lower or higher than the past performance data quoted. The returns in the graph and the tables do not reflect the deduction of taxes that a shareholder would pay on Fund distributions or following the redemption of Fund shares. An investor may obtain performance data current to the most recent month-end by visiting our website at www.prudential.com or by calling (800) 225-1852. The maximum TARGET program fee for retail investors is 1.50%.
The graph compares a $10,000 investment in the TARGET Small Capitalization Growth Portfolio with a similar investment in the Russell 2000 Index and the Russell 2000 Growth Index by portraying the initial account values at the beginning of the 10-year period (December 31, 1994) and the account values at the end of the current fiscal year (December 31, 2004), as measured on a quarterly basis. The graph takes into account the maximum quarterly TARGET program fee of 1.50% annually for retail investors. For individual retirement plans and qualified employee benefit plans, taking into account the maximum TARGET program fee of 1.25%, the average annual total return for the 10-year period would have been 5.80% and the growth of a $10,000 investment would have been $17,582. The average annual total returns in the table and the returns on investment in the graph do not reflect the deduction of taxes that a shareholder would pay on Portfolio distributions or following the redemption of Portfolio shares.
| | |
| | | THE TARGET PORTFOLIO TRUST |
The Russell 2000 Index is a weighted index that comprises the smallest 2,000 stocks among the largest 3,000 equity-capitalized U.S. corporations and represents approximately 10% of their aggregate market value. The Russell 2000 Growth Index comprises securities in the Russell 2000 Index with a greater-than-average growth orientation. Companies in this index tend to exhibit higher price-to-book ratios and higher forecasted growth values. These indexes are unmanaged, and the total returns include the reinvestment of all dividends, but do not include the effect of sales charges, operating expenses, or taxes. These returns would be lower if they included the effect of sales charges, operating expenses, or taxes. The securities in these indexes may differ substantially from the securities in the Portfolio. These indexes are not the only ones that may be used to characterize performance of small-capitalization equity funds, and other indexes may portray different comparative performance. Investors cannot invest directly in an index.
| | |
| THE TARGET PORTFOLIO TRUST | | |
Growth of a $10,000 Investment
Small Capitalization Value Portfolio
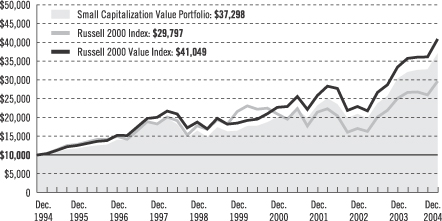
| | | | | | | | | |
| Average Annual Total Returns as of 12/31/04 | | | | | | | | | |
| | | One Year | | | Five Years | | | Ten Years | |
With TARGET Program Fee | | 22.17 | % | | 17.60 | % | | 14.07 | % |
| | | |
| | | One Year | | | Five Years | | | Ten Years | |
Without TARGET Program Fee | | 24.02 | % | | 19.39 | % | | 15.80 | % |
Performance data quoted represent past performance. Past performance does not guarantee future results. The investment return and principal value of an investment will fluctuate so that an investor’s shares, when redeemed, may be worth more or less than their original cost. Current performance may be lower or higher than the past performance data quoted. The returns in the graph and the tables do not reflect the deduction of taxes that a shareholder would pay on Fund distributions or following the redemption of Fund shares. An investor may obtain performance data current to the most recent month-end by visiting our website at www.prudential.com or by calling (800) 225-1852. The maximum TARGET program fee for retail investors is 1.50%.
The graph compares a $10,000 investment in the TARGET Small Capitalization Value Portfolio with a similar investment in the Russell 2000 Index and the Russell 2000 Value Index by portraying the initial account values at the beginning of the 10-year period (December 31, 1994) and the account values at the end of the current fiscal year (December 31, 2004), as measured on a quarterly basis. The graph takes into account the maximum quarterly TARGET program fee of 1.50% annually for retail investors. For individual retirement plans and qualified employee benefit plans, taking into account the maximum TARGET program fee of 1.25%, the average annual total return for the 10-year period would have been 14.36% and the growth of a $10,000 investment would have been $38,302. The average annual total returns in the table and the returns on investment in the graph do not reflect the deduction of taxes that a shareholder would pay on Portfolio distributions or following the redemption of Portfolio shares.
| | |
| | | THE TARGET PORTFOLIO TRUST |
The Russell 2000 Index is a weighted index that comprises the smallest 2,000 stocks among the largest 3,000 equity-capitalized U.S. corporations and represents approximately 10% of their aggregate market value. The Russell 2000 Value Index comprises securities in the Russell 2000 Index with a lesser-than-average growth orientation. Companies in this index tend to exhibit lower price-to-book ratios and lower forecasted growth values. These indexes are unmanaged, and the total returns include the reinvestment of all dividends, but do not include the effect of sales charges, operating expenses, or taxes. These returns would be lower if they included the effect of sales charges, operating expenses, or taxes. The securities in these indexes may differ substantially from the securities in the Portfolio. These indexes are not the only ones that may be used to characterize performance of small-capitalization equity funds, and other indexes may portray different comparative performance. Investors cannot invest directly in an index.
| | |
| THE TARGET PORTFOLIO TRUST | | |
Growth of a $10,000 Investment
International Equity Portfolio
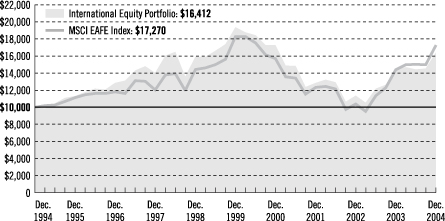
| | | | | | | | | |
| Average Annual Total Returns as of 12/31/04 | | | | | | | | | |
| | | One Year | | | Five Years | | | Ten Years | |
With TARGET Program Fee | | 13.51 | % | | –3.31 | % | | 5.08 | % |
| | | |
| | | One Year | | | Five Years | | | Ten Years | |
Without TARGET Program Fee | | 15.23 | % | | –1.85 | % | | 6.67 | % |
Performance data quoted represent past performance. Past performance does not guarantee future results. The investment return and principal value of an investment will fluctuate so that an investor’s shares, when redeemed, may be worth more or less than their original cost. Current performance may be lower or higher than the past performance data quoted. The returns in the graph and the tables do not reflect the deduction of taxes that a shareholder would pay on Fund distributions or following the redemption of Fund shares. An investor may obtain performance data current to the most recent month-end by visiting our website at www.prudential.com or by calling (800) 225-1852. The maximum TARGET program fee for retail investors is 1.50%.
The graph compares a $10,000 investment in the TARGET International Equity Portfolio with a similar investment in the Morgan Stanley Capital International Europe, Australasia, Far East Index (MSCI EAFE Index) by portraying the initial account values at the beginning of the 10-year period (December 31, 1994) and the account values at the end of the current fiscal year (December 31, 2004), as measured on a quarterly basis. The graph takes into account the maximum quarterly TARGET program fee of 1.50% annually for retail investors. For individual retirement plans and qualified employee benefit plans, taking into account the maximum TARGET program fee of 1.25%, the average annual total return for the 10-year period would have been 5.34% and the growth of a $10,000 investment would have been $16,831. The average annual total returns in the table and the returns on investment in the graph do not reflect the deduction of taxes that a shareholder would pay on Portfolio distributions or following the redemption of Portfolio shares.
| | |
| | | THE TARGET PORTFOLIO TRUST |
The MSCI EAFE Index is a weighted index of performance that reflects stock price movements in Europe, Australasia, and the Far East. The MSCI EAFE Index is unmanaged, and the total returns include the reinvestment of all dividends, but do not include the effect of sales charges, operating expenses, or taxes. These returns would be lower if they included the effect of sales charges, operating expenses, or taxes. The securities in the MSCI EAFE Index may differ substantially from the securities in the Portfolio. The MSCI EAFE Index is not the only one that may be used to characterize performance of international equity funds, and other indexes may portray different comparative performance. Investors cannot invest directly in an index.
| | |
| THE TARGET PORTFOLIO TRUST | | |
Growth of a $10,000 Investment
International Bond Portfolio
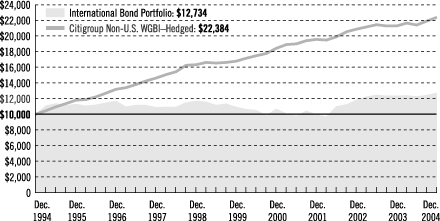
| | | | | | | | |
| Average Annual Total Returns as of 12/31/04 |
| | | One Year | | | Five Years | | | Ten Years |
With TARGET Program Fee | | 2.67 | % | | 3.03 | % | | 2.45% (2.43) |
| | | |
| | | One Year | | | Five Years | | | Ten Years |
Without TARGET Program Fee | | 3.71 | % | | 4.06 | % | | 3.48% (3.46) |
Performance data quoted represent past performance. Past performance does not guarantee future results. The investment return and principal value of an investment will fluctuate so that an investor’s shares, when redeemed, may be worth more or less than their original cost. Current performance may be lower or higher than the past performance data quoted. The returns in the graph and the tables do not reflect the deduction of taxes that a shareholder would pay on Fund distributions or following the redemption of Fund shares. An investor may obtain performance data current to the most recent month-end by visiting our website at www.prudential.com or by calling (800) 225-1852. The maximum TARGET program fee for retirement accounts is 1.35%.
The graph compares a $10,000 investment in the TARGET International Bond Portfolio with a similar investment in the Citigroup Non-U.S. World Government Bond Index–Hedged (Citigroup Non-U.S. WGBI–Hedged) and the Citigroup Non-U.S. World Government Bond Index–Unhedged (Citigroup Non-U.S. WGBI–Unhedged) by portraying the initial account values at the beginning of the 10-year period (December 31, 1994) and the account values at the end of the current fiscal year (December 31, 2004), as measured on a quarterly basis. The graph takes into account the maximum quarterly TARGET program fee of 1% annually for retail investors. For individual retirement plans and qualified employee benefit plans, taking into account the maximum TARGET program fee of 1.35%, the average annual total return for the 10-year period would have been 2.09% and the growth of a $10,000 investment would have been $12,298. The average annual total returns in the table and the returns on
| | |
| | | THE TARGET PORTFOLIO TRUST |
investment in the graph do not reflect the deduction of taxes that a shareholder would pay on Portfolio distributions or following the redemption of Portfolio shares. Without waiver of fees and/or expense subsidization, the Portfolio’s returns would have been lower, as indicated in parentheses.
The Citigroup Non-U.S. WGBI–Hedged is an unmanaged index of approximately 600 high-quality bonds with foreign currency exposure translated to the U.S. dollar. The Citigroup Non-U.S. WGBI–Unhedged is an unmanaged index of approximately 600 high-quality bonds issued in several different currencies. It gives a broad look at how foreign bonds have performed. The indexes’ total returns include the reinvestment of all dividends, but do not include the effect of sales charges, operating expenses, or taxes. These returns would be lower if they included the effect of sales charges, operating expenses, or taxes. The securities in the indexes may differ substantially from the securities in the Portfolio. These indexes are not the only ones that may be used to characterize performance of international bond funds, and other indexes may portray different comparative performance. Investors cannot invest directly in an index.
| | |
| THE TARGET PORTFOLIO TRUST | | |
Growth of a $10,000 Investment
Total Return Bond Portfolio
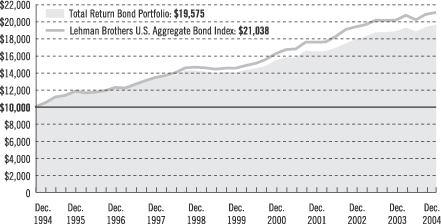
| | | | | | | | | |
| Average Annual Total Returns as of 12/31/04 | |
| | | One Year | | | Five Years | | | Ten Years | |
With TARGET Program Fee | | 3.69 | % | | 6.87 | % | | 6.95 | % |
| | | |
| | | One Year | | | Five Years | | | Ten Years | |
Without TARGET Program Fee | | 4.73 | % | | 7.95 | % | | 8.02 | % |
Performance data quoted represent past performance. Past performance does not guarantee future results. The investment return and principal value of an investment will fluctuate so that an investor’s shares, when redeemed, may be worth more or less than their original cost. Current performance may be lower or higher than the past performance data quoted. The returns in the graph and the tables do not reflect the deduction of taxes that a shareholder would pay on Fund distributions or following the redemption of Fund shares. An investor may obtain performance data current to the most recent month-end by visiting our website at www.prudential.com or by calling (800) 225-1852. The maximum TARGET program fee for retirement accounts is 1.35%.
The graph compares a $10,000 investment in the TARGET Total Return Bond Portfolio with a similar investment in the Lehman Brothers U.S. Aggregate Bond Index and the Lehman Brothers Government/Credit (Govt/Credit Bond) Index by portraying the initial account values at the beginning of the 10-year period (December 31, 1994) and the account values at the end of the current fiscal year (December 31, 2004), as measured on a quarterly basis. The graph takes into account the maximum quarterly TARGET program fee of 1% annually for retail investors. For individual retirement plans and qualified employee benefit plans, taking into account the maximum TARGET program fee of 1.35%, the average annual total return for the 10-year period would have been 5.75% and the growth of a $10,000 investment would have been $17,491. The average annual total returns in the table and the returns on investment in the graph do not reflect the deduction of taxes that a shareholder would pay on Portfolio distributions or following the redemption of Portfolio shares.
| | |
| | | THE TARGET PORTFOLIO TRUST |
The Lehman Brothers U.S. Aggregate Bond Index is an unmanaged index of investment-grade securities issued by the U.S. government and its agencies and by corporations with between 1 and 10 years remaining to maturity. It gives a broad look at how bond prices of short- and intermediate-term bonds have performed. The Lehman Brothers Govt/Credit Bond Index is an index of publicly traded intermediate- and long-term government and corporate debt with an average maturity of 10 years. It gives a broad look at how bonds have performed. These indexes are unmanaged, and the total returns include the reinvestment of all dividends, but do not include the effect of sales charges, operating expenses, or taxes. These returns would be lower if they included the effect of sales charges, operating expenses, or taxes. The securities in these indexes may differ substantially from the securities in the Portfolio. These indexes are not the only ones that may be used to characterize performance of bond funds, and other indexes may portray different comparative performance. Investors cannot invest directly in an index.
| | |
| THE TARGET PORTFOLIO TRUST | | |
Growth of a $10,000 Investment
Intermediate-Term Bond Portfolio
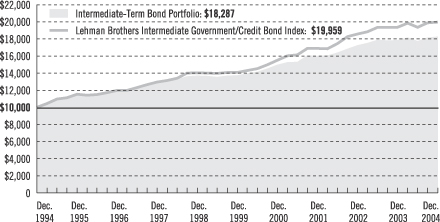
| | | | | | | | | |
| Average Annual Total Returns as of 12/31/04 | | | | | | | | | |
| | | One Year | | | Five Years | | | Ten Years | |
With TARGET Program Fee | | 2.16 | % | | 5.83 | % | | 6.22 | % |
| | | |
| | | One Year | | | Five Years | | | Ten Years | |
Without TARGET Program Fee | | 3.19 | % | | 6.89 | % | | 7.29 | % |
Performance data quoted represent past performance. Past performance does not guarantee future results. The investment return and principal value of an investment will fluctuate so that an investor’s shares, when redeemed, may be worth more or less than their original cost. Current performance may be lower or higher than the past performance data quoted. The returns in the graph and the tables do not reflect the deduction of taxes that a shareholder would pay on Fund distributions or following the redemption of Fund shares. An investor may obtain performance data current to the most recent month-end by visiting our website at www.prudential.com or by calling (800) 225-1852. The maximum TARGET program fee for retirement accounts is 1.35%.
The graph compares a $10,000 investment in the TARGET Intermediate-Term Bond Portfolio with a similar investment in the Lehman Brothers Intermediate Government/Credit Bond Index (formerly Lehman Brothers Int. Govt/Credit Bond Index) by portraying the initial account values at the beginning of the 10-year period (December 31, 1994) and the account values at the end of the current fiscal year (December 31, 2004), as measured on a quarterly basis. The graph takes into account the maximum quarterly TARGET program fee of 1% annually for retail investors. For individual retirement plans and qualified employee benefit plans, taking into account the maximum TARGET program fee of 1.35%, the average annual total return for the 10-year period would have been 5.85% and the growth of a $10,000 investment would have been $17,665. The average annual total returns in the table and the returns on investment in the graph do not reflect the deduction of taxes that a shareholder would pay on Portfolio distributions or following the redemption of Portfolio shares.
| | |
| | | THE TARGET PORTFOLIO TRUST |
The Lehman Brothers Intermediate Government/Credit Bond Index is a weighted index comprising securities issued by the U.S. government and its agencies and securities publicly issued by corporations with 1 to 10 years remaining to maturity and rated investment grade. The Lehman Brothers Intermediate Government/Credit Bond Index is unmanaged, and the total returns include the reinvestment of all dividends, but do not include the effect of sales charges, operating expenses, or taxes. These returns would be lower if they included the effect of sales charges, operating expenses, or taxes. The securities in the Lehman Brothers Intermediate Government/Credit Bond Index may differ substantially from the securities in the Portfolio. The Lehman Brothers Intermediate Government/Credit Bond Index is not the only one that may be used to characterize performance of bond funds, and other indexes may portray different comparative performance. Investors cannot invest directly in an index.
| | |
| THE TARGET PORTFOLIO TRUST | | |
Growth of a $10,000 Investment
Mortgage Backed Securities Portfolio
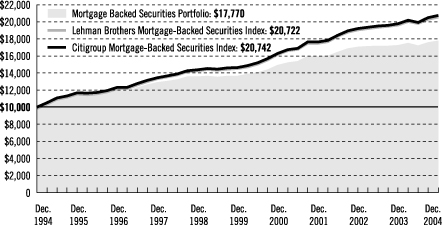
| | | | | | | | |
| Average Annual Total Returns as of 12/31/04 |
| | | One Year | | | Five Years | | | Ten Years |
With TARGET Program Fee | | 2.64 | % | | 5.33 | % | | 5.92% (5.91) |
| | | |
| | | One Year | | | Five Years | | | Ten Years |
Without TARGET Program Fee | | 3.68 | % | | 6.39 | % | | 6.98% (6.97) |
Performance data quoted represent past performance. Past performance does not guarantee future results. The investment return and principal value of an investment will fluctuate so that an investor’s shares, when redeemed, may be worth more or less than their original cost. Current performance may be lower or higher than the past performance data quoted. The returns in the graph and the tables do not reflect the deduction of taxes that a shareholder would pay on Fund distributions or following the redemption of Fund shares. An investor may obtain performance data current to the most recent month-end by visiting our website at www.prudential.com or by calling (800) 225-1852. The maximum TARGET program fee for retirement accounts is 1.35%.
The graph compares a $10,000 investment in the TARGET Mortgage Backed Securities Portfolio with a similar investment in the Lehman Brothers Mortgage-Backed Securities Index and the Citigroup Mortgage-Backed Securities Index by portraying the initial account values at the beginning of the 10-year period (December 31, 1994) and the account values at the end of the current fiscal year (December 31, 2004), as measured on a quarterly basis. The graph takes into account the maximum quarterly TARGET program fee of 1% annually for retail investors. For individual retirement plans and qualified employee benefit plans, taking into account the maximum TARGET program fee of 1.35%, the average annual total return for the 10-year period would have been 5.55% and the growth of a $10,000 investment would have been $17,170. The average annual total returns in the table and the returns on investment in the graph do not reflect the deduction of taxes that a shareholder would pay on Portfolio distributions or following the redemption of Portfolio shares. Without waiver of
| | |
| | | THE TARGET PORTFOLIO TRUST |
management fees and/or expense subsidizations, the Portfolio’s average annual total returns would have been lower, as indicated in parentheses.
The Lehman Brothers Mortgage-Backed Securities Index is a market capitalization-weighted index of 15-year and 30-year fixed-rate securities backed by the mortgage pools of the GNMA, the FNMA, and the FHLMC, and balloon mortgages with fixed-rate coupons. The Citigroup Mortgage-Backed Securities Index is an index of 30- and 15-year mortgage-related securities issued by U.S. government agencies. It gives a broad look at how mortgage-backed securities have performed. These indexes are unmanaged, and the total returns include the reinvestment of all dividends, but do not include the effect of sales charges, operating expenses, or taxes. These returns would be lower if they included the effect of sales charges, operating expenses, or taxes. The securities in these indexes may differ substantially from the securities in the Portfolio. These indexes are not the only ones that may be used to characterize performance of bond funds, and other indexes may portray different comparative performance. Investors cannot invest directly in an index.
| | |
| THE TARGET PORTFOLIO TRUST | | |
| | |
| n MAIL | | n TELEPHONE |
Gateway Center Three 100 Mulberry Street Newark, NJ 07102 | | (800) 225-1852 |
|
| PROXY VOTING |
| The Board of Trustees of The TARGET Portfolio Trust has delegated to the Trust’s investment advisers the responsibility for voting any proxies and maintaining proxy recordkeeping with respect to the Trust. A description of these proxy voting policies and procedures is available without charge, upon request, by calling (800) 225-1852 or by visiting the Securities and Exchange Commission’s (the Commission) website at http://www.sec.gov. Information regarding how the Trust voted proxies relating to portfolio securities during the most recent 12-month period ended June 30, 2004, is available on the Trust’s website at http://www.prudential.com and on the Commission’s website at http://www.sec.gov. |
|
| TRUSTEES |
David E.A. Carson • Robert F. Gunia • Robert E. La Blanc • Douglas H. McCorkindale •
Richard A. Redeker • Judy A. Rice • Robin B. Smith • Stephen D. Stoneburn •
Clay T. Whitehead |
|
| OFFICERS |
Judy A. Rice, President • Robert F. Gunia, Vice President • Grace C. Torres, Treasurer and Principal Financial and Accounting Officer • William V. Healey, Chief Legal Officer •
Deborah A. Docs, Secretary • Maryanne Ryan, Anti-Money Laundering Officer •
Helene Gurian, Acting Anti-Money Laundering Compliance Officer • Lee D. Augsburger, Chief Compliance Officer |
| | | | |
| MANAGER | | Prudential Investments LLC | | Gateway Center Three
100 Mulberry Street
Newark, NJ 07102 |
|
| INVESTMENT ADVISERS | | Columbus Circle Investors LLC | | Metro Center
One Station Place
Stamford, CT 06902 |
|
| | | EARNEST Partners, LLC | | 75 14th Street
Suite 2300
Atlanta, GA 30309 |
|
| | | Hotchkis and Wiley Capital
Management, LLC | | 725 S. Figueroa Street
Suite 3900
Los Angeles, CA 90017 |
|
| | | J.P. Morgan Investment
Management Inc. | | 522 Fifth Avenue
New York, NY 10036 |
|
| | | Lazard Asset Management LLC | | 30 Rockefeller Plaza
New York, NY 10112 |
|
| | | NFJ Investment Group L.P. | | 2121 San Jacinto
Suite 1840
Dallas, TX 75201 |
| | | | |
| | | Oak Associates, Ltd. | | 3875 Embassy Parkway
Suite 250
Akron, OH 44333 |
|
| | | Pacific Investment
Management Company LLC | | 840 Newport Center Drive
Newport Beach, CA 92660 |
|
| | | RS Investment
Management, L.P. | | 388 Market Street
Suite 1700
San Francisco, CA 94111 |
|
| | | Wellington Management
Company, LLP | | 75 State Street
Boston, MA 02109 |
|
| | | Westcap Investors, LLC | | 11111 Santa Monica
Boulevard
Suite 820
Los Angeles, CA 90025 |
|
| DISTRIBUTOR | | Prudential Investment
Management Services LLC | | Gateway Center Three
100 Mulberry Street
Newark, NJ 07102 |
|
| CUSTODIAN | | The Bank of New York | | One Wall Street
New York, NY 10286 |
|
| TRANSFER AGENT | | Prudential Mutual Fund
Services LLC | | PO Box 8098
Philadelphia, PA 19176 |
|
INDEPENDENT REGISTERED PUBLIC ACCOUNTING FIRM | | KPMG LLP | | 757 Third Avenue
New York, NY 10017 |
|
| FUND COUNSEL | | Shearman & Sterling LLP | | 599 Lexington Avenue
New York, NY 10022 |
| | | | | | | | | | | | | | |
| | | The TARGET Portfolio Trust | | NASDAQ | | CUSIP | | | | NASDAQ | | CUSIP | | |
| | | Large Capitalization Growth | | TALGX | | 875921207 | | Large Capitalization Value | | TALVX | | 875921108 | | |
| | | Small Capitalization Growth | | TASGX | | 875921405 | | Small Capitalization Value | | TASVX | | 875921306 | | |
| | | International Equity | | TAIEX | | 875921504 | | International Bond | | TIBPX | | 875921876 | | |
| | | Total Return Bond | | TATBX | | 875921884 | | Intermediate-Term Bond | | TAIBX | | 875921801 | | |
| | | Mortgage Backed Securities | | TGMBX | | 875921702 | | U.S. Government Money Market | | PUGXX | | 875921603 | | |
|
| An investor should consider the investment objectives, risks, charges and expenses of a Portfolio carefully before investing. The prospectuses for the Portfolios contain this and other information about the Portfolios. An investor may obtain a prospectus by visiting our website at www.prudential.com or by calling (800) 225-1852. The prospectus should be read carefully before investing. |
|
| This report is not authorized for distribution to prospective investors unless preceded or accompanied by a current prospectus. The views expressed in this report and information about the Trust’s portfolios’ securities are for the period covered by this report and are subject to change thereafter. |
|
| E-DELIVERY |
To receive your mutual fund documents on-line, go to www.icsdelivery.com/prudential/funds and enroll. Instead of receiving printed documents by mail, you will receive notification via e-mail when new materials are available. You can cancel your enrollment or change your e-mail address at any time by clicking on the change/cancel enrollment option at the icsdelivery website address. |
|
| SHAREHOLDER COMMUNICATIONS WITH TRUSTEES |
| Shareholders of the Trust can communicate directly with the Board of Trustees by writing to the Chair of the Board, The TARGET Portfolio Trust, PO Box 13964, Philadelphia, PA 19176. Shareholders can communicate directly with an individual Trustee by writing to that Trustee at The TARGET Portfolio Trust, PO Box 13964, Philadelphia, PA 19176. Such communications to the Board or individual Trustees are not screened before being delivered to the addressee. |
AVAILABILITY OF QUARTERLY PORTFOLIO SCHEDULE
The Trust files its complete schedule of portfolio holdings with the Securities and Exchange Commission (the Commission) for the first and third quarters of each fiscal year on Form N-Q. The Trust Forms N-Q are available on the Commission’s website at http://www.sec.gov. The Trust Forms N-Q may also be reviewed and copied at the Commission’s Public Reference Room in Washington, D.C. Information on the operation of the Public Reference Room may be obtained by calling (800) SEC-0330 (732-0330). The Trust will provide a full list of its portfolio holdings as of the end of each fiscal quarter on its website at www.prudential.com within 60 days after the end of the fiscal quarter.
Mutual Funds:
| | | | |
| ARE NOT INSURED BY THE FDIC OR ANY FEDERAL GOVERNMENT AGENCY | | MAY LOSE VALUE | | ARE NOT A DEPOSIT OF OR GUARANTEED BY ANY BANK OR ANY BANK AFFILIATE |

| | | | | | | | | | | | | | |
| | | The TARGET Portfolio Trust | | NASDAQ | | CUSIP | | | | NASDAQ | | CUSIP | | |
| | | Large Capitalization Growth | | TALGX | | 875921207 | | Large Capitalization Value | | TALVX | | 875921108 | | |
| | | Small Capitalization Growth | | TASGX | | 875921405 | | Small Capitalization Value | | TASVX | | 875921306 | | |
| | | International Equity | | TAIEX | | 875921504 | | International Bond | | TIBPX | | 875921876 | | |
| | | Total Return Bond | | TATBX | | 875921884 | | Intermediate-Term Bond | | TAIBX | | 875921801 | | |
| | | Mortgage Backed Securities | | TGMBX | | 875921702 | | U.S. Govt Money Market | | PUGXX | | 875921603 | | |
TMF158E IFS-A100968 Ed. 02/2005
Item 2 – Code of Ethics — See Exhibit (a)
As of the end of the period covered by this report, the registrant has adopted a code of ethics (the “Section 406 Standards for Investment Companies – Ethical Standards for Principal Executive and Financial Officers”) that applies to the registrant’s Principal Executive Officer and Principal Financial Officer; the registrant’s Principal Financial Officer also serves as the Principal Accounting Officer.
The registrant hereby undertakes to provide any person, without charge, upon request, a copy of the code of ethics. To request a copy of the code of ethics, contact the registrant 973-367-7521, and ask for a copy of the Section 406 Standards for Investment Companies - Ethical Standards for Principal Executive and Financial Officers.
Item 3 – Audit Committee Financial Expert –
The registrant’s Board has determined that Mr. David Carson, member of the Board’s Audit Committee is an “audit committee financial expert,” and that he is “independent,” for purposes of this Item.
Item 4 – Principal Accountant Fees and Services –
(a) Audit Fees
For the fiscal year ended December 31, 2004, KPMG LLP (“KPMG”), the Registrant’s principal accountant, billed the Registrant $196,200 for professional services rendered for the audit of the Registrant’s annual financial statements or services that are normally provided in connection with statutory and regulatory filings. KPMG did not serve as the Registrant’s principal accountant during fiscal year ended December 31, 2003, so no information for that fiscal year is provided.
(b) Audit-Related Fees
None.
(c) Tax Fees
None.
(d) All Other Fees
None.
(e) (1) Audit Committee Pre-Approval Policies and Procedures
THE PRUDENTIAL MUTUAL FUNDS
AUDIT COMMITTEE POLICY
on
Pre-Approval of Services Provided by the Independent Accountants
The Audit Committee of each Prudential Mutual Fund is charged with the responsibility to monitor the independence of the Fund’s independent accountants. As part of this responsibility, the Audit Committee must pre-approve any independent accounting firm’s engagement to render audit and/or permissible non-audit services, as required by law. In evaluating a proposed engagement of the independent accountants, the Audit Committee will assess the effect that the engagement might reasonably be expected to have on the accountant’s independence. The Committee’s evaluation will be based on:
| | • | | a review of the nature of the professional services expected to be provided, |
| | • | | a review of the safeguards put into place by the accounting firm to safeguard independence, and |
| | • | | periodic meetings with the accounting firm. |
Policy for Audit and Non-Audit Services Provided to the Funds
On an annual basis, the scope of audits for each Fund, audit fees and expenses, and audit-related and non-audit services (and fees proposed in respect thereof) proposed to be performed by the Fund’s independent accountants will be presented by the Treasurer and the independent accountants to the Audit Committee for review and, as appropriate, approval prior to the initiation of such services. Such presentation shall be accompanied by confirmation by both the Treasurer and the independent accountants that the proposed services will not adversely affect the independence of the independent accountants. Proposed services shall be described in sufficient detail to enable the Audit Committee to assess the appropriateness of such services and fees, and the compatibility of the provision of such services with the auditor’s independence. The Committee shall receive periodic reports on the progress of the audit and other services which are approved by the Committee or by the Committee Chair pursuant to authority delegated in this Policy.
The categories of services enumerated under “Audit Services”, “Audit-related Services”, and “Tax Services” are intended to provide guidance to the Treasurer and the independent accountants as to those categories of services which the Committee believes are generally consistent with the independence of the independent accountants and which the Committee (or the Committee Chair) would expect upon the presentation of specific proposals to pre-approve. The enumerated categories are not intended as an exclusive list of audit, audit-related or tax services which the Committee (or the Committee Chair) would consider for pre-approval.
Audit Services
The following categories of audit services are considered to be consistent with the role of the Fund’s independent accountants:
| | • | | Annual Fund financial statement audits |
| | • | | Seed audits (related to new product filings, as required) |
| | • | | SEC and regulatory filings and consents |
Audit-related Services
The following categories of audit-related services are considered to be consistent with the role of the Fund’s independent accountants:
| | • | | Accounting consultations |
| | • | | Fund merger support services |
| | • | | Agreed Upon Procedure Reports |
| | • | | Other Internal Control Reports |
Individual audit-related services that fall within one of these categories and are not presented to the Audit Committee as part of the annual pre-approval process will be subject to pre-approval by the Committee Chair (or any other Committee member on whom this responsibility has been delegated) so long as the estimated fee for those services does not exceed $50,000.
Tax Services
The following categories of tax services are considered to be consistent with the role of the Fund’s independent accountants:
| | • | | Tax compliance services related to the filing or amendment of the following: |
| | • | | Federal, state and local income tax compliance; and, |
| | • | | Sales and use tax compliance |
| | • | | Timely RIC qualification reviews |
| | • | | Tax distribution analysis and planning |
| | • | | Tax authority examination services |
| | • | | Tax appeals support services |
| | • | | Accounting methods studies |
| | • | | Fund merger support services |
| | • | | Tax consulting services and related projects |
Individual tax services that fall within one of these categories and are not presented to the Audit Committee as part of the annual pre-approval process will be subject to pre-approval by the Committee Chair (or any other Committee member on whom this responsibility has been delegated) so long as the estimated fee for those services does not exceed $50,000.
Other Non-audit Services
Certain non-audit services that the independent accountants are legally permitted to render will be subject to pre-approval by the Committee or by one or more Committee members to whom the Committee has delegated this authority and who will report to the full Committee any pre-approval decisions made pursuant to this Policy. Non-audit services presented for pre-approval
pursuant to this paragraph will be accompanied by a confirmation from both the Treasurer and the independent accountants that the proposed services will not adversely affect the independence of the independent accountants.
Proscribed Services
The Fund’s independent accountants will not render services in the following categories of non-audit services:
| | • | | Bookkeeping or other services related to the accounting records or financial statements of the Fund |
| | • | | Financial information systems design and implementation |
| | • | | Appraisal or valuation services, fairness opinions, or contribution-in-kind reports |
| | • | | Internal audit outsourcing services |
| | • | | Management functions or human resources |
| | • | | Broker or dealer, investment adviser, or investment banking services |
| | • | | Legal services and expert services unrelated to the audit |
| | • | | Any other service that the Public Company Accounting Oversight Board determines, by regulation, is impermissible. |
Pre-approval of Non-Audit Services Provided to Other Entities Within the Prudential Fund Complex
Certain non-audit services provided to Prudential Investments LLC or any of its affiliates that also provide ongoing services to the Prudential Mutual Funds will be subject to pre-approval by the Audit Committee. The only non-audit services provided to these entities that will require pre-approval are those related directly to the operations and financial reporting of the Funds. Individual projects that are not presented to the Audit Committee as part of the annual pre-approval process, will be subject to pre-approval by the Committee Chair (or any other Committee member on whom this responsibility has been delegated) so long as the estimated fee for those services does not exceed $50,000. Services presented for pre-approval pursuant to this paragraph will be accompanied by a confirmation from both the Treasurer and the independent accountants that the proposed services will not adversely affect the independence of the independent accountants.
Although the Audit Committee will not pre-approve all services provided to Prudential Investments LLC and its affiliates, the Committee will receive an annual report from the Fund’s independent accounting firm showing the aggregate fees for all services provided to Prudential Investments and its affiliates.
(e) (2) Percentage of services referred to in 4(b)- (4)(d) that were approved by the audit committee –
Not applicable.
(f) Percentage of hours expended attributable to work performed by other than full time employees of principal accountant if greater than 50%.
Not applicable.
(g) Non-Audit Fees
Not applicable to Registrant. The aggregate non-audit fees billed by KPMG for services rendered to the registrant’s investment adviser and any entity controlling, controlled by, or under common control with the investment adviser that provides ongoing services to the registrant for the last fiscal year 2004 was $33,500. KPMG did not serve as the Registrant’s principal accountant during fiscal year 2003, so no information for that fiscal year is provided.
(h) Principal Accountants Independence
Not applicable as KPMG has not provided non-audit services to the registrant’s investment adviser and any entity controlling, controlled by, or under common control with the investment adviser that provides ongoing services to the registrant that were not pre-approved pursuant to Rule 2-01(c)(7)(ii) of Regulation S-X.
Item 5 – Audit Committee of Listed Registrants – Not applicable.
Item 6 – Schedule of Investments – The schedule is included as part of the report to shareholders filed under Item 1 of this Form.
Item 7 – Disclosure of Proxy Voting Policies and Procedures for Closed-End Management Investment Companies – Not applicable.
Item 8 – Portfolio Managers of Closed-End Management Investment Companies – Not applicable.
Item 9 – Purchases of Equity Securities by Closed-End Management Investment Company and Affiliated Purchasers – Not applicable.
Item 10 – Submission of Matters to a Vote of Security Holders:
On September 1, 2004, the Board of Trustees adopted the following nominations and communications policy:
Nominating and Governance Committee. The Nominating and Governance Committee of the Board of Trustees is responsible for nominating trustees and making recommendations to the Board concerning Board composition, committee structure and governance, director education, and governance practices. The Board has determined that each member of the Nominating and Governance Committee is not an “interested person” as defined in the 1940 Act.
The Nominating and Governance Committee Charter is available on the Trust’s website at www.strategicpartners.com.
Selection of Trustee Nominees. The Nominating and Governance Committee is responsible for considering nominees for trustees at such times as it considers electing new members to the Board. The Nominating and Governance Committee may consider recommendations by business and personal contacts of current Board members, and by executive search firms which the Committee may engage from time to time and will also consider shareholder recommendations. The Nominating and Governance Committee has not established specific, minimum qualifications that it
believes must be met by a nominee. In evaluating nominees, the Nominating and Governance Committee considers, among other things, an individual’s background, skills, and experience; whether the individual is an “interested person” as defined in the 1940 Act; and whether the individual would be deemed an “audit committee financial expert” within the meaning of applicable SEC rules. The Nominating and Governance Committee also considers whether the individual’s background, skills, and experience will complement the background, skills, and experience of other nominees and will contribute to the diversity of the Board. There are no differences in the manner in which the Nominating and Governance Committee evaluates nominees for the Board based on whether the nominee is recommended by a shareholder.
A shareholder who wishes to recommend a trustee nominee should submit his or her recommendation in writing to the Chair of the Board (Robin Smith) or the Chair of the Nominating and Governance Committee (Richard Redeker), in either case at The Target Portfolio Trust, P.O. Box 13964, Philadelphia, PA 19176. At a minimum, the recommendation should include:
| | • | | the name, address, and business, educational, and/or other pertinent background of the person being recommended; |
| | • | | a statement concerning whether the person is an “interested person” as defined in the Investment Company Act of 1940; |
| | • | | any other information that the Trust would be required to include in a proxy statement concerning the person if he or she was nominated; and |
| | • | | the name and address of the person submitting the recommendation, together with the number of Trust shares held by such person and the period for which the shares have been held. |
The recommendation also can include any additional information which the person submitting it believes would assist the Nominating and Governance Committee in evaluating the recommendation.
Shareholders should note that a person who owns securities issued by Prudential Financial, Inc. (the parent company of the Trust’s investment adviser) would be deemed an “interested person” under the 1940 Act. In addition, certain other relationships with Prudential Financial, Inc. or its subsidiaries, with registered broker-dealers, or with the Trust’s outside legal counsel may cause a person to be deemed an “interested person.”
Before the Nominating and Governance Committee decides to nominate an individual to the Board, Committee members and other Board members customarily interview the individual in person. In addition, the individual customarily is asked to complete a detailed questionnaire which is designed to elicit information which must be disclosed under SEC and stock exchange rules and to determine whether the individual is subject to any statutory disqualification from serving on the board of a registered investment company.
Shareholder Communications with Trustees
Shareholders of the Trust can communicate directly with the Board of Trustees by writing to the Chair of the Board, The Target Portfolio Trust, P.O. Box 13964, Philadelphia, PA 19176. Shareholders can communicate directly with an individual Trustee by writing to that director at The Target Portfolio Trust, P.O. Box 13964, Philadelphia, PA 19176. Such communications to the Board or individual trustees are not screened before being delivered to the addressee.
Item 11 – Controls and Procedures
| | (a) | It is the conclusion of the registrant’s principal executive officer and principal financial officer that the effectiveness of the registrant’s current disclosure controls and procedures (such disclosure controls and procedures having been evaluated within 90 days of the date of this filing) provide reasonable assurance that the information required to be disclosed by the registrant has been recorded, processed, summarized and reported within the time period specified in the Commission’s rules and forms and that the information required to be disclosed by the registrant has been accumulated and communicated to the registrant’s principal executive officer and principal financial officer in order to allow timely decisions regarding required disclosure. |
| | (b) | There have been no significant changes in the registrant’s internal controls or in other factors that could significantly affect these controls subsequent to the date of their evaluation, including any corrective actions with regard to significant deficiencies and material weaknesses. |
Item 12 – Exhibits
| | (a) | Code of Ethics – Attached hereto |
| | (b) | Certifications pursuant to Section 302 and 906 of the Sarbanes-Oxley Act – Attached hereto |
SIGNATURES
Pursuant to the requirements of the Securities Exchange Act of 1934 and the Investment Company Act of 1940, the registrant has duly caused this report to be signed on its behalf by the undersigned, thereunto duly authorized.
| | |
(Registrant) The Target Portfolio Trust |
| |
By (Signature and Title)* | | /s/ DEBORAH A. DOCS |
| | | Deborah A. Docs |
| | | Secretary |
|
Date February 23, 2005 |
Pursuant to the requirements of the Securities Exchange Act of 1934 and the Investment Company Act of 1940, this report has been signed below by the following persons on behalf of the registrant and in the capacities and on the dates indicated.
| | |
| |
By (Signature and Title)* | | /s/ JUDY A. RICE |
| | | Judy A. Rice |
| | | President and Principal Executive Officer |
|
Date February 23, 2005 |
| |
By (Signature and Title)* | | /s/ GRACE C. TORRES |
| | | Grace C. Torres |
| | | Treasurer and Principal Financial Officer |
|
Date February 23, 2005 |
| * | Print the name and title of each signing officer under his or her signature. |