UNITED STATES
SECURITIES AND EXCHANGE COMMISSION
Washington, D.C. 20549
FORM N-CSR
CERTIFIED SHAREHOLDER REPORT OF REGISTERED
MANAGEMENT INVESTMENT COMPANIES
| | |
Investment Company Act file number: | | 811-07064 |
| |
Exact name of registrant as specified in charter: | | The Target |
| | Portfolio Trust |
| |
Address of principal executive offices: | | Gateway Center 3, |
| | 100 Mulberry Street, |
| | Newark, New Jersey 07102 |
| |
Name and address of agent for service: | | Deborah A. Docs |
| | Gateway Center 3, |
| | 100 Mulberry Street, |
| | Newark, New Jersey 07102 |
| |
Registrant’s telephone number, including area code: | | 800-225-1852 |
| |
Date of fiscal year end: | | 12/31/2006 |
| |
Date of reporting period: | | 12/31/2006 |
Item 1 – Reports to Stockholders


The TARGETPortfolio Trust®
Annual Report
December 31, 2006
TARGET
A STRUCTURED AND PERSONALIZED INVESTMENT PROGRAM
This report is not authorized for distribution to prospective investors unless preceded or accompanied by a current prospectus.
The views expressed in this report and information about the Trust portfolios’ securities are for the period covered by this report and are subject to change thereafter.

February 16, 2007
Dear TARGET Shareholder:
We hope you find the annual report for The TARGET Portfolio Trust informative and useful. Today many investors may be asking where they can find new growth opportunities. We believe that as a TARGET shareholder, you are uniquely positioned for domestic and global growth opportunities because you already have a strategic investment plan in place.
The TARGET program’s structured and professional approach to investing helps you “tune out” the noise of current market developments and allows you to concentrate on what’s really important—your long-term goals. It starts with a personal plan that you and your financial professional construct based on your reasons for investing, the time you have to reach your goals, and the level of risk you are willing to assume. Your financial professional can work closely with you to develop an appropriate asset allocation and select the corresponding TARGET portfolio for each asset class in your investment plan. The managers for each portfolio are carefully chosen, are monitored by our team of experienced investment management analysts, and are among the leading institutional money managers available.
Your TARGET program also evolves with your changing needs. Your financial professional can help you track your plan’s progress, stay informed of important developments, and assist you in determining whether you need to modify your portfolio. In these ways and more, the TARGET program seeks to make your investment goals a reality.
Thank you for your continued confidence.
Sincerely,

Judy A. Rice, President
The TARGET Portfolio Trust
| | |
| THE TARGET PORTFOLIO TRUST | | 1 |
Equity Portfolios Performance
Performance data quoted represent past performance. Past performance does not guarantee future results. The investment return and principal value of an investment will fluctuate, so that an investor’s shares, when redeemed, may be worth more or less than their original cost. Current performance may be lower or higher than the past performance data quoted. An investor may obtain performance data as of the most recent month-end by visiting our website at www.prudential.com or by calling (800) 225-1852. The maximum TARGET program fee for retail investors is 1.50%.
| | | | | | | | | | | | | | | | |
| Equity Portfolios for periods ended 12/31/06 |
| | | Total Returns1
(Without TARGET Program Fee) | | Average Annual Total Returns1
(With TARGET Program Fee) |
| | | One Year | | | Since
Inception2 | | One Year | | | Five Years | | | Ten Years | | | Since
Inception2 |
Large Capitalization Growth Portfolio (Class R) | | N/A | | | 9.34%
(8/22/06) | | N/A | | | N/A | | | N/A | | | N/A |
Large Capitalization Growth Portfolio (Class T) | | 8.67 | % | | — | | 7.04 | % | | 1.25 | % | | 6.05 | % | | — |
S&P 500 Index3 | | 15.78 | | | *** | | 15.78 | | | 6.18 | | | 8.42 | | | N/A |
Russell 1000 Growth Index3 | | 9.07 | | | **** | | 9.07 | | | 2.69 | | | 5.44 | | | N/A |
Lipper Large-Cap Core Funds Avg.4 | | 13.53 | | | ***** | | 13.53 | | | 4.83 | | | 6.87 | | | N/A |
| | | | | | | | | | | | | | | | |
Large Capitalization Value Portfolio (Class R) | | N/A | | | 10.44%
(8/22/06) | | N/A | | | N/A | | | N/A | | | N/A |
Large Capitalization Value Portfolio (Class T) | | 19.34 | % | | — | | 17.56 | % | | 10.56 | % | | 8.67 | % | | — |
S&P 500 Index3 | | 15.78 | | | *** | | 15.78 | | | 6.18 | | | 8.42 | | | N/A |
Russell 1000 Value Index3 | | 22.25 | | | **** | | 22.25 | | | 10.86 | | | 11.00 | | | N/A |
Lipper Multi-Cap Value Funds Avg.4 | | 17.43 | | | ***** | | 17.43 | | | 9.06 | | | 9.34 | | | N/A |
| | | | | | | | | | | | | | | | |
Small Capitalization Growth Portfolio (Class R) | | N/A | | | 9.78%
(8/22/06) | | N/A | | | N/A | | | N/A | | | N/A |
Small Capitalization Growth Portfolio (Class T) | | 7.62 | % | | — | | 6.02 | % | | 1.29 | % | | 2.67 | % | | — |
Russell 2000 Index3 | | 18.37 | | | *** | | 18.37 | | | 11.39 | | | 9.44 | | | N/A |
Russell 2000 Growth Index3 | | 13.35 | | | **** | | 13.35 | | | 6.93 | | | 4.88 | | | N/A |
Lipper Small-Cap Growth Funds Avg.4 | | 10.31 | | | ***** | | 10.31 | | | 5.91 | | | 8.17 | | | N/A |
| | |
| 2 | | THE TARGET PORTFOLIO TRUST |
| | | | | | | | | | | | | | | | |
| Equity Portfolios for periods ended 12/31/06 |
| | | Total Returns1
(Without TARGET Program Fee) | | Average Annual Total Returns1
(With TARGET Program Fee) |
| | | One Year | | | Since
Inception2 | | One Year | | | Five Years | | | Ten Years | | | Since
Inception2 |
Small Capitalization Value Portfolio (Class R) | | N/A | | | 9.45%
(8/22/06) | | N/A | | | N/A | | | N/A | | | N/A |
Small Capitalization Value Portfolio (Class T) | | 17.72 | % | | — | | 15.96 | % | | 14.95 | % | | 12.78 | % | | — |
Russell 2000 Index3 | | 18.37 | | | *** | | 18.37 | | | 11.39 | | | 9.44 | | | N/A |
Russell 2000 Value Index3 | | 23.48 | | | **** | | 23.48 | | | 15.37 | | | 13.27 | | | N/A |
Lipper Small-Cap Core Funds Avg.4 | | 14.87 | | | ***** | | 14.87 | | | 11.44 | | | 10.86 | | | N/A |
| | | | | | | | | | | | | | | | |
International Equity Portfolio (Class R) | | N/A | | | 11.74%
(8/22/06) | | N/A | | | N/A | | | N/A | | | N/A |
International Equity Portfolio (Class T) | | 29.02 | % | | — | | 27.10 | % | | 12.73 | % | | 6.16 | % | | — |
MSCI EAFE ND Index3 | | 26.34 | | | *** | | 26.34 | | | 14.98 | | | 7.71 | | | N/A |
Lipper International Large-Cap Value Funds Avg.4 | | 28.09 | | | ***** | | 28.09 | | | 16.00 | | | 9.20 | | | N/A |
Source: Prudential Investments LLC and Lipper Inc. Performance figures may reflect fee waivers and/or expense reimbursements. In the absence of such fee waivers and/or expense reimbursements, total returns would be lower.
1Total returns assume the reinvestment of all dividends and distributions, and take into account all charges and expenses applicable to an investment in each portfolio. The average annual total returns for the TARGET portfolios assume the imposition of the maximum TARGET annual advisory fee of 1.50% for equity portfolios for retail investors. Class R shares are subject to an annual distribution and service (12b-1) fee of up to 0.75%. Returns in the table do not reflect the deduction of taxes that a shareholder would pay on Portfolio distributions or following the redemption of Portfolio shares.
2Inception date returns are provided for any share class with less than 10 calendar years of returns.
3Investors cannot invest directly in an index. The returns for the benchmark indexes would be lower if they reflected deductions for TARGET program fees, portfolio operating expenses, sales charges, or taxes. The Standard & Poor’s 500 Composite Stock Price Index (S&P 500 Index) is an unmanaged index of 500 stocks of large U.S. companies. It gives a broad look at how stock prices have performed. The Russell 1000 Growth Index contains those securities in the Russell 1000 Index with an above-average growth orientation. Companies in this index tend to exhibit higher price-to-book and price-to-earnings ratios, lower dividend yields, and higher forecasted growth rates. The Russell 1000 Value Index contains those securities in the Russell 1000 Index with a below-average growth orientation. Companies in this index generally have low price-to-book and price-to-earnings ratios, higher dividend yields, and lower forecasted growth values. The Russell 2000 Index is an unmanaged index of the stocks of the 2,000 smallest U.S. companies included in the Russell 3000 Index. It gives a broad look at how the stock prices of smaller companies have performed. The Russell 2000 Growth Index contains those securities in the Russell 2000 Index with an above-average growth orientation. Companies in this index generally have higher price-to-book and price-to-earnings ratios. The Russell 2000 Value Index contains those securities in the Russell 2000 Index with a below-average growth orientation. Companies in this index generally have low price-to-earnings ratios, higher dividend yields, and lower forecasted growth values. The Morgan
| | |
| THE TARGET PORTFOLIO TRUST | | 3 |
Equity Portfolios Performance (continued)
Stanley Capital International Europe, Australasia, and Far East Index (MSCI EAFE ND Index) is an unmanaged, weighted index that reflects stock price movements in Europe, Australasia, and the Far East. It gives a broad look at how foreign stocks have performed.
4The Lipper averages represent returns based on an average of all funds in the respective Lipper categories for the periods noted. The returns for the Lipper averages would be lower if they reflected deductions for TARGET program fees, portfolio operating expenses, sales charges, or taxes. Large-Cap Core funds invest at least 75% of their equity assets in companies with market capitalizations (on a three-year weighted basis) greater than 300% of the dollar-weighted median market capitalization of the middle 1,000 securities of the S&P SuperComposite 1500 Index. Large-cap core funds have an above-average price-to-earnings ratio, price-to-book ratio, and three-year sales-per-share growth value compared with the S&P 500 Index. Multi-Cap Value funds invest in a variety of market capitalization ranges without concentrating 75% of their equity assets in any one market capitalization range over an extended period of time. Multi-cap funds typically have between 25% and 75% of their assets invested in companies with market capitalizations (on a three-year weighted basis) above 300% of the dollar-weighted median market capitalization of the middle 1,000 securities of the S&P SuperComposite 1500 Index. Multi-cap value funds typically have a below-average price-to-earnings ratio and three-year sales-per-share growth value compared with the S&P 500 Index. Small-Cap Growth funds invest at least 75% of their equity assets in companies with market capitalizations (on a three-year weighted basis) less than 250% of the dollar-weighted median of the smallest 500 of the middle 1,000 securities of the S&P SuperComposite 1500 Index. Small-cap growth funds typically have an above-average price-to-earnings ratio, price-to-book ratio, and three-year sales-per-share growth value compared with the S&P SmallCap 600 Index. Small-Cap Core funds invest at least 75% of their equity assets in companies with market capitalizations (on a three-year weighted basis) less than 250% of the dollar-weighted median of the smallest 500 of the middle 1,000 securities of the S&P SuperComposite 1500 Index. Small-cap core funds have more latitude in the companies in which they invest. These funds typically have an average price-to-earnings ratio and three-year sales-per-share growth value compared with the S&P SmallCap 600 Index. International funds invest their assets in securities with primary trading markets outside of the United States.
***Large Capitalization Growth Portfolio—S&P 500 Index Closest Month-End to Inception cumulative total return is 9.44% for Class R. Large Capitalization Value Portfolio—S&P 500 Index Closest Month-End to Inception cumulative total return is 9.44% for Class R. Small Capitalization Growth Portfolio—Russell 2000 Index Closest Month-End to Inception cumulative total return is 9.81% for Class R. Small Capitalization Value Portfolio—Russell 2000 Index Closest Month-End to Inception cumulative total return is 9.81% for Class R. International Equity Portfolio—MSCI EAFE ND Index Closest Month-End to Inception cumulative total return is 10.52% for Class R.
****Large Capitalization Growth Portfolio—Russell 1000 Growth Index Closest Month-End to Inception cumulative total return is 8.84% for Class R. Large Capitalization Value Portfolio—Russell 1000 Value Index Closest Month-End to Inception cumulative total return is 10.15% for Class R. Small Capitalization Growth Portfolio—Russell 2000 Growth Index Closest Month-End to Inception cumulative total return is 9.51% for Class R. Small Capitalization Value Portfolio—Russell 2000 Value Index Closest Month-End to Inception cumulative total return is 10.09% for Class R.
*****Large Capitalization Growth Portfolio—Lipper Average Index Closest Month-End to Inception cumulative total return is 9.01% for Class R. Large Capitalization Value Portfolio—Lipper Average Index Closest Month-End to Inception cumulative total return is 9.61% for Class R. Small Capitalization Growth Portfolio—Lipper Average Closest Month-End to Inception cumulative total return is 9.28% for Class R. Small Capitalization Value Portfolio—Lipper Average Closest Month-End to Inception cumulative total return is 9.18% for Class R. International Equity Portfolio—Lipper Average Closest Month-End to Inception cumulative total return is 10.62% for Class R.
Average Annual Since Inception returns are not available for Class R since it has been in existence for less than one year.
| | |
| 4 | | THE TARGET PORTFOLIO TRUST |
Fixed Income Portfolios Performance
Performance data quoted represent past performance. Past performance does not guarantee future results. The investment return and principal value of an investment will fluctuate, so that an investor’s shares, when redeemed, may be worth more or less than their original cost. Current performance may be lower or higher than the past performance data quoted. An investor may obtain performance data as of the most recent month-end by visiting our website at www.prudential.com or by calling (800) 225-1852. The maximum TARGET program fee for retail investors is 1.50%.
| | | | | | | | | | | | | | | | |
| Fixed Income Portfolios for periods ended 12/31/06 |
| | | Total Returns1
(Without TARGET Program Fee) | | Average Annual
Total Returns1
(with TARGET Program Fee) |
| | | One
Year | | | Since
Inception2 | | One Year | | | Five Years | | | Ten Years | | | Since
Inception2 |
International Bond Portfolio (Class T) | | 1.84 | % | | — | | 0.33 | % | | 5.20 | % | | 0.68 | % | | — |
Citigroup Non-U.S. WGBI–Hedged3 | | 3.10 | | | — | | 3.10 | | | 4.52 | �� | | 6.34 | | | — |
Lipper International Income Funds Avg.4 | | 5.73 | | | — | | 5.73 | | | 8.20 | | | 5.25 | | | — |
| | | | | | | | | | | | | | | | |
Total Return Bond Portfolio (Class R) | | N/A | | | 1.27%
(8/22/06) | | N/A | | | N/A | | | N/A | | | N/A |
Total Return Bond Portfolio (Class T) | | 4.27 | % | | — | | 2.71 | % | | 3.89 | % | | 4.72 | % | | — |
Lehman Brothers U.S. Aggregate Bond Index3 | | 4.33 | | | *** | | 4.33 | | | 5.06 | | | 6.24 | | | N/A |
Lipper Corporate Debt BBB-Rated Funds Avg.4 | | 4.64 | | | **** | | 4.64 | | | 5.70 | | | 5.89 | | | N/A |
| | | | | | | | | | | | | | | | |
Intermediate-Term Bond Portfolio (Class T) | | 4.12 | % | | — | | 2.57 | % | | 2.88 | % | | 4.14 | % | | — |
Lehman Brothers Int. Govt./Credit Bond Index3 | | 4.08 | | | — | | 4.08 | | | 4.53 | | | 5.81 | | | — |
Lipper Int. Inv.-Grade Debt Funds Avg.4 | | 4.06 | | | — | | 4.06 | | | 4.53 | | | 5.52 | | | — |
| | | | | | | | | | | | | | | | |
Mortgage Backed Securities Portfolio (Class T) | | 3.82 | % | | — | | 2.27 | % | | 2.45 | % | | 3.88 | % | | — |
Lehman Brothers Mortgage-Backed Securities Index3 | | 5.22 | | | — | | 5.22 | | | 4.85 | | | 6.16 | | | — |
Citigroup Mortgage-Backed Securities Index3 | | 5.17 | | | — | | 5.17 | | | 4.91 | | | 6.18 | | | — |
Lipper U.S. Mortgage Funds Avg.4 | | 4.33 | | | — | | 4.33 | | | 4.17 | | | 5.27 | | | — |
Source: Prudential Investments LLC and Lipper Inc. Performance figures may reflect fee waivers and/or expense reimbursements. In the absence of such fee waivers and/or expense reimbursements, total returns would be lower.
1Total returns assume the reinvestment of all dividends and distributions, and take into account all charges and expenses applicable to an investment in each portfolio. The average annual total returns for the TARGET portfolios
| | |
| THE TARGET PORTFOLIO TRUST | | 5 |
Fixed Income Portfolios Performance (continued)
assume the imposition of the maximum TARGET annual advisory fee of 1.50% for bond portfolios for retail investors. Class R shares are subject to an annual distribution and service (12b-1) fee of up to 0.75%. Returns in the table do not reflect the deduction of taxes that a shareholder would pay on Portfolio distributions or following the redemption of Portfolio shares.
2Inception date returns are provided for any share class with less than 10 calendar years of returns.
3Investors cannot invest directly in an index. The returns for the benchmark indexes would be lower if they reflected deductions for TARGET program fees, portfolio operating expenses, sales charges, or taxes. The Citigroup Non-U.S. World Government Bond Index Hedged (WGBI–Hedged) is an unmanaged index of approximately 600 high-quality bonds with foreign currency exposure translated to the U.S. dollar. It gives a broad look at how foreign bonds have performed. The Lehman Brothers U.S. Aggregate Bond Index is an unmanaged index of investment-grade securities issued by the U.S. government and its agencies and by corporations with between 1 and 10 years remaining to maturity. It gives a broad look at how bond prices of short- and intermediate-term bonds have performed. The Lehman Brothers Intermediate Government/Credit Bond Index is an unmanaged index of publicly traded U.S. government bonds and investment-grade corporate bonds with maturities of up to 10 years. It gives a broad look at how intermediate-term bonds have performed. The Lehman Brothers Mortgage-Backed Securities Index is a market capitalization-weighted index of 15- and 30-year fixed-rate securities backed by GNMA, FNMA, and FHLMC mortgage pools, and balloon mortgages with fixed-rate coupons. The Citigroup Mortgage-Backed Securities Index is an unmanaged index of 15- and 30-year mortgage-related securities issued by U.S. government agencies. Each of them gives a broad look at how mortgage-backed securities have performed.
4The Lipper averages represent returns based on an average of all funds in the respective Lipper categories for the periods noted. The returns for the Lipper averages would be lower if they reflected deductions for TARGET program fees, portfolio operating expenses, sales charges, or taxes. International Income funds invest primarily in U.S. dollar and non-U.S. dollar debt securities of issuers located in at least three countries, excluding the United States, except in periods of market weakness. Corporate Debt BBB-Rated funds invest primarily in corporate and government debt issues rated in the top four grades. Intermediate Investment-Grade Debt funds invest primarily in investment-grade debt issues (rated in the top four grades) with dollar-weighted average maturities of 5 to 10 years. U.S. Mortgage funds invest primarily in mortgages/securities issued or guaranteed as to principal and interest by the U.S. government and certain federal agencies.
***Lehman Brothers U.S. Aggregate Bond Index Closest Month-End to Inception cumulative total return is 2.13% for Class R.
****Lipper Average Closest Month-End to Inception cumulative total return is 2.48% for Class R.
Average Annual Since Inception returns are not available for Class R since it has been in existence for less than one year.
| | |
| 6 | | THE TARGET PORTFOLIO TRUST |
Money Market Portfolio Performance
Yields will fluctuate from time to time, and past performance does not guarantee future results. Current performance may be lower or higher than the past performance data quoted. The investment return and principal value will fluctuate, and shares, when sold, may be worth more or less than the original cost. For the most recent month-end performance update, call (800) 225-1852.
| | | | | | | | | |
| Money Market Portfolio as of 12/31/06 | | | | | | |
| | | Total Returns1
(Without TARGET
Program Fee)
One Year | | | Net Asset Value
(NAV) | | 7-Day Current
Yield | |
U.S. Government Money Market Portfolio (Class T) | | 4.36 | % | | $ | 1.00 | | 4.56 | % |
Lipper U.S. Government Money Market Funds Avg.2 | | 4.26 | | | | N/A | | N/A | |
iMoneyNet, Inc. All Taxable Money Market Funds Avg.3 | | N/A | | | | N/A | | 4.74 | |
Source: Prudential Investments LLC and Lipper Inc. Performance figures may reflect fee waivers and/or expense reimbursements. In the absence of such fee waivers and/or expense reimbursements, total returns would be lower.
1Total returns assume the reinvestment of all dividends and distributions, and take into account all charges and expenses applicable to an investment in each portfolio. Returns would be lower if the fee were deducted. The returns in the table do not reflect the deduction of taxes that a shareholder would pay on Portfolio distributions or following the redemption of Portfolio shares.
2The Lipper average represents returns based on an average of all funds in the respective Lipper categories for the periods noted. The return for the Lipper average would be lower if it reflected deductions for TARGET program fees, portfolio operating expenses, sales charges, or taxes. U.S. Government Money Market funds invest principally in financial instruments issued or guaranteed by the U.S. government, its agencies, or instrumentalities with dollar-weighted average maturities of less than 90 days. These funds intend to keep a constant net asset value.
3iMoneyNet, Inc. regularly reports a 7-day current yield on Tuesdays for taxable money market funds. This is the data of all funds in the iMoneyNet, Inc. All Taxable Money Market Funds Average category as of 12/26/06, the closest date to the end of our reporting period.
An investment in the U.S. Government Money Market Portfolio (the Portfolio) is not insured or guaranteed by the Federal Deposit Insurance Corporation or any other government agency. Although the Portfolio seeks to preserve the value of your investment at $1 per share, it is possible to lose money by investing in the Portfolio.
| | |
| THE TARGET PORTFOLIO TRUST | | 7 |
Investment Manager’s Report
Large Capitalization Growth Portfolio
The total return of the Large Capitalization Growth Portfolio (Class T) was 8.67% in 2006. During the same period, the S&P 500 Index returned 15.78%, the Russell 1000 Growth Index (the Index) returned 9.07%, and the Lipper Large-Cap Core Funds Average was 13.53%.
The Portfolio was co-managed by Marsico Capital Management and Goldman Sachs Asset Management. They were paired to play different roles in the Portfolio’s long-term performance. Goldman Sachs uses a quantitative approach with rigorously applied risk controls that are aimed at limiting deviations from the return of the Russell 1000 Growth Index. Marsico Capital uses a more active strategy to select a smaller number of high-conviction positions from anywhere in the growth investment spectrum. We expect the overall Portfolio’s performance profile to behave like a traditional growth strategy, but to benefit from the separate strengths of each asset manager.
The value investing style substantially outperformed the growth style during the first half of 2006. The style-neutral S&P 500 Index and Lipper Large-Cap Core Funds group reflected that advantage. Lipper classifies the Portfolio as “Core” in style, in accordance with their proprietary system based upon holdings over several years.
Overall, Goldman Sach’s more conservative approach beat the Index in 2006. Marsico’s selection of individual stocks within certain sectors and industries detracted from the Portfolio’s performance compared with the Index. Positions in homebuilders (among the poorest-performing industries over the year), biotechnology, and medical services hurt performance.
Differences from the Index in the distribution of assets among broad economic sectors, driven primarily by Marsico, added value. During the course of the year, the Fund became increasingly underweight in the technology sector in favor of the consumer services sector. Marsico emphasized the hotel/gaming and asset management industries and underweighted semiconductors and computer software.
The Portfolio of Investments following this report shows the size of the Portfolio’s positions at period-end.
| | |
| 8 | | THE TARGET PORTFOLIO TRUST |
Large Capitalization Value Portfolio
The total return of the Large Capitalization Value Portfolio (Class T) was 19.34% in 2006. During the same period, the S&P 500 Index returned 15.78%, the Russell 1000 Value Index (the Index) returned 22.25%, and the Lipper Multi-Cap Value Funds Average was 17.43%.
The Portfolio is split between three asset managers: JP Morgan Asset Management is responsible for approximately half the Portfolio, managed in a relative value style that is generally sector-neutral to the Russell 1000 Value Index; NFJ Investment Group and Hotchkis and Wiley Capital Management, LLC separately manage the other half in more aggressive complementary value styles. Hotchkis & Wiley focuses on dividends and the profitable reinvestment of retained earnings, whereas NFJ has a “deep value” style emphasizing low ratios of share prices to corporate earnings. We expect the overall Portfolio’s performance profile to behave like a traditional value strategy, but to benefit from the separate strengths of each asset manager.
The Index had an outstanding return in 2006. Although the Portfolio’s performance was very strong by historical standards and above the average of comparable funds, it didn’t keep up with the benchmark primarily due to its holdings in the consumer noncyclical, energy, technology, and commercial services sectors. Certain Index components, including several of the largest companies in the market (ExxonMobil, BellSouth, JPMorgan Chase, Disney, and Comcast), posted exceptional results for the year, driving the Index’s high return. These star performers were underrepresented in the Portfolio, and its holdings, on average, didn’t keep up with them. The Hotchkis & Wiley and JPMorgan segments of the Portfolio largely accounted for this aspect of its underperformance.
The Portfolio’s performance relative to the Index was also hurt by underweights compared with the Index in the strong telecommunications, oil refining, and securities/asset management industries and an overweight in the relatively weak life/health insurance industry. Hotchkis & Wiley’s holdings were primarily responsible for the negative impact of industry weightings.
The Portfolio benefited from a heightened sensitivity to market movements (a tendency to move in the same direction as its benchmark, only more so), which particularly aided its performance during the rising markets of January, August, September, October, and November.
The Portfolio of Investments following this report shows the size of the Portfolio’s positions at period-end.
| | |
| THE TARGET PORTFOLIO TRUST | | 9 |
Investment Manager’s Report (continued)
Small Capitalization Growth Portfolio
The total return of the Small Capitalization Growth Portfolio (Class T) was 7.62% in 2006. During the same period, the Russell 2000 Index returned 18.37%, the Russell 2000 Growth Index (the Index) returned 13.35%, and the Lipper Small-Cap Growth Funds Average was 10.31%.
The Portfolio was subadvised by Transamerica Investment Management and RS Investments. Both use traditional growth investment styles, but they tend to look in different parts of the small-cap growth market. In 2006, the stock selections of both subadvisers substantially underperformed the Index. The combined holdings were particularly weak in the technology and commercial services sectors. The selections of RS Investments, which historically has added value with its stock selection, underperformed the Index most during this year, trailing it in the commercial services, technology, healthcare, financials, and consumer noncyclicals sectors. Transamerica Investment Management trailed in the technology, industrials, specialty retail, and transportation sectors, but outperformed the Index in the oil services and healthcare sectors.
We expect the Portfolio’s fundamental characteristics to generally be in line with those of the Index. That being said, in 2006 the strategy had modestly more exposure to stocks with lower price-to-earnings ratios, which paid off in a market that generally favored the value style of investing. In addition, less exposure to volatile stocks had a positive impact on the Portfolio’s return.
The Portfolio was overweight compared with the Index in the relatively weak commercial services and technology sectors and underweight in the strong basic materials sector. These emphases hurt its performance, as did a lower exposure to “market risk,” the tendency to move in the same direction as the Index.
The Portfolio of Investments following this report shows the size of the Portfolio’s positions at period-end.
| | |
| 10 | | THE TARGET PORTFOLIO TRUST |
Small Capitalization Value Portfolio
The total return of the Small Capitalization Value Portfolio (Class T) was 17.72% in 2006. During the same period, the Russell 2000 Index returned 18.37%, the Russell 2000 Value Index (the Index) returned 23.48%, and the Lipper Small-Cap Core Funds Average was 14.87%.
It is particularly important in small-cap value investing to understand the businesses of the companies in which you invest. Small companies are more vulnerable than large to economic trends and unanticipated events, and firms that are inexpensively valued tend to be poorly known. This makes research critical. Moreover, asset managers may reach the limits of the size of the position they can hold in small firms while still remaining uninvolved in control of the firm. That is why the Portfolio is managed with a multi-manager structure. As subadvisors reach their capacity limits, we may add new subadvisors. In 2006, the Portfolio was managed by EARNEST Partners, LLC; Lee Munder Capital Group; JP Morgan Asset Management; NFJ Investment Group; and Vaughan Nelson Investment Management.
The Portfolio captured much of the exceptional return of its small-cap value benchmark, but trailed it largely because the Portfolio’s characteristic emphasis on companies with strong balance sheets was at a disadvantage in a market that greatly preferred pronounced value characteristics and lower quality stocks. “Lower quality” refers to more earnings variation and higher debt levels. In addition, the Portfolio’s slight emphasis on growth characteristics compared with its value benchmark, due largely to Earnest’s segment, hurt its performance. The Portfolio’s distribution among sectors had a marginally negative impact. It was underweight compared with the benchmark in the relatively strong consumer services and telecommunications sectors and overweight in poor-performing transportation.
Other things being equal, we expect the Portfolio’s return to move less than its benchmark in either direction because the various asset managers’ complementary investment processes and their emphasis on quality dampen extreme movements. This lower profile helped the Portfolio during the weak market in the second quarter of 2006, but hurt it in the strongly rising market during the second half of the year.
Aside from these characteristics of the overall Portfolio, selection of individual positions was good. Several holdings, particularly in the energy, healthcare, and consumer cyclicals sectors performed well.
The Portfolio of Investments following this report shows the size of the Portfolio’s positions at period-end.
| | |
| THE TARGET PORTFOLIO TRUST | | 11 |
Investment Manager’s Report (continued)
International Equity Portfolio
The total return of the International Equity Portfolio (Class T) was 29.02% in 2006. During the same period, the MSCI EAFE Index rose 26.34% and the Lipper International Large-Cap Value Funds Average was 28.09%.
The Portfolio is managed by LSV Asset Management and Thornburg Investment Management, both using value investing styles. LSV uses a purely quantitative style based upon studies of the biases of most investors. Their methods look for undervalued stocks with near-term potential for appreciation. Thornburg’s process is based upon research into the business fundamentals of companies whose stocks are found to be attractive on various measures of value. Both outperformed the MSCI EAFE Index in 2006, but with different strengths.
Thornburg’s segment continued to benefit from investments in emerging markets countries, particularly from positions in China and Mexico. A small exposure to Canada, which also is not included in the EAFE benchmark, and an underweight in the relatively poor-performing Japan market added to performance relative to the benchmark.
The Portfolio’s strong stock selection in the financials sector made a significant contribution to its results, particularly positions in stock exchanges Hong Kong Exchanges, Euronext, and Deutsche Boerse. Barclay’s and Lloyd’s TSB Group (both United Kingdom banks) also were among the strong holdings. In addition, the Portfolio benefited from positions in American Movil (Mexico, wireless telephone services), China Petroleum and Chemicals (China, energy), and Toyota (Japan, automobiles).
Some of the overall risk characteristics of the Portfolio helped its return, including its overweight in smaller firms compared with its benchmark and its value orientation in a market that favored value investing over growth by about eight percentage points over the year.
The Portfolio of Investments following this report shows the size of the Portfolio’s positions at period-end.
| | |
| 12 | | THE TARGET PORTFOLIO TRUST |
International Bond Portfolio
The total return of the International Bond Portfolio (Class T) was 1.84% in 2006. During the same period, the Citigroup Non-U.S. World Government Bond Index (Hedged) returned 3.10% and the Lipper International Income Funds Average returned 5.73%. The Portfolio was subadvised by Pacific Investment Management Company LLC (PIMCO).
The Portfolio was hurt by its exposures to interest rate changes at differing durations (the yield curve). It was positioned to benefit if the yield curve steepened in the United Kingdom, i.e., if interest rates rose further for longer-duration bonds than for near-maturity bonds. Instead, near-maturity interest rates rose on expectations of further interest hikes by the U.K. central bank, while long-term rates actually fell because of strong demand for bonds by pension funds.
The Portfolio held an off-benchmark exposure to the United States, which helped its performance when U.S. bonds rallied late in the year. However, the impact was offset by the distribution of durations in the U.S. holdings, which, like the U.K. holdings, were positioned to benefit from a steepening yield curve. The yield curve for U.S. bonds actually inverted more than in 2005.
Euro-denominated bonds, in contrast, were underweight in shorter durations compared with the Portfolio’s benchmark. This positioning augmented its return as strong economic data and European Central Bank interest-rate increases propped yield up. The Portfolio was underweighted in Japanese bonds and positioned to benefit from a flattening yield curve in Japan. Both exposures paid off.
Overall, currency exposures helped the Portfolio’s performance against its hedged benchmark. Its exposure to the euro helped more than its exposure to the yen detracted.
The Portfolio of Investments following this report shows the size of the Portfolio’s positions at period-end.
| | |
| THE TARGET PORTFOLIO TRUST | | 13 |
Investment Manager’s Report (continued)
Total Return Bond Portfolio
The Total Return Bond Portfolio (Class T) returned 4.27% in 2006. During the same period, the Lehman Brothers U.S. Aggregate Bond Index (the Index) returned 4.33% and the Lipper Corporate Debt BBB-Rated Funds Average was 4.64%. The Portfolio was subadvised by Pacific Investment Management Company LLC (PIMCO).
After a challenging first half of 2006, the U.S. bond market turned favorable. Indications early in the year that the economy was slowing led investors to anticipate a break in the Federal Reserve’s two-year sequence of tightening short-term interest rates at every meeting. The progressive tightening had weighed on bond returns because it often pushes yields generally upward, and bond prices move inversely to yields. The slowing economy, the actual suspension of rate increases in August, and then falling oil prices all eased inflation jitters and allowed bond prices to rise. Many investors even began to anticipate interest rate cuts in 2007, adding to the upswing. However, sporadic signs of strength in the economy late in the 2006 reduced such hopes.
The Portfolio’s above-benchmark exposure to changes in interest rates detracted from its performance over the year. In addition, the Portfolio was underweight compared with the benchmark in corporate debt. Investment-grade corporate bonds outperformed Treasuries as investors turned to them for additional yield in the generally low-yielding markets. However, the Portfolio had an overweight in mortgage-backed bonds, which also benefited from the search for additional yield.
A modest allocation to emerging markets debt, a sector that is not represented in the benchmark, added to the Portfolio’s return. The sector continued to benefit from strong capital inflows and improvements in credit quality.
Currency exposures had a mixed impact. Exposure to the Japanese yen detracted from performance, but this was mitigated by exposures to the strong euro and select emerging markets currencies, which rose against the dollar.
The Portfolio of Investments following this report shows the size of the Portfolio’s positions at period-end.
| | |
| 14 | | THE TARGET PORTFOLIO TRUST |
Intermediate-Term Bond Portfolio
The total return of the Intermediate-Term Bond Portfolio (Class T) was 4.12% in 2006. During the same period, the Lehman Brothers Intermediate Government/Credit Bond Index (the Index) returned 4.08% and the Lipper Intermediate Investment-Grade Debt Funds Average was 4.06%. The Portfolio was subadvised by Pacific Investment Management Company LLC (PIMCO).
After a challenging first half of 2006, the U.S. bond market turned favorable. Indications early in the year that the economy was slowing led investors to anticipate a break in the Federal Reserve’s two-year sequence of tightening short-term interest rates at every meeting. The progressive tightening had weighed on bond returns because it often pushes yields generally upward, and bond prices move inversely to yields. The slowing economy, the actual suspension of rate increases in August, and then falling oil prices all eased inflation jitters and allowed bond prices to rise. Many investors even began to anticipate interest rate cuts in 2007, adding to the upswing. However, sporadic signs of strength in the economy late in 2006 reduced such hopes.
The Portfolio’s above-benchmark exposure to changes in interest rates detracted from its performance over the year. In addition, the Portfolio was underweight compared with the benchmark in corporate debt. Investment-grade corporate bonds outperformed Treasuries as investors turned to them for additional yield in the generally low-yielding markets. However, the Portfolio had an allocation to mortgage-backed bonds, which are not included in its benchmark, but which also benefited from the search for additional yield.
A modest allocation to emerging markets debt added to the Portfolio’s return. The sector continued to benefit from strong capital inflows and improvements in credit quality. Currency exposures had a mixed impact. Exposure to the Japanese yen detracted from performance, but this was mitigated by exposures to the strong euro, which rose against the dollar.
The Portfolio of Investments following this report shows the size of the Portfolio’s positions at period-end.
| | |
| THE TARGET PORTFOLIO TRUST | | 15 |
Investment Manager’s Report (continued)
Mortgage Backed Securities Portfolio
The total return of the Mortgage Backed Securities Portfolio (Class T) was 3.82% in 2006. During the same period, the Lehman Brothers Mortgage-Backed Securities Index returned 5.22%, the Citigroup Mortgage-Backed Securities Index returned 5.17%, and the Lipper U.S. Mortgage Funds Average was 4.33%. The Portfolio was subadvised by Wellington Management Company, LLP.
After a challenging first half of 2006, the U.S. bond market turned favorable. Indications early in the year that the economy was slowing led investors to anticipate a break in the Federal Reserve’s two-year sequence of tightening short-term interest rates at every meeting. The progressive tightening had weighed on bond returns because it often pushes yields across the maturity range upward, and the prices of bonds move inversely to their yields. The slowing economy, continued weakness in the housing sector, the actual suspension of rate increases in August, peaking corporate earnings, and then falling oil prices all eased inflation jitters and allowed long-term bond prices to rise. At year-end, yield-curve inversion (higher yields for very short-term debt than for long-term bonds) was steeper than in 2005, meaning that investors were hurt by holding portfolios with below-average durations over the full year. Substantial amounts of funds for investment and low market volatility led investors to pursue higher yields in more credit-sensitive sectors of the market such as high yield (junk) and emerging market bonds, which consequently outperformed the overall market. Conversely, government bonds trailed, while securities carrying intermediate levels of risk, such as mortgage-backed securities, were in the middle range of returns.
The Portfolio’s performance relative to its benchmark was hurt primarily by its lower exposure to longer-term bonds. It was underweight in longer-term conventional mortgage-backed securities, in part, because of a larger allocation to short-term debt that it loaned out in the repurchase agreement (repo) market. This lending provided additional income with very little additional risk, although it reduced the overall duration of the Portfolio. In addition to the repo income, the Portfolio benefited somewhat from its active trading activity among various pools of mortgage-backed securities.
The Portfolio of Investments following this report shows the size of the Portfolio’s positions at period-end.
| | |
| 16 | | THE TARGET PORTFOLIO TRUST |
U.S. Government Money Market Portfolio
The U.S. Government Money Market Portfolio returned 4.36% in 2006. During the same period, the Lipper U.S. Government Money Market Portfolio Funds Average was 4.26%. The Portfolio was subadvised by Wellington Management Company, LLP.
Among the most influential developments in the money markets during 2006 was the decision by the Federal Reserve (the Fed) to leave short-term interest rates unchanged in the second half of the year after repeatedly increasing them in the first half. Fed policymakers, hoping to slow economic growth and bring down inflation, increased the target for the federal funds rate on overnight loans between banks 17 times from June 2004 to June 2006, raising the rate from 1.00% to 5.25%. The last four rate hikes occurred in the first half of 2006.
Economic growth began to slow in the spring of 2006, particularly as higher interest rates began to take a toll on the housing sector. The economy continued to lose steam in the second half of the year, allowing the Fed to leave short-term rates unchanged from July through December. There was even speculation in the financial markets that the Fed might have to cut short-term rates in 2007 to reinvigorate the economy. Because of the outlook for lower short-term rates, there were times during the second half of the year when the slope of the money market yield curve inverted. That is, yields on longer-term money market securities fell below those on shorter-term money market securities. This is an unusual occurrence because longer-term money market securities usually provide higher yields to compensate investors for the added risk of owning a longer-term asset.
The Portfolio benefited from its increased exposure to longer-term money market securities of the Federal National Mortgage Association and the Federal Home Loan Mortgage Corp. whose yields declined, pushing their prices higher as bond price move inversely to yields. However, the benefit derived from holding these securities was largely offset by the Portfolio’s increased exposure to repurchase agreements, which shortened its average duration bias. Duration measures a portfolio’s sensitivity to changes in the level of interest rates. Having a longer average duration bias would have enabled the Portfolio to benefit more fully in the second half of the year from the decline in money market yields. But the bulk of the Portfolio’s holdings were in repurchase agreements because these transactions provide excess return over comparable U.S. Treasury securities on a duration-adjusted basis.
The Portfolio of Investments following this report shows the size of the Portfolio’s positions at period-end.
| | |
| THE TARGET PORTFOLIO TRUST | | 17 |
Fees and Expenses (Unaudited)
As a shareholder of the Trust, you incur two types of costs: (1) transaction costs, including sales charges (loads) on purchase payments and redemptions, as applicable, and (2) ongoing costs, including management fees, TARGET program fees, and other Trust expenses, as applicable. This example is intended to help you understand your ongoing costs (in dollars) of investing in the Trust and to compare these costs with the ongoing costs of investing in other mutual funds. This example does not reflect TARGET program fees. If TARGET program fees were included, the costs would be higher.
The example is based on an investment of $1,000 invested on July 1, 2006, at the beginning of the period, and held through the six-month period ended December 31, 2006.
The Trust’s transfer agent may charge additional fees to holders of certain accounts that are not included in the expenses shown in the table on the following page. These fees apply to Individual Retirement Accounts (IRAs) and Section 403(b) accounts. As of the close of the six-month period covered by the table, IRA fees included an annual maintenance fee of $15 per account (subject to a maximum annual maintenance fee of $25 for all accounts held by the same shareholder). Section 403(b) accounts are charged an annual $25 fiduciary maintenance fee. Some of the fees may vary in amount, or may be waived, based on your total account balance or the number of JennisonDryden or Strategic Partners Funds, including the Trust, that you own. You should consider the additional fees that were charged to your Trust account over the six-month period when you estimate the total ongoing expenses paid over the period and the impact of these fees on your ending account value, as these additional expenses are not reflected in the information provided in the expense table. Additional fees have the effect of reducing investment returns.
Actual Expenses
The first line for each share class in the table on the following page provides information about actual account values and actual expenses. You may use the information on this line, together with the amount you invested, to estimate the expenses that you paid over the period. Simply divide your account value by $1,000 (for example, an $8,600 account value ÷ $1,000 = 8.6), then multiply the result by the number on the first line under the heading “Expenses Paid During the Six-Month Period” to estimate the expenses you paid on your account during this period.
| | |
| 18 | | THE TARGET PORTFOLIO TRUST |
Hypothetical Example for Comparison Purposes
The second line for each share class in the table on the following page provides information about hypothetical account values and hypothetical expenses based on the Trust’s actual expense ratio and an assumed rate of return of 5% per year before expenses, which is not the Trust’s actual return. The hypothetical account values and expenses may not be used to estimate the actual ending account balance or expenses you paid for the period. You may use this information to compare the ongoing costs of investing in the Trust and other funds. To do so, compare this 5% hypothetical example with the 5% hypothetical examples that appear in the shareholder reports of the other funds.
Please note that the expenses shown in the table are meant to highlight your ongoing costs only, and do not reflect any transactional costs such as sales charges (loads). Therefore the second line for each share class in the table is useful in comparing ongoing costs only, and will not help you determine the relative total costs of owning different funds. In addition, if these transactional costs were included, your costs would have been higher.
| | | | | | | | | | | | | | |
Large
Capitalization
Growth Portfolio | | Beginning Account
Value
July 1, 2006 | | Ending Account
Value December 31, 2006 | | Annualized
Expense Ratio
Based on the
Six-Month Period | | | Expenses Paid
During the Six-
Month Period* |
| | | | | | | | | | | | | | | |
| | | Class R | | | | | | | | | | | | |
| | | Actual** | | $ | 1,000.00 | | $ | 1,093.40 | | 1.25 | % | | $ | 4.73 |
| | | Hypothetical | | $ | 1,000.00 | | $ | 1,018.90 | | 1.25 | % | | $ | 6.36 |
| | | Class T | | | | | | | | | | | | |
| | | Actual | | $ | 1,000.00 | | $ | 1,087.00 | | 0.75 | % | | $ | 3.95 |
| | | Hypothetical | | $ | 1,000.00 | | $ | 1,021.42 | | 0.75 | % | | $ | 3.82 |
| | | | | | | | | | | | | | | |
Large
Capitalization
Value Portfolio | | Beginning Account
Value
July 1, 2006 | | Ending Account
Value December 31, 2006 | | Annualized
Expense Ratio
Based on the
Six-Month Period | | | Expenses Paid
During the Six-
Month Period* |
| | | | | | | | | | | | | | | |
| | | Class R | | | | | | | | | | | | |
| | | Actual** | | $ | 1,000.00 | | $ | 1,104.40 | | 1.19 | % | | $ | 4.53 |
| | | Hypothetical | | $ | 1,000.00 | | $ | 1,019.21 | | 1.19 | % | | $ | 6.06 |
| | | Class T | | | | | | | | | | | | |
| | | Actual | | $ | 1,000.00 | | $ | 1,133.50 | | 0.69 | % | | $ | 3.71 |
| | | Hypothetical | | $ | 1,000.00 | | $ | 1,021.73 | | 0.69 | % | | $ | 3.52 |
| | |
| THE TARGET PORTFOLIO TRUST | | 19 |
| | | | | | | | | | | | | | |
| | | | | | | | | | | | | | | |
Small
Capitalization
Growth Portfolio | | Beginning Account
Value
July 1, 2006 | | Ending Account
Value December 31, 2006 | | Annualized
Expense Ratio
Based on the
Six-Month Period | | | Expenses Paid
During the Six-
Month Period* |
| | | | | | | | | | | | | | | |
| | | Class R | | | | | | | | | | | | |
| | | Actual** | | $ | 1,000.00 | | $ | 1,097.80 | | 1.27 | % | | $ | 4.82 |
| | | Hypothetical | | $ | 1,000.00 | | $ | 1,018.80 | | 1.27 | % | | $ | 6.46 |
| | | Class T | | | | | | | | | | | | |
| | | Actual | | $ | 1,000.00 | | $ | 1,043.00 | | 0.77 | % | | $ | 3.97 |
| | | Hypothetical | | $ | 1,000.00 | | $ | 1,021.32 | | 0.77 | % | | $ | 3.92 |
| | | | | | | | | | | | | | |
Small
Capitalization
Value Portfolio | | Beginning Account
Value
July 1, 2006 | | Ending Account
Value December 31, 2006 | | Annualized
Expense Ratio
Based on the
Six-Month Period | | | Expenses Paid
During the Six-
Month Period* |
| | | | | | | | | | | | | | | |
| | | Class R | | | | | | | | | | | | |
| | | Actual** | | $ | 1,000.00 | | $ | 1,094.50 | | 1.30 | % | | $ | 4.92 |
| | | Hypothetical | | $ | 1,000.00 | | $ | 1,018.65 | | 1.30 | % | | $ | 6.61 |
| | | Class T | | | | | | | | | | | | |
| | | Actual | | $ | 1,000.00 | | $ | 1,088.40 | | 0.80 | % | | $ | 4.21 |
| | | Hypothetical | | $ | 1,000.00 | | $ | 1,021.17 | | 0.80 | % | | $ | 4.08 |
| | | | | | | | | | | | | | | |
International
Equity Portfolio | | Beginning Account
Value
July 1, 2006 | | Ending Account
Value December 31, 2006 | | Annualized
Expense Ratio
Based on the
Six-Month Period | | | Expenses Paid
During the Six-
Month Period* |
| | | | | | | | | | | | | | | |
| | | Class R | | | | | | | | | | | | |
| | | Actual** | | $ | 1,000.00 | | $ | 1,117.40 | | 1.38 | % | | $ | 5.28 |
| | | Hypothetical | | $ | 1,000.00 | | $ | 1,018.25 | | 1.38 | % | | $ | 7.02 |
| | | Class T | | | | | | | | | | | | |
| | | Actual | | $ | 1,000.00 | | $ | 1,157.90 | | 0.88 | % | | $ | 4.79 |
| | | Hypothetical | | $ | 1,000.00 | | $ | 1,020.77 | | 0.88 | % | | $ | 4.48 |
| | | | | | | | | | | | | | | |
International
Bond Portfolio | | Beginning Account
Value
July 1, 2006 | | Ending Account
Value
December 31, 2006 | | Annualized
Expense Ratio
Based on the
Six-Month Period | | | Expenses Paid
During the Six-
Month Period* |
| | | | | | | | | | | | | | | |
| | | Class T | | | | | | | | | | | | |
| | | Actual | | $ | 1,000.00 | | $ | 1,031.40 | | 0.72 | % | | $ | 3.69 |
| | | Hypothetical | | $ | 1,000.00 | | $ | 1,021.58 | | 0.72 | % | | $ | 3.67 |
| | |
| 20 | | THE TARGET PORTFOLIO TRUST |
Fees and Expenses (continued)
| | | | | | | | | | | | | | |
| | | | | | | | | | | | | | | |
Total Return
Bond Portfolio | | Beginning Account
Value
July 1, 2006 | | Ending Account
Value
December 31, 2006 | | Annualized
Expense Ratio
Based on the
Six-Month Period | | | Expenses Paid
During the Six-
Month Period* |
| | | | | | | | | | | | | | | |
| | | Class R | | | | | | | | | | | | |
| | | Actual** | | $ | 1,000.00 | | $ | 1,012.70 | | 1.11 | % | | $ | 4.04 |
| | | Hypothetical | | $ | 1,000.00 | | $ | 1,019.61 | | 1.11 | % | | $ | 5.65 |
| | | Class T | | | | | | | | | | | | |
| | | Actual | | $ | 1,000.00 | | $ | 1,049.40 | | 0.61 | % | | $ | 3.15 |
| | | Hypothetical | | $ | 1,000.00 | | $ | 1,022.13 | | 0.61 | % | | $ | 3.11 |
| | | | | | | | | | | | | | | |
Intermediate-Term
Bond Portfolio | | Beginning Account
Value
July 1, 2006 | | Ending Account
Value
December 31, 2006 | | Annualized
Expense Ratio
Based on the
Six-Month Period | | | Expenses Paid
During the Six-
Month Period* |
| | | | | | | | | | | | | | | |
| | | Class T | | | | | | | | | | | | |
| | | Actual | | $ | 1,000.00 | | $ | 1,043.20 | | 0.61 | % | | $ | 3.14 |
| | | Hypothetical | | $ | 1,000.00 | | $ | 1,022.13 | | 0.61 | % | | $ | 3.11 |
| | | | | | | | | | | | | | | |
Mortgage
Backed
Securities
Portfolio | | Beginning Account
Value
July 1, 2006 | | Ending Account
Value
December 31, 2006 | | Annualized
Expense Ratio
Based on the
Six-Month Period | | | Expenses Paid
During the Six-
Month Period* |
| | | | | | | | | | | | | | | |
| | | Class T | | | | | | | | | | | | |
| | | Actual | | $ | 1,000.00 | | $ | 1,045.80 | | 1.95 | % | | $ | 10.06 |
| | | Hypothetical | | $ | 1,000.00 | | $ | 1,015.38 | | 1.95 | % | | $ | 9.91 |
| | | | | | | | | | | | | | | |
U.S. Government
Money Market
Portfolio | | Beginning Account
Value
July 1, 2006 | | Ending Account
Value December 31, 2006 | | Annualized
Expense Ratio
Based on the
Six-Month Period | | | Expenses Paid
During the Six-
Month Period* |
| | | | | | | | | | | | | | | |
| | | Class T | | | | | | | | | | | | |
| | | Actual | | $ | 1,000.00 | | $ | 1,026.00 | | 0.45 | % | | $ | 2.30 |
| | | Hypothetical | | $ | 1,000.00 | | $ | 1,022.94 | | 0.45 | % | | $ | 2.29 |
* Portfolio expenses (net of fee waivers or subsidies, if any) for each share class are equal to the annualized expense ratio for each share class (provided in the table), multiplied by the average account value over the period, multiplied by the 184 days in the six-month period ended December 31, 2006, and divided by the 365 days in the Portfolio’s fiscal year ended December 31, 2006 (to reflect the six-month period) with the exception of the Class R “Actual” information which reflects the 132 day period ended December 31, 2006 due to its inception date of August 22, 2006.
** Class R shares commenced operations on August 22, 2006.
| | |
| THE TARGET PORTFOLIO TRUST | | 21 |
| | |
Portfolio of Investments
As of December 31, 2006 | | Large Capitalization Growth Portfolio |
| | | | | |
| SHARES | | DESCRIPTION | | VALUE (NOTE 1) |
| | | | | |
| | LONG-TERM INVESTMENTS—99.6% | | | |
| | |
| | Common Stocks | | | |
| | |
| | Aerospace & Defense—6.1% | | | |
| 55,969 | | Boeing Co. | | $ | 4,972,286 |
| 61,260 | | General Dynamics Corp. | | | 4,554,681 |
| 39,067 | | Lockheed Martin Corp.* | | | 3,596,899 |
| 22,300 | | Northrop Grumman Corp. | | | 1,509,710 |
| 60,898 | | United Technologies Corp. | | | 3,807,343 |
| | | | | |
| | | | | 18,440,919 |
| | | | | |
| | |
| | Agriculture/Heavy Equipment—2.6% | | | |
| 4,900 | | Altria Group, Inc. | | | 420,518 |
| 40,800 | | Archer-Daniels-Midland Co. | | | 1,303,968 |
| 118,179 | | Monsanto Co. | | | 6,207,943 |
| | | | | |
| | | | | 7,932,429 |
| | | | | |
| | |
| | Automobile Manufacturers—1.7% | | | |
| 37,679 | | Toyota Motor Corp., ADR (Japan) | | | 5,060,666 |
| | | | | |
| | |
| | Automotive Parts—0.5% | | | |
| 23,900 | | Autoliv, Inc. (Sweden) | | | 1,441,170 |
| | | | | |
| | |
| | Beverages—1.4% | | | |
| 9,400 | | Coca-Cola Co. (The) | | | 453,550 |
| 91,705 | | Heinekin NV, ADR (Netherlands) | | | 2,178,498 |
| 25,349 | | PepsiCo, Inc. | | | 1,585,580 |
| | | | | |
| | | | | 4,217,628 |
| | | | | |
| | |
| | Biotechnology—4.4% | | | |
| 46,000 | | Amgen, Inc. | | | 3,142,260 |
| 18,500 | | Applera Corp.—Applied Biosystems Group | | | 678,765 |
| 93,842 | | Genentech, Inc. | | | 7,613,401 |
| 33,738 | | Genzyme Corp.* | | | 2,077,586 |
| | | | | |
| | | | | 13,512,012 |
| | | | | |
| | |
| | Biotechnology Healthcare—0.7% | | | |
| 34,600 | | Celgene Corp.* | | | 1,990,538 |
| | | | | |
| | |
| | Broadcasting—0.1% | | | |
| 3,700 | | Liberty Media Holding Corp. (Class A Stock) | | | 362,526 |
| | | | | |
| | |
| | Business Services—0.3% | | | |
| 13,600 | | Manpower, Inc. | | | 1,019,048 |
| | | | | |
| | |
| | Cable Television—0.5% | | | |
| 55,938 | | DIRECTV Group, Inc. (The)* | | | 1,395,094 |
| | | | | |
See Notes to Financial Statements
| | |
| THE TARGET PORTFOLIO TRUST | | 23 |
| | |
Large Capitalization Growth Portfolio (cont’d) | | Portfolio of Investments
As of December 31, 2006 |
| | | | | |
| SHARES | | DESCRIPTION | | VALUE (NOTE 1) |
| | | | | |
| | Chemicals—0.7% | | | |
| 2,800 | | Ashland, Inc. | | $ | 193,704 |
| 32,500 | | Praxair, Inc. | | | 1,928,225 |
| | | | | |
| | | | | 2,121,929 |
| | | | | |
| | |
| | Commercial Services—1.4% | | | |
| 32,200 | | McKesson Corp. | | | 1,632,540 |
| 27,000 | | Moody’s Corp. | | | 1,864,620 |
| 18,300 | | Waste Management, Inc. | | | 672,891 |
| | | | | |
| | | | | 4,170,051 |
| | | | | |
| | |
| | Computer Hardware—3.3% | | | |
| 1,700 | | Apple Computer, Inc. | | | 144,228 |
| 41,400 | | Cadence Design System, Inc.* | | | 741,474 |
| 28,300 | | Computer Sciences Corp.* | | | 1,510,371 |
| 74,500 | | Hewlett-Packard Co. | | | 3,068,655 |
| 23,200 | | International Business Machines Corp. | | | 2,253,880 |
| 34,800 | | Synopsys, Inc. | | | 930,204 |
| 70,700 | | Western Digital Corp.* | | | 1,446,522 |
| | | | | |
| | | | | 10,095,334 |
| | | | | |
| | |
| | Computer Networking—0.2% | | | |
| 11,600 | | Network Appliance, Inc.* | | | 455,648 |
| | | | | |
| | |
| | Computer Services & Software—1.9% | | | |
| 9,600 | | Electronic Data Systems Corp. | | | 264,480 |
| 181,900 | | Microsoft Corp. | | | 5,431,534 |
| | | | | |
| | | | | 5,696,014 |
| | | | | |
| | |
| | Computers—0.5% | | | |
| 22,700 | | Lexmark International, Inc. (Class A Stock)* | | | 1,661,640 |
| | | | | |
| | |
| | Computers & Peripherals—0.5% | | | |
| 279,100 | | Sun Microsystems, Inc.* | | | 1,512,722 |
| | | | | |
| | |
| | Construction—1.5% | | | |
| 8,900 | | Granite Construction, Inc. | | | 447,848 |
| 36,089 | | KB Home | | | 1,850,644 |
| 44,480 | | Lennar Corp. (Class A Stock) | | | 2,333,421 |
| | | | | |
| | | | | 4,631,913 |
| | | | | |
| | |
| | Consumer Products & Services—2.6% | | | |
| 13,800 | | American Greetings Corp. (Class A Stock) | | | 329,406 |
| 102,150 | | Proctor & Gamble Co. | | | 6,565,180 |
| 19,300 | | UST, Inc. | | | 1,123,260 |
| | | | | |
| | | | | 8,017,846 |
| | | | | |
See Notes to Financial Statements
| | |
| 24 | | THE TARGET PORTFOLIO TRUST |
| | | | | |
| SHARES | | DESCRIPTION | | VALUE (NOTE 1) |
| | | | | |
| | Distribution/Wholesale—0.4% | | | |
| 19,800 | | WESCO International, Inc.* | | $ | 1,164,438 |
| | | | | |
| | |
| | Diversified—0.4% | | | |
| 13,800 | | 3M Co. | | | 1,075,434 |
| | | | | |
| | |
| | Diversified Financial Services—0.9% | �� | | |
| 26,455 | | Citigroup, Inc. | | | 1,473,543 |
| 4,600 | | Morgan Stanley Dean Witter & Co. | | | 374,578 |
| 16,100 | | Principal Financial Group | | | 945,070 |
| | | | | |
| | | | | 2,793,191 |
| | | | | |
| | |
| | Electronic Components—0.7% | | | |
| 12,200 | | Energizer Holdings, Inc.* | | | 866,078 |
| 18,700 | | Raytheon Co. | | | 987,360 |
| 7,200 | | Waters Corp.* | | | 352,584 |
| | | | | |
| | | | | 2,206,022 |
| | | | | |
| | |
| | Energy—0.6% | | | |
| 33,300 | | TXU Corp. | | | 1,805,193 |
| | | | | |
| | |
| | Energy Equipment & Services—0.3% | | | |
| 17,000 | | Holly Corp. | | | 873,800 |
| | | | | |
| | |
| | Entertainment & Leisure—1.4% | | | |
| 47,434 | | Las Vegas Sands, Inc.* | | | 4,244,394 |
| | | | | |
| | |
| | Environmental Services—0.4% | | | |
| 28,800 | | Republic Services, Inc. | | | 1,171,296 |
| | | | | |
| | |
| | Financial-Bank & Trust—4.0% | | | |
| 117,500 | | China Merchants Bank Co. Ltd. (China)* | | | 248,949 |
| 15,700 | | Hudson City Bancorp, Inc. | | | 217,916 |
| 6,472,000 | | Industrial And Commercial Bank of China. (Hong Kong)* | | | 4,018,842 |
| 75,383 | | UBS AG (Switzerland) | | | 4,547,857 |
| 90,625 | | Wells Fargo & Co. | | | 3,222,625 |
| | | | | |
| | | | | 12,256,189 |
| | | | | |
| | |
| | Financial Services—5.9% | | | |
| 39,000 | | AmeriCredit Corp.* | | | 981,630 |
| 5,640 | | Ameriprise Financial, Inc. | | | 307,380 |
| 41,490 | | Goldman Sachs Group, Inc.* | | | 8,271,032 |
| 23,000 | | JPMorgan Chase & Co. | | | 1,110,900 |
| 61,079 | | Lehman Brothers Holdings, Inc. | | | 4,771,491 |
| 13,900 | | Merrill Lynch & Co., Inc. | | | 1,294,090 |
| 8,800 | | SEI Investments Co. | | | 524,128 |
| 13,500 | | T. Rowe Price Group, Inc. | | | 590,895 |
| | | | | |
| | | | | 17,851,546 |
| | | | | |
| | |
| | Food Products—0.5% | | | |
| 20,200 | | Kraft Foods, Inc. (Class A Stock) | | | 721,140 |
| 38,300 | | Kroger Co. (The) | | | 883,581 |
| | | | | |
| | | | | 1,604,721 |
| | | | | |
See Notes to Financial Statements
| | |
| THE TARGET PORTFOLIO TRUST | | 25 |
| | |
Large Capitalization Growth Portfolio (cont’d) | | Portfolio of Investments
As of December 31, 2006 |
| | | | | |
| SHARES | | DESCRIPTION | | VALUE (NOTE 1) |
| | | | | |
| | Healthcare Providers & Services—0.2% | | | |
| 4,400 | | Caremark Rx, Inc. | | $ | 251,284 |
| 4,600 | | Universal Health Services, Inc. (Class B Stock) | | | 254,978 |
| | | | | |
| | | | | 506,262 |
| | | | | |
| | |
| | Healthcare Services—5.5% | | | |
| 17,700 | | Aetna, Inc. | | | 764,286 |
| 32,600 | | AmerisourceBergen Corp. | | | 1,465,696 |
| 3,400 | | Biogen Idec, Inc.* | | | 167,246 |
| 25,900 | | Humana, Inc.* | | | 1,432,529 |
| 7,400 | | Laboratory Corp. of America Holdings* | | | 543,678 |
| 226,451 | | UnitedHealth Group, Inc. | | | 12,167,212 |
| 2,400 | | Wellcare Group, Inc* | | | 165,360 |
| | | | | |
| | | | | 16,706,007 |
| | | | | |
| | |
| | Hotels & Motels—3.9% | | | |
| 7,900 | | Choice Hotels International, Inc. | | | 332,590 |
| 91,710 | | MGM Mirage | | | 5,259,568 |
| 9,185 | | Station Casinos, Inc.(a) | | | 750,139 |
| 8,400 | | Wyndham Worldwide Corp.* | | | 268,968 |
| 56,540 | | Wynn Resorts Ltd.* | | | 5,306,279 |
| | | | | |
| | | | | 11,917,544 |
| | | | | |
| | |
| | Hotels, Restaurants & Leisure—1.8% | | | |
| 24,900 | | Marriott International, Inc. (Class A Stock) | | | 1,188,228 |
| 123,796 | | Starbucks Corp.* | | | 4,384,854 |
| | | | | |
| | | | | 5,573,082 |
| | | | | |
| | |
| | Insurance—0.8% | | | |
| 5,800 | | AMBAC Financial Group, Inc. | | | 516,606 |
| 9,700 | | Genworth Financial, Inc. | | | 331,837 |
| 8,900 | | Loews Corp. | | | 369,083 |
| 18,011 | | MBIA, Inc. | | | 1,315,884 |
| | | | | |
| | | | | 2,533,410 |
| | | | | |
| | |
| | Internet Services—1.8% | | | |
| 7,550 | | Google, Inc. (Class A Stock)* | | | 3,476,624 |
| 25,700 | | MPS Group, Inc.* | | | 364,426 |
| 72,900 | | Symantec Corp. | | | 1,519,965 |
| | | | | |
| | | | | 5,361,015 |
| | | | | |
| | |
| | Internet Software & Services—0.1% | | | |
| 14,400 | | Oracle Corp.* | | | 246,816 |
| | | | | |
| | |
| | IT Services—0.4% | | | |
| 52,300 | | First Data Corp. | | | 1,334,696 |
| | | | | |
See Notes to Financial Statements
| | |
| 26 | | THE TARGET PORTFOLIO TRUST |
| | | | | |
| SHARES | | DESCRIPTION | | VALUE (NOTE 1) |
| | | | | |
| | Machinery—0.7% | | | |
| 9,700 | | AGCO Corp.* | | $ | 300,118 |
| 4,200 | | Crane Co. | | | 153,888 |
| 27,000 | | Terex Corp.* | | | 1,743,660 |
| | | | | |
| | | | | 2,197,666 |
| | | | | |
| | |
| | Manufacturing—1.0% | | | |
| 80,700 | | General Electric Co. | | | 3,002,847 |
| | | | | |
| | |
| | Media—4.6% | | | |
| 48,350 | | CBS Corp. (Class B Stock) | | | 1,507,553 |
| 156,684 | | Comcast Corp. (Class A Stock) | | | 6,632,434 |
| 23,400 | | McGraw-Hill Cos., Inc. | | | 1,591,668 |
| 76,500 | | Time Warner, Inc. | | | 1,666,170 |
| 12,000 | | Univision Communications, Inc. (Class A Stock)* | | | 425,040 |
| 60,200 | | Walt Disney Co. (The) | | | 2,063,054 |
| | | | | |
| | | | | 13,885,919 |
| | | | | |
| | |
| | Medical Supplies & Equipment—2.4% | | | |
| 14,500 | | Becton Dickinson & Co. | | | 1,017,175 |
| 2,200 | | Idexx Laboratories, Inc.* | | | 174,460 |
| 60,200 | | Johnson & Johnson | | | 3,974,404 |
| 40,500 | | Medtronic, Inc. | | | 2,167,155 |
| | | | | |
| | | | | 7,333,194 |
| | | | | |
| | |
| | Metals & Mining—0.7% | | | |
| 5,200 | | Newmont Mining Corp. | | | 234,780 |
| 9,400 | | Nucor Corp. | | | 513,804 |
| 26,700 | | Southern Copper Corp.(a) | | | 1,438,863 |
| | | | | |
| | | | | 2,187,447 |
| | | | | |
| | |
| | Miscellaneous Manufacturers—0.2% | | | |
| 8,300 | | SPX Corp. | | | 507,628 |
| | | | | |
| | |
| | Oil, Gas & Consumable Fuels—2.8% | | | |
| 3,500 | | Baker Hughes, Inc. | | | 261,310 |
| 21,200 | | Devon Energy Corp. | | | 1,422,096 |
| 2,200 | | Diamond Offshore Drilling | | | 175,868 |
| 26,800 | | Exxon Mobil Corp.* | | | 2,053,684 |
| 6,700 | | Marathon Oil Corp. | | | 619,750 |
| 8,800 | | Noble Corp. (Cayman Islands) | | | 670,120 |
| 52,111 | | Schlumberger Ltd. | | | 3,291,331 |
| | | | | |
| | | | | 8,494,159 |
| | | | | |
| | |
| | Pharmaceuticals—2.5% | | | |
| 51,256 | | Amylin Pharmaceuticals, Inc.* | | | 1,848,804 |
| 19,200 | | Cardinal Health, Inc. | | | 1,237,056 |
| 12,400 | | Forest Laboratories, Inc.* | | | 627,440 |
| 48,400 | | Merck & Co., Inc. | | | 2,110,240 |
| 56,400 | | Pfizer, Inc. | | | 1,460,760 |
| 3,000 | | Wyeth | | | 152,760 |
| | | | | |
| | | | | 7,437,060 |
| | | | | |
See Notes to Financial Statements
| | |
| THE TARGET PORTFOLIO TRUST | | 27 |
| | |
Large Capitalization Growth Portfolio (cont’d) | | Portfolio of Investments
As of December 31, 2006 |
| | | | | |
| SHARES | | DESCRIPTION | | VALUE (NOTE 1) |
| | | | | |
| | Real Estate—0.8% | | | |
| 13,532 | | CB Richard Ellis Group, Inc.* | | $ | 449,263 |
| 18,500 | | New Century Financial Corp. | | | 584,415 |
| 28,423 | | St. Joe Co. (The)(a) | | | 1,522,620 |
| | | | | |
| | | | | 2,556,298 |
| | | | | |
| | |
| | Real Estate Investment Trusts—0.5% | | | |
| 12,800 | | Jones Lang Lasal, Inc. | | | 1,179,776 |
| 2,400 | | Public Storage, Inc. | | | 234,000 |
| 1,600 | | Sl Green Realty Corp. | | | 212,448 |
| | | | | |
| | | | | 1,626,224 |
| | | | | |
| | |
| | Restaurants—1.3% | | | |
| 68,582 | | Yum! Brands, Inc. | | | 4,032,622 |
| | | | | |
| | |
| | Retail & Merchandising—6.6% | | | |
| 32,400 | | American Eagle Outfitters, Inc. | | | 1,011,204 |
| 46,000 | | Autonation, Inc.* | | | 980,720 |
| 57,900 | | Circuit City Stores, Inc. | | | 1,098,942 |
| 12,400 | | Colgate-Palmolive Co. | | | 808,976 |
| 22,500 | | Costco Wholesale Corp. | | | 1,189,575 |
| 19,600 | | CVS Corp. | | | 605,836 |
| 37,300 | | Darden Restaurants, Inc. | | | 1,498,341 |
| 30,700 | | Dillard’s, Inc. (Class A Stock) | | | 1,073,579 |
| 26,590 | | Federated Department Stores | | | 1,013,877 |
| 3,800 | | Home Depot, Inc. | | | 152,608 |
| 127,866 | | Lowe’s Cos., Inc. | | | 3,983,026 |
| 6,942 | | Nordstrom, Inc. | | | 342,518 |
| 37,600 | | Office Depot, Inc.* | | | 1,435,192 |
| 7,200 | | Safeway, Inc. | | | 248,832 |
| 49,962 | | Target Corp. | | | 2,850,332 |
| 24,600 | | TJX Cos., Inc. | | | 700,608 |
| 23,500 | | Wal-Mart Stores, Inc. | | | 1,085,230 |
| | | | | |
| | | | | 20,079,396 |
| | | | | |
| | |
| | Semiconductors—3.0% | | | |
| 31,400 | | Atmel Corp.* | | | 189,970 |
| 89,657 | | Intel Corp. | | | 1,815,554 |
| 61,300 | | Intersil Holding Corp. | | | 1,466,296 |
| 2,700 | | Lam Research Corp. | | | 136,674 |
| 112,400 | | Micron Technology, Inc.*(a) | | | 1,569,104 |
| 46,900 | | Novellus Systems, Inc.* | | | 1,614,298 |
| 81,400 | | Texas Instruments, Inc. | | | 2,344,320 |
| 2,852 | | Verigy Ltd.* | | | 50,623 |
| | | | | |
| | | | | 9,186,839 |
| | | | | |
See Notes to Financial Statements
| | |
| 28 | | THE TARGET PORTFOLIO TRUST |
| | | | | | |
| SHARES | | DESCRIPTION | | VALUE (NOTE 1) | |
| | | | | | |
| | Software—0.1% | | | | |
| 7,500 | | Intuit, Inc.* | | $ | 228,825 | |
| | | | | | |
| | |
| | Telecommunications—4.9% | | | | |
| 4,400 | | Abbott Laboratories | | | 214,324 | |
| 61,610 | | America Movil SA de CV, ADR (Mexico) | | | 2,786,004 | |
| 132,000 | | China Mobile Ltd. (Hong Kong) | | | 1,137,834 | |
| 319,410 | | Cisco Systems, Inc.* | | | 8,729,475 | |
| 51,400 | | Motorola, Inc. | | | 1,056,784 | |
| 9,200 | | Polycom, Inc.* | | | 284,372 | |
| 14,607 | | Sprint Nextel Corp. | | | 275,926 | |
| 4,400 | | United States Cellular Corp.* | | | 306,196 | |
| | | | | | |
| | | | | 14,790,915 | |
| | | | | | |
| | |
| | Tobacco—0.4% | | | | |
| 19,800 | | Reynolds America, Inc. | | | 1,296,306 | |
| | | | | | |
| | |
| | Transportation—5.6% | | | | |
| 73,350 | | Burlington Northern Santa Fe Corp. | | | 5,413,963 | |
| 46,500 | | CSX Corp. | | | 1,600,995 | |
| 53,759 | | FedEx Corp. | | | 5,839,303 | |
| 10,900 | | Norfolk Southern Corp. | | | 548,161 | |
| 39,456 | | Union Pacific Corp. | | | 3,630,741 | |
| | | | | | |
| | | | | 17,033,163 | |
| | | | | | |
| | |
| | Utilities—0.6% | | | | |
| 13,278 | | NRG Energy, Inc* | | | 743,701 | |
| 20,000 | | PG&E Corp. | | | 946,600 | |
| | | | | | |
| | | | | 1,690,301 | |
| | | | | | |
| | Total long-term investments
(cost $255,847,927) | | | 302,526,992 | |
| | | | | | |
| | |
| | SHORT-TERM INVESTMENT—1.8% | | | | |
| | |
| | Affiliated Money Market Mutual Fund | | | | |
| | Dryden Core Investment Fund—Taxable Money Market Series (cost $5,658,842; includes $5,507,790 of cash collateral for securities on loan) (note 3)(b)(w) | | | 5,658,842 | |
| | | | | | |
| | Total Investments(o)—101.4%
(cost $261,506,769; Note 5) | | | 308,185,834 | |
| | Liabilities in excess of other assets—(1.4%) | | | (4,403,734 | ) |
| | | | | | |
| | Net Assets—100% | | $ | 303,782,100 | |
| | | | | | |
The following abbreviations are used in portfolio descriptions:
| * | Non-income producing security. |
ADR—American Depositary Receipt
| (a) | All or a portion of security is on loan. The aggregate market value of such securities is $5,204,156; cash collateral of $5,507,790 (included with liabilities) was received with which the portfolio purchased highly liquid short-term investments. |
| (b) | Represents security, or a portion thereof, purchased with cash collateral received for securities on loan. |
| (o) | As of December 31, 2006, 1 Security representing $1,137,834 and 0.4% of the total market value was fair valued in accordance with the policies adopted by the Board of Trustees. |
| (w) | Prudential Investments LLC, the manager of the Portfolio also serves as manager of the Dryden Core Investment Fund—Taxable Money Market Series. |
See Notes to Financial Statements
| | |
| THE TARGET PORTFOLIO TRUST | | 29 |
| | |
Large Capitalization Growth Portfolio (cont’d) | | Portfolio of Investments
As of December 31, 2006 |
The industry classification of portfolio holdings and liabilities in excess of other assets shown as a percentage of net assets as of December 31, 2006 was as follows:
| | | |
Industry | | | |
Retail & Merchandising | | 6.6 | % |
Aerospace & Defense | | 6.1 | |
Financial Services | | 5.9 | |
Transportation | | 5.6 | |
Healthcare Services | | 5.5 | |
Telecommunications | | 4.9 | |
Media | | 4.6 | |
Biotechnology | | 4.4 | |
Financial—Bank & Trust | | 4.0 | |
Hotels & Motels | | 3.9 | |
Computer Hardware | | 3.3 | |
Semiconductors | | 3.0 | |
Oil, Gas & Consumable Fuels | | 2.8 | |
Consumer Products & Services | | 2.6 | |
Agriculture/Heavy Equipment | | 2.6 | |
Pharmaceuticals | | 2.5 | |
Medical Supplies & Equipment | | 2.4 | |
Computer Services & Software | | 1.9 | |
Affiliated Money Market Mutual Fund (including 1.8% of collateral received for securities on loan) | | 1.8 | |
Hotels, Restaurants & Leisure | | 1.8 | |
Internet Services | | 1.8 | |
Automobile Manufacturers | | 1.7 | |
Construction | | 1.5 | |
Entertainment & Leisure | | 1.4 | |
Beverages | | 1.4 | |
Commercial Services | | 1.4 | |
Restaurants | | 1.3 | |
Manufacturing | | 1.0 | |
Diversified Financial Services | | 0.9 | |
Real Estate | | 0.8 | |
Insurance | | 0.8 | |
Electronic Components | | 0.7 | |
Machinery | | 0.7 | |
Metals & Mining | | 0.7 | |
Chemicals | | 0.7 | |
Biotechnology Healthcare | | 0.7 | |
Energy | | 0.6 | |
Utilities | | 0.6 | |
Computers | | 0.5 | |
Real Estate Investment Trusts | | 0.5 | |
Food Products | | 0.5 | |
Computers & Peripherals | | 0.5 | |
Automotive Parts | | 0.5 | |
Cable Television | | 0.5 | |
See Notes to Financial Statements
| | |
| 30 | | THE TARGET PORTFOLIO TRUST |
| | | |
Industry | | | |
IT Services | | 0.4 | % |
Tobacco | | 0.4 | |
Environmental Services | | 0.4 | |
Distribution/Wholesale | | 0.4 | |
Diversified | | 0.4 | |
Business Services | | 0.3 | |
Energy Equipment & Services | | 0.3 | |
Miscellaneous Manufacturers | | 0.2 | |
Healthcare Providers & Services | | 0.2 | |
Computer Networking | | 0.2 | |
Broadcasting | | 0.1 | |
Internet Software & Services | | 0.1 | |
Software | | 0.1 | |
| | | |
| | 101.4 | |
Liabilities in excess of other assets | | (1.4 | ) |
| | | |
| | 100.0 | % |
| | | |
See Notes to Financial Statements
| | |
| THE TARGET PORTFOLIO TRUST | | 31 |
| | |
| Large Capitalization Value Portfolio | | Portfolio of Investments
As of December 31, 2006 |
| | | | | |
| SHARES | | DESCRIPTION | | VALUE (NOTE 1) |
| | | | | |
| | LONG-TERM INVESTMENTS—99.4% | | | |
| | |
| | Common Stocks | | | |
| | |
| | Aerospace & Defense—2.0% | | | |
| 9,500 | | Goodrich Corp. | | $ | 432,725 |
| 12,600 | | Lockheed Martin Corp. | | | 1,160,082 |
| 91,700 | | Northrop Grumman Corp. | | | 6,208,090 |
| | | | | |
| | | | | 7,800,897 |
| | | | | |
| | |
| | Agriculture—0.3% | | | |
| 40,000 | | Archer Daniels Midland Co. | | | 1,278,400 |
| | | | | |
| | |
| | Auto Components—1.3% | | | |
| 36,200 | | Johnson Controls, Inc. | | | 3,110,304 |
| 10,100 | | Magna International, Inc. (Class A Stock) | | | 813,555 |
| 17,400 | | Paccar, Inc. | | | 1,129,260 |
| | | | | |
| | | | | 5,053,119 |
| | | | | |
| | |
| | Automobile—0.6% | | | |
| 71,300 | | General Motors Corp.(a) | | | 2,190,336 |
| | | | | |
| | |
| | Automotive Parts—0.1% | | | |
| 5,900 | | Advance Auto Parts, Inc.* | | | 209,804 |
| | | | | |
| | |
| | Banks—0.4% | | | |
| 10,700 | | Colonial BancGroup, Inc. (The) | | | 275,418 |
| 13,100 | | SunTrust Banks, Inc. | | | 1,106,295 |
| | | | | |
| | | | | 1,381,713 |
| | | | | |
| | |
| | Beverages—0.7% | | | |
| 23,900 | | Anheuser-Busch Cos., Inc. | | | 1,175,880 |
| 86,000 | | Coca-Cola Enterprises, Inc. | | | 1,756,120 |
| | | | | |
| | | | | 2,932,000 |
| | | | | |
| | |
| | Biotechnology—0.2% | | | |
| 12,300 | | Amgen, Inc.* | | | 840,213 |
| | | | | |
| | |
| | Building Materials—0.8% | | | |
| 104,000 | | Masco Corp. | | | 3,106,480 |
| | | | | |
| | |
| | Chemicals—2.8% | | | |
| 129,400 | | Dow Chemical Co. | | | 5,168,236 |
| 41,500 | | Eastman Chemical Co. | | | 2,461,365 |
| 17,100 | | PPG Industries, Inc. | | | 1,097,991 |
| 7,300 | | Praxair, Inc. | | | 433,109 |
| 34,600 | | Rohm & Haas Co. | | | 1,768,752 |
| | | | | |
| | | | | 10,929,453 |
| | | | | |
See Notes to Financial Statements
| | |
| 32 | | THE TARGET PORTFOLIO TRUST |
| | | | | |
| SHARES | | DESCRIPTION | | VALUE (NOTE 1) |
| | | | | |
| | Commercial Banks—7.9% | | | |
| 255,986 | | Bank of America Corp. | | $ | 13,667,092 |
| 62,900 | | KeyCorp | | | 2,392,087 |
| 30,900 | | Marshall & Ilsley Corp. | | | 1,486,599 |
| 29,900 | | State Street Corp. | | | 2,016,456 |
| 105,500 | | U.S. Bancorp | | | 3,818,045 |
| 13,000 | | UnionBanCal Corp. | | | 796,250 |
| 34,500 | | Wachovia Corp. | | | 1,964,775 |
| 133,200 | | Wells Fargo & Co. | | | 4,736,592 |
| 3,400 | | Zions Bancorp | | | 280,296 |
| | | | | |
| | | | | 31,158,192 |
| | | | | |
| | |
| | Commercial Services & Supplies—0.4% | | | |
| 10,740 | | Avis Budget Group | | | 232,951 |
| 100 | | McKesson Corp. | | | 5,070 |
| 32,000 | | Waste Management, Inc. | | | 1,176,640 |
| | | | | |
| | | | | 1,414,661 |
| | | | | |
| | |
| | Computer Networking | | | |
| 100 | | Network Appliance, Inc.* | | | 3,928 |
| | | | | |
| | |
| | Computers & Peripherals—0.8% | | | |
| 48,400 | | Hewlett-Packard Co. | | | 1,993,596 |
| 7,700 | | International Business Machines Corp. | | | 748,055 |
| 99,600 | | Sun Microsystems, Inc.* | | | 539,832 |
| | | | | |
| | | | | 3,281,483 |
| | | | | |
| | |
| | Conglomerates—0.1% | | | |
| 3,300 | | Textron, Inc. | | | 309,441 |
| | | | | |
| | |
| | Construction—0.2% | | | |
| 9,200 | | D.R. Horton, Inc.(a) | | | 243,708 |
| 17,200 | | Toll Brothers, Inc.* | | | 554,356 |
| | | | | |
| | | | | 798,064 |
| | | | | |
| | |
| | Consumer Products—1.7% | | | |
| 7,200 | | Avon Products, Inc. | | | 237,888 |
| 102,900 | | Procter & Gamble Co. | | | 6,613,383 |
| | | | | |
| | | | | 6,851,271 |
| | | | | |
| | |
| | Diversified Financial Services—8.7% | | | |
| 9,200 | | Bank of New York Co., Inc. (The) | | | 362,204 |
| 4,969 | | Capital One Financial Corp. | | | 381,718 |
| 34,400 | | CIT Group, Inc. | | | 1,918,488 |
| 233,900 | | Citigroup, Inc. | | | 13,028,230 |
| 118,800 | | Countrywide Credit Industries, Inc. | | | 5,043,060 |
| 9,000 | | E*Trade Financial Corp. | | | 201,780 |
| 900 | | Goldman Sachs Group, Inc. | | | 179,415 |
| 56,400 | | JPMorgan Chase & Co. | | | 2,724,120 |
| 38,000 | | Lehman Brothers Holdings, Inc. | | | 2,968,560 |
| 30,900 | | MBIA, Inc. | | | 2,257,554 |
See Notes to Financial Statements
| | |
| THE TARGET PORTFOLIO TRUST | | 33 |
| | |
Large Capitalization Value Portfolio (cont’d) | | Portfolio of Investments
As of December 31, 2006 |
| | | | | |
| SHARES | | DESCRIPTION | | VALUE (NOTE 1) |
| | | | | |
| | Diversified Financial Services (cont’d.) | | | |
| 13,000 | | Merrill Lynch & Co., Inc. | | $ | 1,210,300 |
| 51,400 | | Morgan Stanley Dean Witter & Co. | | | 4,185,502 |
| | | | | |
| | | | | 34,460,931 |
| | | | | |
| | |
| | Diversified Machinery—0.1% | | | |
| 14,500 | | Ingersoll-Rand Co. Ltd. (Class A Stock) | | | 567,385 |
| | | | | |
| | |
| | Diversified Manufacturing—0.1% | | | |
| 4,800 | | Honeywell International, Inc. | | | 217,152 |
| | | | | |
| | |
| | Diversified Telecommunication Services—0.4% | | | |
| 81,700 | | Sprint Nextel Corp. | | | 1,543,313 |
| | | | | |
| | |
| | Electric—0.2% | | | |
| 5,500 | | Dominion Resources, Inc. | | | 461,120 |
| 9,200 | | DTE Energy Co. | | | 445,372 |
| | | | | |
| | | | | 906,492 |
| | | | | |
| | |
| | Electric-Integrated—0.2% | | | |
| 54,200 | | Sierra Pacific Resources* | | | 912,186 |
| | | | | |
| | |
| | Electric Utilities—3.4% | | | |
| 56,300 | | American Electric Power Co., Inc. | | | 2,397,254 |
| 66,800 | | CMS Energy Corp.*(a) | | | 1,115,560 |
| 52,000 | | Edison International | | | 2,364,960 |
| 53,700 | | Exelon Corp. | | | 3,323,493 |
| 42,800 | | FPL Group, Inc. | | | 2,329,176 |
| 15,100 | | Pinnacle West Capital Corp. | | | 765,419 |
| 7,200 | | Wisconsin Energy Corp. | | | 341,712 |
| 39,300 | | Xcel Energy, Inc. | | | 906,258 |
| | | | | |
| | | | | 13,543,832 |
| | | | | |
| | |
| | Energy Equipment & Services—0.7% | | | |
| 49,000 | | GlobalSantaFe Corp. | | | 2,880,220 |
| | | | | |
| | |
| | Entertainment & Leisure | | | |
| 6,000 | | Sabre Group Holdings, Inc. (Class A Stock) | | | 191,340 |
| | | | | |
| | |
| | Exchange Traded Fund—0.2% | | | |
| 7,450 | | iShares Russell 1000 Value Index Fund | | | 615,146 |
| | | | | |
| | |
| | Financial-Bank & Trust—0.8% | | | |
| 44,400 | | Comerica, Inc. | | | 2,605,392 |
| 22,800 | | TCF Financial Corp. | | | 625,176 |
| | | | | |
| | | | | 3,230,568 |
| | | | | |
| | |
| | Financial-Brokerage—0.2% | | | |
| 12,000 | | MGIC Investment Corp.(a) | | | 750,480 |
| | | | | |
See Notes to Financial Statements
| | |
| 34 | | THE TARGET PORTFOLIO TRUST |
| | | | | |
| SHARES | | DESCRIPTION | | VALUE (NOTE 1) |
| | | | | |
| | Financial Services—0.3% | | | |
| 2,800 | | Associated Banc-Corp | | $ | 97,664 |
| 7,600 | | Franklin Resources, Inc. | | | 837,292 |
| 10,300 | | TD Ameritrade Holding Corp. | | | 166,654 |
| | | | | |
| | | | | 1,101,610 |
| | | | | |
| | |
| | Food | | | |
| 5,200 | | SUPERVALU, Inc. | | | 185,900 |
| | | | | |
| | |
| | Food & Staples Retailing—0.5% | | | |
| 21,500 | | Safeway, Inc. | | | 743,040 |
| 24,600 | | Wal-Mart Stores, Inc. | | | 1,136,028 |
| | | | | |
| | | | | 1,879,068 |
| | | | | |
| | |
| | Food Products—0.7% | | | |
| 100 | | H.J. Heinz Co. | | | 4,501 |
| 400 | | Kellogg Co. | | | 20,024 |
| 19,500 | | Kraft Foods, Inc. (Class A Stock) | | | 696,150 |
| 5,000 | | Sysco Corp. | | | 183,800 |
| 60,400 | | Unilever PLC, ADR (United Kingdom) | | | 1,680,328 |
| | | | | |
| | | | | 2,584,803 |
| | | | | |
| | |
| | Gas & Pipeline Utilities—0.2% | | | |
| 31,100 | | Northeast Utilities | | | 875,776 |
| | | | | |
| | |
| | Healthcare Equipment & Supplies—0.6% | | | |
| 8,800 | | Sepracor, Inc.*(a) | | | 541,904 |
| 33,900 | | Wyeth | | | 1,726,188 |
| | | | | |
| | | | | 2,268,092 |
| | | | | |
| | |
| | Healthcare Providers & Services—1.4% | | | |
| 800 | | Aetna, Inc. | | | 34,544 |
| 15,300 | | CIGNA Corp. | | | 2,013,021 |
| 184,800 | | Tenet Healthcare Corp.* | | | 1,288,056 |
| 26,800 | | WellPoint, Inc.* | | | 2,108,892 |
| | | | | |
| | | | | 5,444,513 |
| | | | | |
| | |
| | Hotels, Restaurants & Leisure—1.7% | | | |
| 28,100 | | Carnival Corp. | | | 1,378,305 |
| 14,996 | | Harrah’s Entertainment, Inc. | | | 1,240,469 |
| 53,300 | | McDonald’s Corp. | | | 2,362,789 |
| 21,480 | | Wyndham Worldwide Corp.* | | | 687,790 |
| 15,400 | | Yum! Brands, Inc. | | | 905,520 |
| | | | | |
| | | | | 6,574,873 |
| | | | | |
| | |
| | Household Durables—1.7% | | | |
| 19,100 | | Centex Corp. | | | 1,074,757 |
| 13,600 | | Fortune Brands, Inc. | | | 1,161,304 |
| 75,300 | | Lennar Corp. (Class A Stock) | | | 3,950,238 |
| 7,080 | | Lennar Corp. (Class B Stock) | | | 347,770 |
| | | | | |
| | | | | 6,534,069 |
| | | | | |
See Notes to Financial Statements
| | |
| THE TARGET PORTFOLIO TRUST | | 35 |
| | |
Large Capitalization Value Portfolio (cont’d) | | Portfolio of Investments
As of December 31, 2006 |
| | | | | |
| SHARES | | DESCRIPTION | | VALUE (NOTE 1) |
| | | | | |
| | Household Products—0.6% | | | |
| 35,900 | | Kimberly-Clark Corp. | | $ | 2,439,405 |
| | | | | |
| | |
| | Independent Power Producers & Energy Traders—0.8% | | | |
| 59,400 | | TXU Corp. | | | 3,220,074 |
| | | | | |
| | |
| | Industrial Conglomerates—3.0% | | | |
| 13,700 | | 3M Co. | | | 1,067,641 |
| 197,300 | | General Electric Co. | | | 7,341,533 |
| 111,700 | | Tyco International Ltd. (Bermuda) | | | 3,395,680 |
| | | | | |
| | | | | 11,804,854 |
| | | | | |
| | |
| | Industrial Machinery—0.3% | | | |
| 16,200 | | Eaton Corp. | | | 1,217,268 |
| | | | | |
| | |
| | Insurance—9.3% | | | |
| 91,200 | | Allstate Corp. (The) | | | 5,938,032 |
| 21,800 | | Ambac Financial Group, Inc. | | | 1,941,726 |
| 24,800 | | American International Group, Inc. | | | 1,777,168 |
| 22,200 | | Assurant, Inc. | | | 1,226,550 |
| 2,000 | | Chubb Corp.* | | | 105,820 |
| 128,000 | | Genworth Financial, Inc. | | | 4,378,880 |
| 21,500 | | Hanover Insurance Group, Inc. (The) | | | 1,049,200 |
| 23,900 | | Hartford Financial Services Group, Inc. (The) | | | 2,230,109 |
| 9,500 | | Lincoln National Corp. | | | 630,800 |
| 110,070 | | MetLife, Inc. | | | 6,495,231 |
| 11,300 | | Protective Life Corp. | | | 536,750 |
| 133,700 | | St. Paul Travelers Cos., Inc. (The) | | | 7,178,353 |
| 109,800 | | UnumProvident Corp.(a) | | | 2,281,644 |
| 13,700 | | XL Capital Ltd. | | | 986,674 |
| | | | | |
| | | | | 36,756,937 |
| | | | | |
| | |
| | Internet & Catalog Retail | | | |
| 200 | | eBay, Inc.* | | | 6,014 |
| | | | | |
| | |
| | IT Services—1.0% | | | |
| 147,900 | | Electronic Data System Corp. | | | 4,074,645 |
| | | | | |
| | |
| | Leisure Equipment & Products | | | |
| 2,300 | | Mattel, Inc. | | | 52,118 |
| | | | | |
| | |
| | Machinery—1.2% | | | |
| 35,200 | | Deere & Co. | | | 3,346,464 |
| 23,100 | | SPX Corp. | | | 1,412,796 |
| | | | | |
| | | | | 4,759,260 |
| | | | | |
| | |
| | Machinery & Equipment—0.1% | | | |
| 6,500 | | Rockwell Automation, Inc. | | | 397,020 |
| | | | | |
See Notes to Financial Statements
| | |
| 36 | | THE TARGET PORTFOLIO TRUST |
| | | | | |
| SHARES | | DESCRIPTION | | VALUE (NOTE 1) |
| | | | | |
| | Media—3.5% | | | |
| 144,100 | | CBS Corp. (Class B Stock) | | $ | 4,493,038 |
| 2,300 | | Clear Channel Communications, Inc. | | | 81,742 |
| 20,300 | | Comcast Corp. (Class A Stock)* | | | 859,299 |
| 3,400 | | E.W. Scripps Co. ( Class A Stock) | | | 169,796 |
| 1,500 | | EchoStar Communications Corp. (Class A Stock)* | | | 57,045 |
| 61,500 | | Gannett Co., Inc. | | | 3,718,290 |
| 40,100 | | Idearc, Inc.,* | | | 1,148,865 |
| 71,000 | | News Corp. (Class A Stock) | | | 1,525,080 |
| 50,700 | | Time Warner, Inc. | | | 1,104,246 |
| 7,300 | | Viacom, Inc. (Class B Stock)* | | | 299,519 |
| 14,100 | | Walt Disney Co. | | | 483,207 |
| | | | | |
| | | | | 13,940,127 |
| | | | | |
| | |
| | Metals & Mining—2.4% | | | |
| 191,576 | | Alcoa, Inc. | | | 5,749,196 |
| 23,500 | | Phelps Dodge Corp. | | | 2,813,420 |
| 14,900 | | United States Steel Corp. | | | 1,089,786 |
| | | | | |
| | | | | 9,652,402 |
| | | | | |
| | |
| | Miscellaneous Manufacturers—0.1% | | | |
| 8,500 | | Illinois Tool Works, Inc. | | | 392,615 |
| | | | | |
| | |
| | Multi-Line Retail—0.5% | | | |
| 6,100 | | Abercrombie & Fitch Co., (Class A Stock) | | | 424,743 |
| 10,200 | | J.C. Penney Co., Inc. | | | 789,072 |
| 9,300 | | Kohl’s Corp.* | | | 636,399 |
| | | | | |
| | | | | 1,850,214 |
| | | | | |
| | |
| | Multi-Utilities & Unregulated Power—0.2% | | | |
| 14,600 | | SCANA Corp. | | | 593,052 |
| | | | | |
| | |
| | Networking Equipment—0.1% | | | |
| 11,900 | | Juniper Networks, Inc.* | | | 225,386 |
| | | �� | | |
| | |
| | Oil Field/Equipment Services—0.6% | | | |
| 21,200 | | Devon Energy Corp. | | | 1,422,096 |
| 8,200 | | Dynegy, Inc. (Class A Stock)* | | | 59,368 |
| 34,200 | | Halliburton Co. | | | 1,061,910 |
| | | | | |
| | | | | 2,543,374 |
| | | | | |
| | |
| | Oil, Gas & Consumable Fuels—10.7% | | | |
| 28,400 | | Anadarko Petroleum Corp. | | | 1,235,968 |
| 45,800 | | Apache Corp. | | | 3,046,158 |
| 200 | | Baker Hughes, Inc. | | | 14,932 |
| 34,000 | | ChevronTexaco Corp. | | | 2,500,020 |
| 146,900 | | ConocoPhillips | | | 10,569,455 |
| 148,200 | | Exxon Mobil Corp. | | | 11,356,566 |
| 20,300 | | Marathon Oil Corp. | | | 1,877,750 |
| 97,400 | | Occidental Petroleum Corp. | | | 4,756,042 |
| 6,000 | | Sunoco, Inc. | | | 374,160 |
See Notes to Financial Statements
| | |
| THE TARGET PORTFOLIO TRUST | | 37 |
| | |
Large Capitalization Value Portfolio (cont’d) | | Portfolio of Investments
As of December 31, 2006 |
| | | | | |
| SHARES | | DESCRIPTION | | VALUE (NOTE 1) |
| | | | | |
| | Oil, Gas & Consumable Fuels (cont’d.) | | | |
| 11,700 | | Tesoro Corp. | | $ | 769,509 |
| 88,900 | | Valero Energy Corp. | | | 4,548,124 |
| 11,900 | | Weatherford International Ltd.* | | | 497,301 |
| 14,000 | | XTO Energy, Inc. | | | 658,700 |
| | | | | |
| | | | | 42,204,685 |
| | | | | |
| | |
| | Paper & Forest Products—0.6% | | | |
| 33,320 | | Weyerhauser Co. | | | 2,354,058 |
| | | | | |
| | |
| | Pharmaceuticals—3.7% | | | |
| 30,600 | | Abbott Laboratories | | | 1,490,526 |
| 17,800 | | Johnson & Johnson | | | 1,175,156 |
| 102,800 | | Merck & Co., Inc. | | | 4,482,080 |
| 241,600 | | Pfizer, Inc. | | | 6,257,440 |
| 46,000 | | Schering-Plough Corp. | | | 1,087,440 |
| | | | | |
| | | | | 14,492,642 |
| | | | | |
| | |
| | Railroads & Equipment—0.8% | | | |
| 32,000 | | CSX Corp. | | | 1,101,760 |
| 43,600 | | Norfolk Southern Corp. | | | 2,192,644 |
| | | | | |
| | | | | 3,294,404 |
| | | | | |
| | |
| | Real Estate—0.6% | | | |
| 25,000 | | Simon Property Group, Inc.(a) | | | 2,532,250 |
| | | | | |
| | |
| | Real Estate Investment Trusts—1.7% | | | |
| 19,900 | | Apartment Investment & Management Co. (Class A Stock) | | | 1,114,798 |
| 12,100 | | Cresent Real Estate Equities Co. | | | 238,975 |
| 900 | | Global Signal, Inc. | | | 47,403 |
| 5,400 | | Health Care Property Investors, Inc. | | | 198,828 |
| 12,200 | | Hospitality Properties Trust | | | 579,866 |
| 58,800 | | Host Marriott Corp. | | | 1,443,540 |
| 4,600 | | Mack-Cali Realty Corp. | | | 234,600 |
| 20,000 | | New Century Financial Corp. | | | 631,800 |
| 24,600 | | ProLogis | | | 1,494,942 |
| 10,700 | | Realty Income Corp. | | | 296,390 |
| 6,300 | | Ventas, Inc. | | | 266,616 |
| | | | | |
| | | | | 6,547,758 |
| | | | | |
| | |
| | Real Estate Management & Development—0.5% | | | |
| 63,050 | | Realogy Corp. | | | 1,911,676 |
| | | | | |
| | |
| | Retail & Merchandising—0.3% | | | |
| 35,600 | | Federated Department Stores, Inc. | | | 1,357,428 |
| | | | | |
| | |
| | Road & Rail—0.3% | | | |
| 15,800 | | Burlington North Santa Fe Corp. | | | 1,166,198 |
| | | | | |
See Notes to Financial Statements
| | |
| 38 | | THE TARGET PORTFOLIO TRUST |
| | | | | |
| SHARES | | DESCRIPTION | | VALUE (NOTE 1) |
| | | | | |
| | Semiconductors & Semiconductor Equipment—0.1% | | | |
| 6,200 | | Linear Technology Corp. | | $ | 187,984 |
| 11,500 | | Xilinx, Inc. | | | 273,815 |
| | | | | |
| | | | | 461,799 |
| | | | | |
| | |
| | Software—2.5% | | | |
| 46,600 | | BMC Software, Inc.* | | | 1,500,520 |
| 166,458 | | CA, Inc. | | | 3,770,274 |
| 12,000 | | First Data Corp. | | | 306,240 |
| 138,200 | | Microsoft Corp. | | | 4,126,652 |
| 16,600 | | Oracle Corp.* | | | 284,524 |
| | | | | |
| | | | | 9,988,210 |
| | | | | |
| | |
| | Specialty Retail—1.0% | | | |
| 61,500 | | Home Depot, Inc. | | | 2,469,840 |
| 41,900 | | Limited Brands, Inc. | | | 1,212,586 |
| 15,800 | | Staples, Inc. | | | 421,860 |
| | | | | |
| | | | | 4,104,286 |
| | | | | |
| | |
| | Telecommunication Services—4.8% | | | |
| 242,900 | | AT&T, Inc.(a) | | | 8,683,675 |
| 8,800 | | BellSouth Corp. | | | 414,568 |
| 32,300 | | Corning, Inc.* | | | 604,333 |
| 23,300 | | Motorola, Inc. | | | 479,048 |
| 13,000 | | QUALCOMM, Inc. | | | 491,270 |
| 226,500 | | Verizon Communications, Inc. | | | 8,434,860 |
| | | | | |
| | | | | 19,107,754 |
| | | | | |
| | |
| | Telecommunications—0.3% | | | |
| 27,200 | | Cisco Systems, Inc.* | | | 743,376 |
| 15,500 | | Crown Castle International Corp.*(a) | | | 500,650 |
| | | | | |
| | | | | 1,244,026 |
| | | | | |
| | |
| | Textiles, Apparel & Luxury Goods—0.4% | | | |
| 13,400 | | Coach, Inc.* | | | 575,664 |
| 33,900 | | Jones Apparel Group, Inc. | | | 1,133,277 |
| | | | | |
| | | | | 1,708,941 |
| | | | | |
| | |
| | Thrifts & Mortgage Finance—2.6% | | | |
| 93,700 | | Freddie Mac | | | 6,362,230 |
| 84,000 | | Washington Mutual, Inc. | | | 3,821,160 |
| | | | | |
| | | | | 10,183,390 |
| | | | | |
| | |
| | Tobacco—2.0% | | | |
| 94,000 | | Altria Group, Inc. | | | 8,067,080 |
| | | | | |
| | |
| | Utilities—0.4% | | | |
| 49,900 | | Duke Energy Corp. | | | 1,657,179 |
| | | | | |
| | Total long-term investments
(cost $311,110,220) | | | 393,115,733 |
| | | | | |
See Notes to Financial Statements
| | |
| THE TARGET PORTFOLIO TRUST | | 39 |
| | |
Large Capitalization Value Portfolio (cont’d) | | Portfolio of Investments
As of December 31, 2006 |
| | | | | | |
| SHARES | | DESCRIPTION | | VALUE (NOTE 1) | |
| | SHORT-TERM INVESTMENT—3.0% | | | | |
| | |
| | Affiliated Money Market Mutual Fund | | | | |
| 11,720,989 | | Dryden Core Investment Fund—Taxable Money Market Series
(cost $11,720,989; includes $9,608,073 of cash collateral for securities on loan) (Note 3)(b)(w) | | $ | 11,720,989 | |
| | | | | | |
| | Total Investments—102.4%
(cost $322,831,209; Note 5) | | | 404,836,722 | |
| | Liabilities in excess of other assets—(2.4%) | | | (9,531,748 | ) |
| | | | | | |
| | Net Assets—100% | | $ | 395,304,974 | |
| | | | | | |
The following abbreviations are used in portfolio descriptions:
| * | Non-income producing security. |
ADR—American Depositary Receipt
| (a) | All or a portion of security is on loan. The aggregate market value of such securities is $9,176,651; cash collateral of $9,608,073 (included with liabilities) was received with which the portfolio purchased highly liquid short-term investments. |
| (b) | Represents security, or a portion thereof, purchased with cash collateral received for securities on loan. |
| (w) | Prudential Investments LLC, the manager of the Portfolio also serves as manager of the Dryden Core Investment Fund—Taxable Money Market Series. |
The industry classification of portfolio holdings and liabilities in excess of other assets shown as a percentage of net assets as of December 31, 2006 was as follows:
| | | |
Industry | | | |
Oil, Gas & Consumable Fuels | | 10.7 | % |
Insurance | | 9.3 | |
Diversified Financial Services | | 8.7 | |
Commercial Banks | | 7.9 | |
Telecommunication Services | | 4.8 | |
Pharmaceuticals | | 3.7 | |
Media | | 3.5 | |
Electric Utilities | | 3.4 | |
Affiliated Money Market Mutual Fund (including 2.4% of collateral received for securities on loan) | | 3.0 | |
Industrial Conglomerates | | 3.0 | |
Chemicals | | 2.8 | |
Thrifts & Mortgage Finance | | 2.6 | |
Software | | 2.5 | |
Metals & Mining | | 2.4 | |
Aerospace & Defense | | 2.0 | |
Tobacco | | 2.0 | |
Consumer Products | | 1.7 | |
Hotels, Restaurants & Leisure | | 1.7 | |
Household Durables | | 1.7 | |
Real Estate Investment Trusts | | 1.7 | |
Healthcare Providers & Services | | 1.4 | |
Auto Components | | 1.3 | |
Machinery | | 1.2 | |
See Notes to Financial Statements
| | |
| 40 | | THE TARGET PORTFOLIO TRUST |
| | | |
Industry | | | |
IT Services | | 1.0 | % |
Specialty Retail | | 1.0 | |
Building Materials | | 0.8 | |
Computers & Peripherals | | 0.8 | |
Financial—Bank & Trust | | 0.8 | |
Independent Power Producers & Energy Traders | | 0.8 | |
Railroads & Equipment | | 0.8 | |
Beverages | | 0.7 | |
Energy Equipment & Services | | 0.7 | |
Food Products | | 0.7 | |
Automobile | | 0.6 | |
Healthcare Equipment & Supplies | | 0.6 | |
Household Products | | 0.6 | |
Oil Field/Equipment Services | | 0.6 | |
Paper & Forest Products | | 0.6 | |
Real Estate | | 0.6 | |
Food & Staples Retailing | | 0.5 | |
Multi-Line Retail | | 0.5 | |
Real Estate Management & Development | | 0.5 | |
Banks | | 0.4 | |
Commercial Services & Supplies | | 0.4 | |
Diversified Telecommunication Services | | 0.4 | |
Textiles, Apparel & Luxury Goods | | 0.4 | |
Utilities | | 0.4 | |
Agriculture | | 0.3 | |
Financial Services | | 0.3 | |
Industrial Machinery | | 0.3 | |
Retail & Merchandising | | 0.3 | |
Road & Rail | | 0.3 | |
Telecommunications | | 0.3 | |
Biotechnology | | 0.2 | |
Construction | | 0.2 | |
Electric | | 0.2 | |
Electric—Integrated | | 0.2 | |
Exchange Traded Fund | | 0.2 | |
Financial—Brokerage | | 0.2 | |
Gas & Pipeline Utilities | | 0.2 | |
Multi-Utilities & Unregulated Power | | 0.2 | |
Automotive Parts | | 0.1 | |
Conglomerates | | 0.1 | |
Diversified Machinery | | 0.1 | |
Diversified Manufacturing | | 0.1 | |
Machinery & Equipment | | 0.1 | |
Miscellaneous Manufacturers | | 0.1 | |
Networking Equipment | | 0.1 | |
Semiconductors & Semiconductor Equipment | | 0.1 | |
| | | |
| | 102.4 | |
Liabilities in excess of other assets | | (2.4 | ) |
| | | |
| | 100.0 | % |
| | | |
See Notes to Financial Statements
| | |
| THE TARGET PORTFOLIO TRUST | | 41 |
| | |
| Small Capitalization Growth Portfolio | | Portfolio of Investments
As of December 31, 2006 |
| | | | | |
| SHARES | | DESCRIPTION | | VALUE (NOTE 1) |
| | | | | |
| | LONG-TERM INVESTMENTS—96.5% | | | |
| | |
| | Common Stocks | | | |
| | |
| | Advertising—0.6% | | | |
| 56,450 | | Marchex, Inc. (Class B Stock)(a) | | $ | 755,301 |
| | | | | |
| | |
| | Aerospace—2.5% | | | |
| 62,245 | | AAR Corp.(a) | | | 1,816,931 |
| 36,840 | | Aegean Marine Petroleum Network, Inc. (Marshall Islands)* | | | 604,176 |
| 41,220 | | BE Aerospace, Inc. | | | 1,058,530 |
| | | | | |
| | | | | 3,479,637 |
| | | | | |
| | |
| | Aerospace & Defense—0.3% | | | |
| 11,380 | | HEICO Corp. | | | 441,885 |
| | | | | |
| | |
| | Apparel Manufacturers—0.4% | | | |
| 23,950 | | Carter’s, Inc. | | | 610,725 |
| | | | | |
| | |
| | Automotive Parts—0.7% | | | |
| 40,370 | | Midas, Inc.* | | | 928,510 |
| | | | | |
| | |
| | Banks—0.7% | | | |
| 30,890 | | Signature Bank* | | | 956,972 |
| | | | | |
| | |
| | Beverages—0.4% | | | |
| 20,340 | | Central European Distribution Corp.*(a) | | | 604,098 |
| | | | | |
| | |
| | Biotechnology—1.9% | | | |
| 67,223 | | Cambrex Corp. | | | 1,527,306 |
| 26,177 | | Illumina, Inc.(a) | | | 1,029,018 |
| | | | | |
| | | | | 2,556,324 |
| | | | | |
| | |
| | Business Services—0.3% | | | |
| 5,620 | | Ctrip.com International Ltd., ADR (China)*(a) | | | 351,138 |
| | | | | |
| | |
| | Clothing & Apparel—0.6% | | | |
| 45,430 | | Iconix Brand Group, Inc.* | | | 880,888 |
| | | | | |
| | |
| | Commercial Banks—0.9% | | | |
| 26,458 | | Wintrust Financial Corp. | | | 1,270,513 |
| | | | | |
| | |
| | Commercial Services—6.9% | | | |
| 25,740 | | AMN Healthcare Services, Inc. | | | 708,880 |
| 38,540 | | Barrett Business Services, Inc. | | | 902,607 |
| 20,070 | | CoStar Group, Inc.* | | | 1,074,949 |
| 35,463 | | CRA International, Inc. | | | 1,858,261 |
| 52,190 | | FirstService Corp. (Canada) | | | 1,205,589 |
| 31,310 | | NewStar Financial, Inc.* | | | 577,670 |
| 48,030 | | Rollins, Inc. | | | 1,061,943 |
See Notes to Financial Statements
| | |
| 42 | | THE TARGET PORTFOLIO TRUST |
| | | | | |
| SHARES | | DESCRIPTION | | VALUE (NOTE 1) |
| | | | | |
| | Commercial Services (cont’d.) | | | |
| 21,160 | | Steiner Leisure Ltd. | | $ | 962,780 |
| 33,070 | | Team, Inc. | | | 1,151,828 |
| | | | | |
| | | | | 9,504,507 |
| | | | | |
| | |
| | Communication Equipment—0.5% | | | |
| 30,800 | | Oplink Communications, Inc.* | | | 633,248 |
| | | | | |
| | |
| | Computer Hardware—0.5% | | | |
| 52,480 | | Cray, Inc.* | | | 623,462 |
| | | | | |
| | |
| | Computer Networking—0.5% | | | |
| 31,690 | | Atheros Communications*(a) | | | 675,631 |
| | | | | |
| | |
| | Computer Services & Software—4.5% | | | |
| 28,090 | | Advent Software, Inc. | | | 991,296 |
| 21,530 | | American Reprographics Co.* | | | 717,164 |
| 55,280 | | Concur Technologies, Inc.(a) | | | 886,691 |
| 34,553 | | Hyperion Solutions Corp.(a) | | | 1,241,835 |
| 104,196 | | Informatica Corp. | | | 1,272,233 |
| 34,090 | | The9 Ltd., ADR (Cayman Islands)*(a) | | | 1,098,380 |
| | | | | |
| | | | | 6,207,599 |
| | | | | |
| | |
| | Computers—0.2% | | | |
| 30,637 | | Par Technology Corp.* | | | 276,346 |
| | | | | |
| | |
| | Construction—2.1% | | | |
| 78,437 | | A.S.V., Inc.*(a) | | | 1,276,170 |
| 49,583 | | Shaw Group, Inc.(a) | | | 1,661,030 |
| | | | | |
| | | | | 2,937,200 |
| | | | | |
| | |
| | Consumer Products & Services—0.7% | | | |
| 19,320 | | Central Garden & Pet Co.(a) | | | 935,474 |
| | | | | |
| | |
| | Electronic Components—4.1% | | | |
| 58,418 | | Coherent, Inc.(a) | | | 1,844,256 |
| 17,962 | | ICT Group, Inc.* | | | 567,420 |
| 19,661 | | Rogers Corp. | | | 1,162,948 |
| 39,530 | | SRS Labs, Inc. | | | 427,715 |
| 31,203 | | Trimble Navigation Ltd.*(a) | | | 1,582,928 |
| | | | | |
| | | | | 5,585,267 |
| | | | | |
| | |
| | Entertainment & Leisure—4.7% | | | |
| 100,220 | | Century Casinos, Inc. | | | 1,118,455 |
| 18,090 | | Life Time Fitness, Inc.* | | | 877,546 |
| 14,830 | | Pinnacle Entertainment, Inc.* | | | 491,466 |
| 44,630 | | Scientific Games Corp. (Class A Stock) | | | 1,349,165 |
| 98,447 | | Shuffle Master, Inc.*(a) | | | 2,579,312 |
| | | | | |
| | | | | 6,415,944 |
| | | | | |
| | |
| | Financial-Bank & Trust—0.3% | | | |
| 10,970 | | PrivateBancorp, Inc. | | | 456,681 |
| | | | | |
See Notes to Financial Statements
| | |
| THE TARGET PORTFOLIO TRUST | | 43 |
| | |
Small Capitalization Growth Portfolio (cont’d) | | Portfolio of Investments
As of December 31, 2006 |
| | | | | |
| SHARES | | DESCRIPTION | | VALUE (NOTE 1) |
| | | | | |
| | |
| | Financial-Brokerage—0.4% | | | |
| 42,430 | | TradeStation Group, Inc. | | $ | 583,413 |
| | | | | |
| | |
| | Financial Services—6.0% | | | |
| 47,267 | | Cohen & Steers, Inc. | | | 1,898,715 |
| 27,681 | | Financial Federal Corp.(a) | | | 814,098 |
| 10,110 | | Greenhill & Co., Inc.(a) | | | 746,118 |
| 7,420 | | International Securities Exchange, Inc. | | | 347,182 |
| 30,790 | | Investment Technology Group, Inc.* | | | 1,320,275 |
| 17,830 | | optionsXpress Holdings, Inc. | | | 404,563 |
| 22,050 | | Portfolio Recovery Associates, Inc.(a) | | | 1,029,515 |
| 82,282 | | Texas Capital Banshares, Inc.* | | | 1,635,766 |
| | | | | |
| | | | | 8,196,232 |
| | | | | |
| | |
| | Food & Staples Retailing—0.5% | | | |
| 79,420 | | SunOpta, Inc. | | | 698,896 |
| | | | | |
| | |
| | Hand/Machine Tools—0.4% | | | |
| 9,860 | | Regal-Beloit Corp. | | | 517,749 |
| | | | | |
| | |
| | Healthcare Equipment & Supplies—0.8% | | | |
| 14,550 | | ArthroCare Corp.* | | | 580,836 |
| 12,490 | | Kyphon, Inc.* | | | 504,596 |
| | | | | |
| | | | | 1,085,432 |
| | | | | |
| | |
| | Healthcare Services—2.4% | | | |
| 120,690 | | Five Star Quality Care, Inc.(a) | | | 1,345,693 |
| 43,370 | | HMS Holdings Corp.* | | | 657,056 |
| 61,250 | | Solexa, Inc.* | | | 805,438 |
| 16,400 | | Systems Xcellence, Inc. (Canada)* | | | 330,788 |
| 2,550 | | Vital Signs, Inc. | | | 127,296 |
| | | | | |
| | | | | 3,266,271 |
| | | | | |
| | |
| | Insurance—2.6% | | | |
| 72,790 | | Amerisafe, Inc.* | | | 1,125,334 |
| 72,980 | | Amtrust Financial Services, Inc. | | | 623,979 |
| 33,860 | | First Mercury Financial Corp.* | | | 796,387 |
| 37,100 | | Security Capital Assurance Ltd. (Bermuda) | | | 1,032,493 |
| | | | | |
| | | | | 3,578,193 |
| | | | | |
| | |
| | Internet Services—7.4% | | | |
| 41,318 | | Avocent Corp. | | | 1,398,614 |
| 22,490 | | DealerTrack Holdings, Inc.* | | | 661,656 |
| 7,240 | | Equinix, Inc. | | | 547,489 |
| 39,200 | | J2 Global Communications, Inc. | | | 1,068,200 |
| 16,770 | | Nutri/System, Inc.*(a) | | | 1,063,050 |
| 88,460 | | Online Resources Corp. | | | 903,177 |
See Notes to Financial Statements
| | |
| 44 | | THE TARGET PORTFOLIO TRUST |
| | | | | |
| SHARES | | DESCRIPTION | | VALUE (NOTE 1) |
| | | | | |
| | Internet Services (cont’d.) | | | |
| 36,650 | | Perficient, Inc.* | | $ | 601,426 |
| 31,830 | | RADVision Ltd. (Israel) | | | 639,146 |
| 107,420 | | Valueclick, Inc. | | | 2,538,335 |
| 21,730 | | WebEx Communications, Inc.* | | | 758,160 |
| | | | | |
| | | | | 10,179,253 |
| | | | | |
| | |
| | Machinery—5.2% | | | |
| 78,500 | | Flow International Corp.* | | | 865,070 |
| 59,248 | | Gardner Denver, Inc. | | | 2,210,543 |
| 20,803 | | IDEX Corp. | | | 986,270 |
| 70,746 | | Intermec, Inc.* | | | 1,717,005 |
| 23,176 | | Kennametal, Inc. | | | 1,363,908 |
| | | | | |
| | | | | 7,142,796 |
| | | | | |
| | |
| | Manufacturing—1.4% | | | |
| 29,120 | | American Railcar Industries, Inc. | | | 991,245 |
| 16,850 | | Ceradyne, Inc.*(a) | | | 952,025 |
| | | | | |
| | | | | 1,943,270 |
| | | | | |
| | |
| | Medical Supplies & Equipment—15.6% | | | |
| 192,568 | | American Medical Systems Holdings, Inc.(a) | | | 3,566,359 |
| 51,150 | | AngioDynamics, Inc.*(a) | | | 1,099,213 |
| 28,100 | | Cutera, Inc.* | | | 758,700 |
| 43,361 | | Integra LifeSciences Holdings Corp.* | | | 1,846,745 |
| 59,265 | | Inverness Medical Innovations, Inc.*(a) | | | 2,293,555 |
| 14,510 | | K-V Pharmaceutical Co. (Class A Stock)*(a) | | | 345,048 |
| 21,221 | | Kensey Nash Corp. | | | 674,828 |
| 96,490 | | LeMaitre Vascular, Inc.* | | | 578,940 |
| 47,586 | | Mentor Corp. | | | 2,325,528 |
| 44,840 | | Micrus Endovascular Corp.* | | | 855,547 |
| 79,400 | | NovaMed, Inc. | | | 601,058 |
| 54,815 | | NuVasive, Inc.*(a) | | | 1,266,226 |
| 157,780 | | Orthovita, Inc. | | | 572,741 |
| 27,894 | | PolyMedica Corp.(a) | | | 1,127,197 |
| 48,435 | | PSS World Medical, Inc.(a) | | | 945,936 |
| 16,480 | | ResMed, Inc.*(a) | | | 811,146 |
| 94,640 | | Spectranetics Corp. (The)* | | | 1,068,486 |
| 17,550 | | Vital Images, Inc* | | | 610,740 |
| | | | | |
| | | | | 21,347,993 |
| | | | | |
| | |
| | Metals & Mining—0.5% | | | |
| 19,670 | | Ladish Co., Inc.* | | | 729,364 |
| | | | | |
| | |
| | Office Equipment—1.3% | | | |
| 12,670 | | Cymer, Inc.* | | | 556,847 |
| 56,174 | | Global Imaging Systems, Inc. | | | 1,233,019 |
| | | | | |
| | | | | 1,789,866 |
| | | | | |
See Notes to Financial Statements
| | |
| THE TARGET PORTFOLIO TRUST | | 45 |
| | |
Small Capitalization Growth Portfolio (cont’d) | | Portfolio of Investments
As of December 31, 2006 |
| | | | | |
| SHARES | | DESCRIPTION | | VALUE (NOTE 1) |
| | Oil, Gas & Consumable Fuels—7.2% | | | |
| 3,980 | | Core Laboratories N.V.* | | $ | 322,380 |
| 81,449 | | Dril-Quip, Inc.*(a) | | | 3,189,543 |
| 22,778 | | Hydril Co. | | | 1,712,678 |
| 62,155 | | Oil States International, Inc. | | | 2,003,255 |
| 83,204 | | Superior Energy Services, Inc. | | | 2,719,107 |
| | | | | |
| | | | | 9,946,963 |
| | | | | |
| | |
| | Pharmaceuticals—0.5% | | | |
| 30,964 | | HealthExtras, Inc. | | | 746,232 |
| | | | | |
| | |
| | Real Estate—0.8% | | | |
| 39,790 | | KKR Financial Corp. | | | 1,065,974 |
| | | | | |
| | |
| | Real Estate Investment Trusts—1.0% | | | |
| 96,478 | | Highland Hospitality Corp. | | | 1,374,812 |
| | | | | |
| | |
| | Retail & Merchandising—2.9% | | | |
| 41,140 | | Cache, Inc.*(a) | | | 1,038,373 |
| 29,036 | | Jos. A. Bank Clothiers, Inc.(a) | | | 852,207 |
| 47,424 | | Tractor Supply Co.(a) | | | 2,120,327 |
| | | | | |
| | | | | 4,010,907 |
| | | | | |
| | |
| | Semiconductors—2.3% | | | |
| 151,693 | | Aeroflex, Inc.* | | | 1,777,842 |
| 52,610 | | Silicon Image, Inc.* | | | 669,199 |
| 46,540 | | Silicon Motion Technology Corp., ADR (Cayman Islands) | | | 738,590 |
| | | | | |
| | | | | 3,185,631 |
| | | | | |
| | |
| | Telecommunications—2.2% | | | |
| 51,009 | | NeuStar, Inc. (Class A Stock)* | | | 1,654,732 |
| 32,360 | | Occam Networks, Inc.* | | | 533,940 |
| 38,850 | | Time Warner Telecom, Inc. (Class A Stock)*(a) | | | 774,280 |
| | | | | |
| | | | | 2,962,952 |
| | | | | |
| | |
| | Transportation—0.8% | | | |
| 38,652 | | Forward Air Corp. | | | 1,118,202 |
| | | | | |
| | Total long-term investments
(cost $110,751,412) | | | 132,557,751 |
| | | | | |
See Notes to Financial Statements
| | |
| 46 | | THE TARGET PORTFOLIO TRUST |
| | | | | | |
| SHARES | | DESCRIPTION | | VALUE (NOTE 1) | |
| | SHORT-TERM INVESTMENT—28.7% | | | | |
| | |
| | Affiliated Money Market Mutual Fund | | | | |
| 39,317,465 | | Dryden Core Investment Fund—Taxable Money Market Series
(cost $39,317,465; includes $33,913,062 of cash collateral for securities on loan) (Note 3)(b)(w) | | $ | 39,317,465 | |
| | | | | | |
| | Total Investments—125.2%
(cost $150,068,877) | | | 171,875,216 | |
| | Liabilities in excess of other assets—(25.2%) | | | (34,555,013 | ) |
| | | | | | |
| | Net Assets—100% | | $ | 137,320,203 | |
| | | | | | |
The following abbreviations are used in portfolio descriptions:
| * | Non-income producing security. |
| ADR—American | Depositary Receipt |
| (a) | All or a portion of security is on loan. The aggregate market value of such securities is $31,953,034; cash collateral of $33,913,062 (included with liabilities) was received with which the portfolio purchased highly liquid short- term investments. |
| (b) | Represents security, or a portion thereof, purchased with cash collateral received for securities on loan. |
| (w) | Prudential Investments LLC, the manager of the Portfolio also serves as manager of the Dryden Core Investment Fund—Taxable Money Market Series. |
The industry classification of the portfolio holdings and liabilities in excess of other assets shown as a percentage of net assets as of December 31, 2006 was as follows:
| | | |
Industry | | | |
Affiliated Money Market Mutual Fund (including 24.7% of collateral received for securities on loan) | | 28.7 | % |
Medical Supplies & Equipment | | 15.6 | |
Internet Services | | 7.4 | |
Oil, Gas & Consumable Fuels | | 7.2 | |
Commercial Services | | 6.9 | |
Financial Services | | 6.0 | |
Machinery | | 5.2 | |
Entertainment & Leisure | | 4.7 | |
Computer Services & Software | | 4.5 | |
Electronic Components | | 4.1 | |
Retail & Merchandising | | 2.9 | |
Insurance | | 2.6 | |
Aerospace | | 2.5 | |
Healthcare Services | | 2.4 | |
Semiconductors | | 2.3 | |
Telecommunications | | 2.2 | |
Construction | | 2.1 | |
Biotechnology | | 1.9 | |
Manufacturing | | 1.4 | |
Office Equipment | | 1.3 | |
Real Estate Investment Trusts | | 1.0 | |
Commercial Banks | | 0.9 | |
Transportation | | 0.8 | |
Healthcare Equipment & Supplies | | 0.8 | |
Real Estate | | 0.8 | |
See Notes to Financial Statements
| | |
| THE TARGET PORTFOLIO TRUST | | 47 |
| | |
Small Capitalization Growth Portfolio (cont’d) | | Portfolio of Investments
As of December 31, 2006 |
| | | |
Industry | | | |
Banks | | 0.7 | % |
Consumer Products & Services | | 0.7 | |
Automotive Parts | | 0.7 | |
Clothing & Apparel | | 0.6 | |
Advertising | | 0.6 | |
Pharmaceuticals | | 0.5 | |
Metals & Mining | | 0.5 | |
Food & Staples Retailing | | 0.5 | |
Computer Networking | | 0.5 | |
Communication Equipment | | 0.5 | |
Computer Hardware | | 0.5 | |
Apparel Manufacturers | | 0.4 | |
Beverages | | 0.4 | |
Financial—Brokerage | | 0.4 | |
Hand/Machine Tools | | 0.4 | |
Financial—Bank & Trust | | 0.3 | |
Aerospace & Defense | | 0.3 | |
Business Services | | 0.3 | |
Computers | | 0.2 | |
| | | |
| | 125.2 | |
Liabilities in excess of other assets | | (25.2 | ) |
| | | |
| | 100.0 | % |
| | | |
See Notes to Financial Statements
| | |
| 48 | | THE TARGET PORTFOLIO TRUST |
| | |
Portfolio of Investments
As of December 31, 2006 | | Small Capitalization Value Portfolio |
| | | | | |
| SHARES | | DESCRIPTION | | VALUE (NOTE 1) |
| | | | | |
| | | | | |
| | | | | |
| | LONG-TERM INVESTMENTS—95.2% | | | |
| | |
| | Common Stocks | | | |
| | |
| | Aerospace—0.1% | | | |
| 1,875 | | Alliant Techsystems, Inc.* | | $ | 146,606 |
| | | | | |
| | |
| | Aerospace/Defense—1.7% | | | |
| 800 | | AAR Corp. | | | 23,352 |
| 22,186 | | BE Aerospace, Inc.* | | | 569,736 |
| 32,800 | | Curtiss-Wright Corp. | | | 1,216,224 |
| 19,925 | | DRS Technologies, Inc.* | | | 1,049,649 |
| 1,500 | | Esterline Technologies Corp. | | | 60,345 |
| 200 | | Heico Corp. | | | 7,766 |
| 2,900 | | Kaman Corp. (Class A Stock) | | | 64,931 |
| 43,150 | | Moog, Inc. (Class A Stock) | | | 1,647,899 |
| 1,900 | | Orbital Sciences Corp. | | | 35,036 |
| 16,797 | | Teledyne Technologies, Inc.* | | | 674,064 |
| 800 | | Triumph Group, Inc.(a) | | | 41,944 |
| | | | | |
| | | | | 5,390,946 |
| | | | | |
| | |
| | Agriculture/Heavy Equipment | | | |
| 900 | | Delta & Pine Land Co. | | | 36,405 |
| | | | | |
| | |
| | Airlines—0.8% | | | |
| 2,000 | | Alaska Air Group, Inc. | | | 79,000 |
| 2,100 | | Continental Airlines, Inc. (Class B Stock) | | | 86,625 |
| 6,100 | | ExpressJet Holdings, Inc. | | | 49,410 |
| 2,000 | | Mesa Air Group, Inc.* | | | 17,140 |
| 2,700 | | Republic Airways Holdings, Inc.* | | | 45,306 |
| 89,900 | | SkyWest, Inc. | | | 2,293,349 |
| | | | | |
| | | | | 2,570,830 |
| | | | | |
| | |
| | Apparel | | | |
| 3,000 | | Maidenform Brands, Inc.* | | | 54,360 |
| | | | | |
| | |
| | Asset Management & Custody Banks | | | |
| 7,300 | | W.P. Stewart & Co. Ltd. (Bermuda)(a) | | | 115,632 |
| | | | | |
| | |
| | Auto Related—1.4% | | | |
| 63,163 | | Aftermarket Technology Corp. | | | 1,344,109 |
| 23,900 | | American Axle & Manufacturing Holdings, Inc. | | | 453,861 |
| 118,700 | | ArvinMeritor, Inc.(a) | | | 2,163,901 |
| 32,528 | | Cooper Tire & Rubber Co.(a) | | | 465,150 |
| 600 | | Keystone Automotive Industries, Inc. | | | 20,394 |
| 2,100 | | Modine Manufacturing Co. | | | 52,563 |
| 4,200 | | Tenneco, Inc. | | | 103,824 |
| 3,100 | | Visteon Corp. | | | 26,288 |
| | | | | |
| | | | | 4,630,090 |
| | | | | |
See Notes to Financial Statements
| | |
| THE TARGET PORTFOLIO TRUST | | 49 |
| | |
Small Capitalization Value Portfolio (cont’d) | | Portfolio of Investments
As of December 31, 2006 |
| | | | | |
| SHARES | | DESCRIPTION | | VALUE (NOTE 1) |
| | | | | |
| | Automobile Manufacturers—0.3% | | | |
| 19,400 | | Thor Industries, Inc.(a) | | $ | 853,406 |
| | | | | |
| | |
| | Automotive Components | | | |
| 700 | | Lear Corp. | | | 20,671 |
| | | | | |
| | |
| | Banks—5.6% | | | |
| 23,210 | | Amcore Financial, Inc. | | | 758,271 |
| 700 | | AmericanWest Bancorp | | | 16,954 |
| 1,200 | | Ameris Bancorp | | | 33,816 |
| 600 | | BancFirst Corp. | | | 32,400 |
| 71,620 | | BancorpSouth, Inc. | | | 1,920,848 |
| 84,185 | | Bank Mutual Corp. | | | 1,019,480 |
| 79,427 | | BankAtlantic Bancorp, Inc. (Class A Stock) | | | 1,096,887 |
| 25,400 | | BankUnited Financial Corp. (Class A Stock) | | | 710,184 |
| 400 | | Banner Corp. | | | 17,736 |
| 800 | | Capital Bancorp Ltd. | | | 36,960 |
| 500 | | Capital Corp. of The West | | | 16,045 |
| 48,876 | | Cardinal Financial Corp. | | | 500,979 |
| 900 | | Cathay General Bancorp | | | 31,059 |
| 3,000 | | Central Pacific Financial Corp. | | | 116,280 |
| 1,300 | | Chemical Financial Corp. | | | 43,290 |
| 2,400 | | City Holding Co. | | | 98,136 |
| 3,200 | | Colonial BancGroup, Inc. (The) | | | 82,368 |
| 1,100 | | Columbia Banking System, Inc. | | | 38,632 |
| 2,000 | | Community Bank System, Inc. | | | 46,000 |
| 1,500 | | Community Trust Bancorp, Inc. | | | 62,295 |
| 7,000 | | Corus Bankshares, Inc.(a) | | | 161,490 |
| 1,900 | | Cullen Frost Bankers, Inc. | | | 106,058 |
| 2,300 | | Dime Community Bancshares | | | 32,223 |
| 5,000 | | First Bancorp / Puerto Rico(a) | | | 47,650 |
| 60,644 | | First Financial Bancorp | | | 1,007,297 |
| 500 | | First Financial Holdings, Inc. | | | 19,590 |
| 7,600 | | First Niagara Financial Group, Inc. | | | 112,936 |
| 1,200 | | First Place Financial Corp. (OH) | | | 28,188 |
| 2,300 | | First Republic Bank (CA) | | | 89,884 |
| 900 | | FirstFed Financial Corp.(a) | | | 60,273 |
| 49,303 | | FirstMerit Corp. | | | 1,190,174 |
| 2,600 | | Flagstar Bancorp, Inc. | | | 38,584 |
| 600 | | FNB Corp. | | | 24,930 |
| 800 | | Great Southern Bancorp, Inc. | | | 23,608 |
| 2,800 | | Greater Bay Bancorp Holding Co. | | | 73,724 |
| 9,600 | | Hanmi Financial Corp. | | | 216,288 |
| 2,850 | | IBERIABANK Corp. | | | 168,293 |
| 2,800 | | Independent Bank Corp. | | | 100,884 |
| 3,066 | | Independent Bank Corp. (MI) | | | 77,539 |
See Notes to Financial Statements
| | |
| 50 | | THE TARGET PORTFOLIO TRUST |
| | | | | |
| SHARES | | DESCRIPTION | | VALUE (NOTE 1) |
| | | | | |
| | Banks (cont’d.) | | | |
| 3,400 | | Irwin Financial Corp. | | $ | 76,942 |
| 500 | | ITLA Capital Corp. | | | 28,955 |
| 300 | | Lakeland Financial Corp. | | | 7,659 |
| 1,800 | | MAF Bancorp, Inc. | | | 80,442 |
| 1,680 | | MainSource Financial Group, Inc. | | | 28,459 |
| 4,175 | | MB Financial, Inc. | | | 157,022 |
| 600 | | MBT Financial Corp. | | | 9,192 |
| 771 | | Mercantile Bank Corp. | | | 29,067 |
| 1,300 | | Mid-State Bancshares | | | 47,307 |
| 1,200 | | Nara Bancorp, Inc. | | | 25,104 |
| 28,256 | | Old National Bancorp | | | 534,604 |
| 400 | | Old Second Bancorp, Inc. | | | 11,720 |
| 20,500 | | Oriental Financial Group, Inc. (Puerto Rico) | | | 265,475 |
| 4,000 | | Partners Trust Financial Group, Inc. | | | 46,560 |
| 1,000 | | Peoples Bancorp, Inc. | | | 29,700 |
| 1,100 | | Prosperity Bancshares, Inc. | | | 37,961 |
| 18,400 | | Provident Bankshares Corp. | | | 655,040 |
| 5,800 | | R & G Financial Corp. (Class B Stock) | | | 44,370 |
| 14,561 | | Rainier Pacific Financial Group, Inc. | | | 288,745 |
| 525 | | Republic Bancorp, Inc. (KY) (Class A Stock) | | | 13,172 |
| 6,790 | | Republic Bancorp, Inc. (MI) | | | 91,393 |
| 536 | | Royal Bancshares of Pennsylvania (Class A Stock) | | | 14,073 |
| 200 | | Santander BanCorp (Puerto Rico) | | | 3,570 |
| 300 | | SCBT Financial Corp. | | | 12,519 |
| 900 | | Security Bank Corp. | | | 20,538 |
| 100 | | Sierra Bancorp | | | 2,934 |
| 33,503 | | Signature Bank | | | 1,037,923 |
| 700 | | Simmons First National Corp. (Class A Stock) | | | 22,085 |
| 2,800 | | Southwest Bancorp, Inc. | | | 78,008 |
| 5,250 | | Sterling Bancshares, Inc. (TX) | | | 68,355 |
| 38,650 | | Sterling Financial Corp. | | | 1,306,756 |
| 1,800 | | Sterling Financial Corp. (WA) | | | 42,606 |
| 24,800 | | Susquehanna Bancshares, Inc. | | | 666,624 |
| 900 | | Taylor Capital Group, Inc. | | | 32,949 |
| 2,100 | | TierOne Corp. | | | 66,381 |
| 900 | | Trico Bancshares | | | 24,489 |
| 39,288 | | UMB Financial Corp. | | | 1,434,405 |
| 3,383 | | Umpqua Holdings Corp. | | | 99,562 |
| 800 | | United Bankshares, Inc. | | | 30,920 |
| 7,200 | | W Holding Co., Inc. | | | 42,912 |
| 4,200 | | West Coast Bancorp | | | 145,488 |
| 800 | | WSFS Financial Corp. | | | 53,544 |
| | | | | |
| | | | | 17,973,763 |
| | | | | |
| | |
| | Beverages—0.1% | | | |
| 14,000 | | PepsiAmericas, Inc. | | | 293,720 |
| | | | | |
See Notes to Financial Statements
| | |
| THE TARGET PORTFOLIO TRUST | | 51 |
| | |
Small Capitalization Value Portfolio (cont’d) | | Portfolio of Investments
As of December 31, 2006 |
| | | | | |
| SHARES | | DESCRIPTION | | VALUE (NOTE 1) |
| | | | | |
| | Biotechnology—0.1% | | | |
| 1,300 | | Applera Corp.—Celera Genomics Group | | $ | 18,187 |
| 1,100 | | Bio-Rad Laboratories, Inc. (Class A Stock)* | | | 90,772 |
| 1,300 | | LifeCell Corp.* | | | 31,382 |
| 1,500 | | Nektar Therapeutics* | | | 22,815 |
| | | | | |
| | | | | 163,156 |
| | | | | |
| | |
| | Broadcasting | | | |
| 4,300 | | Cox Radio, Inc.* | | | 70,090 |
| 2,900 | | Entercom Communications Corp. | | | 81,722 |
| 800 | | Lin TV Corp. (Class A Stock)* | | | 7,960 |
| | | | | |
| | | | | 159,772 |
| | | | | |
| | |
| | Building Products—1.6% | | | |
| 41,347 | | Apogee Enterprises, Inc. | | | 798,411 |
| 50,000 | | Crane Co. | | | 1,832,000 |
| 1,300 | | Eagle Materials, Inc. | | | 56,199 |
| 500 | | Genlyte Group, Inc. | | | 39,055 |
| 48,995 | | Lennox International, Inc. | | | 1,499,737 |
| 1,400 | | NCI Buildings Systems, Inc. | | | 72,450 |
| 26,100 | | Simpson Manufacturing Co., Inc.(a) | | | 826,065 |
| 1,800 | | Universal Forest Products, Inc. | | | 83,916 |
| | | | | |
| | | | | 5,207,833 |
| | | | | |
| | |
| | Business Services—1.0% | | | |
| 19,200 | | Administaff, Inc. | | | 821,184 |
| 11,842 | | Clean Harbors, Inc.* | | | 573,271 |
| 800 | | infoUSA, Inc. | | | 9,528 |
| 40,200 | | URS Corp. | | | 1,722,570 |
| | | | | |
| | | | | 3,126,553 |
| | | | | |
| | |
| | Chemicals—3.6% | | | |
| 23,966 | | Arch Chemicals, Inc. | | | 798,308 |
| 1,900 | | CF Industries Holdings, Inc. | | | 48,716 |
| 1,525 | | Cytec Industries, Inc. | | | 86,178 |
| 23,270 | | Ferro Corp. | | | 481,456 |
| 15,697 | | FMC Corp. | | | 1,201,605 |
| 2,900 | | Georgia Gulf Corp. | | | 55,999 |
| 4,200 | | H.B. Fuller Co. | | | 108,444 |
| 6,700 | | Hercules, Inc. | | | 129,377 |
| 700 | | Innospec, Inc. (United Kingdom) | | | 32,585 |
| 13,000 | | Lubrizol Corp. (The) | | | 651,690 |
| 65,000 | | Methanex Corp. (Canada) | | | 1,779,050 |
| 600 | | Minerals Technologies, Inc. | | | 35,274 |
| 600 | | NewMarket Corp. | | | 35,430 |
| 166,115 | | Olin Corp.(a) | | | 2,744,220 |
| 900 | | OM Group, Inc.*(a) | | | 40,752 |
See Notes to Financial Statements
| | |
| 52 | | THE TARGET PORTFOLIO TRUST |
| | | | | |
| SHARES | | DESCRIPTION | | VALUE (NOTE 1) |
| | | | | |
| | Chemicals (cont’d.) | | | |
| 8,400 | | PolyOne Corp. | | $ | 63,000 |
| 2,100 | | Rockwood Holdings, Inc.* | | | 53,046 |
| 58,000 | | RPM International, Inc. | | | 1,211,620 |
| 43,900 | | Sensient Technologies Corp. | | | 1,079,940 |
| 2,800 | | Spartech Corp. | | | 73,416 |
| 2,200 | | UAP Holding Corp. | | | 55,396 |
| 23,650 | | Valspar Corp. (The) | | | 653,686 |
| 2,700 | | W.R. Grace & Co. | | | 53,460 |
| | | | | |
| | | | | 11,472,648 |
| | | | | |
| | |
| | Commercial Banks | | | |
| 1,175 | | PrivateBancorp, Inc. | | | 48,915 |
| | | | | |
| | |
| | Commercial Services—1.3% | | | |
| 50,000 | | Advance America Cash Advance Centers, Inc. | | | 732,500 |
| 300 | | Arbitron, Inc. | | | 13,032 |
| 13,000 | | BearingPoint, Inc. | | | 102,310 |
| 700 | | Clark, Inc. | | | 11,641 |
| 900 | | Consolidated Graphics, Inc. | | | 53,163 |
| 400 | | CRA International, Inc. | | | 20,960 |
| 2,689 | | Dollar Thrifty Automotive Group | | | 122,645 |
| 800 | | Electro Rent Corp. | | | 13,360 |
| 3,000 | | Gartner, Inc. | | | 59,370 |
| 3,100 | | Geo Group, Inc. (The) | | | 116,312 |
| 3,700 | | Healthcare Services Group, Inc. | | | 107,152 |
| 700 | | Healthspring, Inc.* | | | 14,245 |
| 300 | | MAXIMUS, Inc. | | | 9,234 |
| 675 | | On Assignment, Inc. | | | 7,931 |
| 73,600 | | Pharmaceutical Product Development, Inc. | | | 2,371,392 |
| 5,200 | | Spherion Corp. | | | 38,636 |
| 500 | | Startek, Inc. | | | 6,770 |
| 9,100 | | Stewart Enterprises, Inc. | | | 56,875 |
| 1,950 | | Team, Inc. | | | 67,919 |
| 3,800 | | TeleTech Holdings, Inc. | | | 90,744 |
| 1,600 | | Vertrue, Inc. | | | 61,456 |
| 1,800 | | Viad Corp. | | | 73,080 |
| 500 | | Volt Info Sciences, Inc.(a) | | | 25,105 |
| 2,925 | | Waste Connections, Inc.* | | | 121,534 |
| | | | | |
| | | | | 4,297,366 |
| | | | | |
| | |
| | Commercial Services & Supplies—2.3% | | | |
| 42,926 | | Avis Budget Group | | | 931,065 |
| 20,300 | | Banta Corp. | | | 738,920 |
| 29,500 | | John H. Harland Co. | | | 1,480,900 |
| 65,000 | | Schawk, Inc. | | | 1,270,100 |
| 59,525 | | School Specialty, Inc.(a) | | | 2,231,592 |
| 900 | | Valassis Communications, Inc.(a) | | | 13,050 |
| 19,381 | | Watson Wyatt Worldwide, Inc. | | | 875,052 |
| | | | | |
| | | | | 7,540,679 |
| | | | | |
See Notes to Financial Statements
| | |
| THE TARGET PORTFOLIO TRUST | | 53 |
| | |
Small Capitalization Value Portfolio (cont’d) | | Portfolio of Investments
As of December 31, 2006 |
| | | | | |
| SHARES | | DESCRIPTION | | VALUE (NOTE 1) |
| | | | | |
| | Communication Equipment | | | |
| 4,650 | | Tekelec* | | $ | 68,960 |
| | | | | |
| | |
| | Computer Hardware—0.8% | | | |
| 3,200 | | Agilysys, Inc. | | | 53,568 |
| 2,500 | | Aspen Technology, Inc.* | | | 27,550 |
| 43,662 | | BISYS Group, Inc. (The) | | | 563,676 |
| 13,400 | | Brocade Communications Systems, Inc. | | | 110,014 |
| 4,000 | | CIBER, Inc. | | | 27,120 |
| 2,200 | | Covansys Corp. | | | 50,490 |
| 3,200 | | Electronics For Imaging, Inc. | | | 85,056 |
| 4,500 | | Gateway, Inc. | | | 9,045 |
| 1,500 | | Hutchinson Technology, Inc. | | | 35,355 |
| 1,800 | | Imation Corp. | | | 83,574 |
| 1,000 | | Komag, Inc. | | | 37,880 |
| 2,100 | | Magma Design Automation, Inc. | | | 18,753 |
| 10,600 | | McDATA Corp. (Class A Stock)* | | | 58,830 |
| 4,400 | | Palm, Inc.(a) | | | 61,996 |
| 64,352 | | Perot Systems Corp. (Class A Stock) | | | 1,054,729 |
| 19,700 | | Quantum Corp. | | | 45,704 |
| 900 | | Radisys Corp. | | | 15,003 |
| 1,400 | | Silcon Storage Technology, Inc. | | | 6,314 |
| 1,700 | | SYKES Enterprises, Inc. | | | 29,988 |
| 750 | | Talx Corp. | | | 20,588 |
| 4,200 | | Tyler Technologies, Inc. | | | 59,052 |
| | | | | |
| | | | | 2,454,285 |
| | | | | |
| | |
| | Computer Services & Software—2.4% | | | |
| 1,200 | | Altiris, Inc.* | | | 30,456 |
| 31,422 | | Avocent Corp.* | | | 1,063,635 |
| 1,450 | | Blackbaud, Inc. | | | 37,700 |
| 300 | | Computer Programs & Systems, Inc. | | | 10,197 |
| 1,900 | | Digi International, Inc.* | | | 26,201 |
| 38,300 | | Global Payments, Inc. | | | 1,773,290 |
| 2,400 | | Inter-Tel, Inc. | | | 53,184 |
| 1,200 | | JDA Software Group, Inc. | | | 16,524 |
| 900 | | Mantech International Corp. | | | 33,147 |
| 1,650 | | MICROS Systems, Inc.* | | | 86,955 |
| 87,968 | | Parametric Technology Corp.* | | | 1,585,183 |
| 3,700 | | Per-Se Technologies, Inc. | | | 102,786 |
| 1,300 | | Progress Software Corp. | | | 36,309 |
| 700 | | QAD, Inc. | | | 5,873 |
| 1,400 | | Quest Software, Inc.* | | | 20,510 |
| 600 | | Si International, Inc.* | | | 19,452 |
| 300 | | SPSS, Inc.* | | | 9,021 |
| 45,063 | | Sybase, Inc. | | | 1,113,056 |
| 200 | | SYNNEX Corp. | | | 4,388 |
See Notes to Financial Statements
| | |
| 54 | | THE TARGET PORTFOLIO TRUST |
| | | | | |
| SHARES | | DESCRIPTION | | VALUE (NOTE 1) |
| | | | | |
| | Computer Services & Software (cont’d.) | | | |
| 33,030 | | Synopsys, Inc. | | $ | 882,892 |
| 19,777 | | THQ, Inc.(a) | | | 643,148 |
| 3,400 | | webMethods, Inc.* | | | 25,024 |
| | | | | |
| | | | | 7,578,931 |
| | | | | |
| | |
| | Computers | | | |
| 4,600 | | Mentor Graphics Corp.*(a) | | | 82,938 |
| | | | | |
| | |
| | Conglomerates—0.4% | | | |
| 49,859 | | Griffon Corp. | | | 1,271,404 |
| | | | | |
| | |
| | Construction—0.7% | | | |
| 800 | | Builders Firstsource, Inc.* | | | 14,264 |
| 800 | | EMCOR Group, Inc. | | | 45,480 |
| 1,200 | | Granite Construction, Inc. | | | 60,384 |
| 26,587 | | Insituform Technologies, Inc. (Class A Stock)(a) | | | 687,540 |
| 51,000 | | Standard Pacific Corp.(a) | | | 1,366,290 |
| 1,300 | | Washington Group International, Inc. | | | 77,727 |
| | | | | |
| | | | | 2,251,685 |
| | | | | |
| | |
| | Consumer Finance | | | |
| 2,032 | | McGrath Rentcorp | | | 62,240 |
| | | | | |
| | |
| | Consumer Products & Services—1.4% | | | |
| 19,397 | | American Greetings Corp. (Class A Stock) | | | 463,006 |
| 23,617 | | Aptargroup, Inc. | | | 1,394,348 |
| 1,900 | | Elizabeth Arden, Inc.* | | | 36,195 |
| 800 | | Ennis, Inc. | | | 19,568 |
| 1,800 | | Kimball International, Inc. (Class B Stock) | | | 43,740 |
| 24,300 | | Scotts Miracle-Gro Co. (Class A Stock) | | | 1,255,095 |
| 29,346 | | Snap-On, Inc. | | | 1,398,044 |
| | | | | |
| | | | | 4,609,996 |
| | | | | |
| | |
| | Consumer Services | | | |
| 2,900 | | Rent-A-Center, Inc.* | | | 85,579 |
| | | | | |
| | |
| | Containers & Packaging—0.3% | | | |
| 18,965 | | Bemis Co.(a) | | | 644,431 |
| 1,000 | | Greif, Inc. (Class A Stock) | | | 118,400 |
| 3,700 | | Rock-Tenn Co. (Class A Stock) | | | 100,307 |
| 3,600 | | Silgan Holdings, Inc. | | | 158,112 |
| | | | | |
| | | | | 1,021,250 |
| | | | | |
| | |
| | Distribution/Wholesale—0.2% | | | |
| 3,790 | | Brightpoint, Inc. | | | 50,975 |
| 2,400 | | Building Material Holding Corp. | | | 59,256 |
| 1,700 | | United Stationers, Inc. | | | 79,373 |
| 8,539 | | WESCO International, Inc.* | | | 502,179 |
| | | | | |
| | | | | 691,783 |
| | | | | |
See Notes to Financial Statements
| | |
| THE TARGET PORTFOLIO TRUST | | 55 |
| | |
Small Capitalization Value Portfolio (cont’d) | | Portfolio of Investments
As of December 31, 2006 |
| | | | | |
| SHARES | | DESCRIPTION | | VALUE (NOTE 1) |
| | | | | |
| | Diversified Consumer Services | | | |
| 1,350 | | Universal Technical Institute, Inc.*(a) | | $ | 29,984 |
| | | | | |
| | |
| | Diversified Financial Services | | | |
| 2,200 | | CharterMac | | | 47,234 |
| | | | | |
| | |
| | Diversified Financials | | | |
| 4,500 | | Financial Federal Corp.(a) | | | 132,345 |
| | | | | |
| | |
| | Diversified Telecommunication Services—0.3% | | | |
| 51,000 | | Iowa Telecommunications Services, Inc. | | | 1,005,210 |
| | | | | |
| | |
| | Drugs & Healthcare—1.1% | | | |
| 30,700 | | Cooper Cos, Inc.(a) | | | 1,366,150 |
| 35,400 | | Covance, Inc. | | | 2,085,414 |
| | | | | |
| | | | | 3,451,564 |
| | | | | |
| | |
| | Drugs & Medicine—0.3% | | | |
| 17,425 | | Barr Pharmaceuticals, Inc. | | | 873,341 |
| | | | | |
| | |
| | Electric Utilities—2.5% | | | |
| 7,300 | | Avista Corp. | | | 184,763 |
| 1,400 | | Black Hills Corp. | | | 51,716 |
| 1,000 | | CH Energy Group, Inc. | | | 52,800 |
| 45,200 | | Cleco Corp. | | | 1,140,396 |
| 52,000 | | Duquesne Light Holdings, Inc. | | | 1,032,200 |
| 5,000 | | El Paso Electric Co. | | | 121,850 |
| 14,446 | | Idacorp, Inc. | | | 558,338 |
| 3,575 | | Pike Electric Corp.* | | | 58,380 |
| 35,450 | | PNM Resources, Inc. | | | 1,102,495 |
| 500 | | UIL Holdings Corp. | | | 21,095 |
| 5,500 | | Unisource Energy Corp. | | | 200,915 |
| 106,968 | | Westar Energy, Inc. | | | 2,776,889 |
| 14,508 | | Wisconsin Energy Corp. | | | 688,550 |
| | | | | |
| | | | | 7,990,387 |
| | | | | |
| | |
| | Electrical Equipment—1.0% | | | |
| 26,200 | | Acuity Brands, Inc. | | | 1,363,448 |
| 34,300 | | Regal-Beloit Corp. | | | 1,801,093 |
| | | | | |
| | | | | 3,164,541 |
| | | | | |
| | |
| | Electronic Components—0.2% | | | |
| 3,600 | | Blockbuster, Inc. (Class A Stock) | | | 19,044 |
| 26,500 | | Conexant Systems, Inc.* | | | 54,060 |
| 21,957 | | Empire District Electric Co. (The) | | | 542,118 |
| 400 | | Kopin Corp.* | | | 1,428 |
| 800 | | Park Electrochemical Corp. | | | 20,520 |
| 700 | | Plexus Corp.* | | | 16,716 |
| 1,000 | | Technitrol, Inc. | | | 23,890 |
| | | | | |
| | | | | 677,776 |
| | | | | |
See Notes to Financial Statements
| | |
| 56 | | THE TARGET PORTFOLIO TRUST |
| | | | | |
| SHARES | | DESCRIPTION | | VALUE (NOTE 1) |
| | | | | |
| | Electronic Equipment & Instruments | | | |
| 400 | | Global Imaging Systems, Inc. | | $ | 8,780 |
| | | | | |
| | |
| | Electronics—3.5% | | | |
| 33,200 | | Avnet, Inc. | | | 847,596 |
| 900 | | Bel Fuse, Inc. (Class B Stock) | | | 31,311 |
| 23,262 | | Belden CDT, Inc.(a) | | | 909,311 |
| 47,750 | | Benchmark Electronics, Inc. | | | 1,163,190 |
| 48,100 | | Checkpoint Systems, Inc. | | | 971,620 |
| 37,973 | | Coherent, Inc. | | | 1,198,808 |
| 3,200 | | CTS Corp. | | | 50,240 |
| 300 | | Electro Scientific Industries, Inc. | | | 6,042 |
| 900 | | Encore Wire Corp. | | | 19,809 |
| 59,800 | | FLIR Systems, Inc. | | | 1,903,434 |
| 4,200 | | General Cable Corp. | | | 183,582 |
| 1,600 | | KEMET Corp.* | | | 11,680 |
| 26,415 | | Littelfuse, Inc. | | | 842,110 |
| 15,065 | | Mettler-Toledo International, Inc. | | | 1,187,875 |
| 48,210 | | Paxar Corp. | | | 1,111,723 |
| 237,400 | | Sanmina-SCI Corp. | | | 819,030 |
| 1,800 | | TTM Technologies, Inc. | | | 20,394 |
| 1,200 | | Watts Water Technologies, Inc. (Class A Stock)(a) | | | 49,332 |
| | | | | |
| | | | | 11,327,087 |
| | | | | |
| | |
| | Energy | | | |
| 3,700 | | Quantum Fuel Systems Technologies Worldwide, Inc. | | | 5,920 |
| | | | | |
| | |
| | Energy Equipment—0.1% | | | |
| 2,850 | | Universal Compression Holdings, Inc. | | | 177,013 |
| | | | | |
| | |
| | Energy Equipment & Services—0.9% | | | |
| 14,000 | | Frontier Oil Corp. | | | 402,360 |
| 44,483 | | Headwaters, Inc. | | | 1,065,813 |
| 18,000 | | Holly Corp. | | | 925,200 |
| 10,000 | | Tidewater, Inc. | | | 483,600 |
| | | | | |
| | | | | 2,876,973 |
| | | | | |
| | |
| | Entertainment | | | |
| 900 | | Macrovision Corp.* | | | 25,434 |
| | | | | |
| | |
| | Entertainment & Leisure—0.2% | | | |
| 29,851 | | Bally Technologies, Inc.*(a) | | | 557,617 |
| 4,300 | | K2, Inc.* | | | 56,717 |
| 1,400 | | RC2 Corp. | | | 61,600 |
| 1,000 | | Steinway Musical Instruments, Inc.* | | | 30,990 |
| | | | | |
| | | | | 706,924 |
| | | | | |
| | |
| | Environmental Services—0.6% | | | |
| 66,000 | | Allied Waste Industries, Inc. | | | 811,140 |
| 54,757 | | Tetra Tech, Inc. | | | 990,554 |
| 1,066 | | Waste Services, Inc.* | | | 10,500 |
| | | | | |
| | | | | 1,812,194 |
| | | | | |
See Notes to Financial Statements
| | |
| THE TARGET PORTFOLIO TRUST | | 57 |
| | |
Small Capitalization Value Portfolio (cont’d) | | Portfolio of Investments
As of December 31, 2006 |
| | | | | |
| SHARES | | DESCRIPTION | | VALUE (NOTE 1) |
| | | | | |
| | Exchange Traded Funds—1.5% | | | |
| 33,357 | | iShares Russell 2000 Value Index Fund(a) | | $ | 2,669,227 |
| 29,680 | | iShares S&P SmallCap 600 Value Index Fund | | | 2,236,091 |
| | | | | |
| | | | | 4,905,318 |
| | | | | |
| | |
| | Finance-Leasing | | | |
| 1,100 | | Marlin Business Services, Inc. | | | 26,433 |
| | | | | |
| | |
| | Financial-Bank & Trust—0.4% | | | |
| 3,450 | | Alesco Financial, Inc. | | | 36,915 |
| 900 | | City Bank/Lynnwood (WA) | | | 32,220 |
| 1,100 | | Downey Financial Corp. | | | 79,838 |
| 500 | | Heartland Financial USA, Inc. | | | 14,425 |
| 300 | | Heritage Commerce Corp. | | | 7,992 |
| 625 | | Horizon Financial Corp. | | | 15,037 |
| 47,035 | | NewAlliance Bancshares, Inc. | | | 771,374 |
| 18,232 | | Superior Bancorp* | | | 206,751 |
| 600 | | Union Bankshares Corp.* | | | 18,354 |
| | | | | |
| | | | | 1,182,906 |
| | | | | |
| | |
| | Financial-Brokerage | | | |
| 7,500 | | Friedman, Billings, Ramsey Group, Inc.* | | | 60,000 |
| | | | | |
| | |
| | Financial Services—3.7% | | | |
| 2,200 | | Advanta Corp. (Class B Stock) | | | 95,986 |
| 1,175 | | Affiliated Managers Group, Inc. | | | 123,528 |
| 44,150 | | Asset Acceptance Capital Corp.* | | | 742,603 |
| 1,625 | | Bank of Granite Corp. | | | 30,826 |
| 100 | | Berkshire Hills Bancorp, Inc. | | | 3,346 |
| 30,036 | | Calamos Asset Management, Inc. | | | 805,866 |
| 600 | | Camden National Corp. | | | 27,672 |
| 2,125 | | CompuCredit Corp.(a) | | | 84,596 |
| 3,100 | | Deluxe Corp. | | | 78,120 |
| 1,471 | | Dollar Financial Corp.* | | | 40,982 |
| 3,300 | | Doral Financial Corp. | | | 9,471 |
| 39,400 | | Eaton Vance Corp. | | | 1,300,594 |
| 300 | | eSpeed, Inc. (Class A Stock) | | | 2,619 |
| 300 | | Farmers Capital Bank Corp. | | | 10,239 |
| 400 | | Federal Agricultural Mortgage Corp. (Class C Stock) | | | 10,852 |
| 3,125 | | First Cash Financial Services, Inc.* | | | 80,844 |
| 900 | | First Communtiy Banshares | | | 35,604 |
| 600 | | First Regional Bancorp | | | 20,454 |
| 1,090 | | First Source Corp. | | | 35,022 |
| 400 | | Greene County Bancshares, Inc. | | | 15,892 |
| 100 | | Greenhill & Co, Inc.(a) | | | 7,380 |
| 1,000 | | Intervest Bancshares Corp. | | | 34,410 |
| 62,100 | | Jefferies Group, Inc. | | | 1,665,522 |
See Notes to Financial Statements
| | |
| 58 | | THE TARGET PORTFOLIO TRUST |
| | | | | |
| SHARES | | DESCRIPTION | | VALUE (NOTE 1) |
| | | | | |
| | Financial Services (cont’d.) | | | |
| 6,000 | | Knight Trading Group, Inc. (Class A Stock) | | $ | 115,020 |
| 3,300 | | Labranche & Co., Inc.(a) | | | 32,439 |
| 38,900 | | MoneyGram International, Inc. | | | 1,219,904 |
| 1,300 | | National City Bancshares | | | 35,776 |
| 1,648 | | National Penn Bancshares, Inc. | | | 33,372 |
| 2,600 | | Ocwen Financial Corp. | | | 41,236 |
| 37,600 | | Pacific Capital Bancorp(a) | | | 1,262,608 |
| 500 | | Piper Jaffray Cos. | | | 32,575 |
| 56,450 | | Raymond James Financial, Inc. | | | 1,711,000 |
| 1,200 | | Renasant Corp. | | | 36,756 |
| 38,155 | | South Financial Group, Inc. (The)(a) | | | 1,014,541 |
| 4,200 | | Student Loan Corp. (The) | | | 870,660 |
| 2,600 | | United Community Financial Corp. | | | 31,824 |
| 3,500 | | World Acceptance Corp. | | | 164,325 |
| | | | | |
| | | | | 11,864,464 |
| | | | | |
| | |
| | Food & Drug Retailers | | | |
| 2,000 | | Perrigo Co. | | | 34,600 |
| | | | | |
| | |
| | Food & Staples Retailing—0.3% | | | |
| 33,867 | | Casey’s General Stores, Inc. | | | 797,568 |
| | | | | |
| | |
| | Food-Wholesale—0.1% | | | |
| 3,600 | | NBTY, Inc.* | | | 149,652 |
| | | | | |
| | |
| | Food Products—2.2% | | | |
| 4,200 | | Chiquita Brands International, Inc.(a) | | | 67,074 |
| 45,532 | | Corn Products International, Inc. | | | 1,572,675 |
| 1,200 | | Flowers Foods, Inc. | | | 32,388 |
| 21,700 | | Fresh Del Monte Produce, Inc. (Cayman Islands)(a) | | | 323,547 |
| 800 | | J & J Snack Foods Corp. | | | 33,120 |
| 28,221 | | J.M. Smucker Co. (The) | | | 1,367,872 |
| 700 | | Nash Finch Co.(a) | | | 19,110 |
| 65,000 | | Pilgrim’s Pride Corp. | | | 1,912,950 |
| 19,268 | | Ralcorp Holdings, Inc. | | | 980,549 |
| 32,800 | | Ruddick Corp. | | | 910,200 |
| | | | | |
| | | | | 7,219,485 |
| | | | | |
| | |
| | Foods—0.2% | | | |
| 20,519 | | Performance Food Group Co.(a) | | | 567,145 |
| 400 | | Premium Standard Farms, Inc. | | | 7,428 |
| 1,300 | | Reddy Ice Holdings, Inc. | | | 33,566 |
| 4,400 | | Spartan Stores, Inc. | | | 92,092 |
| | | | | |
| | | | | 700,231 |
| | | | | |
| | |
| | Furniture | | | |
| 2,200 | | Sealy Corp.(a) | | | 32,450 |
| | | | | |
| | |
| | Gas & Pipeline Utilities—4.8% | | | |
| 29,276 | | AGL Resources, Inc. | | | 1,139,129 |
| 17,215 | | Atlas America, Inc. | | | 877,449 |
See Notes to Financial Statements
| | |
| THE TARGET PORTFOLIO TRUST | | 59 |
| | |
Small Capitalization Value Portfolio (cont’d) | | Portfolio of Investments
As of December 31, 2006 |
| | | | | |
| SHARES | | DESCRIPTION | | VALUE (NOTE 1) |
| | | | | |
| | Gas & Pipeline Utilities (cont’d.) | | | |
| 62,801 | | Atmos Energy Corp.(a) | | $ | 2,003,980 |
| 70,193 | | Cascade Natural Gas Corp. | | | 1,819,403 |
| 11,000 | | Energen Corp. | | | 516,340 |
| 4,500 | | National Fuel Gas Co. | | | 173,430 |
| 31,000 | | Peoples Energy Corp. | | | 1,381,670 |
| 50,100 | | Southwest Gas Corp. | | | 1,922,337 |
| 58,298 | | Swift Energy Co. | | | 2,612,333 |
| 7,000 | | UGI Corp. | | | 190,960 |
| 24,286 | | W-H Energy Services, Inc. | | | 1,182,485 |
| 50,486 | | WGL Holdings, Inc.(a) | | | 1,644,834 |
| | | | | |
| | | | | 15,464,350 |
| | | | | |
| | |
| | Healthcare Equipment & Supplies—0.4% | | | |
| 11,400 | | Arrow International, Inc. | | | 403,332 |
| 4,500 | | Hillenbrand Industries, Inc. | | | 256,185 |
| 23,300 | | Invacare Corp. | | | 572,015 |
| 500 | | Molecular Devices Corp.* | | | 10,535 |
| | | | | |
| | | | | 1,242,067 |
| | | | | |
| | |
| | Healthcare Products & Services | | | |
| 300 | | ICU Medical, Inc.* | | | 12,204 |
| | | | | |
| | |
| | Healthcare Providers & Services—2.1% | | | |
| 4,800 | | Alliance Imaging, Inc. | | | 31,920 |
| 1,367 | | Amedisys, Inc.* | | | 44,922 |
| 50,900 | | AMERIGROUP Corp.(a) | | | 1,826,801 |
| 2,600 | | AMN Healthcare Services, Inc.* | | | 71,604 |
| 900 | | Apria Healthcare Group, Inc.* | | | 23,985 |
| 6,600 | | Gentiva Health Services, Inc. | | | 125,796 |
| 1,800 | | Kindred Healthcare, Inc. | | | 45,450 |
| 1,500 | | Magellan Health Services, Inc. | | | 64,830 |
| 53,734 | | Owens & Minor, Inc. | | | 1,680,262 |
| 37,765 | | Res-Care, Inc. | | | 685,435 |
| 40,500 | | Sunrise Senior Living, Inc. | | | 1,244,160 |
| 10,200 | | Triad Hospitals, Inc. | | | 426,666 |
| 5,726 | | Universal Health Services, Inc. (Class B Stock) | | | 317,392 |
| | | | | |
| | | | | 6,589,223 |
| | | | | |
| | |
| | Healthcare Services—0.8% | | | |
| 38,300 | | Centene Corp.*(a) | | | 941,031 |
| 100 | | Genesis HealthCare Corp.* | | | 4,723 |
| 28,900 | | Healthways, Inc.*(a) | | | 1,378,819 |
| 2,125 | | LHC Group, Inc.*(a) | | | 60,584 |
| 500 | | Molina Healthcare, Inc.* | | | 16,255 |
| 2,475 | | Pediatrix Medical Group, Inc. | | | 121,027 |
| 2,900 | | Psychiatric Solutions, Inc.* | | | 108,808 |
| | | | | |
| | | | | 2,631,247 |
| | | | | |
See Notes to Financial Statements
| | |
| 60 | | THE TARGET PORTFOLIO TRUST |
| | | | | |
| SHARES | | DESCRIPTION | | VALUE (NOTE 1) |
| | | | | |
| | Home Builders—0.8% | | | |
| 34,500 | | Hovnanian Enterprises, Inc. (Class A Stock)(a) | | $ | 1,169,550 |
| 26,500 | | Meritage Homes Corp. | | | 1,264,580 |
| 1,100 | | WCI Communities, Inc.(a) | | | 21,098 |
| | | | | |
| | | | | 2,455,228 |
| | | | | |
| | |
| | Hotels, Restaurants & Leisure—1.1% | | | |
| 300 | | Ameristar Casinos, Inc. | | | 9,222 |
| 22,072 | | Applebee’s International, Inc. | | | 544,516 |
| 900 | | Aztar Corp. | | | 48,978 |
| 200 | | Bob Evans Farms, Inc. | | | 6,844 |
| 51,810 | | Brinker International, Inc.(a) | | | 1,562,590 |
| 2,800 | | Jack in the Box, Inc. | | | 170,912 |
| 1,200 | | Papa John’s International, Inc. | | | 34,812 |
| 53,450 | | Sonic Corp.(a) | | | 1,280,127 |
| | | | | |
| | | | | 3,658,001 |
| | | | | |
| | |
| | Household Durables—1.3% | | | |
| 24,600 | | Ethan Allen Interiors, Inc. | | | 888,306 |
| 1,400 | | Furniture Brands International, Inc.(a) | | | 22,722 |
| 19,600 | | Harman International Industries, Inc. | | | 1,958,236 |
| 12,700 | | Lancaster Colony Corp. | | | 562,737 |
| 5,000 | | M.D.C. Holdings, Inc.(a) | | | 285,250 |
| 14,300 | | M/I Homes, Inc. | | | 546,117 |
| | | | | |
| �� | | | | 4,263,368 |
| | | | | |
| | |
| | Household Products—0.1% | | | |
| 1,300 | | Spectrum Brands, Inc.*(a) | | | 14,170 |
| 10,400 | | Tupperware Corp. | | | 235,144 |
| | | | | |
| | | | | 249,314 |
| | | | | |
| | |
| | Industrial Conglomerates—0.2% | | | |
| 11,550 | | Teleflex, Inc. | | | 745,668 |
| | | | | |
| | |
| | Industrial Products—2.2% | | | |
| 23,798 | | CIRCOR International, Inc. | | | 875,528 |
| 103,088 | | Flanders Corp.* | | | 1,020,571 |
| 49,632 | | Interface, Inc. | | | 705,767 |
| 69,728 | | Kaydon Corp.(a) | | | 2,770,991 |
| 4,100 | | Myers Industries, Inc. | | | 64,206 |
| 2,600 | | NN, Inc. | | | 32,318 |
| 10,508 | | Robbins & Myers, Inc. | | | 482,527 |
| 22,192 | | Unifirst Corp. | | | 852,395 |
| 2,500 | | Valmont Industries, Inc. | | | 138,725 |
| | | | | |
| | | | | 6,943,028 |
| | | | | |
| | |
| | Insurance—5.6% | | | |
| 900 | | Amercan Physicians Capital, Inc. | | | 36,036 |
| 79,463 | | American Equity Investment Life Holding Co. | | | 1,035,403 |
| 6,000 | | American Financial Group, Inc. | | | 215,460 |
See Notes to Financial Statements
| | |
| THE TARGET PORTFOLIO TRUST | | 61 |
| | |
Small Capitalization Value Portfolio (cont’d) | | Portfolio of Investments
As of December 31, 2006 |
| | | | | |
| SHARES | | DESCRIPTION | | VALUE (NOTE 1) |
| | | | | |
| | Insurance (cont’d.) | | | |
| 2,700 | | Argonaut Group, Inc. | | $ | 94,122 |
| 59,725 | | Delphi Financial Group, Inc. (Class A Stock) | | | 2,416,474 |
| 1,200 | | Direct General Corp. | | | 24,768 |
| 1,000 | | Harleysville Group, Inc. | | | 34,820 |
| 3,075 | | HCC Insurance Holdings | | | 98,677 |
| 19,500 | | Hilb, Rogal & Hobbs Co. | | | 821,340 |
| 42,472 | | Horace Mann Educators Corp. | | | 857,934 |
| 36,660 | | Infinity Property & Casual Corp. | | | 1,773,977 |
| 15,400 | | LandAmerica Financial Group, Inc.(a) | | | 971,894 |
| 1,100 | | Navigators Group, Inc. | | | 52,998 |
| 1,100 | | Odyssey Re Holdings Corp. | | | 41,030 |
| 12,900 | | Ohio Casualty Corp. | | | 384,549 |
| 48,301 | | Philadelphia Consolidated Holding Corp. | | | 2,152,293 |
| 1,100 | | Phoenix Cos., Inc. (The) | | | 17,479 |
| 42,398 | | Platinum Underwriters Holdings, Ltd. (Bermuda) | | | 1,311,794 |
| 9,900 | | PMA Capital Corp. (Class A Stock) | | | 91,278 |
| 16,530 | | PMI Group, Inc. (The) | | | 779,720 |
| 28,869 | | ProAssurance Corp. | | | 1,441,140 |
| 12,600 | | Protective Life Corp. | | | 598,500 |
| 300 | | RLI Corp. | | | 16,926 |
| 2,500 | | Safety Insurance Group, Inc.(a) | | | 126,775 |
| 1,700 | | Selective Insurance Group | | | 97,393 |
| 37,100 | | State Auto Financial Corp. | | | 1,288,483 |
| 2,400 | | Stewart Information Services Corp.(a) | | | 104,064 |
| 23,900 | | United Fire & Casualty Co. | | | 842,475 |
| 4,500 | | Zenith National Insurance Corp. | | | 211,095 |
| | | | | |
| | | | | 17,938,897 |
| | | | | |
| | |
| | Internet | | | |
| 4,500 | | Ariba, Inc.* | | | 34,830 |
| 3,300 | | Interwoven, Inc.* | | | 48,411 |
| | | | | |
| | | | | 83,241 |
| | | | | |
| | |
| | Internet Services—0.1% | | | |
| 3,200 | | FTD Group, Inc.* | | | 57,248 |
| 2,200 | | Ipass, Inc. | | | 12,936 |
| 1,300 | | ProQuest Co. | | | 13,585 |
| 400 | | Redback Networks, Inc. | | | 9,976 |
| 2,700 | | SonicWall, Inc.* | | | 22,734 |
| 1,900 | | TIBCO Software, Inc.* | | | 17,936 |
| 7,400 | | United Online, Inc. | | | 98,272 |
| | | | | |
| | | | | 232,687 |
| | | | | |
| | |
| | Internet Software & Services | | | |
| 2,250 | | Vignette Corp. | | | 38,408 |
| | | | | |
See Notes to Financial Statements
| | |
| 62 | | THE TARGET PORTFOLIO TRUST |
| | | | | |
| SHARES | | DESCRIPTION | | VALUE (NOTE 1) |
| | | | | |
| | Investment Companies | | | |
| 2,800 | | MCG Capital Corp. | | $ | 56,896 |
| 1,700 | | Medallion Financial Corp. | | | 21,029 |
| | | | | |
| | | | | 77,925 |
| | | | | |
| | |
| | Leisure | | | |
| 3,100 | | Jakks Pacific, Inc. | | | 67,704 |
| | | | | |
| | |
| | Leisure Equipment & Products | | | |
| 1,025 | | Brunswick Corp. | | | 32,698 |
| | | | | |
| | |
| | Machinery—3.7% | | | |
| 2,075 | | Actuant Corp. (Class A Stock)(a) | | | 98,874 |
| 36,000 | | Albany International Corp. (Class A Stock)(a) | | | 1,184,760 |
| 9,050 | | Applied Industrial Technologies, Inc. | | | 238,105 |
| 500 | | Astec Industries, Inc. | | | 17,550 |
| 84,300 | | Barnes Group, Inc. | | | 1,833,525 |
| 66,173 | | Briggs & Stratton Corp.(a) | | | 1,783,362 |
| 35,050 | | Bucyrus International, Inc. (Class A Stock) | | | 1,814,188 |
| 900 | | Cascade Corp. | | | 47,610 |
| 600 | | Gehl Co.* | | | 16,518 |
| 800 | | Gibraltar Industries, Inc. | | | 18,808 |
| 1,575 | | IDEX Corp. | | | 74,671 |
| 2,662 | | Jacuzzi Brands, Inc.* | | | 33,089 |
| 36,706 | | Kadant, Inc. | | | 894,892 |
| 26,000 | | Kennametal, Inc. | | | 1,530,100 |
| 15,000 | | Lincoln Electric Holdings, Inc. | | | 906,300 |
| 36,500 | | Mueller Industries, Inc. | | | 1,157,050 |
| 400 | | NACCO Industries, Inc. (Class A Stock) | | | 54,640 |
| 1,925 | | Nordson Corp. | | | 95,923 |
| 900 | | Sauer-Danfoss, Inc. | | | 29,025 |
| 1,100 | | Smith A.O. Corp.(a) | | | 41,316 |
| 700 | | Tecumseh Products Co. (Class A Stock)(a) | | | 11,830 |
| 1,000 | | Tennant Co. | | | 29,000 |
| 3,700 | | Wabtec Corp. | | | 112,406 |
| | | | | |
| | | | | 12,023,542 |
| | | | | |
| | |
| | Manufacturing—1.3% | | | |
| 600 | | Ameron International Corp. | | | 45,822 |
| 600 | | Ceradyne, Inc.*(a) | | | 33,900 |
| 1,300 | | EnPro Industries, Inc.* | | | 43,173 |
| 65,809 | | Federal Signal Corp. | | | 1,055,576 |
| 14,100 | | Harsco Corp. | | | 1,073,010 |
| 78,200 | | Hexel Corp.*(a) | | | 1,361,462 |
| 13,200 | | Winnebago Industries, Inc.(a) | | | 434,412 |
| | | | | |
| | | | | 4,047,355 |
| | | | | |
| | |
| | Marine | | | |
| 3,335 | | Arlington Tankers Ltd. | | | 77,939 |
| | | | | |
See Notes to Financial Statements
| | |
| THE TARGET PORTFOLIO TRUST | | 63 |
| | |
Small Capitalization Value Portfolio (cont’d) | | Portfolio of Investments
As of December 31, 2006 |
| | | | | |
| SHARES | | DESCRIPTION | | VALUE (NOTE 1) |
| | | | | |
| | Media—0.9% | | | |
| 35,441 | | Belo Corp. (Class A Stock) | | $ | 651,051 |
| 24,000 | | Charter Communications, Inc. (Class A Stock)(a) | | | 73,440 |
| 12,886 | | Courier Corp. | | | 502,168 |
| 152,200 | | Journal Register Co. | | | 1,111,060 |
| 6,900 | | Lee Enterprises, Inc. | | | 214,314 |
| 3,700 | | Lodgenet Entertainment Corp. | | | 92,611 |
| 600 | | Media General, Inc. (Class A Stock) | | | 22,302 |
| 10,700 | | Radio One, Inc. (Class D Stock)* | | | 72,118 |
| 2,400 | | Scholastic Corp. | | | 86,016 |
| 600 | | Sinclair Broadcast Group, Inc. (Class A Stock) | | | 6,300 |
| 3,800 | | Westwood One, Inc. | | | 26,828 |
| | | | | |
| | | | | 2,858,208 |
| | | | | |
| | |
| | Medical Products | | | |
| 100 | | Martek Bioscience Corp.* | | | 2,334 |
| 900 | | Savient Pharmaceuticals, Inc.* | | | 10,089 |
| | | | | |
| | | | | 12,423 |
| | | | | |
| | |
| | Medical Supplies & Equipment—0.3% | | | |
| 700 | | Adams Respiratory Therapeutics, Inc.* | | | 28,567 |
| 1,300 | | Advanced Energy Industries, Inc.* | | | 24,531 |
| 1,100 | | Arena Pharmaceuticals, Inc.* | | | 14,201 |
| 500 | | Biosite, Inc.* | | | 24,425 |
| 900 | | Conmed Corp. | | | 20,808 |
| 500 | | Greatbatch, Inc.* | | | 13,460 |
| 1,500 | | HealthTronics Surgical, Inc. | | | 9,990 |
| 2,075 | | Medical Action Industries, Inc.* | | | 66,898 |
| 600 | | Medivation, Inc.*(a) | | | 9,492 |
| 11,704 | | Orthofix International N.V. | | | 585,200 |
| 3,000 | | PSS World Medical, Inc. | | | 58,590 |
| 1,000 | | STERIS Corp. | | | 25,170 |
| 100 | | SurModics, Inc. | | | 3,112 |
| 600 | | Viasys Healthcare, Inc. | | | 16,692 |
| | | | | |
| | | | | 901,136 |
| | | | | |
| | |
| | Metals & Mining—3.1% | | | |
| 30,000 | | Agnico-Eagle Mines Ltd. (Canada) | | | 1,237,200 |
| 2,900 | | Chaparral Steel Co. | | | 128,383 |
| 27,475 | | Cleveland-Cliffs, Inc.(a) | | | 1,330,889 |
| 33,700 | | Commercial Metals Co. | | | 869,460 |
| 175,700 | | IAMGOLD Corp. | | | 1,547,917 |
| 75,000 | | Massey Energy Co. | | | 1,742,250 |
| 700 | | Oregon Steel Mills, Inc. | | | 43,687 |
| 46,100 | | Quanex Corp. | | | 1,594,599 |
| 700 | | Ryerson, Inc. | | | 17,563 |
See Notes to Financial Statements
| | |
| 64 | | THE TARGET PORTFOLIO TRUST |
| | | | | |
| SHARES | | DESCRIPTION | | VALUE (NOTE 1) |
| | | | | |
| | Metals & Mining (cont’d.) | | | |
| 800 | | Schnitzer Steel Industries, Inc. (Class A Stock) | | $ | 31,760 |
| 1,700 | | Steel Dynamics, Inc. | | | 55,165 |
| 41,700 | | Timken Co. | | | 1,216,806 |
| 4,600 | | Usec, Inc. | | | 58,512 |
| | | | | |
| | | | | 9,874,191 |
| | | | | |
| | |
| | Multi-Utilities—0.3% | | | |
| 34,725 | | Vectren Corp. | | | 982,023 |
| | | | | |
| | |
| | Office Equipment—0.1% | | | |
| 1,825 | | Hon Industries, Inc. | | | 81,048 |
| 6,300 | | IKON Office Solutions, Inc. | | | 103,131 |
| | | | | |
| | | | | 184,179 |
| | | | | |
| | |
| | Oil & Gas—0.5% | | | |
| 40,000 | | St. Mary Land & Exploration Co. | | | 1,473,600 |
| | | | | |
| | |
| | Oil & Gas Exploration/Production—1.6% | | | |
| 81,950 | | Cabot Oil & Gas Corp.(a) | | | 4,970,267 |
| | | | | |
| | |
| | Oil, Gas & Consumable Fuels—3.5% | | | |
| 700 | | Alon USA Energy, Inc. | | | 18,417 |
| 2,725 | | Arena Resources, Inc.* | | | 116,385 |
| 36,536 | | Berry Petroleum Co. (Class A Stock) | | | 1,132,981 |
| 1,300 | | Bois d’arc Energy, Inc.* | | | 19,019 |
| 900 | | Callon Petroleum Co.* | | | 13,527 |
| 1,500 | | Comstock Resources, Inc. | | | 46,590 |
| 1,800 | | Energy Partners Ltd.(a) | | | 43,956 |
| 500 | | Giant Industries, Inc. | | | 37,475 |
| 5,075 | | Gulfport Energy Corp.* | | | 68,969 |
| 1,300 | | Hanover Compressor Co. | | | 24,557 |
| 3,000 | | Harvest Natural Resources, Inc. | | | 31,890 |
| 174 | | Helix Energy Solutions Group, Inc.*(a) | | | 5,458 |
| 1,200 | | Hornbeck Offshore Services, Inc.* | | | 42,840 |
| 25,900 | | Houston Exploration Co. | | | 1,341,102 |
| 2,900 | | Laclede Group, Inc. (The) | | | 101,587 |
| 800 | | Lone Star Technologies, Inc. | | | 38,728 |
| 1,500 | | Lufkin Industries, Inc. | | | 87,120 |
| 3,100 | | New Jersey Resources Corp. | | | 150,598 |
| 2,500 | | Nicor, Inc. | | | 117,000 |
| 2,875 | | Northwest Natural Gas Co. | | | 122,015 |
| 50,168 | | Oceaneering International, Inc. | | | 1,991,670 |
| 4,425 | | Oil States International, Inc. | | | 142,618 |
| 30,600 | | Oneok, Inc. | | | 1,319,472 |
| 2,300 | | Petrohawk Energy Corp. | | | 26,450 |
| 53,000 | | Range Resources Corp. | | | 1,455,380 |
| 4,250 | | Rosetta Resources, Inc.*(a) | | | 79,347 |
| 1,500 | | RPC, Inc. | | | 25,320 |
| 19,068 | | South Jersey Industries, Inc. | | | 637,062 |
| 1,800 | | Stone Energy Corp. | | | 63,630 |
See Notes to Financial Statements
| | |
| THE TARGET PORTFOLIO TRUST | | 65 |
| | |
Small Capitalization Value Portfolio (cont’d) | | Portfolio of Investments
As of December 31, 2006 |
| | | | | |
| SHARES | | DESCRIPTION | | VALUE (NOTE 1) |
| | | | | |
| | Oil, Gas & Consumable Fuels (cont’d.) | | | |
| 4,200 | | Trico Marine Services, Inc.* | | $ | 160,902 |
| 1,800 | | Union Drilling, Inc. | | | 25,344 |
| 1,500 | | Veritas DGC, Inc. | | | 128,445 |
| 18,600 | | W&T Offshore, Inc. | | | 571,392 |
| 9,900 | | Western Refining, Inc. | | | 252,054 |
| 15,000 | | World Fuel Services Corp. | | | 666,900 |
| | | | | |
| | | | | 11,106,200 |
| | | | | |
| | |
| | Paper & Forest Products—0.4% | | | |
| 3,000 | | Buckeye Technologies, Inc.* | | | 35,940 |
| 30,541 | | Neenah Paper, Inc. | | | 1,078,708 |
| 1,700 | | P.H. Glatfelter Co. | | | 26,350 |
| 2,700 | | Schweitzer-Mauduit International, Inc. | | | 70,335 |
| | | | | |
| | | | | 1,211,333 |
| | | | | |
| | |
| | Personell Services | | | |
| 2,200 | | Romac International, Inc. | | | 26,774 |
| | | | | |
| | |
| | Pharmaceuticals—0.1% | | | |
| 1,400 | | Adolor Corp. | | | 10,528 |
| 1,500 | | Alpharma, Inc. (Class A Stock) | | | 36,150 |
| 900 | | Atherogenics, Inc. | | | 8,919 |
| 3,700 | | Avanir Pharmaceuticals (Class A Stock)*(a) | | | 8,547 |
| 800 | | Cubist Pharmaceuticals, Inc.* | | | 14,488 |
| 3,700 | | Cypress Bioscience, Inc. | | | 28,675 |
| 3,500 | | Prestige Brands Holdings, Inc.* | | | 45,570 |
| 1,000 | | Progenics Pharmaceuticals, Inc.* | | | 25,740 |
| 400 | | United Therapeutics Corp. | | | 21,748 |
| 1,100 | | Valeant Pharmaceuticals International | | | 18,964 |
| | | | | |
| | | | | 219,329 |
| | | | | |
| | |
| | Real Estate—0.8% | | | |
| 1,500 | | Equity Lifestyle Properties, Inc. | | | 81,645 |
| 15,900 | | First Industrial Realty Trust, Inc. | | | 745,551 |
| 10,000 | | Healthcare Realty Trust, Inc.(a) | | | 395,400 |
| 2,600 | | Housevalues, Inc.(a) | | | 14,638 |
| 34,000 | | HRPT Properties Trust(a) | | | 419,900 |
| 22,213 | | Potlatch Corp.(a) | | | 973,374 |
| | | | | |
| | | | | 2,630,508 |
| | | | | |
| | |
| | Real Estate Investment Trust-Hotels | | | |
| 3,000 | | Hersha Hospitality Trust | | | 34,020 |
| | | | | |
| | |
| | Real Estate Investment Trust-Office Industrial | | | |
| 2,900 | | BioMed Realty Trust, Inc. | | | 82,940 |
| 700 | | Columbia Equity Trust, Inc. | | | 13,377 |
| | | | | |
| | | | | 96,317 |
| | | | | |
See Notes to Financial Statements
| | |
| 66 | | THE TARGET PORTFOLIO TRUST |
| | | | | |
| SHARES | | DESCRIPTION | | VALUE (NOTE 1) |
| | | | | |
| | Real Estate Investment Trust-Other REIT—0.1% | | | |
| 800 | | OMEGA Healthcare Investors, Inc.* | | $ | 14,176 |
| 11,700 | | Spirit Finance Corp.* | | | 145,899 |
| | | | | |
| | | | | 160,075 |
| | | | | |
| | |
| | Real Estate Investment Trusts—3.4% | | | |
| 4,400 | | American Home Mortgage Investment Corp. | | | 154,528 |
| 10,100 | | Anthracite Capital, Inc.(a) | | | 128,573 |
| 20,370 | | Arbor Realty Trust, Inc. | | | 612,933 |
| 7,675 | | Ashford Hospitality Trust | | | 95,554 |
| 800 | | Capital Trust, Inc. (Class A Stock)(a) | | | 39,952 |
| 49,647 | | Education Realty Trust, Inc. | | | 733,286 |
| 4,000 | | Equity Inns, Inc. | | | 63,840 |
| 71,342 | | Equity One, Inc.(a) | | | 1,901,978 |
| 900 | | Extra Space Storage, Inc. | | | 16,434 |
| 14,600 | | FelCor Lodging Trust, Inc. | | | 318,864 |
| 2,900 | | First Potomac Realty Trust | | | 84,419 |
| 3,500 | | Government Properties Trust, Inc. | | | 37,100 |
| 2,113 | | Highland Hospitality Corp. | | | 30,110 |
| 4,100 | | IMPAC Mortgage Holdings, Inc.(a) | | | 36,080 |
| 66,049 | | Innkeepers USA Trust | | | 1,023,759 |
| 1,550 | | Jer Investors Trust, Inc. | | | 32,039 |
| 2,000 | | Kilroy Reality Corp. | | | 156,000 |
| 1,800 | | LaSalle Hotel Properties | | | 82,530 |
| 11,100 | | Lexington Corporate Properties Trust(a) | | | 248,862 |
| 2,300 | | LTC Properties, Inc. | | | 62,813 |
| 1,300 | | Maguire Properties, Inc. | | | 52,000 |
| 14,250 | | MFA Mortgage Investments, Inc. | | | 109,583 |
| 1,700 | | National Health Investors, Inc. | | | 56,100 |
| 31,100 | | Nationwide Health Properties, Inc.(a) | | | 939,842 |
| 6,000 | | New Plan Excel Realty Trust | | | 164,880 |
| 1,100 | | Parkway Properties, Inc. | | | 56,111 |
| 5,000 | | Pennsylvania Real Estate Investment Trust | | | 196,900 |
| 6,100 | | Post Properties, Inc. | | | 278,770 |
| 4,000 | | RAIT Investment Trust | | | 137,920 |
| 1,875 | | Redwood Trust, Inc.(a) | | | 108,900 |
| 2,400 | | Saul Centers, Inc. | | | 132,456 |
| 5,300 | | Senior Housing Properties Trust(a) | | | 129,744 |
| 14,800 | | SL Green Realty Corp.(a) | | | 1,965,144 |
| 4,900 | | Sunstone Hotel Investors, Inc. | | | 130,977 |
| 43,032 | | Winston Hotels, Inc. | | | 570,174 |
| | | | | |
| | | | | 10,889,155 |
| | | | | |
| | |
| | Registered Investment Companies | | | |
| 6,189 | | Technology Investment Capital Corp. | | | 99,890 |
| | | | | |
| | |
| | Restaurants | | | |
| 6,399 | | Triarc Cos., Inc. (Class B Stock) | | | 127,980 |
| | | | | |
See Notes to Financial Statements
| | |
| THE TARGET PORTFOLIO TRUST | | 67 |
| | |
Small Capitalization Value Portfolio (cont’d) | | Portfolio of Investments
As of December 31, 2006 |
| | | | | |
| SHARES | | DESCRIPTION | | VALUE (NOTE 1) |
| | | | | |
| | Retail—1.4% | | | |
| 5,500 | | Asbury Automotive Group, Inc. | | $ | 129,580 |
| 600 | | Build-A-Bear Workshop, Inc.(a) | | | 16,812 |
| 4,500 | | Cash America International, Inc. | | | 211,050 |
| 12,900 | | Charming Shoppes, Inc. | | | 174,537 |
| 39,657 | | CSK Auto Corp.(a) | | | 680,118 |
| 900 | | Genesco, Inc. | | | 33,570 |
| 1,800 | | Group 1 Automotive(a) | | | 93,096 |
| 1,200 | | Insight Enterprises, Inc. | | | 22,644 |
| 2,000 | | Lithia Motors, Inc. (Class A Stock) | | | 57,520 |
| 13,873 | | Men’s Wearhouse, Inc. (The) | | | 530,781 |
| 900 | | Movado Group, Inc. | | | 26,100 |
| 900 | | Pantry, Inc. | | | 42,156 |
| 33,191 | | Regis Corp. | | | 1,312,372 |
| 2,200 | | Smart & Final, Inc. | | | 41,580 |
| 10,800 | | Sonic Automotive, Inc. | | | 313,632 |
| 3,900 | | Stage Stores, Inc.(a) | | | 118,521 |
| 48,000 | | Stein Mart, Inc. | | | 636,480 |
| 2,400 | | Systemax, Inc. | | | 41,880 |
| | | | | |
| | | | | 4,482,429 |
| | | | | |
| | |
| | Retail & Merchandising—0.6% | | | |
| 4,900 | | Big Lots, Inc.*(a) | | | 112,308 |
| 1,100 | | Bon-Ton Stores, Inc. (The) | | | 38,115 |
| 2,100 | | Christopher & Banks Corp. | | | 39,186 |
| 400 | | Deckers Outdoor Corp. | | | 23,980 |
| 35,094 | | Finish Line, Inc. (The)(a) | | | 501,142 |
| 2,225 | | Guitar Center, Inc.*(a) | | | 101,149 |
| 17,747 | | Hot Topic, Inc.* | | | 236,745 |
| 36,628 | | Pacific Sunwear of California, Inc. | | | 717,176 |
| 2,200 | | Retail Ventures, Inc.(a) | | | 41,888 |
| 600 | | Shoe Carnival, Inc. | | | 18,960 |
| 1,300 | | Talbots, Inc. | | | 31,330 |
| 2,100 | | Tween Brands, Inc. | | | 83,853 |
| 500 | | Yankee Candle Co., Inc. (The) | | | 17,140 |
| | | | | |
| | | | | 1,962,972 |
| | | | | |
| | |
| | Retail-Restaurants | | | |
| 4,200 | | Domino’s Pizza, Inc. | | | 117,600 |
| | | | | |
| | |
| | Retail Apparel | | | |
| 1,300 | | Dress Barn, Inc. | | | 30,329 |
| 1,000 | | Kenneth Cole Productions, Inc. (Class A Stock) | | | 23,990 |
| 2,300 | | Payless ShoeSource, Inc.* | | | 75,486 |
| 500 | | Warnaco Group, Inc./The* | | | 12,690 |
| | | | | |
| | | | | 142,495 |
| | | | | |
See Notes to Financial Statements
| | |
| 68 | | THE TARGET PORTFOLIO TRUST |
| | | | | |
| SHARES | | DESCRIPTION | | VALUE (NOTE 1) |
| | | | | |
| | Road & Rail—0.9% | | | |
| 33,900 | | Arkansas Best Corp. | | $ | 1,220,400 |
| 95,500 | | Werner Enterprises, Inc.(a) | | | 1,669,340 |
| | | | | |
| | | | | 2,889,740 |
| | | | | |
| | |
| | Semiconductors—0.4% | | | |
| 1,100 | | Actel Corp. | | | 19,976 |
| 1,200 | | AMIS Holdings, Inc. | | | 12,684 |
| 4,400 | | Amkor Technology, Inc.(a) | | | 41,096 |
| 8,600 | | Applied Micro Circuits, Corp. | | | 30,616 |
| 4,600 | | Asyst Technologies Corp. | | | 33,626 |
| 2,525 | | ATMI, Inc.* | | | 77,088 |
| 4,100 | | Axcelis Technologies, Inc. | | | 23,903 |
| 3,900 | | Brooks Automation, Inc.* | | | 56,160 |
| 3,000 | | Cirrus Logic, Inc. | | | 20,640 |
| 1,200 | | Cohu, Inc. | | | 24,192 |
| 2,500 | | Credence System Corp. | | | 13,000 |
| 1,000 | | DSP Group, Inc. | | | 21,700 |
| 1,000 | | Emulex Corp. | | | 19,510 |
| 5,058 | | Entegris, Inc.(a) | | | 54,728 |
| 800 | | Genesis Microchip, Inc.* | | | 8,112 |
| 4,434 | | Itron, Inc.* | | | 229,858 |
| 2,200 | | Kulicke & Soffa Industries, Inc.(a) | | | 18,480 |
| 3,200 | | Lattice Semiconductor Corp. | | | 20,736 |
| 5,700 | | LTX Corp.* | | | 31,920 |
| 1,475 | | Microsemi Corp. | | | 28,984 |
| 2,300 | | MKS Instruments, Inc. | | | 51,934 |
| 3,600 | | ON Semiconductor Corp. | | | 27,252 |
| 600 | | Pericom Semiconductor Corp.* | | | 6,882 |
| 1,500 | | Photronics, Inc. | | | 24,510 |
| 40,606 | | Richardson Electronics Ltd. | | | 369,921 |
| 2,700 | | Skyworks Solutions, Inc. | | | 19,116 |
| 1,200 | | Standard Microsystems Corp. | | | 33,576 |
| 1,300 | | Zoran Corp.* | | | 18,954 |
| | | | | |
| | | | | 1,339,154 |
| | | | | |
| | |
| | Software | | | |
| 1,600 | | CSG Systems International, Inc.* | | | 42,768 |
| 3,900 | | Lawson Software, Inc.* | | | 28,821 |
| | | | | |
| | | | | 71,589 |
| | | | | |
| | |
| | Specialty Retail—0.7% | | | |
| 38,700 | | Aaron Rents, Inc. | | | 1,113,786 |
| 24,829 | | Claire’s Stores, Inc. | | | 822,833 |
| 2,025 | | Monro Muffler Brake, Inc.* | | | 71,077 |
| 3,675 | | United Auto Group, Inc. | | | 86,620 |
| | | | | |
| | | | | 2,094,316 |
| | | | | |
| | |
| | Telecommunications—1.4% | | | |
| 4,800 | | Adaptec, Inc. | | | 22,368 |
| 67,748 | | Aeroflex, Inc. | | | 794,007 |
See Notes to Financial Statements
| | |
| THE TARGET PORTFOLIO TRUST | | 69 |
| | |
Small Capitalization Value Portfolio (cont’d) | | Portfolio of Investments
As of December 31, 2006 |
| | | | | |
| SHARES | | DESCRIPTION | | VALUE (NOTE 1) |
| | | | | |
| | Telecommunications (cont’d.) | | | |
| 1,400 | | Anixter International, Inc.(a) | | $ | 76,020 |
| 4,700 | | Arris Group, Inc. | | | 58,797 |
| 19,612 | | Black Box Corp. | | | 823,508 |
| 3,600 | | Broadwing Corp. | | | 56,232 |
| 600 | | C-COR, Inc. | | | 6,684 |
| 2,400 | | Centennial Communications Corp. | | | 17,256 |
| 975 | | Ciena Corp.* | | | 27,017 |
| 39,400 | | Cincinnati Bell, Inc. | | | 180,058 |
| 6,271 | | Commonwealth Telephone Enterprises, Inc. | | | 262,504 |
| 4,025 | | CommScope, Inc. | | | 122,682 |
| 4,000 | | CT Communications, Inc. | | | 91,680 |
| 1,200 | | Diteck Networks, Inc.* | | | 8,304 |
| 5,000 | | Dobson Communications Corp. (Class A Stock) | | | 43,550 |
| 2,800 | | Finisar Corp.* | | | 9,044 |
| 2,000 | | Foundry Networks, Inc.* | | | 29,960 |
| 1,800 | | General Communication, Inc. (Class A Stock) | | | 28,314 |
| 1,900 | | Hypercom Corp.* | | | 12,065 |
| 1,300 | | Lightbridge, Inc.* | | | 17,602 |
| 2,300 | | MasTec, Inc.* | | | 26,542 |
| 2,100 | | MRV Communications, Inc. | | | 7,434 |
| 2,700 | | Newport Corp. | | | 56,565 |
| 900 | | North Pittsburgh Systems, Inc. | | | 21,726 |
| 3,300 | | Optical Communication Products, Inc.* | | | 5,412 |
| 26,474 | | Plantronics, Inc. | | | 561,249 |
| 1,100 | | Polycom, Inc.* | | | 34,001 |
| 102,710 | | Powerwave Technologies, Inc.(a) | | | 662,479 |
| 12,200 | | Premiere Global Services, Inc. | | | 115,168 |
| 8,600 | | RF Micro Devices, Inc. | | | 58,394 |
| 1,000 | | SafeNet, Inc. | | | 23,940 |
| 600 | | SureWest Communications | | | 16,524 |
| 3,600 | | Sycamore Networks, Inc. | | | 13,536 |
| 600 | | Time Warner Telecom, Inc. (Class A Stock) | | | 11,958 |
| 1,600 | | Utstarcom, Inc. | | | 14,000 |
| 12,100 | | Windstream Corp. | | | 172,062 |
| | | | | |
| | | | | 4,488,642 |
| | | | | |
| | |
| | Textiles & Apparel—1.7% | | | |
| 39,550 | | Brown Shoe Co., Inc. | | | 1,888,117 |
| 26,000 | | Kellwood Co. | | | 845,520 |
| 200 | | Oxford Industries, Inc. | | | 9,930 |
| 500 | | Perry Ellis International, Inc. | | | 20,500 |
| 48,800 | | Phillips-Van Heusen | | | 2,448,296 |
| 3,100 | | Quiksilver, Inc. | | | 48,825 |
| 2,600 | | Skechers USA, Inc. (Class A Stock) | | | 86,606 |
| | | | | |
| | | | | 5,347,794 |
| | | | | |
See Notes to Financial Statements
| | |
| 70 | | THE TARGET PORTFOLIO TRUST |
| | | | | | |
| SHARES | | DESCRIPTION | | VALUE (NOTE 1) |
| | | | | | |
| | | Thrifts & Mortgage Finance—1.0% | | | |
| | 21,200 | | Accredited Home Lenders Holding Co. | | $ | 578,336 |
| | 24,500 | | Astoria Financial Corp. | | | 738,920 |
| | 70,000 | | Fremont General Corp. | | | 1,134,700 |
| | 29,540 | | Washington Federal, Inc. | | | 695,076 |
| | | | | | |
| | | | | | 3,147,032 |
| | | | | | |
| | |
| | | Tobacco—0.5% | | | |
| | 6,600 | | Alliance One Intertnational, Inc. | | | 46,596 |
| | 5,000 | | Loews Corp.—Carolina Group | | | 323,600 |
| | 28,100 | | Universal Corp. | | | 1,377,181 |
| | | | | | |
| | | | | | 1,747,377 |
| | | | | | |
| | |
| | | Trading Companies & Distributors—0.3% | | | |
| | 22,460 | | Watsco, Inc. | | | 1,059,214 |
| | | | | | |
| | |
| | | Transportation—1.5% | | | |
| | 1,165 | | Amerco, Inc.(a) | | | 101,367 |
| | 900 | | Bristow Group, Inc.* | | | 32,481 |
| | 53,800 | | Frontline Ltd. (Bermuda)(a) | | | 1,713,530 |
| | 40,000 | | General Maritime Corp. (Marshall Islands)(a) | | | 1,407,600 |
| | 6,362 | | Genesee & Wyoming, Inc. (Class A Stock) | | | 166,939 |
| | 600 | | Greenbrier Cos., Inc. | | | 18,000 |
| | 38,515 | | Kansas City Southern(a) | | | 1,116,165 |
| | 2,075 | | Landstar System, Inc.* | | | 79,223 |
| | 3,600 | | RailAmerica, Inc. | | | 57,888 |
| | 600 | | Saia, Inc. | | | 13,926 |
| | 3,500 | | SIRVA, Inc. | | | 12,180 |
| | 4,000 | | Teekay Shipping Corp. (Marshall Islands) | | | 174,480 |
| | 400 | | U.S. Xpress Enterprises, Inc. (Class A Stock) | | | 6,588 |
| | | | | | |
| | | | | | 4,900,367 |
| | | | | | |
| | |
| | | Water Utilities | | | |
| | 600 | | American States Water Co. | | | 23,172 |
| | 600 | | California Water Service Group | | | 24,240 |
| | 400 | | SJW Corp. | | | 15,503 |
| | | | | | |
| | | | | | 62,915 |
| | | | | | |
| | | Total long-term investments
(cost $241,842,351) | | | 306,153,554 |
| | | | | | |
PRINCIPAL AMOUNT (000)# | | SHORT-TERM INVESTMENTS—22.6% | | |
| | |
| | | U.S. Treasury Obligation | | | |
| $ | 100 | | U.S. Treasury Notes 4.25%, 11/30/2007
(cost $99,490)(k) | | | 99,313 |
| | | | | | |
See Notes to Financial Statements
| | |
| THE TARGET PORTFOLIO TRUST | | 71 |
| | |
Small Capitalization Value Portfolio (cont’d) | | Portfolio of Investments
As of December 31, 2006 |
| | | | | | |
| SHARES | | DESCRIPTION | | VALUE (NOTE 1) | |
| | Affiliated Money Market Mutual Fund—22.6% | | | | |
| 72,708,433 | | Dryden Core Investment Fund—Taxable Money Market Series
(cost $72,708,433; includes $55,446,340 of cash collateral received
for securities on loan) (Notes 3)(b)(w) | | $ | 72,708,433 | |
| | | | | | |
| �� | Total short-term investments
(cost $72,807,923) | | | 72,807,746 | |
| | | | | | |
| | Total Investments—117.8%
(cost $314,650,274; Note 5) | | | 378,961,300 | |
| | Liabilities in excess of other assets(x)—(17.8%) | | | (57,173,113 | ) |
| | | | | | |
| | Net Assets—100% | | $ | 321,788,187 | |
| | | | | | |
| * | Non-income producing security. |
The following abbreviations are used in portfolio descriptions:
REIT—Real Estate Investment Trust
| (a) | All or a portion of security is on loan. The aggregate market value of such securities is $52,881,413; cash collateral of $55,446,340 (included with liabilities) was received with which the portfolio purchased highly liquid short-term investments. |
| (b) | Represents security, or a portion thereof, purchased with cash collateral received for securities on loan. |
| (k) | Securities segregated as collateral for futures contracts. |
| (w) | Prudential Investments LLC, the manager of the Portfolio also serves as manager of the Dryden Core Investment Fund—Taxable Money Market Series. |
| (x) | Liabilities in excess of other assets includes net unrealized depreciation on futures contracts as follows: |
Open future contracts outstanding at December 31, 2006:
| | | | | | | | | | | | | | |
Number of
Contracts | | Type | | Expiration
Date | | Value at
December 31, 2006 | | Value at
Trade Date | | Unrealized
Depreciation | |
| | Long Positions: | | | | | | | | | | | | |
| 2 | | Russell 2000 | | Mar 07 | | $ | 794,900 | | $ | 802,800 | | $ | (7,900 | ) |
| | | | | | | | | | | | | | |
The industry classification of portfolio holdings and liabilities in excess of other assets shown as a percentage of net assets as of December 31, 2006 was as follows:
| | | |
Affiliated Money Market Mutual Fund (including 17.0% of collateral received for securities on loan) | | 22.6 | % |
Banks | | 5.6 | |
Insurance | | 5.6 | |
Gas & Pipeline Utilities | | 4.8 | |
Financial Services | | 3.7 | |
Machinery | | 3.7 | |
Chemicals | | 3.6 | |
Electronics | | 3.5 | |
Oil, Gas & Consumable Fuels | | 3.5 | |
Real Estate Investment Trusts | | 3.4 | |
Metals & Mining | | 3.1 | |
Electric Utilities | | 2.5 | |
Computer Services & Software | | 2.4 | |
Commercial Services & Supplies | | 2.3 | |
Food Products | | 2.2 | |
See Notes to Financial Statements
| | |
| 72 | | THE TARGET PORTFOLIO TRUST |
| | | |
Industrial Products | | 2.2 | % |
Healthcare Providers & Services | | 2.1 | |
Aerospace/Defense | | 1.7 | |
Textiles & Apparel | | 1.7 | |
Building Products | | 1.6 | |
Oil & Gas Exploration/Production | | 1.6 | |
Exchange Traded Funds | | 1.5 | |
Transportation | | 1.5 | |
Auto Related | | 1.4 | |
Consumer Products & Services | | 1.4 | |
Retail | | 1.4 | |
Telecommunications | | 1.4 | |
Commercial Services | | 1.3 | |
Household Durables | | 1.3 | |
Manufacturing | | 1.3 | |
Drugs & Healthcare | | 1.1 | |
Hotels, Restaurants & Leisure | | 1.1 | |
Business Services | | 1.0 | |
Electrical Equipment | | 1.0 | |
Thrifts & Mortgage Finance | | 1.0 | |
Energy Equipment & Services | | 0.9 | |
Media | | 0.9 | |
Road & Rail | | 0.9 | |
Airlines | | 0.8 | |
Computer Hardware | | 0.8 | |
Healthcare Services | | 0.8 | |
Home Builders | | 0.8 | |
Real Estate | | 0.8 | |
Construction | | 0.7 | |
Specialty Retail | | 0.7 | |
Environmental Services | | 0.6 | |
Retail & Merchandising | | 0.6 | |
Oil & Gas | | 0.5 | |
Tobacco | | 0.5 | |
Conglomerates | | 0.4 | |
Financial—Bank & Trust | | 0.4 | |
Healthcare Equipment & Supplies | | 0.4 | |
Paper & Forest Products | | 0.4 | |
Semiconductors | | 0.4 | |
Automobile Manufacturers | | 0.3 | |
Containers & Packaging | | 0.3 | |
Diversified Telecommunication Services | | 0.3 | |
Drugs & Medicine | | 0.3 | |
Food & Staples Retailing | | 0.3 | |
Medical Supplies & Equipment | | 0.3 | |
Multi-Utilities | | 0.3 | |
Trading Companies & Distributors | | 0.3 | |
Distribution/Wholesale | | 0.2 | |
Electronic Components | | 0.2 | |
Entertainment & Leisure | | 0.2 | |
Foods | | 0.2 | |
See Notes to Financial Statements
| | |
| THE TARGET PORTFOLIO TRUST | | 73 |
| | |
Small Capitalization Value Portfolio (cont’d) | | Portfolio of Investments
As of December 31, 2006 |
| | | |
Industrial Conglomerates | | 0.2 | % |
Aerospace | | 0.1 | |
Beverages | | 0.1 | |
Biotechnology | | 0.1 | |
Energy Equipment | | 0.1 | |
Food—Wholesale | | 0.1 | |
Household Products | | 0.1 | |
Internet Services | | 0.1 | |
Office Equipment | | 0.1 | |
Pharmaceuticals | | 0.1 | |
Real Estate Investment Trust—Other REIT | | 0.1 | |
| | | |
| | 117.8 | |
Liabilities in excess of other assets | | (17.8 | ) |
| | | |
| | 100.0 | % |
| | | |
See Notes to Financial Statements
| | |
| 74 | | THE TARGET PORTFOLIO TRUST |
| | |
Portfolio of Investments
As of December 31, 2006 | | International Equity Portfolio |
| | | | | |
| SHARES | | DESCRIPTION | | VALUE (NOTE 1) |
| | | | | |
| | LONG-TERM INVESTMENTS—99.7% | | | |
| | |
| | Common Stocks | | | |
| | |
| | Australia—1.9% | | | |
| 59,700 | | AWB Ltd. | | $ | 145,099 |
| 146,000 | | Bluescope Steel Ltd. | | | 990,056 |
| 44,900 | | Commonwealth Bank of Australia | | | 1,748,500 |
| 278,900 | | Qantas Airways Ltd. | | | 1,149,562 |
| 56,600 | | Santos Ltd. | | | 440,483 |
| 238,000 | | Telestra Corp. Ltd. | | | 777,745 |
| | | | | |
| | | | | 5,251,445 |
| | | | | |
| | |
| | Austria—0.4% | | | |
| 17,200 | | Boehler-Uddeholm AG* | | | 1,205,624 |
| | | | | |
| | |
| | Belgium—0.7% | | | |
| 10,300 | | Dexia | | | 282,127 |
| 37,500 | | Fortis | | | 1,599,894 |
| | | | | |
| | | | | 1,882,021 |
| | | | | |
| | |
| | Brazil—0.7% | | | |
| 43,700 | | Empresa Brasileira de Aeronautica SA, ADR | | | 1,810,491 |
| | | | | |
| | |
| | Canada—2.6% | | | |
| 56,600 | | Canadian Natural Resources Ltd. | | | 3,016,499 |
| 88,800 | | Rogers Communications, Inc. (Class B Stock) | | | 2,642,336 |
| 41,700 | | Shaw Communications, Inc. (Class B Stock) | | | 1,319,853 |
| | | | | |
| | | | | 6,978,688 |
| | | | | |
| | |
| | China—5.4% | | | |
| 1,611,900 | | China Merchants Bank Co., Ltd. | | | 3,415,157 |
| 656,700 | | China Merchants Holdings International Co. Ltd. | | | 2,686,354 |
| 291,300 | | China Mobile Ltd. | | | 2,510,991 |
| 1,443,411 | | China Overseas Land and Investment Ltd. | | | 1,925,657 |
| 4,236,543 | | China Petroleum & Chemical Corp. | | | 3,924,744 |
| | | | | |
| | | | | 14,462,903 |
| | | | | |
| | |
| | Denmark—1.4% | | | |
| 21,000 | | Danske Bank SA | | | 933,118 |
| 34,708 | | Novo Nordisk SA (Class B Stock) | | | 2,890,900 |
| | | | | |
| | | | | 3,824,018 |
| | | | | |
| | |
| | Finland—0.7% | | | |
| 34,300 | | Rautaruukki OYJ | | | 1,365,118 |
| 35,000 | | Stora Enso OYJ (Class R Stock) | | | 554,419 |
| | | | | |
| | | | | 1,919,537 |
| | | | | |
See Notes to Financial Statements
| | |
| THE TARGET PORTFOLIO TRUST | | 75 |
| | |
International Equity Portfolio (cont’d) | | Portfolio of Investments
As of December 31, 2006 |
| | | | | |
| SHARES | | DESCRIPTION | | VALUE (NOTE 1) |
| | | | | |
| | France—9.6% | | | |
| 12,375 | | Air Liquide | | $ | 2,938,766 |
| 320 | | Arkema | | | 16,445 |
| 23,900 | | BNP Paribas | | | 2,607,531 |
| 39,300 | | Carrefour SA | | | 2,383,264 |
| 4,200 | | Ciments Francais* | | | 806,679 |
| 6,100 | | CNP Assurances | | | 681,222 |
| 16,000 | | Compagnie Generale des Establissements Michelin (Class B Stock) | | | 1,531,252 |
| 32,000 | | Credit Agricole SA | | | 1,345,812 |
| 123,000 | | France Tele SA | | | 3,401,558 |
| 62,400 | | JC Decaux SA* | | | 1,785,799 |
| 27,611 | | LVMH Moet Hennessy Louis Vuitton | | | 2,913,998 |
| 23,000 | | Natixis | | | 646,083 |
| 15,000 | | PSA Peugeot Citroen SA | | | 993,994 |
| 11,300 | | Rallye SA | | | 612,024 |
| 8,200 | | Renault SA* | | | 985,018 |
| 5,900 | | Schneider Electric SA | | | 654,993 |
| 4,700 | | Societe Generale | | | 797,862 |
| 12,800 | | Total SA | | | 923,398 |
| | | | | |
| | | | | 26,025,698 |
| | | | | |
| | |
| | Germany—7.1% | | | |
| 53,746 | | Adidas AG | | | 2,676,835 |
| 24,500 | | BASF AG | | | 2,388,390 |
| 17,900 | | Deutsche Bank AG* | | | 2,394,543 |
| 14,000 | | Deutsche Boerse AG* | | | 2,576,569 |
| 20,300 | | E.ON AG | | | 2,755,527 |
| 17,900 | | MAN AG* | | | 1,617,628 |
| 37,200 | | SAP AG | | | 1,976,994 |
| 45,400 | | ThyssenKrup AG | | | 2,138,903 |
| 31,100 | | TUI AG | | | 621,549 |
| | | | | |
| | | | | 19,146,938 |
| | | | | |
| | |
| | Greece—0.8% | | | |
| 56,135 | | OPAP SA | | | 2,169,669 |
| | | | | |
| | |
| | Hong Kong—2.3% | | | |
| 1,150,400 | | Chaoda Modern Agriculture Holdings Ltd.* | | | 739,392 |
| 200,000 | | Citic Pacific Ltd. | | | 687,824 |
| 341,300 | | Hong Kong Exchanges and Clearing Ltd. | | | 3,736,253 |
| 159,280 | | Orient Overseas International Ltd.* | | | 1,011,329 |
| | | | | |
| | | | | 6,174,798 |
| | | | | |
| | |
| | Ireland—0.3% | | | |
| 31,300 | | Irish Life & Permanent PLC | | | 863,534 |
| | | | | |
See Notes to Financial Statements
| | |
| 76 | | THE TARGET PORTFOLIO TRUST |
| | | | | |
| SHARES | | DESCRIPTION | | VALUE (NOTE 1) |
| | | | | |
| | Israel—2.1% | | | |
| 62,300 | | Amdocs Ltd.* | | $ | 2,414,125 |
| 102,700 | | Teva Pharmaceutical Industries Ltd., ADR | | | 3,191,916 |
| | | | | |
| | | | | 5,606,041 |
| | | | | |
| | |
| | Italy—2.6% | | | |
| 42,700 | | Benetton Group SpA | | | 815,051 |
| 158,800 | | Eni SpA | | | 5,341,197 |
| 36,100 | | San Paolo-IMI SpA | | | 838,704 |
| | | | | |
| | | | | 6,994,952 |
| | | | | |
| | |
| | Japan—17.8% | | | |
| 4,650 | | Aiful Corp. | | | 130,391 |
| 30,300 | | Alpine Electronics, Inc. | | | 452,504 |
| 37,000 | | Alps Electric Co. Ltd. | | | 401,032 |
| 31,700 | | Asahi Breweries Ltd. | | | 506,567 |
| 92,000 | | Asahi Kasei Corp. | | | 603,173 |
| 323,476 | | Bank of Yokohama Ltd. (The) | | | 2,526,348 |
| 28,700 | | Capcom Co. Ltd. | | | 515,326 |
| 178,000 | | Cosmo Oil Co. Ltd. | | | 722,778 |
| 53,000 | | Daiwa Securities Group, Inc. | | | 593,187 |
| 145,000 | | Denki Kagaku Kogyo Kabushiki Kiasha | | | 601,704 |
| 15,300 | | Fanuc Ltd. | | | 1,501,569 |
| 62,000 | | Fuji Heavy Industries Ltd. | | | 318,271 |
| 102,000 | | Hitachi Ltd. | | | 635,347 |
| 30,100 | | Hokkaido Electric Power Co., Inc. | | | 768,733 |
| 41,300 | | Hokuetsu Paper Mills Ltd. | | | 232,155 |
| 48,200 | | Honda Motor Co. Ltd. | | | 1,902,414 |
| 38,000 | | Hosiden Corp. | | | 407,783 |
| 94,700 | | Kaken Pharmaceutical Co. Ltd. | | | 738,566 |
| 35,000 | | Kansai Electric Power Co., Inc. (The) | | | 942,201 |
| 143,600 | | Komatsu Ltd. | | | 2,906,446 |
| 190,800 | | Kurabo Industries Ltd. | | | 493,334 |
| 23,600 | | Kyushu Electric Power Co., Inc. | | | 622,357 |
| 187,000 | | Marubeni Corp. | | | 947,429 |
| 135,500 | | Mitsubishi Chemical Holdings Corp. | | | 853,220 |
| 130,000 | | Nippon Oil Corp. | | | 869,367 |
| 200 | | Nippon Paper Group, Inc. | | | 753,156 |
| 270 | | Nippon Telegraph and Telephone Corp. | | | 1,331,502 |
| 25,400 | | Nipro Corp. | | | 464,680 |
| 115,100 | | Nissan Motor Co. Ltd. | | | 1,388,878 |
| 43,600 | | Nomura Holdings, Inc. | | | 822,503 |
| 93,700 | | NSK Ltd. | | | 923,056 |
| 900 | | NTT Docomo, Inc. | | | 1,424,097 |
| 103,000 | | Oji Paper Co. Ltd. | | | 545,680 |
| 11,600 | | Ono Pharmaceutical Co. Ltd. | | | 611,973 |
| 269,800 | | Osaka Gas Co. Ltd. | | | 1,002,809 |
| 66,100 | | Rengo Co. Ltd. | | | 422,014 |
| 35,300 | | Ricoh Co. Ltd. | | | 718,895 |
| 18,400 | | Sanyo Electric Credit Co. Ltd. | | | 273,867 |
See Notes to Financial Statements
| | |
| THE TARGET PORTFOLIO TRUST | | 77 |
| | |
International Equity Portfolio (cont’d) | | Portfolio of Investments
As of December 31, 2006 |
| | | | | |
| SHARES | | DESCRIPTION | | VALUE (NOTE 1) |
| | | | | |
| | Japan (cont’d.) | | | |
| 37,800 | | Secom Co. Ltd. | | $ | 1,957,075 |
| 146,800 | | Sharp Corp. | | | 2,524,090 |
| 103,200 | | Shiseido Co. Ltd. | | | 2,234,098 |
| 12,100 | | Takefuji Corp. | | | 478,629 |
| 82,000 | | Tanabe Seiyaku Co. Ltd. | | | 1,072,305 |
| 24,600 | | Tohoku Electric Power Co., Inc. | | | 614,885 |
| 45,000 | | Toppan Printing Co. Ltd. | | | 495,766 |
| 83,800 | | Toyota Motor Corp. | | | 5,608,483 |
| 15,575 | | Yamada Denki Co., Ltd | | | 1,322,027 |
| | | | | |
| | | | | 48,182,670 |
| | | | | |
| | |
| | Korea—1.9% | | | |
| 31,470 | | Hyundai Motor Co. | | | 2,274,276 |
| 53,860 | | Shinhan Financial Group Co. Ltd.* | | | 2,750,914 |
| | | | | |
| | | | | 5,025,190 |
| | | | | |
| | |
| | Mexico—2.3% | | | |
| 73,200 | | America Movil SA de CV, ADR, Series L | | | 3,310,104 |
| 654,000 | | Wal-Mart de Mexico SA de CV | | | 2,877,406 |
| | | | | |
| | | | | 6,187,510 |
| | | | | |
| | |
| | Netherlands—2.8% | | | |
| 29,569 | | ABN AMRO Holding NV | | | 950,439 |
| 59,700 | | ING Groep NV, ADR | | | 2,647,116 |
| 84,200 | | Koninklijke (Royal) KPN NV | | | 1,197,062 |
| 41,600 | | Royal Dutch Shell (Class A Stock) | | | 1,467,299 |
| 22,000 | | Schlumberger Ltd. | | | 1,389,520 |
| | | | | |
| | | | | 7,651,436 |
| | | | | |
| | |
| | Norway—0.6% | | | |
| 52,500 | | Norsk Hydro, ASA | | | 1,629,258 |
| | | | | |
| | |
| | Portugal—0.3% | | | |
| 151,000 | | Energias de Portugal SA* | | | 765,415 |
| | | | | |
| | |
| | Russia—0.7% | | | |
| 19,900 | | Lukoil, ADR | | | 1,750,205 |
| | | | | |
| | |
| | Singapore—0.5% | | | |
| 432,400 | | MobileOne Ltd.* | | | 604,534 |
| 281,000 | | Neptune Orient Lines Ltd. | | | 381,385 |
| 41,000 | | Singapore Airlines Ltd. | | | 466,874 |
| | | | | |
| | | | | 1,452,793 |
| | | | | |
| | |
| | Spain—2.2% | | | |
| 58,900 | | Banco Bilbao Vizcaya Argentaria SA | | | 1,418,172 |
| 60,300 | | Banco Santander Central Hispano SA | | | 1,125,526 |
See Notes to Financial Statements
| | |
| 78 | | THE TARGET PORTFOLIO TRUST |
| | | | | |
| SHARES | | DESCRIPTION | | VALUE (NOTE 1) |
| | | | | |
| | Spain (cont’d.) | | | |
| 34,924 | | Endesa SA | | $ | 1,651,807 |
| 33,600 | | Repsol YPF SA | | | 1,162,062 |
| 27,000 | | Telefonica SA | | | 574,536 |
| | | | | |
| | | | | 5,932,103 |
| | | | | |
| | |
| | Sweden—1.3% | | | |
| 34,200 | | Electrolux AB, Series B | | | 684,405 |
| 34,200 | | Husqvarna AB (Class B Shares) | | | 534,535 |
| 146,400 | | Nordea Bank AB | | | 2,256,107 |
| | | | | |
| | | | | 3,475,047 |
| | | | | |
| | |
| | Switzerland—9.3% | | | |
| 17,300 | | Credit Suisse Group* | | | 1,210,361 |
| 2,000 | | Georg Fischer AG* | | | 1,295,856 |
| 2,200 | | Givaudan SA | | | 2,036,602 |
| 55,950 | | Novartis AG | | | 3,225,677 |
| 1,900 | | Rieter Holdings AG | | | 994,050 |
| 21,900 | | Roche Holding AG | | | 3,927,083 |
| 38,200 | | Swiss Re | | | 3,247,862 |
| 3,400 | | Swisscom AG | | | 1,287,033 |
| 3,800 | | Syngenta AG | | | 706,984 |
| 76,700 | | UBS AG | | | 4,661,169 |
| 3,300 | | Verwaltungs Und Privat Bank AG* | | | 880,181 |
| 5,900 | | Zurich Financial Services AG* | | | 1,588,182 |
| | | | | |
| | | | | 25,061,040 |
| | | | | |
| | |
| | United Kingdom—21.4% | | | |
| 30,000 | | Alliance & Leicester PLC | | | 668,455 |
| 13,100 | | AstraZeneca PLC | | | 703,824 |
| 115,800 | | Aviva PLC | | | 1,863,756 |
| 384,100 | | Barclays PLC | | | 5,490,044 |
| 147,200 | | BP PLC | | | 1,635,620 |
| 137,900 | | Bradford & Bingley PLC | | | 1,269,702 |
| 453,600 | | BT Group PLC | | | 2,677,744 |
| 123,700 | | Cadbury Schweppes PLC | | | 1,323,636 |
| 48,300 | | Carnival PLC | | | 2,447,485 |
| 48,200 | | Dairy Crest Group PLC* | | | 640,804 |
| 285,600 | | DSG International PLC | | | 1,070,867 |
| 185,400 | | GKN PLC* | | | 1,009,167 |
| 24,600 | | GlaxoSmithKline PLC | | | 647,356 |
| 101,700 | | Hanson PLC | | | 1,534,271 |
| 128,000 | | HBOS PLC | | | 2,837,037 |
| 80,600 | | Interserve PLC | | | 632,831 |
| 534,196 | | Kingfisher PLC | | | 2,494,581 |
| 286,800 | | Legal & General PLC | | | 884,440 |
| 354,200 | | Lloyds TSB Group PLC | | | 3,963,450 |
| 82,700 | | Next PLC | | | 2,914,652 |
| 184,500 | | Northern Foods PLC | | | 414,532 |
| 159,400 | | Northumbrian Water Group PLC | | | 955,033 |
See Notes to Financial Statements
| | |
| THE TARGET PORTFOLIO TRUST | | 79 |
| | |
International Equity Portfolio (cont’d) | | Portfolio of Investments
As of December 31, 2006 |
| | | | | | |
| SHARES | | DESCRIPTION | | VALUE (NOTE 1) | |
| | United Kingdom (cont’d.) | | | | |
| 366,300 | | Old Mutual PLC* | | $ | 1,249,736 | |
| 64,200 | | Reckitt Benckiser PLC | | | 2,933,895 | |
| 40,400 | | Rio Tinto PLC | | | 2,150,005 | |
| 264,600 | | Royal & Sun Alliance Insurance Group PLC | | | 790,075 | |
| 73,212 | | Royal Dutch Shell PLC (Class B Stock) | | | 2,565,925 | |
| 130,028 | | SABmiller PLC | | | 2,991,461 | |
| 40,100 | | Tate & Lyle PLC | | | 603,388 | |
| 146,100 | | Taylor Woodrow PLC | | | 1,219,336 | |
| 54,900 | | TT Electronics PLC* | | | 279,482 | |
| 725,100 | | Vodafone Group PLC | | | 2,008,921 | |
| 100,284 | | Vodafone Group PLC, ADR | | | 2,785,889 | |
| | | | | | |
| | | | | 57,657,400 | |
| | | | | | |
| | Total long-term investments
(cost $204,430,510) | | | 269,086,424 | |
| | | | | | |
| | |
| | SHORT-TERM INVESTMENT—0.4% | | | | |
| | |
| | Affiliated Money Market Mutual Fund | | | | |
| 1,202,528 | | Dryden Core Investment Fund—Taxable Money Market Series
(cost $1,202,528; Note 3)(w) | | | 1,202,528 | |
| | | | | | |
| | Total Investments(o)—100.1%
(cost $205,633,038; Note 5) | | | 270,288,952 | |
| | Liabilities in excess of other assets(x)—(0.1%) | | | (246,800 | ) |
| | | | | | |
| | Net Assets—100% | | $ | 270,042,152 | |
| | | | | | |
| * | Non-income producing security. |
The following abbreviations are used in portfolio descriptions:
ADR—American Depositary Receipt
| (o) | As of December 31, 2006, 68 securities representing $80,529,343 and 29.82% of the total market value were fair valued in accordance with the policies adopted by the Board of Trustees. |
| (w) | Prudential Investments LLC, the manager of the Portfolio also serves as manager of the Dryden Core Investment Fund—Taxable Money Market Series. |
See Notes to Financial Statements
| | |
| 80 | | THE TARGET PORTFOLIO TRUST |
| (x) | Liabilities in excess of other assets includes net unrealized depreciation on forward foreign currency contracts as follows: |
Forward foreign currency exchange contracts outstanding at December 31, 2006:
| | | | | | | | | | | | | |
Purchase Contracts | | Notional
Amount (000) | | Value at Settlement
Date Payable | | Current
Value | | Unrealized
Depreciation | |
Korean Won
Expiring 01/12/07 | | KRW | 1,975,100 | | $ | 2,153,190 | | $ | 2,123,763 | | $ | (29,427 | ) |
| | | | | | | | | | | | | |
| | | | |
Sale Contracts | | Notional
Amount (000) | | Value at Settlement
Date Receivable | | Current
Value | | Unrealized
Depreciation | |
Euros,
Expiring 04/04/07 | | EUR | 8,030 | | $ | 10,277,356 | | $ | 10,644,915 | | $ | (367,559 | ) |
Korean Won
Expiring 01/12/07 | | KRW | 1,975,100 | | | 2,056,325 | | | 2,124,403 | | | (68,078 | ) |
Mexican Peso
Expiring 06/06/07 | | MXN | 69,000 | | | 6,218,037 | | | 6,339,097 | | | (121,060 | ) |
| | | | | | | | | | | | | |
| | | | | $ | 18,551,718 | | $ | 19,108,415 | | $ | (556,697 | ) |
| | | | | | | | | | | | | |
The industry classification of portfolio holdings and liabilities in excess of other assets shown as a percentage of net assets as of December 31, 2006 was as follows:
| | | |
Industry | | | |
Financial—Bank & Trust | | 8.9 | % |
Commercial Banks | | 8.6 | |
Telecommunications | | 7.5 | |
Oil, Gas & Consumable Fuels | | 7.4 | |
Pharmaceuticals | | 5.8 | |
Automobile Manufacturers | | 5.0 | |
Insurance | | 3.8 | |
Chemicals | | 3.5 | |
Diversified Operations | | 3.3 | |
Machinery | | 2.5 | |
Electronic Components | | 2.5 | |
Retail | | 2.0 | |
Consumer Products & Services | | 1.8 | |
Food Products | | 1.7 | |
Metals & Mining | | 1.7 | |
Diversified Telecommunication Services | | 1.7 | |
Financial Services | | 1.6 | |
Oil & Gas | | 1.6 | |
Building Products | | 1.5 | |
Media | | 1.5 | |
Energy Equipment & Services | | 1.5 | |
Banks | | 1.4 | |
Auto Parts & Related | | 1.4 | |
Beverages | | 1.3 | |
Retail & Merchandising | | 1.1 | |
Utilities | | 1.0 | |
Diversified Financial Services | | 1.0 | |
Forest & Paper Products | | 0.9 | |
Entertainment & Leisure | | 0.9 | |
See Notes to Financial Statements
| | |
| THE TARGET PORTFOLIO TRUST | | 81 |
| | |
International Equity Portfolio (cont’d) | | Portfolio of Investments
As of December 31, 2006 |
| | | |
Industry | | | |
Electric Utilities | | 0.9 | % |
Household Durables | | 0.9 | |
Household & Personal Products | | 0.8 | |
Electric | | 0.8 | |
Entertainment | | 0.8 | |
Diversified Metals | | 0.8 | |
Computer Services & Software | | 0.7 | |
Real Estate | | 0.7 | |
Multi-Line Retail | | 0.7 | |
Aerospace | | 0.7 | |
Advertising | | 0.7 | |
Airlines | | 0.6 | |
Telecom—Cellular | | 0.5 | |
Transportation | | 0.5 | |
Affiliated Money Market Mutual Fund | | 0.4 | |
Gas Utilities | | 0.4 | |
Iron / Steel | | 0.4 | |
Water Utilities | | 0.3 | |
Trading Companies & Distributors | | 0.3 | |
Metals | | 0.3 | |
Building Materials | | 0.3 | |
Farming & Agriculture | | 0.3 | |
Office Equipment | | 0.3 | |
Agriculture/Heavy Equipment | | 0.3 | |
Medical—Wholesale Drug Distribution | | 0.3 | |
Holding Companies—Diversified | | 0.3 | |
Multi-Line Insurance | | 0.2 | |
Foods | | 0.2 | |
Hotels, Restaurants & Leisure | | 0.2 | |
Software | | 0.2 | |
Commercial Services | | 0.2 | |
Textiles | | 0.2 | |
Healthcare Equipment & Supplies | | 0.2 | |
Electronics | | 0.2 | |
Agriculture | | 0.1 | |
| | | |
| | 100.1 | |
Liabilities in excess of other assets | | (0.1 | ) |
| | | |
| | 100.0 | % |
| | | |
See Notes to Financial Statements
| | |
| 82 | | THE TARGET PORTFOLIO TRUST |
| | |
Portfolio of Investments
As of December 31, 2006 | | International Bond Portfolio |
| | | | | | | |
PRINCIPAL
AMOUNT (000)# | | DESCRIPTION | | VALUE
(NOTE 1) |
| | | | | | | |
| | | | LONG-TERM INVESTMENTS—187.2% | | | |
| | | |
| | | | FOREIGN BONDS—90.1% | | | |
| | | |
| | | | Austria—1.8% | | | |
| EUR | | 560 | | Austrian Government International Bond
4.00%, 07/15/09 | | $ | 740,851 |
| | | | | | | |
| | | |
| | | | Belgium—3.6% | | | |
| EUR | | 1,100 | | Belgium Government Bond
4.25%, 09/28/14 | | | 1,478,230 |
| | | | | | | |
| | | |
| | | | Canada—0.3% | | | |
| CAD | | 100 | | Province of Ontario, Debs.
6.20%, 06/02/31 | | | 106,062 |
| | | | | | | |
| | | |
| | | | Denmark—0.5% | | | |
| DKK | | 1,100 | | Denmark Government Bond
6.00%, 11/15/11 | | | 212,225 |
| | | | | | | |
| | | |
| | | | Finland—11.7% | | | |
| EUR | | 2,010 | | Finnish Government Bond
4.25%, 07/04/15 | | | 2,709,169 |
| EUR | | 1,450 | | 5.375%, 07/04/13 | | | 2,067,860 |
| | | | | | | |
| | | | | | | 4,777,029 |
| | | | | | | |
| | | | France—5.5% | | | |
| EUR | | 80 | | Credit Suisse Group Capital Guernsey V Ltd.(c)
6.905%, 12/29/49 | | | 116,428 |
| EUR | | 1,280 | | French Government Bond
5.75%, 10/25/32 | | | 2,117,952 |
| | | | | | | |
| | | | | | | 2,234,380 |
| | | | | | | |
| | | |
| | | | Germany—11.3% | | | |
| EUR | | 100 | | Deutsche Bundesrepublik
4.25%, 01/04/14 | | | 134,328 |
| EUR | | 100 | | 4.75%, 07/04/34 | | | 145,931 |
| EUR | | 1,000 | | 5.00%, 01/04/12 | | | 1,382,615 |
| EUR | | 660 | | 5.63%, 01/04/28 | | | 1,054,711 |
| EUR | | 900 | | 6.25%, 01/04/24-01/04/30 | | | 1,508,375 |
| EUR | | 300 | | Deutsche Genossenschafts-Hypothekenbank
5.75%, 01/22/07 | | | 396,348 |
| | | | | | | |
| | | | | | | 4,622,308 |
| | | | | | | |
| | | |
| | | | Ireland—0.9% | | | |
| EUR | | 188 | | Atlantes Mortgage PLC,
Series 1, Class A(c)
3.769%, 01/17/36 | | | 249,629 |
See Notes to Financial Statements
| | |
| THE TARGET PORTFOLIO TRUST | | 83 |
| | |
International Bond Portfolio (cont’d) | | Portfolio of Investments
As of December 31, 2006 |
| | | | | | | |
PRINCIPAL
AMOUNT (000)# | | DESCRIPTION | | VALUE
(NOTE 1) |
| | | | | | | |
| | | |
| | | | Ireland (cont’d.) | | | |
| EUR | | 100 | | German Postal Pensions Securitisation PLC
3.375%, 01/18/16 | | $ | 124,203 |
| | | | | | | |
| | | | | | | 373,832 |
| | | | | | | |
| | | |
| | | | Italy—0.6% | | | |
| EUR | | 190 | | Argo Mortgages Series L,
Series 1, Class A(c)
3.81%, 10/28/36 | | | 251,892 |
| | | | | | | |
| | | |
| | | | Japan—25.6% | | | |
| | 500 | | Development Bank of Japan
4.25%, 06/09/15 | | | 472,381 |
| JPY | | 187,000 | | Japanese Government Bonds
0.60%, 03/20/09 | | | 1,563,246 |
| JPY | | 100,000 | | 1.10%, 12/10/16 | | | 835,368 |
| JPY | | 34,000 | | 1.20%, 09/20/12 | | | 283,623 |
| JPY | | 170,000 | | 1.50%, 03/20/11-03/20/15 | | | 1,434,463 |
| JPY | | 1,000 | | 1.55%, 02/21/12 | | | 8,500 |
| JPY | | 260,000 | | 1.60%, 06/20/14-09/20/14 | | | 2,197,391 |
| JPY | | 110,000 | | 1.70%, 09/20/16 | | | 926,362 |
| JPY | | 109,600 | | 2.30%, 05/20/30-06/20/35 | | | 932,635 |
| JPY | | 50,000 | | 2.40%, 03/20/34 | | | 430,812 |
| JPY | | 160,000 | | 2.50%, 09/20/35-06/20/36 | | | 1,404,589 |
| | | | | | | |
| | | | | | | 10,489,370 |
| | | | | | | |
| | | | Netherlands —7.2% | | | |
| EUR | | 500 | | Arena BV, Series 2003-I,
Class A2
4.30%, 05/19/55 | | | 661,436 |
| EUR | | 70 | | Deutsche Telekom International Finance BV
7.50%, 01/24/33 | | | 118,890 |
| EUR | | 484 | | Dutch MBS BV,
Series X, Class A(c)
3.343%, 10/02/49 | | | 642,264 |
| EUR | | 600 | | Netherlands Government Bond
3.75%, 07/15/09 | | | 789,145 |
| EUR | | 400 | | 7.50%, 01/15/23 | | | 738,697 |
| | | | | | | |
| | | | | | | 2,950,432 |
| | | | | | | |
| | | |
| | | | Spain—5.3% | | | |
| EUR | | 1,600 | | Spanish Government Bond
4.40%, 01/31/15 | | | 2,170,787 |
| | | | | | | |
| | | |
| | | | United Kingdom—15.8% | | | |
| EUR | | 500 | | Chester Asset Receivables Dealings No 11,
Series A
6.125%, 12/15/12 | | | 702,278 |
See Notes to Financial Statements
| | |
| 84 | | THE TARGET PORTFOLIO TRUST |
| | | | | | | |
PRINCIPAL
AMOUNT (000)# | | DESCRIPTION | | VALUE
(NOTE 1) |
| | | | | | | |
| | | | United Kingdom (cont’d) | | | |
| EUR | | 60 | | Hilton Group Finance PLC
6.50%, 07/17/09 | | $ | 82,260 |
| EUR | | 900 | | Inter-American Development Bank
5.50%, 03/30/10 | | | 1,243,192 |
| CAD | | 100 | | National Grid PLC
4.98%, 06/22/11 | | | 86,959 |
| EUR | | 500 | | Permanent Financing PLC, Series 4A1(c)
5.10%, 06/11/09 | | | 663,104 |
| | 300 | | Royal Bank of Scotland PLC, 144A(c)
5.424%, 07/21/08 | | | 300,184 |
| GBP | | 425 | | United Kingdom Treasury Stock
4.75%, 06/07/10 | | | 823,068 |
| GBP | | 100 | | 5.00%, 09/07/14 | | | 197,736 |
| GBP | | 1,200 | | 5.75%, 12/07/09 | | | 2,388,111 |
| | | | | | | |
| | | | | | | 6,486,892 |
| | | | | | | |
| | | |
| | | | UNITED STATES BONDS—97.1% | | | |
| | | |
| | | | Asset Backed Securities—4.1% | | | |
| | 5 | | CIT Group Home Equity Loan Trust,
Series 2002-1, Class AV(c)
5.61%, 03/25/33 | | | 5,123 |
| EUR | | 650 | | Citibank Credit Card Issuance Trust,
Series 2001-A4, Class A4
5.375%, 04/10/13 | | | 895,152 |
| EUR | | 550 | | MBNA Credit Card Master Note Trust
5.60%, 02/17/12 | | | 770,596 |
| | | | | | | |
| | | | | | | 1,670,871 |
| | | | | | | |
| | | |
| | | | Collateralized Mortgage Obligations—1.4% | | | |
| | 359 | | Citigroup Mortgage Loan Trust, Inc.,
Series 2006-AR1, Class 1A1(c)
4.90%, 10/25/35 | | | 355,092 |
| | 56 | | Fannie Mae Whole Loan,
Series 2004-W12, Class 1A1
6.00%, 07/25/44 | | | 56,515 |
| | 104 | | Federal Home Loan Mortgage Corp.,
Series R006, Class ZA
6.00%, 04/15/36 | | | 103,220 |
| | 60 | | GMAC Mortgage Corp Loan Trust,
Series 2004-J4, Class A1
5.50%, 09/25/34 | | | 59,242 |
| | | | | | | |
| | | | | | | 574,069 |
| | | | | | | |
| | | |
| | | | Corporate Bonds—8.1% | | | |
| | 100 | | Avon Products, Inc.,
Sr. Unsec’d. Notes
5.13%, 01/15/11 | | | 99,049 |
See Notes to Financial Statements
| | |
| THE TARGET PORTFOLIO TRUST | | 85 |
| | |
International Bond Portfolio (cont’d) | | Portfolio of Investments
As of December 31, 2006 |
| | | | | | | |
PRINCIPAL
AMOUNT (000)# | | DESCRIPTION | | VALUE
(NOTE 1) |
| | | | | | | |
| | | | Corporate Bonds (cont’d.) | | | |
| EUR | | 300 | | Chase Credit Card Master Trust
5.00%, 12/15/10 | | $ | 400,990 |
| | 100 | | Exelon Corp., Notes
4.90%, 06/15/15 | | | 94,322 |
| | 100 | | Federated Department Stores,
Notes
6.30%, 04/01/09 | | | 101,667 |
| | 100 | | Ford Motor Credit Co.,
Notes
7.875%, 06/15/10 | | | 100,831 |
| | 100 | | GMAC LLC,
Sr. Unsec’d. Notes
6.00%, 12/15/11 | | | 99,565 |
| CAD | | 100 | | Goldman Sachs Group, Inc.,
Sr. Unsec’d. Notes
5.25%, 06/01/16 | | | 87,963 |
| | 400 | | HSBC Holdings PLC,
Sub. Notes
6.50%, 05/02/36 | | | 430,308 |
| | 100 | | Istar Financial, Inc.,
Sr. Unsec’d. Notes
5.15%, 03/01/12 | | | 97,253 |
| | 100 | | Johnson Controls, Inc.,
Sr. Notes
5.25%, 01/15/11 | | | 99,212 |
| | 100 | | J.P. Morgan Chase Capital,
Sr. Sub. Notes
6.55%, 09/29/36 | | | 103,261 |
| EUR | | 100 | | Mizuho Financial Group Cayman Ltd.,
Gtd. Notes
4.75%, 04/15/14 | | | 133,134 |
| | 200 | | Mizuho Investment,
Bonds, 144A(c)
9.87%, 12/29/49 | | | 211,943 |
| | 100 | | Mizuho Preferred Capital Co. LLC,
Bonds, 144A(c)
8.79%, 12/29/49 | | | 104,597 |
| | 100 | | Rabobank Cap Fund Trust III,
Sub. Notes, 144A(c)
5.254%, 12/29/49 | | | 96,416 |
| EUR | | 50 | | RBS Capital Trust,
Gtd. Notes(c)
6.467%, 12/29/49 | | | 72,015 |
| | 100 | | Sabre Holdings Corp.,
Notes
7.35%, 08/01/11 | | | 96,654 |
See Notes to Financial Statements
| | |
| 86 | | THE TARGET PORTFOLIO TRUST |
| | | | | | | |
PRINCIPAL
AMOUNT (000)# | | DESCRIPTION | | VALUE
(NOTE 1) |
| | | | | | | |
| | | | Corporate Bonds (cont’d) | | | |
| | 200 | | SB Treasury Co. LLC,
Bonds, 144A
9.40%, 12/29/49 | | $ | 210,504 |
| | 100 | | SMFG Preferred Capital,
Bonds, 144A
6.078%, 12/25/49 | | | 99,290 |
| EUR | | 250 | | Student Loan Marketing Assoc.
3.80%, 12/15/33 | | | 325,375 |
| | 100 | | Viacom, Inc.,
Sr. Notes
5.75%, 04/30/11 | | | 100,051 |
| EUR | | 100 | | Zurich Finance USA, Inc.,
Gtd. Notes
5.75%, 10/02/23 | | | 141,071 |
| | | | | | | |
| | | | | | | 3,305,471 |
| | | | | | | |
| | | | U.S. Government Agency Obligations—0.2% | | | |
| | 92 | | Small Business Administration Participation Certificates,
Series 2005-20, Class 1
4.84%, 05/01/25 | | | 89,656 |
| | | | | | | |
| | | |
| | | | U.S. Government Mortgage Backed Obligations—61.2% | | | |
| | 608 | | Federal National Mortgage Assoc.
5.50%, 04/01/33-05/01/35 | | | 602,776 |
| | 22,000 | | 6.00%, TBA | | | 22,144,364 |
| | 2,000 | | 6.50%, TBA | | | 2,037,500 |
| | 200 | | 8.95%, 02/12/18 | | | 266,377 |
| | | | | | | |
| | | | | | | 25,051,017 |
| | | | | | | |
| | | |
| | | | U.S. Treasury Obligations—22.1% | | | |
| | 200 | | U.S. Treasury Bonds
6.125%, 11/15/27 | | | 232,047 |
| | 800 | | 8.75%, 05/15/17 | | | 1,058,375 |
| | 1,200 | | 8.875%, 02/15/19 | | | 1,640,813 |
| | 200 | | U.S. Treasury Inflationary Bonds, TIPS
0.875%, 04/15/10 | | | 201,964 |
| | 200 | | 1.625%, 01/15/15 | | | 198,943 |
| | 200 | | 1.875%, 07/15/15 | | | 198,838 |
| | 1,400 | | U.S. Treasury Notes
3.875%, 05/15/10 | | | 1,364,180 |
| | 4,200 | | 4.625%, 11/15/16 | | | 4,172,439 |
| | | | | | | |
| | | | | | | 9,067,599 |
| | | | | | | |
| | | | Total long-term investments
(cost $74,794,076) | | | 76,652,973 |
| | | | | | | |
| | | Shares | | SHORT-TERM INVESTMENTS—11.8% | | |
| | | |
| | | | Affiliated Money Market Mutual Fund—2.8% | | | |
| | 1,132,413 | | Dryden Core Investment Fund—Taxable Money Market Series(w)
(cost $1,132,413; Note 3) | | | 1,132,413 |
| | | | | | | |
| | |
PRINCIPAL
AMOUNT (000)# | | Foreign Treasury Obligation—8.0% | | | |
| EUR | | 2,500 | | Dutch Treasury Certificate
3.42%, 02/28/07 (cost $3,269,945) | | | 3,282,325 |
| | | | | | | |
See Notes to Financial Statements
| | |
| THE TARGET PORTFOLIO TRUST | | 87 |
| | |
International Bond Portfolio (cont’d) | | Portfolio of Investments
As of December 31, 2006 |
| | | | | | | |
| | | PRINCIPAL
AMOUNT (000)# | | DESCRIPTION | | VALUE
(NOTE 1) |
| | | | U.S. Treasury Obligations—0.5% | | | |
| | 210 | | U.S. Treasury Bills(k)(n)
4.89%, 03/15/07 (cost $207,954) | | $ | 207,997 |
| | | | | | | |
| | | |
| | | | Certificates of Deposit—0.5% | | | |
| | 200 | | Countrywide Bank NA(c)
5.38%, 08/16/07 (cost $199,987) | | | 199,980 |
| | | | | | | |
| | | Contracts/
Notional
Amounts (000) | | OUTSTANDING OPTIONS PURCHASED | | |
| | | | Call Options | | | |
| | 4,000 | | FNCL, expiring 03/06/07,
Strike price $106.00 | | | 124 |
| JPY | | 400 | | Currency option on 3 Month LIBOR,
expiring 12/07/07,
Strike price $116.00 | | | 7,319 |
| | 3,000 | | Swap on 3 Month LIBOR,
expiring 07/05/07 @ 4.90% | | | 8,960 |
| | 2,000 | | Swap on 3 Month LIBOR,
expiring 03/08/07 @ 5.00% | | | 2,822 |
| | 3,000 | | U.S. Treasury Note Futures,
expiring 02/23/07,
Strike price $114.00 | | | 469 |
| | | | | | | |
| | | | | | | 19,694 |
| | | | | | | |
| | | |
| | | | Put Options | | | |
| | 29,000 | | Eurodollar Futures,
expiring 06/18/07,
Strike price $91.25 | | | 181 |
| | 26,000 | | Eurodollar Futures,
expiring 03/19/07,
Strike price $92.00 | | | 162 |
| | 19,000 | | Eurodollar Futures,
expiring 09/17/07,
Strike price $90.75 | | | 119 |
| | 16,000 | | FNCL, expiring 03/06/07,
Strike price $91.00 | | | 1,024 |
| | 3,000 | | FNCL, expiring 03/06/07,
Strike price $91.88 | | | 165 |
| | 1,400 | | 10 Yr. Euro-Bond Futures,
expiring 02/21/07,
Strike price $113.00 | | | 370 |
| | | | | | | |
| | | | | | | 2,021 |
| | | | | | | |
| | | | Total outstanding options purchased
(cost $27,070) | | | 21,715 |
| | | | | | | |
| | | | Total short-term investments
(cost $4,837,369) | | | 4,844,430 |
| | | | | | | |
| | | | Total Investments, Before Outstanding Options Written and Securities Sold Short—199.0%
(cost $79,631,445; Note 5) | | | 81,497,403 |
| | | | | | | |
See Notes to Financial Statements
| | |
| 88 | | THE TARGET PORTFOLIO TRUST |
| | | | | | | | |
PRINCIPAL AMOUNT (000)# | | DESCRIPTION | | VALUE
(NOTE 1) | |
| | | | | | | | |
| | | | SECURITIES SOLD SHORT—(31.8)% | | | | |
| | | |
| | | | U.S. Government Mortgage Backed Obligations—(14.6)% | | | | |
| | 6,000 | | Federal National Mortgage Assoc.
5.00%, TBA | | $ | (5,792,812 | ) |
| | 200 | | Federal National Mortgage Assoc.
5.50%, TBA | | | (197,625 | ) |
| | | | | | | | |
| | | | | | | (5,990,437 | ) |
| | | | | | | | |
| | | |
| | | | U.S. Treasury Obligations—(17.2)% | | | | |
| | 1,760 | | U.S. Treasury Notes
4.50%, 02/15/16 | | | (1,731,949 | ) |
| | 4,200 | | U.S. Treasury Notes
4.625%, 11/15/16 | | | (4,172,440 | ) |
| | 1,100 | | U.S. Treasury Notes
5.125%, 05/15/16 | | | (1,133,043 | ) |
| | | | | | | | |
| | | | | | | (7,037,432 | ) |
| | | | | | | | |
| | | | Total securities sold short
(proceeds $13,133,359) | | | (13,027,869 | ) |
| | | | | | | | |
| | | Contracts/
Notional
Amounts (000) | | OUSTANDING OPTIONS WRITTEN | | | |
| | | | Call Options | | | | |
| | 1,500 | | 10 Yr. Euro-Bond Futures,
expiring 02/21/07,
Strike price $120.00 | | | (198 | ) |
| | 700 | | 10 Yr. Euro-Bond Futures,
expiring 02/21/07,
Strike price $120.50 | | | (92 | ) |
| | 200 | | 10 Yr. Euro-Bond Futures,
expiring 02/21/07,
Strike price $118.50 | | | (185 | ) |
| | 1,000 | | Swap on 3 Month LIBOR,
expiring 07/05/07 @ 5.00% | | | (8,133 | ) |
| | 1,000 | | Swap on 3 Month LIBOR,
expiring 03/08/07 @ 5.04% | | | (4,603 | ) |
| | | | | | | | |
| | | | | | | (13,211 | ) |
| | | | | | | | |
| | | |
| | | | Put Options | | | | |
| | 300 | | 10 Yr. Euro-Bond Futures,
expiring 02/21/07,
Strike price $116.00 | | | (2,732 | ) |
| | 200 | | 10 Yr. Euro-Bond Futures,
expiring 02/21/07,
Strike price $115.50 | | | (1,267 | ) |
See Notes to Financial Statements
| | |
| THE TARGET PORTFOLIO TRUST | | 89 |
| | |
International Bond Portfolio (cont’d) | | Portfolio of Investments
As of December 31, 2006 |
| | | | | | | | |
CONTRACTS/
NOTIONAL
AMOUNTS (000) | | DESCRIPTION | | VALUE
(NOTE 1) | |
| | | | | | | | |
| | | | Put Options (cont’d.) | | | | |
| | 100 | | Swap on 10 Yr. Euro-Bond Futures,
expiring 02/21/07,
Strike price $115.00 | | $ | (422 | ) |
| | 100 | | Swap on 10 Yr. Euro-Bond Futures,
expiring 02/21/07,
Strike price $114.50 | | | (264 | ) |
| | | | | | | | |
| | | | | | | (4,685 | ) |
| | | | | | | | |
| | | | Total Outstanding Options Written
(premiums received $27,838) | | | (17,896 | ) |
| | | | | | | | |
| | | |
| | | | Total Investments, Net of Outstanding Options Written and
Securities Sold Short—167.2% | | | 68,451,638 | |
| | | | Other liabilities in excess of other assets(x)—(67.2%) | | | (27,507,216 | ) |
| | | | | | | | |
| | | |
| | | | Net Assets—100% | | $ | 40,944,422 | |
| | | | | | | | |
The following abbreviations are used in portfolio descriptions:
# Principal amount is shown in U.S. dollars unless otherwise stated.
144A—Securities were purchased pursuant to Rule 144A under the securities Act of 1933 and may not be resold subject to that rule except to qualified institutional buyers. Unless otherwise noted 144A securities are deemed to be liquid.
AUD—Australian Dollar
BRL—Brazilian Real
CAD—Canadian Dollar
DKK—Danish Krone
EUR—Euro
GBP—British Pound
HUF—Hungarian Forints
JPY—Japanese Yen
KRW—Korean Won
MXN—Mexican Peso
TBA—To Be Announced Security
TIPS—Treasury Inflation Protected Securities
FNCL—Fannie Mae Conventional Loan
| (c) | Indicates a variable rate security. |
| (k) | Securities segregated as collateral for futures contracts. |
| (n) | Rates shown are the effective yields at purchase date. |
| (w) | Prudential Investments LLC, the manager of the Portfolio, also serves as manager of the Dryden Core Investment Fund—Taxable Money Market Series. |
See Notes to Financial Statements
| | |
| 90 | | THE TARGET PORTFOLIO TRUST |
| (x) | Other liabilities in excess of other assets includes net unrealized appreciation (depreciation) on futures contracts, forward foreign currency contracts, interest rate and credit default swaps as follows: |
Open futures contracts outstanding at December 31, 2006:
| | | | | | | | | | | | | | |
Number of
Contracts | | Type | | Expiration
Month | | Value at
December 31,
2006 | | Value at
Trade
Date | | Unrealized
Appreciation
(Depreciation) | |
| | Long Positions: | | | | | | | | | | | | |
| 6 | | 10 Year Japanese Bond | | Mar 07 | | $ | 6,758,540 | | $ | 6,766,775 | | $ | (8,235 | ) |
| 8 | | 5 Year U.S. Treasury Notes | | Mar 07 | | | 840,500 | | | 840,625 | | | (125 | ) |
| 22 | | 10 Year U.S. Treasury Notes | | Mar 07 | | | 2,364,313 | | | 2,383,579 | | | (19,266 | ) |
| 8 | | 30 Year U.S. Treasury Bonds | | Mar 07 | | | 891,499 | | | 905,655 | | | (14,156 | ) |
| 15 | | 90 Day Euro Dollar | | Jun 07 | | | 3,553,875 | | | 3,553,125 | | | 750 | |
| 21 | | 90 Day Euro Dollar | | Sep 07 | | | 4,983,038 | | | 4,972,013 | | | 11,025 | |
| 3 | | 90 Day Euro Dollar | | Mar 08 | | | 713,325 | | | 714,450 | | | (1,125 | ) |
| 3 | | Euro Bobl | | Mar 07 | | | 430,942 | | | 436,605 | | | (5,663 | ) |
| 14 | | Euro Bund | | Mar 07 | | | 2,144,307 | | | 2,195,683 | | | (51,376 | ) |
| | | | | | | | | | | | | | |
| | | | | | | | | | | | $ | (88,171 | ) |
| | | | | | | | | | | | | | |
Forward foreign currency exchange contracts outstanding at December 31, 2006:
| | | | | | | | | | | | | |
| | | | | | | | | | | | | |
Purchase Contracts | | Notional
Amount (000) | | Value at Settlement
Date Payable | | Current
Value | | Unrealized
Appreciation
(Depreciation) | |
Brazilian Real,
Expiring 05/03/07 | | BRL | 44 | | $ | 19,592 | | $ | 20,109 | | $ | 517 | |
Expiring 06/04/07 | | BRL | 42 | | | 18,628 | | | 19,007 | | | 379 | |
Expiring 06/04/07 | | BRL | 42 | | | 18,614 | | | 18,988 | | | 374 | |
Expiring 06/04/07 | | BRL | 42 | | | 18,741 | | | 19,130 | | | 389 | |
Expiring 06/04/07 | | BRL | 42 | | | 18,740 | | | 19,112 | | | 372 | |
Euros,
Expiring 01/23/07 | | EUR | 20 | | | 26,666 | | | 26,435 | | | (231 | ) |
Expiring 01/23/07 | | EUR | 1,964 | | | 2,604,195 | | | 2,595,909 | | | (8,286 | ) |
Korean Won,
Expiring 02/09/07 | | KRW | 236,345 | | | 252,316 | | | 254,358 | | | 2,042 | |
Mexican Peso,
Expiring 04/18/07 | | MXN | 293 | | | 26,372 | | | 27,016 | | | 644 | |
Expiring 04/18/07 | | MXN | 293 | | | 26,365 | | | 27,016 | | | 651 | |
| | | | | | | | | | | | | |
| | | | | $ | 3,030,229 | | $ | 3,027,080 | | $ | (3,149 | ) |
| | | | | | | | | | | | | |
See Notes to Financial Statements
| | |
| THE TARGET PORTFOLIO TRUST | | 91 |
| | |
International Bond Portfolio (cont’d) | | Portfolio of Investments
As of December 31, 2006 |
| | | | | | | | | | | | | |
Sale Contracts | | Notional
Amount
(000) | | Value at Settlement
Date Receivable | | Current
Value | | Unrealized
Appreciation
(Depreciation) | |
Canadian Dollars
Expiring 01/11/07 | | CAD | 335 | | $ | 296,460 | | $ | 287,383 | | $ | 9,077 | |
Danish Krones,
Expiring 03/06/07 | | DKK | 1,225 | | | 218,068 | | | 217,480 | | | 588 | |
Euros,
Expiring 01/23/07 | | EUR | 17,973 | | | 24,019,029 | | | 23,755,741 | | | 263,288 | |
Japanese Yen,
Expiring 01/25/07 | | JPY | 59,788 | | | 513,954 | | | 504,288 | | | 9,666 | |
Expiring 01/25/07 | | JPY | 12,881 | | | 110,230 | | | 108,646 | | | 1,584 | |
Expiring 02/15/07 | | JPY | 953,806 | | | 8,172,585 | | | 8,066,006 | | | 106,579 | |
Pound Sterling,
Expiring 01/11/07 | | GBP | 1,762 | | | 3,429,355 | | | 3,450,298 | | | (20,943 | ) |
| | | | | | | | | | | | | |
| | | | | $ | 36,759,681 | | $ | 36,389,842 | | $ | 369,839 | |
| | | | | | | | | | | | | |
Interest rate swap agreements outstanding at December 31, 2006:
| | | | | | | | | | | | | |
Counterparty | | Termination
Date | | Notional Amount | | Fixed
Rate | | Floating Rate | | Unrealized
Appreciation
(Depreciation) | |
Morgan Stanley Capital Services, Inc.(1) | | 06/20/37 | | $ | 100,000 | | 5.00% | | 3 month LIBOR | | $ | (2,225 | ) |
Citigroup(1) | | 06/20/09 | | AUD | 1,200,000 | | 6.00% | | 6 month Australian Bank Bill rate | | | (4,620 | ) |
Duetsche Bank(1) | | 06/20/09 | | AUD | 1,200,000 | | 6.00% | | 6 month Australian Bank Bill rate | | | (4,665 | ) |
Barclays Capital(2) | | 09/15/17 | | GBP | 200,000 | | 4.50% | | 6 month LIBOR | | | 8 | |
Morgan Stanley Capital Services, Inc.(2) | | 06/18/34 | | GBP | 100,000 | | 5.00% | | 6 month LIBOR | | | (321 | ) |
Goldman Sachs & Co.(2) | | 12/20/13 | | JPY | 200,000,000 | | 2.00% | | 6 month LIBOR | | | (47,702 | ) |
Barclays Capital(2) | | 06/18/34 | | GBP | 100,000 | | 5.00% | | 6 month LIBOR | | | 6,591 | |
Morgan Stanley Capital Services, Inc.(1) | | 06/18/34 | | EUR | 300,000 | | 6.00% | | 6 month Euribor | | | 77,953 | |
Barclays Capital(2) | | 12/15/35 | | GBP | 300,000 | | 4.00% | | 6 month LIBOR | | | 6,431 | |
Morgan Stanley Capital Services, Inc.(2) | | 09/27/16 | | JPY | 100,000,000 | | 1.98% | | 6 month LIBOR | | | (17,758 | ) |
Morgan Stanley Capital Services, Inc.(1) | | 09/18/08 | | JPY | 200,000,000 | | 1.00% | | 6 month LIBOR | | | 540 | |
UBS AG(2) | | 12/20/13 | | JPY | 60,000,000 | | 2.00% | | 6 month LIBOR | | | (14,211 | ) |
Goldman Sachs & Co.(1) | | 03/18/08 | | JPY | 300,000,000 | | 1.00% | | 6 month LIBOR | | | 3,882 | |
Barclays Capital(2) | | 09/15/15 | | GBP | 100,000 | | 5.00% | | 6 month LIBOR | | | 2,431 | |
Morgan Stanley Capital Services, Inc.(1) | | 06/20/09 | | $ | 1,800,000 | | 5.00% | | 3 month LIBOR | | | (6,145 | ) |
Lehman Brothers(2) | | 06/20/14 | | $ | 4,200,000 | | 5.00% | | 3 month LIBOR | | | 34,165 | |
UBS AG(1) | | 12/19/08 | | $ | 100,000 | | 5.00% | | 3 month LIBOR | | | (53 | ) |
Goldman Sachs & Co.(2) | | 12/15/14 | | EUR | 1,000,000 | | 4.00% | | 6 month Euribor | | | 11,178 | |
See Notes to Financial Statements
| | |
| 92 | | THE TARGET PORTFOLIO TRUST |
| | | | | | | | | | | | | |
Counterparty | | Termination
Date | | Notional Amount | | Fixed
Rate | | Floating Rate | | Unrealized
Appreciation
(Depreciation) | |
JP Morgan(2) | | 10/10/16 | | HUF | 19,000,000 | | 7.72% | | 6 month LIBOR | | $ | (6,300 | ) |
Merrill Lynch & Co.(1) | | 09/05/16 | | MXN | 4,000,000 | | 8.72% | | 28 day Mexican interbank rate | | | 11,422 | |
Morgan Stanley Capital Services, Inc.(2) | | 12/15/35 | | GBP | 100,000 | | 4.00% | | 6 month LIBOR | | | 1,099 | |
Bank of America Securities LLC(2) | | 06/20/17 | | $ | 1,600,000 | | 5.00% | | 3 month LIBOR | | | 36,730 | |
Barclays Capital(2) | | 09/27/16 | | HUF | 33,000,000 | | 7.54% | | 6 month LIBOR | | | (7,345 | ) |
Credit Suisse International(2) | | 06/15/17 | | EUR | 3,800,000 | | 4.00% | | 6 month Euribor | | | 87,940 | |
Barclays Capital(2) | | 06/20/16 | | JPY | 110,000,000 | | 2.00% | | 6 month LIBOR | | | (7,267 | ) |
Goldman Sachs & Co.(2) | | 06/20/16 | | JPY | 440,000,000 | | 2.00% | | 6 month LIBOR | | | (26,939 | ) |
Morgan Stanley Capital Services, Inc.(2) | | 06/20/16 | | JPY | 100,000,000 | | 2.00% | | 6 month LIBOR | | | (6,596 | ) |
Morgan Stanley Capital Services, Inc.(2) | | 06/20/17 | | $ | 2,900,000 | | 5.00% | | 3 month LIBOR | | | 61,786 | |
Lehman Brothers(2) | | 06/20/17 | | $ | 600,000 | | 5.00% | | 3 month LIBOR | | | 13,774 | |
JP Morgan(2) | | 06/20/17 | | $ | 5,600,000 | | 5.00% | | 3 month LIBOR | | | 27,691 | |
Duetsche Bank(3) | | 12/07/07 | | $ | 300,000 | | 0.288% | | CMS 10y-2y | | | (919 | ) |
Bank of America Securities LLC(1) | | 06/20/37 | | $ | 100,000 | | 5.00% | | 3 month LIBOR | | | (1,446 | ) |
Barclays Capital(1) | | 06/20/37 | | $ | 300,000 | | 5.00% | | 3 month LIBOR | | | (6,682 | ) |
Goldman Sachs & Co.(1) | | 06/20/09 | | $ | 4,700,000 | | 5.00% | | 3 month LIBOR | | | (16,046 | ) |
Duetsche Bank(2) | | 06/20/14 | | $ | 200,000 | | 5.00% | | 3 month LIBOR | | | 1,625 | |
Goldman Sachs & Co.(2) | | 06/20/14 | | $ | 1,600,000 | | 5.00% | | 3 month LIBOR | | | 12,999 | |
JP Morgan(2) | | 12/19/08 | | $ | 1,900,000 | | 5.00% | | 3 month LIBOR | | | 5,454 | |
Duetsche Bank(1) | | 09/15/10 | | GBP | 200,000 | | 5.00% | | 6 month LIBOR | | | (5,188 | ) |
Barclays Capital(1) | | 09/15/10 | | GBP | 1,600,000 | | 5.00% | | 6 month LIBOR | | | (45,413 | ) |
Duetsche Bank(1) | | 12/19/08 | | $ | 19,100,000 | | 5.00% | | 3 month LIBOR | | | (15,028 | ) |
JP Morgan(1) | | 09/23/16 | | MXN | 1,000,000 | | 8.84% | | 28 day Mexican interbank rate | | | 6,290 | |
Barclays Capital(1) | | 06/12/36 | | GBP | 100,000 | | 4.25% | | 6 month LIBOR | | | (1,667 | ) |
Goldman Sachs & Co.(2) | | 06/20/10 | | JPY | 150,000,000 | | 2.00% | | 6 month LIBOR | | | (9,958 | ) |
Goldman Sachs & Co.(1) | | 09/15/10 | | GBP | 600,000 | | 5.00% | | 6 month LIBOR | | | (18,087 | ) |
Barclays Capital(1) | | 06/20/08 | | $ | 2,400,000 | | 5.00% | | 3 month LIBOR | | | (1,659 | ) |
Morgan Stanley Capital Services, Inc.(1) | | 06/15/09 | | GBP | 100,000 | | 5.00% | | 6 month LIBOR | | | (1,447 | ) |
Duetsche Bank(1) | | 06/15/09 | | GBP | 100,000 | | 5.00% | | 6 month LIBOR | | | (1,505 | ) |
Credit Suisse International(2) | | 06/20/17 | | $ | 500,000 | | 5.00% | | 3 month LIBOR | | | 8,833 | |
| | | | | | | | | | | | | |
| | | | | | | | | | | $ | 141,630 | |
| | | | | | | | | | | | | |
| (1) | Portfolio pays the floating rate and receives the fixed rate. |
| (2) | Portfolio pays the fixed rate and receives the floating rate. |
| (3) | Portfolio pays the fixed and receives the difference between the floating rate and the strike price. |
See Notes to Financial Statements
| | |
| THE TARGET PORTFOLIO TRUST | | 93 |
| | |
International Bond Portfolio (cont’d) | | Portfolio of Investments
As of December 31, 2006 |
Credit default swap agreements outstanding at December 31, 2006:
| | | | | | | | | | | | | |
Counterparty | | Termination
Date | | Notional
Amount | | Fixed
Rate | | Underlying Bond | | Unrealized
Appreciation | |
Credit Suisse International(2) | | 03/20/11 | | $ | 100,000 | | 0.16% | | Avon Products, 5.125%, due 01/15/11 | | $ | (5 | ) |
JP Morgan(2) | | 12/20/16 | | EUR | 100,000 | | 0.85% | | Dow Jones CDX iTraxx HiVol Series 6 Version 1 Index | | | 125 | |
Goldman Sachs & Co.(2) | | 12/20/16 | | EUR | 100,000 | | 0.85% | | Dow Jones CDX iTraxx HiVol Series 6 Version 1 Index | | | 85 | |
Duetsche Bank(2) | | 12/20/16 | | EUR | 100,000 | | 0.85% | | Dow Jones CDX iTraxx HiVol Series 6 Version 1 Index | | | 44 | |
Barclays Capital(2) | | 12/20/16 | | EUR | 100,000 | | 0.85% | | Dow Jones CDX iTraxx HiVol Series 6 Version 1 Index | | | 97 | |
Merrill Lynch & Co.(2) | | 06/20/15 | | $ | 100,000 | | 0.52% | | Exelon Corp., 4.90%, due 06/15/15 | | | (552 | ) |
Morgan Stanley Capital Services, Inc.(2) | | 06/20/09 | | $ | 100,000 | | 0.23% | | Federated Department Stores, Inc., 5.0%, due 07/01/36 | | | (79 | ) |
Merrill Lynch & Co.(2) | | 06/20/07 | | $ | 100,000 | | 2.31% | | Ford Motor Credit Co., 7.875%, due 06/15/10 | | | (555 | ) |
UBS AG(2) | | 06/20/16 | | $ | 100,000 | | 0.31% | | Goldman Sachs Group, Inc., 5.25%, due 06/01/16 | | | 50 | |
Credit Suisse International(2) | | 03/20/12 | | $ | 100,000 | | 0.45% | | iStar Financial, Inc., 5.15%, due 03/01/12 | | | (108 | ) |
JP Morgan(2) | | 03/20/11 | | $ | 100,000 | | 0.28% | | Johnson Controls, Inc., 5.25%, due 01/15/11 | | | (239 | ) |
Barclays Capital(2) | | 06/20/11 | | $ | 100,000 | | 0.21% | | National Grid PLC, 5.0%, due 07/02/18 | | | 155 | |
Merrill Lynch & Co.(1) | | 06/20/07 | | $ | 100,000 | | 0.41% | | Russian Federation, 5.00%, due 3/31/30 | | | 105 | |
JP Morgan(2) | | 09/20/11 | | $ | 100,000 | | 0.93% | | Sabre Holding Corp.,
7.35%, due 08/01/11 | | | 7,402 | |
Duetsche Bank(1) | | 09/20/07 | | JPY | 10,000,000 | | 2.30% | | Softbank Corp.,
1.75%, due 01/31/14 | | | 649 | |
Bear Stearns International Ltd.(2) | | 06/20/11 | | $ | 100,000 | | 0.47% | | Viacom, Inc., 5.75%, due 04/30/11 | | | 147 | |
| | | | | | | | | | | | | |
| | | | | | | | | | | $ | 7,321 | |
| | | | | | | | | | | | | |
| (1) | Portfolio pays the counterparty par in the event that the underlying bond defaults and receives the fixed rate. |
| (2) | Portfolio pays the fixed rate and receives from the counterparty, par in the event that the underlying bond defaults. |
See Notes to Financial Statements
| | |
| 94 | | THE TARGET PORTFOLIO TRUST |
The country breakdown of portfolio holdings and other liabilities in excess of other assets shown as a percentage of net assets as of December 31, 2006 were as follows:
| | | |
United States | | 97.1 | % |
Japan | | 25.6 | |
United Kingdom | | 15.8 | |
Finland | | 11.7 | |
Germany | | 11.3 | |
Netherlands | | 7.2 | |
France | | 5.5 | |
Spain | | 5.3 | |
Belgium | | 3.6 | |
Austria | | 1.8 | |
Ireland | | 0.9 | |
Italy | | 0.6 | |
Denmark | | 0.5 | |
Canada | | 0.3 | |
Short-Term Investments (including Affiliated Money Market Mutual Fund of 2.8%) | | 11.8 | |
| | | |
| | 199.0 | |
Securities sold short and written options | | (31.8 | ) |
Other liabilities in excess of other assets | | (67.2 | ) |
| | | |
| | 100.0 | % |
| | | |
See Notes to Financial Statements
| | |
| THE TARGET PORTFOLIO TRUST | | 95 |
| | |
Total Return Bond Portfolio | | Portfolio of Investments
As of December 31, 2006 |
| | | | | | | |
MOODY’S RATINGS (UNAUDITED) | | PRINCIPAL
AMOUNT (000)# | | DESCRIPTION | | VALUE (NOTE 1) |
| | | | | | | |
| | | | | | | |
| | | | LONG-TERM INVESTMENTS—121.4% | | | |
| | | |
| | | | Asset-Backed Securities—4.6% | | | |
| Aaa | | 88 | | Argent Securities Inc.,
Series 2005-W3, Class A2A(c)
5.45%, 11/25/35 | | $ | 88,135 |
| Aaa | | 1,414 | | Honda Auto Receivables Owner Trust,
Series 2006-1, Class A2
5.10%, 09/18/08 | | | 1,413,281 |
| Aaa | | 700 | | MBNA Master Credit Card Trust,
Series 2000-D, Class C, 144A
8.40%, 09/15/09 | | | 705,750 |
| Aaa | | 2,610 | | Nelnet Student Loan Trust,
Series 2006-2, Class A1(c)
5.347%, 10/27/14 | | | 2,609,522 |
| Aaa | | 1,600 | | Nissan Auto Receivables Owner Trust,
Series 2006-B, Class A2
5.18%, 08/15/08 | | �� | 1,599,159 |
| Aaa | | 474 | | SLC Student Loan Trust,
Series 2006-1, Class A1(c)
5.33%, 07/15/36 | | | 473,529 |
| Aaa | | 933 | | Structured Asset Securities Corp.,
Series 2005-7XS, Class 2A1A(c)
4.90%, 04/25/35 | | | 901,550 |
| | | | | | | |
| | | | Total asset-backed securities
(cost $7,821,545) | | | 7,790,926 |
| | | | | | | |
| | | |
| | | | Bank Notes—0.4% | | | |
| B(d) | | 600 | | Ford Motor Co.,
Term B Notes
8.36%, 11/29/13
(cost $600,000) | | | 600,376 |
| | | | | | | |
| | | |
| | | | Collateralized Mortgage Obligations—1.8% | | | |
| AAA(d) | | 2 | | American Housing Trust,
Series I, Class 5
8.625%, 08/25/18 | | | 2,501 |
| Aaa | | 129 | | Bear Stearns Adjustable Rate Mortgage Trust,
Series 2002-11, Class 1A1(c)
5.625%, 02/25/33 | | | 129,045 |
| Aaa | | 552 | | Series 2005-4, Class 23A2(c) 5.39%, 05/25/35 | | | 549,741 |
| Aaa | | 8 | | Indymac Adjustable Rate Mortgage Trust,
Series 2001-H2, Class A1(c)
6.511%, 01/25/32 | | | 8,050 |
See Notes to Financial Statements
| | |
| 96 | | THE TARGET PORTFOLIO TRUST |
| | | | | | | |
MOODY’S RATINGS (UNAUDITED) | | PRINCIPAL
AMOUNT (000)# | | DESCRIPTION | | VALUE (NOTE 1) |
| | | | | | | |
| | | |
| | | | Collateralized Mortgage Obligations (cont’d.) | | | |
| Aaa | | 99 | | Residential Funding Mortgage Securities,
Series 2003-S9, Class A1
6.50%, 03/25/32 | | $ | 99,136 |
| Aaa | | 2,156 | | Washington Mutual, Inc.,
Series 2003-R1, Class A1(c)
5.59%, 12/25/27 | | | 2,155,181 |
| | | | | | | |
| | | | Total collateralized mortgage obligations
(cost $2,955,649) | | | 2,943,654 |
| | | | | | | |
| | | | Corporate Bonds—11.3% | | | |
| | | |
| | | | Aerospace—0.1% | | | |
| Baa3 | | 200 | | Goodrich (BF) Co.,
Notes
6.29%, 07/01/16 | | | 205,606 |
| | | | | | | |
| | | |
| | | | Airlines—0.3% | | | |
| NR | | 1,000 | | United Air Lines, Inc.,
Equipment Trust(g)(i)
10.85%, 02/19/15 | | | 455,000 |
| | | | | | | |
| | | |
| | | | Automobile Manufacturers—1.3% | | | |
| Baa1 | | 1,800 | | DaimlerChrysler NA Holding Corp.,
Gtd. Notes(c)
5.60%, 03/07/07 | | | 1,800,283 |
| Baa1 | | 400 | | Notes 5.75%, 09/08/11 | | | 398,991 |
| | | | | | | |
| | | | | | | 2,199,274 |
| | | | | | | |
| | | |
| | | | Financial-Bank & Trust—1.4% | | | |
| Aa2 | | 1,200 | | Bank of America Corp.,
Sr. Notes(c)
5.64%, 10/14/16 | | | 1,204,900 |
| Aa2 | | 800 | | HSBC Bank USA NA,
Sr. Notes(c)
5.435%, 09/21/07 | | | 800,706 |
| A2 | | 400 | | VTB Capital SA,
Sr. Notes, 144A(c)
5.976%, 08/01/08 | | | 400,200 |
| | | | | | | |
| | | | | | | 2,405,806 |
| | | | | | | |
| | | |
| | | | Financial Services—3.3% | | | |
| Aa1 | | 400 | | CitiFinancial,
Notes
6.625%, 06/01/15 | | | 429,714 |
| Aaa | | 3,300 | | General Electric Capital Corp.,
Sr. Unsec’d. Notes(c)
5.38%, 10/24/08 | | | 3,301,053 |
See Notes to Financial Statements
| | |
| THE TARGET PORTFOLIO TRUST | | 97 |
| | |
Total Return Bond Portfolio (cont’d) | | Portfolio of Investments
As of December 31, 2006 |
| | | | | | | |
MOODY’S RATINGS (UNAUDITED) | | PRINCIPAL
AMOUNT (000)# | | DESCRIPTION | | VALUE (NOTE 1) |
| | | | | | | |
| | | |
| | | | Financial Services (cont’d.) | | | |
| Baa1 | | 500 | | Pemex Project Funding Master Trust,
Gtd. Notes
8.00%, 11/15/11 | | $ | 550,000 |
| Baa1 | | 250 | | 9.125%, 10/13/10 | | | 280,375 |
| A1 | | 1,000 | | Unicredit Luxembourg Finance SA,
Sr. Notes, 144A (Luxembourg)
5.426%, 10/24/08 | | | 999,974 |
| | | | | | | |
| | | | | | | 5,561,116 |
| | | | | | | |
| | | |
| | | | Medical Supplies & Equipment—1.0% | | | |
| B2 | | 1,600 | | HCA, Inc.,
Sec’d. Notes, 144A
9.25%, 11/15/16 | | | 1,714,000 |
| | | | | | | |
| | | |
| | | | Oil, Gas & Consumable Fuels—0.5% | | | |
| Baa1 | | 800 | | Transocean, Inc.,
Notes(c)
5.566%, 09/05/08 | | | 800,482 |
| | | | | | | |
| | | |
| | | | Pipelines—0.3% | | | |
| Caa1 | | 400 | | El Paso Corp.,
Sr. Notes
7.80%, 08/01/31 | | | 437,000 |
| | | | | | | |
| | | |
| | | | Real Estate Investment Trusts—0.1% | | | |
| Baa2 | | 200 | | iStar Financial, Inc.,
Sr. Unsec’d. Notes
5.80%, 03/15/11 | | | 200,700 |
| | | | | | | |
| | | |
| | | | Telecommunications—2.5% | | | |
| A2 | | 800 | | BellSouth Corp.,
Sr. Unsec’d. Notes(c)
5.474%, 08/15/08 | | | 800,465 |
| Baa3 | | 1,600 | | Embarq Corp.,
Notes
6.738%, 06/01/13 | | | 1,637,613 |
| Ba3 | | 250 | | Qwest Corp.,
Debs.
7.50%, 06/15/23 | | | 251,875 |
| Ba3 | | 1,500 | | Sr. Notes
7.625%, 06/15/15 | | | 1,605,000 |
| | | | | | | |
| | | | | | | 4,294,953 |
| | | | | | | |
See Notes to Financial Statements
| | |
| 98 | | THE TARGET PORTFOLIO TRUST |
| | | | | | | | |
MOODY’S RATINGS (UNAUDITED) | | PRINCIPAL
AMOUNT (000)# | | DESCRIPTION | | VALUE (NOTE 1) |
| | | | | | | | |
| | | |
| | | | | Tobacco—0.5% | | | |
| Ba2 | | | 750 | | Reynolds American, Inc.,
Gtd. Notes, 144A
7.625%, 06/01/16 | | $ | 794,651 |
| | | | | | | | |
| | | | | Total corporate bonds
(cost $19,361,232) | | | 19,068,588 |
| | | | | | | | |
| | | |
| | | | | Foreign Government Bonds—1.8% | | | |
| Ba3 | | | 25 | | Federal Republic of Brazil
7.875%, 03/07/15 | | | 27,850 |
| Ba1 | | | 300 | | Republic of Panama
8.875%, 09/30/27 | | | 381,000 |
| Ba1 | | | 450 | | 9.375%, 07/23/12 | | | 527,625 |
| Ba3 | | | 400 | | Republic of Peru
9.125%, 01/15/08 | | | 415,200 |
| Aaa | | GBP | 700 | | United Kingdom Treasury Gilt
4.25%, 03/07/11 | | | 1,329,487 |
| Aaa | | GBP | 200 | | 5.75%, 12/07/09 | | | 398,019 |
| | | | | | | | |
| | | | | Total foreign government bonds
(cost $2,847,090) | | | 3,079,181 |
| | | | | | | | |
| | | |
| | | | | Municipal Bonds—2.7% | | | |
| | | |
| | | | | California—0.6% | | | |
| Baa3 | | | 500 | | Golden State Tobacco Securitization Corp., Revenue
6.25%, 06/01/33 | | | 558,525 |
| Baa3 | | | 400 | | 6.75%, 06/01/39 | | | 457,968 |
| | | | | | | | |
| | | | | | | | 1,016,493 |
| | | | | | | | |
| | | |
| | | | | Georgia—0.3% | | | |
| Aaa | | | 500 | | Georgia State Road & Tollway Authority Revenue, Governors Transportation Choices
5.00%, 03/01/21 | | | 525,510 |
| | | | | | | | |
| | | |
| | | | | New Jersey—0.9% | | | |
| Baa3 | | | 800 | | Tobacco Settlement Financing Corp., New Jersey State
6.00%, 06/01/37 | | | 868,952 |
| Baa3 | | | 500 | | 6.375%, 06/01/32 | | | 562,315 |
| | | | | | | | |
| | | | | | | | 1,431,267 |
| | | | | | | | |
| | | |
| | | | | New York���0.9% | | | |
| Aaa | | | 1,500 | | New York City Trust For Cultural Resources,
Museum of Modern Art
5.125%, 07/01/31 | | | 1,584,930 |
| | | | | | | | |
| | | | | Total municipal bonds
(cost $3,912,638) | | | 4,558,200 |
| | | | | | | | |
See Notes to Financial Statements
| | |
| THE TARGET PORTFOLIO TRUST | | 99 |
| | |
Total Return Bond Portfolio (cont’d) | | Portfolio of Investments
As of December 31, 2006 |
| | | | | | | | |
MOODY’S RATINGS (UNAUDITED) | | PRINCIPAL
AMOUNT (000)# | | | DESCRIPTION | | VALUE (NOTE 1) |
| | | | | | | | |
| | | |
| | | | | U.S. Government Mortgage Backed Obligations—62.2% | | | |
| | 76 | | | Federal Home Loan Mortgage Corp.
4.40%, 09/01/35(c) | | $ | 74,930 |
| | 1,873 | | | 5.00%, 09/01/35 | | | 1,807,651 |
| | 67 | | | 5.50%, 04/01/29-06/01/29 | | | 67,176 |
| | 100 | | | 6.00%, 09/01/22 | | | 101,175 |
| | 57 | | | 6.671%, 01/01/24(c) | | | 59,074 |
| | 74 | | | 7.50%, 09/01/16-07/01/17 | | | 77,308 |
| | — | (r) | | 9.25%, 01/01/10 | | | 586 |
| | 15,788 | | | Federal National Mortgage Assoc.
4.00%, 08/01/18-06/01/19 | | | 14,891,817 |
| | 10,999 | | | 4.50%, 07/01/20-09/01/35 | | | 10,365,143 |
| | 458 | | | 4.611%, 12/01/34(c) | | | 452,470 |
| | 10,968 | | | 5.00%, 01/01/19-02/01/36 | | | 10,593,479 |
| | 20,234 | | | 5.50%, 07/01/32-10/01/36 | | | 20,005,726 |
| | 9,000 | | | 5.50%, TBA | | | 8,893,125 |
| | 122 | | | 5.555%, 05/01/36(c) | | | 123,196 |
| | 3,046 | | | 6.00%, 11/01/16-01/01/36 | | | 3,068,475 |
| | 14,000 | | | 6.00%, TBA | | | 14,091,868 |
| | 222 | | | 6.50%, 04/01/21-09/01/21 | | | 227,021 |
| | 17,000 | | | 6.50%, TBA | | | 17,318,750 |
| | 164 | | | 6.808%, 01/01/20(c) | | | 167,149 |
| | 162 | | | Government National Mortgage Assoc.
5.125%, 10/20/26-11/20/29 | | | 163,322 |
| | 161 | | | 5.375%, 02/20/17-02/20/26 | | | 163,137 |
| | 98 | | | 5.75%, 07/20/22-07/20/27 | | | 99,622 |
| | 986 | | | 6.00%, 06/15/36-07/15/36 | | | 999,019 |
| | 1,000 | | | 6.00%, TBA | | | 1,013,750 |
| | 92 | | | 8.50%, 06/15/30-08/20/30 | | | 98,303 |
| | | | | | | | |
| | | | | Total U.S. Government mortgage backed obligations
(cost $105,454,443) | | | 104,923,272 |
| | | | | | | | |
| | | |
| | | | | U.S. Treasury Obligations—36.6% | | | |
| | | | | U.S. Treasury Bonds | | | |
| | 1,200 | | | 5.25%, 02/15/29 | | | 1,258,500 |
| | 400 | | | 8.125%, 08/15/19 | | | 522,594 |
| | | | | U.S. Treasury Inflationary Bonds, TIPS | | | |
| | 2,500 | | | 0.875%, 04/15/10, RRB | | | 2,524,554 |
| | 600 | | | 2.00%, 01/15/26, RRB | | | 573,699 |
| | 200 | | | 2.375%, 04/15/11, RRB | | | 202,518 |
| | 7,300 | | | 3.375%, 01/15/07, RRB | | | 9,281,589 |
| | 3,700 | | | 3.625%, 01/15/08, RRB | | | 4,670,769 |
| | 3,650 | | | U.S. Treasury Notes
3.375%, 02/15/08-10/15/09 | | | 3,529,394 |
See Notes to Financial Statements
| | |
| 100 | | THE TARGET PORTFOLIO TRUST |
| | | | | | | |
MOODY’S RATINGS (UNAUDITED) | | PRINCIPAL
AMOUNT (000)# | | DESCRIPTION | | VALUE (NOTE 1) |
| | | |
| | | | U.S. Treasury Obligations (cont’d.) | | | |
| | | | | | | |
| | 600 | | 3.625%, 01/15/10 | | $ | 581,485 |
| | 1,900 | | 3.75%, 05/15/08 | | | 1,870,907 |
| | 2,800 | | 3.875%, 09/15/10 | | | 2,721,796 |
| | 1,050 | | 4.00%, 04/15/10 | | | 1,027,442 |
| | 2,150 | | 4.25%, 10/15/10-11/15/14 | | | 2,092,387 |
| | 800 | | 4.50%, 11/15/15 | | | 787,687 |
| | 5,800 | | 4.625%, 11/15/16 | | | 5,761,940 |
| | 20,300 | | 4.875%, 08/15/09-08/15/16 | | | 20,432,056 |
| | 2,700 | | 5.125%, 06/30/11-05/15/16 | | | 2,756,093 |
| | 2,500 | | U.S. Treasury Strips, PO
7.25%, 02/15/22 | | | 1,184,685 |
| | | | | | | |
| | | | Total U.S. Treasury obligations
(cost $62,136,341) | | | 61,780,095 |
| | | | | | | |
| | | | Total long-term investments
(cost $205,088,938) | | | 204,744,292 |
| | | | | | | |
| | | | SHORT-TERM INVESTMENTS—18.5% | | | |
| | | |
| | | | Commercial Paper—0.5% | | | |
| P-1 | | 100 | | Societe Generale
5.20%, 04/02/07 | | | 98,695 |
| P-1 | | 800 | | Time Warner, Inc.
5.39%, 01/25/07 | | | 797,077 |
| | | | | | | |
| | | | Total commercial paper
(cost $895,811) | | | 895,772 |
| | | | | | | |
| | | |
| | | | Foreign Treasury Obligations(n)—13.6% | | | |
| Aaa | | EUR 6,600 | | Bundesobligation, German Bonds (Germany)
3.42%, 02/16/07 | | | 8,715,084 |
| Aaa | | EUR 1,440 | | Bundesschatzanweisungen (Germany)
3.51%, 03/23/07 | | | 1,896,379 |
| Aaa | | EUR 3,220 | | Dutch Treasury Certificate (Netherlands)
3.54%, 02/28/07 | | | 4,227,634 |
| Aaa | | EUR 1,910 | | French Treasury Notes (France)
3.44%, 03/12/07 | | | 2,514,554 |
| Aaa | | EUR 4,220 | | German Treasury Bill (Germany)
3.53%, 02/14/07 | | | 5,548,418 |
| | | | | | | |
| | | | Total foreign treasury obligations
(cost $22,459,576) | | | 22,902,069 |
| | | | | | | |
| | | |
| | | | Repurchase Agreement—1.8% | | | |
| | 3,000 | | U.S. Treasury Repurchase Agreement, 4.85%, dated 12/29/06, maturing 01/02/07, repurchase price $3,001,617 (cost $3,000,000; collateralized by U.S. Treasury Inflationary Bond, 4.85%, par value $3,050,000, market value $3,061,297) | | | 3,000,000 |
| | | | | | | |
See Notes to Financial Statements
| | |
| THE TARGET PORTFOLIO TRUST | | 101 |
| | |
Total Return Bond Portfolio (cont’d) | | Portfolio of Investments
As of December 31, 2006 |
| | | | | | | |
MOODY’S RATINGS (UNAUDITED) | | PRINCIPAL
AMOUNT (000)# | | DESCRIPTION | | VALUE (NOTE 1) |
| | | | | | | |
| | | |
| | | | U.S. Treasury Obligations—0.2% | | | |
| | 410 | | U.S. Treasury Bills(k)
4.805%, 03/15/07 | | $ | 406,090 |
| | 30 | | 4.905%, 03/01/07 | | | 29,770 |
| | | | | | | |
| | | | Total U.S. Treasury obligations
(cost $435,764) | | | 435,860 |
| | | | | | | |
| | | Shares | | | | |
| | | | Affiliated Money Market Mutual Fund—2.0% | | | |
| | 3,345,440 | | Dryden Core Investment Fund—Taxable Money Market Series
(cost $3,345,440; Note 3)(w) | | | 3,345,440 |
| | | | | | | |
| | | Notional
Amount (000) | | OUTSTANDING OPTIONS PURCHASED(a)—0.4% |
| | | | Call Options—0.2% | | | |
| | 15,000 | | Eurodollar Futures,
expiring 09/17/2007, Strike Price $95.00 | | | 6,937 |
| | 186,000 | | Eurodollar Futures,
expiring 09/14/2007, Strike Price $95.25 | | | 116,250 |
| | 36,000 | | Eurodollar Futures,
expiring 09/14/2007, Strike Price $95.00 | | | 33,750 |
| | 13,400 | | Swap on 3 Month LIBOR,
expiring 07/02/2007, @ 4.90% | | | 40,020 |
| | 9,100 | | Swap on 3 Month LIBOR,
expiring 12/20/2007, @ 5.00% | | | 55,515 |
| | 16,000 | | Swap on 3 Month LIBOR,
expiring 07/02/2007, @ 5.37% | | | 125,904 |
| | 2,100 | | Swap on 3 Month LIBOR,
expiring 04/27/2009, @ 5.75% | | | 186,952 |
| | 9,200 | | U.S. Treasury Note Futures,
expiring 02/23/2007, Strike Price $114.00 | | | 1,438 |
| | | | | | | |
| | | | | | | 566,766 |
| | | | | | | |
| | | |
| | | | Put Options—0.2% | | | |
| | 35,300 | | 5 year U.S. Treasury Note Futures,
expiring 02/23/2007, Strike Price $102.50 | | | 5,516 |
| | 16,700 | | 5 year U.S. Treasury Note Futures,
expiring 02/23/2007, Strike Price $102.00 | | | 2,609 |
| | 275,000 | | Eurodollar Futures,
expiring 03/17/2008, Strike Price $91.75 | | | 1,719 |
See Notes to Financial Statements
| | |
| 102 | | THE TARGET PORTFOLIO TRUST |
| | | | | | | | |
MOODY’S RATINGS (UNAUDITED) | | Notional
Amount (000) | | DESCRIPTION | | VALUE (NOTE 1) | |
| | | | | | | | |
| | | |
| | | | Put Options (cont’d.) | | | | |
| | 2,100 | | Swap on 3 Month LIBOR,
expiring 04/27/2009, @ 6.25% | | $ | 38,300 | |
| | | | | | | | |
| | | | | | | 48,144 | |
| | | | | | | | |
| | | | Total outstanding options purchased
(cost $629,557) | | | 614,910 | |
| | | | | | | | |
| | | | Total short-term investments
(cost $30,766,148) | | | 31,194,051 | |
| | | | | | | | |
| | | |
| | | | Total Investments, Before Outstanding Options Written and Securities Sold Short—139.9%
(cost $235,855,086; Note 5) | | | 235,938,343 | |
| | | | | | | | |
| | | Principal
Amount (000)# | | SECURITIES SOLD SHORT—(26.9)% | | | |
| | | | U.S. Government Agency Obligation—(17.0)% | | | | |
| | 29,000 | | Federal National Mortgage Assoc.
5.50%, TBA | | | (28,646,548 | ) |
| | | | | | | | |
| | | |
| | | | U.S. Treasury Obligations—(9.9)% | | | | |
| | 2,100 | | U.S. Treasury Notes
3.625%, 05/15/13 | | | (1,978,677 | ) |
| | 8,800 | | 4.125%, 05/15/15 | | | (8,449,716 | ) |
| | 750 | | 4.375%, 05/15/07 | | | (748,125 | ) |
| | 3,700 | | 4.75%, 05/15/14 | | | (3,709,539 | ) |
| | 1,700 | | 6.00%, 08/15/09 | | | (1,751,331 | ) |
| | | | | | | | |
| | | | | | | (16,637,388 | ) |
| | | | | | | | |
| | | | Total securities sold short
(proceeds received $45,726,009) | | | (45,283,936 | ) |
| | | | | | | | |
| | |
| | | Notional
Amount (000) | | OUSTANDING OPTIONS WRITTEN(a)—(0.1)% | |
| | | | Call Options | | | | |
| | 5,800 | | Swap on 3 Month LIBOR,
expiring 07/02/2007@ 5.00% | | | (47,173 | ) |
| | 4,000 | | Swap on 3 Month LIBOR,
expiring 12/20/2007, @ 5.15% | | | (60,786 | ) |
| | 5,200 | | Swap on 3 Month LIBOR,
expiring 07/02/2007, @ 5.50% | | | (138,871 | ) |
| | | | | | | | |
| | | | Total outstanding options written
(premiums received $165,270) | | | (246,830 | ) |
| | | | | | | | |
| | | |
| | | | Total Investments, Net of Outstanding Options Written and Securities Sold Short—112.9% | | | 190,407,577 | |
| | | | Other liabilities in excess of other assets(x)—(12.9%) | | | (21,750,478 | ) |
| | | | | | | | |
| | | | Net Assets—100% | | $ | 168,657,099 | |
| | | | | | | | |
See Notes to Financial Statements
| | |
| THE TARGET PORTFOLIO TRUST | | 103 |
| | |
Total Return Bond Portfolio (cont’d) | | Portfolio of Investments
As of December 31, 2006 |
The following abbreviations are used in portfolio descriptions:
144A—Security was purchased pursuant to Rule 144A under the securities Act of 1933 and may not be resold subject to that rule except to qualified institutional buyers. Unless otherwise noted, 144A securities are deemed to be liquid.
AUD—Australian Dollar
EUR—Euro
GBP—British Pound
JPY—Japanese Yen
NR—Not Rated by Moody’s or Standard & Poor’s
PO—Principal Only
RRB—Real Return Bonds
RUB—Russian Ruble
TBA—Securities Purchased on a Forward Commitment Basis
TIPS—Treasury Inflation Protected Securities
# Principal amount is shown in U.S. dollars unless otherwise stated.
| (a) | Non-income producing security. |
| (c) | Indicates a variable rate security. |
| (d) | Standard & Poor’s rating. |
| (g) | Indicates a security that has been deemed illiquid. |
| (i) | Represents issuer in default on interest payments. Non-income producing security. |
| (k) | Securities segregated as collateral for futures contracts. |
| (n) | Rates shown are the effective yields at purchase date. |
| (w) | Prudential Investments LLC, the manager of the Portfolio also serves as manager of the Dryden Core Investment Fund—Taxable Money Market Series. |
| (x) | Other liabilities in excess of other assets includes net unrealized appreciation (depreciation) on futures contracts, forward foreign currency contracts, interest rate and credit default swaps as follows: |
Open futures contracts outstanding at December 31, 2006:
| | | | | | | | | | | | | | |
Number of
Contracts | | Type | | Expiration
Date | | Value at
December 31,
2006 | | Value at
Trade Date | | Unrealized
Appreciation
(Depreciation) | |
| Long Positions: | | | | | | | | | | | | | | |
| 520 | | 5 Year U.S. Treasury Notes | | Dec 07 | | $ | 54,632,500 | | $ | 54,922,422 | | $ | (289,922 | ) |
| 15 | | 90 Day Euro Dollar | | Jun 07 | | | 3,553,875 | | | 3,562,125 | | | (8,250 | ) |
| 95 | | 90 Day Euro Dollar | | Sep 07 | | | 22,542,313 | | | 22,558,401 | | | (16,088 | ) |
| 102 | | 90 Day Euro Dollar | | Dec 07 | | | 24,237,750 | | | 24,274,375 | | | (36,625 | ) |
| 96 | | 90 Day Euro Dollar | | Jun 08 | | | 22,832,400 | | | 22,885,500 | | | (53,100 | ) |
| 70 | | 90 Day Euro EURIBOR | | Jun 07 | | | 22,164,049 | | | 22,204,400 | | | (40,351 | ) |
| 26 | | 90 Day Sterling | | Jun 07 | | | 6,013,451 | | | 6,027,989 | | | (14,538 | ) |
| 62 | | 90 Day Sterling | | Sep 07 | | | 14,341,286 | | | 14,376,922 | | | (35,636 | ) |
| 49 | | 90 Day Sterling | | Dec 07 | | | 11,335,441 | | | 11,356,244 | | | (20,803 | ) |
| | | | | | | | | | | | | | |
| | | | | | | | | | | | | (515,313 | ) |
| | | | | | | | | | | | | | |
| Short Positions: | | | | | | | | | | | | | | |
| 157 | | 10 Year U.S. Treasury Notes | | Mar 07 | | | 16,872,594 | | | 17,069,438 | | | 196,844 | |
| 43 | | 30 Year U.S. Treasury Bonds | | Mar 07 | | | 4,791,812 | | | 4,875,336 | | | 83,524 | |
| | | | | | | | | | | | | | |
| | | | | | | | | | | | | 280,368 | |
| | | | | | | | | | | | | | |
| | | | | | | | | | | | $ | (234,945 | ) |
| | | | | | | | | | | | | | |
See Notes to Financial Statements
| | |
| 104 | | THE TARGET PORTFOLIO TRUST |
Forward foreign currency exchange contracts outstanding at December 31, 2006:
| | | | | | | | | | | | | |
| | | | | | | | | | | | | |
Purchase Contract | | Notional
Amount (000) | | Value at Settlement
Date Payable | | Current
Value | | Unrealized
(Depreciation) | |
Japanese Yen, | | | | | | | | | | | | | |
Expiring 01/25/07 | | JPY | 437,000 | | | $3,708,535 | | | $3,685,920 | | $ | (22,615 | ) |
Expiring 02/15/07 | | JPY | 158,429 | | | 1,374,000 | | | 1,339,776 | | | (34,224 | ) |
Russian Ruble | | | | | | | | | | | | | |
Expiring 09/19/07 | | RUB | 29,050 | | | 1,109,000 | | | 1,105,455 | | | (3,545 | ) |
| | | | | | | | | | | | | |
| | | | | | $6,191,535 | | | $6,131,151 | | $ | (60,384 | ) |
| | | | | | | | | | | | | |
| | | | |
Sale Contracts | | Notional
Amount (000) | | Value at Settlement
Date Receivable | | Current
Value | | Unrealized
Appreciation
(Depreciation) | |
Euros, | | | | | | | | | | | | | |
Expiring 01/23/07 | | EUR | 4,196 | | $ | 5,563,749 | | $ | 5,546,046 | | $ | 17,703 | |
Expiring 01/23/07 | | EUR | 3,200 | | | 4,223,520 | | | 4,229,587 | | | (6,067 | ) |
Expiring 01/23/07 | | EUR | 8,298 | | | 10,872,513 | | | 10,967,848 | | | (95,335 | ) |
Expiring 01/23/07 | | EUR | 465 | | | 616,160 | | | 614,612 | | | 1,548 | |
Japanese Yen, | | | | | | | | | | | | | |
Expiring 02/15/07 | | JPY | 155,256 | | | 1,330,294 | | | 1,312,946 | | | 17,348 | |
Pound Sterling, | | | | | | | | | | | | | |
Expiring 01/11/07 | | GBP | 1,088 | | | 2,117,558 | | | 2,130,490 | | | (12,932 | ) |
| | | | | | | | | | | | | |
| | | | | $ | 24,723,794 | | $ | 24,801,529 | | $ | (77,735 | ) |
| | | | | | | | | | | | | |
Interest rate swap agreements outstanding at December 31, 2006:
| | | | | | | | | | | | | |
Counter Party | | Termination
Date | | Notional
Amount | | Fixed
Rate | | Floating Rate | | Unrealized
Appreciation
(Depreciation) | |
Morgan Stanley & Co.(1) | | 06/20/37 | | $ | 3,900,000 | | 5.00% | | 3 Month LIBOR | | $ | (86,784 | ) |
Deutsche Bank(1) | | 06/20/37 | | $ | 7,200,000 | | 5.00% | | 3 Month LIBOR | | | (181,910 | ) |
UBS AG(1) | | 06/18/09 | | $ | 19,000,000 | | 5.00% | | 3 Month LIBOR | | | 44,833 | |
Bank of America, N.A.(1) | | 06/15/35 | | $ | 900,000 | | 6.00% | | 3 Month LIBOR | | | 91,501 | |
Deutsche Bank(2) | | 12/15/35 | | GBP | 700,000 | | 4.00% | | 6 Month LIBOR | | | (5,056 | ) |
UBS AG(1) | | 10/15/10 | | EUR | 200,000 | | 2.15% | | FRC—Excluding
Tobacco—Non-
Revised Consumer
Price Index | | | 3,875 | |
Deutsche Bank(1) | | 06/15/17 | | AUD | 2,600,000 | | 6.00% | | 6 month Australian
Bank Bill rate | | | (33,554 | ) |
Deutsche Bank(2) | | 06/20/17 | | $ | 5,800,000 | | 5.00% | | 3 Month LIBOR | | | 130,082 | |
Merrill Lynch & Co.(2) | | 06/20/16 | | JPY | 90,000,000 | | 2.00% | | 6 Month LIBOR | | | (3,470 | ) |
Barclays Capital(2) | | 06/20/16 | | | JPY 40,000,000 | | 2.00% | | 6 Month LIBOR | | | (2,642 | ) |
Citigroup(2) | | 06/20/17 | | $ | 2,500,000 | | 5.00% | | 3 Month LIBOR | | | 52,826 | |
Barclays Capital(1) | | 09/15/10 | | GBP | 800,000 | | 5.00% | | 6 Month LIBOR | | | (22,872 | ) |
Barclays Capital(1) | | 06/15/09 | | | GBP 900,000 | | 5.00% | | 6 Month LIBOR | | | (11,678 | ) |
| | | | | | | | | | | | | |
| | | | | | | | | | | $ | (24,849 | ) |
| | | | | | | | | | | | | |
| (1) | Porfolio pays the floating rate and receives the fixed rate. |
| (2) | Portfolio pays the fixed rate and receives the floating rate. |
See Notes to Financial Statements
| | |
| THE TARGET PORTFOLIO TRUST | | 105 |
| | |
Total Return Bond Portfolio (cont’d) | | Portfolio of Investments
As of December 31, 2006 |
Credit default swap agreements outstanding at December 31, 2006:
| | | | | | | | | | | | | |
Counter Party | | Termination
Date | | Notional
Amount | | Fixed
Rate | | Underlying Bond | | Unrealized
Appreciation
(Depreciation) | |
Morgan Stanley & Co.(1) | | 12/20/08 | | $ | 500,000 | | 0.26% | | Allstate Corp.,
6.125%, due 02/15/12 | | $ | (1,970 | ) |
Goldman Sachs(1) | | 07/25/45 | | | 100,000 | | 0.54% | | ABX.HE.A Index | | | (375 | ) |
Bear Stearns International Ltd.(1) | | 07/25/45 | | | 4,000,000 | | 0.54% | | ABX.HE.A Index | | | (12,497 | ) |
UBS AG(1) | | 07/25/45 | | | 1,000,000 | | 0.54% | | ABX.HE.A Index | | | (1,886 | ) |
Lehman Brothers(2) | | 03/20/08 | | | 2,300,000 | | 0.06% | | AIG Corp.,
5.6%, due 10/18/16 | | | 1,005 | |
Merrill Lynch & Co.(1) | | 12/20/08 | | | 200,000 | | 0.27% | | Anadarko Petroleum
Corp.,
5.00%, due 10/01/12 | | | (529 | ) |
UBS AG (1) | | 12/20/08 | | | 600,000 | | 0.35% | | AutoZone, Inc.,
5.875%, due 10/15/12 | | | (3,539 | ) |
Citigroup(1) | | 12/20/16 | | | 1,200,000 | | 0.17% | | Bank of America Corp.,
5.62%, due 10/14/16 | | | 440 | |
Bear Stearns International Ltd.(1) | | 12/20/08 | | | 100,000 | | 1.09% | | Capital One Bank,
4.875%, due 05/15/08 | | | (1,977 | ) |
UBS AG(1) | | 12/20/08 | | | 200,000 | | 0.44% | | Carnival Corp.,
6.15%, due 04/15/08 | | | (1,502 | ) |
Bear Stearns International Ltd.(1) | | 12/20/08 | | | 200,000 | | 0.19% | | Caterpillar, Inc.,
7.25%, due 09/15/09 | | | (518 | ) |
Barclays Bank PLC(1) | | 06/20/15 | | | 400,000 | | 0.15% | | CitiFinancial,
4.625%, 06/01/15 | | | (7 | ) |
Lehman Brothers(1) | | 12/20/08 | | | 100,000 | | 0.24% | | Costco Wholesale
Corp.,
5.50%, due 03/15/07 | | | (320 | ) |
Morgan Stanley & Co.(1) | | 12/20/08 | | | 200,000 | | 0.42% | | Countrywide Home
Loans, Inc.,
5.625%, due 07/15/09 | | | (1,284 | ) |
Barclays Bank PLC(1) | | 09/20/11 | | | 400,000 | | 0.58% | | DaimlerChrysler NA
Holdings,
5.75%, due 09/08/11 | | | (1,723 | ) |
Bear Stearns International Ltd.(1) | | 12/20/08 | | | 200,000 | | 0.24% | | Deere & Co.,
7.85%, due 03/15/07 | | | (787 | ) |
Merrill Lynch & Co.(1) | | 12/20/08 | | | 300,000 | | 0.35% | | Devon Energy Corp.,
6.875%, due 09/30/11 | | | (1,302 | ) |
Barclays Bank PLC(1) | | 12/20/11 | | | 4,000,000 | | 0.75% | | Dow Jones CDX
HVOL7 Index | | | (554 | ) |
Morgan Stanley & Co.(2) | | 12/20/15 | | | 1,000,000 | | 0.46% | | Dow Jones CDX IG5
10YR Index | | | 750 | |
Morgan Stanley & Co.(2) | | 12/20/15 | | | 2,300,000 | | 0.45% | | Dow Jones CDX IG5
10YR Index | | | 2,504 | |
Morgan Stanley & Co.(1) | | 12/20/12 | | | 1,400,000 | | 0.14% | | Dow Jones CDX IG5
7YR Index | | | (643 | ) |
See Notes to Financial Statements
| | |
| 106 | | THE TARGET PORTFOLIO TRUST |
| | | | | | | | | | | | | |
Counter Party | | Termination
Date | | Notional
Amount | | Fixed
Rate | | Underlying Bond | | Unrealized
Appreciation
(Depreciation) | |
Morgan Stanley & Co.(1) | | 12/20/12 | | $ | 3,200,000 | | 0.14% | | Dow Jones CDX IG5
7YR Index | | $ | (1,444 | ) |
Morgan Stanley & Co.(1) | | 12/20/16 | | | 3,200,000 | | 0.65% | | Dow Jones CDX IG7
Index | | | 2,828 | |
JP Morgan(1) | | 12/20/16 | | EUR | 400,000 | | 0.85% | | Dow Jones CDX iTraxx
HiVol Series 6 Version
1 Index | | | 497 | |
Goldman Sachs(1) | | 12/20/16 | | EUR | 1,100,000 | | 0.85% | | Dow Jones CDX iTraxx
HiVol Series 6 Version
1 Index | | | 930 | |
Deutsche Bank(1) | | 12/20/16 | | EUR | 1,500,000 | | 0.85% | | Dow Jones CDX iTraxx
HiVol Series 6 Version
1 Index | | | 1,016 | |
Barclays Bank PLC(1) | | 12/20/16 | | EUR | 1,600,000 | | 0.85% | | Dow Jones CDX iTraxx
HiVol Series 6 Version
1 Index | | | 1,712 | |
Bank of America Securities LLC(1) | | 12/20/08 | | | 300,000 | | 0.13% | | E.I. DuPont,
6.875%, due 10/15/09 | | | (420 | ) |
Citigroup(1) | | 12/20/08 | | | 400,000 | | 0.28% | | Eaton Corp.,
5.75%, due 07/15/12 | | | (1,719 | ) |
Barclays Bank PLC(1) | | 12/20/08 | | | 500,000 | | 0.16% | | Eli Lilly & Co.,
6.00%, due 03/15/12 | | | (1,370 | ) |
Morgan Stanley & Co.(1) | | 12/20/08 | | | 200,000 | | 0.22% | | Emerson Electric Co.
7.125%, due 08/15/10 | | | (640 | ) |
Morgan Stanley & Co.(1) | | 12/20/08 | | | 300,000 | | 0.21% | | Emerson Electric Co.,
4.625%, due 10/15/12 | | | (901 | ) |
Barclays Bank PLC(1) | | 06/20/07 | | | 800,000 | | 0.27% | | Federative Republic of
Brazil,
12.25%, due 03/06/30 | | | (553 | ) |
Citigroup(1) | | 12/20/08 | | | 300,000 | | 0.29% | | FedEx Corp.,
7.25%, due 02/15/11 | | | (1,279 | ) |
Merrill Lynch & Co.(1) | | 12/20/08 | | | 100,000 | | 0.22% | | Gannett Co., Inc.,
6.375%, due 08/10/09 | | | (220 | ) |
Lehman Brothers(2) | | 03/20/07 | | | 3,900,000 | | 0.55% | | GMAC,
6.875%, due 08/28/12 | | | 4,686 | |
Bear Stearns International Ltd.(1) | | 03/20/16 | | | 600,000 | | 0.33% | | Goldman Sachs
Group, Inc.,
5.815%, due 03/22/16 | | | (949 | ) |
Deutsche Bank(1) | | 09/20/16 | | | 200,000 | | 0.51% | | Goodrich Corp.,
6.29%, due 07/01/16 | | | (1,110 | ) |
Lehman Brothers(1) | | 12/20/08 | | | 200,000 | | 0.97% | | Goodrich Corp.,
7.625%, due 12/15/12 | | | (3,587 | ) |
Bear Stearns International Ltd.(1) | | 12/20/08 | | | 400,000 | | 0.32% | | Hewlett Packard Co.,
6.50% due 07/01/12 | | | (2,180 | ) |
Lehman Brothers(1) | | 12/20/08 | | | 400,000 | | 0.12% | | Home Depot, Inc.,
5.375%, due 04/01/06 | | | (343 | ) |
Merrill Lynch & Co.(1) | | 12/20/08 | | | 300,000 | | 0.32% | | Ingersoll-Rand Co.,
6.48%, due 06/01/25 | | | (505 | ) |
See Notes to Financial Statements
| | |
| THE TARGET PORTFOLIO TRUST | | 107 |
| | |
Total Return Bond Portfolio (cont’d) | | Portfolio of Investments
As of December 31, 2006 |
| | | | | | | | | | | | | |
Counter Party | | Termination
Date | | Notional
Amount | | Fixed
Rate | | Underlying Bond | | Unrealized
Appreciation
(Depreciation) | |
Barclays Bank PLC(1) | | 03/20/12 | | $ | 200,000 | | 0.17% | | International Lease
Corp.,
5.4%, due 02/15/12 | | $ | (243 | ) |
Bear Stearns International Ltd.(1) | | 12/20/08 | | | 200,000 | | 0.60% | | International Paper Co.,
6.75%, due 09/01/11 | | | (1,884 | ) |
Barclays Bank PLC(1) | | 03/20/11 | | | 200,000 | | 0.37% | | iStar Financial, Inc.,
5.8%, due 03/15/11 | | | (292 | ) |
Lehman Brothers(1) | | 12/20/08 | | | 400,000 | | 0.11% | | Johnson & Johnson,
3.80%, due 05/15/13 | | | (774 | ) |
Lehman Brothers(1) | | 12/20/08 | | | 200,000 | | 0.53% | | Lockheed Martin Corp.,
8.20%, due 12/01/09 | | | (1,945 | ) |
Lehman Brothers(1) | | 12/20/08 | | | 300,000 | | 0.30% | | Masco Corp.,
5.875%, due 07/15/12 | | | (822 | ) |
Merrill Lynch & Co.(1) | | 12/20/08 | | | 200,000 | | 0.85% | | Motorola, Inc.,
7.625%, due 11/15/10 | | | (3,060 | ) |
Lehman Brothers(1) | | 12/20/08 | | | 200,000 | | 0.48% | | Northrop & Grumman
Corp.,
7.125%, due 02/15/11 | | | (1,676 | ) |
Merrill Lynch & Co.(1) | | 12/20/08 | | | 200,000 | | 0.28% | | Occidental Petroleum
Corp.,
6.75%, due 01/15/12 | | | (853 | ) |
Lehman Brothers(1) | | 06/20/09 | | | 1,200,000 | | 0.40% | | People’s Republic of
China,
6.80%, due 05/23/11 | | | (9,567 | ) |
Lehman Brothers(1) | | 12/20/08 | | | 300,000 | | 0.35% | | RadioShack Corp.,
7.375%, due 05/15/11 | | | 3,090 | |
UBS AG(1) | | 12/20/08 | | | 200,000 | | 0.37% | | RadioShack Corp.,
7.375%, due 05/15/11 | | | 1,983 | |
Morgan Stanley & Co.(1) | | 05/20/16 | | | 1,800,000 | | 0.54% | | Republic of Hungary,
4.75%, due 02/03/15 | | | (18,641 | ) |
JP Morgan(1) | | 05/20/16 | | | 600,000 | | 0.54% | | Republic of Hungary,
4.75%, due 02/03/15 | | | (6,440 | ) |
Morgan Stanley & Co.(1) | | 09/20/10 | | | 200,000 | | 2.70% | | Republic of Turkey,
11.875%, due 01/15/30 | | | (11,534 | ) |
Lehman Brothers(1) | | 09/20/10 | | | 400,000 | | 2.26% | | Republic of Turkey,
11.875%, due 01/15/30 | | | (16,708 | ) |
Merrill Lynch International(2) | | 03/20/07 | | | 700,000 | | 0.61% | | Russian Federation,
5.00% (step-up),
due 03/31/30 | | | 1,957 | |
JP Morgan(2) | | 06/20/07 | | | 800,000 | | 0.42% | | Russian Federation,
5.00% (step-up),
due 03/31/30 | | | 881 | |
Morgan Stanley & Co.(1) | | 09/20/13 | | | 200,000 | | 0.58% | | Sealed Air Corp.,
5.625%, due 07/15/13 | | | (954 | ) |
See Notes to Financial Statements
| | |
| 108 | | THE TARGET PORTFOLIO TRUST |
| | | | | | | | | | | | | |
Counter Party | | Termination
Date | | Notional
Amount | | Fixed
Rate | | Underlying Bond | | Unrealized
Appreciation
(Depreciation) | |
UBS AG(1) | | 12/20/08 | | $ | 200,000 | | 0.44% | | Simon Property
Group, L.P.,
5.45%, due 03/15/13 | | $ | (1,521 | ) |
Morgan Stanley & Co.(1) | | 12/20/08 | | | 200,000 | | 0.53% | | The Kroger Co.,
4.75%, due 04/15/12 | | | (1,734 | ) |
Citigroup(1) | | 12/20/08 | | | 800,000 | | 0.14% | | Wal-Mart Stores, Inc.,
6.875%, due 08/10/09 | | | (1,731 | ) |
Bear Stearns International Ltd.(1) | | 12/20/08 | | | 200,000 | | 0.15% | | Wal-Mart Stores, Inc.,
6.875%, due 08/10/09 | | | (471 | ) |
Barclays Bank PLC(1) | | 12/20/08 | | | 200,000 | | 0.67% | | Walt Disney Co. (The),
6.375%, due 03/12/12 | | | (2,442 | ) |
Bear Stearns International Ltd.(1) | | 06/20/16 | | | 300,000 | | 0.63% | | Whirlpool Corp.,
6.50%, due 06/15/16 | | | 2,748 | |
Lehman Brothers(1) | | 12/20/08 | | | 200,000 | | 0.29% | | Whirlpool Corp.,
8.60%, due 05/01/10 | | | (503 | ) |
| | | | | | | | | | | | | |
| | | | | | | | | | | $ | (105,401 | ) |
| | | | | | | | | | | | | |
| (1) | Portfolio pays the fixed rate and receives from the counterparty, par in the event that the underlying bond defaults. |
| (2) | Portfolio pays the counterparty par in the event that the underlying bond defaults and receives the fixed rate. |
The industry classification of portfolio holdings and other liabilities in excess of other assets shown as a percentage of net assets as of December 31, 2006 was as follows:
| | | |
Industry | | | |
U.S. Government Mortgage Backed Obligations | | 62.2 | % |
U.S. Treasury Obligations | | 36.6 | |
Asset-Backed Securities | | 4.6 | |
Financial Services | | 3.3 | |
Municipal Bonds | | 2.7 | |
Telecommunications | | 2.5 | |
Collateralized Mortgage Obligations | | 1.8 | |
Foreign Government Bonds | | 1.8 | |
Financial—Bank & Trust | | 1.4 | |
Automobile Manufacturers | | 1.3 | |
Medical Supplies & Equipment | | 1.0 | |
Oil, Gas & Consumable Fuels | | 0.5 | |
Tobacco | | 0.5 | |
Bank Notes | | 0.4 | |
Airlines | | 0.3 | |
Pipelines | | 0.3 | |
Aerospace | | 0.1 | |
Real Estate Investment Trusts | | 0.1 | |
Short-Term Investments (including Affiliated Money Market Mutual Fund of 2.0%) | | 18.5 | |
| | | |
| | 139.9 | |
Securities sold short and options written | | (27.0 | ) |
Other liabilities in excess of other assets | | (12.9 | ) |
| | | |
| | 100.0 | % |
| | | |
See Notes to Financial Statements
| | |
| THE TARGET PORTFOLIO TRUST | | 109 |
| | |
| Intermediate-Term Bond Portfolio | | Portfolio of Investments
As of December 31, 2006 |
| | | | | | | |
MOODY’S
RATINGS
(Unaudited) | | PRINCIPAL
AMOUNT (000)# | | DESCRIPTION | | VALUE (NOTE 1) |
| | | | | | | |
| | | | LONG-TERM INVESTMENTS—76.4% | | | |
| | | |
| | | | Asset-Backed Securities—0.5% | | | |
| Aaa | | 1,200 | | Wells Fargo Home Equity Trust,
Series 2005-2, Class Aii2, 144A(g)
5.59%,10/25/35
(cost $1,202,003) | | $ | 1,201,677 |
| | | | | | | |
| | | |
| | | | Collateralized Mortgage Obligations—10.8% | | | |
| Aaa | | 462 | | American Home Mortgage Investment Trust,
Series 2004-4, Class 5 A(c)
4.44%, 02/25/45 | | | 454,196 |
| Aaa | | 455 | | Bank of America Funding Corp.,
Series 2006-A, Class-1A1
4.621%, 02/20/36 | | | 448,585 |
| Aaa | | 1,403 | | Bear Stearns Adjustable Rate Mortgage Trust,
Series 2004-8, Class 11A2(c)
4.173%, 11/25/34 | | | 1,404,135 |
| Aaa | | 1,148 | | Bear Stearns Alt-A Trust,
Series 2006-6, Class 21A1
5.84%, 10/25/36 | | | 1,149,856 |
| Aaa | | 1,138 | | Series 2006-6, Class 31A1 5.84%, 08/25/36 | | | 1,142,919 |
| Aaa | | 450 | | Citigroup Mortgage Loan Trust, Inc.,
Series 2005-11, Class-A2A
4.70%, 12/25/35 | | | 443,531 |
| Aaa | | 2,332 | | Series 2006-AR1, Class 1A1 4.90%, 03/25/36 | | | 2,308,100 |
| AAA(d) | | 233 | | Countrywide Alternative Loan Trust,
Series 2003-J3, Class 2A1, 144A
6.25%, 12/25/33 | | | 231,870 |
| Aaa | | 230 | | Countrywide Home Loan Mortgage Pass Through Trust,
Series 2003-R4, Class 2A, 144A
6.50%, 01/25/34
(cost $276,530, purchased 12/1/03)(f) | | | 234,524 |
| Aaa | | 1,756 | | Series 2004-25, Class 1A1 5.68%, 02/25/35(c) | | | 1,761,716 |
| Aaa | | 349 | | Credit Suisse First Boston Mortgage Securities Corp.,
Series 2005-C6, Class A1
4.938%, 12/15/40 | | | 346,240 |
| Aaa | | 69 | | CS First Boston Mortgage Securities Corp,
Series 2003-8, Class 5A1
6.50%, 04/25/33 | | | 68,751 |
| Aaa | | 740 | | Federal Home Loan Mortgage Corp.,
Series 2692, Class YB
3.50%, 05/15/16 | | | 727,164 |
See Notes to Financial Statements
| | |
| 110 | | THE TARGET PORTFOLIO TRUST |
| | | | | | | |
MOODY’S
RATINGS
(Unaudited) | | PRINCIPAL
AMOUNT (000)# | | DESCRIPTION | | VALUE (NOTE 1) |
| | | | | | | |
| | | | Collateralized Mortgage Obligations (cont’d.) | | | |
| Aaa | | 864 | | Series 2772, Class NQ
4.50%, 12/15/13 | | $ | 855,546 |
| Aaa | | 2,000 | | Series 2828, Class EN
4.50%, 10/15/23 | | | 1,974,785 |
| Aaa | | 100 | | Series 2844, Class PQ
5.00%, 05/15/23 | | | 99,648 |
| Aaa | | 780 | | Series 2892, Class BI
5.00%, 01/15/18 | | | 773,436 |
| Aaa | | 1,007 | | Series 2912, Class ML
4.50%, 12/15/20 | | | 1,000,300 |
| Aaa | | 1,030 | | Series 2931, Class JA
5.00%, 07/15/25 | | | 1,024,508 |
| Aaa | | 325 | | Federal National Mortgage Assoc.,
Series 2003-83, Class A
4.25%, 04/25/28 | | | 320,879 |
| Aaa | | 74 | | Series 2004-41, Class PB
3.50%, 04/25/17 | | | 73,454 |
| Aaa | | 1,098 | | Series 2006-67, Class PA
5.50%, 03/25/28 | | | 1,098,950 |
| Aaa | | 951 | | Series 83, Class PB
3.50%, 09/25/16 | | | 932,638 |
| Aaa | | 450 | | FHLMC Structured Pass Through Securities,
Series T-59, Class 1A2
7.00%, 10/25/43 | | | 465,795 |
| AAA(d) | | 424 | | GE Capital Commerical Mortgage Corp.,
Series 2002-3A, Class A1(c)
4.229%, 12/10/37 | | | 415,173 |
| �� | | | | | | |
| Aaa | | 114 | | Government National Mortgage Assoc.,
Series 1995-2, Class KQ
8.50%, 03/20/25 | | | 120,049 |
| Aaa | | 454 | | Series 2000-11, Class PH 7.50%, 02/20/30 | | | 469,162 |
| Aaa | | 149 | | Series 2000-9, Class FG 5.92%, 02/16/30 | | | 150,768 |
| Aaa | | 229 | | Series 2000-9, Class FH 5.82%, 02/16/30 | | | 230,781 |
| Aaa | | 959 | | Greenpoint Mortgage Funding Trust,
Series 2005-AR2, Class A1
5.58%, 06/25/45 | | | 962,422 |
| Aaa | | 561 | | GS Mortgage Securities Corp II,
Series 2001-1285, Class A1, 144A
(cost $600,417; purchased 10/09/02)
6.044%, 08/15/18(f) | | | 572,130 |
| Aaa | | 661 | | GSR Mortgage Loan Trust,
Series 2005-ARG, Class 2A1
4.54%, 09/25/35 | | | 649,701 |
See Notes to Financial Statements
| | |
| THE TARGET PORTFOLIO TRUST | | 111 |
| | |
Intermediate-Term Bond Portfolio (cont’d) | | Portfolio of Investments
As of December 31, 2006 |
| | | | | | | |
MOODY’S
RATINGS
(Unaudited) | | PRINCIPAL
AMOUNT (000)# | | DESCRIPTION | | VALUE (NOTE 1) |
| | | | | | | |
| | | | Collateralized Mortgage Obligations (cont’d.) | | | |
| Aaa | | 1,196 | | Sequoia Mortgage Trust,
Series 10, Class 2A1 (c)
5.73%, 10/20/27 | | $ | 1,197,425 |
| Aaa | | 568 | | Structured Asset Mortgage Investments, Inc.,
Series 2206 AR3, Classs 12A1
5.57%, 09/25/35 | | | 567,979 |
| Aaa | | 127 | | Structured Asset Securities Corp,
Series 2001-21A, Class 1A1
7.213%, 01/25/32 | | | 126,182 |
| Aaa | | 1,636 | | Washington Mutual, Inc.,
Series 2002-AR6, Class A
6.227%, 06/25/42 | | | 1,636,664 |
| Aaa | | 70 | | Series 2002-AR9, Class 1A 6.158%, 08/25/42 | | | 70,173 |
| | | | | | | |
| | | | Total collateralized mortgage obligations
(cost $26,489,447) | | | 26,510,135 |
| | | | | | | |
| | | |
| | | | Corporate Bonds—23.7% | | | |
| | | |
| | | | Airlines—1.0% | | | |
| Caa | | 1,500 | | United Air Lines, Inc., Equipment Trust,
Sr. Notes(e)(g)(i)
Zero, 02/19/15 | | | 682,500 |
| Caa- | | 1,700 | | Pass-Thru Cert.(e)(i)
Zero, 09/01/08 | | | 1,802,000 |
| | | | | | | |
| | | | | | | 2,484,500 |
| | | | | | | |
| | | |
| | | | Automobiles—0.7% | | | |
| A3 | | 1,500 | | DaimlerChrysler NA Holding Corp.,
Gtd. Notes(c)
5.833%, 09/10/07 | | | 1,503,250 |
| A3 | | 240 | | Notes 5.60%,
03/07/07 | | | 240,038 |
| | | | | | | |
| | | | | | | 1,743,288 |
| | | | | | | |
| | | |
| | | | Cable—0.5% | | | |
| B2 | | 1,100 | | CSC Holdings, Inc.,
Sr. Notes
7.25%, 07/15/08 | | | 1,109,625 |
| | | | | | | |
| | | |
| | | | Computer Hardware—0.5% | | | |
| A3 | | 1,200 | | Hewlett-Packard Co.,
Notes
5.496%, 05/22/09 | | | 1,201,897 |
| | | | | | | |
See Notes to Financial Statements
| | |
| 112 | | THE TARGET PORTFOLIO TRUST |
| | | | | | | |
MOODY’S
RATINGS
(Unaudited) | | PRINCIPAL
AMOUNT (000)# | | DESCRIPTION | | VALUE (NOTE 1) |
| | | | | | | |
| | | | Diversified(g)—0.5% | | | |
| Aa3 | | 1,200 | | Siemens Financieringsmaatschappij,
Notes, 144A (Netherlands)(g)
5.424%, 08/14/09 | | $ | 1,200,026 |
| | | | | | | |
| | | |
| | | | Diversified Financial Services—3.3% | | | |
| Aaa | | 1,300 | | General Electric Capital Corp.,
Notes (c)
5.401%, 03/16/09 | | | 1,299,455 |
| Aa3 | | 1,750 | | Goldman Sachs Group LP,
Notes(c)
5.663%, 06/28/10 | | | 1,760,500 |
| | | | | | | |
| A1 | | 1,000 | | HSBC Finance Corp.,
Sr. Unsec’d. Notes(c)
5.49%, 09/15/08 | | | 1,002,547 |
| A3 | | 2,670 | | Korea Development Bank,
Notes
4.75%, 07/20/09 | | | 2,635,816 |
| Baa1 | | 1,400 | | MBNA Europe Funding PLC,
Bank Gtd., 144A (United Kingdom)(c)(g)(i)
5.45%, 09/07/07 | | | 1,400,863 |
| | | | | | | |
| | | | | | | 8,099,181 |
| | | | | | | |
| | | |
| | | | Electric Utilities—1.9% | | | |
| B1 | | 600 | | CMS Energy Corp.,
Sr. Notes
8.90%, 07/15/08 | | | 627,000 |
| Baa1 | | 500 | | Dayton Power & Light Co. (The)
First Mortgage
5.125%, 10/01/13 | | | 491,502 |
| Baa1 | | 1,050 | | Dominion Resources, Inc.,
Sr. Notes(c)
5.663%, 09/28/07 | | | 1,050,418 |
| Baa3 | | 1,500 | | Nisource Finance Corp.,
Gtd. Notes(c)
5.968%, 11/23/09 | | | 1,500,445 |
| A3 | | 1,100 | | Progress Energy Florida, Inc.,(c)
Notes
5.774%, 11/14/08 | | | 1,102,081 |
| | | | | | | |
| | | | | | | 4,771,446 |
| | | | | | | |
| | | |
| | | | Electronic Components—0.4% | | | |
| Ba1 | | 600 | | IPALCO Enterprises Inc.,
Sec’d Notes
8.375%, 11/14/08 | | | 622,500 |
| B2 | | 400 | | Mission Energy Holding,
Sec’d Notes
13.50%, 07/15/08 | | | 441,000 |
| | | | | | | |
| | | | | | | 1,063,500 |
| | | | | | | |
See Notes to Financial Statements
| | |
| THE TARGET PORTFOLIO TRUST | | 113 |
| | |
Intermediate-Term Bond Portfolio (cont’d) | | Portfolio of Investments
As of December 31, 2006 |
| | | | | | | |
MOODY’S
RATINGS
(Unaudited) | | PRINCIPAL
AMOUNT (000)# | | DESCRIPTION | | VALUE (NOTE 1) |
| | | | | | | |
| | | | Entertainment & Leisure—0.5% | | | |
| A3 | | 1,200 | | Walt Disney Co., (The)
Notes(c)
5.453%, 09/10/09 | | $ | 1,201,252 |
| | | | | | | |
| | | |
| | | | Financial–Bank & Trust—2.8% | | | |
| Aa2 | | 600 | | Bank of America Corp.,
Sr. Notes(c)
5.523%, 02/17/09 | | | 601,580 |
| Aa1 | | 1,200 | | Bank of America NA,
Sr. Notes(c)
5.377%, 07/25/08 | | | 1,200,505 |
| Aa2 | | 1,200 | | Charter One Bank NA,
Sr. Notes(c)
5.43%, 04/26/09 | | | 1,200,787 |
| Aa2 | | 300 | | HSBC Finance Corp.,
Sr. Notes(c)
5.49%, 12/14/09 | | | 300,909 |
| Aa- | | 1,300 | | Merrill Lynch Co.
Sr. Unsec’d. Notes
5.395%, 12/22/08 | | | 1,300,408 |
| A3 | | 500 | | Riggs Capital Trust,
Gtd. Notes
8.875%, 03/15/27 | | | 524,920 |
| Aa1 | | 600 | | Royal Bank of Scotland PLC,
Notes, 144A (United Kingdom)(g)
5.38%, 04/11/08 | | | 600,449 |
| Baa+ | | 1,200 | | VTB Capital SA,
Sr. Notes, 144A(c)
5.976%, 08/01/08 | | | 1,200,600 |
| | | | | | | |
| | | | | | | 6,930,158 |
| | | | | | | |
| | | |
| | | | Financial-Brokerage—0.5% | | | |
| A2 | | 1,200 | | Caterpillar Financial Service Corp.,
Notes
5.426%, 08/11/09 | | | 1,199,744 |
| | | | | | | |
| | | |
| | | | Financial Services—6.7% | | | |
| A2 | | 1,200 | | CIT Group, Inc.,
Sr. Unsec’d. Notes
5.58%, 05/23/08 | | | 1,203,311 |
| Aa1 | | 700 | | Citigroup Global Markets Holdings, Inc.,
Notes
5.461%, 03/17/09 | | | 700,627 |
See Notes to Financial Statements
| | |
| 114 | | THE TARGET PORTFOLIO TRUST |
| | | | | | | |
MOODY’S
RATINGS
(Unaudited) | | PRINCIPAL
AMOUNT (000)# | | DESCRIPTION | | VALUE (NOTE 1) |
| | | | | | | |
| | | | Financial Services (cont’d.) | | | |
| Aa1 | | 500 | | Citigroup, Inc.,
Notes
5.406%, 12/26/08 | | $ | 500,284 |
| Aa1 | | 1,200 | | 5.493%, 06/09/09 | | | 1,203,140 |
| Baa3 | | 300 | | Ford Motor Credit Co.,(c)
Notes
5.56%, 03/13/07 | | | 297,750 |
| Baa3 | | 1,400 | | 6.315%, 03/21/07 | | | 1,399,717 |
| Aaa | | 100 | | General Electric Capital Corp.,
Sr. Unsec’d. Notes
5.431%, 10/24/08 | | | 100,032 |
| Ba1 | | 1,950 | | General Motors Acceptance Corp.,
Notes(c)
6.274%, 01/16/07 | | | 1,949,986 |
| Aa3 | | 1,800 | | Goldman Sachs Group, Inc.,
Sr. Notes
5.456%, 06/23/09 | | | 1,801,075 |
| Aa3 | | 400 | | HSBC Finance Corp.
Sr. Notes
5.433%, 10/21/09 | | | 400,052 |
| A+ | | 1,800 | | Lehman Brothers Holdings,
Notes
5.415%, 12/23/08 | | | 1,799,728 |
| Aa3 | | 2,000 | | Morgan Stanley,
Notes(c)
5.474%, 02/15/07 | | | 2,000,356 |
| A2 | | 1,200 | | SLM Corp.,
Notes, 144A(g)
5.517%, 07/27/09 | | | 1,202,099 |
| A+ | | 1,800 | | Unicredito Luxem,
Sr. Notes, 144A (Luxembourg)
5.424%, 10/24/08 | | | 1,799,953 |
| | | | | | | |
| | | | | | | 16,358,110 |
| | | | | | | |
| | | |
| | | | Healthcare Services—0.3% | | | |
| B1 | | 600 | | Service Corp. International,
Sr. Notes
7.70%, 04/15/09 | | | 622,500 |
| | | | | | | |
| | | |
| | | | Hotels, Restaurants & Leisure—0.2% | | | |
| Ba2 | | 500 | | Mandalay Resort Group,
Sr. Notes
6.50%, 07/31/09 | | | 505,625 |
| Ba2 | | 100 | | Mirage Resorts, Inc.,
Notes
6.75%, 08/01/07 | | | 100,375 |
| | | | | | | |
| | | | | | | 606,000 |
| | | | | | | |
See Notes to Financial Statements
| | |
| THE TARGET PORTFOLIO TRUST | | 115 |
| | |
Intermediate-Term Bond Portfolio (cont’d) | | Portfolio of Investments
As of December 31, 2006 |
| | | | | | | |
MOODY’S
RATINGS
(Unaudited) | | PRINCIPAL
AMOUNT (000)# | | DESCRIPTION | | VALUE (NOTE 1) |
| | | | | | | |
| | | | Lodging—0.2% | | | |
| Ba1 | | 600 | | Starwood Hotels & Resorts Worldwide, Inc.,
Gtd. Notes
7.375%, 05/01/07 | | $ | 602,451 |
| | | | | | | |
| | | |
| | | | Office Equipment—0.3% | | | |
| Ba1 | | 600 | | Xerox Corp., Co.
Gtd. Notes
9.75%, 01/15/09 | | | 648,000 |
| | | | | | | |
| | | |
| | | | Oil, Gas & Consumable Fuels—0.8% | | | |
| Ba2 | | 700 | | Transcontinental Gas Pipe Line Corp.,
Notes(c)(f)
6.654, 04/15/08
(cost $704,458, purchased 09/27/05) | | | 704,375 |
| Baa1 | | 1,200 | | Transocean, Inc.,
Notes
5.566%, 09/05/08 | | | 1,200,724 |
| | | | | | | |
| | | | | | | 1,905,099 |
| | | | | | | |
| | | |
| | | | Pipelines—0.2% | | | |
| B2 | | 600 | | El Paso Corp.,
Sr. Unsec’d. Notes
7.625%, 08/16/07 | | | 588,750 |
| | | | | | | |
| | | |
| | | | Retail—0.3% | | | |
| Ba1 | | 500 | | J.C. Penney Corp., Inc.,
Notes
6.50%, 12/15/07 | | | 503,732 |
| Baa3 | | 100 | | 7.375%, 08/15/08 | | | 102,405 |
| | | | | | | |
| | | | | | | 606,137 |
| | | | | | | |
| | | |
| | | | Telecommunications—2.1% | | | |
| A2 | | 600 | | BellSouth Corp.,
Sr. Unsec’d. Notes
5.474%, 08/15/08 | | | 600,349 |
| A3 | | 2,000 | | France Telecom SA,
Notes (France)(i)
8.50%, 03/01/31 | | | 2,625,456 |
| B2 | | 600 | | Qwest Communications International, Inc.,
Gtd. Notes(c)
8.874%, 02/15/09 | | | 607,500 |
| A3 | | 1,200 | | Vodafone Group PLC, Bonds (United Kingdom)
5.424%, 06/29/07 | | | 1,200,054 |
| | | | | | | |
| | | | | | | 5,033,359 |
| | | | | | | |
| | | | Total corporate bonds
(cost $58,723,446) | | | 57,975,023 |
| | | | | | | |
See Notes to Financial Statements
| | |
| 116 | | THE TARGET PORTFOLIO TRUST |
| | | | | | | | |
MOODY’S
RATINGS
(Unaudited) | | PRINCIPAL
AMOUNT (000)# | | DESCRIPTION | | VALUE (NOTE 1) |
| | | | | | | | |
| | | | | Foreign Government Bonds—2.4% | | | |
| Ba3 | | | 40 | | Federal Republic of Brazil
7.125%, 01/20/37 | | $ | 42,980 |
| Aa3 | | | 1,200 | | National Australia Bank, Sr. Unsec’d.
Notes, 144A(g)
5.393%, 09/11/09 | | | 1,200,278 |
| Aa2 | | JPY | 218,000 | | Republic of Italy
3.80%, 03/27/08 | | | 1,899,327 |
| NR | | | 1,500 | | Republic of Panama
9.375%, 04/01/29 | | | 2,002,500 |
| Baa1 | | | 750 | | Republic of South Africa
9.125%, 05/19/09 | | | 810,000 |
| | | | | | | | |
| | | | | Total foreign government bonds
(cost $5,570,515) | | | 5,955,085 |
| | | | | | | | |
| | | |
| | | | | Municipal Bonds—0.4% | | | |
| Aaa | | | 1,000 | | Honolulu City & County
4.75%, 07/01/28
(cost $846,639)(c) | | | 1,013,850 |
| | | | | | | | |
| | | |
| | | | | U.S. Government Agency Obligations—4.3% | | | |
| | | 1,300 | | Federal Farm Credit Bank
3.65%, 03/16/09 | | | 1,262,660 |
| | | 1,000 | | Federal Home Loan Bank
3.00%, 12/28/07 | | | 978,796 |
| | | 786 | | 4.25%, 07/30/09 | | | 770,343 |
| | | 100 | | 4.09%, 02/20/09 | | | 98,048 |
| | | 900 | | 4.50%, 06/12/13 | | | 865,552 |
| | | 2,800 | | Federal Home Loan Mortgage Corp.
4.24%, 07/30/09 | | | 2,745,520 |
| | | 3,800 | | Federal National Mortgage Assoc.
4.25%, 07/30/09 | | | 3,725,813 |
| | | | | | | | |
| | | | | Total U.S. Government agency obligations
(cost $10,423,462) | | | 10,446,732 |
| | | | | | | | |
| | | |
| | | | | U.S. Government Mortgage Backed Obligations—30.3% | | | |
| | | 21,616 | | Federal National Mortgage Assoc.
5.00%, 10/01/17-08/01/20 | | | 21,274,388 |
| | | 4,442 | | 5.50%, 06/01/33-11/01/35 | | | 4,391,199 |
| | | 116 | | 5.625%, 08/01/24 | | | 116,770 |
| | | 11 | | 5.626%, 12/01/30 | | | 11,381 |
| | | 45,061 | | 6.00%, 11/01/12-01/01/37 | | | 45,360,817 |
| | | 136 | | 6.657%, 07/01/25 | | | 137,608 |
| | | 3 | | 9.25%, 01/01/10 | | | 2,958 |
| | | 98 | | Government National Mortgage Assoc.
5.125%, 10/20/04-12/20/26 | | | 99,750 |
| | | 659 | | 5.25%, 03/20/30 | | | 661,050 |
| | | 576 | | 5.375%, 05/20/23-06/20/27 | | | 582,190 |
| | | 266 | | 5.50%, 07/20/30 | | | 266,928 |
See Notes to Financial Statements
| | |
| THE TARGET PORTFOLIO TRUST | | 117 |
| | |
Intermediate-Term Bond Portfolio (cont’d) | | Portfolio of Investments
As of December 31, 2006 |
| | | | | | | |
MOODY’S
RATINGS
(Unaudited) | | PRINCIPAL
AMOUNT (000)# | | DESCRIPTION | | VALUE (NOTE 1) |
| | | | | | | |
| | | | U.S. Government Mortgage Backed Obligations (cont’d.) | | | |
| | 173 | | 5.75%, 08/20/26 | | $ | 174,765 |
| | 868 | | 6.00%, 01/15/29-07/15/29 | | | 882,314 |
| | 227 | | 6.50%, 10/15/25-06/15/29 | | | 233,829 |
| | 90 | | 8.00%, 09/20/30-07/20/31 | | | 95,273 |
| | | | | | | |
| | | | Tota U.S. Government mortgage backed obligations
(cost $74,991,813) | | | 74,291,220 |
| | | | | | | |
| | | |
| | | | U.S. Treasury Obligations—4.0% | | | |
| | 100 | | U.S. Treasury Bonds, TIPS
2.00%, 01/15/14(k) | | | 106,086 |
| | 100 | | 3.375%, 01/15/07 | | | 127,145 |
| | 2,500 | | 3.375%, 01/15/12 | | | 2,966,148 |
| | 3,090 | | U.S. Treasury Notes
3.875%, 09/15/10 | | | 3,003,697 |
| | 1,100 | | 4.25%, 08/15/13 | | | 1,072,414 |
| | 720 | | 4.805%, 03/15/07(k) | | | 713,134 |
| | 1,800 | | 5.125%, 05/15/16 | | | 1,854,070 |
| | | | | | | |
| | | | Total U.S. Treasury obligations
(cost $9,585,631) | | | 9,842,694 |
| | | | | | | |
| | | UNITS | | | | |
| | | | Warrants* | | | |
| | 2,500,000 | | Mexican Value Recovery Rights,
Series D
(cost $250)
expiring 06/30/2007 | | | 36,250 |
| | | | | | | |
| | | | Total long-term investments
(cost $187,833,206) | | | 187,272,666 |
| | | | | | | |
| | | PRINCIPAL
AMOUNT (000)# | | SHORT-TERM INVESTMENTS—40.7% | | |
| | | |
| | | | Commercial Paper—24.3% | | | |
| A1+ | | 4,200 | | Bank of America Corp.
5.23%, 03/20/07 | | | 4,152,757 |
| A1+ | | 100 | | 5.25%, 03/15/07 | | | 98,948 |
| A1+ | | 6,800 | | Bank of Ireland,
Disc. Notes
5.26%, 03/15/07 | | | 6,728,437 |
| A1+ | | 600 | | CBA (DE) Finance,
Disc. Notes
5.25%, 03/07/07 | | | 594,414 |
| A2 | | 100 | | Daimlerchrysler NA.,
Disc. Notes
5.345%, 06/22/07 | | | 97,432 |
See Notes to Financial Statements
| | |
| 118 | | THE TARGET PORTFOLIO TRUST |
| | | | | | | |
MOODY’S
RATINGS
(Unaudited) | | PRINCIPAL
AMOUNT (000)# | | DESCRIPTION | | VALUE (NOTE 1) |
| | | | | | | |
| | | | Commercial Paper (cont’d.) | | | |
| A1 | | 2,300 | | DNB Nor Bank ASA,
Disc. Notes
5.20%, 03/26/07 | | $ | 2,272,134 |
| A1+ | | 2,200 | | General Elecectric Capital Corp.,
Disc. Notes
5.24%, 02/09/07 | | | 2,199,588 |
| A1+ | | 3,800 | | General Electric Capital Corp.,
5.25%, 01/16/07 | | | 3,791,703 |
| A1+ | | 200 | | HBOS Treasury Service,
Disc. Notes
5.25%, 03/15/07 | | | 197,907 |
| A1+ | | 6,700 | | 5.25%, 02/07/07 | | | 6,663,910 |
| A1+ | | 4,300 | | Ixis Commercial Paper Credit,
Disc. Notes
5.245%, 01/26/07 | | | 4,284,323 |
| A1+ | | 3,200 | | 5.26%, 02/02/07 | | | 3,185,038 |
| A1+ | | 3,800 | | Santander Central Hispano,
SA, Disc. Notes
5.245%, 02/08/07 | | | 3,778,857 |
| A1+ | | 1,400 | | Skandi Bank,
5.235%, 03/05/07 | | | 1,387,296 |
| A1+ | | 1,000 | | Societe Generale N.A.,
5.245%, 01/08/07 | | | 998,983 |
| A1+ | | 6,300 | | UBS Finance (DE) LLC,
Disc. Notes
5.28%, 01/02/07 | | | 6,299,076 |
| A1+ | | 5,500 | | Unicred Italian Bank Ireland,
Disc. Notes
5.25%, 01/19/07 | | | 5,485,535 |
| A1+ | | 4,300 | | Westpac Banking,
5.21%, 03/29/07 | | | 4,246,348 |
| A1+ | | 3,200 | | Westpac Banking Corp.,
Disc. Notes
5.245%, 01/24/07 | | | 3,190,808 |
| | | | | | | |
| | | | Total commercial paper
(cost $59,639,687) | | | 59,653,494 |
| | | | | | | |
| | | |
| | | | Foreign Treasury Obligations(n)—11.3% | | | |
| | 7,200 | | Bundesobligation German Bonds
4.00%, 02/16/07 | | | 9,507,365 |
| | 420 | | Bundesschatzanweisungen Notes,
2.50%, 03/23/07 | | | 553,110 |
| | 12,940 | | Dutch Treasury Certificate Bills,
3.42%, 02/28/07 | | | 16,989,312 |
| | 410 | | French Treasury Notes,
2.25%, 03/12/07 | | | 539,773 |
| | | | | | | |
| | | | Total foreign treasury obligations
(cost $27,100,531) | | | 27,589,560 |
| | | | | | | |
See Notes to Financial Statements
| | |
| THE TARGET PORTFOLIO TRUST | | 119 |
| | |
Intermediate-Term Bond Portfolio (cont’d) | | Portfolio of Investments
As of December 31, 2006 |
| | | | | | | | |
| | | SHARES | | DESCRIPTION | | VALUE (NOTE 1) | |
| | | | | | | | |
| | | | Affiliated Money Market Mutual Fund—5.1% | | | | |
| | 12,572,196 | | Dryden Core Investment Fund—Taxable Money Market Series
(cost $12,572,196); Note 3(w) | | $ | 12,572,196 | |
| | | | | | | | |
| | | Notional
Amount (000)# | | OUTSTANDING OPTIONS PURCHASED* | | | |
| | | | Call Options | | | | |
| | 7,000 | | Swap Option on 3 Month LIBOR
expiring 06/20/09 @ 5.06% | | | 5,303 | |
| | | | | | | | |
| | | | Put Options | | | | |
| | 326,000 | | Euro Dollar Futures
expiring 12/17/07,
Strike Price $92.00 | | | 2,037 | |
| | 262,000 | | Euro Dollar Futures
expiring 09/17/07,
Strike Price $90.75 | | | 1,638 | |
| | 150,000 | | Euro Dollar Futures
expiring 07/17/07,
Strike Price $91.00 | | | 938 | |
| | | | | | | | |
| | 40,000 | | Euro Dollar Futures
expiring 12/17/07,
Strike Price $91.50 | | | 250 | |
| | | | | | | | |
| | | | | | | 4,863 | |
| | | | | | | | |
| | | | Total outstanding options purchased
(cost $37,607) | | | 10,166 | |
| | | | | | | | |
| | | | Total short-term investments
(cost $99,350,021) | | | 99,825,416 | |
| | | | | | | | |
| | | | Total Investments, Before Outstanding Options Written and Securities Sold Short—117.1%
(cost $287,183,227; Note 5) | | | 287,098,082 | |
| | | | | | | | |
| | | PRINCIPAL
AMOUNT
(000)# | | SECURITIES SOLD SHORT—(2.8)% | | | |
| | | |
| | | | U.S. Government Agency Obligation | | | | |
| | 7,000 | | Federal National Mortgage Assoc.
5.00%, 01/17/22
(proceeds received 6,917,969) | | | (6,879,684 | ) |
| | | | | | | | |
See Notes to Financial Statements
| | |
| 120 | | THE TARGET PORTFOLIO TRUST |
| | | | | | | | |
| | | NOTIONAL
AMOUNT# | | DESCRIPTION | | VALUE (NOTE 1) | |
| | | | | | | | |
| | | | OUTSTANDING OPTIONS WRITTEN* | | | | |
| | | | Call Options | | | | |
| | 200 | | Swap Option on 3 Month LIBOR
expiring 06/15/07 @ 4.85%
(premium received $30,215) | | $ | (9,630 | ) |
| | | | | | | | |
| | | | Total Investments, Net of Outstanding Options Written and Securities Sold Short—114.3% | | | 280,208,768 | |
| | | | Other liabilities in excess of other assets(x)—(14.3%) | | | (34,985,794 | ) |
| | | | | | | | |
| | | | Net Assets—100% | | $ | 245,222,974 | |
| | | | | | | | |
The following abbreviations are used in portfolio descriptions:
144A—Security was purchased pursuant to Rule 144A under the Securities Act of 1933 and may not be resold subject to that rule except to qualified institutional buyers. Unless otherwise noted 144A securities are deemed to be liquid.
NR—Not Rated by Moodys or Standard & Poor’s
TIPS—Treasury Inflation Protected Securities
EUR—Euro
GBP—British Pound
JPY—Japanese Yen
| * | Non-income producing security. |
| # | Principal amount is denoted in U.S. dollars unless otherwise stated. |
| (c) | Indicates a variable rate security. |
| (d) | Standard & Poor’s rating. |
| (f) | Private Placement restricted as to resale and does not have a readily available market. The aggregate cost of such securities is $1,581,405. The aggregate value of $1,511,029 is approximately 0.6% of net assets. |
| (g) | Indicates a security that has been deemed illiquid. |
| (i) | Represents issuer in default on interest payments. Non-income producing security. |
| (k) | Securities segregated as collateral for futures contracts. |
| (n) | Rates shown are the effective yields at purchase date. |
| (w) | Prudential Investments LLC, the manager of the Portfolio also serves as manager of the Dryden Core Investment Fund-Taxable Money Market Series. |
| (x) | Other liabilities in excess of other assets includes net unrealized appreciation (depreciation) on futures contracts, forward foreign currency exchange contracts, interest rate and credit default swaps as follows: |
Open futures contracts outstanding at December 31, 2006:
| | | | | | | | | | | | | | |
Number of
Contracts | | Type | | Expiration
Date | | Value at
December 31, 2006 | | Value at
Trade Date | | Unrealized
Appreciation
(Depreciation) | |
| | Long Positions: | | | | | | | | | | | | |
| 236 | | 90 Day Euro Dollar | | Mar 07 | | $ | 55,861,200 | | $ | 55,979,200 | | $ | (118,000 | ) |
| 78 | | 90 Day Euro Dollar | | Sep 07 | | | 18,508,425 | | | 18,432,375 | | | 76,050 | |
| 285 | | 90 Day Euro Dollar | | Dec 07 | | | 67,723,125 | | | 67,639,200 | | | 83,925 | |
| 285 | | 90 Day Euro Dollar | | Mar 08 | | | 67,765,874 | | | 67,660,874 | | | 105,000 | |
| 92 | | 90 Day Sterling | | Dec 07 | | | 21,282,870 | | | 21,327,390 | | | (44,520 | ) |
| 420 | | 5 Year U.S. Treasury Notes | | Mar 07 | | | 44,126,250 | | | 44,336,250 | | | (210,000 | ) |
| 23 | | 30 Year U.S. Treasury Notes | | Sep 06 | | | 2,563,063 | | | 2,619,485 | | | (56,422 | ) |
| | | | | | | | | | | | | | |
| | | | | | | | | | | | $ | (163,967 | ) |
| | | | | | | | | | | | | | |
See Notes to Financial Statements
| | |
| THE TARGET PORTFOLIO TRUST | | 121 |
| | |
Intermediate-Term Bond Portfolio (cont’d) | | Portfolio of Investments
As of December 31, 2006 |
Forward foreign currency exchange contracts outstanding at December 31, 2006:
| | | | | | | | | | | | |
Purchase Contracts | | Notional
Amount
(000) | | Value at Settlement
Date Payable | | Current
Value | | Unrealized
Depreciation | |
Japanese Yen, | | | | | | | | | | | | |
Expiring 01/25/07 | | JPY 213,000 | | $ | 1,807,593 | | $ | 1,796,570 | | $ | (11,023 | ) |
Expiring 02/15/07 | | JPY 120,000 | | | 1,028,815 | | | 1,014,798 | | | (14,017 | ) |
| | | | | | | | | | | | |
| | | | $ | 2,836,408 | | $ | 2,811,368 | | $ | (25,040 | ) |
| | | | | | | | | | | | |
Sale Contracts | | Notional
Amount
(000) | | Value at Settlement
Date Receivable | | Current
Value | | Unrealized
Depreciation | |
Euros, | | | | | | | | | | | | |
expiring 01/23/07 | | EUR 12,856 | | $ | 16,967,993 | | $ | 16,992,368 | | $ | (24,375 | ) |
expiring 01/23/07 | | EUR 6,394 | | | 8,377,784 | | | 8,451,244 | | | (73,460 | ) |
Pound Sterling | | | | | | | | | | | | |
expiring 01/11/07 | | GBP 329 | | | 640,328 | | | 644,238 | | | (3,910 | ) |
| | | | | | | | | | | | |
| | | | $ | 25,986,105 | | $ | 26,087,850 | | $ | (101,745 | ) |
| | | | | | | | | | | | |
Interest rate swap agreements outstanding at December 31, 2006:
| | | | | | | | | | | | | | |
Counterparty | | Termination
Date | | Notional
Amount | | Fixed
Rate | | | Floating Rate | | Unrealized
(Depreciation) | |
Barclays Capital(1) | | 06/20/09 | | $ | 11,600,000 | | 5.00 | % | | 3 month LIBOR | | $ | (39,602 | ) |
Morgan Stanley Capital Services, Inc.(1) | | 06/20/09 | | $ | 51,900,000 | | 5.00 | % | | 3 month LIBOR | | | (177,186 | ) |
Citigroup(1) | | 06/20/17 | | $ | 4,000,000 | | 5.00 | % | | 3 month LIBOR | | | (84,522 | ) |
UBS AG(1) | | 06/20/12 | | $ | 14,600,000 | | 5.00 | % | | 3 month LIBOR | | | (150,109 | ) |
Barclays Capital(1) | | 06/20/12 | | $ | 5,100,000 | | 5.00 | % | | 3 month LIBOR | | | (52,385 | ) |
| | | | | | | | | | | | | | |
| | | | | | | | | | | | $ | (503,804 | ) |
| | | | | | | | | | | | | | |
| (1) | Porfolio pays the floating rate and receives the fixed rate. |
See Notes to Financial Statements
| | |
| 122 | | THE TARGET PORTFOLIO TRUST |
Credit default swap agreements outstanding at December 31, 2006:
| | | | | | | | | | | | | | |
Counterparty | | Termination
Date | | Notional
Amount | | Fixed Rate | | | Underlying Bond | | Unrealized
Appreciation
(Depreciation) | |
Lehman Brothers(1) | | 03/20/08 | | $ | 1,200,000 | | 0.06 | % | | AIG Corp.,
5.6%, due 10/18/16 | | $ | 524 | |
Morgan Stanley Capital Services, Inc.(1) | | 10/20/07 | | $ | 300,000 | | 0.44 | % | | JSC “GAZPROM” | | | 529 | |
Lehman Brothers(1) | | 12/20/08 | | $ | 100,000 | | 0.29 | % | | Petroleos Mexicanos,
9.50%, due 09/15/27 | | | 4 | |
Barclays Capital(1) | | 12/20/08 | | $ | 300,000 | | 0.29 | % | | Petroleos Mexicanos,
9.50%, due 09/15/27 | | | 10 | |
Deutsche Bank(1) | | 12/20/08 | | $ | 100,000 | | 0.42 | % | | Republic of Indonesia, 6.75%, due 03/10/14 | | | 42 | |
Lehman Brothers(1) | | 12/20/08 | | $ | 300,000 | | 0.40 | % | | Republic of Indonesia, 6.75%, due 03/10/14 | | | 23 | |
Barclays Capital(1) | | 12/20/08 | | $ | 100,000 | | 0.26 | % | | Republic of Panama,
8.875%, due 09/30/27 | | | 6 | |
Deutsche Bank(1) | | 12/20/08 | | $ | 200,000 | | 0.25 | % | | Republic of Panama,
8.875%, due 09/30/27 | | | (27 | ) |
Deutsche Bank(1) | | 12/20/08 | | $ | 100,000 | | 0.33 | % | | Republic of Peru,
8.75%, due 11/21/33 | | | (81 | ) |
Lehman Brothers(1) | | 12/20/08 | | $ | 300,000 | | 0.32 | % | | Republic of Peru,
8.875%, due 09/30/27 | | | (301 | ) |
Lehman Brothers(1) | | 12/20/08 | | $ | 100,000 | | 0.31 | % | | Russian Federation,
5.0%, due 03/31/30 | | | 34 | |
Deutsche Bank(1) | | 12/20/07 | | $ | 600,000 | | 0.26 | % | | Russian Federation,
5.0%, due 03/31/30 | | | 75 | |
Morgan Stanley Capital Services, Inc.(1) | | 12/20/07 | | $ | 600,000 | | 0.26 | % | | Russian Federation,
5.0%, due 03/31/30 | | | 75 | |
Barclays Capital(1) | | 12/20/08 | | $ | 100,000 | | 0.72 | % | | Ukraine Government,
7.65%, due 06/11/13 | | | (76 | ) |
Barclays Capital(1) | | 12/20/08 | | $ | 300,000 | | 0.71 | % | | Ukraine Government,
7.65%, due 06/11/13 | | | (304 | ) |
Deutsche Bank(1) | | 12/20/08 | | $ | 300,000 | | 0.72 | % | | Ukraine Government,
7.65%, due 06/11/13 | | | (247 | ) |
| | | | | | | | | | | | | | |
| | | | | | | | | | | | $ | 286 | |
| | | | | | | | | | | | | | |
| (1) | Portfolio pays the counterparty par in the event that the underlying bond defaults and receives the fixed rate. |
See Notes to Financial Statements
| | |
| THE TARGET PORTFOLIO TRUST | | 123 |
| | |
Intermediate-Term Bond Portfolio (cont’d) | | Portfolio of Investments
As of December 31, 2006 |
The industry classification of portfolio holdings and other liabilities in excess of other assets shown as a percentage of net assets as of December 31, 2006 was as follows:
| | | |
Industry | | | |
U.S. Government Mortgage Backed Obligations | | 30.3 | % |
Commercial Paper | | 24.3 | |
Corporate Bonds | | 23.7 | |
Foreign Treasury Obligations | | 11.3 | |
Collateralized Mortgage Obligations | | 10.8 | |
Affiliated Money Market Mutual Fund | | 5.1 | |
U.S. Government Agency Obligations | | 4.3 | |
U.S. Treasury Obligations | | 4.0 | |
Foreign Government Bonds | | 2.4 | |
Asset-Backed Securities | | 0.5 | |
Municipal Bonds | | 0.4 | |
| | | |
| | 117.1 | |
Securities Sold Short | | (2.8 | ) |
Other liabilities in excess of other assets | | (14.3 | ) |
| | | |
| | 100.0 | % |
| | | |
See Notes to Financial Statements
| | |
| 124 | | THE TARGET PORTFOLIO TRUST |
| | |
Portfolio of Investments
As of December 31, 2006 | | Mortgage Backed Securities Portfolio |
| | | | | | |
PRINCIPAL
AMOUNT (000)# | | | DESCRIPTION | | VALUE (NOTE 1) |
| | | | | | |
| | | LONG-TERM INVESTMENTS—125.6% | | | |
| | |
| | | U.S. Government Mortgage Backed Obligations—96.8% | | | |
| 5,613 | | | Federal Home Loan Mortgage Corp.,
5.00%, 08/01/35-10/01/35 | | $ | 5,417,750 |
| 1,500 | | | 5.50%, 06/01/36 | | | 1,482,267 |
| 2,190 | | | 6.00%, 03/01/14-02/01/21 | | | 2,219,081 |
| 3,487 | | | 6.50%, 01/01/18-11/01/26 | | | 3,560,599 |
| 47 | | | 7.50%, 03/01/08-06/01/28 | | | 48,849 |
| 1 | | | 8.25%, 10/01/07-05/01/08 | | | 940 |
| 1 | | | 8.50%, 12/01/07 | | | 674 |
| 13 | | | 8.50%, 10/01/15-07/01/21 | | | 14,846 |
| 3 | | | 8.75%, 12/01/08 | | | 3,356 |
| 23 | | | 9.00%, 06/01/09-03/01/11 | | | 24,006 |
| 27 | | | 11.50%, 03/01/16 | | | 29,897 |
| 1,000 | | | Federal National Mortgage Assoc.,
6.00%, TBA | | | 1,013,750 |
| 1,250 | | | 6.50%, TBA | | | 1,273,437 |
| 2,298 | | | 4.50%, 03/01/35 | | | 2,152,846 |
| 1,808 | | | 5.00%, 08/01/35(k) | | | 1,746,323 |
| 7,000 | | | 5.00%, 11/01/18-08/01/35 | | | 6,796,297 |
| 10,550 | | | 5.50%, TBA | | | 10,424,719 |
| 9,108 | | | 5.50%, 06/01/33-06/01/34 | | | 9,015,181 |
| 847 | | | 5.78%, 11/01/11 | | | 864,108 |
| 6,246 | | | 6.00%, 04/01/14-08/01/34 | | | 6,311,516 |
| 43 | | | 6.047%, 03/01/12 | | | 44,768 |
| 3,971 | | | 6.50%, 05/01/14-09/01/34 | | | 4,061,095 |
| 7 | | | 6.815%, 10/01/07 | | | 7,501 |
| 58 | | | 7.00%, 09/01/11-07/01/12 | | | 58,556 |
| — | (r) | | 8.00%, 06/01/07 | | | 78 |
| 55 | | | 8.00%, 09/01/22-12/01/22 | | | 58,464 |
| — | (r) | | 8.50%, 01/01/07 | | | 57 |
| 9 | | | 9.75%, 08/01/10-11/01/16 | | | 9,886 |
| 2,500 | | | 6.00%, TBA | | | 2,516,405 |
| 623 | | | Government National Mortgage Assoc.,
4.50%, 09/15/33-10/15/33 | | | 588,297 |
| 943 | | | 5.00%, 04/15/35 | | | 917,332 |
| 3,777 | | | 5.50%, 05/15/35-09/15/35 | | | 3,758,263 |
| 322 | | | 6.00%, 07/15/24-08/15/24 | | | 327,598 |
| 4,955 | | | 6.50%, 09/15/21-02/15/35 | | | 5,081,849 |
| 2,163 | | | 7.00%, 11/15/31-03/15/36 | | | 2,235,220 |
| 59 | | | 7.50%, 09/15/11-12/20/23 | | | 60,692 |
| 1 | | | 8.00%, 05/15/30 | | | 689 |
| 628 | | | 8.00%, 01/15/08-11/15/30 | | | 663,721 |
| 54 | | | 8.25%, 06/20/17-07/20/17 | | | 57,203 |
| 56 | | | 8.50%, 04/20/17 | | | 59,589 |
| 91 | | | 9.00%, 09/15/08-01/15/20 | | | 96,722 |
See Notes to Financial Statements
| | |
| THE TARGET PORTFOLIO TRUST | | 125 |
| | |
Mortgage Backed Securities Portfolio (cont’d) | | Portfolio of Investments
As of December 31, 2006 |
| | | | | |
PRINCIPAL
AMOUNT (000)# | | DESCRIPTION | | VALUE (NOTE 1) |
| | | | | |
| | U.S. Government Mortgage Backed Obligations (cont’d.) | | | |
| 1 | | 9.50%, 06/15/20 | | $ | 1,060 |
| 39 | | 9.50%, 08/15/09-09/15/17 | | | 40,841 |
| 9 | | 13.50%, 05/15/11 | | | 9,780 |
| 12 | | 14.00%, 06/15/11 | | | 13,965 |
| 13 | | 16.00%, 05/15/12 | | | 15,487 |
| | | | | |
| | Total U.S. Government mortgage backed obligations
(cost $73,598,902) | | | 73,085,560 |
| | | | | |
| | |
| | Collateralized Mortgage Obligations—28.8% | | | |
| | Citigroup Mortgage Loan Trust, Inc.,
Series 2006-AR1, Class 3A1(c) | | | |
| 452 | | 5.50%, 03/25/36 | | | 450,559 |
| | Countrywide Alternative Loan Trust,
Series 2005-J11, Class 1A3 | | | |
| 1,916 | | 5.50%, 11/25/35 | | | 1,911,270 |
| | Series 2005-73CB, Class 1A7 | | | |
| 642 | | 5.50%, 01/25/36 | | | 641,291 |
| | Series 2005-85CB, Class 2A2 | | | |
| 1,755 | | 5.50%, 02/25/36 | | | 1,754,043 |
| | Countrywide Home Loan Mortgage, Pass Through Trust,
Series 2006-14, Class A3 | | | |
| 1,730 | | 6.25%, 09/25/36 | | | 1,738,753 |
| | Federal Home Loan Mortgage Corp., Pass Through Securities,
Series T-42, Class A-5 | | | |
| 277 | | 7.50%, 02/25/42 | | | 287,741 |
| | Federal Home Loan Mortgage Corp., | | | |
| | Series 83, Class Z | | | |
| 6 | | 9.00%, 10/15/20 | | | 6,040 |
| | Series 186, Class E | | | |
| 49 | | 6.00%, 08/15/21 | | | 48,796 |
| | Series 1058, Class H | | | |
| 14 | | 8.00%, 04/15/21 | | | 14,866 |
| | Series 1116, Class I | | | |
| 12 | | 5.50%, 08/15/21 | | | 12,449 |
| | Series 1120, Class L | | | |
| 56 | | 8.00%, 07/15/21 | | | 55,881 |
| | Series 1630, Class PJ | | | |
| 548 | | 6.00%, 05/15/23 | | | 548,907 |
| | Series 2627, Class BG | | | |
| 1,341 | | 3.25%, 06/15/17 | | | 1,262,782 |
| | Series 2753, Class PE | | | |
| 950 | | 5.00%, 04/15/32 | | | 916,972 |
| | Series 2809, Class UC | | | |
| 425 | | 4.00%, 06/15/19 | | | 384,195 |
See Notes to Financial Statements
| | |
| 126 | | THE TARGET PORTFOLIO TRUST |
| | | | | |
PRINCIPAL
AMOUNT (000)# | | DESCRIPTION | | VALUE (NOTE 1) |
| | | | | |
| | Collateralized Mortgage Obligations (cont’d.) | | | |
| | Series 2852, Class VI-IO | | | |
| 2,000 | | 5.00%, 06/15/24 | | $ | 158,831 |
| | Series 2882, Class YI-IO | | | |
| 1,104 | | 5.00%, 03/15/24 | | | 70,950 |
| | Series 2915, Class K1-IO | | | |
| 1,115 | | 5.00%, 06/15/24 | | | 76,148 |
| | Series 2995, Class ST-IO(c) | | | |
| 1,861 | | 1.40%, 05/15/29 | | | 89,411 |
| | Series 3237, Class SA-IO(c) | | | |
| 1,936 | | 1.30%, 11/15/36 | | | 94,132 |
| | Series G92-59, Class D | | | |
| 31 | | 6.00%, 10/15/20 | | | 30,674 |
| | Federal National Mortgage Assoc., | | | |
| | Series 56, Class 1 | | | |
| 19 | | 6.00%, 04/01/19 | | | 19,595 |
| | Series 352, Class 2 | | | |
| 834 | | 5.50%, 08/01/34 | | | 192,688 |
| | Series 353, Class 2 | | | |
| 1,010 | | 5.00%, 08/01/34 | | | 241,539 |
| | Series 354, Class 2 | | | |
| 1,057 | | 5.50%, 12/01/34 | | | 243,929 |
| | Series 1990-10, Class L | | | |
| 7 | | 8.50%, 02/25/20 | | | 7,399 |
| | Series 1990-108, Class G | | | |
| 21 | | 7.00%, 09/25/20 | | | 21,322 |
| | Series 1991-21, Class J | | | |
| 21 | | 7.00%, 03/25/21 | | | 21,502 |
| | Series 1992-61, Class ZB | | | |
| 7 | | 7.50%, 05/25/07 | | | 7,202 |
| | Series 1992-113, Class Z | | | |
| 43 | | 7.50%, 07/25/22 | | | 45,598 |
| | Series 1993-41, Class H | | | |
| 16 | | 7.00%, 03/25/23 | | | 33 |
| | Series 1993-223, Class ZA | | | |
| 276 | | 6.50%, 12/25/23 | | | 282,226 |
| | Series 1998-19, Class J | | | |
| 19 | | 8.50%, 07/25/18 | | | 19,697 |
| | Series 1998-M4, Class C | | | |
| 78 | | 6.527%, 05/25/30 | | | 78,128 |
| | Series 2001-51, Class QN | | | |
| 603 | | 6.00%, 10/25/16 | | | 610,589 |
| | Series 2003-33, Class PT | | | |
| 228 | | 4.50%, 05/25/33 | | | 219,112 |
| | Series 3144, Class J2 | | | |
| 151 | | 5.50%, 04/15/36 | | | 151,043 |
| | Series G-14, Class L | | | |
| 24 | | 8.50%, 06/25/21 | | | 25,270 |
See Notes to Financial Statements
| | |
| THE TARGET PORTFOLIO TRUST | | 127 |
| | |
Mortgage Backed Securities Portfolio (cont’d) | | Portfolio of Investments
As of December 31, 2006 |
| | | | | |
PRINCIPAL
AMOUNT (000)# | | DESCRIPTION | | VALUE (NOTE 1) |
| | | | | |
| | Collateralized Mortgage Obligations (cont’d.) | | | |
| | Series G92-24, Class Z | | | |
| 26 | | 6.50%, 04/25/22 | | $ | 26,901 |
| | Series G92-59, Class D | | | |
| 132 | | 6.00%, 10/25/22 | | | 134,168 |
| | Series G94-4, Class PG | | | |
| 317 | | 8.00%, 05/25/24 | | | 341,639 |
| | First Boston Mortgage Securities Corp., | | | |
| | Series B, Class IO | | | |
| 61 | | 8.985%, 04/25/17 | | | 14,673 |
| | Series B, Class PO | | | |
| 61 | | Zero Coupon, 04/25/17 | | | 51,358 |
| | Government National Mortgage Assoc., | | | |
| | Series 2006-35, Class LO-PO | | | |
| 342 | | Zero Coupon, 07/20/36 | | | 269,566 |
| | Series 2006-38, Class XS-IO(c) | | | |
| 1,933 | | 1.90%, 09/16/31 | | | 119,046 |
| | GSR Mortgage Loan Trust,
Series 2005-AR2, Class 1A2(c) | | | |
| 415 | | 4.595%, 04/25/35 | | | 411,318 |
| | Morgan Stanley Mortgage Loan Trust,
Series 2004-5AR, Class 3A4(c) | | | |
| 719 | | 4.402%, 07/25/34 | | | 707,842 |
| | Residential Asset Securitization Trust, | | | |
| | Series 2004-A3, Class A7 | | | |
| 750 | | 5.25%, 06/25/34 | | | 712,664 |
| | Series 2005-AR13, Class A1(c) | | | |
| 1,722 | | 5.50%, 07/25/35 | | | 1,664,919 |
| | Salomon Brothers Mortgage Securities,
Series 1986-1, Class A | | | |
| 24 | | 6.00%, 12/25/11 | | | 24,005 |
| | Wells Fargo Mortgage Backed Securities Trust, | | | |
| | Series 2005-AR13, Class A1(c) | | | |
| 1,500 | | 5.312%, 05/25/35 | | | 1,471,427 |
| | Series 2006-AR10, Class 5A2(c) | | | |
| 1,343 | | 5.607%, 07/25/36 | | | 1,341,949 |
| | Series 2006-AR5, Class 2A1(c) | | | |
| 1,350 | | 5.536%, 04/25/36 | | | 1,346,269 |
| | Series 2006-R8, Class 2A1(c) | | | |
| 361 | | 5.24%, 04/28/36 | | | 359,367 |
| | | | | |
| | Total collateralized mortgage obligations
(cost $21,540,101) | | | 21,738,674 |
| | | | | |
| | Total long-term investments
(cost $95,139,003) | | | 94,824,234 |
| | | | | |
See Notes to Financial Statements
| | |
| 128 | | THE TARGET PORTFOLIO TRUST |
| | | | | | |
| SHARES | | DESCRIPTION | | VALUE (NOTE 1) | |
| | | | | | |
| | SHORT-TERM INVESTMENTS—24.0% | | | | |
| | |
| | Affiliated Money Market Mutual Fund | | | | |
| 25,316 | | Dryden Core Investment Fund-Taxable Money Market Series
(cost $25,316; Note 3)(w) | | $ | 25,316 | |
| | | | | | |
PRINCIPAL
AMOUNT (000)# | | | | | |
| | |
| | Repurchase Agreement—23.3% | | | | |
| 17,600 | | BNP Paribas Tri-party Mortgage, 5.31%, dated 12/29/06, due 01/03/07 in the amount of $17,612,980 (cost $17,600,000; collateralized by $18,012,878 Federal National Mortgage Assoc.; 5.50%, 12/01/21, value of the collateral including accrued interest was $17,952,000) | | | 17,600,000 | |
| | | | | | |
CONTRACTS/
NOTIONAL
AMOUNT (000)# | | | | | |
| | |
| | OUTSTANDING OPTIONS PURCHASED*—0.7% | | | | |
| | |
| | Call Option—0.3% | | | | |
| 11,000 | | Swap on 3 Month LIBOR, expiring 12/26/07 @5.09% | | | 198,000 | |
| | | | | | |
| | |
| | Put Option—0.4% | | | | |
| 11,000 | | Swap on 3 Month LIBOR,
expiring 12/26/07 @5.09% | | | 279,400 | |
| | | | | | |
| | Total outstanding options purchased
(cost $471,900) | | | 477,400 | |
| | | | | | |
| | Total short-term investments
(cost $18,097,216) | | | 18,102,716 | |
| | | | | | |
| | Total investments, before outstanding options written and securities sold short—149.6%
(cost $113,236,219; Note 5) | | | 112,926,950 | |
| | | | | | |
PRINCIPAL
AMOUNT (000)# | | | | | |
| | |
| | SECURITIES SOLD SHORT—(26.5)% | | | | |
| | Federal Home Loan Mortgage Corp. | | | | |
| 2,700 | | 6.50%, TBA | | | (2,751,680 | ) |
| 1,000 | | Federal National Mortgage Assoc.
5.50%, TBA | | | (999,688 | ) |
| 2,000 | | 5.50%, TBA | | | (1,976,250 | ) |
| 4,500 | | 6.00%, TBA | | | (4,561,875 | ) |
| 3,500 | | 6.00%, TBA | | | (3,522,967 | ) |
| 2,400 | | 6.50%, TBA | | | (2,453,251 | ) |
| 3,750 | | Government National Mortgage Assoc.
5.50%, TBA | | | (3,731,250 | ) |
| | | | | | |
| | Total securities sold short
(proceeds received $20,076,062) | | | (19,996,961 | ) |
| | | | | | |
See Notes to Financial Statements
| | |
| THE TARGET PORTFOLIO TRUST | | 129 |
| | |
Mortgage Backed Securities Portfolio (cont’d) | | Portfolio of Investments
As of December 31, 2006 |
| | | | | | |
CONTRACTS/
NOTIONAL
AMOUNT (000)# | | DESCRIPTION | | VALUE (NOTE 1) | |
| | |
| | OUTSTANDING OPTIONS WRITTEN* | | | | |
| | |
| | Call Option | | | | |
| 1,000 | | Swap on 3 Month LIBOR,
expiring 01/20/07 @5.21% | | $ | (6,100 | ) |
| | | | | | |
| | |
| | Put Option | | | | |
| 1,000 | | Swap on 3 Month LIBOR,
expiring 01/20/07 @5.21% | | | (1,200 | ) |
| | | | | | |
| | Total outstanding options written
(premiums received $11,900) | | | (7,300 | ) |
| | | | | | |
| | Total Investments, Net of Outstanding Options Written and Securities Sold Short—123.1% | | | 92,922,689 | |
| | Other liabilities in excess of other assets(u)—(23.1)% | | | (17,451,846 | ) |
| | | | | | |
| | Net Assets—100% | | $ | 75,470,843 | |
| | | | | | |
The following abbreviations are used in portfolio descriptions:
TBA To Be Announced
| # | Principal amount is shown in U.S. dollars unless otherwise stated. |
| (c) | Indicates a variable rate security. |
| (k) | Securities segregated as collateral for futures contracts. |
| (w) | Prudential Investments LLC, the manager of the Portfolio also serves as manager of the Dryden Core Investment Fund-Taxable Money Market Series. |
| (u) | Other liabilities in excess of other assets includes net unrealized appreciation (depreciation) on futures contracts as follows: |
Open futures contracts outstanding at December 31, 2006:
| | | | | | | | | | | | | | |
Number of
Contracts | | Type | | Expiration
Date | | Value at
December 31, 2006 | | Value at
Trade Date | | Unrealized
Appreciation
(Depreciation) | |
| | Long Positions: | | | | | | | | | | | | |
| 50 | | 10 Year U.S. Treasury Notes | | Mar 07 | | $ | 5,373,437 | | $ | 5,438,656 | | $ | (65,219 | ) |
| 5 | | 30 Year U.S. Treasury Bonds | | Mar 07 | | | 557,188 | | | 564,188 | | | (7,000 | ) |
| | | | | | | | | | | | | | |
| | | | | | | | | | | | | (72,219 | ) |
| | | | | | | | | | | | | | |
| | Short Positions: | | | | | | | | | | | | |
| 14 | | U.S. Treasury 2 Year Notes | | Mar 07 | | | 2,856,438 | | | 2,866,938 | | | 10,500 | |
| | | | | | | | | | | | | | |
| | | | | | | | | | | | $ | (61,719 | ) |
| | | | | | | | | | | | | | |
See Notes to Financial Statements
| | |
| 130 | | THE TARGET PORTFOLIO TRUST |
The major asset category of portfolio holdings and other liabilities in excess of other assets shown as a percentage of net assets as of December 31, 2006 was as follows:
| | | |
U.S. Government Mortgage Backed Obligations | | 96.8 | % |
Collateralized Mortgage Obligations | | 28.8 | |
Short-Term Investments (Including Affiliated Money Market Mutual Fund of less than 0.05%) | | 24.0 | |
| | | |
| | 149.6 | |
Securities Sold Short and Outstanding Options Written | | (26.5 | ) |
Other liabilities in excess of other assets | | (23.1 | ) |
| | | |
| | 100.0 | % |
| | | |
See Notes to Financial Statements
| | |
| THE TARGET PORTFOLIO TRUST | | 131 |
| | |
U.S. Government Money Market Portfolio | | Portfolio of Investments
As of December 31, 2006 |
| | | | | | |
PRINCIPAL
AMOUNT (000) | | DESCRIPTION | | VALUE
(NOTE 1) |
| | | Federal Home Loan Bank—4.7% | | | |
| $ | 1,000 | | 3.50%, 02/28/07 | | $ | 997,040 |
| | 300 | | 4.885%, 03/05/07 | | | 299,763 |
| | 950 | | 5.375%, 02/15/07 | | | 950,675 |
| | | | | | |
| | | Total Federal Home Loan Bank
(cost $2,247,478) | | | 2,247,478 |
| | | | | | |
| | |
| | | Federal Home Loan Mortgage Association—11.6% | | | |
| | 1,000 | | 2.375%, 02/15/07 | | | 996,403 |
| | 1,180 | | 2.85%, 01/05/07 | | | 1,179,682 |
| | 499 | | 3.00%, 03/28/07 | | | 496,593 |
| | 615 | | 3.05%, 01/19/07 | | | 614,181 |
| | 1,000 | | 3.75%, 04/15/07 | | | 995,351 |
| | 1,200 | | 5.35%, 11/21/07 | | | 1,199,787 |
| | | | | | |
| | | Total Federal Home Loan Mortgage Association
(cost $5,481,997) | | | 5,481,997 |
| | | | | | |
| | |
| | | Federal National Mortgage Association—17.2% | | | |
| | 1,250 | | 2.375%, 02/15/07 | | | 1,245,338 |
| | 2,500 | | 2.71%, 01/30/07 | | | 2,494,812 |
| | 400 | | 3.00%, 01/12/07 | | | 399,713 |
| | 1,000 | | 4.00%, 02/22/07 | | | 998,622 |
| | 325 | | 4.25%, 07/15/07 | | | 322,997 |
| | 850 | | 4.60%, 11/01/07 | | | 844,751 |
| | 822 | | 5.00%, 01/15/07 | | | 821,827 |
| | 1,000 | | 5.25%, 04/27/07 | | | 983,765 |
| | | | | | |
| | | Total Federal National Mortgage Association
(cost $8,111,825) | | | 8,111,825 |
| | | | | | |
| | | Repurchase Agreements—66.4% | | | |
| | 10,900 | | Deutsche 5.30% dated 12/29/06, due 01/02/07 in the amount of $10,906,419 (cost $10,900,000; collateralized by Federal Agency Obligations. The value of the collateral including accrued interest was $11,118,000) | | | 10,900,000 |
| | 9,200 | | Goldman 5.35% dated 12/29/06, due 01/02/07 in the amount of $9,205,468.89 (cost $9,200,000; collateralized by $9,275,000 Federal Home Loan Mortgage Corp.,4.875%, 03/05/08 value of collateral including accrued interest was $9,386,277) | | | 9,200,000 |
| | 11,300 | | Paribas Triparty 5.31% dated 12/29/06, due 01/02/07 in the amount of $11,300,000 (cost $11,300,000; collateralized by $11,565,086 Federal National Mortgage Corp.,5.50%,12/01/21 value of collateral including accrued interest was $11,526,000) | | | 11,300,000 |
| | | | | | |
| | | Total Repurchase Agreements
(cost $31,400,000) | | | 31,400,000 |
| | | | | | |
See Notes to Financial Statements
| | |
| 132 | | THE TARGET PORTFOLIO TRUST |
| | | | | | |
SHARES | | DESCRIPTION | | VALUE
(NOTE 1) | |
| | Affiliated Money Market Mutual Fund—0.1% | | | | |
| 51,877 | | Dryden Core Investment Fund -Taxable Money Market Series
(cost $51,877; Note 3)(w) | | $ | 51,877 | |
| | | | | | |
| | Total Investments(h)—100.0%
(amortized cost $47,293,177) | | | 47,293,177 | |
| | Liabilities in excess of other assets | | | (18,351 | ) |
| | | | | | |
| | Net Assets—100% | | $ | 47,274,826 | |
| | | | | | |
| (h) | Federal income tax basis is the same as for financial reporting purposes. |
| (w) | Prudential Investments LLC, the manager of the Portfolio also serves as manager of the Dryden Core Investment Fund-Taxable Money Market Series. |
The industry classification of portfolio holdings and liabilities in excess of other assets shown as a percentage of net assets as of December 31, 2006 were as follows:
| | | |
Repurchase Agreements | | 66.4 | % |
Federal National Mortgage Association | | 17.2 | |
Federal Home Loan Mortgage Association | | 11.6 | |
Federal Home Loan Bank | | 4.7 | |
Affiliated Money Market Mutual Fund | | 0.1 | |
| | | |
| | 100.0 | |
Liabilities in excess of other assets | | — | |
| | | |
| | 100.0 | % |
| | | |
See Notes to Financial Statements
| | |
| THE TARGET PORTFOLIO TRUST | | 133 |
Statements of Assets and Liabilities December 31, 2006
| | | | | | | | | |
| | | LARGE CAPITALIZATION GROWTH PORTFOLIO | | LARGE CAPITALIZATION VALUE PORTFOLIO | | SMALL CAPITALIZATION GROWTH PORTFOLIO |
| | | |
| ASSETS | | | | | | | | | |
Investments, at value(G): | | | | | | | | | |
Unaffiliated investments(A) | | $ | 302,526,992 | | $ | 393,115,733 | | $ | 132,557,751 |
Affiliated investments(B) | | | 5,658,842 | | | 11,720,989 | | | 39,317,465 |
Repurchase agreements(C) | | | — | | | — | | | — |
Cash | | | 5,915 | | | 481,494 | | | — |
Foreign currency, at value(D) | | | — | | | — | | | — |
Receivable for Trust shares sold | | | 227,291 | | | 194,818 | | | 95,358 |
Dividends and interest receivable | | | 280,154 | | | 729,622 | | | 88,957 |
Prepaid expenses and other assets | | | 10,898 | | | 16,253 | | | 5,804 |
Receivable for investments sold | | | 1,291,921 | | | 120,012 | | | 377,194 |
Receivable for foreign tax reclaim | | | — | | | — | | | — |
Premium for swaps purchased | | | — | | | — | | | — |
Unrealized appreciation on swaps | | | — | | | — | | | — |
Unrealized appreciation on forward currency contracts | | | — | | | — | | | — |
Total assets | | | 310,002,013 | | | 406,378,921 | | | 172,442,529 |
| | | |
| LIABILITIES | | | | | | | | | |
Collateral for securities on loan | | | 5,507,790 | | | 9,608,073 | | | 33,913,062 |
Payable for Trust shares reacquired | | | 294,904 | | | 349,451 | | | 117,461 |
Payable for investments purchased | | | — | | | 712,554 | | | 726,878 |
Accrued expenses and other liabilities | | | 229,835 | | | 131,976 | | | 177,903 |
Management fee payable | | | 154,987 | | | 200,217 | | | 70,462 |
Transfer agent fee payable | | | 19,350 | | | 58,685 | | | 25,014 |
Deferred trustees’ fees | | | 12,464 | | | 12,398 | | | 12,088 |
Distribution fee payable | | | 583 | | | 593 | | | 244 |
Payable to custodian | | | — | | | — | | | 79,214 |
Loan payable | | | — | | | — | | | — |
Interest payable | | | — | | | — | | | — |
Dividends payable | | | — | | | — | | | — |
Due to broker for variation margin | | | — | | | — | | | — |
Outstanding options written(E) | | | — | | | — | | | — |
Premium for swaps written | | | — | | | — | | | — |
Unrealized depreciation on swaps | | | — | | | — | | | — |
Unrealized depreciation on forward currency contracts | | | — | | | — | | | — |
Securities sold short, at value(F) | | | — | | | — | | | — |
Total liabilities | | | 6,219,913 | | | 11,073,947 | | | 35,122,326 |
| | | |
| NET ASSETS | | $ | 303,782,100 | | $ | 395,304,974 | | $ | 137,320,203 |
See Notes to Financial Statements
| | |
| 134 | | THE TARGET PORTFOLIO TRUST |
Statements of Assets and Liabilities December 31, 2006 (cont’d)
| | | | | | | | | | | |
| | | LARGE CAPITALIZATION GROWTH PORTFOLIO | | LARGE CAPITALIZATION VALUE PORTFOLIO | | | SMALL CAPITALIZATION GROWTH PORTFOLIO | |
Net assets were comprised of:
Shares of beneficial interest, at par | | $ | 19,822 | | $ | 25,333 | | | $ | 11,309 | |
Paid-in capital, in excess of par | | | 254,767,763 | | | 310,467,144 | | | | 140,814,371 | |
| | | 254,787,585 | | | 310,492,477 | | | | 140,825,680 | |
Undistributed net investment income (loss) | | | 4,354 | | | (824 | ) | | | (12,088 | ) |
Accumulated net realized gains (losses) | | | 2,311,096 | | | 2,807,808 | | | | (25,299,728 | ) |
Net unrealized appreciation (depreciation) | | | 46,679,065 | | | 82,005,513 | | | | 21,806,339 | |
Net assets, December 31, 2006 | | $ | 303,782,100 | | $ | 395,304,974 | | | $ | 137,320,203 | |
| | | |
(A) Identified cost of unaffiliated investments | | $ | 255,847,927 | | $ | 311,110,220 | | | $ | 110,751,412 | |
(B) Identified cost of affiliated investments | | $ | 5,658,842 | | $ | 11,720,989 | | | $ | 39,317,465 | |
(C) Identified cost of repurchase agreements | | $ | — | | $ | — | | | $ | — | |
(D) Identified cost of currency | | $ | — | | $ | — | | | $ | — | |
(E) Premiums received from options written | | $ | — | | $ | — | | | $ | — | |
(F) Proceeds received from short sales | | $ | — | | $ | — | | | $ | — | |
(G) Including securities on loan of | | $ | 5,204,156 | | $ | 9,176,651 | | | $ | 31,953,034 | |
| | | |
| NET ASSET VALUE: | | | | | | | | | | | |
Class R: Net Assets | | $ | 2,215,849 | | $ | 2,193,664 | | | $ | 897,893 | |
Shares Outstanding | | | 144,713 | | | 140,659 | | | | 74,105 | |
Net asset value, offering price and redemption price per share | | $ | 15.31 | | $ | 15.60 | | | $ | 12.12 | |
Class T: Net Assets | | $ | 301,566,251 | | $ | 393,111,310 | | | $ | 136,422,310 | |
Shares Outstanding | | | 19,676,974 | | | 25,192,716 | | | | 11,234,859 | |
Net asset value, offering price and redemption price per share | | $ | 15.33 | | $ | 15.60 | | | $ | 12.14 | |
See Notes to Financial Statements
| | |
| THE TARGET PORTFOLIO TRUST | | 135 |
Statements of Assets and Liabilities December 31, 2006 (cont’d)
| | | | | | | | | |
| | | SMALL CAPITALIZATION VALUE PORTFOLIO | | INTERNATIONAL EQUITY PORTFOLIO | | INTERNATIONAL BOND PORTFOLIO |
| | | |
| ASSETS | | | | | | | | | |
Investments, at value(G): | | | | | | | | | |
Unaffiliated investments(A) | | $ | 306,252,867 | | $ | 269,086,424 | | $ | 80,364,990 |
Affiliated investments(B) | | | 72,708,433 | | | 1,202,528 | | | 1,132,413 |
Repurchase agreements(C) | | | — | | | — | | | — |
Cash | | | 390,751 | | | — | | | 46,127 |
Foreign currency, at value(D) | | | — | | | 2,345,604 | | | 653,183 |
Receivable for Trust shares sold | | | 390,524 | | | 86,625 | | | 21,115 |
Dividends and interest receivable | | | 441,761 | | | 241,848 | | | 835,331 |
Prepaid expenses and other assets | | | 8,380 | | | 6,228 | | | 969 |
Receivable for investments sold | | | 542,851 | | | 534,707 | | | 24,947,011 |
Receivable for foreign tax reclaim | | | — | | | 533,851 | | | — |
Premium for swaps purchased | | | — | | | — | | | — |
Unrealized appreciation on swaps | | | — | | | — | | | 427,681 |
Unrealized appreciation on forward currency contracts | | | — | | | — | | | 396,150 |
Total assets | | | 380,735,567 | | | 274,037,815 | | | 108,824,970 |
| | | |
| LIABILITIES | | | | | | | | | |
Collateral for securities on loan | | | 55,446,340 | | | — | | | — |
Payable for Trust shares reacquired | | | 296,984 | | | 240,133 | | | 138,860 |
Payable for investments purchased | | | 2,741,170 | | | 1,403,058 | | | 54,039,238 |
Accrued expenses and other liabilities | | | 235,413 | | | 322,672 | | | 197,037 |
Management fee payable | | | 163,416 | | | 157,109 | | | 17,539 |
Transfer agent fee payable | | | 45,476 | | | 15,258 | | | 8,500 |
Deferred trustees’ fees | | | 12,193 | | | 12,189 | | | 11,914 |
Distribution fee payable | | | 288 | | | 462 | | | — |
Payable to custodian | | | — | | | 107,353 | | | — |
Loan payable | | | — | | | 1,150,000 | | | — |
Interest payable | | | — | | | 1,305 | | | — |
Dividends payable | | | — | | | — | | | — |
Due to broker for variation margin | | | 6,100 | | | — | | | 22,247 |
Outstanding options written(E) | | | — | | | — | | | 17,896 |
Premium for swaps written | | | — | | | — | | | 91,258 |
Unrealized depreciation on swaps | | | — | | | — | | | 278,730 |
Unrealized depreciation on forward currency contracts | | | — | | | 586,124 | | | 29,460 |
Securities sold short, at value(F) | | | — | | | — | | | 13,027,869 |
Total liabilities | | | 58,947,380 | | | 3,995,663 | | | 67,880,548 |
| | | |
| NET ASSETS | | $ | 321,788,187 | | $ | 270,042,152 | | $ | 40,944,422 |
See Notes to Financial Statements
| | |
| 136 | | THE TARGET PORTFOLIO TRUST |
Statements of Assets and Liabilities December 31, 2006 (cont’d)
| | | | | | | | | | |
| | | SMALL CAPITALIZATION VALUE PORTFOLIO | | INTERNATIONAL EQUITY PORTFOLIO | | INTERNATIONAL BOND PORTFOLIO | |
Net assets were comprised of:
Shares of beneficial interest, at par | | $ | 15,717 | | $ | 16,652 | | $ | 4,979 | |
Paid-in capital, in excess of par | | | 255,837,755 | | | 203,032,718 | | | 40,972,204 | |
| | | 255,853,472 | | | 203,049,370 | | | 40,977,183 | |
Undistributed net investment income (loss) | | | 74,655 | | | 91,087 | | | (2,198,545 | ) |
Accumulated net realized gains (losses) | | | 1,556,934 | | | 2,750,911 | | | (249,291 | ) |
Net unrealized appreciation (depreciation) | | | 64,303,126 | | | 64,150,784 | | | 2,415,075 | |
Net assets, December 31, 2006 | | $ | 321,788,187 | | $ | 270,042,152 | | $ | 40,944,422 | |
| | | |
(A) Identified cost of unaffiliated investments | | $ | 241,941,841 | | $ | 204,430,510 | | $ | 78,499,032 | |
(B) Identified cost of affiliated investments | | $ | 72,708,433 | | $ | 1,202,528 | | $ | 1,132,413 | |
(C) Identified cost of repurchase agreements | | $ | — | | $ | — | | $ | — | |
(D) Identified cost of currency | | $ | — | | $ | 2,334,008 | | $ | 655,227 | |
(E) Premiums received from options written | | $ | — | | $ | — | | $ | 27,838 | |
(F) Proceeds received from short sales | | $ | — | | $ | — | | $ | 13,133,359 | |
(G) Including securities on loan of | | $ | 52,881,413 | | $ | — | | $ | — | |
| | | |
| NET ASSET VALUE: | | | | | | | | | | |
Class R: Net Assets | | $ | 1,060,616 | | $ | 1,728,295 | | $ | — | |
Shares Outstanding | | | 51,844 | | | 106,644 | | | — | |
Net asset value, offering price and redemption price per share | | $ | 20.46 | | $ | 16.21 | | $ | — | |
Class T: Net Assets | | $ | 320,727,571 | | $ | 268,313,857 | | $ | 40,944,422 | |
Shares Outstanding | | | 15,664,769 | | | 16,545,118 | | | 4,978,631 | |
Net asset value, offering price and redemption price per share | | $ | 20.47 | | $ | 16.22 | | $ | 8.22 | |
See Notes to Financial Statements
| | |
| THE TARGET PORTFOLIO TRUST | | 137 |
Statements of Assets and Liabilities December 31, 2006 (cont’d)
| | | | | | | | | | | | |
| | | TOTAL RETURN BOND PORTFOLIO | | INTERMEDIATE-
TERM BOND
PORTFOLIO | | MORTGAGE BACKED SECURITIES PORTFOLIO | | U.S.
GOVERNMENT MONEY
MARKET
PORTFOLIO |
| | | | |
| ASSETS | | | | | | | | | | | | |
Investments, at value(G): | | | | | | | | | | | | |
Unaffiliated investments(A) | | $ | 229,592,903 | | $ | 274,525,886 | | $ | 95,301,634 | | $ | 15,841,300 |
Affiliated investments(B) | | | 3,345,440 | | | 12,572,196 | | | 25,316 | | | 51,877 |
Repurchase agreements(C) | | | 3,000,000 | | | — | | | 17,600,000 | | | 31,400,000 |
Cash | | | — | | | 598,192 | | | — | | | — |
Foreign currency, at value(D) | | | 3,161,543 | | | 1,401,717 | | | — | | | — |
Receivable for Trust shares sold | | | 369,412 | | | 50,436 | | | 34,459 | | | 102,142 |
Dividends and interest receivable | | | 1,624,449 | | | 1,732,495 | | | 328,625 | | | 187,379 |
Prepaid expenses and other assets | | | 5,445 | | | 9,426 | | | 5,074 | | | 2,425 |
Receivable for investments sold | | | 73,955,966 | | | 6,917,969 | | | 26,640,515 | | | — |
Receivable for foreign tax reclaim | | | — | | | — | | | — | | | — |
Premium for swaps purchased | | | — | | | 335,849 | | | — | | | — |
Unrealized appreciation on swaps | | | 350,144 | | | 1,322 | | | — | | | — |
Unrealized appreciation on forward currency contracts | | | 36,599 | | | — | | | — | | | — |
Total assets | | | 315,441,901 | | | 298,145,488 | | | 139,935,623 | | | 47,585,123 |
| | | | |
| LIABILITIES | | | | | | | | | | | | |
Reverse repurchase agreement | | | — | | | — | | | 18,694,000 | | | — |
Payable for Trust shares reacquired | | | 236,418 | | | 371,752 | | | 37,937 | | | 90,205 |
Payable for investments purchased | | | 97,820,936 | | | 44,596,203 | | | 25,367,886 | | | — |
Accrued expenses and other liabilities | | | 126,764 | | | 192,875 | | | 236,891 | | | 105,465 |
Management fee payable | | | 64,434 | | | 94,531 | | | 28,960 | | | 9,446 |
Transfer agent fee payable | | | 28,360 | | | 78,132 | | | 71,182 | | | 55,431 |
Deferred trustees’ fees | | | 12,094 | | | 12,457 | | | 12,020 | | | 11,989 |
Distribution fee payable | | | 385 | | | — | | | — | | | — |
Payable to custodian | | | 1,963,076 | | | — | | | 5,915 | | | 37,644 |
Loan payable | | | — | | | — | | | — | | | — |
Interest payable | | | — | | | — | | | — | | | — |
Dividends payable | | | 496 | | | 1,140 | | | 103 | | | 117 |
Due to broker for variation margin | | | 9,993 | | | 54,485 | | | 5,625 | | | — |
Outstanding options written(E) | | | 246,830 | | | 9,630 | | | 7,300 | | | — |
Premium for swaps written | | | 335,968 | | | — | | | — | | | — |
Unrealized depreciation on swaps | | | 480,394 | | | 504,840 | | | — | | | — |
Unrealized depreciation on forward currency contracts | | | 174,718 | | | 126,785 | | | — | | | — |
Securities sold short, at value(F) | | | 45,283,936 | | | 6,879,684 | | | 19,996,961 | | | — |
Total liabilities | | | 146,784,802 | | | 52,922,514 | | | 64,464,780 | | | 310,297 |
| | | | |
| NET ASSETS | | $ | 168,657,099 | | $ | 245,222,974 | | $ | 75,470,843 | | $ | 47,274,826 |
See Notes to Financial Statements
| | |
| 138 | | THE TARGET PORTFOLIO TRUST |
Statements of Assets and Liabilities December 31, 2006 (cont’d)
| | | | | | | | | | | | | | | | |
| | | TOTAL RETURN BOND PORTFOLIO | | | INTERMEDIATE-
TERM BOND
PORTFOLIO | | | MORTGAGE BACKED SECURITIES PORTFOLIO | | | U.S.
GOVERNMENT MONEY
MARKET
PORTFOLIO | |
Net assets were comprised of:
Shares of beneficial interest, at par | | $ | 16,257 | | | $ | 24,217 | | | $ | 7,555 | | | $ | 47,275 | |
Paid-in capital, in excess of par | | | 171,178,443 | | | | 250,981,926 | | | | 79,257,437 | | | | 47,227,862 | |
| | | 171,194,700 | | | | 251,006,143 | | | | 79,264,992 | | | | 47,275,137 | |
Undistributed net investment income (loss) | | | (1,213,519 | ) | | | (515,087 | ) | | | (12,123 | ) | | | 2,586 | |
Accumulated net realized gains (losses) | | | (1,305,180 | ) | | | (4,354,574 | ) | | | (3,494,739 | ) | | | (2,897 | ) |
Net unrealized appreciation (depreciation) | | | (18,902 | ) | | | (913,508 | ) | | | (287,287 | ) | | | — | |
Net assets, December 31, 2006 | | $ | 168,657,099 | | | $ | 245,222,974 | | | $ | 75,470,843 | | | $ | 47,274,826 | |
| | | | |
(A) Identified cost of unaffiliated investments | | $ | 229,509,646 | | | $ | 274,611,031 | | | $ | 95,610,903 | | | $ | 15,841,300 | |
(B) Identified cost of affiliated investments | | $ | 3,345,440 | | | $ | 12,572,196 | | | $ | 25,316 | | | $ | 51,877 | |
(C) Identified cost of repurchase agreements | | $ | 3,000,000 | | | $ | — | | | $ | 17,600,000 | | | $ | 31,400,000 | |
(D) Identified cost of currency | | $ | 3,129,776 | | | $ | 1,338,698 | | | $ | — | | | $ | — | |
(E) Premiums received from options written | | $ | 165,270 | | | $ | 30,215 | | | $ | 11,900 | | | $ | — | |
(F) Proceeds received from short sales | | $ | 45,726,009 | | | $ | 6,917,969 | | | $ | 20,076,062 | | | $ | — | |
(G) Including securities on loan of | | $ | — | | | $ | — | | | $ | — | | | $ | — | |
| | | | |
| NET ASSET VALUE: | | | | | | | | | | | | | | | | |
Class R: Net Assets | | $ | 1,502,840 | | | $ | — | | | $ | — | | | $ | — | |
Shares Outstanding | | | 145,720 | | | | — | | | | — | | | | — | |
Net asset value, offering price and redemption price per share | | $ | 10.31 | | | $ | — | | | $ | — | | | $ | — | |
Class T: Net Assets | | $ | 167,154,259 | | | $ | 245,222,974 | | | $ | 75,470,843 | | | $ | 47,274,826 | |
Shares Outstanding | | | 16,110,980 | | | | 24,216,607 | | | | 7,554,883 | | | | 47,275,344 | |
Net asset value, offering price and redemption price per share | | $ | 10.38 | | | $ | 10.13 | | | $ | 9.99 | | | $ | 1.00 | |
See Notes to Financial Statements
| | |
| THE TARGET PORTFOLIO TRUST | | 139 |
Statements of Operations
Year Ended December 31, 2006
| | | | | | | | | | | | |
| | | LARGE
CAPITALIZATION
GROWTH
PORTFOLIO | | | LARGE
CAPITALIZATION
VALUE
PORTFOLIO | | | SMALL
CAPITALIZATION
GROWTH
PORTFOLIO | |
| NET INVESTMENT INCOME (LOSS) | | | | | | | | | | | | |
Income | | | | | | | | | | | | |
Unaffiliated dividend income | | $ | 3,717,120 | | | $ | 9,138,489 | | | $ | 361,612 | |
Affiliated dividend income | | | 116,402 | | | | 157,636 | | | | 240,125 | |
Less: Foreign withholding taxes | | | (55,649 | ) | | | (2,303 | ) | | | — | |
Unaffiliated interest | | | 410 | | | | 430 | | | | 3,306 | |
Affiliated income from securities lending, net | | | 17,292 | | | | 1,790 | | | | 28,789 | |
Total income | | | 3,795,575 | | | | 9,296,042 | | | | 633,832 | |
Expenses | | | | | | | | | | | | |
Management fee | | | 1,798,511 | | | | 2,228,473 | | | | 843,337 | |
Interest expense (Note 7) | | | 1,742 | | | | — | | | | — | |
Distribution fee—Class R | | | 775 | | | | 804 | | | | 337 | |
Transfer agent’s fees and expenses(a) | | | 212,000 | | | | 193,000 | | | | 150,000 | |
Custodian’s fees and expenses | | | 94,000 | | | | 77,000 | | | | 64,000 | |
Reports to shareholders | | | 25,000 | | | | 41,000 | | | | 11,000 | |
Registration fees | | | 30,000 | | | | 33,000 | | | | 23,000 | |
Legal fees | | | 20,000 | | | | 24,000 | | | | 17,000 | |
Trustees’ fees | | | 18,000 | | | | 15,000 | | | | 12,000 | |
Audit fees | | | 22,000 | | | | 17,000 | | | | 18,000 | |
Miscellaneous | | | 35,032 | | | | 32,524 | | | | 41,733 | |
Total expenses | | | 2,257,060 | | | | 2,661,801 | | | | 1,180,407 | |
| Net investment income (loss) | | | 1,538,515 | | | | 6,634,241 | | | | (546,575 | ) |
| REALIZED AND UNREALIZED GAIN (LOSS) ON INVESTMENTS AND FOREIGN CURRENCIES | | | | | | | | | | | | |
Net realized gain (loss) on: | | | | | | | | | | | | |
Investment transactions | | | 8,314,481 | | | | 23,505,886 | | | | 9,674,494 | |
Futures transactions | | | — | | | | — | | | | — | |
Foreign currency transactions | | | 68 | | | | — | | | | — | |
Options written transactions | | | — | | | | — | | | | — | |
Swap transactions | | | — | | | | — | | | | — | |
Short sale transactions | | | — | | | | — | | | | — | |
| Total net realized gain (loss) | | | 8,314,549 | | | | 23,505,886 | | | | 9,674,494 | |
Net change in unrealized appreciation (depreciation) on: | | | | | | | | | | | | |
Investments | | | 14,990,354 | | | | 36,230,197 | | | | 1,412,805 | |
Futures | | | — | | | | — | | | | — | |
Foreign currencies | | | — | | | | — | | | | — | |
Options written | | | — | | | | — | | | | — | |
Swaps | | | — | | | | — | | | | — | |
Short sales | | | — | | | | — | | | | — | |
| Net change in unrealized appreciation (depreciation) | | | 14,990,354 | | | | 36,230,197 | | | | 1,412,805 | |
| Net gain (loss) | | | 23,304,903 | | | | 59,736,083 | | | | 11,087,299 | |
| NET INCREASE (DECREASE) IN NET ASSETS RESULTING FROM OPERATIONS | | $ | 24,843,418 | | | $ | 66,370,324 | | | $ | 10,540,724 | |
a) Including affiliated expense of | | $ | 168,000 | | | $ | 191,000 | | | $ | 148,000 | |
See Notes to Financial Statements
| | |
| 140 | | THE TARGET PORTFOLIO TRUST |
Statements of Operations
Year Ended December 31, 2006 (cont’d)
| | | | | | | | | | | | |
| | | SMALL
CAPITALIZATION
VALUE
PORTFOLIO | | | INTERNATIONAL
EQUITY
PORTFOLIO | | | INTERNATIONAL
BOND
PORTFOLIO | |
| NET INVESTMENT INCOME (LOSS) | | | | | | | | | | | | |
Income | | | | | | | | | | | | |
Unaffiliated dividend income | | $ | 5,179,322 | | | $ | 7,030,883 | | | $ | — | |
Affiliated dividend income | | | 517,939 | | | | 51,575 | | | | 39,509 | |
Less: Foreign withholding taxes | | | (6,937 | ) | | | (484,414 | ) | | | (118 | ) |
Unaffiliated interest | | | — | | | | 6,712 | | | | 1,408,389 | |
Affiliated income from securities lending, net | | | 12,014 | | | | — | | | | — | |
Total income | | | 5,702,338 | | | | 6,604,756 | | | | 1,447,780 | |
Expenses | | | | | | | | | | | | |
Management fee | | | 1,743,499 | | | | 1,740,876 | | | | 205,867 | |
Interest expense (Note 7) | | | — | | | | 6,199 | | | | — | |
Distribution fee—Class R | | | 392 | | | | 626 | | | | — | |
Transfer agent’s fees and expenses(a) | | | 271,000 | | | | 180,000 | | | | 66,000 | |
Custodian’s fees and expenses | | | 122,000 | | | | 218,000 | | | | 90,000 | |
Reports to shareholders | | | 42,000 | | | | 25,000 | | | | 26,000 | |
Registration fees | | | 39,000 | | | | 25,000 | | | | 16,000 | |
Legal fees | | | 30,000 | | | | 24,000 | | | | 27,000 | |
Trustees’ fees | | | 15,000 | | | | 15,000 | | | | 12,000 | |
Audit fees | | | 18,000 | | | | 23,000 | | | | 26,000 | |
Miscellaneous | | | 30,245 | | | | 49,354 | | | | 23,099 | |
Total expenses | | | 2,311,136 | | | | 2,307,055 | | | | 491,966 | |
| Net investment income (loss) | | | 3,391,202 | | | | 4,297,701 | | | | 955,814 | |
| REALIZED AND UNREALIZED GAIN (LOSS) ON INVESTMENTS AND FOREIGN CURRENCIES | | | | | | | | | | | | |
Net realized gain (loss) on: | | | | | | | | | | | | |
Investment transactions | | | 20,392,466 | | | | 25,759,105 | | | | (187,514 | ) |
Futures transactions | | | 28,805 | | | | — | | | | (60,090 | ) |
Foreign currency transactions | | | — | | | | (1,105,162 | ) | | | (1,968,246 | ) |
Options written transactions | | | — | | | | — | | | | 25,770 | |
Swap transactions | | | — | | | | — | | | | 102,762 | |
Short sale transactions | | | — | | | | — | | | | 96,025 | |
| Total net realized gain (loss) | | | 20,421,271 | | | | 24,653,943 | | | | (1,991,293 | ) |
Net change in unrealized appreciation (depreciation) on: | | | | | | | | | | | | |
Investments | | | 22,628,429 | | | | 35,083,130 | | | | 816,608 | |
Futures | | | (7,900 | ) | | | — | | | | (89,780 | ) |
Foreign currencies | | | — | | | | (651,139 | ) | | | 581,712 | |
Options written | | | — | | | | — | | | | 13,299 | |
Swaps | | | — | | | | — | | | | 604,742 | |
Short sales | | | — | | | | — | | | | (48,339 | ) |
| Net change in unrealized appreciation (depreciation) | | | 22,620,529 | | | | 34,431,991 | | | | 1,878,242 | |
| Net gain (loss) | | | 43,041,800 | | | | 59,085,934 | | | | (113,051 | ) |
| NET INCREASE (DECREASE) IN NET ASSETS RESULTING FROM OPERATIONS | | $ | 46,433,002 | | | $ | 63,383,635 | | | $ | 842,763 | |
a) Including affiliated expense of | | $ | 268,000 | | | $ | 131,000 | | | $ | 65,000 | |
See Notes to Financial Statements
| | |
| THE TARGET PORTFOLIO TRUST | | 141 |
Statements of Operations
Year Ended December 31, 2006 (cont’d)
| | | | | | | | | | | | | | | | |
| | | TOTAL RETURN
BOND
PORTFOLIO | | | INTERMEDIATE-
TERM BOND
PORTFOLIO | | | MORTGAGE
BACKED
SECURITIES
PORTFOLIO | | | U.S.
GOVERNMENT
MONEY
MARKET
PORTFOLIO | |
| NET INVESTMENT INCOME (LOSS) | | | | | | | | | | | | | | | | |
Income | | | | | | | | | | | | | | | | |
Unaffiliated dividend income | | $ | 145,899 | | | $ | 275,120 | | | $ | — | | | $ | — | |
Affiliated dividend income | | | 199,701 | | | | 356,160 | | | | 6,845 | | | | 2,314 | |
Less: Foreign withholding taxes | | | — | | | | — | | | | — | | | | — | |
Unaffiliated interest | | | 7,617,632 | | | | 11,493,154 | | | | 4,916,766 | | | | 2,371,504 | |
Affiliated income from securities lending, net | | | — | | | | — | | | | — | | | | — | |
Total income | | | 7,963,232 | | | | 12,124,434 | | | | 4,923,611 | | | | 2,373,818 | |
Expenses | | | | | | | | | | | | | | | | |
Management fee | | | 732,265 | | | | 1,122,194 | | | | 348,528 | | | | 119,965 | |
Interest expense (Note 7) | | | 495 | | | | 660 | | | | 739,695 | | | | — | |
Distribution fee—Class R | | | 446 | | | | — | | | | — | | | | — | |
Transfer agent’s fees and expenses(a) | | | 150,000 | | | | 174,000 | | | | 92,000 | | | | 61,000 | |
Custodian’s fees and expenses | | | 106,000 | | | | 150,000 | | | | 144,000 | | | | 61,000 | |
Reports to shareholders | | | 20,000 | | | | 30,000 | | | | 28,000 | | | | 20,000 | |
Registration fees | | | 20,000 | | | | 20,000 | | | | 32,000 | | | | 16,000 | |
Legal fees | | | 25,000 | | | | 27,000 | | | | 28,000 | | | | 12,000 | |
Trustees’ fees | | | 13,000 | | | | 14,000 | | | | 9,000 | | | | 12,000 | |
Audit fees | | | 20,000 | | | | 23,000 | | | | 21,000 | | | | 15,000 | |
Miscellaneous | | | 20,365 | | | | 33,950 | | | | 24,008 | | | | 18,246 | |
Total expenses | | | 1,107,571 | | | | 1,594,804 | | | | 1,466,231 | | | | 335,211 | |
| Net investment income (loss) | | | 6,855,661 | | | | 10,529,630 | | | | 3,457,380 | | | | 2,038,607 | |
| REALIZED AND UNREALIZED GAIN (LOSS) ON INVESTMENTS AND FOREIGN CURRENCIES | | | | | | | | | | | | | | | | |
Net realized gain (loss) on: | | | | | | | | | | | | | | | | |
Investment transactions | | | (112,690 | ) | | | (605,503 | ) | | | (1,020,583 | ) | | | (2,491 | ) |
Futures transactions | | | (661,257 | ) | | | (1,058,674 | ) | | | (59,207 | ) | | | — | |
Foreign currency transactions | | | (1,506,399 | ) | | | (72,287 | ) | | | — | | | | — | |
Options written transactions | | | (14,293 | ) | | | 32,740 | | | | (21,155 | ) | | | — | |
Swap transactions | | | 977,111 | | | | 380,723 | | | | 19,980 | | | | — | |
Short sale transactions | | | (101,982 | ) | | | (78,615 | ) | | | (220,688 | ) | | | — | |
| Total net realized gain (loss) | | | (1,419,510 | ) | | | (1,401,616 | ) | | | (1,301,653 | ) | | | (2,491 | ) |
Net change in unrealized appreciation (depreciation) on: | | | | | | | | | | | | | | | | |
Investments | | | 806,362 | | | | 699,866 | | | | 705,446 | | | | — | |
Futures | | | (214,978 | ) | | | 345,202 | | | | (81,078 | ) | | | — | |
Foreign currencies | | | 90,389 | | | | 75,096 | | | | — | | | | — | |
Options written | | | (112,821 | ) | | | (1,423 | ) | | | 4,600 | | | | — | |
Swaps | | | 35,713 | | | | (545,527 | ) | | | (5,016 | ) | | | — | |
Short sales | | | 675,027 | | | | 38,285 | | | | 87,747 | | | | — | |
| Net change in unrealized appreciation (depreciation) | | | 1,279,692 | | | | 611,499 | | | | 711,699 | | | | — | |
| Net gain (loss) | | | (139,818 | ) | | | (790,117 | ) | | | (589,954 | ) | | | (2,491 | ) |
| NET INCREASE (DECREASE) IN NET ASSETS RESULTING FROM OPERATIONS | | $ | 6,715,843 | | | $ | 9,739,513 | | | $ | 2,867,426 | | | $ | 2,036,116 | |
a) Including affiliated expense of | | $ | 149,000 | | | $ | 151,000 | | | $ | 81,000 | | | $ | 61,000 | |
See Notes to Financial Statements
| | |
| 142 | | THE TARGET PORTFOLIO TRUST |
Statements of Changes in Net Assets
| | | | | | | | | | | | | | | | |
| | | LARGE CAPITALIZATION
GROWTH PORTFOLIO | | | LARGE CAPITALIZATION
VALUE PORTFOLIO | |
| | | Year
Ended
December 31,
2006 | | | Year
Ended
December 31,
2005 | | | Year
Ended
December 31,
2006 | | | Year
Ended
December 31,
2005 | |
| | | | |
INCREASE (DECREASE)
IN NET ASSETS | | | | | | | | | | | | | | | | |
| Operations | | | | | | | | | | | | | | | | |
Net investment income (loss) | | $ | 1,538,515 | | | $ | 550,049 | | | $ | 6,634,241 | | | $ | 5,414,957 | |
Net realized gain (loss) on investment and foreign currency transactions | | | 8,314,549 | | | | 61,722,889 | | | | 23,505,886 | | | | 62,818,569 | |
Net change in unrealized appreciation/(depreciation) of investments | | | 14,990,354 | | | | (43,590,841 | ) | | | 36,230,197 | | | | (45,800,873 | ) |
Net increase (decrease) in net assets resulting from operations | | | 24,843,418 | | | | 18,682,097 | | | | 66,370,324 | | | | 22,432,653 | |
| Dividends and Distributions (Note 1) | | | | | | | | | | | | | | | | |
Dividends from net investment income | | | | | | | | | | | | | | | | |
Class R | | | (3,514 | ) | | | — | | | | (16,801 | ) | | | — | |
Class T | | | (1,653,855 | ) | | | (424,776 | ) | | | (6,842,579 | ) | | | (5,359,256 | ) |
Total dividends from net investment income | | | (1,657,369 | ) | | | (424,776 | ) | | | (6,859,380 | ) | | | (5,359,256 | ) |
Distributions from net realized gains | | | | | | | | | | | | | | | | |
Class R | | | (20,757 | ) | | | — | | | | (55,232 | ) | | | — | |
Class T | | | (8,582,005 | ) | | | (44,003,589 | ) | | | (45,586,619 | ) | | | (49,641,032 | ) |
Total distributions from net realized gains | | | (8,602,762 | ) | | | (44,003,589 | ) | | | (45,641,851 | ) | | | (49,641,032 | ) |
| Trust share transactions (Note 6) | | | | | | | | | | | | | | | | |
Net proceeds from shares sold | | | 25,008,986 | | | | 30,635,551 | | | | 33,860,437 | | | | 40,152,956 | |
Net asset value of shares issued in reinvestment of dividends and distributions | | | 10,240,926 | | | | 44,414,354 | | | | 51,052,050 | | | | 54,877,512 | |
Cost of shares reacquired | | | (53,885,753 | ) | | | (85,228,600 | ) | | | (65,730,095 | ) | | | (85,622,845 | ) |
Net increase (decrease) in net assets from Trust share transactions | | | (18,635,841 | ) | | | (10,178,695 | ) | | | 19,182,392 | | | | 9,407,623 | |
Total increase (decrease) | | | (4,052,554 | ) | | | (35,924,963 | ) | | | 33,051,485 | | | | (23,160,012 | ) |
| | | | |
| NET ASSETS | | | | | | | | | | | | | | | | |
Beginning of year | | | 307,834,654 | | | | 343,759,617 | | | | 362,253,489 | | | | 385,413,501 | |
End of year(a) | | $ | 303,782,100 | | | $ | 307,834,654 | | | $ | 395,304,974 | | | $ | 362,253,489 | |
(a) Includes undistributed net investment income of | | $ | 4,354 | | | $ | 144,542 | | | $ | — | | | $ | 446,270 | |
See Notes to Financial Statements
| | |
| THE TARGET PORTFOLIO TRUST | | 143 |
Statements of Changes in Net Assets (cont’d)
| | | | | | | | | | | | | | | | |
| | | SMALL CAPITALIZATION
GROWTH PORTFOLIO | | | SMALL CAPITALIZATION
VALUE PORTFOLIO | |
| | | Year Ended
December 31,
2006 | | | Year Ended
December 31,
2005 | | | Year Ended
December 31,
2006 | | | Year Ended
December 31,
2005 | |
| | | | |
| INCREASE (DECREASE) IN NET ASSETS | | | | | | | | | | | | | | | | |
| Operations | | | | | | | | | | | | | | | | |
Net investment income (loss) | | $ | (546,575 | ) | | $ | (892,211 | ) | | $ | 3,391,202 | | | $ | 2,032,694 | |
Net realized gain (loss) on investment and foreign currency transactions | | | 9,674,494 | | | | 11,287,884 | | | | 20,421,271 | | | | 55,992,751 | |
Net change in unrealized appreciation/(depreciation) of investments | | | 1,412,805 | | | | (4,638,598 | ) | | | 22,620,529 | | | | (34,236,849 | ) |
Net increase (decrease) in net assets resulting from operations | | | 10,540,724 | | | | 5,757,075 | | | | 46,433,002 | | | | 23,788,596 | |
| Dividends and Distributions (Note 1) | | | | | | | | | | | | | | | | |
Dividends from net investment income | | | | | | | | | | | | | | | | |
Class R | | | — | | | | — | | | | (2,938 | ) | | | — | |
Class T | | | — | | | | — | | | | (3,240,682 | ) | | | (1,786,572 | ) |
Total dividends from net investment income | | | — | | | | — | | | | (3,243,620 | ) | | | (1,786,572 | ) |
Distributions from net realized gains | | | | | | | | | | | | | | | | |
Class R | | | — | | | | — | | | | (21,073 | ) | | | — | |
Class T | | | — | | | | — | | | | (23,263,451 | ) | | | (54,378,098 | ) |
Total distributions from net realized gains | | | — | | | | — | | | | (23,284,524 | ) | | | (54,378,098 | ) |
| Trust share transactions (Note 6) | | | | | | | | | | | | | | | | |
Net proceeds from shares sold | | | 9,893,507 | | | | 13,851,396 | | | | 70,560,051 | | | | 52,707,779 | |
Net asset value of shares issued in reinvestment of dividends and distributions | | | — | | | | — | | | | 26,049,122 | | | | 55,249,127 | |
Cost of shares reacquired | | | (26,479,801 | ) | | | (34,999,953 | ) | | | (53,840,672 | ) | | | (62,042,254 | ) |
Net increase (decrease) in net assets from Trust share transactions | | | (16,586,294 | ) | | | (21,148,557 | ) | | | 42,768,501 | | | | 45,914,652 | |
Total increase (decrease) | | | (6,045,570 | ) | | | (15,391,482 | ) | | | 62,673,359 | | | | 13,538,578 | |
| | | | |
| NET ASSETS | | | | | | | | | | | | | | | | |
Beginning of year | | | 143,365,773 | | | | 158,757,255 | | | | 259,114,828 | | | | 245,576,250 | |
End of year(a) | | $ | 137,320,203 | | | $ | 143,365,773 | | | $ | 321,788,187 | | | $ | 259,114,828 | |
(a) Includes undistributed net investment income of | | $ | — | | | $ | — | | | $ | 74,655 | | | $ | 281,690 | |
See Notes to Financial Statements
| | |
| 144 | | THE TARGET PORTFOLIO TRUST |
Statements of Changes in Net Assets (cont’d)
| | | | | | | | | | | | | | | | |
| | | INTERNATIONAL EQUITY
PORTFOLIO | | | INTERNATIONAL BOND
PORTFOLIO | |
| | | Year
Ended
December 31,
2006 | | | Year
Ended
December 31,
2005 | | | Year
Ended
December 31,
2006 | | | Year
Ended
December 31,
2005 | |
| | | | |
INCREASE (DECREASE)
IN NET ASSETS | | | | | | | | | | | | | | | | |
| Operations | | | | | | | | | | | | | | | | |
Net investment income (loss) | | $ | 4,297,701 | | | $ | 3,438,526 | | | $ | 955,814 | | | $ | 753,696 | |
Net realized gain (loss) on investment and foreign currency transactions | | | 24,653,943 | | | | 42,374,057 | | | | (1,991,293 | ) | | | 5,456,058 | |
Net change in unrealized appreciation/(depreciation) of investments | | | 34,431,991 | | | | (16,151,609 | ) | | | 1,878,242 | | | | (4,599,975 | ) |
Net increase (decrease) in net assets resulting from operations | | | 63,383,635 | | | | 29,660,974 | | | | 842,763 | | | | 1,609,779 | |
| Dividends and Distributions (Note 1) | | | | | | | | | | | | | | | | |
Dividends from net investment income | | | | | | | | | | | | | | | | |
Class R | | | (10,046 | ) | | | — | | | | — | | | | — | |
Class T | | | (4,341,675 | ) | | | (4,548,361 | ) | | | (1,301,423 | ) | | | (822,648 | ) |
Total dividends from investment income | | | (4,351,721 | ) | | | (4,548,361 | ) | | | (1,301,423 | ) | | | (822,648 | ) |
Distributions from net realized gains | | | | | | | | | | | | | | | | |
Class R | | | (59,614 | ) | | | — | | | | — | | | | — | |
Class T | | | (21,810,241 | ) | | | (10,649,422 | ) | | | (54,720 | ) | | | (33,394 | ) |
Total distributions from net realized gains | | | (21,869,855 | ) | | | (10,649,422 | ) | | | (54,720 | ) | | | (33,394 | ) |
| Trust share transactions (Note 6) | | | | | | | | | | | | | | | | |
Net proceeds from shares sold | | | 18,172,375 | | | | 23,896,686 | | | | 6,238,031 | | | | 8,080,019 | |
Net asset value of shares issued in reinvestment of dividends and distributions | | | 26,171,927 | | | | 15,191,553 | | | | 1,352,078 | | | | 855,615 | |
Cost of shares reacquired | | | (44,614,358 | ) | | | (50,701,115 | ) | | | (9,043,897 | ) | | | (11,682,782 | ) |
Net increase (decrease) in net assets from Trust share transactions | | | (270,056 | ) | | | (11,612,876 | ) | | | (1,453,788 | ) | | | (2,747,148 | ) |
Total increase (decrease) | | | 36,892,003 | | | | 2,850,315 | | | | (1,967,168 | ) | | | (1,993,411 | ) |
| | | | |
| NET ASSETS | | | | | | | | | | | | | | | | |
Beginning of year | | | 233,150,149 | | | | 230,299,834 | | | | 42,911,590 | | | | 44,905,001 | |
End of year(a) | | $ | 270,042,152 | | | $ | 233,150,149 | | | $ | 40,944,422 | | | $ | 42,911,590 | |
(a) Includes undistributed net investment income of | | $ | 91,087 | | | $ | 200,879 | | | $ | — | | | $ | — | |
See Notes to Financial Statements
| | |
| THE TARGET PORTFOLIO TRUST | | 145 |
Statements of Changes in Net Assets (cont’d)
| | | | | | | | | | | | | | | | |
| | | TOTAL RETURN
BOND PORTFOLIO | | | INTERMEDIATE-TERM
BOND PORTFOLIO | |
| | | Year Ended
December 31,
2006 | | | Year Ended
December 31,
2005 | | | Year Ended
December 31,
2006 | | | Year Ended
December 31,
2005 | |
| | | | |
| INCREASE (DECREASE) IN NET ASSETS | | | | | | | | | | | | | | | | |
| Operations | | | | | | | | | | | | | | | | |
Net investment income (loss) | | $ | 6,855,661 | | | $ | 6,315,677 | | | $ | 10,529,630 | | | $ | 9,692,301 | |
Net realized gain (loss) on investment and foreign currency transactions | | | (1,419,510 | ) | | | 246,826 | | | | (1,401,616 | ) | | | (1,215,215 | ) |
Net change in unrealized appreciation/(depreciation) of investments | | | 1,279,692 | | | | (2,230,248 | ) | | | 611,499 | | | | (3,164,852 | ) |
Net increase (decrease) in net assets resulting from operations | | | 6,715,843 | | | | 4,332,255 | | | | 9,739,513 | | | | 5,312,234 | |
| Dividends and Distributions (Note 1) | | | | | | | | | | | | | | | | |
Dividends from net investment income | | | | | | | | | | | | | | | | |
Class R | | | (4,293 | ) | | | — | | | | — | | | | — | |
Class T | | | (6,978,878 | ) | | | (6,859,355 | ) | | | (11,077,415 | ) | | | (10,131,526 | ) |
Total dividends from net investment income | | | (6,983,171 | ) | | | (6,859,355 | ) | | | (11,077,415 | ) | | | (10,131,526 | ) |
Distributions from net realized gains | | | | | | | | | | | | | | | | |
Class R | | | — | | | | — | | | | — | | | | — | |
Class T | | | — | | | | (1,294,402 | ) | | | — | | | | (128,653 | ) |
Total distributions from net realized gains | | | — | | | | (1,294,402 | ) | | | — | | | | (128,653 | ) |
| Trust share transactions (Note 6) | | | | | | | | | | | | | | | | |
Net proceeds from shares sold | | | 34,223,538 | | | | 35,616,451 | | | | 92,017,701 | | | | 40,116,845 | |
Net asset value of shares issued in reinvestment of dividends and distributions | | | 6,956,225 | | | | 8,147,528 | | | | 11,032,073 | | | | 10,256,072 | |
Cost of shares reacquired | | | (33,930,307 | ) | | | (56,755,679 | ) | | | (118,666,524 | ) | | | (81,229,652 | ) |
Net increase (decrease) in net assets from Trust share transactions | | | 7,249,456 | | | | (12,991,700 | ) | | | (15,616,750 | ) | | | (30,856,735 | ) |
Total increase (decrease) | | | 6,982,128 | | | | (16,813,202 | ) | | | (16,954,652 | ) | | | (35,804,680 | ) |
| | | | |
| NET ASSETS | | | | | | | | | | | | | | | | |
Beginning of year | | | 161,674,971 | | | | 178,488,173 | | | | 262,177,626 | | | | 297,982,306 | |
End of year(a) | | $ | 168,657,099 | | | $ | 161,674,971 | | | $ | 245,222,974 | | | $ | 262,177,626 | |
(a) Includes undistributed net investment income of | | $ | — | | | $ | 2,030,789 | | | $ | — | | | $ | — | |
See Notes to Financial Statements
| | |
| 146 | | THE TARGET PORTFOLIO TRUST |
Statements of Changes in Net Assets (cont’d)
| | | | | | | | | | | | | | | | |
| | | MORTGAGE BACKED
SECURITIES PORTFOLIO | | | U.S. GOVERNMENT MONEY
MARKET PORTFOLIO | |
| | | Year Ended
December 31,
2006 | | | Year Ended
December 31,
2005 | | | Year Ended
December 31,
2006 | | | Year Ended
December 31,
2005 | |
| | | | |
| INCREASE (DECREASE) IN NET ASSETS | | | | | | | | | | | | | | | | |
| Operations | | | | | | | | | | | | | | | | |
Net investment income (loss) | | $ | 3,457,380 | | | $ | 4,407,891 | | | $ | 2,038,607 | | | $ | 1,738,551 | |
Net realized gain (loss) on investment and foreign currency transactions | | | (1,301,653 | ) | | | (40,466 | ) | | | (2,491 | ) | | | — | |
Net change in unrealized appreciation/(depreciation) of investments | | | 711,699 | | | | (2,391,039 | ) | | | — | | | | — | |
Net increase (decrease) in net assets resulting from operations | | | 2,867,426 | | | | 1,976,386 | | | | 2,036,116 | | | | 1,738,551 | |
| Dividends and Distributions (Note 1) | | | | | | | | | | | | | | | | |
Dividends from net investment income | | | (3,765,517 | ) | | | (4,564,729 | ) | | | (2,026,702 | ) | | | (1,747,870 | ) |
| Trust share transactions (Note 6)(b) | | | | | | | | | | | | | | | | |
Net proceeds from shares sold | | | 6,808,481 | | | | 7,499,428 | | | | 21,507,914 | | | | 43,342,523 | |
Net asset value of shares issued in reinvestment of dividends and distributions | | | 3,754,874 | | | | 4,564,729 | | | | 2,015,845 | | | | 1,746,159 | |
Cost of shares reacquired | | | (16,389,625 | ) | | | (23,076,242 | ) | | | (33,465,781 | ) | | | (62,061,743 | ) |
Net increase (decrease) in net assets from Trust share transactions | | | (5,826,270 | ) | | | (11,012,085 | ) | | | (9,942,022 | ) | | | (16,973,061 | ) |
Total increase (decrease) | | | (6,724,361 | ) | | | (13,600,428 | ) | | | (9,932,608 | ) | | | (16,982,380 | ) |
| | | | |
| NET ASSETS | | | | | | | | | | | | | | | | |
Beginning of year | | | 82,195,204 | | | | 95,795,632 | | | | 57,207,434 | | | | 74,189,814 | |
End of year(a) | | $ | 75,470,843 | | | $ | 82,195,204 | | | $ | 47,274,826 | | | $ | 57,207,434 | |
(a) Includes undistributed net investment
income of | | $ | — | | | $ | — | | | $ | 2,586 | | | $ | — | |
(b) Trust share transactions are at $1 per share for the U.S. Government Money Market Portfolio. | |
See Notes to Financial Statements
| | |
| THE TARGET PORTFOLIO TRUST | | 147 |
Notes to Financial Statements
The TARGET Portfolio Trust (the “Trust”) is an open-end management investment company. The Trust was established as a Delaware business trust on July 29, 1992 and consists of ten separate portfolios (the “Portfolio” or “Portfolios”). All the Portfolios are diversified, as defined under the Investment Company Act of 1940, except for the International Bond Portfolio. Investment operations commenced on January 5, 1993, with the exception of the International Bond Portfolio, which commenced on May 17, 1994.
The Portfolios and their investment objectives are as follows:
| • | | Large Capitalization Growth Portfolio—long-term capital appreciation through investment primarily in stocks of large corporations that, in the investment adviser’s opinion, should have earnings growth faster than that of the S&P 500; |
| • | | Large Capitalization Value Portfolio—total return consisting of capital appreciation and dividend income through investment primarily in stocks of large corporations that, in the adviser’s opinion, are undervalued; |
| • | | Small Capitalization Growth Portfolio—maximum capital appreciation through investment primarily in small company common stocks that, in the investment adviser’s opinion, should have earnings growth faster than that of the U.S. economy in general; |
| • | | Small Capitalization Value Portfolio—above average capital appreciation through investment in small company common stocks that, in the adviser’s opinion, are undervalued or overlooked in the marketplace; |
| • | | International Equity Portfolio—capital appreciation through investment primarily in stocks of companies domiciled outside the United States; |
| • | | International Bond Portfolio—high total return through investment primarily in high-quality, foreign debt securities; |
| • | | Total Return Bond Portfolio—total return of current income and capital appreciation through investment primarily in fixed-income securities of varying maturities with a dollar-weighted average portfolio maturity of more than four years but not more than fifteen years; |
| • | | Intermediate-Term Bond Portfolio—current income and reasonable stability of principal through investment primarily in high quality fixed-income securities of varying maturities with a dollar-weighted average portfolio maturity of more than three years but not more than ten years; |
| • | | Mortgage Backed Securities Portfolio—high current income primarily and capital appreciation secondarily, each consistent with the protection of capital through investment primarily in mortgage related securities; |
| • | | U.S. Government Money Market Portfolio—maximum current income consistent with maintenance of liquidity and preservation of capital through investment exclusively in short-term securities issued or guaranteed by the U.S. Government, its agencies or instrumentalities. |
The ability of issuers of debt securities (other than those issued or guaranteed by the U.S. Government) held by the Portfolios to meet their obligations may be affected by economic or political developments in a specific industry, region or country.
| | |
| 148 | | THE TARGET PORTFOLIO TRUST |
Note 1. Accounting Policies
The following is a summary of significant accounting policies followed by the Trust and the Portfolios in the preparation of its financial statements.
Securities Valuations: Securities listed on a securities exchange (other than options on securities and indices) are valued at the last sale price on such exchange on the day of valuation or, if there was no sale on such day, at the mean between the last reported bid and ask prices, or at the last bid price on such day in the absence of an asked price. Securities traded via Nasdaq are valued at the NASDAQ official closing price (NOCP) on the day of valuation, or if there was no NOCP, at the last sale price. Securities that are actively traded in the over-the-counter market, including listed securities for which the primary market is believed by Prudential Investments LLC (“PI” or “Manager”), in consultation with the subadvisor(s); to be over-the-counter, are valued at market value using prices provided by an independent pricing agent or principal market maker. Options on securities and indices traded on an exchange are valued at the last sale price as of the close of trading on the applicable exchange or, if there was no sale, at the mean between the most recently quoted bid and asked prices on such exchange or at the last bid price in the absence of an asked price. Futures contracts and options thereon traded on a commodities exchange or board of trade are valued at the last sale price at the close of trading on such exchange or board of trade or, if there was no sale on the applicable commodities exchange or board of trade on such day, at the mean between the most recently quoted bid and asked prices on such exchange or board of trade or at the last bid price in the absence of an asked price. Securities for which reliable market quotations are not readily available, or whose values have been affected by events occurring after the close of the security’s foreign market and before the Portfolio’s pricing time, are valued at fair value in accordance with the Board of Trustees’ approved fair valuation procedures. When determining the fair valuation of securities, some of the factors influencing the valuation include, the nature of any restrictions on disposition of the securities; assessment of the general liquidity of the securities; the issuer’s financial condition and the markets in which it does business; the cost of the investment; the size of the holding and the capitalization of issuer; the prices of any recent transactions or bids/offers for such securities or any comparable securities; any available analyst media or other reports or information deemed reliable by the investment adviser regarding the issuer or the markets or industry in which it operates. Using fair value to price securities may result in a value that is different from a security’s most recent closing price and from the price used by other mutual funds to calculate their net asset values. As of December 31, 2006, Large Capitalization Growth Portfolio and International Equity Portfolio held foreign securities whose value required adjustment in accordance with such procedures.
Certain Portfolios held illiquid securities, including those, which are restricted as to disposition under securities law (“restricted securities”). Restricted securities, sometimes referred to as private placements, are valued pursuant to the valuation procedures noted above. Each Portfolio may hold up to 15% of its net assets in illiquid securities, except for the U.S. Government Money Market Portfolio, which may hold up to 10% of its net assets in illiquid securities.
Investments in mutual funds are valued at their net asset value as of the close of the New York Stock Exchange on the date of the valuation.
U.S. Government securities for which market quotations are available are valued at a price provided by an independent pricing agent or primary dealer (a dealer that trades in U.S. Government securities with the Federal Reserve System).
Securities held by the U.S. Government Money Market Portfolio are valued at amortized cost in accordance with Rule 2a-7 of the Investment Company Act, which approximates market value. The amortized cost method involves valuing a security at its cost on the date of purchase and thereafter assuming a constant amortization to maturity of the difference between the principal amount due at maturity and the cost.
| | |
| THE TARGET PORTFOLIO TRUST | | 149 |
Short-term securities held by the other Portfolios, which mature in 60 days or less, are valued at amortized cost, which approximates market value. Short-term securities held by the other Portfolios, which mature in more than 60 days, are valued at current market quotations.
Repurchase Agreements: In connection with transactions in repurchase agreements with United States financial institutions, it is the Trust’s policy that its custodian or designated sub custodians under tri-party repurchase agreements, as the case may be, take possession of the underlying collateral securities, the value of which exceeds the principal amount of the repurchase transaction, including accrued interest. To the extent that any repurchase transaction exceeds one business day, the value of the collateral is marked-to-market on a daily basis to ensure the adequacy of the collateral. If the seller defaults, and the value of the collateral declines or, if bankruptcy proceedings are commenced with respect to the seller of the security, realization of the collateral by the Portfolio may be delayed or limited.
Financial Futures Contracts: A financial futures contract is an agreement to purchase (long) or sell (short) an agreed amount of securities at a set price for delivery on a future date. Upon entering into a financial futures contract, the Portfolio is required to pledge to the broker an amount of cash and/or other assets equal to a certain percentage of the contract amount. This amount is known as the “initial margin.” Subsequent payments, known as “variation margin,” are made or received by the Portfolio each day, depending on the daily fluctuations in the value of the underlying security. Such variation margin is recorded for financial statement purposes on a daily basis as an unrealized gain or loss. When the contract expires or is closed, the gain or loss is realized and is presented in the Statements of Operations as a net realized gain or loss on financial futures contracts.
The Portfolio invests in financial futures contracts in order to hedge its existing portfolio securities, or securities the Portfolio intends to purchase, against fluctuations in value caused by changes in prevailing interest rates or market conditions. Should interest rates move unexpectedly, the Portfolio may not achieve the anticipated benefits of the financial futures contracts and may realize a loss. The use of futures transactions involves the risk of imperfect correlation in movements in the price of futures contracts, interest rates and the underlying hedged assets. The Portfolio maintains a segregated account of Securities or other liquid assets, the dollar value of which is at least equal to its obligation with respect to financial futures contracts. The International Equity Portfolio, International Bond Portfolio, Intermediate-Term Bond Portfolio, Mortgage-Backed Securities Portfolio and Total Return Bond Portfolio are the only portfolios that may invest in financial futures contracts.
Foreign Currency Translation: The books and records of the Portfolios are maintained in U.S. dollars. Foreign currency amounts are translated into U.S. dollars on the following basis:
| | (i) | market value of investment securities, other assets and liabilities—at the current daily rates of exchange; |
(ii) purchases and sales of investment securities, income and expenses—at the rates of exchange prevailing on the respective dates of such transactions.
Although the net assets of the Portfolios are presented at the foreign exchange rates and market values at the close of the period, the Portfolios do not isolate that portion of the results of operations arising as a result of changes in the foreign exchange rates from the fluctuations arising from changes in the market prices of long-term securities held at period end. Similarly, the Portfolios do not isolate the effect of changes in foreign exchange rates from the fluctuations arising from changes in the market prices of long-term portfolio securities sold during the period. Accordingly, realized foreign currency gains or losses are included in the reported net realized gains or losses on investment transactions.
| | |
| 150 | | THE TARGET PORTFOLIO TRUST |
Net realized gains or losses on foreign currency transactions represent net foreign exchange gains or losses from the holding of foreign currencies, currency gains or losses realized between the trade date and settlement date on securities transactions, and the difference between the amounts of dividends, interest and foreign withholding taxes recorded on the Portfolios’ books and the U.S. dollar equivalent amounts actually received or paid. Net unrealized currency gains or losses from valuing foreign currency denominated assets and liabilities (other than investments) at period-end exchange rates are reflected as a component of net unrealized appreciation (depreciation) on investments and foreign currencies.
Foreign security and currency transactions may involve certain considerations and risks not typically associated with those of domestic origin as a result of, among other factors, the possibility of political and economic instability or the level of governmental supervision and regulation of foreign securities markets.
Forward Foreign Currency Contracts: A forward foreign currency contract is a commitment to purchase or sell a foreign currency at a future date at a negotiated forward rate. The Portfolio enters into forward foreign currency contracts in order to hedge its exposure to changes in foreign currency exchange rates on its foreign portfolio holdings or on specific receivables and payables denominated in a foreign currency. The contracts are valued daily at current forward exchange rates and any unrealized gain or loss is included in net unrealized appreciation or depreciation on foreign currency transactions. Gains or losses are realized on the settlement date of the contract equal to the difference between the settlement value of the original and negotiated forward contracts. This gain or loss, if any, is included in net realized gain or loss on foreign currency transactions. Risks may arise upon entering into these contracts from the potential inability of the counterparties to meet the terms of their contracts. The International Equity Portfolio, International Bond Portfolio, Intermediate-Term Bond Portfolio and Total Return Bond Portfolio may enter into forward foreign currency contracts in order to hedge their exposure to changes in foreign currency exchange rates on their foreign portfolio holdings.
Options: The Portfolio may either purchase or write options in order to hedge against adverse market movements or fluctuations in value caused by changes in prevailing interest rates or foreign currency exchange rates with respect to securities or currencies which the Portfolio currently owns or intends to purchase. The Portfolio’s principal reason for writing options is to realize, through receipt of premiums, a greater current return than would be realized on the underlying security alone. When the Portfolio purchases an option, it pays a premium and an amount equal to that premium is recorded as an asset. When the Portfolio writes an option, it receives a premium and an amount equal to that premium is recorded as a liability. The asset or liability is adjusted daily to reflect the current market value of the option.
If an option expires unexercised, the Portfolio realizes a gain or loss to the extent of the premium received or paid. If an option is exercised, the premium received or paid is recorded as an adjustment to the proceeds from the sale or the cost basis of the purchase in determining whether the Portfolio has realized a gain or loss. The difference between the premium and the amount received or paid on affecting a closing purchase or sale transaction is also treated as a realized gain or loss. Gains or losses on purchased options are included in net realized gains or losses on investment transactions. Gains or losses on written options are presented separately as net realized gains or losses on options written.
The Portfolio, as writer of an option, may have no control over whether the contract may be exercised. As a result, the Portfolio bears the market risk of an unfavorable change in the price of the security or currencies underlying the written option. The Portfolio, as purchaser of an option, bears the risk of the potential inability of the counterparties to meet the terms of their contracts. The Portfolio maintains a segregated account of securities or other liquid assets, the dollar value of which is at least equal to its obligation with respect to options. The International Equity Portfolio, the International Bond Portfolio, the Intermediate-Term Bond Portfolio, the Total Return Bond Portfolio and the Mortgage-Backed Securities Portfolio may either purchase or write options.
| | |
| THE TARGET PORTFOLIO TRUST | | 151 |
Short Sales: Certain portfolios of the Trust may make short sales of securities as a method of hedging potential price declines in similar securities owned. The Portfolio may sell a security, it does not own in anticipation of a decline in the market value of that security (short sale). When the Portfolio makes a short sale, it will borrow the security sold short and deliver it to the broker-dealer through which it made the short sale as collateral for its obligation to deliver the security upon conclusion of the sale. The Portfolio may have to pay a fee to borrow the particular security and may be obligated to return any interest or dividends received on such borrowed securities. A gain, limited to the price at which the Portfolio sold the security short, or a loss, unlimited as to dollar amount, will be recognized upon the termination of a short sale if the market price at termination is less than or greater than the proceeds originally received, respectively, and is presented in the Statement of Operations as net realized gain or loss on short sales. The Portfolio maintains a segregated account of securities or other liquid assets, the dollar value of which is at least equal to its obligation with respect to short sales. The International Bond Portfolio, Total Return Bond Portfolio, Intermediate-Term Bond Portfolio and Mortgage-Backed Securities Portfolio may enter into short sales.
Swap Agreements: Certain portfolios may enter into interest rate swap agreements, forward swap spread lock agreements, and credit default swap agreements. A swap agreement is an agreement to exchange the return generated by one instrument for the return generated by another instrument. Interest rate swap agreements involve the exchange by the Portfolio with another party of their respective commitments to pay or receive interest. Forward spread lock swap agreements involve commitments to pay or receive a settlement amount calculated as the difference between the swap spread and a fixed spread, multiplied by the notional amount times the duration of the swap. The swap spread is the difference between the benchmark swap rate (market rate) and the specific Treasury rate. In a credit default swap agreement, one party (the protection buyer) makes a stream of payments to another party (the protection seller) in exchange for the right to receive a specified payment in the event of a default by a third party, typically corporate issues or sovereign issues of an emerging country, on its obligation. The maximum amount of the payment may equal the notional, at par, of the underlying index or security as a result of a default (or “credit event”). In addition to bearing the risk that the credit event will occur, the Portfolios could be exposed to market risk due to unfavorable changes in interest rates or in the price of the underlying security or index, the possibility that the fund may be unable to close out its position at the same time or at the same price as if it had purchased comparable publicly traded securities, or that the counterparty may default on it’s obligation to perform. The Portfolios may enter into swap agreements as the protection buyer or the protection seller. The swaps are valued daily at current market value and any change in value is included in net unrealized appreciation or depreciation on investments. Payments received or paid by the Portfolio are recorded as realized gains or losses. Risk of loss may exceed amounts recognized on the statements of assets and liabilities. Swap agreements outstanding at period end, if any, are listed on the Portfolio of Investments.
The use of derivative transactions may involve elements of both market and credit risk in excess of the amounts reported in the Statements of Assets and Liabilities.
Securities Lending: The Portfolio may lend its portfolio securities to broker-dealers. The loans are secured by collateral at least equal at all times to the market value of the securities loaned. Loans are subject to termination at the option of the borrower or the Portfolio. Upon termination of the loan, the borrower will return to the lender securities identical to the loaned securities. Should the borrower of the securities fail financially, the Portfolio has the right to repurchase the securities using the collateral in the open market. The Portfolio recognizes income, net of any rebate and securities lending agent fees, for lending its securities in the form of fees or interest on the investment of any cash received as collateral. The Portfolio also continues to receive interest and dividends or amounts equivalent thereto on the securities loaned and recognizes any unrealized gain or loss in the market price of the securities loaned that may occur during the term of the loan.
| | |
| 152 | | THE TARGET PORTFOLIO TRUST |
When-Issued/Delayed Delivery Securities: Certain portfolios may purchase or sell securities on a when-issued or delayed delivery basis. These transactions involve a commitment by the Portfolio to purchase or sell securities for a predetermined price or yield, with payment and delivery taking place beyond the customary settlement period. When delayed delivery purchases are outstanding, the Portfolio will set aside and maintain until the settlement date in a segregated account, liquid assets in an amount sufficient to meet the purchase price. When purchasing a security on a delayed delivery basis, the Portfolio assumes the rights and risks of ownership of the security, including the risk of price and yield fluctuations, and takes such fluctuations into account when determining its net asset value. The Portfolio may dispose of or renegotiate a delayed delivery transaction after it is entered into, and may sell when-issued securities before they are delivered, which may result in a capital gain or loss. When the Portfolio has sold a security on a delayed delivery basis, the Portfolio does not participate in future gains and losses with respect to the security.
Securities Transactions and Net Investment Income: Securities transactions are recorded on the trade date. Realized and unrealized gains and losses from security and currency transactions are calculated on the identified cost basis. Dividend income is recorded on the ex-dividend date and interest income, including amortization of premium and accretion of discount of debt securities, as required, is recorded on the accrual basis. Expenses are recorded on the accrual basis. The Trust’s expenses are allocated to the respective Portfolios on the basis of relative net assets except for expenses that are charged directly at the Portfolio or class level.
Net investment income or loss, (other than distribution fees, which are charged directly to the respective class) and unrealized and realized gains or losses are allocated daily to each class of shares based upon the relative proportion of net assets of each class at the beginning of the day.
Dividends and Distributions: The Total Return Bond Portfolio, Intermediate-Term Bond Portfolio and Mortgage Backed Securities Portfolio declare dividends of their net investment income daily and pay such dividends monthly. The U.S. Government Money Market Portfolio declares net investment income and any net capital gain (loss) daily and pays such dividends monthly. Each other Portfolio declares and pays a dividend of its net investment income, if any, at least annually. Each Portfolio except for the U.S. Government Money Market Portfolio declares and pays its net realized capital gains, if any, at least annually. Dividends and distributions to shareholders, which are determined in accordance with federal income tax regulations and which may differ from generally accepted accounting principles, are recorded on ex-dividend date. Permanent book/tax differences relating to income and gains are reclassified amongst undistributed net investment income, accumulated net realized gain or loss and paid-in capital, in excess of par, as appropriate.
Taxes: For federal income tax purposes, each Portfolio in the Trust is treated as a separate tax-paying entity. It is each Portfolio’s policy to continue to meet the requirements of the Internal Revenue Code applicable to regulated investment companies and to distribute all of its taxable net investment income and capital gains, if any, to its shareholders. Therefore, no federal income tax provision is required.
Withholding taxes on foreign interest and dividends are recorded net of reclaimable amounts, at the time the related income is earned.
Estimates: The preparation of the financial statements requires management to make estimates and assumptions that affect the reported amounts and disclosures in the financial statements. Actual results could differ from those estimates.
| | |
| THE TARGET PORTFOLIO TRUST | | 153 |
Note 2. Agreements
The Trust’s manager is Prudential Investments LLC (“PI”). PI manages the investment operations of the Trust, administers the Trust’s affairs and is responsible for the selection, subject to review and approval of the Trustees, of the advisers. PI supervises the advisers’ performance of advisory services and makes recommendations to the Trustees as to whether the advisers’ contracts should be renewed, modified or terminated. PI pays for the costs pursuant to the advisory agreements, the cost of compensation of officers of the Trust, occupancy and certain clerical and accounting costs of the Trust. The Trust bears all other costs and expenses.
The advisers noted below each furnished investment advisory services in connection with the management of the Portfolios. Each of the advisers of the equity Portfolios—Large Capitalization Growth Portfolio, Large Capitalization Value Portfolio, Small Capitalization Growth Portfolio, Small Capitalization Value Portfolio and International Equity Portfolio—manages a portion of the assets of the respective Portfolios. In general, in order to maintain a division of assets between the advisers as deemed appropriate by PI, all daily cash inflows (i.e., subscriptions and reinvested distributions) and outflows (i.e., redemptions and expense items) are divided between the advisers, as PI deems appropriate. In order to maintain an approximate allocation between the advisers in the ratio deemed appropriate by PI, a periodic rebalancing of each subadvisor’s share of Portfolio assets may occur to account for market fluctuations.
| | |
Portfolio | | Adviser |
Large Capitalization Growth | | Goldman Sachs Asset Management L.P. and Marsico Capital Management, LLC |
Large Capitalization Value | | J.P. Morgan Investment Management, Inc., Hotchkis & Wiley Capital Management, LLC and NFJ Investment Group L.P. |
Small Capitalization Growth | | Transamerica Investment Management, LLC and RS Investment Management, L.P. |
Small Capitalization Value | | NFJ Investment Group L.P. , EARNEST Partners, LLC, Lee Munder Investments Limited, J.P. Morgan Investment Management, Inc. and Vaughan Nelson Investment Management, L.P. |
International Equity | | LSV Asset Management and Thornburg Investment Management, Inc. |
International Bond, Total Return Bond and Intermediate-Term Bond | | Pacific Investment Management Company LLC |
Mortgage Backed Securities and U.S. Government Money Market | | Wellington Management Company, LLP |
The management fee payable to PI is computed daily and paid monthly, at an annual rate of the average daily net assets of the Portfolios specified below and PI, in turn, pays each adviser a fee for its services.
| | | |
Portfolio | | Contracted & Effective
Management Fee | |
Large Capitalization Growth | | 0.60 | % |
Large Capitalization Value | | 0.60 | % |
Small Capitalization Growth | | 0.60 | % |
Small Capitalization Value | | 0.60 | % |
International Equity | | 0.70 | % |
International Bond | | 0.50 | % |
Total Return Bond | | 0.45 | % |
Intermediate-Term Bond | | 0.45 | % |
Mortgage Backed Securities | | 0.45 | % |
U.S. Government Money Market | | 0.25 | % |
| | |
| 154 | | THE TARGET PORTFOLIO TRUST |
The Trust has a distribution agreement with Prudential Investment Management Services LLC (“PIMS”), which acts as the distributor of the Class T and Class R shares of the Trust. The Trust compensates PIMS for distributing and servicing the Trust’s Class R shares, pursuant to plan of distribution (the “Class R Plan”), regardless of expenses actually incurred by PIMS. The distribution fee is accrued daily and payable monthly. No distribution or service fees are paid to PIMS as distributor of the Class T shares of the Trust.
Pursuant to the Class R Plan, the Trust compensates PIMS for distribution related activities at an annual rate of up to .75 of 1% of the average daily net assets of the Class R shares. For the period ended December 31, 2006, PIMS has contractually agreed to limit such fees to .50 of 1% of the average daily net assets of the Class R shares.
PI and PIMS are indirect, wholly-owned subsidiaries of Prudential Financial, Inc. (“Prudential”).
Note 3. Other Transactions with Affiliates
Prudential Mutual Fund Services LLC (“PMFS”), an affiliate of PI and an indirect, wholly-owned subsidiary of Prudential, serves as the Trust’s transfer agent. Transfer agent fees and expenses in the Statement of Operations also include certain out-of-pocket expenses paid to non-affiliates where applicable.
For the year ended December 31, 2006, the amount of brokerage commissions earned by Wachovia Securities, LLC (“Wachovia”), an affiliate of PI, and Prudential Equity Group, LLC, (“PEG”), an indirect, wholly-owned subsidiary of Prudential, from portfolio transactions executed on behalf of the Portfolios were as follows:
| | | | | | |
Portfolio | | Wachovia | | PEG |
Large Capitalization Growth | | | — | | $ | 197 |
Large Capitalization Value | | $ | 207 | | | 17,890 |
Small Capitalization Growth | | | 32 | | | 175 |
Small Capitalization Value | | | — | | | 3,714 |
Prudential Investment Management, Inc. (“PIM”), an indirect, wholly-owned subsidiary of Prudential, is the Trust’s security lending agent. For the year ended December 31, 2006, PIM was compensated for these services by the following Portfolios of Trust:
| | | |
Portfolio | | PIM |
Large Capitalization Growth | | $ | 7,412 |
Large Capitalization Value | | | 768 |
Small Capitalization Growth | | | 12,341 |
Small Capitalization Value | | | 515 |
Certain Portfolios invest in the Taxable Money Market Series (the “Series”), a portfolio of Dryden Core Investment Fund, pursuant to an exemptive order received from the Securities and Exchange Commission. The Series is a money market mutual fund registered under the Investment Company Act of 1940, as amended, and managed by PI.
| | |
| THE TARGET PORTFOLIO TRUST | | 155 |
Note 4. Portfolio Securities
Purchases and sales of portfolio securities, excluding short-term investments and U.S. Government securities, for the year ended December 31, 2006, were as follows:
| | | | | | |
Portfolio | | Purchases | | Sales |
Large Capitalization Growth | | $ | 205,837,894 | | $ | 233,996,811 |
Large Capitalization Value | | | 164,010,787 | | | 185,258,671 |
Small Capitalization Growth | | | 130,201,285 | | | 146,164,962 |
Small Capitalization Value | | | 117,270,668 | | | 102,009,153 |
International Equity | | | 101,359,342 | | | 123,458,959 |
International Bond | | | 81,094,542 | | | 80,370,112 |
Total Return Bond | | | 104,406,663 | | | 18,817,924 |
Intermediate-Term Bond | | | 157,264,324 | | | 17,704,604 |
Mortgage Backed Securities | | | 9,149,979 | | | 3,534,741 |
Transactions in options written during the year ended December 31, 2006, were as follows:
| | | | | | | |
| | |
Target International Bond | | Number of Contracts/
Notional Amount (000) | | | Premium
Received
(Paid) | |
Options outstanding at December 31, 2005 | | 2,500 | | | $ | 39,703 | |
Written options | | 7,700 | | | | 36,590 | |
Written swap options | | 4,010 | | | | 22,133 | |
Expired options | | (6,600 | ) | | | (33,342 | ) |
Expired swap options | | (2,510 | ) | | | (37,246 | ) |
| | | | | | | |
Options outstanding at December 31, 2006 | | 5,100 | | | $ | 27,838 | |
| | | | | | | |
| | |
Target Total Return Bond | | Number of Contracts/
Notional Amount (000) | | | Premium
Received
(Paid) | |
Options outstanding at December 31, 2005 | | 9,100 | | | $ | 93,314 | |
Written swap options | | 15,000 | | | | 165,270 | |
Expired swap options | | (5,300 | ) | | | (52,373 | ) |
Closed options | | (3,800 | ) | | | (27,010 | ) |
Closed swap options | | — | (a) | | | (13,931 | ) |
| | | | | | | |
Options outstanding at December 31, 2006 | | 15,000 | | | $ | 165,270 | |
| | | | | | | |
| | |
Target Intermediate-Term Bond | | Number of Contracts/
Notional Amount (000) | | | Premium
Received
(Paid) | |
Options outstanding at December 31, 2005 | | 18,700 | | | $ | 197,277 | |
Written swap options | | 2,000 | | | | 30,215 | |
Expired options | | (2,000 | ) | | | (48,452 | ) |
Expired swap options | | (8,700 | ) | | | (91,095 | ) |
Closed options | | (8,000 | ) | | | (57,730 | ) |
| | | | | | | |
Options outstanding at December 31, 2006 | | 2,000 | | | $ | 30,215 | |
| | | | | | | |
| | |
| 156 | | THE TARGET PORTFOLIO TRUST |
| | | | | |
Target Mortgage Backed Securities | | Number of Contracts/
Notional Amount (000) | | Premium
Received |
Options outstanding at December 31, 2005 | | — | | | — |
Written swap options | | 2,000 | | $ | 11,900 |
| | | | | |
Options outstanding at December 31, 2006 | | 2,000 | | $ | 11,900 |
| | | | | |
Note 5: Tax and Distribution Information
In order to present undistributed net investment income or loss and accumulated net realized capital gains or losses on the Statement of Assets and Liabilities that more closely represent their tax character, certain adjustments have been made to paid-in capital in excess of par, undistributed net investment income or loss and accumulated net realized gain or loss on investments.
For the year ended December 31, 2006 the adjustments were as follows:
| | | | | | | | | | | | |
Portfolio | | Paid-In
Capital In
Excess of Par | | | Undistributed
Net Investment
Income | | | Accumulated
Net Realized
Gain or Loss | |
Large Capitalization Growth(a)(d)(f)(g) | | | — | | | $ | (21,344 | ) | | $ | 21,344 | |
Large Capitalization Value(f)(g) | | | — | | | | (221,955 | ) | | | 221,955 | |
Small Capitalization Growth(b)(f) | | $ | (562,039 | ) | | | 534,487 | | | | 27,552 | |
Small Capitalization Value(f)(g) | | | — | | | | (354,617 | ) | | | 354,617 | |
International Equity(a)(d) | | | — | | | | (55,772 | ) | | | 55,772 | |
International Bond(a)(b)(c)(d)(e)(h) | | | (1,073,014 | ) | | | (767,401 | ) | | | 1,840,415 | |
Total Return Bond(a)(c)(e)(g) | | | — | | | | (3,116,798 | ) | | | 3,116,798 | |
Intermediate-Term Bond(a)(c)(e)(g) | | | — | | | | 265,900 | | | | (265,900 | ) |
Mortgage Backed Securities(c)(e)(d) | | | (34,765 | ) | | | 333,455 | | | | (298,690 | ) |
| (a) | Reclassification of net foreign currency gain (loss). |
| (b) | Reclassification of tax operating loss. |
| (c) | Reclassification of swap income. |
| (d) | Reclassification of over distribution of ordinary income. |
| (e) | Reclassification of paydown gain/loss. |
| (f) | Reclassification of real estate investment trust distributions. |
| (g) | Reclassification due to other adjustments. |
| (h) | Reclassification of tax operating loss against short-term capital gain. |
Net investment income, net realized gains and net assets were not affected by these reclassifications.
| | |
| THE TARGET PORTFOLIO TRUST | | 157 |
For federal income tax purposes the following Portfolios elected to treat post-October losses incurred in the period November 1, 2006 through December 31, 2006 has having been incurred in the following fiscal year. Certain Portfolios had capital loss carryforwards as of December 31, 2006. Accordingly, no capital gain distributions are expected to be paid to shareholders until future net gains have been realized in excess of such carryforwards. The approximate amounts were as follows:
| | | | | | | | | | |
| | | Post-October Losses | | | |
Portfolio | | Currency | | Capital | | Capital Loss
Carryforward | |
Small Capitalization Growth | | | — | | | — | | $ | 24,789,000 | (a) |
International Equity | | $ | 483,000 | | | — | | | — | |
International Bond | | | 802,000 | | $ | 174,000 | | | — | |
Total Return Bond | | | 1,564,000 | | | 383,000 | | | 895,000 | (b) |
Intermediate-Term Bond | | | 199,000 | | | 246,000 | | | 4,126,000 | (c) |
Mortgage Backed Securities | | | — | | | 212,000 | | | 3,339,000 | (d) |
U.S. Government Money Market | | | — | | | — | | | 3,000 | (e) |
| (a) | Approximately $18,058,000 expiring in 2010 and $6,731,000 expiring in 2011. Approximately $9,897,000 was used to offset net taxable gains realized in the fiscal year ended December 31, 2006. |
| (b) | Approximately $250,000 expiring in 2013 and $645,000 expiring in 2014. |
| (c) | Approximately $2,994,000 expiring in 2013 and $1,132,000 expiring in 2014. |
| (d) | Approximately $384,000 expiring in 2008, $970,000 expiring in 2011, $255,000 expiring in 2012, $65,000 expiring in 2013 and $1,665,000 expiring in 2014. |
| (e) | Approximately $500 expiring in 2013 and $2,500 expiring in 2014. |
For the year ended December 31, 2006, the tax character of distributions paid, as reflected in the Statements of Changes in Net Assets were:
| | | | | | | | | |
Portfolio | | Ordinary
Income | | Long-Term
Capital Gains | | Total
Distributions |
Large Capitalization Growth | | $ | 3,659,700 | | $ | 6,600,431 | | $ | 10,260,131 |
Large Capitalization Value | | | 16,962,108 | | | 35,539,123 | | | 52,501,231 |
Small Capitalization Value | | | 7,979,767 | | | 18,548,377 | | | 26,528,144 |
International Equity | | | 13,141,483 | | | 13,080,093 | | | 26,221,576 |
International Bond | | | 1,301,561 | | | 54,582 | | | 1,356,143 |
Total Return Bond | | | 6,983,171 | | | — | | | 6,983,171 |
Intermediate-Term Bond | | | 11,077,415 | | | — | | | 11,077,415 |
Mortgage Backed Securities | | | 3,765,517 | | | — | | | 3,765,517 |
U.S. Government Money Market | | | 2,026,702 | | | — | | | 2,026,702 |
| | |
| 158 | | THE TARGET PORTFOLIO TRUST |
For the year ended December 31, 2005, the tax character of distributions paid, as reflected in the Statement of Changes in Net Assets were:
| | | | | | | | | |
Portfolio | | Ordinary
Income | | Long-Term
Capital Gains | | Total
Distributions |
Large Capitalization Growth | | $ | 424,776 | | $ | 44,003,589 | | $ | 44,428,365 |
Large Capitalization Value | | | 12,089,901 | | | 42,910,387 | | | 55,000,288 |
Small Capitalization Value | | | 6,235,673 | | | 49,928,997 | | | 56,164,670 |
International Equity | | | 5,329,479 | | | 9,868,304 | | | 15,197,783 |
International Bond | | | 832,969 | | | 23,073 | | | 856,042 |
Total Return Bond | | | 6,859,355 | | | 1,294,402 | | | 8,153,757 |
Intermediate-Term Bond | | | 10,159,553 | | | 100,626 | | | 10,260,179 |
Mortgage Backed Securities | | | 4,564,729 | | | — | | | 4,564,729 |
U.S. Government Money Market | | | 1,747,870 | | | — | | | 1,747,870 |
The tax character of distributable earnings at December 31, 2006 was:
| | | | | | |
Portfolio | | Accumulated
Ordinary Income | | Accumulated
Long-Term
Capital Gains |
Large Capitalization Growth | | $ | 16,818 | | $ | 2,701,487 |
Large Capitalization Value | | | 1,200,325 | | | 3,396,384 |
Small Capitalization Value | | | 701,435 | | | 1,476,178 |
International Equity | | | 11,703 | | | 2,825,357 |
Total Return Bond | | | 290,111 | | | — |
Intermediate-Term Bond | | | 51,692 | | | — |
U.S. Government Money Market | | | 14,575 | | | — |
The United States federal income tax basis and unrealized appreciation (depreciation) of the Portfolios’ investments and the total net unrealized appreciation (depreciation) as of December 31, 2006 were as follows:
| | | | | | | | | | | | | | | | | | | | | | |
| | | Tax Basis | | Appreciation | | (Depreciation) | | | Net Unrealized
Appreciation
(Depreciation)
of Investments | | | Other Cost Basis Adjustments | | | Total Net
Unrealized
Appreciation
(Depreciation) | |
Large Capitalization Growth | | $ | 261,897,160 | | $ | 50,696,506 | | $ | (4,407,832 | ) | | $ | 46,288,674 | | | | — | | | $ | 46,288,674 | |
Large Capitalization Value | | | 324,608,536 | | | 84,923,800 | | | (4,695,614 | ) | | | 80,228,186 | | | | — | | | | 80,228,186 | |
Small Capitalization Growth | | | 150,580,010 | | | 24,412,840 | | | (3,117,634 | ) | | | 21,295,206 | | | | — | | | | 21,295,206 | |
Small Capitalization Value | | | 315,192,005 | | | 71,582,000 | | | (7,812,705 | ) | | | 63,769,295 | | | | — | | | | 63,769,295 | |
International Equity | | | 205,719,187 | | | 67,702,625 | | | (3,132,860 | ) | | | 64,569,765 | | | $ | 80,994 | | | | 64,650,759 | |
International Bond | | | 80,748,186 | | | 2,742,459 | | | (1,993,242 | ) | | | 749,217 | | | | 308,945 | | | | 1,058,162 | |
Total Return Bond | | | 236,103,467 | | | 2,731,787 | | | (2,896,911 | ) | | | (165,124 | ) | | | 191,970 | | | | 26,846 | |
Intermediate-Term Bond | | | 287,768,797 | | | 2,104,550 | | | (2,775,265 | ) | | | (670,715 | ) | | | (180,724 | ) | | | (851,439 | ) |
Mortgage Backed Securities | | | 113,241,375 | | | 640,294 | | | (954,719 | ) | | | (314,425 | ) | | | 83,701 | | | | (230,724 | ) |
The difference between book basis and tax basis are primarily attributable to deferred losses on wash sales, mark to market on purchased options and cost basis adjustments on real estate investment trusts. The other cost basis adjustments are primarily attributable to appreciation (depreciation) on written options, futures, swaps, short sales, forward currency contracts, mark to market of receivables and payables and other book to tax differences.
| | |
| THE TARGET PORTFOLIO TRUST | | 159 |
Note 6. Capital
The Trust has authorized an unlimited number of shares of beneficial interest at $.001 par value per share. Transactions in shares of beneficial interest during the year ended December 31, 2006 were as follows:
| | | | | | | | | | | | | | |
| | | Class R* | | | Class T | |
| | | Shares | | | Amount | | | Shares | | | Amount | |
Large Capitalization Growth | | | | | | | | | | | | | | |
Sold | | 148,623 | | | $ | 2,275,424 | | | 1,536,968 | | | $ | 22,733,562 | |
Reinvested | | 1,582 | | | | 24,269 | | | 679,204 | | | | 10,216,657 | |
Redeemed | | (5,492 | ) | | | (82,668 | ) | | (3,621,818 | ) | | | (53,803,085 | ) |
| | | | | | | | | | | | | | |
Net Increase/(Decrease) | | 144,713 | | | $ | 2,217,025 | | | (1,405,646 | ) | | $ | (20,852,866 | ) |
| | | | | | | | | | | | | | |
Large Capitalization Value | | | | | | | | | | | | | | |
Sold | | 140,128 | | | $ | 2,221,351 | | | 2,045,864 | | | $ | 31,639,086 | |
Reinvested | | 4,659 | | | | 72,026 | | | 3,416,262 | | | | 50,980,024 | |
Redeemed | | (4,128 | ) | | | (64,682 | ) | | (4,246,426 | ) | | | (65,665,413 | ) |
| | | | | | | | | | | | | | |
Net Increase/(Decrease) | | 140,659 | | | $ | 2,228,695 | | | 1,215,700 | | | $ | 16,953,697 | |
| | | | | | | | | | | | | | |
Small Capitalization Growth | | | | | | | | | | | | | | |
Sold | | 75,962 | | | $ | 912,750 | | | 764,833 | | | $ | 8,980,757 | |
Reinvested | | — | | | | — | | | — | | | | — | |
Redeemed | | (1,857 | ) | | | (22,490 | ) | | (2,245,123 | ) | | | (26,457,311 | ) |
| | | | | | | | | | | | | | |
Net Increase/(Decrease) | | 74,105 | | | $ | 890,260 | | | (1,480,290 | ) | | $ | (17,476,554 | ) |
| | | | | | | | | | | | | | |
Small Capitalization Value | | | | | | | | | | | | | | |
Sold | | 53,243 | | | $ | 1,106,981 | | | 3,381,311 | | | $ | 69,453,070 | |
Reinvested | | 1,176 | | | | 24,004 | | | 1,279,367 | | | | 26,025,118 | |
Redeemed | | (2,575 | ) | | | (53,057 | ) | | (2,645,214 | ) | | | (53,787,615 | ) |
| | | | | | | | | | | | | | |
Net Increase/(Decrease) | | 51,844 | | | $ | 1,077,928 | | | 2,015,464 | | | $ | 41,690,573 | |
| | | | | | | | | | | | | | |
International Equity | | | | | | | | | | | | | | |
Sold | | 107,241 | | | $ | 1,751,259 | | | 1,056,436 | | | $ | 16,421,116 | |
Reinvested | | 4,476 | | | | 69,649 | | | 1,676,182 | | | | 26,102,278 | |
Redeemed | | (5,073 | ) | | | (80,505 | ) | | (2,851,896 | ) | | | (44,533,853 | ) |
| | | | | | | | | | | | | | |
Net Increase/(Decrease) | | 106,644 | | | $ | 1,740,403 | | | (119,278 | ) | | $ | (2,010,459 | ) |
| | | | | | | | | | | | | | |
International Bond | | | | | | | | | | | | | | |
Sold | | — | | | $ | — | | | 763,221 | | | $ | 6,238,031 | |
Reinvested | | — | | | | — | | | 171,149 | | | | 1,352,078 | |
Redeemed | | — | | | | — | | | (1,106,726 | ) | | | (9,043,897 | ) |
| | | | | | | | | | | | | | |
Net Increase/(Decrease) | | — | | | $ | — | | | (172,356 | ) | | $ | (1,453,788 | ) |
| | | | | | | | | | | | | | |
| | |
| 160 | | THE TARGET PORTFOLIO TRUST |
| | | | | | | | | | | | | | |
| | | Class R* | | | Class T | |
| | | Shares | | | Amount | | | Shares | | | Amount | |
Total Return Bond | | | | | | | | | | | | | | |
Sold | | 153,639 | | | $ | 1,595,095 | | | 3,166,599 | | | $ | 32,628,443 | |
Reinvested | | 394 | | | | 4,078 | | | 674,025 | | | | 6,952,147 | |
Redeemed | | (8,313 | ) | | | (86,645 | ) | | (3,285,696 | ) | | | (33,843,662 | ) |
| | | | | | | | | | | | | | |
Net Increase/(Decrease) | | 145,720 | | | $ | 1,512,528 | | | 554,928 | | | $ | 5,736,928 | |
| | | | | | | | | | | | | | |
Intermediate-Term Bond | | | | | | | | | | | | | | |
Sold | | — | | | $ | — | | | 9,121,062 | | | $ | 92,017,701 | |
Reinvested | | — | | | | — | | | 1,092,531 | | | | 11,032,073 | |
Redeemed | | — | | | | — | | | (11,754,425 | ) | | | (118,666,524 | ) |
| | | | | | | | | | | | | | |
Net Increase/(Decrease) | | — | | | $ | — | | | (1,540,832 | ) | | $ | (15,616,750 | ) |
| | | | | | | | | | | | | | |
Mortgage Backed Securities | | | | | | | | | | | | | | |
Sold | | — | | | $ | — | | | 684,692 | | | $ | 6,808,481 | |
Reinvested | | — | | | | — | | | 377,117 | | | | 3,754,874 | |
Redeemed | | — | | | | — | | | (1,647,539 | ) | | | (16,389,625 | ) |
| | | | | | | | | | | | | | |
Net Increase/(Decrease) | | — | | | $ | — | | | (585,730 | ) | | $ | (5,826,270 | ) |
| | | | | | | | | | | | | | |
| * | Commencement of Class R shares, August 22, 2006. |
Transactions in shares of beneficial interest during the year ended December 31, 2005 were as follows:
| | | | | | | | | | |
Portfolio | | Shares
Sold | | Shares Issued in
Reinvestment of
Dividends and
Distributions | | Shares
Reacquired | | | Increase/
(Decrease)
in Shares
Outstanding | |
Large Capitalization Growth | | 1,994,317 | | 3,017,201 | | (5,542,592 | ) | | (531,074 | ) |
Large Capitalization Value | | 2,469,433 | | 3,561,971 | | (5,284,616 | ) | | 746,788 | |
Small Capitalization Growth | | 1,326,027 | | — | | (3,325,226 | ) | | (1,999,199 | ) |
Small Capitalization Value | | 2,398,957 | | 2,862,304 | | (2,853,930 | ) | | 2,407,331 | |
International Equity | | 1,809,451 | | 1,137,351 | | (3,825,186 | ) | | (878,384 | ) |
International Bond | | 975,588 | | 103,962 | | (1,410,170 | ) | | (330,620 | ) |
Total Return Bond | | 3,374,867 | | 774,847 | | (5,376,334 | ) | | (1,226,620 | ) |
Intermediate-Term Bond | | 3,906,750 | | 1,000,697 | | (7,912,087 | ) | | (3,004,640 | ) |
Mortgage Backed Securities | | 729,295 | | 446,224 | | (2,250,862 | ) | | (1,075,343 | ) |
Note 7. Borrowings
The Trust (excluding U.S. Government Money Market), along with other affiliated registered investment companies (the “Funds”), is a party to a Syndicated Credit Agreement (“SCA”) with two banks. The SCA provides for a commitment of $500 million. Interest on any borrowings under the SCA would be incurred at contracted market rates and a commitment fee for the unused amount is accrued daily and paid quarterly. Effective October 27, 2006, the Funds renewed the SCA with the banks. The commitment under the renewed SCA continues to be $500 million. The Funds pay a commitment fee of .07 of 1% of the unused portion of the renewed SCA. The expiration date of the renewed SCA is October 26, 2007. For the period from October 29, 2005 through October 26, 2006, the Funds paid a commitment fee of .0725 of 1% of the unused portion
| | |
| THE TARGET PORTFOLIO TRUST | | 161 |
of the agreement. The purpose of the SCA is to provide an alternative source of temporary funding for capital share redemptions.
The following Portfolios utilized the line of credit during the year ended December 31, 2006. The average balance outstanding is for the number of days that each Portfolio had an outstanding balance.
| | | | | | | | | | | |
Portfolio | | Average Balance
Outstanding | | Weighted
Average
Interest
Rate | | | Number of Days
Outstanding | | Outstanding
Borrowings
at December 31, 2006 |
Large Capitalization Growth | | $ | 1,020,909 | | 5.62 | % | | 11 | | | — |
International Equity | | | 711,017 | | 5.22 | | | 60 | | $ | 1,150,000 |
Total Return Bond | | | 1,550,000 | | 5.74 | | | 2 | | | — |
Intermediate-Term Bond | | | 4,500,000 | | 5.24 | | | 1 | | | — |
Reverse Repurchase Agreements: Mortgage Backed Securities Portfolio enters into reverse repurchase agreements with qualified, third party broker-dealers as determined by and under the direction of the Trust’s Board of Trustees. Interest on the value of reverse repurchase agreements issued and outstanding is based upon competitive market rates at the time of issuance. At the time the Portfolio enters into a reverse repurchase agreement, it establishes and maintains a segregated account with the lender containing liquid investment grade securities having a value not less than the repurchase price, including accrued interest, of the reverse repurchase agreement.
At December 31, 2006, Mortgage Backed Securities Portfolio had reverse repurchased agreements outstanding as follows:
| | | | | | | | | | | | |
Broker | | Interest
Rate | | Trade
Date | | Value at
December 31,
2006 | | Maturity
Date | | Cost |
Goldman Sachs | | 5.30% | | 12/12/2006 | | $ | 6,186,000 | | 01/11/2007 | | $ | 6,186,000 |
Goldman Sachs | | 5.295% | | 12/18/2006 | | | 5,194,000 | | 01/17/2007 | | | 5,194,000 |
Lehman Brothers | | 5.30% | | 12/19/2006 | | | 7,314,000 | | 01/22/2007 | | | 7,314,000 |
| | | | | | | | | | | | |
| | | | | | $ | 18,694,000 | | | | $ | 18,694,000 |
| | | | | | | | | | | | |
The average daily balance of reverse repurchase agreements outstanding during the year ended December 31, 2006 in the Mortgage Backed Securities Portfolio was approximately $14,628,000 at a weighted average interest rate of approximately 4.98%. The average daily balance is for the number of days the Portfolio had an outstanding balance. The maximum amount of total reverse repurchase agreements outstanding at any month-end during the period was approximately $19,605,000, at November 30, 2006, which was 26% of total assets.
Note 8. New Accounting Pronouncements
On July 13, 2006, the Financial Accounting Standards Board (FASB) released FASB Interpretation No. 48 “Accounting for Uncertainty in Income Taxes” (FIN 48). FIN 48 provides guidance for how uncertain tax positions should be recognized, measured, presented and disclosed in the financial statements. FIN 48 requires the evaluation of tax positions taken or expected to be taken in the course of preparing the Trust’s tax returns
to determine whether the tax positions are “more-likely-than-not” of being sustained by the applicable tax
| | |
| 162 | | THE TARGET PORTFOLIO TRUST |
authority. The impact of the tax positions not deemed to meet the more-likely-than-not threshold would be recorded in the year in which they arise. On December 22, 2006 the Securities and Exchange Commission delayed the effective date until June 30, 2007. At this time, management is evaluating the implications of FIN 48 and its impact, if any, in the financial statements has not yet been determined.
On September 20, 2006, the FASB released Statement of Financial Accounting Standards No. 157 “Fair Value Measurements” (FAS 157). FAS 157 establishes an authoritative definition of fair value, sets out a framework for measuring fair value, and requires additional disclosures about fair-value measurements. The application of FAS 157 is required for fiscal years beginning after November 15, 2007 and interim periods within those fiscal years. At this time, management is evaluating the implications of FAS 157 and its impact, if any, in the financial statements has not yet been determined.
| | |
| THE TARGET PORTFOLIO TRUST | | 163 |
Financial Highlights
| | | |
| | | LARGE CAPITALIZATION
GROWTH PORTFOLIO | |
| | | Class R | |
| | | August 22, 2006(b)
through
December 31, 2006 | |
| |
| PER SHARE OPERATING PERFORMANCE: | | | |
Net asset value, beginning of period | | $14.32 | |
Income (loss) from investment operations | | | |
Net investment income | | .03 | |
Net realized and unrealized gain on investments | | 1.30 | |
Total from investment operations | | 1.33 | |
Less dividends and distributions | | | |
Dividends from net investment income | | (.05 | ) |
Distributions from net realized gains | | (.29 | ) |
Total dividends and distributions | | (.34 | ) |
Net asset value, end of period | | $15.31 | |
| |
| TOTAL RETURN(a) | | 9.34 | % |
| |
| RATIOS/SUPPLEMENTAL DATA: | | | |
Net assets, end of period (000) | | $2,216 | |
Average net assets (000) | | $429 | |
Ratios to average net assets | | | |
Expenses, including distribution and service (12b-1) fees(e) | | 1.25 | %(c) |
Expenses, excluding distribution and service (12b-1) fees | | .75 | %(c) |
Net investment income | | .28 | %(c) |
Portfolio turnover rate | | 69 | %(d) |
| (a) | Total return is calculated assuming a purchase of shares on the first day and a sale on the last day of each period reported and includes reinvestment of dividends and distributions. Total return for periods of less than one full year are not annualized. |
| (b) | Commencement of operations. |
| (e) | The distributor of the Trust has contractually agreed to limit its distribution and service (12b-1) fees to .50% of 1% of the average daily net assets of the Class R shares. |
See Notes to Financial Statements
| | |
| 164 | | THE TARGET PORTFOLIO TRUST |
Financial Highlights (cont’d)
| | | | | | | | | | | | | | | |
| | | LARGE CAPITALIZATION
GROWTH PORTFOLIO | |
| | | Class T | |
| | | Year Ended December 31, | |
| | | 2006 | | | 2005 | | | 2004 | | | 2003 | | | 2002 | |
| | | | | |
| PER SHARE OPERATING PERFORMANCE: | | | | | | | | | | | | | | | |
Net asset value, beginning of year | | $14.60 | | | $15.90 | | | $15.39 | | | $11.03 | | | $16.15 | |
Income (loss) from investment operations | | | | | | | | | | | | | | | |
Net investment income (loss) | | .08 | | | .03 | | | .07 | | | (.01 | ) | | (.01 | ) |
Net realized and unrealized gain (loss) on investments | | 1.18 | | | 1.06 | | | .51 | | | 4.37 | | | (5.11 | ) |
Total from investment operations | | 1.26 | | | 1.09 | | | .58 | | | 4.36 | | | (5.12 | ) |
Less dividends and distributions | | | | | | | | | | | | | | | |
Dividends from net investment income | | (.09 | ) | | (.02 | ) | | (.07 | ) | | — | | | — | |
Distributions from net realized gains | | (.44 | ) | | (2.37 | ) | | — | | | — | | | — | |
Total dividends and distributions | | (.53 | ) | | (2.39 | ) | | (.07 | ) | | — | | | — | |
Net asset value, end of year | | $15.33 | | | $14.60 | | | $15.90 | | | $15.39 | | | $11.03 | |
| | | | | |
| TOTAL RETURN(a) | | 8.67 | % | | 6.74 | % | | 3.78 | % | | 39.53 | % | | (31.70 | )% |
| | | | |
| RATIOS/SUPPLEMENTAL DATA: | | | | | | | | | | | | | |
Net assets, end of year (000) | | $301,566 | | | $307,835 | | | $343,760 | | | $348,385 | | | $243,748 | |
Average net assets (000) | | $299,597 | | | $310,710 | | | $345,413 | | | $290,985 | | | $297,189 | |
Ratios to average net assets | | | | | | | | | | | | | | | |
Expenses, including distribution and service (12b-1) fees | | .75 | % | | .76 | % | | .77 | % | | .84 | % | | .81 | % |
Expenses, excluding distribution and service (12b-1) fees | | .75 | % | | .76 | % | | .77 | % | | .84 | % | | .81 | % |
Net investment income (loss) | | .51 | % | | .18 | % | | .45 | % | | (.09 | )% | | (.11 | )% |
Portfolio turnover rate | | 69 | % | | 246 | % | | 76 | % | | 49 | % | | 66 | % |
| (a) | Total return is calculated assuming a purchase of shares on the first day and a sale on the last day of each year reported and includes reinvestment of dividends and distributions. |
See Notes to Financial Statements
| | |
| THE TARGET PORTFOLIO TRUST | | 165 |
Financial Highlights (cont’d)
| | | |
| | | LARGE CAPITALIZATION
VALUE PORTFOLIO | |
| | | Class R | |
| | | August 22, 2006(b)
through
December 31, 2006(f) | |
| |
| PER SHARE OPERATING PERFORMANCE: | | | |
Net asset value, beginning of period | | $15.07 | |
Income (loss) from investment operations | | | |
Net investment income | | .08 | |
Net realized and unrealized gain on investments | | 1.48 | |
Total from investment operations | | 1.56 | |
Less dividends and distributions | | | |
Dividends from net investment income | | (.24 | ) |
Distributions from net realized gains | | (.79 | ) |
Total dividends and distributions | | (1.03 | ) |
Net asset value, end of period | | $15.60 | |
| |
| TOTAL RETURN(a) | | 10.44 | % |
| |
| RATIOS/SUPPLEMENTAL DATA: | | | |
Net assets, end of period (000) | | $2,194 | |
Average net assets (000) | | $445 | |
Ratios to average net assets | | | |
Expenses, including distribution and service (12b-1) fees(e) | | 1.22 | %(c) |
Expenses, excluding distribution and service (12b-1) fees | | .72 | %(c) |
Net investment income | | 1.69 | %(c) |
Portfolio turnover rate | | 44 | %(d) |
| (a) | Total return is calculated assuming a purchase of shares on the first day and a sale on the last day of each period reported and includes reinvestment of dividends and distributions. Total return for periods of less than one full year are not annualized. |
| (b) | Commencement of operations. |
| (e) | The distributor of the Trust has contractually agreed to limit its distribution and service (12b-1) fees to .50 of 1% of the average daily net assets of the Class R shares. |
| (f) | Calculated based upon average shares outstanding during the period. |
See Notes to Financial Statements
| | |
| 166 | | THE TARGET PORTFOLIO TRUST |
Financial Highlights (cont’d)
| | | | | | | | | | | | | | | |
| | | LARGE CAPITALIZATION
VALUE PORTFOLIO | |
| | | Class T | |
| | | Year Ended December 31, | |
| | | 2006(b) | | | 2005 | | | 2004 | | | 2003 | | | 2002 | |
| | | | | |
| PER SHARE OPERATING PERFORMANCE: | | | | | | | | | | | | | | | |
Net asset value, beginning of year | | $15.11 | | | $16.59 | | | $14.13 | | | $10.49 | | | $12.45 | |
Income (loss) from investment operations | | | | | | | | | | | | | | | |
Net investment income | | .28 | | | .25 | | | .21 | | | .17 | | | .18 | |
Net realized and unrealized gain (loss) on investments | | 2.45 | | | .80 | | | 2.45 | | | 3.64 | | | (1.85 | ) |
Total from investment operations | | 2.73 | | | 1.05 | | | 2.66 | | | 3.81 | | | (1.67 | ) |
Less dividends and distributions | | | | | | | | | | | | | | | |
Dividends from net investment income | | (.29 | ) | | (.25 | ) | | (.20 | ) | | (.17 | ) | | (.17 | ) |
Distributions from net realized gains | | (1.95 | ) | | (2.28 | ) | | — | | | — | | | (.12 | ) |
Total dividends and distributions | | (2.24 | ) | | (2.53 | ) | | (.20 | ) | | (.17 | ) | | (.29 | ) |
Net asset value, end of year | | $15.60 | | | $15.11 | | | $16.59 | | | $14.13 | | | $10.49 | |
| | | | | |
| TOTAL RETURN(a) | | 19.34 | % | | 6.50 | % | | 18.87 | % | | 36.38 | % | | (13.57 | )% |
| | | | | |
| RATIOS/SUPPLEMENTAL DATA: | | | | | | | | | | | | | | | |
Net assets, end of year (000) | | $393,111 | | | $362,253 | | | $385,414 | | | $316,131 | | | $229,626 | |
Average net assets (000) | | $371,251 | | | $366,301 | | | $346,319 | | | $253,653 | | | $253,096 | |
Ratios to average net assets | | | | | | | | | | | | | | | |
Expenses, including distribution and service (12b-1) fees | | .72 | % | | .74 | % | | .74 | % | | .80 | % | | .80 | % |
Expenses, excluding distribution and service (12b-1) fees | | .72 | % | | .74 | % | | .74 | % | | .80 | % | | .80 | % |
Net investment income | | 1.79 | % | | 1.48 | % | | 1.43 | % | | 1.50 | % | | 1.49 | % |
Portfolio turnover rate | | 44 | % | | 90 | % | | 47 | % | | 56 | % | | 56 | % |
| (a) | Total return is calculated assuming a purchase of shares on the first day and a sale on the last day of each year reported and includes reinvestment of dividends and distributions. |
| (b) | Calculated based on average share outstanding during the year. |
See Notes to Financial Statements
| | |
| THE TARGET PORTFOLIO TRUST | | 167 |
Financial Highlights (cont’d)
| | | |
| | | SMALL CAPITALIZATION
GROWTH PORTFOLIO | |
| | | Class R | |
| | | August 22, 2006(b)
through
December 31, 2006 | |
| |
| PER SHARE OPERATING PERFORMANCE: | | | |
Net asset value, beginning of period | | $11.04 | |
Income (loss) from investment operations | | | |
Net investment loss | | — | (c) |
Net realized and unrealized gain on investments | | 1.08 | |
Total from investment operations | | 1.08 | |
Net asset value, end of period | | $12.12 | |
| |
| TOTAL RETURN(a) | | 9.78 | % |
| |
| RATIOS/SUPPLEMENTAL DATA: | | | |
Net assets, end of period (000) | | $898 | |
Average net assets (000) | | $186 | |
Ratios to average net assets | | | |
Expenses, including distribution and service (12b-1) fees(f) | | 1.34 | %(d) |
Expenses, excluding distribution and service (12b-1) fees | | .84 | %(d) |
Net investment loss | | (.05 | )%(d) |
Portfolio turnover rate | | 96 | %(e) |
| (a) | Total return is calculated assuming a purchase of shares on the first day and a sale on the last day of each period reported and includes reinvestment of dividends and distributions. Total return for periods of less than one full year are not annualized. |
| (b) | Commencement of operations. |
| (c) | Less than $0.005 per share |
| (f) | The distributor of the Trust has contractually agreed to limit its distribution and service (12b-1) fees to .50 of 1% of the average daily net assets of the Class R shares. |
See Notes to Financial Statements
| | |
| 168 | | THE TARGET PORTFOLIO TRUST |
Financial Highlights (cont’d)
| | | | | | | | | | | | | | | |
| | | SMALL CAPITALIZATION
GROWTH PORTFOLIO | |
| | | Class T | |
| | | Year Ended December 31, | |
| | | 2006 | | | 2005 | | | 2004 | | | 2003 | | | 2002 | |
| | | | | |
| PER SHARE OPERATING PERFORMANCE: | | | | | | | | | | | | | | | |
Net asset value, beginning of year | | $11.28 | | | $10.79 | | | $9.38 | | | $7.05 | | | $10.56 | |
Income (loss) from investment operations | | | | | | | | | | | | | | | |
Net investment loss | | (.05 | ) | | (.07 | ) | | (.06 | ) | | (.06 | ) | | (.06 | ) |
Net realized and unrealized gain (loss) on investments | | .91 | | | .56 | | | 1.47 | | | 2.39 | | | (3.45 | ) |
Total from investment operations | | .86 | | | .49 | | | 1.41 | | | 2.33 | | | (3.51 | ) |
Net asset value, end of year | | $12.14 | | | $11.28 | | | $10.79 | | | $9.38 | | | $7.05 | |
| | | | | |
| TOTAL RETURN(a) | | 7.62 | % | | 4.54 | % | | 15.03 | % | | 33.05 | % | | (33.24 | )% |
| | | | | |
| RATIOS/SUPPLEMENTAL DATA: | | | | | | | | | | | | | | | |
Net assets, end of year (000) | | $136,422 | | | $143,366 | | | $158,757 | | | $140,251 | | | $100,868 | |
Average net assets (000) | | $140,489 | | | $144,034 | | | $146,717 | | | $116,632 | | | $122,299 | |
Ratios to average net assets | | | | | | | | | | | | | | | |
Expenses, including distribution and service (12b-1) fees | | .84 | % | | .91 | % | | .90 | % | | 1.03 | % | | .99 | % |
Expenses, excluding distribution and service (12b-1) fees | | .84 | % | | .91 | % | | .90 | % | | 1.03 | % | | .99 | % |
Net investment loss | | (.39 | )% | | (.62 | )% | | (.58 | )% | | (.80 | )% | | (.74 | )% |
Portfolio turnover rate | | 96 | % | | 147 | % | | 107 | % | | 235 | % | | 153 | % |
| (a) | Total return is calculated assuming a purchase of shares on the first day and a sale on the last day of each year reported and includes reinvestment of dividends and distributions. |
See Notes to Financial Statements
| | |
| THE TARGET PORTFOLIO TRUST | | 169 |
Financial Highlights (cont’d)
| | | |
| | | SMALL CAPITALIZATION
VALUE PORTFOLIO | |
| | | Class R | |
| | | August 22, 2006(b)
through
December 31, 2006 | |
| |
| PER SHARE OPERATING PERFORMANCE: | | | |
Net asset value, beginning of period | | $20.05 | |
Income (loss) from investment operations | | | |
Net investment income | | .14 | |
Net realized and unrealized gain on investments | | 1.74 | |
Total from investment operations | | 1.88 | |
Less dividends and distributions | | | |
Dividends from net investment income | | (.18 | ) |
Distributions from net realized gains | | (1.29 | ) |
Total dividends and distributions | | (1.47 | ) |
Net asset value, end of period | | $20.46 | |
| |
| TOTAL RETURN(a) | | 9.45 | % |
| |
| RATIOS/SUPPLEMENTAL DATA: | | | |
Net assets, end of period (000) | | $1,061 | |
Average net assets (000) | | $217 | |
Ratios to average net assets | | | |
Expenses, including distribution and service (12b-1) fees(e) | | 1.30 | %(c) |
Expenses, excluding distribution and service (12b-1) fees | | .80 | %(c) |
Net investment income | | 1.37 | %(c) |
Portfolio turnover rate | | 36 | %(d) |
| (a) | Total return is calculated assuming a purchase of shares on the first day and a sale on the last day of each period reported and includes reinvestment of dividends and distributions. Total return for periods of less than one full year are not annualized. |
| (b) | Commencement of operations. |
| (e) | The distributor of the Trust has contractually agreed to limit its distribution and service (12b-1) fees to .50 of 1% of the average daily net assets of the Class R shares. |
See Notes to Financial Statements
| | |
| 170 | | THE TARGET PORTFOLIO TRUST |
Financial Highlights (cont’d)
| | | | | | | | | | | | | | | |
| | | SMALL CAPITALIZATION
VALUE PORTFOLIO | |
| | | Class T | |
| | | Year Ended December 31, | |
| | | 2006 | | | 2005 | | | 2004 | | | 2003 | | | 2002 | |
| | | | | |
| PER SHARE OPERATING PERFORMANCE: | | | | | | | | | | | | | | | |
Net asset value, beginning of year | | $18.98 | | | $21.84 | | | $18.78 | | | $13.23 | | | $17.54 | |
Income (loss) from investment operations | | | | | | | | | | | | | | | |
Net investment income | | .23 | | | .18 | | | .17 | | | .03 | | | .04 | |
Net realized and unrealized gain (loss) on investments | | 3.09 | | | 2.06 | | | 4.27 | | | 6.18 | | | (1.41 | ) |
Total from investment operations | | 3.32 | | | 2.24 | | | 4.44 | | | 6.21 | | | (1.37 | ) |
Less dividends and distributions | | | | | | | | | | | | | | | |
Dividends from net investment income | | (.22 | ) | | (.16 | ) | | (.17 | ) | | (.03 | ) | | (.04 | ) |
Distributions from net realized gains | | (1.61 | ) | | (4.94 | ) | | (1.21 | ) | | (.63 | ) | | (2.90 | ) |
Total dividends and distributions | | (1.83 | ) | | (5.10 | ) | | (1.38 | ) | | (.66 | ) | | (2.94 | ) |
Net asset value, end of year | | $20.47 | | | $18.98 | | | $21.84 | | | $18.78 | | | $13.23 | |
| | | | | |
| TOTAL RETURN(a) | | 17.72 | % | | 10.10 | % | | 24.02 | % | | 47.10 | % | | (8.48 | )% |
| | | | |
| RATIOS/SUPPLEMENTAL DATA: | | | | | | | | | | | | | |
Net assets, end of year (000) | | $320,728 | | | $259,115 | | | $245,576 | | | $205,989 | | | $147,930 | |
Average net assets (000) | | $290,505 | | | $249,661 | | | $218,487 | | | $161,025 | | | $167,945 | |
Ratios to average net assets | | | | | | | | | | | | | | | |
Expenses, including distribution and service (12b-1) fees | | .80 | % | | .79 | % | | .82 | % | | .93 | % | | .88 | % |
Expenses, excluding distribution and service (12b-1) fees | | .80 | % | | .79 | % | | .82 | % | | .93 | % | | .88 | % |
Net investment income | | 1.17 | % | | .81 | % | | .86 | % | | .15 | % | | .23 | % |
Portfolio turnover rate | | 36 | % | | 118 | % | | 22 | % | | 89 | % | | 95 | % |
| (a) | Total return is calculated assuming a purchase of shares on the first day and a sale on the last day of each year reported and includes reinvestment of dividends and distributions. |
See Notes to Financial Statements
| | |
| THE TARGET PORTFOLIO TRUST | | 171 |
Financial Highlights (cont’d)
| | | |
| | | INTERNATIONAL
EQUITY PORTFOLIO | |
| | | Class R | |
| | | August 22, 2006(b)
through
December 31, 2006 | |
| |
| PER SHARE OPERATING PERFORMANCE: | | | |
Net asset value, beginning of period | | $16.09 | |
Income (loss) from investment operations | | | |
Net investment income | | .16 | |
Net realized and unrealized gain on investments | | 1.66 | |
Total from investment operations | | 1.82 | |
Less dividends and distributions | | | |
Dividends from net investment income | | (.25 | ) |
Distributions from net realized gains | | (1.45 | ) |
Total dividends and distributions | | (1.70 | ) |
Net asset value, end of period | | $16.21 | |
| |
| TOTAL RETURN(a) | | 11.74 | % |
| |
| RATIOS/SUPPLEMENTAL DATA: | | | |
Net assets, end of period (000) | | $1,728 | |
Average net assets (000) | | $346 | |
Ratios to average net assets | | | |
Expenses, including distribution and service (12b-1) fees(e) | | 1.43 | %(c) |
Expenses, excluding distribution and service (12b-1) fees | | .93 | %(c) |
Net investment income | | .39 | %(c) |
Portfolio turnover rate | | 41 | %(d) |
| (a) | Total return is calculated assuming a purchase of shares on the first day and a sale on the last day of each period reported and includes reinvestment of dividends and distributions. Total returns for periods of less than one full year are not annualized. |
| (b) | Commencement of operations. |
| (e) | The distributor of the Trust has contractually agreed to limit its distribution and service (12b-1) fees to .50 of 1% of the average daily net assets of the Class R shares. |
See Notes to Financial Statements
| | |
| 172 | | THE TARGET PORTFOLIO TRUST |
Financial Highlights (cont’d)
| | | | | | | | | | | | | | | |
| | | INTERNATIONAL
EQUITY PORTFOLIO | |
| | | Class T | |
| | | Year Ended December 31, | |
| | | 2006 | | | 2005 | | | 2004 | | | 2003 | | | 2002 | |
| | | | | |
| PER SHARE OPERATING PERFORMANCE: | | | | | | | | | | | | | | | |
Net asset value, beginning of year | | $13.99 | | | $13.13 | | | $11.53 | | | $9.07 | | | $10.10 | |
Income (loss) from investment operations | | | | | | | | | | | | | | | |
Net investment income | | .29 | | | .22 | | | .15 | | | .16 | | | .11 | |
Net realized and unrealized gain (loss) on investments | | 3.68 | | | 1.59 | | | 1.59 | | | 2.43 | | | (1.14 | ) |
Total from investment operations | | 3.97 | | | 1.81 | | | 1.74 | | | 2.59 | | | (1.03 | ) |
Less dividends and distributions | | | | | | | | | | | | | | | |
Dividends from net investment income | | (.29 | ) | | (.28 | ) | | (.14 | ) | | (.13 | ) | | — | (b) |
Distributions from net realized gains | | (1.45 | ) | | (.67 | ) | | — | | | — | | | — | |
Total dividends and distributions | | (1.74 | ) | | (.95 | ) | | (.14 | ) | | (.13 | ) | | — | (b) |
Net asset value, end of year | | $16.22 | | | $13.99 | | | $13.13 | | | $11.53 | | | $9.07 | |
| | | | | |
| TOTAL RETURN(a) | | 29.02 | % | | 14.12 | % | | 15.23 | % | | 28.76 | % | | (10.17 | )% |
| | | | | |
| RATIOS/SUPPLEMENTAL DATA: | | | | | | | | | | | | | | | |
Net assets, end of year (000) | | $268,314 | | | $233,150 | | | $230,300 | | | $191,909 | | | $140,392 | |
Average net assets (000) | | $248,571 | | | $221,543 | | | $209,378 | | | $153,435 | | | $150,249 | |
Ratios to average net assets | | | | | | | | | | | | | | | |
Expenses, including distribution and service (12b-1) fees | | .93 | % | | .99 | % | | 1.00 | % | | 1.07 | % | | 1.09 | % |
Expenses, excluding distribution and service (12b-1) fees | | .93 | % | | .99 | % | | 1.00 | % | | 1.07 | % | | 1.09 | % |
Net investment income | | 1.73 | % | | 1.55 | % | | 1.27 | % | | 1.69 | % | | 1.17 | % |
Portfolio turnover rate | | 41 | % | | 123 | % | | 59 | % | | 47 | % | | 55 | % |
| (a) | Total return is calculated assuming a purchase of shares on the first day and a sale on the last day of each year reported and includes reinvestment of dividends and distributions. |
| (b) | Less than $0.005 per share |
See Notes to Financial Statements
| | |
| THE TARGET PORTFOLIO TRUST | | 173 |
Financial Highlights (cont’d)
| | | | | | | | | | | | | | | |
| | | INTERNATIONAL
BOND PORTFOLIO | |
| | | Class T | |
| | | Year Ended December 31, | |
| | | 2006 | | | 2005 | | | 2004 | | | 2003 | | | 2002 | |
| | | | | |
PER SHARE OPERATING
PERFORMANCE: | | | | | | | | | | | | | | | |
Net asset value, beginning of year | | $8.33 | | | $8.19 | | | $8.45 | | | $8.83 | | | $7.46 | |
Income (loss) from investment operations | | | | | | | | | | | | | | | |
Net investment income | | .19 | | | .03 | | | .26 | | | .21 | | | .15 | |
Net realized and unrealized gain (loss) on investments | | (.03 | ) | | .27 | | | .05 | | | .26 | | | 1.33 | |
Total from investment operations | | .16 | | | .30 | | | .31 | | | .47 | | | 1.48 | |
Less dividends and distributions | | | | | | | | | | | | | | | |
Dividends from net investment income | | (.26 | ) | | (.15 | ) | | (.48 | ) | | (.84 | ) | | (.11 | ) |
Distributions from net realized gains | | (.01 | ) | | (.01 | ) | | (.09 | ) | | (.01 | ) | | — | |
Total dividends and distributions | | (.27 | ) | | (.16 | ) | | (.57 | ) | | (.85 | ) | | (.11 | ) |
Net asset value, end of year | | $8.22 | | | $8.33 | | | $8.19 | | | $8.45 | | | $8.83 | |
| | | | | |
| TOTAL RETURN(a) | | 1.84 | % | | 3.95 | % | | 3.71 | % | | 5.31 | % | | 20.14 | % |
| | | | | |
| RATIOS/SUPPLEMENTAL DATA: | | | | | | | | | | | | | | | |
Net assets, end of year (000) | | $40,944 | | | $42,912 | | | $44,905 | | | $38,553 | | | $27,648 | |
Average net assets (000) | | $41,174 | | | $44,072 | | | $43,199 | | | $32,992 | | | $22,022 | |
Ratios to average net assets | | | | | | | | | | | | | | | |
Expenses, including distribution and service (12b-1) fees | | 1.19 | % | | 1.51 | % | | 1.49 | % | | 1.51 | % | | 1.69 | % |
Expenses, excluding distribution and service (12b-1) fees | | 1.19 | % | | 1.51 | % | | 1.49 | % | | 1.51 | % | | 1.69 | % |
Net investment income | | 2.32 | % | | 1.71 | % | | 2.15 | % | | 1.88 | % | | 1.88 | % |
Portfolio turnover rate | | 323 | % | | 223 | % | | 169 | % | | 235 | % | | 238 | % |
| (a) | Total return is calculated assuming a purchase of shares on the first day and a sale on the last day of each year reported and includes reinvestment of dividends and distributions. |
See Notes to Financial Statements
| | |
| 174 | | THE TARGET PORTFOLIO TRUST |
[THIS PAGE INTENTIONALLY LEFT BLANK]
Financial Highlights (cont’d)
| | | |
| | | TOTAL RETURN
BOND PORTFOLIO | |
| | | Class R | |
| | | August 22, 2006(b)
through
December 31, 2006 | |
| |
| PER SHARE OPERATING PERFORMANCE: | | | |
Net asset value, beginning of period | | $10.31 | |
Income (loss) from investment operations | | | |
Net investment income | | .12 | |
Net realized and unrealized gain on investments | | .01 | |
Total from investment operations | | .13 | |
Less dividends and distributions | | | |
Dividends from net investment income | | (.13 | ) |
Distributions from net realized gains | | — | |
Total dividends and distributions | | (.13 | ) |
Net asset value, end of period | | $10.31 | |
| |
| TOTAL RETURN(a) | | 1.27 | % |
| |
| RATIOS/SUPPLEMENTAL DATA: | | | |
Net assets, end of period (000) | | $1,503 | |
Average net assets (000) | | $246 | |
Ratios to average net assets | | | |
Expenses, including distribution and service (12b-1) fees(e) | | 1.18 | %(c) |
Expenses, excluding distribution and service (12b-1) fees | | .68 | %(c) |
Net investment income | | 3.46 | %(c) |
Portfolio turnover rate | | 483 | %(d) |
| (a) | Total return is calculated assuming a purchase of shares on the first day and a sale on the last day of each period reported and includes reinvestment of dividends and distributions. Total return for periods of less than one full year are not annualized. |
| (b) | Commencement of operations. |
| (e) | The distributor of the Trust has contractually agreed to limit its distribution and service (12b-1) fees to .50 of 1% of the average daily net assets of the Class R shares. |
See Notes to Financial Statements
| | |
| 176 | | THE TARGET PORTFOLIO TRUST |
Financial Highlights (cont’d)
| | | | | | | | | | | | | | | |
| | | TOTAL RETURN
BOND PORTFOLIO | |
| | | Class T | |
| | | Year Ended December 31, | |
| | | 2006 | | | 2005 | | | 2004 | | | 2003 | | | 2002 | |
| | | | | |
| PER SHARE OPERATING PERFORMANCE: | | | | | | | | | | | | | | | |
Net asset value, beginning of year | | $10.39 | | | $10.64 | | | $10.66 | | | $10.73 | | | $10.42 | |
Income (loss) from investment operations | | | | | | | | | | | | | |
Net investment income | | .40 | | | .38 | | | .20 | | | .33 | | | .41 | |
Net realized and unrealized gain (loss) on investments | | .03 | | | (.12 | ) | | .31 | | | .33 | | | .57 | |
Total from investment operations | | .43 | | | .26 | | | .51 | | | .66 | | | .98 | |
Less dividends and distributions | | | | | | | | | | | | | | | |
Dividends from net investment income | | (.44 | ) | | (.43 | ) | | (.44 | ) | | (.36 | ) | | (.45 | ) |
Distributions from net realized gains | | — | | | (.08 | ) | | (.09 | ) | | (.37 | ) | | (.22 | ) |
Total dividends and distributions | | (.44 | ) | | (.51 | ) | | (.53 | ) | | (.73 | ) | | (.67 | ) |
Net asset value, end of year | | $10.38 | | | $10.39 | | | $10.64 | | | $10.66 | | | $10.73 | |
| | | | | |
| TOTAL RETURN(a) | | 4.27 | % | | 2.60 | % | | 4.73 | % | | 6.22 | % | | 9.65 | % |
| | | | |
| RATIOS/SUPPLEMENTAL DATA: | | | | | | | | | | | | | |
Net assets, end of year (000) | | $167,154 | | | $161,675 | | | $178,488 | | | $158,148 | | | $139,488 | |
Average net assets (000) | | $162,621 | | | $169,616 | | | $170,073 | | | $151,999 | | | $122,888 | |
Ratios to average net assets | | | | | | | | | | | | | | | |
Expenses, including distribution and service (12b-1) fees | | .68 | % | | .76 | % | | .75 | % | | .76 | % | | .75 | % |
Expenses, excluding distribution and service (12b-1) fees | | .68 | % | | .76 | % | | .75 | % | | .76 | % | | .75 | % |
Net investment income | | 4.14 | % | | 3.72 | % | | 1.82 | % | | 2.99 | % | | 3.89 | % |
Portfolio turnover rate | | 483 | % | | 366 | % | | 587 | % | | 445 | % | | 429 | % |
| (a) | Total return is calculated assuming a purchase of shares on the first day and a sale on the last day of each year reported and includes reinvestment of dividends and distributions. |
See Notes to Financial Statements
| | |
| THE TARGET PORTFOLIO TRUST | | 177 |
Financial Highlights (cont’d)
| | | | | | | | | | | | | | | |
| | | INTERMEDIATE-TERM
BOND PORTFOLIO | |
| | | Class T | |
| | | Year Ended December 31, | |
| | | 2006 | | | 2005 | | | 2004 | | | 2003 | | | 2002 | |
| | | | | |
| PER SHARE OPERATING PERFORMANCE: | | | | | | | | | | | | | | | |
Net asset value, beginning of year | | $10.18 | | | $10.36 | | | $10.46 | | | $10.50 | | | $10.23 | |
Income (loss) from investment operations | | | | | | | | | | | | | | | |
Net investment income | | .43 | | | .36 | | | .19 | | | .28 | | | .38 | |
Net realized and unrealized gain (loss) on investments | | (.03 | ) | | (.16 | ) | | .14 | | | .19 | | | .47 | |
Total from investment operations | | .40 | | | .20 | | | .33 | | | .47 | | | .85 | |
Less dividends and distributions | | | | | | | | | | | | | | | |
Dividends from net investment income | | (.45 | ) | | (.38 | ) | | (.24 | ) | | (.34 | ) | | (.39 | ) |
Distributions from net realized gains | | — | | | — | (b) | | (.19 | ) | | (.17 | ) | | (.19 | ) |
Total dividends and distributions | | (.45 | ) | | (.38 | ) | | (.43 | ) | | (.51 | ) | | (.58 | ) |
Net asset value, end of year | | $10.13 | | | $10.18 | | | $10.36 | | | $10.46 | | | $10.50 | |
| | | | | |
| TOTAL RETURN(a) | | 4.12 | % | | 1.88 | % | | 3.19 | % | | 4.58 | % | | 8.56 | % |
| | | | | |
| RATIOS/SUPPLEMENTAL DATA: | | | | | | | | | | | | | | | |
Net assets, end of year (000) | | $245,223 | | | $262,177 | | | $297,982 | | | $334,806 | | | $333,069 | |
Average net assets (000) | | $249,376 | | | $278,441 | | | $318,671 | | | $343,466 | | | $258,072 | |
Ratios to average net assets | | | | | | | | | | | | | | | |
Expenses, including distribution and service (12b-1) fees | | .64 | % | | .63 | % | | .64 | % | | .68 | % | | .66 | % |
Expenses, excluding distribution and service (12b-1) fees | | .64 | % | | .63 | % | | .64 | % | | .68 | % | | .66 | % |
Net investment income | | 4.23 | % | | 3.48 | % | | 1.86 | % | | 2.64 | % | | 3.58 | % |
Portfolio turnover rate | | 134 | % | | 208 | % | | 133 | % | | 422 | % | | 377 | % |
| (a) | Total return is calculated assuming a purchase of shares on the first day and a sale on the last day of each year reported and includes reinvestment of dividends and distributions. |
| (b) | Less than $0.005 per share. |
See Notes to Financial Statements
| | |
| 178 | | THE TARGET PORTFOLIO TRUST |
Financial Highlights (cont’d)
| | | | | | | | | | | | | | | |
| | | MORTGAGE BACKED
SECURITIES PORTFOLIO | |
| | | Class T | |
| | | Year Ended December 31, | |
| | | 2006 | | | 2005 | | | 2004 | | | 2003 | | | 2002 | |
| | | | | |
| PER SHARE OPERATING PERFORMANCE: | | | | | | | | | | | | | | | |
Net asset value, beginning of year | | $10.10 | | | $10.39 | | | $10.45 | | | $10.70 | | | $10.44 | |
Income (loss) from investment operations | | | | | | | | | | | | | | | |
Net investment income | | .44 | | | .50 | | | .36 | | | .47 | | | .56 | |
Net realized and unrealized gain (loss) on investments | | (.07 | ) | | (.27 | ) | | .02 | | | (.24 | ) | | .27 | |
Total from investment operations | | .37 | | | .23 | | | .38 | | | .23 | | | .83 | |
Less Dividends | | | | | | | | | | | | | | | |
Dividends from net investment income | | (.48 | ) | | (.52 | ) | | (.44 | ) | | (.48 | ) | | (.57 | ) |
Net asset value, end of year | | $9.99 | | | $10.10 | | | $10.39 | | | $10.45 | | | $10.70 | |
| | | | | |
| TOTAL RETURN(a) | | 3.82 | % | | 2.29 | % | | 3.68 | % | | 2.20 | % | | 8.13 | % |
| | | | | |
| RATIOS/SUPPLEMENTAL DATA: | | | | | | | | | | | | | | | |
Net assets, end of year (000) | | $75,471 | | | $82,195 | | | $95,796 | | | $107,072 | | | $115,546 | |
Average net assets (000) | | $77,483 | | | $89,756 | | | $103,055 | | | $114,526 | | | $94,893 | |
Ratios to average net assets | | | | | | | | | | | | | | | |
Expenses, including distribution and service (12b-1) fees | | 1.89 | %(b) | | 1.70 | %(b) | | .90 | % | | .84 | % | | .80 | % |
Expenses, excluding distribution and service (12b-1) fees | | 1.89 | %(b) | | 1.70 | %(b) | | .90 | % | | .84 | % | | .80 | % |
Net investment income | | 4.46 | % | | 4.91 | % | | 3.48 | % | | 4.43 | % | | 4.43 | % |
Portfolio turnover rate | | 471 | % | | 251 | % | | 279 | % | | 282 | % | | 184 | % |
| (a) | Total return is calculated assuming a purchase of shares on the first day and a sale on the last day of each year reported and includes reinvestment of dividends and distributions. |
| (b) | The annualized expense ratio without interest expense would have been 0.94% and 0.91%, respectively, for the fiscal years ended December 31, 2006 and 2005. |
See Notes to Financial Statements
| | |
| THE TARGET PORTFOLIO TRUST | | 179 |
Financial Highlights (cont’d)
| | | | | | | | | | | | | | | |
| | | U.S. GOVERNMENT MONEY
MARKET PORTFOLIO | |
| | | Class T | |
| | | Year Ended December 31, | |
| | | 2006 | | | 2005 | | | 2004 | | | 2003 | | | 2002 | |
| | | | | |
| PER SHARE OPERATING PERFORMANCE: | | | | | | | | | | | | | | | |
Net asset value, beginning of year | | $1.00 | | | $1.00 | | | $1.00 | | | $1.00 | | | $1.00 | |
Net investment income and net realized gain on investments | | .043 | | | .026 | | | .008 | | | .007 | | | .013 | |
Less dividends and distributions | | (.043 | ) | | (.026 | ) | | (.008 | ) | | (.007 | ) | | (.013 | ) |
Net asset value, end of year | | $1.00 | | | $1.00 | | | $1.00 | | | $1.00 | | | $1.00 | |
| | | | | |
| TOTAL RETURN(a) | | 4.36 | % | | 2.59 | % | | .76 | % | | .70 | % | | 1.31 | % |
| | | | | |
| RATIOS/SUPPLEMENTAL DATA: | | | | | | | | | | | | | | | |
Net assets, end of year (000) | | $47,275 | | | $57,207 | | | $74,190 | | | $98,464 | | | $127,141 | |
Average net assets (000) | | $47,990 | | | $69,488 | | | $94,854 | | | $114,831 | | | $128,550 | |
Ratios to average net assets | | | | | | | | | | | | | | | |
Expenses, including distribution and service (12b-1) fees | | .70 | % | | .71 | % | | .59 | % | | .52 | % | | .45 | % |
Expenses, excluding distribution and service (12b-1) fees | | .70 | % | | .71 | % | | .59 | % | | .52 | % | | .45 | % |
Net investment income | | 4.25 | % | | 2.50 | % | | .72 | % | | .71 | % | | 1.31 | % |
| (a) | Total return is calculated assuming a purchase of shares on the first day and a sale on the last day of each year reported and includes reinvestment of dividends and distributions. |
See Notes to Financial Statements
| | |
| 180 | | THE TARGET PORTFOLIO TRUST |
Report of Independent Registered Public Accounting Firm
The Board of Trustees and Shareholders of The Target Portfolio Trust:
We have audited the accompanying statements of assets and liabilities of The Target Portfolio Trust (comprised of Large Capitalization Growth Portfolio, Large Capitalization Value Portfolio, Small Capitalization Growth Portfolio, Small Capitalization Value Portfolio, International Equity Portfolio, International Bond Portfolio, Total Return Bond Portfolio, Intermediate-Term Bond Portfolio, Mortgage Backed Securities Portfolio, and U.S. Government Money Market Portfolio) hereafter referred to as the “Trust”, including the portfolios of investments, as of December 31, 2006, and the related statements of operations for the year then ended, the statements of changes in net assets for each of the years in the two-year period then ended and the financial highlights for each of the years in the three-year period then ended. These financial statements and financial highlights are the responsibility of the Trust’s management. Our responsibility is to express an opinion on these financial statements and financial highlights based on our audits. The financial highlights for the years presented prior to the year ended December 31, 2004 were audited by another independent registered public accounting firm, whose report dated February 24, 2004, expressed an unqualified opinion thereon.
We conducted our audits in accordance with the standards of the Public Company Accounting Oversight Board (United States). Those standards require that we plan and perform the audit to obtain reasonable assurance about whether the financial statements and financial highlights are free of material misstatement. An audit includes examining, on a test basis, evidence supporting the amounts and disclosures in the financial statements. Our procedures included confirmation of securities owned as of December 31, 2006, by correspondence with the custodian and brokers or by other appropriate auditing procedures where replies from brokers were not received. An audit also includes assessing the accounting principles used and significant estimates made by management, as well as evaluating the overall financial statement presentation. We believe that our audits provide a reasonable basis for our opinion.
In our opinion, the financial statements and financial highlights referred to above present fairly, in all material respects, the financial position of the Trust as of December 31, 2006, and the results of its operations for the year then ended, the changes in its net assets for each of the years in the two-year period then ended and the financial highlights for each of the years in the three-year period then ended, in conformity with U.S. generally accepted accounting principles.

New York, New York
February 28, 2007
| | |
| THE TARGET PORTFOLIO TRUST | | 181 |
Federal Income Tax Information (Unaudited)
As required by the Internal Revenue Code, we wish to advise you as to the federal tax status of dividends and distributions paid by the Portfolios during its fiscal year ended December 31, 2006. Detailed below, please find the aggregate dividends and distributions, per share, paid by each Portfolio during the year ended December 31, 2006:
| | | | | | | | | | | | |
Portfolio | | Ordinary Dividends* | | Long-Term**
Capital Gains
Distributions | | |
| | Income | | Short-Term
Capital Gains | | | Total Dividends
and Distributions |
Large Capitalization Growth Portfolio | | | | | | | | | | | | |
Class R | | $ | 0.048900 | | $ | 0.000000 | | $ | 0.288800 | | $ | 0.337700 |
Class T | | | 0.085000 | | | 0.099100 | | | 0.337400 | | | 0.521500 |
Large Capitalization Value Portfolio | | | | | | | | | | | | |
Class R | | | 0.241160 | | | 0.295650 | | | 0.497160 | | | 1.033970 |
Class T | | | 0.288770 | | | 0.428650 | | | 1.525160 | | | 2.242580 |
Small Capitalization Value Portfolio | | | | | | | | | | | | |
Class R | | | 0.180000 | | | 0.296800 | | | 0.994300 | | | 1.471100 |
Class T | | | 0.224000 | | | 0.327200 | | | 1.285300 | | | 1.836500 |
International Equity Portfolio | | | | | | | | | | | | |
Class R | | | 0.245000 | | | 0.584300 | | | 0.869500 | | | 1.698800 |
Class T | | | 0.288000 | | | 0.584300 | | | 0.869500 | | | 1.741800 |
International Bond Portfolio | | | 0.261926 | | | 0.000000 | | | 0.011013 | | | 0.272939 |
Total Return Bond Portfolio | | | | | | | | | | | | |
Class R | | | 0.130772 | | | 0.000000 | | | 0.000000 | | | 0.130772 |
Class T | | | 0.441796 | | | 0.000000 | | | 0.000000 | | | 0.441796 |
Intermediate-Term Bond Portfolio | | | 0.448465 | | | 0.000000 | | | 0.000000 | | | 0.448465 |
Mortgage Backed Securities Portfolio | | | 0.483500 | | | 0.000000 | | | 0.000000 | | | 0.483500 |
U.S. Government Money Market Portfolio | | | 0.042796 | | | 0.000000 | | | 0.000000 | | | 0.042796 |
| * | For federal income tax purposes, income dividends and short-term capital gains distributions are taxable as ordinary income. |
| ** | Long-term capital gain distributions are taxable as such. |
As required by the Internal Revenue Code, the following percentages of ordinary income distributions for the year ended December 31, 2006 have been designated as 1) qualified for the reduced tax rate under The Job and Growth Tax Relief Reconciliation Act of 2003 (“QDI”), 2) dividends received deduction eligible for the corporate shareholders (“DRD”), 3) qualified interest income under The American Jobs Creation Act of 2004 (“QII”) and 4) qualified short-term capital gains under The American Jobs Creation Act of 2004 (“QSTCG”):
| | | | | | | | | | | | |
Portfolio | | QDI | | | DRD | | | QII | | | QSTCG | |
Large Capitalization Growth Portfolio | | 100.00 | % | | 100.00 | % | | 0.00 | % | | 58.92 | % |
Large Capitalization Value Portfolio | | 49.12 | % | | 57.88 | % | | 0.00 | % | | 65.46 | % |
Small Capitalization Value Portfolio | | 54.47 | % | | 55.40 | % | | 0.00 | % | | 67.99 | % |
International Equity Portfolio | | 47.53 | % | | 0.00 | % | | 0.00 | % | | 75.80 | % |
International Bond Portfolio | | 0.00 | % | | 0.00 | % | | 0.00 | % | | 0.00 | % |
Total Return Bond Portfolio | | 0.00 | % | | 0.00 | % | | 73.50 | % | | 0.00 | % |
Intermediate-Term Bond Portfolio | | 0.00 | % | | 0.00 | % | | 93.28 | % | | 0.00 | % |
Mortgage Backed Securities Portfolio | | 0.00 | % | | 0.00 | % | | 95.50 | % | | 0.00 | % |
U.S. Government Money Market Portfolio | | 0.00 | % | | 0.00 | % | | 100.00 | % | | 0.00 | % |
| | |
| 182 | | THE TARGET PORTFOLIO TRUST |
Pursuant to Section 853 of the Internal Revenue Code, for the International Equity Portfolio $472,404 of foreign taxes paid and $7,024,467 of foreign source income have been designated for the year ended December 31, 2006.
Many states do not tax the portion of mutual fund dividends attributed to interest from U.S. Government obligations. Listed below is the percentage of interest earned by the following Portfolios from U.S. Government obligations for the calendar year 2006.
To determine the amount of your dividends which may be exempt from state and local tax, simply multiply the amount in Box 1a of your 1099-DIV (Ordinary Dividends) by the percentage listed below.
| | | |
Portfolio *** | | Percentage of Interest from
U.S. Government Obligations | |
International Bond Portfolio | | 15.23 | % |
Total Return Bond Portfolio. | | 22.10 | % |
Intermediate-Term Bond Portfolio | | 9.08 | % |
U.S. Government Money Market Portfolio | | 12.05 | % |
| *** | Due to certain minimum portfolio holding requirements in California, Connecticut and New York, residents of those states will not be able to exclude 2006 interest income from state and local taxes. |
Please consult your tax adviser or state/local authorities to properly report this information on your tax return. If you have any questions concerning the amounts listed above, please call your financial adviser.
| | |
| THE TARGET PORTFOLIO TRUST | | 183 |
Management of the Trust (Unaudited)
Information pertaining to the Trustees of The Target Portfolio Trust (the “Trust”) is set forth below. Trustees who are not deemed to be “interested persons” of the Trust, as defined in the Investment Company Act of 1940 (the 1940 Act), are referred to as “Independent Trustees.” Trustees who are deemed to be “interested persons” of the Trust are referred to as “Interested Trustees.” “Fund Complex”† consists of the Trust and any other investment companies managed by PI.
Independent Trustees(2)
Linda W. Bynoe (54), Trustee since 2005(3) Oversees 73 portfolios in Fund complex
Principal occupations (last 5 years): President and Chief Executive Officer (since March 1995) of Telemat, Ltd. (management consulting); formerly Vice President at Morgan Stanley & Co.
Other Directorships held: Director of Simon Property Group, Inc. (real estate investment trust) (since May 2003); Anixter International (communication products distributor) (since January 2006); Director of Northern Trust Corporation (since April 2006).
David E.A. Carson (72), Trustee since 2003(3) Oversees 77 portfolios in Fund complex
Principal occupations (last 5 years): Formerly Director (January 2000 to May 2000), Chairman (January 1999 to December 1999), Chairman and Chief Executive Officer (January 1998 to December 1998) and President, Chairman and Chief Executive Officer of People’s Bank (1983-1997).
Robert E. La Blanc (72), Trustee since 1999(3) Oversees 75 portfolios in Fund complex
Principal occupations (last 5 years): President (since 1981) of Robert E. La Blanc Associates, Inc. (telecommunications).
Other Directorships held:(4) Director of CA, Inc. (since 2002) (software company); FiberNet Telecom Group, Inc. (since 2003) (telecom company).
Douglas H. McCorkindale (67), Trustee since 1996(3) Oversees 72 portfolios in Fund complex
Principal occupations (last 5 years): Formerly Chairman (February 2001 to June 2006), Chief Executive Officer (June 2000 to July 2005) President (September 1997-July 2005) and Vice Chairman (March 1984 to May 2000) of Gannett Co., Inc. (publishing and media).
Other Directorships held:(4) Director of Continental Airlines, Inc. (since May 1993); Director of Lockheed Martin Corp. (aerospace and defense) (since May 2001).
Richard A. Redeker (63), Trustee since 2003(3) Oversees 74 portfolios in Fund complex
Principal occupations (last 5 years): Management Consultant; Director (since 2001) and Chairman of the Board (since 2006) of Invesmart, Inc.; Director of Penn Tank Lines, Inc. (since 1999).
Robin B. Smith (67), Trustee since 2003(3) Oversees 75 portfolios in Fund complex
Principal occupations (last 5 years): Chairman of the Board (since January 2003) of Publishers Clearing House (direct marketing); formerly Chairman and Chief Executive Officer (August 1996 to January 2003) of Publishers Clearing House.
Other Directorships held:(4) Formerly Director of BellSouth Corporation (1992 -2006)
Stephen G. Stoneburn (63), Trustee since 1999(3) Oversees 75 portfolios in Fund complex
Principal occupations (last 5 years): President and Chief Executive Officer (since June 1996) of Quadrant Media Corp. (publishing company); formerly President (June 1995-June 1996) of Argus Integrated Media, Inc.; Senior Vice President and Managing Director (January 1993-1995) of Cowles Business Media; Senior Vice President of Fairchild Publications, Inc. (1975-1989).
| | |
| 184 | | THE TARGET PORTFOLIO TRUST |
Clay T. Whitehead (68), Trustee since 1999(3) Oversees 75 portfolios in Fund complex
Principal occupations (last 5 years): President (since 1983) of YCO (new business development firm).
Interested Trustees(1)
Judy A. Rice (59), President since 2003 and Director since 2000(3) Oversees 74 portfolios in Fund complex
Principal occupations (last 5 years): President, Chief Executive Officer, Chief Operating Officer and Officer-In-Charge (since February 2003) of Prudential Investments LLC; Vice President (since February 1999) of Prudential Investment Management Services LLC; President, Chief Executive Officer and Officer-In-Charge (since April 2003) of Prudential Mutual Fund Services LLC; formerly Director (May 2003 to March 2006) and Executive Vice President (June 2005 to March 2006) of American Skandia Investment Services, Inc.; formerly Executive Vice President (September 1999 to February 2003) of Prudential Investments LLC; Member of Board of Governors of the Investment Company Institute.
Robert F. Gunia (60), Vice President and Trustee since 1999(3) Oversees 154 portfolios in Fund complex
Principal occupations (last 5 years): Chief Administrative Officer (since September 1999) and Executive Vice President (since December 1996) of Prudential Investments LLC; President (since April 1999) of Prudential Investment Management Services LLC; Executive Vice President (since March 1999) and Treasurer (since May 2000) of Prudential Mutual Fund Services LLC. Chief Administrative Officer, Executive Vice President and Director (since May 2003) of American Skandia Investment Services, Inc.
Other Directorships held:(4) Vice President and Director (since May 1989) and Treasurer (since 1999) of The Asia Pacific Fund, Inc.
Information pertaining to the Officers of the Trust who are not also Trustees is set forth below.
Officers(2)
Kathryn L. Quirk (54), Chief Legal Officer since 2005(3)
Principal occupations (last 5 years): Vice President and Corporate Counsel (since September 2004) of Prudential; Executive Vice President, Chief Legal Officer and Secretary (since July 2005) of Prudential Investments LLC and Prudential Mutual Fund Services LLC; formerly Managing Director, General Counsel, Chief Compliance Officer, Chief Risk Officer and Corporate Secretary (1997-2002) of Zurich Scudder Investments, Inc.
Grace C. Torres (47), Treasurer and Principal Financial and Accounting Officer since 2000(3)
Principal occupations (last 5 years): Assistant Treasurer (since March 1999) and Senior Vice President (since September 1999) of PI; Assistant Treasurer (since May 2003) and Vice President (since June 2005) of American Skandia Investment Services, Inc.; Senior Vice President and Assistant Treasurer (since May 2003) of American Skandia Advisory Services, Inc.; formerly Senior Vice President (May 2003 to June 2005) of American Skandia Investment Services, Inc.
Lee D. Augsburger (47), Chief Compliance Officer since 2004(3)
Principal occupations (last 5 years): Senior Vice President and Chief Compliance Officer (since April 2003) of PI; Vice President (since November 2000) and Chief Compliance Officer (since October 2000) of Prudential Investment Management, Inc.; Chief Compliance Officer and Senior Vice President (since May 2003) of American Skandia Investment Services, Inc.
Noreen M. Fierro (42), Anti-Money Laundering Compliance Officer since 2006(3)
Principal occupations (last 5 years): Vice President, Corporate Compliance (since May 2006) of Prudential; formerly Corporate Vice President, Associate General Counsel (April 2002-May 2005) of UBS Financial Services, Inc., in their Money Laundering Prevention Group; Senior Manager (May 2005-May 2006) of Deloitte Financial Advisory Services, LLP, in their Forensic and Dispute Services, Anti-Money Laundering Group.
| | |
| THE TARGET PORTFOLIO TRUST | | 185 |
Deborah A. Docs (49), Secretary since 2004(3)
Principal occupations (last 5 years): Vice President and Corporate Counsel (since January 2001) of Prudential; Vice President (since December 1996) and Assistant Secretary (since March 1999) of PI; formerly Vice President and Assistant Secretary (May 2003 to June 2005) of American Skandia Investment Services, Inc.
Claudia DiGiacomo (32), Assistant Secretary since 2005(3)
Principal occupations (last 5 years): Vice President and Corporate Counsel (since January 2005) of Prudential; Vice President and Assistant Secretary of PI (since December 2005); Associate at Sidley Austin Brown & Wood LLP (1999-2004).
Andrew R. French (44), Assistant Secretary since 2006(3)
Principal occupations (last 5 years): Director and Corporate Counsel (since May 2006) of Prudential; formerly Senior Legal Analyst of Prudential Mutual Fund Law Department (1997-2006).
John P. Schwartz (35), Assistant Secretary since 2006(3)
Principal occupations (last 5 years): Vice President and Corporate Counsel (since April 2005) of Prudential; Vice President and Assistant Secretary of PI (since December 2005); Associate at Sidley, Austin Brown & Wood LLP (1997-2005).
Jonathan D. Shain (48), Assistant Secretary since 2005(3)
Principal occupations (last 5 years): Vice President and Corporate Counsel (since August 1998) of Prudential; Vice President and Assistant Secretary (since May 2001) of PI; Vice President and Assistant Secretary (since February 2001) of PMFS; formerly Vice President and Assistant Secretary (May 2003 to June 2005) of American Skandia Investment Services, Inc.
Jack Benintende (42), Assistant Treasurer since 2006(3)
Principal occupations (last 5 years): Vice President (since June 2000) within Prudential Mutual Fund Administration; formerly Senior Manager within the investment management practice of PricewaterhouseCoopers LLP (May 1994-June 2000).
M. Sadiq Peshimam (43), Assistant Treasurer since 2006(3)
Principal occupations (last 5 years): Vice President (since 2005) and Director (2000-2005) within Prudential Mutual Fund Administration.
| | † | The Fund Complex consists of all investment companies managed by PI. The Funds for which PI serves as manager include JennisonDryden Mutual Funds, Strategic Partners Funds, The Prudential Variable Contract Accounts 2, 10, 11. The Target Portfolio Trust, The Prudential Series Fund, American Skandia Trust, The High Yield Income Fund, Inc., The High Yield Plus Fund, Inc. and Prudential’s Gibraltar Fund, Inc. |
| | (1) | “Interested” Trustee, as defined in the 1940 Act, by reason of employment with the Manager (Prudential Investments LLC or PI), the Subadvisers or the Distributor (Prudential Investment Management Services LLC or PIMS). |
| | (2) | Unless otherwise noted, the address of the Trustees and Officers is c/o: Prudential Investments LLC, Gateway Center Three, 100 Mulberry Street, Newark, NJ 07102. |
| | (3) | There is no set term of office for Trustees and Officers. The independent Trustees have adopted a retirement policy, which calls for the retirement of Trustees on December 31 of the year in which they reach the age of 75. The table shows the individuals length of service as Trustee and/or Officer. |
| | (4) | This includes only directorships of companies required to register, or file reports with the SEC under the Securities and Exchange Act of 1934 (that is, “public companies”) or other investment companies registered under the 1940 Act. |
Additional Information about the Trust’s Trustees is included in the Trust’s Statement of Additional Information which is available without charge, upon request, by calling (800) 521-7466 or (732) 482-7555 (Calling from outside the U.S.)
| | |
| 186 | | THE TARGET PORTFOLIO TRUST |
Growth of a $10,000 Investment
Large Capitalization Growth Portfolio
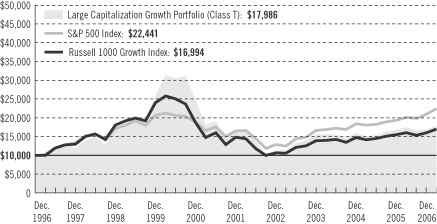
| | | | | | | | | |
| Average Annual Total Returns as of 12/31/06 | | | | | | | | | |
| | | One Year | | | Five Years | | | Ten Years | |
With TARGET Program Fee (Class T) | | 7.04 | % | | 1.25 | % | | 6.05 | % |
| | | |
| | | One Year | | | Five Years | | | Ten Years | |
Without TARGET Program Fee (Class T) | | 8.67 | % | | 2.78 | % | | 7.65 | % |
Performance data quoted represent past performance. Past performance does not guarantee future results. The investment return and principal value of an investment will fluctuate, so that an investor’s shares, when redeemed, may be worth more or less than their original cost. Current performance may be lower or higher than the past performance data quoted. An investor may obtain performance data as of the most recent month-end by visiting our website at www.prudential.com or by calling (800) 225-1852. The maximum TARGET program fee for retail investors is 1.50%.
The returns in the graph and the tables do not reflect the deduction of taxes that a shareholder would pay on Fund distributions or following the redemption of Fund shares.
The graph compares a $10,000 investment in the TARGET Large Capitalization Growth Portfolio (Class T) with a similar investment in the S&P 500 Index and the Russell 1000 Growth Index by portraying the initial account values at the beginning of the 10-year period (December 31, 1996) and the account values at the end of the current fiscal year (December 31, 2006), as measured on a quarterly basis. The graph takes into account the maximum quarterly TARGET program fee of 1.50% annually for retail investors. The average annual total returns in the table and the returns on investment in the graph do not reflect the deduction of taxes that a shareholder would pay on Portfolio distributions or following the redemption of Portfolio shares.
| | |
| | THE TARGET PORTFOLIO TRUST |
The S&P 500 Index is an index of 500 stocks of large U.S. companies. It gives a broad look at how U.S. stock prices have performed. The Russell 1000 Growth Index contains those securities in the Russell 1000 Index with a greater-than-average growth orientation. Companies in this index tend to exhibit higher price-to-book and price-to-earnings ratios, lower dividend yields, and higher forecasted growth rates. These indexes are unmanaged, and the total returns include the reinvestment of all dividends, but do not include the effect of sales charges, operating expenses, or taxes. These returns would be lower if they included the effect of sales charges, operating expenses, or taxes. The securities in these indexes may differ substantially from the securities in the Portfolio. These indexes are not the only ones that may be used to characterize performance of large-capitalization equity funds, and other indexes may portray different comparative performance. Investors cannot invest directly in an index.
| | |
| THE TARGET PORTFOLIO TRUST | | |
Growth of a $10,000 Investment
Large Capitalization Value Portfolio
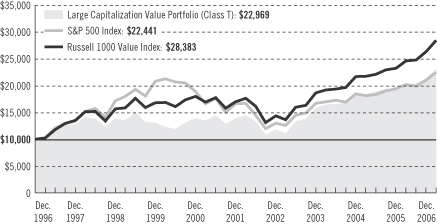
| | | | | | | | | |
| Average Annual Total Returns as of 12/31/06 | | | | | | | | | |
| | | One Year | | | Five Years | | | Ten Years | |
With TARGET Program Fee (Class T) | | 17.56 | % | | 10.56 | % | | 8.67 | % |
| | | |
| | | One Year | | | Five Years | | | Ten Years | |
Without TARGET Program Fee (Class T) | | 19.34 | % | | 12.23 | % | | 10.32 | % |
Performance data quoted represent past performance. Past performance does not guarantee future results. The investment return and principal value of an investment will fluctuate, so that an investor’s shares, when redeemed, may be worth more or less than their original cost. Current performance may be lower or higher than the past performance data quoted. An investor may obtain performance data as of the most recent month-end by visiting our website at www.prudential.com or by calling (800) 225-1852. The maximum TARGET program fee for retail investors is 1.50%.
The returns in the graph and the tables do not reflect the deduction of taxes that a shareholder would pay on Fund distributions or following the redemption of Fund shares.
The graph compares a $10,000 investment in the TARGET Large Capitalization Value Portfolio (Class T) with a similar investment in the S&P 500 Index and the Russell 1000 Value Index by portraying the initial account values at the beginning of the 10-year period (December 31, 1996) and the account values at the end of the current fiscal year (December 31, 2006), as measured on a quarterly basis. The graph takes into account the maximum quarterly TARGET program fee of 1.50% annually for retail investors. The average annual total returns in the table and the returns on investment in the graph do not reflect the deduction of taxes that a shareholder would pay on Portfolio distributions or following the redemption of Portfolio shares.
| | |
| | THE TARGET PORTFOLIO TRUST |
The S&P 500 Index is an index of 500 stocks of large U.S. companies. It gives a broad look at how U.S. stock prices have performed. The Russell 1000 Value Index contains those securities in the Russell 1000 Index with a less-than-average growth orientation. Companies in this index generally have low price-to-book and price-to-earnings ratios, higher dividend yields, and lower forecasted growth values. These indexes are unmanaged, and the total returns include the reinvestment of all dividends, but do not include the effect of sales charges, operating expenses, or taxes. These returns would be lower if they included the effect of sales charges, operating expenses, or taxes. The securities in these indexes may differ substantially from the securities in the Portfolio. These indexes are not the only ones that may be used to characterize performance of large-capitalization equity funds, and other indexes may portray different comparative performance. Investors cannot invest directly in an index.
| | |
| THE TARGET PORTFOLIO TRUST | | |
Growth of a $10,000 Investment
Small Capitalization Growth Portfolio
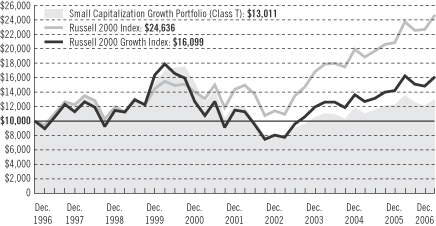
| | | | | | | | | |
| Average Annual Total Returns as of 12/31/06 | | | | | | | | | |
| | | One Year | | | Five Years | | | Ten Years | |
With TARGET Program Fee (Class T) | | 6.02 | % | | 1.29 | % | | 2.67 | % |
| | | |
| | | One Year | | | Five Years | | | Ten Years | |
Without TARGET Program Fee (Class T) | | 7.62 | % | | 2.83 | % | | 4.22 | % |
Performance data quoted represent past performance. Past performance does not guarantee future results. The investment return and principal value of an investment will fluctuate, so that an investor’s shares, when redeemed, may be worth more or less than their original cost. Current performance may be lower or higher than the past performance data quoted. An investor may obtain performance data as of the most recent month-end by visiting our website at www.prudential.com or by calling (800) 225-1852. The maximum TARGET program fee for retail investors is 1.50%.
The returns in the graph and the tables do not reflect the deduction of taxes that a shareholder would pay on Fund distributions or following the redemption of Fund shares.
The graph compares a $10,000 investment in the TARGET Small Capitalization Growth Portfolio (Class T) with a similar investment in the Russell 2000 Index and the Russell 2000 Growth Index by portraying the initial account values at the beginning of the 10-year period (December 31, 1996) and the account values at the end of the current fiscal year (December 31, 2006), as measured on a quarterly basis. The graph takes into account the maximum quarterly TARGET program fee of 1.50% annually for retail investors. The average annual total returns in the table and the returns on investment in the graph do not reflect the deduction of taxes that a shareholder would pay on Portfolio distributions or following the redemption of Portfolio shares.
| | |
| | THE TARGET PORTFOLIO TRUST |
The Russell 2000 Index is a weighted index that comprises the smallest 2,000 stocks among the largest 3,000 equity-capitalized U.S. corporations and represents approximately 10% of their aggregate market value. The Russell 2000 Growth Index comprises securities in the Russell 2000 Index with a greater-than-average growth orientation. Companies in this index tend to exhibit higher price-to-book ratios and higher forecasted growth values. These indexes are unmanaged, and the total returns include the reinvestment of all dividends, but do not include the effect of sales charges, operating expenses, or taxes. These returns would be lower if they included the effect of sales charges, operating expenses, or taxes. The securities in these indexes may differ substantially from the securities in the Portfolio. These indexes are not the only ones that may be used to characterize performance of small-capitalization equity funds, and other indexes may portray different comparative performance. Investors cannot invest directly in an index.
| | |
| THE TARGET PORTFOLIO TRUST | | |
Growth of a $10,000 Investment
Small Capitalization Value Portfolio
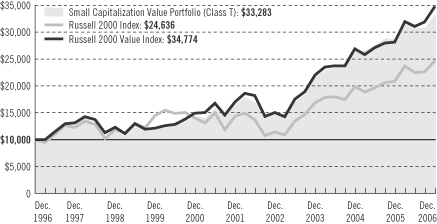
| | | | | | | | | |
| Average Annual Total Returns as of 12/31/06 | | | | | | | | | |
| | | One Year | | | Five Years | | | Ten Years | |
With TARGET Program Fee (Class T) | | 15.96 | % | | 14.95 | % | | 12.78 | % |
| | | |
| | | One Year | | | Five Years | | | Ten Years | |
Without TARGET Program Fee (Class T) | | 17.72 | % | | 16.69 | % | | 14.48 | % |
Performance data quoted represent past performance. Past performance does not guarantee future results. The investment return and principal value of an investment will fluctuate, so that an investor’s shares, when redeemed, may be worth more or less than their original cost. Current performance may be lower or higher than the past performance data quoted. An investor may obtain performance data as of the most recent month-end by visiting our website at www.prudential.com or by calling (800) 225-1852. The maximum TARGET program fee for retail investors is 1.50%.
The returns in the graph and the tables do not reflect the deduction of taxes that a shareholder would pay on Fund distributions or following the redemption of Fund shares.
The graph compares a $10,000 investment in the TARGET Small Capitalization Value Portfolio (Class T) with a similar investment in the Russell 2000 Index and the Russell 2000 Value Index by portraying the initial account values at the beginning of the 10-year period (December 31, 1996) and the account values at the end of the current fiscal year (December 31, 2006), as measured on a quarterly basis. The graph takes into account the maximum quarterly TARGET program fee of 1.50% annually for retail investors. The average annual total returns in the table and the returns on investment in the graph do not reflect the deduction of taxes that a shareholder would pay on Portfolio distributions or following the redemption of Portfolio shares.
| | |
| | THE TARGET PORTFOLIO TRUST |
The Russell 2000 Index is a weighted index that comprises the smallest 2,000 stocks among the largest 3,000 equity-capitalized U.S. corporations and represents approximately 10% of their aggregate market value. The Russell 2000 Value Index comprises securities in the Russell 2000 Index with a less-than-average growth orientation. Companies in this index tend to exhibit lower price-to-book ratios and lower forecasted growth values. These indexes are unmanaged, and the total returns include the reinvestment of all dividends, but do not include the effect of sales charges, operating expenses, or taxes. These returns would be lower if they included the effect of sales charges, operating expenses, or taxes. The securities in these indexes may differ substantially from the securities in the Portfolio. These indexes are not the only ones that may be used to characterize performance of small-capitalization equity funds, and other indexes may portray different comparative performance. Investors cannot invest directly in an index.
| | |
| THE TARGET PORTFOLIO TRUST | | |
Growth of a $10,000 Investment
International Equity Portfolio
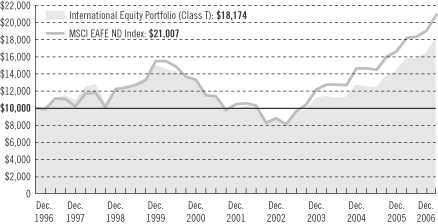
| | | | | | | | | |
| Average Annual Total Returns as of 12/31/06 | | | | | | | | | |
| | | One Year | | | Five Years | | | Ten Years | |
With TARGET Program Fee (Class T) | | 27.10 | % | | 12.73 | % | | 6.16 | % |
| | | |
| | | One Year | | | Five Years | | | Ten Years | |
Without TARGET Program Fee (Class T) | | 29.02 | % | | 14.44 | % | | 7.76 | % |
Performance data quoted represent past performance. Past performance does not guarantee future results. The investment return and principal value of an investment will fluctuate, so that an investor’s shares, when redeemed, may be worth more or less than their original cost. Current performance may be lower or higher than the past performance data quoted. An investor may obtain performance data as of the most recent month-end by visiting our website at www.prudential.com or by calling (800) 225-1852. The maximum TARGET program fee for retail investors is 1.50%.
The returns in the graph and the tables do not reflect the deduction of taxes that a shareholder would pay on Fund distributions or following the redemption of Fund shares.
The graph compares a $10,000 investment in the TARGET International Equity Portfolio (Class T) with a similar investment in the Morgan Stanley Capital International Europe, Australasia, Far East Index (MSCI EAFE ND Index) by portraying the initial account values at the beginning of the 10-year period (December 31, 1996) and the account values at the end of the current fiscal year (December 31, 2006), as measured on a quarterly basis. The graph takes into account the maximum quarterly TARGET program fee of 1.50% annually for retail investors. The average annual total returns in the table and the returns on investment in the graph do not reflect the deduction of taxes that a shareholder would pay on Portfolio distributions or following the redemption of Portfolio shares.
| | |
| | THE TARGET PORTFOLIO TRUST |
The MSCI EAFE ND Index is a weighted index of performance that reflects stock price movements in Europe, Australasia, and the Far East. The MSCI EAFE ND Index is unmanaged, and the total returns include the reinvestment of all dividends, but do not include the effect of sales charges, operating expenses, or taxes. These returns would be lower if they included the effect of sales charges, operating expenses, or taxes. The securities in the MSCI EAFE ND Index may differ substantially from the securities in the Portfolio. The MSCI EAFE ND Index is not the only one that may be used to characterize performance of international equity funds, and other indexes may portray different comparative performance. Investors cannot invest directly in an index.
| | |
| THE TARGET PORTFOLIO TRUST | | |
Growth of a $10,000 Investment
International Bond Portfolio
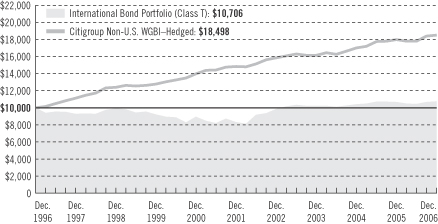
| | | | | | | | | |
| Average Annual Total Returns as of 12/31/06 | | | | | | | | | |
| | | One Year | | | Five Years | | | Ten Years | |
With TARGET Program Fee (Class T) | | 0.33 | % | | 5.20 | % | | 0.68 | % |
| | | |
| | | One Year | | | Five Years | | | Ten Years | |
Without TARGET Program Fee (Class T) | | 1.84 | % | | 6.79 | % | | 2.21 | % |
Performance data quoted represent past performance. Past performance does not guarantee future results. The investment return and principal value of an investment will fluctuate, so that an investor’s shares, when redeemed, may be worth more or less than their original cost. Current performance may be lower or higher than the past performance data quoted. An investor may obtain performance data as of the most recent month-end by visiting our website at www.prudential.com or by calling (800) 225-1852. The maximum TARGET program fee for retail investors is 1.50%.
The returns in the graph and the tables do not reflect the deduction of taxes that a shareholder would pay on Fund distributions or following the redemption of Fund shares.
The graph compares a $10,000 investment in the TARGET International Bond Portfolio (Class T) with a similar investment in the Citigroup Non-U.S. World Government Bond Index–Hedged (Citigroup Non-U.S. WGBI–Hedged) by portraying the initial account values at the beginning of the 10-year period (December 31, 1996) and the account values at the end of the current fiscal year (December 31, 2006), as measured on a quarterly basis. The graph takes into account the maximum quarterly TARGET program fee of 1.50% annually for retail investors. The average annual total returns in the table and the returns on investment in the graph do not reflect the deduction of taxes that a shareholder would pay on Portfolio distributions or following the redemption of Portfolio shares.
| | |
| | THE TARGET PORTFOLIO TRUST |
The Citigroup Non-U.S. WGBI–Hedged is an unmanaged index of approximately 600 high-quality bonds with foreign currency exposure translated to the U.S. dollar. The index’s total return include the reinvestment of all dividends, but does not include the effect of sales charges, operating expenses, or taxes. The return would be lower if it included the effect of sales charges, operating expenses, or taxes. The securities in the index may differ substantially from the securities in the Portfolio. The index is not the only one that may be used to characterize performance of international bond funds, and other indexes may portray different comparative performance. Investors cannot invest directly in an index.
| | |
| THE TARGET PORTFOLIO TRUST | | |
Growth of a $10,000 Investment
Total Return Bond Portfolio
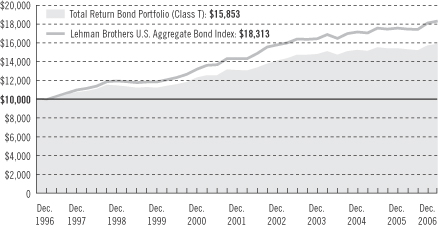
| | | | | | | | | |
| Average Annual Total Returns as of 12/31/06 | | | | | | | | | |
| | | One Year | | | Five Years | | | Ten Years | |
With TARGET Program Fee (Class T) | | 2.71 | % | | 3.89 | % | | 4.72 | % |
| | | |
| | | One Year | | | Five Years | | | Ten Years | |
Without TARGET Program Fee (Class T) | | 4.27 | % | | 5.47 | % | | 6.30 | % |
Performance data quoted represent past performance. Past performance does not guarantee future results. The investment return and principal value of an investment will fluctuate, so that an investor’s shares, when redeemed, may be worth more or less than their original cost. Current performance may be lower or higher than the past performance data quoted. An investor may obtain performance data current to the most recent month-end by visiting our website at www.prudential.com or by calling (800) 225-1852. The maximum TARGET program fee for retail investors is 1.50%.
The returns in the graph and the tables do not reflect the deduction of taxes that a shareholder would pay on Fund distributions or following the redemption of Fund shares.
The graph compares a $10,000 investment in the TARGET Total Return Bond Portfolio (Class T) with a similar investment in the Lehman Brothers U.S. Aggregate Bond Index by portraying the initial account values at the beginning of the 10-year period (December 31, 1996) and the account values at the end of the current fiscal year (December 31, 2006), as measured on a quarterly basis. The graph takes into account the maximum quarterly TARGET program fee of 1.50% annually for retail investors. The average annual total returns in the table and the returns on investment in the graph do not reflect the deduction of taxes that a shareholder would pay on Portfolio distributions or following the redemption of Portfolio shares.
| | |
| | THE TARGET PORTFOLIO TRUST |
The Lehman Brothers U.S. Aggregate Bond Index is an unmanaged index of investment-grade securities issued by the U.S. government and its agencies and by corporations with between 1 and 10 years remaining to maturity. It gives a broad look at how bond prices of short- and intermediate-term bonds have performed. This index is unmanaged, and the total returns include the reinvestment of all dividends, but do not include the effect of sales charges, operating expenses, or taxes. These returns would be lower if they included the effect of sales charges, operating expenses, or taxes. The securities in these indexes may differ substantially from the securities in the Portfolio. This index is not the only one that may be used to characterize performance of bond funds, and other indexes may portray different comparative performance. Investors cannot invest directly in an index.
| | |
| THE TARGET PORTFOLIO TRUST | | |
Growth of a $10,000 Investment
Intermediate-Term Bond Portfolio
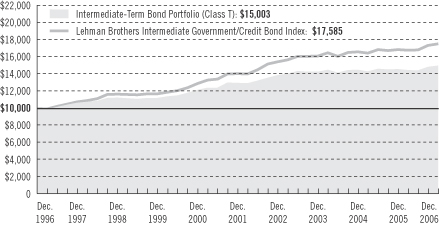
| | | | | | | | | |
| Average Annual Total Returns as of 12/31/06 | | | | | | | | | |
| | | One Year | | | Five Years | | | Ten Years | |
With TARGET Program Fee (Class T) | | 2.57 | % | | 2.88 | % | | 4.14 | % |
| | | |
| | | One Year | | | Five Years | | | Ten Years | |
Without TARGET Program Fee (Class T) | | 4.12 | % | | 4.44 | % | | 5.72 | % |
Performance data quoted represent past performance. Past performance does not guarantee future results. The investment return and principal value of an investment will fluctuate, so that an investor’s shares, when redeemed, may be worth more or less than their original cost. Current performance may be lower or higher than the past performance data quoted. An investor may obtain performance data as of the most recent month-end by visiting our website at www.prudential.com or by calling (800) 225-1852. The maximum TARGET program fee for retail investors is 1.50%.
The returns in the graph and the tables do not reflect the deduction of taxes that a shareholder would pay on Fund distributions or following the redemption of Fund shares.
The graph compares a $10,000 investment in the TARGET Intermediate-Term Bond Portfolio (Class T) with a similar investment in the Lehman Brothers Intermediate Government/Credit Bond Index by portraying the initial account values at the beginning of the 10-year period (December 31, 1996) and the account values at the end of the current fiscal year (December 31, 2006), as measured on a quarterly basis. The graph takes into account the maximum quarterly TARGET program fee of 1.50% annually for retail investors. The average annual total returns in the table and the returns on investment in the graph do not reflect the deduction of taxes that a shareholder would pay on Portfolio distributions or following the redemption of Portfolio shares.
| | |
| | THE TARGET PORTFOLIO TRUST |
The Lehman Brothers Intermediate Government/Credit Bond Index is a weighted index comprising securities issued by the U.S. government and its agencies and securities publicly issued by corporations with 1 to 10 years remaining to maturity and rated investment grade. The Lehman Brothers Intermediate Government/Credit Bond Index is unmanaged, and the total returns include the reinvestment of all dividends, but do not include the effect of sales charges, operating expenses, or taxes. These returns would be lower if they included the effect of sales charges, operating expenses, or taxes. The securities in the Lehman Brothers Intermediate Government/Credit Bond Index may differ substantially from the securities in the Portfolio. The Lehman Brothers Intermediate Government/Credit Bond Index is not the only one that may be used to characterize performance of bond funds, and other indexes may portray different comparative performance. Investors cannot invest directly in an index.
| | |
| THE TARGET PORTFOLIO TRUST | | |
Growth of a $10,000 Investment
Mortgage Backed Securities Portfolio
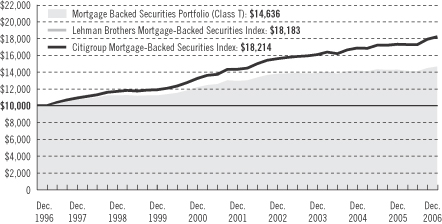
| | | | | | | | | |
| Average Annual Total Returns as of 12/31/06 | | | | | | | | | |
| | | One Year | | | Five Years | | | Ten Years | |
With TARGET Program Fee (Class T) | | 2.27 | % | | 2.45 | % | | 3.88 | % |
| | | |
| | | One Year | | | Five Years | | | Ten Years | |
Without TARGET Program Fee (Class T) | | 3.82 | % | | 4.00 | % | | 5.46 | % |
Performance data quoted represent past performance. Past performance does not guarantee future results. The investment return and principal value of an investment will fluctuate so that an investor’s shares, when redeemed, may be worth more or less than their original cost. Current performance may be lower or higher than the past performance data quoted. An investor may obtain performance data as of the most recent month-end by visiting our website at www.prudential.com or by calling (800) 225-1852. The maximum TARGET program fee for retail investors is 1.50%.
The returns in the graph and the tables do not reflect the deduction of taxes that a shareholder would pay on Fund distributions or following the redemption of Fund shares.
The graph compares a $10,000 investment in the TARGET Mortgage Backed Securities Portfolio (Class T) with a similar investment in the Lehman Brothers Mortgage-Backed Securities Index and the Citigroup Mortgage-Backed Securities Index by portraying the initial account values at the beginning of the 10-year period (December 31, 1996) and the account values at the end of the current fiscal year (December 31, 2006), as measured on a quarterly basis. The graph takes into account the maximum quarterly TARGET program fee of 1.50% annually for retail investors. The average annual total returns in the table and the returns on investment in the graph do not reflect the deduction of taxes that a shareholder would pay on Portfolio distributions or following the redemption of Portfolio shares.
| | |
| | THE TARGET PORTFOLIO TRUST |
The Lehman Brothers Mortgage-Backed Securities Index is a market capitalization-weighted index of 15-year and 30-year fixed-rate securities backed by the mortgage pools of the GNMA, the FNMA, and the FHLMC, and balloon mortgages with fixed-rate coupons. The Citigroup Mortgage-Backed Securities Index is an index of 30- and 15-year mortgage-related securities issued by U.S. government agencies. It gives a broad look at how mortgage-backed securities have performed. These indexes are unmanaged, and the total returns include the reinvestment of all dividends, but do not include the effect of sales charges, operating expenses, or taxes. These returns would be lower if they included the effect of sales charges, operating expenses, or taxes. The securities in these indexes may differ substantially from the securities in the Portfolio. These indexes are not the only ones that may be used to characterize performance of bond funds, and other indexes may portray different comparative performance. Investors cannot invest directly in an index.
| | |
| THE TARGET PORTFOLIO TRUST | | |
| | |
| n MAIL | | n TELEPHONE |
Gateway Center Three 100 Mulberry Street Newark, NJ 07102 | | (800) 225-1852 |
|
| PROXY VOTING |
| The Board of Trustees of The TARGET Portfolio Trust has delegated to the Trust’s investment subadvisers the responsibility for voting any proxies and maintaining proxy recordkeeping with respect to the Trust. A description of these proxy voting policies and procedures is available without charge, upon request, by calling (800) 225-1852 or by visiting the Securities and Exchange Commission’s website at www.sec.gov. Information regarding how the Trust voted proxies relating to portfolio securities during the most recent 12-month period ended June 30 is available on the Trust’s website and on the Commission’s website. |
|
| TRUSTEES |
| Linda W. Bynoe • David E.A. Carson • Robert F. Gunia • Robert E. La Blanc • Douglas H. McCorkindale • Richard A. Redeker • Judy A. Rice • Robin B. Smith • Stephen G. Stoneburn • Clay T. Whitehead |
|
| OFFICERS |
| Judy A. Rice, President • Robert F. Gunia, Vice President • Grace C. Torres, Treasurer and Principal Financial and Accounting Officer • Kathryn L. Quirk, Chief Legal Officer • Deborah A. Docs, Secretary • Lee D. Augsburger, Chief Compliance Officer • Noreen M. Fierro, Anti-Money Laundering Compliance Officer • Jonathan D. Shain, Assistant Secretary • Claudia DiGiacomo, Assistant Secretary • John P. Schwartz, Assistant Secretary • Andrew R. French, Assistant Secretary • Jack Benintende, Assistant Treasurer • M. Sadiq Peshimam, Assistant Treasurer |
| | | | |
| MANAGER | | Prudential Investments LLC | | Gateway Center Three
100 Mulberry Street
Newark, NJ 07102 |
|
| INVESTMENT SUBADVISERS | | EARNEST Partners, LLC | | 75 14th Street
Suite 2300
Atlanta, GA 30309 |
|
| | Goldman Sachs Asset
Management L.P. | | 32 Old Slip
23rd Floor
New York, NY 10005 |
|
| | Hotchkis and Wiley Capital
Management, LLC | | 725 S. Figueroa Street
Suite 3900
Los Angeles, CA 90017 |
|
| | J.P. Morgan Investment
Management, Inc. | | 522 Fifth Avenue
New York, NY 10036 |
|
| | Lee Munder Investments Ltd. | | 200 Clarendon Street
Boston, MA 02116 |
|
| | LSV Asset Management | | One North Wacker Drive
Suite 4000
Chicago, IL 60606 |
| | | | |
| | NFJ Investment Group L.P. | | 2121 San Jacinto Suite 1840 Dallas, TX 75201 |
|
| | Marsico Capital
Management, LLC | | 1200 17th Street Suite 1600 Denver, CO 80202 |
|
| | Pacific Investment Management Company LLC | | 840 Newport Center Drive Newport Beach, CA 92660 |
|
| | RS Investment
Management, L.P. | | 388 Market Street Suite 1700 San Francisco, CA 94111 |
|
| | Thornburg Investment
Management, Inc. | | 119 East Marcy Street
Santa Fe, NM 87501 |
|
| | Transamerica Investment Management, Inc. | | 11111 Santa Monica Boulevard Suite 820 Los Angeles, CA 90025 |
|
| | Vaughan Nelson Investment Management, L.P. | | 600 Travis Street Suite 6300 Houston, TX 77002 |
|
| | Wellington Management Company, LLP | | 75 State Street Boston, MA 02109 |
|
| DISTRIBUTOR | | Prudential Investment Management Services LLC | | Gateway Center Three 100 Mulberry Street
Newark, NJ 07102 |
|
| CUSTODIAN | | PFPC Trust Company | | 400 Bellevue Parkway Wilmington, DE 19809 |
|
| TRANSFER AGENT | | Prudential Mutual Fund Services LLC | | PO Box 8098 Philadelphia, PA 19176 |
|
| INDEPENDENT REGISTERED PUBLIC ACCOUNTING FIRM | | KPMG LLP | | 345 Park Avenue New York, NY 10154 |
|
| FUND COUNSEL | | Willkie, Farr & Gallagher LLP | | 787 Seventh Avenue New York, NY 10019 |
|
| An investor should consider the investment objectives, risks, charges, and expenses of a Portfolio carefully before investing. The prospectuses for the Portfolios contain this and other information about the Portfolios. An investor may obtain a prospectus by visiting our website at www.prudential.com or by calling (800) 225-1852. The prospectus should be read carefully before investing. |
|
| E-DELIVERY |
| To receive your mutual fund documents on-line, go to www.icsdelivery.com/prudential/funds and enroll. Instead of receiving printed documents by mail, you will receive notification via e-mail when new materials are available. You can cancel your enrollment or change your e-mail address at any time by clicking on the change/cancel enrollment option at the icsdelivery website address. |
|
| SHAREHOLDER COMMUNICATIONS WITH TRUSTEES |
| Shareholders can communicate directly with the Board of Trustees by writing to the Chair of the Board, The TARGET Portfolio Trust, PO Box 13964, Philadelphia, PA 19176. Shareholders can communicate directly with an individual Trustee by writing to the same address. Communications are not screened before being delivered to the addressee. |
|
| AVAILABILITY OF PORTFOLIO SCHEDULE |
| The Trust files its complete schedule of portfolio holdings with the Securities and Exchange Commission for the first and third quarters of each fiscal year on Form N-Q. The Trusts’ Forms N-Q are available on the Commission’s website at www.sec.gov. The Trusts’ Forms N-Q may also be reviewed and copied at the Commission’s Public Reference Room in Washington, D.C. Information on the operation and location of the Public Reference Room may be obtained by calling (800) SEC-0330 (732-0330). The Trust’s schedule of portfolio holdings is also available on the Trust’s website as of the end of each fiscal quarter. |
|
| The Trust’s Statement of Additional Information contains additional information about the Trust’s Trustees and is available without charge, upon request, by calling (800) 225-1852. |
Mutual Funds:
| | | | |
ARE NOT INSURED BY THE FDIC OR ANY FEDERAL GOVERNMENT AGENCY | | MAY LOSE VALUE | | ARE NOT A DEPOSIT OF OR GUARANTEED BY ANY BANK OR ANY BANK AFFILIATE |

| | | | | | | | | | | | | | |
| | | The TARGET Portfolio Trust | | NASDAQ | | CUSIP | | | | NASDAQ | | CUSIP | | |
| | | Large Capitalization Growth (Class R) | | TLCRX | | 875921868 | | Mortgage Backed Securities (Class T) | | TGMBX | | 875921702 | | |
| | | Large Capitalization Growth (Class T) | | TALGX | | 875921207 | | Large Capitalization Value (Class R) | | TLVRX | | 875921850 | | |
| | | Small Capitalization Growth (Class R) | | TSCRX | | 875921835 | | Large Capitalization Value (Class T) | | TALVX | | 875921108 | | |
| | | Small Capitalization Growth (Class T) | | TASGX | | 875921405 | | Small Capitalization Value (Class R) | | TSVRX | | 875921843 | | |
| | | International Equity (Class R) | | TEQRX | | 875921827 | | Small Capitalization Value (Class T) | | TASVX | | 875921306 | | |
| | | International Equity (Class T) | | TAIEX | | 875921504 | | International Bond (Class T) | | TIBPX | | 875921876 | | |
| | | Total Return Bond (Class R) | | TTBRX | | 875921819 | | Intermediate-Term Bond (Class T) | | TAIBX | | 875921801 | | |
| | | Total Return Bond (Class T) | | TATBX | | 875921884 | | U.S. Govt Money Market (Class T) | | PUGXX | | 875921603 | | |
TMF158E IFS-A130037 Ed. 02/2007
Item 2 – Code of Ethics – – See Exhibit (a)
As of the end of the period covered by this report, the registrant has adopted a code of ethics (the “Section 406 Standards for Investment Companies – Ethical Standards for Principal Executive and Financial Officers”) that applies to the registrant’s Principal Executive Officer and Principal Financial Officer; the registrant’s Principal Financial Officer also serves as the Principal Accounting Officer.
The registrant hereby undertakes to provide any person, without charge, upon request, a copy of the code of ethics. To request a copy of the code of ethics, contact the registrant 800-225-1852, and ask for a copy of the Section 406 Standards for Investment Companies - Ethical Standards for Principal Executive and Financial Officers.
Item 3 – Audit Committee Financial Expert –
The registrant’s Board has determined that Mr. David E. A. Carson, member of the Board’s Audit Committee is an “audit committee financial expert,” and that he is “independent,” for purposes of this Item.
Item 4 – Principal Accountant Fees and Services –
(a) Audit Fees
For the fiscal years ended December 31, 2006 and December 31, 2005, KPMG LLP (“KPMG”), the Registrant’s principal accountant, billed the Registrant $206,200 and $196,200, respectively, for professional services rendered for the audit of the Registrant’s annual financial statements or services that are normally provided in connection with statutory and regulatory filings.
(b) Audit-Related Fees
For the fiscal year ended December 31, 2006, KPMG, the Registrant’s principal accountant, billed the Registrant $7,000 for assurance and related services that are reasonably related to the performance of the audit of the registrant’s financial statements. Professional services rendered included assistance with evaluating excise tax liability exposure, opportunities to limit such exposure and discuss financial reporting and return filing matters. For the fiscal year ended December 31, 2005, KPMG, the Registrant’s principal accountant, billed the Registrant $9,131 for assurance and related services that are reasonably related to the performance of the audit of the registrant’s financial statements. Professional services rendered included those in connection with additional audit procedures related to the conversion of shareholder accounts.
(c) Tax Fees
For the fiscal year ended December 31, 2006, KPMG, the Registrant’s principal accountant, billed the Registrant $40,000 for professional services rendered by the principal accountant for tax compliance, tax advice, and tax planning. Professional services rendered included assistance with evaluating excise tax liability exposure, opportunities to limit such exposure and discuss financial reporting and return filing matters. For the fiscal year ended December
31, 2005, KPMG, the Registrant’s principal accountant, did not bill the Registrant for professional services rendered by the principal accountant for tax compliance, tax advice, and tax planning.
(d) All Other Fees
None.
(e) (1) Audit Committee Pre-Approval Policies and Procedures
THE PRUDENTIAL MUTUAL FUNDS
AUDIT COMMITTEE POLICY
on
Pre-Approval of Services Provided by the Independent Accountants
The Audit Committee of each Prudential Mutual Fund is charged with the responsibility to monitor the independence of the Fund’s independent accountants. As part of this responsibility, the Audit Committee must pre-approve any independent accounting firm’s engagement to render audit and/or permissible non-audit services, as required by law. In evaluating a proposed engagement of the independent accountants, the Audit Committee will assess the effect that the engagement might reasonably be expected to have on the accountant’s independence. The Committee’s evaluation will be based on:
| | • | | a review of the nature of the professional services expected to be provided, |
| | • | | a review of the safeguards put into place by the accounting firm to safeguard independence, and |
| | • | | periodic meetings with the accounting firm. |
Policy for Audit and Non-Audit Services Provided to the Funds
On an annual basis, the scope of audits for each Fund, audit fees and expenses, and audit-related and non-audit services (and fees proposed in respect thereof) proposed to be performed by the Fund’s independent accountants will be presented by the Treasurer and the independent accountants to the Audit Committee for review and, as appropriate, approval prior to the initiation of such services. Such presentation shall be accompanied by confirmation by both the Treasurer and the independent accountants that the proposed services will not adversely affect the independence of the independent accountants. Proposed services shall be described in sufficient detail to enable the Audit Committee to assess the appropriateness of such services and fees, and the compatibility of the provision of such services with the auditor’s independence. The Committee shall receive periodic reports on the progress of the audit and other services which are approved by the Committee or by the Committee Chair pursuant to authority delegated in this Policy.
The categories of services enumerated under “Audit Services”, “Audit-related Services”, and “Tax Services” are intended to provide guidance to the Treasurer and the independent accountants as to those categories of services which the Committee believes are generally consistent with the independence of the independent accountants and which the Committee (or the Committee Chair) would expect upon the presentation of specific proposals to pre-approve. The enumerated categories are not intended as an exclusive list of audit, audit-related or tax services, which the Committee (or the Committee Chair) would consider for pre-approval.
Audit Services
The following categories of audit services are considered to be consistent with the role of the Fund’s independent accountants:
| | Ø | Annual Fund financial statement audits |
| | Ø | Seed audits (related to new product filings, as required) |
| | Ø | SEC and regulatory filings and consents |
Audit-related Services
The following categories of audit-related services are considered to be consistent with the role of the Fund’s independent accountants:
| | Ø | Accounting consultations |
| | Ø | Fund merger support services |
| | Ø | Agreed Upon Procedure Reports |
| | Ø | Other Internal Control Reports |
Individual audit-related services that fall within one of these categories and are not presented to the Audit Committee as part of the annual pre-approval process will be subject to pre-approval by the Committee Chair (or any other Committee member on whom this responsibility has been delegated) so long as the estimated fee for those services does not exceed $50,000.
Tax Services
The following categories of tax services are considered to be consistent with the role of the Fund’s independent accountants:
| | Ø | Tax compliance services related to the filing or amendment of the following: |
| | n | Federal, state and local income tax compliance; and, |
| | n | Sales and use tax compliance |
| | Ø | Timely RIC qualification reviews |
| | Ø | Tax distribution analysis and planning |
| | Ø | Tax authority examination services |
| | Ø | Tax appeals support services |
| | Ø | Accounting methods studies |
| | Ø | Fund merger support services |
| | Ø | Tax consulting services and related projects |
Individual tax services that fall within one of these categories and are not presented to the Audit Committee as part of the annual pre-approval process will be subject to pre-approval by the Committee Chair (or any other Committee member on whom this responsibility has been delegated) so long as the estimated fee for those services does not exceed $50,000.
Other Non-audit Services
Certain non-audit services that the independent accountants are legally permitted to render will be subject to pre-approval by the Committee or by one or more Committee members to whom the Committee has delegated this authority and who will report to the full Committee any pre-approval decisions made pursuant to this Policy. Non-audit services presented for pre-approval pursuant to this paragraph will be accompanied by a confirmation from both the Treasurer and the independent accountants that the proposed services will not adversely affect the independence of the independent accountants.
Proscribed Services
The Fund’s independent accountants will not render services in the following categories of non-audit services:
| | Ø | Bookkeeping or other services related to the accounting records or financial statements of the Fund |
| | Ø | Financial information systems design and implementation |
| | Ø | Appraisal or valuation services, fairness opinions, or contribution-in-kind reports |
| | Ø | Internal audit outsourcing services |
| | Ø | Management functions or human resources |
| | Ø | Broker or dealer, investment adviser, or investment banking services |
| | Ø | Legal services and expert services unrelated to the audit |
| | Ø | Any other service that the Public Company Accounting Oversight Board determines, by regulation, is impermissible. |
Pre-approval of Non-Audit Services Provided to Other Entities Within the Prudential Fund Complex
Certain non-audit services provided to Prudential Investments LLC or any of its affiliates that also provide ongoing services to the Prudential Mutual Funds will be subject to pre-approval by the Audit Committee. The only non-audit services provided to these entities that will require pre-approval are those related directly to the operations and financial reporting of the Funds. Individual projects that are not presented to the Audit Committee as part of the annual pre-approval process will be subject to pre-approval by the Committee Chair (or any other Committee member on whom this responsibility has been delegated) so long as the estimated fee for those services does not exceed $50,000. Services presented for pre-approval pursuant to this paragraph will be accompanied by a confirmation from both the Treasurer and the independent accountants that the proposed services will not adversely affect the independence of the independent accountants.
Although the Audit Committee will not pre-approve all services provided to Prudential Investments LLC and its affiliates, the Committee will receive an annual report from the Fund’s independent accounting firm showing the aggregate fees for all services provided to Prudential Investments and its affiliates.
(e) (2) Percentage of services referred to in 4(b)- (4)(d) that were approved by the audit committee –
Not applicable.
| (f) | Percentage of hours expended attributable to work performed by other than full time employees of principal accountant if greater than 50%. |
Not applicable.
(g) Non-Audit Fees
Not applicable to Registrant for the fiscal years 2006 and 2005. The aggregate non-audit fees billed by KPMG for services rendered to the registrant’s investment adviser and any entity controlling, controlled by, or under common control with the investment adviser that provides ongoing services to the registrant for the fiscal years 2006 and 2005 was $317,300 and $41,869, respectively.
(h) Principal Accountant’s Independence
Not applicable as KPMG has not provided non-audit services to the registrant’s investment adviser and any entity controlling, controlled by, or under common control with the investment adviser that provides ongoing services to the registrant that were not pre-approved pursuant to Rule 2-01(c)(7)(ii) of Regulation S-X.
Item 5 – Audit Committee of Listed Registrants – Not applicable.
Item 6 – Schedule of Investments – The schedule is included as part of the report to shareholders filed under Item 1 of this Form.
Item 7 – Disclosure of Proxy Voting Policies and Procedures for Closed-End Management Investment Companies – Not applicable.
Item 8 – Portfolio Managers of Closed-End Management Investment Companies – Not applicable.
Item 9 – Purchases of Equity Securities by Closed-End Management Investment Company and Affiliated Purchasers – Not applicable.
Item 10 – Submission of Matters to a Vote of Security Holders – Not applicable.
Item 11 – Controls and Procedures
| | (a) | It is the conclusion of the registrant’s principal executive officer and principal financial officer that the effectiveness of the registrant’s current disclosure controls and procedures (such disclosure controls and procedures having been evaluated within 90 days of the date of this filing) provide reasonable assurance that the information required to be disclosed by the registrant has been recorded, processed, summarized and reported within the time period specified in the Commission’s rules and forms and that the information |
| | required to be disclosed by the registrant has been accumulated and communicated to the registrant’s principal executive officer and principal financial officer in order to allow timely decisions regarding required disclosure. |
| | (b) | There has been no significant change in the registrant’s internal control over financial reporting that occurred during the registrant’s most recent fiscal quarter of the period covered by this report that has materially affected, or is likely to materially affect, the registrant’s internal control over financial reporting. |
Item 12 – Exhibits
| | | | | | | |
| | (a) | | (1 | ) | | Code of Ethics – Attached hereto as Exhibit EX-99.CODE-ETH |
| | | |
| | | | (2 | ) | | Certifications pursuant to Section 302 of the Sarbanes-Oxley Act – Attached hereto as Exhibit EX-99.CERT. |
| | | |
| | | | (3 | ) | | Any written solicitation to purchase securities under Rule 23c-1. – Not applicable. |
| | |
| | (b) | | Certifications pursuant to Section 906 of the Sarbanes-Oxley Act – Attached hereto as Exhibit EX-99.906CERT. |
SIGNATURES
Pursuant to the requirements of the Securities Exchange Act of 1934 and the Investment Company Act of 1940, the registrant has duly caused this report to be signed on its behalf by the undersigned, thereunto duly authorized.
| | |
(Registrant) | | The Target Portfolio Trust |
| |
| By (Signature and Title)* | | /s/ Deborah A. Docs |
| | Deborah A. Docs |
| | Secretary |
| |
| Date | | February 23, 2007 |
Pursuant to the requirements of the Securities Exchange Act of 1934 and the Investment Company Act of 1940, this report has been signed below by the following persons on behalf of the registrant and in the capacities and on the dates indicated.
| | |
| By (Signature and Title)* | | /s/ Judy A. Rice |
| | Judy A. Rice |
| | President and Principal Executive Officer |
| |
| Date | | February 23, 2007 |
| |
| By (Signature and Title)* | | /s/ Grace C. Torres |
| | Grace C. Torres |
| | Treasurer and Principal Financial Officer |
| |
| Date | | February 23, 2007 |
* | Print the name and title of each signing officer under his or her signature. |