UNITED STATES
SECURITIES AND EXCHANGE COMMISSION
Washington, D.C. 20549
FORM N-CSR
CERTIFIED SHAREHOLDER REPORT OF REGISTERED MANAGEMENT
INVESTMENT COMPANIES
| | |
| Investment Company Act file number: | | 811-07064 |
| |
| Exact name of registrant as specified in charter: | | The Target |
| | Portfolio Trust |
| |
| Address of principal executive offices: | | Gateway Center 3, |
| | 100 Mulberry Street, |
| | Newark, New Jersey 07102 |
| |
| Name and address of agent for service: | | Deborah A. Docs |
| | Gateway Center 3, |
| | 100 Mulberry Street, |
| | Newark, New Jersey 07102 |
| |
| Registrant’s telephone number, including area code: | | 800-225-1852 |
| |
| Date of fiscal year end: | | 10/31/2007 |
| | (Registrant changed its fiscal year end from December 31) |
| |
| Date of reporting period: | | 10/31/2007 |
Item 1 – Reports to Stockholders

| | |
| OCTOBER 31, 2007 | | ANNUAL REPORT |
The TARGET Portfolio Trust®
This report is not authorized for distribution to prospective investors unless preceded or accompanied by a current prospectus.
The views expressed in this report and information about the Trust portfolios’ securities are for the period covered by this report and are subject to change thereafter.
TARGET Funds, TARGET Portfolio Trust, Prudential, Prudential Financial, and the Rock Prudential logo are registered service marks of The Prudential Insurance Company of America, Newark, NJ, and its affiliates.

December 14, 2007
Dear TARGET Shareholder:
We hope you find the annual report for The TARGET Portfolio Trust informative and useful. Today many investors may be asking where they can find new growth opportunities. We believe that as a TARGET shareholder, you are uniquely positioned for domestic and global growth opportunities because you already have a strategic investment plan in place.
A structured and professional approach to investing can help you “tune out” the noise of current market developments and allows you to concentrate on what’s really important—your long-term goals. It starts with a personal plan that you and your financial professional construct based on your reasons for investing, the time you have to reach your goals, and the level of risk you are willing to assume. Your financial professional can work closely with you to develop an appropriate asset allocation and select the corresponding TARGET portfolio for each asset class in your investment plan. The managers for each portfolio are carefully chosen, are monitored by our team of experienced investment management analysts, and are among the leading institutional money managers available.
The TARGET portfolios’ fiscal year has changed from a reporting period that ends December 31 to one that ends October 31. This change should have no impact on the way the portfolios are managed. Shareholders will receive future annual and semiannual reports on the new fiscal year-end schedule.
Your selections among the TARGET portfolios can evolve as your needs change. Your financial professional can help you track your plan’s progress, stay informed of important developments, and assist you in determining whether you need to modify your portfolio. In these ways and more, the TARGET portfolios can help make your investment goals a reality.
Thank you for your continued confidence.
Sincerely,

Judy A. Rice, President
The TARGET Portfolio Trust
| | |
| THE TARGET PORTFOLIO TRUST | | 1 |
Equity Portfolios’ Performance
Performance data quoted represent past performance. Past performance does not guarantee future results. The investment return and principal value of an investment will fluctuate, so that an investor’s shares, when redeemed, may be worth more or less than their original cost. Current performance may be lower or higher than the past performance data quoted. An investor may obtain performance data as of the most recent month-end by visiting our website at www.prudential.com or by calling (800) 225-1852. The maximum TARGET program fee for retail investors is 1.50%.
Large Capitalization Growth Portfolio:
Gross operating expenses: Class R, 1.43%; Class T, 0.68%. Net operating expenses apply to: Class R, 1.18%; Class T, 0.68%, after contractual reduction through 2/28/2009.
Large Capitalization Value Portfolio:
Gross operating expenses: Class R, 1.44%; Class T, 0.69%. Net operating expenses apply to: Class R, 1.19%; Class T, 0.69%, after contractual reduction through 2/28/2009.
Small Capitalization Growth Portfolio:
Gross operating expenses: Class R, 1.53%; Class T, 0.78%. Net operating expenses apply to: Class R, 1.28%; Class T, 0.78%, after contractual reduction through 2/28/2009.
Small Capitalization Value Portfolio:
Gross operating expenses: Class R, 1.48%; Class T, 0.73%. Net operating expenses apply to: Class R, 1.23%; Class T, 0.73%, after contractual reduction through 2/28/2009.
International Equity Portfolio:
Gross operating expenses: Class R, 1.58%; Class T, 0.83%. Net operating expenses apply to: Class R, 1.33%; Class T, 0.83%, after contractual reduction through 2/28/2009.
| | | | | | | | | | | |
| Equity Portfolios |
| | | Cumulative Total Returns1
as of 10/31/07 (Without TARGET Program Fee) |
| | | One Year | | | Five Years | | | Ten Years | | | Since Inception2 |
Large Capitalization Growth Portfolio (Class R) | | 18.96 | % | | N/A | | | N/A | | | 25.69% (8/22/06) |
Large Capitalization Growth Portfolio (Class T) | | 19.56 | | | 91.74 | % | | 100.98 | % | | — |
S&P 500 Index3 | | 14.55 | | | 91.45 | | | 98.57 | | | *** |
Russell 1000 Growth Index3 | | 19.23 | | | 81.09 | | | 59.92 | | | **** |
Lipper Large-Cap Core Funds Avg.4 | | 14.56 | | | 81.47 | | | 84.27 | | | ***** |
| | |
| 2 | | THE TARGET PORTFOLIO TRUST |
| | | | | | | | | | | |
| | | Average Annual Total Returns1
as of 9/30/07 (With TARGET Program Fee) |
| | | One Year | | | Five Years | | | Ten Years | | | Since Inception2 |
Large Capitalization Growth Portfolio (Class R) | | 17.85 | % | | N/A | | | N/A | | | 18.44% (8/22/06) |
Large Capitalization Growth Portfolio (Class T) | | 16.86 | | | 13.52 | % | | 4.30 | % | | — |
S&P 500 Index3 | | 16.42 | | | 15.44 | | | 6.57 | | | *** |
Russell 1000 Growth Index3 | | 19.35 | | | 13.84 | | | 4.06 | | | **** |
Lipper Large-Cap Core Funds Avg.4 | | 15.96 | | | 13.91 | | | 5.54 | | | ***** |
| |
| | | Cumulative Total Returns1
as of 10/31/07 (Without TARGET Program Fee) |
| | | One Year | | | Five Years | | | Ten Years | | | Since Inception2 |
Large Capitalization Value Portfolio (Class R) | | 9.75 | % | | N/A | | | N/A | | | 16.23% (8/22/06) |
Large Capitalization Value Portfolio (Class T) | | 10.28 | | | 124.79 | % | | 129.11 | % | | — |
S&P 500 Index3 | | 14.55 | | | 91.45 | | | 98.57 | | | *** |
Russell 1000 Value Index3 | | 10.83 | | | 113.63 | | | 139.20 | | | **** |
Lipper Multi-Cap Value Funds Avg.4 | | 10.94 | | | 107.41 | | | 129.00 | | | ***** |
| |
| | | Average Annual Total Returns1
as of 9/30/07
(With TARGET Program Fee) |
| | | One Year | | | Five Years | | | Ten Years | | | Since Inception2 |
Large Capitalization Value Portfolio (Class R) | | 13.17 | % | | N/A | | | N/A | | | 14.27% (8/22/06) |
Large Capitalization Value Portfolio (Class T) | | 12.02 | | | 17.08 | % | | 6.58 | % | | — |
S&P 500 Index3 | | 16.42 | | | 15.44 | | | 6.57 | | | *** |
Russell 1000 Value Index3 | | 14.45 | | | 18.07 | �� | | 8.80 | | | **** |
Lipper Multi-Cap Value Funds Avg.4 | | 13.55 | | | 16.56 | | | 7.78 | | | ***** |
| | |
| THE TARGET PORTFOLIO TRUST | | 3 |
Equity Portfolios’ Performance (continued)
| | | | | | | | | | | |
| |
| | | Cumulative Total Returns1
as of 10/31/07 (Without TARGET Program Fee) |
| | | One Year | | | Five Years | | | Ten Years | | | Since Inception2 |
Small Capitalization Growth Portfolio (Class R) | | 17.85 | % | | N/A | | | N/A | | | 24.37% (8/22/06) |
Small Capitalization Growth Portfolio (Class T) | | 18.52 | | | 90.62 | % | | 39.74 | % | | — |
Russell 2000 Index3 | | 9.27 | | | 135.37 | | | 116.04 | | | *** |
Russell 2000 Growth Index3 | | 16.73 | | | 134.40
|
| | 59.12 | | | **** |
Lipper Small-Cap Growth Funds Avg.4 | | 20.33 | | | 123.32
|
| | 129.71 | | | ***** |
| |
| | | Average Annual Total Returns1
as of 9/30/07
(With TARGET Program Fee) |
| | | One Year | | | Five Years | | | Ten Years | | | Since Inception2 |
Small Capitalization Growth Portfolio (Class R) | | 18.21 | % | | N/A | | | N/A | | | 18.37% (8/22/06) |
Small Capitalization Growth Portfolio (Class T) | | 16.95 | | | 11.94 | % | | 0.92 | % | | — |
Russell 2000 Index3 | | 12.34 | | | 18.75 | | | 7.22 | | | *** |
Russell 2000 Growth Index3 | | 18.94 | | | 18.70 | | | 3.65 | | | **** |
Lipper Small-Cap Growth Funds Avg.4 | | 21.55 | | | 17.34 | | | 7.04 | | | ***** |
| |
| | | Cumulative Total Returns1
as of 10/31/07 (Without TARGET Program Fee) |
| | | One Year | | | Five Years | | | Ten Years | | | Since Inception2 |
Small Capitalization Value Portfolio (Class R) | | 11.17 | % | | N/A | | | N/A | | | 17.71% (8/22/06) |
Small Capitalization Value Portfolio (Class T) | | 11.67 | | | 163.16 | % | | 225.16 | % | | — |
Russell 2000 Index3 | | 9.27 | | | 135.37 | | | 116.04 | | | *** |
Russell 2000 Value Index3 | | 2.05 | | | 134.66 | | | 171.27 | | | **** |
Lipper Small-Cap Core Funds Avg.4 | | 10.39 | | | 130.16 | | | 144.20 | | | ***** |
| | |
| 4 | | THE TARGET PORTFOLIO TRUST |
| | | | | | | | | | | |
| |
| | | Average Annual Total Returns1
as of 9/30/07
(With TARGET Program Fee) |
| | | One Year | | | Five Years | | | Ten Years | | | Since Inception2 |
Small Capitalization Value Portfolio (Class R) | | 13.79 | % | | N/A | | | N/A | | | 13.31% (8/22/06) |
Small Capitalization Value Portfolio (Class T) | | 12.65 | | | 19.64 | % | | 10.17 | % | | — |
Russell 2000 Index3 | | 12.34 | | | 18.75 | | | 7.22 | | | *** |
Russell 2000 Value Index3 | | 6.09 | | | 18.70 | | | 10.07 | | | **** |
Lipper Small-Cap Core Funds Avg.4 | | 13.40 | | | 18.00 | | | 8.26 | | | ***** |
| |
| | | Cumulative Total Returns1
as of 10/31/07 (Without TARGET Program Fee) |
| | | One Year | | | Five Years | | | Ten Years | | | Since Inception2 |
International Equity Portfolio (Class R) | | 33.23 | % | | N/A | | | N/A | | | 39.52% (8/22/06) |
International Equity Portfolio (Class T) | | 33.85 | | | 175.34 | % | | 143.50 | % | | — |
MSCI EAFE ND Index3 | | 24.91 | | | 183.98 | | | 142.36 | | | *** |
Lipper International Large-Cap Value Funds Avg.4 | | 25.18 | | | 188.54 | | | 157.86 | | | ***** |
| |
| | | Average Annual Total Returns1
as of 9/30/07
(With TARGET Program Fee) |
| | | One Year | | | Five Years | | | Ten Years | | | Since Inception2 |
International Equity Portfolio (Class R) | | 32.09 | % | | N/A | | | N/A | | | 29.61% (8/22/06) |
International Equity Portfolio (Class T) | | 30.69 | | | 21.07 | % | | 6.47 | % | | — |
MSCI EAFE ND Index3 | | 24.86 | | | 23.55 | | | 7.97 | | | *** |
Lipper International Large-Cap Value Funds Avg.4 | | 24.92 | | | 23.72 | | | 8.73 | | | ***** |
Source: Prudential Investments LLC and Lipper Inc. Performance figures may reflect fee waivers and/or expense reimbursements. In the absence of such fee waivers and/or expense reimbursements, total returns would be lower.
1Total returns assume the reinvestment of all dividends and distributions, and take into account all charges and expenses applicable to an investment in each portfolio. The average annual total returns for the TARGET portfolios assume the imposition of the maximum TARGET annual advisory fee of 1.50% for equity portfolios for retail investors. Class R shares are subject to an annual distribution and service (12b-1) fee of up to 0.75%. Returns in the table do not reflect the deduction of taxes that a shareholder would pay on portfolio distributions or following the redemption of portfolio shares.
2Inception date returns are provided for any share class with less than 10 calendar years of returns.
3Investors cannot invest directly in an index. The returns for the benchmark indexes would be lower if they reflected deductions for TARGET program fees, portfolio operating expenses, sales charges, or taxes. The Standard
| | |
| THE TARGET PORTFOLIO TRUST | | 5 |
Equity Portfolios’ Performance (continued)
& Poor’s 500 Composite Stock Price Index (S&P 500 Index) is an unmanaged index of 500 stocks of large U.S. companies. It gives a broad look at how stock prices have performed. The Russell 1000 Growth Index contains those securities in the Russell 1000 Index with an above-average growth orientation. Companies in this index tend to exhibit higher price-to-book and price-to-earnings ratios, lower dividend yields, and higher forecasted growth rates. The Russell 1000 Value Index contains those securities in the Russell 1000 Index with a below-average growth orientation. Companies in this index generally have low price-to-book and price-to-earnings ratios, higher dividend yields, and lower forecasted growth values. The Russell 2000 Index is an unmanaged index of the stocks of the 2,000 smallest U.S. companies included in the Russell 3000 Index. It gives an indication of how the stock prices of smaller companies have performed. The Russell 2000 Growth Index contains those securities in the Russell 2000 Index with an above-average growth orientation. Companies in this index generally have higher price-to-book and price-to-earnings ratios. The Russell 2000 Value Index contains those securities in the Russell 2000 Index with a below-average growth orientation. Companies in this index generally have low price-to-earnings ratios, higher dividend yields, and lower forecasted growth values. The Morgan Stanley Capital International Europe, Australasia, and Far East Index (MSCI EAFE ND Index) is an unmanaged, weighted index that reflects stock price movements in Europe, Australasia, and the Far East. It gives an indication of how foreign stocks have performed.
4The Lipper averages represent returns based on an average of all funds in the respective Lipper categories for the periods noted. The returns for the Lipper averages would be lower if they reflected deductions for TARGET program fees, portfolio operating expenses, sales charges, or taxes. Large-Cap Core funds invest at least 75% of their equity assets in companies with market capitalizations (on a three-year weighted basis) greater than 300% of the dollar-weighted median market capitalization of the middle 1,000 securities of the S&P SuperComposite 1500 Index. Large-cap core funds have an above-average price-to-earnings ratio, price-to-book ratio, and three-year sales-per-share growth value compared with the S&P 500 Index. Multi-Cap Value funds invest in a variety of market capitalization ranges without concentrating 75% of their equity assets in any one market capitalization range over an extended period of time. Multi-cap funds typically have between 25% and 75% of their assets invested in companies with market capitalizations (on a three-year weighted basis) above 300% of the dollar-weighted median market capitalization of the middle 1,000 securities of the S&P SuperComposite 1500 Index. Multi-cap value funds typically have a below-average price-to-earnings ratio and three-year sales-per-share growth value compared with the S&P 500 Index. Small-Cap Growth funds invest at least 75% of their equity assets in companies with market capitalizations (on a three-year weighted basis) less than 250% of the dollar-weighted median of the smallest 500 of the middle 1,000 securities of the S&P SuperComposite 1500 Index. Small-cap growth funds typically have an above-average price-to-earnings ratio, price-to-book ratio, and three-year sales-per-share growth value compared with the S&P SmallCap 600 Index. Small-Cap Core funds invest at least 75% of their equity assets in companies with market capitalizations (on a three-year weighted basis) less than 250% of the dollar-weighted median of the smallest 500 of the middle 1,000 securities of the S&P SuperComposite 1500 Index. Small-cap core funds have more latitude in the companies in which they invest. These funds typically have an average price-to-earnings ratio and three-year sales-per-share growth value compared with the S&P SmallCap 600 Index. International funds invest their assets in securities with primary trading markets outside of the United States.
***Large Capitalization Growth Portfolio—S&P 500 Index Closest Month-End to Inception cumulative total returns as of 10/31/2007 are 21.33% for Class R and 369.13% for Class T. S&P 500 Index Closest Month-End to Inception average annual total returns as of 9/30/2007 are 17.80% for Class R and 10.93% for Class T. Large Capitalization Value Portfolio—S&P 500 Index Closest Month-End to Inception cumulative total returns as of 10/31/2007 are 21.33% for Class R and 369.13% for Class T. S&P 500 Index Closest Month-End to Inception average annual total returns as of 9/30/2007 are 17.80% for Class R and 10.93% for Class T. Small Capitalization Growth Portfolio—Russell 2000 Index Closest Month-End to Inception cumulative total returns as of 10/31/2007 are 16.52% for Class R and 356.69% for Class T. Russell 2000 Index Closest Month-End to Inception average annual total returns as of 9/30/2007 are 10.63% for Class R and 12.19% for Class T. Small
| | |
| 6 | | THE TARGET PORTFOLIO TRUST |
Capitalization Value Portfolio—Russell 2000 Index Closest Month-End to Inception cumulative total returns as of 10/31/2007 are 16.52% for Class R and 356.69% for Class T. Russell 2000 Index Closest Month-End to Inception average annual total returns as of 9/30/2007 are 12.19% for Class R and 10.63% for Class T. International Equity Portfolio—MSCI EAFE ND Index Closest Month-End to Inception cumulative total returns as of 10/31/2007 are 29.97% for Class R and 316.27% for Class T. MSCI EAFE ND Index Closest Month-End to Inception average annual total returns as of 9/30/2007 are 22.93% for Class R and 9.86% for Class T.
****Large Capitalization Growth Portfolio—Russell 1000 Growth Index Closest Month-End to Inception cumulative total returns as of 10/31/2007 are 26.81% for Class R and 252.97% for Class T. Russell 1000 Growth Index Closest Month-End to Inception average annual total returns as of 9/30/2007 are 20.72% for Class R and 8.68% for Class T. Large Capitalization Value Portfolio—Russell 1000 Value Index Closest Month-End to Inception cumulative total returns as of 10/31/2007 are 16.74% for Class R and 486.06% for Class T. Russell 1000 Value Index Closest Month-End to Inception average annual total returns as of 9/30/2007 are 15.35% for Class R and 12.74% for Class T. Small Capitalization Growth Portfolio—Russell 2000 Growth Index Closest Month-End to Inception cumulative total returns as of 10/31/2007 are 25.13% for Class R and 196.78% for Class T. Russell 2000 Growth Index Closest Month-End to Inception average annual total returns as of 9/30/2007 are 7.33% for Class R and 18.09% for Class T. Small Capitalization Value Portfolio—Russell 2000 Value Index Closest Month-End to Inception cumulative total returns as of 10/31/2007 are 8.29% for Class R and 536.09% for Class T. Russell 2000 Value Index Closest Month-End to Inception average annual total returns as of 9/30/2007 are 6.56% for Class R and 13.28% for Class T.
*****Large Capitalization Growth Portfolio—Lipper Average Index Closest Month-End to Inception cumulative total returns as of 10/31/2007 are 21.05% for Class R and 307.43% for Class T. Lipper Average Index Closest Month-End to Inception average annual total returns as of 9/30/2007 are 17.31% for Class R and 9.67% for Class T. Large Capitalization Value Portfolio—Lipper Average Index Closest Month-End to Inception cumulative total returns as of 10/31/2007 are 16.99% for Class R and 394.49% for Class T. Lipper Average Index Closest Month-End to Inception average annual total returns as of 9/30/2007 are 14.62% for Class R and 11.18% for Class T. Small Capitalization Growth Portfolio—Lipper Average Closest Month-End to Inception cumulative total returns as of 10/31/2007 are 27.78% for Class R and 361.73% for Class T. Lipper Average Closest Month-End to Inception average annual total returns as of 9/30/2007 are 20.93% for Class R and 10.01% for Class T. Small Capitalization Value Portfolio—Lipper Average Closest Month-End to Inception cumulative total returns as of 10/31/2007 are 17.03% for Class R and 433.98% for Class T. Lipper Average Closest Month-End to Inception average annual total returns as of 9/30/2007 are 13.30% for Class R and 10.81% for Class T. International Equity Portfolio—Lipper Average Closest Month-End to Inception cumulative total returns as of 10/31/2007 are 30.78% for Class R and 397.84% for Class T. Lipper Average Closest Month-End to Inception average annual total returns as of 9/30/2007 are 23.19% for Class R and 10.84% for Class T.
| | |
| THE TARGET PORTFOLIO TRUST | | 7 |
Fixed Income Portfolios’ Performance
Performance data quoted represent past performance. Past performance does not guarantee future results. The investment return and principal value of an investment will fluctuate, so that an investor’s shares, when redeemed, may be worth more or less than their original cost. Current performance may be lower or higher than the past performance data quoted. An investor may obtain performance data as of the most recent month-end by visiting our website at www.prudential.com or by calling (800) 225-1852. The maximum TARGET program fee for retail investors is 1.50%.
International Bond Portfolio:
Gross operating expenses: Class T, 1.08%. Net operating expenses apply to: Class T, 1.08%.
Total Return Bond Portfolio:
Gross operating expenses: Class R, 1.39%; Class T, 0.64%. Net operating expenses apply to: Class R, 1.14%; Class T, 0.64%, after contractual reduction through 2/28/2009.
Intermediate-Term Bond Portfolio:
Gross operating expenses: Class T, 0.58%. Net operating expenses apply to: Class T, 0.58%.
Mortgage Backed Securities Portfolio:
Gross operating expenses: Class T, 1.82%. Net operating expenses apply to: Class T, 1.82%.
| | | | | | | | | |
| Fixed Income Portfolios | |
| | | Cumulative Total Returns1
as of 10/31/07
(Without Target Program Fee) | |
| | | One Year | | | Five Years | | | Ten Years | |
International Bond Portfolio (Class T) | | 1.59 | % | | 24.49 | % | | 29.03 | % |
Citigroup Non-U.S. WGBI–Hedged3 | | 3.94 | | | 23.10 | | | 76.02 | |
Lipper International Income Funds Avg.4 | | 8.23 | | | 42.99 | | | 71.61 | |
| | | | | | | | | |
| | | Average Annual Total Returns1
as of 9/30/07
(With TARGET Program Fee) | |
| | | One Year | | | Five Years | | | Ten Years | |
International Bond Portfolio (Class T) | | –0.04 | % | | 2.67 | % | | 1.16 | % |
Citigroup Non-U.S. WGBI–Hedged3 | | 3.57 | | | 4.06 | | | 5.81 | |
Lipper International Income Funds Avg.4 | | 7.52 | | | 6.92 | | | 5.35 | |
| | |
| 8 | | THE TARGET PORTFOLIO TRUST |
| | | | | | | | | | | |
| | | Cumulative Total Returns1
as of 10/31/07 (Without Target Program Fee) |
| | | One Year | | | Five Years | | | Ten Years | | | Since Inception2 |
Total Return Bond Portfolio (Class R) | | 5.85 | % | | N/A | | | N/A | | | 6.79% (8/22/06) |
Total Return Bond Portfolio (Class T) | | 6.34 | | | 29.37
| %
| | 81.44 | % | | —
|
Lehman Brothers U.S. Aggregate Bond Index3 | | 5.38 | | | 24.11 | | | 77.57 | | | *** |
Lipper Corporate Debt BBB-Rated Funds Avg.4 | | 4.69 | | | 35.47 | | | 71.63 | | | **** |
| | | | | | | | | | | |
| | | Average Annual Total Returns1
as of 9/30/07
(With TARGET Program Fee) |
| | | One Year | | | Five Years | | | Ten Years | | | Since Inception2 |
Total Return Bond Portfolio (Class R) | | 5.26 | % | | N/A | | | N/A | | | 5.60% (8/22/06) |
Total Return Bond Portfolio (Class T) | | 4.84 | | | 3.65 | % | | 4.61 | % | | — |
Lehman Brothers U.S. Aggregate Bond Index3 | | 5.14 | | | 4.13 | | | 5.97 | | | *** |
Lipper Corporate Debt BBB-Rated Funds Avg.4 | | 4.57 | | | 5.79 | | | 5.45 | | | **** |
| | | | | | | | | | | | | | | | | | |
| | | Cumulative Total Returns1
as of 10/31/07
(Without TARGET Program Fee) | | | Average Annual Total Returns1
as of 9/30/07
(With TARGET Program Fee) | |
| | | One Year | | | Five Years | | | Ten Years | | | One Year | | | Five Years | | | Ten Years | |
Intermediate-Term Bond Portfolio (Class T) | | 5.48 | % | | 23.15 | % | | 71.23 | % | | 4.22 | % | | 2.66 | % | | 4.03 | % |
Lehman Brothers Int. Govt./Credit Bond Index3 | | 5.64 | | | 21.95 | | | 73.11 | | | 5.43 | | | 3.82 | | | 5.68 | |
Lipper Int. Inv.-Grade Debt Funds Avg.4 | | 4.08 | | | 22.47 | | | 65.57 | | | 4.14 | | | 3.87 | | | 5.20 | |
| | | | | | | | | | | | | | | | | | |
Mortgage Backed Securities Portfolio (Class T) | | 4.50 | % | | 18.09 | % | | 64.18 | % | | 2.92 | % | | 1.75 | % | | 3.57 | % |
Lehman Brothers Mortgage-Backed Securities Index3 | | 5.68 | | | 23.27 | | | 76.16 | | | 5.39 | | | 4.14 | | | 5.84 | |
Citigroup Mortgage-Backed Securities Index3 | | 5.64 | | | 23.48 | | | 76.85 | | | 5.40 | | | 4.18 | | | 5.88 | |
Lipper U.S. Mortgage Funds Avg.4 | | 4.09 | | | 18.37 | | | 62.93 | | | 4.07 | | | 3.33 | | | 5.05 | |
Source: Prudential Investments LLC and Lipper Inc. Performance figures may reflect fee waivers and/or expense reimbursements. In the absence of such fee waivers and/or expense reimbursements, total returns would be lower.
1Total returns assume the reinvestment of all dividends and distributions, and take into account all charges and expenses applicable to an investment in each portfolio. The average annual total returns for the TARGET portfolios assume the imposition of the maximum TARGET annual advisory fee of 1.50% for bond portfolios for retail investors. Class R shares are subject to an annual distribution and service (12b-1) fee of up to 0.75%. Returns in the table do not reflect the deduction of taxes that a shareholder would pay on portfolio distributions or following the redemption of portfolio shares.
| | |
| THE TARGET PORTFOLIO TRUST | | 9 |
Fixed Income Portfolios’ Performance (continued)
2Inception date returns are provided for any share class with less than 10 calendar years of returns.
3Investors cannot invest directly in an index. The returns for the benchmark indexes would be lower if they reflected deductions for TARGET program fees, portfolio operating expenses, sales charges, or taxes. The Citigroup Non-U.S. World Government Bond Index Hedged (WGBI–Hedged) is an unmanaged index of approximately 600 high-quality bonds with foreign currency exposure translated to the U.S. dollar. It gives a broad indication of how foreign bonds have performed. The Lehman Brothers U.S. Aggregate Bond Index is an unmanaged index of investment-grade securities issued by the U.S. government and its agencies and by corporations with between one and 10 years remaining to maturity. It gives a broad indication of how bond prices of short- and intermediate-term bonds have performed. The Lehman Brothers Intermediate Government/Credit Bond Index is an unmanaged index of publicly traded U.S. government bonds and investment-grade corporate bonds with maturities of up to 10 years. It gives a broad indication of how intermediate-term bonds have performed. The Lehman Brothers Mortgage-Backed Securities Index is a market capitalization-weighted index of 15- and 30-year fixed-rate securities backed by GNMA, FNMA, and FHLMC mortgage pools, and balloon mortgages with fixed-rate coupons. The Citigroup Mortgage-Backed Securities Index is an unmanaged index of 15- and 30-year mortgage-related securities issued by U.S. government agencies. Each of them gives a broad indication of how mortgage-backed securities have performed.
4The Lipper averages represent returns based on an average of all funds in the respective Lipper categories for the periods noted. The returns for the Lipper averages would be lower if they reflected deductions for TARGET program fees, portfolio operating expenses, sales charges, or taxes. International Income funds invest primarily in U.S. dollar and non-U.S. dollar debt securities of issuers located in at least three countries, excluding the United States, except in periods of market weakness. Corporate Debt BBB-Rated funds invest primarily in corporate and government debt issues rated in the top four grades. Intermediate Investment-Grade Debt funds invest primarily in investment-grade debt issues (rated in the top four grades) with dollar-weighted average maturities of five to 10 years. U.S. Mortgage funds invest primarily in mortgages/securities issued or guaranteed as to principal and interest by the U.S. government and certain federal agencies.
***Total Return Bond Portfolio—Lehman Brothers U.S. Aggregate Bond Index Closest Month-End to Inception cumulative total returns as of 10/31/2007 are 7.01% for Class R and 151.01% for Class T. Lehman Brothers U.S. Aggregate Bond Index Closest Month-End to Inception average annual total returns as of 9/30/2007 are 5.58% for Class R and 6.37% for Class T.
****Total Return Bond Portfolio—Lipper Average Index Closest Month-End to Inception cumulative total returns as of 10/31/2007 are 6.61% for Class R and 163.03% for Class T. Lipper Average Index Closest Month-End to Inception average annual total returns as of 9/30/2007 are 5.15% for Class R and 6.59% for Class T.
| | |
| 10 | | THE TARGET PORTFOLIO TRUST |
Money Market Portfolio Performance
Yields will fluctuate from time to time, and past performance does not guarantee future results. Current performance may be lower or higher than the past performance data quoted. The investment return and principal value will fluctuate, and shares, when sold, may be worth more or less than the original cost. For the most recent month-end performance update, call (800) 225-1852.
U.S. Government Money Market Portfolio:
Gross operating expenses: Class T, 0.50%. Net operating expenses apply to: Class T, 0.50%.
| | | | | | | | | |
| Money Market Portfolio as of 10/31/07 | | | | | | |
| | | Cumulative
Total Returns1
(Without TARGET
Program Fee)
One Year | | | Net Asset Value
(NAV) | | 7-Day Current
Yield | |
U.S. Government Money Market Portfolio (Class T) | | 4.99 | % | | $ | 1.00 | | 4.22 | % |
Lipper U.S. Government Money Market Funds Avg.2 | | 4.54 | | | | N/A | | N/A | |
iMoneyNet, Inc. All Taxable Money Market Funds Avg.3 | | N/A | | | | N/A | | 4.42 | |
Source: Prudential Investments LLC and Lipper Inc. Performance figures may reflect fee waivers and/or expense reimbursements. In the absence of such fee waivers and/or expense reimbursements, total returns would be lower.
1Total returns assume the reinvestment of all dividends and distributions, and take into account all charges and expenses applicable to an investment in each portfolio. Returns would be lower if the fee were deducted. The returns in the table do not reflect the deduction of taxes that a shareholder would pay on portfolio distributions or following the redemption of portfolio shares.
2The Lipper average represents returns based on an average of all funds in the respective Lipper categories for the periods noted. The return for the Lipper average would be lower if it reflected deductions for TARGET program fees, portfolio operating expenses, sales charges, or taxes. U.S. Government Money Market funds invest principally in financial instruments issued or guaranteed by the U.S. government, its agencies, or instrumentalities with dollar-weighted average maturities of less than 90 days. These funds intend to keep a constant net asset value.
3iMoneyNet, Inc. regularly reports a 7-day current yield on Tuesdays for taxable money market funds. This is the data of all funds in the iMoneyNet, Inc. All Taxable Money Market Funds Average category as of 10/30/07, the closest date to the end of our reporting period.
An investment in the U.S. Government Money Market Portfolio (the Portfolio) is not insured or guaranteed by the Federal Deposit Insurance Corporation or any other government agency. Although the Portfolio seeks to preserve the value of your investment at $1 per share, it is possible to lose money by investing in the Portfolio.
| | |
| THE TARGET PORTFOLIO TRUST | | 11 |
Strategy and Performance Overview
Large Capitalization Growth Portfolio
The Large Capitalization Growth Portfolio (Class T) posted a 15.41% total return for the 10-month reporting period ended October 31, 2007*, which trailed the 16.51% total return of the Russell 1000 Growth Index (the Index), but exceeded the 10.86% total return of the S&P 500 Index and the 11.00% total return of the Lipper Large-Cap Core Funds Average.
The Portfolio is co-managed by Marsico Capital Management and Goldman Sachs Asset Management, who play different roles in the Portfolio’s long-term performance. Goldman Sachs uses a quantitative approach with rigorously applied risk controls that aim to limit deviations from the return of the Russell 1000 Growth Index. Marsico Capital uses a more active strategy to select a smaller number of high-conviction growth stock positions. (High conviction investing involves holding fewer stocks and taking larger positions relative to the Index.)
The Goldman Sachs portion of the Portfolio underperformed its benchmark, the Russell 1000 Growth Index primarily, due to the quant downturn that was precipitated by a deleveraging of hedge funds as a result of the meltdown in subprime mortgages (home loans made to borrowers with poor credit histories). Goldman Sachs holdings in the consumer cyclicals, consumer services, healthcare, and technology sectors also detracted from the Portfolio’s relative returns. However, the Marsico portion, which continued to favor larger cap companies with better earnings growth relative to the Index, significantly outperformed particularly in the second half of the period, as the market began to shift from value toward growth investments. Marsico’s holdings in the hotel, chemicals, restaurants, and financial services industries helped to drive performance. Specifically, Marsico’s stock selection in a few hotel and casino operators, a credit card company, and a global chemical producer generated significant positive returns relative to the Index.
Overall, positions in the consumer cyclical, healthcare, financial, and energy stocks hampered the performance relative to the Index. Specifically, holdings in biotech, drug, specialty retail, and financial services companies detracted the most. Underweight holdings in technology and overweight positions in consumer services weakened performance, while underweight positions in consumer cyclicals benefited the Portfolio.
We expect the overall Portfolio’s performance profile to behave like a traditional growth strategy, and continue to benefit from the complementary strengths of each asset manager.
*Portfolio changed its fiscal year-end to October 31. Refer to the Portfolio’s previous annual report for performance information prior to January 1, 2007.
The Portfolio of Investments following this report shows the size of the Portfolio’s positions at period-end.
| | |
| 12 | | THE TARGET PORTFOLIO TRUST |
Large Capitalization Value Portfolio
The Large Capitalization Value Portfolio (Class T) posted a 5.70% total return for the 10-month reporting period ended October 31, 2007*, which trailed the 5.98% total return of the Russell 1000 Value Index (the Index) and the 6.72% total return of the Lipper Multi-Cap Value Funds Average.
The Portfolio has three subadvisers. JP Morgan Asset Management is responsible for approximately half the Portfolio, and uses a value style that is sector-neutral to the Russell 1000 Value Index. NFJ Investment Group follows a disciplined deep value investment strategy, based on research that has shown that portfolios that hold low price-to-earnings (P/E) stocks have substantially outperformed market indexes throughout all capitalization levels over extended periods. Hotchkis and Wiley Capital Management employs a value-oriented investment style and a bottom-up approach, based on the philosophy that stocks derive their value from the contribution of dividends and the profitable reinvestment of retained earnings over time.
The Portfolio’s underperformance was mainly attributable to the subadvisers’ stock selections. A few holdings in the construction & real property, financial services, and property/casualty insurance industries had a negative impact on relative performance. This was evident in companies like Lennar Corporation, Countrywide Financial, Freddie Mac, and Ambac Financial Group. Some of these stocks in the Index included Exxon Mobil, JPMorgan Chase & Co., General Electric, Bristol Myers Squibb, Public Service Enterprise, Goldman Sachs, and Lyondell Chemical Company.
An underexposure to companies with growth attributes (stocks in the Index with above average sales and earnings growth) adversely affected results, as the market rewarded growth-oriented stocks over less expensive stocks with questionable earnings sustainability. An overexposure to companies with volatile stock prices also detracted from returns, as market participants placed a greater emphasis on predictability given the uncertainty around inflation, U.S. housing activity, and the credit crisis.
An underweight position in the financial sector, specifically in banking stocks, contributed positively to performance. An overweight position in the basic materials sector also helped returns. While the JPMorgan portion contributed to positive returns, the NFJ portion contributed most to the Portfolio’s gains.
We expect the overall Portfolio’s performance profile to behave like a traditional value strategy, but to benefit from the complementary strengths of each asset manager.
*Portfolio changed its fiscal year-end to October 31. Refer to the Portfolio’s previous annual report for performance information prior to January 1, 2007.
The Portfolio of Investments following this report shows the size of the Portfolio’s positions at period-end.
| | |
| THE TARGET PORTFOLIO TRUST | | 13 |
Strategy and Performance Overview (continued)
Small Capitalization Growth Portfolio
The Small Capitalization Growth Portfolio (Class T) posted a 13.84% total return for the 10-month reporting period ended October 31, 2007*, which trailed the 14.27% return of the Russell 2000 Growth Index (the Index) and the Lipper Small-Cap Growth Funds Average of 16.86%. It also exceeded the 6.12% return of the Russell 2000 Index.
Transamerica Investment Management and RS Investment Management subadvised the Portfolio. Transamerica uses a fundamental, research-driven approach to identify high-quality growth stocks. RS emphasizes the merits of individual stocks, but is more aggressive as a small-cap growth manager. Both managers use traditional growth investment styles, but they tend to look for stocks in different parts of the small-cap growth market.
For example, the Transamerica portion had a lower exposure to highly leveraged and highly volatile stocks, which helped, and was underweight to momentum stocks (stocks with near-term rapidly growing prices), which detracted from performance relative to the Index. The RS portion registered stronger performance through its higher exposure to momentum stocks and to stocks of companies poised for superior growth and profitability. But RS was overweight in micro-cap stocks, which hurt its performance.
With respect to the aggregate portfolio, industry factors had a positive impact on performance relative to the Index. Overweight positions to stocks in the Internet, oil services, and defense & aerospace industries had a positive effect on performance. An underweight position to clothing stores also helped. Factors regarding specific stocks also affected the portfolio’s performance. Holdings in the consumer cyclicals and the consumer services sectors detracted from performance, while the Portfolio benefited from stocks within the energy sector.
*Portfolio changed its fiscal year-end to October 31. Refer to the Portfolio’s previous annual report for performance information prior to January 1, 2007.
The Portfolio of Investments following this report shows the size of the Portfolio’s positions at period-end.
| | |
| 14 | | THE TARGET PORTFOLIO TRUST |
Small Capitalization Value Portfolio
The Small Capitalization Value Portfolio (Class T) posted an 8.04% total return for the 10-month period ended October 31, 2007*, which outperformed the 1.64% decline of the Russell 2000 Value Index (the Index) and the 7.00% total return of the Lipper Small-Cap Core Funds Average.
Small companies and firms may respond to economic trends differently. For example, some may occupy specific niches in which they are immune to economic cycles. Small companies and firms may respond to economic trends differently. For example, some may occupy specific niches in which they are immune to economic cycles. Also, some inexpensive stocks may be not be followed closely by analysts. Accordingly, small-cap managers can benefit from informational inefficiencies in the market. Research is critical and the Fund’s managers are chosen based on their experience and capabilities. The asset managers themselves may reach position-size limits they can hold in small firms. Consequently, that is why the Portfolio uses several managers. As subadvisers reach their capacity limits, we may add new subadvisers. In 2007, the Portfolio was managed by EARNEST Partners, LLC; Lee Munder Investments; JP Morgan Asset Management; NFJ Investment Group; and Vaughan Nelson Investment Management.
Investment style factors that helped the Portfolio’s performance included underweight holdings versus the Index in stocks with low price-to-book ratios. The book value of a company is generally calculated by total assets minus intangible assets (patents, goodwill) and liabilities. The Portfolio was also underweight in stocks with high dividend yields, stocks with high price volatility, and stocks in highly leveraged companies (those with relatively high levels of debt). Overweight positions versus the Index in momentum stocks (stocks with near-term rapidly growing prices) also benefited the Portfolio.
A higher exposure to the energy, basic materials, and industrials sectors augmented performance. The Portfolio also benefited from underweight positions in the financial and technology sectors. Significantly, not one sector had any meaningful negative impact on performance relative to the benchmark. Holdings in the freight transportation, electronic equipment, and food & beverage industries also helped overall performance.
On the negative side, the Portfolio’s exposure to larger stocks (those with capitalization rates higher than stocks in the Index) detracted from results. Additionally, the Portfolio’s holdings within the energy reserves industry and the construction and real property industry had a negative impact.
*Portfolio changed its fiscal year-end to October 31. Refer to the Portfolio’s previous annual report for performance information prior to January 1, 2007.
The Portfolio of Investments following this report shows the size of the Portfolio’s positions at period-end.
| | |
| THE TARGET PORTFOLIO TRUST | | 15 |
Strategy and Performance Overview (continued)
International Equity Portfolio
The International Equity Portfolio (Class T) posted a 25.33% return for the 10-month reporting period ended October 31, 2007* that significantly outperformed the 17.60% return of the MSCI EAFE Index (the Index) and the 17.74% return of the Lipper International Large-Cap Value Funds Average.
The Portfolio was managed by LSV Asset Management and Thornburg Investment Management who were selected in part because of their complementary investment styles. LSV uses a quantitative deep value investment strategy and maintains a relatively large number of stocks in its portfolio. Thornburg uses traditional analysis of business fundamentals and a relative value strategy to select a portfolio with fewer and larger individual stock positions than LSV. Whereas LSV has no emerging market exposure, Thornburg may invest as much as 30% of its assets in that area. Emerging market stocks are not included in the Index.
The LSV segment posted a solid return but underperformed the Index. A turn in the market that favored firms with large market capitalizations began during the period and picked up steam from July through October, when a financial crisis tied to risky mortgages sent investors fleeing to shares of companies with consistent earnings growth. This posed a challenge for LSV. Its strategy typically creates a portfolio more heavily invested in companies with smaller market capitalizations whose shares have lower valuation multiples than those in the Index. These stocks fell out of favor. The LSV segment was also hurt by exposure to shares of U.K.-based companies mostly in the utilities, consumer staples, and financials sectors.
Thornburg’s strategy enabled its segment and the overall Portfolio to outperform the Index. It favored firms with higher valuations and higher earnings growth than those in the Index. These types of shares generally outperformed the broader stock market. In addition, the Thornburg segment benefited from its roughly 25% exposure to companies not included in the Index, of which about 18% were emerging market stocks. The segment benefited most from companies in Canada (excluded from the Index) and from an underweight exposure to firms in Japan (included in the Index). The Japanese stock market turned in a lackluster performance. However, some shares of Japanese firms held by the segment performed well, as did shares of companies in China and Hong Kong, both of which are not included in the Index.
*Portfolio changed its fiscal year-end to October 31. Refer to the Portfolio’s previous annual report for performance information prior to January 1, 2007.
The Portfolio of Investments following this report shows the size of the Portfolio’s positions at period-end.
| | |
| 16 | | THE TARGET PORTFOLIO TRUST |
International Bond Portfolio
The International Bond Portfolio (Class T) posted a 1.34% total return for the 10-month reporting period ended October 31, 2007*, which trailed the 3.71% total return of the Citigroup Non-U.S. World Government Bond Index (Hedged) (the Index) and the 7.21% total return of the Lipper International Income Funds Average. Pacific Investment Management Company LLC (PIMCO) managed the Portfolio.
What began early in the reporting period as concern about rising delinquencies and foreclosures on subprime mortgages (home loans made to less creditworthy borrowers) grew into a financial crisis in the summer that spread abroad from the United States. Many mortgage lenders went out of business; investor demand for all sorts of risky bonds dried up; and credit rating agencies downgraded mortgage-related securities worth billions of dollars. Conditions in the global bond markets improved as the Federal Reserve cut short-term interest rates in the summer and fall, but signs of financial stress remained as institutions continued to report large losses from securities linked to risky mortgages.
Exposure to mortgage-backed securities and bank loans detracted from the Portfolio’s return as these and other investments that carry more credit risk than ultra safe U.S. Treasury securities came under pressure in the volatile market environment. Similarly, the Portfolio had exposure to certain swap transactions that were also pressured, subtracting from its returns.
When the Fed cut rates, yields on shorter-term bonds, which are more sensitive to changes in monetary policy, declined more than yields on longer-term bonds. This caused the slope of the yield curve—a single line graph that depicts yields on bonds of the same type and credit quality from the shortest to the longest maturities—to become steeper. The Portfolio’s emphasis on shorter-term bonds in the U.S. and U.K. markets worked well as they outperformed longer-term bonds when the yield curve in both markets steepened. Exposure to select currencies of emerging market nations was another positive for the Portfolio as they strengthened versus a U.S. dollar weakened by declining interest rates.
*Portfolio changed its fiscal year-end to October 31. Refer to the Portfolio’s previous annual report for performance information prior to January 1, 2007.
The Portfolio of Investments following this report shows the size of the Portfolio’s positions at period-end.
| | |
| THE TARGET PORTFOLIO TRUST | | 17 |
Strategy and Performance Overview (continued)
Total Return Bond Portfolio
The Total Return Bond Portfolio (Class T) posted a total return of 5.94% for the 10-month reporting period ended October 31, 2007*, which outperformed the 4.78% total return of the Lehman Brothers U.S. Aggregate Bond Index (the Index) and the 3.81% total return of the Lipper Corporate Debt BBB-Rated Funds Average. Pacific Investment Management Company LLC (PIMCO) manages the Portfolio.
The Portfolio’s performance was relatively stable, though conditions in the U.S. bond market turned volatile due to a crisis in bonds linked to subprime mortgages, home loans made to less creditworthy borrowers. In response to strains in the fixed income market in August, the Federal Reserve reduced the discount rate its charges banks to borrow from its discount window by a half point. In mid-September, it cut the discount rate and its target for the federal funds rate on overnight loans between banks by a half point. In late October, it lowered both rates by a quarter point.
The bond market turned in a mixed performance from January through July, but in the final three months of the period, bond prices generally rallied in response to the short-term rate cuts, as bonds prices move inversely to rates. The Portfolio was favorably positioned to benefit from the rally because it had a longer duration (a measure of sensitivity to changes in interest rates) than the Index. When the Fed cut rates, yields on shorter-term bonds, which are more sensitive to changes in monetary policy, declined more than yields on longer-term bonds. This caused the slope of the yield curve—a single line graph that depicts yields on bonds of the same type and credit quality from the shortest to the longest maturities—to become steeper. The Portfolio’s emphasis on shorter-term bonds in the U.S. market, and to a lesser extent in the U.K. market, worked well as they outperformed longer-term bonds.
In the U.S. market, investment-grade corporate bonds, high yield corporate “junk” bonds, and mortgage-backed securities underperformed comparable U.S. Treasury securities. Therefore, a smaller exposure than the Index to investment-grade corporate bonds helped the Portfolio, but a larger exposure than the Index to mortgage-backed securities hurt it, though this was partially offset by favorable security selection in the sector. Exposure to high yield bonds was another negative for the Portfolio.
In the foreign exchange markets, the Portfolio benefited from its currency exposure, particularly select currencies of emerging market nations. They strengthened versus a U.S. dollar weakened by the short-term rate cuts.
*Portfolio changed its fiscal year-end to October 31. Refer to the Portfolio’s previous annual report for performance information prior to January 1, 2007.
The Portfolio of Investments following this report shows the size of the Portfolio’s positions at period-end.
| | |
| 18 | | THE TARGET PORTFOLIO TRUST |
Intermediate-Term Bond Portfolio
The Intermediate-Term Bond Portfolio (Class T) posted a total return of 5.13% for the 10-month period ended October 31, 2007*, which was in line with the 5.12% total return of the Lehman Brothers Intermediate Government/Credit Index (the Index) and exceeded the 3.42% total return of the Lipper Intermediate Investment-Grade Debt Funds Average. Pacific Investment Management Company LLC (PIMCO) manages the Portfolio.
The Portfolio’s performance was relatively stable, though conditions in the U.S. bond market turned volatile due to a crisis in bonds linked to subprime mortgages, home loans made to less creditworthy borrowers. In response to strains in the fixed income market in August, the Federal Reserve reduced the discount rate it charges banks to borrow from its discount window by a half point. In mid-September, it cut the discount rate and its target for the federal funds rate on overnight loans between banks by a half point. In late October, it lowered both rates by a quarter point.
The bond market turned in a mixed performance from January through July, but in the final three months of the period, bond prices generally rallied in response to the short-term rate cuts, as bond prices move inversely to rates. PIMCO’s efforts to adjust the Portfolio’s duration (a measure of sensitivity to changes in interest rates) relative to the duration of the Index did not work well in the volatile interest-rate environment. When the Fed cut rates, yields on shorter-term bonds, which are more sensitive to changes in monetary policy, declined more than yields on longer-term bonds. This caused the slope of the yield curve—a single line graph that depicts yields on bonds of the same type and credit quality from the shortest to the longest maturities—to become steeper. The Portfolio’s focus on shorter-term bonds in the U.S. market, and to a lesser extent in the U.K. market, worked well as they outperformed longer-term bonds.
In the U.S. market, investment-grade corporate bonds, high yield corporate “junk” bonds, and mortgage-backed securities underperformed comparable U.S. Treasury securities. Therefore, a smaller exposure than the Index to investment-grade corporate bonds helped the Portfolio, but exposures to mortgage-backed securities and high yield bonds hurt it.
In the foreign exchange markets, the Portfolio benefited from its exposure to the euro and select currencies of emerging market nations. They strengthened versus a U.S. dollar weakened by the short-term rate cuts.
*Portfolio changed its fiscal year-end to October 31. Refer to the Portfolio’s previous annual report for performance information prior to January 1, 2007.
The Portfolio of Investments following this report shows the size of the Portfolio’s positions at period-end.
| | |
| THE TARGET PORTFOLIO TRUST | | 19 |
Strategy and Performance Overview (continued)
Mortgage Backed Securities Portfolio
The Mortgage Backed Securities Portfolio (Class T) posted a 3.89% total return for the 10-month reporting period ended October 31, 2007*, which trailed the 4.77% total return of the Lehman Brothers Mortgage Backed Securities Index (the Index), but exceeded the 3.41% total return of the Lipper U.S. Mortgage Funds Average. Wellington Management, LLP, managed the Portfolio.
What began early in the reporting period as concern about rising delinquencies and foreclosures on subprime mortgages (home loans made to less creditworthy borrowers) grew into a financial crisis in the summer that spread abroad from the United States. Many mortgage lenders went out of business; investor demand for all sorts of risky bonds dried up; and credit rating agencies downgraded mortgage-related securities worth billions of dollars. Conditions in the bond markets improved as the Federal Reserve cut short-term interest rates in the summer and fall, but signs of financial stress remained as institutions continued to report large losses from securities linked to risky mortgages.
The Portfolio held a variety of mortgage-backed securities issued by a federal agency, or government-sponsored enterprises like the Federal National Mortgage Association, or so-called “private label” issuers such as units of investment banks. Losses on a credit default swap index, a type of derivative security comprised of 20 subprime mortgage-backed securities, was the primary reason the Portfolio underperformed the Index. It was also hurt by losses on adjustable-rate mortgage securities issued by a private entity, as higher quality securities were tainted by the subprime mortgage turmoil.
On a positive note, the largest contributor to the Portfolio’s return was its allocation to interest-only collateralized mortgage obligations, which give investors the right to interest cash flows of the underlying home loans. The Portfolio held these securities as Wellington Management correctly expected they would benefit from slower prepayments on mortgages. Wellington Management also helped the Portfolio by lengthening its duration, a measure of sensitivity to changes in interest rates. This enabled it to benefit more fully as bond prices generally rallied when rates fell in the last few months of the period. (Bond prices move inversely to rates.) A larger exposure to intermediate-term bonds than the Index also aided the Portfolio as the bonds performed well when the slope of the yield curve steepened. The yield curve is a single line graph that depicts yields on bonds of the same type and credit quality from the shortest to the longest maturities.
*Portfolio changed its fiscal year-end to October 31. Refer to the Portfolio’s previous annual report for performance information prior to January 1, 2007.
The Portfolio of Investments following this report shows the size of the Portfolio’s positions at period-end.
| | |
| 20 | | THE TARGET PORTFOLIO TRUST |
U.S. Government Money Market Portfolio
The U.S. Government Money Market Portfolio returned 4.04%* for the 10-month period ended October 31, 2007, which outperformed the 3.75% return of the Lipper U.S. Government Money Market Portfolio Funds Average. The Portfolio was subadvised by Wellington Management Company, LLP.
Two competing views of the U.S. economy and monetary policy held sway in the financial markets as the reporting period began. One view held that the Federal Reserve (the Fed) would soon ease monetary policy to reinvigorate economic growth. The other view held that the economic expansion, though slowing, remained solid, and that a continued threat of higher inflation made it less likely that the Fed would soon cut short-term interest rates.
The direction of monetary policy became clear during the summer after a crisis in debt securities tied to U.S. subprime mortgages (home loans made to borrowers with poor credit histories) began to rattle financial markets. Signs of distress in the credit markets in early August led the Fed, along with certain other central banks, to inject massive amounts of cash into their banking systems. In mid-August, the Fed reduced the discount rate it charges banks to borrow from its discount window by a half point. In mid-September, it cut the discount rate and its target for the federal funds rate on overnight loans between banks by a half point. Finally, in late October, both short-term rates were reduced another quarter point, which lowered the discount rate to 5.0% and the target for the federal funds rate to 4.5%.
The short-term debt market was not immune to the stress in the broader financial markets. Wellington Management’s conservative strategy insulated the Portfolio from volatility associated with riskier types of short-term investments. The Portfolio was largely invested in repurchase agreements, in which parties sell U.S. government securities to the Portfolio and later buy them back at an agreed upon price and time, thereby generating a fixed return of short duration for the Portfolio. The focus on repurchase agreements boosted the Portfolio’s liquidity. The remainder of its assets were invested in short-term bonds of federal agencies.
*Portfolio changed its fiscal year-end to October 31. Refer to the Portfolio’s previous annual report for performance information prior to January 1, 2007.
The Portfolio of Investments following this report shows the size of the Portfolio’s positions at period-end.
| | |
| THE TARGET PORTFOLIO TRUST | | 21 |
Fees and Expenses (Unaudited)
As a shareholder of the Trust, you incur two types of costs: (1) transaction costs, including sales charges (loads) on purchase payments and redemptions, as applicable, and (2) ongoing costs, including management fees, TARGET program fees, and other Trust expenses, as applicable. This example is intended to help you understand your ongoing costs (in dollars) of investing in the Trust and to compare these costs with the ongoing costs of investing in other mutual funds. This example does not reflect TARGET program fees. If TARGET program fees were included, the costs would be higher.
The example is based on an investment of $1,000 invested on May 1, 2007, at the beginning of the period, and held through the six-month period ended October 31, 2007. The example is for illustrative purposes only; you should consult the Prospectus for information on initial and subsequent minimum investment requirements.
The Trust’s transfer agent may charge additional fees to holders of certain accounts that are not included in the expenses shown in the table on the following page. These fees apply to Individual Retirement Accounts (IRAs) and Section 403(b) accounts. As of the close of the six-month period covered by the table, IRA fees included an annual maintenance fee of $15 per account (subject to a maximum annual maintenance fee of $25 for all accounts held by the same shareholder). Section 403(b) accounts are charged an annual $25 fiduciary maintenance fee. Some of the fees may vary in amount, or may be waived, based on your total account balance or the number of JennisonDryden Funds, including the Trust, that you own. You should consider the additional fees that were charged to your Trust account over the six-month period when you estimate the total ongoing expenses paid over the period and the impact of these fees on your ending account value, as these additional expenses are not reflected in the information provided in the expense table. Additional fees have the effect of reducing investment returns.
Actual Expenses
The first line for each share class in the table on the following page provides information about actual account values and actual expenses. You may use the information on this line, together with the amount you invested, to estimate the expenses that you paid over the period. Simply divide your account value by $1,000 (for example, an $8,600 account value ÷ $1,000 = 8.6), then multiply the result by the number on the first line under the heading “Expenses Paid During the Six-Month Period” to estimate the expenses you paid on your account during this period.
| | |
| 22 | | THE TARGET PORTFOLIO TRUST |
Hypothetical Example for Comparison Purposes
The second line for each share class in the table on the following page provides information about hypothetical account values and hypothetical expenses based on the Trust’s actual expense ratio and an assumed rate of return of 5% per year before expenses, which is not the Trust’s actual return. The hypothetical account values and expenses may not be used to estimate the actual ending account balance or expenses you paid for the period. You may use this information to compare the ongoing costs of investing in the Trust and other funds. To do so, compare this 5% hypothetical example with the 5% hypothetical examples that appear in the shareholder reports of the other funds.
Please note that the expenses shown in the table are meant to highlight your ongoing costs only, and do not reflect any transactional costs such as sales charges (loads). Therefore the second line for each share class in the table is useful in comparing ongoing costs only, and will not help you determine the relative total costs of owning different funds. In addition, if these transactional costs were included, your costs would have been higher.
| | | | | | | | | | | | | | |
Large
Capitalization
Growth Portfolio | | Beginning Account
Value
May 1, 2007 | | Ending Account
Value October 31, 2007 | | Annualized
Expense Ratio
Based on the
Six-Month Period | | | Expenses Paid
During the Six-
Month Period* |
| | | | | | | | | | | | | | |
| | | Class R | | | | | | | | | | | | |
| | | Actual | | $ | 1,000.00 | | $ | 1,109.00 | | 1.14 | % | | $ | 6.06 |
| | | Hypothetical | | $ | 1,000.00 | | $ | 1,019.46 | | 1.14 | % | | $ | 5.80 |
| | | Class T | | | | | | | | | | | | |
| | | Actual | | $ | 1,000.00 | | $ | 1,111.30 | | 0.64 | % | | $ | 3.41 |
| | | Hypothetical | | $ | 1,000.00 | | $ | 1,021.98 | | 0.64 | % | | $ | 3.26 |
| | | | | | | | | | | | | | |
Large
Capitalization
Value Portfolio | | Beginning Account
Value
May 1, 2007 | | Ending Account
Value October 31, 2007 | | Annualized
Expense Ratio
Based on the
Six-Month Period | | | Expenses Paid
During the Six-
Month Period* |
| | | | | | | | | | | | | | |
| | | Class R | | | | | | | | | | | | |
| | | Actual | | $ | 1,000.00 | | $ | 998.70 | | 1.17 | % | | $ | 5.89 |
| | | Hypothetical | | $ | 1,000.00 | | $ | 1,019.31 | | 1.17 | % | | $ | 5.96 |
| | | Class T | | | | | | | | | | | | |
| | | Actual | | $ | 1,000.00 | | $ | 1,001.10 | | 0.67 | % | | $ | 3.38 |
| | | Hypothetical | | $ | 1,000.00 | | $ | 1,021.83 | | 0.67 | % | | $ | 3.41 |
| | |
| THE TARGET PORTFOLIO TRUST | | 23 |
Fees and Expenses (continued)
| | | | | | | | | | | | | | |
| | | | | | | | | | | | | | |
Small
Capitalization
Growth Portfolio | | Beginning Account
Value
May 1, 2007 | | Ending Account
Value October 31, 2007 | | Annualized
Expense Ratio
Based on the
Six-Month Period | | | Expenses Paid
During the Six-
Month Period* |
| | | | | | | | | | | | | | |
| | | Class R | | | | | | | | | | | | |
| | | Actual | | $ | 1,000.00 | | $ | 1,088.80 | | 1.25 | % | | $ | 6.58 |
| | | Hypothetical | | $ | 1,000.00 | | $ | 1,018.90 | | 1.25 | % | | $ | 6.36 |
| | | Class T | | | | | | | | | | | | |
| | | Actual | | $ | 1,000.00 | | $ | 1,091.60 | | 0.75 | % | | $ | 3.95 |
| | | Hypothetical | | $ | 1,000.00 | | $ | 1,021.42 | | 0.75 | % | | $ | 3.82 |
| | | | | | | | | | | | | | |
Small
Capitalization
Value Portfolio | | Beginning Account
Value
May 1, 2007 | | Ending Account
Value October 31, 2007 | | Annualized
Expense Ratio
Based on the
Six-Month Period | | | Expenses Paid
During the Six-
Month Period* |
| | | | | | | | | | | | | | |
| | | Class R | | | | | | | | | | | | |
| | | Actual | | $ | 1,000.00 | | $ | 1,025.90 | | 1.21 | % | | $ | 6.18 |
| | | Hypothetical | | $ | 1,000.00 | | $ | 1,019.11 | | 1.21 | % | | $ | 6.16 |
| | | Class T | | | | | | | | | | | | |
| | | Actual | | $ | 1,000.00 | | $ | 1,028.60 | | 0.71 | % | | $ | 3.63 |
| | | Hypothetical | | $ | 1,000.00 | | $ | 1,021.63 | | 0.71 | % | | $ | 3.62 |
| | | | | | | | | | | | | | |
International
Equity Portfolio | | Beginning Account
Value
May 1, 2007 | | Ending Account
Value October 31, 2007 | | Annualized
Expense Ratio
Based on the
Six-Month Period | | | Expenses Paid
During the Six-
Month Period* |
| | | | | | | | | | | | | | |
| | | Class R | | | | | | | | | | | | |
| | | Actual | | $ | 1,000.00 | | $ | 1,147.30 | | 1.29 | % | | $ | 6.98 |
| | | Hypothetical | | $ | 1,000.00 | | $ | 1,018.70 | | 1.29 | % | | $ | 6.56 |
| | | Class T | | | | | | | | | | | | |
| | | Actual | | $ | 1,000.00 | | $ | 1,149.80 | | 0.79 | % | | $ | 4.28 |
| | | Hypothetical | | $ | 1,000.00 | | $ | 1,021.22 | | 0.79 | % | | $ | 4.02 |
| | | | | | | | | | | | | | |
International
Bond Portfolio | | Beginning Account
Value
May 1, 2007 | | Ending Account
Value
October 31, 2007 | | Annualized
Expense Ratio
Based on the
Six-Month Period | | | Expenses Paid
During the Six-
Month Period* |
| | | | | | | | | | | | | | |
| | | Class T | | | | | | | | | | | | |
| | | Actual | | $ | 1,000.00 | | $ | 1,006.00 | | 1.09 | % | | $ | 5.51 |
| | | Hypothetical | | $ | 1,000.00 | | $ | 1,019.71 | | 1.09 | % | | $ | 5.55 |
| | |
| 24 | | THE TARGET PORTFOLIO TRUST |
| | | | | | | | | | | | | | |
| | | | | | | | | | | | | | |
Total Return
Bond Portfolio | | Beginning Account
Value
May 1, 2007 | | Ending Account
Value
October 31, 2007 | | Annualized
Expense Ratio
Based on the
Six-Month Period | | | Expenses Paid
During the Six-
Month Period* |
| | | | | | | | | | | | | | |
| | | Class R | | | | | | | | | | | | |
| | | Actual | | $ | 1,000.00 | | $ | 1,035.20 | | 1.13 | % | | $ | 5.80 |
| | | Hypothetical | | $ | 1,000.00 | | $ | 1,019.51 | | 1.13 | % | | $ | 5.75 |
| | | Class T | | | | | | | | | | | | |
| | | Actual | | $ | 1,000.00 | | $ | 1,036.50 | | 0.63 | % | | $ | 3.23 |
| | | Hypothetical | | $ | 1,000.00 | | $ | 1,022.03 | | 0.63 | % | | $ | 3.21 |
| | | | | | | | | | | | | | |
Intermediate-Term
Bond Portfolio | | Beginning Account
Value
May 1, 2007 | | Ending Account
Value
October 31, 2007 | | Annualized
Expense Ratio
Based on the
Six-Month Period | | | Expenses Paid
During the Six-
Month Period* |
| | | | | | | | | | | | | | |
| | | Class T | | | | | | | | | | | | |
| | | Actual | | $ | 1,000.00 | | $ | 1,034.60 | | 0.57 | % | | $ | 2.92 |
| | | Hypothetical | | $ | 1,000.00 | | $ | 1,022.33 | | 0.57 | % | | $ | 2.91 |
| | | | | | | | | | | | | | |
Mortgage Backed
Securities Portfolio | | Beginning Account
Value
May 1, 2007 | | Ending Account
Value
October 31, 2007 | | Annualized
Expense Ratio
Based on the
Six-Month Period | | | Expenses Paid
During the Six-
Month Period* |
| | | | | | | | | | | | | | |
| | | Class T | | | | | | | | | | | | |
| | | Actual | | $ | 1,000.00 | | $ | 1,019.60 | | 1.79 | % | | $ | 9.11 |
| | | Hypothetical | | $ | 1,000.00 | | $ | 1,016.18 | | 1.79 | % | | $ | 9.10 |
| | | | | | | | | | | | | | |
U.S. Government
Money Market
Portfolio | | Beginning Account
Value
May 1, 2007 | | Ending Account
Value October 31, 2007 | | Annualized
Expense Ratio
Based on the
Six-Month Period | | | Expenses Paid
During the Six-
Month Period* |
| | | | | | | | | | | | | | |
| | | Class T | | | | | | | | | | | | |
| | | Actual | | $ | 1,000.00 | | $ | 1,024.10 | | 0.48 | % | | $ | 2.45 |
| | | Hypothetical | | $ | 1,000.00 | | $ | 1,022.79 | | 0.48 | % | | $ | 2.45 |
* Portfolio expenses (net of fee waivers or subsidies, if any) for each share class are equal to the annualized expense ratio for each share class (provided in the table), multiplied by the average account value over the period, multiplied by the 184 days in the six-month period ended October 31, 2007, and divided by 365 days to reflect the six-month period. Expenses presented in the table include the expenses of any underlying portfolios in which the Trust may invest.
| | |
| THE TARGET PORTFOLIO TRUST | | 25 |
| | |
Portfolio of Investments
As of October 31, 2007 | | Large Capitalization Growth Portfolio |
| | | | | |
| SHARES | | DESCRIPTION | | VALUE (NOTE 1) |
| | | | | |
| | LONG-TERM INVESTMENTS—99.4% | | | |
| | |
| | COMMON STOCKS | | | |
| | |
| | Aerospace & Defense—4.6% | | | |
| 23,105 | | Boeing Co. | | $ | 2,277,922 |
| 61,260 | | General Dynamics Corp. | | | 5,572,209 |
| 56,446 | | Lockheed Martin Corp. | | | 6,211,318 |
| 23,800 | | Northrop Grumman Corp. | | | 1,990,156 |
| | | | | |
| | | | | 16,051,605 |
| | | | | |
| | |
| | Agriculture/Heavy Equipment—2.2% | | | |
| 8,900 | | Altria Group, Inc. | | | 649,077 |
| 72,030 | | Monsanto Co. | | | 7,032,289 |
| | | | | |
| | | | | 7,681,366 |
| | | | | |
| | |
| | Auto Related | | | |
| 2,400 | | ArvinMeritor, Inc.(a) | | | 35,592 |
| | | | | |
| | |
| | Automobile Manufacturers—1.4% | | | |
| 8,200 | | Cummins, Inc.(a) | | | 983,672 |
| 32,230 | | Toyota Motor Corp., ADR (Japan) | | | 3,688,401 |
| | | | | |
| | | | | 4,672,073 |
| | | | | |
| | |
| | Automotive Parts | | | |
| 1,800 | | TRW Automotive Holdings Corp.* | | | 53,442 |
| | | | | |
| | |
| | Beverages—3.2% | | | |
| 58,890 | | Coca-Cola Co. (The) | | | 3,637,047 |
| 6,700 | | Hansen Natural Corp.* | | | 455,600 |
| 91,705 | | Heinekin NV, ADR (Netherlands) | | | 3,204,099 |
| 7,400 | | Molson Coors Brewing Co.(a) | | | 423,502 |
| 1,900 | | Pepsi Bottling Group, Inc. | | | 81,852 |
| 900 | | PepsiAmericas, Inc. | | | 32,148 |
| 42,300 | | PepsiCo, Inc. | | | 3,118,356 |
| | | | | |
| | | | | 10,952,604 |
| | | | | |
| | |
| | Biotechnology—2.1% | | | |
| 28,500 | | Amgen, Inc.* | | | 1,656,135 |
| 1,500 | | Applera Corp. - Applied Biosystems Group | | | 55,710 |
| 72,808 | | Genentech, Inc.* | | | 5,397,257 |
| | | | | |
| | | | | 7,109,102 |
| | | | | |
| | |
| | Business Services—2.3% | | | |
| 19,200 | | Manpower, Inc. | | | 1,435,008 |
| 34,201 | | MasterCard, Inc. | | | 6,482,800 |
| | | | | |
| | | | | 7,917,808 |
| | | | | |
See Notes to Financial Statements.
| | |
| THE TARGET PORTFOLIO TRUST | | 27 |
| | |
Large Capitalization Growth Portfolio (continued) | | Portfolio of Investments
As of October 31, 2007 |
| | | | | |
| SHARES | | DESCRIPTION | | VALUE (NOTE 1) |
| | | | | |
| | COMMON STOCKS (continued) | | | |
| | |
| | Cable Television—0.2% | | | |
| 26,038 | | DIRECTV Group, Inc. (The)* | | $ | 689,486 |
| | | | | |
| | |
| | Chemicals—1.3% | | | |
| 9,833 | | Air Products & Chemicals, Inc. | | | 962,159 |
| 8,800 | | Celanese Corp. | | | 369,248 |
| 500 | | Minerals Technologies, Inc. | | | 35,110 |
| 37,625 | | Praxair, Inc. | | | 3,216,185 |
| 1,000 | | Terra Industries, Inc.*(a) | | | 36,890 |
| | | | | |
| | | | | 4,619,592 |
| | | | | |
| | |
| | Commercial Services—1.1% | | | |
| 35,000 | | Accenture Ltd. (Class A Stock) | | | 1,366,750 |
| 31,701 | | Expedia, Inc.*(a) | | | 1,035,355 |
| 35,300 | | Moody’s Corp.(a) | | | 1,543,316 |
| | | | | |
| | | | | 3,945,421 |
| | | | | |
| | |
| | Commercial Services & Supplies—0.2% | | | |
| 29,800 | | Avis Budget Group* | | | 621,926 |
| | | | | |
| | |
| | Communication Equipment—1.1% | | | |
| 100,817 | | Juniper Networks, Inc.* | | | 3,629,412 |
| | | | | |
| | |
| | Computer Hardware—5.8% | | | |
| 47,121 | | Apple Computer, Inc.* | | | 8,950,634 |
| 9,300 | | Cadence Design System, Inc.* | | | 182,280 |
| 102,800 | | Dell, Inc.* | | | 3,145,680 |
| 90,613 | | Hewlett-Packard Co. | | | 4,682,880 |
| 17,500 | | International Business Machines Corp.(a) | | | 2,032,100 |
| 39,900 | | Synopsys, Inc.* | | | 1,127,574 |
| | | | | |
| | | | | 20,121,148 |
| | | | | |
| | |
| | Computer Services & Software—3.4% | | | |
| 23,600 | | Amazon.com, Inc.*(a) | | | 2,103,940 |
| 2,000 | | Autodesk, Inc.* | | | 97,800 |
| 249,790 | | Microsoft Corp. | | | 9,194,770 |
| 7,500 | | Pitney Bowes, Inc. | | | 300,300 |
| 4,500 | | Riverbed Technology, Inc.* | | | 152,055 |
| | | | | |
| | | | | 11,848,865 |
| | | | | |
| | |
| | Computers—0.1% | | | |
| 10,300 | | Lexmark International, Inc. (Class A Stock)* | | | 432,497 |
| | | | | |
| | |
| | Computers & Peripherals—0.4% | | | |
| 44,700 | | EMC Corp.*(a) | | | 1,134,933 |
| 4,800 | | NCR Corp.* | | | 132,432 |
| | | | | |
| | | | | 1,267,365 |
| | | | | |
See Notes to Financial Statements.
| | |
| 28 | | THE TARGET PORTFOLIO TRUST |
| | | | | |
| SHARES | | DESCRIPTION | | VALUE (NOTE 1) |
| | | | | |
| | COMMON STOCKS (continued) | | | |
| | |
| | Consumer Products & Services—0.7% | | | |
| 16,600 | | American Greetings Corp. (Class A Stock)(a) | | $ | 437,244 |
| 4,845 | | Proctor & Gamble Co. | | | 336,824 |
| 27,900 | | UST, Inc.(a) | | | 1,487,628 |
| | | | | |
| | | | | 2,261,696 |
| | | | | |
| | |
| | Diversified—0.6% | | | |
| 25,600 | | 3M Co. | | | 2,210,816 |
| | | | | |
| | |
| | Diversified Financial Services—0.5% | | | |
| 23,880 | | Morgan Stanley Dean Witter & Co. | | | 1,606,169 |
| | | | | |
| | |
| | Diversified Machinery—0.1% | | | |
| 4,600 | | Ingersoll-Rand Co. Ltd. (Class A Stock) | | | 231,610 |
| | | | | |
| | |
| | Diversified Manufacturing—0.7% | | | |
| 41,100 | | Honeywell International, Inc. | | | 2,482,851 |
| | | | | |
| | |
| | Diversified Operations—0.2% | | | |
| 79,129 | | Tesco PLC (United Kingdom) | | | 802,922 |
| | | | | |
| | |
| | Diversified Telecommunication Services—0.3% | | | |
| 22,100 | | Verizon Communications, Inc. | | | 1,018,147 |
| | | | | |
| | |
| | Education—0.3% | | | |
| 9,200 | | ITT Educational Services, Inc.* | | | 1,170,148 |
| | | | | |
| | |
| | Electrical Equipment—0.1% | | | |
| 4,600 | | Thomas & Betts Corp.* | | | 257,646 |
| | | | | |
| | |
| | Electronic Components—2.8% | | | |
| 5,800 | | Adobe Systems, Inc.* | | | 277,820 |
| 25,600 | | Avnet, Inc.* | | | 1,068,032 |
| 13,700 | | Energizer Holdings, Inc.* | | | 1,428,910 |
| 61,550 | | NVIDIA Corp.*(a) | | | 2,177,639 |
| 34,500 | | Raytheon Co. | | | 2,194,545 |
| 70,665 | | Reliant Energy, Inc.* | | | 1,944,701 |
| 7,900 | | Waters Corp.* | | | 608,142 |
| 500 | | WW Grainger, Inc. | | | 44,960 |
| | | | | |
| | | | | 9,744,749 |
| | | | | |
| | |
| | Energy Equipment & Services—1.0% | | | |
| 29,400 | | GlobalSantaFe Corp. (Cayman Islands) | | | 2,382,282 |
| 14,500 | | Holly Corp. | | | 910,600 |
| 100 | | Tidewater, Inc.(a) | | | 5,467 |
| | | | | |
| | | | | 3,298,349 |
| | | | | |
| | |
| | Entertainment & Leisure—1.8% | | | |
| 47,394 | | Las Vegas Sands, Inc.*(a) | | | 6,307,194 |
| | | | | |
| | |
| | Equipment Services—0.9% | | | |
| 1,400 | | Gen-Probe, Inc.* | | | 98,028 |
| 2,400 | | Genuine Parts Co. | | | 117,768 |
See Notes to Financial Statements.
| | |
| THE TARGET PORTFOLIO TRUST | | 29 |
| | |
Large Capitalization Growth Portfolio (continued) | | Portfolio of Investments
As of October 31, 2007 |
| | | | | |
| SHARES | | DESCRIPTION | | VALUE (NOTE 1) |
| | | | | |
| | COMMON STOCKS (continued) | | | |
| | |
| | Equipment Services (cont’d.) | | | |
| 24,575 | | Transocean, Inc.*(a) | | $ | 2,933,518 |
| | | | | |
| | | | | 3,149,314 |
| | | | | |
| | |
| | Financial—Bank & Trust—3.4% | | | |
| 31,100 | | Bank of New York Mellon Corp. (The) | | | 1,519,235 |
| 117,500 | | China Merchants Bank Co. Ltd. (China) | | | 605,863 |
| 7,015,000 | | Industrial & Commercial Bank of China (Hong Kong) | | | 6,700,118 |
| 87,503 | | Wells Fargo & Co. | | | 2,975,977 |
| | | | | |
| | | | | 11,801,193 |
| | | | | |
| | |
| | Financial—Securities/Asset Management | | | |
| 2,600 | | Federated Investors, Inc. | | | 111,800 |
| | | | | |
| | |
| | Financial Services—4.5% | | | |
| 5,640 | | Ameriprise Financial, Inc. | | | 355,207 |
| 23,000 | | Discover Financial Services LLC | | | 443,900 |
| 38,622 | | Goldman Sachs Group, Inc. | | | 9,575,166 |
| 30,500 | | JPMorgan Chase & Co. | | | 1,433,500 |
| 57,029 | | Lehman Brothers Holdings, Inc. | | | 3,612,217 |
| 3,600 | | SLM Corp. | | | 169,776 |
| 1,300 | | T. Rowe Price Group, Inc. | | | 83,512 |
| | | | | |
| | | | | 15,673,278 |
| | | | | |
| | |
| | Food Products—0.2% | | | |
| 14,700 | | Kroger Co. (The) | | | 432,033 |
| 3,900 | | Sysco Corp. | | | 133,731 |
| | | | | |
| | | | | 565,764 |
| | | | | |
| | |
| | Foods—0.5% | | | |
| 6,700 | | General Mills, Inc. | | | 386,791 |
| 3,100 | | SUPERVALU, Inc. | | | 120,125 |
| 78,200 | | Tyson Foods, Inc. (Class A Stock) | | | 1,235,560 |
| | | | | |
| | | | | 1,742,476 |
| | | | | |
| | |
| | Healthcare Equipment & Supplies—0.3% | | | |
| 15,000 | | Eli Lilly & Co. | | | 812,250 |
| 2,400 | | Zimmer Holdings, Inc.* | | | 166,776 |
| | | | | |
| | | | | 979,026 |
| | | | | |
| | |
| | Healthcare Providers & Services—0.5% | | | |
| 32,800 | | CIGNA Corp. | | | 1,721,672 |
| | | | | |
| | |
| | Healthcare Services—3.5% | | | |
| 19,200 | | Abbott Laboratories | | | 1,048,704 |
| 32,400 | | AmerisourceBergen Corp. | | | 1,526,364 |
| 24,100 | | Biogen Idec, Inc.* | | | 1,794,004 |
| 3,200 | | Humana, Inc.* | | | 239,840 |
See Notes to Financial Statements.
| | |
| 30 | | THE TARGET PORTFOLIO TRUST |
| | | | | |
| SHARES | | DESCRIPTION | | VALUE (NOTE 1) |
| | | | | |
| | COMMON STOCKS (continued) | | | |
| | |
| | Healthcare Services (cont’d.) | | | |
| 2,800 | | Laboratory Corp. of America Holdings* | | $ | 192,500 |
| 147,491 | | UnitedHealth Group, Inc. | | | 7,249,183 |
| | | | | |
| | | | | 12,050,595 |
| | | | | |
| | |
| | Hospitals/Hospital Management—0.2% | | | |
| 8,700 | | Kinetic Concepts, Inc.*(a) | | | 522,870 |
| | | | | |
| | |
| | Hotels & Motels—4.2% | | | |
| 48,716 | | MGM Mirage* | | | 4,462,873 |
| 7,030 | | Station Casinos, Inc. | | | 631,294 |
| 57,760 | | Wynn Resorts Ltd. | | | 9,324,197 |
| | | | | |
| | | | | 14,418,364 |
| | | | | |
| | |
| | Hotels, Restaurants & Leisure—2.6% | | | |
| 400 | | Carnival Corp.(a) | | | 19,192 |
| 20,300 | | Marriott International, Inc. (Class A Stock) | | | 834,533 |
| 135,166 | | McDonald’s Corp. | | | 8,069,410 |
| | | | | |
| | | | | 8,923,135 |
| | | | | |
| | |
| | Industrial Conglomerates—0.3% | | | |
| 33,500 | | Tyco Electronics Ltd. | | | 1,194,945 |
| | | | | |
| | |
| | Insurance—0.1% | | | |
| 6,911 | | MBIA, Inc.(a) | | | 297,449 |
| | | | | |
| | |
| | Internet & Catalog Retail—0.1% | | | |
| 8,800 | | eBay, Inc.*(a) | | | 317,680 |
| 500 | | WebMD Health Corp. (Class A Stock) | | | 22,985 |
| | | | | |
| | | | | 340,665 |
| | | | | |
| | |
| | Internet Services—2.7% | | | |
| 9,153 | | Google, Inc. (Class A Stock)* | | | 6,471,171 |
| 96,900 | | Symantec Corp.* | | | 1,819,782 |
| 1,300 | | Valueclick, Inc.*(a) | | | 35,347 |
| 25,300 | | Verisign, Inc.* | | | 862,477 |
| | | | | |
| | | | | 9,188,777 |
| | | | | |
| | |
| | Machinery—0.3% | | | |
| 12,900 | | Rockwell Automation, Inc. | | | 888,552 |
| | | | | |
| | |
| | Machinery & Equipment—0.6% | | | |
| 34,100 | | AGCO Corp.*(a) | | | 2,035,088 |
| 1,300 | | Crane Co. | | | 61,672 |
| | | | | |
| | | | | 2,096,760 |
| | | | | |
| | |
| | Media—2.8% | | | |
| 66,550 | | CBS Corp. (Class B Stock)(a) | | | 1,909,985 |
| 171,625 | | Comcast Corp. (Class A Stock)*(a) | �� | | 3,612,706 |
| 1,200 | | Idearc, Inc. | | | 32,376 |
| 111,900 | | Time Warner, Inc. | | | 2,043,294 |
See Notes to Financial Statements.
| | |
| THE TARGET PORTFOLIO TRUST | | 31 |
| | |
Large Capitalization Growth Portfolio (continued) | | Portfolio of Investments
As of October 31, 2007 |
| | | | | |
| SHARES | | DESCRIPTION | | VALUE (NOTE 1) |
| | | | | |
| | COMMON STOCKS (continued) | | | |
| | |
| | Media (cont’d.) | | | |
| 63,400 | | Walt Disney Co. (The) | | $ | 2,195,542 |
| | | | | |
| | | | | 9,793,903 |
| | | | | |
| | Medical Products—0.1% | | | |
| 6,800 | | Health Net, Inc.* | | | 364,548 |
| | | | | |
| | |
| | Medical Supplies & Equipment—0.6% | | | |
| 2,100 | | Invitrogen Corp.* | | | 190,827 |
| 12,400 | | Johnson & Johnson | | | 808,108 |
| 2,900 | | Medtronic, Inc. | | | 137,576 |
| 23,300 | | St. Jude Medical, Inc.* | | | 949,009 |
| | | | | |
| | | | | 2,085,520 |
| | | | | |
| | |
| | Metals & Mining—1.5% | | | |
| 7,500 | | AK Steel Holding Corp.* | | | 375,975 |
| 7,800 | | Cleveland-Cliffs, Inc. | | | 746,070 |
| 19,671 | | Freeport-Mcmoran Copper & Gold, Inc. | | | 2,314,883 |
| 200 | | Newmont Mining Corp. | | | 10,172 |
| 4,500 | | Precision Castparts Corp. | | | 674,145 |
| 7,500 | | Southern Copper Corp. | | | 1,047,750 |
| | | | | |
| | | | | 5,168,995 |
| | | | | |
| | |
| | Miscellaneous Manufacturers—0.4% | | | |
| 18,900 | | Goodyear Tire & Rubber Co. | | | 569,835 |
| 8,800 | | SPX Corp. | | | 891,440 |
| | | | | |
| | | | | 1,461,275 |
| | | | | |
| | |
| | Oil, Gas & Consumable Fuels—5.9% | | | |
| 8,500 | | Anadarko Petroleum Corp. | | | 501,670 |
| 12,088 | | Cameron International Corp.* | | | 1,176,888 |
| 500 | | ChevronTexaco Corp. | | | 45,755 |
| 31,191 | | Devon Energy Corp. | | | 2,913,239 |
| 17,800 | | Dresser-Rand Group, Inc.* | | | 688,860 |
| 43,900 | | Exxon Mobil Corp. | | | 4,038,361 |
| 1,300 | | Frontier Oil Corp. | | | 59,527 |
| 24,800 | | Global Industries Ltd.* | | | 610,576 |
| 20,900 | | Halliburton Co.(a) | | | 823,878 |
| 16,600 | | Patterson-UTI Energy, Inc. | | | 331,004 |
| 16,186 | | Petroleo Brasileiro SA (Brazil) | | | 1,547,867 |
| 600 | | Pioneer Natural Resources Co.(a) | | | 30,612 |
| 72,677 | | Schlumberger Ltd. | | | 7,018,418 |
| 17,600 | | Western Refining, Inc. | | | 645,568 |
| | | | | |
| | | | | 20,432,223 |
| | | | | |
| | |
| | Pharmaceuticals—4.6% | | | |
| 51,256 | | Amylin Pharmaceuticals, Inc.*(a) | | | 2,307,545 |
| 4,300 | | Dade Behring Holdings, Inc. | | | 330,799 |
See Notes to Financial Statements.
| | |
| 32 | | THE TARGET PORTFOLIO TRUST |
| | | | | |
| SHARES | | DESCRIPTION | | VALUE (NOTE 1) |
| | | | | |
| | COMMON STOCKS (continued) | | | |
| | |
| | Pharmaceuticals (cont’d.) | | | |
| 61,300 | | Gilead Sciences, Inc.* | | $ | 2,831,447 |
| 26,300 | | Medco Health Solutions* | | | 2,482,194 |
| 49,953 | | Merck & Co., Inc. | | | 2,910,262 |
| 9,700 | | Millennium Pharmaceuticals, Inc.* | | | 114,654 |
| 8,200 | | Perkinelmer, Inc. | | | 225,664 |
| 76,200 | | Pfizer, Inc. | | | 1,875,282 |
| 83,583 | | Schering-Plough Corp. | | | 2,550,953 |
| 11,300 | | Watson Pharmaceuticals, Inc.*(a) | | | 345,328 |
| | | | | |
| | | | | 15,974,128 |
| | | | | |
| | |
| | Real Estate Investment Trust—Apartment | | | |
| 400 | | Avalonbay Communities, Inc. | | | 49,060 |
| | | | | |
| | |
| | Real Estate Investment Trusts—1.1% | | | |
| 4,500 | | Amb Property Corp. | | | 294,075 |
| 600 | | Federal Realty Investment Trust | | | 52,932 |
| 6,800 | | General Growth Properties, Inc. | | | 369,648 |
| 12,500 | | Istar Financial, Inc.(a) | | | 381,375 |
| 8,100 | | Jones Lang Lasal, Inc. | | | 772,173 |
| 9,200 | | Kilroy Realty Corp. | | | 598,368 |
| 2,600 | | Plum Creek Timber Co. | | | 116,142 |
| 16,000 | | ProLogis | | | 1,147,840 |
| 1,400 | | Regency Centers Corp. | | | 100,072 |
| 1,300 | | Ventas, Inc. | | | 55,757 |
| | | | | |
| | | | | 3,888,382 |
| | | | | |
| | |
| | Restaurants—2.1% | | | |
| 176,064 | | Yum! Brands, Inc. | | | 7,090,097 |
| | | | | |
| | |
| | Retail & Merchandising—3.1% | | | |
| 9,800 | | AutoNation, Inc.*(a) | | | 173,362 |
| 4,200 | | Big Lots, Inc.*(a) | | | 100,716 |
| 62,265 | | CVS Corp. | | | 2,600,809 |
| 1,900 | | Darden Restaurants, Inc. | | | 81,700 |
| 19,900 | | Gamestop Corp.* | | | 1,178,478 |
| 14,900 | | Home Depot, Inc. (The) | | | 469,499 |
| 127,866 | | Lowe’s Cos., Inc. | | | 3,438,317 |
| 49,500 | | Radioshack Corp.(a) | | | 1,020,690 |
| 13,000 | | Sotheby’s(a) | | | 704,210 |
| 22,800 | | Wal-Mart Stores, Inc. | | | 1,030,788 |
| | | | | |
| | | | | 10,798,569 |
| | | | | |
| | |
| | Schools—0.1% | | | |
| 3,900 | | Apollo Group, Inc.*(a) | | | 309,114 |
| 3,200 | | Career Education Corp.* | | | 114,368 |
| | | | | |
| | | | | 423,482 |
| | | | | |
| | |
| | Semiconductors—3.0% | | | |
| 297,486 | | Intel Corp. | | | 8,002,373 |
| 19,000 | | Novellus Systems, Inc.* | | | 539,790 |
See Notes to Financial Statements.
| | |
| THE TARGET PORTFOLIO TRUST | | 33 |
| | |
Large Capitalization Growth Portfolio (continued) | | Portfolio of Investments
As of October 31, 2007 |
| | | | | |
| SHARES | | DESCRIPTION | | VALUE (NOTE 1) |
| | | | | |
| | COMMON STOCKS (continued) | | | |
| | |
| | Semiconductors (cont’d.) | | | |
| 55,600 | | Texas Instruments, Inc. | | $ | 1,812,560 |
| 3,100 | | Varian Semiconductor Equipment Associates, Inc.* | | | 142,662 |
| | | | | |
| | | | | 10,497,385 |
| | | | | |
| | |
| | Semiconductors & Semiconductor Equipment—0.4% | | | |
| 34,700 | | Analog Devices, Inc. | | | 1,161,062 |
| 11,900 | | Teradyne, Inc.*(a) | | | 146,846 |
| | | | | |
| | | | | 1,307,908 |
| | | | | |
| | |
| | Software—0.2% | | | |
| 25,900 | | CA, Inc. | | | 685,055 |
| | | | | |
| | |
| | Telecommunication Services—1.4% | | | |
| 119,561 | | AT&T, Inc. | | | 4,996,454 |
| | | | | |
| | |
| | Telecommunications—6.0% | | | |
| 4,600 | | Adtran, Inc. | | | 110,722 |
| 61,610 | | America Movil SA de CV, ADR (Mexico) | | | 4,028,678 |
| 132,000 | | China Mobile Ltd. (Hong Kong) | | | 2,728,898 |
| 308,546 | | Cisco Systems, Inc.* | | | 10,200,531 |
| 3,600 | | Embarq Corp. | | | 190,512 |
| 13,400 | | Garmin Ltd. | | | 1,439,160 |
| 15,800 | | RF Micro Devices, Inc.* | | | 98,276 |
| 103,707 | | Sprint Nextel Corp. | | | 1,773,389 |
| 900 | | Telephone & Data Systems, Inc. | | | 62,820 |
| | | | | |
| | | | | 20,632,986 |
| | | | | |
| | |
| | Thrifts & Mortgage Finance—0.8% | | | |
| 46,892 | | Fannie Mae | | | 2,674,720 |
| | | | | |
| | |
| | Transportation—1.6% | | | |
| 20,266 | | FedEx Corp. | | | 2,094,289 |
| 24,900 | | J.B. Hunt Transport Services, Inc.(a) | | | 690,228 |
| 2,600 | | Overseas Shipholding Group, Inc. | | | 193,440 |
| 2,900 | | Ryder System, Inc. | | | 138,765 |
| 14,408 | | Union Pacific Corp. | | | 1,844,800 |
| 5,600 | | United Parcel Service, Inc. (Class B Stock) | | | 420,560 |
| | | | | |
| | | | | 5,382,082 |
| | | | | |
| | |
| | Utilities—0.3% | | | |
| 11,300 | | Duke Energy Corp. | | | 216,621 |
| 4,900 | | McDermott International, Inc.* | | | 299,194 |
| 11,900 | | NRG Energy, Inc.*(a) | | | 543,354 |
| | | | | |
| | | | | 1,059,169 |
| | | | | |
| | TOTAL LONG-TERM INVESTMENTS
(cost $269,288,200) | | | 343,474,177 |
| | | | | |
See Notes to Financial Statements.
| | |
| 34 | | THE TARGET PORTFOLIO TRUST |
| | | | | | |
| SHARES | | DESCRIPTION | | VALUE (NOTE 1) | |
| | | | | | |
| | SHORT-TERM INVESTMENT—10.8% | | | | |
| | |
| | Affiliated Money Market Mutual Fund | | | | |
| 37,380,017 | | Dryden Core Investment Fund—Taxable Money Market Series
(cost $37,380,017; includes $36,039,826 of cash collateral for securities on loan)(b)(w) | | $ | 37,380,017 | |
| | | | | | |
| | TOTAL INVESTMENTS(o)—110.2%
(cost $306,668,217; Note 5) | | | 380,854,194 | |
| | Liabilities in excess of other assets(x)—(10.2%) | | | (35,154,171 | ) |
| | | | | | |
| | NET ASSETS—100% | | $ | 345,700,023 | |
| | | | | | |
The following abbreviation is used in the portfolio descriptions:
ADR—American Depositary Receipt
| * | Non-income producing security. |
| (a) | All or a portion of security is on loan. The aggregate market value of such securities is $34,812,473; cash collateral of $36,039,826 (included with liabilities) was received with which the portfolio purchased highly liquid short-term investments. |
| (b) | Represents security, or a portion thereof, purchased with cash collateral received for securities on loan. |
| (o) | As of October 31, 2007, 3 securities representing $10,034,879 and 2.9% of the total net assets were fair valued in accordance with the policies adopted by the Board of Trustees. |
| (w) | Prudential Investments LLC, the manager of the Portfolio, also serves as manager of the Dryden Core Investment Fund—Taxable Money Market Series. |
| (x) | Liabilities in excess of other assets includes net unrealized appreciation on futures contracts as follows: |
Open futures contract outstanding at October 31, 2007:
| | | | | | | | | | | | | | |
Number of
Contracts | | Type | | Expiration
Date | | Value at
Trade Date | | | Value at
October 31,
2007 | | Unrealized
Appreciation |
| Long Position: | | | | | | | | | | | | | | |
| 12 | | S&P 500 EMINI | | Dec 07 | | $ | 927,574 | (1) | | $ | 932,940 | | $ | 5,366 |
| | | | | | | | | | | | | | |
| (1) | Cash of $28,350 has been deposited with the broker to cover margin requirements for futures contracts opened. |
The industry classification of investments and liabilities in excess of other assets shown as a percentage of net assets as of October 31, 2007 were as follows:
| | | |
Affiliated Money Market Mutual Fund (10.4% represents investments purchased with collateral from securities on loan) | | 10.8 | % |
Telecommunications | | 6.0 | |
Oil, Gas & Consumable Fuels | | 5.9 | |
Computer Hardware | | 5.8 | |
Aerospace & Defense | | 4.6 | |
Pharmaceuticals | | 4.6 | |
Financial Services | | 4.5 | |
Hotels & Motels | | 4.2 | |
Healthcare Services | | 3.5 | |
Computer Services & Software | | 3.4 | |
Financial—Bank & Trust | | 3.4 | |
Beverages | | 3.2 | |
Retail & Merchandising | | 3.1 | |
Semiconductors | | 3.0 | |
See Notes to Financial Statements.
| | |
| THE TARGET PORTFOLIO TRUST | | 35 |
| | |
Large Capitalization Growth Portfolio (continued) | | Portfolio of Investments
As of October 31, 2007 |
| | | |
Industry (cont’d.) | | | |
Media | | 2.8 | % |
Electronic Components | | 2.8 | |
Internet Services | | 2.7 | |
Hotels, Restaurants & Leisure | | 2.6 | |
Business Services | | 2.3 | |
Agriculture/Heavy Equipment | | 2.2 | |
Biotechnology | | 2.1 | |
Restaurants | | 2.1 | |
Entertainment & Leisure | | 1.8 | |
Transportation | | 1.6 | |
Metals & Mining | | 1.5 | |
Telecommunication Services | | 1.4 | |
Automobile Manufacturers | | 1.4 | |
Chemicals | | 1.3 | |
Commercial Services | | 1.1 | |
Real Estate Investment Trusts | | 1.1 | |
Communication Equipment | | 1.1 | |
Energy Equipment & Services | | 1.0 | |
Equipment Services | | 0.9 | |
Thrifts & Mortgage Finance | | 0.8 | |
Diversified Manufacturing | | 0.7 | |
Consumer Products & Services | | 0.7 | |
Diversified | | 0.6 | |
Machinery & Equipment | | 0.6 | |
Medical Supplies & Equipment | | 0.6 | |
Foods | | 0.5 | |
Healthcare Providers & Services | | 0.5 | |
Diversified Financial Services | | 0.5 | |
Miscellaneous Manufacturers | | 0.4 | |
Semiconductors & Semiconductor Equipment | | 0.4 | |
Computers & Peripherals | | 0.4 | |
Industrial Conglomerates | | 0.3 | |
Education | | 0.3 | |
Utilities | | 0.3 | |
Diversified Telecommunication Services | | 0.3 | |
Healthcare Equipment & Supplies | | 0.3 | |
Machinery | | 0.3 | |
Diversified Operations | | 0.2 | |
Cable Television | | 0.2 | |
Software | | 0.2 | |
Commercial Services & Supplies | | 0.2 | |
Food Products | | 0.2 | |
Hospitals/Hospital Management | | 0.2 | |
Computers | | 0.1 | |
Schools | | 0.1 | |
Medical Products | | 0.1 | |
Internet & Catalog Retail | | 0.1 | |
See Notes to Financial Statements.
| | |
| 36 | | THE TARGET PORTFOLIO TRUST |
| | | |
Industry (cont’d.) | | | |
Insurance | | 0.1 | % |
Electrical Equipment | | 0.1 | |
Diversified Machinery | | 0.1 | |
| | | |
| | 110.2 | |
Liabilities in excess of other assets | | (10.2 | ) |
| | | |
| | 100.0 | % |
| | | |
See Notes to Financial Statements.
| | |
| THE TARGET PORTFOLIO TRUST | | 37 |
| | |
| Large Capitalization Value Portfolio | | Portfolio of Investments
As of October 31, 2007 |
| | | | | |
| SHARES | | DESCRIPTION | | VALUE (NOTE 1) |
| | | | | |
| | LONG-TERM INVESTMENTS—98.7% | | | |
| | |
| | COMMON STOCKS | | | |
| | |
| | Aerospace & Defense—2.2% | | | |
| 4,300 | | General Dynamics Corp. | | $ | 391,128 |
| 5,200 | | Goodrich Corp. | | | 362,232 |
| 2,700 | | Lockheed Martin Corp. | | | 297,108 |
| 68,300 | | Northrop Grumman Corp. | | | 5,711,246 |
| 27,900 | | United Technologies Corp. | | | 2,136,861 |
| | | | | |
| | | | | 8,898,575 |
| | | | | |
| | |
| | Apparel—0.4% | | | |
| 48,500 | | Jones Apparel Group, Inc.(a) | | | 1,015,590 |
| 9,300 | | NIKE, Inc. (Class B Stock) | | | 616,218 |
| | | | | |
| | | | | 1,631,808 |
| | | | | |
| | |
| | Auto Components—1.0% | | | |
| 55,900 | | Johnson Controls, Inc.(a) | | | 2,443,948 |
| 26,100 | | Paccar, Inc. | | | 1,450,116 |
| | | | | |
| | | �� | | 3,894,064 |
| | | | | |
| | |
| | Automobiles—0.6% | | | |
| 35,000 | | General Motors Corp.(a) | | | 1,371,650 |
| 17,300 | | Harley-Davidson, Inc.(a) | | | 890,950 |
| | | | | |
| | | | | 2,262,600 |
| | | | | |
| | |
| | Banks—0.4% | | | |
| 11,600 | | Colonial BancGroup, Inc. (The) | | | 222,488 |
| 26,000 | | Sovereign Bancorp, Inc. | | | 375,180 |
| 15,800 | | SunTrust Banks, Inc. | | | 1,147,080 |
| | | | | |
| | | | | 1,744,748 |
| | | | | |
| | |
| | Beverages—0.6% | | | |
| 23,900 | | Anheuser-Busch Cos., Inc. | | | 1,225,592 |
| 19,000 | | Coca-Cola Enterprises, Inc. | | | 1,173,440 |
| | | | | |
| | | | | 2,399,032 |
| | | | | |
| | |
| | Biotechnology—0.2% | | | |
| 11,300 | | Amgen, Inc.* | | | 656,643 |
| | | | | |
| | |
| | Building Materials—0.2% | | | |
| 39,100 | | Masco Corp. | | | 941,528 |
| | | | | |
| | |
| | Capital Markets—1.2% | | | |
| 74,600 | | Morgan Stanley Dean Witter & Co. | | | 5,017,596 |
| | | | | |
| | |
| | Chemicals—3.5% | | | |
| 9,600 | | Air Products & Chemicals, Inc. | | | 939,360 |
| 139,700 | | Dow Chemical Co. (The) | | | 6,292,088 |
See Notes to Financial Statements.
| | |
| 38 | | THE TARGET PORTFOLIO TRUST |
| | | | | |
| SHARES | | DESCRIPTION | | VALUE (NOTE 1) |
| | | | | |
| | COMMON STOCKS (continued) | | | |
| | |
| | Chemicals (cont’d.) | | | |
| 41,500 | | Eastman Chemical Co. | | $ | 2,763,485 |
| 19,700 | | PPG Industries, Inc.(a) | | | 1,472,378 |
| 10,400 | | Praxair, Inc. | | | 888,992 |
| 37,100 | | Rohm & Haas Co. | | | 1,924,748 |
| | | | | |
| | | | | 14,281,051 |
| | | | | |
| | |
| | Commercial Banks—7.8% | | | |
| 233,386 | | Bank of America Corp. | | | 11,267,876 |
| 13,400 | | BB&T Corp. | | | 495,398 |
| 21,000 | | Capital One Financial Corp. | | | 1,377,390 |
| 5,900 | | Hudson City Bancorp, Inc. | | | 92,394 |
| 15,400 | | National City Corp. | | | 373,450 |
| 151,600 | | Regions Financial Corp. | | | 4,111,392 |
| 76,000 | | U.S. Bancorp | | | 2,520,160 |
| 7,600 | | UnionBanCal Corp. | | | 410,476 |
| 181,400 | | Wachovia Corp. | | | 8,295,422 |
| 71,200 | | Wells Fargo & Co. | | | 2,421,512 |
| 3,500 | | Zions Bancorp | | | 206,885 |
| | | | | |
| | | | | 31,572,355 |
| | | | | |
| | |
| | Computers & Peripherals—1.2% | | | |
| 4,500 | | Affiliated Computer Services, Inc. (Class A Stock)* | | | 227,970 |
| 53,300 | | Hewlett-Packard Co. | | | 2,754,544 |
| 13,100 | | International Business Machines Corp.(a) | | | 1,521,172 |
| 24,700 | | Sun Microsystems, Inc.* | | | 141,037 |
| | | | | |
| | | | | 4,644,723 |
| | | | | |
| | |
| | Conglomerates | | | |
| 200 | | Textron, Inc. | | | 13,842 |
| | | | | |
| | |
| | Consumer Products—0.8% | | | |
| 44,100 | | Procter & Gamble Co. | | | 3,065,832 |
| | | | | |
| | |
| | Diversified Financial Services—3.9% | | | |
| 26,800 | | CIT Group, Inc. | | | 944,432 |
| 253,100 | | Citigroup, Inc.(a) | | | 10,604,890 |
| 3,400 | | Goldman Sachs Group, Inc. | | | 842,928 |
| 47,400 | | JPMorgan Chase & Co. | | | 2,227,800 |
| 12,400 | | Lehman Brothers Holdings, Inc. | | | 785,416 |
| | | | | |
| | | | | 15,405,466 |
| | | | | |
| | |
| | Diversified Machinery—0.1% | | | |
| 5,600 | | Ingersoll-Rand Co. Ltd. (Class A Stock) (Bermuda) | | | 281,960 |
| | | | | |
| | |
| | Diversified Telecommunication Services—2.5% | | | |
| 65,100 | | Sprint Nextel Corp. | | | 1,113,210 |
| 195,200 | | Verizon Communications, Inc. | | | 8,992,864 |
| | | | | |
| | | | | 10,106,074 |
| | | | | |
See Notes to Financial Statements.
| | |
| THE TARGET PORTFOLIO TRUST | | 39 |
| | |
Large Capitalization Value Portfolio (continued) | | Portfolio of Investments
As of October 31, 2007 |
| | | | | |
| SHARES | | DESCRIPTION | | VALUE (NOTE 1) |
| | | | | |
| | COMMON STOCKS (continued) | | | |
| | |
| | Electric—Integrated—0.2% | | | |
| 54,100 | | Sierra Pacific Resources | | $ | 912,667 |
| | | | | |
| | |
| | Electric Utilities—4.9% | | | |
| 46,000 | | American Electric Power Co., Inc. | | | 2,217,660 |
| 67,500 | | CMS Energy Corp. | | | 1,145,475 |
| 14,500 | | Dominion Resources, Inc. | | | 1,328,635 |
| 22,100 | | DTE Energy Co. | | | 1,096,160 |
| 200 | | Dynegy, Inc.* | | | 1,842 |
| 90,700 | | Edison International | | | 5,274,205 |
| 12,500 | | Entergy Corp. | | | 1,498,375 |
| 31,900 | | Exelon Corp. | | | 2,640,682 |
| 39,000 | | FirstEnergy Corp. | | | 2,718,300 |
| 18,100 | | FPL Group, Inc.(a) | | | 1,238,402 |
| 31,300 | | Xcel Energy, Inc.(a) | | | 705,815 |
| | | | | |
| | | | | 19,865,551 |
| | | | | |
| | |
| | Energy Equipment & Services—0.5% | | | |
| 50,000 | | Halliburton Co.(a) | | | 1,971,000 |
| | | | | |
| | |
| | Exchange Traded Fund—0.2% | | | |
| 10,950 | | iShares Russell 1000 Value Index Fund | | | 941,153 |
| | | | | |
| | |
| | Finance | | | |
| 300 | | CME Group, Inc. | | | 199,875 |
| | | | | |
| | |
| | Financial - Bank & Trust—1.6% | | | |
| 46,900 | | Bank of New York Mellon Corp. (The) | | | 2,291,065 |
| 26,100 | | Comerica, Inc.(a) | | | 1,218,348 |
| 26,100 | | State Street Corp. | | | 2,081,997 |
| 37,100 | | TCF Financial Corp. | | | 844,767 |
| | | | | |
| | | | | 6,436,177 |
| | | | | |
| | |
| | Financial Services—0.1% | | | |
| 29,300 | | TD Ameritrade Holding Corp.* | | | 560,802 |
| | | | | |
| | |
| | Food & Staples Retailing—1.0% | | | |
| 34,600 | | Safeway, Inc. | | | 1,176,400 |
| 66,100 | | Wal-Mart Stores, Inc. | | | 2,988,381 |
| | | | | |
| | | | | 4,164,781 |
| | | | | |
| | |
| | Food Products—1.4% | | | |
| 73,600 | | Archer Daniels Midland Co. | | | 2,633,408 |
| 8,700 | | Campbell Soup Co. | | | 321,726 |
| 73,800 | | Kraft Foods, Inc. (Class A Stock) | | | 2,465,658 |
| 5,000 | | Sysco Corp. | | | 171,450 |
| | | | | |
| | | | | 5,592,242 |
| | | | | |
��
See Notes to Financial Statements.
| | |
| 40 | | THE TARGET PORTFOLIO TRUST |
| | | | | |
| SHARES | | DESCRIPTION | | VALUE (NOTE 1) |
| | | | | |
| | COMMON STOCKS (continued) | | | |
| | |
| | Foods—0.5% | | | |
| 22,300 | | General Mills, Inc. | | $ | 1,287,379 |
| 16,700 | | SUPERVALU, Inc. | | | 647,125 |
| | | | | |
| | | | | 1,934,504 |
| | | | | |
| | |
| | Gas & Pipeline Utilities—0.3% | | | |
| 35,200 | | Northeast Utilities | | | 1,085,216 |
| | | | | |
| | |
| | Healthcare Equipment & Supplies —0.4% | | | |
| 5,200 | | Sepracor, Inc.*(a) | | | 143,208 |
| 30,700 | | Wyeth | | | 1,492,941 |
| | | | | |
| | | | | 1,636,149 |
| | | | | |
| | |
| | Healthcare Providers & Services—1.1% | | | |
| 11,400 | | Aetna, Inc. | | | 640,338 |
| 50,900 | | CIGNA Corp. | | | 2,671,741 |
| 12,800 | | WellPoint, Inc.* | | | 1,014,144 |
| | | | | |
| | | | | 4,326,223 |
| | | | | |
| | |
| | Healthcare—Products—0.4% | | | |
| 41,825 | | Covidien Ltd. (Bermuda) | | | 1,739,920 |
| | | | | |
| | |
| | Home Builders—0.2% | | | |
| 4,800 | | KB Home | | | 132,672 |
| 34,500 | | Toll Brothers, Inc.*(a) | | | 790,395 |
| | | | | |
| | | | | 923,067 |
| | | | | |
| | |
| | Hotels, Restaurants & Leisure—1.4% | | | |
| 36,100 | | Carnival Corp.(a) | | | 1,732,078 |
| 46,100 | | McDonald’s Corp. | | | 2,752,170 |
| 6,900 | | Starwood Hotels & Resorts Worldwide, Inc. | | | 392,334 |
| 21,800 | | Wyndham Worldwide Corp. | | | 715,694 |
| | | | | |
| | | | | 5,592,276 |
| | | | | |
| | |
| | Household Durables—1.1% | | | |
| 37,100 | | Centex Corp. | | | 929,726 |
| 13,600 | | Fortune Brands, Inc. | | | 1,139,272 |
| 91,200 | | Lennar Corp. (Class A Stock) | | | 2,083,920 |
| 7,280 | | Lennar Corp. (Class B Stock) | | | 155,064 |
| | | | | |
| | | | | 4,307,982 |
| | | | | |
| | |
| | Household Products—0.6% | | | |
| 35,900 | | Kimberly-Clark Corp. | | | 2,544,951 |
| | | | | |
| | |
| | Industrial Conglomerates—4.0% | | | |
| 13,700 | | 3M Co. | | | 1,183,132 |
| 237,300 | | General Electric Co. | | | 9,767,268 |
| 95,425 | | Tyco Electronics Ltd. (Bermuda) | | | 3,403,810 |
| 47,625 | | Tyco International Ltd. (Bermuda) | | | 1,960,721 |
| | | | | |
| | | | | 16,314,931 |
| | | | | |
See Notes to Financial Statements.
| | |
| THE TARGET PORTFOLIO TRUST | | 41 |
| | |
Large Capitalization Value Portfolio (continued) | | Portfolio of Investments
As of October 31, 2007 |
| | | | | |
| SHARES | | DESCRIPTION | | VALUE (NOTE 1) |
| | | | | |
| | COMMON STOCKS (continued) | | | |
| | |
| | Industrial Machinery—0.2% | | | |
| 7,600 | | Eaton Corp. | | $ | 703,608 |
| | | | | |
| | |
| | Industrial Products—0.3% | | | |
| 23,500 | | Dover Corp. | | | 1,081,000 |
| | | | | |
| | |
| | Insurance—9.3% | | | |
| 13,900 | | AFLAC, Inc. | | | 872,642 |
| 90,900 | | Allstate Corp. (The) | | | 4,763,160 |
| 21,400 | | Ambac Financial Group, Inc.(a) | | | 788,162 |
| 25,200 | | American International Group, Inc. | | | 1,590,624 |
| 18,600 | | Assurant, Inc. | | | 1,086,984 |
| 25,800 | | AXIS Capital Holdings Ltd. (Bermuda) | | | 1,025,292 |
| 15,300 | | Chubb Corp. | | | 816,255 |
| 90,700 | | Genworth Financial, Inc. | | | 2,476,110 |
| 21,000 | | Hanover Insurance Group, Inc. (The) | | | 967,470 |
| 15,400 | | Hartford Financial Services Group, Inc. (The) | | | 1,494,262 |
| 12,400 | | Lincoln National Corp. | | | 773,388 |
| 34,200 | | MBIA, Inc.(a) | | | 1,471,968 |
| 104,470 | | MetLife, Inc.(a) | | | 7,192,759 |
| 1,800 | | MGIC Investment Corp. | | | 34,848 |
| 8,900 | | Protective Life Corp. | | | 381,543 |
| 17,100 | | RenaissanceRe Holdings Ltd. (Bermuda) | | | 997,614 |
| 135,700 | | Travelers Cos., Inc. (The) | | | 7,084,897 |
| 91,700 | | Unum Group | | | 2,140,278 |
| 10,200 | | WR Berkely Corp. | | | 306,918 |
| 18,200 | | XL Capital Ltd. (Class A Stock) (Bermuda) | | | 1,309,490 |
| | | | | |
| | | | | 37,574,664 |
| | | | | |
| | |
| | Internet & Catalog Retail | | | |
| 2,300 | | eBay, Inc.* | | | 83,030 |
| | | | | |
| | |
| | IT Services—0.8% | | | |
| 150,300 | | Electronic Data System Corp. | | | 3,244,977 |
| | | | | |
| | |
| | Machinery—0.7% | | | |
| 12,800 | | Caterpillar, Inc. | | | 955,008 |
| 10,400 | | Deere & Co. | | | 1,610,960 |
| 2,500 | | Rockwell Automation, Inc. | | | 172,200 |
| | | | | |
| | | | | 2,738,168 |
| | | | | |
| | |
| | Media—3.0% | | | |
| 116,800 | | CBS Corp. (Class B Stock)(a) | | | 3,352,160 |
| 49,000 | | Gannett Co., Inc.(a) | | | 2,078,090 |
| 60,600 | | Idearc, Inc. | | | 1,634,988 |
| 83,100 | | News Corp. (Class A Stock) | | | 1,800,777 |
| 4,500 | | Time Warner, Inc. | | | 82,170 |
See Notes to Financial Statements.
| | |
| 42 | | THE TARGET PORTFOLIO TRUST |
| | | | | |
| SHARES | | DESCRIPTION | | VALUE (NOTE 1) |
| | | | | |
| | COMMON STOCKS (continued) | | | |
| | |
| | Media (cont’d.) | | | |
| 88,200 | | Walt Disney Co. (The) | | $ | 3,054,366 |
| | | | | |
| | | | | 12,002,551 |
| | | | | |
| | |
| | Metals & Mining—2.5% | | | |
| 90,200 | | Alcoa, Inc. | | | 3,571,018 |
| 31,000 | | Freeport-McMoRan Copper & Gold, Inc. | | | 3,648,080 |
| 22,900 | | Nucor Corp. | | | 1,420,258 |
| 12,200 | | United States Steel Corp. | | | 1,316,380 |
| | | | | |
| | | | | 9,955,736 |
| | | | | |
| | |
| | Miscellaneous Manufacturers—0.1% | | | |
| 8,100 | | Illinois Tool Works, Inc. | | | 463,806 |
| | | | | |
| | |
| | Multi-Line Retail—0.3% | | | |
| 3,100 | | Abercrombie & Fitch Co. (Class A Stock) | | | 245,520 |
| 9,900 | | J.C. Penney Co., Inc. | | | 556,776 |
| 6,700 | | Kohl’s Corp.* | | | 368,299 |
| | | | | |
| | | | | 1,170,595 |
| | | | | |
| | |
| | Multi-Utilities & Unregulated Power—0.1% | | | |
| 13,300 | | SCANA Corp. | | | 539,847 |
| | | | | |
| | |
| | Networking Equipment | | | |
| 4,300 | | Juniper Networks, Inc.* | | | 154,800 |
| | | | | |
| | |
| | Oil & Gas—1.2% | | | |
| 60,000 | | GlobalSantaFe Corp. | | | 4,861,800 |
| | | | | |
| | |
| | Oil, Gas & Consumable Fuels—12.2% | | | |
| 57,400 | | Apache Corp. | | | 5,958,694 |
| 44,100 | | ChevronTexaco Corp. | | | 4,035,591 |
| 91,900 | | ConocoPhillips | | | 7,807,824 |
| 18,400 | | Devon Energy Corp. | | | 1,718,560 |
| 13,100 | | EOG Resources, Inc. | | | 1,160,660 |
| 105,000 | | Exxon Mobil Corp. | | | 9,658,950 |
| 107,700 | | Marathon Oil Corp. | | | 6,368,301 |
| 40,900 | | Occidental Petroleum Corp. | | | 2,824,145 |
| 16,500 | | Patterson-UTI Energy, Inc.(a) | | | 329,010 |
| 17,000 | | Royal Dutch Shell PLC (Class B Stock), ADR (Netherlands) | | | 1,483,250 |
| 16,100 | | Sunoco, Inc. | | | 1,184,960 |
| 69,000 | | Valero Energy Corp. | | | 4,859,670 |
| 30,500 | | XTO Energy, Inc. | | | 2,024,590 |
| | | | | |
| | | | | 49,414,205 |
| | | | | |
| | |
| | Paper & Forest Products—0.3% | | | |
| 102,900 | | Domtar Corp. (Canada)* | | | 882,882 |
| 2,800 | | Weyerhauser Co. | | | 212,548 |
| | | | | |
| | | | | 1,095,430 |
| | | | | |
See Notes to Financial Statements.
| | |
| THE TARGET PORTFOLIO TRUST | | 43 |
| | |
Large Capitalization Value Portfolio (continued) | | Portfolio of Investments
As of October 31, 2007 |
| | | | | |
| SHARES | | DESCRIPTION | | VALUE (NOTE 1) |
| | | | | |
| | COMMON STOCKS (continued) | | | |
| | |
| | Pharmaceuticals—5.8% | | | |
| 20,100 | | Abbott Laboratories | | $ | 1,097,862 |
| 21,500 | | AstraZeneca PLC, ADR (United Kingdom) | | | 1,055,650 |
| 18,800 | | Bristol-Myers Squibb Co. | | | 563,812 |
| 31,800 | | Eli Lilly & Co. | | | 1,721,970 |
| 61,800 | | Johnson & Johnson | | | 4,027,506 |
| 90,600 | | Merck & Co., Inc. | | | 5,278,356 |
| 311,900 | | Pfizer, Inc. | | | 7,675,859 |
| 66,500 | | Schering-Plough Corp. | | | 2,029,580 |
| | | | | |
| | | | | 23,450,595 |
| | | | | |
| | |
| | Railroads & Equipment—0.5% | | | |
| 40,100 | | Norfolk Southern Corp. | | | 2,071,165 |
| | | | | |
| | |
| | Real Estate Investment Trusts—1.7% | | | |
| 900 | | Alexandria Real Estate Equities, Inc.(a) | | | 92,826 |
| 2,700 | | Apartment Investment & Management Co. (Class A Stock)(a) | | | 126,171 |
| 2,400 | | Boston Properties, Inc.(a) | | | 260,016 |
| 13,900 | | Duke Realty Corp. | | | 446,885 |
| 21,400 | | Hospitality Properties Trust(a) | | | 847,440 |
| 10,500 | | Host Hotels & Resorts, Inc. | | | 232,680 |
| 44,300 | | ProLogis | | | 3,178,082 |
| 7,800 | | Public Storage, Inc. | | | 631,566 |
| 1,000 | | Simon Property Group, Inc.(a) | | | 104,110 |
| 2,700 | | Ventas, Inc.(a) | | | 115,803 |
| 6,000 | | Vornado Realty Trust(a) | | | 670,320 |
| | | | | |
| | | | | 6,705,899 |
| | | | | |
| | |
| | Retail & Merchandising—1.2% | | | |
| 41,800 | | AutoNation, Inc.*(a) | | | 739,442 |
| 10,100 | | Colgate-Palmolive Co. | | | 770,327 |
| 14,200 | | CVS Caremark Corp. | | | 593,134 |
| 12,000 | | Family Dollar Stores, Inc.(a) | | | 304,200 |
| 80,700 | | Gap, Inc. (The) | | | 1,525,230 |
| 31,400 | | Macy’s, Inc. | | | 1,005,742 |
| 1,300 | | Target Corp. | | | 79,768 |
| | | | | |
| | | | | 5,017,843 |
| | | | | |
| | |
| | Road & Rail—0.4% | | | |
| 17,000 | | Burlington Northern Santa Fe Corp. | | | 1,481,550 |
| | | | | |
| | |
| | Semiconductors & Semiconductor Equipment—0.2% | | | |
| 8,600 | | Altera Corp.(a) | | | 168,732 |
| 28,000 | | LSI Corp.*(a) | | | 184,800 |
| 17,300 | | Xilinx, Inc.(a) | | | 422,120 |
| | | | | |
| | | | | 775,652 |
| | | | | |
See Notes to Financial Statements.
| | |
| 44 | | THE TARGET PORTFOLIO TRUST |
| | | | | | |
| SHARES | | DESCRIPTION | | VALUE (NOTE 1) | |
| | | | | | |
| | COMMON STOCKS (continued) | | | | |
| | |
| | Software—2.4% | | | | |
| 47,700 | | BMC Software, Inc.* | | $ | 1,614,168 | |
| 148,258 | | CA, Inc.(a) | | | 3,921,424 | |
| 113,200 | | Microsoft Corp. | | | 4,166,892 | |
| | | | | | |
| | | | | 9,702,484 | |
| | | | | | |
| | |
| | Specialty Retail—1.0% | | | | |
| 1,700 | | Autozone, Inc.* | | | 211,497 | |
| 98,611 | | Home Depot, Inc. (The) | | | 3,107,233 | |
| 7,100 | | Ross Stores, Inc. | | | 191,842 | |
| 20,300 | | Staples, Inc. | | | 473,802 | |
| | | | | | |
| | | | | 3,984,374 | |
| | | | | | |
| | |
| | Telecommunication Services—3.2% | | | | |
| 282,300 | | AT&T, Inc. | | | 11,797,317 | |
| 32,800 | | Corning, Inc. | | | 796,056 | |
| 5,900 | | QUALCOMM, Inc. | | | 252,107 | |
| | | | | | |
| | | | | 12,845,480 | |
| | | | | | |
| | |
| | Telecommunications—0.3% | | | | |
| 26,000 | | Cisco Systems, Inc.* | | | 859,560 | |
| 11,700 | | Crown Castle International Corp.*(a) | | | 480,519 | |
| | | | | | |
| | | | | 1,340,079 | |
| | | | | | |
| | |
| | Thrifts & Mortgage Finance—2.6% | | | | |
| 25,500 | | Countrywide Financial Corp.(a) | | | 395,760 | |
| 13,500 | | Fannie Mae | | | 770,040 | |
| 98,000 | | Freddie Mac | | | 5,118,540 | |
| 146,300 | | Washington Mutual, Inc. | | | 4,078,844 | |
| | | | | | |
| | | | | 10,363,184 | |
| | | | | | |
| | |
| | Tobacco—1.8% | | | | |
| 98,600 | | Altria Group, Inc. | | | 7,190,898 | |
| | | | | | |
| | |
| | Transportation—0.1% | | | | |
| 11,500 | | Royal Caribbean Cruises Ltd. (Liberia)(a) | | | 493,120 | |
| | | | | | |
| | TOTAL LONG-TERM INVESTMENTS
(cost $327,919,638) | | | 398,373,904 | |
| | | | | | |
| | |
| | SHORT-TERM INVESTMENT—12.1% | | | | |
| | |
| | Affiliated Money Market Mutual Fund | | | | |
| 48,943,894 | | Dryden Core Investment Fund—Taxable Money Market Series
(cost $48,943,894; includes $46,163,631 of cash collateral for securities on loan)(b)(w) | | | 48,943,894 | |
| | | | | | |
| | TOTAL INVESTMENTS—110.8%
(cost $376,863,532; Note 5) | | | 447,317,798 | |
| | Liabilities in excess of other assets—(10.8%) | | | (43,459,979 | ) |
| | | | | | |
| | NET ASSETS—100% | | $ | 403,857,819 | |
| | | | | | |
See Notes to Financial Statements.
| | |
| THE TARGET PORTFOLIO TRUST | | 45 |
| | |
Large Capitalization Value Portfolio (continued) | | Portfolio of Investments
As of October 31, 2007 |
The following abbreviation is used in portfolio descriptions:
| ADR—American | Depositary Receipt |
| * | Non-income producing security. |
| (a) | All or a portion of security is on loan. The aggregate market value of such securities is $44,771,953; cash collateral of $46,163,631 (included with liabilities) was received with which the portfolio purchased highly liquid short-term investments. |
| (b) | Represents security, or a portion thereof, purchased with cash collateral received for securities on loan. |
| (w) | Prudential Investments LLC, the manager of the Portfolio, also serves as manager of the Dryden Core Investment Fund—Taxable Money Market Series. |
The industry classification of investments and liabilities in excess of other assets shown as a percentage of net assets as of October 31, 2007 were as follows:
| | | |
Oil, Gas & Consumable Fuels | | 12.2 | % |
Affiliated Money Market Mutual Fund
(11.4% represents investments purchased with collateral from securities on loan) | | 12.1 | |
Insurance | | 9.3 | |
Commercial Banks | | 7.8 | |
Pharmaceuticals | | 5.8 | |
Electric Utilities | | 4.9 | |
Industrial Conglomerates | | 4.0 | |
Diversified Financial Services | | 3.9 | |
Chemicals | | 3.5 | |
Telecommunication Services | | 3.2 | |
Media | | 3.0 | |
Thrifts & Mortgage Finance | | 2.6 | |
Diversified Telecommunication Services | | 2.5 | |
Metals & Mining | | 2.5 | |
Software | | 2.4 | |
Aerospace & Defense | | 2.2 | |
Tobacco | | 1.8 | |
Real Estate Investment Trusts | | 1.7 | |
Financial—Bank & Trust | | 1.6 | |
Hotels, Restaurants & Leisure | | 1.4 | |
Food Products | | 1.4 | |
Capital Markets | | 1.2 | |
Retail & Merchandising | | 1.2 | |
Oil & Gas | | 1.2 | |
Computers & Peripherals | | 1.2 | |
Healthcare Providers & Services | | 1.1 | |
Household Durables | | 1.1 | |
Food & Staples Retailing | | 1.0 | |
Specialty Retail | | 1.0 | |
Auto Components | | 1.0 | |
IT Services | | 0.8 | |
Consumer Products | | 0.8 | |
Machinery | | 0.7 | |
Household Products | | 0.6 | |
See Notes to Financial Statements.
| | |
| 46 | | THE TARGET PORTFOLIO TRUST |
| | | |
Industry (cont’d.) | | | |
Beverages | | 0.6 | % |
Automobiles | | 0.6 | |
Railroads & Equipment | | 0.5 | |
Energy Equipment & Services | | 0.5 | |
Foods | | 0.5 | |
Banks | | 0.4 | |
Healthcare—Products | | 0.4 | |
Healthcare Equipment & Supplies | | 0.4 | |
Apparel | | 0.4 | |
Road & Rail | | 0.4 | |
Telecommunications | | 0.3 | |
Multi-Line Retail | | 0.3 | |
Paper & Forest Products | | 0.3 | |
Gas & Pipeline Utilities | | 0.3 | |
Industrial Products | | 0.3 | |
Building Materials | | 0.2 | |
Exchange Traded Fund | | 0.2 | |
Home Builders | | 0.2 | |
Electric—Integrated | | 0.2 | |
Semiconductors & Semiconductor Equipment | | 0.2 | |
Industrial Machinery | | 0.2 | |
Biotechnology | | 0.2 | |
Financial Services | | 0.1 | |
Multi-Utilities & Unregulated Power | | 0.1 | |
Transportation | | 0.1 | |
Miscellaneous Manufacturers | | 0.1 | |
Diversified Machinery | | 0.1 | |
| | | |
| | 110.8 | |
Liabilities in excess of other assets | | (10.8 | ) |
| | | |
| | 100.0 | % |
| | | |
See Notes to Financial Statements.
| | |
| THE TARGET PORTFOLIO TRUST | | 47 |
| | |
| Small Capitalization Growth Portfolio | | Portfolio of Investments
As of October 31, 2007 |
| | | | | |
| SHARES | | DESCRIPTION | | VALUE (NOTE 1) |
| | | | | |
| | LONG-TERM INVESTMENTS—98.3% | | | |
| | |
| | COMMON STOCKS | | | |
| | |
| | Aerospace—2.6% | | | |
| 65,224 | | AAR Corp.*(a) | | $ | 2,090,429 |
| 23,720 | | Aerovironment, Inc.* | | | 610,316 |
| 26,010 | | BE Aerospace, Inc.* | | | 1,292,957 |
| | | | | |
| | | | | 3,993,702 |
| | | | | |
| | |
| | Aerospace & Defense���1.5% | | | |
| 16,700 | | HEICO Corp.(a) | | | 909,148 |
| 33,410 | | Orbital Sciences Corp.*(a) | | | 852,957 |
| 36,100 | | Smith & Wesson Holding Corp.*(a) | | | 436,449 |
| | | | | |
| | | | | 2,198,554 |
| | | | | |
| | |
| | Automotive Parts—0.5% | | | |
| 37,310 | | Amerigon, Inc.* | | | 732,768 |
| | | | | |
| | |
| | Banks—0.9% | | | |
| 40,595 | | Signature Bank*(a) | | | 1,386,319 |
| | | | | |
| | |
| | Biotechnology—1.1% | | | |
| 29,696 | | Illumina, Inc.*(a) | | | 1,667,430 |
| | | | | |
| | |
| | Broadcasting—0.9% | | | |
| 55,130 | | DG FastChannel, Inc.* | | | 1,355,647 |
| | | | | |
| | |
| | Business Services—0.5% | | | |
| 28,450 | | GSI Commerce, Inc.* | | | 810,540 |
| | | | | |
| | |
| | Capital Markets—0.6% | | | |
| 54,451 | | Thomas Weisel Partners Group, Inc.*(a) | | | 866,315 |
| | | | | |
| | |
| | Clothing & Apparel—1.6% | | | |
| 55,730 | | Iconix Brand Group, Inc.* | | | 1,273,430 |
| 37,176 | | Volcom, Inc.*(a) | | | 1,087,398 |
| | | | | |
| | | | | 2,360,828 |
| | | | | |
| | |
| | Commercial Services—5.9% | | | |
| 35,560 | | Barrett Business Services, Inc. | | | 604,164 |
| 58,168 | | CoStar Group, Inc.*(a) | | | 3,344,660 |
| 33,780 | | CRA International, Inc.* | | | 1,749,129 |
| 21,530 | | FirstService Corp. (Canada)* | | | 817,709 |
| 25,780 | | Rollins, Inc.(a) | | | 782,939 |
| 17,740 | | Steiner Leisure Ltd.* | | | 797,945 |
| 25,320 | | Team, Inc.* | | | 815,051 |
| | | | | |
| | | | | 8,911,597 |
| | | | | |
See Notes to Financial Statements.
| | |
| 48 | | THE TARGET PORTFOLIO TRUST |
| | | | | |
| SHARES | | DESCRIPTION | | VALUE (NOTE 1) |
| | | | | |
| | Computer Networking—0.5% | | | |
| 22,430 | | Atheros Communications, Inc.* | | $ | 787,293 |
| | | | | |
| | |
| | Computer Services & Software—6.3% | | | |
| 14,110 | | Advent Software, Inc.*(a) | | | 780,706 |
| 13,900 | | Concur Technologies, Inc.* | | | 500,956 |
| 17,966 | | Double-Take Software, Inc.* | | | 428,130 |
| 54,880 | | FalconStor Software, Inc.* | | | 769,966 |
| 114,618 | | Informatica Corp.*(a) | | | 1,957,676 |
| 27,283 | | Omniture, Inc.*(a) | | | 931,987 |
| 47,601 | | Polypore International, Inc.*(a) | | | 816,833 |
| 60,530 | | PROS Holdings, Inc.* | | | 1,088,330 |
| 17,740 | | Riverbed Technology, Inc.* | | | 599,435 |
| 22,320 | | The9 Ltd., ADR (Cayman Islands)*(a) | | | 708,660 |
| 34,970 | | THQ, Inc.* | | | 947,337 |
| | | | | |
| | | | | 9,530,016 |
| | | | | |
| | |
| | Consumer Products & Services—1.6% | | | |
| 48,847 | | Bare Escentials, Inc.*(a) | | | 1,206,521 |
| 4,910 | | Chattem, Inc.*(a) | | | 364,813 |
| 43,580 | | FGX International Holdings Ltd. (British Virgin Islands)* | | | 745,218 |
| 3,760 | | Ulta Salon, Cosmetics & Fragrance, Inc.* | | | 128,592 |
| | | | | |
| | | | | 2,445,144 |
| | | | | |
| | |
| | Education—1.1% | | | |
| 30,880 | | DeVry, Inc. | | | 1,688,827 |
| | | | | |
| | |
| | Electronic Components—2.9% | | | |
| 44,209 | | Coherent, Inc.*(a) | | | 1,450,055 |
| 24,910 | | Digital River, Inc.*(a) | | | 1,321,725 |
| 22,650 | | FEI Co.*(a) | | | 657,076 |
| 39,720 | | Mellanox Technologies Ltd. (Israel)* | | | 937,789 |
| | | | | |
| | | | | 4,366,645 |
| | | | | |
| | |
| | Energy Equipment & Services—0.6% | | | |
| 14,226 | | Lufkin Industries, Inc.(a) | | | 845,878 |
| | | | | |
| | |
| | Entertainment & Leisure—4.0% | | | |
| 43,090 | | Allegiant Travel Co.* | | | 1,552,102 |
| 13,410 | | Life Time Fitness, Inc.*(a) | | | 813,182 |
| 45,360 | | Scientific Games Corp. (Class A Stock)*(a) | | | 1,639,764 |
| 152,123 | | Shuffle Master, Inc.*(a) | | | 2,081,043 |
| | | | | |
| | | | | 6,086,091 |
| | | | | |
| | |
| | Financial—Bank & Trust—0.3% | | | |
| 13,684 | | Heartland Payment Systems, Inc.(a) | | | 410,520 |
| | | | | |
| | |
| | Financial Services—9.3% | | | |
| 60,550 | | Cohen & Steers, Inc.(a) | | | 2,276,680 |
| 74,965 | | Euronet Worldwide, Inc.*(a) | | | 2,401,129 |
| 22,684 | | GFI Group, Inc.* | | | 1,958,083 |
| 19,608 | | Greenhill & Co., Inc.(a) | | | 1,450,600 |
See Notes to Financial Statements.
| | |
| THE TARGET PORTFOLIO TRUST | | 49 |
| | |
Small Capitalization Growth Portfolio (continued) | | Portfolio of Investments
As of October 31, 2007 |
| | | | | |
| SHARES | | DESCRIPTION | | VALUE (NOTE 1) |
| | | | | |
| | COMMON STOCKS (continued) | | | |
| | |
| | Financial Services (cont’d.) | | | |
| 32,490 | | Investment Technology Group, Inc.* | | $ | 1,361,331 |
| 36,804 | | KBW, Inc.*(a) | | | 1,114,793 |
| 33,450 | | MarketAxess Holdings, Inc.* | | | 524,162 |
| 34,490 | | optionsXpress Holdings, Inc.(a) | | | 1,026,422 |
| 16,930 | | Portfolio Recovery Associates, Inc.(a) | | | 763,712 |
| 51,243 | | Texas Capital Bancshares, Inc.*(a) | | | 1,134,008 |
| | | | | |
| | | | | 14,010,920 |
| | | | | |
| | |
| | Food & Staples Retailing—0.3% | | | |
| 33,810 | | SunOpta, Inc.*(a) | | | 506,474 |
| | | | | |
| | |
| | Healthcare Equipment & Supplies—1.0% | | | |
| 22,770 | | ArthroCare Corp.* | | | 1,476,407 |
| | | | | |
| | |
| | Healthcare Services—3.8% | | | |
| 22,460 | | Healthways, Inc.*(a) | | | 1,363,322 |
| 24,530 | | HMS Holdings Corp.* | | | 698,369 |
| 17,060 | | Pediatrix Medical Group, Inc.* | | | 1,117,430 |
| 154,356 | | TriZetto Group, Inc. (The)*(a) | | | 2,522,177 |
| | | | | |
| | | | | 5,701,298 |
| | | | | |
| | |
| | Hotels & Motels—0.7% | | | |
| 22,920 | | Home Inns & Hotels Management, Inc. ADR (China)*(a) | | | 1,009,168 |
| | | | | |
| | |
| | Industrial Products—0.5% | | | |
| 24,860 | | A.M. Castle & Co. | | | 748,286 |
| | | | | |
| | |
| | Insurance—0.8% | | | |
| 65,980 | | AmTrust Financial Services, Inc.(a) | | | 920,421 |
| 8,780 | | eHealth, Inc.*(a) | | | 245,313 |
| | | | | |
| | | | | 1,165,734 |
| | | | | |
| | |
| | Internet Services—10.5% | | | |
| 46,591 | | Avocent Corp.*(a) | | | 1,259,355 |
| 101,450 | | CyberSource Corp.*(a) | | | 1,658,708 |
| 12,220 | | DealerTrack Holdings, Inc.*(a) | | | 599,880 |
| 12,570 | | Equinix, Inc.*(a) | | | 1,466,416 |
| 51,660 | | J2 Global Communications, Inc.*(a) | | | 1,740,425 |
| 106,470 | | NaviSite, Inc.* | | | 1,157,329 |
| 33,600 | | NutriSystem, Inc.*(a) | | | 1,011,360 |
| 87,050 | | Perficient, Inc.* | | | 1,640,893 |
| 32,790 | | TheStreet.com, Inc. | | | 442,665 |
| 164,634 | | ValueClick, Inc.*(a) | | | 4,476,398 |
| 52,910 | | Veraz Networks, Inc.*(a) | | | 424,338 |
| | | | | |
| | | | | 15,877,767 |
| | | | | |
See Notes to Financial Statements.
| | |
| 50 | | THE TARGET PORTFOLIO TRUST |
| | | | | |
| SHARES | | DESCRIPTION | | VALUE (NOTE 1) |
| | | | | |
| | COMMON STOCKS (continued) | | | |
| | |
| | Machinery & Equipment—3.0% | | | |
| 91,070 | | Flow International Corp.* | | $ | 765,899 |
| 33,674 | | Gardner Denver, Inc.* | | | 1,216,642 |
| 18,487 | | IDEX Corp. | | | 654,809 |
| 71,500 | | Intermec, Inc.*(a) | | | 1,817,530 |
| | | | | |
| | | | | 4,454,880 |
| | | | | |
| | |
| | Medical Supplies & Equipment—13.9% | | | |
| 143,920 | | American Medical Systems Holdings, Inc.*(a) | | | 1,840,737 |
| 7,660 | | Insulet Corp.* | | | 191,806 |
| 44,047 | | Integra LifeSciences Holdings Corp.*(a) | | | 2,134,958 |
| 42,093 | | Inverness Medical Innovations, Inc.*(a) | | | 2,529,368 |
| 53,000 | | K-V Pharmaceutical Co. (Class A Stock)* | | | 1,661,020 |
| 138,930 | | LeMaitre Vascular, Inc.* | | | 1,051,700 |
| 58,146 | | Mentor Corp.(a) | | | 2,475,275 |
| 22,047 | | Meridian Bioscience, Inc. | | | 729,535 |
| 64,400 | | Micrus Endovascular Corp.* | | | 1,265,460 |
| 145,590 | | NovaMed, Inc.*(a) | | | 771,627 |
| 56,266 | | NuVasive, Inc.* | | | 2,407,622 |
| 38,750 | | Phase Forward, Inc.*(a) | | | 921,863 |
| 18,884 | | PolyMedica Corp.(a) | | | 1,000,097 |
| 88,500 | | Spectranetics Corp. (The)*(a) | | | 1,416,000 |
| 35,210 | | Volcano Corp.* | | | 601,739 |
| | | | | |
| | | | | 20,998,807 |
| | | | | |
| | |
| | Metals & Mining—2.5% | | | |
| 15,630 | | Dynamic Materials Corp. | | | 859,963 |
| 9,350 | | Haynes International, Inc.* | | | 818,312 |
| 45,955 | | Ladish Co., Inc.*(a) | | | 2,108,875 |
| | | | | |
| | | | | 3,787,150 |
| | | | | |
| | |
| | Oil, Gas & Consumable Fuels—6.2% | | | |
| 71,635 | | Cal Dive International, Inc.*(a) | | | 947,731 |
| 9,820 | | Core Laboratories NV*(a) | | | 1,433,131 |
| 87,562 | | Dril-Quip, Inc.* | | | 4,669,682 |
| 36,796 | | Oil States International, Inc.*(a) | | | 1,589,219 |
| 18,450 | | Superior Energy Services, Inc.* | | | 684,126 |
| | | | | |
| | | | | 9,323,889 |
| | | | | |
| | |
| | Pharmaceuticals—1.5% | | | |
| 24,110 | | HealthExtras, Inc.* | | | 702,565 |
| 36,720 | | Obagi Medical Products, Inc.* | | | 801,965 |
| 28,010 | | Sciele Pharma, Inc.*(a) | | | 712,575 |
| | | | | |
| | | | | 2,217,105 |
| | | | | |
| | |
| | Real Estate—1.1% | | | |
| 77,647 | | KKR Financial Holdings LLC | | | 1,212,070 |
| 24,390 | | LoopNet, Inc.*(a) | | | 459,751 |
| | | | | |
| | | | | 1,671,821 |
| | | | | |
See Notes to Financial Statements.
| | |
| THE TARGET PORTFOLIO TRUST | | 51 |
| | |
Small Capitalization Growth Portfolio (continued) | | Portfolio of Investments
As of October 31, 2007 |
| | | | | | |
| SHARES | | DESCRIPTION | | VALUE (NOTE 1) | |
| | | | | | |
| | COMMON STOCKS (continued) | | | | |
| | |
| | Restaurants—0.6% | | | | |
| 42,165 | | BJ’s Restaurants, Inc.*(a) | | $ | 834,445 | |
| | | | | | |
| | |
| | Retail & Merchandising—1.9% | | | | |
| 21,686 | | Jos. A. Bank Clothiers, Inc.*(a) | | | 633,448 | |
| 53,092 | | Tractor Supply Co.*(a) | | | 2,200,133 | |
| | | | | | |
| | | | | 2,833,581 | |
| | | | | | |
| | |
| | Semiconductors—1.1% | | | | |
| 26,000 | | IPG Photonics Corp.* | | | 495,040 | |
| 16,800 | | O2Micro International Ltd., ADR (Cayman Islands)* | | | 291,648 | |
| 33,680 | | Silicon Motion Technology Corp., ADR (Taiwan)* | | | 842,000 | |
| | | | | | |
| | | | | 1,628,688 | |
| | | | | | |
| | |
| | Technology—Wireless—0.5% | | | | |
| 41,580 | | Aruba Networks, Inc.*(a) | | | 793,762 | |
| | | | | | |
| | |
| | Telecommunications—4.8% | | | | |
| 30,040 | | Cbeyond, Inc.* | | | 1,175,165 | |
| 48,390 | | Foundry Networks, Inc.* | | | 1,022,965 | |
| 32,749 | | Harris Stratex Networks, Inc.* | | | 626,161 | |
| 64,302 | | NeuStar, Inc. (Class A Stock)*(a) | | | 2,199,128 | |
| 51,900 | | Nuance Communications, Inc.*(a) | | | 1,147,509 | |
| 32,462 | | ViaSat, Inc.*(a) | | | 990,091 | |
| | | | | | |
| | | | | 7,161,019 | |
| | | | | | |
| | |
| | Transportation—0.9% | | | | |
| 40,443 | | Forward Air Corp. | | | 1,319,655 | |
| | | | | | |
| | TOTAL LONG-TERM INVESTMENTS
(cost $121,909,249) | | | 147,964,970 | |
| | | | | | |
| | |
| | SHORT-TERM INVESTMENT—43.2% | | | | |
| | |
| | Affiliated Money Market Mutual Fund | | | | |
| 65,022,538 | | Dryden Core Investment Fund—Taxable Money Market Series
(cost $65,022,538; includes $63,339,775 of cash collateral for securities on loan)(b)(w) | | | 65,022,538 | |
| | | | | | |
| | TOTAL INVESTMENTS—141.5%
(cost $186,931,787; Note 5) | | | 212,987,508 | |
| | Liabilities in excess of other assets—(41.5%) | | | (62,415,803 | ) |
| | | | | | |
| | NET ASSETS—100% | | $ | 150,571,705 | |
| | | | | | |
The following abbreviation is used in portfolio descriptions:
ADR—American Depositary Receipt
| * | Non-income producing security. |
| (a) | All or a portion of security is on loan. The aggregate market value of such securities is $61,820,362; cash collateral of $63,339,775 (included with liabilities) was received with which the portfolio purchased highly liquid short-term investments. |
See Notes to Financial Statements.
| | |
| 52 | | THE TARGET PORTFOLIO TRUST |
| (b) | Represents security, or a portion thereof, purchased with cash collateral received for securities on loan. |
| (w) | Prudential Investments LLC, the manager of the Portfolio also serves as manager of the Dryden Core Investment Fund—Taxable Money Market Series. |
The industry classification of investments and liabilities in excess of other assets shown as a percentage of net assets as of October 31, 2007 were as follows:
| | | |
Affiliated Money Market Mutual Fund
(42.1% represents investments purchased with collateral from securities on loan) | | 43.2 | % |
Medical Supplies & Equipment | | 13.9 | |
Internet Services | | 10.5 | |
Financial Services | | 9.3 | |
Computer Services & Software | | 6.3 | |
Oil, Gas & Consumable Fuels | | 6.2 | |
Commercial Services | | 5.9 | |
Telecommunications | | 4.8 | |
Entertainment & Leisure | | 4.0 | |
Healthcare Services | | 3.8 | |
Machinery & Equipment | | 3.0 | |
Electronic Components | | 2.9 | |
Aerospace | | 2.6 | |
Metals & Mining | | 2.5 | |
Retail & Merchandising | | 1.9 | |
Consumer Products & Services | | 1.6 | |
Clothing & Apparel | | 1.6 | |
Pharmaceuticals | | 1.5 | |
Aerospace & Defense | | 1.5 | |
Education | | 1.1 | |
Real Estate | | 1.1 | |
Biotechnology | | 1.1 | |
Semiconductors | | 1.1 | |
Healthcare Equipment & Supplies | | 1.0 | |
Banks | | 0.9 | |
Broadcasting | | 0.9 | |
Transportation | | 0.9 | |
Insurance | | 0.8 | |
Hotels & Motels | | 0.7 | |
Capital Markets | | 0.6 | |
Energy Equipment & Services | | 0.6 | |
Restaurants | | 0.6 | |
Business Services | | 0.5 | |
Technology—Wireless | | 0.5 | |
Computer Networking | | 0.5 | |
Industrial Products | | 0.5 | |
Automotive Parts | | 0.5 | |
Food & Staples Retailing | | 0.3 | |
Financial—Bank & Trust | | 0.3 | |
| | | |
| | 141.5 | |
Liabilities in excess of other assets | | (41.5 | ) |
| | | |
| | 100.0 | % |
| | | |
See Notes to Financial Statements.
| | |
| THE TARGET PORTFOLIO TRUST | | 53 |
| | |
| Small Capitalization Value Portfolio | | Portfolio of Investments
As of October 31, 2007 |
| | | | | |
| SHARES | | DESCRIPTION | | VALUE (NOTE 1) |
| | | | | |
| | LONG-TERM INVESTMENTS—98.8% | | | |
| | |
| | COMMON STOCKS | | | |
| | |
| | Aerospace/Defense—2.7% | | | |
| 57,100 | | AAR Corp.*(a) | | $ | 1,830,055 |
| 9,800 | | Alliant Techsystems, Inc.*(a) | | | 1,081,822 |
| 17,339 | | BE Aerospace, Inc.* | | | 861,921 |
| 3,300 | | Curtiss-Wright Corp. | | | 185,757 |
| 36,950 | | DRS Technologies, Inc.(a) | | | 2,122,408 |
| 1,500 | | Esterline Technologies Corp.* | | | 82,170 |
| 3,300 | | Kaman Corp. (Class A Stock) | | | 124,443 |
| 63,900 | | Moog, Inc. (Class A Stock)*(a) | | | 2,948,985 |
| 800 | | Orbital Sciences Corp.* | | | 20,424 |
| 42,612 | | Teledyne Technologies, Inc.*(a) | | | 2,229,034 |
| 800 | | Triumph Group, Inc. | | | 63,696 |
| | | | | |
| | | | | 11,550,715 |
| | | | | |
| | |
| | Airlines—0.9% | | | |
| 8,600 | | Republic Airways Holdings, Inc.* | | | 183,094 |
| 125,500 | | SkyWest, Inc.(a) | | | 3,424,895 |
| | | | | |
| | | | | 3,607,989 |
| | | | | |
| | |
| | Auto Related—1.1% | | | |
| 26,737 | | Aftermarket Technology Corp.* | | | 922,961 |
| 31,461 | | American Axle & Manufacturing Holdings, Inc.(a) | | | 863,919 |
| 116,000 | | ArvinMeritor, Inc.(a) | | | 1,720,280 |
| 39,965 | | Cooper Tire & Rubber Co. | | | 890,420 |
| 4,200 | | Tenneco, Inc.* | | | 128,562 |
| | | | | |
| | | | | 4,526,142 |
| | | | | |
| | |
| | Automobile Manufacturers—0.3% | | | |
| 30,000 | | Thor Industries, Inc. | | | 1,440,000 |
| | | | | |
| | |
| | Automotive Components | | | |
| 4,900 | | Lear Corp.* | | | 174,097 |
| | | | | |
| | |
| | Automotive Parts | | | |
| 1,300 | | Standard Motor Products, Inc. | | | 10,868 |
| | | | | |
| | |
| | Banks—5.0% | | | |
| 45,315 | | Amcore Financial, Inc.(a) | | | 1,074,419 |
| 400 | | AmericanWest Bancorp | | | 7,732 |
| 1,200 | | Ameris Bancorp | | | 20,232 |
| 600 | | BancFirst Corp. | | | 27,264 |
| 88,200 | | BancorpSouth, Inc.(a) | | | 2,139,732 |
| 94,580 | | Bank Mutual Corp.(a) | | | 1,050,784 |
| 1,800 | | BankUnited Financial Corp. (Class A Stock) | | | 15,534 |
| 400 | | Banner Corp. | | | 13,064 |
See Notes to Financial Statements.
| | |
| 54 | | THE TARGET PORTFOLIO TRUST |
| | | | | |
| SHARES | | DESCRIPTION | | VALUE (NOTE 1) |
| | | | | |
| | COMMON STOCKS (continued) | | | |
| | |
| | Banks (cont’d.) | | | |
| 600 | | Capital Corp. of The West | | $ | 11,670 |
| 800 | | Capitol Bancorp Ltd. | | | 16,960 |
| 66,978 | | Cardinal Financial Corp. | | | 655,715 |
| 900 | | Cathay General Bancorp | | | 27,873 |
| 3,400 | | Central Pacific Financial Corp. | | | 76,262 |
| 1,400 | | Chemical Financial Corp. | | | 35,000 |
| 3,000 | | City Holding Co. | | | 113,430 |
| 3,900 | | Colonial BancGroup, Inc. (The) | | | 74,802 |
| 1,100 | | Columbia Banking System, Inc. | | | 34,177 |
| 1,400 | | Community Bank System, Inc. | | | 29,274 |
| 2,900 | | Community Trust Bancorp, Inc. | | | 84,535 |
| 8,000 | | Corus Bankshares, Inc. | | | 88,160 |
| 34,625 | | Cullen Frost Bankers, Inc. | | | 1,841,357 |
| 3,300 | | Dime Community Bancshares | | | 47,487 |
| 6,100 | | First Bancorp. (Puerto Rico) | | | 53,619 |
| 87,760 | | First Financial Bancorp(a) | | | 1,031,180 |
| 1,100 | | First Financial Holdings, Inc. | | | 31,768 |
| 9,000 | | First Niagara Financial Group, Inc. | | | 118,800 |
| 1,000 | | First Place Financial Corp. (OH) | | | 16,690 |
| 900 | | FirstFed Financial Corp.* | | | 38,502 |
| 61,375 | | FirstMerit Corp.(a) | | | 1,301,150 |
| 3,300 | | Flagstar Bancorp, Inc. | | | 26,697 |
| 200 | | FNB Corp. | | | 5,772 |
| 1,000 | | Great Southern Bancorp, Inc. | | | 23,400 |
| 26,289 | | Hancock Holding Co.(a) | | | 999,771 |
| 11,300 | | Hanmi Financial Corp. | | | 124,526 |
| 2,850 | | IBERIABANK Corp. | | | 141,275 |
| 3,400 | | Independent Bank Corp. | | | 100,572 |
| 3,666 | | Independent Bank Corp. (MI) | | | 38,713 |
| 3,900 | | Irwin Financial Corp. | | | 37,596 |
| 600 | | Lakeland Financial Corp. | | | 12,546 |
| 1,980 | | MainSource Financial Group, Inc. | | | 33,284 |
| 9,425 | | MB Financial, Inc.(a) | | | 314,229 |
| 2,400 | | Nara Bancorp, Inc. | | | 37,152 |
| 85,000 | | Old National Bancorp(a) | | | 1,420,350 |
| 2,100 | | Partners Trust Financial Group, Inc. | | | 26,082 |
| 1,000 | | Peoples Bancorp, Inc. | | | 24,970 |
| 17,400 | | Prosperity Bancshares, Inc.(a) | | | 562,368 |
| 71,700 | | Provident Bankshares Corp.(a) | | | 1,768,839 |
| 13,770 | | Rainier Pacific Financial Group, Inc. | | | 232,162 |
| 651 | | Republic Bancorp, Inc. (KY) (Class A Stock) | | | 10,058 |
| 535 | | Royal Bancshares of Pennsylvania (Class A Stock) | | | 10,154 |
| 300 | | Santander BanCorp (Puerto Rico) | | | 4,110 |
| 315 | | SCBT Financial Corp. | | | 10,064 |
| 1,000 | | Security Bank Corp. | | | 10,420 |
| 100 | | Sierra Bancorp | | | 2,718 |
| 29,118 | | Signature Bank*(a) | | | 994,380 |
| 700 | | Simmons First National Corp. (Class A Stock) | | | 18,928 |
| 3,400 | | Southwest Bancorp, Inc. | | | 64,362 |
See Notes to Financial Statements.
| | |
| THE TARGET PORTFOLIO TRUST | | 55 |
| | |
Small Capitalization Value Portfolio (continued) | | Portfolio of Investments
As of October 31, 2007 |
| | | | | |
| SHARES | | DESCRIPTION | | VALUE (NOTE 1) |
| | | | | |
| | COMMON STOCKS (continued) | | | |
| | |
| | Banks (cont’d.) | | | |
| 6,150 | | Sterling Bancshares, Inc. (TX) | | $ | 75,030 |
| 1,700 | | Sterling Financial Corp. (PA) | | | 31,195 |
| 53,950 | | Sterling Financial Corp. (WA)(a) | | | 1,213,875 |
| 50,000 | | Susquehanna Bancshares, Inc. | | | 1,008,500 |
| 1,700 | | Taylor Capital Group, Inc. | | | 43,962 |
| 52,400 | | TierOne Corp. | | | 1,197,340 |
| 1,000 | | Trico Bancshares | | | 22,100 |
| 11,330 | | UMB Financial Corp. | | | 475,860 |
| 3,783 | | Umpqua Holdings Corp. | | | 64,046 |
| 800 | | United Bankshares, Inc. | | | 24,240 |
| 8,900 | | W Holding Co., Inc. | | | 18,690 |
| 4,200 | | West Coast Bancorp | | | 113,904 |
| 800 | | WSFS Financial Corp. | | | 46,128 |
| | | | | |
| | | | | 21,467,540 |
| | | | | |
| | |
| | Beverages—0.4% | | | |
| 45,000 | | PepsiAmericas, Inc. | | | 1,607,400 |
| | | | | |
| | |
| | Biotechnology | | | |
| 1,700 | | Applera Corp. - Celera Genomics Group* | | | 27,727 |
| 1,100 | | Bio-Rad Laboratories, Inc. (Class A Stock)* | | | 106,238 |
| 800 | | LifeCell Corp.* | | | 35,248 |
| 900 | | Nektar Therapeutics* | | | 5,382 |
| 2,325 | | Protalix Biotherapeutics, Inc. (Israel)* | | | 11,858 |
| | | | | |
| | | | | 186,453 |
| | | | | |
| | |
| | Broadcasting—0.1% | | | |
| 4,900 | | Cox Radio, Inc. (Class A Stock)* | | | 59,192 |
| 5,300 | | DG FastChannel, Inc.* | | | 130,327 |
| 3,400 | | Entercom Communications Corp. (Class A Stock) | | | 63,070 |
| 1,800 | | Lin TV Corp. (Class A Stock)* | | | 26,226 |
| | | | | |
| | | | | 278,815 |
| | | | | |
| | |
| | Building Products—1.5% | | | |
| 2,300 | | Apogee Enterprises, Inc. | | | 54,119 |
| 50,000 | | Crane Co. | | | 2,372,000 |
| 500 | | Genlyte Group, Inc.* | | | 32,550 |
| 73,920 | | Lennox International, Inc. | | | 2,638,944 |
| 1,200 | | NCI Buildings Systems, Inc.* | | | 47,016 |
| 45,000 | | Simpson Manufacturing Co., Inc.(a) | | | 1,349,550 |
| 1,900 | | Universal Forest Products, Inc. | | | 68,039 |
| | | | | |
| | | | | 6,562,218 |
| | | | | |
| | |
| | Business Services—1.2% | | | |
| 19,200 | | Administaff, Inc. | | | 765,696 |
| 24,240 | | Clean Harbors, Inc.* | | | 1,193,335 |
See Notes to Financial Statements.
| | |
| 56 | | THE TARGET PORTFOLIO TRUST |
| | | | | |
| SHARES | | DESCRIPTION | | VALUE (NOTE 1) |
| | | | | |
| | COMMON STOCKS (continued) | | | |
| | |
| | Business Services (cont’d.) | | | |
| 1,400 | | COMSYS IT Partners, Inc.* | | $ | 24,892 |
| 1,100 | | infoUSA, Inc. | | | 11,572 |
| 51,625 | | URS Corp.*(a) | | | 3,190,941 |
| | | | | |
| | | | | 5,186,436 |
| | | | | |
| | |
| | Capital Markets—0.2% | | | |
| 21,725 | | Waddell & Reed Financial, Inc. (Class A Stock)(a) | | | 721,705 |
| | | | | |
| | |
| | Chemicals—4.0% | | | |
| 9,550 | | Airgas, Inc. | | | 481,989 |
| 4,400 | | CF Industries Holdings, Inc. | | | 386,760 |
| 5,075 | | Cytec Industries, Inc. | | | 338,553 |
| 17,501 | | Ferro Corp. | | | 362,621 |
| 29,436 | | FMC Corp. | | | 1,692,570 |
| 4,900 | | H.B. Fuller Co. | | | 144,207 |
| 7,700 | | Hercules, Inc. | | | 144,837 |
| 1,900 | | Innospec, Inc. (United Kingdom) | | | 40,451 |
| 13,000 | | Lubrizol Corp. (The) | | | 882,440 |
| 1,100 | | Mattson Technology, Inc.* | | | 9,548 |
| 90,000 | | Methanex Corp. (Canada) | | | 2,737,800 |
| 600 | | Minerals Technologies, Inc. | | | 42,132 |
| 600 | | NewMarket Corp. | | | 32,256 |
| 28,803 | | Olin Corp. | | | 656,132 |
| 900 | | OM Group, Inc.* | | | 47,682 |
| 2,500 | | Rockwood Holdings, Inc.* | | | 97,725 |
| 100,000 | | RPM International, Inc. | | | 2,143,000 |
| 104,600 | | Sensient Technologies Corp. | | | 3,126,494 |
| 3,400 | | Spartech Corp. | | | 52,258 |
| 4,600 | | Terra Industries, Inc.* | | | 169,694 |
| 2,500 | | UAP Holding Corp. | | | 79,575 |
| 60,750 | | Valspar Corp. (The)(a) | | | 1,520,572 |
| 3,100 | | W.R. Grace & Co.* | | | 91,760 |
| 75,000 | | Westlake Chemical Corp.(a) | | | 1,840,500 |
| | | | | |
| | | | | 17,121,556 |
| | | | | |
| | |
| | Clothing & Apparel—0.2% | | | |
| 1,500 | | Cato Corp. (The) | | | 30,120 |
| 15,321 | | G&K Services, Inc.(a) | | | 621,113 |
| 3,500 | | Maidenform Brands, Inc.* | | | 51,975 |
| | | | | |
| | | | | 703,208 |
| | | | | |
| | |
| | Commercial Banks—0.3% | | | |
| 4,900 | | Fulton Financial Corp.(a) | | | 64,239 |
| 40,000 | | Whitney Holding Corp. | | | 1,026,400 |
| | | | | |
| | | | | 1,090,639 |
| | | | | |
| | |
| | Commercial Services—1.5% | | | |
| 100,900 | | Advance America Cash Advance Centers, Inc.(a) | | | 964,604 |
| 800 | | Chemed Corp. | | | 45,856 |
See Notes to Financial Statements.
| | |
| THE TARGET PORTFOLIO TRUST | | 57 |
| | |
Small Capitalization Value Portfolio
(continued) | | Portfolio of Investments
As of October 31, 2007 |
| | | | | |
| SHARES | | DESCRIPTION | | VALUE (NOTE 1) |
| | | | | |
| | COMMON STOCKS (continued) | | | |
| | |
| | Commercial Services (cont’d.) | | | |
| 1,700 | | Consolidated Graphics, Inc.* | | $ | 108,766 |
| 400 | | CRA International, Inc.* | | | 20,712 |
| 700 | | Electro Rent Corp. | | | 10,122 |
| 3,800 | | Gartner, Inc.* | | | 83,220 |
| 4,600 | | Geo Group, Inc. (The)* | | | 145,498 |
| 23,875 | | Healthspring, Inc.* | | | 501,375 |
| 73,600 | | Pharmaceutical Product Development, Inc. | | | 3,108,864 |
| 6,200 | | Spherion Corp.* | | | 54,064 |
| 10,600 | | Stewart Enterprises, Inc. | | | 96,142 |
| 11,875 | | Team, Inc.* | | | 382,256 |
| 2,500 | | TeleTech Holdings, Inc.* | | | 62,325 |
| 37,707 | | TNS, Inc. | | | 608,968 |
| 1,900 | | Viad Corp. | | | 67,336 |
| 9,737 | | Waste Connections, Inc.*(a) | | | 329,208 |
| | | | | |
| | | | | 6,589,316 |
| | | | | |
| | |
| | Commercial Services & Supplies—1.6% | | | |
| 29,618 | | Avis Budget Group, Inc.* | | | 618,127 |
| 16,650 | | Healthcare Services Group, Inc.(a) | | | 365,634 |
| 30,700 | | Heidrick & Struggles International, Inc. | | | 1,326,854 |
| 100,000 | | Schawk, Inc.(a) | | | 2,272,000 |
| 66,477 | | School Specialty, Inc.*(a) | | | 2,243,599 |
| 1,000 | | Valassis Communications, Inc.* | | | 9,850 |
| 1,200 | | Watson Wyatt Worldwide, Inc. | | | 57,204 |
| | | | | |
| | | | | 6,893,268 |
| | | | | |
| | |
| | Computer Hardware—1.0% | | | |
| 3,600 | | Agilysys, Inc. | | | 62,280 |
| 3,900 | | Aspen Technology, Inc.* | | | 68,016 |
| 35,067 | | CACI International, Inc. (Class A Stock)*(a) | | | 1,888,358 |
| 5,100 | | CIBER, Inc.* | | | 39,729 |
| 3,600 | | Electronics For Imaging, Inc.* | | | 82,080 |
| 1,100 | | Hutchinson Technology, Inc.* | | | 26,103 |
| 1,900 | | Imation Corp. | | | 42,332 |
| 2,500 | | Magma Design Automation, Inc.* | | | 37,225 |
| 5,100 | | Palm, Inc. | | | 46,002 |
| 1,600 | | PC Connection, Inc.* | | | 23,520 |
| 112,631 | | Perot Systems Corp. (Class A Stock)*(a) | | | 1,644,413 |
| 9,700 | | Quantum Corp.* | | | 38,800 |
| 500 | | Radisys Corp.* | | | 6,725 |
| 1,600 | | Silcon Storage Technology, Inc.* | | | 5,312 |
| 1,700 | | SYKES Enterprises, Inc.* | | | 30,005 |
| 21,550 | | Tyler Technologies, Inc.* | | | 347,386 |
| | | | | |
| | | | | 4,388,286 |
| | | | | |
See Notes to Financial Statements.
| | |
| 58 | | THE TARGET PORTFOLIO TRUST |
| | | | | |
| SHARES | | DESCRIPTION | | VALUE (NOTE 1) |
| | | | | |
| | COMMON STOCKS (continued) | | | |
| | |
| | Computer Services & Software—2.7% | | | |
| 34,351 | | Avocent Corp.* | | $ | 928,508 |
| 6,900 | | Blackbaud, Inc. | | | 185,955 |
| 2,100 | | Digi International, Inc.* | | | 33,684 |
| 54,900 | | Global Payments, Inc. | | | 2,611,044 |
| 900 | | Mantech International Corp.* | | | 35,784 |
| 5,525 | | MICROS Systems, Inc.*(a) | | | 396,806 |
| 142,902 | | Parametric Technology Corp.*(a) | | | 2,729,428 |
| 1,300 | | Progress Software Corp.* | | | 42,523 |
| 800 | | QAD, Inc. | | | 7,200 |
| 1,400 | | Quest Software, Inc.* | | | 24,360 |
| 200 | | Semtech Corp.* | | | 3,422 |
| 600 | | SI International, Inc.* | | | 16,926 |
| 300 | | SPSS, Inc.* | | | 11,400 |
| 82,147 | | Sybase, Inc.*(a) | | | 2,349,404 |
| 200 | | SYNNEX Corp.* | | | 4,474 |
| 44,328 | | Synopsys, Inc.* | | | 1,252,709 |
| 62,410 | | Xyratex Ltd. (Bermuda)* | | | 1,065,963 |
| | | | | |
| | | | | 11,699,590 |
| | | | | |
| | |
| | Computers | | | |
| 3,900 | | Mentor Graphics Corp.* | | | 62,478 |
| | | | | |
| | |
| | Construction—0.4% | | | |
| 1,700 | | EMCOR Group, Inc.* | | | 58,531 |
| 31,700 | | Granite Construction, Inc. | | | 1,357,394 |
| 74,900 | | Standard Pacific Corp.(a) | | | 359,520 |
| | | | | |
| | | | | 1,775,445 |
| | | | | |
| | |
| | Consumer Finance—0.1% | | | |
| 12,732 | | McGrath RentCorp(a) | | | 436,453 |
| | | | | |
| | |
| | Consumer Products & Services—1.7% | | | |
| 20,212 | | American Greetings Corp. (Class A Stock)(a) | | | 532,384 |
| 13,843 | | Aptargroup, Inc. | | | 618,782 |
| 64,085 | | Central Garden & Pet Co.*(a) | | | 531,265 |
| 50,594 | | Central Garden & Pet Co. (Class A Stock)*(a) | | | 420,942 |
| 7,089 | | Chattem, Inc.*(a) | | | 526,713 |
| 2,100 | | Elizabeth Arden, Inc.* | | | 52,290 |
| 900 | | Ennis, Inc. | | | 18,396 |
| 700 | | Helen of Troy Ltd. (Bermuda)* | | | 12,600 |
| 493 | | Jarden Corp.* | | | 17,511 |
| 51,675 | | Scotts Miracle-Gro Co., (The) (Class A Stock)(a) | | | 2,371,366 |
| 38,746 | | Snap-on, Inc. | | | 1,933,813 |
| | | | | |
| | | | | 7,036,062 |
| | | | | |
| | |
| | Consumer Services | | | |
| 5,100 | | Rent-A-Center, Inc.* | | | 81,600 |
| | | | | |
| | |
| | Containers & Packaging—0.8% | | | |
| 82,512 | | Bemis Co.(a) | | | 2,323,538 |
| 1,700 | | Core-Mark Holding Co, Inc.* | | | 58,990 |
See Notes to Financial Statements.
| | |
| THE TARGET PORTFOLIO TRUST | | 59 |
| | |
Small Capitalization Value Portfolio (continued) | | Portfolio of Investments
As of October 31, 2007 |
| | | | | |
| SHARES | | DESCRIPTION | | VALUE (NOTE 1) |
| | | | | |
| | COMMON STOCKS (continued) | | | |
| | |
| | Containers & Packaging (cont’d.) | | | |
| 2,100 | | Greif, Inc. (Class A Stock) | | $ | 133,560 |
| 28,273 | | Pactiv Corp.* | | | 776,659 |
| 4,300 | | Rock-Tenn Co. (Class A Stock) | | | 125,388 |
| 3,100 | | Silgan Holdings, Inc. | | | 169,167 |
| | | | | |
| | | | | 3,587,302 |
| | | | | |
| | |
| | Distribution/Wholesale—0.4% | | | |
| 1,000 | | United Stationers, Inc.* | | | 57,910 |
| 32,568 | | WESCO International, Inc.* | | | 1,519,297 |
| | | | | |
| | | | | 1,577,207 |
| | | | | |
| | |
| | Diversified Financial Services | | | |
| 3,500 | | Asta Funding, Inc.(a) | | | 124,390 |
| | | | | |
| | |
| | Diversified Financials—0.1% | | | |
| 13,225 | | Financial Federal Corp.(a) | | | 357,340 |
| | | | | |
| | |
| | Diversified Telecommunication Services—0.3% | | | |
| 67,500 | | Iowa Telecommunications Services, Inc.(a) | | | 1,331,100 |
| | | | | |
| | |
| | Drugs & Healthcare—1.1% | | | |
| 19,809 | | Cooper Cos, Inc. (The)(a) | | | 831,978 |
| 44,300 | | Covance, Inc.* | | | 3,654,750 |
| | | | | |
| | | | | 4,486,728 |
| | | | | |
| | |
| | Drugs & Medicine—0.3% | | | |
| 21,825 | | Barr Pharmaceuticals, Inc.*(a) | | | 1,251,009 |
| | | | | |
| | |
| | Electric Utilities—1.9% | | | |
| 500 | | Black Hills Corp. | | | 22,210 |
| 1,000 | | CH Energy Group, Inc. | | | 46,740 |
| 45,900 | | Cleco Corp.(a) | | | 1,209,465 |
| 5,600 | | El Paso Electric Co.* | | | 136,360 |
| 15,729 | | Idacorp, Inc. | | | 548,785 |
| 55,050 | | PNM Resources, Inc. | | | 1,376,800 |
| 1,600 | | UIL Holdings Corp. | | | 56,288 |
| 6,300 | | Unisource Energy Corp. | | | 199,836 |
| 144,426 | | Westar Energy, Inc.(a) | | | 3,844,620 |
| 9,352 | | Wisconsin Energy Corp. | | | 447,774 |
| | | | | |
| | | | | 7,888,878 |
| | | | | |
| | |
| | Electrical Equipment—0.8% | | | |
| 26,200 | | Acuity Brands, Inc. | | | 1,252,360 |
| 43,050 | | Regal-Beloit Corp.(a) | | | 2,111,172 |
| | | | | |
| | | | | 3,363,532 |
| | | | | |
See Notes to Financial Statements.
| | |
| 60 | | THE TARGET PORTFOLIO TRUST |
| | | | | |
| SHARES | | DESCRIPTION | | VALUE (NOTE 1) |
| | | | | |
| | COMMON STOCKS (continued) | | | |
| | |
| | Electronic Components—2.5% | | | |
| 21,876 | | Empire District Electric Co. (The) | | $ | 526,118 |
| 10,500 | | Nam Tai Electronics, Inc. (Hong Kong) | | | 126,525 |
| 80,800 | | Park Electrochemical Corp.(a) | | | 2,530,656 |
| 700 | | Plexus Corp.* | | | 18,060 |
| 107,609 | | Portland General Electric Co. | | | 3,029,193 |
| 76,000 | | Technitrol, Inc. | | | 2,235,160 |
| 55,000 | | Tektronix, Inc. | | | 2,081,750 |
| | | | | |
| | | | | 10,547,462 |
| | | | | |
| | |
| | Electronics—3.4% | | | |
| 900 | | Bel Fuse, Inc. (Class B Stock) | | | 28,638 |
| 16,651 | | Belden CDT, Inc. | | | 970,254 |
| 70,850 | | Benchmark Electronics, Inc.*(a) | | | 1,453,133 |
| 48,500 | | Checkpoint Systems, Inc.*(a) | | | 1,467,125 |
| 45,750 | | Coherent, Inc.*(a) | | | 1,500,600 |
| 3,600 | | CTS Corp. | | | 44,460 |
| 300 | | Electro Scientific Industries, Inc.* | | | 6,546 |
| 82,000 | | FLIR Systems, Inc.*(a) | | | 5,689,980 |
| 10,400 | | General Cable Corp.*(a) | | | 748,696 |
| 43,914 | | Littelfuse, Inc.*(a) | | | 1,397,783 |
| 290,000 | | Sanmina-SCI Corp.* | | | 640,900 |
| 1,900 | | TTM Technologies, Inc.* | | | 24,377 |
| 21,311 | | Watts Water Technologies, Inc. (Class A Stock)(a) | | | 605,872 |
| | | | | |
| | | | | 14,578,364 |
| | | | | |
| | |
| | Energy Equipment & Services—1.3% | | | |
| 4,875 | | Atwood Oceanics, Inc.* | | | 410,670 |
| 30,000 | | Frontier Oil Corp. | | | 1,373,700 |
| 69,583 | | Headwaters, Inc.*(a) | | | 998,516 |
| 25,000 | | Holly Corp. | | | 1,570,000 |
| 20,000 | | Tidewater, Inc. | | | 1,093,400 |
| | | | | |
| | | | | 5,446,286 |
| | | | | |
| | |
| | Entertainment | | | |
| 900 | | Macrovision Corp.* | | | 21,600 |
| | | | | |
| | |
| | Entertainment & Leisure—0.3% | | | |
| 30,537 | | Bally Technologies, Inc.*(a) | | | 1,231,557 |
| 1,400 | | RC2 Corp.* | | | 41,748 |
| 1,000 | | Steinway Musical Instruments, Inc. | | | 29,950 |
| | | | | |
| | | | | 1,303,255 |
| | | | | |
| | |
| | Environmental Services—0.6% | | | |
| 132,400 | | Allied Waste Industries, Inc.*(a) | | | 1,673,536 |
| | | | | |
| 30,111 | | Tetra Tech, Inc.*(a) | | | 703,092 |
| | | | | |
| | | | | 2,376,628 |
| | | | | |
See Notes to Financial Statements.
| | |
| THE TARGET PORTFOLIO TRUST | | 61 |
| | |
Small Capitalization Value Portfolio (continued) | | Portfolio of Investments
As of October 31, 2007 |
| | | | | |
| SHARES | | DESCRIPTION | | VALUE (NOTE 1) |
| | | | | |
| | COMMON STOCKS (continued) | | | |
| | |
| | Exchange Traded Funds—0.9% | | | |
| 31,300 | | iShares Russell 2000 Value Index Fund(a) | | $ | 2,424,811 |
| 18,663 | | iShares S&P SmallCap 600 Value Index Fund(a) | | | 1,421,747 |
| | | | | |
| | | | | 3,846,558 |
| | | | | |
| | |
| | Financial—Bank & Trust—1.0% | | | |
| 1,600 | | Banco Latinoamericano de Exportaciones SA (Panama) | | | 31,152 |
| 24,300 | | Bank of Hawaii Corp. | | | 1,291,788 |
| 1,475 | | Citizens Republic Bankcorp, Inc. | | | 22,449 |
| 1,500 | | City Bank/Lynnwood (WA) | | | 35,925 |
| 700 | | Community Bancorp NV* | | | 14,189 |
| 1,100 | | Downey Financial Corp. | | | 44,803 |
| 1,100 | | First Merchants Corp. | | | 24,255 |
| 83,000 | | Franklin Bank Corp.*(a) | | | 641,590 |
| 500 | | Heartland Financial USA, Inc. | | | 9,970 |
| 300 | | Heritage Commerce Corp. | | | 5,562 |
| 1,225 | | Horizon Financial Corp. | | | 21,242 |
| 600 | | Imperial Capital Bancorp, Inc. | | | 12,954 |
| 69,496 | | NewAlliance Bancshares, Inc.(a) | | | 972,249 |
| 47,400 | | PFF Bancorp, Inc.(a) | | | 504,810 |
| 70,787 | | Superior Bancorp*(a) | | | 540,813 |
| 13,000 | | TCF Financial Corp. | | | 296,010 |
| 600 | | Union Bankshares Corp. | | | 12,822 |
| 1,000 | | Washington Trust Bancorp, Inc. | | | 24,930 |
| | | | | |
| | | | | 4,507,513 |
| | | | | |
| | |
| | Financial—Brokerage | | | |
| 2,900 | | Centerline Holding Co. | | | 40,020 |
| | | | | |
| | |
| | Financial Services—4.1% | | | |
| 3,750 | | Advanta Corp. (Class B Stock) | | | 59,250 |
| 6,475 | | Affiliated Managers Group, Inc.*(a) | | | 851,786 |
| 600 | | Anchor Bancorp Wisconsin, Inc. | | | 14,760 |
| 325 | | Bank of Granite Corp. | | | 4,105 |
| 100 | | Berkshire Hills Bancorp, Inc. | | | 2,787 |
| 39,744 | | Calamos Asset Management, Inc.(a) | | | 1,352,091 |
| 100 | | Camden National Corp. | | | 3,317 |
| 2,700 | | CompuCredit Corp.* | | | 53,811 |
| 10,500 | | Deluxe Corp. | | | 423,570 |
| 4,871 | | Dollar Financial Corp.* | | | 159,769 |
| 65,700 | | Eaton Vance Corp. | | | 3,286,971 |
| 1,400 | | Encore Capital Group, Inc.* | | | 15,974 |
| 400 | | Federal Agricultural Mortgage Corp. (Class C Stock) | | | 11,740 |
| 20,050 | | First Cash Financial Services, Inc.*(a) | | | 394,183 |
| 900 | | First Community Banshares, Inc. | | | 30,906 |
| 600 | | First Regional Bancorp* | | | 14,100 |
See Notes to Financial Statements.
| | |
| 62 | | THE TARGET PORTFOLIO TRUST |
| | | | | |
| SHARES | | DESCRIPTION | | VALUE (NOTE 1) |
| | | | | |
| | COMMON STOCKS (continued) | | | |
| | |
| | Financial Services (cont’d.) | | | |
| 1,290 | | First Source Corp. | | $ | 24,819 |
| 500 | | Greene County Bancshares, Inc. | | | 16,025 |
| 1,300 | | Integra Bank Corp. | | | 22,399 |
| 79,300 | | Jefferies Group, Inc.(a) | | | 2,119,689 |
| 8,525 | | KBW, Inc.* | | | 258,222 |
| 7,100 | | Knight Trading Group, Inc. (Class A Stock)* | | | 95,211 |
| 59,400 | | MoneyGram International, Inc. | | | 947,430 |
| 17,856 | | National Penn Bancshares, Inc.(a) | | | 301,052 |
| 2,500 | | NBT Bancorp, Inc. | | | 61,675 |
| 3,000 | | Ocwen Financial Corp.* | | | 22,380 |
| 59,400 | | Pacific Capital Bancorp(a) | | | 1,231,362 |
| 5,934 | | Patriot Capital Funding, Inc. | | | 74,294 |
| 500 | | Piper Jaffray Cos.* | | | 25,700 |
| 105,400 | | Raymond James Financial, Inc. | | | 3,926,150 |
| 1,200 | | Renasant Corp. | | | 27,900 |
| 37,333 | | South Financial Group, Inc. (The) | | | 771,300 |
| 5,300 | | Student Loan Corp. (The) | | | 880,224 |
| 500 | | Suffolk Bancorp | | | 16,515 |
| 1,900 | | SWS Group, Inc. | | | 36,081 |
| 3,200 | | United Community Financial Corp. | | | 20,480 |
| 4,000 | | World Acceptance Corp.* | | | 129,040 |
| | | | | |
| | | | | 17,687,068 |
| | | | | |
| | |
| | Food & Drug Retailers | | | |
| 2,400 | | Perrigo Co. | | | 56,904 |
| | | | | |
| | |
| | Food & Staples Retailing—0.2% | | | |
| 27,102 | | Casey’s General Stores, Inc. | | | 772,407 |
| | | | | |
| | |
| | Food Products—2.3% | | | |
| 63,954 | | Corn Products International, Inc. | | | 2,720,603 |
| 41,894 | | J.M. Smucker Co. (The) | | | 2,238,396 |
| 4,400 | | Nash Finch Co. | | | 164,780 |
| 50,000 | | Pilgrim’s Pride Corp.(a) | | | 1,485,000 |
| 38,399 | | Ralcorp Holdings, Inc.*(a) | | | 2,161,864 |
| 28,700 | | Ruddick Corp.(a) | | | 975,800 |
| | | | | |
| | | | | 9,746,443 |
| | | | | |
| | |
| | Foods—0.2% | | | |
| 21,636 | | Performance Food Group Co.*(a) | | | 583,956 |
| 1,300 | | Reddy Ice Holdings, Inc. | | | 35,997 |
| 6,700 | | Spartan Stores, Inc. | | | 148,941 |
| | | | | |
| | | | | 768,894 |
| | | | | |
| | |
| | Furniture | | | |
| 2,500 | | Sealy Corp. | | | 33,050 |
| | | | | |
| | |
| | Gas & Pipeline Utilities—3.9% | | | |
| 37,449 | | AGL Resources, Inc.(a) | | | 1,480,359 |
| 19,616 | | Atlas America, Inc. | | | 1,131,843 |
See Notes to Financial Statements.
| | |
| THE TARGET PORTFOLIO TRUST | | 63 |
| | |
Small Capitalization Value Portfolio (continued) | | Portfolio of Investments
As of October 31, 2007 |
| | | | | |
| SHARES | | DESCRIPTION | | VALUE (NOTE 1) |
| | | | | |
| | COMMON STOCKS (continued) | | | |
| | |
| | Gas & Pipeline Utilities (cont’d.) | | | |
| 71,377 | | Atmos Energy Corp. | | $ | 2,002,125 |
| 5,000 | | Energen Corp. | | | 320,000 |
| 4,500 | | National Fuel Gas Co. | | | 218,205 |
| 95,600 | | Southwest Gas Corp. | | | 2,845,056 |
| 75,126 | | Swift Energy Co.*(a) | | | 3,563,226 |
| 100,000 | | UGI Corp.(a) | | | 2,662,000 |
| 13,617 | | W-H Energy Services, Inc.*(a) | | | 783,795 |
| 50,486 | | WGL Holdings, Inc. | | | 1,712,485 |
| | | | | |
| | | | | 16,719,094 |
| | | | | |
| | |
| | Healthcare Equipment & Supplies—0.2% | | | |
| 4,500 | | Hillenbrand Industries, Inc. | | | 248,490 |
| 23,300 | | Invacare Corp. | | | 630,498 |
| | | | | |
| | | | | 878,988 |
| | | | | |
| | |
| | Healthcare Providers & Services—2.4% | | | |
| 6,400 | | Alliance Imaging, Inc.* | | | 63,424 |
| 28,200 | | Amedisys, Inc.* | | | 1,197,090 |
| 68,000 | | AMERIGROUP Corp.*(a) | | | 2,380,000 |
| 1,700 | | AMN Healthcare Services, Inc.* | | | 32,317 |
| 1,000 | | Apria Healthcare Group, Inc.* | | | 24,170 |
| 7,600 | | Gentiva Health Services, Inc.* | | | 144,248 |
| 1,500 | | Magellan Health Services, Inc.* | | | 63,150 |
| 74,794 | | Owens & Minor, Inc.(a) | | | 3,032,149 |
| 36,650 | | Res-Care, Inc.*(a) | | | 900,124 |
| 62,000 | | Sunrise Senior Living, Inc.*(a) | | | 2,294,000 |
| | | | | |
| | | | | 10,130,672 |
| | | | | |
| | |
| | Healthcare Services—0.9% | | | |
| 2,600 | | American Dental Partners, Inc.* | | | 64,454 |
| 38,400 | | Healthways, Inc.*(a) | | | 2,330,880 |
| 18,725 | | LHC Group, Inc.*(a) | | | 430,301 |
| 600 | | Molina Healthcare, Inc.* | | | 22,866 |
| 10,650 | | Pediatrix Medical Group, Inc.* | | | 697,575 |
| 2,000 | | Psychiatric Solutions, Inc.* | | | 79,200 |
| | | | | |
| | | | | 3,625,276 |
| | | | | |
| | |
| | Home Builders—0.3% | | | |
| 60,900 | | Hovnanian Enterprises, Inc. (Class A Stock)*(a) | | | 692,433 |
| 39,300 | | Meritage Homes Corp.*(a) | | | 632,337 |
| | | | | |
| | | | | 1,324,770 |
| | | | | |
| | |
| | Hotels, Restaurants & Leisure—0.9% | | | |
| 7,774 | | Applebee’s International, Inc. | | | 196,993 |
| 200 | | Bob Evans Farms, Inc. | | | 5,636 |
See Notes to Financial Statements.
| | |
| 64 | | THE TARGET PORTFOLIO TRUST |
| | | | | |
| SHARES | | DESCRIPTION | | VALUE (NOTE 1) |
| | | | | |
| | COMMON STOCKS (continued) | | | |
| | |
| | Hotels, Restaurants & Leisure (cont’d.) | | | |
| 67,393 | | Brinker International, Inc. | | $ | 1,711,108 |
| 13,500 | | Dover Downs Gaming & Entertainment, Inc.(a) | | | 147,555 |
| 6,300 | | Jack in the Box, Inc.* | | | 197,631 |
| 800 | | Papa John’s International, Inc.* | | | 18,640 |
| 75,475 | | Sonic Corp.*(a) | | | 1,870,271 |
| | | | | |
| | | | | 4,147,834 |
| | | | | |
| | |
| | Household Durables—0.6% | | | |
| 61,996 | | Ethan Allen Interiors, Inc.(a) | | | 1,913,197 |
| 12,700 | | Lancaster Colony Corp. | | | 510,159 |
| | | | | |
| | | | | 2,423,356 |
| | | | | |
| | |
| | Household Products—0.1% | | | |
| 11,100 | | Tupperware Corp. | | | 400,710 |
| | | | | |
| | |
| | Industrial Conglomerates—0.1% | | | |
| 7,525 | | Teleflex, Inc. | | | 550,905 |
| | | | | |
| | |
| | Industrial Products—1.3% | | | |
| 44,083 | | Brady Corp.(a) | | | 1,626,663 |
| 20,355 | | CIRCOR International, Inc.(a) | | | 1,022,431 |
| 1,400 | | Compass Minerals International, Inc. | | | 51,674 |
| 46,239 | | Interface, Inc. | | | 884,552 |
| 32,839 | | Kaydon Corp.(a) | | | 1,766,410 |
| 4,600 | | Myers Industries, Inc. | | | 97,474 |
| 1,900 | | Valmont Industries, Inc. | | | 181,868 |
| | | | | |
| | | | | 5,631,072 |
| | | | | |
| | |
| | Insurance—5.3% | | | |
| 93,265 | | American Equity Investment Life Holding Co.(a) | | | 911,199 |
| 6,000 | | American Financial Group, Inc. | | | 179,400 |
| 900 | | American Physicians Capital, Inc. | | | 39,204 |
| 2,000 | | Amerisafe, Inc.* | | | 32,340 |
| 5,800 | | Aspen Insurance Holdings Ltd. (Bermuda) | | | 158,688 |
| 81,425 | | Delphi Financial Group, Inc. (Class A Stock)(a) | | | 3,155,219 |
| 68,791 | | Employers Holdings, Inc. | | | 1,318,035 |
| 1,000 | | FPIC Insurance Group, Inc.* | | | 41,780 |
| 1,000 | | Harleysville Group, Inc. | | | 31,170 |
| 22,775 | | HCC Insurance Holdings, Inc. | | | 680,745 |
| 39,475 | | Hilb, Rogal & Hobbs Co.(a) | | | 1,739,663 |
| 42,472 | | Horace Mann Educators Corp.(a) | | | 878,746 |
| 46,487 | | Infinity Property & Casual Corp.(a) | | | 1,869,707 |
| 16,200 | | Ipc Holdings Ltd. (Bermuda) | | | 484,542 |
| 1,500 | | LandAmerica Financial Group, Inc. | | | 41,685 |
| 5,000 | | Max Capital Group Ltd. (Bermuda) | | | 141,450 |
| 2,700 | | Meadowbrook Insurance Group, Inc.* | | | 26,001 |
| 2,800 | | Midland Co.(a) | | | 178,136 |
| 1,100 | | Navigators Group, Inc. (The)* | | | 66,330 |
| 6,600 | | Odyssey Re Holdings Corp. | | | 245,388 |
See Notes to Financial Statements.
| | |
| THE TARGET PORTFOLIO TRUST | | 65 |
| | |
Small Capitalization Value Portfolio (continued) | | Portfolio of Investments
As of October 31, 2007 |
| | | | | |
| SHARES | | DESCRIPTION | | VALUE (NOTE 1) |
| | | | | |
| | COMMON STOCKS (continued) | | | |
| | |
| | Insurance (cont’d.) | | | |
| 48,301 | | Philadelphia Consolidated Holding Corp.* | | $ | 1,970,681 |
| 1,100 | | Phoenix Cos., Inc. (The) | | | 15,158 |
| 49,200 | | Platinum Underwriters Holdings Ltd. (Bermuda)(a) | | | 1,771,200 |
| 9,900 | | PMA Capital Corp. (Class A Stock)* | | | 98,010 |
| 30,942 | | ProAssurance Corp.*(a) | | | 1,706,142 |
| 33,500 | | Protective Life Corp. | | | 1,436,145 |
| 4,900 | | RLI Corp.(a) | | | 285,033 |
| 2,900 | | Safety Insurance Group, Inc. | | | 104,284 |
| 2,100 | | Seabright Insurance Holdings, Inc.* | | | 35,028 |
| 3,700 | | Selective Insurance Group | | | 89,947 |
| 45,600 | | State Auto Financial Corp.(a) | | | 1,254,912 |
| 50,200 | | United Fire & Casualty Co. | | | 1,608,408 |
| 5,100 | | Zenith National Insurance Corp. | | | 204,918 |
| | | | | |
| | | | | 22,799,294 |
| | | | | |
| | |
| | Insurance—Property Insurance | | | |
| 1,915 | | Argo Group International Holdings Ltd. (Bermuda)* | | | 81,598 |
| | | | | |
| | |
| | Internet | | | |
| 2,000 | | Ariba, Inc.* | | | 25,880 |
| 3,700 | | Interwoven, Inc.* | | | 52,503 |
| | | | | |
| | | | | 78,383 |
| | | | | |
| | |
| | Internet Services—0.2% | | | |
| 4,357 | | CheckFree Corp.* | | | 207,088 |
| 1,700 | | Forrester Research, Inc.* | | | 40,324 |
| 11,400 | | FTD Group, Inc. | | | 160,170 |
| 700 | | Ipass, Inc.* | | | 3,360 |
| 2,700 | | SonicWall, Inc.* | | | 27,918 |
| 2,500 | | TIBCO Software, Inc.* | | | 22,950 |
| 8,600 | | United Online, Inc. | | | 151,360 |
| 600 | | USA Mobility, Inc.* | | | 9,384 |
| | | | | |
| | | | | 622,554 |
| | | | | |
| | |
| | Internet Software & Services—0.1% | | | |
| 20,625 | | Vignette Corp.* | | | 355,575 |
| | | | | |
| | |
| | Investment Company | | | |
| 3,800 | | MCG Capital Corp. | | | 53,238 |
| | | | | |
| | |
| | Leisure—0.1% | | | |
| 8,900 | | Jakks Pacific, Inc.* | | | 235,850 |
| | | | | |
| | |
| | Leisure Equipment & Products—0.1% | | | |
| 10,700 | | Brunswick Corp. | | | 238,717 |
| | | | | |
See Notes to Financial Statements.
| | |
| 66 | | THE TARGET PORTFOLIO TRUST |
| | | | | |
| SHARES | | DESCRIPTION | | VALUE (NOTE 1) |
| | | | | |
| | COMMON STOCKS (continued) | | | |
| | |
| | Machinery—4.3% | | | |
| 8,775 | | Actuant Corp. (Class A Stock) | | $ | 605,299 |
| 36,000 | | Albany International Corp. (Class A Stock)(a) | | | 1,350,000 |
| 10,450 | | Applied Industrial Technologies, Inc. | | | 370,453 |
| 500 | | Astec Industries, Inc.* | | | 22,660 |
| 84,900 | | Barnes Group, Inc.(a) | | | 3,118,377 |
| 40,000 | | Briggs & Stratton Corp. | | | 900,400 |
| 46,350 | | Bucyrus International, Inc. (Class A Stock)(a) | | | 3,823,875 |
| 900 | | Cascade Corp. | | | 56,682 |
| 25,006 | | Kadant, Inc.*(a) | | | 811,945 |
| 25,450 | | Kennametal, Inc. | | | 2,321,294 |
| 22,350 | | Lincoln Electric Holdings, Inc. | | | 1,614,787 |
| 61,100 | | Mueller Industries, Inc.(a) | | | 2,197,156 |
| 400 | | NACCO Industries, Inc. (Class A Stock) | | | 41,436 |
| 8,875 | | Nordson Corp. | | | 474,813 |
| 5,575 | | Rofin-Sinar Technologies, Inc.* | | | 438,307 |
| 1,100 | | Smith A.O. Corp. | | | 41,129 |
| 1,100 | | Tennant Co. | | | 51,876 |
| 4,700 | | Wabtec Corp. | | | 176,391 |
| | | | | |
| | | | | 18,416,880 |
| | | | | |
| | |
| | Manufacturing—1.9% | | | |
| 600 | | Ameron International Corp. | | | 64,722 |
| 2,700 | | Ceradyne, Inc.* | | | 184,707 |
| 4,800 | | EnPro Industries, Inc.* | | | 196,848 |
| 57,144 | | Federal Signal Corp. | | | 765,158 |
| 52,200 | | Harsco Corp. | | | 3,164,364 |
| 115,000 | | Hexel Corp.*(a) | | | 2,878,450 |
| 24,300 | | Winnebago Industries, Inc.(a) | | | 626,454 |
| | | | | |
| | | | | 7,880,703 |
| | | | | |
| | |
| | Marine—0.4% | | | |
| 3,200 | | Arlington Tankers Ltd. | | | 78,720 |
| 1,000 | | DryShips, Inc. (Greece) | | | 117,860 |
| 10,400 | | Excel Maritime Carriers Ltd. (Greece) | | | 734,136 |
| 4,200 | | Genco Shipping & Trading Ltd. | | | 301,938 |
| 17,000 | | Quintana Maritime Ltd. (Greece) | | | 475,150 |
| | | | | |
| | | | | 1,707,804 |
| | | | | |
| | |
| | Media—0.7% | | | |
| 114,021 | | Belo Corp. (Class A Stock)(a) | | | 2,109,389 |
| 12,474 | | Courier Corp.(a) | | | 471,392 |
| 7,700 | | Lee Enterprises, Inc. | | | 123,585 |
| 400 | | Media General, Inc. (Class A Stock) | | | 11,192 |
| 12,400 | | Radio One, Inc. (Class D Stock)* | | | 43,276 |
| 2,700 | | Scholastic Corp.* | | | 106,866 |
| 10,100 | | Sinclair Broadcast Group, Inc. (Class A Stock) | | | 121,604 |
| 4,300 | | Westwood One, Inc. | | | 9,202 |
| | | | | |
| | | | | 2,996,506 |
| | | | | |
See Notes to Financial Statements.
| | |
| THE TARGET PORTFOLIO TRUST | | 67 |
| | |
Small Capitalization Value Portfolio (continued) | | Portfolio of Investments
As of October 31, 2007 |
| | | | | |
| SHARES | | DESCRIPTION | | VALUE (NOTE 1) |
| | | | | |
| | COMMON STOCKS (continued) | | | |
| | |
| | Medical Products | | | |
| 100 | | Martek Bioscience Corp.* | | $ | 3,055 |
| 2,200 | | Savient Pharmaceuticals, Inc.* | | | 30,976 |
| | | | | |
| | | | | 34,031 |
| | | | | |
| | |
| | Medical Supplies & Equipment—0.8% | | | |
| 1,100 | | Acadia Pharmaceuticals, Inc.* | | | 16,918 |
| 700 | | Adams Respiratory Therapeutics, Inc.* | | | 30,758 |
| 1,300 | | Advanced Energy Industries, Inc.* | | | 20,800 |
| 700 | | Arena Pharmaceuticals, Inc.* | | | 6,727 |
| 4,400 | | Conmed Corp.* | | | 125,136 |
| 3,793 | | DJO, Inc.* | | | 189,460 |
| 2,100 | | Exelixis, Inc.* | | | 23,100 |
| 2,300 | | Greatbatch, Inc.* | | | 57,178 |
| 13,987 | | Medical Action Industries, Inc.* | | | 287,573 |
| 400 | | Medivation, Inc.* | | | 8,356 |
| 15,309 | | Orthofix International NV*(a) | | | 825,155 |
| 46,311 | | PSS World Medical, Inc.* | | | 935,482 |
| 1,100 | | STERIS Corp. | | | 31,944 |
| 100 | | SurModics, Inc.* | | | 5,674 |
| 46,197 | | Symmetry Medical, Inc.*(a) | | | 792,279 |
| | | | | |
| | | | | 3,356,540 |
| | | | | |
| | |
| | Metals & Mining—4.0% | | | |
| 50,000 | | Agnico-Eagle Mines Ltd. (Canada) | | | 2,844,500 |
| 4,800 | | Century Aluminum Co.* | | | 279,312 |
| 18,825 | | Cleveland-Cliffs, Inc. | | | 1,800,611 |
| 70,000 | | Commercial Metals Co. | | | 2,196,600 |
| 12,500 | | GrafTech International Ltd.* | | | 236,250 |
| 400,000 | | IAMGOLD Corp. | | | 3,508,000 |
| 53,500 | | Quanex Corp.(a) | | | 2,203,665 |
| 50,000 | | Royal Gold, Inc. | | | 1,767,000 |
| 800 | | Schnitzer Steel Industries, Inc. (Class A Stock) | | | 52,856 |
| 63,800 | | Timken Co. | | | 2,121,988 |
| 600 | | USEC, Inc.* | | | 5,280 |
| | | | | |
| | | | | 17,016,062 |
| | | | | |
| | |
| | Multi-Utilities—0.8% | | | |
| 19,200 | | Oge Energy Corp. | | | 735,360 |
| 91,725 | | Vectren Corp. | | | 2,571,969 |
| | | | | |
| | | | | 3,307,329 |
| | | | | |
| | |
| | Office Equipment | | | |
| 5,100 | | IKON Office Solutions, Inc. | | | 67,320 |
| | | | | |
| | |
| | Oil & Gas—0.8% | | | |
| 75,000 | | St. Mary Land & Exploration Co. | | | 3,177,000 |
| | | | | |
See Notes to Financial Statements.
| | |
| 68 | | THE TARGET PORTFOLIO TRUST |
| | | | | |
| SHARES | | DESCRIPTION | | VALUE (NOTE 1) |
| | | | | |
| | COMMON STOCKS (continued) | | | |
| | |
| | Oil & Gas Exploration/Production—1.5% | | | |
| 162,700 | | Cabot Oil & Gas Corp. | | $ | 6,457,563 |
| | | | | |
| | |
| | Oil, Gas & Consumable Fuels—4.3% | | | |
| 4,300 | | Alon USA Energy, Inc. | | | 158,111 |
| 14,675 | | Arena Resources, Inc.*(a) | | | 535,784 |
| 31,634 | | Berry Petroleum Co. (Class A Stock)(a) | | | 1,541,208 |
| 1,700 | | Bois d’Arc Energy, Inc.* | | | 37,298 |
| 1,100 | | Callon Petroleum Co.* | | | 16,038 |
| 60,000 | | Cimarex Energy Co.(a) | | | 2,430,600 |
| 1,500 | | Comstock Resources, Inc.* | | | 54,825 |
| 23,325 | | Concho Resources, Inc.* | | | 454,604 |
| 22,025 | | Continental Resources, Inc.* | | | 517,808 |
| 1,377 | | Energy Partners Ltd.* | | | 21,137 |
| 1,187 | | Exterran Holdings, Inc.* | | | 99,945 |
| 19,975 | | Gulfport Energy Corp.* | | | 442,247 |
| 3,400 | | Harvest Natural Resources, Inc.* | | | 46,784 |
| 50,000 | | Lufkin Industries, Inc.(a) | | | 2,973,000 |
| 2,600 | | Mariner Energy, Inc.* | | | 65,000 |
| 3,500 | | New Jersey Resources Corp. | | | 172,375 |
| 2,900 | | Nicor, Inc. | | | 125,483 |
| 14,375 | | Oil States International, Inc.*(a) | | | 620,856 |
| 38,200 | | ONEOK, Inc. | | | 1,907,708 |
| 26,775 | | Petrohawk Energy Corp.*(a) | | | 495,338 |
| 35,225 | | Petroquest Energy, Inc.* | | | 454,403 |
| 900 | | Rosetta Resources, Inc.* | | | 17,100 |
| 1,500 | | RPC, Inc. | | | 16,770 |
| 1,900 | | South Jersey Industries, Inc. | | | 71,364 |
| 2,000 | | Stone Energy Corp.* | | | 89,160 |
| 7,925 | | Superior Energy Services, Inc.* | | | 293,859 |
| 4,800 | | Trico Marine Services, Inc.* | | | 155,760 |
| 3,200 | | Tsakos Energy Navigation Ltd. (Greece) | | | 222,688 |
| 2,200 | | Union Drilling, Inc.* | | | 29,326 |
| 36,800 | | W&T Offshore, Inc. | | | 986,976 |
| 55,000 | | Western Refining, Inc. | | | 2,017,400 |
| 35,000 | | World Fuel Services Corp. | | | 1,550,150 |
| | | | | |
| | | | | 18,621,105 |
| | | | | |
| | |
| | Paper & Forest Products—0.3% | | | |
| 9,700 | | Buckeye Technologies, Inc.* | | | 173,824 |
| 34,257 | | Neenah Paper, Inc.(a) | | | 1,164,738 |
| 3,300 | | Schweitzer-Mauduit International, Inc. | | | 92,466 |
| | | | | |
| | | | | 1,431,028 |
| | | | | |
| | |
| | Personnel Services | | | |
| 2,100 | | Goodman Global, Inc.* | | | 51,765 |
| 2,600 | | Kforce, Inc.* | | | 31,304 |
| | | | | |
| | | | | 83,069 |
| | | | | |
See Notes to Financial Statements.
| | |
| THE TARGET PORTFOLIO TRUST | | 69 |
| | |
Small Capitalization Value Portfolio (continued) | | Portfolio of Investments
As of October 31, 2007 |
| | | | | |
| SHARES | | DESCRIPTION | | VALUE (NOTE 1) |
| | | | | |
| | COMMON STOCKS (continued) | | | |
| | |
| | Pharmaceuticals—0.1% | | | |
| 900 | | Alpharma, Inc. (Class A Stock)* | | $ | 18,558 |
| 700 | | Auxilium Pharmaceuticals, Inc.* | | | 18,487 |
| 1,100 | | Barrier Therapeutics, Inc.* | | | 5,203 |
| 4,100 | | Bionovo, Inc.* | | | 9,676 |
| 800 | | Bradley Pharmaceuticals, Inc.* | | | 15,736 |
| 2,800 | | Cypress Bioscience, Inc.* | | | 37,772 |
| 800 | | Intermune, Inc.* | | | 15,936 |
| 4,593 | | Kendle International, Inc.*(a) | | | 185,236 |
| 700 | | Onyx Pharmaceuticals, Inc.* | | | 32,697 |
| 700 | | Par Pharmaceutical Cos., Inc.* | | | 12,908 |
| 500 | | Prestige Brands Holdings, Inc.* | | | 5,230 |
| 500 | | Sucampo Pharmaceuticals, Inc.* | | | 6,500 |
| 1,400 | | Uluru, Inc.* | | | 5,866 |
| 400 | | United Therapeutics Corp.* | | | 27,376 |
| 1,200 | | Valeant Pharmaceuticals International* | | | 17,460 |
| 4,000 | | Viropharma, Inc.* | | | 34,440 |
| | | | | |
| | | | | 449,081 |
| | | | | |
| | |
| | Real Estate—0.9% | | | |
| 1,500 | | Equity Lifestyle Properties, Inc. | | | 75,360 |
| 15,900 | | First Industrial Realty Trust, Inc.(a) | | | 647,925 |
| 30,000 | | Healthcare Realty Trust, Inc.(a) | | | 793,200 |
| 2,400 | | HFF, Inc.* | | | 24,120 |
| 105,000 | | HRPT Properties Trust(a) | | | 985,950 |
| 300 | | James River Group, Inc. | | | 10,290 |
| 9,000 | | Northstar Realty Finance Corp. | | | 84,150 |
| 22,213 | | Potlatch Corp. | | | 1,058,672 |
| | | | | |
| | | | | 3,679,667 |
| | | | | |
| | |
| | Real Estate Investment Trust—Office Industrial | | | |
| 4,700 | | BioMed Realty Trust, Inc. | | | 112,283 |
| | | | | |
| | |
| | Real Estate Investment Trust—Other REIT | | | |
| 800 | | OMEGA Healthcare Investors, Inc. | | | 13,384 |
| | | | | |
| | |
| | Real Estate Investment Trusts—2.3% | | | |
| 11,500 | | Anthracite Capital, Inc. | | | 95,680 |
| 22,970 | | Arbor Realty Trust, Inc.(a) | | | 433,674 |
| 5,600 | | Ashford Hospitality Trust, Inc. | | | 55,104 |
| 800 | | Capital Trust, Inc. (Class A Stock) | | | 26,976 |
| 56,882 | | Education Realty Trust, Inc. | | | 736,053 |
| 73,452 | | Equity One, Inc.(a) | | | 1,922,973 |
| 1,100 | | Extra Space Storage, Inc. | | | 17,292 |
| 11,800 | | FelCor Lodging Trust, Inc. | | | 247,092 |
| 3,400 | | First Potomac Realty Trust | | | 71,060 |
See Notes to Financial Statements.
| | |
| 70 | | THE TARGET PORTFOLIO TRUST |
| | | | | |
| SHARES | | DESCRIPTION | | VALUE (NOTE 1) |
| | | | | |
| | COMMON STOCKS (continued) | | | |
| | |
| | Real Estate Investment Trusts (cont’d.) | | | |
| 1,100 | | Gramercy Capital Corp. | | $ | 29,007 |
| 600 | | Home Properties, Inc. | | | 30,852 |
| 5,500 | | IMPAC Mortgage Holdings, Inc. | | | 6,160 |
| 3,900 | | Inland Real Estate Corp. | | | 58,110 |
| 12,600 | | Lexington Corporate Properties Trust | | | 249,354 |
| 2,600 | | LTC Properties, Inc. | | | 65,884 |
| 1,300 | | Maguire Properties, Inc. | | | 35,425 |
| 102,852 | | MFA Mortgage Investments, Inc. | | | 880,413 |
| 21,426 | | Mid-America Apartment Communities, Inc.(a) | | | 1,114,152 |
| 31,100 | | Nationwide Health Properties, Inc.(a) | | | 970,942 |
| 3,200 | | Parkway Properties, Inc. | | | 137,600 |
| 5,500 | | Pennsylvania Real Estate Investment Trust | | | 209,825 |
| 2,400 | | Saul Centers, Inc. | | | 131,568 |
| 6,100 | | Senior Housing Properties Trust | | | 136,762 |
| 14,800 | | SL Green Realty Corp.(a) | | | 1,785,768 |
| 5,400 | | Sunstone Hotel Investors, Inc. | | | 150,174 |
| | | | | |
| | | | | 9,597,900 |
| | | | | |
| | |
| | Registered Investment Companies | | | |
| 6,189 | | Technology Investment Capital Corp. | | | 80,766 |
| | | | | |
| | |
| | Restaurants—0.1% | | | |
| 22,650 | | AFC Enterprises, Inc.* | | | 302,377 |
| 21,699 | | Triarc Cos., Inc. (Class B Stock) | | | 243,029 |
| | | | | |
| | | | | 545,406 |
| | | | | |
| | |
| | Retail—1.8% | | | |
| 7,500 | | Asbury Automotive Group, Inc. | | | 137,475 |
| 38,657 | | Cash America International, Inc. | | | 1,507,623 |
| 40,957 | | CSK Auto Corp.*(a) | | | 466,910 |
| 1,400 | | Group 1 Automotive, Inc. | | | 43,470 |
| 1,200 | | Insight Enterprises, Inc.* | | | 33,168 |
| 24,005 | | Men’s Wearhouse, Inc. (The)(a) | | | 1,014,451 |
| 900 | | Movado Group, Inc. | | | 27,081 |
| 40,372 | | Pantry, Inc. (The)*(a) | | | 1,131,223 |
| 40,293 | | Regis Corp. | | | 1,353,845 |
| 40,800 | | Sonic Automotive, Inc.(a) | | | 1,030,608 |
| 19,425 | | Stage Stores, Inc.(a) | | | 364,413 |
| 76,300 | | Stein Mart, Inc. | | | 501,291 |
| 2,500 | | Systemax, Inc. | | | 58,500 |
| | | | | |
| | | | | 7,670,058 |
| | | | | |
| | |
| | Retail & Merchandising—0.6% | | | |
| 42,867 | | Bebe Stores, Inc.(a) | | | 596,280 |
| 3,500 | | Collective Brands, Inc.* | | | 64,715 |
| 400 | | Deckers Outdoor Corp.* | | | 55,916 |
| 18,867 | | Dillard’s, Inc. (Class A Stock)(a) | | | 434,507 |
| 25,642 | | Finish Line, Inc. (The)(a) | | | 96,158 |
See Notes to Financial Statements.
| | |
| THE TARGET PORTFOLIO TRUST | | 71 |
| | |
Small Capitalization Value Portfolio (continued) | | Portfolio of Investments
As of October 31, 2007 |
| | | | | |
| SHARES | | DESCRIPTION | | VALUE (NOTE 1) |
| | | | | |
| | COMMON STOCKS (continued) | | | |
| | |
| | Retail & Merchandising (cont’d.) | | | |
| 68,809 | | Pacific Sunwear of California, Inc.*(a) | | $ | 1,150,486 |
| 600 | | Shoe Carnival, Inc.* | | | 9,588 |
| 300 | | Tween Brands, Inc.* | | | 9,210 |
| | | | | |
| | | | | 2,416,860 |
| | | | | |
| | |
| | Retail—Restaurants | | | |
| 4,700 | | Domino’s Pizza, Inc. | | | 72,568 |
| | | | | |
| | |
| | Retail Apparel | | | |
| 1,300 | | Dress Barn, Inc.* | | | 21,307 |
| 1,300 | | Warnaco Group, Inc. (The)* | | | 52,897 |
| | | | | |
| | | | | 74,204 |
| | | | | |
| | |
| | Road & Rail—0.7% | | | |
| 40,000 | | Arkansas Best Corp. | | | 1,098,000 |
| 95,000 | | Werner Enterprises, Inc. | | | 1,806,900 |
| | | | | |
| | | | | 2,904,900 |
| | | | | |
| | |
| | Semiconductors—1.6% | | | |
| 1,100 | | Actel Corp.* | | | 12,529 |
| 3,000 | | AMIS Holdings, Inc.* | | | 23,010 |
| 5,000 | | Amkor Technology, Inc.* | | | 56,650 |
| 4,600 | | Applied Micro Circuits Corp.* | | | 14,812 |
| 5,100 | | Asyst Technologies Corp.* | | | 24,480 |
| 10,475 | | ATMI, Inc.* | | | 336,666 |
| 4,600 | | Axcelis Technologies, Inc.* | | | 21,574 |
| 31,875 | | Brooks Automation, Inc.*(a) | | | 413,737 |
| 3,800 | | Cirrus Logic, Inc.* | | | 23,370 |
| 1,200 | | Cohu, Inc. | | | 19,680 |
| 3,200 | | Credence System Corp.* | | | 9,760 |
| 1,000 | | DSP Group, Inc.* | | | 15,790 |
| 800 | | Eagle Test Systems, Inc.* | | | 10,112 |
| 61,192 | | Emulex Corp.*(a) | | | 1,325,419 |
| 5,658 | | Entegris, Inc.* | | | 51,658 |
| 1,000 | | Genesis Microchip, Inc.* | | | 7,380 |
| 34,200 | | Himax Technologies, Inc. (Taiwan) | | | 129,960 |
| 29,734 | | Itron, Inc.* | | | 3,196,108 |
| 2,500 | | Kulicke & Soffa Industries, Inc.* | | | 18,925 |
| 3,000 | | Lattice Semiconductor Corp.* | | | 12,540 |
| 15,900 | | Microsemi Corp.*(a) | | | 423,099 |
| 2,600 | | MKS Instruments, Inc.* | | | 52,208 |
| 4,300 | | ON Semiconductor Corp.* | | | 43,860 |
| 600 | | Pericom Semiconductor Corp.* | | | 8,964 |
| 1,700 | | Photronics, Inc.* | | | 18,598 |
| 37,979 | | Richardson Electronics Ltd. | | | 287,501 |
See Notes to Financial Statements.
| | |
| 72 | | THE TARGET PORTFOLIO TRUST |
| | | | | |
| SHARES | | DESCRIPTION | | VALUE (NOTE 1) |
| | | | | |
| | COMMON STOCKS (continued) | | | |
| | |
| | Semiconductors (cont’d.) | | | |
| 3,100 | | Skyworks Solutions, Inc.* | | $ | 28,582 |
| 1,200 | | Standard Microsystems Corp.* | | | 46,800 |
| 11,825 | | Ultra Clean Holdings* | | | 151,833 |
| 7,400 | | Zoran Corp.* | | | 188,700 |
| | | | | |
| | | | | 6,974,305 |
| | | | | |
| | |
| | Software | | | |
| 1,600 | | CSG Systems International, Inc.* | | | 32,848 |
| 4,500 | | Lawson Software, Inc.* | | | 50,805 |
| | | | | |
| | | | | 83,653 |
| | | | | |
| | |
| | Specialty Retail—0.4% | | | |
| 70,575 | | Aaron Rents, Inc.(a) | | | 1,494,778 |
| 14,175 | | Monro Muffler Brake, Inc. | | | 322,907 |
| | | | | |
| | | | | 1,817,685 |
| | | | | |
| | |
| | Telecommunications—1.3% | | | |
| 2,600 | | Adaptec, Inc.* | | | 9,178 |
| 1,400 | | Anixter International, Inc.* | | | 100,590 |
| 92,625 | | Arris Group, Inc.*(a) | | | 1,065,188 |
| 600 | | Atlantic Tele-Network, Inc. | | | 21,546 |
| 1,300 | | Authorize.Net Holdings, Inc.* | | | 30,381 |
| 27,839 | | Black Box Corp.(a) | | | 1,113,003 |
| 900 | | C-COR, Inc.* | | | 11,034 |
| 3,200 | | Centennial Communications Corp.* | | | 32,768 |
| 45,000 | | Cincinnati Bell, Inc.* | | | 243,900 |
| 11,625 | | CommScope, Inc.*(a) | | | 548,351 |
| 5,600 | | Dobson Communications Corp. (Class A Stock)* | | | 72,464 |
| 3,100 | | Finisar Corp.* | | | 7,192 |
| 2,400 | | Foundry Networks, Inc.* | | | 50,736 |
| 1,900 | | General Communication, Inc. (Class A Stock)* | | | 22,287 |
| 2,900 | | MasTec, Inc.* | | | 45,791 |
| 2,800 | | MRV Communications, Inc.* | | | 7,952 |
| 3,100 | | Newport Corp.* | | | 42,377 |
| 900 | | North Pittsburgh Systems, Inc. | | | 21,852 |
| 37,945 | | Plantronics, Inc. | | | 1,037,796 |
| 1,100 | | Polycom, Inc.* | | | 30,778 |
| 136,615 | | Powerwave Technologies, Inc.*(a) | | | 759,579 |
| 15,300 | | Premiere Global Services, Inc.* | | | 252,144 |
| 2,900 | | RF Micro Devices, Inc.* | | | 18,038 |
| 600 | | SureWest Communications | | | 15,888 |
| 4,400 | | Sycamore Networks, Inc.* | | | 18,788 |
| 1,200 | | Syniverse Holdings, Inc.* | | | 20,028 |
| 1,900 | | Utstarcom, Inc.* | | | 6,080 |
| | | | | |
| | | | | 5,605,709 |
| | | | | |
| | |
| | Textiles & Apparel—0.9% | | | |
| 25,625 | | Brown Shoe Co., Inc. | | | 522,750 |
| 7,897 | | Columbia Sportswear Co.(a) | | | 384,979 |
See Notes to Financial Statements.
| | |
| THE TARGET PORTFOLIO TRUST | | 73 |
| | |
Small Capitalization Value Portfolio (continued) | | Portfolio of Investments
As of October 31, 2007 |
| | | | | | |
| SHARES | | DESCRIPTION | | VALUE (NOTE 1) |
| | | | | | |
| | | COMMON STOCKS (continued) | | | |
| | |
| | | Textiles & Apparel (cont’d.) | | | |
| | 26,800 | | Kellwood Co.(a) | | $ | 444,076 |
| | 200 | | Oxford Industries, Inc. | | | 5,182 |
| | 3,150 | | Perry Ellis International, Inc.* | | | 73,080 |
| | 46,900 | | Phillips-Van Heusen Corp. | | | 2,241,820 |
| | | | | | |
| | | | | | 3,671,887 |
| | | | | | |
| | |
| | | Thrifts & Mortgage Finance—0.7% | | | |
| | 80,600 | | Astoria Financial Corp. | | | 2,094,794 |
| | 29,540 | | Washington Federal, Inc. | | | 713,686 |
| | | | | | |
| | | | | | 2,808,480 |
| | | | | | |
| | |
| | | Tobacco—0.4% | | | |
| | 30,300 | | Alliance One International, Inc.* | | | 197,859 |
| | 1,000 | | Loews Corp. - Carolina Group | | | 85,780 |
| | 28,500 | | Universal Corp.(a) | | | 1,389,090 |
| | | | | | |
| | | | | | 1,672,729 |
| | | | | | |
| | |
| | | Trading Companies & Distributors—0.3% | | | |
| | 27,900 | | Watsco, Inc. | | | 1,161,756 |
| | | | | | |
| | |
| | | Transportation—1.0% | | | |
| | 1,700 | | Atlas Air Worldwide Holdings, Inc.* | | | 99,603 |
| | 900 | | Bristow Group, Inc.* | �� | | 44,901 |
| | 2,300 | | Eagle Bulk Shipping, Inc. | | | 78,407 |
| | 11,425 | | Forward Air Corp.(a) | | | 372,798 |
| | 5,000 | | Frontline Ltd. (Bermuda)(a) | | | 227,000 |
| | 75,000 | | General Maritime Corp. (Marshall Island)(a) | | | 2,113,500 |
| | 6,600 | | Gulfmark Offshore, Inc.* | | | 307,428 |
| | 24,867 | | Kansas City Southern*(a) | | | 962,104 |
| | 1,600 | | Knightsbridge Tankers Ltd. (Bermuda) | | | 40,768 |
| | 2,700 | | TBS International Ltd. (Bermuda)* | | | 169,668 |
| | | | | | |
| | | | | | 4,416,177 |
| | | | | | |
| | |
| | | Water Utilities | | | |
| | 600 | | American States Water Co. | | | 27,270 |
| | | | | | |
| | | TOTAL LONG-TERM INVESTMENTS
(cost $353,266,192) | | | 421,605,771 |
| | | | | | |
| | |
| | | SHORT-TERM INVESTMENTS—46.7% | | | |
Principal
Amount (000)# | | | | |
| | |
| | | U.S. Treasury Obligation | | | |
| $ | 100 | | U.S. Treasury Notes | | | |
| | | 4.25%, 11/30/07
(cost $99,955)(k) | | | 99,992 |
| | | | | | |
See Notes to Financial Statements.
| | |
| 74 | | THE TARGET PORTFOLIO TRUST |
| | | | | | |
| SHARES | | DESCRIPTION | | VALUE (NOTE 1) | |
| | | | | | |
| | Affiliated Money Market Mutual Fund—46.7% | | | | |
| 199,150,843 | | Dryden Core Investment Fund—Taxable Money Market Series
(cost $199,150,843; includes $192,092,845 of cash collateral for securities on loan)(b)(w) | | $ | 199,150,843 | |
| | | | | | |
| | TOTAL SHORT-TERM INVESTMENTS
(cost $199,250,798) | | | 199,250,835 | |
| | | | | | |
| | TOTAL INVESTMENTS—145.5%
(cost $552,516,990; Note 5) | | | 620,856,606 | |
| | Liabilities in excess of other assets(x)—(45.5%) | | | (194,054,331 | ) |
| | | | | | |
| | NET ASSETS—100% | | $ | 426,802,275 | |
| | | | | | |
The following abbreviation was used in portfolio descriptions:
REIT—Real Estate Investment Trust
| * | Non-income producing security. |
| # | Principal amount is shown in U.S. dollars unless otherwise stated. |
| (a) | All or a portion of security is on loan. The aggregate market value of such securities is $187,326,512; cash collateral of $192,092,845 (included with liabilities) was received with which the portfolio purchased highly liquid short-term investments. |
| (b) | Represents security, or a portion thereof, purchased with cash collateral received for securities on loan. |
| (k) | Securities segregated as collateral for futures contracts. |
| (w) | Prudential Investments LLC, the manager of the Portfolio also serves as manager of the Dryden Core Investment Fund—Taxable Money Market Series. |
| (x) | Liabilities in excess of other assets includes unrealized appreciation on futures contracts as follows: |
Open futures contract outstanding at October 31, 2007:
| | | | | | | | | | | | | |
Number of
Contracts | | Type | | Expiration
Date | | Value at
Trade Date | | Value at
October 31,
2007 | | Unrealized
Appreciation |
| Long Positions: | | | | | | | | | | | | | |
| 3 | | Russell 2000 | | Dec 07 | | $ | 1,223,875 | | $ | 1,248,450 | | $ | 24,575 |
| | | | | | | | | | | | | |
The industry classification of investments and liabilities in excess of other assets shown as a percentage of net assets as of October 31, 2007 were as follows:
| | | |
Affiliated Money Market Mutual Fund
(45.0% represents investments purchased with collateral from securities on loan) | | 46.7 | % |
Insurance | | 5.3 | |
Banks | | 5.0 | |
Oil, Gas & Consumable Fuels | | 4.3 | |
Machinery | | 4.3 | |
Financial Services | | 4.1 | |
Chemicals | | 4.0 | |
Metals & Mining | | 4.0 | |
Gas & Pipeline Utilities | | 3.9 | |
Electronics | | 3.4 | |
Computer Services & Software | | 2.7 | |
Aerospace/Defense | | 2.7 | |
Electronic Components | | 2.5 | |
Healthcare Providers & Services | | 2.4 | |
Food Products | | 2.3 | |
See Notes to Financial Statements.
| | |
| THE TARGET PORTFOLIO TRUST | | 75 |
| | |
Small Capitalization Value Portfolio (continued) | | Portfolio of Investments
As of October 31, 2007 |
| | | |
Industry (cont’d.) | | | |
Real Estate Investment Trusts | | 2.3 | % |
Electric Utilities | | 1.9 | |
Manufacturing | | 1.9 | |
Retail | | 1.8 | |
Consumer Products & Services | | 1.7 | |
Commercial Services & Supplies | | 1.6 | |
Semiconductors | | 1.6 | |
Commercial Services | | 1.5 | |
Building Products | | 1.5 | |
Oil & Gas Exploration/Production | | 1.5 | |
Industrial Products | | 1.3 | |
Telecommunications | | 1.3 | |
Energy Equipment & Services | | 1.3 | |
Business Services | | 1.2 | |
Auto Related | | 1.1 | |
Drugs & Healthcare | | 1.1 | |
Financial—Bank & Trust | | 1.0 | |
Transportation | | 1.0 | |
Computer Hardware | | 1.0 | |
Hotels, Restaurants & Leisure | | 0.9 | |
Exchange Traded Funds | | 0.9 | |
Real Estate | | 0.9 | |
Textiles & Apparel | | 0.9 | |
Healthcare Services | | 0.9 | |
Airlines | | 0.9 | |
Containers & Packaging | | 0.8 | |
Electrical Equipment | | 0.8 | |
Medical Supplies & Equipment | | 0.8 | |
Multi-Utilities | | 0.8 | |
Oil & Gas | | 0.8 | |
Media | | 0.7 | |
Road & Rail | | 0.7 | |
Thrifts & Mortgage Finance | | 0.7 | |
Household Durables | | 0.6 | |
Retail & Merchandising | | 0.6 | |
Environmental Services | | 0.6 | |
Specialty Retail | | 0.4 | |
Construction | | 0.4 | |
Marine | | 0.4 | |
Tobacco | | 0.4 | |
Beverages | | 0.4 | |
Distribution/Wholesale | | 0.4 | |
Entertainment & Leisure | | 0.3 | |
Automobile Manufacturers | | 0.3 | |
Paper & Forest Products | | 0.3 | |
Diversified Telecommunication Services | | 0.3 | |
Home Builders | | 0.3 | |
See Notes to Financial Statements.
| | |
| 76 | | THE TARGET PORTFOLIO TRUST |
| | | |
Industry (cont’d.) | | | |
Drugs & Medicine | | 0.3 | % |
Trading Companies & Distributors | | 0.3 | |
Commercial Banks | | 0.3 | |
Healthcare Equipment & Supplies | | 0.2 | |
Food & Staples Retailing | | 0.2 | |
Foods | | 0.2 | |
Capital Markets | | 0.2 | |
Clothing & Apparel | | 0.2 | |
Internet Services | | 0.2 | |
Industrial Conglomerates | | 0.1 | |
Restaurants | | 0.1 | |
Pharmaceuticals | | 0.1 | |
Consumer Finance | | 0.1 | |
Household Products | | 0.1 | |
Diversified Financials | | 0.1 | |
Internet Software & Services | | 0.1 | |
Broadcasting | | 0.1 | |
Leisure Equipment & Products | | 0.1 | |
Leisure | | 0.1 | |
| | | |
| | 145.5 | |
Liabilities in excess of other assets | | (45.5 | ) |
| | | |
| | 100.0 | % |
| | | |
See Notes to Financial Statements.
| | |
| THE TARGET PORTFOLIO TRUST | | 77 |
| | |
| International Equity Portfolio | | Portfolio of Investments
As of October 31, 2007 |
| | | | | |
| SHARES | | DESCRIPTION | | VALUE (NOTE 1) |
| | | | | |
| | LONG-TERM INVESTMENTS—99.2% | | | |
| | |
| | COMMON STOCKS | | | |
| | |
| | Australia—2.6% | | | |
| 59,700 | | AWB Ltd. | | $ | 167,240 |
| 123,600 | | Bluescope Steel Ltd. | | | 1,232,810 |
| 44,900 | | Commonwealth Bank of Australia | | | 2,585,985 |
| 154,900 | | Pacific Brands Ltd. | | | 500,999 |
| 278,900 | | Qantas Airways Ltd. | | | 1,542,435 |
| 56,600 | | Santos Ltd. | | | 747,076 |
| 238,000 | | Telestra Corp. Ltd. | | | 1,041,662 |
| 30,500 | | Zinifex Ltd. | | | 482,681 |
| | | | | |
| | | | | 8,300,888 |
| | | | | |
| | |
| | Belgium—0.6% | | | |
| 28,600 | | AGFA-Gevaert NV | | | 397,297 |
| 10,300 | | Dexia | | | 330,328 |
| 37,500 | | Fortis | | | 1,198,305 |
| | | | | |
| | | | | 1,925,930 |
| | | | | |
| | |
| | Brazil—0.7% | | | |
| 45,500 | | Empresa Brasileira de Aeronautica SA, ADR | | | 2,219,035 |
| | | | | |
| | |
| | Canada—4.8% | | | |
| 60,800 | | Canadian National Railway Co. | | | 3,410,567 |
| 32,500 | | Canadian Natural Resources Ltd. | | | 2,702,800 |
| 47,000 | | Potash Corp. of Saskatchewan | | | 5,772,540 |
| 70,200 | | Rogers Communications, Inc. (Class B Stock) | | | 3,577,439 |
| | | | | |
| | | | | 15,463,346 |
| | | | | |
| | |
| | China—2.7% | | | |
| 424,602 | | China Merchants Bank Co. Ltd. | | | 2,189,367 |
| 2,264,543 | | China Petroleum & Chemical Corp. | | | 3,605,686 |
| 1,810,400 | | Country Garden Holdings Co. Ltd.* | | | 2,983,239 |
| | | | | |
| | | | | 8,778,292 |
| | | | | |
| | |
| | Denmark—2.6% | | | |
| 18,000 | | Carlsberg AS | | | 2,424,325 |
| 21,000 | | Danske Bank SA | | | 925,447 |
| 19,000 | | H Lundbeck AS | | | 543,743 |
| 36,108 | | Novo Nordisk SA (Class B Stock) | | | 4,477,228 |
| | | | | |
| | | | | 8,370,743 |
| | | | | |
| | |
| | Finland—3.4% | | | |
| 107,200 | | Fortum Oyj | | | 4,647,637 |
| 111,300 | | Nokia Oyj | | | 4,409,437 |
| 22,500 | | Rautaruukki Oyj | | | 1,287,390 |
| 21,800 | | Tietoenator Oyj | | | 534,619 |
| | | | | |
| | | | | 10,879,083 |
| | | | | |
See Notes to Financial Statements.
| | |
| 78 | | THE TARGET PORTFOLIO TRUST |
| | | | | |
| SHARES | | DESCRIPTION | | VALUE (NOTE 1) |
| | | | | |
| | COMMON STOCKS (continued) | | | |
| | |
| | France—11.1% | | | |
| 31,950 | | Air Liquide | | $ | 4,396,220 |
| 320 | | Arkema* | | | 21,768 |
| 94,600 | | AXA SA | | | 4,228,806 |
| 23,900 | | BNP Paribas | | | 2,634,245 |
| 2,100 | | Ciments Francais SA | | | 394,509 |
| 6,100 | | CNP Assurances | | | 777,488 |
| 10,700 | | Compagnie Generale des Establissements Michelin (Class B Stock) | | | 1,432,608 |
| 32,000 | | Credit Agricole SA | | | 1,264,982 |
| 100,400 | | France Telecom SA | | | 3,702,736 |
| 41,700 | | Groupe Danone | | | 3,574,113 |
| 30,911 | | LVMH Moet Hennessy Louis Vuitton SA | | | 3,979,677 |
| 23,000 | | Natixis | | | 509,741 |
| 15,000 | | Peugeot SA | | | 1,390,164 |
| 11,300 | | Rallye SA | | | 866,713 |
| 8,200 | | Renault SA | | | 1,376,664 |
| 18,500 | | Sanofi-Aventis SA | | | 1,622,351 |
| 5,900 | | Schneider Electric SA | | | 812,334 |
| 4,700 | | Societe Generale | | | 788,791 |
| 7,800 | | Thales SA | | | 486,067 |
| 12,800 | | Total SA | | | 1,031,824 |
| 7,200 | | Valeo SA | | | 394,339 |
| 10,000 | | Vivendi | | | 450,206 |
| | | | | |
| | | | | 36,136,346 |
| | | | | |
| | |
| | Germany—6.6% | | | |
| 49,100 | | BASF AG | | | 6,792,280 |
| 13,700 | | Daimler AG | | | 1,507,228 |
| 17,900 | | Deutsche Bank AG | | | 2,386,753 |
| 25,700 | | E.ON AG | | | 5,021,989 |
| 25,000 | | Heidelberger Druckmaschinen AG | | | 1,020,859 |
| 45,400 | | ThyssenKrupp AG | | | 3,025,132 |
| 26,000 | | TUI AG* | | | 769,436 |
| 3,600 | | Volkswagen AG | | | 1,031,998 |
| | | | | |
| | | | | 21,555,675 |
| | | | | |
| | |
| | Greece—0.9% | | | |
| 68,990 | | OPAP SA | | | 2,818,162 |
| | | | | |
| | |
| | Hong Kong—4.5% | | | |
| 1,150,400 | | Chaoda Modern Agriculture Holdings Ltd. | | | 1,049,905 |
| 276,678 | | China Mobile Ltd. | | | 5,719,894 |
| 200,000 | | Citic Pacific Ltd. | | | 1,261,175 |
| 102,600 | | Hong Kong Exchanges and Clearing Ltd. | | | 3,425,042 |
| 159,280 | | Orient Overseas International Ltd. | | | 1,644,380 |
| 1,193,400 | | Soho China Ltd.* | | | 1,536,741 |
| | | | | |
| | | | | 14,637,137 |
| | | | | |
See Notes to Financial Statements.
| | |
| THE TARGET PORTFOLIO TRUST | | 79 |
| | |
International Equity Portfolio (continued) | | Portfolio of Investments
As of October 31, 2007 |
| | | | | |
| SHARES | | DESCRIPTION | | VALUE (NOTE 1) |
| | | | | |
| | COMMON STOCKS (continued) | | | |
| | |
| | Ireland—1.2% | | | |
| 90,100 | | Allied Irish Banks PLC ( London Exchange) | | $ | 2,256,579 |
| 37,500 | | Allied Irish Banks PLC (Ireland Exchange) | | | 936,481 |
| 31,300 | | Irish Life & Permanent PLC | | | 709,379 |
| | | | | |
| | | | | 3,902,439 |
| | | | | |
| | |
| | Israel—2.1% | | | |
| 62,300 | | Amdocs Ltd.* | | | 2,143,120 |
| 110,100 | | Teva Pharmaceutical Industries Ltd., ADR | | | 4,845,501 |
| | | | | |
| | | | | 6,988,621 |
| | | | | |
| | |
| | Italy—2.3% | | | |
| 76,600 | | Eni SpA | | | 2,796,147 |
| 18,600 | | Finmeccanica SpA | | | 552,059 |
| 18,400 | | Indesit Co. SpA | | | 326,234 |
| 469,351 | | Intesa Sanpaolo SpA | | | 3,712,112 |
| | | | | |
| | | | | 7,386,552 |
| | | | | |
| | |
| | Japan—13.3% | | | |
| 4,650 | | Aiful Corp. | | | 109,731 |
| 30,300 | | Alpine Electronics, Inc. | | | 487,098 |
| 37,000 | | Alps Electric Co. Ltd. | | | 463,230 |
| 92,000 | | Asahi Kasei Corp. | | | 704,301 |
| 43,754 | | Canon, Inc. | | | 2,213,926 |
| 178,000 | | Cosmo Oil Co. Ltd. | | | 776,359 |
| 53,000 | | Daiwa Securities Group, Inc. | | | 510,764 |
| 145,000 | | Denki Kagaku Kogyo Kabushiki Kiasha | | | 852,998 |
| 34,600 | | Fanuc Ltd. | | | 3,792,836 |
| 137,000 | | Fuji Heavy Industries Ltd. | | | 712,067 |
| 21,400 | | Hokkaido Electric Power Co., Inc. | | | 461,789 |
| 48,200 | | Honda Motor Co. Ltd. | | | 1,804,939 |
| 11,000 | | Kansai Electric Power Co., Inc. (The) | | | 247,719 |
| 190,800 | | Kurabo Industries Ltd. | | | 459,118 |
| 17,300 | | Kyushu Electric Power Co., Inc. | | | 421,816 |
| 187,000 | | Marubeni Corp. | | | 1,605,667 |
| 34,000 | | Matsushita Electric Industrial Co. Ltd. | | | 649,255 |
| 88,700 | | Mitsubishi Chemical Holdings Corp. | | | 733,909 |
| 18,900 | | Nifco, Inc. | | | 442,201 |
| 10,089 | | Nintendo Co. Ltd. | | | 6,407,309 |
| 98,200 | | Nippon Oil Corp. | | | 869,727 |
| 200 | | Nippon Paper Group, Inc. | | | 598,848 |
| 23,000 | | Nippon Shokubai Co. Ltd. | | | 227,301 |
| 270 | | Nippon Telegraph & Telephone Corp. | | | 1,235,693 |
| 25,400 | | Nipro Corp. | | | 484,611 |
| 153,700 | | Nissan Motor Co. Ltd. | | | 1,763,364 |
| 64,900 | | Nomura Holdings, Inc. | | | 1,156,468 |
See Notes to Financial Statements.
| | |
| 80 | | THE TARGET PORTFOLIO TRUST |
| | | | | |
| SHARES | | DESCRIPTION | | VALUE (NOTE 1) |
| | | | | |
| | COMMON STOCKS (continued) | | | |
| | |
| | Japan (cont’d.) | | | |
| 900 | | NTT DoCoMo, Inc. | | $ | 1,309,404 |
| 55,000 | | Oji Paper Co. Ltd. | | | 251,239 |
| 14,100 | | Rengo Co. Ltd. | | | 101,808 |
| 35,300 | | Ricoh Co. Ltd. | | | 697,724 |
| 133,000 | | Sanwa Holdings Corp. | | | 701,420 |
| 23,600 | | Sumitomo Corp. | | | 411,204 |
| 68,000 | | Sumitomo Trust & Banking Co. Ltd. (The) | | | 507,008 |
| 12,100 | | Takefuji Corp. | | | 308,360 |
| 82,000 | | Tanabe Seiyaku Co. Ltd. | | | 944,821 |
| 45,000 | | Toppan Printing Co. Ltd. | | | 439,034 |
| 92,000 | | Toyota Motor Corp. | | | 5,266,467 |
| 18,756 | | Yamada Denki Co. Ltd. | | | 1,933,788 |
| | | | | |
| | | | | 43,065,321 |
| | | | | |
| | |
| | Liechtenstein—0.3% | | | |
| 3,300 | | Verwaltungs Und Privat Bank AG | | | 863,173 |
| | | | | |
| | |
| | Mexico—1.8% | | | |
| 50,500 | | America Movil SAB de CV, ADR (Class L Stock) | | | 3,302,195 |
| 621,200 | | Wal-Mart de Mexico SA de CV | | | 2,522,669 |
| | | | | |
| | | | | 5,824,864 |
| | | | | |
| | |
| | Netherlands—3.7% | | | |
| 59,700 | | ING Groep NV, ADR | | | 2,684,273 |
| 84,200 | | Koninklijke KPN NV | | | 1,588,012 |
| 14,200 | | Oce NV | | | 285,296 |
| 41,600 | | Royal Dutch Shell PLC (Class A Stock) | | | 1,821,036 |
| 73,212 | | Royal Dutch Shell PLC (Class B Stock) | | | 3,189,219 |
| 24,400 | | Schlumberger Ltd. | | | 2,356,308 |
| | | | | |
| | | | | 11,924,144 |
| | | | | |
| | |
| | New Zealand—0.1% | | | |
| 302,900 | | Air New Zealand Ltd. | | | 497,804 |
| | | | | |
| | |
| | Norway—0.4% | | | |
| 33,400 | | Norsk Hydro ASA | | | 490,408 |
| 28,797 | | Statoilhudro ASA | | | 974,423 |
| | | | | |
| | | | | 1,464,831 |
| | | | | |
| | |
| | Russia—1.5% | | | |
| 57,600 | | Gazprom OAO, ADR | | | 2,868,480 |
| 435,000 | | Sberbank | | | 1,870,500 |
| | | | | |
| | | | | 4,738,980 |
| | | | | |
| | |
| | Singapore—0.8% | | | |
| 389,160 | | MobileOne Ltd. | | | 566,858 |
| 281,000 | | Neptune Orient Lines Ltd. | | | 1,006,630 |
| 67,580 | | Singapore Airlines Ltd. | | | 922,515 |
| | | | | |
| | | | | 2,496,003 |
| | | | | |
See Notes to Financial Statements.
| | |
| THE TARGET PORTFOLIO TRUST | | 81 |
| | |
International Equity Portfolio (continued) | | Portfolio of Investments
As of October 31, 2007 |
| | | | | |
| SHARES | | DESCRIPTION | | VALUE (NOTE 1) |
| | | | | |
| | COMMON STOCKS (continued) | | | |
| | |
| | South Korea—0.9% | | | |
| 46,661 | | Shinhan Financial Group Co. Ltd. | | $ | 3,048,540 |
| | | | | |
| | |
| | Spain—2.8% | | | |
| 58,900 | | Banco Bilbao Vizcaya Argentaria SA | | | 1,481,992 |
| 115,500 | | Banco Santander Central Hispano SA | | | 2,509,596 |
| 38,700 | | Repsol YPF SA | | | 1,527,595 |
| 106,600 | | Telefonica SA | | | 3,519,105 |
| | | | | |
| | | | | 9,038,288 |
| | | | | |
| | |
| | Sweden—1.0% | | | |
| 34,200 | | Electrolux AB (Class B Stock) | | | 660,897 |
| 6,690 | | Husqvarna AB | | | 80,307 |
| 146,400 | | Nordea Bank AB | | | 2,618,216 |
| | | | | |
| | | | | 3,359,420 |
| | | | | |
| | |
| | Switzerland—8.6% | | | |
| 6,600 | | Ciba Specialty Chemicals AG | | | 327,892 |
| 24,300 | | Credit Suisse Group | | | 1,634,125 |
| 2,000 | | Georg Fischer AG* | | | 1,500,345 |
| 2,000 | | Givaudan SA | | | 1,964,779 |
| 9,950 | | Nestle SA | | | 4,591,052 |
| 53,150 | | Novartis AG | | | 2,826,347 |
| 1,900 | | Rieter Holdings AG | | | 1,101,390 |
| 21,900 | | Roche Holding AG | | | 3,735,704 |
| 13,600 | | Swiss Reinsurance | | | 1,276,174 |
| 3,400 | | Swisscom AG | | | 1,256,949 |
| 111,100 | | UBS AG | | | 5,941,510 |
| 5,900 | | Zurich Financial Services AG | | | 1,776,265 |
| | | | | |
| | | | | 27,932,532 |
| | | | | |
| | |
| | United Kingdom—17.9% | | | |
| 30,000 | | Alliance & Leicester PLC | | | 493,107 |
| 522,600 | | ARM Holdings PLC | | | 1,613,667 |
| 44,800 | | AstraZeneca PLC | | | 2,210,517 |
| 71,300 | | Aviva PLC | | | 1,120,062 |
| 199,100 | | Barclays PLC | | | 2,500,497 |
| 184,700 | | Beazley Group PLC | | | 664,402 |
| 213,900 | | BP PLC | | | 2,779,770 |
| 137,900 | | Bradford & Bingley PLC | | | 886,015 |
| 453,600 | | BT Group PLC | | | 3,074,743 |
| 63,200 | | Carnival PLC | | | 2,951,515 |
| 48,200 | | Dairy Crest Group PLC | | | 603,840 |
| 285,600 | | DSG International PLC | | | 769,035 |
| 185,400 | | GKN PLC | | | 1,413,833 |
| 30,700 | | GlaxoSmithKline PLC | | | 790,273 |
See Notes to Financial Statements.
| | |
| 82 | | THE TARGET PORTFOLIO TRUST |
| | | | | |
| SHARES | | DESCRIPTION | | VALUE (NOTE 1) |
| | | | | |
| | COMMON STOCKS (continued) | | | |
| | |
| | United Kingdom (cont’d.) | | | |
| 128,000 | | HBOS PLC | | $ | 2,323,498 |
| 499,396 | | Kingfisher PLC | | | 2,048,756 |
| 286,800 | | Legal & General Group PLC | | | 835,479 |
| 534,200 | | Lloyds TSB Group PLC | | | 6,059,221 |
| 246,400 | | Marks & Spencer Group PLC | | | 3,340,461 |
| 62,544 | | Next PLC | | | 2,871,461 |
| 184,500 | | Northern Foods PLC | | | 406,650 |
| 366,300 | | Old Mutual PLC | | | 1,401,435 |
| 50,000 | | Reckitt Benckiser PLC | | | 2,899,590 |
| 264,600 | | Royal & Sun Alliance Insurance Group PLC | | | 867,640 |
| 117,300 | | Royal Bank of Scotland Group PLC | | | 1,259,756 |
| 41,600 | | Royal Dutch Shell PLC | | | — |
| 123,828 | | SABMiller PLC | | | 3,720,530 |
| 40,100 | | Tate & Lyle PLC | | | 363,120 |
| 146,100 | | Taylor Wimpey PLC | | | 751,871 |
| 54,900 | | TT electronics PLC | | | 168,948 |
| 851,700 | | Vodafone Group PLC | | | 3,347,084 |
| 85,284 | | Vodafone Group PLC, ADR | | | 3,349,103 |
| | | | | |
| | | | | 57,885,879 |
| | | | | |
| | TOTAL LONG-TERM INVESTMENTS
(cost $231,413,557) | | | 321,502,028 |
| | | | | |
| | |
| | SHORT-TERM INVESTMENT—0.5% | | | |
| | |
| | Affiliated Money Market Mutual Fund | | | |
| 1,559,851 | | Dryden Core Investment Fund—Taxable Money Market Series
(cost $1,559,851)(w) | | | 1,559,851 |
| | | | | |
| | TOTAL INVESTMENTS(o)—99.7%
(cost $232,973,408; Note 5) | | | 323,061,879 |
| | Other assets in excess of liabilities(x)—0.3% | | | 832,338 |
| | | | | |
| | NET ASSETS—100% | | $ | 323,894,217 |
| | | | | |
The following abbreviations are used in the portfolio descriptions:
ADR—American Depositary Receipt
EUR—Euro
JPY—Japanese Yen
MXN—Mexican Peso
| * | Non-income producing security. |
| (o) | As of October 31, 2007, 59 securities representing $79,065,517 and 24.4% of the total net assets were fair valued in accordance with the policies adopted by the Board of Trustees. |
| (w) | Prudential Investments LLC, the manager of the Fund, also serves as manager of the Dryden Core Investment Fund—Taxable Money Market Series. |
See Notes to Financial Statements.
| | |
| THE TARGET PORTFOLIO TRUST | | 83 |
| | |
International Equity Portfolio (continued) | | Portfolio of Investments
As of October 31, 2007 |
| (x) | Other assets in excess of liabilities includes net unrealized appreciation (depreciation) on forward foreign currency exchange contracts as follows: |
Forward foreign currency exchange contracts outstanding at October 31, 2007:
| | | | | | | | | | | | |
Purchase Contracts | | Notional
Amount
(000) | | Value at Settlement
Date Payable | | Current
Value | | Unrealized
Appreciation |
Euro
Expiring 11/05/07 | | EUR | 2 | | $ | 3,293 | | $ | 3,293 | | $ | — |
Mexican Peso
Expiring 12/06/07 | | MXN | 6,300 | | | 577,373 | | | 589,238 | | | 11,865 |
| | | | | | | | | | | | |
| | | | | $ | 580,666 | | $ | 592,531 | | $ | 11,865 |
| | | | | | | | | | | | |
| | | | | | | | | | | | | |
Sale Contracts | | Notional
Amount
(000) | | Value at Settlement
Date Receivable | | Current
Value | | Unrealized
Appreciation
(Depreciation) | |
Japanese Yen,
Expiring 11/05/07 | | JPY | 379 | | $ | 3,293 | | $ | 3,283 | | $ | 10 | |
Mexican Peso
Expiring 12/06/07 | | MXN | 69,000 | | | 6,342,495 | | | 6,453,562 | | | (111,067 | ) |
| | | | | | | | | | | | | |
| | | | | $ | 6,345,788 | | $ | 6,456,845 | | $ | (111,057 | ) |
| | | | | | | | | | | | | |
The industry classification of investments and other assets in excess of liabilities shown as a percentage of net assets as of October 31, 2007 were as follows:
| | | |
Telecommunications | | 12.2 | % |
Oil & Gas | | 10.2 | |
Financial—Bank & Trust | | 7.6 | |
Pharmaceuticals | | 6.9 | |
Commercial Banks | | 6.3 | |
Chemicals | | 5.4 | |
Insurance | | 4.5 | |
Automobile Manufacturers | | 4.5 | |
Financial Services | | 4.0 | |
Entertainment & Leisure | | 3.8 | |
Electronic Components | | 3.1 | |
Foods | | 2.9 | |
Retail | | 2.8 | |
Electric | | 1.9 | |
Beverages | | 1.9 | |
Transportation | | 1.9 | |
Auto Parts & Related | | 1.5 | |
Metals & Mining | | 1.4 | |
Banks | | 1.4 | |
Media | | 1.2 | |
Diversified Operations | | 1.2 | |
Aerospace & Defense | | 1.1 | |
Retail & Merchandising | | 1.0 | |
See Notes to Financial Statements.
| | |
| 84 | | THE TARGET PORTFOLIO TRUST |
| | | |
Industry (cont’d.) | | | |
Real Estate Management & Development | | 0.9 | % |
Airlines | | 0.9 | |
Household Products | | 0.9 | |
Consumer Products & Services | | 0.8 | |
Office Equipment | | 0.8 | |
Machinery & Equipment | | 0.6 | |
Distribution/Wholesale | | 0.6 | |
Semiconductors | | 0.5 | |
Affiliated Money Market Mutual Fund | | 0.5 | |
Real Estate | | 0.5 | |
Holding Companies—Diversified | | 0.4 | |
Iron/Steel | | 0.4 | |
Agriculture | | 0.4 | |
Paper & Forest Products | | 0.3 | |
Household & Personal Products | | 0.3 | |
Multi-line Insurance | | 0.2 | |
Hotels, Restaurants & Leisure | | 0.2 | |
Home Builders | | 0.2 | |
Lumber & Wood Products | | 0.2 | |
Office Equipment & Supplies | | 0.2 | |
Household Durables | | 0.2 | |
Home Furnishings | | 0.2 | |
Computers | | 0.2 | |
Healthcare Equipment & Supplies | | 0.2 | |
Textiles | | 0.1 | |
Commercial Services | | 0.1 | |
Miscellaneous Manufacturers | | 0.1 | |
Construction Materials | | 0.1 | |
| | | |
| | 99.7 | |
Other assets in excess of liabilities | | 0.3 | |
| | | |
| | 100.0 | % |
| | | |
See Notes to Financial Statements.
| | |
| THE TARGET PORTFOLIO TRUST | | 85 |
| | |
| International Bond Portfolio | | Portfolio of Investments
As of October 31, 2007 |
| | | | | | | |
PRINCIPAL
AMOUNT (000)# | | DESCRIPTION | | VALUE (NOTE 1) |
| | | | | | | |
| | | | LONG-TERM INVESTMENTS—171.6% | | | |
| | | |
| | | | FOREIGN BONDS—95.4% | | | |
| | | |
| | | | Australia—2.3% | | | |
| $ | | 1,000 | | New South Wales Treasury Corp.
6.00%, 05/01/12 | | $ | 893,969 |
| | | | | | | |
| | | |
| | | | Austria—2.1% | | | |
| EUR | | 560 | | Austrian Government International Bond
4.00%, 07/15/09 | | | 809,025 |
| | | | | | | |
| | | |
| | | | Belgium—4.1% | | | |
| EUR | | 1,100 | | Belgium Government Bond
4.25%, 09/28/14 | | | 1,593,044 |
| | | | | | | |
| | | |
| | | | Canada—2.5% | | | |
| CAD | | 800 | | Canada Housing Trust No. 1
4.55%, 12/15/12 | | | 850,448 |
| CAD. | | 100 | | Province of Ontario, Debs.
6.20%, 06/02/31 | | | 125,218 |
| | | | | | | |
| | | | | | | 975,666 |
| | | | | | | |
| | | |
| | | | Denmark—1.5% | | | |
| DKK | | 1,100 | | Denmark Government Bond
6.00%, 11/15/11 | | | 227,283 |
| DKK | | 1,985 | | Realkredit Danmark A/S
5.000%, 10/01/38 | | | 370,244 |
| | | | | | | |
| | | | | | | 597,527 |
| | | | | | | |
| | | |
| | | | Finland—13.2% | | | |
| EUR | | 2,010 | | Finnish Government Bond
4.25%, 07/04/15 | | | 2,907,199 |
| EUR | | 1,450 | | 5.375%, 07/04/13 | | | 2,221,681 |
| | | | | | | |
| | | | | | | 5,128,880 |
| | | | | | | |
| | | |
| | | | France—5.9% | | | |
| EUR | | 80 | | Credit Suisse Group Capital Guernsey V Ltd.
6.905%(c), 12/31/49 | | | 122,029 |
| EUR | | 1,280 | | French Government Bond
5.75%, 10/25/32 | | | 2,174,229 |
| | | | | | | |
| | | | | | | 2,296,258 |
| | | | | | | |
| | | |
| | | | Germany—7.1% | | | |
| EUR | | 100 | | Deutsche Bundesrepublik
4.25%, 01/04/14 | | | 145,388 |
| EUR | | 100 | | 4.75%, 07/04/34 | | | 149,875 |
| EUR | | 660 | | 5.625%, 01/04/28 | | | 1,092,501 |
| EUR | | 800 | | 6.25%, 01/04/24 | | | 1,394,238 |
| | | | | | | |
| | | | | | | 2,782,002 |
| | | | | | | |
See Notes to Financial Statements.
| | |
| 86 | | THE TARGET PORTFOLIO TRUST |
| | | | | | | |
PRINCIPAL
AMOUNT (000)# | | DESCRIPTION | | VALUE (NOTE 1) |
| | | | | | | |
| | | | FOREIGN BONDS (continued) | | | |
| | | |
| | | | Ireland—0.9% | | | |
| EUR | | 158 | | Atlantes Mortgage PLC,
Series 1, Class A
4.929%(c), 01/17/36 | | $ | 229,335 |
| EUR | | 100 | | German Postal Pensions Securitisation PLC
3.375%, 01/18/16 | | | 133,360 |
| | | | | | | |
| | | | | | | 362,695 |
| | | | | | | |
| | | |
| | | | Italy—0.5% | | | |
| EUR | | 140 | | Argo Mortgages Series L,
Series 1, Class A
4.873%(c), 10/28/36 | | | 202,061 |
| | | | | | | |
| | | |
| | | | Japan—24.5% | | | |
| JPY | | 500 | | Development Bank of Japan
4.25%, 06/09/15 | | | 478,265 |
| JPY | | 199,400 | | Japanese Government Bonds
1.10%, 12/10/16 | | | 1,728,256 |
| | 40,000 | | 1.20%, 03/20/12 | | | 349,157 |
| JPY | | 130,000 | | 1.50%, 03/20/11 - 03/20/15 | | | 1,144,217 |
| JPY | | 1,000 | | 1.55%, 02/21/12 | | | 8,858 |
| JPY | | 110,000 | | 1.60%, 06/20/14 | | | 974,552 |
| JPY | | 110,000 | | 1.70%, 09/20/16 | | | 970,298 |
| JPY | | 50,000 | | 2.30%, 06/20/35 | | | 422,853 |
| JPY | | 50,000 | | 2.40%, 03/20/34 | | | 433,330 |
| JPY | | 260,000 | | 2.50%, 09/20/35 - 09/20/37 | | | 2,286,415 |
| JPY | | 20,040 | | Japanese Government CPI Linked Bond
0.80%, 12/10/15 | | | 170,645 |
| JPY | | 40,000 | | Series 11 1.20%, 03/10/17 | | | 346,720 |
| JPY | | 20,000 | | Series 12 1.20%, 06/10/17 | | | 173,363 |
| JPY | | 9,366 | | JLOC Ltd.,
Series 36A, Class A1
(cost $84,228, purchased 04/23/07)(f)(g)
1.188%(c), 02/16/16 | | | 81,216 |
| | | | | | | |
| | | | | | | 9,568,145 |
| | | | | | | |
| | | |
| | | | Korea—0.3% | | | |
| | 100 | | Korea Development Bank Notes
4.25%, 11/13/07 | | | 100,000 |
| | | | | | | |
| | | |
| | | | Netherlands—7.9% | | | |
| EUR | | 500 | | Arena BV,
Series 2003-I, Class A2
4.30%(c), 05/19/55 | | | 710,843 |
| EUR | | 70 | | Deutsche Telekom International Finance BV
7.50%, 01/24/33 | | | 124,827 |
See Notes to Financial Statements.
| | |
| THE TARGET PORTFOLIO TRUST | | 87 |
| | |
International Bond Portfolio (continued) | | Portfolio of Investments
As of October 31, 2007 |
| | | | | | | |
PRINCIPAL
AMOUNT (000)# | | DESCRIPTION | | VALUE (NOTE 1) |
| | | | | | | |
| | | | FOREIGN BONDS (continued) | | | |
| | | |
| | | | Netherlands (cont’d.) | | | |
| EUR | | 426 | | Dutch MBS BV,
Series X, Class A
5.072%(c), 10/02/79 | | $ | 617,229 |
| EUR | | 600 | | Netherlands Government Bond
3.75%, 07/15/09 | | | 863,375 |
| EUR | | 400 | | 7.50%, 01/15/23 | | | 771,076 |
| | | | | | | |
| | | | | | | 3,087,350 |
| | | | | | | |
| | | |
| | | | Spain—6.2% | | | |
| | 100 | | Santander Perpetual SA Unipersonal, 144A
(cost $100,000, purchased 10/18/07)(f)(g)
6.671%, 10/29/49 | | | 99,579 |
| EUR | | 1,600 | | Spanish Government Bond
4.40%, 01/31/15 | | | 2,335,580 |
| | | | | | | |
| | | | | | | 2,435,159 |
| | | | | | | |
| | | |
| | | | United Kingdom—16.4% | | | |
| | 200 | | Barclays Bank PLC
5.45%, 09/12/12 | | | 202,927 |
| EUR | | 500 | | Chester Asset Receivables Dealings No 11,
Series A
6.125%, 10/15/10 | | | 748,758 |
| EUR | | 60 | | Hilton Group Finance PLC
6.50%, 07/17/09 | | | 88,251 |
| | | | Inter-American Development Bank | | | |
| EUR | | 900 | | 5.50%, 03/30/10 | | | 1,342,205 |
| | | | National Grid PLC
(cost $89,690, purchased 11/03/06)(f)(g) | | | |
| CAD | | 100 | | 4.98%, 06/22/11 | | | 105,005 |
| | | | Royal Bank of Scotland PLC, 144A
(cost $300,000, purchased 07/14/05)(f)(g) | | | |
| | 300 | | 5.23%(c), 07/21/08 | | | 299,923 |
| | | | United Kingdom Treasury Stock | | | |
| GBP | | 425 | | 4.75%, 06/07/10 | | | 877,828 |
| GBP | | 100 | | 5.00%, 09/07/14 | | | 208,180 |
| GBP | | 1,200 | | 5.75%, 12/07/09 | | | 2,527,104 |
| | | | | | | |
| | | | | | | 6,400,181 |
| | | | | | | |
| | | | TOTAL FOREIGN BONDS
(cost $33,766,471) | | | 37,231,962 |
| | | | | | | |
| | | |
| | | | UNITED STATES BONDS—76.2% | | | |
| | | |
| | | | Asset Backed Securities—5.4% | | | |
| | | | CIT Group Home Equity Loan Trust,
Series 2002-1, Class AV | | | |
| | 3 | | 5.163%(c), 03/25/33 | | | 3,380 |
| | | | Citibank Credit Card Issuance Trust,
Series 2001-A4, Class A4 | | | |
| EUR | | 650 | | 5.375%, 04/10/13 | | | 962,043 |
See Notes to Financial Statements.
| | |
| 88 | | THE TARGET PORTFOLIO TRUST |
| | | | | | | |
PRINCIPAL
AMOUNT (000)# | | DESCRIPTION | | VALUE (NOTE 1) |
| | | | | | | |
| | | | UNITED STATES BONDS (continued) | | | |
| | | |
| | | | Asset Backed Securities (cont’d.) | | | |
| | | | Fremont Home Loan Trust,
Series 2006-1, Class 2A2 | | | |
| EUR | | 128 | | 4.993%(c), 04/25/36 | | $ | 127,692 |
| | | | Master Asset Backed Securities Trust,
Series 2006-WMC1, Class A2 | | | |
| EUR | | 200 | | 4.983%(c), 02/25/36 | | | 196,258 |
| | | | MBNA Credit Card Master Note Trust,
Series 2002-A2, Class A | | | |
| EUR | | 550 | | 5.60%, 07/17/14 | | | 821,588 |
| | | | | | | |
| | | | | | | 2,110,961 |
| | | | | | | |
| | | |
| | | | Collateralized Mortgage Obligations—4.5% | | | |
| | | | Bear Stearns Adjustable Rate Mortgage Trust, | | | |
| | | | Series 2005-2, Class A1 | | | |
| | 126 | | 4.125%(c), 03/25/35 | | | 124,737 |
| | | | Series 2005-2, Class A2 | | | |
| | 62 | | 4.125%(c), 03/25/35 | | | 61,077 |
| | | | Series 2005-5, Class A1 | | | |
| | 113 | | 4.55%(c), 08/25/35 | | | 112,277 |
| | | | Series 2005-5, Class A2 | | | |
| | 72 | | 4.55%(c), 08/25/35 | | | 71,999 |
| | 58 | | Bear Stearns Alt-A Trust,
Series 2005-7, Class 22A1
5.52%, 09/25/35 | | | 58,155 |
| | | | Citigroup Mortgage Loan Trust, Inc., | | | |
| | | | Series 2005-6, Class A1 | | | |
| | 59 | | 4.748%(c), 08/25/35 | | | 58,755 |
| | | | Series 2006-AR1, Class 1A1 | | | |
| | 317 | | 4.90%(c), 10/25/35 | | | 315,429 |
| | 105 | | Countrywide Alternative Loan Trust,
Series 2005-76, Class 2A1
5.993%(c), 02/25/36 | | | 102,720 |
| | 100 | | Credit Suisse Mortgage Capital Certificates,
Series 2006-C5, Class A3
5.311%, 12/15/39 | | | 97,584 |
| | 19 | | CS First Boston Mortgage Securities Corp.,
Series 2003-AR20, Class 2A1
4.037%, 08/25/33 | | | 18,796 |
| | 47 | | Fannie Mae Whole Loan,
Series 2004-W12, Class 1A1
6.00%, 07/25/44 | | | 47,987 |
| | 109 | | Federal Home Loan Mortgage Corp.,
Series R006, Class ZA
6.00%, 04/15/36 | | | 108,446 |
| | 214 | | Freddie Mac REMICS,
Series 2682, Class JB
4.50%, 09/15/19 | | | 212,014 |
| | 53 | | GMAC Mortgage Corp. Loan Trust,
Series 2004-J4, Class A1
5.50%, 09/25/34 | | | 52,401 |
See Notes to Financial Statements.
| | |
| THE TARGET PORTFOLIO TRUST | | 89 |
| | |
International Bond Portfolio (continued) | | Portfolio of Investments
As of October 31, 2007 |
| | | | | | | |
PRINCIPAL
AMOUNT (000)# | | DESCRIPTION | | VALUE (NOTE 1) |
| | | | | | | |
| | | | UNITED STATES BONDS (continued) | | | |
| | | |
| | | | Collateralized Mortgage Obligations (cont’d.) | | | |
| $ | | 16 | | Harborview Mortgage Loan Trust,
Series 2003-1, Class A
4.928%, 05/19/33 | | $ | 15,555 |
| | 20 | | Merrill Lynch Mortgage Investors Trust,
Series 2003-A2, Class 1A1
4.835%, 02/25/33 | | | 20,288 |
| | 77 | | MLCC Mortgage Investors, Inc.,
Series 2005-2, Class 1A
4.25%, 10/25/35 | | | 75,721 |
| | 206 | | Wells Fargo Mortgage Backed Securities Trust,
Series 2005-AR11, Class 1A1
4.615%, 06/25/35 | | | 202,803 |
| | | | | | | |
| | | | | | | 1,756,744 |
| | | | | | | |
| | | |
| | | | Corporate Bonds—11.3% | | | |
| EUR | | 100 | | American International Group, Inc.,
Jr. Sub. Notes
4.875%(c), 03/15/67 | | | 132,577 |
| | 100 | | Avon Products, Inc.,
Sr. Unsec’d. Notes
5.125%, 01/15/11 | | | 100,157 |
| JPY | | 10,000 | | Bank of America N.A.,
Notes
0.80%, 07/07/08 | | | 86,674 |
| EUR | | 300 | | Chase Credit Card Master Trust,
Series 1998-4, Notes
5.00%, 08/15/08 | | | 435,139 |
| | 100 | | COX Communications, Inc.,
Sr. Unsec’d. Notes
6.75%, 03/15/11 | | | 104,453 |
| | 100 | | El Paso Performance-Linked Trust,
Notes, 144A
(cost $106,250, purchased 03/15/07)(f)(g)
7.75%, 07/15/11 | | | 103,102 |
| | 100 | | Exelon Corp.,
Sr. Unsec’d. Notes
4.90%, 06/15/15 | | | 93,822 |
| | 100 | | Federated Department Stores,
Sr. Unsec’d. Notes
6.30%, 04/01/09 | | | 100,851 |
| | 50 | | Ford Motor Credit Co. LLC,
Notes
7.80%, 06/01/12 | | | 46,979 |
| | 100 | | Sr. Unsec’d. Notes 7.993%(c), 01/13/12 | | | 92,578 |
| | 50 | | Ford Motor Credit Co.,
Sr. Notes
7.25%, 10/25/11 | | | 46,511 |
See Notes to Financial Statements.
| | |
| 90 | | THE TARGET PORTFOLIO TRUST |
| | | | | | | |
PRINCIPAL
AMOUNT (000)# | | DESCRIPTION | | VALUE (NOTE 1) |
| | | | | | | |
| | | | UNITED STATES BONDS (continued) | | | |
| | | |
| | | | Corporate Bonds (cont’d.) | | | |
| | | | General Electric Capital Corp.,
Sr. Unsec’d. Notes | | | |
| EUR | | 100 | | 5.25%, 10/19/12 | | $ | 100,679 |
| | | | Glitnir Bank HF,
Sr. Unsub. Notes, 144A
(cost $100,000, purchased 04/13/07)(f)(g) | | | |
| | 100 | | 5.44%(c), 04/20/10 | | | 98,169 |
| | 100 | | GMAC LLC,
Sr. Unsec’d. Notes
6.00%, 12/15/11 | | | 88,726 |
| CAD | | 100 | | Goldman Sachs Group, Inc.,
Sr. Unsec’d. Notes
(cost $90,598, purchased 11/03/06)(f)(g)
5.25%, 06/01/16 | | | 102,364 |
| | 100 | | HBOS PLC,
Sub. Notes, 144A
(cost $98,011, purchased 05/10/07)(f)
5.92%(c), 09/29/49 | | | 90,884 |
| | 200 | | HSBC Holdings PLC,
Sub. Notes
6.50%, 05/02/36 | | | 197,444 |
| | 100 | | iStar Financial, Inc.,
Sr. Unsec’d. Notes
5.15%, 03/01/12 | | | 91,277 |
| | 100 | | Johnson Controls, Inc.,
Sr. Notes
5.25%, 01/15/11 | | | 100,434 |
| | 100 | | JPMorgan Chase Capital,
Jr. Sub. Notes
6.55%, 09/29/36 | | | 93,761 |
| EUR | | 100 | | Mizuho Financial Group Cayman Ltd.,
Gtd. Notes (Cayman Islands)
4.75%(c), 04/15/14 | | | 143,731 |
| | 200 | | Mizuho Investment
Sub. Notes, 144A
(cost $213,040, purchased 10/25/06)(f)(g)
9.87%(c), 12/29/49 | | | 205,763 |
| | 100 | | Mizuho Preferred Capital Co. LLC,
Bonds, 144A
(cost $111,354, purchased 04/22/05)(f)(g)
8.79%(c), 12/31/49 | | | 102,199 |
| | 100 | | Newell Rubbermaid, Inc.,
Notes
4.00%, 05/01/10 | | | 98,627 |
| | 100 | | Rabobank Capital Fund Trust III,
Gtd. Notes, 144A
(cost $97,583, purchased 12/15/06)(f)(g)
5.254%(c), 10/21/16 | | | 93,901 |
| EUR | | 50 | | RBS Capital Trust,
Bank Gtd. Notes
6.467%(c), 12/31/49 | | | 74,251 |
See Notes to Financial Statements.
| | |
| THE TARGET PORTFOLIO TRUST | | 91 |
| | |
International Bond Portfolio (continued) | | Portfolio of Investments
As of October 31, 2007 |
| | | | | | | |
PRINCIPAL
AMOUNT (000)# | | DESCRIPTION | | VALUE (NOTE 1) |
| | | | | | | |
| | | | UNITED STATES BONDS (continued) | | | |
| | | |
| | | | Corporate Bonds (cont’d.) | | | |
| EUR | | 100 | | Roseton/Danskamme,
Series A, Pass-Thru Certs.
7.27%, 11/08/10 | | $ | 100,250 |
| | 100 | | Sabre Holdings Corp.,
Unsub. Notes
7.35%, 08/01/11 | | | 96,000 |
| EUR | | 200 | | SB Treasury Co. LLC,
Jr. Sub. Bonds, 144A
(cost $211,350, purchased 12/20/06)(f)(g)
9.40%(c), 12/29/49 | | | 204,101 |
| | 100 | | SMFG Preferred Capital,
Sub. Notes, 144A
(cost $100,000, purchased 12/13/2006)(f)(g)
6.078%(c), 01/25/17 | | | 93,541 |
| | 100 | | Sprint Capital Corp.,
Gtd. Notes
8.375%, 03/15/12 | | | 109,215 |
| | 100 | | State Street Capital Trust IV,
Gtd. Notes
6.694%(c), 06/15/37 | | | 90,300 |
| EUR | | 250 | | Student Loan Marketing Assoc.
3.80%, 06/17/10 | | | 354,032 |
| | 100 | | Viacom, Inc.,
Sr. Notes
5.75%, 04/30/11 | | | 100,965 |
| | 100 | | Wells Fargo (Old),
Sr. Unsec’d. Notes
5.17%(c), 03/10/08 | | | 99,976 |
| EUR | | 100 | | Zurich Finance USA, Inc.,
Gtd. Notes
5.75%(c), 10/02/23 | | | 148,115 |
| | | | | | | |
| | | | | | | 4,421,548 |
| | | | | | | |
| | | |
| | | | U.S. Government Agency Obligations—0.2% | | | |
| | | | Small Business Administration Participation Certificates, | | | |
| | | | Series 2005-20E, Class 1 | | | |
| | 87 | | 4.84%, 05/01/25 | | | 85,503 |
| | | | | | | |
| | | |
| | | | U.S. Government Mortgage Backed Obligations—32.2% | | | |
| | | | Federal National Mortgage Assoc. | | | |
| | 274 | | 5.50%, TBA | | | 7,975,973 |
| | 8,100 | | 5.50%, 04/01/33 - 05/01/35 | | | 269,477 |
| | 3,000 | | 6.00%, TBA | | | 3,021,564 |
| | 1,000 | | 6.50%, TBA | | | 1,023,438 |
| | 200 | | 8.95%, 02/12/18 | | | 264,482 |
| | | | | | | |
| | | | | | | 12,554,934 |
| | | | | | | |
See Notes to Financial Statements.
| | |
| 92 | | THE TARGET PORTFOLIO TRUST |
| | | | | | | |
PRINCIPAL
AMOUNT (000)# | | DESCRIPTION | | VALUE (NOTE 1) |
| | | | | | | |
| | | | UNITED STATES BONDS (continued) | | | |
| | | |
| | | | U.S. Treasury Obligations—22.6% | | | |
| | | | U.S. Treasury Bonds | | | |
| | 100 | | 4.50%, 02/15/36 | | $ | 96,000 |
| | 900 | | 5.25%, 02/15/29 | | | 954,422 |
| | | | U.S. Treasury Inflationary Bonds | | | |
| | 299 | | 2.625%, 07/15/17 | | | 313,918 |
| | | | U.S. Treasury Notes | | | |
| | 4,800 | | 4.875%, 01/31/09 | | | 4,849,877 |
| | 2,500 | | 4.875%, 06/30/12 | | | 2,577,148 |
| | | | | | | |
| | | | | | | 8,791,365 |
| | | | | | | |
| | | | TOTAL UNITED STATES BONDS
(cost $29,270,566) | | | 29,721,055 |
| | | | | | | |
| | | | TOTAL LONG-TERM INVESTMENTS
(cost $63,037,037) | | | 66,953,017 |
| | | | | | | |
| | | |
| | | | SHORT-TERM INVESTMENTS—4.7% | | | |
| | | |
| | | | FOREIGN TREASURY OBLIGATION—2.6% | | | |
| EUR | | 700 | | Belgium Treasury Bills(k)(n)
3.85%, 11/15/07
(cost $944,906) | | | 1,012,566 |
| | | | | | | |
| | | |
| | | | U.S. TREASURY OBLIGATIONS—0.7% | | | |
| | | | U.S. Treasury Bills(k)(n) | | | |
| | 270 | | 3.71%, 12/13/07 (cost $268,813) | | | 268,722 |
| | | | | | | |
| | |
Contracts/
Notional
Amount (000) | | OUTSTANDING OPTIONS PURCHASED*—0.8% | | | |
| | | |
| | | | Call Options—0.8% | | | |
| | 2,500 | | 5 Year U.S. Treasury Note Futures
expiring 11/20/2007, Strike Price $117.00 | | | 391 |
| EUR | | 2,000 | | expiring 11/20/2007, Strike Price $119.50 | | | 312 |
| | 11,000 | | expiring 11/20/2007, Strike Price $121.00 | | | 1,719 |
| | 4,500 | | expiring 11/20/2007, Strike Price $123.50 | | | 703 |
| | 6,600 | | 10 Year U.S. Treasury Note Futures
expiring 11/20/2007, Strike Price $126.00 | | | 1,031 |
| | 400 | | Currency Option on USD vs. JPY
expiring 12/05/2007 @ FX Rate 116.00 | | | 2,496 |
| EUR | | 1,400 | | Euro-Bobl
expiring 11/23/2007, Strike Price $113.00 | | | 101 |
| EUR | | 2,200 | | Euro-Schatz
expiring 11/23/2007, Strike Price $104.40 | | | 159 |
| EUR | | 2,300 | | expiring 11/23/2007, Strike Price $105.00 | | | 167 |
| | 700 | | Swap on 3 Month LIBOR
expiring 03/31/2008 @ 4.75% | | | 4,895 |
| | 19,100 | | expiring 09/26/2008 @ 4.75% | | | 155,281 |
| | 10,400 | | expiring 08/03/2009 @ 5.30% | | | 138,069 |
| | 3,300 | | expiring 08/28/2009 @ 5.00% | | | 33,426 |
| | | | | | | |
| | | | | | | 338,750 |
| | | | | | | |
See Notes to Financial Statements.
| | |
| THE TARGET PORTFOLIO TRUST | | 93 |
| | |
International Bond Portfolio (continued) | | Portfolio of Investments
As of October 31, 2007 |
| | | | | | | | | |
Contracts/
Notional
Amount (000) | | DESCRIPTION | | VALUE (NOTE 1) | |
| | | | | | | | | |
| | | | | OUTSTANDING OPTIONS PURCHASED (continued) | | | | |
| | | |
| | | | | Put Options | | | | |
| GBP | | | 11,500 | | 3 Month Sterling,
expiring 03/19/2008, Strike Price $93.00 | | $ | 299 | |
| | | 5,900 | | 10 Year U.S. Treasury Notes Futures
expiring 11/20/2007, Strike Price $96.00 | | | 922 | |
| | | 2,100 | | Euro-Bund
expiring 11/23/2007, Strike Price $106.00 | | | 304 | |
| EUR | | | 4,200 | | Euro-Schatz
expiring 11/23/2007, Strike Price $100.90 | | | 304 | |
| EUR | | | 3,600 | | expiring 11/23/2007, Strike Price $101.40 | | | 261 | |
| | | 26,000 | | Eurodollar Futures,
expiring 03/17/2008, Strike Price $93.00 | | | 162 | |
| | | 2,000 | | expiring 03/17/2008, Strike Price $93.25 | | | 13 | |
| EUR | | | 8,100 | | FNCL
expiring 12/05/2007, Strike Price $86.30 | | | — | |
| | | 5,000 | | expiring 12/05/2007, Strike Price $89.17 | | | — | |
| | | | | | | | | |
| | | | | | | | 2,265 | |
| | | | | | | | | |
| | | | | TOTAL OUTSTANDING OPTIONS PURCHASED
(cost $241,966) | | | 341,015 | |
| | | | | | | | | |
| Shares | | AFFILIATED MONEY MARKET MUTUAL FUND—0.6% | | | | |
| | | 224,060 | | Dryden Core Investment Fund—Taxable Money Market Series
(cost $224,060)(w) | | | 224,060 | |
| | | | | | | | | |
| | | | | TOTAL SHORT-TERM INVESTMENTS
(cost $1,679,745) | | | 1,846,363 | |
| | | | | | | | | |
| | | |
| | | | | TOTAL INVESTMENTS, BEFORE OUTSTANDING OPTIONS WRITTEN AND SECURITIES SOLD SHORT—176.3%
(cost $64,716,782; Note 5) | | | 68,799,380 | |
| | | | | | | | | |
Principal
Amount (000)# | | SECURITIES SOLD SHORT—(10.6)% | | | |
| | | | | U.S. Treasury Obligations—(10.6)% | | | | |
| | | | | U.S. Treasury Notes | | | | |
| | $ | 1,860 | | 4.50%, 02/15/16 - 05/15/17 | | | (1,873,626 | ) |
| | | 1,100 | | 4.625%, 02/15/17 | | | (1,114,266 | ) |
| | | 1,100 | | 5.125%, 05/15/16 | | | (1,154,484 | ) |
| | | | | | | | | |
| | | | | TOTAL SECURITIES SOLD SHORT
(proceeds $4,111,764) | | | (4,142,376 | ) |
| | | | | | | | | |
Contracts/
Notional
Amounts (000) | | OUTSTANDING OPTIONS WRITTEN*—(0.9)% | | | |
| | | | | Call Options—(0.9)% | | | | |
| | | | | Swap on 3 Month LIBOR, | | | | |
| | | 2,200 | | expiring 11/19/07 @ 5.38% | | | (27,918 | ) |
| | | 500 | | expiring 01/30/08 @ 5.53% | | | (18,053 | ) |
See Notes to Financial Statements.
| | |
| 94 | | THE TARGET PORTFOLIO TRUST |
| | | | | | | | |
Contracts
Notional
Amounts (000) | | DESCRIPTION | | VALUE (NOTE 1) | |
| | | | | | | | |
| | | | OUTSTANDING OPTIONS WRITTEN | | | | |
| | | |
| | | | Call Options (continued) | | | | |
| | 2,000 | | expiring 02/01/08 @ 4.90% | | $ | (16,571 | ) |
| | 300 | | expiring 03/31/08 @ 4.95% | | | (3,771 | ) |
| | 8,300 | | expiring 09/26/08 @ 4.95% | | | (123,620 | ) |
| | 4,500 | | expiring 08/03/09 @ 5.50% | | | (127,876 | ) |
| | 1,100 | | expiring 08/28/09 @ 5.32% | | | (31,295 | ) |
| | | | | | | | |
| | | | TOTAL OUTSTANDING OPTIONS WRITTEN
(premiums received $261,954) | | | (349,104 | ) |
| | | | | | | | |
| | | |
| | | | TOTAL INVESTMENTS, NET OF OUTSTANDING OPTIONS WRITTEN AND SECURITIES SOLD SHORT—164.8%
(cost $60,343,064; Note 5) | | | 64,307,900 | |
| | | | Other liabilities in excess of other assets(x)—(64.8%) | | | (25,297,210 | ) |
| | | | | | | | |
| | | | NET ASSETS—100% | | $ | 39,010,690 | |
| | | | | | | | |
The following abbreviations are used in portfolio descriptions:
144A—Security was purchased pursuant to Rule 144A under the securities Act of 1933 and may not be resold subject to that rule except to qualified institutional buyers. Unless otherwise noted, 144A securities are deemed to be liquid.
TBA—To Be Announced
AUD—Australian Dollar
BRL—Brazilian Real
CAD—Canadian Dollar
CNY—Chinese Yuan
DKK—Denmark Krone
EUR—Euro
GBP—British Pound
INR—Indian Rupee
JPY—Japanese Yen
KRW—Korean Won
MXN—Mexican Peso
MYR—Malaysian Ringgit
NOK—Norwegian Krone
NZD—New Zealand Dollar
RUS—Russian Ruble
SEK—Swedish Krona
USD—United States Dollar
| * | Non-income producing security. |
| # | Principal amount is shown in U.S. dollars unless otherwise stated. |
| (c) | Indicates a variable rate security. |
| (f) | Private Placement restricted as to resale and does not have a readily available market. The aggregate cost of such securities is $1,702,104. The aggregate value of $1,679,747 is approximately 4.3% of net assets. |
| (g) | Indicates a security that has been deemed illiquid. |
| (k) | Securities segregated as collateral for futures contracts. |
| (n) | Rate shown is the effective yield at purchase date. |
| (w) | Prudential Investments LLC, the manager of the Portfolio also serves as manager of the Dryden Core Investment Fund—Taxable Money Market Series. |
See Notes to Financial Statements.
| | |
| THE TARGET PORTFOLIO TRUST | | 95 |
| | |
International Bond Portfolio (continued) | | Portfolio of Investments
As of October 31, 2007 |
| (x) | Liabilities in excess of other assets includes net unrealized appreciation (depreciation) on futures contracts, and forward foreign currency exchange contracts, interest rate and credit default swap agreements as follows: |
Open futures contracts outstanding at October 31, 2007:
| | | | | | | | | | | | | | |
Number of
Contracts | | Type | | Expiration
Month | | Value at
Trade Date | | Value at
October 31, 2007 | | Unrealized
Appreciation
(Depreciation) | |
| Long Positions: | | | | | | | | | | | | | | |
| 45 | | 10 Year U.S. Treasury Notes | | Dec 07 | | $ | 4,935,812 | | $ | 4,950,703 | | $ | 14,891 | |
| 11 | | Euro-Bund | | Dec 07 | | | 1,792,569 | | | 1,805,794 | | | 13,225 | |
| 19 | | 3 Month Euro Yen | | Mar 08 | | | 4,074,134 | | | 4,083,192 | | | 9,058 | |
| 40 | | 90 Day Euro Dollar | | Jun 08 | | | 9,526,188 | | | 9,562,000 | | | 35,812 | |
| 20 | | 90 Day Euro Dollar | | Sep 08 | | | 4,732,500 | | | 4,784,500 | | | 52,000 | |
| 7 | | 90 Day Euro Dollar | | Jun 09 | | | 1,666,350 | | | 1,672,300 | | | 5,950 | |
| 14 | | 90 Day Sterling | | Mar 08 | | | 3,429,023 | | | 3,424,823 | | | (4,200 | ) |
| 2 | | 90 Day Sterling | | Sep 08 | | | 489,728 | | | 491,028 | | | 1,300 | |
| 14 | | 90 Day Sterling | | Dec 08 | | | 3,435,375 | | | 3,439,378 | | | 4,003 | |
| 7 | | 90 Day Sterling | | Mar 09 | | | 1,715,323 | | | 1,719,871 | | | 4,548 | |
| 7 | | 90 Day Sterling | | Jun 09 | | | 1,715,504 | | | 1,719,507 | | | 4,003 | |
| | | | | | | | | | | | | | |
| | | | | | | | | | | | | 140,590 | |
| | | | | | | | | | | | | | |
| Short Positions: | | | | | | | | | | | | | | |
| 64 | | 2 Year Euro-Schatz | | Dec 07 | | | 9,582,688 | | | 9,568,248 | | | 14,440 | |
| 187 | | 5 Year U.S. Treasury Notes | | Dec 07 | | | 19,834,515 | | | 20,073,281 | | | (238,766 | ) |
| 5 | | 10 United Kingdom Gilt | | Dec 07 | | | 1,112,428 | | | 1,115,547 | | | (3,119 | ) |
| 14 | | Euro-Bobl | | Dec 07 | | | 2,186,215 | | | 2,184,312 | | | 1,903 | |
| | | | | | | | | | | | | | |
| | | | | | | | | | | | | (225,542 | ) |
| | | | | | | | | | | | | | |
| | | | | | | | | | | | $ | (84,952 | ) |
| | | | | | | | | | | | | | |
Forward foreign currency exchange contracts outstanding at October 31, 2007:
| | | | | | | | | | | | | |
| Purchase Contracts | | Notional
Amount
(000) | | Value at Settlement
Date Payable | | Current
Value | | Unrealized
Appreciation
(Depreciation) | |
Australian Dollar,
Expiring 11/08/07 | | AUD | 405 | | $ | 365,350 | | $ | 377,218 | | $ | 11,868 | |
| Expiring 11/15/07 | | AUD | 809 | | | 727,036 | | | 753,752 | | | 26,716 | |
Brazilian Real,
Expiring 11/05/07 | | BRL | 1,225 | | | 669,000 | | | 707,648 | | | 38,648 | |
| Expiring 03/04/08 | | BRL | 878 | | | 442,849 | | | 498,735 | | | 55,886 | |
| Expiring 07/02/08 | | BRL | 2,300 | | | 1,201,673 | | | 1,283,619 | | | 81,946 | |
Chinese Yuan,
Expiring 04/28/08 | | CNY | 2,085 | | | 290,000 | | | 290,343 | | | 343 | |
Euro,
Expiring 11/05/07 | | EUR | 21 | | | 30,336 | | | 30,419 | | | 83 | |
| Expiring 11/08/07 | | EUR | 272 | | | 385,204 | | | 394,057 | | | 8,853 | |
Indian Rupee,
Expiring 05/12/08 | | INR | 10,339 | | | 252,000 | | | 260,630 | | | 8,630 | |
Japanese Yen,
Expiring 12/13/07 | | JPY | 45,940 | | | 405,000 | | | 400,263 | | | (4,737 | ) |
See Notes to Financial Statements.
| | |
| 96 | | THE TARGET PORTFOLIO TRUST |
| | | | | | | | | | | | |
| Purchase Contracts | | Notional
Amount
(000) | | Value at Settlement
Date Payable | | Current
Value | | Unrealized
Appreciation
(Depreciation) |
Korean Won,
Expiring 01/30/08 | | KRW | 267,099 | | $ | 293,105 | | $ | 297,524 | | $ | 4,419 |
| Expiring 05/30/08 | | KRW | 141,731 | | | 152,787 | | | 158,090 | | | 5,303 |
Malaysian Ringgitt,
Expiring 05/12/08 | | MYR | 2,183 | | | 654,458 | | | 658,205 | | | 3,747 |
Mexican Peso,
Expiring 03/13/08 | | MXN | 3,323 | | | 295,297 | | | 308,336 | | | 13,039 |
Norwegian Krone,
Expiring 12/06/07 | | NOK | 1,672 | | | 302,213 | | | 311,354 | | | 9,141 |
Russian Ruble,
Expiring 12/10/07 | | RUS | 24,360 | | | 948,000 | | | 985,937 | | | 37,937 |
| Expiring 01/11/08 | | RUS | 913 | | | 36,000 | | | 36,929 | | | 929 |
| Expiring 07/10/08 | | RUS | 354 | | | 14,000 | | | 14,252 | | | 252 |
Swedish Krona,
Expiring 12/06/07 | | SEK | 1,725 | | | 264,348 | | | 271,731 | | | 7,383 |
| | | | | | | | | | | | |
| | | | | $ | 7,728,656 | | $ | 8,039,042 | | $ | 310,386 |
| | | | | | | | | | | | |
| | | | | | | | | | | | | |
| Sale Contracts | | Notional
Amount
(000) | | Value at Settlement
Date Receivable | | Current
Value | | Unrealized
Appreciation
(Depreciation) | |
Australian Dollar,
Expiring 11/21/07 | | AUD | 1,450 | | $ | 1,300,589 | | $ | 1,350,533 | | $ | (49,944 | ) |
| Expiring 11/29/07 | | AUD | 337 | | | 310,469 | | | 313,771 | | | (3,302 | ) |
Brazilian Real,
Expiring 11/05/07 | | BRL | 1,225 | | | 675,534 | | | 707,833 | | | (32,299 | ) |
Canadian Dollars,
Expiring 12/20/07 | | CAD | 309 | | | 325,319 | | | 325,319 | | | — | |
Danish Krones,
Expiring 12/06/07 | | DKK | 3,106 | | | 569,908 | | | 603,949 | | | (34,041 | ) |
Euro,
Expiring 11/05/07 | | EUR | 13,529 | | | 19,161,561 | | | 19,597,306 | | | (435,745 | ) |
Japanese Yen,
Expiring 12/13/07 | | JPY | 965,357 | | | 8,458,725 | | | 8,410,853 | | | 47,872 | |
Korean Won,
Expiring 01/30/08 | | KRW | 270,929 | | | 296,000 | | | 301,791 | | | (5,791 | ) |
| Expiring 05/30/08 | | KRW | 116,915 | | | 128,000 | | | 130,410 | | | (2,410 | ) |
Mexican Peso,
Expiring 03/13/08 | | MXN | 2,255 | | | 202,000 | | | 209,246 | | | (7,246 | ) |
New Zealand
Dollar,
Expiring 11/29/07 | | NZD | 27 | | | 20,520 | | | 20,581 | | | (61 | ) |
Pound Sterling,
Expiring 12/20/07 | | GBP | 361 | | | 745,050 | | | 749,414 | | | (4,364 | ) |
Russian Ruble,
Expiring 01/11/08 | | RUB | 15,448 | | | 607,000 | | | 624,744 | | | (17,744 | ) |
Swedish Krona,
Expiring 12/06/07 | | SEK | 1,254 | | | 195,633 | | | 197,536 | | | (1,903 | ) |
| | | | | | | | | | | | | |
| | | | | $ | 32,996,308 | | $ | 33,543,286 | | $ | (546,978 | ) |
| | | | | | | | | | | | | |
See Notes to Financial Statements.
| | |
| THE TARGET PORTFOLIO TRUST | | 97 |
| | |
International Bond Portfolio (continued) | | Portfolio of Investments
As of October 31, 2007 |
Interest rate swap agreements outstanding at October 31, 2007:
| | | | | | | | | | | | | | |
Counterparty | | Termination
Date | | Notional
Amount# | | Fixed
Rate | | | Floating
Rate | | Unrealized
Appreciation
(Depreciation) | |
Bank of America Securities LLC(1) | | 12/19/12 | | $ | 1,400,000 | | 5.00 | % | | 3 month LIBOR | | $ | 9,814 | |
Bank of America Securities LLC(2) | | 06/20/17 | | | 1,300,000 | | 5.00 | % | | 3 month LIBOR | | | 22,731 | |
Barclays Capital(1) | | 06/18/09 | | | 2,500,000 | | 5.00 | % | | 3 month LIBOR | | | 9,900 | |
Barclays Capital(1) | | 12/19/12 | | | 500,000 | | 5.00 | % | | 3 month LIBOR | | | 1,648 | |
Citigroup(1) | | 12/19/17 | | | 1,400,000 | | 5.00 | % | | 3 month LIBOR | | | 17,335 | |
Citigroup(2) | | 12/19/37 | | | 800,000 | | 5.00 | % | | 3 month LIBOR | | | (12,826 | ) |
Deutsche Bank(1) | | 06/18/09 | | | 7,700,000 | | 5.00 | % | | 3 month LIBOR | | | 30,321 | |
Deutsche Bank(1) | | 12/19/08 | | | 5,800,000 | | 5.00 | % | | 3 month LIBOR | | | 20,783 | |
Deutsche Bank(1) | | 12/19/09 | | | 7,200,000 | | 5.00 | % | | 3 month LIBOR | | | 64,486 | |
Deutsche Bank(1) | | 12/17/09 | | | 3,400,000 | | 5.00 | % | | 3 month LIBOR | | | 7,067 | |
Deutsche Bank(2) | | 06/20/14 | | | 200,000 | | 5.00 | % | | 3 month LIBOR | | | 121 | |
Goldman Sachs & Co.(2) | | 06/20/14 | | | 1,600,000 | | 5.00 | % | | 3 month LIBOR | | | 972 | |
Lehman Brothers(1) | | 12/19/12 | | | 600,000 | | 5.00 | % | | 3 month LIBOR | | | 1,546 | |
Lehman Brothers(2) | | 06/20/14 | | | 4,200,000 | | 5.00 | % | | 3 month LIBOR | | | 2,589 | |
Lehman Brothers(2) | | 12/19/37 | | | 200,000 | | 5.00 | % | | 3 month LIBOR | | | (1,903 | ) |
Merrill Lynch & Co.(1) | | 12/19/12 | | | 2,000,000 | | 5.00 | % | | 3 month LIBOR | | | (14,826 | ) |
Morgan Stanley Capital Services, Inc.(1) | | 12/19/12 | | | 500,000 | | 5.00 | % | | 3 month LIBOR | | | (3,421 | ) |
UBS AG(1) | | 12/19/08 | | | 100,000 | | 5.00 | % | | 3 month LIBOR | | | 373 | |
Deutsche Bank(3) | | 12/07/07 | | | 300,000 | | 0.29 | % | | CMS 10y-2y | | | 9,387 | |
Citigroup(1) | | 01/15/09 | | AUD | 1,000,000 | | 6.50 | % | | 3 month Australian
Bank Bill rate | | | (6,878 | ) |
Deutsche Bank(1) | | 01/15/09 | | AUD | 1,380,000 | | 6.50 | % | | 3 month Australian
Bank Bill rate | | | (9,440 | ) |
Morgan Stanley Capital Services, Inc.(1) | | 09/15/09 | | AUD | 3,000,000 | | 7.00 | % | | 3 month Australian
Bank Bill rate | | | (11,792 | ) |
Credit Suisse International(2) | | 06/15/17 | | AUD | 900,000 | | 6.50 | % | | 6 month Australian
Bank Bill rate | | | (977 | ) |
Deutsche Bank(1) | | 06/15/10 | | AUD | 600,000 | | 7.00 | % | | 6 month Australian
Bank Bill rate | | | (12,867 | ) |
Deutsche Bank(2) | | 12/15/17 | | AUD | 500,000 | | 6.75 | % | | 6 month Australian
Bank Bill rate | | | (370 | ) |
Goldman Sachs & Co.(1) | | 01/02/12 | | BRL | 3,400,000 | | 10.15 | % | | Brazilian interbank
lending rate | | | (42,238 | ) |
Morgan Stanley Capital Services, Inc.(1) | | 01/02/12 | | BRL | 900,000 | | 10.12 | % | | Brazilian interbank
lending rate | | | (10,606 | ) |
UBS AG(1) | | 01/02/12 | | BRL | 200,000 | | 10.58 | % | | Brazilian interbank
lending rate | | | (1,119 | ) |
Barclays Capital(1) | | 09/19/12 | | EUR | 2,200,000 | | 5.00 | % | | 6 month Euribor | | | 44,806 | |
Credit Suisse International(2) | | 06/15/17 | | EUR | 2,400,000 | | 4.00 | % | | 6 month Euribor | | | 175,349 | |
Deutsche Bank(1) | | 12/15/11 | | EUR | 300,000 | | 4.00 | % | | 6 month Euribor | | | (8,672 | ) |
Deutsche Bank(1) | | 12/19/37 | | EUR | 1,500,000 | | 4.00 | % | | 6 month Euribor | | | 9,616 | |
Deutsche Bank(2) | | 03/19/38 | | EUR | 600,000 | | 5.00 | % | | 6 month Euribor | | | (37,367 | ) |
See Notes to Financial Statements.
| | |
| 98 | | THE TARGET PORTFOLIO TRUST |
| | | | | | | | | | | | | | |
Counterparty | | Termination
Date | | Notional
Amount# | | Fixed
Rate | | | Floating
Rate | | Unrealized
Appreciation
(Depreciation) | |
Deutsche Bank(2) | | 12/19/17 | | EUR | 2,600,000 | | 5.00 | % | | 6 month Euribor | | $ | (11,211 | ) |
Goldman Sachs & Co.(1) | | 09/19/09 | | EUR | 8,000,000 | | 4.00 | % | | 6 month Euribor | | | (116,227 | ) |
Goldman Sachs & Co.(1) | | 06/21/36 | | EUR | 100,000 | | 4.00 | % | | 6 month Euribor | | | (5,529 | ) |
Goldman Sachs & Co.(2) | | 12/15/14 | | EUR | 900,000 | | 4.00 | % | | 6 month Euribor | | | 45,595 | |
Goldman Sachs & Co.(2) | | 12/15/11 | | EUR | 1,500,000 | | 5.00 | % | | 6 month Euribor | | | 2,005 | |
Lehman Brothers(1) | | 03/19/10 | | EUR | 1,300,000 | | 4.50 | % | | 6 month Euribor | | | (7,200 | ) |
Morgan Stanley Capital Services, Inc.(1) | | 09/19/09 | | EUR | 400,000 | | 4.00 | % | | 6 month Euribor | | | (5,202 | ) |
Morgan Stanley Capital Services, Inc.(1) | | 03/19/10 | | EUR | 2,200,000 | | 4.50 | % | | 6 month Euribor | | | (5,720 | ) |
Barclays Capital(1) | | 04/30/12 | | EUR | 500,000 | | 1.98 | % | | FRC-Excluding Tobacco -
Non-Revised Consumer
Price Index | | | (3,957 | ) |
Goldman Sachs & Co.(1) | | 06/15/12 | | EUR | 300,000 | | 2.08 | % | | FRC-Excluding Tobacco -
Non-Revised Consumer
Price Index | | | (325 | ) |
Barclays Capital(1) | | 09/15/10 | | GBP | 1,600,000 | | 5.00 | % | | 6 month LIBOR | | | (70,023 | ) |
Barclays Capital(1) | | 06/12/36 | | GBP | 100,000 | | 4.25 | % | | 6 month LIBOR | | | (13,845 | ) |
Barclays Capital(2) | | 09/15/17 | | GBP | 200,000 | | 4.50 | % | | 6 month LIBOR | | | 1,778 | |
Barclays Capital(2) | | 06/18/34 | | GBP | 100,000 | | 5.00 | % | | 6 month LIBOR | | | 15,203 | |
Barclays Capital(2) | | 12/15/35 | | GBP | 700,000 | | 4.00 | % | | 6 month LIBOR | | | 31,541 | |
Deutsche Bank(1) | | 09/15/10 | | GBP | 200,000 | | 5.00 | % | | 6 month LIBOR | | | (7,747 | ) |
Deutsche Bank(1) | | 09/15/15 | | GBP | 100,000 | | 5.00 | % | | 6 month LIBOR | | | (3,204 | ) |
Deutsche Bank(1) | | 06/15/09 | | GBP | 100,000 | | 5.00 | % | | 6 month LIBOR | | | (2,824 | ) |
Goldman Sachs & Co.(1) | | 09/15/10 | | GBP | 600,000 | | 5.00 | % | | 6 month LIBOR | | | (26,658 | ) |
Goldman Sachs & Co.(1) | | 03/20/13 | | GBP | 400,000 | | 5.00 | % | | 6 month LIBOR | | | (1,846 | ) |
Goldman Sachs & Co.(1) | | 03/20/13 | | GBP | 700,000 | | 5.50 | % | | 6 month LIBOR | | | (2,412 | ) |
Goldman Sachs & Co.(1) | | 09/20/12 | | GBP | 1,100,000 | | 6.00 | % | | 6 month LIBOR | | | 36,419 | |
Morgan Stanley Capital Services, Inc.(1) | | 06/15/09 | | GBP | 100,000 | | 5.00 | % | | 6 month LIBOR | | | (2,739 | ) |
Morgan Stanley Capital Services, Inc.(1) | | 03/20/18 | | GBP | 600,000 | | 5.00 | % | | 6 month LIBOR | | | (11,678 | ) |
Morgan Stanley Capital Services, Inc.(2) | | 06/18/34 | | GBP | 100,000 | | 5.00 | % | | 6 month LIBOR | | | 7,638 | |
Morgan Stanley Capital Services, Inc.(2) | | 12/15/35 | | GBP | 100,000 | | 4.00 | % | | 6 month LIBOR | | | 8,644 | |
Barclays Capital(1) | | 03/18/09 | | JPY | 440,000,000 | | 1.00 | % | | 6 month LIBOR | | | 5,257 | |
Barclays Capital(1) | | 12/20/13 | | JPY | 290,000,000 | | 2.00 | % | | 6 month LIBOR | | | 21,732 | |
Barclays Capital(2) | | 12/20/16 | | JPY | 160,000,000 | | 2.00 | % | | 6 month LIBOR | | | (54,984 | ) |
Deutsche Bank(1) | | 06/20/12 | | JPY | 50,000,000 | | 1.50 | % | | 6 month LIBOR | | | 3,744 | |
Deutsche Bank(1) | | 09/18/08 | | JPY | 40,000,000 | | 1.00 | % | | 6 month LIBOR | | | (327 | ) |
Deutsche Bank(1) | | 03/18/09 | | JPY | 210,000,000 | | 1.00 | % | | 6 month LIBOR | | | 51,139 | |
Deutsche Bank(2) | | 12/20/27 | | JPY | 40,000,000 | | 2.50 | % | | 6 month LIBOR | | | (1,834 | ) |
Goldman Sachs & Co.(1) | | 06/20/12 | | JPY | 40,000,000 | | 1.50 | % | | 6 month LIBOR | | | 1,274 | |
Goldman Sachs & Co.(1) | | 03/18/09 | | JPY | 300,000,000 | | 1.00 | % | | 6 month LIBOR | | | 1,477 | |
Goldman Sachs & Co.(2) | | 06/20/10 | | JPY | 150,000,000 | | 2.00 | % | | 6 month LIBOR | | | (21,306 | ) |
Goldman Sachs & Co.(2) | | 12/20/16 | | JPY | 200,000,000 | | 2.00 | % | | 6 month LIBOR | | | (66,384 | ) |
Goldman Sachs & Co.(2) | | 06/20/36 | | JPY | 40,000,000 | | 3.00 | % | | 6 month LIBOR | | | (15,060 | ) |
Morgan Stanley Capital Services, Inc.(1) | | 09/18/08 | | JPY | 200,000,000 | | 1.00 | % | | 6 month LIBOR | | | (2,834 | ) |
See Notes to Financial Statements.
| | |
| THE TARGET PORTFOLIO TRUST | | 99 |
| | |
International Bond Portfolio (continued) | | Portfolio of Investments
As of October 31, 2007 |
| | | | | | | | | | | | | | |
Counterparty | | Termination
Date | | Notional
Amount# | | Fixed
Rate | | | Floating
Rate | | Unrealized
Appreciation
(Depreciation) | |
Morgan Stanley Capital Services, Inc.(1) | | 06/20/12 | | JPY | 150,000,000 | | 1.50 | % | | 6 month LIBOR | | $ | 11,507 | |
Morgan Stanley Capital Services, Inc.(1) | | 03/18/09 | | JPY | 430,000,000 | | 1.00 | % | | 6 month LIBOR | | | 1,842 | |
Morgan Stanley Capital Services, Inc.(2) | | 09/27/16 | | JPY | 100,000,000 | | 1.98 | % | | 6 month LIBOR | | | (21,959 | ) |
Morgan Stanley Capital Services, Inc.(2) | | 06/20/36 | | JPY | 60,000,000 | | 2.50 | % | | 6 month LIBOR | | | (7,912 | ) |
UBS AG(1) | | 06/20/12 | | JPY | 180,000,000 | | 1.50 | % | | 6 month LIBOR | | | 14,198 | |
UBS AG(1) | | 03/18/09 | | JPY | 280,000,000 | | 1.00 | % | | 6 month LIBOR | | | 74,839 | |
UBS AG(1) | | 09/18/08 | | JPY | 340,000,000 | | 1.00 | % | | 6 month LIBOR | | | (6,612 | ) |
UBS AG(2) | | 06/20/36 | | JPY | 30,000,000 | | 2.50 | % | | 6 month LIBOR | | | 117 | |
UBS AG(2) | | 12/20/16 | | JPY | 50,000,000 | | 2.00 | % | | 6 month LIBOR | | | (6,386 | ) |
JPMorgan Chase(1) | | 09/23/16 | | MXN | 1,000,000 | | 8.84 | % | | 28 day Mexican interbank rate | | | 3,596 | |
Merrill Lynch & Co.(1) | | 09/05/16 | | MXN | 2,000,000 | | 8.72 | % | | 28 day Mexican interbank rate | | | 1,567 | |
Merrill Lynch & Co.(1) | | 11/04/16 | | MXN | 1,500,000 | | 8.17 | % | | 28 day Mexican interbank rate | | | (1,743 | ) |
| | | | | | | | | | | | | | |
| | | | | | | | | | | | $ | 88,966 | |
| | | | | | | | | | | | | | |
| (1) | Portfolio pays the floating rate and receives the fixed rate. |
| (2) | Portfolio pays the fixed rate and receives the floating rate. |
| (3) | Portfolio pays the fixed and receives the difference between the floating rate and the strike price. |
| # | Notional Amount is shown in U.S. dollars unless otherwise stated. |
Credit default swap agreements outstanding at October 31, 2007:
| | | | | | | | | | | | | | |
Counterparty | | Termination
Date | | Notional
Amount# | | Fixed
Rate | | | Underlying
Bond | | Unrealized
Appreciation
(Depreciation) | |
Credit Suisse International(2) | | 03/20/11 | | $ | 100,000 | | 0.16 | % | | Avon Products,
5.125%, due 01/15/11 | | $ | (170 | ) |
Deutsche Bank(1) | | 06/20/08 | | | 200,000 | | 0.16 | % | | Bear Stearns Co., 5.30%,
due 10/30/15 | | | (1,059 | ) |
Deutsche Bank(1) | | 06/20/08 | | | 100,000 | | 0.16 | % | | Bear Stearns Co., 5.30%,
due 10/30/15 | | | (529 | ) |
Morgan Stanley Capital Services, Inc.(2) | | 03/20/11 | | | 100,000 | | 0.20 | % | | Cox Communications, Inc.,
6.75%, due 03/15/11 | | | 283 | |
Bank of America Securities LLC(2) | | 06/20/17 | | | 100,000 | | 0.48 | % | | Diamond Offshore Drilling,
4.875%, due 07/01/15 | | | (995 | ) |
Deutsche Bank(1) | | 06/20/12 | | | 100,000 | | 4.22 | % | | Dow Jones CDX HY8 Index | | | 9,395 | |
Merrill Lynch & Co.(1) | | 06/20/12 | | | 100,000 | | 3.88 | % | | Dow Jones CDX HY8 Index | | | 8,419 | |
Barclays Capital(2) | | 06/20/17 | | | 800,000 | | 0.60 | % | | Dow Jones CDX IG8 Index | | | 2,147 | |
Goldman Sachs & Co.(2) | | 06/20/12 | | | 5,100,000 | | 0.35 | % | | Dow Jones CDX IG8 Index | | | (13,298 | ) |
Merrill Lynch & Co.(2) | | 06/20/15 | | | 100,000 | | 0.52 | % | | Exelon Corp.,
4.90%, due 06/15/15 | | | 708 | |
See Notes to Financial Statements.
| | |
| 100 | | THE TARGET PORTFOLIO TRUST |
| | | | | | | | | | | | | | |
Counterparty | | Termination
Date | | Notional
Amount# | | Fixed
Rate | | | Underlying
Bond | | Unrealized
Appreciation
(Depreciation) | |
Morgan Stanley Capital Services, Inc.(2) | | 06/20/09 | | $ | 100,000 | | 0.23 | % | | Federated Department Stores, Inc.,
6.30% due 04/01/09 | | $ | 415 | |
Lehman Brothers(2) | | 06/20/10 | | | 100,000 | | 2.31 | % | | Ford Motor Credit Co.,
7.875%, due 06/15/10 | | | 4,947 | |
Morgan Stanley Capital Services, Inc.(2) | | 06/20/10 | | | 100,000 | | 0.17 | % | | Glitnir Banki, 5.44%,(3)
due 04/20/10 | | | 1,865 | |
Bank of America Securities LLC(2) | | 06/20/12 | | | 100,000 | | 0.46 | % | | GlobalSantaFe Corp.,
5.00%, due 02/15/13 | | | (1,410 | ) |
UBS AG(2) | | 06/20/16 | | | 100,000 | | 0.31 | % | | Goldman Sachs Group, Inc.,
5.25%, due 06/01/16 | | | 1,956 | |
Deutsche Bank(1) | | 06/20/08 | | | 100,000 | | 0.12 | % | | Goldman Sachs Group, Inc.,
6.60%, due 01/15/12 | | | (289 | ) |
Credit Suisse International(2) | | 03/20/12 | | | 100,000 | | 0.45 | % | | iStar Financial, Inc.,
5.15%, due 03/01/12 | | | 10,375 | |
JPMorgan Chase(2) | | 03/20/11 | | | 100,000 | | 0.28 | % | | Johnson Controls, Inc.,
5.25%, due 01/15/11 | | | (427 | ) |
Deutsche Bank(1) | | 06/20/08 | | | 200,000 | | 0.16 | % | | Lehman Brothers Holdings,
6.625%, due 01/18/12 | | | (1,022 | ) |
Lehman Brothers(2) | | 06/20/17 | | | 100,000 | | 1.02 | % | | MeadWestvaco Corp.,
6.85%, due 04/01/12 | | | 776 | |
Bank of America Securities LLC(1) | | 06/20/08 | | | 100,000 | | 0.15 | % | | Merrill Lynch & Co.,
6.00%, due 02/17/09 | | | (417 | ) |
Deutsche Bank(1) | | 06/20/08 | | | 200,000 | | 0.14 | % | | Merrill Lynch & Co.,
6.00%, due 02/17/09 | | | (857 | ) |
Deutsche Bank(1) | | 06/20/08 | | | 200,000 | | 0.14 | % | | Morgan Stanley,
6.60%, due 04/01/12 | | | (408 | ) |
Barclays Capital(2) | | 06/20/11 | | | 100,000 | | 0.21 | % | | National Grid PLC,
5.00%, due 07/02/18 | | | 112 | |
Citigroup(2) | | 06/20/10 | | | 100,000 | | 0.13 | % | | Newell Rubbermaid, Inc.,
4.00%, due 05/01/10 | | | 64 | |
Goldman Sachs & Co.(2) | | 06/20/12 | | | 100,000 | | 0.53 | % | | Noble Corp.,
5.875%, due 06/01/13 | | | (739 | ) |
Goldman Sachs & Co.(1) | | 05/20/12 | | | 100,000 | | 0.82 | % | | OJSC Russian Agriculture Bank,
6.875%, due 11/29/10 | | | (3,916 | ) |
JPMorgan Chase(2) | | 09/20/11 | | | 100,000 | | 0.93 | % | | Sabre Holding Corp.,
7.35%, due 08/01/11 | | | 7,794 | |
Merrill Lynch & Co.(2) | | 03/20/12 | | | 100,000 | | 0.46 | % | | Sprint Capital Corp.,
8.375%, due 03/15/12 | | | 1,116 | |
Goldman Sachs & Co.(2) | | 06/20/17 | | | 100,000 | | 0.50 | % | | Transocean, Inc.,
7.375%, due 04/15/18 | | | (227 | ) |
Bear Stearns International Ltd.(2) | | 06/20/11 | | | 100,000 | | 0.47 | % | | Viacom, Inc.,
5.75%, due 04/30/11 | | | (619 | ) |
Morgan Stanley Capital Services, Inc.(2) | | 06/20/17 | | | 100,000 | | 0.99 | % | | Weyerhaeuser Co.,
6.75%, due 03/15/12 | | | 871 | |
| | | | | | | | | | | | | | |
| | | | | | | | | | | | $ | 24,861 | |
| | | | | | | | | | | | | | |
| (1) | Portfolio pays the counterparty par in the event that the underlying bond defaults and receives the fixed rate. |
See Notes to Financial Statements.
| | |
| THE TARGET PORTFOLIO TRUST | | 101 |
| | |
International Bond Portfolio (continued) | | Portfolio of Investments
As of October 31, 2007 |
| (2) | Portfolio pays the fixed rate and receives from the counterparty, par in the event that the underlying bond defaults. |
| (3) | Variable rate, displayed rate is as of 10/31/07. |
| # | Notional Amount is shown in U.S. dollars unless otherwise stated. |
The industry classification of investments and liabilities in excess of other assets as a percentage of net assets as of October 31, 2007 were as follows:
| | | |
Foreign Bonds | | 95.4 | % |
U.S. Government Mortgage Backed Obligations | | 32.2 | |
U.S. Treasury Obligations | | 23.3 | |
Financials | | 7.8 | |
Asset Backed Securities | | 5.4 | |
Collateralized Mortgage Obligations | | 4.5 | |
Foreign Treasury Obligations | | 2.6 | |
Consumer Cyclicals | | 1.3 | |
Finance-Consumer Loans | | 0.9 | |
Outstanding Options Purchased | | 0.8 | |
Communications | | 0.8 | |
Affiliated Money Market Mutual Fund | | 0.6 | |
Energy | | 0.3 | |
U.S. Government Agency Obligations | | 0.2 | |
Utilities | | 0.2 | |
| | | |
| | 176.3 | |
Written Options and Securities Sold Short | | (11.5 | ) |
Other liabilities in excess of other assets | | (64.8 | ) |
| | | |
| | 100.0 | % |
| | | |
See Notes to Financial Statements.
| | |
| 102 | | THE TARGET PORTFOLIO TRUST |
| | |
| Total Return Bond Portfolio | | Portfolio of Investments
As of October 31, 2007 |
| | | | | | | | |
MOODY’S
RATINGS
(UNAUDITED) | | PRINCIPAL
AMOUNT (000)# | | DESCRIPTION | | VALUE (NOTE 1) |
| | | | | | | | |
| | | | | LONG-TERM INVESTMENTS—120.2% | | | |
| | | |
| | | | | ASSET-BACKED SECURITIES—0.4% | | | |
| | | | | Structured Asset Securities Corp.,
Series 2005-7XS, Class 2A1A | | | |
| Aaa | | $ | 776 | | 4.90%(c), 04/25/35 | | | |
| | | | | (cost $770,669) | | $ | 763,653 |
| | | | | | | | |
| | | |
| | | | | BANK NOTES—1.9% | | | |
| B+(d) | | | 596 | | Ford Motor Co.,
Term B Notes
(cost $1,300,000, purchased 12/12/06)(f)(g)
8.70%(c), 11/29/13 | | | 575,131 |
| Ba | | | 3,300 | | SLM Corp.,
Bridge Loan
(cost $3,283,500, purchased 06/27/07)(f)(g)
6.00%, 06/30/08 | | | 3,287,102 |
| | | | | | | | |
| | | | | TOTAL BANK NOTES
(cost $3,879,000) | | | 3,862,233 |
| | | | | | | | |
| | | |
| | | | | COLLATERALIZED MORTGAGE OBLIGATIONS—1.7% | | | |
| AAA(d) | | | 2 | | American Housing Trust,
Series I, Class 5
8.625%, 08/25/18 | | | 2,168 |
| Aaa | | | 116 | | Bear Stearns Adjustable Rate Mortgage Trust,
Series 2002-11, Class 1A1
5.605%(c), 02/25/33 | | | 115,788 |
| Aaa | | | 452 | | Series 2005-4, Class 23A2 5.373%(c), 05/25/35 | | | 450,957 |
| Aaa | | | 715 | | Citigroup Mortgage Loan Trust, Inc.,
Series 2005-6, Class A2
4.248%(c), 08/25/35 | | | 700,139 |
| Aaa | | | 6 | | Indymac Adjustable Rate Mortgage Trust,
Series 2001-H2, Class A1
6.596%(c), 01/25/32 | | | 6,010 |
| Aaa | | | 365 | | Merrill Lynch Mortgage Investors, Inc.,
Series 2005-A10, Class A
5.083%(c), 02/25/36 | | | 361,288 |
| Aaa | | | 73 | | Residential Funding Mortgage Securities,
Series 2003-S9, Class A1
6.50%, 03/25/32 | | | 72,955 |
| Aaa | | | 1,757 | | Washington Mutual, Inc.,
Series 2003-R1, Class A1
5.413%(c), 12/25/27 | | | 1,757,289 |
| | | | | | | | |
| | | | | TOTAL COLLATERALIZED MORTGAGE OBLIGATIONS
(cost $3,462,557) | | | 3,466,594 |
| | | | | | | | |
See Notes to Financial Statements.
| | |
| THE TARGET PORTFOLIO TRUST | | 103 |
| | |
Total Return Bond Portfolio (continued) | | Portfolio of Investments
As of October 31, 2007 |
| | | | | | | | |
MOODY’S
RATINGS
(UNAUDITED) | | PRINCIPAL
AMOUNT (000)# | | DESCRIPTION | | VALUE (NOTE 1) |
| | | | | | | | |
| | | | | CORPORATE BONDS—13.2% | | | |
| | | |
| | | | | Aerospace—0.1% | | | |
| Baa2 | | $ | 200 | | Goodrich (BF) Corp.,
Sr. Unsec’d. Notes
6.29%, 07/01/16 | | $ | 207,679 |
| | | | | | | | |
| | | |
| | | | | Airlines—0.1% | | | |
| | | | | United Air Lines, Inc., Equipment Trust(g)(i) | | | |
| NR | | | 982 | | 10.85%, 02/19/15 | | | 298,338 |
| | | | | | | | |
| | | |
| | | | | Automobile Manufacturers—0.2% | | | |
| A3 | | | 400 | | DaimlerChrysler NA Holding Corp.,
Gtd. Notes, MTN
5.75%, 09/08/11 | | | 407,491 |
| | | | | | | | |
| | | |
| | | | | Financial—Bank & Trust—0.8% | | | |
| Aa1 | | | 1,200 | | Bank of America Corp.,
Sr. Notes
5.503%(c), 10/14/16 | | | 1,181,554 |
| | | | | VTB Capital SA,
Sr. Notes, 144A
(cost $400,000, purchased 10/27/06)(f)(g) | | | |
| A2 | | | 400 | | 5.956%(c), 08/01/08 | | | 396,000 |
| | | | | | | | |
| | | | | | | | 1,577,554 |
| | | | | | | | |
| | | |
| | | | | Financial Services—4.1% | | | |
| Aa2 | | | 400 | | CitiFinancial, Inc.,
Notes
6.625%, 06/01/15 | | | 423,509 |
| Aaa | | | 3,300 | | General Electric Capital Corp.,
Sr. Unsec’d. Notes, MTN
5.065%(c), 10/24/08 | | | 3,292,677 |
| Baa1 | | | 800 | | General Mills, Inc.,
Unsub. Notes
5.31%(c), 01/22/10 | | | 794,213 |
| Ba2 | | | 1,000 | | General Motors Acceptance Corp.,
Bonds
8.00%, 11/01/31 | | | 924,318 |
| Aa3 | | | 1,800 | | Morgan Stanley,
Sr. Unsec’d. Notes, MTN
5.75%, 10/18/16 | | | 1,780,464 |
| Baa1 | | | 250 | | Pemex Project Funding Master Trust,
Gtd. Notes
9.125%, 10/13/10 | | | 278,250 |
See Notes to Financial Statements.
| | |
| 104 | | THE TARGET PORTFOLIO TRUST |
| | | | | | | | |
MOODY’S
RATINGS
(UNAUDITED) | | PRINCIPAL
AMOUNT (000)# | | DESCRIPTION | | VALUE (NOTE 1) |
| | | | | | | | |
| | | | | CORPORATE BONDS (continued) | | | |
| | | |
| | | | | Financial Services (cont’d.) | | | |
| | | | | Unicredit Luxembourg Finance SA,
Gtd. Notes, 144A (Luxembourg)
(cost $1,000,000, purchased 10/17/06)(f)(g) | | | |
| Aa2 | | $ | 1,000 | | 5.143%(c), 10/24/08 | | $ | 997,653 |
| | | | | | | | |
| | | | | | | | 8,491,084 |
| | | | | | | | |
| | | |
| | | | | Healthcare Services—1.7% | | | |
| A2 | | | 3,600 | | Amgen, Inc.,
Sr. Unsec’d. Notes, 144A
(cost $3,600,000, purchased 05/24/07)(f)(g)
5.585%(c), 11/28/08 | | | 3,593,509 |
| | | | | | | | |
| | | |
| | | | | Oil, Gas & Consumable Fuels—0.4% | | | |
| Baa1 | | | 800 | | Transocean, Inc.,
Unsec’d. Notes
5.869%(c), 09/05/08 | | | 798,495 |
| | | | | | | | |
| | | |
| | | | | Pipelines—0.2% | | | |
| Ba3 | | | 400 | | El Paso Corp.,
Sr. Unsec’d. Notes, MTN
7.80%, 08/01/31 | | | 399,582 |
| | | | | | | | |
| | | |
| | | | | Real Estate Investment Trusts—0.1% | | | |
| Baa2 | | | 200 | | iStar Financial, Inc.,
Sr. Unsec’d. Notes
5.80%, 03/15/11 | | | 193,318 |
| | | | | | | | |
| | | |
| | | | | Telecommunications—3.9% | | | |
| A2 | | | 1,700 | | BellSouth Corp.,
Notes, 144A
(cost $1,681,844, purchased 04/18/07)(f)(g)
4.24%, 04/26/21 | | | 1,692,428 |
| A2 | | | 800 | | Sr. Unsec’d. Notes 5.658%(c), 08/15/08 | | | 799,261 |
| Baa3 | | | 1,600 | | Embarq Corp.,
Sr. Unsec’d. Notes
6.738%, 06/01/13 | | | 1,663,718 |
| Baa3 | | | 1,000 | | 7.082%, 06/01/16 | | | 1,045,133 |
| | | | | Qwest Corp.,
Debs. | | | |
| Ba1 | | | 250 | | 7.50%, 06/15/23 | | | 247,188 |
| Ba1 | | | 1,500 | | Sr. Notes 7.625%, 06/15/15 | | | 1,578,750 |
| Baa3 | | | 1,000 | | Sprint Capital Corp.,
Gtd. Notes
8.375%, 03/15/12 | | | 1,092,154 |
| | | | | | | | |
| | | | | | | | 8,118,632 |
| | | | | | | | |
See Notes to Financial Statements.
| | |
| THE TARGET PORTFOLIO TRUST | | 105 |
| | |
Total Return Bond Portfolio (continued) | | Portfolio of Investments
As of October 31, 2007 |
| | | | | | | | |
MOODY’S
RATINGS
(UNAUDITED) | | PRINCIPAL
AMOUNT (000)# | | DESCRIPTION | | VALUE (NOTE 1) |
| | | | | | | | |
| | | | | CORPORATE BONDS (continued) | | | |
| | | |
| | | | | Tobacco—0.4% | | | |
| Ba1 | | $ | 750 | | Reynolds American, Inc.,
Gtd. Notes
7.625%, 06/01/16 | | $ | 811,438 |
| | | | | | | | |
| | | |
| | | | | Utilities—1.2% | | | |
| | | | | Edison Misson Energy,
Sr. Notes, 144A
(cost $300,000, purchased 05/01/07)(f)(g) | | | |
| B1 | | | 300 | | 7.00%, 05/15/17 | | | 293,250 |
| | | | | General Electric Capital Corp.,
Sub. Notes (United Kingdom)
(cost $992,360, purchased 08/30/07)(f)(g) | | | |
| Aa1 | | | 1,000 | | 6.50%(c), 09/15/67 | | | 2,108,664 |
| | | | | | | | |
| | | | | | | | 2,401,914 |
| | | | | | | | |
| | | | | TOTAL CORPORATE BONDS
(cost $27,677,371) | | | 27,299,034 |
| | | | | | | | |
| | | |
| | | | | FOREIGN GOVERNMENT BONDS—2.2% | | | |
| Ba1 | | | 2,200 | | Republic of Brazil
12.50%, 01/05/22 | | | 1,482,536 |
| Ba1 | | | 300 | | Republic of Panama
8.875%, 09/30/27 | | | 389,250 |
| Ba1 | | | 450 | | 9.375%, 07/23/12 | | | 518,625 |
| Ba2 | | | 400 | | Republic of Peru
9.125%, 01/15/08 | | | 403,000 |
| Aaa | | GBP | 700 | | United Kingdom Treasury Gilt
4.25%, 03/07/11 | | | 1,420,508 |
| Aaa | | GBP | 200 | | 5.75%, 12/07/09 | | | 421,184 |
| | | | | | | | |
| | | | | TOTAL FOREIGN GOVERNMENT BONDS
(cost $4,078,738) | | | 4,635,103 |
| | | | | | | | |
| | | |
| | | | | MUNICIPAL BONDS—1.0% | | | |
| | | |
| | | | | Georgia—0.2% | | | |
| Aaa | | | 500 | | Georgia State Road & Tollway Authority Revenue,
Governors Transportation Choices
5.00%, 03/01/21 | | | 520,495 |
| | | | | | | | |
| | | |
| | | | | New York—0.8% | | | |
| Aaa | | | 1,500 | | New York City Trust For Cultural Resources,
Museum of Modern Art
5.125%, 07/01/31 | | | 1,559,745 |
| | | | | | | | |
| | | | | TOTAL MUNICIPAL BONDS
(cost $1,939,162) | | | 2,080,240 |
| | | | | | | | |
See Notes to Financial Statements.
| | |
| 106 | | THE TARGET PORTFOLIO TRUST |
| | | | | | | | | |
| | | PRINCIPAL
AMOUNT (000)# | | | DESCRIPTION | | VALUE (NOTE 1) |
| | | | | | | | | |
| | | | | | U.S. GOVERNMENT MORTGAGE BACKED OBLIGATIONS—74.6% | | | |
| | $ | 61 | | | Federal Home Loan Mortgage Corp.
4.359%(c), 09/01/35 | | $ | 60,362 |
| | | 1,730 | | | 5.00%, 09/01/35 | | | 1,661,684 |
| | | 41 | | | 5.50%, 06/01/29 | | | 41,060 |
| | | 4,000 | | | 5.50%, TBA | | | 3,937,500 |
| | | 87 | | | 6.00%, 09/01/22 | | | 88,319 |
| | | 42 | | | 7.259%(c), 01/01/24 | | | 42,113 |
| | | 59 | | | 7.50%, 09/01/16 - 07/01/17 | | | 62,918 |
| | | — | (r) | | 9.25%, 01/01/10 | | | 289 |
| | | | | | Federal National Mortgage Assoc. | | | |
| | | 14,186 | | | 4.00%, 08/01/18 - 06/01/19 | | | 13,436,213 |
| | | 8,484 | | | 4.50%, 06/01/34 - 09/01/35 | | | 7,913,544 |
| | | 2,000 | | | 4.50%, TBA | | | 1,934,376 |
| | | 353 | | | 4.533%(c), 12/01/34 | | | 350,317 |
| | | 9,230 | | | 5.00%, 01/01/19 - 02/01/36 | | | 8,869,978 |
| | | 3,000 | | | 5.00%, TBA | | | 2,877,186 |
| | | 51,058 | | | 5.50%, 07/01/32 - 10/01/37 | | | 50,347,774 |
| | | 32,000 | | | 5.50%, TBA | | | 31,510,016 |
| | | 104 | | | 5.557%(c), 05/01/36 | | | 104,884 |
| | | 2,615 | | | 6.00%, 11/01/16 - 01/01/36 | | | 2,636,564 |
| | | 184 | | | 6.50%, 04/01/21 - 09/01/21 | | | 189,246 |
| | | 143 | | | 6.788%(c), 01/01/20 | | | 145,424 |
| | | | | | Government National Mortgage Assoc. | | | |
| | | 1,140 | | | 5.00%, 04/15/35 - 11/15/35 | | | 1,107,714 |
| | | 20,932 | | | 5.50%, 01/15/37 - 08/15/37 | | | 20,803,167 |
| | | 4,000 | | | 5.50%, TBA | | | 3,975,000 |
| | | 78 | | | 5.625%, 07/20/22 - 07/20/27 | | | 78,655 |
| | | 1,888 | | | 6.00%, 06/15/36 - 08/15/37 | | | 1,911,348 |
| | | 120 | | | 6.125%, 10/20/26 - 11/20/29 | | | 121,148 |
| | | 127 | | | 6.375%, 02/20/17 - 02/20/26 | | | 128,958 |
| | | 64 | | | 8.50%, 06/15/30 - 08/20/30 | | | 68,856 |
| | | | | | | | | |
| | | | | | TOTAL U.S. GOVERNMENT MORTGAGE BACKED OBLIGATIONS
(cost $154,132,628) | | | 154,404,613 |
| | | | | | | | | |
| | | |
| | | | | | U.S. TREASURY OBLIGATIONS—25.2% | | | |
| | | | | | U.S. Treasury Bonds | | | |
| | | 600 | | | 4.75%, 02/15/37 | | | 599,672 |
| | | 12,000 | | | 5.00%, 05/15/37 | | | 12,477,192 |
| | | 2,900 | | | 6.75%, 08/15/26 | | | 3,593,961 |
| | | 900 | | | 8.125%, 08/15/19 | | | 1,180,195 |
| | | 1,700 | | | 8.75%, 08/15/20 | | | 2,356,227 |
| | | | | | U.S. Treasury Inflationary Bonds, TIPS | | | |
| | | 1,000 | | | 0.875%,04/15/10, RRB | | | 1,072,360 |
| | | 1,700 | | | 2.00%, 04/15/12 - 01/15/26 | | | 1,744,355 |
| | | 2,400 | | | 2.375%, 04/15/11 - 01/15/17, RRB | | | 2,547,857 |
| | | 1,400 | | | 2.375%, 01/15/25 | | | 1,576,902 |
| | | 600 | | | 2.50%, 07/15/16, RRB | | | 638,030 |
See Notes to Financial Statements.
| | |
| THE TARGET PORTFOLIO TRUST | | 107 |
| | |
Total Return Bond Portfolio (continued) | | Portfolio of Investments
As of October 31, 2007 |
| | | | | | | | |
MOODY’S
RATINGS
(UNAUDITED) | | PRINCIPAL
AMOUNT (000)# | | DESCRIPTION | | VALUE (NOTE 1) |
| | | | | | | | |
| | | | | U.S. TREASURY OBLIGATIONS (continued) | | | |
| | | | | U.S. Treasury Notes | | | |
| | $ | 1,900 | | 3.75%, 05/15/08 | | $ | 1,895,695 |
| | | 3,000 | | 4.00%, 02/15/14 | | | 2,964,141 |
| | | 12,900 | | 4.625%, 02/29/12 - 07/31/12 | | | 13,162,025 |
| | | 3,900 | | 4.75%, 05/15/14 - 08/15/17 | | | 4,002,795 |
| | | 1,100 | | 5.125%, 05/15/16 | | | 1,154,484 |
| | | 2,500 | | U.S. Treasury Strips, PO
7.25%, 02/15/22 | | | 1,244,828 |
| | | | | | | | |
| | | | | TOTAL U.S. TREASURY OBLIGATIONS
(cost $51,984,735) | | | 52,210,719 |
| | | | | | | | |
| | | | | TOTAL LONG-TERM INVESTMENTS
(cost $247,924,860) | | | 248,722,189 |
| | | | | | | | |
| | | Shares | | SHORT-TERM INVESTMENTS—7.8% | | |
| | | |
| | | | | AFFILIATED MONEY MARKET MUTUAL FUND—3.9% | | | |
| | | 8,090,143 | | Dryden Core Investment Fund—Taxable Money Market Series (cost $8,090,143; Note 3)(w) | | | 8,090,143 |
| | | | | | | | |
| | | Principal
Amount (000)# | | COMMERCIAL PAPER—1.9% | | |
| | $ | 3,300 | | Bank of America Corp.
5.23%, 11/16/07 | | | 3,292,121 |
| | | 600 | | Rabobank USA
4.80%, 11/01/07 | | | 600,000 |
| | | | | | | | |
| | | | | TOTAL COMMERCIAL PAPER
(cost $3,892,809) | | | 3,892,121 |
| | | | | | | | |
| | | Notional
Amounts (000) | | OUTSTANDING OPTIONS PURCHASED*—1.4% |
| | | |
| | | | | Call Options—1.3% | | | |
| | | 21,000 | | 20 Year U.S. Treasury Bond Futures,
expiring 11/20/2007, Strike Price $137.00 | | | 3,281 |
| | | 2,000 | | Currency Option EUR vs. USD
expiring 05/19/2008 @ FX Rate 1.36 | | | 197,787 |
| | | 4,100 | | expiring 05/21/2010 @ FX Rate 1.38 | | | 433,477 |
| | | 2,400 | | Currency Option USD vs. JPY
expiring 09/16/2008 @ FX Rate 118.00 | | | 12,077 |
| | | 3,500 | | expiring 03/17/2010 @ FX Rate 104.00 | | | 217,633 |
| | | 1,400 | | expiring 03/31/2010 @ FX Rate 104.65 | | | 78,168 |
| | | 62,000 | | Eurodollar Futures,
expiring 12/17/2007, Strike Price $95.25 | | | 13,563 |
| | | 197,000 | | expiring 03/17/2008, Strike Price $95.00 | | | 258,562 |
| | | 92,000 | | expiring 06/16/2008, Strike Price $95.25 | | | 105,800 |
| | | 17,000 | | Swap on 3 Month LIBOR,
expiring 12/19/2008 @ 4.50% | | | 101,919 |
See Notes to Financial Statements.
| | |
| 108 | | THE TARGET PORTFOLIO TRUST |
| | | | | | | | |
| | | NOTIONAL
AMOUNTS (000) | | DESCRIPTION | | VALUE (NOTE 1) |
| | | | | | | | |
| | | | | OUTSTANDING OPTIONS PURCHASED (continued) | | | |
| | | | | Call Options (con’t.) | | | |
| | $ | 8,600 | | Swap on 3 Month LIBOR,
expiring 11/23/2007 @ 4.84% | | $ | 40,970 |
| | | 9,100 | | expiring 12/20/2007 @ 5.00% | | | 81,423 |
| | | 39,400 | | expiring 09/19/2008 @ 4.55% | | | 243,492 |
| | | 25,600 | | expiring 09/26/2008 @ 4.75% | | | 208,126 |
| | | 21,900 | | expiring 12/15/2008 @ 5.55% | | | 396,520 |
| | | 17,000 | | expiring 12/19/2008 @ 4.50% | | | 101,919 |
| | | 18,000 | | expiring 12/31/2008 @ 4.72% | | | 142,385 |
| | | 2,400 | | expiring 09/08/2009 @ 4.75% | | | 19,142 |
| | | | | | | | |
| | | | | | | | 2,656,244 |
| | | | | | | | |
| | | | | Put Options—0.1% | | | |
| | | 2,000 | | Currency Option EUR vs. USD
expiring 05/19/2008 @ FX Rate 1.36 | | | 14,068 |
| | | 4,100 | | expiring 05/21/2010 @ FX Rate 1.38 | | | 123,051 |
| | | 3,500 | | Currency Option USD vs. JPY
expiring 03/17/2010 @ FX Rate 104.00 | | | 151,637 |
| | | 1,400 | | expiring 03/31/2010 @ FX Rate 104.65 | | | 62,276 |
| | | 1,400 | | EURO-BOBL Futures,
expiring 11/23/2007, Strike Price $103.00 | | | 101 |
| | | 275,000 | | Eurodollar Futures,
expiring 03/17/2008, Strike Price $91.75 | | | 1,719 |
| | | 100,000 | | expiring 03/17/2008, Strike Price $92.25 | | | 625 |
| | | 183,000 | | expiring 03/17/2008, Strike Price $92.50 | | | 1,144 |
| | | 40,000 | | Federal National Conventional Loan
expiring 12/05/2007, Strike Price $86.94 | | | — |
| | | 28,500 | | Swap on 3 Month LIBOR,
expiring 03/19/2008, Strike Price $93.00 | | | 741 |
| | | 108,500 | | expiring 06/18/2008, Strike Price $92.50 | | | — |
| | | | | | | | |
| | | | | | | | 355,362 |
| | | | | | | | |
| | | | | TOTAL OUTSTANDING OPTIONS PURCHASED
(cost $2,377,623) | | | 3,011,606 |
| | | | | | | | |
| | | | | U.S. TREASURY OBLIGATIONS(k)—0.6% | | | |
| | | 70 | | U.S. Treasury Bills
3.53%, 12/13/07 | | | 69,669 |
| | | 25 | | 3.718%, 12/13/07 | | | 24,882 |
| | | 90 | | 3.76%, 12/13/07 | | | 89,605 |
| | | 845 | | 3.77%, 12/13/07 | | | 841,001 |
| | | 10 | | 3.78%, 12/13/07 | | | 9,956 |
| | | 50 | | 3.842%, 12/13/07 | | | 49,763 |
| | | 45 | | 3.918%, 12/13/07 | | | 44,794 |
| | | 70 | | 4.11%, 12/13/07 | | | 69,664 |
| | | | | | | | |
| | | | | TOTAL U.S. TREASURY OBLIGATIONS
(cost $1,199,678) | | | 1,199,334 |
| | | | | | | | |
| | | | | TOTAL SHORT-TERM INVESTMENTS
(cost $15,560,253) | | | 16,193,204 |
| | | | | | | | |
| | | | | TOTAL INVESTMENTS, BEFORE OUTSTANDING OPTIONS WRITTEN AND SECURITIES SOLD SHORT—128.0%
(cost $263,485,113; Note 5) | | | 264,915,393 |
| | | | | | | | |
See Notes to Financial Statements.
| | |
| THE TARGET PORTFOLIO TRUST | | 109 |
| | |
Total Return Bond Portfolio (continued) | | Portfolio of Investments
As of October 31, 2007 |
| | | | | | | | | |
| | | PRINCIPAL
AMOUNT (000)# | | DESCRIPTION | | VALUE (NOTE 1) | |
| | | | | | | | | |
| | | |
| | | | | SECURITIES SOLD SHORT—(19.2)% | | | | |
| | | |
| | | | | U.S. Government Mortgage Backed Obligations—(6.3)% | | | | |
| | $ | 11,000 | | Federal National Mortgage Assoc.
5.50%, TBA | | $ | (10,863,359 | ) |
| | | 900 | | 6.50%, TBA | | | (919,969 | ) |
| | | | | | | | | |
| | | | | | | | (11,783,328 | ) |
| | | | | | | | | |
| | | 1,205 | | Government National Mortgage Assoc.
5.00%, TBA | | | (1,169,167 | ) |
| | | | | | | | | |
| | | |
| | | | | U.S. Treasury Obligations—(12.9)% | | | | |
| | | 8,800 | | U.S. Treasury Notes
4.125%, 05/15/15 | | | (8,675,559 | ) |
| | | 15,150 | | 4.875%, 04/30/11 - 07/31/11 | | | (15,577,156 | ) |
| | | 2,100 | | 3.625%, 05/15/13 | | | (2,044,054 | ) |
| | | 500 | | 4.75%, 05/15/14 | | | (513,867 | ) |
| | | | | | | | | |
| | | | | | | | (26,810,636 | ) |
| | | | | | | | | |
| | | | | TOTAL SECURITIES SOLD SHORT
(proceeds received $39,746,135) | | | (39,763,131 | ) |
| | | | | | | | | |
| | | Notional
Amounts (000) | | OUTSTANDING OPTIONS WRITTEN*—(0.6)% | | | |
| | | | | Call Options—(0.6)% | | | | |
| | | 9,000 | | 5 Year U.S. Treasury Note Futures,
expiring 11/20/2007, Strike Price $107.00 | | | (54,844 | ) |
| | | 4,000 | | Swap on 3 Month LIBOR,
expiring 12/20/2007 @ 5.15% | | | (62,779 | ) |
| | | 13,100 | | expiring 09/19/2008 @ 5.05% | | | (240,265 | ) |
| | | 11,100 | | expiring 09/26/2008 @ 4.95% | | | (165,323 | ) |
| | | 7,300 | | expiring 12/15/2008 @ 5.75% | | | (318,727 | ) |
| | | 11,400 | | expiring 12/19/2008 @ 5.00% | | | (206,374 | ) |
| | | 6,000 | | expiring 12/31/2008 @ 5.22% | | | (146,155 | ) |
| | | 900 | | expiring 09/08/2009 @ 5.15% | | | (21,575 | ) |
| | | | | | | | | |
| | | | | | | | (1,216,042 | ) |
| | | | | | | | | |
| | | | | Put Options | | | | |
| | | 2,400 | | Currency Option USD vs. JPY
expiring 09/16/2008 @ FX Rate 100 | | | (17,136 | ) |
| | | | | | | | | |
| | | | | TOTAL OUTSTANDING OPTIONS WRITTEN
(premiums received $1,073,658) | | | (1,233,178 | ) |
| | | | | | | | | |
| | | |
| | | | | TOTAL INVESTMENTS, NET OF OUTSTANDING OPTIONS WRITTEN AND SECURITIES SOLD SHORT—108.2%
(cost $222,665,320; Note 5) | | | 223,919,084 | |
| | | | | Other liabilities in excess of other assets(x)—(8.2%) | | | (16,986,321 | ) |
| | | | | | | | | |
| | | | | NET ASSETS—100% | | $ | 206,932,763 | |
| | | | | | | | | |
See Notes to Financial Statements.
| | |
| 110 | | THE TARGET PORTFOLIO TRUST |
The following abbreviations are used in portfolio descriptions:
144A—Security was purchased pursuant to Rule 144A under the securities Act of 1933 and may not be resold subject to that rule except to qualified institutional buyers. Unless otherwise noted, 144A securities are deemed to be liquid.
MTN—Medium Term Note
PO—Principal Only Securities
RRB—Real Return Bonds
TBA—To Be Announced
TIPS—Treasury Inflation Protected Securities
AUD—Australian Dollar
BRL—Brazilian Real
CAD—Canadian Dollar
CHF—Swiss Franc
CNY—Chinese Yuan
EUR—Euro
GBP—British Pound
INR—Indian Rupee
JPY—Japanese Yen
KRW—South Korean Won
MXN—Mexican Peso
RUB—Russian Ruble
| # | Principal amount is shown in U.S. dollars unless otherwise stated. |
| * | Non-income producing security. |
| (c) | Indicates a variable rate security. |
| (d) | Standard & Poor’s rating. |
| (f) | Private Placement restricted as to resale and does not have a readily available market. The aggregate cost of such securities is $12,557,704. The aggregate value of $12,943,737 is approximately 6.0% of net assets. |
| (g) | Indicates a security that has been deemed illiquid. |
| (i) | Represents issuer in default on interest payments. Non-income producing security. |
| (k) | Securities segregated as collateral for futures contracts. |
| (w) | Prudential Investments LLC, the manager of the Portfolio also serves as manager of the Dryden Core Investment Fund—Taxable Money Market Series. |
| (x) | Other liabilities in excess of assets includes net unrealized appreciation (depreciation) on futures contracts, forward foreign currency contracts, interest rate and credit default swaps as follows: |
Open future contracts outstanding at October 31, 2007:
| | | | | | | | | | | | | | |
Number of
Contracts | | Type | | Expiration
Date | | Value at
Trade Date | | Value at
October 31, 2007 | | Unrealized
Appreciation
(Depreciation) | |
| Long Positions: | | | | | | | | | | | | | | |
| 14 | | 5 Year Euro-Bobl | | Dec 07 | | $ | 2,184,718 | | $ | 2,184,312 | | $ | (406 | ) |
| 80 | | 90 Day Euro Dollar | | Dec 07 | | | 19,008,425 | | | 19,050,000 | | | 41,575 | |
| 52 | | 90 Day Euro Dollar | | Mar 08 | | | 12,409,800 | | | 12,415,650 | | | 5,850 | |
| 247 | | 90 Day Euro Dollar | | Sep 08 | | | 59,190,325 | | | 59,088,575 | | | (101,750 | ) |
| 379 | | 90 Day Euro Dollar | | Dec 08 | | | 90,586,625 | | | 90,675,750 | | | 89,125 | |
| 16 | | 90 Day Euro Dollar | | Jun 09 | | | 3,818,800 | | | 3,822,400 | | | 3,600 | |
| 22 | | 90 Day Euro Dollar | | Sep 09 | | | 5,251,125 | | | 5,250,300 | | | (825 | ) |
| 22 | | 90 Day Euro Dollar | | Dec 09 | | | 5,245,350 | | | 5,244,800 | | | (550 | ) |
| 43 | | 90 Day EUROBOR | | Mar 08 | | | 14,897,886 | | | 14,883,537 | | | (14,349 | ) |
| 132 | | 90 Day EUROBOR | | Jun 08 | | | 45,716,746 | | | 45,708,119 | | | (8,627 | ) |
| 53 | | 90 Day EUROBOR | | Dec 08 | | | 18,391,468 | | | 18,364,018 | | | (27,450 | ) |
See Notes to Financial Statements.
| | |
| THE TARGET PORTFOLIO TRUST | | 111 |
| | |
Total Return Bond Portfolio (continued) | | Portfolio of Investments
As of October 31, 2007 |
| | | | | | | | | | | | | | |
Number of
Contracts | | Type | | Expiration
Date | | Value at
Trade Date | | Value at
October 31, 2007 | | Unrealized
Appreciation
(Depreciation) | |
| 13 | | 90 Day EUROBOR | | Mar 09 | | $ | 4,512,385 | | $ | 4,505,794 | | $ | (6,591 | ) |
| 70 | | 90 Day Sterling | | Mar 08 | | | 17,134,077 | | | 17,124,114 | | | (9,963 | ) |
| 67 | | 90 Day Sterling | | Sep 08 | | | 16,468,301 | | | 16,449,431 | | | (18,870 | ) |
| 137 | | 90 Day Sterling | | Dec 08 | | | 33,603,305 | | | 33,656,769 | | | 53,464 | |
| 23 | | 90 Day Sterling | | Jun 09 | | | 5,612,745 | | | 5,649,809 | | | 37,064 | |
| | | | | | | | | | | | | | |
| | | | | | | | | | | | | 41,297 | |
| | | | | | | | | | | | | | |
| Short Positions: | | | | | | | | | | | | | | |
| 113 | | 2 Year U.S. Treasury Notes | | Dec 07 | | | 23,341,562 | | | 23,403,359 | | | (61,797 | ) |
| 325 | | 5 Year U.S. Treasury Notes | | Dec 07 | | | 34,654,797 | | | 34,886,719 | | | (231,922 | ) |
| 18 | | 10 Year U.S. Treasury Notes | | Dec 07 | | | 1,981,125 | | | 1,980,281 | | | 844 | |
| 485 | | 20 Year U.S. Treasury Bonds | | Dec 07 | | | 53,741,094 | | | 54,607,969 | | | (866,875 | ) |
| 17 | | 90 Day Euro Dollar | | Jun 08 | | | 4,070,014 | | | 4,063,850 | | | 6,164 | |
| 182 | | 90 Day Sterling | | Jun 08 | | | 44,692,990 | | | 44,622,034 | | | 70,956 | |
| | | | | | | | | | | | | | |
| | | | | | | | | | | | | (1,082,630 | ) |
| | | | | | | | | | | | | | |
| | | | | | | | | | | | $ | (1,041,333 | ) |
| | | | | | | | | | | | | | |
Forward foreign currency exchange contracts outstanding at October 31, 2007:
| | | | | | | | | | | | | |
Purchase Contract | | Notional
Amount (000) | | Value at Settlement
Date Payable | | Current
Value | | Unrealized
Appreciation
(Depreciation) | |
Brazilian Real, | | | | | | | | | | | | | |
Expiring 07/02/08 | | BRL | 4,515 | | $ | 2,242,916 | | $ | 2,520,082 | | $ | 277,166 | |
Canadian Dollars, | | | | | | | | | | | | | |
Expiring 12/20/07 | | CAD | 74 | | | 77,908 | | | 77,908 | | | — | |
Chinese Yuan, | | | | | | | | | | | | | |
Expiring 07/02/08 | | CNY | 29,040 | | | 4,000,000 | | | 4,090,125 | | | 90,125 | |
Indian Rupee, | | | | | | | | | | | | | |
Expiring 05/12/08 | | INR | 213,074 | | | 5,175,446 | | | 5,371,423 | | | 195,977 | |
Japanese Yen, | | | | | | | | | | | | | |
Expiring 12/13/07 | | JPY | 724,204 | | | 6,346,015 | | | 6,309,762 | | | (36,253 | ) |
Mexican Peso, | | | | | | | | | | | | | |
Expiring 03/13/08 | | MXN | 8,367 | | | 734,001 | | | 776,250 | | | 42,249 | |
Russian Ruble, | | | | | | | | | | | | | |
Expiring 01/11/08 | | RUB | 72,974 | | | 2,842,000 | | | 2,951,168 | | | 109,168 | |
Expiring 07/10/08 | | RUB | 144,689 | | | 5,708,324 | | | 5,818,317 | | | 109,993 | |
South Korean Won, | | | | | | | | | | | | | |
Expiring 08/04/08 | | KRW | 1,505,406 | | | 1,628,711 | | | 1,679,860 | | | 51,149 | |
Swiss Franc, | | | | | | | | | | | | | |
Expiring 12/06/07 | | CHF | 929 | | | 773,715 | | | 803,976 | | | 30,261 | |
| | | | | | | | | | | | | |
| | | | | $ | 29,529,036 | | $ | 30,398,871 | | $ | 869,835 | |
| | | | | | | | | | | | | |
See Notes to Financial Statements.
| | |
| 112 | | THE TARGET PORTFOLIO TRUST |
| | | | | | | | | | | | | |
Sale Contracts | | Notional
Amount (000) | | Value at Settlement
Date Receivable | | Current
Value | | Unrealized
(Depreciation) | |
British Pound, | | | | | | | | | | | | | |
Expiring 11/01/07 | | GBP | 2,518 | | $ | 5,072,188 | | $ | 5,235,523 | | $ | (163,335 | ) |
Expiring 12/20/07 | | GBP | 2,412 | | | 4,978,007 | | | 5,007,162 | | | (29,155 | ) |
Russian Ruble, | | | | | | | | | | | | | |
Expiring 01/11/08 | | RUB | 50,920 | | | 2,000,000 | | | 2,059,279 | | | (59,279 | ) |
Euros, | | | | | | | | | | | | | |
Expiring 11/05/07 | | EUR | 3,842 | | | 5,442,088 | | | 5,565,769 | | | (123,681 | ) |
Mexican Peso, | | | | | | | | | | | | | |
Expiring 03/13/08 | | MXN | 8,367 | | | 757,861 | | | 776,249 | | | (18,388 | ) |
| | | | | | | | | | | | | |
| | | | | $ | 18,250,144 | | $ | 18,643,982 | | ($ | 393,838 | ) |
| | | | | | | | | | | | | |
Interest rate swap agreements outstanding at October 31, 2007:
| | | | | | | | | | | | | | |
Counter Party | | Termination
Date | | Notional
Amount# | | Fixed
Rate | | | Floating Rate | | Unrealized
Appreciation
(Depreciation) | |
Bank of America, N.A.(1) | | 06/15/35 | | $ | 900,000 | | 6.00 | % | | 3 Month LIBOR | | $ | 85,369 | |
Bank of America, N.A.(1) | | 12/19/09 | | | 4,500,000 | | 5.00 | % | | 3 Month LIBOR | | | 70,031 | |
Bank of America, N.A.(2) | | 06/20/22 | | | 100,000 | | 5.00 | % | | 3 Month LIBOR | | | (1,491 | ) |
Barclays Capital(1) | | 12/19/09 | | | 12,000,000 | | 5.00 | % | | 3 Month LIBOR | | | 14,492 | |
Barclays Capital(1) | | 12/19/12 | | | 19,000,000 | | 5.00 | % | | 3 Month LIBOR | | | 526,909 | |
Citigroup(1) | | 12/19/37 | | | 2,500,000 | | 5.00 | % | | 3 Month LIBOR | | | 171,918 | |
Citigroup(2) | | 06/20/17 | | | 2,500,000 | | 5.00 | % | | 3 Month LIBOR | | | 33,149 | |
Deutsche Bank(1) | | 12/19/17 | | | 2,900,000 | | 5.00 | % | | 3 Month LIBOR | | | 47,124 | |
Deutsche Bank(1) | | 12/19/12 | | | 8,800,000 | | 5.00 | % | | 3 Month LIBOR | | | 260,446 | |
Deutsche Bank(1) | | 12/19/14 | | | 3,500,000 | | 5.00 | % | | 3 Month LIBOR | | | 115,634 | |
Goldman Sachs(1) | | 12/19/37 | | | 3,000,000 | | 5.00 | % | | 3 Month LIBOR | | | 251,155 | |
Lehman Brothers(1) | | 12/19/12 | | | 22,900,000 | | 5.00 | % | | 3 Month LIBOR | | | 676,468 | |
Merrill Lynch & Co.(1) | | 12/01/09 | | | 3,100,000 | | 5.00 | % | | 3 Month LIBOR | | | 14,855 | |
Merrill Lynch & Co.(1) | | 12/19/17 | | | 3,000,000 | | 5.00 | % | | 3 Month LIBOR | | | 27,622 | |
Citigroup(1) | | 04/15/09 | | AUD | 9,900,000 | | 7.00 | % | | 3 month Australian Bank Bill rate | | | (44,170 | ) |
Morgan Stanley & Co.(1) | | 12/15/09 | | AUD | 5,000,000 | | 7.00 | % | | 6 month Australian Bank Bill rate | | | (21,041 | ) |
Goldman Sachs(1) | | 01/02/12 | | BRL | 7,500,000 | | 10.15 | % | | Brazilian interbank lending rate | | | (179,757 | ) |
Morgan Stanley & Co.(1) | | 01/02/12 | | BRL | 22,400,000 | | 10.12 | % | | Brazilian interbank lending rate | | | (285,134 | ) |
UBS AG(1) | | 01/02/12 | | BRL | 11,400,000 | | 10.58 | % | | Brazilian interbank lending rate | | | (85,990 | ) |
Merrill Lynch & Co.(1) | | 06/20/12 | | CAD | 18,000,000 | | 5.00 | % | | 3 month Canadian Bank
floating rate | | | 30,271 | |
Merrill Lynch & Co.(2) | | 06/20/17 | | CAD | 12,800,000 | | 5.50 | % | | 3 month Canadian Bank
floating rate | | | (30,090 | ) |
Deutsche Bank(1) | | 06/18/34 | | EUR | 1,300,000 | | 5.00 | % | | 6 month Euribor | | | 20,326 | |
UBS AG(1) | | 10/15/10 | | EUR | 200,000 | | 2.15 | % | | FRC -Excluding Tobacco -
Non-Revised Consumer Price Index | | | 4,359 | |
Barclays Capital(1) | | 09/15/10 | | GBP | 4,200,000 | | 5.00 | % | | 6 Month LIBOR | | | (104,176 | ) |
Barclays Capital(2) | | 12/20/16 | | JPY | 40,000,000 | | 2.00 | % | | 6 Month LIBOR | | | (13,773 | ) |
UBS AG(2) | | 12/20/16 | | JPY | 90,000,000 | | 2.00 | % | | 6 Month LIBOR | | | (29,689 | ) |
Citigroup(1) | | 05/14/09 | | MXN | 39,000,000 | | 7.91 | % | | 28 day Mexican interbank rate | | | (5,475 | ) |
Merrill Lynch & Co.(1) | | 11/04/16 | | MXN | 2,000,000 | | 8.17 | % | | 28 day Mexican interbank rate | | | (1,203 | ) |
| | | | | | | | | | | | | | |
| | | | | | | | | | | | $ | 1,548,139 | |
| | | | | | | | | | | | | | |
| (1) | Portfolio pays the floating rate and receives the fixed rate. |
| (2) | Portfolio pays the fixed rate and receives the floating rate. |
| # | Notional Amount is shown in U.S. dollars unless otherwise stated. |
See Notes to Financial Statements.
| | |
| THE TARGET PORTFOLIO TRUST | | 113 |
| | |
Total Return Bond Portfolio (continued) | | Portfolio of Investments
As of October 31, 2007 |
Credit default swap agreements outstanding at October 31, 2007:
| | | | | | | | | | | | | | |
Counter Party | | Termination
Date | | Notional
Amount# | | Fixed
Rate | | | Underlying
Bond | | Unrealized
Appreciation
(Depreciation) | |
Lehman Brothers(2) | | 03/20/08 | | $ | 2,300,000 | | 0.06 | % | | AIG Corp.,
5.60%, due 10/18/16 | | $ | (2,027 | ) |
Morgan Stanley & Co.(1) | | 12/20/08 | | | 500,000 | | 0.26 | % | | Allstate Corp.,
6.125%, due 02/15/12 | | | (826 | ) |
Merrill Lynch & Co.(1) | | 12/20/08 | | | 200,000 | | 0.27 | % | | Anadarko Petroleum Corp.,
5.00%, due 10/01/12 | | | (310 | ) |
UBS AG (1) | | 12/20/08 | | | 600,000 | | 0.35 | % | | AutoZone, Inc.,
5.875%, due 10/15/12 | | | (1,998 | ) |
Citigroup(1) | | 12/20/16 | | | 1,200,000 | | 0.17 | % | | Bank of America Corp.,
5.503%, due 10/14/16(3) | | | 24,168 | |
Bear Stearns International Ltd.(1) | | 12/20/08 | | | 100,000 | | 1.09 | % | | Capital One Bank,
4.875%, due 05/15/08 | | | (744 | ) |
UBS AG(1) | | 12/20/08 | | | 200,000 | | 0.44 | % | | Carnival Corp.,
6.15%, due 04/15/08 | | | (947 | ) |
Bear Stearns International Ltd.(1) | | 12/20/08 | | | 200,000 | | 0.19 | % | | Caterpillar, Inc.,
7.25%, due 09/15/09 | | | (314 | ) |
Barclays Bank PLC(1) | | 06/20/15 | | | 400,000 | | 0.15 | % | | CitiFinancial,
6.625%, 06/01/15 | | | 8,263 | |
Lehman Brothers(1) | | 12/20/08 | | | 100,000 | | 0.24 | % | | Costco Wholesale Corp.,
5.50%, due 03/15/07 | | | (208 | ) |
Morgan Stanley & Co.(1) | | 12/20/08 | | | 200,000 | | 0.42 | % | | Countrywide Home Loans, Inc.,
5.625%, due 07/15/09 | | | 12,580 | |
UBS AG(2) | | 12/20/08 | | | 200,000 | | 13.00 | % | | Countrywide Home Loans, Inc.,
5.625%, due 07/15/09 | | | 18,028 | |
Barclays Bank PLC(1) | | 09/20/11 | | | 400,000 | | 0.58 | % | | DaimlerChrysler NA Holdings,
5.75%, due 09/08/11 | | | (5,071 | ) |
Bear Stearns International Ltd.(1) | | 12/20/08 | | | 200,000 | | 0.24 | % | | Deere & Co.,
7.85%, due 05/15/10 | | | (415 | ) |
Merrill Lynch & Co.(1) | | 12/20/08 | | | 300,000 | | 0.35 | % | | Devon Energy Corp.,
6.875%, due 09/30/11 | | | (1,067 | ) |
Bank of America Securities LLC(2) | | 06/20/12 | | | 700,000 | | 0.75 | % | | Dow Jones CDX HVOL8 Index | | | (192 | ) |
Lehman Brothers(1) | | 12/20/11 | | | 1,000,000 | | 0.00 | % | | Dow Jones CDX HY7 Index | | | 8,827 | |
Merrill Lynch & Co.(1) | | 12/20/11 | | | 400,000 | | 0.00 | % | | Dow Jones CDX HY7 Index | | | 4,991 | |
Citigroup(1) | | 06/20/12 | | | 7,500,000 | | 2.11 | % | | Dow Jones CDX HY8 Index | | | 65,862 | |
Merrill Lynch & Co.(1) | | 06/20/12 | | | 2,200,000 | | 2.75 | % | | Dow Jones CDX HY8 Index | | | 17,810 | |
UBS AG(1) | | 06/20/12 | | | 2,500,000 | | 2.75 | % | | Dow Jones CDX HY8 Index | | | (39,436 | ) |
Morgan Stanley & Co.(2) | | 12/20/15 | | | 670,000 | | 0.46 | % | | Dow Jones CDX IG5 10YR Index | | | (9,232 | ) |
Morgan Stanley & Co.(2) | | 12/20/15 | | | 2,300,000 | | 0.45 | % | | Dow Jones CDX IG5 10YR Index | | | (30,892 | ) |
Morgan Stanley & Co.(1) | | 12/20/12 | | | 900,000 | | 0.14 | % | | Dow Jones CDX IG5 7YR Index | | | 7,503 | |
Morgan Stanley & Co.(1) | | 12/20/12 | | | 3,200,000 | | 0.14 | % | | Dow Jones CDX IG5 7YR Index | | | 26,678 | |
Goldman Sachs(1) | | 12/20/16 | | | 100,000 | | 0.65 | % | | Dow Jones CDX IG7 Index | | | 1,890 | |
JPMorgan Chase(1) | | 12/20/11 | | | 2,000,000 | | 1.65 | % | | Dow Jones CDX IG7 Index | | | 41,223 | |
Morgan Stanley & Co.(1) | | 12/20/16 | | | 1,500,000 | | 0.65 | % | | Dow Jones CDX IG7 Index | | | 28,976 | |
See Notes to Financial Statements.
| | |
| 114 | | THE TARGET PORTFOLIO TRUST |
| | | | | | | | | | | | | | |
Counter Party | | Termination
Date | | Notional
Amount# | | Fixed
Rate | | | Underlying
Bond | | Unrealized
Appreciation
(Depreciation) | |
Lehman Brothers(1) | | 06/20/12 | | $ | 2,000,000 | | 0.35 | % | | Dow Jones CDX IG8 5YR
Index | | $ | 2,129 | |
Morgan Stanley & Co.(1) | | 06/20/12 | | | 6,400,000 | | 0.17 | % | | Dow Jones CDX IG8 5YR
Index | | | (32,079 | ) |
Bank of America Securities LLC(1) | | 12/20/08 | | | 300,000 | | 0.13 | % | | E.I. DuPont,
6.875%, due 10/15/09 | | | (169 | ) |
Citigroup(1) | | 12/20/08 | | | 400,000 | | 0.28 | % | | Eaton Corp.,
5.75%, due 07/15/12 | | | (1,120 | ) |
Barclays Bank PLC(1) | | 12/20/08 | | | 500,000 | | 0.16 | % | | Eli Lilly & Co.,
6.00%, due 03/15/12 | | | (881 | ) |
Morgan Stanley & Co.(1) | | 12/20/08 | | | 200,000 | | 0.22 | % | | Emerson Electric Co.
7.125%, due 08/15/10 | | | (434 | ) |
Morgan Stanley & Co.(1) | | 12/20/08 | | | 300,000 | | 0.21 | % | | Emerson Electric Co.,
4.625%, due 10/15/12 | | | (614 | ) |
Citigroup(1) | | 12/20/08 | | | 300,000 | | 0.29 | % | | FedEx Corp.,
7.25%, due 02/15/11 | | | (792 | ) |
Merrill Lynch & Co.(1) | | 12/20/08 | | | 100,000 | | 0.22 | % | | Gannett Co., Inc.,
6.375%, due 04/01/12 | | | (26 | ) |
Bear Stearns International Ltd.(1) | | 03/20/16 | | | 600,000 | | 0.33 | % | | Goldman Sachs Group, Inc.,
5.815%, due 03/22/16 | | | 10,649 | |
Deutsche Bank(1) | | 09/20/16 | | | 200,000 | | 0.51 | % | | Goodrich Corp.,
6.29%, due 07/01/16 | | | (2,278 | ) |
Lehman Brothers(1) | | 12/20/08 | | | 200,000 | | 0.97 | % | | Goodrich Corp.,
7.625%, due 12/15/12 | | | (2,274 | ) |
Bear Stearns International Ltd.(1) | | 12/20/08 | | | 400,000 | | 0.32 | % | | Hewlett Packard Co.,
6.50% due 07/01/12 | | | (1,365 | ) |
Lehman Brothers(1) | | 12/20/08 | | | 400,000 | | 0.12 | % | | Home Depot, Inc.,
5.375%, due 04/01/06 | | | 260 | |
Merrill Lynch & Co.(1) | | 12/20/08 | | | 300,000 | | 0.32 | % | | Ingersoll-Rand Co.,
6.48%, due 06/01/25 | | | (821 | ) |
Barclays Bank PLC(1) | | 03/20/12 | | | 200,000 | | 0.17 | % | | International Lease Finance
Corp.,
5.40%, due 02/15/12 | | | 1,873 | |
Bear Stearns International Ltd.(1) | | 12/20/08 | | | 200,000 | | 0.60 | % | | International Paper Co.,
6.75%, due 09/01/11 | | | (1,151 | ) |
Barclays Bank PLC(1) | | 03/20/11 | | | 200,000 | | 0.37 | % | | iStar Financial, Inc.,
5.80%, due 03/15/11 | | | 17,281 | |
Lehman Brothers(1) | | 12/20/08 | | | 400,000 | | 0.11 | % | | Johnson & Johnson,
3.80%, due 05/15/13 | | | (457 | ) |
Lehman Brothers(1) | | 12/20/08 | | | 200,000 | | 0.53 | % | | Lockheed Martin Corp.,
8.20%, due 12/01/09 | | | (1,181 | ) |
Lehman Brothers(1) | | 12/20/08 | | | 300,000 | | 0.30 | % | | Masco Corp.,
5.875%, due 07/15/12 | | | (375 | ) |
Merrill Lynch & Co.(1) | | 12/20/08 | | | 200,000 | | 0.85 | % | | Motorola, Inc.,
7.625%, due 11/15/10 | | | (1,862 | ) |
UBS AG(1) | | 06/20/17 | | | 200,000 | | 0.48 | % | | Newell Rubbermain, Inc.,
6.75%, due 03/15/12 | | | (565 | ) |
Lehman Brothers(1) | | 12/20/08 | | | 200,000 | | 0.48 | % | | Northrop & Grumman Corp.,
7.125%, due 02/15/11 | | | (1,080 | ) |
See Notes to Financial Statements.
| | |
| THE TARGET PORTFOLIO TRUST | | 115 |
| | |
Total Return Bond Portfolio (continued) | | Portfolio of Investments
As of October 31, 2007 |
| | | | | | | | | | | | | | |
Counter Party | | Termination
Date | | Notional
Amount# | | Fixed
Rate | | | Underlying
Bond | | Unrealized
Appreciation
(Depreciation) | |
Merrill Lynch & Co.(1) | | 12/20/08 | | $ | 200,000 | | 0.28 | % | | Occidental Petroleum Corp.,
6.75%, due 01/15/12 | | $ | (538 | ) |
Lehman Brothers(1) | | 06/20/09 | | | 1,200,000 | | 0.40 | % | | People’s Republic of China,
6.80%, due 05/23/11 | | | (5,790 | ) |
Lehman Brothers(1) | | 12/20/08 | | | 300,000 | | 0.35 | % | | RadioShack Corp.,
7.375%, due 05/15/11 | | | 550 | |
UBS AG(1) | | 12/20/08 | | | 200,000 | | 0.37 | % | | RadioShack Corp.,
7.375%, due 05/15/11 | | | 318 | |
JPMorgan Chase(1) | | 05/20/16 | | | 600,000 | | 0.54 | % | | Republic of Hungary,
4.75%, due 02/03/15 | | | (3,645 | ) |
Morgan Stanley & Co.(1) | | 05/20/16 | | | 1,800,000 | | 0.54 | % | | Republic of Hungary,
4.75%, due 02/03/15 | | | (10,181 | ) |
Lehman Brothers(1) | | 09/20/10 | | | 400,000 | | 2.26 | % | | Republic of Turkey,
11.875%, due 01/15/30 | | | (14,016 | ) |
Morgan Stanley & Co.(1) | | 09/20/10 | | | 200,000 | | 2.70 | % | | Republic of Turkey,
11.875%, due 01/15/30 | | | (9,464 | ) |
Morgan Stanley & Co.(2) | | 06/20/08 | | | 100,000 | | 0.25 | % | | Russian Federation,
7.50%, 03/31/30 | | | (230 | ) |
Morgan Stanley & Co.(1) | | 09/20/13 | | | 200,000 | | 0.58 | % | | Sealed Air Corp.,
5.625%, due 07/15/13 | | | 1,575 | |
UBS AG(1) | | 12/20/08 | | | 200,000 | | 0.44 | % | | Simon Property Group,
L.P.,
5.45%, due 03/15/13 | | | (462 | ) |
Bear Stearns International Ltd.(1) | | 03/20/12 | | | 1,000,000 | | 0.55 | % | | Sprint Capital Corp.,
8.375%, due 03/15/12 | | | 7,521 | |
Morgan Stanley & Co.(1) | | 06/20/12 | | | 500,000 | | 0.11 | % | | Target Corp.,
5.875%, due 03/01/12 | | | 1,983 | |
Morgan Stanley & Co.(1) | | 12/20/08 | | | 200,000 | | 0.53 | % | | The Kroger Co.,
4.75%, due 04/15/12 | | | (1,112 | ) |
Bear Stearns International Ltd.(1) | | 12/20/08 | | | 200,000 | | 0.15 | % | | Walmart Stores, Inc.,
6.875%, due 08/10/09 | | | (170 | ) |
Citigroup(1) | | 12/20/08 | | | 800,000 | | 0.14 | % | | Walmart Stores, Inc.,
6.875%, due 08/10/09 | | | (580 | ) |
Barclays Bank PLC(1) | | 12/20/08 | | | 200,000 | | 0.67 | % | | Walt Disney Co. (The),
6.375%, due 03/01/12 | | | (1,540 | ) |
Bear Stearns International Ltd.(1) | | 06/20/16 | | | 300,000 | | 0.63 | % | | Whirlpool Corp.,
6.50%, due 06/15/16 | | | 708 | |
Lehman Brothers(1) | | 12/20/08 | | | 200,000 | | 0.29 | % | | Whirlpool Corp.,
8.60%, due 05/01/10 | | | (472 | ) |
| | | | | | | | | | | | | | |
| | | | | | | | | | | | $ | 120,243 | |
| | | | | | | | | | | | | | |
| (1) | Portfolio pays the fixed rate and receives from the counterparty, par in the event that the underlying bond defaults. |
| (2) | Portfolio pays the counterparty par in the event that the underlying bond defaults and receives the fixed rate. |
| (3) | Variable rate, displayed rate is as of 10/31/07. |
| # | Notional Amount is shown in U.S. dollars unless otherwise stated. |
See Notes to Financial Statements.
| | |
| 116 | | THE TARGET PORTFOLIO TRUST |
The industry classification of investments and other liabilities in excess of other assets shown as a percentage of net assets as of October 31, 2007 were as follows:
| | | |
U.S. Government Mortgage Backed Obligations | | 74.6 | % |
U.S. Treasury Obligations | | 25.8 | |
Financial Services | | 4.1 | |
Telecommunications | | 3.9 | |
Affiliated Money Market Mutual Fund | | 3.9 | |
Foreign Government Bonds | | 2.2 | |
Commercial Paper | | 1.9 | |
Bank Notes | | 1.9 | |
Healthcare Services | | 1.7 | |
Collateralized Mortgage Obligations | | 1.7 | |
Outstanding Options Purchased | | 1.4 | |
Utilities | | 1.2 | |
Municipal Bonds | | 1.0 | |
Financial—Bank & Trust | | 0.8 | |
Tobacco | | 0.4 | |
Oil, Gas & Consumable Fuels | | 0.4 | |
Asset-Backed Securities | | 0.4 | |
Automobile Manufacturers | | 0.2 | |
Pipelines | | 0.2 | |
Airlines | | 0.1 | |
Aerospace | | 0.1 | |
Real Estate Investment Trusts | | 0.1 | |
| | | |
| | 128.0 | |
Written options and securities sold short | | (19.8 | ) |
Liabilities in excess of other assets | | (8.2 | ) |
| | | |
| | 100.0 | % |
| | | |
See Notes to Financial Statements.
| | |
| THE TARGET PORTFOLIO TRUST | | 117 |
| | |
| Intermediate-Term Bond Portfolio | | Portfolio of Investments
As of October 31, 2007 |
| | | | | | | | |
MOODY’S
RATINGS
(UNAUDITED) | | PRINCIPAL
AMOUNT (000)# | | DESCRIPTION | | VALUE (NOTE 1) |
| | | | | | | | |
| | | | | LONG-TERM INVESTMENTS—122.7% | | | |
| | | |
| | | | | ASSET-BACKED SECURITIES—1.1% | | | |
| Aaa | | $ | 1,003 | | Securitized Asset Backed Receivables,
Series 2007-BR5, Class A2A
5.003%(c), 05/25/37 | | $ | 979,200 |
| Aaa | | | 1,036 | | SLM Student Loan Trust,
Series 2006-8, Class A2
5.084%(c), 10/25/16 | | | 1,031,701 |
| Aaa | | | 521 | | Wells Fargo Home Equity Trust,
Series 2005-2, Class AII2, 144A
(cost $1,202,063, purchased 09/29/06)(f)(g)
5.113%(c), 10/25/35 | | | 517,323 |
| | | | | | | | |
| | | | | TOTAL ASSET-BACKED SECURITIES
(cost $2,561,195) | | | 2,528,224 |
| | | | | | | | |
| | | |
| | | | | COLLATERALIZED MORTGAGE OBLIGATIONS—12.4% | | | |
| Aaa | | | 391 | | American Home Mortgage Investment Trust,
Series 2004-4, Class 5A
4.44%(c), 02/25/45 | | | 380,279 |
| Aaa | | | 412 | | Bank of America Funding Corp.,
Series 2006-A, Class 1A1
4.614%(c), 02/20/36 | | | 409,202 |
| Aaa | | | 1,017 | | Bear Stearns Adjustable Rate Mortgage Trust,
Series 2004-8, Class 13A1
5.656%(c), 11/25/34 | | | 1,016,658 |
| | | | | Series 2004-8, Class 11A2 | | | |
| Aaa | | | 785 | | 5.97%(c), 11/25/34 | | | 787,056 |
| Aaa | | | 963 | | Bear Stearns Alt-A Trust,
Series 2006-6, Class 31A1
5.81%(c), 11/25/36 | | | 963,726 |
| | | | | Series 2006-6, Class 32A1 | | | |
| Aaa | | | 935 | | 5.819%(c), 11/25/36 | | | 937,889 |
| Aaa | | | 1,071 | | Bear Stearns Structured Products, Inc.
Series 2007-R7A, 144A
(cost $1,092,523, purchased 08/27/07)(f)(g)
5.06%, 01/25/37 | | | 1,063,562 |
| Aaa | | | 407 | | Citigroup Mortgage Loan Trust, Inc.,
Series 2005-11, Class A2A
4.70%(c), 12/25/35 | | | 400,581 |
| | | | | Series 2006-AR1, Class 1A1 | | | |
| Aaa | | | 2,060 | | 4.90%(c), 10/25/36 | | | 2,050,292 |
| AAA(d) | | | 179 | | Countrywide Alternative Loan Trust,
Series 2003-J3, Class 2A1, 144A
6.25%, 12/25/33 | | | 178,846 |
See Notes to Financial Statements.
| | |
| 118 | | THE TARGET PORTFOLIO TRUST |
| | | | | | | | |
MOODY’S
RATINGS
(UNAUDITED) | | PRINCIPAL
AMOUNT (000)# | | DESCRIPTION | | VALUE (NOTE 1) |
| | | | | | | | |
| | | | | COLLATERALIZED MORTGAGE OBLIGATIONS (continued) | | | |
| | | | | Countrywide Home Loan, Mortgage Pass-Through Trust,
| | | |
| Aaa | | $ | 183 | | Series 2003-R4, Class 2A, 144A
(cost $368,627, purchased 12/01/03)(f)(g)
6.50%(c), 01/25/34 | | $ | 188,129 |
| Aaa | | | 1,250 | | Series 2004-25, Class 1A1
5.203%(c), 02/25/35 | | | 1,240,718 |
| | | | | CS First Boston Mortgage Securities Corp., | | | |
| Aaa | | | 286 | | Series 2003-8, Class 5A1
4.938%, 12/15/40 | | | 284,409 |
| Aaa | | | 46 | | Series 2005-C6, Class A1
6.50%, 04/25/33 | | | 46,732 |
| Aaa | | | 414 | | Federal Home Loan Mortgage Corp.,
Series 2692, Class YB
3.50%, 05/15/16 | | | 410,979 |
| | | | | Series 2772, Class NQ | | | |
| Aaa | | | 565 | | 4.50%, 12/15/13 | | | 562,631 |
| | | | | Series 2828, Class EN | | | |
| Aaa | | | 1,965 | | 4.50%, 10/15/23 | | | 1,955,045 |
| | | | | Series 2844, Class PQ | | | |
| Aaa | | | 96 | | 5.00%, 05/15/23 | | | 96,318 |
| | | | | Series 2892, Class BL | | | |
| Aaa | | | 637 | | 5.00%, 01/15/18 | | | 635,614 |
| | | | | Series 2912, Class ML | | | |
| Aaa | | | 210 | | 4.50%, 12/15/20 | | | 209,922 |
| | | | | Series 2931, Class JA | | | |
| Aaa | | | 770 | | 5.00%, 07/15/25 | | | 769,595 |
| AAA(d) | | | 547 | | Federal National Mortgage Assoc.,
Series 83, Class PB
3.50%, 09/25/16 | | | 542,304 |
| Aaa | | | 180 | | Series 2003-83, Class A 4.25%, 04/25/28 | | | 179,044 |
| | | | | Series 2006-67, Class PA | | | |
| Aaa | | | 907 | | 5.50%, 03/25/28 | | | 912,370 |
| | | | | Series 3346, Class FA | | | |
| Aaa | | | 4,307 | | 5.321%(c), 02/15/19 | | | 4,291,337 |
| Aaa | | | 370 | | FHLMC Structured Pass Through Securities,
Series T-59, Class 1A2
7.00%, 10/25/43 | | | 387,573 |
| | | | | Series T-75, Class A1 | | | |
| Aaa | | | 2,057 | | 4.913%, 12/25/36 | | | 2,049,939 |
| AAA(d) | | | 332 | | GE Capital Commercial Mortgage Corp.,
Series 2002-3A, Class A1
4.229%, 12/10/37 | | | 327,518 |
| AAA(d) | | | 94 | | Government National Mortgage Assoc.,
Series 1995-2, Class KQ
8.50%, 03/20/25 | | | 100,317 |
| | | | | Series 2000-9, Class FG | | | |
| AAA(d) | | | 123 | | 5.66%(c), 02/16/30 | | | 124,639 |
See Notes to Financial Statements.
| | |
| THE TARGET PORTFOLIO TRUST | | 119 |
| | |
Intermediate-Term Bond Portfolio (continued) | | Portfolio of Investments
As of October 31, 2007 |
| | | | | | | | |
MOODY’S
RATINGS
(UNAUDITED) | | PRINCIPAL
AMOUNT (000)# | | DESCRIPTION | | VALUE (NOTE 1) |
| | | | | | | | |
| | | | | COLLATERALIZED MORTGAGE OBLIGATIONS (continued) | | | |
| | | | | Series 2000-9, Class FH | | | |
| Aaa | | $ | 193 | | 5.56%(c), 02/16/30 | | $ | 194,817 |
| | | | | Series 2000-11, Class PH | | | |
| Aaa | | | 385 | | 7.50%, 02/20/30 | | | 403,613 |
| Aaa | | | 673 | | Greenpoint Mortgage Funding Trust,
Series 2005-AR2, Class A1
5.103%(c), 06/25/45 | | | 659,664 |
| Aaa | | | 477 | | GS Mortgage Securities Corp II,
Series 2001-1285, Class A1, 144A
(cost $740,414; purchased 10/09/02)(f)(g)
6.044%, 08/15/18 | | | 485,905 |
| Aaa | | | 586 | | GSR Mortgage Loan Trust,
Series 2005-AR6, Class 2A1
4.54%(c), 09/25/35 | | | 581,016 |
| Aaa | | | 438 | | Merrill Lynch Mortgage Investors, Inc.,
Series 2005, Class A10
5.53%, 02/25/36 | | | 433,546 |
| Aaa | | | 410 | | MLLC Mortgage Investors, Inc.
Series 2005-2 Class 3A
6.131%, 10/25/35 | | | 408,938 |
| Aaa | | | 717 | | Sequoia Mortgage Trust,
Series 10, Class 2A1
5.378%(c), 10/20/27 | | | 715,516 |
| Aaa | | | 162 | | Structured Asset Mortgage Investments, Inc.,
Series 2005, Class AR5
5.753%, 07/19/35 | | | 161,510 |
| | | | | Series 2206 AR3, Class 12A1 | | | |
| Aaa | | | 485 | | 5.093%(c), 09/25/35 | | | 476,495 |
| Aaa | | | 52 | | Structured Asset Securities Corp.,
Series 2001-21A, Class 1A1
7.188%(c), 01/25/32 | | | 51,579 |
| Aaa | | | 795 | | Washington Mutual, Inc., Mortgage Pass-Thru. Cert.,
Series 2002-AR6, Class A
6.383%(c), 06/25/42 | | | 783,170 |
| | | | | Series 2002-AR9, Class 1A | | | |
| Aaa | | | 33 | | 6.383%(c), 08/25/42 | | | 33,338 |
| | | | | | | | |
| | | | | TOTAL COLLATERALIZED MORTGAGE OBLIGATIONS
(cost $28,820,780) | | | 28,892,331 |
| | | | | | | | |
| | | |
| | | | | CORPORATE BONDS—25.5% | | | |
| | | |
| | | | | Advertising—0.5% | | | |
| B3 | | | 1,200 | | RH Donnelley Holdings,
Sr. Notes
8.875%, 01/15/16 | | | 1,200,000 |
| | | | | | | | |
See Notes to Financial Statements.
| | |
| 120 | | THE TARGET PORTFOLIO TRUST |
| | | | | | | | |
MOODY’S
RATINGS
(UNAUDITED) | | PRINCIPAL
AMOUNT (000)# | | DESCRIPTION | | VALUE (NOTE 1) |
| | | | | | | | |
| | | | | CORPORATE BONDS (continued) | | | |
| | | |
| | | | | Airlines—1.0% | | | |
| NR | | $ | 1,700 | | United Air Lines, Inc.,
Pass-Thru Cert., 144A(e)(g)(i)
Zero Coupon, 03/01/24 | | $ | 1,974,890 |
| NR | | | 1,442 | | United Air Lines, Inc., Equipment Trust,
Sr. Notes, 144A(e)(g)(i)
Zero Coupon, 02/19/15 | | | 438,051 |
| | | | | | | | |
| | | | | | | | 2,412,941 |
| | | | | | | | |
| | | |
| | | | | Cable—0.5% | | | |
| B2 | | | 1,100 | | CSC Holdings, Inc.,
Sr. Unsec’d. Notes
7.25%, 07/15/08 | | | 1,102,750 |
| | | | | | | | |
| | | |
| | | | | Commercial Banks—1.9% | | | |
| Aa1 | | | 2,300 | | Barclays Bank PLC (United Kingdom)
5.45%, 09/12/12 | | | 2,333,658 |
| Aa3 | | | 1,200 | | National Australia Bank,
Sr. Unsec’d. Notes, 144A
(cost $1,200,000, purchased 09/06/06)(f)(g)
5.765%(c), 09/11/09 | | | 1,198,223 |
| NR | | JPY | 100,000 | | Sumitomo Mitsui Banking,
Sub. Notes (Japan)
1.521%(c), 11/26/49 | | | 874,363 |
| | | | | | | | |
| | | | | | | | 4,406,244 |
| | | | | | | | |
| | | |
| | | | | Distribution/Wholesale—0.3% | | | |
| B1 | | | 700 | | SUPERVALU Inc.
Sr. Unsec’d. Notes
7.50%, 11/15/14 | | | 719,250 |
| | | | | | | | |
| | | |
| | | | | Diversified—0.5% | | | |
| Aa3 | | | 1,200 | | Siemens Financieringsmaatschappij,
Co. Gtd. Notes, 144A (Netherlands)
(cost $1,200,000, purchased 08/09/06)(f)(g)
5.625%(c), 08/14/09 | | | 1,200,196 |
| | | | | | | | |
| | | |
| | | | | Diversified Financial Services—8.3% | | | |
| A1 | | | 500 | | Bear Stearns Cos., Inc. (The)
5.59%(c), 08/21/09 | | | 488,369 |
| A2 | | | 1,200 | | Caterpillar Financial Service Corp.,
Notes
5.55%(c), 08/11/09 | | | 1,194,198 |
| A2 | | | 1,200 | | CIT Group, Inc.,
Sr. Unsec’d. Notes
5.704%(c), 05/23/08 | | | 1,182,506 |
| Aa1 | | | 700 | | Citigroup Global Markets Holdings, Inc.,
Notes
5.794%(c), 03/17/09 | | | 700,520 |
See Notes to Financial Statements.
| | |
| THE TARGET PORTFOLIO TRUST | | 121 |
| | |
Intermediate-Term Bond Portfolio (continued) | | Portfolio of Investments
As of October 31, 2007 |
| | | | | | | | |
MOODY’S
RATINGS
(UNAUDITED) | | PRINCIPAL
AMOUNT (000)# | | DESCRIPTION | | VALUE (NOTE 1) |
| | | | | | | | |
| | | | | CORPORATE BONDS (continued) | | | |
| | | |
| | | | | Diversified Financial Services (cont’d.) | | | |
| Aa1 | | $ | 500 | | Citigroup, Inc.,
Notes
5.24%(c), 12/26/08 | | $ | 499,968 |
| Aa1 | | | 1,200 | | 5.864%(c), 06/09/09 | | | 1,200,842 |
| | | | | Ford Motor Credit Co., LLC, | | | |
| | | | | Notes | | | |
| B1 | | | 600 | | 5.625%, 10/01/08 | | | 587,746 |
| | | | | Sr. Notes | | | |
| B1 | | | 1,200 | | 4.95%, 01/15/08 | | | 1,194,805 |
| | | | | General Electric Capital Corp., | | | |
| | | | | Notes | | | |
| Aaa | | | 1,300 | | 5.734%(c), 03/16/09 | | | 1,299,582 |
| | | | | Sr. Unsec’d. Notes | | | |
| Aaa | | | 100 | | 5.065%(c), 10/24/08 | | | 99,778 |
| Ba1 | | | 500 | | GMAC LLC,
Notes
7.25%, 03/02/11 | | | 472,794 |
| Aa3 | | | 1,750 | | Goldman Sachs Group LP,
Notes
5.498%(c), 06/28/10 | | | 1,744,932 |
| Aa3 | | | 1,800 | | Goldman Sachs Group, Inc.,
Sr. Notes
5.30%(c), 06/23/09 | | | 1,795,203 |
| Aa3 | | | 400 | | HSBC Finance Corp.,
Sr. Notes
5.24%(c), 10/21/09 | | | 397,751 |
| | | | | Sr. Unsec’d. Notes | | | |
| A1 | | | 1,000 | | 5.82%(c), 09/15/08 | | | 999,540 |
| A3 | | | 2,670 | | Korea Development Bank,
Notes
4.75%, 07/20/09 | | | 2,649,759 |
| A1 | | | 1,800 | | Lehman Brothers Holdings,
Notes
5.26%(c), 12/23/08 | | | 1,784,214 |
| A2 | | | 1,200 | | SLM Corp.,
Unsec’d. Notes(g)
5.224%(c), 07/27/09 | | | 1,153,538 |
| | | | | | | | |
| | | | | | | | 19,446,045 |
| | | | | | | | |
| | | |
| | | | | Electric—Integrated—2.3% | | | |
| A3 | | | 500 | | Dayton Power & Light Co. (The),
First Mortgage
5.125%, 10/01/13 | | | 495,612 |
See Notes to Financial Statements.
| | |
| 122 | | THE TARGET PORTFOLIO TRUST |
| | | | | | | | |
MOODY’S
RATINGS
(UNAUDITED) | | PRINCIPAL
AMOUNT (000)# | | DESCRIPTION | | VALUE (NOTE 1) |
| | | | | | | | |
| | | | | CORPORATE BONDS (continued) | | | |
| | | |
| | | | | Electric—Integrated (cont’d.) | | | |
| B1 | | $ | 400 | | Edison Mission Energy,
Sr. Unsec’d. Notes
7.75%, 06/15/16 | | $ | 411,000 |
| A1 | | | 1,200 | | Enel Finance International SA, 144A,
Co. Gtd. Notes
(cost $1,197,444, purchased 09/13/07)(f)(g)
5.70%, 01/15/13 | | | 1,212,272 |
| A3 | | | 1,100 | | Florida Power Corp.,
Sr. Unsec’d. Notes
5.975%(c), 11/14/08 | | | 1,101,393 |
| Ba1 | | | 600 | | IPALCO Enterprises, Inc.,
Sec’d. Notes
8.375%, 11/14/08 | | | 610,500 |
| Baa3 | | | 1,500 | | Nisource Finance Corp.,
Co. Gtd. Notes
6.064%(c), 11/23/09 | | | 1,494,171 |
| | | | | | | | |
| | | | | | | | 5,324,948 |
| | | | | | | | |
| | | |
| | | | | Entertainment & Leisure—0.5% | | | |
| A3 | | | 1,200 | | Walt Disney Co. (The),
Sr. Notes
5.824%(c), 09/10/09 | | | 1,196,042 |
| | | | | | | | |
| | | |
| | | | | Financial—Bank & Trust—3.6% | | | |
| Aa2 | | | 600 | | Bank of America Corp.,
Sr. Notes
5.67%(c), 02/17/09 | | | 600,631 |
| Aa2 | | | 1,200 | | Charter One Bank NA,
Sr. Notes
5.115%(c), 04/24/09 | | | 1,192,921 |
| Aa1 | | | 1,000 | | General Electric Capital Corp.,
Sub. Notes
5.50%(c), 09/15/49 | | | 1,456,186 |
| Aa2 | | | 300 | | HSBC Bank USA,
Notes
5.833%(c), 12/14/09 | | | 298,122 |
| A1 | | | 1,300 | | Merrill Lynch & Co.,
Sr. Unsec’d. Notes
5.26%(c), 12/22/08 | | | 1,293,741 |
| Aa1 | | | 600 | | Royal Bank of Scotland PLC,
Co. Gtd. Notes, 144A (United Kingdom)
(cost $600,000, purchased 04/03/06)(f)(g)
5.259%(c), 04/11/08 | | | 600,160 |
| A1 | | | 1,800 | | Unicredito Luxem, 144A,
Co. Gtd. Notes (Luxembourg)
(cost $1,800,000, purchased 10/17/06)(f)(g)
5.143%(c), 10/24/08 | | | 1,795,775 |
See Notes to Financial Statements.
| | |
| THE TARGET PORTFOLIO TRUST | | 123 |
| | |
Intermediate-Term Bond Portfolio (continued) | | Portfolio of Investments
As of October 31, 2007 |
| | | | | | | | |
MOODY’S
RATINGS
(UNAUDITED) | | PRINCIPAL
AMOUNT (000)# | | DESCRIPTION | | VALUE (NOTE 1) |
| | | | | | | | |
| | | | | CORPORATE BONDS (continued) | | | |
| | | |
| | | | | Financial—Bank & Trust (cont’d.) | | | |
| A2 | | $ | 1,200 | | VTB Capital SA,
Sr. Notes, 144A
(cost $1,200,000, purchased 10/27/06)(f)(g)
5.956%(c), 08/01/08 | | $ | 1,188,000 |
| | | | | | | | |
| | | | | | | | 8,425,536 |
| | | | | | | | |
| | | |
| | | | | Hotels, Restaurants & Leisure—0.2% | | | |
| Ba2 | | | 500 | | Mandalay Resort Group,
Sr. Unsec’d. Notes
6.50%, 07/31/09 | | | 500,000 |
| | | | | | | | |
| | | |
| | | | | Forest Products—0.1% | | | |
| Baa2 | | | 200 | | Weyerhaeuser Co.,
Sr. Unsec’d. Notes
6.238%(c), 09/24/09 | | | 200,481 |
| | | | | | | | |
| | | |
| | | | | Medical Supplies & Equipment—0.6% | | | |
| B2 | | | 1,200 | | HCA, Inc.,
Co. Gtd. Notes
(cost $1,232,000, purchased 08/06/07 - 08/09/07)(f)(g)
9.25%, 11/15/16 | | | 1,263,000 |
| | | | | | | | |
| | | |
| | | | | Office Equipment—0.3% | | | |
| Ba1 | | | 600 | | Xerox Corp.,
Co. Gtd. Notes
9.75%, 01/15/09 | | | 629,886 |
| | | | | | | | |
| | | |
| | | | | Oil & Field Services—0.4% | | | |
| Ba1 | | | 950 | | Tesoro Corp.,
Sr. Notes, 144A
(cost $929,875, purchased 08/07/07 - 08/21/07)(f)(g)
6.50%, 06/01/17 | | | 938,125 |
| | | | | | | | |
| | | | | Oil, Gas & Consumable Fuels—1.0% | | | |
| B1 | | | 500 | | Forest Oil Corp.,
Sr. Usec’d. Notes
8.00%, 06/15/08 | | | 503,750 |
| Ba2 | | | 700 | | Transcontinental Gas Pipe Line Corp.,
144A, Notes
(cost $707,000; purchased 9/27/05)(f)(g)
6.523%(c), 04/15/08 | | | 700,875 |
| Baa1 | | | 1,200 | | Transocean, Inc.,
Unsec’d. Notes
5.869%(c), 09/05/08 | | | 1,197,743 |
| | | | | | | | |
| | | | | | | | 2,402,368 |
| | | | | | | | |
See Notes to Financial Statements.
| | |
| 124 | | THE TARGET PORTFOLIO TRUST |
| | | | | | | | |
MOODY’S
RATINGS
(UNAUDITED) | | PRINCIPAL
AMOUNT (000)# | | DESCRIPTION | | VALUE (NOTE 1) |
| | | | | | | | |
| | | | | CORPORATE BONDS (continued) | | | |
| | | |
| | | | | Packaging—0.2% | | | |
| Ba2 | | $ | 500 | | Owen Brockway Glass Container, Inc,
Co. Gtd. Notes
8.75%, 11/15/12 | | $ | 521,875 |
| | | | | | | | |
| | | |
| | | | | Pipelines—0.4% | | | |
| B2 | | | 1,000 | | Dynegy Holdings,
Sr. Notes
(cost $910,000, purchased 08/06/07)(f)(g)
7.50%, 06/01/15 | | | 955,000 |
| | | | | | | | |
| | | |
| | | | | Real Estate Investment Trust—0.5% | | | |
| Ba2 | | | 1,200 | | Ventas Realty LP,
Co. Gtd. Notes
6.75%, 04/01/17 | | | 1,200,000 |
| | | | | | | | |
| | | |
| | | | | Retail—1.0% | | | |
| Baa3 | | | 100 | | J.C. Penney Corp., Inc.,
Notes
7.375%, 08/15/08 | | | 101,576 |
| | | | | Unsub. Notes | | | |
| Ba1 | | | 500 | | 6.50%, 12/15/07 | | | 500,639 |
| A2 | | | 1,700 | | Kimberly-Clark Corp.,
Sr. Notes
5.084%(c), 07/30/10 | | | 1,695,886 |
| | | | | | | | |
| | | | | | | | 2,298,101 |
| | | | | | | | |
| | | |
| | | | | Telecommunications—1.4% | | | |
| A2 | | | 600 | | BellSouth Corp.,
Notes, 144A
(cost $593,592, purchased 09/18/07)(f)(g)
4.24%, 04/26/08 | | | 597,328 |
| | | | | Sr. Unsec’d. Notes | | | |
| A2 | | | 600 | | 5.658%(c), 08/15/08 | | | 599,446 |
| A3 | | | 1,000 | | France Telecom SA,
Sr. Unsec’d. Notes (France)(i)
8.50%, 03/01/31 | | | 1,310,345 |
| B2 | | | 200 | | Qwest Communications International, Inc.,
Co. Gtd. Notes
9.058%(c), 02/15/09 | | | 201,000 |
| Baa3 | | | 500 | | Sprint Nextel,
Sr. Unsec’d. Notes
5.598%(c), 06/28/10 | | | 498,434 |
| | | | | | | | |
| | | | | | | | 3,206,553 |
| | | | | | | | |
| | | | | TOTAL CORPORATE BONDS
(cost $60,169,845) | | | 59,549,341 |
| | | | | | | | |
See Notes to Financial Statements.
| | |
| THE TARGET PORTFOLIO TRUST | | 125 |
| | |
Intermediate-Term Bond Portfolio (continued) | | Portfolio of Investments
As of October 31, 2007 |
| | | | | | | | |
MOODY’S
RATINGS
(UNAUDITED) | | PRINCIPAL
AMOUNT (000)# | | DESCRIPTION | | VALUE (NOTE 1) |
| | | | | | | | |
| | | |
| | | | | FOREIGN GOVERNMENT BONDS—2.3% | | | |
| | | | | Republic of Brazil | | | |
| Ba2 | | BRL | 1,200 | | 10.25%, 01/10/28 | | $ | 697,749 |
| | | | | Republic of Italy | | | |
| Aa2 | | JPY | 218,000 | | 3.80%, 03/27/08 | | | 1,909,708 |
| | | | | Republic of Panama | | | |
| Ba1 | | | 1,500 | | 9.375%, 04/01/29 | | | 2,044,950 |
| | | | | Republic of South Africa | | | |
| Baa1 | | | 750 | | 5.875%, 05/30/22 | | | 750,000 |
| | | | | | | | |
| | | | | TOTAL FOREIGN GOVERNMENT BONDS
(cost $4,834,560) | | | 5,402,407 |
| | | | | | | | |
| | | |
| | | | | MUNICIPAL BONDS—0.8% | | | |
| | | | | Honolulu City & County | | | |
| Aaa | | | 1,000 | | 4.75%, 07/01/28 | | | 1,004,910 |
| | | | | Tobacco Settlement Financial Authority of West Virginia | | | |
| Aaa | | | 1,000 | | 7.467%, 06/01/47 | | | 988,260 |
| | | | | | | | |
| | | | | TOTAL MUNICIPAL BONDS
(cost $1,789,821) | | | 1,993,170 |
| | | | | | | | |
| | | |
| | | | | U.S. GOVERNMENT AGENCY OBLIGATIONS—12.9% | | | |
| | | | | Federal Farm Credit Bank | | | |
| | | 1,300 | | 3.65%, 03/16/09 | | | 1,286,373 |
| | | | | Federal Home Loan Bank | | | |
| | | 1,000 | | 3.00%, 12/28/07 | | | 997,344 |
| | | 100 | | 4.09%, 02/20/09 | | | 99,504 |
| | | 2,200 | | 4.24%, 05/19/10 | | | 2,183,256 |
| | | 786 | | 4.25%, 07/30/09 | | | 782,299 |
| | | 900 | | 4.50%, 06/12/13 | | | 881,707 |
| | | | | Federal Home Loan Mortgage Corp. | | | |
| | | 2,800 | | 4.24%, 07/30/09 | | | 2,788,724 |
| | | | | Federal National Mortgage Assoc. | | | |
| | | 3,800 | | 4.25%, 07/30/09 | | | 3,783,706 |
| | | 17,500 | | 5.50, TBA | | | 17,237,656 |
| | | | | | | | |
| | | | | TOTAL U.S. GOVERNMENT AGENCY OBLIGATIONS
(cost $29,900,864) | | | 30,040,569 |
| | | | | | | | |
| | |
| | | | | U.S. GOVERNMENT MORTGAGE BACKED OBLIGATIONS—33.8% |
| | | | | Federal National Mortgage Assoc. | | | |
| | | 18,658 | | 5.00%, 10/01/17 - 08/01/20 | | | 18,404,297 |
| | | 47,399 | | 5.50%, 06/01/33 - 10/01/37 | | | 46,717,091 |
| | | 10 | | 5.634%(c), 12/01/30 | | | 9,977 |
| | | 11,153 | | 6.00%, 11/01/12 - 01/01/37 | | | 11,254,694 |
| | | 70 | | 6.25%(c), 08/01/24 | | | 70,858 |
| | | 131 | | 7.169%(c), 07/01/25 | | | 132,415 |
| | | 1 | | 9.25%, 01/01/10 | | | 1,459 |
See Notes to Financial Statements.
| | |
| 126 | | THE TARGET PORTFOLIO TRUST |
| | | | | | | | |
MOODY’S
RATINGS
(UNAUDITED) | | PRINCIPAL
AMOUNT (000)# | | DESCRIPTION | | VALUE (NOTE 1) |
| | | | | | | | |
| | | | | U.S. GOVERNMENT MORTGAGE BACKED OBLIGATIONS (continued) |
| | | | | Government National Mortgage Assoc. | | | |
| | $ | 172 | | 5.50%(c), 07/20/30 | | $ | 173,431 |
| | | 130 | | 5.75%(c), 08/20/26 | | | 130,808 |
| | | 696 | | 6.00%, 01/15/29 - 07/15/29 | | | 707,774 |
| | | 81 | | 6.125%, 10/20/24 - 12/20/26 | | | 82,161 |
| | | 381 | | 6.25%(c), 03/20/30 | | | 384,795 |
| | | 139 | | 6.375%, 05/20/23 - 01/20/24 | | | 140,686 |
| | | 319 | | 6.375%, 06/20/23 - 06/20/27 | | | 322,449 |
| | | 176 | | 6.50%, 10/15/25 - 06/15/29 | | | 182,150 |
| | | 60 | | 8.00%, 09/20/30 - 07/20/31 | | | 63,312 |
| | | 17 | | 8.00%, 05/20/31 | | | 18,048 |
| | | | | | | | |
| | | | | TOTAL U.S. GOVERNMENT MORTGAGE BACKED OBLIGATIONS
(cost $78,716,964) | | | 78,796,405 |
| | | | | | | | |
| | | |
| | | | | U.S. TREASURY OBLIGATIONS(k)—33.9% | | | |
| | | | | U.S. Treasury Bond | | | |
| | | 600 | | 4.75%, 02/15/37 | | | 599,672 |
| | | | | U.S. Treasury Notes | | | |
| | | 51,400 | | 4.00%, 08/31/09 | | | 51,436,134 |
| | | 19,800 | | 4.25%, 01/15/11 | | | 19,954,678 |
| | | 5,400 | | 4.25%, 09/30/12 | | | 5,422,783 |
| | | 700 | | 5.125%, 06/30/11 | | | 725,976 |
| | | 1,055 | | 5.125%, 05/15/16 | | | 1,107,255 |
| | | | | | | | |
| | | | | TOTAL U.S. TREASURY OBLIGATIONS
(cost $78,523,154) | | | 79,246,498 |
| | | | | | | | |
| | | | | TOTAL LONG-TERM INVESTMENTS
(cost $285,317,183) | | | 286,448,945 |
| | | | | | | | |
| | | | | SHORT-TERM INVESTMENTS—3.1% | | |
| | | | | U.S. TREASURY OBLIGATIONS(k)(n)—0.5% | | | |
| | | | | U.S. Treasury Bills | | | |
| | | 90 | | 3.53%, 12/13/07 | | | 89,574 |
| | | 10 | | 3.718%, 12/13/07 | | | 9,952 |
| | | 975 | | 3.77%, 12/13/07 | | | 970,385 |
| | | 10 | | 3.79%, 12/13/07 | | | 9,953 |
| | | 60 | | 3.842%, 12/13/07 | | | 59,716 |
| | | 10 | | 4.11%, 12/13/07 | | | 9,952 |
| | | | | | | | |
| | | | | TOTAL U.S. TREASURY OBLIGATIONS
(cost $1,149,932) | | | 1,149,532 |
| | | | | | | | |
| | | Shares | | AFFILIATED MONEY MARKET MUTUAL FUND—2.5% | | | |
| | | 5,993,787 | | Dryden Core Investment Fund—Taxable Money Market Series
(cost $5,993,787; Note 3)(w) | | | 5,993,787 |
| | | | | | | | |
See Notes to Financial Statements.
| | |
| THE TARGET PORTFOLIO TRUST | | 127 |
| | |
Intermediate-Term Bond Portfolio (continued) | | Portfolio of Investments
As of October 31, 2007 |
| | | | | | | | | |
| | | NOTIONAL
AMOUNT (000)# | | DESCRIPTION | | VALUE (NOTE 1) | |
| | | | | | | | | |
| | | | | OUTSTANDING OPTIONS PURCHASED*—0.1% | |
| | | |
| | | | | Call Options—0.1% | | | | |
| | | | | Eurodollar Futures | | | | |
| | $ | 900 | | expiring 03/20/08, Strike Price $95.50 | | $ | 4,219 | |
| | | | | USD Swap Option on 3 Month LIBOR | | | | |
| | | 12,300 | | expiring 02/01/08 @ 4.75% | | | 38,070 | |
| | | 11,000 | | expiring 09/26/08 @ 4.75% | | | 89,429 | |
| | | | | | | | | |
| | | | | | | | 131,718 | |
| | | | | | | | | |
| | | | | Put Options | | | | |
| | | | | Eurodollar Futures | | | | |
| | | 40,000 | | expiring 12/17/07, Strike Price $91.50 | | | 250 | |
| | | 326,000 | | expiring 12/17/07, Strike Price $92.00 | | | 2,038 | |
| | | 1,378,000 | | expiring 06/16/08, Strike Price $92.50 | | | 8,613 | |
| | | | | | | | | |
| | | | | | | | 10,901 | |
| | | | | | | | | |
| | | | | TOTAL OUTSTANDING OPTIONS PURCHASED
(cost $94,741) | | | 142,619 | |
| | | | | | | | | |
| | | | | TOTAL SHORT-TERM INVESTMENTS
(cost $7,238,460) | | | 7,285,938 | |
| | | | | | | | | |
| | | |
| | | | | TOTAL INVESTMENTS, BEFORE OUTSTANDING OPTIONS WRITTEN AND SECURITIES SOLD SHORT—125.8%
(cost $292,555,643; Note 5) | | | 293,734,883 | |
| | | | | | | | | |
| | | Principal
Amount (000)# | | SECURITIES SOLD SHORT—(22.1)% | | | |
| | | |
| | | | | U.S. Government Agency Obligation—(11.0)% | | | | |
| | | | | Federal National Mortgage Assoc. | | | | |
| | | 14,300 | | Zero coupon, 11/19/22 | | | (14,076,563 | ) |
| | | 11,500 | | 6.00%, TBA | | | (11,571,875 | ) |
| | | | | | | | | |
| | | | | | | | (25,648,438 | ) |
| | | | | | | | | |
| | | |
| | | | | U.S. Treasury Obligations—(11.1)% | | | | |
| | | | | U.S. Treasury Note | | | | |
| | | 26,100 | | 4.25%, 11/15/14 | | | (26,008,232 | ) |
| | | | | | | | | |
| | | | | TOTAL SECURITIES SOLD SHORT
(proceeds received $51,278,204) | | | (51,656,670 | ) |
| | | | | | | | | |
| | | Notional
Amount (000)# | | OUTSTANDING OPTIONS WRITTEN* | | | |
| | | |
| | | | | Call Options | | | | |
| | | | | Eurodollar Futures | | | | |
| | | 400 | | expiring 03/20/08, Strike Price $95.75 | | | (2,000 | ) |
| | | 400 | | expiring 03/20/08, Strike Price $95.88 | | | (1,575 | ) |
See Notes to Financial Statements.
| | |
| 128 | | THE TARGET PORTFOLIO TRUST |
| | | | | | | | | |
| | | NOTIONAL
AMOUNTS (000)# | | DESCRIPTION | | VALUE (NOTE 1) | |
| | | | | | | | | |
| | | | | OUTSTANDING OPTIONS WRITTEN (continued) | | | | |
| | | |
| | | | | Call Options (cont’d.) | | | | |
| | | | | USD Swap Option on 3 Month LIBOR | | | | |
| | $ | 2,700 | | expiring 02/01/08 @ 4.90% | | $ | (25,699 | ) |
| | | 5,000 | | expiring 09/26/08 @ 4.95% | | | (74,470 | ) |
| | | | | | | | | |
| | | | | TOTAL OUTSTANDING OPTIONS WRITTEN
(premiums received $77,970) | | | (103,744 | ) |
| | | | | | | | | |
| | | |
| | | | | TOTAL INVESTMENTS, NET OF SECURITIES SOLD SHORT AND
OUTSTANDING OPTIONS WRITTEN—103.7%
(cost $241,199,469; Note 5) | | | 241,974,469 | |
| | | | | Liabilities in excess of other assets(x)—(3.7%) | | | (8,551,652 | ) |
| | | | | | | | | |
| | | | | NET ASSETS—100% | | $ | 233,422,817 | |
| | | | | | | | | |
The following abbreviations were used in Portfolio descriptions:
144A—Security was purchased pursuant to Rule 144A under the securities Act of 1933 and may not be resold subject to that rule except to qualified institutional buyers. Unless otherwise noted, 144A securities are deemed to be liquid.
NR—Not Rated
TBA—To Be Announced
AUD—Australian Dollar
BRL—Brazilian Real
EUR—Euro
GBP—British Pound
JPY—Japanese Yen
NOK—Norwegian Krone
| # | Principal amount is shown in U.S. dollars unless otherwise stated. |
| * | Non-income producing security. |
| (c) | Indicates a variable rate security. |
| (d) | Standard & Poor’s rating. |
| (f) | Private Placement restricted as to resale and does not have a readily available market. The aggregate cost of such securities is $14,973,538. The aggregate value of $13,903,873 is approximately 6.0% of net assets. |
| (g) | Indicates a security that has been deemed illiquid. |
| (i) | Represents issuer in default on interest payments. Non-income producing security. |
| (k) | Securities segregated as collateral for futures contracts. |
| (n) | Rates shown are the effective yields at purchase date. |
| (w) | Prudential Investments LLC, the manager of the Portfolio, also serves as manager of the Dryden Core Investment Fund—Taxable Money Market Series. |
| (x) | Liabilities in excess of other assets includes net unrealized appreciation (depreciation) on futures contracts, forward foreign currency contracts, interest rate and credit default swap agreements as follows: |
Open futures contracts outstanding at October 31, 2007:
| | | | | | | | | | | | | | |
Number of
Contracts | | Type | | Expiration
Date | | Value at
Trade Date | | Value at
October 31, 2007 | | Unrealized
Appreciation
(Depreciation) | |
| Long Positions: | | | | | | | | | | | | | | |
| 784 | | 90 Day Euro Dollar | | Mar 08 | | $ | 186,539,675 | | $ | 187,189,800 | | $ | 650,125 | |
| 147 | | 90 Day Euro Dollar | | Mar 09 | | | 35,121,975 | | | 35,153,213 | | | 31,238 | |
| 1,100 | | 90 Day Euro Dollar | | Jun 08 | | | 260,726,587 | | | 262,955,000 | | | 2,228,413 | |
| 291 | | 90 Day Sterling | | Dec 07 | | | 71,211,351 | | | 70,983,173 | | | (228,178 | ) |
| 11 | | 90 Day Sterling | | Mar 08 | | | 2,700,653 | | | 2,690,932 | | | (9,721 | ) |
| 8 | | 2 Year U.S. Treasury
Notes | | Dec 07 | | | 1,650,500 | | | 1,656,875 | | | 6,375 | |
| | | | | | | | | | | | | | |
| | | | | | | | | | | | | 2,678,252 | |
| | | | | | | | | | | | | | |
See Notes to Financial Statements.
| | |
| THE TARGET PORTFOLIO TRUST | | 129 |
| | |
Intermediate-Term Bond Portfolio (continued) | | Portfolio of Investments
As of October 31, 2007 |
| | | | | | | | | | | | | | |
Number of
Contracts | | Type | | Expiration
Date | | Value at
Trade Date | | Value at
October 31, 2007 | | Unrealized
Appreciation
(Depreciation) | |
| Short Positions: | | | | | | | | | | | | | | |
| 90 | | 2 Year Euro Shatz | | Dec 07 | | $ | 13,495,546 | | $ | 13,455,349 | | $ | 40,197 | |
| 216 | | 20 Year U.S. Treasury Notes | | Dec 07 | | | 23,901,750 | | | 24,320,250 | | | (418,500 | ) |
| | | | | | | | | | | | | | |
| | | | | | | | | | | | | (378,303 | ) |
| | | | | | | | | | | | | | |
| | | | | | | | | | | | $ | 2,299,949 | |
| | | | | | | | | | | | | | |
Forward foreign currency exchange contracts outstanding at October 31, 2007:
| | | | | | | | | | | | |
Purchase Contracts | | Notional
Amount (000) | | Value at Settlement
Date Payable | | Current
Value | | Unrealized
Appreciation |
Euro, | | | | | | | | | | | | |
Expiring 11/05/07 | | EUR | 1,348 | | $ | 1,909,113 | | $ | 1,952,800 | | $ | 43,687 |
Norwegian Krone | | | | | | | | | | | | |
Expiring 12/06/07 | | NOK | 3,811 | | | 655,803 | | | 709,672 | | | 53,869 |
| | | | | | | | | | | | |
| | | | | $ | 2,564,916 | | $ | 2,662,472 | | $ | 97,556 |
| | | | | | | | | | | | |
| | | | | | | | | | | | | |
Sale Contracts | | Notional
Amount (000) | | Value at Settlement
Date Receivable | | Current
Value | | Unrealized
Appreciation
(Depreciation) | |
British Pound, | | | | | | | | | | | | | |
Expiring 12/20/07 | | GBP | 724 | | $ | 1,494,228 | | $ | 1,502,979 | | $ | (8,751 | ) |
Japanese Yen, | | | | | | | | | | | | | |
Expiring 12/13/07 | | JPY | 334,129 | | | 2,927,887 | | | 2,911,161 | | | 16,726 | |
| | | | | | | | | | | | | |
| | | | | $ | 4,422,115 | | $ | 4,414,140 | | $ | 7,975 | |
| | | | | | | | | | | | | |
Interest rate swap agreements outstanding at October 31, 2007:
| | | | | | | | | | | | | | |
Counterparty | | Termination
Date | | Notional
Amount# | | Fixed
Rate | | | Floating
Rate | | Unrealized
Appreciation
(Depreciation) | |
Barclays Capital(1) | | 06/18/09 | | $ | 16,100,000 | | 5.00 | % | | 3 month LIBOR | | $ | 56,113 | |
Barclays Capital(1) | | 12/19/09 | | | 74,100,000 | | 5.00 | % | | 3 month LIBOR | | | 992,257 | |
Barclays Capital(1) | | 12/19/12 | | | 3,300,000 | | 5.00 | % | | 3 month LIBOR | | | 103,307 | |
Barclays Capital(2) | | 12/19/17 | | | 19,000,000 | | 5.00 | % | | 3 month LIBOR | | | (636,800 | ) |
Deutsche Bank(1) | | 12/19/09 | | | 47,700,000 | | 5.00 | % | | 3 month LIBOR | | | 427,219 | |
Deutsche Bank(1) | | 01/15/10 | | AUD | 2,600,000 | | 6.50 | % | | 6 month Australian
Bank Bill rate | | | (37,877 | ) |
Morgan Stanley Capital Services, Inc.(1) | | 03/19/10 | | EUR | 5,800,000 | | 4.50 | % | | 6 month Euribor | | | (35,179 | ) |
Lehman Brothers(1) | | 03/19/10 | | EUR | 3,000,000 | | 4.50 | % | | 6 month Euribor | | | (16,616 | ) |
Barclays Capital(1) | | 03/20/09 | | GBP | 16,000,000 | | 6.00 | % | | 6 month LIBOR | | | (2,621 | ) |
Barclays Capital(1) | | 06/19/09 | | GBP | 6,500,000 | | 6.00 | % | | 6 month LIBOR | | | (1,216 | ) |
| | | | | | | | | | | | | | |
| | | | | | | | | | | | $ | 848,587 | |
| | | | | | | | | | | | | | |
| (1) | Porfolio pays the floating rate and receives the fixed rate. |
| (2) | Portfolio pays the fixed rate and receives the floating rate. |
| # | Notional Amount is shown in U.S. dollars unless otherwise stated. |
See Notes to Financial Statements.
| | |
| 130 | | THE TARGET PORTFOLIO TRUST |
Credit default swap agreements outstanding at October 31, 2007:
| | | | | | | | | | | | | | |
Counterparty | | Termination
Date | | Notional
Amount# | | Fixed
Rate | | | Underlying
Bond | | Unrealized
Appreciation
(Depreciation) | |
Lehman Brothers(1) | | 03/20/08 | | $ | 1,200,000 | | 0.06 | % | | AIG Corp.,
5.60%, due 10/18/16 | | $ | (1,058 | ) |
Bank of America, N.A.(1) | | 12/20/07 | | | 1,100,000 | | 0.10 | % | | ConocoPhillips,
8.75%, due 05/25/10 | | | 145 | |
Deutsche Bank(2) | | 06/20/12 | | | 200,000 | | 0.23 | % | | Diamond Offshore Drilling,
0% (Convertible), 06/06/20 | | | (456 | ) |
Merrill Lynch & Co.(1) | | 06/20/12 | | | 200,000 | | 0.28 | % | | Enbridge Energy Partners,
4.75%, due 06/01/13 | | | (1,286 | ) |
Bank of America, N.A.(1) | | 06/20/12 | | | 200,000 | | 0.33 | % | | Energy Transfer Partners,
5.95%, due 02/01/15 | | | (2,833 | ) |
Deutsche Bank(2) | | 06/20/12 | | | 200,000 | | 0.50 | % | | GlobalSantaFe Corp.,
5.00%, due 02/15/13 | | | (3,208 | ) |
Lehman Brothers(1) | | 03/20/08 | | | 600,000 | | 1.55 | % | | GMAC LLC,
6.875%, due 08/28/12 | | | (4,603 | ) |
Merrill Lynch & Co.(1) | | 06/20/12 | | | 200,000 | | 0.29 | % | | Kinder Morgan,
6.75%, due 03/15/11 | | | (683 | ) |
Bank of America, N.A.(1) | | 09/20/12 | | | 700,000 | | 0.89 | % | | Merrill Lynch,
5.00%, due 01/15/15 | | | 2,242 | |
Merrill Lynch & Co.(1) | | 09/20/12 | | | 3,800,000 | | 0.80 | % | | Morgan Stanley,
6.60%, due 04/01/12 | | | 19,784 | |
Citigroup(2) | | 06/20/12 | | | 200,000 | | 0.48 | % | | Nabors Industries, Inc.,
5.375%, due 08/15/12 | | | (1,759 | ) |
Deutsche Bank(2) | | 06/20/12 | | | 200,000 | | 0.51 | % | | Noble Corp.,
5.875%, due 06/01/13 | | | (1,307 | ) |
Lehman Brothers(1) | | 12/20/08 | | | 100,000 | | 0.29 | % | | Petroleos Mexicanos,
9.50%, due 09/15/27 | | | 122 | |
Barclays Capital(1) | | 12/20/08 | | | 300,000 | | 0.29 | % | | Petroleos Mexicanos,
9.50%, due 09/15/27 | | | 366 | |
Bank of America, N.A.(1) | | 06/20/12 | | | 200,000 | | 0.32 | % | | Plains All-American Pipeline,
7.75%, due 10/15/12 | | | (664 | ) |
Deutsche Bank(1) | | 12/20/08 | | | 100,000 | | 0.42 | % | | Republic of Indonesia,
6.75%, due 03/10/14 | | | (39 | ) |
Lehman Brothers(1) | | 12/20/08 | | | 300,000 | | 0.40 | % | | Republic of Indonesia,
6.75%, due 03/10/14 | | | (192 | ) |
Barclays Capital(1) | | 12/20/08 | | | 100,000 | | 0.26 | % | | Republic of Panama,
8.875%, due 09/30/27 | | | (61 | ) |
Deutsche Bank(1) | | 12/20/08 | | | 200,000 | | 0.25 | % | | Republic of Panama,
8.875%, due 09/30/27 | | | (152 | ) |
Deutsche Bank(1) | | 12/20/08 | | | 100,000 | | 0.33 | % | | Republic of Peru,
8.75%, due 11/21/33 | | | 39 | |
Lehman Brothers(1) | | 12/20/08 | | | 300,000 | | 0.32 | % | | Republic of Peru,
8.75%, due 11/21/33 | | | 72 | |
Lehman Brothers(1) | | 12/20/08 | | | 100,000 | | 0.31 | % | | Russian Federation,
7.50%, due 03/31/30 | | | (101 | ) |
Deutsche Bank(1) | | 12/20/07 | | | 600,000 | | 0.26 | % | | Russian Federation,
7.50%, due 03/31/30 | | | 466 | |
See Notes to Financial Statements.
| | |
| THE TARGET PORTFOLIO TRUST | | 131 |
| | |
Intermediate-Term Bond Portfolio (continued) | | Portfolio of Investments
As of October 31, 2007 |
| | | | | | | | | | | | | | |
Counterparty | | Termination
Date | | Notional
Amount# | | Fixed
Rate | | | Underlying
Bond | | Unrealized
Appreciation
(Depreciation) | |
Morgan Stanley Capital Services, Inc.(1) | | 12/20/07 | | $ | 600,000 | | 0.26 | % | | Russian Federation,
7.50%, due 03/31/30 | | $ | 466 | |
Deutsche Bank(2) | | 06/20/12 | | | 200,000 | | 0.28 | % | | Transocean, Inc.,
7.375%, due 04/15/18 | | | (131 | ) |
Barclays Capital(1) | | 12/20/08 | | | 100,000 | | 0.72 | % | | Ukraine Government,
7.65%, due 06/11/13 | | | 120 | |
Barclays Capital(1) | | 12/20/08 | | | 300,000 | | 0.71 | % | | Ukraine Government,
7.65%, due 06/11/13 | | | 315 | |
Deutsche Bank(1) | | 12/20/08 | | | 300,000 | | 0.72 | % | | Ukraine Government,
7.65%, due 06/11/13 | | | 359 | |
Bank of America, N.A.(1) | | 06/20/12 | | | 200,000 | | 0.32 | % | | Valero Energy Corp.,
6.875%, due 04/15/12 | | | (406 | ) |
Bank of America, N.A.(1) | | 12/20/07 | | | 1,100,000 | | 0.12 | % | | Valero Energy Corp.,
6.875%, due 04/15/12 | | | 47 | |
| | | | | | | | | | | | | | |
| | | | | | | | | | | | $ | 5,604 | |
| | | | | | | | | | | | | | |
| (1) | Portfolio pays the counterparty par in the event that the underlying bond defaults and receives the fixed rate. |
| (2) | Portfolio pays the fixed rate and receives from the counterparty, par in the event that the underlying bond defaults. |
| # | Notional Amount is shown in U.S. dollars unless otherwise stated. |
The industry classification of investments and liabilities in excess of other assets shown as a percentage of net assets as of October 31, 2007 were as follows:
| | | |
U.S. Treasury Obligations | | 34.4 | % |
U.S. Government Mortgage Backed Obligations | | 33.8 | |
U.S. Government Agency Obligations | | 12.9 | |
Collateralized Mortgage Obligations | | 12.4 | |
Diversified Financial Services | | 8.3 | |
Financial—Bank & Trust | | 3.6 | |
Affiliated Money Market Mutual Fund | | 2.5 | |
Foreign Government Bonds | | 2.3 | |
Electric—Integrated | | 2.3 | |
Commercial Banks | | 1.9 | |
Telecommunications | | 1.4 | |
Asset-Backed Securities | | 1.1 | |
Retail | | 1.0 | |
Airlines | | 1.0 | |
Oil, Gas & Consumable Fuels | | 1.0 | |
Municipal Bonds | | 0.8 | |
Medical Supplies & Equipment | | 0.6 | |
Diversified | | 0.5 | |
Advertising | | 0.5 | |
Real Estate Investment Trust | | 0.5 | |
Entertainment & Leisure | | 0.5 | |
Cable | | 0.5 | |
See Notes to Financial Statements.
| | |
| 132 | | THE TARGET PORTFOLIO TRUST |
| | | |
Industry (cont’d.) | | | |
Pipelines | | 0.4 | % |
Oil & Field Services | | 0.4 | |
Distribution/Wholesale | | 0.3 | |
Office Equipment | | 0.3 | |
Packaging | | 0.2 | |
Hotels, Restaurants & Leisure | | 0.2 | |
Forest Products | | 0.1 | |
Outstanding Options Purchased | | 0.1 | |
| | | |
| | 125.8 | |
Written options and securities sold short | | (22.1 | ) |
Liabilities in excess of other assets | | (3.7 | ) |
| | | |
| | 100.0 | % |
| | | |
See Notes to Financial Statements.
| | |
| THE TARGET PORTFOLIO TRUST | | 133 |
| | |
Mortgage Backed Securities Portfolio | | Portfolio of Investments
As of October 31, 2007 |
| | | | | | | |
PRINCIPAL
AMOUNT (000)# | | | DESCRIPTION | | VALUE (NOTE 1) |
| | | | | | | |
| | | | LONG-TERM INVESTMENTS—147.5% | | | |
| |
| | | | U.S. GOVERNMENT MORTGAGE BACKED OBLIGATIONS—115.5% |
| | | | Federal Home Loan Mortgage Corp., | | | |
| $ | 5,238 | | | 5.00%, 08/01/35 - 10/01/35 | | $ | 5,032,261 |
| | 1,661 | | | 6.00%, 01/01/15 - 02/01/21 | | | 1,688,758 |
| | 2,986 | | | 6.50%, 01/01/18 - 11/01/26 | | | 3,063,707 |
| | 40 | | | 7.50%, 06/01/28 | | | 42,020 |
| | — | (r) | | 8.25%, 05/01/08 | | | 89 |
| | 12 | | | 8.50%, 12/01/07 - 07/01/21 | | | 12,347 |
| | 12 | | | 9.00%, 6/01/09 - 03/01/11 | | | 11,725 |
| | 25 | | | 11.50%, 03/01/16 | | | 28,979 |
| | | | Federal National Mortgage Assoc., | | | |
| | 2,203 | | | 4.50%, 03/01/35 | | | 2,052,967 |
| | 15,525 | | | 5.00%, 11/01/18 - 11/01/37 | | | 14,949,789 |
| | 1,660 | | | 5.00%, 08/31/35(k) | | | 1,594,551 |
| | 6,470 | | | 5.00%, TBA | | | 6,209,181 |
| | 28,647 | | | 5.50%, 06/01/33 - 08/01/37 | | | 28,076,153 |
| | 2,115 | | | 5.50%, TBA | | | 2,083,935 |
| | 837 | | | 5.78%, 11/01/11 | | | 854,566 |
| | 4,043 | | | 6.00%, 04/01/14 - 01/01/33 | | | 4,097,124 |
| | 43 | | | 6.087%, 03/01/12 | | | 44,172 |
| | 4,384 | | | 6.50%, 05/01/14 - 09/01/36 | | | 4,502,288 |
| | 39 | | | 7.00%, 09/01/11 - 07/01/12 | | | 39,352 |
| | 43 | | | 8.00%, 09/01/22 - 12/01/22 | | | 45,779 |
| | 8 | | | 9.75%, 08/01/10 - 11/01/16 | | | 8,342 |
| | | | Government National Mortgage Assoc., | | | |
| | 559 | | | 4.50%, 09/15/33 - 10/15/33 | | | 527,903 |
| | 842 | | | 5.00%, 04/15/35 | | | 817,508 |
| | 242 | | | 6.00%, 07/15/24 - 08/15/24 | | | 246,259 |
| | 4,000 | | | 6.00%, TBA | | | 4,050,000 |
| | 2,150 | | | 6.50%, 05/15/23 - 02/15/35 | | | 2,214,392 |
| | 1,836 | | | 7.00%, 11/15/31 - 11/15/33 | | | 1,913,582 |
| | 39 | | | 7.50%, 09/15/11 - 12/20/23 | | | 40,558 |
| | 508 | | | 8.00%, 01/15/08 - 11/15/30 | | | 541,016 |
| | 51 | | | 8.25%, 06/20/17 - 07/20/17 | | | 54,368 |
| | 53 | | | 8.50%, 04/20/17 | | | 56,856 |
| | 77 | | | 9.00%, 09/15/08 - 01/15/20 | | | 84,582 |
| | 13 | | | 9.50%, 08/15/09 - 06/15/20 | | | 14,480 |
| | 7 | | | 13.50%, 05/15/11 | | | 8,252 |
| | 10 | | | 14.00%, 06/15/11 | | | 11,934 |
| | 12 | | | 16.00%, 05/15/12 | | | 13,494 |
| | | | | | | |
| | | | TOTAL U.S. GOVERNMENT MORTGAGE BACKED OBLIGATIONS
(cost $84,974,588) | | | 85,033,269 |
| | | | | | | |
See Notes to Financial Statements.
| | |
| 134 | | THE TARGET PORTFOLIO TRUST |
| | | | | | |
PRINCIPAL
AMOUNT (000)# | | DESCRIPTION | | VALUE (NOTE 1) |
| | | | | | |
| | |
| | | COLLATERALIZED MORTGAGE OBLIGATIONS—32.0% | | | |
| | | Citigroup Mortgage Loan Trust, Inc.,
Series 2006-AR1, Class 3A1 | | | |
| $ | 394 | | 5.50%(c), 03/25/36 | | $ | 391,132 |
| | | Countrywide Alternative Loan Trust, | | | |
| | | Series 2005-73CB, Class 1A7 | | | |
| | 556 | | 5.50%, 01/25/36 | | | 555,273 |
| | | Series 2005-85CB, Class 2A2 | | | |
| | 1,518 | | 5.50%, 02/25/36 | | | 1,518,589 |
| | | Series 2005-J11, Class 1A3 | | | |
| | 1,658 | | 5.50%, 11/25/35 | | | 1,655,975 |
| | | Series 2007-HY5R, Class 2A1A | | | |
| | 1,108 | | 5.544%(c), 03/25/47 | | | 1,075,864 |
| | | Countrywide Home Loan Mortgage Pass-Through Trust, | | | |
| | | Series 2006-14, Class A3 | | | |
| | 1,560 | | 6.25%, 09/25/36 | | | 1,567,024 |
| | | Series 2006-J2, Class 1A6 | | | |
| | 90 | | 6.00%, 04/25/36 | | | 87,675 |
| | | Series 2007-4, Class 1A1 | | | |
| | 373 | | 6.00%, 05/25/37 | | | 374,028 |
| | | Series 2007-13, Class A10 | | | |
| | 790 | | 6.00%, 08/25/37 | | | 768,901 |
| | | Federal Home Loan Mortgage Corp., Structured Pass-Through Securities,
Series T-42, Class A5 | | | |
| | 232 | | 7.50%, 02/25/42 | | | 242,663 |
| | | Federal Home Loan Mortgage Corp., | | | |
| | | Series 74, Class F | | | |
| | 23 | | 6.00%, 10/15/20 | | | 22,880 |
| | | Series 83, Class Z | | | |
| | 5 | | 9.00%, 10/15/20 | | | 4,973 |
| | | Series 186, Class E | | | |
| | 38 | | 6.00%, 08/15/21 | | | 37,971 |
| | | Series 245, Class IO | | | |
| | 343 | | 5.00%, 05/15/37 | | | 92,354 |
| | | Series 1058, Class H | | | |
| | 12 | | 8.00%, 04/15/21 | | | 12,791 |
| | | Series 1116, Class I | | | |
| | 10 | | 5.50%, 08/15/21 | | | 10,275 |
| | | Series 1120, Class L | | | |
| | 46 | | 8.00%, 07/15/21 | | | 49,171 |
| | | Series 1630, Class PJ | | | |
| | 285 | | 6.00%, 05/15/23 | | | 285,808 |
| | | Series 2627, Class BG | | | |
| | 1,141 | | 3.25%, 06/15/17 | | | 1,093,792 |
| | | Series 2809, Class UC | | | |
| | 425 | | 4.00%, 06/15/19 | | | 390,312 |
| | | Series 2852, Class VI-IO | | | |
| | 1,586 | | 5.00%, 06/15/24 | | | 90,332 |
See Notes to Financial Statements.
| | |
| THE TARGET PORTFOLIO TRUST | | 135 |
| | |
Mortgage Backed Securities Portfolio (continued) | | Portfolio of Investments
As of October 31, 2007 |
| | | | | | |
PRINCIPAL
AMOUNT (000)# | | DESCRIPTION | | VALUE (NOTE 1) |
| | | | | | |
| | | COLLATERALIZED MORTGAGE OBLIGATIONS (continued) | | | |
| | | Series 2882, Class YI-IO | | | |
| $ | 774 | | 5.00%, 03/15/24 | | $ | 35,441 |
| | | Series 2915, Class K1-IO | | | |
| | 803 | | 5.00%, 06/15/24 | | | 41,915 |
| | | Series 2995, Class ST-IO | | | |
| | 1,585 | | 1.659%(c), 05/15/29 | | | 88,605 |
| | | Series 3279, Class SD-IO | | | |
| | 4,763 | | 1.339%(c), 02/15/37 | | | 257,911 |
| | | Series 3309, Class SC-IO | | | |
| | 4,411 | | 1.359%(c), 04/15/37 | | | 234,890 |
| | | Federal National Mortgage Assoc., | | | |
| | | Series 56, Class 1 | | | |
| | 16 | | 6.00%, 04/01/19 | | | 16,106 |
| | | Series 340, Class 2-IO | | | |
| | 616 | | 5.00%, 09/01/33 | | | 155,180 |
| | | Series 347, Class 2-IO | | | |
| | 1,313 | | 5.00%, 01/01/34 | | | 332,392 |
| | | Series 353, Class 2-IO | | | |
| | 928 | | 5.00%, 08/01/34 | | | 238,504 |
| | | Series 377, Class 2-IO | | | |
| | 368 | | 5.00%, 10/01/36 | | | 93,887 |
| | | Series 379, Class 2-IO | | | |
| | 1,248 | | 5.50%, 05/25/37 | | | 316,664 |
| | | Series 1990-10, Class L | | | |
| | 6 | | 8.50%, 02/25/20 | | | 6,781 |
| | | Series 1990-108, Class G | | | |
| | 17 | | 7.00%, 09/25/20 | | | 17,991 |
| | | Series 1991-21, Class J | | | |
| | 18 | | 7.00%, 03/25/21 | | | 19,229 |
| | | Series 1992-113, Class Z | | | |
| | 36 | | 7.50%, 07/25/22 | | | 38,531 |
| | 276 | | Series 1993-223, Class ZA 6.50%, 12/25/23 | | | 285,855 |
| | | Series 1998-19, Class J | | | |
| | 16 | | 8.50%, 07/25/18 | | | 16,830 |
| | | Series 1998-M4, Class C | | | |
| | 40 | | 6.527%, 05/25/30 | | | 40,340 |
| | | Series 2001-51, Class QN | | | |
| | 491 | | 6.00%, 10/25/16 | | | 504,327 |
| | | Series 2003-33, Class PT | | | |
| | 182 | | 4.50%, 05/25/33 | | | 174,698 |
| | | Series 2007-22, Class SD-IO | | | |
| | 2,740 | | 1.528%(c), 03/25/37 | | | 169,245 |
| | | Series G-14, Class L | | | |
| | 20 | | 8.50%, 06/25/21 | | | 21,341 |
See Notes to Financial Statements.
| | |
| 136 | | THE TARGET PORTFOLIO TRUST |
| | | | | | |
PRINCIPAL
AMOUNT (000)# | | DESCRIPTION | | VALUE (NOTE 1) |
| | | | | | |
| | | COLLATERALIZED MORTGAGE OBLIGATIONS (continued) | | | |
| | | Series G92-24, Class Z | | | |
| $ | 22 | | 6.50%, 04/25/22 | | $ | 22,388 |
| | | Series G92-59, Class D | | | |
| | 111 | | 6.00%, 10/25/22 | | | 113,259 |
| | | Series G94-4, Class PG | | | |
| | 317 | | 8.00%, 05/25/24 | | | 343,529 |
| | | First Boston Mortgage Securities Corp., | | | |
| | | Series B, Class I-O, IO | | | |
| | 57 | | 8.985%, 04/25/17 | | | 12,115 |
| | | Series B, Class P-O, PO | | | |
| | 55 | | Zero Coupon, 04/25/17 | | | 48,038 |
| | | Government National Mortgage Assoc., | | | |
| | | Series 2006-35, Class LO, PO | | | |
| | 309 | | Zero Coupon, 07/20/36 | | | 238,007 |
| | | Series 2006-38, Class XS, IO | | | |
| | 1,617 | | 2.19%(c), 09/16/35 | | | 119,735 |
| | | GSR Mortgage Loan Trust, | | | |
| | | Series 2005-AR2, Class 1A2 | | | |
| | 312 | | 4.636%(c), 04/25/35 | | | 312,968 |
| | | Series 2007-AR1, Class 2A1 | | | |
| | 431 | | 6.007%(c), 03/25/37 | | | 435,011 |
| | | Series 2007-AR2, Class 1A1 | | | |
| | 388 | | 5.797%(c), 05/25/47 | | | 388,957 |
| | | JPMorgan Mortgage Trust,
Series 2007-S2, Class 2A3 | | | |
| | 1,033 | | 5.50%, 06/25/37 | | | 1,022,125 |
| | | Morgan Stanley Mortgage Loan Trust, | | | |
| | | Series 2004-5AR, Class 3A4 | | | |
| | 554 | | 4.377%(c), 07/25/34 | | | 549,560 |
| | | Series 2007-12, Class 3A22 | | | |
| | 318 | | 6.00%, 08/25/37 | | | 317,382 |
| | | Series 2007-13, Class B1 | | | |
| | 97 | | 6.276%(c), 10/25/37 | | | 88,689 |
| | | Residential Asset Securitization Trust, | | | |
| | | Series 2004-A3, Class A7 | | | |
| | 750 | | 5.25%, 06/25/34 | | | 704,554 |
| | | Series 2005-A9, Class A3 | | | |
| | 1,722 | | 5.50%(c), 07/25/35 | | | 1,627,840 |
| | | Salomon Brothers Mortgage Securities,
Series 1986-1, Class A | | | |
| | 15 | | 6.00%, 12/25/11 | | | 15,105 |
| | | Wells Fargo Mortgage Backed Securities Trust, | | | |
| | | Series 2005-AR13, Class A1 | | | |
| | 1,500 | | 5.31%(c), 05/25/35 | | | 1,473,207 |
| | | Series 2006-AR10, Class 5A2 | | | |
| | 1,083 | | 5.597%(c), 07/25/36 | | | 1,082,271 |
See Notes to Financial Statements.
| | |
| THE TARGET PORTFOLIO TRUST | | 137 |
| | |
Mortgage Backed Securities Portfolio (continued) | | Portfolio of Investments
As of October 31, 2007 |
| | | | | | | |
PRINCIPAL
AMOUNT (000)# | | DESCRIPTION | | VALUE (NOTE 1) | |
| | | | | | | |
| | | COLLATERALIZED MORTGAGE OBLIGATIONS (continued) | | | | |
| | | Series 2006-AR5, Class 2A1 | | | | |
| $ | 1,173 | | 5.533%(c), 04/25/36 | | $ | 1,179,885 | |
| | | | | | | |
| | | TOTAL COLLATERALIZED MORTGAGE OBLIGATIONS
(cost $23,166,026) | | | 23,529,071 | |
| | | | | | | |
| | | TOTAL LONG-TERM INVESTMENTS
(cost $108,140,614) | | | 108,562,340 | |
| | | | | | | |
| Shares | | SHORT-TERM INVESTMENTS—6.2% | | | |
| | |
| | | AFFILIATED MONEY MARKET MUTUAL FUND—0.1% | | | | |
| | 40,444 | | Dryden Core Investment Fund—Taxable Money Market Series
(cost $40,444)(w) | | | 40,444 | |
| | | | | | | |
Principal
Amount (000)# | | | | | |
| | |
| | | REPURCHASE AGREEMENT—6.1% | | | | |
| $ | 4,500 | | JPMorgan, 4.96%, dated 10/31/07, due 11/01/07 in the amount of $4,500,620 (cost $4,500,000; collateralized by 4,530,000 Federal National Mortgage Assoc., 6.00%, 09/01/37, value of collateral including accrued interest was $4,594,068) | | | 4,500,000 | |
| | | | | | | |
| | | TOTAL SHORT-TERM INVESTMENTS
(cost $4,540,444) | | | 4,540,444 | |
| | | | | | | |
| | | TOTAL INVESTMENTS,
BEFORE SECURITIES SOLD SHORT—153.7%
(cost $112,681,058; Note 5) | | | 113,102,784 | |
| | | | | | | |
| | | SECURITIES SOLD SHORT—(43.4)% | | | |
| | |
| | | U.S. Government Obligations | | | | |
| | | Federal National Mortgage Assoc., | | | | |
| | 16,230 | | 5.00%, 11/01/37 | | | (15,575,736 | ) |
| | 1,000 | | 5.50%, 11/01/36 | | | (985,312 | ) |
| | 6,000 | | 6.00%, 11/01/22 | | | (6,103,128 | ) |
| | 9,229 | | 6.00%, TBA | | | (9,295,338 | ) |
| | | | | | | |
| | | TOTAL SECURITIES SOLD SHORT
(proceeds $31,828,923) | | | (31,959,514 | ) |
| | | | | | | |
| | | TOTAL INVESTMENTS, NET OF SECURITIES SOLD
SHORT—110.3%
(cost $80,852,135) | | | 81,143,270 | |
| | | Other liabilities in excess of other assets(x)—(10.3%) | | | (7,562,502 | ) |
| | | | | | | |
| | | NET ASSETS—100% | | $ | 73,580,768 | |
| | | | | | | |
The following abbreviations are used in portfolio descriptions:
IO—Interest Only
PO—Principal Only Securities
See Notes to Financial Statements.
| | |
| 138 | | THE TARGET PORTFOLIO TRUST |
TBA—To Be Announced
| # | Principal amount is shown in U.S. dollars unless otherwise stated. |
| (c) | Indicates a variable rate security. |
| (k) | Securities segregated as collateral for futures contracts. |
| (w) | Prudential Investments LLC, the manager of the Portfolio also serves as manager of the Dryden Core Investment Fund—Taxable Money Market Series. |
| (x) | Other liabilities in excess of other assets includes net unrealized appreciation (depreciation) on futures contracts, interest rate and credit default swaps and the reverse repurchase agreements as follows: |
Open futures contracts outstanding at October 31, 2007:
| | | | | | | | | | | | | | |
Number of
Contracts | | Type | | Expiration
Date | | Value at
Trade Date | | Value at
October 31, 2007 | | Unrealized
Appreciation
(Depreciation) | |
| Long Positions: | | | | | | | | | | | | | | |
| 7 | | 2 Year U.S. Treasury Notes | | Dec 07 | | $ | 1,448,782 | | $ | 1,449,766 | | $ | 984 | |
| 32 | | 90 Day Euro Dollar | | Dec 07 | | | 7,609,782 | | | 7,620,000 | | | 10,218 | |
| | | | | | | | | | | | | | |
| | | | | | | | | | | | $ | 11,202 | |
| | | | | | | | | | | | | | |
| Short Positions: | | | | | | | | | | | | | | |
| 4 | | 5 Year U.S. Treasury Notes | | Dec 07 | | | 425,063 | | | 429,375 | | | (4,312 | ) |
| 3 | | 10 Year U.S. Treasury Notes | | Dec 07 | | | 326,110 | | | 330,047 | | | (3,937 | ) |
| 10 | | 20 Year U.S. Treasury Bonds | | Dec 07 | | | 1,106,835 | | | 1,125,938 | | | (19,103 | ) |
| 8 | | 90 Day Euro Dollar | | Mar 08 | | | 1,905,800 | | | 1,910,100 | | | (4,300 | ) |
| 8 | | 90 Day Euro Dollar | | Jun 08 | | | 1,907,300 | | | 1,912,400 | | | (5,100 | ) |
| 9 | | 90 Day Euro Dollar | | Sep 08 | | | 2,146,050 | | | 2,153,025 | | | (6,975 | ) |
| 4 | | 30 Day Federal Fund | | Dec 07 | | | 1,591,481 | | | 1,593,044 | | | (1,563 | ) |
| 8 | | 30 Day Federal Fund | | Jan 08 | | | 3,185,288 | | | 3,187,088 | | | (1,800 | ) |
| 8 | | 30 Day Federal Fund | | Feb 08 | | | 3,189,626 | | | 3,189,421 | | | 205 | |
| 4 | | 30 Day Federal Fund | | Mar 08 | | | 1,595,174 | | | 1,595,044 | | | 130 | |
| | | | | | | | | | | | | | |
| | | | | | | | | | | | | (46,755 | ) |
| | | | | | | | | | | | | | |
| | | | | | | | | | | | $ | (35,553 | ) |
| | | | | | | | | | | | | | |
Interest rate swap agreements outstanding at October 31, 2007:
| | | | | | | | | | | | | | |
Counter Party | | Termination
Date | | Notional
Amount | | Fixed
Rate | | | Floating Rate | | Unrealized
Appreciation (Depreciation) | |
Goldman Sachs (1) | | 06/12/17 | | $ | 2,600,000 | | 5.75 | % | | 3 Month LIBOR | | $ | 184,010 | |
Goldman Sachs (1) | | 11/19/07 | | | 1,000,000 | | 5.75 | % | | 3 Month LIBOR | | | 7,630 | |
Goldman Sachs (1) | | 09/14/17 | | | 650,000 | | 5.06 | % | | 3 Month LIBOR | | | (1,568 | ) |
| | | | | | | | | | | | | | |
| | | | | | | | | | | | $ | 190,072 | |
| | | | | | | | | | | | | | |
| (1) | Portfolio pays the floating rate and receives the fixed rate. |
Credit default swap agreements outstanding at October 31, 2007:
| | | | | | | | | | | | | | |
Counterparty | | Termination
Date | | Notional
Amount | | Fixed
Rate | | | Underlying
Bond | | Unrealized
Depreciation | |
Goldman Sachs (1) | | 07/25/45 | | $ | 800,000 | | 0.54 | % | | ABX.HE.A Index | | $ | (292,066 | ) |
| | | | | | | | | | | | | | |
| (1) | Portfolio sold credit default protection to the counterparty in the event that the underlying bond defaults. |
See Notes to Financial Statements.
| | |
| THE TARGET PORTFOLIO TRUST | | 139 |
| | |
Mortgage Backed Securities Portfolio (continued) | | Portfolio of Investments
As of October 31, 2007 |
Reverse repurchased agreements outstanding at October 31,2007:
| | | | | | | | | | | | |
Broker | | Interest Rate | | Trade Date | | Value at October 31, 2007 | | Maturity Date | | Cost |
First Boston Corp. Mortgage | | 4.88% | | 10/11/2007 | | $ | 9,582,000 | | 11/13/2007 | | $ | 9,582,000 |
First Boston Corp. Mortgage | | 4.89%
| | 10/11/2007 | | | 7,464,000 | | 11/13/2007 | | | 7,464,000 |
Lehman Brothers | | 4.88% | | 10/18/2007 | | | 3,300,000 | | 11/20/2007 | | | 3,300,000 |
Merrill Lynch | | 4.92% | | 10/15/2007 | | | 3,200,000 | | 11/13/2007 | | | 3,200,000 |
Merrill Lynch | | 4.92% | | 10/16/2007 | | | 2,440,000 | | 11/19/2007 | | | 2,440,000 |
| | | | | | | | | | | | |
| | | | | | $ | 25,986,000 | | | | $ | 25,986,000 |
| | | | | | | | | | | | |
The industry classification of investments and other liabilities in excess of other assets shown as a percentage of net assets as of October 31, 2007 were as follows:
| | | |
U.S. Government Mortgage Backed Obligations | | 115.5 | % |
Collateralized Mortgage Obligations | | 32.0 | |
Short-Term Investments (Including Affiliated Money Market Mutual Fund of 0.1%) | | 6.2 | |
| | | |
| | 153.7 | |
| | | |
Securities sold short | | (43.4 | ) |
Other liabilities in excess of other assets | | (10.3 | ) |
| | | |
| | 100.0 | % |
| | | |
See Notes to Financial Statements.
| | |
| 140 | | THE TARGET PORTFOLIO TRUST |
| | |
Portfolio of Investments
As of October 31, 2007 | | U.S. GOVERNMENT MONEY MARKET PORTFOLIO |
| | | | | | |
PRINCIPAL
AMOUNT (000) | | DESCRIPTION | | VALUE (NOTE 1) |
| | | | | | |
| | | FEDERAL FARM CREDIT BANKS—1.6% | | | |
| $ | 200 | | 3.19%, 07/09/08 | | $ | 196,933 |
| | 850 | | 4.60%, 11/01/07 | | | 850,000 |
| | | | | | |
| | | TOTAL FEDERAL FARM CREDIT BANKS
(cost $1,046,933) | | | 1,046,933 |
| | | | | | |
| | |
| | | FEDERAL HOME LOAN BANK—17.1% | | | |
| | 590 | | 3.00%, 03/24/08 | | | 584,533 |
| | 1,280 | | 4.00%, 02/01/08 | | | 1,275,832 |
| | 300 | | 4.17%, 11/16/07 | | | 299,856 |
| | 5,000 | | 4.81%, 11/16/07 | | | 4,989,979 |
| | 3,000 | | 4.84%, 02/06/08 | | | 2,960,877 |
| | 475 | | 5.00%, 02/15/08 | | | 474,419 |
| | 100 | | 5.15%, 12/21/07 | | | 99,973 |
| | 450 | | 5.27%, 03/05/08 | | | 449,804 |
| | 300 | | 5.925%, 04/09/08 | | | 300,637 |
| | | | | | |
| | | TOTAL FEDERAL HOME LOAN BANK
(cost $11,435,910) | | | 11,435,910 |
| | | | | | |
| | |
| | | FEDERAL HOME LOAN MORTGAGE ASSOCIATION—6.8% | | | |
| | 782 | | 3.125%, 04/04/08 | | | 774,722 |
| | 300 | | 3.15%, 06/04/08 | | | 296,247 |
| | 560 | | 3.75%, 04/23/08 | | | 555,711 |
| | 3,000 | | 4.73%, 02/19/08 | | | 2,956,642 |
| | | | | | |
| | | TOTAL FEDERAL HOME LOAN MORTGAGE ASSOCIATION
(cost $4,583,322) | | | 4,583,322 |
| | | | | | |
| | |
| | | FEDERAL NATIONAL MORTGAGE ASSOCIATION—8.9% | | | |
| | 5,000 | | 4.95%, 11/07/07 | | | 4,995,875 |
| | 1,000 | | 5.25%, 06/18/08 | | | 999,733 |
| | | | | | |
| | | TOTAL FEDERAL NATIONAL MORTGAGE ASSOCIATION
(cost $5,995,608) | | | 5,995,608 |
| | | | | | |
| | |
| | | REPURCHASE AGREEMENTS—65.6% | | | |
| | 15,100 | | BNP Triparty 4.94% dated 10/31/07, due 11/01/07 in the amount of $15,102,072. (cost $15,100,000; collateralized by Federal Agency Obligations. The value of collateral including accrued interest was 15,402,001.) | | | 15,100,000 |
| | 14,400 | | Deutsche Triparty 4.94% dated 10/31/07, due 11/01/07 in the amount of $14,401,976. (cost $14,400,000; collateralized by Federal Agency Obligations. The value of collateral including accrued interest was $14,688,000.) | | | 14,400,000 |
See Notes to Financial Statements.
| | |
| THE TARGET PORTFOLIO TRUST | | 141 |
| | |
U.S. GOVERNMENT MONEY MARKET PORTFOLIO (continued) | | Portfolio of Investments
As of October 31, 2007 |
| | | | | | | |
PRINCIPAL
AMOUNT (000) | | DESCRIPTION | | VALUE (NOTE 1) | |
| | | | | | | |
| | | REPURCHASE AGREEMENTS (continued) | | | | |
| $ | 14,500 | | JPM Triparty 4.96% dated 10/31/07, due 11/01/07 in the amount of $14,501,998. (cost $14,500,000; collateralized by Federal Agency Obligations. The value of collateral including accrued interest was $14,791,276.) | | $ | 14,500,000 | |
| | | | | | | |
| | | TOTAL REPURCHASE AGREEMENTS
(cost $44,000,000) | | | 44,000,000 | |
| | | | | | | |
| Shares | | | | | |
| | | AFFILIATED MONEY MARKET MUTUAL FUND—0.1% | | | | |
| | 74,109 | | Dryden Core Investment Fund—Taxable Money Market Series
(cost $74,109; Note 3)(w) | | | 74,109 | |
| | | | | | | |
| | | TOTAL INVESTMENTS(h)—100.1%
(amortized cost $67,135,882) | | | 67,135,882 | |
| | | Liabilities in excess of other assets—(0.1%) | | | (68,826 | ) |
| | | | | | | |
| | | NET ASSETS—100% | | $ | 67,067,056 | |
| | | | | | | |
| (h) | Federal income tax basis is the same as for financial reporting purposes. |
| (w) | Prudential Investments LLC, the manager of the Portfolio also serves as manager of the Dryden Core Investment Fund—Taxable Money Market Series. |
The industry classification of investments and liabilities in excess of other assets shown as a percentage of net assets as of October 31, 2007 were as follows:
| | | |
Repurchase Agreements | | 65.6 | % |
Federal Home Loan Bank | | 17.1 | |
Federal National Mortgage Association | | 8.9 | |
Federal Home Loan Mortgage Association | | 6.8 | |
Federal Farm Credit Banks | | 1.6 | |
Affiliated Money Market Mutual Fund | | 0.1 | |
| | | |
| | 100.1 | |
Liabilities in excess of other assets | | (0.1 | ) |
| | | |
| | 100.0 | % |
| | | |
See Notes to Financial Statements.
| | |
| 142 | | THE TARGET PORTFOLIO TRUST |
Statement of Assets and Liabilities October 31, 2007
| | | | | | | | | |
| | | LARGE
CAPITALIZATION
GROWTH
PORTFOLIO | | LARGE
CAPITALIZATION
VALUE
PORTFOLIO | | SMALL
CAPITALIZATION
GROWTH
PORTFOLIO |
| | | |
| ASSETS | | | | | | | | | |
Investments, at value(G): | | | | | | | | | |
Unaffiliated investments(A) | | $ | 343,474,177 | | $ | 398,373,904 | | $ | 147,964,970 |
Affiliated investments(B) | | | 37,380,017 | | | 48,943,894 | | | 65,022,538 |
Repurchase agreements(C) | | | — | | | — | | | — |
Cash | | | — | | | 1,555,663 | | | 491,404 |
Foreign currency, at value(D) | | | — | | | — | | | — |
Deposit with broker | | | 28,350 | | | — | | | — |
Receivable for Trust shares sold | | | 307,116 | | | 353,469 | | | 118,729 |
Dividends and interest receivable | | | 288,746 | | | 599,002 | | | 64,857 |
Prepaid expenses and other assets | | | 5,229 | | | 11,054 | | | 3,437 |
Receivable for investments sold | | | 7,903,861 | | | 2,878,960 | | | 962,972 |
Receivable for foreign tax reclaim | | | — | | | — | | | — |
Due from broker for variation margin | | | 7,576 | | | — | | | — |
Premium for swaps purchased | | | — | | | — | | | — |
Unrealized appreciation on swaps | | | — | | | — | | | — |
Unrealized appreciation on forward currency contracts | | | — | | | — | | | — |
Total assets | | | 389,395,072 | | | 452,715,946 | | | 214,628,907 |
| | | |
| LIABILITIES | | | | | | | | | |
Collateral for securities on loan | | | 36,039,826 | | | 46,163,631 | | | 63,339,775 |
Payable for Trust shares reacquired | | | 378,711 | | | 457,419 | | | 140,230 |
Payable for investments purchased | | | 6,004,181 | | | 1,840,337 | | | 307,835 |
Accrued expenses and other liabilities | | | 118,564 | | | 133,942 | | | 141,362 |
Management fee payable | | | 172,811 | | | 208,632 | | | 76,680 |
Transfer agent fee payable | | | 45,392 | | | 29,973 | | | 34,633 |
Deferred trustees’ fees | | | 6,001 | | | 11,874 | | | 11,616 |
Distribution fee payable | | | 12,393 | | | 12,319 | | | 5,071 |
Payable to custodian | | | 917,170 | | | — | | | — |
Interest payable | | | — | | | — | | | — |
Dividends payable | | | — | | | — | | | — |
Due to broker for variation margin | | | — | | | — | | | — |
Outstanding options written(E) | | | — | | | — | | | — |
Premium for swaps written | | | — | | | — | | | — |
Unrealized depreciation on swaps | | | — | | | — | | | — |
Unrealized depreciation on forward currency contracts | | | — | | | — | | | — |
Total liabilities | | | 43,695,049 | | | 48,858,127 | | | 64,057,202 |
| | | |
| NET ASSETS | | $ | 345,700,023 | | $ | 403,857,819 | | $ | 150,571,705 |
See Notes to Financial Statements.
| | |
| THE TARGET PORTFOLIO TRUST | | 143 |
Statement of Assets and Liabilities October 31, 2007 (continued)
| | | | | | | | | | |
| | | LARGE
CAPITALIZATION
GROWTH
PORTFOLIO | | LARGE
CAPITALIZATION
VALUE
PORTFOLIO | | SMALL
CAPITALIZATION
GROWTH
PORTFOLIO | |
Net assets were comprised of: | | | | | | | | | | |
Shares of beneficial interest, at par | | $ | 19,711 | | $ | 24,770 | | $ | 10,904 | |
Paid-in capital, in excess of par | | | 252,833,156 | | | 301,324,971 | | | 135,509,886 | |
| | | 252,852,867 | | | 301,349,741 | | | 135,520,790 | |
Undistributed net investment income (loss) | | | 694,729 | | | 5,375,999 | | | (11,616 | ) |
Accumulated net realized gains (losses) | | | 17,960,993 | | | 26,677,813 | | | (10,993,190 | ) |
Net unrealized appreciation (depreciation) | | | 74,191,434 | | | 70,454,266 | | | 26,055,721 | |
Net assets, October 31, 2007 | | $ | 345,700,023 | | $ | 403,857,819 | | $ | 150,571,705 | |
(A) Identified cost of unaffiliated investments | | $ | 269,288,200 | | $ | 327,919,638 | | $ | 121,909,249 | |
(B) Identified cost of affiliated investments | | $ | 37,380,017 | | $ | 48,943,894 | | $ | 65,022,538 | |
(C) Identified cost of repurchase agreements | | $ | — | | $ | — | | $ | — | |
(D) Identified cost of currency | | $ | — | | $ | — | | $ | — | |
(E) Premiums received from options written | | $ | — | | $ | — | | $ | — | |
(F) Proceeds received from short sales | | $ | — | | $ | — | | $ | — | |
(G) Including securities on loan of | | $ | 34,812,473 | | $ | 44,771,953 | | $ | 61,820,362 | |
| | | |
| NET ASSET VALUE: | | | | | | | | | | |
Class R: Net Assets | | $ | 31,981,989 | | $ | 30,958,103 | | $ | 12,941,535 | |
Shares Outstanding | | | 1,831,479 | | | 1,906,265 | | | 942,278 | |
Net asset value, offering price and redemption price per share | | $ | 17.46 | | $ | 16.24 | | $ | 13.73 | |
Class T: Net Assets | | $ | 313,718,034 | | $ | 372,899,716 | | $ | 137,630,170 | |
Shares Outstanding | | | 17,879,287 | | | 22,863,374 | | | 9,961,862 | |
Net asset value, offering price and redemption price per share | | $ | 17.55 | | $ | 16.31 | | $ | 13.82 | |
See Notes to Financial Statements.
| | |
| 144 | | THE TARGET PORTFOLIO TRUST |
Statement of Assets and Liabilities October 31, 2007 (continued)
| | | | | | | | | |
| | | SMALL
CAPITALIZATION
VALUE
PORTFOLIO | | INTERNATIONAL
EQUITY
PORTFOLIO | | INTERNATIONAL
BOND
PORTFOLIO |
| | | |
| ASSETS | | | | | | | | | |
Investments, at value(G): | | | | | | | | | |
Unaffiliated investments(A) | | $ | 421,705,763 | | $ | 321,502,028 | | $ | 68,575,320 |
Affiliated investments(B) | | | 199,150,843 | | | 1,559,851 | | | 224,060 |
Repurchase agreements(C) | | | — | | | — | | | — |
Cash | | | — | | | — | | | — |
Foreign currency, at value(D) | | | — | | | 946,587 | | | 129,517 |
Receivable for Trust shares sold | | | 455,966 | | | 310,765 | | | 27,659 |
Dividends and interest receivable | | | 362,379 | | | 530,203 | | | 503,101 |
Prepaid expenses and other assets | | | 6,993 | | | 4,842 | | | 635 |
Receivable for investments sold | | | 3,536,248 | | | 220,059 | | | 12,203,840 |
Receivable for foreign tax reclaim | | | — | | | 618,202 | | | — |
Due from broker for variation margin | | | 18,875 | | | — | | | 57,174 |
Premium for swaps purchased | | | — | | | — | | | — |
Unrealized appreciation on swaps | | | — | | | — | | | 821,199 |
Unrealized appreciation on forward currency contracts | | | — | | | 11,875 | | | 362,995 |
Total assets | | | 625,237,067 | | | 325,704,412 | | | 82,905,500 |
| | | |
| LIABILITIES | | | | | | | | | |
Collateral for securities on loan | | | 192,092,845 | | | — | | | — |
Payable for Trust shares reacquired | | | 902,672 | | | 395,383 | | | 37,791 |
Payable for investments purchased | | | 3,441,577 | | | 746,695 | | | 37,402,362 |
Accrued expenses and other liabilities | | | 33,588 | | | 255,271 | | | 188,345 |
Management fee payable | | | 217,559 | | | 187,175 | | | 16,552 |
Transfer agent fee payable | | | 150,118 | | | 22,766 | | | 12,044 |
Deferred trustees’ fees | | | 10,720 | | | 10,755 | | | 11,199 |
Distribution fee payable | | | 5,975 | | | 10,345 | | | — |
Payable to custodian | | | 1,579,738 | | | 70,738 | | | 56,033 |
Dividends payable | | | — | | | — | | | — |
Due to broker for variation margin | | | — | | | — | | | — |
Outstanding options written(E) | | | — | | | — | | | 349,104 |
Premium for swaps written | | | — | | | — | | | 372,045 |
Unrealized depreciation on swaps | | | — | | | — | | | 707,372 |
Unrealized depreciation on forward currency contracts | | | — | | | 111,067 | | | 599,587 |
Securities sold short, at value(F) | | | — | | | — | | | 4,142,376 |
Total liabilities | | | 198,434,792 | | | 1,810,195 | | | 43,894,810 |
| | | |
| NET ASSETS | | $ | 426,802,275 | | $ | 323,894,217 | | $ | 39,010,690 |
See Notes to Financial Statements.
| | |
| THE TARGET PORTFOLIO TRUST | | 145 |
Statement of Assets and Liabilities October 31, 2007 (continued)
| | | | | | | | | | |
| | | SMALL
CAPITALIZATION
VALUE
PORTFOLIO | | INTERNATIONAL
EQUITY
PORTFOLIO | | INTERNATIONAL
BOND
PORTFOLIO | |
Net assets were comprised of: | | | | | | | | | | |
Shares of beneficial interest, at par | | $ | 19,406 | | $ | 16,094 | | $ | 4,683 | |
Paid-in capital, in excess of par | | | 331,146,134 | | | 193,094,863 | | | 36,625,843 | |
| | | 331,165,540 | | | 193,110,957 | | | 36,630,526 | |
Undistributed net investment income (loss) | | | 4,666,593 | | | 5,525,097 | | | (523,955 | ) |
Accumulated net realized gains (losses) | | | 22,605,951 | | | 35,150,170 | | | (627,617 | ) |
Net unrealized appreciation (depreciation) | | | 68,364,191 | | | 90,107,993 | | | 3,531,736 | |
Net assets, October 31, 2007 | | $ | 426,802,275 | | $ | 323,894,217 | | $ | 39,010,690 | |
(A) Identified cost of unaffiliated investments | | $ | 353,366,147 | | $ | 231,413,557 | | $ | 64,492,722 | |
(B) Identified cost of affiliated investments | | $ | 199,150,843 | | $ | 1,559,851 | | $ | 224,060 | |
(C) Identified cost of repurchase agreements | | $ | — | | $ | — | | $ | — | |
(D) Identified cost of currency | | $ | — | | $ | 910,144 | | $ | 122,593 | |
(E) Premiums received from options written | | $ | — | | $ | — | | $ | 261,954 | |
(F) Proceeds received from short sales | | $ | — | | $ | — | | $ | 4,111,764 | |
(G) Including securities on loan of | | $ | 187,326,512 | | $ | — | | $ | — | |
| | | |
| NET ASSET VALUE: | | | | | | | | | | |
Class R: Net Assets | | $ | 15,111,880 | | $ | 26,811,001 | | $ | — | |
Shares Outstanding | | | 690,067 | | | 1,337,954 | | | — | |
Net asset value, offering price and redemption price per share | | $ | 21.90 | | $ | 20.04 | | $ | — | |
Class T: Net Assets | | $ | 411,690,395 | | $ | 297,083,216 | | $ | 39,010,690 | |
Shares Outstanding | | | 18,716,182 | | | 14,756,521 | | | 4,683,475 | |
Net asset value, offering price and redemption price per share | | $ | 22.00 | | $ | 20.13 | | $ | 8.33 | |
See Notes to Financial Statements.
| | |
| 146 | | THE TARGET PORTFOLIO TRUST |
Statement of Assets and Liabilities October 31, 2007 (continued)
| | | | | | | | | | | | |
| | | TOTAL RETURN
BOND
PORTFOLIO | | INTERMEDIATE-
TERM BOND
PORTFOLIO | | MORTGAGE
BACKED
SECURITIES
PORTFOLIO | | U.S.
GOVERNMENT
MONEY MARKET
PORTFOLIO |
| | | | |
| ASSETS | | | | | | | | | | | | |
Investments, at value: | | | | | | | | | | | | |
Unaffiliated investments(A) | | $ | 256,825,250 | | $ | 287,741,096 | | $ | 108,562,340 | | $ | 23,061,773 |
Affiliated investments(B) | | | 8,090,143 | | | 5,993,787 | | | 40,444 | | | 74,109 |
Repurchase agreements(C) | | | — | | | — | | | 4,500,000 | | | 44,000,000 |
Cash | | | 141,361 | | | — | | | — | | | 10,247 |
Foreign currency, at value(D) | | | 3,715,124 | | | 419,648 | | | — | | | — |
Receivable for Trust shares sold | | | 304,017 | | | 85,844 | | | 28,724 | | | 287,103 |
Dividends and interest receivable | | | 1,444,126 | | | 2,172,012 | | | 384,554 | | | 86,135 |
Prepaid expenses and other assets | | | 3,083 | | | 3,671 | | | 1,259 | | | 1,132 |
Receivable for investments sold | | | 80,276,819 | | | 62,795,890 | | | 55,100,376 | | | — |
Receivable for foreign tax reclaim | | | — | | | — | | | — | | | — |
Due from broker for variation margin | | | 299,838 | | | — | | | 21,721 | | | — |
Premium for swaps purchased | | | — | | | 610,703 | | | — | | | — |
Unrealized appreciation on swaps | | | 2,661,774 | | | 1,603,439 | | | 191,640 | | | — |
Unrealized appreciation on forward currency contracts | | | 906,088 | | | 114,282 | | | — | | | — |
Total assets | | | 354,667,623 | | | 361,540,372 | | | 168,831,058 | | | 67,520,499 |
| | | | |
| LIABILITIES | | | | | | | | | | | | |
Collateral for securities on loan | | | — | | | — | | | — | | | — |
Reverse repurchase agreement | | | — | | | — | | | 25,986,000 | | | — |
Payable for Trust shares reacquired | | | 203,669 | | | 146,110 | | | 74,231 | | | 212,541 |
Payable for investments purchased | | | 102,579,299 | | | 74,313,179 | | | 36,442,284 | | | — |
Accrued expenses and other liabilities | | | 56,458 | | | 201,336 | | | 218,583 | | | 103,227 |
Management fee payable | | | 78,069 | | | 89,230 | | | 28,268 | | | 14,202 |
Transfer agent fee payable | | | 81,065 | | | 55,064 | | | 83,517 | | | 29,992 |
Deferred trustees’ fees | | | 11,622 | | | 10,983 | | | 10,797 | | | 10,786 |
Distribution fee payable | | | 14,045 | | | — | | | — | | | — |
Payable to custodian | | | — | | | 63,576 | | | 24,332 | | | — |
Dividends payable | | | 369,106 | | | 321,728 | | | 113,760 | | | 82,695 |
Due to broker for variation margin | | | — | | | 397,936 | | | — | | | — |
Outstanding options written(E) | | | 1,233,178 | | | 103,744 | | | — | | | — |
Premium for swaps written | | | 1,921,735 | | | — | | | 15,370 | | | — |
Unrealized depreciation on swaps | | | 993,392 | | | 749,248 | | | 293,634 | | | — |
Unrealized depreciation on forward currency contracts | | | 430,091 | | | 8,751 | | | — | | | — |
Securities sold short, at value(F) | | | 39,763,131 | | | 51,656,670 | | | 31,959,514 | | | — |
Total liabilities | | | 147,734,860 | | | 128,117,555 | | | 95,250,290 | | | 453,443 |
| | | | |
| NET ASSETS | | $ | 206,932,763 | | $ | 233,422,817 | | $ | 73,580,768 | | $ | 67,067,056 |
See Notes to Financial Statements.
| | |
| THE TARGET PORTFOLIO TRUST | | 147 |
Statement of Assets and Liabilities October 31, 2007 (continued)
| | | | | | | | | | | | | | | | |
| | | TOTAL RETURN
BOND
PORTFOLIO | | | INTERMEDIATE-
TERM BOND
PORTFOLIO | | | MORTGAGE
BACKED
SECURITIES
PORTFOLIO | | | U.S.
GOVERNMENT
MONEY MARKET
PORTFOLIO | |
Net assets were comprised of: | | | | | | | | | | | | | | | | |
Shares of beneficial interest, at par | | $ | 19,532 | | | $ | 22,773 | | | $ | 7,392 | | | $ | 67,065 | |
Paid-in capital, in excess of par | | | 204,984,298 | | | | 236,258,752 | | | | 77,455,427 | | | | 66,997,805 | |
| | | 205,003,830 | | | | 236,281,525 | | | | 77,462,819 | | | | 67,064,870 | |
Undistributed net investment income (loss) | | | (792,728 | ) | | | 315,759 | | | | 167,509 | | | | 2,586 | |
Accumulated net realized gains (losses) | | | 283,355 | | | | (7,177,909 | ) | | | (4,203,168 | ) | | | (400 | ) |
Net unrealized appreciation (depreciation) | | | 2,438,306 | | | | 4,003,442 | | | | 153,608 | | | | — | |
Net assets, October 31, 2007 | | $ | 206,932,763 | | | $ | 233,422,817 | | | $ | 73,580,768 | | | $ | 67,067,056 | |
(A) Identified cost of unaffiliated investments | | $ | 255,394,970 | | | $ | 286,561,856 | | | $ | 108,140,614 | | | $ | 23,061,773 | |
(B) Identified cost of affiliated investments | | $ | 8,090,143 | | | $ | 5,993,787 | | | $ | 40,444 | | | $ | 74,109 | |
(C) Identified cost of repurchase agreements | | $ | — | | | $ | — | | | $ | 4,500,000 | | | $ | 44,000,000 | |
(D) Identified cost of currency | | $ | 3,576,434 | | | $ | 403,979 | | | $ | — | | | $ | — | |
(E) Premiums received from options written | | $ | 1,073,658 | | | $ | 77,970 | | | $ | — | | | $ | — | |
(F) Proceeds received from short sales | | $ | 39,746,135 | | | $ | 51,278,204 | | | $ | 31,828,923 | | | $ | — | |
| | | | |
| NET ASSET VALUE: | | | | | | | | | | | | | | | | |
Class R: Net Assets | | $ | 23,670,369 | | | $ | — | | | $ | — | | | $ | — | |
Shares Outstanding | | | 2,246,527 | | | | — | | | | — | | | | — | |
Net asset value, offering price and redemption price per share | | $ | 10.54 | | | $ | — | | | $ | — | | | $ | — | |
Class T: Net Assets | | $ | 183,262,394 | | | $ | 233,422,817 | | | $ | 73,580,768 | | | $ | 67,067,056 | |
Shares Outstanding | | | 17,284,993 | | | | 22,772,749 | | | | 7,391,684 | | | | 67,065,077 | |
Net asset value, offering price and redemption price per share | | $ | 10.60 | | | $ | 10.25 | | | $ | 9.95 | | | $ | 1.00 | |
See Notes to Financial Statements.
| | |
| 148 | | THE TARGET PORTFOLIO TRUST |
Statement of Operations
| | | | | | | | | | | | | | | | |
| | | LARGE CAPITALIZATION
GROWTH PORTFOLIO | | | LARGE CAPITALIZATION
VALUE PORTFOLIO | |
| | | Ten Months
Ended
October 31, 2007 | | | Year Ended
December 31,
2006 | | | Ten Months
Ended
October 31, 2007 | | | Year Ended
December 31,
2006 | |
| | | | |
| NET INVESTMENT INCOME (LOSS) | | | | | | | | | | | | | | | | |
Income | | | | | | | | | | | | | | | | |
Unaffiliated dividend income | | $ | 2,332,531 | | | $ | 3,717,120 | | | $ | 7,459,535 | | | $ | 9,138,489 | |
Affiliated dividend income | | | 158,418 | | | | 116,402 | | | | 247,046 | | | | 157,636 | |
Less: Foreign withholding taxes | | | (55,245 | ) | | | (55,649 | ) | | | (1,162 | ) | | | (2,303 | ) |
Affiliated income from securities lending, net | | | 104,336 | | | | 17,292 | | | | 70,795 | | | | 1,790 | |
Unaffiliated Interest | | | 24,283 | | | | 410 | | | | — | | | | 430 | |
Total income | | | 2,564,323 | | | | 3,795,575 | | | | 7,776,214 | | | | 9,296,042 | |
Expenses | | | | | | | | | | | | | | | | |
Management fee | | | 1,586,167 | | | | 1,798,511 | | | | 2,031,937 | | | | 2,228,473 | |
Interest expense (Note 7) | | | 912 | | | | 1,742 | | | | 2,715 | | | | — | |
Distribution fee—Class R | | | 58,546 | | | | 775 | | | | 58,491 | | | | 804 | |
Transfer agent’s fees and expenses(a) | | | 30,000 | | | | 212,000 | | | | 100,000 | | | | 193,000 | |
Custodian’s fees and expenses | | | 62,000 | | | | 94,000 | | | | 97,000 | | | | 77,000 | |
Reports to shareholders | | | 20,000 | | | | 25,000 | | | | 25,000 | | | | 41,000 | |
Registration fees | | | 25,000 | | | | 30,000 | | | | 10,000 | | | | 33,000 | |
Legal fees | | | 20,000 | | | | 20,000 | | | | 15,000 | | | | 24,000 | |
Trustees’ fees | | | 13,000 | | | | 18,000 | | | | 15,000 | | | | 15,000 | |
Audit fees | | | 22,000 | | | | 22,000 | | | | 22,000 | | | | 17,000 | |
Miscellaneous | | | 18,268 | | | | 35,032 | | | | 10,428 | | | | 32,524 | |
Total expenses | | | 1,855,893 | | | | 2,257,060 | | | | 2,387,571 | | | | 2,661,801 | |
| Net investment income (loss) | | | 708,430 | | | | 1,538,515 | | | | 5,388,643 | | | | 6,634,241 | |
| | | | |
| REALIZED AND UNREALIZED GAIN (LOSS) ON INVESTMENTS AND FOREIGN CURRENCIES | | | | | | | | | | | | | | | | |
Net realized gain (loss) on: | | | | | | | | | | | | | | | | |
Investment transactions | | | 18,357,543 | | | | 8,314,481 | | | | 28,455,806 | | | | 23,505,886 | |
Futures transactions | | | (2,884 | ) | | | — | | | | — | | | | — | |
Foreign currency transactions | | | (1,036 | ) | | | 68 | | | | — | | | | — | |
Options written transactions | | | — | | | | — | | | | — | | | | — | |
Swap agreement transactions | | | — | | | | — | | | | — | | | | — | |
Short sale transactions | | | — | | | | — | | | | — | | | | — | |
| Total net realized gain (loss) | | | 18,353,623 | | | | 8,314,549 | | | | 28,455,806 | | | | 23,505,886 | |
Net change in unrealized appreciation (depreciation) on: | | | | | | | | | | | | | | | | |
Investments | | | 27,506,912 | | | | 14,990,354 | | | | (11,551,247 | ) | | | 36,230,197 | |
Futures | | | 5,366 | | | | — | | | | — | | | | — | |
Foreign currencies | | | 91 | | | | — | | | | — | | | | — | |
Options written | | | — | | | | — | | | | — | | | | — | |
Swaps | | | — | | | | — | | | | — | | | | — | |
Short sales | | | — | | | | — | | | | — | | | | — | |
| Net change in unrealized appreciation (depreciation) | | | 27,512,369 | | | | 14,990,354 | | | | (11,551,247 | ) | | | 36,230,197 | |
| Net gain (loss) | | | 45,865,992 | | | | 23,304,903 | | | | 16,904,559 | | | | 59,736,083 | |
| NET INCREASE IN NET ASSETS RESULTING FROM OPERATIONS | | $ | 46,574,422 | | | $ | 24,843,418 | | | $ | 22,293,202 | | | $ | 66,370,324 | |
(a) Including affiliated expense of | | $ | 30,000 | | | $ | 168,000 | | | $ | 90,000 | | | $ | 191,000 | |
See Notes to Financial Statements.
| | |
| THE TARGET PORTFOLIO TRUST | | 149 |
Statement of Operations (continued)
| | | | | | | | | | | | | | | | |
| | | SMALL CAPITALIZATION
GROWTH PORTFOLIO | | | SMALL CAPITALIZATION
VALUE PORTFOLIO | |
| | | Ten Months
Ended
October 31, 2007 | | | Year Ended
December 31,
2006 | | | Ten Months
Ended
October 31, 2007 | | | Year Ended
December 31,
2006 | |
| | | | |
| NET INVESTMENT INCOME (LOSS) | | | | | | | | | | | | | | | | |
Income | | | | | | | | | | | | | | | | |
Unaffiliated dividend income | | $ | 296,549 | | | $ | 361,612 | | | $ | 6,079,250 | | | $ | 5,179,322 | |
Affiliated dividend income | | | 261,632 | | | | 240,125 | | | | 787,949 | | | | 517,939 | |
Less: Foreign withholding taxes | | | — | | | | — | | | | (9,480 | ) | | | (6,937 | ) |
Affiliated income from securities lending, net | | | 283,270 | | | | 28,789 | | | | 323,261 | | | | 12,014 | |
Unaffiliated Interest | | | — | | | | 3,306 | | | | 3,986 | | | | — | |
Total income | | | 841,451 | | | | 633,832 | | | | 7,184,966 | | | | 5,702,338 | |
Expenses | | | | | | | | | | | | | | | | |
Management fee | | | 712,489 | | | | 843,337 | | | | 2,048,186 | | | | 1,743,499 | |
Interest expense (Note 7) | | | 581 | | | | — | | | | — | | | | — | |
Distribution fee—Class R | | | 23,840 | | | | 337 | | | | 28,433 | | | | 392 | |
Transfer agent’s fees and expenses(a) | | | 85,000 | | | | 150,000 | | | | 189,000 | | | | 271,000 | |
Custodian’s fees and expenses | | | 40,000 | | | | 64,000 | | | | 100,000 | | | | 122,000 | |
Reports to shareholders | | | 5,000 | | | | 11,000 | | | | 30,000 | | | | 42,000 | |
Registration fees | | | 18,000 | | | | 23,000 | | | | 30,000 | | | | 39,000 | |
Legal fees | | | 16,000 | | | | 17,000 | | | | 15,000 | | | | 30,000 | |
Trustees’ fees | | | 11,000 | | | | 12,000 | | | | 14,000 | | | | 15,000 | |
Audit fees | | | 23,000 | | | | 18,000 | | | | 30,000 | | | | 18,000 | |
Miscellaneous | | | 10,105 | | | | 41,733 | | | | 20,589 | | | | 30,245 | |
Total expenses | | | 945,015 | | | | 1,180,407 | | | | 2,505,208 | | | | 2,311,136 | |
| Net investment income (loss) | | | (103,564 | ) | | | (546,575 | ) | | | 4,679,758 | | | | 3,391,202 | |
| | | | |
| REALIZED AND UNREALIZED GAIN (LOSS) ON INVESTMENTS AND FOREIGN CURRENCIES | | | | | | | | | | | | | | | | |
Net realized gain (loss) on: | | | | | | | | | | | | | | | | |
Investment transactions | | | 14,306,538 | | | | 9,674,494 | | | | 23,137,867 | | | | 20,392,466 | |
Futures transactions | | | — | | | | — | | | | 6,097 | | | | 28,805 | |
Foreign currency transactions | | | — | | | | — | | | | — | | | | — | |
Options written transactions | | | — | | | | — | | | | — | | | | — | |
Swap agreement transactions | | | — | | | | — | | | | — | | | | — | |
Short sale transactions | | | — | | | | — | | | | — | | | | — | |
| Total net realized gain (loss) | | | 14,306,538 | | | | 9,674,494 | | | | 23,143,964 | | | | 20,421,271 | |
Net change in unrealized appreciation (depreciation) on: | | | | | | | | | | | | | | | | |
Investments | | | 4,249,382 | | | | 1,412,805 | | | | 4,028,590 | | | | 22,628,429 | |
Futures | | | — | | | | — | | | | 32,475 | | | | (7,900 | ) |
Foreign currencies | | | — | | | | — | | | | — | | | | — | |
Options written | | | — | | | | — | | | | — | | | | — | |
Swaps | | | — | | | | — | | | | — | | | | — | |
Short sales | | | — | | | | — | | | | — | | | | — | |
| Net change in unrealized appreciation (depreciation) | | | 4,249,382 | | | | 1,412,805 | | | | 4,061,065 | | | | 22,620,529 | |
| Net gain (loss) | | | 18,555,920 | | | | 11,087,299 | | | | 27,205,029 | | | | 43,041,800 | |
| NET INCREASE IN NET ASSETS RESULTING FROM OPERATIONS | | $ | 18,452,356 | | | $ | 10,540,724 | | | $ | 31,884,787 | | | $ | 46,433,002 | |
(a) Including affiliated expense of | | $ | 83,000 | | | $ | 148,000 | | | $ | 189,000 | | | $ | 268,000 | |
See Notes to Financial Statements.
| | |
| 150 | | THE TARGET PORTFOLIO TRUST |
Statement of Operations (continued)
| | | | | | | | | | | | | | | | |
| | | INTERNATIONAL EQUITY
PORTFOLIO | | | INTERNATIONAL BOND
PORTFOLIO | |
| | | Ten Months
Ended
October 31, 2007 | | | Year Ended
December 31,
2006 | | | Ten Months
Ended
October 31, 2007 | | | Year Ended
December 31,
2006 | |
| | | | |
| NET INVESTMENT INCOME (LOSS) | | | | | | | | | | | | | | | | |
Income | | | | | | | | | | | | | | | | |
Unaffiliated dividend income | | $ | 8,805,579 | | | $ | 7,030,883 | | | $ | — | | | $ | — | |
Affiliated dividend income | | | 90,857 | | | | 51,575 | | | | 41,667 | | | | 39,509 | |
Less: Foreign withholding taxes | | | (601,225 | ) | | | (484,414 | ) | | | — | | | | (118 | ) |
Affiliated income from securities lending, net | | | — | | | | — | | | | — | | | | — | |
Unaffiliated Interest | | | — | | | | 6,712 | | | | 1,103,846 | | | | 1,408,389 | |
Total income | | | 8,295,211 | | | | 6,604,756 | | | | 1,145,513 | | | | 1,447,780 | |
Expenses | | | | | | | | | | | | | | | | |
Management fee | | | 1,686,985 | | | | 1,740,876 | | | | 166,299 | | | | 205,867 | |
Interest expense (Note 7) | | | 5,897 | | | | 6,199 | | | | — | | | | — | |
Distribution fee—Class R | | | 48,355 | | | | 626 | | | | — | | | | — | |
Transfer agent’s fees and expenses(a) | | | 96,000 | | | | 180,000 | | | | 31,000 | | | | 66,000 | |
Custodian’s fees and expenses | | | 107,000 | | | | 218,000 | | | | 62,000 | | | | 90,000 | |
Reports to shareholders | | | 27,000 | | | | 25,000 | | | | 18,000 | | | | 26,000 | |
Registration fees | | | 8,000 | | | | 25,000 | | | | 5,000 | | | | 16,000 | |
Legal fees | | | 12,000 | | | | 24,000 | | | | 13,000 | | | | 27,000 | |
Trustees’ fees | | | 10,000 | | | | 15,000 | | | | 8,000 | | | | 12,000 | |
Audit fees | | | 26,000 | | | | 23,000 | | | | 49,000 | | | | 26,000 | |
Miscellaneous | | | 14,980 | | | | 49,354 | | | | 5,946 | | | | 23,099 | |
Total expenses | | | 2,042,217 | | | | 2,307,055 | | | | 358,245 | | | | 491,966 | |
| Net investment income (loss) | | | 6,252,994 | | | | 4,297,701 | | | | 787,268 | | | | 955,814 | |
| | | | |
| REALIZED AND UNREALIZED GAIN (LOSS) ON INVESTMENTS AND FOREIGN CURRENCIES | | | | | | | | | | | | | | | | |
Net realized gain (loss) on: | | | | | | | | | | | | | | | | |
Investment transactions | | | 35,243,689 | | | | 25,759,105 | | | | (517,824 | ) | | | (187,514 | ) |
Futures transactions | | | — | | | | — | | | | (188,314 | ) | | | (60,090 | ) |
Foreign currency transactions | | | (818,984 | ) | | | (1,105,162 | ) | | | (857,031 | ) | | | (1,968,246 | ) |
Options written transactions | | | — | | | | — | | | | (52,711 | ) | | | 25,770 | |
Swap agreement transactions | | | — | | | | — | | | | 157,812 | | | | 102,762 | |
Short sale transactions | | | — | | | | — | | | | 63,699 | | | | 96,025 | |
| Total net realized gain (loss) | | | 34,424,705 | | | | 24,653,943 | | | | (1,394,369 | ) | | | (1,991,293 | ) |
Net change in unrealized appreciation (depreciation) on: | | | | | | | | | | | | | | | | |
Investments | | | 25,432,557 | | | | 35,083,130 | | | | 2,216,640 | | | | 816,608 | |
Futures | | | — | | | | — | | | | 3,219 | | | | (89,780 | ) |
Foreign currencies | | | 524,652 | | | | (651,139 | ) | | | (834,880 | ) | | | 581,712 | |
Options written | | | — | | | | — | | | | (97,092 | ) | | | 13,299 | |
Swaps | | | — | | | | — | | | | (35,124 | ) | | | 604,742 | |
Short sales | | | — | | | | — | | | | (136,102 | ) | | | (48,339 | ) |
| Net change in unrealized appreciation (depreciation) | | | 25,957,209 | | | | 34,431,991 | | | | 1,116,661 | | | | 1,878,242 | |
| Net gain (loss) | | | 60,381,914 | | | | 59,085,934 | | | | (277,708 | ) | | | (113,051 | ) |
| NET INCREASE IN NET ASSETS RESULTING FROM OPERATIONS | | $ | 66,634,908 | | | $ | 63,383,635 | | | $ | 509,560 | | | $ | 842,763 | |
(a) Including affiliated expense of | | $ | 68,000 | | | $ | 131,000 | | | $ | 31,000 | | | $ | 65,000 | |
See Notes to Financial Statements.
| | |
| THE TARGET PORTFOLIO TRUST | | 151 |
Statement of Operations (continued)
| | | | | | | | | | | | | | | | |
| | | TOTAL RETURN
BOND PORTFOLIO | | | INTERMEDIATE-TERM
BOND PORTFOLIO | |
| | | Ten Months
Ended
October 31, 2007 | | | Year Ended
December 31,
2006 | | | Ten Months
Ended
October 31, 2007 | | | Year Ended
December 31,
2006 | |
| | | | |
| NET INVESTMENT INCOME (LOSS) | | | | | | | | | | | | | | | | |
Income | | | | | | | | | | | | | | | | |
Unaffiliated dividend income | | $ | — | | | $ | 145,899 | | | $ | 56,250 | | | $ | 275,120 | |
Affiliated dividend income | | | 293,960 | | | | 199,701 | | | | 559,231 | | | | 356,160 | |
Less: Foreign withholding taxes | | | — | | | | — | | | | — | | | | — | |
Affiliated income from securities lending, net | | | — | | | | — | | | | — | | | | — | |
Unaffiliated Interest | | | 7,650,665 | | | | 7,617,632 | | | | 9,772,683 | | | | 11,493,154 | |
Total income | | | 7,944,625 | | | | 7,963,232 | | | | 10,388,164 | | | | 12,124,434 | |
Expenses | | | | | | | | | | | | | | | | |
Management fee | | | 694,291 | | | | 732,265 | | | | 883,037 | | | | 1,122,194 | |
Interest expense (Note 7) | | | — | | | | 495 | | | | — | | | | 660 | |
Distribution fee—Class R | | | 43,430 | | | | 446 | | | | — | | | | — | |
Transfer agent’s fees and expenses(a) | | | 69,000 | | | | 150,000 | | | | 60,000 | | | | 174,000 | |
Custodian’s fees and expenses | | | 95,000 | | | | 106,000 | | | | 72,000 | | | | 150,000 | |
Reports to shareholders | | | 26,000 | | | | 20,000 | | | | 25,000 | | | | 30,000 | |
Registration fees | | | 25,000 | | | | 20,000 | | | | 15,000 | | | | 20,000 | |
Legal fees | | | 19,000 | | | | 25,000 | | | | 15,000 | | | | 27,000 | |
Trustees’ fees | | | 11,000 | | | | 13,000 | | | | 13,000 | | | | 14,000 | |
Audit fees | | | 35,000 | | | | 20,000 | | | | 36,000 | | | | 23,000 | |
Miscellaneous | | | 11,784 | | | | 20,365 | | | | 16,967 | | | | 33,950 | |
Total expenses | | | 1,029,505 | | | | 1,107,571 | | | | 1,136,004 | | | | 1,594,804 | |
| Net investment income (loss) | | | 6,915,120 | | | | 6,855,661 | | | | 9,252,160 | | | | 10,529,630 | |
| | | | |
| REALIZED AND UNREALIZED GAIN (LOSS) ON INVESTMENTS AND FOREIGN CURRENCIES | | | | | | | | | | | | | | | | |
Net realized gain (loss) on: | | | | | | | | | | | | | | | | |
Investment transactions | | | 940,971 | | | | (112,690 | ) | | | (483,642 | ) | | | (605,503 | ) |
Futures transactions | | | (69,913 | ) | | | (661,257 | ) | | | (1,113,476 | ) | | | (1,058,674 | ) |
Foreign currency transactions | | | 686,994 | | | | (1,506,399 | ) | | | 655,740 | | | | (72,287 | ) |
Options written transactions | | | (329,419 | ) | | | (14,293 | ) | | | (3,914 | ) | | | 32,740 | |
Swap agreement transactions | | | 800,450 | | | | 977,111 | | | | (1,286,862 | ) | | | 380,723 | |
Short sale transactions | | | (235,748 | ) | | | (101,982 | ) | | | 35,548 | | | | (78,615 | ) |
| Total net realized gain (loss) | | | 1,793,335 | | | | (1,419,510 | ) | | | (2,196,606 | ) | | | (1,401,616 | ) |
Net change in unrealized appreciation (depreciation) on: | | | | | | | | | | | | | | | | |
Investments | | | 1,347,023 | | | | 806,362 | | | | 1,264,385 | | | | 699,866 | |
Futures | | | (806,388 | ) | | | (214,978 | ) | | | 2,463,916 | | | | 345,202 | |
Foreign currencies | | | 654,970 | | | | 90,389 | | | | 294,050 | | | | 75,096 | |
Options written | | | (77,960 | ) | | | (112,821 | ) | | | (46,359 | ) | | | (1,423 | ) |
Swaps | | | 1,798,632 | | | | 35,713 | | | | 1,357,709 | | | | (545,527 | ) |
Short sales | | | (459,069 | ) | | | 675,027 | | | | (416,751 | ) | | | 38,285 | |
| Net change in unrealized appreciation (depreciation) | | | 2,457,208 | | | | 1,279,692 | | | | 4,916,950 | | | | 611,499 | |
| Net gain (loss) | | | 4,250,543 | | | | (139,818 | ) | | | 2,720,344 | | | | (790,117 | ) |
| NET INCREASE IN NET ASSETS RESULTING FROM OPERATIONS | | $ | 11,165,663 | | | $ | 6,715,843 | | | $ | 11,972,504 | | | $ | 9,739,513 | |
(a) Including affiliated expense of | | $ | 69,000 | | | $ | 149,000 | | | $ | 60,000 | | | $ | 151,000 | |
See Notes to Financial Statements.
| | |
| 152 | | THE TARGET PORTFOLIO TRUST |
Statement of Operations (continued)
| | | | | | | | | | | | | | | |
| | | MORTGAGE BACKED
SECURITIES PORTFOLIO | | | U.S. GOVERNMENT
MONEY MARKET PORTFOLIO | |
| | | Ten Months
Ended
October 31, 2007 | | | Year Ended
December 31,
2006 | | | Ten Months
Ended
October 31, 2007 | | Year Ended
December 31,
2006 | |
| | | | |
| NET INVESTMENT INCOME (LOSS) | | | | | | | | | | | | | | | |
Income | | | | | | | | | | | | | | | |
Unaffiliated dividend income | | $ | — | | | $ | — | | | $ | — | | $ | — | |
Affiliated dividend income | | | 8,445 | | | | 6,845 | | | | 4,640 | | | 2,314 | |
Less: Foreign withholding taxes | | | — | | | | — | | | | — | | | — | |
Affiliated income from securities lending, net | | | — | | | | — | | | | — | | | — | |
Unaffiliated Interest | | | 4,221,521 | | | | 4,916,766 | | | | 2,780,535 | | | 2,371,504 | |
Total income | | | 4,229,966 | | | | 4,923,611 | | | | 2,785,175 | | | 2,373,818 | |
Expenses | | | | | | | | | | | | | | | |
Management fee | | | 283,007 | | | | 348,528 | | | | 132,083 | | | 119,965 | |
Interest expense (Note 7) | | | 663,471 | | | | 739,695 | | | | — | | | — | |
Distribution fee—Class R | | | — | | | | — | | | | — | | | — | |
Transfer agent’s fees and expenses(a) | | | 46,000 | | | | 92,000 | | | | 25,000 | | | 61,000 | |
Custodian’s fees and expenses | | | 51,000 | | | | 144,000 | | | | 42,000 | | | 61,000 | |
Reports to shareholders | | | 10,000 | | | | 28,000 | | | | 10,000 | | | 20,000 | |
Registration fees | | | 29,000 | | | | 32,000 | | | | 5,000 | | | 16,000 | |
Legal fees | | | 17,000 | | | | 28,000 | | | | 13,000 | | | 12,000 | |
Trustees’ fees | | | 9,000 | | | | 9,000 | | | | 9,000 | | | 12,000 | |
Audit fees | | | 22,000 | | | | 21,000 | | | | 18,000 | | | 15,000 | |
Miscellaneous | | | 13,299 | | | | 24,008 | | | | 8,850 | | | 18,246 | |
Total expenses | | | 1,143,777 | | | | 1,466,231 | | | | 262,933 | | | 335,211 | |
| Net investment income (loss) | | | 3,086,189 | | | | 3,457,380 | | | | 2,522,242 | | | 2,038,607 | |
| | | | |
| REALIZED AND UNREALIZED GAIN (LOSS) ON INVESTMENTS AND FOREIGN CURRENCIES | | | | | | | | | | | | | | | |
Net realized gain (loss) on: | | | | | | | | | | | | | | | |
Investment transactions | | | (174,280 | ) | | | (1,020,583 | ) | | | 2,497 | | | (2,491 | ) |
Futures transactions | | | (502,694 | ) | | | (59,207 | ) | | | — | | | — | |
Foreign currency transactions | | | — | | | | — | | | | — | | | — | |
Options written transactions | | | (6,438 | ) | | | (21,155 | ) | | | — | | | — | |
Swap agreement transactions | | | (2,820 | ) | | | 19,980 | | | | — | | | — | |
Short sale transactions | | | 38,663 | | | | (220,688 | ) | | | — | | | — | |
| Total net realized gain (loss) | | | (647,569 | ) | | | (1,301,653 | ) | | | 2,497 | | | (2,491 | ) |
Net change in unrealized appreciation (depreciation) on: | | | | | | | | | | | | | | | |
Investments | | | 730,995 | | | | 705,446 | | | | — | | | — | |
Futures | | | 26,186 | | | | (81,078 | ) | | | — | | | — | |
Foreign currencies | | | — | | | | — | | | | — | | | — | |
Options written | | | (4,600 | ) | | | 4,600 | | | | — | | | — | |
Swaps | | | (101,994 | ) | | | (5,016 | ) | | | — | | | — | |
Short sales | | | (209,692 | ) | | | 87,747 | | | | — | | | — | |
| Net change in unrealized appreciation (depreciation) | | | 440,895 | | | | 711,699 | | | | — | | | — | |
| Net gain (loss) | | | (206,674 | ) | | | (589,954 | ) | | | 2,497 | | | (2,491 | ) |
| NET INCREASE IN NET ASSETS RESULTING FROM OPERATIONS | | $ | 2,879,515 | | | $ | 2,867,426 | | | $ | 2,524,739 | | $ | 2,036,116 | |
(a) Including affiliated expense of | | $ | 40,000 | | | $ | 81,000 | | | $ | 24,000 | | $ | 61,000 | |
See Notes to Financial Statements.
| | |
| THE TARGET PORTFOLIO TRUST | | 153 |
Statement of Changes in Net Assets
| | | | | | | | | | | | |
| | | LARGE CAPITALIZATION
GROWTH PORTFOLIO | |
| | | Ten Months
Ended
October 31,
2007 | | | Year
Ended
December 31,
2006 | | | Year
Ended
December 31,
2005 | |
| | | |
| INCREASE (DECREASE) IN NET ASSETS | | | | | | | | | | | | |
| Operations | | | | | | | | | | | | |
Net investment income | | $ | 708,430 | | | $ | 1,538,515 | | | $ | 550,049 | |
Net realized gain on investment and foreign currency transactions | | | 18,353,623 | | | | 8,314,549 | | | | 61,722,889 | |
Net change in unrealized appreciation/(depreciation) of investments | | | 27,512,369 | | | | 14,990,354 | | | | (43,590,841 | ) |
Net increase in net assets resulting from operations | | | 46,574,422 | | | | 24,843,418 | | | | 18,682,097 | |
| Dividends and Distributions (Note 1) | | | | | | | | | | | | |
Dividends from net investment income | | | | | | | | | | | | |
Class R | | | — | | | | (3,514 | ) | | | — | |
Class T | | | (17,019 | ) | | | (1,653,855 | ) | | | (424,776 | ) |
Total dividends from net investment income | | | (17,019 | ) | | | (1,657,369 | ) | | | (424,776 | ) |
Distributions from net realized gains | | | | | | | | | | | | |
Class R | | | (100,340 | ) | | | (20,757 | ) | | | — | |
Class T | | | (2,604,422 | ) | | | (8,582,005 | ) | | | (44,003,589 | ) |
Total distributions from net realized gains | | | (2,704,762 | ) | | | (8,602,762 | ) | | | (44,003,589 | ) |
| Trust share transactions (Note 6) | | | | | | | | | | | | |
Net proceeds from shares sold | | | 43,248,143 | | | | 25,008,986 | | | | 30,635,551 | |
Net asset value of shares issued in reinvestment of dividends and distributions | | | 2,719,343 | | | | 10,240,926 | | | | 44,414,354 | |
Cost of shares reacquired | | | (47,902,204 | ) | | | (53,885,753 | ) | | | (85,228,600 | ) |
Net decrease in net assets from Trust share transactions | | | (1,934,718 | ) | | | (18,635,841 | ) | | | (10,178,695 | ) |
Total increase (decrease) | | | 41,917,923 | | | | (4,052,554 | ) | | | (35,924,963 | ) |
| | | |
| NET ASSETS | | | | | | | | | | | | |
Beginning of period | | | 303,782,100 | | | | 307,834,654 | | | | 343,759,617 | |
End of period(a) | | $ | 345,700,023 | | | $ | 303,782,100 | | | $ | 307,834,654 | |
(a) Includes undistributed net investment income of | | $ | 694,729 | | | $ | 4,354 | | | $ | 144,542 | |
See Notes to Financial Statements.
| | |
| 154 | | THE TARGET PORTFOLIO TRUST |
Statement of Changes in Net Assets (continued)
| | | | | | | | | | | | |
| | | LARGE CAPITALIZATION
VALUE PORTFOLIO | |
| | | Ten Months
Ended
October 31,
2007 | | | Year
Ended
December 31,
2006 | | | Year
Ended
December 31,
2005 | |
| | | |
| INCREASE (DECREASE) IN NET ASSETS | | | | | | | | | | | | |
| Operations | | | | | | | | | | | | |
Net investment income | | $ | 5,388,643 | | | $ | 6,634,241 | | | $ | 5,414,957 | |
Net realized gain on investment and foreign currency transactions | | | 28,455,806 | | | | 23,505,886 | | | | 62,818,569 | |
Net change in unrealized appreciation/(depreciation) of investments | | | (11,551,247 | ) | | | 36,230,197 | | | | (45,800,873 | ) |
Net increase in net assets resulting from operations | | | 22,293,202 | | | | 66,370,324 | | | | 22,432,653 | |
| Dividends and Distributions (Note 1) | | | | | | | | | | | | |
Dividends from net investment income | | | | | | | | | | | | |
Class R | | | (158 | ) | | | (16,801 | ) | | | — | |
Class T | | | (11,662 | ) | | | (6,842,579 | ) | | | (5,359,256 | ) |
Total dividends from net investment income | | | (11,820 | ) | | | (6,859,380 | ) | | | (5,359,256 | ) |
Distributions from net realized gains | | | | | | | | | | | | |
Class R | | | (131,354 | ) | | | (55,232 | ) | | | — | |
Class T | | | (4,454,447 | ) | | | (45,586,619 | ) | | | (49,641,032 | ) |
Total distributions from net realized gains | | | (4,585,801 | ) | | | (45,641,851 | ) | | | (49,641,032 | ) |
| Fund share transactions (Note 6) | | | | | | | | | | | | |
Net proceeds from shares sold | | | 51,636,755 | | | | 33,860,437 | | | | 40,152,956 | |
Net asset value of shares issued in reinvestment of dividends and distributions | | | 4,449,727 | | | | 51,052,050 | | | | 54,877,512 | |
Cost of shares reacquired | | | (65,229,218 | ) | | | (65,730,095 | ) | | | (85,622,845 | ) |
Net increase (decrease) in net assets from Trust share transactions | | | (9,142,736 | ) | | | 19,182,392 | | | | 9,407,623 | |
Total increase (decrease) | | | 8,552,845 | | | | 33,051,485 | | | | (23,160,012 | ) |
| | | |
| NET ASSETS | | | | | | | | | | | | |
Beginning of period | | | 395,304,974 | | | | 362,253,489 | | | | 385,413,501 | |
End of period(a) | | $ | 403,857,819 | | | $ | 395,304,974 | | | $ | 362,253,489 | |
(a) Includes undistributed net investment income of | | $ | 5,375,999 | | | $ | — | | | $ | 446,270 | |
See Notes to Financial Statements.
| | |
| THE TARGET PORTFOLIO TRUST | | 155 |
Statement of Changes in Net Assets (continued)
| | | | | | | | | | | | |
| | | SMALL CAPITALIZATION
GROWTH PORTFOLIO | |
| | | Ten Months
Ended
October 31,
2007 | | | Year
Ended
December 31,
2006 | | | Year
Ended
December 31,
2005 | |
| | | |
| INCREASE (DECREASE) IN NET ASSETS | | | | | | | | | | | | |
| Operations | | | | | | | | | | | | |
Net investment loss | | $ | (103,564 | ) | | $ | (546,575 | ) | | $ | (892,211 | ) |
Net realized gain on investment and foreign currency transactions | | | 14,306,538 | | | | 9,674,494 | | | | 11,287,884 | |
Net change in unrealized appreciation/(depreciation) of investments | | | 4,249,382 | | | | 1,412,805 | | | | (4,638,598 | ) |
Net increase in net assets resulting from operations | | | 18,452,356 | | | | 10,540,724 | | | | 5,757,075 | |
| Dividends and Distributions (Note 1) | | | | | | | | | | | | |
Dividends from net investment income | | | | | | | | | | | | |
Class R | | | — | | | | — | | | | — | |
Class T | | | — | | | | — | | | | — | |
Total dividends from net investment income | | | — | | | | — | | | | — | |
Distributions from net realized gains | | | | | | | | | | | | |
Class R | | | — | | | | — | | | | — | |
Class T | | | — | | | | — | | | | — | |
Total distributions from net realized gains | | | — | | | | — | | | | — | |
| Trust share transactions (Note 6) | | | | | | | | | | | | |
Net proceeds from shares sold | | | 19,225,054 | | | | 9,893,507 | | | | 13,851,396 | |
Net asset value of shares issued in reinvestment of dividends and distributions | | | — | | | | — | | | | — | |
Cost of shares reacquired | | | (24,425,908 | ) | | | (26,479,801 | ) | | | (34,999,953 | ) |
Net increase (decrease) in net assets from Trust share transactions | | | (5,200,854 | ) | | | (16,586,294 | ) | | | (21,148,557 | ) |
Total increase (decrease) | | | 13,251,502 | | | | (6,045,570 | ) | | | (15,391,482 | ) |
| | | |
| NET ASSETS | | | | | | | | | | | | |
Beginning of period | | | 137,320,203 | | | | 143,365,773 | | | | 158,757,255 | |
End of period | | $ | 150,571,705 | | | $ | 137,320,203 | | | $ | 143,365,773 | |
See Notes to Financial Statements.
| | |
| 156 | | THE TARGET PORTFOLIO TRUST |
Statement of Changes in Net Assets (continued)
| | | | | | | | | | | | |
| | | SMALL CAPITALIZATION
VALUE PORTFOLIO | |
| | | Ten Months
Ended
October 31,
2007 | | | Year
Ended
December 31,
2006 | | | Year Ended
December 31,
2005 | |
| | | |
| INCREASE (DECREASE) IN NET ASSETS | | | | | | | | | | | | |
| Operations | | | | | | | | | | | | |
Net investment income | | $ | 4,679,758 | | | $ | 3,391,202 | | | $ | 2,032,694 | |
Net realized gain on investment and foreign currency transactions | | | 23,143,964 | | | | 20,421,271 | | | | 55,992,751 | |
Net change in unrealized appreciation/(depreciation) of investments | | | 4,061,065 | | | | 22,620,529 | | | | (34,236,849 | ) |
Net increase in net assets resulting from operations | | | 31,884,787 | | | | 46,433,002 | | | | 23,788,596 | |
| Dividends and Distributions (Note 1) | | | | | | | | | | | | |
Dividends from net investment income | | | | | | | | | | | | |
Class R | | | (1,204 | ) | | | (2,938 | ) | | | — | |
Class T | | | (86,616 | ) | | | (3,240,682 | ) | | | (1,786,572 | ) |
Total dividends from net investment income | | | (87,820 | ) | | | (3,243,620 | ) | | | (1,786,572 | ) |
Distributions from net realized gains | | | | | | | | | | | | |
Class R | | | (28,734 | ) | | | (21,073 | ) | | | — | |
Class T | | | (2,066,213 | ) | | | (23,263,451 | ) | | | (54,378,098 | ) |
Total distributions from net realized gains | | | (2,094,947 | ) | | | (23,284,524 | ) | | | (54,378,098 | ) |
| Trust share transactions (Note 6) | | | | | | | | | | | | |
Net proceeds from shares sold | | | 141,295,801 | | | | 70,560,051 | | | | 52,707,779 | |
Net asset value of shares issued in reinvestment of dividends and distributions | | | 2,136,118 | | | | 26,049,122 | | | | 55,249,127 | |
Cost of shares reacquired | | | (68,119,851 | ) | | | (53,840,672 | ) | | | (62,042,254 | ) |
Net increase in net assets from Trust share transactions | | | 75,312,068 | | | | 42,768,501 | | | | 45,914,652 | |
Total increase | | | 105,014,088 | | | | 62,673,359 | | | | 13,538,578 | |
| | | |
| NET ASSETS | | | | | | | | | | | | |
Beginning of period | | | 321,788,187 | | | | 259,114,828 | | | | 245,576,250 | |
End of period(a) | | $ | 426,802,275 | | | $ | 321,788,187 | | | $ | 259,114,828 | |
(a) Includes undistributed net investment income of | | $ | 4,666,593 | | | $ | 74,655 | | | $ | 281,690 | |
See Notes to Financial Statements.
| | |
| THE TARGET PORTFOLIO TRUST | | 157 |
Statement of Changes in Net Assets (continued)
| | | | | | | | | | | | |
| | | INTERNATIONAL
EQUITY PORTFOLIO | |
| | | Ten Months
Ended
October 31,
2007 | | | Year
Ended
December 31,
2006 | | | Year
Ended
December 31,
2005 | |
| | | |
| INCREASE (DECREASE) IN NET ASSETS | | | | | | | | | | | | |
| Operations | | | | | | | | | | | | |
Net investment income | | $ | 6,252,994 | | | $ | 4,297,701 | | | $ | 3,438,526 | |
Net realized gain on investment and foreign currency transactions | | | 34,424,705 | | | | 24,653,943 | | | | 42,374,057 | |
Net change in unrealized appreciation/(depreciation) of investments | | | 25,957,209 | | | | 34,431,991 | | | | (16,151,609 | ) |
Net increase in net assets resulting from operations | | | 66,634,908 | | | | 63,383,635 | | | | 29,660,974 | |
| Dividends and Distributions (Note 1) | | | | | | | | | | | | |
Dividends from net investment income | | | | | | | | | | | | |
Class R | | | — | | | | (10,046 | ) | | | — | |
Class T | | | — | | | | (4,341,675 | ) | | | (4,548,361 | ) |
Total dividends from net investment income | | | — | | | | (4,351,721 | ) | | | (4,548,361 | ) |
Distributions from net realized gains | | | | | | | | | | | | |
Class R | | | (95,559 | ) | | | (59,614 | ) | | | — | |
Class T | | | (2,748,871 | ) | | | (21,810,241 | ) | | | (10,649,422 | ) |
Total distributions from net realized gains | | | (2,844,430 | ) | | | (21,869,855 | ) | | | (10,649,422 | ) |
| Trust share transactions (Note 6) | | | | | | | | | | | | |
Net proceeds from shares sold | | | 35,839,930 | | | | 18,172,375 | | | | 23,896,686 | |
Net asset value of shares issued in reinvestment of dividends and distributions | | | 2,840,246 | | | | 26,171,927 | | | | 15,191,553 | |
Cost of shares reacquired | | | (48,618,589 | ) | | | (44,614,358 | ) | | | (50,701,115 | ) |
Net decrease in net assets from Trust share transactions | | | (9,938,413 | ) | | | (270,056 | ) | | | (11,612,876 | ) |
Total increase | | | 53,852,065 | | | | 36,892,003 | | | | 2,850,315 | |
| | | |
| NET ASSETS | | | | | | | | | | | | |
Beginning of period | | | 270,042,152 | | | | 233,150,149 | | | | 230,299,834 | |
End of period(a) | | $ | 323,894,217 | | | $ | 270,042,152 | | | $ | 233,150,149 | |
(a) Includes undistributed net investment income of | | $ | 5,525,097 | | | $ | 91,087 | | | $ | 200,879 | |
See Notes to Financial Statements.
| | |
| 158 | | THE TARGET PORTFOLIO TRUST |
Statement of Changes in Net Assets (continued)
| | | | | | | | | | | | |
| | | INTERNATIONAL
BOND PORTFOLIO | |
| | | Ten Months
Ended
October 31,
2007 | | | Year
Ended
December 31,
2006 | | | Year
Ended
December 31,
2005 | |
| | | |
| INCREASE (DECREASE) IN NET ASSETS | | | | | | | | | | | | |
| Operations | | | | | | | | | | | | |
Net investment income | | $ | 787,268 | | | $ | 955,814 | | | $ | 753,696 | |
Net realized gain (loss) on investment and foreign currency transactions | | | (1,394,369 | ) | | | (1,991,293 | ) | | | 5,456,058 | |
Net change in unrealized appreciation/(depreciation) of investments | | | 1,116,661 | | | | 1,878,242 | | | | (4,599,975 | ) |
Net increase in net assets resulting from operations | | | 509,560 | | | | 842,763 | | | | 1,609,779 | |
| Dividends and Distributions (Note 1) | | | | | | | | | | | | |
Dividends from net investment income | | | | | | | | | | | | |
Class R | | | — | | | | — | | | | — | |
Class T | | | — | | | | (1,301,423 | ) | | | (822,648 | ) |
Total dividends from net investment income | | | — | | | | (1,301,423 | ) | | | (822,648 | ) |
Distributions from net realized gains | | | | | | | | | | | | |
Class R | | | — | | | | — | | | | — | |
Class T | | | — | | | | (54,720 | ) | | | (33,394 | ) |
Total distributions from net realized gains | | | — | | | | (54,720 | ) | | | (33,394 | ) |
| Trust share transactions (Note 6) | | | | | | | | | | | | |
Net proceeds from shares sold | | | 5,021,348 | | | | 6,238,031 | | | | 8,080,019 | |
Net asset value of shares issued in reinvestment of dividends and distributions | | | — | | | | 1,352,078 | | | | 855,615 | |
Cost of shares reacquired | | | (7,464,640 | ) | | | (9,043,897 | ) | | | (11,682,782 | ) |
Net decrease in net assets from Trust share transactions | | | (2,443,292 | ) | | | (1,453,788 | ) | | | (2,747,148 | ) |
Total decrease | | | (1,933,732 | ) | | | (1,967,168 | ) | | | (1,993,411 | ) |
| | | |
| NET ASSETS | | | | | | | | | | | | |
Beginning of period | | | 40,944,422 | | | | 42,911,590 | | | | 44,905,001 | |
End of period | | $ | 39,010,690 | | | $ | 40,944,422 | | | $ | 42,911,590 | |
See Notes to Financial Statements.
| | |
| THE TARGET PORTFOLIO TRUST | | 159 |
Statement of Changes in Net Assets (continued)
| | | | | | | | | | | | |
| | | TOTAL RETURN
BOND PORTFOLIO | |
| | | Ten Months
Ended
October 31,
2007 | | | Year
Ended
December 31,
2006 | | | Year Ended
December 31,
2005 | |
| | | |
| INCREASE (DECREASE) IN NET ASSETS | | | | | | | | | | | | |
| Operations | | | | | | | | | | | | |
Net investment income | | $ | 6,915,120 | | | $ | 6,855,661 | | | $ | 6,315,677 | |
Net realized gain (loss) on investment and foreign currency transactions | | | 1,793,335 | | | | (1,419,510 | ) | | | 246,826 | |
Net change in unrealized appreciation/(depreciation) of investments | | | 2,457,208 | | | | 1,279,692 | | | | (2,230,248 | ) |
Net increase in net assets resulting from operations | | | 11,165,663 | | | | 6,715,843 | | | | 4,332,255 | |
| Dividends and Distributions (Note 1) | | | | | | | | | | | | |
Dividends from net investment income | | | | | | | | | | | | |
Class R | | | (335,215 | ) | | | (4,293 | ) | | | — | |
Class T | | | (6,447,129 | ) | | | (6,978,878 | ) | | | (6,859,355 | ) |
Total dividends from net investment income | | | (6,782,344 | ) | | | (6,983,171 | ) | | | (6,859,355 | ) |
Distributions from net realized gains | | | | | | | | | | | | |
Class R | | | — | | | | — | | | | — | |
Class T | | | — | | | | — | | | | (1,294,402 | ) |
Total distributions from net realized gains | | | — | | | | — | | | | (1,294,402 | ) |
| Trust share transactions (Note 6) | | | | | | | | | | | | |
Net proceeds from shares sold | | | 58,081,933 | | | | 34,223,538 | | | | 35,616,451 | |
Net asset value of shares issued in reinvestment of dividends and distributions | | | 6,377,803 | | | | 6,956,225 | | | | 8,147,528 | |
Cost of shares reacquired | | | (30,567,391 | ) | | | (33,930,307 | ) | | | (56,755,679 | ) |
Net increase (decrease) in net assets from Trust share transactions | | | 33,892,345 | | | | 7,249,456 | | | | (12,991,700 | ) |
Total increase (decrease) | | | 38,275,664 | | | | 6,982,128 | | | | (16,813,202 | ) |
| | | |
| NET ASSETS | | | | | | | | | | | | |
Beginning of period | | | 168,657,099 | | | | 161,674,971 | | | | 178,488,173 | |
End of period(a) | | $ | 206,932,763 | | | $ | 168,657,099 | | | $ | 161,674,971 | |
(a) Includes undistributed net investment income of | | $ | — | | | $ | — | | | $ | 2,030,789 | |
See Notes to Financial Statements.
| | |
| 160 | | THE TARGET PORTFOLIO TRUST |
Statement of Changes in Net Assets (continued)
| | | | | | | | | | | | |
| | | INTERMEDIATE-TERM
BOND PORTFOLIO | |
| | | Ten Months
Ended
October 31,
2007 | | | Year
Ended
December 31,
2006 | | | Year Ended
December 31,
2005 | |
| | | |
| INCREASE (DECREASE) IN NET ASSETS | | | | | | | | | | | | |
| Operations | | | | | | | | | | | | |
Net investment income | | $ | 9,252,160 | | | $ | 10,529,630 | | | $ | 9,692,301 | |
Net realized loss on investment and foreign currency transactions | | | (2,196,606 | ) | | | (1,401,616 | ) | | | (1,215,215 | ) |
Net change in unrealized appreciation/(depreciation) of investments | | | 4,916,950 | | | | 611,499 | | | | (3,164,852 | ) |
Net increase in net assets resulting from operations | | | 11,972,504 | | | | 9,739,513 | | | | 5,312,234 | |
| Dividends and Distributions (Note 1) | | | | | | | | | | | | |
Dividends from net investment income | | | | | | | | | | | | |
Class R | | | — | | | | — | | | | — | |
Class T | | | (9,048,043 | ) | | | (11,077,415 | ) | | | (10,131,526 | ) |
Total dividends from net investment income | | | (9,048,043 | ) | | | (11,077,415 | ) | | | (10,131,526 | ) |
Distributions from net realized gains | | | | | | | | | | | | |
Class R | | | — | | | | — | | | | — | |
Class T | | | — | | | | — | | | | (128,653 | ) |
Total distributions from net realized gains | | | — | | | | — | | | | (128,653 | ) |
| Trust share transactions (Note 6) | | | | | | | | | | | | |
Net proceeds from shares sold | | | 26,040,464 | | | | 92,017,701 | | | | 40,116,845 | |
Net asset value of shares issued in reinvestment of dividends and distributions | | | 8,698,808 | | | | 11,032,073 | | | | 10,256,072 | |
Cost of shares reacquired | | | (49,463,890 | ) | | | (118,666,524 | ) | | | (81,229,652 | ) |
Net decrease in net assets from Trust share transactions | | | (14,724,618 | ) | | | (15,616,750 | ) | | | (30,856,735 | ) |
Total decrease | | | (11,800,157 | ) | | | (16,954,652 | ) | | | (35,804,680 | ) |
| | | |
| NET ASSETS | | | | | | | | | | | | |
Beginning of period | | | 245,222,974 | | | | 262,177,626 | | | | 297,982,306 | |
End of period(a) | | $ | 233,422,817 | | | $ | 245,222,974 | | | $ | 262,177,626 | |
(a) Includes undistributed net investment income of | | $ | 315,759 | | | | — | | | | — | |
See Notes to Financial Statements.
| | |
| THE TARGET PORTFOLIO TRUST | | 161 |
Statement of Changes in Net Assets (continued)
| | | | | | | | | | | | |
| | | MORTGAGE BACKED
SECURITIES PORTFOLIO | |
| | | Ten Months
Ended
October 31,
2007 | | | Year
Ended
December 31,
2006 | | | Year Ended
December 31,
2005 | |
| | | |
| INCREASE (DECREASE) IN NET ASSETS | | | | | | | | | | | | |
| Operations | | | | | | | | | | | | |
Net investment income | | $ | 3,086,189 | | | $ | 3,457,380 | | | $ | 4,407,891 | |
Net realized loss on investment and foreign currency transactions | | | (647,569 | ) | | | (1,301,653 | ) | | | (40,466 | ) |
Net change in unrealized appreciation/(depreciation) of investments | | | 440,895 | | | | 711,699 | | | | (2,391,039 | ) |
Net increase in net assets resulting from operations | | | 2,879,515 | | | | 2,867,426 | | | | 1,976,386 | |
| Dividends and Distributions (Note 1) | | | | | | | | | | | | |
Dividends from net investment income | | | (2,967,417 | ) | | | (3,765,517 | ) | | | (4,564,729 | ) |
Tax return of capital | | | (225,427 | ) | | | — | | | | — | |
Total dividends and distributions | | | (3,192,844 | ) | | | (3,765,517 | ) | | | (4,564,729 | ) |
| Trust share transactions (Note 6) | | | | | | | | | | | | |
Net proceeds from shares sold | | | 7,731,632 | | | | 6,808,481 | | | | 7,499,428 | |
Net asset value of shares issued in reinvestment of dividends and distributions | | | 3,073,764 | | | | 3,754,874 | | | | 4,564,729 | |
Cost of shares reacquired | | | (12,382,142 | ) | | | (16,389,625 | ) | | | (23,076,242 | ) |
Net decrease in net assets from Trust share transactions | | | (1,576,746 | ) | | | (5,826,270 | ) | | | (11,012,085 | ) |
Total decrease | | | (1,890,075 | ) | | | (6,724,361 | ) | | | (13,600,428 | ) |
| | | |
| NET ASSETS | | | | | | | | | | | | |
Beginning of period | | | 75,470,843 | | | | 82,195,204 | | | | 95,795,632 | |
End of period(a) | | $ | 73,580,768 | | | $ | 75,470,843 | | | $ | 82,195,204 | |
(a) Includes undistributed net investment income of | | $ | 167,509 | | | $ | — | | | $ | — | |
See Notes to Financial Statements.
| | |
| 162 | | THE TARGET PORTFOLIO TRUST |
Statement of Changes in Net Assets (continued)
| | | | | | | | | | | | |
| | | U.S. GOVERNMENT
MONEY MARKET PORTFOLIO | |
| | | Ten Months
Ended
October 31,
2007 | | | Year
Ended
December 31,
2006 | | | Year Ended
December 31,
2005 | |
| | | |
| INCREASE (DECREASE) IN NET ASSETS | | | | | | | | | | | | |
| Operations | | | | | | | | | | | | |
Net investment income | | $ | 2,522,242 | | | $ | 2,038,607 | | | $ | 1,738,551 | |
Net realized gain (loss) on investment and foreign currency transactions | | | 2,497 | | | | (2,491 | ) | | | — | |
Net increase (decrease) in net assets resulting from operations | | | 2,524,739 | | | | 2,036,116 | | | | 1,738,551 | |
| Dividends and Distributions (Note 1) | | | | | | | | | | | | |
Dividends from net investment income | | | (2,522,242 | ) | | | (2,026,702 | ) | | | (1,747,870 | ) |
| Trust share transactions (Note 6)(b) | | | | | | | | | | | | |
Net proceeds from shares sold | | | 72,192,472 | | | | 21,507,914 | | | | 43,342,523 | |
Net asset value of shares issued in reinvestment of dividends and distributions | | | 2,433,906 | | | | 2,015,845 | | | | 1,746,159 | |
Cost of shares reacquired | | | (54,836,645 | ) | | | (33,465,781 | ) | | | (62,061,743 | ) |
Net increase (decrease) in net assets from Trust share transactions | | | 19,789,733 | | | | (9,942,022 | ) | | | (16,973,061 | ) |
Total increase (decrease) | | | 19,792,230 | | | | (9,932,608 | ) | | | (16,982,380 | ) |
| | | |
| NET ASSETS | | | | | | | | | | | | |
Beginning of period | | | 47,274,826 | | | | 57,207,434 | | | | 74,189,814 | |
End of period(a) | | $ | 67,067,056 | | | $ | 47,274,826 | | | $ | 57,207,434 | |
(a) Includes undistributed net investment income of | | $ | 2,586 | | | $ | 2,586 | | | $ | — | |
(b) Fund share transactions are at $1 per share for the U.S. Government Money Market Portfolio | | | | | | | | | | | | |
See Notes to Financial Statements.
| | |
| THE TARGET PORTFOLIO TRUST | | 163 |
Statement of Cash Flows
For The Ten Months Ended October 31, 2007
| | | | |
| | | MORTGAGE
BACKED
SECURITIES
PORTFOLIO | |
| |
| INCREASE (DECREASE) IN CASH | | | | |
Cash flows provided from operating activities: | | | | |
Interest and dividends received | | $ | 4,174,037 | |
Operating expenses paid | | | (469,777 | ) |
Interest expenses paid | | | (663,471 | ) |
Purchases of long-term portfolio investments | | | (299,026,953 | ) |
Proceeds from disposition of short-term portfolio investments | | | 13,084,872 | |
Proceeds from disposition of long-term portfolio investments | | | 268,469,990 | |
Net proceeds from cover of short sales | | | 11,749,391 | |
Increase in other assets | | | 3,815 | |
Net cash provided from operating activities | | | (2,678,096 | ) |
Cash flows from financing activities: | | | | |
Net proceeds from reverse repurchase agreement transactions | | | 7,292,000 | |
Cash dividends paid | | | (5,423 | ) |
Proceeds from shares sold | | | 7,737,367 | |
Payment of shares redeemed | | | (12,345,848 | ) |
Net cash provided by financing activities | | | 2,678,096 | |
Net increase in cash | | | — | |
Cash at beginning of period | | | — | |
| Cash at end of period | | $ | — | |
| |
| RECONCILIATION OF NET INCREASE IN NET ASSETS TO NET CASH PROVIDED FROM OPERATING ACTIVITIES | | | | |
| Net increase in net assets resulting from operations | | $ | 2,879,515 | |
Change in investments | | | 11,662,763 | |
Net realized loss on investments | | | 647,569 | |
Net increase in unrealized appreciation on investments | | | (440,895 | ) |
Change in receivable for investments sold | | | (28,459,861 | ) |
Change in interest receivable | | | (55,929 | ) |
Change in other assets | | | 3,815 | |
Change in payable for investments purchased | | | 11,074,398 | |
Change in accrued expenses and other liabilities | | | 10,529 | |
Total adjustments | | | (5,557,611 | ) |
| |
| NET CASH PROVIDED FROM OPERATING ACTIVITIES | | $ | (2,678,096 | ) |
See Notes to Financial Statements.
| | |
| 164 | | THE TARGET PORTFOLIO TRUST |
Notes to Financial Statements
The TARGET Portfolio Trust (the ‘Trust’) is an open-end management investment company. The Trust was established as a Delaware business trust on July 29, 1992 and consists of ten separate portfolios (the “Portfolio” or “Portfolios”). All the Portfolios are diversified, as defined under the Investment Company Act of 1940, except for the International Bond Portfolio. Investment operations commenced on January 5, 1993, with the exception of the International Bond Portfolio, which commenced on May 17, 1994.
The Trust’s fiscal year has changed from an annual reporting period that ends December 31 to one that ends October 31. This change should have no impact on the way the Trust is managed. Shareholders will receive future annual and semi-annual reports on the new fiscal year-end schedule.
The Portfolios and their investment objectives are as follows:
| • | | Large Capitalization Growth Portfolio—long-term capital appreciation through investment primarily in stocks of large corporations that, in the investment adviser’s opinion, should have earnings growth faster than that of the S&P 500; |
| • | | Large Capitalization Value Portfolio—total return consisting of capital appreciation and dividend income through investment primarily in stocks of large corporations that, in the adviser’s opinion, are undervalued; |
| • | | Small Capitalization Growth Portfolio—maximum capital appreciation through investment primarily in small company common stocks that, in the investment adviser’s opinion, should have earnings growth faster than that of the U.S. economy in general; |
| • | | Small Capitalization Value Portfolio—above average capital appreciation through investment in small company common stocks that, in the adviser’s opinion, are undervalued or overlooked in the marketplace; |
| • | | International Equity Portfolio—capital appreciation through investment primarily in stocks of companies domiciled outside the United States; |
| • | | International Bond Portfolio—high total return through investment primarily in high-quality, foreign debt securities; |
| • | | Total Return Bond Portfolio—total return of current income and capital appreciation through investment primarily in fixed-income securities of varying maturities with a dollar-weighted average portfolio maturity of more than four years but not more than fifteen years; |
| • | | Intermediate-Term Bond Portfolio—current income and reasonable stability of principal through investment primarily in high quality fixed-income securities of varying maturities with a dollar-weighted average portfolio maturity of more than three years but not more than ten years; |
| • | | Mortgage Backed Securities Portfolio—high current income primarily and capital appreciation secondarily, each consistent with the protection of capital through investment primarily in mortgage related securities; |
| • | | U.S. Government Money Market Portfolio—maximum current income consistent with maintenance of liquidity and preservation of capital through investment exclusively in short-term securities issued or guaranteed by the U.S. Government, its agencies or instrumentalities. |
The ability of issuers of debt securities (other than those issued or guaranteed by the U.S. Government) held by the Portfolios to meet their obligations may be affected by economic or political developments in a specific industry, region or country.
| | |
| THE TARGET PORTFOLIO TRUST | | 165 |
Note 1. Accounting Policies
The following is a summary of significant accounting policies followed by the Trust and the Portfolios in the preparation of its financial statements.
Securities Valuations: Securities listed on a securities exchange (other than options on securities and indices) are valued at the last sale price on such exchange on the day of valuation or, if there was no sale on such day, at the mean between the last reported bid and ask prices, or at the last bid price on such day in the absence of an asked price. Securities traded via Nasdaq are valued at the NASDAQ official closing price (NOCP) on the day of valuation, or if there was no NOCP, at the last sale price. Securities that are actively traded in the over-the-counter market, including listed securities for which the primary market is believed by Prudential Investments LLC (“PI” or “Manager”), in consultation with the subadvisor(s), to be over-the-counter, are valued at market value using prices provided by an independent pricing agent or principal market maker. Options on securities and indices traded on an exchange are valued at the last sale price as of the close of trading on the applicable exchange or, if there was no sale, at the mean between the most recently quoted bid and asked prices on such exchange or at the last bid price in the absence of an asked price. Futures contracts and options thereon traded on a commodities exchange or board of trade are valued at the last sale price at the close of trading on such exchange or board of trade or, if there was no sale on the applicable commodities exchange or board of trade on such day, at the mean between the most recently quoted bid and asked prices on such exchange or board of trade or at the last bid price in the absence of an asked price. Securities for which reliable market quotations are not readily available, or whose values have been affected by events occurring after the close of the security’s foreign market and before the Portfolio’s pricing time, are valued at fair value in accordance with the Board of Trustees’ approved fair valuation procedures. When determining the fair valuation of securities, some of the factors influencing the valuation include, the nature of any restrictions on disposition of the securities; assessment of the general liquidity of the securities; the issuer’s financial condition and the markets in which it does business; the cost of the investment; the size of the holding and the capitalization of issuer; the prices of any recent transactions or bids/offers for such securities or any comparable securities; any available analyst media or other reports or information deemed reliable by the investment adviser regarding the issuer or the markets or industry in which it operates. Using fair value to price securities may result in a value that is different from a security’s most recent closing price and from the price used by other mutual funds to calculate their net asset values. As of October 31, 2007, Large Capitalization Growth Portfolio and International Equity Portfolio held foreign securities whose value required adjustment in accordance with such procedures.
Certain Portfolios held illiquid securities, including those which are restricted as to disposition under securities law (“restricted securities”). Restricted securities are valued pursuant to the valuation procedures noted above. Each Portfolio may hold up to 15% of its net assets in illiquid securities, except for the U.S. Government Money Market Portfolio, which may hold up to 10% of its net assets in illiquid securities.
Investments in mutual funds are valued at their net asset value as of the close of the New York Stock Exchange on the date of the valuation.
U.S. Government securities for which market quotations are available are valued at a price provided by an independent pricing agent or primary dealer (a dealer that trades in U.S. Government securities within the Federal Reserve System).
Securities held by the U.S. Government Money Market Portfolio are valued at amortized cost in accordance with Rule 2a-7 of the Investment Company Act, which approximates market value. The amortized cost
| | |
| 166 | | THE TARGET PORTFOLIO TRUST |
method involves valuing a security at its cost on the date of purchase and thereafter assuming a constant amortization to maturity of the difference between the principal amount due at maturity and the cost.
Short-term debt securities held by the other Portfolios, which mature in 60 days or less, are valued at amortized cost, which approximates market value. Short-term debt securities held by the other Portfolios, which mature in more than 60 days, are valued at current market quotations.
Repurchase Agreements: In connection with transactions in repurchase agreements with United States financial institutions, it is the Trust’s policy that its custodian or designated sub custodians under tri-party repurchase agreements, as the case may be, take possession of the underlying collateral securities, the value of which exceeds the principal amount of the repurchase transaction, including accrued interest. The value of the collateral is marked-to-market on a daily basis to ensure the adequacy of the collateral. If the seller defaults, and the value of the collateral declines or, if bankruptcy proceedings are commenced with respect to the seller of the security, realization of the collateral by the Trust may be delayed or limited.
Financial Futures Contracts: A financial futures contract is an agreement to purchase (long) or sell (short) an agreed amount of securities at a set price for delivery on a future date. Upon entering into a financial futures contract, the Portfolio is required to pledge to the broker an amount of cash and/or other assets equal to a certain percentage of the contract amount. This amount is known as the “initial margin.” Subsequent payments, known as “variation margin,” are made or received by the Portfolio each day, depending on the daily fluctuations in the value of the underlying security. Such variation margin is recorded for financial statement purposes on a daily basis as an unrealized gain or loss. When the contract expires or is closed, the gain or loss is realized and is presented in the Statements of Operations as a net realized gain or loss on financial futures contracts.
The Portfolio invests in financial futures contracts in order to hedge its existing portfolio securities, or securities the Portfolio intends to purchase, against fluctuations in value caused by changes in prevailing interest rates or market conditions. Should interest rates move unexpectedly, the Portfolio may not achieve the anticipated benefits of the financial futures contracts and may realize a loss. The use of futures transactions involves the risk of imperfect correlation in movements in the price of futures contracts, interest rates and the underlying hedged assets. The Portfolio maintains a segregated account of securities or other liquid assets, the dollar value of which is at least equal to its obligation with respect to financial futures contracts. The Large Capitalization Growth Portfolio, Small Capitalization Value Portfolio, International Equity Portfolio, International Bond Portfolio, Intermediate-Term Bond Portfolio, Mortgage-Backed Securities Portfolio and Total Return Bond Portfolio are the only portfolios that may invest in financial futures contracts.
Foreign Currency Translation: The books and records of the Portfolios are maintained in U.S. dollars. Foreign currency amounts are translated into U.S. dollars on the following basis:
(i) market value of investment securities, other assets and liabilities-at the current daily rates of exchange;
(ii) purchases and sales of investment securities, income and expenses-at the rates of exchange prevailing on the respective dates of such transactions.
The Portfolios do not isolate that portion of the results of operations arising as a result of changes in the foreign exchange rates from the fluctuations arising from changes in the market prices of long-term securities held at period end. Similarly, the Portfolios do not isolate the effect of changes in foreign exchange rates from the fluctuations arising from changes in the market prices of long-term portfolio securities sold during the period. Accordingly, realized foreign currency gains or losses are included in the reported net realized gains or losses on investment transactions.
| | |
| THE TARGET PORTFOLIO TRUST | | 167 |
Net realized gains or losses on foreign currency transactions represent net foreign exchange gains or losses from the holding of foreign currencies, currency gains or losses realized between the trade date and settlement date on securities transactions, and the difference between the amounts of dividends, interest and foreign withholding taxes recorded on the Portfolios’ books and the U.S. dollar equivalent amounts actually received or paid. Net unrealized currency gains or losses from valuing foreign currency denominated assets and liabilities (other than investments) at period-end exchange rates are reflected as a component of net unrealized appreciation (depreciation) on investments and foreign currencies.
Foreign security and currency transactions may involve certain considerations and risks not typically associated with those of domestic origin as a result of, among other factors, the possibility of political and economic instability or the level of governmental supervision and regulation of foreign securities markets.
Forward Foreign Currency Contracts: A forward foreign currency contract is a commitment to purchase or sell a foreign currency at a future date at a negotiated forward rate. The Portfolio enters into forward foreign currency contracts in order to hedge its exposure to changes in foreign currency exchange rates on its foreign portfolio holdings or on specific receivables and payables denominated in a foreign currency. The contracts are valued daily at current forward exchange rates and any unrealized gain or loss is included in net unrealized appreciation or depreciation on foreign currency transactions. Gains or losses are realized on the settlement date of the contract equal to the difference between the settlement value of the original and negotiated forward contracts. This gain or loss, if any, is included in net realized gain or loss on foreign currency transactions. Risks may arise upon entering into these contracts from the potential inability of the counterparties to meet the terms of their contracts. The International Equity Portfolio, International Bond Portfolio, Intermediate-Term Bond Portfolio and Total Return Bond Portfolio may enter into forward foreign currency contracts in order to hedge their exposure to changes in foreign currency exchange rates on their foreign portfolio holdings.
Options: The Portfolio may either purchase or write options in order to hedge against adverse market movements or fluctuations in value caused by changes in prevailing interest rates or foreign currency exchange rates with respect to securities or currencies which the Portfolio currently owns or intends to purchase. The Portfolio’s principal reason for writing options is to realize, through receipt of premiums, a greater current return than would be realized on the underlying security alone. When the Portfolio purchases an option, it pays a premium and an amount equal to that premium is recorded as an asset. When the Portfolio writes an option, it receives a premium and an amount equal to that premium is recorded as a liability. The asset or liability is adjusted daily to reflect the current market value of the option.
If an option expires unexercised, the Portfolio realizes a gain or loss to the extent of the premium received or paid. If an option is exercised, the premium received or paid is recorded as an adjustment to the proceeds from the sale or the cost basis of the purchase in determining whether the Portfolio has realized a gain or loss. The difference between the premium and the amount received or paid on affecting a closing purchase or sale transaction is also treated as a realized gain or loss. Gains or losses on purchased options are included in net realized gains or losses on investment transactions. Gains or losses on written options are presented separately as net realized gains or losses on options written.
The Portfolio, as writer of an option, may have no control over whether the contract may be exercised. As a result, the Portfolio bears the market risk of an unfavorable change in the price of the security or currencies underlying the written option. The Portfolio, as purchaser of an option, bears the risk of the potential inability of the counterparties to meet the terms of their contracts. The Portfolio maintains a segregated account of securities or other liquid assets, the dollar value of which is at least equal to its obligation with respect to options. The International Equity Portfolio, the International Bond Portfolio, the Intermediate-Term Bond Portfolio, the Total Return Bond Portfolio and the Mortgage-Backed Securities Portfolio may either purchase or write options.
| | |
| 168 | | THE TARGET PORTFOLIO TRUST |
Short Sales: Certain portfolios of the Trust may make short sales of securities as a method of hedging potential price declines in similar securities owned. The Portfolio may sell a security, it does not own in anticipation of a decline in the market value of that security (short sale). When the Portfolio makes a short sale, it will borrow the security sold short and deliver it to the broker-dealer through which it made the short sale as collateral for its obligation to deliver the security upon conclusion of the sale. The Portfolio may have to pay a fee to borrow the particular security and may be obligated to return any interest or dividends received on such borrowed securities. A gain, limited to the price at which the Portfolio sold the security short, or a loss, unlimited as to dollar amount, will be recognized upon the termination of a short sale if the market price at termination is less than or greater than the proceeds originally received, respectively, and is presented in the Statement of Operations as net realized gain or loss on short sales. The Portfolio maintains a segregated account of securities or other liquid assets, the dollar value of which is at least equal to its obligation with respect to short sales. The Total Return Bond Portfolio, Intermediate-Term Bond Portfolio and Mortgage-Backed Securities Portfolio may enter into short sales.
Swap Agreements: Certain Portfolios may enter into interest rate swap agreements, forward swap spread lock agreements, and credit default swap agreements. A swap agreement is an agreement to exchange the return generated by one instrument for the return generated by another instrument. Interest rate swap agreements involve the exchange by the Portfolio with another party of their respective commitments to pay or receive interest. Forward spread lock swap agreements involve commitments to pay or receive a settlement amount calculated as the difference between the swap spread and a fixed spread, multiplied by the notional amount times the duration of the swap. The swap spread is the difference between the benchmark swap rate (market rate) and the specific Treasury rate. In a credit default swap agreement, one party (the protection buyer) makes a stream of payments to another party (the protection seller) in exchange for the right to receive a specified payment in the event of a default by a third party, typically corporate issues or sovereign issues of an emerging country, on its obligation. The maximum amount of the payment may equal the notional, at par, of the underlying index or security as a result of a default (or “credit event”). In addition to bearing the risk that the credit event will occur, the Portfolios could be exposed to market risk due to unfavorable changes in interest rates or in the price of the underlying security or index, the possibility that the fund may be unable to close out its position at the same time or at the same price as if it had purchased comparable publicly traded securities, or that the counterparty may default on it’s obligation to perform. The Portfolios may enter into swap agreements as the protection buyer or the protection seller. The swaps are valued daily at current market value and any change in value is included in net unrealized appreciation or depreciation on investments. Payments received or paid by the Portfolio are recorded as realized gains or losses. Risk of loss may exceed amounts recognized on the statements of assets and liabilities. Swap agreements outstanding at period end, if any, are listed on the Schedule of Investments.
The use of derivative transactions may involve elements of both market and credit risk in excess of the amounts reported in the Statements of Assets and Liabilities.
Securities Lending: The Portfolio may lend its portfolio securities to broker-dealers. The loans are secured by collateral at least equal at all times to the market value of the securities loaned. Loans are subject to termination at the option of the borrower or the Portfolio. Upon termination of the loan, the borrower will return to the lender securities identical to the loaned securities. Should the borrower of the securities fail financially, the Portfolio has the right to repurchase the securities using the collateral in the open market. The Portfolio recognizes income, net of any rebate and securities lending agent fees, for lending its securities in the form of fees or interest on the investment of any cash received as collateral. The Portfolio also continues to receive interest and dividends or amounts equivalent thereto on the securities loaned and recognizes any unrealized gain or loss in the market price of the securities loaned that may occur during the term of the loan.
| | |
| THE TARGET PORTFOLIO TRUST | | 169 |
When-Issued/Delayed Delivery Securities: Certain Portfolios may purchase or sell securities on a when-issued or delayed delivery basis. These transactions involve a commitment by the Portfolio to purchase or sell securities for a predetermined price or yield, with payment and delivery taking place beyond the customary settlement period. When delayed delivery purchases are outstanding, the Portfolio will set aside and maintain until the settlement date in a segregated account, liquid assets in an amount sufficient to meet the purchase price. When purchasing a security on a delayed delivery basis, the Portfolio assumes the rights and risks of ownership of the security, including the risk of price and yield fluctuations, and takes such fluctuations into account when determining its net asset value. The Portfolio may dispose of or renegotiate a delayed delivery transaction after it is entered into, and may sell when-issued securities before they are delivered, which may result in a capital gain or loss. When the Portfolio has sold a security on a delayed delivery basis, the Portfolio does not participate in future gains and losses with respect to the security.
Securities Transactions and Net Investment Income: Securities transactions are recorded on the trade date. Realized and unrealized gains and losses from security and currency transactions are calculated on the identified cost basis. Dividend income is recorded on the ex-dividend date and interest income, including amortization of premium and accretion of discount of debt securities, as required, is recorded on the accrual basis. Expenses are recorded on the accrual basis. The Trust’s expenses are allocated to the respective Portfolios on the basis of relative net assets except for expenses that are charged directly at the Portfolio or class level.
Dividends and Distributions: The Total Return Bond Portfolio, Intermediate-Term Bond Portfolio and Mortgage Backed Securities Portfolio declare dividends of their net investment income daily and pay such dividends monthly. The U.S. Government Money Market Portfolio declares net investment income daily and pays such dividends monthly. All other Portfolios declare and pay a dividend from net investment income, if any, at least annually. Each Portfolio declares and pays its net realized capital gains, if any, at least annually. Dividends and distributions to shareholders, which are determined in accordance with federal income tax regulations and which may differ from generally accepted accounting principles, are recorded on ex-dividend date. Permanent book/tax differences relating to income and gains are reclassified amongst undistributed net investment income, accumulated net realized gain or loss and paid-in capital, in excess of par, as appropriate.
Taxes: For federal income tax purposes, each Portfolio in the Trust is treated as a separate tax-paying entity. It is each Portfolio’s policy to continue to meet the requirements of the Internal Revenue Code applicable to regulated investment companies and to distribute all of its taxable net investment income and capital gains, if any, to its shareholders. Therefore, no federal income tax provision is required.
Withholding taxes on foreign interest and dividends are recorded net of reclaimable amounts, at the time the related income is earned.
Estimates: The preparation of the financial statements requires management to make estimates and assumptions that affect the reported amounts and disclosures in the financial statements. Actual results could differ from those estimates.
Note 2. Agreements
The Trust’s manager is Prudential Investments LLC (“PI”). PI manages the investment operations of the Trust, administers the Trust’s affairs and is responsible for the selection, subject to review and approval of the Trustees, of the advisers. PI supervises the advisers’ performance of advisory services and makes
| | |
| 170 | | THE TARGET PORTFOLIO TRUST |
recommendations to the Trustees as to whether the advisers’ contracts should be renewed, modified or terminated. PI pays for the costs pursuant to the advisory agreements, the cost of compensation of officers of the Trust, occupancy and certain clerical and accounting costs of the Trust. The Trust bears all other costs and expenses.
The advisers noted below each furnished investment advisory services in connection with the management of the Portfolios. Each of the advisors of the equity Portfolios—Large Capitalization Growth Portfolio, Large Capitalization Value Portfolio, Small Capitalization Growth Portfolio, Small Capitalization Value Portfolio and International Equity Portfolio—manages a portion of the assets of the respective Portfolios. In general, in order to maintain a division of assets between the advisers as deemed appropriate by PI, all daily cash inflows (i.e., subscriptions and reinvested distributions) and outflows (i.e., redemptions and expense items) are divided between the advisers, as PI deems appropriate. In order to maintain an approximate allocation between the advisers in the ratio deemed appropriate by PI, a periodic rebalancing of each subadvisor’s share of Portfolio assets may occur to account for market fluctuations.
| | |
Portfolio | | Adviser |
Large Capitalization Growth | | Goldman Sachs Asset Management LLP and Marsico Capital Management, LLC |
Large Capitalization Value | | J.P. Morgan Investment Management, Inc., Hotchkis & Wiley Capital Management, LLC and NFJ Investment Group L.P. |
Small Capitalization Growth | | Transamerica Investment Management, LLC and RS Investment Management, L.P. |
Small Capitalization Value | | NFJ Investment Group L.P., EARNEST Partners, LLC, Lee Munder Investments Limited, J.P. Morgan Investment Management, Inc. and Vaughan Nelson Investment Management, L.P. |
International Equity | | LSV Asset Management and Thornburg Investment Management, Inc. |
International Bond, Total Return Bond and Intermediate-Term Bond | | Pacific Investment Management Company LLC |
Mortgage Backed Securities and U.S. Government Money Market | | Wellington Management Company, LLP |
The management fee payable to PI is computed daily and paid monthly, at an annual rate of the average daily net assets of the Portfolios specified below and PI, in turn, pays each adviser a fee for its services.
| | | |
Portfolio | | Contracted & Effective
Management Fee | |
Large Capitalization Growth | | 0.60 | % |
Large Capitalization Value | | 0.60 | % |
Small Capitalization Growth | | 0.60 | % |
Small Capitalization Value | | 0.60 | % |
International Equity | | 0.70 | % |
International Bond | | 0.50 | % |
Total Return Bond | | 0.45 | % |
Intermediate-Term Bond | | 0.45 | % |
Mortgage Backed Securities | | 0.45 | % |
U.S. Government Money Market | | 0.25 | % |
The Trust has a distribution agreement with Prudential Investment Management Services LLC (“PIMS”) which acts as the distributor of the Class T and Class R shares of the Trust. The Trust compensates PIMS for distributing and servicing the Trust’s Class R shares, pursuant to plan of distribution (the “Class R Plan”),
| | |
| THE TARGET PORTFOLIO TRUST | | 171 |
regardless of expenses actually incurred by PIMS. The distribution fee is accrued daily and payable monthly. No distribution or service fees are paid to PIMS as distributor of the Class T shares of the Trust.
Pursuant to the Class R Plan, the Trust compensates PIMS for distribution related activities at an annual rate of up to .75 of 1% of the average daily net assets of the Class R shares. For the ten months ended October 31, 2007, PIMS has contractually agreed to limit such fees to .50 of 1% of the average daily net assets of the Class R shares.
PI and PIMS are indirect, wholly-owned subsidiaries of Prudential Financial, Inc. (“Prudential”).
Note 3. Other Transactions with Affiliates
Prudential Mutual Fund Services LLC (“PMFS”), an affiliate of PI and an indirect, wholly-owned subsidiary of Prudential, serves as the Trust’s transfer agent. Transfer agent fees and expenses in the Statement of Operations also include certain out-of-pocket expenses paid to non-affiliates where applicable.
For the ten months ended October 31, 2007, the amount of brokerage commissions earned by Prudential Equity Group, LLC, (“PEG”), an indirect, wholly-owned subsidiary of Prudential, from portfolio transactions executed on behalf of the Portfolios were as follows:
| | | |
Portfolio | | PEG |
Large Capitalization Value | | $ | 3,266 |
Small Capitalization Value | | | 136 |
Prudential Investment Management, Inc. (“PIM”), an indirect, wholly-owned subsidiary of Prudential, is the Trust’s security lending agent. For the ten months ended October 31, 2007 and the year ended December 31, 2006, PIM was compensated for these services by the following Portfolios of the Trust:
| | | | | | |
Portfolio | | 2007 | | 2006 |
Large Capitalization Growth | | $ | 44,800 | | $ | 7,412 |
Large Capitalization Value | | | 30,400 | | | 768 |
Small Capitalization Growth | | | 121,885 | | | 12,341 |
Small Capitalization Value | | | 139,300 | | | 515 |
Certain Portfolios invest in the Taxable Money Market Series (the “Series”), a portfolio of Dryden Core Investment Fund, pursuant to an exemptive order received from the Securities and Exchange Commission. The Series is a money market mutual fund registered under the Investment Company Act of 1940, as amended, and managed by PI.
| | |
| 172 | | THE TARGET PORTFOLIO TRUST |
Note 4. Portfolio Securities
Purchases and sales of portfolio securities, excluding short-term investments and U.S. Government securities, for the ten months ended October 31, 2007, were as follows:
| | | | | | |
Portfolio | | Purchases | | Sales |
Large Capitalization Growth | | $ | 252,936,491 | | $ | 256,780,540 |
Large Capitalization Value | | | 191,775,227 | | | 195,554,843 |
Small Capitalization Growth | | | 119,681,046 | | | 122,817,471 |
Small Capitalization Value | | | 224,225,683 | | | 123,539,324 |
International Equity | | | 106,182,570 | | | 113,671,580 |
International Bond | | | 88,762,686 | | | 86,032,093 |
Total Return Bond | | | 88,508,220 | | | 13,369,263 |
Intermediate-Term Bond | | | 101,207,811 | | | 9,880,872 |
Mortgage Backed Securities | | | 8,407,157 | | | 3,829,081 |
Transactions in options written during the ten months ended October 31, 2007, were as follows:
| | | | | | | | | | | | | | |
| | | Intermediate-Term
Bond | | | International
Bond | |
| | | Number of
Contracts/Notional
Amount (000) | | | Premium
Received | | | Number of
Contracts/Notional
Amount (000) | | | Premium
Received | |
Options outstanding at December 31, 2006 | | 2,000 | | | $ | 30,215 | | | 5,100 | | | $ | 27,838 | |
Written options | | 800 | | | | 4,074 | | | 1,600 | | | | 4,948 | |
Written swap options | | 7,700 | | | | 73,896 | | | 19,200 | | | | 263,572 | |
Expired options | | — | | | | — | | | (1,600 | ) | | | (4,948 | ) |
Expired swap options | | (2,000 | ) | | | (30,215 | ) | | — | | | | — | |
Closed Currency Option | | — | | | | | | | (300 | ) | | | (1,618 | ) |
Closed options | | — | | | | — | | | (3,100 | ) | | | (10,138 | ) |
Closed swap options | | — | | | | — | | | (2,000 | ) | | | (17,700 | ) |
| | | | | | | | | | | | | | |
Options outstanding at October 31, 2007 | | 8,500 | | | $ | 77,970 | | | 18,900 | | | $ | 261,954 | |
| | | | | | | | | | | | | | |
| | |
| | | Total Return
Bond | | | Mortgage Backed
Securities | |
| | | Number of
Contracts/Notional
Amount (000) | | | Premium
Received | | | Number of
Contracts/Notional
Amount (000) | | | Premium
Received | |
Options outstanding at December 31, 2006 | | 15,000 | | | $ | 165,270 | | | 2,000 | | | $ | 11,900 | |
Written options | | 9,000 | | | | 73,208 | | | — | | | | — | |
Written swap options | | 49,800 | | | | 923,820 | | | 800 | | | | 147,900 | |
Written Currency Option | | 2,400 | | | | 18,840 | | | — | | | | — | |
Expired swap options | | (5,200 | ) | | | (59,920 | ) | | (2,000 | ) | | | (11,900 | ) |
Closed swap options | | (5,800 | ) | | | (47,560 | ) | | (800 | ) | | | (147,900 | ) |
| | | | | | | | | | | | | | |
Options outstanding at October 31, 2007 | | 65,200 | | | $ | 1,073,658 | | | — | | | $ | — | |
| | | | | | | | | | | | | | |
| | |
| THE TARGET PORTFOLIO TRUST | | 173 |
Note 5. Distributions and Tax Information
Distributions to shareholders, which are determined in accordance with federal income tax regulations, which may differ from generally accepted accounting principles, are recorded on the ex-dividend date. In order to present undistributed net investment income or loss and accumulated net realized gains or losses on the Statement of Assets and Liabilities that more closely represent their tax character, certain adjustments have been made to paid-in-capital in excess of par, undistributed net investment income or loss and accumulated net realized gain or loss on investments.
For the fiscal period ended October 31, 2007 the adjustments were as follows:
| | | | | | | | | | | | |
| | | Undistributed
Net Investment
Income (Loss) | | | Accumulated
Net Gain
(Loss) on
Investments | | | Paid-In
Capital In
Excess of Par | |
Large Capitalization Growth(a) | | $ | (1,036 | ) | | $ | 1,036 | | | $ | — | |
Small Capitalization Growth(b) | | | 104,036 | | | | — | | | | (104,036 | ) |
International Equity(a) | | | (818,984 | ) | | | 818,984 | | | | — | |
International Bond(a),(b),(c),(f) | | | 887,322 | | | | 1,016,043 | | | | (1,903,365 | ) |
Total Return Bond(a),(c),(e),(f) | | | 288,015 | | | | (204,800 | ) | | | (83,215 | ) |
Intermediate-Term Bond(a),(c),(d),(f) | | | 626,729 | | | | (626,729 | ) | | | — | |
Mortgage Backed Securities(c),(e),(f) | | | 60,860 | | | | (60,860 | ) | | | — | |
| (a) | Reclassification of net foreign currency gain (loss). |
| (b) | Reclassification of net operating loss. |
| (c) | Reclassification of swap income. |
| (d) | Reclassification due to other adjustments. |
| (e) | Reclassification of return of capital distribution or overdistribution of income. |
| (f) | Reclassification of paydowns. |
Net investment income or loss, net realized gains or losses and net assets were not affected by these adjustments.
For the fiscal period ended October 31, 2007, the tax character of dividends paid as reflected in the Statement of Changes in Net Assets was as follows:
| | | | | | | | | | | | |
| | | Ordinary
Income | | Long-Term
Capital Gains | | Return of
Capital | | Total
Distributions |
Large Capitalization Growth | | $ | 17,019 | | $ | 2,704,762 | | | — | | $ | 2,721,781 |
Large Capitalization Value | | | 1,201,237 | | | 3,396,384 | | | — | | | 4,597,621 |
Small Capitalization Value | | | 704,299 | | | 1,478,468 | | | — | | | 2,182,767 |
International Equity | | | 12,922 | | | 2,831,508 | | | — | | | 2,844,430 |
Total Return Bond | | | 6,782,344 | | | — | | | — | | | 6,782,344 |
Intermediate-Term Bond | | | 9,048,043 | | | — | | | — | | | 9,048,043 |
Mortgage Backed Securities | | | 2,967,417 | | | — | | $ | 225,427 | | | 3,192,844 |
U.S. Government Money Market | | | 2,522,242 | | | — | | | — | | | 2,522,242 |
| | |
| 174 | | THE TARGET PORTFOLIO TRUST |
For the year ended December 31, 2006, the tax character of dividends and distributions paid as reflected in the Statement of Changes in Net Assets was as follows:
| | | | | | | | | |
| | | Ordinary
Income | | Long-Term
Capital Gains | | Total
Distributions |
Large Capitalization Growth | | $ | 3,659,700 | | $ | 6,600,431 | | $ | 10,260,131 |
Large Capitalization Value | | | 16,962,108 | | | 35,539,123 | | | 52,501,231 |
Small Capitalization Value | | | 7,979,767 | | | 18,548,377 | | | 26,528,144 |
International Equity | | | 13,141,483 | | | 13,080,093 | | | 26,221,576 |
International Bond | | | 1,301,561 | | | 54,582 | | | 1,356,143 |
Total Return Bond | | | 6,983,171 | | | — | | | 6,983,171 |
Intermediate-Term Bond | | | 11,077,415 | | | — | | | 11,077,415 |
Mortgage Backed Securities | | | 3,765,517 | | | — | | | 3,765,517 |
U.S. Government Money Market | | | 2,026,702 | | | — | | | 2,026,702 |
For the year ended December 31, 2005, the tax character of distributions paid, as reflected in the Statement of Changes in Net Assets were:
| | | | | | | | | |
Portfolio | | Ordinary
Income | | Long-Term
Capital Gains | | Total
Distributions |
Large Capitalization Growth | | $ | 424,776 | | $ | 44,003,589 | | $ | 44,428,365 |
Large Capitalization Value | | | 12,089,901 | | | 42,910,387 | | | 55,000,288 |
Small Capitalization Value | | | 6,235,673 | | | 49,928,997 | | | 56,164,670 |
International Equity | | | 5,329,479 | | | 9,868,304 | | | 15,197,783 |
International Bond | | | 832,969 | | | 23,073 | | | 856,042 |
Total Return Bond | | | 6,859,355 | | | 1,294,402 | | | 8,153,757 |
Intermediate-Term Bond | | | 10,159,553 | | | 100,626 | | | 10,260,179 |
Mortgage Backed Securities | | | 4,564,729 | | | — | | | 4,564,729 |
U.S. Government Money Market | | | 1,747,870 | | | — | | | 1,747,870 |
For federal income tax purposes, dividends from net investment income and distributions from short-term capital gains are taxable as ordinary income. Long-term capital gain distributions are taxable as such.
As of October 31, 2007, the Fund had the following amounts of accumulated undistributed earnings on a tax basis:
| | | | | | |
| | | Undistributed
Ordinary
Income | | Undistributed
Long-Term
Capital Gains |
Large Capitalization Growth | | $ | 2,336,230 | | $ | 17,103,313 |
Large Capitalization Value | | | 12,909,154 | | | 21,256,591 |
Small Capitalization Value | | | 12,340,361 | | | 15,670,625 |
International Equity | | | 17,160,914 | | | 23,511,024 |
Intermediate-Term Bond | | | 1,380,873 | | | — |
U.S. Government Money Market | | | 96,067 | | | — |
This differs from the amounts shown on the Statement of Assets and Liabilities primarily due to cumulative timing differences between financial and tax reporting.
| | |
| THE TARGET PORTFOLIO TRUST | | 175 |
For federal income tax purposes, certain Portfolios had capital loss carryforwards as of October 31, 2007 of approximately:
| | | | | | | | | | | | | | | | | | | | | | | | | | | |
| | | Expiring October 31 |
| | | 2008 | | 2009 | | 2010 | | 2011 | | 2012 | | 2013 | | 2014 | | 2015 | | Total |
Small Capitalization Growth | | $ | — | | $ | — | | $ | 3,809,000 | | $ | 6,731,000 | | $ | — | | $ | — | | $ | — | | $ | — | | $ | 10,540,000 |
International Bond | | | — | | | — | | | — | | | — | | | — | | | — | | | — | | | 739,000 | | | 739,000 |
Total Return Bond | | | — | | | — | | | — | | | — | | | — | | | — | | | 293,000 | | | — | | | 293,000 |
Intermediate-Term Bond | | | — | | | — | | | — | | | — | | | — | | | 2,994,000 | | | 1,132,000 | | | 351,000 | | | 4,477,000 |
Mortgage Backed Securities | | | 384,000 | | | — | | | — | | | 970,000 | | | 255,000 | | | 65,000 | | | 1,665,000 | | | 900,000 | | | 4,239,000 |
U.S. Government Money Market | | | — | | | — | | | — | | | — | | | — | | | — | | | 400 | | | — | | | 400 |
Accordingly, no capital gain distributions are expected to be paid to shareholders until future net gains have been realized in excess of such carryforwards.
Prior year capital loss carryforwards were used to offset net taxable capital gains realized in the fiscal period ended October 31, 2007 approximately as follows:
| | | |
Small Capitalization Growth | | $ | 14,249,000 |
Total Return Bond | | | 603,000 |
U.S. Government Money Market | | | 2,000 |
| | |
| 176 | | THE TARGET PORTFOLIO TRUST |
The federal income tax basis of the Portfolio’s investments and the net unrealized appreciation (depreciation) as of October 31, 2007 was as follows:
| | | | | | | | | | | | | | | | | | | | |
| | | Tax Basis of
Investments | | Unrealized
Appreciation | | Unrealized
(Depreciation) | | | Net
Unrealized
Appreciation
(Depreciation) | | Other
Cost Basis
Adjustments | | | Total Net
Unrealized
Appreciation
(Depreciation) |
Large Capitalization Growth | | $ | 307,440,671 | | $ | 78,961,153 | | $ | (5,547,630 | ) | | $ | 73,413,523 | | $ | 91 | | | $ | 73,413,614 |
Large Capitalization Value | | | 378,963,591 | | | 84,039,896 | | | (15,685,689 | ) | | | 68,354,207 | | | — | | | | 68,354,207 |
Small Capitalization Growth | | | 187,385,531 | | | 33,167,879 | | | (7,565,902 | ) | | | 25,601,977 | | | — | | | | 25,601,977 |
Small Capitalization Value | | | 553,220,137 | | | 93,954,784 | | | (26,318,315 | ) | | | 67,636,469 | | | — | | | | 67,636,469 |
International Equity | | | 233,058,516 | | | 94,995,436 | | | (4,992,073 | ) | | | 90,003,363 | | | 118,714 | | | | 90,122,077 |
International Bond | | | 65,450,098 | | | 4,268,547 | | | (919,265 | ) | | | 3,349,282 | | | (226,476 | ) | | | 3,122,806 |
Total Return Bond | | | 263,597,468 | | | 2,933,398 | | | (1,615,473 | ) | | | 1,317,925 | | | 1,284,619 | | | | 2,602,544 |
Intermediate-Term Bond | | | 293,385,578 | | | 3,365,089 | | | (3,015,784 | ) | | | 349,305 | | | 220,953 | | | | 570,258 |
Mortgage Backed Securities | | | 112,681,058 | | | 1,229,972 | | | (808,246 | ) | | | 421,726 | | | 59,501 | | | | 481,227 |
The difference between book basis and tax basis are primarily attributable to deferred losses on wash sales and tax adjustments due to investments in real estate investment trusts. The other cost basis adjustments are primarily attributable to appreciation (depreciation) on written options, futures, swaps, short sales, forward currency contracts and mark to market of receivables and payables.
Note 6. Capital
The Trust has authorized an unlimited number of shares of beneficial interest at $.001 par value per share. Transactions in shares of beneficial interest were as follows:
| | | | | | | | | | | | | | |
| | | CLASS R* | | | CLASS T | |
| | | SHARES | | | AMOUNT | | | SHARES | | | AMOUNT | |
Large Capitalization Growth | | | | | | | | | | | | | | |
Ten months ended October 31, 2007 | | | | | | | | | | | | | | |
Sold | | 1,936,247 | | | $ | 31,128,370 | | | 760,946 | | | $ | 12,119,773 | |
Reinvested | | 6,279 | | | | 100,339 | | | 163,483 | | | | 2,619,004 | |
Redeemed | | (255,760 | ) | | | (4,158,285 | ) | | (2,722,116 | ) | | | (43,743,919 | ) |
| | | | | | | | | | | | | | |
Net Increase/(Decrease) | | 1,686,766 | | | $ | 27,070,424 | | | (1,797,687 | ) | | $ | (29,005,142 | ) |
| | | | | | | | | | | | | | |
Year Ended December 31, 2006: | | | | | | | | | | | | | | |
Sold | | 148,623 | | | $ | 2,275,424 | | | 1,536,968 | | | $ | 22,733,562 | |
Reinvested | | 1,582 | | | | 24,269 | | | 679,204 | | | | 10,216,657 | |
Redeemed | | (5,492 | ) | | | (82,668 | ) | | (3,621,818 | ) | | | (53,803,085 | ) |
| | | | | | | | | | | | | | |
Net Increase/(Decrease) | | 144,713 | | | $ | 2,217,025 | | | (1,405,646 | ) | | $ | (20,852,866 | ) |
| | | | | | | | | | | | | | |
| | |
| THE TARGET PORTFOLIO TRUST | | 177 |
| | | | | | | | | | | | | | |
| | | CLASS R* | | | CLASS T | |
| | | SHARES | | | AMOUNT | | | SHARES | | | AMOUNT | |
Year Ended December 31, 2005: | | | | | | | | | | | | | | |
Sold | | — | | | $ | — | | | 1,994,317 | | | $ | 30,635,551 | |
Reinvested | | — | | | | — | | | 3,017,201 | | | | 44,414,354 | |
Redeemed | | — | | | | — | | | (5,542,592 | ) | | | (85,228,600 | ) |
| | | | | | | | | | | | | | |
Net Increase/(Decrease) | | — | | | $ | — | | | (531,074 | ) | | $ | (10,178,695 | ) |
| | | | | | | | | | | | | | |
| | | | |
Large Capitalization Value | | | | | | | | | | | | | | |
Ten months ended October 31, 2007 | | | | | | | | | | | | | | |
Sold | | 1,976,397 | | | $ | 31,948,577 | | | 1,218,304 | | | $ | 19,688,178 | |
Reinvested | | 7,861 | | | | 131,510 | | | 257,650 | | | | 4,318,217 | |
Redeemed | | (218,652 | ) | | | (3,530,088 | ) | | (3,805,296 | ) | | | (61,699,130 | ) |
| | | | | | | | | | | | | | |
Net Increase/(Decrease) | | 1,765,606 | | | $ | 28,549,999 | | | (2,329,342 | ) | | $ | (37,692,735 | ) |
| | | | | | | | | | | | | | |
Year Ended December 31, 2006: | | | | | | | | | | | | | | |
Sold | | 140,128 | | | $ | 2,221,351 | | | 2,045,864 | | | $ | 31,639,086 | |
Reinvested | | 4,659 | | | | 72,026 | | | 3,416,262 | | | | 50,980,024 | |
Redeemed | | (4,128 | ) | | | (64,682 | ) | | (4,246,426 | ) | | | (65,665,413 | ) |
| | | | | | | | | | | | | | |
Net Increase/(Decrease) | | 140,659 | | | $ | 2,228,695 | | | 1,215,700 | | | $ | 16,953,697 | |
| | | | | | | | | | | | | | |
Year Ended December 31, 2005: | | | | | | | | | | | | | | |
Sold | | — | | | $ | — | | | 2,469,433 | | | $ | 40,152,956 | |
Reinvested | | — | | | | — | | | 3,561,971 | | | | 54,877,512 | |
Redeemed | | — | | | | — | | | (5,284,616 | ) | | | (85,622,845 | ) |
| | | | | | | | | | | | | | |
Net Increase/(Decrease) | | — | | | $ | — | | | 746,788 | | | $ | 9,407,623 | |
| | | | | | | | | | | | | | |
| | | | |
Small Capitalization Growth | | | | | | | | | | | | | | |
Ten months ended October 31, 2007 | | | | | | | | | | | | | | |
Sold | | 1,002,654 | | | $ | 12,927,092 | | | 493,272 | | | $ | 6,297,962 | |
Reinvested | | — | | | | — | | | — | | | | — | |
Redeemed | | (134,481 | ) | | | (1,748,523 | ) | | (1,766,269 | ) | | | (22,677,385 | ) |
| | | | | | | | | | | | | | |
Net Increase/(Decrease) | | 868,173 | | | $ | 11,178,569 | | | (1,272,997 | ) | | $ | (16,379,423 | ) |
| | | | | | | | | | | | | | |
Year Ended December 31, 2006: | | | | | | | | | | | | | | |
Sold | | 75,962 | | | $ | 912,750 | | | 764,833 | | | $ | 8,980,757 | |
Reinvested | | — | | | | — | | | — | | | | — | |
Redeemed | | (1,857 | ) | | | (22,490 | ) | | (2,245,123 | ) | | | (26,457,311 | ) |
| | | | | | | | | | | | | | |
Net Increase/(Decrease) | | 74,105 | | | $ | 890,260 | | | (1,480,290 | ) | | $ | (17,476,554 | ) |
| | | | | | | | | | | | | | |
Year Ended December 31, 2005: | | | | | | | | | | | | | | |
Sold | | — | | | $ | — | | | 1,326,027 | | | $ | 13,851,396 | |
Reinvested | | — | | | | — | | | — | | | | — | |
Redeemed | | — | | | | — | | | (3,325,226 | ) | | | (34,999,953 | ) |
| | | | | | | | | | | | | | |
Net Increase/(Decrease) | | — | | | $ | — | | | (1,999,199 | ) | | $ | (21,148,557 | ) |
| | | | | | | | | | | | | | |
| | | | |
Small Capitalization Value | | | | | | | | | | | | | | |
Ten months ended October 31, 2007 | | | | | | | | | | | | | | |
Sold | | 720,757 | | | $ | 15,410,198 | | | 6,056,104 | | | $ | 125,885,603 | |
Reinvested | | 1,389 | | | | 29,937 | | | 97,463 | | | | 2,106,181 | |
Redeemed | | (83,923 | ) | | | (1,794,034 | ) | | (3,102,154 | ) | | | (66,325,817 | ) |
| | | | | | | | | | | | | | |
Net Increase/(Decrease) | | 638,223 | | | $ | 13,646,101 | | | 3,051,413 | | | $ | 61,665,967 | |
| | | | | | | | | | | | | | |
| | |
| 178 | | THE TARGET PORTFOLIO TRUST |
| | | | | | | | | | | | | | |
| | | CLASS R* | | | CLASS T | |
| | | SHARES | | | AMOUNT | | | SHARES | | | AMOUNT | |
Year Ended December 31, 2006: | | | | | | | | | | | | | | |
Sold | | 53,243 | | | $ | 1,106,981 | | | 3,381,311 | | | $ | 69,453,070 | |
Reinvested | | 1,176 | | | | 24,004 | | | 1,279,367 | | | | 26,025,118 | |
Redeemed | | (2,575 | ) | | | (53,057 | ) | | (2,645,214 | ) | | | (53,787,615 | ) |
| | | | | | | | | | | | | | |
Net Increase/(Decrease) | | 51,844 | | | $ | 1,077,928 | | | 2,015,464 | | | $ | 41,690,573 | |
| | | | | | | | | | | | | | |
Year Ended December 31, 2005: | | | | | | | | | | | | | | |
Sold | | — | | | $ | — | | | 2,398,957 | | | $ | 52,707,779 | |
Reinvested | | — | | | | — | | | 2,862,304 | | | | 55,249,127 | |
Redeemed | | — | | | | — | | | (2,853,930 | ) | | | (62,042,254 | ) |
| | | | | | | | | | | | | | |
Net Increase/(Decrease) | | — | | | $ | — | | | 2,407,331 | | | $ | 45,914,652 | |
| | | | | | | | | | | | | | |
| | | | |
International Equity | | | | | | | | | | | | | | |
Ten months ended October 31, 2007 | | | | | | | | | | | | | | |
Sold | | 1,431,768 | | | $ | 25,704,541 | | | 574,281 | | | $ | 10,135,389 | |
Reinvested | | 5,384 | | | | 95,558 | | | 154,283 | | | | 2,744,688 | |
Redeemed | | (205,842 | ) | | | (3,742,756 | ) | | (2,517,161 | ) | | | (44,875,833 | ) |
| | | | | | | | | | | | | | |
Net Increase/(Decrease) | | 1,231,310 | | | $ | 22,057,343 | | | (1,788,597 | ) | | $ | (31,995,756 | ) |
| | | | | | | | | | | | | | |
Year Ended December 31, 2006: | | | | | | | | | | | | | | |
Sold | | 107,241 | | | $ | 1,751,259 | | | 1,056,436 | | | $ | 16,421,116 | |
Reinvested | | 4,476 | | | | 69,649 | | | 1,676,182 | | | | 26,102,278 | |
Redeemed | | (5,073 | ) | | | (80,505 | ) | | (2,851,896 | ) | | | (44,533,853 | ) |
| | | | | | | | | | | | | | |
Net Increase/(Decrease) | | 106,644 | | | $ | 1,740,403 | | | (119,278 | ) | | $ | (2,010,459 | ) |
| | | | | | | | | | | | | | |
Year Ended December 31, 2005: | | | | | | | | | | | | | | |
Sold | | — | | | $ | — | | | 1,809,451 | | | $ | 23,896,686 | |
Reinvested | | — | | | | — | | | 1,137,351 | | | | 15,191,553 | |
Redeemed | | — | | | | — | | | (3,825,186 | ) | | | (50,701,115 | ) |
| | | | | | | | | | | | | | |
Net Increase/(Decrease) | | — | | | $ | — | | | (878,384 | ) | | $ | (11,612,876 | ) |
| | | | | | | | | | | | | | |
| | | | |
International Bond | | | | | | | | | | | | | | |
Ten months ended October 31, 2007 | | | | | | | | | | | | | | |
Sold | | — | | | $ | — | | | 610,055 | | | $ | 5,021,348 | |
Reinvested | | — | | | | — | | | — | | | | — | |
Redeemed | | — | | | | — | | | (905,211 | ) | | | (7,464,640 | ) |
| | | | | | | | | | | | | | |
Net Increase/(Decrease) | | — | | | $ | — | | | (295,156 | ) | | $ | (2,443,292 | ) |
| | | | | | | | | | | | | | |
Year Ended December 31, 2006: | | | | | | | | | | | | | | |
Sold | | — | | | $ | — | | | 763,221 | | | $ | 6,238,031 | |
Reinvested | | — | | | | — | | | 171,149 | | | | 1,352,078 | |
Redeemed | | — | | | | — | | | (1,106,726 | ) | | | (9,043,897 | ) |
| | | | | | | | | | | | | | |
Net Increase/(Decrease) | | — | | | $ | — | | | (172,356 | ) | | $ | (1,453,788 | ) |
| | | | | | | | | | | | | | |
Year Ended December 31, 2005: | | | | | | | | | | | | | | |
Sold | | — | | | $ | — | | | 975,588 | | | $ | 8,080,019 | |
Reinvested | | — | | | | — | | | 103,962 | | | | 855,615 | |
Redeemed | | — | | | | — | | | (1,410,170 | ) | | | (11,682,782 | ) |
| | | | | | | | | | | | | | |
Net Increase/(Decrease) | | — | | | $ | — | | | (330,620 | ) | | $ | (2,747,148 | ) |
| | | | | | | | | | | | | | |
| | |
| THE TARGET PORTFOLIO TRUST | | 179 |
| | | | | | | | | | | | | | |
| | | CLASS R* | | | CLASS T | |
| | | SHARES | | | AMOUNT | | | SHARES | | | AMOUNT | |
| | | | |
Total Return Bond | | | | | | | | | | | | | | |
Ten months ended October 31, 2007 | | | | | | | | | | | | | | |
Sold | | 2,343,516 | | | $ | 24,169,022 | | | 3,273,665 | | | $ | 33,912,911 | |
Reinvested | | 28,530 | | | | 295,200 | | | 585,973 | | | | 6,082,603 | |
Redeemed | | (271,239 | ) | | | (2,803,157 | ) | | (2,685,625 | ) | | | (27,764,234 | ) |
| | | | | | | | | | | | | | |
Net Increase/(Decrease) | | 2,100,807 | | | $ | 21,661,065 | | | 1,174,013 | | | $ | 12,231,280 | |
| | | | | | | | | | | | | | |
Year Ended December 31, 2006: | | | | | | | | | | | | | | |
Sold | | 153,639 | | | $ | 1,595,095 | | | 3,166,599 | | | $ | 32,628,443 | |
Reinvested | | 394 | | | | 4,078 | | | 674,025 | | | | 6,952,147 | |
Redeemed | | (8,313 | ) | | | (86,645 | ) | | (3,285,696 | ) | | | (33,843,662 | ) |
| | | | | | | | | | | | | | |
Net Increase/(Decrease) | | 145,720 | | | $ | 1,512,528 | | | 554,928 | | | $ | 5,736,928 | |
| | | | | | | | | | | | | | |
Year Ended December 31, 2005: | | | | | | | | | | | | | | |
Sold | | — | | | $ | — | | | 3,374,867 | | | $ | 35,616,451 | |
Reinvested | | — | | | | — | | | 774,847 | | | | 8,147,528 | |
Redeemed | | — | | | | — | | | (5,376,334 | ) | | | (56,755,679 | ) |
| | | | | | | | | | | | | | |
Net Increase/(Decrease) | | — | | | $ | — | | | (1,226,620 | ) | | $ | (12,991,700 | ) |
| | | | | | | | | | | | | | |
| | | | |
Intermediate-Term Bond | | | | | | | | | | | | | | |
Ten months ended October 31, 2007 | | | | | | | | | | | | | | |
Sold | | — | | | $ | — | | | 2,586,605 | | | $ | 26,040,464 | |
Reinvested | | — | | | | — | | | 857,943 | | | | 8,698,808 | |
Redeemed | | — | | | | — | | | (4,888,406 | ) | | | (49,463,890 | ) |
| | | | | | | | | | | | | | |
Net Increase/(Decrease) | | — | | | $ | — | | | (1,443,858 | ) | | $ | (14,724,618 | ) |
| | | | | | | | | | | | | | |
Year Ended December 31, 2006: | | | | | | | | | | | | | | |
Sold | | — | | | $ | — | | | 9,121,062 | | | $ | 92,017,701 | |
Reinvested | | — | | | | — | | | 1,092,531 | | | | 11,032,073 | |
Redeemed | | — | | | | — | | | (11,754,425 | ) | | | (118,666,524 | ) |
| | | | | | | | | | | | | | |
Net Increase/(Decrease) | | — | | | $ | — | | | (1,540,832 | ) | | $ | (15,616,750 | ) |
| | | | | | | | | | | | | | |
Year Ended December 31, 2005: | | | | | | | | | | | | | | |
Sold | | — | | | $ | — | | | 3,906,750 | | | $ | 40,116,845 | |
Reinvested | | — | | | | — | | | 1,000,697 | | | | 10,256,072 | |
Redeemed | | — | | | | — | | | (7,912,087 | ) | | | (81,229,652 | ) |
| | | | | | | | | | | | | | |
Net Increase/(Decrease) | | — | | | $ | — | | | (3,004,640 | ) | | $ | (30,856,735 | ) |
| | | | | | | | | | | | | | |
| | | | |
Mortgage Backed Securities | | | | | | | | | | | | | | |
Ten months ended October 31, 2007 | | | | | | | | | | | | | | |
Sold | | — | | | $ | — | | | 777,432 | | | $ | 7,731,632 | |
Reinvested | | — | | | | — | | | 309,345 | | | | 3,073,764 | |
Redeemed | | — | | | | — | | | (1,249,976 | ) | | | (12,382,142 | ) |
| | | | | | | | | | | | | | |
Net Increase/(Decrease) | | — | | | $ | — | | | (163,199 | ) | | $ | (1,576,746 | ) |
| | | | | | | | | | | | | | |
Year Ended December 31, 2006: | | | | | | | | | | | | | | |
Sold | | — | | | $ | — | | | 684,692 | | | $ | 6,808,481 | |
Reinvested | | — | | | | — | | | 377,117 | | | | 3,754,874 | |
Redeemed | | — | | | | — | | | (1,647,539 | ) | | | (16,389,625 | ) |
| | | | | | | | | | | | | | |
Net Increase/(Decrease) | | — | | | $ | — | | | (585,730 | ) | | $ | (5,826,270 | ) |
| | | | | | | | | | | | | | |
| | |
| 180 | | THE TARGET PORTFOLIO TRUST |
| | | | | | | | | | | | |
| | | CLASS R* | | CLASS T | |
| | | SHARES | | AMOUNT | | SHARES | | | AMOUNT | |
Year Ended December 31, 2005: | | | | | | | | | | | | |
Sold | | — | | $ | — | | 729,295 | | | $ | 7,499,428 | |
Reinvested | | — | | | — | | 446,224 | | | | 4,564,729 | |
Redeemed | | — | | | — | | (2,250,862 | ) | | | (23,076,242 | ) |
| | | | | | | | | | | | |
Net Increase/(Decrease) | | — | | $ | — | | (1,075,343 | ) | | $ | (11,012,085 | ) |
| | | | | | | | | | | | |
| * | Commencement of Class R shares, August 22, 2006 |
Note 7. Borrowings
The Trust (excluding U.S. Government Money Market), along with other affiliated registered investment companies (the “Funds”), is a party to a syndicated credit agreement (“SCA”) with two banks. The SCA provides for a commitment of $500 million. Interest on any borrowings under the SCA would be incurred at contracted market rates and a commitment fee for the unused amount is accrued daily and paid quarterly. Effective October 26, 2007, the Funds renewed the SCA with the banks. The commitment under the renewed SCA continues to be $500 million. The Trust pays a commitment fee of .06 of 1% of the unused portion of the renewed SCA. The expiration date of the SCA will be October 24, 2008. For the period October 27, 2006 through October 26, 2007, the Funds paid a commitment fee of .07 of 1% of the unused portion of the agreement. The purpose of the SCA is to serve as an alternative source of funding for capital share redemptions.
The following Portfolios utilized the line of credit during the ten months ended October 31, 2007. The average balance outstanding is for the number of days that each Portfolio had an outstanding balance.
| | | | | | | | | | |
Portfolio | | Average Advances
Outstanding
During the Period | | Average
Interest
Rate | | | Number of Days
Advances Outstanding
During the Period | | Outstanding
Borrowings
at October 31, 2007 |
Large Capitalization Growth | | $ | 960,333 | | 5.72 | % | | 6 | | — |
Large Capitalization Value | | | 1,363,846 | | 5.52 | % | | 13 | | — |
Small Capitalization Growth | | | 520,000 | | 5.72 | % | | 7 | | — |
International Equity | | | 501,622 | | 5.72 | % | | 74 | | — |
Reverse Repurchase Agreements: Mortgage Backed Securities Portfolio enters into reverse repurchase agreements with qualified, third party broker-dealers as determined by and under the direction of the Trust’s Board of Trustees. Interest on the value of reverse repurchase agreements issued and outstanding is based upon competitive market rates at the time of issuance. At the time the Portfolio enters into a reverse repurchase agreement, it establishes and maintains a segregated account with the lender containing liquid investment grade securities having a value not less than the repurchase price, including accrued interest, of the reverse repurchase agreement.
The average daily balance of reverse repurchase agreements outstanding during the ten months ended October 31, 2007 in the Mortgage Backed Securities Portfolio was approximately $14,095,300 at a weighted average interest rate of approximately 5.35%. The average daily balance is for the number of days the Portfolio had an outstanding balance. The maximum amount of total reverse repurchase agreements outstanding at any month-end during the period was approximately $25,986,000 as of October 31, 2007, which was 15% of total assets.
| | |
| THE TARGET PORTFOLIO TRUST | | 181 |
Note 8. New Accounting Pronouncements
On September 20, 2006, the FASB released Statement of Financial Accounting Standards No. 157 “Fair Value Measurements” (FAS 157). FAS 157 establishes an authoritative definition of fair value, sets out a framework for measuring fair value, and requires additional disclosures about fair-value measurements. The application of FAS 157 is required for fiscal years beginning after November 15, 2007 and interim periods within those fiscal years. At this time, management is evaluating the implications of FAS 157 and its impact, if any, in the financial statements has not yet been determined.
| | |
| 182 | | THE TARGET PORTFOLIO TRUST |
Financial Highlights
| | | | | | |
| | | LARGE CAPITALIZATION
GROWTH PORTFOLIO | |
| | | Class R | |
| | | Ten Months
Ended
October 31,
2007(f)(g) | | | August 22,
2006(b)
through
December 31,
2006 | |
| | |
| PER SHARE OPERATING PERFORMANCE: | | | | | | |
Net asset value, beginning of period | | $15.31 | | | $14.32 | |
Income (loss) from investment operations | | | | | | |
Net investment income (loss) | | (.02 | ) | | .03 | |
Net realized and unrealized gain on investments | | 2.31 | | | 1.30 | |
Total from investment operations | | 2.29 | | | 1.33 | |
Less dividends and distributions | | | | | | |
Dividends from net investment income | | — | | | (.05 | ) |
Distributions from net realized gains | | (.14 | ) | | (.29 | ) |
Total dividends and distributions | | (.14 | ) | | (.34 | ) |
| Net asset value, end of period | | $17.46 | | | $15.31 | |
| | |
| TOTAL RETURN(a) | | 14.95 | % | | 9.34 | % |
| | |
| RATIOS/SUPPLEMENTAL DATA: | | | | | | |
Net assets, end of period (000) | | $31,982 | | | $2,216 | |
Average net assets (000) | | $14,059 | | | $429 | |
Ratios to average net assets | | | | | | |
Expenses, including distribution and service (12b-1) fees(e) | | 1.18 | %(c) | | 1.25 | %(c) |
Expenses, excluding distribution and service (12b-1) fees | | .68 | %(c) | | .75 | %(c) |
Net investment income (loss) | | (.14 | %)(c) | | .28 | %(c) |
Portfolio turnover rate | | 81 | %(d) | | 69 | %(d) |
| (a) | Total return is calculated assuming a purchase of a share on the first day and a sale on the last day of each period reported and includes reinvestment of dividends and distributions. Total returns may reflect adjustments to conform to generally accepted accounting principles. Total returns for periods less than one full year are not annualized. |
| (b) | Commencement of operations. |
| (e) | The distributor of the Trust has contractually agreed to limit its distribution and service (12b-1) fees to .50 of 1% of the average daily net assets of the Class R shares. |
| (f) | Calculated based upon average shares outstanding during the period. |
| (g) | For the ten month period ended October 31, 2007. The Trust changed its fiscal year end from December 31 to October 31, effective October 31, 2007. |
See Notes to Financial Statements.
| | |
| THE TARGET PORTFOLIO TRUST | | 183 |
Financial Highlights (continued)
| | | | | | | | | | | | | | | | | | |
| | | LARGE CAPITALIZATION
GROWTH PORTFOLIO | |
| | | Ten Months
Ended
October 31,
2007(e)(f) | | | Class T | |
| | | | Year Ended December 31, | |
| | | | 2006 | | | 2005 | | | 2004 | | | 2003 | | | 2002 | |
| | | | | | |
| PER SHARE OPERATING PERFORMANCE: | | | | | | | | | | | | | | | | | | |
Net asset value, beginning of period | | $15.33 | | | $14.60 | | | $15.90 | | | $15.39 | | | $11.03 | | | $16.15 | |
Income (loss) from investment operations | | | | | | | | | | | | | | | | | | |
Net investment income (loss) | | .04 | | | .08 | | | .03 | | | .07 | | | (.01 | ) | | (.01 | ) |
Net realized and unrealized gain (loss) on investments | | 2.32 | | | 1.18 | | | 1.06 | | | .51 | | | 4.37 | | | (5.11 | ) |
Total from investment operations | | 2.36 | | | 1.26 | | | 1.09 | | | .58 | | | 4.36 | | | (5.12 | ) |
Less dividends and distributions | | | | | | | | | | | | | | | | | | |
Dividends from net investment income | | — | (d) | | (.09 | ) | | (.02 | ) | | (.07 | ) | | — | | | — | |
Distributions from net realized gains | | (.14 | ) | | (.44 | ) | | (2.37 | ) | | — | | | — | | | — | |
Total distributions | | (.14 | ) | | (.53 | ) | | (2.39 | ) | | (.07 | ) | | — | | | — | |
| Net asset value, end of period | | $17.55 | | | $15.33 | | | $14.60 | | | $15.90 | | | $15.39 | | | $11.03 | |
| | | | | | |
| TOTAL RETURN(a) | | 15.41 | % | | 8.67 | % | | 6.74 | % | | 3.78 | % | | 39.53 | % | | (31.70 | %) |
| | | | | |
| RATIOS/SUPPLEMENTAL DATA: | | | | | | | | | | | | | | | | |
Net assets, end of period (000) | | $313,718 | | | $301,566 | | | $307,835 | | | $343,760 | | | $348,385 | | | $243,748 | |
Average net assets (000) | | $303,340 | | | $299,597 | | | $310,710 | | | $345,413 | | | $290,985 | | | $297,189 | |
Ratios to average net assets | | | | | | | | | | | | | | | | | | |
Expenses, including distribution and service (12b-1) fees | | .68 | %(b) | | .75 | % | | .76 | % | | .77 | % | | .84 | % | | .81 | % |
Expenses, excluding distribution and service (12b-1) fees | | .68 | %(b) | | .75 | % | | .76 | % | | .77 | % | | .84 | % | | .81 | % |
Net investment income (loss) | | .29 | %(b) | | .51 | % | | .18 | % | | .45 | % | | (.09 | )% | | (.11 | )% |
Portfolio turnover rate | | 81 | %(c) | | 69 | % | | 246 | % | | 76 | % | | 49 | % | | 66 | % |
| (a) | Total return is calculated assuming a purchase of a share on the first day and a sale on the last day of each period reported and includes reinvestment of dividends and distributions. Total returns may reflect adjustments to conform to generally accepted accounting principles. Total returns for periods less than one full year are not annualized. |
| (d) | Less than $0.005 per share. |
| (e) | Calculated based upon average shares outstanding during the period. |
| (f) | For the ten month period ended October 31, 2007. The Trust changed its fiscal year end from December 31 to October 31, effective October 31, 2007. |
See Notes to Financial Statements.
| | |
| 184 | | THE TARGET PORTFOLIO TRUST |
Financial Highlights (continued)
| | | | | | |
| | | LARGE CAPITALIZATION
VALUE PORTFOLIO | |
| | | Class R | |
| | | Ten Months
Ended
October 31,
2007(g)(h) | | | August 22,
2006(b)
through
December 31,
2006(g) | |
| | |
| PER SHARE OPERATING PERFORMANCE: | | | | | | |
Net asset value, beginning of period | | $15.60 | | | $15.07 | |
Income (loss) from investment operations | | | | | | |
Net investment income | | .15 | | | .08 | |
Net realized and unrealized gain on investments | | .67 | | | 1.48 | |
Total from investment operations | | .82 | | | 1.56 | |
Less dividends and distributions | | | | | | |
Dividends from net investment income | | — | (f) | | (.24 | ) |
Distributions from net realized gains | | (.18 | ) | | (.79 | ) |
Total dividends and distributions | | (.18 | ) | | (1.03 | ) |
| Net asset value, end of period | | $16.24 | | | $15.60 | |
| | |
| TOTAL RETURN(a) | | 5.24 | % | | 10.44 | % |
| | |
| RATIOS/SUPPLEMENTAL DATA: | | | | | | |
Net assets, end of period (000) | | $30,958 | | | $2,194 | |
Average net assets (000) | | $14,046 | | | $445 | |
Ratios to average net assets | | | | | | |
Expenses, including distribution and service (12b-1) fees(e) | | 1.19 | %(c) | | 1.22 | %(c) |
Expenses, excluding distribution and service (12b-1) fees | | .69 | %(c) | | .72 | %(c) |
Net investment income | | 1.13 | %(c) | | 1.69 | %(c) |
Portfolio turnover rate | | 48 | %(d) | | 44 | %(d) |
| (a) | Total return is calculated assuming a purchase of a share on the first day and a sale on the last day of each period reported and includes reinvestment of dividends and distributions. Total returns may reflect adjustments to conform to generally accepted accounting principles. Total returns for periods less than one full year are not annualized. |
| (b) | Commencement of operations. |
| (e) | The distributor of the Trust has contractually agreed to limit its distribution and service (12b-1) fees to .50 of 1% of the average daily net assets of the Class R shares. |
| (f) | Less than $0.005 per share. |
| (g) | Calculated based upon average shares outstanding during the period. |
| (h) | For the ten month period ended October 31, 2007. The Trust changed its fiscal year end from December 31 to October 31, effective October 31, 2007. |
See Notes to Financial Statements.
| | |
| THE TARGET PORTFOLIO TRUST | | 185 |
Financial Highlights (continued)
| | | | | | | | | | | | | | | | | | |
| | | LARGE CAPITALIZATION
VALUE PORTFOLIO | |
| | | Ten Months
Ended
October 31,
2007(e)(f) | | | Class T | |
| | | | Year Ended December 31, | |
| | | | 2006(e) | | | 2005 | | | 2004 | | | 2003 | | | 2002 | |
| | | | | | |
| PER SHARE OPERATING PERFORMANCE: | | | | | | | | | | | | | | | | | | |
Net asset value, beginning of period | | $15.60 | | | $15.11 | | | $16.59 | | | $14.13 | | | $10.49 | | | $12.45 | |
Income (loss) from investment operations | | | | | | | | | | | | | | | | | | |
Net investment income | | .22 | | | .28 | | | .25 | | | .21 | | | .17 | | | .18 | |
Net realized and unrealized gain (loss) on investments | | .67 | | | 2.45 | | | .80 | | | 2.45 | | | 3.64 | | | (1.85 | ) |
Total from investment operations | | .89 | | | 2.73 | | | 1.05 | | | 2.66 | | | 3.81 | | | (1.67 | ) |
Less dividends and distributions | | | | | | | | | | | | | | | | | | |
Dividends from net investment income | | — | (d) | | (.29 | ) | | (.25 | ) | | (.20 | ) | | (.17 | ) | | (.17 | ) |
Distributions from net realized gains | | (.18 | ) | | (1.95 | ) | | (2.28 | ) | | — | | | — | | | (.12 | ) |
Total dividends and distributions | | (.18 | ) | | (2.24 | ) | | (2.53 | ) | | (.20 | ) | | (.17 | ) | | (.29 | ) |
| Net asset value, end of period | | $16.31 | | | $15.60 | | | $15.11 | | | $16.59 | | | $14.13 | | | $10.49 | |
| | | | | | |
| TOTAL RETURN(a) | | 5.70 | % | | 19.34 | % | | 6.50 | % | | 18.87 | % | | 36.38 | % | | (13.57 | %) |
| | | | | |
| RATIOS/SUPPLEMENTAL DATA: | | | | | | | | | | | | | | | | |
Net assets, end of period (000) | | $372,900 | | | $393,111 | | | $362,253 | | | $385,414 | | | $316,131 | | | $229,626 | |
Average net assets (000) | | $392,564 | | | $371,251 | | | $366,301 | | | $346,319 | | | $253,653 | | | $253,096 | |
Ratios to average net assets | | | | | | | | | | | | | | | | | | |
Expenses, including distribution and service (12b-1) fees | | .69 | %(b) | | .72 | % | | .74 | % | | .74 | % | | .80 | % | | .80 | % |
Expenses, excluding distribution and service (12b-1) fees | | .69 | %(b) | | .72 | % | | .74 | % | | .74 | % | | .80 | % | | .80 | % |
Net investment income | | 1.61 | %(b) | | 1.79 | % | | 1.48 | % | | 1.43 | % | | 1.50 | % | | 1.49 | % |
Portfolio turnover rate | | 48 | %(c) | | 44 | % | | 90 | % | | 47 | % | | 56 | % | | 56 | % |
| (a) | Total return is calculated assuming a purchase of a share on the first day and a sale on the last day of each period reported and includes reinvestment of dividends and distributions. Total returns may reflect adjustments to conform to generally accepted accounting principles. Total returns for periods less than one full year are not annualized. |
| (d) | Less than $0.005 per share. |
| (e) | Calculated based upon average shares outstanding during the period. |
| (f) | For the ten month period ended October 31, 2007. The Trust changed its fiscal year end from December 31 to October 31, effective October 31, 2007. |
See Notes to Financial Statements.
| | |
| 186 | | THE TARGET PORTFOLIO TRUST |
Financial Highlights (continued)
| | | | | | |
| | | SMALL CAPITALIZATION
GROWTH PORTFOLIO | |
| | | Class R | |
| | | Ten Months
Ended
October 31,
2007(g)(h) | | | August 22,
2006(b)
through
December 31,
2006 | |
| | |
| PER SHARE OPERATING PERFORMANCE: | | | | | | |
Net asset value, beginning of period | | $12.12 | | | $11.04 | |
Income (loss) from investment operations | | | | | | |
Net investment loss | | (.06 | ) | | — | (c) |
Net realized and unrealized gain on investments | | 1.67 | | | 1.08 | |
Total from investment operations | | 1.61 | | | 1.08 | |
| Net asset value, end of period | | $13.73 | | | $12.12 | |
| | |
| TOTAL RETURN(a) | | 13.28 | % | | 9.78 | % |
| | |
| RATIOS/SUPPLEMENTAL DATA: | | | | | | |
Net assets, end of period (000) | | $12,942 | | | $898 | |
Average net assets (000) | | $5,725 | | | $186 | |
Ratios to average net assets | | | | | | |
Expenses, including distribution and service (12b-1) fees(f) | | 1.28 | %(d) | | 1.34 | %(d) |
Expenses, excluding distribution and service (12b-1) fees | | .78 | %(d) | | .84 | %(d) |
Net investment loss | | (.56 | )%(d) | | (.05 | )%(d) |
Portfolio turnover rate | | 87 | %(e) | | 96 | %(e) |
| (a) | Total return is calculated assuming a purchase of a share on the first day and a sale on the last day of each period reported and includes reinvestment of dividends and distributions. Total returns may reflect adjustments to conform to generally accepted accounting principles. Total returns for periods less than one full year are not annualized. |
| (b) | Commencement of operations. |
| (c) | Less than $0.005 per share. |
| (f) | The distributor of the Trust has contractually agreed to limit its distribution and service (12b-1) fees to .50 of 1% of the average daily net assets of the Class R shares. |
| (g) | Calculated based upon average shares outstanding during the period. |
| (h) | For the ten month period ended October 31, 2007. The Trust changed its fiscal year end from December 31 to October 31, effective October 31, 2007. |
See Notes to Financial Statements.
| | |
| THE TARGET PORTFOLIO TRUST | | 187 |
Financial Highlights (continued)
| | | | | | | | | | | | | | | | | | |
| | | SMALL CAPITALIZATION
GROWTH PORTFOLIO | |
| | | Ten Months
Ended
October 31,
2007(d)(e) | | | Class T | |
| | | | Year Ended December 31, | |
| | | | 2006 | | | 2005 | | | 2004 | | | 2003 | | | 2002 | |
| | | | | | |
| PER SHARE OPERATING PERFORMANCE: | | | | | | | | | | | | | | | | | | |
Net asset value, beginning of period | | $12.14 | | | $11.28 | | | $10.79 | | | $9.38 | | | $7.05 | | | $10.56 | |
Income (loss) from investment operations | | | | | | | | | | | | | | | | | | |
Net investment loss | | (.01 | ) | | (.05 | ) | | (.07 | ) | | (.06 | ) | | (.06 | ) | | (.06 | ) |
Net realized and unrealized gain (loss) on investments | | 1.69 | | | .91 | | | .56 | | | 1.47 | | | 2.39 | | | (3.45 | ) |
Total from investment operations | | 1.68 | | | .86 | | | .49 | | | 1.41 | | | 2.33 | | | (3.51 | ) |
| Net asset value, end of period | | $13.82 | | | $12.14 | | | $11.28 | | | $10.79 | | | $9.38 | | | $7.05 | |
| | | | | | |
| TOTAL RETURN(a) | | 13.84 | % | | 7.62 | % | | 4.54 | % | | 15.03 | % | | 33.05 | % | | (33.24 | %) |
| | | | | |
| RATIOS/SUPPLEMENTAL DATA: | | | | | | | | | | | | | | | | |
Net assets, end of period (000) | | $137,630 | | | $136,422 | | | $143,366 | | | $158,757 | | | $140,251 | | | $100,868 | |
Average net assets (000) | | $136,851 | | | $140,489 | | | $144,034 | | | $146,717 | | | $116,632 | | | $122,299 | |
Ratios to average net assets | | | | | | | | | | | | | | | | | | |
Expenses, including distribution and service (12b-1) fees | | .78 | %(b) | | .84 | % | | .91 | % | | .90 | % | | 1.03 | % | | .99 | % |
Expenses, excluding distribution and service (12b-1) fees | | .78 | %(b) | | .84 | % | | .91 | % | | .90 | % | | 1.03 | % | | .99 | % |
Net investment loss | | (.07 | )%(b) | | (.39 | )% | | (.62 | )% | | (.58 | )% | | (.80 | )% | | (.74 | )% |
Portfolio turnover rate | | 87 | %(c) | | 96 | % | | 147 | % | | 107 | % | | 235 | % | | 153 | % |
| (a) | Total return is calculated assuming a purchase of a share on the first day and a sale on the last day of each period reported and includes reinvestment of dividends and distributions. Total returns may reflect adjustments to conform to generally accepted accounting principles. Total returns for periods less than one full year are not annualized. |
| (d) | Calculated based upon average shares outstanding during the period. |
| (e) | For the ten month period ended October 31, 2007. The Trust changed its fiscal year end from December 31 to October 31, effective October 31, 2007. |
See Notes to Financial Statements.
| | |
| 188 | | THE TARGET PORTFOLIO TRUST |
Financial Highlights (continued)
| | | | | | |
| | | SMALL CAPITALIZATION
VALUE PORTFOLIO | |
| | | Class R | |
| | | Ten Months
Ended
October 31,
2007(g)(h) | | | August 22,
2006(b)
through
December 31,
2006 | |
| | |
| PER SHARE OPERATING PERFORMANCE: | | | | | | |
Net asset value, beginning of period | | $20.46 | | | $20.05 | |
Income from investment operations | | | | | | |
Net investment income | | .13 | | | .14 | |
Net realized and unrealized gain on investments | | 1.42 | | | 1.74 | |
Total from investment operations | | 1.55 | | | 1.88 | |
Less dividends and distributions | | | | | | |
Dividends from net investment income | | — | (f) | | (.18 | ) |
Distributions from net realized gains | | (.11 | ) | | (1.29 | ) |
Total dividends and distributions | | (.11 | ) | | (1.47 | ) |
| Net asset value, end of period | | $21.90 | | | $20.46 | |
| | |
| TOTAL RETURN(a) | | 7.55 | % | | 9.45 | % |
| | |
| RATIOS/SUPPLEMENTAL DATA: | | | | | | |
Net assets, end of period (000) | | $15,112 | | | $1,061 | |
Average net assets (000) | | $6,828 | | | $217 | |
Ratios to average net assets | | | | | | |
Expenses, including distribution and service (12b-1) fees(e) | | 1.23 | %(c) | | 1.30 | %(c) |
Expenses, excluding distribution and service (12b-1) fees | | .73 | %(c) | | .80 | %(c) |
Net investment income | | .73 | %(c) | | 1.37 | %(c) |
Portfolio turnover rate | | 32 | %(d) | | 36 | %(d) |
| (a) | Total return is calculated assuming a purchase of a share on the first day and a sale on the last day of each period reported and includes reinvestment of dividends and distributions. Total returns may reflect adjustments to conform to generally accepted accounting principles. Total returns for periods less than one full year are not annualized. |
| (b) | Commencement of operations. |
| (e) | The distributor of the Trust has contractually agreed to limit its distribution and service (12b-1) fees to .50 of 1% of the average daily net assets of the Class R shares. |
| (f) | Less than $0.005 per share. |
| (g) | Calculated based upon average shares outstanding during the period. |
| (h) | For the ten month period ended October 31, 2007. The Trust changed its fiscal year end from December 31 to October 31, effective October 31, 2007. |
See Notes to Financial Statements.
| | |
| THE TARGET PORTFOLIO TRUST | | 189 |
Financial Highlights (continued)
| | | | | | | | | | | | | | | | | | |
| | | SMALL CAPITALIZATION
VALUE PORTFOLIO | |
| | | Ten Months
Ended
October 31,
2007(e)(f) | | | Class T | |
| | | | Year Ended December 31, | |
| | | | 2006 | | | 2005 | | | 2004 | | | 2003 | | | 2002 | |
| | | | | | |
| PER SHARE OPERATING PERFORMANCE: | | | | | | | | | | | | | | | | | | |
Net asset value, beginning of period | | $20.47 | | | $18.98 | | | $21.84 | | | $18.78 | | | $13.23 | | | $17.54 | |
Income (loss) from investment operations | | | | | | | | | | | | | | | | | | |
Net investment income | | .25 | | | .23 | | | .18 | | | .17 | | | .03 | | | .04 | |
Net realized and unrealized gain (loss) on investments | | 1.39 | | | 3.09 | | | 2.06 | | | 4.27 | | | 6.18 | | | (1.41 | ) |
Total from investment operations | | 1.64 | | | 3.32 | | | 2.24 | | | 4.44 | | | 6.21 | | | (1.37 | ) |
Less dividends and distributions | | | | | | | | | | | | | | | | | | |
Dividends from net investment income | | — | (d) | | (.22 | ) | | (.16 | ) | | (.17 | ) | | (.03 | ) | | (.04 | ) |
Distributions from net realized gains | | (.11 | ) | | (1.61 | ) | | (4.94 | ) | | (1.21 | ) | | (.63 | ) | | (2.90 | ) |
Total distributions | | (.11 | ) | | (1.83 | ) | | (5.10 | ) | | (1.38 | ) | | (.66 | ) | | (2.94 | ) |
| Net asset value, end of period | | $22.00 | | | $20.47 | | | $18.98 | | | $21.84 | | | $18.78 | | | $13.23 | |
| | | | | | |
| TOTAL RETURN(a) | | 8.04 | % | | 17.72 | % | | 10.10 | % | | 24.02 | % | | 47.10 | % | | (8.48 | %) |
| | | | | |
| RATIOS/SUPPLEMENTAL DATA: | | | | | | | | | | | | | | | | |
Net assets, end of period (000) | | $411,690 | | | $320,728 | | | $259,115 | | | $245,576 | | | $205,989 | | | $147,930 | |
Average net assets (000) | | $403,020 | | | $290,505 | | | $249,661 | | | $218,487 | | | $161,025 | | | $167,945 | |
Ratios to average net assets | | | | | | | | | | | | | | | | | | |
Expenses, including distribution and service (12b-1) fees | | .73 | %(b) | | .80 | % | | .79 | % | | .82 | % | | .93 | % | | .88 | % |
Expenses, excluding distribution and service (12b-1) fees | | .73 | %(b) | | .80 | % | | .79 | % | | .82 | % | | .93 | % | | .88 | % |
Net investment income | | 1.38 | %(b) | | 1.17 | % | | .81 | % | | .86 | % | | .15 | % | | .23 | % |
Portfolio turnover rate | | 32 | %(c) | | 36 | % | | 118 | % | | 22 | % | | 89 | % | | 95 | % |
| (a) | Total return is calculated assuming a purchase of a share on the first day and a sale on the last day of each period reported and includes reinvestment of dividends and distributions. Total returns may reflect adjustments to conform to generally accepted accounting principles. Total returns for periods less than one full year are not annualized. |
| (d) | Less than $0.005 per share. |
| (e) | Calculated based upon average shares outstanding during the period. |
| (f) | For the ten month period ended October 31, 2007. The Trust changed its fiscal year end from December 31 to October 31, effective October 31, 2007. |
See Notes to Financial Statements.
| | |
| 190 | | THE TARGET PORTFOLIO TRUST |
Financial Highlights (continued)
| | | | | | |
| | | INTERNATIONAL
EQUITY PORTFOLIO | |
| | | Class R | |
| | | Ten Months
Ended
October 31,
2007(f)(g) | | | August 22,
2006(b)
through
December 31,
2006 | |
| | |
| PER SHARE OPERATING PERFORMANCE: | | | | | | |
Net asset value, beginning of period | | $16.21 | | | $16.09 | |
Income (loss) from investment operations | | | | | | |
Net investment income | | .33 | | | .16 | |
Net realized and unrealized gain on investments | | 3.68 | | | 1.66 | |
Total from investment operations | | 4.01 | | | 1.82 | |
Less dividends and distributions | | | | | | |
Dividends from net investment income | | — | | | (.25 | ) |
Distributions from net realized gains | | (.18 | ) | | (1.45 | ) |
Total dividends and distributions | | (.18 | ) | | (1.70 | ) |
| Net asset value, end of period | | $20.04 | | | $16.21 | |
| | |
| TOTAL RETURN(a) | | 24.85 | % | | 11.74 | % |
| | |
| RATIOS/SUPPLEMENTAL DATA: | | | | | | |
Net assets, end of period (000) | | $26,811 | | | $1,728 | |
Average net assets (000) | | $11,612 | | | $346 | |
Ratios to average net assets | | | | | | |
Expenses, including distribution and service (12b-1) fees(e) | | 1.33 | %(c) | | 1.43 | %(c) |
Expenses, excluding distribution and service (12b-1) fees | | .83 | %(c) | | .93 | %(c) |
Net investment income | | 2.20 | %(c) | | .39 | %(c) |
Portfolio turnover rate | | 37 | %(d) | | 41 | %(d) |
| (a) | Total return is calculated assuming a purchase of a share on the first day and a sale on the last day of each period reported and includes reinvestment of dividends and distributions. Total returns may reflect adjustments to conform to generally accepted accounting principles. Total returns for periods less than one full year are not annualized. |
| (b) | Commencement of operations. |
| (e) | The distributor of the Trust has contractually agreed to limit its distribution and service (12b-1) fees to .50 of 1% of the average daily net assets of the Class R shares. |
| (f) | Calculated based upon average shares outstanding during the period. |
| (g) | For the ten month period ended October 31, 2007. The Trust changed its fiscal year end from December 31 to October 31, effective October 31, 2007. |
See Notes to Financial Statements.
| | |
| THE TARGET PORTFOLIO TRUST | | 191 |
Financial Highlights (continued)
| | | | | | | | | | | | | | | | | | |
| | | INTERNATIONAL
EQUITY PORTFOLIO | |
| | | Ten Months
Ended
October 31,
2007(e)(f) | | | Class T | |
| | | | Year Ended December 31, | |
| | | | 2006 | | | 2005 | | | 2004 | | | 2003 | | | 2002 | |
| | | | | | |
| PER SHARE OPERATING PERFORMANCE: | | | | | | | | | | | | | | | | | | |
Net asset value, beginning of period | | $16.22 | | | $13.99 | | | $13.13 | | | $11.53 | | | $9.07 | | | $10.10 | |
Income (loss) from investment operations | | | | | | | | | | | | | | | | | | |
Net investment income | | .39 | | | .29 | | | .22 | | | .15 | | | .16 | | | .11 | |
Net realized and unrealized gain (loss) on investments | | 3.70 | | | 3.68 | | | 1.59 | | | 1.59 | | | 2.43 | | | (1.14 | ) |
Total from investment operations | | 4.09 | | | 3.97 | | | 1.81 | | | 1.74 | | | 2.59 | | | (1.03 | ) |
Less dividends and distributions | | | | | | | | | | | | | | | | | | |
Dividends from net investment income | | — | | | (.29 | ) | | (.28 | ) | | (.14 | ) | | (.13 | ) | | — | (b) |
Distributions from net realized gains | | (.18 | ) | | (1.45 | ) | | (.67 | ) | | — | | | — | | | — | |
Total dividends and distributions | | (.18 | ) | | (1.74 | ) | | (.95 | ) | | (.14 | ) | | (.13 | ) | | — | (b) |
| Net asset value, end of period | | $20.13 | | | $16.22 | | | $13.99 | | | $13.13 | | | $11.53 | | | $9.07 | |
| | | | | | |
| TOTAL RETURN(a) | | 25.33 | % | | 29.02 | % | | 14.12 | % | | 15.23 | % | | 28.76 | % | | (10.17 | %) |
| | | | | |
| RATIOS/SUPPLEMENTAL DATA: | | | | | | | | | | | | | | | | |
Net assets, end of period (000) | | $297,083 | | | $268,314 | | | $233,150 | | | $230,300 | | | $191,909 | | | $140,392 | |
Average net assets (000) | | $277,744 | | | $248,571 | | | $221,543 | | | $209,378 | | | $153,435 | | | $150,249 | |
Ratios to average net assets | | | | | | | | | | | | | | | | | | |
Expenses, including distribution and service (12b-1) fees | | .83 | %(c) | | .93 | % | | .99 | % | | 1.00 | % | | 1.07 | % | | 1.09 | % |
Expenses, excluding distribution and service (12b-1) fees | | .83 | %(c) | | .93 | % | | .99 | % | | 1.00 | % | | 1.07 | % | | 1.09 | % |
Net investment income | | 2.61 | %(c) | | 1.73 | % | | 1.55 | % | | 1.27 | % | | 1.69 | % | | 1.17 | % |
Portfolio turnover rate | | 37 | %(d) | | 41 | % | | 123 | % | | 59 | % | | 47 | % | | 55 | % |
| (a) | Total return is calculated assuming a purchase of a share on the first day and a sale on the last day of each period reported and includes reinvestment of dividends and distributions. Total returns may reflect adjustments to conform to generally accepted accounting principles. Total returns for periods less than one full year are not annualized. |
| (b) | Less than $0.005 per share. |
| (e) | Calculated based upon average shares outstanding during the period. |
| (f) | For the ten month period ended October 31, 2007. The Trust changed its fiscal year end from December 31 to October 31, effective October 31, 2007. |
See Notes to Financial Statements.
| | |
| 192 | | THE TARGET PORTFOLIO TRUST |
Financial Highlights (continued)
| | | | | | | | | | | | | | | | | | |
| | | INTERNATIONAL
BOND PORTFOLIO | |
| | | Ten Months
Ended
October 31,
2007(d) | | | Class T | |
| | | | Year Ended December 31, | |
| | | | 2006 | | | 2005 | | | 2004 | | | 2003 | | | 2002 | |
| | | | | | |
| PER SHARE OPERATING PERFORMANCE: | | | | | | | | | | | | | | | | | | |
Net asset value, beginning of period | | $8.22 | | | $8.33 | | | $8.19 | | | $8.45 | | | $8.83 | | | $7.46 | |
Income (loss) from investment operations | | | | | | | | | | | | | | | | | | |
Net investment income | | .14 | | | .19 | | | .03 | | | .26 | | | .21 | | | .15 | |
Net realized and unrealized gain (loss) on investments | | (.03 | ) | | (.03 | ) | | .27 | | | .05 | | | .26 | | | 1.33 | |
Total from investment operations | | .11 | | | .16 | | | .30 | | | .31 | | | .47 | | | 1.48 | |
Less dividends and distributions | | | | | | | | | | | | | | | | | | |
Dividends from net investment income | | — | | | (.26 | ) | | (.15 | ) | | (.48 | ) | | (.84 | ) | | (.11 | ) |
Distributions from net realized gains | | — | | | (.01 | ) | | (.01 | ) | | (.09 | ) | | (.01 | ) | | — | |
Total dividends distributions | | — | | | (.27 | ) | | (.16 | ) | | (.57 | ) | | (.85 | ) | | (.11 | ) |
| Net asset value, end of period | | $8.33 | | | $8.22 | | | $8.33 | | | $8.19 | | | $8.45 | | | $8.83 | |
| | | | | | |
| TOTAL RETURN(a) | | 1.34 | % | | 1.84 | % | | 3.95 | % | | 3.71 | % | | 5.31 | % | | 20.14 | % |
| | | | | |
| RATIOS/SUPPLEMENTAL DATA: | | | | | | | | | | | | | | | | |
Net assets, end of period (000) | | $39,011 | | | $40,944 | | | $42,912 | | | $44,905 | | | $38,553 | | | $27,648 | |
Average net assets (000) | | $39,934 | | | $41,174 | | | $44,072 | | | $43,199 | | | $32,992 | | | $22,022 | |
Ratios to average net assets | | | | | | | | | | | | | | | | | | |
Expenses, including distribution and service (12b-1) fees | | 1.08 | %(b) | | 1.19 | % | | 1.51 | % | | 1.49 | % | | 1.51 | % | | 1.69 | % |
Expenses, excluding distribution and service (12b-1) fees | | 1.08 | %(b) | | 1.19 | % | | 1.51 | % | | 1.49 | % | | 1.51 | % | | 1.69 | % |
Net investment income | | 2.37 | %(b) | | 2.32 | % | | 1.71 | % | | 2.15 | % | | 1.88 | % | | 1.88 | % |
Portfolio turnover rate | | 595 | %(c) | | 323 | % | | 223 | % | | 169 | % | | 235 | % | | 238 | % |
| (a) | Total return is calculated assuming a purchase of a share on the first day and a sale on the last day of each period reported and includes reinvestment of dividends and distributions. Total returns may reflect adjustments to conform to generally accepted accounting principles. Total returns for periods less than one full year are not annualized. |
| (d) | For the ten month period ended October 31, 2007. The Trust changed its fiscal year end from December 31 to October 31, effective October 31, 2007. |
See Notes to Financial Statements.
| | |
| THE TARGET PORTFOLIO TRUST | | 193 |
Financial Highlights (continued)
| | | | | | |
| | | TOTAL RETURN
BOND PORTFOLIO | |
| | | Class R | |
| | | Ten Months
Ended
October 31,
2007(f)(g) | | | August 22,
2006(b)
through
December 31,
2006 | |
| | |
| PER SHARE OPERATING PERFORMANCE: | | | | | | |
Net asset value, beginning of period | | $10.31 | | | $10.31 | |
Income (loss) from investment operations | | | | | | |
Net investment income | | .33 | | | .12 | |
Net realized and unrealized gain on investments | | .24 | | | .01 | |
Total from investment operations | | .57 | | | .13 | |
Less dividends and distributions | | | | | | |
Dividends from net investment income | | (.34 | ) | | (.13 | ) |
Distributions from net realized gains | | — | | | — | |
Total dividends and distributions | | (.34 | ) | | (.13 | ) |
| Net asset value, end of period | | $10.54 | | | $10.31 | |
| | |
| TOTAL RETURN(a) | | 5.63 | % | | 1.27 | % |
| | |
| RATIOS/SUPPLEMENTAL DATA: | | | | | | |
Net assets, end of period (000) | | $23,670 | | | $1,503 | |
Average net assets (000) | | $10,429 | | | $246 | |
Ratios to average net assets | | | | | | |
Expenses, including distribution and service (12b-1) fees(e) | | 1.14 | %(c) | | 1.18 | %(c) |
Expenses, excluding distribution and service (12b-1) fees | | .64 | %(c) | | .68 | %(c) |
Net investment income | | 3.84 | %(c) | | 3.46 | %(c) |
Portfolio turnover rate | | 421 | %(d) | | 483 | %(d) |
| (a) | Total return is calculated assuming a purchase of a share on the first day and a sale on the last day of each period reported and includes reinvestment of dividends and distributions. Total returns may reflect adjustments to conform to generally accepted accounting principles. Total returns for periods less than one full year are not annualized. |
| (b) | Commencement of operations. |
| (e) | The distributor of the Trust has contractually agreed to limit its distribution and service (12b-1) fees to .50 of 1% of the average daily net assets of the Class R shares. |
| (f) | Calculated based upon average shares outstanding during the period. |
| (g) | For the ten month period ended October 31, 2007. The Trust changed its fiscal year end from December 31 to October 31, effective October 31, 2007. |
See Notes to Financial Statements.
| | |
| 194 | | THE TARGET PORTFOLIO TRUST |
Financial Highlights (continued)
| | | | | | | | | | | | | | | | | | |
| | | TOTAL RETURN
BOND PORTFOLIO | |
| | | Ten Months
Ended
October 31,
2007(d)(e) | | | Class T | |
| | | | Year Ended December 31, | |
| | | | 2006 | | | 2005 | | | 2004 | | | 2003 | | | 2002 | |
| | | | | | |
| PER SHARE OPERATING PERFORMANCE: | | | | | | | | | | | | | | | | | | |
Net asset value, beginning of period | | $10.38 | | | $10.39 | | | $10.64 | | | $10.66 | | | $10.73 | | | $10.42 | |
Income (loss) from investment operations | | | | | | | | | | | | | | | | | | |
Net investment income | | .39 | | | .40 | | | .38 | | | .20 | | | .33 | | | .41 | |
Net realized and unrealized gain (loss) on investments | | .22 | | | .03 | | | (.12 | ) | | .31 | | | .33 | | | .57 | |
Total from investment operations | | .61 | | | .43 | | | .26 | | | .51 | | | .66 | | | .98 | |
Less dividends and distributions | | | | | | | | | | | | | | | | | | |
Dividends from net investment income | | (.39 | ) | | (.44 | ) | | (.43 | ) | | (.44 | ) | | (.36 | ) | | (.45 | ) |
Distributions from net realized gains | | — | | | — | | | (.08 | ) | | (.09 | ) | | (.37 | ) | | (.22 | ) |
Total dividends and distributions | | (.39 | ) | | (.44 | ) | | (.51 | ) | | (.53 | ) | | (.73 | ) | | (.67 | ) |
| Net asset value, end of period | | $10.60 | | | $10.38 | | | $10.39 | | | $10.64 | | | $10.66 | | | $10.73 | |
| | | | | | |
| TOTAL RETURN(a) | | 5.94 | % | | 4.27 | % | | 2.60 | % | | 4.73 | % | | 6.22 | % | | 9.65 | % |
| | | | | |
| RATIOS/SUPPLEMENTAL DATA: | | | | | | | | | | | | | | | | |
Net assets, end of period (000) | | $183,262 | | | $167,154 | | | $161,675 | | | $178,488 | | | $158,148 | | | $139,488 | |
Average net assets (000) | | $174,725 | | | $162,621 | | | $169,616 | | | $170,073 | | | $151,999 | | | $122,888 | |
Ratios to average net assets | | | | | | | | | | | | | | | | | | |
Expenses, including distribution and service (12b-1) fees | | .64 | %(b) | | .68 | % | | .76 | % | | .75 | % | | .76 | % | | .75 | % |
Expenses, excluding distribution and service (12b-1) fees | | .64 | %(b) | | .68 | % | | .76 | % | | .75 | % | | .76 | % | | .75 | % |
Net investment income | | 4.53 | %(b) | | 4.14 | % | | 3.72 | % | | 1.82 | % | | 2.99 | % | | 3.89 | % |
Portfolio turnover rate | | 421 | %(c) | | 483 | % | | 366 | % | | 587 | % | | 445 | % | | 429 | % |
| (a) | Total return is calculated assuming a purchase of a share on the first day and a sale on the last day of each period reported and includes reinvestment of dividends and distributions. Total returns may reflect adjustments to conform to generally accepted accounting principles. Total returns for periods less than one full year are not annualized. |
| (d) | Calculated based upon average shares outstanding during the period. |
| (e) | For the ten month period ended October 31, 2007. The Trust changed its fiscal year end from December 31 to October 31, effective October 31, 2007. |
See Notes to Financial Statements.
| | |
| THE TARGET PORTFOLIO TRUST | | 195 |
Financial Highlights (continued)
| | | | | | | | | | | | | | | | | | |
| | | INTERMEDIATE-TERM
BOND PORTFOLIO | |
| | | Class T | |
| | | Ten Months
Ended
October 31,
2007(e) | | | Year Ended December 31, | |
| | | | 2006 | | | 2005 | | | 2004 | | | 2003 | | | 2002 | |
| | | | | | |
| PER SHARE OPERATING PERFORMANCE: | | | | | | | | | | | | | | | | | | |
Net asset value, beginning of period | | $10.13 | | | $10.18 | | | $10.36 | | | $10.46 | | | $10.50 | | | $10.23 | |
Income (loss) from investment operations | | | | | | | | | | | | | | | | | | |
Net investment income | | .40 | | | .43 | | | .36 | | | .19 | | | .28 | | | .38 | |
Net realized and unrealized gain (loss) on investments | | .11 | | | (.03 | ) | | (.16 | ) | | .14 | | | .19 | | | .47 | |
Total from investment operations | | .51 | | | .40 | | | .20 | | | .33 | | | .47 | | | .85 | |
Less dividends and distributions | | | | | | | | | | | | | | | | | | |
Dividends from net investment income | | (.39 | ) | | (.45 | ) | | (.38 | ) | | (.24 | ) | | (.34 | ) | | (.39 | ) |
Distributions from net realized gains | | — | | | — | | | — | (b) | | (.19 | ) | | (.17 | ) | | (.19 | ) |
Total distributions | | (.39 | ) | | (.45 | ) | | (.38 | ) | | (.43 | ) | | (.51 | ) | | (.58 | ) |
| Net asset value, end of period | | $10.25 | | | $10.13 | | | $10.18 | | | $10.36 | | | $10.46 | | | $10.50 | |
| | | | | | |
| TOTAL RETURN(a) | | 5.13 | % | | 4.12 | % | | 1.88 | % | | 3.19 | % | | 4.58 | % | | 8.56 | % |
| | | | | |
| RATIOS/SUPPLEMENTAL DATA: | | | | | | | | | | | | | | | | |
Net assets, end of period (000) | | $233,423 | | | $245,223 | | | $262,177 | | | $297,982 | | | $334,806 | | | $333,069 | |
Average net assets (000) | | $235,800 | | | $249,376 | | | $278,441 | | | $318,671 | | | $343,466 | | | $258,072 | |
Ratios to average net assets | | | | | | | | | | | | | | | | | | |
Expenses, including distribution and service (12b-1) fees | | .58 | %(c) | | .64 | % | | .63 | % | | .64 | % | | .68 | % | | .66 | % |
Expenses, excluding distribution and service (12b-1) fees | | .58 | %(c) | | .64 | % | | .63 | % | | .64 | % | | .68 | % | | .66 | % |
Net investment income | | 4.71 | %(c) | | 4.23 | % | | 3.48 | % | | 1.86 | % | | 2.64 | % | | 3.58 | % |
Portfolio turnover rate | | 284 | %(d) | | 134 | % | | 208 | % | | 133 | % | | 422 | % | | 377 | % |
| (a) | Total return is calculated assuming a purchase of a share on the first day and a sale on the last day of each period reported and includes reinvestment of dividends and distributions. Total returns may reflect adjustments to conform to generally accepted accounting principles. Total returns for periods less than one full year are not annualized. |
| (b) | Less than $0.005 per share. |
| (e) | For the ten month period ended October 31, 2007. The Trust changed its fiscal year end from December 31 to October 31, effective October 31, 2007. |
See Notes to Financial Statements.
| | |
| 196 | | THE TARGET PORTFOLIO TRUST |
Financial Highlights (continued)
| | | | | | | | | | | | | | | | | | |
| | | MORTGAGE BACKED
SECURITIES PORTFOLIO | |
| | | Class T | |
| | | Ten Months
Ended
October 31,
2007(e) | | | Year Ended December 31, | |
| | | | 2006 | | | 2005 | | | 2004 | | | 2003 | | | 2002 | |
| | | | | | |
| PER SHARE OPERATING PERFORMANCE: | | | | | | | | | | | | | | | | | | |
Net asset value, beginning of period | | $9.99 | | | $10.10 | | | $10.39 | | | $10.45 | | | $10.70 | | | $10.44 | |
Income (loss) from investment operations | | | | | | | | | | | | | | | | | | |
Net investment income | | .41 | | | .44 | | | .50 | | | .36 | | | .47 | | | .56 | |
Net realized and unrealized gain (loss) on investments | | (.03 | ) | | (.07 | ) | | (.27 | ) | | .02 | | | (.24 | ) | | .27 | |
Total from investment operations | | .38 | | | .37 | | | .23 | | | .38 | | | .23 | | | .83 | |
Less Dividends | | | | | | | | | | | | | | | | | | |
Dividends from net investment income | | (.39 | ) | | (.48 | ) | | (.52 | ) | | (.44 | ) | | (.48 | ) | | (.57 | ) |
Tax return of capital | | (.03 | ) | | — | | | — | | | — | | | — | | | — | |
| | | | | | |
| Total dividends | | (.42 | ) | | (.48 | ) | | (.52 | ) | | (.44 | ) | | (.48 | ) | | (.57 | ) |
| Net asset value, end of period | | $9.95 | | | $9.99 | | | $10.10 | | | $10.39 | | | $10.45 | | | $10.70 | |
| | | | | | |
| TOTAL RETURN(a) | | 3.89 | % | | 3.82 | % | | 2.29 | % | | 3.68 | % | | 2.20 | % | | 8.13 | % |
| | | | | |
| RATIOS/SUPPLEMENTAL DATA: | | | | | | | | | | | | | | | | |
Net assets, end of period (000) | | $73,581 | | | $75,471 | | | $82,195 | | | $95,796 | | | $107,072 | | | $115,546 | |
Average net assets (000) | | $75,508 | | | $77,483 | | | $89,756 | | | $103,055 | | | $114,526 | | | $94,893 | |
Ratios to average net assets | | | | | | | | | | | | | | | | | | |
Expenses, including distribution and service (12b-1) fees | | 1.82 | %(b)(c) | | 1.89 | %(b) | | 1.70 | %(b) | | .90 | % | | .84 | % | | .80 | % |
Expenses, excluding distribution and service (12b-1) fees | | 1.82 | %(b)(c) | | 1.89 | %(b) | | 1.70 | %(b) | | .90 | % | | .84 | % | | .80 | % |
Net investment income | | 4.91 | %(c) | | 4.46 | % | | 4.91 | % | | 3.48 | % | | 4.43 | % | | 4.43 | % |
Portfolio turnover rate | | 318 | %(d) | | 471 | % | | 251 | % | | 279 | % | | 282 | % | | 184 | % |
| (a) | Total return is calculated assuming a purchase of a share on the first day and a sale on the last day of each period reported and includes reinvestment of dividends and distributions. Total returns may reflect adjustments to conform to generally accepted accounting principles. Total returns for periods less than one full year are not annualized. |
| (b) | The annualized expense ratio without interest expense would have been 0.76% for the ten months ended October 31, 2007, and 0.94% and 0.91%, respectively, for the fiscal years ended December 31, 2006 and 2005. |
| (e) | For the ten month period ended October 31, 2007. The Trust changed its fiscal year end from December 31 to October 31, effective October 31, 2007. |
See Notes to Financial Statements.
| | |
| THE TARGET PORTFOLIO TRUST | | 197 |
Financial Highlights (continued)
| | | | | | | | | | | | | | | | | | |
| | | U.S. GOVERNMENT
MONEY MARKET PORTFOLIO | |
| | | Ten Months
Ended
October 31,
2007(c) | | | Class T | |
| | | | Year Ended December 31, | |
| | | | 2006 | | | 2005 | | | 2004 | | | 2003 | | | 2002 | |
| | | | | | |
| PER SHARE OPERATING PERFORMANCE: | | | | | | | | | | | | | | | | | | |
Net asset value, beginning of period | | $1.00 | | | $1.00 | | | $1.00 | | | $1.00 | | | $1.00 | | | $1.00 | |
Net investment income and net realized gain on investments | | .040 | | | .043 | | | .026 | | | .008 | | | .007 | | | .013 | |
Less dividends and distributions | | (.040 | ) | | (.043 | ) | | (.026 | ) | | (.008 | ) | | (.007 | ) | | (.013 | ) |
| Net asset value, end of period | | $1.00 | | | $1.00 | | | $1.00 | | | $1.00 | | | $1.00 | | | $1.00 | |
| | | | | | |
| TOTAL RETURN(a) | | 4.04 | % | | 4.36 | % | | 2.59 | % | | .76 | % | | .70 | % | | 1.31 | % |
| | | | | |
| RATIOS/SUPPLEMENTAL DATA: | | | | | | | | | | | | | | | | |
Net assets, end of period (000) | | $67,067 | | | $47,275 | | | $57,207 | | | $74,190 | | | $98,464 | | | $127,141 | |
Average net assets (000) | | $63,409 | | | $47,990 | | | $69,488 | | | $94,854 | | | $114,831 | | | $128,550 | |
Ratios to average net assets | | | | | | | | | | | | | | | | | | |
Expenses, including distribution and service (12b-1) fees | | .50 | %(b) | | .70 | % | | .71 | % | | .59 | % | | .52 | % | | .45 | % |
Expenses, excluding distribution and service (12b-1) fees | | .50 | %(b) | | .70 | % | | .71 | % | | .59 | % | | .52 | % | | .45 | % |
Net investment income | | 4.78 | %(b) | | 4.25 | % | | 2.50 | % | | .72 | % | | .71 | % | | 1.31 | % |
| (a) | Total return is calculated assuming a purchase of a share on the first day and a sale on the last day of each period reported and includes reinvestment of dividends and distributions. Total returns may reflect adjustments to conform to generally accepted accounting principles. Total returns for periods less than one full year are not annualized. |
| (c) | For the ten month period ended October 31, 2007. The Trust changed its fiscal year end from December 31 to October 31, effective October 31, 2007. |
See Notes to Financial Statements.
| | |
| 198 | | THE TARGET PORTFOLIO TRUST |
Report of Independent Accountants
The Board of Directors and Shareholders of The Target Portfolio Trust:
We have audited the accompanying statement of assets and liabilities of Target Portfolio Trust (comprised of Large Capitalization Growth Portfolio, Large Capitalization Value Portfolio, Small Capitalization Growth Portfolio, Small Capitalization Value Portfolio, International Equity Portfolio, International Bond Portfolio, Total Return Bond Portfolio, Intermediate-Term Bond Portfolio, Mortgage Backed Securities Portfolio, and U.S. Government Money Market Portfolio) (hereafter referred to as the “Trusts”), including the portfolios of investments, as of October 31, 2007, and the related statements of operations for the ten-month period then ended and the year ended December 31, 2006, the statements of changes in net assets for the ten-month period then ended each of the years in the two-year period ended December 31, 2006 and the financial highlights for the ten-month period then ended and each of the years in the three-year period ended December 31, 2006. These financial statements and financial highlights are the responsibility of the Fund’s management. Our responsibility is to express an opinion on these financial statements and financial highlights based on our audits. The financial highlights for the years ended December 31, 2003 and December 31, 2002 were audited by another independent registered public accounting firm, whose report dated February 24, 2004, expressed an unqualified opinion thereon.
We conducted our audits in accordance with the standards of the Public Company Accounting Oversight Board (United States). Those standards require that we plan and perform the audit to obtain reasonable assurance about whether the financial statements and financial highlights are free of material misstatement. An audit includes examining, on a test basis, evidence supporting the amounts and disclosures in the financial statements. Our procedures included confirmation of securities owned as of October 31, 2007, by correspondence with the custodian and brokers or by other appropriate auditing procedures where replies from brokers were not received. An audit also includes assessing the accounting principles used and significant estimates made by management, as well as evaluating the overall financial statement presentation. We believe that our audits provide a reasonable basis for our opinion.
In our opinion, the financial statements and financial highlights referred to above present fairly, in all material respects, the financial position of the Trusts as of October 31, 2007, and the results of its operations for the ten-month period then ended and the year ended December 31, 2006, the changes in its net assets for the ten-month period then ended and each of the years in the two-year period ended December 31, 2006 and the financial highlights for the ten-month period then ended and each of the years in the three-year period ended December 31, 2006, in conformity with U.S. generally accepted accounting principles.

New York, New York
December 28, 2007
| | |
| THE TARGET PORTFOLIO TRUST | | 199 |
Federal Tax Information (Unaudited)
For the fiscal period ended October 31, 2007, the tax character of dividends and distributions paid as reflected in the Statement of Changes in Net Assets was as follows:
| | | | | | | | |
| | | | | Ordinary
Income | | Long-Term
Capital Gains | | Return of
Capital |
Large Capitalization Growth Portfolio | | Class R | | — | | 0.14 | | — |
| | Class T | | — | | 0.14 | | — |
Large Capitalization Value Portfolio | | Class R | | 0.05 | | 0.13 | | — |
| | Class T | | 0.05 | | 0.13 | | — |
Small Capitalization Value Portfolio | | Class R | | 0.03 | | 0.08 | | — |
| | Class T | | 0.03 | | 0.08 | | — |
International Equity Portfolio | | Class R | | — | | 0.18 | | — |
| | Class T | | — | | 0.18 | | — |
Total Return Bond Portfolio | | Class R | | 0.34 | | — | | — |
| | Class T | | 0.39 | | — | | — |
Intermediate-Term Bond Portfolio | | Class T | | 0.39 | | — | | — |
Mortgage Backed Securities Portfolio | | Class T | | 0.39 | | — | | 0.03 |
U.S. Government Money Market Portfolio | | Class T | | 0.04 | | — | | — |
For federal income tax purposes, dividends from net investment income and distributions from short-term capital gain are taxable as ordinary income dividends. Long-term capital gain distributions are taxable as capital gain distributions.
As required by the Internal Revenue Code, the following percentages of ordinary income dividends and distributions paid for the fiscal period ended October 31, 2007 have been designated as 1) qualified for the reduced tax rate under The Job and Growth Tax Relief Reconciliation Act of 2003 (‘QDI’), 2) dividends received deduction eligible for corporate shareholders ("DRD"), 3) interest related dividends under the American Jobs Creation Act of 2004 (“QII”), and 4) short-term capital gain distributions under the American Jobs Creation Act of 2004 (“QSTCG”):
| | | | | | | | |
| | | QDI | | DRD | | QII | | QSTCG |
Large Capitalization Growth Portfolio | | 100.00% | | 99.83% | | 0.00% | | 100.00% |
Large Capitalization Value Portfolio | | 56.71% | | 56.20% | | 0.00% | | 61.17% |
Small Capitalization Value Portfolio | | 54.09% | | 54.23% | | 0.00% | | 67.23% |
International Equity Portfolio | | 46.75% | | 0.00% | | 0.00% | | 78.08% |
Total Return Bond Portfolio | | 0.00% | | 0.00% | | 100.00% | | 0.00% |
Intermediate-Term Bond Portfolio | | 0.00% | | 0.00% | | 94.00% | | 0.00% |
Mortgage Backed Securities Portfolio | | 0.00% | | 0.00% | | 100.00% | | 0.00% |
U.S. Government Money Market Portfolio | | 0.00% | | 0.00% | | 100.00% | | 0.00% |
Pursuant to Section 853 of the Internal Revenue Code, International Equity Portfolio designates $599,749 of foreign taxes paid and $8,463,343 of foreign source income in connection with dividends distributed from investment company taxable income for the period ended October 31, 2007.
Many states do not tax the portion of mutual fund dividends attributed to interest from U.S. Government obligations. Listed below is the percentage of interest earned by the following Portfolios from U.S. Government obligations for the fiscal period 2007.
| | |
| 200 | | THE TARGET PORTFOLIO TRUST |
We are required by Massachusetts, Missouri and Oregon to inform you that dividends which have been derived from interest on federal obligations are not taxable to shareholders providing the mutual fund meets certain requirements mandated by the respective state’s taxing authorities.
| | | |
Portfolio*** | | Percentage of interest from
U.S. Government Obligations | |
Mortgaged Backed Securities Portfolio | | 3.81 | % |
Total Return Bond Portfolio | | 12.62 | % |
Intermediate-Term Bond Portfolio | | 13.21 | % |
U.S. Government Money Market Portfolio | | 15.33 | % |
| *** | Due to certain minimum portfolio holding requirements in California, Connecticut and New York, residents of those states will not be able to exclude 2007 interest income from state and local taxes. |
Please consult your tax adviser or state/local authorities to properly report this information on your tax return. If you have any questions concerning the amounts listed above, please call your financial adviser.
| | |
| THE TARGET PORTFOLIO TRUST | | 201 |
Management of the Fund (Unaudited)
Information pertaining to the Trustees of The Target Portfolio Trust (the “Trust”) is set forth below. Trustees who are not deemed to be “interested persons” of the Trust, as defined in the Investment Company Act of 1940 (the 1940 Act), are referred to as “Independent Trustees.” Trustees who are deemed to be “interested persons” of the Trust are referred to as “Interested Trustees.” “Fund Complex”† consists of the Trust and any other investment companies managed by PI.
Independent Trustees(2)
Linda W. Bynoe (55), Trustee since 2005(3) Oversees 59 portfolios in Fund complex
Principal occupations (last 5 years): President and Chief Executive Officer (since March 1995) of Telemat, Ltd. (management consulting); formerly Vice President at Morgan Stanley & Co.
Other Directorships held: Director of Simon Property Group, Inc. (real estate investment trust) (since May 2003); Anixter International (communication products distributor) (since January 2006); Director of Northern Trust Corporation (since April 2006).
David E.A. Carson (73), Trustee since 2003(3) Oversees 63 portfolios in Fund complex
Principal occupations (last 5 years): Director (since October 2007) of ICI Mutual Insurance Company; formerly Chairman and Chief Executive Officer of People’s Bank (1988-2000).
Robert E. La Blanc (73), Trustee since 1999(3) Oversees 61 portfolios in Fund complex
Principal occupations (last 5 years): President (since 1981) of Robert E. La Blanc Associates, Inc. (telecommunications).
Other Directorships held:(4) Director of CA, Inc. (since 2002) (software company); FiberNet Telecom Group, Inc. (since 2003) (telecom company).
Douglas H. McCorkindale (68), Trustee since 1996(3) Oversees 59 portfolios in Fund complex
Principal occupations (last 5 years): Formerly Chairman (February 2001-June 2006), Chief Executive Officer (June 2000-July 2005), President (September 1997-July 2005) and Vice Chairman (March 1984-May 2000) of Gannett Co., Inc. (publishing and media).
Other Directorships held:(4) Director of Continental Airlines, Inc. (since May 1993); Director of Lockheed Martin Corp. (aerospace and defense) (since May 2001).
Richard A. Redeker (64), Trustee since 2003(3) Oversees 60 portfolios in Fund complex
Principal occupations (last 5 years): Management Consultant; Director (since 2001); Director of Penn Tank Lines, Inc. (since 1999).
Robin B. Smith (68), Trustee since 2003(3) Oversees 61 portfolios in Fund complex
Principal occupations (last 5 years): Chairman of the Board (since January 2003) of Publishers Clearing House (direct marketing); formerly Chairman and Chief Executive Officer (August 1996-January 2003) of Publishers Clearing House.
Other Directorships held:(4) Formerly Director of BellSouth Corporation (1992-2006).
Stephen G. Stoneburn (64), Trustee since 1999(3) Oversees 61 portfolios in Fund complex
Principal occupations (last 5 years): President and Chief Executive Officer (since June 1996) of Quadrant Media Corp. (publishing company); formerly President (June 1995-June 1996) of Argus Integrated Media, Inc.; Senior Vice President and Managing Director (January 1993-1995) of Cowles Business Media; Senior Vice President of Fairchild Publications, Inc. (1975-1989).
| | |
| 202 | | THE TARGET PORTFOLIO TRUST |
Clay T. Whitehead (69), Trustee since 1999(3) Oversees 61 portfolios in Fund complex
Principal occupations (last 5 years): President (since 1983) of YCO (new business development firm).
Interested Trustees(1)
Judy A. Rice (59), President since 2003 and Trustee since 2003(3) Oversees 59 portfolios in Fund complex
Principal occupations (last 5 years): President, Chief Executive Officer, Chief Operating Officer and Officer-In-Charge (since February 2003) of Prudential Investments LLC; Vice President (since February 1999) of Prudential Investment Management Services LLC; President, Chief Executive Officer and Officer-In-Charge (since April 2003) of Prudential Mutual Fund Services LLC; formerly Director (May 2003-March 2006) and Executive Vice President (June 2005-March 2006) of AST Investment Services, Inc.; formerly Executive Vice President (September 1999-February 2003) of Prudential Investments LLC; Member of Board of Governors of the Investment Company Institute.
Robert F. Gunia (61), Vice President and Trustee since 1999(3) Oversees 145 portfolios in Fund complex
Principal occupations (last 5 years): Chief Administrative Officer (since September 1999) and Executive Vice President (since December 1996) of Prudential Investments LLC; President (since April 1999) of Prudential Investment Management Services LLC; Executive Vice President (since March 1999) and Treasurer (since May 2000) of Prudential Mutual Fund Services LLC; Chief Administrative Officer, Executive Vice President and Director (since May 2003) of AST Investment Services, Inc.
Other Directorships held:(4) Vice President and Director (since May 1989) and Treasurer (since 1999) of The Asia Pacific Fund, Inc.
Information pertaining to the Officers of the Trust who are not also Trustees is set forth below.
Officers(2)
Kathryn L. Quirk (55), Chief Legal Officer since 2005(3)
Principal occupations (last 5 years): Vice President and Corporate Counsel (since September 2004) of Prudential; Executive Vice President, Chief Legal Officer and Secretary (since July 2005) of Prudential Investments LLC and Prudential Mutual Fund Services LLC; formerly Managing Director, General Counsel, Chief Compliance Officer, Chief Risk Officer and Corporate Secretary (1997-2002) of Zurich Scudder Investments, Inc.
Deborah A. Docs (49), Secretary since 2004(3)
Principal occupations (last 5 years): Vice President and Corporate Counsel (since January 2001) of Prudential; Vice President (since December 1996) and Assistant Secretary (since March 1999) of PI; formerly Vice President and Assistant Secretary (May 2003-June 2005) of AST Investment Services, Inc.
Jonathan D. Shain (49), Assistant Secretary since 2005(3)
Principal occupations (last 5 years): Vice President and Corporate Counsel (since August 1998) of Prudential; Vice President and Assistant Secretary (since May 2001) of PI; Vice President and Assistant Secretary (since February 2001) of PMFS; formerly Vice President and Assistant Secretary (May 2003-June 2005) of AST Investment Services, Inc.
Claudia DiGiacomo (33), Assistant Secretary since 2005(3)
Principal occupations (last 5 years): Vice President and Corporate Counsel (since January 2005) of Prudential; Vice President and Assistant Secretary of PI (since December 2005); Associate at Sidley Austin Brown & Wood LLP (1999-2004).
Timothy J. Knierim (48), Chief Compliance Officer since 2007(3)
Principal occupations (last 5 years): Chief Compliance Officer of Prudential Investment Management, Inc. (since July 2007); formerly Chief Risk Officer of PIM and PI (2002-2007) and formerly Chief Ethics Officer of PIM and PI (2006-2007).
| | |
| THE TARGET PORTFOLIO TRUST | | 203 |
Valerie M. Simpson (49), Deputy Chief Compliance Officer since 2007(3)
Principal occupations (last 5 years): Vice President and Senior Compliance Officer (since March 2006) of PI; Vice President-Financial Reporting (since March 2006) for Prudential Life and Annuities Finance.
Grace C. Torres (48), Treasurer and Principal Financial and Accounting Officer since 2000(3)
Principal occupations (last 5 years): Assistant Treasurer (since March 1999) and Senior Vice President (since September 1999) of PI; Assistant Treasurer (since May 2003) and Vice President (since June 2005) of AST Investment Services, Inc.; Senior Vice President and Assistant Treasurer (since May 2003) of Prudential Annuities Advisory Services, Inc.; formerly Senior Vice President (May 2003-June 2005) of AST Investment Services, Inc.
John P. Schwartz (36), Assistant Secretary since 2006(3)
Principal occupations (last 5 years): Vice President and Corporate Counsel (since April 2005) of Prudential; Vice President and Assistant Secretary of PI (since December 2005); Associate at Sidley, Austin Brown & Wood LLP (1997-2005).
M. Sadiq Peshimam (43), Assistant Treasurer since 2006(3)
Principal occupations (last 5 years): Vice President (since 2005) and Director (2000-2005) within Prudential Mutual Fund Administration.
Peter Parrella (49), Assistant Treasurer since 2007(3)
Principal occupations (last 5 years): Vice President (since 2007) and Director (2004-2007) within Prudential Mutual Fund Administration; formerly Tax Manager at SSB Citi Fund Management LLC (1997-2004).
Andrew R. French (45), Assistant Secretary since 2006(3)
Principal occupations (last 5 years): Director and Corporate Counsel (since May 2006) of Prudential; Vice President and Assistant Secretary (since January 2007) of PI; Vice President and Assistant Secretary (since January 2007) of PMFS; formerly Senior Legal Analyst of Prudential Mutual Fund Law Department (1997-2006).
Noreen M. Fierro (43), Anti-Money Laundering Compliance Officer since 2006(3)
Principal occupations (last 5 years): Vice President, Corporate Compliance (since May 2006) of Prudential; formerly Corporate Vice President, Associate General Counsel (April 2002-May 2005) of UBS Financial Services, Inc., in their Money Laundering Prevention Group; Senior Manager (May 2005-May 2006) of Deloitte Financial Advisory Services, LLP, in their Forensic and Dispute Services, Anti-Money Laundering Group.
† | The Fund Complex consists of all investment companies managed by PI. The Funds for which PI serves as manager include Jennison Dryden Mutual Funds, Strategic Partners Funds, The Prudential Variable Contract Accounts 2, 10, 11. The Target Portfolio Trust, The Prudential Series Fund, The High Yield Income Fund, Inc., The High Yield Plus Fund, Inc., Nicholas-Applegate Fund, Inc., Advanced Series Trust, and Prudential’s Gibraltar Fund, Inc. |
(1) | “Interested” Trustee, as defined in the 1940 Act, by reason of employment with the Manager, a Subadvisor or the Distributor. |
(2) | Unless otherwise noted, the address of the Trustees and Officers is c/o: Prudential Investments LLC, Gateway Center Three, 100 Mulberry Street, Newark, NJ 07102. |
(3) | There is no set term of office for Trustees and Officers. The Independent Directors have adopted a retirement policy, which calls for the retirement of Trustees on December 31 of the year in which they reach the age of 75. The table shows the individual’s length of service as Trustee and/or Officer. |
(4) | This includes only directorships of companies required to register, or file reports with the SEC under the Securities and Exchange Act of 1934 (that is, “public companies”) or other investment companies registered under the 1940 Act. |
Additional Information about the Trustees is included in the Statement of Additional Information which is available without charge, upon request, by calling (800) 521-7466 or (732) 482-7555 (Calling from outside the U.S.)
| | |
| 204 | | THE TARGET PORTFOLIO TRUST |
Approval of Advisory Agreements
Large Capitalization Growth Portfolio
At meetings of the Board held on September 18-20, 2007, the Trustees, including the Independent Trustees, unanimously approved the recommendations by Prudential Investments LLC (PI) to appoint Marsico Capital Management LLC (“Marsico”) as a subadviser with respect to the Large Capitalization Growth Portfolio (the Portfolio) and to approve a new subadvisory agreements between PI and Marsico (the “Subadvisory Agreement”).
The Board considered that, on June 14, 2007, Marsico and Bank of America Corporation (BAC) announced they had signed a definitive agreement by which Marsico would acquire ownership of the firm from BAC (the Transaction). The Transaction was completed on December 14, 2007, at which time Marsico began operating as an independent entity under the leadership of Thomas F. Marsico. The Board also considered that, although there were no changes in the Marsico portfolio management teams as a result of the Transaction, the Portfolio’s prior subadvisory agreement with Marsico would be automatically terminated as a result of a change in control.
Board Consideration of Subadvisory Agreement
The Board of Trustees considered whether the approval of the Subadvisory Agreement with Marsico was in the best interests of the Portfolio and its shareholders. Before approving the Subadvisory Agreement, the Trustees reviewed performance, compliance and organization materials regarding Marsico and received presentations from PI, as well as from Mr. Marsico. The Board also received materials relating to the Subadvisory Agreement and had the opportunity to ask questions and request further information in connection with its consideration. In making the determination to retain Marsico as a subadviser, the Trustees, including the Independent Trustees advised by independent legal counsel, considered the following information:
Nature, Quality and Extent of Services
The Board received and considered information regarding the nature and extent of services to be provided to the Portfolio by Marsico under the Subadvisory Agreement, namely, that Marsico would provide day-to-day portfolio management services and comply with all Portfolio policies and applicable rules and regulations. The Board also noted that the nature and extent of services provided to the Portfolio under the prior subadvisory agreement with Marsico were identical in all material respects to those to be provided by Marsico under the Subadvisory Agreement and generally similar to those provided by the other current subadviser to the Portfolio (Goldman Sachs Asset Management) under its subadvisory agreement.
| | |
| THE TARGET PORTFOLIO TRUST | | |
Approval of Advisory Agreements (continued)
With respect to the quality of services, the Board considered, among other things, the background and experience of Marsico’s portfolio management team, which was not affected by the Transaction. In connection with the recent annual review of advisory agreements, the Board had reviewed the qualifications, backgrounds and responsibilities of the portfolio manager who is responsible for the day-to-day management of the Portfolio, and the Board was provided with information pertaining to Marsico’s organizational structure, senior management, investment operations, and other relevant information pertaining to Marsico. The Board noted that it received a favorable compliance report from the Trust’s Chief Compliance Officer (CCO) as to Marsico.
The Board concluded that it was satisfied with the nature, extent and quality of the investment subadvisory services provided to the Portfolio by Marsico under the prior subadvisory agreement and that there was a reasonable basis on which to conclude that the quality of investment subadvisory services to be provided by Marsico under the Subadvisory Agreement should equal the quality of similar services provided by Marsico under the prior subadvisory agreement.
Performance of Marsico
The Board noted that at its June 2007 meetings, it had reviewed the performance of the Portfolio in connection with its annual consideration of the renewal of the Portfolios’ subadvisory agreements. As part of that review, the Board reviewed the performance record of the Portfolio, and at that time concluded that the performance of the Portfolio was satisfactory.
Investment Subadvisory Fee Rate
The Board also considered, among other things, that the proposed fee rates payable under the Subadvisory Agreement is identical to the fee rates payable under the prior subadvisory agreement. The Board noted that it had recently reviewed the fee rates paid to Marsico in connection with the recent annual review of advisory agreements and determined that the fee rates were reasonable. The Board concluded that Marsico’s proposed subadvisory fee rates under the Subadvisory Agreement were reasonable.
Profitability
In connection with its recent annual review of advisory agreements, the Board considered the profitability of PI and subadvisers affiliated with PI. The Board concluded that the level of profitability of a subadviser not affiliated with PI, such as Marsico, may not be as significant as PI’s profitability given the arm’s length nature of the process by which the subadvisory fee rates were negotiated by PI and the unaffiliated subadvisers, as well as the fact that PI compensates the subadvisers out of its management fee.
| | |
| | THE TARGET PORTFOLIO TRUST |
Economies of Scale
In connection with its recent annual review of advisory agreements, the Board considered economies of scale. The Board noted that there was no proposed change in fee rates and breakpoints and that it would again review economies of scale at the next annual review of advisory agreements.
Other Benefits to the Subadviser or its Affiliates from Serving as Subadviser
The Board considered potential “fall-out” or ancillary benefits anticipated to be received by Marsico and its affiliates as a result of Marsico’s relationship with the Portfolio. The Board concluded that any potential benefits to be derived by Marsico included its ability to use soft dollar credits, brokerage commissions received by affiliates of Marsico, potential access to additional research resources, larger assets under management and benefits to the reputation, which were consistent with those generally derived by subadvisers to mutual funds.
| | |
| THE TARGET PORTFOLIO TRUST | | |
Growth of a $10,000 Investment
Large Capitalization Growth Portfolio
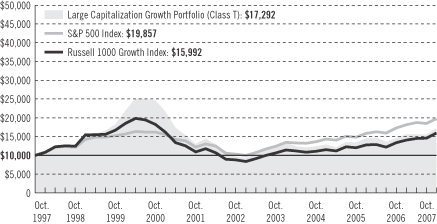
| | | | | | | | | | | |
| Average Annual Total Returns as of 10/31/07 | | | | | | | | | |
| | | One Year | | | Five Years | | | Ten Years | | | Since Inception |
With TARGET Program Fee (Class R) | | 18.96 | % | | N/A | | | N/A | | | 21.11% (8/22/2006) |
With TARGET Program Fee (Class T) | | 17.77 | | | 12.20 | % | | 5.63 | % | | — |
| | | | |
| | | One Year | | | Five Years | | | Ten Years | | | Since Inception |
Without TARGET Program Fee (Class R) | | 18.96 | % | | N/A | | | N/A | | | 21.11% (8/22/2006) |
Without TARGET Program Fee (Class T) | | 19.56 | | | 13.91 | % | | 7.23 | % | | — |
Performance data quoted represent past performance. Past performance does not guarantee future results. The investment return and principal value of an investment will fluctuate, so that an investor’s shares, when redeemed, may be worth more or less than their original cost. Current performance may be lower or higher than the past performance data quoted. An investor may obtain performance data as of the most recent month-end by visiting our website at www.prudential.com or by calling (800) 225-1852. The maximum TARGET program fee for retail investors is 1.50%. Gross operating expenses: Class R, 1.43%; Class T, 0.68%. Net operating expenses apply to: Class R, 1.18%; Class T, 0.68%, after contractual reduction through 2/28/2009.
The returns in the graph and the tables do not reflect the deduction of taxes that a shareholder would pay on Fund distributions or following the redemption of Fund shares.
The graph compares a $10,000 investment in the TARGET Large Capitalization Growth Portfolio (Class T) with a similar investment in the S&P 500 Index and the Russell 1000 Growth Index by portraying the initial account
| | |
| | THE TARGET PORTFOLIO TRUST |
values at the beginning of the 10-year period (October 31, 1997) and the account values at the end of the current fiscal year (October 31, 2007), as measured on a quarterly basis. The graph takes into account the maximum quarterly TARGET program fee of 1.50% annually for retail investors. The average annual total returns in the table and the returns on investment in the graph do not reflect the deduction of taxes that a shareholder would pay on Portfolio distributions or following the redemption of Portfolio shares.
The S&P 500 Index is an index of 500 stocks of large U.S. companies. It gives a broad look at how U.S. stock prices have performed. The Russell 1000 Growth Index contains those securities in the Russell 1000 Index with a greater-than-average growth orientation. Companies in this index tend to exhibit higher price-to-book and price-to-earnings ratios, lower dividend yields, and higher forecasted growth rates. These indexes are unmanaged, and the total returns include the reinvestment of all dividends, but do not include the effect of sales charges, operating expenses, or taxes. These returns would be lower if they included the effect of sales charges, operating expenses, or taxes. The securities in these indexes may differ substantially from the securities in the Portfolio. These indexes are not the only ones that may be used to characterize performance of large-capitalization equity funds, and other indexes may portray different comparative performance. Investors cannot invest directly in an index.
| | |
| THE TARGET PORTFOLIO TRUST | | |
Growth of a $10,000 Investment
Large Capitalization Value Portfolio
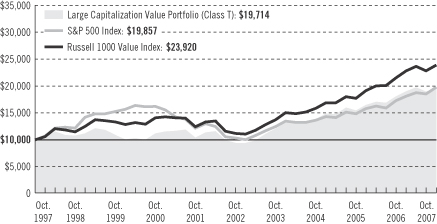
| | | | | | | | | | | |
| Average Annual Total Returns as of 10/31/07 | | | | | | | | | |
| | | One Year | | | Five Years | | | Ten Years | | | Since Inception |
With TARGET Program Fee (Class R) | | 9.75 | % | | N/A | | | N/A | | | 13.43% (8/22/2006) |
With TARGET Program Fee (Class T) | | 8.64 | | | 15.83 | % | | 7.02 | % | | — |
| | | | |
| | | One Year | | | Five Years | | | Ten Years | | | Since Inception |
Without TARGET Program Fee (Class R) | | 9.75 | % | | N/A | | | N/A | | | 13.43% (8/22/2006) |
Without TARGET Program Fee (Class T) | | 10.28 | | | 17.59 | % | | 8.64 | % | | — |
Performance data quoted represent past performance. Past performance does not guarantee future results. The investment return and principal value of an investment will fluctuate, so that an investor’s shares, when redeemed, may be worth more or less than their original cost. Current performance may be lower or higher than the past performance data quoted. An investor may obtain performance data as of the most recent month-end by visiting our website at www.prudential.com or by calling (800) 225-1852. The maximum TARGET program fee for retail investors is 1.50%. Gross operating expenses: Class R, 1.44%; Class T, 0.69%. Net operating expenses apply to: Class R, 1.19%; Class T, 0.69%, after contractual reduction through 2/28/2009.
The returns in the graph and the tables do not reflect the deduction of taxes that a shareholder would pay on Fund distributions or following the redemption of Fund shares.
The graph compares a $10,000 investment in the TARGET Large Capitalization Value Portfolio (Class T) with a similar investment in the S&P 500 Index and the Russell 1000 Value Index by portraying the initial account
| | |
| | THE TARGET PORTFOLIO TRUST |
values at the beginning of the 10-year period (October 31, 1997) and the account values at the end of the current fiscal year (October 31, 2007), as measured on a quarterly basis. The graph takes into account the maximum quarterly TARGET program fee of 1.50% annually for retail investors. The average annual total returns in the table and the returns on investment in the graph do not reflect the deduction of taxes that a shareholder would pay on Portfolio distributions or following the redemption of Portfolio shares.
The S&P 500 Index is an index of 500 stocks of large U.S. companies. It gives a broad indication of how U.S. stock prices have performed. The Russell 1000 Value Index contains those securities in the Russell 1000 Index with a less-than-average growth orientation. Companies in this index generally have low price-to-book and price-to-earnings ratios, higher dividend yields, and lower forecasted growth values. These indexes are unmanaged, and the total returns include the reinvestment of all dividends, but do not include the effect of sales charges, operating expenses, or taxes. These returns would be lower if they included the effect of sales charges, operating expenses, or taxes. The securities in these indexes may differ substantially from the securities in the Portfolio. These indexes are not the only ones that may be used to characterize performance of large-capitalization equity funds, and other indexes may portray different comparative performance. Investors cannot invest directly in an index.
| | |
| THE TARGET PORTFOLIO TRUST | | |
Growth of a $10,000 Investment
Small Capitalization Growth Portfolio
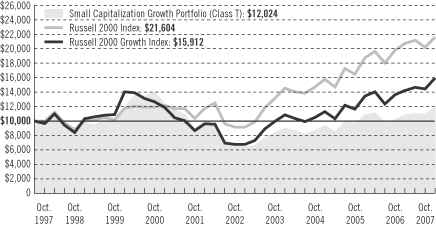
| | | | | | | | | | | |
| Average Annual Total Returns as of 10/31/07 | | | | | | | | | |
| | | One Year | | | Five Years | | | Ten Years | | | Since Inception |
With TARGET Program Fee (Class R) | | 17.85 | % | | N/A | | | N/A | | | 20.04% (8/22/2006) |
With TARGET Program Fee (Class T) | | 16.75 | | | 12.07 | % | | 1.86 | % | | — |
| | | | |
| | | One Year | | | Five Years | | | Ten Years | | | Since Inception |
Without TARGET Program Fee (Class R) | | 17.85 | % | | N/A | | | N/A | | | 20.04% (8/22/2006) |
Without TARGET Program Fee (Class T) | | 18.52 | | | 13.77 | % | | 3.40 | % | | — |
Performance data quoted represent past performance. Past performance does not guarantee future results. The investment return and principal value of an investment will fluctuate, so that an investor’s shares, when redeemed, may be worth more or less than their original cost. Current performance may be lower or higher than the past performance data quoted. An investor may obtain performance data as of the most recent month-end by visiting our website at www.prudential.com or by calling (800) 225-1852. The maximum TARGET program fee for retail investors is 1.50%. Gross operating expenses: Class R, 1.53%; Class T, 0.78%. Net operating expenses apply to: Class R, 1.28%; Class T, 0.78%, after contractual reduction through 2/28/2009.
The returns in the graph and the tables do not reflect the deduction of taxes that a shareholder would pay on Fund distributions or following the redemption of Fund shares.
The graph compares a $10,000 investment in the TARGET Small Capitalization Growth Portfolio (Class T) with a similar investment in the Russell 2000 Index and the Russell 2000 Growth Index by portraying the initial account
| | |
| | THE TARGET PORTFOLIO TRUST |
values at the beginning of the 10-year period (October 31, 1997) and the account values at the end of the current fiscal year (October 31, 2007), as measured on a quarterly basis. The graph takes into account the maximum quarterly TARGET program fee of 1.50% annually for retail investors. The average annual total returns in the table and the returns on investment in the graph do not reflect the deduction of taxes that a shareholder would pay on Portfolio distributions or following the redemption of Portfolio shares.
The Russell 2000 Index is a weighted index that comprises the smallest 2,000 stocks among the largest 3,000 equity-capitalized U.S. corporations and represents approximately 10% of their aggregate market value. The Russell 2000 Growth Index comprises securities in the Russell 2000 Index with a greater-than-average growth orientation. Companies in this index tend to exhibit higher price-to-book ratios and higher forecasted growth values. These indexes are unmanaged, and the total returns include the reinvestment of all dividends, but do not include the effect of sales charges, operating expenses, or taxes. These returns would be lower if they included the effect of sales charges, operating expenses, or taxes. The securities in these indexes may differ substantially from the securities in the Portfolio. These indexes are not the only ones that may be used to characterize performance of small-capitalization equity funds, and other indexes may portray different comparative performance. Investors cannot invest directly in an index.
| | |
| THE TARGET PORTFOLIO TRUST | | |
Growth of a $10,000 Investment
Small Capitalization Value Portfolio
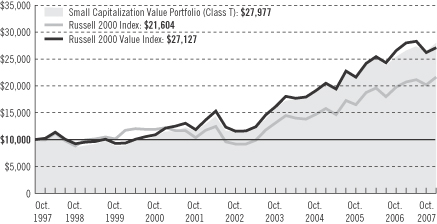
| | | | | | | | | | | |
| Average Annual Total Returns as of 10/31/07 | | | | | | | | | |
| | | One Year | | | Five Years | | | Ten Years | | | Since Inception |
With TARGET Program Fee (Class R) | | 11.17 | % | | N/A | | | N/A | | | 14.64% (8/22/2006) |
With TARGET Program Fee (Class T) | | 9.99 | | | 19.54 | % | | 10.84 | % | | — |
| | | | |
| | | One Year | | | Five Years | | | Ten Years | | | Since Inception |
Without TARGET Program Fee (Class R) | | 11.17 | % | | N/A | | | N/A | | | 14.64% (8/22/2006) |
Without TARGET Program Fee (Class T) | | 11.67 | | | 21.35 | % | | 12.51 | % | | — |
Performance data quoted represent past performance. Past performance does not guarantee future results. The investment return and principal value of an investment will fluctuate, so that an investor’s shares, when redeemed, may be worth more or less than their original cost. Current performance may be lower or higher than the past performance data quoted. An investor may obtain performance data as of the most recent month-end by visiting our website at www.prudential.com or by calling (800) 225-1852. The maximum TARGET program fee for retail investors is 1.50%. Gross operating expenses: Class R, 1.48%; Class T, 0.73%. Net operating expenses apply to: Class R, 1.23%; Class T, 0.73%, after contractual reduction through 2/28/2009.
The returns in the graph and the tables do not reflect the deduction of taxes that a shareholder would pay on Fund distributions or following the redemption of Fund shares.
The graph compares a $10,000 investment in the TARGET Small Capitalization Value Portfolio (Class T) with a similar investment in the Russell 2000 Index and the Russell 2000 Value Index by portraying the initial account
| | |
| | THE TARGET PORTFOLIO TRUST |
values at the beginning of the 10-year period (October 31, 1997) and the account values at the end of the current fiscal year (October 31, 2007), as measured on a quarterly basis. The graph takes into account the maximum quarterly TARGET program fee of 1.50% annually for retail investors. The average annual total returns in the table and the returns on investment in the graph do not reflect the deduction of taxes that a shareholder would pay on Portfolio distributions or following the redemption of Portfolio shares.
The Russell 2000 Index is a weighted index that comprises the smallest 2,000 stocks among the largest 3,000 equity-capitalized U.S. corporations and represents approximately 10% of their aggregate market value. The Russell 2000 Value Index comprises securities in the Russell 2000 Index with a less-than-average growth orientation. Companies in this index tend to exhibit lower price-to-book ratios and lower forecasted growth values. These indexes are unmanaged, and the total returns include the reinvestment of all dividends, but do not include the effect of sales charges, operating expenses, or taxes. These returns would be lower if they included the effect of sales charges, operating expenses, or taxes. The securities in these indexes may differ substantially from the securities in the Portfolio. These indexes are not the only ones that may be used to characterize performance of small-capitalization equity funds, and other indexes may portray different comparative performance. Investors cannot invest directly in an index.
| | |
| THE TARGET PORTFOLIO TRUST | | |
Growth of a $10,000 Investment
International Equity Portfolio
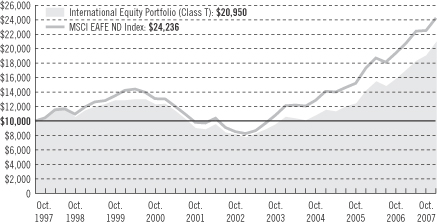
| | | | | | | | | | | |
| Average Annual Total Returns as of 10/31/07 | | | | | | | | | |
| | | One Year | | | Five Years | | | Ten Years | | | Since Inception |
With TARGET Program Fee (Class R) | | 33.23 | % | | N/A | | | N/A | | | 32.18% (8/22/2006) |
With TARGET Program Fee (Class T) | | 31.84 | | | 20.62 | % | | 7.68 | % | | — |
| | | | |
| | | One Year | | | Five Years | | | Ten Years | | | Since Inception |
Without TARGET Program Fee (Class R) | | 33.23 | % | | N/A | | | N/A | | | 32.18% (8/22/2006) |
Without TARGET Program Fee (Class T) | | 33.85 | | | 22.45 | % | | 9.31 | % | | — |
Performance data quoted represent past performance. Past performance does not guarantee future results. The investment return and principal value of an investment will fluctuate, so that an investor’s shares, when redeemed, may be worth more or less than their original cost. Current performance may be lower or higher than the past performance data quoted. An investor may obtain performance data as of the most recent month-end by visiting our website at www.prudential.com or by calling (800) 225-1852. The maximum TARGET program fee for retail investors is 1.50%. Gross operating expenses: Class R, 1.58%; Class T, 0.83%. Net operating expenses apply to: Class R, 1.33%; Class T, 0.83%, after contractual reduction through 2/28/2009.
The returns in the graph and the tables do not reflect the deduction of taxes that a shareholder would pay on Fund distributions or following the redemption of Fund shares.
The graph compares a $10,000 investment in the TARGET International Equity Portfolio (Class T) with a similar investment in the Morgan Stanley Capital International Europe, Australasia, Far East Index (MSCI EAFE ND Index)
| | |
| | THE TARGET PORTFOLIO TRUST |
by portraying the initial account values at the beginning of the 10-year period (October 31, 1997) and the account values at the end of the current fiscal year (October 31, 2007), as measured on a quarterly basis. The graph takes into account the maximum quarterly TARGET program fee of 1.50% annually for retail investors. The average annual total returns in the table and the returns on investment in the graph do not reflect the deduction of taxes that a shareholder would pay on Portfolio distributions or following the redemption of Portfolio shares.
The MSCI EAFE ND Index is a weighted index of performance that reflects stock price movements in Europe, Australasia, and the Far East. The MSCI EAFE ND Index is unmanaged, and the total returns include the reinvestment of all dividends, but do not include the effect of sales charges, operating expenses, or taxes. These returns would be lower if they included the effect of sales charges, operating expenses, or taxes. The securities in the MSCI EAFE ND Index may differ substantially from the securities in the Portfolio. The MSCI EAFE ND Index is not the only one that may be used to characterize performance of international equity funds, and other indexes may portray different comparative performance. Investors cannot invest directly in an index.
| | |
| THE TARGET PORTFOLIO TRUST | | |
Growth of a $10,000 Investment
International Bond Portfolio
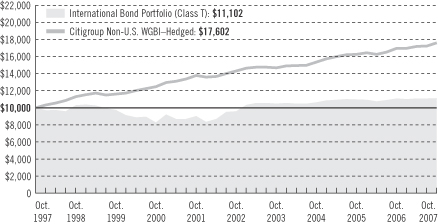
| | | | | | | | | |
| Average Annual Total Returns as of 10/31/07 | | | | | | | | | |
| | | One Year | | | Five Years | | | Ten Years | |
With TARGET Program Fee (Class T) | | 0.07 | % | | 2.92 | % | | 1.05 | % |
| | | One Year | | | Five Years | | | Ten Years | |
Without TARGET Program Fee (Class T) | | 1.59 | % | | 4.48 | % | | 2.58 | % |
Performance data quoted represent past performance. Past performance does not guarantee future results. The investment return and principal value of an investment will fluctuate, so that an investor’s shares, when redeemed, may be worth more or less than their original cost. Current performance may be lower or higher than the past performance data quoted. An investor may obtain performance data as of the most recent month-end by visiting our website at www.prudential.com or by calling (800) 225-1852. The maximum TARGET program fee for retail investors is 1.50%. Gross operating expenses: Class T, 1.08%. Net operating expenses apply to: Class T, 1.08%.
The returns in the graph and the tables do not reflect the deduction of taxes that a shareholder would pay on Fund distributions or following the redemption of Fund shares.
The graph compares a $10,000 investment in the TARGET International Bond Portfolio (Class T) with a similar investment in the Citigroup Non-U.S. World Government Bond Index–Hedged (Citigroup Non-U.S. WGBI–Hedged) by portraying the initial account values at the beginning of the 10-year period (October 31, 1997) and the account values at the end of the current fiscal year (October 31, 2007), as measured on a quarterly basis. The graph takes into account the maximum quarterly TARGET program fee of 1.50% annually for retail investors. The average annual total returns in the table and the returns on investment in the graph do not reflect the deduction of taxes that a shareholder would pay on Portfolio distributions or following the redemption of Portfolio shares.
| | |
| | THE TARGET PORTFOLIO TRUST |
The Citigroup Non-U.S. WGBI–Hedged is an unmanaged index of approximately 600 high-quality bonds with foreign currency exposure translated to the U.S. dollar. The index’s total return include the reinvestment of all dividends, but does not include the effect of sales charges, operating expenses, or taxes. The return would be lower if it included the effect of sales charges, operating expenses, or taxes. The securities in the index may differ substantially from the securities in the Portfolio. The index is not the only one that may be used to characterize performance of international bond funds, and other indexes may portray different comparative performance. Investors cannot invest directly in an index.
| | |
| THE TARGET PORTFOLIO TRUST | | |
Growth of a $10,000 Investment
Total Return Bond Portfolio

| | | | | | | | | | | |
| Average Annual Total Returns as of 10/31/07 | | | | | | | | | |
| | | One Year | | | Five Years | | | Ten Years | | | Since Inception |
With TARGET Program Fee (Class R) | | 5.85 | % | | N/A | | | N/A | | | 5.66% (8/22/2006) |
With TARGET Program Fee (Class T) | | 4.75 | | | 3.71 | % | | 4.56 | % | | — |
| | | | |
| | | One Year | | | Five Years | | | Ten Years | | | Since Inception |
Without TARGET Program Fee (Class R) | | 5.85 | % | | N/A | | | N/A | | | 5.66% (8/22/2006) |
Without TARGET Program Fee (Class T) | | 6.34 | | | 5.29 | % | | 6.14 | % | | — |
Performance data quoted represent past performance. Past performance does not guarantee future results. The investment return and principal value of an investment will fluctuate, so that an investor’s shares, when redeemed, may be worth more or less than their original cost. Current performance may be lower or higher than the past performance data quoted. An investor may obtain performance data current to the most recent month-end by visiting our website at www.prudential.com or by calling (800) 225-1852. The maximum TARGET program fee for retail investors is 1.50%. Gross operating expenses: Class R, 1.39%; Class T, 0.64%. Net operating expenses apply to: Class R, 1.14%; Class T, 0.64%, after contractual reduction through 2/28/2009.
The returns in the graph and the tables do not reflect the deduction of taxes that a shareholder would pay on Fund distributions or following the redemption of Fund shares.
The graph compares a $10,000 investment in the TARGET Total Return Bond Portfolio (Class T) with a similar investment in the Lehman Brothers U.S. Aggregate Bond Index by portraying the initial account values at the
| | |
| | THE TARGET PORTFOLIO TRUST |
beginning of the 10-year period (October 31, 1997) and the account values at the end of the current fiscal year (October 31, 2007), as measured on a quarterly basis. The graph takes into account the maximum quarterly TARGET program fee of 1.50% annually for retail investors. The average annual total returns in the table and the returns on investment in the graph do not reflect the deduction of taxes that a shareholder would pay on Portfolio distributions or following the redemption of Portfolio shares.
The Lehman Brothers U.S. Aggregate Bond Index is an unmanaged index of investment-grade securities issued by the U.S. government and its agencies and by corporations with between one and 10 years remaining to maturity. It gives a broad look at how bond prices of short- and intermediate-term bonds have performed. This index is unmanaged, and the total returns include the reinvestment of all dividends, but do not include the effect of sales charges, operating expenses, or taxes. These returns would be lower if they included the effect of sales charges, operating expenses, or taxes. The securities in these indexes may differ substantially from the securities in the Portfolio. This index is not the only one that may be used to characterize performance of bond funds, and other indexes may portray different comparative performance. Investors cannot invest directly in an index.
| | |
| THE TARGET PORTFOLIO TRUST | | |
Growth of a $10,000 Investment
Intermediate-Term Bond Portfolio
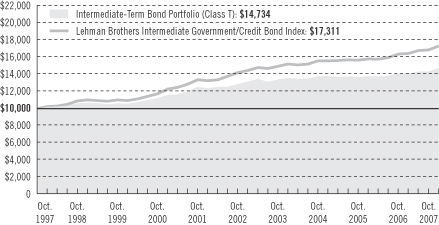
| | | | | | | | | |
| Average Annual Total Returns as of 10/31/07 | | | | | | | | | |
| | | One Year | | | Five Years | | | Ten Years | |
With TARGET Program Fee (Class T) | | 3.90 | % | | 2.70 | % | | 3.95 | % |
| | | |
| | | One Year | | | Five Years | | | Ten Years | |
Without TARGET Program Fee (Class T) | | 5.48 | % | | 4.25 | % | | 5.53 | % |
Performance data quoted represent past performance. Past performance does not guarantee future results. The investment return and principal value of an investment will fluctuate, so that an investor’s shares, when redeemed, may be worth more or less than their original cost. Current performance may be lower or higher than the past performance data quoted. An investor may obtain performance data as of the most recent month-end by visiting our website at www.prudential.com or by calling (800) 225-1852. The maximum TARGET program fee for retail investors is 1.50%. Gross operating expenses: Class T, 0.58%. Net operating expenses apply to: Class T, 0.58%.
The returns in the graph and the tables do not reflect the deduction of taxes that a shareholder would pay on Fund distributions or following the redemption of Fund shares.
The graph compares a $10,000 investment in the TARGET Intermediate-Term Bond Portfolio (Class T) with a similar investment in the Lehman Brothers Intermediate Government/Credit Bond Index by portraying the initial account values at the beginning of the 10-year period (October 31, 1997) and the account values at the end of the current fiscal year (October 31, 2007), as measured on a quarterly basis. The graph takes into account the maximum quarterly TARGET program fee of 1.50% annually for retail investors. The average annual total returns in the table and the returns on investment in the graph do not reflect the deduction of taxes that a shareholder would pay on Portfolio distributions or following the redemption of Portfolio shares.
| | |
| | THE TARGET PORTFOLIO TRUST |
The Lehman Brothers Intermediate Government/Credit Bond Index is a weighted index comprising securities issued by the U.S. government and its agencies and securities publicly issued by corporations with 1 to 10 years remaining to maturity and rated investment grade. The Lehman Brothers Intermediate Government/Credit Bond Index is unmanaged, and the total returns include the reinvestment of all dividends, but do not include the effect of sales charges, operating expenses, or taxes. These returns would be lower if they included the effect of sales charges, operating expenses, or taxes. The securities in the Lehman Brothers Intermediate Government/Credit Bond Index may differ substantially from the securities in the Portfolio. The Lehman Brothers Intermediate Government/Credit Bond Index is not the only one that may be used to characterize performance of bond funds, and other indexes may portray different comparative performance. Investors cannot invest directly in an index.
| | |
| THE TARGET PORTFOLIO TRUST | | |
Growth of a $10,000 Investment
Mortgage Backed Securities Portfolio
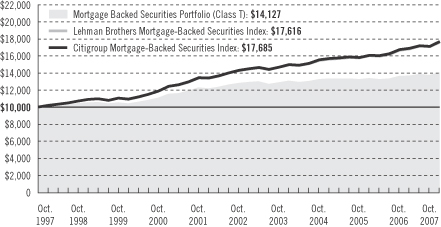
| | | | | | | | | |
| Average Annual Total Returns as of 10/31/07 | | | | | | | | | |
| | | One Year | | | Five Years | | | Ten Years | |
With TARGET Program Fee (Class T) | | 2.94 | % | | 1.84 | % | | 3.52 | % |
| | | |
| | | One Year | | | Five Years | | | Ten Years | |
Without TARGET Program Fee (Class T) | | 4.50 | % | | 3.38 | % | | 5.08 | % |
Performance data quoted represent past performance. Past performance does not guarantee future results. The investment return and principal value of an investment will fluctuate so that an investor’s shares, when redeemed, may be worth more or less than their original cost. Current performance may be lower or higher than the past performance data quoted. An investor may obtain performance data as of the most recent month-end by visiting our website at www.prudential.com or by calling (800) 225-1852. The maximum TARGET program fee for retail investors is 1.50%. Gross operating expenses: Class T, 1.82%. Net operating expenses apply to: Class T, 1.82%.
The returns in the graph and the tables do not reflect the deduction of taxes that a shareholder would pay on Fund distributions or following the redemption of Fund shares.
The graph compares a $10,000 investment in the TARGET Mortgage Backed Securities Portfolio (Class T) with a similar investment in the Lehman Brothers Mortgage-Backed Securities Index and the Citigroup Mortgage-Backed Securities Index by portraying the initial account values at the beginning of the 10-year period (October 31, 1997) and the account values at the end of the current fiscal year (October 31, 2007), as measured on a quarterly basis. The graph takes into account the maximum quarterly TARGET program fee of
| | |
| | THE TARGET PORTFOLIO TRUST |
1.50% annually for retail investors. The average annual total returns in the table and the returns on investment in the graph do not reflect the deduction of taxes that a shareholder would pay on Portfolio distributions or following the redemption of Portfolio shares.
The Lehman Brothers Mortgage-Backed Securities Index is a market capitalization-weighted index of 15-year and 30-year fixed-rate securities backed by the mortgage pools of the GNMA, the FNMA, and the FHLMC, and balloon mortgages with fixed-rate coupons. The Citigroup Mortgage-Backed Securities Index is an index of 30- and 15-year mortgage-related securities issued by U.S. government agencies. It gives a broad indication of how mortgage-backed securities have performed. These indexes are unmanaged, and the total returns include the reinvestment of all dividends, but do not include the effect of sales charges, operating expenses, or taxes. These returns would be lower if they included the effect of sales charges, operating expenses, or taxes. The securities in these indexes may differ substantially from the securities in the Portfolio. These indexes are not the only ones that may be used to characterize performance of bond funds, and other indexes may portray different comparative performance. Investors cannot invest directly in an index.
| | |
| THE TARGET PORTFOLIO TRUST | | |
| | | | |
| n MAIL | | n TELEPHONE | | n WEBSITE |
Gateway Center Three 100 Mulberry Street Newark, NJ 07102 | | (800) 225-1852 | | www.prudential.com |
|
| PROXY VOTING |
| The Board of Trustees of The TARGET Portfolio Trust has delegated to the Trust’s investment subadvisers the responsibility for voting any proxies and maintaining proxy recordkeeping with respect to the Trust. A description of these proxy voting policies and procedures is available without charge, upon request, by calling (800) 225-1852 or by visiting the Securities and Exchange Commission’s website at www.sec.gov. Information regarding how the Trust voted proxies relating to portfolio securities during the most recent 12-month period ended June 30 is available on the Trust’s website and on the Commission’s website. |
|
| TRUSTEES |
| Linda W. Bynoe • David E.A. Carson • Robert F. Gunia • Robert E. La Blanc • Douglas H. McCorkindale • Richard A. Redeker • Judy A. Rice • Robin B. Smith • Stephen G. Stoneburn • Clay T. Whitehead |
|
| OFFICERS |
| Judy A. Rice, President • Robert F. Gunia, Vice President • Grace C. Torres, Treasurer and Principal Financial and Accounting Officer • Kathryn L. Quirk, Chief Legal Officer • Deborah A. Docs, Secretary • Timothy J. Knierim, Chief Compliance Officer • Valerie M. Simpson, Deputy Chief Compliance Officer • Noreen M. Fierro, Anti-Money Laundering Compliance Officer • Jonathan D. Shain, Assistant Secretary • Claudia DiGiacomo, Assistant Secretary • John P. Schwartz, Assistant Secretary • Andrew R. French, Assistant Secretary • M. Sadiq Peshimam, Assistant Treasurer • Peter Parrella, Assistant Treasurer |
| | | | |
| MANAGER | | Prudential Investments LLC | | Gateway Center Three
100 Mulberry Street
Newark, NJ 07102 |
|
| INVESTMENT SUBADVISERS | | EARNEST Partners, LLC | | 75 14th Street
Suite 2300
Atlanta, GA 30309 |
|
| | Goldman Sachs Asset
Management L.P.
| | 32 Old Slip
23rd Floor
New York, NY 10005 |
|
| | Hotchkis and Wiley Capital
Management, LLC | | 725 S. Figueroa Street
Suite 3900
Los Angeles, CA 90017 |
|
| | J.P. Morgan Investment
Management, Inc. | | 522 Fifth Avenue
New York, NY 10036 |
|
| | Lee Munder Investments Ltd. | | 200 Clarendon Street
Boston, MA 02116 |
|
| | LSV Asset Management | | One North Wacker Drive
Suite 4000
Chicago, IL 60606 |
| | | | |
| | NFJ Investment Group L.P. | | 2121 San Jacinto
Suite 1840
Dallas, TX 75201 |
|
| | Marsico Capital
Management, LLC | | 1200 17th Street
Suite 1600
Denver, CO 80202 |
|
| | Pacific Investment
Management Company LLC | | 840 Newport Center Drive
Newport Beach, CA 92660 |
|
| | RS Investment
Management, L.P. | | 388 Market Street
Suite 1700
San Francisco, CA 94111 |
|
| | Thornburg Investment
Management, Inc. | | 119 East Marcy Street
Santa Fe, NM 87501 |
|
| | Transamerica Investment
Management, Inc.
| | 11111 Santa Monica
Boulevard
Suite 820
Los Angeles, CA 90025 |
|
| | Vaughan Nelson Investment
Management, L.P. | | 600 Travis Street
Suite 6300
Houston, TX 77002 |
|
| | Wellington Management
Company, LLP | | 75 State Street
Boston, MA 02109 |
|
| DISTRIBUTOR | | Prudential Investment
Management Services LLC | | Gateway Center Three
100 Mulberry Street
Newark, NJ 07102 |
|
| CUSTODIAN | | PFPC Trust Company | | 400 Bellevue Parkway
Wilmington, DE 19809 |
|
| TRANSFER AGENT | | Prudential Mutual Fund
Services LLC | | PO Box 9658
Providence, RI 02940 |
|
| INDEPENDENT REGISTERED PUBLIC ACCOUNTING FIRM | | KPMG LLP | | 345 Park Avenue
New York, NY 10154 |
|
| FUND COUNSEL | | Willkie Farr & Gallagher LLP | | 787 Seventh Avenue
New York, NY 10019 |
|
| An investor should consider the investment objectives, risks, charges, and expenses of a Portfolio carefully before investing. The prospectuses for the Portfolios contain this and other information about the Portfolios. An investor may obtain a prospectus by visiting our website at www.prudential.com or by calling (800) 225-1852. The prospectus should be read carefully before investing. |
|
| E-DELIVERY |
| To receive your mutual fund documents on-line, go to www.icsdelivery.com/prudential/funds and enroll. Instead of receiving printed documents by mail, you will receive notification via e-mail when new materials are available. You can cancel your enrollment or change your e-mail address at any time by clicking on the change/cancel enrollment option at the icsdelivery website address. |
|
| SHAREHOLDER COMMUNICATIONS WITH TRUSTEES |
| Shareholders can communicate directly with the Board of Trustees by writing to the Chair of the Board, The TARGET Portfolio Trust, Prudential Investments, Attn: Board of Trustees, 100 Mulberry Street, Gateway Center Three, Newark, NJ 07102. Shareholders can communicate directly with an individual Trustee by writing to the same address. Communications are not screened before being delivered to the addressee. |
|
| AVAILABILITY OF PORTFOLIO SCHEDULE |
| The Trust files its complete schedule of portfolio holdings with the Securities and Exchange Commission for the first and third quarters of each fiscal year on Form N-Q. The Trusts’ Forms N-Q are available on the Commission’s website at www.sec.gov. The Trusts’ Forms N-Q may also be reviewed and copied at the Commission’s Public Reference Room in Washington, D.C. Information on the operation and location of the Public Reference Room may be obtained by calling (800) SEC-0330 (732-0330). The Trust’s schedule of portfolio holdings is also available on the Trust’s website as of the end of each fiscal quarter. |
|
| The Trust’s Statement of Additional Information contains additional information about the Trust’s Trustees and is available without charge, upon request, by calling (800) 225-1852. |
Mutual Funds:
| | | | |
ARE NOT INSURED BY THE FDIC OR ANY FEDERAL GOVERNMENT AGENCY | | MAY LOSE VALUE | | ARE NOT A DEPOSIT OF OR GUARANTEED BY ANY BANK OR ANY BANK AFFILIATE |

| | | | | | | | | | | | | | |
| | | The TARGET Portfolio Trust | | NASDAQ | | CUSIP | | | | NASDAQ | | CUSIP | | |
| | Large Capitalization Growth (Class R) | | TLCRX | | 875921868 | | Mortgage Backed Securities (Class T) | | TGMBX | | 875921702 | | |
| | Large Capitalization Growth (Class T) | | TALGX | | 875921207 | | Large Capitalization Value (Class R) | | TLVRX | | 875921850 | | |
| | Small Capitalization Growth (Class R) | | TSCRX | | 875921835 | | Large Capitalization Value (Class T) | | TALVX | | 875921108 | | |
| | Small Capitalization Growth (Class T) | | TASGX | | 875921405 | | Small Capitalization Value (Class R) | | TSVRX | | 875921843 | | |
| | International Equity (Class R) | | TEQRX | | 875921827 | | Small Capitalization Value (Class T) | | TASVX | | 875921306 | | |
| | International Equity (Class T) | | TAIEX | | 875921504 | | International Bond (Class T) | | TIBPX | | 875921876 | | |
| | Total Return Bond (Class R) | | TTBRX | | 875921819 | | Intermediate-Term Bond (Class T) | | TAIBX | | 875921801 | | |
| | Total Return Bond (Class T) | | TATBX | | 875921884 | | U.S. Govt Money Market (Class T) | | PUGXX | | 875921603 | | |
TMF158E IFS-A141797 Ed. 12/2007
Item 2 – Code of Ethics – – See Exhibit (a)
As of the end of the period covered by this report, the Registrant has adopted a code of ethics (the “Section 406 Standards for Investment Companies – Ethical Standards for Principal Executive and Financial Officers”) that applies to the Registrant’s Principal Executive Officer and Principal Financial Officer; the Registrant’s Principal Financial Officer also serves as the Principal Accounting Officer.
The Registrant hereby undertakes to provide any person, without charge, upon request, a copy of the code of ethics. To request a copy of the code of ethics, contact the registrant 800-225-1852, and ask for a copy of the Section 406 Standards for Investment Companies - Ethical Standards for Principal Executive and Financial Officers.
Item 3 – Audit Committee Financial Expert –
The Registrant’s Board has determined that Mr. David E. A. Carson, member of the Board’s Audit Committee is an “audit committee financial expert,” and that he is “independent,” for purposes of this Item.
Item 4 – Principal Accountant Fees and Services –
(a) Audit Fees
For the fiscal period January 1, 2007 through October 31, 2007 and fiscal year ended December 31, 2006, KPMG LLP (“KPMG”), the Registrant’s principal accountant, billed the Registrant $288,816 and $206,200, respectively, for professional services rendered for the audit of the Registrant’s annual financial statements or services that are normally provided in connection with statutory and regulatory filings.
(b) Audit-Related Fees
For the fiscal period January 1, 2007 through October 31, 2007, KPMG, the Registrant’s principal accountant, did not bill the Registrant for assurance and related services that are reasonably related to the performance of the audit of the Registrant’s financial statements. For the fiscal year ended December 31, 2006, KPMG, the Registrant’s principal accountant, billed the Registrant $7,000 for assurance and related services that are reasonably related to the performance of the audit of the Registrant’s financial statements.
(c) Tax Fees
For the fiscal period January 1, 2007 through October 31, 2007, KPMG, the Registrant’s principal accountant, did not bill the Registrant for professional services rendered by the principal accountant for tax compliance, tax advice, and tax planning. For the fiscal year ended December 31, 2006, KPMG, the Registrant’s principal accountant, billed the Registrant $40,000 for professional services rendered by the principal accountant for tax compliance, tax advice, and tax planning. Professional services rendered included assistance with evaluating excise tax liability exposure, opportunities to limit such exposure and discuss financial reporting and return filing matters.
(d) All Other Fees
None.
(e) (1) Audit Committee Pre-Approval Policies and Procedures
THE PRUDENTIAL MUTUAL FUNDS
AUDIT COMMITTEE POLICY
on
Pre-Approval of Services Provided by the Independent Accountants
The Audit Committee of each Prudential Mutual Fund is charged with the responsibility to monitor the independence of the Fund’s independent accountants. As part of this responsibility, the Audit Committee must pre-approve any independent accounting firm’s engagement to render audit and/or permissible non-audit services, as required by law. In evaluating a proposed engagement of the independent accountants, the Audit Committee will assess the effect that the engagement might reasonably be expected to have on the accountant’s independence. The Committee’s evaluation will be based on:
| | • | | a review of the nature of the professional services expected to be provided, |
| | • | | a review of the safeguards put into place by the accounting firm to safeguard independence, and |
| | • | | periodic meetings with the accounting firm. |
Policy for Audit and Non-Audit Services Provided to the Funds
On an annual basis, the scope of audits for each Fund, audit fees and expenses, and audit-related and non-audit services (and fees proposed in respect thereof) proposed to be performed by the Fund’s independent accountants will be presented by the Treasurer and the independent accountants to the Audit Committee for review and, as appropriate, approval prior to the initiation of such services. Such presentation shall be accompanied by confirmation by both the Treasurer and the independent accountants that the proposed services will not adversely affect the independence of the independent accountants. Proposed services shall be described in sufficient detail to enable the Audit Committee to assess the appropriateness of such services and fees, and the compatibility of the provision of such services with the auditor’s independence. The Committee shall receive periodic reports on the progress of the audit and other services which are approved by the Committee or by the Committee Chair pursuant to authority delegated in this Policy.
The categories of services enumerated under “Audit Services”, “Audit-related Services”, and “Tax Services” are intended to provide guidance to the Treasurer and the independent accountants as to those categories of services which the Committee believes are generally consistent with the independence of the independent accountants and which the Committee (or
the Committee Chair) would expect upon the presentation of specific proposals to pre-approve. The enumerated categories are not intended as an exclusive list of audit, audit-related or tax services, which the Committee (or the Committee Chair) would consider for pre-approval.
Audit Services
The following categories of audit services are considered to be consistent with the role of the Fund’s independent accountants:
| | • | | Annual Fund financial statement audits |
| | • | | Seed audits (related to new product filings, as required) |
| | • | | SEC and regulatory filings and consents |
Audit-related Services
The following categories of audit-related services are considered to be consistent with the role of the Fund’s independent accountants:
| | • | | Accounting consultations |
| | • | | Fund merger support services |
| | • | | Agreed Upon Procedure Reports |
| | • | | Other Internal Control Reports |
Individual audit-related services that fall within one of these categories and are not presented to the Audit Committee as part of the annual pre-approval process will be subject to pre-approval by the Committee Chair (or any other Committee member on whom this responsibility has been delegated) so long as the estimated fee for those services does not exceed $50,000.
Tax Services
The following categories of tax services are considered to be consistent with the role of the Fund’s independent accountants:
| | • | | Tax compliance services related to the filing or amendment of the following: |
| | • | | Federal, state and local income tax compliance; and, |
| | • | | Sales and use tax compliance |
| | • | | Timely RIC qualification reviews |
| | • | | Tax distribution analysis and planning |
| | • | | Tax authority examination services |
| | • | | Tax appeals support services |
| | • | | Accounting methods studies |
| | • | | Fund merger support services |
| | • | | Tax consulting services and related projects |
Individual tax services that fall within one of these categories and are not presented to the Audit Committee as part of the annual pre-approval process will be subject to pre-approval by the Committee Chair (or any other Committee member on whom this responsibility has been delegated) so long as the estimated fee for those services does not exceed $50,000.
Other Non-audit Services
Certain non-audit services that the independent accountants are legally permitted to render will be subject to pre-approval by the Committee or by one or more Committee members to whom the Committee has delegated this authority and who will report to the full Committee any pre-approval decisions made pursuant to this Policy. Non-audit services presented for pre-approval pursuant to this paragraph will be accompanied by a confirmation from both the Treasurer and the independent accountants that the proposed services will not adversely affect the independence of the independent accountants.
Proscribed Services
The Fund’s independent accountants will not render services in the following categories of non-audit services:
| | • | | Bookkeeping or other services related to the accounting records or financial statements of the Fund |
| | • | | Financial information systems design and implementation |
| | • | | Appraisal or valuation services, fairness opinions, or contribution-in-kind reports |
| | • | | Internal audit outsourcing services |
| | • | | Management functions or human resources |
| | • | | Broker or dealer, investment adviser, or investment banking services |
| | • | | Legal services and expert services unrelated to the audit |
| | • | | Any other service that the Public Company Accounting Oversight Board determines, by regulation, is impermissible. |
Pre-approval of Non-Audit Services Provided to Other Entities Within the Prudential Fund Complex
Certain non-audit services provided to Prudential Investments LLC or any of its affiliates that also provide ongoing services to the Prudential Mutual Funds will be subject to pre-approval by the Audit Committee. The only non-audit services provided to these entities that will require pre-approval are those related directly to the operations and financial reporting of the Funds. Individual projects that are not presented to the Audit Committee as part of the annual pre-approval process will be subject to pre-approval by the Committee Chair (or any other Committee member on whom this responsibility has been delegated) so long as the estimated fee for those services does not exceed $50,000. Services presented for pre-approval pursuant to this paragraph will be accompanied by a confirmation from both the Treasurer and the independent accountants that the proposed services will not adversely affect the independence of the independent accountants.
Although the Audit Committee will not pre-approve all services provided to Prudential Investments LLC and its affiliates, the Committee will receive an annual report from the Fund’s independent accounting firm showing the aggregate fees for all services provided to Prudential Investments and its affiliates.
(e) (2) Percentage of services referred to in 4(b)- (4)(d) that were approved by the audit committee –
Not applicable.
(f) Percentage of hours expended attributable to work performed by other than full time employees of principal accountant if greater than 50%.
Not applicable.
(g) Non-Audit Fees
Not applicable to Registrant for the fiscal period January 1, 2007 through October 31, 2007 and fiscal year ended December 31, 2006. The aggregate non-audit fees billed by KPMG for services rendered to the registrant’s investment adviser and any entity controlling, controlled by, or under common control with the investment adviser that provides ongoing services to the registrant for the fiscal period January 1, 2007 through October 31, 2007 and fiscal year ended December 31, 2006 was $44,700 and $317,300, respectively.
(h) Principal Accountant’s Independence
Not applicable as KPMG has not provided non-audit services to the Registrant’s investment adviser and any entity controlling, controlled by, or under common control with the investment adviser that provides ongoing services to the registrant that were not pre-approved pursuant to Rule 2-01(c)(7)(ii) of Regulation S-X.
Item 5 – Audit Committee of Listed Registrants – Not applicable.
Item 6 – Schedule of Investments – The schedule is included as part of the report to shareholders filed under Item 1 of this Form.
Item 7 – Disclosure of Proxy Voting Policies and Procedures for Closed-End Management Investment Companies – Not applicable.
Item 8 – Portfolio Managers of Closed-End Management Investment Companies – Not applicable.
Item 9 – Purchases of Equity Securities by Closed-End Management Investment Company and Affiliated Purchasers – Not applicable.
Item 10 – Submission of Matters to a Vote of Security Holders – Not applicable.
Item 11 – Controls and Procedures
| | (a) | It is the conclusion of the Registrant’s principal executive officer and principal financial officer that the effectiveness of the Registrant’s current disclosure controls and procedures (such disclosure controls and procedures having been evaluated within 90 days of the date of this filing) provide reasonable assurance that the information required to be disclosed by the Registrant has been recorded, processed, summarized and reported within the time period specified in the Commission’s rules and forms and that the information required to be disclosed by the Registrant has been accumulated and communicated to the Registrant’s principal executive officer and principal financial officer in order to allow timely decisions regarding required disclosure. |
| | (b) | There has been no significant change in the Registrant’s internal control over financial reporting that occurred during the registrant’s most recent fiscal quarter of the period covered by this report that has materially affected, or is likely to materially affect, the Registrant’s internal control over financial reporting. |
Item 12 – Exhibits
| | | | |
(a) | | (1) | | Code of Ethics – Attached hereto as Exhibit EX-99.CODE-ETH |
| | |
| | (2) | | Certifications pursuant to Section 302 of the Sarbanes-Oxley Act – Attached hereto as Exhibit EX-99.CERT. |
| | |
| | (3) | | Any written solicitation to purchase securities under Rule 23c-1. – Not applicable. |
| |
(b) | | Certifications pursuant to Section 906 of the Sarbanes-Oxley Act – Attached hereto as Exhibit EX-99.906CERT. |
SIGNATURES
Pursuant to the requirements of the Securities Exchange Act of 1934 and the Investment Company Act of 1940, the registrant has duly caused this report to be signed on its behalf by the undersigned, thereunto duly authorized.
(Registrant) The Target Portfolio Trust
| | |
| By (Signature and Title)* | | /s/ Deborah A. Docs |
| | Deborah A. Docs |
| | Secretary |
Date December 20, 2007
Pursuant to the requirements of the Securities Exchange Act of 1934 and the Investment Company Act of 1940, this report has been signed below by the following persons on behalf of the registrant and in the capacities and on the dates indicated.
| | |
| By (Signature and Title)* | | /s/ Judy A. Rice |
| | Judy A. Rice |
| | President and Principal Executive Officer |
Date December 20, 2007
| | |
| By (Signature and Title)* | | /s/ Grace C. Torres |
| | Grace C. Torres |
| | Treasurer and Principal Financial Officer |
Date December 20, 2007
* | Print the name and title of each signing officer under his or her signature. |