UNITED STATES
SECURITIES AND EXCHANGE COMMISSION
Washington, D.C. 20549
FORM N-CSR
CERTIFIED SHAREHOLDER REPORT OF REGISTERED MANAGEMENT
INVESTMENT COMPANIES
| | |
| Investment Company Act file number: | | 811-07064 |
| |
| Exact name of registrant as specified in charter: | | The Target Portfolio Trust |
| |
| Address of principal executive offices: | | Gateway Center 3, |
| | 100 Mulberry Street, |
| | Newark, New Jersey 07102 |
| |
| Name and address of agent for service: | | Deborah A. Docs |
| | Gateway Center 3, |
| | 100 Mulberry Street, |
| | Newark, New Jersey 07102 |
| |
| Registrant’s telephone number, including area code: | | 800-225-1852 |
| |
| Date of fiscal year end: | | 10/31/2008 |
| |
| Date of reporting period: | | 10/31/2008 |
Item 1 – Reports to Stockholders

| | |
| OCTOBER 31, 2008 | | ANNUAL REPORT |
The TARGET Portfolio Trust®
This report is not authorized for distribution to prospective investors unless preceded or accompanied by a current prospectus.
The views expressed in this report and information about the Trust portfolios’ securities are for the period covered by this report and are subject to change thereafter.
TARGET Funds, TARGET Portfolio Trust, Prudential, Prudential Financial, and the Rock Prudential logo are registered service marks of The Prudential Insurance Company of America, Newark, NJ, and its affiliates.

December 15, 2008
Dear TARGET Shareholder:
We hope you find the annual report for The TARGET Portfolio Trust informative and useful. Today many investors may be asking where they can find new growth opportunities. We believe that as a TARGET shareholder, you are uniquely positioned for domestic and global growth opportunities because you already have a strategic investment plan in place.
A structured and professional approach to investing can help you “tune out” the noise of current market developments and allows you to concentrate on what’s really important—your long-term goals. It starts with a personal plan that you and your financial professional construct based on your reasons for investing, the time you have to reach your goals, and the level of risk you are willing to assume. Your financial professional can work closely with you to develop an appropriate asset allocation and select the corresponding TARGET portfolio for each asset class in your investment plan. The managers for each portfolio are carefully chosen from among the leading institutional money managers available, and are monitored by our team of experienced investment management analysts.
Your selections among the TARGET portfolios can evolve as your needs change. Your financial professional can help you track your plan’s progress, stay informed of important developments, and assist you in determining whether you need to modify your portfolio. In these ways and more, the TARGET portfolios can help make your investment goals a reality.
Thank you for your continued confidence.
Sincerely,

Judy A. Rice, President
The TARGET Portfolio Trust
| | |
| THE TARGET PORTFOLIO TRUST | | 1 |
Equity Portfolios’ Performance
Performance data quoted represent past performance. Past performance does not guarantee future results. The investment return and principal value of an investment will fluctuate, so that an investor’s shares, when redeemed, may be worth more or less than their original cost. Current performance may be lower or higher than the past performance data quoted. An investor may obtain performance data as of the most recent month-end by visiting our website at www.prudential.com or by calling (800) 225-1852. The maximum TARGET program fee for retail investors is 1.50%. Pursuant to the termination of the TARGET program on December 15, 2008, such fee is no longer applicable.
Large Capitalization Growth Portfolio:
Gross operating expenses: Class R, 1.49%; Class T, 0.74%. Net operating expenses apply to: Class R, 1.24%; Class T, 0.74%, after contractual reduction through 2/28/2010.
Large Capitalization Value Portfolio:
Gross operating expenses: Class R, 1.46%; Class T, 0.71%. Net operating expenses apply to: Class R, 1.21%; Class T, 0.71%, after contractual reduction through 2/28/2010.
Small Capitalization Growth Portfolio:
Gross operating expenses: Class R, 1.55%; Class T, 0.80%. Net operating expenses apply to: Class R, 1.30%; Class T, 0.80%, after contractual reduction through 2/28/2010.
Small Capitalization Value Portfolio:
Gross operating expenses: Class R, 1.55%; Class T, 0.80%. Net operating expenses apply to: Class R, 1.30%; Class T, 0.80%, after contractual reduction through 2/28/2010.
International Equity Portfolio:
Gross operating expenses: Class R, 1.58%; Class T, 0.83%. Net operating expenses apply to: Class R, 1.33%; Class T, 0.83%, after contractual reduction through 2/28/2010.
| | | | | | | | | | | |
| Equity Portfolios |
| | | Cumulative Total Returns1
as of 10/31/08 (Without TARGET Program Fee) |
| | | One Year | | | Five Years | | | Ten Years | | | Since Inception2 |
Large Capitalization Growth Portfolio (Class R) | | –38.48 | % | | N/A | | | N/A | | | –22.68% (8/22/06) |
Large Capitalization Growth Portfolio (Class T) | | –38.14 | | | –10.81 | % | | 5.34 | % | | — |
S&P 500 Index3 | | –36.08 | | | 1.31 | | | 4.03 | | | *** |
Russell 1000 Growth Index3 | | –36.95 | | | –6.28 | | | –19.11 | | | **** |
Lipper Large-Cap Growth Funds Avg.4 | | –38.55 | | | –7.21 | | | –3.57 | | | ***** |
| | |
| 2 | | THE TARGET PORTFOLIO TRUST |
| | | | | | | | | | | |
| | | Average Annual Total Returns1
as of 9/30/08 (With TARGET Program Fee) |
| | | One Year | | | Five Years | | | Ten Years | | | Since Inception2 |
Large Capitalization Growth Portfolio (Class R) | | –24.06 | % | | N/A | | | N/A | | | –4.06% (8/22/06) |
Large Capitalization Growth Portfolio (Class T) | | –24.88 | | | 1.23 | % | | 1.50 | % | | �� |
S&P 500 Index3 | | –21.96 | | | 5.17 | | | 3.06 | | | *** |
Russell 1000 Growth Index3 | | –20.88 | | | 3.74 | | | 0.59 | | | **** |
Lipper Large-Cap Growth Funds Avg.4 | | –22.95 | | | 3.25 | | | 1.72 | | | ***** |
| | | | | | | | | | | |
| | | Cumulative Total Returns1
as of 10/31/08 (Without TARGET Program Fee) |
| | | One Year | | | Five Years | | | Ten Years | | | Since Inception2 |
Large Capitalization Value Portfolio (Class R) | | –40.60 | % | | N/A | | | N/A | | | –30.96% (8/22/06) |
Large Capitalization Value Portfolio (Class T) | | –40.29 | | | 3.26 | % | | 24.24 | % | | — |
S&P 500 Index3 | | –36.08 | | | 1.31 | | | 4.03 | | | *** |
Russell 1000 Value Index3 | | –36.80 | | | 9.88 | | | 31.66 | | | **** |
Lipper Large-Cap Value Funds Avg.4 | | –37.28 | | | 3.07 | | | 19.90 | | | ***** |
| | | | | | | | | | | |
| | | Average Annual Total Returns1
as of 9/30/08 (With TARGET Program Fee) |
| | | One Year | | | Five Years | | | Ten Years | | | Since Inception2 |
Large Capitalization Value Portfolio (Class R) | | –26.62 | % | | N/A | | | N/A | | | –7.37% (8/22/06) |
Large Capitalization Value Portfolio (Class T) | | –27.35 | | | 4.66 | % | | 3.49 | % | | — |
S&P 500 Index3 | | –21.96 | | | 5.17 | | | 3.06 | | | *** |
Russell 1000 Value Index3 | | –23.56 | | | 7.12 | | | 5.55 | | | **** |
Lipper Large-Cap Value Funds Avg.4 | | –23.80 | | | 5.52 | | | 4.34 | | | ***** |
| | |
| THE TARGET PORTFOLIO TRUST | | 3 |
Equity Portfolios’ Performance (continued)
| | | | | | | | | | | |
| | | Cumulative Total Returns1
as of 10/31/08 (Without TARGET Program Fee) |
| | | One Year | | | Five Years | | | Ten Years | | | Since Inception2 |
Small Capitalization Growth Portfolio (Class R) | | –47.78 | % | | N/A | | | N/A | | | –35.05% (8/22/06) |
Small Capitalization Growth Portfolio (Class T) | | –47.54 | | | –20.59 | % | | –15.01 | % | | — |
Russell 2000 Index3 | | –34.16 | | | 8.09 | | | 61.34 | | | *** |
Russell 2000 Growth Index3 | | –37.87 | | | –0.63 | | | 17.50 | | | **** |
Lipper Small-Cap Growth Funds Avg.4 | | –42.01 | | | –7.67 | | | 51.83 | | | ***** |
| |
| | | Average Annual Total Returns1
as of 9/30/08 (With TARGET Program Fee) |
| | | One Year | | | Five Years | | | Ten Years | | | Since Inception2 |
Small Capitalization Growth Portfolio (Class R) | | –31.63 | % | | N/A | | | N/A | | | –8.75% (8/22/06) |
Small Capitalization Growth Portfolio (Class T) | | –32.27 | | | 0.01 | % | | –0.26 | % | | — |
Russell 2000 Index3 | | –14.48 | | | 8.15 | | | 7.81 | | | *** |
Russell 2000 Growth Index3 | | –17.07 | | | 6.64 | | | 4.67 | | | **** |
Lipper Small-Cap Growth Funds Avg.4 | | –23.61 | | | 4.81 | | | 6.56 | | | ***** |
| |
| | | Cumulative Total Returns1
as of 10/31/08 (Without TARGET Program Fee) |
| | | One Year | | | Five Years | | | Ten Years | | | Since Inception2 |
Small Capitalization Value Portfolio (Class R) | | –30.57 | % | | N/A | | | N/A | | | –18.27% (8/22/06) |
Small Capitalization Value Portfolio (Class T) | | –30.23 | | | 31.00 | % | | 161.60 | % | | — |
Russell 2000 Index3 | | –34.16 | | | 8.09 | | | 61.34 | | | *** |
Russell 2000 Value Index3 | | –30.54 | | | 16.19 | | | 104.12 | | | **** |
Lipper Small-Cap Core Funds Avg.4 | | –36.97 | | | 5.74 | | | 88.99 | | | ***** |
| | |
| 4 | | THE TARGET PORTFOLIO TRUST |
| | | | | | | | | | | |
| | | Average Annual Total Returns1
as of 9/30/08 (With TARGET Program Fee) |
| | | One Year | | | Five Years | | | Ten Years | | | Since Inception2 |
Small Capitalization Value Portfolio (Class R) | | –11.60 | % | | N/A | | | N/A | | | 0.72% (8/22/06) |
Small Capitalization Value Portfolio (Class T) | | –12.48 | | | 10.56 | % | | 11.38 | % | | — |
Russell 2000 Index3 | | –14.48 | | | 8.15 | | | 7.81 | | | *** |
Russell 2000 Value Index3 | | –12.25 | | | 9.45 | | | 10.14 | | | **** |
Lipper Small-Cap Core Funds Avg.4 | | –18.73 | | | 7.35 | | | 8.87 | | | ***** |
| |
| | | Cumulative Total Returns1
as of 10/31/08 (Without TARGET Program Fee) |
| | | One Year | | | Five Years | | | Ten Years | | | Since Inception2 |
International Equity Portfolio (Class R) | | –48.30 | % | | N/A | | | N/A | | | –27.87% (8/22/06) |
International Equity Portfolio (Class T) | | –47.99 | | | 20.68 | % | | 18.14 | % | | — |
MSCI EAFE ND Index3 | | –46.62 | | | 19.32 | | | 17.98 | | | *** |
Lipper International Large-Cap Core Funds Avg.4 | | –47.80 | | | 13.41 | | | 13.75 | | | ***** |
| |
| | | Average Annual Total Returns1
as of 9/30/08 (With TARGET Program Fee) |
| | | One Year | | | Five Years | | | Ten Years | | | Since Inception2 |
International Equity Portfolio (Class R) | | –32.04 | % | | N/A | | | N/A | | | –4.56% (8/22/06) |
International Equity Portfolio (Class T) | | –32.71 | | | 8.11 | % | | 3.23 | % | | — |
MSCI EAFE ND Index3 | | –30.50 | | | 9.69 | | | 5.02 | | | *** |
Lipper International Large-Cap Core Funds Avg.4 | | –30.65 | | | 8.68 | | | 4.50 | | | ***** |
Source: Prudential Investments LLC and Lipper Inc. Performance figures may reflect fee waivers and/or expense reimbursements. In the absence of such fee waivers and/or expense reimbursements, total returns would be lower.
1Total returns assume the reinvestment of all dividends and distributions, and take into account all charges and expenses applicable to an investment in each portfolio. The average annual total returns for the TARGET portfolios assume the imposition of the maximum TARGET annual advisory fee of 1.50% for equity portfolios for retail investors. Class R shares are subject to an annual distribution and service (12b-1) fee of up to 0.75%. Returns in the table do not reflect the deduction of taxes that a shareholder would pay on portfolio distributions or following the redemption of portfolio shares.
2Inception date returns are provided for any share class with less than 10 calendar years of returns.
3Investors cannot invest directly in an index. The returns for the benchmark indexes would be lower if they reflected deductions for TARGET program fees, portfolio operating expenses, sales charges, or taxes. The Standard & Poor’s 500 Composite Stock Price Index (S&P 500 Index) is an unmanaged index of 500 stocks of large U.S. companies. It gives a broad look at how stock prices have performed. The Russell 1000 Growth Index contains
| | |
| THE TARGET PORTFOLIO TRUST | | 5 |
Equity Portfolios’ Performance (continued)
those securities in the Russell 1000 Index with an above-average growth orientation. Companies in this index tend to exhibit higher price-to-book and price-to-earnings ratios, lower dividend yields, and higher forecasted growth rates. The Russell 1000 Value Index contains those securities in the Russell 1000 Index with a below-average growth orientation. Companies in this index generally have low price-to-book and price-to-earnings ratios, higher dividend yields, and lower forecasted growth values. The Russell 2000 Index is an unmanaged index of the stocks of the 2,000 smallest U.S. companies included in the Russell 3000 Index. It gives an indication of how the stock prices of smaller companies have performed. The Russell 2000 Growth Index contains those securities in the Russell 2000 Index with an above-average growth orientation. Companies in this index generally have higher price-to-book and price-to-earnings ratios. The Russell 2000 Value Index contains those securities in the Russell 2000 Index with a below-average growth orientation. Companies in this index generally have low price-to-earnings ratios, higher dividend yields, and lower forecasted growth values. The Morgan Stanley Capital International Europe, Australasia, and Far East Index (MSCI EAFE ND Index) is an unmanaged, weighted index that reflects stock price movements in Europe, Australasia, and the Far East. It gives an indication of how foreign stocks have performed.
4The Lipper averages represent returns based on an average of all funds in the respective Lipper categories for the periods noted. The returns for the Lipper averages would be lower if they reflected deductions for TARGET program fees, portfolio operating expenses, sales charges, or taxes. Large-Cap Growth funds invest at least 75% of their equity assets in companies with market capitalizations (on a three-year weighted basis) above Lipper’s USDE large-cap floor. Large-cap growth funds have an above-average price-to-earnings ratio, price-to-book ratio, and three-year sales-per-share growth value compared with the S&P 500 Index. Large-Cap Value funds invest at least 75% of their equity assets in companies with market capitalizations (on a three-year weighted basis) above Lipper’s USDE large-cap floor. Large-cap value funds typically have a below-average price-to-earnings ratio and three-year sales-per-share growth value compared with the S&P 500 Index. Small-Cap Growth funds invest at least 75% of their equity assets in companies with market capitalizations (on a three-year weighted basis) less than 250% of the dollar-weighted median of the smallest 500 of the middle 1,000 securities of the S&P SuperComposite 1500 Index. Small-cap growth funds typically have an above-average price-to-earnings ratio, price-to-book ratio, and three-year sales-per-share growth value compared with the S&P SmallCap 600 Index. Small-Cap Core funds invest at least 75% of their equity assets in companies with market capitalizations (on a three-year weighted basis) less than 250% of the dollar-weighted median of the smallest 500 of the middle 1,000 securities of the S&P SuperComposite 1500 Index. Small-cap core funds have more latitude in the companies in which they invest. These funds typically have an average price-to-earnings ratio and three-year sales-per-share growth value compared with the S&P SmallCap 600 Index. International Large Cap Core funds invest at least 75% of their equity assets in companies strictly outside of the U.S. with market capitalizations (on a three-year weighted basis) above Lipper’s international large-cap floor. International large-cap core funds typically have an average price-to-cash flow ratio, price-to-book ratio, and three-year sales-per-share growth value compared to their large-cap-specific subset of the S&P/Citigroup World ex-U.S. BMI.
***Large Capitalization Growth Portfolio—S&P 500 Index Closest Month-End to Inception cumulative total return as of 10/31/08 is –22.45% for Class R. S&P 500 Index Closest Month-End to Inception average annual total return as of 9/30/08 is –3.32% for Class R. Large Capitalization Value Portfolio—S&P 500 Index Closest Month-End to Inception cumulative total return as of 10/31/08 is –22.45% for Class R. S&P 500 Index Closest Month-End to Inception average annual total return as of 9/30/08 is –3.32% for Class R. Small Capitalization Growth Portfolio—Russell 2000 Index Closest Month-End to Inception cumulative total return as of 10/31/08 is –23.28% for Class R. Russell 2000 Index Closest Month-End to Inception average annual total return as of 9/30/08 is –1.51% for Class R. Small Capitalization Value Portfolio—Russell 2000 Index Closest Month-End to Inception cumulative total return as of 10/31/08 is –23.28% for Class R. Russell 2000 Index Closest Month-End to Inception average annual total return as of 9/30/08 is –1.51% for Class R. International Equity Portfolio—MSCI EAFE ND Index Closest Month-End to Inception cumulative total return as of 10/31/08 is –30.63% for Class R. MSCI EAFE ND Index Closest Month-End to Inception average annual total return as of 9/30/08 is –6.51% for Class R.
| | |
| 6 | | THE TARGET PORTFOLIO TRUST |
****Large Capitalization Growth Portfolio—Russell 1000 Growth Index Closest Month-End to Inception cumulative total return as of 10/31/08 is –20.05% for Class R. Russell 1000 Growth Index Closest Month-End to Inception average annual total return as of 9/30/08 is –1.44% for Class R. Large Capitalization Value Portfolio—Russell 1000 Value Index Closest Month-End to Inception cumulative total return as of 10/31/08 is –26.22% for Class R. Russell 1000 Value Index Closest Month-End to Inception average annual total return as of 9/30/08 is –5.32% for Class R. Small Capitalization Growth Portfolio—Russell 2000 Growth Index Closest Month-End to Inception cumulative total return as of 10/31/08 is –22.25% for Class R. Russell 2000 Growth Index Closest Month-End to Inception average annual total return as of 9/30/08 is –0.34% for Class R. Small Capitalization Value Portfolio—Russell 2000 Value Index Closest Month-End to Inception cumulative total return as of 10/31/08 is –24.78% for Class R. Russell 2000 Value Index Closest Month-End to Inception average annual total return as of 9/30/08 is –2.93% for Class R.
*****Large Capitalization Growth Portfolio—Lipper Average Index Closest Month-End to Inception cumulative total return as of 10/31/08 is –20.87% for Class R. Lipper Average Index Closest Month-End to Inception average annual total return as of 9/30/08 is –2.32% for Class R. Large Capitalization Value Portfolio—Lipper Average Index Closest Month-End to Inception cumulative total return as of 10/31/08 is –26.02% for Class R. Lipper Average Index Closest Month-End to Inception average annual total return as of 9/30/08 is –5.30% for Class R. Small Capitalization Growth Portfolio—Lipper Average Closest Month-End to Inception cumulative total return as of 10/31/08 is –25.84% for Class R. Lipper Average Closest Month-End to Inception average annual total return as of 9/30/08 is –3.14% for Class R. Small Capitalization Value Portfolio—Lipper Average Closest Month-End to Inception cumulative total return as of 10/31/08 is –26.09% for Class R. Lipper Average Closest Month-End to Inception average annual total return as of 9/30/08 is –3.41% for Class R. International Equity Portfolio—Lipper Average Closest Month-End to Inception cumulative total return as of 10/31/08 is –31.48% for Class R. Lipper Average Closest Month-End to Inception average annual total return as of 9/30/08 is –6.50% for Class R.
| | |
| THE TARGET PORTFOLIO TRUST | | 7 |
Fixed Income Portfolios’ Performance
Performance data quoted represent past performance. Past performance does not guarantee future results. The investment return and principal value of an investment will fluctuate, so that an investor’s shares, when redeemed, may be worth more or less than their original cost. Current performance may be lower or higher than the past performance data quoted. An investor may obtain performance data as of the most recent month-end by visiting our website at www.prudential.com or by calling (800) 225-1852. The maximum TARGET program fee for retail investors is 1.50%. Pursuant to the termination of the TARGET program on December 15, 2008, such fee is no longer applicable.
International Bond Portfolio:
Gross operating expenses: Class T, 1.15%. Net operating expenses apply to: Class T, 1.15%.
Total Return Bond Portfolio:
Gross operating expenses: Class R, 1.48%; Class T, 0.73%. Net operating expenses apply to: Class R, 1.23%; Class T, 0.73%, after contractual reduction through 2/28/2010.
Intermediate-Term Bond Portfolio:
Gross operating expenses: Class T, 0.60%. Net operating expenses apply to: Class T, 0.60%.
Mortgage Backed Securities Portfolio:
Gross operating expenses: Class T, 1.94%. Net operating expenses apply to: Class T, 1.94%.
| | | | | | | | | |
| Fixed Income Portfolios | |
| | | Cumulative Total Returns1
as of 10/31/08 (Without TARGET Program Fee) | |
| | | One Year | | | Five Years | | | Ten Years | |
International Bond Portfolio (Class T) | | –2.40 | % | | 9.55 | % | | 20.32 | % |
Citigroup Non-U.S. WGBI–Hedged3 | | 4.54 | | | 25.46 | | | 62.87 | |
Lipper International Income Funds Avg.4 | | –5.88 | | | 18.50 | | | 56.46 | |
| |
| | | Average Annual Total Returns1
as of 9/30/08 (With TARGET Program Fee) | |
| | | One Year | | | Five Years | | | Ten Years | |
International Bond Portfolio (Class T) | | –1.73 | % | | 0.53 | % | | 0.75 | % |
Citigroup Non-U.S. WGBI–Hedged3 | | 4.36 | | | 4.24 | | | 4.89 | |
Lipper International Income Funds Avg.4 | | 0.29 | | | 4.10 | | | 4.92 | |
| | |
| 8 | | THE TARGET PORTFOLIO TRUST |
| | | | | | | | | | | |
| | | Cumulative Total Returns1
as of 10/31/08 (Without TARGET Program Fee) |
| | | One Year | | | Five Years | | | Ten Years | | | Since Inception2 |
Total Return Bond Portfolio (Class R) | | –2.24 | % | | N/A | | | N/A | | | 4.58% (8/22/06) |
Total Return Bond Portfolio (Class T) | | –1.71 | | | 18.29 | % | | 63.13 | % | | — |
Barclays Capital U.S. Aggregate Bond Index3 | | 0.30 | | | 18.67 | | | 62.90 | | | *** |
Lipper Corporate Debt BBB-Rated Funds Avg.4 | | –13.76 | | | 2.88 | | | 38.93 | | | **** |
| | | | | | | | | | | |
| | | Average Annual Total Returns1
as of 9/30/08 (With TARGET Program Fee) |
| | | One Year | | | Five Years | | | Ten Years | | | Since Inception2 |
Total Return Bond Portfolio (Class R) | | 0.66 | % | | N/A | | | N/A | | | 3.25% (8/22/06) |
Total Return Bond Portfolio (Class T) | | –0.37 | | | 2.17 | % | | 3.60 | % | | — |
Barclays Capital U.S. Aggregate Bond Index3 | | 3.65 | | | 3.78 | | | 5.20 | | | *** |
Lipper Corporate Debt BBB-Rated Funds Avg.4 | | –6.20 | | | 2.13 | | | 4.06 | | | **** |
| | | | | | | | | | | | | | | | | | |
| | | Cumulative Total Returns1
as of 10/31/08
(Without TARGET Program Fee) | | | Average Annual Total Returns1
as of 9/30/08
(With TARGET Program Fee) | |
| | | One Year | | | Five Years | | | Ten Years | | | One Year | | | Five Years | | | Ten Years | |
Intermediate-Term Bond Portfolio (Class T) | | 5.07 | % | | 22.19 | % | | 66.48 | % | | 3.73 | % | | 2.37 | % | | 3.65 | % |
Barclays Capital Int. Govt./Credit Bond Index3 | | 0.98 | | | 16.81 | | | 60.21 | | | 3.13 | | | 3.25 | | | 4.96 | |
Lipper Int. Inv.-Grade Debt Funds Avg.4 | | –7.01 | | | 7.53 | | | 44.70 | | | –2.43 | | | 2.00 | | | 4.06 | |
| | | | | | | | | | | | | | | | | | |
Mortgage Backed Securities Portfolio (Class T) | | –0.36 | % | | 15.12 | % | | 52.87 | % | | 0.56 | % | | 1.59 | % | | 2.94 | % |
Barclays Capital Mortgage-Backed Securities Index3 | | 4.62 | | | 25.51 | | | 71.76 | | | 7.02 | | | 4.84 | | | 5.68 | |
Citigroup Mortgage-Backed Securities Index3 | | 4.52 | | | 25.61 | | | 72.28 | | | 7.30 | | | 4.94 | | | 5.75 | |
Lipper U.S. Mortgage Funds Avg.4 | | –2.27 | | | 13.04 | | | 48.17 | | | 0.42 | | | 2.77 | | | 4.09 | |
Source: Prudential Investments LLC and Lipper Inc. Performance figures may reflect fee waivers and/or expense reimbursements. In the absence of such fee waivers and/or expense reimbursements, total returns would be lower.
1Total returns assume the reinvestment of all dividends and distributions, and take into account all charges and expenses applicable to an investment in each portfolio. The average annual total returns for the TARGET portfolios assume the imposition of the maximum TARGET annual advisory fee of 1.50% for bond portfolios for retail investors. Class R shares are subject to an annual distribution and service (12b-1) fee of up to 0.75%. Returns in the table do not reflect the deduction of taxes that a shareholder would pay on portfolio distributions or following the redemption of portfolio shares.
2Inception date returns are provided for any share class with less than 10 calendar years of returns.
| | |
| THE TARGET PORTFOLIO TRUST | | 9 |
Fixed Income Portfolios’ Performance (continued)
3Investors cannot invest directly in an index. The returns for the benchmark indexes would be lower if they reflected deductions for TARGET program fees, portfolio operating expenses, sales charges, or taxes. The Citigroup Non-U.S. World Government Bond Index Hedged (WGBI–Hedged) is an unmanaged index of approximately 600 high-quality bonds with foreign currency exposure translated to the U.S. dollar. It gives a broad indication of how foreign bonds have performed. The Barclays Capital U.S. Aggregate Bond Index is an unmanaged index of investment-grade securities issued by the U.S. government and its agencies and by corporations with between one and 10 years remaining to maturity. It gives a broad indication of how bond prices of short- and intermediate-term bonds have performed. The Barclays Capital Intermediate Government/Credit Bond Index is an unmanaged index of publicly traded U.S. government bonds and investment-grade corporate bonds with maturities of up to 10 years. It gives a broad indication of how intermediate-term bonds have performed. The Barclays Capital Mortgage-Backed Securities Index is a market capitalization-weighted index of 15- and 30-year fixed-rate securities backed by GNMA, FNMA, and FHLMC mortgage pools, and balloon mortgages with fixed-rate coupons. The Citigroup Mortgage-Backed Securities Index is an unmanaged index of 15- and 30-year mortgage-related securities issued by U.S. government agencies. Each of them gives a broad indication of how mortgage-backed securities have performed.
4The Lipper Averages represent returns based on an average of all funds in the respective Lipper categories for the periods noted. The returns for the Lipper averages would be lower if they reflected deductions for TARGET program fees, portfolio operating expenses, sales charges, or taxes. International Income funds invest primarily in U.S. dollar and non-U.S. dollar debt securities of issuers located in at least three countries, excluding the United States, except in periods of market weakness. Corporate Debt BBB-Rated funds invest primarily in corporate and government debt issues rated in the top four grades. Intermediate Investment-Grade Debt funds invest primarily in investment-grade debt issues (rated in the top four grades) with dollar-weighted average maturities of five to 10 years. U.S. Mortgage funds invest primarily in mortgages/securities issued or guaranteed as to principal and interest by the U.S. government and certain federal agencies.
***Total Return Bond Portfolio—Barclays Capital U.S. Aggregate Bond Index Closest Month-End to Inception cumulative total return as of 10/31/08 is 7.34% for Class R. Barclays Capital U.S. Aggregate Bond Index Closest Month-End to Inception average annual total return as of 9/30/08 is 4.65% for Class R.
****Total Return Bond Portfolio—Lipper Average Index Closest Month-End to Inception cumulative total return as of 10/31/08 is –7.76% for Class R. Lipper Average Index Closest Month-End to Inception average annual total return as of 9/30/08 is –0.21% for Class R.
| | |
| 10 | | THE TARGET PORTFOLIO TRUST |
Money Market Portfolio Performance
Yields will fluctuate from time to time, and past performance does not guarantee future results. Current performance may be lower or higher than the past performance data quoted. The investment return and principal value will fluctuate, and shares, when sold, may be worth more or less than the original cost. For the most recent month-end performance update, call (800) 225-1852.
U.S. Government Money Market Portfolio:
Gross operating expenses: Class T, 0.47%. Net operating expenses apply to: Class T, 0.47%.
| | | | | | | | | |
| Money Market Portfolio as of 10/31/08 | | | | | | |
| | | Cumulative
Total Returns1
(Without Target
Program Fee)
12 Months | | | Net Asset Value
(NAV) | | 7-Day Current
Yield | |
U.S. Government Money Market Portfolio (Class T) | | 2.63 | % | | $ | 1.00 | | 1.67 | % |
Lipper U.S. Government Money Market Funds Avg.2 | | 2.23 | | | | N/A | | N/A | |
iMoneyNet, Inc. All Taxable Money Market Funds Avg.3 | | N/A | | | | N/A | | 1.54 | |
Source: Prudential Investments LLC and Lipper Inc. Performance figures may reflect fee waivers and/or expense reimbursements. In the absence of such fee waivers and/or expense reimbursements, total returns would be lower.
1Total returns assume the reinvestment of all dividends and distributions, and take into account all charges and expenses applicable to an investment in each portfolio. Returns would be lower if the fee were deducted. The returns in the table do not reflect the deduction of taxes that a shareholder would pay on portfolio distributions or following the redemption of portfolio shares.
2The Lipper average represents returns based on an average of all funds in the respective Lipper categories for the periods noted. The return for the Lipper average would be lower if it reflected deductions for TARGET program fees, portfolio operating expenses, sales charges, or taxes. U.S. Government Money Market funds invest principally in financial instruments issued or guaranteed by the U.S. government, its agencies, or instrumentalities with dollar-weighted average maturities of less than 90 days. These funds intend to keep a constant net asset value.
3iMoneyNet, Inc. regularly reports a 7-day current yield on Tuesdays for taxable money market funds. This is the data of all funds in the iMoneyNet, Inc. All Taxable Money Market Funds Average category as of 10/28/08, the closest date to the end of our reporting period.
An investment in the U.S. Government Money Market Portfolio (the Portfolio) is not insured or guaranteed by the Federal Deposit Insurance Corporation or any other government agency. Although the Portfolio seeks to preserve the value of your investment at $1 per share, it is possible to lose money by investing in the Portfolio.
Notwithstanding the preceding statements, the Fund is participating in the U.S. Treasury’s Temporary Guarantee Program for Money Market Funds. The Program generally does not guarantee any new investments in the Portfolio made after September 19, 2008, and is scheduled to expire on April 30, 2009. For more Information about the Program’s scope and limitations, please see the most recent Target Portfolio Trust prospectus.
| | |
| THE TARGET PORTFOLIO TRUST | | 11 |
Strategy and Performance Overview
Large Capitalization Growth Portfolio
The Large Capitalization Growth Portfolio (Class T) declined 38.14% for the 12-month reporting period ended October 31, 2008, trailing the 36.95% decline of the Russell 1000 Growth Index (the Index) and the 36.08% decline of the S&P 500 Index, and declined marginally less than 38.55% decline of the Lipper Large-Cap Growth Funds Average.
The multi-managed portfolio blends Goldman Sachs’ quantitative approach to traditional growth investing with Marsico Capital Management’s flexible growth investing approach. Overall, the Portfolio seeks traditional growth with an emphasis on companies with large market capitalizations. For the period, the Goldman Sachs portion of the Portfolio underperformed while the Marsico portion slightly outperformed. On or about December 15, 2008, Goldman Sachs was replaced by Massachusetts Financial Services Company (MFS).
During the reporting period, stocks of large capitalization companies were jolted by extremely volatile market conditions and a series of unprecedented events in the financials sector. Amid these conditions, the Portfolio’s risk strategy and style characteristics detracted from relative performance.
The Portfolio’s relative performance declined due to several factors: an exposure to momentum stocks (companies exhibiting near-term rapid price trends); a slight exposure to leveraged stocks (companies with above-average debt-to-equity ratio); and an exposure to stocks with earnings variations (companies exhibiting swings in earnings). For the period, earnings stability was rewarded. Most companies with earnings variability declined in share price more than the broad market.
Sector allocation within the overall Portfolio helped performance relative to the Index. An overweight position to the financials sector proved positive to relative performance when the financial sector rebounded in September and October. As for stock selection, holdings in consumer services, financials, transportation, and materials helped performance. Among the top contributors to relative performance were Wells Fargo and MasterCard (financials), Wynn Resorts and McDonalds (consumer services), and Monsanto (materials).
Relative to the Index, the Marsico portion of the Portfolio slightly outperformed, as positive asset selection and sector allocation marginally offset the relative weakness of risk and style factors. Holdings in the consumer services and materials sectors helped relative performance. The risk or style factor that detracted the most from relative performance was the Portfolio’s exposure to positions of companies larger in market capitalization than the average size of those in the Index.
The Goldman Sachs portion underperformed relative to the Index, mainly due to asset selection. Stock selection within the energy, technology and healthcare sectors was the largest detractor. The Goldman Sachs portion closely tracks the Index. As a result, no single stock holding significantly affected relative performance for the period. Sector positioning also had little effect on relative performance.
The Portfolio of Investments following this report shows the size of the Portfolio’s positions at period-end.
| | |
| 12 | | THE TARGET PORTFOLIO TRUST |
Large Capitalization Value Portfolio
The Large Capitalization Value Portfolio (Class T) declined 40.29% for the 12-month reporting period ending October 31, 2008, trailing the 36.80% decline of the Russell 1000 Value Index (the Index), and underperformed the 36.08% decline of the S&P 500 Index and the 37.28% decline of the Lipper Large-Cap Value Funds Average. Until the end of the reporting period, the Portfolio was managed by NFJ Investment Group, Hotchkis and Wiley, and JP Morgan. On or about December 15, 2008, JP Morgan was replaced by Eaton Vance Management.
Stock selection primarily drove the Portfolio’s weak performance. Holdings in market sectors and positions within specific industries also detracted from returns relative to the Index. Stock-specific style choices had a negligible effect on the Portfolio’s performance. Asset selection and positions within sectors and specific industries negatively affected performance in all three portions of this multi-managed portfolio.
The Portfolio’s holdings registered significant declines in all sectors, as did the Index. Holdings in the financial, consumer, non-cyclical, utility, consumer services, technology, healthcare, energy, and materials sectors adversely affected the Portfolio’s relative performance. Specific stocks among the largest detractors included Freddie Mac, Wachovia, Washington Mutual, and Alcoa. The Portfolio’s underexposure to stocks in the Index that showed strength during the reporting period, such as Exxon-Mobil, Procter & Gamble, JPMorgan Chase, and Amgen, hurt overall performance.
Positions in specific sectors and industries negatively affected the Portfolio’s relative performance. An underweight position in the energy reserves industry proved detrimental to performance, and overweight positions in the life and health insurance industries also hurt returns.
The Portfolio’s risk posture contributed positively to relative return. The Portfolio reduced its beta position, or its sensitivity to market movements, which favorably affected performance and helped reduce negative returns relative to the Index. This was particularly helpful in September and October when stock prices rapidly declined in value. A modest cash position helped to preserve capital amidst the steep market decline. The NFJ and JPMorgan portions were mostly responsible for the positive return generated by the Portfolio’s risk profile.
The Portfolio of Investments following this report shows the size of the Portfolio’s positions at period-end.
| | |
| THE TARGET PORTFOLIO TRUST | | 13 |
Strategy and Performance Overview (continued)
Small Capitalization Growth Portfolio
The Small Cap Growth Portfolio (ClassT) declined 47.54%, which trailed the 37.87% decline of the Russell 2000 Growth Index (the Index) for the 12-month period ending October 31, 2008. The Portfolio also underperformed the 42.01% decline of the Lipper Small Cap Growth Funds Average. Most of the underperformance occurred early in the period, prior to the change in subadvisers. Since the management change, the Portfolio has outperformed the Russell 2000 Growth Index.
The Mutual Fund Board of Directors approved the recommendation to replace RS Investments (“RS”) and Transamerica Investment Management (“Transamerica”) with Eagle Asset Management (“Eagle”) and Ashfield Capital Partners (“Ashfield”) as subadvisers for the Target Small Cap Growth Portfolio. The transition occurred on July 28, 2008. Eagle and Ashfield were selected for the Target Small-Cap Growth Portfolio because of their complementary investment styles.
Eagle describes its traditional growth investment process as “Rapid Growth at a Reasonable Price.” The portfolio manager looks to purchase companies with rapid growth characteristics, as measured by an accelerating and sustainable earnings growth rate, a positive catalyst, a high or expanding return on equity, and a credible and competent management team. The manager also looks to buy companies trading at reasonable valuations relative to their projected earnings growth rate and reasonable levels of debt. The portfolio tends to have a modestly conservative approach versus the Index, due to some valuation sensitivity in its investment process.
Ashfield’s investment philosophy is based upon the belief that the price of a stock will be directly related to the underlying growth potential of the business. The manager’s bottom-up, fundamental research emphasizes consistent revenue growth, earnings quality, and sustainable competitive advantage. Ashfield tends to outperform when higher quality stocks (companies with lower debt and earnings variation) with strong earnings momentum are rewarded by the market. Conversely, this strategy may also underperform when companies with weaker balance sheets and fundamentals are in favor.
Stock-specific factors primarily drove the Portfolio’s weak performance. Stock selection within the technology and materials sectors detracted from performance relative to the Index. From a sector and industry standpoint, an underweight to healthcare detracted from performance. An emphasis on medical services and an underweight to biotech also hurt performance. Within the materials sector, an underweight to mining and metals stocks negatively affected results.
However, style factors had little impact on the Portfolio’s overall performance relative to the Index. An overweight to high quality stocks was rewarded as investors sought safety in higher quality companies with less debt and more constant earnings. Conversely, a bias towards stocks with lower price-to-earnings ratios (P/E) and stocks with strong growth and profitability characteristics hindered the Fund’s performance, as these factors were not rewarded.
The Portfolio of Investments following this report shows the size of the Portfolio’s positions at period-end.
| | |
| 14 | | THE TARGET PORTFOLIO TRUST |
Small Capitalization Value Portfolio
The Small Capitalization Value Portfolio (Class T) posted a 30.23% decline for the twelve-month period ended October 31, 2008, which performed relatively inline with the 30.54% decline of the Russell 2000 Value Index (the Index), and declined significantly less than the 36.97% of the Lipper Small-Cap Core Funds Average.
Small companies and firms may respond to economic trends differently. For example, some may occupy specific niches in which they are immune to economic cycles. Also, some inexpensive stocks may be not be followed closely by analysts. Accordingly, small-cap managers can benefit from informational inefficiencies in the market. Research is critical and the Fund’s managers are chosen based on their experience and capabilities. The asset managers themselves may reach position-size limits they can hold in small firms. Consequently, that is why the Portfolio uses several managers. As subadvisers reach their capacity limits, we may add new subadvisers. In 2008, EARNEST Partners, LLC; Lee Munder Investments; JP Morgan Asset Management; NFJ Investment Group; and Vaughan Nelson Investment Management managed the Portfolio.
Investment style factors that helped the Portfolio’s performance included underweight holdings versus the Index in stocks with low price-to-book ratios (the book value of a company is generally calculated by total assets minus intangible assets, patents, goodwill, and liabilities.), highly leveraged stocks (stocks with high debt-to-asset levels), and those with high earnings variability. Also, the Portfolio’s overexposure to stocks in the industrials sector and underexposure to stocks in the consumer services sector also augmented performance over the measurement period.
On the negative side, in terms of investment style factors, the Portfolio’s exposure to larger stocks (those with capitalization rates higher than stocks in the Index) detracted from results. Additionally, an underweight allocation to stocks with high price volatility and an overweight allocation versus the Index in stocks experiencing price momentum also detracted from relative performance. In terms of sector positioning, the Portfolio’s underexposure to financial stocks proved to be the largest single detractor from relative performance. In addition, an overweight allocation to healthcare stocks also detracted from relative results.
The Portfolio of Investments following this report shows the size of the Portfolio’s positions at period-end.
| | |
| THE TARGET PORTFOLIO TRUST | | 15 |
Strategy and Performance Overview (continued)
International Equity Portfolio
The International Equity Portfolio (Class T) posted a 47.99% decline for the 12-month reporting period ended October 31, 2008, underperforming the 46.62% decline of the MSCI EAFE Index (the Index) but nominally in line with the 47.80% decline of the Lipper International Large-Cap Core Funds Average.
LSV Asset Management and Thornburg Investment Management were selected to manage the Portfolio because of their complementary investment styles. LSV uses a quantitative, deep value investment strategy and maintains a relatively large number of stocks in its portfolio. Thornburg uses traditional analysis of business fundamentals and a relative value strategy to select a portfolio with fewer and larger individual stock positions than LSV. While LSV has no emerging market exposure, Thornburg may invest as much as 30% of its assets in that area. Emerging market stocks are not included in the Index.
The LSV portion of the Portfolio underperformed the Index. During the reporting period, equity investors were more concerned with news surrounding companies than they were on specific information about company fundamentals and valuation levels. LSV’s quantitative models focus on companies that are traded at low valuations determined by a stock’s earnings-to-price ratio, which is the inverse of the price-to-earnings ratio or P/E. LSV also uses other earnings and price multiples to indicate a company’s potential near-term improvement. Investor behavior during the reporting period did not reward LSV’s deep-value approach.
Thornburg’s slight outperformance of the MSCI EAFE Index for the period was largely due to favorable sector allocations and style factors. A slight bias toward larger cap stocks and the manager’s relative focus on value helped performance, as small caps underperformed large-cap stocks and growth outperformed value in non-U.S. markets.
Overall, asset selection and country positioning detracted from relative results. An overweight to the Canadian market along with stock selection in financials, services, capital equipment, and materials detracted from relative performance. Positions in telecommunications (Nokia, China Mobile, Telefonica), insurance (AXA, Swiss Re), banking (National Bank of Greece), and diversified financial services (Hong Kong Exchange, UBS, ING) detracted significantly as the credit crisis expanded globally and accelerated toward the end of the period. Top detractors in other industries included Nintendo, Carlsberg, and BASF. Contributors to performance included holdings in Potash Corp and NTT Docomo.
The Portfolio of Investments following this report shows the size of the Portfolio’s positions at period-end.
| | |
| 16 | | THE TARGET PORTFOLIO TRUST |
International Bond Portfolio
The International Bond Portfolio (Class T) declined 2.40% for the 12-month reporting period ended October 31, 2008, significantly underperforming the positive 4.54% total return of the Citigroup Non-U.S. World Government Bond Index–Hedged (the Index) but outperforming the 5.88% decline of the Lipper International Income Funds Average. Pacific Investment Management Company LLC (PIMCO) managed the Portfolio.
The credit crisis worsened as delinquencies and foreclosures rose on subprime mortgages in the United States. Many key financial institutions around the world took huge write-downs and losses on debt securities linked to risky home loans. Commercial banks in the United States and some other nations grew reluctant to lend to each other, to businesses, and to consumers. Concern about the credit crisis’ negative impact on the economies of many nations led their central banks to try to stimulate growth by cutting short-term interest rates and to take innovative steps to aid their financial systems.
A flight to quality emerged that generally favored government bond markets of economically developed nations over riskier debt securities, such as high yield corporate (“junk”) bonds and emerging market bonds, which are (bonds of issuers from economically developing nations). The Index is composed solely of government bonds. The Portfolio lagged the Index partly because it owned bonds of financial firms such as Lehman Brothers Holdings, which declared bankruptcy, and American International Group, which was taken over by the federal government. Modest allocations to high yield bonds and emerging market bonds were among other strategies that hurt the Portfolio’s return.
A flight to quality in foreign exchange markets largely favored the U.S. dollar, the world’s reserve currency. The greenback strengthened versus the euro and several other currencies as it became increasingly clear economic troubles in the United States were affecting other nations. The Portfolio benefited from having smaller positions in the euro and the British pound compared to the U.S. dollar, but this impact was partially offset by its exposure to certain emerging market currencies that performed poorly. PIMCO also employed a strategy that helped the Portfolio benefit from steeper yield curves in government bond markets of the United States, the United Kingdom, Australia, and the eurozone. A yield curve is a single line graph that shows the relationship between yields on short-, intermediate-, and long-term bonds. As risk-averse investors bought the short-term government bonds of these nations, their prices rose and yields declined markedly, causing the slope of yield curves to become steeper in these markets.
The Portfolio of Investments following this report shows the size of the Portfolio’s positions at period-end.
| | |
| THE TARGET PORTFOLIO TRUST | | 17 |
Strategy and Performance Overview (continued)
Total Return Bond Portfolio
The Total Return Bond Portfolio (Class T) declined 1.71% for the 12-month reporting period ended October 31, 2008, underperforming the nominally positive 0.30% total return of the Barclays Capital U.S. Aggregate Bond Index (the Index) but outperforming the 13.76% decline of the Lipper Corporate Debt BBB-Rated Funds Average. Pacific Investment Management Company LLC (PIMCO) manages the Portfolio.
The credit crisis worsened as delinquencies and foreclosures continued to rise on subprime mortgages in the United States. Commercial banks, Wall Street firms, and savings and loan institutions took huge write-downs and losses related to risky home loans. Commercial banks grew reluctant to lend to each other, to businesses, and to consumers. Concerned that the credit crisis would engulf the broader U.S. economy, the Federal Reserve (the Fed) tried to boost growth by repeatedly cutting short-term interest rates, lowering its target for the federal funds rate on overnight loans between banks from 4.50% to 1.00%. The Fed and the U.S. Department of the Treasury took innovative steps to aid the financial system.
A flight to quality played out in the bond markets. Investors flocked to the ultra-safe U.S. Treasury market, enabling it to outperform other U.S. bond markets for the reporting period. The Portfolio was hurt by its overweight exposure to bonds of financial firms such as Lehman Brothers Holdings, which declared bankruptcy, and American International Group, which was taken over by the federal government. Modest allocations to high yield corporate (“junk”) bonds and emerging market bonds also detracted from the Portfolio’s return, as both risky asset classes posted declines for the reporting period. The Portfolio’s exposure to municipal bonds did not work well either, as that market also underperformed the U.S. Treasury market for the reporting period.
The Portfolio benefited from having a longer duration than the Index. Duration measures a fund’s sensitivity to changes in the level of interest rates. Having a longer duration enabled the Portfolio to benefit more fully as yields declined in major government bond markets and pushed bond prices higher. (Bond prices move inversely to rates.) While the mortgage-backed market underperformed the U.S. Treasury market, the Portfolio benefited from favorable security selection by emphasizing mortgage pass-through securities of federal agencies. These high-quality securities performed better than the broader mortgage-backed market. Overall, the Portfolio had a smaller exposure than the Index to investment-grade corporate bonds, which benefited the Portfolio’s relative performance as this market ended the reporting period in the red.
The Portfolio of Investments following this report shows the size of the Portfolio’s positions at period-end.
| | |
| 18 | | THE TARGET PORTFOLIO TRUST |
Intermediate-Term Bond Portfolio
The Intermediate-Term Bond Portfolio (Class T) posted a 5.07% total return for the 12-month reporting period ended October 31, 2008, significantly outperforming the 0.98% total return of the Barclays Capital Intermediate Government/Credit Bond Index (the Index) and the 7.01% decline of the Lipper Intermediate Investment-Grade Debt Funds Average. Pacific Investment Management Company LLC (PIMCO) manages the Portfolio.
The credit crisis worsened as delinquencies and foreclosures rose on subprime mortgages in the United States. Commercial banks, Wall Street firms, and savings and loan institutions took huge write-downs and losses related to risky home loans. Commercial banks grew reluctant to lend to each other, to businesses, and to consumers. Concerned that the credit crisis would engulf the broader U.S. economy, the Federal Reserve (the Fed) tried to boost growth by repeatedly cutting short-term rates, lowering its target for the federal funds rate on overnight loans between banks from 4.50% to 1.00%. The Fed and the U.S. Department of the Treasury also took innovative steps to aid the financial system.
A flight to quality played out in the bond markets. Investors flocked to the ultra-safe U.S. Treasury market, enabling it to outperform other U.S. bond markets. While the mortgage-backed market underperformed the U.S. Treasury market, the Portfolio benefited from favorable security selection by emphasizing mortgage pass-through securities of federal agencies. These high-quality securities performed better than the broader mortgage-backed market. Overall, the Portfolio had a smaller exposure than the Index to investment-grade corporate bonds. This benefited the Portfolio’s performance relative to the Index as this market ended the reporting period in the red. The Portfolio had non-benchmark exposures to government bond markets of the eurozone and the United Kingdom. This helped as yields in these markets declined and pushed bond prices higher. (Bond prices move inversely to interest rates.)
The Portfolio was hurt by its overweight exposure to bonds of financial firms such as Lehman Brothers Holdings, which declared bankruptcy, and American International Group, which was taken over by the federal government. Modest allocations to high yield corporate (“junk”) bonds and emerging market bonds also detracted from the Portfolio’s return as both risky asset classes posted declines for the reporting period. The Portfolio’s exposure to municipal bonds did not work well either as that market also underperformed Treasurys.
The Portfolio of Investments following this report shows the size of the Portfolio’s positions at period-end.
| | |
| THE TARGET PORTFOLIO TRUST | | 19 |
Strategy and Performance Overview (continued)
Mortgage Backed Securities Portfolio
The Mortgage Backed Securities Portfolio (Class T) declined 0.36% for the 12-month reporting period ended October 31, 2008, underperforming the positive 4.62% total return of the Barclays Capital Mortgage-Backed Securities Index (the Index), but outperforming the 2.27% decline of the Lipper U.S. Mortgage Funds Average. Wellington Management Company, LLP managed the Portfolio.
The key reason the Portfolio lagged the Index was the Portfolio’s allocation to non-agency mortgage-backed securities, which are issued by firms such as banks or mortgage originators rather than by Ginnie Mae, Fannie Mae, or Freddie Mac. (The Index is composed solely of mortgage-backed securities issued by the latter three.) The Portfolio primarily held AAA-rated non-agency mortgage-backed securities based on their attractive valuations and the solid fundamentals of the underlying home loans, but these securities performed poorly. They were pressured as rising delinquencies and foreclosures on subprime mortgages in the United States caused a worsening credit crisis that led to de-leveraging, reduced liquidity in most bond markets, and heightened aversion to risky investments.
The Portfolio benefited from favorable security selection among mortgage pass-through securities. It had an overweight exposure to 30-year mortgage pass-through securities compared with those that mature in 15 years. The former outperformed the latter for the reporting period, aiding the Portfolio’s relative performance.
Wellington Management continues to favor select non-agency securities backed by prime-quality mortgages. The non-agency mortgage-backed market remains illiquid and securities trade at deep discounts to their face value. Wellington Management expects that as mortgage rates decline, the highest quality borrowers will refinance from non-agency loans into agency loans. It believes increased refinancing from non-agency loans into agency loans will support valuations in the mortgage-backed market.
Wellington Management see signs of improving conditions in fixed income markets that it believes will help mortgage-backed securities longer term. For example, market volatility has decreased and recent pre-payment data on mortgage-backed securities has been in line with Wellington Management’s expectations. It believes a decline in the overall supply of mortgages will continue along with the U.S. Treasury Department’s commitment to lowering mortgage rates. The Treasury is actively buying agency mortgage-backed securities, and banks are adding to their mortgage positions. Wellington Management believes the massive unwinding of leveraged mortgage positions is coming to a close. It expects all of these factors will over time prove favorable to the agency mortgage-backed market.
The Portfolio of Investments following this report shows the size of the Portfolio’s positions at period-end.
| | |
| 20 | | THE TARGET PORTFOLIO TRUST |
U.S. Government Money Market Portfolio
The U.S. Government Money Market Portfolio returned 2.63% for the 12-month period ended October 31, 2008, which outperformed the 2.23% return of the Lipper U.S. Government Money Market Funds Average. The Portfolio was subadvised by Wellington Management Company, LLP.
The credit crisis worsened as delinquencies and foreclosures rose on subprime mortgages in the United States. Commercial banks, Wall Street firms, and savings and loan institutions took huge write-downs and losses related to risky home loans. Commercial banks grew reluctant to lend to each other, to businesses, and to consumers. Concerned that the credit crisis would engulf the broader U.S. economy, the Federal Reserve (the Fed) tried to boost growth by repeatedly cutting short-term rates, lowering its target for the federal funds rate on overnight loans between banks from 4.50% to 1.00%. The Fed and the U.S. Department of the Treasury also took innovative steps to aid the financial system.
The Portfolio invested in short-term discount notes of federal agencies, which helped insulate its return from the market volatility that affected certain types of money market securities, such as asset-backed commercial paper. The Portfolio maintained a highly liquid posture by keeping its average maturity shorter than that of the average comparable fund during the reporting period. However, Wellington Management extended the Portfolio’s average maturity to 74 days as of October 31, 2008, to lock in yields on select money market securities. It adopted this approach because it believes short-term rates will remain low in coming months.
The Portfolio participates in the U.S. Department of the Treasury’s Temporary Guarantee Program for Money Market Funds (the Program). The Program provides a guarantee to the Portfolio’s shareholders based on the number of shares invested in the Portfolio at the close of business on September 19, 2008. Any increase in the number of shares an investor holds after the close of business on September 19, 2008 will not be guaranteed.
If a customer closes his/her account with the Portfolio or broker/dealer, any future investment in the Portfolio will not be guaranteed. The Program does not guarantee money market fund shares purchased in new accounts after that date. If the number of shares held in an account fluctuates over the period, investors will be covered for the lesser of the current amount of shares held or the number of shares held as of the close of business on September 19, 2008. The Program expires on April 30, 2009, unless extended by the U.S. Treasury Department. For more information about the scope and limitations of the Program, see the most recent Target Portfolio Trust prospectus.
The Portfolio of Investments following this report shows the size of the Portfolio’s positions at period-end.
| | |
| THE TARGET PORTFOLIO TRUST | | 21 |
Fees and Expenses (Unaudited)
As a shareholder of the Trust, you incur two types of costs: (1) transaction costs, including sales charges (loads) on purchase payments and redemptions, as applicable, and (2) ongoing costs, including management fees, TARGET program fees, and other Trust expenses, as applicable. This example is intended to help you understand your ongoing costs (in dollars) of investing in the Trust and to compare these costs with the ongoing costs of investing in other mutual funds. This example does not reflect TARGET program fees. If TARGET program fees were included, the costs would be higher.
The example is based on an investment of $1,000 invested on May 1, 2008, at the beginning of the period, and held through the six-month period ended October 31, 2008. The example is for illustrative purposes only; you should consult the Prospectus for information on initial and subsequent minimum investment requirements.
The Trust’s transfer agent may charge additional fees to holders of certain accounts that are not included in the expenses shown in the table on the following page. These fees apply to individual retirement accounts (IRAs) and Section 403(b) accounts. As of the close of the six-month period covered by the table, IRA fees included an annual maintenance fee of $15 per account (subject to a maximum annual maintenance fee of $25 for all accounts held by the same shareholder). Section 403(b) accounts are charged an annual $25 fiduciary maintenance fee. Some of the fees may vary in amount, or may be waived, based on your total account balance or the number of JennisonDryden funds, including the Trust, that you own. You should consider the additional fees that were charged to your Trust account over the six-month period when you estimate the total ongoing expenses paid over the period and the impact of these fees on your ending account value, as these additional expenses are not reflected in the information provided in the expense table. Additional fees have the effect of reducing investment returns.
Actual Expenses
The first line for each share class in the table on the following pages provides information about actual account values and actual expenses. You may use the information on this line, together with the amount you invested, to estimate the expenses that you paid over the period. Simply divide your account value by $1,000 (for example, an $8,600 account value ÷ $1,000 = 8.6), then multiply the result by the number on the first line under the heading “Expenses Paid During the Six-Month Period” to estimate the expenses you paid on your account during this period.
| | |
| 22 | | THE TARGET PORTFOLIO TRUST |
Hypothetical Example for Comparison Purposes
The second line for each share class in the table below and on the following pages provides information about hypothetical account values and hypothetical expenses based on the Trust’s actual expense ratio and an assumed rate of return of 5% per year before expenses, which is not the Trust’s actual return. The hypothetical account values and expenses may not be used to estimate the actual ending account balance or expenses you paid for the period. You may use this information to compare the ongoing costs of investing in the Trust and other funds. To do so, compare this 5% hypothetical example with the 5% hypothetical examples that appear in the shareholder reports of the other funds.
Please note that the expenses shown in the table are meant to highlight your ongoing costs only and do not reflect any transactional costs such as sales charges (loads). Therefore, the second line for each share class in the table is useful in comparing ongoing costs only and will not help you determine the relative total costs of owning different funds. In addition, if these transactional costs were included, your costs would have been higher.
| | | | | | | | | | | | | | |
Large
Capitalization
Growth Portfolio | | Beginning Account
Value
May 1, 2008 | | Ending Account
Value October 31, 2008 | | Annualized
Expense Ratio
Based on the
Six-Month Period | | | Expenses Paid
During the Six-
Month Period* |
| | | | | | | | | | | | | | |
| | | Class R | | | | | | | | | | | | |
| | | Actual | | $ | 1,000.00 | | $ | 706.50 | | 1.26 | % | | $ | 5.40 |
| | | Hypothetical | | $ | 1,000.00 | | $ | 1,018.80 | | 1.26 | % | | $ | 6.39 |
| | | Class T | | | | | | | | | | | | |
| | | Actual | | $ | 1,000.00 | | $ | 708.10 | | 0.76 | % | | $ | 3.26 |
| | | Hypothetical | | $ | 1,000.00 | | $ | 1,021.32 | | 0.76 | % | | $ | 3.86 |
| | | | | | | | | | | | | | |
Large
Capitalization
Value Portfolio | | Beginning Account
Value
May 1, 2008 | | Ending Account
Value
October 31, 2008 | | Annualized
Expense Ratio
Based on the
Six-Month Period | | | Expenses Paid
During the Six-
Month Period* |
| | | | | | | | | | | | | | |
| | | Class R | | | | | | | | | | | | |
| | | Actual | | $ | 1,000.00 | | $ | 668.20 | | 1.23 | % | | $ | 5.16 |
| | | Hypothetical | | $ | 1,000.00 | | $ | 1,018.95 | | 1.23 | % | | $ | 6.24 |
| | | Class T | | | | | | | | | | | | |
| | | Actual | | $ | 1,000.00 | | $ | 670.20 | | 0.73 | % | | $ | 3.06 |
| | | Hypothetical | | $ | 1,000.00 | | $ | 1,021.47 | | 0.73 | % | | $ | 3.71 |
| | |
| THE TARGET PORTFOLIO TRUST | | 23 |
Fees and Expenses (continued)
| | | | | | | | | | | | | | |
| | | | | | | | | | | | | | |
Small
Capitalization
Growth Portfolio | | Beginning Account
Value
May 1, 2008 | | Ending Account
Value
October 31, 2008 | | Annualized
Expense Ratio
Based on the
Six-Month Period | | | Expenses Paid
During the Six-
Month Period* |
| | | | | | | | | | | | | | |
| | | Class R | | | | | | | | | | | | |
| | | Actual | | $ | 1,000.00 | | $ | 665.10 | | 1.35 | % | | $ | 5.65 |
| | | Hypothetical | | $ | 1,000.00 | | $ | 1,018.35 | | 1.35 | % | | $ | 6.85 |
| | | Class T | | | | | | | | | | | | |
| | | Actual | | $ | 1,000.00 | | $ | 667.00 | | 0.85 | % | | $ | 3.56 |
| | | Hypothetical | | $ | 1,000.00 | | $ | 1,020.86 | | 0.85 | % | | $ | 4.32 |
| | | | | | | | | | | | | | |
Small
Capitalization
Value Portfolio | | Beginning Account
Value
May 1, 2008 | | Ending Account
Value
October 31, 2008 | | Annualized
Expense Ratio
Based on the
Six-Month Period | | | Expenses Paid
During the Six-
Month Period* |
| | | | | | | | | | | | | | |
| | | Class R | | | | | | | | | | | | |
| | | Actual | | $ | 1,000.00 | | $ | 751.30 | | 1.33 | % | | $ | 5.85 |
| | | Hypothetical | | $ | 1,000.00 | | $ | 1,018.45 | | 1.33 | % | | $ | 6.75 |
| | | Class T | | | | | | | | | | | | |
| | | Actual | | $ | 1,000.00 | | $ | 753.00 | | 0.83 | % | | $ | 3.66 |
| | | Hypothetical | | $ | 1,000.00 | | $ | 1,020.96 | | 0.83 | % | | $ | 4.22 |
| | | | | | | | | | | | | | |
International
Equity Portfolio | | Beginning Account
Value
May 1, 2008 | | Ending Account
Value
October 31, 2008 | | Annualized
Expense Ratio
Based on the
Six-Month Period | | | Expenses Paid
During the Six-
Month Period* |
| | | | | | | | | | | | | | |
| | | Class R | | | | | | | | | | | | |
| | | Actual | | $ | 1,000.00 | | $ | 591.60 | | 1.35 | % | | $ | 5.40 |
| | | Hypothetical | | $ | 1,000.00 | | $ | 1,018.35 | | 1.35 | % | | $ | 6.85 |
| | | Class T | | | | | | | | | | | | |
| | | Actual | | $ | 1,000.00 | | $ | 593.70 | | 0.85 | % | | $ | 3.41 |
| | | Hypothetical | | $ | 1,000.00 | | $ | 1,020.86 | | 0.85 | % | | $ | 4.32 |
| | | | | | | | | | | | | | |
International
Bond Portfolio | | Beginning Account
Value
May 1, 2008 | | Ending Account
Value
October 31, 2008 | | Annualized
Expense Ratio
Based on the
Six-Month Period | | | Expenses Paid
During the Six-
Month Period* |
| | | | | | | | | | | | | | |
| | | Class T | | | | | | | | | | | | |
| | | Actual | | $ | 1,000.00 | | $ | 945.30 | | 1.17 | % | | $ | 5.72 |
| | | Hypothetical | | $ | 1,000.00 | | $ | 1,019.25 | | 1.17 | % | | $ | 5.94 |
| | |
| 24 | | THE TARGET PORTFOLIO TRUST |
| | | | | | | | | | | | | | |
| | | | | | | | | | | | | | |
Total Return
Bond Portfolio | | Beginning Account
Value
May 1, 2008 | | Ending Account
Value
October 31, 2008 | | Annualized
Expense Ratio
Based on the
Six-Month Period | | | Expenses Paid
During the Six-
Month Period* |
| | | | | | | | | | | | | | |
| | | Class R | | | | | | | | | | | | |
| | | Actual | | $ | 1,000.00 | | $ | 916.20 | | 1.32 | % | | $ | 6.36 |
| | | Hypothetical | | $ | 1,000.00 | | $ | 1,018.50 | | 1.32 | % | | $ | 6.70 |
| | | Class T | | | | | | | | | | | | |
| | | Actual | | $ | 1,000.00 | | $ | 918.30 | | 0.82 | % | | $ | 3.95 |
| | | Hypothetical | | $ | 1,000.00 | | $ | 1,021.01 | | 0.82 | % | | $ | 4.17 |
| | | | | | | | | | | | | | |
Intermediate-Term
Bond Portfolio | | Beginning Account
Value
May 1, 2008 | | Ending Account
Value
October 31, 2008 | | Annualized
Expense Ratio
Based on the
Six-Month Period | | | Expenses Paid
During the Six-
Month Period* |
| | | | | | | | | | | | | | |
| | | Class T | | | | | | | | | | | | |
| | | Actual | | $ | 1,000.00 | | $ | 989.80 | | 0.62 | % | | $ | 3.10 |
| | | Hypothetical | | $ | 1,000.00 | | $ | 1,022.02 | | 0.62 | % | | $ | 3.15 |
| | | | | | | | | | | | | | |
Mortgage Backed
Securities Portfolio | | Beginning Account
Value
May 1, 2008 | | Ending Account
Value
October 31, 2008 | | Annualized
Expense Ratio
Based on the
Six-Month Period | | | Expenses Paid
During the Six-
Month Period* |
| | | | | | | | | | | | | | |
| | | Class T | | | | | | | | | | | | |
| | | Actual | | $ | 1,000.00 | | $ | 967.80 | | 1.93 | % | | $ | 9.55 |
| | | Hypothetical | | $ | 1,000.00 | | $ | 1,015.43 | | 1.93 | % | | $ | 9.78 |
| | | | | | | | | | | | | | |
U.S. Government
Money Market
Portfolio | | Beginning Account
Value
May 1, 2008 | | Ending Account
Value October 31, 2008 | | Annualized
Expense Ratio
Based on the
Six-Month Period | | | Expenses Paid
During the Six-
Month Period* |
| | | | | | | | | | | | | | |
| | | Class T | | | | | | | | | | | | |
| | | Actual | | $ | 1,000.00 | | $ | 1,009.10 | | 0.49 | % | | $ | 2.47 |
| | | Hypothetical | | $ | 1,000.00 | | $ | 1,022.67 | | 0.49 | % | | $ | 2.49 |
* Portfolio expenses (net of fee waivers or subsidies, if any) for each share class are equal to the annualized expense ratio for each share class (provided in the table), multiplied by the average account value over the period, multiplied by the 184 days in the six-month period ended October 31, 2008, and divided by 366 days to reflect the six-month period. Expenses presented in the table include the expenses of any underlying portfolios in which the Fund may invest.
| | |
| THE TARGET PORTFOLIO TRUST | | 25 |
| | |
Portfolio of Investments
As of October 31, 2008 | | Large Capitalization Growth Portfolio |
| | | | | |
| SHARES | | DESCRIPTION | | VALUE (NOTE 1) |
| | | | | |
| | LONG-TERM INVESTMENTS—91.7% | | | |
| | |
| | COMMON STOCKS | | | |
| | |
| | Aerospace & Defense—5.3% | | | |
| 4,809 | | Boeing Co. (The) | | $ | 251,366 |
| 75,052 | | General Dynamics Corp. | | | 4,527,137 |
| 65,438 | | Lockheed Martin Corp. | | | 5,565,502 |
| 2,118 | | Northrop Grumman Corp. | | | 99,313 |
| | | | | |
| | | | | 10,443,318 |
| | | | | |
| | |
| | Agriculture/Heavy Equipment—3.7% | | | |
| 34,062 | | Altria Group, Inc. | | | 653,649 |
| 11,837 | | Lorillard, Inc. | | | 779,585 |
| 65,756 | | Monsanto Co. | | | 5,850,969 |
| 1,527 | | Universal Corp.(a) | | | 60,454 |
| | | | | |
| | | | | 7,344,657 |
| | | | | |
| | |
| | Airlines | | | |
| 3,599 | | Delta Air Lines, Inc.* | | | 39,517 |
| | | | | |
| | |
| | Beverages—0.9% | | | |
| 6,299 | | Anheuser-Busch Cos., Inc. | | | 390,727 |
| 3,977 | | Coca-Cola Co. (The) | | | 175,227 |
| 1,752 | | Coca-Cola Enterprises, Inc. | | | 17,608 |
| 5,270 | | Hansen Natural Corp.*(a) | | | 133,436 |
| 19,598 | | PepsiCo, Inc. | | | 1,117,282 |
| | | | | |
| | | | | 1,834,280 |
| | | | | |
| | |
| | Biotechnology—3.2% | | | |
| 2,160 | | Amgen, Inc.* | | | 129,362 |
| 5,599 | | Celgene Corp.* | | | 359,792 |
| 71,606 | | Genentech, Inc.* | | | 5,939,002 |
| | | | | |
| | | | | 6,428,156 |
| | | | | |
| | |
| | Building Materials | | | |
| 4,820 | | Armstrong World Industries, Inc. | | | 94,617 |
| | | | | |
| | |
| | Business Services—1.9% | | | |
| 8,457 | | Genpact Ltd. (Bermuda)*(a) | | | 66,218 |
| 927 | | Hewitt Associates, Inc. (Class A Stock)* | | | 25,854 |
| 4,314 | | Manpower, Inc. | | | 134,295 |
| 24,575 | | MasterCard, Inc. (Class A Stock)(a) | | | 3,632,677 |
| | | | | |
| | | | | 3,859,044 |
| | | | | |
| | |
| | Cable Television—0.4% | | | |
| 33,650 | | DIRECTV Group, Inc. (The)*(a) | | | 736,598 |
| 3,466 | | DISH Network Corp. (Class A Stock)* | | | 54,555 |
| | | | | |
| | | | | 791,153 |
| | | | | |
See Notes to Financial Statements.
| | |
| THE TARGET PORTFOLIO TRUST | | 27 |
| | |
Large Capitalization Growth Portfolio (continued) | | Portfolio of Investments
As of October 31, 2008 |
| | | | | |
| SHARES | | DESCRIPTION | | VALUE (NOTE 1) |
| | | | | |
| | COMMON STOCKS (continued) | | | |
| | |
| | Chemicals—1.9% | | | |
| 16,901 | | Air Products & Chemicals, Inc. | | $ | 982,455 |
| 1,081 | | Airgas, Inc. | | | 41,467 |
| 1,023 | | Ashland, Inc. | | | 23,109 |
| 1,519 | | CF Industries Holdings, Inc. | | | 97,505 |
| 977 | | Cytec Industries, Inc. | | | 27,669 |
| 916 | | Dow Chemical Co. (The) | | | 24,430 |
| 3,598 | | Ecolab, Inc. | | | 134,061 |
| 37,625 | | Praxair, Inc. | | | 2,451,269 |
| | | | | |
| | | | | 3,781,965 |
| | | | | |
| | |
| | Clothing & Apparel—0.3% | | | |
| 12,415 | | Avon Products, Inc.(a) | | | 308,264 |
| 9,063 | | Coach, Inc.* | | | 186,698 |
| | | | | |
| | | | | 494,962 |
| | | | | |
| | |
| | Commercial Banks—1.4% | | | |
| 3,063 | | Regions Financial Corp. | | | 33,968 |
| 1,374 | | State Street Corp. | | | 59,563 |
| 88,870 | | U.S. Bancorp | | | 2,649,215 |
| | | | | |
| | | | | 2,742,746 |
| | | | | |
| | |
| | Commercial Services—0.6% | | | |
| 28,200 | | Accenture Ltd. (Class A Stock) | | | 932,010 |
| 2,025 | | Gartner, Inc.* | | | 37,260 |
| 1,550 | | McKesson Corp. | | | 57,024 |
| 3,633 | | Moody’s Corp.(a) | | | 93,005 |
| 8,230 | | Total System Services, Inc. | | | 113,080 |
| 4,898 | | United Rentals, Inc.* | | | 50,205 |
| | | | | |
| | | | | 1,282,584 |
| | | | | |
| | |
| | Communication Equipment | | | |
| 2,707 | | Juniper Networks, Inc.* | | | 50,729 |
| | | | | |
| | |
| | Computer Hardware—4.5% | | | |
| 49,406 | | Apple, Inc.* | | | 5,315,592 |
| 5,172 | | Cadence Design Systems, Inc.* | | | 21,050 |
| 25,070 | | Dell, Inc.* | | | 304,600 |
| 44,754 | | Hewlett-Packard Co. | | | 1,713,183 |
| 11,331 | | International Business Machines Corp. | | | 1,053,443 |
| 19,854 | | NetApp, Inc.*(a) | | | 268,625 |
| 15,979 | | Seagate Technology | | | 108,178 |
| 10,224 | | Western Digital Corp.* | | | 168,696 |
| | | | | |
| | | | | 8,953,367 |
| | | | | |
| | |
| | Computer Networking | | | |
| 1,633 | | Sohu.com, Inc.* | | | 89,717 |
| | | | | |
See Notes to Financial Statements.
| | |
| 28 | | THE TARGET PORTFOLIO TRUST |
| | | | | |
| SHARES | | DESCRIPTION | | VALUE (NOTE 1) |
| | | | | |
| | COMMON STOCKS (continued) | | | |
| | |
| | Computer Services & Software—1.9% | | | |
| 2,498 | | Acxiom Corp. | | $ | 19,634 |
| 7,859 | | Advent Software, Inc.*(a) | | | 147,278 |
| 3,522 | | Amazon.com, Inc.* | | | 201,599 |
| 7,455 | | Autodesk, Inc.* | | | 158,866 |
| 23,274 | | Brocade Communications Systems, Inc.* | | | 87,743 |
| 1,821 | | DreamWorks Animation SKG, Inc. (Class A Stock)* | | | 51,170 |
| 2,122 | | Global Payments, Inc. | | | 85,962 |
| 16,374 | | Ingram Micro, Inc. (Class A Stock)* | | | 218,266 |
| 6,739 | | Mentor Graphics Corp.* | | | 49,464 |
| 112,547 | | Microsoft Corp. | | | 2,513,175 |
| 786 | | SRA International, Inc. (Class A Stock)* | | | 14,525 |
| 9,379 | | Sun Microsystems, Inc.* | | | 43,143 |
| 5,805 | | Tech Data Corp.* | | | 124,517 |
| 4,455 | | Teradata Corp.* | | | 68,563 |
| 2,441 | | VMware, Inc.* | | | 75,671 |
| | | | | |
| | | | | 3,859,576 |
| | | | | |
| | |
| | Computers & Peripherals—0.2% | | | |
| 37,812 | | EMC Corp.* | | | 445,425 |
| | | | | |
| | |
| | Consumer Finance—0.1% | | | |
| 5,431 | | American Express Co. | | | 149,353 |
| | | | | |
| | |
| | Consumer Products & Services—0.7% | | | |
| 644 | | AptarGroup, Inc. | | | 19,526 |
| 4,480 | | Bare Escentuals, Inc.* | | | 18,726 |
| 1,089 | | Church & Dwight Co., Inc.(a) | | | 64,349 |
| 4,736 | | Fluor Corp. | | | 189,109 |
| 12,945 | | Procter & Gamble Co. | | | 835,470 |
| 5,592 | | Salesforce.com, Inc.*(a) | | | 173,128 |
| 3,408 | | Toro Co. (The) | | | 114,645 |
| 386 | | UST, Inc. | | | 26,090 |
| | | | | |
| | | | | 1,441,043 |
| | | | | |
| | |
| | Diversified—0.1% | | | |
| 1,758 | | 3M Co. | | | 113,039 |
| | | | | |
| | |
| | Diversified Financial Services—0.1% | | | |
| 475 | | IntercontinentalExchange, Inc.* | | | 40,641 |
| 5,827 | | Morgan Stanley | | | 101,798 |
| 1,525 | | NYSE Euronext, Inc. | | | 46,024 |
| | | | | |
| | | | | 188,463 |
| | | | | |
| | |
| | Diversified Manufacturing—0.2% | | | |
| 12,601 | | Honeywell International, Inc. | | | 383,700 |
| | | | | |
| | |
| | Diversified Telecommunication Services—0.1% | | | |
| 6,448 | | Verizon Communications, Inc. | | | 191,312 |
| | | | | |
See Notes to Financial Statements.
| | |
| THE TARGET PORTFOLIO TRUST | | 29 |
| | |
Large Capitalization Growth Portfolio (continued) | | Portfolio of Investments
As of October 31, 2008 |
| | | | | |
| SHARES | | DESCRIPTION | | VALUE (NOTE 1) |
| | | | | |
| | COMMON STOCKS (continued) | | | |
| | |
| | Electric Utilities—0.3% | | | |
| 563 | | Entergy Corp. | | $ | 43,942 |
| 9,348 | | Exelon Corp. | | | 507,036 |
| 4,200 | | PPL Corp. | | | 137,844 |
| | | | | |
| | | | | 688,822 |
| | | | | |
| | |
| | Electronic Components—1.0% | | | |
| 4,654 | | Activision Blizzard, Inc.* | | | 57,989 |
| 19,976 | | Adobe Systems, Inc.* | | | 532,161 |
| 1,165 | | Applied Biosystems, Inc. | | | 35,917 |
| 29,258 | | Emerson Electric Co. | | | 957,614 |
| 26,306 | | LSI Corp.* | | | 101,278 |
| 2,451 | | QLogic Corp.* | | | 29,461 |
| 700 | | Raytheon Co. | | | 35,777 |
| 5,650 | | Vestas Wind Systems A/S (Denmark)* | | | 231,424 |
| | | | | |
| | | | | 1,981,621 |
| | | | | |
| | |
| | Energy Equipment & Services—0.1% | | | |
| 7,509 | | Alpha Natural Resources, Inc.* | | | 268,597 |
| | | | | |
| | |
| | Entertainment & Leisure—0.3% | | | |
| 36,688 | | Las Vegas Sands Corp.*(a) | | | 520,603 |
| | | | | |
| | |
| | Equipment Services | | | |
| 1,969 | | Gen-Probe, Inc.*(a) | | | 92,661 |
| | | | | |
| | |
| | Farming & Agriculture—0.2% | | | |
| 11,998 | | Bunge Ltd.(a) | | | 460,843 |
| | | | | |
| | |
| | Finance—0.2% | | | |
| 1,355 | | CME Group, Inc. | | | 382,313 |
| | | | | |
| | |
| | Financial—Bank & Trust—6.2% | | | |
| 168,243 | | Bank of America Corp. | | | 4,066,433 |
| 3,738 | | Bank of New York Mellon Corp. (The) | | | 121,859 |
| 3,062 | | Charles Schwab Corp. (The) | | | 58,545 |
| 7,015,000 | | Industrial & Commercial Bank of China Ltd. (Class H Stock) (Hong Kong) | | | 3,300,702 |
| 139,041 | | Wells Fargo & Co. | | | 4,734,346 |
| | | | | |
| | | | | 12,281,885 |
| | | | | |
| | |
| | Financial—Securities/Asset Management | | | |
| 984 | | Federated Investors, Inc. (Class B Stock) | | | 23,813 |
| | | | | |
| | |
| | Financial Services—5.0% | | | |
| 781 | | Ameriprise Financial, Inc. | | | 16,870 |
| 1,977 | | BlackRock, Inc. | | | 259,659 |
| 15,745 | | Broadridge Financial Solutions, Inc. | | | 190,514 |
| 11,974 | | Eaton Vance Corp. | | | 263,428 |
| 23,012 | | Goldman Sachs Group, Inc. (The) | | | 2,128,610 |
See Notes to Financial Statements.
| | |
| 30 | | THE TARGET PORTFOLIO TRUST |
| | | | | |
| SHARES | | DESCRIPTION | | VALUE (NOTE 1) |
| | | | | |
| | COMMON STOCKS (continued) | | | |
| | |
| | Financial Services (continued) | | | |
| 4,674 | | Invesco Ltd.(a) | | $ | 69,689 |
| 66,432 | | JPMorgan Chase & Co. | | | 2,740,320 |
| 10,372 | | SEI Investments Co. | | | 183,377 |
| 6,042 | | T. Rowe Price Group, Inc. | | | 238,901 |
| 62,671 | | Visa, Inc. (Class A Stock) | | | 3,468,840 |
| 23,064 | | Western Union Co. (The) | | | 351,957 |
| | | | | |
| | | | | 9,912,165 |
| | | | | |
| | |
| | Food Products—0.6% | | | |
| 2,836 | | Corn Products International, Inc. | | | 68,971 |
| 26,786 | | Kroger Co. (The) | | | 735,544 |
| 33,851 | | Tyson Foods, Inc. (Class A Stock) | | | 295,858 |
| | | | | |
| | | | | 1,100,373 |
| | | | | |
| | |
| | Healthcare Equipment & Supplies—0.5% | | | |
| 24,023 | | Boston Scientific Corp.* | | | 216,928 |
| 24,595 | | Eli Lilly & Co. | | | 831,803 |
| | | | | |
| | | | | 1,048,731 |
| | | | | |
| | |
| | Healthcare Services—0.9% | | | |
| 8,999 | | Abbott Laboratories | | | 496,295 |
| 7,684 | | AmerisourceBergen Corp. | | | 240,279 |
| 11,679 | | Biogen Idec, Inc.* | | | 496,941 |
| 1,812 | | CR Bard, Inc.(a) | | | 159,909 |
| 442 | | Edwards Lifesciences Corp.* | | | 23,355 |
| 10,643 | | Herbalife Ltd.(a) | | | 260,008 |
| 1,450 | | Hill-Rom Holdings, Inc.(a) | | | 33,002 |
| 4,453 | | Hologic, Inc.* | | | 54,505 |
| 570 | | Mosaic Co. (The) | | | 22,464 |
| 2,128 | | UnitedHealth Group, Inc. | | | 50,497 |
| | | | | |
| | | | | 1,837,255 |
| | | | | |
| | |
| | Healthcare-Products—0.2% | | | |
| 8,221 | | Covidien Ltd. (Bermuda) | | | 364,108 |
| | | | | |
| | |
| | Hotels & Motels—1.5% | | | |
| 49,439 | | Wynn Resorts Ltd.(a) | | | 2,986,116 |
| | | | | |
| | |
| | Hotels, Restaurants & Leisure—5.4% | | | |
| 186,083 | | McDonald’s Corp. | | | 10,779,788 |
| | | | | |
| | |
| | Household Durables | | | |
| 1,253 | | Harman International Industries, Inc. | | | 23,018 |
| | | | | |
| | |
| | Industrial Conglomerates—0.1% | | | |
| 5,558 | | Tyco International Ltd. | | | 140,506 |
| | | | | |
| | |
| | Insurance—0.1% | | | |
| 2,868 | | MetLife, Inc. | | | 95,275 |
| 1,047 | | Reinsurance Group of America, Inc. | | | 39,095 |
| | | | | |
| | | | | 134,370 |
| | | | | |
See Notes to Financial Statements.
| | |
| THE TARGET PORTFOLIO TRUST | | 31 |
| | |
Large Capitalization Growth Portfolio (continued) | | Portfolio of Investments
As of October 31, 2008 |
| | | | | |
| SHARES | | DESCRIPTION | | VALUE (NOTE 1) |
| | | | | |
| | COMMON STOCKS (continued) | | | |
| | |
| | Internet & Catalog Retail—0.2% | | | |
| 22,408 | | eBay, Inc.* | | $ | 342,170 |
| | | | | |
| | |
| | Internet Services—1.9% | | | |
| 8,413 | | Google, Inc. (Class A Stock)* | | | 3,023,296 |
| 6,972 | | MPS Group, Inc.* | | | 54,312 |
| 5,996 | | NetFlix, Inc.*(a) | | | 148,461 |
| 2,013 | | Symantec Corp.* | | | 25,323 |
| 9,717 | | VeriSign, Inc.*(a) | | | 206,000 |
| 17,267 | | Yahoo!, Inc.* | | | 221,363 |
| | | | | |
| | | | | 3,678,755 |
| | | | | |
| | |
| | Internet Software & Services—0.7% | | | |
| 71,041 | | Oracle Corp.* | | | 1,299,340 |
| | | | | |
| | |
| | Machinery—0.1% | | | |
| 1,809 | | Flowserve Corp. | | | 102,968 |
| 924 | | Lincoln Electric Holdings, Inc. | | | 39,871 |
| | | | | |
| | | | | 142,839 |
| | | | | |
| | |
| | Machinery & Equipment—0.7% | | | |
| 8,326 | | AGCO Corp.* | | | 262,436 |
| 14,395 | | Caterpillar, Inc. | | | 549,457 |
| 7,557 | | Deere & Co. | | | 291,398 |
| 2,911 | | Graco, Inc. | | | 71,989 |
| 1,299 | | IDEX Corp. | | | 30,111 |
| 6,184 | | Joy Global, Inc. | | | 179,212 |
| | | | | |
| | | | | 1,384,603 |
| | | | | |
| | |
| | Media—0.4% | | | |
| 16,965 | | CBS Corp. (Class B Stock) | | | 164,730 |
| 54,500 | | Time Warner, Inc. | | | 549,905 |
| 1,834 | | Walt Disney Co. (The) | | | 47,501 |
| | | | | |
| | | | | 762,136 |
| | | | | |
| | |
| | Medical Supplies & Equipment—1.4% | | | |
| 5,032 | | Advanced Medical Optics, Inc.* | | | 31,047 |
| 7,196 | | Baxter International, Inc. | | | 435,286 |
| 2,755 | | Becton, Dickinson and Co. | | | 191,197 |
| 3,602 | | Cerner Corp.* | | | 134,102 |
| 1,699 | | DENTSPLY International, Inc. | | | 51,616 |
| 1,774 | | IDEXX Laboratories, Inc.* | | | 62,427 |
| 3,032 | | Invitrogen Corp.*(a) | | | 87,291 |
| 8,754 | | Johnson & Johnson | | | 536,970 |
| 3,711 | | King Pharmaceuticals, Inc.* | | | 32,620 |
| 15,547 | | Medtronic, Inc. | | | 627,011 |
| 25,605 | | PDL BioPharma, Inc. | | | 249,649 |
See Notes to Financial Statements.
| | |
| 32 | | THE TARGET PORTFOLIO TRUST |
| | | | | |
| SHARES | | DESCRIPTION | | VALUE (NOTE 1) |
| | | | | |
| | COMMON STOCKS (continued) | | | |
| | |
| | Medical Supplies & Equipment (continued) | | | |
| 4,059 | | St. Jude Medical, Inc.* | | $ | 154,364 |
| 5,326 | | Varian Medical Systems, Inc.* | | | 242,386 |
| | | | | |
| | | | | 2,835,966 |
| | | | | |
| | |
| | Metals & Mining—1.5% | | | |
| 9,282 | | Alcoa, Inc.(a) | | | 106,836 |
| 2,414 | | Peabody Energy Corp. | | | 83,307 |
| 34,015 | | Transocean, Inc.*(a) | | | 2,800,455 |
| 1,125 | | United States Steel Corp. | | | 41,490 |
| | | | | |
| | | | | 3,032,088 |
| | | | | |
| | |
| | Miscellaneous Manufacturers | | | |
| 669 | | Donaldson Co., Inc. | | | 23,515 |
| 844 | | SPX Corp. | | | 32,697 |
| | | | | |
| | | | | 56,212 |
| | | | | |
| | |
| | Office Equipment | | | |
| 1,400 | | Herman Miller, Inc.(a) | | | 30,800 |
| | | | | |
| | |
| | Oil, Gas & Consumable Fuels—6.4% | | | |
| 4,835 | | Apache Corp. | | | 398,066 |
| 11,885 | | Baker Hughes, Inc. | | | 415,381 |
| 840 | | Cabot Oil & Gas Corp. | | | 23,579 |
| 30,179 | | Cameron International Corp.*(a) | | | 732,143 |
| 306 | | Cimarex Energy Co. | | | 12,381 |
| 9,426 | | Devon Energy Corp. | | | 762,186 |
| 1,621 | | EOG Resources, Inc. | | | 131,171 |
| 8,229 | | Exxon Mobil Corp. | | | 609,933 |
| 12,944 | | FMC Technologies, Inc.*(a) | | | 452,911 |
| 2,261 | | Frontier Oil Corp. | | | 29,868 |
| 40,928 | | Halliburton Co. | | | 809,965 |
| 5,789 | | Hess Corp. | | | 348,556 |
| 6,819 | | Murphy Oil Corp. | | | 345,314 |
| 1,566 | | National Oilwell Varco, Inc.* | | | 46,808 |
| 987 | | Noble Energy, Inc. | | | 51,146 |
| 16,913 | | Occidental Petroleum Corp. | | | 939,348 |
| 1,995 | | Oil States International, Inc.* | | | 46,144 |
| 69,943 | | Petroleo Brasileiro SA, ADR (Brazil) | | | 1,880,767 |
| 3,307 | | Pioneer Natural Resources Co.(a) | | | 92,034 |
| 65,478 | | Schlumberger Ltd. | | | 3,381,939 |
| 1,390 | | Smith International, Inc.(a) | | | 47,927 |
| 713 | | Southwestern Energy Co.* | | | 25,397 |
| 3,427 | | St. Mary Land & Exploration Co. | | | 85,298 |
| 3,415 | | Sunoco, Inc.(a) | | | 104,157 |
| 15,153 | | Tesoro Corp.(a) | | | 146,530 |
| 2,612 | | Ultra Petroleum Corp.*(a) | | | 121,589 |
| 18,499 | | Valero Energy Corp. | | | 380,709 |
| 8,132 | | W&T Offshore, Inc.(a) | | | 155,890 |
| 3,152 | | Weatherford International Ltd.*(a) | | | 53,206 |
| | | | | |
| | | | | 12,630,343 |
| | | | | |
See Notes to Financial Statements.
| | |
| THE TARGET PORTFOLIO TRUST | | 33 |
| | |
Large Capitalization Growth Portfolio (continued) | | Portfolio of Investments
As of October 31, 2008 |
| | | | | |
| SHARES | | DESCRIPTION | | VALUE (NOTE 1) |
| | | | | |
| | COMMON STOCKS (continued) | | | |
| | |
| | Pharmaceuticals—3.9% | | | |
| 3,584 | | Allergan, Inc. | | $ | 142,177 |
| 8,082 | | Bristol-Myers Squibb Co. | | | 166,085 |
| 2,094 | | Cardinal Health, Inc. | | | 79,991 |
| 3,575 | | Express Scripts, Inc.* | | | 216,681 |
| 97,210 | | Gilead Sciences, Inc.* | | | 4,457,078 |
| 16,229 | | Medco Health Solutions, Inc.* | | | 615,891 |
| 27,509 | | Merck & Co., Inc. | | | 851,403 |
| 44,207 | | Pfizer, Inc. | | | 782,906 |
| 22,985 | | Schering-Plough Corp. | | | 333,053 |
| 4,943 | | Wyeth | | | 159,066 |
| | | | | |
| | | | | 7,804,331 |
| | | | | |
| | |
| | Real Estate | | | |
| 3,975 | | Fidelity National Financial, Inc. | | | 35,815 |
| 2,308 | | First American Corp. | | | 47,106 |
| | | | | |
| | | | | 82,921 |
| | | | | |
| | |
| | Real Estate Investment Trust—Apartment—0.1% | | | |
| 1,677 | | AvalonBay Communities, Inc. | | | 119,101 |
| | | | | |
| | |
| | Real Estate Investment Trusts—0.5% | | | |
| 3,310 | | AMB Property Corp. | | | 79,539 |
| 1,285 | | Essex Property Trust, Inc. | | | 125,030 |
| 2,043 | | Jones Lang LaSalle, Inc.(a) | | | 67,256 |
| 980 | | Kilroy Realty Corp. | | | 31,507 |
| 5,979 | | Macerich Co. (The) | | | 175,902 |
| 8,077 | | Nationwide Health Properties, Inc.(a) | | | 241,018 |
| 3,801 | | Simon Property Group, Inc. | | | 254,781 |
| | | | | |
| | | | | 975,033 |
| | | | | |
| | |
| | Restaurants—2.2% | | | |
| 303 | | Chipotle Mexican Grill, Inc. (Class A Stock)*(a) | | | 15,377 |
| 146,679 | | Yum! Brands, Inc. | | | 4,255,158 |
| | | | | |
| | | | | 4,270,535 |
| | | | | |
| | |
| | Retail & Merchandising—8.6% | | | |
| 23,937 | | Aeropostale, Inc.*(a) | | | 579,515 |
| 5,854 | | Big Lots, Inc.*(a) | | | 143,013 |
| 16,734 | | BJ’s Wholesale Club, Inc.*(a) | | | 589,037 |
| 6,708 | | Colgate-Palmolive Co. | | | 420,994 |
| 58,998 | | Costco Wholesale Corp. | | | 3,363,476 |
| 118,052 | | CVS/Caremark Corp. | | | 3,618,294 |
| 10,791 | | Dollar Tree, Inc.* | | | 410,274 |
| 2,113 | | Family Dollar Stores, Inc. | | | 56,861 |
| 5,788 | | GameStop Corp. (Class A Stock)* | | | 158,533 |
| 154,773 | | Lowe’s Cos., Inc. | | | 3,358,574 |
See Notes to Financial Statements.
| | |
| 34 | | THE TARGET PORTFOLIO TRUST |
| | | | | |
| SHARES | | DESCRIPTION | | VALUE (NOTE 1) |
| | | | | |
| | COMMON STOCKS (continued) | | | |
| | |
| | Retail & Merchandising (continued) | | | |
| 2,270 | | Panera Bread Co.*(a) | | $ | 102,422 |
| 38,805 | | Target Corp. | | | 1,556,857 |
| 3,090 | | TJX Cos., Inc. | | | 82,688 |
| 3,353 | | Urban Outfitters, Inc.*(a) | | | 72,894 |
| 44,659 | | Wal-Mart Stores, Inc. | | | 2,492,419 |
| | | | | |
| | | | | 17,005,851 |
| | | | | |
| | |
| | Road & Rail—0.3% | | | |
| 6,138 | | Landstar System, Inc. | | | 236,865 |
| 14,629 | | Werner Enterprises, Inc.(a) | | | 287,021 |
| | | | | |
| | | | | 523,886 |
| | | | | |
| | |
| | School—0.1% | | | |
| 2,529 | | Apollo Group, Inc. (Class A Stock)* | | | 175,791 |
| | | | | |
| | |
| | Semiconductors—1.1% | | | |
| 24,583 | | Advanced Micro Devices, Inc.* | | | 86,040 |
| 1,942 | | Applied Materials, Inc. | | | 25,071 |
| 88,119 | | Intel Corp. | | | 1,409,904 |
| 6,883 | | Marvell Technology Group Ltd. (Bermuda)* | | | 47,906 |
| 35,407 | | Texas Instruments, Inc. | | | 692,561 |
| | | | | |
| | | | | 2,261,482 |
| | | | | |
| | |
| | Semiconductors & Semiconductor Equipment—0.2% | | | |
| 3,816 | | Altera Corp. | | | 66,208 |
| 14,104 | | Broadcom Corp. (Class A Stock)* | | | 240,897 |
| 2,699 | | Linear Technology Corp.(a) | | | 61,213 |
| 4,946 | | Xilinx, Inc. | | | 91,105 |
| | | | | |
| | | | | 459,423 |
| | | | | |
| | |
| | Software | | | |
| 676 | | Sybase, Inc.*(a) | | | 18,002 |
| | | | | |
| | |
| | Specialty Retail—0.2% | | | |
| 695 | | Best Buy Co., Inc. | | | 18,633 |
| 9,512 | | Ross Stores, Inc.(a) | | | 310,947 |
| | | | | |
| | | | | 329,580 |
| | | | | |
| | |
| | Telecommunication Services—0.2% | | | |
| 1,836 | | American Tower Corp. (Class A Stock)* | | | 59,321 |
| 10,467 | | AT&T, Inc. | | | 280,202 |
| 24,892 | | Tellabs, Inc.* | | | 105,542 |
| | | | | |
| | | | | 445,065 |
| | | | | |
| | |
| | Telecommunications—3.2% | | | |
| 623 | | Amdocs Ltd. (Guernsey)* | | | 14,055 |
| 35,500 | | China Mobile Ltd. (Hong Kong) | | | 312,518 |
| 103,389 | | Cisco Systems, Inc.* | | | 1,837,222 |
| 1,109 | | Polycom, Inc.*(a) | | | 23,300 |
| 106,378 | | QUALCOMM, Inc. | | | 4,070,022 |
See Notes to Financial Statements.
| | |
| THE TARGET PORTFOLIO TRUST | | 35 |
| | |
Large Capitalization Growth Portfolio (continued) | | Portfolio of Investments
As of October 31, 2008 |
| | | | | | |
| SHARES | | DESCRIPTION | | VALUE (NOTE 1) | |
| | | | | | |
| | COMMON STOCKS (continued) | | | | |
| | |
| | Telecommunications (continued) | | | | |
| 45,523 | | Sprint Nextel Corp. | | $ | 142,487 | |
| 7,613 | | Virgin Media, Inc. | | | 43,851 | |
| | | | | | |
| | | | | 6,443,455 | |
| | | | | | |
| | |
| | Textiles, Apparel & Luxury Goods—0.8% | | | | |
| 28,484 | | NIKE, Inc. (Class B Stock)(a) | | | 1,641,533 | |
| | | | | | |
| | |
| | Tobacco—0.8% | | | | |
| 36,106 | | Philip Morris International, Inc. | | | 1,569,528 | |
| | | | | | |
| | |
| | Transportation—6.0% | | | | |
| 773 | | Alexander & Baldwin, Inc. | | | 24,659 | |
| 1,318 | | Burlington Northern Santa Fe Corp. | | | 117,381 | |
| 2,071 | | CH Robinson Worldwide, Inc. | | | 107,236 | |
| 20,280 | | CSX Corp. | | | 927,202 | |
| 8,025 | | Expeditors International of Washington, Inc. | | | 262,016 | |
| 25,805 | | J.B. Hunt Transport Services, Inc. | | | 733,636 | |
| 49,556 | | Norfolk Southern Corp. | | | 2,970,387 | |
| 98,602 | | Union Pacific Corp. | | | 6,583,655 | |
| 282 | | United Parcel Service, Inc. (Class B Stock) | | | 14,884 | |
| 6,521 | | UTI Worldwide, Inc. (British Virgin Islands) | | | 76,687 | |
| 4,427 | | YRC Worldwide, Inc.* | | | 20,276 | |
| | | | | | |
| | | | | 11,838,019 | |
| | | | | | |
| | |
| | Utilities—0.1% | | | | |
| 2,198 | | Mirant Corp* | | | 38,509 | |
| 5,506 | | NRG Energy, Inc.*(a) | | | 128,015 | |
| | | | | | |
| | | | | 166,524 | |
| | | | | | |
| | TOTAL LONG-TERM INVESTMENTS
(cost $202,940,615) | | | 182,355,623 | |
| | | | | | |
| | |
| | SHORT-TERM INVESTMENT—15.2% | | | | |
| | |
| | AFFILIATED MONEY MARKET MUTUAL FUND | | | | |
| 30,131,193 | | Dryden Core Investment Fund—Taxable Money Market Series
(cost $30,131,193; includes $12,698,539 of cash collateral for securities on loan)(b)(w) | | | 30,131,193 | |
| | | | | | |
| | TOTAL INVESTMENTS(o)—106.9%
(cost $233,071,808; Note 5) | | | 212,486,816 | |
| | Other liabilities in excess of other assets(x)—(6.9%) | | | (13,711,093 | ) |
| | | | | | |
| | NET ASSETS—100% | | $ | 198,775,723 | |
| | | | | | |
The following abbreviation is used in Portfolio descriptions:
ADR—American Depositary Receipt
| * | Non-income producing security. |
See Notes to Financial Statements.
| | |
| 36 | | THE TARGET PORTFOLIO TRUST |
| (a) | All or a portion of security is on loan. The aggregate market value of such securities is $13,353,352; cash collateral of $12,698,539 (included with liabilities) was received with which the Portfolio purchased highly liquid short-term investments. Cash Collateral is less than 102% of the market value of securities loaned due to significant market increases on October 31, 2008. Collateral was subsequently received on November 3, 2008 and the Portfolio remained in compliance. |
| (b) | Represents security, or a portion thereof, purchased with cash collateral received for securities on loan. |
| (o) | As of October 31, 2008, 3 securities representing $3,844,644 and 1.9% of net assets were fair valued in accordance with the policies adopted by the Board of Trustees. |
| (w) | Prudential Investments LLC, the manager of the Portfolio, also serves as manager of the Dryden Core Investment Fund-Taxable Money Market Series. |
| (x) | Other liabilities in excess of other assets includes unrealized depreciation on future contracts as follows: |
Open futures contracts outstanding at October 31, 2008:
| | | | | | | | | | | | | | |
Number of
Contracts | | Type | | Expiration
Date | | Value at
Trade Date | | Value at
October 31, 2008 | | Unrealized
Depreciation | |
| Long Positions: | | | | | | | | | | | | | | |
| 2 | | S&P 500 E-Mini | | Dec 08 | | $ | 1,420,103 | | $ | 1,402,585 | | $ | (17,518 | )(1) |
| | | | | | | | | | | | | | |
(1) | Cash of $219,600 has been segregated with the broker to cover requirements for open futures contacts as October 31, 2008. |
The industry classification of investments and other liabilities in excess of other assets shown as a percentage of net assets as of October 31, 2008 were as follows:
| | | |
Affiliated Money Market Mutual Fund (6.4% represents investments purchased with collateral from securities on loan) | | 15.2 | % |
Retail & Merchandising | | 8.6 | |
Oil, Gas & Consumable Fuels | | 6.4 | |
Financial—Bank & Trust | | 6.2 | |
Transportation | | 6.0 | |
Hotels, Restaurants & Leisure | | 5.4 | |
Aerospace & Defense | | 5.3 | |
Financial Services | | 5.0 | |
Computer Hardware | | 4.5 | |
Pharmaceuticals | | 3.9 | |
Agriculture/Heavy Equipment | | 3.7 | |
Telecommunications | | 3.2 | |
Biotechnology | | 3.2 | |
Restaurants | | 2.2 | |
Computer Services & Software | | 1.9 | |
Business Services | | 1.9 | |
Chemicals | | 1.9 | |
Internet Services | | 1.9 | |
Metals & Mining | | 1.5 | |
Hotels & Motels | | 1.5 | |
Medical Supplies & Equipment | | 1.4 | |
Commercial Banks | | 1.4 | |
Semiconductors | | 1.1 | |
Electronic Components | | 1.0 | |
Beverages | | 0.9 | |
Healthcare Services | | 0.9 | |
Textiles, Apparel & Luxury Goods | | 0.8 | |
Tobacco | | 0.8 | |
Consumer Products & Services | | 0.7 | |
Machinery & Equipment | | 0.7 | |
Internet Software & Services | | 0.7 | |
See Notes to Financial Statements.
| | |
| THE TARGET PORTFOLIO TRUST | | 37 |
| | |
Large Capitalization Growth Portfolio (continued) | | Portfolio of Investments
As of October 31, 2008 |
| | | |
Commercial Services | | 0.6 | % |
Food Products | | 0.6 | |
Healthcare Equipment & Supplies | | 0.5 | |
Real Estate Investment Trusts | | 0.5 | |
Cable Television | | 0.4 | |
Media | | 0.4 | |
Electric Utilities | | 0.3 | |
Road & Rail | | 0.3 | |
Entertainment & Leisure | | 0.3 | |
Clothing & Apparel | | 0.3 | |
Farming & Agriculture | | 0.2 | |
Semiconductors & Semiconductor Equipment | | 0.2 | |
Computers & Peripherals | | 0.2 | |
Telecommunication Services | | 0.2 | |
Diversified Manufacturing | | 0.2 | |
Finance | | 0.2 | |
Healthcare-Products | | 0.2 | |
Internet & Catalog Retail | | 0.2 | |
Specialty Retail | | 0.2 | |
Energy Equipment & Services | | 0.1 | |
Diversified Telecommunication Services | | 0.1 | |
Diversified Financial Services | | 0.1 | |
Schools | | 0.1 | |
Utilities | | 0.1 | |
Consumer Finance | | 0.1 | |
Machinery | | 0.1 | |
Industrial Conglomerates | | 0.1 | |
Insurance | | 0.1 | |
Real Estate Investment Trust—Apartment | | 0.1 | |
Diversified | | 0.1 | |
| | | |
| | 106.9 | |
Other liabilities in excess of other assets | | (6.9 | ) |
| | | |
| | 100.0 | % |
| | | |
See Notes to Financial Statements.
| | |
| 38 | | THE TARGET PORTFOLIO TRUST |
| | |
Portfolio of Investments
As of October 31, 2008 | | Large Capitalization Value Portfolio |
| | | | | |
| SHARES | | DESCRIPTION | | VALUE (NOTE 1) |
| | | | | |
| | LONG-TERM INVESTMENTS—98.5% | | | |
| | |
| | COMMON STOCKS | | | |
| | |
| | Aerospace & Defense—2.2% | | | |
| 4,000 | | Boeing Co. (The) | | $ | 209,080 |
| 15,300 | | Embraer-Empresa Brasileira de Aeronautica SA, ADR (Brazil) | | | 320,076 |
| 4,200 | | Goodrich Corp. | | | 153,552 |
| 64,400 | | Northrop Grumman Corp. | | | 3,019,716 |
| 16,900 | | United Technologies Corp. | | | 928,824 |
| | | | | |
| | | | | 4,631,248 |
| | | | | |
| | |
| | Agriculture—0.2% | | | |
| 17,200 | | Archer-Daniels-Midland Co. | | | 356,556 |
| | | | | |
| | |
| | Air Freight & Couriers—0.4% | | | |
| 13,400 | | FedEx Corp.(a) | | | 875,958 |
| | | | | |
| | |
| | Airlines | | | |
| 2,100 | | Southwest Airlines Co. | | | 24,738 |
| | | | | |
| | |
| | Auto Components—0.6% | | | |
| 72,100 | | Johnson Controls, Inc. | | | 1,278,333 |
| | | | | |
| | |
| | Automobile—0.4% | | | |
| 35,000 | | Harley-Davidson, Inc. | | | 856,800 |
| | | | | |
| | |
| | Automobile Manufacturers | | | |
| 2,400 | | Ford Motor Co.*(a) | | | 5,256 |
| | | | | |
| | |
| | Automotive Parts—0.2% | | | |
| 11,500 | | Advance Auto Parts, Inc. | | | 358,800 |
| 1,300 | | Autoliv, Inc. (Sweden) | | | 27,768 |
| | | | | |
| | | | | 386,568 |
| | | | | |
| | |
| | Banks | | | |
| 1,000 | | SunTrust Banks, Inc. | | | 40,140 |
| | | | | |
| | |
| | Beverages—0.9% | | | |
| 25,100 | | Coca-Cola Co. (The) | | | 1,105,906 |
| 14,600 | | Coca-Cola Enterprises, Inc. | | | 146,730 |
| 2,400 | | Pepsi Bottling Group, Inc.(a) | | | 55,488 |
| 9,800 | | PepsiCo, Inc. | | | 558,698 |
| | | | | |
| | | | | 1,866,822 |
| | | | | |
| | |
| | Biotechnology—0.5% | | | |
| 19,300 | | Amgen, Inc.* | | | 1,155,877 |
| | | | | |
| | |
| | Biotechnology Healthcare—0.1% | | | |
| 3,200 | | Celgene Corp.* | | | 205,632 |
| | | | | |
See Notes to Financial Statements.
| | |
| THE TARGET PORTFOLIO TRUST | | 39 |
| | |
Large Capitalization Value Portfolio (continued) | | Portfolio of Investments
As of October 31, 2008 |
| | | | | |
| SHARES | | DESCRIPTION | | VALUE (NOTE 1) |
| | | | | |
| | COMMON STOCKS (continued) | | | |
| | |
| | Building Materials | | | |
| 1,000 | | Masco Corp.(a) | | $ | 10,150 |
| | | | | |
| | |
| | Business Services—0.1% | | | |
| 6,300 | | Genpact Ltd. (Bermuda)*(a) | | | 49,329 |
| 1,200 | | MasterCard, Inc. (Class A Stock)(a) | | | 177,384 |
| | | | | |
| | | | | 226,713 |
| | | | | |
| | |
| | Chemicals—3.6% | | | |
| 5,900 | | Air Products & Chemicals, Inc. | | | 342,967 |
| 194,600 | | Dow Chemical Co. (The) | | | 5,189,982 |
| 200 | | E.I. du Pont de Nemours & Co. | | | 6,400 |
| 13,300 | | Eastman Chemical Co. | | | 537,187 |
| 27,700 | | PPG Industries, Inc. | | | 1,373,366 |
| 1,000 | | Praxair, Inc. | | | 65,150 |
| 2,800 | | Rohm & Haas Co. | | | 196,980 |
| | | | | |
| | | | | 7,712,032 |
| | | | | |
| | |
| | Clothing & Apparel—0.2% | | | |
| 6,100 | | VF Corp. | | | 336,110 |
| | | | | |
| | |
| | Commercial Banks—7.2% | | | |
| 287,186 | | Bank of America Corp. | | | 6,941,286 |
| 6,400 | | BB&T Corp.(a) | | | 229,440 |
| 21,200 | | KeyCorp(a) | | | 259,276 |
| 8,100 | | Marshall & Ilsley Corp.(a) | | | 146,043 |
| 19,200 | | National City Corp.(a) | | | 51,840 |
| 16,000 | | Regions Financial Corp. | | | 177,440 |
| 10,100 | | State Street Corp. | | | 437,835 |
| 36,300 | | U.S. Bancorp | | | 1,082,103 |
| 144,300 | | Wachovia Corp. | | | 924,963 |
| 145,600 | | Wells Fargo & Co. | | | 4,957,680 |
| 6,500 | | Zions Bancorp | | | 247,715 |
| | | | | |
| | | | | 15,455,621 |
| | | | | |
| | |
| | Commercial Services & Supplies—1.2% | | | |
| 6,400 | | McKesson Corp. | | | 235,456 |
| 73,400 | | Waste Management, Inc. | | | 2,292,282 |
| | | | | |
| | | | | 2,527,738 |
| | | | | |
| | |
| | Communications Equipment—0.3% | | | |
| 209,700 | | Alcatel-Lucent, ADR (France)*(a) | | | 538,929 |
| | | | | |
| | |
| | Computer Hardware | | | |
| 1,200 | | NetApp, Inc.*(a) | | | 16,236 |
| | | | | |
| | |
| | Computer Services & Software | | | |
| 7,500 | | SanDisk Corp.* | | | 66,675 |
| | | | | |
See Notes to Financial Statements.
| | |
| 40 | | THE TARGET PORTFOLIO TRUST |
| | | | | |
| SHARES | | DESCRIPTION | | VALUE (NOTE 1) |
| | | | | |
| | COMMON STOCKS (continued) | | | |
| | |
| | Computers & Peripherals—1.4% | | | |
| 1,400 | | EMC Corp.* | | $ | 16,492 |
| 44,800 | | Hewlett-Packard Co. | | | 1,714,944 |
| 12,000 | | International Business Machines Corp. | | | 1,115,640 |
| 3,500 | | Pitney Bowes, Inc. | | | 86,730 |
| | | | | |
| | | | | 2,933,806 |
| | | | | |
| | |
| | Conglomerates | | | |
| 4,000 | | Textron, Inc. | | | 70,800 |
| | | | | |
| | |
| | Consumer Finance—0.3% | | | |
| 3,600 | | American Express Co. | | | 99,000 |
| 12,600 | | Capital One Financial Corp. | | | 492,912 |
| | | | | |
| | | | | 591,912 |
| | | | | |
| | |
| | Consumer Products & Services—1.0% | | | |
| 31,600 | | Procter & Gamble Co. | | | 2,039,464 |
| 600 | | Snap-on, Inc. | | | 22,170 |
| | | | | |
| | | | | 2,061,634 |
| | | | | |
| | |
| | Diversified—0.1% | | | |
| 7,900 | | Pepco Holdings, Inc. | | | 163,135 |
| | | | | |
| | |
| | Diversified Financial Services—4.6% | | | |
| 205,500 | | Citigroup, Inc. | | | 2,805,075 |
| 10,600 | | Goldman Sachs Group, Inc. (The) | | | 980,500 |
| 98,800 | | JPMorgan Chase & Co. | | | 4,075,500 |
| 28,300 | | Merrill Lynch & Co., Inc.(a) | | | 526,097 |
| 69,300 | | Morgan Stanley | | | 1,210,671 |
| 8,700 | | NYSE Euronext, Inc. | | | 262,566 |
| 2,100 | | Principal Financial Group, Inc. | | | 39,879 |
| | | | | |
| | | | | 9,900,288 |
| | | | | |
| | |
| | Diversified Machinery—0.2% | | | |
| 6,400 | | Cooper Industries Ltd. (Class A Stock) (Bermuda) | | | 198,080 |
| 7,900 | | Ingersoll-Rand Co. Ltd. (Class A Stock) (Bermuda)(a) | | | 145,755 |
| | | | | |
| | | | | 343,835 |
| | | | | |
| | |
| | Diversified Telecommunication Services—2.7% | | | |
| 199,300 | | Verizon Communications, Inc. | | | 5,913,231 |
| | | | | |
| | |
| | Education—0.2% | | | |
| 5,500 | | ITT Educational Services, Inc.*(a) | | | 482,075 |
| | | | | |
| | |
| | Electric—Integrated—0.1% | | | |
| 14,000 | | Sierra Pacific Resources | | | 116,060 |
| | | | | |
| | |
| | Electric Utilities—4.8% | | | |
| 27,300 | | American Electric Power Co., Inc. | | | 890,799 |
| 38,400 | | CMS Energy Corp.(a) | | | 393,600 |
| 3,600 | | DTE Energy Co. | | | 127,080 |
| 98,400 | | Edison International | | | 3,502,056 |
See Notes to Financial Statements.
| | |
| THE TARGET PORTFOLIO TRUST | | 41 |
| | |
Large Capitalization Value Portfolio (continued) | | Portfolio of Investments
As of October 31, 2008 |
| | | | | |
| SHARES | | DESCRIPTION | | VALUE (NOTE 1) |
| | | | | |
| | COMMON STOCKS (continued) | | | |
| | |
| | Electric Utilities (continued) | | | |
| 3,500 | | Entergy Corp. | | $ | 273,175 |
| 34,700 | | Exelon Corp. | | | 1,882,128 |
| 11,500 | | FirstEnergy Corp. | | | 599,840 |
| 32,400 | | FPL Group, Inc. | | | 1,530,576 |
| 13,700 | | PG&E Corp. | | | 502,379 |
| 18,400 | | PPL Corp. | | | 603,888 |
| | | | | |
| | | | | 10,305,521 |
| | | | | |
| | |
| | Energy Equipment & Services—1.6% | | | |
| 23,400 | | Diamond Offshore Drilling, Inc. | | | 2,077,920 |
| 64,500 | | Halliburton Co. | | | 1,276,455 |
| | | | | |
| | | | | 3,354,375 |
| | | | | |
| | |
| | Exchange Traded Fund—0.5% | | | |
| 20,920 | | iShares Russell 1000 Value Index Fund | | | 1,109,597 |
| | | | | |
| | |
| | Financial—Bank & Trust—1.5% | | | |
| 44,800 | | Bank of New York Mellon Corp. (The) | | | 1,460,480 |
| 29,500 | | Comerica, Inc. | | | 813,905 |
| 10,000 | | Huntington Bancshares, Inc.(a) | | | 94,500 |
| 4,100 | | M&T Bank Corp.(a) | | | 332,510 |
| 7,300 | | PNC Financial Services Group, Inc. | | | 486,691 |
| 1,500 | | Synovus Financial Corp.(a) | | | 15,495 |
| 5,100 | | TCF Financial Corp. | | | 90,474 |
| | | | | |
| | | | | 3,294,055 |
| | | | | |
| | |
| | Financial—Brokerage | | | |
| 900 | | PartnerRe Ltd. (Bermuda)(a) | | | 60,921 |
| | | | | |
| | |
| | Financial Services—0.2% | | | |
| 9,300 | | Fifth Third Bancorp(a) | | | 100,905 |
| 3,200 | | Paychex, Inc. | | | 91,328 |
| 14,500 | | TD Ameritrade Holding Corp.* | | | 192,705 |
| | | | | |
| | | | | 384,938 |
| | | | | |
| | |
| | Food—0.3% | | | |
| 11,100 | | General Mills, Inc. | | | 751,914 |
| | | | | |
| | |
| | Food & Drug Retailers—2.0% | | | |
| 46,600 | | CVS/Caremark Corp. | | | 1,428,290 |
| 137,000 | | Safeway, Inc. | | | 2,913,990 |
| | | | | |
| | | | | 4,342,280 |
| | | | | |
| | |
| | Food & Staples Retailing—0.3% | | | |
| 13,000 | | Wal-Mart Stores, Inc. | | | 725,530 |
| | | | | |
See Notes to Financial Statements.
| | |
| 42 | | THE TARGET PORTFOLIO TRUST |
| | | | | |
| SHARES | | DESCRIPTION | | VALUE (NOTE 1) |
| | | | | |
| | COMMON STOCKS (continued) | | | |
| | |
| | Food Products—0.8% | | | |
| 1,700 | | Kellogg Co. | | $ | 85,714 |
| 45,000 | | Kraft Foods, Inc. (Class A Stock) | | | 1,311,300 |
| 3,100 | | Kroger Co. (The) | | | 85,126 |
| 9,800 | | SYSCO Corp. | | | 256,760 |
| | | | | |
| | | | | 1,738,900 |
| | | | | |
| | |
| | Gas & Pipeline Utilities—0.1% | | | |
| 6,200 | | Northeast Utilities | | | 139,872 |
| | | | | |
| | |
| | Gas Utilities | | | |
| 4,900 | | El Paso Corp. | | | 47,530 |
| | | | | |
| | |
| | Hand/Machine Tools | | | |
| 1,600 | | Stanley Works (The) | | | 52,384 |
| | | | | |
| | |
| | Healthcare Equipment & Supplies—0.2% | | | |
| 21,100 | | Boston Scientific Corp.* | | | 190,533 |
| 4,300 | | Zimmer Holdings, Inc.* | | | 199,649 |
| | | | | |
| | | | | 390,182 |
| | | | | |
| | |
| | Healthcare Products—0.2% | | | |
| 9,200 | | Covidien Ltd. (Bermuda) | | | 407,468 |
| | | | | |
| | |
| | Healthcare Providers & Services—1.0% | | | |
| 12,300 | | Aetna, Inc. | | | 305,901 |
| 89,700 | | CIGNA Corp. | | | 1,462,110 |
| 11,000 | | WellPoint, Inc.* | | | 427,570 |
| | | | | |
| | | | | 2,195,581 |
| | | | | |
| | |
| | Healthcare Services—0.1% | | | |
| 1,500 | | Bard (C.R.), Inc.(a) | | | 132,375 |
| | | | | |
| | |
| | Home Builder—0.1% | | | |
| 6,100 | | Toll Brothers, Inc.* | | | 141,032 |
| | | | | |
| | |
| | Hotels, Restaurants & Leisure—1.1% | | | |
| 82,900 | | Carnival Corp. (Panama)(a) | | | 2,105,660 |
| 1,300 | | Choice Hotels International, Inc. | | | 35,542 |
| 10,400 | | International Game Technology(a) | | | 145,600 |
| 4,600 | | Wyndham Worldwide Corp. | | | 37,674 |
| | | | | |
| | | | | 2,324,476 |
| | | | | |
| | |
| | Household Durables—0.4% | | | |
| 22,600 | | Fortune Brands, Inc. | | | 861,964 |
| 8,100 | | Lennar Corp. (Class A Stock)(a) | | | 62,694 |
| | | | | |
| | | | | 924,658 |
| | | | | |
| | |
| | Household Products—1.2% | | | |
| 42,500 | | Kimberly-Clark Corp. | | | 2,604,825 |
| | | | | |
See Notes to Financial Statements.
| | |
| THE TARGET PORTFOLIO TRUST | | 43 |
| | |
Large Capitalization Value Portfolio (continued) | | Portfolio of Investments
As of October 31, 2008 |
| | | | | |
| SHARES | | DESCRIPTION | | VALUE (NOTE 1) |
| | | | | |
| | COMMON STOCKS (continued) | | | |
| | |
| | Industrial Conglomerates—3.3% | | | |
| 13,700 | | 3M Co. | | $ | 880,910 |
| 219,600 | | General Electric Co. | | | 4,284,396 |
| 64,025 | | Tyco Electronics Ltd. (Bermuda) | | | 1,244,646 |
| 30,525 | | Tyco International Ltd. (Bermuda) | | | 771,672 |
| | | | | |
| | | | | 7,181,624 |
| | | | | |
| | |
| | Industrial Machinery—0.1% | | | |
| 5,800 | | Eaton Corp. | | | 258,680 |
| | | | | |
| | |
| | Industrial Products—0.1% | | | |
| 5,100 | | Dover Corp. | | | 162,027 |
| 400 | | Mohawk Industries, Inc.*(a) | | | 19,352 |
| | | | | |
| | | | | 181,379 |
| | | | | |
| | |
| | Insurance—6.3% | | | |
| 105,000 | | Allstate Corp. (The) | | | 2,770,950 |
| 2,100 | | American Financial Group, Inc. | | | 47,733 |
| 36,500 | | American International Group, Inc. | | | 69,715 |
| 6,700 | | AON Corp. | | | 283,410 |
| 5,800 | | Assurant, Inc. | | | 147,784 |
| 10,000 | | AXIS Capital Holdings Ltd. (Bermuda) | | | 284,800 |
| 5,900 | | Chubb Corp. | | | 305,738 |
| 1,100 | | Gallagher, (Arthur J.) & Co. | | | 26,796 |
| 74,400 | | Genworth Financial, Inc. (Class A Stock) | | | 360,096 |
| 11,500 | | Hanover Insurance Group, Inc. (The) | | | 451,375 |
| 5,900 | | Hartford Financial Service Group, Inc. (The) | | | 60,888 |
| 8,900 | | Lincoln National Corp. | | | 153,436 |
| 3,400 | | Loews Corp. | | | 112,914 |
| 104,969 | | MetLife, Inc. | | | 3,487,070 |
| 6,100 | | RenaissanceRe Holdings Ltd. (Bermuda) | | | 279,990 |
| 76,300 | | Travelers Cos., Inc. (The)(a) | | | 3,246,565 |
| 30,000 | | Unum Group | | | 472,500 |
| 1,600 | | W.R. Berkely Corp. | | | 42,032 |
| 87,800 | | XL Capital Ltd. (Class A Stock) (Cayman Islands) | | | 851,660 |
| | | | | |
| | | | | 13,455,452 |
| | | | | |
| | |
| | Internet Software & Services—0.3% | | | |
| 30,100 | | eBay, Inc.* | | | 459,627 |
| 9,300 | | Expedia, Inc.* | | | 88,443 |
| 1,400 | | Symantec Corp.* | | | 17,612 |
| | | | | |
| | | | | 565,682 |
| | | | | |
| | |
| | IT Services | | | |
| 2,650 | | Computer Sciences Corp.* | | | 79,924 |
| | | | | |
See Notes to Financial Statements.
| | |
| 44 | | THE TARGET PORTFOLIO TRUST |
| | | | | |
| SHARES | | DESCRIPTION | | VALUE (NOTE 1) |
| | | | | |
| | COMMON STOCKS (continued) | | | |
| | |
| | Machinery—1.4% | | | |
| 34,200 | | Caterpillar, Inc. | | $ | 1,305,414 |
| 61,100 | | PACCAR, Inc.(a) | | | 1,786,564 |
| | | | | |
| | | | | 3,091,978 |
| | | | | |
| | |
| | Manufacturing—0.1% | | | |
| 2,200 | | Danaher Corp. | | | 130,328 |
| | | | | |
| | |
| | Media—2.3% | | | |
| 150,000 | | CBS Corp. (Class B Stock) | | | 1,456,500 |
| 47,800 | | News Corp. (Class A Stock) | | | 508,592 |
| 168,000 | | Time Warner, Inc. | | | 1,695,120 |
| 50,700 | | Walt Disney Co. (The) | | | 1,313,130 |
| | | | | |
| | | | | 4,973,342 |
| | | | | |
| | |
| | Medical Supplies & Equipment | | | |
| 1,600 | | Invitrogen Corp.*(a) | | | 46,064 |
| | | | | |
| | |
| | Metals & Mining—1.5% | | | |
| 106,500 | | Alcoa, Inc.(a) | | | 1,225,815 |
| 30,000 | | Freeport-McMoRan Copper & Gold, Inc. | | | 873,000 |
| 25,900 | | Nucor Corp. | | | 1,049,209 |
| 1,200 | | Reliance Steel & Aluminum Co. | | | 30,048 |
| 1,600 | | Transocean, Inc. (Cayman Islands)*(a) | | | 131,728 |
| | | | | |
| | | | | 3,309,800 |
| | | | | |
| | |
| | Miscellaneous Manufacturers | | | |
| 100 | | Illinois Tool Works, Inc. | | | 3,339 |
| | | | | |
| | |
| | Multi-Utilities & Unregulated Power—0.7% | | | |
| 29,000 | | Dominion Resources, Inc. | | | 1,052,120 |
| 9,400 | | Wisconsin Energy Corp. | | | 408,900 |
| | | | | |
| | | | | 1,461,020 |
| | | | | |
| | |
| | Multiline Retail—0.2% | | | |
| 1,400 | | Abercrombie & Fitch Co. (Class A Stock)(a) | | | 40,544 |
| 20,800 | | JC Penney Co., Inc. | | | 497,536 |
| | | | | |
| | | | | 538,080 |
| | | | | |
| | |
| | Networking Equipment | | | |
| 3,900 | | Juniper Networks, Inc.* | | | 73,086 |
| | | | | |
| | |
| | Office Electronics—0.8% | | | |
| 221,500 | | Xerox Corp.(a) | | | 1,776,430 |
| | | | | |
| | |
| | Oil, Gas & Consumable Fuels—11.9% | | | |
| 9,500 | | Anadarko Petroleum Corp. | | | 335,350 |
| 34,200 | | Apache Corp. | | | 2,815,686 |
| 7,700 | | Baker Hughes, Inc. | | | 269,115 |
| 2,300 | | Chesapeake Energy Corp.(a) | | | 50,531 |
| 66,700 | | Chevron Corp. | | | 4,975,820 |
See Notes to Financial Statements.
| | |
| THE TARGET PORTFOLIO TRUST | | 45 |
| | |
Large Capitalization Value Portfolio (continued) | | Portfolio of Investments
As of October 31, 2008 |
| | | | | |
| SHARES | | DESCRIPTION | | VALUE (NOTE 1) |
| | | | | |
| | COMMON STOCKS (continued) | | | |
| | |
| | Oil, Gas & Consumable Fuels (continued) | | | |
| 75,000 | | ConocoPhillips | | $ | 3,901,500 |
| 1,200 | | Devon Energy Corp. | | | 97,032 |
| 500 | | EOG Resources, Inc. | | | 40,460 |
| 90,400 | | Exxon Mobil Corp. | | | 6,700,448 |
| 117,400 | | Marathon Oil Corp. | | | 3,416,340 |
| 10,500 | | Occidental Petroleum Corp. | | | 583,170 |
| 7,000 | | Pride International, Inc.* | | | 131,530 |
| 34,100 | | Royal Dutch Shell PLC (Class B Stock), ADR (Netherlands)(a) | | | 1,885,389 |
| 6,400 | | Sunoco, Inc.(a) | | | 195,200 |
| 11,200 | | Valero Energy Corp. | | | 230,496 |
| | | | | |
| | | | | 25,628,067 |
| | | | | |
| | |
| | Paper & Forest Products—0.5% | | | |
| 46,700 | | Domtar Corp. (Canada)* | | | 115,816 |
| 35,900 | | International Paper Co. | | | 618,198 |
| 6,800 | | Weyerhaeuser Co. | | | 259,896 |
| | | | | |
| | | | | 993,910 |
| | | | | |
| | |
| | Pharmaceuticals—9.5% | | | |
| 11,300 | | Abbott Laboratories | | | 623,195 |
| 69,800 | | Bristol-Myers Squibb Co. | | | 1,434,390 |
| 4,200 | | Cardinal Health, Inc. | | | 160,440 |
| 75,000 | | Eli Lilly & Co. | | | 2,536,500 |
| 11,100 | | Forest Laboratories, Inc.* | | | 257,853 |
| 1,700 | | Gilead Sciences, Inc.* | | | 77,945 |
| 2,500 | | IMS Health, Inc. | | | 35,850 |
| 68,500 | | Johnson & Johnson | | | 4,201,790 |
| 82,900 | | Merck & Co., Inc. | | | 2,565,755 |
| 290,300 | | Pfizer, Inc. | | | 5,141,213 |
| 6,000 | | Schering-Plough Corp. | | | 86,940 |
| 300 | | Vertex Pharmaceuticals, Inc.*(a) | | | 7,863 |
| 101,900 | | Wyeth | | | 3,279,142 |
| | | | | |
| | | | | 20,408,876 |
| | | | | |
| | |
| | Railroads & Equipment—0.5% | | | |
| 17,400 | | Norfolk Southern Corp. | | | 1,042,956 |
| | | | | |
| | |
| | Real Estate Investment Trusts—1.7% | | | |
| 2,200 | | Alexandria Real Estate Equities, Inc.(a) | | | 152,944 |
| 1,800 | | Apartment Investment & Management Co. (Class A Stock) | | | 26,334 |
| 1,100 | | Boston Properties, Inc.(a) | | | 77,968 |
| 900 | | Brandywine Realty Trust | | | 7,776 |
| 2,800 | | Camden Property Trust | | | 94,388 |
| 2,800 | | Colonial Properties Trust | | | 29,512 |
| 9,800 | | DCT Industrial Trust, Inc. | | | 48,314 |
| 200 | | Duke Realty Corp.(a) | | | 2,822 |
See Notes to Financial Statements.
| | |
| 46 | | THE TARGET PORTFOLIO TRUST |
| | | | | |
| SHARES | | DESCRIPTION | | VALUE (NOTE 1) |
| | | | | |
| | COMMON STOCKS (continued) | | | |
| | |
| | Real Estate Investment Trusts (continued) | | | |
| 1,300 | | Eastgroup Properties, Inc. | | $ | 43,524 |
| 10,000 | | General Growth Properties, Inc. | | | 41,400 |
| 12,900 | | HCP, Inc. | | | 386,097 |
| 3,500 | | Highwoods Properties, Inc. | | | 86,870 |
| 6,400 | | Hospitality Properties Trust(a) | | | 64,960 |
| 100 | | Kimco Realty Corp.(a) | | | 2,258 |
| 12,400 | | Liberty Property Trust(a) | | | 295,740 |
| 2,000 | | Macerich Co. (The) | | | 58,840 |
| 39,500 | | ProLogis | | | 553,000 |
| 2,800 | | Realty Income Corp. | | | 64,736 |
| 5,700 | | Senior Housing Properties Trust | | | 109,269 |
| 12,100 | | Simon Property Group, Inc. | | | 811,063 |
| 2,800 | | Taubman Centers, Inc. | | | 93,016 |
| 9,100 | | Ventas, Inc. | | | 328,146 |
| 3,100 | | Vornado Realty Trust(a) | | | 218,705 |
| 2,300 | | Weingarten Realty Investors | | | 47,035 |
| | | | | |
| | | | | 3,644,717 |
| | | | | |
| | |
| | Retail & Merchandising—0.6% | | | |
| 2,100 | | Best Buy Co., Inc. | | | 56,301 |
| 3,400 | | Colgate-Palmolive Co. | | | 213,384 |
| 2,900 | | Darden Restaurants, Inc. | | | 64,293 |
| 14,000 | | Family Dollar Stores, Inc.(a) | | | 376,740 |
| 4,600 | | Lauder, (Estee) Cos., Inc. (The)(Class A Stock) | | | 165,784 |
| 5,300 | | Newell Rubbermaid, Inc. | | | 72,875 |
| 800 | | Polo Ralph Lauren Corp. | | | 37,736 |
| 2,300 | | Target Corp. | | | 92,276 |
| 4,600 | | TJX Cos., Inc.(a) | | | 123,096 |
| | | | | |
| | | | | 1,202,485 |
| | | | | |
| | |
| | Road & Rail—0.6% | | | |
| 15,700 | | Burlington Northern Santa Fe Corp. | | | 1,398,242 |
| | | | | |
| | |
| | Semiconductors & Semiconductor Equipment—0.3% | | | |
| 600 | | Applied Materials, Inc. | | | 7,746 |
| 2,300 | | KLA-Tencor Corp. | | | 53,475 |
| 3,400 | | Lam Research Corp.* | | | 76,024 |
| 6,700 | | Marvell Technology Group Ltd. (Bermuda)* | | | 46,632 |
| 17,800 | | Texas Instruments, Inc. | | | 348,168 |
| 8,100 | | Xilinx, Inc. | | | 149,202 |
| | | | | |
| | | | | 681,247 |
| | | | | |
| | |
| | Software—2.7% | | | |
| 27,000 | | BMC Software, Inc.* | | | 697,140 |
| 101,058 | | CA, Inc. | | | 1,798,832 |
| 152,100 | | Microsoft Corp. | | | 3,396,393 |
| | | | | |
| | | | | 5,892,365 |
| | | | | |
See Notes to Financial Statements.
| | |
| THE TARGET PORTFOLIO TRUST | | 47 |
| | |
Large Capitalization Value Portfolio (continued) | | Portfolio of Investments
As of October 31, 2008 |
| | | | | |
| SHARES | | DESCRIPTION | | VALUE (NOTE 1) |
| | | | | |
| | COMMON STOCKS (continued) | | | |
| | |
| | Specialty Retail—1.7% | | | |
| 29,600 | | AutoNation, Inc.*(a) | | $ | 203,352 |
| 20,300 | | Gap, Inc. (The) | | | 262,682 |
| 104,611 | | Home Depot, Inc. (The)(a) | | | 2,467,774 |
| 11,900 | | Limited Brands, Inc. | | | 142,562 |
| 12,800 | | Lowe’s Cos., Inc. | | | 277,760 |
| 200 | | Phillips-Van Heusen Corp. | | | 4,902 |
| 2,800 | | Ross Stores, Inc.(a) | | | 91,532 |
| 10,500 | | Staples, Inc. | | | 204,015 |
| | | | | |
| | | | | 3,654,579 |
| | | | | |
| | |
| | Telecommunication Services—3.5% | | | |
| 4,200 | | American Tower Corp. (Class A Stock)* | | | 135,702 |
| 260,800 | | AT&T, Inc. | | | 6,981,616 |
| 11,700 | | Cisco Systems, Inc.* | | | 207,909 |
| 7,600 | | Corning, Inc. | | | 82,308 |
| 3,600 | | QUALCOMM, Inc. | | | 137,736 |
| | | | | |
| | | | | 7,545,271 |
| | | | | |
| | |
| | Textiles, Apparel & Luxury Goods—0.2% | | | |
| 34,500 | | Jones Apparel Group, Inc. | | | 383,295 |
| | | | | |
| | |
| | Thrifts & Mortgage Finance | | | |
| 156,500 | | Washington Mutual, Inc.(g)�� | | | — |
| | | | | |
| | |
| | Tobacco—2.2% | | | |
| 160,000 | | Altria Group, Inc. | | | 3,070,400 |
| 37,900 | | Philip Morris International, Inc. | | | 1,647,513 |
| | | | | |
| | | | | 4,717,913 |
| | | | | |
| | |
| | Transportation—0.1% | | | |
| 14,600 | | Royal Caribbean Cruises Ltd. (Liberia)(a) | | | 197,976 |
| | | | | |
| | |
| | Utilities—0.3% | | | |
| 6,200 | | Duke Energy Corp. | | | 101,556 |
| 500 | | First Solar, Inc.*(a) | | | 71,850 |
| 5,900 | | NRG Energy, Inc.*(a) | | | 137,175 |
| 5,100 | | Progress Energy, Inc. | | | 200,787 |
| 5,800 | | Spectra Energy Corp. | | | 112,114 |
| | | | | |
| | | | | 623,482 |
| | | | | |
| | TOTAL LONG-TERM INVESTMENTS
(cost $268,510,023) | | | 211,720,911 |
| | | | | |
See Notes to Financial Statements.
| | |
| 48 | | THE TARGET PORTFOLIO TRUST |
| | | | | | |
| SHARES | | DESCRIPTION | | VALUE (NOTE 1) | |
| | | | | | |
| | SHORT-TERM INVESTMENT—6.9% | | | | |
| | |
| | AFFILIATED MONEY MARKET MUTUAL FUND | | | | |
| 14,846,277 | | Dryden Core Investment Fund—Taxable Money Market Series
(cost $14,846,277; includes $13,009,558 of cash collateral for securities on loan) (b)(w) | | $ | 14,846,277 | |
| | | | | | |
| | TOTAL INVESTMENTS—105.4%
(cost $283,356,300; Note 5) | | | 226,567,188 | |
| | Liabilities in excess of other assets—(5.4%) | | | (11,571,870 | ) |
| | | | | | |
| | NET ASSETS—100% | | $ | 214,995,318 | |
| | | | | | |
The following abbreviation is used in Portfolio descriptions:
ADR—American Depositary Receipt
| * | Non-income producing security. |
| † | Security has been fair valued. The fair value represents 0.00% of net assets at October 31, 2008. |
| (a) | All or a portion of security is on loan. The aggregate market value of such securities is $12,498,540; cash collateral of $13,009,558 (included with liabilities) was received with which the Portfolio purchased highly liquid short-term investments. |
| (b) | Represents security, or a portion thereof, purchased with cash collateral received for securities on loan. |
| (g) | Indicates a security that has been deemed illiquid. |
| (w) | Prudential Investments LLC, the manager of the Portfolio, also serves as manager of the Dryden Core Investment Fund-Taxable Money Market Series. |
The industry classification of investments and liabilities in excess of other assets shown as a percentage of net assets as of October 31, 2008 were as follows:
| | | |
Oil, Gas & Consumable Fuels | | 11.9 | % |
Pharmaceuticals | | 9.5 | |
Commercial Banks | | 7.2 | |
Affiliated Money Market Mutual Fund (6.1% represents investments purchased with collateral from securities on loan) | | 6.9 | |
Insurance | | 6.3 | |
Electric Utilities | | 4.8 | |
Diversified Financial Services | | 4.6 | |
Chemicals | | 3.6 | |
Telecommunication Services | | 3.5 | |
Industrial Conglomerates | | 3.3 | |
Diversified Telecommunication Services | | 2.7 | |
Software | | 2.7 | |
Media | | 2.3 | |
Tobacco | | 2.2 | |
Aerospace & Defense | | 2.2 | |
Food & Drug Retailers | | 2.0 | |
Specialty Retail | | 1.7 | |
Real Estate Investment Trusts | | 1.7 | |
Energy Equipment & Services | | 1.6 | |
Metals & Mining | | 1.5 | |
Financial—Bank & Trust | | 1.5 | |
Machinery | | 1.4 | |
Computers & Peripherals | | 1.4 | |
Household Products | | 1.2 | |
Commercial Services & Supplies | | 1.2 | |
See Notes to Financial Statements.
| | |
| THE TARGET PORTFOLIO TRUST | | 49 |
| | |
Large Capitalization Value Portfolio (continued) | | Portfolio of Investments
As of October 31, 2008 |
| | | |
Hotels, Restaurants & Leisure | | 1.1 | % |
Healthcare Providers & Services | | 1.0 | |
Consumer Products & Services | | 1.0 | |
Beverages | | 0.9 | |
Office Electronics | | 0.8 | |
Food Products | | 0.8 | |
Multi-Utilities & Unregulated Power | | 0.7 | |
Road & Rail | | 0.6 | |
Auto Components | | 0.6 | |
Retail & Merchandising | | 0.6 | |
Biotechnology | | 0.5 | |
Exchange Traded Fund | | 0.5 | |
Railroads & Equipment | | 0.5 | |
Paper & Forest Products | | 0.5 | |
Household Durables | | 0.4 | |
Air Freight & Couriers | | 0.4 | |
Automobiles | | 0.4 | |
Food | | 0.3 | |
Food & Staples Retailing | | 0.3 | |
Semiconductors & Semiconductor Equipment | | 0.3 | |
Utilities | | 0.3 | |
Consumer Finance | | 0.3 | |
Internet Software & Services | | 0.3 | |
Communications Equipment | | 0.3 | |
Multiline Retail | | 0.2 | |
Education | | 0.2 | |
Healthcare Products | | 0.2 | |
Healthcare Equipment & Supplies | | 0.2 | |
Automotive Parts | | 0.2 | |
Financial Services | | 0.2 | |
Textiles, Apparel & Luxury Goods | | 0.2 | |
Agriculture | | 0.2 | |
Diversified Machinery | | 0.2 | |
Clothing & Apparel | | 0.2 | |
Industrial Machinery | | 0.1 | |
Business Services | | 0.1 | |
Biotechnology Healthcare | | 0.1 | |
Transportation | | 0.1 | |
Industrial Products | | 0.1 | |
Diversified | | 0.1 | |
Home Builder | | 0.1 | |
Gas & Pipeline Utilities | | 0.1 | |
Healthcare Services | | 0.1 | |
Manufacturing | | 0.1 | |
Electric—Integrated | | 0.1 | |
| | | |
| | 105.4 | |
Liabilities in excess of other assets | | (5.4 | ) |
| | | |
| | 100.0 | % |
| | | |
See Notes to Financial Statements.
| | |
| 50 | | THE TARGET PORTFOLIO TRUST |
| | |
Portfolio of Investments
As of October 31, 2008 | | Small Capitalization Growth Portfolio |
| | | | | |
| SHARES | | DESCRIPTION | | VALUE (NOTE 1) |
| | | | | |
| | LONG-TERM INVESTMENTS—98.3% | | | |
| | |
| | COMMON STOCKS | | | |
| | |
| | Aerospace & Defense—1.7% | | | |
| 19,000 | | Esterline Technologies Corp.* | | $ | 684,950 |
| 29,600 | | Orbital Sciences Corp.* | | | 606,504 |
| | | | | |
| | | | | 1,291,454 |
| | | | | |
| | |
| | Biotechnology—0.8% | | | |
| 19,800 | | Martek Biosciences Corp.*(a) | | | 590,634 |
| | | | | |
| | |
| | Building Materials—0.5% | | | |
| 11,730 | | Texas Industries, Inc.(a) | | | 371,020 |
| | | | | |
| | |
| | Chemicals—1.6% | | | |
| 28,345 | | Intrepid Potash, Inc.*(a) | | | 616,220 |
| 14,200 | | Quaker Chemical Corp. | | | 271,646 |
| 16,660 | | Terra Industries, Inc. | | | 366,354 |
| | | | | |
| | | | | 1,254,220 |
| | | | | |
| | |
| | Clothing & Apparel—1.7% | | | |
| 20,300 | | Gymboree Corp.* | | | 524,958 |
| 23,920 | | True Religion Apparel, Inc.(a) | | | 400,660 |
| 13,455 | | Warnaco Group, Inc. (The)*(a) | | | 401,094 |
| | | | | |
| | | | | 1,326,712 |
| | | | | |
| | |
| | Commercial Services—6.2% | | | |
| 24,800 | | Corrections Corp. of America* | | | 473,928 |
| 39,735 | | GEO Group, Inc. (The)*(a) | | | 701,720 |
| 20,800 | | MAXIMUS, Inc. | | | 664,352 |
| 28,775 | | Monster Worldwide, Inc.*(a) | | | 409,756 |
| 25,400 | | PAREXEL International Corp. | | | 264,160 |
| 19,870 | | School Specialty, Inc.*(a) | | | 417,270 |
| 22,365 | | Team, Inc.*(a) | | | 621,076 |
| 9,500 | | VistaPrint Ltd. (Bermuda)(a) | | | 162,165 |
| 31,880 | | Waste Connections, Inc.*(a) | | | 1,079,138 |
| | | | | |
| | | | | 4,793,565 |
| | | | | |
| | |
| | Computer Hardware—0.7% | | | |
| 35,510 | | Sykes Enterprises, Inc.* | | | 566,740 |
| | | | | |
| | |
| | Computer Networking—0.6% | | | |
| 23,926 | | Atheros Communications | | | 429,950 |
| | | | | |
| | |
| | Computer Services & Software—7.7% | | | |
| 30,295 | | ANSYS, Inc.*(a) | | | 867,346 |
| 72,780 | | Compellent Technologies, Inc.*(a) | | | 793,302 |
| 47,800 | | eResearchTechnology, Inc. | | | 308,788 |
See Notes to Financial Statements.
| | |
| THE TARGET PORTFOLIO TRUST | | 51 |
| | |
Small Capitalization Growth Portfolio (continued) | | Portfolio of Investments
As of October 31, 2008 |
| | | | | |
| SHARES | | DESCRIPTION | | VALUE (NOTE 1) |
| | | | | |
| | COMMON STOCKS (continued) | | | |
| | |
| | Computer Services & Software (continued) | | | |
| 40,400 | | JDA Software Group, Inc.* | | $ | 576,912 |
| 15,200 | | Mantech International Corp. (Class A Stock)* | | | 819,888 |
| 61,340 | | Netezza Corp.*(a) | | | 594,998 |
| 21,870 | | Solera Holdings, Inc. | | | 544,344 |
| 20,900 | | SPSS, Inc.* | | | 488,224 |
| 14,277 | | Stanley, Inc. | | | 489,130 |
| 31,800 | | The9 Ltd., ADR (Cayman Islands)(a) | | | 452,196 |
| | | | | |
| | | | | 5,935,128 |
| | | | | |
| | |
| | Distribution/Wholesale—0.4% | | | |
| 9,485 | | MWI Veterinary Supply, Inc.*(a) | | | 328,466 |
| | | | | |
| | |
| | Education—2.3% | | | |
| 18,165 | | American Public Education, Inc.*(a) | | | 804,164 |
| 14,495 | | Blackboard, Inc.* | | | 354,838 |
| 12,400 | | Capella Education Co.*(a) | | | 587,760 |
| | | | | |
| | | | | 1,746,762 |
| | | | | |
| | |
| | Electrical Equipment—1.5% | | | |
| 40,120 | | Advanced Energy Industries, Inc.* | | | 428,080 |
| 12,700 | | Canadian Solar, Inc. (China)(a) | | | 122,936 |
| 66,300 | | Ultralife Corp.(a) | | | 576,147 |
| | | | | |
| | | | | 1,127,163 |
| | | | | |
| | |
| | Electronic Components—6.6% | | | |
| 9,800 | | Axsys Technologies, Inc.*(a) | | | 647,094 |
| 44,845 | | Coherent, Inc.*(a) | | | 1,134,578 |
| 13,675 | | Dolby Laboratories, Inc. (Class A Stock)*(a) | | | 431,720 |
| 19,280 | | Eagle Test Systems, Inc.* | | | 291,899 |
| 10,986 | | Energy Conversion Devices, Inc.(a) | | | 375,062 |
| 18,900 | | II-VI, Inc. | | | 530,901 |
| 24,200 | | OYO Geospace Corp.* | | | 693,814 |
| 45,100 | | Universal Electronics, Inc.* | | | 952,963 |
| | | | | |
| | | | | 5,058,031 |
| | | | | |
| | |
| | Energy Equipment & Services—1.5% | | | |
| 22,580 | | Lufkin Industries, Inc.(a) | | | 1,181,386 |
| | | | | |
| | |
| | Entertainment & Leisure—5.7% | | | |
| 59,515 | | Bally Technologies, Inc.*(a) | | | 1,318,257 |
| 61,545 | | Lions Gate Entertainment Corp. (Canada)* | | | 430,815 |
| 37,995 | | Macrovision Solutions Corp.* | | | 420,985 |
| 10,020 | | Penn National Gaming, Inc.* | | | 192,985 |
| 99,800 | | Shuffle Master, Inc.* | | | 385,228 |
| 9,700 | | Vail Resorts, Inc.*(a) | | | 322,622 |
| 51,050 | | WMS Industries, Inc.*(a) | | | 1,276,250 |
| | | | | |
| | | | | 4,347,142 |
| | | | | |
See Notes to Financial Statements.
| | |
| 52 | | THE TARGET PORTFOLIO TRUST |
| | | | | |
| SHARES | | DESCRIPTION | | VALUE (NOTE 1) |
| | | | | |
| | COMMON STOCKS (continued) | | | |
| | |
| | Environmental Services—0.8% | | | |
| 8,960 | | Clean Harbors, Inc.* | | $ | 587,507 |
| | | | | |
| | |
| | Financial Services—2.9% | | | |
| 34,035 | | FCStone Group, Inc.*(a) | | | 202,508 |
| 28,895 | | First Commonwealth Financial Corp. | | | 318,712 |
| 18,480 | | Investment Technology Group, Inc.*(a) | | | 377,177 |
| 38,753 | | Knight Capital Group, Inc. (Class A Stock)* | | | 560,369 |
| 15,465 | | SVB Financial Group*(a) | | | 795,674 |
| | | | | |
| | | | | 2,254,440 |
| | | | | |
| | |
| | Healthcare Providers & Services—0.9% | | | |
| 25,560 | | Gentiva Health Services, Inc.* | | | 693,954 |
| | | | | |
| | |
| | Healthcare Services—10.4% | | | |
| 12,987 | | Almost Family, Inc.*(a) | | | 625,454 |
| 14,515 | | Amedisys, Inc.*(a) | | | 818,791 |
| 53,555 | | Animal Health International, Inc.* | | | 345,430 |
| 25,740 | | Brookdale Senior Living, Inc.(a) | | | 221,879 |
| 59,600 | | Centene Corp.*(a) | | | 1,122,864 |
| 21,315 | | Emergency Medical Services Corp.*(a) | | | 700,411 |
| 27,990 | | HMS Holdings Corp.* | | | 693,312 |
| 52,800 | | ICON PLC, ADR (Ireland)* | | | 1,339,536 |
| 16,334 | | LHC Group, Inc.* | | | 576,264 |
| 7,395 | | Lincare Holdings, Inc.* | | | 194,858 |
| 21,400 | | Psychiatric Solutions, Inc.*(a) | | | 712,406 |
| 54,400 | | Sun Healthcare Group, Inc.* | | | 624,512 |
| | | | | |
| | | | | 7,975,717 |
| | | | | |
| | |
| | Industrial Products—1.0% | | | |
| 26,195 | | CIRCOR International, Inc. | | | 802,877 |
| | | | | |
| | |
| | Insurance—0.6% | | | |
| 22,445 | | Tower Group, Inc.(a) | | | 472,018 |
| | | | | |
| | |
| | Internet Services—4.4% | | | |
| 35,300 | | Internet Capital Group, Inc.* | | | 201,916 |
| 34,600 | | NetFlix, Inc.*(a) | | | 856,696 |
| 10,300 | | Perfect World Co. Ltd., ADR (China)(a) | | | 191,889 |
| 105,200 | | Sapient Corp. | | | 577,548 |
| 27,000 | | Shanda Interactive Entertainment Ltd., ADR (China)* | | | 746,550 |
| 4,600 | | Sohu.com, Inc. (China)*(a) | | | 252,724 |
| 113,490 | | TIBCO Software, Inc.*(a) | | | 584,473 |
| | | | | |
| | | | | 3,411,796 |
| | | | | |
| | |
| | Machinery & Equipment—2.5% | | | |
| 16,325 | | Bucyrus International, Inc. (Class A Stock) | | | 393,922 |
| 22,970 | | Chart Industries, Inc. | | | 312,852 |
| 21,090 | | DXP Enterprises, Inc. | | | 294,416 |
| 15,000 | | Gardner Denver, Inc.* | | | 384,300 |
| 18,500 | | Rofin-Sinar Technologies, Inc.* | | | 412,365 |
See Notes to Financial Statements.
| | |
| THE TARGET PORTFOLIO TRUST | | 53 |
| | |
Small Capitalization Growth Portfolio (continued) | | Portfolio of Investments
As of October 31, 2008 |
| | | | | |
| SHARES | | DESCRIPTION | | VALUE (NOTE 1) |
| | | | | |
| | COMMON STOCKS (continued) | | | |
| | |
| | Machinery & Equipment (continued) | | | |
| 11,855 | | Sauer-Danfoss, Inc.(a) | | $ | 121,514 |
| | | | | |
| | | | | 1,919,369 |
| | | | | |
| | |
| | Manufacturing—1.7% | | | |
| 13,540 | | Ameron International Corp. | | | 636,380 |
| 31,900 | | Barnes Group, Inc.(a) | | | 462,869 |
| 23,795 | | Polypore International, Inc.*(a) | | | 202,971 |
| | | | | |
| | | | | 1,302,220 |
| | | | | |
| | |
| | Media—0.9% | | | |
| 88,225 | | Entravision Communications Corp. (Class A Stock)* | | | 166,745 |
| 13,145 | | Factset Research Systems, Inc.(a) | | | 509,895 |
| | | | | |
| | | | | 676,640 |
| | | | | |
| | |
| | Medical Supplies & Equipment—10.3% | | | |
| 79,675 | | American Medical Systems Holdings, Inc.*(a) | | | 862,083 |
| 28,500 | | American Oriental Bioengineering, Inc. (China) | | | 174,135 |
| 45,805 | | Cutera, Inc.* | | | 389,801 |
| 33,190 | | Cynosure, Inc. (Class A Stock) | | | 290,744 |
| 82,960 | | Eclipsys Corp.*(a) | | | 1,231,956 |
| 15,730 | | Hansen Medical, Inc.*(a) | | | 146,446 |
| 15,145 | | Mentor Corp.(a) | | | 255,951 |
| 7,100 | | Mindray Medical International Ltd., ADR (China)(a) | | | 153,076 |
| 6,335 | | Myriad Genetics, Inc.*(a) | | | 399,675 |
| 29,640 | | Quality Systems, Inc.(a) | | | 1,140,844 |
| 5,395 | | ResMed, Inc.* | | | 184,833 |
| 17,865 | | SurModics, Inc.*(a) | | | 473,422 |
| 59,315 | | Thoratec Corp.*(a) | | | 1,460,335 |
| 19,330 | | Vital Images, Inc.* | | | 252,257 |
| 21,700 | | Zoll Medical Corp. | | | 522,536 |
| | | | | |
| | | | | 7,938,094 |
| | | | | |
| | |
| | Metals & Mining—1.9% | | | |
| 17,235 | | Northwest Pipe Co.*(a) | | | 495,161 |
| 20,130 | | RBC Bearings, Inc.*(a) | | | 477,685 |
| 39,400 | | Worthington Industries, Inc.(a) | | | 475,558 |
| | | | | |
| | | | | 1,448,404 |
| | | | | |
| | |
| | Oil, Gas & Consumable Fuels—3.4% | | | |
| 13,200 | | Carrizo Oil & Gas, Inc.(a) | | | 308,748 |
| 6,400 | | Core Laboratories NV (Netherlands)(a) | | | 471,680 |
| 16,600 | | Dawson Geophysical Co. | | | 407,198 |
| 13,985 | | McMoRan Exploration Co.* | | | 198,447 |
| 14,400 | | Natco Group, Inc. (Class A Stock)(a) | | | 304,416 |
| 41,000 | | Parallel Petroleum Corp.(a) | | | 164,410 |
| 23,320 | | Petroleum Development Corp.* | | | 482,957 |
See Notes to Financial Statements.
| | |
| 54 | | THE TARGET PORTFOLIO TRUST |
| | | | | |
| SHARES | | DESCRIPTION | | VALUE (NOTE 1) |
| | | | | |
| | COMMON STOCKS (continued) | | | |
| | |
| | Oil, Gas & Consumable Fuels (continued) | | | |
| 10,500 | | T-3 Energy Services, Inc. | | $ | 253,155 |
| | | | | |
| | | | | 2,591,011 |
| | | | | |
| | |
| | Pharmaceuticals—3.7% | | | |
| 11,765 | | BioMarin Pharmaceutical, Inc.*(a) | | | 215,535 |
| 47,254 | | Cubist Pharmaceuticals, Inc.* | | | 1,199,779 |
| 15,000 | | Kendle International, Inc. | | | 271,050 |
| 29,810 | | Pharmerica Corp.*(a) | | | 611,999 |
| 6,300 | | United Therapeutics Corp.*(a) | | | 549,549 |
| | | | | |
| | | | | 2,847,912 |
| | | | | |
| | |
| | Restaurants—0.7% | | | |
| 40,915 | | BJ’s Restaurants, Inc.*(a) | | | 363,735 |
| 13,345 | | Carrols Restaurant Group, Inc.* | | | 27,090 |
| 10,020 | | Red Robin Gourmet Burgers, Inc.*(a) | | | 152,204 |
| | | | | |
| | | | | 543,029 |
| | | | | |
| | |
| | Retail—3.2% | | | |
| 21,590 | | Cash America International, Inc. | | | 763,639 |
| 45,400 | | Genesco, Inc.*(a) | | | 1,126,374 |
| 25,765 | | Pantry, Inc. (The)* | | | 567,345 |
| | | | | |
| | | | | 2,457,358 |
| | | | | |
| | |
| | Retail & Merchandising—3.9% | | | |
| 26,600 | | Aeropostale, Inc.*(a) | | | 643,986 |
| 21,425 | | Big Lots, Inc.*(a) | | | 523,413 |
| 17,940 | | Children’s Place Retail Stores, Inc. (The)*(a) | | | 599,734 |
| 6,400 | | Deckers Outdoor Corp.*(a) | | | 543,104 |
| 33,557 | | Ezcorp, Inc. (Class A Stock) | | | 531,543 |
| 9,410 | | Ritchie Bros Auctioneers, Inc. (Canada) | | | 174,744 |
| | | | | |
| | | | | 3,016,524 |
| | | | | |
| | |
| | Semiconductors—1.4% | | | |
| 28,500 | | Microsemi Corp.*(a) | | | 619,590 |
| 19,945 | | Netlogic Microsystems, Inc.(a) | | | 421,238 |
| | | | | |
| | | | | 1,040,828 |
| | | | | |
| | |
| | Telecommunications—3.5% | | | |
| 15,300 | | Comtech Telecommunications Corp.*(a) | | | 740,826 |
| 52,105 | | EMS Technologies, Inc.*(a) | | | 1,088,994 |
| 61,200 | | Infinera Corp.(a) | | | 476,136 |
| 21,000 | | Sierra Wireless, Inc. (Canada)(a) | | | 183,750 |
| 18,795 | | Switch & Data Facilities Co., Inc.*(a) | | | 177,049 |
| | | | | |
| | | | | 2,666,755 |
| | | | | |
| | |
| | Transportation—0.7% | | | |
| 16,680 | | HUB Group, Inc. (Class A Stock) | | | 524,586 |
| | | | | |
| | TOTAL LONG-TERM INVESTMENTS
(cost $101,765,347) | | | 75,519,412 |
| | | | | |
See Notes to Financial Statements.
| | |
| THE TARGET PORTFOLIO TRUST | | 55 |
| | |
Small Capitalization Growth Portfolio (continued) | | Portfolio of Investments
As of October 31, 2008 |
| | | | | | |
| SHARES | | DESCRIPTION | | VALUE (NOTE 1) | |
| | | | | | |
| | SHORT-TERM INVESTMENT—36.8% | | | | |
| | |
| | AFFILIATED MONEY MARKET MUTUAL FUND | | | | |
| 28,274,130 | | Dryden Core Investment Fund—Taxable Money Market Series
(cost $28,274,130; includes $26,163,283 of cash collateral for securities on loan)(b)(w) | | $ | 28,274,130 | |
| | | | | | |
| | TOTAL INVESTMENTS—135.1%
(cost $130,039,477; Note 5) | | | 103,793,542 | |
| | Liabilities in excess of other assets—(35.1%) | | | (26,951,393 | ) |
| | | | | | |
| | NET ASSETS—100% | | $ | 76,842,149 | |
| | | | | | |
The following abbreviation is used in Portfolio descriptions:
ADR—American Depositary Receipt
| * | Non-income producing security. |
| (a) | All or a portion of security is on loan. The aggregate market value of such securities is $25,930,584; cash collateral of $26,163,283 (included with liabilities) was received with which the Portfolio purchased highly liquid short-term investments. |
| (b) | Represents security, or a portion thereof, purchased with cash collateral received for securities on loan. |
| (w) | Prudential Investments LLC, the manager of the Portfolio also serves as manager of the Dryden Core Investment Fund-Taxable Money Market Series. |
The industry classification of investments and liabilities in excess of other assets shown as a percentage of net assets as of October 31, 2008 were as follows:
| | | |
Affiliated Money Market Mutual Fund (34.0% represents investments purchased with collateral from securities on loan) | | 36.8 | % |
Healthcare Services | | 10.4 | |
Medical Supplies & Equipment | | 10.3 | |
Computer Services & Software | | 7.7 | |
Electronic Components | | 6.6 | |
Commercial Services | | 6.2 | |
Entertainment & Leisure | | 5.7 | |
Internet Services | | 4.4 | |
Retail & Merchandising | | 3.9 | |
Pharmaceuticals | | 3.7 | |
Telecommunications | | 3.5 | |
Oil, Gas & Consumable Fuels | | 3.4 | |
Retail | | 3.2 | |
Financial Services | | 2.9 | |
Machinery & Equipment | | 2.5 | |
Education | | 2.3 | |
Metals & Mining | | 1.9 | |
Clothing & Apparel | | 1.7 | |
Manufacturing | | 1.7 | |
Aerospace & Defense | | 1.7 | |
Chemicals | | 1.6 | |
Energy Equipment & Services | | 1.5 | |
See Notes to Financial Statements.
| | |
| 56 | | THE TARGET PORTFOLIO TRUST |
| | | |
Electrical Equipment | | 1.5 | % |
Semiconductors | | 1.4 | |
Industrial Products | | 1.0 | |
Healthcare Providers & Services | | 0.9 | |
Media | | 0.9 | |
Biotechnology | | 0.8 | |
Environmental Services | | 0.8 | |
Computer Hardware | | 0.7 | |
Restaurants | | 0.7 | |
Transportation | | 0.7 | |
Insurance | | 0.6 | |
Computer Networking | | 0.6 | |
Building Materials | | 0.5 | |
Distribution/Wholesale | | 0.4 | |
| | | |
| | 135.1 | |
Liabilities in excess of other assets | | (35.1 | ) |
| | | |
| | 100.0 | % |
| | | |
See Notes to Financial Statements.
| | |
| THE TARGET PORTFOLIO TRUST | | 57 |
| | |
Small Capitalization Value Portfolio | | Portfolio of Investments
As of October 31, 2008 |
| | | | | |
| SHARES | | DESCRIPTION | | VALUE (NOTE 1) |
| | | | | |
| | LONG-TERM INVESTMENTS—91.6% | | | |
| | |
| | COMMON STOCKS | | | |
| | |
| | Aerospace/Defense—2.1% | | | |
| 72,300 | | AAR Corp.(a) | | $ | 1,156,077 |
| 9,100 | | Alliant Techsystems, Inc.*(a) | | | 751,114 |
| 102,882 | | BE Aerospace, Inc.* | | | 1,324,091 |
| 22,500 | | Curtiss-Wright Corp.(a) | | | 830,250 |
| 2,400 | | Esterline Technologies Corp.*(a) | | | 86,520 |
| 58,800 | | Moog, Inc. (Class A Stock)* | | | 2,065,056 |
| 31,300 | | Teledyne Technologies, Inc.* | | | 1,426,341 |
| 20,086 | | Triumph Group, Inc.(a) | | | 880,972 |
| | | | | |
| | | | | 8,520,421 |
| | | | | |
| | |
| | Airlines—0.5% | | | |
| 12,600 | | Republic Airways Holdings, Inc.*(a) | | | 188,370 |
| 120,400 | | SkyWest, Inc. | | | 1,855,364 |
| | | | | |
| | | | | 2,043,734 |
| | | | | |
| | |
| | Apparel/Shoes—0.1% | | | |
| 17,525 | | Hanesbrands, Inc.* | | | 306,162 |
| | | | | |
| | |
| | Auto Related—0.1% | | | |
| 1,800 | | American Axle & Manufacturing Holdings, Inc. | | | 6,462 |
| 75,577 | | Cooper Tire & Rubber Co. | | | 576,653 |
| 3,000 | | Tenneco, Inc.*(a) | | | 14,730 |
| | | | | |
| | | | | 597,845 |
| | | | | |
| | |
| | Automobile Manufacturers—0.5% | | | |
| 1,500 | | Commercial Vehicle Group, Inc.* | | | 1,995 |
| 117,463 | | Oshkosh Corp. | | | 899,767 |
| 60,000 | | Thor Industries, Inc.(a) | | | 1,074,000 |
| | | | | |
| | | | | 1,975,762 |
| | | | | |
| | |
| | Automotive Components | | | |
| 13,200 | | Lear Corp.* | | | 26,532 |
| | | | | |
| | |
| | Automotive Parts—0.2% | | | |
| 42,025 | | ATC Technology Corp.*(a) | | | 921,608 |
| | | | | |
| | |
| | Banks—4.6% | | | |
| 1,490 | | 1st Source Corp. | | | 31,975 |
| 2,400 | | Ameris Bancorp. | | | 26,496 |
| 900 | | BancFirst Corp. | | | 45,360 |
| 101,699 | | BancorpSouth, Inc.(a) | | | 2,468,235 |
| 68,471 | | Bank Mutual Corp. | | | 789,471 |
| 500 | | Banner Corp. | | | 6,385 |
| 86,280 | | Cardinal Financial Corp. | | | 538,387 |
See Notes to Financial Statements.
| | |
| 58 | | THE TARGET PORTFOLIO TRUST |
| | | | | |
| SHARES | | DESCRIPTION | | VALUE (NOTE 1) |
| | | | | |
| | COMMON STOCKS (continued) | | | |
| | |
| | Banks (continued) | | | |
| 2,200 | | Cathay General Bancorp | | $ | 53,856 |
| 5,300 | | Central Pacific Financial Corp.(a) | | | 82,680 |
| 2,700 | | Chemical Financial Corp.(a) | | | 70,929 |
| 4,600 | | City Holding Co.(a) | | | 192,464 |
| 16,200 | | Colonial BancGroup, Inc. (The)(a) | | | 65,772 |
| 2,900 | | Columbia Banking System, Inc. | | | 46,168 |
| 2,800 | | Community Bank System, Inc.(a) | | | 69,860 |
| 4,600 | | Community Trust Bancorp, Inc.(a) | | | 153,548 |
| 44,725 | | Cullen/Frost Bankers, Inc. | | | 2,503,258 |
| 4,800 | | Dime Community Bancshares | | | 80,160 |
| 96,600 | | East West Bancorp, Inc.(a) | | | 1,676,010 |
| 9,900 | | First Bancorp (Puerto Rico)(a) | | | 101,178 |
| 82,251 | | First Financial Bancorp(a) | | | 1,106,276 |
| 1,400 | | First Financial Holdings, Inc.(a) | | | 30,380 |
| 13,700 | | First Niagara Financial Group, Inc. | | | 216,049 |
| 500 | | First Place Financial Corp. (OH) | | | 3,435 |
| 1,200 | | FirstFed Financial Corp.*(a) | | | 10,740 |
| 43,338 | | FirstMerit Corp.(a) | | | 1,010,642 |
| 10,790 | | Hancock Holding Co.(a) | | | 476,486 |
| 17,400 | | Hanmi Financial Corp. | | | 69,600 |
| 4,250 | | IBERIABANK Corp.(a) | | | 216,495 |
| 4,900 | | Independent Bank Corp. | | | 140,973 |
| 1,600 | | Lakeland Financial Corp. | | | 35,920 |
| 3,280 | | MainSource Financial Group, Inc. | | | 58,581 |
| 4,100 | | Nara Bancorp, Inc. | | | 45,100 |
| 400 | | Old Second Bancorp, Inc. | | | 5,400 |
| 3,300 | | Oriental Financial Group, Inc. (Puerto Rico) | | | 53,592 |
| 1,700 | | Peoples Bancorp, Inc. | | | 32,555 |
| 27,450 | | Prosperity Bancshares, Inc. | | | 911,615 |
| 5,400 | | Provident Bankshares Corp.(a) | | | 57,618 |
| 1,351 | | Republic Bancorp, Inc. (KY) (Class A Stock) | | | 31,100 |
| 415 | | SCBT Financial Corp. | | | 14,064 |
| 1,700 | | Sierra Bancorp | | | 33,932 |
| 53,861 | | Signature Bank (NY)*(a) | | | 1,754,791 |
| 1,100 | | Simmons First National Corp. (Class A Stock) | | | 34,122 |
| 2,600 | | Southside Bancshares, Inc.(a) | | | 62,634 |
| 4,800 | | Southwest Bancorp, Inc. | | | 69,504 |
| 9,750 | | Sterling Bancshares, Inc. | | | 77,610 |
| 70,250 | | Sterling Financial Corp.(a) | | | 596,423 |
| 50,000 | | Susquehanna Bancshares, Inc. | | | 774,500 |
| 1,700 | | Trico Bancshares | | | 36,618 |
| 5,783 | | Umpqua Holdings Corp.(a) | | | 98,427 |
| 32,285 | | United Bankshares, Inc.(a) | | | 1,029,891 |
| 4,100 | | West Coast Bancorp | | | 35,752 |
| 1,000 | | WSFS Financial Corp.(a) | | | 47,870 |
| | | | | |
| | | | | 18,180,887 |
| | | | | |
| | |
| | Beverages—0.3% | | | |
| 54,700 | | PepsiAmericas, Inc. | | | 1,035,471 |
| | | | | |
See Notes to Financial Statements.
| | |
| THE TARGET PORTFOLIO TRUST | | 59 |
| | |
Small Capitalization Value Portfolio (continued) | | Portfolio of Investments
As of October 31, 2008 |
| | | | | |
| SHARES | | DESCRIPTION | | VALUE (NOTE 1) |
| | | | | |
| | COMMON STOCKS (continued) | | | |
| | |
| | Biotechnology—0.1% | | | |
| 500 | | Alexion Pharmaceuticals, Inc.* | | $ | 20,375 |
| 2,100 | | Bio-Rad Laboratories, Inc. (Class A Stock)*(a) | | | 179,298 |
| 2,900 | | Celera Corp.* | | | 32,799 |
| 4,625 | | Protalix BioTherapeutics, Inc. (Israel)* | | | 7,863 |
| | | | | |
| | | | | 240,335 |
| | | | | |
| | |
| | Broadcasting | | | |
| 7,300 | | Cox Radio, Inc. (Class A Stock)*(a) | | | 39,785 |
| 2,200 | | DG Fastchannel, Inc.* | | | 38,962 |
| 4,800 | | Entercom Communications Corp. (Class A Stock) | | | 3,216 |
| | | | | |
| | | | | 81,963 |
| | | | | |
| | |
| | Building & Construction—0.2% | | | |
| 58,700 | | Chicago Bridge & Iron Co. NV (Netherlands) | | | 727,293 |
| | | | | |
| | |
| | Building Materials | | | |
| 10,300 | | Comfort Systems USA, Inc.(a) | | | 96,099 |
| 1,500 | | Perini Corp.* | | | 28,530 |
| | | | | |
| | | | | 124,629 |
| | | | | |
| | |
| | Building Products—0.7% | | | |
| 3,600 | | Apogee Enterprises, Inc. | | | 35,496 |
| 50,000 | | Crane Co. | | | 818,500 |
| 60,000 | | Lennox International, Inc. | | | 1,789,200 |
| 3,500 | | NCI Building Systems, Inc.* | | | 65,135 |
| 2,400 | | Universal Forest Products, Inc.(a) | | | 56,760 |
| | | | | |
| | | | | 2,765,091 |
| | | | | |
| | |
| | Business Services—0.6% | | | |
| 85,600 | | 3Com Corp.* | | | 233,688 |
| 2,400 | | COMSYS IT Partners, Inc.* | | | 14,592 |
| 75,850 | | URS Corp.* | | | 2,229,231 |
| | | | | |
| | | | | 2,477,511 |
| | | | | |
| | |
| | Cable Television | | | |
| 1,000 | | Macrovision Solutions Corp.* | | | 11,080 |
| | | | | |
| | |
| | Capital Markets—0.6% | | | |
| 100,200 | | Jefferies Group, Inc. | | | 1,586,166 |
| 48,700 | | Waddell & Reed Financial, Inc. (Class A Stock) | | | 707,124 |
| | | | | |
| | | | | 2,293,290 |
| | | | | |
| | |
| | Chemicals—3.4% | | | |
| 22,475 | | Airgas, Inc. | | | 862,141 |
| 14,346 | | Arch Chemicals, Inc. | | | 406,996 |
| 29,920 | | Cabot Corp. | | | 791,384 |
See Notes to Financial Statements.
| | |
| 60 | | THE TARGET PORTFOLIO TRUST |
| | | | | |
| SHARES | | DESCRIPTION | | VALUE (NOTE 1) |
| | | | | |
| | COMMON STOCKS (continued) | | | |
| | |
| | Chemicals (continued) | | | |
| 15,820 | | Cytec Industries, Inc. | | $ | 448,022 |
| 27,540 | | FMC Corp.(a) | | | 1,199,092 |
| 7,600 | | H.B. Fuller Co.(a) | | | 134,292 |
| 11,300 | | Hercules, Inc. | | | 189,953 |
| 3,100 | | Innospec, Inc. (United Kingdom) | | | 27,125 |
| 35,000 | | Lubrizol Corp. (The)(a) | | | 1,315,300 |
| 90,000 | | Methanex Corp. (Canada) | | | 1,061,100 |
| 700 | | Minerals Technologies, Inc. | | | 39,732 |
| 700 | | NewMarket Corp. | | | 26,383 |
| 23,263 | | Olin Corp. | | | 422,456 |
| 1,100 | | OM Group, Inc.* | | | 23,474 |
| 3,800 | | Rockwood Holdings, Inc.* | | | 46,930 |
| 100,000 | | RPM International, Inc. | | | 1,420,000 |
| 101,900 | | Sensient Technologies Corp. | | | 2,570,937 |
| 4,700 | | Spartech Corp. | | | 29,892 |
| 54,500 | | Terra Industries, Inc. | | | 1,198,455 |
| 56,100 | | Valspar Corp. (The) | | | 1,147,245 |
| 4,000 | | WR Grace & Co.* | | | 36,040 |
| | | | | |
| | | | | 13,396,949 |
| | | | | |
| | |
| | Clothing & Apparel—0.2% | | | |
| 2,400 | | Cato Corp. (The) (Class A Stock) | | | 37,248 |
| 30,461 | | G & K Services, Inc. (Class A Stock) | | | 688,114 |
| 4,600 | | Gymboree Corp.* | | | 118,956 |
| 5,200 | | Maidenform Brands, Inc.*(a) | | | 57,096 |
| | | | | |
| | | | | 901,414 |
| | | | | |
| | |
| | Commercial Banks—0.7% | | | |
| 1,749 | | Amcore Financial, Inc. | | | 8,133 |
| 97,781 | | First Horizon National Corp.(a) | | | 1,164,572 |
| 4,900 | | Fulton Financial Corp.(a) | | | 51,450 |
| 12,200 | | International Bancshares Corp.(a) | | | 316,834 |
| 8,100 | | UCBH Holdings, Inc.(a) | | | 42,768 |
| 29,541 | | Zions Bancorp | | | 1,125,807 |
| | | | | |
| | | | | 2,709,564 |
| | | | | |
| | |
| | Commercial Services—1.4% | | | |
| 2,800 | | Consolidated Graphics, Inc.* | | | 36,428 |
| 500 | | CRA International, Inc.* | | | 13,530 |
| 700 | | Electro Rent Corp. | | | 8,393 |
| 5,700 | | Gartner, Inc.*(a) | | | 104,880 |
| 2,800 | | GEO Group, Inc. (The)*(a) | | | 49,448 |
| 49,900 | | Healthspring, Inc.* | | | 824,348 |
| 400 | | MAXIMUS, Inc. | | | 12,776 |
| 95,500 | | Pharmaceutical Product Development, Inc.(a) | | | 2,958,590 |
| 9,700 | | Spherion Corp.* | | | 30,846 |
| 15,700 | | Stewart Enterprises, Inc. (Class A Stock) | | | 81,169 |
| 8,000 | | Team, Inc.*(a) | | | 222,160 |
See Notes to Financial Statements.
| | |
| THE TARGET PORTFOLIO TRUST | | 61 |
| | |
Small Capitalization Value Portfolio (continued) | | Portfolio of Investments
As of October 31, 2008 |
| | | | | |
| SHARES | | DESCRIPTION | | VALUE (NOTE 1) |
| | | | | |
| | COMMON STOCKS (continued) | | | |
| | |
| | Commercial Services (continued) | | | |
| 3,000 | | Viad Corp.(a) | | $ | 65,550 |
| 35,137 | | Waste Connections, Inc.*(a) | | | 1,189,387 |
| | | | | |
| | | | | 5,597,505 |
| | | | | |
| | |
| | Commercial Services & Supplies—1.5% | | | |
| 58,057 | | Avis Budget Group, Inc.* | | | 95,214 |
| 9,400 | | Ennis, Inc.(a) | | | 110,638 |
| 33,975 | | Healthcare Services Group, Inc. | | | 562,626 |
| 30,700 | | Heidrick & Struggles International, Inc.(a) | | | 740,791 |
| 17,700 | | Kelly Services, Inc. (Class A Stock)(a) | | | 252,048 |
| 100,000 | | Schawk, Inc. | | | 1,313,000 |
| 77,449 | | School Specialty, Inc.*(a) | | | 1,626,429 |
| 1,300 | | Valassis Communications, Inc.* | | | 5,772 |
| 26,575 | | Watson Wyatt Worldwide, Inc. (Class A Stock)(a) | | | 1,128,640 |
| | | | | |
| | | | | 5,835,158 |
| | | | | |
| | |
| | Communication Equipment | | | |
| 4,100 | | Tekelec* | | | 52,029 |
| | | | | |
| | |
| | Computer Hardware—1.0% | | | |
| 11,400 | | Aspen Technology, Inc.* | | | 89,262 |
| 39,963 | | CACI International, Inc. (Class A Stock)* | | | 1,645,676 |
| 7,300 | | CIBER, Inc.* | | | 39,420 |
| 5,300 | | Electronics for Imaging, Inc.* | | | 56,180 |
| 73,000 | | Imation Corp.(a) | | | 899,360 |
| 1,000 | | Palm, Inc.*(a) | | | 3,990 |
| 2,800 | | PC Connection, Inc.* | | | 16,912 |
| 77,413 | | Perot Systems Corp. (Class A Stock)*(a) | | | 1,113,973 |
| 24,100 | | Quantum Corp.* | | | 6,989 |
| 3,100 | | Silcon Storage Technology, Inc.* | | | 9,765 |
| 2,800 | | Sykes Enterprises, Inc.* | | | 44,688 |
| | | | | |
| | | | | 3,926,215 |
| | | | | |
| | |
| | Computer Services & Software—3.1% | | | |
| 48,021 | | Avocent Corp.* | | | 721,275 |
| 34,174 | | Diebold, Inc. | | | 1,015,651 |
| 2,100 | | Digi International, Inc.* | | | 21,504 |
| 69,400 | | Global Payments, Inc. | | | 2,811,394 |
| 1,500 | | infoGROUP, Inc. | | | 6,690 |
| 2,400 | | JDA Software Group, Inc.* | | | 34,272 |
| 1,100 | | Mantech International Corp. (Class A Stock)* | | | 59,334 |
| 22,350 | | MICROS Systems, Inc.* | | | 380,621 |
| 78,969 | | Parametric Technology Corp.*(a) | | | 1,025,807 |
| 1,100 | | PC Mall, Inc.* | | | 4,928 |
| 2,300 | | Progress Software Corp.* | | | 52,762 |
| 2,300 | | Quest Software, Inc.* | | | 30,475 |
See Notes to Financial Statements.
| | |
| 62 | | THE TARGET PORTFOLIO TRUST |
| | | | | |
| SHARES | | DESCRIPTION | | VALUE (NOTE 1) |
| | | | | |
| | COMMON STOCKS (continued) | | | |
| | |
| | Computer Services & Software (continued) | | | |
| 2,700 | | Semtech Corp.* | | $ | 32,724 |
| 700 | | SI International, Inc.* | | | 20,160 |
| 400 | | SPSS, Inc.* | | | 9,344 |
| 133,850 | | SRA International, Inc. (Class A Stock)* | | | 2,473,548 |
| 9,300 | | Sutor Technology Group Ltd. (China)* | | | 19,995 |
| 80,472 | | Sybase, Inc.*(a) | | | 2,142,969 |
| 4,600 | | SYNNEX Corp.*(a) | | | 70,978 |
| 37,853 | | Synopsys, Inc.* | | | 691,953 |
| 700 | | Virtusa Corp.* | | | 3,857 |
| 103,731 | | Xyratex Ltd. (Bermuda)* | | | 580,894 |
| | | | | |
| | | | | 12,211,135 |
| | | | | |
| | |
| | Computers | | | |
| 6,400 | | Mentor Graphics Corp.* | | | 46,976 |
| | | | | |
| | |
| | Conglomerates | | | |
| 10,400 | | Tomkins PLC, ADR (United Kingdom) | | | 76,544 |
| | | | | |
| | |
| | Construction & Engineering—0.8% | | | |
| 2,700 | | EMCOR Group, Inc.* | | | 47,979 |
| 82,100 | | Granite Construction, Inc. | | | 2,928,507 |
| | | | | |
| | | | | 2,976,486 |
| | | | | |
| | |
| | Consumer Finance—0.1% | | | |
| 104,900 | | Advance America Cash Advance Centers, Inc. | | | 281,132 |
| | | | | |
| | |
| | Consumer Products & Services—1.6% | | | |
| 7,500 | | American Greetings Corp. (Class A Stock) | | | 87,600 |
| 63,708 | | Central Garden & Pet Co.* | | | 215,333 |
| 54,586 | | Central Garden & Pet Co. (Class A Stock)*(a) | | | 173,584 |
| 3,500 | | Compass Diversified Holdings | | | 42,700 |
| 4,800 | | Helen of Troy Ltd. (Bermuda)* | | | 86,352 |
| 593 | | Jarden Corp.* | | | 10,555 |
| 88,850 | | Scotts Miracle-Gro Co. (The) (Class A Stock) | | | 2,320,762 |
| 43,646 | | Snap-on, Inc.(a) | | | 1,612,720 |
| 51,300 | | Toro Co. (The)(a) | | | 1,725,732 |
| | | | | |
| | | | | 6,275,338 |
| | | | | |
| | |
| | Consumer Services—0.2% | | | |
| 20,200 | | Rent-A-Center, Inc.* | | | 294,920 |
| 65,000 | | Sotheby`s(a) | | | 605,150 |
| | | | | |
| | | | | 900,070 |
| | | | | |
| | |
| | Containers & Packaging—1.9% | | | |
| 99,916 | | Bemis Co., Inc.(a) | | | 2,481,913 |
| 2,800 | | Core-Mark Holding Co., Inc.* | | | 55,356 |
| 82,771 | | Pactiv Corp.* | | | 1,950,085 |
| 6,700 | | Rock-Tenn Co. (Class A Stock)(a) | | | 203,747 |
| 57,203 | | Silgan Holdings, Inc.(a) | | | 2,662,228 |
| | | | | |
| | | | | 7,353,329 |
| | | | | |
See Notes to Financial Statements.
| | |
| THE TARGET PORTFOLIO TRUST | | 63 |
| | |
Small Capitalization Value Portfolio (continued) | | Portfolio of Investments
As of October 31, 2008 |
| | | | | |
| SHARES | | DESCRIPTION | | VALUE (NOTE 1) |
| | | | | |
| | COMMON STOCKS (continued) | | | |
| | |
| | Distribution/Wholesale—0.2% | | | |
| 1,300 | | United Stationers, Inc.*(a) | | $ | 48,607 |
| 28,474 | | WESCO International, Inc.* | | | 566,063 |
| | | | | |
| | | | | 614,670 |
| | | | | |
| | |
| | Diversified Financial Services—0.4% | | | |
| 66,618 | | Federated Investors, Inc. (Class B Stock) | | | 1,612,156 |
| 2,300 | | Nelnet, Inc. | | | 33,649 |
| | | | | |
| | | | | 1,645,805 |
| | | | | |
| | |
| | Diversified Financials | | | |
| 2,400 | | Financial Federal Corp.(a) | | | 55,560 |
| 5,200 | | LaBranche & Co., Inc.* | | | 32,396 |
| | | | | |
| | | | | 87,956 |
| | | | | |
| | |
| | Diversified Telecommunication Services—0.3% | | | |
| 68,800 | | Iowa Telecommunications Services, Inc.(a) | | | 1,040,256 |
| | | | | |
| | |
| | Drugs & Healthcare—0.7% | | | |
| 44,270 | | Cooper Cos., Inc. (The)(a) | | | 729,570 |
| 39,000 | | Covance, Inc.*(a) | | | 1,950,000 |
| | | | | |
| | | | | 2,679,570 |
| | | | | |
| | |
| | Electric Utilities—1.6% | | | |
| 71,100 | | Cleco Corp.(a) | | | 1,636,011 |
| 8,100 | | El Paso Electric Co.*(a) | | | 150,012 |
| 18,612 | | Idacorp, Inc. | | | 496,196 |
| 2,700 | | UIL Holdings Corp. | | | 89,100 |
| 9,500 | | Unisource Energy Corp. | | | 262,010 |
| 187,588 | | Westar Energy, Inc. | | | 3,656,090 |
| | | | | |
| | | | | 6,289,419 |
| | | | | |
| | |
| | Electrical Equipment—0.9% | | | |
| 43,100 | | Acuity Brands, Inc.(a) | | | 1,506,776 |
| 58,475 | | Regal-Beloit Corp. | | | 1,903,946 |
| | | | | |
| | | | | 3,410,722 |
| | | | | |
| | |
| | Electronic Components—1.8% | | | |
| 48,100 | | Digital River, Inc.*(a) | | | 1,191,918 |
| 21,520 | | Empire District Electric Co. (The)(a) | | | 413,399 |
| 112,100 | | Jabil Circuit, Inc. | | | 942,761 |
| 10,500 | | Nam Tai Electronics, Inc. (China) | | | 79,800 |
| 81,000 | | Park Electrochemical Corp.(a) | | | 1,751,220 |
| 800 | | Plexus Corp.* | | | 14,928 |
| 110,210 | | Portland General Electric Co. | | | 2,261,509 |
| 76,300 | | Technitrol, Inc.(a) | | | 440,251 |
| | | | | |
| | | | | 7,095,786 |
| | | | | |
See Notes to Financial Statements.
| | |
| 64 | | THE TARGET PORTFOLIO TRUST |
| | | | | |
| SHARES | | DESCRIPTION | | VALUE (NOTE 1) |
| | | | | |
| | COMMON STOCKS (continued) | | | |
| | |
| | Electronics—2.5% | | | |
| 97,267 | | Belden CDT, Inc.(a) | | $ | 2,027,044 |
| 5,450 | | Benchmark Electronics, Inc.*(a) | | | 65,345 |
| 80,600 | | Checkpoint Systems, Inc.*(a) | | | 1,016,366 |
| 38,224 | | Coherent, Inc.*(a) | | | 967,067 |
| 5,800 | | CTS Corp. | | | 40,542 |
| 400 | | Electro Scientific Industries, Inc.* | | | 3,348 |
| 129,100 | | FLIR Systems, Inc.*(a) | | | 4,144,110 |
| 43,686 | | Littelfuse, Inc.* | | | 815,181 |
| 413,600 | | Sanmina-SCI Corp.*(a) | | | 310,200 |
| 10,300 | | TTM Technologies, Inc.* | | | 73,748 |
| 21,113 | | Watts Water Technologies, Inc. (Class A Stock) | | | 558,017 |
| | | | | |
| | | | | 10,020,968 |
| | | | | |
| | |
| | Energy Equipment & Services—0.9% | | | |
| 3,500 | | Complete Production Services, Inc.* | | | 43,365 |
| 72,683 | | Headwaters, Inc.*(a) | | | 770,440 |
| 45,000 | | Holly Corp. | | | 883,350 |
| 40,000 | | Tidewater, Inc.(a) | | | 1,744,400 |
| | | | | |
| | | | | 3,441,555 |
| | | | | |
| | |
| | Engineering/Construction—0.3% | | | |
| 69,900 | | KBR, Inc. | | | 1,037,316 |
| 11,800 | | KHD Humboldt Wedag International Ltd. (Hong Kong)* | | | 201,544 |
| | | | | |
| | | | | 1,238,860 |
| | | | | |
| | |
| | Entertainment & Leisure—0.8% | | | |
| 36,600 | | International Speedway Corp. (Class A Stock) | | | 1,148,874 |
| 70,500 | | Life Time Fitness, Inc.*(a) | | | 1,342,320 |
| 2,300 | | RC2 Corp.* | | | 29,210 |
| 25,315 | | Scientific Games Corp. (Class A Stock)* | | | 455,670 |
| 1,300 | | Steinway Musical Instruments, Inc.* | | | 28,938 |
| | | | | |
| | | | | 3,005,012 |
| | | | | |
| | |
| | Environmental Services—0.4% | | | |
| 160,200 | | Allied Waste Industries, Inc.* | | | 1,669,284 |
| | | | | |
| | |
| | Equipment Services | | | |
| 1,400 | | MedAssets, Inc.* | | | 20,202 |
| | | | | |
| | |
| | Exchange Traded Funds—0.6% | | | |
| 5,870 | | iShares Russell 2000 Index Fund(a) | | | 313,928 |
| 37,225 | | iShares Russell 2000 Value Index Fund | | | 1,962,502 |
| | | | | |
| | | | | 2,276,430 |
| | | | | |
| | |
| | Financial—Bank & Trust—1.4% | | | |
| 3,200 | | Banco Latinoamericano de Exportaciones SA (Panama) | | | 34,016 |
| 30,000 | | Bank of Hawaii Corp.(a) | | | 1,521,300 |
| 25,133 | | Boston Private Financial Holdings, Inc. | | | 222,176 |
| 3,175 | | Citizens Republic Bancorp, Inc.(a) | | | 9,366 |
| 2,900 | | City Bank/Lynnwood (WA)(a) | | | 29,870 |
See Notes to Financial Statements.
| | |
| THE TARGET PORTFOLIO TRUST | | 65 |
| | |
Small Capitalization Value Portfolio (continued) | | Portfolio of Investments
As of October 31, 2008 |
| | | | | |
| SHARES | | DESCRIPTION | | VALUE (NOTE 1) |
| | | | | |
| | COMMON STOCKS (continued) | | | |
| | |
| | Financial—Bank & Trust (continued) | | | |
| 19,109 | | Commerce Bancshares, Inc. | | $ | 903,473 |
| 3,400 | | Conn’s, Inc.*(a) | | | 46,070 |
| 2,000 | | Downey Financial Corp.(a) | | | 3,200 |
| 800 | | First Bancorp | | | 14,000 |
| 1,700 | | First Merchants Corp.(a) | | | 37,417 |
| 2,000 | | Flushing Financial Corp.(a) | | | 31,100 |
| 7,700 | | FNB Corp. | | | 100,870 |
| 600 | | Heartland Financial USA, Inc. | | | 14,250 |
| 400 | | Heritage Commerce Corp. | | | 5,176 |
| 2,800 | | Lakeland Bancorp, Inc. | | | 30,856 |
| 65,231 | | NewAlliance Bancshares, Inc.(a) | | | 900,188 |
| 3,404 | | Prospect Capital Corp.(a) | | | 42,825 |
| 500 | | S&T Bancorp, Inc. | | | 17,050 |
| 158 | | Stellarone Corp. | | | 2,686 |
| 3,700 | | Stifel Financial Corp.* | | | 161,505 |
| 17,884 | | Superior Bancorp*(a) | | | 98,898 |
| 57,443 | | TCF Financial Corp. | | | 1,019,039 |
| 700 | | Union Bankshares Corp. | | | 16,681 |
| 4,533 | | United Community Banks, Inc.(a) | | | 59,473 |
| 1,700 | | Washington Trust Bancorp, Inc. | | | 36,244 |
| 2,900 | | Wilshire Bancorp, Inc. | | | 31,987 |
| | | | | |
| | | | | 5,389,716 |
| | | | | |
| | |
| | Financial—Brokerage | | | |
| 1,400 | | Penson Worldwide, Inc.* | | | 9,996 |
| 1,100 | | West Bancorp, Inc. | | | 13,750 |
| | | | | |
| | | | | 23,746 |
| | | | | |
| | |
| | Financial Services—3.0% | | | |
| 5,450 | | Advanta Corp. (Class B Stock) | | | 24,634 |
| 100 | | Berkshire Hills Bancorp, Inc. | | | 2,603 |
| 700 | | BGC Partners, Inc. (Class A Stock) | | | 2,863 |
| 6,300 | | Brookline Bancorp, Inc. | | | 73,710 |
| 26,944 | | Calamos Asset Management, Inc. (Class A Stock)(a) | | | 221,210 |
| 4,400 | | CompuCredit Corp.*(a) | | | 11,352 |
| 24,900 | | CVB Financial Corp. | | | 315,234 |
| 15,800 | | Deluxe Corp.(a) | | | 192,128 |
| 7,371 | | Dollar Financial Corp.*(a) | | | 85,725 |
| 79,500 | | Eaton Vance Corp. | | | 1,749,000 |
| 2,200 | | Encore Capital Group, Inc.* | | | 20,592 |
| 900 | | Farmers Capital Bank Corp. | | | 17,802 |
| 9,400 | | Federal Agricultural Mortgage Corp. (Class C Stock) | | | 54,520 |
| 54,250 | | First Cash Financial Services, Inc.* | | | 833,822 |
| 1,400 | | First Community Banshares, Inc.(a) | | | 43,820 |
| 400 | | First South Bancorp, Inc. Washington NC | | | 5,620 |
| 8,100 | | Global Cash Access Holdings, Inc.* | | | 22,842 |
See Notes to Financial Statements.
| | |
| 66 | | THE TARGET PORTFOLIO TRUST |
| | | | | |
| SHARES | | DESCRIPTION | | VALUE (NOTE 1) |
| | | | | |
| | COMMON STOCKS (continued) | | | |
| | |
| | Financial Services (continued) | | | |
| 3,200 | | Green Bankshares, Inc.(a) | | $ | 63,200 |
| 1,400 | | Hallmark Financial Services* | | | 9,100 |
| 7,900 | | Hawaiian Holdings, Inc.* | | | 55,300 |
| 6,200 | | Innophos Holdings, Inc. | | | 165,850 |
| 3,300 | | Integra Bank Corp. | | | 19,899 |
| 10,700 | | Knight Capital Group, Inc. (Class A Stock)*(a) | | | 154,722 |
| 900 | | Koppers Holdings, Inc. | | | 21,411 |
| 25,256 | | National Penn Bancshares, Inc. | | | 427,837 |
| 3,800 | | NBT Bancorp, Inc.(a) | | | 105,944 |
| 4,800 | | Ocwen Financial Corp.* | | | 32,160 |
| 7,200 | | Pacer International, Inc. | | | 81,288 |
| 76,900 | | Pacific Capital Bancorp(a) | | | 1,510,316 |
| 44,162 | | PacWest Bancorp(a) | | | 1,103,608 |
| 13,448 | | Patriot Capital Funding, Inc.(a) | | | 66,568 |
| 600 | | Piper Jaffray Cos.* | | | 23,670 |
| 5,400 | | Provident Financial Services, Inc. | | | 79,164 |
| 143,500 | | Raymond James Financial, Inc.(a) | | | 3,342,115 |
| 2,800 | | Renasant Corp. | | | 58,688 |
| 3,400 | | Resource Capital Corp. | | | 16,830 |
| 40,513 | | South Financial Group, Inc. (The)(a) | | | 235,381 |
| 10,800 | | Student Loan Corp. (The) | | | 394,200 |
| 600 | | Suffolk Bancorp | | | 19,470 |
| 3,700 | | Sun Communities, Inc. | | | 55,648 |
| 3,000 | | SWS Group, Inc. | | | 55,680 |
| 1,900 | | UDR, Inc. | | | 37,544 |
| 10,100 | | United Community Financial Corp. | | | 47,369 |
| 6,200 | | World Acceptance Corp.*(a) | | | 114,576 |
| 500 | | Yadkin Valley Financial Corp. | | | 7,445 |
| | | | | |
| | | | | 11,982,460 |
| | | | | |
| | |
| | Food & Drug Retailers—0.5% | | | |
| 60,400 | | Casey’s General Stores, Inc. | | | 1,824,080 |
| 2,600 | | Perrigo Co. | | | 88,400 |
| 6,600 | | Weis Markets, Inc. | | | 214,104 |
| | | | | |
| | | | | 2,126,584 |
| | | | | |
| | |
| | Food Products—1.9% | | | |
| 152,868 | | Corn Products International, Inc. | | | 3,717,750 |
| 273,239 | | Del Monte Foods Co. | | | 1,724,138 |
| 6,000 | | Fresh Del Monte Produce, Inc. (Cayman Islands)* | | | 126,660 |
| 6,800 | | Nash-Finch Co. | | | 268,124 |
| 25,938 | | Ralcorp Holdings, Inc.* | | | 1,755,484 |
| 600 | | Ruddick Corp. | | | 17,184 |
| | | | | |
| | | | | 7,609,340 |
| | | | | |
| | |
| | Foods—1.3% | | | |
| 2,200 | | Chiquita Brands International, Inc.* | | | 30,030 |
| 54,639 | | Dean Foods Co.*(a) | | | 1,194,409 |
| 30,000 | | JM Smucker Co. (The)(a) | | | 1,336,800 |
See Notes to Financial Statements.
| | |
| THE TARGET PORTFOLIO TRUST | | 67 |
| | |
Small Capitalization Value Portfolio (continued) | | Portfolio of Investments
As of October 31, 2008 |
| | | | | |
| SHARES | | DESCRIPTION | | VALUE (NOTE 1) |
| | | | | |
| | COMMON STOCKS (continued) | | | |
| | |
| | Foods (continued) | | | |
| 28,690 | | Sanderson Farms, Inc.(a) | | $ | 895,702 |
| 7,400 | | Spartan Stores, Inc.(a) | | | 199,726 |
| 23,325 | | TreeHouse Foods, Inc.*(a) | | | 705,814 |
| 105,997 | | Tyson Foods, Inc. (Class A Stock) | | | 926,414 |
| | | | | |
| | | | | 5,288,895 |
| | | | | |
| | |
| | Furniture | | | |
| 2,400 | | Knoll, Inc. | | | 34,704 |
| | | | | |
| | |
| | Gas & Pipeline Utilities—4.3% | | | |
| 44,370 | | Atlas America, Inc. | | | 1,016,517 |
| 139,788 | | Atmos Energy Corp. | | | 3,392,655 |
| 30,000 | | Energen Corp. | | | 1,007,100 |
| 35,000 | | National Fuel Gas Co.(a) | | | 1,266,650 |
| 98,200 | | Southwest Gas Corp.(a) | | | 2,564,984 |
| 104,531 | | Swift Energy Co.*(a) | | | 3,353,354 |
| 100,000 | | UGI Corp. | | | 2,387,000 |
| 67,181 | | WGL Holdings, Inc. | | | 2,162,556 |
| | | | | |
| | | | | 17,150,816 |
| | | | | |
| | |
| | Gas Utilities—0.7% | | | |
| 97,361 | | AGL Resources, Inc.(a) | | | 2,959,774 |
| | | | | |
| | |
| | Healthcare Equipment & Supplies—0.5% | | | |
| 4,500 | | Hill-Rom Holdings, Inc. | | | 102,420 |
| 27,500 | | Invacare Corp. | | | 500,225 |
| 35,000 | | West Pharmaceutical Services, Inc. | | | 1,397,200 |
| | | | | |
| | | | | 1,999,845 |
| | | | | |
| | |
| | Healthcare Providers & Services—2.0% | | | |
| 2,900 | | Alliance Imaging, Inc.* | | | 23,635 |
| 35,700 | | Amedisys, Inc.*(a) | | | 2,013,837 |
| 78,500 | | AMERIGROUP Corp.*(a) | | | 1,962,500 |
| 2,800 | | AMN Healthcare Services, Inc.* | | | 25,172 |
| 11,500 | | Gentiva Health Services, Inc.* | | | 312,225 |
| 37,050 | | inVentiv Health, Inc.* | | | 350,864 |
| 2,200 | | Magellan Health Services, Inc.*(a) | | | 81,268 |
| 54,500 | | Owens & Minor, Inc.(a) | | | 2,358,215 |
| 33,259 | | Res-Care, Inc.* | | | 512,521 |
| 77,600 | | Sunrise Senior Living, Inc.*(a) | | | 234,352 |
| | | | | |
| | | | | 7,874,589 |
| | | | | |
| | |
| | Healthcare Services—1.8% | | | |
| 33,671 | | Amsurg Corp.* | | | 839,755 |
| 82,300 | | Healthways, Inc.*(a) | | | 831,230 |
| 28,225 | | LHC Group, Inc.* | | | 995,778 |
See Notes to Financial Statements.
| | |
| 68 | | THE TARGET PORTFOLIO TRUST |
| | | | | |
| SHARES | | DESCRIPTION | | VALUE (NOTE 1) |
| | | | | |
| | COMMON STOCKS (continued) | | | |
| | |
| | Healthcare Services (continued) | | | |
| 19,386 | | LifePoint Hospitals, Inc.*(a) | | $ | 464,683 |
| 700 | | Molina Healthcare, Inc.*(a) | | | 15,589 |
| 100,139 | | Pediatrix Medical Group, Inc.*(a) | | | 3,870,372 |
| 2,300 | | Psychiatric Solutions, Inc.*(a) | | | 76,567 |
| 1,100 | | Rehabcare Group, Inc.* | | | 18,843 |
| | | | | |
| | | | | 7,112,817 |
| | | | | |
| | |
| | Home Builders—0.2% | | | |
| 77,000 | | Hovnanian Enterprises, Inc. (Class A Stock)*(a) | | | 330,330 |
| 43,400 | | Meritage Homes Corp.*(a) | | | 595,882 |
| | | | | |
| | | | | 926,212 |
| | | | | |
| | |
| | Hotels, Restaurants & Leisure—0.6% | | | |
| 200 | | Bob Evans Farms, Inc. | | | 4,176 |
| 64,500 | | Brinker International, Inc.(a) | | | 599,850 |
| 42,500 | | CKE Restaurants, Inc. | | | 360,825 |
| 13,500 | | Dover Downs Gaming & Entertainment, Inc. | | | 69,120 |
| 7,400 | | Jack in the Box, Inc.* | | | 148,740 |
| 1,000 | | Papa John’s International, Inc.* | | | 22,560 |
| 118,700 | | Sonic Corp.*(a) | | | 1,270,090 |
| 9,700 | | Strategic Hotels & Resorts, Inc. | | | 48,015 |
| | | | | |
| | | | | 2,523,376 |
| | | | | |
| | |
| | Household Durables—0.5% | | | |
| 60,141 | | Ethan Allen Interiors, Inc.(a) | | | 1,075,923 |
| 7,500 | | Furniture Brands International, Inc. | | | 42,675 |
| 10,860 | | Lancaster Colony Corp. | | | 342,524 |
| 63,696 | | Tempur-Pedic International, Inc.(a) | | | 497,466 |
| | | | | |
| | | | | 1,958,588 |
| | | | | |
| | |
| | Household Products—0.1% | | | |
| 11,000 | | Tupperware Brands Corp. | | | 278,300 |
| 3,500 | | WD-40 Co. | | | 101,850 |
| 1,250 | | Zep, Inc. | | | 26,312 |
| | | | | |
| | | | | 406,462 |
| | | | | |
| | |
| | Industrial Conglomerates—0.6% | | | |
| 42,678 | | Teleflex, Inc. | | | 2,261,507 |
| | | | | |
| | |
| | Industrial Products—0.8% | | | |
| 14,457 | | Brady Corp. (Class A Stock) | | | 448,167 |
| 1,300 | | CIRCOR International, Inc. | | | 39,845 |
| 2,300 | | Compass Minerals International, Inc. | | | 126,339 |
| 45,363 | | Interface, Inc. (Class A Stock) | | | 319,809 |
| 40,429 | | Kaydon Corp.(a) | | | 1,350,733 |
| 8,500 | | Myers Industries, Inc.(a) | | | 89,845 |
| 95,800 | | Steelcase, Inc. | | | 890,940 |
| | | | | |
| | | | | 3,265,678 |
| | | | | |
See Notes to Financial Statements.
| | |
| THE TARGET PORTFOLIO TRUST | | 69 |
| | |
Small Capitalization Value Portfolio (continued) | | Portfolio of Investments
As of October 31, 2008 |
| | | | | |
| SHARES | | DESCRIPTION | | VALUE (NOTE 1) |
| | | | | |
| | COMMON STOCKS (continued) | | | |
| | |
| | Insurance—6.9% | | | |
| 9,400 | | AMBAC Financial Group, Inc. | | $ | 25,192 |
| 87,429 | | American Equity Investment Life Holding Co.(a) | | | 395,179 |
| 75,000 | | American Financial Group, Inc. | | | 1,704,750 |
| 1,100 | | American Physicians Capital, Inc.(a) | | | 45,001 |
| 12,500 | | Amerisafe, Inc.* | | | 215,500 |
| 3,500 | | AmTrust Financial Services, Inc. | | | 34,370 |
| 30,050 | | Arthur J. Gallagher & Co. | | | 732,018 |
| 47,575 | | Aspen Insurance Holdings Ltd. (Bermuda)(a) | | | 1,092,322 |
| 6,300 | | Assured Guaranty Ltd. (Bermuda)(a) | | | 70,749 |
| 1,200 | | Castlepoint Holdings Ltd. (Bermuda) | | | 10,824 |
| 137,850 | | Delphi Financial Group, Inc. (Class A Stock)(a) | | | 2,171,138 |
| 96,183 | | Employers Holdings, Inc. | | | 1,227,295 |
| 26,128 | | Endurance Specialty Holdings Ltd. (Bermuda)(a) | | | 790,111 |
| 1,300 | | FPIC Insurance Group, Inc.*(a) | | | 58,188 |
| 1,300 | | Harleysville Group, Inc. | | | 41,054 |
| 65,775 | | HCC Insurance Holdings, Inc. | | | 1,450,997 |
| 52,813 | | Horace Mann Educators Corp. | | | 420,391 |
| 47,164 | | Infinity Property & Casualty Corp.(a) | | | 1,878,070 |
| 35,650 | | IPC Holdings Ltd. (Bermuda)(a) | | | 984,297 |
| 7,600 | | Max Capital Group Ltd. (Bermuda)(a) | | | 121,220 |
| 4,600 | | Meadowbrook Insurance Group, Inc.(a) | | | 24,242 |
| 2,800 | | Navigators Group, Inc.*(a) | | | 141,428 |
| 71,101 | | Philadelphia Consolidated Holding Corp.* | | | 4,158,697 |
| 1,400 | | Phoenix Cos., Inc. (The) | | | 9,058 |
| 39,988 | | Platinum Underwriters Holdings Ltd. (Bermuda)(a) | | | 1,269,219 |
| 9,600 | | PMA Capital Corp. (Class A Stock)* | | | 44,352 |
| 23,889 | | ProAssurance Corp.*(a) | | | 1,312,701 |
| 42,400 | | Protective Life Corp. | | | 354,040 |
| 22,072 | | Reinsurance Group of America, Inc. | | | 824,168 |
| 20,400 | | RLI Corp. | | | 1,170,756 |
| 4,300 | | Safety Insurance Group, Inc.(a) | | | 163,357 |
| 3,700 | | Seabright Insurance Holdings, Inc.* | | | 38,702 |
| 5,400 | | Selective Insurance Group(a) | | | 128,250 |
| 57,700 | | State Auto Financial Corp.(a) | | | 1,519,818 |
| 47,575 | | United Fire & Casualty Co.(a) | | | 1,102,313 |
| 44,400 | | Zenith National Insurance Corp. | | | 1,458,984 |
| | | | | |
| | | | | 27,188,751 |
| | | | | |
| | |
| | Insurance—Property Insurance | | | |
| 2,915 | | Argo Group International Holdings Ltd. (Bermuda)*(a) | | | 92,989 |
| | | | | |
| | |
| | Internet | | | |
| 5,400 | | Interwoven, Inc.* | | | 68,094 |
| | | | | |
| | |
| | Internet Services—0.1% | | | |
| 13,600 | | EarthLink, Inc.* | | | 93,840 |
| 700 | | Forrester Research, Inc.* | | | 19,635 |
See Notes to Financial Statements.
| | |
| 70 | | THE TARGET PORTFOLIO TRUST |
| | | | | |
| SHARES | | DESCRIPTION | | VALUE (NOTE 1) |
| | | | | |
| | COMMON STOCKS (continued) | | | |
| | |
| | Internet Services (continued) | | | |
| 4,300 | | SonicWALL, Inc.* | | $ | 19,264 |
| 3,700 | | TIBCO Software, Inc.* | | | 19,055 |
| 14,684 | | United Online, Inc.(a) | | | 108,662 |
| 900 | | USA Mobility, Inc.* | | | 8,685 |
| | | | | |
| | | | | 269,141 |
| | | | | |
| | |
| | Investment Company | | | |
| 7,315 | | MCG Capital Corp. | | | 5,998 |
| | | | | |
| | |
| | Leisure—0.4% | | | |
| 120,600 | | Callaway Golf Co.(a) | | | 1,261,476 |
| 12,400 | | Jakks Pacific, Inc.*(a) | | | 277,388 |
| | | | | |
| | | | | 1,538,864 |
| | | | | |
| | |
| | Machinery—3.1% | | | |
| 17,300 | | Actuant Corp. (Class A Stock) | | | 310,189 |
| 60,000 | | Albany International Corp. (Class A Stock) | | | 873,600 |
| 88,500 | | Barnes Group, Inc.(a) | | | 1,284,135 |
| 97,700 | | Bucyrus International, Inc. | | | 2,357,501 |
| 1,100 | | Cascade Corp. | | | 36,311 |
| 28,736 | | Gardner Denver, Inc.* | | | 736,216 |
| 24,825 | | General Cable Corp.*(a) | | | 424,011 |
| 7,000 | | Gibraltar Industries, Inc.(a) | | | 92,750 |
| 33,796 | | IDEX Corp. | | | 783,391 |
| 34,428 | | Kadant, Inc.*(a) | | | 565,996 |
| 40,000 | | Kennametal, Inc. | | | 848,800 |
| 28,125 | | Lincoln Electric Holdings, Inc. | | | 1,213,594 |
| 61,400 | | Mueller Industries, Inc.(a) | | | 1,404,218 |
| 4,375 | | Nordson Corp. | | | 161,569 |
| 11,375 | | Rofin-Sinar Technologies, Inc.* | | | 253,549 |
| 15,350 | | Smith A.O. Corp. | | | 484,293 |
| 1,400 | | Tennant Co.(a) | | | 35,126 |
| 6,300 | | Wabtec Corp. | | | 250,488 |
| | | | | |
| | | | | 12,115,737 |
| | | | | |
| | |
| | Machinery & Equipment | | | |
| 4,700 | | Pioneer Drilling Co.* | | | 36,378 |
| | | | | |
| | |
| | Manufacturing—1.1% | | | |
| 1,100 | | Ameron International Corp. | | | 51,700 |
| 3,800 | | Ceradyne, Inc.* | | | 89,300 |
| 7,200 | | EnPro Industries, Inc.* | | | 159,912 |
| 4,200 | | Harmonic, Inc.* | | | 29,862 |
| 93,300 | | Harsco Corp. | | | 2,208,411 |
| 145,400 | | Hexcel Corp.*(a) | | | 1,919,280 |
| | | | | |
| | | | | 4,458,465 |
| | | | | |
| | |
| | Marine—0.4% | | | |
| 25,000 | | DryShips, Inc. (Greece)(a) | | | 481,250 |
| 36,575 | | Eagle Bulk Shipping, Inc.(a) | | | 364,653 |
| 32,400 | | Genco Shipping & Trading Ltd.(a) | | | 675,540 |
| | | | | |
| | | | | 1,521,443 |
| | | | | |
See Notes to Financial Statements.
| | |
| THE TARGET PORTFOLIO TRUST | | 71 |
| | |
Small Capitalization Value Portfolio (continued) | | Portfolio of Investments
As of October 31, 2008 |
| | | | | |
| SHARES | | DESCRIPTION | | VALUE (NOTE 1) |
| | | | | |
| | COMMON STOCKS (continued) | | | |
| | |
| | Media—0.4% | | | |
| 131,087 | | Belo Corp. (Class A Stock)(a) | | $ | 279,215 |
| 38,171 | | Courier Corp. | | | 664,557 |
| 15,775 | | Factset Research Systems, Inc. | | | 611,912 |
| 9,900 | | Idearc, Inc.(a) | | | 3,762 |
| 8,900 | | Lee Enterprises, Inc.(a) | | | 22,250 |
| 900 | | Scholastic Corp. | | | 16,713 |
| 14,800 | | Sinclair Broadcast Group, Inc. (Class A Stock) | | | 47,804 |
| 6,300 | | Westwood One, Inc.* | | | 1,701 |
| 1,375 | | Wiley (John) & Sons, Inc. (Class A Stock) | | | 47,823 |
| | | | | |
| | | | | 1,695,737 |
| | | | | |
| | |
| | Medical Supplies & Equipment—0.4% | | | |
| 2,200 | | Advanced Energy Industries, Inc.* | | | 23,474 |
| 900 | | Arena Pharmaceuticals, Inc.*(a) | | | 3,312 |
| 31,408 | | Conmed Corp.* | | | 822,889 |
| 700 | | Medivation, Inc.* | | | 13,139 |
| 16,575 | | Patterson Cos., Inc.* | | | 419,845 |
| 8,198 | | PSS World Medical, Inc.*(a) | | | 148,712 |
| 1,700 | | Seattle Genetics, Inc.* | | | 17,476 |
| 1,400 | | STERIS Corp.(a) | | | 47,656 |
| | | | | |
| | | | | 1,496,503 |
| | | | | |
| | |
| | Metals & Mining—2.4% | | | |
| 25,000 | | Amcol International Corp. | | | 613,250 |
| 38,000 | | Carpenter Technology Corp. | | | 687,800 |
| 11,800 | | Cliffs Natural Resources, Inc. | | | 318,482 |
| 1,100 | | Columbus McKinnon Corp.* | | | 15,444 |
| 70,000 | | Commercial Metals Co. | | | 777,000 |
| 16,300 | | GrafTech International Ltd.* | | | 132,193 |
| 383,500 | | IAMGOLD Corp. (Canada)(a) | | | 1,265,550 |
| 1,000 | | Olympic Steel, Inc. | | | 22,860 |
| 55,700 | | Quanex Building Products Corp. | | | 510,212 |
| 75,000 | | Royal Gold, Inc. | | | 2,162,250 |
| 80,700 | | Timken Co. | | | 1,281,516 |
| 165,000 | | Titanium Metals Corp.(a) | | | 1,536,150 |
| 6,100 | | Worthington Industries, Inc.(a) | | | 73,627 |
| | | | | |
| | | | | 9,396,334 |
| | | | | |
| | |
| | Multi-Utilities—1.0% | | | |
| 40,000 | | Oge Energy Corp. | | | 1,092,000 |
| 111,525 | | Vectren Corp. | | | 2,810,430 |
| | | | | |
| | | | | 3,902,430 |
| | | | | |
| | |
| | Office Equipment—0.1% | | | |
| 13,900 | | IKON Office Solutions, Inc. | | | 239,497 |
| | | | | |
See Notes to Financial Statements.
| | |
| 72 | | THE TARGET PORTFOLIO TRUST |
| | | | | |
| SHARES | | DESCRIPTION | | VALUE (NOTE 1) |
| | | | | |
| | COMMON STOCKS (continued) | | | |
| | |
| | Oil & Gas—0.2% | | | |
| 25,700 | | Equitable Resources, Inc. | | $ | 892,047 |
| | | | | |
| | |
| | Oil & Gas Exploration/Production—1.1% | | | |
| 86,700 | | Cabot Oil & Gas Corp. | | | 2,433,669 |
| 7,600 | | Penn Virginia Corp. | | | 282,492 |
| 71,800 | | St. Mary Land & Exploration Co. | | | 1,787,102 |
| | | | | |
| | | | | 4,503,263 |
| | | | | |
| | |
| | Oil, Gas & Consumable Fuels—2.6% | | | |
| 12,650 | | Arena Resources, Inc.* | | | 385,572 |
| 92,575 | | Berry Petroleum Co. (Class A Stock) | | | 2,156,997 |
| 1,400 | | Callon Petroleum Co.* | | | 14,448 |
| 31,000 | | Cimarex Energy Co. | | | 1,254,260 |
| 2,400 | | Comstock Resources, Inc.* | | | 118,608 |
| 28,175 | | Concho Resources, Inc.*(a) | | | 598,719 |
| 12,450 | | Encore Acquisition Co.* | | | 387,817 |
| 2,277 | | Energy Partners Ltd.* | | | 9,837 |
| 1,100 | | Laclede Group, Inc. (The)(a) | | | 57,552 |
| 22,000 | | Lufkin Industries, Inc. | | | 1,151,040 |
| 2,200 | | McMoRan Exploration Co.*(a) | | | 31,218 |
| 8,050 | | New Jersey Resources Corp.(a) | | | 299,782 |
| 12,250 | | Oil States International, Inc.* | | | 283,343 |
| 46,200 | | ONEOK, Inc. | | | 1,473,780 |
| 28,850 | | Petroquest Energy, Inc.*(a) | | | 287,057 |
| 1,100 | | Rosetta Resources, Inc.* | | | 11,605 |
| 2,400 | | RPC, Inc. | | | 25,416 |
| 3,000 | | South Jersey Industries, Inc.(a) | | | 102,210 |
| 6,629 | | Stone Energy Corp.*(a) | | | 201,124 |
| 4,900 | | Trico Marine Services, Inc.*(a) | | | 44,100 |
| 32,000 | | Tsakos Energy Navigation Ltd. (Greece) | | | 791,680 |
| 1,400 | | Union Drilling, Inc.* | | | 7,672 |
| 4,800 | | Vaalco Energy, Inc. | | | 25,440 |
| 35,000 | | World Fuel Services Corp. | | | 750,050 |
| | | | | |
| | | | | 10,469,327 |
| | | | | |
| | |
| | Paper & Forest Products—0.6% | | | |
| 14,700 | | Buckeye Technologies, Inc.*(a) | | | 86,583 |
| 40,005 | | Neenah Paper, Inc. | | | 361,245 |
| 83,505 | | Owens-Illinois, Inc.* | | | 1,910,595 |
| 5,100 | | Schweitzer-Mauduit International, Inc.(a) | | | 85,272 |
| | | | | |
| | | | | 2,443,695 |
| | | | | |
| | |
| | Personell Services | | | |
| 4,000 | | Kforce, Inc.* | | | 31,480 |
| | | | | |
| | |
| | Pharmaceuticals—0.1% | | | |
| 1,300 | | Alpharma, Inc. (Class A Stock)* | | | 40,703 |
| 800 | | Auxilium Pharmaceuticals, Inc.*(a) | | | 15,720 |
| 9,000 | | Bionovo, Inc.* | | | 6,390 |
| 1,100 | | Cypress Bioscience, Inc.* | | | 5,984 |
See Notes to Financial Statements.
| | |
| THE TARGET PORTFOLIO TRUST | | 73 |
| | |
Small Capitalization Value Portfolio (continued) | | Portfolio of Investments
As of October 31, 2008 |
| | | | | |
| SHARES | | DESCRIPTION | | VALUE (NOTE 1) |
| | | | | |
| | COMMON STOCKS (continued) | | | |
| | |
| | Pharmaceuticals (continued) | | | |
| 800 | | Par Pharmaceutical Cos., Inc.* | | $ | 8,000 |
| 4,600 | | Prestige Brands Holdings, Inc.*(a) | | | 31,786 |
| 500 | | Rigel Pharmaceuticals, Inc.*(a) | | | 4,355 |
| 4,200 | | ULURU, Inc.* | | | 2,016 |
| 500 | | United Therapeutics Corp.* | | | 43,615 |
| 2,300 | | Valeant Pharmaceuticals International*(a) | | | 43,171 |
| 6,500 | | Viropharma, Inc.* | | | 81,510 |
| | | | | |
| | | | | 283,250 |
| | | | | |
| | |
| | Real Estate | | | |
| 1,000 | | HFF, Inc. (Class A Stock)*(a) | | | 2,540 |
| | | | | |
| | |
| | Real Estate Investment Trust—Office Industrial | | | |
| 7,100 | | BioMed Realty Trust, Inc.(a) | | | 99,755 |
| 3,600 | | Hersha Hospitality Trust | | | 15,156 |
| | | | | |
| | | | | 114,911 |
| | | | | |
| | |
| | Real Estate Investment Trust—Other REIT | | | |
| 7,200 | | OMEGA Healthcare Investors, Inc. | | | 108,504 |
| | | | | |
| | |
| | Real Estate Investment Trusts—3.1% | | | |
| 13,700 | | Anthracite Capital, Inc.(a) | | | 59,458 |
| 10,500 | | Anworth Mortgage Asset Corp. | | | 61,530 |
| 4,000 | | Arbor Realty Trust, Inc.(a) | | | 14,400 |
| 8,200 | | Ashford Hospitality Trust, Inc. | | | 13,284 |
| 2,200 | | Associated Estates Realty Corp. | | | 17,952 |
| 1,000 | | Capital Trust, Inc. (Class A Stock) | | | 7,900 |
| 112,154 | | CBL & Associates Properties, Inc.(a) | | | 1,035,181 |
| 19,600 | | DCT Industrial Trust, Inc.(a) | | | 96,628 |
| 10,900 | | DiamondRock Hospitality Co. | | | 56,462 |
| 82,732 | | Education Realty Trust, Inc.(a) | | | 351,611 |
| 3,200 | | Entertainment Properties Trust | | | 119,840 |
| 2,400 | | Equity LifeStyle Properties, Inc. | | | 100,776 |
| 101,753 | | Equity One, Inc.(a) | | | 1,777,625 |
| 1,300 | | Extra Space Storage, Inc. | | | 14,963 |
| 70,000 | | First Industrial Realty Trust, Inc.(a) | | | 723,800 |
| 4,900 | | First Potomac Realty Trust(a) | | | 60,172 |
| 5,700 | | Glimcher Realty Trust | | | 29,868 |
| 50,000 | | Healthcare Realty Trust, Inc. | | | 1,277,500 |
| 700 | | Home Properties, Inc. | | | 28,343 |
| 105,000 | | HRPT Properties Trust | | | 379,050 |
| 5,800 | | Inland Real Estate Corp. | | | 66,468 |
| 31,700 | | Lexington Realty Trust(a) | | | 254,551 |
| 4,000 | | LTC Properties, Inc. | | | 96,680 |
| 2,200 | | Maguire Properties, Inc. | | | 7,810 |
| 314,250 | | MFA Mortgage Investments, Inc. | | | 1,728,375 |
See Notes to Financial Statements.
| | |
| 74 | | THE TARGET PORTFOLIO TRUST |
| | | | | |
| SHARES | | DESCRIPTION | | VALUE (NOTE 1) |
| | | | | |
| | COMMON STOCKS (continued) | | | |
| | |
| | Real Estate Investment Trusts (continued) | | | |
| 16,479 | | Mid-America Apartment Communities, Inc. | | $ | 580,720 |
| 12,800 | | National Retail Properties, Inc.(a) | | | 228,224 |
| 31,100 | | Nationwide Health Properties, Inc. | | | 928,024 |
| 12,800 | | NorthStar Realty Finance Corp.(a) | | | 73,600 |
| 7,200 | | Parkway Properties, Inc.(a) | | | 124,200 |
| 5,400 | | Pennsylvania Real Estate Investment Trust(a) | | | 68,310 |
| 35,000 | | Potlatch Corp. | | | 1,162,350 |
| 3,000 | | Saul Centers, Inc.(a) | | | 109,770 |
| 14,000 | | Senior Housing Properties Trust | | | 268,380 |
| 8,700 | | Sovran Self Storage, Inc. | | | 282,315 |
| 7,900 | | Sunstone Hotel Investors, Inc. | | | 51,745 |
| | | | | |
| | | | | 12,257,865 |
| | | | | |
| | |
| | Restaurants—0.1% | | | |
| 800 | | Einstein Noah Restaurant Group, Inc.* | | | 6,416 |
| 77,639 | | Wendy’s Arby’s Group, Inc. (Class A Stock) | | | 281,053 |
| | | | | |
| | | | | 287,469 |
| | | | | |
| | |
| | Retail—0.9% | | | |
| 50,057 | | Cash America International, Inc. | | | 1,770,516 |
| 4,900 | | CEC Entertainment, Inc.* | | | 125,832 |
| 2,600 | | Insight Enterprises, Inc.* | | | 25,298 |
| 700 | | Jo-Ann Stores, Inc.* | | | 13,412 |
| 17,532 | | Men’s Wearhouse, Inc. (The)(a) | | | 268,064 |
| 1,100 | | Movado Group, Inc. | | | 16,731 |
| 34,185 | | Pantry, Inc. (The)* | | | 752,754 |
| 34,315 | | Regis Corp. | | | 424,477 |
| 7,250 | | Stage Stores, Inc. | | | 55,897 |
| 3,800 | | Systemax, Inc. | | | 53,808 |
| | | | | |
| | | | | 3,506,789 |
| | | | | |
| | |
| | Retail & Merchandising—1.0% | | | |
| 49,162 | | Bebe Stores, Inc.(a) | | | 435,575 |
| 182,600 | | CarMax, Inc.*(a) | | | 1,939,212 |
| 5,300 | | Collective Brands, Inc.* | | | 67,787 |
| 500 | | Deckers Outdoor Corp.* | | | 42,430 |
| 60,049 | | DSW, Inc. (Class A Stock)*(a) | | | 776,434 |
| 7,000 | | Finish Line, Inc. (The) (Class A Stock) | | | 66,990 |
| 5,400 | | Jos. A. Bank Clothiers, Inc.*(a) | | | 137,538 |
| 84,632 | | Pacific Sunwear of California, Inc.* | | | 289,441 |
| 3,000 | | Shoe Carnival, Inc.* | | | 42,030 |
| 400 | | Tween Brands, Inc.* | | | 3,408 |
| | | | | |
| | | | | 3,800,845 |
| | | | | |
| | |
| | Retail—Restaurants | | | |
| 4,400 | | Domino’s Pizza, Inc.* | | | 26,180 |
| | | | | |
| | |
| | Retail Apparel | | | |
| 4,500 | | Dress Barn, Inc.*(a) | | | 43,020 |
| 2,200 | | Warnaco Group, Inc. (The)* | | | 65,582 |
| | | | | |
| | | | | 108,602 |
| | | | | |
See Notes to Financial Statements.
| | |
| THE TARGET PORTFOLIO TRUST | | 75 |
| | |
Small Capitalization Value Portfolio (continued) | | Portfolio of Investments
As of October 31, 2008 |
| | | | | |
| SHARES | | DESCRIPTION | | VALUE (NOTE 1) |
| | | | | |
| | COMMON STOCKS (continued) | | | |
| | |
| | Road & Rail—0.3% | | | |
| 42,600 | | Arkansas Best Corp. | | $ | 1,243,494 |
| | | | | |
| | |
| | Semiconductors—1.3% | | | |
| 8,100 | | Amkor Technology, Inc.* | | | 32,886 |
| 5,950 | | Applied Micro Circuits Corp.* | | | 30,405 |
| 1,100 | | Asyst Technologies, Inc.* | | | 693 |
| 12,775 | | ATMI, Inc.* | | | 155,344 |
| 1,700 | | Brooks Automation, Inc.* | | | 11,645 |
| 5,400 | | Cirrus Logic, Inc.* | | | 30,996 |
| 400 | | Cohu, Inc. | | | 5,656 |
| 1,300 | | DSP Group, Inc.* | | | 8,190 |
| 1,000 | | Eagle Test Systems, Inc.* | | | 15,140 |
| 125,250 | | Emulex Corp.*(a) | | | 1,189,875 |
| 8,358 | | Entegris, Inc.* | | | 22,483 |
| 34,200 | | Himax Technologies, Inc., ADR (Taiwan) | | | 63,954 |
| 37,534 | | Itron, Inc.*(a) | | | 1,819,648 |
| 2,200 | | IXYS Corp. | | | 17,468 |
| 3,800 | | Kulicke & Soffa Industries, Inc.*(a) | | | 11,172 |
| 4,600 | | Lattice Semiconductor Corp.* | | | 8,648 |
| 34,975 | | Microsemi Corp.*(a) | | | 760,356 |
| 4,000 | | MKS Instruments, Inc.*(a) | | | 74,200 |
| 700 | | Pericom Semiconductor Corp.* | | | 5,460 |
| 1,600 | | Photronics, Inc.* | | | 1,104 |
| 18,100 | | PMC - Sierra, Inc.*(a) | | | 84,708 |
| 43,120 | | Richardson Electronics Ltd. | | | 216,462 |
| 20,200 | | Skyworks Solutions, Inc.*(a) | | | 144,026 |
| 1,700 | | Standard Microsystems Corp.* | | | 30,617 |
| 14,100 | | TriQuint Semiconductor, Inc.* | | | 63,168 |
| 19,325 | | Varian Semiconductor Equipment Associates, Inc.* | | | 379,157 |
| 6,400 | | Zoran Corp.* | | | 52,096 |
| | | | | |
| | | | | 5,235,557 |
| | | | | |
| | |
| | Software—0.4% | | | |
| 2,900 | | CSG Systems International, Inc.* | | | 48,227 |
| 166,384 | | Lawson Software, Inc.*(a) | | | 885,163 |
| 2,300 | | Take-Two Interactive Software, Inc.* | | | 27,278 |
| 50,950 | | Tyler Technologies, Inc.*(a) | | | 692,410 |
| | | | | |
| | | | | 1,653,078 |
| | | | | |
| | |
| | Specialized Consumer Services—0.1% | | | |
| 26,825 | | Hillenbrand, Inc. | | | 509,675 |
| �� | | | | |
| | |
| | Specialty Retail—0.7% | | | |
| 97,750 | | Aaron Rents, Inc. | | | 2,423,223 |
| 15,265 | | Abercrombie & Fitch Co. (Class A Stock)(a) | | | 442,074 |
| | | | | |
| | | | | 2,865,297 |
| | | | | |
See Notes to Financial Statements.
| | |
| 76 | | THE TARGET PORTFOLIO TRUST |
| | | | | |
| SHARES | | DESCRIPTION | | VALUE (NOTE 1) |
| | | | | |
| | COMMON STOCKS (continued) | | | |
| | |
| | Telecommunications—1.2% | | | |
| 4,000 | | Adaptec, Inc.* | | $ | 12,840 |
| 2,300 | | Anixter International, Inc.*(a) | | | 77,303 |
| 181,016 | | Arris Group, Inc.*(a) | | | 1,250,820 |
| 700 | | Atlantic Tele-Network, Inc. | | | 17,031 |
| 28,046 | | Black Box Corp. | | | 852,879 |
| 10,600 | | Centennial Communications Corp.* | | | 37,736 |
| 68,800 | | Cincinnati Bell, Inc.*(a) | | | 164,432 |
| 1,100 | | Consolidated Communications Holdings, Inc. | | | 11,330 |
| 4,700 | | Finisar Corp.* | | | 2,867 |
| 3,600 | | Foundry Networks, Inc.* | | | 53,460 |
| 4,200 | | MasTec, Inc.* | | | 36,624 |
| 4,100 | | MRV Communications, Inc.* | | | 3,034 |
| 2,400 | | Newport Corp.* | | | 17,256 |
| 23,150 | | Nice Systems Ltd. (Israel)* | | | 517,634 |
| 2,900 | | Plantronics, Inc.(a) | | | 41,876 |
| 1,400 | | Polycom, Inc.*(a) | | | 29,414 |
| 177,185 | | Powerwave Technologies, Inc.*(a) | | | 168,326 |
| 10,100 | | Premiere Global Services, Inc.* | | | 100,495 |
| 4,300 | | RF Micro Devices, Inc.* | | | 8,557 |
| 62,575 | | Syniverse Holdings, Inc.*(a) | | | 1,176,410 |
| 3,200 | | UTStarcom, Inc.* | | | 7,616 |
| | | | | |
| | | | | 4,587,940 |
| | | | | |
| | |
| | Textiles & Apparel—1.3% | | | |
| 77,425 | | Brown Shoe Co., Inc. | | | 816,059 |
| 200 | | Oxford Industries, Inc. | | | 2,694 |
| 4,650 | | Perry Ellis International, Inc.* | | | 45,524 |
| 126,075 | | Phillips-Van Heusen Corp. | | | 3,090,098 |
| 1,600 | | Quiksilver, Inc.* | | | 4,144 |
| 2,300 | | Skechers USA, Inc. (Class A Stock)* | | | 31,234 |
| 46,200 | | Wolverine World Wide, Inc. | | | 1,085,700 |
| | | | | |
| | | | | 5,075,453 |
| | | | | |
| | |
| | Thrifts & Mortgage Finance—0.7% | | | |
| 90,300 | | Astoria Financial Corp. | | | 1,717,506 |
| 70,000 | | Washington Federal, Inc. | | | 1,233,400 |
| | | | | |
| | | | | 2,950,906 |
| | | | | |
| | |
| | Tobacco—0.3% | | | |
| 29,400 | | Universal Corp. | | | 1,163,946 |
| | | | | |
| | |
| | Trading Companies & Distributors—0.6% | | | |
| 58,650 | | Applied Industrial Technologies, Inc.(a) | | | 1,184,143 |
| 30,600 | | Watsco, Inc.(a) | | | 1,257,354 |
| | | | | |
| | | | | 2,441,497 |
| | | | | |
| | |
| | Transportation—0.6% | | | |
| 3,000 | | Atlas Air Worldwide Holdings, Inc.*(a) | | | 57,960 |
| 20,900 | | Forward Air Corp.(a) | | | 546,953 |
See Notes to Financial Statements.
| | |
| THE TARGET PORTFOLIO TRUST | | 77 |
| | |
Small Capitalization Value Portfolio (continued) | | Portfolio of Investments
As of October 31, 2008 |
| | | | | | | |
| SHARES | | DESCRIPTION | | VALUE (NOTE 1) | |
| | | | | | | |
| | | COMMON STOCKS (continued) | | | | |
| | |
| | | Transportation (continued) | | | | |
| | 75,000 | | General Maritime Corp. (Marshall Islands)(a) | | $ | 1,136,250 | |
| | 6,300 | | GulfMark Offshore, Inc.* | | | 233,100 | |
| | 16,359 | | Kansas City Southern*(a) | | | 505,002 | |
| | 2,800 | | Knightsbridge Tankers Ltd. (Bermuda)(a) | | | 50,148 | |
| | | | | | | |
| | | | | | 2,529,413 | |
| | | | | | | |
| | |
| | | Water Utilities | | | | |
| | 700 | | American States Water Co. | | | 23,947 | |
| | | | | | | |
| | | TOTAL LONG-TERM INVESTMENTS
(cost $448,069,304) | | | 363,444,393 | |
| | | | | | | |
Principal
Amount
(000)# | | SHORT-TERM INVESTMENTS—31.8% | | | |
| | |
| | | U.S. TREASURY OBLIGATION | | | | |
| | | U.S. Treasury Notes(k)
4.625%, 11/30/08 | | | | |
| $ | 125 | | (cost $125,155) | | | 125,391 | |
| | | | | | | |
| Shares | | | | | |
| | |
| | | AFFILIATED MONEY MARKET MUTUAL FUND—31.8% | | | | |
| | 126,151,942 | | Dryden Core Investment Fund—Taxable Money Market Series
(cost $126,151,942; includes $97,961,484 of cash collateral for securities on loan) (b)(w) | | | 126,151,942 | |
| | | | | | | |
| | | TOTAL SHORT-TERM INVESTMENTS
(cost $126,277,097) | | | 126,277,333 | |
| | | | | | | |
| | | TOTAL INVESTMENTS—123.4%
(cost $574,346,401, Note 5) | | | 489,721,726 | |
| | | Other liabilities in excess of other assets(x)—(23.4%) | | | (92,960,474 | ) |
| | | | | | | |
| | | NET ASSETS—100% | | $ | 396,761,252 | |
| | | | | | | |
The following abbreviations are used in Portfolio descriptions:
| ADR—American | Depositary Receipt |
| REIT—Real | Estate Investment Trust |
| * | Non-income producing security. |
| # | Principal amount is shown in U.S. dollars unless otherwise stated. |
| (a) | All or a portion of security is on loan. The aggregate market value of such securities is $97,081,874; cash collateral of $97,961,484 (included with liabilities) was received with which the Portfolio purchased highly liquid short-term investments. Cash Collateral is less than 102% of the market value of securities loaned due to significant market increases on October 31, 2008. Collateral was subsequently received on November 3, 2008 and the Portfolio remained in compliance. |
| (b) | Represents security, or a portion thereof, purchased with cash collateral received for securities on loan. |
| (k) | Security segregated as collateral for futures contracts. |
See Notes to Financial Statements.
| | |
| 78 | | THE TARGET PORTFOLIO TRUST |
| (w) | Prudential Investments LLC, the manager of the Portfolio, also serves as manager of the Dryden Core Investment Fund-Taxable Money Market Series. |
| (x) | Liabilities in excess of other assets includes unrealized depreciation on future contract as follows: |
Open future contract outstanding at October 31, 2008:
| | | | | | | | | | | | | | |
Number of
Contracts | | Type | | Expiration
Date | | Value at
Trade Date | | Value at
October 31, 2008 | | Unrealized
Depreciation | |
| Long Positions: | | | | | | | | | | | | | | |
| 4 | | Russell 2000 | | Dec 08 | | $ | 1,144,900 | | $ | 1,073,000 | | $ | (71,900 | ) |
| | | | | | | | | | | | | | |
The industry classification of investments and liabilities in excess of other assets shown as a percentage of net assets as of October 31, 2008 were as follows:
| | | |
Affiliated Money Market Mutual Fund (24.7% represents investments purchased with collateral from securities on loan) | | 31.8 | % |
Insurance | | 6.9 | |
Banks | | 4.6 | |
Gas & Pipeline Utilities | | 4.3 | |
Chemicals | | 3.4 | |
Real Estate Investment Trusts | | 3.1 | |
Computer Services & Software | | 3.1 | |
Machinery | | 3.1 | |
Financial Services | | 3.0 | |
Oil, Gas & Consumable Fuels | | 2.6 | |
Electronics | | 2.5 | |
Metals & Mining | | 2.4 | |
Aerospace/Defense | | 2.1 | |
Healthcare Providers & Services | | 2.0 | |
Food Products | | 1.9 | |
Containers & Packaging | | 1.9 | |
Healthcare Services | | 1.8 | |
Electronic Components | | 1.8 | |
Electric Utilities | | 1.6 | |
Consumer Products & Services | | 1.6 | |
Commercial Services & Supplies | | 1.5 | |
Commercial Services | | 1.4 | |
Financial—Bank & Trust | | 1.4 | |
Foods | | 1.3 | |
Semiconductors | | 1.3 | |
Textiles & Apparel | | 1.3 | |
Telecommunications | | 1.2 | |
Oil & Gas Exploration/Production | | 1.1 | |
Manufacturing | | 1.1 | |
Computer Hardware | | 1.0 | |
Multi-Utilities | | 1.0 | |
Retail & Merchandising | | 1.0 | |
Retail | | 0.9 | |
Energy Equipment & Services | | 0.9 | |
Electrical Equipment | | 0.9 | |
Industrial Products | | 0.8 | |
Construction & Engineering | | 0.8 | |
Entertainment & Leisure | | 0.8 | |
Gas Utilities | | 0.7 | |
Thrifts & Mortgage Finance | | 0.7 | |
See Notes to Financial Statements.
| | |
| THE TARGET PORTFOLIO TRUST | | 79 |
| | |
Small Capitalization Value Portfolio (continued) | | Portfolio of Investments
As of October 31, 2008 |
| | | |
Specialty Retail | | 0.7 | % |
Building Products | | 0.7 | |
Commercial Banks | | 0.7 | |
Drugs & Healthcare | | 0.7 | |
Transportation | | 0.6 | |
Hotels, Restaurants & Leisure | | 0.6 | |
Business Services | | 0.6 | |
Paper & Forest Products | | 0.6 | |
Trading Companies & Distributors | | 0.6 | |
Capital Markets | | 0.6 | |
Exchange Traded Funds | | 0.6 | |
Industrial Conglomerates | | 0.6 | |
Food & Drug Retailers | | 0.5 | |
Airlines | | 0.5 | |
Healthcare Equipment & Supplies | | 0.5 | |
Automobile Manufacturers | | 0.5 | |
Household Durables | | 0.5 | |
Media | | 0.4 | |
Environmental Services | | 0.4 | |
Software | | 0.4 | |
Diversified Financial Services | | 0.4 | |
Leisure | | 0.4 | |
Marine | | 0.4 | |
Medical Supplies & Equipment | | 0.4 | |
Road & Rail | | 0.3 | |
Engineering/Construction | | 0.3 | |
Tobacco | | 0.3 | |
Diversified Telecommunication Services | | 0.3 | |
Beverages | | 0.3 | |
Home Builders | | 0.2 | |
Automotive Parts | | 0.2 | |
Clothing & Apparel | | 0.2 | |
Consumer Services | | 0.2 | |
Oil & Gas | | 0.2 | |
Building & Construction | | 0.2 | |
Distribution/Wholesale | | 0.2 | |
Auto Related | | 0.1 | |
Specialized Consumer Services | | 0.1 | |
Household Products | | 0.1 | |
Apparel/Shoes | | 0.1 | |
Restaurants | | 0.1 | |
Pharmaceuticals | | 0.1 | |
Consumer Finance | | 0.1 | |
Internet Services | | 0.1 | |
Biotechnology | | 0.1 | |
Office Equipment | | 0.1 | |
| | | |
| | 123.4 | |
Liabilities in excess of other assets | | (23.4 | ) |
| | | |
| | 100.0 | % |
| | | |
See Notes to Financial Statements.
| | |
| 80 | | THE TARGET PORTFOLIO TRUST |
| | |
Portfolio of Investments
As of October 31, 2008 | | International Equity Portfolio |
| | | | | |
| SHARES | | DESCRIPTION | | VALUE (NOTE 1) |
| | | | | |
| | LONG-TERM INVESTMENTS—92.4% | | | |
| | |
| | COMMON STOCKS | | | |
| | |
| | Australia—1.2% | | | |
| 59,700 | | AWB Ltd. | | $ | 104,409 |
| 123,600 | | BlueScope Steel Ltd. | | | 363,529 |
| 129,600 | | Centennial Coal Co. Ltd. | | | 304,763 |
| 142,400 | | Foster’s Group Ltd. | | | 544,365 |
| 97,390 | | OZ Minerals Ltd. | | | 61,182 |
| 154,900 | | Pacific Brands Ltd. | | | 103,913 |
| 278,900 | | Qantas Airways Ltd. | | | 453,007 |
| | | | | |
| | | | | 1,935,168 |
| | | | | |
| | |
| | Belgium—0.1% | | | |
| 28,600 | | AGFA-Gevaert NV* | | | 119,702 |
| 10,300 | | Dexia NV/SA | | | 54,784 |
| 20,900 | | Fortis | | | 24,214 |
| | | | | |
| | | | | 198,700 |
| | | | | |
| | |
| | Brazil—1.0% | | | |
| 45,500 | | Empresa Brasileira de Aeronautica SA, ADR | | | 951,860 |
| 65,600 | | Redecard SA | | | 711,865 |
| | | | | |
| | | | | 1,663,725 |
| | | | | |
| | |
| | Canada—4.7% | | | |
| 46,800 | | Canadian National Railway Co. | | | 2,031,508 |
| 29,600 | | Canadian Natural Resources Ltd. | | | 1,493,630 |
| 17,000 | | Canadian Oil Sands Trust | | | 456,135 |
| 11,100 | | Potash Corp. of Saskatchewan, Inc. | | | 946,386 |
| 87,400 | | Rogers Communications, Inc. (Class B Stock) | | | 2,537,232 |
| | | | | |
| | | | | 7,464,891 |
| | | | | |
| | |
| | China—1.6% | | | |
| 654,400 | | China Life Insurance Co. Ltd. (Class H Stock) | | | 1,748,815 |
| 511,585 | | China Merchants Bank Co. Ltd. (Class H Stock) | | | 783,772 |
| 585,662 | | Country Garden Holdings Co. Ltd. | | | 104,035 |
| | | | | |
| | | | | 2,636,622 |
| | | | | |
| | |
| | Denmark—3.9% | | | |
| 18,300 | | Carlsberg A/S (Class B Stock) | | | 720,444 |
| 21,000 | | Danske Bank A/S | | | 310,870 |
| 42,000 | | H. Lundbeck A/S | | | 750,313 |
| 65,816 | | Novo Nordisk A/S (Class B Stock) | | | 3,527,946 |
| 20,798 | | Vestas Wind Systems A/S* | | | 851,887 |
| | | | | |
| | | | | 6,161,460 |
| | | | | |
See Notes to Financial Statements.
| | |
| THE TARGET PORTFOLIO TRUST | | 81 |
| | |
International Equity Portfolio (continued) | | Portfolio of Investments
As of October 31, 2008 |
| | | | | |
| SHARES | | DESCRIPTION | | VALUE (NOTE 1) |
| | | | | |
| | COMMON STOCKS (continued) | | | |
| | |
| | Finland—2.7% | | | |
| 67,049 | | Fortum Oyj | | $ | 1,647,800 |
| 136,600 | | Nokia Oyj | | | 2,092,467 |
| 16,700 | | Rautaruukki Oyj | | | 272,546 |
| 25,900 | | TietoEnator Oyj | | | 287,244 |
| | | | | |
| | | | | 4,300,057 |
| | | | | |
| | |
| | France—11.3% | | | |
| 10,033 | | Air Liquide | | | 865,799 |
| 320 | | Arkema SA | | | 7,324 |
| 105,100 | | AXA SA | | | 2,007,836 |
| 40,153 | | BNP Paribas | | | 2,899,101 |
| 2,100 | | Ciments Francais SA | | | 152,474 |
| 10,700 | | Compagnie Generale des Establissements Michelin (Class B Stock) | | | 550,741 |
| 32,000 | | Credit Agricole SA | | | 462,945 |
| 93,577 | | France Telecom SA | | | 2,359,600 |
| 34,400 | | Groupe Danone | | | 1,915,423 |
| 31,211 | | LVMH Moet Hennessy Louis Vuitton SA | | | 2,076,905 |
| 23,000 | | Natixis | | | 50,935 |
| 15,000 | | PSA Peugeot Citroen SA | | | 400,273 |
| 11,300 | | Rallye SA | | | 228,872 |
| 8,200 | | Renault SA | | | 251,312 |
| 32,600 | | Safran SA | | | 413,745 |
| 27,500 | | Sanofi-Aventis SA | | | 1,742,322 |
| 4,700 | | Societe Generale | | | 256,174 |
| 5,100 | | Thales SA | | | 204,638 |
| 47,000 | | THOMSON* | | | 65,896 |
| 12,800 | | Total SA | | | 704,173 |
| 7,200 | | Valeo SA | | | 125,418 |
| 10,000 | | Vivendi | | | 261,391 |
| | | | | |
| | | | | 18,003,297 |
| | | | | |
| | |
| | Germany—5.2% | | | |
| 33,800 | | BASF SE | | | 1,115,862 |
| 13,700 | | Daimler AG | | | 464,430 |
| 17,900 | | Deutsche Bank AG | | | 668,689 |
| 15,100 | | Deutsche Lufthansa AG | | | 209,137 |
| 41,713 | | E.ON AG | | | 1,563,189 |
| 8,000 | | Hannover Rueckversicherung AG | | | 198,046 |
| 10,700 | | Heidelberger Druckmaschinen AG | | | 100,290 |
| 17,300 | | MTU Aero Engines Holding AG | | | 333,698 |
| 9,000 | | Muenchener Rueckversicherungs AG | | | 1,168,377 |
| 5,400 | | Norddeutsche Affinerie AG | | | 172,497 |
| 49,956 | | SAP AG | | | 1,749,020 |
| 33,800 | | ThyssenKrupp AG | | | 640,192 |
| | | | | |
| | | | | 8,383,427 |
| | | | | |
See Notes to Financial Statements.
| | |
| 82 | | THE TARGET PORTFOLIO TRUST |
| | | | | |
| SHARES | | DESCRIPTION | | VALUE (NOTE 1) |
| | | | | |
| | COMMON STOCKS (continued) | | | |
| | |
| | Greece—1.2% | | | |
| 63,628 | | National Bank of Greece SA | | $ | 1,397,798 |
| 21,850 | | OPAP SA | | | 477,088 |
| | | | | |
| | | | | 1,874,886 |
| | | | | |
| | |
| | Guernsey—0.9% | | | |
| 62,300 | | Amdocs Ltd.* | | | 1,405,488 |
| | | | | |
| | |
| | Hong Kong—2.3% | | | |
| 590,000 | | Chaoda Modern Agriculture Holdings Ltd. | | | 415,671 |
| 186,078 | | China Mobile Ltd. | | | 1,638,103 |
| 157,500 | | Citic Pacific Ltd. | | | 128,089 |
| 125,604 | | Hong Kong Exchanges and Clearing Ltd. | | | 1,273,727 |
| 159,280 | | Orient Overseas International Ltd. | | | 284,434 |
| | | | | |
| | | | | 3,740,024 |
| | | | | |
| | |
| | Ireland—0.3% | | | |
| 37,500 | | Allied Irish Banks PLC | | | 199,749 |
| 56,400 | | Governor & Co. of The Bank of Ireland (The) | | | 166,535 |
| 31,300 | | Irish Life & Permanent PLC | | | 107,067 |
| | | | | |
| | | | | 473,351 |
| | | | | |
| | |
| | Israel—2.3% | | | |
| 87,300 | | Teva Pharmaceutical Industries Ltd., ADR | | | 3,743,424 |
| | | | | |
| | |
| | Italy—1.6% | | | |
| 54,700 | | Eni SpA | | | 1,305,589 |
| 12,200 | | Finmeccanica SpA | | | 151,307 |
| 10,000 | | Fondiaria Sai SpA | | | 187,868 |
| 18,400 | | Indesit Co. SpA | | | 149,911 |
| 112,451 | | Intesa Sanpaolo SpA | | | 411,559 |
| 243,800 | | Telecom Italia SpA | | | 280,069 |
| | | | | |
| | | | | 2,486,303 |
| | | | | |
| | |
| | Japan—13.4% | | | |
| 4,650 | | Aiful Corp. | | | 21,548 |
| 30,300 | | Alpine Electronics, Inc. | | | 266,545 |
| 37,000 | | Alps Electric Co. Ltd. | | | 203,545 |
| 92,000 | | Asahi Kasei Corp. | | | 346,050 |
| 16,600 | | Astellas Pharma, Inc. | | | 668,627 |
| 141,000 | | Cosmo Oil Co. Ltd. | | | 299,945 |
| 145,000 | | Denki Kagaku Kogyo Kabushiki Kaisha | | | 321,240 |
| 25,100 | | Fanuc Ltd. | | | 1,672,379 |
| 137,000 | | Fuji Heavy Industries Ltd. | | | 481,921 |
| 18,900 | | Hitachi Information Systems Ltd. | | | 350,732 |
| 48,200 | | Honda Motor Co. Ltd. | | | 1,198,512 |
| 87,042 | | Komatsu Ltd. | | | 956,911 |
| 190,800 | | Kurabo Industries Ltd. | | | 271,058 |
| 42,000 | | Kyowa Exeo Corp. | | | 411,795 |
| 145,800 | | Marubeni Corp. | | | 566,440 |
| 45,500 | | Mitsubishi Corp. | | | 762,664 |
See Notes to Financial Statements.
| | |
| THE TARGET PORTFOLIO TRUST | | 83 |
| | |
International Equity Portfolio (continued) | | Portfolio of Investments
As of October 31, 2008 |
| | | | | |
| SHARES | | DESCRIPTION | | VALUE (NOTE 1) |
| | | | | |
| | COMMON STOCKS (continued) | | | |
| | |
| | Japan (continued) | | | |
| 17,000 | | Mitsui & Co. Ltd. | | $ | 164,722 |
| 18,900 | | Nifco, Inc. | | | 277,786 |
| 6,589 | | Nintendo Co. Ltd. | | | 2,117,100 |
| 98,200 | | Nippon Oil Corp. | | | 403,088 |
| 83,000 | | Nippon Shokubai Co. Ltd. | | | 480,992 |
| 300 | | Nippon Telegraph & Telephone Corp. | | | 1,224,217 |
| 173,400 | | Nissan Motor Co. Ltd. | | | 861,173 |
| 1,000 | | NTT DoCoMo, Inc. | | | 1,585,949 |
| 25,600 | | Omron Corp. | | | 365,496 |
| 34,000 | | Panasonic Corp. | | | 547,527 |
| 63,000 | | Ricoh Co. Ltd. | | | 678,007 |
| 133,000 | | Sanwa Holdings Corp. | | | 441,237 |
| 23,600 | | Sumitomo Corp. | | | 207,634 |
| 83,600 | | Toyota Motor Corp. | | | 3,264,657 |
| | | | | |
| | | | | 21,419,497 |
| | | | | |
| | |
| | Liechtenstein—0.3% | | | |
| 3,300 | | Verwaltungs und Privat Bank AG | | | 457,786 |
| | | | | |
| | |
| | Mexico—1.4% | | | |
| 40,500 | | America Movil SAB de CV (Class L Stock), ADR | | | 1,253,070 |
| 374,700 | | Wal-Mart de Mexico SAB de CV (Class V Stock), ADR | | | 1,007,548 |
| | | | | |
| | | | | 2,260,618 |
| | | | | |
| | |
| | Netherlands—3.1% | | | |
| 36,600 | | Aegon NV | | | 152,079 |
| 10,100 | | CSM | | | 187,026 |
| 59,700 | | ING Groep NV, ADR | | | 560,008 |
| 13,100 | | Koninklijke DSM NV | | | 364,814 |
| 19,300 | | Oce NV | | | 89,315 |
| 17,100 | | Royal Dutch Shell PLC (Class A Stock) | | | 473,960 |
| 73,212 | | Royal Dutch Shell PLC (Class B Stock) | | | 1,984,905 |
| 20,407 | | Schlumberger Ltd. | | | 1,054,022 |
| | | | | |
| | | | | 4,866,129 |
| | | | | |
| | |
| | New Zealand—0.2% | | | |
| 515,100 | | Air New Zealand Ltd. | | | 275,401 |
| | | | | |
| | |
| | Norway—0.7% | | | |
| 59,200 | | DnB NOR ASA | | | 343,084 |
| 33,400 | | Norsk Hydro ASA | | | 139,555 |
| 28,797 | | StatoilHydro ASA | | | 579,212 |
| | | | | |
| | | | | 1,061,851 |
| | | | | |
| | |
| | Russia—1.2% | | | |
| 57,600 | | OAO Gazprom, ADR | | | 1,144,512 |
| 165,145 | | Rosneft Oil Co., GDR | | | 759,667 |
| | | | | |
| | | | | 1,904,179 |
| | | | | |
See Notes to Financial Statements.
| | |
| 84 | | THE TARGET PORTFOLIO TRUST |
| | | | | |
| SHARES | | DESCRIPTION | | VALUE (NOTE 1) |
| | | | | |
| | COMMON STOCKS (continued) | | | |
| | |
| | Singapore—0.7% | | | |
| 389,160 | | MobileOne Ltd. | | $ | 346,448 |
| 281,000 | | Neptune Orient Lines Ltd. | | | 237,335 |
| 67,580 | | Singapore Airlines Ltd. | | | 517,765 |
| | | | | |
| | | | | 1,101,548 |
| | | | | |
| | |
| | Spain—3.1% | | | |
| 58,900 | | Banco Bilbao Vizcaya Argentaria SA | | | 683,613 |
| 110,600 | | Banco Santander Central Hispano SA | | | 1,196,157 |
| 10,000 | | Banco Santander SA | | | 109,877 |
| 33,700 | | Repsol YPF SA | | | 640,836 |
| 126,000 | | Telefonica SA | | | 2,332,884 |
| | | | | |
| | | | | 4,963,367 |
| | | | | |
| | |
| | Sweden—2.0% | | | |
| 45,800 | | Electrolux AB (Class B Stock) | | | 421,644 |
| 62,487 | | Hennes & Mauritz AB (Class B Stock) | | | 2,240,747 |
| 65,200 | | Nordea Bank AB | | | 522,587 |
| | | | | |
| | | | | 3,184,978 |
| | | | | |
| | |
| | Switzerland—10.5% | | | |
| 6,500 | | Baloise Holding AG | | | 347,519 |
| 6,600 | | Ciba Holding AG | | | 274,744 |
| 46,700 | | Clariant AG* | | | 289,720 |
| 24,300 | | Credit Suisse Group AG | | | 908,671 |
| 1,300 | | Georg Fischer AG* | | | 291,493 |
| 1,659 | | Givaudan SA | | | 1,130,467 |
| 65,474 | | Logitech International SA* | | | 976,120 |
| 80,200 | | Nestle SA | | | 3,118,737 |
| 35,438 | | Novartis AG | | | 1,798,762 |
| 1,900 | | Rieter Holding AG | | | 329,228 |
| 20,100 | | Roche Holding AG | | | 3,073,830 |
| 46,050 | | Swiss Reinsurance | | | 1,920,454 |
| 3,400 | | Swisscom AG | | | 1,038,909 |
| 5,900 | | Zurich Financial Services AG | | | 1,196,978 |
| | | | | |
| | | | | 16,695,632 |
| | | | | |
| | |
| | United Kingdom—15.5% | | | |
| 596,800 | | ARM Holdings PLC | | | 930,486 |
| 40,000 | | AstraZeneca PLC | | | 1,695,138 |
| 71,300 | | Aviva PLC | | | 425,305 |
| 199,100 | | Barclays PLC | | | 570,736 |
| 184,700 | | Beazley Group PLC | | | 314,889 |
| 290,700 | | BP PLC | | | 2,369,634 |
| 137,900 | | Bradford & Bingley PLC* | | | — |
| 453,600 | | BT Group PLC | | | 852,335 |
| 79,277 | | Carnival PLC | | | 1,743,420 |
| 86,200 | | Centrica PLC | | | 423,571 |
| 48,200 | | Dairy Crest Group PLC | | | 240,818 |
| 52,400 | | Drax Group PLC | | | 486,915 |
See Notes to Financial Statements.
| | |
| THE TARGET PORTFOLIO TRUST | | 85 |
| | |
International Equity Portfolio (continued) | | Portfolio of Investments
As of October 31, 2008 |
| | | | | |
| SHARES | | DESCRIPTION | | VALUE (NOTE 1) |
| | | | | |
| | COMMON STOCKS (continued) | | | |
| | |
| | United Kingdom (continued) | | | |
| 285,600 | | DSG International PLC | | $ | 148,681 |
| 185,400 | | GKN PLC | | | 355,509 |
| 30,700 | | GlaxoSmithKline PLC | | | 590,175 |
| 131,348 | | HBOS PLC | | | 215,073 |
| 52,600 | | IMI PLC | | | 233,766 |
| 286,800 | | Legal & General Group PLC | | | 329,846 |
| 146,500 | | Lloyds TSB Group PLC | | | 473,503 |
| 77,200 | | Marston’s PLC | | | 118,120 |
| 20,288 | | NEXT PLC | | | 344,835 |
| 184,500 | | Northern Foods PLC | | | 144,336 |
| 366,300 | | Old Mutual PLC | | | 296,619 |
| 59,014 | | Reckitt Benckiser PLC | | | 2,496,278 |
| 264,600 | | Royal & Sun Alliance Insurance Group PLC | | | 588,426 |
| 120,233 | | Royal Bank of Scotland Group PLC | | | 132,438 |
| 63,628 | | SABMiller PLC | | | 1,010,653 |
| 243,100 | | Smith & Nephew PLC | | | 2,225,903 |
| 15,100 | | Spectris PLC | | | 121,203 |
| 108,400 | | Standard Chartered PLC | | | 1,791,528 |
| 40,100 | | Tate & Lyle PLC | | | 238,394 |
| 146,100 | | Taylor Wimpey PLC | | | 23,841 |
| 100,600 | | Tomkins PLC | | | 184,651 |
| 54,900 | | TT Electronics PLC | | | 41,808 |
| 355,200 | | Vodafone Group PLC | | | 683,303 |
| 95,184 | | Vodafone Group PLC, ADR | | | 1,834,196 |
| | | | | |
| | | | | 24,676,332 |
| | | | | |
| | TOTAL LONG-TERM INVESTMENTS
(cost $212,748,074) | | | 147,338,141 |
| | | | | |
| | |
| | SHORT-TERM INVESTMENT—4.5% | | | |
| | |
| | AFFILIATED MONEY MARKET MUTUAL FUND | | | |
| 7,194,334 | | Dryden Core Investment Fund—Taxable Money Market Series
(cost $7,194,334)(w) | | | 7,194,334 |
| | | | | |
| | TOTAL INVESTMENTS(o)—96.9%
(cost $219,942,408; Note 5) | | | 154,532,475 |
| | Other assets in excess of liabilities(x)—3.1% | | | 4,919,852 |
| | | | | |
| | NET ASSETS—100% | | $ | 159,452,327 |
| | | | | |
The following abbreviations are used in Portfolio descriptions:
ADR—American Depositary Receipt
GDR—Global Depositary Receipt
CHF—Swiss Franc
EUR—Euro
GBP—British Pound
MXN—Mexican Peso
See Notes to Financial Statements.
| | |
| 86 | | THE TARGET PORTFOLIO TRUST |
| * | Non-income producing security. |
| (o) | As of October 31, 2008, 173 securities representing $126,023,096 and 79.0% of net assets were fair valued in accordance with the policies adopted by the Board of Trustees. |
| (w) | Prudential Investments LLC, the manager of the Fund, also serves as manager of the Dryden Core Investment Fund-Taxable Money Market Series. |
| (x) | Other assets in excess of liabilities includes unrealized appreciation (depreciation) on forward foreign currency exchange contracts as follows: |
Forward foreign currency exchange contracts outstanding at October 31, 2008:
| | | | | | | | | | | | | |
Purchase Contracts | | Notional
Amount
(000) | | Value at Settlement
Date Payable | | Current
Value | | Unrealized
Depreciation | |
Euro, | | | | | | | | | | | | | |
Expiring 12/19/08 | | EUR | 5,557 | | $ | 7,732,076 | | $ | 7,097,844 | | $ | (634,232 | ) |
Mexican Peso | | | | | | | | | | | | | |
Expiring 12/08/08 | | MXN | 23,200 | | | 2,141,317 | | | 1,783,264 | | | (358,053 | ) |
| | | | | | | | | | | | | |
| | | | | $ | 9,873,393 | | $ | 8,881,108 | | $ | (992,285 | ) |
| | | | | | | | | | | | | |
| | | | |
Sale Contracts | | Notional
Amount
(000) | | Value at Settlement
Date Receivable | | Current
Value | | Unrealized
Appreciation | |
British Pound, | | | | | | | | | | | | | |
Expiring 12/29/08 | | GBP | 2,753 | | $ | 4,955,200 | | $ | 4,416,275 | | $ | 538,925 | |
Euro, | | | | | | | | | | | | | |
Expiring 12/19/08 | | EUR | 13,133 | | | 19,269,596 | | | 16,714,877 | | | 2,554,719 | |
Mexican Peso, | | | | | | | | | | | | | |
Expiring 12/08/08 | | MXN | 45,257 | | | 4,305,844 | | | 3,478,739 | | | 827,105 | |
Swiss Franc, | | | | | | | | | | | | | |
Expiring 12/23/08 | | CHF | 1,181 | | | 1,130,934 | | | 1,019,329 | | | 111,605 | |
| | | | | | | | | | | | | |
| | | | | $ | 29,661,574 | | $ | 25,629,220 | | $ | 4,032,354 | |
| | | | | | | | | | | | | |
The industry classification of investments and other assets in excess of liabilities shown as a percentage of net assets as of October 31, 2008 were as follows:
| | | |
Telecommunications | | 11.9 | % |
Pharmaceuticals | | 10.6 | |
Oil & Gas | | 7.9 | |
Insurance | | 7.5 | |
Commercial Banks | | 5.9 | |
Affiliated Money Market Mutual Fund | | 4.5 | |
Automobile Manufacturers | | 4.4 | |
Entertainment & Leisure | | 4.1 | |
Chemicals | | 3.8 | |
Foods | | 3.8 | |
Financial Services | | 3.3 | |
Machinery & Equipment | | 2.5 | |
Financial—Bank & Trust | | 1.9 | |
Electronic Components | | 1.8 | |
Media | | 1.8 | |
Household & Personal Products | | 1.7 | |
Transportation | | 1.7 | |
Diversified Operations | | 1.5 | |
See Notes to Financial Statements.
| | |
| THE TARGET PORTFOLIO TRUST | | 87 |
| | |
International Equity Portfolio (continued) | | Portfolio of Investments
As of October 31, 2008 |
| | | |
Beverages | | 1.4 | % |
Medical Supplies & Equipment | | 1.4 | |
Computer Services & Software | | 1.4 | |
Retail | | 1.0 | |
Auto Parts & Related | | 1.0 | |
Electric | | 1.0 | |
Airlines | | 0.9 | |
Aerospace & Defense | | 0.8 | |
Oil, Gas & Consumable Fuels | | 0.8 | |
Metals & Mining | | 0.7 | |
Computer Hardware | | 0.6 | |
Semiconductors | | 0.6 | |
Distribution/Wholesale | | 0.5 | |
Office Equipment | | 0.5 | |
Healthcare Services | | 0.4 | |
Home Furnishings | | 0.3 | |
Agriculture | | 0.3 | |
Utilities | | 0.3 | |
Lumber & Wood Products | | 0.3 | |
Household Durables | | 0.3 | |
Iron/Steel | | 0.2 | |
Aerospace | | 0.2 | |
Energy—Coal | | 0.2 | |
Computers | | 0.2 | |
Textiles | | 0.2 | |
Electronic Components & Equipment | | 0.2 | |
Commercial Services | | 0.1 | |
Construction Materials | | 0.1 | |
Holding Companies—Diversified | | 0.1 | |
Miscellaneous Manufacturers | | 0.1 | |
Real Estate Management & Development | | 0.1 | |
Consumer Products & Services | | 0.1 | |
| | | |
| | 96.9 | |
Other assets in excess of liabilities | | 3.1 | |
| | | |
| | 100.0 | % |
| | | |
See Notes to Financial Statements.
| | |
| 88 | | THE TARGET PORTFOLIO TRUST |
| | |
Portfolio of Investments
As of October 31, 2008 | | International Bond Portfolio |
| | | | | | | |
PRINCIPAL
AMOUNT (000)# | | DESCRIPTION | | VALUE (NOTE 1) |
| | | | | | | |
| | | | | | | |
| | | | LONG-TERM INVESTMENTS—172.1% | | | |
| | | |
| | | | FOREIGN BONDS—104.3% | | | |
| | | |
| | | | Australia—2.3% | | | |
| AUD | | 1,000 | | New South Wales Treasury Corp.
6.00%, 05/01/12 | | $ | 675,386 |
| | | | | | | |
| | | |
| | | | Canada—2.7% | | | |
| CAD | | 700 | | Canada Housing Trust Global (original cost $573,484; purchased 10/30/08)(f)(g)
3.55%, 09/15/13 | | | 581,756 |
| CAD | | 100 | | Province of Ontario,
Debs.
6.20%, 06/02/31 | | | 88,798 |
| EUR | | 100 | | Toronto-Dominion Bank,
Sr. Unsec’d. Notes
5.375%, 05/14/15 | | | 115,943 |
| | | | | | | |
| | | | | | | 786,497 |
| | | | | | | |
| | | |
| | | | Cayman Islands—0.4% | | | |
| EUR | | 100 | | Mizuho Financial Group Cayman Ltd.,
Bank Gtd. Notes
4.75%(c), 04/15/14 | | | 126,442 |
| | | | | | | |
| | | |
| | | | Denmark—1.7% | | | |
| DKK | | 1,100 | | Denmark Government Bond
6.00%, 11/15/11 | | | 197,917 |
| DKK | | 969 | | Realkredit Danmark A/S
5.00%(c), 10/01/38 | | | 146,994 |
| DKK | | 996 | | 5.00%(c), 10/01/38 | | | 148,516 |
| | | | | | | |
| | | | | | | 493,427 |
| | | | | | | |
| | | |
| | | | Finland—8.9% | | | |
| EUR | | 2,010 | | Finnish Government Bond
4.25%, 07/04/15 | | | 2,600,199 |
| | | | | | | |
| | | |
| | | | France—7.6% | | | |
| EUR | | 100 | | BNP Paribas Covered Bonds SA
4.75%, 05/28/13 | | | 129,278 |
| EUR | | 80 | | Credit Suisse Group Capital Guernsey V Ltd.
6.905%(c), 11/29/49 | | | 86,669 |
| EUR | | 100 | | France Government Bonds
4.00%, 04/25/55 | | | 112,358 |
| EUR | | 1,180 | | 5.75%, 10/25/32 | | | 1,701,141 |
| EUR | | 70 | | France Telecom SA,
Sr. Unsub. Notes
8.125%, 01/28/33 | | | 99,470 |
See Notes to Financial Statements.
| | |
| THE TARGET PORTFOLIO TRUST | | 89 |
| | |
International Bond Portfolio (continued) | | Portfolio of Investments
As of October 31, 2008 |
| | | | | | | | |
PRINCIPAL
AMOUNT (000)# | | DESCRIPTION | | VALUE (NOTE 1) |
| | | | | | | | |
| | | | | FOREIGN BONDS (continued) | | | |
| | | |
| | | | | France (continued) | | | |
| $ | | | 100 | | Vivendi,
144A (original cost $99,397; purchased 04/01/08)(f)(g)
5.75%, 04/04/13 | | $ | 91,872 |
| | | | | | | | |
| | | | | | | | 2,220,788 |
| | | | | | | | |
| | | | | Germany—14.7% | | | |
| | EUR | | 400 | | Bundesrepublik Deutschland
4.00%, 07/04/16 | | | 515,377 |
| | EUR | | 300 | | 4.00%, 01/04/37 | | | 355,474 |
| | EUR | | 100 | | 4.75%, 07/04/34 | | | 131,369 |
| | EUR | | 600 | | 5.50%, 01/04/31 | | | 851,528 |
| | EUR | | 660 | | 5.625%, 01/04/28 | | | 941,559 |
| | EUR | | 800 | | 6.25%, 01/04/24 | | | 1,212,659 |
| | | 200 | | Deutsche Bank AG
4.875%, 05/20/13 | | | 186,376 |
| | EUR | | 96 | | Immeo Residential Finance PLC,
Series 2, Class A
5.118%(c), 12/15/16 | | | 104,307 |
| | | | | | | | |
| | | | | | | | 4,298,649 |
| | | | | | | | |
| | | |
| | | | | Ireland—2.3% | | | |
| | EUR | | 127 | | Atlantes Mortgage PLC,
Series 1, Class A
5.438%(c), 01/17/36 | | | 157,169 |
| | GBP | | 200 | | GE Capital UK Funding
6.00%, 04/11/13 | | | 283,951 |
| | EUR | | 100 | | German Postal Pensions Securitisation PLC
3.375%, 01/18/16 | | | 118,941 |
| | EUR | | 100 | | Ireland Government Bond
4.40%, 06/18/19 | | | 121,633 |
| | | | | | | | |
| | | | | | | | 681,694 |
| | | | | | | | |
| | | |
| | | | | Italy—0.8% | | | |
| | EUR | | 91 | | Argo Mortgages,
Series 1, Class A
5.178%(c), 10/28/36 | | | 115,373 |
| | EUR | | 100 | | Locat Securitisation Vehicle,
Series 2006-4, Class A2
5.119%(c), 12/12/28 | | | 116,779 |
| | | | | | | | |
| | | | | | | | 232,152 |
| | | | | | | | |
| | | |
| | | | | Japan—40.3% | | | |
| | JPY | | 290,000 | | Japanese Government Bonds
1.10%, 09/20/12 | | | 2,982,840 |
| | JPY | | 199,900 | | 1.10%, 12/10/16 | | | 1,730,329 |
| | JPY | | 130,000 | | 1.20%, 03/20/12 | | | 1,340,887 |
| | JPY | | 290,000 | | 1.50%, 12/20/17 | | | 2,978,004 |
| | JPY | | 1,000 | | 1.55%, 02/21/12 | | | 10,366 |
| | JPY | | 30,000 | | 2.30%, 06/20/35 | | | 306,372 |
See Notes to Financial Statements.
| | |
| 90 | | THE TARGET PORTFOLIO TRUST |
| | | | | | | |
PRINCIPAL
AMOUNT (000)# | | DESCRIPTION | | VALUE (NOTE 1) |
| | | | | | | |
| | | | FOREIGN BONDS (continued) | | | |
| | | |
| | | | Japan (continued) | | | |
| JPY | | 50,000 | | 2.40%, 03/20/34 | | $ | 520,186 |
| JPY | | 40,000 | | 2.50%, 09/20/35 | | | 425,833 |
| JPY | | 20,000 | | 2.50%, 06/20/36 | | | 212,927 |
| JPY | | 10,000 | | 2.50%, 09/20/37 | | | 106,896 |
| | | | Japanese Government CPI Linked Bond,
Series 6 | | | |
| JPY | | 20,080 | | 0.80%, 12/10/15 | | | 173,425 |
| | | | Series 11 | | | |
| JPY | | 39,840 | | 1.20%, 03/10/17 | | | 346,512 |
| | | | Series 12 | | | |
| JPY | | 20,000 | | 1.20%, 06/10/17 | | | 172,409 |
| | | | Series 14 | | | |
| JPY | | 30,690 | | 1.20%, 12/10/17 | | | 263,066 |
| | | | Series 16 | | | |
| JPY | | 20,360 | | 1.40%, 06/10/18 | | | 176,360 |
| JPY | | 10,180 | | JLOC Ltd.,
Series 36A, Class A1, 144A
(original cost $61,655; purchased 04/23/07)(f)(g) 1.154%(c), 02/16/16 | | | 72,983 |
| | | | | | | |
| | | | | | | 11,819,395 |
| | | | | | | |
| | | |
| | | | Luxembourg—0.5% | | | |
| $ | | 189 | | Gazstream SA for OAO Gazprom
5.625%, 07/22/13 | | | 155,137 |
| | | | | | | |
| | | |
| | | | Netherlands—6.6% | | | |
| EUR | | 500 | | Arena BV,
Series 2003-I, Class A2
4.30%(c), 05/19/55 | | | 627,092 |
| EUR | | 358 | | Dutch MBS BV,
Series X, Class A
5.557%(c), 10/02/79 | | | 446,739 |
| EUR | | 400 | | Netherlands Government Bond
7.50%, 01/15/23 | | | 661,686 |
| | 200 | | Rabobank Nederland NV, 144A
(original cost $200,000; purchased 05/14/08)(f)(g)
3.209%(c), 05/19/10 | | | 199,701 |
| | | | | | | |
| | | | | | | 1,935,218 |
| | | | | | | |
| | | |
| | | | Norway—0.4% | | | |
| EUR | | 100 | | DnB NOR Boligkreditt
4.50%, 05/16/11 | | | 128,660 |
| | | | | | | |
| | | |
| | | | Portugal—0.4% | | | |
| EUR | | 100 | | Banco Espirito Santo SA
5.50%, 07/21/10 | | | 129,469 |
| | | | | | | |
| | | |
| | | | South Korea—0.4% | | | |
| EUR | | 100 | | Export-Import Bank of Korea
5.75%, 05/22/13 | | | 103,854 |
| | | | | | | |
See Notes to Financial Statements.
| | |
| THE TARGET PORTFOLIO TRUST | | 91 |
| | |
International Bond Portfolio (continued) | | Portfolio of Investments
As of October 31, 2008 |
| | | | | | | | |
PRINCIPAL
AMOUNT (000)# | | DESCRIPTION | | VALUE (NOTE 1) |
| | | | | | | | |
| | | | | FOREIGN BONDS (continued) | | | |
| | | |
| | | | | Spain—0.7% | | | |
| | EUR | | 100 | | Caixa d’Estalvis de Catalunya
5.00%, 05/19/10 | | $ | 127,985 |
| $ | | | 100 | | Santander Perpetual SA Unipersonal,
144A (original cost $100,000; purchased 10/18/07)(f)(g)
6.671%(c), 10/29/49 | | | 70,407 |
| | | | | | | | |
| | | | | | | | 198,392 |
| | | | | | | | |
| | | |
| | | | | Switzerland—0.5% | | | |
| | | 200 | | UBS AG,
5.75%, 04/25/18 | | | 155,494 |
| | | | | | | | |
| | | |
| | | | | United Kingdom—13.1% | | | |
| | | 200 | | Barclays Bank PLC,
Sr. Unsub. Notes
5.45%, 09/12/12 | | | 192,728 |
| | | | | Sub. Notes, 144A | | | |
| | | 200 | | 6.05%(c), 12/04/17 (original cost $198,654; purchased 12/07/07)(f)(g) | | | 150,853 |
| | | 100 | | 7.70%(c), 04/29/49 (original cost $100,000; purchased 04/18/08)(f)(g) | | | 69,413 |
| | EUR | | 500 | | Chester Asset Receivables Dealings No 11,
Series A
6.125%, 10/15/10 | | | 624,849 |
| | EUR | | 60 | | Hilton Group Finance PLC
6.50%, 07/17/09 | | | 74,783 |
| | EUR | | 900 | | Inter-American Development Bank
5.50%, 03/30/10 | | | 1,176,921 |
| | CAD | | 100 | | National Grid PLC (original cost $89,690; purchased 11/03/06)(f)(g)
4.98%, 06/22/11 | | | 85,385 |
| | GBP | | 400 | | United Kingdom Gilt,
4.50%, 12/07/42 | | | 638,782 |
| | GBP | | 500 | | 5.00%, 03/07/18 | | | 833,199 |
| | | | | | | | |
| | | | | | | | 3,846,913 |
| | | | | | | | |
| | | | | TOTAL FOREIGN BONDS
(cost $30,375,812) | | | 30,587,766 |
| | | | | | | | |
| | | |
| | | | | UNITED STATES BONDS—67.8% | | | |
| | | |
| | | | | Asset Backed Securities—10.5% | | | |
| | | 100 | | Bank of America Credit Card Trust,
Series 2006-A9, Class A9
4.57%(c), 02/15/13 | | | 91,393 |
| | | 100 | | Capital Auto Receivable Asset Trust,
Series 2008-2, Class A2B
5.48%(c), 03/15/11 | | | 97,822 |
See Notes to Financial Statements.
| | |
| 92 | | THE TARGET PORTFOLIO TRUST |
| | | | | | | | |
PRINCIPAL
AMOUNT (000)# | | DESCRIPTION | | VALUE (NOTE 1) |
| | | | | | | | |
| | | | | UNITED STATES BONDS (continued) | | | |
| | | |
| | | | | Asset Backed Securities (continued) | | | |
| $ | | | 400 | | Chase Issuance Trust,
Series 2008-A7, Class A7
5.21%(c), 11/15/11 | | $ | 384,632 |
| | | 3 | | CIT Group Home Equity Loan Trust,
Series 2002-1, Class AV
3.549%(c), 03/25/33 | | | 2,464 |
| | EUR | | 650 | | Citibank Credit Card Issuance Trust,
Series 2001-A4, Class A4
5.375%, 04/10/13 | | | 767,994 |
| | | | | Series 2007-A2, Class A2 | | | |
| | | 100 | | 2.801%(c), 05/21/12 | | | 92,960 |
| | | 300 | | Ford Credit Auto Owner Trust,
Series 2008-C, Class A2B
5.46%(c), 01/15/11 | | | 292,173 |
| | | | | Series 2008-C, Class A3 | | | |
| | | 100 | | 5.98%(c), 06/15/12 | | | 92,224 |
| | | 116 | | Master Asset Backed Securities Trust,
Series 2006-WMC1, Class A2
3.369%(c), 02/25/36 | | | 112,749 |
| | | | | MBNA Credit Card Master Note Trust,
Series 2002-A2, Class A | | | |
| | EUR | | 550 | | 5.60%, 07/17/14 | | | 655,363 |
| | | | | SLM Student Loan Trust,
Series 2008-7, Class A2 | | | |
| | | 200 | | 4.035%(c), 10/25/17 | | | 187,750 |
| | | | | Student Loan Marketing Assoc.,
Series 2003-7, Class A5B | | | |
| | EUR | | 250 | | 3.80%, 06/17/10 | | | 314,853 |
| | | | | | | | |
| | | | | | | | 3,092,377 |
| | | | | | | | |
| | | |
| | | | | Collateralized Mortgage Obligations—8.7% | | | |
| | | | | American Home Mortgage Investment Trust,
Series 2005-2, Class 4A1 | | | |
| | | 102 | | 5.66%(c), 09/25/45 | | | 64,956 |
| | | | | Banc of America Mortgage Securities, Inc.,
Series 2006-A, Class 2A1 | | | |
| | | 67 | | 5.436%(c), 02/25/36 | | | 52,972 |
| | | | | Bear Stearns Adjustable Rate Mortgage Trust, | | | |
| | | | | Series 2003-5, Class 1A2 | | | |
| | | 10 | | 4.487%(c), 08/25/33 | | | 9,757 |
| | | | | Series 2004-10, Class 13A1 | | | |
| | | 59 | | 5.01%(c), 01/25/35 | | | 44,150 |
| | | | | Series 2005-2, Class A1 | | | |
| | | 100 | | 4.125%(c), 03/25/35 | | | 92,919 |
| | | | | Series 2005-2, Class A2 | | | |
| | | 45 | | 4.125%(c), 03/25/35 | | | 43,259 |
| | | | | Series 2005-5, Class A1 | | | |
| | | 75 | | 4.13%(c), 08/25/35 | | | 60,088 |
See Notes to Financial Statements.
| | |
| THE TARGET PORTFOLIO TRUST | | 93 |
| | |
International Bond Portfolio (continued) | | Portfolio of Investments
As of October 31, 2008 |
| | | | | | | |
PRINCIPAL
AMOUNT (000)# | | DESCRIPTION | | VALUE (NOTE 1) |
| | | | | | | |
| | | | UNITED STATES BONDS (continued) | | | |
| | | |
| | | | Collateralized Mortgage Obligations (continued) | | | |
| | | | Series 2005-5, Class A2 | | | |
| $ | | 61 | | 4.55%(c), 08/25/35 | | $ | 58,561 |
| | | | Bear Stearns Alt-A Trust, | | | |
| | | | Series 2005-7, Class 22A1 | | | |
| | 51 | | 5.499%(c), 09/25/35 | | | 39,282 |
| | | | Series 2005-9, Class 24A1 | | | |
| | 54 | | 5.577%(c), 11/25/35 | | | 41,125 |
| | | | Series 2006-5, Class 2A2 | | | |
| | 67 | | 6.25%(c), 08/25/36 | | | 38,831 |
| | | | Citigroup Mortgage Loan Trust, Inc., | | | |
| | | | Series 2004-HYB2, Class 2A | | | |
| | 31 | | 4.663%(c), 03/25/34 | | | 27,140 |
| | | | Series 2005-6, Class A1 | | | |
| | 41 | | 4.748%(c), 08/25/35 | | | 38,519 |
| | | | Series 2006-AR1, Class 1A1 | | | |
| | 284 | | 4.90%(c), 10/25/35 | | | 231,707 |
| | | | Countrywide Alternative Loan Trust, | | | |
| | | | Series 2005-59, Class 1A1 | | | |
| | 109 | | 3.589%(c), 11/20/35 | | | 60,635 |
| | | | Series 2005-62, Class 2A1 | | | |
| | 130 | | 3.665%(c), 12/25/35 | | | 74,317 |
| | | | Series 2005-76, Class 2A1 | | | |
| | 90 | | 3.665%(c), 02/25/36 | | | 48,157 |
| | | | Credit Suisse Mortgage Capital Certificates,
Series 2006-C5, Class A3 | | | |
| | 100 | | 5.311%, 12/15/39 | | | 73,595 |
| | | | CS First Boston Mortgage Securities Corp.,
Series 2003-AR20, Class 2A1 | | | |
| | 12 | | 4.556%(c), 08/25/33 | | | 10,925 |
| | | | Fannie Mae Whole Loan,
Series 2004-W12, Class 1A1 | | | |
| | 41 | | 6.00%, 07/25/44 | | | 41,161 |
| | | | Federal Home Loan Mortgage Corp.,
Series 2006-5, Class 3A2 | | | |
| | 178 | | 4.665%(c), 05/25/35 | | | 169,607 |
| | | | Federal National Mortgage Assoc., | | | |
| | | | Series 2395, Class FT | | | |
| | 3 | | 5.038%(c), 12/15/31 | | | 2,525 |
| | | | Series 2682, Class JB | | | |
| | 162 | | 4.50%, 09/15/19 | | | 161,473 |
| | | | Series 3346, Class FA | | | |
| | 158 | | 4.818%(c), 02/15/19 | | | 153,674 |
| | | | Series R006, Class ZA | | | |
| | 116 | | 6.00%, 04/15/36 | | | 107,734 |
See Notes to Financial Statements.
| | |
| 94 | | THE TARGET PORTFOLIO TRUST |
| | | | | | | | |
PRINCIPAL
AMOUNT (000)# | | DESCRIPTION | | VALUE (NOTE 1) |
| | | | | | | | |
| | | | | UNITED STATES BONDS (continued) | | | |
| | | |
| | | | | Collateralized Mortgage Obligations (continued) | | | |
| | | | | GMAC Mortgage Corp. Loan Trust,
Series 2004-J4, Class A1 | | | |
| $ | | | 44 | | 5.50%, 09/25/34 | | $ | 42,129 |
| | | | | Harborview Mortgage Loan Trust,
Series 2003-1, Class A | | | |
| | | 11 | | 5.156%(c), 05/19/33 | | | 9,819 |
| | | | | Indymac Index Mortgage Loan Trust,
Series 2005-AR12, Class 2A1A | | | |
| | | 37 | | 3.499%(c), 07/25/35 | | | 22,994 |
| | | | | JPMorgan Chase Commercial Mortgage Securities Corp.,
Series 2002-CIB5, Class A2 | | | |
| | | 100 | | 5.161%, 10/12/37 | | | 89,747 |
| | | | | Merrill Lynch Floating Trust,
Series 2008-LAQA, Class A1 (original cost $92,250; purchased 06/26/08)(f)(g) | | | |
| | | 100 | | 4.68%(c), 07/09/21 | | | 84,881 |
| | | | | Merrill Lynch Mortgage Investors, Inc.,
Series 2003-A2, Class 1A1 | | | |
| | | 5 | | 6.013%(c), 02/25/33 | | | 4,662 |
| | | | | MLCC Mortgage Investors, Inc.,
Series 2005-2, Class 1A | | | |
| | | 68 | | 4.78%(c), 10/25/35 | | | 63,415 |
| | | | | Morgan Stanley Dean Witter Capital I,
Series 2003-TOP9, Class A2 | | | |
| | | 200 | | 4.74%, 11/13/36 | | | 175,004 |
| | | | | Residential Accredit Loans, Inc.,
Series 2006-QO6, Class A1 | | | |
| | | 150 | | 3.439%(c), 06/25/46 | | | 86,978 |
| | | | | Structured Asset Mortgage Investments, Inc.,
Series 2007-AR4, Class A3 | | | |
| | | 100 | | 3.479%(c), 09/25/47 | | | 20,116 |
| | | | | Wells Fargo Mortgage Backed Securities Trust,
Series 2005-AR11, Class 1A1 | | | |
| | | 240 | | 4.616%(c), 06/25/35 | | | 205,938 |
| | | | | | | | |
| | | | | | | | 2,552,752 |
| | | | | | | | |
| | | |
| | | | | Corporate Bonds—17.3% | | | |
| | | | | Allstate Life Global Funding Trusts,
Notes | | | |
| | | 100 | | 5.375%, 04/30/13 | | | 90,371 |
| | | 400 | | American Express Credit Corp.,
Sr. Unsec’d. Notes
4.659%(c), 05/27/10 | | | 350,463 |
| | | 100 | | 5.875%, 05/02/13 | | | 83,594 |
| | EUR | | 100 | | American International Group, Inc.,
Jr. Sub. Notes
4.875%(c), 03/15/67 | | | 17,844 |
| | | | | Jr. Sub. Notes, 144A | | | |
| | | 100 | | 8.175%(c) (original cost $100,000; purchased 05/13/08)(f)(g) | | | 15,977 |
| | | | | Sr. Unsec’d. Notes | | | |
| | | 100 | | 5.85%, 01/16/18 | | | 36,287 |
See Notes to Financial Statements.
| | |
| THE TARGET PORTFOLIO TRUST | | 95 |
| | |
International Bond Portfolio (continued) | | Portfolio of Investments
As of October 31, 2008 |
| | | | | | | | |
PRINCIPAL
AMOUNT (000)# | | DESCRIPTION | | VALUE (NOTE 1) |
| | | | | | | | |
| | | | | UNITED STATES BONDS (continued) | | | |
| | | |
| | | | | Corporate Bonds (continued) | | | |
| | | | | Avon Products, Inc.,
Sr. Unsec’d. Notes | | | |
| $ | | | 100 | | 5.125%, 01/15/11 | | $ | 97,079 |
| | | | | Bank of America Corp., | | | |
| | | | | Jr. Sub. Notes | | | |
| | | 100 | | 8.125%(c), 12/29/49 | | | 77,493 |
| | | | | Sub. Notes | | | |
| | EUR | | 100 | | 4.75%(c), 05/23/17 | | | 113,019 |
| | | | | Caterpillar Financial Services Corp., | | | |
| | | | | Notes | | | |
| | | 200 | | 4.001%(c), 06/25/10 | | | 194,630 |
| | | | | Sr. Unsec’d. Notes | | | |
| | | 200 | | 4.226%(c), 06/24/11 | | | 169,287 |
| | | | | Citigroup Funding, Inc.,
Gtd. Notes | | | |
| | | 200 | | 3.852%(c), 05/07/10 | | | 186,757 |
| | | | | Citigroup, Inc., | | | |
| | | | | Jr. Sub. Notes | | | |
| | | 200 | | 8.40%(c), 04/29/49 | | | 139,020 |
| | | | | Sr. Unsec’d. Notes | | | |
| | | 400 | | 5.50%, 04/11/13 | | | 365,892 |
| | | | | Consolidated Edison Co. of New York, Inc.,
Sr. Unsec’d. Notes | | | |
| | | 100 | | 5.85%, 04/01/18 | | | 85,183 |
| | | | | COX Communications, Inc.,
Sr. Unsec’d. Notes | | | |
| | | 100 | | 6.75%, 03/15/11 | | | 97,244 |
| | | | | Dynegy Roseton / Danskammer Pass-Through Trust, Series A,
Pass-Thru. Certificates | | | |
| | | 81 | | 7.27%(c), 11/08/10 | | | 82,012 |
| | | | | El Paso Performance-Linked Trust,
Sr. Unsec’d. Notes, 144A
(original cost $106,250; purchased 03/15/07)(f)(g) | | | |
| | | 100 | | 7.75%, 07/15/11 | | | 83,305 |
| | | | | Exelon Corp.,
Sr. Unsec’d. Notes | | | |
| | | 100 | | 4.90%, 06/15/15 | | | 74,816 |
| | | | | Federated Department Stores,
Gtd. Notes | | | |
| | | 100 | | 6.30%, 04/01/09 | | | 97,216 |
| | | | | GMAC LLC,
Sr. Unsec’d. Notes | | | |
| | EUR | | 100 | | 4.75%, 09/14/09 | | | 96,866 |
| | | | | Goldman Sachs Group, Inc. (The), | | | |
| | | | | Sr. Unsec’d. Notes | | | |
| | | 100 | | 3.29%(c), 12/23/09 | | | 94,466 |
| | | | | Sr. Unsec’d. Notes, 144A | | | |
| | | | | (original cost $90,598; purchased 11/03/06)(f)(g) | | | |
| | CAD | | 100 | | 5.25%, 06/01/16 | | | 67,461 |
See Notes to Financial Statements.
| | |
| 96 | | THE TARGET PORTFOLIO TRUST |
| | | | | | | | |
PRINCIPAL
AMOUNT (000)# | | DESCRIPTION | | VALUE (NOTE 1) |
| | | | | | | | |
| | | | | UNITED STATES BONDS (continued) | | | |
| | | |
| | | | | Corporate Bonds (continued) | | | |
| | | | | Sr. Unsec’d. Notes | | | |
| $ | | | 100 | | 6.15%, 04/01/18 | | $ | 82,839 |
| | GBP | | 100 | | 7.25%, 04/10/28 | | | 139,394 |
| | | | | HBOS PLC,
Jr. Sub. Notes, 144A
(original cost $98,011; purchased 05/10/07)(f)(g) | | | |
| | | 100 | | 5.92%(c), 09/29/49 | | | 47,699 |
| | | | | HSBC Holdings PLC,
Sub. Notes | | | |
| | | 200 | | 6.50%, 05/02/36 | | | 158,236 |
| | | | | iStar Financial, Inc.,
Sr. Unsec’d. Notes | | | |
| | | 100 | | 5.15%, 03/01/12 | | | 39,000 |
| | | | | Johnson Controls, Inc.,
Sr. Unsec’d. Notes | | | |
| | | 100 | | 5.25%, 01/15/11 | | | 93,188 |
| | | | | JPMorgan Chase Bank NA,
Jr. Sub. Notes | | | |
| | EUR | | 200 | | 4.375%(c), 11/30/21 | | | 180,508 |
| | | | | JPMorgan Chase Capital XX,
Gtd. Notes | | | |
| | | 100 | | 6.55%, 09/29/36 | | | 70,056 |
| | | | | Lehman Brothers Holdings, Inc.,
Sr. Unsec’d. Notes(i) | | | |
| | | 200 | | 5.625%, 01/24/13 | | | 26,000 |
| | | | | Merrill Lynch & Co., Inc.,
Notes | | | |
| | | 200 | | 6.875%, 04/25/18 | | | 177,638 |
| | | | | Sr. Unsec’d. Notes | | | |
| | | 300 | | 5.054%(c), 05/12/10 | | | 277,162 |
| | | | | Morgan Stanley,
Sr. Unsec’d. Notes | | | |
| | | 100 | | 4.904%(c), 05/14/10 | | | 92,019 |
| | | 300 | | 6.00%, 04/28/15 | | | 243,764 |
| | | | | Newell Rubbermaid, Inc.,
Sr. Unsec’d. Notes | | | |
| | | 100 | | 4.00%, 05/01/10 | | | 95,000 |
| | | | | Rabobank Capital Funding Trust III,
Gtd. Notes, 144A
(original cost $97,583; purchased 12/15/06)(f)(g) | | | |
| | | 100 | | 5.254%(c), 10/21/16 | | | 64,881 |
| | | | | RBS Capital Trust,
Bank Gtd. Notes | | | |
| | EUR | | 50 | | 6.467%(c), 12/31/49 | | | 36,962 |
| | | | | Sabre Holdings Corp.,
Sr. Unsec’d. Notes | | | |
| | | 100 | | 7.35%, 08/01/11 | | | 53,000 |
See Notes to Financial Statements.
| | |
| THE TARGET PORTFOLIO TRUST | | 97 |
| | |
International Bond Portfolio (continued) | | Portfolio of Investments
As of October 31, 2008 |
| | | | | | | | |
PRINCIPAL
AMOUNT (000)# | | DESCRIPTION | | VALUE (NOTE 1) |
| | | | | | | | |
| | | | | UNITED STATES BONDS (continued) | | | |
| | | |
| | | | | Corporate Bonds (continued) | | | |
| | | | | SMFG Preferred Capital,
Sub. Notes, 144A
(original cost $100,000; purchased 12/13/06)(f)(g) | | | |
| $ | | | 100 | | 6.078%(c), 12/25/49 | | $ | 68,750 |
| | | | | Sprint Capital Corp.,
Gtd. Notes | | | |
| | | 100 | | 8.375%, 03/15/12 | | | 80,500 |
| | | | | State Street Capital Trust IV,
Gtd. Notes | | | |
| | | 100 | | 3.819%(c), 06/01/77 | | | 64,032 |
| | | | | Target Corp.,
Sr. Unsec’d. Notes | | | |
| | | 100 | | 7.00%, 01/15/38 | | | 76,512 |
| | | | | Viacom, Inc.,
Sr. Unsec’d. Notes | | | |
| | | 100 | | 5.75%, 04/30/11 | | | 89,461 |
| | | | | Zurich Finance USA, Inc.,
Gtd. Notes | | | |
| | EUR | | 100 | | 5.75%(c), 10/02/23 | | | 111,072 |
| | | | | | | | |
| | | | | | | | 5,083,955 |
| | | | | | | | |
| | | |
| | | | | Municipal Bonds—1.3% | | | |
| | | |
| | | | | California—0.6% | | | |
| | | | | State of California,
General Obligation Unlimited | | | |
| | | 200 | | 5.00%, 11/01/37 | | | 176,398 |
| | | | | | | | |
| | | | | Illinois—0.3% | | | |
| | | | | Chicago Illinois Transit Authority,
Revenue Bonds | | | |
| | | 100 | | 6.30%, 12/01/21 | | | 92,320 |
| | | | | | | | |
| | | |
| | | | | Texas—0.3% | | | |
| | | | | City of San Antonio,
Revenue Bonds | | | |
| | | 100 | | 4.50%, 05/15/32 | | | 82,749 |
| | | | | | | | |
| | | |
| | | | | Washington—0.1% | | | |
| | | | | State of Washington,
General Obligation Unlimited | | | |
| | | 100 | | 6.584%(n), 12/01/25 | | | 37,842 |
| | | | | | | | |
| | | | | | | | 389,309 |
| | | | | | | | |
See Notes to Financial Statements.
| | |
| 98 | | THE TARGET PORTFOLIO TRUST |
| | | | | | | | |
PRINCIPAL
AMOUNT (000)# | | DESCRIPTION | | VALUE (NOTE 1) |
| | | | | | | | |
| | | | | UNITED STATES BONDS (continued) | | | |
| | | |
| | | | | U.S. Government Agency Obligations—1.0% | | | |
| | | | | Small Business Administration Participation Certificates, | | | |
| | | | | Series 2005-20E, Class 1 | | | |
| | $ | 77 | | 4.84%, 05/01/25 | | $ | 73,983 |
| | | | | Series 2008-20E, Class 1 | | | |
| | | 100 | | 5.49%, 05/01/28 | | | 100,532 |
| | | | | Series 2008-20G, Class 1 | | | |
| | | 100 | | 5.87%, 07/01/28 | | | 100,693 |
| | | | | | | | |
| | | | | | | | 275,208 |
| | | | | | | | |
| | | |
| | | | | U.S. Government Mortgage Backed Obligations—29.0% | | | |
| | | | | Federal Home Loan Mortgage Corp. | | | |
| | | 34 | | 4.00%, 03/01/10 | | | 33,558 |
| | | 620 | | 5.00%, 08/01/35 | | | 573,279 |
| | | | | Federal National Mortgage Assoc. | | | |
| | | 264 | | 5.00%, 12/01/36 | | | 250,607 |
| | | 595 | | 5.00%, 04/01/38 | | | 550,403 |
| | | 500 | | 5.00%, TBA | | | 472,969 |
| | | 294 | | 5.50%, 03/01/48 | | | 280,441 |
| | | 2,000 | | 6.00%, TBA | | | 1,996,875 |
| | | 179 | | 7.00%, 09/01/36 | | | 184,742 |
| | | 200 | | 8.95%, 02/12/18 | | | 254,391 |
| | | | | Government National Mortgage Assoc. | | | |
| | | 200 | | 6.00%, 09/20/38 | | | 199,622 |
| | | 2,000 | | 6.00%, TBA | | | 2,000,000 |
| | | 698 | | 6.50%, 09/20/38 | | | 706,481 |
| | | 1,000 | | 6.50%, TBA | | | 1,010,625 |
| | | | | | | | |
| | | | | | | | 8,513,993 |
| | | | | | | | |
| | | | | TOTAL UNITED STATES BONDS
(cost $21,994,156) | | | 19,907,594 |
| | | | | | | | |
| | | | | TOTAL LONG-TERM INVESTMENTS
(cost $52,369,968) | | | 50,495,360 |
| | | | | | | | |
| | | |
| | | | | SHORT-TERM INVESTMENTS—6.0% | | | |
| | | |
| | | | | U.S. TREASURY OBLIGATION—0.8% | | | |
| | | 250 | | U.S. Treasury Bill(n)
1.70%, 12/11/08
(cost $249,551) | | | 249,962 |
| | | | | | | | |
| | | |
| | | | | REPURCHASE AGREEMENT—2.4% | | | |
| | | 700 | | JPMorgan Chase 0.15%, dated 10/31/08, due 11/03/08 in the amount of $700,009 (cost $700,000; the value of collateral plus accrued interest was $699,759)(e) | | | 700,000 |
| | | | | | | | |
| Shares | | | | |
| | | | | AFFILIATED MONEY MARKET MUTUAL FUND—1.0% | | | |
| | | 285,195 | | Dryden Core Investment Fund—Taxable Money Market Series
(cost $285,195)(w) | | | 285,195 |
| | | | | | | | |
See Notes to Financial Statements.
| | |
| THE TARGET PORTFOLIO TRUST | | 99 |
| | |
International Bond Portfolio (continued) | | Portfolio of Investments
As of October 31, 2008 |
| | | | | | | | |
CONTRACTS/
NOTIONAL
AMOUNTS (000)# | | DESCRIPTION | | VALUE (NOTE 1) |
| | | | | | | | |
| | | | | OPTIONS PURCHASED*—1.8% | | | |
| | | |
| | | | | Call Options—1.8% | | | |
| | | | | 2 Year Euro-Schatz Futures, | | | |
| | EUR | | 4,400 | | expiring 11/21/2008, Strike Price $106.70 | | $ | 6,169 |
| | | | | 5 Year U.S. Treasury Note Futures, | | | |
| $ | | | 2,400 | | expiring 11/21/2008, Strike Price $125.00 | | | 187 |
| | | | | 10 Year U.S. Treasury Note Futures, | | | |
| | | 1,200 | | expiring 11/21/2008, Strike Price $138.00 | | | 187 |
| | | 600 | | expiring 12/12/2008, Strike Price $117.50 | | | — |
| | | | | 20 Year U.S. Treasury Bond Futures, | | | |
| | | 100 | | expiring 11/21/2008, Strike Price $140.00 | | | 16 |
| | | | | Interest Rate Swap Options, | | | |
| | | 1,800 | | expiring 08/03/2009 @ 3.45% | | | 19,267 |
| | | 2,600 | | expiring 08/03/2009 @ 3.45% | | | 27,830 |
| | | 10,400 | | expiring 08/03/2009 @ 3.50% | | | 116,634 |
| | | 14,700 | | expiring 08/03/2009 @ 3.85% | | | 222,454 |
| | | 1,500 | | expiring 08/28/2009 @ 5.00% | | | 46,068 |
| | | 1,800 | | expiring 08/28/2009 @ 5.00% | | | 55,282 |
| | EUR | | 2,100 | | expiring 09/14/2009 @ 4.00% | | | 30,939 |
| | | | | | | | |
| | | | | | | | 525,033 |
| | | | | | | | |
| | | |
| | | | | Put Options | | | |
| | | | | 5 Year Euro-Bobl Futures, | | | |
| | EUR | | 2,500 | | expiring 11/21/2008, Strike Price $100.00 | | | 160 |
| | | | | 6 Year Euro-Bund Futures, | | | |
| | EUR | | 1,100 | | expiring 11/21/2008, Strike Price $103.50 | | | 140 |
| | | | | 10 Year U.S. Treasury Notes Futures, | | | |
| | | 200 | | expiring 11/21/2008, Strike Price $96.00 | | | 31 |
| | | 200 | | expiring 11/21/2008, Strike Price $97.00 | | | 31 |
| | | 900 | | expiring 11/21/2008, Strike Price $100.00 | | | 141 |
| | | 500 | | expiring 01/16/2009, Strike Price $76.06 | | | 30 |
| | | | | 20 Year U.S. Treasury Notes Futures, | | | |
| | | 200 | | expiring 11/21/2008, Strike Price $94.00 | | | 31 |
| | �� | | | Federal National Mortgage Association | | | |
| | | 1,000 | | expiring 12/04/2008, Strike Price $67.06 | | | — |
| | | 500 | | expiring 12/04/2008, Strike Price $72.00 | | | 1 |
| | | 1,000 | | expiring 01/06/2009, Strike Price $81.25 | | | 32 |
| | | | | Government National Mortgage Association | | | |
| | | 2,000 | | expiring 12/11/2008, Strike Price $81.00 | | | 17 |
| | | 1,000 | | expiring 12/11/2008, Strike Price $86.00 | | | 26 |
| | | | | | | | |
| | | | | | | | 640 |
| | | | | | | | |
See Notes to Financial Statements.
| | |
| 100 | | THE TARGET PORTFOLIO TRUST |
| | | | | | | | |
| | | DESCRIPTION | | VALUE (NOTE 1) | |
| | | | | | | | |
| | | | TOTAL OPTIONS PURCHASED
(cost $357,198) | | $ | 525,673 | |
| | | | | | | | |
| | | | TOTAL SHORT-TERM INVESTMENTS
(cost $1,591,944) | | | 1,760,830 | |
| | | | | | | | |
| | | |
| | | | TOTAL INVESTMENTS, BEFORE OPTIONS
WRITTEN AND SECURITY SOLD SHORT—178.1%
(cost $53,961,912; Note 5) | | | 52,256,190 | |
| | | | | | | | |
CONTRACTS/
NOTIONAL
AMOUNTS (000)# | | OPTIONS WRITTEN—(1.3%) | | | |
| | | |
| | | | Call Options | | | | |
| | | | Interest Rate Swap Options, | | | | |
| $ | | 800 | | expiring 08/03/2009 @ 4.15% | | | (17,165 | ) |
| | 4,500 | | expiring 08/03/2009 @ 4.30% | | | (107,952 | ) |
| | 900 | | expiring 08/03/2009 @ 4.40% | | | (24,259 | ) |
| | 4,900 | | expiring 08/03/2009 @ 4.55% | | | (153,668 | ) |
| | 500 | | expiring 08/28/2009 @ 5.32% | | | (29,434 | ) |
| | 600 | | expiring 08/28/2009 @ 5.32% | | | (35,321 | ) |
| EUR | | 700 | | expiring 09/14/2009 @ 4.23% | | | (15,555 | ) |
| | | | | | | | |
| | | | TOTAL OPTIONS WRITTEN
(premiums received $346,377) | | | (383,354 | ) |
| | | | | | | | |
Principal
Amount (000)# | | SECURITY SOLD SHORT—(0.4%) | | | |
| | | |
| | | | U.S. Treasury Obligation | | | | |
| | | | U.S. Treasury Bonds
5.00%, 05/15/37 | | | | |
| | 100 | | (proceeds received $110,987) | | | (110,141 | ) |
| | | | | | | | |
| | | |
| | | | TOTAL INVESTMENTS, NET OF OPTIONS WRITTEN AND SECURITY SOLD SHORT—176.4%
(cost $53,504,548; Note 5) | | | 51,762,695 | |
| | | | Other liabilities in excess of other assets(x)—(76.4%) | | | (22,416,732 | ) |
| | | | | | | | |
| | | | NET ASSETS—100% | | $ | 29,345,963 | |
| | | | | | | | |
The following abbreviations are used in Portfolio descriptions:
144A—Security was purchased pursuant to Rule 144A under the Securities Act of 1933 and may not be resold subject to that rule except to qualified institutional buyers. Unless otherwise noted, 144A securities are deemed to be liquid.
TBA—To Be Announced
AED—United Arab Emirates Dirham
AUD—Australian Dollar
BRL—Brazilian Real
CAD—Canadian Dollar
CNY—Chinese Yuan
DKK—Danish Krone
EUR—Euro
GBP—British Pound
HUF—Hungarian Forint
INR—Indian Rupee
See Notes to Financial Statements.
| | |
| THE TARGET PORTFOLIO TRUST | | 101 |
| | |
International Bond Portfolio (continued) | | Portfolio of Investments
As of October 31, 2008 |
JPY—Japanese Yen
KRW—South Korean Won
MXN—Mexican Peso
MYR—Malaysian Ringgit
PHP—Philippine Peso
PLN—Polish Zloty
RUB—Russian Ruble
SAR—Saudi Arabian Riyal
SEK—Swedish Krona
SGD—Singapore Dollar
| * | Non-income producing security. |
| # | Principal amount is shown in U.S. dollars unless otherwise stated. |
| (c) | Indicates a variable rate security. |
| (e) | Repurchase agreement is collateralized by United States Treasury or federal agency obligations. |
| (f) | Private Placement restricted as to resale and does not have a readily available market. The aggregate original cost of such securities is $2,107,572. The aggregate value of $1,755,324 is approximately 6.0% of net assets. |
| (g) | Indicates a security that has been deemed illiquid. |
| (i) | Represents issuer in default on interest payments. Non-income producing security. |
| (n) | Rate shown is the effective yield at purchase date. |
| (w) | Prudential Investments LLC, the manager of the Portfolio, also serves as manager of the Dryden Core Investment Fund-Taxable Money Market Series. |
| (x) | Other liabilities in excess of other assets includes net unrealized appreciation (depreciation) on futures contracts, forward foreign currency exchange contracts, interest rate and credit default swap agreements as follows: |
Open future contracts outstanding at October 31, 2008:
| | | | | | | | | | | | | | |
Number of
Contracts | | Type | | Expiration
Month | | Value at
Trade
Date | | Value at
October 31,
2008 | | Unrealized
Appreciation
(Depreciation) | |
| | Long Positions: | | | | | | | | | | | | |
| 14 | | 90 Day Euro | | Sep 09 | | $ | 3,390,900 | | $ | 3,408,475 | | $ | 17,575 | |
| 13 | | 90 Day Euro | | Dec 09 | | | 3,150,875 | | | 3,157,700 | | | 6,825 | |
| 23 | | 90 Day Euro | | Mar 10 | | | 5,576,912 | | | 5,580,950 | | | 4,038 | |
| 16 | | 90 Day Euro Euribor | | Dec 08 | | | 4,837,932 | | | 4,911,355 | | | 73,423 | |
| 1 | | 90 Day Euro Euribor | | Jun 09 | | | 306,545 | | | 309,381 | | | 2,836 | |
| 2 | | 90 Day Euro Euribor | | Sep 09 | | | 613,346 | | | 618,890 | | | 5,544 | |
| 11 | | 5 Year Euro-Bobl | | Dec 08 | | | 1,527,821 | | | 1,573,331 | | | 45,510 | |
| 2 | | 10 Year Euro-Bund | | Dec 08 | | | 291,740 | | | 295,517 | | | 3,777 | |
| 3 | | 10 Year Long Gilt | | Dec 08 | | | 539,534 | | | 537,313 | | | (2,221 | ) |
| 2 | | 10 Year U.S. Treasury Note | | Dec 08 | | | 237,750 | | | 226,156 | | | (11,594 | ) |
| | | | | | | | | | | | | | |
| | | | | | | | | | | | | 145,713 | |
| | | | | | | | | | | | | | |
| | Short Positions: | | | | | | | | | | | | |
| 4 | | 3 Month Bank Acceptance | | Dec 08 | | | 804,945 | | | 812,246 | | | (7,301 | ) |
| 44 | | 2 Year Euro-Schatz | | Dec 08 | | | 5,806,549 | | | 5,945,347 | | | (138,798 | ) |
| 10 | | 3 Year Aust Bond | | Dec 08 | | | 1,566,571 | | | 1,580,347 | | | (13,776 | ) |
| 6 | | 30 Year Euro Buxl Bond | | Dec 08 | | | 692,999 | | | 701,717 | | | (8,718 | ) |
| | | | | | | | | | | | | | |
| | | | | | | | | | | | | (168,593 | ) |
| | | | | | | | | | | | | | |
| | | | | | | | | | | | $ | (22,880 | )(1) |
| | | | | | | | | | | | | | |
(1) | Cash of $190,600 has been segregated with the broker to cover requirements for open futures contracts at October 31, 2008. |
See Notes to Financial Statements.
| | |
| 102 | | THE TARGET PORTFOLIO TRUST |
Forward foreign currency exchange contracts outstanding at October 31, 2008:
| | | | | | | | | | | | | |
Purchase Contracts | | Notional
Amount
(000) | | Value at Settlement
Date Payable | | Current
Value | | Unrealized
Appreciation
(Depreciation) | |
Australian Dollar, | | | | | | | | | | | | | |
Expiring 11/28/08 | | AUD | 97 | | $ | 58,281 | | $ | 64,461 | | $ | 6,180 | |
Brazilian Real, | | | | | | | | | | | | | |
Expiring 12/02/08 | | BRL | 970 | | | 564,505 | | | 442,075 | | | (122,430 | ) |
Expiring 06/02/09 | | BRL | 69 | | | 36,496 | | | 30,523 | | | (5,973 | ) |
British Pound, | | | | | | | | | | | | | |
Expiring 11/03/08 | | GBP | 15 | | | 24,109 | | | 23,818 | | | (291 | ) |
Chinese Yuan, | | | | | | | | | | | | | |
Expiring 11/13/08 | | CNY | 654 | | | 96,000 | | | 95,460 | | | (540 | ) |
Expiring 05/06/09 | | CNY | 4,509 | | | 682,257 | | | 645,960 | | | (36,297 | ) |
Expiring 07/15/09 | | CNY | 960 | | | 149,000 | | | 137,222 | | | (11,778 | ) |
Expiring 09/08/09 | | CNY | 554 | | | 80,000 | | | 79,096 | | | (904 | ) |
Expiring 05/17/10 | | CNY | 649 | | | 105,000 | | | 90,638 | | | (14,362 | ) |
Euro, | | | | | | | | | | | | | |
Expiring 11/03/08 | | EUR | 1,855 | | | 2,403,776 | | | 2,364,292 | | | (39,484 | ) |
Expiring 11/05/08 | | EUR | 69 | | | 90,531 | | | 87,944 | | | (2,587 | ) |
Expiring 12/04/08 | | EUR | 29 | | | 36,903 | | | 36,617 | | | (286 | ) |
Hungarian Forint, | | | | | | | | | | | | | |
Expiring 11/19/08 | | HUF | 455 | | | 2,854 | | | 2,229 | | | (625 | ) |
Indian Rupee, | | | | | | | | | | | | | |
Expiring 11/12/08 | | INR | 12,570 | | | 308,053 | | | 253,394 | | | (54,659 | ) |
Expiring 04/09/09 | | INR | 820 | | | 16,283 | | | 16,399 | | | 116 | |
Japanese Yen, | | | | | | | | | | | | | |
Expiring 11/05/08 | | JPY | 461,628 | | | 4,701,848 | | | 4,686,098 | | | (15,750 | ) |
Malaysian Ringgit, | | | | | | | | | | | | | |
Expiring 11/12/08 | | MYR | 2,453 | | | 786,072 | | | 690,613 | | | (95,459 | ) |
Expiring 02/12/09 | | MYR | 190 | | | 54,399 | | | 53,702 | | | (697 | ) |
Expiring 04/14/09 | | MYR | 211 | | | 60,000 | | | 59,538 | | | (462 | ) |
Mexican Peso, | | | | | | | | | | | | | |
Expiring 11/19/08 | | MXN | 7 | | | 695 | | | 570 | | | (125 | ) |
Expiring 05/19/09 | | MXN | 7 | | | 676 | | | 548 | | | (128 | ) |
Philippine Peso, | | | | | | | | | | | | | |
Expiring 11/12/08 | | PHP | 2,100 | | | 47,364 | | | 42,909 | | | (4,455 | ) |
Expiring 02/06/09 | | PHP | 2,440 | | | 52,580 | | | 49,779 | | | (2,801 | ) |
Expiring 05/06/09 | | PHP | 1,452 | | | 30,000 | | | 29,550 | | | (450 | ) |
Polish Zloty, | | | | | | | | | | | | | |
Expiring 11/19/08 | | PLN | 40 | | | 14,302 | | | 14,552 | | | 250 | |
Russian Ruble, | | | | | | | | | | | | | |
Expiring 11/05/08 | | RUB | 25,976 | | | 1,043,004 | | | 953,943 | | | (89,061 | ) |
Expiring 11/19/08 | | RUB | 19,368 | | | 685,711 | | | 715,455 | | | 29,744 | |
Expiring 05/06/09 | | RUB | 19,443 | | | 720,340 | | | 626,828 | | | (93,512 | ) |
Saudi Arabian Riyal, | | | | | | | | | | | | | |
Expiring 04/16/09 | | SAR | 373 | | | 101,000 | | | 98,939 | | | (2,061 | ) |
Singapore Dollar, | | | | | | | | | | | | | |
Expiring 11/12/08 | | SGD | 155 | | | 106,254 | | | 104,280 | | | (1,974 | ) |
Expiring 11/21/08 | | SGD | 121 | | | 86,147 | | | 81,337 | | | (4,810 | ) |
Expiring 01/16/09 | | SGD | 15 | | | 10,000 | | | 9,942 | | | (58 | ) |
Expiring 04/14/09 | | SGD | 59 | | | 40,000 | | | 39,806 | | | (194 | ) |
South Korean Won, | | | | | | | | | | | | | |
Expiring 11/04/08 | | KRW | 14,716 | | | 9,910 | | | 11,399 | | | 1,489 | |
Expiring 02/09/09 | | KRW | 109,965 | | | 107,619 | | | 88,709 | | | (18,910 | ) |
United Arab Emirates Dirham, | | | | | | | | | | | | | |
Expiring 04/16/09 | | AED | 443 | | | 123,000 | | | 119,558 | | | (3,442 | ) |
| | | | | | | | | | | | | |
| | | | | $ | 13,434,969 | | $ | 12,848,183 | | $ | (586,786 | ) |
| | | | | | | | | | | | | |
See Notes to Financial Statements.
| | |
| THE TARGET PORTFOLIO TRUST | | 103 |
| | |
International Bond Portfolio (continued) | | Portfolio of Investments
As of October 31, 2008 |
Forward foreign currency exchange contracts outstanding at October 31, 2008 (continued):
| | | | | | | | | | | | | |
| | | | |
Sale Contracts | | Notional
Amount
(000) | | Value at Settlement
Date Receivable | | Current
Value | | Unrealized
Appreciation
(Depreciation) | |
Australian Dollar, | | | | | | | | | | | | | |
Expiring 11/06/08 | | AUD | 1,203 | | $ | 818,079 | | $ | 799,749 | | $ | 18,330 | |
Expiring 11/24/08 | | AUD | 15 | | | 9,280 | | | 9,968 | | | (688 | ) |
Brazilian Real, | | | | | | | | | | | | | |
Expiring 12/02/08 | | BRL | 970 | | | 528,224 | | | 442,075 | | | 86,149 | |
British Pound, | | | | | | | | | | | | | |
Expiring 11/03/08 | | GBP | 19 | | | 34,572 | | | 30,571 | | | 4,001 | |
Expiring 11/05/08 | | GBP | 309 | | | 538,782 | | | 497,289 | | | 41,493 | |
Expiring 12/09/08 | | GBP | 25 | | | 40,791 | | | 40,016 | | | 775 | |
Canadian Dollar, | | | | | | | | | | | | | |
Expiring 11/05/08 | | CAD | 193 | | | 163,168 | | | 160,126 | | | 3,042 | |
Chinese Yuan, | | | | | | | | | | | | | |
Expiring 11/13/08 | | CNY | 655 | | | 95,347 | | | 95,667 | | | (320 | ) |
Expiring 05/06/09 | | CNY | 4,509 | | | 649,000 | | | 645,959 | | | 3,041 | |
Expiring 07/15/09 | | CNY | 960 | | | 137,109 | | | 137,222 | | | (113 | ) |
Expiring 09/08/09 | | CNY | 554 | | | 78,479 | | | 79,097 | | | (618 | ) |
Expiring 05/17/10 | | CNY | 649 | | | 90,386 | | | 90,638 | | | (252 | ) |
Danish Krone | | | | | | | | | | | | | |
Expiring 12/09/08 | | DKK | 3,163 | | | 610,972 | | | 540,056 | | | 70,916 | |
Euro, | | | | | | | | | | | | | |
Expiring 11/05/08 | | EUR | 69 | | | 87,585 | | | 87,944 | | | (359 | ) |
Expiring 12/04/08 | | EUR | 8,762 | | | 11,083,129 | | | 11,153,041 | | | (69,912 | ) |
Indian Rupee, | | | | | | | | | | | | | |
Expiring 11/12/08 | | INR | 12,570 | | | 282,416 | | | 253,447 | | | 28,969 | |
Japanese Yen, | | | | | | | | | | | | | |
Expiring 11/05/08 | | JPY | 461,628 | | | 4,580,669 | | | 4,686,129 | | | (105,460 | ) |
Expiring 12/03/08 | | JPY | 410,143 | | | 4,190,927 | | | 4,168,735 | | | 22,192 | |
Malaysian Ringgit, | | | | | | | | | | | | | |
Expiring 11/12/08 | | MYR | 2,425 | | | 708,364 | | | 682,872 | | | 25,492 | |
Expiring 02/12/09 | | MYR | 307 | | | 85,000 | | | 86,563 | | | (1,563 | ) |
Mexican Peso, | | | | | | | | | | | | | |
Expiring 11/19/08 | | MXN | 7 | | | 692 | | | 570 | | | 122 | |
Philippine Peso, | | | | | | | | | | | | | |
Expiring 11/12/08 | | PHP | 2,100 | | | 44,046 | | | 42,923 | | | 1,123 | |
Expiring 02/06/09 | | PHP | 2,993 | | | 58,000 | | | 61,281 | | | (3,281 | ) |
Polish Zloty, | | | | | | | | | | | | | |
Expiring 11/19/08 | | PLN | 40 | | | 13,000 | | | 14,552 | | | (1,552 | ) |
Expiring 05/06/09 | | PLN | 40 | | | 14,216 | | | 14,422 | | | (206 | ) |
Russian Ruble, | | | | | | | | | | | | | |
Expiring 11/05/08 | | RUB | 25,976 | | | 1,004,756 | | | 958,078 | | | 46,678 | |
Expiring 11/19/08 | | RUB | 19,368 | | | 781,605 | | | 699,766 | | | 81,839 | |
Expiring 05/06/09 | | RUB | 17,877 | | | 533,654 | | | 576,366 | | | (42,712 | ) |
Saudi Arabian Riyal, | | | | | | | | | | | | | |
Expiring 04/16/09 | | SAR | 373 | | | 99,229 | | | 98,939 | | | 290 | |
Singapore Dollar, | | | | | | | | | | | | | |
Expiring 11/12/08 | | SGD | 155 | | | 108,000 | | | 104,299 | | | 3,701 | |
Expiring 11/21/08 | | SGD | 117 | | | 80,000 | | | 78,607 | | | 1,393 | |
Expiring 01/16/09 | | SGD | 85 | | | 57,563 | | | 57,421 | | | 142 | |
See Notes to Financial Statements.
| | |
| 104 | | THE TARGET PORTFOLIO TRUST |
Forward foreign currency exchange contracts outstanding at October 31, 2008 (continued):
| | | | | | | | | | | | | |
| | | | |
Sale Contracts (continued) | | Notional
Amount
(000) | | Value at Settlement
Date Receivable | | Current
Value | | Unrealized
Appreciation
(Depreciation) | |
South Korean Won, | | | | | | | | | | | | | |
Expiring 11/04/08 | | KRW | 14,716 | | $ | 13,000 | | $ | 11,408 | | $ | 1,592 | |
Expiring 02/09/09 | | KRW | 109,410 | | | 100,025 | | | 85,881 | | | 14,144 | |
Swedish Krona, | | | | | | | | | | | | | |
Expiring 12/09/08 | | SEK | 72 | | | 9,000 | | | 9,225 | | | (225 | ) |
United Arab Emirates Dirham, | | | | | | | | | | | | | |
Expiring 04/16/09 | | AED | 443 | | | 120,634 | | | 119,558 | | | 1,076 | |
| | | | | | | | | | | | | |
| | | | | $ | 27,849,699 | | $ | 27,620,460 | | $ | 229,239 | |
| | | | | | | | | | | | | |
Interest rate swap agreements outstanding at October 31, 2008:
| | | | | | | | | | | | | |
Counterparty | | Termination
Date | | Notional
Amount#
(000) | | Fixed
Rate | | | Floating
Rate | | Unrealized
Appreciation
(Depreciation) | |
Barclays Capital(2) | | 12/18/15 | | $ | 21,200 | | 5.00 | % | | 3 month LIBOR | | $ (26,903 | ) |
Barclays Capital(2) | | 12/17/38 | | | 1,600 | | 5.00 | % | | 3 month LIBOR | | (179,446 | ) |
Deutsche Bank(1) | | 12/17/13 | | | 800 | | 4.00 | % | | 3 month LIBOR | | (8,301 | ) |
Morgan Stanley Capital Services, Inc.(1) | | 06/17/10 | | | 200 | | 4.00 | % | | 3 month LIBOR | | 812 | |
Morgan Stanley Capital Services, Inc.(2) | | 12/17/18 | | | 800 | | 5.00 | % | | 3 month LIBOR | | (24,191 | ) |
Deutsche Bank(1) | | 06/15/13 | | AUD | 800 | | 7.75 | % | | 3 month Australian
Bank Bill rate | | 14,604 | |
Morgan Stanley Capital Services, Inc.(1) | | 09/15/09 | | AUD | 500 | | 7.00 | % | | 3 month Australian
Bank Bill rate | | 4,929 | |
Credit Suisse International(2) | | 06/15/17 | | AUD | 900 | | 6.50 | % | | 6 month Australian
Bank Bill rate | | (44,151 | ) |
Deutsche Bank(1) | | 06/15/13 | | AUD | 500 | | 7.25 | % | | 6 month Australian
Bank Bill rate | | 39,794 | |
Deutsche Bank(1) | | 06/15/10 | | AUD | 600 | | 7.00 | % | | 6 month Australian
Bank Bill rate | | 8,113 | |
Deutsche Bank(2) | | 12/15/17 | | AUD | 200 | | 6.75 | % | | 6 month Australian
Bank Bill rate | | (10,049 | ) |
UBS AG(1) | | 06/16/11 | | AUD | 1,100 | | 7.25 | % | | 6 month Australian
Bank Bill rate | | 42,683 | |
UBS AG(1) | | 03/15/11 | | AUD | 400 | | 7.50 | % | | 6 month Australian
Bank Bill rate | | 11,827 | |
Bank of America Securities LLC(2) | | 12/20/13 | | CAD | 600 | | 4.25 | % | | 3 month Canadian
Bank floating rate | | (23,944 | ) |
Merrill Lynch & Co.(2) | | 12/20/13 | | CAD | 300 | | 4.25 | % | | 3 month Canadian
Bank floating rate | | (7,568 | ) |
Citigroup(1) | | 03/18/11 | | EUR | 700 | | 4.50 | % | | 6 month EURIBOR | | 18,203 | |
Credit Suisse International(1) | | 03/18/14 | | EUR | 300 | | 4.50 | % | | 6 month EURIBOR | | 9,366 | |
Deutsche Bank(1) | | 09/17/13 | | EUR | 1,400 | | 4.00 | % | | 6 month EURIBOR | | (10,726 | ) |
Deutsche Bank(2) | | 03/18/16 | | EUR | 3,300 | | 4.50 | % | | 6 month EURIBOR | | (60,819 | ) |
Goldman Sachs & Co.(1) | | 09/19/09 | | EUR | 8,000 | | 4.00 | % | | 6 month EURIBOR | | 4,833 | |
Goldman Sachs & Co.(1) | | 03/18/14 | | EUR | 300 | | 4.50 | % | | 6 month EURIBOR | | 11,940 | |
Goldman Sachs & Co.(2) | | 03/18/16 | | EUR | 2,400 | | 4.50 | % | | 6 month EURIBOR | | (69,891 | ) |
Morgan Stanley Capital Services, Inc.(1) | | 09/19/09 | | EUR | 400 | | 4.00 | % | | 6 month EURIBOR | | 462 | |
Morgan Stanley Capital Services, Inc.(1) | | 03/18/14 | | EUR | 1,100 | | 4.50 | % | | 6 month EURIBOR | | 29,281 | |
Morgan Stanley Capital Services, Inc.(1) | | 03/19/10 | | EUR | 900 | | 4.50 | % | | 6 month EURIBOR | | 7,768 | |
Morgan Stanley Capital Services, Inc.(1) | | 12/15/14 | | EUR | 100 | | 4.00 | % | | 6 month EURIBOR | | 1,581 | |
See Notes to Financial Statements.
| | |
| THE TARGET PORTFOLIO TRUST | | 105 |
| | |
International Bond Portfolio (continued) | | Portfolio of Investments
As of October 31, 2008 |
Interest rate swap agreements outstanding at October 31, 2008 (continued):
| | | | | | | | | | | | | | |
Counterparty | | Termination
Date | | Notional
Amount#
(000) | | Fixed
Rate | | | Floating
Rate | | Unrealized
Appreciation
(Depreciation) | |
Barclays Capital(1) | | 04/30/12 | | EUR | 500 | | 1.98 | % | | FRC-Excluding
Tobacco-Non-Revised
Consumer Price Index | | $ | 6,341 | |
Goldman Sachs & Co.(1) | | 06/15/12 | | EUR | 300 | | 2.08 | % | | FRC-Excluding
Tobacco-Non-Revised
Consumer Price Index | | | 6,231 | |
Barclays Capital(1) | | 03/18/16 | | GBP | 100 | | 5.00 | % | | 6 month LIBOR | | | 2,837 | |
Barclays Capital(2) | | 12/15/35 | | GBP | 200 | | 4.00 | % | | 6 month LIBOR | | | 27,220 | |
Credit Suisse International(1) | | 03/18/14 | | GBP | 600 | | 5.00 | % | | 6 month LIBOR | | | 26,089 | |
Deutsche Bank(2) | | 09/17/18 | | GBP | 200 | | 5.00 | % | | 6 month LIBOR | | | (16,490 | ) |
Goldman Sachs & Co.(1) | | 03/20/13 | | GBP | 300 | | 5.00 | % | | 6 month LIBOR | | | 16,243 | |
Goldman Sachs & Co.(1) | | 03/20/13 | | GBP | 200 | | 5.50 | % | | 6 month LIBOR | | | 11,165 | |
Morgan Stanley Capital Services, Inc.(1) | | 03/18/14 | | GBP | 600 | | 5.00 | % | | 6 month LIBOR | | | 21,169 | |
Morgan Stanley Capital Services, Inc.(2) | | 06/18/34 | | GBP | 100 | | 5.00 | % | | 6 month LIBOR | | | 4,299 | |
Barclays Capital(1) | | 03/18/09 | | JPY | 410,000 | | 1.00 | % | | 6 month LIBOR | | | 3,275 | |
Barclays Capital(2) | | 12/17/17 | | JPY | 50,000 | | 2.00 | % | | 6 month LIBOR | | | (19,351 | ) |
Deutsche Bank(1) | | 06/17/13 | | JPY | 70,000 | | 1.50 | % | | 6 month LIBOR | | | 9,954 | |
Deutsche Bank(2) | | 12/20/27 | | JPY | 40,000 | | 2.50 | % | | 6 month LIBOR | | | (34,281 | ) |
Deutsche Bank(2) | | 12/17/17 | | JPY | 240,000 | | 2.00 | % | | 6 month LIBOR | | | (88,759 | ) |
Deutsche Bank(2) | | 12/17/10 | | JPY | 150,000 | | 1.30 | % | | 6 month LIBOR | | | (15,707 | ) |
Goldman Sachs & Co.(2) | | 06/20/36 | | JPY | 10,000 | | 3.00 | % | | 6 month LIBOR | | | (17,551 | ) |
Morgan Stanley Capital Services, Inc.(1) | | 12/17/15 | | JPY | 260,000 | | 1.75 | % | | 6 month LIBOR | | | 81,584 | |
Morgan Stanley Capital Services, Inc.(2) | | 09/27/16 | | JPY | 100,000 | | 1.98 | % | | 6 month LIBOR | | | (43,319 | ) |
UBS AG(1) | | 06/17/13 | | JPY | 220,000 | | 1.50 | % | | 6 month LIBOR | | | 41,588 | |
UBS AG(2) | | 12/17/17 | | JPY | 30,000 | | 2.00 | % | | 6 month LIBOR | | | (7,674 | ) |
Barclays Capital(1) | | 03/18/14 | | SEK | 2,000 | | 4.50 | % | | 3 month Stockholm
interbank offered rate | | | 9,207 | |
| | | | | | | | | | | | | | |
| | | | | | | | | | | | $ | (235,723 | ) |
| | | | | | | | | | | | | | |
| (1) | Portfolio pays the floating rate and receives the fixed rate. |
| (2) | Portfolio pays the fixed rate and receives the floating rate. |
| # | Notional Amount is shown in U.S. dollars unless otherwise stated. |
Credit default swap agreements outstanding at October 31, 2008:
| | | | | | | | | | | | | | |
| Sell Protection: | | | | | | | | | | | | | | |
Counterparty | | Termination
Date | | Notional
Amount#
(000) | | Fixed
Rate | | | Reference
Entity/Obligation | | Unrealized
Depreciation | |
Goldman Sachs & Co.(1) | | 03/20/13 | | $ | 100 | | 1.32 | % | | General Electric Capital Corp., 6.00%, due 06/15/12 | | $ | (13,743 | ) |
Morgan Stanley Capital Services, Inc.(1) | | 04/20/09 | | | 200 | | 1.68 | % | | JSC GAZPROM | | | (9,470 | ) |
Goldman Sachs & Co.(1) | | 03/20/13 | | | 1,100 | | 0.27 | % | | Kingdom of Spain, 5.50%, due 07/30/17 | | | (21,528 | ) |
See Notes to Financial Statements.
| | |
| 106 | | THE TARGET PORTFOLIO TRUST |
Credit default swap agreements outstanding at October 31, 2008 (continued):
| | | | | | | | | | | | | | |
| Sell Protection: (continued) | | | | | | | | | | | | |
Counterparty | | Termination
Date | | Notional
Amount#
(000) | | Fixed
Rate | | | Reference
Entity/Obligation | | Unrealized
Depreciation | |
Goldman Sachs & Co.(1) | | 05/20/12 | | $ | 100 | | 0.82 | % | | OJSC Russian Agriculture Bank, 6.875%, due 11/29/10 | | $ | (29,755 | ) |
Morgan Stanley Capital Services, Inc.(1) | | 02/20/09 | | | 400 | | 0.49 | % | | Russian Federation, 7.50%, due 03/31/30 | | | (8,764 | ) |
Citigroup(1) | | 03/20/09 | | | 100 | | 4.30 | % | | SLM Corp., 5.125%, due 08/27/12 | | | (4,694 | ) |
Goldman Sachs & Co.(1) | | 03/20/09 | | | 100 | | 3.30 | % | | SLM Corp., 5.125%, due 08/27/12 | | | (5,177 | ) |
| | | | | | | | | | | | | | |
| | | | | | | | | | | | $ | (93,131 | ) |
| | | | | | | | | | | | | | |
| (1) | Portfolio pays the counterparty par in the event that the reference entity defaults and receives the fixed rate. |
| # | Notional Amount is shown in U.S. dollars unless otherwise stated. |
| | | | | | | | | | | | | | |
| Buy Protection: | | | | | | | | | | | | | | |
Counterparty | | Termination
Date | | Notional
Amount#
(000) | | Fixed
Rate | | | Reference
Entity/Obligation | | Unrealized
Appreciation
(Depreciation) | |
Credit Suisse International(2) | | 03/20/11 | | $ | 100 | | 0.16 | % | | Avon Products, Inc., 5.125%, due 01/15/11 | | $ | 800 | |
Barclays Capital(2) | | 12/20/13 | | | 900 | | 3.60 | % | | Citigroup, Inc., 6.50%, due 01/18/11 | | | (54,852 | ) |
Morgan Stanley Capital Services, Inc.(2) | | 03/20/11 | | | 100 | | 0.20 | % | | Cox Communications, Inc., 6.75%, due 03/15/11 | | | 1,358 | |
Barclays Capital(2) | | 09/20/13 | | | 100 | | 0.76 | % | | Deutsche Bank AG, 4.875%, due 05/20/13 | | | 2,664 | |
Barclays Capital(2) | | 06/20/13 | | | 1,464 | | 1.55 | % | | Dow Jones CDX IG10 5Y Index | | | 45,940 | |
Deutsche Bank(2) | | 06/20/13 | | | 98 | | 1.55 | % | | Dow Jones CDX IG10 5Y Index | | | 3,264 | |
Goldman Sachs & Co.(2) | | 06/20/13 | | | 1,464 | | 1.55 | % | | Dow Jones CDX IG10 5Y Index | | | 46,635 | |
Morgan Stanley Capital Services, Inc.(2) | | 06/20/13 | | | 98 | | 1.55 | % | | Dow Jones CDX IG10 5Y Index | | | 3,327 | |
Merrill Lynch & Co.(2) | | 12/20/13 | | | 300 | | 1.50 | % | | Dow Jones CDX IG11 5Y Index | | | (512 | ) |
Barclays Capital(2) | | 06/20/17 | | | 781 | | 0.60 | % | | Dow Jones CDX IG8 Index | | | 58,587 | |
Merrill Lynch & Co.(2) | | 06/20/15 | | | 100 | | 0.52 | % | | Exelon Corp., 4.90%, due 06/15/15 | | | 15,937 | |
Morgan Stanley Capital Services, Inc.(2) | | 06/20/09 | | | 100 | | 0.23 | % | | Federated Department Stores, 6.30%, due 04/01/09 | | | 2,828 | |
Bank of America Securities LLC(2) | | 06/20/12 | | | 100 | | 0.46 | % | | GlobalSantaFe Corp., 5.00%, due 02/15/13 | | | 818 | |
UBS AG(2) | | 06/20/16 | | | 100 | | 0.31 | % | | Goldman Sachs Group, Inc. (The), 5.25%, due 06/01/16 | | | 15,200 | |
Credit Suisse International(2) | | 03/20/12 | | | 100 | | 0.45 | % | | iStar Financial, Inc., 5.15%, due 03/01/12 | | | 54,751 | |
Deutsche Bank(2) | | 06/20/18 | | EUR | 700 | | 1.75 | % | | iTraxx Europe HiVol Series 9 | | | 41,844 | |
JPMorgan Chase(2) | | 03/20/11 | | | 100 | | 0.28 | % | | Johnson Controls, Inc., 5.25%, due 01/15/11 | | | 5,930 | |
Barclays Capital(2) | | 06/20/11 | | | 100 | | 0.21 | % | | National Grid PLC, 5.00%, due 07/02/18 | | | 4,431 | |
Citigroup(2) | | 06/20/10 | | | 100 | | 0.13 | % | | Newell Rubbermaid, Inc., 4.00%, due 05/01/10 | | | 1,213 | |
See Notes to Financial Statements.
| | |
| THE TARGET PORTFOLIO TRUST | | 107 |
| | |
International Bond Portfolio (continued) | | Portfolio of Investments
As of October 31, 2008 |
Credit default swap agreements outstanding at October 31, 2008 (continued):
| | | | | | | | | | | | | |
| Buy Protection: (continued) | | | | | | | | | | | | | |
Counterparty | | Termination
Date | | Notional
Amount#
(000) | | Fixed
Rate | | | Reference
Entity/Obligation | | Unrealized
Appreciation
(Depreciation) |
JPMorgan Chase(2) | | 09/20/11 | | $ | 100 | | 0.93 | % | | Sabre Holdings Corp., 7.35%, due 08/01/11 | | $ | 42,036 |
Merrill Lynch & Co.(2) | | 03/20/12 | | | 100 | | 0.46 | % | | Sprint Capital Corp., 8.375%, due 03/15/12 | | | 15,490 |
UBS AG(2) | | 06/20/11 | | | 100 | | 0.47 | % | | Viacom, Inc., 5.75%, due 04/30/11 | | | 1,425 |
| | | | | | | | | | | | | |
| | | | | | | | | | | | $ | 309,114 |
| | | | | | | | | | | | | |
| (2) | Portfolio pays the fixed rate and receives from the counterparty par in the event that the reference entity defaults. |
| # | Notional Amount is shown in U.S. dollars unless otherwise stated. |
The industry classification of investments and other liabilities in excess of other assets shown as a percentage of net assets as of October 31, 2008 were as follows:
| | | |
Foreign Bonds | | 104.3 | % |
U.S. Government Mortgage Backed Obligations | | 29.0 | |
Asset Backed Securities | | 10.5 | |
Financials | | 9.0 | |
Collateralized Mortgage Obligations | | 8.7 | |
Repurchase Agreement | | 2.4 | |
Financial—Bank & Trust | | 2.2 | |
Commercial Banks | | 1.9 | |
Options Purchased | | 1.8 | |
Municipal Bonds | | 1.3 | |
Affiliated Money Market Mutual Fund | | 1.0 | |
U.S. Government Agency Obligations | | 1.0 | |
U.S. Treasury Obligation | | 0.8 | |
Electric Utilities | | 0.6 | |
Insurance | | 0.6 | |
Media | | 0.6 | |
Retail | | 0.6 | |
Auto Parts & Equipment | | 0.3 | |
Cosmetics & Toiletries | | 0.3 | |
Housewares | | 0.3 | |
Pipelines | | 0.3 | |
Telecommunications | | 0.3 | |
Leisure | | 0.2 | |
Real Estate Investment Trusts | | 0.1
|
|
| | | |
| | 178.1 | |
Options Written and Security Sold Short | | (1.7 | ) |
Other liabilities in excess of other assets | | (76.4 | ) |
| | | |
| | 100.0 | % |
| | | |
See Notes to Financial Statements.
| | |
| 108 | | THE TARGET PORTFOLIO TRUST |
| | |
Portfolio of Investments
As of October 31, 2008 | | Total Return Bond Portfolio |
| | | | | | | | |
MOODY’S
RATINGS†
(UNAUDITED) | | PRINCIPAL
AMOUNT (000)# | | DESCRIPTION | | VALUE (NOTE 1) |
| | | | | | | | |
| | | | | LONG-TERM INVESTMENTS—153.7% | | | |
| | | |
| | | | | ASSET-BACKED SECURITIES—2.3% | | | |
| | | | | Bear Stearns Second Lien Trust,
Series 2007-SV1A, Class A1, 144A (original cost $373,986; purchased 01/15/08)(f)(g) | | | |
| Baa1 | | $ | 463 | | 3.479%(c), 12/25/36 | | $ | 312,033 |
| | | | | SLM Student Loan Trust,
Series 2008-9, Class A | | | |
| Aaa | | | 5,400 | | 5.035%(c), 04/25/23 | | | 4,928,343 |
| | | | | Structured Asset Securities Corp.,
Series 2005-7XS, Class 2A1A | | | |
| Aaa | | | 643 | | 4.90%(c), 04/25/35 | | | 399,687 |
| | | | | | | | |
| | | | | TOTAL ASSET-BACKED SECURITIES
(cost $6,395,598) | | | 5,640,063 |
| | | | | | | | |
| | | |
| | | | | BANK NOTES(c)—2.0% | | | |
| | | | | Cablevision, Term B2 10/27/08 (original cost $888,436; purchased 10/27/08)(f)(g) | | | |
| BA-(d) | | | 993 | | 4.57%, 02/24/13 | | | 854,144 |
| | | | | Chrysler Financial, Term, 144A (original cost $4,514,400; purchased 11/28/07)(f)(g) | | | |
| B+(d) | | | 4,752 | | 6.82%, 08/03/12 | | | 3,207,600 |
| | | | | Ford Motor Co., Term B (original cost $589,500;
purchased 12/12/06)(f)(g) | | | |
| B-(d) | | | 590 | | 7.59%, 11/29/13 | | | 323,804 |
| | | | | Las Vegas Sands, Term DD (original cost $417,364;
purchased 02/06/08)(f)(g) | | | |
| BA-(d) | | | 417 | | 5.52%, 05/23/14 | | | 233,724 |
| | | | | TXU Corp., Term B3(f)(g) | | | |
| B+(d) | | | 534 | | 6.30%, 10/10/14 (original cost $518,441; purchased 01/16/08) | | | 414,578 |
| B+(d) | | | 5 | | 7.26%, 10/10/14 (original cost $4,511; purchased 08/11/08) | | | 3,500 |
| B+(d) | | | 57 | | 7.64%, 10/10/14 (original cost $54,942; purchased 01/16/08) | | | 43,947 |
| | | | | | | | |
| | | | | TOTAL BANK NOTES
(cost $7,048,902) | | | 5,081,297 |
| | | | | | | | |
| | | |
| | | | | COLLATERALIZED MORTGAGE OBLIGATIONS—3.1% | | | |
| | | | | American Home Mortgage Investment Trust,
Series 2006-1, Class 2A1 | | | |
| Aaa | | | 1,387 | | 3.449%(c), 05/25/46 | | | 811,974 |
| | | | | American Housing Trust,
Series I, Class 5 | | | |
| AAA(d) | | | 2 | | 8.625%, 08/25/18 | | | 1,789 |
| | | | | Bear Stearns Adjustable Rate Mortgage Trust,
Series 2002-11, Class 1A1 | | | |
| Aaa | | | 92 | | 5.598%(c), 02/25/33 | | | 84,922 |
See Notes to Financial Statements.
| | |
| THE TARGET PORTFOLIO TRUST | | 109 |
| | |
Total Return Bond Portfolio (continued) | | Portfolio of Investments
As of October 31, 2008 |
| | | | | | | | |
MOODY’S
RATINGS†
(UNAUDITED) | | PRINCIPAL
AMOUNT (000)# | | DESCRIPTION | | VALUE (NOTE 1) |
| | | | | | | | |
| | | | | COLLATERALIZED MORTGAGE OBLIGATIONS (continued) | | | |
| | | | | Series 2005-4, Class 23A2 | | | |
| Aaa | | $ | 385 | | 5.366%(c), 05/25/35 | | $ | 319,694 |
| | | | | Series 2007-3, Class 1A1 | | | |
| AAA(d) | | | 1,387 | | 5.468%(c), 05/25/47 | | | 1,069,962 |
| | | | | Citigroup Mortgage Loan Trust, Inc.,
Series 2005-6, Class A2 | | | |
| Aaa | | | 625 | | 4.248%(c), 08/25/35 | | | 594,126 |
| | | | | Series 2007-10, Class 22AA | | | |
| AAA(d) | | | 1,388 | | 6.013%(c), 09/25/37 | | | 954,034 |
| | | | | Countrywide Alternative Loan Trust,
Series 2006-OA17, Class 1A1A | | | |
| Aaa | | | 1,386 | | 4.473%(c), 12/20/46 | | | 692,992 |
| | | | | Series 2006-OA9, Class 2A1A | | | |
| Aaa | | | 1,380 | | 4.488%(c), 07/20/46 | | | 747,502 |
| | | | | FHLMC Structured Pass—Through Securities,
Series T-61, Class 1A1 | | | |
| Aaa | | | 287 | | 4.255%(c), 07/25/44 | | | 261,199 |
| | | | | Indymac Adjustable Rate Mortgage Trust,
Series 2001-H2, Class A1 | | | |
| Aaa | | | 4 | | 4.906%(c), 01/25/32 | | | 4,122 |
| | | | | Merrill Lynch Mortgage Investors, Inc.,
Series 2005-A10, Class A | | | |
| Aaa | | | 311 | | 3.469%(c), 02/25/36 | | | 240,266 |
| | | | | Residential Funding Mortgage Securities I,
Series 2003-S9, Class A1 | | | |
| Aaa | | | 59 | | 6.50%, 03/25/32 | | | 54,622 |
| | | | | WaMu Mortgage Pass-Through Certificates,
Series 2003-R1, Class A1 | | | |
| Aaa | | | 1,475 | | 3.799%(c), 12/25/27 | | | 1,260,856 |
| | | | | Series 2007-OA2, Class 1A | | | |
| Aaa | | | 1,173 | | 3.365%(c), 03/25/47 | | | 538,588 |
| | | | | | | | |
| | | | | TOTAL COLLATERALIZED MORTGAGE OBLIGATIONS
(cost $8,182,915) | | | 7,636,648 |
| | | | | | | | |
| | | |
| | | | | CONVERTIBLE BOND—0.4% | | | |
| | | |
| | | | | Financial Services | | | |
| | | | | National City Corp.,
Sr. Unsec’d. Notes | | | |
| A3 | | | 1,200 | | 4.00%, 02/01/11
(cost $985,135) | | | 1,000,500 |
| | | | | | | | |
See Notes to Financial Statements.
| | |
| 110 | | THE TARGET PORTFOLIO TRUST |
| | | | | | | | |
MOODY’S
RATINGS†
(UNAUDITED) | | PRINCIPAL
AMOUNT (000)# | | DESCRIPTION | | VALUE (NOTE 1) |
| | | | | | | | |
| | | | | CORPORATE BONDS—31.2% | | | |
| | | |
| | | | | Aerospace—0.1% | | | |
| | | | | Goodrich Corp.,
Sr. Unsec’d. Notes | | | |
| Baa2 | | $ | 200 | | 6.29%, 07/01/16 | | $ | 181,243 |
| | | | | | | | |
| | | | | Airlines—0.1% | | | |
| | | | | United Air Lines, Inc.,
Equipment Trust(g)(i) | | | |
| NR | | | 825 | | 10.85%, 02/19/15 | | | 291,817 |
| | | | | | | | |
| | | |
| | | | | Automobile Manufacturers—0.1% | | | |
| | | | | DaimlerChrysler NA Holding Corp.,
Gtd. Notes, MTN | | | |
| A3 | | | 400 | | 5.75%, 09/08/11 | | | 320,309 |
| | | | | | | | |
| | | |
| | | | | Automotive Parts—0.4% | | | |
| | | | | Autozone, Inc.,
Sr. Unsec’d. Notes | | | |
| Baa2 | | | 1,100 | | 6.95%, 06/15/16 | | | 917,352 |
| | | | | | | | |
| | | |
| | | | | Computer Services & Software—0.5% | | | |
| | | | | Electronic Data Systems Corp.,
Sr. Unsec’d. Notes | | | |
| A2 | | | 1,200 | | 6.00%, 08/01/13 | | | 1,132,787 |
| | | | | | | | |
| | | |
| | | | | Electronic Components | | | |
| | | | | General Electric Co.,
Sr. Unsec’d. Notes | | | |
| Aaa | | | 100 | | 5.25%, 12/06/17 | | | 83,705 |
| | | | | | | | |
| | | |
| | | | | Financial—Bank & Trust—16.2% | | | |
| | | | | American Express Bank FSB,
Sr. Unsec’d. Notes | | | |
| A1 | | | 7,700 | | 5.50%, 04/16/13 | | | 6,318,766 |
| | | | | American Express Co.,
Sr. Unsec’d. Notes | | | |
| A2 | | | 1,100 | | 7.00%, 03/19/18 | | | 847,348 |
| | | | | Bank of America Corp.,
Jr. Sub. Notes | | | |
| A1 | | | 7,100 | | 8.00%(c), 12/29/49 | | | 5,315,841 |
| A1 | | | 2,700 | | 8.125%(c), 12/29/49 | | | 2,092,311 |
| | | | | Sr. Unsec’d. Notes | | | |
| Aa2 | | | 1,200 | | 5.079%(c), 10/14/16 | | | 1,064,878 |
| Aa2 | | | 300 | | 5.65%, 05/01/18 | | | 257,859 |
| | | | | Barclays Bank PLC,
Jr. Sub. Notes, 144A (United Kingdom)
(original cost $5,661,639; purchased 12/07/07)(f)(g) | | | |
| Aa2 | | | 5,700 | | 6.05%, 12/04/17 | | | 4,299,299 |
See Notes to Financial Statements.
| | |
| THE TARGET PORTFOLIO TRUST | | 111 |
| | |
Total Return Bond Portfolio (continued) | | Portfolio of Investments
As of October 31, 2008 |
| | | | | | | | |
MOODY’S
RATINGS†
(UNAUDITED) | | PRINCIPAL
AMOUNT (000)# | | DESCRIPTION | | VALUE (NOTE 1) |
| | | | | | | | |
| | | | | CORPORATE BONDS (continued) | | | |
| | | |
| | | | | Financial—Bank & Trust (continued) | | | |
| | | | | Citigroup, Inc.,
Jr. Sub. Notes | | | |
| A2 | | $ | 3,200 | | 8.40%(c), 04/29/49 | | $ | 2,224,320 |
| | | | | Sr. Unsec’d. Notes | | | |
| Aa3 | | | 6,300 | | 5.50%, 04/11/13 | | | 5,762,799 |
| | | | | Credit Suisse / New York NY,
Sr. Unsec’d. Notes, MTN (Switzerland) | | | |
| Aa1 | | | 3,900 | | 5.00%, 05/15/13 | | | 3,517,219 |
| | | | | Deutsche Bank AG,
Notes (Germany) | | | |
| Aa1 | | | 5,300 | | 4.875%, 05/20/13 | | | 4,938,964 |
| | | | | Goldman Sachs Group, Inc. (The),
Sub. Notes | | | |
| A1 | | | 500 | | 6.75%, 10/01/37 | | | 325,649 |
| | | | | Lehman Brothers Holdings, Inc.,(i)
Sr. Unsec’d. Notes, MTN | | | |
| NR | | | 3,500 | | 5.625%, 01/24/13 | | | 455,000 |
| NR | | | 900 | | 6.875%, 05/02/18 | | | 117,000 |
| | | | | Morgan Stanley,
Sr. Unsec’d. Notes, MTN | | | |
| A1 | | | 1,600 | | 4.904%(c), 05/14/10 | | | 1,472,309 |
| | | | | National Australia Bank Ltd.,
Bonds, 144A (Australia)
(original cost $1,200,000; purchased 02/01/08)(f)(g) | | | |
| Aa1 | | | 1,200 | | 2.838%(c), 02/08/10 | | | 1,199,813 |
| | | | | | | | |
| | | | | | | | 40,209,375 |
| | | | | | | | |
| | | |
| | | | | Financial Services—5.6% | | | |
| | | | | ANZ National International Ltd.,
Bank Gtd. Notes, 144A (New Zealand)
(original cost $2,697,462; purchased 07/09/08)(f)(g) | | | |
| Aa2 | | | 2,700 | | 6.20%, 07/19/13 | | | 2,436,850 |
| | | | | Caterpillar Financial Services Corp.,
Sr. Unsec’d. Notes, MTN | | | |
| A2 | | | 2,600 | | 4.226%(c), 06/24/11 | | | 2,200,734 |
| | | | | CitiFinancial, Inc.,
Sr. Unsec’d. Notes | | | |
| Aa3 | | | 400 | | 6.625%, 06/01/15 | | | 323,222 |
| | | | | Ford Motor Credit Co. LLC,
Sr. Unsec’d. Notes | | | |
| B3 | | | 1,100 | | 7.00%, 10/01/13 | | | 609,350 |
| | | | | General Electric Capital Corp.,
Sr. Unsec’d. Notes, MTN | | | |
| Aaa | | | 400 | | 5.875%, 01/14/38 | | | 285,336 |
See Notes to Financial Statements.
| | |
| 112 | | THE TARGET PORTFOLIO TRUST |
| | | | | | | | |
MOODY’S
RATINGS†
(UNAUDITED) | | PRINCIPAL
AMOUNT (000)# | | DESCRIPTION | | VALUE (NOTE 1) |
| | | | | | | | |
| | | | | CORPORATE BONDS (continued) | | | |
| | | |
| | | | | Financial Services (continued) | | | |
| | | | | Sub. Notes, 144A(f)(g) | | | |
| Aa1 | | GBP | 1,000 | | 6.50%(c), 09/15/67 (original cost $1,996,178; purchased 08/30/07) | | $ | 885,302 |
| | | | | General Motors Acceptance Corp. LLC,
Sr. Unsec’d. Notes | | | |
| Caa1 | | $ | 900 | | 6.75%, 12/01/14 | | | 454,495 |
| Caa1 | | | 100 | | 8.00%, 11/01/31 | | | 45,339 |
| | | | | Morgan Stanley,
Sr. Unsec’d. Notes, MTN | | | |
| A1 | | | 1,800 | | 5.75%, 10/18/16 | | | 1,403,957 |
| A1 | | | 1,900 | | 6.625%, 04/01/18 | | | 1,580,754 |
| | | | | Pearson Dollar Finance PLC,
Gtd. Notes, 144A (United Kingdom)
(original cost $4,274,340; purchased 01/14/08)(f)(g) | | | |
| Baa1 | | | 4,200 | | 5.70%, 06/01/14 | | | 3,689,087 |
| Baa1 | | | 60 | | Pemex Project Funding Master Trust,
Gtd. Notes
9.125%, 10/13/10 | | | 60,000 |
| | | | | | | | |
| | | | | | | | 13,974,426 |
| | | | | | | | |
| | | |
| | | | | Food—0.3% | | | |
| Baa1 | | | 800 | | General Mills, Inc.,
Sr. Unsec’d. Notes
4.189%(c), 01/22/10 | | | 791,202 |
| | | | | | | | |
| | | |
| | | | | Healthcare Services—0.6% | | | |
| A+ | | | 1,500 | | Amgen, Inc.,
Sr. Unsec’d. Notes
2.889%(c), 11/28/08 | | | 1,498,935 |
| | | | | | | | |
| | | |
| | | | | Insurance—1.2% | | | |
| Baa1 | | | 2,600 | | American International Group, Inc.,
Jr. Sub. Debs., 144A
8.175%(c), 05/15/68
(original cost $2,600,000; purchased 05/13/08)(f)(g) | | | 415,410 |
| | | | | Sr. Unsec’d. Notes, 144A | | | |
| A3 | | | 2,300 | | 8.25%, 08/15/18 (original cost $2,300,000; purchased 08/13/08)(f)(g) | | | 947,345 |
| | | | | Sr. Unsec’d. Notes, MTN | | | |
| A3 | | | 1,400 | | 5.85%, 01/16/18 | | | 508,016 |
| | | | | Travelers Cos., Inc. (The),
Sr. Unsec’d. Notes | | | |
| A2 | | | 1,400 | | 5.80%, 05/15/18 | | | 1,171,085 |
| | | | | | | | |
| | | | | | | | 3,041,856 |
| | | | | | | | |
| | | |
| | | | | Oil, Gas & Consumable Fuels—0.4% | | | |
| A3 | | | 1,300 | | Suncor Energy, Inc.,
Sr. Unsec’d. Notes (Canada)
6.85%, 06/01/39 | | | 895,661 |
| | | | | | | | |
See Notes to Financial Statements.
| | |
| THE TARGET PORTFOLIO TRUST | | 113 |
| | |
Total Return Bond Portfolio (continued) | | Portfolio of Investments
As of October 31, 2008 |
| | | | | | | | |
MOODY’S
RATINGS†
(UNAUDITED) | | PRINCIPAL
AMOUNT (000)# | | DESCRIPTION | | VALUE (NOTE 1) |
| | | | | | | | |
| | | | | CORPORATE BONDS (continued) | | | |
| | | |
| | | | | Paper & Forest Products—1.0% | | | |
| Baa3 | | $ | 3,600 | | International Paper Co.,
Sr. Unsec’d. Notes
5.25%, 04/01/16 | | $ | 2,533,741 |
| | | | | | | | |
| | | |
| | | | | Pharmaceuticals—0.4% | | | |
| Baa2 | | | 1,200 | | Cardinal Health, Inc.,
Sr. Unsec’d. Notes
6.00%, 06/15/17 | | | 969,929 |
| | | | | | | | |
| | | |
| | | | | Pipelines—0.1% | | | |
| Ba3 | | | 300 | | El Paso Corp.,
Sr. Unsec’d. Notes, MTN
7.80%, 08/01/31 | | | 208,204 |
| | | | | | | | |
| | | |
| | | | | Printing & Publishing—0.3% | | | |
| Baa2 | | | 1,000 | | Donnelley (R.R.) & Sons Co.,
Sr. Unsec’d. Notes
6.125%, 01/15/17 | | | 707,647 |
| | | | | | | | |
| | | |
| | | | | Real Estate Investment Trusts | | | |
| Ba3 | | | 200 | | iStar Financial, Inc.,
Sr. Unsec’d. Notes
5.80%, 03/15/11 | | | 82,000 |
| | | | | | | | |
| | | |
| | | | | Retail & Merchandising—0.6% | | | |
| Baa3 | | | 1,900 | | Limited Brands, Inc.,
Sr. Unsec’d. Notes
6.90%, 07/15/17 | | | 1,164,518 |
| A2 | | | 300 | | Target Corp.,
Sr. Unsec’d. Notes
7.00%, 01/15/38 | | | 229,537 |
| | | | | | | | |
| | | | | | | | 1,394,055 |
| | | | | | | | |
| | | |
| | | | | Telecommunications—1.7% | | | |
| Baa3 | | | 1,600 | | Embarq Corp.,
Sr. Unsec’d. Notes
6.738%, 06/01/13 | | | 1,392,000 |
| Baa3 | | | 1,000 | | 7.082%, 06/01/16 | | | 770,000 |
| Ba1 | | | 250 | | Qwest Corp.,
Sr. Unsec’d. Notes
7.50%, 06/15/23 | | | 161,250 |
| Ba1 | | | 1,500 | | 7.625%, 06/15/15 | | | 1,147,500 |
| Baa3 | | | 1,000 | | Sprint Capital Corp.,
Gtd. Notes
8.375%, 03/15/12 | | | 805,000 |
| | | | | | | | |
| | | | | | | | 4,275,750 |
| | | | | | | | |
See Notes to Financial Statements.
| | |
| 114 | | THE TARGET PORTFOLIO TRUST |
| | | | | | | | |
MOODY’S
RATINGS†
(UNAUDITED) | | PRINCIPAL
AMOUNT (000)# | | DESCRIPTION | | VALUE (NOTE 1) |
| | | | | | | | |
| | | | | CORPORATE BONDS (continued) | | | |
| | | |
| | | | | Tobacco—0.3% | | | |
| Baa3 | | $ | 750 | | Reynolds American, Inc.,
Sr. Sec’d. Notes
7.625%, 06/01/16 | | $ | 615,280 |
| | | | | | | | |
| | | |
| | | | | Transportation—0.5% | | | |
| Baa3 | | | 1,600 | | CSX Corp.,
Sr. Unsec’d. Notes
6.25%, 03/15/18 | | | 1,287,947 |
| | | | | | | | |
| | | |
| | | | | Utilities—0.8% | | | |
| Baa3 | | | 2,500 | | Illinois Power Co.,
Sr. Sec’d. Notes
6.25%, 04/01/18 | | | 1,977,580 |
| | | | | | | | |
| | | | | TOTAL CORPORATE BONDS
(cost $103,830,784) | | | 77,390,801 |
| | | | | | | | |
| | | |
| | | | | FOREIGN GOVERNMENT BONDS—2.7% | | | |
| Aaa | | EUR | 1,900 | | Bundesrepublik Deutschland,
Bonds (Germany)
4.25%, 07/04/39 | | | 2,332,772 |
| Aaa | | EUR | 1,300 | | 6.25%, 01/04/30 | | | 2,002,798 |
| Ba1 | | BRL | 2,200 | | Republic of Brazil,
Sr. Unsec’d. Notes (Brazil)
12.50%, 01/05/22 | | | 822,525 |
| Aaa | | GBP | 700 | | United Kingdom Gilt,
Bonds (United Kingdom)
4.25%, 03/07/11 | | | 1,149,040 |
| Aaa | | GBP | 200 | | 5.75%, 12/07/09 | | | 332,555 |
| | | | | | | | |
| | | | | TOTAL FOREIGN GOVERNMENT BONDS
(cost $7,290,070) | | | 6,639,690 |
| | | | | | | | |
| | | |
| | | | | MUNICIPAL BONDS—1.4% | | | |
| | | |
| | | | | Georgia—0.2% | | | |
| Aaa | | | 500 | | Georgia State Road & Tollway Authority,
Revenue Bonds
5.00%, 03/01/21 | | | 501,180 |
| | | | | | | | |
| | | |
| | | | | Illinois—0.6% | | | |
| Aa3 | | | 1,500 | | Chicago Illinois Transit Authority,
Revenue Bonds
6.899 %, 12/01/40 | | | 1,505,115 |
| | | | | | | | |
| | | |
| | | | | New York—0.6% | | | |
| Aa2 | | | 1,500 | | New York City Trust For Cultural Resources, Museum of Modern Art,
Revenue Bonds
5.125%, 07/01/31 | | | 1,389,090 |
| | | | | | | | |
| | | | | TOTAL MUNICIPAL BONDS
(cost $3,439,884) | | | 3,395,385 |
| | | | | | | | |
See Notes to Financial Statements.
| | |
| THE TARGET PORTFOLIO TRUST | | 115 |
| | |
Total Return Bond Portfolio (continued) | | Portfolio of Investments
As of October 31, 2008 |
| | | | | | | | | |
| | | PRINCIPAL
AMOUNT (000)# | | | DESCRIPTION | | VALUE (NOTE 1) |
| | | | | | | | | |
| | | | | | U.S. GOVERNMENT MORTGAGE BACKED OBLIGATIONS—91.3% |
| | $ | 1,604 | | | Federal Home Loan Mortgage Corp.
5.00%, 01/01/37 | | $ | 1,519,767 |
| | | 35 | | | 5.329%(c), 09/01/35 | | | 35,265 |
| | | 5,687 | | | 5.50%, 06/01/31 - 08/01/38 | | | 5,548,499 |
| | | 34 | | | 5.776%(c), 01/01/24 | | | 35,024 |
| | | 73 | | | 6.00%, 09/01/22 | | | 73,205 |
| | | 47 | | | 7.50%, 09/01/16 - 07/01/17 | | | 49,908 |
| | | — | (r) | | 9.25%, 01/01/10 | | | 29 |
| | | 12,119 | | | Federal National Mortgage Assoc.
4.00%, 08/01/18 - 06/01/19 | | | 11,328,201 |
| | | 87 | | | 4.346%(c), 05/01/36 | | | 86,589 |
| | | 8,806 | | | 4.50%, 06/01/34 - 02/01/38 | | | 8,005,067 |
| | | 2,000 | | | 4.50%, TBA | | | 1,903,124 |
| | | 9,000 | | | 4.50%, TBA | | | 8,173,125 |
| | | 301 | | | 4.574%(c), 12/01/34 | | | 303,190 |
| | | 118 | | | 4.852%(c), 01/01/20 | | | 118,455 |
| | | 12,089 | | | 5.00%, 11/01/33 - 05/01/38 | | | 11,458,161 |
| | | 37,500 | | | 5.00%, TBA | | | 35,519,550 |
| | | 12,000 | | | 5.00%, TBA | | | 11,351,256 |
| | | 45,388 | | | 5.50%, 07/01/32 - 06/01/38 | | | 44,394,701 |
| | | 16,378 | | | 6.00%, 11/01/16 - 05/01/38 | | | 16,381,100 |
| | | 3,600 | | | 6.00%, TBA | | | 3,586,500 |
| | | 3,600 | | | 6.00%, TBA | | | 3,597,750 |
| | | 147 | | | 6.50%, 04/01/21 - 09/01/21 | | | 149,454 |
| | | 5,100 | | | 6.50%, TBA | | | 5,168,534 |
| | | 67 | | | Government National Mortgage Assoc.
4.625%, 07/20/22 - 07/20/27 | | | 67,408 |
| | | 6,800 | | | 5.00%, TBA | | | 6,487,622 |
| | | 97 | | | 5.125%, 10/20/26 - 11/20/29 | | | 97,259 |
| | | 102 | | | 5.375%, 02/20/17 - 02/20/26 | | | 102,036 |
| | | 6,700 | | | 5.50%, TBA | | | 6,570,187 |
| | | 5,251 | | | 6.00%, 03/15/29 - 08/15/36 | | | 5,257,147 |
| | | 28,100 | | | 6.00%, TBA | | | 28,100,000 |
| | | 3,568 | | | 6.50%, 05/15/36 - 07/15/37 | | | 3,610,659 |
| | | 7,500 | | | 6.50%, TBA | | | 7,579,687 |
| | | 60 | | | 8.50%, 06/15/30 - 08/20/30 | | | 64,179 |
| | | | | | | | | |
| | | | | | TOTAL U.S. GOVERNMENT MORTGAGE BACKED OBLIGATIONS
(cost $231,455,667) | | | 226,722,638 |
| | | | | | | | | |
| | | |
| | | | | | U.S. TREASURY OBLIGATIONS—19.3% | | | |
| | | 500 | | | U.S. Treasury Bonds
4.75%, 02/15/37 | | | 530,117 |
| | | 3,700 | | | 5.25%, 02/15/29 | | | 3,936,163 |
| | | 11,300 | | | 5.375%, 02/15/31 | | | 12,363,793 |
| | | 2,900 | | | 6.75%, 08/15/26 | | | 3,573,116 |
See Notes to Financial Statements.
| | |
| 116 | | THE TARGET PORTFOLIO TRUST |
| | | | | | | | |
| | | PRINCIPAL
AMOUNT (000)# | | DESCRIPTION | | VALUE (NOTE 1) |
| | | | | | | | |
| | | | | U.S. TREASURY OBLIGATIONS (continued) | | | |
| | $ | 800 | | 8.50%, 02/15/20 | | $ | 1,063,250 |
| | | 400 | | U.S. Treasury Inflationary Indexed Bonds, TIPS
1.75%, 01/15/28, RRB | | | 326,987 |
| | | 600 | | 2.00%, 01/15/26, RRB | | | 543,629 |
| | | 1,400 | | 2.375%, 01/15/25, RRB | | | 1,409,241 |
| | | 6,800 | | U.S. Treasury Notes
2.875%, 06/30/10 | | | 6,955,659 |
| | | 5,500 | | U.S. Treasury Strips, IO
7.25%, 02/15/22 - 08/15/22 | | | 2,700,409 |
| | | 1,200 | | 7.625%, 05/15/22 | | | 588,708 |
| | | 1,900 | | 8.00%, 11/15/21 | | | 956,487 |
| | | 9,300 | | U.S. Treasury Strips, PO
8.00%, 11/15/21 | | | 4,691,264 |
| | | 16,000 | | 8.125%, 05/15/21 - 08/15/21 | | | 8,269,315 |
| | | | | | | | |
| | | | | TOTAL U.S. TREASURY OBLIGATIONS
(cost $49,798,940) | | | 47,908,138 |
| | | | | | | | |
| | | | | TOTAL LONG-TERM INVESTMENTS
(cost $418,427,895) | | | 381,415,160 |
| | | | | | | | |
| | | NOTIONAL
AMOUNTS (000) | | SHORT-TERM INVESTMENTS—1.9% | | |
| | | | | OPTIONS PURCHASED*—1.5% | | | |
| | | |
| | | | | Call Options—1.2% | | | |
| | | | | 2 Year Euro-Schatz, | | | |
| | | EUR 13,000 | | expiring 11/21/2008, Strike Price $106.70 | | | 18,226 |
| | | | | 5 Year Euro-Bobl, | | | |
| | | EUR 10,500 | | expiring 11/21/2008, Strike Price $116.00 | | | 4,015 |
| | | | | 5 Year U.S. Treasury Note Futures, | | | |
| | | 36,000 | | expiring 11/21/2008, Strike Price $125.00 | | | 2,813 |
| | | | | 10 Year U.S. Treasury Note Futures, | | | |
| | | 1,800 | | expiring 11/21/2008, Strike Price $138.00 | | | 281 |
| | | | | 20 Year U.S. Treasury Bond Futures, | | | |
| | | 24,800 | | expiring 11/21/2008, Strike Price $140.00 | | | 3,875 |
| | | | | Currency Option, on EUR vs USD, | | | |
| | | EUR 1,100 | | expiring 05/21/2010 @ FX Rate 1.38 | | | 68,834 |
| | | EUR 3,000 | | expiring 05/21/2010 @ FX Rate 1.38 | | | 187,730 |
| | | | | Currency Option, on USD vs JPY, | | | |
| | | 1,400 | | expiring 03/31/2010 @ FX Rate 104.65 | | | 40,583 |
| | | | | FNMA, | | | |
| | | 8,000 | | expiring 11/14/2008, Strike Price $96.41 | | | 140,636 |
| | | | | Interest Rate Swap Options, | | | |
| | | 2,500 | | expiring 08/03/2009 @3.45% | | | 26,760 |
| | | 9,300 | | expiring 08/03/2009 @3.45% | | | 99,546 |
| | | 3,500 | | expiring 08/03/2009 @3.45% | | | 37,464 |
| | EUR | 93,200 | | expiring 04/20/2009 @4.18% | | | 1,915,321 |
| | EUR | 19,600 | | expiring 08/03/2009 @3.85% | | | 296,605 |
| | | 2,400 | | expiring 09/08/2009 @4.75% | | | 63,411 |
| | | | | | | | |
| | | | | | | | 2,906,100 |
| | | | | | | | |
See Notes to Financial Statements.
| | |
| THE TARGET PORTFOLIO TRUST | | 117 |
| | |
Total Return Bond Portfolio (continued) | | Portfolio of Investments
As of October 31, 2008 |
| | | | | | | | | |
| | | NOTIONAL
AMOUNTS (000) | | DESCRIPTION | | VALUE (NOTE 1) | |
| | | | | | | | | |
| | | | | Put Options—0.3% | | | | |
| | | | | Currency Option, on EUR vs USD, | | | | |
| | EUR | 1,100 | | expiring 05/21/2010 @ FX Rate 1.38 | | $ | 167,847 | |
| | EUR | 3,000 | | expiring 05/21/2010 @ FX Rate 1.38 | | | 457,764 | |
| | | | | Currency Option, on USD vs JPY, | | | | |
| | $ | 1,400 | | expiring 03/31/2010 @ FX Rate 104.65 | | | 154,269 | |
| | | | | FNMA, | | | | |
| | | 500 | | expiring 11/06/2008, Strike Price $89.00 | | | — | |
| | | | | GNMA, | | | | |
| | | 19,000 | | expiring 11/12/2008, Strike Price $76.00 | | | — | |
| | | 6,000 | | expiring 11/12/2008, Strike Price $70.00 | | | — | |
| | | | | | | | | |
| | | | | | | | 779,880 | |
| | | | | | | | | |
| | | | | TOTAL OPTIONS PURCHASED
(cost $1,859,182) | | | 3,685,980 | |
| | | | | | | | | |
| | | PRINCIPAL
AMOUNTS (000)# | | | | | |
| | | | | U.S. TREASURY OBLIGATIONS(n)—0.4% | | | | |
| | | 750 | | U.S. Treasury Bills
0.17%, 12/26/08 | | | 749,450 | |
| | | 380 | | 0.84%, 12/11/08 | | | 379,759 | |
| | | | | | | | | |
| | | | | TOTAL U.S. TREASURY OBLIGATIONS
(cost $1,129,620) | | | 1,129,209 | |
| | | | | | | | | |
| | | | | TOTAL SHORT-TERM INVESTMENTS
(cost $2,988,802) | | | 4,815,189 | |
| | | | | | | | | |
| | | | | TOTAL INVESTMENTS, BEFORE OPTIONS
WRITTEN AND SECURITIES SOLD SHORT—155.6%
(cost $421,416,697; Note 5) | | | 386,230,349 | |
| | | | | | | | | |
| | | NOTIONAL
AMOUNTS (000) | | OPTIONS WRITTEN—(0.6%) | | | |
| | | | | Call Options—(0.6%) | | | | |
| | | EUR 30,100 | | Interest Rate Swap Options,
expiring 04/20/2009 @4.44% | | | (1,028,953 | ) |
| | | 1,100 | | expiring 08/03/2009 @4.15% | | | (23,601 | ) |
| | | 3,100 | | expiring 08/03/2009 @4.40% | | | (83,559 | ) |
| | | 1,200 | | expiring 08/03/2009 @4.40% | | | (32,346 | ) |
| | | 6,500 | | expiring 08/03/2009 @4.55% | | | (203,845 | ) |
| | | 900 | | expiring 09/08/2009 @5.15% | | | (46,570 | ) |
| | | | | | | | | |
| | | | | | | | (1,418,874 | ) |
| | | | | | | | | |
| | | | | Put Options | | | | |
| | EUR | 40,000 | | 90 Day Euro Dollar Futures,
expiring 12/15/2008, Strike Price $97.00 | | | (4,500 | ) |
| | | | | | | | | |
| | | | | TOTAL OPTIONS WRITTEN
(premiums received $1,143,511) | | | (1,423,374 | ) |
| | | | | | | | | |
See Notes to Financial Statements.
| | |
| 118 | | THE TARGET PORTFOLIO TRUST |
| | | | | | | | | |
| | | PRINCIPAL
AMOUNT (000)# | | DESCRIPTION | | VALUE (NOTE 1) | |
| | | | | | | | | |
| | | | | SECURITIES SOLD SHORT—(25.3%) | | | | |
| | | |
| | | | | U.S. TREASURY OBLIGATIONS—(10.0%) | | | | |
| | $ | 12,600 | | U.S. Treasury Notes
2.875%, 06/30/10 | | $ | (12,888,427 | ) |
| | | 1,300 | | 3.50%, 02/15/18 | | | (1,264,554 | ) |
| | | 3,400 | | 4.00%, 08/15/18 | | | (3,404,515 | ) |
| | | 500 | | 4.75%, 05/15/14 | | | (548,633 | ) |
| | | 6,150 | | 4.875%, 07/31/11 | | | (6,670,345 | ) |
| | | | | | | | | |
| | | | | | | | (24,776,474 | ) |
| | | | | | | | | |
| | |
| | | | | U.S. GOVERNMENT MORTGAGE BACKED OBLIGATIONS—(15.3%) | |
| | | 4,000 | | Federal National Mortgage Assoc.
5.50%, TBA | | | (3,901,248 | ) |
| | | 31,300 | | 5.50%, TBA | | | (30,576,188 | ) |
| | | 3,600 | | 6.00%, TBA | | | (3,592,123 | ) |
| | | | | | | | | |
| | | | | | | | (38,069,559 | ) |
| | | | | | | | | |
| | | | | TOTAL SECURITIES SOLD SHORT
(proceeds received $63,465,448) | | | (62,846,033 | ) |
| | | | | | | | | |
| | | |
| | | | | TOTAL INVESTMENTS, NET OF OPTIONS
WRITTEN AND SECURITIES SOLD SHORT—129.7%
(cost $356,807,738; Note 5) | | | 321,960,942 | |
| | | | | Other liabilities in excess of other assets(x)—(29.7%) | | | (73,772,299 | ) |
| | | | | | | | | |
| | | | | NET ASSETS—100% | | $ | 248,188,643 | |
| | | | | | | | | |
The following abbreviations are used in Portfolio descriptions:
144A—Security was purchased pursuant to Rule 144A under the securities Act of 1933 and may not be resold subject to that rule except to qualified institutional buyers. Unless otherwise noted 144A securities are deemed to be liquid. FHLMC—Federal Home Loan Mortgage Corp.
FNMA—Federal National Mortgage Assoc.
GNMA—Government National Mortgage Assoc.
IO—Interest Only
MTN—Medium Term Note
NR—Not Rated by Moodys or Standard & Poor’s
PO—Principal Only Securities
RRB—Real Return Bonds
TBA—To Be Announced
TIPS—Treasury Inflation Protected Securities
BRL—Brazilian Real
CNY—Chinese Yuan
EUR—Euro
GBP—British Pound
INR—Indian Rupee
JPY—Japanese Yen
MYR—Malaysian Ringgit
RUB—Russian Ruble
USD—United States Dollar
* Non-income producing.
See Notes to Financial Statements.
| | |
| THE TARGET PORTFOLIO TRUST | | 119 |
| | |
Total Return Bond Portfolio (continued) | | Portfolio of Investments
As of October 31, 2008 |
# Principal amount is shown in U.S. dollars unless otherwise stated.
† The rating reflected is as of October 31, 2008. Rating of certain bonds may have changed subsequent to that date.
| (c) | Indicates a variable rate security. |
| (d) | Standard & Poor’s rating. |
| (f) | Private Placement restricted as to resale and does not have a readily available market. The aggregate original cost of such securities is $28,091,199. The aggregate value of $19,266,436 is approximately 7.8% of net assets. |
| (g) | Indicates a security that has been deemed illiquid. |
| (i) | Represents issuer in default on interest payments. Non-income producing security. |
| (n) | Rates shown are the effective yields at purchase date. |
| (x) | Other liabilities in excess of other assets includes net unrealized appreciation (depreciation) on futures contracts, forward foreign currency contracts, interest rate and credit default swaps as follows: |
Open futures contracts outstanding at October 31, 2008:
| | | | | | | | | | | | | | |
Number of
Contracts | | Type | | Expiration
Date | | Value at
Trade Date | | Value at
October 31,
2008 | | Unrealized
Appreciation
(Depreciation) | |
| Long Positions: | | | | | | | | | | | | | | |
| 76 | | 90 Day Euribor | | Dec 08 | | $ | 23,016,257 | | $ | 23,328,936 | | $ | 312,679 | |
| 95 | | 90 Day Euribor | | Mar 09 | | | 28,808,228 | | | 29,318,577 | | | 510,349 | |
| 5 | | 90 Day Euribor | | Dec 09 | | | 1,520,539 | | | 1,543,561 | | | 23,022 | |
| 146 | | 90 Day Euro Dollar | | Dec 08 | | | 35,375,062 | | | 35,680,575 | | | 305,513 | |
| 19 | | 90 Day Euro Dollar | | Mar 09 | | | 4,645,775 | | | 4,644,550 | | | (1,225 | ) |
| 32 | | 90 Day Euro Dollar | | Jun 09 | | | 7,770,000 | | | 7,806,400 | | | 36,400 | |
| 45 | | 90 Day Euro Dollar | | Dec 09 | | | 10,866,075 | | | 10,930,500 | | | 64,425 | |
| 155 | | 90 Day Euro Dollar | | Mar 10 | | | 37,320,375 | | | 37,610,750 | | | 290,375 | |
| 133 | | 90 Day Sterling | | Dec 08 | | | 25,292,331 | | | 25,630,331 | | | 338,000 | |
| 23 | | 90 Day Sterling | | Jun 09 | | | 4,344,171 | | | 4,479,970 | | | 135,799 | |
| 51 | | 90 Day Sterling | | Sep 09 | | | 9,711,182 | | | 9,923,073 | | | 211,891 | |
| 377 | | 90 Day Sterling | | Dec 09 | | | 71,891,844 | | | 73,155,728 | | | 1,263,884 | |
| 25 | | 2 Year U.S. Treasury Notes | | Dec 08 | | | 5,310,547 | | | 5,370,703 | | | 60,156 | |
| 86 | | 10 Year U.S. Treasury Notes | | Dec 08 | | | 9,959,125 | | | 9,724,719 | | | (234,406 | ) |
| | | | | | | | | | | | | | |
| | | | | | | | | | | | | 3,316,862 | |
| | | | | | | | | | | | | | |
| Short Positions: | | | | | | | | | | | | | | |
| 130 | | 2 Year Euro Shatz | | Dec 08 | | | 17,157,664 | | | 17,565,799 | | | (408,135 | ) |
| 103 | | 5 Year Euro-Bobl | | Dec 08 | | | 14,294,118 | | | 14,732,102 | | | (437,984 | ) |
| 342 | | 5 Year U.S. Treasury Notes | | Dec 08 | | | 38,357,555 | | | 38,734,172 | | | (376,617 | ) |
| 59 | | 10 Year Euro-Bund | | Dec 08 | | | 8,631,098 | | | 8,717,763 | | | (86,665 | ) |
| 2 | | 10 Year U.K. Gilt | | Dec 08 | | | 355,021 | | | 358,208 | | | (3,187 | ) |
| 173 | | 20 Year U.S. Treasury Bonds | | Dec 08 | | | 20,372,102 | | | 19,570,625 | | | 801,477 | |
| | | | | | | | | | | | | | |
| | | | | | | | | | | | | (511,111 | ) |
| | | | | | | | | | | | | | |
| | | | | | | | | | | | $ | 2,805,751 | (1) |
| | | | | | | | | | | | | | |
(1) | Cash of $2,027,600 has been segregated with the broker to cover requirements for open futures contacts as October 31, 2008. |
See Notes to Financial Statements.
| | |
| 120 | | THE TARGET PORTFOLIO TRUST |
Forward foreign currency exchange contracts outstanding at October 31, 2008:
| | | | | | | | | | | | | |
Purchase Contract | | Notional
Amount (000) | | Value at Settlement
Date Payable | | Current
Value | | Unrealized
Appreciation
(Depreciation) | |
Brazilian Real,
Expiring 12/02/08 | | BRL | 2,729 | | $ | 1,339,304 | | $ | 1,243,926 | | $ | (95,378 | ) |
British Pound,
Expiring 11/03/08 | | GBP | 3,959 | | | 6,474,945 | | | 6,371,405 | | | (103,540 | ) |
Expiring 11/05/08 | | GBP | 498 | | | 782,778 | | | 801,454 | | | 18,676 | |
Chinese Yuan,
Expiring 12/09/08 | | CNY | 24,548 | | | 3,591,401 | | | 3,564,246 | | | (27,155 | ) |
Expiring 02/11/09 | | CNY | 1,728 | | | 261,000 | | | 248,864 | | | (12,136 | ) |
Expiring 07/15/09 | | CNY | 20,104 | | | 2,991,955 | | | 2,874,426 | | | (117,529 | ) |
Euro,
Expiring 11/05/08 | | EUR | 633 | | | 793,687 | | | 806,791 | | | 13,104 | |
Expiring 12/04/08 | | EUR | 633 | | | 805,493 | | | 805,851 | | | 358 | |
Indian Rupee,
Expiring 11/12/08 | | INR | 95,354 | | | 2,359,705 | | | 1,922,232 | | | (437,473 | ) |
Expiring 04/09/09 | | INR | 96,562 | | | 1,924,026 | | | 1,931,965 | | | 7,939 | |
Japanese Yen,
Expiring 11/05/08 | | JPY | 368,778 | | | 3,673,348 | | | 3,743,559 | | | 70,211 | |
Malaysian Ringgitt,
Expiring 11/12/08 | | MYR | 2,792 | | | 861,623 | | | 786,172 | | | (75,451 | ) |
Expiring 02/12/09 | | MYR | 1,329 | | | 376,195 | | | 374,816 | | | (1,379 | ) |
Expiring 04/14/09 | | MYR | 1,235 | | | 350,000 | | | 349,119 | | | (881 | ) |
Russian Ruble,
Expiring 11/19/08 | | RUB | 28,005 | | | 1,104,665 | | | 1,015,860 | | | (88,805 | ) |
Expiring 05/06/09 | | RUB | 79,454 | | | 3,254,643 | | | 2,561,589 | | | (693,054 | ) |
| | | | | | | | | | | | | |
| | | | | $ | 30,944,768 | | $ | 29,402,275 | | $ | (1,542,493 | ) |
| | | | | | | | | | | | | |
| | | | | | | | | | | | | |
Sale Contracts | | Notional
Amount (000) | | Value at Settlement
Date Receivable | | Current
Value | | Unrealized
Appreciation
(Depreciation) | |
Brazilian Real,
Expiring 12/02/08 | | BRL | 925 | | $ | 514,000 | | $ | 421,640 | | $ | 92,360 | |
Expiring 06/02/09 | | BRL | 622 | | | 326,959 | | | 273,447 | | | 53,512 | |
British Pound,
Expiring 11/03/08 | | GBP | 3,959 | | | 7,192,316 | | | 6,370,218 | | | 822,098 | |
Expiring 12/09/08 | | GBP | 3,959 | | | 6,460,296 | | | 6,356,565 | | | 103,731 | |
Chinese Yuan,
Expiring 07/15/09 | | CNY | 11,899 | | | 1,700,000 | | | 1,701,274 | | | (1,274 | ) |
Euro,
Expiring 11/05/08 | | EUR | 633 | | | 806,379 | | | 806,791 | | | (412 | ) |
Expiring 12/04/08 | | EUR | 1,311 | | | 1,647,206 | | | 1,668,907 | | | (21,701 | ) |
Indian Rupee,
Expiring 11/12/08 | | INR | 95,354 | | | 1,936,129 | | | 1,928,296 | | | 7,833 | |
Japanese Yen,
Expiring 11/05/08 | | JPY | 368,778 | | | 3,633,322 | | | 3,743,723 | | | (110,401 | ) |
Expiring 12/03/08 | | JPY | 42,710 | | | 436,420 | | | 434,109 | | | 2,311 | |
Malaysian Ringgitt,
Expiring 11/12/08 | | MYR | 2,564 | | | 726,048 | | | 722,143 | | | 3,905 | |
Russian Ruble,
Expiring 11/19/08 | | RUB | 28,005 | | | 1,103,000 | | | 1,011,838 | | | 91,162 | |
Expiring 05/06/09 | | RUB | 4,967 | | | 147,163 | | | 160,127 | | | (12,964 | ) |
| | | | | | | | | | | | | |
| | | | | $ | 26,629,238 | | $ | 25,599,078 | | $ | 1,030,160 | |
| | | | | | | | | | | | | |
See Notes to Financial Statements.
| | |
| THE TARGET PORTFOLIO TRUST | | 121 |
| | |
Total Return Bond Portfolio (continued) | | Portfolio of Investments
As of October 31, 2008 |
Interest rate swap agreements outstanding at October 31, 2008:
| | | | | | | | | | | | | | |
Counter Party | | Termination
Date | | Notional
Amount#
(000) | | Fixed
Rate | | | Floating
Rate | | Unrealized
Appreciation
(Depreciation) | |
Bank of America, N.A.(1) | | 06/15/35 | | $ | 900 | | 6.00 | % | | 3 month LIBOR | | $ | 226,427 | |
Bank of America, N.A.(1) | | 12/17/13 | | | 5,400 | | 4.00 | % | | 3 month LIBOR | | | 68,375 | |
Bank of America, N.A.(2) | | 12/17/28 | | | 21,700 | | 5.00 | % | | 3 month LIBOR | | | (533,015 | ) |
Bank of America, N.A.(2) | | 12/17/38 | | | 3,800 | | 5.00 | % | | 3 month LIBOR | | | (246,486 | ) |
Bank of America, N.A.(2) | | 12/17/23 | | | 2,500 | | 5.00 | % | | 3 month LIBOR | | | 8,355 | |
Barclays Capital(1) | | 12/17/15 | | | 100 | | 5.00 | % | | 3 month LIBOR | | | 4,551 | |
Barclays Capital(2) | | 12/17/38 | | | 2,000 | | 5.00 | % | | 3 month LIBOR | | | (52,503 | ) |
Barclays Capital(2) | | 12/17/23 | | | 1,200 | | 5.00 | % | | 3 month LIBOR | | | (12,149 | ) |
Citigroup(1) | | 12/17/13 | | | 5,000 | | 4.00 | % | | 3 month LIBOR | | | 97,192 | |
Deutsche Bank(2) | | 12/17/28 | | | 1,600 | | 5.00 | % | | 3 month LIBOR | | | (130,523 | ) |
Goldman Sachs & Co.(2) | | 12/17/28 | | | 500 | | 5.00 | % | | 3 month LIBOR | | | (4,276 | ) |
Goldman Sachs & Co.(2) | | 12/17/23 | | | 1,600 | | 5.00 | % | | 3 month LIBOR | | | (5,379 | ) |
Merrill Lynch & Co.(1) | | 12/17/13 | | | 6,200 | | 4.00 | % | | 3 month LIBOR | | | 65,955 | |
Merrill Lynch & Co.(2) | | 12/17/38 | | | 4,800 | | 5.00 | % | | 3 month LIBOR | | | (284,233 | ) |
Merrill Lynch & Co.(2) | | 12/17/23 | | | 11,400 | | 5.00 | % | | 3 month LIBOR | | | (501,184 | ) |
Morgan Stanley & Co.(1) | | 12/17/13 | | | 40,000 | | 4.00 | % | | 3 month LIBOR | | | 522,845 | |
Morgan Stanley & Co.(2) | | 12/17/38 | | | 4,500 | | 5.00 | % | | 3 month LIBOR | | | (95,630 | ) |
Morgan Stanley & Co.(2) | | 12/17/23 | | | 100 | | 5.00 | % | | 3 month LIBOR | | | (4,587 | ) |
Merrill Lynch & Co.(2) | | 01/23/09 | | | 1,800 | | 4.50 | % | | ICAP CMM FRA Fixing Rate | | | 232,785 | |
Merrill Lynch & Co.(1) | | 01/02/12 | | BRL | 1,300 | | 14.77 | % | | Brazilian interbank lending rate | | | (26,537 | ) |
Morgan Stanley & Co.(1) | | 01/02/12 | | BRL | 22,400 | | 10.12 | % | | Brazilian interbank lending rate | | | (1,288,109 | ) |
UBS AG(1) | | 01/02/12 | | BRL | 10,100 | | 10.58 | % | | Brazilian interbank lending rate | | | (522,503 | ) |
Barclays Capital(1) | | 12/17/10 | | EUR | 800 | | 5.50 | % | | 6 month EURIBOR | | | 37,943 | |
Barclays Capital(1) | | 06/15/10 | | EUR | 32,900 | | 4.50 | % | | 6 month EURIBOR | | | 513,751 | |
Barclays Capital(1) | | 03/19/18 | | EUR | 1,400 | | 5.00 | % | | 6 month EURIBOR | | | (21,812 | ) |
Barclays Capital(2) | | 09/17/38 | | EUR | 1,900 | | 5.00 | % | | 6 month EURIBOR | | | (207,494 | ) |
Deutsche Bank(1) | | 03/18/14 | | EUR | 1,300 | | 4.50 | % | | 6 month EURIBOR | | | 30,745 | |
Deutsche Bank(1) | | 09/17/10 | | EUR | 3,000 | | 5.00 | % | | 6 month EURIBOR | | | 103,539 | |
Deutsche Bank(1) | | 06/15/13 | | EUR | 4,000 | | 4.00 | % | | 6 month EURIBOR | | | 155,425 | |
Deutsche Bank(1) | | 09/15/10 | | EUR | 11,900 | | 5.50 | % | | 6 month EURIBOR | | | 475,330 | |
Deutsche Bank(2) | | 09/17/18 | | EUR | 600 | | 5.00 | % | | 6 month EURIBOR | | | (23,978 | ) |
Goldman Sachs & Co.(1) | | 03/18/14 | | EUR | 1,400 | | 4.50 | % | | 6 month EURIBOR | | | 39,070 | |
Goldman Sachs & Co.(2) | | 03/18/39 | | EUR | 900 | | 5.00 | % | | 6 month EURIBOR | | | (81,569 | ) |
Morgan Stanley & Co.(1) | | 12/17/10 | | EUR | 3,700 | | 5.50 | % | | 6 month EURIBOR | | | 184,672 | |
UBS AG(1) | | 10/15/10 | | EUR | 200 | | 2.15 | % | | FRC—Excluding Tobacco— Non-Revised Consumer Price Index | | | 7,104 | |
Barclays Capital(1) | | 09/15/10 | | GBP | 4,200 | | 5.00 | % | | 6 month LIBOR | | | 154,635 | |
Barclays Capital(2) | | 06/15/37 | | GBP | 800 | | 4.00 | % | | 6 month LIBOR | | | (39,795 | ) |
Citigroup(1) | | 03/18/11 | | GBP | 1,100 | | 5.00 | % | | 6 month LIBOR | | | 60,393 | |
Deutsche Bank(1) | | 03/18/11 | | GBP | 900 | | 5.00 | % | | 6 month LIBOR | | | 50,842 | |
Deutsche Bank(2) | | 06/15/37 | | GBP | 2,800 | | 4.25 | % | | 6 month LIBOR | | | (147,075 | ) |
Goldman Sachs & Co.(1) | | 09/17/11 | | GBP | 1,700 | | 4.50 | % | | 6 month LIBOR | | | 62,661 | |
Goldman Sachs & Co.(2) | | 06/15/37 | | GBP | 900 | | 4.00 | % | | 6 month LIBOR | | | (43,128 | ) |
Morgan Stanley & Co.(2) | | 06/15/37 | | GBP | 1,000 | | 4.25 | % | | 6 month LIBOR | | | (51,140 | ) |
See Notes to Financial Statements.
| | |
| 122 | | THE TARGET PORTFOLIO TRUST |
Interest rate swap agreements outstanding at October 31, 2008 (continued):
| | | | | | | | | | | | | | |
Counter Party | | Termination
Date | | Notional
Amount#
(000) | | Fixed
Rate | | | Floating
Rate | | Unrealized
Appreciation
(Depreciation) | |
Barclays Capital(2) | | 12/17/17 | | JPY | 30,000 | | 2.00 | % | | 6 month LIBOR | | $ | (11,610 | ) |
Deutsche Bank(2) | | 12/17/17 | | JPY | 100,000 | | 2.00 | % | | 6 month LIBOR | | | (39,254 | ) |
Citigroup(1) | | 05/14/09 | | MXN | 39,000 | | 7.91 | % | | 28 day Mexican interbank rate | | | (27,708 | ) |
Merrill Lynch & Co.(1) | | 11/04/16 | | MXN | 2,000 | | 8.17 | % | | 28 day Mexican interbank rate | | | (11,420 | ) |
| | | | | | | | | | | | | | |
| | | | | | | | | | | | $ | (1,310,502 | ) |
| | | | | | | | | | | | | | |
| (1) | Portfolio pays the floating rate and receives the fixed rate. |
| (2) | Portfolio pays the fixed rate and receives the floating rate. |
| # | Notional Amount is shown in U.S. dollars unless otherwise stated. |
Credit default swap agreements outstanding at October 31, 2008:
| | | | | | | | | | | | | | |
| Sell Protection: | | | | | | | | | | | | | | |
Counter Party | | Termination
Date | | Notional
Amount#
(000) | | Fixed
Rate | | | Reference
Entity/Obligation | | Unrealized
Appreciation
(Depreciation) | |
Morgan Stanley & Co.(1) | | 12/20/08 | | $ | 500 | | 0.26 | % | | Allstate Corp.,
6.125%, due 02/15/12 | | $ | 1,834 | |
Merrill Lynch & Co.(1) | | 12/20/08 | | | 200 | | 0.27 | % | | Anadarko Petroleum Corp., 5.00%, due 10/01/12 | | | 134 | |
UBS AG (1) | | 12/20/08 | | | 600 | | 0.35 | % | | AutoZone, Inc.,
5.875%, due 10/15/12 | | | (402 | ) |
Deutsche Bank(1) | | 06/20/16 | | | 1,100 | | 0.72 | % | | AutoZone, Inc., 6.95%, due 06/15/16 | | | 48,720 | |
Citigroup(1) | | 12/20/16 | | | 1,200 | | 0.17 | % | | Bank of America Corp., 5.08%, due 10/14/16 (3) | | | 85,036 | |
Bear Stearns International Ltd.(1) | | 12/20/08 | | | 100 | | 1.09 | % | | Capital One Bank, 4.875%, due 05/15/08 | | | 134 | |
UBS AG(1) | | 06/20/17 | | | 1,200 | | 0.56 | % | | Cardinal Health, Inc.,
6.00%, due 06/15/17 | | | 16,383 | |
UBS AG(1) | | 12/20/08 | | | 200 | | 0.44 | % | | Carnival Corp., 6.15%, due 04/15/08 | | | 326 | |
Bear Stearns International Ltd.(1) | | 12/20/08 | | | 200 | | 0.19 | % | | Caterpillar, Inc.,
7.25%, due 09/15/09 | | | 272 | |
Barclays Bank PLC(1) | | 06/20/15 | | | 400 | | 0.15 | % | | CitiFinancial, 6.625%, 06/01/15 | | | 40,089 | |
Goldman Sachs & Co.(1) | | 03/20/18 | | | 1,600 | | 1.65 | % | | CSX Corp., 6.25%, due 03/15/18 | | | (6,162 | ) |
Barclays Bank PLC(1) | | 09/20/11 | | | 400 | | 0.58 | % | | DaimlerChrysler NA Holdings, 5.75%, due 09/08/11 | | | 31,921 | |
Bear Stearns International Ltd.(1) | | 12/20/08 | | | 200 | | 0.24 | % | | Deere & Co.,
7.85%, due 05/15/10 | | | 135 | |
Merrill Lynch & Co.(1) | | 12/20/08 | | | 300 | | 0.35 | % | | Devon Energy Corp., 6.875%, due 09/30/11 | | | (55 | ) |
Bank of America Securities LLC(1) | | 03/20/17 | | | 1,000 | | 0.80 | % | | Donnelley (R.R.) & Sons, 6.125%, due 01/15/17 | | | 87,323 | |
Barclays Bank PLC(1) | | 06/20/13 | | | 1,100 | | 5.00 | % | | Dow Jones CDX HY10 Index | | | 141,926 | |
UBS AG(1) | | 06/20/13 | | | 1,100 | | 5.00 | % | | Dow Jones CDX HY10 Index | | | 128,498 | |
Merrill Lynch & Co.(1) | | 12/20/11 | | | 400 | | 0.00 | % | | Dow Jones CDX HY7 Index | | | 167,483 | |
Merrill Lynch & Co.(1) | | 06/20/12 | | | 2,156 | | 2.75 | % | | Dow Jones CDX HY8 Index | | | 287,697 | |
UBS AG(1) | | 06/20/12 | | | 2,450 | | 2.75 | % | | Dow Jones CDX HY8 Index | | | 280,464 | |
Deutsche Bank(1) | | 06/20/18 | | | 4,685 | | 1.50 | % | | Dow Jones CDX IG10 10Y Index | | | 191,786 | |
Goldman Sachs & Co.(1) | | 06/20/18 | | | 4,294 | | 1.50 | % | | Dow Jones CDX IG10 10Y Index | | | 269,427 | |
See Notes to Financial Statements.
| | |
| THE TARGET PORTFOLIO TRUST | | 123 |
| | |
Total Return Bond Portfolio (continued) | | Portfolio of Investments
As of October 31, 2008 |
Credit default swap agreements outstanding at October 31, 2008 (continued):
| | | | | | | | | | | | | | |
| Sell Protection: (continued) | | | | | | | | |
Counter Party | | Termination
Date | | Notional
Amount#
(000) | | Fixed
Rate | | | Reference
Entity/Obligation | | Unrealized
Appreciation
(Depreciation) | |
Morgan Stanley & Co.(1) | | 06/20/18 | | $ | 11,126 | | 1.50 | % | | Dow Jones CDX IG10 10Y Index | | $ | 598,037 | |
Goldman Sachs & Co.(1) | | 06/20/13 | | | 10,346 | | 1.55 | % | | Dow Jones CDX IG10 5Y Index | | | 111,966 | |
Morgan Stanley & Co.(1) | | 06/20/13 | | | 781 | | 1.55 | % | | Dow Jones CDX IG10 5Y Index | | | 21,832 | |
Morgan Stanley & Co.(1) | | 12/20/12 | | | 900 | | 0.14 | % | | Dow Jones CDX IG5 7Y Index | | | 152,432 | |
Morgan Stanley & Co.(1) | | 12/20/12 | | | 3,200 | | 0.14 | % | | Dow Jones CDX IG5 7Y Index | | | 541,956 | |
JPMorgan Chase(1) | | 12/20/11 | | | 1,943 | | 1.65 | % | | Dow Jones CDX IG7 Index | | | 267,570 | |
Barclays Bank PLC(1) | | 12/20/17 | | | 1,269 | | 0.80 | % | | Dow Jones CDX IG9 10Y Index | | | 78,820 | |
Goldman Sachs & Co.(1) | | 12/20/17 | | | 1,659 | | 0.80 | % | | Dow Jones CDX IG9 10Y Index | | | 96,166 | |
Morgan Stanley & Co.(1) | | 12/20/17 | | | 1,854 | | 0.80 | % | | Dow Jones CDX IG9 10Y Index | | | 96,712 | |
Goldman Sachs & Co.(1) | | 12/20/12 | | | 1,171 | | 0.60 | % | | Dow Jones CDX IG9 5Y Index | | | 43,653 | |
Bank of America Securities LLC(1) | | 12/20/08 | | | 300 | | 0.13 | % | | E.I. DuPont,
6.875%, due 10/15/09 | | | 86 | |
Barclays Bank PLC(1) | | 09/20/13 | | | 2,300 | | 0.65 | % | | Eastman Chemical,
7.60%, due 02/01/27 | | | 26,507 | |
Citigroup(1) | | 12/20/08 | | | 400 | | 0.28 | % | | Eaton Corp.,
5.75%, due 07/15/12 | | | 260 | |
Morgan Stanley & Co.(1) | | 09/20/13 | | | 1,200 | | 1.22 | % | | Electronic Data Systems, 6.00%, due 08/01/13 | | | (34,685 | ) |
Barclays Bank PLC(1) | | 12/20/08 | | | 500 | | 0.16 | % | | Eli Lilly & Co.,
6.00%, due 03/15/12 | | | (99 | ) |
Morgan Stanley & Co.(1) | | 12/20/08 | | | 200 | | 0.22 | % | | Emerson Electric Co.
7.125%, due 08/15/10 | | | (23 | ) |
Morgan Stanley & Co.(1) | | 12/20/08 | | | 300 | | 0.21 | % | | Emerson Electric Co.,
4.625%, due 10/15/12 | | | (27 | ) |
Citigroup(1) | | 12/20/08 | | | 300 | | 0.29 | % | | FedEx Corp.,
7.25%, due 02/15/11 | | | 245 | |
Merrill Lynch & Co.(1) | | 12/20/08 | | | 100 | | 0.22 | % | | Gannett Co., Inc.,
6.375%, due 04/01/12 | | | 504 | |
Bear Stearns International Ltd.(1) | | 03/20/16 | | | 600 | | 0.33 | % | | Goldman Sachs Group, Inc., 5.815%, due 03/22/16 | | | 88,826 | |
Deutsche Bank(1) | | 09/20/16 | | | 200 | | 0.51 | % | | Goodrich Corp.,
6.29%, due 07/01/16 | | | 4,145 | |
Bear Stearns International Ltd.(1) | | 12/20/08 | | | 400 | | 0.32 | % | | Hewlett-Packard Co.,
6.50% due 07/01/12 | | | (206 | ) |
Merrill Lynch & Co.(1) | | 12/20/08 | | | 300 | | 0.32 | % | | Ingersoll-Rand Co., 6.48%, due 06/01/25 | | | (6 | ) |
Barclays Bank PLC(1) | | 03/20/12 | | | 200 | | 0.17 | % | | International Lease Finance Corp., 5.40%, due 02/15/12 | | | 45,839 | |
Bear Stearns International Ltd.(1) | | 12/20/08 | | | 200 | | 0.60 | % | | International Paper Co.,
6.75%, due 09/01/11 | | | 556 | |
Barclays Bank PLC(1) | | 03/20/11 | | | 200 | | 0.37 | % | | iStar Financial, Inc.,
5.80%, due 03/15/11 | | | 100,958 | |
Bank of America Securities LLC(1) | | 09/20/17 | | | 1,900 | | 2.29 | % | | Limited Brands, Inc.,
6.90%, due 07/15/17 | | | 253,539 | |
Merrill Lynch & Co.(1) | | 12/20/08 | | | 200 | | 0.85 | % | | Motorola, Inc.,
7.625%, due 11/15/10 | | | 223 | |
UBS AG(1) | | 06/20/17 | | | 200 | | 0.48 | % | | Newell Rubbermaid, Inc.,
6.75%, due 03/15/12 | | | 15,972 | |
See Notes to Financial Statements.
| | |
| 124 | | THE TARGET PORTFOLIO TRUST |
Credit default swap agreements outstanding at October 31, 2008 (continued):
| | | | | | | | | | | | | | |
| Sell Protection: (continued) | | | | | | | | |
Counter Party | | Termination
Date | | Notional
Amount#
(000) | | Fixed
Rate | | | Reference
Entity/Obligation | | Unrealized
Appreciation
(Depreciation) | |
Merrill Lynch & Co.(1) | | 12/20/08 | | $ | 200 | | 0.28 | % | | Occidental Petroleum Corp., 6.75%, due 01/15/12 | | $ | — | |
Morgan Stanley & Co.(1) | | 06/20/14 | | | 4,200 | | 0.76 | % | | Pearson Dollar,
5.70%, due 06/01/14 | | | 3,338 | |
UBS AG(1) | | 12/20/08 | | | 200 | | 0.37 | % | | RadioShack Corp.,
7.375%, due 05/15/11 | | | 269 | |
Morgan Stanley & Co.(1) | | 09/20/13 | | | 200 | | 0.58 | % | | Sealed Air Corp.,
5.625%, due 07/15/13 | | | 15,044 | |
UBS AG(1) | | 12/20/08 | | | 200 | | 0.44 | % | | Simon Property Group, L.P., 5.45%, due 03/15/13 | | | 722 | |
Bear Stearns International Ltd.(1) | | 03/20/12 | | | 1,000 | | 0.55 | % | | Sprint Capital Corp.,
8.375%, due 03/15/12 | | | 152,287 | |
Morgan Stanley & Co.(1) | | 06/20/12 | | | 500 | | 0.11 | % | | Target Corp., 5.875%, due 03/01/12 | | | 28,156 | |
Morgan Stanley & Co.(1) | | 12/20/08 | | | 200 | | 0.53 | % | | The Kroger Co., 4.75%, due 04/15/12 | | | (155 | ) |
Deutsche Bank(1) | | 06/20/18 | | | 1,400 | | 0.62 | % | | Travelers Cos., Inc., 5.80%, due 05/15/18 | | | 45,348 | |
Bear Stearns International Ltd.(1) | | 12/20/08 | | | 200 | | 0.15 | % | | Wal-mart Stores, Inc.,
6.875%, due 08/10/09 | | | 134 | |
Citigroup(1) | | 12/20/08 | | | 800 | | 0.14 | % | | Wal-mart Stores, Inc., 6.875%, due 08/10/09 | | | 557 | |
Barclays Bank PLC(1) | | 12/20/08 | | | 200 | | 0.67 | % | | Walt Disney Co. (The),
6.375%, due 03/01/12 | | | (248 | ) |
Bear Stearns International Ltd.(1) | | 06/20/16 | | | 300 | | 0.63 | % | | Whirlpool Corp.,
6.50%, due 06/15/16 | | | 40,999 | |
Barclays Bank PLC(1) | | 09/20/13 | | | 2,300 | | 0.39 | % | | Wyeth, 5.25%, due 03/15/13 | | | 8,067 | |
| | | | | | | | | | | | | | |
| | | | | | | | | | | | $ | 4,579,245 | |
| | | | | | | | | | | | | | |
| (1) | Portfolio pays the fixed rate and receives from the counterparty par in the event that the reference entity defaults. |
| (3) | Variable rate, displayed rate is as of 10/31/08. |
| # | Notional Amount is shown in U.S. dollars unless otherwise stated. |
| | | | | | | | | | | | | | |
| Buy Protection: | | | | | | | | | | | | | | |
Counter Party | | Termination
Date | | Notional
Amount#
(000) | | Fixed
Rate | | | Reference
Entity/Obligation | | Unrealized
Appreciation
(Depreciation) | |
Citigroup(2) | | 06/20/12 | | $ | 7,500 | | 2.11 | % | | Dow Jones CDX HY8 Index | | $ | (920,209 | ) |
Morgan Stanley & Co.(2) | | 12/20/15 | | | 670 | | 0.46 | % | | Dow Jones CDX IG5 10Y Index | | | (169,664 | ) |
Morgan Stanley & Co.(2) | | 12/20/15 | | | 2,300 | | 0.45 | % | | Dow Jones CDX IG5 10Y Index | | | (581,736 | ) |
Barclays Bank PLC(2) | | 12/20/12 | | | 1,070 | | 0.82 | % | | Dow Jones CDX IG9 5Y Index | | | 9,860 | |
Deutsche Bank(2) | | 12/20/12 | | | 4,000 | | 1.16 | % | | Dow Jones CDX IG9 5Y Index | | | (6,354 | ) |
Deutsche Bank(2) | | 12/20/12 | | | 583 | | 0.82 | % | | Dow Jones CDX IG9 5Y Index | | | 5,378 | |
Goldman Sachs & Co.(2) | | 12/20/12 | | | 4,861 | | 0.71 | % | | Dow Jones CDX IG9 5Y Index | | | 22,159 | |
| | | | | | | | | | | | | | |
| | | | | | | | | | | | $ | (1,640,566 | ) |
| | | | | | | | | | | | | | |
| (2) | Portfolio pays the counterparty par in the event that the reference entity defaults and receives the fixed rate. |
| # | Notional Amount is shown in U.S. dollars unless otherwise stated. |
See Notes to Financial Statements.
| | |
| THE TARGET PORTFOLIO TRUST | | 125 |
| | |
Total Return Bond Portfolio (continued) | | Portfolio of Investments
As of October 31, 2008 |
The industry classification of investments and liabilities in excess of other assets shown as a percentage of net assets as of October 31, 2008 were as follows:
| | | |
U.S. Government Mortgage Backed Obligations | | 91.3 | % |
U.S. Treasury Obligations | | 19.7 | |
Financial—Bank & Trust | | 16.2 | |
Financial Services | | 5.6 | |
Collateralized Mortgage Obligations | | 3.1 | |
Foreign Government Bonds | | 2.7 | |
Asset-Backed Securities | | 2.3 | |
Bank Notes | | 2.0 | |
Telecommunications | | 1.7 | |
Options Purchased | | 1.5 | |
Municipal Bonds | | 1.4 | |
Insurance | | 1.2 | |
Paper & Forest Products | | 1.0 | |
Utilities | | 0.8 | |
Healthcare Services | | 0.6 | |
Retail & Merchandising | | 0.6 | |
Transportation | | 0.5 | |
Computer Services & Software | | 0.5 | |
Convertible Bonds | | 0.4 | |
Pharmaceuticals | | 0.4 | |
Automotive Parts | | 0.4 | |
Oil, Gas & Consumable Fuels | | 0.4 | |
Foods | | 0.3 | |
Printing & Publishing | | 0.3 | |
Tobacco | | 0.3 | |
Automobile Manufacturers | | 0.1 | |
Airlines | | 0.1 | |
Pipelines | | 0.1 | |
Aerospace | | 0.1 | |
| | | |
| | 155.6 | |
Options Written and Securities Sold Short | | (25.9 | ) |
Other liabilities in excess of other assets | | (29.7 | ) |
| | | |
| | 100.0 | % |
| | | |
See Notes to Financial Statements.
| | |
| 126 | | THE TARGET PORTFOLIO TRUST |
| | |
Portfolio of Investments
As of October 31, 2008 | | Intermediate-Term Bond Portfolio |
| | | | | | | | |
MOODY’S
RATINGS†
(UNAUDITED) | | PRINCIPAL
AMOUNT (000)# | | DESCRIPTION | | VALUE (NOTE 1) |
| | | | | | | | |
| | | | | LONG-TERM INVESTMENTS—105.9% | | | |
| | | |
| | | | | ASSET-BACKED SECURITIES—2.2% | | | |
| | | | | BA Credit Card Trust,
Series 2008-A5, Class A5 | | | |
| Aaa | | $ | 1,000 | | 2.623%(c), 12/16/13 | | $ | 900,655 |
| | | | | Securitized Asset Backed Receivables LLC Trust,
Series 2007-BR5, Class A2A | | | |
| Aaa | | | 720 | | 3.389%(c), 05/25/37 | | | 633,250 |
| | | | | SLM Student Loan Trust,
Series 2006-8, Class A2 | | | |
| Aaa | | | 570 | | 3.535%(c), 10/25/16 | | | 562,324 |
| | | | | Series 2008-9, Class A | | | |
| Aaa | | | 2,400 | | 5.035%(c), 04/25/23 | | | 2,190,374 |
| | | | | Wells Fargo Home Equity Trust,
Series 2005-2, Class AII2, 144A
(original cost $223,809; purchased 09/29/06)(f)(g) | | | |
| Aaa | | | 223 | | 3.499%(c), 10/25/35 | | | 219,196 |
| | | | | | | | |
| | | | | TOTAL ASSET-BACKED SECURITIES
(cost $4,893,710) | | | 4,505,799 |
| | | | | | | | |
| | | |
| | | | | BANK NOTES(c)—0.4% | | | |
| NR | | | 462 | | First Data Corp. Term B2, 144A(f)(g)
5.93%, 09/24/14
(original cost $462,328; purchased 06/23/08) | | | 338,490 |
| | | | | 5.95%, 09/24/14 | | | |
| NR | | | 469 | | (original cost $415,938; purchased 02/08/08) | | | 343,128 |
| | | | | 6.51%, 09/24/14 | | | |
| NR | | | 61 | | (original cost $55,189; purchased 02/08/08) | | | 45,020 |
| | | | | | | | |
| | | | | TOTAL BANK NOTES
(cost $938,144) | | | 726,638 |
| | | | | | | | |
| | | |
| | | | | Collateralized Mortgage Obligations—8.6% | | | |
| | | | | American Home Mortgage Investment Trust,
Series 2004-4, Class 5A | | | |
| Aaa | | | 332 | | 4.44%(c), 02/25/45 | | | 222,448 |
| | | | | Banc of America Funding Corp.,
Series 2006-A, Class 1A1 | | | |
| Aaa | | | 360 | | 4.622%(c), 02/20/36 | | | 342,336 |
| | | | | Bear Stearns Adjustable Rate Mortgage Trust,
Series 2004-8, Class 11A2 | | | |
| Aaa | | | 490 | | 4.744%(c), 11/25/34 | | | 378,626 |
| | | | | Series 2004-8, Class 13A1 | | | |
| Aaa | | | 951 | | 5.608%(c), 11/25/34 | | | 791,116 |
See Notes to Financial Statements.
| | |
| THE TARGET PORTFOLIO TRUST | | 127 |
| | |
Intermediate-Term Bond Portfolio (continued) | | Portfolio of Investments
As of October 31, 2008 |
| | | | | | | | |
MOODY’S
RATINGS†
(UNAUDITED) | | PRINCIPAL
AMOUNT (000)# | | DESCRIPTION | | VALUE (NOTE 1) |
| | | | | | | | |
| | | | | COLLATERALIZED MORTGAGE OBLIGATIONS (continued) | | | |
| | | | | Bear Stearns Alt-A Trust, | | | |
| | | | | Series 2006-6, Class 31A1 | | | |
| Aaa | | $ | 868 | | 5.77%(c), 11/25/36 | | $ | 515,586 |
| | | | | Series 2006-6, Class 32A1 | | | |
| Aaa | | | 809 | | 5.756%(c), 11/25/36 | | | 465,236 |
| | | | | Citigroup Mortgage Loan Trust, Inc.,
Series 2005-11, Class A2A | | | |
| Aaa | | | 367 | | 4.70%(c), 12/25/35 | | | 331,472 |
| | | | | Series 2006-AR1, Class 1A1 | | | |
| Aaa | | | 1,846 | | 4.90%(c), 10/25/35 | | | 1,506,097 |
| | | | | Countrywide Alternative Loan Trust,
Series 2003-J3, Class 2A1 | | | |
| AAA(d) | | | 123 | | 6.25%, 12/25/33 | | | 120,034 |
| | | | | Countrywide Home Loan Mortgage Pass-Through Trust,
Series 2003-R4, Class 2A, 144A | | | |
| | | | | 6.50%(c), 01/25/34 | | | |
| Aaa | | | 158 | | (original cost $165,223; purchased 12/01/03)(f)(g) | | | 142,351 |
| | | | | Series 2004-25, Class 1A1 | | | |
| Aaa | | | 907 | | 3.589%(c), 02/25/35 | | | 517,370 |
| | | | | Credit Suisse First Boston Mortgage Securities Corp.,
Series 2003-8, Class 5A1 | | | |
| Aaa | | | 32 | | 6.50%, 04/25/33 | | | 29,993 |
| | | | | Series 2005-C6, Class A1 | | | |
| Aaa | | | 183 | | 4.938%, 12/15/40 | | | 178,159 |
| Aaa | | | 52 | | Federal Home Loan Mortgage Corp.,
Series 2692, Class YB
3.50%, 05/15/16 | | | 51,618 |
| | | | | Series 2772, Class NQ | | | |
| Aaa | | | 231 | | 4.50%, 12/15/13 | | | 231,455 |
| | | | | Series 2828, Class EN | | | |
| Aaa | | | 744 | | 4.50%, 10/15/23 | | | 745,767 |
| | | | | Series 2844, Class PQ | | | |
| Aaa | | | 41 | | 5.00%, 05/15/23 | | | 41,694 |
| | | | | Series 2892, Class BL | | | |
| Aaa | | | 481 | | 5.00%, 01/15/18 | | | 486,495 |
| | | | | Series 2931, Class JA | | | |
| Aaa | | | 480 | | 5.00%, 07/15/25 | | | 482,629 |
| | | | | Series 3346, Class FA | | | |
| Aaa | | | 3,559 | | 4.818%(c), 02/15/19 | | | 3,457,659 |
| Aaa | | | 52 | | Federal National Mortgage Assoc.,
Series 2003-83, Class A
4.25%, 04/25/28 | | | 52,395 |
| | | | | Series 2003-83, Class PB | | | |
| Aaa | | | 95 | | 3.50%, 09/25/16 | | | 94,928 |
See Notes to Financial Statements.
| | |
| 128 | | THE TARGET PORTFOLIO TRUST |
| | | | | | | | |
MOODY’S
RATINGS†
(UNAUDITED) | | PRINCIPAL
AMOUNT (000)# | | DESCRIPTION | | VALUE (NOTE 1) |
| | | | | | | | |
| | | | | COLLATERALIZED MORTGAGE OBLIGATIONS (continued) | | | |
| | | | | Series 2006-67, Class PA | | | |
| Aaa | | $ | 661 | | 5.50%, 03/25/28 | | $ | 670,693 |
| Aaa | | | 314 | | FHLMC Structured Pass-Through Securities,
Series T-59, Class 1A2
7.00%, 10/25/43 | | | 332,398 |
| | | | | Series T-75, Class A1 | | | |
| Aaa | | | 1,298 | | 3.299%(c), 12/25/36 | | | 1,248,607 |
| AAA(d) | | | 269 | | GE Capital Commercial Mortgage Corp.,
Series 2002-3A, Class A1
4.229%, 12/10/37 | | | 258,553 |
| Aaa | | | 78 | | Government National Mortgage Assoc.,
Series 1995-2, Class KQ
8.50%, 03/20/25 | | | 83,166 |
| | | | | Series 2000-9, Class FG | | | |
| Aaa | | | 106 | | 2.023%(c), 02/16/30 | | | 107,140 |
| | | | | Series 2000-9, Class FH | | | |
| Aaa | | | 163 | | 1.923%(c), 02/16/30 | | | 164,470 |
| | | | | Series 2000-11, Class PH | | | |
| Aaa | | | 318 | | 7.50%, 02/20/30 | | | 335,341 |
| Aaa | | | 542 | | Greenpoint Mortgage Funding Trust,
Series 2005-AR2, Class A1
3.489%(c), 06/25/45 | | | 332,238 |
| | | | | GS Mortgage Securities Corp II,
Series 2001-1285, Class A1, 144A
(original cost $398,852; purchased 10/09/02)(f)(g) | | | |
| Aaa | | | 370 | | 6.044%, 08/15/18 | | | 361,607 |
| Aaa | | | 529 | | GSR Mortgage Loan Trust,
Series 2005-AR6, Class 2A1
4.539%(c), 09/25/35 | | | 419,244 |
| | | | | Merrill Lynch Floating Trust,
Series 2008-LAQA, Class A1
(original cost $369,000; purchased 06/26/08)(f)(g) | | | |
| NR | | | 400 | | 3.025%, 07/09/21 | | | 339,523 |
| Aaa | | | 374 | | Merrill Lynch Mortgage Investors, Inc.,
Series 2005-A10, Class A
3.469%(c), 02/25/36 | | | 288,319 |
| Aaa | | | 319 | | MLCC Mortgage Investors, Inc.,
Series 2005-2, Class 3A
4.259%(c), 10/25/35 | | | 289,104 |
| Aaa | | | 529 | | Sequoia Mortgage Trust,
Series 10, Class 2A1
4.658%(c), 10/20/27 | | | 465,281 |
| | | | | Structured Asset Mortgage Investments, Inc., | | | |
| | | | | Series 2005-AR5, Class A1 | | | |
| Aaa | | | 133 | | 1.724%(c), 07/19/35 | | | 78,204 |
| | | | | Series 2006-AR3, Class 12A1 | | | |
| Aaa | | | 457 | | 3.479%(c), 05/25/36 | | | 256,778 |
See Notes to Financial Statements.
| | |
| THE TARGET PORTFOLIO TRUST | | 129 |
| | |
Intermediate-Term Bond Portfolio (continued) | | Portfolio of Investments
As of October 31, 2008 |
| | | | | | | | |
MOODY’S
RATINGS†
(UNAUDITED) | | PRINCIPAL
AMOUNT (000)# | | DESCRIPTION | | VALUE (NOTE 1) |
| | | | | | | | |
| | | | | COLLATERALIZED MORTGAGE OBLIGATIONS (continued) | | | |
| Aaa | | $ | 46 | | Structured Asset Securities Corp.,
Series 2001-21A, Class 1A1
5.057%(c), 01/25/32 | | $ | 45,738 |
| Aaa | | | 448 | | Washington Mutual, Inc., Mortgage Pass-Through Certificate, Series 2002-AR6, Class A
4.065%(c), 06/25/42 | | | 366,189 |
| | | | | Series 2002-AR9, Class 1A | | | |
| Aaa | | | 24 | | 4.065%(c), 08/25/42 | | | 21,571 |
| | | | | | | | |
| | | | | TOTAL COLLATERALIZED MORTGAGE OBLIGATIONS
(cost $20,489,750) | | | 17,649,628 |
| | | | | | | | |
| | | |
| | | | | CORPORATE BONDS—33.1% | | | |
| | | |
| | | | | Airlines—1.1% | | | |
| NR | | | 1,237 | | United Air Lines, Inc.,(g)
Equipment Trust(i)
10.85%, 02/19/15 | | | 437,725 |
| | | | | Pass-Through Certificates | | | |
| B2 | | | 1,700 | | 6.831%, 03/01/10 | | | 1,785,000 |
| | | | | | | | |
| | | | | | | | 2,222,725 |
| | | | | | | | |
| | | |
| | | | | Commercial Banks—9.2% | | | |
| Aa3 | | | 2,300 | | American Express Bank FSB,
Sr. Unsec’d. Notes
5.50%, 04/16/13 | | | 1,887,424 |
| Aa2 | | | 2,200 | | ANZ National International Ltd.,
Gtd. Notes, 144A (New Zealand)
(original cost $2,197,932; purchased 07/09/08)(f)(g)
6.20%, 07/19/13 | | | 1,985,581 |
| Aa2 | | | 600 | | Bank of America Corp.,
Sr. Unsec’d. Notes
3.404%(c), 02/17/09 | | | 599,736 |
| Aaa | | | 3,000 | | Bank of America NA,
Sr. Unsec’d. Notes
2.835%(c), 05/12/10 | | | 3,008,553 |
| Aa1 | | | 2,300 | | Barclays Bank PLC,
Sr. Unsec’d. Notes (United Kingdom)
5.45%, 09/12/12 | | | 2,216,370 |
| Aa2 | | | 1,200 | | Charter One Bank NA,
Sr. Unsec’d. Notes
3.585%(c), 04/24/09 | | | 1,199,363 |
| Aa1 | | | 2,200 | | Credit Suisse New York,
Sr. Unsec’d. Notes (Switzerland)
5.00%, 05/15/13 | | | 1,984,072 |
See Notes to Financial Statements.
| | |
| 130 | | THE TARGET PORTFOLIO TRUST |
| | | | | | | | |
MOODY’S
RATINGS†
(UNAUDITED) | | PRINCIPAL
AMOUNT (000)# | | DESCRIPTION | | VALUE (NOTE 1) |
| | | | | | | | |
| | | | | CORPORATE BONDS (continued) | | | |
| | | |
| | | | | Commercial Banks (continued) | | | |
| Aa2 | | $ | 300 | | HSBC Bank USA,
Sr. Unsec’d. Notes
2.949%(c), 12/14/09 | | $ | 286,842 |
| A3 | | | 2,670 | | Korea Development Bank,
Sr. Unsec’d. Notes
4.75%, 07/20/09 | | | 2,584,645 |
| Aa3 | | | 1,200 | | National Australia Bank Ltd.,
Sr. Unsec’d. Notes, 144A
(original cost $1,200,000; purchased 09/06/06)(f)(g)
2.858%(c), 09/11/09 | | | 1,198,837 |
| Aa2 | | | 1,500 | | Rabobank Capital Funding II,
Sub. Notes, 144A
(original cost $1,419,795; purchased 01/30/08)(f)(g)
5.26%(c), 12/29/49 | | | 900,600 |
| NR | | JPY | 100,000 | | Sumitomo Mitsui Banking Corp.,
Sub. Notes (Japan)
1.718%(c), 11/26/49 | | | 1,017,510 |
| | | | | | | | |
| | | | | | | | 18,869,533 |
| | | | | | | | |
| | | |
| | | | | Distribution/Wholesale—0.1% | | | |
| B1 | | | 300 | | SUPERVALU, Inc.,
Sr. Unsec’d. Notes
7.50%, 11/15/14 | | | 246,000 |
| | | | | | | | |
| | | |
| | | | | Diversified Financial Services—14.5% | | | |
| Aa2 | | | 2,300 | | Allstate Life Global Funding Trusts,
Notes
5.375%, 04/30/13 | | | 2,078,528 |
| Aa3 | | | 1,800 | | American Express Credit Corp.,
Sr. Unsec’d. Notes
5.875%, 05/02/13 | | | 1,504,683 |
| A1 | | | 500 | | Bear Stearns Cos., Inc. (The),
Sr. Unsec’d. Notes
2.308%(c), 08/21/09 | | | 490,617 |
| | | 500 | | 2.356%(c), 05/18/10 | | | 490,853 |
| | | 600 | | 3.65%(c), 01/31/11 | | | 547,823 |
| A1 | | | 700 | | 6.95%, 08/10/12 | | | 690,732 |
| A2 | | | 1,200 | | Caterpillar Financial Service Corp.,
Sr. Unsec’d. Notes
2.853%(c), 08/11/09 | | | 1,180,226 |
| Aa1 | | | 700 | | Citigroup Global Markets Holdings, Inc.,
Sr. Unsec’d. Notes
2.916%(c), 03/17/09 | | | 695,012 |
| Aa1 | | | 1,200 | | Citigroup, Inc.,
Sr. Unsec’d. Notes
2.954%(c), 06/09/09 | | | 1,161,406 |
| Aa1 | | | 500 | | 3.809%(c), 12/26/08 | | | 499,294 |
| Aa3 | | | 1,700 | | 5.50%, 04/11/13 | | | 1,555,041 |
See Notes to Financial Statements.
| | |
| THE TARGET PORTFOLIO TRUST | | 131 |
| | |
Intermediate-Term Bond Portfolio (continued) | | Portfolio of Investments
As of October 31, 2008 |
| | | | | | | | |
MOODY’S
RATINGS†
(UNAUDITED) | | PRINCIPAL
AMOUNT (000)# | | DESCRIPTION | | VALUE (NOTE 1) |
| | | | | | | | |
| | | | | CORPORATE BONDS (continued) | | | |
| | | |
| | | | | Diversified Financial Services (continued) | | | |
| Aa2 | | $ | 2,000 | | Countrywide Financial Corp.,
Gtd. Notes
5.80%, 06/07/12 | | $ | 1,859,934 |
| Aa1 | | | 1,000 | | General Electric Capital Corp.,
Sub. Notes, 144A
5.50%(c), 09/15/67 | | | 729,603 |
| Aa3 | | | 1,800 | | Goldman Sachs Group, Inc. (The),
Sr. Unsec’d. Notes
3.30%(c), 06/23/09 | | | 1,743,813 |
| Aa3 | | | 1,750 | | 4.069%(c), 06/28/10 | | | 1,588,018 |
| | | 1,500 | | 4.084%(c), 10/23/09 | | | 1,432,170 |
| Aa3 | | | 400 | | HSBC Finance Corp.,
Sr. Unsec’d. Notes
4.479%(c), 10/21/09 | | | 384,522 |
| A2 | | | 3,400 | | John Deere Capital Corp.,
Sr. Unsec’d. Notes
3.567%(c), 06/10/11 | | | 3,202,606 |
| Aa2 | | | 2,600 | | JPMorgan Chase & Co.,
Sr. Unsec’d. Notes
3.569%(c), 06/13/11 | | | 2,585,534 |
| B3 | | | 1,800 | | Lehman Brothers Holdings, Inc.,(i)
Sr. Unsec’d. Notes
2.851%, 12/23/08 | | | 211,500 |
| B3 | | | 600 | | 5.625%, 01/24/13 | | | 78,000 |
| A2 | | | 1,300 | | Merrill Lynch & Co., Inc.,
Sr. Unsec’d. Notes
3.234%(c), 12/22/08 | | | 1,284,966 |
| A2 | | | 1,400 | | 6.15%, 04/25/13 | | | 1,291,781 |
| | | | | Morgan Stanley,
Sr. Unsec’d. Notes | | | |
| Aa3 | | | 1,600 | | 6.00%, 04/28/15 | | | 1,300,077 |
| | | | | SLM Corp.,
Sr. Unsec’d. Notes | | | |
| A2 | | | 1,200 | | 3.675%(c), 07/27/09 | | | 1,068,722 |
| | | | | | | | |
| | | | | | | | 29,655,461 |
| | | | | | | | |
| | | |
| | | | | Electric—1.6% | | | |
| | | | | NiSource Finance Corp.,
Gtd. Notes | | | |
| Baa3 | | | 1,500 | | 3.381%(c), 11/23/09 | | | 1,365,129 |
| | | | | Public Service Electric & Gas Co.,
Sec’d. Notes | | | |
| A3 | | | 2,300 | | 5.30%, 05/01/18 | | | 1,894,761 |
| | | | | | | | |
| | | | | | | | 3,259,890 |
| | | | | | | | |
See Notes to Financial Statements.
| | |
| 132 | | THE TARGET PORTFOLIO TRUST |
| | | | | | | | |
MOODY’S
RATINGS†
(UNAUDITED) | | PRINCIPAL
AMOUNT (000)# | | DESCRIPTION | | VALUE (NOTE 1) |
| | | | | | | | |
| | | | | CORPORATE BONDS (continued) | | | |
| | | |
| | | | | Electric—Integrated—0.8% | | | |
| | | | | Dayton Power & Light Co. (The),
First Mortgage | | | |
| Baa1 | | $ | 500 | | 5.125%, 10/01/13 | | $ | 484,333 |
| | | | | Enel Finance International SA,
Co. Gtd., 144A
(original cost $1,197,444; purchased 09/13/07)(f)(g) | | | |
| A1 | | | 1,200 | | 5.70%, 01/15/13 | | | 1,104,394 |
| | | | | | | | |
| | | | | | | | 1,588,727 |
| | | | | | | | |
| | | |
| | | | | Financial Services—1.0% | | | |
| | | | | Rabobank Nederland NV,
Notes, 144A (Netherlands)
(original cost $2,000,000; purchased 05/14/08)(f)(g) | | | |
| Aaa | | | 2,000 | | 3.209%(c), 05/19/10 | | | 1,997,014 |
| | | | | | | | |
| | | |
| | | | | Forest Products—0.1% | | | |
| | | | | Weyerhaeuser Co.,
Sr. Unsec’d. Notes | | | |
| Baa2 | | | 200 | | 4.198%(c), 09/24/09 | | | 191,091 |
| | | | | | | | |
| | | |
| | | | | Hotels, Restaurants & Leisure | | | |
| | | | | Mandalay Resort Group,
Gtd. Notes | | | |
| Ba2 | | | 100 | | 6.50%, 07/31/09 | | | 91,000 |
| | | | | | | | |
| | | |
| | | | | Household & Personal Products—0.8% | | | |
| | | | | Kimberly-Clark Corp.,
Sr. Unsec’d. Notes | | | |
| A2 | | | 1,700 | | 3.52%(c), 07/30/10 | | | 1,694,631 |
| | | | | | | | |
| | | |
| | | | | Media—0.6% | | | |
| | | | | Walt Disney Co. (The),
Sr. Unsec’d. Notes | | | |
| A3 | | | 1,200 | | 2.917%(c), 09/10/09 | | | 1,180,763 |
| | | | | | | | |
| | | |
| | | | | Miscellaneous Manufacturing—0.6% | | | |
| | | | | Siemens Financieringsmaatschappij NV,
Co. Gtd., 144A (Netherlands)
(original cost $1,200,000; purchased 08/09/06)(f)(g) | | | |
| Aa3 | | | 1,200 | | 2.854%(c), 08/14/09 | | | 1,200,064 |
| | | | | | | | |
| | | |
| | | | | Office Equipment—0.3% | | | |
| | | | | Xerox Corp.,
Gtd. Notes | | | |
| Baa3 | | | 600 | | 9.75%, 01/15/09 | | | 597,737 |
| | | | | | | | |
| | | |
| | | | | Oil, Gas & Consumable Fuels—1.0% | | | |
| | | | | XTO Energy, Inc.,
Sr. Unsec’d. Notes | | | |
| Baa2 | | | 2,500 | | 4.625%, 06/15/13 | | | 2,143,340 |
| | | | | | | | |
See Notes to Financial Statements.
| | |
| THE TARGET PORTFOLIO TRUST | | 133 |
| | |
Intermediate-Term Bond Portfolio (continued) | | Portfolio of Investments
As of October 31, 2008 |
| | | | | | | | |
MOODY’S
RATINGS†
(UNAUDITED) | | PRINCIPAL
AMOUNT (000)# | | DESCRIPTION | | VALUE (NOTE 1) |
| | | | | | | | |
| | | | | CORPORATE BONDS (continued) | | | |
| | | |
| | | | | Pipelines—0.1% | | | |
| | | | | Dynegy Holdings, Inc.,
Sr. Unsec’d. Notes | | | |
| B2 | | $ | 400 | | 7.50%, 06/01/15 | | $ | 292,000 |
| | | | | | | | |
| | | |
| | | | | Real Estate Investment Trusts—0.5% | | | |
| | | | | Ventas Realty LP,
Gtd. Notes | | | |
| Ba2 | | | 1,200 | | 6.75%, 04/01/17 | | | 984,000 |
| | | | | | | | |
| | | |
| | | | | Telecommunications—0.8% | | | |
| | | | | France Telecom SA,
Sr. Unsec’d. Notes (France) | | | |
| A3 | | | 1,000 | | 8.50%, 03/01/31 | | | 942,261 |
| | | | | Qwest Communications International, Inc.,
Gtd. Notes | | | |
| B2 | | | 200 | | 5.649%(c), 02/15/09 | | | 193,000 |
| | | | | Sprint Nextel Corp.,
Sr. Unsec’d. Notes | | | |
| Baa3 | | | 500 | | 4.169%(c), 06/28/10 | | | 396,805 |
| | | | | | | | |
| | | | | | | | 1,532,066 |
| | | | | | | | |
| | | | | TOTAL CORPORATE BONDS
(cost $76,267,224) | | | 67,746,042 |
| | | | | | | | |
| | | |
| | | | | FOREIGN GOVERNMENT BONDS—1.1% | | | |
| | | | | Republic of Brazil,
Sr. Unsec’d. Notes | | | |
| Ba2 | | | BRL 1,200 | | 10.25%, 01/10/28 | | | 384,953 |
| | | | | Republic of Panama,
Sr. Unsec’d. Notes | | | |
| Ba1 | | | 1,500 | | 9.375%, 04/01/29 | | | 1,455,000 |
| | | | | Republic of South Africa,
Sr. Unsec’d. Notes | | | |
| Baa1 | | | 750 | | 5.875%, 05/30/22 | | | 483,750 |
| | | | | | | | |
| | | | | TOTAL FOREIGN GOVERNMENT BONDS
(cost $2,894,739) | | | 2,323,703 |
| | | | | | | | |
| | | |
| | | | | MUNICIPAL BONDS—1.0% | | | |
| | | | | Golden State Tobacco Securitization Corp. (CA),
Revenue Bonds | | | |
| Baa3 | | | 100 | | 5.00%, 06/01/33 | | | 62,009 |
| | | | | Honolulu City & County,
Revenue Bonds | | | |
| Aaa | | | 1,000 | | 4.75%, 07/01/28 | | | 823,590 |
See Notes to Financial Statements.
| | |
| 134 | | THE TARGET PORTFOLIO TRUST |
| | | | | | | | | |
MOODY’S
RATINGS†
(UNAUDITED) | | PRINCIPAL
AMOUNT (000)# | | | DESCRIPTION | | VALUE (NOTE 1) |
| | | | | | | | | |
| | | | | | MUNICIPAL BONDS (continued) | | | |
| | | | | | Tobacco Securitization Authority of Southern California, Revenue Bonds | | | |
| Baa3 | | BRL | 800 | | | 5.00%, 06/01/37 | | $ | 478,472 |
| | | | | | Tobacco Settlement Financial Authority of West Virginia, Revenue Bonds | | | |
| Baa3 | | $ | 985 | | | 7.467%, 06/01/47 | | | 640,014 |
| | | | | | | | | |
| | | | | | TOTAL MUNICIPAL BONDS
(cost $2,542,821) | | | 2,004,085 |
| | | | | | | | | |
| | | |
| | | | | | U.S. GOVERNMENT AGENCY OBLIGATIONS—2.3% | | | |
| | | | | | Federal Home Loan Bank | | | |
| | | 900 | | | 4.50%, 06/12/13 | | | 898,419 |
| | | | | | Federal Home Loan Mortgage Corp. | | | |
| | | 2,000 | | | 6.00%, 06/15/11 | | | 2,139,994 |
| | | | | | Federal National Mortgage Assoc. | | | |
| | | 700 | | | 5.375%, 11/15/11 | | | 737,810 |
| | | 800 | | | 5.25%, 08/01/12 | | | 799,624 |
| | | | | | | | | |
| | | | | | TOTAL U.S. GOVERNMENT AGENCY OBLIGATIONS
(cost $4,592,023) | | | 4,575,847 |
| | | | | | | | | |
| | | |
| | | | | | U.S. GOVERNMENT MORTGAGE BACKED OBLIGATIONS—57.2% | | | |
| | | | | | Federal Home Loan Mortgage Corp. | | | |
| | | 14,181 | | | 6.00%, 11/01/37 - 11/13/38 | | | 14,156,170 |
| | | — | (r) | | 9.25%, 01/01/10 | | | 144 |
| | | | | | Federal National Mortgage Assoc. | | | |
| | | 15,035 | | | 5.00%, 10/01/17 - 07/01/38 | | | 14,756,135 |
| | | 3,000 | | | 5.00%, TBA | | | 2,837,814 |
| | | 8,000 | | | 5.00%, TBA | | | 7,577,504 |
| | | 8 | | | 5.026%(c), 12/01/30 | | | 7,536 |
| | | 121 | | | 5.229%(c), 07/01/25 | | | 123,246 |
| | | 67 | | | 5.375%(c), 08/01/24 | | | 66,584 |
| | | 54,806 | | | 5.50%, 07/01/17 - 10/14/38 | | | 53,739,057 |
| | | 9,847 | | | 6.00%, 11/01/12 - 05/01/38 | | | 9,861,507 |
| | | 1,000 | | | 6.00%, TBA | | | 997,812 |
| | | 11,000 | | | 6.00%, TBA | | | 10,993,125 |
| | | | | | Government National Mortgage Assoc. | | | |
| | | 68 | | | 5.125%(c), 10/20/24 - 12/20/26 | | | 68,158 |
| | | 361 | | | 5.25%(c), 03/20/30 | | | 362,789 |
| | | 367 | | | 5.375%(c), 05/20/23 - 06/20/27 | | | 367,890 |
| | | 242 | | | 5.625%(c), 08/20/26 - 07/20/30 | | | 244,009 |
| | | 621 | | | 6.00%, 01/15/29 - 07/15/29 | | | 622,942 |
| | | 161 | | | 6.50%, 10/15/25 - 06/15/29 | | | 162,697 |
| | | 64 | | | 8.00%, 09/20/30 - 07/20/31 | | | 67,907 |
| | | | | | | | | |
| | | | | | TOTAL U.S. GOVERNMENT MORTGAGE BACKED OBLIGATIONS
(cost $119,104,687) | | | 117,013,026 |
| | | | | | | | | |
| | | | | | TOTAL LONG-TERM INVESTMENTS
(cost $231,723,098) | | | 216,544,768 |
| | | | | | | | | |
See Notes to Financial Statements.
| | |
| THE TARGET PORTFOLIO TRUST | | 135 |
| | |
Intermediate-Term Bond Portfolio (continued) | | Portfolio of Investments
As of October 31, 2008 |
| | | | | | | | |
| | | PRINCIPAL
AMOUNT (000)# | | DESCRIPTION | | VALUE (NOTE 1) |
| | | | | | | | |
| | | | | SHORT-TERM INVESTMENTS—9.1% | | | |
| | | |
| | | | | COMMERCIAL PAPER(n)—1.0% | | | |
| | | | | Citigroup Funding Corp. | | | |
| | $ | 1,100 | | 3.60%, 01/22/09 | | $ | 1,091,811 |
| | | | | Merrill Lynch & Co. | | | |
| | | 900 | | 3.69%, 01/05/09 | | | 894,865 |
| | | | | | | | |
| | | | | TOTAL COMMERCIAL PAPER
(cost $1,985,388) | | | 1,986,676 |
| | | | | | | | |
| | | |
| | | | | REPURCHASE AGREEMENTS(m)—3.1% | | | |
| | | 6,400 | | U.S. Agency, 0.15% dated 10/31/08, due 11/03/08 in the amount of $6,400,080 (cost $6,400,000; the value of collateral plus accrued interest was $6,575,202) | | | 6,400,000 |
| | | | | | | | |
| | | |
| | | | | U.S. TREASURY OBLIGATIONS(k)(n)—3.2% | | | |
| | | | | U.S. Treasury Bills | | | |
| | | 6,400 | | 0.55%, 11/28/08 | | | 6,397,556 |
| | | 250 | | 1.695%, 12/11/08 | | | 249,962 |
| | | | | | | | |
| | | | | TOTAL U.S. TREASURY OBLIGATIONS
(cost $6,647,106) | | | 6,647,518 |
| | | | | | | | |
| | | Contracts/
Notional
Amounts | | OPTIONS PURCHASED*—0.1% | | |
| | | | | Call Options—0.1% | | | |
| | | 1,200 | | Interest Rate Swap Options,
expiring 08/03/09 @ 3.45% | | | 12,845 |
| | | 9,800 | | expiring 08/03/09 @ 3.45% | | | 104,898 |
| | | 6,200 | | expiring 07/05/09 @ 3.60% | | | 79,181 |
| | | | | | | | |
| | | | | TOTAL OPTIONS PURCHASED
(cost $182,437) | | | 196,924 |
| | | | | | | | |
| | | Shares | | |
| | | | | AFFILIATED MONEY MARKET MUTUAL FUND—1.7% |
| | | 3,409,332 | | Dryden Core Investment Fund—Taxable Money Market Series
(cost $3,409,332; Note 3)(w) | | | 3,409,332 |
| | | | | | | | |
| | | | | TOTAL SHORT-TERM INVESTMENTS
(cost $18,624,263) | | | 18,640,450 |
| | | | | | | | |
| | | |
| | | | | TOTAL INVESTMENTS, BEFORE OPTIONS WRITTEN AND
SECURITIES SOLD SHORT—115.0%
(cost $250,347,361; Note 5) | | | 235,185,218 |
| | | | | | | | |
See Notes to Financial Statements.
| | |
| 136 | | THE TARGET PORTFOLIO TRUST |
| | | | | | | | | |
| | | NOTIONAL
AMOUNT (000)# | | DESCRIPTION | | VALUE (NOTE 1) | |
| | | | | OPTIONS WRITTEN—(0.1%) | | | | |
| | | |
| | | | | Call Options—(0.1%) | | | | |
| | $ | 500 | | Interest Rate Swap Options,
expiring 08/05/09 @ 4.15% | | $ | (10,728 | ) |
| | | 3,300 | | expiring 08/03/09 @ 4.40% | | | (88,950 | ) |
| | | 2,700 | | expiring 07/05/09 @ 4.20% | | | (61,065 | ) |
| | | | | | | | | |
| | | | | TOTAL OPTIONS WRITTEN
(premiums received $181,120) | | | (160,743 | ) |
| | | | | | | | | |
| | | PRINCIPAL
AMOUNT (000)# | | SECURITIES SOLD SHORT—(20.0%) | | | |
| | | | | U.S. Government Mortgage Backed Obligations | | | | |
| | | | | Federal National Mortgage Assoc. | | | | |
| | | 13,000 | | 5.00%, 11/19/22 | | | (12,707,500 | ) |
| | | 9,300 | | 5.50%, 11/18/23 | | | (9,270,937 | ) |
| | | 19,300 | | 5.50%, TBA | | | (18,853,688 | ) |
| | | | | | | | | |
| | | | | TOTAL SECURITIES SOLD SHORT
(proceeds received $41,094,059) | | | (40,832,125 | ) |
| | | | | | | | | |
| | | | | TOTAL INVESTMENTS, NET OF OPTIONS WRITTEN AND
SECURITIES SOLD SHORT—94.9%
(cost $209,072,182) | | | 194,192,350 | |
| | | | | Other assets in excess of other liabilities(x)—5.1% | | | 10,355,581 | |
| | | | | | | | | |
| | | | | NET ASSETS—100% | | $ | 204,547,931 | |
| | | | | | | | | |
The following abbreviations were used in Portfolio descriptions:
144A—Security was purchased pursuant to Rule 144A under the Securities Act of 1933 and may not be resold subject to that rule except to qualified institutional buyers. Unless otherwise noted 144A securities are deemed to be liquid.
FHLMC—Federal Home Loan Mortgage Corp.
NR—Not Rated by Moodys or Standard & Poor’s
TBA—To Be Announced
AUD—Australian Dollar
BRL—Brazilian Real
CNY—Chinese Yuan
EUR—Euro
GBP—British Pound
JPY—Japanese Yen
NOK—Norwegian Krone
| † | The rating reflected is as of October 31, 2008. Rating of certain bonds may have changed subsequent to that date. |
| # | Principal amount is shown in U.S. dollars unless otherwise stated. |
| * | Non-income producing security. |
| (c) | Indicates a variable rate security. |
| (d) | Standard & Poor’s rating. |
| (f) | Private Placement restricted as to resale and does not have a readily available market. The aggregate cost of such securities is $11,305,510 The aggregate value of $10,175,805 is approximately 5.0% of net assets. |
| (g) | Indicates a security that has been deemed illiquid. |
| (i) | Represents issuer in default on interest payments. Non-income producing security. |
| (k) | Securities segregated as collateral for futures contracts. |
| (m) | Repurchase agreement is collateralized by United States Treasuries or federal agency obligations. |
| (n) | Rates shown are the effective yields at purchase date. |
| (w) | Prudential Investments LLC, the manager of the Portfolio, also serves as manager of the Dryden Core Investment Fund-Taxable Money Market Series. |
See Notes to Financial Statements.
| | |
| THE TARGET PORTFOLIO TRUST | | 137 |
| | |
Intermediate-Term Bond Portfolio (continued) | | Portfolio of Investments
As of October 31, 2008 |
| (x) | Other assets in excess of other liabilities include net unrealized appreciation (depreciation) on futures contracts, forward foreign currency exchange contracts, interest rate and credit default swap agreements as follows: |
Open futures contracts outstanding at October 31, 2008:
| | | | | | | | | | | | | | |
Number of
Contracts | | Type | | Expiration
Date | | Value at
Trade Date | | Value at
October 31,
2008 | | Unrealized
Appreciation
(Depreciation) | |
| Long Positions: | | | | | | | | | | | | | | |
| 252 | | 90 Day Euro Futures | | Mar 09 | | $ | 60,881,713 | | $ | 61,601,400 | | $ | 719,687 | |
| 59 | | 90 Day Euro Futures | | Jun 09 | | | 14,163,687 | | | 14,393,050 | | | 229,363 | |
| 464 | | 90 Day Euro Futures | | Sep 09 | | | 111,173,513 | | | 112,966,601 | | | 1,793,088 | |
| 721 | | 90 Day Euro Futures | | Dec 09 | | | 172,905,100 | | | 175,130,900 | | | 2,225,800 | |
| | | | | | | | | | | | | | |
| | | | | | | | | | | | | 4,967,938 | |
| | | | | | | | | | | | | | |
| Short Positions: | | | | | | | | | | | | | | |
| 88 | | 2 Year Euro Schatz | | Dec 08 | | | 11,619,362 | | | 11,890,695 | | | (271,333 | ) |
| 70 | | 2 Year Treasury Note | | Dec 08 | | | 14,888,125 | | | 15,037,969 | | | (149,844 | ) |
| 60 | | 5 Year Treasury Note | | Dec 08 | | | 6,713,438 | | | 6,795,469 | | | (82,031 | ) |
| | | | | | | | | | | | | | |
| | | | | | | | | | | | | (503,208 | ) |
| | | | | | | | | | | | | | |
| | | | | | | | | | | | $ | 4,464,730 | (1) |
| | | | | | | | | | | | | | |
(1) | Cash of $2,166,000 has been segregated with the broker to cover requirements for open futures contacts as of October 31, 2008. |
Forward foreign currency exchange contracts outstanding at October 31, 2008:
| | | | | | | | | | | | | |
Purchase Contracts | | Notional
Amount
(000) | | Value at Settlement
Date Payable | | Current
Value | | Unrealized
Appreciation
(Depreciation) | |
British Pound,
Expiring 11/03/08 | | GBP | 2,731 | | $ | 4,466,551 | | $ | 4,395,127 | | $ | (71,424 | ) |
Expiring 11/05/08 | | GBP | 147 | | | 256,314 | | | 236,574 | | | (19,740 | ) |
Chinese Yuan,
Expiring 07/15/09 | | CNY | 28,670 | | | 4,401,000 | | | 4,099,224 | | | (301,776 | ) |
Euro,
Expiring 11/04/08 | | EUR | 20 | | | 25,480 | | | 25,283 | | | (197 | ) |
Japanese Yen,
Expiring 11/05/08 | | JPY | 265,961 | | | 2,662,130 | | | 2,699,838 | | | 37,708 | |
Norwegian Krone,
Expiring 12/09/08 | | NOK | 3,811 | | | 678,066 | | | 564,137 | | | (113,929 | ) |
| | | | | | | | | | | | | |
| | | | | $ | 12,489,541 | | $ | 12,020,183 | | $ | (469,358 | ) |
| | | | | | | | | | | | | |
See Notes to Financial Statements.
| | |
| 138 | | THE TARGET PORTFOLIO TRUST |
Forward foreign currency exchange contracts outstanding at October 31, 2008 (continued):
| | | | | | | | | | | | | |
Sale Contracts | | Notional
Amount
(000) | | Value at Settlement
Date Receivable | | Current
Value | | Unrealized
Appreciation
(Depreciation) | |
Australian Dollar,
Expiring 11/06/08 | | AUD | 2,090 | | $ | 1,420,740 | | $ | 1,388,907 | | $ | 31,833 | |
British Pound,
Expiring 11/03/08 | | GBP | 2,731 | | | 4,961,408 | | | 4,394,308 | | | 567,100 | |
Expiring 12/09/08 | | GBP | 2,731 | | | 4,456,447 | | | 4,384,890 | | | 71,557 | |
Euro,
Expiring 12/04/08 | | EUR | 1,069 | | | 1,343,275 | | | 1,360,634 | | | (17,359 | ) |
Japanese Yen,
Expiring 11/05/08 | | JPY | 265,961 | | | 2,602,046 | | | 2,699,916 | | | (97,870 | ) |
Expiring 12/03/08 | | JPY | 77,801 | | | 794,987 | | | 790,778 | | | 4,209 | |
| | | | | | | | | | | | | |
| | | | | $ | 15,578,903 | | $ | 15,019,433 | | $ | 559,470 | |
| | | | | | | | | | | | | |
Interest rate swap agreements outstanding at October 31, 2008:
| | | | | | | | | | | | | | | | |
Counterparty | | Termination
Date | | Notional
Amount#
(000) | | Fixed
Rate | | | Floating
Rate | | Unrealized
Appreciation
(Depreciation) | |
Bank of America, N.A.(2) | | 12/17/38 | | $ | | | 1,300 | | 5.00 | % | | 3 month LIBOR | | $ | 52,751 | |
Barclays Capital(1) | | 12/17/10 | | | | | 78,100 | | 4.00 | % | | 3 month LIBOR | | | 1,315,289 | |
Barclays Capital(2) | | 12/17/38 | | | | | 600 | | 5.00 | % | | 3 month LIBOR | | | (60,576 | ) |
Barclays Capital(2) | | 12/17/18 | | | | | 8,900 | | 5.00 | % | | 3 month LIBOR | | | (350,027 | ) |
Credit Suisse International(1) | | 06/17/10 | | | | | 9,500 | | 4.00 | % | | 3 month LIBOR | | | 109,035 | |
Deutsche Bank(1) | | 12/17/10 | | | | | 65,700 | | 4.00 | % | | 3 month LIBOR | | | 1,097,861 | |
Deutsche Bank(2) | | 12/17/28 | | | | | 4,500 | | 5.00 | % | | 3 month LIBOR | | | (321,707 | ) |
Merrill Lynch & Co.(1) | | 12/17/10 | | | | | 1,500 | | 4.00 | % | | 3 month LIBOR | | | 4,178 | |
Merrill Lynch & Co.(2) | | 12/17/38 | | | | | 3,000 | | 5.00 | % | | 3 month LIBOR | | | (369,842 | ) |
Merrill Lynch & Co.(2) | | 12/17/18 | | | | | 3,600 | | 5.00 | % | | 3 month LIBOR | | | (36,115 | ) |
Deutsche Bank(1) | | 01/15/10 | | | AUD | | 2,600 | | 6.50 | % | | 6 month Australian
Bank Bill rate | | | 13,577 | |
UBS AG(1) | | 03/15/11 | | | AUD | | 6,600 | | 7.50 | % | | 6 month Australian
Bank Bill rate | | | 169,669 | |
Citigroup(1) | | 03/18/11 | | | EUR | | 1,600 | | 4.50 | % | | 6 month EURIBOR | | | 40,807 | |
Credit Suisse International(1) | | 03/18/14 | | | EUR | | 700 | | 4.50 | % | | 6 month EURIBOR | | | 21,855 | |
Morgan Stanley Capital Services, Inc.(1) | | 03/19/10 | | | EUR | | 20,000 | | 4.50 | % | | 6 month EURIBOR | | | 177,951 | |
Barclays Capital(1) | | 03/18/14 | | | GBP | | 10,100 | | 5.00 | % | | 6 month LIBOR | | | 559,792 | |
Barclays Capital(2) | | 03/18/39 | | | GBP | | 2,700 | | 4.50 | % | | 6 month LIBOR | | | (160,599 | ) |
| | | | | | | | | | | | | | | | |
| | | | | | | | | | | | | | $ | 2,263,899 | |
| | | | | | | | | | | | | | | | |
| (1) | Portfolio pays the floating rate and receives the fixed rate. |
| (2) | Portfolio pays the fixed rate and receives the floating rate. |
| # | Notional Amount is shown in U.S. dollars unless otherwise stated. |
See Notes to Financial Statements.
| | |
| THE TARGET PORTFOLIO TRUST | | 139 |
| | |
Intermediate-Term Bond Portfolio (continued) | | Portfolio of Investments
As of October 31, 2008 |
Credit default swap agreements outstanding at October 31, 2008:
| | | | | | | | | | | | | |
| Sell Protection: | | | | | | | | | | | | | |
Counterparty | | Termination
Date | | Notional
Amount#
(000) | | Fixed
Rate | | Reference
Entity/Obligation | | Unrealized
Appreciation
(Depreciation) | |
Barclays Capital(1) | | 03/20/13 | | $ | 2,500 | | 1.00% | | Berkshire Hathaway, 4.625%, due 10/15/13 | | $ | (143,319 | ) |
Barclays Capital(1) | | 06/20/10 | | | 2,000 | | 4.10% | | Countrywide Home Loan, 6.00%, due 01/24/18 | | | 112,869 | |
Deutsche Bank(1) | | 12/20/12 | | | 6,806 | | 0.72% | | Dow Jones CDX IG9 5Y Index | | | 35,119 | |
Goldman Sachs (1) | | 12/20/12 | | | 2,333 | | 0.70% | | Dow Jones CDX IG9 5Y Index | | | 9,700 | |
Merrill Lynch & Co.(1) | | 06/20/12 | | | 200 | | 0.28% | | Enbridge Energy Partners, 4.75%, due 06/01/13 | | | (17,732 | ) |
Bank of America, N.A.(1) | | 06/20/12 | | | 200 | | 0.33% | | Energy Transfer Partners, 5.95%, due 02/01/15 | | | (16,811 | ) |
Citigroup(1) | | 03/20/09 | | | 1,300 | | 0.80% | | General Electric Capital Corp., 6.00%, due 06/15/12 | | | (28,088 | ) |
Merrill Lynch & Co.(1) | | 06/20/12 | | | 200 | | 0.29% | | Kinder Morgan,
6.75%, due 03/15/11 | | | (13,835 | ) |
Bank of America, N.A.(1) | | 09/20/12 | | | 700 | | 0.89% | | Merrill Lynch & Co.,
5.00%, due 01/15/15 | | | (31,737 | ) |
Merrill Lynch & Co.(1) | | 09/20/12 | | | 3,800 | | 0.80% | | Morgan Stanley,
6.60%, due 04/01/12 | | | (439,619 | ) |
Barclays Capital(1) | | 12/20/08 | | | 300 | | 0.29% | | Petroleos Mexicanos,
9.50%, due 09/15/27 | | | (155 | ) |
Bank of America, N.A.(1) | | 06/20/12 | | | 200 | | 0.32% | | Plains All-American Pipeline, 7.75%, due 10/15/12 | | | (19,530 | ) |
Deutsche Bank(1) | | 12/20/08 | | | 100 | | 0.42% | | Republic of Indonesia, 6.75%, due 03/10/14 | | | (614 | ) |
Barclays Capital(1) | | 12/20/08 | | | 100 | | 0.26% | | Republic of Panama,
8.875%, due 09/30/27 | | | (284 | ) |
Deutsche Bank(1) | | 12/20/08 | | | 200 | | 0.25% | | Republic of Panama,
8.875%, due 09/30/27 | | | (578 | ) |
Deutsche Bank(1) | | 12/20/08 | | | 100 | | 0.33% | | Republic of Peru,
8.75%, due 11/21/33 | | | (2 | ) |
Barclays Capital(1) | | 12/20/08 | | | 100 | | 0.72% | | Ukraine Government,
7.65%, due 06/11/13 | | | (3,174 | ) |
Barclays Capital(1) | | 12/20/08 | | | 300 | | 0.71% | | Ukraine Government, 7.65%, due 06/11/13 | | | (9,537 | ) |
Deutsche Bank(1) | | 12/20/08 | | | 300 | | 0.72% | | Ukraine Government, 7.65%, due 06/11/13 | | | (9,522 | ) |
Bank of America, N.A.(1) | | 06/20/12 | | | 200 | | 0.32% | | Valero Energy Corp., 6.875%, due 04/15/12 | | | (12,253 | ) |
| | | | | | | | | | | | | |
| | | | | | | | | | | $ | (589,102 | ) |
| | | | | | | | | | | | | |
| (1) | Portfolio pays the counterparty par in the event that the reference entity defaults and receives the fixed rate. |
| # | Notional Amount is shown in U.S. dollars unless otherwise stated. |
See Notes to Financial Statements.
| | |
| 140 | | THE TARGET PORTFOLIO TRUST |
Credit default swap agreements outstanding at October 31, 2008 (continued):
| | | | | | | | | | | | |
| Buy Protection: | | | | | | | | | | |
Counterparty | | Termination
Date | | Notional
Amount#
(000) | | Fixed
Rate | | Reference
Entity/Obligation | | Unrealized
Appreciation |
Deutsche Bank(2) | | 06/20/12 | | $ | 200 | | 0.23% | | Diamond Offshore Drilling,
0% (Convertible), 06/06/20 | | $ | 4,195 |
Deutsche Bank(2) | | 06/20/12 | | | 200 | | 0.50% | | GlobalSantaFe Corp.,
5.00%, due 02/15/13 | | | 1,312 |
Citigroup(2) | | 06/20/12 | | | 200 | | 0.48% | | Nabors Industries, Inc.,
5.375%, due 08/15/12 | | | 10,683 |
Deutsche Bank(2) | | 06/20/12 | | | 200 | | 0.51% | | Noble Corp.,
5.875%, due 06/01/13 | | | 4,119 |
| | | | | | | | | | | | |
| | | | | | | | | | | $ | 20,309 |
| | | | | | | | | | | | |
| (2) | Portfolio pays the fixed rate and receives from the counterparty par in the event that the reference entity defaults. |
| # | Notional Amount is shown in U.S. dollars unless otherwise stated. |
The industry classification of investments and other assets in excess of other liabilities shown as a percentage of net assets as of October 31, 2008 were as follows:
| | | |
U.S. Government Mortgage Backed Obligations | | 57.2 | % |
Diversified Financial Services | | 14.5 | |
Commercial Banks | | 9.2 | |
Collateralized Mortgage Obligations | | 8.6 | |
U.S. Treasury Obligations | | 3.2 | |
Repurchase Agreements | | 3.1 | |
U.S. Government Agency Obligations | | 2.3 | |
Asset-Backed Securities | | 2.2 | |
Affiliated Money Market Mutual Fund | | 1.7 | |
Electric | | 1.6 | |
Foreign Government Bonds | | 1.1 | |
Airlines | | 1.1 | |
Oil, Gas & Consumable Fuels | | 1.0 | |
Municipal Bonds | | 1.0 | |
Financial Services | | 1.0 | |
Commercial Paper | | 1.0 | |
Household & Personal Products | | 0.8 | |
Electric—Integrated | | 0.8 | |
Telecommunications | | 0.8 | |
Miscellaneous Manufacturing | | 0.6 | |
Media | | 0.6 | |
Real Estate Investment Trusts | | 0.5 | |
Bank Notes | | 0.4 | |
Office Equipment | | 0.3 | |
Pipelines | | 0.1 | |
Distribution/Wholesale | | 0.1 | |
Options Purchased | | 0.1 | |
Forest Products | | 0.1 | |
| | | |
| | 115.0 | |
Options Written and Securities Sold Short | | (20.1 | ) |
Other assets in excess of other liabilities | | 5.1 | |
| | | |
| | 100.0 | % |
| | | |
See Notes to Financial Statements.
| | |
| THE TARGET PORTFOLIO TRUST | | 141 |
| | |
| Mortgage Backed Securities Portfolio | | Portfolio of Investments
As of October 31, 2008 |
| | | | | | | | |
PRINCIPAL
AMOUNT (000)# | | DESCRIPTION | | VALUE (NOTE1) |
| | | | | | | | |
| | | | | LONG-TERM INVESTMENTS—185.7% | | | |
| | | |
| | | | | U.S. GOVERNMENT MORTGAGE BACKED OBLIGATIONS—150.4% | | | |
| | | | | Federal Home Loan Mortgage Corp., | | | |
| | $ | 4,844 | | 5.00%, 08/01/35 - 10/01/35 | | $ | 4,588,913 |
| | | 7,000 | | 5.00%, TBA | | | 6,623,750 |
| | | 10,200 | | 5.50%, TBA | | | 9,948,182 |
| | | 1,379 | | 6.00%, 01/01/15 - 02/01/21 | | | 1,388,311 |
| | | 155 | | 6.50%, 01/01/18 - 06/01/22 | | | 157,624 |
| | | 35 | | 7.50%, 06/01/28 | | | 36,059 |
| | | 9 | | 8.50%, 04/01/18 - 07/01/21 | | | 9,085 |
| | | 2 | | 9.00%, 06/01/09 - 03/01/11 | | | 2,548 |
| | | 23 | | 11.50%, 03/01/16 | | | 28,158 |
| | | | | Federal National Mortgage Assoc., | | | |
| | | 2,014 | | 4.50%, 03/01/35 | | | 1,829,765 |
| | | 7,233 | | 5.00%, 11/01/18 - 08/01/35 | | | 6,899,040 |
| | | 235 | | 5.00%, 07/01/33(k) | | | 223,154 |
| | | 7,340 | | 5.00%, TBA | | | 6,952,360 |
| | | 12,432 | | 5.50%, 06/01/33 - 07/01/37 | | | 12,167,338 |
| | | 823 | | 5.78%, 11/01/11 | | | 838,945 |
| | | 1,973 | | 6.00%, 04/01/14 - 01/01/33 | | | 1,979,957 |
| | | 41 | | 6.095%, 03/01/12 | | | 42,351 |
| | | 12,864 | | 6.50%, 05/01/14 - 12/01/37 | | | 13,059,763 |
| | | 258 | | 6.50%, 08/01/36(k) | | | 261,567 |
| | | 16 | | 7.00%, 09/01/11 - 07/01/12 | | | 16,909 |
| | | 37 | | 8.00%, 09/01/22 - 12/01/22 | | | 40,257 |
| | | 4 | | 9.75%, 01/01/11 - 11/01/16 | | | 4,806 |
| | | | | Government National Mortgage Assoc., | | | |
| | | 498 | | 4.50%, 09/15/33 - 10/15/33 | | | 456,361 |
| | | 206 | | 6.00%, 07/15/24 - 08/15/24 | | | 207,442 |
| | | 2,963 | | 6.50%, 06/15/23 - 06/15/38 | | | 2,999,838 |
| | | 4,200 | | 6.50%, TBA | | | 4,244,625 |
| | | 1,540 | | 7.00%, 11/15/31 - 11/15/33 | | | 1,583,332 |
| | | 31 | | 7.50%, 09/15/11 - 12/20/23 | | | 32,590 |
| | | 391 | | 8.00%, 03/15/17 - 11/15/30 | | | 417,060 |
| | | 47 | | 8.25%, 06/20/17 - 07/20/17 | | | 50,536 |
| | | 50 | | 8.50%, 04/20/17 | | | 53,413 |
| | | 65 | | 9.00%, 01/15/09 - 01/15/20 | | | 70,332 |
| | | 4 | | 9.50%, 08/15/09 - 06/15/20 | | | 6,902 |
| | | 5 | | 13.50%, 05/15/11 | | | 6,008 |
| | | 8 | | 14.00%, 06/15/11 | | | 8,985 |
| | | 9 | | 16.00%, 05/15/12 | | | 10,391 |
| | | | | | | | |
| | | | | TOTAL U.S. GOVERNMENT MORTGAGE BACKED OBLIGATIONS
(cost $78,912,125) | | | 77,246,657 |
| | | | | | | | |
See Notes to Financial Statements.
| | |
| 142 | | THE TARGET PORTFOLIO TRUST |
| | | | | | | | |
PRINCIPAL
AMOUNT (000)# | | DESCRIPTION | | VALUE (NOTE1) |
| | | | | | | | |
| | | | | COLLATERALIZED MORTGAGE OBLIGATIONS—35.3% | | | |
| | | | | Citigroup Mortgage Loan Trust, Inc.,
Series 2006-AR1, Class 3A1 | | | |
| | $ | 348 | | 5.50%(c), 03/25/36 | | $ | 255,134 |
| | | | | Countrywide Alternative Loan Trust, | | | |
| | | | | Series 2005-73CB, Class 1A7 | | | |
| | | 457 | | 5.50%, 01/25/36 | | | 399,069 |
| | | | | Series 2005-85CB, Class 2A2 | | | |
| | | 1,235 | | 5.50%, 02/25/36 | | | 1,070,989 |
| | | | | Series 2005-J11, Class 1A3 | | | |
| | | 1,442 | | 5.50%, 11/25/35 | | | 1,343,656 |
| | | | | Series 2007-HY5R, Class 2A1A | | | |
| | | 916 | | 5.544%(c), 03/25/47 | | | 692,483 |
| | | | | Countrywide Home Loan Mortgage Pass-Through Trust, | | | |
| | | | | Series 2006-14, Class A3 | | | |
| | | 1,368 | | 6.25%, 09/25/36 | | | 1,253,180 |
| | | | | Series 2006-J2, Class 1A6 | | | |
| | | 90 | | 6.00%, 04/25/36 | | | 63,720 |
| | | | | Series 2007-4, Class 1A1 | | | |
| | | 344 | | 6.00%, 05/25/37 | | | 257,763 |
| | | | | Series 2007-13, Class A10 | | | |
| | | 790 | | 6.00%, 08/25/37 | | | 413,898 |
| | | | | Federal Home Loan Mortgage Corp. Structured Pass-Through Securities, | | | |
| | | | | Series T-42, Class A5 | | | |
| | | 197 | | 7.50%, 02/25/42 | | | 215,307 |
| | | | | Federal Home Loan Mortgage Corp., | | | |
| | | | | Series 74, Class F | | | |
| | | 20 | | 6.00%, 10/15/20 | | | 20,325 |
| | | | | Series 83, Class Z | | | |
| | | 4 | | 9.00%, 10/15/20 | | | 4,140 |
| | | | | Series 186, Class E | | | |
| | | 33 | | 6.00%, 08/15/21 | | | 32,608 |
| | | | | Series 245, Class IO, IO | | | |
| | | 320 | | 5.00%, 05/15/37 | | | 77,751 |
| | | | | Series 1058, Class H | | | |
| | | 11 | | 8.00%, 04/15/21 | | | 11,196 |
| | | | | Series 1116, Class I | | | |
| | | 8 | | 5.50%, 08/15/21 | | | 8,441 |
| | | | | Series 1120, Class L | | | |
| | | 37 | | 8.00%, 07/15/21 | | | 40,094 |
| | | | | Series 1630, Class PJ | | | |
| | | 52 | | 6.00%, 05/15/23 | | | 51,993 |
| | | | | Series 2627, Class BG | | | |
| | | 915 | | 3.25%, 06/15/17 | | | 890,017 |
| | | | | Series 2809, Class UC | | | |
| | | 425 | | 4.00%, 06/15/19 | | | 383,125 |
| | | | | Series 2852, Class VI, IO | | | |
| | | 969 | | 5.00%, 06/15/24 | | | 40,159 |
| | | | | Series 2882, Class YI, IO | | | |
| | | 415 | | 5.00%, 03/15/24 | | | 11,859 |
See Notes to Financial Statements.
| | |
| THE TARGET PORTFOLIO TRUST | | 143 |
| | |
Mortgage Backed Securities Portfolio (continued) | | Portfolio of Investments
As of October 31, 2008 |
| | | | | | | | |
PRINCIPAL
AMOUNT (000)# | | DESCRIPTION | | VALUE (NOTE1) |
| | | | | | | | |
| | | | | COLLATERALIZED MORTGAGE OBLIGATIONS (continued) | | | |
| | | | | Series 2915, Class K1, IO | | | |
| | $ | 446 | | 5.00%, 06/15/24 | | $ | 14,677 |
| | | | | Series 2995, Class ST, IO | | | |
| | | 1,334 | | 2.163%(c), 05/15/29 | | | 178,935 |
| | | | | Series 3279, Class SD, IO | | | |
| | | 4,278 | | 1.843%(c), 02/15/37 | | | 368,678 |
| | | | | Series 3309, Class SC, IO | | | |
| | | 3,852 | | 1.863%(c), 04/15/37 | | | 280,122 |
| | | | | Federal National Mortgage Assoc., | | | |
| | | | | Series 56, Class 1 | | | |
| | | 14 | | 6.00%, 04/01/19 | | | 14,745 |
| | | | | Series 340, Class 2, IO | | | |
| | | 563 | | 5.00%, 09/01/33 | | | 129,016 |
| | | | | Series 347, Class 2, IO | | | |
| | | 1,208 | | 5.00%, 01/01/34 | | | 279,978 |
| | | | | Series 353, Class 2, IO | | | |
| | | 854 | | 5.00%, 08/01/34 | | | 201,325 |
| | | | | Series 370, Class 1, PO | | | |
| | | 192 | | 1.00%(n), 05/25/36 | | | 146,362 |
| | | | | Series 1988-19, Class J | | | |
| | | 14 | | 8.50%, 07/25/18 | | | 15,171 |
| | | | | Series 1990-10, Class L | | | |
| | | 5 | | 8.50%, 02/25/20 | | | 5,981 |
| | | | | Series 1990-108, Class G | | | |
| | | 15 | | 7.00%, 09/25/20 | | | 15,192 |
| | | | | Series 1991-21, Class J | | | |
| | | 15 | | 7.00%, 03/25/21 | | | 16,009 |
| | | | | Series 1992-113, Class Z | | | |
| | | 29 | | 7.50%, 07/25/22 | | | 30,967 |
| | | | | Series 1993-223, Class ZA | | | |
| | | 276 | | 6.50%, 12/25/23 | | | 284,739 |
| | | | | Series 2001-51, Class QN | | | |
| | | 385 | | 6.00%, 10/25/16 | | | 396,804 |
| | | | | Series 2003-33, Class PT | | | |
| | | 161 | | 4.50%, 05/25/33 | | | 154,956 |
| | | | | Series 2007-22, Class SD, IO | | | |
| | | 2,394 | | 3.142%(c), 03/25/37 | | | 192,726 |
| | | | | Series G-14, Class L | | | |
| | | 17 | | 8.50%, 06/25/21 | | | 18,602 |
| | | | | Series G92-24, Class Z | | | |
| | | 18 | | 6.50%, 04/25/22 | | | 18,588 |
| | | | | Series G92-59, Class D | | | |
| | | 94 | | 6.00%, 10/25/22 | | | 96,621 |
| | | | | Series G94-4, Class PG | | | |
| | | 317 | | 8.00%, 05/25/24 | | | 341,779 |
See Notes to Financial Statements.
| | |
| 144 | | THE TARGET PORTFOLIO TRUST |
| | | | | | | | |
PRINCIPAL
AMOUNT (000)# | | DESCRIPTION | | VALUE (NOTE1) |
| | | | | | | | |
| | | | | COLLATERALIZED MORTGAGE OBLIGATIONS (continued) | | | |
| | | | | First Boston Mortgage Securities Corp., | | | |
| | | | | Series B, Class I-O, IO | | | |
| | $ | 47 | | 8.985%, 04/25/17 | | $ | 9,724 |
| | | | | Series B, Class P-O, PO | | | |
| | | 47 | | 3.77%(n), 04/25/17 | | | 38,424 |
| | | | | Government National Mortgage Assoc., | | | |
| | | | | Series 2006-35, Class LO, PO | | | |
| | | 260 | | 5.40%(n), 07/20/36 | | | 200,618 |
| | | | | Series 2006-38, Class XS, IO | | | |
| | | 1,353 | | 2.78%(c), 09/16/35 | | | 141,438 |
| | | | | GSR Mortgage Loan Trust, | | | |
| | | | | Series 2005-AR2, Class 1A2 | | | |
| | | 130 | | 6.321%(c), 04/25/35 | | | 98,258 |
| | | | | Series 2007-AR1, Class 2A1 | | | |
| | | 373 | | 5.998%(c), 03/25/47 | | | 245,192 |
| | | | | Series 2007-AR2, Class 1A1 | | | |
| | | 359 | | 5.779%(c), 05/25/47 | | | 246,657 |
| | | | | JPMorgan Mortgage Trust, | | | |
| | | | | Series 2007-S2, Class 2A3 | | | |
| | | 867 | | 5.50%, 06/25/37 | | | 725,811 |
| | | | | Morgan Stanley Mortgage Loan Trust, | | | |
| | | | | Series 2004-5AR, Class 3A4 | | | |
| | | 386 | | 4.37%(c), 07/25/34 | | | 361,592 |
| | | | | Series 2007-12, Class 3A22 | | | |
| | | 293 | | 6.00%, 08/25/37 | | | 239,990 |
| | | | | Series 2007-13, Class B1 | | | |
| | | 96 | | 6.277%(c), 10/25/37 | | | 44,473 |
| | | | | Residential Asset Securitization Trust, | | | |
| | | | | Series 2004-A3, Class A7 | | | |
| | | 750 | | 5.25%, 06/25/34 | | | 587,774 |
| | | | | Series 2005-A9, Class A3 | | | |
| | | 1,722 | | 5.50%, 07/25/35 | | | 1,225,613 |
| | | | | Salomon Brothers Mortgage Securities VI, Inc., | | | |
| | | | | Series 1986-1, Class A | | | |
| | | 6 | | 6.00%, 12/25/11 | | | 6,104 |
| | | | | Thornburg Mortgage Securities Trust, | | | |
| | | | | Series 2005-1, Class A3 | | | |
| | | 644 | | 4.769%(c), 04/25/45 | | | 534,949 |
| | | | | Wells Fargo Mortgage Backed Securities Trust, | | | |
| | | | | Series 2005-AR13, Class A1 | | | |
| | | 1,500 | | 5.31%(c), 05/25/35 | | | 1,230,180 |
| | | | | Series 2006-AR5, Class 2A1 | | | |
| | | 1,020 | | 5.539%(c), 04/25/36 | | | 767,507 |
| | | | | Series 2006-AR10, Class 5A2 | | | |
| | | 770 | | 5.594%(c), 07/25/36 | | | 701,883 |
| | | | | | | | |
| | | | | TOTAL COLLATERALIZED MORTGAGE OBLIGATIONS
(cost $20,275,676) | | | 18,145,067 |
| | | | | | | | |
| | | | | TOTAL LONG-TERM INVESTMENTS
(cost $99,187,801) | | | 95,391,724 |
| | | | | | | | |
See Notes to Financial Statements.
| | |
| THE TARGET PORTFOLIO TRUST | | 145 |
| | |
Mortgage Backed Securities Portfolio (continued) | | Portfolio of Investments
As of October 31, 2008 |
| | | | | | | | | |
| SHARES | | DESCRIPTION | | VALUE (NOTE1) | |
| | | | | | |
| | | | | SHORT-TERM INVESTMENTS—12.2% | | | | |
| | | | | AFFILIATED MONEY MARKET MUTUAL FUND—0.2% | | | | |
| | | 94,005 | | Dryden Core Investment Fund—Taxable Money Market Series
(cost $94,005)(w) | | $ | 94,005 | |
| | | | | | | | | |
Principal
Amount (000)# | | | | | |
| | | | | REPURCHASE AGREEMENT—12.0% | | | | |
| | $ | 6,200 | | Deutsche Bank Securities, Inc., 0.25%, dated 10/31/08, due 11/03/08 in the amount of $6,200,129 (cost $6,200,000; the value of collateral plus accrued interest was $6,227,794)(g) | | | 6,200,000 | |
| | | | | | | | | |
| | | | | TOTAL SHORT-TERM INVESTMENTS
(cost $6,294,005) | | | 6,294,005 | |
| | | | | | | | | |
| | | |
| | | | | TOTAL INVESTMENTS, BEFORE SECURITIES SOLD SHORT—197.9%
(cost $105,481,806; Note 5) | | | 101,685,729 | |
| | | | | | | | | |
| | | |
| | | | | SECURITIES SOLD SHORT—(55.7%) | | | | |
| | | | | Federal National Mortgage Association | | | | |
| | | 1,480 | | 5.00%, TBA | | | (1,401,838 | ) |
| | | 3,000 | | 5.50%, TBA | | | (2,990,625 | ) |
| | | 1,000 | | 5.50%, TBA | | | (976,875 | ) |
| | | 1,465 | | 6.00%, 11/01/22 | | | (1,475,072 | ) |
| | | 21,500 | | 6.50%, TBA | | | (21,788,917 | ) |
| | | | | | | | | |
| | | | | TOTAL SECURITIES SOLD SHORT
(proceeds received $28,866,028) | | | (28,633,327 | ) |
| | | | | | | | | |
| | | |
| | | | | TOTAL INVESTMENTS, NET OF SECURITIES SOLD SHORT—142.2%
(cost $76,615,778) | | | 73,052,402 | |
| | | | | Other liabilities in excess of other assets(x)—(42.2%) | | | (21,684,139 | ) |
| | | | | | | | | |
| | | | | NET ASSETS—100% | | $ | 51,368,263 | |
| | | | | | | | | |
The following abbreviations are used in Portfolio descriptions:
IO—Interest Only.
PO—Principal Only Securities.
TBA—To Be Announced.
| # | Principal amount is shown in U.S. dollars unless otherwise stated. |
| (c) | Indicates a variable rate security. |
| (g) | Repurchase agreement is collateralized by United States Treasuries or federal agency obligations. |
| (k) | Securities segregated as collateral for futures contracts. |
| (n) | Rate shown is the effective yield at purchase date. |
| (w) | Prudential Investments LLC, the manager of the Portfolio also serves as manager of the Dryden Core Investment Fund-Taxable Money Market Series. |
| (x) | Other liabilities in excess of other assets includes net unrealized appreciation (depreciation) on futures contracts, interest rate swaps as follows: |
See Notes to Financial Statements.
| | |
| 146 | | THE TARGET PORTFOLIO TRUST |
Open futures contracts outstanding at October 31, 2008:
| | | | | | | | | | | | | |
Number of
Contracts | | Type | | Expiration
Date | | Value at
Trade Date | | Value at
October 31,
2008 | | Unrealized
Appreciation |
| Long Positions: | | | | | | | | | | | | | |
| 13 | | 90 Day Euro Dollar | | Sep 09 | | $ | 3,117,400 | | $ | 3,165,013 | | $ | 47,613 |
| | | | | | | | | | | | | |
| Short Positions: | | | | | | | | | | | | | |
| 16 | | 10 Year U.S. Treasury Notes | | Dec 08 | | | 1,848,425 | | | 1,809,250 | | | 39,175 |
| 28 | | 20 Year U.S. Treasury Bonds | | Dec 08 | | | 3,349,306 | | | 3,167,500 | | | 181,806 |
| | | | | | | | | | | | | |
| | | | | | | | | | | | | 220,981 |
| | | | | | | | | | | | | |
| | | | | | | | | | | | $ | 268,594 |
| | | | | | | | | | | | | |
Interest rate swap agreements outstanding at October 31, 2008:
| | | | | | | | | | | | | |
Counter Party | | Termination
Date | | Notional
Amount#
(000) | | Fixed
Rate | | | Floating
Rate | | Unrealized
Appreciation |
Goldman Sachs(1) | | 11/07/09 | | $ | 2,725 | | 4.37 | % | | 3 Month LIBOR | | $ | 71,030 |
Goldman Sachs(2) | | 10/31/18 | | | 2,600 | | 4.31 | % | | 3 Month LIBOR | | | 31,501 |
| | | | | | | | | | | | | |
| | | | | | | | | | | | $ | 102,531 |
| | | | | | | | | | | | | |
| (1) | Portfolio pays the floating rate and receives the fixed rate. |
| (2) | Portfolio pays the fixed rate and receives the floating rate. |
Reverse Repurchase Agreements outstanding at October 31, 2008:
| | | | | | | | | | | | |
Broker | | Interest
Rate | | Trade
Date | | Value at
October 31,
2008 | | Maturity
Date | | Cost |
First Boston Corp. | | 4.00% | | 10/10/2008 | | $ | 22,000,000 | | 11/13/2008 | | $ | 22,000,000 |
| | | | | | | | | | | | |
The industry classification of investments and other liabilities in excess of other assets shown as a percentage of net assets as of October 31, 2008 were as follows:
| | | |
U.S. Government Mortgage Backed Obligations | | 150.4 | % |
Collateralized Mortgage Obligations | | 35.3 | |
Repurchase Agreements | | 12.0 | |
Affiliated Money Market Mutual Fund | | 0.2 | |
| | | |
| | 197.9 | |
Securities Sold Short | | (55.7 | ) |
Other liabilities in excess of other assets | | (42.2 | ) |
| | | |
| | 100.0 | % |
| | | |
See Notes to Financial Statements.
| | |
| THE TARGET PORTFOLIO TRUST | | 147 |
| | |
| U.S. Government Money Market Portfolio | | Portfolio of Investments
As of October 31, 2008 |
| | | | | | | | | |
PRINCIPAL
AMOUNT (000) | | DESCRIPTION | | VALUE (NOTE 1) | |
| | | | | | | | | |
| | | | | FEDERAL HOME LOAN BANK—44.3% | | | | |
| | $ | 2,000 | | 1.25%(n), 11/18/08 | | $ | 1,998,819 | |
| | | 4,000 | | 1.30%(n), 12/29/08 | | | 3,991,622 | |
| | | 3,500 | | 2.28%(n), 02/27/09 | | | 3,473,844 | |
| | | 4,000 | | 2.32%(n), 02/04/09 | | | 3,975,511 | |
| | | 3,000 | | 2.50%(n), 02/10/09 | | | 2,978,958 | |
| | | 2,500 | | 2.50%(n), 12/16/08 | | | 2,492,187 | |
| | | 3,000 | | 2.52%(n), 11/19/08 | | | 2,996,220 | |
| | | 2,000 | | 2.65%(n), 12/17/08 | | | 1,993,228 | |
| | | 2,000 | | 2.90%(n), 03/17/09 | | | 1,978,089 | |
| | | 2,000 | | 3.05%(n), 03/12/09 | | | 1,977,803 | |
| | | 2,675 | | 3.135%, 12/29/08 | | | 2,675,000 | |
| | | | | | | | | |
| | | | | TOTAL FEDERAL HOME LOAN BANK
(cost $30,531,281) | | | 30,531,281 | |
| | | | | | | | | |
| | | |
| | | | | FEDERAL HOME LOAN MORTGAGE CORP.(n)—24.2% | | | | |
| | | 4,000 | | 2.19%, 01/20/09 | | | 3,980,534 | |
| | | 3,000 | | 2.20%, 01/23/09 | | | 2,984,784 | |
| | | 2,000 | | 2.41%, 11/10/08 | | | 1,998,893 | |
| | | 3,000 | | 2.47%, 11/17/08 | | | 2,996,706 | |
| | | 3,500 | | 2.57%, 12/16/08 | | | 3,488,756 | |
| | | 1,200 | | 2.61%, 11/10/08 | | | 1,199,137 | |
| | | | | | | | | |
| | | | | TOTAL FEDERAL HOME LOAN MORTGAGE CORP.
(cost $16,648,810) | | | 16,648,810 | |
| | | | | | | | | |
| | | |
| | | | | FEDERAL NATIONAL MORTGAGE ASSOCIATION(n)—31.9% | | | | |
| | | 760 | | 2.56%, 11/05/08 | | | 759,786 | |
| | | 3,500 | | 1.85%, 02/23/09 | | | 3,479,496 | |
| | | 3,500 | | 1.98%, 02/04/09 | | | 3,481,713 | |
| | | 4,000 | | 2.39%, 02/17/09 | | | 3,971,320 | |
| | | 4,000 | | 2.69%, 12/22/08 | | | 3,984,758 | |
| | | 2,850 | | 2.80%, 01/22/09 | | | 2,831,824 | |
| | | 3,500 | | 2.85%, 03/04/09 | | | 3,465,919 | |
| | | | | | | | | |
| | | | | TOTAL FEDERAL NATIONAL MORTGAGE ASSOCIATION
(cost $21,974,816) | | | 21,974,816 | |
| | | | | | | | | |
| Shares | | | | | |
| | | |
| | | | | AFFILIATED MONEY MARKET MUTUAL FUND—0.6% | | | | |
| | | 407,973 | | Dryden Core Investment Fund—Taxable Money Market Series(w) | | | 407,973 | |
| | | | | | | | | |
| | | | | TOTAL INVESTMENTS(h)—101.0%
(amortized cost $69,562,880) | | | 69,562,880 | |
| | | | | Liabilities in excess of other assets—(1.0%) | | | (718,461 | ) |
| | | | | | | | | |
| | | | | NET ASSETS—100% | | $ | 68,844,419 | |
| | | | | | | | | |
| (h) | Federal income tax basis is the same as for financial reporting purposes. |
See Notes to Financial Statements.
| | |
| 148 | | THE TARGET PORTFOLIO TRUST |
| (n) | Rates shown are the effective yields at purchase date. |
| (w) | Prudential Investments LLC, the manager of the Portfolio, also serves as manager of the Dryden Core Investment Fund-Taxable Money Market Series. |
The industry classification of investments and liabilities in excess of other assets shown as a percentage of net assets as of October 31, 2008 were as follows:
| | | |
Federal Home Loan Bank | | 44.3 | % |
Federal National Mortgage Assoc. | | 31.9 | |
Federal Home Loan Mortgage Corp. | | 24.2 | |
Affiliated Money Market Mutual Fund | | 0.6 | |
| | | |
| | 101.0 | |
Liabilities in excess of other assets | | (1.0 | ) |
| | | |
| | 100.0 | % |
| | | |
See Notes to Financial Statements.
| | |
| THE TARGET PORTFOLIO TRUST | | 149 |
Statements of Assets and Liabilities October 31, 2008
| | | | | | | | | | | | |
| | | LARGE
CAPITALIZATION
GROWTH
PORTFOLIO | | LARGE
CAPITALIZATION
VALUE
PORTFOLIO | | SMALL
CAPITALIZATION
GROWTH
PORTFOLIO | | SMALL
CAPITALIZATION
VALUE
PORTFOLIO |
| | | | |
| ASSETS | | | | | | | | | | | | |
Investments, at value(G): | | | | | | | | | | | | |
Unaffiliated investments(A) | | $ | 182,355,623 | | $ | 211,720,911 | | $ | 75,519,412 | | $ | 363,569,784 |
Affiliated investments(B) | | | 30,131,193 | | | 14,846,277 | | | 28,274,130 | | | 126,151,942 |
Repurchase agreements(C) | | | — | | | — | | | — | | | — |
Cash | | | 1,505,777 | | | 706,882 | | | — | | | 390,568 |
Deposit with broker | | | 219,600 | | | — | | | — | | | — |
Foreign currency, at value(D) | | | — | | | — | | | — | | | — |
Receivable for Trust shares sold | | | 402,563 | | | 431,363 | | | 189,701 | | | 7,481,259 |
Dividends and interest receivable | | | 205,361 | | | 529,047 | | | 39,176 | | | 507,793 |
Prepaid expenses and other assets | | | 4,440 | | | 8,645 | | | 1,764 | | | 7,452 |
Receivable for investments sold | | | 2,804,429 | | | 2,595,779 | | | 688,610 | | | 4,631,421 |
Receivable for foreign tax reclaim | | | — | | | — | | | — | | | — |
Due from broker for variation margin | | | 8,410 | | | — | | | — | | | 40,000 |
Payments made for swap agreements | | | — | | | — | | | — | | | — |
Unrealized appreciation on swaps | | | — | | | — | | | — | | | — |
Unrealized appreciation on forward currency contracts | | | — | | | — | | | — | | | — |
Total assets | | | 217,637,396 | | | 230,838,904 | | | 104,712,793 | | | 502,780,219 |
| | | | |
| LIABILITIES | | | | | | | | | | | | |
Collateral for securities on loan | | | 12,698,539 | | | 13,009,558 | | | 26,163,283 | | | 97,961,484 |
Reverse repurchase agreement | | | — | | | — | | | — | | | — |
Payable for Trust shares reacquired | | | 326,177 | | | 375,446 | | | 94,550 | | | 682,386 |
Payable for investments purchased | | | 5,482,348 | | | 2,171,278 | | | 785,621 | | | 4,722,319 |
Accrued expenses and other liabilities | | | 87,398 | | | 76,438 | | | 107,265 | | | 114,190 |
Management fee payable | | | 101,519 | | | 111,667 | | | 39,992 | | | 198,504 |
Affiliated transfer agent fee payable | | | 49,075 | | | 49,000 | | | 5,925 | | | 122,699 |
Deferred trustees’ fees | | | 5,406 | | | 11,241 | | | 10,912 | | | 10,126 |
Distribution fee payable | | | 20,126 | | | 19,598 | | | 7,875 | | | 9,483 |
Payable to custodian | | | — | | | — | | | 81,241 | | | — |
Dividends payable | | | — | | | — | | | — | | | — |
Payable to broker | | | 91,085 | | | 19,360 | | | 573,980 | | | 2,197,776 |
Options written(E) | | | — | | | — | | | — | | | — |
Payments received for swap agreements | | | — | | | — | | | — | | | — |
Unrealized depreciation on swaps | | | — | | | — | | | — | | | — |
Unrealized depreciation on forward currency contracts | | | — | | | — | | | — | | | — |
Securities sold short, at value(F) | | | — | | | — | | | — | | | — |
Total liabilities | | | 18,861,673 | | | 15,843,586 | | | 27,870,644 | | | 106,018,967 |
| | | | |
| NET ASSETS | | $ | 198,775,723 | | $ | 214,995,318 | | $ | 76,842,149 | | $ | 396,761,252 |
See Notes to Financial Statements.
| | |
| 150 | | THE TARGET PORTFOLIO TRUST |
Statements of Assets and Liabilities October 31, 2008 (continued)
| | | | | | | | | | | | | | | | |
| | | LARGE
CAPITALIZATION
GROWTH
PORTFOLIO | | | LARGE
CAPITALIZATION
VALUE
PORTFOLIO | | | SMALL
CAPITALIZATION
GROWTH
PORTFOLIO | | | SMALL
CAPITALIZATION
VALUE
PORTFOLIO | |
Net assets were comprised of: | | | | | | | | | | | | | | | | |
Shares of beneficial interest, at par | | $ | 19,551 | | | $ | 24,394 | | | $ | 10,624 | | | $ | 27,931 | |
Paid-in capital, in excess of par | | | 253,840,437 | | | | 303,243,968 | | | | 132,979,441 | | | | 483,406,781 | |
| | | 253,859,988 | | | | 303,268,362 | | | | 132,990,065 | | | | 483,434,712 | |
Undistributed net investment income (loss) | | | 1,789,138 | | | | 5,703,717 | | | | 81,789 | | | | 4,925,952 | |
Accumulated net realized gains (losses) | | | (36,270,893 | ) | | | (37,187,649 | ) | | | (29,983,770 | ) | | | (6,902,837 | ) |
Net unrealized appreciation (depreciation) | | | (20,602,510 | ) | | | (56,789,112 | ) | | | (26,245,935 | ) | | | (84,696,575 | ) |
Net assets, October 31, 2008 | | $ | 198,775,723 | | | $ | 214,995,318 | | | $ | 76,842,149 | | | $ | 396,761,252 | |
(A) Identified cost of unaffiliated investments | | $ | 202,940,615 | | | $ | 268,510,023 | | | $ | 101,765,347 | | | $ | 448,194,459 | |
(B) Identified cost of affiliated investments | | $ | 30,131,193 | | | $ | 14,846,277 | | | $ | 28,274,130 | | | $ | 126,151,942 | |
(C) Identified cost of repurchase agreements | | | — | | | | — | | | | — | | | | — | |
(D) Identified cost of currency | | | — | | | | — | | | | — | | | | — | |
(E) Premiums received from options written | | | — | | | | — | | | | — | | | | — | |
(F) Proceeds received from short sales | | | — | | | | — | | | | — | | | | — | |
(G) Including securities on loan of | | $ | 13,353,352 | | | $ | 12,498,540 | | | $ | 25,930,584 | | | $ | 97,081,874 | |
| | | | |
| NET ASSET VALUE: | | | | | | | | | | | | | | | | |
Class R: | | | | | | | | | | | | | | | | |
Net Assets | | $ | 48,348,059 | | | $ | 46,778,147 | | | $ | 18,607,493 | | | $ | 22,660,459 | |
Shares Outstanding | | | 4,782,084 | | | | 5,324,824 | | | | 2,593,879 | | | | 1,606,692 | |
Net asset value, offering price and redemption price per share | | $ | 10.11 | | | $ | 8.78 | | | $ | 7.17 | | | $ | 14.10 | |
Class T: | | | | | | | | | | | | | | | | |
Net Assets | | $ | 150,427,664 | | | $ | 168,217,171 | | | $ | 58,234,656 | | | $ | 374,100,793 | |
Shares Outstanding | | | 14,769,138 | | | | 19,068,925 | | | | 8,030,343 | | | | 26,324,468 | |
Net asset value, offering price and redemption price per share | | $ | 10.19 | | | $ | 8.82 | | | $ | 7.25 | | | $ | 14.21 | |
See Notes to Financial Statements.
| | |
| THE TARGET PORTFOLIO TRUST | | 151 |
Statements of Assets and Liabilities October 31, 2008 (continued)
| | | | | | | | | |
| | | INTERNATIONAL
EQUITY
PORTFOLIO | | INTERNATIONAL
BOND
PORTFOLIO | | TOTAL RETURN
BOND
PORTFOLIO |
| | | |
| ASSETS | | | | | | | | | |
Investments, at value(G): | | | | | | | | | |
Unaffiliated investments(A) | | $ | 147,338,141 | | $ | 51,270,995 | | $ | 386,230,349 |
Affiliated investments(B) | | | 7,194,334 | | | 285,195 | | | — |
Repurchase agreements(C) | | | — | | | 700,000 | | | — |
Cash | | | — | | | 80,554 | | | 8,255,622 |
Deposit with broker | | | — | | | 190,600 | | | 2,027,600 |
Foreign currency, at value(D) | | | 380,762 | | | 168,628 | | | 4,472,813 |
Receivable for Trust shares sold | | | 488,228 | | | 33,419 | | | 3,727,538 |
Dividends and interest receivable | | | 442,462 | | | 1,679,825 | | | 3,016,877 |
Prepaid expenses and other assets | | | 3,957 | | | 542 | | | 4,221 |
Receivable for investments sold | | | 182,732 | | | 24,674,832 | | | 194,787,561 |
Receivable for foreign tax reclaim | | | 999,772 | | | — | | | — |
Due from broker for variation margin | | | — | | | — | | | 405,969 |
Payments made for swap agreements | | | — | | | — | | | — |
Unrealized appreciation on swaps | | | — | | | 837,876 | | | 7,761,305 |
Unrealized appreciation on forward currency contracts | | | 4,032,354 | | | 494,279 | | | 1,287,200 |
Total assets | | | 161,062,742 | | | 80,416,745 | | | 611,977,055 |
| | | |
| LIABILITIES | | | | | | | | | |
Collateral for securities on loan | | | — | | | — | | | — |
Reverse repurchase agreement | | | — | | | — | | | — |
Payable for Trust shares reacquired | | | 254,879 | | | 107,387 | | | 3,667,296 |
Payable for investments purchased | | | 6,343 | | | 48,598,827 | | | 284,399,701 |
Accrued expenses and other liabilities | | | 114,161 | | | 105,045 | | | 119,717 |
Management fee payable | | | 98,370 | | | 12,884 | | | 96,901 |
Affiliated transfer agent fee payable | | | 37,701 | | | 11,005 | | | 115,838 |
Deferred trustees’ fees | | | 10,964 | | | 10,727 | | | 11,028 |
Distribution fee payable | | | 15,358 | | | — | | | 22,665 |
Payable to custodian | | | 80,354 | | | — | | | — |
Dividends payable | | | — | | | — | | | 282,805 |
Due to broker for variation margin | | | — | | | 6,675 | | | — |
Options written(E) | | | — | | | 383,354 | | | 1,423,374 |
Payments received for swap agreements | | | — | | | 15,295 | | | 2,870,393 |
Unrealized depreciation on swaps | | | — | | | 857,616 | | | 6,133,128 |
Unrealized depreciation on forward currency contracts | | | 992,285 | | | 851,826 | | | 1,799,533 |
Securities sold short, at value(F) | | | — | | | 110,141 | | | 62,846,033 |
Total liabilities | | | 1,610,415 | | | 51,070,782 | | | 363,788,412 |
| | | |
| NET ASSETS | | $ | 159,452,327 | | $ | 29,345,963 | | $ | 248,188,643 |
See Notes to Financial Statements.
| | |
| 152 | | THE TARGET PORTFOLIO TRUST |
Statements of Assets and Liabilities October 31, 2008 (continued)
| | | | | | | | | | | | |
| | | INTERNATIONAL
EQUITY
PORTFOLIO | | | INTERNATIONAL
BOND
PORTFOLIO | | | TOTAL RETURN
BOND
PORTFOLIO | |
Net assets were comprised of: | | | | | | | | | | | | |
Shares of beneficial interest, at par | | $ | 17,679 | | | $ | 3,609 | | | $ | 25,037 | |
Paid-in capital, in excess of par | | | 220,969,796 | | | | 27,528,153 | | | | 265,874,198 | |
| | | 220,987,475 | | | | 27,531,762 | | | | 265,899,235 | |
Undistributed net investment income (loss) | | | 3,945,290 | | | | 2,967,697 | | | | 2,468,626 | |
Accumulated net realized gains (losses) | | | (3,078,441 | ) | | | (152,780 | ) | | | 10,483,876 | |
Net unrealized appreciation (depreciation) | | | (62,401,997 | ) | | | (1,000,716 | ) | | | (30,663,094 | ) |
Net assets, October 31, 2008 | | $ | 159,452,327 | | | $ | 29,345,963 | | | $ | 248,188,643 | |
(A) Identified cost of unaffiliated investments | | $ | 212,748,074 | | | $ | 52,976,717 | | | $ | 421,416,697 | |
(B) Identified cost of affiliated investments | | $ | 7,194,334 | | | $ | 285,195 | | | | — | |
(C) Identified cost of repurchase agreements | | | — | | | $ | 700,000 | | | | — | |
(D) Identified cost of currency | | $ | 414,773 | | | $ | 171,639 | | | $ | 4,721,189 | |
(E) Premiums received from options written | | | — | | | $ | 346,377 | | | $ | 1,143,511 | |
(F) Proceeds received from short sales | | | — | | | $ | 110,987 | | | $ | 63,465,448 | |
(G) Including securities on loan of | | | — | | | | — | | | | — | |
| | | |
| NET ASSET VALUE: | | | | | | | | | | | | |
Class R: | | | | | | | | | | | | |
Net Assets | | $ | 35,482,197 | | | | — | | | $ | 53,218,452 | |
Shares Outstanding | | | 3,948,960 | | | | — | | | | 5,394,860 | |
Net asset value, offering price and redemption price per share | | $ | 8.99 | | | | — | | | $ | 9.86 | |
Class T: | | | | | | | | | | | | |
Net Assets | | $ | 123,970,130 | | | $ | 29,345,963 | | | $ | 194,970,191 | |
Shares Outstanding | | | 13,730,040 | | | | 3,608,733 | | | | 19,641,678 | |
Net asset value, offering price and redemption price per share | | $ | 9.03 | | | $ | 8.13 | | | $ | 9.93 | |
See Notes to Financial Statements.
| | |
| THE TARGET PORTFOLIO TRUST | | 153 |
Statements of Assets and Liabilities October 31, 2008 (continued)
| | | | | | | | | |
| | | INTERMEDIATE-
TERM BOND
PORTFOLIO | | MORTGAGE
BACKED
SECURITIES
PORTFOLIO | | U.S.
GOVERNMENT
MONEY MARKET
PORTFOLIO |
| | | |
| ASSETS | | | | | | | | | |
Investments, at value(G): | | | | | | | | | |
Unaffiliated investments(A) | | $ | 225,375,886 | | $ | 95,391,724 | | $ | 69,154,907 |
Affiliated investments(B) | | | 3,409,332 | | | 94,005 | | | 407,973 |
Repurchase agreements(C) | | | 6,400,000 | | | 6,200,000 | | | — |
Cash | | | — | | | — | | | — |
Deposit with broker | | | 1,166,000 | | | — | | | — |
Foreign currency, at value(D) | | | 125,520 | | | — | | | — |
Receivable for Trust shares sold | | | 217,494 | | | 67,393 | | | 1,782,448 |
Dividends and interest receivable | | | 1,401,915 | | | 330,577 | | | 7,937 |
Prepaid expenses and other assets | | | 3,526 | | | 994 | | | 9,901 |
Receivable for investments sold | | | 91,167,800 | | | 28,866,028 | | | — |
Receivable for foreign tax reclaim | | | — | | | — | | | — |
Due from broker for variation margin | | | — | | | 36,863 | | | — |
Payments made for swap agreements | | | 670,564 | | | — | | | — |
Unrealized appreciation on swaps | | | 3,740,762 | | | 102,531 | | | — |
Unrealized appreciation on forward currency contracts | | | 712,407 | | | — | | | — |
Total assets | | | 334,391,206 | | | 131,090,115 | | | 71,363,166 |
| | | |
| LIABILITIES | | | | | | | | | |
Collateral for securities on loan | | | — | | | — | | | — |
Reverse repurchase agreement | | | — | | | 22,000,000 | | | — |
Payable for Trust shares reacquired | | | 759,657 | | | 210,188 | | | 1,975,838 |
Payable for investments purchased | | | 84,391,250 | | | 28,547,493 | | | — |
Accrued expenses and other liabilities | | | 120,781 | | | 151,266 | | | 54,742 |
Management fee payable | | | 80,424 | | | 20,424 | | | 21,262 |
Affiliated transfer agent fee payable | | | 35,532 | | | 73,348 | | | 30,327 |
Deferred trustees’ fees | | | 11,304 | | | 10,587 | | | 10,807 |
Payable to custodian | | | 94,819 | | | 14,332 | | | 393,797 |
Dividends payable | | | 287,479 | | | 60,887 | | | 31,974 |
Due to broker for variation margin | | | 401,210 | | | — | | | — |
Options written(E) | | | 160,743 | | | — | | | — |
Payments received for swap agreements | | | — | | | — | | | — |
Unrealized depreciation on swaps | | | 2,045,656 | | | — | | | — |
Unrealized depreciation on forward currency contracts | | | 622,295 | | | — | | | — |
Securities sold short, at value(F) | | | 40,832,125 | | | 28,633,327 | | | — |
Total liabilities | | | 129,843,275 | | | 79,721,852 | | | 2,518,747 |
| | | |
| NET ASSETS | | $ | 204,547,931 | | $ | 51,368,263 | | $ | 68,844,419 |
See Notes to Financial Statements.
| | |
| 154 | | THE TARGET PORTFOLIO TRUST |
Statements of Assets and Liabilities October 31, 2008 (continued)
| | | | | | | | | | | |
| | | INTERMEDIATE-
TERM BOND
PORTFOLIO | | | MORTGAGE
BACKED
SECURITIES
PORTFOLIO | | | U.S.
GOVERNMENT
MONEY MARKET
PORTFOLIO |
Net assets were comprised of: | | | | | | | | | | | |
Shares of beneficial interest, at par | | $ | 19,911 | | | $ | 5,544 | | | $ | 68,830 |
Paid-in capital, in excess of par | | | 206,184,647 | | | | 59,040,797 | | | | 68,761,206 |
| | | 206,204,558 | | | | 59,046,341 | | | | 68,830,036 |
Undistributed net investment income (loss) | | | 565,449 | | | | 168,578 | | | | 14,383 |
Accumulated net realized gains (losses) | | | 6,460,724 | | | | (4,654,405 | ) | | | — |
Net unrealized appreciation (depreciation) | | | (8,682,800 | ) | | | (3,192,251 | ) | | | — |
Net assets, October 31, 2008 | | $ | 204,547,931 | | | $ | 51,368,263 | | | $ | 68,844,419 |
(A) Identified cost of unaffiliated investments | | $ | 240,538,029 | | | $ | 99,187,801 | | | $ | 69,154,907 |
(B) Identified cost of affiliated investments | | $ | 3,409,332 | | | $ | 94,005 | | | $ | 407,973 |
(C) Identified cost of repurchase agreements | | $ | 6,400,000 | | | $ | 6,200,000 | | | | — |
(D) Identified cost of currency | | $ | 132,164 | | | | — | | | | — |
(E) Premiums received from options written | | $ | 181,120 | | | | — | | | | — |
(F) Proceeds received from short sales | | $ | 41,094,059 | | | $ | 28,866,028 | | | | — |
(G) Including securities on loan of | | | — | | | | — | | | | — |
| | | |
| NET ASSET VALUE: | | | | | | | | | | | |
Class R: | | | | | | | | | | | |
Net Assets | | | — | | | | — | | | | — |
Shares Outstanding | | | — | | | | — | | | | — |
Net asset value, offering price and redemption price per share | | | — | | | | — | | | | — |
Class T: | | | | | | | | | | | |
Net Assets | | $ | 204,547,931 | | | $ | 51,368,263 | | | $ | 68,844,419 |
Shares Outstanding | | | 19,910,853 | | | | 5,544,339 | | | | 68,830,243 |
Net asset value, offering price and redemption price per share | | $ | 10.27 | | | $ | 9.26 | | | $ | 1.00 |
See Notes to Financial Statements.
| | |
| THE TARGET PORTFOLIO TRUST | | 155 |
Statements of Operations
Year Ended October 31, 2008
| | | | | | | | | | | | | | | | |
| | | LARGE
CAPITALIZATION
GROWTH
PORTFOLIO | | | LARGE
CAPITALIZATION
VALUE
PORTFOLIO | | | SMALL
CAPITALIZATION
GROWTH
PORTFOLIO | | | SMALL
CAPITALIZATION
VALUE
PORTFOLIO | |
| | | | |
| NET INVESTMENT INCOME (LOSS) | | | | | | | | | | | | | | | | |
Income | | | | | | | | | | | | | | | | |
Unaffiliated dividend income | | $ | 3,988,703 | | | $ | 9,698,510 | | | $ | 370,628 | | | $ | 7,577,521 | |
Affiliated dividend income | | | 391,057 | | | | 143,638 | | | | 247,278 | | | | 604,675 | |
Less: Foreign withholding taxes | | | (19,817 | ) | | | (573 | ) | | | — | | | | (13,586 | ) |
Affiliated income from securities lending, net | | | 283,170 | | | | 296,560 | | | | 504,057 | | | | 1,339,680 | |
Unaffiliated interest | | | 16 | | | | — | | | | 546 | | | | 3,670 | |
Total income | | | 4,643,129 | | | | 10,138,135 | | | | 1,122,509 | | | | 9,511,960 | |
Expenses | | | | | | | | | | | | | | | | |
Management fee | | | 1,703,689 | | | | 1,954,175 | | | | 699,199 | | | | 2,621,939 | |
Interest expense (Note 7) | | | — | | | | — | | | | — | | | | — | |
Distribution fee—Class R | | | 231,603 | | | | 231,412 | | | | 93,809 | | | | 113,128 | |
Transfer agent’s fees and expenses(a) | | | 160,000 | | | | 160,000 | | | | 50,000 | | | | 565,000 | |
Custodian’s fees and expenses | | | 113,000 | | | | 105,000 | | | | 79,000 | | | | 164,000 | |
Reports to shareholders | | | 29,000 | | | | 20,000 | | | | 23,000 | | | | 33,000 | |
Registration fees | | | 20,000 | | | | 17,000 | | | | 25,000 | | | | 26,000 | |
Legal fees | | | 17,000 | | | | 12,000 | | | | 15,000 | | | | 18,000 | |
Trustees’ fees | | | 16,000 | | | | 19,000 | | | | 13,000 | | | | 17,000 | |
Audit fees | | | 23,000 | | | | 23,000 | | | | 23,000 | | | | 31,000 | |
Miscellaneous | | | 13,124 | | | | 12,490 | | | | 8,096 | | | | 14,927 | |
Total expenses | | | 2,326,416 | | | | 2,554,077 | | | | 1,029,104 | | | | 3,603,994 | |
| Net investment income (loss) | | | 2,316,713 | | | | 7,584,058 | | | | 93,405 | | | | 5,907,966 | |
| | | | |
| REALIZED AND UNREALIZED GAIN (LOSS) ON INVESTMENTS AND FOREIGN CURRENCIES | | | | | | | | | | | | | | | | |
Net realized gain (loss) on: | | | | | | | | | | | | | | | | |
Investment transactions | | | (34,875,915 | ) | | | (35,177,662 | ) | | | (18,990,580 | ) | | | (5,964,837 | ) |
Future transactions | | | (629,682 | ) | | | — | | | | — | | | | (370,255 | ) |
Foreign currency transactions | | | (1,627 | ) | | | — | | | | — | | | | — | |
Options written transactions | | | — | | | | — | | | | — | | | | — | |
Swap agreement transactions | | | — | | | | — | | | | — | | | | — | |
Short sale transactions | | | — | | | | — | | | | — | | | | — | |
| Total net realized gain (loss) | | | (35,507,224 | ) | | | (35,177,662 | ) | | | (18,990,580 | ) | | | (6,335,092 | ) |
Net change in unrealized appreciation (depreciation) on: | | | | | | | | | | | | | | | | |
Investments | | | (94,770,969 | ) | | | (127,243,378 | ) | | | (52,301,656 | ) | | | (152,964,291 | ) |
Futures | | | (22,884 | ) | | | — | | | | — | | | | (96,475 | ) |
Foreign currencies | | | (91 | ) | | | — | | | | — | | | | — | |
Options written | | | — | | | | — | | | | — | | | | — | |
Swaps | | | — | | | | — | | | | — | | | | — | |
Short sales | | | — | | | | — | | | | — | | | | — | |
| Net change in unrealized appreciation (depreciation) | | | (94,793,944 | ) | | | (127,243,378 | ) | | | (52,301,656 | ) | | | (153,060,766 | ) |
| Net gain (loss) | | | (130,301,168 | ) | | | (162,421,040 | ) | | | (71,292,236 | ) | | | (159,395,858 | ) |
| | | | |
| NET INCREASE (DECREASE) IN NET ASSETS RESULTING FROM OPERATIONS | | $ | (127,984,455 | ) | | $ | (154,836,982 | ) | | $ | (71,198,831 | ) | | $ | (153,487,892 | ) |
a) Including affiliated expense of | | $ | 160,000 | | | $ | 159,000 | | | $ | 50,000 | | | $ | 494,000 | |
See Notes to Financial Statements.
| | |
| 156 | | THE TARGET PORTFOLIO TRUST |
Statements of Operations
Year Ended October 31, 2008 (continued)
| | | | | | | | | | | | |
| | | INTERNATIONAL EQUITY PORTFOLIO | | | INTERNATIONAL BOND PORTFOLIO | | | TOTAL RETURN BOND PORTFOLIO | |
| | | |
| NET INVESTMENT INCOME (LOSS) | | | | | | | | | | | | |
Income | | | | | | | | | | | | |
Unaffiliated dividend income | | $ | 9,238,435 | | | $ | — | | | $ | — | |
Affiliated dividend income | | | 101,216 | | | | 18,221 | | | | 113,884 | |
Less: Foreign withholding taxes | | | (817,734 | ) | | | — | | | | — | |
Unaffiliated interest | | | — | | | | 1,530,190 | | | | 13,856,020 | |
Total income | | | 8,521,917 | | | | 1,548,411 | | | | 13,969,904 | |
Expenses | | | | | | | | | | | | |
Management fee | | | 1,788,223 | | | | 179,649 | | | | 1,122,569 | |
Interest expense (Note 7) | | | 1,158 | | | | — | | | | — | |
Distribution fee—Class R | | | 183,952 | | | | — | | | | 212,371 | |
Transfer agent’s fees and expenses(a) | | | 97,000 | | | | 36,000 | | | | 361,000 | |
Custodian’s fees and expenses | | | 124,000 | | | | 95,000 | | | | 188,000 | |
Reports to shareholders | | | 21,000 | | | | 19,000 | | | | 33,000 | |
Registration fees | | | 22,000 | | | | 4,000 | | | | 49,000 | |
Legal fees | | | 10,000 | | | | 13,000 | | | | 21,000 | |
Trustees’ fees | | | 11,000 | | | | 13,000 | | | | 15,000 | |
Audit fees | | | 30,000 | | | | 51,000 | | | | 36,000 | |
Miscellaneous | | | 13,450 | | | | 2,634 | | | | 6,893 | |
Total expenses | | | 2,301,783 | | | | 413,283 | | | | 2,044,833 | |
| Net investment income (loss) | | | 6,220,134 | | | | 1,135,128 | | | | 11,925,071 | |
| | | |
REALIZED AND UNREALIZED GAIN (LOSS)
ON INVESTMENTS AND FOREIGN CURRENCIES | | | | | | | | | | | | |
Net realized gain (loss) on: | | | | | | | | | | | | |
Investment transactions | | | (2,993,332 | ) | | | 360,899 | | | | 6,343,834 | |
Future transactions | | | — | | | | 284,566 | | | | (2,697,023 | ) |
Foreign currency transactions | | | (1,430,518 | ) | | | 1,974,736 | | | | 1,467,600 | |
Options written transactions | | | — | | | | 55,080 | | | | 1,404,480 | |
Swap agreement transactions | | | — | | | | 428,900 | | | | 9,760,230 | |
Short sale transactions | | | — | | | | (272,820 | ) | | | (2,978,688 | ) |
| Total net realized gain (loss) | | | (4,423,850 | ) | | | 2,831,361 | | | | 13,300,433 | |
Net change in unrealized appreciation (depreciation) on: | | | | | | | | | | | | |
Investments | | | (155,498,404 | ) | | | (5,788,320 | ) | | | (36,616,628 | ) |
Futures | | | — | | | | 62,072 | | | | 3,847,084 | |
Foreign currencies | | | 2,988,414 | | | | 1,245,732 | | | | (807,719 | ) |
Options written | | | — | | | | 50,173 | | | | (120,343 | ) |
Swaps | | | — | | | | (133,567 | ) | | | (40,205 | ) |
Short sales | | | — | | | | 31,458 | | | | 636,411 | |
| Net change in unrealized appreciation (depreciation) | | | (152,509,990 | ) | | | (4,532,452 | ) | | | (33,101,400 | ) |
| Net gain (loss) | | | (156,933,840 | ) | | | (1,701,091 | ) | | | (19,800,967 | ) |
| | | |
| NET INCREASE (DECREASE) IN NET ASSETS RESULTING FROM OPERATIONS | | $ | (150,713,706 | ) | | $ | (565,963 | ) | | $ | (7,875,896 | ) |
a) Including affiliated expense of | | $ | 97,000 | | | $ | 33,200 | | | $ | 325,500 | |
See Notes to Financial Statements.
| | |
| THE TARGET PORTFOLIO TRUST | | 157 |
Statements of Operations
Year Ended October 31, 2008 (continued)
| | | | | | | | | | | |
| | | INTERMEDIATE- TERM BOND PORTFOLIO | | | MORTGAGE
BACKED
SECURITIES
PORTFOLIO | | | U.S.
GOVERNMENT
MONEY MARKET
PORTFOLIO |
| | | |
| NET INVESTMENT INCOME (LOSS) | | | | | | | | | | | |
Income | | | | | | | | | | | |
Unaffiliated dividend income | | $ | — | | | $ | — | | | $ | — |
Affiliated dividend income | | | 140,104 | | | | 3,368 | | | | 3,350 |
Less: Foreign withholding taxes | | | — | | | | — | | | | — |
Unaffiliated interest | | | 10,808,734 | | | | 5,378,452 | | | | 2,638,516 |
Total income | | | 10,948,838 | | | | 5,381,820 | | | | 2,641,866 |
Expenses | | | | | | | | | | | |
Management fee | | | 1,023,640 | | | | 292,494 | | | | 228,513 |
Interest expense (Note 7) | | | — | | | | 804,221 | | | | — |
Distribution fee—Class R | | | — | | | | — | | | | — |
Transfer agent’s fees and expenses(a) | | | 127,000 | | | | 30,000 | | | | 64,000 |
Custodian’s fees and expenses | | | 101,000 | | | | 61,000 | | | | 58,000 |
Reports to shareholders | | | 25,000 | | | | 15,000 | | | | 15,000 |
Registration fees | | | 14,000 | | | | 5,000 | | | | 17,000 |
Legal fees | | | 10,000 | | | | 9,000 | | | | 13,000 |
Trustees’ fees | | | 15,000 | | | | 10,000 | | | | 11,000 |
Audit fees | | | 38,000 | | | | 28,000 | | | | 19,000 |
Miscellaneous | | | 8,543 | | | | 4,178 | | | | 6,444 |
Total expenses | | | 1,362,183 | | | | 1,258,893 | | | | 431,957 |
| Net investment income (loss) | | | 9,586,655 | | | | 4,122,927 | | | | 2,209,909 |
| | | |
REALIZED AND UNREALIZED GAIN (LOSS)
ON INVESTMENTS AND FOREIGN CURRENCIES | | | | | | | | | | | |
Net realized gain (loss) on: | | | | | | | | | | | |
Investment transactions | | | 6,469,405 | | | | 1,589,380 | | | | 12,197 |
Future transactions | | | 9,326,926 | | | | (1,132,854 | ) | | | — |
Foreign currency transactions | | | 1,159,137 | | | | — | | | | — |
Options written transactions | | | 105,791 | | | | — | | | | — |
Swap agreement transactions | | | 2,739,741 | | | | (363,901 | ) | | | — |
Short sale transactions | | | (4,675,704 | ) | | | (737,954 | ) | | | — |
| Total net realized gain (loss) | | | 15,125,296 | | | | (645,329 | ) | | | 12,197 |
Net change in unrealized appreciation (depreciation) on: | | | | | | | | | | | |
Investments | | | (16,341,383 | ) | | | (4,217,803 | ) | | | — |
Futures | | | 2,164,781 | | | | 304,127 | | | | — |
Foreign currencies | | | (37,106 | ) | | | — | | | | — |
Options written | | | 46,151 | | | | — | | | | — |
Swaps | | | 840,915 | | | | 204,525 | | | | — |
Short sales | | | 640,400 | | | | 363,292 | | | | — |
| Net change in unrealized appreciation (depreciation) | | | (12,686,242 | ) | | | (3,345,859 | ) | | | — |
| Net gain (loss) | | | 2,439,054 | | | | (3,991,188 | ) | | | 12,197 |
| | | |
NET INCREASE (DECREASE) IN NET ASSETS
RESULTING FROM OPERATIONS | | $ | 12,025,709 | | | $ | 131,739 | | | $ | 2,222,106 |
a) Including affiliated expense of | | $ | 127,000 | | | $ | 30,000 | | | $ | 64,000 |
See Notes to Financial Statements.
| | |
| 158 | | THE TARGET PORTFOLIO TRUST |
Statement of Changes in Net Assets
| | | | | | | | | | | | |
| | | LARGE CAPITALIZATION
GROWTH PORTFOLIO | |
| | | Year
Ended
October 31,
2008 | | | Ten Months
Ended
October 31,
2007 | | | Year
Ended
December 31,
2006 | |
| | | |
| INCREASE (DECREASE) IN NET ASSETS | | | | | | | | | | | | |
| Operations | | | | | | | | | | | | |
Net investment income | | $ | 2,316,713 | | | $ | 708,430 | | | $ | 1,538,515 | |
Net realized gain (loss) on investment and foreign currency transactions | | | (35,507,224 | ) | | | 18,353,623 | | | | 8,314,549 | |
Net change in unrealized appreciation (depreciation) of investments | | | (94,793,944 | ) | | | 27,512,369 | | | | 14,990,354 | |
Net increase (decrease) in net assets resulting from operations | | | (127,984,455 | ) | | | 46,574,422 | | | | 24,843,418 | |
| Dividends and Distributions (Note 1) | | | | | | | | | | | | |
Dividends from net investment income | | | | | | | | | | | | |
Class R | | | (50,148 | ) | | | — | | | | (3,514 | ) |
Class T | | | (1,151,430 | ) | | | (17,019 | ) | | | (1,653,855 | ) |
Total dividends from net investment income | | | (1,201,578 | ) | | | (17,019 | ) | | | (1,657,369 | ) |
Distributions from net realized gains | | | | | | | | | | | | |
Class R | | | (1,996,522 | ) | | | (100,340 | ) | | | (20,757 | ) |
Class T | | | (16,748,866 | ) | | | (2,604,422 | ) | | | (8,582,005 | ) |
Total distributions from net realized gains | | | (18,745,388 | ) | | | (2,704,762 | ) | | | (8,602,762 | ) |
| Trust share transactions (Note 6) | | | | | | | | | | | | |
Net proceeds from shares sold | | | 68,111,502 | | | | 43,248,143 | | | | 25,008,986 | |
Net asset value of shares issued in reinvestment of dividends and distributions | | | 19,916,546 | | | | 2,719,343 | | | | 10,240,926 | |
Cost of shares reacquired | | | (87,020,927 | ) | | | (47,902,204 | ) | | | (53,885,753 | ) |
Net increase (decrease) in net assets from Trust share transactions | | | 1,007,121 | | | | (1,934,718 | ) | | | (18,635,841 | ) |
Total increase (decrease) | | | (146,924,300 | ) | | | 41,917,923 | | | | (4,052,554 | ) |
| | | |
| NET ASSETS | | | | | | | | | | | | |
Beginning of period | | | 345,700,023 | | | | 303,782,100 | | | | 307,834,654 | |
End of period(a) | | $ | 198,775,723 | | | $ | 345,700,023 | | | $ | 303,782,100 | |
(a) Includes undistributed net investment income of | | $ | 1,789,138 | | | $ | 694,729 | | | $ | 4,354 | |
See Notes to Financial Statements.
| | |
| THE TARGET PORTFOLIO TRUST | | 159 |
Statement of Changes in Net Assets (continued)
| | | | | | | | | | | | |
| | | LARGE CAPITALIZATION
VALUE PORTFOLIO | |
| | | Year
Ended
October 31,
2008 | | | Ten Months
Ended
October 31,
2007 | | | Year
Ended
December 31,
2006 | |
| | | |
| INCREASE (DECREASE) IN NET ASSETS | | | | | | | | | | | | |
| Operations | | | | | | | | | | | | |
Net investment income | | $ | 7,584,058 | | | $ | 5,388,643 | | | $ | 6,634,241 | |
Net realized gain (loss) on investment and foreign currency transactions | | | (35,177,662 | ) | | | 28,455,806 | | | | 23,505,886 | |
Net change in unrealized appreciation (depreciation) of investments | | | (127,243,378 | ) | | | (11,551,247 | ) | | | 36,230,197 | |
Net increase (decrease) in net assets resulting from operations | | | (154,836,982 | ) | | | 22,293,202 | | | | 66,370,324 | |
| Dividends and Distributions (Note 1) | | | | | | | | | | | | |
Dividends from net investment income | | | | | | | | | | | | |
Class R | | | (478,872 | ) | | | (158 | ) | | | (16,801 | ) |
Class T | | | (6,667,475 | ) | | | (11,662 | ) | | | (6,842,579 | ) |
Total dividends from net investment income | | | (7,146,347 | ) | | | (11,820 | ) | | | (6,859,380 | ) |
Distributions from net realized gains | | | | | | | | | | | | |
Class R | | | (2,552,515 | ) | | | (131,354 | ) | | | (55,232 | ) |
Class T | | | (26,245,278 | ) | | | (4,454,447 | ) | | | (45,586,619 | ) |
Total distributions from net realized gains | | | (28,797,793 | ) | | | (4,585,801 | ) | | | (45,641,851 | ) |
| Trust share transactions (Note 6) | | | | | | | | | | | | |
Net proceeds from shares sold | | | 76,462,326 | | | | 51,636,755 | | | | 33,860,437 | |
Net asset value of shares issued in reinvestment of dividends and distributions | | | 34,220,003 | | | | 4,449,727 | | | | 51,052,050 | |
Cost of shares reacquired | | | (108,763,708 | ) | | | (65,229,218 | ) | | | (65,730,095 | ) |
Net increase (decrease) in net assets from Trust share transactions | | | 1,918,621 | | | | (9,142,736 | ) | | | 19,182,392 | |
Total increase (decrease) | | | (188,862,501 | ) | | | 8,552,845 | | | | 33,051,485 | |
| | | |
| NET ASSETS | | | | | | | | | | | | |
Beginning of period | | | 403,857,819 | | | | 395,304,974 | | | | 362,253,489 | |
End of period(a) | | $ | 214,995,318 | | | $ | 403,857,819 | | | $ | 395,304,974 | |
(a) Includes undistributed net investment income of | | $ | 5,703,717 | | | $ | 5,375,999 | | | | — | |
See Notes to Financial Statements.
| | |
| 160 | | THE TARGET PORTFOLIO TRUST |
Statement of Changes in Net Assets (continued)
| | | | | | | | | | | | |
| | | SMALL CAPITALIZATION
GROWTH PORTFOLIO | |
| | | Year
Ended
October 31,
2008 | | | Ten Months
Ended
October 31,
2007 | | | Year
Ended
December 31,
2006 | |
| | | |
| INCREASE (DECREASE) IN NET ASSETS | | | | | | | | | | | | |
| Operations | | | | | | | | | | | | |
Net investment income (loss) | | $ | 93,405 | | | $ | (103,564 | ) | | $ | (546,575 | ) |
Net realized gain (loss) on investment and foreign currency transactions | | | (18,990,580 | ) | | | 14,306,538 | | | | 9,674,494 | |
Net change in unrealized appreciation (depreciation) of investments | | | (52,301,656 | ) | | | 4,249,382 | | | | 1,412,805 | |
Net increase (decrease) in net assets resulting from operations | | | (71,198,831 | ) | | | 18,452,356 | | | | 10,540,724 | |
| Dividends and Distributions (Note 1) | | | | | | | | | | | | |
Dividends from net investment income | | | | | | | | | | | | |
Class R | | | — | | | | — | | | | — | |
Class T | | | — | | | | — | | | | — | |
Total dividends from net investment income | | | — | | | | — | | | | — | |
Distributions from net realized gains | | | | | | | | | | | | |
Class R | | | — | | | | — | | | | — | |
Class T | | | — | | | | — | | | | — | |
Total distributions from net realized gains | | | — | | | | — | | | | — | |
| Trust share transactions (Note 6) | | | | | | | | | | | | |
Net proceeds from shares sold | | | 31,455,208 | | | | 19,225,054 | | | | 9,893,507 | |
Net asset value of shares issued in reinvestment of dividends and distributions | | | — | | | | — | | | | — | |
Cost of shares reacquired | | | (33,985,933 | ) | | | (24,425,908 | ) | | | (26,479,801 | ) |
Net decrease in net assets from Trust share transactions | | | (2,530,725 | ) | | | (5,200,854 | ) | | | (16,586,294 | ) |
Total increase (decrease) | | | (73,729,556 | ) | | | 13,251,502 | | | | (6,045,570 | ) |
| | | |
| NET ASSETS | | | | | | | | | | | | |
Beginning of period | | | 150,571,705 | | | | 137,320,203 | | | | 143,365,773 | |
End of period(a) | | $ | 76,842,149 | | | $ | 150,571,705 | | | $ | 137,320,203 | |
(a) Includes undistributed net investment income of | | $ | 81,789 | | | | — | | | | — | |
See Notes to Financial Statements.
| | |
| THE TARGET PORTFOLIO TRUST | | 161 |
Statement of Changes in Net Assets (continued)
| | | | | | | | | | | | |
| | | SMALL CAPITALIZATION
VALUE PORTFOLIO | |
| | | Year
Ended
October 31,
2008 | | | Ten Months
Ended
October 31,
2007 | | | Year
Ended
December 31,
2006 | |
| | | |
| INCREASE (DECREASE) IN NET ASSETS | | | | | | | | | | | | |
| Operations | | | | | | | | | | | | |
Net investment income | | $ | 5,907,966 | | | $ | 4,679,758 | | | $ | 3,391,202 | |
Net realized gain (loss) on investment and foreign currency transactions | | | (6,335,092 | ) | | | 23,143,964 | | | | 20,421,271 | |
Net change in unrealized appreciation (depreciation) of investments | | | (153,060,766 | ) | | | 4,061,065 | | | | 22,620,529 | |
Net increase (decrease) in net assets resulting from operations | | | (153,487,892 | ) | | | 31,884,787 | | | | 46,433,002 | |
| Dividends and Distributions (Note 1) | | | | | | | | | | | | |
Dividends from net investment income | | | | | | | | | | | | |
Class R | | | (184,467 | ) | | | (1,204 | ) | | | (2,938 | ) |
Class T | | | (5,212,824 | ) | | | (86,616 | ) | | | (3,240,682 | ) |
Total dividends from net investment income | | | (5,397,291 | ) | | | (87,820 | ) | | | (3,243,620 | ) |
Distributions from net realized gains | | | | | | | | | | | | |
Class R | | | (975,462 | ) | | | (28,734 | ) | | | (21,073 | ) |
Class T | | | (22,449,550 | ) | | | (2,066,213 | ) | | | (23,263,451 | ) |
Total distributions from net realized gains | | | (23,425,012 | ) | | | (2,094,947 | ) | | | (23,284,524 | ) |
| Trust share transactions (Note 6) | | | | | | | | | | | | |
Net proceeds from shares sold | | | 254,520,649 | | | | 141,295,801 | | | | 70,560,051 | |
Net asset value of shares issued in reinvestment of dividends and distributions | | | 28,185,614 | | | | 2,136,118 | | | | 26,049,122 | |
Cost of shares reacquired | | | (130,437,091 | ) | | | (68,119,851 | ) | | | (53,840,672 | ) |
Net increase in net assets from Trust share transactions | | | 152,269,172 | | | | 75,312,068 | | | | 42,768,501 | |
Total increase (decrease) | | | (30,041,023 | ) | | | 105,014,088 | | | | 62,673,359 | |
| | | |
| NET ASSETS | | | | | | | | | | | | |
Beginning of period | | | 426,802,275 | | | | 321,788,187 | | | | 259,114,828 | |
End of period(a) | | $ | 396,761,252 | | | $ | 426,802,275 | | | $ | 321,788,187 | |
(a) Includes undistributed net investment income of | | $ | 4,925,952 | | | $ | 4,666,593 | | | $ | 74,655 | |
See Notes to Financial Statements.
| | |
| 162 | | THE TARGET PORTFOLIO TRUST |
Statement of Changes in Net Assets (continued)
| | | | | | | | | | | | |
| | | INTERNATIONAL
EQUITY PORTFOLIO | |
| | | Year
Ended
October 31,
2008 | | | Ten Months
Ended
October 31,
2007 | | | Year
Ended
December 31,
2006 | |
| | | |
| INCREASE (DECREASE) IN NET ASSETS | | | | | | | | | | | | |
| Operations | | | | | | | | | | | | |
Net investment income | | $ | 6,220,134 | | | $ | 6,252,994 | | | $ | 4,297,701 | |
Net realized gain (loss) on investment and foreign currency transactions | | | (4,423,850 | ) | | | 34,424,705 | | | | 24,653,943 | |
Net change in unrealized appreciation (depreciation) of investments | | | (152,509,990 | ) | | | 25,957,209 | | | | 34,431,991 | |
Net increase (decrease) in net assets resulting from operations | | | (150,713,706 | ) | | | 66,634,908 | | | | 63,383,635 | |
| Dividends and Distributions (Note 1) | | | | | | | | | | | | |
Dividends from net investment income | | | | | | | | | | | | |
Class R | | | (483,414 | ) | | | — | | | | (10,046 | ) |
Class T | | | (5,909,515 | ) | | | — | | | | (4,341,675 | ) |
Total dividends from net investment income | | | (6,392,929 | ) | | | — | | | | (4,351,721 | ) |
Distributions from net realized gains | | | | | | | | | | | | |
Class R | | | (3,376,642 | ) | | | (95,559 | ) | | | (59,614 | ) |
Class T | | | (31,835,131 | ) | | | (2,748,871 | ) | | | (21,810,241 | ) |
Total distributions from net realized gains | | | (35,211,773 | ) | | | (2,844,430 | ) | | | (21,869,855 | ) |
| Trust share transactions (Note 6) | | | | | | | | | | | | |
Net proceeds from shares sold | | | 61,750,269 | | | | 35,839,930 | | | | 18,172,375 | |
Net asset value of shares issued in reinvestment of dividends and distributions | | | 41,528,330 | | | | 2,840,246 | | | | 26,171,927 | |
Cost of shares reacquired | | | (75,402,081 | ) | | | (48,618,589 | ) | | | (44,614,358 | ) |
Net increase (decrease) in net assets from Trust share transactions | | | 27,876,518 | | | | (9,938,413 | ) | | | (270,056 | ) |
Total increase (decrease) | | | (164,441,890 | ) | | | 53,852,065 | | | | 36,892,003 | |
| | | |
| NET ASSETS | | | | | | | | | | | | |
Beginning of period | | | 323,894,217 | | | | 270,042,152 | | | | 233,150,149 | |
End of period(a) | | $ | 159,452,327 | | | $ | 323,894,217 | | | $ | 270,042,152 | |
(a) Includes undistributed net investment income of | | $ | 3,945,290 | | | $ | 5,525,097 | | | $ | 91,087 | |
See Notes to Financial Statements.
| | |
| THE TARGET PORTFOLIO TRUST | | 163 |
Statement of Changes in Net Assets (continued)
| | | | | | | | | | | | |
| | | INTERNATIONAL
BOND PORTFOLIO | |
| | | Year
Ended
October 31,
2008 | | | Ten Months
Ended
October 31,
2007 | | | Year
Ended
December 31,
2006 | |
| | | |
| INCREASE (DECREASE) IN NET ASSETS | | | | | | | | | | | | |
| Operations | | | | | | | | | | | | |
Net investment income | | $ | 1,135,128 | | | $ | 787,268 | | | $ | 955,814 | |
Net realized gain (loss) on investment and foreign currency transactions | | | 2,831,361 | | | | (1,394,369 | ) | | | (1,991,293 | ) |
Net change in unrealized appreciation (depreciation)
of investments | | | (4,532,452 | ) | | | 1,116,661 | | | | 1,878,242 | |
Net increase (decrease) in net assets resulting from operations | | | (565,963 | ) | | | 509,560 | | | | 842,763 | |
| Dividends and Distributions (Note 1) | | | | | | | | | | | | |
Dividends from net investment income | | | | | | | | | | | | |
Class R | | | — | | | | — | | | | — | |
Class T | | | — | | | | — | | | | (1,301,423 | ) |
Total dividends from net investment income | | | — | | | | — | | | | (1,301,423 | ) |
Distributions from net realized gains | | | | | | | | | | | | |
Class R | | | — | | | | — | | | | — | |
Class T | | | — | | | | — | | | | (54,720 | ) |
Total distributions from net realized gains | | | — | | | | — | | | | (54,720 | ) |
| Trust share transactions (Note 6) | | | | | | | | | | | | |
Net proceeds from shares sold | | | 2,097,222 | | | | 5,021,348 | | | | 6,238,031 | |
Net asset value of shares issued in reinvestment of dividends and distributions | | | — | | | | — | | | | 1,352,078 | |
Cost of shares reacquired | | | (11,195,986 | ) | | | (7,464,640 | ) | | | (9,043,897 | ) |
Net decrease in net assets from Trust share transactions | | | (9,098,764 | ) | | | (2,443,292 | ) | | | (1,453,788 | ) |
Total decrease | | | (9,664,727 | ) | | | (1,933,732 | ) | | | (1,967,168 | ) |
| | | |
| NET ASSETS | | | | | | | | | | | | |
Beginning of period | | | 39,010,690 | | | | 40,944,422 | | | | 42,911,590 | |
End of period(a) | | $ | 29,345,963 | | | $ | 39,010,690 | | | $ | 40,944,422 | |
(a) Includes undistributed net income of | | $ | 2,967,697 | | | | — | | | | — | |
See Notes to Financial Statements.
| | |
| 164 | | THE TARGET PORTFOLIO TRUST |
Statement of Changes in Net Assets (continued)
| | | | | | | | | | | | |
| | | TOTAL RETURN
BOND PORTFOLIO | |
| | | Year
Ended
October 31,
2008 | | | Ten Months
Ended
October 31,
2007 | | | Year
Ended
December 31,
2006 | |
| | | |
| INCREASE (DECREASE) IN NET ASSETS | | | | | | | | | | | | |
| Operations | | | | | | | | | | | | |
Net investment income | | $ | 11,925,071 | | | $ | 6,915,120 | | | $ | 6,855,661 | |
Net realized gain (loss) on investment and foreign currency transactions | | | 13,300,433 | | | | 1,793,335 | | | | (1,419,510 | ) |
Net change in unrealized appreciation (depreciation) of investments | | | (33,101,400 | ) | | | 2,457,208 | | | | 1,279,692 | |
Net increase (decrease) in net assets resulting from operations | | | (7,875,896 | ) | | | 11,165,663 | | | | 6,715,843 | |
| Dividends and Distributions (Note 1) | | | | | | | | | | | | |
Dividends from net investment income | | | | | | | | | | | | |
Class R | | | (1,846,601 | ) | | | (335,215 | ) | | | (4,293 | ) |
Class T | | | (9,917,028 | ) | | | (6,447,129 | ) | | | (6,978,878 | ) |
Total dividends from net investment income | | | (11,763,629 | ) | | | (6,782,344 | ) | | | (6,983,171 | ) |
Distributions from net realized gains | | | | | | | | | | | | |
Class R | | | — | | | | — | | | | — | |
Class T | | | — | | | | — | | | | — | |
Total distributions from net realized gains | | | — | | | | — | | | | — | |
| Trust share transactions (Note 6) | | | | | | | | | | | | |
Net proceeds from shares sold | | | 120,139,933 | | | | 58,081,933 | | | | 34,223,538 | |
Net asset value of shares issued in reinvestment of dividends and distributions | | | 11,740,429 | | | | 6,377,803 | | | | 6,956,225 | |
Cost of shares reacquired | | | (70,984,957 | ) | | | (30,567,391 | ) | | | (33,930,307 | ) |
Net increase in net assets from Trust share transactions | | | 60,895,405 | | | | 33,892,345 | | | | 7,249,456 | |
Total increase | | | 41,255,880 | | | | 38,275,664 | | | | 6,982,128 | |
| | | |
| NET ASSETS | | | | | | | | | | | | |
Beginning of period | | | 206,932,763 | | | | 168,657,099 | | | | 161,674,971 | |
End of period(a) | | $ | 248,188,643 | | | $ | 206,932,763 | | | $ | 168,657,099 | |
(a) Includes undistributed net income of | | $ | 2,468,626 | | | | — | | | | — | |
See Notes to Financial Statements.
| | |
| THE TARGET PORTFOLIO TRUST | | 165 |
Statement of Changes in Net Assets (continued)
| | | | | | | | | | | | |
| | | INTERMEDIATE-TERM
BOND PORTFOLIO | |
| | | Year
Ended
October 31,
2008 | | | Ten Months
Ended
October 31,
2007 | | | Year
Ended
December 31,
2006 | |
| | | |
| INCREASE (DECREASE) IN NET ASSETS | | | | | | | | | | | | |
| Operations | | | | | | | | | | | | |
Net investment income | | $ | 9,586,655 | | | $ | 9,252,160 | | | $ | 10,529,630 | |
Net realized gain (loss) on investment and foreign currency transactions | | | 15,125,296 | | | | (2,196,606 | ) | | | (1,401,616 | ) |
Net change in unrealized appreciation (depreciation) of investments | | | (12,686,242 | ) | | | 4,916,950 | | | | 611,499 | |
Net increase in net assets resulting from operations | | | 12,025,709 | | | | 11,972,504 | | | | 9,739,513 | |
| Dividends and Distributions (Note 1) | | | | | | | | | | | | |
Dividends from net investment income | | | | | | | | | | | | |
Class R | | | — | | | | — | | | | — | |
Class T | | | (10,823,628 | ) | | | (9,048,043 | ) | | | (11,077,415 | ) |
Total dividends from net investment income | | | (10,823,628 | ) | | | (9,048,043 | ) | | | (11,077,415 | ) |
Distributions from net realized gains | | | | | | | | | | | | |
Class R | | | — | | | | — | | | | — | |
Class T | | | — | | | | — | | | | — | |
Total distributions from net realized gains | | | — | | | | — | | | | — | |
| Trust share transactions (Note 6) | | | | | | | | | | | | |
Net proceeds from shares sold | | | 22,926,973 | | | | 26,040,464 | | | | 92,017,701 | |
Net asset value of shares issued in reinvestment of dividends and distributions | | | 10,817,173 | | | | 8,698,808 | | | | 11,032,073 | |
Cost of shares reacquired | | | (63,821,113 | ) | | | (49,463,890 | ) | | | (118,666,524 | ) |
Net decrease in net assets from Trust share transactions | | | (30,076,967 | ) | | | (14,724,618 | ) | | | (15,616,750 | ) |
Total decrease | | | (28,874,886 | ) | | | (11,800,157 | ) | | | (16,954,652 | ) |
| | | |
| NET ASSETS | | | | | | | | | | | | |
Beginning of period | | | 233,422,817 | | | | 245,222,974 | | | | 262,177,626 | |
End of period(a) | | $ | 204,547,931 | | | $ | 233,422,817 | | | $ | 245,222,974 | |
(a) Includes undistributed net investment income of | | $ | 565,449 | | | $ | 315,759 | | | | — | |
See Notes to Financial Statements.
| | |
| 166 | | THE TARGET PORTFOLIO TRUST |
Statement of Changes in Net Assets (continued)
| | | | | | | | | | | | |
| | | MORTGAGE BACKED
SECURITIES PORTFOLIO | |
| | | Year
Ended
October 31,
2008 | | | Ten Months
Ended
October 31,
2007 | | | Year
Ended
December 31,
2006 | |
| | | |
| INCREASE (DECREASE) IN NET ASSETS | | | | | | | | | | | | |
| Operations | | | | | | | | | | | | |
Net investment income | | $ | 4,122,927 | | | $ | 3,086,189 | | | $ | 3,457,380 | |
Net realized gain (loss) on investment and foreign currency transactions | | | (645,329 | ) | | | (647,569 | ) | | | (1,301,653 | ) |
Net change in unrealized appreciation (depreciation) of investments | | | (3,345,859 | ) | | | 440,895 | | | | 711,699 | |
Net increase in net assets resulting from operations | | | 131,739 | | | | 2,879,515 | | | | 2,867,426 | |
| Dividends and Distributions (Note 1) | | | | | | | | | | | | |
Dividends from net investment income | | | (4,312,137 | ) | | | (2,967,417 | ) | | | (3,765,517 | ) |
Tax return of capital | | | — | | | | (225,427 | ) | | | — | |
Total dividends and distributions | | | (4,312,137 | ) | | | (3,192,844 | ) | | | (3,765,517 | ) |
| Trust share transactions (Note 6) | | | | | | | | | | | | |
Net proceeds from shares sold | | | 2,057,259 | | | | 7,731,632 | | | | 6,808,481 | |
Net asset value of shares issued in reinvestment of dividends and distributions | | | 4,354,324 | | | | 3,073,764 | | | | 3,754,874 | |
Cost of shares reacquired | | | (24,443,690 | ) | | | (12,382,142 | ) | | | (16,389,625 | ) |
Net decrease in net assets from Trust share transactions | | | (18,032,107 | ) | | | (1,576,746 | ) | | | (5,826,270 | ) |
Total decrease | | | (22,212,505 | ) | | | (1,890,075 | ) | | | (6,724,361 | ) |
| | | |
| NET ASSETS | | | | | | | | | | | | |
Beginning of period | | | 73,580,768 | | | | 75,470,843 | | | | 82,195,204 | |
End of period(a) | | $ | 51,368,263 | | | $ | 73,580,768 | | | $ | 75,470,843 | |
(a) Includes undistributed net investment income of | | $ | 168,578 | | | $ | 167,509 | | | | — | |
See Notes to Financial Statements.
| | |
| THE TARGET PORTFOLIO TRUST | | 167 |
Statement of Changes in Net Assets (continued)
| | | | | | | | | | | | |
| | | U.S. GOVERNMENT MONEY
MARKET PORTFOLIO | |
| | | Year
Ended
October 31,
2008 | | | Ten Months
Ended
October 31,
2007 | | | Year
Ended
December 31,
2006 | |
| | | |
| INCREASE (DECREASE) IN NET ASSETS | | | | | | | | | | | | |
| Operations | | | | | | | | | | | | |
Net investment income | | $ | 2,209,909 | | | $ | 2,522,242 | | | $ | 2,038,607 | |
Net realized gain (loss) on investment and foreign currency transactions | | | 12,197 | | | | 2,497 | | | | (2,491 | ) |
Net increase in net assets resulting from operations | | | 2,222,106 | | | | 2,524,739 | | | | 2,036,116 | |
| Dividends and Distributions (Note 1) | | | | | | | | | | | | |
Dividends from net investment income | | | (2,209,909 | ) | | | (2,522,242 | ) | | | (2,026,702 | ) |
| Trust share transactions(b) | | | | | | | | | | | | |
Net proceeds from shares sold | | | 151,264,824 | | | | 72,192,472 | | | | 21,507,914 | |
Net asset value of shares issued in reinvestment of dividends and distributions | | | 2,249,665 | | | | 2,433,906 | | | | 2,015,845 | |
Cost of shares reacquired | | | (151,749,323 | ) | | | (54,836,645 | ) | | | (33,465,781 | ) |
Net increase (decrease) in net assets from Trust share transactions | | | 1,765,166 | | | | 19,789,733 | | | | (9,942,022 | ) |
Total increase (decrease) | | | 1,777,363 | | | | 19,792,230 | | | | (9,932,608 | ) |
| | | |
| NET ASSETS | | | | | | | | | | | | |
Beginning of period | | | 67,067,056 | | | | 47,274,826 | | | | 57,207,434 | |
End of period(a) | | $ | 68,844,419 | | | $ | 67,067,056 | | | $ | 47,274,826 | |
(a) Includes undistributed net investment income of | | $ | 14,383 | | | $ | 2,586 | | | $ | 2,586 | |
(b) Fund share transactions are at $1 per share for the U.S. Government Money Market Portfolio | | | | | | | | | | | | |
See Notes to Financial Statements.
| | |
| 168 | | THE TARGET PORTFOLIO TRUST |
Statement of Cash Flows
| | | | |
| | | MORTGAGE BACKED
SECURITIES PORTFOLIO | |
| | | Year Ended
October 31, 2008 | |
| |
| INCREASE (DECREASE) IN CASH | | | | |
| Cash flows provided from operating activities: | | | | |
Interest and dividends received | | $ | 5,412,421 | |
Operating expenses paid | | | (540,212 | ) |
Interest expenses paid | | | (804,221 | ) |
Purchases of long-term portfolio investments | | | (365,784,645 | ) |
Proceeds from disposition of short-term portfolio investments | | | (1,753,561 | ) |
Proceeds from disposition of long-term portfolio investments | | | 394,622,691 | |
Net proceeds from cover of short sales | | | (3,700,849 | ) |
Decrease in other assets | | | (1,165,765 | ) |
Net cash provided from operating activities | | | 26,285,859 | |
| Cash flows from financing activities: | | | | |
Net proceeds from reverse repurchase agreement transactions | | | (3,986,000 | ) |
Cash dividends paid | | | (10,716 | ) |
Proceeds from shares sold | | | 2,018,590 | |
Payment of shares redeemed | | | (24,307,733 | ) |
Net cash provided by financing activities | | | (26,285,859 | ) |
Net change in cash | | | — | |
Cash at beginning of period | | | — | |
Cash at end of period | | $ | — | |
| Reconciliation of Net Increase in Net Assets to Net Cash Provided From Operating Activities | | | | |
Net increase in net assets resulting from operations | | $ | 131,739 | |
Change in investments | | | 3,576,818 | |
Net realized loss on investments | | | 645,329 | |
Net decrease in unrealized appreciation on investments | | | 3,345,859 | |
Change in receivable for investments sold | | | 26,234,348 | |
Change in interest receivable | | | 53,977 | |
Change in other assets | | | 278,120 | |
Change in payable for investments purchased | | | (7,894,791 | ) |
Change in accrued expenses and other liabilities | | | (85,540 | ) |
Total adjustments | | | 26,154,120 | |
Net cash provided from operating activities | | $ | 26,285,859 | |
See Notes to Financial Statements.
| | |
| THE TARGET PORTFOLIO TRUST | | 169 |
Notes to Financial Statements
The TARGET Portfolio Trust (the “Trust”) is an open-end management investment company. The Trust was established as a Delaware business trust on July 29, 1992 and consists of ten separate portfolios (the “Portfolio” or “Portfolios”). All the Portfolios are diversified, as defined under the Investment Company Act of 1940, except for the International Bond Portfolio. Investment operations commenced on January 5, 1993, with the exception of the International Bond Portfolio, which commenced on May 17, 1994.
The Trust’s fiscal year has changed from an annual reporting period that ends on December 31 to one that ends October 31. This change should have no impact on the way the Trust is managed. Shareholders will receive future annual and semi-annual reports on the new fiscal year-end schedule.
The Portfolios and their investment objectives are as follows:
| • | | Large Capitalization Growth Portfolio—long-term capital appreciation through investment primarily in stocks of large corporations that, in the investment adviser’s opinion, should have earnings growth faster than that of the S&P 500; |
| • | | Large Capitalization Value Portfolio—total return consisting of capital appreciation and dividend income through investment primarily in stocks of large corporations that, in the adviser’s opinion, are undervalued; |
| • | | Small Capitalization Growth Portfolio—maximum capital appreciation through investment primarily in small company common stocks that, in the investment adviser’s opinion, should have earnings growth faster than that of the U.S. economy in general; |
| • | | Small Capitalization Value Portfolio—above average capital appreciation through investment in small company common stocks that, in the adviser’s opinion, are undervalued or overlooked in the marketplace; |
| • | | International Equity Portfolio—capital appreciation through investment primarily in stocks of companies domiciled outside the United States; |
| • | | International Bond Portfolio—high total return through investment primarily in high-quality, foreign debt securities; |
| • | | Total Return Bond Portfolio—total return of current income and capital appreciation through investment primarily in fixed-income securities of varying maturities with a dollar-weighted average portfolio maturity of more than four years but not more than fifteen years; |
| • | | Intermediate-Term Bond Portfolio—current income and reasonable stability of principal through investment primarily in high quality fixed-income securities of varying maturities with a dollar-weighted average portfolio maturity of more than three years but not more than ten years; |
| • | | Mortgage Backed Securities Portfolio—high current income primarily and capital appreciation secondarily, each consistent with the protection of capital through investment primarily in mortgage related securities; |
| • | | U.S. Government Money Market Portfolio—maximum current income consistent with maintenance of liquidity and preservation of capital through investment exclusively in short-term securities issued or guaranteed by the U.S. Government, its agencies or instrumentalities. |
The ability of issuers of debt securities (other than those issued or guaranteed by the U.S. Government) held by the Portfolios to meet their obligations may be affected by economic or political developments in a specific industry, region or country.
| | |
| 170 | | THE TARGET PORTFOLIO TRUST |
Note 1. Accounting Policies
The following is a summary of significant accounting policies followed by the Trust and the Portfolios in the preparation of its financial statements.
Securities Valuations: Securities listed on a securities exchange (other than options on securities and indices) are valued at the last sale price on such exchange on the day of valuation or, if there was no sale on such day, at the mean between the last reported bid and asked prices, or at the last bid price on such day in the absence of an asked price. Securities traded via Nasdaq are valued at the NASDAQ official closing price (NOCP) on the day of valuation, or if there was no NOCP, at the last sale price. Securities that are actively traded in the over-the-counter market, including listed securities for which the primary market is believed by Prudential Investments LLC (“PI” or “Manager”), in consultation with the subadvisor(s), to be over-the-counter, are valued at market value using prices provided by an independent pricing agent or principal market maker. Options on securities and indices traded on an exchange are valued at the last sale price as of the close of trading on the applicable exchange or, if there was no sale, at the mean between the most recently quoted bid and ask prices on such exchange or at the last bid price in the absence of an asked price. Futures contracts and options thereon traded on a commodities exchange or board of trade are valued at the last sale price at the close of trading on such exchange or board of trade or, if there was no sale on the applicable commodities exchange or board of trade on such day, at the mean between the most recently quoted bid and asked prices on such exchange or board of trade or at the last bid price in the absence of an asked price. Securities for which reliable market quotations are not readily available, or whose values have been affected by events occurring after the close of the security’s foreign market and before the Portfolio’s pricing time, are valued at fair value in accordance with the Board of Trustees’ approved fair valuation procedures. When determining the fair value of securities, some of the factors influencing the valuation include, the nature of any restrictions on disposition of the securities; assessment of the general liquidity of the securities; the issuer’s financial condition and the markets in which it does business; the cost of the investment; the size of the holding and the capitalization of issuer; the prices of any recent transactions or bids/offers for such securities or any comparable securities; any available analyst media or other reports or information deemed reliable by the investment adviser regarding the issuer or the markets or industry in which it operates. Using fair value to price securities may result in a value that is different from a security’s most recent closing price and from the price used by other mutual funds to calculate their net asset values. As of October 31, 2008, Large Capitalization Growth Portfolio and International Equity Portfolio held foreign securities whose value required adjustment in accordance with such procedures.
Certain Portfolios held illiquid securities, including those which are restricted as to disposition under securities law (“restricted securities”). Restricted securities are valued pursuant to the valuation procedures noted above. Each Portfolio may hold up to 15% of its net assets in illiquid securities, except for the U.S. Government Money Market Portfolio, which may hold up to 10% of its net assets in illiquid securities.
Investments in mutual funds are valued at their net asset value as of the close of the New York Stock Exchange on the date of the valuation.
U.S. Government securities for which market quotations are available are valued at a price provided by an independent pricing agent or primary dealer (a dealer that trades in U.S. Government securities within the Federal Reserve System).
Securities held by the U.S. Government Money Market Portfolio are valued at amortized cost in accordance with Rule 2a-7 of the Investment Company Act, which approximates market value. The amortized cost method involves valuing a security at its cost on the date of purchase and thereafter assuming a constant amortization to maturity of the difference between the principal amount due at maturity and the cost.
| | |
| THE TARGET PORTFOLIO TRUST | | 171 |
Short-term debt securities held by the other Portfolios, which mature in 60 days or less, are valued at amortized cost, which approximates market value. Short-term debt securities held by the other Portfolios, which mature in more than 60 days, are valued at current market quotations.
Repurchase Agreements: In connection with transactions in repurchase agreements with United States financial institutions, it is the Trust’s policy that its custodian or designated sub custodians under tri-party repurchase agreements, as the case may be, take possession of the underlying collateral securities, the value of which exceeds the principal amount of the repurchase transaction, including accrued interest. The value of the collateral is marked-to-market on a daily basis to ensure the adequacy of the collateral. If the seller defaults, and the value of the collateral declines or, if bankruptcy proceedings are commenced with respect to the seller of the security, realization of the collateral by the Trust may be delayed or limited.
Financial Futures Contracts: A financial futures contract is an agreement to purchase (long) or sell (short) an agreed amount of securities at a set price for delivery on a future date. Upon entering into a financial futures contract, the Portfolio is required to pledge to the broker an amount of cash and/or other assets equal to a certain percentage of the contract amount. This amount is known as the “initial margin.” Subsequent payments, known as “variation margin,” are made or received by the Portfolio each day, depending on the daily fluctuations in the value of the underlying security. Such variation margin is recorded for financial statement purposes on a daily basis as an unrealized gain or loss. When the contract expires or is closed, the gain or loss is realized and is presented in the Statements of Operations as a net realized gain or loss on financial futures contracts.
The Portfolio invests in financial futures contracts in order to hedge its existing portfolio securities, or securities the Portfolio intends to purchase, against fluctuations in value caused by changes in prevailing interest rates or market conditions. Should interest rates move unexpectedly, the Portfolio may not achieve the anticipated benefits of the financial futures contracts and may realize a loss. The use of futures transactions involves the risk of imperfect correlation in movements in the price of futures contracts, interest rates and the underlying hedged assets. The Portfolio maintains a segregated account of securities or other liquid assets, the dollar value of which is at least equal to its obligation with respect to financial futures contracts. The International Equity Portfolio, International Bond Portfolio, Intermediate-Term Bond Portfolio, Mortgage-Backed Securities Portfolio and Total Return Bond Portfolio are the only portfolios that may invest in financial futures contracts.
Foreign Currency Translation: The books and records of the Portfolios are maintained in U.S. dollars. Foreign currency amounts are translated into U.S. dollars on the following basis:
(i) market value of investment securities, other assets and liabilities—at the current daily rates of exchange;
(ii) purchases and sales of investment securities, income and expenses—at the rates of exchange prevailing on the respective dates of such transactions.
The Portfolios do not isolate that portion of the results of operations arising as a result of changes in the foreign exchange rates from the fluctuations arising from changes in the market prices of long-term securities held at period end. Similarly, the Portfolios do not isolate the effect of changes in foreign exchange rates from the fluctuations arising from changes in the market prices of long-term portfolio securities sold during the period. Accordingly, realized foreign currency gains or losses are included in the reported net realized gains or losses on investment transactions.
Net realized gains or losses on foreign currency transactions represent net foreign exchange gains or losses from the holding of foreign currencies, currency gains or losses realized between the trade date and
| | |
| 172 | | THE TARGET PORTFOLIO TRUST |
settlement date on securities transactions, and the difference between the amounts of dividends, interest and foreign withholding taxes recorded on the Portfolios’ books and the U.S. dollar equivalent amounts actually received or paid. Net unrealized currency gains or losses from valuing foreign currency denominated assets and liabilities (other than investments) at period-end exchange rates are reflected as a component of net unrealized appreciation (depreciation) on investments and foreign currencies.
Foreign security and currency transactions may involve certain considerations and risks not typically associated with those of domestic origin as a result of, among other factors, the possibility of political and economic instability or the level of governmental supervision and regulation of foreign securities markets.
Forward Foreign Currency Contracts: A forward foreign currency contract is a commitment to purchase or sell a foreign currency at a future date at a negotiated forward rate. The Portfolio enters into forward foreign currency contracts in order to hedge its exposure to changes in foreign currency exchange rates on its foreign portfolio holdings or on specific receivables and payables denominated in a foreign currency. The contracts are valued daily at current forward exchange rates and any unrealized gain or loss is included in net unrealized appreciation or depreciation on foreign currency transactions. Gains or losses are realized on the settlement date of the contract equal to the difference between the settlement value of the original and negotiated forward contracts. This gain or loss, if any, is included in net realized gain or loss on foreign currency transactions. Risks may arise upon entering into these contracts from the potential inability of the counterparties to meet the terms of their contracts. The International Equity Portfolio, International Bond Portfolio, Intermediate-Term Bond Portfolio and Total Return Bond Portfolio may enter into forward foreign currency contracts in order to hedge their exposure to changes in foreign currency exchange rates on their foreign portfolio holdings.
Options: The Portfolio may either purchase or write options in order to hedge against adverse market movements or fluctuations in value caused by changes in prevailing interest rates or foreign currency exchange rates with respect to securities or currencies which the Portfolio currently owns or intends to purchase. The Portfolio’s principal reason for writing options is to realize, through receipt of premiums, a greater current return than would be realized on the underlying security alone. When the Portfolio purchases an option, it pays a premium and an amount equal to that premium is recorded as an asset. When the Portfolio writes an option, it receives a premium and an amount equal to that premium is recorded as a liability. The asset or liability is adjusted daily to reflect the current market value of the option.
If an option expires unexercised, the Portfolio realizes a gain or loss to the extent of the premium received or paid. If an option is exercised, the premium received or paid is recorded as an adjustment to the proceeds from the sale or the cost basis of the purchase in determining whether the Portfolio has realized a gain or loss. The difference between the premium and the amount received or paid on affecting a closing purchase or sale transaction is also treated as a realized gain or loss. Gains or losses on purchased options are included in net realized gains or losses on investment transactions. Gains or losses on written options are presented separately as net realized gains or losses on options written.
The Portfolio, as writer of an option, may have no control over whether the contract may be exercised. As a result, the Portfolio bears the market risk of an unfavorable change in the price of the security or currencies underlying the written option. The Portfolio, as purchaser of an OTC option, bears the risk of the potential inability of the counterparties to meet the terms of their contracts. The Portfolio maintains a segregated account of securities or other liquid assets, the dollar value of which is at least equal to its obligation with respect to options. The International Equity Portfolio, the International Bond Portfolio, the Intermediate-Term Bond Portfolio, the Total Return Bond Portfolio and the Mortgage-Backed Securities Portfolio may either purchase or write options.
| | |
| THE TARGET PORTFOLIO TRUST | | 173 |
Short Sales: Certain portfolios of the Trust may make short sales of securities as a method of hedging potential price declines in similar securities owned. The Portfolio may sell a security it does not own in anticipation of a decline in the market value of that security (short sale). When the Portfolio makes a short sale, it will borrow the security sold short and deliver it to the broker-dealer through which it made the short sale as collateral for its obligation to deliver the security upon conclusion of the sale. The Portfolio may have to pay a fee to borrow the particular security and may be obligated to return any interest or dividends received on such borrowed securities. A gain, limited to the price at which the Portfolio sold the security short, or a loss, unlimited as to dollar amount, will be recognized upon the termination of a short sale if the market price at termination is less than or greater than the proceeds originally received, respectively, and is presented in the Statement of Operations as net realized gain or loss on short sales. The Portfolio maintains a segregated account of securities or other liquid assets, the dollar value of which is at least equal to its obligation with respect to short sales. The Total Return Bond Portfolio, Intermediate-Term Bond Portfolio and Mortgage-Backed Securities Portfolio may enter into short sales.
Swap Agreements: Certain Portfolios may enter into interest rate swap agreements, forward swap spread lock agreements, and credit default swap agreements. A swap agreement is an agreement to exchange the return generated by one instrument for the return generated by another instrument. Interest rate swap agreements involve the exchange by the Portfolio with another party of their respective commitments to pay or receive interest. Forward spread lock swap agreements involve commitments to pay or receive a settlement amount calculated as the difference between the swap spread and a fixed spread, multiplied by the notional amount times the duration of the swap. The swap spread is the difference between the benchmark swap rate (market rate) and the specific Treasury rate. In a credit default swap agreement, one party (the protection buyer) makes a stream of payments to another party (the protection seller) in exchange for the right to receive a specified payment in the event of a default by a third party, typically corporate issues or sovereign issues of an emerging country, on its obligation. The maximum amount of the payment may equal the notional, at par, of the underlying index or security as a result of a default (or “credit event”). In addition to bearing the risk that the credit event will occur, the Portfolios could be exposed to market risk due to unfavorable changes in interest rates or in the price of the underlying security or index, the possibility that the fund may be unable to close out its position at the same time or at the same price as if it had purchased comparable publicly traded securities, or that the counterparty may default on its obligation to perform. The Portfolios may enter into swap agreements as the protection buyer or the protection seller. The swaps are valued daily at current market value and any change in value is included in net unrealized appreciation or depreciation on investments. Payments received or paid by the Portfolio are recorded as realized gains or losses. Risk of loss may exceed amounts recognized on the statements of assets and liabilities. Swap agreements outstanding at period end, if any, are listed on the Portfolio of Investments.
The use of derivative transactions may involve elements of both market and credit risk in excess of the amounts reported in the Statements of Assets and Liabilities.
Securities Lending: The Portfolio may lend its portfolio securities to broker-dealers. The loans are secured by collateral at least equal at all times to the market value of the securities loaned. Loans are subject to termination at the option of the borrower or the Portfolio. Upon termination of the loan, the borrower will return to the lender securities identical to the loaned securities. Should the borrower of the securities fail financially, the Portfolio has the right to repurchase the securities using the collateral in the open market. The Portfolio recognizes income, net of any rebate and securities lending agent fees, for lending its securities in the form of fees or interest on the investment of any cash received as collateral. The Portfolio also continues to receive interest and dividends or amounts equivalent thereto on the securities loaned and recognizes any unrealized gain or loss in the market price of the securities loaned that may occur during the term of the loan.
As a result of the bankruptcy filing by Lehman Brothers Holdings Inc., which was the parent company to the Portfolios’ Securities Lending Counter Party, Lehman Brothers Inc. (Lehman), the Portfolios’ Securities
| | |
| 174 | | THE TARGET PORTFOLIO TRUST |
Lending Agent utilized collateral held on behalf of the Portfolios for securities out on loan to compensate the Portfolios for the failure of Lehman to return the securities.
When-Issued/Delayed Delivery Securities: Certain Portfolios may purchase or sell securities on a when-issued or delayed delivery basis. These transactions involve a commitment by the Portfolio to purchase or sell securities for a predetermined price or yield, with payment and delivery taking place beyond the customary settlement period. When delayed delivery purchases are outstanding, the Portfolio will set aside and maintain until the settlement date in a segregated account, liquid assets in an amount sufficient to meet the purchase price. When purchasing a security on a delayed delivery basis, the Portfolio assumes the rights and risks of ownership of the security, including the risk of price and yield fluctuations, and takes such fluctuations into account when determining its net asset value. The Portfolio may dispose of or renegotiate a delayed delivery transaction after it is entered into, and may sell when-issued securities before they are delivered, which may result in a capital gain or loss. When the Portfolio has sold a security on a delayed delivery basis, the Portfolio does not participate in future gains and losses with respect to the security.
Securities Transactions and Net Investment Income: Securities transactions are recorded on the trade date. Realized and unrealized gains and losses from security and currency transactions are calculated on the identified cost basis. Dividend income is recorded on the ex-dividend date and interest income, including amortization of premium and accretion of discount of debt securities, as required, is recorded on the accrual basis. Expenses are recorded on the accrual basis. The Trust’s expenses are allocated to the respective Portfolios on the basis of relative net assets except for expenses that are charged directly at the Portfolio or class level.
Dividends and Distributions: The Total Return Bond Portfolio, Intermediate-Term Bond Portfolio and Mortgage Backed Securities Portfolio declare dividends of their net investment income daily and pay such dividends monthly. The U.S. Government Money Market Portfolio declares net investment income daily and pays such dividends monthly. All Portfolios declare and pay a dividend from net investment income, if any, at least annually. Each Portfolio declares and pays its net realized capital gains, if any, at least annually. Dividends and distributions to shareholders, which are determined in accordance with federal income tax regulations and which may differ from generally accepted accounting principles, are recorded on ex-dividend date. Permanent book/ tax differences relating to income and gains are reclassified amongst undistributed net investment income, accumulated net realized gain or loss and paid-in capital, in excess of par, as appropriate.
Taxes: For federal income tax purposes, each Portfolio in the Trust is treated as a separate tax-paying entity. It is each Portfolio’s policy to continue to meet the requirements of the Internal Revenue Code applicable to regulated investment companies and to distribute all of its taxable net investment income and capital gains, if any, to its shareholders. Therefore, no federal income tax provision is required.
Withholding taxes on foreign interest and dividends are recorded net of reclaimable amounts, at the time the related income is earned.
Estimates: The preparation of the financial statements requires management to make estimates and assumptions that affect the reported amounts and disclosures in the financial statements. Actual results could differ from those estimates.
Note 2. Agreements
The Trust’s manager is Prudential Investments LLC (“PI”). PI manages the investment operations of the Trust, administers the Trust’s affairs and is responsible for the selection, subject to review and approval of
| | |
| THE TARGET PORTFOLIO TRUST | | 175 |
the Trustees, of the advisers. PI supervises the advisers’ performance of advisory services and makes recommendations to the Trustees as to whether the advisers’ contracts should be renewed, modified or terminated. PI pays for the costs pursuant to the advisory agreements, the cost of compensation of officers of the Trust, occupancy and certain clerical and accounting costs of the Trust. The Trust bears all other costs and expenses.
The advisers noted below each furnished investment advisory services in connection with the management of the Portfolios. Each of the advisers of the equity Portfolios—Large Capitalization Growth Portfolio, Large Capitalization Value Portfolio, Small Capitalization Growth Portfolio, Small Capitalization Value Portfolio and International Equity Portfolio—manages a portion of the assets of the respective Portfolios. In general, in order to maintain a division of assets between the advisers as deemed appropriate by PI, all daily cash inflows (i.e., subscriptions and reinvested distributions) and outflows (i.e., redemptions and expense items) are divided between the advisers, as PI deems appropriate. In order to maintain an approximate allocation between the advisers in the ratio deemed appropriate by PI, a periodic rebalancing of each subadvisor’s share of Portfolio assets may occur to account for market fluctuations.
| | |
Portfolio | | Adviser |
Large Capitalization Growth | | Goldman Sachs Asset Management LLP and Marsico Capital Management, LLC |
Large Capitalization Value | | J.P. Morgan Investment Management, Inc., Hotchkis & Wiley Capital Management, LLC and NFJ Investment Group L.P. |
Small Capitalization Growth | | Ashfield Capital Partners, LLC and Eagle Asset Management, Inc. |
Small Capitalization Value | | NFJ Investment Group L.P. , EARNEST Partners, LLC, Lee Munder Investments Limited, J.P. Morgan Investment Management, Inc. and Vaughan Nelson Investment Management, L.P. |
International Equity | | LSV Asset Management and Thornburg Investment Management, Inc. |
International Bond, Total Return Bond and Intermediate-Term Bond | | Pacific Investment Management Company LLC |
Mortgage Backed Securities and U.S. Government Money Market | | Wellington Management Company, LLP |
Effective December 15, 2008, the following sub-advisory changes were made:
| | |
Portfolio | | Adviser |
Large Capitalization Growth | | Massachusetts Financial Services Company replaced Goldman Sachs Asset Management LLP |
Large Capitalization Value | | Eaton Vance Management replaced NFJ Investment Group L.P. |
The management fee payable to PI is computed daily and paid monthly, at an annual rate of the average daily net assets of the Portfolios specified below and PI, in turn, pays each adviser a fee for its services.
| | | |
Portfolio | | Contracted & Effective
Management Fee | |
Large Capitalization Growth | | 0.60 | % |
Large Capitalization Value | | 0.60 | % |
Small Capitalization Growth | | 0.60 | % |
Small Capitalization Value | | 0.60 | % |
International Equity | | 0.70 | % |
International Bond | | 0.50 | % |
Total Return Bond | | 0.45 | % |
Intermediate-Term Bond | | 0.45 | % |
Mortgage Backed Securities | | 0.45 | % |
U.S. Government Money Market | | 0.25 | % |
| | |
| 176 | | THE TARGET PORTFOLIO TRUST |
The Trust has a distribution agreement with Prudential Investment Management Services LLC (“PIMS”) which acts as the distributor of the Class T and Class R shares of the Trust. The Trust compensates PIMS for distributing and servicing the Trust’s Class R shares, pursuant to plan of distribution (the “Class R Plan”), regardless of expenses actually incurred by PIMS. The distribution fee is accrued daily and payable monthly. No distribution or service fees are paid to PIMS as distributor of the Class T shares of the Trust.
Pursuant to the Class R Plan, the Trust compensates PIMS for distribution related activities at an annual rate of up to .75 of 1% of the average daily net assets of the Class R shares. For the year ended October 31, 2008, PIMS has contractually agreed to limit such fees to .50 of 1% of the average daily net assets of the Class R shares through February 28, 2010.
PI and PIMS are indirect, wholly-owned subsidiaries of Prudential Financial, Inc. (“Prudential”).
Note 3. Other Transactions with Affiliates
Prudential Mutual Fund Services LLC (“PMFS”), an affiliate of PI and an indirect, wholly-owned subsidiary of Prudential, serves as the Trust’s transfer agent. Transfer agent fees and expenses in the Statement of Operations also include certain out-of-pocket expenses paid to non-affiliates where applicable.
For the year ended October 31, 2008, the amount of brokerage commissions earned by Wachovia Securities, LLC (Wachovia), an affiliate of Prudential, from portfolio transactions executed on behalf of the Portfolios were as follows:
| | | |
Portfolio | | Wachovia |
Small Capitalization Growth | | $ | 199 |
Small Capitalization Value | | | 725 |
Prudential Investment Management, Inc. (“PIM”), an indirect, wholly-owned subsidiary of Prudential, is the Trust’s security lending agent. For the year ended October 31, 2008, PIM was compensated for these services by the following Portfolios of the Trust:
| | | |
Portfolio | | PIM |
Large Capitalization Growth | | $ | 110,694 |
Large Capitalization Value | | | 127,158 |
Small Capitalization Growth | | | 215,987 |
Small Capitalization Value | | | 518,467 |
Certain Portfolios invest in the Taxable Money Market Series (the “Series”), a portfolio of the Dryden Core Investment Fund. The Series is a money market mutual fund registered under the Investment Company Act of 1940, as amended, and managed by PI.
Note 4. Portfolio Securities
Purchases and sales of portfolio securities, excluding short-term investments and U.S. Government securities, for the year ended October 31, 2008, were as follows:
| | | | | | |
Portfolio | | Purchases | | Sales |
Large Capitalization Growth | | $ | 276,650,139 | | $ | 305,315,201 |
Large Capitalization Value | | | 249,657,160 | | | 271,086,263 |
Small Capitalization Growth | | | 248,367,253 | | | 248,480,922 |
Small Capitalization Value | | | 337,704,225 | | | 228,241,153 |
International Equity | | | 75,276,286 | | | 90,716,155 |
International Bond | | | 284,291,279 | | | 286,056,995 |
Total Return Bond | | | 1,619,535,817 | | | 1,412,032,634 |
Intermediate-Term Bond | | | 948,649,043 | | | 880,568,327 |
Mortgage Backed Securities | | | 357,889,854 | | | 356,290,119 |
| | |
| THE TARGET PORTFOLIO TRUST | | 177 |
Transactions in options written during the year ended October 31, 2008, were as follows:
| | | | | | | |
Intermediate-Term Bond | | Number of Contracts/
Notional Amount (000) | | | Premium Received | |
Options outstanding at October 31, 2007 | | 8,500 | | | $ | 77,970 | |
Options written | | 694,500 | | | | 656,975 | |
Options expired | | (400 | ) | | | (2,237 | ) |
Options closed | | (696,100 | ) | | | (551,588 | ) |
| | | | | | | |
Options outstanding at October 31, 2008 | | 6,500 | | | $ | 181,120 | |
| | | | | | | |
| | |
International Bond | | Number of Contracts/
Notional Amount (000) | | | Premium Received | |
Options outstanding at October 31, 2007 | | 18,900 | | | $ | 261,954 | |
Options written | | 24,650 | | | | 379,100 | |
Options expired | | (10,880 | ) | | | (51,928 | ) |
Options closed | | (19,770 | ) | | | (242,749 | ) |
| | | | | | | |
Options outstanding at October 31, 2008 | | 12,900 | | | $ | 346,377 | |
| | | | | | | |
| | |
Total Return Bond | | Number of Contracts/
Notional Amount (000) | | | Premium Received | |
Options outstanding at October 31, 2007 | | 65,200 | | | $ | 1,073,658 | |
Options written | | 109,430 | | | | 2,005,620 | |
Options expired | | (11,500 | ) | | | (153,396 | ) |
Options closed | | (80,230 | ) | | | (1,782,371 | ) |
| | | | | | | |
Options outstanding at October 31, 2008 | | 82,900 | | | $ | 1,143,511 | |
| | | | | | | |
Note 5. Distributions and Tax Information
Distributions to shareholders, which are determined in accordance with federal income tax regulations, which may differ from generally accepted accounting principles, are recorded on the ex-dividend date. In order to present undistributed net investment income or loss and accumulated net realized gains or losses on the Statement of Assets and Liabilities that more closely represent their tax character, certain adjustments have been made to paid-in-capital in excess of par, undistributed net investment income or loss and accumulated net realized gain or loss on investments.
For the fiscal period ended October 31, 2008 the adjustments were as follows:
| | | | | | | | | | | | |
| | | Undistributed
Net Investment
Income or Loss | | | Accumulated
Net Gain
or Loss | | | Paid-In
Capital In
Excess of Par | |
Large Capitalization Growth(a),(g),(h) | | $ | (20,726 | ) | | $ | 20,726 | | | $ | — | |
Large Capitalization Value(g),(h) | | | (109,993 | ) | | | 109,993 | | | | — | |
Small Capitalization Value(g),(h) | | | (251,316 | ) | | | 251,316 | | | | — | |
International Equity(a),(h) | | | (1,407,012 | ) | | | 1,407,012 | | | | — | |
International Bond(a),(c),(f) | | | 2,356,524 | | | | (2,356,524 | ) | | | — | |
Total Return Bond(a),(c),(d),(f) | | | 3,099,912 | | | | (3,099,912 | ) | | | — | |
Intermediate-Term Bond(a),(c),(d),(f) | | | 1,486,663 | | | | (1,486,663 | ) | | | — | |
Mortgage Backed Securities(c),(e),(f) | | | 190,279 | | | | 194,092 | | | | (384,371 | ) |
U.S. Government Money Market(h) | | | 11,797 | | | | (11,797 | ) | | | — | |
| (a) | Reclassification of net foreign currency gain (loss). |
| | |
| 178 | | THE TARGET PORTFOLIO TRUST |
| (b) | Reclassification of net operating loss. |
| (c) | Reclassification of swap income. |
| (d) | Reclassification of income from defaulted securities. |
| (e) | Reclassification of CLCF expiration |
| (f) | Reclassification of paydowns. |
| (g) | Reclassification of REIT adjustments |
| (h) | Redesignation of distributions |
Net investment income or loss, net realized gains or losses and net assets were not affected by these adjustments.
For the fiscal period ended October 31, 2008, the tax character of dividends paid as reflected in the Statement of Changes in Net Assets were as follows:
| | | | | | | | | |
| | | Ordinary
Income | | Long-Term
Capital Gains | | Total
Distributions |
Large Capitalization Growth | | $ | 2,843,653 | | $ | 17,103,313 | | $ | 19,946,966 |
Large Capitalization Value | | | 14,687,549 | | | 21,256,591 | | | 35,944,140 |
Small Capitalization Value | | | 13,091,103 | | | 15,731,200 | | | 28,822,303 |
International Equity | | | 18,093,678 | | | 23,511,024 | | | 41,604,702 |
Total Return Bond | | | 11,763,629 | | | — | | | 11,763,629 |
Intermediate-Term Bond | | | 10,823,628 | | | — | | | 10,823,628 |
Mortgage Backed Securities | | | 4,312,137 | | | — | | | 4,312,137 |
U.S. Government Money Market | | | 2,209,909 | | | — | | | 2,209,909 |
For the fiscal period ended October 31, 2007, the tax character of dividends paid as reflected in the Statement of Changes in Net Assets were as follows:
| | | | | | | | | | | | |
| | | Ordinary
Income | | Long-Term
Capital Gains | | Return of
Capital | | Total
Distributions |
Large Capitalization Growth | | $ | 17,019 | | $ | 2,704,762 | | | — | | $ | 2,721,781 |
Large Capitalization Value | | | 1,201,237 | | | 3,396,384 | | | — | | | 4,597,621 |
Small Capitalization Value | | | 704,299 | | | 1,478,468 | | | — | | | 2,182,767 |
International Equity | | | 12,922 | | | 2,831,508 | | | — | | | 2,844,430 |
Total Return Bond | | | 6,782,344 | | | — | | | — | | | 6,782,344 |
Intermediate-Term Bond | | | 9,048,043 | | | — | | | — | | | 9,048,043 |
Mortgage Backed Securities | | | 2,967,417 | | | — | | $ | 225,427 | | | 3,192,844 |
U.S. Government Money Market | | | 2,522,242 | | | — | | | — | | | 2,522,242 |
For the year ended December 31, 2006, the tax character of dividends and distributions paid as reflected in the Statement of Changes in Net Assets were as follows:
| | | | | | | | | |
| | | Ordinary
Income | | Long-Term
Capital Gains | | Total
Distributions |
Large Capitalization Growth | | $ | 3,659,700 | | $ | 6,600,431 | | $ | 10,260,131 |
Large Capitalization Value | | | 16,962,108 | | | 35,539,123 | | | 52,501,231 |
Small Capitalization Value | | | 7,979,767 | | | 18,548,377 | | | 26,528,144 |
International Equity | | | 13,141,483 | | | 13,080,093 | | | 26,221,576 |
International Bond | | | 1,301,561 | | | 54,582 | | | 1,356,143 |
Total Return Bond | | | 6,983,171 | | | — | | | 6,983,171 |
Intermediate-Term Bond | | | 11,077,415 | | | — | | | 11,077,415 |
Mortgage Backed Securities | | | 3,765,517 | | | — | | | 3,765,517 |
U.S. Government Money Market | | | 2,026,702 | | | — | | | 2,026,702 |
| | |
| THE TARGET PORTFOLIO TRUST | | 179 |
For federal income tax purposes, dividends from net investment income and distributions from short-term capital gains are taxable as ordinary income. Long-term capital gain distributions are taxable as such.
As of October 31, 2008, the Portfolios had the following amounts of accumulated undistributed earnings on a tax basis:
| | | | | | |
| | | Undistributed
Ordinary
Income | | Undistributed
Long-Term
Capital Gains |
Large Capitalization Growth | | $ | 1,794,545 | | $ | — |
Large Capitalization Value | | | 5,714,958 | | | — |
Small Capitalization Growth | | | 92,701 | | | — |
Small Capitalization Value | | | 4,936,078 | | | 2,269,207 |
International Equity | | | 6,996,323 | | | — |
International Bond | | | 2,983,144 | | | — |
Total Return Bond | | | 18,929,334 | | | 201,919 |
Intermediate-Term Bond | | | 5,267,707 | | | 7,318,413 |
Mortgage Backed Securities | | | 240,052 | | | — |
U.S. Government Money Market | | | 57,164 | | | — |
This differs from the amounts shown on the Statement of Assets and Liabilities primarily due to cumulative timing differences between financial and tax reporting.
For federal income tax purposes, certain Portfolios had capital loss carryforwards as of October 31, 2008 of:
| | | | | | | | | | | | | | | | | | | | | | | | | | |
| | | Expiring October 31 |
| | | 2009 | | 2010 | | 2011 | | 2012 | | 2013 | | 2014 | | 2015 | | 2016 | | Total |
Large Capitalization Growth | | — | | | — | | | — | | | — | | | — | | | — | | | — | | $ | 31,755,259 | | $ | 31,755,259 |
Large Capitalization Value | | — | | | — | | | — | | | — | | | — | | | — | | | — | | | 18,709,126 | | | 18,709,126 |
Small Capitalization Growth | | — | | $ | 3,809,117 | | $ | 6,730,329 | | | — | | | — | | | — | | | — | | | 18,081,505 | | | 28,620,951 |
International Equity | | — | | | — | | | — | | | — | | | — | | | — | | | — | | | 2,993,331 | | | 2,993,331 |
International Bond | | — | | | — | | | — | | | — | | | — | | | — | | $ | 132,314 | | | — | | | 132,314 |
Mortgage Backed Securities | | — | | | — | | | 969,438 | | $ | 255,003 | | $ | 65,043 | | $ | 1,665,133 | | | 899,733 | | | 531,379 | | | 4,385,729 |
Accordingly, no capital gain distributions are expected to be paid to shareholders until future net gains have been realized in excess of such carryforwards.
Prior year capital loss carryforwards were used to offset net taxable capital gains realized in the fiscal period ended October 31, 2008 as follows:
| | | |
International Bond | | $ | 606,202 |
Total Return Bond | | | 292,883 |
Intermediate Term Bond | | | 4,477,128 |
U.S. Government Money Market | | | 400 |
| | |
| 180 | | THE TARGET PORTFOLIO TRUST |
The federal income tax basis of the Portfolio’s investments and the net unrealized appreciation (depreciation) as of October 31, 2008 was as follows:
| | | | | | | | | | | | | | | | | | | | | | |
| | | Tax Basis | | Unrealized
Appreciation | | Unrealized
Depreciation | | | Net
Unrealized
Apprec/
(Deprec) | | | Other
Unrealized
Apprec/
(Deprec) | | | Total Net
Unrealized
Apprec/
(Deprec) | |
Large Capitalization Growth | | $ | 237,604,960 | | $ | 10,719,747 | | $ | (35,837,891 | ) | | $ | (25,118,144 | ) | | $ | (5,407 | ) | | $ | (25,123,551 | ) |
Large Capitalization Value | | | 301,834,823 | | | 12,281,150 | | | (87,548,785 | ) | | | (75,267,635 | ) | | | (11,241 | ) | | | (75,278,876 | ) |
Small Capitalization Growth | | | 131,402,296 | | | 1,442,126 | | | (29,050,880 | ) | | | (27,608,754 | ) | | | (10,912 | ) | | | (27,619,666 | ) |
Small Capitalization Value | | | 583,590,345 | | | 24,266,004 | | | (118,134,623 | ) | | | (93,868,619 | ) | | | (10,126 | ) | | | (93,878,745 | ) |
International Equity | | | 220,027,518 | | | 8,800,242 | | | (74,295,285 | ) | | | (65,495,043 | ) | | | (43,097 | ) | | | (65,538,140 | ) |
International Bond | | | 54,070,142 | | | 1,535,303 | | | (3,349,255 | ) | | | (1,813,952 | ) | | | 777,323 | | | | (1,036,629 | ) |
Total Return Bond | | | 422,876,774 | | | 946,097 | | | (37,592,522 | ) | | | (36,646,425 | ) | | | 87,385 | | | | (36,559,040 | ) |
Intermediate-Term Bond | | | 251,351,143 | | | 374,394 | | | (16,540,319 | ) | | | (16,165,925 | ) | | | 2,305,337 | | | | (13,860,588 | ) |
Mortgage Backed Securities | | | 105,481,888 | | | 840,918 | | | (4,637,077 | ) | | | (3,796,159 | ) | | | 324,645 | | | | (3,471,514 | ) |
The difference between book basis and tax basis are primarily attributable to deferred losses on wash sales, tax adjustments due to investments in real estate investment trusts and other book to tax differences. The other cost basis adjustments are primarily attributable to appreciation (depreciation) on written options, futures, swaps, short sales, forward currency contracts and mark to market of receivables and payables.
Management has analyzed the Funds’ tax positions taken on federal income tax returns for all open tax years and has concluded that as of October 31, 2008, no provisions for income tax would be required in the Funds’ financial statements. The Funds’ federal and state income and federal excise tax returns for tax years for which the applicable statuses of limitations have not expired are subject to examination by the Internal Revenue Service and state departments of revenue.
Note 6. Capital
The Trust has authorized an unlimited number of shares of beneficial interest at $.001 par value per share. Transactions in shares of beneficial interest were as follows:
| | | | | | | | | | | | | | |
| | | Class R* | | | Class T | |
| | | Shares | | | Amount | | | Shares | | | Amount | |
| Large Capitalization Growth | | | | | | | | | | | | | | |
Year Ended October 31, 2008: | | | | | | | | | | | | | | |
Sold | | 4,174,936 | | | $ | 57,482,189 | | | 834,274 | | | $ | 10,629,313 | |
Reinvested | | 130,694 | | | | 2,046,671 | | | 1,137,484 | | | | 17,869,875 | |
Redeemed | | (1,355,025 | ) | | | (17,724,892 | ) | | (5,081,907 | ) | | | (69,296,035 | ) |
| | | | | | | | | | | | | | |
Net Increase (Decrease) | | 2,950,605 | | | $ | 41,803,968 | | | (3,110,149 | ) | | $ | (40,796,847 | ) |
| | | | | | | | | | | | | | |
Ten Months Ended October 31, 2007 | | | | | | | | | | | | | | |
Sold | | 1,936,247 | | | $ | 31,128,370 | | | 760,946 | | | $ | 12,119,773 | |
Reinvested | | 6,279 | | | | 100,339 | | | 163,483 | | | | 2,619,004 | |
Redeemed | | (255,760 | ) | | | (4,158,285 | ) | | (2,722,116 | ) | | | (43,743,919 | ) |
| | | | | | | | | | | | | | |
Net Increase (Decrease) | | 1,686,766 | | | $ | 27,070,424 | | | (1,797,687 | ) | | $ | (29,005,142 | ) |
| | | | | | | | | | | | | | |
| | |
| THE TARGET PORTFOLIO TRUST | | 181 |
| | | | | | | | | | | | | | |
| | | Class R* | | | Class T | |
| | | Shares | | | Amount | | | Shares | | | Amount | |
Period Ended December 31, 2006: | | | | | | | | | | | | | | |
Sold | | 148,623 | | | $ | 2,275,424 | | | 1,536,968 | | | $ | 22,733,562 | |
Reinvested | | 1,582 | | | | 24,269 | | | 679,204 | | | | 10,216,657 | |
Redeemed | | (5,492 | ) | | | (82,668 | ) | | (3,621,818 | ) | | | (53,803,085 | ) |
| | | | | | | | | | | | | | |
Net Increase (Decrease) | | 144,713 | | | $ | 2,217,025 | | | (1,405,646 | ) | | $ | (20,852,866 | ) |
| | | | | | | | | | | | | | |
| Large Capitalization Value | | | | | | | | | | | | | | |
Year Ended October 31, 2008: | | | | | | | | | | | | | | |
Sold | | 4,691,921 | | | $ | 58,193,466 | | | 1,488,277 | | | $ | 18,268,860 | |
Reinvested | | 216,837 | | | | 3,031,385 | | | 2,230,945 | | | | 31,188,618 | |
Redeemed | | (1,490,199 | ) | | | (17,215,469 | ) | | (7,513,671 | ) | | | (91,548,239 | ) |
| | | | | | | | | | | | | | |
Net Increase (Decrease) | | 3,418,559 | | | $ | 44,009,382 | | | (3,794,449 | ) | | $ | (42,090,761 | ) |
| | | | | | | | | | | | | | |
Ten Months Ended October 31, 2007 | | | | | | | | | | | | | | |
Sold | | 1,976,397 | | | $ | 31,948,577 | | | 1,218,304 | | | $ | 19,688,178 | |
Reinvested | | 7,861 | | | | 131,510 | | | 257,650 | | | | 4,318,217 | |
Redeemed | | (218,652 | ) | | | (3,530,088 | ) | | (3,805,296 | ) | | | (61,699,130 | ) |
| | | | | | | | | | | | | | |
Net Increase (Decrease) | | 1,765,606 | | | $ | 28,549,999 | | | (2,329,342 | ) | | $ | (37,692,735 | ) |
| | | | | | | | | | | | | | |
Period Ended December 31, 2006: | | | | | | | | | | | | | | |
Sold | | 140,128 | | | $ | 2,221,351 | | | 2,045,864 | | | $ | 31,639,086 | |
Reinvested | | 4,659 | | | | 72,026 | | | 3,416,262 | | | | 50,980,024 | |
Redeemed | | (4,128 | ) | | | (64,682 | ) | | (4,246,426 | ) | | | (65,665,413 | ) |
| | | | | | | | | | | | | | |
Net Increase (Decrease) | | 140,659 | | | $ | 2,228,695 | | | 1,215,700 | | | $ | 16,953,697 | |
| | | | | | | | | | | | | | |
| Small Capitalization Growth | | | | | | | | | | | | | | |
Year Ended October 31, 2008 | | | | | | | | | | | | | | |
Sold | | 2,361,701 | | | $ | 24,783,256 | | | 646,754 | | | $ | 6,671,952 | |
Reinvested | | — | | | | — | | | — | | | | — | |
Redeemed | | (710,100 | ) | | | (6,980,383 | ) | | (2,578,273 | ) | | | (27,005,550 | ) |
| | | | | | | | | | | | | | |
Net Increase (Decrease) | | 1,651,601 | | | $ | 17,802,873 | | | (1,931,519 | ) | | $ | (20,333,598 | ) |
| | | | | | | | | | | | | | |
Ten Months Ended October 31, 2007 | | | | | | | | | | | | | | |
Sold | | 1,002,654 | | | $ | 12,927,092 | | | 493,272 | | | $ | 6,297,962 | |
Reinvested | | — | | | | — | | | — | | | | — | |
Redeemed | | (134,481 | ) | | | (1,748,523 | ) | | (1,766,269 | ) | | | (22,677,385 | ) |
| | | | | | | | | | | | | | |
Net Increase (Decrease) | | 868,173 | | | $ | 11,178,569 | | | (1,272,997 | ) | | $ | (16,379,423 | ) |
| | | | | | | | | | | | | | |
Period Ended December 31, 2006: | | | | | | | | | | | | | | |
Sold | | 75,962 | | | $ | 912,750 | | | 764,833 | | | $ | 8,980,757 | |
Reinvested | | — | | | | — | | | — | | | | — | |
Redeemed | | (1,857 | ) | | | (22,490 | ) | | (2,245,123 | ) | | | (26,457,311 | ) |
| | | | | | | | | | | | | | |
Net Increase (Decrease) | | 74,105 | | | $ | 890,260 | | | (1,480,290 | ) | | $ | (17,476,554 | ) |
| | | | | | | | | | | | | | |
| Small Capitalization Value | | | | | | | | | | | | | | |
Year Ended October 31, 2008 | | | | | | | | | | | | | | |
Sold | | 1,444,029 | | | $ | 26,235,024 | | | 12,894,581 | | | $ | 228,285,625 | |
Reinvested | | 62,362 | | | | 1,159,928 | | | 1,449,099 | | | | 27,025,686 | |
Redeemed | | (589,766 | ) | | | (10,315,042 | ) | | (6,735,394 | ) | | | (120,122,049 | ) |
| | | | | | | | | | | | | | |
Net Increase (Decrease) | | 916,625 | | | $ | 17,079,910 | | | 7,608,286 | | | $ | 135,189,262 | |
| | | | | | | | | | | | | | |
| | |
| 182 | | THE TARGET PORTFOLIO TRUST |
| | | | | | | | | | | | | | |
| | | Class R* | | | Class T | |
| | | Shares | | | Amount | | | Shares | | | Amount | |
Ten Months Ended October 31, 2007 | | | | | | | | | | | | | | |
Sold | | 720,757 | | | $ | 15,410,198 | | | 6,056,104 | | | $ | 125,885,603 | |
Reinvested | | 1,389 | | | | 29,937 | | | 97,463 | | | | 2,106,181 | |
Redeemed | | (83,923 | ) | | | (1,794,034 | ) | | (3,102,154 | ) | | | (66,325,817 | ) |
| | | | | | | | | | | | | | |
Net Increase (Decrease) | | 638,223 | | | $ | 13,646,101 | | | 3,051,413 | | | $ | 61,665,967 | |
| | | | | | | | | | | | | | |
Period Ended December 31, 2006: | | | | | | | | | | | | | | |
Sold | | 53,243 | | | $ | 1,106,981 | | | 3,381,311 | | | $ | 69,453,070 | |
Reinvested | | 1,176 | | | | 24,004 | | | 1,279,367 | | | | 26,025,118 | |
Redeemed | | (2,575 | ) | | | (53,057 | ) | | (2,645,214 | ) | | | (53,787,615 | ) |
| | | | | | | | | | | | | | |
Net Increase (Decrease) | | 51,844 | | | $ | 1,077,928 | | | 2,015,464 | | | $ | 41,690,573 | |
| | | | | | | | | | | | | | |
| International Equity | | | | | | | | | | | | | | |
Year Ended October 31, 2008 | | | | | | | | | | | | | | |
Sold | | 3,397,842 | | | $ | 47,390,921 | | | 1,158,108 | | | $ | 14,359,348 | |
Reinvested | | 237,394 | | | | 3,860,041 | | | 2,315,199 | | | | 37,668,289 | |
Redeemed | | (1,024,230 | ) | | | (13,321,156 | ) | | (4,499,788 | ) | | | (62,080,925 | ) |
| | | | | | | | | | | | | | |
Net Increase (Decrease) | | 2,611,006 | | | $ | 37,929,806 | | | (1,026,481 | ) | | $ | (10,053,288 | ) |
| | | | | | | | | | | | | | |
Ten Months Ended October 31, 2007 | | | | | | | | | | | | | | |
Sold | | 1,431,768 | | | $ | 25,704,541 | | | 574,281 | | | $ | 10,135,389 | |
Reinvested | | 5,384 | | | | 95,558 | | | 154,283 | | | | 2,744,688 | |
Redeemed | | (205,842 | ) | | | (3,742,756 | ) | | (2,517,161 | ) | | | (44,875,833 | ) |
| | | | | | | | | | | | | | |
Net Increase (Decrease) | | 1,231,310 | | | $ | 22,057,343 | | | (1,788,597 | ) | | $ | (31,995,756 | ) |
| | | | | | | | | | | | | | |
Period Ended December 31, 2006: | | | | | | | | | | | | | | |
Sold | | 107,241 | | | $ | 1,751,259 | | | 1,056,436 | | | $ | 16,421,116 | |
Reinvested | | 4,476 | | | | 69,649 | | | 1,676,182 | | | | 26,102,278 | |
Redeemed | | (5,073 | ) | | | (80,505 | ) | | (2,851,896 | ) | | | (44,533,853 | ) |
| | | | | | | | | | | | | | |
Net Increase (Decrease) | | 106,644 | | | $ | 1,740,403 | | | (119,278 | ) | | $ | (2,010,459 | ) |
| | | | | | | | | | | | | | |
| International Bond | | | | | | | | | | | | | | |
Year Ended October 31, 2008: | | | | | | | | | | | | | | |
Sold | | — | | | $ | — | | | 247,183 | | | $ | 2,097,222 | |
Reinvested | | — | | | | — | | | — | | | | — | |
Redeemed | | — | | | | — | | | (1,321,925 | ) | | | (11,195,986 | ) |
| | | | | | | | | | | | | | |
Net Increase (Decrease) | | — | | | $ | — | | | (1,074,742 | ) | | $ | (9,098,764 | ) |
| | | | | | | | | | | | | | |
Ten Months Ended October 31, 2007 | | | | | | | | | | | | | | |
Sold | | — | | | $ | — | | | 610,055 | | | $ | 5,021,348 | |
Reinvested | | — | | | | — | | | — | | | | — | |
Redeemed | | — | | | | — | | | (905,211 | ) | | | (7,464,640 | ) |
| | | | | | | | | | | | | | |
Net Increase (Decrease) | | — | | | $ | — | | | (295,156 | ) | | $ | (2,443,292 | ) |
| | | | | | | | | | | | | | |
Year Ended December 31, 2006: | | | | | | | | | | | | | | |
Sold | | — | | | $ | — | | | 763,221 | | | $ | 6,238,031 | |
Reinvested | | — | | | | — | | | 171,149 | | | | 1,352,078 | |
Redeemed | | — | | | | — | | | (1,106,726 | ) | | | (9,043,897 | ) |
| | | | | | | | | | | | | | |
Net Increase (Decrease) | | — | | | $ | — | | | (172,356 | ) | | $ | (1,453,788 | ) |
| | | | | | | | | | | | | | |
| | |
| THE TARGET PORTFOLIO TRUST | | 183 |
| | | | | | | | | | | | | | |
| | | Class R* | | | Class T | |
| | | Shares | | | Amount | | | Shares | | | Amount | |
| Total Return Bond | | | | | | | | | | | | | | |
Year Ended October 31, 2008: | | | | | | | | | | | | | | |
Sold | | 4,964,690 | | | $ | 53,274,308 | | | 6,160,070 | | | $ | 66,865,625 | |
Reinvested | | 171,830 | | | | 1,830,430 | | | 920,683 | | | | 9,909,999 | |
Redeemed | | (1,988,187 | ) | | | (21,055,023 | ) | | (4,724,068 | ) | | | (49,929,934 | ) |
| | | | | | | | | | | | | | |
Net Increase (Decrease) | | 3,148,333 | | | $ | 34,049,715 | | | 2,356,685 | | | $ | 26,845,690 | |
| | | | | | | | | | | | | | |
Ten Months Ended October 31, 2007 | | | | | | | | | | | | | | |
Sold | | 2,343,516 | | | $ | 24,169,022 | | | 3,273,665 | | | $ | 33,912,911 | |
Reinvested | | 28,530 | | | | 295,200 | | | 585,973 | | | | 6,082,603 | |
Redeemed | | (271,239 | ) | | | (2,803,157 | ) | | (2,685,625 | ) | | | (27,764,234 | ) |
| | | | | | | | | | | | | | |
Net Increase (Decrease) | | 2,100,807 | | | $ | 21,661,065 | | | 1,174,013 | | | $ | 12,231,280 | |
| | | | | | | | | | | | | | |
Period Ended December 31, 2006: | | | | | | | | | | | | | | |
Sold | | 153,639 | | | $ | 1,595,095 | | | 3,166,599 | | | $ | 32,628,443 | |
Reinvested | | 394 | | | | 4,078 | | | 674,025 | | | | 6,952,147 | |
Redeemed | | (8,313 | ) | | | (86,645 | ) | | (3,285,696 | ) | | | (33,843,662 | ) |
| | | | | | | | | | | | | | |
Net Increase (Decrease) | | 145,720 | | | $ | 1,512,528 | | | 554,928 | | | $ | 5,736,928 | |
| | | | | | | | | | | | | | |
| Intermediate-Term Bond | | | | | | | | | | | | | | |
Year Ended October 31, 2008: | | | | | | | | | | | | | | |
Sold | | — | | | $ | — | | | 2,182,053 | | | $ | 22,926,973 | |
Reinvested | | — | | | | — | | | 1,031,563 | | | | 10,817,173 | |
Redeemed | | — | | | | — | | | (6,075,512 | ) | | | (63,821,113 | ) |
| | | | | | | | | | | | | | |
Net Increase (Decrease) | | — | | | $ | — | | | (2,861,896 | ) | | $ | (30,076,967 | ) |
| | | | | | | | | | | | | | |
Ten Months Ended October 31, 2007 | | | | | | | | | | | | | | |
Sold | | — | | | $ | — | | | 2,586,605 | | | $ | 26,040,464 | |
Reinvested | | — | | | | — | | | 857,943 | | | | 8,698,808 | |
Redeemed | | — | | | | — | | | (4,888,406 | ) | | | (49,463,890 | ) |
| | | | | | | | | | | | | | |
Net Increase (Decrease) | | — | | | $ | — | | | (1,443,858 | ) | | $ | (14,724,618 | ) |
| | | | | | | | | | | | | | |
Year Ended December 31, 2006: | | | | | | | | | | | | | | |
Sold | | — | | | $ | — | | | 9,121,062 | | | $ | 92,017,701 | |
Reinvested | | — | | | | — | | | 1,092,531 | | | | 11,032,073 | |
Redeemed | | — | | | | — | | | (11,754,425 | ) | | | (118,666,524 | ) |
| | | | | | | | | | | | | | |
Net Increase (Decrease) | | — | | | $ | — | | | (1,540,832 | ) | | $ | (15,616,750 | ) |
| | | | | | | | | | | | | | |
| Mortgage Backed Securities | | | | | | | | | | | | | | |
Year Ended October 31, 2008: | | | | | | | | | | | | | | |
Sold | | — | | | $ | — | | | 204,617 | | | $ | 2,057,259 | |
Reinvested | | — | | | | — | | | 442,622 | | | | 4,354,324 | |
Redeemed | | — | | | | — | | | (2,494,584 | ) | | | (24,443,690 | ) |
| | | | | | | | | | | | | | |
Net Increase (Decrease) | | — | | | $ | — | | | (1,847,345 | ) | | $ | (18,032,107 | ) |
| | | | | | | | | | | | | | |
Ten Months Ended October 31, 2007 | | | | | | | | | | | | | | |
Sold | | — | | | $ | — | | | 777,432 | | | $ | 7,731,632 | |
Reinvested | | — | | | | — | | | 309,345 | | | | 3,073,764 | |
Redeemed | | — | | | | — | | | (1,249,976 | ) | | | (12,382,142 | ) |
| | | | | | | | | | | | | | |
Net Increase (Decrease) | | — | | | $ | — | | | (163,199 | ) | | $ | (1,576,746 | ) |
| | | | | | | | | | | | | | |
| | |
| 184 | | THE TARGET PORTFOLIO TRUST |
| | | | | | | | | | | | |
| | | CLASS R* | | CLASS T | |
| | | SHARES | | AMOUNT | | SHARES | | | AMOUNT | |
Year Ended December 31, 2006: | | | | | | | | | | | | |
Sold | | — | | $ | — | | 683,015 | | | $ | 6,808,481 | |
Reinvested | | — | | | — | | 377,117 | | | | 3,754,874 | |
Redeemed | | — | | | — | | (1,645,863 | ) | | | (16,389,625 | ) |
| | | | | | | | | | | | |
Net Increase (Decrease) | | — | | $ | — | | (585,731 | ) | | $ | (5,826,270 | ) |
| | | | | | | | | | | | |
| * | Commencement of Class R shares, August 22, 2006 |
Note 7. Borrowings
The Trust (excluding U.S. Government Money Market), along with other affiliated registered investment companies (the “Funds”), is a party to a Syndicated Credit Agreement (“SCA”) with two banks. The SCA provides for a commitment of $500 million. Interest on any borrowings under the SCA is incurred at contracted market rates and a commitment fee for the unused amount is accrued daily and paid quarterly. Effective October 24, 2008, the Funds renewed the SCA with the banks. The commitment under the renewed SCA continues to be $500 million. The Funds pay a commitment fee of .13 of 1% of the unused portion of the renewed SCA. The expiration date of the renewed SCA will be October 23, 2009. For the period from October 26, 2007 through October 23, 2008, the Funds paid a commitment fee of .06 of 1% of the unused portion of the agreement. The purpose of the SCA is to provide an alternative source of temporary funding for capital share redemptions.
The following Portfolio utilized the line of credit during the year ended October 31, 2008. The average balance outstanding is for the number of days that the Portfolio had an outstanding balance.
| | | | | | | | |
Portfolio | | Average Advances
Outstanding
During the Period | | Average
Interest
Rate | | | Number of Days
Advances Outstanding
During the Period |
International Equity | | $ | 596,889 | | 3.88 | % | | 18 |
Reverse Repurchase Agreements: Mortgage Backed Securities Portfolio enters into reverse repurchase agreements with qualified, third party broker-dealers as determined by and under the direction of the Trust’s Board of Trustees. Interest on the value of reverse repurchase agreements entered into and outstanding is based upon competitive market rates at the time of execution of the agreement. At the time the Portfolio enters into a reverse repurchase agreement, it establishes and maintains a segregated account with the lender containing liquid investment grade securities having a value not less than the repurchase price, including accrued interest, of the reverse repurchase agreement.
The average daily balance of reverse repurchase agreements outstanding during the year ended October 31, 2008 in the Mortgage Backed Securities Portfolio was approximately $25,846,505 at a weighted average interest rate of approximately 3.09%. The average daily balance is for the number of days the Portfolio had an outstanding balance. The maximum amount of total reverse repurchase agreements outstanding at any month-end during the period was approximately $31,687,000 as of July 31, 2008 which was 54% of total assets.
| | |
| THE TARGET PORTFOLIO TRUST | | 185 |
Note 8. New Accounting Pronouncements
On September 20, 2006, the Financial Accounting Standards Board (“FASB”) released Statement of Financial Accounting Standards No. 157, “Fair Value Measurements” (“FAS 157”). FAS 157 establishes an authoritative definition of fair value, sets out a framework for measuring fair value, and requires additional disclosures about fair-value measurements. The application of FAS 157 is required for fiscal years beginning after November 15, 2007 and interim periods within those fiscal years. At this time, management is evaluating the implications of FAS 157 and its impact, if any, in the financial statements has not yet been determined.
In March 2008, the FASB released Statement of Financial Accounting Standards No. 161, Disclosures about Derivative Instruments and Hedging Activities (“FAS 161”). FAS 161 requires qualitative disclosures about objectives and strategies for using derivatives, quantitative disclosures about fair value amounts of and gains and losses on derivative instruments, and disclosures about credit-risk-related contigent features in derivative agreements. The application of FAS 161 is required for any reporting period beginning after November 15, 2008. At this time, management is evaluating the implications of FAS 161 and its impact on the financial statements has not yet been determined.
On September 12, 2008, the FASB issued FASB Staff Position (“FSP”) No. FAS 133-1 and FASB Interpretation Number (“FIN”) 45-4 (“FSP 133-1”), Disclosures about Credit Derivatives and Certain Guarantees: An Amendment of FASB Statement No. 133 and FASB Interpretation No. 45; and Clarification of the Effective Date of FASB Statement No. 161. The FSP is intended to improve disclosures about credit derivatives by requiring more information about the potential adverse effects of changes in credit risk on the financial position, financial performance, and cash flows of the sellers of credit derivatives. It amends FASB Statement No. 133, Accounting for Derivative Instruments and Hedging Activities, to require disclosures by sellers of credit derivatives, including credit derivatives embedded in hybrid instruments. The FSP also amends FIN 45, Guarantor’s Accounting and Disclosure Requirements for Guarantees, Including Indirect Guarantees of Indebtedness to Others, to require an additional disclosure about the current status of the payment/ performance risk of a guarantee. FSP 133-1 and FIN 45-4 is effective for reporting periods (annual or interim) ending after November 15, 2008. Management of the Fund is currently assessing the impact of adopting FSP No. FAS 133-1 and FIN 45-4.
Note 9. Other
On October 6, 2008, the Board of Trustees approved the participation of the U.S. Government Money Market Portfolio in the U.S. Department of the Treasury’s Temporary Guarantee Program for Money Market Funds (the “Program”) through December 18, 2008. On December 3, 2008, the Board of Trustees approved the Money Market Portfolio’s participation in the Program through April 30, 2009.
The Money Market Portfolio is responsible for payment of fees required to participate in the Program. Such fees are not subject to any waivers or expense limitation, if any, in effect for the Money Market Portfolio. The participation fee for the initial three-month term of the Program is 0.01% of the net asset value of the Money Market Portfolio as of September 19, 2008.
As a requirement of participation in the Program, the Money Market Portfolio has agreed to liquidate if its net asset value per share declines to below $0.995 (a “Guarantee Event”) if such Guarantee Event is not cured. The Program’s guarantee only applies to the lesser of the number of shares owned as of the close of business on September 19, 2008 and the number of shares owned when a Guarantee Event occurs.
| | |
| 186 | | THE TARGET PORTFOLIO TRUST |
Financial Highlights
| | | | | | | | | |
| | | LARGE CAPITALIZATION
GROWTH PORTFOLIO | |
| | | Class R | |
| | | Year
Ended
October 31,
2008(f) | | | Ten Months
Ended
October 31,
2007(f)(g) | | | August 22,
2006(b)
through
December 31,
2006 | |
| | | |
| PER SHARE OPERATING PERFORMANCE: | | | | | | | | | |
Net asset value, beginning of period | | $17.46 | | | $15.31 | | | $14.32 | |
Income (loss) from investment operations | | | | | | | | | |
Net investment income (loss) | | .05 | | | (.02 | ) | | .03 | |
Net realized and unrealized gain (loss) on investments | | (6.43 | ) | | 2.31 | | | 1.30 | |
Total from investment operations | | (6.38 | ) | | 2.29 | | | 1.33 | |
Less dividends and distributions | | | | | | | | | |
Dividends from net investment income | | (.02 | ) | | — | | | (.05 | ) |
Distributions from net realized gains | | (.95 | ) | | (.14 | ) | | (.29 | ) |
Total dividends and distributions | | (.97 | ) | | (.14 | ) | | (.34 | ) |
Net asset value, end of period | | $10.11 | | | $17.46 | | | $15.31 | |
| | | |
| TOTAL RETURN(a) | | (38.48 | )% | | 14.95 | % | | 9.34 | % |
| | | |
| RATIOS/SUPPLEMENTAL DATA: | | | | | | | | | |
Net assets, end of period (000) | | $48,348 | | | $31,982 | | | $2,216 | |
Average net assets (000) | | $46,321 | | | $14,059 | | | $429 | |
Ratios to average net assets(h) | | | | | | | | | |
Expenses, including distribution and service (12b-1) fees(e) | | 1.24 | % | | 1.18 | %(c) | | 1.25 | %(c) |
Expenses, excluding distribution and service (12b-1) fees | | .74 | % | | .68 | %(c) | | .75 | %(c) |
Net investment income (loss) | | .35 | % | | (.14 | %)(c) | | .28 | %(c) |
Portfolio turnover rate | | 101 | % | | 81 | %(d) | | 69 | %(d) |
| (a) | Total return is calculated assuming a purchase of a share on the first day and a sale on the last day of each period reported and includes reinvestment of dividends and distributions. Total returns may reflect adjustments to conform to generally accepted accounting principles. Total returns for periods less than one full year are not annualized. |
| (b) | Commencement of operations. |
| (e) | The distributor of the Trust has contractually agreed to limit its distribution and service (12b-1) fees to .50 of 1% of the average daily net assets of the Class R shares. |
| (f) | Calculated based upon average shares outstanding during the period. |
| (g) | For the ten month period ended October 31, 2007. The Trust changed its fiscal year end from December 31 to October 31, effective October 31, 2007. |
| (h) | Does not include expenses of the underlying fund in which the Portfolio invests. |
See Notes to Financial Statements.
| | |
| THE TARGET PORTFOLIO TRUST | | 187 |
Financial Highlights (continued)
| | | | | | | | | | | | | | | | | | |
| | | LARGE CAPITALIZATION
GROWTH PORTFOLIO | |
| | | Class T | |
| | | Year
Ended
October 31,
2008(f) | | | Ten Months
Ended
October 31,
2007(e)(f) | | | Year Ended December 31, | |
| | | | | 2006 | | | 2005 | | | 2004 | | | 2003 | |
| | | | | | |
| PER SHARE OPERATING PERFORMANCE: | | | | | | | | | | | | | | | | | | |
Net asset value, beginning of period | | $17.55 | | | $15.33 | | | $14.60 | | | $15.90 | | | $15.39 | | | $11.03 | |
Income (loss) from investment operations | | | | | | | | | | | | | | | | | | |
Net investment income (loss) | | .13 | | | .04 | | | .08 | | | .03 | | | .07 | | | (.01 | ) |
Net realized and unrealized gain (loss) on investments | | (6.47 | ) | | 2.32 | | | 1.18 | | | 1.06 | | | .51 | | | 4.37 | |
Total from investment operations | | (6.34 | ) | | 2.36 | | | 1.26 | | | 1.09 | | | .58 | | | 4.36 | |
Less dividends and distributions | | | | | | | | | | | | | | | | | | |
Dividends from net investment income | | (.07 | ) | | — | (d) | | (.09 | ) | | (.02 | ) | | (.07 | ) | | — | |
Distributions from net realized gains | | (.95 | ) | | (.14 | ) | | (.44 | ) | | (2.37 | ) | | — | | | — | |
Total dividends and distributions | | (1.02 | ) | | (.14 | ) | | (.53 | ) | | (2.39 | ) | | (.07 | ) | | — | |
Net asset value, end of period | | $10.19 | | | $17.55 | | | $15.33 | | | $14.60 | | | $15.90 | | | $15.39 | |
| | | | | | |
| TOTAL RETURN(a) | | (38.14 | )% | | 15.41 | % | | 8.67 | % | | 6.74 | % | | 3.78 | % | | 39.53 | % |
| | | | | |
| RATIOS/SUPPLEMENTAL DATA: | | | | | | | | | | | | | | | | |
Net assets, end of period (000) | | $150,428 | | | $313,718 | | | $301,566 | | | $307,835 | | | $343,760 | | | $348,385 | |
Average net assets (000) | | $237,628 | | | $303,340 | | | $299,597 | | | $310,710 | | | $345,413 | | | $290,985 | |
Ratios to average net assets(g) | | | | | | | | | | | | | | | | | | |
Expenses, including distribution and service (12b-1) fees | | .74 | % | | .68 | %(b) | | .75 | % | | .76 | % | | .77 | % | | .84 | % |
Expenses, excluding distribution and service (12b-1) fees | | .74 | % | | .68 | %(b) | | .75 | % | | .76 | % | | .77 | % | | .84 | % |
Net investment income (loss) | | .91 | % | | .29 | %(b) | | .51 | % | | .18 | % | | .45 | % | | (.09 | )% |
Portfolio turnover rate | | 101 | % | | 81 | %(c) | | 69 | % | | 246 | % | | 76 | % | | 49 | % |
| (a) | Total return is calculated assuming a purchase of a share on the first day and a sale on the last day of each period reported and includes reinvestment of dividends and distributions. Total returns may reflect adjustments to conform to generally accepted accounting principles. Total returns for periods less than one full year are not annualized. |
| (d) | Less than $0.005 per share. |
| (e) | Calculated based upon average shares outstanding during the period. |
| (f) | For the ten month period ended October 31, 2007. The Trust changed its fiscal year end from December 31 to October 31, effective October 31, 2007. |
| (g) | Does not include expenses of the underlying fund in which the Portfolio invests. |
See Notes to Financial Statements.
| | |
| 188 | | THE TARGET PORTFOLIO TRUST |
Financial Highlights (continued)
| | | | | | | | | |
| | | LARGE CAPITALIZATION
VALUE PORTFOLIO | |
| | | Class R | |
| | | Year Ended October 31, 2008(g) | | | Ten Months Ended October 31, 2007(g)(h) | | | August 22, 2006(b) through December 31, 2006(g) | |
| | | |
| PER SHARE OPERATING PERFORMANCE: | | | | | | | | | |
Net asset value, beginning of period | | $16.24 | | | $15.60 | | | $15.07 | |
Income (loss) from investment operations | | | | | | | | | |
Net investment income | | .23 | | | .15 | | | .08 | |
Net realized and unrealized gain (loss) on investments | | (6.31 | ) | | .67 | | | 1.48 | |
Total from investment operations | | (6.08 | ) | | .82 | | | 1.56 | |
Less dividends and distributions | | | | | | | | | |
Dividends from net investment income | | (.22 | ) | | — | (f) | | (.24 | ) |
Distributions from net realized gains | | (1.16 | ) | | (.18 | ) | | (.79 | ) |
Total dividends and distributions | | (1.38 | ) | | (.18 | ) | | (1.03 | ) |
Net asset value, end of period | | $8.78 | | | $16.24 | | | $15.60 | |
| | | |
| TOTAL RETURN(a) | | (40.60 | )% | | 5.24 | % | | 10.44 | % |
| | |
| RATIOS/SUPPLEMENTAL DATA: | | | | | | | |
Net assets, end of period (000) | | $46,778 | | | $30,958 | | | $2,194 | |
Average net assets (000) | | $46,282 | | | $14,046 | | | $445 | |
Ratios to average net assets(i) | | | | | | | | | |
Expenses, including distribution and service (12b-1) fees(e) | | 1.21 | % | | 1.19 | %(c) | | 1.22 | %(c) |
Expenses, excluding distribution and service (12b-1) fees | | .71 | % | | .69 | %(c) | | .72 | %(c) |
Net investment income | | 1.90 | % | | 1.13 | %(c) | | 1.69 | %(c) |
Portfolio turnover rate | | 77 | % | | 48 | %(d) | | 44 | %(d) |
| (a) | Total return is calculated assuming a purchase of a share on the first day and a sale on the last day of each period reported and includes reinvestment of dividends and distributions. Total returns may reflect adjustments to conform to generally accepted accounting principles. Total returns for periods less than one full year are not annualized. |
| (b) | Commencement of operations. |
| (e) | The distributor of the Trust has contractually agreed to limit its distribution and service (12b-1) fees to .50 of 1% of the average daily net assets of the Class R shares. |
| (f) | Less than $0.005 per share. |
| (g) | Calculated based upon average shares outstanding during the period. |
| (h) | For the ten month period ended October 31, 2007. The Trust changed its fiscal year end from December 31 to October 31, effective October 31, 2007. |
| (i) | Does not include expenses of the underlying fund in which the Portfolio invests. |
See Notes to Financial Statements.
| | |
| THE TARGET PORTFOLIO TRUST | | 189 |
Financial Highlights (continued)
| | | | | | | | | | | | | | | | | | |
| | | LARGE CAPITALIZATION
VALUE PORTFOLIO | |
| | | Class T | |
| | | Year
Ended
October 31,
2008(e) | | | Ten Months
Ended
October 31,
2007(e)(f) | | | Year Ended December 31, | |
| | | | | 2006(e) | | | 2005 | | | 2004 | | | 2003 | |
| | | | | | |
| PER SHARE OPERATING PERFORMANCE: | | | | | | | | | | | | | | | | | | |
Net asset value, beginning of period | | $16.31 | | | $15.60 | | | $15.11 | | | $16.59 | | | $14.13 | | | $10.49 | |
Income (loss) from investment operations | | | | | | | | | | | | | | | | | | |
Net investment income | | .30 | | | .22 | | | .28 | | | .25 | | | .21 | | | .17 | |
Net realized and unrealized gain (loss) on investments | | (6.33 | ) | | .67 | | | 2.45 | | | .80 | | | 2.45 | | | 3.64 | |
Total from investment operations | | (6.03 | ) | | .89 | | | 2.73 | | | 1.05 | | | 2.66 | | | 3.81 | |
Less dividends and distributions | | | | | | | | | | | | | | | | | | |
Dividends from net investment income | | (.30 | ) | | — | (d) | | (.29 | ) | | (.25 | ) | | (.20 | ) | | (.17 | ) |
Distributions from net realized gains | | (1.16 | ) | | (.18 | ) | | (1.95 | ) | | (2.28 | ) | | — | | | — | |
Total dividends and distributions | | (1.46 | ) | | (.18 | ) | | (2.24 | ) | | (2.53 | ) | | (.20 | ) | | (.17 | ) |
Net asset value, end of period | | $8.82 | | | $16.31 | | | $15.60 | | | $15.11 | | | $16.59 | | | $14.13 | |
| | | | | | |
| TOTAL RETURN(a) | | (40.29 | )% | | 5.70 | % | | 19.34 | % | | 6.50 | % | | 18.87 | % | | 36.38 | % |
| | | | | |
| RATIOS/SUPPLEMENTAL DATA: | | | | | | | | | | | | | | | | |
Net assets, end of period (000) | | $168,217 | | | $372,900 | | | $393,111 | | | $362,253 | | | $385,414 | | | $316,131 | |
Average net assets (000) | | $279,413 | | | $392,564 | | | $371,251 | | | $366,301 | | | $346,319 | | | $253,653 | |
Ratios to average net assets(g) | | | | | | | | | | | | | | | | | | |
Expenses, including distribution and service (12b-1) fees | | .71 | % | | .69 | %(b) | | .72 | % | | .74 | % | | .74 | % | | .80 | % |
Expenses, excluding distribution and service (12b-1) fees | | .71 | % | | .69 | %(b) | | .72 | % | | .74 | % | | .74 | % | | .80 | % |
Net investment income | | 2.40 | % | | 1.61 | %(b) | | 1.79 | % | | 1.48 | % | | 1.43 | % | | 1.50 | % |
Portfolio turnover rate | | 77 | % | | 48 | %(c) | | 44 | % | | 90 | % | | 47 | % | | 56 | % |
| (a) | Total return is calculated assuming a purchase of a share on the first day and a sale on the last day of each period reported and includes reinvestment of dividends and distributions. Total returns may reflect adjustments to conform to generally accepted accounting principles. Total returns for periods less than one full year are not annualized. |
| (d) | Less than $0.005 per share. |
| (e) | Calculated based upon average shares outstanding during the period. |
| (f) | For the ten month period ended October 31, 2007. The Trust changed its fiscal year end from December 31 to October 31, effective October 31, 2007. |
| (g) | Does not include expenses of the underlying fund in which the Portfolio invests. |
See Notes to Financial Statements.
| | |
| 190 | | THE TARGET PORTFOLIO TRUST |
Financial Highlights (continued)
| | | | | | | | | |
| | | SMALL CAPITALIZATION
GROWTH PORTFOLIO | |
| | | Class R | |
| | | Year Ended October 31, 2008 | | | Ten Months Ended October 31, 2007(g)(h) | | | August 22, 2006(b) through December 31, 2006 | |
| | | |
| PER SHARE OPERATING PERFORMANCE: | | | | | | | | | |
Net asset value, beginning of period | | $13.73 | | | $12.12 | | | $11.04 | |
Income (loss) from investment operations | | | | | | | | | |
Net investment loss | | (.03 | ) | | (.06 | ) | | — | (c) |
Net realized and unrealized gain (loss) on investments | | (6.53 | ) | | 1.67 | | | 1.08 | |
Total from investment operations | | (6.56 | ) | | 1.61 | | | 1.08 | |
Net asset value, end of period | | $7.17 | | | $13.73 | | | $12.12 | |
| | | |
| TOTAL RETURN(a) | | (47.78 | )% | | 13.28 | % | | 9.78 | % |
| | |
| RATIOS/SUPPLEMENTAL DATA: | | | | | | | |
Net assets, end of period (000) | | $18,607 | | | $12,942 | | | $898 | |
Average net assets (000) | | $18,762 | | | $5,725 | | | $186 | |
Ratios to average net assets(i) | | | | | | | | | |
Expenses, including distribution and service (12b-1) fees(f) | | 1.30 | % | | 1.28 | %(d) | | 1.34 | %(d) |
Expenses, excluding distribution and service (12b-1) fees | | .80 | % | | .78 | %(d) | | .84 | %(d) |
Net investment loss | | (.39 | )% | | (.56 | )%(d) | | (.05 | )%(d) |
Portfolio turnover rate | | 223 | % | | 87 | %(e) | | 96 | %(e) |
| (a) | Total return is calculated assuming a purchase of a share on the first day and a sale on the last day of each period reported and includes reinvestment of dividends and distributions. Total returns may reflect adjustments to conform to generally accepted accounting principles. Total returns for periods less than one full year are not annualized. |
| (b) | Commencement of operations. |
| (c) | Less than $0.005 per share. |
| (f) | The distributor of the Trust has contractually agreed to limit its distribution and service (12b-1) fees to .50 of 1% of the average daily net assets of the Class R shares. |
| (g) | Calculated based upon average shares outstanding during the period. |
| (h) | For the ten month period ended October 31, 2007. The Trust changed its fiscal year end from December 31 to October 31, effective October 31, 2007. |
| (i) | Does not include expenses of the underlying fund in which the Portfolio invests. |
See Notes to Financial Statements.
| | |
| THE TARGET PORTFOLIO TRUST | | 191 |
Financial Highlights (continued)
| | | | | | | | | | | | | | | | | | |
| | | SMALL CAPITALIZATION
GROWTH PORTFOLIO | |
| | | Class T | |
| | | Year
Ended
October 31,
2008 | | | Ten Months
Ended
October 31,
2007(d)(e) | | | Year Ended December 31, | |
| | | | | 2006 | | | 2005 | | | 2004 | | | 2003 | |
| | | | | | |
| PER SHARE OPERATING PERFORMANCE: | | | | | | | | | | | | | | | | | | |
Net asset value, beginning of period | | $13.82 | | | $12.14 | | | $11.28 | | | $10.79 | | | $9.38 | | | $7.05 | |
Income (loss) from investment operations | | | | | | | | | | | | | | | | | | |
Net investment income (loss) | | .02 | | | (.01 | ) | | (.05 | ) | | (.07 | ) | | (.06 | ) | | (.06 | ) |
Net realized and unrealized gain (loss) on investments | | (6.59 | ) | | 1.69 | | | .91 | | | .56 | | | 1.47 | | | 2.39 | |
Total from investment operations | | (6.57 | ) | | 1.68 | | | .86 | | | .49 | | | 1.41 | | | 2.33 | |
Net asset value, end of period | | $7.25 | | | $13.82 | | | $12.14 | | | $11.28 | | | $10.79 | | | $9.38 | |
| | | | | | |
| TOTAL RETURN(a) | | (47.54 | )% | | 13.84 | % | | 7.62 | % | | 4.54 | % | | 15.03 | % | | 33.05 | % |
| | | | | |
| RATIOS/SUPPLEMENTAL DATA: | | | | | | | | | | | | | | | | |
Net assets, end of period (000) | | $58,235 | | | $137,630 | | | $136,422 | | | $143,366 | | | $158,757 | | | $140,251 | |
Average net assets (000) | | $97,771 | | | $136,851 | | | $140,489 | | | $144,034 | | | $146,717 | | | $116,632 | |
Ratios to average net assets(f) | | | | | | | | | | | | | | | | | | |
Expenses, including distribution and service (12b-1) fees | | .80 | % | | .78 | %(b) | | .84 | % | | .91 | % | | .90 | % | | 1.03 | % |
Expenses, excluding distribution and service (12b-1) fees | | .80 | % | | .78 | %(b) | | .84 | % | | .91 | % | | .90 | % | | 1.03 | % |
Net investment income (loss) | | .17 | % | | (.07 | )%(b) | | (.39 | )% | | (.62 | )% | | (.58 | )% | | (.80 | )% |
Portfolio turnover rate | | 223 | % | | 87 | %(c) | | 96 | % | | 147 | % | | 107 | % | | 235 | % |
| (a) | Total return is calculated assuming a purchase of a share on the first day and a sale on the last day of each period reported and includes reinvestment of dividends and distributions. Total returns may reflect adjustments to conform to generally accepted accounting principles. Total returns for periods less than one full year are not annualized. |
| (d) | Calculated based upon average shares outstanding during the period. |
| (e) | For the ten month period ended October 31, 2007. The Trust changed its fiscal year end from December 31 to October 31, effective October 31, 2007. |
| (f) | Does not include expenses of the underlying fund in which the Portfolio invests. |
See Notes to Financial Statements.
| | |
| 192 | | THE TARGET PORTFOLIO TRUST |
Financial Highlights (continued)
| | | | | | | | | |
| | | SMALL CAPITALIZATION
VALUE PORTFOLIO | |
| | | Class R | |
| | | Year
Ended
October 31,
2008 | | | Ten Months
Ended
October 31,
2007(g)(h) | | | August 22,
2006(b)
through
December 31,
2006 | |
| | | |
| PER SHARE OPERATING PERFORMANCE: | | | | | | | | | |
Net asset value, beginning of period | | $21.90 | | | $20.46 | | | $20.05 | |
Income (loss) from investment operations | | | | | | | | | |
Net investment income | | .19 | | | .13 | | | .14 | |
Net realized and unrealized gain (loss) on investments | | (6.55 | ) | | 1.42 | | | 1.74 | |
Total from investment operations | | (6.36 | ) | | 1.55 | | | 1.88 | |
Less dividends and distributions | | | | | | | | | |
Dividends from net investment income | | (.23 | ) | | — | (f) | | (.18 | ) |
Distributions from net realized gains | | (1.21 | ) | | (.11 | ) | | (1.29 | ) |
Total dividends and distributions | | (1.44 | ) | | (.11 | ) | | (1.47 | ) |
Net asset value, end of period | | $14.10 | | | $21.90 | | | $20.46 | |
| | | |
| TOTAL RETURN(a) | | (30.57 | )% | | 7.55 | % | | 9.45 | % |
| | | |
| RATIOS/SUPPLEMENTAL DATA: | | | | | | | | | |
Net assets, end of period (000) | | $22,660 | | | $15,112 | | | $1,061 | |
Average net assets (000) | | $22,626 | | | $6,828 | | | $217 | |
Ratios to average net assets(i) | | | | | | | | | |
Expenses, including distribution and service (12b-1) fees(e) | | 1.30 | % | | 1.23 | %(c) | | 1.30 | %(c) |
Expenses, excluding distribution and service (12b-1) fees | | .80 | % | | .73 | %(c) | | .80 | %(c) |
Net investment income | | .89 | % | | .73 | %(c) | | 1.37 | %(c) |
Portfolio turnover rate | | 54 | % | | 32 | %(d) | | 36 | %(d) |
| (a) | Total return is calculated assuming a purchase of a share on the first day and a sale on the last day of each period reported and includes reinvestment of dividends and distributions. Total returns may reflect adjustments to conform to generally accepted accounting principles. Total returns for periods less than one full year are not annualized. |
| (b) | Commencement of operations. |
| (e) | The distributor of the Trust has contractually agreed to limit its distribution and service (12b-1) fees to .50 of 1% of the average daily net assets of the Class R shares. |
| (f) | Less than $0.005 per share. |
| (g) | Calculated based upon average shares outstanding during the period. |
| (h) | For the ten month period ended October 31, 2007. The Trust changed its fiscal year end from December 31 to October 31, effective October 31, 2007. |
| (i) | Does not include expenses of the underlying fund in which the Portfolio invests. |
See Notes to Financial Statements.
| | |
| THE TARGET PORTFOLIO TRUST | | 193 |
Financial Highlights (continued)
| | | | | | | | | | | | | | | | | | |
| | | SMALL CAPITALIZATION
VALUE PORTFOLIO | |
| | | Class T | |
| | | Year
Ended
October 31,
2008 | | | Ten Months
Ended
October 31,
2007(e)(f) | | | Year Ended December 31, | |
| | | | | 2006 | | | 2005 | | | 2004 | | | 2003 | |
| | | | | | |
| PER SHARE OPERATING PERFORMANCE: | | | | | | | | | | | | | | | | | | |
Net asset value, beginning of period | | $22.00 | | | $20.47 | | | $18.98 | | | $21.84 | | | $18.78 | | | $13.23 | |
Income (loss) from investment operations | | | | | | | | | | | | | | | | | | |
Net investment income | | .23 | | | .25 | | | .23 | | | .18 | | | .17 | | | .03 | |
Net realized and unrealized gain (loss) on investments | | (6.53 | ) | | 1.39 | | | 3.09 | | | 2.06 | | | 4.27 | | | 6.18 | |
Total from investment operations | | (6.30 | ) | | 1.64 | | | 3.32 | | | 2.24 | | | 4.44 | | | 6.21 | |
Less dividends and distributions | | | | | | | | | | | | | | | | | | |
Dividends from net investment income | | (.28 | ) | | — | (d) | | (.22 | ) | | (.16 | ) | | (.17 | ) | | (.03 | ) |
Distributions from net realized gains | | (1.21 | ) | | (.11 | ) | | (1.61 | ) | | (4.94 | ) | | (1.21 | ) | | (.63 | ) |
Total dividends and distributions | | (1.49 | ) | | (.11 | ) | | (1.83 | ) | | (5.10 | ) | | (1.38 | ) | | (.66 | ) |
Net asset value, end of period | | $14.21 | | | $22.00 | | | $20.47 | | | $18.98 | | | $21.84 | | | $18.78 | |
| | | | | | |
| TOTAL RETURN(a) | | (30.23 | )% | | 8.04 | % | | 17.72 | % | | 10.10 | % | | 24.02 | % | | 47.10 | % |
| | | | | |
| RATIOS/SUPPLEMENTAL DATA: | | | | | | | | | | | | | | | | |
Net assets, end of period (000) | | $374,101 | | | $411,690 | | | $320,728 | | | $259,115 | | | $245,576 | | | $205,989 | |
Average net assets (000) | | $414,364 | | | $403,020 | | | $290,505 | | | $249,661 | | | $218,487 | | | $161,025 | |
Ratios to average net assets(g) | | | | | | | | | | | | | | | | | | |
Expenses, including distribution and service (12b-1) fees | | .80 | % | | .73 | %(b) | | .80 | % | | .79 | % | | .82 | % | | .93 | % |
Expenses, excluding distribution and service (12b-1) fees | | .80 | % | | .73 | %(b) | | .80 | % | | .79 | % | | .82 | % | | .93 | % |
Net investment income | | 1.38 | % | | 1.38 | %(b) | | 1.17 | % | | .81 | % | | .86 | % | | .15 | % |
Portfolio turnover rate | | 54 | % | | 32 | %(c) | | 36 | % | | 118 | % | | 22 | % | | 89 | % |
| (a) | Total return is calculated assuming a purchase of a share on the first day and a sale on the last day of each period reported and includes reinvestment of dividends and distributions. Total returns may reflect adjustments to conform to generally accepted accounting principles. Total returns for periods less than one full year are not annualized. |
| (d) | Less than $0.005 per share. |
| (e) | Calculated based upon average shares outstanding during the period. |
| (f) | For the ten month period ended October 31, 2007. The Trust changed its fiscal year end from December 31 to October 31, effective October 31, 2007. |
| (g) | Does not include expenses of the underlying fund in which the Portfolio invests. |
See Notes to Financial Statements.
| | |
| 194 | | THE TARGET PORTFOLIO TRUST |
Financial Highlights (continued)
| | | | | | | | | |
| | | INTERNATIONAL
EQUITY PORTFOLIO | |
| | | Class R | |
| | | Year
Ended
October 31,
2008 | | | Ten Months
Ended
October 31,
2007(f)(g) | | | August 22,
2006(b)
through
December 31,
2006 | |
| | | |
| PER SHARE OPERATING PERFORMANCE: | | | | | | | | | |
Net asset value, beginning of period | | $20.04 | | | $16.21 | | | $16.09 | |
Income (loss) from investment operations | | | | | | | | | |
Net investment income | | .29 | | | .33 | | | .16 | |
Net realized and unrealized gain (loss) on investments | | (8.84 | ) | | 3.68 | | | 1.66 | |
Total from investment operations | | (8.55 | ) | | 4.01 | | | 1.82 | |
Less dividends and distributions | | | | | | | | | |
Dividends from net investment income | | (.31 | ) | | — | | | (.25 | ) |
Distributions from net realized gains | | (2.19 | ) | | (.18 | ) | | (1.45 | ) |
Total dividends and distributions | | (2.50 | ) | | (.18 | ) | | (1.70 | ) |
Net asset value, end of period | | $8.99 | | | $20.04 | | | $16.21 | |
| | | |
| TOTAL RETURN(a) | | (48.30 | )% | | 24.85 | % | | 11.74 | % |
| | | |
| RATIOS/SUPPLEMENTAL DATA: | | | | | | | | | |
Net assets, end of period (000) | | $35,482 | | | $26,811 | | | $1,728 | |
Average net assets (000) | | $36,790 | | | $11,612 | | | $346 | |
Ratios to average net assets(i) | | | | | | | | | |
Expenses, including distribution and service (12b-1) fees(e) | | 1.33 | % | | 1.33 | %(c) | | 1.43 | %(c) |
Expenses, excluding distribution and service (12b-1) fees | | .83 | % | | .83 | %(c) | | .93 | %(c) |
Net investment income | | 2.12 | % | | 2.20 | %(c) | | .39 | %(c) |
Portfolio turnover rate | | 30 | % | | 37 | %(d) | | 41 | %(d) |
| (a) | Total return is calculated assuming a purchase of a share on the first day and a sale on the last day of each period reported and includes reinvestment of dividends and distributions. Total returns may reflect adjustments to conform to generally accepted accounting principles. Total returns for periods less than one full year are not annualized. |
| (b) | Commencement of operations. |
| (e) | The distributor of the Trust has contractually agreed to limit its distribution and service (12b-1) fees to .50 of 1% of the average daily net assets of the Class R shares. |
| (f) | Calculated based upon average shares outstanding during the period. |
| (g) | For the ten month period ended October 31, 2007. The Trust changed its fiscal year end from December 31 to October 31, effective October 31, 2007. |
| (i) | Does not include expenses of the underlying fund in which the Portfolio invests. |
See Notes to Financial Statements.
| | |
| THE TARGET PORTFOLIO TRUST | | 195 |
Financial Highlights (continued)
| | | | | | | | | | | | | | | | | | |
| | | INTERNATIONAL
EQUITY PORTFOLIO | |
| | | Class T | |
| | | Year
Ended
October 31,
2008 | | | Ten Months
Ended
October 31,
2007(e)(f) | | | Year Ended December 31, | |
| | | | | 2006 | | | 2005 | | | 2004 | | | 2003 | |
| | | | | | |
| PER SHARE OPERATING PERFORMANCE: | | | | | | | | | | | | | | | | | | |
Net asset value, beginning of period | | $20.13 | | | $16.22 | | | $13.99 | | | $13.13 | | | $11.53 | | | $9.07 | |
Income (loss) from investment operations | | | | | | | | | | | | | | | | | | |
Net investment income | | .36 | | | .39 | | | .29 | | | .22 | | | .15 | | | .16 | |
Net realized and unrealized gain (loss) on investments | | (8.86 | ) | | 3.70 | | | 3.68 | | | 1.59 | | | 1.59 | | | 2.43 | |
Total from investment operations | | (8.50 | ) | | 4.09 | | | 3.97 | | | 1.81 | | | 1.74 | | | 2.59 | |
Less dividends and distributions | | | | | | | | | | | | | | | | | | |
Dividends from net investment income | | (.41 | ) | | — | | | (.29 | ) | | (.28 | ) | | (.14 | ) | | (.13 | ) |
Distributions from net realized gains | | (2.19 | ) | | (.18 | ) | | (1.45 | ) | | (.67 | ) | | — | | | — | |
Total dividends and distributions | | (2.60 | ) | | (.18 | ) | | (1.74 | ) | | (.95 | ) | | (.14 | ) | | (.13 | ) |
Net asset value, end of period | | $9.03 | | | $20.13 | | | $16.22 | | | $13.99 | | | $13.13 | | | $11.53 | |
| | | | | | |
| TOTAL RETURN(a) | | (47.99 | )% | | 25.33 | % | | 29.02 | % | | 14.12 | % | | 15.23 | % | | 28.76 | % |
| | | | | |
| RATIOS/SUPPLEMENTAL DATA: | | | | | | | | | | | | | | | | |
Net assets, end of period (000) | | $123,970 | | | $297,083 | | | $268,314 | | | $233,150 | | | $230,300 | | | $191,909 | |
Average net assets (000) | | $218,670 | | | $277,744 | | | $248,571 | | | $221,543 | | | $209,378 | | | $153,435 | |
Ratios to average net assets(b) | | | | | | | | | | | | | | | | | | |
Expenses, including distribution and service (12b-1) fees | | .83 | % | | .83 | %(c) | | .93 | % | | .99 | % | | 1.00 | % | | 1.07 | % |
Expenses, excluding distribution and service (12b-1) fees | | .83 | % | | .83 | %(c) | | .93 | % | | .99 | % | | 1.00 | % | | 1.07 | % |
Net investment income | | 2.49 | % | | 2.61 | %(c) | | 1.73 | % | | 1.55 | % | | 1.27 | % | | 1.69 | % |
Portfolio turnover rate | | 30 | % | | 37 | %(d) | | 41 | % | | 123 | % | | 59 | % | | 47 | % |
| (a) | Total return is calculated assuming a purchase of a share on the first day and a sale on the last day of each period reported and includes reinvestment of dividends and distributions. Total returns may reflect adjustments to conform to generally accepted accounting principles. Total returns for periods less than one full year are not annualized. |
| (b) | Does not include expenses of the underlying fund in which the Portfolio invests. |
| (e) | Calculated based upon average shares outstanding during the period. |
| (f) | For the ten month period ended October 31, 2007. The Trust changed its fiscal year end from December 31 to October 31, effective October 31, 2007. |
See Notes to Financial Statements.
| | |
| 196 | | THE TARGET PORTFOLIO TRUST |
Financial Highlights (continued)
| | | | | | | | | | | | | | | | | | | | | | | | |
| | | INTERNATIONAL
BOND PORTFOLIO | |
| | | Class T | |
| | | Year
Ended
October 31,
2008 | | | Ten Months
Ended
October 31,
2007(d) | | | Year Ended December 31, | |
| | | | | 2006 | | | 2005 | | | 2004 | | | 2003 | |
| | | | | | |
| PER SHARE OPERATING PERFORMANCE: | | | | | | | | | | | | | | | | | | | | | | | | |
Net asset value, beginning of period | | | $8.33 | | | | $8.22 | | | | $8.33 | | | | $8.19 | | | | $8.45 | | | | $8.83 | |
Income (loss) from investment operations | | | | | | | | | | | | | | | | | | | | | | | | |
Net investment income | | | .28 | | | | .14 | | | | .19 | | | | .03 | | | | .26 | | | | .21 | |
Net realized and unrealized gain (loss) on investments | | | (.48 | ) | | | (.03 | ) | | | (.03 | ) | | | .27 | | | | .05 | | | | .26 | |
Total from investment operations | | | (.20 | ) | | | .11 | | | | .16 | | | | .30 | | | | .31 | | | | .47 | |
Less dividends and distributions | | | | | | | | | | | | | | | | | | | | | | | | |
Dividends from net investment income | | | — | | | | — | | | | (.26 | ) | | | (.15 | ) | | | (.48 | ) | | | (.84 | ) |
Distributions from net realized gains | | | — | | | | — | | | | (.01 | ) | | | (.01 | ) | | | (.09 | ) | | | (.01 | ) |
Total dividends and distributions | | | — | | | | — | | | | (.27 | ) | | | (.16 | ) | | | (.57 | ) | | | (.85 | ) |
Net asset value, end of period | | | $8.13 | | | | $8.33 | | | | $8.22 | | | | $8.33 | | | | $8.19 | | | | $8.45 | |
| | | | | | |
| TOTAL RETURN(a) | | | (2.40 | )% | | | 1.34 | % | | | 1.84 | % | | | 3.95 | % | | | 3.71 | % | | | 5.31 | % |
| | | | | |
| RATIOS/SUPPLEMENTAL DATA: | | | | | | | | | | | | | | | | | | | | | |
Net assets, end of period (000) | | $ | 29,346 | | | $ | 39,011 | | | $ | 40,944 | | | $ | 42,912 | | | $ | 44,905 | | | $ | 38,553 | |
Average net assets (000) | | $ | 35,921 | | | $ | 39,934 | | | $ | 41,174 | | | $ | 44,072 | | | $ | 43,199 | | | $ | 32,992 | |
Ratios to average net assets(e) | | | | | | | | | | | | | | | | | | | | | | | | |
Expenses, including distribution and service (12b-1) fees | | | 1.15 | % | | | 1.08 | %(b) | | | 1.19 | % | | | 1.51 | % | | | 1.49 | % | | | 1.51 | % |
Expenses, excluding distribution and service (12b-1) fees | | | 1.15 | % | | | 1.08 | %(b) | | | 1.19 | % | | | 1.51 | % | | | 1.49 | % | | | 1.51 | % |
Net investment income | | | 3.16 | % | | | 2.37 | %(b) | | | 2.32 | % | | | 1.71 | % | | | 2.15 | % | | | 1.88 | % |
Portfolio turnover rate | | | 560 | % | | | 595 | %(c) | | | 323 | % | | | 223 | % | | | 169 | % | | | 235 | % |
| (a) | Total return is calculated assuming a purchase of a share on the first day and a sale on the last day of each period reported and includes reinvestment of dividends and distributions. Total returns may reflect adjustments to conform to generally accepted accounting principles. Total returns for periods less than one full year are not annualized. |
| (d) | For the ten month period ended October 31, 2007. The Trust changed its fiscal year end from December 31 to October 31, effective October 31, 2007. |
| (e) | Does not include expenses of the underlying fund in which the Portfolio invests. |
See Notes to Financial Statements.
| | |
| THE TARGET PORTFOLIO TRUST | | 197 |
Financial Highlights (continued)
| | | | | | | | | |
| | | TOTAL RETURN
BOND PORTFOLIO | |
| | | Class R | |
| | | Year
Ended
October 31,
2008 | | | Ten Months
Ended
October 31,
2007(f)(g) | | | August 22,
2006(b)
through
December 31,
2006 | |
| | | |
| PER SHARE OPERATING PERFORMANCE: | | | | | | | | | |
Net asset value, beginning of period | | $10.54 | | | $10.31 | | | $10.31 | |
Income (loss) from investment operations | | | | | | | | | |
Net investment income | | .46 | | | .33 | | | .12 | |
Net realized and unrealized gain (loss) on investments | | (.68 | ) | | .24 | | | .01 | |
Total from investment operations | | (.22 | ) | | .57 | | | .13 | |
Less dividends and distributions | | | | | | | | | |
Dividends from net investment income | | (.46 | ) | | (.34 | ) | | (.13 | ) |
Distributions from net realized gains | | — | | | — | | | — | |
Total dividends and distributions | | (.46 | ) | | (.34 | ) | | (.13 | ) |
Net asset value, end of period | | $9.86 | | | $10.54 | | | $10.31 | |
| | | |
| TOTAL RETURN(a) | | (2.24 | )% | | 5.63 | % | | 1.27 | % |
| | | |
| RATIOS/SUPPLEMENTAL DATA: | | | | | | | | | |
Net assets, end of period (000) | | $53,218 | | | $23,670 | | | $1,503 | |
Average net assets (000) | | $42,474 | | | $10,429 | | | $246 | |
Ratios to average net assets(h) | | | | | | | | | |
Expenses, including distribution and service (12b-1) fees(e) | | 1.23 | % | | 1.14 | %(c) | | 1.18 | %(c) |
Expenses, excluding distribution and service (12b-1) fees | | .73 | % | | .64 | %(c) | | .68 | %(c) |
Net investment income | | 4.39 | % | | 3.84 | %(c) | | 3.46 | %(c) |
Portfolio turnover rate | | 697 | % | | 421 | %(d) | | 483 | %(d) |
| (a) | Total return is calculated assuming a purchase of a share on the first day and a sale on the last day of each period reported and includes reinvestment of dividends and distributions. Total returns may reflect adjustments to conform to generally accepted accounting principles. Total returns for periods less than one full year are not annualized. |
| (b) | Commencement of operations. |
| (e) | The distributor of the Trust has contractually agreed to limit its distribution and service (12b-1) fees to .50 of 1% of the average daily net assets of the Class R shares. |
| (f) | Calculated based upon average shares outstanding during the period. |
| (g) | For the ten month period ended October 31, 2007. The Trust changed its fiscal year end from December 31 to October 31, effective October 31, 2007. |
| (h) | Does not include expenses of the underlying fund in which the Portfolio invests. |
See Notes to Financial Statements.
| | |
| 198 | | THE TARGET PORTFOLIO TRUST |
Financial Highlights (continued)
| | | | | | | | | | | | | | | | | | |
| | | TOTAL RETURN
BOND PORTFOLIO | |
| | | Class T | |
| | | Year
Ended
October 31,
2008 | | | Ten Months
Ended
October 31,
2007(d)(e) | | | Year Ended December 31, | |
| | | | | 2006 | | | 2005 | | | 2004 | | | 2003 | |
| | | | | | |
| PER SHARE OPERATING PERFORMANCE: | | | | | | | | | | | | | | | | | | |
Net asset value, beginning of period | | $10.60 | | | $10.38 | | | $10.39 | | | $10.64 | | | $10.66 | | | $10.73 | |
Income (loss) from investment operations | | | | | | | | | | | | | | | | | | |
Net investment income | | .53 | | | .39 | | | .40 | | | .38 | | | .20 | | | .33 | |
Net realized and unrealized gain (loss) on investments | | (.68 | ) | | .22 | | | .03 | | | (.12 | ) | | .31 | | | .33 | |
Total from investment operations | | (.15 | ) | | .61 | | | .43 | | | .26 | | | .51 | | | .66 | |
Less dividends and distributions | | | | | | | | | | | | | | | | | | |
Dividends from net investment income | | (.52 | ) | | (.39 | ) | | (.44 | ) | | (.43 | ) | | (.44 | ) | | (.36 | ) |
Distributions from net realized gains | | — | | | — | | | — | | | (.08 | ) | | (.09 | ) | | (.37 | ) |
Total dividends and distributions | | (.52 | ) | | (.39 | ) | | (.44 | ) | | (.51 | ) | | (.53 | ) | | (.73 | ) |
Net asset value, end of period | | $9.93 | | | $10.60 | | | $10.38 | | | $10.39 | | | $10.64 | | | $10.66 | |
| | | | | | |
| TOTAL RETURN(a) | | (1.71 | )% | | 5.94 | % | | 4.27 | % | | 2.60 | % | | 4.73 | % | | 6.22 | % |
| | | | | |
| RATIOS/SUPPLEMENTAL DATA: | | | | | | | | | | | | | | | | |
Net assets, end of period (000) | | $194,970 | | | $183,262 | | | $167,154 | | | $161,675 | | | $178,488 | | | $158,148 | |
Average net assets (000) | | $206,986 | | | $174,725 | | | $162,621 | | | $169,616 | | | $170,073 | | | $151,999 | |
Ratios to average net assets(f) | | | | | | | | | | | | | | | | | | |
Expenses, including distribution and service (12b-1) fees | | .73 | % | | .64 | %(b) | | .68 | % | | .76 | % | | .75 | % | | .76 | % |
Expenses, excluding distribution and service (12b-1) fees | | .73 | % | | .64 | %(b) | | .68 | % | | .76 | % | | .75 | % | | .76 | % |
Net investment income | | 4.86 | % | | 4.53 | %(b) | | 4.14 | % | | 3.72 | % | | 1.82 | % | | 2.99 | % |
Portfolio turnover rate | | 697 | % | | 421 | %(c) | | 483 | % | | 366 | % | | 587 | % | | 445 | % |
| (a) | Total return is calculated assuming a purchase of a share on the first day and a sale on the last day of each period reported and includes reinvestment of dividends and distributions. Total returns may reflect adjustments to conform to generally accepted accounting principles. Total returns for periods less than one full year are not annualized. |
| (d) | Calculated based upon average shares outstanding during the period. |
| (e) | For the ten month period ended October 31, 2007. The Trust changed its fiscal year end from December 31 to October 31, effective October 31, 2007. |
| (f) | Does not include expenses of the underlying fund in which the Portfolio invests. |
See Notes to Financial Statements.
| | |
| THE TARGET PORTFOLIO TRUST | | 199 |
Financial Highlights (continued)
| | | | | | | | | | | | | | | | | | | | | | | | |
| | | INTERMEDIATE-TERM
BOND PORTFOLIO | |
| | | Class T | |
| | | Year
Ended
October 31,
2008 | | | Ten Months
Ended
October 31,
2007(e) | | | Year Ended December 31, | |
| | | | | 2006 | | | 2005 | | | 2004 | | | 2003 | |
| | | | | | |
| PER SHARE OPERATING PERFORMANCE: | | | | | | | | | | | | | | | | | | | | | | | | |
Net asset value, beginning of period | | | $10.25 | | | | $10.13 | | | | $10.18 | | | | $10.36 | | | | $10.46 | | | | $10.50 | |
Income (loss) from investment operations | | | | | | | | | | | | | | | | | | | | | | | | |
Net investment income | | | .44 | | | | .40 | | | | .43 | | | | .36 | | | | .19 | | | | .28 | |
Net realized and unrealized gain (loss) on investments | | | .08 | | | | .11 | | | | (.03 | ) | | | (.16 | ) | | | .14 | | | | .19 | |
Total from investment operations | | | .52 | | | | .51 | | | | .40 | | | | .20 | | | | .33 | | | | .47 | |
Less dividends and distributions | | | | | | | | | | | | | | | | | | | | | | | | |
Dividends from net investment income | | | (.50 | ) | | | (.39 | ) | | | (.45 | ) | | | (.38 | ) | | | (.24 | ) | | | (.34 | ) |
Distributions from net realized gains | | | — | | | | — | | | | — | | | | — | (b) | | | (.19 | ) | | | (.17 | ) |
Total dividends and distributions | | | (.50 | ) | | | (.39 | ) | | | (.45 | ) | | | (.38 | ) | | | (.43 | ) | | | (.51 | ) |
Net asset value, end of period | | | $10.27 | | | | $10.25 | | | | $10.13 | | | | $10.18 | | | | $10.36 | | | | $10.46 | |
| | | | | | |
| TOTAL RETURN(a) | | | 5.07 | % | | | 5.13 | % | | | 4.12 | % | | | 1.88 | % | | | 3.19 | % | | | 4.58 | % |
| | | | | |
| RATIOS/SUPPLEMENTAL DATA: | | | | | | | | | | | | | | | | | | | | | |
Net assets, end of period (000) | | $ | 204,548 | | | $ | 233,423 | | | $ | 245,223 | | | $ | 262,177 | | | $ | 297,982 | | | $ | 334,806 | |
Average net assets (000) | | $ | 227,475 | | | $ | 235,800 | | | $ | 249,376 | | | $ | 278,441 | | | $ | 318,671 | | | $ | 343,466 | |
Ratios to average net assets(f) | | | | | | | | | | | | | | | | | | | | | | | | |
Expenses, including distribution and service (12b-1) fees | | | .60 | % | | | .58 | %(c) | | | .64 | % | | | .63 | % | | | .64 | % | | | .68 | % |
Expenses, excluding distribution and service (12b-1) fees | | | .60 | % | | | .58 | %(c) | | | .64 | % | | | .63 | % | | | .64 | % | | | .68 | % |
Net investment income | | | 4.21 | % | | | 4.71 | %(c) | | | 4.23 | % | | | 3.48 | % | | | 1.86 | % | | | 2.64 | % |
Portfolio turnover rate | | | 395 | % | | | 284 | %(d) | | | 134 | % | | | 208 | % | | | 133 | % | | | 422 | % |
| (a) | Total return is calculated assuming a purchase of a share on the first day and a sale on the last day of each period reported and includes reinvestment of dividends and distributions. Total returns may reflect adjustments to conform to generally accepted accounting principles. Total returns for periods less than one full year are not annualized. |
| (b) | Less than $0.005 per share. |
| (e) | For the ten month period ended October 31, 2007. The Trust changed its fiscal year end from December 31 to October 31, effective October 31, 2007. |
| (f) | Does not include expenses of the underlying fund in which the Portfolio invests. |
See Notes to Financial Statements.
| | |
| 200 | | THE TARGET PORTFOLIO TRUST |
Financial Highlights (continued)
| | | | | | | | | | | | | | | | | | |
| | | MORTGAGE BACKED
SECURITIES PORTFOLIO | |
| | | Class T | |
| | | Year
Ended
October 31,
2008 | | | Ten Months
Ended
October 31,
2007(e) | | | Year Ended December 31, | |
| | | | | 2006 | | | 2005 | | | 2004 | | | 2003 | |
| | | | | | |
| PER SHARE OPERATING PERFORMANCE: | | | | | | | | | | | | | | | | | | |
Net asset value, beginning of period | | $9.95 | | | $9.99 | | | $10.10 | | | $10.39 | | | $10.45 | | | $10.70 | |
Income (loss) from investment operations | | | | | | | | | | | | | | | | | | |
Net investment income | | .63 | | | .41 | | | .44 | | | .50 | | | .36 | | | .47 | |
Net realized and unrealized gain (loss) on investments | | (.66 | ) | | (.03 | ) | | (.07 | ) | | (.27 | ) | | .02 | | | (.24 | ) |
Total from investment operations | | (.03 | ) | | .38 | | | .37 | | | .23 | | | .38 | | | .23 | |
Less dividends | | | | | | | | | | | | | | | | | | |
Dividends from net investment income | | (.66 | ) | | (.39 | ) | | (.48 | ) | | (.52 | ) | | (.44 | ) | | (.48 | ) |
Tax return of capital | | — | | | (.03 | ) | | — | | | — | | | — | | | — | |
Total dividends | | (.66 | ) | | (.42 | ) | | (.48 | ) | | (.52 | ) | | (.44 | ) | | (.48 | ) |
Net asset value, end of period | | $9.26 | | | $9.95 | | | $9.99 | | | $10.10 | | | $10.39 | | | $10.45 | |
| | | | | | |
| TOTAL RETURN(a) | | (.36 | )% | | 3.89 | % | | 3.82 | % | | 2.29 | % | | 3.68 | % | | 2.20 | % |
| | | | | |
| RATIOS/SUPPLEMENTAL DATA: | | | | | | | | | | | | | | | | |
Net assets, end of period (000) | | $51,368 | | | $73,581 | | | $75,471 | | | $82,195 | | | $95,796 | | | $107,072 | |
Average net assets (000) | | $64,999 | | | $75,508 | | | $77,483 | | | $89,756 | | | $103,055 | | | $114,526 | |
Ratios to average net assets(f) | | | | | | | | | | | | | | | | | | |
Expenses, including distribution and service (12b-1) fees | | 1.94 | %(b) | | 1.82 | %(b)(c) | | 1.89 | %(b) | | 1.70 | %(b) | | .90 | % | | .84 | % |
Expenses, excluding distribution and service (12b-1) fees | | 1.94 | %(b) | | 1.82 | %(b)(c) | | 1.89 | %(b) | | 1.70 | %(b) | | .90 | % | | .84 | % |
Net investment income | | 6.34 | % | | 4.91 | %(c) | | 4.46 | % | | 4.91 | % | | 3.48 | % | | 4.43 | % |
Portfolio turnover rate | | 338 | % | | 318 | %(d) | | 471 | % | | 251 | % | | 279 | % | | 282 | % |
| (a) | Total return is calculated assuming a purchase of a share on the first day and a sale on the last day of each period reported and includes reinvestment of dividends and distributions. Total returns may reflect adjustments to conform to generally accepted accounting principles. Total returns for periods less than one full year are not annualized. |
| (b) | The annualized expense ratio without interest expense would have been 0.70% for the year ended October 31, 2008, 0.76% for the ten months ended October 31, 2007, and 0.94% and 0.91%, respectively, for the fiscal years ended December 31, 2006 and 2005. |
| (e) | For the ten month period ended October 31, 2007. The Trust changed its fiscal year end from December 31 to October 31, effective October 31, 2007. |
| (f) | Does not include expenses of the underlying fund in which the Portfolio invests. |
See Notes to Financial Statements.
| | |
| THE TARGET PORTFOLIO TRUST | | 201 |
Financial Highlights (continued)
| | | | | | | | | | | | | | | | | | | | | | | | |
| | | U.S. GOVERNMENT
MONEY MARKET PORTFOLIO | |
| | | Class T | |
| | | Year
Ended
October 31,
2008 | | | Ten Months
Ended
October 31,
2007(c) | | | Year Ended December 31, | |
| | | | | 2006 | | | 2005 | | | 2004 | | | 2003 | |
| | | | | | |
| PER SHARE OPERATING PERFORMANCE: | | | | | | | | | | | | | | | | | | | | | | | | |
Net asset value, beginning of period | | | $1.00 | | | | $1.00 | | | | $1.00 | | | | $1.00 | | | | $1.00 | | | | $1.00 | |
Net investment income and net realized gain on investments | | | .026 | | | | .040 | | | | .043 | | | | .026 | | | | .008 | | | | .007 | |
Less dividends and distributions | | | (.026 | ) | | | (.040 | ) | | | (.043 | ) | | | (.026 | ) | | | (.008 | ) | | | (.007 | ) |
Net asset value, end of period | | | $1.00 | | | | $1.00 | | | | $1.00 | | | | $1.00 | | | | $1.00 | | | | $1.00 | |
| | | | | | |
| TOTAL RETURN(a) | | | 2.63 | % | | | 4.04 | % | | | 4.36 | % | | | 2.59 | % | | | .76 | % | | | .70 | % |
| | | | | |
| RATIOS/SUPPLEMENTAL DATA: | | | | | | | | | | | | | | | | | | | | | |
Net assets, end of period (000) | | $ | 68,844 | | | $ | 67,067 | | | $ | 47,275 | | | $ | 57,207 | | | $ | 74,190 | | | $ | 98,464 | |
Average net assets (000) | | $ | 91,457 | | | $ | 63,409 | | | $ | 47,990 | | | $ | 69,488 | | | $ | 94,854 | | | $ | 114,831 | |
Ratios to average net assets(d) | | | | | | | | | | | | | | | | | | | | | | | | |
Expenses, including distribution and service (12b-1) fees | | | .47 | % | | | .50 | %(b) | | | .70 | % | | | .71 | % | | | .59 | % | | | .52 | % |
Expenses, excluding distribution and service (12b-1) fees | | | .47 | % | | | .50 | %(b) | | | .70 | % | | | .71 | % | | | .59 | % | | | .52 | % |
Net investment income | | | 2.42 | % | | | 4.78 | %(b) | | | 4.25 | % | | | 2.50 | % | | | .72 | % | | | .71 | % |
| (a) | Total return is calculated assuming a purchase of a share on the first day and a sale on the last day of each period reported and includes reinvestment of dividends and distributions. Total returns may reflect adjustments to conform to generally accepted accounting principles. Total returns for periods less than one full year are not annualized. |
| (c) | For the ten month period ended October 31, 2007. The Trust changed its fiscal year end from December 31 to October 31, effective October 31, 2007. |
| (d) | Does not include expenses of the underlying fund in which the Portfolio invests. |
See Notes to Financial Statements.
| | |
| 202 | | THE TARGET PORTFOLIO TRUST |
Report of Independent Accountants
The Board of Trustees and Shareholders of The Target Portfolio Trust:
We have audited the accompanying statement of assets and liabilities of Target Portfolio Trust (comprised of Large Capitalization Growth Portfolio, Large Capitalization Value Portfolio, Small Capitalization Growth Portfolio, Small Capitalization Value Portfolio, International Equity Portfolio, International Bond Portfolio, Total Return Bond Portfolio, Intermediate-Term Bond Portfolio, Mortgage Backed Securities Portfolio, and U.S. Government Money Market Portfolio, hereafter referred to as the “Funds”), including the portfolios of investments, as of October 31, 2008, and the related statements of operations for the year then ended, the statements of changes in net assets for the year then ended, the ten-month period ended October 31, 2007 and the year ended December 31, 2006 and the financial highlights for the year then ended, the ten-month period ended October 31, 2007 and each of the years in the three-year period ended December 31, 2006. These financial statements and financial highlights are the responsibility of the Funds’ management. Our responsibility is to express an opinion on these financial statements and financial highlights based on our audits. The financial highlights for the year ended December 31, 2003 were audited by another independent registered public accounting firm, whose report dated February 24, 2004, expressed an unqualified opinion thereon.
We conducted our audits in accordance with the standards of the Public Company Accounting Oversight Board (United States). Those standards require that we plan and perform the audit to obtain reasonable assurance about whether the financial statements and financial highlights are free of material misstatement. An audit includes examining, on a test basis, evidence supporting the amounts and disclosures in the financial statements. Our procedures included confirmation of securities owned as of October 31, 2008, by correspondence with the custodian and brokers or by other appropriate auditing procedures where replies from brokers were not received. An audit also includes assessing the accounting principles used and significant estimates made by management, as well as evaluating the overall financial statement presentation. We believe that our audits provide a reasonable basis for our opinion.
In our opinion, the financial statements and financial highlights referred to above present fairly, in all material respects, the financial position of the Funds as of October 31, 2008, and the results of their operations for the year then ended, the changes in their net assets for the year then ended, the ten-month period ended October 31, 2007 and the year ended December 31, 2006 and the financial highlights for the year then ended, the ten-month period ended October 31, 2007 and each of the years in the three-year period ended December 31, 2006, in conformity with U.S. generally accepted accounting principles.

New York, New York
December 23, 2008
| | |
| THE TARGET PORTFOLIO TRUST | | 203 |
Federal Tax Information (Unaudited)
For the fiscal period ended October 31, 2008, the tax character of dividends and distributions paid as reflected in the Statement of Changes in Net Assets was as follows:
| | | | | | |
| | | | | Ordinary
Income | | Long-Term
Capital Gains |
Large Capitalization Growth Portfolio | | Class R | | 0.11 | | 0.87 |
| | Class T | | 0.15 | | 0.87 |
Large Capitalization Value Portfolio | | Class R | | 0.52 | | 0.86 |
| | Class T | | 0.60 | | 0.86 |
Small Capitalization Value Portfolio | | Class R | | 0.63 | | 0.82 |
| | Class T | | 0.68 | | 0.82 |
International Equity Portfolio | | Class R | | 1.04 | | 1.46 |
| | Class T | | 1.13 | | 1.46 |
Total Return Bond Portfolio | | Class R | | 0.46 | | — |
| | Class T | | 0.52 | | — |
Intermediate-Term Bond Portfolio | | Class T | | 0.50 | | — |
Mortgage Backed Securities Portfolio | | Class T | | 0.66 | | — |
U.S. Government Money Market Portfolio | | Class T | | 0.03 | | — |
For federal income tax purposes, dividends from net investment income and distributions from short-term capital gain are taxable as ordinary income dividends. Long-term capital gain distributions are taxable as capital gain distributions.
As required by the Internal Revenue Code, the following percentages of ordinary income dividends and distributions paid for the fiscal period ended October 31, 2008 have been designated as 1) qualified for the reduced tax rate under The Job and Growth Tax Relief Reconciliation Act of 2003 (‘QDI’), 2) dividends received deduction eligible for corporate shareholders ("DRD"), 3) interest related dividends under the American Jobs Creation Act of 2004 (“QII”), and 4) short-term capital gain distributions under the American Jobs Creation Act of 2004 (“QSTCG”):
| | | | | | | | |
| | | QDI | | DRD | | QII | | QSTCG |
Large Capitalization Growth Portfolio | | 92.25% | | 88.14% | | 0.00% | | 82.16% |
Large Capitalization Value Portfolio | | 60.19% | | 60.04% | | 0.00% | | 87.89% |
Small Capitalization Value Portfolio | | 42.57% | | 42.21% | | 0.00% | | 94.27% |
International Equity Portfolio | | 42.33% | | 0.00% | | 0.00% | | 94.84% |
Total Return Bond Portfolio | | 0.00% | | 0.00% | | 100.00% | | 100.00% |
Intermediate-Term Bond Portfolio | | 0.00% | | 0.00% | | 96.82% | | 45.11% |
Mortgage Backed Securities Portfolio | | 0.00% | | 0.00% | | 90.20% | | 0.00% |
U.S. Government Money Market Portfolio | | 0.00% | | 0.00% | | 100.00% | | 0.53% |
Pursuant to Section 853 of the Internal Revenue Code, International Equity Portfolio designates $817,734 of foreign taxes paid and $8,972,804 of foreign source income in connection with dividends distributed from investment company taxable income for the period ended October 31, 2008.
Many states do not tax the portion of mutual fund dividends attributed to interest from U.S. Government obligations. Listed below is the percentage of interest earned by the following Portfolios from U.S. Government obligations for the fiscal period 2008.
| | |
| 204 | | THE TARGET PORTFOLIO TRUST |
Federal Tax Information (Unaudited) (continued)
We are required by Massachusetts, Missouri and Oregon to inform you that dividends which have been derived from interest on federal obligations are not taxable to shareholders providing the mutual fund meets certain requirements mandated by the respective state’s taxing authorities.
| | |
Portfolio*** | | Percentage of interest from
U.S. Government Obligations |
Mortgaged Backed Securities Portfolio | | 14.33 |
Total Return Bond Portfolio | | 3.83 |
Intermediate-Term Bond Portfolio | | 1.46 |
U.S. Government Money Market Portfolio | | 23.22 |
| *** | Due to certain minimum portfolio holding requirements in California, Connecticut and New York, residents of those states will not be able to exclude 2008 interest income from state and local taxes. |
Please consult your tax adviser or state/local authorities to properly report this information on your tax return. If you have any questions concerning the amounts listed above, please call your financial adviser.
| | |
| THE TARGET PORTFOLIO TRUST | | 205 |
MANAGEMENT OF THE FUND
(Unaudited)
Information about Fund Directors/Trustees (referred to herein as “Board Members”) and Fund Officers is set forth below. Board Members who are not deemed to be “interested persons,” as defined in the 1940 Act, are referred to as “Independent Board Members.” Board Members who are deemed to be “interested persons” are referred to as “Interested Board Members.” The Board Members are responsible for the overall supervision of the operations of the Fund and perform the various duties imposed on the directors or trustees of investment companies by the 1940 Act.
Independent Board Members
| | | | |
Name, Address, Age Position(s) Portfolios Overseen (1) | | Principal Occupation(s) During Past Five Years | | Other Directorships Held |
Kevin J. Bannon (56) Board Member Portfolios Overseen: 62 | | Managing Director (since April 2008) of Highmount Capital LLC (registered investment adviser); formerly Executive Vice President and Chief Investment Officer (April 1993-August 2007) of Bank of New York Company; President (May 2003-May 2007) of BNY Hamilton Family of Mutual Funds. | | Director of Urstadt Biddle Properties (since September 2008) |
| | | |
Linda W. Bynoe (56) Board Member Portfolios Overseen: 62 | | President and Chief Executive Officer (since March 1995) of Telemat Ltd. (management consulting); formerly Vice President at Morgan Stanley Co (broker- dealer). | | Director of Simon Property Group, Inc. (real estate investment trust) (since May 2003); Director of Anixter International (communication products distributor) (since January 2006); Director of Northern Trust Corporation (banking) (since April 2006). |
| | | |
David E.A. Carson (74) Board Member Portfolios Overseen: 62 | | Director (since May 2008) of Liberty Bank; Director (since October 2007) of ICI Mutual Insurance Company; formerly President, Chairman and Chief Executive Officer of People’s Bank (1987 – 2000). | | None. |
| | | |
Michael S. Hyland, CFA (63) Board Member Portfolios Overseen: 62 | | Independent Consultant (since February 2005); formerly Senior Managing Director (July 2001-February 2005) of Bear Stearns Co, Inc.; Global Partner, INVESCO (1999-2001); Managing Director and President Salomon Brothers Asset Management (1989-1999). | | None. |
| | | |
Robert E. La Blanc (74) Board Member Portfolios Overseen: 62 | | President (since 1981) of Robert E. La Blanc Associates, Inc. (telecommunications). | | Director of CA, Inc. (since 2002) (software company); FiberNet Telecom Group, Inc. (since 2003) (telecom company). |
THE TARGET PORTFOLIO TRUST
| | | | |
| | | |
Douglas H. McCorkindale (69) Board Member Portfolios Overseen: 62 | | Formerly Chairman (February 2001-June 2006), Chief Executive Officer (June 2000-July 2005), President (September 1997-July 2005) and Vice Chairman (March 1984-May 2000) of Gannett Co. Inc. (publishing and media). | | Director of Continental Airlines, Inc. (since May 1993); Director of Lockheed Martin Corp. (aerospace and defense) (since May 2001). |
| | | |
Stephen P. Munn (66) Board Member Portfolios Overseen: 62 | | Lead Director (since 2007) and formerly Chairman (1993-2007) of Carlisle Companies Incorporated (manufacturer of industrial products). | | None. |
| | | |
Richard A. Redeker (65) Board Member Portfolios Overseen: 62 | | Retired Mutual Fund Executive (36 years); Management Consultant; Director of Penn Tank Lines, Inc. (since 1999). | | None. |
| | | |
Robin B. Smith (69) Board Member & Independent Chair Portfolios Overseen: 62 | | Chairman of the Board (since January 2003) of Publishers Clearing House (direct marketing); formerly Chairman and Chief Executive Officer (August 1996-January 2003) of Publishers Clearing House. | | Formerly Director of BellSouth Corporation (telecommunications) (1992-2006). |
| | | |
Stephen G. Stoneburn (65) Board Member Portfolios Overseen: 62 | | President and Chief Executive Officer (since June 1996) of Quadrant Media Corp. (publishing company); formerly President (June 1995-June 1996) of Argus Integrated Media, Inc.; Senior Vice President and Managing Director (January 1993-1995) of Cowles Business Media; Senior Vice President of Fairchild Publications, Inc (1975-1989). | | None. |
Interested Board Members |
Judy A. Rice (60) Board Member & President Portfolios Overseen: 62 | | President, Chief Executive Officer, Chief Operating Officer and Officer-In-Charge (since February 2003) of Prudential Investments LLC; President, Chief Executive Officer and Officer-In-Charge (since April 2003) of Prudential Mutual Fund Services LLC; formerly Vice President (February 1999-April 2006) of Prudential Investment Management Services LLC; formerly President, Chief Executive Officer, Chief Operating Officer and Officer-In-Charge (May 2003-June 2005) and Director (May 2003-March 2006) and Executive Vice President (June 2005-March 2006) of AST Investment Services, Inc.; Member of Board of Governors of the Investment Company Institute. | | None. |
THE TARGET PORTFOLIO TRUST
| | | | |
| | | |
Robert F. Gunia (62) Board Member & Vice President Portfolios Overseen: 146 | | Chief Administrative Officer (since September 1999) and Executive Vice President (since December 1996) of Prudential Investments LLC; President (since April 1999) of Prudential Investment Management Services LLC; Executive Vice President (since March 1999) and Treasurer (since May 2000) of Prudential Mutual Fund Services LLC; Chief Administrative Officer, Executive Vice President and Director (since May 2003) of AST Investment Services, Inc. | | Director (since May 1989) of The Asia Pacific Fund, Inc. and Vice President (since January 2007) of The Greater China Fund, Inc. |
1 | The year that each individual joined the Fund’s Board is as follows: |
Linda W. Bynoe, 2005; David E.A. Carson, 2003; Robert E. La Blanc, 1999; Douglas H. McCorkindale, 1996; Richard A. Redeker, 2003; Robin B. Smith, 2003; Stephen G. Stoneburn, 1999; Kevin J. Bannon, 2008; Michael S. Hyland, 2008; Stephen P. Munn, 2008; Judy A. Rice, Board Member and President since 2003; Robert F. Gunia, Board Member and Vice President since 1999.
THE TARGET PORTFOLIO TRUST
Fund Officers (a)(1)
| | |
Name, Address and Age Position with Fund | | Principal Occupation(s) During Past Five Years |
Kathryn L. Quirk (56) Chief Legal Officer | | Vice President and Corporate Counsel (since September 2004) of Prudential; Executive Vice President, Chief Legal Officer and Secretary (since July 2005) of PI and Prudential Mutual Fund Services LLC; Vice President and Corporate Counsel (since June 2005) and Secretary (since February 2006) of AST Investment Services, Inc.; formerly Senior Vice President and Assistant Secretary (November 2004-August 2005) of PI; formerly Assistant Secretary (June 2005-February 2006) of AST Investment Services, Inc.; formerly Managing Director, General Counsel, Chief Compliance Officer, Chief Risk Officer and Corporate Secretary (1997-2002) of Zurich Scudder Investments, Inc. |
| | |
Deborah A. Docs (50) Secretary | | Vice President and Corporate Counsel (since January 2001) of Prudential; Vice President (since December 1996) and Assistant Secretary (since March 1999) of PI; formerly Vice President and Assistant Secretary (May 2003-June 2005) of AST Investment Services, Inc. |
| | |
Jonathan D. Shain (50) Assistant Secretary | | Vice President and Corporate Counsel (since August 1998) of Prudential; Vice President and Assistant Secretary (since May 2001) of PI; Vice President and Assistant Secretary (since February 2001) of PMFS; formerly Vice President and Assistant Secretary (May 2003-June 2005) of AST Investment Services, Inc. |
| | |
Claudia DiGiacomo (34) Assistant Secretary | | Vice President and Corporate Counsel (since January 2005) of Prudential; Vice President and Assistant Secretary of PI (since December 2005); Associate at Sidley Austin LLP (1999-2004). |
| | |
John P. Schwartz (37) Assistant Secretary | | Vice President and Corporate Counsel (since April 2005) of Prudential; Vice President and Assistant Secretary of PI (since December 2005); Associate at Sidley Austin LLP (1997-2005). |
| | |
Andrew R. French (46) Assistant Secretary | | Director and Corporate Counsel (since May 2006) of Prudential; Vice President and Assistant Secretary (since January 2007) of PI; Vice President and Assistant Secretary (since January 2007) of PMFS; formerly Senior Legal Analyst of Prudential Mutual Fund Law Department (1997-2006). |
| | |
Timothy J. Knierim (49) Chief Compliance Officer | | Chief Compliance Officer of Prudential Investment Management, Inc. (PIM) (since July 2007); formerly Chief Risk Officer of PIM and PI (2002-2007) and formerly Chief Ethics Officer of PIM and PI (2006-2007). |
| | |
Valerie M. Simpson (50) Deputy Chief Compliance Officer | | Chief Compliance Officer (since April 2007) of PI and AST Investment Services, Inc.; formerly Vice President-Financial Reporting (June 1999-March 2006) for Prudential Life and Annuities Finance. |
| | |
Theresa C. Thompson (46) Deputy Chief Compliance Officer | | Vice President, Mutual Fund Compliance, PI (since April 2004); and Director, Compliance, PI (2001 - 2004). |
THE TARGET PORTFOLIO TRUST
| | |
| | |
Noreen M. Fierro (44) Anti-Money Laundering Compliance Officer | | Vice President, Corporate Compliance (since May 2006) of Prudential; formerly Corporate Vice President, Associate General Counsel (April 2002-May 2005) of UBS Financial Services, Inc., in their Money Laundering Prevention Group; Senior Manager (May 2005-May 2006) of Deloitte Financial Advisory Services, LLP, in their Forensic and Dispute Services, Anti-Money Laundering Group. |
| | |
Grace C. Torres (49) Treasurer and Principal Financial and Accounting Officer | | Assistant Treasurer (since March 1999) and Senior Vice President (since September 1999) of PI; Assistant Treasurer (since May 2003) and Vice President (since June 2005) of AST Investment Services, Inc.; Senior Vice President and Assistant Treasurer (since May 2003) of Prudential Annuities Advisory Services, Inc.; formerly Senior Vice President (May 2003-June 2005) of AST Investment Services, Inc. |
| | |
M. Sadiq Peshimam (44) Assistant Treasurer | | Vice President (since 2005) and Director (2000-2005) within Prudential Mutual Fund Administration. |
| | |
Peter Parrella (50) Assistant Treasurer | | Vice President (since 2007) and Director (2004-2007) within Prudential Mutual Fund Administration; formerly Tax Manager at SSB Citi Fund Management LLC (1997-2004). |
(a) | Excludes interested Board Members who also serve as President or Vice President. |
1 | The year that each individual became an Officer of the Fund is as follows: |
Kathryn L. Quirk, 2005; Deborah A. Docs, 2004; Jonathan D. Shain, 2005; Claudia DiGiacomo, 2005; John P. Schwartz, 2006; Andrew R. French, 2006; Timothy J. Knierim, 2007; Valerie M. Simpson 2007; Theresa C. Thompson, 2008; Noreen M. Fierro, 2006, Grace C. Torres, 2000; M. Sadiq Peshimam, 2006; Peter Parrella, 2007.
Explanatory Notes
| | • | | Board Members are deemed to be “Interested,” as defined in the 1940 Act, by reason of their affiliation with Prudential Investments LLC and/or an affiliate of Prudential Investments LLC. |
| | • | | Unless otherwise noted, the address of all Board Members and Officers is c/o Prudential Investments LLC, Gateway Center Three, 100 Mulberry Street, Newark, New Jersey 07102. |
| | • | | There is no set term of office for Board Members or Officers. The Board Members have adopted a retirement policy, which calls for the retirement of Board Members on December 31st of the year in which they reach the age of 75. |
| | • | | “Other Directorships Held” includes only directorships of companies required to register or file reports with the SEC under the Securities Exchange Act of 1934 (that is, “public companies”) or other investment companies registered under the 1940 Act. |
| | • | | “Portfolios Overseen” includes all investment companies managed by Prudential Investments LLC. The investment companies for which PI serves as manager include the JennisonDryden Funds, Strategic Partners Funds, The Prudential Variable Contract Accounts, The Target Portfolio Trust, The Prudential Series Fund, The High Yield Income Fund, Inc., The High Yield Plus Fund, Inc., Nicholas-Applegate Fund, Inc., Prudential’s Gibraltar Fund, Inc. and the Advanced Series Trust. |
THE TARGET PORTFOLIO TRUST
Approval of Advisory Agreements
The Board of Trustees (the “Board”) of The Target Portfolio Trust (the “Trust”) oversees the management of each of the Trust’s Portfolios, and, as required by law, determines annually whether to renew the Trust’s management agreement with Prudential Investments LLC (“PI”) and each Portfolio’s subadvisory agreement. In considering the renewal of the agreements, the Board, including all of the Independent Trustees, met on June 3-5, 2008, and approved the renewal of the agreements through July 31, 2009, after concluding that renewal of the agreements was in the best interests of each of the Trust’s Portfolios and their shareholders.
In advance of the meetings, the Trustees received materials relating to the agreements, and had the opportunity to ask questions and request further information in connection with their consideration. In approving the agreements, the Trustees, including the Independent Trustees advised by independent legal counsel, considered the factors they deemed relevant, including the nature, quality and extent of services provided, the performance of each Portfolio of the Trust, the profitability of PI and its affiliates, expenses and fees, and the potential for economies of scale that may be shared with each Portfolio and its shareholders. In their deliberations, the Trustees did not identify any single factor which alone was responsible for the Board’s decision to approve the agreements. In connection with their deliberations, the Board considered information provided by PI throughout the year at regular Board meetings, presentations from portfolio managers and other information, as well as information furnished at or in advance of the meetings on June 3-5, 2008.
The Trustees determined that the overall arrangements between the Trust and PI, which serves as the Trust’s investment manager pursuant to a management agreement, and between PI and each subadviser, each of which serves pursuant to the terms of subadvisory agreements with PI, are fair and reasonable in light of the services performed, fees charged and such other matters as the Trustees considered relevant in the exercise of their business judgment.
The material factors and conclusions that formed the basis for the Trustees’ determinations to approve the renewal of the agreements are discussed separately below.
I. Renewal of Existing Management & Subadvisory Agreements
Nature, Quality, and Extent of Services
The Board received and considered information regarding the nature and extent of services provided to the Trust by PI and each subadviser. The Board considered the services provided by PI, including but not limited to the oversight of the subadvisers, as well as the provision of fund recordkeeping and compliance services to the Trust.
| | |
| THE TARGET PORTFOLIO TRUST | | |
Approval of Advisory Agreements (continued)
With respect to PI’s oversight of the subadvisers, the Board noted that PI’s Strategic Investment Research Group (“SIRG”), a business unit of PI, is responsible for screening and recommending new subadvisers when appropriate, as well as monitoring and reporting to the Board on the performance and operations of the subadvisers. The Board also considered that PI pays the salaries of all of the officers and non-independent Trustees of the Fund. The Board also considered the investment subadvisory services provided by each subadviser, as well as compliance with the Trust’s investment restrictions, policies and procedures. The Board considered PI’s evaluation of the subadvisers; as well as PI’s recommendation, based on its review of the subadvisers, to renew the subadvisory agreements or to replace certain subadvisers, as applicable.
The Board reviewed the qualifications, backgrounds and responsibilities of PI’s senior management responsible for the oversight of the Trust and each subadviser, and also reviewed the qualifications, backgrounds and responsibilities of the subadvisers’ portfolio managers who are responsible for the day-to-day management of each Portfolio. The Board was provided with information pertaining to PI’s and each subadviser’s organizational structure, senior management, investment operations, and other relevant information pertaining to both PI and each subadviser. The Board also noted that it received favorable compliance reports from the Fund’s Chief Compliance Officer (CCO) as to both PI and each subadviser.
The Board concluded that it was satisfied with the nature, extent and quality of the investment management services provided by PI and the subadvisory services provided to the Portfolios by each subadviser, and that there was a reasonable basis on which to conclude that the Trust and its Portfolios benefit from the services provided by PI and each subadviser under the management and subadvisory agreements.
Costs of Services and Profits Realized by PI
The Board was provided with information on the profitability of PI and its affiliates in serving as the Trust’s investment manager. The Board discussed with PI the methodology utilized in assembling the information regarding profitability and considered its reasonableness. The Board recognized that it is difficult to make comparisons of profitability from fund management contracts because comparative information is not generally publicly available and is affected by numerous factors, including the structure of the particular adviser, the types of funds it manages, its business mix, numerous assumptions regarding allocations and the adviser’s capital structure and cost of capital. Taking these factors into account, the Board concluded that the profitability of PI and its affiliates in relation to the services rendered was not unreasonable.
| | |
| | THE TARGET PORTFOLIO TRUST |
The Board noted that none of the Trust’s subadvisers were affiliated with PI, and concluded that the level of profitability of a subadviser not affiliated with PI may not be as significant as PI’s profitability given the arm’s length nature of the process by which the subadvisory fee rates were negotiated by PI and the unaffiliated subadvisers, as well as the fact that PI compensates the subadvisers out of its management fee.
Economies of Scale
The Board noted that the advisory fee schedule for the Portfolios of the Trust does not contain breakpoints that reduce the fee rate on assets above specified levels. The Board received and discussed information concerning whether PI realizes economies of scale as each Portfolio’s assets grow beyond current levels. However, because of the nature of PI’s business, the Board could not reach definitive conclusions as to whether PI might realize economies of scale on a particular Portfolio or how great they may be. In light of each Portfolio’s current size and fee rate, the Board concluded that the absence of breakpoints in each Portfolio’s fee schedule is acceptable at this time.
Other Benefits to PI and the Subadvisers
The Board considered potential ancillary benefits that might be received by PI, the subadvisers, and their affiliates as a result of their relationship with the Fund. The Board concluded that potential benefits to be derived by PI included brokerage commissions received by affiliates of PI, transfer agency fees received by the Trust’s transfer agent (which is affiliated with PI), as well as benefits to the reputation or other intangible benefits resulting from PI’s association with the Fund. The Board concluded that the potential benefits to be derived by the subadvisers included the ability to use soft dollar credits, brokerage commissions received by affiliates of the subadvisers, as well as the potential benefits consistent with those generally resulting from an increase in assets under management, specifically, potential access to additional research resources and benefits to the reputation. The Board concluded that the benefits derived by PI and the subadvisers were consistent with the types of benefits generally derived by investment managers and subadvisers to mutual funds.
Performance of the Portfolios / Fees and Expenses / Other Factors
With respect to each Portfolio of the Trust, the Board also considered certain additional specific factors and related conclusions relating to the performance and fees and expenses of the Portfolios, as detailed below. Among other things, the Board
| | |
| THE TARGET PORTFOLIO TRUST | | |
Approval of Advisory Agreements (continued)
considered comparisons with other mutual funds in relevant Peer Universes and Peer Groups. The mutual funds included in each Peer Universe or Peer Group were objectively determined solely by Lipper Inc., an independent provider of mutual fund data. The comparisons placed the Portfolios of the Trust in various quartiles over one-year, three-year, five-year, and, where applicable, ten-year time periods ending December 31, with the first quartile being the best 25% of the mutual funds (for performance, the best performing mutual funds and, for expenses, the lowest cost mutual funds).
The Board also considered each Portfolio’s actual management fee (which reflects any subsidies, expense caps or waivers), as well as each Portfolio’s total expenses.
Intermediate-Term Bond Portfolio. The Board received and considered information about the Portfolio’s historical performance, noting that the Portfolio’s gross performance in relation to its Peer Universe (the Lipper Intermediate Investment-Grade Debt Funds Performance Universe) was in the first quartile over the one- and three-year periods, and in the second quartile over the five- and ten-year periods. The Board noted that the Portfolio outperformed against its benchmark index over all periods. The Board concluded that, in light of the Portfolio’s competitive performance, it would be in the interest of the Portfolio and its shareholders to renew the agreements.
The Board considered that the Portfolio’s actual management fee (which reflects any subsidies, expense caps or waivers) ranked in the Expense Group’s second quartile and that the Portfolio’s total expenses ranked in the Expense Group’s first quartile. The Board concluded that the management and subadvisory fees are reasonable in light of the services provided.
International Bond Portfolio. The Board received and considered information about the Portfolio’s historical performance, noting that the Portfolio’s gross performance in relation to its Peer Universe (the Lipper International Income Funds Performance Universe) was in the second quartile over the three-year period, but was in the fourth quartile over the one-, five- and ten-year periods. The Board noted that the Portfolio underperformed its benchmark index for all periods. The Board noted PI’s assertion that most of the other mutual funds included in the Peer Universe do not utilize a currency hedging strategy, which the Portfolio uses. Also, the Board considered PI’s assertion that the performance of the Portfolio suffered because of the Portfolio’s utilization of currency hedging and the weakness of the dollar during the periods under review. The Board further noted that in periods when the dollar was stronger, such as in 2005, the Portfolio had performed above the median of the Peer Universe.
| | |
| | THE TARGET PORTFOLIO TRUST |
The Board also noted that the Portfolio’s current subadviser, Pacific Investment Management Company LLC (PIMCO), had assumed responsibility for the Portfolio in late 2004. In light of this, the Board concluded that it was reasonable to allow PIMCO to continue to create a performance record against which PIMCO should be evaluated, to approve the continuance of the management and subadvisory agreements and to continue to monitor the Portfolio.
The Board considered that the Portfolio’s actual management fee (which reflects any subsidies, expense caps or waivers) and total expenses both ranked in the Expense Group’s first quartile. The Board concluded that the management and subadvisory fees are reasonable in light of the services provided.
International Equity Portfolio. The Board received and considered information about the Portfolio’s historical performance, noting that the Portfolio’s gross performance in relation to its Peer Universe (a custom blend of mutual funds included in the Lipper Multi-Cap Core Funds and Large-Cap Core Funds Performance Universe)1 was in the first quartile over the one- and three-year periods, and was in the third quartile over the five- and ten-year periods. The Board noted that the Portfolio outperformed its benchmark index for all periods. The Board noted that the Portfolio’s current subadvisers (LSV Asset Management and Thornburg Investment Management, Inc.) had assumed responsibility for the Portfolio in 2005, and that the Portfolio’s recent performance was satisfactory. The Board concluded that, in light of the Portfolio’s recent competitive performance, it would be in the interest of the Portfolio and its shareholders to renew the agreements.
The Board considered that the Portfolio’s actual management fee (which reflects any subsidies, expense caps or waivers) ranked in the Expense Group’s second quartile, and that total expenses ranked in the Expense Group’s first quartile. The Board concluded that the management and subadvisory fees are reasonable in light of the services provided.
Large Capitalization Growth Portfolio. The Board received and considered information about the Portfolio’s historical performance, noting that the Portfolio’s gross performance in relation to its Peer Universe (the Lipper Large-Cap Growth Funds Performance Universe)2 was in the second quartile
1 | The custom blend was utilized for performance comparisons, although Lipper classifies the Portfolio in its International Large-Cap Value Funds Performance Universe because PI believes that the funds included in this Universe provide a more appropriate basis for Portfolio performance comparisons. |
2 | The Large-Cap Growth Funds Performance Universe was utilized for performance comparisons, although Lipper classifies the Portfolio in its Large-Cap Core Funds Performance Universe because PI believes that the funds included in this Universe provide a more appropriate basis for Portfolio performance comparisons. |
| | |
| THE TARGET PORTFOLIO TRUST | | |
Approval of Advisory Agreements (continued)
over the five- and ten-year periods, in the third quartile over the three-year period, and in the fourth quartile over the one-year period. The Board noted that the Portfolio outperformed its benchmark index over all periods except the one-year period. While the Board concluded that it would be in the interest of the Portfolio and its shareholders to renew the Agreement, it also decided to pursue strategic alternatives to address Portfolio performance.
The Board considered that the Portfolio’s actual management fee (which reflects any subsidies, expense caps or waivers) and total expenses both ranked in the Expense Group’s first quartile. The Board concluded that the management and subadvisory fees are reasonable in light of the services provided.
Large Capitalization Value Portfolio. The Board received and considered information about the Portfolio’s historical performance, noting that the Portfolio’s gross performance in relation to its Peer Universe (the Lipper Large-Cap Value Funds Performance Universe)3 was in the first quartile over the five-year period, in the second quartile over the ten-year period, in the third quartile over the three-year period, and in the fourth quartile over the one-year period. The Board also noted that the Portfolio outperformed its benchmark index over all periods except the three-year period. The Board determined that, in light of the Portfolio’s competitive performance vis-à-vis its benchmark index, it would be in the interest of the Portfolio and its shareholders to renew the agreements.
The Board considered that the Portfolio’s actual management fee (which reflects any subsidies, expense caps or waivers) and total expenses both ranked in the Expense Group’s first quartile. The Board concluded that the management and subadvisory fees are reasonable in light of the services provided.
Mortgage Backed Securities Portfolio. The Board received and considered information about the Portfolio’s historical performance, noting that the Portfolio’s gross performance in relation to its Peer Universe (the Lipper U.S. Mortgage Funds Performance Universe) was in the first quartile over the one-, three-, five- and ten-year periods. The Board also noted that the Portfolio outperformed its benchmark index over all periods. The Board determined that, in light of the Portfolio’s competitive performance, it would be in the interest of the Portfolio and its shareholders to renew the agreements.
3 | The Large-Cap Value Funds Performance Universe was utilized for performance comparisons, although Lipper classifies the Fund in its Multi-Cap Value Funds Performance Universe because PI believes that the funds included in this Universe provide a more appropriate basis for Portfolio performance comparisons. |
| | |
| | THE TARGET PORTFOLIO TRUST |
4 | The factors considered by the Board in approving new subadvisory agreements for the Portfolio are discussed separately in Section II. |
5 | Although Lipper classifies the Portfolio in its Small-Cap Core Funds Performance Universe, the Small-Cap Value Funds Performance Universe was utilized for performance comparisons, because PI believes that the funds included in this Universe provide a more appropriate basis for Portfolio performance comparisons. |
The Board considered that the Portfolio’s actual management fee (which reflects any subsidies, expense caps or waivers) and total expenses both ranked in the Expense Group’s first quartile. The Board concluded that the management and subadvisory fees are reasonable in light of the services provided.
Small Capitalization Growth Portfolio. The Board received and considered information about the Portfolio’s historical performance, noting that the Portfolio’s gross performance in relation to its Peer Universe (the Lipper Small-Cap Growth Funds Performance Universe) was in the third quartile over the one-year period, and in the fourth quartile over the three-, five- and ten-year periods. The Board also noted that the Portfolio underperformed its benchmark index over all periods.
The Board considered that SIRG had recommended, and the Board had approved, the replacement of the existing subadvisers (RS Investment Management Company LLC and Transamerica Investment Management) with new subadvisers, and that the new subadvisers were expected to assume subadvisory responsibilities for the Portfolio later in 2008. Accordingly, the Board determined that it was in the interest of the Portfolio and its shareholders to renew the existing agreements on an interim basis, until the new subadvisers began to manage the Portfolio.4
The Board considered that the Portfolio’s actual management fee (which reflects any subsidies, expense caps or waivers) and total expenses both ranked in the Expense Group’s first quartile. The Board concluded that the management and subadvisory fees are reasonable in light of the services provided.
Small Capitalization Value Portfolio. The Board received and considered information about the Portfolio’s historical performance, noting that the Portfolio’s gross performance in relation to its Peer Universe (the Lipper Small-Cap Value Funds Performance Universe)5 was in the first quartile over the one-, three-, five- and ten-year periods. The Board also noted that the Portfolio outperformed against its benchmark index over all periods. The Board determined that, in light of the Portfolio’s competitive performance, it would be in the interest of the Portfolio and its shareholders to renew the agreements.
| | |
| THE TARGET PORTFOLIO TRUST | | |
Approval of Advisory Agreements (continued)
The Board considered that the Portfolio’s actual management fee (which reflects any subsidies, expense caps or waivers) and total expenses both ranked in the Expense Group’s first quartile. The Board concluded that the management and subadvisory fees are reasonable in light of the services provided.
Total Return Bond Portfolio. The Board received and considered information about the Portfolio’s historical performance, noting that the Portfolio’s gross performance in relation to its Peer Universe (the Lipper Intermediate Investment-Grade Debt Funds Performance Universe)6 was in the first quartile over the one-, three-, five- and ten-year periods. The Board also noted that the Portfolio outperformed its benchmark index over all periods. The Board determined that, in light of the Portfolio’s competitive performance, it would be in the interest of the Portfolio and its shareholders to renew the agreements.
The Board considered that the Portfolio’s actual management fee (which reflects any subsidies, expense caps or waivers) ranked in the Expense Group’s second quartile, and that total expenses ranked in the Expense Group’s first quartile. The Board concluded that the management and subadvisory fees are reasonable in light of the services provided.
U.S. Government Money Market Portfolio. The Board received and considered information about the Portfolio’s historical performance, noting that the Portfolio’s gross performance in relation to its Peer Universe (the Lipper U.S. Government Money Market Funds Performance Universe) was in the second quartile over the one- and three-year periods, in the first quartile over the five-year period, and in the third quartile over the ten-year period. The Board also considered that the Portfolio outperformed or performed competitively vis-à-vis the Portfolio benchmark average over all periods. The Board determined that, in light of the Portfolio’s competitive performance, it would be in the interest of the Portfolio and its shareholders to renew the agreements.
The Board considered that the Portfolio’s actual management fee (which reflects any subsidies, expense caps or waivers) and total expenses both ranked in the Expense Group’s second quartile. The Board concluded that the management and subadvisory fees are reasonable in light of the services provided.
6 | Although Lipper classifies the Portfolio in its BBB-rated Corporate Debt Funds Performance Universe, the Intermediate Investment-Grade Debt Funds Performance Universe was utilized for performance comparisons, because PI believes that the funds included in this Universe provide a more appropriate basis for Portfolio performance comparisons. |
| | |
| | THE TARGET PORTFOLIO TRUST |
II. Approval of New Subadvisory Agreements: Small Capitalization Growth Portfolio
At the meetings held on June 3-5, 2008, the Board, including all of the Independent Trustees, approved two new subadvisory agreements for the Small Capitalization Growth Portfolio of the Trust, as explained below.
Pursuant to a recommendation by PI, the Board approved a new subadvisory agreement between PI and Eagle Asset Management (“Eagle”) and the termination of the existing subadvisory agreement with RS Investment Management Co. LLC. (“RS”). Also pursuant to a recommendation by PI, the Board approved a new subadvisory agreement between PI and Ashfield Capital Partners LLC (“Ashfield”) and the termination of the existing subadvisory agreement with Transamerica Investment Management LLC (“Transamerica”). The Board noted that its renewal of the existing subadvisory agreements between PI and each of RS and Transamerica were intended only as interim renewals to permit PI to effect an orderly transition of subadvisory responsibilities from RS and Transamerica to Eagle and Ashfield, respectively.
Reasons for Recommending the New Subadvisory Agreements
PI recommended to the Board that it approve a new subadvisory agreement with Eagle and Ashfield with respect to the Small Capitalization Growth Portfolio of the Trust based on the Portfolio’s long-term underperformance. The Board considered an analysis prepared by SIRG and noted SIRG’s recommendation that the Portfolio would be better served in the future by switching subadvisers.
Nature, Quality, and Extent of Services
The Board received and considered information regarding the nature and extent of services provided to the Portfolio by RS and Transamerica under the current subadvisory agreements and those that would be provided by Eagle and Ashfield under the new subadvisory agreements, noting that the nature and extent of services under the existing and new agreements were generally similar in that RS, Transamerica, Eagle and Ashfield were each required to provide day-to-day portfolio management services and comply with all Portfolio policies and applicable rules and regulations.
With respect to the quality of services, the Board considered, among other things, the background and experience of the Eagle and Ashfield management teams. The Board met with representatives from Eagle and Ashfield and reviewed the qualifications,
| | |
| THE TARGET PORTFOLIO TRUST | | |
Approval of Advisory Agreements (continued)
backgrounds and responsibilities of the portfolio managers who would be responsible for the day-to-day management of the Portfolio. The Board was also provided with information pertaining to the organizational structure, senior management, investment operations, and other relevant information pertaining to Eagle and Ashfield. The Board noted that it received a favorable compliance reports from the Trust’s CCO as to both Eagle and Ashfield.
The Board concluded that it was satisfied with the nature, extent and quality of the investment subadvisory services anticipated to be provided to the Portfolio by Eagle and Ashfield and that there was a reasonable basis on which to conclude that the Portfolio would benefit from the subadvisory services to be provided by Eagle and Ashfield under the new subadvisory agreements.
Performance of the Portfolio
The Board received and considered information regarding the performance of other investment companies managed by Eagle and Ashfield utilizing investment styles and strategies similar to that proposed for the Portfolio.
Investment Subadvisory Fee Rates
The Board considered the proposed subadvisory fee rates payable by PI to Eagle and Ashfield under the proposed new subadvisory agreements. The Board also considered, among other things, the fee rates payable to Eagle and Ashfield by other funds with investment objective similar to that of the Portfolio. The Board noted that PI pays the subadvisory fees, and therefore any change in the proposed subadvisory fee rates would not have any impact on the amount of fees paid by the Portfolio. Instead, any increase or decrease will increase or decrease, as applicable, the net fee rates retained by PI.
The Board concluded that the proposed subadvisory fee rates under the new subadvisory agreements were reasonable.
Subadvisers’ Profitability
Because the engagement of Eagle and Ashfield is new, there is no historical profitability with regard to their arrangements with the Portfolio. As a result, the Board did not consider this factor. The Board noted that profitability would be reviewed annually in connection with the review of advisory agreements.
| | |
| | THE TARGET PORTFOLIO TRUST |
Economies of Scale
The Board noted that the proposed subadvisory fee schedules for the Portfolio contained breakpoints that would reduce the fee rate on assets above specified levels, noting that PI pays the subadvisory fees.
Other Benefits to the Subadvisers or their Affiliates from Serving as Subadviser
The Board considered potential ancillary benefits that might be received by Eagle and Ashfield and their affiliates as a result of its relationships with the Portfolio. The Board concluded that the potential benefits to be derived by Eagle and Ashfield included the ability to use soft dollar credits, brokerage commissions received by affiliates of Eagle or Ashfield, as well as the potential benefits consistent with those generally resulting from an increase in assets under management, specifically, potential access to additional research resources and benefits to the reputation. The Board concluded that the benefits to be derived by PI and Eagle and Ashfield were consistent with the types of benefits generally derived by subadvisers to mutual funds.
After full consideration of these factors, the Board concluded that the approval of the agreements was in the best interest of the Portfolio and its shareholders.
| | |
| THE TARGET PORTFOLIO TRUST | | |
Growth of a $10,000 Investment
Large Capitalization Growth Portfolio
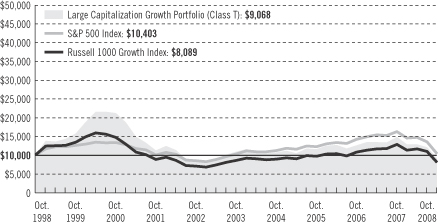
| | | | | | | | | | | |
| Average Annual Total Returns as of 10/31/08 | | | | | | | | | |
| | | One Year | | | Five Years | | | Ten Years | | | Since Inception |
With TARGET Program Fee (Class R) | | –38.48 | % | | N/A | | | N/A | | | –11.05% (8/22/06) |
With TARGET Program Fee (Class T) | | –39.03 | | | –3.71 | % | | –0.97 | % | | — |
| | | | |
| | | One Year | | | Five Years | | | Ten Years | | | Since Inception |
Without TARGET Program Fee (Class R) | | –38.48 | % | | N/A | | | N/A | | | –11.05% (8/22/06) |
Without TARGET Program Fee (Class T) | | –38.14 | | | –2.26 | % | | 0.52 | % | | — |
Performance data quoted represent past performance. Past performance does not guarantee future results. The investment return and principal value of an investment will fluctuate, so that an investor’s shares, when redeemed, may be worth more or less than their original cost. Current performance may be lower or higher than the past performance data quoted. An investor may obtain performance data as of the most recent month-end by visiting our website at www.prudential.com or by calling (800) 225-1852. The maximum TARGET program fee for retail investors is 1.50%. Gross operating expenses: Class R, 1.49%; Class T, 0.74%. Net operating expenses apply to: Class R, 1.24%; Class T, 0.74%, after contractual reduction through 2/28/2010.
The returns in the graph and the tables do not reflect the deduction of taxes that a shareholder would pay on Fund distributions or following the redemption of Fund shares.
The graph compares a $10,000 investment in the TARGET Large Capitalization Growth Portfolio (Class T) with a similar investment in the S&P 500 Index and the Russell 1000 Growth Index by portraying the initial account
| | |
| | THE TARGET PORTFOLIO TRUST |
values at the beginning of the 10-year period (October 31, 1998) and the account values at the end of the current fiscal year (October 31, 2008), as measured on a quarterly basis. The graph takes into account the maximum quarterly TARGET program fee of 1.50% annually for retail investors. The average annual total returns in the table and the returns on investment in the graph do not reflect the deduction of taxes that a shareholder would pay on Portfolio distributions or following the redemption of Portfolio shares.
The S&P 500 Index is an index of 500 stocks of large U.S. companies. It gives a broad look at how U.S. stock prices have performed. The Russell 1000 Growth Index contains those securities in the Russell 1000 Index with a greater-than-average growth orientation. Companies in this index tend to exhibit higher price-to-book and price-to-earnings ratios, lower dividend yields, and higher forecasted growth rates. These indexes are unmanaged, and the total returns include the reinvestment of all dividends, but do not include the effect of sales charges, operating expenses, or taxes. These returns would be lower if they included the effect of sales charges, operating expenses, or taxes. The securities in these indexes may differ substantially from the securities in the Portfolio. These indexes are not the only ones that may be used to characterize performance of large-capitalization equity funds, and other indexes may portray different comparative performance. Investors cannot invest directly in an index.
| | |
| THE TARGET PORTFOLIO TRUST | | |
Growth of a $10,000 Investment
Large Capitalization Value Portfolio
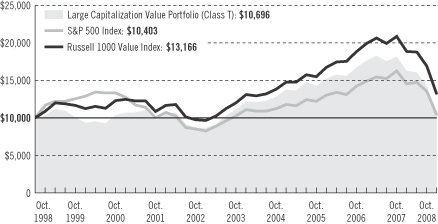
| | | | | | | | | | | |
| Average Annual Total Returns as of 10/31/08 | | | | | | | | | |
| | | One Year | | | Five Years | | | Ten Years | | | Since Inception |
With TARGET Program Fee (Class R) | | –40.60 | % | | N/A | | | N/A | | | –15.52% (8/22/06) |
With TARGET Program Fee (Class T) | | –41.14 | | | –0.85 | % | | 0.68 | % | | — |
| | | | |
| | | One Year | | | Five Years | | | Ten Years | | | Since Inception |
Without TARGET Program Fee (Class R) | | –40.60 | % | | N/A | | | N/A | | | –15.52% (8/22/06) |
Without TARGET Program Fee (Class T) | | –40.29 | | | 0.64 | % | | 2.19 | % | | — |
Performance data quoted represent past performance. Past performance does not guarantee future results. The investment return and principal value of an investment will fluctuate, so that an investor’s shares, when redeemed, may be worth more or less than their original cost. Current performance may be lower or higher than the past performance data quoted. An investor may obtain performance data as of the most recent month-end by visiting our website at www.prudential.com or by calling (800) 225-1852. The maximum TARGET program fee for retail investors is 1.50%. Gross operating expenses: Class R, 1.46%; Class T, 0.71%. Net operating expenses apply to: Class R, 1.21%; Class T, 0.71%, after contractual reduction through 2/28/2010.
The returns in the graph and the tables do not reflect the deduction of taxes that a shareholder would pay on Fund distributions or following the redemption of Fund shares.
The graph compares a $10,000 investment in the TARGET Large Capitalization Value Portfolio (Class T) with a similar investment in the S&P 500 Index and the Russell 1000 Value Index by portraying the initial account
| | |
| | THE TARGET PORTFOLIO TRUST |
values at the beginning of the 10-year period (October 31, 1998) and the account values at the end of the current fiscal year (October 31, 2008), as measured on a quarterly basis. The graph takes into account the maximum quarterly TARGET program fee of 1.50% annually for retail investors. The average annual total returns in the table and the returns on investment in the graph do not reflect the deduction of taxes that a shareholder would pay on Portfolio distributions or following the redemption of Portfolio shares.
The S&P 500 Index is an index of 500 stocks of large U.S. companies. It gives a broad indication of how U.S. stock prices have performed. The Russell 1000 Value Index contains those securities in the Russell 1000 Index with a less-than-average growth orientation. Companies in this index generally have low price-to-book and price-to-earnings ratios, higher dividend yields, and lower forecasted growth values. These indexes are unmanaged, and the total returns include the reinvestment of all dividends, but do not include the effect of sales charges, operating expenses, or taxes. These returns would be lower if they included the effect of sales charges, operating expenses, or taxes. The securities in these indexes may differ substantially from the securities in the Portfolio. These indexes are not the only ones that may be used to characterize performance of large-capitalization equity funds, and other indexes may portray different comparative performance. Investors cannot invest directly in an index.
| | |
| THE TARGET PORTFOLIO TRUST | | |
Growth of a $10,000 Investment
Small Capitalization Growth Portfolio
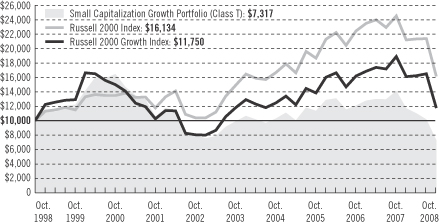
| | | | | | | | | | | |
| Average Annual Total Returns as of 10/31/08 | | | | | | | | | |
| | | One Year | | | Five Years | | | Ten Years | | | Since Inception |
With TARGET Program Fee (Class R) | | –47.78 | % | | N/A | | | N/A | | | –17.85% (8/22/06) |
With TARGET Program Fee (Class T) | | –48.29 | | | –5.92 | % | | –3.07 | % | | — |
| | | | |
| | | One Year | | | Five Years | | | Ten Years | | | Since Inception |
Without TARGET Program Fee (Class R) | | –47.78 | % | | N/A | | | N/A | | | –17.85% (8/22/06) |
Without TARGET Program Fee (Class T) | | –47.54 | | | –4.51 | % | | –1.61 | % | | — |
Performance data quoted represent past performance. Past performance does not guarantee future results. The investment return and principal value of an investment will fluctuate, so that an investor’s shares, when redeemed, may be worth more or less than their original cost. Current performance may be lower or higher than the past performance data quoted. An investor may obtain performance data as of the most recent month-end by visiting our website at www.prudential.com or by calling (800) 225-1852. The maximum TARGET program fee for retail investors is 1.50%. Gross operating expenses: Class R, 1.55%; Class T, 0.80%. Net operating expenses apply to: Class R, 1.30%; Class T, 0.80%, after contractual reduction through 2/28/2010.
The returns in the graph and the tables do not reflect the deduction of taxes that a shareholder would pay on Fund distributions or following the redemption of Fund shares.
The graph compares a $10,000 investment in the TARGET Small Capitalization Growth Portfolio (Class T) with a similar investment in the Russell 2000 Index and the Russell 2000 Growth Index by portraying the initial account
| | |
| | THE TARGET PORTFOLIO TRUST |
values at the beginning of the 10-year period (October 31, 1998) and the account values at the end of the current fiscal year (October 31, 2008), as measured on a quarterly basis. The graph takes into account the maximum quarterly TARGET program fee of 1.50% annually for retail investors. The average annual total returns in the table and the returns on investment in the graph do not reflect the deduction of taxes that a shareholder would pay on Portfolio distributions or following the redemption of Portfolio shares.
The Russell 2000 Index is a weighted index that comprises the smallest 2,000 stocks among the largest 3,000 equity-capitalized U.S. corporations and represents approximately 10% of their aggregate market value. The Russell 2000 Growth Index comprises securities in the Russell 2000 Index with a greater-than-average growth orientation. Companies in this index tend to exhibit higher price-to-book ratios and higher forecasted growth values. These indexes are unmanaged, and the total returns include the reinvestment of all dividends, but do not include the effect of sales charges, operating expenses, or taxes. These returns would be lower if they included the effect of sales charges, operating expenses, or taxes. The securities in these indexes may differ substantially from the securities in the Portfolio. These indexes are not the only ones that may be used to characterize performance of small-capitalization equity funds, and other indexes may portray different comparative performance. Investors cannot invest directly in an index.
| | |
| THE TARGET PORTFOLIO TRUST | | |
Growth of a $10,000 Investment
Small Capitalization Value Portfolio
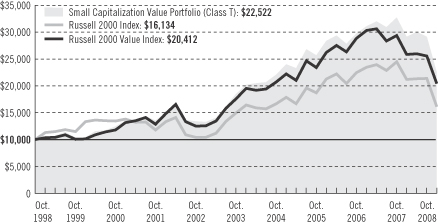
| | | | | | | | | | | |
| Average Annual Total Returns as of 10/31/08 | | | | | | | | | |
| | | One Year | | | Five Years | | | Ten Years | | | Since Inception |
With TARGET Program Fee (Class R) | | –30.57 | % | | N/A | | | N/A | | | –8.78% (8/22/06) |
With TARGET Program Fee (Class T) | | –31.23 | | | 3.99 | % | | 8.46 | % | | — |
| | | | |
| | | One Year | | | Five Years | | | Ten Years | | | Since Inception |
Without TARGET Program Fee (Class R) | | –30.57 | % | | N/A | | | N/A | | | –8.78% (8/22/06) |
Without TARGET Program Fee (Class T) | | –30.23 | | | 5.55 | % | | 10.09 | % | | — |
Performance data quoted represent past performance. Past performance does not guarantee future results. The investment return and principal value of an investment will fluctuate, so that an investor’s shares, when redeemed, may be worth more or less than their original cost. Current performance may be lower or higher than the past performance data quoted. An investor may obtain performance data as of the most recent month-end by visiting our website at www.prudential.com or by calling (800) 225-1852. The maximum TARGET program fee for retail investors is 1.50%. Gross operating expenses: Class R, 1.55%; Class T, 0.80%. Net operating expenses apply to: Class R, 1.30%; Class T, 0.80%, after contractual reduction through 2/28/2010.
The returns in the graph and the tables do not reflect the deduction of taxes that a shareholder would pay on Fund distributions or following the redemption of Fund shares.
The graph compares a $10,000 investment in the TARGET Small Capitalization Value Portfolio (Class T) with a similar investment in the Russell 2000 Index and the Russell 2000 Value Index by portraying the initial account
| | |
| | THE TARGET PORTFOLIO TRUST |
values at the beginning of the 10-year period (October 31, 1998) and the account values at the end of the current fiscal year (October 31, 2008), as measured on a quarterly basis. The graph takes into account the maximum quarterly TARGET program fee of 1.50% annually for retail investors. The average annual total returns in the table and the returns on investment in the graph do not reflect the deduction of taxes that a shareholder would pay on Portfolio distributions or following the redemption of Portfolio shares.
The Russell 2000 Index is a weighted index that comprises the smallest 2,000 stocks among the largest 3,000 equity-capitalized U.S. corporations and represents approximately 10% of their aggregate market value. The Russell 2000 Value Index comprises securities in the Russell 2000 Index with a less-than-average growth orientation. Companies in this index tend to exhibit lower price-to-book ratios and lower forecasted growth values. These indexes are unmanaged, and the total returns include the reinvestment of all dividends, but do not include the effect of sales charges, operating expenses, or taxes. These returns would be lower if they included the effect of sales charges, operating expenses, or taxes. The securities in these indexes may differ substantially from the securities in the Portfolio. These indexes are not the only ones that may be used to characterize performance of small-capitalization equity funds, and other indexes may portray different comparative performance. Investors cannot invest directly in an index.
| | |
| THE TARGET PORTFOLIO TRUST | | |
Growth of a $10,000 Investment
International Equity Portfolio
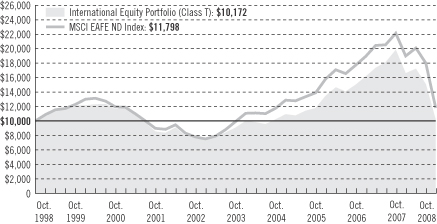
| | | | | | | | | | | |
| Average Annual Total Returns as of 10/31/08 | | | | | | | | | |
| | | One Year | | | Five Years | | | Ten Years | | | Since Inception |
With TARGET Program Fee (Class R) | | –48.30 | % | | N/A | | | N/A | | | –13.82% (8/22/06) |
With TARGET Program Fee (Class T) | | –48.73 | | | 2.30 | % | | 0.17 | % | | — |
| | | | |
| | | One Year | | | Five Years | | | Ten Years | | | Since Inception |
Without TARGET Program Fee (Class R) | | –48.30 | % | | N/A | | | N/A | | | –13.82% (8/22/06) |
Without TARGET Program Fee (Class T) | | –47.99 | | | 3.83 | % | | 1.68 | % | | — |
Performance data quoted represent past performance. Past performance does not guarantee future results. The investment return and principal value of an investment will fluctuate, so that an investor’s shares, when redeemed, may be worth more or less than their original cost. Current performance may be lower or higher than the past performance data quoted. An investor may obtain performance data as of the most recent month-end by visiting our website at www.prudential.com or by calling (800) 225-1852. The maximum TARGET program fee for retail investors is 1.50%. Gross operating expenses: Class R, 1.58%; Class T, 0.83%. Net operating expenses apply to: Class R, 1.33%; Class T, 0.83%, after contractual reduction through 2/28/2010.
The returns in the graph and the tables do not reflect the deduction of taxes that a shareholder would pay on Fund distributions or following the redemption of Fund shares.
The graph compares a $10,000 investment in the TARGET International Equity Portfolio (Class T) with a similar investment in the Morgan Stanley Capital International Europe, Australasia, Far East Index (MSCI EAFE ND Index)
| | |
| | THE TARGET PORTFOLIO TRUST |
by portraying the initial account values at the beginning of the 10-year period (October 31, 1998) and the account values at the end of the current fiscal year (October 31, 2008), as measured on a quarterly basis. The graph takes into account the maximum quarterly TARGET program fee of 1.50% annually for retail investors. The average annual total returns in the table and the returns on investment in the graph do not reflect the deduction of taxes that a shareholder would pay on Portfolio distributions or following the redemption of Portfolio shares.
The MSCI EAFE ND Index is a weighted index of performance that reflects stock price movements in Europe, Australasia, and the Far East. The MSCI EAFE ND Index is unmanaged, and the total returns include the reinvestment of all dividends, but do not include the effect of sales charges, operating expenses, or taxes. These returns would be lower if they included the effect of sales charges, operating expenses, or taxes. The securities in the MSCI EAFE ND Index may differ substantially from the securities in the Portfolio. The MSCI EAFE ND Index is not the only one that may be used to characterize performance of international equity funds, and other indexes may portray different comparative performance. Investors cannot invest directly in an index.
| | |
| THE TARGET PORTFOLIO TRUST | | |
Growth of a $10,000 Investment
International Bond Portfolio
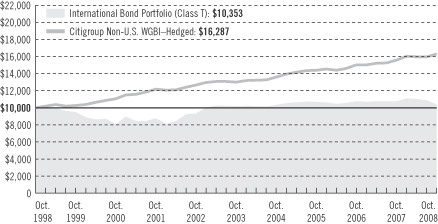
| | | | | | | | | |
| Average Annual Total Returns as of 10/31/08 | | | | | | | | | |
| | | One Year | | | Five Years | | | Ten Years | |
With TARGET Program Fee (Class T) | | –3.85 | % | | 0.32 | % | | 0.35 | % |
| | | |
| | | One Year | | | Five Years | | | Ten Years | |
Without TARGET Program Fee (Class T) | | –2.40 | % | | 1.84 | % | | 1.87 | % |
Performance data quoted represent past performance. Past performance does not guarantee future results. The investment return and principal value of an investment will fluctuate, so that an investor’s shares, when redeemed, may be worth more or less than their original cost. Current performance may be lower or higher than the past performance data quoted. An investor may obtain performance data as of the most recent month-end by visiting our website at www.prudential.com or by calling (800) 225-1852. The maximum TARGET program fee for retail investors is 1.50%. Gross operating expenses: Class T, 1.15%. Net operating expenses apply to: Class T, 1.15%.
The returns in the graph and the tables do not reflect the deduction of taxes that a shareholder would pay on Fund distributions or following the redemption of Fund shares.
The graph compares a $10,000 investment in the TARGET International Bond Portfolio (Class T) with a similar investment in the Citigroup Non-U.S. World Government Bond Index–Hedged (Citigroup Non-U.S. WGBI–Hedged) by portraying the initial account values at the beginning of the 10-year period (October 31, 1998) and the account values at the end of the current fiscal year (October 31, 2008), as measured on a quarterly basis. The
| | |
| | THE TARGET PORTFOLIO TRUST |
graph takes into account the maximum quarterly TARGET program fee of 1.50% annually for retail investors. The average annual total returns in the table and the returns on investment in the graph do not reflect the deduction of taxes that a shareholder would pay on Portfolio distributions or following the redemption of Portfolio shares.
The Citigroup Non-U.S. WGBI–Hedged is an unmanaged index of approximately 600 high-quality bonds with foreign currency exposure translated to the U.S. dollar. The index’s total return include the reinvestment of all dividends, but does not include the effect of sales charges, operating expenses, or taxes. The return would be lower if it included the effect of sales charges, operating expenses, or taxes. The securities in the index may differ substantially from the securities in the Portfolio. The index is not the only one that may be used to characterize performance of international bond funds, and other indexes may portray different comparative performance. Investors cannot invest directly in an index.
| | |
| THE TARGET PORTFOLIO TRUST | | |
Growth of a $10,000 Investment
Total Return Bond Portfolio
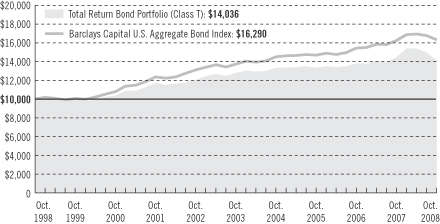
| | | | | | | | | | | |
| Average Annual Total Returns as of 10/31/08 | | | | | | | | | |
| | | One Year | | | Five Years | | | Ten Years | | | Since Inception |
With TARGET Program Fee (Class R) | | –2.24 | % | | N/A | | | N/A | | | 2.06% (8/22/06) |
With TARGET Program Fee (Class T) | | –3.13 | | | 1.87 | % | | 3.45 | % | | — |
| | | | |
| | | One Year | | | Five Years | | | Ten Years | | | Since Inception |
Without TARGET Program Fee (Class R) | | –2.24 | % | | N/A | | | N/A | | | 2.06% (8/22/06) |
Without TARGET Program Fee (Class T) | | –1.71 | | | 3.42 | % | | 5.02 | % | | — |
Performance data quoted represent past performance. Past performance does not guarantee future results. The investment return and principal value of an investment will fluctuate, so that an investor’s shares, when redeemed, may be worth more or less than their original cost. Current performance may be lower or higher than the past performance data quoted. An investor may obtain performance data current to the most recent month-end by visiting our website at www.prudential.com or by calling (800) 225-1852. The maximum TARGET program fee for retail investors is 1.50%. Gross operating expenses: Class R, 1.48%; Class T, 0.73%. Net operating expenses apply to: Class R, 1.23%; Class T, 0.73%, after contractual reduction through 2/28/2010.
The returns in the graph and the tables do not reflect the deduction of taxes that a shareholder would pay on Fund distributions or following the redemption of Fund shares.
The graph compares a $10,000 investment in the TARGET Total Return Bond Portfolio (Class T) with a similar investment in the Barclays Capital U.S. Aggregate Bond Index by portraying the initial account values at the
| | |
| | THE TARGET PORTFOLIO TRUST |
beginning of the 10-year period (October 31, 1998) and the account values at the end of the current fiscal year (October 31, 2008), as measured on a quarterly basis. The graph takes into account the maximum quarterly TARGET program fee of 1.50% annually for retail investors. The average annual total returns in the table and the returns on investment in the graph do not reflect the deduction of taxes that a shareholder would pay on Portfolio distributions or following the redemption of Portfolio shares.
The Barclays Capital U.S. Aggregate Bond Index is an unmanaged index of investment-grade securities issued by the U.S. government and its agencies and by corporations with between one and 10 years remaining to maturity. It gives a broad look at how bond prices of short- and intermediate-term bonds have performed. This index is unmanaged, and the total returns include the reinvestment of all dividends, but do not include the effect of sales charges, operating expenses, or taxes. These returns would be lower if they included the effect of sales charges, operating expenses, or taxes. The securities in these indexes may differ substantially from the securities in the Portfolio. This index is not the only one that may be used to characterize performance of bond funds, and other indexes may portray different comparative performance. Investors cannot invest directly in an index.
| | |
| THE TARGET PORTFOLIO TRUST | | |
Growth of a $10,000 Investment
Intermediate-Term Bond Portfolio
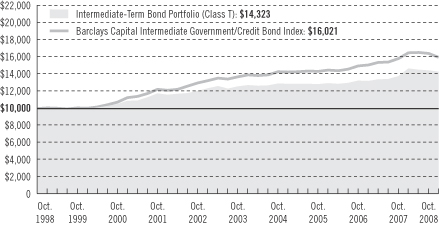
| | | | | | | | | |
| Average Annual Total Returns as of 10/31/08 | | | | | | | | | |
| | | One Year | | | Five Years | | | Ten Years | |
With TARGET Program Fee (Class T) | | 3.48 | % | | 2.52 | % | | 3.66 | % |
| | | |
| | | One Year | | | Five Years | | | Ten Years | |
Without TARGET Program Fee (Class T) | | 5.07 | % | | 4.09 | % | | 5.23 | % |
Performance data quoted represent past performance. Past performance does not guarantee future results. The investment return and principal value of an investment will fluctuate, so that an investor’s shares, when redeemed, may be worth more or less than their original cost. Current performance may be lower or higher than the past performance data quoted. An investor may obtain performance data as of the most recent month-end by visiting our website at www.prudential.com or by calling (800) 225-1852. The maximum TARGET program fee for retail investors is 1.50%. Gross operating expenses: Class T, 0.60%. Net operating expenses apply to: Class T, 0.60%.
The returns in the graph and the tables do not reflect the deduction of taxes that a shareholder would pay on Fund distributions or following the redemption of Fund shares.
The graph compares a $10,000 investment in the TARGET Intermediate-Term Bond Portfolio (Class T) with a similar investment in the Barclays Capital Intermediate Government/Credit Bond Index by portraying the initial account values at the beginning of the 10-year period (October 31, 1998) and the account values at the end of the current fiscal year (October 31, 2008), as measured on a quarterly basis. The graph takes into account the maximum quarterly TARGET program fee of 1.50% annually for retail investors. The average annual total returns in the table and the returns on investment in the graph do not reflect the deduction of taxes that a shareholder would pay on Portfolio distributions or following the redemption of Portfolio shares.
| | |
| | THE TARGET PORTFOLIO TRUST |
The Barclays Capital Intermediate Government/Credit Bond Index is a weighted index comprising securities issued by the U.S. government and its agencies and securities publicly issued by corporations with 1 to 10 years remaining to maturity and rated investment grade. The Barclays Capital Intermediate Government/Credit Bond Index is unmanaged, and the total returns include the reinvestment of all dividends, but do not include the effect of sales charges, operating expenses, or taxes. These returns would be lower if they included the effect of sales charges, operating expenses, or taxes. The securities in the Barclays Capital Intermediate Government/Credit Bond Index may differ substantially from the securities in the Portfolio. The Barclays Capital Intermediate Government/Credit Bond Index is not the only one that may be used to characterize performance of bond funds, and other indexes may portray different comparative performance. Investors cannot invest directly in an index.
| | |
| THE TARGET PORTFOLIO TRUST | | |
Growth of a $10,000 Investment
Mortgage Backed Securities Portfolio
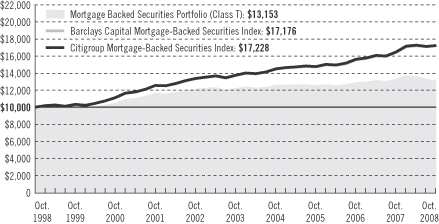
| | | | | | | | | |
| Average Annual Total Returns as of 10/31/08 | | | | | | | | | |
| | | One Year | | | Five Years | | | Ten Years | |
With TARGET Program Fee (Class T) | | –1.84 | % | | 1.32 | % | | 2.78 | % |
| | | |
| | | One Year | | | Five Years | | | Ten Years | |
Without TARGET Program Fee (Class T) | | –0.36 | % | | 2.86 | % | | 4.34 | % |
Performance data quoted represent past performance. Past performance does not guarantee future results. The investment return and principal value of an investment will fluctuate so that an investor’s shares, when redeemed, may be worth more or less than their original cost. Current performance may be lower or higher than the past performance data quoted. An investor may obtain performance data as of the most recent month-end by visiting our website at www.prudential.com or by calling (800) 225-1852. The maximum TARGET program fee for retail investors is 1.50%. Gross operating expenses: Class T, 1.94%. Net operating expenses apply to: Class T, 1.94%.
The returns in the graph and the tables do not reflect the deduction of taxes that a shareholder would pay on Fund distributions or following the redemption of Fund shares.
The graph compares a $10,000 investment in the TARGET Mortgage Backed Securities Portfolio (Class T) with a similar investment in the Barclays Capital Mortgage-Backed Securities Index and the Citigroup Mortgage-Backed Securities Index by portraying the initial account values at the beginning of the 10-year period (October 31, 1998) and the account values at the end of the current fiscal year (October 31, 2008), as measured on a
| | |
| | THE TARGET PORTFOLIO TRUST |
quarterly basis. The graph takes into account the maximum quarterly TARGET program fee of 1.50% annually for retail investors. The average annual total returns in the table and the returns on investment in the graph do not reflect the deduction of taxes that a shareholder would pay on Portfolio distributions or following the redemption of Portfolio shares.
The Barclays Capital Mortgage-Backed Securities Index is a market capitalization-weighted index of 15-year and 30-year fixed-rate securities backed by the mortgage pools of the GNMA, the FNMA, and the FHLMC, and balloon mortgages with fixed-rate coupons. The Citigroup Mortgage-Backed Securities Index is an index of 30- and 15-year mortgage-related securities issued by U.S. government agencies. It gives a broad indication of how mortgage-backed securities have performed. These indexes are unmanaged, and the total returns include the reinvestment of all dividends, but do not include the effect of sales charges, operating expenses, or taxes. These returns would be lower if they included the effect of sales charges, operating expenses, or taxes. The securities in these indexes may differ substantially from the securities in the Portfolio. These indexes are not the only ones that may be used to characterize performance of bond funds, and other indexes may portray different comparative performance. Investors cannot invest directly in an index.
| | |
| THE TARGET PORTFOLIO TRUST | | |
| | | | |
| n MAIL | | n TELEPHONE | | n WEBSITE |
Gateway Center Three 100 Mulberry Street Newark, NJ 07102 | | (800) 225-1852 | | www.prudential.com |
|
| PROXY VOTING |
| The Board of Trustees of The TARGET Portfolio Trust has delegated to the Trust’s investment subadvisers the responsibility for voting any proxies and maintaining proxy recordkeeping with respect to the Trust. A description of these proxy voting policies and procedures is available without charge, upon request, by calling (800) 225-1852 or by visiting the Securities and Exchange Commission’s website at www.sec.gov. Information regarding how the Trust voted proxies relating to portfolio securities during the most recent 12-month period ended June 30 is available on the Trust’s website and on the Commission’s website. |
|
| TRUSTEES |
| Kevin J. Bannon • Linda W. Bynoe • David E.A. Carson • Robert F. Gunia • Michael S. Hyland • Robert E. La Blanc • Douglas H. McCorkindale • Stephen P. Munn • Richard A. Redeker • Judy A. Rice • Robin B. Smith • Stephen G. Stoneburn |
|
| OFFICERS |
| Judy A. Rice, President • Robert F. Gunia, Vice President • Grace C. Torres, Treasurer and Principal Financial and Accounting Officer • Kathryn L. Quirk, Chief Legal Officer • Deborah A. Docs, Secretary • Timothy J. Knierim, Chief Compliance Officer • Valerie M. Simpson, Deputy Chief Compliance Officer • Theresa C. Thompson, Deputy Chief Compliance Officer • Noreen M. Fierro, Anti-Money Laundering Compliance Officer • Jonathan D. Shain, Assistant Secretary • Claudia DiGiacomo, Assistant Secretary • John P. Schwartz, Assistant Secretary • Andrew R. French, Assistant Secretary • M. Sadiq Peshimam, Assistant Treasurer • Peter Parrella, Assistant Treasurer |
| | | | |
| MANAGER | | Prudential Investments LLC | | Gateway Center Three
100 Mulberry Street Newark, NJ 07102 |
|
| INVESTMENT SUBADVISERS | | Ashfield Capital Partners, LLC
| | 750 Battery Street
Suite 600 San Francisco, CA 94111 |
|
| | Eagle Asset Management | | 880 Carillon Parkway
St. Petersburg, FL 33716 |
|
| | EARNEST Partners, LLC | | 75 14th Street
Suite 2300 Atlanta, GA 30309 |
|
| | Eaton Vance Management | | 255 State Street
Boston, MA 02109 |
|
| | Hotchkis and Wiley Capital
Management, LLC | | 725 S. Figueroa Street
Suite 3900 Los Angeles, CA 90017 |
|
| | J.P. Morgan Investment
Management, Inc. | | 522 Fifth Avenue
New York, NY 10036 |
| | | | |
| | Lee Munder Investments Ltd. | | 200 Clarendon Street
Boston, MA 02116 |
|
| | LSV Asset Management | | One North Wacker Drive
Suite 4000 Chicago, IL 60606 |
|
| | Marsico Capital
Management, LLC | | 1200 17th Street
Suite 1600 Denver, CO 80202 |
|
| | Massachusetts Financial
Services Company | | 500 Boylston Street
Boston, MA 02109 |
|
| | NFJ Investment Group L.P. | | 2121 San Jacinto
Suite 1840 Dallas, TX 75201 |
|
| | Pacific Investment
Management Company LLC | | 840 Newport Center Drive
Newport Beach, CA 92660 |
|
| | Thornburg Investment
Management, Inc. | | 119 East Marcy Street
Santa Fe, NM 87501 |
|
| | Vaughan Nelson Investment
Management, L.P. | | 600 Travis Street
Suite 6300 Houston, TX 77002 |
|
| | Wellington Management
Company, LLP | | 75 State Street
Boston, MA 02109 |
|
| DISTRIBUTOR | | Prudential Investment
Management Services LLC | | Gateway Center Three
100 Mulberry Street
Newark, NJ 07102 |
|
| CUSTODIAN | | PFPC Trust Company | | 400 Bellevue Parkway
Wilmington, DE 19809 |
|
| TRANSFER AGENT | | Prudential Mutual Fund
Services LLC | | PO Box 9658
Providence, RI 02940 |
|
| INDEPENDENT REGISTERED PUBLIC ACCOUNTING FIRM | | KPMG LLP | | 345 Park Avenue
New York, NY 10154 |
|
| FUND COUNSEL | | Willkie Farr & Gallagher LLP | | 787 Seventh Avenue
New York, NY 10019 |
|
| An investor should consider the investment objectives, risks, charges, and expenses of a Portfolio carefully before investing. The prospectuses for the Portfolios contain this and other information about the Portfolios. An investor may obtain a prospectus by visiting our website at www.prudential.com or by calling (800) 225-1852. The prospectus should be read carefully before investing. |
|
| E-DELIVERY |
| To receive your mutual fund documents on-line, go to www.icsdelivery.com/prudential/funds and enroll. Instead of receiving printed documents by mail, you will receive notification via e-mail when new materials are available. You can cancel your enrollment or change your e-mail address at any time by clicking on the change/cancel enrollment option at the icsdelivery website address. |
|
| SHAREHOLDER COMMUNICATIONS WITH TRUSTEES |
| Shareholders can communicate directly with the Board of Trustees by writing to the Chair of the Board, The TARGET Portfolio Trust, Prudential Investments, Attn: Board of Trustees, 100 Mulberry Street, Gateway Center Three, Newark, NJ 07102. Shareholders can communicate directly with an individual Trustee by writing to the same address. Communications are not screened before being delivered to the addressee. |
|
| AVAILABILITY OF PORTFOLIO SCHEDULE |
| The Trust files its complete schedule of portfolio holdings with the Securities and Exchange Commission for the first and third quarters of each fiscal year on Form N-Q. The Trusts’ Forms N-Q are available on the Commission’s website at www.sec.gov. The Trusts’ Forms N-Q may also be reviewed and copied at the Commission’s Public Reference Room in Washington, D.C. Information on the operation and location of the Public Reference Room may be obtained by calling (202) 551-8090. The Trust’s schedule of portfolio holdings is also available on the Trust’s website as of the end of each fiscal quarter. |
|
| The Trust’s Statement of Additional Information contains additional information about the Trust’s Trustees and is available without charge, upon request, by calling (800) 225-1852. |
Mutual Funds:
| | | | |
| ARE NOT INSURED BY THE FDIC OR ANY FEDERAL GOVERNMENT AGENCY | | MAY LOSE VALUE | | ARE NOT A DEPOSIT OF OR GUARANTEED BY ANY BANK OR ANY BANK AFFILIATE |

| | | | | | | | | | | | | | |
| | | The TARGET Portfolio Trust | | NASDAQ | | CUSIP | | | | NASDAQ | | CUSIP | | |
| | Large Capitalization Growth (Class R) | | TLCRX | | 875921868 | | Mortgage Backed Securities (Class T) | | TGMBX | | 875921702 | | |
| | Large Capitalization Growth (Class T) | | TALGX | | 875921207 | | Large Capitalization Value (Class R) | | TLVRX | | 875921850 | | |
| | Small Capitalization Growth (Class R) | | TSCRX | | 875921835 | | Large Capitalization Value (Class T) | | TALVX | | 875921108 | | |
| | Small Capitalization Growth (Class T) | | TASGX | | 875921405 | | Small Capitalization Value (Class R) | | TSVRX | | 875921843 | | |
| | International Equity (Class R) | | TEQRX | | 875921827 | | Small Capitalization Value (Class T) | | TASVX | | 875921306 | | |
| | International Equity (Class T) | | TAIEX | | 875921504 | | International Bond (Class T) | | TIBPX | | 875921876 | | |
| | Total Return Bond (Class R) | | TTBRX | | 875921819 | | Intermediate-Term Bond (Class T) | | TAIBX | | 875921801 | | |
| | Total Return Bond (Class T) | | TATBX | | 875921884 | | U.S. Govt Money Market (Class T) | | PUGXX | | 875921603 | | |
TMF158E IFS-A159497 Ed. 12/2008
Item 2 – Code of Ethics – See Exhibit (a)
As of the end of the period covered by this report, the registrant has adopted a code of ethics (the “Section 406 Standards for Investment Companies – Ethical Standards for Principal Executive and Financial Officers”) that applies to the registrant’s Principal Executive Officer and Principal Financial Officer; the registrant’s Principal Financial Officer also serves as the Principal Accounting Officer.
The registrant hereby undertakes to provide any person, without charge, upon request, a copy of the code of ethics. To request a copy of the code of ethics, contact the registrant 800-225-1852, and ask for a copy of the Section 406 Standards for Investment Companies – Ethical Standards for Principal Executive and Financial Officers.
Item 3 – Audit Committee Financial Expert –
The registrant’s Board has determined that Mr. David E. A. Carson, member of the Board’s Audit Committee is an “audit committee financial expert,” and that he is “independent,” for purposes of this Item.
Item 4 – Principal Accountant Fees and Services –
(a) Audit Fees
For the fiscal year ended October 31, 2008 and fiscal period January 1, 2007 through October 31, 2007, KPMG LLP (“KPMG”), the Registrant’s principal accountant, billed the Registrant $353,498 and $288,816, respectively, for professional services rendered for the audit of the Registrant’s annual financial statements or services that are normally provided in connection with statutory and regulatory filings.
(b) Audit-Related Fees
None.
(c) Tax Fees
None.
(d) All Other Fees
None.
(e) (1) Audit Committee Pre-Approval Policies and Procedures
THE PRUDENTIAL MUTUAL FUNDS
AUDIT COMMITTEE POLICY
on
Pre-Approval of Services Provided by the Independent Accountants
The Audit Committee of each Prudential Mutual Fund is charged with the responsibility to monitor the independence of the Fund’s independent accountants. As part of this responsibility, the Audit Committee must pre-approve any independent accounting firm’s engagement to render audit and/or permissible non-audit services, as required by law. In evaluating a proposed engagement of the independent accountants, the Audit Committee will assess the effect that the engagement might reasonably be expected to have on the accountant’s independence. The Committee’s evaluation will be based on:
| | • | | a review of the nature of the professional services expected to be provided, |
| | • | | a review of the safeguards put into place by the accounting firm to safeguard independence, and |
| | • | | periodic meetings with the accounting firm. |
Policy for Audit and Non-Audit Services Provided to the Funds
On an annual basis, the scope of audits for each Fund, audit fees and expenses, and audit-related and non-audit services (and fees proposed in respect thereof) proposed to be performed by the Fund’s independent accountants will be presented by the Treasurer and the independent accountants to the Audit Committee for review and, as appropriate, approval prior to the initiation of such services. Such presentation shall be accompanied by confirmation by both the Treasurer and the independent accountants that the proposed services will not adversely affect the independence of the independent accountants. Proposed services shall be described in sufficient detail to enable the Audit Committee to assess the appropriateness of such services and fees, and the compatibility of the provision of such services with the auditor’s independence. The Committee shall receive periodic reports on the progress of the audit and other services which are approved by the Committee or by the Committee Chair pursuant to authority delegated in this Policy.
The categories of services enumerated under “Audit Services”, “Audit-related Services”, and “Tax Services” are intended to provide guidance to the Treasurer and the independent accountants as to those categories of services which the Committee believes are generally consistent with the independence of the independent accountants and which the Committee (or the Committee Chair) would expect upon the presentation of specific proposals to pre-approve. The enumerated categories are not intended as an exclusive list of audit, audit-related or tax services, which the Committee (or the Committee Chair) would consider for pre-approval.
Audit Services
The following categories of audit services are considered to be consistent with the role of the Fund’s independent accountants:
| | • | | Annual Fund financial statement audits |
| | • | | Seed audits (related to new product filings, as required) |
| | • | | SEC and regulatory filings and consents |
Audit-related Services
The following categories of audit-related services are considered to be consistent with the role of the Fund’s independent accountants:
| | • | | Accounting consultations |
| | • | | Fund merger support services |
| | • | | Agreed Upon Procedure Reports |
| | • | | Other Internal Control Reports |
Individual audit-related services that fall within one of these categories and are not presented to the Audit Committee as part of the annual pre-approval process will be subject to pre-approval by the Committee Chair (or any other Committee member on whom this responsibility has been delegated) so long as the estimated fee for those services does not exceed $50,000.
Tax Services
The following categories of tax services are considered to be consistent with the role of the Fund’s independent accountants:
| | • | | Tax compliance services related to the filing or amendment of the following: |
| | • | | Federal, state and local income tax compliance; and, |
| | • | | Sales and use tax compliance |
| | • | | Timely RIC qualification reviews |
| | • | | Tax distribution analysis and planning |
| | • | | Tax authority examination services |
| | • | | Tax appeals support services |
| | • | | Accounting methods studies |
| | • | | Fund merger support services |
| | • | | Tax consulting services and related projects |
Individual tax services that fall within one of these categories and are not presented to the Audit Committee as part of the annual pre-approval process will be subject to pre-approval by the Committee Chair (or any other Committee member on whom this responsibility has been delegated) so long as the estimated fee for those services does not exceed $50,000.
Other Non-audit Services
Certain non-audit services that the independent accountants are legally permitted to render will be subject to pre-approval by the Committee or by one or more Committee members to whom the Committee has delegated this authority and who will report to the full Committee any pre-approval decisions made pursuant to this Policy. Non-audit services presented for pre-approval pursuant to this paragraph will be accompanied by a confirmation from both the Treasurer and the independent accountants that the proposed services will not adversely affect the independence of the independent accountants.
Proscribed Services
The Fund’s independent accountants will not render services in the following categories of non-audit services:
| | • | | Bookkeeping or other services related to the accounting records or financial statements of the Fund |
| | • | | Financial information systems design and implementation |
| | • | | Appraisal or valuation services, fairness opinions, or contribution-in-kind reports |
| | • | | Internal audit outsourcing services |
| | • | | Management functions or human resources |
| | • | | Broker or dealer, investment adviser, or investment banking services |
| | • | | Legal services and expert services unrelated to the audit |
| | • | | Any other service that the Public Company Accounting Oversight Board determines, by regulation, is impermissible. |
Pre-approval of Non-Audit Services Provided to Other Entities Within the Prudential Fund Complex
Certain non-audit services provided to Prudential Investments LLC or any of its affiliates that also provide ongoing services to the Prudential Mutual Funds will be subject to pre-approval by the Audit Committee. The only non-audit services provided to these entities that will require pre-approval are those related directly to the operations and financial reporting of the Funds. Individual projects that are not presented to the Audit Committee as part of the annual pre-approval process will be subject to pre-approval by the Committee Chair (or any other Committee member on whom this responsibility has been delegated) so long as the estimated fee for those services does not exceed $50,000. Services presented for pre-approval pursuant to this paragraph will be accompanied by a confirmation from both the Treasurer and the independent accountants that the proposed services will not adversely affect the independence of the independent accountants.
Although the Audit Committee will not pre-approve all services provided to Prudential Investments LLC and its affiliates, the Committee will receive an annual report from the Fund’s independent accounting firm showing the aggregate fees for all services provided to Prudential Investments and its affiliates.
(e) (2) Percentage of services referred to in 4(b) – 4(d) that were approved by the audit committee –
Not applicable.
(f) Percentage of hours expended attributable to work performed by other than full time employees of principal accountant if greater than 50%.
The percentage of hours expended on the principal accountant’s engagement to audit the registrant’s financial statements for the most recent fiscal year that were attributed to work performed by persons other than the principal accountant’s full-time, permanent employees was 0%.
(g) Non-Audit Fees
Not applicable to Registrant for the fiscal year ended October 31, 2008 and fiscal period January 1, 2007 through October 31, 2007. The aggregate non-audit fees billed by KPMG for services rendered to the registrant’s investment adviser and any entity controlling, controlled by, or under common control with the investment adviser that provides ongoing services to the registrant for the fiscal year ended October 31, 2008 and fiscal period January 1, 2007 through October 31, 2007 was $0 and $44,700, respectively.
(h) Principal Accountant’s Independence
Not applicable as KPMG has not provided non-audit services to the registrant’s investment adviser and any entity controlling, controlled by, or under common control with the investment adviser that provides ongoing services to the registrant that were not pre-approved pursuant to Rule 2-01(c)(7)(ii) of Regulation S-X.
Item 5 – Audit Committee of Listed Registrants – Not applicable.
Item 6 – Schedule of Investments – The schedule is included as part of the report to shareholders filed under Item 1 of this Form.
Item 7 – Disclosure of Proxy Voting Policies and Procedures for Closed-End Management Investment Companies – Not applicable.
Item 8 – Portfolio Managers of Closed-End Management Investment Companies – Not applicable.
Item 9 – Purchases of Equity Securities by Closed-End Management Investment Company and Affiliated Purchasers – Not applicable.
Item 10 – Submission of Matters to a Vote of Security Holders – Not applicable.
Item 11 – Controls and Procedures
| | (a) | It is the conclusion of the registrant’s principal executive officer and principal financial officer that the effectiveness of the registrant’s current disclosure controls and procedures (such disclosure controls and procedures having been evaluated within 90 days of the date of this filing) provide reasonable assurance that the information required to be disclosed by the registrant has been recorded, processed, summarized and reported within the time period specified in the Commission’s rules and forms and that the information required to be disclosed by the registrant has been accumulated and communicated to the registrant’s principal executive officer and principal financial officer in order to allow timely decisions regarding required disclosure. |
| | (b) | There has been no significant change in the registrant’s internal control over financial reporting that occurred during the registrant’s most recent fiscal quarter of the period covered by this report that has materially affected, or is likely to materially affect, the registrant’s internal control over financial reporting. |
Item 12 – Exhibits
| | | | |
| (a) | | (1) | | Code of Ethics – Attached hereto as Exhibit EX-99.CODE-ETH |
| | |
| | (2) | | Certifications pursuant to Section 302 of the Sarbanes-Oxley Act – Attached hereto as Exhibit EX-99.CERT. |
| | |
| | (3) | | Any written solicitation to purchase securities under Rule 23c-1. – Not applicable. |
| |
| (b) | | Certifications pursuant to Section 906 of the Sarbanes-Oxley Act – Attached hereto as Exhibit EX-99.906CERT. |
SIGNATURES
Pursuant to the requirements of the Securities Exchange Act of 1934 and the Investment Company Act of 1940, the registrant has duly caused this report to be signed on its behalf by the undersigned, thereunto duly authorized.
| | | | |
| (Registrant) | | The Target Portfolio Trust | | |
| | | | |
| | |
| By (Signature and Title)* | | /s/ Deborah A. Docs | | |
| | Deborah A. Docs | | |
| | Secretary | | |
Pursuant to the requirements of the Securities Exchange Act of 1934 and the Investment Company Act of 1940, this report has been signed below by the following persons on behalf of the registrant and in the capacities and on the dates indicated.
| | | | |
| By (Signature and Title)* | | /s/ Judy A. Rice | | |
| | Judy A. Rice | | |
| | President and Principal Executive Officer |
| | | | |
| | |
| By (Signature and Title)* | | /s/ Grace C. Torres | | |
| | Grace C. Torres | | |
| | Treasurer and Principal Financial Officer |
| * | Print the name and title of each signing officer under his or her signature. |