UNITED STATES
SECURITIES AND EXCHANGE COMMISSION
Washington, D.C. 20549
FORM N-CSR
CERTIFIED SHAREHOLDER REPORT OF REGISTERED
MANAGEMENT INVESTMENT COMPANIES
| | |
| Investment Company Act file number: | | 811-07064 |
| |
| Exact name of registrant as specified in charter: | | The Target Portfolio Trust |
| |
| Address of principal executive offices: | | Gateway Center 3, |
| | 100 Mulberry Street, |
| | Newark, New Jersey 07102 |
| |
| Name and address of agent for service: | | Deborah A. Docs |
| | Gateway Center 3, |
| | 100 Mulberry Street, |
| | Newark, New Jersey 07102 |
| |
| Registrant’s telephone number, including area code: | | 800-225-1852 |
| |
| Date of fiscal year end: | | 10/31/2011 |
| |
| Date of reporting period: | | 10/31/2011 |
Item 1 – Reports to Stockholders

PRUDENTIAL INVESTMENTS»MUTUAL FUNDS
THE TARGET PORTFOLIO TRUST®
ANNUAL REPORT · OCTOBER 31, 2011
This report is not authorized for distribution to prospective investors unless preceded or accompanied by a current prospectus.
The views expressed in this report and information about the Trust portfolios’ securities are for the period covered by this report and are subject to change thereafter.
TARGET FUNDS and TARGET Portfolio Trust are distributed by Prudential Investment Management Services LLC, Newark, NJ, a Prudential Financial company and member SIPC. Prudential Investments®, Prudential, the Prudential logo, and the Rock symbol are service marks of Prudential Financial, Inc., and its related entities, registered in many jurisdictions worldwide.

December 15, 2011
Dear TARGET Shareholder:
After leading Prudential Investments for the past eight years, I have decided to retire at the end of 2011 from my positions as President of Prudential Investments and President and Trustee of the TARGET Portfolio Trust. Prudential Investments is the advisory firm that runs TARGET. Effective January 1, 2012, I will become Chairman of Prudential Investments and act as an advisor to the business during 2012 to help facilitate a smooth transition to my successor, Stuart Parker.
Stuart, who will become President of Prudential Investments and President and Trustee of TARGET on January 1, 2012, previously served as the Executive Vice President of Retail Mutual Fund Distribution at Prudential Investments. With more than 20 years of investment industry experience, Stuart brings a deep understanding of the needs and challenges facing today’s investors.
We hope you find the annual report for TARGET informative and useful. Today many investors are asking where they can find new growth opportunities. Whether you are looking for capital growth, current income, or a combination of both, the TARGET portfolios feature a wide range of strategies to suit a variety of investment needs.
TARGET is founded upon the belief that investment management talent is dispersed across a variety of firms and can be systematically identified through research. The managers for each portfolio are carefully chosen from among the leading institutional money managers and are monitored by your team of experienced investment management analysts. Of course, the future performance of the TARGET portfolios cannot be guaranteed.
Your selections among the TARGET portfolios can evolve as your needs change. Your financial professional can help you stay informed of important developments and assist you in determining whether you need to modify your investments.
Thank you for your continued confidence.
Sincerely,

Judy A. Rice, President
The TARGET Portfolio Trust
| | | | |
| THE TARGET PORTFOLIO TRUST | | | 1 | |
Equity Portfolios’ Performance
Performance data quoted represent past performance. Past performance does not guarantee future results. The investment return and principal value of an investment will fluctuate, so that an investor’s shares, when redeemed, may be worth more or less than their original cost. Current performance may be lower or higher than the past performance data quoted. An investor may obtain performance data as of the most recent month-end by visiting our website at www.prudentialfunds.com or by calling (800) 225-1852.
Large Capitalization Growth Portfolio:
Gross operating expenses: Class R, 1.59%; Class T, 0.84%. Net operating expenses: Class R, 1.34%; Class T, 0.84%, after contractual reduction through 2/28/2013.
Large Capitalization Value Portfolio:
Gross operating expenses: Class R, 1.58%; Class T, 0.83%. Net operating expenses: Class R, 1.33%; Class T, 0.83%, after contractual reduction through 2/28/2013.
Small Capitalization Growth Portfolio:
Gross operating expenses: Class R, 1.69%; Class T, 0.94%. Net operating expenses: Class R, 1.44%; Class T, 0.94%, after contractual reduction through 2/28/2013.
Small Capitalization Value Portfolio:
Gross operating expenses: Class R, 1.46%; Class T, 0.71%. Net operating expenses: Class R, 1.21%; Class T, 0.71%, after contractual reduction through 2/28/2013.
International Equity Portfolio:
Gross operating expenses: Class Q, 0.87%; Class R, 1.73%; Class T, 0.98%. Net operating expenses: Class Q, 0.87%; Class R, 1.48%; Class T, 0.98%, after contractual reduction through 2/28/2013.
| | | | | | | | | | | | | | | | |
| Equity Portfolios | |
| | | Cumulative Total Returns
as of 10/31/11 | |
| | | One Year | | | Five Years | | | Ten Years | | | Since Inception | |
Large Capitalization Growth Portfolio (Class R) | | | 6.27 | % | | | –0.78 | % | | | N/A | | | | 4.83% (8/22/06) | |
Large Capitalization Growth Portfolio (Class T) | | | 6.83 | | | | 1.77 | | | | 22.75 | % | | | — | |
S&P 500 Index | | | 8.07 | | | | 1.25 | | | | 43.67 | | | | — | |
Russell 1000 Growth Index | | | 9.92 | | | | 16.16 | | | | 41.83 | | | | — | |
Lipper Large-Cap Growth Funds Avg. | | | 6.86 | | | | 10.60 | | | | 36.79 | | | | — | |
| | |
| 2 | | THE TARGET PORTFOLIO TRUST |
| | | | | | | | | | | | | | | | |
| | | Average Annual Total Returns
as of 9/30/11 | |
| | | One Year | | | Five Years | | | Ten Years | | | Since Inception | |
Large Capitalization Growth Portfolio (Class R) | | | 0.08 | % | | | –1.82 | % | | | N/A | | | | –1.33% (8/22/06) | |
Large Capitalization Growth Portfolio (Class T) | | | 0.61 | | | | –1.30 | | | | 1.92 | % | | | — | |
S&P 500 Index | | | 1.13 | | | | –1.18 | | | | 2.82 | | | | — | |
Russell 1000 Growth Index | | | 3.78 | | | | 1.62 | | | | 3.01 | | | | — | |
Lipper Large-Cap Growth Funds Avg. | | | 0.27 | | | | 0.34 | | | | 2.42 | | | | — | |
| |
| | | Average Annual Total Returns
as of 10/31/11 | |
| | | One Year | | | Five Years | | | Ten Years | | | Since Inception | |
Large Capitalization Growth Portfolio (Class R) | | | 6.27 | % | | | –0.16 | % | | | N/A | | | | 0.91% (8/22/06) | |
Large Capitalization Growth Portfolio (Class T) | | | 6.83 | | | | 0.35 | | | | 2.07 | % | | | — | |
| |
| | | Cumulative Total Returns
as of 10/31/11 | |
| | | One Year | | | Five Years | | | Ten Years | | | Since Inception | |
Large Capitalization Value Portfolio (Class R) | | | 3.19 | % | | | –21.63 | % | | | N/A | | | | –17.00% (8/22/06) | |
Large Capitalization Value Portfolio (Class T) | | | 3.62 | | | | –19.68 | | | | 50.15 | % | | | — | |
S&P 500 Index | | | 8.07 | | | | 1.25 | | | | 43.67 | | | | — | |
Russell 1000 Value Index | | | 6.16 | | | | –9.84 | | | | 56.37 | | | | — | |
Lipper Large-Cap Value Funds Avg. | | | 4.15 | | | | –9.49 | | | | 43.19 | | | | — | |
| |
| | | Average Annual Total Returns
as of 9/30/11 | |
| | | One Year | | | Five Years | | | Ten Years | | | Since Inception | |
Large Capitalization Value Portfolio (Class R) | | | –4.24 | % | | | –6.08 | % | | | N/A | | | | –5.51% (8/22/06) | |
Large Capitalization Value Portfolio (Class T) | | | –3.81 | | | | –5.62 | | | | 2.99 | % | | | — | |
S&P 500 Index | | | 1.13 | | | | –1.18 | | | | 2.82 | | | | — | |
Russell 1000 Value Index | | | –1.89 | | | | –3.53 | | | | 3.36 | | | | — | |
Lipper Large-Cap Value Funds Avg. | | | –3.54 | | | | –3.57 | | | | 2.54 | | | | — | |
| |
| | | Average Annual Total Returns
as of 10/31/11 | |
| | | One Year | | | Five Years | | | Ten Years | | | Since Inception | |
Large Capitalization Value Portfolio (Class R) | | | 3.19 | % | | | –4.76 | % | | | N/A | | | | –3.52% (8/22/06) | |
Large Capitalization Value Portfolio (Class T) | | | 3.62 | | | | –4.29 | | | | 4.15 | % | | | — | |
| | | | |
| THE TARGET PORTFOLIO TRUST | | | 3 | |
Equity Portfolios’ Performance (continued)
| | | | | | | | | | | | | | | | |
| | | Cumulative Total Returns
as of 10/31/11 | |
| | | One Year | | | Five Years | | | Ten Years | | | Since Inception | |
Small Capitalization Growth Portfolio (Class R) | | | 13.56 | % | | | –5.84 | % | | | N/A | | | | –0.63% (8/22/06) | |
Small Capitalization Growth Portfolio (Class T) | | | 14.23 | | | | –3.43 | | | | 18.91 | % | | | — | |
Russell 2000 Index | | | 6.71 | | | | 3.45 | | | | 97.05 | | | | — | |
Russell 2000 Growth Index | | | 9.84 | | | | 14.12 | | | | 79.74 | | | | — | |
Lipper Small-Cap Growth Funds Avg. | | | 9.06 | | | | 12.66 | | | | 76.80 | | | | — | |
| |
| | | Average Annual Total Returns
as of 9/30/11 | |
| | | One Year | | | Five Years | | | Ten Years | | | Since Inception | |
Small Capitalization Growth Portfolio (Class R) | | | 4.00 | % | | | –3.10 | % | | | N/A | | | | –2.66% (8/22/06) | |
Small Capitalization Growth Portfolio (Class T) | | | 4.56 | | | | –2.62 | | | | 0.91 | % | | | — | |
Russell 2000 Index | | | –3.53 | | | | –1.02 | | | | 6.12 | | | | — | |
Russell 2000 Growth Index | | | –1.12 | | | | 0.96 | | | | 5.45 | | | | — | |
Lipper Small-Cap Growth Funds Avg. | | | –0.61 | | | | 0.51 | | | | 5.06 | | | | — | |
| |
| | | Average Annual Total Returns
as of 10/31/11 | |
| | | One Year | | | Five Years | | | Ten Years | | | Since Inception | |
Small Capitalization Growth Portfolio (Class R) | | | 13.56 | % | | | –1.20 | % | | | N/A | | | | –0.12% (8/22/06) | |
Small Capitalization Growth Portfolio (Class T) | | | 14.23 | | | | –0.69 | | | | 1.75 | % | | | — | |
| |
| | | Cumulative Total Returns
as of 10/31/11 | |
| | | One Year | | | Five Years | | | Ten Years | | | Since Inception | |
Small Capitalization Value Portfolio (Class R) | | | 7.75 | % | | | 13.78 | % | | | N/A | | | | 20.48% (8/22/06) | |
Small Capitalization Value Portfolio (Class T) | | | 8.27 | | | | 16.56 | | | | 175.85 | % | | | — | |
Russell 2000 Index | | | 6.71 | | | | 3.45 | | | | 97.05 | | | | — | |
Russell 2000 Value Index | | | 3.54 | | | | –6.89 | | | | 108.70 | | | | — | |
Lipper Small-Cap Core Funds Avg. | | | 7.31 | | | | 6.59 | | | | 105.42 | | | | — | |
| |
| | | Average Annual Total Returns
as of 9/30/11 | |
| | | One Year | | | Five Years | | | Ten Years | | | Since Inception | |
Small Capitalization Value Portfolio (Class R) | | | –1.95 | % | | | 0.97 | % | | | N/A | | | | 1.14% (8/22/06) | |
Small Capitalization Value Portfolio (Class T) | | | –1.44 | | | | 1.48 | | | | 9.71 | % | | | — | |
Russell 2000 Index | | | –3.53 | | | | –1.02 | | | | 6.12 | | | | — | |
Russell 2000 Value Index | | | –5.99 | | | | –3.08 | | | | 6.47 | | | | — | |
Lipper Small-Cap Core Funds Avg. | | | –2.88 | | | | –0.75 | | | | 6.31 | | | | — | |
| | |
| 4 | | THE TARGET PORTFOLIO TRUST |
| | | | | | | | | | | | | | | | |
| | | Average Annual Total Returns
as of 10/31/11 | |
| | | One Year | | | Five Years | | | Ten Years | | | Since Inception | |
Small Capitalization Value Portfolio (Class R) | | | 7.75 | % | | | 2.62 | % | | | N/A | | | | 3.65% (8/22/06) | |
Small Capitalization Value Portfolio (Class T) | | | 8.27 | | | | 3.11 | | | | 10.68 | % | | | — | |
| |
| | | Cumulative Total Returns
as of 10/31/11 | |
| | | One Year | | | Five Years | | | Ten Years | | | Since Inception | |
International Equity Portfolio (Class Q) | | | N/A | | | | N/A | | | | N/A | | | | –11.62% (3/1/11) | |
International Equity Portfolio (Class R) | | | –5.92 | % | | | –9.23 | % | | | N/A | | | | –4.94 (8/22/06) | |
International Equity Portfolio (Class T) | | | –5.45 | | | | –6.94 | | | | 76.42 | % | | | — | |
MSCI EAFE ND Index | | | –4.08 | | | | –11.50 | | | | 74.62 | | | | — | |
Lipper International Large-Cap Core Funds Avg. | | | –5.53 | | | | –12.63 | | | | 63.13 | | | | — | |
| |
| | | Average Annual Total Returns
as of 9/30/11 | |
| | | One Year | | | Five Years | | | Ten Years | | | Since Inception | |
International Equity Portfolio (Class Q) | | | N/A | | | | N/A | | | | N/A | | | | N/A (3/1/11) | |
International Equity Portfolio (Class R) | | | –10.58 | % | | | –3.00 | % | | | N/A | | | | –2.76% (8/22/06) | |
International Equity Portfolio (Class T) | | | –10.20 | | | | –2.52 | | | | 4.98 | % | | | — | |
MSCI EAFE ND Index | | | –9.36 | | | | –3.46 | | | | 5.03 | | | | — | |
Lipper International Large-Cap Core Funds Avg. | | | –10.77 | | | | –3.92 | | | | 4.15 | | | | — | |
| |
| | | Average Annual Total Returns
as of 10/31/11 | |
| | | One Year | | | Five Years | | | Ten Years | | | Since Inception | |
International Equity Portfolio (Class Q) | | | N/A | | | | N/A | | | | N/A | | | | N/A (3/1/11) | |
International Equity Portfolio (Class R) | | | –5.92 | % | | | –1.92 | % | | | N/A | | | | –0.97% (8/22/06) | |
International Equity Portfolio (Class T) | | | –5.45 | | | | –1.43 | | | | 5.84 | % | | | — | |
| | | | |
| THE TARGET PORTFOLIO TRUST | | | 5 | |
Equity Portfolios’ Performance (continued)
Growth of a $10,000 Investment
Large Capitalization Growth Portfolio
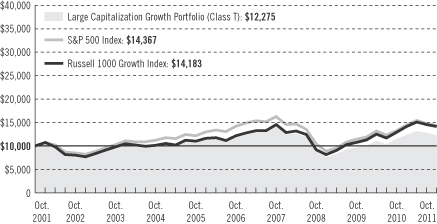
The graph compares a $10,000 investment in the TARGET Large Capitalization Growth Portfolio (Class T) with a similar investment in the S&P 500 Index and the Russell 1000 Growth Index by portraying the initial account values at the beginning of the 10-year period (October 31, 2001) and the account values at the end of the current fiscal year (October 31, 2011), as measured on a quarterly basis.
Total returns and the ending account values in the graph include changes in share price and reinvestment of dividends and capital gains distributions in a hypothetical investment for the periods shown. The Portfolio’s total returns do not reflect the deduction of income taxes on an individual’s investment. Taxes may reduce your actual investment returns on income or gains paid by the Portfolio or any gains you may realize if you sell your shares.
| | |
| 6 | | THE TARGET PORTFOLIO TRUST |
Large Capitalization Value Portfolio
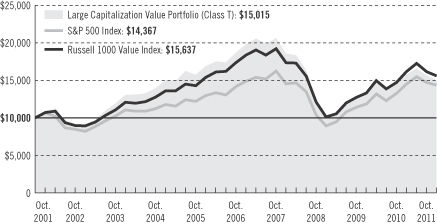
The graph compares a $10,000 investment in the TARGET Large Capitalization Value Portfolio (Class T) with a similar investment in the S&P 500 Index and the Russell 1000 Value Index by portraying the initial account values at the beginning of the 10-year period (October 31, 2001) and the account values at the end of the current fiscal year (October 31, 2011), as measured on a quarterly basis.
Total returns and the ending account values in the graph include changes in share price and reinvestment of dividends and capital gains distributions in a hypothetical investment for the periods shown. The Portfolio’s total returns do not reflect the deduction of income taxes on an individual’s investment. Taxes may reduce your actual investment returns on income or gains paid by the Portfolio or any gains you may realize if you sell your shares.
| | | | |
| THE TARGET PORTFOLIO TRUST | | | 7 | |
Equity Portfolios’ Performance (continued)
Small Capitalization Growth Portfolio
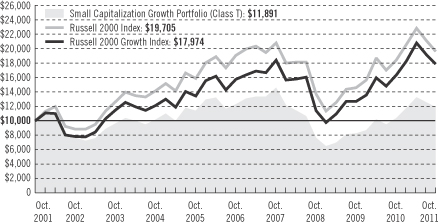
The graph compares a $10,000 investment in the TARGET Small Capitalization Growth Portfolio (Class T) with a similar investment in the Russell 2000 Index and the Russell 2000 Growth Index by portraying the initial account values at the beginning of the 10-year period (October 31, 2001) and the account values at the end of the current fiscal year (October 31, 2011), as measured on a quarterly basis.
Total returns and the ending account values in the graph include changes in share price and reinvestment of dividends and capital gains distributions in a hypothetical investment for the periods shown. The Portfolio’s total returns do not reflect the deduction of income taxes on an individual’s investment. Taxes may reduce your actual investment returns on income or gains paid by the Portfolio or any gains you may realize if you sell your shares.
| | |
| 8 | | THE TARGET PORTFOLIO TRUST |
Small Capitalization Value Portfolio
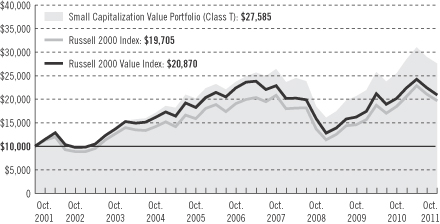
The graph compares a $10,000 investment in the TARGET Small Capitalization Value Portfolio (Class T) with a similar investment in the Russell 2000 Index and the Russell 2000 Value Index by portraying the initial account values at the beginning of the 10-year period (October 31, 2001) and the account values at the end of the current fiscal year (October 31, 2011), as measured on a quarterly basis.
Total returns and the ending account values in the graph include changes in share price and reinvestment of dividends and capital gains distributions in a hypothetical investment for the periods shown. The Portfolio’s total returns do not reflect the deduction of income taxes on an individual’s investment. Taxes may reduce your actual investment returns on income or gains paid by the Portfolio or any gains you may realize if you sell your shares.
| | | | |
| THE TARGET PORTFOLIO TRUST | | | 9 | |
Equity Portfolios’ Performance (continued)
International Equity Portfolio
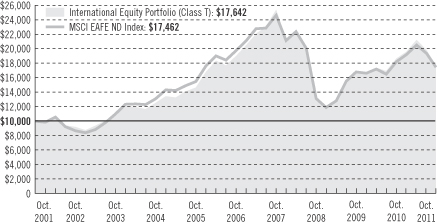
The graph compares a $10,000 investment in the TARGET International Equity Portfolio (Class T) with a similar investment in the Morgan Stanley Capital International Europe, Australasia, Far East Net Dividend Index (MSCI EAFE ND Index) by portraying the initial account values at the beginning of the 10-year period (October 31, 2001) and the account values at the end of the current fiscal year (October 31, 2011), as measured on a quarterly basis.
Total returns and the ending account values in the graph include changes in share price and reinvestment of dividends and capital gains distributions in a hypothetical investment for the periods shown. The Portfolio’s total returns do not reflect the deduction of income taxes on an individual’s investment. Taxes may reduce your actual investment returns on income or gains paid by the Portfolio or any gains you may realize if you sell your shares.
Source: Prudential Investments LLC and Lipper Inc. Performance figures may reflect fee waivers and/or expense reimbursements. In the absence of such fee waivers and/or expense reimbursements, total returns would be lower.
Total returns assume the reinvestment of all dividends and distributions, and take into account all charges and expenses applicable to an investment in each Portfolio. Class R shares are subject to an annual distribution and service (12b-1) fee of up to 0.75%. Returns in the table do not reflect the deduction of taxes that a shareholder would pay on Portfolio distributions or following the redemption of Portfolio shares.
Inception returns are provided for any share class with less than 10 calendar years of returns.
| | |
| 10 | | THE TARGET PORTFOLIO TRUST |
Benchmark Definitions
Lipper International Large-Cap Core Funds Average
Lipper International Large-Cap Core funds invest at least 75% of their equity assets in companies strictly outside of the U.S. with market capitalizations (on a three-year weighted basis) above Lipper’s international large-cap floor. International large-cap core funds typically have an average price-to-cash-flow ratio, price-to-book ratio, and three-year sales-per-share-growth value compared to their large-cap-specific subset of the S&P/Citigroup World ex-U.S. Broad Market Index (BMI).
Lipper Large-Cap Growth Funds Average
Lipper Large-Cap Growth funds invest at least 75% of their equity assets in companies with market capitalizations (on a three-year weighted basis) above Lipper’s USDE large-cap floor. Large-cap growth funds typically have an above-average price-to-earnings ratio, price-to-book ratio, and three-year sales-per-share growth value compared with the S&P 500 Index.
Lipper Large-Cap Value Funds Average
Lipper Large-Cap Value funds invest at least 75% of their equity assets in companies with market capitalizations (on a three-year weighted basis) above Lipper’s USDE large-cap floor. Large-cap value funds typically have a below-average price-to-earnings ratio and three-year sales-per-share growth value compared with the S&P 500 Index.
Lipper Small-Cap Growth Funds Average
Lipper Small-Cap Growth funds invest at least 75% of their equity assets in companies with market capitalizations (on a three-year weighted basis) less than 250% of the dollar-weighted median of the smallest 500 of the middle 1,000 securities of the S&P SuperComposite 1500 Index. Small-cap growth funds typically have an above-average price-to-earnings ratio, price-to-book ratio, and three-year sales-per-share-growth value compared with the S&P SmallCap 600 Index.
Lipper Small-Cap Core Funds Average
Lipper Small-Cap Core funds invest at least 75% of their equity assets in companies with market capitalizations (on a three-year weighted basis) below Lipper’s USDE small-cap ceiling. Small-cap core funds typically have an average price-to-earnings ratio, price-to-book ratio, and three-year sales-per-share-growth value, compared to the S&P SmallCap 600 Index.
Morgan Stanley Capital International Europe, Australasia, and Far East Net Dividend Index
The Morgan Stanley Capital International Europe, Australasia, and Far East Net Dividend Index (MSCI EAFE ND Index) is an unmanaged, weighted index that reflects stock price movements in Europe, Australasia, and the Far East. It gives an indication of how foreign stocks have performed.
Russell 1000 Growth Index
The Russell 1000 Growth Index is an unmanaged index which contains those securities in the Russell 1000 Index with an above-average growth orientation. Companies in this index tend to exhibit higher price-to-book and price-to-earnings ratios, lower dividend yields, and higher forecasted growth rates.
| | | | |
| THE TARGET PORTFOLIO TRUST | | | 11 | |
Equity Portfolios’ Performance (continued)
Russell 1000 Value Index
The Russell 1000 Value Index is an unmanaged index which contains those securities in the Russell 1000 Index with a below-average growth orientation. Companies in this index generally have low price-to-book and price-to-earnings ratios, higher dividend yields, and lower forecasted growth values.
Russell 2000 Index
The Russell 2000 Index is an unmanaged index of the stocks of the 2,000 smallest U.S. companies included in the Russell 3000 Index. It gives an indication of how the stock prices of smaller companies have performed.
Russell 2000 Growth Index
The Russell 2000 Growth Index is an unmanaged index which contains those securities in the Russell 2000 Index with an above-average growth orientation. Companies in this index generally have higher price-to-book and price-to-earnings ratios.
Russell 2000 Value Index
The Russell 2000 Value Index is an unmanaged index which contains those securities in the Russell 2000 Index with a below-average growth orientation. Companies in this index generally have low price-to-earnings ratios, higher dividend yields, and lower forecasted growth values.
S&P 500 Index
The Standard & Poor’s 500 Composite Stock Price Index (S&P 500 Index) is an unmanaged index of 500 stocks of large U.S. companies. It gives a broad look at how stock prices have performed.
Benchmark Inception Returns
Large Capitalization Growth Portfolio—S&P 500 Index Closest Month-End to Inception cumulative total return as of 10/31/11 is 7.24% for Class R. S&P 500 Index Closest Month-End to Inception average annual total return as of 9/30/11 is –0.66% for Class R. Russell 1000 Growth Index Closest Month-End to Inception cumulative total return as of 10/31/11 is 23.55% for Class R. Russell 1000 Growth Index Closest Month-End to Inception average annual total return as of 9/30/11 is 2.13% for Class R. Lipper Average Closest Month-End to Inception cumulative total return as of 10/31/11 is 17.15% for Class R. Lipper Average Closest Month-End to Inception average annual total return as of 9/30/11 is 0.87% for Class R.
Large Capitalization Value Portfolio—S&P 500 Index Closest Month-End to Inception cumulative total return as of 10/31/11 is 7.24% for Class R. S&P 500 Index Closest Month-End to Inception average annual total return as of 9/30/11 is –0.66% for Class R. Russell 1000 Value Index Closest Month-End to Inception cumulative total return as of 10/31/11 is –5.03% for Class R. Russell 1000 Value Index Closest Month-End to Inception average annual total return as of 9/30/11 is –3.10% for Class R. Lipper Average Closest Month-End to Inception cumulative total return as of 10/31/11 is –4.84% for Class R. Lipper Average Closest Month-End to Inception average annual total return as of 9/30/11 is –3.14% for Class R.
Small Capitalization Growth Portfolio—Russell 2000 Index Closest Month-End to Inception cumulative total return as of 10/31/11 is 10.31% for Class R. Russell 2000 Index Closest Month-End to Inception average annual total return as of 9/30/11 is –0.84% for Class R. Russell 2000 Growth Index Closest Month-End to Inception cumulative total return as of 10/31/11 is 22.34% for Class R. Russell 2000 Growth Index Closest Month-End to Inception average annual total return as of 9/30/11 is 1.08% for Class R. Lipper Average Closest Month-End to Inception cumulative total return as of 10/31/11 is 19.70% for Class R. Lipper Average Closest Month-End to Inception average annual total return as of 9/30/11 is 0.72% for Class R.
| | |
| 12 | | THE TARGET PORTFOLIO TRUST |
Small Capitalization Value Portfolio—Russell 2000 Index Closest Month-End to Inception cumulative total return as of 10/31/11 is 10.31% for Class R. Russell 2000 Index Closest Month-End to Inception average annual total return as of 9/30/11 is –0.84% for Class R. Russell 2000 Value Index Closest Month-End to Inception cumulative total return as of 10/31/11 is –1.19% for Class R. Russell 2000 Value Index Month-End to Inception average annual total return as of 9/30/11 is –2.84% for Class R. Lipper Average Closest Month-End to Inception cumulative total return as of 10/31/11 is 12.69% for Class R. Lipper Average Closest Month-End to Inception average annual total return as of 9/30/11 is –0.57% for Class R.
International Equity Portfolio—MSCI EAFE ND Index Closest Month-End to Inception cumulative total returns as of 10/31/11 are –11.83% for Class Q; –7.91% for Class R. MSCI EAFE ND Index Closest Month-End to Inception average annual total return as of 9/30/11 is –3.37% for Class R. Lipper Average Closest Month-End to Inception cumulative total returns as of 10/31/11 are –12.48% for Class Q; –9.28% for Class R. Lipper Average Closest Month-End to Inception average annual total return as of 9/30/11 is –3.85% for Class R. Class Q shares have been in existence for less than one year and have no average annual total return performance information available.
Investors cannot invest directly in an index or average. The returns for the benchmark indexes would be lower if they reflected deductions for portfolio operating expenses, sales charges, or taxes.
The Lipper averages represent returns based on an average of all funds in the respective Lipper categories for the periods noted. The returns for the Lipper averages would be lower if they reflected deductions for sales charges or taxes.
| | | | |
| THE TARGET PORTFOLIO TRUST | | | 13 | |
Fixed Income Portfolios’ Performance
Performance data quoted represent past performance. Past performance does not guarantee future results. The investment return and principal value of an investment will fluctuate, so that an investor’s shares, when redeemed, may be worth more or less than their original cost. Current performance may be lower or higher than the past performance data quoted. An investor may obtain performance data as of the most recent month-end by visiting our website at www.prudentialfunds.com or by calling (800) 225-1852.
Total Return Bond Portfolio:
Gross operating expenses: Class R, 1.40%; Class T, 0.65%. Net operating expenses: Class R, 1.15%; Class T, 0.65%, after contractual reduction through 2/28/2013.
Intermediate-Term Bond Portfolio:
Gross operating expenses: Class T, 0.66%. Net operating expenses: Class T, 0.66%.
Mortgage Backed Securities Portfolio:
Gross operating expenses: Class T, 1.03%. Net operating expenses: Class T, 1.03%.
| | | | | | | | | | | | | | | | |
| | | Cumulative Total Returns
as of 10/31/11 | |
| | | One Year | | | Five Years | | | Ten Years | | | Since Inception | |
Total Return Bond Portfolio (Class R) | | | 2.24 | % | | | 44.06 | % | | | N/A | | | | 45.48% (8/22/06) | |
Total Return Bond Portfolio (Class T) | | | 2.76 | | | | 47.73 | | | | 87.73 | % | | | — | |
Barclays Capital U.S. Aggregate Bond Index | | | 5.00 | | | | 36.42 | | | | 70.12 | | | | — | |
Lipper Corporate Debt BBB-Rated Funds Avg. | | | 5.09 | | | | 36.05 | | | | 80.80 | | | | — | |
| |
| | | Average Annual Total Returns
as of 9/30/11 | |
| | | One Year | | | Five Years | | | Ten Years | | | Since Inception | |
Total Return Bond Portfolio (Class R) | | | 2.60 | % | | | 7.56 | % | | | N/A | | | | 7.61% (8/22/06) | |
Total Return Bond Portfolio (Class T) | | | 3.20 | | | | 8.24 | | | | 6.70 | % | | | — | |
Barclays Capital U.S. Aggregate Bond Index | | | 5.26 | | | | 6.53 | | | | 5.66 | | | | — | |
Lipper Corporate Debt BBB-Rated Funds Avg. | | | 3.91 | | | | 6.16 | | | | 6.05 | | | | — | |
| |
| | | Average Annual Total Returns
as of 10/31/11 | |
| | | One Year | | | Five Years | | | Ten Years | | | Since Inception | |
Total Return Bond Portfolio (Class R) | | | 2.24 | % | | | 7.57 | % | | | N/A | | | | 7.48% (8/22/06) | |
Total Return Bond Portfolio (Class T) | | | 2.76 | | | | 8.12 | | | | 6.50 | % | | | — | |
| | |
| 14 | | THE TARGET PORTFOLIO TRUST |
| | | | | | | | | | | | |
| | | Cumulative Total Returns
as of 10/31/11 | |
| | | One Year | | | Five Years | | | Ten Years | |
Intermediate-Term Bond Portfolio (Class T) | | | 2.70 | % | | | 45.30 | % | | | 76.81 | % |
Barclays Capital Int. Govt./Credit Bond Index | | | 3.22 | | | | 33.00 | | | | 62.61 | |
Lipper Int. Inv.-Grade Debt Funds Avg. | | | 3.94 | | | | 31.50 | | | | 61.61 | |
| |
| | | Average Annual Total Returns
as of 9/30/11 | |
| | | One Year | | | Five Years | | | Ten Years | |
Intermediate-Term Bond Portfolio (Class T) | | | 2.77 | % | | | 7.77 | % | | | 6.00 | % |
Barclays Capital Int. Govt./Credit Bond Index | | | 3.40 | | | | 5.92 | | | | 5.12 | |
Lipper Int. Inv.-Grade Debt Funds Avg. | | | 3.77 | | | | 5.64 | | | | 5.00 | |
| |
| | | Average Annual Total Returns
as of 10/31/11 | |
| | | One Year | | | Five Years | | | Ten Years | |
Intermediate-Term Bond Portfolio (Class T) | | | 2.70 | % | | | 7.76 | % | | | 5.86 | % |
| |
| | | Cumulative Total Returns
as of 10/31/11 | |
| | | One Year | | | Five Years | | | Ten Years | |
Mortgage Backed Securities Portfolio (Class T) | | | 5.36 | % | | | 42.83 | % | | | 70.45 | % |
Barclays Capital Mortgage-Backed Securities Index | | | 4.53 | | | | 37.25 | | | | 70.18 | |
Citigroup Mortgage-Backed Securities Index | | | 4.62 | | | | 37.65 | | | | 71.25 | |
Lipper U.S. Mortgage Funds Avg. | | | 4.06 | | | | 29.46 | | | | 54.18 | |
| |
| | | Average Annual Total Returns
as of 9/30/11 | |
| | | One Year | | | Five Years | | | Ten Years | |
Mortgage Backed Securities Portfolio (Class T) | | | 6.73 | % | | | 7.58 | % | | | 5.63 | % |
Barclays Capital Mortgage-Backed Securities Index | | | 5.56 | | | | 6.69 | | | | 5.61 | |
Citigroup Mortgage-Backed Securities Index | | | 5.66 | | | | 6.76 | | | | 5.67 | |
Lipper U.S. Mortgage Funds Avg. | | | 5.22 | | | | 5.37 | | | | 4.51 | |
| |
| | | Average Annual Total Returns
as of 10/31/11 | |
| | | One Year | | | Five Years | | | Ten Years | |
Mortgage Backed Securities Portfolio (Class T) | | | 5.36 | % | | | 7.39 | % | | | 5.48 | % |
| | | | |
| THE TARGET PORTFOLIO TRUST | | | 15 | |
Fixed Income Portfolios’ Performance (continued)
Growth of a $10,000 Investment
Total Return Bond Portfolio
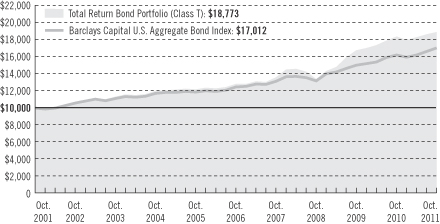
The graph compares a $10,000 investment in the TARGET Total Return Bond Portfolio (Class T) with a similar investment in the Barclays Capital U.S. Aggregate Bond Index by portraying the initial account values at the beginning of the 10-year period (October 31, 2001) and the account values at the end of the current fiscal year (October 31, 2011), as measured on a quarterly basis.
Total returns and the ending account values in the graph include changes in share price and reinvestment of dividends and capital gains distributions in a hypothetical investment for the periods shown. The Portfolio’s total returns do not reflect the deduction of income taxes on an individual’s investment. Taxes may reduce your actual investment returns on income or gains paid by the Portfolio or any gains you may realize if you sell your shares.
| | |
| 16 | | THE TARGET PORTFOLIO TRUST |
Intermediate-Term Bond Portfolio
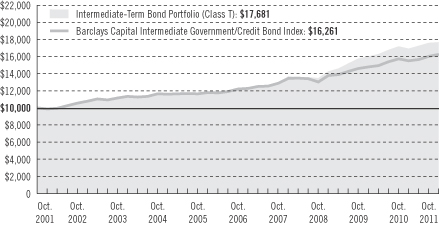
The graph compares a $10,000 investment in the TARGET Intermediate-Term Bond Portfolio (Class T) with a similar investment in the Barclays Capital Intermediate Government/Credit Bond Index by portraying the initial account values at the beginning of the 10-year period (October 31, 2001) and the account values at the end of the current fiscal year (October 31, 2011), as measured on a quarterly basis.
Total returns and the ending account values in the graph include changes in share price and reinvestment of dividends and capital gains distributions in a hypothetical investment for the periods shown. The Portfolio’s total returns do not reflect the deduction of income taxes on an individual’s investment. Taxes may reduce your actual investment returns on income or gains paid by the Portfolio or any gains you may realize if you sell your shares.
| | | | |
| THE TARGET PORTFOLIO TRUST | | | 17 | |
Fixed Income Portfolios’ Performance (continued)
Mortgage Backed Securities Portfolio
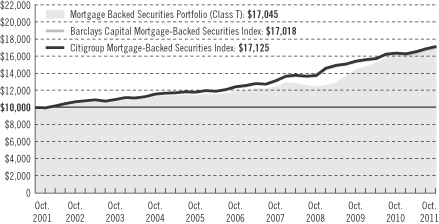
The graph compares a $10,000 investment in the TARGET Mortgage Backed Securities Portfolio (Class T) with a similar investment in the Barclays Capital Mortgage-Backed Securities Index and the Citigroup Mortgage-Backed Securities Index by portraying the initial account values at the beginning of the 10-year period (October 31, 2001) and the account values at the end of the current fiscal year (October 31, 2011), as measured on a quarterly basis.
Total returns and the ending account values in the graph include changes in share price and reinvestment of dividends and capital gains distributions in a hypothetical investment for the periods shown. The Portfolio’s total returns do not reflect the deduction of income taxes on an individual’s investment. Taxes may reduce your actual investment returns on income or gains paid by the Portfolio or any gains you may realize if you sell your shares.
Source: Prudential Investments LLC and Lipper Inc. Performance figures may reflect fee waivers and/or expense reimbursements. In the absence of such fee waivers and/or expense reimbursements, total returns would be lower.
Total returns assume the reinvestment of all dividends and distributions, and take into account all charges and expenses applicable to an investment in each Portfolio. Class R shares are subject to an annual distribution and service (12b-1) fee of up to 0.75%. Returns in the table do not reflect the deduction of taxes that a shareholder would pay on Portfolio distributions or following the redemption of Portfolio shares.
Inception returns are provided for any share class with less than 10 calendar years of returns.
Investors cannot invest directly in an index or average. The returns for the benchmark indexes would be lower if they reflected deductions for portfolio operating expenses, sales charges, or taxes.
| | |
| 18 | | THE TARGET PORTFOLIO TRUST |
Benchmark Definitions
Barclays Capital Intermediate Government/Credit Bond Index
The Barclays Capital Intermediate Government/Credit Bond Index is an unmanaged index of publicly traded U.S. government bonds and investment-grade corporate bonds with maturities of up to 10 years. It gives a broad indication of how intermediate-term bonds have performed.
Barclays Capital Mortgage-Backed Securities Index
The Barclays Capital Mortgage-Backed Securities Index is an unmanaged, market capitalization-weighted index of 15- and 30-year fixed-rate securities backed by GNMA, FNMA, and FHLMC mortgage pools, and balloon mortgages with fixed-rate coupons.
Barclays Capital U.S. Aggregate Bond Index
The Barclays Capital U.S. Aggregate Bond Index is an unmanaged index of investment-grade securities issued by the U.S. government and its agencies and by corporations with between one and 10 years remaining to maturity. It gives a broad indication of how bond prices of short- and intermediate-term bonds have performed.
Citigroup Mortgage-Backed Securities Index
The Citigroup Mortgage-Backed Securities Index is an unmanaged index of 15- and 30-year mortgage-related securities issued by U.S. government agencies. It gives a broad indication of how mortgage-backed securities have performed.
Lipper Corporate Debt BBB-Rated Funds Average
Lipper Corporate Debt BBB-Rated funds invest primarily in corporate and government debt issues rated in the top four grades.
Lipper Intermediate Investment-Grade Debt Funds Average
Lipper Intermediate Investment-Grade Debt funds invest primarily in investment-grade debt issues (rated in the top four grades) with dollar-weighted average maturities of five to 10 years.
Lipper U.S. Mortgage Funds Average
Lipper U.S. Mortgage funds invest primarily in mortgages/securities issued or guaranteed as to principal and interest by the U.S. government and certain federal agencies.
Benchmark Inception Returns
Total Return Bond Portfolio—Barclays Capital U.S. Aggregate Bond Index Closest Month-End to Inception cumulative total return as of 10/31/11 is 38.53% for Class R. Barclays Capital U.S. Aggregate Bond Index Closest Month-End to Inception average annual total return as of 9/30/11 is 6.60% for Class R. Lipper Average Closest Month-End to Inception cumulative total return as of 10/31/11 is 38.78% for Class R. Lipper Average Closest Month-End to Inception average annual total return as of 9/30/11 is 6.26% for Class R.
The Lipper Averages represent returns based on an average of all funds in the respective Lipper categories for the periods noted. The returns for the Lipper averages would be lower if they reflected deductions for sales charges or taxes.
| | | | |
| THE TARGET PORTFOLIO TRUST | | | 19 | |
Strategy and Performance Overview
Large Capitalization Growth Portfolio
The Large Cap Growth Portfolio’s Class T shares returned 6.83% for the 12-month period ended October 31, 2011, which trailed the 9.92% return of its benchmark, the Russell 1000® Growth Index (the Index), and slightly underperformed the 6.86% return of the Lipper Large Cap Growth Funds Average.
The Large Cap Growth Portfolio uses a multi-manager approach, seeking to maximize returns by diversifying Portfolio performance across firms and by combining complementary approaches. Marsico Capital Management, LLC (Marsico), is a traditional large-cap growth manager. It constructs a relatively concentrated portfolio using an active top-down, bottom-up approach to investing. MFS Investment Management (MFS) follows a more diversified strategy that takes a traditional approach to capture forward-looking earnings and rate of growth that investors generally miss and/or underestimate.
| | • | | Large-cap stocks achieved gains early in the reporting period, but market conditions pressured stocks downward later. A series of geopolitical conflicts and the crisis in Japan hit equities hard. Also, the sovereign debt crisis in the euro zone, weakness in the U.S. economy, and U.S. fiscal issues continued to weigh on equities. |
| | • | | Underweight holdings in the energy reserves and semiconductor industries detracted. Overweight positions in medical products and supplies and the construction industries also detracted from the Portfolio’s performance. |
| | • | | The Portfolio’s holdings in the apparel and textile industries, in addition to holdings in the railroad industries, helped performance. An overweight position in the entertainment industry detracted from performance. |
| | • | | MFS stock selection included overweights in individual stocks in the information technology and industrials sectors, which enhanced performance. An underweight in energy and an overweight in consumer discretionary sectors detracted from performance. Also, underweight exposure to Exxon Mobile detracted. Overweight positions in American Tower Corp. and Check Point Software Technologies Ltd. benefited performance. |
| | • | | Marsico’s stock selection in the energy, industrials, financials, and technology sectors detracted from performance. Specifically, underweights to Exxon Mobile, Broadcom, Hutchinson Port Holdings Trust, and IBM hurt performance. |
The Portfolio of Investments following this report shows the size of the Portfolio’s positions at period-end.
| | |
| 20 | | THE TARGET PORTFOLIO TRUST |
| | • | | The Portfolio was overweight in stocks with high price volatility and was underweight in stocks with high earnings-to-price ratios (the company’s earnings per share divided by its price). These positions hurt performance. However, the Portfolio benefited from an overweight in stocks experiencing recent price strength (momentum). |
The Portfolio of Investments following this report shows the size of the Portfolio’s positions at period-end.
| | | | |
| THE TARGET PORTFOLIO TRUST | | | 21 | |
Strategy and Performance Overview (continued)
Large Capitalization Value Portfolio
The Large Cap Value Portfolio’s Class T shares returned 3.62% for the 12-month reporting period ended October 31, 2011, trailing the 6.16% return of its benchmark, the Russell 1000® Value Index (the Index), and underperformed the 4.15% return of the Lipper Large-Cap Value Funds Average.
The Portfolio is managed by NFJ, Eaton Vance, and Hotchkis and Wiley Capital Management, LLC (Hotchkis and Wiley). NFJ follows a disciplined deep value investment strategy, based on research that has shown that portfolios of low price-to-earnings (P/E) stocks have substantially outperformed market indexes throughout all capitalization levels over extended periods. The manager uses an elaborate screening process to identify the lowest-valued stocks within an industry based on their price-to-earnings (P/E) ratio.
In contrast, Eaton Vance’s portion of the overall portfolio follows a relative value or “growthier” investment style. The manager evaluates traditional measures of value, overall business health, and changes in business momentum to capture market inefficiencies in the universe of large capitalization companies. Eaton Vance focuses on companies that exhibit strong business franchises with attractive earnings-per share (EPS) ratios and dividend growth potential.
Hotchkis and Wiley uses a value-oriented investment style and a bottom-up approach to security selection, primarily investing in above-market yielding securities. The investment team seeks to identify companies with strong cash flow, improving profit margins, sustainability of projected growth, and competitive/strategic positioning within their industries.
| | • | | Large-cap value stocks achieved most gains in the first half of the reporting period, but later on severe turbulence in the markets pressured stocks downward. A series of geopolitical conflicts and the crisis in Japan hit equities hard. Also, the sovereign debt crisis in the euro zone, weakness in the U.S. economy, and U.S. fiscal issues continued to weigh on equities. Large-cap value stocks also posted weaker returns than large-cap growth stocks. |
| | • | | The Portfolio’s underperformance, relative to the Index, was the result of poor stock selection in the technology sector in the Hotchkis and Wiley and NFJ portions of the Portfolio. That sector posted a modest return in the Index. Weak |
The Portfolio of Investments following this report shows the size of the Portfolio’s positions at period-end.
| | |
| 22 | | THE TARGET PORTFOLIO TRUST |
| | stock selection in the energy sector in the Eaton Vance portion also contributed negatively to the Portfolio’s relative performance. Energy was the top-performing sector in the Index. |
| | • | | During the first six months of the reporting period, the Eaton Vance and NFJ portions of the Portfolio selected stocks in the Index with larger capitalization ranges. This style positioning detracted from performance, as large-cap stocks with smaller capitalization levels generally outperformed more highly capitalized companies in the Index. |
The Portfolio of Investments following this report shows the size of the Portfolio’s positions at period-end.
| | | | |
| THE TARGET PORTFOLIO TRUST | | | 23 | |
Strategy and Performance Overview (continued)
Small Capitalization Growth Portfolio
The Small Cap Growth Portfolio’s Class T shares rose 14.23% for the 12-month reporting period ended October 31, 2011, outperforming the 9.84% gain of the Russell 2000® Growth Index (the Index), and outperforming the 9.06% return of the Lipper Small-Cap Growth Funds Average.
Eagle Asset Management (Eagle) has managed all the assets of the Portfolio effective February 25, 2011. Ashfield Capital Partners (Ashfield) resigned from the Portfolio in February 2011, as Ashfield closed down their small cap growth operations. As a result of that decision, Ashfield’s assets were reallocated to the remaining manager, Eagle.*
| | • | | Eagle describes its traditional growth investment process as “rapid growth at a reasonable price.” The manager seeks companies with accelerating and sustainable earnings growth, a positive catalyst, a high or expanding return on equity, and a credible and competent management team. |
| | • | | Stocks gained early in the reporting period, but market conditions pressured stocks later on. A series of geopolitical conflicts and the crisis in Japan hit equities hard. Also, the sovereign debt crisis in the euro zone, weakness in the U.S. economy, and U.S. fiscal issues continued to weigh on equities. |
| | • | | Portfolio holdings, specifically in the apparel retail, restaurants, biotechnology, technology hardware and equipment, and food and staples retail industries, added to the Portfolio’s returns. Conversely, transportation and commercial and professional services detracted from performance results. |
| | • | | Relative to the Index, the Portfolio’s underweight position in the energy and telecommunication services sectors were the largest contributors. However, it was the Portfolio’s overweight to oil and gas equipment and services in the energy sector that had the largest positive impact. An overweight in materials and an underweight in one of the better performing sectors (consumer staples) marginally dampened results. |
| * | Effective on or about January 17, 2012, Emerald Mutual Fund Advisers Trust, will be added as a co-manager to the Portfolio. |
The Portfolio of Investments following this report shows the size of the Portfolio’s positions at period-end.
| | |
| 24 | | THE TARGET PORTFOLIO TRUST |
Small Capitalization Value Portfolio
The Small Cap Value Portfolio’s Class T shares gained 8.27% for the 12-month reporting period ended October 31, 2011, which outperformed the 3.54% return of its benchmark, the Russell 2000® Value Index (the Index), and outperformed the 7.31% return of the Lipper Small-Cap Core Funds Average.
Small companies may respond to economic trends differently. For example, some may occupy specific niches in which they are immune to economic cycles. Also, some inexpensive stocks may not be followed closely by analysts. Accordingly, small-cap managers can benefit from informational inefficiencies in the market. Research is critical.
This is why the Portfolio uses several managers chosen based on their experience and capabilities. As managers reach their capacity limits, new asset managers may be added. EARNEST Partners, LLC; Lee Munder Capital Group; J.P. Morgan Investment Management, Inc.; NFJ Investment Group L.P.; and Vaughan Nelson Investment Management, L.P. co-manage the Portfolio.
| | • | | Stocks gained early in the reporting period, but market conditions pressured stocks later on. A series of geopolitical conflicts and the crisis in Japan hit equities hard. Also, the sovereign debt crisis in the euro zone, weakness in the U.S. economy, and U.S. fiscal issues continued to weigh on equities. |
| | • | | Style factors helped returns. An underweight stance in value-oriented stocks and stocks with higher price volatility helped performance. Additionally, an overweight in securities exhibiting a high degree of price momentum proved beneficial. On the negative side, the Portfolio’s overweight in the largest capitalization stocks within the Index detracted from relative returns. |
| | • | | Risk positioning hurt returns. This multi-managed strategy tends to be less sensitive to movements in the broad market and is also less sensitive than the Index. Accordingly, this defensive positioning tends to detract from relative performance during broad market gains, which was generally the case during the past year. |
| | • | | Sector positioning drove positive returns. An underweight to financials helped as the sector lagged due to an endless stream of global macroeconomic issues, including the European debt crisis, anemic U.S. GDP growth, and historically high unemployment rates. |
The Portfolio of Investments following this report shows the size of the Portfolio’s positions at period-end.
| | | | |
| THE TARGET PORTFOLIO TRUST | | | 25 | |
Strategy and Performance Overview (continued)
| | • | | Overall, asset selection added to relative performance. Stock selection within the energy and consumer discretionary sectors was a source of positive returns. |
| | • | | NFJ and Earnest, which had the two largest portions of the Portfolio, were also the best performers, helping drive outperformance relative to the benchmark during the period. |
| | • | | The JP Morgan portion takes a small position in Russell 2000 futures to “equitize” cash, which helps manage flows and general market exposure. Over the last year, this exposure had very little impact on Portfolio results. It is important to note, however, the sole purpose for using futures in this portion is to maintain full market exposure. |
The Portfolio of Investments following this report shows the size of the Portfolio’s positions at period-end.
| | |
| 26 | | THE TARGET PORTFOLIO TRUST |
International Equity Portfolio
The TARGET International Equity Portfolio’s Class T shares declined 5.45% for the 12-month reporting period ended October 31, 2011, underperforming the Morgan Stanley Capital International Europe, Australasia, and Far East Net Dividend Index (MSCI EAFE ND Index) (the Index), which fell 4.08%. The Class T shares outperformed the Lipper International Large-Cap Core Funds Average, which fell 5.53%.
LSV Asset Management (LSV) and Thornburg Investment Management, Inc. (Thornburg) are co-managers of the Portfolio, which combines the distinct approaches of LSV international value (deep value) and Thornburg international (core/relative value).
LSV’s active quantitative strategy is based on research in value investing and behavioral finance. It believes that superior investment performance can be achieved by exploiting investor biases. Some of these biases include: a tendency to extrapolate the past too far into the future; wrongly equating a good company with a good investment irrespective of price; ignoring statistical evidence; and developing a “mindset” about a firm. LSV does not use derivatives to manage its portion of the Portfolio.
Thornburg seeks companies trading at a discount to what it believes are their intrinsic value. It tries to cut risk by diversifying the Portfolio to select traditional, relative, and/or deep value stocks. Thornburg uses quantitative screens and performs fundamental research on the firms. It also searches for investment value among firms not identified by the screening process. Thornburg also uses forward contracts, which are derivatives, to prevent currency movements from undermining stock positions in its Portfolio.
International equity markets got off to a volatile start. A sharp decline for November 2010, caused largely by a flare-up in the sovereign-debt crisis in the euro zone, was followed by a large gain for December, with gains in three of the first four months of 2011. Political upheaval hurt economic growth in parts of the Middle East and North Africa, which threatened the stability of the global oil supply. Natural disasters occurred in Japan, Southeast Asia, and the United States. The remainder of the period saw the Index experience five consecutive monthly declines (the largest in September) before rebounding sharply in October.
International value stocks underperformed for the period in U.S. dollar terms, declining more than international growth stocks, according to MSCI EAFE indexes.
The Portfolio of Investments following this report shows the size of the Portfolio’s positions at period-end.
| | | | |
| THE TARGET PORTFOLIO TRUST | | | 27 | |
Strategy and Performance Overview (continued)
Broadly, it was the large amount of shares of financial companies that caused the international value style that caused it to lag international growth.
| | • | | The Portfolio underperformed largely due to an emphasis and de-emphasis of particular countries relative to their index weightings, including positions in several regions not included in the Index. |
| | • | | Investments in Canada, South Korea, and the United States aided its performance, but allocations to emerging markets countries hurt, particularly in China, Brazil, and Turkey. |
| | • | | The Portfolio had smaller exposures than the Index to Australia and the United Kingdom, which hurt its relative performance, but this was largely offset by the absence of exposure to Greece. Favorable stock selection aided its performance, particularly in the consumer discretionary, industrials, and telecommunications sectors as well as in Japan and the United Kingdom. |
| | • | | The LSV portion slightly outperformed the Index for the period due partly to favorable stock selection in Japan, which accounted for most of its outperformance regionally. It benefited greatly from having larger exposures than the Index to several telecommunications firms and from exposures to several Japanese stocks not in the Index that performed well. |
| | • | | Favorable sector allocation also helped the Portfolio’s LSV portion. Asset selection in the financials sector proved profitable, specifically avoiding financials in the Index that performed poorly, including European and Asian banks. Holdings in utilities and telecommunications also benefited the LSV portion of the Portfolio. |
| | • | | The Thornburg portion of the Portfolio slightly underperformed the Index due primarily to poor stock selection in the financials and materials sectors. This impact was offset somewhat by strong performance from Thornburg’s holdings in the consumer discretionary and industrials sectors. Another key detractor was its underweight in Japan and its exposure to China. |
| | • | | Thornburg was rewarded for overweighting stocks with positive price momentum and underweighting leveraged companies. |
| | • | | Thornburg evaluates the need for hedging on a stock-by-stock basis, considering how each company might be affected by currency movements. It used forward contracts to hedge where it believed there was a significant risk of a major adverse currency movement. Overall, foreign exchange hedging had a slightly negative effect on the Portfolio for the period. |
The Portfolio of Investments following this report shows the size of the Portfolio’s positions at period-end.
| | |
| 28 | | THE TARGET PORTFOLIO TRUST |
Total Return Bond Portfolio
The Total Return Bond Portfolio’s Class T shares gained 2.76% for the 12-month reporting period ended October 31, 2011, underperforming the 5.00% gain of the Barclays Capital U.S. Aggregate Bond Index (the Index). The Portfolio’s Class T shares also lagged the 5.09% gain of the Lipper Corporate Debt BBB-Rated Funds Average. Pacific Investment Management Company LLC (PIMCO) manages the Portfolio.
Growing uncertainty and volatility characterized conditions in the U.S. fixed income market, but all sectors of the market posted gains for the period.
| | • | | Modest signs of improving economic conditions in the United States, supported by the aggressively accommodative monetary policy of the Federal Reserve (the Fed), an agreement in Washington to extend certain tax cuts, and continued strong corporate earnings fostered an environment in late 2010 that favored riskier asset classes such as high yield corporate “junk” bonds over U.S. Treasury securities. |
| | • | | Riskier asset classes largely remained in favor in the first quarter of 2011, though growing political upheaval in the Middle East North African (MENA) region boosted the price of oil, and an earthquake and tsunami caused a nuclear accident in Japan. |
| | • | | But the bond market grew increasingly volatile, and investors became more risk averse, as the period continued. This reflected a worsening sovereign-debt crisis in the euro zone, data indicating the global economic recovery was slowing, and Standard & Poor’s lowering the long-term U.S. credit rating to AA+ from AAA. |
| | • | | Investors fled riskier asset classes and sought refuge in U.S. Treasury securities, boosting their prices and driving down their yields, as bond prices move inversely to yields. Treasury securities also gained in September after the Fed announced it would begin in October to exchange $400 billion of short-term Treasury securities for longer-term Treasury securities. |
| | • | | Riskier asset classes returned to favor in October 2011. Signs of strength in the U.S. economy quieted concerns that it might slip into a double-dip recession. European leaders also appeared to make progress in containing the region’s sovereign-debt crisis. |
The Portfolio of Investments following this report shows the size of the Portfolio’s positions at period-end.
| | | | |
| THE TARGET PORTFOLIO TRUST | | | 29 | |
Strategy and Performance Overview (continued)
The Portfolio’s duration strategies in various bond markets had a mixed impact on its performance versus the Index. Duration measures a fund’s sensitivity to changes in the level of interest rates, which move inversely to bond prices. When declining bond yields push bond prices higher (as during the period), a fund with a longer duration will tend to derive greater benefit from the market rally than a fund with a shorter duration.
| | • | | The Portfolio had a shorter duration than the Index in the U.S. bond market for most of the period. This subtracted from its relative performance, as yields on U.S. Treasury securities declined, pushing their prices higher. |
| | • | | It had duration exposures in the Australian and core European bond markets, which had a positive impact on its relative performance as declining bond yields in these markets pushed bond prices higher. |
| | • | | It also used interest rate swaps to gain duration exposure in the market for Brazilian bonds denominated in the nation’s currency, the Brazilian real. This benefited the Portfolio’s performance as declining rates in that market pushed up bond prices. |
Its sector allocation strategy had a mixed impact on its performance versus the Index.
| | • | | It had a larger exposure than the Index to the investment-grade corporate bond sector, particularly to debt securities of financial companies. This subtracted from its relative performance, as the sector underperformed similar-duration Treasury securities for the period. |
| | • | | It had a smaller exposure than the Index to mortgage-backed securities of federal agencies for most of its fiscal year. This approach helped its relative performance, as the sector underperformed similar-duration Treasury securities for the period. |
The Portfolio’s yield curve strategy also detracted from its relative performance.
| | • | | It had a smaller exposure than the Index to longer-term bonds that was partially implemented by employing long-dated interest rate swaps. This strategy detracted from performance as yields on bonds maturing in 30 years declined, causing the slope of the two-to-30-year portion of the yield curve to flatten. |
The Portfolio of Investments following this report shows the size of the Portfolio’s positions at period-end.
| | |
| 30 | | THE TARGET PORTFOLIO TRUST |
Intermediate-Term Bond Portfolio
The Intermediate-Term Bond Portfolio’s Class T shares gained 2.70% for the 12-month reporting period ended October 31, 2011, underperforming the 3.22% gain of the Barclays Capital Intermediate Government/Credit Index (the Index). The Portfolio’s Class T shares also lagged the 3.94% gain of the Lipper Intermediate Investment-Grade Debt Funds Average. Pacific Investment Management Company LLC (PIMCO) manages the Portfolio.
Growing uncertainty and volatility characterized conditions in the U.S. fixed income market, but all sectors of the market posted gains for the period.
| | • | | Modest signs of improving economic conditions in the United States, supported by the aggressively accommodative monetary policy of the Federal Reserve (the Fed), an agreement in Washington to extend certain tax cuts, and continued strong corporate earnings fostered an environment in late 2010 that favored riskier asset classes such as high yield corporate “junk” bonds over U.S. Treasury securities. |
| | • | | Riskier asset classes largely remained in favor in the first quarter of 2011, though growing political upheaval in the Middle East North African (MENA) region boosted the price of oil, and an earthquake and tsunami caused a nuclear accident in Japan. |
| | • | | But the bond market grew increasingly volatile, and investors more risk averse, as the period continued. This reflected a worsening sovereign-debt crisis in the euro zone, data indicating the global economic recovery was slowing, and Standard & Poor’s lowering the long-term U.S. credit rating to AA+ from AAA. |
| | • | | Investors fled riskier asset classes and sought refuge in U.S. Treasury securities, boosting their prices and driving down their yields, as bond prices move inversely to yields. Treasury securities also gained in September after the Fed announced it would begin in October to exchange $400 billion of short-term Treasury securities for longer-term Treasury securities. |
| | • | | Riskier asset classes returned to favor in October 2011. Signs of strength in the U.S. economy quieted concerns that it might slip into a double-dip recession. European leaders also appeared to make progress in containing the region’s sovereign-debt crisis. |
The Portfolio of Investments following this report shows the size of the Portfolio’s positions at period-end.
| | | | |
| THE TARGET PORTFOLIO TRUST | | | 31 | |
Strategy and Performance Overview (continued)
The Portfolio’s duration strategies in various bond markets had a mixed impact on its performance versus the Index. Duration measures a fund’s sensitivity to changes in the level of interest rates, which move inversely to bond prices. When declining bond yields push bond prices higher (as during the period), a fund with a longer duration will tend to derive greater benefit from the market rally than a fund with a shorter duration.
| | • | | The Portfolio’s tactical duration positioning in the U.S. bond market had a slightly negative impact on its relative performance as yields on U.S. Treasury securities declined, pushing their prices higher. |
| | • | | Its duration exposures in the U.K. and Australian bond markets had a positive impact on its relative performance, as declining bond yields in both markets pushed bond prices higher. |
Its sector allocation strategies had a mixed impact on its performance versus the Index.
| | • | | It had a larger exposure than the Index to the investment-grade corporate bond sector, particularly to bonds of financial companies. This subtracted from its relative performance, because the sector underperformed similar-duration Treasury securities for the period. |
| | • | | Its exposure to mortgage-backed securities of federal agencies had a neutral impact on its relative performance, as that sector performed in line with similar-duration Treasury securities for the period. |
The Portfolio’s yield curve strategy benefited its relative performance.
| | • | | The Portfolio benefited from using money market futures contracts to position itself for an anticipated steepening in the slope of the yield curve. This worked well as the futures contracts increased in value. |
The Portfolio of Investments following this report shows the size of the Portfolio’s positions at period-end.
| | |
| 32 | | THE TARGET PORTFOLIO TRUST |
Mortgage Backed Securities Portfolio
The Mortgage Backed Securities Portfolio’s Class T shares returned 5.36% for the 12-month reporting period ended October 31, 2011, outperforming the 4.53% gain of the Barclays Capital U.S. Mortgage Backed Securities Index (the Index) and the 4.06% gain of the Lipper U.S. Mortgage Funds Average. The Portfolio is managed by Wellington Management Company, LLP (Wellington Management).
Mortgage rates declined during the period. This gave rise to concerns that homeowners taking advantage of lower rates by refinancing their mortgages could trigger prepayments on mortgage-backed securities. However, prepayments were slower than expected, as the availability of mortgage credit remained constrained and underwriting standards remained high, making it difficult for homeowners to refinance their loans. Mortgage rates fell reflecting a sharp decline in U.S. interest rates, which influence home loan rates.
The Portfolio outperformed the Index primarily due to its holdings in collateralized mortgage obligations (CMOs) created from pools of mortgage-backed securities of federal agencies and government-sponsored entities. CMOs are not included in the Index.
| | • | | Among CMOs of federal agencies, the Portfolio continued to favor inverse interest only (IIO) bonds, which as the name implies do not receive principal payments from the underlying mortgages and have coupon payments that move inversely to a short-term floating rate. Slower-than-expected prepayments and low short-term rates benefited IIO bonds, which contributed to performance. |
The Portfolio also benefited from its exposure to mortgage pass-through securities of Ginnie Mae as well as its favorable coupon positioning among Fannie Mae and Freddie Mac mortgage pass-through securities collateralized with 30-year fixed rate mortgage loans.
Favorable security selection among higher coupon mortgage pass-through securities, which Wellington Management believed were least likely to be prepaid, also helped relative performance.
The Portfolio’s emphasis on mortgage pass-through securities of Ginnie Mae, over those of Fannie Mae and Freddie Mac, worked well as Ginnie Mae securities gained,
The Portfolio of Investments following this report shows the size of the Portfolio’s positions at period-end.
| | | | |
| THE TARGET PORTFOLIO TRUST | | | 33 | |
Strategy and Performance Overview (continued)
reflecting demand from overseas investors and the fact that Ginnie Mae securities are backed by the full faith and credit of the U.S. government.
A barbell strategy in which the Portfolio had overweight exposures to mortgage pass-through securities with lower and higher coupons, coupled with an underweight exposure to securities with mid-range coupons, also aided its results.
The Portfolio benefited from its exposure to commercial mortgage-backed securities (CMBS), which outperformed mortgage pass-through securities with similar interest rate risk for the period. CMBS were aided by a combination of strong investor demand for a limited supply of CMBS.
It also benefited from its exposure to mortgage-backed securities of the Fannie Mae Delegated Underwriting and Servicing (DUS) program. These securities are backed by loans on multifamily properties. CMBS and DUS bonds are not included in the Index.
An allocation to “private label” mortgage pass-through securities (those without government backing) subtracted from the Portfolio’s performance versus the Index.
| | • | | Positive performance by private label mortgage pass-through securities in the first half of the period was more than offset by their poor performance during the second half. The securities underperformed, reflecting continued declines in house prices, the weak housing market, and selling pressure from the Fed’s unwinding of the Maiden Lane II portfolio, which included large amounts of risky residential mortgage-backed securities. Further macroeconomic weakness and low investors’ appetite for risk assets in recent months also hurt the performance of these securities. |
The Portfolio employed derivatives contracts, including interest rate swaps and interest rate futures, to tactically manage its exposure to interest rate risk. These strategies contributed positively to the Portfolio’s performance versus the Index.
The Portfolio of Investments following this report shows the size of the Portfolio’s positions at period-end.
| | |
| 34 | | THE TARGET PORTFOLIO TRUST |
Fees and Expenses (Unaudited)
As a shareholder of the Trust, you incur two types of costs: (1) transaction costs, including sales charges (loads) on purchase payments and redemptions, as applicable, and (2) ongoing costs, including management fees, and other Trust expenses, as applicable. This example is intended to help you understand your ongoing costs (in dollars) of investing in the Trust and to compare these costs with the ongoing costs of investing in other mutual funds.
The example is based on an investment of $1,000 invested on May 1, 2011, at the beginning of the period, and held through the six-month period ended October 31, 2011. The example is for illustrative purposes only; you should consult the Prospectus for information on initial and subsequent minimum investment requirements.
The Trust’s transfer agent may charge additional fees to holders of certain accounts that are not included in the expenses shown in the table on the following page. These fees apply to individual retirement accounts (IRAs) and Section 403(b) accounts. As of the close of the six-month period covered by the table, IRA fees included an annual maintenance fee of $15 per account (subject to a maximum annual maintenance fee of $25 for all accounts held by the same shareholder). Section 403(b) accounts are charged an annual $25 fiduciary maintenance fee. Some of the fees may vary in amount, or may be waived, based on your total account balance or the number of Prudential Investments funds, including the Trust, that you own. You should consider the additional fees that were charged to your Trust account over the six-month period when you estimate the total ongoing expenses paid over the period and the impact of these fees on your ending account value, as these additional expenses are not reflected in the information provided in the expense table. Additional fees have the effect of reducing investment returns.
Actual Expenses
The first line for each share class in the table on the following pages provides information about actual account values and actual expenses. You may use the information on this line, together with the amount you invested, to estimate the expenses that you paid over the period. Simply divide your account value by $1,000 (for example, an $8,600 account value ÷ $1,000 = 8.6), then multiply the result by the number on the first line under the heading “Expenses Paid During the Six-Month Period” to estimate the expenses you paid on your account during this period.
Hypothetical Example for Comparison Purposes
The second line for each share class in the table below and on the following pages provides information about hypothetical account values and hypothetical expenses based on the Trust’s actual expense ratio and an assumed rate of return of 5% per
| | | | |
| THE TARGET PORTFOLIO TRUST | | | 35 | |
Fees and Expenses (continued)
year before expenses, which is not the Trust’s actual return. The hypothetical account values and expenses may not be used to estimate the actual ending account balance or expenses you paid for the period. You may use this information to compare the ongoing costs of investing in the Trust and other funds. To do so, compare this 5% hypothetical example with the 5% hypothetical examples that appear in the shareholder reports of the other funds.
Please note that the expenses shown in the table are meant to highlight your ongoing costs only and do not reflect any transactional costs such as sales charges (loads). Therefore, the second line for each share class in the table is useful in comparing ongoing costs only and will not help you determine the relative total costs of owning different funds. In addition, if these transactional costs were included, your costs would have been higher.
| | | | | | | | | | | | | | | | |
Large
Capitalization
Growth Portfolio | | Beginning Account
Value
May 1, 2011 | | | Ending Account
Value
October 31, 2011 | | | Annualized
Expense Ratio
Based on the
Six-Month Period | | | Expenses Paid
During the Six-
Month Period* | |
| | | | | | | | | | | | | | | | |
| Class R | | | | | | | | | | | | | | | | |
| Actual | | $ | 1,000.00 | | | $ | 930.70 | | | | 1.37 | % | | $ | 6.67 | |
| Hypothetical | | $ | 1,000.00 | | | $ | 1,018.30 | | | | 1.37 | % | | $ | 6.97 | |
| Class T | | | | | | | | | | | | | | | | |
| Actual | | $ | 1,000.00 | | | $ | 933.20 | | | | 0.87 | % | | $ | 4.24 | |
| Hypothetical | | $ | 1,000.00 | | | $ | 1,020.82 | | | | 0.87 | % | | $ | 4.43 | |
| | | | | | | | | | | | | | | | |
Large
Capitalization
Value Portfolio | | Beginning Account
Value
May 1, 2011 | | | Ending Account
Value
October 31, 2011 | | | Annualized
Expense Ratio
Based on the
Six-Month Period | | | Expenses Paid
During the Six-
Month Period* | |
| | | | | | | | | | | | | | | | |
| Class R | | | | | | | | | | | | | | | | |
| Actual | | $ | 1,000.00 | | | $ | 902.60 | | | | 1.34 | % | | $ | 6.43 | |
| Hypothetical | | $ | 1,000.00 | | | $ | 1,018.45 | | | | 1.34 | % | | $ | 6.82 | |
| Class T | | | | | | | | | | | | | | | | |
| Actual | | $ | 1,000.00 | | | $ | 904.70 | | | | 0.84 | % | | $ | 4.03 | |
| Hypothetical | | $ | 1,000.00 | | | $ | 1,020.97 | | | | 0.84 | % | | $ | 4.28 | |
| | |
| 36 | | THE TARGET PORTFOLIO TRUST |
| | | | | | | | | | | | | | | | |
Small
Capitalization
Growth Portfolio | | Beginning Account
Value
May 1, 2011 | | | Ending Account
Value
October 31, 2011 | | | Annualized
Expense Ratio
Based on the
Six-Month Period | | | Expenses Paid
During the Six-
Month Period* | |
| | | | | | | | | | | | | | | | |
Class R | | | | | | | | | | | | | | | | |
Actual | | $ | 1,000.00 | | | $ | 892.60 | | | | 1.48 | % | | $ | 7.06 | |
Hypothetical | | $ | 1,000.00 | | | $ | 1,017.74 | | | | 1.48 | % | | $ | 7.53 | |
Class T | | | | | | | | | | | | | | | | |
Actual | | $ | 1,000.00 | | | $ | 894.90 | | | | 0.98 | % | | $ | 4.68 | |
Hypothetical | | $ | 1,000.00 | | | $ | 1,020.27 | | | | 0.98 | % | | $ | 4.99 | |
| | | | | | | | | | | | | | | | |
Small
Capitalization
Value Portfolio | | Beginning Account
Value
May 1, 2011 | | | Ending Account
Value
October 31, 2011 | | | Annualized
Expense Ratio
Based on the
Six-Month Period | | | Expenses Paid
During the Six-
Month Period* | |
| | | | | | | | | | | | | | | | |
Class R | | | | | | | | | | | | | | | | |
Actual | | $ | 1,000.00 | | | $ | 887.40 | | | | 1.21 | % | | $ | 5.76 | |
Hypothetical | | $ | 1,000.00 | | | $ | 1,019.11 | | | | 1.21 | % | | $ | 6.16 | |
Class T | | | | | | | | | | | | | | | | |
Actual | | $ | 1,000.00 | | | $ | 889.30 | | | | 0.71 | % | | $ | 3.38 | |
Hypothetical | | $ | 1,000.00 | | | $ | 1,021.63 | | | | 0.71 | % | | $ | 3.62 | |
| | | | | | | | | | | | | | | | |
International
Equity Portfolio | | Beginning Account
Value
May 1, 2011 | | | Ending Account
Value
October 31, 2011 | | | Annualized
Expense Ratio
Based on the
Six-Month Period | | | Expenses Paid
During the Six-
Month Period* | |
| | | | | | | | | | | | | | | | |
Class Q | | | | | | | | | | | | | | | | |
Actual | | $ | 1,000.00 | | | $ | 833.30 | | | | 0.86 | % | | $ | 3.97 | |
Hypothetical | | $ | 1,000.00 | | | $ | 1,020.87 | | | | 0.86 | % | | $ | 4.38 | |
Class R | | | | | | | | | | | | | | | | |
Actual | | $ | 1,000.00 | | | $ | 830.40 | | | | 1.52 | % | | $ | 7.01 | |
Hypothetical | | $ | 1,000.00 | | | $ | 1,017.54 | | | | 1.52 | % | | $ | 7.73 | |
Class T | | | | | | | | | | | | | | | | |
Actual | | $ | 1,000.00 | | | $ | 832.50 | | | | 1.02 | % | | $ | 4.71 | |
Hypothetical | | $ | 1,000.00 | | | $ | 1,020.06 | | | | 1.02 | % | | $ | 5.19 | |
| | | | | | | | | | | | | | | | |
| | | | |
| THE TARGET PORTFOLIO TRUST | | | 37 | |
Fees and Expenses (continued)
| | | | | | | | | | | | | | | | |
Total Return
Bond Portfolio | | Beginning Account
Value
May 1, 2011 | | | Ending Account
Value
October 31, 2011 | | | Annualized
Expense Ratio
Based on the
Six-Month Period | | | Expenses Paid
During the Six-
Month Period* | |
| | | | | | | | | | | | | | | | |
| Class R | | | | | | | | | | | | | | | | |
| Actual | | $ | 1,000.00 | | | $ | 1,029.30 | | | | 1.16 | % | | $ | 5.93 | |
| Hypothetical | | $ | 1,000.00 | | | $ | 1,019.36 | | | | 1.16 | % | | $ | 5.90 | |
| Class T | | | | | | | | | | | | | | | | |
| Actual | | $ | 1,000.00 | | | $ | 1,032.70 | | | | 0.66 | % | | $ | 3.38 | |
| Hypothetical | | $ | 1,000.00 | | | $ | 1,021.88 | | | | 0.66 | % | | $ | 3.36 | |
| | | | | | | | | | | | | | | | |
Intermediate-Term
Bond Portfolio | | Beginning Account
Value
May 1, 2011 | | | Ending Account
Value
October 31, 2011 | | | Annualized
Expense Ratio
Based on the
Six-Month Period | | | Expenses Paid
During the Six-
Month Period* | |
| | | | | | | | | | | | | | | | |
Class T | | | | | | | | | | | | | | | | |
Actual | | $ | 1,000.00 | | | $ | 1,023.80 | | | | 0.68 | % | | $ | 3.47 | |
Hypothetical | | $ | 1,000.00 | | | $ | 1,021.78 | | | | 0.68 | % | | $ | 3.47 | |
| | | | | | | | | | | | | | | | |
Mortgage Backed
Securities Portfolio | | Beginning Account
Value
May 1, 2011 | | | Ending Account
Value
October 31, 2011 | | | Annualized
Expense Ratio
Based on the
Six-Month Period | | | Expenses Paid
During the Six-
Month Period* | |
| | | | | | | | | | | | | | | | |
Class T | | | | | | | | | | | | | | | | |
Actual | | $ | 1,000.00 | | | $ | 1,034.50 | | | | 1.06 | % | | $ | 5.44 | |
Hypothetical | | $ | 1,000.00 | | | $ | 1,019.86 | | | | 1.06 | % | | $ | 5.40 | |
* Portfolio expenses (net of fee waivers or subsidies, if any) for each share class are equal to the annualized expense ratio for each share class (provided in the table), multiplied by the average account value over the period, multiplied by the 184 days in the six-month period ended October 31, 2011, and divided by the 365 days in the Portfolio’s fiscal year ended October 31, 2011 (to reflect the six-month period).
| | |
| 38 | | THE TARGET PORTFOLIO TRUST |
| | |
Portfolio of Investments
As of October 31, 2011 | | Large Capitalization Growth Portfolio |
| | | | | | | | |
| SHARES | | | DESCRIPTION | | VALUE (NOTE 1) | |
| | | | LONG-TERM INVESTMENTS—96.8% | | | | |
| | |
| | | | COMMON STOCKS—95.4% | | | | |
| | |
| | | | Auto Parts and Equipment—0.3% | | | | |
| | 19,590 | | | Johnson Controls, Inc. | | $ | 645,099 | |
| | | | | | | | |
| | |
| | | | Beverages—1.7% | | | | |
| | 11,100 | | | Coca-Cola Co. (The) | | | 758,352 | |
| | 12,020 | | | Coca-Cola Enterprises, Inc. | | | 322,376 | |
| | 43,137 | | | Diageo PLC (United Kingdom) | | | 892,753 | |
| | 21,668 | | | Green Mountain Coffee Roasters, Inc.* | | | 1,408,853 | |
| | | | | | | | |
| | | | | | | 3,382,334 | |
| | | | | | | | |
| | |
| | | | Biotechnology—2.5% | | | | |
| | 13,180 | | | Alexion Pharmaceuticals, Inc.* | | | 889,782 | |
| | 26,739 | | | Biogen Idec, Inc.* | | | 3,111,350 | |
| | 16,330 | | | Celgene Corp.* | | | 1,058,674 | |
| | | | | | | | |
| | | | | | | 5,059,806 | |
| | | | | | | | |
| | |
| | | | Broadcasting—0.3% | | | | |
| | 12,220 | | | Discovery Communications, Inc. (Class A Stock)* | | | 531,081 | |
| | | | | | | | |
| | |
| | | | Building Materials—0.1% | | | | |
| | 10,240 | | | Owens Corning* | | | 290,611 | |
| | | | | | | | |
| | |
| | | | Business Services—0.6% | | | | |
| | 3,570 | | | MasterCard, Inc. (Class A Stock) | | | 1,239,647 | |
| | | | | | | | |
| | |
| | | | Chemicals—6.6% | | | | |
| | 6,920 | | | Airgas, Inc. | | | 477,134 | |
| | 8,880 | | | Celanese Corp. (Class A Stock) | | | 386,724 | |
| | 66,203 | | | Dow Chemical Co. (The) | | | 1,845,740 | |
| | 56,118 | | | Monsanto Co. | | | 4,082,584 | |
| | 25,472 | | | PPG Industries, Inc. | | | 2,201,036 | |
| | 43,932 | | | Praxair, Inc. | | | 4,466,566 | |
| | | | | | | | |
| | | | | | | 13,459,784 | |
| | | | | | | | |
| | |
| | | | Commercial Banks—1.0% | | | | |
| | 77,949 | | | U.S. Bancorp | | | 1,994,715 | |
| | | | | | | | |
| | |
| | | | Commercial Services—0.8% | | | | |
| | 6,060 | | | FleetCor Technologies, Inc.* | | | 169,438 | |
| | 20,982 | | | Sotheby’s | | | 738,986 | |
| | 20,290 | | | Verisk Analytics, Inc. (Class A Stock)* | �� | | 713,193 | |
| | | | | | | | |
| | | | | | | 1,621,617 | |
| | | | | | | | |
| | |
| | | | Computer Hardware—5.6% | | | | |
| | 26,460 | | | Apple, Inc.* | | | 10,710,479 | |
| | 4,300 | | | International Business Machines Corp. | | | 793,909 | |
| | | | | | | | |
| | | | | | | 11,504,388 | |
| | | | | | | | |
See Notes to Financial Statements.
| | | | |
| THE TARGET PORTFOLIO TRUST | | | 39 | |
| | |
Large Capitalization Growth Portfolio (continued) | | Portfolio of Investments
As of October 31, 2011 |
| | | | | | | | |
| SHARES | | | DESCRIPTION | | VALUE (NOTE 1) | |
| | | | COMMON STOCKS (continued) | | | | |
| | |
| | | | Computer Services & Software—5.4% | | | | |
| | 55,885 | | | Accenture PLC (Class A Stock) (Ireland) | | $ | 3,367,630 | |
| | 21,234 | | | Amazon.com, Inc.* | | | 4,533,671 | |
| | 14,623 | | | Cognizant Technology Solutions Corp. (Class A Stock)* | | | 1,063,823 | |
| | 14,746 | | | salesforce.com, Inc.* | | | 1,963,725 | |
| | 3,400 | | | Teradata Corp.* | | | 202,844 | |
| | | | | | | | |
| | | | | | | 11,131,693 | |
| | | | | | | | |
| | |
| | | | Computers & Peripherals—1.1% | | | | |
| | 88,770 | | | EMC Corp.* | | | 2,175,753 | |
| | | | | | | | |
| | |
| | | | Cosmetics & Toiletries—1.5% | | | | |
| | 11,020 | | | Colgate-Palmolive Co. | | | 995,877 | |
| | 21,811 | | | Estee Lauder Cos., Inc. (The) (Class A Stock) | | | 2,147,293 | |
| | | | | | | | |
| | | | | | | 3,143,170 | |
| | | | | | | | |
| | |
| | | | Distribution/Wholesale—0.4% | | | | |
| | 470,000 | | | Li & Fung Ltd. (Bermuda) | | | 905,781 | |
| | | | | | | | |
| | |
| | | | Diversified Financial Services—0.5% | | | | |
| | 7,550 | | | Affiliated Managers Group, Inc.* | | | 699,205 | |
| | 2,438 | | | BlackRock, Inc. | | | 384,692 | |
| | | | | | | | |
| | | | | | | 1,083,897 | |
| | | | | | | | |
| | |
| | | | Engineering/Construction—0.4% | | | | |
| | 12,710 | | | Fluor Corp.(a) | | | 722,563 | |
| | | | | | | | |
| | |
| | | | Entertainment & Leisure—0.4% | | | | |
| | 10,850 | | | Carnival Corp. (Panama) | | | 382,028 | |
| | 11,180 | | | Las Vegas Sands Corp.* | | | 524,901 | |
| | | | | | | | |
| | | | | | | 906,929 | |
| | | | | | | | |
| | |
| | | | Environmental Services—0.3% | | | | |
| | 6,220 | | | Stericycle, Inc.*(a) | | | 519,868 | |
| | | | | | | | |
| | |
| | | | Financial Services—2.4% | | | | |
| | 3,240 | | | Goldman Sachs Group, Inc. (The) | | | 354,942 | |
| | 48,095 | | | Visa, Inc. (Class A Stock) | | | 4,485,340 | |
| | | | | | | | |
| | | | | | | 4,840,282 | |
| | | | | | | | |
| | |
| | | | Food—1.7% | | | | |
| | 8,244 | | | Danone (France) | | | 571,498 | |
| | 5,500 | | | General Mills, Inc. | | | 211,915 | |
| | 38,185 | | | Mead Johnson Nutrition Co. | | | 2,743,592 | |
| | | | | | | | |
| | | | | | | 3,527,005 | |
| | | | | | | | |
| | |
| | | | Hand/Machine Tools—0.2% | | | | |
| | 6,930 | | | Stanley Black & Decker, Inc. | | | 442,480 | |
| | | | | | | | |
See Notes to Financial Statements.
| | | | |
| 40 | | | THE TARGET PORTFOLIO TRUST | |
| | | | | | | | |
| SHARES | | | DESCRIPTION | | VALUE (NOTE 1) | |
| | | | COMMON STOCKS (continued) | | | | |
| | |
| | | | Healthcare Products—0.8% | | | | |
| | 4,343 | | | Becton, Dickinson and Co. | | $ | 339,753 | |
| | 4,190 | | | Cooper Cos., Inc. (The) | | | 290,367 | |
| | 16,837 | | | Covidien PLC (Ireland) | | | 792,012 | |
| | 2,850 | | | IDEXX Laboratories, Inc.*(a) | | | 205,172 | |
| | | | | | | | |
| | | | | | | 1,627,304 | |
| | | | | | | | |
| | |
| | | | Holding Companies—Diversified—0.2% | | | | |
| | 2,285 | | | LVMH Moet Hennessy Louis Vuitton SA (France) | | | 378,725 | |
| | | | | | | | |
| | |
| | | | Hotels, Restaurants & Leisure—3.5% | | | | |
| | 42,749 | | | McDonald’s Corp. | | | 3,969,245 | |
| | 24,689 | | | Wynn Resorts Ltd. | | | 3,278,699 | |
| | | | | | | | |
| | | | | | | 7,247,944 | |
| | | | | | | | |
| | |
| | | | Internet—2.5% | | | | |
| | 30,975 | | | Baidu, Inc., ADR (Cayman Islands)* | | | 4,342,075 | |
| | 32,982 | | | Youku.com, Inc., ADR (Cayman Islands)*(a) | | | 700,538 | |
| | | | | | | | |
| | | | | | | 5,042,613 | |
| | | | | | | | |
| | |
| | | | Internet Software & Services—7.5% | | | | |
| | 8,433 | | | Google, Inc. (Class A Stock)* | | | 4,997,733 | |
| | 164,943 | | | Oracle Corp. | | | 5,405,182 | |
| | 9,156 | | | priceline.com, Inc.* | | | 4,648,684 | |
| | 8,520 | | | VeriSign, Inc. | | | 273,407 | |
| | | | | | | | |
| | | | | | | 15,325,006 | |
| | | | | | | | |
| | |
| | | | Investment Company—0.5% | | | | |
| | 1,674,000 | | | Hutchison Port Holdings Trust (Singapore) | | | 1,121,580 | |
| | | | | | | | |
| | |
| | | | Machinery & Equipment—1.6% | | | | |
| | 17,061 | | | Cummins, Inc. | | | 1,696,375 | |
| | 4,710 | | �� | Joy Global, Inc. | | | 410,712 | |
| | 16,459 | | | Rockwell Automation, Inc. | | | 1,113,452 | |
| | | | | | | | |
| | | | | | | 3,220,539 | |
| | | | | | | | |
| | |
| | | | Media—3.2% | | | | |
| | 94,625 | | | British Sky Broadcasting Group PLC (United Kingdom) | | | 1,066,941 | |
| | 36,160 | | | Comcast Corp. (Special Class A Stock) | | | 831,680 | |
| | 78,077 | | | Time Warner, Inc. | | | 2,731,914 | |
| | 29,470 | | | Viacom, Inc. (Class B Stock) | | | 1,292,260 | |
| | 14,890 | | | Walt Disney Co. (The) | | | 519,363 | |
| | | | | | | | |
| | | | | | | 6,442,158 | |
| | | | | | | | |
| | |
| | | | Medical Equipment—0.6% | | | | |
| | 25,617 | | | Thermo Fisher Scientific, Inc.* | | | 1,287,767 | |
| | | | | | | | |
| | |
| | | | Metals & Mining—2.2% | | | | |
| | 7,172 | | | Freeport-McMoRan Copper & Gold, Inc. | | | 288,745 | |
| | 25,790 | | | Precision Castparts Corp. | | | 4,207,638 | |
| | | | | | | | |
| | | | | | | 4,496,383 | |
| | | | | | | | |
See Notes to Financial Statements.
| | | | |
| THE TARGET PORTFOLIO TRUST | | | 41 | |
| | |
Large Capitalization Growth Portfolio (continued) | | Portfolio of Investments
As of October 31, 2011 |
| | | | | | | | |
| SHARES | | | DESCRIPTION | | VALUE (NOTE 1) | |
| | | | COMMON STOCKS (continued) | | | | |
| | |
| | | | Miscellaneous Manufacturers—4.2% | | | | |
| | 99,536 | | | Danaher Corp. | | $ | 4,812,566 | |
| | 55,569 | | | Eaton Corp. | | | 2,490,603 | |
| | 20,160 | | | Honeywell International, Inc. | | | 1,056,384 | |
| | 6,270 | | | Polypore International, Inc.*(a) | | | 328,861 | |
| | | | | | | | |
| | | | | | | 8,688,414 | |
| | | | | | | | |
| | |
| | | | Oil & Gas Services—4.3% | | | | |
| | 22,400 | | | Cameron International Corp.* | | | 1,100,736 | |
| | 9,790 | | | Dresser-Rand Group, Inc.* | | | 473,836 | |
| | 12,990 | | | Ensco PLC, ADR (United Kingdom) | | | 645,083 | |
| | 5,380 | | | FMC Technologies, Inc.*(a) | | | 241,132 | |
| | 32,372 | | | National Oilwell Varco, Inc. | | | 2,309,095 | |
| | 40,865 | | | Occidental Petroleum Corp. | | | 3,797,993 | |
| | 3,410 | | | SM Energy Co. | | | 282,723 | |
| | | | | | | | |
| | | | | | | 8,850,598 | |
| | | | | | | | |
| | |
| | | | Oil, Gas & Consumable Fuels—4.3% | | | | |
| | 11,686 | | | Anadarko Petroleum Corp. | | | 917,351 | |
| | 4,932 | | | Apache Corp. | | | 491,375 | |
| | 6,730 | | | Cabot Oil & Gas Corp. | | | 523,056 | |
| | 6,963 | | | Continental Resources, Inc.*(a) | | | 422,306 | |
| | 10,960 | | | EQT Corp. | | | 695,960 | |
| | 96,596 | | | Halliburton Co. | | | 3,608,826 | |
| | 9,570 | | | Noble Energy, Inc. | | | 854,984 | |
| | 16,180 | | | Schlumberger Ltd. (Netherlands) | | | 1,188,745 | |
| | | | | | | | |
| | | | | | | 8,702,603 | |
| | | | | | | | |
| | |
| | | | Pharmaceuticals—1.9% | | | | |
| | 12,500 | | | Abbott Laboratories | | | 673,375 | |
| | 21,621 | | | Allergan, Inc. | | | 1,818,759 | |
| | 19,540 | | | AmerisourceBergen Corp. | | | 797,232 | |
| | 12,820 | | | Teva Pharmaceutical Industries Ltd., ADR (Israel) | | | 523,697 | |
| | | | | | | | |
| | | | | | | 3,813,063 | |
| | | | | | | | |
| | |
| | | | Real Estate—0.1% | | | | |
| | 3,470 | | | Jones Lang LaSalle, Inc. | | | 224,231 | |
| | | | | | | | |
| | |
| | | | Retail—4.7% | | | | |
| | 1,473 | | | Autozone, Inc.* | | | 476,648 | |
| | 9,340 | | | Costco Wholesale Corp. | | | 777,555 | |
| | 11,740 | | | Dollar General Corp.* | | | 465,608 | |
| | 2,341 | | | Lululemon Athletica, Inc.*(a) | | | 132,220 | |
| | 19,175 | | | O’Reilly Automotive, Inc.*(a) | | | 1,458,259 | |
| | 8,950 | | | PetSmart, Inc. | | | 420,202 | |
| | 2,870 | | | PVH Corp. | | | 213,557 | |
See Notes to Financial Statements.
| | | | |
| 42 | | | THE TARGET PORTFOLIO TRUST | |
| | | | | | | | |
| SHARES | | | DESCRIPTION | | VALUE (NOTE 1) | |
| | | | COMMON STOCKS (continued) | | | | |
| | |
| | | | Retail (continued) | | | | |
| | 10,575 | | | Ross Stores, Inc. | | $ | 927,745 | |
| | 102,015 | | | Starbucks Corp. | | | 4,319,315 | |
| | 5,120 | | | Tractor Supply Co. | | | 363,213 | |
| | | | | | | | |
| | | | | | | 9,554,322 | |
| | | | | | | | |
| | |
| | | | Retail & Merchandising—7.9% | | | | |
| | 4,300 | | | Abercrombie & Fitch Co. (Class A Stock)(a) | | | 319,920 | |
| | 607,097 | | | Cie Financiere Richemont SA, ADR (Switzerland) | | | 3,387,601 | |
| | 8,470 | | | Kohl’s Corp. | | | 448,995 | |
| | 25,890 | | | Target Corp. | | | 1,417,478 | |
| | 28,136 | | | Tiffany & Co. | | | 2,243,283 | |
| | 85,909 | | | TJX Cos., Inc. (The) | | | 5,062,617 | |
| | 15,370 | | | Urban Outfitters, Inc.*(a) | | | 418,833 | |
| | 53,516 | | | Yum! Brands, Inc. | | | 2,866,852 | |
| | | | | | | | |
| | | | | | | 16,165,579 | |
| | | | | | | | |
| | |
| | | | Semiconductors—1.7% | | | | |
| | 4,920 | | | Altera Corp. | | | 186,567 | |
| | 14,227 | | | ASML Holding NV (Netherlands)(a) | | | 596,538 | |
| | 20,355 | | | Broadcom Corp. (Class A Stock)* | | | 734,612 | |
| | 37,922 | | | QUALCOMM, Inc. | | | 1,956,775 | |
| | | | | | | | |
| | | | | | | 3,474,492 | |
| | | | | | | | |
| | |
| | | | Software—3.0% | | | | |
| | 23,740 | | | Autodesk, Inc.* | | | 821,404 | |
| | 7,450 | | | Cerner Corp.*(a) | | | 472,554 | |
| | 43,434 | | | Check Point Software Technologies Ltd. (Israel)*(a) | | | 2,503,101 | |
| | 6,140 | | | MSCI, Inc. (Class A Stock)* | | | 205,015 | |
| | 40,568 | | | Red Hat, Inc.* | | | 2,014,201 | |
| | 5,100 | | | VeriFone Systems, Inc.* | | | 215,271 | |
| | | | | | | | |
| | | | | | | 6,231,546 | |
| | | | | | | | |
| | |
| | | | Telecommunications—1.0% | | | | |
| | 32,980 | | | American Tower Corp. (Class A Stock)* | | | 1,817,198 | |
| | 10,690 | | | JDS Uniphase Corp.* | | | 128,280 | |
| | | | | | | | |
| | | | | | | 1,945,478 | |
| | | | | | | | |
| | |
| | | | Textiles, Apparel & Luxury Goods—3.3% | | | | |
| | 32,142 | | | Coach, Inc. | | | 2,091,480 | |
| | 48,147 | | | NIKE, Inc. (Class B Stock) | | | 4,638,963 | |
| | | | | | | | |
| | | | | | | 6,730,443 | |
| | | | | | | | |
| | |
| | | | Tobacco—0.5% | | | | |
| | 13,410 | | | Philip Morris International, Inc. | | | 936,957 | |
| | | | | | | | |
| | |
| | | | Transportation—2.1% | | | | |
| | 14,520 | | | Expeditors International of Washington, Inc. | | | 662,112 | |
| | 12,950 | | | Kansas City Southern*(a) | | | 818,051 | |
See Notes to Financial Statements.
| | | | |
| THE TARGET PORTFOLIO TRUST | | | 43 | |
| | |
Large Capitalization Growth Portfolio (continued) | | Portfolio of Investments
As of October 31, 2011 |
| | | | | | | | |
| SHARES | | | DESCRIPTION | | VALUE (NOTE 1) | |
| | | | COMMON STOCKS (continued) | | | | |
| | |
| | | | Transportation (continued) | | | | |
| | 28,822 | | | Union Pacific Corp. | | $ | 2,869,807 | |
| | | | | | | | |
| | | | | | | 4,349,970 | |
| | | | | | | | |
| | | | TOTAL COMMON STOCKS
(cost $150,536,762) | | | 194,986,218 | |
| | | | | | | | |
| | |
| | | | PREFERRED STOCKS—1.4% | | | | |
| | |
| | | | Commercial Banks—0.9% | | | | |
| | 92,600 | | | Itau Unibanco Holding SA (PRFC), ADR (Brazil) | | | 1,770,512 | |
| | | | | | | | |
| | |
| | | | Financial—Bank & Trust—0.5% | | | | |
| | 35,375 | | | Wells Fargo & Co., Series J, 8.00% | | | 998,990 | |
| | | | | | | | |
| | | | TOTAL PREFERRED STOCKS
(cost $2,775,847) | | | 2,769,502 | |
| | | | | | | | |
| | | | TOTAL LONG-TERM INVESTMENTS
(cost $153,312,609) | | | 197,755,720 | |
| | | | | | | | |
| | |
| | | | SHORT-TERM INVESTMENT—6.3% | | | | |
| | |
| | | | AFFILIATED MONEY MARKET MUTUAL FUND | | | | |
| | 12,956,905 | | | Prudential Investment Portfolios 2—Prudential Core Taxable Money Market Fund (cost $12,956,905; includes $6,791,528 of cash collateral for securities on loan)(b)(w) | | | 12,956,905 | |
| | | | | | | | |
| | | | TOTAL INVESTMENTS—103.1%
(cost $166,269,514; Note 5) | | | 210,712,625 | |
| | | | Liabilities in excess of other assets—(3.1%) | | | (6,308,458 | ) |
| | | | | | | | |
| | | | NET ASSETS—100% | | $ | 204,404,167 | |
| | | | | | | | |
The following abbreviations are used in the Portfolio descriptions:
ADR—American Depositary Receipt
PRFC—Preference Shares
| * | Non-income producing security. |
| (a) | All or a portion of security is on loan. The aggregate market value of such securities, including those sold and pending settlement, is $6,425,843; cash collateral of $6,791,528 (included with liabilities) was received with which the Portfolio purchased highly liquid short-term investments. |
| (b) | Represents security, or a portion thereof, purchased with cash collateral received for securities on loan. |
| (w) | Prudential Investments LLC, the manager of the Portfolio, also serves as manager of the Prudential Investment Portfolios 2-Prudential Core Taxable Money Market Fund. |
Various inputs are used in determining the value of the Portfolio’s investments. These inputs are summarized in the three broad levels listed below.
Level 1—quoted prices generally for securities actively traded on a regulated securities exchange and for open-end mutual funds which trade at daily net asset value.
See Notes to Financial Statements.
| | | | |
| 44 | | | THE TARGET PORTFOLIO TRUST | |
Level 2—other significant observable inputs (including, but not limited to, quoted prices for similar securities, interest rates, prepayment speeds, foreign currency exchange rates, and amortized cost) generally for debt securities, swaps, forward foreign currency contracts and for foreign stocks priced using vendor modeling tools.
Level 3—significant unobservable inputs for securities valued in accordance with Board approved fair valuation procedures.
The following is a summary of the inputs used as of October 31, 2011 in valuing such portfolio securities:
| | | | | | | | | | | | |
| | | Level 1 | | | Level 2 | | | Level 3 | |
| Investments in Securities | | | | | | | | | | | | |
Common Stocks | | $ | 191,170,520 | | | $ | 3,815,698 | | | $ | — | |
Preferred Stocks | | | 2,769,502 | | | | — | | | | — | |
Affiliated Money Market Mutual Fund | | | 12,956,905 | | | | — | | | | — | |
| | | | | | | | | | | | |
Total | | $ | 206,896,927 | | | $ | 3,815,698 | | | $ | — | |
| | | | | | | | | | | | |
The industry classification of investments and liabilities in excess of other assets shown as a percentage of net assets as of October 31, 2011 were as follows:
| | | | |
Retail & Merchandising | | | 7.9 | % |
Internet Software & Services | | | 7.5 | |
Chemicals | | | 6.6 | |
Affiliated Money Market Mutual Fund (3.3% represents investments purchased with collateral from securities on loan) | | | 6.3 | |
Computer Hardware | | | 5.6 | |
Computer Services & Software | | | 5.4 | |
Retail | | | 4.7 | |
Oil & Gas Services | | | 4.3 | |
Oil, Gas & Consumable Fuels | | | 4.3 | |
Miscellaneous Manufacturers | | | 4.2 | |
Hotels, Restaurants & Leisure | | | 3.5 | |
Textiles, Apparel & Luxury Goods | | | 3.3 | |
Media | | | 3.2 | |
Software | | | 3.0 | |
Biotechnology | | | 2.5 | |
Internet | | | 2.5 | |
Financial Services | | | 2.4 | |
Metals & Mining | | | 2.2 | |
Transportation | | | 2.1 | |
Pharmaceuticals | | | 1.9 | |
Commercial Banks | | | 1.9 | |
Food | | | 1.7 | |
Semiconductors | | | 1.7 | |
Beverages | | | 1.7 | |
Machinery & Equipment | | | 1.6 | |
Cosmetics & Toiletries | | | 1.5 | |
Computers & Peripherals | | | 1.1 | |
Telecommunications | | | 1.0 | |
Healthcare Products | | | 0.8 | |
Commercial Services | | | 0.8 | |
Medical Equipment | | | 0.6 | |
Business Services | | | 0.6 | |
Investment Companies | | | 0.5 | |
Diversified Financial Services | | | 0.5 | |
See Notes to Financial Statements.
| | | | |
| THE TARGET PORTFOLIO TRUST | | | 45 | |
| | |
Large Capitalization Growth Portfolio (continued) | | Portfolio of Investments
As of October 31, 2011 |
| | | | |
Industry (cont’d.) | | | |
Financial—Bank & Trust | | | 0.5 | % |
Tobacco | | | 0.5 | |
Entertainment & Leisure | | | 0.4 | |
Distribution/Wholesale | | | 0.4 | |
Engineering/Construction | | | 0.4 | |
Auto Parts And Equipment | | | 0.3 | |
Broadcasting | | | 0.3 | |
Environmental Services | | | 0.3 | |
Hand/Machine Tools | | | 0.2 | |
Holding Companies—Diversified | | | 0.2 | |
Building Materials | | | 0.1 | |
Real Estate | | | 0.1 | |
| | | | |
| | | 103.1 | |
Liabilities in excess of other assets | | | (3.1 | ) |
| | | | |
| | | 100.0 | % |
| | | | |
See Notes to Financial Statements.
| | | | |
| 46 | | | THE TARGET PORTFOLIO TRUST | |
| | |
Portfolio of Investments
As of October 31, 2011 | | Large Capitalization Value Portfolio |
| | | | | | | | |
| SHARES | | | DESCRIPTION | | VALUE (NOTE 1) | |
| | | | LONG-TERM INVESTMENTS—97.3% | | | | |
| | |
| | | | COMMON STOCKS | | | | |
| | |
| | | | Aerospace & Defense—3.9% | | | | |
| | 8,297 | | | Boeing Co. (The) | | $ | 545,860 | |
| | 10,100 | | | Embraer SA, ADR (Brazil) | | | 280,982 | |
| | 6,881 | | | General Dynamics Corp. | | | 441,691 | |
| | 2,783 | | | Huntington Ingalls Industries, Inc.* | | | 82,099 | |
| | 27,166 | | | Lockheed Martin Corp. | | | 2,061,899 | |
| | 48,900 | | | Northrop Grumman Corp. | | | 2,823,975 | |
| | 20,879 | | | United Technologies Corp. | | | 1,628,144 | |
| | | | | | | | |
| | | | | | | 7,864,650 | |
| | | | | | | | |
| | |
| | | | Air Freight & Logistics—0.2% | | | | |
| | 5,000 | | | FedEx Corp. | | | 409,150 | |
| | | | | | | | |
| | |
| | | | Auto Parts and Equipment—0.6% | | | | |
| | 16,600 | | | Johnson Controls, Inc. | | | 546,638 | |
| | 18,100 | | | Magna International, Inc. (Canada) | | | 690,515 | |
| | | | | | | | |
| | | | | | | 1,237,153 | |
| | | | | | | | |
| | |
| | | | Automobile—0.1% | | | | |
| | 6,600 | | | Harley-Davidson, Inc. | | | 256,740 | |
| | | | | | | | |
| | |
| | | | Beverages—0.8% | | | | |
| | 14,100 | | | Molson Coors Brewing Co. (Class B Stock) | | | 596,994 | |
| | 16,502 | | | PepsiCo, Inc. | | | 1,038,801 | |
| | | | | | | | |
| | | | | | | 1,635,795 | |
| | | | | | | | |
| | |
| | | | Biotechnology—0.8% | | | | |
| | 22,311 | | | Amgen, Inc. | | | 1,277,751 | |
| | 5,900 | | | Gilead Sciences, Inc.* | | | 245,794 | |
| | | | | | | | |
| | | | | | | 1,523,545 | |
| | | | | | | | |
| | |
| | | | Capital Markets—1.8% | | | | |
| | 20,183 | | | Goldman Sachs Group, Inc. (The) | | | 2,211,048 | |
| | 42,900 | | | Morgan Stanley | | | 756,756 | |
| | 17,900 | | | State Street Corp. | | | 722,981 | |
| | | | | | | | |
| | | | | | | 3,690,785 | |
| | | | | | | | |
| | |
| | | | Chemicals—0.5% | | | | |
| | 5,004 | | | Air Products & Chemicals, Inc. | | | 431,045 | |
| | 6,500 | | | PPG Industries, Inc. | | | 561,665 | |
| | | | | | | | |
| | | | | | | 992,710 | |
| | | | | | | | |
| | |
| | | | Commercial Banks—6.2% | | | | |
| | 100,107 | | | Fifth Third Bancorp | | | 1,202,285 | |
| | 82,510 | | | KeyCorp | | | 582,521 | |
See Notes to Financial Statements.
| | | | |
| THE TARGET PORTFOLIO TRUST | | | 47 | |
| | |
Large Capitalization Value Portfolio (continued) | | Portfolio of Investments
As of October 31, 2011 |
| | | | | | | | |
| SHARES | | | DESCRIPTION | | VALUE (NOTE 1) | |
| | | | COMMON STOCKS (continued) | | | | |
| | |
| | | | Commercial Banks (continued) | | | | |
| | 70,617 | | | PNC Financial Services Group, Inc. | | $ | 3,792,839 | |
| | 109,600 | | | Regions Financial Corp. | | | 430,728 | |
| | 28,520 | | | U.S. Bancorp | | | 729,827 | |
| | 220,472 | | | Wells Fargo & Co. | | | 5,712,429 | |
| | | | | | | | |
| | | | | | | 12,450,629 | |
| | | | | | | | |
| | |
| | | | Computer Services & Software—0.7% | | | | |
| | 22,241 | | | Accenture PLC (Class A Stock) (Ireland) | | | 1,340,243 | |
| | | | | | | | |
| | |
| | | | Computers—1.0% | | | | |
| | 4,744 | | | Apple, Inc.* | | | 1,920,276 | |
| | | | | | | | |
| | |
| | | | Computers & Peripherals—1.2% | | | | |
| | 90,300 | | | Hewlett-Packard Co. | | | 2,402,883 | |
| | | | | | | | |
| | |
| | | | Consumer Finance—0.4% | | | | |
| | 18,300 | | | Capital One Financial Corp.(a) | | | 835,578 | |
| | | | | | | | |
| | |
| | | | Diversified Consumer Services—0.1% | | | | |
| | 16,000 | | | H&R Block, Inc. | | | 244,640 | |
| | | | | | | | |
| | |
| | | | Diversified Financial Services—5.8% | | | | |
| | 32,591 | | | American Express Co. | | | 1,649,756 | |
| | 160,786 | | | Bank of America Corp. | | | 1,098,168 | |
| | 74,184 | | | Citigroup, Inc. | | | 2,343,473 | |
| | 7,303 | | | Franklin Resources, Inc. | | | 778,719 | |
| | 165,505 | | | JPMorgan Chase & Co. | | | 5,752,954 | |
| | | | | | | | |
| | | | | | | 11,623,070 | |
| | | | | | | | |
| | |
| | | | Diversified Telecommunication Services—2.8% | | | | |
| | 115,675 | | | AT&T, Inc. | | | 3,390,434 | |
| | 61,694 | | | Verizon Communications, Inc. | | | 2,281,444 | |
| | | | | | | | |
| | | | | | | 5,671,878 | |
| | | | | | | | |
| | |
| | | | Electric Utilities—4.6% | | | | |
| | 62,784 | | | American Electric Power Co., Inc. | | | 2,466,156 | |
| | 53,600 | | | Edison International | | | 2,176,160 | |
| | 40,900 | | | Exelon Corp. | | | 1,815,551 | |
| | 28,117 | | | PG&E Corp. | | | 1,206,219 | |
| | 55,458 | | | PPL Corp. | | | 1,628,801 | |
| | | | | | | | |
| | | | | | | 9,292,887 | |
| | | | | | | | |
| | |
| | | | Electronic Components & Equipment—0.3% | | | | |
| | 11,001 | | | Thermo Fisher Scientific, Inc.* | | | 553,020 | |
| | | | | | | | |
See Notes to Financial Statements.
| | | | |
| 48 | | | THE TARGET PORTFOLIO TRUST | |
| | | | | | | | |
| SHARES | | | DESCRIPTION | | VALUE (NOTE 1) | |
| | | | COMMON STOCKS (continued) | | | | |
| | |
| | | | Electronic Equipment & Instruments—0.1% | | | | |
| | 8,900 | | | Corning, Inc. | | $ | 127,181 | |
| | | | | | | | |
| | |
| | | | Electronic Equipment, Instrument & Components—0.2% | | | | |
| | 13,325 | | | TE Connectivity Ltd. (Switzerland) | | | 473,704 | |
| | | | | | | | |
| | |
| | | | Energy Equipment & Services—1.2% | | | | |
| | 19,500 | | | Diamond Offshore Drilling, Inc. | | | 1,278,030 | |
| | 21,617 | | | Sempra Energy | | | 1,161,481 | |
| | | | | | | | |
| | | | | | | 2,439,511 | |
| | | | | | | | |
| | |
| | | | Food & Staples Retailing—3.5% | | | | |
| | 91,487 | | | CVS Caremark Corp. | | | 3,320,978 | |
| | 25,300 | | | Kroger Co. (The) | | | 586,454 | |
| | 56,100 | | | Safeway, Inc. | | | 1,086,657 | |
| | 33,671 | | | Wal-Mart Stores, Inc. | | | 1,909,819 | |
| | | | | | | | |
| | | | | | | 6,903,908 | |
| | | | | | | | |
| | |
| | | | Food Products—2.1% | | | | |
| | 46,600 | | | ConAgra Foods, Inc. | | | 1,180,378 | |
| | 34,478 | | | Kraft Foods, Inc. (Class A Stock) | | | 1,212,936 | |
| | 14,712 | | | Nestle SA, ADR (Switzerland) | | | 849,765 | |
| | 28,491 | | | Unilever NV (Netherlands) | | | 983,794 | |
| | | | | | | | |
| | | | | | | 4,226,873 | |
| | | | | | | | |
| | |
| | | | Forest & Paper Products—0.3% | | | | |
| | 22,500 | | | International Paper Co. | | | 623,250 | |
| | | | | | | | |
| | |
| | | | Healthcare Equipment & Supplies—0.2% | | | | |
| | 12,000 | | | Medtronic, Inc. | | | 416,880 | |
| | | | | | | | |
| | |
| | | | Healthcare Products—0.4% | | | | |
| | 18,702 | | | Covidien PLC (Ireland) | | | 879,742 | |
| | | | | | | | |
| | |
| | | | Healthcare Providers & Services—1.8% | | | | |
| | 24,300 | | | CIGNA Corp. | | | 1,077,462 | |
| | 5,406 | | | Humana, Inc. | | | 458,915 | |
| | 41,559 | | | UnitedHealth Group, Inc. | | | 1,994,417 | |
| | | | | | | | |
| | | | | | | 3,530,794 | |
| | | | | | | | |
| | |
| | | | Hotels, Restaurants & Leisure—1.3% | | | | |
| | 28,327 | | | Carnival Corp. (Panama) | | | 997,394 | |
| | 17,525 | | | McDonald’s Corp. | | | 1,627,196 | |
| | | | | | | | |
| | | | | | | 2,624,590 | |
| | | | | | | | |
| | |
| | | | Household Products—0.6% | | | | |
| | 16,700 | | | Kimberly-Clark Corp. | | | 1,164,157 | |
| | | | | | | | |
| | |
| | | | Industrial Conglomerates—1.5% | | | | |
| | 179,716 | | | General Electric Co. | | | 3,003,054 | |
| | | | | | | | |
See Notes to Financial Statements.
| | | | |
| THE TARGET PORTFOLIO TRUST | | | 49 | |
| | |
Large Capitalization Value Portfolio (continued) | | Portfolio of Investments
As of October 31, 2011 |
| | | | | | | | |
| SHARES | | | DESCRIPTION | | VALUE (NOTE 1) | |
| | | | COMMON STOCKS (continued) | | | | |
| | |
| | | | Insurance—7.2% | | | | |
| | 14,513 | | | ACE Ltd. (Switzerland) | | $ | 1,047,113 | |
| | 118,900 | | | Allstate Corp. (The) | | | 3,131,826 | |
| | 29,417 | | | Aon Corp. | | | 1,371,421 | |
| | 22,100 | | | Genworth Financial, Inc. (Class A Stock)* | | | 140,998 | |
| | 14,900 | | | Loews Corp. | | | 591,530 | |
| | 21,400 | | | Marsh & McLennan Cos., Inc. | | | 655,268 | |
| | 100,234 | | | MetLife, Inc. | | | 3,524,227 | |
| | 30,132 | | | Travelers Cos., Inc. (The) | | | 1,758,202 | |
| | 10,600 | | | Unum Group | | | 252,704 | |
| | 89,301 | | | XL Group PLC (Ireland) | | | 1,941,404 | |
| | | | | | | | |
| | | | | | | 14,414,693 | |
| | | | | | | | |
| | |
| | | | IT Services—1.4% | | | | |
| | 14,707 | | | International Business Machines Corp. | | | 2,715,353 | |
| | | | | | | | |
| | |
| | | | Machinery—1.3% | | | | |
| | 5,400 | | | Cummins, Inc. | | | 536,922 | |
| | 29,800 | | | PACCAR, Inc.(a) | | | 1,288,552 | |
| | 9,500 | | | Parker Hannifin Corp. | | | 774,725 | |
| | | | | | | | |
| | | | | | | 2,600,199 | |
| | | | | | | | |
| | |
| | | | Media—2.9% | | | | |
| | 28,200 | | | CBS Corp. (Class B Stock) | | | 727,842 | |
| | 30,254 | | | Comcast Corp. (Class A Stock) | | | 709,456 | |
| | 63,000 | | | Comcast Corp. (Special Class A Stock) | | | 1,449,000 | |
| | 8,900 | | | Interpublic Group of Cos., Inc. (The) | | | 84,372 | |
| | 6,180 | | | Time Warner Cable, Inc. | | | 393,604 | |
| | 42,296 | | | Time Warner, Inc. | | | 1,479,937 | |
| | 27,501 | | | Walt Disney Co. (The) | | | 959,235 | |
| | | | | | | | |
| | | | | | | 5,803,446 | |
| | | | | | | | |
| | |
| | | | Metals & Mining—1.7% | | | | |
| | 15,952 | | | BHP Billiton Ltd., ADR (Australia) | | | 1,245,532 | |
| | 51,403 | | | Freeport-McMoRan Copper & Gold, Inc. | | | 2,069,485 | |
| | | | | | | | |
| | | | | | | 3,315,017 | |
| | | | | | | | |
| | |
| | | | Miscellaneous Manufacturers—0.5% | | | | |
| | 19,279 | | | Illinois Tool Works, Inc. | | | 937,538 | |
| | | | | | | | |
| | |
| | | | Multi-Utilities—1.6% | | | | |
| | 12,400 | | | Dominion Resources, Inc. | | | 639,716 | |
| | 74,611 | | | Public Service Enterprise Group, Inc. | | | 2,514,391 | |
| | | | | | | | |
| | | | | | | 3,154,107 | |
| | | | | | | | |
See Notes to Financial Statements.
| | | | |
| 50 | | | THE TARGET PORTFOLIO TRUST | |
| | | | | | | | |
| SHARES | | | DESCRIPTION | | VALUE (NOTE 1) | |
| | | | COMMON STOCKS (continued) | | | | |
| | |
| | | | Multiline Retail—1.2% | | | | |
| | 35,200 | | | J.C. Penney Co., Inc. | | $ | 1,129,216 | |
| | 25,352 | | | Kohl’s Corp. | | | 1,343,910 | |
| | | | | | | | |
| | | | | | | 2,473,126 | |
| | | | | | | | |
| | |
| | | | Office Electronics—0.7% | | | | |
| | 162,500 | | | Xerox Corp. | | | 1,329,250 | |
| | | | | | | | |
| | |
| | | | Oil, Gas & Consumable Fuels—12.5% | | | | |
| | 12,250 | | | Anadarko Petroleum Corp. | | | 961,625 | |
| | 18,462 | | | Apache Corp. | | | 1,839,369 | |
| | 11,746 | | | Baker Hughes, Inc. | | | 681,151 | |
| | 35,900 | | | Chesapeake Energy Corp.(a) | | | 1,009,508 | |
| | 30,801 | | | Chevron Corp. | | | 3,235,645 | |
| | 77,459 | | | ConocoPhillips | | | 5,395,019 | |
| | 22,918 | | | Exxon Mobil Corp. | | | 1,789,667 | |
| | 22,178 | | | Hess Corp. | | | 1,387,456 | |
| | 50,300 | | | Marathon Oil Corp. | | | 1,309,309 | |
| | 21,238 | | | Occidental Petroleum Corp. | | | 1,973,860 | |
| | 36,977 | | | Peabody Energy Corp. | | | 1,603,692 | |
| | 27,400 | | | Royal Dutch Shell PLC (Class B Stock), ADR (United Kingdom) | | | 1,967,320 | |
| | 23,900 | | | Total SA, ADR (France) | | | 1,249,970 | |
| | 28,300 | | | Valero Energy Corp. | | | 696,180 | |
| | | | | | | | |
| | | | | | | 25,099,771 | |
| | | | | | | | |
| | |
| | | | Pharmaceuticals—8.8% | | | | |
| | 21,200 | | | Abbott Laboratories | | | 1,142,044 | |
| | 69,200 | | | Eli Lilly & Co. | | | 2,571,472 | |
| | 63,397 | | | Johnson & Johnson | | | 4,082,133 | |
| | 95,664 | | | Merck & Co., Inc. | | | 3,300,408 | |
| | 10,700 | | | Novartis AG, ADR (Switzerland)(a) | | | 604,229 | |
| | 277,835 | | | Pfizer, Inc. | | | 5,351,102 | |
| | 17,100 | | | Sanofi, ADR (France)(a) | | | 611,325 | |
| | | | | | | | |
| | | | | | | 17,662,713 | |
| | | | | | | | |
| | |
| | | | Professional Services—0.2% | | | | |
| | 7,900 | | | Manpower, Inc. | | | 340,806 | |
| | | | | | | | |
| | |
| | | | Railroads—0.7% | | | | |
| | 14,716 | | | Union Pacific Corp. | | | 1,465,272 | |
| | | | | | | | |
| | |
| | | | Real Estate Investment Trusts—2.4% | | | | |
| | 104,500 | | | Annaly Capital Management, Inc. | | | 1,760,825 | |
| | 7,353 | | | AvalonBay Communities, Inc. | | | 983,022 | |
| | 10,311 | | | Boston Properties, Inc. | | | 1,020,686 | |
| | 8,390 | | | Simon Property Group, Inc.(a) | | | 1,077,612 | |
| | | | | | | | |
| | | | | | | 4,842,145 | |
| | | | | | | | |
See Notes to Financial Statements.
| | | | |
| THE TARGET PORTFOLIO TRUST | | | 51 | |
| | |
Large Capitalization Value Portfolio (continued) | | Portfolio of Investments
As of October 31, 2011 |
| | | | | | | | |
| SHARES | | | DESCRIPTION | | VALUE (NOTE 1) | |
| | | | COMMON STOCKS (continued) | | | | |
| | |
| | | | Retail & Merchandising—1.2% | | | | |
| | 16,514 | | | Target Corp. | | $ | 904,142 | |
| | 26,527 | | | TJX Cos., Inc. (The) | | | 1,563,236 | |
| | | | | | | | |
| | | | | | | 2,467,378 | |
| | | | | | | | |
| | |
| | | | Semiconductors & Semiconductor Equipment—0.6% | | | | |
| | 52,100 | | | Intel Corp. | | | 1,278,534 | |
| | | | | | | | |
| | |
| | | | Software—4.3% | | | | |
| | 70,858 | | | CA, Inc. | | | 1,534,784 | |
| | 201,428 | | | Microsoft Corp. | | | 5,364,028 | |
| | 54,931 | | | Oracle Corp. | | | 1,800,089 | |
| | | | | | | | |
| | | | | | | 8,698,901 | |
| | | | | | | | |
| | |
| | | | Specialty Retail—0.9% | | | | |
| | 71,200 | | | Gap, Inc. (The)(a) | | | 1,345,680 | |
| | 14,011 | | | Home Depot, Inc. (The)(a) | | | 501,594 | |
| | | | | | | | |
| | | | | | | 1,847,274 | |
| | | | | | | | |
| | |
| | | | Tobacco—0.9% | | | | |
| | 20,900 | | | Altria Group, Inc. | | | 575,795 | |
| | 17,951 | | | Philip Morris International, Inc. | | | 1,254,236 | |
| | | | | | | | |
| | | | | | | 1,830,031 | |
| | | | | | | | |
| | |
| | | | Wireless Telecommunication Services—1.3% | | | | |
| | 91,848 | | | Vodafone Group PLC, ADR (United Kingdom) | | | 2,557,048 | |
| | | | | | | | |
| | | | TOTAL LONG-TERM INVESTMENTS
(cost $168,446,205) | | | 195,191,878 | |
| | | | | | | | |
| | |
| | | | SHORT-TERM INVESTMENT—5.7% | | | | |
| | |
| | | | AFFILIATED MONEY MARKET MUTUAL FUND | | | | |
| | 11,445,656 | | | Prudential Investment Portfolios 2—Prudential Core Taxable Money Market Fund (cost $11,445,656; includes $6,097,256 of cash collateral for securities on loan)(b)(w) | | | 11,445,656 | |
| | | | | | | | |
| | | | TOTAL INVESTMENTS—103.0%
(cost $179,891,861; Note 5) | | | 206,637,534 | |
| | | | Liabilities in excess of other assets—(3.0%) | | | (6,032,190 | ) |
| | | | | | | | |
| | | | NET ASSETS—100% | | $ | 200,605,344 | |
| | | | | | | | |
The following abbreviation is used in the Portfolio descriptions:
ADR—American Depositary Receipt
| * | Non-income producing security. |
| (a) | All or a portion of security is on loan. The aggregate market value of such securities, including those sold and pending settlement, is $5,784,691; cash collateral of $6,097,256 (included with liabilities) was received with which the Portfolio purchased highly liquid short-term investments. |
See Notes to Financial Statements.
| | | | |
| 52 | | | THE TARGET PORTFOLIO TRUST | |
| (b) | Represents security, or a portion thereof, purchased with cash collateral received for securities on loan. |
| (w) | Prudential Investments LLC, the manager of the Portfolio, also serves as manager of the Prudential Investment Portfolios 2-Prudential Core Taxable Money Market Fund. |
Various inputs are used in determining the value of the Portfolio’s investments. These inputs are summarized in the three broad levels listed below.
Level 1—quoted prices generally for securities actively traded on a regulated securities exchange and for open-end mutual funds which trade at daily net asset value.
Level 2—other significant observable inputs (including, but not limited to, quoted prices for similar securities, interest rates, prepayment speeds, foreign currency exchange rates, and amortized cost) generally for debt securities, swaps, forward foreign currency contracts and for foreign stocks priced using vendor modeling tools.
Level 3—significant unobservable inputs for securities valued in accordance with Board approved fair valuation procedures.
The following is a summary of the inputs used as of October 31, 2011 in valuing such portfolio securities:
| | | | | | | | | | | | |
| | | Level 1 | | | Level 2 | | | Level 3 | |
| Investments in Securities | | | | | | | | | | | | |
Common Stocks | | $ | 195,191,878 | | | $ | — | | | $ | — | |
Affiliated Money Market Mutual Fund | | | 11,445,656 | | | | — | | | | — | |
| | | | | | | | | | | | |
Total | | $ | 206,637,534 | | | $ | — | | | $ | — | |
| | | | | | | | | | | | |
The industry classification of investments and liabilities in excess of other assets shown as a percentage of net assets as of October 31, 2011 were as follows:
| | | | |
Oil, Gas & Consumable Fuels | | | 12.5 | % |
Pharmaceuticals | | | 8.8 | |
Insurance | | | 7.2 | |
Commercial Banks | | | 6.2 | |
Diversified Financial Services | | | 5.8 | |
Affiliated Money Market Mutual Fund (3.0% represents investment purchased with collateral from securities on loan) | | | 5.7 | |
Electric Utilities | | | 4.6 | |
Software | | | 4.3 | |
Aerospace & Defense | | | 3.9 | |
Food & Staples Retailing | | | 3.5 | |
Media | | | 2.9 | |
Diversified Telecommunication Services | | | 2.8 | |
Real Estate Investment Trusts | | | 2.4 | |
Food Products | | | 2.1 | |
Capital Markets | | | 1.8 | |
Healthcare Providers & Services | | | 1.8 | |
Metals & Mining | | | 1.7 | |
Multi-Utilities | | | 1.6 | |
Industrial Conglomerates | | | 1.5 | |
IT Services | | | 1.4 | |
Hotels, Restaurants & Leisure | | | 1.3 | |
Machinery | | | 1.3 | |
Wireless Telecommunication Services | | | 1.3 | |
Multiline Retail | | | 1.2 | |
Retail & Merchandising | | | 1.2 | |
Energy Equipment & Services | | | 1.2 | |
See Notes to Financial Statements.
| | | | |
| THE TARGET PORTFOLIO TRUST | | | 53 | |
| | |
Large Capitalization Value Portfolio (continued) | | Portfolio of Investments
As of October 31, 2011 |
| | | | |
Industry (cont’d.) | | | |
Computers & Peripherals | | | 1.2 | % |
Computers | | | 1.0 | |
Specialty Retail | | | 0.9 | |
Tobacco | | | 0.9 | |
Beverages | | | 0.8 | |
Biotechnology | | | 0.8 | |
Railroads | | | 0.7 | |
Computer Services & Software | | | 0.7 | |
Office Electronics | | | 0.7 | |
Semiconductors & Semiconductor Equipment | | | 0.6 | |
Auto Parts And Equipment | | | 0.6 | |
Household Products | | | 0.6 | |
Chemicals | | | 0.5 | |
Miscellaneous Manufacturers | | | 0.5 | |
Healthcare Products | | | 0.4 | |
Consumer Finance | | | 0.4 | |
Forest & Paper Products | | | 0.3 | |
Electronic Components & Equipment | | | 0.3 | |
Electronic Equipment, Instrument & Components | | | 0.2 | |
Healthcare Equipment & Supplies | | | 0.2 | |
Air Freight & Logistics | | | 0.2 | |
Professional Services | | | 0.2 | |
Automobile | | | 0.1 | |
Diversified Consumer Services | | | 0.1 | |
Electronic Equipment & Instruments | | | 0.1 | |
| | | | |
| | | 103.0 | |
Liabilities in excess of other assets | | | (3.0 | ) |
| | | | |
| | | 100.0 | % |
| | | | |
See Notes to Financial Statements.
| | | | |
| 54 | | | THE TARGET PORTFOLIO TRUST | |
| | |
Portfolio of Investments
As of October 31, 2011 | | Small Capitalization Growth Portfolio |
| | | | | | | | |
| SHARES | | | DESCRIPTION | | VALUE (NOTE 1) | |
| | | | LONG-TERM INVESTMENTS—99.5% | | | | |
| | |
| | | | COMMON STOCKS | | | | |
| | |
| | | | Aerospace & Defense—2.0% | | | | |
| | 32,374 | | | Triumph Group, Inc.(a) | | $ | 1,880,929 | |
| | | | | | | | |
| | |
| | | | Airlines—0.9% | | | | |
| | 183,499 | | | JetBlue Airways Corp.*(a) | | | 822,076 | |
| | | | | | | | |
| | |
| | | | Automotive Parts—2.8% | | | | |
| | 89,217 | | | Meritor, Inc.* | | | 849,346 | |
| | 36,901 | | | WABCO Holdings, Inc.* | | | 1,852,799 | |
| | | | | | | | |
| | | | | | | 2,702,145 | |
| | | | | | | | |
| | |
| | | | Biotechnology—1.7% | | | | |
| | 55,262 | | | Seattle Genetics, Inc.*(a) | | | 1,215,764 | |
| | 10,505 | | | United Therapeutics Corp.* | | | 459,384 | |
| | | | | | | | |
| | | | | | | 1,675,148 | |
| | | | | | | | |
| | |
| | | | Building Materials—1.2% | | | | |
| | 37,431 | | | Texas Industries, Inc.(a) | | | 1,122,930 | |
| | | | | | | | |
| | |
| | | | Chemicals—2.8% | | | | |
| | 105,709 | | | Huntsman Corp. | | | 1,241,024 | |
| | 25,969 | | | Intrepid Potash, Inc.*(a) | | | 722,717 | |
| | 19,631 | | | Quaker Chemical Corp. | | | 682,962 | |
| | | | | | | | |
| | | | | | | 2,646,703 | |
| | | | | | | | |
| | |
| | | | Commercial Banks—0.4% | | | | |
| | 11,685 | | | UMB Financial Corp. | | | 430,826 | |
| | | | | | | | |
| | |
| | | | Commercial Services—7.9% | | | | |
| | 30,213 | | | Acacia Research—Acacia Technologies*(a) | | | 1,203,686 | |
| | 73,295 | | | Geo Group, Inc. (The)* | | | 1,336,168 | |
| | 78,250 | | | Monster Worldwide, Inc.*(a) | | | 722,247 | |
| | 30,818 | | | PAREXEL International Corp.* | | | 678,921 | |
| | 23,784 | | | Sotheby’s(a) | | | 837,672 | |
| | 42,927 | | | SuccessFactors, Inc.* | | | 1,146,151 | |
| | 48,920 | | | Waste Connections, Inc. | | | 1,665,726 | |
| | | | | | | | |
| | | | | | | 7,590,571 | |
| | | | | | | | |
| | |
| | | | Computer Services & Software—3.9% | | | | |
| | 21,863 | | | 3D Systems Corp.*(a) | | | 355,711 | |
| | 21,573 | | | ANSYS, Inc.* | | | 1,172,708 | |
| | 67,760 | | | Fortinet, Inc.* | | | 1,562,546 | |
| | 22,706 | | | Riverbed Technology, Inc.* | | | 626,231 | |
| | | | | | | | |
| | | | | | | 3,717,196 | |
| | | | | | | | |
See Notes to Financial Statements.
| | | | |
| THE TARGET PORTFOLIO TRUST | | | 55 | |
| | |
Small Capitalization Growth Portfolio (continued) | | Portfolio of Investments
As of October 31, 2011 |
| | | | | | | | |
| SHARES | | | DESCRIPTION | | VALUE (NOTE 1) | |
| | | | COMMON STOCKS (continued) | | | | |
| | |
| | | | Diversified Financial Services—0.6% | | | | |
| | 41,854 | | | Duff & Phelps Corp. (Class A Stock) | | $ | 531,127 | |
| | | | | | | | |
| | |
| | | | Electronic Components—3.9% | | | | |
| | 28,458 | | | Coherent, Inc.* | | | 1,450,504 | |
| | 17,757 | | | OYO Geospace Corp.* | | | 1,395,345 | |
| | 49,482 | | | Universal Electronics, Inc.* | | | 919,871 | |
| | | | | | | | |
| | | | | | | 3,765,720 | |
| | | | | | | | |
| | |
| | | | Electronic Components & Equipment—3.1% | | | | |
| | 17,982 | | | Cymer, Inc.*(a) | | | 781,318 | |
| | 86,689 | | | GrafTech International Ltd.* | | | 1,361,884 | |
| | 18,887 | | | Universal Display Corp.*(a) | | | 884,478 | |
| | | | | | | | |
| | | | | | | 3,027,680 | |
| | | | | | | | |
| | |
| | | | Entertainment & Leisure—4.2% | | | | |
| | 38,900 | | | Bally Technologies, Inc.*(a) | | | 1,410,903 | |
| | 62,862 | | | Pinnacle Entertainment, Inc.* | | | 711,598 | |
| | 176,997 | | | Shuffle Master, Inc.* | | | 1,877,938 | |
| | | | | | | | |
| | | | | | | 4,000,439 | |
| | | | | | | | |
| | |
| | | | Food—1.2% | | | | |
| | 29,030 | | | Fresh Market, Inc. (The)*(a) | | | 1,161,200 | |
| | | | | | | | |
| | |
| | | | Hand/Machine Tools—0.9% | | | | |
| | 16,061 | | | Regal-Beloit Corp. | | | 853,321 | |
| | | | | | | | |
| | |
| | | | Healthcare Products—0.7% | | | | |
| | 9,820 | | | Cooper Cos., Inc. (The) | | | 680,526 | |
| | | | | | | | |
| | |
| | | | Healthcare Services—3.7% | | | | |
| | 9,841 | | | Air Methods Corp.* | | | 795,350 | |
| | 14,777 | | | AMERIGROUP Corp.*(a) | | | 822,044 | |
| | 40,415 | | | Centene Corp.*(a) | | | 1,420,587 | |
| | 32,362 | | | ICON PLC, ADR (Ireland)* | | | 543,682 | |
| | | | | | | | |
| | | | | | | 3,581,663 | |
| | | | | | | | |
| | |
| | | | Home Furnishings—1.2% | | | | |
| | 41,323 | | | DTS, Inc.* | | | 1,160,763 | |
| | | | | | | | |
| | |
| | | | Hotels & Motels—0.7% | | | | |
| | 77,033 | | | Orient-Express Hotels Ltd. (Class A Stock) (Bermuda)*(a) | | | 657,092 | |
| | | | | | | | |
| | |
| | | | Insurance—0.6% | | | | |
| | 22,107 | | | Validus Holdings Ltd. (Bermuda) | | | 604,848 | |
| | | | | | | | |
| | |
| | | | Internet Services—3.0% | | | | |
| | 129,134 | | | Sapient Corp. | | | 1,596,096 | |
See Notes to Financial Statements.
| | | | |
| 56 | | | THE TARGET PORTFOLIO TRUST | |
| | | | | | | | |
| SHARES | | | DESCRIPTION | | VALUE (NOTE 1) | |
| | | | COMMON STOCKS (continued) | | | | |
| | |
| | | | Internet Services (continued) | | | | |
| | 44,019 | | | TIBCO Software, Inc.* | | $ | 1,271,709 | |
| | | | | | | | |
| | | | | | | 2,867,805 | |
| | | | | | | | |
| | |
| | | | Investment Company—0.4% | | | | |
| | 51,035 | | | KKR Financial Holdings LLC(a) | | | 426,142 | |
| | | | | | | | |
| | |
| | | | Medical Supplies & Equipment—8.7% | | | | |
| | 44,245 | | | ArthroCare Corp.* | | | 1,333,987 | |
| | 70,461 | | | Bruker Corp.* | | | 1,016,752 | |
| | 37,916 | | | Cepheid, Inc.* | | | 1,360,426 | |
| | 44,379 | | | Delcath Systems, Inc.*(a) | | | 160,652 | |
| | 42,206 | | | Quality Systems, Inc.(a) | | | 1,642,235 | |
| | 30,142 | | | Sirona Dental Systems, Inc.* | | | 1,443,802 | |
| | 38,525 | | | Thoratec Corp.* | | | 1,406,548 | |
| | | | | | | | |
| | | | | | | 8,364,402 | |
| | | | | | | | |
| | |
| | | | Metal Fabricate/Hardware—1.5% | | | | |
| | 54,039 | | | RTI International Metals, Inc.*(a) | | | 1,426,089 | |
| | | | | | | | |
| | |
| | | | Metals & Mining—2.8% | | | | |
| | 20,728 | | | Cloud Peak Energy, Inc.*(a) | | | 475,708 | |
| | 34,249 | | | Northwest Pipe Co.* | | | 913,421 | |
| | 78,992 | | | Titanium Metals Corp. | | | 1,323,116 | |
| | | | | | | | |
| | | | | | | 2,712,245 | |
| | | | | | | | |
| | |
| | | | Miscellaneous Manufacturers—0.8% | | | | |
| | 30,226 | | | Hexcel Corp.* | | | 746,885 | |
| | | | | | | | |
| | |
| | | | Oil & Gas Services—1.7% | | | | |
| | 57,374 | | | Oasis Petroleum, Inc.*(a) | | | 1,683,353 | |
| | | | | | | | |
| | |
| | | | Oil, Gas & Consumable Fuels—3.4% | | | | |
| | 16,297 | | | Gulfport Energy Corp.* | | | 507,489 | |
| | 46,861 | | | Lufkin Industries, Inc. | | | 2,769,016 | |
| | | | | | | | |
| | | | | | | 3,276,505 | |
| | | | | | | | |
| | |
| | | | Pharmaceuticals—4.8% | | | | |
| | 29,921 | | | BioMarin Pharmaceutical, Inc.*(a) | | | 1,020,605 | |
| | 24,581 | | | Catalyst Health Solutions, Inc.* | | | 1,351,218 | |
| | 16,562 | | | Herbalife Ltd. (Cayman Islands) | | | 1,032,806 | |
| | 34,247 | | | Salix Pharmaceuticals Ltd.*(a) | | | 1,173,131 | |
| | | | | | | | |
| | | | | | | 4,577,760 | |
| | | | | | | | |
| | |
| | | | Real Estate Investment Trust—0.6% | | | | |
| | 53,701 | | | Redwood Trust, Inc.(a) | | | 624,006 | |
| | | | | | | | |
| | |
| | | | Restaurants—2.2% | | | | |
| | 40,116 | | | BJ’s Restaurants, Inc.*(a) | | | 2,123,340 | |
| | 2 | | | Buffalo Wild Wings, Inc.* | | | 132 | |
| | | | | | | | |
| | | | | | | 2,123,472 | |
| | | | | | | | |
See Notes to Financial Statements.
| | | | |
| THE TARGET PORTFOLIO TRUST | | | 57 | |
| | |
Small Capitalization Growth Portfolio (continued) | | Portfolio of Investments
As of October 31, 2011 |
| | | | | | | | |
| SHARES | | | DESCRIPTION | | VALUE (NOTE 1) | |
| | | | COMMON STOCKS (continued) | | | | |
| | |
| | | | Retail—10.2% | | | | |
| | 35,989 | | | Cash America International, Inc. | | $ | 1,970,398 | |
| | 43,924 | | | Chico’s FAS, Inc.(a) | | | 542,901 | |
| | 59,825 | | | Genesco, Inc.* | | | 3,526,085 | |
| | 50,381 | | | GNC Holdings, Inc. (Class A Stock)*(a) | | | 1,246,930 | |
| | 19,690 | | | Sally Beauty Holdings, Inc.* | | | 377,851 | |
| | 56,537 | | | Vitamin Shoppe, Inc.*(a) | | | 2,132,010 | |
| | | | | | | | |
| | | | | | | 9,796,175 | |
| | | | | | | | |
| | |
| | | | Retail & Merchandising—1.7% | | | | |
| | 16,980 | | | EZCORP, Inc. (Class A Stock)* | | | 471,704 | |
| | 30,862 | | | Steven Madden Ltd.*(a) | | | 1,138,808 | |
| | | | | | | | |
| | | | | | | 1,610,512 | |
| | | | | | | | |
| | |
| | | | Semiconductors—2.5% | | | | |
| | 16,955 | | | Cavium, Inc.* | | | 554,259 | |
| | 83,308 | | | Teradyne, Inc.*(a) | | | 1,192,970 | |
| | 24,827 | | | Veeco Instruments, Inc.*(a) | | | 662,633 | |
| | | | | | | | |
| | | | | | | 2,409,862 | |
| | | | | | | | |
| | |
| | | | Software—6.3% | | | | |
| | 49,537 | | | Allscripts Healthcare Solutions, Inc.* | | | 948,633 | |
| | 146,335 | | | Compuware Corp.* | | | 1,236,531 | |
| | 22,051 | | | Informatica Corp.* | | | 1,003,320 | |
| | 47,259 | | | MedAssets, Inc.* | | | 503,781 | |
| | 23,918 | | | Medidata Solutions, Inc.* | | | 430,046 | |
| | 37,483 | | | Progress Software Corp.* | | | 789,392 | |
| | 40,626 | | | QLIK Technologies, Inc.*(a) | | | 1,160,685 | |
| | | | | | | | |
| | | | | | | 6,072,388 | |
| | | | | | | | |
| | |
| | | | Telecommunications—2.6% | | | | |
| | 13,615 | | | EZchip Semiconductor Ltd. (Israel)*(a) | | | 495,994 | |
| | 13,594 | | | IPG Photonics Corp.* | | | 718,579 | |
| | 34,992 | | | NICE Systems Ltd., ADR (Israel)* | | | 1,251,314 | |
| | | | | | | | |
| | | | | | | 2,465,887 | |
| | | | | | | | |
| | |
| | | | Transportation—1.9% | | | | |
| | 22,504 | | | Atlas Air Worldwide Holdings, Inc.* | | | 866,854 | |
| | 22,603 | | | Landstar System, Inc. | | | 1,008,772 | |
| | | | | | | | |
| | | | | | | 1,875,626 | |
| | | | | | | | |
| | | | TOTAL LONG-TERM INVESTMENTS
(cost $81,402,851) | | | 95,672,017 | |
| | | | | | | | |
See Notes to Financial Statements.
| | | | |
| 58 | | | THE TARGET PORTFOLIO TRUST | |
| | | | | | | | |
| SHARES | | | DESCRIPTION | | VALUE (NOTE 1) | |
| | | | SHORT-TERM INVESTMENT—21.7% | | | | |
| | |
| | | | AFFILIATED MONEY MARKET MUTUAL FUND | | | | |
| | 20,853,670 | | | Prudential Investment Portfolios 2—Prudential Core Taxable Money Market Fund (cost $20,853,670; includes $20,403,240 of cash collateral for securities on loan)(b)(w) | | $ | 20,853,670 | |
| | | | | | | | |
| | | | TOTAL INVESTMENTS—121.2%
(cost $102,256,521; Note 5) | | | 116,525,687 | |
| | | | Liabilities in excess of other assets—(21.2%) | | | (20,362,770 | ) |
| | | | | | | | |
| | | | NET ASSETS—100% | | $ | 96,162,917 | |
| | | | | | | | |
The following abbreviation is used in the Portfolio descriptions:
ADR—American Depositary Receipt
| * | Non-income producing security. |
| (a) | All or a portion of security is on loan. The aggregate market value of such securities, including those sold and pending settlement, is $19,067,703; cash collateral of $20,403,240 (included with liabilities) was received with which the Portfolio purchased highly liquid short-term investments. |
| (b) | Represents security, or a portion thereof, purchased with cash collateral received for securities on loan. |
| (w) | Prudential Investments LLC, the manager of the Portfolio, also serves as manager of the Prudential Investment Portfolios 2-Prudential Core Taxable Money Market Fund. |
Various inputs are used in determining the value of the Portfolio’s investments. These inputs are summarized in the three broad levels listed below.
Level 1—quoted prices generally for securities actively traded on a regulated securities exchange and for open-end mutual funds which trade at daily net asset value.
Level 2—other significant observable inputs (including, but not limited to, quoted prices for similar securities, interest rates, prepayment speeds, foreign currency exchange rates, and amortized cost) generally for debt securities, swaps, forward foreign currency contracts and for foreign stocks priced using vendor modeling tools.
Level 3—significant unobservable inputs for securities valued in accordance with Board approved fair valuation procedures.
The following is a summary of the inputs used as of October 31, 2011 in valuing such portfolio securities:
| | | | | | | | | | | | |
| | | Level 1 | | | Level 2 | | | Level 3 | |
| Investments in Securities | | | | | | | | | | | | |
Common Stocks | | $ | 95,672,017 | | | $ | — | | | $ | — | |
Affiliated Money Market Mutual Fund | | | 20,853,670 | | | | — | | | | — | |
| | | | | | | | | | | | |
Total | | $ | 116,525,687 | | | $ | — | | | $ | — | |
| | | | | | | | | | | | |
The industry classification of investments and liabilities in excess of other assets shown as a percentage of net assets as of October 31, 2011 were as follows:
| | | | |
Affiliated Money Market Mutual Fund (21.2% represents investments purchased from securities on loan) | | | 21.7 | % |
Retail | | | 10.2 | |
Medical Supplies & Equipment | | | 8.7 | |
Commercial Services | | | 7.9 | |
Software | | | 6.3 | |
Pharmaceuticals | | | 4.8 | |
Entertainment & Leisure | | | 4.2 | |
Electronic Components | | | 3.9 | |
Computer Services & Software | | | 3.9 | |
See Notes to Financial Statements.
| | | | |
| THE TARGET PORTFOLIO TRUST | | | 59 | |
| | |
Small Capitalization Growth Portfolio (continued) | | Portfolio of Investments
As of October 31, 2011 |
| | | | |
Industry (cont’d.) | | | |
Healthcare Services | | | 3.7 | % |
Oil, Gas & Consumable Fuels | | | 3.4 | |
Electronic Components & Equipment | | | 3.1 | |
Internet Services | | | 3.0 | |
Metals & Mining | | | 2.8 | |
Automotive Parts | | | 2.8 | |
Chemicals | | | 2.8 | |
Telecommunications | | | 2.6 | |
Semiconductors | | | 2.5 | |
Restaurants | | | 2.2 | |
Aerospace & Defense | | | 2.0 | |
Transportation | | | 1.9 | |
Oil & Gas Services | | | 1.7 | |
Biotechnology | | | 1.7 | |
Retail & Merchandising | | | 1.7 | |
Metal Fabricate/Hardware | | | 1.5 | |
Food | | | 1.2 | |
Home Furnishings | | | 1.2 | |
Building Materials | | | 1.2 | |
Hand/Machine Tools | | | 0.9 | |
Airlines | | | 0.9 | |
Miscellaneous Manufacturers | | | 0.8 | |
Healthcare Products | | | 0.7 | |
Hotels & Motels | | | 0.7 | |
Real Estate Investment Trust | | | 0.6 | |
Insurance | | | 0.6 | |
Diversified Financial Services | | | 0.6 | |
Commercial Banks | | | 0.4 | |
Investment Companies | | | 0.4 | |
| | | | |
| | | 121.2 | |
Liabilities in excess of other assets | | | (21.2 | ) |
| | | | |
| | | 100.0 | % |
| | | | |
See Notes to Financial Statements.
| | | | |
| 60 | | | THE TARGET PORTFOLIO TRUST | |
| | |
Portfolio of Investments
As of October 31, 2011 | | Small Capitalization Value Portfolio |
| | | | | | | | |
| SHARES | | | DESCRIPTION | | VALUE (NOTE 1) | |
| | | | LONG-TERM INVESTMENTS—94.9% | | | | |
| | |
| | | | COMMON STOCKS—93.4% | | | | |
| | |
| | | | Aerospace & Defense—3.4% | | | | |
| | 133,800 | | | AAR Corp. | | $ | 2,666,634 | |
| | 69,175 | | | Alliant Techsystems, Inc. | | | 4,017,684 | |
| | 24,248 | | | BE Aerospace, Inc.* | | | 914,877 | |
| | 105,500 | | | Curtiss-Wright Corp. | | | 3,458,290 | |
| | 7,200 | | | Ducommun, Inc. | | | 102,744 | |
| | 48,500 | | | Elbit Systems Ltd. (Israel) | | | 2,213,055 | |
| | 4,200 | | | Esterline Technologies Corp.* | | | 234,780 | |
| | 268,900 | | | Hexcel Corp.* | | | 6,644,519 | |
| | 12,500 | | | Kratos Defense & Security Solutions, Inc.* | | | 79,125 | |
| | 16,900 | | | LMI Aerospace, Inc.* | | | 339,859 | |
| | 102,075 | | | Moog, Inc. (Class A Stock)* | | | 3,953,365 | |
| | 106,200 | | | Teledyne Technologies, Inc.* | | | 5,784,714 | |
| | 39,862 | | | Triumph Group, Inc.(a) | | | 2,315,982 | |
| | | | | | | | |
| | | | | | | 32,725,628 | |
| | | | | | | | |
| | |
| | | | Airlines—0.2% | | | | |
| | 9,900 | | | Alaska Air Group, Inc.*(a) | | | 658,647 | |
| | 45,500 | | | JetBlue Airways Corp.*(a) | | | 203,840 | |
| | 45,500 | | | Republic Airways Holdings, Inc.* | | | 118,300 | |
| | 5,100 | | | Spirit Airlines, Inc.* | | | 83,946 | |
| | 71,200 | | | US Airways Group, Inc.* | | | 410,824 | |
| | | | | | | | |
| | | | | | | 1,475,557 | |
| | | | | | | | |
| | |
| | | | Auto Components—0.1% | | | | |
| | 16,900 | | | Tenneco, Inc.* | | | 552,968 | |
| | | | | | | | |
| | |
| | | | Auto Parts and Equipment | | | | |
| | 11,000 | | | Superior Industries International, Inc. | | | 201,190 | |
| | | | | | | | |
| | |
| | | | Auto Related—0.2% | | | | |
| | 127,902 | | | Cooper Tire & Rubber Co. | | | 1,832,836 | |
| | | | | | | | |
| | |
| | | | Banks—1.4% | | | | |
| | 1,590 | | | 1st Source Corp. | | | 38,224 | |
| | 1,900 | | | BancFirst Corp. | | | 73,530 | |
| | 3,800 | | | Bank of the Ozarks, Inc. | | | 94,506 | |
| | 1,200 | | | Camden National Corp. | | | 35,616 | |
| | 70,582 | | | Cardinal Financial Corp. | | | 758,051 | |
| | 8,300 | | | Cathay General Bancorp | | | 116,117 | |
| | 3,400 | | | Chemical Financial Corp. | | | 68,442 | |
| | 6,500 | | | City Holding Co. | | | 213,590 | |
| | 9,400 | | | CoBiz Financial, Inc. | | | 49,820 | |
| | 4,100 | | | Columbia Banking System, Inc. | | | 78,187 | |
| | 3,900 | | | Community Bank System, Inc. | | | 99,684 | |
See Notes to Financial Statements.
| | | | |
| THE TARGET PORTFOLIO TRUST | | | 61 | |
| | |
Small Capitalization Value Portfolio (continued) | | Portfolio of Investments
As of October 31, 2011 |
| | | | | | | | |
| SHARES | | | DESCRIPTION | | VALUE (NOTE 1) | |
| | | | COMMON STOCKS (continued) | | | | |
| | |
| | | | Banks (continued) | | | | |
| | 6,300 | | | Community Trust Bancorp, Inc. | | $ | 178,479 | |
| | 4,600 | | | Dime Community Bancshares, Inc. | | | 54,832 | |
| | 5,300 | | | East West Bancorp, Inc. | | | 103,191 | |
| | 7,000 | | | Financial Institutions, Inc. | | | 114,660 | |
| | 65,128 | | | First Financial Bancorp | | | 1,068,099 | |
| | 18,100 | | | First Niagara Financial Group, Inc. | | | 166,339 | |
| | 2,200 | | | Great Southern Bancorp, Inc. | | | 43,758 | |
| | 54,545 | | | Hancock Holding Co. | | | 1,652,713 | |
| | 114,492 | | | Hanmi Financial Corp.*(a) | | | 114,492 | |
| | 28,258 | | | IBERIABANK Corp. | | | 1,461,504 | |
| | 6,400 | | | Independent Bank Corp. | | | 165,888 | |
| | 3,600 | | | Lakeland Financial Corp. | | | 86,004 | |
| | 10,000 | | | MainSource Financial Group, Inc. | | | 93,800 | |
| | 8,300 | | | Nara Bancorp, Inc.* | | | 70,384 | |
| | 22,000 | | | Oriental Financial Group, Inc. (Puerto Rico) | | | 232,980 | |
| | 3,800 | | | Peoples Bancorp, Inc. | | | 50,274 | |
| | 29,100 | | | Pinnacle Financial Partners, Inc.*(a) | | | 436,791 | |
| | 3,351 | | | Republic Bancorp, Inc. (Class A Stock) | | | 68,159 | |
| | 10,700 | | | Sierra Bancorp | | | 117,058 | |
| | 11,842 | | | Signature Bank* | | | 660,192 | |
| | 4,369 | | | Southside Bancshares, Inc. | | | 89,870 | |
| | 20,900 | | | Southwest Bancorp, Inc.* | | | 98,230 | |
| | 2,600 | | | State Bancorp, Inc. | | | 30,758 | |
| | 127,610 | | | TCF Financial Corp. | | | 1,357,770 | |
| | 200 | | | Tower Bancorp, Inc. | | | 5,144 | |
| | 300 | | | Trico Bancshares | | | 4,449 | |
| | 125,100 | | | United Bankshares, Inc.(a) | | | 2,969,874 | |
| | 2,600 | | | Washington Trust Bancorp, Inc. | | | 61,048 | |
| | 4,500 | | | WesBanco, Inc. | | | 89,370 | |
| | 11,500 | | | West Bancorp, Inc. | | | 113,160 | |
| | 4,660 | | | West Coast Bancorp* | | | 69,574 | |
| | 30,600 | | | Wilshire Bancorp, Inc.* | | | 104,652 | |
| | 1,200 | | | WSFS Financial Corp. | | | 47,700 | |
| | | | | | | | |
| | | | | | | 13,606,963 | |
| | | | | | | | |
| | |
| | | | Beverages—0.3% | | | | |
| | 104,700 | | | Embotelladora Andina SA, ADR (Class B Stock) (Chile) | | | 2,983,950 | |
| | | | | | | | |
| | |
| | | | Biotechnology—0.1% | | | | |
| | 9,700 | | | Ariad Pharmaceuticals, Inc.* | | | 112,811 | |
| | 3,900 | | | Emergent Biosolutions, Inc.* | | | 73,554 | |
| | 11,200 | | | Incyte Corp.*(a) | | | 154,224 | |
| | 166,200 | | | Lexicon Pharmaceuticals, Inc.*(a) | | | 201,102 | |
| | 17,700 | | | RTI Biologics, Inc.* | | | 79,650 | |
| | | | | | | | |
| | | | | | | 621,341 | |
| | | | | | | | |
See Notes to Financial Statements.
| | | | |
| 62 | | | THE TARGET PORTFOLIO TRUST | |
| | | | | | | | |
| SHARES | | | DESCRIPTION | | VALUE (NOTE 1) | |
| | | | COMMON STOCKS (continued) | | | | |
| | |
| | | | Broadcasting | | | | |
| | 30,700 | | | Entercom Communications Corp. (Class A Stock)*(a) | | $ | 201,392 | |
| | 22,900 | | | LIN TV Corp. (Class A Stock)* | | | 71,448 | |
| | | | | | | | |
| | | | | | | 272,840 | |
| | | | | | | | |
| | |
| | | | Building Materials | | | | |
| | 5,300 | | | Interline Brands, Inc.* | | | 78,970 | |
| | | | | | | | |
| | |
| | | | Building Products—0.4% | | | | |
| | 63,975 | | | A.O. Smith Corp. | | | 2,377,311 | |
| | 35,200 | | | Lennox International, Inc. | | | 1,133,088 | |
| | | | | | | | |
| | | | | | | 3,510,399 | |
| | | | | | | | |
| | |
| | | | Business Services—0.2% | | | | |
| | 2,500 | | | ABM Industries, Inc. | | | 50,550 | |
| | 64,500 | | | URS Corp.* | | | 2,302,650 | |
| | | | | | | | |
| | | | | | | 2,353,200 | |
| | | | | | | | |
| | |
| | | | Capital Markets—1.2% | | | | |
| | 57,770 | | | Federated Investors, Inc. (Class B Stock)(a) | | | 1,128,826 | |
| | 128,200 | | | Jefferies Group, Inc. | | | 1,699,932 | |
| | 91,625 | | | LPL Investment Holdings, Inc.* | | | 2,658,041 | |
| | 207,475 | | | Raymond James Financial, Inc. | | | 6,301,016 | |
| | | | | | | | |
| | | | | | | 11,787,815 | |
| | | | | | | | |
| | |
| | | | Chemicals—4.7% | | | | |
| | 90,800 | | | Cabot Corp. | | | 2,740,344 | |
| | 22,721 | | | Cytec Industries, Inc. | | | 1,014,947 | |
| | 124,084 | | | Ferro Corp.* | | | 802,823 | |
| | 9,200 | | | Fuller (H.B.) Co. | | | 197,708 | |
| | 29,700 | | | Georgia Gulf Corp.* | | | 537,570 | |
| | 85,101 | | | Huntsman Corp. | | | 999,086 | |
| | 113,004 | | | Innophos Holdings, Inc. | | | 4,971,046 | |
| | 1,400 | | | Innospec, Inc.* | | | 42,280 | |
| | 45,800 | | | International Flavors & Fragrances, Inc. | | | 2,773,648 | |
| | 26,750 | | | Kraton Performance Polymers, Inc.* | | | 526,440 | |
| | 116,200 | | | Methanex Corp. (Canada) | | | 3,002,608 | |
| | 20,400 | | | NewMarket Corp.(a) | | | 3,960,456 | |
| | 27,450 | | | Olin Corp. | | | 517,707 | |
| | 36,450 | | | OM Group, Inc.* | | | 1,053,769 | |
| | 18,600 | | | PolyOne Corp. | | | 208,134 | |
| | 4,200 | | | Rockwood Holdings, Inc.* | | | 193,368 | |
| | 219,225 | | | Scotts Miracle-Gro Co. (The) (Class A Stock)(a) | | | 10,634,605 | |
| | 173,650 | | | Sensient Technologies Corp. | | | 6,418,104 | |
| | 11,000 | | | Solutia, Inc.* | | | 178,750 | |
| | 119,500 | | | Valspar Corp. (The) | | | 4,166,965 | |
| | 900 | | | Westlake Chemical Corp. | | | 37,089 | |
| | | | | | | | |
| | | | | | | 44,977,447 | |
| | | | | | | | |
See Notes to Financial Statements.
| | | | |
| THE TARGET PORTFOLIO TRUST | | | 63 | |
| | |
Small Capitalization Value Portfolio (continued) | | Portfolio of Investments
As of October 31, 2011 |
| | | | | | | | |
| SHARES | | | DESCRIPTION | | VALUE (NOTE 1) | |
| | | | COMMON STOCKS (continued) | | | | |
| | |
| | | | Clothing & Apparel—0.2% | | | | |
| | 54,488 | | | G & K Services, Inc. (Class A Stock) | | $ | 1,654,256 | |
| | 11,600 | | | Iconix Brand Group, Inc.* | | | 208,220 | |
| | 5,600 | | | Maidenform Brands, Inc.* | | | 137,648 | |
| | 3,100 | | | Warnaco Group, Inc. (The)* | | | 152,210 | |
| | | | | | | | |
| | | | | | | 2,152,334 | |
| | | | | | | | |
| | |
| | | | Commercial Banks—3.4% | | | | |
| | 205,850 | | | Associated Banc-Corp. | | | 2,295,227 | |
| | 49,614 | | | BancorpSouth, Inc.(a) | | | 484,729 | |
| | 109,775 | | | Bank of Hawaii Corp.(a) | | | 4,635,798 | |
| | 4,500 | | | Banner Corp | | | 79,065 | |
| | 600 | | | Cascade Bancorp* | | | 3,174 | |
| | 6,200 | | | Citizens & Northern Corp. | | | 102,734 | |
| | 1,200 | | | CNB Financial Corp. | | | 17,184 | |
| | 55,900 | | | Cullen/Frost Bankers, Inc. | | | 2,741,336 | |
| | 4,400 | | | Enterprise Financial Services Corp. | | | 67,892 | |
| | 600 | | | First Bancorp, Inc. | | | 8,634 | |
| | 17,000 | | | First Busey Corp. | | | 86,700 | |
| | 2,200 | | | First Financial Corp. | | | 72,292 | |
| | 166,809 | | | First Horizon National Corp. | | | 1,165,995 | |
| | 1,200 | | | First of Long Island Corp. (The) | | | 30,660 | |
| | 299,356 | | | FirstMerit Corp. | | | 4,193,978 | |
| | 1,200 | | | German American Bancorp, Inc. | | | 20,844 | |
| | 2,360 | | | Hudson Valley Holding Corp. | | | 51,259 | |
| | 1,200 | | | Merchants Bancshares, Inc. | | | 34,164 | |
| | 167,379 | | | National Penn Bancshares, Inc. | | | 1,305,556 | |
| | 3,528 | | | Orrstown Financial Services, Inc. | | | 32,316 | |
| | 142,450 | | | Prosperity Bancshares, Inc.(a) | | | 5,482,900 | |
| | 2,200 | | | S.Y. Bancorp, Inc. | | | 45,276 | |
| | 17,700 | | | Susquehanna Bancshares, Inc. | | | 128,502 | |
| | 329,883 | | | Trustmark Corp.(a) | | | 7,303,610 | |
| | 112,557 | | | Zions Bancorp. | | | 1,953,990 | |
| | | | | | | | |
| | | | | | | 32,343,815 | |
| | | | | | | | |
| | |
| | | | Commercial Services—0.9% | | | | |
| | 30,600 | | | Cenveo, Inc.* | | | 114,750 | |
| | 15,057 | | | DFC Global Corp.*(a) | | | 330,050 | |
| | 2,600 | | | Gartner, Inc.* | | | 100,152 | |
| | 20,900 | | | Lincoln Educational Services Corp. | | | 195,415 | |
| | 3,900 | | | Mac-Gray Corp. | | | 54,132 | |
| | 14,200 | | | Metalico, Inc.* | | | 64,184 | |
| | 173,700 | | | Pharmaceutical Product Development, Inc. | | | 5,730,363 | |
| | 20,200 | | | Stewart Enterprises, Inc. (Class A Stock) | | | 130,088 | |
| | 6,400 | | | Team, Inc.* | | | 160,064 | |
See Notes to Financial Statements.
| | | | |
| 64 | | | THE TARGET PORTFOLIO TRUST | |
| | | | | | | | |
| SHARES | | | DESCRIPTION | | VALUE (NOTE 1) | |
| | | | COMMON STOCKS (continued) | | | | |
| | |
| | | | Commercial Services (continued) | | | | |
| | 2,300 | | | TeleTech Holdings, Inc.* | | $ | 40,204 | |
| | 71,072 | | | TNS, Inc.* | | | 1,388,036 | |
| | | | | | | | |
| | | | | | | 8,307,438 | |
| | | | | | | | |
| | |
| | | | Commercial Services & Supplies—2.2% | | | | |
| | 112,900 | | | Brink’s Co. (The) | | | 3,137,491 | |
| | 39,400 | | | Consolidated Graphics, Inc.* | | | 1,795,064 | |
| | 161,525 | | | Corrections Corp. of America* | | | 3,590,701 | |
| | 184,200 | | | Ennis, Inc. | | | 2,694,846 | |
| | 176,350 | | | KAR Auction Services, Inc.*(a) | | | 2,424,812 | |
| | 14,900 | | | Kelly Services, Inc. (Class A Stock) | | | 243,615 | |
| | 70,475 | | | McGrath RentCorp | | | 1,883,092 | |
| | 11,200 | | | Navigant Consulting, Inc.* | | | 126,896 | |
| | 36,600 | | | PHH Corp.* | | | 675,270 | |
| | 74,970 | | | School Specialty, Inc.*(a) | | | 573,520 | |
| | 57,100 | | | UniFirst Corp. | | | 2,989,185 | |
| | 17,055 | | | Waste Connections, Inc. | | | 580,723 | |
| | 1,600 | | | Zillow, Inc.*(a) | | | 47,504 | |
| | | | | | | | |
| | | | | | | 20,762,719 | |
| | | | | | | | |
| | |
| | | | Communications Equipment—0.2% | | | | |
| | 33,125 | | | ADTRAN, Inc. | | | 1,113,000 | |
| | 103,275 | | | Calix, Inc.* | | | 899,525 | |
| | 5,500 | | | Tekelec* | | | 54,010 | |
| | | | | | | | |
| | | | | | | 2,066,535 | |
| | | | | | | | |
| | |
| | | | Computer Hardware | | | | |
| | 7,600 | | | Aspen Technology, Inc.* | | | 131,784 | |
| | 18,700 | | | CIBER, Inc.* | | | 65,076 | |
| | 4,700 | | | Mercury Computer Systems, Inc.* | | | 68,620 | |
| | 7,180 | | | Radisys Corp.* | | | 42,075 | |
| | | | | | | | |
| | | | | | | 307,555 | |
| | | | | | | | |
| | |
| | | | Computer Services & Software—1.3% | | | | |
| | 323,941 | | | Brocade Communications Systems, Inc.* | | | 1,418,862 | |
| | 9,000 | | | Electronics for Imaging, Inc.* | | | 135,000 | |
| | 4,800 | | | Fusion-io, Inc.*(a) | | | 148,896 | |
| | 102,200 | | | Global Payments, Inc. | | | 4,693,024 | |
| | 7,500 | | | Imation Corp.* | | | 50,400 | |
| | 13,407 | | | JDA Software Group, Inc.* | | | 427,281 | |
| | 6,800 | | | Mantech International Corp. (Class A Stock) | | | 238,884 | |
| | 2,800 | | | NetScout Systems, Inc.* | | | 45,892 | |
| | 72,814 | | | Parametric Technology Corp.* | | | 1,516,716 | |
| | 3,300 | | | Quest Software, Inc.* | | | 58,047 | |
| | 2,300 | | | Rimage Corp. | | | 25,530 | |
| | 3,700 | | | Semtech Corp.* | | | 90,354 | |
| | 6,100 | | | SYNNEX Corp.* | | | 176,107 | |
| | 57,466 | | | Synopsys, Inc.* | | | 1,540,663 | |
See Notes to Financial Statements.
| | | | |
| THE TARGET PORTFOLIO TRUST | | | 65 | |
| | |
Small Capitalization Value Portfolio (continued) | | Portfolio of Investments
As of October 31, 2011 |
| | | | | | | | |
| SHARES | | | DESCRIPTION | | VALUE (NOTE 1) | |
| | | | COMMON STOCKS (continued) | | | | |
| | |
| | | | Computer Services & Software (continued) | | | | |
| | 49,700 | | | Take-Two Interactive Software, Inc.*(a) | | $ | 784,266 | |
| | 3,300 | | | Unisys Corp.* | | | 85,767 | |
| | 69,911 | | | Xyratex Ltd. (Bermuda)(a) | | | 953,586 | |
| | | | | | | | |
| | | | | | | 12,389,275 | |
| | | | | | | | |
| | |
| | | | Computers & Peripherals—0.9% | | | | |
| | 155,702 | | | Diebold, Inc. | | | 5,026,061 | |
| | 161,625 | | | QLogic Corp.* | | | 2,257,901 | |
| | 86,725 | | | Super Micro Computer, Inc.* | | | 1,387,600 | |
| | | | | | | | |
| | | | | | | 8,671,562 | |
| | | | | | | | |
| | |
| | | | Construction & Engineering—0.8% | | | | |
| | 21,500 | | | EMCOR Group, Inc. | | | 539,005 | |
| | 81,000 | | | KBR, Inc. | | | 2,260,710 | |
| | 148,450 | | | MasTec, Inc.* | | | 3,209,489 | |
| | 56,325 | | | MYR Group, Inc.* | | | 1,086,509 | |
| | 101,679 | | | Orion Marine Group, Inc.* | | | 690,401 | |
| | 4,200 | | | VSE Corp. | | | 102,144 | |
| | | | | | | | |
| | | | | | | 7,888,258 | |
| | | | | | | | |
| | |
| | | | Construction Materials—0.1% | | | | |
| | 54,725 | | | Eagle Materials, Inc. | | | 1,126,240 | |
| | | | | | | | |
| | |
| | | | Consumer Finance—0.6% | | | | |
| | 440,300 | | | Advance America Cash Advance Centers, Inc. | | | 3,711,729 | |
| | 38,800 | | | First Cash Financial Services, Inc.* | | | 1,610,200 | |
| | | | | | | | |
| | | | | | | 5,321,929 | |
| | | | | | | | |
| | |
| | | | Consumer Products & Services—1.1% | | | | |
| | 8,600 | | | American Greetings Corp. (Class A Stock) | | | 137,686 | |
| | 63,111 | | | Central Garden & Pet Co.* | | | 545,910 | |
| | 56,256 | | | Central Garden & Pet Co. (Class A Stock)*(a) | | | 494,490 | |
| | 4,900 | | | GP Strategies Corp.* | | | 57,918 | |
| | 165,400 | | | Helen of Troy Ltd. (Bermuda)* | | | 4,785,022 | |
| | 900 | | | La-Z-Boy, Inc.* | | | 9,144 | |
| | 17,200 | | | Rent-A-Center, Inc. | | | 587,380 | |
| | 65,346 | | | Snap-on, Inc. | | | 3,507,120 | |
| | | | | | | | |
| | | | | | | 10,124,670 | |
| | | | | | | | |
| | |
| | | | Containers & Packaging—2.1% | | | | |
| | 34,600 | | | Graphic Packaging Holding Co.* | | | 152,932 | |
| | 19,326 | | | Greif, Inc. (Class A Stock) | | | 865,418 | |
| | 57,058 | | | Owens-Illinois, Inc.* | | | 1,145,725 | |
| | 137,342 | | | Packaging Corp of America | | | 3,581,879 | |
| | 55,600 | | | Rock-Tenn Co. (Class A Stock) | | | 3,290,964 | |
See Notes to Financial Statements.
| | | | |
| 66 | | | THE TARGET PORTFOLIO TRUST | |
| | | | | | | | |
| SHARES | | | DESCRIPTION | | VALUE (NOTE 1) | |
| | | | COMMON STOCKS (continued) | | | | |
| | |
| | | | Containers & Packaging (continued) | | | | |
| | 209,125 | | | Silgan Holdings, Inc. | | $ | 7,850,553 | |
| | 95,900 | | | Sonoco Products Co. | | | 3,010,301 | |
| | | | | | | | |
| | | | | | | 19,897,772 | |
| | | | | | | | |
| | |
| | | | Cosmetics/Personal Care | | | | |
| | 4,200 | | | Revlon, Inc. (Class A Stock)* | | | 61,866 | |
| | | | | | | | |
| | |
| | | | Distribution/Wholesale | | | | |
| | 4,400 | | | Brightpoint, Inc.* | | | 44,660 | |
| | 4,500 | | | Core-Mark Holding Co., Inc.* | | | 150,705 | |
| | 4,500 | | | United Stationers, Inc. | | | 143,145 | |
| | | | | | | | |
| | | | | | | 338,510 | |
| | | | | | | | |
| | |
| | | | Diversified Financial Services—0.1% | | | | |
| | 10,600 | | | Artio Global Investors, Inc. | | | 77,592 | |
| | 80,255 | | | Cowen Group, Inc. (Class A Stock)*(a) | | | 218,294 | |
| | 4,200 | | | Edelman Financial Group, Inc. | | | 29,148 | |
| | 99,500 | | | Gleacher & Co., Inc.* | | | 127,360 | |
| | 22,300 | | | SeaCube Container Leasing Ltd. (Bermuda) | | | 309,970 | |
| | 16,138 | | | SWS Group, Inc. | | | 88,920 | |
| | | | | | | | |
| | | | | | | 851,284 | |
| | | | | | | | |
| | |
| | | | Drugs & Healthcare—0.3% | | | | |
| | 53,300 | | | Covance, Inc.* | | | 2,703,909 | |
| | | | | | | | |
| | |
| | | | Electric Utilities—2.5% | | | | |
| | 1,400 | | | Central Vermont Public Service Corp. | | | 49,518 | |
| | 2,200 | | | Chesapeake Utilities Corp. | | | 93,258 | |
| | 97,525 | | | Cleco Corp. | | | 3,595,747 | |
| | 106,450 | | | El Paso Electric Co. | | | 3,409,593 | |
| | 7,700 | | | Empire District Electric Co. (The) | | | 153,769 | |
| | 284,355 | | | Great Plains Energy, Inc. | | | 5,897,523 | |
| | 33,270 | | | IDACORP, Inc. | | | 1,343,443 | |
| | 3,100 | | | MGE Energy, Inc. | | | 135,284 | |
| | 180,074 | | | Portland General Electric Co. | | | 4,419,016 | |
| | 3,100 | | | UIL Holdings Corp. | | | 105,648 | |
| | 13,200 | | | UniSource Energy Corp. | | | 492,096 | |
| | 143,047 | | | Westar Energy, Inc.(a) | | | 3,899,461 | |
| | | | | | | | |
| | | | | | | 23,594,356 | |
| | | | | | | | |
| | |
| | | | Electrical Equipment—1.5% | | | | |
| | 145,087 | | | Belden, Inc. | | | 4,683,408 | |
| | 246,275 | | | EnerSys* | | | 5,548,576 | |
| | 33,456 | | | General Cable Corp.* | | | 938,106 | |
| | 5,000 | | | Regal-Beloit Corp. | | | 265,650 | |
| | 59,275 | | | Thomas & Betts Corp.* | | | 2,945,375 | |
| | | | | | | | |
| | | | | | | 14,381,115 | |
| | | | | | | | |
See Notes to Financial Statements.
| | | | |
| THE TARGET PORTFOLIO TRUST | | | 67 | |
| | |
Small Capitalization Value Portfolio (continued) | | Portfolio of Investments
As of October 31, 2011 |
| | | | | | | | |
| SHARES | | | DESCRIPTION | | VALUE (NOTE 1) | |
| | | | COMMON STOCKS (continued) | | | | |
| | |
| | | | Electronic Components—0.4% | | | | |
| | 6,400 | | | Daktronics, Inc. | | $ | 64,640 | |
| | 205,267 | | | Digital River, Inc.*(a) | | | 3,762,544 | |
| | 4,400 | | | FEI Co.* | | | 174,944 | |
| | | | | | | | |
| | | | | | | 4,002,128 | |
| | | | | | | | |
| | |
| | | | Electronic Equipment & Instruments—0.1% | | | | |
| | 39,725 | | | ScanSource, Inc.* | | | 1,380,841 | |
| | | | | | | | |
| | |
| | | | Electronic Equipment, Instrument & Components—0.6% | | | | |
| | 237,000 | | | AVX Corp. | | | 3,178,170 | |
| | 136,600 | | | Jabil Circuit, Inc. | | | 2,808,496 | |
| | | | | | | | |
| | | | | | | 5,986,666 | |
| | | | | | | | |
| | |
| | | | Electronics—1.5% | | | | |
| | 201,900 | | | Checkpoint Systems, Inc.* | | | 2,675,175 | |
| | 38,082 | | | Coherent, Inc.* | | | 1,941,040 | |
| | 6,700 | | | DDi Corp. | | | 61,573 | |
| | 168,900 | | | FLIR Systems, Inc. | | | 4,442,070 | |
| | 69,434 | | | Itron, Inc.* | | | 2,554,477 | |
| | 21,702 | | | Littelfuse, Inc. | | | 1,062,530 | |
| | 13,800 | | | TTM Technologies, Inc.* | | | 154,146 | |
| | 33,621 | | | Watts Water Technologies, Inc. (Class A Stock)(a) | | | 1,058,725 | |
| | | | | | | | |
| | | | | | | 13,949,736 | |
| | | | | | | | |
| | |
| | | | Energy—Alternate Sources | | | | |
| | 1,100 | | | FutureFuel Corp. | | | 12,430 | |
| | 16,100 | | | Green Plains Renewable Energy, Inc.*(a) | | | 168,406 | |
| | 4,800 | | | KiOR, Inc. (Class A Stock)*(a) | | | 79,344 | |
| | 2,000 | | | Solazyme, Inc.* | | | 20,340 | |
| | | | | | | | |
| | | | | | | 280,520 | |
| | | | | | | | |
| | |
| | | | Energy Equipment & Services—2.8% | | | | |
| | 161,700 | | | Bristow Group, Inc. | | | 8,049,426 | |
| | 4,300 | | | Complete Production Services, Inc.* | | | 141,040 | |
| | 125,292 | | | Key Energy Services, Inc.* | | | 1,620,026 | |
| | 101,190 | | | Lufkin Industries, Inc. | | | 5,979,317 | |
| | 51,250 | | | Oil States International, Inc.*(a) | | | 3,567,512 | |
| | 147,900 | | | Patterson-UTI Energy, Inc. | | | 3,005,328 | |
| | 59,500 | | | Tidewater, Inc. | | | 2,929,185 | |
| | 39,725 | | | Unit Corp.* | | | 1,948,909 | |
| | | | | | | | |
| | | | | | | 27,240,743 | |
| | | | | | | | |
| | |
| | | | Entertainment & Leisure—0.8% | | | | |
| | 19,900 | | | Isle of Capri Casinos, Inc.*(a) | | | 108,256 | |
| | 130,400 | | | Life Time Fitness, Inc.*(a) | | | 5,624,152 | |
See Notes to Financial Statements.
| | | | |
| 68 | | | THE TARGET PORTFOLIO TRUST | |
| | | | | | | | |
| SHARES | | | DESCRIPTION | | VALUE (NOTE 1) | |
| | | | COMMON STOCKS (continued) | | | | |
| | |
| | | | Entertainment & Leisure (continued) | | | | |
| | 128,176 | | | Scientific Games Corp. (Class A Stock)* | | $ | 1,113,850 | |
| | 3,700 | | | Speedway Motorsports, Inc. | | | 48,100 | |
| | 1,800 | | | Town Sports International Holdings, Inc.* | | | 15,624 | |
| | 56,488 | | | WMS Industries, Inc.* | | | 1,237,652 | |
| | | | | | | | |
| | | | | | | 8,147,634 | |
| | | | | | | | |
| | |
| | | | Environmental Services—0.3% | | | | |
| | 17,572 | | | Clean Harbors, Inc.* | | | 1,023,921 | |
| | 12,400 | | | Darling International, Inc.* | | | 173,848 | |
| | 93,316 | | | Tetra Tech, Inc.* | | | 2,037,088 | |
| | | | | | | | |
| | | | | | | 3,234,857 | |
| | | | | | | | |
| | |
| | | | Financial—Bank & Trust—0.5% | | | | |
| | 5,500 | | | Banco Latinoamericano de Comercio Exterior SA (Panama) | | | 89,375 | |
| | 130,231 | | | Boston Private Financial Holdings, Inc. | | | 987,151 | |
| | 27,887 | | | Citizens Republic Bancorp, Inc.* | | | 251,262 | |
| | 7,400 | | | First BanCorp | | | 93,832 | |
| | 6,500 | | | First Merchants Corp. | | | 52,390 | |
| | 155,440 | | | First Midwest Bancorp, Inc. | | | 1,400,514 | |
| | 2,400 | | | Flushing Financial Corp. | | | 29,424 | |
| | 26,200 | | | FNB Corp. | | | 264,358 | |
| | 1,600 | | | Heartland Financial USA, Inc. | | | 25,008 | |
| | 9,115 | | | Lakeland Bancorp, Inc. | | | 84,678 | |
| | 1,600 | | | Park National Corp.(a) | | | 95,536 | |
| | 38,543 | | | Prospect Capital Corp. | | | 368,857 | |
| | 3,400 | | | S&T Bancorp, Inc. | | | 63,478 | |
| | 4,800 | | | StellarOne Corp. | | | 57,552 | |
| | 250,845 | | | Synovus Financial Corp. | | | 376,267 | |
| | 1,700 | | | Tompkins Financial Corp. | | | 67,031 | |
| | 20,302 | | | United Community Banks, Inc.*(a) | | | 150,032 | |
| | | | | | | | |
| | | | | | | 4,456,745 | |
| | | | | | | | |
| | |
| | | | Financial Services—1.1% | | | | |
| | 1,600 | | | Alliance Financial Corp. | | | 49,264 | |
| | 3,700 | | | Berkshire Hills Bancorp, Inc. | | | 74,074 | |
| | 32,400 | | | BGC Partners, Inc. (Class A Stock)(a) | | | 221,940 | |
| | 4,800 | | | Brookline Bancorp, Inc. | | | 40,128 | |
| | 165,394 | | | CVB Financial Corp.(a) | | | 1,605,976 | |
| | 27,500 | | | Deluxe Corp. | | | 649,550 | |
| | 108,700 | | | Eaton Vance Corp. | | | 2,857,723 | |
| | 7,500 | | | Encore Capital Group, Inc.* | | | 203,175 | |
| | 81,300 | | | First Commonwealth Financial Corp. | | | 374,793 | |
| | 9,700 | | | First Community Bancshares, Inc. | | | 116,497 | |
| | 13,500 | | | Knight Capital Group, Inc. (Class A Stock)* | | | 168,615 | |
| | 34,200 | | | National Financial Partners Corp.*(a) | | | 467,514 | |
| | 5,400 | | | NBT Bancorp, Inc. | | | 116,208 | |
| | 12,700 | | | Nelnet, Inc. (Class A Stock) | | | 272,796 | |
| | 4,100 | | | OceanFirst Financial Corp. | | | 53,464 | |
See Notes to Financial Statements.
| | | | |
| THE TARGET PORTFOLIO TRUST | | | 69 | |
| | |
Small Capitalization Value Portfolio (continued) | | Portfolio of Investments
As of October 31, 2011 |
| | | | | | | | |
| SHARES | | | DESCRIPTION | | VALUE (NOTE 1) | |
| | | | COMMON STOCKS (continued) | | | | |
| | |
| | | | Financial Services (continued) | | | | |
| | 57,200 | | | Ocwen Financial Corp.* | | $ | 829,400 | |
| | 82,432 | | | PacWest Bancorp | | | 1,454,100 | |
| | 7,900 | | | Provident Financial Services, Inc. | | | 102,305 | |
| | 6,900 | | | Renasant Corp. | | | 99,498 | |
| | 1,400 | | | Suffolk Bancorp | | | 11,914 | |
| | 9,100 | | | Trustco Bank Corp. | | | 45,136 | |
| | 7,700 | | | World Acceptance Corp.* | | | 520,905 | |
| | | | | | | | |
| | | | | | | 10,334,975 | |
| | | | | | | | |
| | |
| | | | Food & Staples Retailing—1.4% | | | | |
| | 82,400 | | | Andersons, Inc. (The) | | | 3,042,208 | |
| | 98,656 | | | Casey’s General Stores, Inc. | | | 4,888,405 | |
| | 67,700 | | | Ruddick Corp. | | | 2,959,167 | |
| | 73,100 | | | Weis Markets, Inc. | | | 2,891,105 | |
| | | | | | | | |
| | | | | | | 13,780,885 | |
| | | | | | | | |
| | |
| | | | Food Products—0.8% | | | | |
| | 88,100 | | | Cal-Maine Foods, Inc.(a) | | | 2,935,492 | |
| | 105,217 | | | Corn Products International, Inc. | | | 5,103,024 | |
| | | | | | | | |
| | | | | | | 8,038,516 | |
| | | | | | | | |
| | |
| | | | Foods—0.6% | | | | |
| | 6,700 | | | B&G Foods, Inc. | | | 142,174 | |
| | 9,100 | | | Chefs’ Warehouse Holdings, Inc.* | | | 130,039 | |
| | 84,741 | | | Dole Food Co., Inc.*(a) | | | 896,560 | |
| | 18,266 | | | Sanderson Farms, Inc. | | | 904,167 | |
| | 30,200 | | | Spartan Stores, Inc. | | | 517,024 | |
| | 98,500 | | | United Natural Foods, Inc.* | | | 3,596,235 | |
| | | | | | | | |
| | | | | | | 6,186,199 | |
| | | | | | | | |
| | |
| | | | Furniture | | | | |
| | 7,200 | | | Knoll, Inc. | | | 109,800 | |
| | | | | | | | |
| | |
| | | | Gas Utilities—4.0% | | | | |
| | 119,077 | | | AGL Resources, Inc. | | | 4,994,089 | |
| | 188,275 | | | Atmos Energy Corp. | | | 6,461,598 | |
| | 141,515 | | | South Jersey Industries, Inc. | | | 7,968,710 | |
| | 87,000 | | | Southwest Gas Corp. | | | 3,434,760 | |
| | 200,496 | | | Swift Energy Co.*(a) | | | 6,139,188 | |
| | 104,100 | | | UGI Corp. | | | 2,984,547 | |
| | 141,168 | | | WGL Holdings, Inc. | | | 6,043,402 | |
| | | | | | | | |
| | | | | | | 38,026,294 | |
| | | | | | | | |
| | |
| | | | Hand/Machine Tools—0.4% | | | | |
| | 83,700 | | | Franklin Electric Co., Inc. | | | 3,843,504 | |
| | | | | | | | |
See Notes to Financial Statements.
| | | | |
| 70 | | | THE TARGET PORTFOLIO TRUST | |
| | | | | | | | |
| SHARES | | | DESCRIPTION | | VALUE (NOTE 1) | |
| | | | COMMON STOCKS (continued) | | | | |
| | |
| | | | Healthcare Equipment & Supplies—3.1% | | | | |
| | 214,000 | | | Cantel Medical Corp. | | $ | 5,906,400 | |
| | 42,400 | | | Cooper Cos., Inc. (The) | | | 2,938,320 | |
| | 18,800 | | | Greatbatch, Inc.* | | | 419,804 | |
| | 115,300 | | | Invacare Corp. | | | 2,588,485 | |
| | 138,094 | | | STERIS Corp. | | | 4,278,152 | |
| | 148,163 | | | Teleflex, Inc. | | | 8,869,037 | |
| | 128,925 | | | West Pharmaceutical Services, Inc. | | | 5,011,315 | |
| | | | | | | | |
| | | | | | | 30,011,513 | |
| | | | | | | | |
| | |
| | | | Healthcare Products—0.5% | | | | |
| | 207,900 | | | PSS World Medical, Inc.*(a) | | | 4,625,775 | |
| | | | | | | | |
| | |
| | | | Healthcare Providers & Services—1.1% | | | | |
| | 125,100 | | | AMERIGROUP Corp.*(a) | | | 6,959,313 | |
| | 4,700 | | | Magellan Health Services, Inc.* | | | 241,909 | |
| | 106,925 | | | Owens & Minor, Inc. | | | 3,199,196 | |
| | 19,500 | | | Vanguard Health Systems, Inc.* | | | 189,540 | |
| | | | | | | | |
| | | | | | | 10,589,958 | |
| | | | | | | | |
| | |
| | | | Healthcare Services—1.2% | | | | |
| | 133,700 | | | Amedisys, Inc.* | | | 1,755,481 | |
| | 55,460 | | | AmSurg Corp.* | | | 1,404,802 | |
| | 60,200 | | | Five Star Quality Care, Inc.* | | | 155,918 | |
| | 91,753 | | | HealthSouth Corp.* | | | 1,620,358 | |
| | 152,300 | | | Healthways, Inc.* | | | 1,090,468 | |
| | 75,198 | | | MEDNAX, Inc.*(a) | | | 4,948,028 | |
| | 600 | | | Molina Healthcare, Inc.* | | | 12,708 | |
| | 26,100 | | | Triple-S Management Corp. (Class B Stock) (Puerto Rico)*(a) | | | 495,900 | |
| | | | | | | | |
| | | | | | | 11,483,663 | |
| | | | | | | | |
| | |
| | | | Home Builder—0.2% | | | | |
| | 119,800 | | | Meritage Homes Corp.* | | | 2,126,450 | |
| | | | | | | | |
| | |
| | | | Home Furnishings | | | | |
| | 8,000 | | | Select Comfort Corp.* | | | 166,160 | |
| | 5,800 | | | Skullcandy, Inc.*(a) | | | 91,350 | |
| | | | | | | | |
| | | | | | | 257,510 | |
| | | | | | | | |
| | |
| | | | Hotels, Restaurants & Leisure—0.7% | | | | |
| | 74,425 | | | Choice Hotels International, Inc. | | | 2,663,671 | |
| | 150,329 | | | International Speedway Corp. (Class A Stock) | | | 3,586,850 | |
| | | | | | | | |
| | | | | | | 6,250,521 | |
| | | | | | | | |
| | |
| | | | Household Durables—0.1% | | | | |
| | 51,761 | | | Ethan Allen Interiors, Inc. | | | 1,024,868 | |
| | | | | | | | |
| | |
| | | | Household Products—0.3% | | | | |
| | 3,000 | | | Blyth, Inc. | | | 167,490 | |
See Notes to Financial Statements.
| | | | |
| THE TARGET PORTFOLIO TRUST | | | 71 | |
| | |
Small Capitalization Value Portfolio (continued) | | Portfolio of Investments
As of October 31, 2011 |
| | | | | | | | |
| SHARES | | | DESCRIPTION | | VALUE (NOTE 1) | |
| | | | COMMON STOCKS (continued) | | | | |
| | |
| | | | Household Products (continued) | | | | |
| | 4,700 | | | Lifetime Brands, Inc. | | $ | 57,481 | |
| | 65,450 | | �� | WD-40 Co. | | | 2,881,109 | |
| | | | | | | | |
| | | | | | | 3,106,080 | |
| | | | | | | | |
| | |
| | | | Industrial Products—0.3% | | | | |
| | 37,918 | | | Brady Corp. (Class A Stock) | | | 1,164,841 | |
| | 63,431 | | | Kaydon Corp. | | | 1,995,539 | |
| | | | | | | | |
| | | | | | | 3,160,380 | |
| | | | | | | | |
| | |
| | | | Insurance—5.7% | | | | |
| | 8,700 | | | Alterra Capital Holdings Ltd. (Bermuda) | | | 188,616 | |
| | 328,600 | | | American Equity Investment Life Holding Co.(a) | | | 3,562,024 | |
| | 86,700 | | | American Financial Group, Inc. | | | 3,106,461 | |
| | 4,000 | | | American Safety Insurance Holdings Ltd. (Bermuda)* | | | 81,640 | |
| | 17,200 | | | AMERISAFE, Inc.* | | | 370,660 | |
| | 9,200 | | | AmTrust Financial Services, Inc. | | | 233,496 | |
| | 8,700 | | | Aspen Insurance Holdings Ltd. (Bermuda) | | | 230,463 | |
| | 14,600 | | | Assured Guaranty Ltd. (Bermuda) | | | 186,004 | |
| | 485,750 | | | CNO Financial Group, Inc.* | | | 3,035,938 | |
| | 288,525 | | | Delphi Financial Group, Inc. (Class A Stock) | | | 7,640,142 | |
| | 124,704 | | | Employers Holdings, Inc. | | | 2,022,699 | |
| | 36,837 | | | Endurance Specialty Holdings Ltd. (Bermuda) | | | 1,370,336 | |
| | 3,900 | | | FBL Financial Group, Inc. (Class A Stock) | | | 127,335 | |
| | 149,125 | | | HCC Insurance Holdings, Inc. | | | 3,968,216 | |
| | 77,947 | | | Horace Mann Educators Corp. | | | 1,048,387 | |
| | 94,130 | | | Infinity Property & Casualty Corp. | | | 5,455,775 | |
| | 12,800 | | | Meadowbrook Insurance Group, Inc. | | | 132,608 | |
| | 41,114 | | | Platinum Underwriters Holdings Ltd. (Bermuda) | | | 1,423,778 | |
| | 22,817 | | | ProAssurance Corp. | | | 1,746,641 | |
| | 194,500 | | | Protective Life Corp. | | | 3,617,700 | |
| | 99,952 | | | Reinsurance Group of America, Inc. | | | 5,220,493 | |
| | 48,900 | | | RLI Corp.(a) | | | 3,439,626 | |
| | 8,400 | | | Selective Insurance Group, Inc. | | | 134,652 | |
| | 106,600 | | | State Auto Financial Corp. | | | 1,416,714 | |
| | 6,500 | | | Symetra Financial Corp. | | | 60,255 | |
| | 134,133 | | | Tower Group, Inc. | | | 3,182,976 | |
| | 99,200 | | | United Fire & Casualty Co. | | | 1,865,952 | |
| | | | | | | | |
| | | | | | | 54,869,587 | |
| | | | | | | | |
| | |
| | | | Internet—0.1% | | | | |
| | 35,408 | | | Comtech Telecommunications Corp. | | | 1,172,359 | |
| | 11,500 | | | TeleCommunication Systems, Inc. (Class A Stock)* | | | 37,950 | |
| | | | | | | | |
| | | | | | | 1,210,309 | |
| | | | | | | | |
See Notes to Financial Statements.
| | | | |
| 72 | | | THE TARGET PORTFOLIO TRUST | |
| | | | | | | | |
| SHARES | | | DESCRIPTION | | VALUE (NOTE 1) | |
| | | | COMMON STOCKS (continued) | | | | |
| | |
| | | | Internet Services | | | | |
| | 4,200 | | | Boingo Wireless, Inc.*(a) | | $ | 32,130 | |
| | 3,600 | | | Pandora Media, Inc.*(a) | | | 56,880 | |
| | 39,400 | | | United Online, Inc. | | | 232,854 | |
| | | | | | | | |
| | | | | | | 321,864 | |
| | | | | | | | |
| | |
| | | | Internet Software & Services—0.1% | | | | |
| | 23,600 | | | j2 Global Communications, Inc. | | | 726,408 | |
| | | | | | | | |
| | |
| | | | Investment Company | | | | |
| | 16,915 | | | MCG Capital Corp. | | | 78,486 | |
| | | | | | | | |
| | |
| | | | IT Services—0.6% | | | | |
| | 100,700 | | | Broadridge Financial Solutions, Inc. | | | 2,240,575 | |
| | 56,781 | | | CACI International, Inc. (Class A Stock)* | | | 3,116,709 | |
| | | | | | | | |
| | | | | | | 5,357,284 | |
| | | | | | | | |
| | |
| | | | Leisure Equipment & Products—0.4% | | | | |
| | 158,992 | | | Callaway Golf Co.(a) | | | 923,744 | |
| | 18,400 | | | JAKKS Pacific, Inc. | | | 349,048 | |
| | 89,600 | | | Sturm Ruger & Co., Inc. | | | 2,716,672 | |
| | | | | | | | |
| | | | | | | 3,989,464 | |
| | | | | | | | |
| | |
| | | | Life Science Tools & Services—0.3% | | | | |
| | 140,950 | | | PerkinElmer, Inc. | | | 2,913,436 | |
| | | | | | | | |
| | |
| | | | Machinery—3.0% | | | | |
| | 142,225 | | | Actuant Corp. (Class A Stock)(a) | | | 3,200,062 | |
| | 140,900 | | | Barnes Group, Inc. | | | 3,278,743 | |
| | 68,289 | | | Briggs & Stratton Corp. | | | 997,019 | |
| | 800 | | | Cascade Corp. | | | 34,480 | |
| | 72,500 | | | Crane Co. | | | 3,197,975 | |
| | 225,200 | | | Harsco Corp. | | | 5,190,860 | |
| | 25,650 | | | IDEX Corp. | | | 909,293 | |
| | 41,561 | | | Kadant, Inc.* | | | 899,796 | |
| | 87,600 | | | Kennametal, Inc.(a) | | | 3,406,764 | |
| | 900 | | | Robbins & Myers, Inc. | | | 40,221 | |
| | 76,400 | | | Titan International, Inc. | | | 1,719,000 | |
| | 70,225 | | | Valmont Industries, Inc. | | | 6,021,794 | |
| | | | | | | | |
| | | | | | | 28,896,007 | |
| | | | | | | | |
| | |
| | | | Machinery & Equipment—0.2% | | | | |
| | 2,800 | | | Altra Holdings, Inc.* | | | 41,160 | |
| | 146,940 | | | Intermec, Inc.* | | | 1,185,806 | |
| | 5,000 | | | Intevac, Inc.* | | | 40,250 | |
| | 53,745 | | | Terex Corp.* | | | 894,317 | |
| | | | | | | | |
| | | | | | | 2,161,533 | |
| | | | | | | | |
See Notes to Financial Statements.
| | | | |
| THE TARGET PORTFOLIO TRUST | | | 73 | |
| | |
Small Capitalization Value Portfolio (continued) | | Portfolio of Investments
As of October 31, 2011 |
| | | | | | | | |
| SHARES | | | DESCRIPTION | | VALUE (NOTE 1) | |
| | | | COMMON STOCKS (continued) | | | | |
| | |
| | | | Manufacturing—0.2% | | | | |
| | 3,100 | | | Ceradyne, Inc.* | | $ | 103,726 | |
| | 16,400 | | | EnPro Industries, Inc.* | | | 564,816 | |
| | 2,300 | | | Koppers Holdings, Inc. | | | 76,107 | |
| | 2,200 | | | Standex International Corp. | | | 84,942 | |
| | 36,066 | | | Zebra Technologies Corp. (Class A Stock)* | | | 1,288,999 | |
| | | | | | | | |
| | | | | | | 2,118,590 | |
| | | | | | | | |
| | |
| | | | Media—1.1% | | | | |
| | 147,018 | | | Belo Corp. (Class A Stock) | | | 932,094 | |
| | 168,300 | | | Cinemark Holdings, Inc. | | | 3,478,761 | |
| | 27,318 | | | Courier Corp. | | | 237,394 | |
| | 7,100 | | | Dolan Co. (The)* | | | 62,125 | |
| | 109,000 | | | Meredith Corp.(a) | | | 2,924,470 | |
| | 66,975 | | | Wiley, (John) & Sons, Inc. (Class A Stock) | | | 3,185,331 | |
| | | | | | | | |
| | | | | | | 10,820,175 | |
| | | | | | | | |
| | |
| | | | Metals & Mining—3.2% | | | | |
| | 167,200 | | | AMCOL International Corp. | | | 5,047,768 | |
| | 14,900 | | | Century Aluminum Co.* | | | 166,284 | |
| | 12,400 | | | Cloud Peak Energy, Inc.* | | | 284,580 | |
| | 21,100 | | | Coeur d’Alene Mines Corp.* | | | 539,527 | |
| | 40,700 | | | Compass Minerals International, Inc. | | | 3,096,049 | |
| | 142,879 | | | Gold Resource Corp.(a) | | | 3,214,777 | |
| | 239,700 | | | HudBay Minerals, Inc. (Canada) | | | 2,624,715 | |
| | 144,400 | | | IAMGOLD Corp. (Canada) | | | 3,104,600 | |
| | 5,000 | | | LB Foster Co. (Class A Stock) | | | 127,500 | |
| | 9,400 | | | Revett Minerals, Inc.*(a) | | | 39,574 | |
| | 52,500 | | | Royal Gold, Inc.(a) | | | 3,757,950 | |
| | 37,017 | | | RTI International Metals, Inc.*(a) | | | 976,879 | |
| | 218,300 | | | Steel Dynamics, Inc. | | | 2,726,567 | |
| | 120,800 | | | Timken Co. | | | 5,088,096 | |
| | 2,200 | | | Westmoreland Coal Co.* | | | 24,222 | |
| | 15,500 | | | Worthington Industries, Inc. | | | 267,840 | |
| | | | | | | | |
| | | | | | | 31,086,928 | |
| | | | | | | | |
| | |
| | | | Miscellaneous Manufacturers—0.1% | | | | |
| | 15,199 | | | AptarGroup, Inc. | | | 729,096 | |
| | | | | | | | |
| | |
| | | | Multi-Utilities—0.8% | | | | |
| | 119,300 | | | NorthWestern Corp. | | | 4,109,885 | |
| | 56,100 | | | OGE Energy Corp. | | | 2,902,614 | |
| | 31,437 | | | Vectren Corp. | | | 892,182 | |
| | | | | | | | |
| | | | | | | 7,904,681 | |
| | | | | | | | |
See Notes to Financial Statements.
| | | | |
| 74 | | | THE TARGET PORTFOLIO TRUST | |
| | | | | | | | |
| SHARES | | | DESCRIPTION | | VALUE (NOTE 1) | |
| | | | COMMON STOCKS (continued) | | | | |
| | |
| | | | Office Equipment & Supplies—0.1% | | | | |
| | 60,753 | | | Interface, Inc. (Class A Stock) | | $ | 792,219 | |
| | | | | | | | |
| | |
| | | | Oil & Gas—0.2% | | | | |
| | 15,800 | | | CVR Energy, Inc.* | | | 391,208 | |
| | 4,500 | | | Energy Partners Ltd.* | | | 64,530 | |
| | 99,972 | | | Goodrich Petroleum Corp.*(a) | | | 1,584,556 | |
| | 1,100 | | | Gulf Island Fabrication, Inc. | | | 30,635 | |
| | | | | | | | |
| | | | | | | 2,070,929 | |
| | | | | | | | |
| | |
| | | | Oil & Gas Exploration/Production—1.0% | | | | |
| | 122,500 | | | Cabot Oil & Gas Corp. | | | 9,520,700 | |
| | | | | | | | |
| | |
| | | | Oil, Gas & Consumable Fuels—3.5% | | | | |
| | 124,675 | | | Berry Petroleum Co. (Class A Stock) | | | 4,307,521 | |
| | 3,800 | | | Brigham Exploration Co.* | | | 138,377 | |
| | 4,400 | | | C&J Energy Services, Inc.*(a) | | | 74,184 | |
| | 13,400 | | | Cal Dive International, Inc.* | | | 30,016 | |
| | 32,900 | | | Cimarex Energy Co. | | | 2,105,600 | |
| | 64,100 | | | Core Laboratories NV (Netherlands)(a) | | | 6,939,466 | |
| | 50,500 | | | Energen Corp. | | | 2,477,530 | |
| | 133,200 | | | EXCO Resources, Inc. | | | 1,679,652 | |
| | 5,300 | | | Gulfport Energy Corp.* | | | 165,042 | |
| | 9,800 | | | Helix Energy Solutions Group, Inc.* | | | 176,988 | |
| | 103,400 | | | HollyFrontier Corp. | | | 3,173,346 | |
| | 7,600 | | | Laclede Group, Inc. (The) | | | 304,912 | |
| | 6,850 | | | New Jersey Resources Corp. | | | 322,087 | |
| | 4,700 | | | Newpark Resources, Inc.* | | | 41,971 | |
| | 66,000 | | | Oasis Petroleum, Inc.*(a) | | | 1,936,440 | |
| | 5,000 | | | RPC, Inc.(a) | | | 92,850 | |
| | 71,600 | | | Southern Union Co. | | | 3,009,348 | |
| | 4,100 | | | Stone Energy Corp.* | | | 99,589 | |
| | 8,000 | | | TETRA Technologies, Inc.* | | | 76,000 | |
| | 10,500 | | | VAALCO Energy, Inc.* | | | 71,505 | |
| | 141,600 | | | W&T Offshore, Inc. | | | 2,788,104 | |
| | 15,700 | | | Warren Resources, Inc.* | | | 49,141 | |
| | 2,500 | | | Western Refining, Inc.*(a) | | | 39,950 | |
| | 98,300 | | | World Fuel Services Corp.(a) | | | 3,917,255 | |
| | | | | | | | |
| | | | | | | 34,016,874 | |
| | | | | | | | |
| | |
| | | | Paper & Forest Products—0.6% | | | | |
| | 134,000 | | | Buckeye Technologies, Inc. | | | 4,052,160 | |
| | 1,700 | | | Domtar Corp. | | | 139,247 | |
| | 8,100 | | | P.H. Glatfelter Co. | | | 121,500 | |
| | 14,723 | | | Schweitzer-Mauduit International, Inc. | | | 1,035,321 | |
| | | | | | | | |
| | | | | | | 5,348,228 | |
| | | | | | | | |
| | |
| | | | Personal Products—0.2% | | | | |
| | 149,728 | | | Prestige Brands Holdings, Inc.* | | | 1,584,122 | |
| | | | | | | | |
See Notes to Financial Statements.
| | | | |
| THE TARGET PORTFOLIO TRUST | | | 75 | |
| | |
Small Capitalization Value Portfolio (continued) | | Portfolio of Investments
As of October 31, 2011 |
| | | | | | | | |
| SHARES | | | DESCRIPTION | | VALUE (NOTE 1) | |
| | | | COMMON STOCKS (continued) | | | | |
| | |
| | | | Pharmaceuticals—0.2% | | | | |
| | 8,300 | | | Achillion Pharmaceuticals, Inc.* | | $ | 52,622 | |
| | 18,000 | | | Alkermes PLC (Ireland)*(a) | | | 314,820 | |
| | 41,300 | | | Idenix Pharmaceuticals, Inc.* | | | 247,800 | |
| | 6,500 | | | Par Pharmaceutical Cos., Inc.* | | | 198,900 | |
| | 2,400 | | | Pharmasset, Inc.* | | | 168,960 | |
| | 33,000 | | | PharMerica Corp.* | | | 514,800 | |
| | | | | | | | |
| | | | | | | 1,497,902 | |
| | | | | | | | |
| | |
| | | | Pipelines—0.5% | | | | |
| | 63,200 | | | ONEOK, Inc. | | | 4,806,360 | |
| | | | | | | | |
| | |
| | | | Printing & Publishing | | | | |
| | 21,000 | | | Journal Communications, Inc. (Class A Stock)* | | | 81,060 | |
| | | | | | | | |
| | |
| | | | Professional Services—0.6% | | | | |
| | 91,761 | | | Towers Watson & Co. (Class A Stock) | | | 6,028,698 | |
| | | | | | | | |
| | |
| | | | Real Estate Investment Trusts—5.2% | | | | |
| | 12,700 | | | American Campus Communities, Inc.(a) | | | 494,411 | |
| | 24,300 | | | American Capital Agency Corp. | | | 668,493 | |
| | 85,600 | | | Anworth Mortgage Asset Corp. | | | 552,120 | |
| | 64,700 | | | Ashford Hospitality Trust, Inc. | | | 575,830 | |
| | 1,600 | | | Associated Estates Realty Corp. | | | 27,168 | |
| | 21,700 | | | CapLease, Inc. | | | 84,847 | |
| | 47,800 | | | Capstead Mortgage Corp. | | | 579,336 | |
| | 62,671 | | | CBL & Associates Properties, Inc.(a) | | | 963,880 | |
| | 9,500 | | | Colonial Properties Trust(a) | | | 192,660 | |
| | 90,000 | | | CommonWealth REIT | | | 1,741,500 | |
| | 60,800 | | | DCT Industrial Trust, Inc.(a) | | | 301,568 | |
| | 8,600 | | | DDR Corp. | | | 110,166 | |
| | 38,300 | | | DiamondRock Hospitality Co. | | | 346,615 | |
| | 3,100 | | | EastGroup Properties, Inc. | | | 135,191 | |
| | 115,822 | | | Education Realty Trust, Inc. | | | 1,071,353 | |
| | 4,800 | | | Entertainment Properties Trust | | | 215,040 | |
| | 3,700 | | | Equity LifeStyle Properties, Inc. | | | 244,681 | |
| | 198,671 | | | Equity One, Inc.(a) | | | 3,407,208 | |
| | 5,100 | | | Extra Space Storage, Inc.(a) | | | 114,903 | |
| | 63,000 | | | First Industrial Realty Trust, Inc.* | | | 620,550 | |
| | 224,300 | | | First Potomac Realty Trust | | | 3,187,303 | |
| | 253,700 | | | Franklin Street Properties Corp.(a) | | | 3,221,990 | |
| | 4,500 | | | Getty Realty Corp.(a) | | | 71,730 | |
| | 93,000 | | | Government Properties Income Trust(a) | | | 2,188,290 | |
| | 158,700 | | | Healthcare Realty Trust, Inc. | | | 2,997,843 | |
| | 86,050 | | | Highwoods Properties, Inc. | | | 2,665,829 | |
| | 1,600 | | | Home Properties, Inc. | | | 94,240 | |
See Notes to Financial Statements.
| | | | |
| 76 | | | THE TARGET PORTFOLIO TRUST | |
| | | | | | | | |
| SHARES | | | DESCRIPTION | | VALUE (NOTE 1) | |
| | | | COMMON STOCKS (continued) | | | | |
| | |
| | | | Real Estate Investment Trusts (continued) | | | | |
| | 4,600 | | | Invesco Mortgage Capital, Inc. | | $ | 72,588 | |
| | 17,600 | | | Kite Realty Group Trust | | | 72,688 | |
| | 50,075 | | | LaSalle Hotel Properties(a) | | | 1,197,293 | |
| | 86,078 | | | Lexington Realty Trust(a) | | | 676,573 | |
| | 10,100 | | | LTC Properties, Inc. | | | 286,436 | |
| | 680,250 | | | Medical Properties Trust, Inc. | | | 6,870,525 | |
| | 177,865 | | | MFA Financial, Inc. | | | 1,200,589 | |
| | 27,908 | | | Mid-America Apartment Communities, Inc. | | | 1,741,459 | |
| | 8,100 | | | National Retail Properties, Inc.(a) | | | 220,725 | |
| | 190,100 | | | Omega Healthcare Investors, Inc.(a) | | | 3,376,176 | |
| | 31,000 | | | Parkway Properties, Inc. | | | 398,350 | |
| | 32,300 | | | Pennsylvania Real Estate Investment Trust | | | 331,398 | |
| | 57,600 | | | PS Business Parks, Inc. | | | 3,066,048 | |
| | 9,200 | | | Ramco-Gershenson Properties Trust(a) | | | 88,780 | |
| | 19,800 | | | Senior Housing Properties Trust | | | 444,312 | |
| | 70,300 | | | Sovran Self Storage, Inc. | | | 3,107,260 | |
| | 4,800 | | | Sun Communities, Inc.(a) | | | 182,784 | |
| | 11,400 | | | Winthrop Realty Trust | | | 103,170 | |
| | | | | | | | |
| | | | | | | 50,311,899 | |
| | | | | | | | |
| | |
| | | | Registered Investment Companies | | | | |
| | 19,400 | | | American Capital Ltd.* | | | 150,738 | |
| | 4,400 | | | Gladstone Capital Corp. | | | 36,256 | |
| | | | | | | | |
| | | | | | | 186,994 | |
| | | | | | | | |
| | |
| | | | Restaurants—0.1% | | | | |
| | 27,100 | | | Domino’s Pizza, Inc.* | | | 868,013 | |
| | | | | | | | |
| | |
| | | | Retail—1.3% | | | | |
| | 44,582 | | | ANN, Inc.* | | | 1,187,664 | |
| | 138,157 | | | Cash America International, Inc. | | | 7,564,096 | |
| | 2,000 | | | Dunkin’ Brands Group, Inc.*(a) | | | 58,220 | |
| | 8,400 | | | Insight Enterprises, Inc.* | | | 141,960 | |
| | 37,698 | | | Men’s Wearhouse, Inc. (The) | | | 1,164,114 | |
| | 85,554 | | | Pantry, Inc. (The)* | | | 1,209,734 | |
| | 500 | | | Papa John’s International, Inc.* | | | 16,880 | |
| | 51,989 | | | Regis Corp. | | | 850,540 | |
| | | | | | | | |
| | | | | | | 12,193,208 | |
| | | | | | | | |
| | |
| | | | Retail & Merchandising—0.5% | | | | |
| | 105,168 | | | American Eagle Outfitters, Inc. | | | 1,380,856 | |
| | 36,200 | | | Cabela’s, Inc.*(a) | | | 902,104 | |
| | 55,862 | | | Conn’s, Inc.*(a) | | | 514,489 | |
| | 4,700 | | | Dillard’s, Inc. (Class A Stock) | | | 242,191 | |
| | 20,900 | | | Finish Line, Inc. (The) (Class A Stock) | | | 420,090 | |
| | 64,691 | | | hhgregg, Inc.*(a) | | | 824,810 | |
| | 1,300 | | | Teavana Holdings, Inc.*(a) | | | 29,718 | |
| | | | | | | | |
| | | | | | | 4,314,258 | |
| | | | | | | | |
See Notes to Financial Statements.
| | | | |
| THE TARGET PORTFOLIO TRUST | | | 77 | |
| | |
Small Capitalization Value Portfolio (continued) | | Portfolio of Investments
As of October 31, 2011 |
| | | | | | | | |
| SHARES | | | DESCRIPTION | | VALUE (NOTE 1) | |
| | | | COMMON STOCKS (continued) | | | | |
| | |
| | | | Road & Rail—0.2% | | | | |
| | 79,650 | | | Werner Enterprises, Inc. | | $ | 1,887,705 | |
| | | | | | | | |
| | |
| | | | Semiconductors—1.2% | | | | |
| | 92,900 | | | Amkor Technology, Inc.*(a) | | | 449,636 | |
| | 12,100 | | | Brooks Automation, Inc. | | | 126,445 | |
| | 85,484 | | | Cabot Microelectronics Corp.* | | | 3,292,844 | |
| | 7,600 | | | DSP Group, Inc.* | | | 46,968 | |
| | 175,757 | | | Emulex Corp.* | | | 1,472,843 | |
| | 19,358 | | | Entegris, Inc.* | | | 173,448 | |
| | 209,800 | | | International Rectifier Corp.* | | | 5,096,042 | |
| | 4,400 | | | IXYS Corp.* | | | 60,148 | |
| | 4,700 | | | MKS Instruments, Inc. | | | 125,208 | |
| | 6,200 | | | Photronics, Inc.* | | | 38,874 | |
| | 14,700 | | | PMC—Sierra, Inc.* | | | 93,198 | |
| | 8,400 | | | Sigma Designs, Inc.* | | | 70,056 | |
| | | | | | | | |
| | | | | | | 11,045,710 | |
| | | | | | | | |
| | |
| | | | Semiconductors & Semiconductor Equipment—1.3% | | | | |
| | 23,375 | | | Cymer, Inc.*(a) | | | 1,015,644 | |
| | 8,100 | | | GSI Technology, Inc.* | | | 39,690 | |
| | 14,000 | | | Integrated Silicon Solution, Inc.* | | | 128,940 | |
| | 50,700 | | | LTX-Credence Corp.* | | | 320,931 | |
| | 317,600 | | | Micrel, Inc. | | | 3,499,952 | |
| | 89,050 | | | Microsemi Corp.* | | | 1,643,863 | |
| | 37,400 | | | Mindspeed Technologies, Inc.* | | | 207,944 | |
| | 304,700 | | | RF Micro Devices, Inc.*(a) | | | 2,236,498 | |
| | 55,350 | | | Silicon Laboratories, Inc.*(a) | | | 2,366,212 | |
| | 3,900 | | | Skyworks Solutions, Inc.* | | | 77,259 | |
| | 27,625 | | | Veeco Instruments, Inc.*(a) | | | 737,311 | |
| | | | | | | | |
| | | | | | | 12,274,244 | |
| | | | | | | | |
| | |
| | | | Software—0.3% | | | | |
| | 4,200 | | | CSG Systems International, Inc.* | | | 59,808 | |
| | 7,000 | | | Digi International, Inc.* | | | 89,530 | |
| | 3,800 | | | DynaVox, Inc. (Class A Stock)* | | | 12,844 | |
| | 1,700 | | | Ebix, Inc.*(a) | | | 29,087 | |
| | 5,600 | | | EPIQ Systems, Inc. | | | 79,856 | |
| | 1,100 | | | Tangoe, Inc.* | | | 14,795 | |
| | 80,275 | | | Verint Systems, Inc.* | | | 2,392,195 | |
| | | | | | | | |
| | | | | | | 2,678,115 | |
| | | | | | | | |
| | |
| | | | Specialty Retail—2.3% | | | | |
| | 414,875 | | | Aaron’s, Inc.(a) | | | 11,102,055 | |
| | 74,200 | | | Buckle, Inc. (The)(a) | | | 3,306,352 | |
| | 38,325 | | | DSW, Inc. (Class A Stock) | | | 2,005,930 | |
See Notes to Financial Statements.
| | | | |
| 78 | | | THE TARGET PORTFOLIO TRUST | |
| | | | | | | | |
| SHARES | | | DESCRIPTION | | VALUE (NOTE 1) | |
| | | | COMMON STOCKS (continued) | | | | |
| | |
| | | | Specialty Retail (continued) | | | | |
| | 78,000 | | | Group 1 Automotive, Inc. | | $ | 3,553,680 | |
| | 116,900 | | | Penske Automotive Group, Inc. | | | 2,383,591 | |
| | | | | | | | |
| | | | | | | 22,351,608 | |
| | | | | | | | |
| | |
| | | | Storage / Warehouse | | | | |
| | 15,200 | | | Wesco Aircraft Holdings, Inc.*(a) | | | 171,608 | |
| | | | | | | | |
| | |
| | | | Telecommunications—0.9% | | | | |
| | 2,500 | | | Anixter International, Inc.* | | | 146,725 | |
| | 395,916 | | | Arris Group, Inc.* | | | 4,260,056 | |
| | 9,500 | | | Black Box Corp. | | | 265,905 | |
| | 110,400 | | | Cincinnati Bell, Inc.*(a) | | | 355,488 | |
| | 22,300 | | | Consolidated Communications Holdings, Inc. | | | 421,024 | |
| | 3,100 | | | Oplink Communications, Inc.* | | | 50,282 | |
| | 5,700 | | | Plantronics, Inc. | | | 190,437 | |
| | 50,200 | | | Premiere Global Services, Inc.* | | | 454,812 | |
| | 70,500 | | | SBA Communications Corp. (Class A Stock)* | | | 2,685,345 | |
| | 7,000 | | | Symmetricon, Inc.* | | | 36,050 | |
| | | | | | | | |
| | | | | | | 8,866,124 | |
| | | | | | | | |
| | |
| | | | Textiles, Apparel & Luxury Goods—1.9% | | | | |
| | 75,150 | | | Hanesbrands, Inc.* | | | 1,981,705 | |
| | 7,931 | | | Oxford Industries, Inc. | | | 313,275 | |
| | 17,150 | | | Perry Ellis International, Inc.* | | | 430,465 | |
| | 132,875 | | | PVH Corp. | | | 9,887,229 | |
| | 136,225 | | | Wolverine World Wide, Inc. | | | 5,167,014 | |
| | | | | | | | |
| | | | | | | 17,779,688 | |
| | | | | | | | |
| | |
| | | | Thrifts & Mortgage Finance—0.8% | | | | |
| | 277,500 | | | Astoria Financial Corp. | | | 2,303,250 | |
| | 3,300 | | | BankFinancial Corp. | | | 26,400 | |
| | 236,550 | | | Capitol Federal Financial, Inc. | | | 2,623,339 | |
| | 179,150 | | | Washington Federal, Inc. | | | 2,445,398 | |
| | | | | | | | |
| | | | | | | 7,398,387 | |
| | | | | | | | |
| | |
| | | | Tobacco—0.3% | | | | |
| | 76,000 | | | Universal Corp. | | | 3,254,320 | |
| | | | | | | | |
| | |
| | | | Trading Companies & Distributors—0.7% | | | | |
| | 17,450 | | | Applied Industrial Technologies, Inc. | | | 586,669 | |
| | 39,350 | | | United Rentals, Inc.*(a) | | | 921,184 | |
| | 100,444 | | | WESCO International, Inc.*(a) | | | 4,867,516 | |
| | | | | | | | |
| | | | | | | 6,375,369 | |
| | | | | | | | |
| | |
| | | | Transportation—0.2% | | | | |
| | 10,900 | | | Aircastle Ltd. (Bermuda) | | | 132,217 | |
| | 2,600 | | | Amerco, Inc.* | | | 196,846 | |
| | 14,200 | | | Atlas Air Worldwide Holdings, Inc.* | | | 546,984 | |
See Notes to Financial Statements.
| | | | |
| THE TARGET PORTFOLIO TRUST | | | 79 | |
| | |
Small Capitalization Value Portfolio (continued) | | Portfolio of Investments
As of October 31, 2011 |
| | | | | | | | |
| SHARES | | | DESCRIPTION | | VALUE (NOTE 1) | |
| | | | COMMON STOCKS (continued) | | | | |
| | |
| | | | Transportation (continued) | | | | |
| | 8,800 | | | Gulfmark Offshore, Inc. (Class A Stock)* | | $ | 365,992 | |
| | 13,500 | | | Pacer International, Inc.* | | | 63,585 | |
| | 13,800 | | | Quality Distribution, Inc.* | | | 155,526 | |
| | | | | | | | |
| | | | | | | 1,461,150 | |
| | | | | | | | |
| | |
| | | | Water Utilities | | | | |
| | 1,700 | | | American States Water Co. | | | 59,398 | |
| | 3,100 | | | California Water Service Group | | | 57,567 | |
| | 1,600 | | | Consolidated Water Co., Inc. (Ordinary Shares) (Cayman Islands) | | | 14,848 | |
| | 2,800 | | | York Water Co. | | | 47,600 | |
| | | | | | | | |
| | | | | | | 179,413 | |
| | | | | | | | |
| | |
| | | | Wireless Telecommunication Services—0.3% | | | | |
| | 121,000 | | | Cellcom Israel Ltd. (Israel) | | | 2,666,840 | |
| | | | | | | | |
| | | | TOTAL COMMON STOCKS
(cost $755,339,727) | | | 897,104,600 | |
| | | | | | | | |
| | |
| | | | EXCHANGE TRADED FUND—0.8% | | | | |
| | 115,925 | | | iShares Russell 2000 Value Index Fund
(cost $6,683,188)(a) | | | 7,567,584 | |
| | | | | | | | |
| | |
| | | | UNAFFILIATED MUTUAL FUNDS—0.7% | | | | |
| | 231,525 | | | Apollo Investment Corp.(a) | | | 1,917,027 | |
| | 293,975 | | | Ares Capital Corp. | | | 4,547,793 | |
| | | | | | | | |
| | | | TOTAL UNAFFILIATED MUTUAL FUNDS
(cost $6,424,212) | | | 6,464,820 | |
| | | | | | | | |
| | | | TOTAL LONG-TERM INVESTMENTS
(cost $768,447,127) | | | 911,137,004 | |
| | | | | | | | |
Principal
Amount (000)# | | | SHORT-TERM INVESTMENTS—18.9% | | | |
| | |
| | | | U.S. TREASURY OBLIGATION | | | | |
| | | | U.S. Treasury Notes(k)
0.75%, 11/30/11 | | | | |
| $ | 315 | | | (cost $315,136) | | | 315,136 | |
| | | | | | | | |
See Notes to Financial Statements.
| | | | |
| 80 | | | THE TARGET PORTFOLIO TRUST | |
| | | | | | | | |
| SHARES | | | DESCRIPTION | | VALUE (NOTE 1) | |
| | | | AFFILIATED MONEY MARKET MUTUAL FUND—18.9% | | | | |
| | 181,169,360 | | | Prudential Investment Portfolios 2—Prudential Core Taxable Money Market Fund (cost $181,169,360; includes $131,538,899 of cash collateral for securities on loan)(b)(w) | | $ | 181,169,360 | |
| | | | | | | | |
| | | | TOTAL SHORT-TERM INVESTMENTS
(cost $181,484,496) | | | 181,484,496 | |
| | | | | | | | |
| | | | TOTAL INVESTMENTS—113.8%
(cost $949,931,623; Note 5) | | | 1,092,621,500 | |
| | | | Liabilities in excess of other assets(x)—(13.8%) | | | (132,586,096 | ) |
| | | | | | | | |
| | | | NET ASSETS—100% | | $ | 960,035,404 | |
| | | | | | | | |
The following abbreviations are used in the Portfolio descriptions:
ADR—American Depositary Receipt
REIT—Real Estate Investment Trust
| * | Non-income producing security. |
| # | Principal amount is shown in U.S. dollars unless otherwise stated. |
| (a) | All or a portion of security is on loan. The aggregate market value of such securities, including those sold and pending settlement, is $125,093,334; cash collateral of $131,538,899 (included with liabilities) was received with which the Portfolio purchased highly liquid short-term investments. |
| (b) | Represents security, or a portion thereof, purchased with cash collateral received for securities on loan. |
| (k) | Represents security, or a portion thereof, segregated as collateral for futures contracts. |
| (w) | Prudential Investments LLC, the manager of the Portfolio, also serves as manager of the Prudential Investment Portfolios 2-Prudential Core Taxable Money Market Fund. |
| (x) | Liabilities in excess of other assets includes unrealized appreciation on futures contracts as follows: |
Futures contracts open at October 31, 2011:
| | | | | | | | | | | | | | | | |
Number of
Contracts | | Type | | Expiration
Date | | Value at
Trade Date | | | Value at
October 31, 2011 | | | Unrealized
Appreciation | |
| Long Positions: | | | | | | | | | | | | | | | | |
| 45 | | Russell 2000 Mini | | Dec. 11 | | $ | 2,975,770 | | | $ | 3,326,850 | | | $ | 351,080 | |
| | | | | | | | | | | | | | | | |
Various inputs are used in determining the value of the Portfolio’s investments. These inputs are summarized in the three broad levels listed below.
Level 1—quoted prices generally for securities actively traded on a regulated securities exchange and for open-end mutual funds which trade at daily net asset value.
Level 2—other significant observable inputs (including, but not limited to, quoted prices for similar securities, interest rates, prepayment speeds, foreign currency exchange rates, and amortized cost) generally for debt securities, swaps, forward foreign currency contracts and for foreign stocks priced using vendor modeling tools.
Level 3—significant unobservable inputs for securities valued in accordance with Board approved fair valuation procedures.
See Notes to Financial Statements.
| | | | |
| THE TARGET PORTFOLIO TRUST | | | 81 | |
| | |
Small Capitalization Value Portfolio (continued) | | Portfolio of Investments
As of October 31, 2011 |
The following is a summary of the inputs used as of October 31, 2011 in valuing such portfolio securities:
| | | | | | | | | | | | |
| | | Level 1 | | | Level 2 | | | Level 3 | |
| Investments in Securities | | | | | | | | | | | | |
Common Stocks | | $ | 896,755,552 | | | $ | 349,048 | | | $ | — | |
Exchange Traded Fund | | | 7,567,584 | | | | — | | | | — | |
Unaffiliated Mutual Funds | | | 6,464,820 | | | | — | | | | — | |
U.S. Treasury Obligation | | | — | | | | 315,136 | | | | — | |
Affiliated Money Market Mutual Fund | | | 181,169,360 | | | | — | | | | — | |
| Other Financial Instruments* | | | | | | | | | | | | |
Futures | | | 351,080 | | | | — | | | | — | |
| | | | | | | | | | | | |
Total | | $ | 1,092,308,396 | | | $ | 664,184 | | | $ | — | |
| | | | | | | | | | | | |
| * | Other financial instruments are derivative instruments not reflected in the Portfolio of Investments, such as futures, forwards and swap contracts, which are recorded at the unrealized appreciation/depreciation on the instrument. |
The industry classification of investments and liabilities in excess of other assets shown as a percentage of net assets as of October 31, 2011 were as follows:
| | | | |
Affiliated Money Market Mutual Fund (13.7% represents investments purchased from securities on loan) | | | 18.9 | % |
Insurance | | | 5.7 | |
Real Estate Investment Trusts | | | 5.2 | |
Chemicals | | | 4.7 | |
Gas Utilities | | | 4.0 | |
Oil, Gas & Consumable Fuels | | | 3.5 | |
Aerospace & Defense | | | 3.4 | |
Commercial Banks | | | 3.4 | |
Metals & Mining | | | 3.2 | |
Healthcare Equipment & Supplies | | | 3.1 | |
Machinery | | | 3.0 | |
Energy Equipment & Services | | | 2.8 | |
Electric Utilities | | | 2.5 | |
Specialty Retail | | | 2.3 | |
Commercial Services & Supplies | | | 2.2 | |
Containers & Packaging | | | 2.1 | |
Textiles, Apparel & Luxury Goods | | | 1.9 | |
Electrical Equipment | | | 1.5 | |
Electronics | | | 1.5 | |
Food & Staples Retailing | | | 1.4 | |
Banks | | | 1.4 | |
Computer Services & Software | | | 1.3 | |
Semiconductors & Semiconductor Equipment | | | 1.3 | |
Retail | | | 1.3 | |
Capital Markets | | | 1.2 | |
Healthcare Services | | | 1.2 | |
Semiconductors | | | 1.2 | |
Media | | | 1.1 | |
Healthcare Providers & Services | | | 1.1 | |
Financial Services | | | 1.1 | |
See Notes to Financial Statements.
| | | | |
| 82 | | | THE TARGET PORTFOLIO TRUST | |
| | | | |
Industry (cont’d.) | | | |
Consumer Products & Services | | | 1.1 | % |
Oil & Gas Exploration/Production | | | 1.0 | |
Telecommunications | | | 0.9 | |
Computers & Peripherals | | | 0.9 | |
Commercial Services | | | 0.9 | |
Entertainment & Leisure | | | 0.8 | |
Food Products | | | 0.8 | |
Multi-Utilities | | | 0.8 | |
Construction & Engineering | | | 0.8 | |
Exchange Traded Funds | | | 0.8 | |
Thrifts & Mortgage Finance | | | 0.8 | |
Unaffiliated Mutual Funds | | | 0.7 | |
Trading Companies & Distributors | | | 0.7 | |
Hotels, Restaurants & Leisure | | | 0.7 | |
Foods | | | 0.6 | |
Professional Services | | | 0.6 | |
Electronic Equipment, Instrument & Components | | | 0.6 | |
IT Services | | | 0.6 | |
Paper & Forest Products | | | 0.6 | |
Consumer Finance | | | 0.6 | |
Pipelines | | | 0.5 | |
Healthcare Products | | | 0.5 | |
Financial—Bank & Trust | | | 0.5 | |
Retail & Merchandising | | | 0.5 | |
Electronic Components | | | 0.4 | |
Leisure Equipment & Products | | | 0.4 | |
Hand/Machine Tools | | | 0.4 | |
Building Products | | | 0.4 | |
Tobacco | | | 0.3 | |
Environmental Services | | | 0.3 | |
Industrial Products | | | 0.3 | |
Household Products | | | 0.3 | |
Beverages | | | 0.3 | |
Life Science Tools & Services | | | 0.3 | |
Drugs & Healthcare | | | 0.3 | |
Software | | | 0.3 | |
Wireless Telecommunication Services | | | 0.3 | |
Business Services | | | 0.2 | |
Machinery & Equipment | | | 0.2 | |
Clothing & Apparel | | | 0.2 | |
Home Builders | | | 0.2 | |
Manufacturing | | | 0.2 | |
Oil & Gas | | | 0.2 | |
Communications Equipment | | | 0.2 | |
Road & Rail | | | 0.2 | |
Auto Related | | | 0.2 | |
Personal Products | | | 0.2 | |
Pharmaceuticals | | | 0.2 | |
Airlines | | | 0.2 | |
Transportation | | | 0.2 | |
See Notes to Financial Statements.
| | | | |
| THE TARGET PORTFOLIO TRUST | | | 83 | |
| | |
Small Capitalization Value Portfolio (continued) | | Portfolio of Investments
As of October 31, 2011 |
| | | | |
Industry (cont’d.) | | | |
Electronic Equipment & Instruments | | | 0.1 | % |
Internet | | | 0.1 | |
Construction Materials | | | 0.1 | |
Household Durables | | | 0.1 | |
Restaurants | | | 0.1 | |
Diversified Financial Services | | | 0.1 | |
Office Equipment & Supplies | | | 0.1 | |
Miscellaneous Manufacturers | | | 0.1 | |
Internet Software & Services | | | 0.1 | |
Biotechnology | | | 0.1 | |
Auto Components | | | 0.1 | |
| | | | |
| | | 113.8 | |
Liabilities in excess of other assets | | | (13.8 | ) |
| | | | |
| | | 100.0 | % |
| | | | |
See Notes to Financial Statements.
| | | | |
| 84 | | | THE TARGET PORTFOLIO TRUST | |
| | |
Portfolio of Investments
As of October 31, 2011 | | International Equity Portfolio |
| | | | | | | | |
| SHARES | | �� | DESCRIPTION | | VALUE (NOTE 1) | |
| | | | LONG-TERM INVESTMENTS—96.6% | | | | |
| | |
| | | | COMMON STOCKS—95.7% | | | | |
| | |
| | | | Australia—4.8% | | | | |
| | 65,000 | | | Bendigo and Adelaide Bank Ltd. | | $ | 641,831 | |
| | 53,145 | | | BHP Billiton Ltd. | | | 2,080,334 | |
| | 191,700 | | | BlueScope Steel Ltd. | | | 167,704 | |
| | 53,400 | | | Caltex Australia Ltd. | | | 741,615 | |
| | 248,800 | | | Challenger Ltd. | | | 1,186,064 | |
| | 213,375 | | | Downer Edi Ltd. | | | 677,607 | |
| | 21,800 | | | Echo Entertainment Group Ltd.* | | | 84,617 | |
| | 765,800 | | | Emeco Holdings Ltd. | | | 793,358 | |
| | 559,583 | | | Goodman Fielder Ltd. | | | 325,435 | |
| | 41,700 | | | GrainCorp Ltd. | | | 343,499 | |
| | 221,300 | | | Metcash Ltd. | | | 968,432 | |
| | 69,800 | | | National Australia Bank Ltd. | | | 1,864,311 | |
| | 286,100 | | | OneSteel Ltd. | | | 363,854 | |
| | 252,800 | | | Pacific Brands Ltd. | | | 157,945 | |
| | 14,700 | | | Rio Tinto Ltd. | | | 1,055,370 | |
| | 109,100 | | | Tabcorp Holdings Ltd. | | | 335,460 | |
| | 331,500 | | | Telstra Corp. Ltd. | | | 1,076,356 | |
| | 43,800 | | | Westpac Banking Corp. | | | 1,016,430 | |
| | | | | | | | |
| | | | | | | 13,880,222 | |
| | | | | | | | |
| | |
| | | | Austria—0.7% | | | | |
| | 39,100 | | | OMV AG | | | 1,362,491 | |
| | 18,000 | | | Voestalpine AG | | | 618,461 | |
| | | | | | | | |
| | | | | | | 1,980,952 | |
| | | | | | | | |
| | |
| | | | Belgium—0.6% | | | | |
| | 102,600 | | | AGFA-Gevaert NV* | | | 256,292 | |
| | 20,300 | | | Delhaize Group | | | 1,326,001 | |
| | 16,878 | | | Dexia SA* | | | 13,093 | |
| | | | | | | | |
| | | | | | | 1,595,386 | |
| | | | | | | | |
| | |
| | | | Brazil—1.4% | | | | |
| | 243,060 | | | BM&FBOVESPA SA | | | 1,462,451 | |
| | 42,890 | | | Embraer SA, ADR | | | 1,193,200 | |
| | 72,450 | | | Natura Cosmeticos SA | | | 1,413,679 | |
| | | | | | | | |
| | | | | | | 4,069,330 | |
| | | | | | | | |
| | |
| | | | Canada—2.6% | | | | |
| | 31,580 | | | Canadian National Railway Co. | | | 2,473,806 | |
| | 53,740 | | | Canadian Natural Resources Ltd. | | | 1,895,660 | |
| | 41,947 | | | Cenovus Energy, Inc. | | | 1,436,740 | |
| | 39,630 | | | Potash Corp. of Saskatchewan, Inc. | | | 1,875,688 | |
| | | | | | | | |
| | | | | | | 7,681,894 | |
| | | | | | | | |
See Notes to Financial Statements.
| | | | |
| THE TARGET PORTFOLIO TRUST | | | 85 | |
| | |
International Equity Portfolio (continued) | | Portfolio of Investments
As of October 31, 2011 |
| | | | | | | | |
| SHARES | | | DESCRIPTION | | VALUE (NOTE 1) | |
| | | | COMMON STOCKS (continued) | | | | |
| | |
| | | | China—2.4% | | | | |
| | 455,290 | | | China Life Insurance Co. Ltd. (Class H Stock) | | $ | 1,177,106 | |
| | 835,350 | | | China Merchants Bank Co. Ltd. (Class H Stock) | | | 1,686,708 | |
| | 54,900 | | | Citi Securities Co. Ltd. (Class H Stock)* | | | 109,393 | |
| | 2,318,300 | | | Industrial & Commercial Bank of China Ltd. (Class H Stock) | | | 1,447,693 | |
| | 425,999 | | | Sinopharm Group Co. Ltd. (Class H Stock) | | | 1,159,537 | |
| | 57,306 | | | Tencent Holdings Ltd. | | | 1,325,349 | |
| | | | | | | | |
| | | | | | | 6,905,786 | |
| | | | | | | | |
| | |
| | | | Denmark—1.5% | | | | |
| | 23,100 | | | Danske Bank A/S* | | | 315,835 | |
| | 40,500 | | | H. Lundbeck A/S | | | 816,655 | |
| | 29,883 | | | Novo Nordisk A/S (Class B Stock) | | | 3,172,572 | |
| | | | | | | | |
| | | | | | | 4,305,062 | |
| | | | | | | | |
| | |
| | | | Finland—0.4% | | | | |
| | 90,200 | | | Nokia Oyj | | | 606,972 | |
| | 41,200 | | | Tieto Oyj | | | 652,301 | |
| | | | | | | | |
| | | | | | | 1,259,273 | |
| | | | | | | | |
| | |
| | | | France—8.0% | | | | |
| | 20,435 | | | Air Liquide SA | | | 2,638,513 | |
| | 9,200 | | | Arkema SA | | | 625,224 | |
| | 38,700 | | | AXA SA | | | 622,449 | |
| | 20,600 | | | BNP Paribas | | | 919,890 | |
| | 7,600 | | | Ciments Francais SA | | | 671,226 | |
| | 97,828 | | | Credit Agricole SA | | | 757,222 | |
| | 44,000 | | | France Telecom SA | | | 791,068 | |
| | 21,617 | | | LVMH Moet Hennessy Louis Vuitton SA | | | 3,582,891 | |
| | 38,800 | | | Publicis Groupe SA | | | 1,871,753 | |
| | 13,800 | | | Rallye SA | | | 441,224 | |
| | 12,500 | | | Renault SA | | | 522,277 | |
| | 36,764 | | | Sanofi | | | 2,630,061 | |
| | 26,100 | | | SCOR SE | | | 608,042 | |
| | 13,611 | | | Societe Generale | | | 389,707 | |
| | 15,200 | | | Thales SA | | | 536,061 | |
| | 49,700 | | | Total SA | | | 2,593,209 | |
| | 11,200 | | | Valeo SA | | | 562,187 | |
| | 14,100 | | | Vallourec SA | | | 854,972 | |
| | 82,000 | | | Vivendi | | | 1,832,407 | |
| | | | | | | | |
| | | | | | | 23,450,383 | |
| | | | | | | | |
| | |
| | | | Germany—10.0% | | | | |
| | 44,990 | | | Adidas AG | | | 3,168,501 | |
| | 36,700 | | | Allianz SE | | | 4,083,320 | |
See Notes to Financial Statements.
| | | | |
| 86 | | | THE TARGET PORTFOLIO TRUST | |
| | | | | | | | |
| SHARES | | | DESCRIPTION | | VALUE (NOTE 1) | |
| | | | COMMON STOCKS (continued) | | | | |
| | |
| | | | Germany (continued) | | | | |
| | 3,600 | | | Aurubis AG | | $ | 203,117 | |
| | 21,900 | | | BASF SE | | | 1,598,609 | |
| | 28,900 | | | Bayer AG | | | 1,841,277 | |
| | 12,000 | | | Daimler AG | | | 609,469 | |
| | 26,700 | | | Deutsche Bank AG | | | 1,104,007 | |
| | 35,700 | | | E.ON AG | | | 860,905 | |
| | 40,660 | | | Fresenius Medical Care AG & Co. KGaA | | | 2,961,908 | |
| | 12,800 | | | Hannover Rueckversicherung AG | | | 630,202 | |
| | 7,400 | | | Heidelberger Druckmaschinen AG* | | | 14,536 | |
| | 7,000 | | | Merck KGaA | | | 653,203 | |
| | 16,400 | | | Metro AG | | | 759,873 | |
| | 8,400 | | | MTU Aero Engines Holding AG | | | 562,505 | |
| | 8,400 | | | Muenchener Rueckversicherungs-Gesellschaft AG | | | 1,124,923 | |
| | 14,500 | | | Rheinmetall AG | | | 768,991 | |
| | 22,000 | | | RWE AG | | | 937,793 | |
| | 61,281 | | | SAP AG | | | 3,705,536 | |
| | 27,800 | | | Siemens AG | | | 2,914,021 | |
| | 27,700 | | | ThyssenKrupp AG | | | 793,566 | |
| | | | | | | | |
| | | | | | | 29,296,262 | |
| | | | | | | | |
| | |
| | | | Hong Kong—2.4% | | | | |
| | 368,000 | | | Cathay Pacific Airways Ltd. | | | 667,983 | |
| | 962,200 | | | Chaoda Modern Agriculture Holdings Ltd. | | | 78,028 | |
| | 1,314,654 | | | CNOOC Ltd. | | | 2,485,169 | |
| | 583,200 | | | First Pacific Co. Ltd. | | | 607,582 | |
| | 142,704 | | | Hong Kong Exchanges and Clearing Ltd. | | | 2,419,103 | |
| | 175,900 | | | Kingboard Chemical Holdings Ltd. | | | 600,805 | |
| | 46,300 | | | Yue Yuen Industrial Holdings Ltd. | | | 131,861 | |
| | | | | | | | |
| | | | | | | 6,990,531 | |
| | | | | | | | |
| | |
| | | | Ireland—0.8% | | | | |
| | 60,300 | | | Allied Irish Banks PLC* | | | 8,344 | |
| | 32,800 | | | Bank of Ireland* | | | 4,618 | |
| | 313,989 | | | Beazley PLC | | | 633,394 | |
| | 34,400 | | | Covidien PLC | | | 1,618,176 | |
| | 33,100 | | | Irish Life & Permanent Group Holdings PLC (XDUB)* | | | 1,511 | |
| | 15,500 | | | Irish Life & Permanent Group Holdings PLC (XLON)* | | | 708 | |
| | | | | | | | |
| | | | | | | 2,266,751 | |
| | | | | | | | |
| | |
| | | | Israel—1.8% | | | | |
| | 182,600 | | | Bank Hapoalim BM | | | 707,768 | |
| | 26,100 | | | Check Point Software Technologies Ltd.* | | | 1,504,143 | |
| | 5,200 | | | Elbit Systems Ltd. | | | 230,181 | |
| | 3,000 | | | Teva Pharmaceutical Industries Ltd | | | 122,305 | |
| | 67,518 | | | Teva Pharmaceutical Industries Ltd., ADR | | | 2,758,111 | |
| | | | | | | | |
| | | | | | | 5,322,508 | |
| | | | | | | | |
See Notes to Financial Statements.
| | | | |
| THE TARGET PORTFOLIO TRUST | | | 87 | |
| | |
International Equity Portfolio (continued) | | Portfolio of Investments
As of October 31, 2011 |
| | | | | | | | |
| SHARES | | | DESCRIPTION | | VALUE (NOTE 1) | |
| | | | COMMON STOCKS (continued) | | | | |
| | |
| | | | Italy—1.7% | | | | |
| | 15,900 | | | Banco Popolare Scarl | | $ | 23,597 | |
| | 361,000 | | | Enel SpA | | | 1,703,234 | |
| | 90,000 | | | ENI SpA | | | 1,989,352 | |
| | 50,900 | | | Finmeccanica SpA | | | 348,877 | |
| | 16,200 | | | Fondiaria-Sai SpA* | | | 35,592 | |
| | 682,500 | | | Telecom Italia SpA | | | 849,219 | |
| | | | | | | | |
| | | | | | | 4,949,871 | |
| | | | | | | | |
| | |
| | | | Japan—16.1% | | | | |
| | 22,600 | | | Alpine Electronics, Inc. | | | 265,382 | |
| | 36,400 | | | Aoyama Trading Co. Ltd. | | | 574,994 | |
| | 42,789 | | | Canon, Inc. | | | 1,942,527 | |
| | 29,000 | | | Circle K Sunkus Co. Ltd. | | | 472,816 | |
| | 79,100 | | | COMSYS Holdings Corp. | | | 774,246 | |
| | 831 | | | Dai-ichi Life Insurance Co. Ltd. (The) | | | 946,346 | |
| | 10,514 | | | Fanuc Corp. | | | 1,700,011 | |
| | 114,100 | | | Fukuoka Financial Group, Inc. | | | 441,798 | |
| | 30,600 | | | Fuyo General Lease Co. Ltd. | | | 1,051,445 | |
| | 51,900 | | | Heiwa Corp. | | | 860,036 | |
| | 38,400 | | | Hitachi Capital Corp. | | | 469,242 | |
| | 26,100 | | | Itochu Techno-Solutions Corp. | | | 1,130,098 | |
| | 169,160 | | | JX Holdings, Inc. | | | 985,338 | |
| | 19,400 | | | K’s Holdings Corp. | | | 814,672 | |
| | 497 | | | KDDI Corp. | | | 3,640,703 | |
| | 39,800 | | | Keihin Corp. | | | 613,888 | |
| | 122,872 | | | Komatsu Ltd. | | | 3,037,987 | |
| | 149,300 | | | Kurabo Industries Ltd. | | | 283,133 | |
| | 13,300 | | | Kyoei Steel Ltd. | | | 235,198 | |
| | 22,600 | | | Kyorin Holdings, Inc. | | | 415,855 | |
| | 56,700 | | | Kyowa Exeo Corp. | | | 498,746 | |
| | 247,900 | | | Marubeni Corp. | | | 1,442,919 | |
| | 3,900 | | | Megmilk Snow Brand Co. Ltd. | | | 74,974 | |
| | 9,100 | | | Miraca Holdings, Inc. | | | 347,054 | |
| | 17,800 | | | Mitsubishi Corp. | | | 366,092 | |
| | 772,700 | | | Mitsubishi UFJ Financial Group, Inc. | | | 3,358,106 | |
| | 26,900 | | | Mitsui & Co. Ltd. | | | 392,593 | |
| | 591,500 | | | Mizuho Financial Group, Inc. | | | 827,916 | |
| | 152,400 | | | Nichirei Corp. | | | 676,447 | |
| | 61,300 | | | Nippon Electric Glass Co. Ltd. | | | 549,935 | |
| | 59,200 | | | Nippon Shokubai Co. Ltd. | | | 603,795 | |
| | 30,100 | | | Nippon Telegraph & Telephone Corp. | | | 1,544,005 | |
| | 254,300 | | | Nishi-Nippon City Bank Ltd. (The) | | | 693,500 | |
| | 99,600 | | | Nissan Shatai Co. Ltd. | | | 892,949 | |
| | 800 | | | NTT DoCoMo, Inc. | | | 1,420,834 | |
See Notes to Financial Statements.
| | | | |
| 88 | | | THE TARGET PORTFOLIO TRUST | |
| | | | | | | | |
| SHARES | | | DESCRIPTION | | VALUE (NOTE 1) | |
| | | | COMMON STOCKS (continued) | | | | |
| | |
| | | | Japan (continued) | | | | |
| | 13,700 | | | Sankyo Co. Ltd. | | $ | 715,919 | |
| | 150,200 | | | Sankyu, Inc. | | | 594,712 | |
| | 52,600 | | | Seino Holdings Co. Ltd. | | | 394,626 | |
| | 28,100 | | | Shimachu Co. Ltd. | | | 606,064 | |
| | 28,200 | | | Shizuoka Gas Co. Ltd. | | | 170,450 | |
| | 11,800 | | | Sumitomo Bakelite Co. Ltd. | | | 69,091 | |
| | 149,600 | | | Sumitomo Corp. | | | 1,852,220 | |
| | 46,100 | | | Sumitomo Mitsui Financial Group, Inc. | | | 1,288,565 | |
| | 15,794 | | | Sumitomo Mitsui Trust Holdings, Inc. | | | 54,049 | |
| | 25,200 | | | Takeda Pharmaceutical Co. Ltd. | | | 1,136,051 | |
| | 203,400 | | | Toagosei Co. Ltd. | | | 908,524 | |
| | 50,400 | | | Toppan Forms Co. Ltd. | | | 394,477 | |
| | 72,143 | | | Toyota Motor Corp. | | | 2,395,204 | |
| | 56,300 | | | Toyota Tsusho Corp | | | 888,432 | |
| | 9,500 | | | Tsuruha Holdings, Inc. | | | 485,358 | |
| | 130,100 | | | Yokohama Rubber Co. Ltd. (The) | | | 742,635 | |
| | | | | | | | |
| | | | | | | 47,041,957 | |
| | | | | | | | |
| | |
| | | | Liechtenstein—0.1% | | | | |
| | 3,800 | | | Verwaltungs-und Privat-Bank AG | | | 382,901 | |
| | | | | | | | |
| | |
| | | | Mexico—0.6% | | | | |
| | 699,880 | | | Wal-Mart de Mexico SAB de CV (Class V Stock) | | | 1,806,549 | |
| | | | | | | | |
| | |
| | | | Netherlands—4.0% | | | | |
| | 57,400 | | | Aegon NV* | | | 273,738 | |
| | 220,400 | | | ING Groep NV, CVA* | | | 1,900,064 | |
| | 86,300 | | | Koninklijke Ahold NV | | | 1,102,600 | |
| | 22,300 | | | Koninklijke DSM NV | | | 1,141,133 | |
| | 94,100 | | | Koninklijke KPN NV | | | 1,232,045 | |
| | 9,200 | | | Koninklijke Philips Electronics NV | | | 191,514 | |
| | 5,700 | | | Nutreco NV | | | 378,704 | |
| | 4,300 | | | Royal Dutch Shell PLC (Class A Stock) | | | 152,476 | |
| | 119,912 | | | Royal Dutch Shell PLC (Class B Stock) | | | 4,302,215 | |
| | 32,000 | | | Yandex NV* | | | 880,640 | |
| | | | | | | | |
| | | | | | | 11,555,129 | |
| | | | | | | | |
| | |
| | | | New Zealand—0.2% | | | | |
| | 825,600 | | | Air New Zealand Ltd. | | | 697,743 | |
| | | | | | | | |
| | |
| | | | Norway—0.6% | | | | |
| | 54,400 | | | DnB NOR ASA | | | 629,244 | |
| | 43,500 | | | Statoil ASA | | | 1,103,772 | |
| | | | | | | | |
| | | | | | | 1,733,016 | |
| | | | | | | | |
| | |
| | | | Singapore—0.3% | | | | |
| | 56,000 | | | United Overseas Bank Ltd. | | | 759,502 | |
| | | | | | | | |
See Notes to Financial Statements.
| | | | |
| THE TARGET PORTFOLIO TRUST | | | 89 | |
| | |
International Equity Portfolio (continued) | | Portfolio of Investments
As of October 31, 2011 |
| | | | | | | | |
| SHARES | | | DESCRIPTION | | VALUE (NOTE 1) | |
| | | | COMMON STOCKS (continued) | | | | |
| | |
| | | | South Korea—1.0% | | | | |
| | 13,839 | | | Hyundai Motor Co. | | $ | 2,787,015 | |
| | | | | | | | |
| | |
| | | | Spain—2.7% | | | | |
| | 79,800 | | | Banco Bilbao Vizcaya Argentaria SA | | | 718,193 | |
| | 67,800 | | | Banco Espanol de Credito SA | | | 401,449 | |
| | 208,800 | | | Banco Santander SA | | | 1,767,254 | |
| | 63,100 | | | Repsol YPF SA | | | 1,899,293 | |
| | 138,867 | | | Telefonica SA | | | 2,951,148 | |
| | | | | | | | |
| | | | | | | 7,737,337 | |
| | | | | | | | |
| | |
| | | | Sweden—2.2% | | | | |
| | 87,100 | | | Boliden AB | | | 1,238,249 | |
| | 19,700 | | | Electrolux AB (Class B Stock) | | | 366,822 | |
| | 87,274 | | | Hennes & Mauritz AB (Class B Stock) | | | 2,885,658 | |
| | 76,900 | | | Meda AB | | | 782,595 | |
| | 15,400 | | | NCC AB (Class B Stock) | | | 282,245 | |
| | 57,500 | | | Svenska Cellulosa AB (Class B Stock) | | | 839,418 | |
| | | | | | | | |
| | | | | | | 6,394,987 | |
| | | | | | | | |
| | |
| | | | Switzerland—7.3% | | | | |
| | 13,600 | | | Baloise Holding AG | | | 1,107,799 | |
| | 44,058 | | | Clariant AG* | | | 477,108 | |
| | 109,200 | | | Credit Suisse Group AG* | | | 3,149,441 | |
| | 1,300 | | | Georg Fischer AG* | | | 538,671 | |
| | 35,897 | | | Julius Baer Group Ltd.* | | | 1,348,824 | |
| | 55,800 | | | Nestle SA | | | 3,227,343 | |
| | 100,105 | | | Novartis AG | | | 5,639,443 | |
| | 8,900 | | | Roche Holding AG | | | 1,460,218 | |
| | 1,970 | | | Swatch Group AG (The) | | | 829,343 | |
| | 22,000 | | | Swiss Re Ltd.* | | | 1,201,167 | |
| | 32,600 | | | UBS AG* | | | 412,006 | |
| | 8,700 | | | Zurich Financial Services AG* | | | 2,004,859 | |
| | | | | | | | |
| | | | | | | 21,396,222 | |
| | | | | | | | |
| | |
| | | | Taiwan—0.7% | | | | |
| | 95,550 | | | HTC Corp. | | | 2,147,348 | |
| | | | | | | | |
| | |
| | | | Turkey—0.4% | | | | |
| | 359,900 | | | Turkiye Garanti Bankasi A/S | | | 1,262,734 | |
| | | | | | | | |
| | |
| | | | United Kingdom—19.4% | | | | |
| | 150,072 | | | ARM Holdings PLC | | | 1,408,106 | |
| | 56,500 | | | AstraZeneca PLC | | | 2,712,514 | |
| | 183,100 | | | Aviva PLC | | | 998,913 | |
| | 259,100 | | | BAE Systems PLC | | | 1,149,014 | |
| | 242,700 | | | Barclays PLC | | | 752,355 | |
See Notes to Financial Statements.
| | | | |
| 90 | | | THE TARGET PORTFOLIO TRUST | |
| | | | | | | | |
| SHARES | | | DESCRIPTION | | VALUE (NOTE 1) | |
| | | | COMMON STOCKS (continued) | | | | |
| | |
| | | | United Kingdom (continued) | | | | |
| | 107,700 | | | Berendsen PLC | | $ | 802,408 | |
| | 137,000 | | | BG Group PLC | | | 2,970,706 | |
| | 292,900 | | | BP PLC | | | 2,155,400 | |
| | 71,513 | | | British American Tobacco PLC | | | 3,278,890 | |
| | 685,700 | | | BT Group PLC | | | 2,068,909 | |
| | 71,077 | | | Carnival PLC | | | 2,600,667 | |
| | 80,600 | | | Cookson Group PLC | | | 619,534 | |
| | 80,900 | | | Dairy Crest Group PLC | | | 448,616 | |
| | 113,200 | | | Drax Group PLC | | | 985,412 | |
| | 294,000 | | | DS Smith PLC | | | 1,004,439 | |
| | 43,300 | | | Eurasian Natural Resources Corp. PLC | | | 456,087 | |
| | 86,300 | | | GlaxoSmithKline PLC | | | 1,936,773 | |
| | 268,500 | | | Home Retail Group PLC | | | 433,257 | |
| | 61,000 | | | Intermediate Capital Group PLC | | | 238,854 | |
| | 75,200 | | | J. Sainsbury PLC | | | 360,355 | |
| | 567,155 | | | Kingfisher PLC | | | 2,349,773 | |
| | 621,400 | | | Legal & General Group PLC | | | 1,094,663 | |
| | 390,200 | | | Logica PLC | | | 585,513 | |
| | 225,597 | | | Marks & Spencer Group PLC | | | 1,163,089 | |
| | 144,620 | | | Marston’s PLC | | | 224,865 | |
| | 66,100 | | | Micro Focus International PLC | | | 357,612 | |
| | 141,000 | | | Mondi PLC | | | 1,072,397 | |
| | 32,400 | | | Next PLC | | | 1,327,951 | |
| | 599,900 | | | Old Mutual PLC | | | 1,054,702 | |
| | 85,773 | | | Pearson PLC | | | 1,575,721 | |
| | 52,547 | | | Reckitt Benckiser Group PLC | | | 2,697,219 | |
| | 115,600 | | | Rexam PLC | | | 640,769 | |
| | 97,560 | | | Rolls-Royce Holdings PLC* | | | 1,098,180 | |
| | 6,731,640 | | | Rolls-Royce Holdings PLC (Class C Stock)* | | | 10,824 | |
| | 293,000 | | | RSA Insurance Group PLC | | | 523,254 | |
| | 50,435 | | | SABMiller PLC | | | 1,836,851 | |
| | 130,590 | | | Standard Chartered PLC | | | 3,047,226 | |
| | 492,832 | | | Tesco PLC | | | 3,177,489 | |
| | 177,400 | | | Thomas Cook Group PLC | | | 147,202 | |
| | 153,300 | | | Tullett Prebon PLC | | | 864,425 | |
| | 1,037,800 | | | Vodafone Group PLC | | | 2,881,641 | |
| | 319,800 | | | WM Morrison Supermarkets PLC | | | 1,550,844 | |
| | | | | | | | |
| | | | | | | 56,663,419 | |
| | | | | | | | |
| | |
| | | | United States—1.0% | | | | |
| | 37,787 | | | Schlumberger Ltd. | | | 2,776,211 | |
| | | | | | | | |
| | | | TOTAL COMMON STOCKS
(cost $290,798,556) | | | 279,096,281 | |
| | | | | | | | |
| | |
| | | | PREFERRED STOCKS—0.9% | | | | |
| | |
| | | | Germany | | | | |
| | 15,616 | | | Volkswagen AG (PRFC)
(cost $1,521,364) | | | 2,719,522 | |
| | | | | | | | |
| | | | TOTAL LONG-TERM INVESTMENTS
(cost $292,319,920) | | | 281,815,803 | |
| | | | | | | | |
See Notes to Financial Statements.
| | | | |
| THE TARGET PORTFOLIO TRUST | | | 91 | |
| | |
International Equity Portfolio (continued) | | Portfolio of Investments
As of October 31, 2011 |
| | | | | | | | |
| SHARES | | | DESCRIPTION | | VALUE (NOTE 1) | |
| | | | SHORT-TERM INVESTMENT—2.8% | | | | |
| | |
| | | �� | AFFILIATED MONEY MARKET MUTUAL FUND | | | | |
| | 8,014,802 | | | Prudential Investment Portfolios 2—Prudential Core Taxable Money Market Fund (cost $8,014,802)(w) | | $ | 8,014,802 | |
| | | | | | | | |
| | | | TOTAL INVESTMENTS—99.4%
(cost $300,334,722; Note 5) | | | 289,830,605 | |
| | | | Other assets in excess of liabilities(x)—0.6% | | | 1,854,204 | |
| | | | | | | | |
| | | | NET ASSETS—100% | | $ | 291,684,809 | |
| | | | | | | | |
The following abbreviations are used in the Portfolio descriptions:
ADR—American Depositary Receipt
CVA—Certificate Van Aandelen (Bearer)
PRFC—Preference Shares
XDUB—Dublin Stock Exchange
XLON—London Stock Exchange
EUR—Euro
| * | Non-income producing security. |
| (w) | Prudential Investments LLC, the manager of the Fund also serves as manager of the Prudential Investment Portfolios 2-Prudential Core Taxable Money Market Fund. |
| (x) | Includes net unrealized appreciation on the following derivative contracts held at reporting period end: |
Forward foreign currency exchange contracts outstanding at October 31, 2011:
| | | | | | | | | | | | | | | | | | |
Sale Contracts | | Counterparty | | Notional
Amount
(000) | | | Value at
Settlement
Date
Receivable | | | Current
Value | | | Unrealized
Appreciation | |
Euro, | | | | | | | | | | | | | | | | | | |
Expiring 11/09/11 | | State Street Bank | | EUR | 2,861 | | | $ | 4,100,299 | | | $ | 3,958,553 | | | $ | 141,746 | |
Expiring 11/09/11 | | Citigroup Global Markets | | EUR | 2,194 | | | | 3,151,715 | | | | 3,035,707 | | | | 116,008 | |
| | | | | | | | | | | | | | | | | | |
| | | | | | | | $ | 7,252,014 | | | $ | 6,994,260 | | | $ | 257,754 | |
| | | | | | | | | | | | | | | | | | |
Various inputs are used in determining the value of the Portfolio’s investments. These inputs are summarized in the three broad levels listed below.
Level 1—quoted prices generally for securities actively traded on a regulated securities exchange and for open-end mutual funds which trade at daily net asset value.
Level 2—other significant observable inputs (including, but not limited to, quoted prices for similar securities, interest rates, prepayment speeds, foreign currency exchange rates, and amortized cost) generally for debt securities, swaps, forward foreign currency contracts and for foreign stocks priced using vendor modeling tools.
Level 3—significant unobservable inputs for securities valued in accordance with Board approved fair valuation procedures.
See Notes to Financial Statements.
| | | | |
| 92 | | | THE TARGET PORTFOLIO TRUST | |
The following is a summary of the inputs used as of October 31, 2011 in valuing such portfolio securities:
| | | | | | | | | | | | |
| | | Level 1 | | | Level 2 | | | Level 3 | |
| Investments in Securities | | | | | | | | | | | | |
Common Stocks: | | | | | | | | | | | | |
Australia | | $ | — | | | $ | 13,880,222 | | | $ | — | |
Austria | | | — | | | | 1,980,952 | | | | — | |
Belgium | | | — | | | | 1,595,386 | | | | — | |
Brazil | | | 4,069,330 | | | | — | | | | — | |
Canada | | | 7,681,894 | | | | — | | | | — | |
China | | | 109,393 | | | | 6,796,393 | | | | — | |
Denmark | | | — | | | | 4,305,062 | | | | — | |
Finland | | | — | | | | 1,259,273 | | | | — | |
France | | | — | | | | 23,450,383 | | | | — | |
Germany | | | — | | | | 29,296,262 | | | | — | |
Hong Kong | | | — | | | | 6,912,503 | | | | 78,028 | |
Ireland | | | 1,628,739 | | | | 638,012 | | | | — | |
Israel | | | 4,262,254 | | | | 1,060,254 | | | | — | |
Italy | | | — | | | | 4,949,871 | | | | — | |
Japan | | | — | | | | 47,041,957 | | | | — | |
Liechtenstein | | | 382,901 | | | | — | | | | — | |
Mexico | | | 1,806,549 | | | | — | | | | — | |
Netherlands | | | 880,640 | | | | 10,674,489 | | | | — | |
New Zealand | | | — | | | | 697,743 | | | | — | |
Norway | | | — | | | | 1,733,016 | | | | — | |
Singapore | | | — | | | | 759,502 | | | | — | |
South Korea | | | — | | | | 2,787,015 | | | | — | |
Spain | | | — | | | | 7,737,337 | | | | — | |
Sweden | | | — | | | | 6,394,987 | | | | — | |
Switzerland | | | — | | | | 21,396,222 | | | | — | |
Taiwan | | | — | | | | 2,147,348 | | | | — | |
Turkey | | | — | | | | 1,262,734 | | | | — | |
United Kingdom | | | — | | | | 56,663,419 | | | | — | |
United States | | | 2,776,211 | | | | — | | | | — | |
Preferred Stock—Germany | | | — | | | | 2,719,522 | | | | — | |
Affiliated Money Market Mutual Fund | | | 8,014,802 | | | | — | | | | — | |
| Other Financial Instruments* | | | | | | | | | | | | |
Forward foreign currency exchange contracts | | | — | | | | 257,754 | | | | — | |
| | | | | | | | | | | | |
Total | | $ | 31,612,713 | | | $ | 258,397,618 | | | $ | 78,028 | |
| | | | | | | | | | | | |
| * | Other financial instruments are derivative instruments not reflected in the Portfolio of Investments, such as futures, forwards and swap contracts, which are recorded at the unrealized appreciation/depreciation on the instrument. |
Fair Value of Level 2 investments at 10/31/10 was $0. $126,207,437 was transferred into Level 2 from Level 1 at 10/31/11 as a result of using third-party vendor modeling tools due to significant market movements between the time at which the Portfolio valued its securities and the earlier closing of foreign markets.
It is the Portfolio’s policy to recognize transfers in and transfers out at the fair value as of the beginning of period.
See Notes to Financial Statements.
| | | | |
| THE TARGET PORTFOLIO TRUST | | | 93 | |
| | |
International Equity Portfolio (continued) | | Portfolio of Investments
As of October 31, 2011 |
The industry classification of investments and other assets in excess of liabilities shown as a percentage of net assets as of October 31, 2011 were as follows:
| | | | |
Commercial Banks | | | 10.9 | % |
Oil & Gas | | | 10.3 | |
Pharmaceuticals | | | 8.8 | |
Telecommunications | | | 7.3 | |
Insurance | | | 6.8 | |
Retail | | | 5.0 | |
Food | | | 4.8 | |
Chemicals | | | 3.9 | |
Automobile Manufacturers | | | 3.4 | |
Affiliated Money Market Mutual Fund | | | 2.8 | |
Diversified Financial Services | | | 2.7 | |
Software | | | 1.9 | |
Machinery & Equipment | | | 1.9 | |
Aerospace/Defense | | | 1.8 | |
Holding Companies—Diversified | | | 1.7 | |
Mining | | | 1.7 | |
Distribution/Wholesale | | | 1.6 | |
Entertainment & Leisure | | | 1.6 | |
Agriculture | | | 1.2 | |
Electric | | | 1.2 | |
Apparel | | | 1.2 | |
Transportation | | | 1.1 | |
Media | | | 1.1 | |
Miscellaneous Manufacturers | | | 1.1 | |
Healthcare—Services | | | 1.0 | |
Forest & Paper Products | | | 1.0 | |
Household Products/Wares | | | 1.0 | |
Auto Parts And Equipment | | | 0.9 | |
Iron/Steel | | | 0.9 | |
Computers | | | 0.8 | |
Engineering/Construction | | | 0.8 | |
Internet | | | 0.8 | |
Beverages | | | 0.7 | |
Office Equipment | | | 0.7 | |
Advertising | | | 0.6 | |
Healthcare—Products | | | 0.6 | |
Cosmetics & Toiletries | | | 0.5 | |
Semiconductors | | | 0.5 | |
Airlines | | | 0.4 | |
Commercial Services | | | 0.4 | |
Metal Fabricate/Hardware | | | 0.3 | |
Trading Companies & Distributors | | | 0.3 | |
Electronics | | | 0.3 | |
Building Materials | | | 0.2 | |
Containers & Packaging | | | 0.2 | |
See Notes to Financial Statements.
| | | | |
| 94 | | | THE TARGET PORTFOLIO TRUST | |
| | | | |
Industry (cont’d.) | | | |
Home Furnishings | | | 0.2 | % |
Industrial Conglomerates | | | 0.2 | |
Electronic Equipment & Instruments | | | 0.2 | |
Textiles | | | 0.1 | |
| | | | |
| | | 99.4 | |
Other assets in excess of liabilities | | | 0.6 | |
| | | | |
| | | 100.0 | % |
| | | | |
See Notes to Financial Statements.
| | | | |
| THE TARGET PORTFOLIO TRUST | | | 95 | |
| | |
| Total Return Bond Portfolio | | Portfolio of Investments
As of October 31, 2011 |
| | | | | | | | | | |
MOODY’S
RATINGS†
(UNAUDITED) | | PRINCIPAL AMOUNT (000)# | | | DESCRIPTION | | VALUE (NOTE 1) | |
| | | | | | LONG-TERM INVESTMENTS—112.3% | | | | |
| | | |
| | | | | | ASSET-BACKED SECURITIES—2.4% | | | | |
| B3 | | $ | 98 | | | Bear Stearns Second Lien Trust,
Series 2007-SV1A, Class A1, 144A
0.465%(c), 12/25/36 | | $ | 93,288 | |
| Ba1 | | | 1,460 | | | Countrywide Asset-Backed Certificates,
Series 2006-15, Class A2
5.683%(c), 10/25/46 | | | 1,413,462 | |
| NR | | EUR | 1,256 | | | Magnolia Funding Ltd.,
Series 2010-1A, Class A1, 144A
3.00%, 04/20/17 | | | 1,735,088 | |
| AAA(d) | | | 1,553 | | | Plymouth Rock CLO Ltd., Inc.,
Series 2010-1A, Class A, 144A
1.79%(c), 02/16/19 | | | 1,534,080 | |
| Aaa | | | 4,073 | | | SLM Student Loan Trust,
Series 2008-9, Class A
1.918%(c), 04/25/23 | | | 4,168,910 | |
| Caa2 | | | 447 | | | Structured Asset Securities Corp.,
Series 2005-7XS, Class 2A1A
1.745%(c), 04/25/35 | | | 343,025 | |
| | | | | | | | | | |
| | | | | | TOTAL ASSET-BACKED SECURITIES
(cost $9,201,007) | | | 9,287,853 | |
| | | | | | | | | | |
| | | |
| | | | | | BANK LOAN(c)—0.1% | | | | |
| | | |
| | | | | | Utilities | | | | |
| B2 | | | 559 | | | TXU Corp., 2014 Term Loan
3.774%, 10/10/14
(cost $546,650) | | | 418,914 | |
| | | | | | | | | | |
| | | |
| | | | | | CORPORATE BONDS—29.6% | | | | |
| | | |
| | | | | | Aerospace—0.1% | | | | |
| Baa2 | | | 200 | | | Goodrich Corp.,
Sr. Unsec’d. Notes
6.29%, 07/01/16 | | | 234,493 | |
| | | | | | | | | | |
| | | |
| | | | | | Airlines—0.1% | | | | |
| NR | | | 608 | | | UAL 1991 Equipment Trust AB,
Equipment Trust(g)(i)
10.85%, 02/19/15 | | | 281,334 | |
| | | | | | | | | | |
| | | |
| | | | | | Automotive Parts—0.3% | | | | |
| Baa2 | | | 1,100 | | | AutoZone, Inc.,
Sr. Unsec’d. Notes
6.95%, 06/15/16 | | | 1,295,322 | |
| | | | | | | | | | |
See Notes to Financial Statements.
| | | | |
| 96 | | | THE TARGET PORTFOLIO TRUST | |
| | | | | | | | | | |
MOODY’S
RATINGS†
(UNAUDITED) | | PRINCIPAL AMOUNT (000)# | | | DESCRIPTION | | VALUE (NOTE 1) | |
| | | | | | CORPORATE BONDS (continued) | | | | |
| | | |
| | | | | | Computer Services & Software—0.3% | | | | |
| A2 | | $ | 1,200 | | | Electronic Data Systems LLC,
Sr. Unsec’d. Notes
6.00%, 08/01/13 | | $ | 1,294,508 | |
| | | | | | | | | | |
| | | |
| | | | | | Construction—0.4% | | | | |
| B1 | | | 1,600 | | | Pulte Group, Inc.,
Gtd. Notes
6.25%, 02/15/13 | | | 1,616,000 | |
| | | | | | | | | | |
| | | |
| | | | | | Electronic Components | | | | |
| Aa2 | | | 100 | | | General Electric Co.,
Sr. Unsec’d. Notes
5.25%, 12/06/17 | | | 113,931 | |
| | | | | | | | | | |
| | | |
| | | | | | Financial—Bank & Trust—11.9% | | | | |
| A2 | | | 500 | | | American Express Bank FSB,
Sr. Unsec’d. Notes
5.50%, 04/16/13 | | | 528,542 | |
| Baa1 | | | 1,200 | | | Bank of America Corp.,
Sr. Unsec’d. Notes
0.661%(c), 10/14/16 | | | 973,538 | |
| Baa1 | | | 800 | | | 7.625%, 06/01/19 | | | 869,305 | |
| Baa1 | | | 300 | | | Sr. Unsec’d. Notes, MTN
5.65%, 05/01/18 | | | 300,402 | |
| Baa1 | | | 5,700 | | | Barclays Bank PLC,
Sub. Notes, 144A (United Kingdom)
6.05%, 12/04/17 | | | 5,470,256 | |
| B2 | | | 1,900 | | | CIT Group, Inc.,
Sec’d. Notes, 144A
5.25%, 04/01/14 | | | 1,890,500 | |
| A3 | | | 6,300 | | | Citigroup, Inc.,
Sr. Unsec’d. Notes
5.50%, 04/11/13 | | | 6,536,830 | |
| Aaa | | | 4,200 | | | Cooperatieve Centrale Raiffeisen-Boerenleenbank BA,
Gtd. Notes (Netherlands)
4.50%, 01/11/21 | | | 4,605,246 | |
| Aaa | | | 3,000 | | | DnB NOR Boligkreditt,
Covered Bonds, 144A (Norway)
2.90%, 03/29/16 | | | 3,117,633 | |
| A1 | | | 2,600 | | | Export-Import Bank of Korea,
Sr. Unsec’d. Notes (South Korea)
8.125%, 01/21/14 | | | 2,888,733 | |
| A1 | | | 300 | | | Goldman Sachs Group, Inc. (The),
Sr. Unsec’d. Notes
6.15%, 04/01/18 | | | 320,318 | |
| A1 | | | 1,100 | | | 6.25%, 09/01/17 | | | 1,189,443 | |
See Notes to Financial Statements.
| | | | |
| THE TARGET PORTFOLIO TRUST | | | 97 | |
| | |
Total Return Bond Portfolio (continued) | | Portfolio of Investments
As of October 31, 2011 |
| | | | | | | | | | |
MOODY’S
RATINGS†
(UNAUDITED) | | PRINCIPAL AMOUNT (000)# | | | DESCRIPTION | | VALUE (NOTE 1) | |
| | | | | | CORPORATE BONDS (continued) | | | | |
| | | |
| | | | | | Financial—Bank & Trust (continued) | | | | |
| A1 | | $ | 400 | | | Sr. Unsec’d. Notes, MTN
0.816%(c), 07/22/15 | | $ | 357,378 | |
| A1 | | | 1,900 | | | HSBC Bank USA NA,
Sub. Notes
4.875%, 08/24/20 | | | 1,853,389 | |
| Aa3 | | | 400 | | | JPMorgan Chase & Co.,
Sr. Unsec’d. Notes
4.25%, 10/15/20 | | | 398,078 | |
| NR | | | 3,500 | | | Lehman Brothers Holdings, Inc.,(i)
Sr. Unsec’d. Notes, MTN
5.625%, 01/24/13 | | | 896,875 | |
| NR | | | 900 | | | 6.875%, 05/02/18 | | | 231,750 | |
| A1 | | | 3,000 | | | Lloyds TSB Bank PLC, (United Kingdom)
Bank Gtd. Notes, 144A, MTN
4.375%, 01/12/15 | | | 3,008,253 | |
| Ba1 | | | 3,100 | | | Jr. Sub. Notes, 144A
12.00%(c), 12/16/24 | | | 2,829,122 | |
| A2 | | | 5,100 | | | Royal Bank of Scotland PLC (The),
Gtd. Notes (United Kingdom)
5.625%, 08/24/20 | | | 5,188,087 | |
| Aa3 | | | 2,100 | | | UBS AG,
Sr. Unsec’d. Notes, MTN (Switzerland)
1.403%(c), 02/23/12 | | | 2,105,187 | |
| | | | | | | | | | |
| | | | | | | | | 45,558,865 | |
| | | | | | | | | | |
| | | |
| | | | | | Financial Services—7.4% | | | | |
| B1 | | | 3,600 | | | Ally Financial, Inc.,
Gtd. Notes
8.00%, 03/15/20 | | | 3,708,000 | |
| B1 | | | 100 | | | Sr. Unsec’d. Notes
8.00%, 11/01/31 | | | 100,187 | |
| Aa3 | | | 700 | | | ANZ National International Ltd.,
Bank Gtd. Notes, 144A (New Zealand)
6.20%, 07/19/13 | | | 749,041 | |
| A3 | | | 400 | | | CitiFinancial, Inc.,
Sr. Unsec’d. Notes
6.625%, 06/01/15 | | | 429,696 | |
| Ba1 | | | 2,000 | | | Ford Motor Credit Co. LLC,
Sr. Unsec’d. Notes
5.625%, 09/15/15 | | | 2,116,970 | |
| Ba1 | | | 1,100 | | | 7.00%, 10/01/13 | | | 1,182,964 | |
See Notes to Financial Statements.
| | | | |
| 98 | | | THE TARGET PORTFOLIO TRUST | |
| | | | | | | | | | |
MOODY’S
RATINGS†
(UNAUDITED) | | PRINCIPAL AMOUNT (000)# | | | DESCRIPTION | | VALUE (NOTE 1) | |
| | | | | | CORPORATE BONDS (continued) | | | | |
| | | |
| | | | | | Financial Services (continued) | | | | |
| Aa2 | | $ | 1,700 | | | General Electric Capital Corp.,
Sr. Unsec’d. Notes, MTN
0.651%(c), 06/20/14 | | $ | 1,666,976 | |
| Aa3 | | GBP | 300 | | | Sub. Notes, 144A
6.50%(c), 09/15/67 | | | 434,132 | |
| Ba3 | | | 1,900 | | | International Lease Finance Corp.,
Sr. Sec’d. Notes, 144A
7.125%, 09/01/18 | | | 1,961,750 | |
| Baa1 | | | 800 | | | Merrill Lynch & Co., Inc.,
Sr. Unsec’d. Notes, MTN
5.571%, 10/04/12 | | | 818,466 | |
| A2 | | EUR | 1,200 | | | 6.75%, 05/21/13 | | | 1,682,433 | |
| A2 | | | 3,500 | | | Morgan Stanley,
Sr. Unsec’d. Notes
1.408%(c), 04/29/13 | | | 3,388,326 | |
| A2 | | | 1,800 | | | Sr. Unsec’d. Notes, MTN
5.75%, 10/18/16 | | | 1,845,893 | |
| A2 | | | 3,200 | | | 6.625%, 04/01/18 | | | 3,335,123 | |
| Baa1 | | | 4,200 | | | Pearson Dollar Finance PLC,
Gtd. Notes, 144A (United Kingdom)
5.70%, 06/01/14 | | | 4,610,831 | |
| B3 | | | 100 | | | Springleaf Finance Corp.,
Sr. Unsec’d. Notes, MTN
5.40%, 12/01/15 | | | 78,000 | |
| | | | | | | | | | |
| | | | | | | | | 28,108,788 | |
| | | | | | | | | | |
| | | |
| | | | | | Insurance—1.3% | | | | |
| Baa1 | | | 2,300 | | | American International Group, Inc.,
Sr. Unsec’d. Notes
8.25%, 08/15/18 | | | 2,587,997 | |
| Baa1 | | EUR | 600 | | | Sr. Unsec’d. Notes, MTN
1.753%(c), 07/19/13 | | | 773,720 | |
| Baa1 | | | 1,400 | | | 5.85%, 01/16/18 | | | 1,408,890 | |
| | | | | | | | | | |
| | | | | | | | | 4,770,607 | |
| | | | | | | | | | |
| | | |
| | | | | | Metals & Mining—0.9% | | | | |
| BBB-(d) | | | 3,600 | | | Gerdau Trade, Inc.,
Gtd. Notes, 144A (British Virgin Islands)
5.75%, 01/30/21 | | | 3,555,000 | |
| | | | | | | | | | |
| | | |
| | | | | | Oil, Gas & Consumable Fuels—0.4% | | | | |
| Baa2 | | | 1,300 | | | Suncor Energy, Inc.,
Sr. Unsec’d. Notes (Canada)
6.85%, 06/01/39 | | | 1,659,749 | |
| | | | | | | | | | |
See Notes to Financial Statements.
| | | | |
| THE TARGET PORTFOLIO TRUST | | | 99 | |
| | |
Total Return Bond Portfolio (continued) | | Portfolio of Investments
As of October 31, 2011 |
| | | | | | | | | | |
MOODY’S
RATINGS†
(UNAUDITED) | | PRINCIPAL AMOUNT (000)# | | | DESCRIPTION | | VALUE (NOTE 1) | |
| | | | | | CORPORATE BONDS (continued) | | | | |
| | | |
| | | | | | Paper & Forest Products—1.0% | | | | |
| Baa3 | | $ | 3,600 | | | International Paper Co.,
Sr. Unsec’d. Notes
5.25%, 04/01/16 | | $ | 3,879,745 | |
| | | | | | | | | | |
| | | |
| | | | | | Pharmaceuticals—0.7% | | | | |
| Baa3 | | | 1,200 | | | Cardinal Health, Inc.,
Sr. Unsec’d. Notes
6.00%, 06/15/17 | | | 1,384,094 | |
| B1 | | | 1,275 | | | Valeant Pharmaceuticals International,
Gtd. Notes, 144A
6.75%, 08/15/21 | | | 1,230,375 | |
| | | | | | | | | | |
| | | | | | | | | 2,614,469 | |
| | | | | | | | | | |
| | | |
| | | | | | Pipelines—0.1% | | | | |
| Ba3 | | | 300 | | | El Paso Corp.,
Sr. Unsec’d. Notes, MTN
7.80%, 08/01/31 | | | 343,500 | |
| | | | | | | | | | |
| | | |
| | | | | | Printing & Publishing—0.2% | | | | |
| Ba1 | | | 614 | | | RR Donnelley & Sons Co.,
Sr. Unsec’d. Notes
6.125%, 01/15/17 | | | 583,300 | |
| | | | | | | | | | |
| | | |
| | | | | | Real Estate Investment Trust—1.0% | | | | |
| Baa3 | | | 3,700 | | | Goodman Funding Pty Ltd.,
Gtd. Notes, 144A (Australia)
6.375%, 11/12/20 | | | 3,737,799 | |
| | | | | | | | | | |
| | | |
| | | | | | Retail & Merchandising—0.5% | | | | |
| Ba2 | | | 1,900 | | | Limited Brands, Inc.,
Sr. Unsec’d. Notes
6.90%, 07/15/17 | | | 2,028,250 | |
| | | | | | | | | | |
| | | |
| | | | | | Telecommunications—1.4% | | | | |
| Baa3 | | | 1,600 | | | Embarq Corp.,
Sr. Unsec’d. Notes
6.738%, 06/01/13 | | | 1,684,800 | |
| Baa3 | | | 1,000 | | | 7.082%, 06/01/16 | | | 1,083,773 | |
| Baa3 | | | 1,500 | | | Qwest Corp.,
Sr. Unsec’d. Notes
7.625%, 06/15/15 | | | 1,665,000 | |
| B2 | | | 1,000 | | | Sprint Capital Corp.,
Gtd. Notes
8.375%, 03/15/12 | | | 1,010,000 | |
| | | | | | | | | | |
| | | | | | | | | 5,443,573 | |
| | | | | | | | | | |
See Notes to Financial Statements.
| | | | |
| 100 | | | THE TARGET PORTFOLIO TRUST | |
| | | | | | | | | | |
MOODY’S
RATINGS†
(UNAUDITED) | | PRINCIPAL AMOUNT (000)# | | | DESCRIPTION | | VALUE (NOTE 1) | |
| | | | | | CORPORATE BONDS (continued) | | | | |
| | | |
| | | | | | Tobacco—0.4% | | | | |
| Baa1 | | $ | 400 | | | Altria Group, Inc.,
Gtd. Notes
9.70%, 11/10/18 | | $ | 537,608 | |
| Baa3 | | | 750 | | | Reynolds American, Inc.,
Gtd. Notes
7.625%, 06/01/16 | | | 893,422 | |
| | | | | | | | | | |
| | | | | | | | | 1,431,030 | |
| | | | | | | | | | |
| | | |
| | | | | | Transportation—0.5% | | | | |
| Baa3 | | | 1,600 | | | CSX Corp.,
Sr. Unsec’d. Notes
6.25%, 03/15/18 | | | 1,908,981 | |
| | | | | | | | | | |
| | | |
| | | | | | Utilities—0.7% | | | | |
| Baa1 | | | 2,500 | | | Ameren Illinois Co.,
Sr. Sec’d. Notes
6.25%, 04/01/18 | | | 2,853,950 | |
| | | | | | | | | | |
| | | | | | TOTAL CORPORATE BONDS
(cost $112,795,523) | | | 113,313,194 | |
| | | | | | | | | | |
| | | |
| | | | | | FOREIGN GOVERNMENT BONDS—13.2% | | | | |
| Aaa | | AUD | 7,000 | | | Australia Government,
Sr. Unsec’d. Notes (Australia)
4.75%, 06/15/16 | | | 7,592,690 | |
| Aaa | | AUD | 5,300 | | | 5.25%, 03/15/19 | | | 5,905,038 | |
| Aaa | | AUD | 3,900 | | | 5.50%, 12/15/13 | | | 4,243,571 | |
| Aaa | | AUD | 5,400 | | | 5.50%, 01/21/18 | | | 6,076,096 | |
| Aaa | | AUD | 2,800 | | | 5.75%, 07/15/22 | | | 3,235,082 | |
| Aaa | | AUD | 2,100 | | | 6.00%, 02/15/17 | | | 2,410,399 | |
| Aaa | | CAD | 8,000 | | | Canadian Government,
Bonds (Canada)
1.50%, 03/01/12 | | | 8,041,655 | |
| Aaa | | CAD | 5,000 | | | 2.25%, 08/01/14 | | | 5,160,171 | |
| Aaa | | CAD | 1,300 | | | 3.25%, 06/01/21 | | | 1,406,882 | |
| Baa3 | | BRL | 2,200 | | | Republic of Brazil,
Sr. Unsec’d. Notes (Brazil)
12.50%, 01/05/22 | | | 1,592,160 | |
| Aaa | | GBP | 900 | | | United Kingdom Gilt,
Bonds (United Kingdom)
4.25%, 03/07/36 | | | 1,666,924 | |
| Aaa | | GBP | 800 | | | 4.25%, 09/07/39 | | | 1,484,051 | |
| Aaa | | GBP | 800 | | | 4.25%, 12/07/40 | | | 1,484,283 | |
| | | | | | | | | | |
| | | | | | TOTAL FOREIGN GOVERNMENT BONDS
(cost $47,536,538) | | | 50,299,002 | |
| | | | | | | | | | |
See Notes to Financial Statements.
| | | | |
| THE TARGET PORTFOLIO TRUST | | | 101 | |
| | |
Total Return Bond Portfolio (continued) | | Portfolio of Investments
As of October 31, 2011 |
| | | | | | | | | | |
MOODY’S
RATINGS†
(UNAUDITED) | | PRINCIPAL AMOUNT (000)# | | | DESCRIPTION | | VALUE (NOTE 1) | |
| | | | | | MUNICIPAL BONDS—5.4% | | | | |
| | | |
| | | | | | California—0.2% | | | | |
| Aa1 | | $ | 600 | | | East Bay Municipal Utility District Water System,
Revenue Bonds
5.874%, 06/01/40 | | $ | 724,122 | |
| | | | | | | | | | |
| | | |
| | | | | | Illinois—1.7% | | | | |
| Aa3 | | | 700 | | | Chicago Transit Authority, Series A,
Revenue Bonds
6.899%, 12/01/40 | | | 812,308 | |
| Aa3 | | | 800 | | | Chicago Transit Authority, Series B,
Revenue Bonds
6.899%, 12/01/40 | | | 928,352 | |
| A1 | | | 4,700 | | | State of Illinois,
General Obligation Unlimited
2.766%, 01/01/12 | | | 4,715,416 | |
| | | | | | | | | | |
| | | | | | | | | 6,456,076 | |
| | | | | | | | | | |
| | | |
| | | | | | Kentucky—1.1% | | | | |
| Aa3 | | | 800 | | | Kentucky State Property & Building Commission,
Revenue Bonds
4.303%, 11/01/19 | | | 870,432 | |
| Aa3 | | | 1,000 | | | 4.403%, 11/01/20 | | | 1,081,810 | |
| Aa3 | | | 1,900 | | | 5.373%, 11/01/25 | | | 2,099,899 | |
| | | | | | | | | | |
| | | | | | | | | 4,052,141 | |
| | | | | | | | | | |
| | | |
| | | | | | New York—2.4% | | | | |
| Aa1 | | | 1,400 | | | New York City Transitional Finance Authority,
Revenue Bonds
4.725%, 11/01/23 | | | 1,538,040 | |
| Aa1 | | | 1,100 | | | 4.905%, 11/01/24 | | | 1,229,778 | |
| Aa1 | | | 1,100 | | | 5.075%, 11/01/25 | | | 1,214,620 | |
| Aa2 | | | 1,500 | | | New York City Trust For Cultural Resources,
Revenue Bonds
5.125%, 07/01/31 | | | 1,532,160 | |
| Aaa | | | 3,800 | | | New York Liberty Development Corp.,
Revenue Bonds
0.33%, 12/01/49 | | | 3,800,000 | |
| | | | | | | | | | |
| | | | | | | | | 9,314,598 | |
| | | | | | | | | | |
| | | | | | TOTAL MUNICIPAL BONDS
(cost $19,348,518) | | | 20,546,937 | |
| | | | | | | | | | |
See Notes to Financial Statements.
| | | | |
| 102 | | | THE TARGET PORTFOLIO TRUST | |
| | | | | | | | | | |
MOODY’S
RATINGS†
(UNAUDITED) | | PRINCIPAL AMOUNT (000)# | | | DESCRIPTION | | VALUE (NOTE 1) | |
| | | | | | RESIDENTIAL MORTGAGE-BACKED SECURITIES—3.1% | | | | |
| Ca | | $ | 1,009 | | | American Home Mortgage Assets,
Series 2006-1, Class 2A1
0.435%(c), 05/25/46 | | $ | 499,103 | |
| AAA(d) | | | 1 | | | American Housing Trust,
Series I, Class 5
8.625%, 08/25/18 | | | 1,029 | |
| Aaa | | | 23 | | | Bear Stearns Adjustable Rate Mortgage Trust,
Series 2002-11, Class 1A1
5.68%(c), 02/25/33 | | | 21,431 | |
| Caa2 | | | 1,078 | | | Series 2005-4, Class 3A1
5.196%(c), 08/25/35 | | | 841,361 | |
| CCC(d) | | | 984 | | | Series 2007-3, Class 1A1
5.182%(c), 05/25/47 | | | 612,037 | |
| Caa1 | | | 278 | | | Bear Stearns Alt-A Trust,
Series 2005-4, Class 23A2
2.587%(c), 05/25/35 | | | 216,263 | |
| B3 | | | 349 | | | Citigroup Mortgage Loan Trust, Inc.,
Series 2005-6, Class A2
2.45%(c), 08/25/35 | | | 285,507 | |
| D(d) | | | 950 | | | Series 2007-10, Class 22AA
5.489%(c), 09/25/37 | | | 546,909 | |
| Ca | | | 1,118 | | | Countrywide Alternative Loan Trust,
Series 2006-OA9, Class 2A1A
0.455%(c), 07/20/46 | | | 407,818 | |
| Ca | | | 1,173 | | | Series 2006-OA17, Class 1A1A
0.44%(c), 12/20/46 | | | 563,806 | |
| Aaa | | | 506 | | | FHLMC Structured Pass-Through Securities,
Series T-61, Class 1A1
1.639%(c), 07/25/44 | | | 507,563 | |
| B(d) | | | 1,153 | | | Greenpoint Mortgage Pass-Through Certificates,
Series 2003-1, Class A1
2.80%(c), 10/25/33 | | | 924,318 | |
| BB(d) | | | 3 | | | Indymac Adjustable Rate Mortgage Trust,
Series 2001-H2, Class A1
1.717%(c), 01/25/32 | | | 2,342 | |
| B2 | | | 262 | | | Merrill Lynch Mortgage Investors, Inc.,
Series 2005-A10, Class A
0.455%(c), 02/25/36 | | | 171,906 | |
| Aaa | | | 1,300 | | | Permanent Master Issuer PLC, (United Kingdom)
Series 2011-1A, Class 1A1, 144A
1.803%(c), 07/15/42 | | | 1,292,074 | |
| Aaa | | EUR | 2,500 | | | Series 2011-1A, Class 1A3, 144A
2.872%(c), 07/15/42 | | | 3,448,578 | |
| BB(d) | | | 17 | | | Residential Funding Mortgage Securities I,
Series 2003-S9, Class A1
6.50%, 03/25/32 | | | 17,907 | |
See Notes to Financial Statements.
| | | | |
| THE TARGET PORTFOLIO TRUST | | | 103 | |
| | |
Total Return Bond Portfolio (continued) | | Portfolio of Investments
As of October 31, 2011 |
| | | | | | | | | | |
MOODY’S
RATINGS†
(UNAUDITED) | | PRINCIPAL AMOUNT (000)# | | | DESCRIPTION | | VALUE (NOTE 1) | |
| | | | | | RESIDENTIAL MORTGAGE-BACKED SECURITIES (continued) | | | | |
| Caa3 | | $ | 889 | | | Washington Mutual Mortgage Pass-Through Certificates,
Series 2007-OA2, Class 1A
0.93%(c), 03/25/47 | | $ | 511,339 | |
| CCC(d) | | | 1,092 | | | Wells Fargo Mortgage Backed Securities Trust,
Series 2006-AR2, Class 2A1
2.718%(c), 03/25/36 | | | 883,555 | |
| | | | | | | | | | |
| | | | | | TOTAL RESIDENTIAL MORTGAGE-BACKED SECURITIES
(cost $13,008,673) | | | 11,754,846 | |
| | | | | | | | | | |
| | | |
| | | | | | U.S. GOVERNMENT MORTGAGE-BACKED OBLIGATIONS—44.0% | | | | |
| | | 22 | | | Federal Home Loan Mortgage Corp.
2.516%(c), 01/01/24 | | | 22,995 | |
| | | 16 | | | 2.521%(c), 09/01/35 | | | 16,702 | |
| | | 16 | | | 5.50%, 06/01/31 | | | 16,934 | |
| | | 20 | | | 7.50%, 09/01/16-07/01/17 | | | 21,737 | |
| | | 68 | | | Federal National Mortgage Assoc.
1.889%(c), 01/01/20 | | | 70,549 | |
| | | 142 | | | 2.141%(c), 12/01/34 | | | 147,710 | |
| | | 9,878 | | | 3.50%, 09/01/25-10/01/41 | | | 10,185,787 | |
| | | 39,000 | | | 3.50%, TBA | | | 40,517,342 | |
| | | 12,000 | | | 3.50%, TBA | | | 12,195,000 | |
| | | 54 | | | 3.661%(c), 05/01/36 | | | 54,575 | |
| | | 77,630 | | | 4.00%, 05/01/13-08/01/41 | | | 81,230,558 | |
| | | 9,372 | | | 4.50%, 01/01/25-07/01/41 | | | 9,934,075 | |
| | | 13,000 | | | 4.50%, TBA | | | 13,745,469 | |
| | | 7 | | | 5.50%, 07/01/32 | | | 7,160 | |
| | | 68 | | | Government National Mortgage Assoc.
2.125%, 10/20/26-11/20/29 | | | 70,944 | |
| | | 66 | | | 2.375%, 02/20/17-02/20/26 | | | 68,133 | |
| | | 45 | | | 2.625%, 07/20/22-07/20/27 | | | 47,383 | |
| | | 40 | | | 8.50%, 06/15/30-08/20/30 | | | 48,048 | |
| | | | | | | | | | |
| | | | | | TOTAL U.S. GOVERNMENT MORTGAGE-BACKED OBLIGATIONS
(cost $165,578,771) | | | 168,401,101 | |
| | | | | | | | | | |
| | | |
| | | | | | U.S. TREASURY OBLIGATIONS—14.5% | | | | |
| | | 4,900 | | | U.S. Treasury Bonds
3.75%, 08/15/41 | | | 5,414,500 | |
| | | 2,400 | | | 3.875%, 08/15/40 | | | 2,707,126 | |
| | | 4,700 | | | 4.375%, 02/15/38-05/15/41 | | | 5,762,750 | |
| | | 4,200 | | | 7.50%, 11/15/24 | | | 6,516,560 | |
| | | 1,700 | | | 7.625%, 11/15/22 | | | 2,584,530 | |
| | | 3,800 | | | U.S. Treasury Inflationary Indexed Bonds, TIPS
1.125%, 01/15/21(h)(k) | | | 4,326,977 | |
| | | 1,800 | | | 2.125%, 02/15/41 | | | 2,459,626 | |
See Notes to Financial Statements.
| | | | |
| 104 | | | THE TARGET PORTFOLIO TRUST | |
| | | | | | | | | | |
PRINCIPAL AMOUNT (000)# | | | DESCRIPTION | | | | VALUE (NOTE 1) | |
| | | | U.S. TREASURY OBLIGATIONS (continued) | | | | | | |
| $ | 100 | | | U.S. Treasury Notes
1.875%, 08/31/17 | | | | $ | 103,344 | |
| | 1,200 | | | 2.125%, 08/15/21 | | | | | 1,194,756 | |
| | 3,400 | | | 2.25%, 07/31/18 | | | | | 3,555,125 | |
| | 200 | | | 2.50%, 04/30/15 | | | | | 213,484 | |
| | 1,100 | | | 2.625%, 08/15/20 | | | | | 1,157,320 | |
| | 6,600 | | | 2.875%, 03/31/18(h)(k) | | | | | 7,185,750 | |
| | 11,200 | | | 3.125%, 05/15/21(h)(k) | | | | | 12,175,632 | |
| | | | | | | | | | |
| | | | TOTAL U.S. TREASURY OBLIGATIONS
(cost $51,397,369) | | | | | 55,357,480 | |
| | | | | | | | | | |
| | | | TOTAL LONG-TERM INVESTMENTS
(cost $419,413,049) | | | | | 429,379,327 | |
| | | | | | | | | | |
| | | |
| | | | SHORT-TERM INVESTMENTS—5.1% | | | | | | |
| | | |
| | | | U.S. TREASURY OBLIGATIONS(n)—2.8% | | | | | | |
| | | | U S Treasury Bills | | | | | | |
| | 280 | | | 0.03%, 03/22/12 | | | | | 279,961 | |
| | 3,700 | | | 0.035%, 03/29/12(h) | | | | | 3,699,434 | |
| | 3,800 | | | 0.065%, 04/19/12(h) | | | | | 3,799,157 | |
| | 2,700 | | | 0.143%, 05/03/12 | | | | | 2,699,253 | |
| | 260 | | | 0.26%, 03/08/12 | | | | | 259,977 | |
| | | | | | | | | | |
| | | | TOTAL U.S. TREASURY OBLIGATIONS
(cost $10,737,399) | | | | | 10,737,782 | |
| | | | | | | | | | |
| |
| | | | REPURCHASE AGREEMENT(m)—2.1% | |
| | 8,200 | | | JPMorgan Securities LLC, 0.12%, dated 10/31/11, due 11/01/11 in the amount of $8,200,027 (cost $8,200,000) | | | | | 8,200,000 | |
| | | | | | | | | | |
| SHARES | | | | | | | | |
| | | | AFFILIATED MONEY MARKET MUTUAL FUND—0.2% | | | | | | |
| | 715,090 | | | Prudential Investment Portfolios 2—Prudential Core Taxable Money Market Fund; Note 3 (cost $715,090)(w) | | | | | 715,090 | |
| | | | | | | | | | |
| | | | TOTAL SHORT-TERM INVESTMENTS
(cost $19,652,489) | | | | | 19,652,872 | |
| | | | | | | | | | |
| | | | TOTAL INVESTMENTS, BEFORE OPTIONS
WRITTEN AND SECURITIES SOLD SHORT—117.4%
(cost $439,065,538; Note 5) | | | | | 449,032,199 | |
| | | | | | | | | | |
NOTIONAL
AMOUNTS (000)# | | | OPTIONS WRITTEN—(0.1%) | | COUNTERPARTY | | | |
| | | |
| | | | Call Option—(0.1%) | | | | | | |
| | 25,500 | | | Option on forward 2 year swap rate,
expiring 11/14/11, Strike Price $—(q) | | Morgan Stanley | | | (299,508 | ) |
| | | | | | | | | | |
| | | |
| | | | Put Options | | | | | | |
| | 10,300 | | | 5 Year CDX North America IG 16,
expiring 12/21/11, Strike Price $1.20 | | Morgan Stanley | | | (48,997 | ) |
See Notes to Financial Statements.
| | | | |
| THE TARGET PORTFOLIO TRUST | | | 105 | |
| | |
Total Return Bond Portfolio (continued) | | Portfolio of Investments
As of October 31, 2011 |
| | | | | | | | | | |
NOTIONAL
AMOUNTS (000)# | | | DESCRIPTION | | COUNTERPARTY | | VALUE (NOTE 1) | |
| | | | OPTIONS WRITTEN (continued) | | | | | | |
| | | |
| | | | Put Options (continued) | | | | | | |
| $ | 3,500 | | | Interest Rate Swap Options,
Pay a fixed rate of 2.75% and receive a floating rate based on 3-month LIBOR, expiring 06/18/12 | | Deutsche Bank | | $ | (1,498 | ) |
| | 1,200 | | | Pay a fixed rate of 3.00% and receive a floating rate based on 3-month LIBOR, expiring 06/18/12 | | Barclays Capital Group | | | (366 | ) |
| | 600 | | | Pay a fixed rate of 3.00% and receive a floating rate based on 3-month LIBOR, expiring 06/18/12 | | Deutsche Bank | | | (183 | ) |
| | 200 | | | Pay a fixed rate of 10.00% and receive a floating rate based on 3-month LIBOR, expiring 07/10/12 | | Barclays Capital Group | | | — | |
| | 100 | | | Pay a fixed rate of 10.00% and receive a floating rate based on 3-month LIBOR, expiring 07/10/12 | | Credit Suisse First Boston Corp. | | | — | |
| | 4,700 | | | Pay a fixed rate of 10.00% and receive a floating rate based on 3-month LIBOR, expiring 07/10/12 | | Morgan Stanley | | | (1 | ) |
| | 1,200 | | | Pay a fixed rate of 2.25% and receive a floating rate based on 3-month LIBOR, expiring 09/24/12 | | Citigroup Global Markets | | | (904 | ) |
| | | | | | | | | | |
| | | | | | | | | (51,949 | ) |
| | | | | | | | | | |
| | | | TOTAL OPTIONS WRITTEN
(premiums received $416,073) | | | | | (351,457 | ) |
| | | | | | | | | | |
PRINCIPAL
AMOUNT (000)# | | | SECURITIES SOLD SHORT—(6.3%) | | | |
| | |
| | | | U.S. GOVERNMENT MORTGAGE-BACKED OBLIGATIONS | | | | |
| | 9,000 | | | Federal National Mortgage Assoc.
4.00%, TBA | | | | | (9,354,375 | ) |
| | 7,000 | | | 4.00%, TBA | | | | | (7,355,468 | ) |
| | 7,000 | | | 5.50%, TBA | | | | | (7,592,813 | ) |
| | | | | | | | | | |
| | | | TOTAL SECURITIES SOLD SHORT
(proceeds $24,256,875) | | | | | (24,302,656 | ) |
| | | | | | | | | | |
| | | | TOTAL INVESTMENTS, NET OF OPTIONS
WRITTEN AND SECURITIES SOLD SHORT—111.0%
(cost $414,392,590; Note 5) | | | 424,378,086 | |
| | | | Liabilities in excess of other assets(x)—(11.0%) | | | (41,943,061 | ) |
| | | | | | | | | | |
| | | | NET ASSETS—100% | | | | $ | 382,435,025 | |
| | | | | | | | | | |
See Notes to Financial Statements.
| | | | |
| 106 | | | THE TARGET PORTFOLIO TRUST | |
The following abbreviations are used in the Portfolio descriptions:
144A—Security was purchased pursuant to Rule 144A under the Securities Act of 1933 and may not be resold subject to that rule except to qualified institutional buyers. Unless otherwise noted, 144A securities are deemed to be liquid.
CDX—Credit Derivative Index
CLO—Collateralized Loan Obligation
FHLMC—Federal Home Loan Mortgage Corp.
FSB—Federal Saving Bank
LIBOR—London Interbank Offered Rate
MTN—Medium Term Note
NR—Not Rated by Moodys or Standard & Poor’s
SLM—Student Loan Mortgage
TBA—To Be Announced
TIPS—Treasury Inflation Protected Securities
AUD—Australian Dollar
BRL—Brazilian Real
CAD—Canadian Dollar
CNY—Chinese Yuan
EUR—Euro
GBP—British Pound
INR—Indian Rupee
JPY—Japanese Yen
KRW—South Korean Won
MXN—Mexican Peso
MYR—Malaysian Ringgit
NOK—Norwegian Krone
SGD—Singapore Dollar
TWD—New Taiwanese Dollar
| * | Non-income producing security. |
| # | Principal and notional amount is shown in U.S. dollars unless otherwise stated. |
| † | The ratings reflected are as of October 31, 2011. Ratings of certain bonds may have changed subsequent to that date. |
| (c) | Variable rate instrument. The interest rate shown reflects the rate in effect at October 31, 2011. |
| (d) | Standard & Poor’s rating. |
| (g) | Indicates a security or securities that have been deemed illiquid. |
| (h) | Represents security, or a portion thereof, segregated as collateral for swap agreements. |
| (i) | Represents issuer in default on interest payments. Non-income producing security. |
| (k) | Represents security, or a portion thereof, segregated as collateral for futures contracts. |
| (m) | Repurchase agreement is collateralized by $8,376,125 Federal National Mortgage Assoc., 0.87%, maturity date 9/12/2014; the value of collateral plus interest was $8,386,031. |
| (n) | Rates shown are the effective yields at purchase date. |
| (q) | Exercise price and final cost determined on a future date, based upon the implied volatility. |
| (w) | Prudential Investments LLC, the manager of the Portfolio, also serves as manager of the Prudential Investment Portfolios 2-Prudential Core Taxable Money Market Fund. |
See Notes to Financial Statements.
| | | | |
| THE TARGET PORTFOLIO TRUST | | | 107 | |
| | |
Total Return Bond Portfolio (continued) | | Portfolio of Investments
As of October 31, 2011 |
| (x) | Includes net unrealized appreciation (depreciation) on the following derivative contracts held at reporting period end: |
Futures contracts open at October 31, 2011:
| | | | | | | | | | | | | | | | |
Number of
Contracts | | Type | | Expiration
Date | | Value at
Trade Date | | | Value at
October 31,
2011 | | | Unrealized
Appreciation
(Depreciation) | |
| Long Positions: | | | | | | | | | | | | | | | | |
| 123 | | 90 Day Euro Dollar | | Dec. 2011 | | $ | 30,590,063 | | | $ | 30,594,713 | | | $ | 4,650 | |
| 6 | | 90 Day Euro Dollar | | Mar. 2014 | | | 1,454,550 | | | | 1,484,700 | | | | 30,150 | |
| 47 | | 2 Year Euro-Schatz | | Dec. 2011 | | | 7,148,527 | | | | 7,133,894 | | | | (14,633 | ) |
| 14 | | 5 Year Euro-Bobl | | Dec. 2011 | | | 2,366,265 | | | | 2,369,946 | | | | 3,681 | |
| | | | | | | | | | | | | | | | |
| | | | | | | | | | | | | | | 23,848 | |
| | | | | | | | | | | | | | | | |
| Short Positions: | | | | | | | | | | | | | | | | |
| 112 | | 5 Year U.S. Treasury Notes | | Dec. 2011 | | | 13,772,531 | | | | 13,732,250 | | | | 40,281 | |
| 29 | | 10 Year U.S. Treasury Notes | | Dec. 2011 | | | 3,717,125 | | | | 3,742,812 | | | | (25,687 | ) |
| | | | | | | | | | | | | | | | |
| | | | | | | | | | | | | | | 14,594 | |
| | | | | | | | | | | | | | | | |
| | | | | | | | | | | | | | $ | 38,442 | |
| | | | | | | | | | | | | | | | |
Forward foreign currency exchange contracts outstanding at October 31, 2011:
| | | | | | | | | | | | | | | | | | |
Purchase Contracts | | Counterparty | | Notional
Amount
(000) | | | Value at
Settlement
Date
Payable | | | Current
Value | | | Unrealized
Appreciation
(Depreciation)(1) | |
Brazilian Real, | | | | | | | | | | | | | | | | | | |
Expiring 11/03/11 | | Hong Kong & Shanghai Bank | | BRL | 4,215 | | | $ | 2,221,922 | | | $ | 2,453,119 | | | $ | 231,197 | |
Chinese Yuan, | | | | | | | | | | | | | | | | | | |
Expiring 11/04/11 | | Deutsche Bank | | CNY | 2,943 | | | | 461,000 | | | | 463,185 | | | | 2,185 | |
Expiring 11/15/11 | | Deutsche Bank | | CNY | 2,589 | | | | 391,000 | | | | 407,437 | | | | 16,437 | |
Expiring 02/13/12 | | Barclays Capital Group | | CNY | 7,579 | | | | 1,178,220 | | | | 1,193,866 | | | | 15,646 | |
Expiring 02/13/12 | | Barclays Capital Group | | CNY | 3,197 | | | | 495,753 | | | | 503,508 | | | | 7,755 | |
Expiring 02/13/12 | | Citigroup Global Markets | | CNY | 6,222 | | | | 968,274 | | | | 980,065 | | | | 11,791 | |
Expiring 02/13/12 | | Citigroup Global Markets | | CNY | 4,379 | | | | 680,286 | | | | 689,802 | | | | 9,516 | |
Expiring 02/13/12 | | Citigroup Global Markets | | CNY | 3,046 | | | | 472,412 | | | | 479,727 | | | | 7,315 | |
Expiring 02/13/12 | | Deutsche Bank | | CNY | 3,029 | | | | 470,186 | | | | 477,171 | | | | 6,985 | |
Expiring 02/13/12 | | Deutsche Bank | | CNY | 2,916 | | | | 452,501 | | | | 459,258 | | | | 6,757 | |
Expiring 02/13/12 | | Deutsche Bank | | CNY | 1,677 | | | | 258,269 | | | | 264,099 | | | | 5,830 | |
Expiring 02/13/12 | | Hong Kong & Shanghai Bank | | CNY | 1,914 | | | | 300,000 | | | | 301,479 | | | | 1,479 | |
Expiring 02/13/12 | | JPMorgan Chase | | CNY | 3,824 | | | | 600,000 | | | | 602,297 | | | | 2,297 | |
Expiring 02/13/12 | | JPMorgan Chase | | CNY | 3,823 | | | | 600,000 | | | | 602,203 | | | | 2,203 | |
Expiring 02/13/12 | | JPMorgan Chase | | CNY | 3,823 | | | | 600,000 | | | | 602,156 | | | | 2,156 | |
Expiring 02/13/12 | | JPMorgan Chase | | CNY | 3,691 | | | | 574,000 | | | | 581,442 | | | | 7,442 | |
Expiring 02/13/12 | | JPMorgan Chase | | CNY | 3,084 | | | | 478,654 | | | | 485,802 | | | | 7,148 | |
Expiring 02/13/12 | | UBS Securities | | CNY | 2,435 | | | | 378,083 | | | | 383,491 | | | | 5,408 | |
Expiring 06/01/12 | | BNP Paribas | | CNY | 2,943 | | | | 463,067 | | | | 464,457 | | | | 1,390 | |
Expiring 06/01/12 | | JPMorgan Chase | | CNY | 4,885 | | | | 763,000 | | | | 770,829 | | | | 7,829 | |
Expiring 06/01/12 | | JPMorgan Chase | | CNY | 2,445 | | | | 382,000 | | | | 385,829 | | | | 3,829 | |
Expiring 02/01/13 | | Deutsche Bank | | CNY | 4,875 | | | | 770,188 | | | | 769,959 | | | | (229 | ) |
Expiring 02/01/13 | | Deutsche Bank | | CNY | 2,851 | | | | 453,022 | | | | 450,311 | | | | (2,711 | ) |
Expiring 02/01/13 | | Goldman Sachs & Co. | | CNY | 3,971 | | | | 633,000 | | | | 627,212 | | | | (5,788 | ) |
Expiring 02/01/13 | | JPMorgan Chase | | CNY | 2,986 | | | | 475,494 | | | | 471,597 | | | | (3,897 | ) |
See Notes to Financial Statements.
| | | | |
| 108 | | | THE TARGET PORTFOLIO TRUST | |
Forward foreign currency exchange contracts outstanding at October 31, 2011 (continued):
| | | | | | | | | | | | | | | | | | |
Purchase Contracts (continued) | | Counterparty | | Notional
Amount
(000) | | | Value at
Settlement
Date
Payable | | | Current
Value | | | Unrealized
Appreciation
(Depreciation)(1) | |
Expiring 08/05/13 | | Deutsche Bank | | CNY | 1,000 | | | $ | 159,643 | | | $ | 157,478 | | | $ | (2,165 | ) |
Expiring 08/05/13 | | UBS Securities | | CNY | 2,887 | | | | 457,175 | | | | 454,647 | | | | (2,528 | ) |
Euro, | | | | | | | | | | | | | | | | | | |
Expiring 01/17/12 | | Deutsche Bank | | EUR | 619 | | | | 858,250 | | | | 856,060 | | | | (2,190 | ) |
Indian Rupee, | | | | | | | | | | | | | | | | | | |
Expiring 07/12/12 | | JPMorgan Chase | | INR | 133,539 | | | | 2,873,046 | | | | 2,666,517 | | | | (206,529 | ) |
Malaysian Ringgit, | | | | | | | | | | | | | | | | | | |
Expiring 11/10/11 | | Citigroup Global Markets | | MYR | 17 | | | | 5,612 | | | | 5,627 | | | | 15 | |
Mexican Peso, | | | | | | | | | | | | | | | | | | |
Expiring 11/18/11 | | Morgan Stanley | | MXN | 42,249 | | | | 3,601,675 | | | | 3,164,587 | | | | (437,088 | ) |
Expiring 03/15/12 | | Hong Kong & Shanghai Bank | | MXN | 42,249 | | | | 3,114,202 | | | | 3,130,785 | | | | 16,583 | |
New Taiwanese Dollar, | | | | | | | | | | | | | | | | | | |
Expiring 01/11/12 | | Barclays Capital Group | | TWD | 80,103 | | | | 2,794,924 | | | | 2,682,127 | | | | (112,797 | ) |
Norwegian Krone, | | | | | | | | | | | | | | | | | | |
Expiring 12/09/11 | | Citigroup Global Markets | | NOK | 9,509 | | | | 1,609,450 | | | | 1,704,072 | | | | 94,622 | |
South Korean Won, | | | | | | | | | | | | | | | | | | |
Expiring 11/14/11 | | JPMorgan Chase | | KRW | 3,996,508 | | | | 3,751,181 | | | | 3,602,513 | | | | (148,668 | ) |
| | | | | | | | | | | | | | | | | | |
| | | | | | | | $ | 34,745,489 | | | $ | 34,294,714 | | | $ | (450,775 | ) |
| | | | | | | | | | | | | | | | | | |
| | | | | | | | | | | | | | | | | | |
Sale Contracts | | Counterparty | | Notional
Amount
(000) | | | Value at
Settlement
Date
Receivable | | | Current
Value | | | Unrealized
Appreciation
(Depreciation)(1) | |
Australian Dollar, | | | | | | | | | | | | | | | | | | |
Expiring 12/01/11 | | Barclays Capital Group | | AUD | 3,918 | | | $ | 4,010,206 | | | $ | 4,113,597 | | | $ | (103,391 | ) |
Expiring 12/01/11 | | Goldman Sachs & Co. | | AUD | 29,236 | | | | 29,607,005 | | | | 30,695,543 | | | | (1,088,538 | ) |
Brazilian Real, | | | | | | | | | | | | | | | | | | |
Expiring 11/03/11 | | Citigroup Global Markets | | BRL | 359 | | | | 222,000 | | | | 208,703 | | | | 13,297 | |
Expiring 11/03/11 | | Credit Suisse First Boston Corp. | | BRL | 87 | | | | 54,000 | | | | 50,772 | | | | 3,228 | |
Expiring 11/03/11 | | Hong Kong & Shanghai Bank | | BRL | 2,541 | | | | 1,576,148 | | | | 1,478,899 | | | | 97,249 | |
Expiring 11/03/11 | | Hong Kong & Shanghai Bank | | BRL | 325 | | | | 201,000 | | | | 189,160 | | | | 11,840 | |
Expiring 11/03/11 | | Hong Kong & Shanghai Bank | | BRL | 325 | | | | 201,000 | | | | 188,867 | | | | 12,133 | |
Expiring 11/03/11 | | Hong Kong & Shanghai Bank | | BRL | 251 | | | | 155,000 | | | | 145,960 | | | | 9,040 | |
Expiring 11/03/11 | | UBS Securities | | BRL | 328 | | | | 203,000 | | | | 190,759 | | | | 12,241 | |
Expiring 01/04/12 | | Hong Kong & Shanghai Bank | | BRL | 4,215 | | | | 2,198,970 | | | | 2,418,444 | | | | (219,474 | ) |
British Pound, | | | | | | | | | | | | | | | | | | |
Expiring 12/08/11 | | Barclays Capital Group | | GBP | 1,969 | | | | 3,142,800 | | | | 3,164,696 | | | | (21,896 | ) |
Expiring 12/08/11 | | JPMorgan Chase | | GBP | 2,709 | | | | 4,220,378 | | | | 4,354,069 | | | | (133,691 | ) |
Canadian Dollar, | | | | | | | | | | | | | | | | | | |
Expiring 11/17/11 | | Citigroup Global Markets | | CAD | 2,086 | | | | 2,072,919 | | | | 2,091,999 | | | | (19,080 | ) |
Expiring 11/17/11 | | Deutsche Bank | | CAD | 6,065 | | | | 6,105,922 | | | | 6,082,442 | | | | 23,480 | |
Expiring 11/17/11 | | Royal Bank of Canada | | CAD | 6,065 | | | | 6,127,538 | | | | 6,082,442 | | | | 45,096 | |
Expiring 11/17/11 | | Royal Bank of Canada | | CAD | 1,401 | | | | 1,378,415 | | | | 1,405,029 | | | | (26,614 | ) |
Expiring 11/17/11 | | UBS Securities | | CAD | 892 | | | | 881,397 | | | | 894,565 | | | | (13,168 | ) |
Chinese Yuan, | | | | | | | | | | | | | | | | | | |
Expiring 11/04/11 | | BNP Paribas | | CNY | 2,943 | | | | 464,639 | | | | 463,185 | | | | 1,454 | |
Euro, | | | | | | | | | | | | | | | | | | |
Expiring 01/17/12 | | JPMorgan Chase | | EUR | 6,850 | | | | 9,313,774 | | | | 9,473,364 | | | | (159,590 | ) |
Japanese Yen, | | | | | | | | | | | | | | | | | | |
Expiring 01/13/12 | | Citigroup Global Markets | | JPY | 102,979 | | | | 1,341,316 | | | | 1,319,178 | | | | 22,138 | |
See Notes to Financial Statements.
| | | | |
| THE TARGET PORTFOLIO TRUST | | | 109 | |
| | |
Total Return Bond Portfolio (continued) | | Portfolio of Investments
As of October 31, 2011 |
Forward foreign currency exchange contracts outstanding at October 31, 2011 (continued):
| | | | | | | | | | | | | | | | | | |
Sale Contracts (continued) | | Counterparty | | Notional
Amount
(000) | | | Value at
Settlement
Date
Receivable | | | Current
Value | | | Unrealized
Appreciation
(Depreciation)(1) | |
Malaysian Ringgit, | | | | | | | | | | | | | | | | | | |
Expiring 11/10/11 | | Barclays Capital Group | | MYR | 17 | | | $ | 5,836 | | | $ | 5,620 | | | $ | 216 | |
Expiring 04/13/12 | | Citigroup Global Markets | | MYR | 17 | | | | 5,574 | | | | 5,568 | | | | 6 | |
Mexican Peso, | | | | | | | | | | | | | | | | | | |
Expiring 11/18/11 | | Hong Kong & Shanghai Bank | | MXN | 42,249 | | | | 3,145,901 | | | | 3,164,586 | | | | (18,685 | ) |
Singapore Dollar, | | | | | | | | | | | | | | | | | | |
Expiring 12/09/11 | | Deutsche Bank | | SGD | 8 | | | | 6,323 | | | | 6,091 | | | | 232 | |
| | | | | | | | | | | | | | | | | | |
| | | | | | | | $ | 76,641,061 | | | $ | 78,193,538 | | | $ | (1,552,477 | ) |
| | | | | | | | | | | | | | | | | | |
| (1) | Cash of $14,000 has been segregated to cover requirements for open forward foreign currency exchange contracts at October 31, 2011. |
Interest rate swap agreements outstanding at October 31, 2011:
| | | | | | | | | | | | | | | | | | | | | | | | | | |
Notional
Amount
(000)# | | | Termination
Date | | | Fixed
Rate | | | Floating
Rate | | Fair
Value | | | Upfront
Premiums
Paid
(Received) | | | Unrealized
Appreciation
(Depreciation) | | | Counterparty |
| | Over-the-counter swap agreements: | | | | | | | | | | | |
| AUD | 1,900 | | | | 12/15/17 | | | | 5.50% | | | 6 month Australian Bank Bill rate(1) | | $ | 72,815 | | | $ | (8,044 | ) | | $ | 80,859 | | | Barclays Bank PLC |
| AUD | 1,200 | | | | 12/15/17 | | | | 5.50% | | | 6 month Australian Bank Bill rate(1) | | | 45,988 | | | | (4,520 | ) | | | 50,508 | | | Deutsche Bank |
| BRL | 11,700 | | | | 01/02/13 | | | | 12.51% | | | Brazilian interbank overnight lending rate(1) | | | 177,932 | | | | (7,479 | ) | | | 185,411 | | | UBS AG |
| BRL | 9,300 | | | | 01/02/13 | | | | 11.91% | | | Brazilian interbank overnight lending rate(1) | | | 116,529 | | | | 19,409 | | | | 97,120 | | | Barclays Bank PLC |
| BRL | 800 | | | | 01/02/13 | | | | 12.59% | | | Brazilian interbank overnight lending rate(1) | | | 13,921 | | | | 469 | | | | 13,452 | | | Morgan Stanley & Co. |
| BRL | 700 | | | | 01/02/13 | | | | 11.93% | | | Brazilian interbank overnight lending rate(1) | | | 8,922 | | | | (793 | ) | | | 9,715 | | | Goldman Sachs & Co. |
| BRL | 19,600 | | | | 01/02/14 | | | | 11.86% | | | Brazilian interbank overnight lending rate(1) | | | 378,268 | | | | 10,846 | | | | 367,422 | | | Merrill Lynch & Co. |
| BRL | 11,200 | | | | 01/02/14 | | | | 11.96% | | | Brazilian interbank overnight lending rate(1) | | | 241,407 | | | | (3,609 | ) | | | 245,016 | | | Goldman Sachs & Co. |
| BRL | 8,700 | | | | 01/02/14 | | | | 11.99% | | | Brazilian interbank overnight lending rate(1) | | | 191,180 | | | | 1,571 | | | | 189,609 | | | Barclays Bank PLC |
| BRL | 7,500 | | | | 01/02/14 | | | | 12.51% | | | Brazilian interbank overnight lending rate(1) | | | 193,345 | | | | 6,633 | | | | 186,712 | | | Barclays Bank PLC |
| EUR | 6,300 | | | | 03/21/17 | | | | 2.00% | | | 6 month Euribor(1) | | | (28,223 | ) | | | (41,374 | ) | | | 13,151 | | | Barclays Bank PLC |
| EUR | 6,300 | | | | 03/21/17 | | | | 2.00% | | | 6 month Euribor(1) | | | (28,223 | ) | | | (41,887 | ) | | | 13,664 | | | Morgan Stanley & Co. |
| MXN | 37,200 | | | | 03/05/13 | | | | 6.50% | | | 28 day Mexican interbank rate(1) | | | 47,698 | | | | (983 | ) | | | 48,681 | | | Morgan Stanley & Co. |
| | Exchange-traded swap agreements: | | | | | | | | | | | |
| | $5,600 | | | | 10/13/16 | | | | 1.80% | | | 3 month LIBOR(1) | | | (143,420 | ) | | | (107,841 | ) | | | (35,579 | ) | | — |
| | 7,100 | | | | 12/21/21 | | | | 3.25% | | | 3 month LIBOR(1) | | | (574,140 | ) | | | (566,947 | ) | | | (7,193 | ) | | — |
| | | | | | | | | | | | | | | | | | | | | | | | | | |
| | | | | | | | | | | | | | $ | 713,999 | | | $ | (744,549 | ) | | $ | 1,458,548 | | | |
| | | | | | | | | | | | | | | | | | | | | | | | | | |
| (1) | Porfolio pays the floating rate and receives the fixed rate. |
| # | Notional Amount is shown in U.S. dollars unless otherwise stated. |
See Notes to Financial Statements.
| | | | |
| 110 | | | THE TARGET PORTFOLIO TRUST | |
Credit default swap agreements outstanding at October 31, 2011:
| | | | | | | | | | | | | | | | | | | | | | | | | | |
Reference
Entity/Obligation | | Termination
Date | | | Fixed
Rate | | | Notional
Amount#
(000)(3) | | | Fair
Value(4) | | | Upfront
Premiums
Paid
(Received) | | | Unrealized
Appreciation | | | Counterparty |
| Over-the-counter credit default swaps on credit indices—Sell Protection(2): |
Dow Jones CDX IG16 5Y Index | | | 06/20/16 | | | | 1.00 | % | | | 7,700 | | | $ | (43,773 | ) | | $ | (87,837 | ) | | $ | 44,064 | | | Barclays Bank PLC |
| | | | | | | | | | | | | | | | | | | | | | | | | | |
The Portfolio entered into credit default swap agreements on corporate issues, sovereign issues, asset-backed securities and credit indices as the protection seller to provide a measure of protection against the current portfolio of investments’ exposure to market conditions, or to take an active position with respect to the likelihood of a particular issuer’s default or the referenced entity’s credit soundness
| | | | | | | | | | | | | | | | | | | | | | | | | | |
Reference
Entity/Obligation | | Termination
Date | | | Fixed
Rate | | | Notional
Amount
(000)(3)# | | | Fair
Value | | | Upfront
Premiums
Paid
(Received) | | | Unrealized
Appreciation
(Depreciation) | | | Counterparty |
| Over-the-counter credit default swaps—Buy Protection(1): | | | | | | | |
AutoZone, Inc. | | | 06/20/16 | | | | 0.72 | % | | $ | 1,100 | | | $ | (6,793 | ) | | $ | — | | | $ | (6,793 | ) | | Deutsche Bank |
Cardinal Health, Inc. | | | 06/20/17 | | | | 0.56 | % | | | 1,200 | | | | 6,292 | | | | — | | | | 6,292 | | | UBS AG |
CitiFinancial | | | 06/20/15 | | | | 0.15 | % | | | 400 | | | | 26,597 | | | | — | | | | 26,597 | | | Barclays Bank PLC |
CSX Corp. | | | 03/20/18 | | | | 1.65 | % | | | 1,600 | | | | (85,345 | ) | | | — | | | | (85,345 | ) | | Goldman Sachs & Co. |
Donnelley (R.R.) & Sons | | | 03/20/17 | | | | 0.80 | % | | | 600 | | | | 137,019 | | | | — | | | | 137,019 | | | Bank of America, N.A. |
Dow Jones CDX HY15 5Y Index | | | 12/20/15 | | | | 5.00 | % | | | 4,500 | | | | 42,738 | | | | (135,524 | ) | | | 178,262 | | | Citigroup |
Dow Jones CDX HY7 Index | | | 12/20/11 | | | | 0.00 | % | | | 363 | | | | 40,383 | | | | 3,615 | | | | 36,768 | | | Merrill Lynch & Co. |
Embarq Corp. | | | 03/20/14 | | | | 1.25 | % | | | 700 | | | | (784 | ) | | | — | | | | (784 | ) | | Deutsche Bank |
Embarq Corp. | | | 03/20/14 | | | | 1.27 | % | | | 600 | | | | (968 | ) | | | — | | | | (968 | ) | | Deutsche Bank |
Embarq Corp. | | | 03/20/14 | | | | 1.43 | % | | | 600 | | | | (3,265 | ) | | | — | | | | (3,265 | ) | | Deutsche Bank |
Embarq Corp. | | | 03/20/14 | | | | 1.30 | % | | | 200 | | | | (471 | ) | | | — | | | | (471 | ) | | Morgan Stanley & Co. |
Goodrich Corp. | | | 09/20/16 | | | | 0.51 | % | | | 200 | | | | (2,153 | ) | | | — | | | | (2,153 | ) | | Deutsche Bank |
Limited Brands, Inc. | | | 09/20/17 | | | | 2.29 | % | | | 1,900 | | | | (3,043 | ) | | | — | | | | (3,043 | ) | | Bank of America, N.A. |
Pearson Dollar | | | 06/20/14 | | | | 0.76 | % | | | 4,200 | | | | (37,665 | ) | | | — | | | | (37,665 | ) | | Morgan Stanley & Co. |
Sprint Capital Corp. | | | 03/20/12 | | | | 0.55 | % | | | 1,000 | | | | 20,599 | | | | — | | | | 20,599 | | | JPMorgan Chase |
Target Corp. | | | 06/20/12 | | | | 0.11 | % | | | 300 | | | | (5 | ) | | | — | | | | (5 | ) | | Morgan Stanley & Co. |
| Exchange-traded credit default swaps—Buy Protection(1): |
Dow Jones CDX IG09 10Y Index | | | 12/20/17 | | | | 0.80 | % | | | 4,646 | | | | 172,118 | | | | 206,968 | | | | (34,850 | ) | | — |
Dow Jones CDX IG10 10Y Index | | | 06/20/18 | | | | 1.50 | % | | | 17,327 | | | | (44,022 | ) | | | 156,197 | | | | (200,219 | ) | | — |
Dow Jones CDX IG14 5Y Index | | | 06/20/15 | | | | 1.00 | % | | | 9,400 | | | | (5,039 | ) | | | 37,526 | | | | (42,565 | ) | | — |
Dow Jones CDX IG15 5Y Index | | | 12/20/15 | | | | 1.00 | % | | | 1,300 | | | | 2,631 | | | | 9,023 | | | | (6,392 | ) | | — |
| | | | | | | | | | | | | | | | | | | | | | | | | | |
| | | | | | | | | | | | | | $ | 258,824 | | | $ | 277,805 | | | $ | (18,981 | ) | | |
| | | | | | | | | | | | | | | | | | | | | | | | | | |
See Notes to Financial Statements.
| | | | |
| THE TARGET PORTFOLIO TRUST | | | 111 | |
| | |
Total Return Bond Portfolio (continued) | | Portfolio of Investments
As of October 31, 2011 |
| (1) | If the Portfolio is a buyer of protection, it pays the fixed rate. When a credit event occurs, as defined under the terms of that particular swap agreement, the Portfolio will either (i) receive from the seller of protection an amount equal to the notional amount of the swap and make delivery of the referenced obligation or underlying securities comprising the referenced index or (ii) receive a net settlement amount in the form of cash or securities equal to the notional amount of the swap less the recovery value of the referenced obligation or underlying securities comprising the referenced index. |
| (2) | If the Portfolio is a seller of protection, it receives the fixed rate. When a credit event occurs, as defined under the terms of that particular swap agreement, the Portfolio will either (i) pay to the buyer of protection an amount equal to the notional amount of the swap and take delivery of the referenced obligation or underlying securities comprising the referenced index or (ii) pay a net settlement amount in the form of cash or securities equal to the notional amount of the swap less the recovery value of the referenced obligation or underlying securities comprising the referenced index. |
| (3) | Notional amount represents the maximum potential amount the Portfolio could be required to pay as a seller of credit protection or receive as a buyer of credit protection if a credit event occurs as defined under the terms of that particular swap agreement. |
| (4) | The fair value of credit default swap agreements on asset-backed securities and credit indices serves as an indicator of the current status of the payment/performance risk and represents the likelihood of an expected liability (or profit) for the credit derivative should the notional amount of the swap agreement be closed/sold as of the reporting date. Increasing fair value in absolute terms, represents a deterioration of the referenced entity’s credit soundness and a greater likelihood of risk of default or other credit event occurring as defined under the terms of the agreement. |
| # | Notional Amount is shown in U.S. dollars unless otherwise stated. |
Various inputs are used in determining the value of the Portfolio’s investments. These inputs are summarized in the three broad levels listed below.
Level 1—quoted prices generally for securities actively traded on a regulated securities exchange and for open-end mutual funds which trade at daily net asset value.
Level 2—other significant observable inputs (including, but not limited to, quoted prices for similar securities, interest rates, prepayment speeds, foreign currency exchange rates, and amortized cost) generally for debt securities, swaps, forward foreign currency contracts and for foreign stocks priced using vendor modeling tools.
Level 3—significant unobservable inputs for securities valued in accordance with Board approved fair valuation procedures.
The following is a summary of the inputs used as of October 31, 2011 in valuing such portfolio securities:
| | | | | | | | | | | | |
| | | Level 1 | | | Level 2 | | | Level 3 | |
| Investments in Securities | | | | | | | | | | | | |
Asset-Backed Securities | | $ | — | | | $ | 9,287,853 | | | $ | — | |
Bank Loan | | | — | | | | 418,914 | | | | — | |
Corporate Bonds | | | — | | | | 113,313,194 | | | | — | |
Foreign Government Bonds | | | — | | | | 50,299,002 | | | | — | |
Municipal Bonds | | | — | | | | 20,546,937 | | | | — | |
Residential Mortgage-Backed Securities | | | — | | | | 11,754,846 | | | | — | |
U.S. Government Mortgage-Backed Obligations | | | — | | | | 168,401,101 | | | | — | |
U.S. Treasury Obligations | | | — | | | | 66,095,262 | | | | — | |
Repurchase Agreements | | | — | | | | 8,200,000 | | | | — | |
Affiliated Money Market Fund | | | 715,090 | | | | — | | | | — | |
Options Written | | | — | | | | (51,949 | ) | | | (299,508 | ) |
Securities Sold Short—U.S. Government Mortgage-Backed Obligations | | | — | | | | (24,302,656 | ) | | | — | |
See Notes to Financial Statements.
| | | | |
| 112 | | | THE TARGET PORTFOLIO TRUST | |
| | | | | | | | | | | | |
| | | Level 1 | | | Level 2 | | | Level 3 | |
| Other Financial Instruments* | | | | | | | | | | | | |
Futures | | $ | 38,442 | | | $ | — | | | $ | — | |
Forward foreign currency exchange contracts | | | — | | | | (2,003,252 | ) | | | — | |
Interest rate swap agreements | | | (42,772 | ) | | | 1,501,320 | | | | — | |
Credit default swap agreements | | | (284,026 | ) | | | 309,109 | | | | — | |
| | | | | | | | | | | | |
Total | | $ | 426,734 | | | $ | 423,769,681 | | | $ | (299,508 | ) |
| | | | | | | | | | | | |
| * | Other financial instruments are derivative instruments not reflected in the Portfolio of Investments, such as futures, forwards and swap contracts, which are recorded at the unrealized appreciation/depreciation on the instrument. |
The industry classification of investments and liabilities in excess of other assets shown as a percentage of net assets as of October 31, 2011 were as follows:
| | | | |
U.S. Government Mortgage-Backed Obligations | | | 44.0 | % |
U.S. Treasury Obligations | | | 17.3 | |
Foreign Government Bonds | | | 13.2 | |
Financial—Bank & Trust | | | 11.9 | |
Financial Services | | | 7.4 | |
Municipal Bonds | | | 5.4 | |
Residential Mortgage-Backed Securities | | | 3.1 | |
Asset-Backed Securities | | | 2.4 | |
Repurchase Agreements | | | 2.1 | |
Telecommunications | | | 1.4 | |
Insurance | | | 1.3 | |
Paper & Forest Products | | | 1.0 | |
Real Estate Investment Trusts | | | 1.0 | |
Metals & Mining | | | 0.9 | |
Utilities | | | 0.7 | |
Pharmaceuticals | | | 0.7 | |
Retail & Merchandising | | | 0.5 | |
Transportation | | | 0.5 | |
Oil, Gas & Consumable Fuels | | | 0.4 | |
Construction | | | 0.4 | |
Tobacco | | | 0.4 | |
Automotive Parts | | | 0.3 | |
Computer Services & Software | | | 0.3 | |
Affiliated Money Market Mutual Fund | | | 0.2 | |
Printing & Publishing | | | 0.2 | |
Bank Loans | | | 0.1 | |
Pipelines | | | 0.1 | |
Airlines | | | 0.1 | |
Aerospace | | | 0.1 | |
| | | | |
| | | 117.4 | |
Options Written and Securities Sold Short | | | (6.4 | ) |
Liabilities in excess of other assets | | | (11.0 | ) |
| | | | |
| | | 100.0 | % |
| | | | |
See Notes to Financial Statements.
| | | | |
| THE TARGET PORTFOLIO TRUST | | | 113 | |
| | |
| Intermediate-Term Bond Portfolio | | Portfolio of Investments
As of October 31, 2011 |
| | | | | | | | | | |
MOODY’S
RATINGS†
(UNAUDITED) | | PRINCIPAL
AMOUNT (000)# | | | DESCRIPTION | | VALUE (NOTE 1) | |
| | | | | | LONG-TERM INVESTMENTS—102.4% | | | | |
| | | |
| | | | | | ASSET-BACKED SECURITIES—1.6% | | | | |
| Aaa | | $ | 496 | | | AMMC CDO,
Series 2006-6A, Class A1A, 144A (Cayman Islands) 0.537%(c), 05/03/18 | | $ | 463,798 | |
| Aaa | | | 380 | | | Ford Credit Auto Owner Trust,
Series 2009-A, Class A3B
2.743%(c), 05/15/13 | | | 381,136 | |
| B3 | | | 321 | | | Securitized Asset Backed Receivables LLC Trust,
Series 2007-BR5, Class A2A
0.375%(c), 05/25/37 | | | 188,312 | |
| Aaa | | | 1,810 | | | SLM Student Loan Trust,
Series 2008-9, Class A
1.918%(c), 04/25/23 | | | 1,852,848 | |
| | | | | | | | | | |
| | | | | | TOTAL ASSET-BACKED SECURITIES
(cost $2,983,378) | | | 2,886,094 | |
| | | | | | | | | | |
| | | |
| | | | | | BANK LOANS(c)—0.9% | | | | |
| | | |
| | | | | | Diversified Financial Services—0.7% | | | | |
| B2 | | | 800 | | | AGFS Funding Co., Initial Loan
5.50%, 05/28/17 | | | 731,666 | |
| Ba3 | | | 500 | | | International Lease Finance, Term B2
7.00%, 03/17/16 | | | 501,875 | |
| | | | | | | | | | |
| | | | | | | | | 1,233,541 | |
| | | | | | | | | | |
| | | |
| | | | | | Healthcare—Services—0.2% | | | | |
| Ba3 | | | 500 | | | HCA, Inc., Tranche Term B-1
2.619%, 11/14/13 | | | 492,500 | |
| | | | | | | | | | |
| | | | | | TOTAL BANK LOANS
(cost $1,785,804) | | | 1,726,041 | |
| | | | | | | | | | |
| | | |
| | | | | | COMMERCIAL MORTGAGE-BACKED SECURITIES—2.5% | | | | |
| NR | | | 1,132 | | | Banc of America Large Loan, Inc.,
Series 2010-HLTN, Class HLTN, 144A
1.993%(c), 11/15/15 | | | 1,030,610 | |
| Aaa | | | 1,079 | | | Commercial Mortgage Pass-Through Certificates,
Series 2010-C1, Class A1, 144A
3.156%, 07/10/46 | | | 1,101,332 | |
| NR | | | 600 | | | Credit Suisse Mortgage Capital Certificates,
Series 2010-RR1, Class 2A, 144A
5.695%(c), 09/15/40 | | | 669,046 | |
| NR | | | 600 | | | Series 2010-RR1, Class 3A, 144A
5.624%(c), 06/10/49 | | | 666,134 | |
| NR | | | 700 | | | Series 2010-RR7, Class 2A, 144A
5.467%(c), 09/18/39 | | | 767,626 | |
See Notes to Financial Statements.
| | | | |
| 114 | | | THE TARGET PORTFOLIO TRUST | |
| | | | | | | | | | |
MOODY’S
RATINGS†
(UNAUDITED) | | PRINCIPAL
AMOUNT (000)# | | | DESCRIPTION | | VALUE (NOTE 1) | |
| | | | | | COMMERCIAL MORTGAGE-BACKED SECURITIES (continued) | | | | |
| Aaa | | $ | 400 | | | Merrill Lynch Floating Trust,
Series 2008-LAQA, Class A1, 144A
0.781%(c), 07/09/21 | | $ | 373,924 | |
| | | | | | | | | | |
| | | | | | TOTAL COMMERCIAL MORTGAGE-BACKED SECURITIES
(cost $4,381,449) | | | 4,608,672 | |
| | | | | | | | | | |
| | | |
| | | | | | CORPORATE BONDS—66.9% | | | | |
| | | |
| | | | | | Airlines—0.9% | | | | |
| Baa2 | | | 377 | | | Delta Air Lines, Inc.,
Pass-Through Certificates
6.20%, 01/02/20 | | | 396,172 | |
| BBB(d) | | | 750 | | | Southwest Airlines Co.,
First Mortgage, 144A
10.50%, 12/15/11 | | | 757,448 | |
| NR | | | 912 | | | United Airlines, Inc.,
Equipment Trust(g)(i)
10.85%, 02/19/15 | | | 422,001 | |
| | | | | | | | | | |
| | | | | | | | | 1,575,621 | |
| | | | | | | | | | |
| | | |
| | | | | | Auto Manufacturers—1.3% | | | | |
| A3 | | | 2,300 | | | Volkswagen International Finance NV,
Gtd. Notes, 144A (Netherlands)
1.625%, 08/12/13 | | | 2,306,527 | |
| | | | | | | | | | |
| | | |
| | | | | | Building & Construction—2.3% | | | | |
| B2 | | | 4,800 | | | KB Home,
Gtd. Notes
5.875%, 01/15/15 | | | 4,248,000 | |
| | | | | | | | | | |
| | | |
| | | | | | Chemicals—1.1% | | | | |
| Baa3 | | | 1,200 | | | Dow Chemical Co. (The),
Sr. Unsec’d. Notes
2.50%, 02/15/16 | | | 1,204,349 | |
| Baa1 | | | 800 | | | Potash Corp. of Saskatchewan, Inc.,
Sr. Unsec’d. Notes (Canada)
5.25%, 05/15/14 | | | 881,856 | |
| | | | | | | | | | |
| | | | | | | | | 2,086,205 | |
| | | | | | | | | | |
| | | |
| | | | | | Commercial Banks—12.6% | | | | |
| NR | | | 2,200 | | | Banco do Brasil SA, (Brazil)
Certificate of Deposit
2.252%(c), 02/14/14 | | | 2,196,551 | |
| Baa1 | | | 1,100 | | | Sr. Unsec’d. Notes, 144A
4.50%, 01/22/15 | | | 1,139,600 | |
| BBB-(d) | | | 1,800 | | | Banco Santander Brasil SA,
Sr. Unsec’d. Notes, 144A (Brazil)
2.45%(c), 03/18/14 | | | 1,714,266 | |
| Baa1 | | | 300 | | | 4.25%, 01/14/16 | | | 288,450 | |
See Notes to Financial Statements.
| | | | |
| THE TARGET PORTFOLIO TRUST | | | 115 | |
| | |
Intermediate-Term Bond Portfolio (continued) | | Portfolio of Investments
As of October 31, 2011 |
| | | | | | | | | | |
MOODY’S
RATINGS†
(UNAUDITED) | | PRINCIPAL
AMOUNT (000)# | | | DESCRIPTION | | VALUE (NOTE 1) | |
| | | | | | CORPORATE BONDS (continued) | | | | |
| | | |
| | | | | | Commercial Banks (continued) | | | | |
| Aa3 | | $ | 500 | | | Banco Santander Chile,
Sr. Unsec’d. Notes, 144A (Chile)
3.75%, 09/22/15 | | $ | 494,463 | |
| Baa2 | | | 800 | | | Banco Votorantim Nassau,
Sr. Notes, 144A (Brazil)
3.363%(c), 03/28/14 | | | 785,576 | |
| Baa1 | | | 1,100 | | | Banco Votorantim SA,
Sr. Unsec’d. Notes, 144A (Brazil)
5.25%, 02/11/16 | | | 1,100,755 | |
| Baa1 | | | 600 | | | Bank of America Corp.,
Sr. Unsec’d. Notes
0.837%(c), 09/11/12 | | | 584,597 | |
| Baa1 | | | 2,000 | | | Sr. Unsec’d. Notes, MTN
0.677%(c), 09/15/14 | | | 1,775,298 | |
| B2 | | | 400 | | | CIT Group, Inc.,
Sec’d. Notes, 144A
5.25%, 04/01/14 | | | 398,000 | |
| A1 | | | 2,900 | | | Goldman Sachs Group, Inc. (The),
Sr. Unsec’d. Notes
7.50%, 02/15/19 | | | 3,276,353 | |
| A1 | | | 600 | | | Korea Development Bank,
Sr. Unsec’d. Notes (South Korea)
5.75%, 09/10/13 | | | 634,934 | |
| Aa2 | | | 1,600 | | | Nordea Bank AB,
Sr. Unsec’d. Notes, 144A (Sweden)
1.301%(c), 01/14/14 | | | 1,606,195 | |
| Aaa | | DKK | 13,000 | | | Nykredit Realkredit A/S,
Covered Bonds (Denmark)
4.00%, 01/01/12 | | | 2,426,377 | |
| Ba2 | | | 1,100 | | | Royal Bank of Scotland Group PLC,
Sub. Notes (United Kingdom)
5.05%, 01/08/15 | | | 1,011,756 | |
| A2 | | | 1,200 | | | Royal Bank of Scotland PLC (The),
Gtd. Notes (United Kingdom)
2.723%(c), 08/23/13 | | | 1,183,597 | |
| Aaa | | | 1,200 | | | Sparebanken 1 Boligkreditt,
Covered Bonds, 144A (Norway)
1.25%, 10/25/14 | | | 1,200,093 | |
| Aaa | | | 1,200 | | | Toronto-Dominion Bank (The),
Covered Bonds, 144A (Canada)
2.20%, 07/29/15 | | | 1,229,327 | |
| | | | | | | | | | |
| | | | | | | | | 23,046,188 | |
| | | | | | | | | | |
See Notes to Financial Statements.
| | | | |
| 116 | | | THE TARGET PORTFOLIO TRUST | |
| | | | | | | | | | |
MOODY’S
RATINGS†
(UNAUDITED) | | PRINCIPAL
AMOUNT (000)# | | | DESCRIPTION | | VALUE (NOTE 1) | |
| | | | | | CORPORATE BONDS (continued) | | | | |
| | | |
| | | | | | Diversified Financial Services—15.6% | | | | |
| B1 | | $ | 800 | | | Ally Financial, Inc.,
Gtd. Notes
6.00%, 12/15/11 | | $ | 804,000 | |
| B1 | | | 1,500 | | | 6.25%, 12/01/17 | | | 1,481,250 | |
| A2 | | | 500 | | | American Express Bank FSB,
Sr. Unsec’d. Notes
5.50%, 04/16/13 | | | 528,542 | |
| A2 | | | 1,800 | | | American Express Credit Corp.,
Sr. Unsec’d. Notes, MTN
5.875%, 05/02/13 | | | 1,914,169 | |
| Aaa | | | 2,500 | | | BNP Paribas Home Loan Covered Bonds SA,
Covered Bonds, 144A (France)
2.20%, 11/02/15 | | | 2,404,913 | |
| Aaa | | | 1,000 | | | BRFkredit A/S,
Gov’t. Liquid Gtd. Notes, 144A (Denmark)
0.653%(c), 04/15/13 | | | 999,928 | |
| Baa1 | | | 2,300 | | | Capital One Bank USA NA,
Sub. Notes
6.50%, 06/13/13 | | | 2,446,121 | |
| Aaa | | | 2,500 | | | Cie De Financement Foncier,
Covered Bonds, 144A (France)
1.625%, 07/23/12 | | | 2,500,625 | |
| A3 | | | 1,200 | | | Citigroup, Inc.,
Sr. Unsec’d. Notes
5.50%, 04/11/13 | | | 1,245,110 | |
| A3 | | | 2,200 | | | 6.50%, 08/19/13 | | | 2,330,561 | |
| Aa2 | | | 600 | | | Credit Agricole SA,
Notes, 144A (France)
0.606%(c), 02/02/12 | | | 594,364 | |
| Aa1 | | | 750 | | | Credit Suisse,
Sr. Unsec’d. Notes, MTN (Switzerland)
3.50%, 03/23/15 | | | 762,952 | |
| Aa1 | | | 2,200 | | | 5.00%, 05/15/13 | | | 2,289,582 | |
| Aaa | | | 1,200 | | | DanFin Funding Ltd.,
Gov’t. Liquid Gtd. Notes, 144A (Ireland)
1.103%(c), 07/16/13 | | | 1,199,280 | |
| Ba1 | | | 200 | | | Ford Motor Credit Co. LLC,
Sr. Unsec’d. Notes
7.50%, 08/01/12 | | | 206,814 | |
| Aa3 | | EUR | 1,000 | | | General Electric Capital Corp.,
Sub. Notes, 144A
5.50%(c), 09/15/67 | | | 1,176,145 | |
| NR | | | 1,800 | | | Lehman Brothers Holdings, Inc.,(i)
Sr. Unsec’d. Notes, MTN
2.85%, 12/23/24 | | | 443,250 | |
| NR | | | 600 | | | 5.625%, 01/24/13 | | | 153,750 | |
See Notes to Financial Statements.
| | | | |
| THE TARGET PORTFOLIO TRUST | | | 117 | |
| | |
Intermediate-Term Bond Portfolio (continued) | | Portfolio of Investments
As of October 31, 2011 |
| | | | | | | | | | |
MOODY’S
RATINGS†
(UNAUDITED) | | PRINCIPAL
AMOUNT (000)# | | | DESCRIPTION | | VALUE (NOTE 1) | |
| | | | | | CORPORATE BONDS (continued) | | | | |
| | | |
| | | | | | Diversified Financial Services (continued) | | | | |
| Baa1 | | $ | 1,400 | | | Merrill Lynch & Co., Inc.,
Sr. Unsec’d. Notes, MTN
6.15%, 04/25/13 | | $ | 1,437,451 | |
| A2 | | | 1,600 | | | Morgan Stanley,
Sr. Unsec’d. Notes, MTN
6.00%, 04/28/15 | | | 1,686,278 | |
| Aaa | | | 1,900 | | | Stadshypotek AB,
Covered Bonds, 144A (Sweden)
0.919%(c), 09/30/13 | | | 1,899,815 | |
| | | | | | | | | | |
| | | | | | | | | 28,504,900 | |
| | | | | | | | | | |
| | | |
| | | | | | Electric—2.4% | | | | |
| Ba1 | | | 1,200 | | | CMS Energy Corp.,
Sr. Unsec’d. Notes
4.25%, 09/30/15 | | | 1,214,618 | |
| Aa3 | | | 500 | | | Dayton Power & Light Co. (The),
First Mortgage
5.125%, 10/01/13 | | | 536,353 | |
| A2 | | | 2,300 | | | Public Service Electric & Gas Co.,
Sr. Sec’d. Notes, MTN
5.30%, 05/01/18 | | | 2,687,598 | |
| | | | | | | | | | |
| | | | | | | | | 4,438,569 | |
| | | | | | | | | | |
| | | |
| | | | | | Electric—Integrated—1.0% | | | | |
| Baa3 | | | 1,200 | | | Entergy Corp.,
Sr. Unsec’d. Notes
3.625%, 09/15/15 | | | 1,211,406 | |
| Baa1 | | | 600 | | | Orange & Rockland Utilities, Inc.,
Sr. Unsec’d. Notes, 144A(g)
2.50%, 08/15/15 | | | 610,651 | |
| | | | | | | | | | |
| | | | | | | | | 1,822,057 | |
| | | | | | | | | | |
| | | |
| | | | | | Electronics—0.7% | | | | |
| Baa2 | | | 1,200 | | | Agilent Technologies, Inc.,
Sr. Unsec’d. Notes
2.50%, 07/15/13 | | | 1,216,166 | |
| | | | | | | | | | |
| | | |
| | | | | | Financial—Bank & Trust—4.9% | | | | |
| Aa1 | | | 3,000 | | | Dexia Credit Local SA,
Gov’t. Liquid Gtd. Notes, 144A (France)
0.644%(c), 01/12/12 | | | 2,996,808 | |
| Aa1 | | | 2,000 | | | 0.731%(c), 03/05/13 | | | 1,878,884 | |
| Aa1 | | | 2,000 | | | 0.908%(c), 04/29/14 | | | 1,800,826 | |
See Notes to Financial Statements.
| | | | |
| 118 | | | THE TARGET PORTFOLIO TRUST | |
| | | | | | | | | | |
MOODY’S
RATINGS†
(UNAUDITED) | | PRINCIPAL
AMOUNT (000)# | | | DESCRIPTION | | VALUE (NOTE 1) | |
| | | | | | CORPORATE BONDS (continued) | | | | |
| | | |
| | | | | | Financial—Bank & Trust (continued) | | | | |
| Aaa | | $ | 2,200 | | | Swedbank AB,
Gov’t. Liquid Gtd. Notes, 144A (Sweden)
0.851%(c), 01/14/13 | | $ | 2,202,156 | |
| | | | | | | | | | |
| | | | | | | | | 8,878,674 | |
| | | | | | | | | | |
| | | |
| | | | | | Food—0.7% | | | | |
| Baa1 | | | 1,200 | | | WM Wrigley Jr. Co.,
Sec’d. Notes, 144A
2.45%, 06/28/12 | | | 1,213,201 | |
| | | | | | | | | | |
| | | |
| | | | | | Healthcare-Services—0.3% | | | | |
| Ba3 | | | 500 | | | HCA, Inc.,
Sr. Sec’d. Notes
7.25%, 09/15/20 | | | 535,625 | |
| | | | | | | | | | |
| | | |
| | | | | | Hotels—0.4% | | | | |
| Ba3 | | | 700 | | | MGM Resorts International,
Sr. Sec’d. Notes
9.00%, 03/15/20 | | | 773,500 | |
| | | | | | | | | | |
| | | |
| | | | | | Insurance—3.9% | | | | |
| Baa2 | | | 500 | | | American International Group, Inc.,
Jr. Sub. Debs.
8.175%(c), 05/15/68 | | | 482,500 | |
| Baa1 | | | 160 | | | Sr. Unsec’d. Notes
4.25%, 05/15/13 | | | 159,180 | |
| Baa1 | | | 300 | | | 8.25%, 08/15/18 | | | 337,565 | |
| Baa1 | | | 800 | | | Sr. Unsec’d. Notes, 144A
3.75%, 11/30/13 | | | 789,587 | |
| A3 | | | 1,100 | | | MetLife, Inc.,
Sr. Unsec’d. Notes
1.519%(c), 08/06/13 | | | 1,106,096 | |
| A1 | | | 1,000 | | | Monumental Global Funding III,
Sr. Sec’d. Notes, 144A
0.588%(c), 01/25/13 | | | 991,638 | |
| Baa1 | | | 1,000 | | | Ohio National Financial Services, Inc.,
Sr. Notes, 144A
6.375%, 04/30/20 | | | 1,081,694 | |
| A1 | | | 2,200 | | | Sun Life Financial Global Funding LP,
Gtd. Notes, 144A
0.496%(c), 10/06/13 | | | 2,184,809 | |
| | | | | | | | | | |
| | | | | | | | | 7,133,069 | |
| | | | | | | | | | |
| | | |
| | | | | | Investment Company—1.1% | | | | |
| Aaa | | | 2,000 | | | FIH Erhvervsbank A/S,
Gov’t. Liquid Gtd. Notes, 144A (Denmark)
0.708%(c), 06/13/13 | | | 1,998,320 | |
| | | | | | | | | | |
See Notes to Financial Statements.
| | | | |
| THE TARGET PORTFOLIO TRUST | | | 119 | |
| | |
Intermediate-Term Bond Portfolio (continued) | | Portfolio of Investments
As of October 31, 2011 |
| | | | | | | | | | |
MOODY’S
RATINGS†
(UNAUDITED) | | PRINCIPAL
AMOUNT (000)# | | | DESCRIPTION | | VALUE (NOTE 1) | |
| | | | | | CORPORATE BONDS (continued) | | | | |
| | | |
| | | | | | Media—3.8% | | | | |
| Ba2 | | $ | 1,200 | | | Charter Communications Operating LLC/Charter Communications Operating Capital,
Sec’d. Notes, 144A
8.00%, 04/30/12 | | $ | 1,227,000 | |
| Baa2 | | | 1,200 | | | NBC Universal Media LLC,
Sr. Unsec’d. Notes, 144A
4.375%, 04/01/21 | | | 1,276,114 | |
| Baa1 | | | 850 | | | Pearson Dollar Finance Two PLC,
Gtd. Notes, 144A (United Kingdom)
5.50%, 05/06/13 | | | 900,362 | |
| Baa1 | | | 800 | | | Reed Elsevier Capital, Inc.,
Gtd. Notes
7.75%, 01/15/14 | | | 904,662 | |
| Baa2 | | | 2,500 | | | Vivendi SA,
Sr. Unsec’d. Notes, 144A (France)
5.75%, 04/04/13 | | | 2,644,560 | |
| | | | | | | | | | |
| | | | | | | | | 6,952,698 | |
| | | | | | | | | | |
| | | |
| | | | | | Metals & Mining—2.0% | | | | |
| Baa1 | | | 1,200 | | | Anglo American Capital PLC,
Gtd. Notes, 144A (United Kingdom)
2.15%, 09/27/13 | | | 1,198,701 | |
| Baa3 | | | 600 | | | AngloGold Ashanti Holdings PLC,
Gtd. Notes (United Kingdom)
5.375%, 04/15/20 | | | 589,290 | |
| Ba1 | | | 800 | | | CSN Resources SA,
Gtd. Notes, 144A (Luxembourg)
6.50%, 07/21/20 | | | 858,000 | |
| Baa2 | | | 900 | | | Teck Resources Ltd.,
Gtd. Notes (Canada)
4.50%, 01/15/21 | | | 946,697 | |
| | | | | | | | | | |
| | | | | | | | | 3,592,688 | |
| | | | | | | | | | |
| | | |
| | | | | | Oil, Gas & Consumable Fuels—5.0% | | | | |
| Baa2 | | | 1,100 | | | Cenovus Energy, Inc.,
Sr. Unsec’d. Notes (Canada)
4.50%, 09/15/14 | | | 1,191,367 | |
| Baa2 | | | 400 | | | Florida Gas Transmission Co. LLC,
Sr. Unsec’d. Notes, 144A
4.00%, 07/15/15 | | | 421,634 | |
| Baa2 | | | 600 | | | 5.45%, 07/15/20 | | | 666,806 | |
See Notes to Financial Statements.
| | | | |
| 120 | | | THE TARGET PORTFOLIO TRUST | |
| | | | | | | | | | |
MOODY’S
RATINGS†
(UNAUDITED) | | PRINCIPAL
AMOUNT (000)# | | | DESCRIPTION | | VALUE (NOTE 1) | |
| | | | | | CORPORATE BONDS (continued) | | | | |
| | | |
| | | | | | Oil, Gas & Consumable Fuels (continued) | | | | |
| Baa1 | | $ | 1,200 | | | Gazprom Via Gaz Capital SA,
Sr. Unsec’d. Notes, 144A (Luxembourg)
5.092%, 11/29/15 | | $ | 1,248,000 | |
| Baa1 | | | 400 | | | Noble Holding International Ltd.,
Gtd. Notes (Cayman Islands)
3.45%, 08/01/15 | | | 422,745 | |
| A3 | | | 800 | | | Petrobras International Finance Co.,
Gtd. Notes (Cayman Islands)
7.875%, 03/15/19 | | | 960,690 | |
| A3 | | | 500 | | | 8.375%, 12/10/18 | | | 608,750 | |
| Baa1 | | | 1,200 | | | Petroleos Mexicanos,
Gtd. Notes (Mexico)
5.50%, 01/21/21 | | | 1,281,000 | |
| Aa1 | | | 1,200 | | | Shell International Finance BV,
Gtd. Notes (Netherlands)
3.10%, 06/28/15 | | | 1,277,686 | |
| Aa1 | | | 1,000 | | | Total Capital SA,
Gtd. Notes (France)
3.00%, 06/24/15 | | | 1,060,999 | |
| | | | | | | | | | |
| | | | | | | | | 9,139,677 | |
| | | | | | | | | | |
| | | |
| | | | | | Pipelines—3.2% | | | | |
| Baa2 | | | 2,400 | | | Kinder Morgan Energy Partners LP,
Sr. Unsec’d. Notes
5.80%, 03/01/21 | | | 2,722,426 | |
| Ba2 | | | 250 | | | NGPL PipeCo LLC,
Sr. Unsec’d. Notes, 144A
7.119%, 12/15/17 | | | 262,042 | |
| Baa2 | | | 1,075 | | | Spectra Energy Capital LLC,
Gtd. Notes
5.50%, 03/01/14 | | | 1,157,780 | |
| A3 | | | 1,500 | | | TransCanada Pipelines Ltd.,
Sr. Unsec’d. Notes (Canada)
3.80%, 10/01/20 | | | 1,599,847 | |
| | | | | | | | | | |
| | | | | | | | | 5,742,095 | |
| | | | | | | | | | |
| | | |
| | | | | | Real Estate Investment Trust—0.7% | | | | |
| Baa2 | | | 1,200 | | | Ventas Realty LP,
Gtd. Notes
6.75%, 04/01/17 | | | 1,248,100 | |
| | | | | | | | | | |
| | | |
| | | | | | Software—0.7% | | | | |
| A1 | | | 1,200 | | | Oracle Corp.,
Sr. Unsec’d. Notes, 144A
3.875%, 07/15/20 | | | 1,301,370 | |
| | | | | | | | | | |
See Notes to Financial Statements.
| | | | |
| THE TARGET PORTFOLIO TRUST | | | 121 | |
| | |
Intermediate-Term Bond Portfolio (continued) | | Portfolio of Investments
As of October 31, 2011 |
| | | | | | | | | | |
MOODY’S
RATINGS†
(UNAUDITED) | | PRINCIPAL
AMOUNT (000)# | | | DESCRIPTION | | VALUE (NOTE 1) | |
| | | | | | CORPORATE BONDS (continued) | | | | |
| | | |
| | | | | | Telecommunications—1.7% | | | | |
| A2 | | $ | 675 | | | Cellco Partnership/Verizon Wireless Capital LLC,
Sr. Unsec’d. Notes
5.55%, 02/01/14 | | $ | 741,130 | |
| Baa1 | | | 1,680 | | | Rogers Communications, Inc.,
Gtd. Notes (Canada)
6.375%, 03/01/14 | | | 1,870,845 | |
| Baa2 | | | 500 | | | Telecom Italia Capital SA,
Gtd. Notes (Luxembourg)
6.175%, 06/18/14 | | | 507,899 | |
| | | | | | | | | | |
| | | | | | | | | 3,119,874 | |
| | | | | | | | | | |
| | | |
| | | | | | Tobacco—0.6% | | | | |
| Baa1 | | | 1,000 | | | Altria Group, Inc.,
Gtd. Notes
8.50%, 11/10/13 | | | 1,143,868 | |
| | | | | | | | | | |
| | | | | | TOTAL CORPORATE BONDS
(cost $122,390,374) | | | 122,016,992 | |
| | | | | | | | | | |
| | | |
| | | | | | FOREIGN GOVERNMENT BONDS—13.4% | | | | |
| Aaa | | AUD | 1,400 | | | Australia Government,
Sr. Unsec’d. Notes (Australia)
5.50%, 04/21/23 | | | 1,584,270 | |
| Aaa | | AUD | 7,200 | | | 5.75%, 07/15/22 | | | 8,318,782 | |
| Baa3 | | | 1,500 | | | Republic of Panama,
Sr. Unsec’d. Notes (Panama)
9.375%, 04/01/29 | | | 2,350,500 | |
| Aaa | | GBP | 1,500 | | | United Kingdom Gilt,
Bonds (United Kingdom)
3.75%, 09/07/20 | | | 2,688,968 | |
| Aaa | | GBP | 1,300 | | | 3.75%, 09/07/21 | | | 2,322,224 | |
| Aaa | | GBP | 3,600 | | | 4.75%, 12/07/30 | | | 7,100,092 | |
| | | | | | | | | | |
| | | | | | TOTAL FOREIGN GOVERNMENT BONDS
(cost $22,755,652) | | | 24,364,836 | |
| | | | | | | | | | |
| | | |
| | | | | | MUNICIPAL BONDS—3.2% | | | | |
| | | |
| | | | | | California—0.5% | | | | |
| B3 | | | 800 | | | Tobacco Securitization Authority of Southern California,
Revenue Bonds
5.00%, 06/01/37 | | | 554,648 | |
See Notes to Financial Statements.
| | | | |
| 122 | | | THE TARGET PORTFOLIO TRUST | |
| | | | | | | | | | |
MOODY’S
RATINGS†
(UNAUDITED) | | PRINCIPAL
AMOUNT (000)# | | | DESCRIPTION | | VALUE (NOTE 1) | |
| | | | | | MUNICIPAL BONDS (continued) | | | | |
| | | |
| | | | | | California (continued) | | | | |
| Aa2 | | $ | 325 | | | University of California,
Revenue Bonds
5.035%, 05/15/21 | | $ | 348,982 | |
| | | | | | | | | | |
| | | | | | | | | 903,630 | |
| | | | | | | | | | |
| | | |
| | | | | | Florida—0.4% | | | | |
| Aa2 | | | 800 | | | County of Broward Florida,
Revenue Bonds
6.206%, 10/01/30 | | | 851,856 | |
| | | | | | | | | | |
| | | |
| | | | | | Illinois—0.6% | | | | |
| Aa3 | | | 1,000 | | | Illinois State Toll Highway Authority,
Revenue Bonds
5.293%, 01/01/24 | | | 1,043,910 | |
| | | | | | | | | | |
| | | |
| | | | | | New York—1.3% | | | | |
| Aa1 | | | 1,100 | | | New York City Transitional Finance Authority,
Revenue Bonds
4.075%, 11/01/20 | | | 1,175,383 | |
| Aa1 | | | 1,200 | | | 5.008%, 08/01/27 | | | 1,252,164 | |
| | | | | | | | | | |
| | | | | | | | | 2,427,547 | |
| | | | | | | | | | |
| | | |
| | | | | | West Virginia—0.4% | | | | |
| B2 | | | 935 | | | Tobacco Settlement Financial Authority of West Virginia,
Revenue Bonds
7.467%, 06/01/47 | | | 675,098 | |
| | | | | | | | | | |
| | | | | | TOTAL MUNICIPAL BONDS
(cost $5,987,251) | | | 5,902,041 | |
| | | | | | | | | | |
| | | |
| | | | | | RESIDENTIAL MORTGAGE-BACKED SECURITIES—6.4% | | | | |
| A3 | | | 167 | | | American Home Mortgage Investment Trust,
Series 2004-4, Class 5A
2.483%(c), 02/25/45 | | | 142,359 | |
| Aaa | | | 224 | | | Bank of America Funding Corp.,
Series 2006-A, Class 1A1
2.678%(c), 02/20/36 | | | 193,374 | |
| NR | | | 1,085 | | | BCAP LLC Trust,
Series 2011-RR4, Class 7A1, 144A
5.25%, 04/26/37 | | | 997,988 | |
| B3 | | | 334 | | | Bear Stearns Adjustable Rate Mortgage Trust,
Series 2004-8, Class 11A2
2.708%(c), 11/25/34 | | | 292,006 | |
| B3 | | | 717 | | | Series 2004-8, Class 13A1
2.823%(c), 11/25/34 | | | 552,936 | |
| Caa3 | | | 643 | | | Bear Stearns Alt-A Trust,
Series 2006-6, Class 31A1
3.42%(c), 11/25/36 | | | 364,034 | |
See Notes to Financial Statements.
| | | | |
| THE TARGET PORTFOLIO TRUST | | | 123 | |
| | |
Intermediate-Term Bond Portfolio (continued) | | Portfolio of Investments
As of October 31, 2011 |
| | | | | | | | | | |
MOODY’S
RATINGS†
(UNAUDITED) | | PRINCIPAL
AMOUNT (000)# | | | DESCRIPTION | | VALUE (NOTE 1) | |
| | | | | | RESIDENTIAL MORTGAGE-BACKED SECURITIES (continued) | | | | |
| Caa3 | | $ | 591 | | | Series 2006-6, Class 32A1
2.839%(c), 11/25/36 | | $ | 294,152 | |
| Aaa | | | 218 | | | Citigroup Mortgage Loan Trust, Inc.,
Series 2005-11, Class A2A
2.58%(c), 10/25/35 | | | 172,571 | |
| CC(d) | | | 1,251 | | | Series 2006-AR1, Class 1A1
2.66%(c), 10/25/35 | | | 967,653 | |
| AAA(d) | | | 58 | | | Countrywide Alternative Loan Trust,
Series 2003-J3, Class 2A1
6.25%, 12/25/33 | | | 61,286 | |
| Baa3 | | | 117 | | | Countrywide Home Loan Mortgage Pass-Through Trust,
Series 2003-R4, Class 2A, 144A
6.50%(c), 01/25/34 | | | 117,053 | |
| B2 | | | 697 | | | Series 2004-25, Class 1A1
0.575%(c), 02/25/35 | | | 469,984 | |
| Aaa | | | 17 | | | Credit Suisse First Boston Mortgage Securities Corp.,
Series 2003-8, Class 5A1
6.50%, 04/25/33 | | | 17,909 | |
| Aa1 | | EUR | 800 | | | EMF-NL,
Series 2008-APRX, Class A2 (Netherlands)
2.372%(c), 04/17/41 | | | 822,561 | |
| Aaa | | | 35 | | | Federal Home Loan Mortgage Corp.,
Series 2892, Class BL
5.00%, 01/15/18 | | | 35,169 | |
| Aaa | | | 1,339 | | | Series 3346, Class FA
0.473%(c), 02/15/19 | | | 1,341,270 | |
| Aaa | | | 236 | | | FHLMC Structured Pass-Through Securities,
Series T-59, Class 1A2
7.00%, 10/25/43 | | | 278,961 | |
| Aaa | | | 677 | | | Series T-75, Class A1
0.285%(c), 12/25/36 | | | 672,547 | |
| Aaa | | | 50 | | | Government National Mortgage Assoc.,
Series 1995-2, Class KQ
8.50%, 03/20/25 | | | 56,512 | |
| Aaa | | | 68 | | | Series 2000-9, Class FG
0.843%(c), 02/16/30 | | | 68,111 | |
| Aaa | | | 99 | | | Series 2000-9, Class FH
0.743%(c), 02/16/30 | | | 99,344 | |
| Aaa | | | 202 | | | Series 2000-11, Class PH
7.50%, 02/20/30 | | | 212,095 | |
| Aaa | | | 131 | | | Granite Master Issuer PLC,
Series 2006-3, Class A7 (United Kingdom)
0.345%(c), 12/20/54 | | | 126,644 | |
See Notes to Financial Statements.
| | | | |
| 124 | | | THE TARGET PORTFOLIO TRUST | |
| | | | | | | | | | |
MOODY’S
RATINGS†
(UNAUDITED) | | PRINCIPAL
AMOUNT (000)# | | | DESCRIPTION | | VALUE (NOTE 1) | |
| | | | | | RESIDENTIAL MORTGAGE-BACKED SECURITIES (continued) | | | | |
| Caa2 | | $ | 378 | | | Greenpoint Mortgage Funding Trust,
Series 2005-AR2, Class A1
0.475%(c), 06/25/45 | | $ | 208,702 | |
| Aaa | | | 306 | | | GSR Mortgage Loan Trust,
Series 2005-AR6, Class 2A1
2.725%(c), 09/25/35 | | | 273,716 | |
| B2 | | | 315 | | | Merrill Lynch Mortgage Investors, Inc.,
Series 2005-A10, Class A
0.455%(c), 02/25/36 | | | 206,287 | |
| A1 | | | 253 | | | MLCC Mortgage Investors, Inc.,
Series 2005-2, Class 3A
1.239%(c), 10/25/35 | | | 199,356 | |
| Aaa | | | 1,759 | | | NCUA Guaranteed Notes,
Series 2010-R2, Class 1A
0.615%(c), 11/06/17 | | | 1,759,430 | |
| Aaa | | | 355 | | | Sequoia Mortgage Trust,
Series 10, Class 2A1
1.005%(c), 10/20/27 | | | 302,638 | |
| Baa2 | | | 116 | | | Structured Asset Mortgage Investments, Inc.,
Series 2005-AR5, Class A1
0.494%(c), 07/19/35 | | | 76,157 | |
| BBB(d) | | | 30 | | | Structured Asset Securities Corp.,
Series 2001-21A, Class 1A1
2.273%(c), 01/25/32 | | | 24,359 | |
| Baa2 | | | 272 | | | Washington Mutual, Inc., Mortgage Pass-Through Certificates,
Series 2002-AR6, Class A
1.63%(c), 06/25/42 | | | 203,265 | |
| B2 | | | 15 | | | Series 2002-AR9, Class 1A
1.63%(c), 08/25/42 | | | 12,513 | |
| | | | | | | | | | |
| | | | | | TOTAL RESIDENTIAL MORTGAGE-BACKED SECURITIES
(cost $13,391,300) | | | 11,622,942 | |
| | | | | | | | | | |
| | | |
| | | | | | U.S. GOVERNMENT AGENCY OBLIGATIONS—0.3% | | | | |
| | | 172 | | | Small Business Administration Participation Certificates,
Series 2008-20A, Class 1
5.17%, 01/01/28 | | | 193,981 | |
| | | 337 | | | Series 2008-20D, Class 1
5.37%, 04/01/28 | | | 379,440 | |
| | | | | | | | | | |
| | | | | | TOTAL U.S. GOVERNMENT AGENCY OBLIGATIONS
(cost $534,318) | | | 573,421 | |
| | | | | | | | | | |
| | | |
| | | | | | U.S. GOVERNMENT MORTGAGE-BACKED OBLIGATIONS—2.4% | | | | |
| | | 97 | | | Federal National Mortgage Assoc.
2.32%(c), 07/01/25 | | | 98,398 | |
| | | 56 | | | 3.50%(c), 08/01/24 | | | 56,868 | |
| | | 3,245 | | | 4.50%, 09/01/41 | | | 3,435,513 | |
| | | 5 | | | 5.078%(c), 12/01/30 | | | 5,231 | |
See Notes to Financial Statements.
| | | | |
| THE TARGET PORTFOLIO TRUST | | | 125 | |
| | |
Intermediate-Term Bond Portfolio (continued) | | Portfolio of Investments
As of October 31, 2011 |
| | | | | | | | | | |
| | | PRINCIPAL
AMOUNT (000)# | | | DESCRIPTION | | VALUE (NOTE 1) | |
| | | | | | U.S. GOVERNMENT MORTGAGE-BACKED OBLIGATIONS (continued) | | | | |
| | $ | 48 | | | Government National Mortgage Assoc.
2.125%, 10/20/24-12/20/26 | | $ | 49,863 | |
| | | 293 | | | 2.25%(c), 03/20/30 | | | 302,962 | |
| | | 212 | | | 2.375%, 05/20/23-06/20/27 | | | 219,208 | |
| | | 43 | | | 2.50%(c), 02/20/25 | | | 44,980 | |
| | | 154 | | | 2.625%, 08/20/26-07/20/30 | | | 159,757 | |
| | | | | | | | | | |
| | | | | | TOTAL U.S. GOVERNMENT MORTGAGE-BACKED OBLIGATIONS
(cost $4,320,824) | | | 4,372,780 | |
| | | | | | | | | | |
| | |
| | | | | | U.S. TREASURY OBLIGATIONS—4.8% | |
| | | 2,300 | | | U.S. Treasury Bonds
3.75%, 08/15/41 | | | 2,541,500 | |
| | | 1,700 | | | U.S. Treasury Notes
2.125%, 08/15/21 | | | 1,692,571 | |
| | | 4,100 | | | 3.125%, 05/15/21(k) | | | 4,457,151 | |
| | | | | | | | | | |
| | | | | | TOTAL U.S. TREASURY OBLIGATIONS
(cost $8,648,414) | | | 8,691,222 | |
| | | | | | | | | | |
| | | | | | TOTAL LONG-TERM INVESTMENTS
(cost $187,178,764) | | | 186,765,041 | |
| | | | | | | | | | |
| | | |
| | | | | | SHORT-TERM INVESTMENTS—2.1% | | | | |
| | | |
| | | | | | CERTIFICATE OF DEPOSITS(n)—1.2% | | | | |
| | | 2,200 | | | Itau Unibanco
1.389%, 02/06/12
(cost $2,190,378) | | | 2,191,826 | |
| | | | | | | | | | |
| | | |
| | | | | | U.S. TREASURY OBLIGATIONS(n)—0.7% | | | | |
| | | 681 | | | U.S. Treasury Bills
0.03%, 03/22/12 | | | 680,906 | |
| | | 356 | | | 0.035%, 03/01/12(k) | | | 355,974 | |
| | | 152 | | | 0.143%, 03/12/12 | | | 151,960 | |
| | | 63 | | | 0.26%, 03/08/12 | | | 62,994 | |
| | | | | | | | | | |
| | | | | | TOTAL U.S. TREASURY OBLIGATIONS
(cost $1,251,856) | | | 1,251,834 | |
| | | | | | | | | | |
| | | | | | | | | | |
NOTIONAL
AMOUNTS (000)# | | | | | COUNTERPARTY | | | |
| | | |
| | | | OPTIONS PURCHASED*—0.2% | | | | | | |
| | | |
| | | | Put Options | | | | | | |
| | 4,100 | | | Interest Rate Swap Options,
Pay a fixed rate of 3.27% and receive a floating rate based on 3-month LIBOR, expiring 09/24/12
(cost $210,467) | | Credit Suisse First Boston Corp. | | | 284,918 | |
| | | | | | | | | | |
See Notes to Financial Statements.
| | | | |
| 126 | | | THE TARGET PORTFOLIO TRUST | |
| | | | | | | | |
| | | DESCRIPTION | | VALUE (NOTE 1) | |
| | | | TOTAL SHORT-TERM INVESTMENTS
(cost $3,652,701) | | $ | 3,728,578 | |
| | | | | | | | |
| | | | TOTAL INVESTMENTS, BEFORE OPTIONS
WRITTEN—104.5%
(cost $190,831,465; Note 5) | | | 190,493,619 | |
| | | | | | | | |
| | | | | | | | | | |
NOTIONAL
AMOUNTS (000)# | | | OPTIONS WRITTEN*—(0.2%) | | COUNTERPARTY | | | |
| | | |
| | | | Put Options —(0.2%) | | | | | | |
| $ | 9,000 | | | Interest Rate Swap Options,
Pay a fixed rate of 2.75% and receive a floating rate based on 3-month LIBOR, expiring 06/18/12 | | Deutsche Bank | | | (3,851 | ) |
| | 5,400 | | | Pay a fixed rate of 3.00% and receive a
floating rate based on 3-month LIBOR, expiring 06/18/12 | | Bank of America | | | (1,649 | ) |
| | 3,000 | | | Pay a fixed rate of 3.00% and receive a
floating rate based on 3-month LIBOR, expiring 06/18/12 | | Barclays Capital Group | | | (916 | ) |
| | 5,100 | | | Pay a fixed rate of 3.00% and receive a floating rate based on 3-month LIBOR, expiring 06/18/12 | | Citigroup Global Markets | | | (1,557 | ) |
| | 1,000 | | | Pay a fixed rate of 3.00% and receive a floating rate based on 3-month LIBOR, expiring 06/18/12 | | Deutsche Bank | | | (305 | ) |
| | 9,600 | | | Pay a fixed rate of 2.22% and receive a floating rate based on 3-month LIBOR, expiring 09/24/12 | | Credit Suisse First Boston Corp. | | | (280,758 | ) |
| | 3,200 | | | Pay a fixed rate of 2.25% and receive a floating rate based on 3-month LIBOR, expiring 09/24/12 | | Bank of America | | | (2,412 | ) |
| | 700 | | | Pay a fixed rate of 2.25% and receive a floating rate based on 3-month LIBOR, expiring 09/24/12 | | Citigroup Global Markets | | | (527 | ) |
| | 16,300 | | | Pay a fixed rate of 2.25% and receive a floating rate based on 3-month LIBOR, expiring 09/24/12 | | Morgan Stanley | | | (12,284 | ) |
| | | | | | | | | | |
| | | | TOTAL OPTIONS WRITTEN
(premiums received $580,005) | | | | | (304,259 | ) |
| | | | | | | | | | |
| | | | TOTAL INVESTMENTS, NET OF OPTIONS WRITTEN—104.3%
(cost $190,251,460; Note 5) | | | 190,189,360 | |
| | | | Liabilities in excess of other assets(x)—(4.3%) | | | | | (7,818,728 | ) |
| | | | | | | | | | |
| | | | NET ASSETS—100% | | | | $ | 182,370,632 | |
| | | | | | | | | | |
See Notes to Financial Statements.
| | | | |
| THE TARGET PORTFOLIO TRUST | | | 127 | |
| | |
Intermediate-Term Bond Portfolio (continued) | | Portfolio of Investments
As of October 31, 2011 |
The following abbreviations were used in the Portfolio descriptions:
144A—Security was purchased pursuant to Rule 144A under the Securities Act of 1933 and may not be resold subject to that rule except to qualified institutional buyers. Unless otherwise noted, 144A securities are deemed to be liquid.
FHLMC—Federal Home Loan Mortgage Corp.
FSB—Federal Saving Bank
LIBOR—London Interbank Offered Rate
MTN—Medium Term Note
NR—Not Rated by Moodys or Standard & Poor’s
SLM—Student Loan Mortgage
AUD—Australian Dollar
BRL—Brazilian Real
CAD—Canadian Dollar
CNY—Chinese Yuan
DKK—Danish Krone
EUR—Euro
GBP—British Pound
IDR—Indonesian Rupiah
INR—Indian Rupee
JPY—Japanese Yen
KRW—South Korean Won
MXN—Mexican Peso
MYR—Malaysian Ringgit
PHP—Philippine Peso
SGD—Singapore Dollar
TWD—New Taiwanese Dollar
| # | Principal or notional amount is shown in U.S. dollars unless otherwise stated. |
| † | The ratings reflected are as of October 31, 2011. Ratings of certain bonds may have changed subsequent to that date. |
| * | Non-income producing security. |
| (c) | Variable rate instrument. The interest rate shown reflects the rate in effect at October 31, 2011. |
| (d) | Standard & Poor’s rating. |
| (g) | Indicates a security or securities that have been deemed illiquid. |
| (i) | Represents issuer in default on interest payments. Non-income producing security. |
| (k) | Represents security, or a portion thereof, segregated as collateral for futures contracts. |
| (n) | Rates shown are the effective yields at purchase date. |
| (x) | Includes net unrealized appreciation (depreciation) on the following derivative contracts held at reporting period end: |
Futures contracts open at October 31, 2011:
| | | | | | | | | | | | | | | | |
Number of
Contracts | | Type | | Expiration
Date | | Value at
Trade Date | | | Value at
October 31,
2011 | | | Unrealized
Appreciation(1) | |
| Long Positions: | | | | | | | | | | | | | | | | |
| 362 | | 90 Day Euro Dollar | | Jun. 2014 | | $ | 88,934,300 | | | $ | 89,400,425 | | | $ | 466,125 | |
| 82 | | 90 Day Euro Dollar | | Mar. 2016 | | | 19,626,700 | | | | 19,958,800 | | | | 332,100 | |
| | | | | | | | | | | | | | | | |
| | | | | | | | | | | | | | $ | 798,225 | |
| | | | | | | | | | | | | | | | |
| (1) | Cash of $4,000 and U.S. Treasury Securities with a market value of $655,986 has been segregated to cover requirements for open futures contracts at October 31, 2011. |
See Notes to Financial Statements.
| | | | |
| 128 | | | THE TARGET PORTFOLIO TRUST | |
Forward foreign currency exchange contracts outstanding at October 31, 2011:
| | | | | | | | | | | | | | | | | | |
Purchase Contracts | | Counterparty | | Notional
Amount
(000) | | | Value at
Settlement
Date
Payable | | | Current
Value | | | Unrealized
Appreciation
(Depreciation) | |
Brazilian Real, | | | | | | | | | | | | | | | | | | |
Expiring 11/03/11 | | Hong Kong & Shanghai Bank | | BRL | 243 | | | $ | 128,144 | | | $ | 141,478 | | | $ | 13,334 | |
Canadian Dollar, | | | | | | | | | | | | | | | | | | |
Expiring 11/17/11 | | Citigroup Global Markets | | CAD | 635 | | | | 647,089 | | | | 636,826 | | | | (10,263 | ) |
Chinese Yuan, | | | | | | | | | | | | | | | | | | |
Expiring 08/05/13 | | UBS Securities | | CNY | 5,656 | | | | 895,677 | | | | 890,725 | | | | (4,952 | ) |
Expiring 11/15/11 | | Barclays Capital Group | | CNY | 536 | | | | 83,424 | | | | 84,345 | | | | 921 | |
Expiring 11/15/11 | | Citigroup Global Markets | | CNY | 3,227 | | | | 496,656 | | | | 507,727 | | | | 11,071 | |
Expiring 11/15/11 | | JPMorgan Chase | | CNY | 1,318 | | | | 205,200 | | | | 207,401 | | | | 2,201 | |
Expiring 11/15/11 | | JPMorgan Chase | | CNY | 677 | | | | 105,161 | | | | 106,471 | | | | 1,310 | |
Expiring 02/01/13 | | Deutsche Bank | | CNY | 14,553 | | | | 2,296,512 | | | | 2,298,730 | | | | 2,218 | |
Expiring 08/05/13 | | Deutsche Bank | | CNY | 2,000 | | | | 319,285 | | | | 314,955 | | | | (4,330 | ) |
Indian Rupee, | | | | | | | | | | | | | | | | | | |
Expiring 07/12/12 | | JPMorgan Chase | | INR | 94,534 | | | | 2,033,874 | | | | 1,887,669 | | | | (146,205 | ) |
Indonesian Rupiah, | | | | | | | | | | | | | | | | | | |
Expiring 01/31/12 | | UBS Securities | | IDR | 9,714,000 | | | | 1,085,363 | | | | 1,086,476 | | | | 1,113 | |
Expiring 07/02/12 | | Hong Kong & Shanghai Bank | | IDR | 8,616,000 | | | | 953,625 | | | | 947,806 | | | | (5,819 | ) |
Malaysian Ringgit, | | | | | | | | | | | | | | | | | | |
Expiring 04/23/12 | | JPMorgan Chase | | MYR | 6,278 | | | | 2,069,832 | | | | 2,034,568 | | | | (35,264 | ) |
Mexican Peso, | | | | | | | | | | | | | | | | | | |
Expiring 11/18/11 | | Hong Kong & Shanghai Bank | | MXN | 44 | | | | 3,251 | | | | 3,270 | | | | 19 | |
New Taiwanese Dollar, | | | | | | | | | | | | | | | | | | |
Expiring 01/11/12 | | Deutsche Bank | | TWD | 34,164 | | | | 1,200,000 | | | | 1,143,936 | | | | (56,064 | ) |
Expiring 01/11/12 | | Goldman Sachs & Co. | | TWD | 27,500 | | | | 970,000 | | | | 920,784 | | | | (49,216 | ) |
Philippine Peso, | | | | | | | | | | | | | | | | | | |
Expiring 03/15/12 | | Citigroup Global Markets | | PHP | 43,020 | | | | 992,044 | | | | 1,003,263 | | | | 11,219 | |
Singapore Dollar, | | | | | | | | | | | | | | | | | | |
Expiring 12/09/11 | | Royal Bank of Canada | | SGD | 500 | | | | 413,702 | | | | 398,470 | | | | (15,232 | ) |
Expiring 12/09/11 | | UBS Securities | | SGD | 2,114 | | | | 1,754,311 | | | | 1,684,478 | | | | (69,833 | ) |
Expiring 12/09/11 | | UBS Securities | | SGD | 100 | | | | 82,710 | | | | 79,694 | | | | (3,016 | ) |
South Korean Won, | | | | | | | | | | | | | | | | | | |
Expiring 11/14/11 | | JPMorgan Chase | | KRW | 3,520,993 | | | | 3,304,855 | | | | 3,173,876 | | | | (130,979 | ) |
| | | | | | | | | | | | | | | | | | |
| | | | | | | | $ | 20,040,715 | | | $ | 19,552,948 | | | $ | (487,767 | ) |
| | | | | | | | | | | | | | | | | | |
| | | | | | | | | | | | | | | | | | |
Sale Contracts | | Counterparty | | Notional
Amount (000) | | | Value at
Settlement
Date
Receivable | | | Current
Value | | | Unrealized
Appreciation
(Depreciation) | |
Australian Dollar, | | | | | | | | | | | | | | | | | | |
Expiring 11/10/11 | | Citigroup Global Markets | | AUD | 4,849 | | | $ | 4,655,186 | | | $ | 5,104,123 | | | $ | (448,937 | ) |
Expiring 11/10/11 | | Deutsche Bank | | AUD | 4,862 | | | | 4,738,919 | | | | 5,117,807 | | | | (378,888 | ) |
Expiring 11/10/11 | | JPMorgan Chase | | AUD | 1,577 | | | | 1,502,077 | | | | 1,659,972 | | | | (157,895 | ) |
Expiring 11/10/11 | | JPMorgan Chase | | AUD | 958 | | | | 912,486 | | | | 1,008,404 | | | | (95,918 | ) |
Brazilian Real, | | | | | | | | | | | | | | | | | | |
Expiring 11/03/11 | | Barclays Capital Group | | BRL | 26 | | | | 15,657 | | | | 15,060 | | | | 597 | |
Expiring 11/03/11 | | Citigroup Global Markets | | BRL | 217 | | | | 134,000 | | | | 126,418 | | | | 7,582 | |
Expiring 01/04/12 | | Hong Kong & Shanghai Bank | | BRL | 243 | | | | 126,821 | | | | 139,479 | | | | (12,658 | ) |
British Pound, | | | | | | | | | | | | | | | | | | |
Expiring 12/08/11 | | Barclays Capital Group | | GBP | 3,846 | | | | 5,944,416 | | | | 6,181,525 | | | | (237,109 | ) |
Expiring 12/08/11 | | Barclays Capital Group | | GBP | 1,749 | | | | 2,791,649 | | | | 2,811,099 | | | | (19,450 | ) |
See Notes to Financial Statements.
| | | | |
| THE TARGET PORTFOLIO TRUST | | | 129 | |
| | |
Intermediate-Term Bond Portfolio (continued) | | Portfolio of Investments
As of October 31, 2011 |
Forward foreign currency exchange contracts outstanding at October 31, 2011 (continued):
| | | | | | | | | | | | | | | | | | |
Sale Contracts (continued) | | Counterparty | | Notional
Amount
(000) | | | Value at
Settlement
Date
Receivable | | | Current
Value | | | Unrealized
Appreciation
(Depreciation) | |
Expiring 12/08/11 | | Barclays Capital Group | | GBP | 254 | | | $ | 392,088 | | | $ | 408,244 | | | $ | (16,156 | ) |
Expiring 12/08/11 | | Barclays Capital Group | | GBP | 115 | | | | 179,803 | | | | 184,835 | | | | (5,032 | ) |
Expiring 12/08/11 | | Citigroup Global Markets | | GBP | 1,674 | | | | 2,585,367 | | | | 2,690,555 | | | | (105,188 | ) |
Canadian Dollar, | | | | | | | | | | | | | | | | | | |
Expiring 11/17/11 | | Deutsche Bank | | CAD | 312 | | | | 314,105 | | | | 312,897 | | | | 1,208 | |
Expiring 11/17/11 | | Royal Bank of Canada | | CAD | 313 | | | | 316,227 | | | | 313,900 | | | | 2,327 | |
Danish Krone, | | | | | | | | | | | | | | | | | | |
Expiring 01/03/12 | | Hong Kong & Shanghai Bank | | DKK | 13,317 | | | | 2,328,671 | | | | 2,474,810 | | | | (146,139 | ) |
Euro, | | | | | | | | | | | | | | | | | | |
Expiring 01/17/12 | | JPMorgan Chase | | EUR | 4,763 | | | | 6,476,132 | | | | 6,587,100 | | | | (110,968 | ) |
Japanese Yen, | | | | | | | | | | | | | | | | | | |
Expiring 01/13/12 | | Citigroup Global Markets | | JPY | 354,780 | | | | 4,621,060 | | | | 4,544,790 | | | | 76,270 | |
Mexican Peso, | | | | | | | | | | | | | | | | | | |
Expiring 11/18/11 | | Hong Kong & Shanghai Bank | | MXN | 44 | | | | 3,692 | | | | 3,270 | | | | 422 | |
Expiring 03/15/12 | | Hong Kong & Shanghai Bank | | MXN | 44 | | | | 3,218 | | | | 3,235 | | | | (17 | ) |
| | | | | | | | | | | | | | | | | | |
| | | | | | | | $ | 38,041,574 | | | $ | 39,687,523 | | | $ | (1,645,949 | ) |
| | | | | | | | | | | | | | | | | | |
Interest rate swap agreements outstanding at October 31, 2011:
| | | | | | | | | | | | | | | | | | | | | | | | | | |
Notional
Amount
(000) | | | Termination
Date | | | Fixed
Rate | | | Floating
Rate | | Fair
Value | | | Upfront
Premiums
Paid
(Received) | | | Unrealized
Appreciation
(Depreciation) | | | Counterparty |
| | Over-the-counter swap agreements: | | | | | | | |
| AUD | 1,700 | | | | 12/15/20 | | | | 6.00 | % | | 6 month Australian Bank Bill rate(1) | | $ | 127,278 | | | $ | (13,015 | ) | | $ | 140,293 | | | Citigroup |
| AUD | 2,900 | | | | 12/15/20 | | | | 6.00 | % | | 6 month Australian Bank Bill rate(1) | | | 217,121 | | | | 2,149 | | | | 214,972 | | | Barclays Bank PLC |
| AUD | 1,500 | | | | 12/15/21 | | | | 5.75 | % | | 6 month Australian Bank Bill rate(1) | | | 76,695 | | | | (15,389 | ) | | | 92,084 | | | Barclays Bank PLC |
| BRL | 14,100 | | | | 01/02/14 | | | | 11.89 | % | | Brazilian interbank overnight lending rate(1) | | | 282,009 | | | | (35,768 | ) | | | 317,777 | | | Morgan Stanley & Co. |
| | Exchange-traded swap agreements: | | | | | | | | | | | |
| $ | 8,800 | | | | 09/21/16 | | | | 4.00 | % | | 3 month LIBOR(1) | | | 205,772 | | | | 232,449 | | | | (26,677 | ) | | — |
| | | | | | | | | | | | | | | | | | | | | | | | | | |
| | | | | | | | | | | | | | $ | 908,875 | | | $ | 170,426 | | | $ | 738,449 | | | |
| | | | | | | | | | | | | | | | | | | | | | | | | | |
| (1) | Porfolio pays the floating rate and receives the fixed rate. |
See Notes to Financial Statements.
| | | | |
| 130 | | | THE TARGET PORTFOLIO TRUST | |
Credit default swap agreements outstanding at October 31, 2011:
| | | | | | | | | | | | | | | | | | | | | | | | | | | | |
Reference
Entity/Obligation | | Termination
Date | | | Fixed
Rate | | | Notional
Amount
(000)(3)# | | | Implied
Credit
Spread at
October 31,
2011(4) | | Fair
Value | | | Upfront
Premiums
Paid
(Received) | | | Unrealized
Appreciation
(Depreciation) | | | Counterparty |
| Over-the-counter credit default swaps on corporate and/or sovereign issues—Sell Protection(1): |
Abu Dhabi Government | | | 12/20/11 | | | | 1.00 | % | | $ | 1,000 | | | 0.120% | | $ | 2,191 | | | $ | 611 | | | $ | 1,580 | | | Deutsche Bank |
Abu Dhabi Government | | | 12/20/11 | | | | 1.00 | % | | | 700 | | | 0.120% | | | 1,495 | | | | 425 | | | | 1,070 | | | Credit Suisse International |
Arab Republic of Egypt | | | 03/20/16 | | | | 1.00 | % | | | 1,200 | | | 4.137% | | | (147,928 | ) | | | (148,843 | ) | | | 915 | | | Morgan Stanley & Co. |
Arab Republic of Egypt | | | 03/20/16 | | | | 1.00 | % | | | 100 | | | 4.137% | | | (12,327 | ) | | | (10,379 | ) | | | (1,948 | ) | | Morgan Stanley & Co. |
Berkshire Hathaway | | | 03/20/13 | | | | 1.00 | % | | | 2,500 | | | 0.929% | | | 6,181 | | | | — | | | | 6,181 | | | Barclays Bank PLC |
BP Capital Markets | | | 06/20/15 | | | | 5.00 | % | | | 800 | | | 0.956% | | | 117,753 | | | | 8,748 | | | | 109,005 | | | Credit Suisse International |
BP Capital Markets | | | 06/20/15 | | | | 5.00 | % | | | 700 | | | 0.956% | | | 103,033 | | | | 15,466 | | | | 87,567 | | | Goldman Sachs |
Enbridge Energy Partners | | | 06/20/12 | | | | 0.28 | % | | | 200 | | | 0.517% | | | (187 | ) | | | — | | | | (187 | ) | | Merrill Lynch & Co. |
Energy Transfer Partners | | | 06/20/12 | | | | 0.33 | % | | | 200 | | | 0.742% | | | (448 | ) | | | — | | | | (448 | ) | | Bank of America, N.A. |
Federal Republic of Brazil | | | 03/20/16 | | | | 1.00 | % | | | 2,800 | | | 1.272% | | | (26,880 | ) | | | (23,268 | ) | | | (3,612 | ) | | Citigroup |
France (Gov’t. of) | | | 09/20/16 | | | | 0.25 | % | | | 800 | | | 1.684% | | | (53,748 | ) | | | (46,054 | ) | | | (7,694 | ) | | Deutsche Bank |
France (Gov’t. of) | | | 09/20/16 | | | | 0.25 | % | | | 400 | | | 1.684% | | | (26,756 | ) | | | (22,930 | ) | | | (3,826 | ) | | Goldman Sachs |
France (Gov’t. of) | | | 09/20/16 | | | | 0.25 | % | | | 400 | | | 1.684% | | | (26,873 | ) | | | (24,167 | ) | | | (2,706 | ) | | Goldman Sachs |
France (Gov’t. of) | | | 09/20/16 | | | | 0.25 | % | | | 300 | | | 1.684% | | | (20,154 | ) | | | (18,254 | ) | | | (1,900 | ) | | UBS AG |
Japan Gov’t. Series 55 | | | 03/20/16 | | | | 1.00 | % | | | 600 | | | 0.884% | | | 3,299 | | | | 3,852 | | | | (553 | ) | | Goldman Sachs |
Kinder Morgan | | | 06/20/12 | | | | 0.29 | % | | | 200 | | | 0.718% | | | (277 | ) | | | — | | | | (277 | ) | | Merrill Lynch & Co. |
MetLife, Inc. | | | 06/20/12 | | | | 5.00 | % | | | 1,200 | | | 1.558% | | | 34,744 | | | | 13,592 | | | | 21,152 | | | Deutsche Bank |
Morgan Stanley | | | 09/20/12 | | | | 0.80 | % | | | 3,800 | | | 3.757% | | | (94,747 | ) | | | — | | | | (94,747 | ) | | Merrill Lynch & Co. |
Plains All-American Pipeline | | | 06/20/12 | | | | 0.32 | % | | | 200 | | | 0.479% | | | (96 | ) | | | — | | | | (96 | ) | | Bank of America, N.A. |
Republic of Korea | | | 03/20/16 | | | | 1.00 | % | | | 2,500 | | | 1.246% | | | (26,749 | ) | | | 1,818 | | | | (28,567 | ) | | Barclays Bank PLC |
Valero Energy Corp. | | | 06/20/12 | | | | 0.32 | % | | | 200 | | | 0.701% | | | (149 | ) | | | — | | | | (149 | ) | | Bank of America, N.A. |
| | | | | | | | | | | | | | | | | | | | | | | | | | | | |
| | | | | | | | | | | | | | | | $ | (168,623 | ) | | $ | (249,383 | ) | | $ | 80,760 | | | |
| | | | | | | | | | | | | | | | | | | | | | | | | | | | |
The Portfolio entered into credit default swap agreements on corporate issues, sovereign issues, asset-backed securities and credit indices as the protection seller to provide a measure of protection against the current portfolio of investments’ exposure to market conditions, or to take an active position with respect to the likelihood of a particular issuer’s default or the referenced entity’s credit soundness
See Notes to Financial Statements.
| | | | |
| THE TARGET PORTFOLIO TRUST | | | 131 | |
| | |
Intermediate-Term Bond Portfolio (continued) | | Portfolio of Investments
As of October 31, 2011 |
| | | | | | | | | | | | | | | | | | | | | | | | | | |
Reference
Entity/Obligation | | Termination
Date | | | Fixed
Rate | | | Notional
Amount
(000)(3)# | | | Fair
Value | | | Upfront
Premiums
Paid
(Received) | | | Unrealized
Appreciation
(Depreciation) | | | Counterparty |
| Over-the-counter credit default swaps—Buy Protection(2): |
CMS Energy Corp. | | | 3/20/2012 | | | | 0.09 | % | | $ | 200 | | | $ | 702 | | | $ | 245 | | | $ | 457 | | | Deutsche Bank |
Dow Jones CDX HY16 5Y Index | | | 6/20/2016 | | | | 5.00 | % | | | 4,000 | | | | 109,953 | | | | (100,323 | ) | | | 210,276 | | | Bank of America, N.A. |
Dow Jones iTraxx 15 | | | 6/20/2016 | | | | 1.00 | % | | EUR | 2,100 | | | | 395,674 | | | | 395,748 | | | | (74 | ) | | Bank of America, N.A. |
KB Home | | | 3/20/2015 | | | | 5.00 | % | | | 4,000 | | | | 212,666 | | | | (208,412 | ) | | | 421,078 | | | Deutsche Bank |
| | | | | | | | | | | | | | | | | | | | | | | | | | |
| | | | | | | | | | | | | | $ | 718,995 | | | $ | 87,258 | | | $ | 631,737 | | | |
| | | | | | | | | | | | | | | | | | | | | | | | | | |
| (1) | If the Portfolio is a seller of protection, it receives the fixed rate. When a credit event occurs, as defined under the terms of that particular swap agreement, the Portfolio will either (i) pay to the buyer of protection an amount equal to the notional amount of the swap and take delivery of the referenced obligation or underlying securities comprising the referenced index or (ii) pay a net settlement amount in the form of cash or securities equal to the notional amount of the swap less the recovery value of the referenced obligation or underlying securities comprising the referenced index. |
| (2) | If the Portfolio is a buyer of protection, it pays the fixed rate. When a credit event occurs, as defined under the terms of that particular swap agreement, the Portfolio will either (i) receive from the seller of protection an amount equal to the notional amount of the swap and make delivery of the referenced obligation or underlying securities comprising the referenced index or (ii) receive a net settlement amount in the form of cash or securities equal to the notional amount of the swap less the recovery value of the referenced obligation or underlying securities comprising the referenced index. |
| (3) | Notional amount represents the maximum potential amount the Portfolio could be required to pay as a seller of credit protection or receive as a buyer of credit protection if a credit event occurs as defined under the terms of that particular swap agreement. |
| (4) | Implied credit spreads, represented in absolute terms, utilized in determining the fair value of credit default swap agreements on corporate issues or sovereign issues of an emerging country as of reporting date serve as an indicator of the current status of the payment/performance risk and represent the likelihood of risk of default for the credit derivative. The implied credit spread of a particular referenced entity reflects the cost of buying/selling protection and may include up-front payments required to be made to enter into the agreement. Wider credit spreads represent a deterioration of the referenced entity’s credit soundness and a greater likelihood of risk of default or other credit event occurring as defined under the terms of the agreement. |
| # | Notional amount is shown in U.S. dollars unless otherwise stated. |
Various inputs are used in determining the value of the Portfolio’s investments. These inputs are summarized in the three broad levels listed below.
Level 1—quoted prices generally for securities actively traded on a regulated securities exchange and for open-end mutual funds which trade at daily net asset value.
Level 2—other significant observable inputs (including, but not limited to, quoted prices for similar securities, interest rates, prepayment speeds, foreign currency exchange rates, and amortized cost) generally for debt securities, swaps, forward foreign currency contracts and for foreign stocks priced using vendor modeling tools.
Level 3—significant unobservable inputs for securities valued in accordance with Board approved fair valuation procedures.
See Notes to Financial Statements.
| | | | |
| 132 | | | THE TARGET PORTFOLIO TRUST | |
The following is a summary of the inputs used as of October 31, 2011 in valuing such portfolio securities:
| | | | | | | | | | | | |
| | | Level 1 | | | Level 2 | | | Level 3 | |
| Investments in Securities | | | | | | | | | | | | |
Asset-Backed Securities | | $ | — | | | $ | 2,886,094 | | | $ | — | |
Bank Loans | | | — | | | | 1,726,041 | | | | — | |
Commercial Mortgage-Backed Securities | | | — | | | | 4,608,672 | | | | — | |
Corporate Bonds | | | — | | | | 122,016,992 | | | | — | |
Foreign Government Bonds | | | — | | | | 24,364,836 | | | | — | |
Municipal Bonds | | | — | | | | 5,902,041 | | | | — | |
Residential Mortgage-Backed Securities | | | — | | | | 11,622,942 | | | | — | |
U.S. Government Agency Obligations | | | — | | | | 573,421 | | | | — | |
U.S. Government Mortgage Backed Obligations | | | — | | | | 4,372,780 | | | | — | |
U.S. Treasury Obligations | | | — | | | | 9,943,056 | | | | — | |
Certificate of Deposits | | | — | | | | 2,191,826 | | | | — | |
Options Purchased | | | — | | | | 284,918 | | | | — | |
Options Written | | | — | | | | (304,259 | ) | | | — | |
| Other Financial Instruments* | | | | | | | | | | | | |
Futures | | | 798,225 | | | | — | | | | — | |
Forward foreign currency exchange contracts | | | — | | | | (2,133,716 | ) | | | — | |
Interest rate swap agreements | | | (26,677 | ) | | | 765,126 | | | | — | |
Credit default swap agreements | | | — | | | | 712,497 | | | | — | |
| | | | | | | | | | | | |
Total | | $ | 771,548 | | | $ | 189,533,267 | | | $ | — | |
| | | | | | | | | | | | |
| * | Other financial instruments are derivative instruments not reflected in the Portfolio of Investments, such as futures, forwards and swap contracts, which are recorded at the unrealized appreciation/depreciation on the instrument. |
| | | | | | | | |
| | | Asset-Backed
Securities | | | Commercial Mortgage-
Backed Securities | |
| Balance as of 10/31/10 | | $ | 473,796 | | | $ | 1,904,507 | |
Accrued discounts/premiums | | | — | | | | — | |
Realized gain (loss) | | | — | | | | — | |
Change in unrealized appreciation (depreciation) | | | — | | | | — | |
Purchases | | | — | | | | — | |
Sales | | | — | | | | — | |
Transfers into Level 3 | | | — | | | | — | |
Transfers out of Level 3 | | | (473,796 | ) | | | (1,904,507 | ) |
| | | | | | | | |
| Balance as of 10/31/11 | | $ | — | | | $ | — | |
| | | | | | | | |
It is the Portfolio’s policy to recognize transfers in and transfers out at the fair value as of the beginning of the period. At the reporting period end, there were two Commercial Mortgage-Backed securities and one Asset-Backed security transferred out of Level 3 as a result of being priced by a vendor.
The industry classification of investments and other liabilities in excess of other assets shown as a percentage of net assets as of October 31, 2011 were as follows:
| | | | |
Diversified Financial Services | | | 15.6 | % |
Foreign Government Bonds | | | 13.4 | |
Commercial Banks | | | 12.6 | |
Residential Mortgage-Backed Securities | | | 6.4 | |
U.S. Treasury Obligations | | | 5.5 | |
Oil, Gas & Consumable Fuels | | | 5.0 | |
See Notes to Financial Statements.
| | | | |
| THE TARGET PORTFOLIO TRUST | | | 133 | |
| | |
Intermediate-Term Bond Portfolio (continued) | | Portfolio of Investments
As of October 31, 2011 |
| | | | |
Industry (cont’d.) | | | |
Financial—Bank & Trust | | | 4.9 | % |
Insurance | | | 3.9 | |
Media | | | 3.8 | |
Municipal Bonds | | | 3.2 | |
Pipelines | | | 3.2 | |
Commercial Mortgage-Backed Securities | | | 2.5 | |
Electric | | | 2.4 | |
U.S. Government Mortgage-Backed Obligations | | | 2.4 | |
Building & Construction | | | 2.3 | |
Metals & Mining | | | 2.0 | |
Telecommunications | | | 1.7 | |
Asset-Backed Securities | | | 1.6 | |
Auto Manufacturers | | | 1.3 | |
Certificate Of Deposits | | | 1.2 | |
Chemicals | | | 1.1 | |
Investment Companies | | | 1.1 | |
Electric—Integrated | | | 1.0 | |
Bank Loans | | | 0.9 | |
Airlines | | | 0.9 | |
Software | | | 0.7 | |
Real Estate Investment Trusts | | | 0.7 | |
Electronics | | | 0.7 | |
Food | | | 0.7 | |
Tobacco | | | 0.6 | |
Hotels | | | 0.4 | |
U.S. Government Agency Obligations | | | 0.3 | |
Healthcare—Services | | | 0.3 | |
Options Purchased | | | 0.2 | |
| | | | |
| | | 104.5 | |
Options Written | | | (0.2 | ) |
Liabilities in excess of other assets | | | (4.3 | ) |
| | | | |
| | | 100.0 | % |
| | | | |
See Notes to Financial Statements.
| | | | |
| 134 | | | THE TARGET PORTFOLIO TRUST | |
| | |
Portfolio of Investments
As of October 31, 2011 | | Mortgage Backed Securities Portfolio |
| | | | | | | | | | |
| | | PRINCIPAL AMOUNT (000)# | | | DESCRIPTION | | VALUE (NOTE 1) | |
| | | | | | LONG-TERM INVESTMENTS—131.3% | | | | |
| | | |
| | | | | | COMMERCIAL MORTGAGE-BACKED SECURITY—1.5% | | | | |
| | $ | 523 | | | Bear Stearns Commercial Mortgage Securities,
Series 2004-PWR4, Class A2
5.286%(c), 06/11/41
(cost $425,656) | | $ | 543,841 | |
| | | | | | | | | | |
| | | |
| | | | | | RESIDENTIAL MORTGAGE-BACKED SECURITIES—20.0% | | | | |
| | | 221 | | | Citigroup Mortgage Loan Trust, Inc.,
Series 2006-AR1, Class 3A1
2.69%(c), 03/25/36 | | | 135,388 | |
| | | 174 | | | Countrywide Alternative Loan Trust,
Series 2005-73CB, Class 1A7
5.50%, 01/25/36 | | | 161,417 | |
| | | 412 | | | Series 2005-85CB, Class 2A2
5.50%, 02/25/36 | | | 287,802 | |
| | | 584 | | | Series 2005-J11, Class 1A3
5.50%, 11/25/35 | | | 528,158 | |
| | | 404 | | | Series 2007-HY5R, Class 2A1A
5.544%(c), 03/25/47 | | | 389,907 | |
| | | 349 | | | Countrywide Home Loan Mortgage Pass-Through Trust,
Series 2006-14, Class A3
6.25%, 09/25/36 | | | 329,721 | |
| | | | | | Series 2006-J2, Class 1A6 | | | | |
| | | 88 | | | 6.00%, 04/25/36 | | | 70,250 | |
| | | 12 | | | Federal Home Loan Mortgage Corp.,
Series 74, Class F
6.00%, 10/15/20 | | | 12,715 | |
| | | 2 | | | Series 83, Class Z
9.00%, 10/15/20 | | | 2,208 | |
| | | 19 | | | Series 186, Class E
6.00%, 08/15/21 | | | 20,931 | |
| | | 5 | | | Series 1058, Class H
8.00%, 04/15/21 | | | 5,403 | |
| | | 4 | | | Series 1116, Class I
5.50%, 08/15/21 | | | 4,807 | |
| | | 23 | | | Series 1120, Class L
8.00%, 07/15/21 | | | 26,671 | |
| | | 425 | | | Series 2809, Class UC
4.00%, 06/15/19 | | | 450,132 | |
| | | 675 | | | Series 2995, Class ST, IO
6.507%(c), 05/15/29 | | | 117,544 | |
| | | 2,020 | | | Series 3279, Class SD, IO
6.187%(c), 02/15/37 | | | 266,146 | |
See Notes to Financial Statements.
| | | | |
| THE TARGET PORTFOLIO TRUST | | | 135 | |
| | |
Mortgage Backed Securities Portfolio (continued) | | Portfolio of Investments
As of October 31, 2011 |
| | | | | | | | | | |
| | | PRINCIPAL AMOUNT (000)# | | | DESCRIPTION | | VALUE (NOTE 1) | |
| | | | | | RESIDENTIAL MORTGAGE-BACKED SECURITIES (continued) | | | | |
| | $ | 1,890 | | | Series 3309, Class SC, IO
6.207%(c), 04/15/37 | | $ | 272,212 | |
| | | 285 | | | Series 3787, Class AY
3.50%, 01/15/26 | | | 293,000 | |
| | | 330 | | | Series 3840, Class HB
3.50%, 04/15/26 | | | 334,871 | |
| | | 150 | | | Federal Home Loan Mortgage Corp. Structured Pass-Through Securities,
Series T-42, Class A5
7.50%, 02/25/42 | | | 181,515 | |
| | | 7 | | | Federal National Mortgage Assoc.,
Series 56, Class 1
6.00%, 04/01/19 | | | 7,874 | |
| | | 7 | | | Series 1988-19, Class J
8.50%, 07/25/18 | | | 8,113 | |
| | | 3 | | | Series 1990-10, Class L
8.50%, 02/25/20 | | | 3,834 | |
| | | 8 | | | Series 1990-108, Class G
7.00%, 09/25/20 | | | 8,522 | |
| | | 7 | | | Series 1991-21, Class J
7.00%, 03/25/21 | | | 8,277 | |
| | | 15 | | | Series 1992-113, Class Z
7.50%, 07/25/22 | | | 17,229 | |
| | | 199 | | | Series 1993-223, Class ZA
6.50%, 12/25/23 | | | 226,590 | |
| | | 144 | | | Series 2001-51, Class QN
6.00%, 10/25/16 | | | 154,405 | |
| | | 90 | | | Series 2003-33, Class PT
4.50%, 05/25/33 | | | 97,447 | |
| | | 1,277 | | | Series 2007-22, Class SD, IO
6.155%(c), 03/25/37 | | | 191,541 | |
| | | 285 | | | Series 2011-67, Class BE
3.50%, 07/25/26 | | | 291,025 | |
| | | 10 | | | Series G-14, Class L
8.50%, 06/25/21 | | | 12,392 | |
| | | 11 | | | Series G92-24, Class Z
6.50%, 04/25/22 | | | 11,914 | |
| | | 56 | | | Series G92-59, Class D
6.00%, 10/25/22 | | | 60,769 | |
| | | 184 | | | Series G94-4, Class PG
8.00%, 05/25/24 | | | 210,827 | |
| | | 22 | | | First Boston Mortgage Securities Corp.,
Series B, Class I-O, IO
8.985%, 04/25/17 | | | 2,817 | |
| | | | | | Series B, Class P-O, PO | | | | |
| | | 22 | | | 2.32%(s), 04/25/17 | | | 21,344 | |
See Notes to Financial Statements.
| | | | |
| 136 | | | THE TARGET PORTFOLIO TRUST | |
| | | | | | | | | | |
| | | PRINCIPAL AMOUNT (000)# | | | DESCRIPTION | | VALUE (NOTE 1) | |
| | | | | | RESIDENTIAL MORTGAGE-BACKED SECURITIES (continued) | | | | |
| | $ | 91 | | | Government National Mortgage Assoc.,
Series 2006-35, Class LO, PO
2.98%(s), 07/20/36 | | $ | 81,620 | |
| | | 842 | | | Series 2006-38, Class XS, IO
7.007%(c), 09/16/31 | | | 175,760 | |
| | | 81 | | | GSR Mortgage Loan Trust,
Series 2005-AR2, Class 1A2
2.845%(c), 04/25/35 | | | 63,237 | |
| | | 251 | | | Series 2007-AR1, Class 2A1
3.988%(c), 03/25/47 | | | 157,800 | |
| | | 239 | | | Series 2007-AR2, Class 1A1
5.413%(c), 05/25/47 | | | 144,720 | |
| | | 325 | | | JPMorgan Mortgage Trust,
Series 2007-S2, Class 2A3
5.50%, 06/25/37 | | | 290,867 | |
| | | 6 | | | Morgan Stanley Mortgage Loan Trust,
Series 2004-5AR, Class 3A4
2.437%(c), 07/25/34 | | | 6,275 | |
| | | 184 | | | Series 2007-12, Class 3A22
6.00%, 08/25/37 | | | 156,264 | |
| | | 607 | | | Residential Asset Securitization Trust,
Series 2004-A3, Class A7
5.25%, 06/25/34 | | | 615,527 | |
| | | 165 | | | Wells Fargo Mortgage Backed Securities Trust,
Series 2006-AR10, Class 5A2
2.734%(c), 07/25/36 | | | 120,154 | |
| | | | | | | | | | |
| | | | | | TOTAL RESIDENTIAL MORTGAGE-BACKED SECURITIES
(cost $6,669,356) | | | 7,037,942 | |
| | | | | | | | | | |
| | | |
| | | | | | U.S. GOVERNMENT MORTGAGE-BACKED OBLIGATIONS—109.8% | | | | |
| | | 300 | | | Federal Home Loan Mortgage Corp.
3.50%, TBA | | | 304,219 | |
| | | 5,300 | | | 4.00%, TBA | | | 5,497,094 | |
| | | 2,146 | | | 5.00%, 10/01/35 | | | 2,306,846 | |
| | | 722 | | | 6.00%, 01/01/15-02/01/21 | | | 780,797 | |
| | | 66 | | | 6.50%, 01/01/18-06/01/22 | | | 72,668 | |
| | | 19 | | | 7.50%, 06/01/28 | | | 22,062 | |
| | | 2 | | | 8.50%, 04/01/18 | | | 2,610 | |
| | | 16 | | | 11.50%, 03/01/16 | | | 19,145 | |
| | | 1,100 | | | Federal National Mortgage Assoc.
3.50%, TBA | | | 1,142,797 | |
| | | 1,640 | | | 4.35%, 07/01/20 | | | 1,797,534 | |
| | | 1,239 | | | 4.50%, 05/01/35 | | | 1,321,247 | |
| | | 1,071 | | | 4.57%, 06/01/20 | | | 1,187,764 | |
| | | 2,494 | | | 5.00%, 11/01/18-08/01/35 | | | 2,690,870 | |
| | | 283 | | | 5.00%, 07/01/33-09/01/34(k) | | | 305,494 | |
| | | 1,000 | | | 5.50%, TBA | | | 1,083,437 | |
| | | 848 | | | 5.50%, 06/01/33-05/01/36 | | | 927,338 | |
| | | 435 | | | 6.00%, 04/01/14-12/01/39 | | | 477,501 | |
| | | 1,300 | | | 6.00%, TBA | | | 1,424,516 | |
See Notes to Financial Statements.
| | | | |
| THE TARGET PORTFOLIO TRUST | | | 137 | |
| | |
Mortgage Backed Securities Portfolio (continued) | | Portfolio of Investments
As of October 31, 2011 |
| | | | | | | | | | |
| | | PRINCIPAL AMOUNT (000)# | | | DESCRIPTION | | VALUE (NOTE 1) | |
| | | | | | U.S. GOVERNMENT MORTGAGE-BACKED OBLIGATIONS (continued) | | | | |
| | $ | 19 | | | 6.02%, 03/01/12 | | $ | 19,019 | |
| | | 429 | | | 6.50%, 05/01/14-08/01/17 | | | 458,296 | |
| | | 400 | | | 6.50%, TBA | | | 440,812 | |
| | | 1 | | | 7.00%, 05/01/12-07/01/12 | | | 1,105 | |
| | | 15 | | | 8.00%, 09/01/22-12/01/22 | | | 16,031 | |
| | | 2 | | | 9.75%, 11/01/16 | | | 2,480 | |
| | | 2,000 | | | Government National Mortgage Assoc.
3.50%, TBA | | | 2,072,188 | |
| | | 5,500 | | | 4.00%, TBA | | | 5,866,094 | |
| | | 2,200 | | | 4.50%, TBA | | | 2,391,125 | |
| | | 2,900 | | | 5.50%, TBA | | | 3,218,547 | |
| | | 111 | | | 6.00%, 07/15/24-08/15/24 | | | 123,840 | |
| | | 1,140 | | | 6.50%, 06/15/23-12/15/35 | | | 1,289,473 | |
| | | 932 | | | 7.00%, 11/15/31-11/15/33 | | | 1,087,255 | |
| | | 15 | | | 7.50%, 07/20/17-12/20/23 | | | 16,914 | |
| | | 237 | | | 8.00%, 03/15/17-11/15/30 | | | 258,010 | |
| | | 33 | | | 8.25%, 06/20/17-07/20/17 | | | 36,148 | |
| | | 36 | | | 8.50%, 04/20/17 | | | 40,917 | |
| | | 41 | | | 9.00%, 01/15/20 | | | 47,634 | |
| | | — | (r) | | 9.50%, 06/15/20 | | | 469 | |
| | | | | | | | | | |
| | | | | | TOTAL U.S. GOVERNMENT MORTGAGE-BACKED OBLIGATIONS
(cost $37,307,912) | | | 38,750,296 | |
| | | | | | | | | | |
| | | | | | TOTAL LONG-TERM INVESTMENTS
(cost $44,402,924) | | | 46,332,079 | |
| | | | | | | | | | |
| | | SHARES | | | SHORT-TERM INVESTMENT—30.9% | | | |
| | | | | | AFFILIATED MONEY MARKET MUTUAL FUND | | | | |
| | | 10,898,071 | | | Prudential Investment Portfolios 2—Prudential Core Taxable Money Market Fund (cost $10,898,071)(w) | | | 10,898,071 | |
| | | | | | | | | | |
| | | | | | TOTAL INVESTMENTS, BEFORE SECURITY SOLD SHORT—162.2%
(cost $55,300,995; Note 5) | | | 57,230,150 | |
| | | | | | | | | | |
| | | PRINCIPAL
AMOUNT (000)# | | | SECURITY SOLD SHORT—(8.8%) | | | |
| | | | | | U.S. GOVERNMENT MORTGAGE-BACKED OBLIGATIONS | | | | |
| | | | | | Federal National Mortgage Assoc. | | | | |
| | $ | 3,000 | | | 4.00%, TBA
(proceeds received $3,112,500) | | | (3,118,125 | ) |
| | | | | | | | | | |
| | | | | | TOTAL INVESTMENTS, NET OF SECURITY SOLD SHORT—153.4%
(cost $52,188,495; Note 5) | | | 54,112,025 | |
| | | | | | Liabilities in excess of other assets(x)—(53.4%) | | | (18,830,962 | ) |
| | | | | | | | | | |
| | | | | | NET ASSETS—100% | | $ | 35,281,063 | |
| | | | | | | | | | |
The following abbreviations are used in the Portfolio descriptions:
IO—Interest Only
See Notes to Financial Statements.
| | | | |
| 138 | | | THE TARGET PORTFOLIO TRUST | |
PO—Principal Only
TBA—To Be Announced
| # | Principal amount is shown in U.S. dollars unless otherwise stated. |
| (c) | Variable rate instrument. The interest rate shown reflects the rate in effect at October 31, 2011. |
| (k) | Represents security, or a portion thereof, segregated as collateral for futures contracts. |
| (s) | Represents zero coupon bond or step coupon bond. Rate quoted represents effective yield at October 31, 2011. |
| (w) | Prudential Investments LLC, the manager of the Portfolio, also serves as manager of the Prudential Investment Portfolios 2-Prudential Core Taxable Money Market Fund. |
| (x) | Includes net unrealized appreciation (depreciation) on the following derivative contracts held at reporting period end: |
Futures contracts open at October 31, 2011:
| | | | | | | | | | | | | | | | |
Number of
Contracts | | Type | | Expiration
Date | | Value at
Trade Date | | | Value at
October 31,
2011 | | | Unrealized
Appreciation
(Depreciation) | |
| Long Positions: | | | | | | | | | | | | | | | | |
| 13 | | 90 Day Euro Dollar | | Dec. 2011 | | $ | 3,233,946 | | | $ | 3,233,588 | | | $ | (358 | ) |
| | | | | | | | | | | | | | | | |
| Short Positions: | | | | | | | | | | | | | | | | |
| 29 | | 2 Year U.S. Treasury Notes | | Dec. 2011 | | | 6,394,953 | | | | 6,388,156 | | | | 6,797 | |
| 7 | | 10 Year U.S. Treasury Notes | | Dec. 2011 | | | 895,782 | | | | 903,438 | | | | (7,656 | ) |
| | | | | | | | | | | | | | | | |
| | | | | | | | | | | | | | | (859 | ) |
| | | | | | | | | | | | | | | | |
| | | | | | | | | | | | | | $ | (1,217 | ) |
| | | | | | | | | | | | | | | | |
Interest rate swap agreements outstanding at October 31, 2011:
| | | | | | | | | | | | | | | | | | | | | | | | | | |
Notional Amount (000)# | | | Termination
Date | | | Fixed
Rate | | | Floating
Rate | | Fair
Value | | | Upfront
Premiums
Paid
(Received) | | | Unrealized
Depreciation | | | Counterparty |
| $ | 2,250 | | | | 06/24/20 | | | | 5.37 | % | | 3 Month LIBOR(1) | | $ | (233,597 | ) | | $ | — | | | $ | (233,597 | ) | | Goldman Sachs |
| | 5,500 | | | | 05/26/12 | | | | 1.21 | % | | 3 Month LIBOR(1) | | | (47,991 | ) | | | — | | | | (47,991 | ) | | Goldman Sachs |
| | | | | | | | | | | | | | | | | | | | | | | | | | |
| | | | | | | | | | | | | | $ | (281,588 | ) | | $ | — | | | $ | (281,588 | ) | | |
| | | | | | | | | | | | | | | | | | | | | | | | | | |
| (1) | Portfolio pays the fixed rate and receives the floating rate. |
| # | Notional Amount is shown in U.S. dollars unless otherwise stated. |
Total Return swap agreements outstanding at October 31, 2011:
| | | | | | | | | | | | | | | | | | | | | | |
Description | | Termination
Date | | | Notional
Amount
(000)# | | | Fair
Value | | | Upfront
Premiums
Paid
(Received) | | | Unrealized
Appreciation
(Depreciation) | | | Counterparty |
Receive fixed rate payments on IOS.FN30.550.08 Index and pay variable payments on the one month LIBOR. | | | 01/12/39 | | | $ | 769 | | | $ | (8,232 | ) | | $ | (3,701 | ) | | $ | (4,531 | ) | | Goldman Sachs |
Receive fixed rate payments on IOS.FN30.600.08 Index and pay variable payments on the one month LIBOR. | | | 01/12/39 | | | | 335 | | | | (2,817 | ) | | | (3,932 | ) | | | 1,115 | | | Goldman Sachs |
Receive fixed rate payments on IOS.FN30.600.08 Index and pay variable payments on the one month LIBOR. | | | 01/12/39 | | | | 232 | | | | (1,952 | ) | | | (1,330 | ) | | | (622 | ) | | Goldman Sachs |
See Notes to Financial Statements.
| | | | |
| THE TARGET PORTFOLIO TRUST | | | 139 | |
| | |
Mortgage Backed Securities Portfolio (continued) | | Portfolio of Investments
As of October 31, 2011 |
Total Return swap agreements outstanding at October 31, 2011 (continued):
| | | | | | | | | | | | | | | | | | | | | | |
Description | | Termination
Date | | | Notional
Amount
(000)# | | | Fair
Value | | | Upfront
Premiums
Paid
(Received) | | | Unrealized
Appreciation
(Depreciation) | | | Counterparty |
Receive fixed rate payments on IOS.FN30.600.08 Index and pay variable payments on the one month LIBOR. | | | 01/12/39 | | | $ | 425 | | | $ | (3,577 | ) | | $ | (2,375 | ) | | $ | (1,202 | ) | | Goldman Sachs |
| | | | | | | | | | | | | | | | | | | | | | |
| | | | | | | | | | $ | (16,578 | ) | | $ | (11,338 | ) | | $ | (5,240 | ) | | |
| | | | | | | | | | | | | | | | | | | | | | |
| # | Notional Amount is shown in U.S. dollars unless otherwise stated. |
Various inputs are used in determining the value of the Portfolio’s investments. These inputs are summarized in the three broad levels listed below.
Level 1—quoted prices generally for securities actively traded on a regulated securities exchange and for open-end mutual funds which trade at daily net asset value.
Level 2—other significant observable inputs (including, but not limited to, quoted prices for similar securities, interest rates, prepayment speeds, foreign currency exchange rates, and amortized cost) generally for debt securities, swaps, forward foreign currency contracts and for foreign stocks priced using vendor modeling tools.
Level 3—significant unobservable inputs for securities valued in accordance with Board approved fair valuation procedures.
The following is a summary of the inputs used as of October 31, 2011 in valuing such portfolio securities:
| | | | | | | | | | | | |
| | | Level 1 | | | Level 2 | | | Level 3 | |
| Investments in Securities | | | | | | | | | | | | |
Commerical Mortgage-Backed Security | | $ | — | | | $ | 543,841 | | | $ | — | |
Residential Mortgage-Backed Securities | | | — | | | | 7,037,942 | | | | — | |
U.S. Government Mortgage-Backed Obligations | | | — | | | | 38,750,296 | | | | — | |
Affiliated Money Market Mutual Fund | | | 10,898,071 | | | | — | | | | — | |
Security Sold Short—U.S. Government Mortgage-Backed Obligation | | | — | | | | (3,118,125 | ) | | | — | |
| Other Financial Instruments* | | | | | | | | | | | | |
Futures | | | (1,217 | ) | | | — | | | | — | |
Interest rate swap agreements | | | — | | | | (281,588 | ) | | | — | |
Total return swap agreements | | | — | | | | (5,240 | ) | | | — | |
| | | | | | | | | | | | |
Total | | $ | 10,896,854 | | | $ | 42,927,126 | | | $ | — | |
| | | | | | | | | | | | |
| * | Other financial instruments are derivative instruments not reflected in the Portfolio of Investments, such as futures, forwards and swap contracts, which are recorded at the unrealized appreciation/depreciation on the instrument. |
The industry classification of investments and liabilities in excess of other assets shown as a percentage of net assets as of October 31, 2011 were as follows:
| | | | |
U.S. Government Mortgage-Backed Obligations | | | 109.8 | % |
Affiliated Money Market Mutual Fund | | | 30.9 | |
Residential Mortgage-Backed Securities | | | 20.0 | |
Commercial Mortgage-Backed Security | | | 1.5 | |
| | | | |
| | | 162.2 | |
Security Sold Short | | | (8.8 | ) |
Liabilities in excess of other assets | | | (53.4 | ) |
| | | | |
| | | 100.0 | % |
| | | | |
See Notes to Financial Statements.
| | | | |
| 140 | | | THE TARGET PORTFOLIO TRUST | |
Statement of Assets and Liabilities October 31, 2011
| | | | | | | | | | | | | | | | |
| | | LARGE
CAPITALIZATION
GROWTH
PORTFOLIO | | | LARGE
CAPITALIZATION
VALUE
PORTFOLIO | | | SMALL
CAPITALIZATION
GROWTH
PORTFOLIO | | | SMALL
CAPITALIZATION
VALUE
PORTFOLIO | |
| | | | |
| ASSETS | | | | | | | | | | | | | | | | |
Investments, at value(G): | | | | | | | | | | | | | | | | |
Unaffiliated investments(A) | | $ | 197,755,720 | | | $ | 195,191,878 | | | $ | 95,672,017 | | | $ | 911,452,140 | |
Affiliated investments(B) | | | 12,956,905 | | | | 11,445,656 | | | | 20,853,670 | | | | 181,169,360 | |
Repurchase agreements(C) | | | — | | | | — | | | | — | | | | — | |
Cash | | | — | | | | — | | | | — | | | | — | |
Deposit with broker | | | — | | | | — | | | | — | | | | — | |
Foreign currency, at value(D) | | | — | | | | — | | | | — | | | | — | |
Receivable for Trust shares sold | | | 198,111 | | | | 155,211 | | | | 117,532 | | | | 1,746,617 | |
Dividends and interest receivable | | | 103,409 | | | | 283,625 | | | | 15,529 | | | | 706,155 | |
Receivable for investments sold | | | 2,282,478 | | | | 413,555 | | | | 168,006 | | | | 4,396,055 | |
Receivable for foreign tax reclaim | | | 2,663 | | | | 3,179 | | | | — | | | | — | |
Due from broker for variation margin | | | — | | | | — | | | | — | | | | — | |
Payments made for swap agreements | | | — | | | | — | | | | — | | | | — | |
Unrealized appreciation on swaps | | | — | | | | — | | | | — | | | | — | |
Unrealized appreciation on forward currency contracts | | | — | | | | — | | | | — | | | | — | |
Prepaid expenses and other assets | | | 3,517 | | | | 5,517 | | | | 1,734 | | | | 16,446 | |
Total assets | | | 213,302,803 | | | | 207,498,621 | | | | 116,828,488 | | | | 1,099,486,773 | |
| | | | |
| LIABILITIES | | | | | | | | | | | | | | | | |
Collateral for securities on loan | | | 6,791,528 | | | | 6,097,256 | | | | 20,403,240 | | | | 131,538,899 | |
Payable for Trust shares reacquired | | | 213,545 | | | | 172,834 | | | | 80,688 | | | | 1,481,383 | |
Payable for investments purchased | | | 1,614,439 | | | | 350,461 | | | | — | | | | 5,579,163 | |
Accrued expenses and other liabilities | | | 104,078 | | | | 99,371 | | | | 98,381 | | | | 227,203 | |
Management fee payable | | | 99,922 | | | | 97,945 | | | | 46,012 | | | | 460,932 | |
Affiliated transfer agent fee payable | | | 23,610 | | | | 23,391 | | | | 10,471 | | | | 41,543 | |
Deferred trustees’ fees | | | 6,108 | | | | 6,108 | | | | 6,108 | | | | 6,108 | |
Distribution fee payable | | | 45,406 | | | | 45,911 | | | | 20,671 | | | | 27,818 | |
Dividends payable | | | — | | | | — | | | | — | | | | — | |
Due to broker for variation margin | | | — | | | | — | | | | — | | | | 88,320 | |
Options written(E) | | | — | | | | — | | | | — | | | | — | |
Payments received for swap agreements | | | — | | | | — | | | | — | | | | — | |
Unrealized depreciation on swaps | | | — | | | | — | | | | — | | | | — | |
Unrealized depreciation on forward currency contracts | | | — | | | | — | | | | — | | | | — | |
Securities sold short, at value(F) | | | — | | | | — | | | | — | | | | — | |
Total liabilities | | | 8,898,636 | | | | 6,893,277 | | | | 20,665,571 | | | | 139,451,369 | |
| | | | |
| NET ASSETS | | $ | 204,404,167 | | | $ | 200,605,344 | | | $ | 96,162,917 | | | $ | 960,035,404 | |
See Notes to Financial Statements.
| | | | |
| THE TARGET PORTFOLIO TRUST | | | 141 | |
Statement of Assets and Liabilities October 31, 2011 (continued)
| | | | | | | | | | | | | | | | |
| | | LARGE
CAPITALIZATION
GROWTH
PORTFOLIO | | | LARGE
CAPITALIZATION
VALUE
PORTFOLIO | | | SMALL
CAPITALIZATION
GROWTH
PORTFOLIO | | | SMALL
CAPITALIZATION
VALUE
PORTFOLIO | |
Net assets were comprised of: | | | | | | | | | | | | | | | | |
Shares of beneficial interest, at par | | $ | 15,003 | | | $ | 20,179 | | | $ | 8,671 | | | $ | 47,243 | |
Paid-in capital, in excess of par | | | 201,534,305 | | | | 265,161,264 | | | | 111,649,928 | | | | 791,811,339 | |
| | | 201,549,308 | | | | 265,181,443 | | | | 111,658,599 | | | | 791,858,582 | |
Undistributed net investment income (loss) | | | 289,690 | | | | 2,532,739 | | | | (6,108 | ) | | | 7,392,063 | |
Accumulated net realized gains (losses) | | | (41,878,468 | ) | | | (93,854,511 | ) | | | (29,758,740 | ) | | | 17,743,802 | |
Net unrealized appreciation (depreciation) | | | 44,443,637 | | | | 26,745,673 | | | | 14,269,166 | | | | 143,040,957 | |
Net assets, October 31, 2011 | | $ | 204,404,167 | | | $ | 200,605,344 | | | $ | 96,162,917 | | | $ | 960,035,404 | |
(A) Identified cost of unaffiliated investments | | $ | 153,312,609 | | | $ | 168,446,205 | | | $ | 81,402,851 | | | $ | 768,762,263 | |
(B) Identified cost of affiliated investments | | $ | 12,956,905 | | | $ | 11,445,656 | | | $ | 20,853,670 | | | $ | 181,169,360 | |
(C) Identified cost of repurchase agreements | | | — | | | | — | | | | — | | | | — | |
(D) Identified cost of currency | | | — | | | | — | | | | — | | | | — | |
(E) Premiums received from options written | | | — | | | | — | | | | — | | | | — | |
(F) Proceeds received from short sales | | | — | | | | — | | | | — | | | | — | |
(G) Including securities on loan of | | $ | 6,425,843 | | | $ | 5,784,691 | | | $ | 19,067,703 | | | $ | 125,093,334 | |
| | | | |
| NET ASSET VALUE: | | | | | | | | | | | | | | | | |
Class R: | | | | | | | | | | | | | | | | |
Net Assets | | $ | 112,254,775 | | | $ | 113,434,350 | | | $ | 52,325,340 | | | $ | 69,790,336 | |
Shares Outstanding | | | 8,277,589 | | | | 11,437,707 | | | | 4,769,952 | | | | 3,460,247 | |
Net asset value, offering price and redemption price per share | | $ | 13.56 | | | $ | 9.92 | | | $ | 10.97 | | | $ | 20.17 | |
Class T: | | | | | | | | | | | | | | | | |
Net Assets | | $ | 92,149,392 | | | $ | 87,170,994 | | | $ | 43,837,577 | | | $ | 890,245,068 | |
Shares Outstanding | | | 6,725,605 | | | | 8,740,911 | | | | 3,900,904 | | | | 43,783,103 | |
Net asset value, offering price and redemption price per share | | $ | 13.70 | | | $ | 9.97 | | | $ | 11.24 | | | $ | 20.33 | |
See Notes to Financial Statements.
| | | | |
| 142 | | | THE TARGET PORTFOLIO TRUST | |
Statement of Assets and Liabilities October 31, 2011 (continued)
| | | | | | | | | | | | | | | | |
| | | INTERNATIONAL
EQUITY
PORTFOLIO | | | TOTAL RETURN
BOND
PORTFOLIO | | | INTERMEDIATE-
TERM BOND
PORTFOLIO | | | MORTGAGE
BACKED
SECURITIES
PORTFOLIO | |
| | | | |
| ASSETS | | | | | | | | | | | | | | | | |
Investments, at value(G): | | | | | | | | | | | | | | | | |
Unaffiliated investments(A) | | $ | 281,815,803 | | | $ | 440,117,109 | | | $ | 190,493,619 | | | $ | 46,332,079 | |
Affiliated investments(B) | | | 8,014,802 | | | | 715,090 | | | | — | | | | 10,898,071 | |
Repurchase agreements(C) | | | — | | | | 8,200,000 | | | | — | | | | — | |
Cash | | | — | | | | — | | | | 1,632,121 | | | | — | |
Deposit with broker | | | — | | | | 532,851 | | | | 315,562 | | | | 280,000 | |
Foreign currency, at value(D) | | | 780,733 | | | | 125,803 | | | | 331,239 | | | | ��� | |
Receivable for Trust shares sold | | | 247,728 | | | | 597,938 | | | | 255,141 | | | | 1,054,383 | |
Dividends and interest receivable | | | 758,714 | | | | 3,393,809 | | | | 1,685,335 | | | | 113,584 | |
Receivable for investments sold | | | — | | | | 59,543,906 | | | | 2,398,491 | | | | 3,758,207 | |
Receivable for foreign tax reclaim | | | 397,251 | | | | — | | | | — | | | | — | |
Due from broker for variation margin | | | — | | | | 544,122 | | | | — | | | | — | |
Payments made for swap agreements | | | — | | | | 452,257 | | | | 675,103 | | | | — | |
Unrealized appreciation on swaps | | | — | | | | 1,950,921 | | | | 1,624,407 | | | | 1,115 | |
Unrealized appreciation on forward currency contracts | | | 257,754 | | | | 725,465 | | | | 131,812 | | | | — | |
Due from affiliated transfer agent | | | 38,805 | | | | — | | | | — | | | | — | |
Prepaid expenses and other assets | | | 5,099 | | | | 5,885 | | | | 3,144 | | | | 717 | |
Total assets | | | 292,316,689 | | | | 516,905,156 | | | | 199,545,974 | | | | 62,438,156 | |
| | | | |
| LIABILITIES | | | | | | | | | | | | | | | | |
Collateral for securities on loan | | | — | | | | — | | | | — | | | | — | |
Payable for Trust shares reacquired | | | 259,118 | | | | 847,553 | | | | 963,006 | | | | 25,731 | |
Payable for investments purchased | | | — | | | | 76,166,059 | | | | 11,747,357 | | | | 23,610,016 | |
Accrued expenses and other liabilities | | | 155,188 | | | | 171,366 | | | | 121,176 | | | | 68,688 | |
Management fee payable | | | 167,343 | | | | 144,773 | | | | 69,832 | | | | 12,911 | |
Affiliated transfer agent fee payable | | | — | | | | 29,999 | | | | 12,025 | | | | 314 | |
Deferred trustees’ fees | | | 6,108 | | | | 6,108 | | | | 6,108 | | | | 6,108 | |
Payable to custodian | | | — | | | | 26,045,941 | | | | — | | | | — | |
Distribution fee payable | | | 44,123 | | | | 53,458 | | | | — | | | | — | |
Dividends payable | | | — | | | | 7,916 | | | | 9,947 | | | | 4,022 | |
Due to broker | | | — | | | | 2,140,000 | | | | 830,000 | | | | — | |
Due to broker for variation margin | | | — | | | | — | | | | 5,841 | | | | 11,897 | |
Options written(E) | | | — | | | | 351,457 | | | | 304,259 | | | | — | |
Payments received for swap agreements | | | — | | | | 1,006,838 | | | | 666,802 | | | | 11,338 | |
Unrealized depreciation on swaps | | | — | | | | 467,290 | | | | 173,461 | | | | 287,943 | |
Unrealized depreciation on forward currency contracts | | | — | | | | 2,728,717 | | | | 2,265,528 | | | | — | |
Securities sold short, at value(F) | | | — | | | | 24,302,656 | | | | — | | | | 3,118,125 | |
Total liabilities | | | 631,880 | | | | 134,470,131 | | | | 17,175,342 | | | | 27,157,093 | |
| | | | |
| NET ASSETS | | $ | 291,684,809 | | | $ | 382,435,025 | | | $ | 182,370,632 | | | $ | 35,281,063 | |
See Notes to Financial Statements.
| | | | |
| THE TARGET PORTFOLIO TRUST | | | 143 | |
Statement of Assets and Liabilities October 31, 2011 (continued)
| | | | | | | | | | | | | | | | |
| | | INTERNATIONAL
EQUITY
PORTFOLIO | | | TOTAL RETURN
BOND
PORTFOLIO | | | INTERMEDIATE-
TERM BOND
PORTFOLIO | | | MORTGAGE
BACKED
SECURITIES
PORTFOLIO | |
Net assets were comprised of: | | | | | | | | | | | | | | | | |
Shares of beneficial interest, at par | | $ | 26,365 | | | $ | 34,777 | | | $ | 17,375 | | | $ | 3,304 | |
Paid-in capital, in excess of par | | | 330,930,857 | | | | 372,870,794 | | | | 179,310,492 | | | | 37,355,712 | |
| | | 330,957,222 | | | | 372,905,571 | | | | 179,327,867 | | | | 37,359,016 | |
Undistributed net investment income (loss) | | | 4,975,136 | | | | 925,539 | | | | 3,412,137 | | | | 92,501 | |
Accumulated net realized gains (losses) | | | (34,028,134 | ) | | | (910,919 | ) | | | (182,667 | ) | | | (3,805,939 | ) |
Net unrealized appreciation (depreciation) | | | (10,219,415 | ) | | | 9,514,834 | | | | (186,705 | ) | | | 1,635,485 | |
Net assets, October 31, 2011 | | $ | 291,684,809 | | | $ | 382,435,025 | | | $ | 182,370,632 | | | $ | 35,281,063 | |
(A) Identified cost of unaffiliated investments | | $ | 292,319,920 | | | $ | 430,150,448 | | | $ | 190,831,465 | | | $ | 44,402,924 | |
(B) Identified cost of affiliated investments | | $ | 8,014,802 | | | $ | 715,090 | | | $ | — | | | $ | 10,898,071 | |
(C) Identified cost of repurchase agreements | | | — | | | $ | 8,200,000 | | | | — | | | | — | |
(D) Identified cost of currency | | $ | 764,003 | | | $ | 126,291 | | | $ | 324,307 | | | | — | |
(E) Premiums received from options written | | | — | | | $ | 416,073 | | | $ | 580,005 | | | | — | |
(F) Proceeds received from short sales | | | — | | | $ | 24,256,875 | | | | — | | | $ | 3,112,500 | |
(G) Including securities on loan of | | | — | | | | — | | | | — | | | | — | |
| | | | |
| NET ASSET VALUE: | | | | | | | | | | | | | | | | |
Class Q: | | | | | | | | | | | | | | | | |
Net Assets | | $ | 108,377,842 | | | | — | | | | — | | | | — | |
Shares Outstanding | | | 9,766,806 | | | | — | | | | — | | | | — | |
Net asset value, offering price and redemption price per share | | $ | 11.10 | | | | — | | | | — | | | | — | |
Class R: | | | | | | | | | | | | | | | | |
Net Assets | | $ | 108,715,111 | | | $ | 127,837,228 | | | | — | | | | — | |
Shares Outstanding | | | 9,865,592 | | | | 11,680,684 | | | | — | | | | — | |
Net asset value, offering price and redemption price per share | | $ | 11.02 | | | $ | 10.94 | | | | — | | | | — | |
Class T: | | | | | | | | | | | | | | | | |
Net Assets | | $ | 74,591,856 | | | $ | 254,597,797 | | | $ | 182,370,632 | | | $ | 35,281,063 | |
Shares Outstanding | | | 6,732,333 | | | | 23,096,081 | | | | 17,375,154 | | | | 3,303,971 | |
Net asset value, offering price and redemption price per share | | $ | 11.08 | | | $ | 11.02 | | | $ | 10.50 | | | $ | 10.68 | |
See Notes to Financial Statements.
| | | | |
| 144 | | | THE TARGET PORTFOLIO TRUST | |
Statement of Operations
Year Ended October 31, 2011
| | | | | | | | | | | | | | | | |
| | | LARGE
CAPITALIZATION
GROWTH
PORTFOLIO | | | LARGE
CAPITALIZATION
VALUE
PORTFOLIO | | | SMALL
CAPITALIZATION
GROWTH
PORTFOLIO | | | SMALL
CAPITALIZATION
VALUE
PORTFOLIO | |
| | | | |
| NET INVESTMENT INCOME (LOSS) | | | | | | | | | | | | | | | | |
Income | | | | | | | | | | | | | | | | |
Unaffiliated dividend income | | $ | 2,642,812 | | | $ | 5,475,381 | | | $ | 476,569 | | | $ | 15,405,073 | |
Affiliated dividend income | | | 11,046 | | | | 9,111 | | | | 1,891 | | | | 105,370 | |
Less: Foreign withholding taxes | | | (23,722 | ) | | | (35,608 | ) | | | — | | | | (79,251 | ) |
Affiliated income from securities lending, net | | | 58,178 | | | | 24,416 | | | | 156,187 | | | | 1,041,607 | |
Unaffiliated interest | | | — | | | | — | | | | — | | | | 594 | |
Total income | | | 2,688,314 | | | | 5,473,300 | | | | 634,647 | | | | 16,473,393 | |
Expenses | | | | | | | | | | | | | | | | |
Management fee | | | 1,272,088 | | | | 1,248,166 | | | | 587,312 | | | | 5,615,636 | |
Loan interest expense (Note 7) | | | 530 | | | | 245 | | | | 1,776 | | | | — | |
Distribution fee—Class R | | | 546,624 | | | | 542,035 | | | | 237,734 | | | | 316,759 | |
Transfer agent’s fees and expenses(a) | | | 233,000 | | | | 217,000 | | | | 119,000 | | | | 463,000 | |
Custodian’s fees and expenses | | | 134,000 | | | | 101,000 | | | | 63,000 | | | | 230,000 | |
Reports to shareholders | | | 42,000 | | | | 56,000 | | | | 51,000 | | | | 119,000 | |
Registration fees | | | 31,000 | | | | 32,000 | | | | 30,000 | | | | 47,000 | |
Legal fees | | | 19,000 | | | | 18,000 | | | | 17,000 | | | | 25,000 | |
Trustees’ fees | | | 15,000 | | | | 15,000 | | | | 12,000 | | | | 33,000 | |
Audit fees | | | 25,000 | | | | 25,000 | | | | 26,000 | | | | 33,000 | |
Miscellaneous | | | 15,726 | | | | 20,685 | | | | 16,200 | | | | 34,155 | |
Total expenses | | | 2,333,968 | | | | 2,275,131 | | | | 1,161,022 | | | | 6,916,550 | |
| Net investment income (loss) | | | 354,346 | | | | 3,198,169 | | | | (526,375 | ) | | | 9,556,843 | |
| | | | |
| REALIZED AND UNREALIZED GAIN (LOSS) ON INVESTMENTS AND FOREIGN CURRENCIES | | | | | | | | | | | | | | | | |
Net realized gain (loss) on: | | | | | | | | | | | | | | | | |
Investment transactions (Note 8) | | | 19,332,685 | | | | 10,800,354 | | | | 19,144,294 | | | | 51,859,119 | |
Futures transactions | | | — | | | | — | | | | — | | | | (14,955 | ) |
Foreign currency transactions | | | (653 | ) | | | — | | | | — | | | | — | |
Options written transactions | | | — | | | | — | | | | — | | | | — | |
Swap agreement transactions | | | — | | | | — | | | | — | | | | — | |
Short sale transactions | | | — | | | | — | | | | — | | | | — | |
| Total net realized gain (loss) | | | 19,332,032 | | | | 10,800,354 | | | | 19,144,294 | | | | 51,844,164 | |
Net change in unrealized appreciation (depreciation) on: | | | | | | | | | | | | | | | | |
Investments | | | (5,555,671 | ) | | | (5,810,052 | ) | | | (4,951,558 | ) | | | 2,920,953 | |
Futures | | | — | | | | — | | | | — | | | | 286,000 | |
Foreign currencies | | | (1,488 | ) | | | — | | | | — | | | | — | |
Options written | | | — | | | | — | | | | — | | | | — | |
Swaps | | | — | | | | — | | | | — | | | | — | |
Short sales | | | — | | | | — | | | | — | | | | — | |
| Net change in unrealized appreciation (depreciation) | | | (5,557,159 | ) | | | (5,810,052 | ) | | | (4,951,558 | ) | | | 3,206,953 | |
| Net gain (loss) | | | 13,774,873 | | | | 4,990,302 | | | | 14,192,736 | | | | 55,051,117 | |
| | | | |
| NET INCREASE (DECREASE) IN NET ASSETS RESULTING FROM OPERATIONS | | $ | 14,129,219 | | | $ | 8,188,471 | | | $ | 13,666,361 | | | $ | 64,607,960 | |
(a) Including affiliated expense of | | $ | 144,000 | | | $ | 143,000 | | | $ | 63,000 | | | $ | 265,000 | |
See Notes to Financial Statements.
| | | | |
| THE TARGET PORTFOLIO TRUST | | | 145 | |
Statement of Operations
Year Ended October 31, 2011 (continued)
| | | | | | | | | | | | | | | | |
| | | INTERNATIONAL
EQUITY
PORTFOLIO | | | TOTAL RETURN
BOND
PORTFOLIO | | | INTERMEDIATE-
TERM BOND
PORTFOLIO | | | MORTGAGE
BACKED
SECURITIES
PORTFOLIO | |
| | | | |
| NET INVESTMENT INCOME (LOSS) | | | | | | | | | | | | | | | | |
Income | | | | | | | | | | | | | | | | |
Unaffiliated dividend income | | $ | 10,434,850 | | | $ | — | | | $ | — | | | $ | — | |
Affiliated dividend income | | | 5,572 | | | | 3,279 | | | | 1,293 | | | | 11,110 | |
Less: Foreign withholding taxes | | | (839,482 | ) | | | — | | | | — | | | | — | |
Unaffiliated interest | | | — | | | | 13,373,290 | | | | 6,871,300 | | | | 1,930,168 | |
Total income | | | 9,600,940 | | | | 13,376,569 | | | | 6,872,593 | | | | 1,941,278 | |
Expenses | | | | | | | | | | | | | | | | |
Management fee | | | 1,887,287 | | | | 1,652,205 | | | | 946,565 | | | | 153,936 | |
Interest expense | | | — | | | | — | | | | 6,125 | | | | — | |
Loan interest expense (Note 7) | | | 927 | | | | — | | | | — | | | | — | |
Distribution fee—Class R | | | 469,396 | | | | 589,633 | | | | — | | | | — | |
Transfer agent’s fees and expenses(a) | | | 229,000 | | | | 339,000 | | | | 119,000 | | | | 31,000 | |
Custodian’s fees and expenses | | | 225,000 | | | | 149,000 | | | | 116,000 | | | | 60,000 | |
Reports to shareholders | | | 60,000 | | | | 78,000 | | | | 57,000 | | | | 24,000 | |
Registration fees | | | 38,000 | | | | 38,000 | | | | 31,000 | | | | 16,000 | |
Legal fees | | | 26,000 | | | | 20,000 | | | | 19,000 | | | | 16,000 | |
Trustees’ fees | | | 19,000 | | | | 18,000 | | | | 15,000 | | | | 10,000 | |
Audit fees | | | 33,000 | | | | 61,000 | | | | 57,000 | | | | 33,000 | |
Miscellaneous | | | 47,152 | | | | 31,539 | | | | 21,006 | | | | 7,396 | |
Total expenses | | | 3,034,762 | | | | 2,976,377 | | | | 1,387,696 | | | | 351,332 | |
| Net investment income (loss) | | | 6,566,178 | | | | 10,400,192 | | | | 5,484,897 | | | | 1,589,946 | |
| | | | |
REALIZED AND UNREALIZED GAIN (LOSS)
ON INVESTMENTS AND FOREIGN
CURRENCIES | | | | | | | | | | | | | | | | |
Net realized gain (loss) on: | | | | | | | | | | | | | | | | |
Investment transactions | | | (3,087,139 | ) | | | (699,753 | ) | | | 1,462,892 | | | | 1,326,545 | |
Futures transactions | | | — | | | | 1,365,591 | | | | 2,663,153 | | | | (228,918 | ) |
Foreign currency transactions | | | (1,006,748 | ) | | | (164,903 | ) | | | 1,031,091 | | | | — | |
Options written transactions | | | — | | | | 1,130,482 | | | | (40,613 | ) | | | 2,000 | |
Swap agreement transactions | | | — | | | | (242,261 | ) | | | (269,944 | ) | | | (204,145 | ) |
Short sale transactions | | | — | | | | (1,318,535 | ) | | | (3,775 | ) | | | (49,946 | ) |
| Total net realized gain (loss) | | | (4,093,887 | ) | | | 70,621 | | | | 4,842,804 | | | | 845,536 | |
Net change in unrealized appreciation (depreciation) on: | | | | | | | | | | | | | | | | |
Investments and other assets | | | (24,035,994 | ) | | | (1,720,084 | ) | | | (5,767,312 | ) | | | (673,874 | ) |
Futures | | | — | | | | 323,227 | | | | 798,225 | | | | 34,828 | |
Foreign currencies | | | 725,599 | | | | (1,140,869 | ) | | | (1,995,089 | ) | | | — | |
Options written | | | — | | | | 419,785 | | | | 63,879 | | | | — | |
Swaps | | | — | | | | 1,058,144 | | | | 957,649 | | | | (72,272 | ) |
Short sales | | | — | | | | (45,781 | ) | | | — | | | | (1,594 | ) |
| Net change in unrealized appreciation (depreciation) | | | (23,310,395 | ) | | | (1,105,578 | ) | | | (5,942,648 | ) | | | (712,912 | ) |
| Net gain (loss) | | | (27,404,282 | ) | | | (1,034,957 | ) | | | (1,099,844 | ) | | | 132,624 | |
| | | | |
NET INCREASE (DECREASE) IN NET ASSETS
RESULTING FROM OPERATIONS | | $ | (20,838,104 | ) | | $ | 9,365,235 | | | $ | 4,385,053 | | | $ | 1,722,570 | |
(a) Including affiliated expense of | | $ | 158,000 | | | $ | 163,000 | | | $ | 11,000 | | | $ | 2,000 | |
See Notes to Financial Statements.
| | | | |
| 146 | | | THE TARGET PORTFOLIO TRUST | |
Statement of Changes in Net Assets
| | | | | | | | |
| | | LARGE CAPITALIZATION
GROWTH PORTFOLIO | |
| | | Year
Ended
October 31,
2011 | | | Year
Ended
October 31,
2010 | |
| | |
| INCREASE (DECREASE) IN NET ASSETS | | | | | | | | |
Operations | | | | | | | | |
Net investment income | | $ | 354,346 | | | $ | 464,882 | |
Net realized gain on investment and foreign currency transactions | | | 19,332,032 | | | | 13,477,694 | |
Net change in unrealized appreciation (depreciation) of investments | | | (5,557,159 | ) | | | 20,487,297 | |
Net increase in net assets resulting from operations | | | 14,129,219 | | | | 34,429,873 | |
Dividends and Distributions (Note 1) | | | | | | | | |
Dividends from net investment income | | | | | | | | |
Class R | | | — | | | | (252,959 | ) |
Class T | | | (310,242 | ) | | | (965,944 | ) |
Total dividends from net investment income | | | (310,242 | ) | | | (1,218,903 | ) |
Trust share transactions (Note 6) | | | | | | | | |
Net proceeds from shares sold | | | 45,987,894 | | | | 44,744,200 | |
Net asset value of shares issued in reinvestment of dividends and distributions | | | 302,077 | | | | 1,210,988 | |
Cost of shares reacquired | | | (65,930,611 | ) | | | (63,159,146 | ) |
Net decrease in net assets from Trust share transactions | | | (19,640,640 | ) | | | (17,203,958 | ) |
Total increase (decrease) | | | (5,821,663 | ) | | | 16,007,012 | |
| | |
| NET ASSETS | | | | | | | | |
Beginning of year | | | 210,225,830 | | | | 194,218,818 | |
End of year(a) | | $ | 204,404,167 | | | $ | 210,225,830 | |
(a) Includes undistributed net investment income of | | $ | 289,690 | | | $ | 246,239 | |
See Notes to Financial Statements.
| | | | |
| THE TARGET PORTFOLIO TRUST | | | 147 | |
Statement of Changes in Net Assets (continued)
| | | | | | | | |
| | | LARGE CAPITALIZATION
VALUE PORTFOLIO | |
| | | Year
Ended
October 31,
2011 | | | Year
Ended
October 31,
2010 | |
| | |
| INCREASE (DECREASE) IN NET ASSETS | | | | | | | | |
Operations | | | | | | | | |
Net investment income | | $ | 3,198,169 | | | $ | 3,112,471 | |
Net realized gain on investment and foreign currency transactions | | | 10,800,354 | | | | 3,741,835 | |
Net change in unrealized appreciation (depreciation) of investments | | | (5,810,052 | ) | | | 18,096,224 | |
Net increase in net assets resulting from operations | | | 8,188,471 | | | | 24,950,530 | |
Dividends and Distributions (Note 1) | | | | | | | | |
Dividends from net investment income | | | | | | | | |
Class R | | | (1,256,153 | ) | | | (1,209,413 | ) |
Class T | | | (1,800,447 | ) | | | (2,603,094 | ) |
Total dividends from net investment income | | | (3,056,600 | ) | | | (3,812,507 | ) |
Trust share transactions (Note 6) | | | | | | | | |
Net proceeds from shares sold | | | 50,859,161 | | | | 46,507,821 | |
Net asset value of shares issued in reinvestment of dividends and distributions | | | 3,009,450 | | | | 3,783,736 | |
Cost of shares reacquired | | | (64,799,524 | ) | | | (63,503,068 | ) |
Net decrease in net assets from Trust share transactions | | | (10,930,913 | ) | | | (13,211,511 | ) |
Total increase (decrease) | | | (5,799,042 | ) | | | 7,926,512 | |
| | |
| NET ASSETS | | | | | | | | |
Beginning of year | | | 206,404,386 | | | | 198,477,874 | |
End of year(a) | | $ | 200,605,344 | | | $ | 206,404,386 | |
(a) Includes undistributed net investment income of | | $ | 2,532,739 | | | $ | 2,391,170 | |
See Notes to Financial Statements.
| | | | |
| 148 | | | THE TARGET PORTFOLIO TRUST | |
Statement of Changes in Net Assets (continued)
| | | | | | | | |
| | | SMALL CAPITALIZATION
GROWTH PORTFOLIO | |
| | | Year
Ended
October 31,
2011 | | | Year
Ended
October 31,
2010 | |
| | |
| INCREASE (DECREASE) IN NET ASSETS | | | | | | | | |
Operations | | | | | | | | |
Net investment loss | | $ | (526,375 | ) | | $ | (349,906 | ) |
Net realized gain on investment and foreign currency transactions | | | 19,144,294 | | | | 6,988,091 | |
Net change in unrealized appreciation (depreciation) of investments | | | (4,951,558 | ) | | | 13,470,527 | |
Net increase in net assets resulting from operations | | | 13,666,361 | | | | 20,108,712 | |
Trust share transactions (Note 6) | | | | | | | | |
Net proceeds from shares sold | | | 28,492,814 | | | | 20,145,119 | |
Net asset value of shares issued in reinvestment of dividends and distributions | | | — | | | | — | |
Cost of shares reacquired | | | (38,798,427 | ) | | | (28,258,975 | ) |
Net decrease in net assets from Trust share transactions | | | (10,305,613 | ) | | | (8,113,856 | ) |
Capital Contributions (Note 6) | | | | | | | | |
Proceeds from regulatory settlement | | | — | | | | 7,375 | |
Total increase | | | 3,360,748 | | | | 12,002,231 | |
| | |
| NET ASSETS | | | | | | | | |
Beginning of year | | | 92,802,169 | | | | 80,799,938 | |
Endof year | | $ | 96,162,917 | | | $ | 92,802,169 | |
See Notes to Financial Statements.
| | | | |
| THE TARGET PORTFOLIO TRUST | | | 149 | |
Statement of Changes in Net Assets (continued)
| | | | | | | | |
| | | SMALL CAPITALIZATION
VALUE PORTFOLIO | |
| | | Year
Ended
October 31,
2011 | | | Year
Ended
October 31,
2010 | |
| | |
| INCREASE (DECREASE) IN NET ASSETS | | | | | | | | |
Operations | | | | | | | | |
Net investment income | | $ | 9,556,843 | | | $ | 7,484,736 | |
Net realized gain on investment and foreign currency transactions | | | 51,844,164 | | | | 32,146,699 | |
Net change in unrealized appreciation (depreciation) of investments | | | 3,206,953 | | | | 103,825,102 | |
Net increase in net assets resulting from operations | | | 64,607,960 | | | | 143,456,537 | |
Dividends and Distributions (Note 1) | | | | | | | | |
Dividends from net investment income | | | | | | | | |
Class R | | | (251,514 | ) | | | (285,001 | ) |
Class T | | | (7,554,613 | ) | | | (6,778,937 | ) |
Total dividends from net investment income | | | (7,806,127 | ) | | | (7,063,938 | ) |
Trust share transactions (Note 6) | | | | | | | | |
Net proceeds from shares sold | | | 346,237,356 | | | | 277,617,518 | |
Net asset value of shares issued in reinvestment of dividends and distributions | | | 6,956,118 | | | | 6,406,096 | |
Cost of shares reacquired | | | (303,307,277 | ) | | | (138,845,160 | ) |
Net increase in net assets from Trust share transactions | | | 49,886,197 | | | | 145,178,454 | |
Total increase | | | 106,688,030 | | | | 281,571,053 | |
| | |
| NET ASSETS | | | | | | | | |
Beginning of year | | | 853,347,374 | | | | 571,776,321 | |
End of year(a) | | $ | 960,035,404 | | | $ | 853,347,374 | |
(a) Includes undistributed net investment income of | | $ | 7,392,063 | | | $ | 5,640,605 | |
See Notes to Financial Statements.
| | | | |
| 150 | | | THE TARGET PORTFOLIO TRUST | |
Statement of Changes in Net Assets (continued)
| | | | | | | | |
| | | INTERNATIONAL EQUITY
PORTFOLIO | |
| | | Year
Ended
October 31,
2011 | | | Year
Ended
October 31,
2010 | |
| | |
| INCREASE (DECREASE) IN NET ASSETS | | | | | | | | |
Operations | | | | | | | | |
Net investment income | | $ | 6,566,178 | | | $ | 2,737,931 | |
Net realized gain on investment and foreign currency transactions | | | (4,093,887 | ) | | | 1,822,323 | |
Net change in unrealized appreciation (depreciation) of investments | | | (23,310,395 | ) | | | 13,736,760 | |
Net increase (decrease) in net assets resulting from operations | | | (20,838,104 | ) | | | 18,297,014 | |
Dividends and Distributions (Note 1) | | | | | | | | |
Dividends from net investment income | | | | | | | | |
Class Q | | | — | | | | — | |
Class R | | | (924,975 | ) | | | (604,417 | ) |
Class T | | | (1,553,315 | ) | | | (1,685,394 | ) |
Total dividends from net investment income | | | (2,478,290 | ) | | | (2,289,811 | ) |
Trust share transactions (Note 6) | | | | | | | | |
Net proceeds from shares sold | | | 199,728,217 | | | | 40,858,239 | |
Net asset value of shares issued in reinvestment of dividends and distributions | | | 2,450,416 | | | | 2,280,694 | |
Cost of shares reacquired | | | (65,389,746 | ) | | | (57,647,930 | ) |
Net increase (decrease) in net assets from Trust share transactions | | | 136,788,887 | | | | (14,508,997 | ) |
Capital Contributions (Note 6) | | | | | | | | |
Proceeds from regulatory settlement | | | — | | | | 523,739 | |
Total increase | | | 113,472,493 | | | | 2,021,945 | |
| | |
| NET ASSETS | | | | | | | | |
Beginning of year | | | 178,212,316 | | | | 176,190,371 | |
End of year(a) | | $ | 291,684,809 | | | $ | 178,212,316 | |
(a) Includes undistributed net investment income of | | $ | 4,975,136 | | | $ | 1,866,176 | |
See Notes to Financial Statements.
| | | | |
| THE TARGET PORTFOLIO TRUST | | | 151 | |
Statement of Changes in Net Assets (continued)
| | | | | | | | |
| | | TOTAL RETURN
BOND PORTFOLIO | |
| | | Year Ended
October 31,
2011 | | | Year
Ended
October 31,
2010 | |
| | |
| INCREASE (DECREASE) IN NET ASSETS | | | | | | | | |
Operations | | | | | | | | |
Net investment income | | $ | 10,400,192 | | | $ | 10,376,939 | |
Net realized gain on investment and foreign currency transactions | | | 70,621 | | | | 12,926,086 | |
Net change in unrealized appreciation (depreciation) of investments | | | (1,105,578 | ) | | | 7,924,408 | |
Net increase in net assets resulting from operations | | | 9,365,235 | | | | 31,227,433 | |
Dividends and Distributions (Note 1) | | | | | | | | |
Dividends from net investment income | | | | | | | | |
Class R | | | (2,958,289 | ) | | | (2,384,900 | ) |
Class T | | | (7,513,396 | ) | | | (7,867,421 | ) |
Total dividends from net investment income | | | (10,471,685 | ) | | | (10,252,321 | ) |
Distributions from net realized gains | | | | | | | | |
Class R | | | (3,301,173 | ) | | | (1,880,114 | ) |
Class T | | | (8,246,685 | ) | | | (5,451,974 | ) |
Total distributions from net realized gains | | | (11,547,858 | ) | | | (7,332,088 | ) |
Trust share transactions (Note 6) | | | | | | | | |
Net proceeds from shares sold | | | 142,552,732 | | | | 128,063,280 | |
Net asset value of shares issued in reinvestment of dividends and distributions | | | 22,062,856 | | | | 17,608,459 | |
Cost of shares reacquired | | | (139,477,523 | ) | | | (78,606,814 | ) |
Net increase in net assets from Trust share transactions | | | 25,138,065 | | | | 67,064,925 | |
Capital Contributions (Note 6) | | | | | | | | |
Proceeds from regulatory settlement | | | — | | | | 3,012 | |
Total increase | | | 12,483,757 | | | | 80,710,961 | |
| | |
| NET ASSETS | | | | | | | | |
Beginning of year | | | 369,951,268 | | | | 289,240,307 | |
Endof year(a) | | $ | 382,435,025 | | | $ | 369,951,268 | |
(a) Includes undistributed net investment income of | | $ | 925,539 | | | $ | 532,734 | |
See Notes to Financial Statements.
| | | | |
| 152 | | | THE TARGET PORTFOLIO TRUST | |
Statement of Changes in Net Assets (continued)
| | | | | | | | |
| | | INTERMEDIATE-TERM
BOND PORTFOLIO | |
| | | Year
Ended
October 31,
2011 | | | Year
Ended
October 31,
2010 | |
| | |
| INCREASE (DECREASE) IN NET ASSETS | | | | | | | | |
Operations | | | | | | | | |
Net investment income | | $ | 5,484,897 | | | $ | 6,274,976 | |
Net realized gain on investment and foreign currency transactions | | | 4,842,804 | | | | 11,968,992 | |
Net change in unrealized appreciation (depreciation) of investments | | | (5,942,648 | ) | | | 3,474,463 | |
Net increase (decrease) in net assets resulting from operations | | | 4,385,053 | | | | 21,718,431 | |
Dividends and Distributions (Note 1) | | | | | | | | |
Dividends from net investment income | | | (7,492,175 | ) | | | (6,490,702 | ) |
Distributions from net realized gains | | | (8,139,626 | ) | | | (12,338,752 | ) |
Trust share transactions (Note 6) | | | | | | | | |
Net proceeds from shares sold | | | 35,487,485 | | | | 63,494,251 | |
Net asset value of shares issued in reinvestment of dividends and distributions | | | 15,323,051 | | | | 18,426,780 | |
Cost of shares reacquired | | | (106,009,822 | ) | | | (81,516,531 | ) |
Net increase (decrease) in net assets from Trust share transactions | | | (55,199,286 | ) | | | 404,500 | |
Capital Contributions (Note 6) | | | | | | | | |
Proceeds from regulatory settlement | | | — | | | | 6,361 | |
Total increase (decrease) | | | (66,446,034 | ) | | | 3,299,838 | |
| | |
| NET ASSETS | | | | | | | | |
Beginning of year | | | 248,816,666 | | | | 245,516,828 | |
End of year(a) | | $ | 182,370,632 | | | $ | 248,816,666 | |
(a) Includes undistributed net investment income | | $ | 3,412,137 | | | $ | 1,696,181 | |
See Notes to Financial Statements.
| | | | |
| THE TARGET PORTFOLIO TRUST | | | 153 | |
Statement of Changes in Net Assets (continued)
| | | | | | | | |
| | | MORTGAGE BACKED
SECURITIES PORTFOLIO | |
| | | Year
Ended
October 31,
2011 | | | Year
Ended
October 31,
2010 | |
| | |
| INCREASE (DECREASE) IN NET ASSETS | | | | | | | | |
Operations | | | | | | | | |
Net investment income | | $ | 1,589,946 | | | $ | 2,017,958 | |
Net realized gain on investment transactions | | | 845,536 | | | | 594,760 | |
Net change in unrealized appreciation (depreciation) of investments | | | (712,912 | ) | | | 1,783,455 | |
Net increase in net assets resulting from operations | | | 1,722,570 | | | | 4,396,173 | |
Dividends and Distributions (Note 1) | | | | | | | | |
Dividends from net investment income | | | (1,498,727 | ) | | | (2,036,104 | ) |
Trust share transactions (Note 6) | | | | | | | | |
Net proceeds from shares sold | | | 10,685,987 | | | | 3,562,213 | |
Net asset value of shares issued in reinvestment of dividends and distributions | | | 1,484,331 | | | | 2,071,518 | |
Cost of shares reacquired | | | (13,269,886 | ) | | | (12,948,810 | ) |
Net decrease in net assets from Trust share transactions | | | (1,099,568 | ) | | | (7,315,079 | ) |
Total decrease | | | (875,725 | ) | | | (4,955,010 | ) |
| | |
| NET ASSETS | | | | | | | | |
Beginning of year | | | 36,156,788 | | | | 41,111,798 | |
End of year(a) | | $ | 35,281,063 | | | $ | 36,156,788 | |
(a) Includes undistributed net investment income of | | $ | 92,501 | | | $ | 104,288 | |
See Notes to Financial Statements.
| | | | |
| 154 | | | THE TARGET PORTFOLIO TRUST | |
Notes to Financial Statements
The TARGET Portfolio Trust (the “Trust”) is an open-end management investment company. The Trust was established as a Delaware business trust on July 29, 1992 and consists of eight separate portfolios (the “Portfolio” or “Portfolios”). All the Portfolios are diversified, as defined under the Investment Company Act of 1940, as amended, (“1940 Act”). Investment operations commenced on January 5, 1993.
The Portfolios and their investment objectives are as follows:
| • | | Large Capitalization Growth Portfolio—long-term capital appreciation through investment primar- ily in stocks of large corporations that, in the investment adviser’s opinion, should have earnings growth faster than that of the S&P 500; |
| • | | Large Capitalization Value Portfolio—total return consisting of capital appreciation and dividend income through investment primarily in stocks of large corporations that, in the adviser’s opinion, are undervalued; |
| • | | Small Capitalization Growth Portfolio—maximum capital appreciation through investment primar- ily in small company common stocks that, in the investment adviser’s opinion, should have earnings growth faster than that of the U.S. economy in general; |
| • | | Small Capitalization Value Portfolio—above average capital appreciation through investment in small company common stocks that, in the adviser’s opinion, are undervalued or overlooked in the marketplace; |
| • | | International Equity Portfolio—capital appreciation through investment primarily in stocks of companies domiciled outside the United States; |
| • | | Total Return Bond Portfolio—total return of current income and capital appreciation through investment primarily in fixed-income securities of varying maturities with a dollar-weighted average portfolio maturity of more than four years but not more than fifteen years; |
| • | | Intermediate-Term Bond Portfolio—current income and reasonable stability of principal through investment primarily in high quality fixed-income securities of varying maturities with a dollar-weighted average portfolio maturity of more than three years but not more than ten years; |
| • | | Mortgage Backed Securities Portfolio—high current income primarily and capital appreciation secondarily, each consistent with the protection of capital through investment primarily in mortgage related securities; |
The ability of issuers of debt securities held by the Portfolios to meet their obligations may be affected by economic or political developments in a specific industry, region or country.
Note 1. Accounting Policies
The following is a summary of significant accounting policies followed by the Trust and the Portfolios in the preparation of its financial statements.
Securities Valuations: Securities listed on a securities exchange (other than options on securities and indices) are valued at the last sale price on such exchange on the day of valuation or, if there was no sale on such day, at the mean between the last reported bid and asked prices, or at the last bid price on such
| | | | |
| THE TARGET PORTFOLIO TRUST | | | 155 | |
day in the absence of an asked price. Securities traded via NASDAQ are valued at the NASDAQ official closing price (NOCP) on the day of valuation, or if there was no NOCP, at the last sale price. Securities that are actively traded in the over-the-counter market, including listed securities for which the primary market is believed by Prudential Investments LLC (“PI” or “Manager”), in consultation with the subadvisor(s), to be over-the-counter, are valued at market value using prices provided by an independent pricing agent or principal market maker. Options on securities and indices traded on an exchange are valued at the last sale price as of the close of trading on the applicable exchange or, if there was no sale, at the mean between the most recently quoted bid and ask prices on such exchange or at the last bid price in the absence of an asked price. Futures contracts and options thereon traded on a commodities exchange or board of trade are valued at the last sale price at the close of trading on such exchange or board of trade or, if there was no sale on the applicable commodities exchange or board of trade on such day, at the mean between the most recently quoted bid and asked prices on such exchange or board of trade or at the last bid price in the absence of an asked price. Securities for which reliable market quotations are not readily available, or whose values have been affected by events occurring after the close of the security’s foreign market and before the Portfolio’s pricing time, are valued at fair value in accordance with the Board of Trustees’ approved fair valuation procedures. When determining the fair value of securities, some of the factors influencing the valuation include, the nature of any restrictions on disposition of the securities; assessment of the general liquidity of the securities; the issuer’s financial condition and the markets in which it does business; the cost of the investment; the size of the holding and the capitalization of issuer; the prices of any recent transactions or bids/offers for such securities or any comparable securities; any available analyst media or other reports or information deemed reliable by the investment adviser regarding the issuer or the markets or industry in which it operates. Using fair value to price securities may result in a value that is different from a security’s most recent closing price and from the price used by other mutual funds to calculate their net asset values.
Certain Portfolios may hold illiquid securities, including those which are restricted as to disposition under securities law (“restricted securities”). Restricted securities are valued pursuant to the valuation procedures noted above. Each Portfolio may hold up to 15% of its net assets in illiquid securities.
Investments in open end, non exchange-traded mutual funds are valued at their net asset value as of the close of the New York Stock Exchange on the date of the valuation.
U.S. Government securities, for which market quotations are available, are valued at a price provided by an independent pricing agent or primary dealer (a dealer that trades in U.S. Government securities within the Federal Reserve System).
Short-term debt securities of sufficient credit quality held by the Portfolios, which mature in 60 days or less, are valued at amortized cost, which approximates fair value. Short-term debt securities held by such Portfolios, which mature in more than 60 days, are valued at fair value.
Repurchase Agreements: In connection with transactions in repurchase agreements with United States financial institutions, it is the Trust’s policy that its custodian or designated sub custodians under tri-party repurchase agreements, as the case may be, take possession of the underlying collateral securities, the value of which exceeds the principal amount of the repurchase transaction, including accrued interest. The value of the collateral is marked-to-market on a daily basis to ensure the adequacy of the collateral. If the seller defaults, and the value of the collateral declines or, if bankruptcy proceedings are commenced with respect to the seller of the security, realization of the collateral by the Trust may be delayed or limited.
Financial Futures Contracts: A financial futures contract is an agreement to purchase (long) or sell (short) an agreed amount of securities at a set price for delivery on a future date. Upon entering into a financial futures contract, the Portfolio is required to pledge to the broker an amount of cash and/or other assets
| | | | |
| 156 | | | THE TARGET PORTFOLIO TRUST | |
equal to a certain percentage of the contract amount. This amount is known as the “initial margin.” Subsequent payments, known as “variation margin,” are made or received by the Portfolio each day, depending on the daily fluctuations in the value of the underlying security. Such variation margin is recorded for financial statement purposes on a daily basis as an unrealized gain or loss. When the contract expires or is closed, the gain or loss is realized and is presented in the Statements of Operations as a net realized gain or loss on financial futures contracts.
Certain Portfolios invested in financial futures contracts in order to hedge their existing portfolio securities, or securities the Portfolio intends to purchase, against fluctuations in value caused by changes in prevailing interest rates and to manage yield curve and duration. The Portfolio may not achieve the anticipated benefits of the financial futures contracts and may realize a loss. Certain Portfolios entered into equity index futures contracts to gain market exposure. The use of futures transactions involves the risk of imperfect correlation in movements in the price of futures contracts, interest rates and the underlying hedged assets. The Portfolio maintains a segregated account of securities or other liquid assets, the dollar value of which is at least equal to its obligation with respect to financial futures contracts. Financial futures contracts involve certain elements of risk in excess of the amounts reflected on the Statement of Assets and Liabilities.
Foreign Currency Translation: The books and records of the Portfolios are maintained in U.S. dollars. Foreign currency amounts are translated into U.S. dollars on the following basis:
(i) market value of investment securities, other assets and liabilities—at the current daily rates of exchange;
(ii) purchases and sales of investment securities, income and expenses—at the rates of exchange prevailing on the respective dates of such transactions.
The Portfolios do not isolate that portion of the results of operations arising as a result of changes in the foreign exchange rates from the fluctuations arising from changes in the market prices of long-term securities held at period end. Similarly, the Portfolios do not isolate the effect of changes in foreign exchange rates from the fluctuations arising from changes in the market prices of long-term portfolio securities sold during the period. Accordingly, realized foreign currency gains or losses are included in the reported net realized gains or losses on investment transactions.
Net realized gains or losses on foreign currency transactions represent net foreign exchange gains or losses from the holding of foreign currencies, currency gains or losses realized between the trade date and settlement date on securities transactions, and the difference between the amounts of dividends, interest and foreign withholding taxes recorded on the Portfolios’ books and the U.S. dollar equivalent amounts actually received or paid. Net unrealized currency gains or losses from valuing foreign currency denominated assets and liabilities (other than investments) at period-end exchange rates are reflected as a component of net unrealized appreciation (depreciation) on investments and foreign currencies.
Foreign security and currency transactions may involve certain considerations and risks not typically associated with those of domestic origin as a result of, among other factors, the possibility of political and economic instability or the level of governmental supervision and regulation of foreign securities markets.
Forward Foreign Currency Contracts: A forward foreign currency contract is a commitment to purchase or sell a foreign currency at a future date at a negotiated forward rate. Certain Portfolios entered into forward foreign currency contracts in order to hedge their exposure to changes in foreign currency exchange rates on their foreign portfolio holdings or on specific receivables and payables denominated in a foreign currency and to gain exposure to certain currencies. The contracts are valued daily at current forward exchange rates and any unrealized gain or loss is included in net unrealized appreciation or depreciation on
| | | | |
| THE TARGET PORTFOLIO TRUST | | | 157 | |
foreign currency transactions. Gains or losses are realized on the settlement date of the contract equal to the difference between the settlement value of the original and negotiated forward contracts. This gain or loss, if any, is included in net realized gain or loss on foreign currency transactions. Risks may arise upon entering into these contracts from the potential inability of the counterparties to meet the terms of their contracts. Forward currency contracts involve risks from currency exchange rate and credit risk in excess of the amounts reflected on the Statement of Assets and Liabilities. The Portfolio’s maximum risk of loss from counterparty credit risk is the net value of the cash flows to be received from the counterparty at the end of the contract’s life. A master netting agreement between the Portfolio and the counterparty permits the Portfolio to offset amounts payable by the Portfolio to the same counterparty against amounts to be received; and by the receipt of collateral from the counterparty by the Portfolio to cover the Portfolio’s exposure to the counterparty. However, there is no assurance that such mitigating factors are easily enforceable.
Options: Certain Portfolios purchased or wrote options in order to hedge against adverse market movements or fluctuations in value caused by changes in prevailing interest rates and foreign currency exchange rates with respect to securities or currencies which the Portfolio currently owns or intends to purchase. Certain Portfolios also used purchased options to gain exposure to certain securities or foreign currencies. The Portfolios’ principal reason for writing options is to realize, through receipt of premiums, a greater current return than would be realized on the underlying security alone. When the Portfolio purchases an option, it pays a premium and an amount equal to that premium is recorded as an asset. When the Portfolio writes an option, it receives a premium and an amount equal to that premium is recorded as a liability. The asset or liability is adjusted daily to reflect the current market value of the option.
If an option expires unexercised, the Portfolio realizes a gain or loss to the extent of the premium received or paid. If an option is exercised, the premium received or paid is recorded as an adjustment to the proceeds from the sale or the cost basis of the purchase in determining whether the Portfolio has realized a gain or loss. The difference between the premium and the amount received or paid on affecting a closing purchase or sale transaction is also treated as a realized gain or loss. Gains or losses on purchased options are included in net realized gains or losses on investment transactions. Gains or losses on written options are presented separately as net realized gains or losses on options written.
The Portfolio, as writer of an option, may have no control over whether the underlying securities or financial instruments may be sold (called) or purchased (put). As a result, the Portfolio bears the market risk of an unfavorable change in the price of the security or financial instrument underlying the written option. Over-the-counter options involve the risk of the potential inability of the counterparties to meet the terms of their contracts.
With exchange-traded futures and options contracts, there is minimal counterparty credit risk to the Portfolio since the exchanges’ clearinghouse acts as counterparty to all exchange traded futures and options, and guarantees the futures and options contracts against default.
When a Portfolio writes an option on a swap, an amount equal to any premium received by the Portfolio is recorded as a liability and is subsequently adjusted to the current market value of the written option on the swap. If a call option on a swap is exercised, the Portfolio becomes obligated to pay a fixed interest rate (noted as the strike price) and receive a variable interest rate on a notional amount. If a put option on a swap is exercised, the Portfolio becomes obligated to pay a variable interest rate and receive a fixed interest rate (noted as the strike price) on a notional amount. Premiums received from writing options on swaps that expire or are exercised are treated as realized gains upon the expiration or exercise of such options on swaps. The risk associated with writing put and call options on swaps is that the Portfolio will be obligated to be party to a swap agreement if an option on a swap is exercised.
| | | | |
| 158 | | | THE TARGET PORTFOLIO TRUST | |
Short Sales: Certain Portfolios of the Trust may make short sales of securities as a method of hedging potential price declines in similar securities owned. The Portfolio may sell a security it does not own in anticipation of a decline in the market value of that security (short sale). When the Portfolio makes a short sale, it will borrow the security sold short and deliver it to the broker-dealer through which it made the short sale as collateral for its obligation to deliver the security upon conclusion of the sale. The Portfolio may have to pay a fee to borrow the particular security and may be obligated to return any interest or dividends received on such borrowed securities. A gain, limited to the price at which the Portfolio sold the security short, or a loss, unlimited as to dollar amount, will be recognized upon the termination of a short sale if the market price at termination is less than or greater than the proceeds originally received, respectively, and is presented in the Statement of Operations as net realized gain or loss on short sales. The Portfolio maintains a segregated account of securities or other liquid assets, the dollar value of which is at least equal to its obligation with respect to short sales.
Swap Agreements: Certain Portfolios may enter into credit default, interest rate, total return and other forms of swap agreements. A swap agreement is an agreement to exchange the return generated by one instrument for the return generated by another instrument. Swap agreements are negotiated in the over-the-counter market and may be executed either directly with counterparty (“OTC Traded”) or through a central clearing facility, such as a registered commodities exchange (“Exchange Traded”). Swap agreements are valued daily at current market value and any change in value is included in the net unrealized appreciation or depreciation on investments. Upon entering into an exchange traded swap, the Portfolio pledges with the cleaning broker an initial margin and thereafter, pays or receives an amount, known as “variation margin”, based on daily changes in valuation of swap contract. Payments received or paid by the Portfolio are recorded as realized gains or losses upon termination or maturity of the swap. Risk of loss may exceed amounts recognized on the Statements of Assets and Liabilities. Swap agreements outstanding at period end, if any, are listed on the Portfolio of Investments.
Interest Rate Swaps: Interest rate swaps represent agreements between counterparties to exchange cash flows based on the difference between two interest rates, applied to a notional principal amount for a specified period. The Portfolio is subject to interest rate risk exposure in the normal course of pursuing its investment objectives. Certain Portfolios used interest rate swaps to generate steady cash flow by receiving a stream of fixed rate payments and to increase exposure to prevailing market rates by receiving floating rate payments. The Portfolio’s maximum risk of loss from counterparty credit risk is the discounted net value of the cash flows to be received from the counterparty over the contract’s remaining life. A master netting arrangement between the Portfolio and the counterparty permits the Portfolio to offset amounts payable by the Portfolio to the same counterparty against amounts to be received; and by the receipt of collateral from the counterparty by the Portfolio to cover the Portfolio’s exposure to the counterparty. However, there is no assurance that such mitigating factors are easily enforceable.
Credit Default Swaps: Credit default swaps involve one party (the protection buyer) making a stream of payments to another party (the protection seller) in exchange for the right to receive a specified payment in the event of a default or as a result of a default (“credit event”) for the referenced party, typically corporate issues or sovereign issues of an emerging country, on its obligation; or in the event of a write-down, principal shortfall, interest shortfall or default of all or part of the referenced entities comprising a credit index.
The Portfolio is subject to credit risk in the normal course of pursuing its investment objectives. Certain Portfolios purchased credit default swaps to provide a measure of protection against defaults of the issuers. Certain Portfolios used credit default swaps on credit indices to hedge a portfolio of credit default swaps or bonds, which is less expensive than it would be to buy many credit default swaps to achieve a similar effect. Certain Portfolios took an active short position with respect to the likelihood of a particular issuer’s default by selling credit default swaps. The Portfolio’s maximum risk of loss from counterparty credit risk for purchased credit default swaps is the notional value of a credit default swap agreement. A master netting
| | | | |
| THE TARGET PORTFOLIO TRUST | | | 159 | |
arrangement between the Portfolio and the counterparty permits the Portfolio to offset amounts payable by the Portfolio to the same counterparty against amounts to be received; and by the receipt of collateral from the counterparty by the Portfolio to cover the Portfolio’s exposure to the counterparty. However, there is no assurance that such mitigating factors are easily enforceable.
As a seller of protection on credit default swap agreements, a Portfolio will generally receive from the buyer of protection an agreed upon payment throughout the term of the swap provided that there is no credit event. As the seller, a Portfolio would effectively increase investment risk to its portfolio because, in addition to its total net assets, a Portfolio may be subject to investment exposure on the notional amount of the swap.
The maximum amount of the payment that a Portfolio as a seller of protection could be required to make under a credit default swap agreement would be equal the notional amount of the underlying security or index contract as a result of a credit event. These potential amounts will be partially offset by any recovery values of the respective referenced obligations, or net amounts received from the settlement of buy protection credit default swap agreements entered into by the Portfolio for the same referenced entity or index. As a buyer of protection, the Portfolio generally receives an amount up to the notional value of the swap if a credit event occurs.
Implied credit spreads, represented in absolute terms, utilized in determining the market value of credit default swap agreements on corporate issues or sovereign issues of an emerging country as of period end are disclosed in the footnotes to the Schedules of Investments and serve as an indicator of the current status of the payment/performance risk and represent the likelihood or risk of default for the credit derivative. The implied credit spread of a particular referenced entity reflects the cost of buying/selling protection and may include upfront payments required to enter into the agreement. For credit default swap agreements on asset-backed securities and credit indices, the quoted market prices and resulting values serve as the indicator of the current status of the payment and/or performance risk. Wider credit spreads and increasing market value in absolute terms, when compared to the notional amount of the swap, represent a deterioration of the referenced entity’s credit soundness and a greater likelihood or risk of default or other credit event occurring as defined under the terms of the agreement.
In addition to each instrument’s primary underlying risk exposure (e.g. interest rate, credit, equity or foreign exchange, etc.), swap agreements involve, to varying degrees, elements of credit, market and documentation risk. Such risks involve the possibility that there will be no liquid market for these agreements, that the counterparty to the agreement may default on its obligation to perform or disagree as to the meaning of the contractual terms in the agreement, and that there will be unfavorable changes in net interest rates. In connection with these agreements, securities in the portfolio may be identified as collateral or received as collateral from the counterparty in accordance with the terms of the respective swap agreements to provide or receive assets of value and serve as recourse in the event of default or bankruptcy/insolvency of either party. Such over-the-counter derivative agreements include conditions which, when materialized, give the counterparty the right to cause an early termination of the transactions under those agreements. Any election by the counterparty for early termination of the contract(s) may impact the amounts reported on financial statements.
Total Return Swap: In a total return swap, one party would receive payments based on the market value of the security or the commodity involved, or total return of a specific referenced asset, such as an equity, index or bond, and in return pay a fixed amount. The Portfolio is subject to risk exposures associated with the referenced asset in the normal course of pursuing its investment objectives. Mortgage Backed Securities entered into total return swaps to manage its exposure to an index. The Portfolio’s maximum risk of loss from counterparty credit risk is the change in the value of the security, in favor of the Portfolio, from the point of entering into the contract. A master netting arrangement between the Portfolio and the counterparty permits the Portfolio to offset amounts payable by the Portfolio to the same counterparty against amounts to be received; and by the receipt of collateral from the counterparty by the Portfolio to cover the Portfolio’s exposure to the counterparty. However, there is no assurance that such mitigating factors are easily enforceable.
| | | | |
| 160 | | | THE TARGET PORTFOLIO TRUST | |
In addition to each instrument’s primary underlying risk exposure (e.g. interest rate, credit, equity or foreign exchange, etc.), swap agreements involve, to varying degrees, elements of credit, market and documentation risk. Such risks involve the possibility that there will be no liquid market for these agreements, that the counterparty to the agreement may default on its obligation to perform or disagree as to the meaning of the contractual terms in the agreement, and that there will be unfavorable changes in net interest rates. In connection with these agreements, securities in the portfolio may be identified as collateral or received as collateral from the counterparty in accordance with the terms of the respective swap agreements to provide or receive assets of value and serve as recourse in the event of default or bankruptcy/insolvency of either party. Such over-the-counter derivative agreements include conditions which, when materialized, give the counterparty the right to cause an early termination of the transactions under those agreements. Any election by the counterparty for early termination of the contract(s) may impact the amounts reported on financial statements.
As of October 31, 2011, none of the Portfolios have met conditions under such agreements, which give the counterparty the right to call for an early termination.
Forward currency contracts, written options, short sales, swaps and financial futures contracts involve elements of both market and credit risk in excess of the amounts reflected on the Statement of Assets and Liabilities.
Warrants and Rights: Certain Portfolios hold warrants and rights acquired either through a direct purchase, included as part of a private placement, or pursuant to corporate actions. Warrants and rights entitle the holder to buy a proportionate amount of common stock at a specific price and time through the expiration dates. Such warrants and rights are held as long positions by the Portfolio until exercised, sold or expired. Warrants and rights are valued at fair value in accordance with the Board of Trustees’ approved fair valuation procedures.
The Portfolios invested in various derivative instruments during the reporting period. The primary types of risk associated with these derivative instruments are credit risk, equity risk, foreign exchange risk and interest rate risk.
The effect of such derivative instruments on each Portfolio’s financial position and financial performance as reflected in the Statement of Assets and Liabilities and Statement of Operations is presented in the summary below.
Fair values of derivative instruments as of October 31, 2011 as presented in the Statement of Assets and Liabilities:
| | | | | | | | | | | | |
| | | Asset Derivatives | | | Liability Derivatives | |
Derivatives not accounted
for as hedging instruments,
carried at fair value | | Balance Sheet Location | | Fair
Value | | | Balance Sheet Location | | Fair
Value | |
| Small Capitalization Value | | | | | | | | | | | | |
Equity contracts | | Due to broker for variation margin | | $ | 351,080 | * | | — | | | — | |
| | | | | | | | | | | | |
| International Equity | | | | | | | | | | | | |
Foreign exchange contracts | | Unrealized appreciation on forward currency contracts | | $ | 257,754 | | | — | | | — | |
| | | | | | | | | | | | |
| | | | |
| THE��TARGET PORTFOLIO TRUST | | | 161 | |
| | | | | | | | | | | | |
| | | Asset Derivatives | | | Liability Derivatives | |
Derivatives not accounted
for as hedging instruments,
carried at fair value | | Balance Sheet Location | | Fair Value | | | Balance Sheet Location | | Fair Value | |
| Total Return Bond | | | | | | | | | | | | |
Interest rate contracts | | Due from broker for variation margin | | $ | 78,762 | * | | Due from broker for variation margin | | $ | 40,320 | * |
Interest rate contracts | | Payments made for swap agreements | | | 38,928 | | | Payments received for swap agreements | | | 783,477 | |
Interest rate contracts | | Unrealized appreciation on swaps | | | 1,501,320 | | | Unrealized depreciation on swaps | | | 42,772 | |
Interest rate contracts | | — | | | — | | | Options written | | | 302,460 | |
Foreign exchange contracts | | Unrealized appreciation on forward currency contracts | | | 725,465 | | | Unrealized depreciation on forward currency contracts | | | 2,728,717 | |
Credit contracts | | Unrealized appreciation on swaps | | | 449,601 | | | Unrealized depreciation on swaps | | | 424,518 | |
Credit contracts | | Payments made for swap agreements | | | 413,329 | | | Payments received for swap agreements | | | 223,361 | |
Credit contracts | | — | | | — | | | Options written | | | 48,997 | |
| | | | | | | | | | | | |
Total | | | | $ | 3,207,405 | | | | | $ | 4,594,622 | |
| | | | | | | | | | | | |
| Intermediate-Term Bond | | | | | | | | | | | | |
Interest rate contracts | | Due to broker for variation margin | | $ | 798,225 | * | | — | | $ | — | |
Interest rate contracts | | Unaffiliated investments | | | 284,918 | | | Options written | | | 304,259 | |
Interest rate contracts | | Unrealized appreciation on swaps | | | 765,126 | | | Unrealized depreciation on swaps | | | 26,677 | |
Interest rate contracts | | Payments made for swap agreements | | | 234,598 | | | Payments received for swap agreements | | | 64,172 | |
Foreign exchange contracts | | Unrealized appreciation on forward currency contracts | | | 131,812 | | | Unrealized depreciation on forward currency contracts | | | 2,265,528 | |
Credit contracts | | Unrealized appreciation on swaps | | | 859,281 | | | Unrealized depreciation on swaps | | | 146,784 | |
Credit contracts | | Payments made for swap agreements | | | 440,505 | | | Payments received for swap agreements | | | 602,630 | |
| | | | | | | | | | | | |
Total | | | | $ | 3,514,465 | | | | | $ | 3,410,050 | |
| | | | | | | | | | | | |
| Mortgage Backed Securities | | | | | | | | | | | | |
Interest rate contracts | | Due to broker for variation margin | | $ | 6,797 | * | | Due to broker for variation margin | | $ | 8,014 | * |
Interest rate contracts | | — | | | — | | | Unrealized depreciation on swaps | | | 281,588 | |
Equity contracts | | Unrealized appreciation on swaps | | | 1,115 | | | Unrealized depreciation on swaps | | | 6,355 | |
Equity contracts | | — | | | — | | | Payments received for swap agreements | | | 11,338 | |
| | | | | | | | | | | | |
Total | | | | $ | 7,912 | | | | | $ | 307,295 | |
| | | | | | | | | | | | |
| * | Includes cumulative appreciation/depreciation on futures contracts as reported in the Portfolio of Investments. Only unsettled variation margin receivable (payable) is reported within the Statement of Assets and Liabilities. |
| | | | |
| 162 | | | THE TARGET PORTFOLIO TRUST | |
The effects of derivative instruments on the Statement of Operations for the year ended October 31, 2011 are as follows:
| | | | | | | | | | | | | | | | | | | | | | | | | | | | |
| Amount of Realized Gain or (Loss) on Derivatives Recognized in Income | |
| | | | | | | |
Derivatives not accounted
for as hedging instruments,
carried at fair value | | Rights | | | Options
Purchased | | | Futures | | | Options
Written | | | Swaps | | | Forward
Currency
Contracts | | | Total | |
| Small Capitalization Value | | | | | | | | | | | | | | | | | | | | | | | | | | | | |
Interest rate contracts | | $ | — | | | $ | — | | | $ | 124,031 | | | $ | — | | | $ | — | | | $ | — | | | $ | 124,031 | |
Equity contracts | | | — | | | | — | | | | (138,986 | ) | | | — | | | | — | | | | — | | | | (138,986 | ) |
| | | | | | | | | | | | | | | | | | | | | | | | | | | | |
Total | | $ | — | | | $ | — | | | $ | (14,955 | ) | | $ | — | | | $ | — | | | $ | — | | | $ | (14,955 | ) |
| | | | | | | | | | | | | | | | | | | | | | | | | | | | |
| International Equity | | | | | | | | | | | | | | | | | | | | | | | | | | | | |
Foreign exchange contracts | | $ | — | | | $ | — | | | $ | — | | | $ | — | | | $ | — | | | $ | (844,819 | ) | | $ | (844,819 | ) |
Equity contracts | | | (3,145 | ) | | | — | | | | — | | | | — | | | | — | | | | — | | | | (3,145 | ) |
| | | | | | | | | | | | | | | | | | | | | | | | | | | | |
Total | | $ | (3,145 | ) | | $ | — | | | $ | — | | | $ | — | | | $ | — | | | $ | (844,819 | ) | | $ | (847,964 | ) |
| | | | | | | | | | | | | | | | | | | | | | | | | | | | |
| Total Return Bond | | | | | | | | | | | | | | | | | | | | | | | | | | | | |
Interest rate contracts | | $ | — | | | $ | — | | | $ | 1,365,591 | | | $ | 911,279 | | | $ | (482,956 | ) | | $ | — | | | $ | 1,793,914 | |
Foreign exchange contracts | | | — | | | | — | | | | — | | | | 35,090 | | | | — | | | | (588,957 | ) | | | (553,867 | ) |
Credit contracts | | | — | | | | — | | | | — | | | | 184,113 | | | | 240,695 | | | | — | | | | 424,808 | |
| | | | | | | | | | | | | | | | | | | | | | | | | | | | |
Total | | $ | — | | | $ | — | | | $ | 1,365,591 | | | $ | 1,130,482 | | | $ | (242,261 | ) | | $ | (588,957 | ) | | $ | 1,664,855 | |
| | | | | | | | | | | | | | | | | | | | | | | | | | | | |
| Intermediate-Term Bond | | | | | | | | | | | | | | | | | | | | | | | | | | | | |
Interest rate contracts | | $ | — | | | $ | — | | | $ | 2,627,165 | | | $ | (40,613 | ) | | $ | (550,818 | ) | | $ | — | | | $ | 2,035,734 | |
Foreign exchange contracts | | | — | | | | — | | | | 35,988 | | | | — | | | | — | | | | 926,724 | | | | 962,712 | |
Credit contracts | | | — | | | | — | | | | — | | | | — | | | | 280,874 | | | | — | | | | 280,874 | |
| | | | | | | | | | | | | | | | | | | | | | | | | | | | |
Total | | $ | — | | | $ | — | | | $ | 2,663,153 | | | $ | (40,613 | ) | | $ | (269,944 | ) | | $ | 926,724 | | | $ | 3,279,320 | |
| | | | | | | | | | | | | | | | | | | | | | | | | | | | |
| Mortgage Backed Securities | | | | | | | | | | | | | | | | | | | | | | | | | | | | |
Interest rate contracts | | $ | — | | | $ | (4,400 | ) | | $ | (228,918 | ) | | $ | 2,000 | | | $ | (142,065 | ) | | $ | — | | | $ | (373,383 | ) |
Credit contracts | | | — | | | | — | | | | — | | | | — | | | | (62,080 | ) | | | — | | | | (62,080 | ) |
| | | | | | | | | | | | | | | | | | | | | | | | | | | | |
Total | | $ | — | | | $ | (4,400 | ) | | $ | (228,918 | ) | | $ | 2,000 | | | $ | (204,145 | ) | | $ | — | | | $ | (435,463 | ) |
| | | | | | | | | | | | | | | | | | | | | | | | | | | | |
| | | | | | | | | | | | | | | | | | | | | | | | | | | | |
| Change in Unrealized Appreciation or (Depreciation) on Derivatives Recognized in Income | |
| | | | | | | |
Derivatives not accounted
for as hedging instruments,
carried at fair value | | Rights | | | Options
Purchased | | | Futures | | | Options
Written | | | Swaps | | | Forward
Currency
Contracts | | | Total | |
| Small Capitalization Value | | | | | | | | | | | | | | | | | | | | | | | | | | | | |
Equity contracts | | $ | — | | | $ | — | | | $ | 286,000 | | | $ | — | | | $ | — | | | $ | — | | | $ | 286,000 | |
| | | | | | | | | | | | | | | | | | | | | | | | | | | | |
| International Equity | | | | | | | | | | | | | | | | | | | | | | | | | | | | |
Foreign exchange contracts | | $ | — | | | $ | — | | | $ | — | | | $ | — | | | $ | — | | | $ | 816,513 | | | $ | 816,513 | |
Equity contracts | | | (71,092 | ) | | | — | | | | — | | | | — | | | | — | | | | — | | | | (71,092 | ) |
| | | | | | | | | | | | | | | | | | | | | | | | | | | | |
Total | | $ | (71,092 | ) | | $ | — | | | $ | — | | | $ | — | | | $ | — | | | $ | 816,513 | | | $ | 745,421 | |
| | | | | | | | | | | | | | | | | | | | | | | | | | | | |
| Total Return Bond | | | | | | | | | | | | | | | | | | | | | | | | | | | | |
Interest rate contracts | | $ | — | | | $ | — | | | $ | 323,227 | | | $ | 576,763 | | | $ | 1,219,265 | | | $ | — | | | $ | 2,119,255 | |
Foreign exchange contracts | | | — | | | | — | | | | — | | | | (9,491 | ) | | | — | | | | (1,142,893 | ) | | | (1,152,384 | ) |
Credit contracts | | | — | | | | — | | | | — | | | | (147,487 | ) | | | (161,121 | ) | | | — | | | | (308,608 | ) |
| | | | | | | | | | | | | | | | | | | | | | | | | | | | |
Total | | $ | — | | | $ | — | | | $ | 323,227 | | | $ | 419,785 | | | $ | 1,058,144 | | | $ | (1,142,893 | ) | | $ | 658,263 | |
| | | | | | | | | | | | | | | | | | | | | | | | | | | | |
| | | | |
| THE TARGET PORTFOLIO TRUST | | | 163 | |
| | | | | | | | | | | | | | | | | | | | | | | | | | | | |
| Change in Unrealized Appreciation or (Depreciation) on Derivatives Recognized in Income | |
| | | | | | | |
Derivatives not accounted
for as hedging instruments,
carried at fair value | | Rights | | | Options
Purchased | | | Futures | | | Options
Written | | | Swaps | | | Forward
Currency
Contracts | | | Total | |
| Intermediate-Term Bond | | | | | | | | | | | | | | | | | | | | | | | | | | | | |
Interest rate contracts | | $ | — | | | $ | 74,452 | | | $ | 798,225 | | | $ | 63,879 | | | $ | 541,654 | | | $ | — | | | $ | 1,478,210 | |
Foreign exchange contracts | | | — | | | | — | | | | — | | | | — | | | | — | | | | (1,998,549 | ) | | | (1,998,549 | ) |
Credit contracts | | | — | | | | — | | | | — | | | | — | | | | 415,995 | | | | — | | | | 415,995 | |
| | | | | | | | | | | | | | | | | | | | | | | | | | | | |
Total | | $ | — | | | $ | 74,452 | | | $ | 798,225 | | | $ | 63,879 | | | $ | 957,649 | | | $ | (1,998,549 | ) | | $ | (104,344 | ) |
| | | | | | | | | | | | | | | | | | | | | | | | | | | | |
| Mortgage Backed Securities | | | | | | | | | | | | | | | | | | | | | | | | | | | | |
Interest rate contracts | | $ | — | | | $ | — | | | $ | 34,828 | | | $ | — | | | $ | (67,032 | ) | | $ | — | | | $ | (32,204 | ) |
Equity contracts | | | — | | | | | | | | — | | | | — | | | | (5,240 | ) | | | — | | | | (5,240 | ) |
| | | | | | | | | | | | | | | | | | | | | | | | | | | | |
Total | | $ | — | | | $ | — | | | $ | 34,828 | | | $ | — | | | $ | (72,272 | ) | | $ | — | | | $ | (37,444 | ) |
| | | | | | | | | | | | | | | | | | | | | | | | | | | | |
For the year ended October 31, 2011, the average volume of derivative activities are as follows:
| | | | | | | | | | | | | | | | | | | | |
Portfolio | | Options
Purchased(1) | | | Options
Written(2) | | | Futures
Contracts - Long
Positions(3) | | | Futures
Contracts - Short
Positions(3) | | | Forward
foreign
currency
exchange
purchase
contracts(4) | |
Small Capitalization Value | | $ | — | | | $ | — | | | $ | 2,142,462 | | | $ | — | | | $ | — | |
International Equity | | | — | | | | — | | | | — | | | | — | | | | 1,666,653 | |
Total Return Bond | | | — | | | | 769,856 | | | | 149,248,771 | | | | 7,271,931 | | | | 39,872,312 | |
Intermediate-Term Bond | | | 42,093 | | | | 447,334 | | | | 108,587,992 | | | | — | | | | 27,688,310 | |
Mortgage Backed Securities | | | — | | | | — | | | | 5,261,533 | | | | 9,784,115 | | | | — | |
| | | | | | | | | | | | | | | | | | | | |
Portfolio | | Forward
foreign
currency
exchange sale
contracts(5) | | | Interest rate
swap
agreements(6) | | | Credit default
swap
agreements - Buy
Protection(6) | | | Credit default
swap
agreements - Sell
Protection(6) | | | Total Return
swap
agreements(6) | |
Small Capitalization Value | | $ | — | | | $ | — | | | $ | — | | | $ | — | | | $ | — | |
International Equity | | | 6,627,255 | | | | — | | | | — | | | | — | | | | — | |
Total Return Bond | | | 57,477,559 | | | | 57,395,744 | | | | 48,336,920 | | | | 1,540,000 | | | | — | |
Intermediate-Term Bond | | | 28,954,342 | | | | 22,015,241 | | | | 5,681,154 | | | | 24,185,000 | | | | — | |
Mortgage Backed Securities | | | — | | | | 7,750,000 | | | | — | | | | — | | | | 708,657 | |
| (4) | Value at Settlement Date Payable. |
| (5) | Value at Settlement Date Receivable. |
Securities Lending: The Portfolio may lend its portfolio securities to broker-dealers. The loans are secured by collateral at least equal at all times to the market value of the securities loaned. Loans are subject to termination at the option of the borrower or the Portfolio. Upon termination of the loan, the borrower will return to the lender securities identical to the loaned securities. Should the borrower of the securities fail
| | | | |
| 164 | | | THE TARGET PORTFOLIO TRUST | |
financially, the Portfolio has the right to repurchase the securities using the collateral in the open market. The Portfolio recognizes income, net of any rebate and securities lending agent fees, for lending its securities in the form of fees or interest on the investment of any cash received as collateral. The Portfolio also continues to receive interest and dividends or amounts equivalent thereto on the securities loaned and recognizes any unrealized gain or loss in the market price of the securities loaned that may occur during the term of the loan.
When-Issued/Delayed Delivery Securities: Certain Portfolios may purchase or sell securities on a when-issued or delayed delivery basis. These transactions involve a commitment by the Portfolio to purchase or sell securities for a predetermined price or yield, with payment and delivery taking place beyond the customary settlement period. When delayed delivery purchases are outstanding, the Portfolio will set aside and maintain until the settlement date in a segregated account, liquid assets in an amount sufficient to meet the purchase price. When purchasing a security on a delayed delivery basis, the Portfolio assumes the rights and risks of ownership of the security, including the risk of price and yield fluctuations, and takes such fluctuations into account when determining its net asset value. The Portfolio may dispose of or renegotiate a delayed delivery transaction after it is entered into, and may sell when-issued securities before they are delivered, which may result in a capital gain or loss. When the Portfolio has sold a security on a delayed delivery basis, the Portfolio does not participate in future gains and losses with respect to the security.
Securities Transactions and Net Investment Income: Securities transactions are recorded on the trade date. Realized and unrealized gains and losses from security and currency transactions are calculated on the identified cost basis. Dividend income is recorded on the ex-dividend date and interest income, including amortization of premium and accretion of discount of debt securities, as required, is recorded on the accrual basis. Expenses are recorded on the accrual basis. The Trust’s expenses are allocated to the respective Portfolios on the basis of relative net assets except for expenses that are charged directly at the Portfolio or class level.
Dividends and Distributions: The Total Return Bond Portfolio, Intermediate-Term Bond Portfolio, and Mortgage Backed Securities Portfolio declare dividends of their net investment income daily and pay such dividends monthly. All other Portfolios declare and pay a dividend from net investment income, if any, at least annually. Each Portfolio declares and pays its net realized capital gains, if any, at least annually. Dividends and distributions to shareholders, which are determined in accordance with federal income tax regulations and which may differ from generally accepted accounting principles, are recorded on ex-dividend date. Permanent book/ tax differences relating to income and gains are reclassified amongst undistributed net investment income, accumulated net realized gain or loss and paid-in capital, in excess of par, as appropriate.
Taxes: For federal income tax purposes, each Portfolio in the Trust is treated as a separate tax-paying entity. It is each Portfolio’s policy to continue to meet the requirements of the Internal Revenue Code applicable to regulated investment companies and to distribute all of its taxable net investment income and capital gains, if any, to its shareholders. Therefore, no federal income tax provision is required.
Withholding taxes on foreign interest and dividends are recorded net of reclaimable amounts, at the time the related income is earned.
Estimates: The preparation of the financial statements requires management to make estimates and assumptions that affect the reported amounts and disclosures in the financial statements. Actual results could differ from those estimates.
| | | | |
| THE TARGET PORTFOLIO TRUST | | | 165 | |
Note 2. Agreements
The Trust’s manager is Prudential Investments LLC (“PI”). PI manages the investment operations of the Trust, administers the Trust’s affairs and is responsible for the selection, subject to review and approval of the Trustees, of the sub-advisers. PI supervises the sub-advisers’ performance of advisory services and makes recommendations to the Trustees as to whether the sub-advisers’ contracts should be renewed, modified or terminated. PI pays for the costs pursuant to the advisory agreements, the cost of compensation of officers of the Trust, occupancy and certain clerical and accounting costs of the Trust. The Trust bears all other costs and expenses.
The sub-advisers noted below each furnished investment advisory services in connection with the manage- ment of the Portfolios. Each of the sub-advisers of the equity Portfolios—Large Capitalization Growth Portfolio, Large Capitalization Value Portfolio, Small Capitalization Growth Portfolio, Small Capitalization Value Portfolio and International Equity Portfolio—manages a portion of the assets of the respective Portfolios. In general, in order to maintain a division of assets between the sub-advisers as deemed appropriate by PI, all daily cash inflows (i.e., subscriptions and reinvested distributions) and outflows (i.e., redemptions and expense items) are divided between the sub-advisers, as PI deems appropriate. In order to maintain an approximate allocation between the sub-advisers in the ratio deemed appropriate by PI, a periodic rebalancing of each sub- adviser’s share of Portfolio assets may occur to account for market fluctuations.
At October 31, 2011, the sub-advisers that provide subadvisory services are:
| | |
Portfolio | | Adviser |
Large Capitalization Growth | | Marsico Capital Management, LLC and Massachusetts Financial Services Company (MFS) |
Large Capitalization Value | | NFJ Investment Group LLC., Hotchkis and Wiley Capital Management, LLC and Eaton Vance Management |
Small Capitalization Growth | | Ashfield Capital Partners, LLC through February 24, 2011, Eagle Asset Management, Inc. and Emerald Mutual Fund Advisers Trust, effective on or about January 17, 2012 |
Small Capitalization Value | | NFJ Investment Group L.P. , EARNEST Partners, LLC, Lee Munder Investments Limited, J.P. Morgan Investment Management, Inc. and Vaughan Nelson Investment Management, L.P. |
International Equity | | LSV Asset Management and Thornburg Investment Management, Inc. |
Total Return Bond and Intermediate-Term Bond | | Pacific Investment Management Company LLC |
Mortgage Backed Securities | | Wellington Management Company, LLP |
The management fee payable to PI is computed daily and paid monthly, at an annual rate of the average daily net assets of the Portfolios specified below and PI, in turn, pays each sub-adviser a fee for its services.
| | | | |
Portfolio | | Contracted & Effective
Management Fee | |
Large Capitalization Growth | | | 0.60 | % |
Large Capitalization Value | | | 0.60 | % |
Small Capitalization Growth | | | 0.60 | % |
Small Capitalization Value | | | 0.60 | % |
International Equity | | | 0.70 | % |
Total Return Bond | | | 0.45 | % |
Intermediate-Term Bond | | | 0.45 | % |
Mortgage Backed Securities | | | 0.45 | % |
| | | | |
| 166 | | | THE TARGET PORTFOLIO TRUST | |
The Trust has a distribution agreement with Prudential Investment Management Services LLC (“PIMS”) which acts as the distributor of the Class Q, Class R and Class T shares of the Trust. The Trust compensates PIMS for distributing and servicing the Trust’s Class R shares, pursuant to plan of distribution (the “Class R Plan”), regardless of expenses actually incurred by PIMS. The distribution fee is accrued daily and payable monthly. No distribution or service fees are paid to PIMS as distributor of the Class Q and Class T shares of the Trust.
Pursuant to the Class R Plan, the Trust compensates PIMS for distribution related activities at an annual rate of up to 0.75% of the average daily net assets of the Class R shares. For the year ended October 31, 2011, PIMS has contractually agreed to limit such fees to 0.50% of the average daily net assets of the Class R shares through February 28, 2013.
PI and PIMS are indirect, wholly-owned subsidiaries of Prudential Financial, Inc. (“Prudential”).
Note 3. Other Transactions with Affiliates
Prudential Mutual Fund Services LLC (“PMFS”), an affiliate of PI and an indirect, wholly-owned subsidiary of Prudential, serves as the Trust’s transfer agent. Transfer agent fees and expenses in the Statement of Operations also include certain out-of-pocket expenses paid to non-affiliates where applicable.
Prudential Investment Management, Inc. (“PIM”), an indirect, wholly-owned subsidiary of Prudential, is the Trust’s securities lending agent. For the year ended October 31, 2011, PIM was compensated for these services by the following Portfolios of the Trust:
| | | | |
Portfolio | | PIM | |
Large Capitalization Growth | | $ | 18,264 | |
Large Capitalization Value | | | 7,277 | |
Small Capitalization Growth | | | 46,121 | |
Small Capitalization Value | | | 311,037 | |
Certain Portfolios invest in the Prudential Core Taxable Money Market Series (the “Core Fund”), a series of the Prudential Investment Portfolios 2, registered under the 1940 Act, as amended, and managed by PI. Earnings from the Core Fund are disclosed on the Statement of Operations as affiliated dividend income.
Note 4. Portfolio Securities
Purchases and sales of portfolio securities, excluding short-term investments and U.S. Government securities, for the year ended October 31, 2011, were as follows:
| | | | | | | | |
Portfolio | | Purchases | | | Sales | |
Large Capitalization Growth | | $ | 201,149,660 | | | $ | 224,258,343 | |
Large Capitalization Value | | | 86,889,416 | | | | 99,766,487 | |
Small Capitalization Growth | | | 89,849,402 | | | | 99,818,748 | |
Small Capitalization Value | | | 431,968,085 | | | | 388,753,057 | |
International Equity | | | 182,200,959 | | | | 50,545,,831 | |
Total Return Bond | | | 804,619,082 | | | | 747,229,984 | |
Intermediate-Term Bond | | | 237,247,103 | | | | 316,122,794 | |
Mortgage Backed Securities | | | 347,072,958 | | | | 350,340,712 | |
| | | | |
| THE TARGET PORTFOLIO TRUST | | | 167 | |
Transactions in options written during the year ended October 31, 2011, were as follows:
| | | | | | | | |
Intermediate-Term Bond | | Notional Amount (000) | | | Premium Received | |
Options outstanding at October 31, 2010 | | | 87,900 | | | $ | 480,660 | |
Written options | | | 16,300 | | | | 548,883 | |
Expired options | | | (34,330 | ) | | | (152,184 | ) |
Closed options | | | (16,570 | ) | | | (297,354 | ) |
| | | | | | | | |
Options outstanding at October 31, 2011 | | | 53,300 | | | $ | 580,005 | |
| | | | | | | | |
| | |
Total Return Bond | | Notional Amount (000) | | | Premium Received | |
Options outstanding at October 31, 2010 | | | 187,400 | | | $ | 1,305,138 | |
Written options | | | 557,904 | | | | 720,033 | |
Expired options | | | (133,040 | ) | | | (811,855 | ) |
Closed options | | | (564,964 | ) | | | (797,243 | ) |
| | | | | | | | |
Options outstanding at October 31, 2011 | | | 47,300 | | | $ | 416,073 | |
| | | | | | | | |
Note 5. Tax Information
Distributions to shareholders, which are determined in accordance with federal income tax regulations, which may differ from generally accepted accounting principles, are recorded on the ex-dividend date. In order to present undistributed net investment income or loss, accumulated net realized gains or losses and paid-in capital in excess of par on the Statement of Assets and Liabilities that more closely represent their tax character, certain adjustments have been made to undistributed net investment income or loss, accumulated net realized gains or losses and paid-in capital in excess of par.
For the year ended October 31, 2011 the adjustments were as follows:
| | | | | | | | | | | | |
| | | Undistributed
Net Investment
Income or Loss | | | Accumulated
Net Gains
or Losses | | | Paid-In
Capital In
Excess of Par | |
Large Capitalization Growth(a) | | $ | (653 | ) | | $ | 653 | | | $ | — | |
Small Capitalization Growth(b) | | | 529,116 | | | | — | | | | (529,116 | ) |
Small Capitalization Value(f),(g) | | | 742 | | | | 37,508 | | | | (38,250 | ) |
International Equity(a),(f) | | | (978,928 | ) | | | 978,928 | | | | — | |
Total Return Bond(a),(c),(d),(e),(g) | | | 464,298 | | | | (464,298 | ) | | | — | |
Intermediate-Term Bond(a),(c),(d),(e),(g) | | | 3,723,234 | | | | (3,723,234 | ) | | | — | |
Mortgage Backed Securities(a),(c),(e) | | | (103,006 | ) | | | 103,006 | | | | — | |
| (a) | Reclassification of net foreign currency gain (loss). |
| (b) | Reclassification of net operating loss. |
| (c) | Reclassification of swap income. |
| (d) | Reclassification of income from defaulted securities. |
| (e) | Reclassification of paydowns. |
| (f) | Reclassification of PFIC adjustments. |
| (g) | Other book to tax differences. |
| | | | |
| 168 | | | THE TARGET PORTFOLIO TRUST | |
Net investment income or loss, net realized gains or losses and net assets were not affected by these adjustments.
For the fiscal year ended October 31, 2011, the tax character of dividends paid as reflected in the Statement of Changes in Net Assets were as follows:
| | | | | | | | | | | | |
| | | Ordinary
Income | | | Long-Term
Capital Gains | | | Total Dividends
and Distributions | |
Large Capitalization Growth | | $ | 310,242 | | | $ | — | | | $ | 310,242 | |
Large Capitalization Value | | | 3,056,600 | | | | — | | | | 3,056,600 | |
Small Capitalization Value | | | 7,806,127 | | | | — | | | | 7,806,127 | |
International Equity | | | 2,478,920 | | | | — | | | | 2,478,920 | |
Total Return Bond | | | 18,187,248 | | | | 3,832,295 | | | | 22,019,543 | |
Intermediate-Term Bond | | | 13,936,786 | | | | 1,695,015 | | | | 15,631,801 | |
Mortgage Backed Securities | | | 1,498,727 | | | | — | | | | 1,498,727 | |
For the fiscal year ended October 31, 2010, the tax character of dividends paid as reflected in the Statement of Changes in Net Assets were as follows:
| | | | | | | | | | | | |
| | | Ordinary
Income | | | Long-Term
Capital Gains | | | Total Dividends
and
Distributions | |
Large Capitalization Growth | | $ | 1,218,903 | | | $ | — | | | $ | 1,218,903 | |
Large Capitalization Value | | | 3,812,507 | | | | — | | | | 3,812,507 | |
Small Capitalization Value | | | 7,063,938 | | | | | | | | 7,063,938 | |
International Equity | | | 2,289,811 | | | | — | | | | 2,289,811 | |
Total Return Bond | | | 17,584,409 | | | | — | | | | 17,584,409 | |
Intermediate-Term Bond | | | 14,470,943 | | | | 4,358,511 | | | | 18,829,454 | |
Mortgage Backed Securities | | | 2,036,104 | | | | — | | | | 2,036,104 | |
For federal income tax purposes, dividends from net investment income and distributions from short-term capital gains are taxable as ordinary income. Long-term capital gain distributions are taxable as such.
As of October 31, 2011, the Portfolios had the following amounts of accumulated undistributed earnings on a tax basis:
| | | | | | | | |
| | | Undistributed
Ordinary
Income | | | Undistributed
Long-Term
Capital Gains | |
Large Capitalization Growth | | $ | 295,798 | | | $ | — | |
Large Capitalization Value | | | 2,538,847 | | | | — | |
Small Capitalization Value | | | 7,445,969 | | | | 29,365,321 | |
International Equity | | | 5,377,398 | | | | — | |
Total Return Bond | | | 190,547 | | | | — | |
Intermediate-Term Bond | | | 2,903,067 | | | | 969,520 | |
Mortgage Backed Securities | | | 102,273 | | | | — | |
| | | | |
| THE TARGET PORTFOLIO TRUST | | | 169 | |
These amounts may differ from the amounts shown on the Statement of Assets and Liabilities primarily due to cumulative timing differences between financial and tax reporting.
For federal income tax purposes, certain Portfolios had capital loss carryforwards as of October 31, 2011 of approximately:
| | | | | | | | | | | | | | | | | | | | | | | | | | | | | | | | | | | | |
| | | Expiring October 31, | |
| | | 2012 | | | 2013 | | | 2014 | | | 2015 | | | 2016 | | | 2017 | | | 2018 | | | 2019 | | | Total | |
Large Capitalization Growth | | $ | — | | | $ | — | | | $ | — | | | $ | — | | | $ | 4,808,000 | | | $ | 32,835,000 | | | $ | — | | | $ | — | | | $ | 37,643,000 | |
Large Capitalization Value | | | — | | | | — | | | | — | | | | — | | | | 8,553,000 | | | | 74,753,000 | | | | 221,000 | | | | — | | | | 83,527,000 | |
Small Capitalization Growth | | | — | | | | — | | | | — | | | | — | | | | 2,396,000 | | | | 26,562,000 | | | | — | | | | — | | | | 28,958,000 | |
International Equity | | | — | | | | — | | | | — | | | | — | | | | 1,524,000 | | | | 28,616,000 | | | | — | | | | 2,738,000 | | | | 32,878,000 | |
Mortgage Backed Securities | | | — | | | | — | | | | 1,457,000 | | | | 900,000 | | | | 531,000 | | | | 958,000 | | | | — | | | | — | | | | 3,846,000 | |
Total Return Bond | | | — | | | | — | | | | — | | | | — | | | | — | | | | — | | | | — | | | | 527,000 | | | | 527,000 | |
Accordingly, no capital gain distributions are expected to be paid to shareholders until future net gains have been realized in excess of such carryforwards. Under the recently enacted Regulated Investment Company Modernization Act of 2010 (“the Act”), the Portfolios are permitted to carryforward capital losses incurred in taxable years beginning after December 22, 2010 (“post-enactment losses”) for an unlimited period. However, any post-enactment losses are required to be utilized before the utilization of losses incurred prior to the effective date of the Act. As a result of this ordering rule, capital loss carryforwards related to the taxable years beginning prior to the effective date of the Act may have an increased likelihood to expire unused. Additionally, post-enactment capital losses that are carried forward will retain their character as either short-term or long-term capital losses rather than being considered all short-term as under previous law.
The following Portfolios utilized capital loss carryforward to offset net taxable capital gains realized in the fiscal year ended October 31, 2011 of approximately:
| | | | |
Large Capitalization Growth | | $ | 16,936,000 | |
Large Capitalization Value | | | 10,156,000 | |
Small Capitalization Growth | | | 19,464,000 | |
Small Capitalization Value | | | 22,342,000 | |
Mortgage Backed Securities | | | 970,000 | |
The federal income tax basis of the Portfolio’s investments and the net unrealized appreciation/ depreciation as of October 31, 2011 were as follows:
| | | | | | | | | | | | | | | | | | | | | | | | |
| | | Tax Basis | | | Unrealized
Appreciation | | | Unrealized
Depreciation | | | Net
Unrealized
Appreciation/
Depreciation | | | Other Cost
Basis
Adjustments | | | Total Net
Unrealized
Appreciation/
Depreciation | |
Large Capitalization Growth | | $ | 170,505,306 | | | $ | 48,636,086 | | | $ | (8,428,767 | ) | | $ | 40,207,319 | | | $ | 525 | | | $ | 40,207,844 | |
Large Capitalization Value | | | 190,218,746 | | | | 32,413,162 | | | | (15,994,374 | ) | | | 16,418,788 | | | | — | | | | 16,418,788 | |
Small Capitalization Growth | | | 103,056,864 | | | | 19,542,354 | | | | (6,073,531 | ) | | | 13,468,823 | | | | — | | | | 13,468,823 | |
Small Capitalization Value | | | 961,249,860 | | | | 192,344,717 | | | | (60,973,077 | ) | | | 131,371,640 | | | | — | | | | 131,371,640 | |
International Equity | | | 301,623,114 | | | | 28,306,810 | | | | (40,099,319 | ) | | | (11,792,509 | ) | | | 26,948 | | | | (11,765,561 | ) |
Total Return Bond | | | 440,418,093 | | | | 16,366,451 | | | | (7,752,345 | ) | | | 8,614,106 | | | | 1,347,757 | | | | 9,961,863 | |
Intermediate-Term Bond | | | 192,281,153 | | | | 5,644,233 | | | | (7,431,767 | ) | | | (1,787,534 | ) | | | 975,350 | | | | (812,184 | ) |
Mortgage Backed Securities | | | 55,312,011 | | | | 2,546,441 | | | | (628,302 | ) | | | 1,918,139 | | | | (190,384 | ) | | | 1,727,755 | |
| | | | |
| 170 | | | THE TARGET PORTFOLIO TRUST | |
The difference between book basis and tax basis are primarily attributable to deferred losses on wash sales and other book to tax differences. The other cost basis adjustments are primarily attributable to appreciation (depreciation) on written options, futures, swaps, short sales, forward currency contracts and mark-to-market of receivables and payables.
Management has analyzed the Funds’ tax positions taken on federal income tax returns for all open tax years and has concluded that no provision for income tax is required in the Funds’ financial statements for the current reporting period. The Funds’ federal and state income and federal excise tax returns for tax years for which the applicable statutes of limitations have not expired are subject to examination by the Internal Revenue Service and state departments of revenue.
Note 6. Capital
For the year ended October 31, 2010 the following Portfolios received amounts related to settlements of regulatory proceedings involving allegations of improper trading. The total amount is presented in the respective Portfolio’s statement of changes in the net assets. The Portfolios were not involved in the proceedings or the calculations of the payments.
| | | | | | | | | | | | |
| | | Affiliate | | | Third
Party | | | Total
Settlement | |
Small Capitalization Growth | | $ | — | | | $ | 7,375 | | | $ | 7,375 | |
International Equity | | | 384,721 | | | | 139,018 | | | | 523,739 | |
Total Return Bond | | | — | | | | 3,012 | | | | 3,012 | |
Intermediate-Term Bond | | | — | | | | 6,361 | | | | 6,361 | |
The Trust has authorized an unlimited number of shares of beneficial interest at $.001 par value per share. Transactions in shares of beneficial interest were as follows:
| | | | | | | | | | | | | | | | |
| | | Class R | | | Class T | |
| | | Shares | | | Amount | | | Shares | | | Amount | |
| Large Capitalization Growth | | | | | | | | | | | | | | | | |
Year Ended October 31, 2011: | | | | | | | | | | | | | | | | |
Sold | | | 2,816,204 | | | $ | 38,117,451 | | | | 577,380 | | | $ | 7,870,443 | |
Reinvested | | | — | | | | — | | | | 22,526 | | | | 302,077 | |
Redeemed | | | (2,351,978 | ) | | | (31,911,333 | ) | | | (2,471,202 | ) | | | (34,019,278 | ) |
| | | | | | | | | | | | | | | | |
Net Increase (Decrease) | | | 464,226 | | | $ | 6,206,118 | | | | (1,871,296 | ) | | $ | (25,846,758 | ) |
| | | | | | | | | | | | | | | | |
Year Ended October 31, 2010: | | | | | | | | | | | | | | | | |
Sold | | | 3,247,610 | | | $ | 37,778,561 | | | | 591,571 | | | $ | 6,965,639 | |
Reinvested | | | 21,863 | | | | 252,959 | | | | 82,518 | | | | 958,029 | |
Redeemed | | | (1,918,588 | ) | | | (22,508,394 | ) | | | (3,437,478 | ) | | | (40,650,752 | ) |
| | | | | | | | | | | | | | | | |
Net Increase (Decrease) | | | 1,350,885 | | | $ | 15,523,126 | | | | (2,763,389 | ) | | $ | (32,727,084 | ) |
| | | | | | | | | | | | | | | | |
| Large Capitalization Value | | | | | | | | | | | | | | | | |
Year Ended October 31, 2011: | | | | | | | | | | | | | | | | |
Sold | | | 4,173,124 | | | $ | 42,081,540 | | | | 860,501 | | | $ | 8,777,621 | |
Reinvested | | | 124,372 | | | | 1,256,153 | | | | 173,422 | | | | 1,753,297 | |
Redeemed | | | (2,857,323 | ) | | | (29,120,411 | ) | | | (3,448,245 | ) | | | (35,679,113 | ) |
| | | | | | | | | | | | | | | | |
Net Increase (Decrease) | | | 1,440,173 | | | $ | 14,217,282 | | | | (2,414,322 | ) | | $ | (25,148,195 | ) |
| | | | | | | | | | | | | | | | |
| | | | |
| THE TARGET PORTFOLIO TRUST | | | 171 | |
| | | | | | | | | | | | | | | | |
| | | Class R | | | Class T | |
| | | Shares | | | Amount | | | Shares | | | Amount | |
Year Ended October 31, 2010: | | | | | | | | | | | | | | | | |
Sold | | | 4,206,880 | | | $ | 39,035,970 | | | | 800,535 | | | $ | 7,471,851 | |
Reinvested | | | 131,744 | | | | 1,209,413 | | | | 280,122 | | | | 2,574,323 | |
Redeemed | | | (2,333,900 | ) | | | (21,812,808 | ) | | | (4,440,616 | ) | | | (41,690,260 | ) |
| | | | | | | | | | | | | | | | |
Net Increase (Decrease) | | | 2,004,724 | | | $ | 18,432,575 | | | | (3,359,959 | ) | | $ | (31,644,086 | ) |
| | | | | | | | | | | | | | | | |
| Small Capitalization Growth | | | | | | | | | | | | | | | | |
Year Ended October 31, 2011: | | | | | | | | | | | | | | | | |
Sold | | | 2,239,152 | | | $ | 24,344,979 | | | | 368,799 | | | $ | 4,147,835 | |
Reinvested | | | — | | | | — | | | | — | | | | — | |
Redeemed | | | (1,717,953 | ) | | | (19,145,178 | ) | | | (1,728,981 | ) | | | (19,653,249 | ) |
| | | | | | | | | | | | | | | | |
Net Increase (Decrease) | | | 521,199 | | | $ | 5,199,801 | | | | (1,360,182 | ) | | $ | (15,505,414 | ) |
| | | | | | | | | | | | | | | | |
Year Ended October 31, 2010: | | | | | | | | | | | | | | | | |
Sold | | | 1,783,410 | | | $ | 15,618,007 | | | | 504,925 | | | $ | 4,527,112 | |
Reinvested | | | — | | | | — | | | | — | | | | — | |
Redeemed | | | (1,185,108 | ) | | | (10,425,202 | ) | | | (1,983,060 | ) | | | (17,833,773 | ) |
| | | | | | | | | | | | | | | | |
Net Increase (Decrease) | | | 598,302 | | | $ | 5,192,805 | | | | (1,478,135 | ) | | $ | (13,306,661 | ) |
| | | | | | | | | | | | | | | | |
| Small Capitalization Value | | | | | | | | | | | | | | | | |
Year Ended October 31, 2011: | | | | | | | | | | | | | | | | |
Sold | | | 1,762,400 | | | $ | 35,858,712 | | | | 14,715,096 | | | $ | 310,378,644 | |
Reinvested | | | 12,402 | | | | 251,514 | | | | 329,465 | | | | 6,704,604 | |
Redeemed | | | (1,111,170 | ) | | | (23,053,163 | ) | | | (13,529,063 | ) | | | (280,254,114 | ) |
| | | | | | | | | | | | | | | | |
Net Increase (Decrease) | | | 663,632 | | | $ | 13,057,063 | | | | 1,515,498 | | | $ | 36,829,134 | |
| | | | | | | | | | | | | | | | |
Year Ended October 31, 2010: | | | | | | | | | | | | | | | | |
Sold | | | 1,361,954 | | | $ | 23,742,362 | | | | 14,338,950 | | | $ | 253,875,156 | |
Reinvested | | | 17,571 | | | | 285,001 | | | | 376,220 | | | | 6,121,095 | |
Redeemed | | | (761,992 | ) | | | (13,283,009 | ) | | | (7,145,079 | ) | | | (125,562,151 | ) |
| | | | | | | | | | | | | | | | |
Net Increase (Decrease) | | | 617,533 | | | $ | 10,744,354 | | | | 7,570,091 | | | $ | 134,434,100 | |
| | | | | | | | | | | | | | | | |
| Total Return Bond | | | | | | | | | | | | | | | | |
Year Ended October 31, 2011: | | | | | | | | | | | | | | | | |
Sold | | | 5,980,875 | | | $ | 64,642,701 | | | | 7,135,190 | | | $ | 77,910,031 | |
Reinvested | | | 591,539 | | | | 6,331,587 | | | | 1,459,943 | | | | 15,731,269 | |
Redeemed | | | (3,970,230 | ) | | | (43,056,478 | ) | | | (8,867,059 | ) | | | (96,421,045 | ) |
| | | | | | | | | | | | | | | | |
Net Increase (Decrease) | | | 2,602,184 | | | $ | 27,917,810 | | | | (271,926 | ) | | $ | (2,779,745 | ) |
| | | | | | | | | | | | | | | | |
Year Ended October 31, 2010: | | | | | | | | | | | | | | | | |
Sold | | | 4,691,739 | | | $ | 51,454,818 | | | | 6,944,205 | | | $ | 76,608,462 | |
Reinvested | | | 398,369 | | | | 4,307,472 | | | | 1,220,163 | | | | 13,300,987 | |
Redeemed | | | (2,546,608 | ) | | | (27,938,039 | ) | | | (4,580,343 | ) | | | (50,668,775 | ) |
| | | | | | | | | | | | | | | | |
Net Increase (Decrease) | | | 2,543,500 | | | $ | 27,824,251 | | | | 3,584,025 | | | $ | 39,240,674 | |
| | | | | | | | | | | | | | | | |
| Intermediate-Term Bond | | | | | | | | | | | | | | | | |
Year Ended October 31, 2011: | | | | | | | | | | | | | | | | |
Sold | | | — | | | $ | — | | | | 3,382,892 | | | $ | 35,487,485 | |
Reinvested | | | — | | | | — | | | | 1,482,405 | | | | 15,323,051 | |
Redeemed | | | — | | | | — | | | | (10,182,399 | ) | | | (106,009,822 | ) |
| | | | | | | | | | | | | | | | |
Net Increase (Decrease) | | | — | | | $ | — | | | | (5,317,102 | ) | | $ | (55,199,286 | ) |
| | | | | | | | | | | | | | | | |
| | | | |
| 172 | | | THE TARGET PORTFOLIO TRUST | |
| | | | | | | | | | | | | | | | |
| | | Class R | | | Class T | |
| | | Shares | | | Amount | | | Shares | | | Amount | |
Year Ended October 31, 2010: | | | | | | | | | | | | | | | | |
Sold | | | — | | | $ | — | | | | 5,966,152 | | | $ | 63,494,251 | |
Reinvested | | | — | | | | — | | | | 1,768,681 | | | | 18,426,780 | |
Redeemed | | | — | | | | — | | | | (7,668,356 | ) | | | (81,516,531 | ) |
| | | | | | | | | | | | | | | | |
Net Increase (Decrease) | | | — | | | $ | — | | | | 66,477 | | | $ | 404,500 | |
| | | | | | | | | | | | | | | | |
| Mortgage Backed Securities | | | | | | | | | | | | | | | | |
Year Ended October 31, 2011: | | | | | | | | | | | | | | | | |
Sold | | | — | | | $ | — | | | | 1,004,440 | | | $ | 10,685,987 | |
Reinvested | | | — | | | | — | | | | 140,629 | | | | 1,484,331 | |
Redeemed | | | — | | | | — | | | | (1,253,523 | ) | | | (13,269,886 | ) |
| | | | | | | | | | | | | | | | |
Net Increase (Decrease) | | | — | | | $ | — | | | | (108,454 | ) | | $ | (1,099,568 | ) |
| | | | | | | | | | | | | | | | |
Year Ended October 31, 2010: | | | | | | | | | | | | | | | | |
Sold | | | — | | | $ | — | | | | 345,226 | | | $ | 3,562,213 | |
Reinvested | | | — | | | | — | | | | 201,878 | | | | 2,071,518 | |
Redeemed | | | — | | | | — | | | | (1,261,130 | ) | | | (12,948,810 | ) |
| | | | | | | | | | | | | | | | |
Net Increase (Decrease) | | | — | | | $ | — | | | | (714,026 | ) | | $ | (7,315,079 | ) |
| | | | | | | | | | | | | | | | |
| | | | | | | | | | | | | | | | | | | | | | | | |
| | | Class Q* | | | Class R | | | Class T | |
| | | Shares | | | Amount | | | Shares | | | Amount | | | Shares | | | Amount | |
| International Equity | | | | | | | | | | | | | | | | | | | | | | | | |
Year Ended October 31, 2011: | | | | | | | | | | | | | | | | | | | | | | | | |
Sold | | | 1,023,837 | | | $ | 11,246,758 | | | | 5,147,523 | | | $ | 60,065,463 | | | | 10,416,360 | | | $ | 128,415,996 | |
Reinvested | | | — | | | | — | | | | 79,602 | | | | 924,975 | | | | 131,164 | | | | 1,525,441 | |
Redeemed | | | (608,944 | ) | | | (7,220,510 | ) | | | (2,055,676 | ) | | | (24,384,369 | ) | | | (2,780,213 | ) | | | (33,784,867 | ) |
| | | | | | | | | | | | | | | | | | | | | | | | |
| | | 414,893 | | | | 4,026,248 | | | | 3,171,449 | | | | 36,606,069 | | | | 7,767,311 | | | | 96,156,570 | |
Shares issued upon conversion from Class T | | | 9,351,913 | | | | 118,675,777 | | | | — | | | | — | | | | — | | | | — | |
Shares reacquired upon conversion into Class Q | | | — | | | | — | | | | — | | | | — | | | | (9,351,913 | ) | | | (118,675,777 | ) |
| | | | | | | | | | | | | | | | | | | | | | | | |
Net Increase (Decrease) | | | 9,766,806 | | | $ | 122,702,025 | | | | 3,171,449 | | | $ | 36,606,069 | | | | (1,584,602 | ) | | $ | (22,519,207 | ) |
| | | | | | | | | | | | | | | | | | | | | | | | |
Year Ended October 31, 2010: | | | | | | | | | | | | | | | | | | | | | | | | |
Sold | | | | | | | | | | | 3,092,876 | | | $ | 33,409,588 | | | | 689,820 | | | $ | 7,448,651 | |
Reinvested | | | | | | | | | | | 55,299 | | | | 604,417 | | | | 153,225 | | | | 1,676,277 | |
Redeemed | | | | | | | | | | | (1,760,213 | ) | | | (19,252,379 | ) | | | (3,516,516 | ) | | | (38,395,551 | ) |
| | | | | | | | | | | | | | | | | | | | | | | | |
Net Increase (Decrease) | | | | | | | | | | | 1,387,962 | | | $ | 14,761,626 | | | | (2,673,471 | ) | | $ | (29,270,623 | ) |
| | | | | | | | | | | | | | | | | | | | | | | | |
| * | Commencement of offering was March 1, 2011. |
Note 7. Borrowings
The Trust, along with other affiliated registered investment companies (the “Companies”), is a party to a syndicated Credit Agreement (“SCA”) with a group of banks. The purpose of the SCA is to provide an alternative source of temporary funding for capital share redemptions. The SCA provides for a commitment of $750 million for the period December 17, 2010 through December 16, 2011. The Companies pay an annualized
| | | | |
| THE TARGET PORTFOLIO TRUST | | | 173 | |
commitment fee of 0.10% of the unused portion of the SCA. Prior to December 17, 2010, the Companies had another Syndicated Credit Agreement (the “Expired SCA”) of a $500 million commitment with an annualized commitment fee of 0.15% of the unused portion. Interest on any borrowings under these is contracted market rates. The commitment fee for the unused amount is accrued daily and paid quarterly. The SCA has been renewed on substantially similar terms with an increase in the amount of commitment to $900 million.
The following Portfolios utilized the line of credit during the year ended October 31, 2011. The approximate average balance outstanding is for the number of days that each Portfolio had an outstanding balance.
| | | | | | | | | | | | | | | | |
Portfolio | | Average Balance
Outstanding
During the Period | | | Average
Interest
Rate | | | Number of Days
Advances Outstanding
During the Period | | | Outstanding
Borrowings at
October 31, 2011 | |
Large Capitalization Growth | | $ | 1,405,000 | | | | 1.51 | % | | | 9 | | | $ | — | |
Large Capitalization Value | | | 302,000 | | | | 1.51 | % | | | 13 | | | | — | |
Small Capitalization Growth | | | 632,000 | | | | 1.51 | % | | | 61 | | | | — | |
International Equity | | | 292,000 | | | | 1.47 | % | | | 72 | | | | — | |
Note 8. In-Kind Redemption
During the year ended October 31, 2011, Small Capitalization Value settled the redemption of certain portfolio shares by delivery of certain portfolio securities in lieu of cash. The value of such securities was $63,275,780. The Portfolio realized a gain of $390,705 related to the in-kind redemption transactions, which amount is included in the Statement of Operations under “Realized gain/loss on investment and foreign currency transactions”. Such gain is excluded from calculation of the Portfolio’s taxable gain for federal income tax purposes.
Note 9. In-Kind Subscription
During the year ended October 31, 2011, International Equity settled the subscription of certain portfolio shares by receipt of certain portfolio securities in lieu of cash. The value of such securities was $112,688,510.
Note 10. Dividends and Distributions to Shareholders
Subsequent to the fiscal year end, in addition to the monthly dividends paid by the Total Return Bond Portfolio, Intermediate-Term Bond Portfolio, and Mortgage Backed Securities Portfolio, the Portfolios declared ordinary income dividends and capital gain distributions. The per share amounts declared were as follows:
| | | | | | | | | | | | | | | | | | | | | | | | |
Portfolio | | | | | Declaration
Date | | | Paid to
Shareholders
of Record | | | Ex-Dividend
Date | | | Ordinary
Income | | | Long-Term
Capital Gains | |
Large Capitalization Growth | | | Class T | | | | 12/9/2011 | | | | 12/12/2011 | | | | 12/13/2011 | | | $ | 0.04628 | | | $ | — | |
Large Capitalization Value | | | Class R | | | | 12/9/2011 | | | | 12/12/2011 | | | | 12/13/2011 | | | | 0.14860 | | | | — | |
| | | Class T | | | | 12/9/2011 | | | | 12/12/2011 | | | | 12/13/2011 | | | | 0.19900 | | | | — | |
| | | | |
| 174 | | | THE TARGET PORTFOLIO TRUST | |
| | | | | | | | | | | | | | | | | | | | | | | | |
Portfolio | | | | | Declaration
Date | | | Paid to
Shareholders
of Record | | | Ex-Dividend
Date | | | Ordinary
Income | | | Long-Term
Capital Gains | |
Small Capitalization Value | | | Class R | | | | 11/29/2011 | | | | 11/30/2011 | | | | 12/1/2011 | | | $ | 0.13663 | | | $ | 0.65780 | |
| | | Class T | | | | 11/29/2011 | | | | 11/30/2011 | | | | 12/1/2011 | | | | 0.23931 | | | | 0.65780 | |
International Equity | | | Class Q | | | | 12/6/2011 | | | | 12/7/2011 | | | | 12/8/2011 | | | | 0.27120 | | | | — | |
| | | Class R | | | | 12/6/2011 | | | | 12/7/2011 | | | | 12/8/2011 | | | | 0.19150 | | | | | |
| | | Class T | | | | 12/6/2011 | | | | 12/7/2011 | | | | 12/8/2011 | | | | 0.25370 | | | | — | |
Intermediate-Term Bond | | | Class T | | | | 12/21/2011 | | | | 12/22/2011 | | | | 12/23/2011 | | | | 0.16967 | | | | — | |
Note 11. New Accounting Pronouncements
In April 2011, the Financial Accounting Standards Board (“FASB”) issued Accounting Standards Update (“ASU”) No. 2011-03 “Reconsideration of Effective control for Repurchase Agreements.” The objective of ASU No. 2011-03 is to improve the accounting for repurchase agreements and other agreements that both entitle and obligate a transferor to repurchase or redeem financial assets before their maturity. Under previous guidance, whether or not to account for a transaction as a sale was based on, in part, if the entity maintained effective control over the transferred financial assets. ASU No. 2011-03 removes the transferor’s ability criterion from the effective control assessment. This guidance is effective prospectively for interim and annual reporting periods beginning on or after December 15, 2011. At this time, management is evaluating the implications of ASU No. 2011-03 and its impact on the financial statements has not been determined.
In May 2011, the FASB issued ASU No. 2011-04 “Amendments to Achieve Common Fair Value Measurement and Disclosure Requirements in U.S. GAAP and IFRSs.” ASU No. 2011-04 includes common requirements for measurement of and disclosure about fair value between U.S. GAAP and IFRS. ASU No. 2011-04 will require reporting entities to disclose quantitative information about the unobservable inputs used in the fair value measurements categorized within Level 3 of the fair value hierarchy. In addition, ASU No. 2011-04 will require reporting entities to make disclosures about amounts and reasons for all transfers in and out of Level 1 and Level 2 fair value measurements. The new and revised disclosures are effective for interim and annual reporting periods beginning after December 15, 2011. At this time, management is evaluating the implications of ASU No. 2011-04 and its impact on the financial statements has not been determined.
| | | | |
| THE TARGET PORTFOLIO TRUST | | | 175 | |
Financial Highlights
| | | | | | | | | | | | | | | | | | | | | | | | |
| | | LARGE CAPITALIZATION
GROWTH PORTFOLIO | |
| | | Class R | |
| | | Year Ended October 31, | | | Ten Months
Ended
October 31,
2007(f)(g) | | | August 22,
2006(b)
through
December 31,
2006 | |
| | | 2011(f) | | | 2010(f) | | | 2009 | | | 2008(f) | | | |
| | | | | | |
| PER SHARE OPERATING PERFORMANCE: | | | | | | | | | | | | | | | | | | | | | | | | |
Net asset value, beginning of period | | $ | 12.76 | | | $ | 10.85 | | | $ | 10.11 | | | $ | 17.46 | | | $ | 15.31 | | | $ | 14.32 | |
Income (loss) from investment operations | | | | | | | | | | | | | | | | | | | | | | | | |
Net investment income (loss) | | | (.01 | ) | | | (.01 | ) | | | .05 | | | | .05 | | | | (.02 | ) | | | .03 | |
Net realized and unrealized gain (loss) on investments | | | .81 | | | | 1.96 | | | | .76 | | | | (6.43 | ) | | | 2.31 | | | | 1.30 | |
Total from investment operations | | | .80 | | | | 1.95 | | | | .81 | | | | (6.38 | ) | | | 2.29 | | | | 1.33 | |
Less dividends and distributions | | | | | | | | | | | | | | | | | | | | | | | | |
Dividends from net investment income | | | — | | | | (.04 | ) | | | (.07 | ) | | | (.02 | ) | | | — | | | | (.05 | ) |
Distributions from net realized gains | | | — | | | | — | | | | — | | | | (.95 | ) | | | (.14 | ) | | | (.29 | ) |
Total dividends and distributions | | | — | | | | (.04 | ) | | | (.07 | ) | | | (.97 | ) | | | (.14 | ) | | | (.34 | ) |
Net asset value, end of period | | $ | 13.56 | | | $ | 12.76 | | | $ | 10.85 | | | $ | 10.11 | | | $ | 17.46 | | | $ | 15.31 | |
| | | | | | |
| TOTAL RETURN(a) | | | 6.27 | % | | | 17.99 | % | | | 8.13 | % | | | (38.48 | )% | | | 14.95 | % | | | 9.34 | % |
| | | | | | |
| RATIOS/SUPPLEMENTAL DATA: | | | | | | | | | | | | | | | | | | | | | | | | |
Net assets, end of period (000) | | $ | 112,255 | | | $ | 99,676 | | | $ | 70,097 | | | $ | 48,348 | | | $ | 31,982 | | | $ | 2,216 | |
Average net assets (000) | | $ | 109,325 | | | $ | 84,636 | | | $ | 54,036 | | | $ | 46,321 | | | $ | 14,059 | | | $ | 429 | |
Ratios to average net assets(h) | | | | | | | | | | | | | | | | | | | | | | | | |
Expenses, including distribution and service (12b-1) fees(e) | | | 1.34 | % | | | 1.33 | % | | | 1.36 | % | | | 1.24 | % | | | 1.18 | %(c) | | | 1.25 | %(c) |
Expenses, excluding distribution and service (12b-1) fees | | | .84 | % | | | .83 | % | | | .86 | % | | | .74 | % | | | .68 | %(c) | | | .75 | %(c) |
Net investment income (loss) | | | (.08 | )% | | | (.08 | )% | | | .28 | % | | | .35 | % | | | (.14 | )%(c) | | | .28 | %(c) |
Portfolio turnover rate | | | 97 | % | | | 171 | % | | | 243 | % | | | 101 | % | | | 81 | %(d) | | | 69 | %(d) |
| (a) | Total return is calculated assuming a purchase of a share on the first day and a sale on the last day of each period reported and includes reinvestment of dividends and distributions. Total returns may reflect adjustments to conform to generally accepted accounting principles. Total returns for periods less than one full year are not annualized. |
| (b) | Commencement of offering. |
| (e) | The distributor of the Trust has contractually agreed to limit its distribution and service (12b-1) fees to .50% of the average daily net assets of the Class R shares. |
| (f) | Calculated based upon average shares outstanding during the period. |
| (g) | For the ten month period ended October 31, 2007. The Trust changed its fiscal year end from December 31 to October 31, effective October 31, 2007. |
| (h) | Does not include expenses of the underlying fund in which the Portfolio invests. |
See Notes to Financial Statements.
| | | | |
| 176 | | | THE TARGET PORTFOLIO TRUST | |
Financial Highlights (continued)
| | | | | | | | | | | | | | | | | | | | | | | | |
| | | LARGE CAPITALIZATION
GROWTH PORTFOLIO | |
| | | Class T | |
| | | Year Ended October 31, | | | Ten Months
Ended
October 31,
2007(e)(f) | | | Year
Ended
December 31,
2006 | |
| | | 2011(e) | | | 2010(e) | | | 2009 | | | 2008(e) | | | |
| | | | | | |
| PER SHARE OPERATING PERFORMANCE: | | | | | | | | | | | | | | | | | | | | | | | | |
Net asset value, beginning of period | | $ | 12.86 | | | $ | 10.93 | | | $ | 10.19 | | | $ | 17.55 | | | $ | 15.33 | | | $ | 14.60 | |
Income (loss) from investment operations | | | | | | | | | | | | | | | | | | | | | | | | |
Net investment income | | | .06 | | | | .05 | | | | .10 | | | | .13 | | | | .04 | | | | .08 | |
Net realized and unrealized gain (loss) on investments | | | .82 | | | | 1.97 | | | | .76 | | | | (6.47 | ) | | | 2.32 | | | | 1.18 | |
Total from investment operations | | | .88 | | | | 2.02 | | | | .86 | | | | (6.34 | ) | | | 2.36 | | | | 1.26 | |
Less dividends and distributions | | | | | | | | | | | | | | | | | | | | | | | | |
Dividends from net investment income | | | (.04 | ) | | | (.09 | ) | | | (.12 | ) | | | (.07 | ) | | | — | (d) | | | (.09 | ) |
Distributions from net realized gains | | | — | | | | — | | | | — | | | | (.95 | ) | | | (.14 | ) | | | (.44 | ) |
Total dividends and distributions | | | (.04 | ) | | | (.09 | ) | | | (.12 | ) | | | (1.02 | ) | | | (.14 | ) | | | (.53 | ) |
Net asset value, end of period | | $ | 13.70 | | | $ | 12.86 | | | $ | 10.93 | | | $ | 10.19 | | | $ | 17.55 | | | $ | 15.33 | |
| | | | | | |
| TOTAL RETURN(a) | | | 6.83 | % | | | 18.55 | % | | | 8.64 | % | | | (38.14 | )% | | | 15.41 | % | | | 8.67 | % |
| | | | | | |
| RATIOS/SUPPLEMENTAL DATA: | | | | | | | | | | | | | | | | | | | | | | | | |
Net assets, end of period (000) | | $ | 92,149 | | | $ | 110,550 | | | $ | 124,122 | | | $ | 150,428 | | | $ | 313,718 | | | $ | 301,566 | |
Average net assets (000) | | $ | 102,690 | | | $ | 116,806 | | | $ | 123,629 | | | $ | 237,628 | | | $ | 303,340 | | | $ | 299,597 | |
Ratios to average net assets(g) | | | | | | | | | | | | | | | | | | | | | | | | |
Expenses, including distribution and service (12b-1) fees | | | .84 | % | | | .83 | % | | | .86 | % | | | .74 | % | | | .68 | %(b) | | | .75 | % |
Expenses, excluding distribution and service (12b-1) fees | | | .84 | % | | | .83 | % | | | .86 | % | | | .74 | % | | | .68 | %(b) | | | .75 | % |
Net investment income | | | .44 | % | | | .45 | % | | | .84 | % | | | .91 | % | | | .29 | %(b) | | | .51 | % |
Portfolio turnover rate | | | 97 | % | | | 171 | % | | | 243 | % | | | 101 | % | | | 81 | %(c) | | | 69 | % |
| (a) | Total return is calculated assuming a purchase of a share on the first day and a sale on the last day of each period reported and includes reinvestment of dividends and distributions. Total returns may reflect adjustments to conform to generally accepted accounting principles. Total returns for periods less than one full year are not annualized. |
| (d) | Less than $0.005 per share. |
| (e) | Calculated based upon average shares outstanding during the period. |
| (f) | For the ten month period ended October 31, 2007. The Trust changed its fiscal year end from December 31 to October 31, effective October 31, 2007. |
| (g) | Does not include expenses of the underlying fund in which the Portfolio invests. |
See Notes to Financial Statements.
| | | | |
| THE TARGET PORTFOLIO TRUST | | | 177 | |
Financial Highlights (continued)
| | | | | | | | | | | | | | | | | | | | | | | | |
| | | LARGE CAPITALIZATION
VALUE PORTFOLIO | |
| | | Class R | |
| | | Year Ended October 31, | | | Ten Months
Ended
October 31,
2007(g)(h) | | | August 22,
2006(b)
through
December 31,
2006(g) | |
| | | 2011(g) | | | 2010(g) | | | 2009(g) | | | 2008(g) | | | |
| | | | | | |
| PER SHARE OPERATING PERFORMANCE: | | | | | | | | | | | | | | | | | | | | | | | | |
Net asset value, beginning of period | | $ | 9.73 | | | $ | 8.79 | | | $ | 8.78 | | | $ | 16.24 | | | $ | 15.60 | | | $ | 15.07 | |
Income (loss) from investment operations | | | | | | | | | | | | | | | | | | | | | | | | |
Net investment income | | | .13 | | | | .11 | | | | .15 | | | | .23 | | | | .15 | | | | .08 | |
Net realized and unrealized gain (loss) on investments | | | .18 | | | | .98 | | | | .13 | | | | (6.31 | ) | | | .67 | | | | 1.48 | |
Total from investment operations | | | .31 | | | | 1.09 | | | | .28 | | | | (6.08 | ) | | | .82 | | | | 1.56 | |
Less dividends and distributions | | | | | | | | | | | | | | | | | | | | | | | | |
Dividends from net investment income | | | (.12 | ) | | | (.15 | ) | | | (.27 | ) | | | (.22 | ) | | | — | (f) | | | (.24 | ) |
Distributions from net realized gains | | | — | | | | — | | | | — | | | | (1.16 | ) | | | (.18 | ) | | | (.79 | ) |
Total dividends and distributions | | | (.12 | ) | | | (.15 | ) | | | (.27 | ) | | | (1.38 | ) | | | (.18 | ) | | | (1.03 | ) |
Net asset value, end of period | | $ | 9.92 | | | $ | 9.73 | | | $ | 8.79 | | | $ | 8.78 | | | $ | 16.24 | | | $ | 15.60 | |
| | | | | | |
| TOTAL RETURN(a) | | | 3.19 | % | | | 12.45 | % | | | 3.59 | % | | | (40.60 | )% | | | 5.24 | % | | | 10.44 | % |
| | | | | | |
| RATIOS/SUPPLEMENTAL DATA: | | | | | | | | | | | | | | | | | | | | | | | | |
Net assets, end of period (000) | | $ | 113,434 | | | $ | 97,308 | | | $ | 70,291 | | | $ | 46,778 | | | $ | 30,958 | | | $ | 2,194 | |
Average net assets (000) | | $ | 108,407 | | | $ | 84,613 | | | $ | 53,491 | | | $ | 46,282 | | | $ | 14,046 | | | $ | 445 | |
Ratios to average net assets(i) | | | | | | | | | | | | | | | | | | | | | | | | |
Expenses, including distribution and service (12b-1) fees(e) | | | 1.33 | % | | | 1.31 | % | | | 1.33 | % | | | 1.21 | % | | | 1.19 | %(c) | | | 1.22 | %(c) |
Expenses, excluding distribution and service (12b-1) fees | | | .83 | % | | | .81 | % | | | .83 | % | | | .71 | % | | | .69 | %(c) | | | .72 | %(c) |
Net investment income | | | 1.30 | % | | | 1.21 | % | | | 1.96 | % | | | 1.90 | % | | | 1.13 | %(c) | | | 1.69 | %(c) |
Portfolio turnover rate | | | 43 | % | | | 32 | % | | | 104 | % | | | 77 | % | | | 48 | %(d) | | | 44 | %(d) |
| (a) | Total return is calculated assuming a purchase of a share on the first day and a sale on the last day of each period reported and includes reinvestment of dividends and distributions. Total returns may reflect adjustments to conform to generally accepted accounting principles. Total returns for periods less than one full year are not annualized. |
| (b) | Commencement of offering. |
| (e) | The distributor of the Trust has contractually agreed to limit its distribution and service (12b-1) fees to .50% of the average daily net assets of the Class R shares. |
| (f) | Less than $0.005 per share. |
| (g) | Calculated based upon average shares outstanding during the period. |
| (h) | For the ten month period ended October 31, 2007. The Trust changed its fiscal year end from December 31 to October 31, effective October 31, 2007. |
| (i) | Does not include expenses of the underlying fund in which the Portfolio invests. |
See Notes to Financial Statements.
| | | | |
| 178 | | | THE TARGET PORTFOLIO TRUST | |
Financial Highlights (continued)
| | | | | | | | | | | | | | | | | | | | | | | | |
| | | LARGE CAPITALIZATION
VALUE PORTFOLIO | |
| | | Class T | |
| | | Year Ended October 31, | | | Ten Months
Ended
October 31,
2007(e)(f) | | | Year
Ended
December 31,
2006(e) | |
| | | 2011(e) | | | 2010(e) | | | 2009(e) | | | 2008(e) | | | |
| | | | | | |
| PER SHARE OPERATING PERFORMANCE: | | | | | | | | | | | | | | | | | | | | | | | | |
Net asset value, beginning of period | | $ | 9.78 | | | $ | 8.83 | | | $ | 8.82 | | | $ | 16.31 | | | $ | 15.60 | | | $ | 15.11 | |
Income (loss) from investment operations | | | | | | | | | | | | | | | | | | | | | | | | |
Net investment income | | | .18 | | | | .16 | | | | .20 | | | | .30 | | | | .22 | | | | .28 | |
Net realized and unrealized gain (loss) on investments | | | .18 | | | | .98 | | | | .12 | | | | (6.33 | ) | | | .67 | | | | 2.45 | |
Total from investment operations | | | .36 | | | | 1.14 | | | | .32 | | | | (6.03 | ) | | | .89 | | | | 2.73 | |
Less dividends and distributions | | | | | | | | | | | | | | | | | | | | | | | | |
Dividends from net investment income | | | (.17 | ) | | | (.19 | ) | | | (.31 | ) | | | (.30 | ) | | | — | (d) | | | (.29 | ) |
Distributions from net realized gains | | | — | | | | — | | | | — | | | | (1.16 | ) | | | (.18 | ) | | | (1.95 | ) |
Total dividends and distributions | | | (.17 | ) | | | (.19 | ) | | | (.31 | ) | | | (1.46 | ) | | | (.18 | ) | | | (2.24 | ) |
Net asset value, end of period | | $ | 9.97 | | | $ | 9.78 | | | $ | 8.83 | | | $ | 8.82 | | | $ | 16.31 | | | $ | 15.60 | |
| | | | | | |
| TOTAL RETURN(a) | | | 3.62 | % | | | 13.00 | % | | | 4.15 | % | | | (40.29 | )% | | | 5.70 | % | | | 19.34 | % |
| | | | |
| RATIOS/SUPPLEMENTAL DATA: | | | | | | | | | | | | | | | | | |
Net assets, end of period (000) | | $ | 87,171 | | | $ | 109,097 | | | $ | 128,187 | | | $ | 168,217 | | | $ | 372,900 | | | $ | 393,111 | |
Average net assets (000) | | $ | 99,621 | | | $ | 119,520 | | | $ | 129,379 | | | $ | 279,413 | | | $ | 392,564 | | | $ | 371,251 | |
Ratios to average net assets(g) | | | | | | | | | | | | | | | | | | | | | | | | |
Expenses, including distribution and service (12b-1) fees | | | .83 | % | | | .81 | % | | | .83 | % | | | .71 | % | | | .69 | %(b) | | | .72 | % |
Expenses, excluding distribution and service (12b-1) fees | | | .83 | % | | | .81 | % | | | .83 | % | | | .71 | % | | | .69 | %(b) | | | .72 | % |
Net investment income | | | 1.80 | % | | | 1.74 | % | | | 2.64 | % | | | 2.40 | % | | | 1.61 | %(b) | | | 1.79 | % |
Portfolio turnover rate | | | 43 | % | | | 32 | % | | | 104 | % | | | 77 | % | | | 48 | %(c) | | | 44 | % |
| (a) | Total return is calculated assuming a purchase of a share on the first day and a sale on the last day of each period reported and includes reinvestment of dividends and distributions. Total returns may reflect adjustments to conform to generally accepted accounting principles. Total returns for periods less than one full year are not annualized. |
| (d) | Less than $0.005 per share. |
| (e) | Calculated based upon average shares outstanding during the period. |
| (f) | For the ten month period ended October 31, 2007. The Trust changed its fiscal year end from December 31 to October 31, effective October 31, 2007. |
| (g) | Does not include expenses of the underlying fund in which the Portfolio invests. |
See Notes to Financial Statements.
| | | | |
| THE TARGET PORTFOLIO TRUST | | | 179 | |
Financial Highlights (continued)
| | | | | | | | | | | | | | | | | | | | | | | | |
| | | SMALL CAPITALIZATION
GROWTH PORTFOLIO | |
| | | Class R | |
| | | Year Ended October 31, | | | Ten Months
Ended
October 31,
2007(g)(h) | | | August 22,
2006(b)
through
December 31,
2006 | |
| | | 2011 | | | 2010 | | | 2009 | | | 2008 | | | |
| | | | | | |
| PER SHARE OPERATING PERFORMANCE: | | | | | | | | | | | | | | | | | | | | | | | | |
Net asset value, beginning of period | | $ | 9.66 | | | $ | 7.71 | | | $ | 7.17 | | | $ | 13.73 | | | $ | 12.12 | | | $ | 11.04 | |
Income (loss) from investment operations | | | | | | | | | | | | | | | | | | | | | | | | |
Net investment loss | | | (.07 | ) | | | (.05 | ) | | | (.04 | ) | | | (.03 | ) | | | (.06 | ) | | | — | (c) |
Net realized and unrealized gain (loss) on investments | | | 1.38 | | | | 2.00 | | | | .58 | | | | (6.53 | ) | | | 1.67 | | | | 1.08 | |
Total from investment operations | | | 1.31 | | | | 1.95 | | | | .54 | | | | (6.56 | ) | | | 1.61 | | | | 1.08 | |
Capital contributions | | | — | | | | — | (c) | | | — | | | | — | | | | — | | | | — | |
Net asset value, end of period | | $ | 10.97 | | | $ | 9.66 | | | $ | 7.71 | | | $ | 7.17 | | | $ | 13.73 | | | $ | 12.12 | |
| | | | | | |
| TOTAL RETURN(a) | | | 13.56 | % | | | 25.29 | % | | | 7.53 | % | | | (47.78 | )% | | | 13.28 | % | | | 9.78 | % |
| | | | | | |
| RATIOS/SUPPLEMENTAL DATA: | | | | | | | | | | | | | | | | | | | | | | | | |
Net assets, end of period (000) | | $ | 52,325 | | | $ | 41,025 | | | $ | 28,129 | | | $ | 18,607 | | | $ | 12,942 | | | $ | 898 | |
Average net assets (000) | | $ | 47,547 | | | $ | 35,238 | | | $ | 22,037 | | | $ | 18,762 | | | $ | 5,725 | | | $ | 186 | |
Ratios to average net assets(i) | | | | | | | | | | | | | | | | | | | | | | | | |
Expenses, including distribution and service (12b-1) fees(f) | | | 1.44 | % | | | 1.46 | % | | | 1.52 | % | | | 1.30 | % | | | 1.28 | %(d) | | | 1.34 | %(d) |
Expenses, excluding distribution and service (12b-1) fees | | | .94 | % | | | .96 | % | | | 1.02 | % | | | .80 | % | | | .78 | %(d) | | | .84 | %(d) |
Net investment loss | | | (.80 | )% | | | (.72 | )% | | | (.77 | )% | | | (.39 | )% | | | (.56 | )%(d) | | | (.05 | )%(d) |
Portfolio turnover rate | | | 92 | % | | | 64 | % | | | 92 | % | | | 223 | % | | | 87 | %(e) | | | 96 | %(e) |
| (a) | Total return is calculated assuming a purchase of a share on the first day and a sale on the last day of each period reported and includes reinvestment of dividends and distributions. Total returns may reflect adjustments to conform to generally accepted accounting principles. Total returns for periods less than one full year are not annualized. |
| (b) | Commencement of offering. |
| (c) | Less than $0.005 per share. |
| (f) | The distributor of the Trust has contractually agreed to limit its distribution and service (12b-1) fees to .50% of the average daily net assets of the Class R shares. |
| (g) | Calculated based upon average shares outstanding during the period. |
| (h) | For the ten month period ended October 31, 2007. The Trust changed its fiscal year end from December 31 to October 31, effective October 31, 2007. |
| (i) | Does not include expenses of the underlying fund in which the Portfolio invests. |
See Notes to Financial Statements.
| | | | |
| 180 | | | THE TARGET PORTFOLIO TRUST | |
Financial Highlights (continued)
| | | | | | | | | | | | | | | | | | | | | | | | |
| | | SMALL CAPITALIZATION
GROWTH PORTFOLIO | |
| | | Class T | |
| | | Year Ended October 31, | | | Ten Months
Ended
October 31,
2007(d)(e) | | | Year
Ended
December 31,
2006 | |
| | | 2011 | | | 2010 | | | 2009 | | | 2008 | | | |
| | | | | | |
| PER SHARE OPERATING PERFORMANCE: | | | | | | | | | | | | | | | | | | | | | | | | |
Net asset value, beginning of period | | $ | 9.84 | | | $ | 7.82 | | | $ | 7.25 | | | $ | 13.82 | | | $ | 12.14 | | | $ | 11.28 | |
Income (loss) from investment operations | | | | | | | | | | | | | | | | | | | | | | | | |
Net investment income (loss) | | | (.02 | ) | | | (.01 | ) | | | (.02 | ) | | | .02 | | | | (.01 | ) | | | (.05 | ) |
Net realized and unrealized gain (loss) on investments | | | 1.42 | | | | 2.03 | | | | .60 | | | | (6.59 | ) | | | 1.69 | | | | .91 | |
Total from investment operations | | | 1.40 | | | | 2.02 | | | | .58 | | | | (6.57 | ) | | | 1.68 | | | | .86 | |
Less dividends from net investment income | | | — | | | | — | | | | (.01 | ) | | | — | | | | — | | | | — | |
Capital contributions | | | — | | | | — | (g) | | | — | | | | — | | | | — | | | | — | |
Net asset value, end of period | | $ | 11.24 | | | $ | 9.84 | | | $ | 7.82 | | | $ | 7.25 | | | $ | 13.82 | | | $ | 12.14 | |
| | | | | | |
| TOTAL RETURN(a) | | | 14.23 | % | | | 25.83 | % | | | 8.06 | % | | | (47.54 | )% | | | 13.84 | % | | | 7.62 | % |
| | | | | | |
| RATIOS/SUPPLEMENTAL DATA: | | | | | | | | | | | | | | | | | | | | | | | | |
Net assets, end of period (000) | | $ | 43,838 | | | $ | 51,777 | | | $ | 52,671 | | | $ | 58,235 | | | $ | 137,630 | | | $ | 136,422 | |
Average net assets (000) | | $ | 50,339 | | | $ | 53,128 | | | $ | 51,109 | | | $ | 97,771 | | | $ | 136,851 | | | $ | 140,489 | |
Ratios to average net assets(f) | | | | | | | | | | | | | | | | | | | | | | | | |
Expenses, including distribution and service (12b-1) fees | | | .94 | % | | | .96 | % | | | 1.02 | % | | | .80 | % | | | .78 | %(b) | | | .84 | % |
Expenses, excluding distribution and service (12b-1) fees | | | .94 | % | | | .96 | % | | | 1.02 | % | | | .80 | % | | | .78 | %(b) | | | .84 | % |
Net investment income (loss) | | | (.29 | )% | | | (.18 | )% | | | (.26 | )% | | | .17 | % | | | (.07 | )%(b) | | | (.39 | )% |
Portfolio turnover rate | | | 92 | % | | | 64 | % | | | 92 | % | | | 223 | % | | | 87 | %(c) | | | 96 | % |
| (a) | Total return is calculated assuming a purchase of a share on the first day and a sale on the last day of each period reported and includes reinvestment of dividends and distributions. Total returns may reflect adjustments to conform to generally accepted accounting principles. Total returns for periods less than one full year are not annualized. |
| (d) | Calculated based upon average shares outstanding during the period. |
| (e) | For the ten month period ended October 31, 2007. The Trust changed its fiscal year end from December 31 to October 31, effective October 31, 2007. |
| (f) | Does not include expenses of the underlying fund in which the Portfolio invests. |
| (g) | Less than $0.005 per share. |
See Notes to Financial Statements.
| | | | |
| THE TARGET PORTFOLIO TRUST | | | 181 | |
Financial Highlights (continued)
| | | | | | | | | | | | | | | | | | | | | | | | |
| | | SMALL CAPITALIZATION
VALUE PORTFOLIO | |
| | | Class R | |
| | | Year Ended October 31, | | | Ten Months
Ended
October 31,
2007(g)(h) | | | August 22,
2006(b)
through
December 31,
2006 | |
| | | 2011(g) | | | 2010(g) | | | 2009(g) | | | 2008 | | | |
| | | | | | |
| PER SHARE OPERATING PERFORMANCE: | | | | | | | | | | | | | | | | | | | | | | | | |
Net asset value, beginning of period | | $ | 18.80 | | | $ | 15.41 | | | $ | 14.10 | | | $ | 21.90 | | | $ | 20.46 | | | $ | 20.05 | |
Income (loss) from investment operations | | | | | | | | | | | | | | | | | | | | | | | | |
Net investment income | | | .11 | | | | .10 | | | | .13 | | | | .16 | | | | .13 | | | | .14 | |
Net realized and unrealized gain (loss) on investments | | | 1.35 | | | | 3.41 | | | | 1.42 | | | | (6.52 | ) | | | 1.42 | | | | 1.74 | |
Total from investment operations | | | 1.46 | | | | 3.51 | | | | 1.55 | | | | (6.36 | ) | | | 1.55 | | | | 1.88 | |
Less dividends and distributions | | | | | | | | | | | | | | | | | | | | | | | | |
Dividends from net investment income | | | (.09 | ) | | | (.12 | ) | | | (.16 | ) | | | (.23 | ) | | | — | (f) | | | (.18 | ) |
Distributions from net realized gains | | | — | | | | — | | | | (.08 | ) | | | (1.21 | ) | | | (.11 | ) | | | (1.29 | ) |
Total dividends and distributions | | | (.09 | ) | | | (.12 | ) | | | (.24 | ) | | | (1.44 | ) | | | (.11 | ) | | | (1.47 | ) |
Net asset value, end of period | | $ | 20.17 | | | $ | 18.80 | | | $ | 15.41 | | | $ | 14.10 | | | $ | 21.90 | | | $ | 20.46 | |
| | | | | | |
| TOTAL RETURN(a) | | | 7.75 | % | | | 22.93 | % | | | 11.37 | % | | | (30.57 | )% | | | 7.55 | % | | | 9.45 | % |
| | | | | | |
| RATIOS/SUPPLEMENTAL DATA: | | | | | | | | | | | | | | | | | | | | | | | | |
Net assets, end of period (000) | | $ | 69,790 | | | $ | 52,587 | | | $ | 33,574 | | | $ | 22,660 | | | $ | 15,112 | | | $ | 1,061 | |
Average net assets (000) | | $ | 63,352 | | | $ | 43,680 | | | $ | 26,425 | | | $ | 22,626 | | | $ | 6,828 | | | $ | 217 | |
Ratios to average net assets(i) | | | | | | | | | | | | | | | | | | | | | | | | |
Expenses, including distribution and service (12b-1) fees(e) | | | 1.21 | % | | | 1.26 | % | | | 1.30 | % | | | 1.30 | % | | | 1.23 | %(c) | | | 1.30 | %(c) |
Expenses, excluding distribution and service (12b-1) fees | | | .71 | % | | | .76 | % | | | .80 | % | | | .80 | % | | | .73 | %(c) | | | .80 | %(c) |
Net investment income | | | .55 | % | | | .57 | % | | | .96 | % | | | .89 | % | | | .73 | %(c) | | | 1.37 | %(c) |
Portfolio turnover rate | | | 44 | % | | | 33 | % | | | 48 | % | | | 54 | % | | | 32 | %(d) | | | 36 | %(d) |
| (a) | Total return is calculated assuming a purchase of a share on the first day and a sale on the last day of each period reported and includes reinvestment of dividends and distributions. Total returns may reflect adjustments to conform to generally accepted accounting principles. Total returns for periods less than one full year are not annualized. |
| (b) | Commencement of offering. |
| (e) | The distributor of the Trust has contractually agreed to limit its distribution and service (12b-1) fees to .50% of the average daily net assets of the Class R shares. |
| (f) | Less than $0.005 per share. |
| (g) | Calculated based upon average shares outstanding during the period. |
| (h) | For the ten month period ended October 31, 2007. The Trust changed its fiscal year end from December 31 to October 31, effective October 31, 2007. |
| (i) | Does not include expenses of the underlying fund in which the Portfolio invests. |
See Notes to Financial Statements.
| | | | |
| 182 | | | THE TARGET PORTFOLIO TRUST | |
Financial Highlights (continued)
| | | | | | | | | | | | | | | | | | | | | | | | |
| | | SMALL CAPITALIZATION
VALUE PORTFOLIO | |
| | | Class T | |
| | | Year Ended October 31, | | | Ten Months
Ended
October 31,
2007(e)(f) | | | Year
Ended
December 31,
2006 | |
| | | 2011(e) | | | 2010(e) | | | 2009(e) | | | 2008 | | | |
| | | | | | |
| PER SHARE OPERATING PERFORMANCE: | | | | | | | | | | | | | | | | | | | | | | | | |
Net asset value, beginning of period | | $ | 18.95 | | | $ | 15.51 | | | $ | 14.21 | | | $ | 22.00 | | | $ | 20.47 | | | $ | 18.98 | |
Income (loss) from investment operations | | | | | | | | | | | | | | | | | | | | | | | | |
Net investment income | | | .22 | | | | .19 | | | | .20 | | | | .23 | | | | .25 | | | | .23 | |
Net realized and unrealized gain (loss) on investments | | | 1.34 | | | | 3.45 | | | | 1.41 | | | | (6.53 | ) | | | 1.39 | | | | 3.09 | |
Total from investment operations | | | 1.56 | | | | 3.64 | | | | 1.61 | | | | (6.30 | ) | | | 1.64 | | | | 3.32 | |
Less dividends and distributions | | | | | | | | | | | | | | | | | | | | | | | | |
Dividends from net investment income | | | (.18 | ) | | | (.20 | ) | | | (.23 | ) | | | (.28 | ) | | | — | (d) | | | (.22 | ) |
Distributions from net realized gains | | | — | | | | — | | | | (.08 | ) | | | (1.21 | ) | | | (.11 | ) | | | (1.61 | ) |
Total dividends and distributions | | | (.18 | ) | | | (.20 | ) | | | (.31 | ) | | | (1.49 | ) | | | (.11 | ) | | | (1.83 | ) |
Net asset value, end of period | | $ | 20.33 | | | $ | 18.95 | | | $ | 15.51 | | | $ | 14.21 | | | $ | 22.00 | | | $ | 20.47 | |
| | | | | | |
| TOTAL RETURN(a) | | | 8.22 | % | | | 23.64 | % | | | 11.82 | % | | | (30.23 | )% | | | 8.04 | % | | | 17.72 | % |
| | | | | |
| RATIOS/SUPPLEMENTAL DATA: | | | | | | | | | | | | | | | | | | | | | |
Net assets, end of period (000) | | $ | 890,245 | | | $ | 800,761 | | | $ | 538,202 | | | $ | 374,101 | | | $ | 411,690 | | | $ | 320,728 | |
Average net assets (000) | | $ | 872,587 | | | $ | 674,452 | | | $ | 439,058 | | | $ | 414,364 | | | $ | 403,020 | | | $ | 290,505 | |
Ratios to average net assets(g) | | | | | | | | | | | | | | | | | | | | | | | | |
Expenses, including distribution and service (12b-1) fees | | | .71 | % | | | .76 | % | | | .80 | % | | | .80 | % | | | .73 | %(b) | | | .80 | % |
Expenses, excluding distribution and service (12b-1) fees | | | .71 | % | | | .76 | % | | | .80 | % | | | .80 | % | | | .73 | %(b) | | | .80 | % |
Net investment income | | | 1.06 | % | | | 1.07 | % | | | 1.46 | % | | | 1.38 | % | | | 1.38 | %(b) | | | 1.17 | % |
Portfolio turnover rate | | | 44 | % | | | 33 | % | | | 48 | % | | | 54 | % | | | 32 | %(c) | | | 36 | % |
| (a) | Total return is calculated assuming a purchase of a share on the first day and a sale on the last day of each period reported and includes reinvestment of dividends and distributions. Total returns may reflect adjustments to conform to generally accepted accounting principles. Total returns for periods less than one full year are not annualized. |
| (d) | Less than $0.005 per share. |
| (e) | Calculated based upon average shares outstanding during the period. |
| (f) | For the ten month period ended October 31, 2007. The Trust changed its fiscal year end from December 31 to October 31, effective October 31, 2007. |
| (g) | Does not include expenses of the underlying fund in which the Portfolio invests. |
See Notes to Financial Statements.
| | | | |
| THE TARGET PORTFOLIO TRUST | | | 183 | |
Financial Highlights (continued)
| | | | |
| | | INTERNATIONAL EQUITY PORTFOLIO | |
| | | Class Q | |
| | | March 1,
2011(b),
through
October 31,
2011(e) | |
| |
| PER SHARE OPERATING PERFORMANCE: | | | | |
Net asset value, beginning of period | | $ | 12.56 | |
Income (loss) from investment operations | | | | |
Net investment income | | | .26 | |
Net realized and unrealized gain (loss) on investments | | | (1.72 | ) |
Total from investment operations | | | (1.46 | ) |
Less dividends and distributions | | | | |
Dividends from net investment income | | | — | |
Distributions from net realized gains | | | — | |
Total dividends and distributions | | | — | |
Capital Contributions | | | — | |
Net asset value, end of period | | $ | 11.10 | |
| |
| TOTAL RETURN(a) | | | (11.62 | )% |
| |
| RATIOS/SUPPLEMENTAL DATA: | | | | |
Net assets, end of period (000) | | $ | 108,378 | |
Average net assets (000) | | $ | 94,827 | |
Ratios to average net assets(f) | | | | |
Expenses, including distribution and service (12b-1) fees | | | .87 | %(c) |
Expenses, excluding distribution and service (12b-1) fees | | | .87 | %(c) |
Net investment income | | | 3.21 | %(c) |
Portfolio turnover rate | | | 19 | %(d) |
| (a) | Total return is calculated assuming a purchase of a share on the first day and a sale on the last day of each period reported and includes reinvestment of dividends and distributions. Total returns may reflect adjustments to conform to generally accepted accounting principles. Total returns for periods less than one full year are not annualized. |
| (b) | Commencement of offering. |
| (e) | Calculated based upon average shares outstanding during the period. |
| (f) | Does not include expenses of the underlying fund in which the Portfolio invests. |
See Notes to Financial Statements.
| | | | |
| 184 | | | THE TARGET PORTFOLIO TRUST | |
Financial Highlights (continued)
| | | | | | | | | | | | | | | | | | | | | | | | |
| | | INTERNATIONAL EQUITY PORTFOLIO | |
| | | Class R | |
| | | Year Ended October 31, | | | Ten Months
Ended
October 31,
2007(f)(g) | | | August 22,
2006(b)
through
December 31,
2006 | |
| | | 2011(f) | | | 2010(f) | | | 2009(f) | | | 2008(f) | | | |
| | | | | | |
| PER SHARE OPERATING PERFORMANCE: | | | | | | | | | | | | | | | | | | | | | | | | |
Net asset value, beginning of period | | $ | 11.84 | | | $ | 10.78 | | | $ | 8.99 | | | $ | 20.04 | | | $ | 16.21 | | | $ | 16.09 | |
Income (loss) from investment operations | | | | | | | | | | | | | | | | | | | | | | | | |
Net investment income | | | .22 | | | | .14 | | | | .13 | | | | .29 | | | | .33 | | | | .16 | |
Net realized and unrealized gain (loss) on investments | | | (.90 | ) | | | 1.00 | | | | 2.08 | | | | (8.84 | ) | | | 3.68 | | | | 1.66 | |
Total from investment operations | | | (.68 | ) | | | 1.14 | | | | 2.21 | | | | (8.55 | ) | | | 4.01 | | | | 1.82 | |
Less dividends and distributions | | | | | | | | | | | | | | | | | | | | | | | | |
Dividends from net investment income | | | (.14 | ) | | | (.11 | ) | | | (.42 | ) | | | (.31 | ) | | | — | | | | (.25 | ) |
Distributions from net realized gains | | | — | | | | — | | | | — | | | | (2.19 | ) | | | (.18 | ) | | | (1.45 | ) |
Total dividends and distributions | | | (.14 | ) | | | (.11 | ) | | | (.42 | ) | | | (2.50 | ) | | | (.18 | ) | | | (1.70 | ) |
Capital contributions | | | — | | | | .03 | | | | — | | | | — | | | | — | | | | — | |
Net asset value, end of period | | $ | 11.02 | | | $ | 11.84 | | | $ | 10.78 | | | $ | 8.99 | | | $ | 20.04 | | | $ | 16.21 | |
| | | | | | |
| TOTAL RETURN(a) | | | (5.84 | )% | | | 10.93 | % | | | 26.13 | % | | | (48.30 | )% | | | 24.85 | % | | | 11.74 | % |
| | | | | | |
| RATIOS/SUPPLEMENTAL DATA: | | | | | | | | | | | | | | | | | | | | | | | | |
Net assets, end of period (000) | | $ | 108,715 | | | $ | 79,234 | | | $ | 57,184 | | | $ | 35,482 | | | $ | 26,811 | | | $ | 1,728 | |
Average net assets (000) | | $ | 93,879 | | | $ | 68,032 | | | $ | 43,233 | | | $ | 36,790 | | | $ | 11,612 | | | $ | 346 | |
Ratios to average net assets(h) | | | | | | | | | | | | | | | | | | | | | | | | |
Expenses, including distribution and service (12b-1) fees(e) | | | 1.48 | % | | | 1.54 | % | | | 1.51 | % | | | 1.33 | % | | | 1.33 | %(c) | | | 1.43 | %(c) |
Expenses, excluding distribution and service (12b-1) fees | | | .98 | % | | | 1.04 | % | | | 1.01 | % | | | .83 | % | | | .83 | %(c) | | | .93 | %(c) |
Net investment income | | | 1.87 | % | | | 1.29 | % | | | 1.46 | % | | | 2.12 | % | | | 2.20 | %(c) | | | .39 | %(c) |
Portfolio turnover rate | | | 19 | % | | | 41 | % | | | 38 | % | | | 30 | % | | | 37 | %(d) | | | 41 | %(d) |
| (a) | Total return is calculated assuming a purchase of a share on the first day and a sale on the last day of each period reported and includes reinvestment of dividends and distributions. Total returns may reflect adjustments to conform to generally accepted accounting principles. Total returns for periods less than one full year are not annualized. |
| (b) | Commencement of offering. |
| (e) | The distributor of the Trust has contractually agreed to limit its distribution and service (12b-1) fees to .50% of the average daily net assets of the Class R shares. |
| (f) | Calculated based upon average shares outstanding during the period. |
| (g) | For the ten month period ended October 31, 2007. The Trust changed its fiscal year end from December 31 to October 31, effective October 31, 2007. |
| (h) | Does not include expenses of the underlying fund in which the Portfolio invests. |
See Notes to Financial Statements.
| | | | |
| THE TARGET PORTFOLIO TRUST | | | 185 | |
Financial Highlights (continued)
| | | | | | | | | | | | | | | | | | | | | | | | |
| | | INTERNATIONAL EQUITY PORTFOLIO | |
| | | Class T | |
| | | Year Ended October 31, | | | Ten Months
Ended
October 31,
2007(e)(f) | | | Year
Ended
December 31,
2006 | |
| | | 2011(e) | | | 2010(e) | | | 2009(e) | | | 2008(e) | | | |
| | | | | | |
| PER SHARE OPERATING PERFORMANCE: | | | | | | | | | | | | | | | | | | | | | | | | |
Net asset value, beginning of period | | $ | 11.90 | | | $ | 10.83 | | | $ | 9.03 | | | $ | 20.13 | | | $ | 16.22 | | | $ | 13.99 | |
Income (loss) from investment operations | | | | | | | | | | | | | | | | | | | | | | | | |
Net investment income | | | .30 | | | | .19 | | | | .17 | | | | .36 | | | | .39 | | | | .29 | |
Net realized and unrealized gain (loss) on investments | | | (.93 | ) | | | 1.01 | | | | 2.10 | | | | (8.86 | ) | | | 3.70 | | | | 3.68 | |
Total from investment operations | | | (.63 | ) | | | 1.20 | | | | 2.27 | | | | (8.50 | ) | | | 4.09 | | | | 3.97 | |
Less dividends and distributions | | | | | | | | | | | | | | | | | | | | | | | | |
Dividends from net investment income | | | (.19 | ) | | | (.16 | ) | | | (.47 | ) | | | (.41 | ) | | | — | | | | (.29 | ) |
Distributions from net realized gains | | | — | | | | — | | | | — | | | | (2.19 | ) | | | (.18 | ) | | | (1.45 | ) |
Total dividends and distributions | | | (.19 | ) | | | (.16 | ) | | | (.47 | ) | | | (2.60 | ) | | | (.18 | ) | | | (1.74 | ) |
Capital contributions | | | — | | | | .03 | | | | — | | | | — | | | | — | | | | — | |
Net asset value, end of period | | $ | 11.08 | | | $ | 11.90 | | | $ | 10.83 | | | $ | 9.03 | | | $ | 20.13 | | | $ | 16.22 | |
| | | | | | |
| TOTAL RETURN(a) | | | (5.36 | )% | | | 11.45 | % | | | 26.84 | % | | | (47.99 | )% | | | 25.33 | % | | | 29.02 | % |
| | | | | |
| RATIOS/SUPPLEMENTAL DATA: | | | | | | | | | | | | | | | | | | | | | |
Net assets, end of period (000) | | $ | 74,592 | | | $ | 98,978 | | | $ | 119,006 | | | $ | 123,970 | | | $ | 297,083 | | | $ | 268,314 | |
Average net assets (000) | | $ | 112,082 | | | $ | 106,108 | | | $ | 110,053 | | | $ | 218,670 | | | $ | 277,744 | | | $ | 248,571 | |
Ratios to average net assets(b) | | | | | | | | | | | | | | | | | | | | | | | | |
Expenses, including distribution and service (12b-1) fees | | | .98 | % | | | 1.04 | % | | | 1.01 | % | | | .83 | % | | | .83 | %(c) | | | .93 | % |
Expenses, excluding distribution and service (12b-1) fees | | | .98 | % | | | 1.04 | % | | | 1.01 | % | | | .83 | % | | | .83 | %(c) | | | .93 | % |
Net investment income | | | 2.47 | % | | | 1.75 | % | | | 1.94 | % | | | 2.49 | % | | | 2.61 | %(c) | | | 1.73 | % |
Portfolio turnover rate | | | 19 | % | | | 41 | % | | | 38 | % | | | 30 | % | | | 37 | %(d) | | | 41 | % |
| (a) | Total return is calculated assuming a purchase of a share on the first day and a sale on the last day of each period reported and includes reinvestment of dividends and distributions. Total returns may reflect adjustments to conform to generally accepted accounting principles. Total returns for periods less than one full year are not annualized. |
| (b) | Does not include expenses of the underlying fund in which the Portfolio invests. |
| (e) | Calculated based upon average shares outstanding during the period. |
| (f) | For the ten month period ended October 31, 2007. The Trust changed its fiscal year end from December 31 to October 31, effective October 31, 2007. |
See Notes to Financial Statements.
| | | | |
| 186 | | | THE TARGET PORTFOLIO TRUST | |
Financial Highlights (continued)
| | | | | | | | | | | | | | | | | | | | | | | | |
| | | TOTAL RETURN BOND PORTFOLIO | |
| | | Class R | |
| | | Year Ended October 31, | | | Ten Months
Ended
October 31,
2007(f)(g) | | | August 22,
2006(b)
through
December 31,
2006 | |
| | | 2011 | | | 2010 | | | 2009 | | | 2008 | | | |
| | | | | | |
| PER SHARE OPERATING PERFORMANCE: | | | | | | | | | | | | | | | | | | | | | | | | |
Net asset value, beginning of period | | $ | 11.34 | | | $ | 10.93 | | | $ | 9.86 | | | $ | 10.54 | | | $ | 10.31 | | | $ | 10.31 | |
Income (loss) from investment operations | | | | | | | | | | | | | | | | | | | | | | | | |
Net investment income | | | .26 | | | | .30 | | | | .42 | | | | .46 | | | | .33 | | | | .12 | |
Net realized and unrealized gain (loss) on investments | | | (.03 | ) | | | .68 | | | | 1.82 | | | | (.68 | ) | | | .24 | | | | .01 | |
Total from investment operations | | | .23 | | | | .98 | | | | 2.24 | | | | (.22 | ) | | | .57 | | | | .13 | |
Less dividends and distributions | | | | | | | | | | | | | | | | | | | | | | | | |
Dividends from net investment income | | | (.27 | ) | | | (.30 | ) | | | (.62 | ) | | | (.46 | ) | | | (.34 | ) | | | (.13 | ) |
Distributions from net realized gains | | | (.36 | ) | | | (.27 | ) | | | (.55 | ) | | | — | | | | — | | | | — | |
Total dividends and distributions | | | (.63 | ) | | | (.57 | ) | | | (1.17 | ) | | | (.46 | ) | | | (.34 | ) | | | (.13 | ) |
Capital contributions | | | — | | | | — | (k) | | | — | | | | — | | | | — | | | | — | |
Net asset value, end of period | | $ | 10.94 | | | $ | 11.34 | | | $ | 10.93 | | | $ | 9.86 | | | $ | 10.54 | | | $ | 10.31 | |
| | | | | | |
| TOTAL RETURN(a) | | | 2.24 | % | | | 9.33 | % | | | 24.57 | % | | | (2.24 | )% | | | 5.63 | % | | | 1.27 | % |
| | | | | | |
| RATIOS/SUPPLEMENTAL DATA: | | | | | | | | | | | | | | | | | | | | | | | | |
Net assets, end of period (000) | | $ | 127,837 | | | $ | 102,992 | | | $ | 71,457 | | | $ | 53,218 | | | $ | 23,670 | | | $ | 1,503 | |
Average net assets (000) | | $ | 117,927 | | | $ | 86,806 | | | $ | 56,103 | | | $ | 42,474 | | | $ | 10,429 | | | $ | 246 | |
Ratios to average net assets(h) | | | | | | | | | | | | | | | | | | | | | | | | |
Expenses, including distribution and service (12b-1) fees(e) | | | 1.15 | % | | | 1.17 | % | | | 1.32 | %(i) | | | 1.23 | % | | | 1.14 | %(c) | | | 1.18 | %(c) |
Expenses, excluding distribution and service (12b-1) fees | | | .65 | % | | | .67 | % | | | .82 | %(j) | | | .73 | % | | | .64 | %(c) | | | .68 | %(c) |
Net investment income | | | 2.50 | % | | | 2.79 | % | | | 4.20 | % | | | 4.39 | % | | | 3.84 | %(c) | | | 3.46 | %(c) |
Portfolio turnover rate | | | 243 | % | | | 369 | % | | | 657 | % | | | 697 | % | | | 421 | %(d) | | | 483 | %(d) |
| (a) | Total return is calculated assuming a purchase of a share on the first day and a sale on the last day of each period reported and includes reinvestment of dividends and distributions. Total returns may reflect adjustments to conform to generally accepted accounting principles. Total returns for periods less than one full year are not annualized. |
| (b) | Commencement of offering. |
| (e) | The distributor of the Trust has contractually agreed to limit its distribution and service (12b-1) fees to .50% of the average daily net assets of the Class R shares. |
| (f) | Calculated based upon average shares outstanding during the period. |
| (g) | For the ten month period ended October 31, 2007. The Trust changed its fiscal year end from December 31 to October 31, effective October 31, 2007. |
| (h) | Does not include expenses of the underlying fund in which the Portfolio invests. |
| (i) | The annualized expense ratio without interest expense would have been 1.30% for the year ended October 31, 2009. |
| (j) | The annualized expense ratio without interest expense would have been .80% for the year ended October 31, 2009. |
| (k) | Less than $0.005 per share. |
See Notes to Financial Statements.
| | | | |
| THE TARGET PORTFOLIO TRUST | | | 187 | |
Financial Highlights (continued)
| | | | | | | | | | | | | | | | | | | | | | | | |
| | | TOTAL RETURN BOND PORTFOLIO | |
| | | Class T | |
| | | Year Ended October 31, | | | Ten Months
Ended
October 31,
2007(d)(e) | | | Year
Ended
December 31,
2006 | |
| | | 2011 | | | 2010 | | | 2009 | | | 2008 | | | |
| | | | | | |
| PER SHARE OPERATING PERFORMANCE: | | | | | | | | | | | | | | | | | | | | | | | | |
Net asset value, beginning of period | | $ | 11.42 | | | $ | 11.01 | | | $ | 9.93 | | | $ | 10.60 | | | $ | 10.38 | | | $ | 10.39 | |
Income (loss) from investment operations | | | | | | | | | | | | | | | | | | | | | | | | |
Net investment income | | | .33 | | | | .36 | | | | .47 | | | | .53 | | | | .39 | | | | .40 | |
Net realized and unrealized gain (loss) on investments | | | (.04 | ) | | | .68 | | | | 1.84 | | | | (.68 | ) | | | .22 | | | | .03 | |
Total from investment operations | | | .29 | | | | 1.04 | | | | 2.31 | | | | (.15 | ) | | | .61 | | | | .43 | |
Less dividends and distributions | | | | | | | | | | | | | | | | | | | | | | | | |
Dividends from net investment income | | | (.33 | ) | | | (.36 | ) | | | (.68 | ) | | | (.52 | ) | | | (.39 | ) | | | (.44 | ) |
Distributions from net realized gains | | | (.36 | ) | | | (.27 | ) | | | (.55 | ) | | | — | | | | — | | | | — | |
Total dividends and distributions | | | (.69 | ) | | | (.63 | ) | | | (1.23 | ) | | | (.52 | ) | | | (.39 | ) | | | (.44 | ) |
Capital contributions | | | — | | | | — | (h) | | | — | | | | — | | | | — | | | | — | |
Net asset value, end of period | | $ | 11.02 | | | $ | 11.42 | | | $ | 11.01 | | | $ | 9.93 | | | $ | 10.60 | | | $ | 10.38 | |
| | | | | | |
| TOTAL RETURN(a) | | | 2.76 | % | | | 9.82 | % | | | 25.15 | % | | | (1.71 | )% | | | 5.94 | % | | | 4.27 | % |
| | | | | | |
| RATIOS/SUPPLEMENTAL DATA: | | | | | | | | | | | | | | | | | | | | | | | | |
Net assets, end of period (000) | | $ | 254,598 | | | $ | 266,960 | | | $ | 217,784 | | | $ | 194,970 | | | $ | 183,262 | | | $ | 167,154 | |
Average net assets (000) | | $ | 249,230 | | | $ | 242,590 | | | $ | 198,247 | | | $ | 206,986 | | | $ | 174,725 | | | $ | 162,621 | |
Ratios to average net assets(f) | | | | | | | | | | | | | | | | | | | | | | | | |
Expenses, including distribution and service (12b-1) fees | | | .65 | % | | | .67 | % | | | .82 | %(g) | | | .73 | % | | | .64 | %(b) | | | .68 | % |
Expenses, excluding distribution and service (12b-1) fees | | | .65 | % | | | .67 | % | | | .82 | %(g) | | | .73 | % | | | .64 | %(b) | | | .68 | % |
Net investment income | | | 2.99 | % | | | 3.28 | % | | | 4.71 | % | | | 4.86 | % | | | 4.53 | %(b) | | | 4.14 | % |
Portfolio turnover rate | | | 243 | % | | | 369 | % | | | 657 | % | | | 697 | % | | | 421 | %(c) | | | 483 | % |
| (a) | Total return is calculated assuming a purchase of a share on the first day and a sale on the last day of each period reported and includes reinvestment of dividends and distributions. Total returns may reflect adjustments to conform to generally accepted accounting principles. Total returns for periods less than one full year are not annualized. |
| (d) | Calculated based upon average shares outstanding during the period. |
| (e) | For the ten month period ended October 31, 2007. The Trust changed its fiscal year end from December 31 to October 31, effective October 31, 2007. |
| (f) | Does not include expenses of the underlying fund in which the Portfolio invests. |
| (g) | The annualized expense ratio without interest expense would have been .80% for the year ended October 31, 2009. |
| (h) | Less than $0.005 per share. |
See Notes to Financial Statements.
| | | | |
| 188 | | | THE TARGET PORTFOLIO TRUST | |
Financial Highlights (continued)
| | | | | | | | | | | | | | | | | | | | | | | | |
| | | INTERMEDIATE-TERM BOND PORTFOLIO | |
| | | Class T | |
| | | Year Ended October 31, | | | Ten Months
Ended
October 31,
2007(e) | | | Year
Ended
December 31,
2006 | |
| | | 2011 | | | 2010 | | | 2009 | | | 2008 | | | |
| | | | | | |
| PER SHARE OPERATING PERFORMANCE: | | | | | | | | | | | | | | | | | | | | | | | | |
Net asset value, beginning of period | | $ | 10.96 | | | $ | 10.85 | | | $ | 10.27 | | | $ | 10.25 | | | $ | 10.13 | | | $ | 10.18 | |
Income (loss) from investment operations | | | | | | | | | | | | | | | | | | | | | | | | |
Net investment income | | | .27 | | | | .27 | | | | .36 | | | | .44 | | | | .40 | | | | .43 | |
Net realized and unrealized gain (loss) on investments | | | — | (b) | | | .66 | | | | 1.27 | | | | .08 | | | | .11 | | | | (.03 | ) |
Total from investment operations | | | .27 | | | | .93 | | | | 1.63 | | | | .52 | | | | .51 | | | | .40 | |
Less dividends and distributions | | | | | | | | | | | | | | | | | | | | | | | | |
Dividends from net investment income | | | (.36 | ) | | | (.28 | ) | | | (.42 | ) | | | (.50 | ) | | | (.39 | ) | | | (.45 | ) |
Distributions from net realized gains | | | (.37 | ) | | | (.54 | ) | | | (.63 | ) | | | — | | | | — | | | | — | |
Total dividends and distributions | | | (.73 | ) | | | (.82 | ) | | | (1.05 | ) | | | (.50 | ) | | | (.39 | ) | | | (.45 | ) |
Capital contributions | | | — | | | | — | (b) | | | — | | | | — | | | | — | | | | — | |
Net asset value, end of period | | $ | 10.50 | | | $ | 10.96 | | | $ | 10.85 | | | $ | 10.27 | | | $ | 10.25 | | | $ | 10.13 | |
| | | | | | |
| TOTAL RETURN(a) | | | 2.70 | % | | | 9.07 | % | | | 17.01 | % | | | 5.07 | % | | | 5.13 | % | | | 4.12 | % |
| | | | | |
| RATIOS/SUPPLEMENTAL DATA: | | | | | | | | | | | | | | | | | | | | | |
Net assets, end of period (000) | | $ | 182,371 | | | $ | 248,817 | | | $ | 245,517 | | | $ | 204,548 | | | $ | 233,423 | | | $ | 245,223 | |
Average net assets (000) | | $ | 210,348 | | | $ | 247,716 | | | $ | 218,911 | | | $ | 227,475 | | | $ | 235,800 | | | $ | 249,376 | |
Ratios to average net assets(f) | | | | | | | | | | | | | | | | | | | | | | | | |
Expenses, including distribution and service (12b-1) fees | | | .66 | % | | | .66 | %(g) | | | .74 | %(g) | | | .60 | % | | | .58 | %(c) | | | .64 | % |
Expenses, excluding distribution and service (12b-1) fees | | | .66 | % | | | .66 | %(g) | | | .74 | %(g) | | | .60 | % | | | .58 | %(c) | | | .64 | % |
Net investment income | | | 2.61 | % | | | 2.53 | % | | | 3.47 | % | | | 4.21 | % | | | 4.71 | %(c) | | | 4.23 | % |
Portfolio turnover rate | | | 392 | % | | | 938 | % | | | 527 | % | | | 395 | % | | | 284 | %(d) | | | 134 | % |
| (a) | Total return is calculated assuming a purchase of a share on the first day and a sale on the last day of each period reported and includes reinvestment of dividends and distributions. Total returns may reflect adjustments to conform to generally accepted accounting principles. Total returns for periods less than one full year are not annualized. |
| (b) | Less than $0.005 per share. |
| (e) | For the ten month period ended October 31, 2007. The Trust changed its fiscal year end from December 31 to October 31, effective October 31, 2007. |
| (f) | Does not include expenses of the underlying fund in which the Portfolio invests. |
| (g) | The annualized expense ratio without interest expense would have been .64% and .69%, respectively, for the years ended October 31, 2010 and 2009. |
See Notes to Financial Statements.
| | | | |
| THE TARGET PORTFOLIO TRUST | | | 189 | |
Financial Highlights (continued)
| | | | | | | | | | | | | | | | | | | | | | | | |
| | | MORTGAGE BACKED SECURITIES PORTFOLIO | |
| | | Class T | |
| | | Year Ended October 31, | | | Ten Months
Ended
October 31,
2007(e) | | | Year
Ended
December 31,
2006 | |
| | | 2011 | | | 2010 | | | 2009 | | | 2008 | | | |
| | | | | | |
| PER SHARE OPERATING PERFORMANCE: | | | | | | | | | | | | | | | | | | | | | | | | |
Net asset value, beginning of period | | $ | 10.60 | | | $ | 9.96 | | �� | $ | 9.26 | | | $ | 9.95 | | | $ | 9.99 | | | $ | 10.10 | |
Income (loss) from investment operations | | | | | | | | | | | | | | | | | | | | | | | | |
Net investment income | | | .49 | | | | .54 | | | | .70 | | | | .63 | | | | .41 | | | | .44 | |
Net realized and unrealized gain (loss) on investments | | | .05 | | | | .64 | | | | .74 | | | | (.66 | ) | | | (.03 | ) | | | (.07 | ) |
Total from investment operations | | | .54 | | | | 1.18 | | | | 1.44 | | | | (.03 | ) | | | .38 | | | | .37 | |
Less dividends | | | | | | | | | | | | | | | | | | | | | | | | |
Dividends from net investment income | | | (.46 | ) | | | (.54 | ) | | | (.74 | ) | | | (.66 | ) | | | (.39 | ) | | | (.48 | ) |
Tax return of capital | | | — | | | | — | | | | — | | | | — | | | | (.03 | ) | | | — | |
Total dividends | | | (.46 | ) | | | (.54 | ) | | | (.74 | ) | | | (.66 | ) | | | (.42 | ) | | | (.48 | ) |
Net asset value, end of period | | $ | 10.68 | | | $ | 10.60 | | | $ | 9.96 | | | $ | 9.26 | | | $ | 9.95 | | | $ | 9.99 | |
| | | | | | |
| TOTAL RETURN(a) | | | 5.26 | % | | | 12.13 | % | | | 16.20 | % | | | (.36 | )% | | | 3.89 | % | | | 3.82 | % |
| | | | | |
| RATIOS/SUPPLEMENTAL DATA: | | | | | | | | | | | | | | | | | | | | | |
Net assets, end of period (000) | | $ | 35,281 | | | $ | 36,157 | | | $ | 41,112 | | | $ | 51,368 | | | $ | 73,581 | | | $ | 75,471 | |
Average net assets (000) | | $ | 34,208 | | | $ | 38,594 | | | $ | 44,081 | | | $ | 64,999 | | | $ | 75,508 | | | $ | 77,483 | |
Ratios to average net assets(f) | | | | | | | | | | | | | | | | | | | | | | | | |
Expenses, including distribution and service (12b-1) fees | | | 1.03 | % | | | .88 | %(b) | | | 1.07 | %(b) | | | 1.94 | %(b) | | | 1.82 | %(b)(c) | | | 1.89 | %(b) |
Expenses, excluding distribution and service (12b-1) fees | | | 1.03 | % | | | .88 | %(b) | | | 1.07 | %(b) | | | 1.94 | %(b) | | | 1.82 | %(b)(c) | | | 1.89 | %(b) |
Net investment income | | | 4.65 | % | | | 5.23 | % | | | 7.35 | % | | | 6.34 | % | | | 4.91 | %(c) | | | 4.46 | % |
Portfolio turnover rate | | | 670 | % | | | 646 | % | | | 425 | % | | | 338 | % | | | 318 | %(d) | | | 471 | % |
| (a) | Total return is calculated assuming a purchase of a share on the first day and a sale on the last day of each period reported and includes reinvestment of dividends and distributions. Total returns may reflect adjustments to conform to generally accepted accounting principles. Total returns for periods less than one full year are not annualized. |
| (b) | The annualized expense ratio without interest expense would have been .87%, .79%, and .70%, respectively, for the years ended October 31, 2010, 2009, and 2008, .76% for the ten months ended October 31, 2007, and .94%, for the year ended December 31, 2006. |
| (e) | For the ten month period ended October 31, 2007. The Trust changed its fiscal year end from December 31 to October 31, effective October 31, 2007. |
| (f) | Does not include expenses of the underlying fund in which the Portfolio invests. |
See Notes to Financial Statements.
| | | | |
| 190 | | | THE TARGET PORTFOLIO TRUST | |
Report of Independent Registered Public Accounting Firm
The Board of Trustee and Shareholders
The Target Portfolio Trust:
We have audited the accompanying statement of assets and liabilities of The Target Portfolio Trust (comprised of Large Capitalization Growth Portfolio, Large Capitalization Value Portfolio, Small Capitalization Growth Portfolio, Small Capitalization Value Portfolio, International Equity Portfolio, Total Return Bond Portfolio, Intermediate-Term Bond Portfolio and Mortgage Backed Securities Portfolio, hereafter referred to as the “Funds”), including the portfolio of investments, as of October 31, 2011, and the related statement of operations for the year then ended, the statement of changes in net assets for each of the years in the two-year period then ended and the financial highlights for each of the years in the four-year period then ended, the ten-month period ended October 31, 2007 and the year ended December 31, 2006. These financial statements and financial highlights are the responsibility of the Funds’ management. Our responsibility is to express an opinion on these financial statements and financial highlights based on our audits.
We conducted our audits in accordance with the standards of the Public Company Accounting Oversight Board (United States). Those standards require that we plan and perform the audit to obtain reasonable assurance about whether the financial statements and financial highlights are free of material misstatement. An audit includes examining, on a test basis, evidence supporting the amounts and disclosures in the financial statements. Our procedures included confirmation of securities owned as of October 31, 2011, by correspondence with the custodian, transfer agent and brokers or by other appropriate auditing procedures when replies from brokers were not received. An audit also includes assessing the accounting principles used and significant estimates made by management, as well as evaluating the overall financial statement presentation. We believe that our audits provide a reasonable basis for our opinion.
In our opinion, the financial statements and financial highlights referred to above present fairly, in all material respects, the financial position of the Funds as of October 31, 2011, and the results of their operations for the year then ended, the changes in their net assets for each of the years in the two-year period then ended and the financial highlights for each of the years in the four-year period then ended, the ten-month period ended October 31, 2007 and the year ended December 31, 2006, in conformity with U.S. generally accepted accounting principles.

New York, New York
December 22, 2011
| | | | |
| THE TARGET PORTFOLIO TRUST | | | 191 | |
Federal Tax Information (Unaudited)
We are required by the Internal Revenue Code of 1986, as amended (“the Code”), to advise you within 60 days of the Funds’ fiscal year end (October 31, 2011) as to the federal income tax status of dividends and distributions paid during such fiscal year. We are advising you that during its fiscal year ended October 31, 2011, The Target Portfolio Trust paid ordinary income dividends and designated the maximum amount allowable per share, but not less than the following amounts as a capital gain distributions per share in accordance with Section 852(b)(3)(C) of the Internal Revenue Code for Class R and T shares as follows:
| | | | | | | | | | | | |
| | | | | | Ordinary
Income
Dividends | | | Capital
Gains
Distributions | |
Large Capitalization Growth | | | Class T | | | $ | 0.04 | | | $ | — | |
Large Capitalization Value | | | Class R | | | | 0.12 | | | | — | |
| | | Class T | | | | 0.17 | | | | — | |
Small Capitalization Value | | | Class R | | | | 0.09 | | | | — | |
| | | Class T | | | | 0.18 | | | | — | |
International Equity | | | Class R | | | | 0.14 | | | | — | |
| | | Class T | | | | 0.19 | | | | — | |
Total Return Bond | | | Class R | | | | 0.27 | | | | 0.36 | |
| | | Class T | | | | 0.33 | | | | 0.36 | |
Intermediate-Term Bond | | | Class T | | | | 0.36 | | | | 0.37 | |
Mortgage Backed Securities | | | Class T | | | | 0.46 | | | | — | |
For the fiscal year ended October 31, 2011 the Funds designate the maximum amount allowable but not less than the following percentages of their ordinary income dividends paid during the fiscal year as 1) qualified dividend income in accordance with Section 854 of the Internal Revenue Code (“QDI”), 2) eligible for corporate dividend received deduction in accordance with Section 854 of the Internal Revenue Code ("DRD"), 3) interest related dividends in accordance with Section 871(k)(1) and 881(e)(1) of the Internal Revenue Code (“IR”) and 4) short-term capital gain distributions in accordance with Section 871(k)(2) and 881(e)(2) of the Internal Revenue Code (“STCG”):
| | | | | | | | | | | | | | | | |
| | | QDI | | | DRD | | | IR | | | STCG | |
Large Capitalization Growth | | | 100.00% | | | | 100.00% | | | | 0.00% | | | | 0.00% | |
Large Capitalization Value | | | 100.00% | | | | 100.00% | | | | 0.00% | | | | 0.00% | |
Small Capitalization Value | | | 100.00% | | | | 100.00% | | | | 0.00% | | | | 0.00% | |
International Equity | | | 100.00% | | | | 0.00% | | | | 0.00% | | | | 0.00% | |
Total Return Bond | | | 0.00% | | | | 0.00% | | | | 38.11% | | | | 0.00% | |
Intermediate-Term Bond | | | 0.00% | | | | 0.00% | | | | 27.03% | | | | 0.00% | |
Mortgage Backed Securities | | | 0.00% | | | | 0.00% | | | | 76.54% | | | | 0.00% | |
For the fiscal year ended October 31, 2011, International Equity Portfolio has made an election to pass-through the maximum amount of the portion of the ordinary income dividends paid derived from foreign source income as well as any foreign taxes paid by the Portfolio in accordance with Section 853 of the Internal Revenue Code of the following amounts: $839,482 foreign tax credit from foreign source income of $10,368,589.
| | | | |
| 192 | | | THE TARGET PORTFOLIO TRUST | |
Federal Tax Information (Unaudited) (continued)
Many states do not tax the portion of mutual fund dividends attributed to interest from U.S. Government obligations. Listed below is the percentage of interest earned by the following Portfolios from U.S. Government obligations for the fiscal year ended October 31, 2011. We are required by Massachusetts, Missouri and Oregon to inform you that dividends which have been derived from interest on federal obligations are not taxable to shareholders providing the mutual fund meets certain requirements mandated by the respective state’s taxing authorities.
| | | | |
Portfolio*** | | Percentage of interest from
U.S. Government Obligations | |
Total Return Bond | | | 5.61 | |
Intermediate-Term Bond | | | 1.21 | |
| *** | Due to certain minimum portfolio holding requirements in California, Connecticut and New York, residents of those states will not be able to exclude 2011 interest income from state and local taxes. |
Please consult your tax adviser or state/local authorities to properly report this information on your tax return. If you have any questions concerning the amounts listed above, please call your financial adviser.
In January 2012, you will be advised on IRS Form 1099 DIV or Substitute 1099 DIV as to the federal tax status of the distributions received by you in calendar year 2011.
| | | | |
| THE TARGET PORTFOLIO TRUST | | | 193 | |
INFORMATION ABOUT BOARD MEMBERS AND OFFICERS
(Unaudited)
Information about Board Members and Officers is set forth below. Board Members who are not deemed to be “interested persons” of the Portfolios, as defined in the 1940 Act, are referred to as “Independent Board Members.” Board Members who are deemed to be “interested persons” of the Portfolios are referred to as “Interested Board Members.” The Board Members are responsible for the overall supervision of the operations of the Portfolios and perform the various duties imposed on the directors of investment companies by the 1940 Act.
| | | | |
Independent Board Members(1) | | | | |
Name, Address, Age Position(s) Portfolios Overseen | | Principal Occupation(s) During Past Five Years | | Other Directorships Held |
Kevin J. Bannon (59) Board Member Portfolios Overseen: 58 | | Managing Director (since April 2008) and Chief Investment Officer (since October 2008) of Highmount Capital LLC (registered investment adviser); formerly Executive Vice President and Chief Investment Officer (April 1993-August 2007) of Bank of New York Company; President (May 2003-May 2007) of BNY Hamilton Family of Mutual Funds. | | Director of Urstadt Biddle Properties (since September 2008). |
Linda W. Bynoe (59) Board Member Portfolios Overseen: 58 | | President and Chief Executive Officer (since March 1995) and formerly Chief Operating Officer (December 1989-February 1995) of Telemat Ltd. (management consulting); formerly Vice President (January 1985-June 1989) at Morgan Stanley & Co (broker-dealer). | | Director of Simon Property Group, Inc. (retail real estate) (since May 2003); Director of Anixter International, Inc. (communication products distributor) (since January 2006); Director of Northern Trust Corporation (financial services) (since April 2006); Trustee of Equity Residential (residential real estate) (since December 2009); formerly Director of Dynegy Inc. (power generation) (September 2002-May 2006). |
Michael S. Hyland, CFA (66) Board Member Portfolios Overseen: 58 | | Independent Consultant (since February 2005); formerly Senior Managing Director (July 2001-February 2005) of Bear Stearns & Co, Inc.; Global Partner, INVESCO (1999-2001); Managing Director and President of Salomon Brothers Asset Management (1989-1999). | | None. |
Douglas H. McCorkindale (72) Board Member Portfolios Overseen: 58 | | Formerly Chairman (February 2001-June 2006), Chief Executive Officer (June 2000-July 2005), President (September 1997-July 2005) and Vice Chairman (March 1984-May 2000) of Gannett Co. Inc. (publishing and media). | | Director of Lockheed Martin Corp. (aerospace and defense) (since May 2001). |
THE TARGET PORTFOLIO TRUST
| | | | |
Independent Board Members(1) | | | | |
Name, Address, Age Position(s) Portfolios Overseen | | Principal Occupation(s) During Past Five Years | | Other Directorships Held |
Stephen P. Munn (69) Board Member Portfolios Overseen: 58 | | Lead Director (since 2007) and formerly Chairman (1993-2007) of Carlisle Companies Incorporated (manufacturer of industrial products). | | Lead Director (since 2007) of Carlisle Companies Incorporated (manufacturer of industrial products). |
Richard A. Redeker (68) Board Member & Independent Chair Portfolios Overseen: 58 | | Retired Mutual Fund Senior Executive (43 years); Management Consultant; Independent Directors Council (organization of 2,800 Independent Mutual Fund Directors)-Executive Committee, Chair of Policy Steering Committee, Governing Council. | | None. |
Robin B. Smith (72) Board Member Portfolios Overseen: 58 | | Chairman of the Board (since January 2003) of Publishers Clearing House (direct marketing); Member of the Board of Directors of ADLPartner (marketing) (since December 2010); formerly Chairman and Chief Executive Officer (August 1996-January 2003) of Publishers Clearing House. | | Formerly Director of BellSouth Corporation (telecommunications) (1992-2006). |
Stephen G. Stoneburn (68) Board Member Portfolios Overseen: 58 | | President and Chief Executive Officer (since June 1996) of Quadrant Media Corp. (publishing company); formerly President (June 1995-June 1996) of Argus Integrated Media, Inc.; Senior Vice President and Managing Director (January 1993-1995) of Cowles Business Media; Senior Vice President of Fairchild Publications, Inc (1975-1989). | | None. |
THE TARGET PORTFOLIO TRUST
| | | | |
| Interested Board Members(1) |
Name, Address, Age
Position(s) Portfolios Overseen | | Principal Occupation(s) During Past Five Years | | Other Directorships Held |
Judy A. Rice* (63) Board Member & President Portfolios Overseen: 58 | | President, Chief Executive Officer, Chief Operating Officer and Officer-In-Charge (since February 2003) of Prudential Investments LLC; President, Chief Executive Officer and Officer-In-Charge (since April 2003) of Prudential Mutual Fund Services LLC; President, Chief Executive Officer (since May 2011) and Executive Vice President (since December 2008) of Prudential Investment Management Services LLC; Member of the Board of Directors of Jennison Associates LLC (since November 2010); formerly Vice President (February 1999-April 2006) of Prudential Investment Management Services LLC; President, COO, CEO and Manager of PIFM Holdco, LLC (since April 2006); formerly President, Chief Executive Officer, Chief Operating Officer and Officer-In-Charge (May 2003-June 2005) and Director (May 2003-March 2006) and Executive Vice President (June 2005-March 2006) of AST Investment Services, Inc.; Member of Board of Governors of the Investment Company Institute. | | None. |
Stuart S. Parker* (49) Board Member & President Portfolios Overseen: 58 | | President of Prudential Investments LLC (since January 2012); Executive Vice President of Jennison Associates LLC and Head of Retail Distribution of Prudential Investments LLC (June 2005 - December 2011). | | None. |
Scott E. Benjamin (38) Board Member & Vice President Portfolios Overseen: 58 | | Executive Vice President (since June 2009) of Prudential Investments LLC and Prudential Investment Management Services LLC; Executive Vice President (since September 2009) of AST Investment Services, Inc.; Senior Vice President of Product Development and Marketing, Prudential Investments (since February 2006); Vice President of Product Development and Product Management, Prudential Investments (2003-2006). | | None. |
* Ms. Rice has announced her retirement as President and Board Member effective December 31, 2011. Ms. Rice has been appointed as Vice President effective January 1, 2012. The Board has appointed Stuart S. Parker as President and Board Member effective January 1, 2012.
THE TARGET PORTFOLIO TRUST
(1) The year that each individual joined the Board of the Target Portfolio Trust is as follows:
Linda W. Bynoe, 2005; Douglas H. McCorkindale, 1996; Richard A. Redeker, 2003; Robin B. Smith, 2003; Stephen G. Stoneburn, 1999; Kevin J. Bannon, 2008; Michael S. Hyland, 2008; Stephen P. Munn, 2008; Judy A. Rice, Board Member and President since 2003; Scott E. Benjamin, Board Member since 2010 and Vice President since 2009.
| | |
| Fund Officers(a)(1) |
Name, Address and Age Position with Fund | | Principal Occupation(s) During Past Five Years |
Kathryn L. Quirk (59) Chief Legal Officer | | Vice President and Corporate Counsel (since September 2004) of Prudential; Executive Vice President, Chief Legal Officer and Secretary (since July 2005) of PI and Prudential Mutual Fund Services LLC; Vice President and Corporate Counsel (since June 2005) and Secretary (since February 2006) of AST Investment Services, Inc.; formerly Senior Vice President and Assistant Secretary (November 2004-August 2005) of PI; formerly Assistant Secretary (June 2005-February 2006) of AST Investment Services, Inc.; formerly Managing Director, General Counsel, Chief Compliance Officer, Chief Risk Officer and Corporate Secretary (1997-2002) of Zurich Scudder Investments, Inc. |
Deborah A. Docs (53) Secretary | | Vice President and Corporate Counsel (since January 2001) of Prudential; Vice President (since December 1996) and Assistant Secretary (since March 1999) of PI; formerly Vice President and Assistant Secretary (May 2003-June 2005) of AST Investment Services, Inc. |
Jonathan D. Shain (53) Assistant Secretary | | Vice President and Corporate Counsel (since August 1998) of Prudential; Vice President and Assistant Secretary (since May 2001) of PI; Vice President and Assistant Secretary (since February 2001) of PMFS; formerly Vice President and Assistant Secretary (May 2003-June 2005) of AST Investment Services, Inc. |
Claudia DiGiacomo (37) Assistant Secretary | | Vice President and Corporate Counsel (since January 2005) of Prudential; Vice President and Assistant Secretary of PI (since December 2005); Associate at Sidley Austin Brown & Wood LLP (1999-2004). |
John P. Schwartz (40) Assistant Secretary | | Vice President and Corporate Counsel (since April 2005) of Prudential; Vice President and Assistant Secretary of PI (since December 2005); Associate at Sidley Austin Brown & Wood LLP (1997-2005). |
Andrew R. French (49) Assistant Secretary | | Vice President and Corporate Counsel (since February 2010) of Prudential; formerly Director and Corporate Counsel (2006-2010) of Prudential; Vice President and Assistant Secretary (since January 2007) of PI; Vice President and Assistant Secretary (since January 2007) of PMFS. |
Timothy J. Knierim (52) Chief Compliance Officer | | Chief Compliance Officer of Prudential Investment Management, Inc. (since July 2007); formerly Chief Risk Officer of PIM and PI (2002-2007) and formerly Chief Ethics Officer of PIM and PI (2006-2007). |
Valerie M. Simpson (53) Deputy Chief Compliance Officer | | Chief Compliance Officer (since April 2007) of PI and AST Investment Services, Inc.; formerly Vice President-Financial Reporting (June 1999-March 2006) for Prudential Life and Annuities Finance. |
THE TARGET PORTFOLIO TRUST
| | |
| Fund Officers(a)(1) |
Name, Address and Age Position with Fund | | Principal Occupation(s) During Past Five Years |
Theresa C. Thompson (49) Deputy Chief Compliance Officer | | Vice President, Compliance, PI (since April 2004); and Director, Compliance, PI (2001-2004). |
Richard W. Kinville (43) Anti-Money Laundering Compliance Officer | | Vice President, Corporate Compliance, Anti-Money Laundering Unit (since January 2005) of Prudential; committee member of the American Council of Life Insurers Anti-Money Laundering and Critical Infrastructure Committee (since January 2007); formerly Investigator and Supervisor in the Special Investigations Unit for the New York Central Mutual Fire Insurance Company (August 1994-January 1999); Investigator in AXA Financial’s Internal Audit Department and Manager in AXA’s Anti-Money Laundering Office (January 1999-January 2005); first chair of the American Council of Life Insurers Anti-Money Laundering and Critical Infrastructure Committee (June 2007-December 2009). |
Grace C. Torres (52) Treasurer and Principal Financial and Accounting Officer | | Assistant Treasurer (since March 1999) and Senior Vice President (since September 1999) of PI; Assistant Treasurer (since May 2003) and Vice President (since June 2005) of AST Investment Services, Inc.; Senior Vice President and Assistant Treasurer (since May 2003) of Prudential Annuities Advisory Services, Inc.; formerly Senior Vice President (May 2003-June 2005) of AST Investment Services, Inc. |
M. Sadiq Peshimam (47) Assistant Treasurer | | Vice President (since 2005) of Prudential Investments LLC. |
Peter Parrella (53) Assistant Treasurer | | Vice President (since 2007) and Director (2004-2007) within Prudential Mutual Fund Administration; formerly Tax Manager at SSB Citi Fund Management LLC (1997-2004). |
(a) Excludes Ms. Rice and Mr. Benjamin, interested Board Members who also serve as President and Vice President, respectively.
(1) The year that each individual became an Officer of the Target Portfolio Trust is as follows:
Kathryn L. Quirk, 2005; Deborah A. Docs, 2004; Jonathan D. Shain, 2005; Claudia DiGiacomo, 2005; John P. Schwartz, 2006; Andrew R. French, 2006; Timothy J. Knierim, 2007; Valerie M. Simpson 2007; Theresa C. Thompson, 2008; Richard W. Kinville, 2011, Grace C. Torres, 2000; M. Sadiq Peshimam, 2006; Peter Parrella, 2007.
Explanatory Notes to Tables:
| n | Board Members are deemed to be “Interested,” as defined in the 1940 Act, by reason of their affiliation with Prudential Investments LLC and/or an affiliate of Prudential Investments LLC. |
| n | Unless otherwise noted, the address of all Board Members and Officers is c/o Prudential Investments LLC, Gateway Center Three, 100 Mulberry Street, Newark, New Jersey 07102-4077. |
| n | There is no set term of office for Board Members or Officers. The Board Members have adopted a retirement policy, which calls for the retirement of Board Members on December 31 of the year in which they reach the age of 75. |
| n | “Other Directorships Held” includes only directorships of companies required to register or file reports with the SEC under the 1934 Act) (that is, “public companies”) or other investment companies registered under the 1940 Act. |
| n | “Portfolios Overseen” includes all investment companies managed by Prudential Investments LLC. The investment companies for which PI serves as manager include the Prudential Investments Mutual Funds, The Prudential Variable Contract Accounts, Target Mutual Funds, The Prudential Series Fund, Prudential’s Gibraltar Fund, Inc. and the Advanced Series Trust. |
THE TARGET PORTFOLIO TRUST
Approval of Advisory Agreements
The Trust’s Board of Trustees
The Board of Trustees (the “Board”) of The Target Portfolio Trust (the “Trust”)1 consists of 10 individuals, eight of whom are not “interested persons” of the Trust, as defined in the Investment Company Act of 1940, as amended (the “1940 Act”) (the “Independent Trustees”). The Board is responsible for the oversight of the Trust and each of its Portfolios and their operations, and performs the various duties imposed on the directors of investment companies by the 1940 Act. The Independent Trustees have retained independent legal counsel to assist them in connection with their duties. The Chair of the Board is an Independent Trustee. The Board has established three standing committees: the Audit Committee, the Nominating and Governance Committee, and the Target Investment Committee. Each committee is chaired by, and composed of, Independent Trustees.
Annual Approval of the Trust’s Advisory Agreements
As required under the 1940 Act, the Board determines annually whether to renew the Trust’s management agreement with Prudential Investments LLC (“PI”) and each Portfolio’s subadvisory agreement. In considering the renewal of the agreements, the Board, including all of the Independent Trustees, met on June 6-8, 2011 and approved the renewal of the agreements through July 31, 2012, after concluding that the renewal of the agreements was in the best interest of each of the Trust’s Portfolios and their shareholders.
In advance of the meetings, the Trustees requested and received materials relating to the agreements, and had the opportunity to ask questions and request further information in connection with their consideration. In approving the agreements, the Trustees, including the Independent Trustees advised by independent legal counsel, considered the factors they deemed relevant, including the nature, quality and extent of services provided by PI and each subadviser, the performance of each Portfolio of the Trust, the profitability of PI and its affiliates, expenses and fees, and the potential for economies of scale that may be shared with each Portfolio and its shareholders. In their deliberations, the Trustees did not identify any single factor which alone was responsible for the Board’s decision to approve the agreements. In connection with its deliberations, the Board considered information provided by PI throughout the year at
| 1 | The Trust is comprised of the following series (each, a “Portfolio” and collectively, the “Portfolios”): Target Large Capitalization Value Portfolio, Target Large Capitalization Growth Portfolio, Target Small Capitalization Value Portfolio, Target Small Capitalization Growth Portfolio, Target International Equity Portfolio, Target Intermediate-Term Bond Portfolio, Target Mortgage-Backed Securities Portfolio and Target Total Return Bond Portfolio. |
THE TARGET PORTFOLIO TRUST
Approval of Advisory Agreements (continued)
regular Board meetings, presentations from portfolio managers and other information, as well as information furnished at or in advance of the meetings on June 6-8, 2011.
The Trustees determined that the overall arrangements between the Trust and PI, which serves as the Trust’s investment manager pursuant to a management agreement, and between PI and each subadviser,2 each of which serves pursuant to the terms of subadvisory agreements with PI, are in the interest of the Trust, each Portfolio and its shareholders in light of the services performed, fees charged and such other matters as the Trustees considered relevant in the exercise of their business judgment.
The material factors and conclusions that formed the basis for the Trustees’ determinations to approve the renewal of the agreements are discussed separately below.
Nature, Quality and Extent of Services
The Board received and considered information regarding the nature, quality and extent of services provided to the Trust by PI and each subadviser. The Board considered the services provided by PI, including but not limited to the oversight of the subadvisers, as well as the provision of fund recordkeeping and compliance services to the Trust. With respect to PI’s oversight of the subadvisers, the Board noted that PI’s Strategic Investment Research Group (“SIRG”), a business unit of PI, is responsible for screening and recommending new subadvisers when appropriate, as well as monitoring and reporting to the Board on the performance and operations of the subadvisers. The Board also considered that PI pays the salaries of all of the officers and non-independent Trustees of the Trust. The Board also considered the investment subadvisory services provided by each subadviser, as well as compliance with the Trust’s investment restrictions, policies and procedures. The Board considered PI’s evaluation of the subadvisers as well as PI’s recommendation, based on its review of the subadvisers, to renew the subadvisory agreements or to replace certain subadvisers, as applicable.
| 2 | The respective subadvisers for each Portfolio are as follows: Target Large Capitalization Value Portfolio (Hotchkis and Wiley Capital Management, Eaton Vance Management and NFJ Investment Group LLC), Target Large Capitalization Growth Portfolio (Marsico Capital Management LLC and Massachusetts Financial Services Company), Target Small Capitalization Value Portfolio (EARNEST Partners LLC, JP Morgan Investment Management, Inc., Lee Munder Investments, Ltd., NFJ Investment Group LLC and Vaughan Nelson Investment Management), Target Small Capitalization Growth Portfolio (Eagle Asset Management), Target International Equity Portfolio (LSV Asset Management and Thornburg Investment Management, Inc.), Target Intermediate-Term Bond Portfolio (Pacific Investment Management Company LLC), Target Mortgage-Backed Securities Portfolio (Wellington Management Company LLC) and Target Total Return Bond Portfolio (Pacific Investment Management Company LLC). |
THE TARGET PORTFOLIO TRUST
The Board reviewed the qualifications, backgrounds and responsibilities of PI’s senior management responsible for the oversight of the Trust and each subadviser, and also reviewed the qualifications, backgrounds and responsibilities of the subadvisers’ portfolio managers who are responsible for the day-to-day management of each Portfolio. The Board was provided with information pertaining to PI’s and each subadviser’s organizational structure, senior management, investment operations, and other relevant information pertaining to both PI and each subadviser. The Board also noted that it received favorable compliance reports from the Trust’s Chief Compliance Officer (“CCO”) as to both PI and each subadviser.
The Board concluded that it was satisfied with the nature, extent and quality of the investment management services provided by PI and the subadvisory services provided to the Portfolios by each subadviser, and that there was a reasonable basis on which to conclude that the Trust and its Portfolios benefit from the services provided by PI and each subadviser under the management and subadvisory agreements.
Costs of Services and Profits Realized by PI
The Board was provided with information on the profitability of PI and its affiliates in serving as the Trust’s investment manager. The Board discussed with PI the methodology utilized in assembling the information regarding profitability and considered its reasonableness. The Board recognized that it is difficult to make comparisons of profitability from fund management contracts because comparative information is not generally publicly available and is affected by numerous factors, including the structure of the particular adviser, the types of funds it manages, its business mix, numerous assumptions regarding allocations and the adviser’s capital structure and cost of capital. However, the Board considered that the cost of services provided by PI to certain of the Portfolios during the year ended December 31, 2010 exceeded the benefits gained by PI, resulting in an operating loss to PI. Taking these factors into account, the Board concluded that the profitability of PI and its affiliates in relation to the services rendered was not unreasonable.
The Board separately considered the profitability, to the extent available, of the Trust’s subadvisers. However, the Board noted that none of the Trust’s subadvisers was affiliated with PI, and concluded that the level of profitability of a subadviser not affiliated with PI may not be as significant as PI’s profitability given the arm’s length nature of the process by which the subadvisory fee rates were negotiated by PI and the unaffiliated subadvisers, as well as the fact that PI compensates the subadvisers out of its management fee.
THE TARGET PORTFOLIO TRUST
Approval of Advisory Agreements (continued)
Economies of Scale
The Board noted that the advisory fee schedule for the Portfolios of the Trust does not contain breakpoints that would reduce the fee rate on assets above specified levels. The Board received and discussed information concerning whether PI realizes economies of scale as each Portfolio’s assets grow beyond current levels. However, because of the nature of PI’s business, the Board could not reach definitive conclusions as to whether PI might realize economies of scale on a particular Portfolio or how great they may be. In light of each Portfolio’s current size and fee rate, the Board concluded that the absence of breakpoints in each Portfolio’s fee schedule is acceptable at this time.
Other Benefits to PI and the Subadvisers
The Board considered potential ancillary benefits that might be received by PI, the subadvisers, and their affiliates as a result of their relationship with the Trust and its Portfolios. The Board concluded that potential benefits to be derived by PI included fees received by affiliates of PI for serving as the Portfolios’ securities lending agent, transfer agency fees received by the Trust’s transfer agent (which is affiliated with PI), as well as benefits to the reputation or other intangible benefits resulting from PI’s association with the Fund. The Board concluded that the potential benefits to be derived by the subadvisers included the ability to use soft dollar credits, brokerage commissions received by affiliates of the subadvisers, as well as the potential benefits consistent with those generally resulting from an increase in assets under management, specifically, potential access to additional research resources and benefits to their reputations. The Board concluded that the benefits derived by PI and the subadvisers were consistent with the types of benefits generally derived by investment managers and subadvisers to mutual funds.
Performance of the Portfolios / Fees and Expenses / Other Factors
With respect to each Portfolio of the Trust, the Board also considered certain additional specific factors and related conclusions relating to the performance and fees and expenses of the Portfolios, as detailed below. Among other things, the Board considered comparative fee information from PI and each subadviser. Also, the Board considered comparisons with other mutual funds in relevant Peer Universes and Peer Groups. The mutual funds included in each Peer Universe or Peer Group were objectively determined by Lipper Inc. (“Lipper”), an independent provider of mutual fund data. To the extent that PI deems appropriate, and for reasons addressed in detail with the Board, PI may have provided supplemental data compiled by Lipper for the Board’s consideration. The comparisons placed the Portfolios of the Trust in various
THE TARGET PORTFOLIO TRUST
quartiles over the one-, three-, five-, and, where applicable, 10-year periods ending December 31, 2010 (unless noted otherwise), with the first quartile being the best 25% of the mutual funds (for performance, the best performing mutual funds and, for expenses, the lowest cost mutual funds).
The Board also considered each Portfolio’s actual management fee (which reflects any subsidies, expense caps or waivers), as well as each Portfolio’s total expenses.
Intermediate-Term Bond Portfolio. The Board considered that the Portfolio’s gross performance in relation to its Peer Universe (the Lipper Intermediate Investment-Grade Debt Funds Performance Universe) was in the first quartile over the three-, five- and 10-year periods, and in the third quartile over the one-year period. The Board also noted that the Portfolio outperformed its benchmark index over all periods. The Board concluded that, in light of the Portfolio’s competitive performance, it would be in the interest of the Portfolio and its shareholders to renew the agreements.
The Board considered that the Portfolio’s actual management fee (which reflects any subsidies, expense caps or waivers) ranked in the Expense Group’s third quartile, and that total expenses ranked in the Expense Group’s second quartile. The Board concluded that the management fees (including subadvisory fees) and total expenses were reasonable in light of the services provided.
International Equity Portfolio. The Board considered that the Portfolio’s gross performance in relation to its Peer Universe (a custom blend of mutual funds included in the Lipper International Multi-Cap Core Funds and International Large-Cap Core Funds Performance Universe)3 was in the second quartile over the one-, three-, five- and 10-year periods. The Board noted that the Portfolio outperformed its benchmark index for all periods. The Board concluded that, in light of the Portfolio’s competitive performance, it would be in the interest of the Portfolio and its shareholders to renew the agreements.
The Board considered that the Portfolio’s actual management fee (which reflects any subsidies, expense caps or waivers) and total expenses both ranked in the Expense Group’s first quartile. The Board concluded that the management fees (including subadvisory fees) and total expenses were reasonable in light of the services provided.
| 3 | Although Lipper classifies the Portfolio in its International Large-Cap Core Funds Performance Universe, the custom blend was utilized for performance comparisons, because PI believes that the funds included in this custom blend provide a more appropriate basis for Portfolio performance comparisons. |
THE TARGET PORTFOLIO TRUST
Approval of Advisory Agreements (continued)
Large Capitalization Growth Portfolio. The Board considered that the Portfolio’s gross performance in relation to its Peer Universe (the Lipper Large-Cap Growth Funds Performance Universe) was in the second quartile over the one-year period, in the third quartile over the three-year period, and in the fourth quartile over the five- and 10-year periods. The Board noted that PI had taken action in December 2008 to address the Portfolio’s performance record by replacing one of the Portfolio’s existing subadvisers with a new subadviser, Massachusetts Financial Services Company (MFS). The Board further noted that the Portfolio’s recent performance had shown improvement. The Board concluded that it was reasonable to renew the agreements, subject to its continued close scrutiny of the Portfolio’s performance.
The Board considered that the Portfolio’s actual management fee (which reflects any subsidies, expense caps or waivers) and total expenses both ranked in the Expense Group’s second quartile. The Board concluded that the management fees (including subadvisory fees) and total expenses were reasonable in light of the services provided.
Large Capitalization Value Portfolio. The Board considered that the Portfolio’s gross performance in relation to its Peer Universe (the Lipper Large-Cap Value Funds Performance Universe) was in the second quartile over the 10-year period, in the fourth quartile over the three- and five-year periods, and in the third quartile over the one-year period. The Board noted PI’s explanation that the Portfolio’s underperformance was primarily attributable to the fact that the “deep value” style of investing was out of favor during the extraordinary market conditions which occurred in 2008 and, as a result, the Portfolio’s “deep value” sleeve, managed by Hotchkis and Wiley, depressed the Portfolio’s performance. The Board also noted that one of the Portfolio’s existing subadvisers had been replaced in December 2008 by Eaton Vance Management. The Board concluded that it was reasonable to renew the agreements, subject to its continued close scrutiny of the Portfolio’s performance.
The Board considered that the Portfolio’s actual management fee (which reflects any subsidies, expense caps or waivers) and total expenses both ranked in the Expense Group’s first quartile. The Board concluded that the management fees (including subadvisory fees) and total expenses were reasonable in light of the services provided.
Mortgage Backed Securities Portfolio. The Board considered that the Portfolio’s gross performance in relation to its Peer Universe (the Lipper U.S. Mortgage
THE TARGET PORTFOLIO TRUST
Funds Performance Universe) was in the first quartile over the one-, three-, five- and 10-year periods. The Board also noted that the Portfolio outperformed its benchmark index over all periods. The Board determined that, in light of the Portfolio’s competitive performance, it would be in the interest of the Portfolio and its shareholders to renew the agreements.
The Board considered that the Portfolio’s actual management fee (which reflects any subsidies, expense caps or waivers) ranked in the Expense Group’s first quartile, and that total expenses ranked in the Expense Group’s second quartile. The Board concluded that the management fees (including subadvisory fees) and total expenses were reasonable in light of the services provided.
Small Capitalization Growth Portfolio. The Board considered that the Portfolio’s gross performance in relation to its Peer Universe (the Lipper Small-Cap Growth Funds Performance Universe) was in the fourth quartile over the three-, five- and 10-year periods, and in the third quartile for the one-year period. The Board also noted that the Portfolio underperformed its benchmark index over all periods.
The Board considered that PI had taken action to address the Portfolio’s performance record by replacing both of the Portfolio’s existing subadvisers with two new subadvisers in July 2008: Eagle Asset Management and Ashfield Capital Partners. The Board further noted that Ashfield had resigned as a subadviser in February 2011, and that the segment of the Portfolio managed by Eagle Asset Management had outperformed the segment formerly managed by Ashfield Capital Partners over the one-year period. The Board concluded that it was reasonable to renew the agreements, subject to its continued close scrutiny of the Fund’s performance.
The Board considered that the Portfolio’s actual management fee (which reflects any subsidies, expense caps or waivers) and total expenses both ranked in the Expense Group’s first quartile. The Board concluded that the management fees (including subadvisory fees) and total expenses were reasonable in light of the services provided.
Small Capitalization Value Portfolio. The Board considered that the Portfolio’s gross performance in relation to its Peer Universe (the Lipper Small-Cap Value Funds Performance Universe)4 was in the second quartile over the three-, five-
| 4 | Although Lipper classifies the Portfolio in its Small-Cap Core Funds Performance Universe, the Lipper Small-Cap Value Funds Performance Universe was utilized for performance comparisons, because PI believes that the funds included in this Universe provide a more appropriate basis for Portfolio performance comparisons. |
THE TARGET PORTFOLIO TRUST
Approval of Advisory Agreements (continued)
and 10-year periods, and in the fourth quartile over the one-year period. The Board also noted that the Portfolio outperformed its benchmark index over all periods. The Board determined that, in light of the Portfolio’s competitive performance over long-term periods, it would be in the interest of the Portfolio and its shareholders to renew the agreements.
The Board considered that the Portfolio’s actual management fee (which reflects any subsidies, expense caps or waivers) and total expenses both ranked in the Expense Group’s first quartile. The Board concluded that the management fees (including subadvisory fees) and total expenses were reasonable in light of the services provided.
Total Return Bond Portfolio. The Board considered that the Portfolio’s gross performance in relation to its Peer Universe (the Lipper Intermediate Investment-Grade Debt Funds Performance Universe)5 was in the first quartile over the three-, five- and 10-year periods, and in the third quartile for the one-year period. The Board also noted that the Portfolio outperformed its benchmark index over all periods. The Board determined that, in light of the Portfolio’s competitive performance over long-term periods, it would be in the interest of the Portfolio and its shareholders to renew the agreements.
The Board considered that the Portfolio’s actual management fee (which reflects any subsidies, expense caps or waivers) ranked in the Expense Group’s third quartile, and that total expenses ranked in the Expense Group’s second quartile. The Board noted that the Portfolio’s actual management fees were 5 basis points higher than the Expense Group median. The Board concluded that the management fees (including subadvisory fees) and total expenses were reasonable in light of the services provided.
After full consideration of these factors, the Board concluded that the approval of the agreements was in the best interest of each Portfolio of the Trust and their respective shareholders.
| 5 | Although Lipper classifies the Portfolio in its BBB-rated Corporate Debt Funds Performance Universe, the Intermediate Investment-Grade Debt Funds Performance Universe was utilized for performance comparisons, because PI believes that the funds included in this Universe provide a more appropriate basis for Portfolio performance comparisons. |
THE TARGET PORTFOLIO TRUST
| | | | |
| n MAIL | | n TELEPHONE | | n WEBSITE |
Gateway Center Three 100 Mulberry Street Newark, NJ 07102 | | (800) 225-1852 | | www.prudentialfunds.com |
|
| PROXY VOTING |
| The Board of Trustees of The TARGET Portfolio Trust has delegated to the Trust’s investment subadvisers the responsibility for voting any proxies and maintaining proxy recordkeeping with respect to the Trust. A description of these proxy voting policies and procedures is available without charge, upon request, by calling (800) 225-1852 or by visiting the Securities and Exchange Commission’s website at www.sec.gov. Information regarding how the Trust voted proxies relating to portfolio securities during the most recent 12-month period ended June 30 is available on the Trust’s website and on the Commission’s website. |
|
| TRUSTEES |
| Kevin J. Bannon • Scott E. Benjamin • Linda W. Bynoe • Michael S. Hyland • Douglas H. McCorkindale • Stephen P. Munn • Richard A. Redeker • Judy A. Rice • Robin B. Smith • Stephen G. Stoneburn |
|
| OFFICERS |
| Judy A. Rice, President • Scott E. Benjamin, Vice President • Grace C. Torres, Treasurer and Principal Financial and Accounting Officer • Kathryn L. Quirk, Chief Legal Officer • Deborah A. Docs, Secretary • Timothy J. Knierim, Chief Compliance Officer • Valerie M. Simpson, Deputy Chief Compliance Officer • Theresa C. Thompson, Deputy Chief Compliance Officer • Richard W. Kinville, Anti-Money Laundering Compliance Officer • Jonathan D. Shain, Assistant Secretary • Claudia DiGiacomo, Assistant Secretary • John P. Schwartz, Assistant Secretary • Andrew R. French, Assistant Secretary • M. Sadiq Peshimam, Assistant Treasurer • Peter Parrella, Assistant Treasurer |
| | | | |
| MANAGER | | Prudential Investments LLC | | Gateway Center Three
100 Mulberry Street Newark, NJ 07102 |
|
| INVESTMENT SUBADVISERS | | Eagle Asset Management | | 880 Carillon Parkway
St. Petersburg, FL 33716 |
|
| | EARNEST Partners, LLC | | 1180 Peachtree Street
Suite 2300 Atlanta, GA 30309 |
|
| | Eaton Vance Management | | Two International Place
Boston, MA 02110 |
|
| | Hotchkis and Wiley Capital
Management, LLC | | 725 S. Figueroa Street
39th Floor Los Angeles, CA 90017 |
|
| | J.P. Morgan Investment
Management, Inc. | | 245 Park Avenue
New York, NY 10167 |
|
| | Lee Munder Capital Group | | 200 Clarendon Street
Boston, MA 02116 |
| | | | |
| | LSV Asset Management | | 155 North Wacker Drive
Suite 4600 Chicago, IL 60606 |
|
| | Marsico Capital
Management, LLC | | 1200 17th Street
Suite 1600 Denver, CO 80202 |
|
| | Massachusetts Financial
Services Company | | 500 Boylston Street
Boston, MA 02109 |
|
| | NFJ Investment Group L.P. | | 2100 Ross Avenue
Dallas, TX 75201 |
|
| | Pacific Investment
Management Company LLC | | 840 Newport Center Drive
Newport Beach, CA 92660 |
|
| | Thornburg Investment
Management, Inc. | | 2300 North Ridgetop Road
Santa Fe, NM 87506 |
|
| | Vaughan Nelson Investment
Management, L.P. | | 600 Travis Street
Suite 6300 Houston, TX 77002 |
|
| | Wellington Management
Company, LLP | | 280 Congress Street
Boston, MA 02110 |
|
| DISTRIBUTOR | | Prudential Investment
Management Services LLC | | Gateway Center Three
100 Mulberry Street
Newark, NJ 07102 |
|
| CUSTODIAN | | The Bank of New York Mellon | | One Wall Street
New York, NY 10286 |
|
| TRANSFER AGENT | | Prudential Mutual Fund
Services LLC | | PO Box 9658
Providence, RI 02940 |
|
| INDEPENDENT REGISTERED PUBLIC ACCOUNTING FIRM | | KPMG LLP | | 345 Park Avenue
New York, NY 10154 |
|
| FUND COUNSEL | | Willkie Farr & Gallagher LLP | | 787 Seventh Avenue
New York, NY 10019 |
|
| An investor should consider the investment objectives, risks, charges, and expenses of the Trust carefully before investing. The prospectus and summary prospectuses contain this and other information about the Trust. An investor may obtain a prospectus and summary prospectuses by visiting our website at www.prudentialfunds.com or by calling (800) 225-1852. The prospectuses and summary prospectuses should be read carefully before investing. |
|
| E-DELIVERY |
| To receive your mutual fund documents online, go to www.prudentialfunds.com/edelivery and enroll. Instead of receiving printed documents by mail, you will receive notification via email when new materials are available. You can cancel your enrollment or change your email address at any time by visiting the website address above. |
|
| SHAREHOLDER COMMUNICATIONS WITH TRUSTEES |
| Shareholders can communicate directly with the Board of Trustees by writing to the Chair of the Board, The TARGET Portfolio Trust, Prudential Investments, Attn: Board of Trustees, 100 Mulberry Street, Gateway Center Three, Newark, NJ 07102. Shareholders can communicate directly with an individual Trustee by writing to the same address. Communications are not screened before being delivered to the addressee. |
|
| AVAILABILITY OF PORTFOLIO SCHEDULE |
| The Trust files its complete schedule of portfolio holdings with the Securities and Exchange Commission for the first and third quarters of each fiscal year on Form N-Q. The Trust’s Forms N-Q are available on the Commission’s website at www.sec.gov. The Trust’s Forms N-Q may also be reviewed and copied at the Commission’s Public Reference Room in Washington, D.C. Information on the operation and location of the Public Reference Room may be obtained by calling (202) 551-8090. The Trust’s schedule of portfolio holdings is also available on the Trust’s website as of the end of each fiscal quarter. |
|
| The Trust’s Statement of Additional Information contains additional information about the Trust’s Trustees and is available without charge, upon request, by calling (800) 225-1852. |
Mutual Funds:
| | | | |
| ARE NOT INSURED BY THE FDIC OR ANY FEDERAL GOVERNMENT AGENCY | | MAY LOSE VALUE | | ARE NOT A DEPOSIT OF OR GUARANTEED BY ANY BANK OR ANY BANK AFFILIATE |

| | | | | | | | | | |
| THE TARGET PORTFOLIO TRUST | | NASDAQ | | CUSIP | | | | NASDAQ | | CUSIP |
| Large Capitalization Growth (Class R) | | TLCRX | | 875921868 | | Total Return Bond (Class T) | | TATBX | | 875921884 |
| Large Capitalization Growth (Class T) | | TALGX | | 875921207 | | Mortgage Backed Securities (Class T) | | TGMBX | | 875921702 |
| Small Capitalization Growth (Class R) | | TSCRX | | 875921835 | | Large Capitalization Value (Class R) | | TLVRX | | 875921850 |
| Small Capitalization Growth (Class T) | | TASGX | | 875921405 | | Large Capitalization Value (Class T) | | TALVX | | 875921108 |
| International Equity (Class Q) | | TIEQX | | 875921793 | | Small Capitalization Value (Class R) | | TSVRX | | 875921843 |
| International Equity (Class R) | | TEQRX | | 875921827 | | Small Capitalization Value (Class T) | | TASVX | | 875921306 |
| International Equity (Class T) | | TAIEX | | 875921504 | | Intermediate-Term Bond (Class T) | | TAIBX | | 875921801 |
| Total Return Bond (Class R) | | TTBRX | | 875921819 | | | | | | |
TMF158E 0215426-00001-00
Item 2 – Code of Ethics — See Exhibit (a)
As of the end of the period covered by this report, the registrant has adopted a code of ethics (the “Section 406 Standards for Investment Companies – Ethical Standards for Principal Executive and Financial Officers”) that applies to the registrant’s Principal Executive Officer and Principal Financial Officer; the registrant’s Principal Financial Officer also serves as the Principal Accounting Officer.
The registrant hereby undertakes to provide any person, without charge, upon request, a copy of the code of ethics. To request a copy of the code of ethics, contact the registrant 800-225-1852, and ask for a copy of the Section 406 Standards for Investment Companies - Ethical Standards for Principal Executive and Financial Officers.
Item 3 – Audit Committee Financial Expert –
The registrant’s Board has determined that Mr. Stephen P. Munn, member of the Board’s Audit Committee is an “audit committee financial expert,” and that he is “independent,” for purposes of this Item.
Item 4 – Principal Accountant Fees and Services –
(a) Audit Fees
For the fiscal years ended October 31, 2011 and October 31, 2010, KPMG LLP (“KPMG”), the Registrant’s principal accountant, billed the Registrant $290,500 and $308,000, respectively, for professional services rendered for the audit of the Registrant’s annual financial statements or services that are normally provided in connection with statutory and regulatory filings.
(b) Audit-Related Fees
None.
(c) Tax Fees
None.
(d) All Other Fees
None.
(e) (1) Audit Committee Pre-Approval Policies and Procedures
THE PRUDENTIAL MUTUAL FUNDS
AUDIT COMMITTEE POLICY
on
Pre-Approval of Services Provided by the Independent Accountants
The Audit Committee of each Prudential Mutual Fund is charged with the responsibility to monitor the independence of the Fund’s independent accountants. As part of this responsibility, the Audit Committee must pre-approve any independent accounting firm’s engagement to render audit and/or permissible non-audit services, as required by law. In evaluating a proposed engagement of the independent accountants, the Audit Committee will assess the effect that the engagement might reasonably be expected to have on the accountant’s independence. The Committee’s evaluation will be based on:
| | • | | a review of the nature of the professional services expected to be provided, |
| | • | | a review of the safeguards put into place by the accounting firm to safeguard independence, and |
| | • | | periodic meetings with the accounting firm. |
Policy for Audit and Non-Audit Services Provided to the Funds
On an annual basis, the scope of audits for each Fund, audit fees and expenses, and audit-related and non-audit services (and fees proposed in respect thereof) proposed to be performed by the Fund’s independent accountants will be presented by the Treasurer and the independent accountants to the Audit Committee for review and, as appropriate, approval prior to the initiation of such services. Such presentation shall be accompanied by confirmation by both the Treasurer and the independent accountants that the proposed services will not adversely affect the independence of the independent accountants. Proposed services shall be described in sufficient detail to enable the Audit Committee to assess the appropriateness of such services and fees, and the compatibility of the provision of such services with the auditor’s independence. The Committee shall receive periodic reports on the progress of the audit and other services which are approved by the Committee or by the Committee Chair pursuant to authority delegated in this Policy.
The categories of services enumerated under “Audit Services”, “Audit-related Services”, and “Tax Services” are intended to provide guidance to the Treasurer and the independent accountants as to those categories of services which the Committee believes are generally consistent with the independence of the independent accountants and which the Committee (or the Committee Chair) would expect upon the presentation of specific proposals to pre-approve. The enumerated categories are not intended as an exclusive list of audit, audit-related or tax services, which the Committee (or the Committee Chair) would consider for pre-approval.
Audit Services
The following categories of audit services are considered to be consistent with the role of the Fund’s independent accountants:
| | • | | Annual Fund financial statement audits |
| | • | | Seed audits (related to new product filings, as required) |
| | • | | SEC and regulatory filings and consents |
Audit-related Services
The following categories of audit-related services are considered to be consistent with the role of the Fund’s independent accountants:
| | • | | Accounting consultations |
| | • | | Fund merger support services |
| | • | | Agreed Upon Procedure Reports |
| | • | | Other Internal Control Reports |
Individual audit-related services that fall within one of these categories and are not presented to the Audit Committee as part of the annual pre-approval process will be subject to pre-approval by the Committee Chair (or any other Committee member on whom this responsibility has been delegated) so long as the estimated fee for those services does not exceed $50,000.
Tax Services
The following categories of tax services are considered to be consistent with the role of the Fund’s independent accountants:
| | • | | Tax compliance services related to the filing or amendment of the following: |
| | • | | Federal, state and local income tax compliance; and, |
| | • | | Sales and use tax compliance |
| | • | | Timely RIC qualification reviews |
| | • | | Tax distribution analysis and planning |
| | • | | Tax authority examination services |
| | • | | Tax appeals support services |
| | • | | Accounting methods studies |
| | • | | Fund merger support services |
| | • | | Tax consulting services and related projects |
Individual tax services that fall within one of these categories and are not presented to the Audit Committee as part of the annual pre-approval process will be subject to pre-approval by the Committee Chair (or any other Committee member on whom this responsibility has been delegated) so long as the estimated fee for those services does not exceed $50,000.
Other Non-audit Services
Certain non-audit services that the independent accountants are legally permitted to render will be subject to pre-approval by the Committee or by one or more Committee members to whom the Committee has delegated this authority and who will report to the full Committee any pre-approval decisions made pursuant to this Policy. Non-audit services presented for pre-approval pursuant to this paragraph will be accompanied by a confirmation from both the Treasurer and the independent accountants that the proposed services will not adversely affect the independence of the independent accountants.
Proscribed Services
The Fund’s independent accountants will not render services in the following categories of non-audit services:
| | • | | Bookkeeping or other services related to the accounting records or financial statements of the Fund |
| | • | | Financial information systems design and implementation |
| | • | | Appraisal or valuation services, fairness opinions, or contribution-in-kind reports |
| | • | | Internal audit outsourcing services |
| | • | | Management functions or human resources |
| | • | | Broker or dealer, investment adviser, or investment banking services |
| | • | | Legal services and expert services unrelated to the audit |
| | • | | Any other service that the Public Company Accounting Oversight Board determines, by regulation, is impermissible. |
Pre-approval of Non-Audit Services Provided to Other Entities Within the Prudential Fund Complex
Certain non-audit services provided to Prudential Investments LLC or any of its affiliates that also provide ongoing services to the Prudential Mutual Funds will be subject to pre-approval by the Audit Committee. The only non-audit services provided to these entities that will require pre-approval are those related directly to the operations and financial reporting of the Funds. Individual projects that are not presented to the Audit Committee as part of the annual pre-approval process will be subject to pre-approval by the Committee Chair (or any other Committee member on whom this responsibility has been delegated) so long as the estimated fee for those services does not exceed $50,000. Services presented for pre-approval pursuant to this paragraph will be accompanied by a confirmation from both the Treasurer and the independent accountants that the proposed services will not adversely affect the independence of the independent accountants.
Although the Audit Committee will not pre-approve all services provided to Prudential Investments LLC and its affiliates, the Committee will receive an annual report from the Fund’s independent accounting firm showing the aggregate fees for all services provided to Prudential Investments and its affiliates.
(e) (2) Percentage of services referred to in 4(b) – 4(d) that were approved by the audit committee –
Not applicable.
(f) Percentage of hours expended attributable to work performed by other than full time employees of principal accountant if greater than 50%.
The percentage of hours expended on the principal accountant’s engagement to audit the registrant’s financial statements for the most recent fiscal year that were attributed to work performed by persons other than the principal accountant’s full-time, permanent employees was 0%.
(g) Non-Audit Fees
Not applicable to Registrant for the fiscal years 2011 and 2010. The aggregate non-audit fees billed by KPMG for services rendered to the registrant’s investment adviser and any entity controlling, controlled by, or under common control with the investment adviser that provides ongoing services to the registrant for the fiscal years 2011 and 2010 was $0 and $0, respectively.
(h) Principal Accountant’s Independence
Not applicable as KPMG has not provided non-audit services to the registrant’s investment adviser and any entity controlling, controlled by, or under common control with the investment adviser that provides ongoing services to the registrant that were not pre-approved pursuant to Rule 2-01(c)(7)(ii) of Regulation S-X.
| | |
| Item 5 – | | Audit Committee of Listed Registrants – Not applicable. |
| |
| Item 6 – | | Schedule of Investments – The schedule is included as part of the report to shareholders filed under Item 1 of this Form. |
| |
| Item 7 – | | Disclosure of Proxy Voting Policies and Procedures for Closed-End Management Investment Companies – Not applicable. |
| |
| Item 8 – | | Portfolio Managers of Closed-End Management Investment Companies – Not applicable. |
| |
| Item 9 – | | Purchases of Equity Securities by Closed-End Management Investment Company and Affiliated Purchasers – Not applicable. |
| |
| Item 10 – | | Submission of Matters to a Vote of Security Holders – Not applicable. |
| |
| Item 11 – | | Controls and Procedures |
| | (a) | It is the conclusion of the registrant’s principal executive officer and principal financial officer that the effectiveness of the registrant’s current disclosure controls and procedures (such disclosure controls and procedures having been evaluated within 90 days of the date of this filing) provide reasonable assurance that the information required to be disclosed by the registrant has been recorded, processed, summarized and reported within the time period specified in the Commission’s rules and forms and that the information required to be disclosed by the registrant has been accumulated and communicated to the registrant’s principal executive officer and principal financial officer in order to allow timely decisions regarding required disclosure. |
| | (b) | There has been no significant change in the registrant’s internal control over financial reporting that occurred during the registrant’s most recent fiscal quarter of the period covered by this report that has materially affected, or is likely to materially affect, the registrant’s internal control over financial reporting. |
Item 12 – Exhibits
| | | | | | | | | | |
| | | | | | (a) | | (1) | | Code of Ethics – Attached hereto as Exhibit EX-99.CODE-ETH |
| | | | | |
| | | | | | | | (2) | | Certifications pursuant to Section 302 of the Sarbanes-Oxley Act – Attached hereto as Exhibit EX-99.CERT. |
| | | | | |
| | | | | | | | (3) | | Any written solicitation to purchase securities under Rule 23c-1. – Not applicable. |
| | | | |
| | | | | | (b) | | Certifications pursuant to Section 906 of the Sarbanes-Oxley Act – Attached hereto as Exhibit EX-99.906CERT. |
SIGNATURES
Pursuant to the requirements of the Securities Exchange Act of 1934 and the Investment Company Act of 1940, the registrant has duly caused this report to be signed on its behalf by the undersigned, thereunto duly authorized.
| | |
| Registrant: | | The Target Portfolio Trust |
| |
| By: | | /s/ Deborah A. Docs |
| | Deborah A. Docs |
| | Secretary |
| |
| Date: | | December 20, 2011 |
Pursuant to the requirements of the Securities Exchange Act of 1934 and the Investment Company Act of 1940, this report has been signed below by the following persons on behalf of the registrant and in the capacities and on the dates indicated.
| | |
| By: | | /s/ Judy A. Rice |
| | Judy A. Rice |
| | President and Principal Executive Officer |
| |
| Date: | | December 20, 2011 |
| |
| By: | | /s/ Grace C. Torres |
| | Grace C. Torres |
| | Treasurer and Principal Financial Officer |
| |
| Date: | | December 20, 2011 |