UNITED STATES
SECURITIES AND EXCHANGE COMMISSION
Washington, D.C. 20549
FORM N-CSR
CERTIFIED SHAREHOLDER REPORT OF REGISTERED
MANAGEMENT INVESTMENT COMPANIES
| | |
| Investment Company Act file number: | | 811-07064 |
| |
| Exact name of registrant as specified in charter: | | The Target Portfolio Trust |
| |
| Address of principal executive offices: | | Gateway Center 3, |
| | 100 Mulberry Street, |
| | Newark, New Jersey 07102 |
| |
| Name and address of agent for service: | | Deborah A. Docs |
| | Gateway Center 3, |
| | 100 Mulberry Street, |
| | Newark, New Jersey 07102 |
| |
| Registrant’s telephone number, including area code: | | 800-225-1852 |
| |
| Date of fiscal year end: | | 7/31/2014 |
| | (Registrant changed its fiscal year end from October 31) |
| |
| Date of reporting period: | | 7/31/2014 |
| | | | |
| Item 1 | | – | | Reports to Stockholders |

PRUDENTIAL INVESTMENTS»MUTUAL FUNDS
THE TARGET PORTFOLIO TRUST®
ANNUAL REPORT · JULY 31, 2014
This report is not authorized for distribution to prospective investors unless preceded or accompanied by a current prospectus.
The views expressed in this report and information about each Portfolio’s securities are for the period covered by this report and are subject to change thereafter.
Target Funds are distributed by Prudential Investment Management Services LLC, a Prudential Financial company and member SIPC. © 2014 Prudential Financial, Inc. and its related entities. Prudential Investments LLC, Prudential, the Prudential logo, the Rock symbol, Bring Your Challenges, Target Funds, and Target Portfolio Trust are service marks of Prudential Financial, Inc. and its related entities, registered in many jurisdictions worldwide.

September 16, 2014
Dear Target Shareholder:
We hope you find the annual report for Target informative and useful. The report covers performance for the 12-month period that ended July 31, 2014. Please note Target has changed its fiscal year-end from October 31 to July 31. Going forward, Target’s annual and semi-annual reports will be based on the new fiscal year-end cycle. The change in fiscal year-end will not affect the management or operation of the portfolios.
Since market conditions change over time, we believe it is important to maintain a diversified portfolio of funds consistent with your tolerance for risk, time horizon, and financial goals. Whether you are looking for capital growth, current income, or a combination of both, the Target portfolios feature a wide range of strategies to suit a variety of investment needs.
Target is founded upon the belief that investment management talent is dispersed across a variety of firms and can be systematically identified through research. The managers for each portfolio are carefully chosen from among the leading institutional money managers and are monitored by our team of experienced investment management analysts. Of course, the future performance of the Target portfolios cannot be guaranteed.
Your selections among the Target portfolios can evolve as your needs change. Your financial professional can help you stay informed of important developments and assist you in determining whether you need to modify your investments.
Thank you for your continued confidence.
Sincerely,

Stuart S. Parker, President
The Target Portfolio Trust
| | | | |
| The TARGET Portfolio Trust | | | 1 | |
Target Large Capitalization Growth Portfolio
Performance (Unaudited)
Performance data quoted represent past performance. Past performance does not guarantee future results. The investment return and principal value of an investment will fluctuate, so that an investor’s shares, when redeemed, may be worth more or less than their original cost. Current performance may be lower or higher than the past performance data quoted. An investor may obtain performance data as of the most recent month-end by visiting our website at www.prudentialfunds.com or by calling (800) 225-1852.
| | | | | | | | | | | | | | | | |
| | | Cumulative Total Returns
as of 7/31/14 | |
| | | One Year | | | Five Years | | | Ten Years | | | Since Inception | |
Class R | | | 15.15 | % | | | 98.08 | % | | | N/A | | | | 57.98% (8/22/06) | |
Class T | | | 15.73 | | | | 103.16 | | | | 94.16 | % | | | — | |
Russell 1000® Growth Index | | | 18.69 | | | | 121.61 | | | | 129.44 | | | | — | |
S&P 500 Index | | | 16.92 | | | | 117.17 | | | | 115.70 | | | | — | |
Lipper Large-Cap Growth Funds Average | | | 18.20 | | | | 106.16 | | | | 117.73 | | | | — | |
| |
| | | Average Annual Total Returns as of 6/30/14 | |
| | | One Year | | | Five Years | | | Ten Years | | | Since Inception | |
Class R | | | 21.80 | % | | | 16.44 | % | | | N/A | | | | 6.11% (8/22/06) | |
Class T | | | 22.48 | | | | 17.05 | | | | 6.17 | % | | | — | |
Russell 1000 Growth Index | | | 26.92 | | | | 19.24 | | | | 8.20 | | | | — | |
S&P 500 Index | | | 24.58 | | | | 18.82 | | | | 7.78 | | | | — | |
Lipper Large-Cap Growth Funds Average | | | 26.61 | | | | 17.40 | | | | 7.51 | | | | — | |
| |
| | | Average Annual Total Returns
as of 7/31/14 | |
| | | One Year | | | Five Years | | | Ten Years | | | Since Inception | |
Class R | | | 15.15 | % | | | 14.65 | % | | | N/A | | | | 5.93% (8/22/06) | |
Class T | | | 15.73 | | | | 15.23 | | | | 6.86 | % | | | — | |
| | |
| 2 | | The TARGET Portfolio Trust |
Growth of a $10,000 Investment
Large Capitalization Growth Portfolio
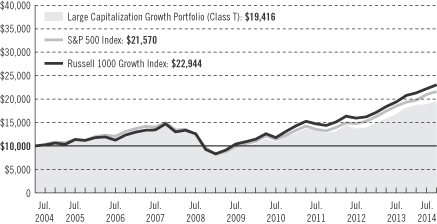
The graph compares a $10,000 investment in the Target Large Capitalization Growth Portfolio (Class T) with a similar investment in the S&P 500 Index and the Russell 1000 Growth Index by portraying the initial account values at the beginning of the 10-year period (July 31, 2004) and the account values at the end of the current fiscal period (July 31, 2014), as measured on a quarterly basis.
Past performance does not predict future performance. Total returns and the ending account values in the graph include changes in share price and reinvestment of dividends and capital gains distributions in a hypothetical investment for the periods shown. The Portfolio’s total returns do not reflect the deduction of income taxes on an individual’s investment. Taxes may reduce your actual investment returns on income or gains paid by the Portfolio or any gains you may realize if you sell your shares.
Source: Prudential Investments LLC and Lipper Inc.
Inception returns are provided for any share class with less than 10 calendar years of returns.
| | | | |
| The TARGET Portfolio Trust | | | 3 | |
Target Large Capitalization Growth Portfolio
Performance (continued)
The returns in the tables do not reflect the deduction of taxes that a shareholder would pay on Portfolio distributions or following the redemption of Portfolio shares. The average annual total returns take into account applicable sales charges, which are described for each share class in the table below.
| | | | |
| | | Class R | | Class T |
Maximum initial sales charge | | None | | None |
Contingent deferred sales charge (CDSC) (as a percentage of the lower of original purchase price or sale proceeds) | | None | | None |
Annual distribution and service (12b-1) fees (shown as a percentage of average daily net assets) | | .75% (.50% currently) | | None |
Benchmark Definitions
Russell 1000 Growth Index
The Russell 1000 Growth Index is an unmanaged index which contains those securities in the Russell 1000 Index with an above-average growth orientation. Companies in this index tend to exhibit higher price-to-book and price-to-earnings ratios, lower dividend yields, and higher forecasted growth rates.
S&P 500 Index
The Standard & Poor’s 500 Composite Stock Price Index (S&P 500 Index) is an unmanaged index of 500 stocks of large U.S. companies. It gives a broad look at how stock prices have performed.
Lipper Large-Cap Growth Funds Average
Lipper Large-Cap Growth funds invest at least 75% of their equity assets in companies with market capitalizations (on a three-year weighted basis) above Lipper’s U.S. Diversified Equity (USDE) large-cap floor. Large-cap growth funds typically have an above-average price-to-earnings ratio, price-to-book ratio, and three-year sales-per-share growth value compared with the S&P 500 Index.
Benchmark Inception Returns
Large Capitalization Growth Portfolio—Russell 1000 Growth Index Closest Month-End to Inception cumulative total return as of 7/31/14 is 98.32% for Class R. Russell 1000 Growth Index Closest Month-End to Inception average annual total return as of 6/30/14 is 9.35% for Class R. S&P 500 Index Closest Month-End to Inception cumulative total return as of 7/31/14 is 75.33% for Class R. S&P 500 Index Closest Month-End to Inception average annual total return as of 6/30/14 is 7.62% for Class R. Lipper Average Closest Month-End to Inception cumulative total return as of 7/31/14 is 86.11% for Class R. Lipper Average Closest Month-End to Inception average annual total return as of 6/30/14 is 8.33% for Class R.
Investors cannot invest directly in an index or average. The returns for the benchmark indexes would be lower if they reflected deduction for portfolio operating expenses, sales charges, or taxes.
The Lipper Average represents returns based on an average of all funds in the respective Lipper category for the periods noted. The returns for the Lipper Average reflect the deduction of operating expenses, but not sales charges or taxes.
| | |
| 4 | | The TARGET Portfolio Trust |
Strategy and Performance Overview
How did the Portfolio perform?
The Large Capitalization Growth Portfolio’s Class T shares returned 15.73% for the 12-month period ended July 31, 2014. This compares to the 18.69% return of its benchmark, the Russell 1000® Growth Index (the Index) and the 18.20% return of the Lipper Large Cap Growth Funds Average during the 12-month period ended July 31, 2014.
The Portfolio was sub-advised during this reporting period by Brown Advisory, LLC (Brown) and Massachusetts Financial Services Company (MFS).
What were market conditions?
U.S. large-cap equities generated strong returns for the reporting period, posting their eighth consecutive quarter of gains during the second quarter of 2014. Investors were buoyed by improving employment figures, housing data, and automobile sales, as well as the Federal Reserve’s (Fed) continued commitment to low interest rates. These factors outweighed the contraction in first-quarter U.S. economic growth, anxiety about the crisis in Ukraine, and mixed news about China’s growth prospects. For the period overall, large-cap stocks outperformed small-cap stocks by a wide margin, and micro-cap stocks registered losses during the second quarter.
What affected the Portfolio’s performance?
| | • | | Stock selection was the primary contributor to the Portfolio’s underperformance relative to the Index, particularly holdings in the information technology and industrials sectors. Although the Portfolio benefited from good stock selection in the consumer discretionary and financials sectors, these results were not enough to offset the weak performance of holdings in other sectors. |
| | • | | Style factors slightly detracted from relative performance, particularly the Portfolio’s underweight compared with the Index in stocks with high dividend yields and low valuations. Stocks with lower price-to-earnings ratios and higher yields outperformed their higher growth, lower-yielding counterparts during the reporting period. Both Brown and MFS seek to buy companies with high earnings per share growth rates, but these companies tend to be more expensive and do not pay dividends. |
The Portfolio of Investments following this report shows the size of the Portfolio’s positions at period-end.
| | | | |
| The TARGET Portfolio Trust | | | 5 | |
Target Large Capitalization Value Portfolio
Performance (Unaudited)
Performance data quoted represent past performance. Past performance does not guarantee future results. The investment return and principal value of an investment will fluctuate, so that an investor’s shares, when redeemed, may be worth more or less than their original cost. Current performance may be lower or higher than the past performance data quoted. An investor may obtain performance data as of the most recent month-end by visiting our website at www.prudentialfunds.com or by calling (800) 225-1852.
| | | | | | | | | | | | | | | | |
| | | Cumulative Total Returns
as of 7/31/14 | |
| | | One Year | | | Five Years | | | Ten Years | | | Since Inception | |
Class R | | | 15.66 | % | | | 102.50 | % | | | N/A | | | | 35.77% (8/22/06) | |
Class T | | | 16.26 | | | | 107.45 | | | | 87.34 | % | | | — | |
Russell 1000® Value Index | | | 15.47 | | | | 118.92 | | | | 115.76 | | | | — | |
S&P 500 Index | | | 16.92 | | | | 117.17 | | | | 115.70 | | | | — | |
Lipper Large-Cap Value Funds Average | | | 14.72 | | | | 102.46 | | | | 100.97 | | | | — | |
| |
| | | Average Annual Total Returns
as of 6/30/14 | |
| | | One Year | | | Five Years | | | Ten Years | | | Since Inception | |
Class R | | | 24.25 | % | | | 17.07 | % | | | N/A | | | | 4.15% (8/22/06) | |
Class T | | | 24.95 | | | | 17.66 | | | | 6.40 | % | | | — | |
Russell 1000 Value Index | | | 23.81 | | | | 19.23 | | | | 8.03 | | | | — | |
S&P 500 Index | | | 24.58 | | | | 18.82 | | | | 7.78 | | | | — | |
Lipper Large-Cap Value Funds Average | | | 22.72 | | | | 17.24 | | | | 7.08 | | | | — | |
| |
| | | Average Annual Total Returns
as of 7/31/14 | |
| | | One Year | | | Five Years | | | Ten Years | | | Since Inception | |
Class R | | | 15.66 | % | | | 15.16 | % | | | N/A | | | | 3.93% (8/22/06) | |
Class T | | | 16.26 | | | | 15.71 | | | | 6.48 | % | | | — | |
| | |
| 6 | | The TARGET Portfolio Trust |
Growth of a $10,000 Investment
Large Capitalization Value Portfolio
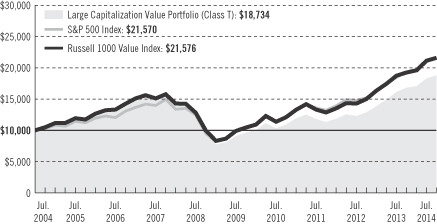
The graph compares a $10,000 investment in the Target Large Capitalization Value Portfolio (Class T) with a similar investment in the S&P 500 Index and the Russell 1000 Value Index by portraying the initial account values at the beginning of the 10-year period (July 31, 2004) and the account values at the end of the current fiscal period (July 31, 2014), as measured on a quarterly basis.
Past performance does not predict future performance. Total returns and the ending account values in the graph include changes in share price and reinvestment of dividends and capital gains distributions in a hypothetical investment for the periods shown. The Portfolio’s total returns do not reflect the deduction of income taxes on an individual’s investment. Taxes may reduce your actual investment returns on income or gains paid by the Portfolio or any gains you may realize if you sell your shares.
Source: Prudential Investments LLC and Lipper Inc.
Inception returns are provided for any share class with less than 10 calendar years of returns.
| | | | |
| The TARGET Portfolio Trust | | | 7 | |
Target Large Capitalization Value Portfolio
Performance (continued)
The returns in the tables do not reflect the deduction of taxes that a shareholder would pay on Portfolio distributions or following the redemption of Portfolio shares. The average annual total returns take into account applicable sales charges, which are described for each share class in the table below.
| | | | |
| | | Class R | | Class T |
Maximum initial sales charge | | None | | None |
Contingent deferred sales charge (CDSC) (as a percentage of the lower of original purchase price or sale proceeds) | | None | | None |
Annual distribution and service (12b-1) fees (shown as a percentage of average daily net assets) | | .75% (.50% currently) | | None |
Benchmark Definitions
Russell 1000 Value Index
The Russell 1000 Value Index is an unmanaged index which contains those securities in the Russell 1000 Index with a below-average growth orientation. Companies in this index generally have lower price-to-book and price-to-earnings ratios, higher dividend yields, and lower forecasted growth values.
S&P 500 Index
The Standard & Poor’s 500 Composite Stock Price Index (S&P 500 Index) is an unmanaged index of 500 stocks of large U.S. companies. It gives a broad look at how stock prices have performed.
Lipper Large-Cap Value Funds Average
Lipper Large-Cap Value funds invest at least 75% of their equity assets in companies with market capitalizations (on a three-year weighted basis) above Lipper’s U.S. Diversified Equity (USDE) large-cap floor. Large-cap value funds typically have a below-average price-to-earnings ratio and three-year sales-per-share growth value compared with the S&P 500 Index.
Benchmark Inception Returns
Large Capitalization Value Portfolio—Russell 1000 Value Index Closest Month-End to Inception cumulative total return as of 7/31/14 is 59.75% for Class R. Russell 1000 Value Index Closest Month-End to Inception average annual total return as of 6/30/14 is 6.40% for Class R. S&P 500 Index Closest Month-End to Inception cumulative total return as of 7/31/14 is 75.33% for Class R. S&P 500 Index Closest Month-End to Inception average annual total return as of 6/30/14 is 7.62% for Class R. Lipper Average Closest Month-End to Inception cumulative total return as of 7/31/14 is 55.41% for Class R. Lipper Average Closest Month-End to Inception average annual total return as of 6/30/14 is 5.93% for Class R.
Investors cannot invest directly in an index or average. The returns for the benchmark indexes would be lower if they reflected deduction for portfolio operating expenses, sales charges, or taxes.
The Lipper Average represents returns based on an average of all funds in the respective Lipper category for the periods noted. The returns for the Lipper Average reflect the deduction of operating expenses, but not sales charges or taxes.
| | |
| 8 | | The TARGET Portfolio Trust |
Strategy and Performance Overview
How did the Portfolio perform?
The Large Capitalization Value Portfolio’s Class T shares returned 16.26% for the 12-month period ended July 31, 2014. This compares to the 15.47% return of its benchmark, the Russell 1000® Value Index (the Index), and the 14.72% return of the Lipper Large-Cap Value Funds Average for the 12-month period ended July 31, 2014.
The Portfolio was sub-advised during this reporting period by NFJ Investment Group LLC (NFJ); Hotchkis and Wiley Capital Management, LLC (H&W); and Epoch Investment Partners, Inc. (Epoch).
What were market conditions?
U.S. large-cap equities generated strong returns for the reporting period, posting their eighth consecutive quarter of gains during the second quarter of 2014. Investors were buoyed by improving employment figures, housing data, and automobile sales, as well as the U.S. Federal Reserve’s (Fed) continued commitment to low interest rates. These factors outweighed the contraction in first-quarter U.S. economic growth, anxiety about the crisis in Ukraine, and mixed news about China’s growth prospects. For the period overall, large-cap stocks outperformed small-cap stocks by a wide margin, and micro-cap stocks registered losses during the second quarter.
What affected the Portfolio’s performance?
| | • | | Sector allocation helped relative results as the Portfolio had an overweight position to the technology sector, which was the best performing sector within the Index during the reporting period. The Portfolio’s cash holdings was a modest drag on relative results, which is not unexpected given the sound gains of the Index and the fact that cash earned little. |
| | • | | Stock selection was a modest plus for the Portfolio as gains within the pharmaceutical and oil and gas industries offset weakness among consumer discretionary and semiconductor companies. |
| | • | | While Epoch and Hotchkis and Wiley outperformed the Index for the reporting period, NFJ trailed, although modestly. |
The Portfolio of Investments following this report shows the size of the Portfolio’s positions at period-end.
| | | | |
| The TARGET Portfolio Trust | | | 9 | |
Target Small Capitalization Growth Portfolio
Performance (Unaudited)
Performance data quoted represent past performance. Past performance does not guarantee future results. The investment return and principal value of an investment will fluctuate, so that an investor’s shares, when redeemed, may be worth more or less than their original cost. Current performance may be lower or higher than the past performance data quoted. An investor may obtain performance data as of the most recent month-end by visiting our website at www.prudentialfunds.com or by calling (800) 225-1852.
| | | | | | | | | | | | | | | | |
| | | Cumulative Total Returns
as of 7/31/14 | |
| | | One Year | | | Five Years | | | Ten Years | | | Since Inception | |
Class R | | | 2.57 | % | | | 98.95 | % | | | N/A | | | | 37.14% (8/22/06) | |
Class T | | | 3.01 | | | | 103.89 | | | | 74.60 | % | | | — | |
Russell 2000® Growth Index | | | 8.93 | | | | 121.46 | | | | 145.26 | | | | — | |
Russell 2000® Index | | | 8.56 | | | | 115.11 | | | | 132.02 | | | | — | |
Lipper Small-Cap Growth Funds Average | | | 7.92 | | | | 119.60 | | | | 133.80 | | | | — | |
| |
| | | Average Annual Total Returns
as of 6/30/14 | |
| | | One Year | | | Five Years | | | Ten Years | | | Since Inception | |
Class R | | | 17.54 | % | | | 18.03 | % | | | N/A | | | | 5.02% (8/22/06) | |
Class T | | | 18.11 | | | | 18.61 | | | | 5.54 | % | | | — | |
Russell 2000 Growth Index | | | 24.73 | | | | 20.50 | | | | 9.04 | | | | — | |
Russell 2000 Index | | | 23.64 | | | | 20.21 | | | | 8.70 | | | | — | |
Lipper Small-Cap Growth Funds Average | | | 22.44 | | | | 20.00 | | | | 8.50 | | | | — | |
| |
| | | Average Annual Total Returns
as of 7/31/14 | |
| | | One Year | | | Five Years | | | Ten Years | | | Since Inception | |
Class R | | | 2.57 | % | | | 14.75 | % | | | N/A | | | | 4.06% (8/22/06) | |
Class T | | | 3.01 | | | | 15.31 | | | | 5.73 | % | | | — | |
| | |
| 10 | | The TARGET Portfolio Trust |
Growth of a $10,000 Investment
Small Capitalization Growth Portfolio
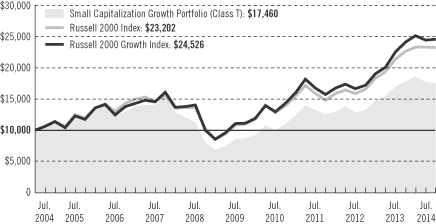
The graph compares a $10,000 investment in the Target Small Capitalization Growth Portfolio (Class T) with a similar investment in the Russell 2000 Index and the Russell 2000 Growth Index by portraying the initial account values at the beginning of the 10-year period (July 31, 2004) and the account values at the end of the current fiscal period (July 31, 2014), as measured on a quarterly basis.
Past performance does not predict future performance. Total returns and the ending account values in the graph include changes in share price and reinvestment of dividends and capital gains distributions in a hypothetical investment for the periods shown. The Portfolio’s total returns do not reflect the deduction of income taxes on an individual’s investment. Taxes may reduce your actual investment returns on income or gains paid by the Portfolio or any gains you may realize if you sell your shares.
Source: Prudential Investments LLC and Lipper Inc.
Inception returns are provided for any share class with less than 10 calendar years of returns.
| | | | |
| The TARGET Portfolio Trust | | | 11 | |
Target Small Capitalization Growth Portfolio
Performance (continued)
The returns in the tables do not reflect the deduction of taxes that a shareholder would pay on Portfolio distributions or following the redemption of Portfolio shares. The average annual total returns take into account applicable sales charges, which are described for each share class in the table below.
| | | | |
| | | Class R | | Class T |
Maximum initial sales charge | | None | | None |
Contingent deferred sales charge (CDSC) (as a percentage of the lower of original purchase price or sale proceeds) | | None | | None |
Annual distribution and service (12b-1) fees (shown as a percentage of average daily net assets) | | .75% (.50% currently) | | None |
Benchmark Definitions
Russell 2000 Growth Index
The Russell 2000 Growth Index is an unmanaged index which contains those securities in the Russell 2000 Index with an above-average growth orientation. Companies in this index generally have higher price-to-book and price-to-earnings ratios.
Russell 2000 Index
The Russell 2000 Index is an unmanaged index of the stocks of the 2,000 smallest U.S. companies included in the Russell 3000 Index. It gives an indication of how the stock prices of smaller companies have performed.
Lipper Small-Cap Growth Funds Average
Lipper Small-Cap Growth funds invest at least 75% of their equity assets in companies with market capitalizations (on a three-year weighted basis) below Lipper’s U.S. Diversified Equity (USDE) small-cap ceiling. Small-cap growth funds typically have an above-average price-to-earnings ratio, price-to-book ratio, and three-year sales-per-share-growth value compared with the S&P SmallCap 600 Index.
Benchmark Inception Returns
Small Capitalization Growth Portfolio—Russell 2000 Growth Index Closest Month-End to Inception cumulative total return as of 7/31/14 is 91.45% for Class R. Russell 2000 Growth Index Closest Month-End to Inception average annual total return as of 6/30/14 is 9.51% for Class R. Russell 2000 Index Closest Month-End to Inception cumulative total return as of 7/31/14 is 73.24% for Class R. Russell 2000 Index Closest Month-End to Inception average annual total return as of 6/30/14 is 8.13% for Class R. Lipper Average Closest Month-End to Inception cumulative total return as of 7/31/14 is 84.22% for Class R. Lipper Average Closest Month-End to Inception average annual total return as of 6/30/14 is 8.82% for Class R.
Investors cannot invest directly in an index or average. The returns for the benchmark indexes would be lower if they reflected deduction for portfolio operating expenses, sales charges, or taxes.
The Lipper Average represents returns based on an average of all funds in the respective Lipper category for the periods noted. The returns for the Lipper Average reflect the deduction of operating expenses, but not sales charges or taxes.
| | |
| 12 | | The TARGET Portfolio Trust |
Strategy and Performance Overview
How did the Portfolio perform?
The Small Capitalization Growth Portfolio’s Class T shares rose 3.01% for the 12-month period ended July 31, 2014. This compares to the 8.93% return of the Russell 2000® Growth Index (the Index) and the 7.92% return of the Lipper Small-Cap Growth Funds Average.
The Portfolio was sub-advised during the reporting period by Eagle Asset Management, Inc. (Eagle) and Emerald Mutual Fund Advisers Trust (Emerald).
What were market conditions?
During the reporting period, the overall stock market advanced, reflecting sustained improvement in the U.S. economic outlook. Corporate profits remained strong, housing and employment indicators improved, and consumer confidence rose to post-recession highs. The Federal Reserve (Fed) began incrementally tapering its quantitative easing program in December 2013, signaling confidence in U.S. economic activity and labor market conditions. U.S. GDP contracted in the first quarter of 2014, largely because of severe winter weather, but rebounded in the second quarter.
Small-cap stocks with the highest forecast long-term growth were the best performers in January and February, followed by inexpensive stocks in March. During the first and second quarters of 2014, small-capitalization stocks were the worst performers of all capitalization ranges. Investors then began to favor value-style stocks. Healthcare was one of the best performing sectors led by continued strength from the biotechnology industry, while financial services and consumer discretionary lagged other sectors.
What affected the Portfolio’s performance?
| | • | | The Portfolio trailed the Index, largely because of its holdings in the information technology, healthcare, and energy sectors. In particular, investments in the Internet software and services and biotechnology industries hampered results. |
| | • | | Most of the Portfolio’s relative underperformance can be attributed to Eagle’s and Emerald’s positions in Internet software and services companies that fell short of earnings growth expectations during the second quarter of 2014. |
| | • | | In addition, Eagle did not own many of the high-priced, high-growth biotechnology companies that outperformed during the reporting period. Conversely, Emerald’s biotechnology holdings performed well in November and December 2013. |
The Portfolio of Investments following this report shows the size of the Portfolio’s positions at period-end.
| | | | |
| The TARGET Portfolio Trust | | | 13 | |
Strategy and Performance Overview (continued)
| | • | | Although sector allocation does not generally play a role in managing the Portfolio, a slight underweight relative to the Index in the information technology sector hurt performance. |
| | • | | The Portfolio’s exposure to larger market-cap securities and to those more actively traded companies had a positive impact. An underexposure to less leveraged and less risky companies were a slight drag on performance. |
| | • | | On the positive side, the Portfolio’s marginal overweight in the energy sector added to relative returns. Its exposure to larger-cap stocks also enhanced performance. |
The Portfolio of Investments following this report shows the size of the Portfolio’s positions at period-end.
| | |
| 14 | | The TARGET Portfolio Trust |
Target Small Capitalization Value Portfolio
Performance (Unaudited)
Performance data quoted represent past performance. Past performance does not guarantee future results. The investment return and principal value of an investment will fluctuate, so that an investor’s shares, when redeemed, may be worth more or less than their original cost. Current performance may be lower or higher than the past performance data quoted. An investor may obtain performance data as of the most recent month-end by visiting our website at www.prudentialfunds.com or by calling (800) 225-1852.
| | | | | | | | | | | | | | | | |
| | | Cumulative Total Returns as of 7/31/14 | |
| | | One Year | | | Five Years | | | Ten Years | | | Since Inception | |
Class A | | | N/A | | | | N/A | | | | N/A | | | | 1.68% (2/14/14) | |
Class R | | | 10.57 | % | | | 112.27 | % | | | N/A | | | | 84.92 (8/22/06) | |
Class T | | | 11.18 | | | | 117.69 | | | | 169.78 | % | | | — | |
Russell 2000® Value Index | | | 8.18 | | | | 108.48 | | | | 117.31 | | | | — | |
Russell 2000 Index | | | 8.56 | | | | 115.11 | | | | 132.02 | | | | — | |
Lipper Small-Cap Value Funds Average | | | 10.18 | | | | 115.84 | | | | 130.11 | | | | — | |
Lipper Small-Cap Core Funds Average | | | 9.78 | | | | 113.85 | | | | 134.73 | | | | — | |
| |
| | | Average Annual Total Returns as of 6/30/14 | |
| | | One Year | | | Five Years | | | Ten Years | | | Since Inception | |
Class A | | | N/A | | | | N/A | | | | N/A | | | | N/A (2/14/14) | |
Class R | | | 23.01 | % | | | 19.49 | % | | | N/A | | | | 8.85% (8/22/06) | |
Class T | | | 23.64 | | | | 20.09 | | | | 10.59 | % | | | — | |
Russell 2000 Value Index | | | 22.54 | | | | 19.88 | | | | 8.24 | | | | — | |
Russell 2000 Index | | | 23.64 | | | | 20.21 | | | | 8.70 | | | | — | |
Lipper Small-Cap Value Funds Average | | | 23.67 | | | | 20.28 | | | | 8.71 | | | | — | |
Lipper Small-Cap Core Funds Average | | | 23.73 | | | | 19.79 | | | | 8.88 | | | | — | |
| |
| | | Average Annual Total Returns
as of 7/31/14 | |
| | | One Year | | | Five Years | | | Ten Years | | | Since Inception | |
Class A | | | N/A | | | | N/A | | | | N/A | | | | N/A (2/14/14) | |
Class R | | | 10.57 | % | | | 16.25 | % | | | N/A | | | | 8.05% (8/22/06) | |
Class T | | | 11.18 | | | | 16.83 | | | | 10.43 | % | | | — | |
| | | | |
| The TARGET Portfolio Trust | | | 15 | |
Target Small Capitalization Value Portfolio
Performance (continued)
Growth of a $10,000 Investment
Small Capitalization Value Portfolio
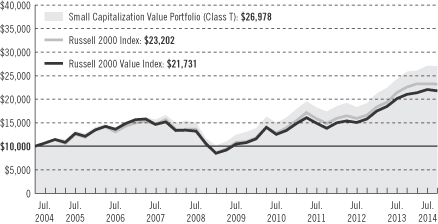
The graph compares a $10,000 investment in the Target Small Capitalization Value Portfolio (Class T) with a similar investment in the Russell 2000 Index and the Russell 2000 Value Index by portraying the initial account values at the beginning of the 10-year period (July 31, 2004) and the account values at the end of the current fiscal period (July 31, 2014), as measured on a quarterly basis.
Past performance does not predict future performance. Total returns and the ending account values in the graph include changes in share price and reinvestment of dividends and capital gains distributions in a hypothetical investment for the periods shown. The Portfolio’s total returns do not reflect the deduction of income taxes on an individual’s investment. Taxes may reduce your actual investment returns on income or gains paid by the Portfolio or any gains you may realize if you sell your shares.
Source: Prudential Investments LLC and Lipper Inc.
Inception returns are provided for any share class with less than 10 calendar years of returns.
| | |
| 16 | | The TARGET Portfolio Trust |
The returns in the tables do not reflect the deduction of taxes that a shareholder would pay on Portfolio distributions or following the redemption of Portfolio shares. The average annual total returns take into account applicable sales charges, which are described for each share class in the table below.
| | | | | | |
| | | Class A | | Class R | | Class T |
Maximum initial sales charge | | 5.50% of the public Offering price | | None | | None |
Contingent deferred sales charge (CDSC) (as a percentage of the lower of original purchase price or sale proceeds) | | 1% on sales of $1 million or more made within 12 months of purchase | | None | | None |
Annual distribution and service (12b-1) fees (shown as a percentage of average daily net assets) | | .30% (.25% currently) | | .75% (.50% currently) | | None |
Benchmark Definitions
Russell 2000 Value Index
The Russell 2000 Value Index is an unmanaged index which contains those securities in the Russell 2000 Index with a below-average growth orientation. Companies in this index generally have lower price-to-earnings ratios, higher dividend yields, and lower forecasted growth values.
Russell 2000 Index
The Russell 2000 Index is an unmanaged index of the stocks of the 2,000 smallest U.S. companies included in the Russell 3000 Index. It gives an indication of how the stock prices of smaller companies have performed.
Lipper Small-Cap Value Funds Average
Lipper Small-Cap Value funds invest at least 75% of their equity assets in companies with market capitalizations (on a three-year weighted basis) below Lipper’s USDE small-cap ceiling. Small-cap value funds typically have a below-average price-to-earnings ratio, price-to-book ratio, and a three-year sales-per-share growth value, compared to the S&P SmallCap 600 Index. Although Lipper classifies the Portfolio in the Lipper Small-Cap Core Funds Performance Universe, returns for the Lipper Small-Cap Value Funds Performance Universe are also shown because the Portfolio’s manager believes that the funds included in the Lipper Small-Cap Value Funds Performance Universe provide a more appropriate basis for Portfolio performance comparisons.
Lipper Small-Cap Core Funds Average
Lipper Small-Cap Core funds invest at least 75% of their equity assets in companies with market capitalizations (on a three-year weighted basis) below Lipper’s U.S. Diversified Equity (USDE) small-cap ceiling. Small-cap core funds typically have an average price-to-earnings ratio, price-to-book ratio, and three-year sales-per-share-growth value, compared to the S&P SmallCap 600 Index.
| | | | |
| The TARGET Portfolio Trust | | | 17 | |
Target Small Capitalization Value Portfolio
Performance (continued)
Benchmark Inception Returns
Small Capitalization Value Portfolio—Russell 2000 Value Index Closest Month-End to Inception cumulative total returns as of 7/31/14 are 1.84% for Class A and 55.71% for Class R. Russell 2000 Value Index Month-End to Inception average annual total return as of 6/30/14 is 6.66% for Class R. Russell 2000 Index Closest Month-End to Inception cumulative total returns as of 7/31/14 are –0.30% for Class A and 73.24% for Class R. Russell 2000 Index Closest Month-End to Inception average annual total return as of 6/30/14 is 8.13% for Class R. Lipper Small-Cap Value Funds Average Closest Month-End to Inception cumulative total returns as of 7/31/14 are 2.84% for Class A and 72.12% for Class R. Lipper Small-Cap Value Funds Average Closest Month-End to Inception average annual total return as of 6/30/14 is 7.83% for Class R. Lipper Small-Cap Core Funds Average Closest Month-End to Inception cumulative total returns as of 7/31/14 are 1.81% for Class A and 76.16% for Class R. Lipper Small-Cap Core Funds Average Closest Month-End to Inception average annual total return as of 6/30/14 is 8.20% for Class R. Class A shares have been in existence for less than one year and have no average annual total return performance information available.
Investors cannot invest directly in an index or average. The returns for the benchmark indexes would be lower if they reflected deduction for portfolio operating expenses, sales charges, or taxes.
The Lipper Averages represent returns based on an average of all funds in the respective Lipper categories for the periods noted. The returns for the Lipper averages reflect the deduction of operating expenses, but not sales charges or taxes.
| | |
| 18 | | The TARGET Portfolio Trust |
Strategy and Performance Overview
How did the Portfolio perform?
The Small Capitalization Value Portfolio’s Class T shares returned 11.18% for the 12-month period ended July 31, 2014. This compares to the 8.18% return of its benchmark, the Russell 2000® Value Index (the Index), the 9.78% return of the Lipper Small-Cap Core Funds Average, and the 10.18% return of the Lipper Small Cap Value Funds Average.
The Portfolio was sub-advised during this reporting period by EARNEST Partners, LLC; Lee Munder Capital Group, LLC (Lee Munder); J.P. Morgan Investment Management, Inc. (J.P. Morgan); NFJ Investment Group LLC (NFJ); Vaughan Nelson Investment Management, L.P. (Vaughan Nelson); and Sterling Capital Management LLC (Sterling was added as a subadviser in January 2014).
What were market conditions?
During the reporting period, the overall stock market advanced, reflecting sustained improvement in the U.S. economic outlook. Corporate profits remained strong, housing and employment indicators improved, and consumer confidence rose to post-recession highs. The Federal Reserve (Fed) began incrementally tapering its quantitative easing program in December 2013, signaling confidence in U.S. economic activity and labor market conditions. U.S. GDP contracted in the first quarter of 2014, largely because of severe winter weather, but rebounded in the second quarter.
Small cap stocks underperformed mid-cap and large-cap stocks, while growth-oriented stocks outperformed value-oriented stocks. Nine of the 10 sectors in the Index generated positive returns, with healthcare, energy, and materials posting double-digit gains. The telecommunication services sector recorded a double-digit decline.
What affected the Portfolio’s performance?
| | • | | The Portfolio’s outperformance was driven mostly by positive, broad-based stock selection, but sector allocation helped, too. In particular, the Portfolio benefited from an overweight to the healthcare sector (which was the Index’s best performing area) and an underweight to financials (which was an area of weakness). The Portfolio’s cash holdings was a modest drag on relative results, which is not unexpected given the benchmark’s sound gains and the fact that cash earned little over the reporting period. |
The Portfolio of Investments following this report shows the size of the Portfolio’s positions at period-end.
| | | | |
| The TARGET Portfolio Trust | | | 19 | |
Strategy and Performance Overview (continued)
| | • | | Of the investment subadvisers that comprise the Portfolio, all but Lee Munder posted results that exceed the Index. Lee Munder’s performance modestly trailed the Index. Please note that in January 2014, Sterling Capital was added to the Portfolio. As a result, their performance does not reflect an entire year. |
The Portfolio of Investments following this report shows the size of the Portfolio’s positions at period-end.
| | |
| 20 | | The TARGET Portfolio Trust |
Target International Equity Portfolio
Performance (Unaudited)
Performance data quoted represent past performance. Past performance does not guarantee future results. The investment return and principal value of an investment will fluctuate, so that an investor’s shares, when redeemed, may be worth more or less than their original cost. Current performance may be lower or higher than the past performance data quoted. An investor may obtain performance data as of the most recent month-end by visiting our website at www.prudentialfunds.com or by calling (800) 225-1852.
| | | | | | | | | | | | | | | | |
| | | Cumulative Total Returns
as of 7/31/14 | |
| | | One Year | | | Five Years | | | Ten Years | | | Since Inception | |
Class Q | | | 10.53 | % | | | N/A | | | | N/A | | | | 17.92% (3/1/11) | |
Class R | | | 9.84 | | | | 45.54 | % | | | N/A | | | | 24.94 (8/22/06) | |
Class T | | | 10.42 | | | | 49.20 | | | | 101.62 | % | | | — | |
MSCI EAFE ND Index | | | 15.07 | | | | 56.67 | | | | 98.08 | | | | — | |
Lipper Customized Blend Funds Average | | | 12.64 | | | | 53.57 | | | | 93.64 | | | | — | |
Lipper International Multi-Cap Core Funds Average | | | 12.52 | | | | 54.80 | | | | 91.00 | | | | — | |
| |
| | | Average Annual Total Returns
as of 6/30/14 | |
| | | One Year | | | Five Years | | | Ten Years | | | Since Inception | |
Class Q | | | 20.37 | % | | | N/A | | | | N/A | | | | 5.93% (3/1/11) | |
Class R | | | 19.67 | | | | 10.49 | % | | | N/A | | | | 3.23 (8/22/06) | |
Class T | | | 20.26 | | | | 11.03 | | | | 7.22 | % | | | — | |
MSCI EAFE ND Index | | | 23.57 | | | | 11.77 | | | | 6.93 | | | | — | |
Lipper Customized Blend Funds Average | | | 21.12 | | | | 11.49 | | | | 6.74 | | | | — | |
Lipper International Multi-Cap Core Funds Average | | | 21.02 | | | | 11.71 | | | | 6.66 | | | | — | |
| |
| | | Average Annual Total Returns
as of 7/31/14 | |
| | | One Year | | | Five Years | | | Ten Years | | | Since Inception | |
Class Q | | | 10.53 | % | | | N/A | | | | N/A | | | | 4.94% (3/1/11) | |
Class R | | | 9.84 | | | | 7.80 | % | | | N/A | | | | 2.84 (8/22/06) | |
Class T | | | 10.42 | | | | 8.33 | | | | 7.26 | % | | | — | |
| | | | |
| The TARGET Portfolio Trust | | | 21 | |
Target International Equity Portfolio
Performance (continued)
Growth of a $10,000 Investment
International Equity Portfolio
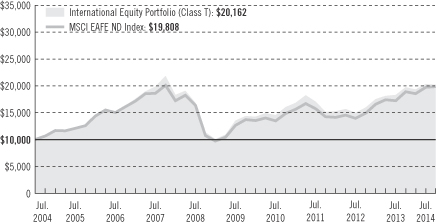
The graph compares a $10,000 investment in the Target International Equity Portfolio (Class T) with a similar investment in the Morgan Stanley Capital International Europe, Australasia, Far East Net Dividend Index (MSCI EAFE ND Index) by portraying the initial account values at the beginning of the 10-year period (July 31, 2004) and the account values at the end of the current fiscal period (July 31, 2014), as measured on a quarterly basis.
Past performance does not predict future performance. Total returns and the ending account values in the graph include changes in share price and reinvestment of dividends and capital gains distributions in a hypothetical investment for the periods shown. The Portfolio’s total returns do not reflect the deduction of income taxes on an individual’s investment. Taxes may reduce your actual investment returns on income or gains paid by the Portfolio or any gains you may realize if you sell your shares.
Source: Prudential Investments LLC and Lipper Inc.
Inception returns are provided for any share class with less than 10 calendar years of returns.
| | |
| 22 | | The TARGET Portfolio Trust |
The returns in the tables do not reflect the deduction of taxes that a shareholder would pay on Portfolio distributions or following the redemption of Portfolio shares. The average annual total returns take into account applicable sales charges, which are described for each share class in the table below.
| | | | | | |
| | | Class Q | | Class R | | Class T |
Maximum initial sales charge | | None | | None | | None |
Contingent deferred sales charge (CDSC) (as a percentage of the lower of original purchase price or sale proceeds) | | None | | None | | None |
Annual distribution and service (12b-1) fees (shown as a percentage of average daily net assets) | | None | | .75% (.50% currently) | | None |
Benchmark Definitions
Morgan Stanley Capital International Europe, Australasia, and Far East Net Dividend Index
The Morgan Stanley Capital International Europe, Australasia, and Far East Net Dividend Index (MSCI EAFE ND Index) is an unmanaged, weighted index that reflects stock price movements of developed country markets in Europe, Australasia, and the Far East. It gives an indication of how foreign stocks have performed. The MSCI EAFE Index reflects the impact of the maximum withholding taxes on reinvested dividends.
Lipper Customized Blend Funds Average
The Lipper Customized Blend Funds Average is a 50/50 blend of the Lipper International Multi-Cap Core Funds and Lipper International Large-Cap Core Funds Averages. Although Lipper classifies the Portfolio in the Lipper International Multi-Cap Core Funds Performance Universe, returns for the Lipper Customized Blend Funds Performance Universe are also shown because the Portfolio’s manager believes that the funds included in this custom blend universe provide a more appropriate basis for Portfolio performance comparisons.
Lipper International Multi-Cap Core Funds Average
Lipper International Multi-Cap Core funds invest in a variety of market capitalization ranges without concentrating 75% of their equity assets in any one market capitalization range over an extended period of time. International multi-cap core funds typically have an average price-to-cash flow ratio, price-to-book ratio, and three-year sales-per-share growth value compared to the MSCI EAFE Index.
Benchmark Inception Returns
International Equity Portfolio—MSCI EAFE ND Index Closest Month-End to Inception cumulative total returns as of 7/31/14 are 22.94% for Class Q and 28.41% for Class R. MSCI EAFE ND Index Closest Month-End to Inception average annual total returns as of 6/30/14 are 7.03% for Class Q and 3.51% for Class R. Lipper Customized Blend Funds Average Closest Month-End to Inception cumulative total returns as of 7/31/14 are 20.25% for Class Q and 26.57% for Class R. Lipper Customized Blend Funds Average Closest Month-End to Inception average annual total returns as of 6/30/14 are 6.41% for Class Q and 3.28% for Class R. Lipper International Multi-Cap Core Funds Average Closest Month-End to Inception cumulative total returns as of 7/31/14 are 20.38% for Class Q and 25.96% for Class R. Lipper International Multi-Cap Core Funds Average Closest Month-End to Inception average annual total returns as of 6/30/14 are 6.58% for Class Q and 3.32% for Class R.
| | | | |
| The TARGET Portfolio Trust | | | 23 | |
Target International Equity Portfolio
Performance (continued)
Investors cannot invest directly in an index or average. The returns for the benchmark indexes would be lower if they reflected deductions for portfolio operating expenses, sales charges, or taxes.
The Lipper Averages represent returns based on an average of all funds in the respective Lipper categories for the periods noted. The returns for the Lipper averages reflect the deduction of operating expenses, but not sales charges or taxes.
| | |
| 24 | | The TARGET Portfolio Trust |
Strategy and Performance Overview
How did the Portfolio perform?
The International Equity Portfolio’s Class T shares returned 10.42% for the 12-month period ended July 31, 2014. This compares to the 15.07% return of the MSCI EAFE (Europe, Australasia, and Far East) Net Dividend Index (the Index), the 12.52% return of the Lipper International Multi-Cap Core Funds Average, and the 12.64% return of the Lipper Customized Blend Funds Average for the 12-month period ended July 31, 2014.
The Portfolio was sub-advised during the reporting period by LSV Asset Management (LSV) and Thornburg Investment Management, Inc. (Thornburg).
What were market conditions?
Investors seemed optimistic during the reporting period in spite of global geopolitical turmoil, including tensions between Russia and the Ukraine and the sectarian uprising in Iraq. Positive sentiment was driven by continued assurances from the U.S. Federal Reserve (Fed) and the European Central Bank that interest rates would remain low, which lifted several global equity indexes toward multi-year highs and sent volatility to historic lows. The number of mergers and acquisitions contributed to investors’ positive mood, as more than $1 trillion in deals have recently taken place.
During the reporting period, all international regions and sectors in the Index turned in positive returns, led by strength in the healthcare, energy, and information technology sectors. From a regional perspective, Western Europe (led by the U.K.) delivered the best results within the Index. Emerging markets stocks also performed well, posting gains during the 2014 calendar year through July 31, 2014.
What affected the Portfolio’s performance?
| | • | | The Portfolio underperformed the Index during the reporting period, because of allocation effects and stock selection. An overweight position in consumer discretionary, the worst-performing sector in the Index, detracted from relative performance. In addition, the Portfolio’s holdings failed to keep up with Index returns. |
| | • | | The Portfolio experienced similar results in the consumer staples and information technology sectors, as it failed to keep pace with each sector’s Index returns. On a positive note, the Portfolio’s stock selection was very strong in the utilities sector, which added to relative performance. |
The Portfolio of Investments following this report shows the size of the Portfolio’s positions at period-end.
| | | | |
| The TARGET Portfolio Trust | | | 25 | |
Strategy and Performance Overview (continued)
| | • | | From a regional standpoint, stock selection in Western Europe hurt results, while the Portfolio’s holdings in the Pacific Rim and North America had a neutral and positive impact, respectively, on performance versus the Index. |
| | • | | The LSV portion of the Portfolio outperformed the Index as a result of allocation and stock selection. Returns were strongest in the consumer discretionary, financials, and telecommunications services sectors. From a country perspective, LSV benefited most from its holdings in Japan, Switzerland, and Spain. |
| | • | | The Thornburg portion of the Portfolio underperformed, with security selection trailing the Index in nine out of 10 sectors. The largest areas of weakness were in the consumer discretionary, financials, and information technology sectors. In financials, what the Portfolio didn’t hold hurt performance the most. For example, Thornburg was underweight real estate securities, the best performing group within the financials sector. In country allocation, Thornburg’s underweight to Japan dampened relative returns, while its exposure to emerging markets such as Brazil and Mexico detracted significantly. |
Did the Portfolio use derivatives and how did they affect performance?
| | • | | Thornburg used currency forwards (a form of a derivative instrument) as a tool to hedge some of the currency risk from investing in non-U.S. stocks. During the reporting period, this foreign exchange hedging had a slightly positive effect on the Portfolio. |
The Portfolio of Investments following this report shows the size of the Portfolio’s positions at period-end.
| | |
| 26 | | The TARGET Portfolio Trust |
Target Total Return Bond Portfolio
Performance (Unaudited)
Performance data quoted represent past performance. Past performance does not guarantee future results. The investment return and principal value of an investment will fluctuate, so that an investor’s shares, when redeemed, may be worth more or less than their original cost. Current performance may be lower or higher than the past performance data quoted. An investor may obtain performance data as of the most recent month-end by visiting our website at www.prudentialfunds.com or by calling (800) 225-1852.
| | | | | | | | | | | | | | | | |
| | | Cumulative Total Returns as of 7/31/14 | |
| | | One Year | | | Five Years | | | Ten Years | | | Since Inception | |
Class R | | | 2.80 | % | | | 25.23 | % | | | N/A | | | | 55.53% (8/22/06) | |
Class T | | | 3.39 | | | | 28.49 | | | | 76.43 | % | | | — | |
Barclays U.S. Aggregate Bond Index | | | 3.97 | | | | 24.42 | | | | 59.88 | | | | — | |
Lipper Core Bond Funds Average | | | 4.44 | | | | 29.24 | | | | 54.91 | | | | — | |
Lipper Corporate Debt BBB-Rated Funds Average | | | 6.93 | | | | 42.85 | | | | 75.35 | | | | — | |
| |
| | | Average Annual Total Returns as of 6/30/14 | |
| | | One Year | | | Five Years | | | Ten Years | | | Since Inception | |
Class R | | | 3.46 | % | | | 5.22 | % | | | N/A | | | | 5.85% (8/22/06) | |
Class T | | | 4.05 | | | | 5.76 | | | | 5.98 | % | | | — | |
Barclays U.S. Aggregate Bond Index | | | 4.37 | | | | 4.85 | | | | 4.93 | | | | — | |
Lipper Core Bond Funds Average | | | 4.93 | | | | 5.85 | | | | 4.56 | | | | — | |
Lipper Corporate Debt BBB-Rated Funds Average | | | 7.85 | | | | 8.21 | | | | 5.81 | | | | — | |
| |
| | | Average Annual Total Returns
as of 7/31/14 | |
| | | One Year | | | Five Years | | | Ten Years | | | Since Inception | |
Class R | | | 2.80 | % | | | 4.60 | % | | | N/A | | | | 5.72% (8/22/06) | |
Class T | | | 3.39 | | | | 5.14 | | | | 5.84 | % | | | — | |
| | | | |
| The TARGET Portfolio Trust | | | 27 | |
Target Total Return Bond Portfolio
Performance (continued)
Growth of a $10,000 Investment
Total Return Bond Portfolio
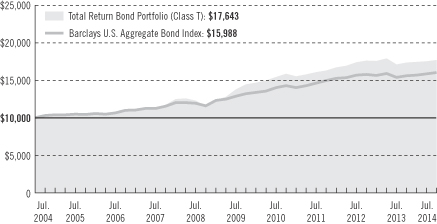
The graph compares a $10,000 investment in the Target Total Return Bond Portfolio (Class T) with a similar investment in the Barclays U.S. Aggregate Bond Index by portraying the initial account values at the beginning of the 10-year period (July 31, 2004) and the account values at the end of the current fiscal period (July 31, 2014), as measured on a quarterly basis.
Past performance does not predict future performance. Total returns and the ending account values in the graph include changes in share price and reinvestment of dividends and capital gains distributions in a hypothetical investment for the periods shown. The Portfolio’s total returns do not reflect the deduction of income taxes on an individual’s investment. Taxes may reduce your actual investment returns on income or gains paid by the Portfolio or any gains you may realize if you sell your shares.
Source: Prudential Investments LLC and Lipper Inc.
Inception returns are provided for any share class with less than 10 calendar years of returns.
| | |
| 28 | | The TARGET Portfolio Trust |
The returns in the tables do not reflect the deduction of taxes that a shareholder would pay on Portfolio distributions or following the redemption of Portfolio shares. The average annual total returns take into account applicable sales charges, which are described for each share class in the table below.
| | | | |
| | | Class R | | Class T |
Maximum initial sales charge | | None | | None |
Contingent deferred sales charge (CDSC) (as a percentage of the lower of original purchase price or sale proceeds) | | None | | None |
Annual distribution and service (12b-1) fees (shown as a percentage of average daily net assets) | | .75% (.50% currently) | | None |
Benchmark Definitions
Barclays U.S. Aggregate Bond Index
The Barclays U.S. Aggregate Bond Index is an unmanaged index of investment-grade securities issued by the U.S. government and its agencies and by corporations with between one and 10 years remaining to maturity. It gives a broad indication of how bond prices of short- and intermediate-term bonds have performed.
Lipper Core Bond Funds Average
Lipper Core Bond funds invest at least 85% in domestic investment-grade debt issues (rated in the top four grades) with any remaining investment in non-benchmark sectors such as high yield, global and emerging market debt. These funds maintain dollar-weighted average maturities of five to ten years. Although Lipper classifies the Portfolio in the Lipper Corporate Debt BBB-Rated Funds Performance Universe, returns for the Lipper Core Bond Funds Performance Universe are also shown because the Portfolio’s manager believes that the funds included in the Lipper Core Bond Funds Performance Universe provide a more appropriate basis for Portfolio performance comparisons.
Lipper Corporate Debt BBB-Rated Funds Average
Lipper Corporate Debt BBB-Rated funds invest at least 65% of their assets in corporate and government debt issues rated in the top four grades.
Benchmark Inception Returns
Total Return Bond Portfolio—Barclays U.S. Aggregate Bond Index Closest Month-End to Inception cumulative total return as of 7/31/14 is 48.11% for Class R. Barclays U.S. Aggregate Bond Index Closest Month-End to Inception average annual total return as of 6/30/14 is 5.18% for Class R. Lipper Core Bond Funds Average Closest Month-End to Inception cumulative total return as of 7/31/14 is 44.90% for Class R. Lipper Core Bond Funds Average Closest Month-End to Inception average annual total return as of 6/30/14 is 4.84% for Class R. Lipper Corporate Debt BBB-Rated Funds Average Closest Month-End to Inception cumulative total return as of 7/31/14 is 61.88% for Class R. Lipper Corporate Debt BBB-Rated Funds Average Closest Month-End to Inception average annual total return as of 6/30/14 is 6.30% for Class R.
| | | | |
| The TARGET Portfolio Trust | | | 29 | |
Target Total Return Bond Portfolio
Performance (continued)
Investors cannot invest directly in an index or average. The returns for the benchmark indexes would be lower if they reflected deduction for portfolio operating expenses, sales charges, or taxes.
The Lipper Averages represent returns based on an average of all funds in the respective Lipper categories for the periods noted. The returns for the Lipper averages reflect the deduction of operating expenses, but not sales charges or taxes.
| | |
| 30 | | The TARGET Portfolio Trust |
Strategy and Performance Overview
How did the Portfolio perform?
The Total Return Bond Portfolio’s Class T shares returned 3.39% for the 12-month period ended July 31, 2014. This compares to the 3.97% return of the Barclays U.S. Aggregate Bond Index (the Index), the 4.44% return of the Lipper Core Bond Funds Average, and the 6.93% return of the Lipper Corporate Debt BBB-Rated Funds Average for the 12-month period ended July 31, 2014.
Pacific Investment Management Company LLC (PIMCO) managed the Portfolio during this reporting period.
What were market conditions?
The reporting period was dominated by news of global central bank policies, tighter spreads (yield differentials between bonds of comparable maturities), and rising geopolitical tensions.
| | • | | Global fixed income markets posted solid returns during the reporting period overall, benefiting from a decline in interest rates across most maturities and sentiment that the federal funds rate would remain low. |
| | • | | In January, the Federal Reserve (Fed) began to gradually exit its quantitative easing bond-buying program. The Fed reassured the markets that the federal funds rate would remain near zero until signs of sustainable economic growth were broadly evident. |
| | • | | Rising geopolitical tensions between Russia and the Ukraine led to increased volatility, particularly in the equity markets. |
| | • | | An uncharacteristically cold winter took a toll on the U.S. economy, leading to a contraction in first-quarter growth. Investors seemed to ignore the news, apparently trusting that a spring bounce-back was likely. |
| | • | | In the second quarter, improving global economic data, supportive central bank policy, and the easing of global political risks led to sizable equity market gains. Meanwhile, the strong momentum of the high yield market in the first half of 2014 reversed during July. After yields on high yield bonds reached all-time lows in June, investors appeared to focus on valuations despite continued strong fundamentals. |
| | • | | To spur business lending, the European Central Bank (ECB) announced new easing measures, including the introduction of a negative deposit rate and a cut in the key policy rate, as well as targeted long-term refinancing operations. |
The Portfolio of Investments following this report shows the size of the Portfolio’s positions at period-end.
| | | | |
| The TARGET Portfolio Trust | | | 31 | |
Strategy and Performance Overview (continued)
What affected the Portfolio’s performance?
| | • | | The Portfolio’s yield curve positioning, specifically a focus on short-to-intermediate maturities coupled with an underweight to longer maturities, dampened performance as the yield curve flattened. |
| | • | | Interest rate exposures to non-U.S. economies contributed positively to returns. Among developed countries, the Portfolio’s exposures to Italy and Spain added to performance as rates declined on continuing support from the ECB. |
| | • | | The Portfolio’s mortgage exposure added to relative performance for the period. Although an underweight position in agency mortgage-backed securities (MBS) was negative, it was more than offset by the Portfolio’s allocation to non-agency MBS, which continued to benefit from limited supply and the housing sector recovery. |
| | • | | Other positive contributors to performance included the Portfolio’s exposure to Build America Bonds, as spreads tightened on investor demand for attractive yields. Holdings of Treasury inflation-protected securities (TIPS) also added to returns as breakeven inflation (the yield difference between nominal Treasury bonds and TIPS) rose over the period. |
| | • | | The Portfolio’s underweight position in the investment grade corporate sector detracted from returns as spreads generally narrowed; however, this was slightly offset by a focus on investment-grade credit and high yield financials, which outperformed the broader corporate sector during the period. |
| | • | | Modest currency exposure also contributed to returns for the period. In particular, the Portfolio benefited from its underweight position versus the euro starting in the second quarter of 2014, as the euro depreciated versus the U.S. dollar. |
Did the Portfolio use derivatives and how did they affect performance?
| | • | | Derivatives were used in the Portfolio and are instrumental in attaining specific exposures targeted to gain from anticipated market developments. The Portfolio’s U.S. duration positioning, which was negative for relative returns, was partly facilitated through the use of interest rate swaps. However, U.S. duration exposure gained through futures and swaptions contributed significantly to returns because of their positioning on the steepest portion of the yield curve. The Portfolio’s allocations to emerging markets local debt, which had a relatively neutral impact on performance, included exposure to local debt in Brazil and Mexico that was partially implemented through interest rate swaps. However, the Portfolio’s exposures to those two countries through sell protection credit default swaps was positive for performance, more than offsetting the negative contribution from interest rate swaps. Additionally, although the Portfolio’s corporate exposure was negative overall for performance, exposure gained through index credit default swaps was positive. |
The Portfolio of Investments following this report shows the size of the Portfolio’s positions at period-end.
| | |
| 32 | | The TARGET Portfolio Trust |
Target Intermediate-Term Bond Portfolio
Performance (Unaudited)
Performance data quoted represent past performance. Past performance does not guarantee future results. The investment return and principal value of an investment will fluctuate, so that an investor’s shares, when redeemed, may be worth more or less than their original cost. Current performance may be lower or higher than the past performance data quoted. An investor may obtain performance data as of the most recent month-end by visiting our website at www.prudentialfunds.com or by calling (800) 225-1852.
| | | | | | | | | | | | |
| | | Cumulative Total Returns
as of 7/31/14 | |
| | | One Year | | | Five Years | | | Ten Years | |
Class T | | | 1.80 | % | | | 24.98 | % | | | 69.15 | % |
Barclays Intermediate Govt./Credit Bond Index | | | 2.32 | | | | 20.28 | | | | 51.20 | |
Lipper Core Bond Funds Average | | | 4.44 | | | | 29.24 | | | | 54.91 | |
| |
| | | Average Annual Total Returns
as of 6/30/14 | |
| | | One Year | | | Five Years | | | Ten Years | |
Class T | | | 2.27 | % | | | 4.93 | % | | | 5.52 | % |
Barclays Intermediate Govt./Credit Bond Index | | | 2.86 | | | | 4.09 | | | | 4.33 | |
Lipper Core Bond Funds Average | | | 4.93 | | | | 5.85 | | | | 4.56 | |
| |
| | | Average Annual Total Returns
as of 7/31/14 | |
| | | One Year | | | Five Years | | | Ten Years | |
Class T | | | 1.80 | % | | | 4.56 | % | | | 5.40 | % |
| | | | |
| The TARGET Portfolio Trust | | | 33 | |
Target Intermediate-Term Bond Portfolio
Performance (continued)
Growth of a $10,000 Investment
Intermediate-Term Bond Portfolio
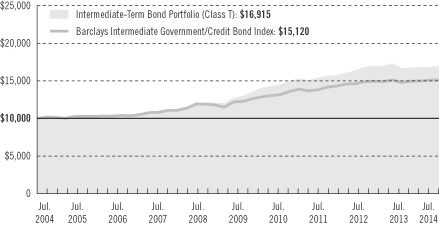
The graph compares a $10,000 investment in the Target Intermediate-Term Bond Portfolio (Class T) with a similar investment in the Barclays Intermediate Government/Credit Bond Index by portraying the initial account values at the beginning of the 10-year period (July 31, 2004) and the account values at the end of the current fiscal period (July 31, 2014), as measured on a quarterly basis.
Past performance does not predict future performance. Total returns and the ending account values in the graph include changes in share price and reinvestment of dividends and capital gains distributions in a hypothetical investment for the periods shown. The Portfolio’s total returns do not reflect the deduction of income taxes on an individual’s investment. Taxes may reduce your actual investment returns on income or gains paid by the Portfolio or any gains you may realize if you sell your shares.
Source: Prudential Investments LLC and Lipper Inc.
Inception returns are provided for any share class with less than 10 calendar years of returns.
| | |
| 34 | | The TARGET Portfolio Trust |
The returns in the tables do not reflect the deduction of taxes that a shareholder would pay on Portfolio distributions or following the redemption of Portfolio shares. The average annual total returns take into account applicable sales charges, which are described in the table below.
| | |
| | | Class T |
Maximum initial sales charge | | None |
Contingent deferred sales charge (CDSC) (as a percentage of the lower of original purchase price or sale proceeds) | | None |
Annual distribution and service (12b-1) fees | | None |
Benchmark Definitions
Barclays Intermediate Government/Credit Bond Index
The Barclays Intermediate Government/Credit Bond Index is an unmanaged index of publicly traded U.S. government bonds and investment-grade corporate bonds with maturities of up to 10 years. It gives a broad indication of how intermediate-term bonds have performed.
Lipper Core Bond Funds Average
Lipper Core Bond funds invest at least 85% in domestic investment-grade debt issues (rated in the top four grades) with any remaining investment in non-benchmark sectors such as high yield, global and emerging market debt. These funds maintain dollar-weighted average maturities of five to ten years.
Investors cannot invest directly in an index or average. The returns for the benchmark indexes would be lower if they reflected deduction for portfolio operating expenses, sales charges, or taxes.
The Lipper Average represents returns based on an average of all funds in the respective Lipper category for the periods noted. The returns for the Lipper Average reflect the deduction of operating expenses, but not sales charges or taxes.
| | | | |
| The TARGET Portfolio Trust | | | 35 | |
Strategy and Performance Overview
How did the Portfolio perform?
The Intermediate-Term Bond Portfolio’s Class T shares returned 1.80% for the 12-month period ended July 31, 2014. This compares to the 2.32% return of the Barclays Intermediate Government/Credit Index (the Index) and the 4.44% return of the Lipper Core Bond Funds Average for the 12-month period ended July 31, 2014.
Pacific Investment Management Company LLC (PIMCO) managed the Portfolio during this reporting period.
What were market conditions?
The reporting period was dominated by news of global central bank policies, tighter spreads (yield differentials between bonds of comparable maturities), and rising geopolitical tensions.
| | • | | Global fixed income markets posted solid returns during the reporting period overall, benefiting from a decline in interest rates across most maturities and sentiment that the federal funds rate would remain low. |
| | • | | In January, the Federal Reserve (Fed) began to gradually exit its quantitative easing bond-buying program. The Fed reassured the markets that the federal funds rate would remain near zero until signs of sustainable economic growth were broadly evident. |
| | • | | Rising geopolitical tensions between Russia and the Ukraine led to increased volatility, particularly in the equity markets. |
| | • | | An uncharacteristically cold winter took a toll on the U.S. economy, leading to a contraction in first-quarter growth. Investors seemed to ignore the news, apparently trusting that a spring bounce-back was likely. |
| | • | | In the second quarter, improving global economic data, supportive central bank policy, and the easing of global political risks led to sizable equity market gains. Meanwhile, the strong momentum of the high yield market in the first half of 2014 reversed during July. After yields on high yield bonds reached all-time lows in June, investors appeared to focus on valuations despite continued strong fundamentals. |
| | • | | To spur business lending, the European Central Bank announced new easing measures, including the introduction of a negative deposit rate and a cut in the key policy rate, as well as targeted long-term refinancing operations. |
The Portfolio of Investments following this report shows the size of the Portfolio’s positions at period-end.
| | |
| 36 | | The TARGET Portfolio Trust |
What affected the Portfolio’s performance?
| | • | | The Portfolio’s U.S. interest rate strategies were neutral for performance. While yield curve positioning detracted from relative returns during the reporting period, positioning on the steepest part of the yield curve benefited from roll-down strategies. |
| | • | | The Portfolio was hurt by its defensive position in core eurozone interest rates, which declined during the period. This performance was partially offset by the Portfolio’s exposure to Australian interest rates as yields rallied. |
| | • | | Although an allocation to Brazilian interest rates slightly detracted from returns, select exposure to emerging markets external debt offset this impact as spreads narrowed. |
| | • | | An overall underweight to the broader corporate sector, as well as defensive positioning within high yield credit, hampered performance; however, this was partially offset by a focus on financials, which outperformed the broader corporate sector during the period. |
| | • | | The Portfolio’s mortgage exposure added to relative performance. More specifically, positioning and security selection within agency mortgage-backed securities (MBS) was modestly positive for performance, while the Portfolio’s allocation to non-agency MBS contributed substantially as these issues continued to rally amid limited supply and the ongoing housing recovery. A modest allocation to European residential mortgage-backed securities also enhanced results. |
| | • | | Other positive contributors to performance included the Portfolio’s exposure to Build America Bonds, as spreads tightened on investor demand for attractive yields. Exposure to the Brazilian real, which appreciated versus the U.S. dollar during the period, also added to results. |
Did the Portfolio use derivatives and how did they affect performance?
| | • | | Derivatives were used in the Portfolio and are instrumental in attaining specific exposures targeted to gain from anticipated market developments. The Portfolio’s U.S. interest rate positioning, which was neutral for relative returns, was partly facilitated through the use of interest rate swaps. However, U.S. duration exposure gained through swaptions contributed to returns because of their positioning on the steepest portion of the yield curve. The Portfolio’s exposure to core euro-zone interest rates, implemented through interest rate swaps, was negative for performance. Additionally, exposure to high yield corporate bonds gained through the use of index credit default swaps was negative for returns. |
The Portfolio of Investments following this report shows the size of the Portfolio’s positions at period-end.
| | | | |
| The TARGET Portfolio Trust | | | 37 | |
Target Mortgage-Backed Securities Portfolio
Performance (Unaudited)
Performance data quoted represent past performance. Past performance does not guarantee future results. The investment return and principal value of an investment will fluctuate, so that an investor’s shares, when redeemed, may be worth more or less than their original cost. Current performance may be lower or higher than the past performance data quoted. An investor may obtain performance data as of the most recent month-end by visiting our website at www.prudentialfunds.com or by calling (800) 225-1852.
| | | | | | | | | | | | |
| | | Cumulative Total Returns
as of 7/31/14 | |
| | | One Year | | | Five Years | | | Ten Years | |
Class T | | | 4.62 | % | | | 31.95 | % | | | 64.13 | % |
Barclays Mortgage-Backed Securities Index | | | 4.14 | | | | 19.49 | | | | 59.66 | |
Citigroup Mortgage-Backed Securities Index | | | 4.05 | | | | 19.81 | | | | 60.43 | |
Lipper U.S. Mortgage Funds Average | | | 3.93 | | | | 24.09 | | | | 51.06 | |
| |
| | | Average Annual Total Returns
as of 6/30/14 | |
| | | One Year | | | Five Years | | | Ten Years | |
Class T | | | 4.94 | % | | | 6.29 | % | | | 5.22 | % |
Barclays Mortgage-Backed Securities Index | | | 4.66 | | | | 3.92 | | | | 4.95 | |
Citigroup Mortgage-Backed Securities Index | | | 4.59 | | | | 3.97 | | | | 5.00 | |
Lipper U.S. Mortgage Funds Average | | | 4.10 | | | | 4.73 | | | | 4.27 | |
| |
| | | Average Annual Total Returns
as of 7/31/14 | |
| | | One Year | | | Five Years | | | Ten Years | |
Class T | | | 4.62 | % | | | 5.70 | % | | | 5.08 | % |
| | |
| 38 | | The TARGET Portfolio Trust |
Growth of a $10,000 Investment
Mortgage Backed Securities Portfolio
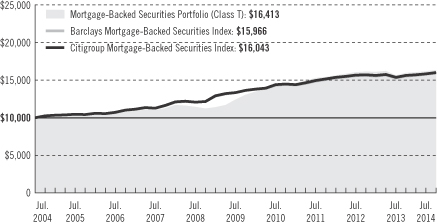
The graph compares a $10,000 investment in the Target Mortgage-Backed Securities Portfolio (Class T) with a similar investment in the Barclays Mortgage-Backed Securities Index and the Citigroup Mortgage-Backed Securities Index by portraying the initial account values at the beginning of the 10-year period (July 31, 2004) and the account values at the end of the current fiscal period (July 31, 2014), as measured on a quarterly basis.
Past performance does not predict future performance. Total returns and the ending account values in the graph include changes in share price and reinvestment of dividends and capital gains distributions in a hypothetical investment for the periods shown. The Portfolio’s total returns do not reflect the deduction of income taxes on an individual’s investment. Taxes may reduce your actual investment returns on income or gains paid by the Portfolio or any gains you may realize if you sell your shares.
Source: Prudential Investments LLC and Lipper Inc.
Inception returns are provided for any share class with less than 10 calendar years of returns.
| | | | |
| The TARGET Portfolio Trust | | | 39 | |
Target Mortgage-Backed Securities Portfolio
Performance (continued)
The returns in the tables do not reflect the deduction of taxes that a shareholder would pay on Portfolio distributions or following the redemption of Portfolio shares. The average annual total returns take into account applicable sales charges, which are described in the table below.
| | |
| | | Class T |
Maximum initial sales charge | | None |
Contingent deferred sales charge (CDSC) (as a percentage of the lower of original purchase price or sale proceeds) | | None |
Annual distribution and service (12b-1) fees | | None |
Benchmark Definitions
Barclays Mortgage-Backed Securities Index
The Barclays Mortgage-Backed Securities Index is an unmanaged, market capitalization-weighted index of 15- and 30-year fixed-rate securities backed by GNMA, FNMA, and FHLMC mortgage pools, and balloon mortgages with fixed-rate coupons.
Citigroup Mortgage-Backed Securities Index
The Citigroup Mortgage-Backed Securities Index is an unmanaged index of 15- and 30-year mortgage-related securities issued by U.S. government agencies. It gives a broad indication of how mortgage-backed securities have performed.
Lipper U.S. Mortgage Funds Average
Lipper U.S. Mortgage funds invest primarily in mortgages/securities issued or guaranteed as to principal and interest by the U.S. government and certain federal agencies.
Investors cannot invest directly in an index or average. The returns for the benchmark indexes would be lower if they reflected deduction for portfolio operating expenses, sales charges, or taxes.
The Lipper Average represents returns based on an average of all funds in the respective Lipper category for the periods noted. The returns for the Lipper Average reflect the deduction of operating expenses, but not sales charges or taxes.
| | |
| 40 | | The TARGET Portfolio Trust |
Strategy and Performance Overview
How did the Portfolio perform?
The Mortgage-Backed Securities Portfolio’s Class T shares returned 4.62% for the 12-month period ended July 31, 2014. This compares to the 4.14% return of the Barclays U.S. Mortgage Backed Securities Index (the Index) and the 3.93% return of the Lipper U.S. Mortgage Funds Average.
Wellington Management Company, LLP (Wellington Management) managed the Portfolio during this reporting period.
What were market conditions?
| | • | | After stabilizing in July and August, agency mortgage-backed securities (MBS) returns moved back into positive territory after the Fed surprised the market by leaving its purchase pace unchanged. |
| | • | | Heading into year-end 2013, the performance of the MBS market was driven by changes to and expectations for the Federal Reserve (Fed) quantitative easing asset purchase program. In December, sooner than some market participants expected, the Fed announced its long-awaited tapering plan, but also signaled that purchases could last much longer than anticipated. Though Treasury yields rose on the taper announcement, MBS spreads (the difference in yield between comparable-duration MBS and Treasuries) tightened as investors realized the Fed’s purchases would continue at a relatively high level for some time. |
| | • | | During the first quarter of 2014, ongoing Fed tapering and indications the Fed might raise short-term rates earlier than expected weighed on the MBS sector. |
| | • | | MBS rebounded early in the second quarter, despite continued Fed tapering and geopolitical concerns, as signs of stronger U.S. economic growth kept volatility low and Treasury yields largely range-bound. In May, the Fed said it was likely to delay the end of MBS principal reinvestment beyond the first short-term rate hike, further supporting agency MBS spreads. |
| | • | | Relative to market technicals, supply remained below projections, which buoyed MBS prices. By July, a much anticipated supply/demand imbalance began to appear, as the Fed’s MBS purchases continued to decline and market supply increased. As a result, MBS underperformed toward the end of the period, but nevertheless held onto a large portion of their 2014 year-to-date gains. |
The Portfolio of Investments following this report shows the size of the Portfolio’s positions at period-end.
| | | | |
| The TARGET Portfolio Trust | | | 41 | |
Strategy and Performance Overview (continued)
What affected the Portfolio’s performance?
The following is a summary of the main factors that contributed to and detracted from the relative performance of the Portfolio versus its benchmark for the reporting period:
| | • | | Exposure to non-agency residential mortgage-backed securities (RMBS) was the primary contributor to relative outperformance during the period. RMBS continued to benefit from strong housing market fundamentals and a solid technical backdrop. |
| | • | | An underweight position in and issue selection among 30-year Government National Mortgage Association securities (GNMAs) contributed to relative performance. Conventional securities (Fannie Mae and Freddie Mac) outperformed GNMAs, particularly toward the end of the period, as bank demand for collateralized mortgage obligations, which had been supporting GNMA prices, appeared to end. |
| | • | | The Portfolio benefited from its allocation to agency collateralized mortgage obligations, particularly inverse interest-only securities (Inverse IOs), which pay a coupon inversely related to market rates. |
| | • | | An allocation to asset-backed securities also added to returns during the period, as did yield curve and duration positioning. |
| | • | | The Portfolio was hurt by its underweight in 30-year conventional MBS with higher yields, particularly those yielding 5.5% and 6.0%. Higher-yielding conventional MBS benefited from continued slow prepayments as well as favorable supply and demand dynamics. |
Did the Portfolio use derivatives and how did they affect performance?
| | • | | During the period, the Portfolio used interest rate futures and options to tactically manage exposure to interest rate risk. The Portfolio’s exposure to derivatives added slightly to performance. |
The Portfolio of Investments following this report shows the size of the Portfolio’s positions at period-end.
| | |
| 42 | | The TARGET Portfolio Trust |
Fees and Expenses (Unaudited)
As a shareholder of the Trust, you incur two types of costs: (1) transaction costs, including sales charges (loads) on purchase payments and redemptions, as applicable, and (2) ongoing costs, including management fees, and other Trust expenses, as applicable. This example is intended to help you understand your ongoing costs (in dollars) of investing in the Trust and to compare these costs with the ongoing costs of investing in other mutual funds.
The example is based on an investment of $1,000 invested on February 1, 2014, at the beginning of the period, and held through the six-month period ended July 31, 2014. The example is for illustrative purposes only; you should consult the Prospectus for information on initial and subsequent minimum investment requirements.
Actual Expenses
The first line for each share class in the table on the following pages provides information about actual account values and actual expenses. You may use the information on this line, together with the amount you invested, to estimate the expenses that you paid over the period. Simply divide your account value by $1,000 (for example, an $8,600 account value ÷ $1,000 = 8.6), then multiply the result by the number on the first line under the heading “Expenses Paid During the Six-Month Period” to estimate the expenses you paid on your account during this period.
Hypothetical Example for Comparison Purposes
The second line for each share class in the table on the following pages provides information about hypothetical account values and hypothetical expenses based on the Trust’s actual expense ratio and an assumed rate of return of 5% per year before expenses, which is not the Trust’s actual return. The hypothetical account values and expenses may not be used to estimate the actual ending account balance or expenses you paid for the period. You may use this information to compare the ongoing costs of investing in the Trust and other funds. To do so, compare this 5% hypothetical example with the 5% hypothetical examples that appear in the shareholder reports of the other funds.
The Trust’s transfer agent may charge additional fees to holders of certain accounts that are not included in the expenses shown in the table on the following pages. These fees apply to individual retirement accounts (IRAs) and Section 403(b) accounts. As of the close of the six-month period covered by the table, IRA fees included an annual maintenance fee of $15 per account (subject to a maximum annual maintenance fee of $25 for all accounts held by the same shareholder). Section 403(b) accounts are charged an annual $25 fiduciary maintenance fee. Some of the fees may vary in amount, or may be waived, based on your total account
| | | | |
| The TARGET Portfolio Trust | | | 43 | |
Fees and Expenses (continued)
balance or the number of Prudential Investments funds, including the Trust, that you own. You should consider the additional fees that were charged to your Trust account over the six-month period when you estimate the total ongoing expenses paid over the period and the impact of these fees on your ending account value, as these additional expenses are not reflected in the information provided in the expense table. Additional fees have the effect of reducing investment returns.
Please note that the expenses shown in the table are meant to highlight your ongoing costs only and do not reflect any transactional costs such as sales charges (loads). Therefore, the second line for each share class in the table is useful in comparing ongoing costs only and will not help you determine the relative total costs of owning different funds. In addition, if these transactional costs were included, your costs would have been higher.
| | | | | | | | | | | | | | | | |
Large
Capitalization
Growth Portfolio | | Beginning Account
Value
February 1, 2014 | | | Ending Account
Value
July 31, 2014 | | | Annualized
Expense Ratio
Based on the
Six-Month Period | | | Expenses Paid
During the
Six-Month Period* | |
| | | | | | | | | | | | | | | | |
| Class R | | | | | | | | | | | | | | | | |
| Actual | | $ | 1,000.00 | | | $ | 1,035.30 | | | | 1.31 | % | | $ | 6.61 | |
| Hypothetical | | $ | 1,000.00 | | | $ | 1,018.30 | | | | 1.31 | % | | $ | 6.56 | |
| Class T | | | | | | | | | | | | | | | | |
| Actual | | $ | 1,000.00 | | | $ | 1,038.00 | | | | 0.81 | % | | $ | 4.09 | |
| Hypothetical | | $ | 1,000.00 | | | $ | 1,020.78 | | | | 0.81 | % | | $ | 4.06 | |
| | | | | | | | | | | | | | | | |
Large
Capitalization
Value Portfolio | | Beginning Account
Value
February 1, 2014 | | | Ending Account
Value
July 31, 2014 | | | Annualized
Expense Ratio
Based on the
Six-Month Period | | | Expenses Paid
During the
Six-Month Period* | |
| | | | | | | | | | | | | | | | |
| Class R | | | | | | | | | | | | | | | | |
| Actual | | $ | 1,000.00 | | | $ | 1,096.50 | | | | 1.29 | % | | $ | 6.71 | |
| Hypothetical | | $ | 1,000.00 | | | $ | 1,018.40 | | | | 1.29 | % | | $ | 6.46 | |
| Class T | | | | | | | | | | | | | | | | |
| Actual | | $ | 1,000.00 | | | $ | 1,099.00 | | | | 0.79 | % | | $ | 4.11 | |
| Hypothetical | | $ | 1,000.00 | | | $ | 1,020.88 | | | | 0.79 | % | | $ | 3.96 | |
| | |
| 44 | | The TARGET Portfolio Trust |
| | | | | | | | | | | | | | | | |
Small
Capitalization
Growth Portfolio | | Beginning Account
Value
February 1, 2014 | | | Ending Account
Value
July 31, 2014 | | | Annualized
Expense Ratio
Based on the
Six-Month Period | | | Expenses Paid
During the
Six-Month Period* | |
| | | | | | | | | | | | | | | | |
Class R | | | | | | | | | | | | | | | | |
Actual | | $ | 1,000.00 | | | $ | 939.80 | | | | 1.40 | % | | $ | 6.73 | |
Hypothetical | | $ | 1,000.00 | | | $ | 1,017.85 | | | | 1.40 | % | | $ | 7.00 | |
Class T | | | | | | | | | | | | | | | | |
Actual | | $ | 1,000.00 | | | $ | 941.90 | | | | 0.90 | % | | $ | 4.33 | |
Hypothetical | | $ | 1,000.00 | | | $ | 1,020.33 | | | | 0.90 | % | | $ | 4.51 | |
| | | | | | | | | | | | | | | | |
Small
Capitalization
Value Portfolio | | Beginning Account
Value
February 1, 2014 | | | Ending Account
Value
July 31, 2014 | | | Annualized
Expense Ratio
Based on the
Six-Month Period | | | Expenses Paid
During the
Six-Month Period* | |
| | | | | | | | | | | | | | | | |
Class A | | | | | | | | | | | | | | | | |
Actual** | | $ | 1,000.00 | | | $ | 1,016.80 | | | | 1.07 | % | | $ | 4.97 | |
Hypothetical | | $ | 1,000.00 | | | $ | 1,019.49 | | | | 1.07 | % | | $ | 5.36 | |
Class R | | | | | | | | | | | | | | | | |
Actual | | $ | 1,000.00 | | | $ | 1,035.10 | | | | 1.32 | % | | $ | 6.66 | |
Hypothetical | | $ | 1,000.00 | | | $ | 1,018.25 | | | | 1.32 | % | | $ | 6.61 | |
Class T | | | | | | | | | | | | | | | | |
Actual | | $ | 1,000.00 | | | $ | 1,037.70 | | | | 0.82 | % | | $ | 4.14 | |
Hypothetical | | $ | 1,000.00 | | | $ | 1,020.73 | | | | 0.82 | % | | $ | 4.11 | |
| | | | | | | | | | | | | | | | |
International
Equity Portfolio | | Beginning Account
Value
February 1, 2014 | | | Ending Account
Value
July 31, 2014 | | | Annualized
Expense Ratio
Based on the
Six-Month Period | | | Expenses Paid
During the
Six-Month Period* | |
| | | | | | | | | | | | | | | | |
Class Q | | | | | | | | | | | | | | | | |
Actual | | $ | 1,000.00 | | | $ | 1,047.00 | | | | 0.81 | % | | $ | 4.11 | |
Hypothetical | | $ | 1,000.00 | | | $ | 1,020.78 | | | | 0.81 | % | | $ | 4.06 | |
Class R | | | | | | | | | | | | | | | | |
Actual | | $ | 1,000.00 | | | $ | 1,044.00 | | | | 1.41 | % | | $ | 7.15 | |
Hypothetical | | $ | 1,000.00 | | | $ | 1,017.80 | | | | 1.41 | % | | $ | 7.05 | |
Class T | | | | | | | | | | | | | | | | |
Actual | | $ | 1,000.00 | | | $ | 1,046.20 | | | | 0.91 | % | | $ | 4.62 | |
Hypothetical | | $ | 1,000.00 | | | $ | 1,020.28 | | | | 0.91 | % | | $ | 4.56 | |
| | | | |
| The TARGET Portfolio Trust | | | 45 | |
Fees and Expenses (continued)
| | | | | | | | | | | | | | | | |
Total Return
Bond Portfolio | | Beginning Account
Value
February 1, 2014 | | | Ending Account
Value
July 31, 2014 | | | Annualized
Expense Ratio
Based on the
Six-Month Period | | | Expenses Paid
During the
Six-Month Period* | |
| | | | | | | | | | | | | | | | |
| Class R | | | | | | | | | | | | | | | | |
| Actual | | $ | 1,000.00 | | | $ | 1,011.60 | | | | 1.15 | % | | $ | 5.74 | |
| Hypothetical | | $ | 1,000.00 | | | $ | 1,019.09 | | | | 1.15 | % | | $ | 5.76 | |
| Class T | | | | | | | | | | | | | | | | |
| Actual | | $ | 1,000.00 | | | $ | 1,014.00 | | | | 0.65 | % | | $ | 3.25 | |
| Hypothetical | | $ | 1,000.00 | | | $ | 1,021.57 | | | | 0.65 | % | | $ | 3.26 | |
| | | | | | | | | | | | | | | | |
Intermediate-Term
Bond Portfolio | | Beginning Account
Value
February 1, 2014 | | | Ending Account
Value
July 31, 2014 | | | Annualized
Expense Ratio
Based on the
Six-Month Period | | | Expenses Paid
During the
Six-Month Period* | |
| | | | | | | | | | | | | | | | |
| Class T | | | | | | | | | | | | | | | | |
| Actual | | $ | 1,000.00 | | | $ | 1,008.10 | | | | 0.77 | % | | $ | 3.83 | |
| Hypothetical | | $ | 1,000.00 | | | $ | 1,020.98 | | | | 0.77 | % | | $ | 3.86 | |
| | | | | | | | | | | | | | | | |
Mortgage Backed
Securities Portfolio | | Beginning Account
Value
February 1, 2014 | | | Ending Account
Value
July 31, 2014 | | | Annualized
Expense Ratio
Based on the
Six-Month Period | | | Expenses Paid
During the
Six-Month Period* | |
| | | | | | | | | | | | | | | | |
| Class T | | | | | | | | | | | | | | | | |
| Actual | | $ | 1,000.00 | | | $ | 1,020.40 | | | | 1.00 | % | | $ | 5.01 | |
| Hypothetical | | $ | 1,000.00 | | | $ | 1,019.84 | | | | 1.00 | % | | $ | 5.01 | |
* Portfolio expenses (net of fee waivers or subsidies, if any) for each share class are equal to the annualized expense ratio for each share class (provided in the table), multiplied by the average account value over the period, multiplied by the 181 days in the six-month period ended July 31, 2014, and divided by 365 days.
** “Actual” expenses are calculated using the 168 day period ended July 31, 2014 due to the class’s inception date of February 14, 2014.
Each Portfolio’s annualized expense ratios for the period ended July 31, 2014, are as follows:
Target Portfolio Trust—Large Capitalization Growth Portfolio
| | | | | | | | |
| Class | | Gross Operating Expenses | | | Net Operating Expenses | |
R | | | 1.56 | % | | | 1.31 | % |
T | | | 0.81 | | | | 0.81 | |
| | |
| 46 | | The TARGET Portfolio Trust |
Target Portfolio Trust—Large Capitalization Value Portfolio
| | | | | | | | |
| Class | | Gross Operating Expenses | | | Net Operating Expenses | |
R | | | 1.54 | % | | | 1.29 | % |
T | | | 0.79 | | | | 0.79 | |
Target Portfolio Trust—Small Capitalization Growth Portfolio
| | | | | | | | |
| Class | | Gross Operating Expenses | | | Net Operating Expenses | |
R | | | 1.64 | % | | | 1.39 | % |
T | | | 0.89 | | | | 0.89 | |
Target Portfolio Trust—Small Capitalization Value Portfolio
| | | | | | | | |
| Class | | Gross Operating Expenses | | | Net Operating Expenses | |
A | | | 0.98 | % | | | 0.93 | % |
R | | | 1.43 | | | | 1.18 | |
T | | | 0.68 | | | | 0.68 | |
Target Portfolio Trust—International Equity Portfolio
| | | | | | | | |
| Class | | Gross Operating Expenses | | | Net Operating Expenses | |
Q | | | 0.81 | % | | | 0.81 | % |
R | | | 1.67 | | | | 1.42 | |
T | | | 0.92 | | | | 0.92 | |
Target Portfolio Trust—Total Return Bond Portfolio
| | | | | | | | |
| Class | | Gross Operating Expenses | | | Net Operating Expenses | |
R | | | 1.41 | % | | | 1.16 | % |
T | | | 0.66 | | | | 0.66 | |
Target Portfolio Trust—Intermediate-Term Bond Portfolio
| | | | | | | | |
| Class | | Gross Operating Expenses | | | Net Operating Expenses | |
T | | | 0.77 | % | | | 0.77 | % |
Target Portfolio Trust—Mortgage-Backed Securities Portfolio
| | | | | | | | |
| Class | | Gross Operating Expenses | | | Net Operating Expenses | |
T | | | 0.99 | % | | | 0.99 | % |
Net operating expenses shown above reflect any fee waivers and/or expense reimbursements. Additional information on Portfolio expenses and any fee waivers and/or expense reimbursements can be found in the “Financial Highlights” tables in this report and in the Notes to the Financial Statements in this report.
| | | | |
| The TARGET Portfolio Trust | | | 47 | |
| | |
Portfolio of Investments
As of July 31, 2014 | | Large Capitalization Growth Portfolio |
| | | | | | | | |
| SHARES | | | DESCRIPTION | | VALUE (NOTE 1) | |
| | | | LONG-TERM INVESTMENTS—97.3% | | | | |
| | |
| | | | COMMON STOCKS | | | | |
| | |
| | | | Aerospace & Defense—1.3% | | | | |
| | 4,311 | | | B/E Aerospace, Inc.* | | $ | 367,039 | |
| | 14,328 | | | Honeywell International, Inc. | | | 1,315,740 | |
| | 8,428 | | | Precision Castparts Corp. | | | 1,928,326 | |
| | | | | | | | |
| | | | | | | 3,611,105 | |
| | | | | | | | |
| | |
| | | | Auto Components—0.4% | | | | |
| | 19,324 | | | BorgWarner, Inc. | | | 1,202,919 | |
| | | | | | | | |
| | |
| | | | Beverages—0.6% | | | | |
| | 8,330 | | | Constellation Brands, Inc. (Class A Stock)* | | | 693,556 | |
| | 13,550 | | | Diageo PLC (United Kingdom) | | | 406,939 | |
| | 5,218 | | | Pernod-Ricard SA (France) | | | 584,369 | |
| | | | | | | | |
| | | | | | | 1,684,864 | |
| | | | | | | | |
| | |
| | | | Biotechnology—5.7% | | | | |
| | 12,350 | | | Alexion Pharmaceuticals, Inc.* | | | 1,963,526 | |
| | 8,969 | | | Biogen Idec, Inc.* | | | 2,999,144 | |
| | 18,421 | | | Celgene Corp.* | | | 1,605,390 | |
| | 83,374 | | | Gilead Sciences, Inc.* | | | 7,632,890 | |
| | 4,050 | | | Isis Pharmaceuticals, Inc.*(a) | | | 125,509 | |
| | 2,190 | | | Puma Biotechnology, Inc.* | | | 485,567 | |
| | 4,472 | | | Regeneron Pharmaceuticals, Inc.*(a) | | | 1,414,136 | |
| | | | | | | | |
| | | | | | | 16,226,162 | |
| | | | | | | | |
| | |
| | | | Capital Markets—3.0% | | | | |
| | 4,984 | | | Affiliated Managers Group, Inc.* | | | 993,062 | |
| | 2,316 | | | BlackRock, Inc. | | | 705,755 | |
| | 221,098 | | | Charles Schwab Corp. (The) | | | 6,135,469 | |
| | 23,740 | | | Morgan Stanley | | | 767,752 | |
| | | | | | | | |
| | | | | | | 8,602,038 | |
| | | | | | | | |
| | |
| | | | Chemicals—3.3% | | | | |
| | 8,130 | | | Airgas, Inc. | | | 869,259 | |
| | 41,894 | | | Ecolab, Inc. | | | 4,546,756 | |
| | 22,898 | | | Monsanto Co. | | | 2,589,535 | |
| | 7,722 | | | Sherwin-Williams Co. (The) | | | 1,592,508 | |
| | | | | | | | |
| | | | | | | 9,598,058 | |
| | | | | | | | |
| | |
| | | �� | Commercial Services & Supplies—1.4% | | | | |
| | 34,850 | | | Stericycle, Inc.* | | | 4,100,103 | |
| | | | | | | | |
| | |
| | | | Communications Equipment—2.5% | | | | |
| | 98,900 | | | QUALCOMM, Inc. | | | 7,288,930 | |
| | | | | | | | |
See Notes to Financial Statements.
| | | | |
| The TARGET Portfolio Trust | | | 49 | |
| | |
Large Capitalization Growth Portfolio (continued) | | Portfolio of Investments
As of July 31, 2014 |
| | | | | | | | |
| SHARES | | | DESCRIPTION | | VALUE (NOTE 1) | |
| | | | COMMON STOCKS (continued) | | | | |
| | |
| | | | Construction & Engineering—1.1% | | | | |
| | 41,750 | | | Fluor Corp. | | $ | 3,042,323 | |
| | | | | | | | |
| | |
| | | | Consumer Finance—0.6% | | | | |
| | 21,100 | | | American Express Co. | | | 1,856,800 | |
| | | | | | | | |
| | |
| | | | Diversified Financial Services—1.0% | | | | |
| | 12,582 | | | IntercontinentalExchange Group, Inc. | | | 2,418,512 | |
| | 5,033 | | | Moody’s Corp. | | | 437,871 | |
| | | | | | | | |
| | | | | | | 2,856,383 | |
| | | | | | | | |
| | |
| | | | Electrical Equipment—0.5% | | | | |
| | 28,470 | | | AMETEK, Inc. | | | 1,386,204 | |
| | | | | | | | |
| | |
| | | | Electronic Equipment, Instruments & Components—2.3% | | | | |
| | 43,275 | | | Amphenol Corp. (Class A Stock) | | | 4,161,757 | |
| | 74,539 | | | National Instruments Corp. | | | 2,373,322 | |
| | | | | | | | |
| | | | | | | 6,535,079 | |
| | | | | | | | |
| | |
| | | | Energy Equipment & Services—5.9% | | | | |
| | 27,112 | | | Core Laboratories NV | | | 3,970,010 | |
| | 82,351 | | | FMC Technologies, Inc.* | | | 5,006,941 | |
| | 15,754 | | | Halliburton Co. | | | 1,086,868 | |
| | 63,007 | | | Schlumberger Ltd. | | | 6,829,329 | |
| | | | | | | | |
| | | | | | | 16,893,148 | |
| | | | | | | | |
| | |
| | | | Food & Staples Retailing—3.3% | | | | |
| | 35,174 | | | Costco Wholesale Corp. | | | 4,134,352 | |
| | 15,610 | | | CVS Caremark Corp. | | | 1,191,979 | |
| | 108,895 | | | Whole Foods Market, Inc. | | | 4,161,967 | |
| | | | | | | | |
| | | | | | | 9,488,298 | |
| | | | | | | | |
| | |
| | | | Food Products—3.0% | | | | |
| | 9,869 | | | Danone (France) | | | 712,844 | |
| | 68,591 | | | Mead Johnson Nutrition Co. | | | 6,271,961 | |
| | 44,891 | | | Mondelez International, Inc. (Class A Stock) | | | 1,616,076 | |
| | | | | | | | |
| | | | | | | 8,600,881 | |
| | | | | | | | |
| | |
| | | | Health Care Equipment & Supplies—3.0% | | | | |
| | 10,415 | | | Abbott Laboratories | | | 438,680 | |
| | 3,226 | | | C.R. Bard, Inc. | | | 481,416 | |
| | 4,132 | | | Cooper Cos., Inc. (The) | | | 664,756 | |
| | 23,098 | | | Covidien PLC | | | 1,998,208 | |
| | 11,324 | | | Intuitive Surgical, Inc.* | | | 5,181,296 | |
| | | | | | | | |
| | | | | | | 8,764,356 | |
| | | | | | | | |
See Notes to Financial Statements.
| | | | |
| 50 | | | The TARGET Portfolio Trust | |
| | | | | | | | |
| SHARES | | | DESCRIPTION | | VALUE (NOTE 1) | |
| | | | COMMON STOCKS (continued) | | | | |
| | |
| | | | Health Care Providers & Services—3.8% | | | | |
| | 57,306 | | | DaVita HealthCare Partners, Inc.* | | $ | 4,036,635 | |
| | 83,631 | | | Express Scripts Holding Co.* | | | 5,824,899 | |
| | 6,102 | | | McKesson Corp. | | | 1,170,730 | |
| | | | | | | | |
| | | | | | | 11,032,264 | |
| | | | | | | | |
| | |
| | | | Health Care Technology—0.3% | | | | |
| | 14,092 | | | Cerner Corp.* | | | 777,878 | |
| | | | | | | | |
| | |
| | | | Hotels, Restaurants & Leisure—4.6% | | | | |
| | 21,623 | | | Hilton Worldwide Holdings, Inc.* | | | 523,493 | |
| | 23,400 | | | Las Vegas Sands Corp. | | | 1,728,090 | |
| | 22,180 | | | Marriott International, Inc. (Class A Stock)(a) | | | 1,435,268 | |
| | 86,136 | | | Starbucks Corp. | | | 6,691,044 | |
| | 10,896 | | | Wynn Resorts Ltd. | | | 2,323,027 | |
| | 7,227 | | | Yum! Brands, Inc. | | | 501,554 | |
| | | | | | | | |
| | | | | | | 13,202,476 | |
| | | | | | | | |
| | |
| | | | Household Products—0.5% | | | | |
| | 20,591 | | | Colgate-Palmolive Co. | | | 1,305,469 | |
| | | | | | | | |
| | |
| | | | Industrial Conglomerates—3.1% | | | | |
| | 104,389 | | | Danaher Corp. | | | 7,712,259 | |
| | 8,014 | | | Roper Industries, Inc. | | | 1,154,577 | |
| | | | | | | | |
| | | | | | | 8,866,836 | |
| | | | | | | | |
| | |
| | | | Insurance—0.2% | | | | |
| | 8,560 | | | MetLife, Inc. | | | 450,256 | |
| | | | | | | | |
| | |
| | | | Internet & Catalog Retail—1.6% | | | | |
| | 3,964 | | | Amazon.com, Inc.* | | | 1,240,692 | |
| | 2,430 | | | Priceline Group, Inc. (The)* | | | 3,019,154 | |
| | 2,855 | | | TripAdvisor, Inc.* | | | 270,768 | |
| | | | | | | | |
| | | | | | | 4,530,614 | |
| | | | | | | | |
| | |
| | | | Internet Software & Services—6.6% | | | | |
| | 44,693 | | | Facebook, Inc. (Class A Stock)* | | | 3,246,946 | |
| | 12,497 | | | Google, Inc. (Class A Stock)* | | | 7,242,636 | |
| | 11,683 | | | Google, Inc. (Class C Stock)* | | | 6,678,003 | |
| | 6,414 | | | LinkedIn Corp. (Class A Stock)* | | | 1,158,625 | |
| | 1,940 | | | Twitter, Inc.* | | | 87,669 | |
| | 15,685 | | | Yahoo!, Inc.* | | | 561,680 | |
| | | | | | | | |
| | | | | | | 18,975,559 | |
| | | | | | | | |
| | |
| | | | IT Services—8.4% | | | | |
| | 34,407 | | | Accenture PLC (Class A Stock) | | | 2,727,787 | |
| | 105,267 | | | Cognizant Technology Solutions Corp. (Class A Stock)* | | | 5,163,346 | |
| | 11,187 | | | FleetCor Technologies, Inc.* | | | 1,485,522 | |
| | 167,207 | | | Genpact Ltd.* | | | 2,942,843 | |
| | 34,457 | | | MasterCard, Inc. (Class A Stock) | | | 2,554,987 | |
See Notes to Financial Statements.
| | | | |
| The TARGET Portfolio Trust | | | 51 | |
| | |
Large Capitalization Growth Portfolio (continued) | | Portfolio of Investments
As of July 31, 2014 |
| | | | | | | | |
| SHARES | | | DESCRIPTION | | VALUE (NOTE 1) | |
| | | | COMMON STOCKS (continued) | | | | |
| | |
| | | | IT Services (continued) | | | | |
| | 43,812 | | | Visa, Inc. (Class A Stock)(a) | | $ | 9,244,770 | |
| | | | | | | | |
| | | | | | | 24,119,255 | |
| | | | | | | | |
| | |
| | | | Life Sciences Tools & Services—2.2% | | | | |
| | 35,756 | | | Covance, Inc.* | | | 3,000,644 | |
| | 27,217 | | | Thermo Fisher Scientific, Inc. | | | 3,306,865 | |
| | | | | | | | |
| | | | | | | 6,307,509 | |
| | | | | | | | |
| | |
| | | | Machinery—0.6% | | | | |
| | 11,505 | | | Colfax Corp.*(a) | | | 724,470 | |
| | 4,644 | | | Cummins, Inc. | | | 647,327 | |
| | 6,989 | | | Joy Global, Inc.(a) | | | 414,168 | |
| | | | | | | | |
| | | | | | | 1,785,965 | |
| | | | | | | | |
| | |
| | | | Media—4.7% | | | | |
| | 44,012 | | | Comcast Corp. (Class A Stock)(a) | | | 2,353,322 | |
| | 56,123 | | | Discovery Communications, Inc. (Class A Stock)* | | | 4,782,241 | |
| | 18,920 | | | Time Warner, Inc. | | | 1,570,738 | |
| | 72,770 | | | Twenty-First Century Fox, Inc. (Class A Stock) | | | 2,305,354 | |
| | 8,814 | | | Viacom, Inc. (Class B Stock) | | | 728,653 | |
| | 20,909 | | | Walt Disney Co. (The) | | | 1,795,665 | |
| | | | | | | | |
| | | | | | | 13,535,973 | |
| | | | | | | | |
| | |
| | | | Oil, Gas & Consumable Fuels—2.1% | | | | |
| | 15,724 | | | Anadarko Petroleum Corp. | | | 1,680,109 | |
| | 15,206 | | | Cabot Oil & Gas Corp. | | | 501,038 | |
| | 1,028 | | | Concho Resources, Inc.* | | | 144,742 | |
| | 19,710 | | | Noble Energy, Inc. | | | 1,310,518 | |
| | 9,061 | | | Pioneer Natural Resources Co. | | | 2,006,649 | |
| | 3,397 | | | Whiting Petroleum Corp.* | | | 300,601 | |
| | | | | | | | |
| | | | | | | 5,943,657 | |
| | | | | | | | |
| | |
| | | | Personal Products—1.8% | | | | |
| | 71,238 | | | Estee Lauder Cos., Inc. (The) (Class A Stock) | | | 5,233,143 | |
| | | | | | | | |
| | |
| | | | Pharmaceuticals—2.3% | | | | |
| | 12,283 | | | Actavis PLC* | | | 2,631,755 | |
| | 38,009 | | | Bristol-Myers Squibb Co. | | | 1,924,016 | |
| | 4,245 | | | Perrigo Co. PLC | | | 638,660 | |
| | 7,730 | | | Valeant Pharmaceuticals International, Inc.*(a) | | | 907,425 | |
| | 17,809 | | | Zoetis, Inc. | | | 586,094 | |
| | | | | | | | |
| | | | | | | 6,687,950 | |
| | | | | | | | |
| | |
| | | | Professional Services—0.3% | | | | |
| | 13,370 | | | Verisk Analytics, Inc. (Class A Stock)* | | | 802,735 | |
| | | | | | | | |
See Notes to Financial Statements.
| | | | |
| 52 | | | The TARGET Portfolio Trust | |
| | | | | | | | |
| SHARES | | | DESCRIPTION | | VALUE (NOTE 1) | |
| | | | COMMON STOCKS (continued) | | | | |
| | |
| | | | Real Estate Investment Trusts (REITs)—1.1% | | | | |
| | 33,962 | | | American Tower Corp. | | $ | 3,205,673 | |
| | | | | | | | |
| | |
| | | | Real Estate Management & Development—0.1% | | | | |
| | 4,731 | | | Realogy Holdings Corp.* | | | 173,912 | |
| | | | | | | | |
| | |
| | | | Road & Rail—0.6% | | | | |
| | 5,133 | | | Kansas City Southern | | | 559,805 | |
| | 11,658 | | | Union Pacific Corp. | | | 1,146,098 | |
| | | | | | | | |
| | | | | | | 1,705,903 | |
| | | | | | | | |
| | |
| | | | Semiconductors & Semiconductor Equipment—0.4% | | | | |
| | 27,256 | | | Altera Corp. | | | 891,816 | |
| | 3,396 | | | Linear Technology Corp. | | | 149,883 | |
| | | | | | | | |
| | | | | | | 1,041,699 | |
| | | | | | | | |
| | |
| | | | Software—4.2% | | | | |
| | 32,139 | | | ANSYS, Inc.* | | | 2,472,775 | |
| | 9,487 | | | Autodesk, Inc.* | | | 506,131 | |
| | 8,909 | | | Citrix Systems, Inc.*(a) | | | 603,407 | |
| | 724 | | | NetSuite, Inc.* | | | 61,040 | |
| | 57,335 | | | Oracle Corp. | | | 2,315,761 | |
| | 11,110 | | | PTC, Inc.* | | | 399,516 | |
| | 103,267 | | | Salesforce.com, inc.* | | | 5,602,235 | |
| | 2,321 | | | VMware, Inc. (Class A Stock)*(a) | | | 230,614 | |
| | | | | | | | |
| | | | | | | 12,191,479 | |
| | | | | | | | |
| | |
| | | | Specialty Retail—1.7% | | | | |
| | 1,338 | | | AutoZone, Inc.*(a) | | | 691,786 | |
| | 27,191 | | | Ross Stores, Inc. | | | 1,751,100 | |
| | 8,840 | | | Tiffany & Co. | | | 862,872 | |
| | 18,274 | | | TJX Cos., Inc. (The) | | | 973,822 | |
| | 5,963 | | | Tractor Supply Co. | | | 370,720 | |
| | 4,130 | | | Urban Outfitters, Inc.* | | | 147,565 | |
| | | | | | | | |
| | | | | | | 4,797,865 | |
| | | | | | | | |
| | |
| | | | Technology Hardware, Storage & Peripherals—3.5% | | | | |
| | 74,445 | | | Apple, Inc. | | | 7,114,708 | |
| | 101,686 | | | EMC Corp. | | | 2,979,400 | |
| | | | | | | | |
| | | | | | | 10,094,108 | |
| | | | | | | | |
| | |
| | | | Textiles, Apparel & Luxury Goods—2.3% | | | | |
| | 21,908 | | | Fossil Group, Inc.* | | | 2,146,984 | |
| | 5,043 | | | LVMH Moet Hennessy Louis Vuitton SA (France) | | | 867,505 | |
| | 4,373 | | | Michael Kors Holdings Ltd.* | | | 356,312 | |
| | 11,077 | | | NIKE, Inc. (Class B Stock) | | | 854,369 | |
| | 5,409 | | | PVH Corp. | | | 595,964 | |
| | 27,010 | | | VF Corp. | | | 1,654,903 | |
| | | | | | | | |
| | | | | | | 6,476,037 | |
| | | | | | | | |
See Notes to Financial Statements.
| | | | |
| The TARGET Portfolio Trust | | | 53 | |
| | |
Large Capitalization Growth Portfolio (continued) | | Portfolio of Investments
As of July 31, 2014 |
| | | | | | | | |
| SHARES | | | DESCRIPTION | | VALUE (NOTE 1) | |
| | | | COMMON STOCKS (continued) | | | | |
| | |
| | | | Tobacco—0.2% | | | | |
| | 8,815 | | | Philip Morris International, Inc. | | $ | 722,918 | |
| | | | | | | | |
| | |
| | | | Trading Companies & Distributors—1.2% | | | | |
| | 74,882 | | | Fastenal Co. | | | 3,321,017 | |
| | | | | | | | |
| | | | TOTAL LONG-TERM INVESTMENTS
(cost $198,032,977) | | | 279,025,801 | |
| | | | | | | | |
| | |
| | | | SHORT-TERM INVESTMENT—7.9% | | | | |
| | |
| | | | AFFILIATED MONEY MARKET MUTUAL FUND | | | | |
| | 22,698,987 | | | Prudential Investment Portfolios 2—Prudential Core Taxable Money Market Fund (cost $22,698,987; includes $14,192,964 of cash collateral for securities on loan)(Note 3)(b)(w) | | | 22,698,987 | |
| | | | | | | | |
| | | | TOTAL INVESTMENTS—105.2%
(cost $220,731,964; Note 5) | | | 301,724,788 | |
| | | | Liabilities in excess of other assets—(5.2%) | | | (14,819,320 | ) |
| | | | | | | | |
| | | | NET ASSETS—100.0% | | $ | 286,905,468 | |
| | | | | | | | |
| * | Non-income producing security. |
| (a) | All or a portion of security is on loan. The aggregate market value of such securities, including those sold and pending settlement, is $13,575,423; cash collateral of $14,192,964 (included in liabilities) was received with which the Portfolio purchased highly liquid short-term investments. Securities on loan are subject to contractual netting arrangements. |
| (b) | Represents security, or a portion thereof, purchased with cash collateral received for securities on loan. |
| (w) | Prudential Investments LLC, the manager of the Portfolio, also serves as manager of the Prudential Investment Portfolios 2—Prudential Core Taxable Money Market Fund. |
Various inputs are used in determining the value of the Portfolio’s investments. These inputs are summarized in the three broad levels listed below.
Level 1—quoted prices generally in active markets for identical securities.
Level 2—other significant observable inputs including, but not limited to, quoted prices for similar securities, interest rates and yield curves, prepayment speeds, foreign currency exchange rates, and amortized cost.
Level 3—significant unobservable inputs for securities valued in accordance with Board approved fair valuation procedures.
The following is a summary of the inputs used as of July 31, 2014 in valuing such portfolio securities:
| | | | | | | | | | | | |
| | | Level 1 | | | Level 2 | | | Level 3 | |
| Investments in Securities | | | | | | | | | | | | |
Common Stocks | | | | | | | | | | | | |
Aerospace & Defense | | $ | 3,611,105 | | | $ | — | | | $ | — | |
Auto Components | | | 1,202,919 | | | | — | | | | — | |
Beverages | | | 693,556 | | | | 991,308 | | | | — | |
Biotechnology | | | 16,226,162 | | | | — | | | | — | |
Capital Markets | | | 8,602,038 | | | | — | | | | — | |
See Notes to Financial Statements.
| | | | |
| 54 | | | The TARGET Portfolio Trust | |
| | | | | | | | | | | | |
| | | Level 1 | | | Level 2 | | | Level 3 | |
| Investments in Securities (continued) | | | | | | | | | | | | |
Chemicals | | $ | 9,598,058 | | | $ | — | | | $ | — | |
Commercial Services & Supplies | | | 4,100,103 | | | | — | | | | — | |
Communications Equipment | | | 7,288,930 | | | | — | | | | — | |
Construction & Engineering | | | 3,042,323 | | | | — | | | | — | |
Consumer Finance | | | 1,856,800 | | | | — | | | | — | |
Diversified Financial Services | | | 2,856,383 | | | | — | | | | — | |
Electrical Equipment | | | 1,386,204 | | | | — | | | | — | |
Electronic Equipment, Instruments & Components | | | 6,535,079 | | | | — | | | | — | |
Energy Equipment & Services | | | 16,893,148 | | | | — | | | | — | |
Food & Staples Retailing | | | 9,488,298 | | | | — | | | | — | |
Food Products | | | 7,888,037 | | | | 712,844 | | | | — | |
Health Care Equipment & Supplies | | | 8,764,356 | | | | — | | | | — | |
Health Care Providers & Services | | | 11,032,264 | | | | — | | | | — | |
Health Care Technology | | | 777,878 | | | | — | | | | — | |
Hotels, Restaurants & Leisure | | | 13,202,476 | | | | — | | | | — | |
Household Products | | | 1,305,469 | | | | — | | | | — | |
Industrial Conglomerates | | | 8,866,836 | | | | — | | | | — | |
Insurance | | | 450,256 | | | | — | | | | — | |
Internet & Catalog Retail | | | 4,530,614 | | | | — | | | | — | |
Internet Software & Services | | | 18,975,559 | | | | — | | | | — | |
IT Services | | | 24,119,255 | | | | — | | | | — | |
Life Sciences Tools & Services | | | 6,307,509 | | | | — | | | | — | |
Machinery | | | 1,785,965 | | | | — | | | | — | |
Media | | | 13,535,973 | | | | — | | | | — | |
Oil, Gas & Consumable Fuels | | | 5,943,657 | | | | — | | | | — | |
Personal Products | | | 5,233,143 | | | | — | | | | — | |
Pharmaceuticals | | | 6,687,950 | | | | — | | | | — | |
Professional Services | | | 802,735 | | | | — | | | | — | |
Real Estate Investment Trusts (REITs) | | | 3,205,673 | | | | — | | | | — | |
Real Estate Management & Development | | | 173,912 | | | | — | | | | — | |
Road & Rail | | | 1,705,903 | | | | — | | | | — | |
Semiconductors & Semiconductor Equipment | | | 1,041,699 | | | | — | | | | — | |
Software | | | 12,191,479 | | | | — | | | | — | |
Specialty Retail | | | 4,797,865 | | | | — | | | | — | |
Technology Hardware, Storage & Peripherals | | | 10,094,108 | | | | — | | | | — | |
Textiles, Apparel & Luxury Goods | | | 5,608,532 | | | | 867,505 | | | | — | |
Tobacco | | | 722,918 | | | | — | | | | — | |
Trading Companies & Distributors | | | 3,321,017 | | | | — | | | | — | |
Affiliated Money Market Mutual Fund | | | 22,698,987 | | | | — | | | | — | |
| | | | | | | | | | | | |
Total | | $ | 299,153,131 | | | $ | 2,571,657 | | | $ | — | |
| | | | | | | | | | | | |
See Notes to Financial Statements.
| | | | |
| The TARGET Portfolio Trust | | | 55 | |
| | |
Large Capitalization Growth Portfolio (continued) | | Portfolio of Investments
As of July 31, 2014 |
The industry classification of investments and liabilities in excess of other assets shown as a percentage of net assets as of July 31, 2014 was as follows (unaudited):
| | | | |
IT Services | | | 8.4 | % |
Affiliated Money Market Mutual Fund (including 4.9% of collateral for securities on loan) | | | 7.9 | |
Internet Software & Services | | | 6.6 | |
Energy Equipment & Services | | | 5.9 | |
Biotechnology | | | 5.7 | |
Media | | | 4.7 | |
Hotels, Restaurants & Leisure | | | 4.6 | |
Software | | | 4.2 | |
Health Care Providers & Services | | | 3.8 | |
Technology Hardware, Storage & Peripherals | | | 3.5 | |
Chemicals | | | 3.3 | |
Food & Staples Retailing | | | 3.3 | |
Industrial Conglomerates | | | 3.1 | |
Capital Markets | | | 3.0 | |
Food Products | | | 3.0 | |
Health Care Equipment & Supplies | | | 3.0 | |
Communications Equipment | | | 2.5 | |
Electronic Equipment, Instruments & Components | | | 2.3 | |
Pharmaceuticals | | | 2.3 | |
Textiles, Apparel & Luxury Goods | | | 2.3 | |
Life Sciences Tools & Services | | | 2.2 | |
Oil, Gas & Consumable Fuels | | | 2.1 | |
Personal Products | | | 1.8 | |
Specialty Retail | | | 1.7 | |
Internet & Catalog Retail | | | 1.6 | % |
Commercial Services & Supplies | | | 1.4 | |
Aerospace & Defense | | | 1.3 | |
Trading Companies & Distributors | | | 1.2 | |
Construction & Engineering | | | 1.1 | |
Real Estate Investment Trusts (REITs) | | | 1.1 | |
Diversified Financial Services | | | 1.0 | |
Beverages | | | 0.6 | |
Consumer Finance | | | 0.6 | |
Machinery | | | 0.6 | |
Road & Rail | | | 0.6 | |
Electrical Equipment | | | 0.5 | |
Household Products | | | 0.5 | |
Auto Components | | | 0.4 | |
Semiconductors & Semiconductor Equipment | | | 0.4 | |
Health Care Technology | | | 0.3 | |
Professional Services | | | 0.3 | |
Insurance | | | 0.2 | |
Tobacco | | | 0.2 | |
Real Estate Management & Development | | | 0.1 | |
| | | | |
| | | 105.2 | |
Liabilities in excess of other assets | | | (5.2 | ) |
| | | | |
| | | 100.0 | % |
| | | | |
See Notes to Financial Statements.
| | | | |
| 56 | | | The TARGET Portfolio Trust | |
| | |
Portfolio of Investments
As of July 31, 2014 | | Large Capitalization Value Portfolio |
| | | | | | | | |
| SHARES | | | DESCRIPTION | | VALUE (NOTE 1) | |
| | | | | | | | |
| | | | LONG-TERM INVESTMENTS—98.4% | | | | |
| | |
| | | | COMMON STOCKS | | | | |
| | |
| | | | Aerospace & Defense—3.5% | | | | |
| | 37,770 | | | Boeing Co. (The) | | $ | 4,550,530 | |
| | 9,600 | | | Embraer SA (Brazil), ADR | | | 365,184 | |
| | 7,700 | | | Lockheed Martin Corp. | | | 1,285,669 | |
| | 31,500 | | | Northrop Grumman Corp. | | | 3,883,005 | |
| | | | | | | | |
| | | | | | | 10,084,388 | |
| | | | | | | | |
| | |
| | | | Auto Components—1.8% | | | | |
| | 40,800 | | | Delphi Automotive PLC (United Kingdom) | | | 2,725,440 | |
| | 42,800 | | | Johnson Controls, Inc. | | | 2,021,872 | |
| | 500 | | | Lear Corp. | | | 47,085 | |
| | 4,200 | | | Magna International, Inc. (Canada) | | | 451,080 | |
| | | | | | | | |
| | | | | | | 5,245,477 | |
| | | | | | | | |
| | |
| | | | Automobiles—2.0% | | | | |
| | 172,900 | | | Ford Motor Co. | | | 2,942,758 | |
| | 53,200 | | | General Motors Co. | | | 1,799,224 | |
| | 26,700 | | | Honda Motor Co. Ltd. (Japan) | | | 931,296 | |
| | | | | | | | |
| | | | | | | 5,673,278 | |
| | | | | | | | |
| | |
| | | | Banks—11.2% | | | | |
| | 344,786 | | | Bank of America Corp. | | | 5,257,986 | |
| | 11,000 | | | BB&T Corp. | | | 407,220 | |
| | 70,125 | | | CIT Group, Inc. | | | 3,443,839 | |
| | 119,093 | | | Citigroup, Inc. | | | 5,824,839 | |
| | 97,120 | | | Fifth Third Bancorp | | | 1,989,017 | |
| | 123,800 | | | JPMorgan Chase & Co. | | | 7,139,546 | |
| | 25,700 | | | PNC Financial Services Group, Inc. (The) | | | 2,121,792 | |
| | 118,343 | | | Wells Fargo & Co. | | | 6,023,659 | |
| | | | | | | | |
| | | | | | | 32,207,898 | |
| | | | | | | | |
| | |
| | | | Beverages—1.1% | | | | |
| | 19,200 | | | Molson Coors Brewing Co. (Class B Stock) | | | 1,296,576 | |
| | 19,850 | | | PepsiCo, Inc. | | | 1,748,785 | |
| | | | | | | | |
| | | | | | | 3,045,361 | |
| | | | | | | | |
| | |
| | | | Biotechnology—0.3% | | | | |
| | 7,000 | | | Amgen, Inc. | | | 891,730 | |
| | | | | | | | |
| | |
| | | | Capital Markets—2.5% | | | | |
| | 23,500 | | | Bank of New York Mellon Corp. (The) | | | 917,440 | |
| | 7,700 | | | Goldman Sachs Group, Inc. (The) | | | 1,331,099 | |
| | 106,660 | | | Morgan Stanley | | | 3,449,384 | |
| | 19,900 | | | State Street Corp. | | | 1,401,756 | |
| | | | | | | | |
| | | | | | | 7,099,679 | |
| | | | | | | | |
See Notes to Financial Statements.
| | | | |
| The TARGET Portfolio Trust | | | 57 | |
| | |
Large Capitalization Value Portfolio (continued) | | Portfolio of Investments
As of July 31, 2014 |
| | | | | | | | |
| SHARES | | | DESCRIPTION | | VALUE (NOTE 1) | |
| | | | COMMON STOCKS (continued) | | | | |
| | |
| | | | Chemicals—2.0% | | | | |
| | 33,715 | | | E.I. du Pont de Nemours & Co. | | $ | 2,168,212 | |
| | 27,565 | | | Praxair, Inc. | | | 3,532,179 | |
| | | | | | | | |
| | | | | | | 5,700,391 | |
| | | | | | | | |
| | |
| | | | Communications Equipment—1.1% | | | | |
| | 91,200 | | | Cisco Systems, Inc. | | | 2,300,976 | |
| | 74,100 | | | Telefonaktiebolaget LM Ericsson (Sweden) | | | 921,063 | |
| | | | | | | | |
| | | | | | | 3,222,039 | |
| | | | | | | | |
| | |
| | | | Consumer Finance—2.0% | | | | |
| | 51,900 | | | Capital One Financial Corp. | | | 4,128,126 | |
| | 92,500 | | | Navient Corp. | | | 1,591,000 | |
| | | | | | | | |
| | | | | | | 5,719,126 | |
| | | | | | | | |
| | |
| | | | Diversified Financial Services—0.9% | | | | |
| | 35,590 | | | CME Group, Inc.(a) | | | 2,631,525 | |
| | | | | | | | |
| | |
| | | | Diversified Telecommunication Services—2.2% | | | | |
| | 52,500 | | | AT&T, Inc. | | | 1,868,475 | |
| | 56,085 | | | CenturyLink, Inc. | | | 2,200,775 | |
| | 46,700 | | | Verizon Communications, Inc. | | | 2,354,614 | |
| | | | | | | | |
| | | | | | | 6,423,864 | |
| | | | | | | | |
| | |
| | | | Electric Utilities—2.0% | | | | |
| | 40,300 | | | American Electric Power Co., Inc. | | | 2,095,197 | |
| | 8,200 | | | Edison International | | | 449,360 | |
| | 12,900 | | | Exelon Corp. | | | 400,932 | |
| | 57,700 | | | PPL Corp. | | | 1,903,523 | |
| | 20,800 | | | Southern Co. (The)(a) | | | 900,432 | |
| | | | | | | | |
| | | | | | | 5,749,444 | |
| | | | | | | | |
| | |
| | | | Electronic Equipment, Instruments & Components—1.0% | | | | |
| | 139,700 | | | Corning, Inc. | | | 2,745,105 | |
| | | | | | | | |
| | |
| | | | Energy Equipment & Services—1.3% | | | | |
| | 46,915 | | | National Oilwell Varco, Inc. | | | 3,801,992 | |
| | | | | | | | |
| | |
| | | | Food & Staples Retailing—3.2% | | | | |
| | 54,180 | | | CVS Caremark Corp. | | | 4,137,185 | |
| | 24,700 | | | Kroger Co. (The) | | | 1,209,806 | |
| | 36,600 | | | Wal-Mart Stores, Inc. | | | 2,693,028 | |
| | 16,708 | | | Walgreen Co. | | | 1,149,009 | |
| | | | | | | | |
| | | | | | | 9,189,028 | |
| | | | | | | | |
See Notes to Financial Statements.
| | | | |
| 58 | | | The TARGET Portfolio Trust | |
| | | | | | | | |
| SHARES | | | DESCRIPTION | | VALUE (NOTE 1) | |
| | | | COMMON STOCKS (continued) | | | | |
| | |
| | | | Food Products—0.8% | | | | |
| | 36,100 | | | ConAgra Foods, Inc. | | $ | 1,087,693 | |
| | 10,700 | | | Kellogg Co. | | | 640,181 | |
| | 12,200 | | | Mondelez International, Inc. (Class A Stock) | | | 439,200 | |
| | | | | | | | |
| | | | | | | 2,167,074 | |
| | | | | | | | |
| | |
| | | | Health Care Equipment & Supplies—2.4% | | | | |
| | 63,000 | | | Abbott Laboratories | | | 2,653,560 | |
| | 53,500 | | | Medtronic, Inc. | | | 3,303,090 | |
| | 8,800 | | | Zimmer Holdings, Inc. | | | 880,616 | |
| | | | | | | | |
| | | | | | | 6,837,266 | |
| | | | | | | | |
| | |
| | | | Health Care Providers & Services—3.7% | | | | |
| | 13,524 | | | Cigna Corp. | | | 1,217,701 | |
| | 8,800 | | | Humana, Inc. | | | 1,035,320 | |
| | 79,925 | | | UnitedHealth Group, Inc. | | | 6,477,921 | |
| | 16,700 | | | WellPoint, Inc. | | | 1,833,827 | |
| | | | | | | | |
| | | | | | | 10,564,769 | |
| | | | | | | | |
| | |
| | | | Hotels, Restaurants & Leisure—0.2% | | | | |
| | 6,700 | | | McDonald’s Corp. | | | 633,552 | |
| | | | | | | | |
| | |
| | | | Household Durables—0.4% | | | | |
| | 7,300 | | | Whirlpool Corp. | | | 1,041,272 | |
| | | | | | | | |
| | |
| | | | Independent Power & Renewable Electricity Producers—0.4% | | | | |
| | 41,300 | | | NRG Energy, Inc. | | | 1,278,648 | |
| | | | | | | | |
| | |
| | | | Industrial Conglomerates—1.0% | | | | |
| | 116,000 | | | General Electric Co. | | | 2,917,400 | |
| | | | | | | | |
| | |
| | | | Insurance—8.2% | | | | |
| | 97,300 | | | Allstate Corp. (The) | | | 5,687,185 | |
| | 138,790 | | | American International Group, Inc. | | | 7,214,304 | |
| | 68,815 | | | Marsh & McLennan Cos., Inc. | | | 3,493,738 | |
| | 87,560 | | | MetLife, Inc. | | | 4,605,656 | |
| | 11,600 | | | Travelers Cos., Inc. (The) | | | 1,038,896 | |
| | 46,000 | | | Unum Group | | | 1,579,180 | |
| | | | | | | | |
| | | | | | | 23,618,959 | |
| | | | | | | | |
| | |
| | | | IT Services—1.3% | | | | |
| | 7,200 | | | International Business Machines Corp. | | | 1,380,024 | |
| | 174,900 | | | Xerox Corp. | | | 2,319,174 | |
| | | | | | | | |
| | | | | | | 3,699,198 | |
| | | | | | | | |
| | |
| | | | Life Sciences Tools & Services—1.4% | | | | |
| | 72,275 | | | Agilent Technologies, Inc. | | | 4,053,905 | |
| | | | | | | | |
| | |
| | | | Machinery—3.2% | | | | |
| | 14,200 | | | Cummins, Inc. | | | 1,979,338 | |
See Notes to Financial Statements.
| | | | |
| The TARGET Portfolio Trust | | | 59 | |
| | |
Large Capitalization Value Portfolio (continued) | | Portfolio of Investments
As of July 31, 2014 |
| | | | | | | | |
| SHARES | | | DESCRIPTION | | VALUE (NOTE 1) | |
| | | | COMMON STOCKS (continued) | | | | |
| | |
| | | | Machinery (continued) | | | | |
| | 11,500 | | | Deere & Co. | | $ | 978,765 | |
| | 56,885 | | | Ingersoll-Rand PLC | | | 3,344,269 | |
| | 16,300 | | | PACCAR, Inc. | | | 1,015,001 | |
| | 7,600 | | | Parker Hannifin Corp. | | | 873,620 | |
| | 10,500 | | | Stanley Black & Decker, Inc. | | | 918,225 | |
| | | | | | | | |
| | | | | | | 9,109,218 | |
| | | | | | | | |
| | |
| | | | Media—1.2% | | | | |
| | 27,600 | | | Comcast Corp. (Special Class A Stock)(a) | | | 1,475,772 | |
| | 47,300 | | | Interpublic Group of Cos., Inc. (The) | | | 932,283 | |
| | 6,300 | | | Time Warner Cable, Inc. | | | 914,130 | |
| | | | | | | | |
| | | | | | | 3,322,185 | |
| | | | | | | | |
| | |
| | | | Metals & Mining—0.7% | | | | |
| | 55,300 | | | Freeport-McMoRan, Inc. | | | 2,058,266 | |
| | | | | | | | |
| | |
| | | | Multi-Utilities—0.8% | | | | |
| | 64,400 | | | Public Service Enterprise Group, Inc. | | | 2,264,948 | |
| | | | | | | | |
| | |
| | | | Multiline Retail—1.6% | | | | |
| | 37,400 | | | Macy’s, Inc. | | | 2,161,346 | |
| | 42,500 | | | Target Corp.(a) | | | 2,532,575 | |
| | | | | | | | |
| | | | | | | 4,693,921 | |
| | | | | | | | |
| | |
| | | | Oil, Gas & Consumable Fuels—9.7% | | | | |
| | 22,800 | | | Chevron Corp. | | | 2,946,672 | |
| | 29,300 | | | ConocoPhillips | | | 2,417,250 | |
| | 15,500 | | | Devon Energy Corp. | | | 1,170,250 | |
| | 11,000 | | | Exxon Mobil Corp. | | | 1,088,340 | |
| | 36,265 | | | HollyFrontier Corp. | | | 1,704,817 | |
| | 97,200 | | | Marathon Oil Corp. | | | 3,766,500 | |
| | 44,200 | | | Murphy Oil Corp. | | | 2,746,146 | |
| | 33,410 | | | Occidental Petroleum Corp. | | | 3,264,491 | |
| | 70,019 | | | Royal Dutch Shell PLC (Netherlands), ADR | | | 5,729,655 | |
| | 46,200 | | | Total SA, ADR (France)(a) | | | 2,979,900 | |
| | | | | | | | |
| | | | | | | 27,814,021 | |
| | | | | | | | |
| | |
| | | | Paper & Forest Products—1.5% | | | | |
| | 92,175 | | | International Paper Co. | | | 4,378,312 | |
| | | | | | | | |
| | |
| | | | Pharmaceuticals—6.2% | | | | |
| | 50,520 | | | AbbVie, Inc. | | | 2,644,217 | |
| | 43,100 | | | Eli Lilly & Co. | | | 2,631,686 | |
| | 47,700 | | | GlaxoSmithKline PLC (United Kingdom)(a) | | | 2,307,249 | |
| | 22,200 | | | Johnson & Johnson | | | 2,221,998 | |
See Notes to Financial Statements.
| | | | |
| 60 | | | The TARGET Portfolio Trust | |
| | | | | | | | |
| SHARES | | | DESCRIPTION | | VALUE (NOTE 1) | |
| | | | COMMON STOCKS (continued) | | | | |
| | |
| | | | Pharmaceuticals (continued) | | | | |
| | 44,500 | | | Merck & Co., Inc. | | $ | 2,524,930 | |
| | 69,600 | | | Pfizer, Inc. | | | 1,997,520 | |
| | 43,800 | | | Sanofi, ADR (France) | | | 2,289,426 | |
| | 21,600 | | | Teva Pharmaceutical Industries Ltd. (Israel), ADR | | | 1,155,600 | |
| | | | | | | | |
| | | | | | | 17,772,626 | |
| | | | | | | | |
| | |
| | | | Professional Services—0.1% | | | | |
| | 5,300 | | | ManpowerGroup, Inc. | | | 412,817 | |
| | | | | | | | |
| | |
| | | | Road & Rail—0.4% | | | | |
| | 11,300 | | | Norfolk Southern Corp. | | | 1,148,758 | |
| | | | | | | | |
| | |
| | | | Semiconductors & Semiconductor Equipment—2.0% | | | | |
| | 82,900 | | | Intel Corp. | | | 2,809,481 | |
| | 66,810 | | | Texas Instruments, Inc. | | | 3,089,962 | |
| | | | | | | | |
| | | | | | | 5,899,443 | |
| | | | | | | | |
| | |
| | | | Software—5.7% | | | | |
| | 63,958 | | | CA, Inc. | | | 1,847,107 | |
| | 37,690 | | | Check Point Software Technologies Ltd. (Israel)*(a) | | | 2,558,020 | |
| | 217,285 | | | Microsoft Corp. | | | 9,378,021 | |
| | 63,700 | | | Oracle Corp. | | | 2,572,843 | |
| | | | | | | | |
| | | | | | | 16,355,991 | |
| | | | | | | | |
| | |
| | | | Specialty Retail—1.0% | | | | |
| | 14,300 | | | Bed Bath & Beyond, Inc.*(a) | | | 905,047 | |
| | 29,141 | | | PetSmart, Inc. | | | 1,985,668 | |
| | | | | | | | |
| | | | | | | 2,890,715 | |
| | | | | | | | |
| | |
| | | | Technology Hardware, Storage & Peripherals—4.9% | | | | |
| | 70,840 | | | Apple, Inc. | | | 6,770,179 | |
| | 135,231 | | | Hewlett-Packard Co. | | | 4,815,576 | |
| | 44,440 | | | Seagate Technology PLC(a) | | | 2,604,184 | |
| | | | | | | | |
| | | | | | | 14,189,939 | |
| | | | | | | | |
| | |
| | | | Tobacco—0.5% | | | | |
| | 25,500 | | | Altria Group, Inc. | | | 1,035,300 | |
| | 5,500 | | | Philip Morris International, Inc. | | | 451,055 | |
| | | | | | | | |
| | | | | | | 1,486,355 | |
| | | | | | | | |
| | |
| | | | Wireless Telecommunication Services—1.0% | | | | |
| | 83,500 | | | Vodafone Group PLC (United Kingdom), ADR | | | 2,773,870 | |
| | | | | | | | |
| | | | TOTAL LONG-TERM INVESTMENTS
(cost $210,543,884) | | | 282,813,753 | |
| | | | | | | | |
See Notes to Financial Statements.
| | | | |
| The TARGET Portfolio Trust | | | 61 | |
| | |
Large Capitalization Value Portfolio (continued) | | Portfolio of Investments
As of July 31, 2014 |
| | | | | | | | |
| SHARES | | | DESCRIPTION | | VALUE (NOTE 1) | |
| | | | SHORT-TERM INVESTMENT—6.9% | | | | |
| | |
| | | | AFFILIATED MONEY MARKET MUTUAL FUND | | | | |
| | 19,880,162 | | | Prudential Investment Portfolios 2—Prudential Core Taxable Money Market Fund (cost $19,880,162; includes $14,843,227 of cash collateral for securities on loan)(Note 3)(b)(w) | | $ | 19,880,162 | |
| | | | | | | | |
| | | | TOTAL INVESTMENTS—105.3%
(cost $230,424,046; Note 5) | | | 302,693,915 | |
| | | | Liabilities in excess of other assets—(5.3%) | | | (15,323,133 | ) |
| | | | | | | | |
| | | | NET ASSETS—100.0% | | $ | 287,370,782 | |
| | | | | | | | |
| * | Non-income producing security. |
| (a) | All or a portion of security is on loan. The aggregate market value of such securities, including those sold and pending settlement, is $14,149,809; cash collateral of $14,843,227 (included in liabilities) was received with which the Portfolio purchased highly liquid short-term investments. Securities on loan are subject to contractual netting arrangements. |
| (b) | Represents security, or a portion thereof, purchased with cash collateral received for securities on loan. |
| (w) | Prudential Investments LLC, the manager of the Portfolio, also serves as manager of the Prudential Investment Portfolios 2—Prudential Core Taxable Money Market Fund. |
Various inputs are used in determining the value of the Portfolio’s investments. These inputs are summarized in the three broad levels listed below.
Level 1—quoted prices generally in active markets for identical securities.
Level 2—other significant observable inputs including, but not limited to, quoted prices for similar securities, interest rates and yield curves, prepayment speeds, foreign currency exchange rates, and amortized cost.
Level 3—significant unobservable inputs for securities valued in accordance with Board approved fair valuation procedures.
The following is a summary of the inputs used as of July 31, 2014 in valuing such portfolio securities:
| | | | | | | | | | | | |
| | | Level 1 | | | Level 2 | | | Level 3 | |
| Investments in Securities | | | | | | | | | | | | |
Common Stocks | | | | | | | | | | | | |
Aerospace & Defense | | $ | 10,084,388 | | | $ | — | | | $ | — | |
Auto Components | | | 5,245,477 | | | | — | | | | — | |
Automobiles | | | 5,673,278 | | | | — | | | | — | |
Banks | | | 32,207,898 | | | | — | | | | — | |
Beverages | | | 3,045,361 | | | | — | | | | — | |
Biotechnology | | | 891,730 | | | | — | | | | — | |
Capital Markets | | | 7,099,679 | | | | — | | | | — | |
Chemicals | | | 5,700,391 | | | | — | | | | — | |
Communications Equipment | | | 3,222,039 | | | | — | | | | — | |
Consumer Finance | | | 5,719,126 | | | | — | | | | — | |
Diversified Financial Services | | | 2,631,525 | | | | — | | | | — | |
Diversified Telecommunication Services | | | 6,423,864 | | | | — | | | | — | |
Electric Utilities | | | 5,749,444 | | | | — | | | | — | |
Electronic Equipment, Instruments & Components | | | 2,745,105 | | | | — | | | | — | |
See Notes to Financial Statements.
| | | | |
| 62 | | | The TARGET Portfolio Trust | |
| | | | | | | | | | | | |
| | | Level 1 | | | Level 2 | | | Level 3 | |
| Investments in Securities (continued) | | | | | | | | | | | | |
Energy Equipment & Services | | $ | 3,801,992 | | | $ | — | | | $ | — | |
Food & Staples Retailing | | | 9,189,028 | | | | — | | | | — | |
Food Products | | | 2,167,074 | | | | — | | | | — | |
Health Care Equipment & Supplies | | | 6,837,266 | | | | — | | | | — | |
Health Care Providers & Services | | | 10,564,769 | | | | — | | | | — | |
Hotels, Restaurants & Leisure | | | 633,552 | | | | — | | | | — | |
Household Durables | | | 1,041,272 | | | | — | | | | — | |
Independent Power & Renewable Electricity Producers | | | 1,278,648 | | | | — | | | | — | |
Industrial Conglomerates | | | 2,917,400 | | | | — | | | | — | |
Insurance | | | 23,618,959 | | | | — | | | | — | |
IT Services | | | 3,699,198 | | | | — | | | | — | |
Life Sciences Tools & Services | | | 4,053,905 | | | | — | | | | — | |
Machinery | | | 9,109,218 | | | | — | | | | — | |
Media | | | 3,322,185 | | | | — | | | | — | |
Metals & Mining | | | 2,058,266 | | | | — | | | | — | |
Multi-Utilities | | | 2,264,948 | | | | — | | | | — | |
Multiline Retail | | | 4,693,921 | | | | — | | | | — | |
Oil, Gas & Consumable Fuels | | | 27,814,021 | | | | — | | | | — | |
Paper & Forest Products | | | 4,378,312 | | | | — | | | | — | |
Pharmaceuticals | | | 17,772,626 | | | | — | | | | — | |
Professional Services | | | 412,817 | | | | — | | | | — | |
Road & Rail | | | 1,148,758 | | | | — | | | | — | |
Semiconductors & Semiconductor Equipment | | | 5,899,443 | | | | — | | | | — | |
Software | | | 16,355,991 | | | | — | | | | — | |
Specialty Retail | | | 2,890,715 | | | | — | | | | — | |
Technology Hardware, Storage & Peripherals | | | 14,189,939 | | | | — | | | | — | |
Tobacco | | | 1,486,355 | | | | — | | | | — | |
Wireless Telecommunication Services | | | 2,773,870 | | | | — | | | | — | |
Affiliated Money Market Mutual Fund | | | 19,880,162 | | | | — | | | | — | |
| | | | | | | | | | | | |
Total | | $ | 302,693,915 | | | $ | — | | | $ | — | |
| | | | | | | | | | | | |
The industry classification of investments and liabilities in excess of other assets shown as a percentage of net assets as of July 31, 2014 was as follows (unaudited):
| | | | |
Banks | | | 11.2 | % |
Oil, Gas & Consumable Fuels | | | 9.7 | |
Insurance | | | 8.2 | |
Affiliated Money Market Mutual Fund (including 5.2% of collateral for securities on loan) | | | 6.9 | |
Pharmaceuticals | | | 6.2 | |
Software | | | 5.7 | |
Technology Hardware, Storage & Peripherals | | | 4.9 | |
Health Care Providers & Services | | | 3.7 | |
Aerospace & Defense | | | 3.5 | |
Food & Staples Retailing | | | 3.2 | |
Machinery | | | 3.2 | |
Capital Markets | | | 2.5 | |
Health Care Equipment & Supplies | | | 2.4 | |
Diversified Telecommunication Services | | | 2.2 | |
Automobiles | | | 2.0 | % |
Chemicals | | | 2.0 | |
Consumer Finance | | | 2.0 | |
Electric Utilities | | | 2.0 | |
Semiconductors & Semiconductor Equipment | | | 2.0 | |
Auto Components | | | 1.8 | |
Multiline Retail | | | 1.6 | |
Paper & Forest Products | | | 1.5 | |
Life Sciences Tools & Services | | | 1.4 | |
Energy Equipment & Services | | | 1.3 | |
IT Services | | | 1.3 | |
Media | | | 1.2 | |
Beverages | | | 1.1 | |
Communications Equipment | | | 1.1 | |
See Notes to Financial Statements.
| | | | |
| The TARGET Portfolio Trust | | | 63 | |
| | |
Large Capitalization Value Portfolio (continued) | | Portfolio of Investments
As of July 31, 2014 |
| | | | |
Industry (cont’d.) | | | |
Electronic Equipment, Instruments & Components | | | 1.0 | % |
Industrial Conglomerates | | | 1.0 | |
Specialty Retail | | | 1.0 | |
Wireless Telecommunication Services | | | 1.0 | |
Diversified Financial Services | | | 0.9 | |
Food Products | | | 0.8 | |
Multi-Utilities | | | 0.8 | |
Metals & Mining | | | 0.7 | |
Tobacco | | | 0.5 | |
Household Durables | | | 0.4 | % |
Independent Power & Renewable Electricity Producers | | | 0.4 | |
Road & Rail | | | 0.4 | |
Biotechnology | | | 0.3 | |
Hotels, Restaurants & Leisure | | | 0.2 | |
Professional Services | | | 0.1 | |
| | | | |
| | | 105.3 | |
Liabilities in excess of other assets | | | (5.3 | ) |
| | | | |
| | | 100.0 | % |
| | | | |
See Notes to Financial Statements.
| | | | |
| 64 | | | The TARGET Portfolio Trust | |
| | |
Portfolio of Investments
As of July 31, 2014 | | Small Capitalization Growth Portfolio |
| | | | | | | | |
| SHARES | | | DESCRIPTION | | VALUE (NOTE 1) | |
| | | | LONG-TERM INVESTMENTS—97.6% | | | | |
| | |
| | | | COMMON STOCKS—97.6% | | | | |
| | |
| | | | Aerospace & Defense—1.5% | | | | |
| | 13,664 | | | Astronics Corp.* | | $ | 792,512 | |
| | 34,495 | | | Hexcel Corp.* | | | 1,284,939 | |
| | | | | | | | |
| | | | | | | 2,077,451 | |
| | | | | | | | |
| | |
| | | | Airlines—2.3% | | | | |
| | 104,394 | | | JetBlue Airways Corp.*(a) | | | 1,119,104 | |
| | 31,107 | | | Spirit Airlines, Inc.* | | | 2,035,020 | |
| | | | | | | | |
| | | | | | | 3,154,124 | |
| | | | | | | | |
| | |
| | | | Auto Components—1.1% | | | | |
| | 24,320 | | | Tenneco, Inc.* | | | 1,549,184 | |
| | | | | | | | |
| | |
| | | | Banks—4.5% | | | | |
| | 39,206 | | | Bank of the Ozarks, Inc. | | | 1,206,369 | |
| | 45,292 | | | CoBiz Financial, Inc. | | | 512,705 | |
| | 14,920 | | | ConnectOne Bancorp, Inc. | | | 283,480 | |
| | 16,995 | | | Customers Bancorp, Inc.* | | | 322,225 | |
| | 4,320 | | | First Internet Bancorp | | | 75,989 | |
| | 21,700 | | | First NBC Bank Holding Co.* | | | 689,843 | |
| | 34,560 | | | Opus Bank*(a) | | | 1,026,432 | |
| | 19,452 | | | Pacific Premier Bancorp, Inc.* | | | 278,164 | |
| | 10,742 | | | PacWest Bancorp | | | 447,619 | |
| | 20,371 | | | Square 1 Financial, Inc.* | | | 388,271 | |
| | 18,807 | | | Talmer Bancorp, Inc.* | | | 251,826 | |
| | 12,280 | | | UMB Financial Corp. | | | 695,416 | |
| | | | | | | | |
| | | | | | | 6,178,339 | |
| | | | | | | | |
| | |
| | | | Biotechnology—7.2% | | | | |
| | 24,165 | | | Acorda Therapeutics, Inc.* | | | 707,310 | |
| | 8,020 | | | Adamas Pharmaceuticals, Inc.* | | | 127,598 | |
| | 11,466 | | | Akebia Therapeutics, Inc.*(a) | | | 253,857 | |
| | 14,496 | | | Alnylam Pharmaceuticals, Inc.* | | | 783,509 | |
| | 11,872 | | | Anacor Pharmaceuticals, Inc.*(a) | | | 197,669 | |
| | 6,530 | | | Auspex Pharmaceuticals, Inc.* | | | 118,911 | |
| | 13,006 | | | Cepheid, Inc.*(a) | | | 489,546 | |
| | 129,677 | | | CTI BioPharma Corp.*(a) | | | 335,863 | |
| | 5,742 | | | Cubist Pharmaceuticals, Inc.*(a) | | | 349,688 | |
| | 6,748 | | | Enanta Pharmaceuticals, Inc.*(a) | | | 253,792 | |
| | 16,070 | | | Epizyme, Inc.* | | | 503,312 | |
| | 26,230 | | | Heron Therapeutics, Inc.* | | | 230,562 | |
| | 1,040 | | | Intercept Pharmaceuticals, Inc.*(a) | | | 241,654 | |
| | 10,690 | | | InterMune, Inc.* | | | 468,970 | |
| | 16,640 | | | Intrexon Corp.* | | | 367,578 | |
See Notes to Financial Statements.
| | | | |
| The TARGET Portfolio Trust | | | 65 | |
| | |
Small Capitalization Growth Portfolio (continued) | | Portfolio of Investments
As of July 31, 2014 |
| | | | | | | | |
| SHARES | | | DESCRIPTION | | VALUE (NOTE 1) | |
| | | | COMMON STOCKS (continued) | | | | |
| | |
| | | | Biotechnology (continued) | | | | |
| | 11,565 | | | Isis Pharmaceuticals, Inc.*(a) | | $ | 358,399 | |
| | 4,070 | | | Keryx Biopharmaceuticals, Inc.*(a) | | | 61,254 | |
| | 1,120 | | | Kite Pharma, Inc.* | | | 26,320 | |
| | 13,200 | | | MacroGenics, Inc.* | | | 267,960 | |
| | 17,570 | | | Neurocrine Biosciences, Inc.* | | | 238,601 | |
| | 22,829 | | | NPS Pharmaceuticals, Inc.* | | | 637,842 | |
| | 15,833 | | | Ophthotech Corp.*(a) | | | 618,437 | |
| | 14,050 | | | Ovascience, Inc.*(a) | | | 137,831 | |
| | 29,134 | | | Portola Pharmaceuticals, Inc.*(a) | | | 732,429 | |
| | 840 | | | Puma Biotechnology, Inc.* | | | 186,245 | |
| | 9,963 | | | Receptos, Inc.* | | | 412,568 | |
| | 14,663 | | | Sarepta Therapeutics, Inc.*(a) | | | 312,908 | |
| | 9,295 | | | Seattle Genetics, Inc.*(a) | | | 327,184 | |
| | 2,270 | | | Ultragenyx Pharmaceutical, Inc.*(a) | | | 99,199 | |
| | | | | | | | |
| | | | | | | 9,846,996 | |
| | | | | | | | |
| | |
| | | | Building Products—1.8% | | | | |
| | 23,823 | | | Apogee Enterprises, Inc. | | | 773,057 | |
| | 36,192 | | | PGT, Inc.* | | | 335,138 | |
| | 47,675 | | | Trex Co., Inc.*(a) | | | 1,342,051 | |
| | | | | | | | |
| | | | | | | 2,450,246 | |
| | | | | | | | |
| | |
| | | | Capital Markets—2.1% | | | | |
| | 11,310 | | | Evercore Partners, Inc. (Class A Stock) | | | 617,074 | |
| | 45,696 | | | Fortress Investment Group LLC (Class A Stock) | | | 330,839 | |
| | 29,654 | | | FXCM, Inc. (Class A Stock)(a) | | | 403,888 | |
| | 6,460 | | | Greenhill & Co., Inc.(a) | | | 295,674 | |
| | 6,640 | | | Moelis & Co.* | | | 226,158 | |
| | 21,246 | | | Stifel Financial Corp.* | | | 972,854 | |
| | | | | | | | |
| | | | | | | 2,846,487 | |
| | | | | | | | |
| | |
| | | | Chemicals—2.7% | | | | |
| | 9,370 | | | Chemtura Corp.* | | | 217,946 | |
| | 43,584 | | | Huntsman Corp. | | | 1,135,363 | |
| | 24,911 | | | PolyOne Corp. | | | 945,372 | |
| | 18,747 | | | Quaker Chemical Corp. | | | 1,323,726 | |
| | | | | | | | |
| | | | | | | 3,622,407 | |
| | | | | | | | |
| | |
| | | | Commercial Services & Supplies—0.9% | | | | |
| | 24,935 | | | Waste Connections, Inc. | | | 1,180,423 | |
| | | | | | | | |
| | |
| | | | Communications Equipment—1.1% | | | | |
| | 17,480 | | | Applied Optoelectronics, Inc.* | | | 314,640 | |
| | 14,986 | | | Aruba Networks, Inc.*(a) | | | 267,650 | |
See Notes to Financial Statements.
| | | | |
| 66 | | | The TARGET Portfolio Trust | |
| | | | | | | | |
| SHARES | | | DESCRIPTION | | VALUE (NOTE 1) | |
| | | | COMMON STOCKS (continued) | | | | |
| | |
| | | | Communications Equipment (continued) | | | | |
| | 11,917 | | | CalAmp Corp.* | | $ | 202,708 | |
| | 9,440 | | | Palo Alto Networks, Inc.*(a) | | | 763,319 | |
| | | | | | | | |
| | | | | | | 1,548,317 | |
| | | | | | | | |
| | |
| | | | Construction & Engineering—1.9% | | | | |
| | 10,236 | | | EMCOR Group, Inc. | | | 418,959 | |
| | 19,989 | | | Northwest Pipe Co.* | | | 716,606 | |
| | 28,970 | | | Primoris Services Corp. | | | 691,804 | |
| | 29,678 | | | Tutor Perini Corp.* | | | 808,132 | |
| | | | | | | | |
| | | | | | | 2,635,501 | |
| | | | | | | | |
| | |
| | | | Construction Materials—1.0% | | | | |
| | 10,551 | | | Martin Marietta Materials, Inc. | | | 1,310,788 | |
| | | | | | | | |
| | |
| | | | Consumer Finance—0.2% | | | | |
| | 3,415 | | | Portfolio Recovery Associates, Inc.*(a) | | | 201,348 | |
| | | | | | | | |
| | |
| | | | Diversified Consumer Services—0.6% | | | | |
| | 35,410 | | | Chegg, Inc.*(a) | | | 227,686 | |
| | 8,810 | | | Grand Canyon Education, Inc.* | | | 378,830 | |
| | 5,848 | | | Sotheby’s(a) | | | 231,873 | |
| | | | | | | | |
| | | | | | | 838,389 | |
| | | | | | | | |
| | |
| | | | Diversified Telecommunication Services—0.7% | | | | |
| | 69,687 | | | 8x8, Inc.* | | | 563,071 | |
| | 41,710 | | | ORBCOMM, Inc.* | | | 261,939 | |
| | 50,890 | | | Vonage Holdings Corp.* | | | 177,097 | |
| | | | | | | | |
| | | | | | | 1,002,107 | |
| | | | | | | | |
| | |
| | | | Electrical Equipment—0.8% | | | | |
| | 4,530 | | | Acuity Brands, Inc.(a) | | | 485,933 | |
| | 24,525 | | | Thermon Group Holdings, Inc.* | | | 597,920 | |
| | | | | | | | |
| | | | | | | 1,083,853 | |
| | | | | | | | |
| | |
| | | | Electronic Equipment, Instruments & Components—3.2% | | | | |
| | 12,490 | | | Coherent, Inc.* | | | 735,786 | |
| | 21,098 | | | FARO Technologies, Inc.* | | | 1,068,192 | |
| | 26,465 | | | InvenSense, Inc.*(a) | | | 608,959 | |
| | 23,821 | | | IPG Photonics Corp.* | | | 1,604,344 | |
| | 12,660 | | | Methode Electronics, Inc. | | | 404,867 | |
| | | | | | | | |
| | | | | | | 4,422,148 | |
| | | | | | | | |
| | |
| | | | Energy Equipment & Services—0.8% | | | | |
| | 12,420 | | | Forum Energy Technologies, Inc.* | | | 413,462 | |
| | 15,356 | | | Geospace Technologies Corp.*(a) | | | 617,925 | |
| | | | | | | | |
| | | | | | | 1,031,387 | |
| | | | | | | | |
See Notes to Financial Statements.
| | | | |
| The TARGET Portfolio Trust | | | 67 | |
| | |
Small Capitalization Growth Portfolio (continued) | | Portfolio of Investments
As of July 31, 2014 |
| | | | | | | | |
| SHARES | | | DESCRIPTION | | VALUE (NOTE 1) | |
| | | | COMMON STOCKS (continued) | | | | |
| | |
| | | | Food & Staples Retailing—1.3% | | | | |
| | 17,416 | | | Fresh Market, Inc. (The)*(a) | | $ | 521,261 | |
| | 28,841 | | | Natural Grocers by Vitamin Cottage, Inc.* | | | 654,114 | |
| | 9,245 | | | United Natural Foods, Inc.* | | | 541,942 | |
| | | | | | | | |
| | | | | | | 1,717,317 | |
| | | | | | | | |
| | |
| | | | Food Products—1.2% | | | | |
| | 9,460 | | | Pinnacle Foods, Inc. | | | 285,030 | |
| | 42,900 | | | Whitewave Foods Co. (The) (Class A Stock)* | | | 1,277,991 | |
| | | | | | | | |
| | | | | | | 1,563,021 | |
| | | | | | | | |
| | |
| | | | Health Care Equipment & Supplies—5.3% | | | | |
| | 11,160 | | | Align Technology, Inc.* | | | 604,984 | |
| | 13,820 | | | Atricure, Inc.* | | | 227,615 | |
| | 7,225 | | | Cooper Cos., Inc. (The) | | | 1,162,358 | |
| | 9,986 | | | Cyberonics, Inc.*(a) | | | 593,867 | |
| | 8,800 | | | Cynosure, Inc. (Class A Stock)* | | | 200,112 | |
| | 43,626 | | | Endologix, Inc.* | | | 617,308 | |
| | 20,790 | | | Inogen, Inc.* | | | 415,800 | |
| | 19,737 | | | K2M Group Holdings, Inc.* | | | 334,937 | |
| | 8,070 | | | LDR Holding Corp.* | | | 184,884 | |
| | 15,866 | | | Natus Medical, Inc.* | | | 456,465 | |
| | 11,011 | | | Sirona Dental Systems, Inc.*(a) | | | 883,082 | |
| | 21,928 | | | Spectranetics Corp. (The)* | | | 562,453 | |
| | 28,888 | | | Thoratec Corp.* | | | 938,860 | |
| | | | | | | | |
| | | | | | | 7,182,725 | |
| | | | | | | | |
| | |
| | | | Health Care Providers & Services—5.4% | | | | |
| | 30,358 | | | Acadia Healthcare Co., Inc.*(a) | | | 1,446,862 | |
| | 21,116 | | | Air Methods Corp.*(a) | | | 1,061,079 | |
| | 24,562 | | | Centene Corp.* | | | 1,770,675 | |
| | 11,225 | | | Hanger, Inc.* | | | 355,271 | |
| | 13,890 | | | MWI Veterinary Supply, Inc.* | | | 1,962,101 | |
| | 13,918 | | | Team Health Holdings, Inc.* | | | 787,063 | |
| | | | | | | | |
| | | | | | | 7,383,051 | |
| | | | | | | | |
| | |
| | | | Health Care Technology—1.2% | | | | |
| | 11,830 | | | Icad, Inc.*(a) | | | 107,890 | |
| | 52,889 | | | MedAssets, Inc.* | | | 1,123,362 | |
| | 9,347 | | | Medidata Solutions, Inc.* | | | 419,119 | |
| | | | | | | | |
| | | | | | | 1,650,371 | |
| | | | | | | | |
| | |
| | | | Hotels, Restaurants & Leisure—4.1% | | | | |
| | 16,346 | | | Bally Technologies, Inc.*(a) | | | 983,539 | |
| | 87,858 | | | Belmond Ltd. (Class A Stock)* | | | 1,089,439 | |
See Notes to Financial Statements.
| | | | |
| 68 | | | The TARGET Portfolio Trust | |
| | | | | | | | |
| SHARES | | | DESCRIPTION | | VALUE (NOTE 1) | |
| | | | COMMON STOCKS (continued) | | | | |
| | |
| | | | Hotels, Restaurants & Leisure (continued) | | | | |
| | 23,685 | | | Chuy’s Holdings, Inc.* | | $ | 678,575 | |
| | 32,107 | | | Diversified Restaurant Holdings, Inc.* | | | 150,582 | |
| | 16,608 | | | Jack in the Box, Inc. | | | 949,812 | |
| | 30,472 | | | Multimedia Games Holding Co., Inc.* | | | 734,985 | |
| | 11,379 | | | Red Robin Gourmet Burgers, Inc.* | | | 732,352 | |
| | 39,530 | | | Scientific Games Corp. (Class A Stock)* | | | 337,586 | |
| | | | | | | | |
| | | | | | | 5,656,870 | |
| | | | | | | | |
| | |
| | | | Household Durables—1.0% | | | | |
| | 28,456 | | | Universal Electronics, Inc.* | | | 1,355,359 | |
| | | | | | | | |
| | |
| | | | Insurance—1.0% | | | | |
| | 20,581 | | | AmTrust Financial Services, Inc.(a) | | | 877,574 | |
| | 3,358 | | | Enstar Group Ltd.* | | | 463,404 | |
| | | | | | | | |
| | | | | | | 1,340,978 | |
| | | | | | | | |
| | |
| | | | Internet & Catalog Retail—1.2% | | | | |
| | 48,801 | | | HomeAway, Inc.* | | | 1,694,371 | |
| | | | | | | | |
| | |
| | | | Internet Software & Services—3.8% | | | | |
| | 33,464 | | | Angie’s List, Inc.*(a) | | | 278,755 | |
| | 16,720 | | | ChannelAdvisor Corp.* | | | 383,390 | |
| | 20,557 | | | Cornerstone OnDemand, Inc.*(a) | | | 860,105 | |
| | 15,476 | | | Demandware, Inc.*(a) | | | 932,274 | |
| | 21,964 | | | E2open, Inc.*(a) | | | 355,377 | |
| | 14,917 | | | Everyday Health, Inc.*(a) | | | 247,921 | |
| | 28,670 | | | Global Eagle Entertainment, Inc.* | | | 292,434 | |
| | 28,082 | | | Marin Software, Inc.*(a) | | | 257,512 | |
| | 21,962 | | | SciQuest, Inc.* | | | 337,995 | |
| | 10,968 | | | Trulia, Inc.* | | | 663,893 | |
| | 10,345 | | | WebMD Health Corp.*(a) | | | 515,491 | |
| | | | | | | | |
| | | | | | | 5,125,147 | |
| | | | | | | | |
| | |
| | | | IT Services—0.5% | | | | |
| | 18,442 | | | EPAM Systems, Inc.* | | | 712,968 | |
| | | | | | | | |
| | |
| | | | Leisure Products—0.7% | | | | |
| | 29,599 | | | Black Diamond, Inc.*(a) | | | 259,879 | |
| | 11,340 | | | Brunswick Corp. | | | 457,342 | |
| | 15,540 | | | Malibu Boats, Inc. (Class A Stock)* | | | 299,145 | |
| | | | | | | | |
| | | | | | | 1,016,366 | |
| | | | | | | | |
| | |
| | | | Life Sciences Tools & Services—1.0% | | | | |
| | 27,060 | | | Cambrex Corp.* | | | 570,154 | |
| | 20,113 | | | NanoString Technologies, Inc.* | | | 242,362 | |
| | 9,958 | | | PAREXEL International Corp.*(a) | | | 533,350 | |
| | | | | | | | |
| | | | | | | 1,345,866 | |
| | | | | | | | |
See Notes to Financial Statements.
| | | | |
| The TARGET Portfolio Trust | | | 69 | |
| | |
Small Capitalization Growth Portfolio (continued) | | Portfolio of Investments
As of July 31, 2014 |
| | | | | | | | |
| SHARES | | | DESCRIPTION | | VALUE (NOTE 1) | |
| | | | COMMON STOCKS (continued) | | | | |
| | |
| | | | Machinery—4.3% | | | | |
| | 9,180 | | | Adept Technology, Inc.* | | $ | 83,538 | |
| | 7,969 | | | Chart Industries, Inc.* | | | 606,042 | |
| | 16,723 | | | Colfax Corp.* | | | 1,053,047 | |
| | 6,096 | | | Crane Co. | | | 418,247 | |
| | 28,918 | | | Manitowoc Co., Inc. (The) | | | 768,062 | |
| | 7,810 | | | Middleby Corp. (The)* | | | 569,037 | |
| | 5,360 | | | NN, Inc. | | | 155,440 | |
| | 7,528 | | | Proto Labs, Inc.*(a) | | | 609,768 | |
| | 4,290 | | | Tennant Co. | | | 312,956 | |
| | 6,044 | | | WABCO Holdings, Inc.* | | | 589,169 | |
| | 13,676 | | | Woodward, Inc. | | | 683,253 | |
| | | | | | | | |
| | | | | | | 5,848,559 | |
| | | | | | | | |
| | |
| | | | Media—0.1% | | | | |
| | 5,778 | | | Carmike Cinemas, Inc.* | | | 181,660 | |
| | | | | | | | |
| | |
| | | | Metals & Mining—1.2% | | | | |
| | 32,046 | | | RTI International Metals, Inc.* | | | 796,664 | |
| | 14,410 | | | U.S. Silica Holdings, Inc. | | | 810,130 | |
| | | | | | | | |
| | | | | | | 1,606,794 | |
| | | | | | | | |
| | |
| | | | Oil, Gas & Consumable Fuels—4.0% | | | | |
| | 11,325 | | | Diamondback Energy, Inc.* | | | 931,255 | |
| | 21,144 | | | Gulfport Energy Corp.* | | | 1,129,301 | |
| | 98,719 | | | Magnum Hunter Resources Corp.*(a) | | | 634,763 | |
| | 53,400 | | | Penn Virginia Corp.* | | | 695,268 | |
| | 41,590 | | | Rice Energy, Inc.* | | | 1,093,817 | |
| | 30,012 | | | Sanchez Energy Corp.*(a) | | | 951,981 | |
| | | | | | | | |
| | | | | | | 5,436,385 | |
| | | | | | | | |
| | |
| | | | Pharmaceuticals—1.5% | | | | |
| | 6,710 | | | Ani Pharmaceuticals, Inc.* | | | 171,910 | |
| | 12,497 | | | Depomed, Inc.* | | | 124,345 | |
| | 29,106 | | | Horizon Pharma, Inc.*(a) | | | 247,401 | |
| | 9,250 | | | Marinus Pharmaceuticals, Inc.* | | | 74,000 | |
| | 5,151 | | | Pacira Pharmaceuticals, Inc.*(a) | | | 473,892 | |
| | 9,309 | | | Theravance Biopharma, Inc. (Cayman Islands)*(a) | | | 260,931 | |
| | 20,209 | | | Theravance, Inc.*(a) | | | 438,536 | |
| | 7,630 | | | ZS Pharma, Inc.* | | | 213,716 | |
| | | | | | | | |
| | | | | | | 2,004,731 | |
| | | | | | | | |
| | |
| | | | Professional Services—1.2% | | | | |
| | 7,956 | | | Advisory Board Co. (The)*(a) | | | 398,914 | |
| | 34,201 | | | Kforce, Inc. | | | 680,258 | |
See Notes to Financial Statements.
| | | | |
| 70 | | | The TARGET Portfolio Trust | |
| | | | | | | | |
| SHARES | | | DESCRIPTION | | VALUE (NOTE 1) | |
| | | | COMMON STOCKS (continued) | | | | |
| | |
| | | | Professional Services (continued) | | | | |
| | 12,550 | | | Korn/Ferry International* | | $ | 369,221 | |
| | 8,424 | | | Paylocity Holding Corp.* | | | 165,026 | |
| | | | | | | | |
| | | | | | | 1,613,419 | |
| | | | | | | | |
| | |
| | | | Real Estate Investment Trusts (REITs)—0.9% | | | | |
| | 27,953 | | | Geo Group, Inc. (The) | | | 961,862 | |
| | 30,725 | | | Two Harbors Investment Corp. | | | 314,317 | |
| | | | | | | | |
| | | | | | | 1,276,179 | |
| | | | | | | | |
| | |
| | | | Road & Rail—1.6% | | | | |
| | 13,052 | | | Landstar System, Inc. | | | 863,129 | |
| | 32,010 | | | Quality Distribution, Inc.* | | | 427,334 | |
| | 32,632 | | | Roadrunner Transportation Systems, Inc.* | | | 820,368 | |
| | | | | | | | |
| | | | | | | 2,110,831 | |
| | | | | | | | |
| | |
| | | | Semiconductors & Semiconductor Equipment—4.3% | | | | |
| | 41,270 | | | Cavium, Inc.* | | | 1,925,245 | |
| | 27,562 | | | Inphi Corp.* | | | 420,596 | |
| | 26,961 | | | Kulicke & Soffa Industries, Inc. (Singapore)* | | | 367,209 | |
| | 32,700 | | | Microsemi Corp.* | | | 784,146 | |
| | 14,182 | | | PDF Solutions, Inc.* | | | 271,727 | |
| | 45,280 | | | Pixelworks, Inc.*(a) | | | 356,354 | |
| | 34,020 | | | RF Micro Devices, Inc.* | | | 379,663 | |
| | 23,453 | | | Teradyne, Inc. | | | 427,314 | |
| | 27,272 | | | Veeco Instruments, Inc.*(a) | | | 946,611 | |
| | | | | | | | |
| | | | | | | 5,878,865 | |
| | | | | | | | |
| | |
| | | | Software—7.1% | | | | |
| | 21,591 | | | Aspen Technology, Inc.* | | | 937,913 | |
| | 7,210 | | | CommVault Systems, Inc.* | | | 346,224 | |
| | 4,421 | | | Concur Technologies, Inc.*(a) | | | 410,976 | |
| | 29,314 | | | Fortinet, Inc.* | | | 719,659 | |
| | 111,095 | | | Glu Mobile, Inc.*(a) | | | 623,243 | |
| | 21,645 | | | Guidewire Software, Inc.*(a) | | | 876,622 | |
| | 32,359 | | | Imperva, Inc.* | | | 717,399 | |
| | 1,980 | | | MicroStrategy, Inc. (Class A Stock)* | | | 283,397 | |
| | 9,587 | | | NICE Systems Ltd., ADR (Israel) | | | 379,070 | |
| | 24,470 | | | Proofpoint, Inc.*(a) | | | 863,057 | |
| | 13,987 | | | PTC, Inc.* | | | 502,973 | |
| | 24,552 | | | QLIK Technologies, Inc.* | | | 649,646 | |
| | 24,940 | | | Qualys, Inc.* | | | 595,817 | |
| | 4,820 | | | Tableau Software, Inc. (Class A Stock)* | | | 313,300 | |
| | 9,557 | | | Ultimate Software Group, Inc. (The)* | | | 1,289,335 | |
| | 10,836 | | | Varonis Systems, Inc.*(a) | | | 228,423 | |
| | | | | | | | |
| | | | | | | 9,737,054 | |
| | | | | | | | |
| | |
| | | | Specialty Retail—5.0% | | | | |
| | 46,683 | | | Christopher & Banks Corp.* | | | 399,140 | |
See Notes to Financial Statements.
| | | | |
| The TARGET Portfolio Trust | | | 71 | |
| | |
Small Capitalization Growth Portfolio (continued) | | Portfolio of Investments
As of July 31, 2014 |
| | | | | | | | |
| SHARES | | | DESCRIPTION | | VALUE (NOTE 1) | |
| | | | COMMON STOCKS (continued) | | | | |
| | |
| | | | Specialty Retail (continued) | | | | |
| | 8,265 | | | Five Below, Inc.*(a) | | $ | 302,664 | |
| | 33,479 | | | Genesco, Inc.* | | | 2,553,443 | |
| | 5,305 | | | Lithia Motors, Inc. (Class A Stock) | | | 471,349 | |
| | 30,202 | | | MarineMax, Inc.* | | | 503,468 | |
| | 7,748 | | | Outerwall, Inc.*(a) | | | 426,295 | |
| | 10,274 | | | Penske Automotive Group, Inc. | | | 477,227 | |
| | 15,312 | | | Tilly’s, Inc. (Class A Stock)* | | | 115,912 | |
| | 38,144 | | | Vitamin Shoppe, Inc.* | | | 1,626,842 | |
| | | | | | | | |
| | | | | | | 6,876,340 | |
| | | | | | | | |
| | |
| | | | Technology Hardware, Storage & Peripherals—0.1% | | | | |
| | 12,529 | | | Transact Technologies, Inc. | | | 113,262 | |
| | | | | | | | |
| | |
| | | | Textiles, Apparel & Luxury Goods—1.9% | | | | |
| | 9,260 | | | Deckers Outdoor Corp.*(a) | | | 819,602 | |
| | 10,420 | | | Kate Spade & Co.* | | | 394,189 | |
| | 22,334 | | | Steven Madden Ltd.* | | | 711,338 | |
| | 19,967 | | | Vince Holding Corp.* | | | 674,685 | |
| | | | | | | | |
| | | | | | | 2,599,814 | |
| | | | | | | | |
| | |
| | | | Thrifts & Mortgage Finance—1.0% | | | | |
| | 38,084 | | | Home Loan Servicing Solutions Ltd. | | | 814,997 | |
| | 75,630 | | | MGIC Investment Corp.* | | | 558,906 | |
| | | | | | | | |
| | | | | | | 1,373,903 | |
| | | | | | | | |
| | |
| | | | Trading Companies & Distributors—0.9% | | | | |
| | 18,329 | | | H&E Equipment Services, Inc.* | | | 663,143 | |
| | 7,380 | | | WESCO International, Inc.*(a) | | | 579,256 | |
| | | | | | | | |
| | | | | | | 1,242,399 | |
| | | | | | | | |
| | |
| | | | Transportation Infrastructure—0.4% | | | | |
| | 31,382 | | | Wesco Aircraft Holdings, Inc.* | | | 594,689 | |
| | | | | | | | |
| | | | TOTAL COMMON STOCKS
(cost $107,919,072) | | | 133,218,789 | |
| | | | | | | | |
| | |
| | | | WARRANTS* | | | | |
| | |
| | | | Oil, Gas & Consumable Fuels | | | | |
| | 8,265 | | | Magnum Hunter Resources Corp., expiring 04/15/16
(cost $—)(a) | | | 6,488 | |
| | | | | | | | |
| | | | TOTAL LONG-TERM INVESTMENTS
(cost $107,919,072) | | | 133,225,277 | |
| | | | | | | | |
See Notes to Financial Statements.
| | | | |
| 72 | | | The TARGET Portfolio Trust | |
| | | | | | | | |
| SHARES | | | DESCRIPTION | | VALUE (NOTE 1) | |
| | | | SHORT-TERM INVESTMENT—16.8% | | | | |
| | |
| | | | AFFILIATED MONEY MARKET MUTUAL FUND | | | | |
| | 22,957,087 | | | Prudential Investment Portfolios 2—Prudential Core Taxable Money Market Fund (cost $22,957,087; includes $19,159,676 of cash collateral for securities on loan); (Note 3)(b)(w) | | $ | 22,957,087 | |
| | | | | | | | |
| | | | TOTAL INVESTMENTS—114.4%
(cost $130,876,159; Note 5) | | | 156,182,364 | |
| | | | Liabilities in excess of other assets—(14.4%) | | | (19,611,483 | ) |
| | | | | | | | |
| | | | NET ASSETS—100.0% | | $ | 136,570,881 | |
| | | | | | | | |
| * | Non-income producing security. |
| (a) | All or a portion of security is on loan. The aggregate market value of such securities, including those sold and pending settlement, is $17,946,398; cash collateral of $19,159,676 (included in liabilities) was received with which the Portfolio purchased highly liquid short-term investments. Securities on loan are subject to contractual netting arrangements. |
| (b) | Represents security, or a portion thereof, purchased with cash collateral received for securities on loan. |
| (w) | Prudential Investments LLC, the manager of the Portfolio, also serves as manager of the Prudential Investment Portfolios 2—Prudential Core Taxable Money Market Fund. |
Various inputs are used in determining the value of the Portfolio’s investments. These inputs are summarized in the three broad levels listed below.
Level 1—quoted prices generally in active markets for identical securities.
Level 2—other significant observable inputs including, but not limited to, quoted prices for similar securities, interest rates and yield curves, prepayment speeds, foreign currency exchange rates, and amortized cost.
Level 3—significant unobservable inputs for securities valued in accordance with Board approved fair valuation procedures.
The following is a summary of the inputs used as of July 31, 2014 in valuing such portfolio securities:
| | | | | | | | | | | | |
| | | Level 1 | | | Level 2 | | | Level 3 | |
| Investments in Securities | | | | | | | | | | | | |
Common Stocks | | | | | | | | | | | | |
Aerospace & Defense | | $ | 2,077,451 | | | $ | — | | | $ | — | |
Airlines | | | 3,154,124 | | | | — | | | | — | |
Auto Components | | | 1,549,184 | | | | — | | | | — | |
Banks | | | 6,178,339 | | | | — | | | | — | |
Biotechnology | | | 9,846,996 | | | | — | | | | — | |
Building Products | | | 2,450,246 | | | | — | | | | — | |
Capital Markets | | | 2,846,487 | | | | — | | | | — | |
Chemicals | | | 3,622,407 | | | | — | | | | — | |
Commercial Services & Supplies | | | 1,180,423 | | | | — | | | | — | |
Communications Equipment | | | 1,548,317 | | | | — | | | | — | |
Construction & Engineering | | | 2,635,501 | | | | — | | | | — | |
Construction Materials | | | 1,310,788 | | | | — | | | | — | |
Consumer Finance | | | 201,348 | | | | — | | | | — | |
Diversified Consumer Services | | | 838,389 | | | | — | | | | — | |
Diversified Telecommunication Services | | | 1,002,107 | | | | — | | | | — | |
Electrical Equipment | | | 1,083,853 | | | | — | | | | — | |
Electronic Equipment, Instruments & Components | | | 4,422,148 | | | | — | | | | — | |
See Notes to Financial Statements.
| | | | |
| The TARGET Portfolio Trust | | | 73 | |
| | |
Small Capitalization Growth Portfolio (continued) | | Portfolio of Investments
As of July 31, 2014 |
| | | | | | | | | | | | |
| | | Level 1 | | | Level 2 | | | Level 3 | |
| Investments in Securities (continued) | | | | | | | | | | | | |
Energy Equipment & Services | | $ | 1,031,387 | | | $ | — | | | $ | — | |
Food & Staples Retailing | | | 1,717,317 | | | | — | | | | — | |
Food Products | | | 1,563,021 | | | | — | | | | — | |
Health Care Equipment & Supplies | | | 7,182,725 | | | | — | | | | — | |
Health Care Providers & Services | | | 7,383,051 | | | | — | | | | — | |
Health Care Technology | | | 1,650,371 | | | | — | | | | — | |
Hotels, Restaurants & Leisure | | | 5,656,870 | | | | — | | | | — | |
Household Durables | | | 1,355,359 | | | | — | | | | — | |
Insurance | | | 1,340,978 | | | | — | | | | — | |
Internet & Catalog Retail | | | 1,694,371 | | | | — | | | | — | |
Internet Software & Services | | | 5,125,147 | | | | — | | | | — | |
IT Services | | | 712,968 | | | | — | | | | — | |
Leisure Products | | | 1,016,366 | | | | — | | | | — | |
Life Sciences Tools & Services | | | 1,345,866 | | | | — | | | | — | |
Machinery | | | 5,848,559 | | | | — | | | | — | |
Media | | | 181,660 | | | | — | | | | — | |
Metals & Mining | | | 1,606,794 | | | | — | | | | — | |
Oil, Gas & Consumable Fuels | | | 5,436,385 | | | | — | | | | — | |
Pharmaceuticals | | | 2,004,731 | | | | — | | | | — | |
Professional Services | | | 1,613,419 | | | | — | | | | — | |
Real Estate Investment Trusts (REITs) | | | 1,276,179 | | | | — | | | | — | |
Road & Rail | | | 2,110,831 | | | | — | | | | — | |
Semiconductors & Semiconductor Equipment | | | 5,878,865 | | | | — | | | | — | |
Software | | | 9,737,054 | | | | — | | | | — | |
Specialty Retail | | | 6,876,340 | | | | — | | | | — | |
Technology Hardware, Storage & Peripherals | | | 113,262 | | | | — | | | | — | |
Textiles, Apparel & Luxury Goods | | | 2,599,814 | | | | — | | | | — | |
Thrifts & Mortgage Finance | | | 1,373,903 | | | | — | | | | — | |
Trading Companies & Distributors | | | 1,242,399 | | | | — | | | | — | |
Transportation Infrastructure | | | 594,689 | | | | — | | | | — | |
Warrants | | | | | | | | | | | | |
Oil, Gas & Consumable Fuels | | | — | | | | — | | | | 6,488 | |
Affiliated Money Market Mutual Fund | | | 22,957,087 | | | | — | | | | — | |
| | | | | | | | | | | | |
Total | | $ | 156,175,876 | | | $ | — | | | $ | 6,488 | |
| | | | | | | | | | | | |
The industry classification of investments and liabilities in excess of other assets shown as a percentage of net assets as of July 31, 2014 was as follows (unaudited):
| | | | |
Affiliated Money Market Mutual Fund (including 14.0% of collateral for securities on loan) | | | 16.8 | % |
Biotechnology | | | 7.2 | |
Software | | | 7.1 | |
Health Care Providers & Services | | | 5.4 | |
Health Care Equipment & Supplies | | | 5.3 | |
Specialty Retail | | | 5.0 | |
Banks | | | 4.5 | |
Machinery | | | 4.3 | % |
Semiconductors & Semiconductor
Equipment | | | 4.3 | |
Hotels, Restaurants & Leisure | | | 4.1 | |
Oil, Gas & Consumable Fuels | | | 4.0 | |
Internet Software & Services | | | 3.8 | |
Electronic Equipment, Instruments & Components | | | 3.2 | |
See Notes to Financial Statements.
| | | | |
| 74 | | | The TARGET Portfolio Trust | |
| | | | |
Industry (cont’d.) | | | |
Chemicals | | | 2.7 | % |
Airlines | | | 2.3 | |
Capital Markets | | | 2.1 | |
Construction & Engineering | | | 1.9 | |
Textiles, Apparel & Luxury Goods | | | 1.9 | |
Building Products | | | 1.8 | |
Road & Rail | | | 1.6 | |
Aerospace & Defense | | | 1.5 | |
Pharmaceuticals | | | 1.5 | |
Food & Staples Retailing | | | 1.3 | |
Food Products | | | 1.2 | |
Health Care Technology | | | 1.2 | |
Internet & Catalog Retail | | | 1.2 | |
Metals & Mining | | | 1.2 | |
Professional Services | | | 1.2 | |
Auto Components | | | 1.1 | |
Communications Equipment | | | 1.1 | |
Construction Materials | | | 1.0 | |
Household Durables | | | 1.0 | |
Insurance | | | 1.0 | |
Life Sciences Tools & Services | | | 1.0 | % |
Thrifts & Mortgage Finance | | | 1.0 | |
Commercial Services & Supplies | | | 0.9 | |
Real Estate Investment Trusts (REITs) | | | 0.9 | |
Trading Companies & Distributors | | | 0.9 | |
Electrical Equipment | | | 0.8 | |
Energy Equipment & Services | | | 0.8 | |
Diversified Telecommunication Services | | | 0.7 | |
Leisure Products | | | 0.7 | |
Diversified Consumer Services | | | 0.6 | |
IT Services | | | 0.5 | |
Transportation Infrastructure | | | 0.4 | |
Consumer Finance | | | 0.2 | |
Media | | | 0.1 | |
Technology Hardware, Storage & Peripherals | | | 0.1 | |
| | | | |
| | | 114.4 | |
Liabilities in excess of other assets | | | (14.4 | ) |
| | | | |
| | | 100.0 | % |
| | | | |
See Notes to Financial Statements.
| | | | |
| The TARGET Portfolio Trust | | | 75 | |
| | |
| Small Capitalization Value Portfolio | | Portfolio of Investments
As of July 31, 2014 |
| | | | | | | | |
| SHARES | | | DESCRIPTION | | VALUE (NOTE 1) | |
| | | | LONG-TERM INVESTMENTS—97.6% | | | | |
| | |
| | | | COMMON STOCKS—97.1% | | | | |
| | |
| | | | Aerospace & Defense—3.3% | | | | |
| | 259,293 | | | AAR Corp. | | $ | 6,974,982 | |
| | 30,700 | | | Alliant Techsystems, Inc. | | | 3,988,851 | |
| | 81,172 | | | Curtiss-Wright Corp. | | | 5,155,234 | |
| | 67,252 | | | Elbit Systems Ltd. (Israel) | | | 4,219,390 | |
| | 22,800 | | | Engility Holdings, Inc.* | | | 787,968 | |
| | 67,700 | | | Esterline Technologies Corp.* | | | 7,348,835 | |
| | 281,542 | | | Hexcel Corp.* | | | 10,487,439 | |
| | 110,916 | | | Moog, Inc. (Class A Stock)* | | | 7,322,674 | |
| | 72,586 | | | Orbital Sciences Corp.* | | | 1,863,283 | |
| | 89,548 | | | Teledyne Technologies, Inc.* | | | 8,166,778 | |
| | 126,899 | | | Triumph Group, Inc. | | | 8,039,052 | |
| | | | | | | | |
| | | | | | | 64,354,486 | |
| | | | | | | | |
| | |
| | | | Air Freight & Logistics | | | | |
| | 4,500 | | | Park-Ohio Holdings Corp. | | | 267,120 | |
| | | | | | | | |
| | |
| | | | Airlines—0.5% | | | | |
| | 28,580 | | | Alaska Air Group, Inc. | | | 1,256,663 | |
| | 200,574 | | | Hawaiian Holdings, Inc.*(a) | | | 2,793,996 | |
| | 230,734 | | | JetBlue Airways Corp.*(a) | | | 2,473,468 | |
| | 57,700 | | | Republic Airways Holdings, Inc.* | | | 573,538 | |
| | 171,944 | | | SkyWest, Inc. | | | 1,838,081 | |
| | | | | | | | |
| | | | | | | 8,935,746 | |
| | | | | | | | |
| | |
| | | | Auto Components—0.4% | | | | |
| | 124,321 | | | Cooper Tire & Rubber Co. | | | 3,591,634 | |
| | 23,800 | | | Dana Holding Corp. | | | 532,644 | |
| | 8,497 | | | Lear Corp. | | | 800,162 | |
| | 101,473 | | | Modine Manufacturing Co.* | | | 1,397,283 | |
| | 12,100 | | | Remy International, Inc. | | | 268,378 | |
| | 53,700 | | | Stoneridge, Inc.* | | | 589,089 | |
| | 45,168 | | | Tower International, Inc.* | | | 1,422,792 | |
| | | | | | | | |
| | | | | | | 8,601,982 | |
| | | | | | | | |
| | |
| | | | Automobiles | | | | |
| | 3,968 | | | Thor Industries, Inc. | | | 210,185 | |
| | | | | | | | |
| | |
| | | | Banks—8.3% | | | | |
| | 2,090 | | | 1st Source Corp. | | | 59,335 | |
| | 10,100 | | | Ameris Bancorp | | | 220,584 | |
| | 65,228 | | | Associated Banc-Corp. | | | 1,168,886 | |
| | 6,900 | | | Banco Latinoamericano de Comercio Exterior SA (Panama) | | | 204,861 | |
| | 1,600 | | | Bank of Kentucky Financial Corp. (The) | | | 55,280 | |
See Notes to Financial Statements.
| | | | |
| 76 | | | The TARGET Portfolio Trust | |
| | | | | | | | |
| SHARES | | | DESCRIPTION | | VALUE (NOTE 1) | |
| | | | COMMON STOCKS (continued) | | | | |
| | |
| | | | Banks (continued) | | | | |
| | 2,500 | | | Bank of Marin Bancorp | | $ | 112,050 | |
| | 90,397 | | | BankUnited, Inc. | | | 2,824,002 | |
| | 32,317 | | | Banner Corp. | | | 1,300,436 | |
| | 10,200 | | | BBCN Bancorp, Inc. | | | 153,204 | |
| | 2,900 | | | BNC Bancorp | | | 48,082 | |
| | 105,232 | | | Boston Private Financial Holdings, Inc. | | | 1,313,295 | |
| | 183,500 | | | Capital Bank Financial Corp. (Class A Stock)* | | | 4,180,130 | |
| | 65,127 | | | Cardinal Financial Corp. | | | 1,150,143 | |
| | 89,736 | | | Cathay General Bancorp | | | 2,296,344 | |
| | 73,090 | | | Central Pacific Financial Corp. | | | 1,308,311 | |
| | 4,300 | | | Chemical Financial Corp. | | | 118,680 | |
| | 4,200 | | | Citizens & Northern Corp. | | | 79,758 | |
| | 8,100 | | | City Holding Co. | | | 337,365 | |
| | 4,543 | | | Columbia Banking System, Inc. | | | 115,801 | |
| | 8,250 | | | Community Trust Bancorp, Inc. | | | 288,668 | |
| | 6,700 | | | CommunityOne Bancorp* | | | 61,707 | |
| | 5,000 | | | ConnectOne Bancorp, Inc. | | | 95,000 | |
| | 110,549 | | | Customers Bancorp, Inc.* | | | 2,096,009 | |
| | 50,500 | | | CVB Financial Corp. | | | 772,145 | |
| | 67,917 | | | Eagle Bancorp, Inc.* | | | 2,262,315 | |
| | 7,971 | | | East West Bancorp, Inc. | | | 271,492 | |
| | 16,500 | | | Enterprise Financial Services Corp. | | | 287,925 | |
| | 15,808 | | | Fidelity Southern Corp. | | | 218,941 | |
| | 8,600 | | | Financial Institutions, Inc. | | | 190,920 | |
| | 21,800 | | | First BanCorp (Puerto Rico)* | | | 112,052 | |
| | 3,300 | | | First Bancorp (United States) | | | 53,064 | |
| | 21,000 | | | First Busey Corp. | | | 116,550 | |
| | 1,900 | | | First Business Financial Services, Inc. | | | 82,878 | |
| | 800 | | | First Citizens BancShares, Inc. (Class A Stock) | | | 177,880 | |
| | 66,800 | | | First Commonwealth Financial Corp. | | | 571,808 | |
| | 12,600 | | | First Community Bancshares, Inc. | | | 185,346 | |
| | 12,500 | | | First Financial Bancorp | | | 204,250 | |
| | 2,600 | | | First Financial Corp. | | | 79,716 | |
| | 173,310 | | | First Horizon National Corp. | | | 2,041,592 | |
| | 228,647 | | | First Interstate Bancsystem, Inc. | | | 5,967,687 | |
| | 71,025 | | | First Merchants Corp. | | | 1,415,528 | |
| | 291,442 | | | First Midwest Bancorp, Inc. | | | 4,721,360 | |
| | 87,437 | | | First NBC Bank Holding Co.* | | | 2,779,622 | |
| | 403,700 | | | First Niagara Financial Group, Inc. | | | 3,471,820 | |
| | 1,600 | | | First of Long Island Corp. (The) | | | 56,288 | |
| | 883,673 | | | FirstMerit Corp. | | | 15,552,645 | |
| | 8,300 | | | Flushing Financial Corp. | | | 154,214 | |
| | 349,500 | | | Fulton Financial Corp. | | | 3,963,330 | |
| | 1,600 | | | German American Bancorp, Inc. | | | 41,360 | |
| | 5,500 | | | Great Southern Bancorp, Inc. | | | 171,490 | |
| | 11,200 | | | Hampton Roads Bankshares, Inc.* | | | 18,480 | |
| | 83,166 | | | Hancock Holding Co. | | | 2,697,905 | |
| | 78,812 | | | Hanmi Financial Corp. | | | 1,664,509 | |
See Notes to Financial Statements.
| | | | |
| The TARGET Portfolio Trust | | | 77 | |
| | |
Small Capitalization Value Portfolio (continued) | | Portfolio of Investments
As of July 31, 2014 |
| | | | | | | | |
| SHARES | | | DESCRIPTION | | VALUE (NOTE 1) | |
| | | | COMMON STOCKS (continued) | | | | |
| | |
| | | | Banks (continued) | | | | |
| | 6,350 | | | Horizon Bancorp | | $ | 135,382 | |
| | 23,459 | | | IBERIABANK Corp. | | | 1,539,145 | |
| | 7,900 | | | Independent Bank Corp. | | | 288,429 | |
| | 53,958 | | | International Bancshares Corp. | | | 1,367,835 | |
| | 216,205 | | | Investors Bancorp, Inc. | | | 2,237,722 | |
| | 12,600 | | | MainSource Financial Group, Inc. | | | 205,758 | |
| | 85,658 | | | MB Financial, Inc. | | | 2,307,627 | |
| | 531,856 | | | National Penn Bancshares, Inc. | | | 5,478,117 | |
| | 18,502 | | | NBT Bancorp, Inc. | | | 432,392 | |
| | 124,770 | | | OFG Bancorp | | | 1,991,329 | |
| | 301,800 | | | Old National Bancorp | | | 4,038,084 | |
| | 75,803 | | | PacWest Bancorp | | | 3,158,711 | |
| | 12,900 | | | Park Sterling Corp. | | | 88,494 | |
| | 7,300 | | | Peoples Bancorp, Inc. | | | 170,309 | |
| | 7,783 | | | Peoples Financial Services Corp.(a) | | | 364,089 | |
| | 36,600 | | | Pinnacle Financial Partners, Inc. | | | 1,354,200 | |
| | 40,961 | | | Popular, Inc. (Puerto Rico)* | | | 1,306,656 | |
| | 17,300 | | | Preferred Bank* | | | 383,887 | |
| | 113,575 | | | PrivateBancorp, Inc. | | | 3,270,960 | |
| | 125,375 | | | Prosperity Bancshares, Inc. | | | 7,288,049 | |
| | 4,151 | | | Republic Bancorp, Inc. (Class A Stock) | | | 96,552 | |
| | 6,900 | | | Sierra Bancorp | | | 109,020 | |
| | 2,900 | | | Simmons First National Corp. (Class A Stock) | | | 114,927 | |
| | 3,686 | | | South State Corp. | | | 214,193 | |
| | 31,700 | | | Southwest Bancorp, Inc. | | | 488,814 | |
| | 112,844 | | | Sterling Bancorp | | | 1,342,844 | |
| | 2,600 | | | Stock Yards Bancorp, Inc. | | | 76,102 | |
| | 373,265 | | | Susquehanna Bancshares, Inc. | | | 3,799,838 | |
| | 43,549 | | | Synovus Financial Corp. | | | 1,025,579 | |
| | 4,900 | | | Taylor Capital Group, Inc.* | | | 104,468 | |
| | 173,038 | | | TCF Financial Corp. | | | 2,735,731 | |
| | 2,400 | | | Tompkins Financial Corp. | | | 106,752 | |
| | 13,100 | | | Tristate Capital Holdings, Inc.* | | | 128,249 | |
| | 349,445 | | | Trustmark Corp. | | | 8,047,718 | |
| | 17,300 | | | UMB Financial Corp. | | | 979,699 | |
| | 98,940 | | | Umpqua Holdings Corp. | | | 1,674,065 | |
| | 232,973 | | | Union Bankshares Corp. | | | 5,563,395 | |
| | 133,101 | | | United Bankshares, Inc. | | | 4,269,880 | |
| | 82,062 | | | United Community Banks, Inc. | | | 1,358,126 | |
| | 418,746 | | | Webster Financial Corp. | | | 12,005,448 | |
| | 28,700 | | | WesBanco, Inc. | | | 857,556 | |
| | 9,000 | | | West Bancorporation, Inc. | | | 131,040 | |
| | 81,509 | | | Western Alliance Bancorp* | | | 1,866,556 | |
| | 192,625 | | | Wilshire Bancorp, Inc. | | | 1,814,528 | |
See Notes to Financial Statements.
| | | | |
| 78 | | | The TARGET Portfolio Trust | |
| | | | | | | | |
| SHARES | | | DESCRIPTION | | VALUE (NOTE 1) | |
| | | | COMMON STOCKS (continued) | | | | |
| | |
| | | | Banks (continued) | | | | |
| | 40,898 | | | Wintrust Financial Corp. | | $ | 1,894,804 | |
| | 7,252 | | | Yadkin Financial Corp.* | | | 134,597 | |
| | 37,194 | | | Zions Bancorporation(a) | | | 1,071,931 | |
| | | | | | | | |
| | | | | | | 159,312,630 | |
| | | | | | | | |
| | |
| | | | Biotechnology—0.2% | | | | |
| | 2,700 | | | Applied Genetic Technologies Corp.*(a) | | | 43,200 | |
| | 8,800 | | | Ardelyx, Inc.* | | | 127,248 | |
| | 800 | | | Auspex Pharmaceuticals, Inc.* | | | 14,568 | |
| | 10,200 | | | Cara Therapeutics, Inc.*(a) | | | 130,050 | |
| | 16,600 | | | Celldex Therapeutics, Inc.*(a) | | | 217,294 | |
| | 9,000 | | | Dicerna Pharmaceuticals, Inc.*(a) | | | 135,180 | |
| | 1,600 | | | Flexion Therapeutics, Inc.* | | | 19,648 | |
| | 3,900 | | | Kite Pharma, Inc.* | | | 91,650 | |
| | 22,298 | | | Myriad Genetics, Inc.*(a) | | | 804,958 | |
| | 125,071 | | | PDL BioPharma, Inc.(a) | | | 1,173,166 | |
| | 6,300 | | | Ultragenyx Pharmaceutical, Inc.*(a) | | | 275,310 | |
| | 10,112 | | | United Therapeutics Corp.* | | | 919,585 | |
| | 76,900 | | | XOMA Corp.* | | | 298,372 | |
| | 3,700 | | | Zafgen, Inc.*(a) | | | 64,750 | |
| | | | | | | | |
| | | | | | | 4,314,979 | |
| | | | | | | | |
| | |
| | | | Building Products—0.2% | | | | |
| | 6,700 | | | Gibraltar Industries, Inc.* | | | 98,423 | |
| | 50,000 | | | Lennox International, Inc. | | | 4,266,000 | |
| | | | | | | | |
| | | | | | | 4,364,423 | |
| | | | | | | | |
| | |
| | | | Capital Markets—2.9% | | | | |
| | 226,679 | | | Apollo Investment Corp. | | | 1,924,505 | |
| | 62,462 | | | Ares Capital Corp. | | | 1,043,740 | |
| | 90,369 | | | Arlington Asset Investment Corp. (Class A Stock)(a) | | | 2,356,824 | |
| | 214,576 | | | BGC Partners, Inc. (Class A Stock) | | | 1,680,130 | |
| | 106,444 | | | BlackRock Kelso Capital Corp.(a) | | | 932,449 | |
| | 458,241 | | | Cowen Group, Inc. (Class A Stock)* | | | 1,832,964 | |
| | 127,400 | | | Eaton Vance Corp. | | | 4,475,562 | |
| | 44,010 | | | Federated Investors, Inc. (Class B Stock) | | | 1,241,962 | |
| | 185,782 | | | Fifth Street Finance Corp. | | | 1,796,512 | |
| | 95,061 | | | Hercules Technology Growth Capital, Inc.(a) | | | 1,560,902 | |
| | 19,100 | | | Investment Technology Group, Inc.* | | | 349,339 | |
| | 119,894 | | | KCG Holdings, Inc. (Class A Stock)*(a) | | | 1,369,189 | |
| | 153,200 | | | LPL Financial Holdings, Inc. | | | 7,273,936 | |
| | 9,800 | | | Manning & Napier, Inc. | | | 168,070 | |
| | 72,472 | | | Medley Capital Corp.(a) | | | 910,973 | |
| | 69,913 | | | New Mountain Finance Corp. | | | 1,012,340 | |
| | 95,255 | | | PennantPark Investment Corp.(a) | | | 1,060,188 | |
| | 49,516 | | | Piper Jaffray Cos.*(a) | | | 2,555,026 | |
| | 225,975 | | | Prospect Capital Corp. | | | 2,397,595 | |
| | 160,075 | | | Raymond James Financial, Inc. | | | 8,155,821 | |
See Notes to Financial Statements.
| | | | |
| The TARGET Portfolio Trust | | | 79 | |
| | |
Small Capitalization Value Portfolio (continued) | | Portfolio of Investments
As of July 31, 2014 |
| | | | | | | | |
| SHARES | | | DESCRIPTION | | VALUE (NOTE 1) | |
| | | | COMMON STOCKS (continued) | | | | |
| | |
| | | | Capital Markets (continued) | | | | |
| | 127,324 | | | Stifel Financial Corp.* | | $ | 5,830,166 | |
| | 269,733 | | | TCP Capital Corp. | | | 4,612,434 | |
| | 62,473 | | | THL Credit, Inc. | | | 825,893 | |
| | 97,151 | | | TICC Capital Corp. | | | 924,878 | |
| | | | | | | | |
| | | | | | | 56,291,398 | |
| | | | | | | | |
| | |
| | | | Chemicals—2.7% | | | | |
| | 16,100 | | | Axiall Corp. | | | 689,563 | |
| | 133,370 | | | Cabot Corp. | | | 6,987,254 | |
| | 23,433 | | | Cytec Industries, Inc. | | | 2,363,218 | |
| | 1,600 | | | FutureFuel Corp. | | | 25,216 | |
| | 5,000 | | | GSE Holding, Inc.* | | | 290 | |
| | 1,000 | | | Hawkins, Inc. | | | 34,250 | |
| | 112,237 | | | Innophos Holdings, Inc. | | | 6,782,482 | |
| | 1,800 | | | Innospec, Inc. | | | 72,378 | |
| | 3,100 | | | Koppers Holdings, Inc. | | | 111,693 | |
| | 50,965 | | | Kraton Performance Polymers, Inc.* | | | 1,050,389 | |
| | 4,800 | | | Kronos Worldwide, Inc. | | | 71,568 | |
| | 66,100 | | | Methanex Corp. (Canada)(a) | | | 4,301,127 | |
| | 13,600 | | | Minerals Technologies, Inc. | | | 789,752 | |
| | 152,617 | | | Olin Corp. | | | 4,055,034 | |
| | 110,400 | | | Rayonier Advanced Materials, Inc. | | | 3,583,584 | |
| | 15,700 | | | Schulman (A.), Inc. | | | 623,918 | |
| | 80,350 | | | Scotts Miracle-Gro Co. (The) (Class A Stock) | | | 4,274,620 | |
| | 35,528 | | | Sensient Technologies Corp. | | | 1,865,220 | |
| | 219,075 | | | Taminco Corp.* | | | 4,578,667 | |
| | 120,200 | | | Valspar Corp. (The) | | | 9,021,010 | |
| | 11,600 | | | Zep, Inc. | | | 180,844 | |
| | | | | | | | |
| | | | | | | 51,462,077 | |
| | | | | | | | |
| | |
| | | | Commercial Services & Supplies—2.4% | | | | |
| | 44,400 | | | ABM Industries, Inc. | | | 1,092,684 | |
| | 59,900 | | | ACCO Brands Corp.* | | | 396,538 | |
| | 21,500 | | | ARC Document Solutions, Inc.* | | | 117,175 | |
| | 10,200 | | | Brady Corp. (Class A Stock) | | | 266,730 | |
| | 82,600 | | | Brink’s Co. (The) | | | 2,216,984 | |
| | 112,200 | | | Cenveo, Inc.*(a) | | | 378,114 | |
| | 54,394 | | | Clean Harbors, Inc.*(a) | | | 3,134,726 | |
| | 275,384 | | | Ennis, Inc. | | | 3,904,945 | |
| | 32,466 | | | G&K Services, Inc. (Class A Stock) | | | 1,561,290 | |
| | 48,002 | | | Interface, Inc. | | | 760,832 | |
| | 441,036 | | | KAR Auction Services, Inc. | | | 12,926,765 | |
| | 67,500 | | | Kimball International, Inc. (Class B Stock) | | | 1,064,475 | |
| | 48,565 | | | Pitney Bowes, Inc.(a) | | | 1,314,169 | |
See Notes to Financial Statements.
| | | | |
| 80 | | | The TARGET Portfolio Trust | |
| | | | | | | | |
| SHARES | | | DESCRIPTION | | VALUE (NOTE 1) | |
| | | | COMMON STOCKS (continued) | | | | |
| | |
| | | | Commercial Services & Supplies (continued) | | | | |
| | 75,510 | | | Quad/Graphics, Inc. | | $ | 1,594,771 | |
| | 66,391 | | | RR Donnelley & Sons Co. | | | 1,152,548 | |
| | 30,900 | | | Steelcase, Inc. (Class A Stock) | | | 466,590 | |
| | 41,312 | | | Team, Inc.* | | | 1,636,369 | |
| | 96,435 | | | Tetra Tech, Inc. | | | 2,341,442 | |
| | 52,753 | | | UniFirst Corp. | | | 5,128,119 | |
| | 15,100 | | | United Stationers, Inc. | | | 582,558 | |
| | 17,100 | | | Viad Corp. | | | 362,862 | |
| | 168,751 | | | West Corp. | | | 4,348,713 | |
| | | | | | | | |
| | | | | | | 46,749,399 | |
| | | | | | | | |
| | |
| | | | Communications Equipment—0.9% | | | | |
| | 67,991 | | | Alliance Fiber Optic Products, Inc. | | | 909,719 | |
| | 107,280 | | | ARRIS Group, Inc.* | | | 3,665,758 | |
| | 118,089 | | | Brocade Communications Systems, Inc. | | | 1,087,600 | |
| | 275,725 | | | CommScope Holding Co., Inc.* | | | 6,793,864 | |
| | 420,161 | | | Ixia* | | | 4,495,723 | |
| | | | | | | | |
| | | | | | | 16,952,664 | |
| | | | | | | | |
| | |
| | | | Construction & Engineering—0.7% | | | | |
| | 44,829 | | | Argan, Inc. | | | 1,519,703 | |
| | 81,609 | | | EMCOR Group, Inc. | | | 3,340,256 | |
| | 55,997 | | | MYR Group, Inc.* | | | 1,389,286 | |
| | 38,791 | | | Northwest Pipe Co.* | | | 1,390,657 | |
| | 105,226 | | | Orion Marine Group, Inc.* | | | 1,137,493 | |
| | 18,907 | | | Tutor Perini Corp.* | | | 514,838 | |
| | 83,860 | | | URS Corp. | | | 4,802,662 | |
| | | | | | | | |
| | | | | | | 14,094,895 | |
| | | | | | | | |
| | |
| | | | Consumer Finance—1.5% | | | | |
| | 229,772 | | | Cash America International, Inc. | | | 10,199,579 | |
| | 5,467 | | | Credit Acceptance Corp.* | | | 621,735 | |
| | 6,900 | | | Ezcorp, Inc. (Class A Stock)* | | | 67,551 | |
| | 117,000 | | | First Cash Financial Services, Inc.* | | | 6,599,970 | |
| | 84,100 | | | Green Dot Corp. (Class A Stock)* | | | 1,512,959 | |
| | 43,938 | | | Nelnet, Inc. (Class A Stock) | | | 1,811,564 | |
| | 102,700 | | | Portfolio Recovery Associates, Inc.* | | | 6,055,192 | |
| | 13,143 | | | World Acceptance Corp.*(a) | | | 1,065,634 | |
| | | | | | | | |
| | | | | | | 27,934,184 | |
| | | | | | | | |
| | |
| | | | Containers & Packaging—2.0% | | | | |
| | 125,517 | | | Berry Plastics Group, Inc.* | | | 3,048,808 | |
| | 916,300 | | | Graphic Packaging Holding Co.* | | | 10,995,600 | |
| | 36,990 | | | Greif, Inc. (Class A Stock) | | | 1,856,158 | |
| | 44,300 | | | Rock-Tenn Co. (Class A Stock) | | | 4,404,749 | |
| | 273,610 | | | Silgan Holdings, Inc. | | | 13,467,084 | |
| | 102,400 | | | Sonoco Products Co. | | | 4,007,936 | |
| | | | | | | | |
| | | | | | | 37,780,335 | |
| | | | | | | | |
See Notes to Financial Statements.
| | | | |
| The TARGET Portfolio Trust | | | 81 | |
| | |
Small Capitalization Value Portfolio (continued) | | Portfolio of Investments
As of July 31, 2014 |
| | | | | | | | |
| SHARES | | | DESCRIPTION | | VALUE (NOTE 1) | |
| | | | COMMON STOCKS (continued) | | | | |
| | |
| | | | Distributors | | | | |
| | 2,600 | | | Core-Mark Holding Co., Inc. | | $ | 122,720 | |
| | | | | | | | |
| | |
| | | | Diversified Consumer Services—0.4% | | | | |
| | 8,500 | | | 2U, Inc.*(a) | | | 119,510 | |
| | 33,253 | | | Apollo Education Group, Inc. (Class A Stock)* | | | 928,756 | |
| | 37,100 | | | Chegg, Inc.* | | | 238,553 | |
| | 24,779 | | | ITT Educational Services, Inc.*(a) | | | 352,605 | |
| | 49,742 | | | K12, Inc.*(a) | | | 1,159,486 | |
| | 22,300 | | | Lifelock, Inc.* | | | 309,524 | |
| | 56,165 | | | Matthews International Corp. (Class A Stock) | | | 2,442,616 | |
| | 11,400 | | | ServiceMaster Global Holdings, Inc.* | | | 200,298 | |
| | 25,007 | | | Strayer Education, Inc.* | | | 1,295,863 | |
| | | | | | | | |
| | | | | | | 7,047,211 | |
| | | | | | | | |
| | |
| | | | Diversified Financial Services—0.1% | | | | |
| | 49,292 | | | Interactive Brokers Group, Inc. (Class A Stock) | | | 1,134,455 | |
| | 73,976 | | | PHH Corp.* | | | 1,727,340 | |
| | | | | | | | |
| | | | | | | 2,861,795 | |
| | | | | | | | |
| | |
| | | | Diversified Telecommunication Services—0.4% | | | | |
| | 27,849 | | | Atlantic Tele-Network, Inc. | | | 1,629,445 | |
| | 49,683 | | | Cogent Communications Holdings, Inc. | | | 1,724,497 | |
| | 5,000 | | | IDT Corp. (Class B Stock) | | | 77,950 | |
| | 174,610 | | | Inteliquent, Inc. | | | 1,852,612 | |
| | 33,000 | | | Intelsat SA* | | | 611,820 | |
| | 188,781 | | | Iridium Communications, Inc.*(a) | | | 1,544,229 | |
| | | | | | | | |
| | | | | | | 7,440,553 | |
| | | | | | | | |
| | |
| | | | Electric Utilities—1.9% | | | | |
| | 43,052 | | | Cleco Corp. | | | 2,399,719 | |
| | 169,246 | | | El Paso Electric Co. | | | 6,236,715 | |
| | 86,362 | | | Empire District Electric Co. (The)(a) | | | 2,116,733 | |
| | 380,967 | | | Great Plains Energy, Inc. | | | 9,444,172 | |
| | 94,368 | | | IDACORP, Inc. | | | 5,053,406 | |
| | 6,100 | | | MGE Energy, Inc. | | | 229,482 | |
| | 24,003 | | | Pinnacle West Capital Corp. | | | 1,283,920 | |
| | 97,335 | | | PNM Resources, Inc. | | | 2,496,643 | |
| | 153,364 | | | Portland General Electric Co. | | | 4,896,913 | |
| | 3,900 | | | UIL Holdings Corp. | | | 136,929 | |
| | 5,300 | | | Unitil Corp. | | | 169,600 | |
| | 12,900 | | | UNS Energy Corp. | | | 779,418 | |
| | 50,435 | | | Westar Energy, Inc.(a) | | | 1,817,677 | |
| | | | | | | | |
| | | | | | | 37,061,327 | |
| | | | | | | | |
See Notes to Financial Statements.
| | | | |
| 82 | | | The TARGET Portfolio Trust | |
| | | | | | | | |
| SHARES | | | DESCRIPTION | | VALUE (NOTE 1) | |
| | | | COMMON STOCKS (continued) | | | | |
| | |
| | | | Electrical Equipment—1.9% | | | | |
| | 84,800 | | | AZZ, Inc. | | $ | 3,700,672 | |
| | 131,123 | | | Babcock & Wilcox Co. (The) | | | 4,070,058 | |
| | 224,440 | | | EnerSys | | | 14,236,229 | |
| | 190,516 | | | Franklin Electric Co., Inc. | | | 6,982,411 | |
| | 22,498 | | | Generac Holdings, Inc.*(a) | | | 976,413 | |
| | 72,011 | | | General Cable Corp.(a) | | | 1,600,805 | |
| | 30,376 | | | Regal-Beloit Corp. | | | 2,135,129 | |
| | 155,725 | | | Thermon Group Holdings, Inc.* | | | 3,796,576 | |
| | | | | | | | |
| | | | | | | 37,498,293 | |
| | | | | | | | |
| | |
| | | | Electronic Equipment, Instruments & Components—3.5% | | | | |
| | 20,727 | | | Arrow Electronics, Inc.* | | | 1,201,130 | |
| | 294,700 | | | AVX Corp. | | | 4,007,920 | |
| | 81,577 | | | Belden, Inc. | | | 5,539,078 | |
| | 119,033 | | | Benchmark Electronics, Inc.* | | | 2,874,647 | |
| | 240,890 | | | Checkpoint Systems, Inc.* | | | 2,948,494 | |
| | 117,112 | | | Coherent, Inc.* | | | 6,899,068 | |
| | 238,540 | | | FLIR Systems, Inc. | | | 7,938,611 | |
| | 13,400 | | | GSI Group, Inc.* | | | 154,502 | |
| | 39,812 | | | Ingram Micro, Inc. (Class A Stock)* | | | 1,142,604 | |
| | 75,598 | | | Insight Enterprises, Inc.* | | | 1,985,959 | |
| | 99,066 | | | Itron, Inc.* | | | 3,564,395 | |
| | 143,087 | | | Littelfuse, Inc. | | | 12,437,122 | |
| | 43,274 | | | Plexus Corp.* | | | 1,701,966 | |
| | 17,850 | | | Rogers Corp.* | | | 1,023,876 | |
| | 363,747 | | | Sanmina Corp.* | | | 8,471,668 | |
| | 42,468 | | | ScanSource, Inc.* | | | 1,520,779 | |
| | 19,391 | | | Tech Data Corp.* | | | 1,217,561 | |
| | 28,010 | | | Zebra Technologies Corp. (Class A Stock)* | | | 2,242,761 | |
| | | | | | | | |
| | | | | | | 66,872,141 | |
| | | | | | | | |
| | |
| | | | Energy Equipment & Services—3.1% | | | | |
| | 11,200 | | | Basic Energy Services, Inc.* | | | 268,688 | |
| | 199,588 | | | Bristow Group, Inc. | | | 14,244,596 | |
| | 54,600 | | | C&J Energy Services, Inc.* | | | 1,635,816 | |
| | 64,100 | | | Core Laboratories NV | | | 9,386,163 | |
| | 7,900 | | | Dawson Geophysical Co. | | | 198,290 | |
| | 57,591 | | | Exterran Holdings, Inc.(a) | | | 2,433,220 | |
| | 285,225 | | | Forum Energy Technologies, Inc.* | | | 9,495,140 | |
| | 17,100 | | | GulfMark Offshore, Inc. (Class A Stock) | | | 654,417 | |
| | 31,600 | | | Helix Energy Solutions Group, Inc.* | | | 803,588 | |
| | 95,500 | | | ION Geophysical Corp.* | | | 358,125 | |
| | 119,879 | | | Key Energy Services, Inc.* | | | 736,057 | |
| | 172,583 | | | McDermott International, Inc.*(a) | | | 1,259,856 | |
| | 64,922 | | | Nabors Industries Ltd. | | | 1,763,281 | |
| | 412,086 | | | Newpark Resources, Inc.* | | | 5,039,812 | |
| | 265,796 | | | Parker Drilling Co.* | | | 1,642,619 | |
| | 353,400 | | | Precision Drilling Corp. (Canada) | | | 4,403,364 | |
See Notes to Financial Statements.
| | | | |
| The TARGET Portfolio Trust | | | 83 | |
| | |
Small Capitalization Value Portfolio (continued) | | Portfolio of Investments
As of July 31, 2014 |
| | | | | | | | |
| SHARES | | | DESCRIPTION | | VALUE (NOTE 1) | |
| | | | COMMON STOCKS (continued) | | | | |
| | |
| | | | Energy Equipment & Services (continued) | | | | |
| | 10,763 | | | Superior Energy Services, Inc. | | $ | 361,637 | |
| | 5,400 | | | Tesco Corp. | | | 105,408 | |
| | 82,400 | | | Tidewater, Inc. | | | 3,895,048 | |
| | 22,300 | | | Willbros Group, Inc.* | | | 258,457 | |
| | | | | | | | |
| | | | | | | 58,943,582 | |
| | | | | | | | |
| | |
| | | | Food & Staples Retailing—1.3% | | | | |
| | 124,192 | | | Andersons, Inc. (The) | | | 6,708,852 | |
| | 64,428 | | | Casey’s General Stores, Inc. | | | 4,263,201 | |
| | 132,617 | | | Pantry, Inc. (The)* | | | 2,375,170 | |
| | 272,200 | | | Rite Aid Corp.* | | | 1,821,018 | |
| | 39,700 | | | Roundy’s, Inc. | | | 191,751 | |
| | 85,363 | | | SpartanNash Co. | | | 1,789,208 | |
| | 3,805 | | | Susser Holdings Corp.* | | | 305,047 | |
| | 51,995 | | | United Natural Foods, Inc.* | | | 3,047,947 | |
| | 93,200 | | | Weis Markets, Inc. | | | 3,975,912 | |
| | | | | | | | |
| | | | | | | 24,478,106 | |
| | | | | | | | |
| | |
| | | | Food Products—1.2% | | | | |
| | 67,500 | | | Cal-Maine Foods, Inc. | | | 4,806,000 | |
| | 103,600 | | | Chiquita Brands International, Inc.* | | | 993,524 | |
| | 127,082 | | | Darling Ingredients, Inc.* | | | 2,378,975 | |
| | 58,800 | | | Ingredion, Inc. | | | 4,329,444 | |
| | 69,770 | | | Pilgrim’s Pride Corp.* | | | 1,950,769 | |
| | 15,200 | | | Pinnacle Foods, Inc. | | | 457,976 | |
| | 65,625 | | | Sanderson Farms, Inc. | | | 5,977,781 | |
| | 30,635 | | | Snyder’s-Lance, Inc. | | | 760,054 | |
| | 27,587 | | | TreeHouse Foods, Inc.* | | | 2,027,645 | |
| | | | | | | | |
| | | | | | | 23,682,168 | |
| | | | | | | | |
| | |
| | | | Gas Utilities—1.4% | | | | |
| | 24,362 | | | AGL Resources, Inc. | | | 1,258,054 | |
| | 24,266 | | | Atmos Energy Corp. | | | 1,172,533 | |
| | 2,600 | | | Chesapeake Utilities Corp. | | | 169,234 | |
| | 98,200 | | | Laclede Group, Inc. (The) | | | 4,613,436 | |
| | 8,450 | | | New Jersey Resources Corp. | | | 431,626 | |
| | 11,400 | | | Northwest Natural Gas Co. | | | 492,708 | |
| | 99,906 | | | South Jersey Industries, Inc. | | | 5,351,965 | |
| | 57,797 | | | Southwest Gas Corp. | | | 2,862,685 | |
| | 89,800 | | | UGI Corp. | | | 4,358,892 | |
| | 148,737 | | | WGL Holdings, Inc. | | | 5,797,768 | |
| | | | | | | | |
| | | | | | | 26,508,901 | |
| | | | | | | | |
See Notes to Financial Statements.
| | | | |
| 84 | | | The TARGET Portfolio Trust | |
| | | | | | | | |
| SHARES | | | DESCRIPTION | | VALUE (NOTE 1) | |
| | | | COMMON STOCKS (continued) | | | | |
| | |
| | | | Health Care Equipment & Supplies—2.8% | | | | |
| | 195,800 | | | Alere, Inc.* | | $ | 7,832,000 | |
| | 7,459 | | | Analogic Corp. | | | 536,377 | |
| | 31,946 | | | Anika Therapeutics, Inc.*(a) | | | 1,343,649 | |
| | 198,140 | | | Cantel Medical Corp. | | | 6,643,634 | |
| | 20,000 | | | Cynosure, Inc. (Class A Stock)* | | | 454,800 | |
| | 3,300 | | | Greatbatch, Inc.* | | | 163,383 | |
| | 151,575 | | | Haemonetics Corp.* | | | 5,391,523 | |
| | 156,650 | | | Integra LifeSciences Holdings Corp.*(a) | | | 7,428,343 | |
| | 44,748 | | | Invacare Corp. | | | 669,877 | |
| | 218,925 | | | Merit Medical Systems, Inc.* | | | 2,810,997 | |
| | 28,300 | | | NuVasive, Inc.* | | | 1,057,854 | |
| | 15,500 | | | OraSure Technologies, Inc.* | | | 127,565 | |
| | 80,800 | | | STERIS Corp. | | | 4,111,104 | |
| | 138,005 | | | Teleflex, Inc. | | | 14,868,659 | |
| | | | | | | | |
| | | | | | | 53,439,765 | |
| | | | | | | | |
| | |
| | | | Health Care Providers & Services—3.1% | | | | |
| | 221,273 | | | Amsurg Corp.* | | | 10,567,999 | |
| | 83,363 | | | Centene Corp.* | | | 6,009,639 | |
| | 84,500 | | | Community Health Systems, Inc.* | | | 4,030,650 | |
| | 68,800 | | | Cross Country Healthcare, Inc.* | | | 494,672 | |
| | 46,069 | | | HealthSouth Corp. | | | 1,765,825 | |
| | 205,326 | | | Healthways, Inc.*(a) | | | 3,550,087 | |
| | 11,600 | | | Kindred Healthcare, Inc. | | | 277,240 | |
| | 83,056 | | | LifePoint Hospitals, Inc.* | | | 5,956,776 | |
| | 135,996 | | | MEDNAX, Inc.*(a) | | | 8,048,243 | |
| | 171,798 | | | Molina Healthcare, Inc.*(a) | | | 7,017,948 | |
| | 58,021 | | | PharMerica Corp.* | | | 1,565,987 | |
| | 14,321 | | | Premier, Inc. (Class A Stock)* | | | 405,284 | |
| | 430,599 | | | Select Medical Holdings Corp. | | | 6,691,509 | |
| | 34,348 | | | Surgical Care Affiliates, Inc.* | | | 1,009,144 | |
| | 10,600 | | | Triple-S Management Corp. (Class B Stock) (Puerto Rico)* | | | 183,168 | |
| | 42,567 | | | WellCare Health Plans, Inc.* | | | 2,655,329 | |
| | | | | | | | |
| | | | | | | 60,229,500 | |
| | | | | | | | |
| | |
| | | | Health Care Technology—0.3% | | | | |
| | 2,500 | | | Imprivata, Inc.* | | | 36,250 | |
| | 274,150 | | | MedAssets, Inc.* | | | 5,822,946 | |
| | | | | | | | |
| | | | | | | 5,859,196 | |
| | | | | | | | |
| | |
| | | | Hotels, Restaurants & Leisure—1.4% | | | | |
| | 37,525 | | | Bob Evans Farms, Inc.(a) | | | 1,782,813 | |
| | 87,897 | | | Boyd Gaming Corp.* | | | 966,867 | |
| | 43,800 | | | Cracker Barrel Old Country Store, Inc. | | | 4,246,848 | |
| | 201,538 | | | International Game Technology | | | 3,412,038 | |
| | 128,420 | | | International Speedway Corp. (Class A Stock) | | | 3,893,695 | |
| | 73,750 | | | Jack in the Box, Inc. | | | 4,217,763 | |
| | 124,195 | | | Life Time Fitness, Inc.* | | | 4,887,073 | |
See Notes to Financial Statements.
| | | | |
| The TARGET Portfolio Trust | | | 85 | |
| | |
Small Capitalization Value Portfolio (continued) | | Portfolio of Investments
As of July 31, 2014 |
| | | | | | | | |
| SHARES | | | DESCRIPTION | | VALUE (NOTE 1) | |
| | | | COMMON STOCKS (continued) | | | | |
| | |
| | | | Hotels, Restaurants & Leisure (continued) | | | | |
| | 89,321 | | | Penn National Gaming, Inc.* | | $ | 936,084 | |
| | 17,922 | | | Red Robin Gourmet Burgers, Inc.* | | | 1,153,460 | |
| | 44,600 | | | Ruth’s Hospitality Group, Inc. | | | 506,210 | |
| | 95,295 | | | Scientific Games Corp. (Class A Stock)* | | | 813,819 | |
| | 11,000 | | | Speedway Motorsports, Inc. | | | 191,840 | |
| | | | | | | | |
| | | | | | | 27,008,510 | |
| | | | | | | | |
| | |
| | | | Household Durables—0.6% | | | | |
| | 5,600 | | | Century Communities, Inc.* | | | 106,792 | |
| | 34,277 | | | Ethan Allen Interiors, Inc. | | | 785,629 | |
| | 3,100 | | | GoPro, Inc. (Class A Stock)*(a) | | | 148,707 | |
| | 35,200 | | | Helen of Troy Ltd.* | | | 1,887,776 | |
| | 14,500 | | | Lifetime Brands, Inc. | | | 246,500 | |
| | 130,041 | | | Meritage Homes Corp.* | | | 4,980,570 | |
| | 78,125 | | | Ryland Group, Inc. (The) | | | 2,507,812 | |
| | 195,964 | | | Skullcandy, Inc.* | | | 1,324,717 | |
| | 10,200 | | | Universal Electronics, Inc.* | | | 485,826 | |
| | | | | | | | |
| | | | | | | 12,474,329 | |
| | | | | | | | |
| | |
| | | | Household Products | | | | |
| | 6,200 | | | Central Garden & Pet Co. (Class A Stock)* | | | 57,846 | |
| | | | | | | | |
| | |
| | | | Independent Power & Renewable Electricity Producers—0.1% | | | | |
| | 48,000 | | | Dynegy, Inc.* | | | 1,274,400 | |
| | | | | | | | |
| | |
| | | | Insurance—8.6% | | | | |
| | 146,871 | | | Allied World Assurance Co. Holdings AG | | | 5,288,825 | |
| | 61,163 | | | Ambac Financial Group, Inc.* | | | 1,385,954 | |
| | 606,501 | | | American Equity Investment Life Holding Co.(a) | | | 13,427,932 | |
| | 89,521 | | | American Financial Group, Inc. | | | 5,012,281 | |
| | 17,900 | | | AMERISAFE, Inc. | | | 655,140 | |
| | 47,240 | | | AmTrust Financial Services, Inc.(a) | | | 2,014,314 | |
| | 33,851 | | | Argo Group International Holdings Ltd. | | | 1,686,118 | |
| | 156,775 | | | Aspen Insurance Holdings Ltd. | | | 6,272,568 | |
| | 16,582 | | | Assurant, Inc. | | | 1,050,636 | |
| | 69,511 | | | Assured Guaranty Ltd. | | | 1,551,486 | |
| | 23,038 | | | Axis Capital Holdings Ltd. | | | 994,090 | |
| | 655,463 | | | CNO Financial Group, Inc. | | | 10,605,391 | |
| | 102,661 | | | Employers Holdings, Inc. | | | 2,186,679 | |
| | 68,649 | | | Endurance Specialty Holdings Ltd. | | | 3,630,846 | |
| | 8,527 | | | Enstar Group Ltd.* | | | 1,176,726 | |
| | 33,149 | | | FBL Financial Group, Inc. (Class A Stock) | | | 1,418,114 | |
| | 12,500 | | | Fidelity & Guaranty Life | | | 270,125 | �� |
| | 233,888 | | | First American Financial Corp.(a) | | | 6,347,720 | |
| | 66,559 | | | Genworth Financial, Inc. (Class A Stock)* | | | 871,923 | |
See Notes to Financial Statements.
| | | | |
| 86 | | | The TARGET Portfolio Trust | |
| | | | | | | | |
| SHARES | | | DESCRIPTION | | VALUE (NOTE 1) | |
| | | | COMMON STOCKS (continued) | | | | |
| | |
| | | | Insurance (continued) | | | | |
| | 51,223 | | | Greenlight Capital Re Ltd. (Class A Stock)* | | $ | 1,657,576 | |
| | 75,094 | | | Hanover Insurance Group, Inc. (The) | | | 4,341,184 | |
| | 220,189 | | | HCC Insurance Holdings, Inc. | | | 10,278,422 | |
| | 22,089 | | | HCI Group, Inc. | | | 881,351 | |
| | 20,700 | | | Hilltop Holdings, Inc.* | | | 424,350 | |
| | 256,965 | | | Horace Mann Educators Corp. | | | 7,362,047 | |
| | 38,992 | | | Infinity Property & Casualty Corp. | | | 2,525,122 | |
| | 29,231 | | | Kemper Corp. | | | 1,011,685 | |
| | 204,033 | | | Maiden Holdings Ltd. | | | 2,342,299 | |
| | 97,385 | | | MBIA, Inc.* | | | 932,948 | |
| | 193,057 | | | Montpelier Re Holdings Ltd. (Bermuda) | | | 5,700,973 | |
| | 25,096 | | | Navigators Group, Inc. (The)* | | | 1,525,837 | |
| | 66,812 | | | Old Republic International Corp. | | | 961,425 | |
| | 11,279 | | | PartnerRe Ltd. | | | 1,177,076 | |
| | 161,581 | | | Platinum Underwriters Holdings Ltd. | | | 9,468,647 | |
| | 32,058 | | | Primerica, Inc. | | | 1,477,233 | |
| | 23,991 | | | ProAssurance Corp. | | | 1,046,727 | |
| | 219,540 | | | Protective Life Corp. | | | 15,231,685 | |
| | 101,250 | | | Reinsurance Group of America, Inc. | | | 8,126,325 | |
| | 12,336 | | | RenaissanceRe Holdings Ltd. | | | 1,206,584 | |
| | 43,980 | | | RLI Corp. | | | 1,879,705 | |
| | 92,326 | | | Selective Insurance Group, Inc. | | | 2,057,947 | |
| | 17,656 | | | StanCorp Financial Group, Inc. | | | 1,065,363 | |
| | 88,399 | | | State Auto Financial Corp. | | | 1,866,103 | |
| | 6,300 | | | Stewart Information Services Corp.(a) | | | 185,661 | |
| | 327,418 | | | Symetra Financial Corp. | | | 7,465,130 | |
| | 174,895 | | | United Fire Group, Inc. | | | 4,942,533 | |
| | 30,274 | | | Validus Holdings Ltd. | | | 1,105,909 | |
| | 27,020 | | | W.R. Berkley Corp. | | | 1,205,362 | |
| | 1,895 | | | White Mountains Insurance Group Ltd. | | | 1,146,304 | |
| | | | | | | | |
| | | | | | | 166,446,381 | |
| | | | | | | | |
| | |
| | | | Internet & Catalog Retail—0.4% | | | | |
| | 100,925 | | | HSN, Inc. | | | 5,640,698 | |
| | 72,186 | | | Nutrisystem, Inc. | | | 1,158,586 | |
| | 39,180 | | | Overstock.com, Inc.* | | | 636,675 | |
| | | | | | | | |
| | | | | | | 7,435,959 | |
| | | | | | | | |
| | |
| | | | Internet Software & Services— 0.4% | | | | |
| | 170,706 | | | Digital River, Inc.* | | | 2,439,389 | |
| | 5,074 | | | Five9, Inc.* | | | 36,938 | |
| | 26,100 | | | IntraLinks Holdings, Inc.* | | | 209,322 | |
| | 86,400 | | | j2 Global, Inc.(a) | | | 4,226,688 | |
| | 300 | | | OPOWER, Inc.*(a) | | | 4,800 | |
| | 500 | | | Q2 Holdings, Inc.*(a) | | | 6,585 | |
| | 17,300 | | | WebMD Health Corp.*(a) | | | 862,059 | |
| | | | | | | | |
| | | | | | | 7,785,781 | |
| | | | | | | | |
See Notes to Financial Statements.
| | | | |
| The TARGET Portfolio Trust | | | 87 | |
| | |
Small Capitalization Value Portfolio (continued) | | Portfolio of Investments
As of July 31, 2014 |
| | | | | | | | |
| SHARES | | | DESCRIPTION | | VALUE (NOTE 1) | |
| | | | COMMON STOCKS (continued) | | | | |
| | |
| | | | IT Services—3.1% | | | | |
| | 193,700 | | | Booz Allen Hamilton Holding Corp. | | $ | 4,307,888 | |
| | 307,417 | | | Broadridge Financial Solutions, Inc. | | | 12,410,424 | |
| | 77,550 | | | CACI International, Inc. (Class A Stock)*(a) | | | 5,350,175 | |
| | 109,719 | | | Convergys Corp.(a) | | | 2,127,452 | |
| | 161,200 | | | CSG Systems International, Inc.(a) | | | 4,197,648 | |
| | 12,314 | | | DST Systems, Inc. | | | 1,109,122 | |
| | 60,792 | | | ExlService Holdings, Inc.* | | | 1,705,216 | |
| | 93,160 | | | Global Payments, Inc. | | | 6,453,193 | |
| | 47,942 | | | Heartland Payment Systems, Inc. | | | 2,277,245 | |
| | 157,075 | | | iGATE Corp.* | | | 5,604,436 | |
| | 81,400 | | | Jack Henry & Associates, Inc. | | | 4,749,690 | |
| | 308,715 | | | Sapient Corp.* | | | 4,556,633 | |
| | 30,407 | | | Science Applications International Corp. | | | 1,270,100 | |
| | 80,241 | | | Sykes Enterprises, Inc.* | | | 1,660,989 | |
| | 116,497 | | | Unisys Corp.*(a) | | | 2,480,221 | |
| | | | | | | | |
| | | | | | | 60,260,432 | |
| | | | | | | | |
| | |
| | | | Leisure Products—0.6% | | | | |
| | 119,593 | | | Arctic Cat, Inc. | | | 4,257,511 | |
| | 261,600 | | | Callaway Golf Co. | | | 1,988,160 | |
| | 78,561 | | | Smith & Wesson Holding Corp.*(a) | | | 970,228 | |
| | 79,078 | | | Sturm Ruger & Co., Inc.(a) | | | 3,950,737 | |
| | | | | | | | |
| | | | | | | 11,166,636 | |
| | | | | | | | |
| | |
| | | | Life Sciences Tools & Services—0.9% | | | | |
| | 79,575 | | | Albany Molecular Research, Inc.*(a) | | | 1,515,108 | |
| | 54,174 | | | Charles River Laboratories International, Inc.* | | | 2,936,772 | |
| | 70,780 | | | Covance, Inc.* | | | 5,939,858 | |
| | 151,365 | | | PerkinElmer, Inc. | | | 6,996,090 | |
| | | | | | | | |
| | | | | | | 17,387,828 | |
| | | | | | | | |
| | |
| | | | Machinery—5.0% | | | | |
| | 51,344 | | | Actuant Corp. (Class A Stock) | | | 1,657,384 | |
| | 101,882 | | | Albany International Corp. (Class A Stock) | | | 3,651,451 | |
| | 47,017 | | | Altra Industrial Motion Corp. | | | 1,473,983 | |
| | 173,600 | | | Barnes Group, Inc. | | | 5,945,800 | |
| | 115,908 | | | Briggs & Stratton Corp.(a) | | | 2,124,594 | |
| | 58,300 | | | Crane Co. | | | 3,999,963 | |
| | 25,455 | | | EnPro Industries, Inc.* | | | 1,741,631 | |
| | 16,900 | | | Global Brass & Copper Holdings, Inc. | | | 256,542 | |
| | 42,025 | | | Greenbrier Cos., Inc. (The)(a) | | | 2,708,511 | |
| | 220,375 | �� | | Hillenbrand, Inc. | | | 6,622,269 | |
| | 2,000 | | | Hurco Cos., Inc. | | | 64,220 | |
| | 18,764 | | | Hyster-Yale Materials Handling, Inc. | | | 1,502,996 | |
See Notes to Financial Statements.
| | | | |
| 88 | | | The TARGET Portfolio Trust | |
| | | | | | | | |
| SHARES | | | DESCRIPTION | | VALUE (NOTE 1) | |
| | | | COMMON STOCKS (continued) | | | | |
| | |
| | | | Machinery (continued) | | | | |
| | 59,271 | | | ITT Corp. | | $ | 2,724,688 | |
| | 50,034 | | | Kadant, Inc. | | | 1,908,297 | |
| | 198,400 | | | Kennametal, Inc. | | | 8,388,352 | |
| | 10,200 | | | LB Foster Co. (Class A Stock) | | | 475,830 | |
| | 1,500 | | | NN, Inc. | | | 43,500 | |
| | 20,850 | | | Oshkosh Corp. | | | 963,687 | |
| | 270,725 | | | Rexnord Corp.*(a) | | | 7,285,210 | |
| | 84,346 | | | Snap-on, Inc. | | | 10,138,389 | |
| | 35,575 | | | Standex International Corp. | | | 2,346,171 | |
| | 30,268 | | | Terex Corp.(a) | | | 1,044,549 | |
| | 121,500 | | | Timken Co. (The) | | | 5,382,450 | |
| | 66,833 | | | Titan International, Inc.(a) | | | 997,148 | |
| | 85,626 | | | TriMas Corp.* | | | 2,712,632 | |
| | 168,614 | | | Trinity Industries, Inc. | | | 7,358,315 | |
| | 26,700 | | | Valmont Industries, Inc.(a) | | | 3,888,321 | |
| | 410,286 | | | Wabash National Corp.*(a) | | | 5,583,992 | |
| | 44,539 | | | Watts Water Technologies, Inc. (Class A Stock) | | | 2,603,750 | |
| | | | | | | | |
| | | | | | | 95,594,625 | |
| | | | | | | | |
| | |
| | | | Marine—0.2% | | | | |
| | 26,100 | | | Knightsbridge Tankers Ltd. (Bermuda) | | | 297,540 | |
| | 96,361 | | | Matson, Inc. | | | 2,596,929 | |
| | | | | | | | |
| | | | | | | 2,894,469 | |
| | | | | | | | |
| | |
| | | | Media—0.8% | | | | |
| | 4,300 | | | AMC Entertainment Holdings, Inc. (Class A Stock) | | | 97,352 | |
| | 123,400 | | | Cinemark Holdings, Inc. | | | 4,047,520 | |
| | 169,887 | | | Cumulus Media, Inc. (Class A Stock)*(a) | | | 880,015 | |
| | 16,462 | | | Dex Media, Inc.*(a) | | | 210,549 | |
| | 10,800 | | | Entercom Communications Corp. (Class A Stock)*(a) | | | 102,060 | |
| | 40,800 | | | EW Scripps Co. (The) (Class A Stock)*(a) | | | 884,544 | |
| | 41,100 | | | Journal Communications, Inc. (Class A Stock)* | | | 447,168 | |
| | 125,288 | | | Live Nation Entertainment, Inc.* | | | 2,907,934 | |
| | 186,320 | | | McClatchy Co. (The) (Class A Stock)* | | | 899,926 | |
| | 49,400 | | | Meredith Corp. | | | 2,268,448 | |
| | 44,071 | | | Scholastic Corp. | | | 1,560,995 | |
| | 5,000 | | | Sinclair Broadcast Group, Inc. (Class A Stock) | | | 161,550 | |
| | | | | | | | |
| | | | | | | 14,468,061 | |
| | | | | | | | |
| | |
| | | | Metals & Mining—2.3% | | | | |
| | 54,501 | | | Allegheny Technologies, Inc. | | | 2,051,963 | |
| | 70,786 | | | Ampco-Pittsburgh Corp. | | | 1,427,754 | |
| | 50,018 | | | Cliffs Natural Resources, Inc.(a) | | | 872,814 | |
| | 404,822 | | | Commercial Metals Co. | | | 6,979,131 | |
| | 148,900 | | | Globe Specialty Metals, Inc. | | | 2,833,567 | |
| | 352,300 | | | HudBay Minerals, Inc. (Canada) | | | 3,822,455 | |
| | 31,464 | | | Materion Corp. | | | 1,016,602 | |
| | 89,875 | | | Reliance Steel & Aluminum Co. | | | 6,133,969 | |
See Notes to Financial Statements.
| | | | |
| The TARGET Portfolio Trust | | | 89 | |
| | |
Small Capitalization Value Portfolio (continued) | | Portfolio of Investments
As of July 31, 2014 |
| | | | | | | | |
| SHARES | | | DESCRIPTION | | VALUE (NOTE 1) | |
| | | | COMMON STOCKS (continued) | | | | |
| | |
| | | | Metals & Mining (continued) | | | | |
| | 73,300 | | | Royal Gold, Inc. | | $ | 5,539,281 | |
| | 40,440 | | | RTI International Metals, Inc.* | | | 1,005,338 | |
| | 48,514 | | | Schnitzer Steel Industries, Inc. (Class A Stock)(a) | | | 1,295,809 | |
| | 216,200 | | | Steel Dynamics, Inc. | | | 4,585,602 | |
| | 60,750 | | | TimkenSteel Corp.* | | | 2,643,232 | |
| | 54,881 | | | United States Steel Corp.(a) | | | 1,837,965 | |
| | 34,400 | | | Worthington Industries, Inc. | | | 1,315,800 | |
| | | | | | | | |
| | | | | | | 43,361,282 | |
| | | | | | | | |
| | |
| | | | Multi-Utilities—0.3% | | | | |
| | 21,873 | | | Alliant Energy Corp. | | | 1,235,824 | |
| | 72,555 | | | Avista Corp.(a) | | | 2,251,382 | |
| | 20,911 | | | Integrys Energy Group, Inc. | | | 1,370,925 | |
| | 13,400 | | | NorthWestern Corp. | | | 619,348 | |
| | | | | | | | |
| | | | | | | 5,477,479 | |
| | | | | | | | |
| | |
| | | | Multiline Retail—0.2% | | | | |
| | 42,752 | | | Burlington Stores, Inc.*(a) | | | 1,399,273 | |
| | 18,077 | | | Dillard’s, Inc. (Class A Stock) | | | 2,155,140 | |
| | | | | | | | |
| | | | | | | 3,554,413 | |
| | | | | | | | |
| | |
| | | | Oil, Gas & Consumable Fuels—4.1% | | | | |
| | 26,530 | | | Bill Barrett Corp.* | | | 636,985 | |
| | 71,750 | | | Bonanza Creek Energy, Inc.*(a) | | | 4,022,305 | |
| | 24,447 | | | Carrizo Oil & Gas, Inc.* | | | 1,501,290 | |
| | 9,827 | | | Clayton Williams Energy, Inc.* | | | 1,045,691 | |
| | 87,848 | | | Comstock Resources, Inc.(a) | | | 2,078,484 | |
| | 95,500 | | | CVR Energy, Inc.(a) | | | 4,496,140 | |
| | 28,300 | | | Delek US Holdings, Inc. | | | 826,926 | |
| | 18,666 | | | Energy XXI (Bermuda) Ltd. | | | 372,573 | |
| | 121,100 | | | EXCO Resources, Inc.(a) | | | 558,271 | |
| | 36,210 | | | Goodrich Petroleum Corp.* | | | 697,405 | |
| | 103,294 | | | Green Plains, Inc.(a) | | | 3,872,492 | |
| | 438,275 | | | Kodiak Oil & Gas Corp.* | | | 6,810,793 | |
| | 135,884 | | | LinnCo LLC(a) | | | 3,952,866 | |
| | 104,517 | | | Northern Oil and Gas, Inc.*(a) | | | 1,681,679 | |
| | 213,898 | | | Oasis Petroleum, Inc.* | | | 11,432,848 | |
| | 58,627 | | | ONEOK, Inc. | | | 3,777,338 | |
| | 13,900 | | | Pacific Ethanol, Inc.* | | | 247,976 | |
| | 1,600 | | | Panhandle Oil And Gas, Inc. (Class A Stock) | | | 103,072 | |
| | 40,776 | | | PBF Energy, Inc. (Class A Stock) | | | 1,105,030 | |
| | 118,864 | | | Penn Virginia Corp.* | | | 1,547,609 | |
| | 189,344 | | | Renewable Energy Group, Inc.*(a) | | | 2,120,653 | |
| | 24,467 | | | REX American Resources Corp.* | | | 2,063,791 | |
See Notes to Financial Statements.
| | | | |
| 90 | | | The TARGET Portfolio Trust | |
| | | | | | | | |
| SHARES | | | DESCRIPTION | | VALUE (NOTE 1) | |
| | | | COMMON STOCKS (continued) | | | | |
| | |
| | | | Oil, Gas & Consumable Fuels (continued) | | | | |
| | 24,274 | | | Rosetta Resources, Inc.* | | $ | 1,239,673 | |
| | 2,400 | | | SemGroup Corp. (Class A Stock) | | | 184,992 | |
| | 239,906 | | | Ship Finance International Ltd. (Norway) | | | 4,366,289 | |
| | 86,914 | | | Stone Energy Corp.* | | | 3,307,078 | |
| | 249,310 | | | Swift Energy Co.*(a) | | | 2,754,876 | |
| | 10,100 | | | TransAtlantic Petroleum Ltd. (Canada)* | | | 105,444 | |
| | 84,100 | | | VAALCO Energy, Inc.* | | | 580,290 | |
| | 217,100 | | | Warren Resources, Inc.* | | | 1,278,719 | |
| | 146,514 | | | Western Refining, Inc. | | | 6,001,213 | |
| | 345 | | | Westmoreland Coal Co.* | | | 14,866 | |
| | 106,700 | | | World Fuel Services Corp. | | | 4,582,765 | |
| | | | | | | | |
| | | | | | | 79,368,422 | |
| | | | | | | | |
| | |
| | | | Paper & Forest Products—0.8% | | | | |
| | 69,275 | | | Clearwater Paper Corp.* | | | 4,682,990 | |
| | 28,550 | | | Domtar Corp. | | | 1,025,516 | |
| | 42,981 | | | KapStone Paper & Packaging Corp.* | | | 1,278,255 | |
| | 23,909 | | | Neenah Paper, Inc. | | | 1,186,365 | |
| | 34,983 | | | P.H. Glatfelter Co. | | | 832,595 | |
| | 110,136 | | | Resolute Forest Products, Inc.*(a) | | | 1,694,993 | |
| | 114,615 | | | Schweitzer-Mauduit International, Inc. | | | 4,679,730 | |
| | | | | | | | |
| | | | | | | 15,380,444 | |
| | | | | | | | |
| | |
| | | | Personal Products—0.1% | | | | |
| | 5,300 | | | Revlon, Inc. (Class A Stock)* | | | 161,650 | |
| | 18,832 | | | USANA Health Sciences, Inc.*(a) | | | 1,202,423 | |
| | | | | | | | |
| | | | | | | 1,364,073 | |
| | | | | | | | |
| | |
| | | | Pharmaceuticals—0.2% | | | | |
| | 22,200 | | | Amphastar Pharmaceuticals, Inc.* | | | 197,136 | |
| | 94,292 | | | Impax Laboratories, Inc.*(a) | | | 2,205,490 | |
| | 11,200 | | | Lannett Co., Inc.* | | | 376,432 | |
| | 9,600 | | | Medicines Co. (The)* | | | 224,352 | |
| | 43,907 | | | Prestige Brands Holdings, Inc.* | | | 1,352,335 | |
| | 6,500 | | | Revance Therapeutics, Inc.* | | | 199,420 | |
| | 2,200 | | | ZS Pharma, Inc.* | | | 61,622 | |
| | | | | | | | |
| | | | | | | 4,616,787 | |
| | | | | | | | |
| | |
| | | | Professional Services—1.1% | | | | |
| | 6,100 | | | CDI Corp. | | | 84,607 | |
| | 61,375 | | | Dun & Bradstreet Corp. (The) | | | 6,753,091 | |
| | 10,400 | | | Heidrick & Struggles International, Inc. | | | 194,168 | |
| | 161,830 | | | ICF International, Inc.* | | | 5,594,463 | |
| | 39,700 | | | Kelly Services, Inc. (Class A Stock) | | | 632,818 | |
| | 106,971 | | | Korn/Ferry International* | | | 3,147,087 | |
| | 63,832 | | | Navigant Consulting, Inc.* | | | 1,041,738 | |
| | 3,600 | | | Paylocity Corp* | | | 70,524 | |
| | 28,100 | | | Resources Connection, Inc. | | | 424,310 | |
See Notes to Financial Statements.
| | | | |
| The TARGET Portfolio Trust | | | 91 | |
| | |
Small Capitalization Value Portfolio (continued) | | Portfolio of Investments
As of July 31, 2014 |
| | | | | | | | |
| SHARES | | | DESCRIPTION | | VALUE (NOTE 1) | |
| | | | COMMON STOCKS (continued) | | | | |
| | |
| | | | Professional Services (continued) | | | | |
| | 105,341 | | | RPX Corp.* | | $ | 1,643,320 | |
| | 31,800 | | | TrueBlue, Inc.* | | | 858,282 | |
| | 9,600 | | | VSE Corp. | | | 571,872 | |
| | | | | | | | |
| | | | | | | 21,016,280 | |
| | | | | | | | |
| | |
| | | | Real Estate Investment Trusts (REITs)—5.4% | | | | |
| | 4,900 | | | Acadia Realty Trust | | | 138,327 | |
| | 146,700 | | | Altisource Residential Corp. | | | 3,401,973 | |
| | 16,500 | | | American Campus Communities, Inc. | | | 642,180 | |
| | 482,639 | | | Anworth Mortgage Asset Corp. | | | 2,451,806 | |
| | 63,178 | | | Apollo Commercial Real Estate Finance, Inc. | | | 1,046,859 | |
| | 7,900 | | | Armada Hoffler Properties, Inc. | | | 74,260 | |
| | 11,980 | | | Ashford Hospitality Prime, Inc. | | | 199,467 | |
| | 126,000 | | | Ashford Hospitality Trust, Inc. | | | 1,450,260 | |
| | 238,600 | | | Associated Estates Realty Corp. | | | 4,216,062 | |
| | 212,488 | | | Blackstone Mortgage Trust, Inc. (Class A Stock) | | | 6,049,533 | |
| | 261,278 | | | Capstead Mortgage Corp.(a) | | | 3,354,810 | |
| | 24,361 | | | CBL & Associates Properties, Inc. | | | 455,551 | |
| | 60,100 | | | Cedar Realty Trust, Inc. | | | 378,630 | |
| | 11,000 | | | Chatham Lodging Trust | | | 232,870 | |
| | 18,300 | | | Chesapeake Lodging Trust | | | 543,144 | |
| | 370,246 | | | Chimera Investment Corp. | | | 1,173,680 | |
| | 87,265 | | | Colony Financial, Inc. | | | 1,932,920 | |
| | 24,000 | | | CoreSite Realty Corp. | | | 783,840 | |
| | 100,503 | | | Corporate Office Properties Trust | | | 2,851,270 | |
| | 122,600 | | | Cousins Properties, Inc. | | | 1,517,788 | |
| | 12,900 | | | CyrusOne, Inc. | | | 320,565 | |
| | 33,000 | | | CYS Investments, Inc. | | | 293,040 | |
| | 137,400 | | | DCT Industrial Trust, Inc. | | | 1,075,842 | |
| | 127,400 | | | DiamondRock Hospitality Co. | | | 1,561,924 | |
| | 114,641 | | | Dynex Capital, Inc. | | | 951,520 | |
| | 2,000 | | | EastGroup Properties, Inc. | | | 124,720 | |
| | 204,236 | | | Education Realty Trust, Inc. | | | 2,156,732 | |
| | 5,700 | | | EPR Properties | | | 307,230 | |
| | 89,387 | | | Equity One, Inc. | | | 2,075,566 | |
| | 6,500 | | | Extra Space Storage, Inc. | | | 336,245 | |
| | 38,300 | | | FelCor Lodging Trust, Inc. | | | 401,001 | |
| | 79,800 | | | First Industrial Realty Trust, Inc. | | | 1,440,390 | |
| | 371,666 | | | First Potomac Realty Trust | | | 4,902,275 | |
| | 334,500 | | | Franklin Street Properties Corp. | | | 4,060,830 | |
| | 8,300 | | | Geo Group, Inc. (The) | | | 285,603 | |
| | 5,500 | | | Getty Realty Corp. | | | 101,035 | |
| | 4,500 | | | Government Properties Income Trust | | | 105,075 | |
| | 1,082,675 | | | Hersha Hospitality Trust | | | 7,156,482 | |
See Notes to Financial Statements.
| | | | |
| 92 | | | The TARGET Portfolio Trust | |
| | | | | | | | |
| SHARES | | | DESCRIPTION | | VALUE (NOTE 1) | |
| | | | COMMON STOCKS (continued) | | | | |
| | |
| | | | Real Estate Investment Trusts (REITs) (continued) | | | | |
| | 74,400 | | | Highwoods Properties, Inc.(a) | | $ | 3,130,008 | |
| | 2,000 | | | Home Properties, Inc. | | | 131,580 | |
| | 84,500 | | | Kite Realty Group Trust | | | 515,450 | |
| | 4,300 | | | LaSalle Hotel Properties | | | 149,597 | |
| | 190,951 | | | Lexington Realty Trust | | | 2,089,004 | |
| | 12,800 | | | LTC Properties, Inc. | | | 490,624 | |
| | 421,951 | | | Medical Properties Trust, Inc. | | | 5,679,460 | |
| | 452,556 | | | MFA Financial, Inc. | | | 3,683,806 | |
| | 287,928 | | | New Residential Investment Corp. | | | 1,721,809 | |
| | 189,906 | | | New York Mortgage Trust, Inc.(a) | | | 1,433,790 | |
| | 105,900 | | | Omega Healthcare Investors, Inc. | | | 3,869,586 | |
| | 39,100 | | | Parkway Properties, Inc. | | | 810,543 | |
| | 8,800 | | | Pennsylvania Real Estate Investment Trust | | | 169,224 | |
| | 118,086 | | | Pennymac Mortgage Investment Trust | | | 2,528,221 | |
| | 31,300 | | | Potlatch Corp. | | | 1,292,690 | |
| | 59,200 | | | RAIT Financial Trust | | | 455,840 | |
| | 11,600 | | | Ramco-Gershenson Properties Trust | | | 192,560 | |
| | 165,058 | | | Redwood Trust, Inc.(a) | | | 3,132,801 | |
| | 183,388 | | | Resource Capital Corp. | | | 1,010,468 | |
| | 326,197 | | | Retail Properties of America, Inc. (Class A Stock) | | | 4,909,265 | |
| | 4,400 | | | Rouse Properties, Inc. | | | 74,580 | |
| | 137,900 | | | Starwood Property Trust, Inc. | | | 3,254,440 | |
| | 5,700 | | | Sun Communities, Inc. | | | 299,991 | |
| | 71,700 | | | Sunstone Hotel Investors, Inc. | | | 1,017,423 | |
| | 114,355 | | | Two Harbors Investment Corp. | | | 1,169,852 | |
| | 14,300 | | | Winthrop Realty Trust | | | 215,501 | |
| | | | | | | | |
| | | | | | | 103,979,418 | |
| | | | | | | | |
| | |
| | | | Real Estate Management & Development—0.1% | | | | |
| | 14,700 | | | Alexander & Baldwin, Inc. | | | 561,099 | |
| | 53,956 | | | St. Joe Co. (The)*(a) | | | 1,232,355 | |
| | | | | | | | |
| | | | | | | 1,793,454 | |
| | | | | | | | |
| | |
| | | | Road & Rail—0.7% | | | | |
| | 4,700 | | | AMERCO | | | 1,236,852 | |
| | 54,230 | | | ArcBest Corp. | | | 1,720,718 | |
| | 74,825 | | | Celadon Group, Inc. | | | 1,589,283 | |
| | 144,775 | | | Con-way, Inc. | | | 7,144,646 | |
| | 73,914 | | | Quality Distribution, Inc.* | | | 986,752 | |
| | 68,347 | | | Swift Transportation Co.*(a) | | | 1,397,696 | |
| | 3,300 | | | Universal Truckload Services, Inc. | | | 80,157 | |
| | | | | | | | |
| | | | | | | 14,156,104 | |
| | | | | | | | |
| | |
| | | | Semiconductors & Semiconductor Equipment—2.1% | | | | |
| | 35,700 | | | Alpha & Omega Semiconductor Ltd.* | | | 326,655 | |
| | 249,672 | | | Amkor Technology, Inc.* | | | 2,209,597 | |
| | 2,400 | | | Audience, Inc.* | | | 22,872 | |
| | 102,879 | | | Brooks Automation, Inc. | | | 1,047,308 | |
See Notes to Financial Statements.
| | | | |
| The TARGET Portfolio Trust | | | 93 | |
| | |
Small Capitalization Value Portfolio (continued) | | Portfolio of Investments
As of July 31, 2014 |
| | | | | | | | |
| SHARES | | | DESCRIPTION | | VALUE (NOTE 1) | |
| | | | COMMON STOCKS (continued) | | | | |
| | |
| | | | Semiconductors & Semiconductor Equipment (continued) | | | | |
| | 145,987 | | | Cabot Microelectronics Corp.* | | $ | 5,867,218 | |
| | 72,992 | | | Cirrus Logic, Inc.*(a) | | | 1,637,211 | |
| | 511,416 | | | Entegris, Inc.* | | | 5,876,170 | |
| | 117,193 | | | Fairchild Semiconductor International, Inc.* | | | 1,783,677 | |
| | 31,557 | | | First Solar, Inc.* | | | 1,991,562 | |
| | 38,900 | | | Integrated Silicon Solution, Inc. | | | 568,718 | |
| | 72,298 | | | International Rectifier Corp.* | | | 1,795,882 | |
| | 80,285 | | | MKS Instruments, Inc. | | | 2,551,457 | |
| | 146,815 | | | Monolithic Power Systems, Inc. | | | 6,054,651 | |
| | 90,915 | | | OmniVision Technologies, Inc.* | | | 2,036,496 | |
| | 12,400 | | | Pericom Semiconductor Corp.* | | | 109,492 | |
| | 213,000 | | | RF Micro Devices, Inc.*(a) | | | 2,377,080 | |
| | 49,190 | | | Semtech Corp.* | | | 1,098,413 | |
| | 165,123 | | | Spansion, Inc. (Class A Stock)* | | | 3,132,383 | |
| | 94,000 | | | Ultra Clean Holdings, Inc.* | | | 814,980 | |
| | 7,400 | | | Xcerra Corp.* | | | 69,190 | |
| | | | | | | | |
| | | | | | | 41,371,012 | |
| | | | | | | | |
| | |
| | | | Software—2.6% | | | | |
| | 21,342 | | | AVG Technologies NV* | | | 362,814 | |
| | 255,421 | | | BroadSoft, Inc.* | | | 6,232,273 | |
| | 131,118 | | | Cadence Design Systems, Inc.*(a) | | | 2,206,716 | |
| | 99,850 | | | CommVault Systems, Inc.* | | | 4,794,797 | |
| | 133,100 | | | Compuware Corp. | | | 1,211,210 | |
| | 84,725 | | | Ellie Mae, Inc.* | | | 2,433,302 | |
| | 170,248 | | | Epiq Systems, Inc. | | | 2,454,976 | |
| | 44,175 | | | Fair Isaac Corp. | | | 2,524,601 | |
| | 3,500 | | | FireEye, Inc.* | | | 124,250 | |
| | 13,400 | | | Imperva, Inc.* | | | 297,078 | |
| | 199,888 | | | Mentor Graphics Corp. | | | 3,947,788 | |
| | 5,800 | | | Paycom Software, Inc.* | | | 74,124 | |
| | 1,600 | | | Proofpoint, Inc.* | | | 56,432 | |
| | 75,284 | | | PTC, Inc.* | | | 2,707,213 | |
| | 159,625 | | | SS&C Technologies Holdings, Inc.* | | | 6,913,359 | |
| | 22,700 | | | Take-Two Interactive Software, Inc.* | | | 508,026 | |
| | 325 | | | Telenav, Inc.* | | | 1,615 | |
| | 230,381 | | | Tivo, Inc.* | | | 3,100,928 | |
| | 25,700 | | | Varonis Systems, Inc.* | | | 541,756 | |
| | 183,350 | | | Verint Systems, Inc.* | | | 8,606,449 | |
| | | | | | | | |
| | | | | | | 49,099,707 | |
| | | | | | | | |
| | |
| | | | Specialty Retail—3.2% | | | | |
| | 130,085 | | | Aaron’s, Inc. | | | 3,431,642 | |
| | 125,792 | | | Abercrombie & Fitch Co. (Class A Stock)(a) | | | 4,948,657 | |
See Notes to Financial Statements.
| | | | |
| 94 | | | The TARGET Portfolio Trust | |
| | | | | | | | |
| SHARES | | | DESCRIPTION | | VALUE (NOTE 1) | |
| | | | COMMON STOCKS (continued) | | | | |
| | |
| | | | Specialty Retail (continued) | | | | |
| | 161,746 | | | American Eagle Outfitters, Inc.(a) | | $ | 1,724,212 | |
| | 165,568 | | | Barnes & Noble, Inc.*(a) | | | 3,447,126 | |
| | 73,662 | | | Brown Shoe Co., Inc. | | | 2,076,532 | |
| | 97,400 | | | Buckle, Inc. (The)(a) | | | 4,334,300 | |
| | 23,263 | | | Cabela’s, Inc.* | | | 1,357,629 | |
| | 5,500 | | | Cato Corp. (The) (Class A Stock) | | | 169,730 | |
| | 41,830 | | | Children’s Place, Inc. (The)(a) | | | 2,099,866 | |
| | 34,001 | | | CST Brands, Inc. | | | 1,136,654 | |
| | 5,700 | | | Destination Maternity Corp. | | | 108,471 | |
| | 122,243 | | | Express, Inc.* | | | 1,902,101 | |
| | 29,794 | | | GameStop Corp. (Class A Stock)(a) | | | 1,250,454 | |
| | 173,800 | | | GNC Holdings, Inc. (Class A Stock) | | | 5,702,378 | |
| | 115,775 | | | Group 1 Automotive, Inc.(a) | | | 8,558,088 | |
| | 23,800 | | | Guess?, Inc. | | | 619,038 | |
| | 80,720 | | | hhgregg, Inc.*(a) | | | 573,919 | |
| | 56,833 | | | Kirkland’s, Inc.* | | | 1,069,029 | |
| | 170,793 | | | Men’s Wearhouse, Inc. (The) | | | 8,594,304 | |
| | 2,200 | | | Michaels Cos., Inc. (The)*(a) | | | 33,176 | |
| | 27,122 | | | Murphy USA, Inc.* | | | 1,340,369 | |
| | 20,171 | | | Outerwall, Inc.*(a) | | | 1,109,808 | |
| | 81,307 | | | Pier 1 Imports, Inc. | | | 1,224,483 | |
| | 65,868 | | | Sally Beauty Holdings, Inc. | | | 1,709,275 | |
| | 82,380 | | | Select Comfort Corp.* | | | 1,664,076 | |
| | 7,800 | | | Systemax, Inc.* | | | 106,626 | |
| | 44,300 | | | Zumiez, Inc.* | | | 1,233,755 | |
| | | | | | | | |
| | | | | | | 61,525,698 | |
| | | | | | | | |
| | |
| | | | Technology Hardware, Storage & Peripherals—0.2% | | | | |
| | 26,300 | | | Avid Technology, Inc.* | | | 195,935 | |
| | 48,912 | | | Diebold, Inc. | | | 1,843,004 | |
| | 8,100 | | | Electronics For Imaging, Inc.* | | | 356,967 | |
| | 31,289 | | | Lexmark International, Inc. (Class A Stock) | | | 1,502,811 | |
| | | | | | | | |
| | | | | | | 3,898,717 | |
| | | | | | | | |
| | |
| | | | Textiles, Apparel & Luxury Goods—0.7% | | | | |
| | 21,126 | | | Columbia Sportswear Co. | | | 1,579,380 | |
| | 17,700 | | | Iconix Brand Group, Inc.* | | | 747,471 | |
| | 15,573 | | | Oxford Industries, Inc. | | | 927,683 | |
| | 4,100 | | | RG Barry Corp. | | | 77,449 | |
| | 143,275 | | | Steven Madden Ltd.* | | | 4,563,309 | |
| | 51,872 | | | Vera Bradley, Inc.*(a) | | | 1,028,622 | |
| | 182,550 | | | Wolverine World Wide, Inc.(a) | | | 4,428,663 | |
| | | | | | | | |
| | | | | | | 13,352,577 | |
| | | | | | | | |
| | |
| | | | Thrifts & Mortgage Finance—1.1% | | | | |
| | 350,919 | | | Astoria Financial Corp. | | | 4,519,837 | |
| | 2,900 | | | BankFinancial Corp. | | | 29,638 | |
| | 4,700 | | | Berkshire Hills Bancorp, Inc. | | | 113,599 | |
See Notes to Financial Statements.
| | | | |
| The TARGET Portfolio Trust | | | 95 | |
| | |
Small Capitalization Value Portfolio (continued) | | Portfolio of Investments
As of July 31, 2014 |
| | | | | | | | |
| SHARES | | | DESCRIPTION | | VALUE (NOTE 1) | |
| | | | COMMON STOCKS (continued) | | | | |
| | |
| | | | Thrifts & Mortgage Finance (continued) | | | | |
| | 15,700 | | | Charter Financial Corp. | | $ | 171,915 | |
| | 5,900 | | | First Defiance Financial Corp. | | | 159,359 | |
| | 170,433 | | | Flagstar Bancorp, Inc.* | | | 3,118,924 | |
| | 281,336 | | | Home Loan Servicing Solutions Ltd. | | | 6,020,590 | |
| | 23,700 | | | HomeStreet, Inc. | | | 413,328 | |
| | 1,200 | | | OceanFirst Financial Corp. | | | 19,092 | |
| | 7,961 | | | PennyMac Financial Services, Inc. (Class A Stock)* | | | 120,450 | |
| | 78,813 | | | Provident Financial Services, Inc. | | | 1,316,965 | |
| | 227,246 | | | Washington Federal, Inc. | | | 4,763,076 | |
| | 5,300 | | | WSFS Financial Corp. | | | 379,427 | |
| | | | | | | | |
| | | | | | | 21,146,200 | |
| | | | | | | | |
| | |
| | | | Tobacco—0.2% | | | | |
| | 77,500 | | | Universal Corp. | | | 4,024,575 | |
| | | | | | | | |
| | |
| | | | Trading Companies & Distributors—1.7% | | | | |
| | 13,150 | | | Applied Industrial Technologies, Inc. | | | 637,249 | |
| | 148,602 | | | CAI International, Inc.* | | | 2,836,812 | |
| | 40,000 | | | DXP Enterprises, Inc.* | | | 2,841,200 | |
| | 200,127 | | | GATX Corp. | | | 12,407,874 | |
| | 188,733 | | | TAL International Group, Inc.*(a) | | | 8,341,999 | |
| | 75,900 | | | WESCO International, Inc.*(a) | | | 5,957,391 | |
| | | | | | | | |
| | | | | | | 33,022,525 | |
| | | | | | | | |
| | |
| | | | Water Utilities | | | | |
| | 4,700 | | | American States Water Co. | | | 143,585 | |
| | 2,400 | | | Artesian Resources Corp. (Class A Stock) | | | 52,296 | |
| | 3,900 | | | California Water Service Group | | | 88,803 | |
| | | | | | | | |
| | | | | | | 284,684 | |
| | | | | | | | |
| | |
| | | | Wireless Telecommunication Services—0.5% | | | | |
| | 41,500 | | | RingCentral, Inc. (Class A Stock)*(a) | | | 619,595 | |
| | 70,500 | | | SBA Communications Corp. (Class A Stock)* | | | 7,538,565 | |
| | 41,246 | | | Telephone & Data Systems, Inc. | | | 1,031,150 | |
| | | | | | | | |
| | | | | | | 9,189,310 | |
| | | | | | | | |
| | | | TOTAL COMMON STOCKS
(cost $1,507,346,325) | | | 1,868,910,179 | |
| | | | | | | | |
| | |
| | | | EXCHANGE TRADED FUNDS—0.4% | | | | |
| | 20,004 | | | iShares Russell 2000 Index Fund(a) | | | 2,222,244 | |
| | 44,700 | | | iShares Russell 2000 Value Index Fund(a) | | | 4,307,739 | |
| | | | | | | | |
| | | | TOTAL EXCHANGE TRADED FUNDS
(cost $6,248,683) | | | 6,529,983 | |
| | | | | | | | |
See Notes to Financial Statements.
| | | | |
| 96 | | | The TARGET Portfolio Trust | |
| | | | | | | | |
| SHARES | | | DESCRIPTION | | VALUE (NOTE 1) | |
| | | | UNAFFILIATED MUTUAL FUND—0.1% | | | | |
| | 128,500 | | | Central Fund of Canada Ltd. (Class A Stock) (Canada)
(cost $1,871,404) | | $ | 1,806,710 | |
| | | | | | | | |
| | | | TOTAL LONG-TERM INVESTMENTS
(cost $1,515,466,412) | | | 1,877,246,872 | |
| | | | | | | | |
| | |
| | | | SHORT-TERM INVESTMENTS—11.7% | | | | |
| | |
| | | | AFFILIATED MONEY MARKET MUTUAL FUND—11.7% | | | | |
| | 225,765,610 | | | Prudential Investment Portfolios 2—Prudential Core Taxable Money Market Fund (cost $225,765,610; includes $169,391,744 of cash collateral for securities on loan)(b)(w)(Note 3) | | | 225,765,610 | |
| | | | | | | | |
PRINCIPAL
AMOUNT (000)# | | | | | | |
| | | | U.S. TREASURY OBLIGATION | | | | |
| | 575 | | | U.S. Treasury Notes(k)
0.250%, 11/30/14
(cost $575,276) | | | 575,360 | |
| | | | | | | | |
| | | | TOTAL SHORT-TERM INVESTMENTS
(cost $226,340,886) | | | 226,340,970 | |
| | | | | | | | |
| | | | TOTAL INVESTMENTS—109.3%
(cost $1,741,807,298; Note 5) | | | 2,103,587,842 | |
| | | | Liabilities in excess of other assets(x)—(9.3%) | | | (178,449,917 | ) |
| | | | | | | | |
| | | | NET ASSETS—100.0% | | $ | 1,925,137,925 | |
| | | | | | | | |
| * | Non-income producing security. |
| # | Principal or notional amount is shown in U.S. dollars unless otherwise stated. |
| (a) | All or a portion of security is on loan. The aggregate market value of such securities, including those sold and pending settlement, is $161,683,782; cash collateral of $169,391,744 (included in liabilities) was received with which the Portfolio purchased highly liquid short-term investments. Securities on loan are subject to contractual netting arrangements. |
| (b) | Represents security, or a portion thereof, purchased with cash collateral received for securities on loan. |
| (k) | Represents security, or a portion thereof, segregated as collateral for futures contracts. |
| (w) | Prudential Investments LLC, the manager of the Portfolio, also serves as manager of the Prudential Investment Portfolios 2—Prudential Core Taxable Money Market Fund. |
| (x) | Includes net unrealized appreciation (depreciation) on the following derivative contracts held at reporting period end: |
Futures contracts open at July 31, 2014:
| | | | | | | | | | | | | | | | |
Number of
Contracts | | Type | | Expiration
Date | | Value at
Trade Date | | | Value at
July 31, 2014 | | | Unrealized
Depreciation(1) | |
| Long Position: | | | | | | | | | | | | | | | | |
| 51 | | Russell 2000 Mini Index | | Sep. 2014 | | $ | 5,925,635 | | | $ | 5,695,170 | | | $ | (230,465 | ) |
| | | | | | | | | | | | | | | | |
| (1) | U.S. Treasury security with a market value of $446,967 has been segregated with Goldman Sachs & Co. to cover requirements for open contacts at July 31, 2014. |
See Notes to Financial Statements.
| | | | |
| The TARGET Portfolio Trust | | | 97 | |
| | |
Small Capitalization Value Portfolio (continued) | | Portfolio of Investments
As of July 31, 2014 |
Various inputs are used in determining the value of the Portfolio’s investments. These inputs are summarized in the three broad levels listed below.
Level 1—quoted prices generally in active markets for identical securities.
Level 2—other significant observable inputs including, but not limited to, quoted prices for similar securities, interest rates and yield curves, prepayment speeds, foreign currency exchange rates, and amortized cost.
Level 3—significant unobservable inputs for securities valued in accordance with Board approved fair valuation procedures.
The following is a summary of the inputs used as of July 31, 2014 in valuing such portfolio securities:
| | | | | | | | | | | | |
| | | Level 1 | | | Level 2 | | | Level 3 | |
| Investments in Securities | | | | | | | | | | | | |
Common Stocks | | | | | | | | | | | | |
Aerospace & Defense | | $ | 64,354,486 | | | $ | — | | | $ | — | |
Air Freight & Logistics | | | 267,120 | | | | — | | | | — | |
Airlines | | | 8,935,746 | | | | — | | | | — | |
Auto Components | | | 8,601,982 | | | | — | | | | — | |
Automobiles | | | 210,185 | | | | — | | | | — | |
Banks | | | 159,312,630 | | | | — | | | | — | |
Biotechnology | | | 4,314,979 | | | | — | | | | — | |
Building Products | | | 4,364,423 | | | | — | | | | — | |
Capital Markets | | | 56,291,398 | | | | — | | | | — | |
Chemicals | | | 51,462,077 | | | | — | | | | — | |
Commercial Services & Supplies | | | 46,749,399 | | | | — | | | | — | |
Communications Equipment | | | 16,952,664 | | | | — | | | | — | |
Construction & Engineering | | | 14,094,895 | | | | — | | | | — | |
Consumer Finance | | | 27,934,184 | | | | — | | | | — | |
Containers & Packaging | | | 37,780,335 | | | | — | | | | — | |
Distributors | | | 122,720 | | | | — | | | | — | |
Diversified Consumer Services | | | 7,047,211 | | | | — | | | | — | |
Diversified Financial Services | | | 2,861,795 | | | | — | | | | — | |
Diversified Telecommunication Services | | | 7,440,553 | | | | — | | | | — | |
Electric Utilities | | | 37,061,327 | | | | — | | | | — | |
Electrical Equipment | | | 37,498,293 | | | | — | | | | — | |
Electronic Equipment, Instruments & Components | | | 66,872,141 | | | | — | | | | — | |
Energy Equipment & Services | | | 58,943,582 | | | | — | | | | — | |
Food & Staples Retailing | | | 24,478,106 | | | | — | | | | — | |
Food Products | | | 23,682,168 | | | | — | | | | — | |
Gas Utilities | | | 26,508,901 | | | | — | | | | — | |
Health Care Equipment & Supplies | | | 53,439,765 | | | | — | | | | — | |
Health Care Providers & Services | | | 60,229,500 | | | | — | | | | — | |
Health Care Technology | | | 5,859,196 | | | | — | | | | — | |
Hotels, Restaurants & Leisure | | | 27,008,510 | | | | — | | | | — | |
Household Durables | | | 12,474,329 | | | | — | | | | — | |
Household Products | | | 57,846 | | | | — | | | | — | |
Independent Power & Renewable Electricity Producers | | | 1,274,400 | | | | — | | | | — | |
Insurance | | | 166,446,381 | | | | — | | | | — | |
Internet & Catalog Retail | | | 7,435,959 | | | | — | | | | — | |
See Notes to Financial Statements.
| | | | |
| 98 | | | The TARGET Portfolio Trust | |
| | | | | | | | | | | | |
| | | Level 1 | | | Level 2 | | | Level 3 | |
| Investments in Securities (continued) | | | | | | | | | | | | |
Internet Software & Services | | $ | 7,785,781 | | | $ | — | | | $ | — | |
IT Services | | | 60,260,432 | | | | — | | | | — | |
Leisure Products | | | 11,166,636 | | | | — | | | | — | |
Life Sciences Tools & Services | | | 17,387,828 | | | | — | | | | — | |
Machinery | | | 95,594,625 | | | | — | | | | — | |
Marine | | | 2,894,469 | | | | — | | | | — | |
Media | | | 14,468,061 | | | | — | | | | — | |
Metals & Mining | | | 43,361,282 | | | | — | | | | — | |
Multi-Utilities | | | 5,477,479 | | | | — | | | | — | |
Multiline Retail | | | 3,554,413 | | | | — | | | | — | |
Oil, Gas & Consumable Fuels | | | 79,368,422 | | | | — | | | | — | |
Paper & Forest Products | | | 15,380,444 | | | | — | | | | — | |
Personal Products | | | 1,364,073 | | | | — | | | | — | |
Pharmaceuticals | | | 4,616,787 | | | | — | | | | — | |
Professional Services | | | 21,016,280 | | | | — | | | | — | |
Real Estate Investment Trusts (REITs) | | | 103,979,418 | | | | — | | | | — | |
Real Estate Management & Development | | | 1,793,454 | | | | — | | | | — | |
Road & Rail | | | 14,156,104 | | | | — | | | | — | |
Semiconductors & Semiconductor Equipment | | | 41,371,012 | | | | — | | | | — | |
Software | | | 49,099,707 | | | | — | | | | — | |
Specialty Retail | | | 61,525,698 | | | | — | | | | — | |
Technology Hardware, Storage & Peripherals | | | 3,898,717 | | | | — | | | | — | |
Textiles, Apparel & Luxury Goods | | | 13,352,577 | | | | — | | | | — | |
Thrifts & Mortgage Finance | | | 21,146,200 | | | | — | | | | — | |
Tobacco | | | 4,024,575 | | | | — | | | | — | |
Trading Companies & Distributors | | | 33,022,525 | | | | — | | | | — | |
Water Utilities | | | 284,684 | | | | — | | | | — | |
Wireless Telecommunication Services | | | 9,189,310 | | | | — | | | | — | |
Exchange Traded Funds | | | 6,529,983 | | | | — | | | | — | |
Unaffiliated Mutual Fund | | | 1,806,710 | | | | — | | | | — | |
Affiliated Money Market Mutual Fund | | | 225,765,610 | | | | — | | | | — | |
U.S. Treasury Obligation | | | — | | | | 575,360 | | | | — | |
| Other Financial Instruments*: | | | | | | | | | | | | |
Futures Contracts | | | (230,465 | ) | | | — | | | | — | |
| | | | | | | | | | | | |
Total | | $ | 2,102,782,017 | | | $ | 575,360 | | | $ | — | |
| | | | | | | | | | | | |
| * | Other financial instruments are derivative instruments not reflected in the Portfolio of Investments, such as, futures, forwards and swaps contracts, which are recorded at the unrealized appreciation/depreciation of the instrument. |
The industry classification of investments and liabilities in excess of other assets shown as a percentage of net assets as of July 31, 2014 was as follows (unaudited):
| | | | |
Affiliated Money Market Mutual Fund (including 8.8% of collateral for securities on loan) | | | 11.7 | % |
Insurance | | | 8.6 | |
Banks | | | 8.3 | |
Real Estate Investment Trusts (REITs) | | | 5.4 | |
Machinery | | | 5.0 | |
Oil, Gas & Consumable Fuels | | | 4.1 | |
Electronic Equipment, Instruments & Components | | | 3.5 | % |
Aerospace & Defense | | | 3.3 | |
Specialty Retail | | | 3.2 | |
Energy Equipment & Services | | | 3.1 | |
Health Care Providers & Services | | | 3.1 | |
IT Services | | | 3.1 | |
Capital Markets | | | 2.9 | |
See Notes to Financial Statements.
| | | | |
| The TARGET Portfolio Trust | | | 99 | |
| | |
Small Capitalization Value Portfolio (continued) | | Portfolio of Investments
As of July 31, 2014 |
| | | | |
Industry (cont’d.) | | | |
Health Care Equipment & Supplies | | | 2.8 | % |
Chemicals | | | 2.7 | |
Software | | | 2.6 | |
Commercial Services & Supplies | | | 2.4 | |
Metals & Mining | | | 2.3 | |
Semiconductors & Semiconductor Equipment | | | 2.1 | |
Containers & Packaging | | | 2.0 | |
Electric Utilities | | | 1.9 | |
Electrical Equipment | | | 1.9 | |
Trading Companies & Distributors | | | 1.7 | |
Consumer Finance | | | 1.5 | |
Gas Utilities | | | 1.4 | |
Hotels, Restaurants & Leisure | | | 1.4 | |
Food & Staples Retailing | | | 1.3 | |
Food Products | | | 1.2 | |
Professional Services | | | 1.1 | |
Thrifts & Mortgage Finance | | | 1.1 | |
Communications Equipment | | | 0.9 | |
Life Sciences Tools & Services | | | 0.9 | |
Media | | | 0.8 | |
Paper & Forest Products | | | 0.8 | |
Construction & Engineering | | | 0.7 | |
Road & Rail | | | 0.7 | |
Textiles, Apparel & Luxury Goods | | | 0.7 | |
Household Durables | | | 0.6 | |
Leisure Products | | | 0.6 | |
Airlines | | | 0.5 | % |
Wireless Telecommunication Services | | | 0.5 | |
Auto Components | | | 0.4 | |
Diversified Consumer Services | | | 0.4 | |
Diversified Telecommunication Services | | | 0.4 | |
Exchange Traded Funds | | | 0.4 | |
Internet & Catalog Retail | | | 0.4 | |
Internet Software & Services | | | 0.4 | |
Health Care Technology | | | 0.3 | |
Multi-Utilities | | | 0.3 | |
Biotechnology | | | 0.2 | |
Building Products | | | 0.2 | |
Marine | | | 0.2 | |
Multiline Retail | | | 0.2 | |
Pharmaceuticals | | | 0.2 | |
Technology Hardware, Storage & Peripherals | | | 0.2 | |
Tobacco | | | 0.2 | |
Diversified Financial Services | | | 0.1 | |
Independent Power & Renewable Electricity Producers | | | 0.1 | |
Personal Products | | | 0.1 | |
Real Estate Management & Development | | | 0.1 | |
Unaffiliated Mutual Fund | | | 0.1 | |
| | | | |
| | | 109.3 | |
Liabilities in excess of other assets | | | (9.3 | ) |
| | | | |
| | | 100.0 | % |
| | | | |
See Notes to Financial Statements.
| | | | |
| 100 | | | The TARGET Portfolio Trust | |
| | |
Portfolio of Investments
As of July 31, 2014 | | International Equity Portfolio |
| | | | | | | | |
| SHARES | | | DESCRIPTION | | VALUE (NOTE 1) | |
| | | | LONG-TERM INVESTMENTS—95.4% | | | | |
| | |
| | | | COMMON STOCKS | | | | |
| | |
| | | | Australia—3.8% | | | | |
| | 645,700 | | | Arrium Ltd. | | $ | 485,170 | |
| | 166,700 | | | Ausdrill Ltd. | | | 166,712 | |
| | 165,969 | | | Bank of Queensland Ltd. | | | 1,915,452 | |
| | 91,300 | | | Bendigo & Adelaide Bank Ltd. | | | 1,074,162 | |
| | 125,300 | | | Bradken Ltd. | | | 520,722 | |
| | 248,800 | | | Challenger Ltd. | | | 1,842,479 | |
| | 288,000 | | | Downer EDI Ltd. | | | 1,284,565 | |
| | 355,100 | | | Fortescue Metals Group Ltd. | | | 1,591,997 | |
| | 51,200 | | | GrainCorp Ltd. (Class A Stock) | | | 411,586 | |
| | 178,100 | | | Lend Lease Group | | | 2,222,542 | |
| | 259,000 | | | Metcash Ltd. | | | 700,403 | |
| | 75,100 | | | Mineral Resources Ltd. | | | 762,581 | |
| | 54,600 | | | National Australia Bank Ltd. | | | 1,772,840 | |
| | 46,600 | | | Orica Ltd. | | | 941,183 | |
| | 914,400 | | | Pacific Brands Ltd. | | | 476,067 | |
| | 260,000 | | | Primary Health Care Ltd. | | | 1,162,563 | |
| | 237,600 | | | Toll Holdings Ltd. | | | 1,193,649 | |
| | | | | | | | |
| | | | | | | 18,524,673 | |
| | | | | | | | |
| | |
| | | | Austria—0.5% | | | | |
| | 39,100 | | | OMV AG | | | 1,572,543 | |
| | 18,000 | | | Voestalpine AG | | | 792,137 | |
| | | | | | | | |
| | | | | | | 2,364,680 | |
| | | | | | | | |
| | |
| | | | Belgium—1.0% | | | | |
| | 102,600 | | | AGFA-Gevaert NV* | | | 306,508 | |
| | 27,290 | | | Anheuser-Busch InBev NV | | | 2,945,478 | |
| | 25,400 | | | Delhaize Group SA | | | 1,657,526 | |
| | 16,878 | | | Dexia SA* | | | 678 | |
| | | | | | | | |
| | | | | | | 4,910,190 | |
| | | | | | | | |
| | |
| | | | Brazil—0.1% | | | | |
| | 17,525 | | | Embraer SA, ADR | | | 666,651 | |
| | | | | | | | |
| | |
| | | | Canada—0.6% | | | | |
| | 43,973 | | | Canadian National Railway Co. | | | 2,939,599 | |
| | | | | | | | |
| | |
| | | | China—2.7% | | | | |
| | 12,856 | | | Baidu, Inc., ADR* | | | 2,777,539 | |
| | 381,789 | | | China Mobile Ltd. | | | 4,171,673 | |
| | 3,747,365 | | | Industrial & Commercial Bank of China Ltd. (Class H Stock) | | | 2,555,769 | |
| | 1,482,000 | | | Poly Property Group Co. Ltd. | | | 719,159 | |
| | 1,824,000 | | | Shougang Fushan Resources Group Ltd. | | | 477,767 | |
See Notes to Financial Statements.
| | | | |
| The TARGET Portfolio Trust | | | 101 | |
| | |
International Equity Portfolio (continued) | | Portfolio of Investments
As of July 31, 2014 |
| | | | | | | | |
| SHARES | | | DESCRIPTION | | VALUE (NOTE 1) | |
| | | | COMMON STOCKS (continued) | | | | |
| | |
| | | | China (continued) | | | | |
| | 141,641 | | | Tencent Holdings Ltd. | | $ | 2,300,216 | |
| | | | | | | | |
| | | | | | | 13,002,123 | |
| | | | | | | | |
| | |
| | | | Denmark—1.3% | | | | |
| | 600 | | | A.P. Moeller—Maersk A/S (Class B Stock) | | | 1,398,792 | |
| | 102,911 | | | Novo Nordisk A/S (Class B Stock) | | | 4,737,218 | |
| | | | | | | | |
| | | | | | | 6,136,010 | |
| | | | | | | | |
| | |
| | | | Finland—0.7% | | | | |
| | 50,175 | | | Kone Oyj (Class B Stock) | | | 2,109,739 | |
| | 41,200 | | | Tieto Oyj | | | 1,095,154 | |
| | | | | | | | |
| | | | | | | 3,204,893 | |
| | | | | | | | |
| | |
| | | | France—9.5% | | | | |
| | 46,945 | | | Accor SA | | | 2,273,429 | |
| | 16,261 | | | Air Liquide SA | | | 2,069,275 | |
| | 37,700 | | | Alstom SA | | | 1,355,887 | |
| | 6,200 | | | Arkema SA | | | 574,851 | |
| | 62,600 | | | AXA SA | | | 1,438,210 | |
| | 32,000 | | | BNP Paribas SA | | | 2,123,306 | |
| | 37,269 | | | Cie Generale des Etablissements Michelin | | | 4,088,380 | |
| | 73,800 | | | CNP Assurances | | | 1,449,909 | |
| | 97,828 | | | Credit Agricole SA* | | | 1,323,356 | |
| | 42,900 | | | Electricite de France | | | 1,385,831 | |
| | 25,787 | | | LVMH Moet Hennessy Louis Vuitton SA | | | 4,435,923 | |
| | 48,425 | | | Publicis Groupe SA | | | 3,513,387 | |
| | 19,800 | | | Renault SA | | | 1,652,901 | |
| | 30,000 | | | Sanofi | | | 3,149,719 | |
| | 26,100 | | | SCOR SE | | | 839,604 | |
| | 24,200 | | | Societe Generale SA | | | 1,214,897 | |
| | 37,000 | | | Thales SA | | | 2,104,356 | |
| | 121,173 | | | Total SA | | | 7,814,999 | |
| | 20,400 | | | Valeo SA | | | 2,444,275 | |
| | 37,300 | | | Vivendi SA | | | 936,163 | |
| | | | | | | | |
| | | | | | | 46,188,658 | |
| | | | | | | | |
| | |
| | | | Germany—6.7% | | | | |
| | 27,221 | | | Adidas AG | | | 2,155,476 | |
| | 18,300 | | | Allianz SE | | | 3,046,688 | |
| | 3,600 | | | Aurubis AG | | | 174,811 | |
| | 21,900 | | | BASF SE | | | 2,266,512 | |
| | 12,900 | | | Bayerische Motoren Werke AG | | | 1,536,644 | |
| | 6,900 | | | Continental AG | | | 1,486,011 | |
| | 37,400 | | | Daimler AG | | | 3,086,192 | |
See Notes to Financial Statements.
| | | | |
| 102 | | | The TARGET Portfolio Trust | |
| | | | | | | | |
| SHARES | | | DESCRIPTION | | VALUE (NOTE 1) | |
| | | | COMMON STOCKS (continued) | | | | |
| | |
| | | | Germany (continued) | | | | |
| | 70,572 | | | Deutsche Bank AG | | $ | 2,413,449 | |
| | 24,600 | | | DMG Mori Seiki AG | | | 751,426 | |
| | 54,400 | | | E.ON SE | | | 1,026,978 | |
| | 48,100 | | | Freenet AG | | | 1,269,188 | |
| | 47,846 | | | Fresenius Medical Care AG & Co. KGaA | | | 3,316,575 | |
| | 12,800 | | | Hannover Rueck SE | | | 1,092,652 | |
| | 7,400 | | | Heidelberger Druckmaschinen AG* | | | 24,190 | |
| | 12,600 | | | Muenchener Rueckversicherungs AG | | | 2,673,363 | |
| | 18,900 | | | Rheinmetall AG | | | 1,145,561 | |
| | 22,000 | | | RWE AG | | | 883,262 | |
| | 31,800 | | | Stada Arzneimittel AG | | | 1,313,208 | |
| | 12,100 | | | Volkswagen AG | | | 2,790,474 | |
| | | | | | | | |
| | | | | | | 32,452,660 | |
| | | | | | | | |
| | |
| | | | Hong Kong—3.5% | | | | |
| | 830,424 | | | AIA Group Ltd. | | | 4,448,914 | |
| | 97,000 | | | Cheung Kong Holdings Ltd. | | | 1,873,991 | |
| | 583,200 | | | First Pacific Co. Ltd. | | | 697,210 | |
| | 134,041 | | | Hong Kong Exchanges and Clearing Ltd. | | | 3,002,616 | |
| | 1,087,000 | | | Huabao International Holdings Ltd. | | | 789,321 | |
| | 292,680 | | | Kingboard Chemical Holdings Ltd. | | | 614,164 | |
| | 423,996 | | | Sands China Ltd. | | | 3,112,848 | |
| | 2,444,000 | | | Skyworth Digital Holdings Ltd. | | | 1,206,365 | |
| | 410,800 | | | Yue Yuen Industrial Holdings Ltd. | | | 1,372,827 | |
| | | | | | | | |
| | | | | | | 17,118,256 | |
| | | | | | | | |
| | |
| | | | Ireland—0.3% | | | | |
| | 33,100 | | | Permanent TSB Group Holdings PLC (Chi-X)* | | | 3,413 | |
| | 15,500 | | | Permanent TSB Group Holdings PLC (XLON)* | | | 1,660 | |
| | 66,600 | | | Smurfit Kappa Group PLC | | | 1,445,297 | |
| | | | | | | | |
| | | | | | | 1,450,370 | |
| | | | | | | | |
| | |
| | | | Israel—0.7% | | | | |
| | 182,600 | | | Bank Hapoalim BM | | | 1,065,152 | |
| | 16,000 | | | Elbit Systems Ltd. | | | 1,002,636 | |
| | 29,400 | | | Teva Pharmaceutical Industries Ltd. | | | 1,574,250 | |
| | | | | | | | |
| | | | | | | 3,642,038 | |
| | | | | | | | |
| | |
| | | | Italy—1.6% | | | | |
| | 361,000 | | | Enel SpA | | | 2,055,161 | |
| | 104,300 | | | Eni SpA | | | 2,654,003 | |
| | 693,501 | | | Intesa Sanpaolo SpA | | | 2,059,431 | |
| | 682,500 | | | Telecom Italia SpA*(a) | | | 786,438 | |
| | | | | | | | |
| | | | | | | 7,555,033 | |
| | | | | | | | |
| | |
| | | | Japan—17.8% | | | | |
| | 18,300 | | | Alfresa Holdings Corp. | | | 1,092,520 | |
| | 22,600 | | | Alpine Electronics, Inc. | | | 356,017 | |
See Notes to Financial Statements.
| | | | |
| The TARGET Portfolio Trust | | | 103 | |
| | |
International Equity Portfolio (continued) | | Portfolio of Investments
As of July 31, 2014 |
| | | | | | | | |
| SHARES | | | DESCRIPTION | | VALUE (NOTE 1) | |
| | | | COMMON STOCKS (continued) | | | | |
| | |
| | | | Japan (continued) | | | | |
| | 36,400 | | | Aoyama Trading Co. Ltd. | | $ | 927,549 | |
| | 513,000 | | | Aozora Bank Ltd. | | | 1,743,218 | |
| | 124,000 | | | Asahi Kasei Corp. | | | 979,987 | |
| | 156,000 | | | Bank of Yokohama Ltd. (The) | | | 887,661 | |
| | 147,000 | | | Calsonic Kansei Corp. | | | 966,809 | |
| | 65,200 | | | Daihatsu Motor Co. Ltd. | | | 1,157,306 | |
| | 17,062 | | | FANUC Corp. | | | 2,948,831 | |
| | 243,000 | | | Fukuoka Financial Group, Inc. | | | 1,243,122 | |
| | 30,600 | | | Fuyo General Lease Co. Ltd. | | | 1,228,846 | |
| | 51,900 | | | Heiwa Corp. | | | 1,222,529 | |
| | 16,700 | | | Hogy Medical Co. Ltd | | | 932,679 | |
| | 69,869 | | | Japan Tobacco, Inc. | | | 2,457,121 | |
| | 169,160 | | | JX Holdings, Inc. | | | 869,838 | |
| | 35,300 | | | KDDI Corp. | | | 2,029,147 | |
| | 49,200 | | | Keihin Corp. | | | 754,520 | |
| | 295,651 | | | Kubota Corp. | | | 3,892,333 | |
| | 56,000 | | | KYORIN Holdings, Inc. | | | 1,153,854 | |
| | 78,200 | | | Kyowa Exeo Corp. | | | 1,083,432 | |
| | 247,900 | | | Marubeni Corp. | | | 1,742,252 | |
| | 26,500 | | | Matsumotokiyoshi Holdings Co. Ltd. | | | 870,204 | |
| | 27,100 | | | Megmilk Snow Brand Co. Ltd. | | | 351,023 | |
| | 9,100 | | | Miraca Holdings, Inc. | | | 421,147 | |
| | 58,300 | | | Mitsubishi Corp. | | | 1,228,490 | |
| | 103,869 | | | Mitsubishi Estate Co. Ltd. | | | 2,539,917 | |
| | 719,147 | | | Mitsubishi UFJ Financial Group, Inc. | | | 4,241,028 | |
| | 130,500 | | | Mitsui & Co. Ltd. | | | 2,092,881 | |
| | 719,300 | | | Mizuho Financial Group, Inc. | | | 1,396,502 | |
| | 245,000 | | | Morinaga Milk Industry Co. Ltd. | | | 878,327 | |
| | 36,300 | | | Namco Bandai Holdings, Inc. | | | 918,710 | |
| | 65,700 | | | Nichii Gakkan Co. | | | 560,780 | |
| | 75,407 | | | Nippon Telegraph & Telephone Corp. | | | 5,007,349 | |
| | 254,300 | | | Nishi-Nippon City Bank Ltd. (The) | | | 660,197 | |
| | 127,600 | | | Nissan Motor Co. Ltd. | | | 1,251,808 | |
| | 110,000 | | | NTT DOCOMO, Inc. | | | 1,928,977 | |
| | 67,200 | | | Otsuka Holdings Co. Ltd. | | | 2,139,837 | |
| | 432,600 | | | Resona Holdings, Inc. | | | 2,410,698 | |
| | 213,000 | | | Sankyu, Inc. | | | 1,037,156 | |
| | 82,000 | | | Seino Holdings Co. Ltd. | | | 881,600 | |
| | 36,500 | | | Shimachu Co. Ltd. | | | 846,274 | |
| | 28,200 | | | Shizuoka Gas Co. Ltd. | | | 185,757 | |
| | 161,300 | | | SKY Perfect JSAT Holdings, Inc. | | | 956,483 | |
| | 29,477 | | | SoftBank Corp. | | | 2,119,050 | |
| | 149,600 | | | Sumitomo Corp. | | | 1,971,437 | |
| | 57,000 | | | Sumitomo Metal Mining Co. Ltd. | | | 949,577 | |
See Notes to Financial Statements.
| | | | |
| 104 | | | The TARGET Portfolio Trust | |
| | | | | | | | |
| SHARES | | | DESCRIPTION | | VALUE (NOTE 1) | |
| | | | COMMON STOCKS (continued) | | | | |
| | |
| | | | Japan (continued) | | | | |
| | 52,700 | | | Sumitomo Mitsui Financial Group, Inc. | | $ | 2,148,288 | |
| | 708,737 | | | Sumitomo Mitsui Trust Holdings, Inc. | | | 3,084,215 | |
| | 203,400 | | | Toagosei Co. Ltd. | | | 856,973 | |
| | 51,700 | | | Toho Holdings Co. Ltd. | | | 976,060 | |
| | 13,443 | | | Tokyo Electron Ltd. | | | 878,142 | |
| | 50,400 | | | Toppan Forms Co. Ltd. | | | 492,598 | |
| | 102,058 | | | Toyota Motor Corp. | | | 6,025,510 | |
| | 45,800 | | | Tsumura & Co. | | | 1,101,114 | |
| | 9,400 | | | Tsuruha Holdings, Inc. | | | 539,603 | |
| | 65,900 | | | UNY Group Holdings Co. Ltd. | | | 391,747 | |
| | 30,200 | | | West Japan Railway Co. | | | 1,369,761 | |
| | 130,100 | | | Yokohama Rubber Co. Ltd. (The) | | | 1,126,465 | |
| | | | | | | | |
| | | | | | | 86,505,256 | |
| | | | | | | | |
| | |
| | | | Liechtenstein—0.1% | | | | |
| | 3,800 | | | Verwaltungs-und Privat-Bank AG(g) | | | 328,671 | |
| | | | | | | | |
| | |
| | | | Mexico—0.1% | | | | |
| | 12,700 | | | America Movil SAB De CV | | | 299,339 | |
| | | | | | | | |
| | |
| | | | Netherlands—4.1% | | | | |
| | 175,900 | | | Aegon NV | | | 1,426,487 | |
| | 24,475 | | | ASML Holding NV | | | 2,308,238 | |
| | 386,836 | | | ING Groep NV, CVA* | | | 5,024,055 | |
| | 113,907 | | | Koninklijke Ahold NV | | | 1,986,114 | |
| | 58,601 | | | Koninklijke Philips NV | | | 1,806,111 | |
| | 4,300 | | | Royal Dutch Shell PLC (Class A Stock) | | | 176,825 | |
| | 162,900 | | | Royal Dutch Shell PLC (Class B Stock) | | | 7,014,790 | |
| | | | | | | | |
| | | | | | | 19,742,620 | |
| | | | | | | | |
| | |
| | | | New Zealand—0.3% | | | | |
| | 825,600 | | | Air New Zealand Ltd. | | | 1,383,920 | |
| | | | | | | | |
| | |
| | | | Norway—1.5% | | | | |
| | 94,500 | | | DNB ASA | | | 1,674,690 | |
| | 11,700 | | | Fred Olsen Energy ASA | | | 265,533 | |
| | 116,300 | | | Marine Harvest ASA | | | 1,581,968 | |
| | 66,900 | | | Statoil ASA | | | 1,911,639 | |
| | 37,700 | | | Yara International ASA | | | 1,727,771 | |
| | | | | | | | |
| | | | | | | 7,161,601 | |
| | | | | | | | |
| | |
| | | | Portugal—0.2% | | | | |
| | 226,600 | | | EDP-Energias de Portugal SA | | | 1,061,185 | |
| | | | | | | | |
| | |
| | | | Singapore—0.7% | | | | |
| | 168,000 | | | DBS Group Holdings Ltd. | | | 2,447,649 | |
| | 56,000 | | | United Overseas Bank Ltd. | | | 1,080,724 | |
| | | | | | | | |
| | | | | | | 3,528,373 | |
| | | | | | | | |
See Notes to Financial Statements.
| | | | |
| The TARGET Portfolio Trust | | | 105 | |
| | |
International Equity Portfolio (continued) | | Portfolio of Investments
As of July 31, 2014 |
| | | | | | | | |
| SHARES | | | DESCRIPTION | | VALUE (NOTE 1) | |
| | | | COMMON STOCKS (continued) | | | | |
| | |
| | | | Spain—3.0% | | | | |
| | 22,600 | | | ACS Actividades de Construccion y Servicios SA | | $ | 988,276 | |
| | 60,450 | | | Amadeus IT Holding SA (Class A Stock) | | | 2,378,740 | |
| | 264,868 | | | Banco Bilbao Vizcaya Argentaria SA | | | 3,255,936 | |
| | 211,617 | | | Banco Santander SA | | | 2,126,172 | |
| | 86,900 | | | Gas Natural SDG SA | | | 2,669,801 | |
| | 63,100 | | | Repsol SA | | | 1,573,557 | |
| | 89,000 | | | Telefonica SA | | | 1,450,919 | |
| | | | | | | | |
| | | | | | | 14,443,401 | |
| | | | | | | | |
| | |
| | | | Sweden—3.0% | | | | |
| | 87,100 | | | Boliden AB | | | 1,411,032 | |
| | 57,992 | | | Hennes & Mauritz AB (Class B Stock) | | | 2,370,798 | |
| | 147,900 | | | Nordea Bank AB | | | 1,983,453 | |
| | 17,400 | | | Oriflame Cosmetics SA, SDR(a) | | | 377,351 | |
| | 71,400 | | | Securitas AB (Class B Stock) | | | 830,150 | |
| | 67,400 | | | Svenska Cellulosa AB SCA (Class B Stock) | | | 1,659,796 | |
| | 61,000 | | | Swedbank AB (Class A Stock) | | | 1,562,675 | |
| | 203,600 | | | Telefonaktiebolaget LM Ericsson (Class B Stock) | | | 2,535,204 | |
| | 249,900 | | | TeliaSonera AB | | | 1,871,684 | |
| | | | | | | | |
| | | | | | | 14,602,143 | |
| | | | | | | | |
| | |
| | | | Switzerland—8.9% | | | | |
| | 13,600 | | | Baloise Holding AG | | | 1,637,511 | |
| | 4,400 | | | Bucher Industries AG | | | 1,322,781 | |
| | 72,936 | | | Credit Suisse Group AG* | | | 1,978,590 | |
| | 2,200 | | | Georg Fischer AG* | | | 1,453,820 | |
| | 2,000 | | | Helvetia Holding AG | | | 974,535 | |
| | 25,953 | | | Holcim Ltd.* | | | 2,076,668 | |
| | 53,482 | | | Julius Baer Group Ltd.* | | | 2,268,821 | |
| | 9,200 | | | Lonza Group AG* | | | 1,020,222 | |
| | 70,740 | | | Nestle SA | | | 5,237,595 | |
| | 100,509 | | | Novartis AG | | | 8,744,147 | |
| | 16,520 | | | Roche Holding AG | | | 4,794,199 | |
| | 8,400 | | | Swiss Life Holding AG* | | | 1,942,486 | |
| | 40,700 | | | Swiss Re AG* | | | 3,459,806 | |
| | 203,679 | | | UBS AG* | | | 3,499,519 | |
| | 8,700 | | | Zurich Insurance Group AG* | | | 2,527,436 | |
| | | | | | | | |
| | | | | | | 42,938,136 | |
| | | | | | | | |
| | |
| | | | Taiwan—0.6% | | | | |
| | 138,583 | | | Taiwan Semiconductor Manufacturing Co. Ltd., ADR(a) | | | 2,771,660 | |
| | | | | | | | |
| | |
| | | | United Kingdom—17.1% | | | | |
| | 152,600 | | | 3i Group PLC | | | 969,238 | |
| | 80,600 | | | Alent PLC | | | 455,179 | |
See Notes to Financial Statements.
| | | | |
| 106 | | | The TARGET Portfolio Trust | |
| | | | | | | | |
| SHARES | | | DESCRIPTION | | VALUE (NOTE 1) | |
| | | | COMMON STOCKS (continued) | | | | |
| | |
| | | | United Kingdom (continued) | | | | |
| | 53,000 | | | AMEC PLC | | $ | 1,014,570 | |
| | 51,900 | | | Anglo American PLC | | | 1,393,830 | |
| | 77,700 | | | AstraZeneca PLC | | | 5,673,400 | |
| | 544,560 | | | Aviva PLC | | | 4,608,511 | |
| | 346,800 | | | BAE Systems PLC | | | 2,499,379 | |
| | 300,600 | | | Barclays PLC | | | 1,139,486 | |
| | 313,989 | | | Beazley PLC | | | 1,289,559 | |
| | 32,000 | | | Bellway PLC | | | 812,257 | |
| | 612,900 | | | BP PLC | | | 4,991,318 | |
| | 789,486 | | | BT Group PLC | | | 5,168,704 | |
| | 84,106 | | | Burberry Group PLC | | | 1,999,926 | |
| | 219,400 | | | Carillion PLC | | | 1,233,927 | |
| | 243,200 | | | Centrica PLC | | | 1,267,188 | |
| | 126,752 | | | Compass Group PLC | | | 2,065,376 | |
| | 80,900 | | | Dairy Crest Group PLC | | | 572,565 | |
| | 507,900 | | | Debenhams PLC | | | 564,544 | |
| | 225,758 | | | Experian PLC | | | 3,862,898 | |
| | 31,400 | | | GlaxoSmithKline PLC | | | 756,703 | |
| | 142,100 | | | Home Retail Group PLC | | | 396,919 | |
| | 259,200 | | | HSBC Holdings PLC (XLON) | | | 2,778,872 | |
| | 204,800 | | | Intermediate Capital Group PLC | | | 1,387,438 | |
| | 397,300 | | | J. Sainsbury PLC | | | 2,094,123 | |
| | 757,697 | | | Kingfisher PLC | | | 3,827,046 | |
| | 257,700 | | | Legal & General Group PLC | | | 1,016,648 | |
| | 144,620 | | | Marston’s PLC | | | 350,618 | |
| | 38,574 | | | Micro Focus International PLC | | | 552,006 | |
| | 71,700 | | | Mondi PLC | | | 1,255,756 | |
| | 524,912 | | | Old Mutual PLC | | | 1,726,847 | |
| | 166,100 | | | Pace PLC | | | 893,132 | |
| | 69,966 | | | Pearson PLC | | | 1,347,794 | |
| | 52,900 | | | Petrofac Ltd. | | | 974,862 | |
| | 57,417 | | | Reckitt Benckiser Group PLC | | | 5,068,643 | |
| | 36,800 | | | Rio Tinto Ltd. | | | 2,235,366 | |
| | 30,928 | | | Rio Tinto PLC | | | 1,767,666 | |
| | 54,738 | | | SABMiller PLC | | | 2,980,582 | |
| | 115,684 | | | Standard Chartered PLC | | | 2,399,036 | |
| | 73,600 | | | Tate & Lyle PLC | | | 772,698 | |
| | 402,500 | | | Tesco PLC | | | 1,746,341 | |
| | 153,300 | | | Tullett Prebon PLC | | | 638,867 | |
| | 80,600 | | | Vesuvius PLC | | | 630,909 | |
| | 61,300 | | | WH Smith PLC | | | 1,166,576 | |
| | 568,100 | | | Wm Morrison Supermarkets PLC | | | 1,612,444 | |
| | 56,314 | | | WPP PLC | | | 1,121,022 | |
| | | | | | | | |
| | | | | | | 83,080,769 | |
| | | | | | | | |
| | |
| | | | United States—5.0% | | | | |
| | 42,136 | | | Accenture PLC (Class A Stock) | | | 3,340,542 | |
| | 18,545 | | | Actavis, Inc.* | | | 3,973,452 | |
See Notes to Financial Statements.
| | | | |
| The TARGET Portfolio Trust | | | 107 | |
| | |
International Equity Portfolio (continued) | | Portfolio of Investments
As of July 31, 2014 |
| | | | | | | | |
| SHARES | | | DESCRIPTION | | VALUE (NOTE 1) | |
| | | | COMMON STOCKS (continued) | | | | |
| | |
| | | | United States (continued) | | | | |
| | 93,300 | | | Boart Longyear Ltd.*(a) | | $ | 16,040 | |
| | 64,327 | | | Carnival PLC | | | 2,331,719 | |
| | 43,253 | | | Ensco PLC (Class A Stock)(a) | | | 2,190,764 | |
| | 68,756 | | | Liberty Global PLC (Class C Stock)* | | | 2,749,552 | |
| | 53,682 | | | Lululemon Athletica, Inc.*(a) | | | 2,065,147 | |
| | 42,170 | | | MasterCard, Inc. (Class A Stock) | | | 3,126,905 | |
| | 23,068 | | | Schlumberger Ltd. | | | 2,500,341 | |
| | 25,769 | | | Yum! Brands, Inc. | | | 1,788,369 | |
| | | | | | | | |
| | | | | | | 24,082,831 | |
| | | | | | | | |
| | | | TOTAL LONG-TERM INVESTMENTS
(cost $400,559,419) | | | 462,085,739 | |
| | | | | | | | |
| | |
| | | | SHORT-TERM INVESTMENT—5.3% | | | | |
| | |
| | | | AFFILIATED MONEY MARKET MUTUAL FUND | | | | |
| | 25,912,369 | | | Prudential Investment Portfolios 2—Prudential Core Taxable Money Market Fund (cost $25,912,369; includes $8,780,409 of cash collateral for securities on loan)(b)(w) | | | 25,912,369 | |
| | | | | | | | |
| | | | TOTAL INVESTMENTS—100.7%
(cost $426,471,788; Note 5) | | | 487,998,108 | |
| | | | Liabilities in excess of other assets(x)—(0.7%) | | | (3,506,405 | ) |
| | | | | | | | |
| | | | NET ASSETS—100.0% | | $ | 484,491,703 | |
| | | | | | | | |
| * | Non-income producing security. |
| (a) | All or a portion of security is on loan. The aggregate market value of such securities, including those sold and pending settlement, is $8,128,312; cash collateral of $8,780,409 (included in liabilities) was received with which the Portfolio purchased highly liquid short-term investments. Securities on loan are subject to contractual netting arrangements. |
| (b) | Represents security, or a portion thereof, purchased with cash collateral received for securities on loan. |
| (g) | Indicates a security or securities that have been deemed illiquid. |
| (w) | Prudential Investments LLC, the manager of the Portfolio, also serves as manager of the Prudential Investment Portfolios 2—Prudential Core Taxable Money Market Fund. |
| (x) | Includes net unrealized appreciation (depreciation) on the following derivative contracts held at reporting period end: |
Forward foreign currency exchange contracts outstanding at July 31, 2014:
| | | | | | | | | | | | | | | | | | |
Sale Contracts | | Counterparty | | Notional
Amount
(000) | | | Value at
Settlement
Date
Receivable | | | Current
Value | | | Unrealized
Appreciation | |
Euro, | | | | | | | | | | | | | | | | | | |
Expiring 10/28/14 | | State Street Bank | | EUR | 9,310 | | | $ | 12,856,409 | | | $ | 12,470,749 | | | $ | 385,660 | |
Japanese Yen, | | | | | | | | | | | | | | | | | | |
Expiring 10/02/14 | | State Street Bank | | JPY | 1,358,441 | | | | 13,423,997 | | | | 13,211,551 | | | | 212,446 | |
| | | | | | | | | | | | | | | | | | |
| | | | | | | | $ | 26,280,406 | | | $ | 25,682,300 | | | $ | 598,106 | |
| | | | | | | | | | | | | | | | | | |
See Notes to Financial Statements.
| | | | |
| 108 | | | The TARGET Portfolio Trust | |
Various inputs are used in determining the value of the Portfolio’s investments. These inputs are summarized in the three broad levels listed below.
Level 1—quoted prices generally in active markets for identical securities.
Level 2—other significant observable inputs including, but not limited to, quoted prices for similar securities, interest rates and yield curves, prepayment speeds, foreign currency exchange rates, and amortized cost.
Level 3—significant unobservable inputs for securities valued in accordance with Board approved fair valuation procedures.
The following is a summary of the inputs used as of July 31, 2014 in valuing such portfolio securities:
| | | | | | | | | | | | |
| | | Level 1 | | | Level 2 | | | Level 3 | |
| Investments in Securities | | | | | | | | | | | | |
Common Stocks | | | | | | | | | | | | |
Australia | | $ | 700,403 | | | $ | 17,824,270 | | | $ | — | |
Austria | | | — | | | | 2,364,680 | | | | — | |
Belgium | | | 307,186 | | | | 4,603,004 | | | | — | |
Brazil | | | 666,651 | | | | — | | | | — | |
Canada | | | 2,939,599 | | | | — | | | | — | |
China | | | 3,255,306 | | | | 9,746,817 | | | | — | |
Denmark | | | — | | | | 6,136,010 | | | | — | |
Finland | | | — | | | | 3,204,893 | | | | — | |
France | | | — | | | | 46,188,658 | | | | — | |
Germany | | | — | | | | 32,452,660 | | | | — | |
Hong Kong | | | — | | | | 17,118,256 | | | | — | |
Ireland | | | 5,073 | | | | 1,445,297 | | | | — | |
Israel | | | — | | | | 3,642,038 | | | | — | |
Italy | | | — | | | | 7,555,033 | | | | — | |
Japan | | | — | | | | 86,505,256 | | | | — | |
Liechtenstein | | | 328,671 | | | | — | | | | — | |
Mexico | | | 299,339 | | | | — | | | | — | |
Netherlands | | | — | | | | 19,742,620 | | | | — | |
New Zealand | | | — | | | | 1,383,920 | | | | — | |
Norway | | | 1,727,771 | | | | 5,433,830 | | | | — | |
Portugal | | | — | | | | 1,061,185 | | | | — | |
Singapore | | | — | | | | 3,528,373 | | | | — | |
Spain | | | — | | | | 14,443,401 | | | | — | |
Sweden | | | 377,351 | | | | 14,224,792 | | | | — | |
Switzerland | | | — | | | | 42,938,136 | | | | — | |
Taiwan | | | 2,771,660 | | | | — | | | | — | |
United Kingdom | | | 2,153,591 | | | | 80,927,178 | | | | — | |
United States | | | 24,082,831 | | | | — | | | | — | |
Affiliated Money Market Mutual Fund | | | 25,912,369 | | | | — | | | | — | |
| Other Financial Instruments* | | | | | | | | | | | | |
Forward Foreign Currency Exchange Contracts | | | — | | | | 598,106 | | | | — | |
| | | | | | | | | | | | |
Total | | $ | 65,527,801 | | | $ | 423,068,413 | | | $ | — | |
| | | | | | | | | | | | |
| * | Other financial instruments are derivative instruments not reflected in the Portfolio of Investments, such as futures, forwards and swaps contracts, which are recorded at the unrealized appreciation/depreciation of the instrument. |
See Notes to Financial Statements.
| | | | |
| The TARGET Portfolio Trust | | | 109 | |
| | |
International Equity Portfolio (continued) | | Portfolio of Investments
As of July 31, 2014 |
The industry classification of investments and liabilities in excess of other assets shown as a percentage of net assets as of July 31, 2014 was as follows (unaudited):
| | | | |
Banks | | | 10.9 | % |
Pharmaceuticals | | | 8.0 | |
Insurance | | | 7.4 | |
Oil, Gas & Consumable Fuels | | | 5.9 | |
Affiliated Money Market Mutual Fund (including 1.8% of collateral for securities on loan) | | | 5.3 | |
Automobiles | | | 3.5 | |
Diversified Telecommunication Services | | | 3.2 | |
Machinery | | | 2.9 | |
Capital Markets | | | 2.8 | |
Hotels, Restaurants & Leisure | | | 2.5 | |
Wireless Telecommunication Services | | | 2.5 | |
Diversified Financial Services | | | 2.4 | |
Metals & Mining | | | 2.4 | |
Textiles, Apparel & Luxury Goods | | | 2.4 | |
Chemicals | | | 2.3 | |
Food & Staples Retailing | | | 2.3 | |
Auto Components | | | 2.2 | |
Food Products | | | 2.1 | |
IT Services | | | 2.0 | |
Media | | | 2.0 | |
Specialty Retail | | | 1.9 | |
Energy Equipment & Services | | | 1.5 | |
Health Care Providers & Services | | | 1.5 | |
Real Estate Management & Development | | | 1.5 | |
Trading Companies & Distributors | | | 1.5 | |
Household Products | | | 1.3 | |
Road & Rail | | | 1.3 | |
Semiconductors & Semiconductor Equipment | | | 1.3 | |
Aerospace & Defense | | | 1.2 | |
Beverages | | | 1.2 | |
Internet Software & Services | | | 1.1 | |
Electric Utilities | | | 0.9 | % |
Commercial Services & Supplies | | | 0.8 | |
Professional Services | | | 0.8 | |
Communications Equipment | | | 0.7 | |
Multi-Utilities | | | 0.7 | |
Construction & Engineering | | | 0.6 | |
Gas Utilities | | | 0.6 | |
Household Durables | | | 0.6 | |
Industrial Conglomerates | | | 0.6 | |
Tobacco | | | 0.5 | |
Construction Materials | | | 0.4 | |
Leisure Products | | | 0.4 | |
Airlines | | | 0.3 | |
Containers & Packaging | | | 0.3 | |
Electrical Equipment | | | 0.3 | |
Marine | | | 0.3 | |
Paper & Forest Products | | | 0.3 | |
Air Freight & Logistics | | | 0.2 | |
Health Care Equipment & Supplies | | | 0.2 | |
Life Sciences Tools & Services | | | 0.2 | |
Distributors | | | 0.1 | |
Electronic Equipment, Instruments & Components | | | 0.1 | |
Health Care Technology | | | 0.1 | |
Internet & Catalog Retail | | | 0.1 | |
Multiline Retail | | | 0.1 | |
Personal Products | | | 0.1 | |
Software | | | 0.1 | |
| | | | |
| | | 100.7 | |
Liabilities in excess of other assets | | | (0.7 | ) |
| | | | |
| | | 100.0 | % |
| | | | |
See Notes to Financial Statements.
| | | | |
| 110 | | | The TARGET Portfolio Trust | |
Offsetting of over-the-counter (OTC) derivative assets and liabilities:
The Portfolio invested in OTC derivatives during the reporting period that are either offset in accordance with current requirements or are subject to enforceable master netting arrangements or similar agreements that permit offsetting. The information about offsetting and related netting arrangements for OTC derivatives, where the legal right to set-off exists, is presented in the summary below.
| | | | | | | | | | | | | | | | |
Counterparty | | Gross amounts of
recognized assets(1) | | | Gross amounts
available for offset | | | Collateral
Received(3) | | | Net Amount | |
State Street Bank | | $ | 598,106 | | | $ | — | | | $ | — | | | $ | 598,106 | |
| | | | | | | | | | | | | | | | |
| | | | | | | | | | | | | | | | |
| | | | |
Counterparty | | Gross amounts of
recognized liabilities(2) | | | Gross amounts
available for offset | | | Collateral
Pledged(3) | | | Net Amount | |
State Street Bank | | $ | — | | | $ | — | | | $ | — | | | $ | — | |
| | | | | | | | | | | | | | | | |
| (1) | Includes unrealized appreciation on swaps and forwards, premiums paid on swap agreements and market value of purchased options. |
| (2) | Includes unrealized depreciation on swaps and forwards, premiums received on swap agreements and market value of written options. |
| (3) | Amounts shown reflect actual collateral received or pledged by the Portfolio. Such amounts are applied up to 100% of the Portfolio’s OTC derivative exposure by counterparty. |
See Notes to Financial Statements.
| | | | |
| The TARGET Portfolio Trust | | | 111 | |
| | |
| Total Return Bond Portfolio | | Portfolio of Investments
As of July 31, 2014 |
| | | | | | | | | | |
PRINCIPAL
AMOUNT (000)# | | | DESCRIPTION | | VALUE (NOTE 1) | |
| | | | | | LONG-TERM INVESTMENTS—90.2% | | | | |
| | | |
| | | | | | ASSET-BACKED SECURITIES—10.4% | | | | |
| | | |
| | | | | | Collateralized Loan Obligations—0.4% | | | | |
| | | 1,700 | | | CIFC Funding Ltd.,
Series 2012-1AR, Class A1R, 144A(g)
1.382%(c), 08/14/24 | | $ | 1,700,000 | |
| | | | | | | | | | |
| | | |
| | | | | | Non-Residential Mortgage-Backed Securities—6.2% | | | | |
| | | 3,484 | | | Ally Auto Receivables Trust,
Series 2012-4, Class A3
0.590%, 01/17/17 | | | 3,487,209 | |
| | | 3,400 | | | Series 2014-1, Class A2
0.480%, 02/15/17 | | | 3,398,691 | |
| | | 1,278 | | | Banc of America Funding Ltd.,
Series 2012-R5, Class A, 144A(g)
0.411%(c), 10/03/39 | | | 1,266,807 | |
| | | 3,400 | | | Citibank Omni Master Trust,
Series 2009-A17, Class A17, 144A
4.900%, 11/15/18 | | | 3,443,720 | |
| | | 3,156 | | | Ford Credit Auto Owner Trust,
Series 2014-B, Class A1, 144A
0.180%, 07/15/15 | | | 3,156,201 | |
| | | 2,994 | | | Hyundai Auto Lease Securitization Trust,
Series 2014-B, Class A1, 144A
0.200%, 07/15/15 | | | 2,994,174 | |
| | | 3,121 | | | Nissan Auto Lease Trust,
Series 2014-A, Class A1
0.180%, 06/15/15 | | | 3,120,596 | |
| | | 2,821 | | | SLM Student Loan Trust,
Series 2008-9, Class A
1.734%(c), 04/25/23 | | | 2,928,620 | |
| | | 2,100 | | | Toyota Auto Receivables Owner Trust,
Series 2014-B, Class A2
0.400%, 12/15/16 | | | 2,097,157 | |
| | | | | | | | | | |
| | | | | | | | | 25,893,175 | |
| | | | | | | | | | |
| | | |
| | | | | | Residential Mortgage-Backed Securities—3.8% | | | | |
| | | 3,217 | | | ABFC Trust,
Series 2006-HE1, Class A2C
0.315%(c), 01/25/37 | | | 2,004,635 | |
| | | 3,846 | | | Bear Stearns Asset Backed Securities I Trust,
Series 2007-HE5, Class 1A2
0.335%(c), 06/25/47 | | | 3,701,670 | |
| | | 700 | | | Citigroup Mortgage Loan Trust, Inc.,
Series 2006-WFH3, Class A4
0.395%(c), 10/25/36 | | | 655,876 | |
See Notes to Financial Statements.
| | | | |
| 112 | | | The TARGET Portfolio Trust | |
| | | | | | | | | | |
PRINCIPAL
AMOUNT (000)# | | | DESCRIPTION | | VALUE (NOTE 1) | |
| | | | | | ASSET-BACKED SECURITIES (continued) | | | | |
| | | |
| | | | | | Residential Mortgage-Backed Securities (continued) | | | | |
| | | 1,000 | | | Countrywide Asset-Backed Certificates,
Series 2005-16, Class MV1
0.612%(c), 05/25/36 | | $ | 826,157 | |
| | | 1,868 | | | Credit-Based Asset Servicing and Securitization LLC,
Series 2007-CB6, Class A3, 144A
0.375%(c), 07/25/37 | | | 1,235,701 | |
| | | 2,000 | | | Option One Mortgage Loan Trust Asset-Backed Certificates,
Series 2005-4, Class M2
0.615%(c), 11/25/35 | | | 1,478,714 | |
| | | 1,800 | | | Ownit Mortgage Loan Trust,
Series 2005-2, Class M4
1.085%(c), 03/25/36 | | | 1,769,576 | |
| | | 2,200 | | | Securitized Asset Backed Receivables LLC Trust,
Series 2005-FR5, Class M1
0.595%(c), 08/25/35 | | | 1,353,425 | |
| | | 2,422 | | | Specialty Underwriting & Residential Finance Trust,
Series 2004-BC2, Class M1
0.980%(c), 05/25/35 | | | 2,258,748 | |
| | | 304 | | | Structured Asset Securities Corp. Mortgage Loan Trust,
Series 2005-7XS, Class 2A1A
1.651%(c), 04/25/35 | | | 295,056 | |
| | | | | | | | | | |
| | | | | | | | | 15,579,558 | |
| | | | | | | | | | |
| | | | | | TOTAL ASSET-BACKED SECURITIES
(cost $42,895,011) | | | 43,172,733 | |
| | | | | | | | | | |
| | | |
| | | | | | CERTIFICATES OF DEPOSIT(n)—0.4% | | | | |
| | | 1,000 | | | Banco Bilbao Vizcaya Argentaria (Spain)
1.075%, 05/16/16 | | | 999,642 | |
| | | 600 | | | Intesa Sanpaolo SpA (Italy)
1.614%, 04/11/16 | | | 605,789 | |
| | | | | | | | | | |
| | | | | | TOTAL CERTIFICATES OF DEPOSIT
(cost $1,605,430) | | | 1,605,431 | |
| | | | | | | | | | |
| | | |
| | | | | | COMMERCIAL MORTGAGE-BACKED SECURITIES—0.5% | | | | |
| | | 800 | | | Banc of America Commercial Mortgage Trust,
Series 2007-3, Class A5
5.377%, 06/10/49 | | | 876,858 | |
| | | 15,616 | | | UBS - Barclays Commercial Mortgage Trust,
Series 2013-C5, Class XA, IO, 144A
1.135%(c), 03/10/46 | | | 1,089,842 | |
| | | | | | | | | | |
| | | | | | TOTAL COMMERCIAL MORTGAGE-BACKED SECURITIES
(cost $2,064,182) | | | 1,966,700 | |
| | | | | | | | | | |
| | | |
| | | | | | CORPORATE BONDS—35.9% | | | | |
| | | |
| | | | | | Airlines—0.1% | | | | |
| | | 403 | | | UAL 1991 Equipment Trust AB, Equipment Trust(g)(i)
10.850%, 02/19/15 | | | 197,461 | |
| | | | | | | | | | |
See Notes to Financial Statements.
| | | | |
| The TARGET Portfolio Trust | | | 113 | |
| | |
Total Return Bond Portfolio (continued) | | Portfolio of Investments
As of July 31, 2014 |
| | | | | | | | | | |
PRINCIPAL
AMOUNT (000)# | | | DESCRIPTION | | VALUE (NOTE 1) | |
| | | | | | CORPORATE BONDS (continued) | | | | |
| | | |
| | | | | | Auto Components—0.3% | | | | |
| | | 1,100 | | | AutoZone, Inc.,
Sr. Unsec’d. Notes
6.950%, 06/15/16 | | $ | 1,217,378 | |
| | | | | | | | | | |
| | | |
| | | | | | Automobiles—1.5% | | | | |
| | | 2,000 | | | Daimler Finance North America LLC (Germany),
Gtd. Notes, 144A
0.834%(c), 01/09/15 | | | 2,003,810 | |
| | | 2,600 | | | 1.300%, 07/31/15 | | | 2,618,023 | |
| | | 1,400 | | | 2.300%, 01/09/15 | | | 1,411,045 | |
| | | | | | | | | | |
| | | | | | | | | 6,032,878 | |
| | | | | | | | | | |
| | | |
| | | | | | Banks—12.2% | | | | |
| | | 1,400 | | | Banco Santander Chile (Chile),
Sr. Unsec’d. Notes, 144A
1.134%(c), 04/11/17 | | | 1,399,975 | |
| | | 1,200 | | | Bank of America Corp.,
Sr. Unsec’d. Notes
0.494%(c), 10/14/16 | | | 1,195,111 | |
| | | 800 | | | 7.625%, 06/01/19 | | | 979,152 | |
| | | 2,400 | | | Sr. Unsec’d. Notes, MTN
3.625%, 03/17/16 | | | 2,501,623 | |
| | | 900 | | | 4.500%, 04/01/15 | | | 923,458 | |
| | | 2,000 | | | 5.650%, 05/01/18 | | | 2,249,228 | |
| GBP | | | 300 | | | 5.750%, 12/12/14 | | | 514,889 | |
| | | 3,600 | | | Bank Of Nova Scotia (Canada),
Sr. Unsec’d. Notes
0.544%(c), 04/11/17 | | | 3,601,858 | |
| EUR | | | 600 | | | CaixaBank SA (Spain),
Covered Bonds
3.250%, 10/05/15 | | | 828,024 | |
| EUR | | | 200 | | | 5.125%, 04/27/16 | | | 288,306 | |
| | | 2,100 | | | Citigroup, Inc.,
Sr. Unsec’d. Notes
0.904%(c), 11/15/16 | | | 2,109,815 | |
| | | 3,800 | | | 1.250%, 01/15/16 | | | 3,820,231 | |
| | | 2,450 | | | Sub. Notes
4.875%, 05/07/15 | | | 2,526,891 | |
| | | 1,000 | | | 5.000%, 09/15/14 | | | 1,005,057 | |
| | | 1,300 | | | HSBC USA, Inc.,
Sr. Unsec’d. Notes
2.375%, 02/13/15 | | | 1,313,962 | |
| | | 3,200 | | | ING Bank NV (Netherlands),
Unsec’d. Notes, 144A
0.574%(c), 01/04/16 | | | 3,199,075 | |
See Notes to Financial Statements.
| | | | |
| 114 | | | The TARGET Portfolio Trust | |
| | | | | | | | | | |
PRINCIPAL
AMOUNT (000)# | | | DESCRIPTION | | VALUE (NOTE 1) | |
| | | | | | CORPORATE BONDS (continued) | | | | |
| | | |
| | | | | | Banks (continued) | | | | |
| | | 4,900 | | | JPMorgan Chase & Co.,
Sr. Unsec’d. Notes, MTN
0.847%(c), 02/26/16 | | $ | 4,925,985 | |
| | | 6,400 | | | 0.894%(c), 10/15/15 | | | 6,433,811 | |
| | | 1,200 | | | KBC Bank NV (Belgium),
Sub. Notes
8.000%(c), 01/25/23 | | | 1,362,000 | |
| | | 3,100 | | | Lloyds Bank PLC (United Kingdom),
Jr. Sub. Notes, 144A(g)
12.000%(c), 12/29/49 | | | 4,526,000 | |
| | | 2,035 | | | Royal Bank of Scotland Group PLC (United Kingdom),
Sub. Notes
5.000%, 10/01/14 | | | 2,047,210 | |
| | | 2,700 | | | Sumitomo Mitsui Trust Bank Ltd. (Japan),
Gtd. Notes, 144A
1.800%, 03/28/18 | | | 2,688,941 | |
| | | | | | | | | | |
| | | | | | | | | 50,440,602 | |
| | | | | | | | | | |
| | | |
| | | | | | Beverages—0.5% | | | | |
| | | 1,800 | | | FBG Finance Pty. Ltd. (Australia),
Gtd. Notes, 144A(g)
5.125%, 06/15/15 | | | 1,866,600 | |
| | | | | | | | | | |
| | | |
| | | | | | Capital Markets—1.6% | | | | |
| | | 300 | | | Goldman Sachs Group, Inc. (The),
Sr. Unsec’d. Notes
3.300%, 05/03/15 | | | 306,219 | |
| | | 300 | | | 6.150%, 04/01/18 | | | 341,206 | |
| | | 400 | | | Sr. Unsec’d. Notes, MTN
0.632%(c), 07/22/15 | | | 400,222 | |
| | | 1,800 | | | Morgan Stanley,
Sr. Unsec’d. Notes, MTN
5.750%, 10/18/16 | | | 1,975,073 | |
| | | 3,200 | | | 6.625%, 04/01/18 | | | 3,701,149 | |
| | | | | | | | | | |
| | | | | | | | | 6,723,869 | |
| | | | | | | | | | |
| | | |
| | | | | | Consumer Finance—4.4% | | | | |
| | | 1,000 | | | Ally Financial, Inc.,
Gtd. Notes
2.750%, 01/30/17 | | | 1,001,250 | |
| | | 2,300 | | | 6.750%, 12/01/14 | | | 2,325,875 | |
| | | 3,600 | | | 8.000%, 03/15/20 | | | 4,212,000 | |
| | | 400 | | | CitiFinancial, Inc.,
Sr. Unsec’d. Notes
6.625%, 06/01/15 | | | 417,800 | |
| | | 2,100 | | | Ford Motor Credit Co. LLC,
Sr. Unsec’d. Notes
2.500%, 01/15/16 | | | 2,146,024 | |
| | | 2,000 | | | 5.625%, 09/15/15 | | | 2,104,722 | |
See Notes to Financial Statements.
| | | | |
| The TARGET Portfolio Trust | | | 115 | |
| | |
Total Return Bond Portfolio (continued) | | Portfolio of Investments
As of July 31, 2014 |
| | | | | | | | | | |
PRINCIPAL
AMOUNT (000)# | | | DESCRIPTION | | VALUE (NOTE 1) | |
| | | | | | CORPORATE BONDS (continued) | | | | |
| | | |
| | | | | | Consumer Finance (continued) | | | | |
| | | 1,300 | | | Sr. Unsec’d. Notes, MTN
0.673%(c), 11/08/16 | | $ | 1,299,416 | |
| | | 800 | | | 1.329%(c), 08/28/14 | | | 800,502 | |
| | | 3,200 | | | John Deere Capital Corp.,
Sr. Unsec’d. Notes, MTN
0.363%(c), 04/12/16 | | | 3,201,046 | |
| | | 100 | | | Springleaf Finance Corp.,
Gtd. Notes, MTN
5.400%, 12/01/15 | | | 103,750 | |
| | | 500 | | | 6.900%, 12/15/17 | | | 541,250 | |
| | | | | | | | | | |
| | | | | | | | | 18,153,635 | |
| | | | | | | | | | |
| | | |
| | | | | | Diversified Financial Services—0.6% | | | | |
| | | 2,000 | | | Anglo American Capital PLC (United Kingdom),
Gtd. Notes, 144A(g)
1.184%(c), 04/15/16 | | | 2,006,004 | |
| | | 600 | | | Navient LLC,
Sr. Unsec’d. Notes, MTN
6.000%, 01/25/17 | | | 640,500 | |
| | | | | | | | | | |
| | | | | | | | | 2,646,504 | |
| | | | | | | | | | |
| | | |
| | | | | | Diversified Telecommunication Services—2.6% | | | | |
| | | 1,300 | | | AT&T, Inc.,
Sr. Unsec’d. Notes
0.654%(c), 03/30/17 | | | 1,302,375 | |
| | | 1,000 | | | Telefonica Emisiones SAU (Spain),
Gtd. Notes
0.880%(c), 06/23/17 | | | 1,000,556 | |
| | | 1,900 | | | Verizon Communications, Inc.,
Sr. Unsec’d. Notes
0.630%(c), 06/09/17 | | | 1,903,196 | |
| | | 2,400 | | | 0.700%, 11/02/15 | | | 2,402,422 | |
| | | 1,000 | | | 1.761%(c), 09/15/16 | | | 1,026,433 | |
| | | 200 | | | 1.981%(c), 09/14/18 | | | 210,276 | |
| | | 2,200 | | | 2.500%, 09/15/16 | | | 2,270,710 | |
| | | 500 | | | 3.650%, 09/14/18 | | | 533,057 | |
| | | | | | | | | | |
| | | | | | | | | 10,649,025 | |
| | | | | | | | | | |
| | | |
| | | | | | Food Products—0.5% | | | | |
| | | 2,100 | | | ConAgra Foods, Inc.,
Sr. Unsec’d. Notes
0.603%(c), 07/21/16 | | | 2,099,141 | |
| | | | | | | | | | |
See Notes to Financial Statements.
| | | | |
| 116 | | | The TARGET Portfolio Trust | |
| | | | | | | | | | |
PRINCIPAL
AMOUNT (000)# | | | DESCRIPTION | | VALUE (NOTE 1) | |
| | | | | | CORPORATE BONDS (continued) | | | | |
| | | |
| | | | | | Health Care Equipment & Supplies—1.3% | | | | |
| | | 5,300 | | | Covidien International Finance SA,
Gtd. Notes
1.350%, 05/29/15 | | $ | 5,336,814 | |
| | | | | | | | | | |
| | | |
| | | | | | Health Care Providers & Services—0.9% | | | | |
| | | 2,200 | | | HCA, Inc.,
Sr. Unsec’d. Notes
6.375%, 01/15/15 | | | 2,241,250 | |
| | | 1,400 | | | Sr. Unsec’d. Notes, MTN
9.000%, 12/15/14 | | | 1,433,250 | |
| | | | | | | | | | |
| | | | | | | | | 3,674,500 | |
| | | | | | | | | | |
| | | |
| | | | | | Hotels, Restaurants & Leisure—0.9% | | | | |
| | | 2,000 | | | MGM Resorts International,
Gtd. Notes
6.625%, 07/15/15 | | | 2,080,000 | |
| | | 1,400 | | | 7.625%, 01/15/17 | | | 1,547,000 | |
| | | | | | | | | | |
| | | | | | | | | 3,627,000 | |
| | | | | | | | | | |
| | | |
| | | | | | Insurance—0.5% | | | | |
| | | 2,000 | | | Metropolitan Life Global Funding I,
Sr. Sec’d. Notes, 144A(g)
1.700%, 06/29/15 | | | 2,023,376 | |
| | | 200 | | | XLIT Ltd. (Ireland),
Gtd. Notes
5.250%, 09/15/164 | | | 201,071 | |
| | | | | | | | | | |
| | | | | | | | | 2,224,447 | |
| | | | | | | | | | |
| | | |
| | | | | | Media—1.8% | | | | |
| | | 3,700 | | | Discovery Communications LLC,
Gtd. Notes
3.700%, 06/01/15 | | | 3,798,002 | |
| | | 1,000 | | | DISH DBS Corp.,
Gtd. Notes
6.625%, 10/01/14 | | | 1,006,250 | |
| | | 1,100 | | | 7.125%, 02/01/16 | | | 1,171,500 | |
| | | 1,500 | | | 7.750%, 05/31/15 | | | 1,571,250 | |
| | | | | | | | | | |
| | | | | | | | | 7,547,002 | |
| | | | | | | | | | |
| | | |
| | | | | | Metals & Mining—0.6% | | | | |
| | | 2,500 | | | Gerdau Trade, Inc. (Brazil),
Gtd. Notes, 144A
5.750%, 01/30/21 | | | 2,650,000 | |
| | | | | | | | | | |
| | | |
| | | | | | Oil, Gas & Consumable Fuels—1.5% | | | | |
| | | 1,900 | | | Canadian Natural Resources Ltd. (Canada),
Sr. Unsec’d. Notes
0.609%(c), 03/30/16 | | | 1,905,774 | |
See Notes to Financial Statements.
| | | | |
| The TARGET Portfolio Trust | | | 117 | |
| | |
Total Return Bond Portfolio (continued) | | Portfolio of Investments
As of July 31, 2014 |
| | | | | | | | | | |
PRINCIPAL
AMOUNT (000)# | | | DESCRIPTION | | VALUE (NOTE 1) | |
| | | | | | CORPORATE BONDS (continued) | | | | |
| | | |
| | | | | | Oil, Gas & Consumable Fuels (continued) | | | | |
| | | 300 | | | El Paso LLC,
Gtd. Notes, MTN
7.800%, 08/01/31 | | $ | 330,000 | |
| | | 2,300 | | | Statoil ASA (Norway),
Gtd. Notes
0.685%(c), 11/08/18 | | | 2,314,511 | |
| | | 1,300 | | | Suncor Energy, Inc. (Canada),
Sr. Unsec’d. Notes
6.850%, 06/01/39 | | | 1,717,959 | |
| | | | | | | | | | |
| | | | | | | | | 6,268,244 | |
| | | | | | | | | | |
| | | |
| | | | | | Paper & Forest Products—0.9% | | | | |
| | | 3,600 | | | International Paper Co.,
Sr. Unsec’d. Notes
5.250%, 04/01/16 | | | 3,832,103 | |
| | | | | | | | | | |
| | | |
| | | | | | Pharmaceuticals—1.0% | | | | |
| | | 1,200 | | | Cardinal Health, Inc.,
Sr. Unsec’d. Notes
6.000%, 06/15/17 | | | 1,347,987 | |
| | | 1,300 | | | Teva Pharmaceutical Finance II BV/Teva Pharmaceutical
Finance III LLC (Israel),
Gtd. Notes
3.000%, 06/15/15 | | | 1,327,466 | |
| | | 1,275 | | | Valeant Pharmaceuticals International,
Gtd. Notes, 144A
6.750%, 08/15/21 | | | 1,326,000 | |
| | | | | | | | | | |
| | | | | | | | | 4,001,453 | |
| | | | | | | | | | |
| | | |
| | | | | | Road & Rail—0.4% | | | | |
| | | 1,600 | | | CSX Corp.,
Sr. Unsec’d. Notes
6.250%, 03/15/18 | | | 1,845,598 | |
| | | | | | | | | | |
| | | |
| | | | | | Specialty Retail—0.5% | | | | |
| | | 1,900 | | | L Brands, Inc.,
Sr. Unsec’d. Notes
6.900%, 07/15/17 | | | 2,128,000 | |
| | | | | | | | | | |
| | | |
| | | | | | Technology Hardware, Storage & Peripherals—0.1% | | | | |
| | | 400 | | | Apple, Inc.,
Sr. Unsec’d. Notes
2.850%, 05/06/21 | | | 401,502 | |
| | | | | | | | | | |
See Notes to Financial Statements.
| | | | |
| 118 | | | The TARGET Portfolio Trust | |
| | | | | | | | | | |
PRINCIPAL
AMOUNT (000)# | | | DESCRIPTION | | VALUE (NOTE 1) | |
| | | | | | CORPORATE BONDS (continued) | | | | |
| | | |
| | | | | | Tobacco | | | | |
| | | 89 | | | Altria Group, Inc.,
Gtd. Notes
9.700%, 11/10/18 | | $ | 115,359 | |
| | | | | | | | | | |
| | | |
| | | | | | Trading Companies & Distributors—0.5% | | | | |
| | | 1,900 | | | International Lease Finance Corp.,
Sr. Sec’d. Notes, 144A
7.125%, 09/01/18 | | | 2,175,500 | |
| | | | | | | | | | |
| | | |
| | | | | | Wireless Telecommunication Services—0.7% | | | | |
| | | 1,900 | | | Sprint Communications, Inc.,
Sr. Unsec’d. Notes
6.000%, 12/01/16 | | | 2,052,000 | |
| | | 700 | | | 9.125%, 03/01/17 | | | 805,000 | |
| | | | | | | | | | |
| | | | | | | | | 2,857,000 | |
| | | | | | | | | | |
| | | | | | TOTAL CORPORATE BONDS
(cost $144,092,123) | | | 148,711,615 | |
| | | | | | | | | | |
| | | |
| | | | | | FOREIGN GOVERNMENT BONDS—17.5% | | | | |
| BRL | | | 3,000 | | | Brazil Letras do Tesouro Nacional (Brazil),
Bills
10.810%(s), 07/01/15 | | | 1,201,609 | |
| BRL | | | 7,000 | | | 10.870%(s), 04/01/15 | | | 2,876,888 | |
| BRL | | | 5,000 | | | 10.880%(s), 10/01/15 | | | 1,946,263 | |
| BRL | | | 11,000 | | | 10.930%(s), 01/01/15 | | | 4,636,305 | |
| BRL | | | 7,400 | | | 11.240%(s), 01/01/17 | | | 2,503,671 | |
| EUR | | | 1,700 | | | Italy Buoni Poliennali del Tesoro (Italy),
Bonds
1.150%, 05/15/17 | | | 2,301,055 | |
| EUR | | | 700 | | | 2.250%, 05/15/16 | | | 967,014 | |
| EUR | | | 200 | | | 3.000%, 06/15/15 | | | 273,956 | |
| EUR | | | 600 | | | 3.000%, 11/01/15 | | | 829,506 | |
| EUR | | | 6,500 | | | 3.750%, 08/01/15 | | | 8,993,083 | |
| EUR | | | 400 | | | 3.750%, 04/15/16 | | | 565,399 | |
| EUR | | | 3,900 | | | 3.750%, 08/01/16 | | | 5,553,374 | |
| EUR | | | 3,700 | | | 4.500%, 07/15/15 | | | 5,146,756 | |
| EUR | | | 2,500 | | | 4.750%, 09/15/16 | | | 3,639,937 | |
| EUR | | | 1,400 | | | 4.750%, 06/01/17 | | | 2,082,174 | |
| EUR | | | 500 | | | Italy Certificati di Credito del Tesoro (Italy)
0.860%, 04/29/16 | | | 663,307 | |
| MXN | | | 32,000 | | | Mexican Bonos (Mexico),
Bonds
9.500%, 12/18/14 | | | 2,477,304 | |
| EUR | | | 1,100 | | | Spain Government Bond (Spain),
Bonds
2.100%, 04/30/17 | | | 1,531,425 | |
| EUR | | | 200 | | | 3.150%, 01/31/16 | | | 279,134 | |
| EUR | | | 500 | | | 3.250%, 04/30/16 | | | 703,261 | |
| EUR | | | 3,300 | | | 3.300%, 07/30/16 | | | 4,670,861 | |
See Notes to Financial Statements.
| | | | |
| The TARGET Portfolio Trust | | | 119 | |
| | |
Total Return Bond Portfolio (continued) | | Portfolio of Investments
As of July 31, 2014 |
| | | | | | | | | | |
PRINCIPAL
AMOUNT (000)# | | | DESCRIPTION | | VALUE (NOTE 1) | |
| | | | | | FOREIGN GOVERNMENT BONDS (continued) | | | | |
| EUR | | | 800 | | | 3.750%, 10/31/15 | | $ | 1,117,103 | |
| EUR | | | 8,900 | | | 4.000%, 07/30/15 | | | 12,349,048 | |
| EUR | | | 1,300 | | | 4.250%, 10/31/16 | | | 1,886,410 | |
| EUR | | | 1,300 | | | Sr. Unsec’d. Notes
3.800%, 01/31/17 | | | 1,881,931 | |
| EUR | | | 1,000 | | | 5.500%, 07/30/17 | | | 1,528,669 | |
| | | | | | | | | | |
| | | | | | TOTAL FOREIGN GOVERNMENT BONDS
(cost $73,694,409) | | | 72,605,443 | |
| | | | | | | | | | |
| | | |
| | | | | | MUNICIPAL BONDS—4.2% | | | | |
| | | |
| | | | | | California—1.4% | | | | |
| | | 4,300 | | | Los Angeles County Public Works Financing Authority,
Revenue Bonds, BABs
7.618%, 08/01/40 | | | 5,787,370 | |
| | | | | | | | | | |
| | | |
| | | | | | Illinois—0.3% | | | | |
| | | 800 | | | Chicago Transit Authority,
Series B, Revenue Bonds
6.899%, 12/01/40 | | | 993,368 | |
| | | | | | | | | | |
| | | |
| | | | | | Kentucky—1.0% | | | | |
| | | 800 | | | Kentucky State Property & Building Commission,
Revenue Bonds, BABs
4.303%, 11/01/19 | | | 860,712 | |
| | | 1,000 | | | 4.403%, 11/01/20 | | | 1,087,000 | |
| | | 1,900 | | | 5.373%, 11/01/25 | | | 2,147,228 | |
| | | | | | | | | | |
| | | | | | | | | 4,094,940 | |
| | | | | | | | | | |
| | | |
| | | | | | New Jersey—0.1% | | | | |
| | | 500 | | | New Jersey State Turnpike Authority,
Revenue Bonds
5.000%, 01/01/27 | | | 569,890 | |
| | | | | | | | | | |
| | | |
| | | | | | New York—1.4% | | | | |
| | | 1,400 | | | New York City Transitional Finance Authority Future Tax Secured Revenue, Revenue Bonds, BABs
4.725%, 11/01/23 | | | 1,544,144 | |
| | | 1,100 | | | 4.905%, 11/01/24 | | | 1,230,086 | |
| | | 1,100 | | | 5.075%, 11/01/25 | | | 1,243,506 | |
| | | 1,800 | | | Port Authority of New York & New Jersey,
Revenue Bonds
4.458%, 10/01/62 | | | 1,834,686 | |
| | | | | | | | | | |
| | | | | | | | | 5,852,422 | |
| | | | | | | | | | |
| | | | | | TOTAL MUNICIPAL BONDS
(cost $15,883,355) | | | 17,297,990 | |
| | | | | | | | | | |
See Notes to Financial Statements.
| | | | |
| 120 | | | The TARGET Portfolio Trust | |
| | | | | | | | | | |
PRINCIPAL
AMOUNT (000)# | | | DESCRIPTION | | VALUE (NOTE 1) | |
| | | | | | RESIDENTIAL MORTGAGE-BACKED SECURITIES—2.9% | | | | |
| | | 950 | | | Alternative Loan Trust,
Series 2006-OA17, Class 1A1A
0.351%(c), 12/20/46 | | $ | 746,450 | |
| | | 96 | | | Series 2007-16CB, Class 5A1
6.250%, 08/25/37 | | | 79,798 | |
| | | 804 | | | American Home Mortgage Assets Trust,
Series 2006-1, Class 2A1
0.342%(c), 05/25/46 | | | 606,927 | |
| | | 78 | | | Banc of America Funding Trust,
Series 2006-I, Class 4A1
2.735%(c), 10/20/46 | | | 58,131 | |
| | | 46 | | | Banc of America Mortgage Trust,
Series 2005-B, Class 2A2
2.861%(c), 03/25/35 | | | 43,334 | |
| | | 876 | | | BCAP LLC Trust,
Series 2011-RR2, Class 1A1, 144A
2.885%(c), 07/26/36 | | | 884,676 | |
| | | 5 | | | Bear Stearns Adjustable Rate Mortgage Trust,
Series 2002-11, Class 1A1
2.344%(c), 02/25/33 | | | 4,368 | |
| | | 766 | | | Series 2005-4, Class 3A1
2.688%(c), 08/25/35 | | | 689,233 | |
| | | 634 | | | Series 2007-3, Class 1A1
2.892%(c), 05/25/47 | | | 537,126 | |
| | | 224 | | | Bear Stearns Alt-A Trust,
Series 2005-4, Class 23A2
2.537%(c), 05/25/35 | | | 226,541 | |
| | | 2,131 | | | CHL Mortgage Pass-Through Trust,
Series 2005-29, Class A1
5.750%, 12/25/35 | | | 2,014,539 | |
| | | 194 | | | Citigroup Mortgage Loan Trust,
Series 2005-6, Class A2
2.280%(c), 09/25/35 | | | 195,016 | |
| | | 676 | | | Series 2007-10, Class 22AA
2.885%(c), 09/25/37 | | | 569,169 | |
| | | 670 | | | Countrywide Alternative Loan Trust,
Series 2006-OA9, Class 2A1A
0.366%(c), 07/20/46 | | | 459,446 | |
| | | 356 | | | FHLMC Structured Pass-Through Securities,
Series T-61, Class 1A1
1.524%(c), 07/25/44 | | | 367,000 | |
| | | 739 | | | Greenpoint Mortgage Pass-Through Certificates,
Series 2003-1, Class A1
2.795%(c), 10/25/33 | | | 726,127 | |
| | | 1 | | | Indymac ARM Trust,
Series 2001-H2, Class A1
1.717%(c), 01/25/32 | | | 1,428 | |
| | | 199 | | | Merrill Lynch Mortgage Investors Trust,
Series 2005-A10, Class A
0.365%(c), 02/25/36 | | | 182,263 | |
See Notes to Financial Statements.
| | | | |
| The TARGET Portfolio Trust | | | 121 | |
| | |
Total Return Bond Portfolio (continued) | | Portfolio of Investments
As of July 31, 2014 |
| | | | | | | | | | |
PRINCIPAL
AMOUNT (000)# | | | DESCRIPTION | | VALUE (NOTE 1) | |
| | | | | | RESIDENTIAL MORTGAGE-BACKED SECURITIES (continued) | | | | |
| | | 2,576 | | | Opteum Mortgage Acceptance Corp. Trust,
Series 2006-1, Class 1A1B
0.345%(c), 04/25/36 | | $ | 2,525,527 | |
| | | 10 | | | Residential Funding Mortgage Securities I Trust,
Series 2003-S9, Class A1
6.500%, 03/25/32 | | | 10,244 | |
| | | 717 | | | Wells Fargo Mortgage Backed Securities Trust,
Series 2006-AR2, Class 2A1
2.613%(c), 03/25/36 | | | 718,207 | |
| | | 494 | | | Series 2006-AR10, Class 1A1
2.610%(c), 07/25/36 | | | 479,884 | |
| | | | | | | | | | |
| | | | | | TOTAL RESIDENTIAL MORTGAGE-BACKED SECURITIES
(cost $11,407,481) | | | 12,125,434 | |
| | | | | | | | | | |
| | | |
| | | | | | U.S. GOVERNMENT AGENCY OBLIGATIONS—9.0% | | | | |
| | | 9 | | | Federal Home Loan Mortgage Corp.
2.391%(c), 01/01/24 | | | 8,737 | |
| | | 10 | | | 2.403%(c), 09/01/35 | | | 11,019 | |
| | | 4,000 | | | 4.500%, TBA | | | 4,301,656 | |
| | | 6 | | | 5.500%, 06/01/31 | | | 7,189 | |
| | | 5 | | | 7.500%, 09/01/16-07/01/17 | | | 5,128 | |
| | | 31 | | | Federal National Mortgage Assoc.
1.841%(c), 01/01/20 | | | 32,385 | |
| | | 43 | | | 1.995%(c), 12/01/34 | | | 45,174 | |
| | | 31 | | | 3.275%(c), 05/01/36 | | | 33,006 | |
| | | 195 | | | 3.500%, 08/01/20 | | | 205,947 | |
| | | 285 | | | 4.000%, 12/01/40 | | | 300,673 | |
| | | 329 | | | 4.500%, 01/01/25-02/01/33 | | | 351,084 | |
| | | 1,000 | | | 4.500%, TBA | | | 1,074,203 | |
| | | 15,000 | | | 5.000%, TBA | | | 16,542,187 | |
| | | 13,000 | | | 5.000%, TBA | | | 14,306,855 | |
| | | 99 | | | Government National Mortgage Assoc.
1.625%(c), 02/20/17-11/20/29 | | | 99,606 | |
| | | 28 | | | 2.000%(c), 08/20/22-10/20/26 | | | 29,487 | |
| | | 24 | | | 8.500%, 06/15/30-08/20/30 | | | 27,206 | |
| | | | | | | | | | |
| | | | | | TOTAL U.S. GOVERNMENT AGENCY OBLIGATIONS
(cost $37,363,368) | | | 37,381,542 | |
| | | | | | | | | | |
| | | |
| | | | | | U.S. TREASURY OBLIGATIONS—9.4% | | | | |
| | | 3,200 | | | U.S. Treasury Bonds
3.375%, 05/15/44 | | | 3,238,499 | |
| | | 9,400 | | | U.S. Treasury Inflation Indexed Bonds, TIPS
0.125%, 07/15/22-01/15/23 | | | 9,718,305 | |
| | | 6,800 | | | 0.125%(h)(k), 01/15/22 | | | 7,158,949 | |
| | | 5,300 | | | 0.375%, 07/15/23 | | | 5,503,309 | |
| | | 3,800 | | | 1.125%(h)(k), 01/15/21 | | | 4,443,037 | |
See Notes to Financial Statements.
| | | | |
| 122 | | | The TARGET Portfolio Trust | |
| | | | | | | | | | |
PRINCIPAL
AMOUNT (000)# | | | DESCRIPTION | | VALUE (NOTE 1) | |
| | | | | | U.S. TREASURY OBLIGATIONS (continued) | | | | |
| | | 100 | | | 1.250%(h), 07/15/20 | | $ | 118,600 | |
| | | 5,800 | | | 2.375%, 01/15/25 | | | 8,837,496 | |
| | | | | | | | | | |
| | | | | | TOTAL U.S. TREASURY OBLIGATIONS
(cost $39,179,376) | | | 39,018,195 | |
| | | | | | | | | | |
| | | | | | TOTAL LONG-TERM INVESTMENTS
(cost $368,184,735) | | | 373,885,083 | |
| | | | | | | | | | |
| | | |
| | | | | | SHORT-TERM INVESTMENTS—20.5% | | | | |
| | | |
| | | | | | COMMERCIAL PAPER(n)—7.9% | | | | |
| | | 3,300 | | | Eni Finance USA, Inc.
0.573%, 05/15/15 | | | 3,288,014 | |
| | | 3,800 | | | Entergy Corp.
0.892%, 09/18/14 | | | 3,797,599 | |
| | | 2,000 | | | 0.953%, 08/05/14 | | | 1,999,898 | |
| | | 2,100 | | | Glencore Funding LLC
0.451%, 09/15/14 | | | 2,099,250 | |
| | | 4,100 | | | 0.693%, 10/07/14 | | | 4,097,793 | |
| | | 2,200 | | | Holcim US Finance Sarl & Cie SCS
0.390%, 09/12/14 | | | 2,199,267 | |
| | | 2,100 | | | Kansas City Southern Railway Co. (The)(g)
0.550%, 08/14/14 | | | 2,099,583 | |
| | | 3,100 | | | NiSource Finance Corp.
0.600%, 08/28/14 | | | 3,098,605 | |
| | | 1,100 | | | 0.620%, 08/26/14 | | | 1,099,526 | |
| | | 3,100 | | | Thermo Fisher Scientific, Inc.
0.385%, 09/12/14 | | | 3,098,284 | |
| | | 1,400 | | | 0.410%, 09/03/14 | | | 1,399,381 | |
| | | 4,100 | | | Vodafone Group PLC
0.513%, 06/01/15 | | | 4,083,084 | |
| | | 400 | | | 0.604%, 06/29/15 | | | 398,176 | |
| | | | | | | | | | |
| | | | | | TOTAL COMMERCIAL PAPER
(cost $32,748,761) | | | 32,758,460 | |
| | | | | | | | | | |
| | | |
| | | | | | REPURCHASE AGREEMENTS(m)—7.8% | | | | |
| | | 3,100 | | | Barclays Capital, Inc., 0.13%, dated 07/31/14, due 08/01/14 in the amount of $3,100,011 | | | 3,100,000 | |
| | | 8,300 | | | Citigroup Global Markets, Inc., 0.13%, dated 07/31/14, due 08/01/14 in the amount of $8,300,030 | | | 8,300,000 | |
| | | 10,100 | | | JP Morgan Securities LLC 0.13%, dated 07/31/14, due 08/01/14 in the amount of $10,100,036 | | | 10,100,000 | |
| | | 11,000 | | | Morgan Stanley & Co. LLC, 0.13%, dated 07/31/14, due 08/01/14 in the amount of $11,000,040 | | | 11,000,000 | |
| | | | | | | | | | |
| | | | | | TOTAL REPURCHASE AGREEMENTS
(cost $32,500,000) | | | 32,500,000 | |
| | | | | | | | | | |
| | | |
| | | | | | FOREIGN TREASURY OBLIGATIONS(n)—3.2% | | | | |
| EUR | | | 1,000 | | | Italy Certificati di Credito del Tesoro (Italy)
0.830%, 06/30/15 | | | 1,335,029 | |
See Notes to Financial Statements.
| | | | |
| The TARGET Portfolio Trust | | | 123 | |
| | |
Total Return Bond Portfolio (continued) | | Portfolio of Investments
As of July 31, 2014 |
| | | | | | | | | | |
PRINCIPAL
AMOUNT (000)# | | | DESCRIPTION | | VALUE (NOTE 1) | |
| | | | | | FOREIGN TREASURY OBLIGATIONS(n) (continued) | | | | |
| MXN | | | 653,000 | | | Mexico Cetes (Mexico)
2.940%, 09/25/14 | | $ | 4,910,580 | |
| MXN | | | 741,000 | | | 3.040%, 01/08/15 | | | 5,530,932 | |
| MXN | | | 224,000 | | | 3.090%, 12/24/14 | | | 1,672,050 | |
| | | | | | | | | | |
| | | | | | TOTAL FOREIGN TREASURY OBLIGATIONS
(cost $13,665,173) | | | 13,448,591 | |
| | | | | | | | | | |
| | | |
| | | | | | CERTIFICATES OF DEPOSIT(n)—1.3% | | | | |
| | | 2,100 | | | Bank of Montreal (Canada)
0.193%, 12/08/14 | | | 2,100,286 | |
| CAD | | | 3,100 | | | Bank of Nova Scotia (Canada)
1.260%, 02/01/15 | | | 2,824,928 | |
| | | 300 | | | Credit Suisse (Switzerland)
0.462%, 09/17/14 | | | 299,960 | |
| | | | | | | | | | |
| | | | | | TOTAL CERTIFICATES OF DEPOSIT
(cost $5,226,553) | | | 5,225,174 | |
| | | | | | | | | | |
| | | |
| | | | | | AFFILIATED MONEY MARKET MUTUAL FUND—0.3% | | | | |
| | | 1,405,831 | | | Prudential Investment Portfolios 2—Prudential Core Taxable Money Market Fund (cost $1,405,831)(w) | | | 1,405,831 | |
| | | | | | | | | | |
| | | | | | TOTAL SHORT-TERM INVESTMENTS
(cost $85,546,318) | | | 85,338,056 | |
| | | | | | | | | | |
| | | | | | TOTAL INVESTMENTS, BEFORE OPTIONS WRITTEN—110.7%
(cost $453,731,053; Note 5) | | | 459,223,139 | |
| | | | | | | | | | |
| | | | | | | | | | |
| | | |
Notional
Amount (000)# | | | OPTIONS WRITTEN* | | Counterparty | | | |
| | | |
| | | | Call Options | | | | | | |
| | | | Interest Rate Swap Options, | | | | | | |
| EUR | 3,800 | | | Pay a fixed rate of 1.20% and receive a floating rate based on 3-month LIBOR, expiring 01/20/15 | | Goldman Sachs & Co. | | | (15,943 | ) |
| | 4,300 | | | Pay a fixed rate of 1.56% and receive a floating rate based on 3-month LIBOR, expiring 09/02/14 | | JPMorgan Chase | | | (76 | ) |
| | 7,000 | | | Pay a fixed rate of 2.55% and receive a floating rate based on 3-month LIBOR, expiring 10/14/14 | | Morgan Stanley | | | (20,295 | ) |
| | | | | | | | | | |
| | | | | | | | | (36,314 | ) |
| | | | | | | | | | |
| | | |
| | | | Put Options | | | | | | |
| | 200 | | | Currency Option USD vs JPY(g)
expiring 02/18/19, Strike Price $80.00 | | Bank of America | | | (7,662 | ) |
| EUR | 3,800 | | | Interest Rate Swap Options,
Receive a fixed rate of 1.60% and pay a floating rate based on 3-month LIBOR, expiring 01/20/15 | | Goldman Sachs & Co. | | | (45,054 | ) |
See Notes to Financial Statements.
| | | | |
| 124 | | | The TARGET Portfolio Trust | |
| | | | | | | | | | |
Notional
Amount (000)# | | | DESCRIPTION | | Counterparty | | VALUE (NOTE 1) | |
| | | | Put Options (continued) | | | | | | |
| | 4,300 | | | Receive a fixed rate of 1.86% and pay a floating rate based on 3-month LIBOR, expiring 09/02/14 | | JPMorgan Chase | | $ | (24,810 | ) |
| | 7,000 | | | Receive a fixed rate of 2.95% and pay a floating rate
based on 3-month LIBOR, expiring 10/14/14 | | Morgan Stanley | | | (32,428 | ) |
| | | | | | | | | | |
| | | | | | | | | (109,954 | ) |
| | | | | | | | | | |
| | | | TOTAL OPTIONS WRITTEN
(premiums received $201,671) | | | | | (146,268 | ) |
| | | | | | | | | | |
| | | | TOTAL INVESTMENTS, NET OF OPTIONS
WRITTEN—110.7%
(cost $453,529,382; Note 5) | | | | | 459,076,871 | |
| | | | Liabilities in excess of other assets(x)—(10.7%) | | | | | (44,481,812 | ) |
| | | | | | | | | | |
| | | | NET ASSETS—100.0% | | | | $ | 414,595,059 | |
| | | | | | | | | | |
| * | Non-income producing security. |
| # | Principal or notional amount is shown in U.S. dollars unless otherwise stated. |
| (c) | Variable rate instrument. The interest rate shown reflects the rate in effect at July 31, 2014. |
| (g) | Indicates a security or securities that has been deemed illiquid. |
| (h) | Represents security, or a portion thereof, segregated as collateral for swap agreements. |
| (i) | Represents issuer in default on interest payments and/or principal repayments; non-income producing securities. |
| (k) | Represents security, or a portion thereof, segregated as collateral for futures contracts. |
| (m) | The aggregate value of Repurchase Agreements is $32,500,000. Repurchase Agreements are collateralized by U.S. Treasury Securities (coupon rates 0.875%-3.875%, maturity dates 07/31/19-05/15/43), with the aggregate value, including accrued interest, of $33,274,833. Repurchase Agreements are subject to contractual netting agreements. For further detail on individual repurchase agreements and the corresponding counterparty, see the Portfolio of Investments. |
| (n) | Rate quoted represents yield-to-maturity as of purchase date. |
| (s) | Represents zero coupon bond or principal only securities. Rate represents yield to maturity at purchase date. |
| (w) | Prudential Investments LLC, the manager of the Portfolio, also serves as manager of the Prudential Investment Portfolios 2—Prudential Core Taxable Money Market Fund. |
| (x) | Includes net unrealized appreciation (depreciation) on the following derivative contracts held at reporting period end: |
Futures contracts outstanding at July 31, 2014:
| | | | | | | | | | | | | | | | |
Number of
Contracts | | Type | | Expiration
Date | | Value at
Trade Date | | | Value at
July 31, 2014 | | | Unrealized
Appreciation
(Depreciation)(1) | |
| Long Positions: | | | | | | | | | | | | | | | | |
| 332 | | 90 Day Euro Dollar | | Mar. 2016 | | $ | 81,892,104 | | | $ | 81,858,754 | | | $ | (33,350 | ) |
| 98 | | 90 Day Euro Dollar | | Jun. 2016 | | | 24,036,590 | | | | 24,093,300 | | | | 56,710 | |
| 20 | | 90 Day Euro Dollar | | Sep. 2016 | | | 4,917,299 | | | | 4,902,751 | | | | (14,548 | ) |
| 2 | | 90 Day Euro Dollar | | Dec. 2016 | | | 489,925 | | | | 488,975 | | | | (950 | ) |
| 28 | | 90 Day Euro Dollar | | Mar. 2017 | | | 6,843,903 | | | | 6,830,950 | | | | (12,953 | ) |
| 11 | | 90 Day Euro Dollar | | Jun. 2017 | | | 2,683,150 | | | | 2,678,225 | | | | (4,925 | ) |
| 1,999 | | 10 Year U.S. Treasury Notes | | Sep. 2014 | | | 249,139,958 | | | | 249,094,144 | | | | (45,814 | ) |
| 92 | | 30 Year U.S. Treasury Bonds | | Sep. 2014 | | | 12,481,561 | | | | 12,641,376 | | | | 159,815 | |
| | | | | | | | | | | | | | | | |
| | | | | | | | | | | | | | $ | 103,985 | |
| | | | | | | | | | | | | | | | |
| (1) | Cash of $7,000 and U.S. Treasury Securities with a combined market value of $3,179,632 have been segregated with the Bank of America and Goldman Sachs & Co. to cover requirements for open futures contracts at July 31, 2014. |
See Notes to Financial Statements.
| | | | |
| The TARGET Portfolio Trust | | | 125 | |
| | |
Total Return Bond Portfolio (continued) | | Portfolio of Investments
As of July 31, 2014 |
Forward foreign currency exchange contracts outstanding at July 31, 2014:
| | | | | | | | | | | | | | | | | | |
Purchase Contracts | | Counterparty | | Notional
Amount
(000) | | | Value at
Settlement
Date
Payable | | | Current
Value | | | Unrealized
Appreciation
(Depreciation) | |
Brazilian Real, | | | | | | | | | | | | | | | | | | |
Expiring 08/04/14 | | Deutsche Bank AG | | BRL | 501 | | | $ | 225,859 | | | $ | 220,657 | | | $ | (5,202 | ) |
Expiring 08/04/14 | | Goldman Sachs & Co. | | BRL | 1,340 | | | | 599,517 | | | | 589,879 | | | | (9,638 | ) |
Expiring 08/04/14 | | Goldman Sachs & Co. | | BRL | 2,200 | | | | 990,973 | | | | 968,673 | | | | (22,300 | ) |
Expiring 08/04/14 | | UBS AG | | BRL | 4,419 | | | | 1,980,030 | | | | 1,945,585 | | | | (34,445 | ) |
Expiring 08/04/14 | | UBS AG | | BRL | 5,749 | | | | 2,521,410 | | | | 2,530,827 | | | | 9,417 | |
Euro, | | | | | | | | | | | | | | | | | | |
Expiring 08/05/14 | | Citigroup Global Markets | | EUR | 1,315 | | | | 1,794,581 | | | | 1,760,876 | | | | (33,705 | ) |
Expiring 08/05/14 | | Citigroup Global Markets | | EUR | 41,868 | | | | 56,270,592 | | | | 56,064,141 | | | | (206,451 | ) |
Expiring 09/03/14 | | Credit Suisse First Boston Corp. | | EUR | 520 | | | | 698,689 | | | | 696,384 | | | | (2,305 | ) |
Japanese Yen, | | | | | | | | | | | | | | | | | | |
Expiring 08/05/14 | | UBS AG | | JPY | 382,000 | | | | 3,710,539 | | | | 3,713,715 | | | | 3,176 | |
Mexican Peso, | | | | | | | | | | | | | | | | | | |
Expiring 08/25/14 | | Goldman Sachs & Co. | | MXN | 20,070 | | | | 1,523,658 | | | | 1,515,271 | | | | (8,387 | ) |
Expiring 09/23/14 | | Goldman Sachs & Co. | | MXN | 9,028 | | | | 691,073 | | | | 680,084 | | | | (10,989 | ) |
Expiring 09/23/14 | | Goldman Sachs & Co. | | MXN | 12,965 | | | | 994,169 | | | | 976,713 | | | | (17,456 | ) |
Expiring 12/18/14 | | Goldman Sachs & Co. | | MXN | 20,040 | | | | 1,500,000 | | | | 1,500,631 | | | | 631 | |
Expiring 12/18/14 | | JPMorgan Chase | | MXN | 10,384 | | | | 792,436 | | | | 777,608 | | | | (14,828 | ) |
Expiring 12/18/14 | | UBS AG | | MXN | 5,341 | | | | 400,000 | | | | 399,980 | | | | (20 | ) |
Norwegian Krone, | | | | | | | | | | | | | | | | | | |
Expiring 08/13/14 | | Deutsche Bank AG | | NOK | 80 | | | | 13,485 | | | | 12,720 | | | | (765 | ) |
| | | | | | | | | | | | | | | | | | |
| | | | | | | | $ | 74,707,011 | | | $ | 74,353,744 | | | $ | (353,267 | ) |
| | | | | | | | | | | | | | | | | | |
| | | | | | | | | | | | | | | | | | |
Sale Contracts | | Counterparty | | Notional
Amount
(000) | | | Value at
Settlement
Date
Receivable | | | Current
Value | | | Unrealized
Appreciation
(Depreciation) | |
Australian Dollar, | | | | | | | | | | | | | | | | | | |
Expiring 08/05/14 | | Citigroup Global Markets | | AUD | 222 | | | $ | 208,085 | | | $ | 206,231 | | | $ | 1,854 | |
Brazilian Real, | | | | | | | | | | | | | | | | | | |
Expiring 08/04/14 | | BNP Paribas | | BRL | 1,340 | | | | 600,000 | | | | 589,879 | | | | 10,121 | |
Expiring 08/04/14 | | Citigroup Global Markets | | BRL | 2,702 | | | | 1,216,984 | | | | 1,189,331 | | | | 27,653 | |
Expiring 08/04/14 | | JPMorgan Chase | | BRL | 5,749 | | | | 2,544,793 | | | | 2,530,827 | | | | 13,966 | |
Expiring 08/04/14 | | JPMorgan Chase | | BRL | 4,419 | | | | 1,982,028 | | | | 1,945,584 | | | | 36,444 | |
Expiring 09/03/14 | | Goldman Sachs & Co. | | BRL | 1,340 | | | | 594,490 | | | | 584,578 | | | | 9,912 | |
Expiring 01/05/15 | | JPMorgan Chase | | BRL | 11,000 | | | | 4,732,811 | | | | 4,641,017 | | | | 91,794 | |
Expiring 01/05/15 | | UBS AG | | BRL | 5,992 | | | | 2,521,410 | | | | 2,528,144 | | | | (6,734 | ) |
Expiring 04/02/15 | | BNP Paribas | | BRL | 23 | | | | 9,430 | | | | 9,569 | | | | (139 | ) |
Expiring 04/02/15 | | BNP Paribas | | BRL | 18 | | | | 7,431 | | | | 7,548 | | | | (117 | ) |
Expiring 04/02/15 | | Credit Suisse First Boston Corp. | | BRL | 1,977 | | | | 802,370 | | | | 815,365 | | | | (12,995 | ) |
Expiring 04/02/15 | | Hong Kong & Shanghai Bank | | BRL | 1,982 | | | | 804,653 | | | | 817,386 | | | | (12,733 | ) |
Expiring 04/02/15 | | JPMorgan Chase | | BRL | 3,000 | | | | 1,267,159 | | | | 1,237,401 | | | | 29,758 | |
Expiring 07/02/15 | | BNP Paribas | | BRL | 52 | | | | 21,618 | | | | 21,075 | | | | 543 | |
Expiring 07/02/15 | | Deutsche Bank AG | | BRL | 547 | | | | 225,859 | | | | 220,283 | | | | 5,576 | |
Expiring 07/02/15 | | Goldman Sachs & Co. | | BRL | 2,401 | | | | 990,973 | | | | 967,704 | | | | 23,269 | |
Expiring 10/02/15 | | UBS AG | | BRL | 5,000 | | | | 2,007,226 | | | | 2,163,584 | | | | (156,358 | ) |
See Notes to Financial Statements.
| | | | |
| 126 | | | The TARGET Portfolio Trust | |
Forward foreign currency exchange contracts outstanding at July 31, 2014 (continued):
| | | | | | | | | | | | | | | | | | |
Sale Contracts (continued) | | Counterparty | | Notional
Amount
(000) | | | Value at
Settlement
Date
Receivable | | | Current
Value | | | Unrealized
Appreciation
(Depreciation) | |
British Pound, | | | | | | | | | | | | | | | | | | |
Expiring 09/11/14 | | Barclays Capital Group | | GBP | 330 | | | $ | 553,908 | | | $ | 556,941 | | | $ | (3,033 | ) |
Canadian Dollar, | | | | | | | | | | | | | | | | | | |
Expiring 02/10/15 | | Citigroup Global Markets | | CAD | 3,070 | | | | 2,802,867 | | | | 2,802,561 | | | | 306 | |
Euro, | | | | | | | | | | | | | | | | | | |
Expiring 08/05/14 | | Barclays Capital Group | | EUR | 2,707 | | | | 3,697,348 | | | | 3,624,860 | | | | 72,488 | |
Expiring 08/05/14 | | Barclays Capital Group | | EUR | 2,599 | | | | 3,537,267 | | | | 3,480,240 | | | | 57,027 | |
Expiring 08/05/14 | | Barclays Capital Group | | EUR | 117 | | | | 158,332 | | | | 156,671 | | | | 1,661 | |
Expiring 08/05/14 | | BNP Paribas | | EUR | 358 | | | | 482,323 | | | | 479,387 | | | | 2,936 | |
Expiring 08/05/14 | | Credit Suisse First Boston Corp. | | EUR | 33,535 | | | | 45,751,130 | | | | 44,905,679 | | | | 845,451 | |
Expiring 08/05/14 | | Deutsche Bank AG | | EUR | 3,631 | | | | 4,935,971 | | | | 4,862,160 | | | | 73,811 | |
Expiring 08/05/14 | | JPMorgan Chase | | EUR | 236 | | | | 318,034 | | | | 316,020 | | | | 2,014 | |
Expiring 09/03/14 | | Barclays Capital Group | | EUR | 270 | | | | 362,830 | | | | 361,584 | | | | 1,246 | |
Expiring 09/03/14 | | Citigroup Global Markets | | EUR | 41,868 | | | | 56,273,732 | | | | 56,069,585 | | | | 204,147 | |
Expiring 06/15/15 | | Barclays Capital Group | | EUR | 962 | | | | 1,306,983 | | | | 1,290,576 | | | | 16,407 | |
Expiring 06/15/15 | | BNP Paribas | | EUR | 708 | | | | 960,183 | | | | 949,821 | | | | 10,362 | |
Expiring 06/15/15 | | Citigroup Global Markets | | EUR | 1,315 | | | | 1,797,605 | | | | 1,764,146 | | | | 33,459 | |
Expiring 06/15/15 | | Credit Suisse First Boston Corp. | | EUR | 966 | | | | 1,310,041 | | | | 1,295,943 | | | | 14,098 | |
Expiring 06/15/15 | | Credit Suisse First Boston Corp. | | EUR | 396 | | | | 538,611 | | | | 531,256 | | | | 7,355 | |
Expiring 06/13/16 | | Deutsche Bank AG | | EUR | 1,423 | | | | 1,948,372 | | | | 1,926,902 | | | | 21,470 | |
Expiring 06/27/16 | | Barclays Capital Group | | EUR | 1,137 | | | | 1,563,432 | | | | 1,540,227 | | | | 23,205 | |
Japanese Yen, | | | | | | | | | | | | | | | | | | |
Expiring 08/05/14 | | JPMorgan Chase | | JPY | 382,000 | | | | 3,762,227 | | | | 3,713,715 | | | | 48,512 | |
Expiring 09/03/14 | | UBS AG | | JPY | 382,000 | | | | 3,711,116 | | | | 3,714,370 | | | | (3,254 | ) |
Mexican Peso, | | | | | | | | | | | | | | | | | | |
Expiring 09/25/14 | | BNP Paribas | | MXN | 64,824 | | | | 4,948,505 | | | | 4,882,551 | | | | 65,954 | |
Expiring 12/18/14 | | Barclays Capital Group | | MXN | 1,359 | | | | 101,779 | | | | 101,764 | | | | 15 | |
Expiring 12/18/14 | | Deutsche Bank AG | | MXN | 33,065 | | | | 2,514,625 | | | | 2,475,952 | | | | 38,673 | |
Expiring 12/24/14 | | BNP Paribas | | MXN | 22,062 | | | | 1,674,490 | | | | 1,651,358 | | | | 23,132 | |
Expiring 01/08/15 | | BNP Paribas | | MXN | 72,993 | | | | 5,549,528 | | | | 5,457,718 | | | | 91,810 | |
| | | | | | | | | | | | | | | | | | |
| | | | | | | | $ | 171,098,559 | | | $ | 169,387,493 | | | $ | 1,711,066 | |
| | | | | | | | | | | | | | | | | | |
Interest rate swap agreements outstanding at July 31, 2014:
| | | | | | | | | | | | | | | | | | | | | | | | | | |
Notional
Amount
(000)# | | | Termination
Date | | | Fixed
Rate | | | Floating
Rate | | Fair
Value | | | Upfront
Premiums
Paid
(Received) | | | Unrealized
Appreciation
(Depreciation) | | | Counterparty |
| | Over-the-counter swap agreements: | | | | | | | | | | | | | | |
| BRL | 8,900 | | | | 01/02/15 | | | | 8.270% | | | Brazilian interbank overnight lending rate(1) | | $ | (82,557 | ) | | $ | (5,807 | ) | | $ | (76,750 | ) | | Morgan Stanley |
| BRL | 7,900 | | | | 01/02/15 | | | | 8.560% | | | Brazilian interbank overnight lending rate(1) | | | (58,226 | ) | | | 107 | | | | (58,333 | ) | | UBS AG |
| BRL | 6,800 | | | | 01/02/15 | | | | 9.930% | | | Brazilian interbank overnight lending rate(1) | | | 71,064 | | | | 810 | | | | 70,254 | | | Morgan Stanley |
See Notes to Financial Statements.
| | | | |
| The TARGET Portfolio Trust | | | 127 | |
| | |
Total Return Bond Portfolio (continued) | | Portfolio of Investments
As of July 31, 2014 |
Interest rate swap agreements outstanding at July 31, 2014 (continued):
| | | | | | | | | | | | | | | | | | | | | | | | | | |
Notional
Amount
(000)# | | | Termination
Date | | | Fixed
Rate | | | Floating
Rate | | Fair
Value | | | Upfront
Premiums
Paid
(Received) | | | Unrealized
Appreciation
(Depreciation) | | | Counterparty |
| | Over-the-counter swap agreements (continued): | | | | | | | |
| MXN | 2,000 | | | | 01/18/19 | | | | 5.700% | | | 28 day Mexican interbank rate(1) | | $ | 4,650 | | | $ | (748 | ) | | $ | 5,398 | | | Deutsche Bank AG |
| MXN | 5,000 | | | | 01/18/19 | | | | 5.700% | | | 28 day Mexican interbank rate(1) | | | 11,624 | | | | (1,208 | ) | | | 12,832 | | | Bank of America |
| MXN | 2,000 | | | | 01/18/19 | | | | 5.700% | | | 28 day Mexican interbank rate(1) | | | 4,686 | | | | (523 | ) | | | 5,209 | | | Goldman Sachs & Co. |
| MXN | 2,000 | | | | 01/18/19 | | | | 5.700% | | | 28 day Mexican interbank rate(1) | | | 4,635 | | | | (613 | ) | | | 5,248 | | | JPMorgan Chase |
| MXN | 3,000 | | | | 06/19/34 | | | | 6.810% | | | 28 day Mexican interbank rate(1) | | | (715 | ) | | | (2,902 | ) | | | 2,187 | | | Deutsche Bank AG |
| | | | | | | | | | | | | | | | | | | | | | | | | | |
| | | | | | | | | | | | | | $ | (44,839 | ) | | $ | (10,884 | ) | | $ | (33,955 | ) | | |
| | | | | | | | | | | | | | | | | | | | | | | | | | |
| | | | | | | | | | | | | | | | | | | | | | | | |
Notional
Amount
(000)# | | | Termination
Date | | | Fixed
Rate | | | Floating Rate | | Value at
July 31,
2014 | | | Value at
Trade
Date | | | Unrealized
(Depreciation) | |
| | Exchange-traded swap agreements: | | | | | | | | | | | | |
| MXN | 68,000 | | | | 06/19/34 | | | | 6.810% | | | 28 day Mexican interbank rate(1) | | $ | (42,158 | ) | | $ | 40,197 | | | $ | (82,355 | ) |
| | 66,100 | | | | 09/21/17 | | | | 3.000% | | | 3-month LIBOR(1) | | | 469,149 | | | | 519,457 | | | | (50,308 | ) |
| | 1,100 | | | | 06/19/24 | | | | 4.000% | | | 3-month LIBOR(1) | | | 17,837 | | | | 18,118 | | | | (281 | ) |
| | 35,200 | | | | 06/19/43 | | | | 3.000% | | | 3-month LIBOR(1) | | | 1,912,726 | | | | 1,934,610 | | | | (21,884 | ) |
| | | | | | | | | | | | | | | | | | | | | | | | |
| | | | | | | | | | | | | | $ | 2,357,554 | | | $ | 2,512,382 | | | $ | (154,828 | ) |
| | | | | | | | | | | | | | | | | | | | | | | | |
| (1) | Portfolio pays the fixed rate and receives the floating rate. |
| # | Notional Amount is shown in U.S. dollars unless otherwise stated. |
Credit default swap agreements outstanding at July 31, 2014:
| | | | | | | | | | | | | | | | | | | | | | | | | | | | | | |
Reference
Entity/
Obligation | | Termination
Date | | | Fixed
Rate | | | Notional
Amount
(000)(2)# | | | Implied
Credit
Spread at
July 31,
2014(4)
(Unaudited) | | | Fair
Value | | | Upfront
Premiums
Paid
(Received) | | | Unrealized
Appreciation
(Depreciation) | | | Counterparty |
| Over-the-counter credit default swaps on sovereign issues—Sell Protection(1): |
| Federal Republic of Brazil | | | 09/20/16 | | | | 1.000% | | | | 9,800 | | | | 0.711% | | | $ | 68,386 | | | $ | (94,259 | ) | | $ | 162,645 | | | JPMorgan Chase |
| Government of Italy | | | 06/20/17 | | | | 1.000% | | | | 100 | | | | 0.731% | | | | 847 | | | | 540 | | | | 307 | | | Goldman Sachs & Co. |
| Government of Italy | | | 03/20/19 | | | | 1.000% | | | | 1,400 | | | | 0.961% | | | | 3,953 | | | | (21,679 | ) | | | 25,632 | | | Morgan Stanley |
| Government of Italy | | | 03/20/19 | | | | 1.000% | | | | 5,800 | | | | 0.961% | | | | 16,378 | | | | (88,574 | ) | | | 104,952 | | | Deutsche Bank AG |
| Government of Italy | | | 06/20/19 | | | | 1.000% | | | | 100 | | | | 0.988% | | | | 173 | | | | (599 | ) | | | 772 | | | Barclays Capital Group |
See Notes to Financial Statements.
| | | | |
| 128 | | | The TARGET Portfolio Trust | |
Credit default swap agreements outstanding at July 31, 2014 (continued):
| | | | | | | | | | | | | | | | | | | | | | | | | | | | | | |
Reference
Entity/
Obligation | | Termination
Date | | | Fixed
Rate | | | Notional
Amount
(000)(2)# | | | Implied
Credit
Spread at
July 31,
2014(4)
(Unaudited) | | | Fair
Value | | | Upfront
Premiums
Paid
(Received) | | | Unrealized
Appreciation
(Depreciation) | | | Counterparty |
| Over-the-counter credit default swaps on sovereign issues—Sell Protection (1) (continued): |
| Government of Italy | | | 06/20/19 | | | | 1.000% | | | | 100 | | | | 0.988% | | | $ | 173 | | | $ | (704 | ) | | $ | 877 | | | Deutsche Bank AG |
| Government of Italy | | | 06/20/19 | | | | 1.000% | | | | 800 | | | | 0.988% | | | | 1,388 | | | | (13,834 | ) | | | 15,222 | | | Deutsche Bank AG |
| Government of Italy | | | 06/20/19 | | | | 1.000% | | | | 3,300 | | | | 0.988% | | | | 5,725 | | | | (55,595 | ) | | | 61,320 | | | Bank of America |
| Russian Federation | | | 09/20/19 | | | | 1.000% | | | | 2,600 | | | | 2.359% | | | | (163,478 | ) | | | (152,804 | ) | | | (10,674 | ) | | Barclays Capital Group |
| United Mexican States | | | 09/20/16 | | | | 1.000% | | | | 9,800 | | | | 0.302% | | | | 142,871 | | | | 26,968 | | | | 115,903 | | | JPMorgan Chase |
| United Mexican States | | | 09/20/19 | | | | 1.000% | | | | 600 | | | | N/A | | | | 4,751 | | | | 4,099 | | | | 652 | | | Morgan Stanley |
| United Mexican States | | | 09/20/19 | | | | 1.000% | | | | 100 | | | | N/A | | | | 811 | | | | 697 | | | | 114 | | | Bank of America |
| United Mexican States | | | 09/20/19 | | | | 1.000% | | | | 1,200 | | | | N/A | | | | 9,503 | | | | 8,786 | | | | 717 | | | JPMorgan Chase |
| | | | | | | | | | | | | | | | | | | | | | | | | | | | | | |
| | | | | | | | | | | | | | | | | | $ | 91,481 | | | $ | (386,958 | ) | | $ | 478,439 | | | |
| | | | | | | | | | | | | | | | | | | | | | | | | | | | | | |
| | | | | | | | | | | | | | | | | | | | | | | | |
Reference Entity/
Obligation | | Termination
Date | | | Fixed
Rate | | | Notional
Amount
(000)(2)# | | | Value at
July 31,
2014(3) | | | Value at
Trade Date | | | Unrealized
Appreciation | |
| Exchange-traded credit default swaps on credit indices—Sell Protection(1): | |
| Dow Jones CDX IG22 5Y Index | | | 06/20/19 | | | | 1.000% | | | | 6,900 | | | $ | 123,411 | | | $ | 103,936 | | | $ | 19,475 | |
| | | | | | | | | | | | | | | | | | | | | | | | |
The Portfolio entered into credit default swaps (“CDS”) to provide a measure of protection against defaults or to take an active long or short position with respect to the likelihood of a particular issuer’s default or the reference entity’s credit soundness. CDS contracts generally trade based on a spread which represents the cost a protection buyer has to pay the protection seller. The protection buyer is said to be short the credit as the value of the contract rises the more the credit deteriorates. The value of the CDS contract increases for the protection buyer if the spread increases.
| (1) | If the Portfolio is a seller of protection, it receives the fixed rate. When a credit event occurs, as defined under the terms of that particular swap agreement, the Portfolio will either (i) pay to the buyer of protection an amount equal to the notional amount of the swap and take delivery of the referenced obligation or underlying securities comprising the referenced index or (ii) pay a net settlement amount in the form of cash or securities equal to the notional amount of the swap less the recovery value of the referenced obligation or underlying securities comprising the referenced index. |
| (2) | Notional amount represents the maximum potential amount the Portfolio could be required to pay as a seller of credit protection or receive as a buyer of credit protection if a credit event occurs as defined under the terms of that particular swap agreement. |
| (3) | The fair value of credit default swap agreements on credit indices serves as an indicator of the current status of the payment/performance risk and represents the likelihood of an expected liability (or profit) for the credit derivative should the notional amount of the swap agreement be closed/sold as of the reporting date. Increasing fair value in absolute terms when compared to the notional amount of the swap, represents a deterioration of the referenced entity’s credit soundness and a greater likelihood of risk of default or other credit event occurring as defined under the terms of the agreement. |
See Notes to Financial Statements.
| | | | |
| The TARGET Portfolio Trust | | | 129 | |
| | |
Total Return Bond Portfolio (continued) | | Portfolio of Investments
As of July 31, 2014 |
| (4) | Implied credit spreads, represented in absolute terms, utilized in determining the fair value of credit default swap agreements on corporate issues or sovereign issues of an emerging country as of the reporting date serve as an indicator of the current status of the payment/performance risk and represent the likelihood of risk of default for the credit derivative. The implied credit spread of a particular referenced entity reflects the cost of buying/selling protection and may include up-front payments required to be made to enter into the agreement. Wider credit spreads represent a deterioration of the referenced entity’s credit soundness and a greater likelihood of risk of default or other credit event occurring as defined under the terms of the agreement. |
| # | Notional Amount is shown in U.S. dollars unless otherwise stated. |
Cash of $17,000 and U.S. Treasury Securities with a combined market value of $3,105,056 have been segregated with Barclays Capital Group, Credit Suisse First Boston Corp. and Morgan Stanley to cover requirements for open exchange-traded interest rate and credit default swap contracts at July 31, 2014.
Various inputs are used in determining the value of the Portfolio’s investments. These inputs are summarized in the three broad levels listed below.
Level 1—quoted prices generally in active markets for identical securities.
Level 2—other significant observable inputs including, but not limited to, quoted prices for similar securities, interest rates and yield curves, prepayment speeds, foreign currency exchange rates, and amortized cost.
Level 3—significant unobservable inputs for securities valued in accordance with Board approved fair valuation procedures.
The following is a summary of the inputs used as of July 31, 2014 in valuing such portfolio securities:
| | | | | | | | | | | | |
| | | Level 1 | | | Level 2 | | | Level 3 | |
| Investments in Securities | | | | | | | | | | | | |
Asset-Backed Securities | | | | | | | | | | | | |
Collateralized Loan Obligations | | $ | — | | | $ | — | | | $ | 1,700,000 | |
Non-Residential Mortgage-Backed Securities | | | — | | | | 25,893,175 | | | | — | |
Residential Mortgage-Backed Securities | | | — | | | | 15,579,558 | | | | — | |
Commercial Mortgage-Backed Securities | | | — | | | | 1,966,700 | | | | — | |
Corporate Bonds | | | — | | | | 148,711,615 | | | | — | |
Foreign Government Bonds | | | — | | | | 72,605,443 | | | | — | |
Municipal Bonds | | | — | | | | 17,297,990 | | | | — | |
Residential Mortgage-Backed Securities | | | — | | | | 12,125,434 | | | | — | |
U.S. Government Agency Obligations | | | — | | | | 37,381,542 | | | | — | |
U.S. Treasury Obligations | | | — | | | | 39,018,195 | | | | — | |
Commercial Paper | | | — | | | | 30,658,877 | | | | 2,099,583 | |
Repurchase Agreements | | | — | | | | 32,500,000 | | | | — | |
Foreign Treasury Obligations | | | — | | | | 13,448,591 | | | | — | |
Certificates of Deposit | | | — | | | | 6,830,605 | | | | — | |
Affiliated Money Market Mutual Fund | | | 1,405,831 | | | | — | | | | — | |
Options Written | | | — | | | | (146,268 | ) | | | — | |
| Other Financial Instruments* | | | | | | | | | | | | |
Futures Contracts | | | 103,985 | | | | — | | | | — | |
Forward Foreign Currency Exchange Contracts | | | — | | | | 1,357,799 | | | | — | |
Interest Rate Swap Agreements | | | — | | | | (188,783 | ) | | | — | |
Credit Default Swap Agreements | | | — | | | | 497,914 | | | | — | |
| | | | | | | | | | | | |
Total | | $ | 1,509,816 | | | $ | 455,538,387 | | | $ | 3,799,583 | |
| | | | | | | | | | | | |
See Notes to Financial Statements.
| | | | |
| 130 | | | The TARGET Portfolio Trust | |
The following is a reconciliation of assets in which significant unobservable inputs (Level 3) were used in determining fair value:
| | | | | | | | |
| | | Asset-Backed
Securities—
Collateralized Loan
Obligations | | | Commercial
Paper | |
| Balance as of 10/31/13 | | $ | — | | | $ | — | |
Accrued discount/premium | | | — | | | | — | |
Realized gain (loss) | | | — | | | | — | |
Change in unrealized appreciation (depreciation) | | | — | | | | — | |
Purchases | | | 1,700,000 | | | | 2,099,583 | |
Sales | | | — | | | | — | |
Transfers into Level 3 | | | — | | | | — | |
Transfers out of Level 3 | | | — | | | | — | |
| | | | | | | | |
| Balance as of 07/31/14 | | $ | 1,700,000 | | | $ | 2,099,583 | |
| | | | | | | | |
Level 3 securities as presented in the table above are being fair valued using pricing methodologies approved by the Valuation Committee, which contain unobservable inputs. Such methodologies include, but are not limited to, using prices provided by a single broker/dealer, the cost of the investment, and broker quotes adjusted for changes in yields of comparable U.S. Government and other securities using fixed income securities valuation model.
| * | Other financial instruments are derivative instruments not reflected in the Portfolio of Investments, such as futures, forwards and swaps contracts, which are recorded at the unrealized appreciation/depreciation of the instrument. |
The industry classification of investments and liabilities in excess of other assets shown as a percentage of net assets as of July 31, 2014 was as follows (unaudited):
| | | | |
Foreign Government Bonds | | | 17.5 | % |
Banks | | | 12.2 | |
U.S. Treasury Obligations | | | 9.4 | |
U.S. Government Agency Obligations | | | 9.0 | |
Commercial Paper | | | 7.9 | |
Repurchase Agreements | | | 7.8 | |
Residential Mortgage-Backed Securities | | | 6.7 | |
Non-Residential Mortgage-Backed Securities | | | 6.2 | |
Consumer Finance | | | 4.4 | |
Municipal Bonds | | | 4.2 | |
Foreign Treasury Obligations | | | 3.2 | |
Diversified Telecommunication Services | | | 2.6 | |
Media | | | 1.8 | |
Certificates of Deposit | | | 1.7 | |
Capital Markets | | | 1.6 | |
Automobiles | | | 1.5 | |
Oil, Gas & Consumable Fuels | | | 1.5 | |
Health Care Equipment & Supplies | | | 1.3 | |
Pharmaceuticals | | | 1.0 | |
Health Care Providers & Services | | | 0.9 | |
Hotels, Restaurants & Leisure | | | 0.9 | % |
Paper & Forest Products | | | 0.9 | |
Wireless Telecommunication Services | | | 0.7 | |
Diversified Financial Services | | | 0.6 | |
Metals & Mining | | | 0.6 | |
Beverages | | | 0.5 | |
Commercial Mortgage-Backed Securities | | | 0.5 | |
Food Products | | | 0.5 | |
Insurance | | | 0.5 | |
Specialty Retail | | | 0.5 | |
Trading Companies & Distributors | | | 0.5 | |
Road & Rail | | | 0.4 | |
Collateralized Loan Obligations | | | 0.4 | |
Affiliated Money Market Mutual Fund | | | 0.3 | |
Auto Components | | | 0.3 | |
Airlines | | | 0.1 | |
Technology Hardware, Storage & Peripherals | | | 0.1 | |
| | | | |
| | | 110.7 | |
Liabilities in excess of other assets | | | (10.7 | ) |
| | | | |
| | | 100.0 | % |
| | | | |
See Notes to Financial Statements.
| | | | |
| The TARGET Portfolio Trust | | | 131 | |
| | |
Total Return Bond Portfolio (continued) | | Portfolio of Investments
As of July 31, 2014 |
Offsetting of over-the-counter (OTC) derivative assets and liabilities:
The Portfolio invested in OTC derivatives during the reporting period that are either offset in accordance with current requirements or are subject to enforceable master netting arrangements or similar agreements that permit offsetting. The information about offsetting and related netting arrangements for OTC derivatives, where the legal right to set-off exists, is presented in the summary below.
| | | | | | | | | | | | | | | | |
Counterparty | | Gross amounts of
recognized assets(1) | | | Gross amounts
available for offset | | | Collateral
Received(3) | | | Net
Amount | |
Bank of America | | $ | 74,963 | | | $ | (64,465 | ) | | $ | — | | | $ | 10,498 | |
Barclays Capital Group | | | 172,821 | | | | (167,110 | ) | | | — | | | | 5,711 | |
BNP Paribas | | | 204,858 | | | | (256 | ) | | | — | | | | 204,602 | |
Citigroup Global Markets | | | 267,419 | | | | (240,156 | ) | | | — | | | | 27,263 | |
Credit Suisse First Boston Corp. | | | 866,904 | | | | (15,300 | ) | | | (590,016 | ) | | | 261,588 | |
Deutsche Bank AG | | | 268,166 | | | | (112,729 | ) | | | — | | | | 155,437 | |
Goldman Sachs & Co. | | | 39,868 | | | | (39,868 | ) | | | — | | | | — | |
Hong Kong & Shanghai Bank | | | — | | | | — | | | | — | | | | — | |
JPMorgan Chase | | | 542,755 | | | | (134,586 | ) | | | (280,022 | ) | | | 128,147 | |
Morgan Stanley | | | 101,447 | | | | (101,447 | ) | | | — | | | | — | |
UBS AG | | | 12,700 | | | | (12,700 | ) | | | — | | | | — | |
| | | | | | | | | | | | | | | | |
| | $ | 2,551,901 | | | | | | | | | | | | | |
| | | | | | | | | | | | | | | | |
| | | | | | | | | | | | | | | | |
Counterparty | | Gross amounts of
recognized liabilities(2) | | | Gross amounts
available for offset | | | Collateral
Pledged(3) | | | Net
Amount | |
Bank of America | | $ | (64,465 | ) | | $ | 64,465 | | | $ | — | | | $ | — | |
Barclays Capital Group | | | (167,110 | ) | | | 167,110 | | | | — | | | | — | |
BNP Paribas | | | (256 | ) | | | 256 | | | | — | | | | — | |
Citigroup Global Markets | | | (240,156 | ) | | | 240,156 | | | | — | | | | — | |
Credit Suisse First Boston Corp. | | | (15,300 | ) | | | 15,300 | | | | — | | | | — | |
Deutsche Bank AG | | | (112,729 | ) | | | 112,729 | | | | — | | | | — | |
Goldman Sachs & Co. | | | (130,290 | ) | | | 39,868 | | | | — | | | | (90,422 | ) |
Hong Kong & Shanghai Bank | | | (12,733 | ) | | | — | | | | — | | | | (12,733 | ) |
JPMorgan Chase | | | (134,586 | ) | | | 134,586 | | | | — | | | | — | |
Morgan Stanley | | | (156,959 | ) | | | 101,447 | | | | — | | | | (55,512 | ) |
UBS AG | | | (259,144 | ) | | | 12,700 | | | | — | | | | (246,444 | ) |
| | | | | | | | | | | | | | | | |
| | $ | (1,293,728 | ) | | | | | | | | | | | | |
| | | | | | | | | | | | | | | | |
| (1) | Includes unrealized appreciation on swaps and forwards, premiums paid on swap agreements and market value of purchased options. |
| (2) | Includes unrealized depreciation on swaps and forwards, premiums received on swap agreements and market value of written options. |
| (3) | Amounts shown reflect actual collateral received or pledged by the Portfolio. Such amounts are applied up to 100% of the Portfolio’s OTC derivative exposure by counterparty. |
See Notes to Financial Statements.
| | | | |
| 132 | | | The TARGET Portfolio Trust | |
| | |
Portfolio of Investments
As of July 31, 2014 | | Intermediate-Term Bond Portfolio |
| | | | | | | | | | |
PRINCIPAL
AMOUNT (000)# | | | DESCRIPTION | | VALUE (NOTE 1) | |
| | | | | | LONG-TERM INVESTMENTS—95.1% | | | | |
| | | |
| | | | | | ASSET-BACKED SECURITIES—3.9% | | | | |
| | | |
| | | | | | Collateralized Loan Obligations—0.8% | | | | |
| | | 31 | | | BlueMountain CLO Ltd. (Cayman Islands),
Series 2005-1A, Class A1F, 144A
0.461%(c), 11/15/14 | | $ | 30,709 | |
| | | 613 | | | Franklin CLO Ltd.,
Series 5A, Class A2, 144A
0.491%(c), 09/15/14 | | | 610,027 | |
| | | 316 | | | Jersey Street CLO Ltd. (Cayman Islands),
Series 2006-1A, Class A, 144A
0.484%(c), 10/20/18 | | | 315,326 | |
| | | | | | | | | | |
| | | | | | | | | 956,062 | |
| | | | | | | | | | |
| | | |
| | | | | | Non-Residential Mortgage-Backed Security—1.0% | | | | |
| | | 1,254 | | | SLM Student Loan Trust,
Series 2008-9, Class A
1.734%(c), 10/27/14 | | | 1,301,609 | |
| | | | | | | | | | |
| | | |
| | | | | | Residential Mortgage-Backed Securities—2.1% | | | | |
| | | 500 | | | Countrywide Asset-Backed Certificates,
Series 2004-15, Class MV5
1.052%(c), 04/25/35 | | | 389,564 | |
| | | 1,210 | | | GSAA Home Equity Trust,
Series 2007-8, Class A3
0.605%(c), 08/25/14 | | | 1,034,371 | |
| | | 855 | | | Morgan Stanley ABS Capital I Inc., Trust,
Series 2007-HE5, Class A2A
0.265%(c), 08/25/14 | | | 495,108 | |
| | | 564 | | | RAAC Trust,
Series 2007-SP3, Class A1
1.355%(c), 08/25/14 | | | 555,566 | |
| | | 212 | | | Securitized Asset Backed Receivables LLC Trust,
Series 2007-BR5, Class A2A
0.285%(c), 05/25/37 | | | 150,821 | |
| | | | | | | | | | |
| | | | | | | | | 2,625,430 | |
| | | | | | | | | | |
| | | | | | TOTAL ASSET-BACKED SECURITIES
(cost $4,730,208) | | | 4,883,101 | |
| | | | | | | | | | |
| | | |
| | | | | | COMMERCIAL MORTGAGE-BACKED SECURITIES—2.3% | | | | |
| | | 966 | | | Commercial Mortgage Trust, Pass-Through Certificates,
Series 2010-C1, Class A1, 144A
3.156%, 07/10/46 | | | 984,290 | |
See Notes to Financial Statements.
| | | | |
| The TARGET Portfolio Trust | | | 133 | |
| | |
Intermediate-Term Bond Portfolio (continued) | | Portfolio of Investments
As of July 31, 2014 |
| | | | | | | | | | |
PRINCIPAL
AMOUNT (000)# | | | DESCRIPTION | | VALUE (NOTE 1) | |
| | | | | | COMMERCIAL MORTGAGE-BACKED SECURITIES (continued) | | | | |
| | | 600 | | | Credit Suisse Mortgage Capital Certificates,
Series 2010-RR1, Class 2A, 144A
5.695%(c), 09/15/40 | | $ | 637,173 | |
| | | 600 | | | Series 2010-RR1, Class 3A, 144A
5.565%(c), 06/10/49 | | | 656,623 | |
| | | 570 | | | Series 2010-RR7, Class 2A, 144A
5.467%(c), 09/18/39 | | | 601,800 | |
| | | | | | | | | | |
| | | | | | TOTAL COMMERCIAL MORTGAGE-BACKED SECURITIES
(cost $2,713,473) | | | 2,879,886 | |
| | | | | | | | | | |
| | | |
| | | | | | CORPORATE BONDS—24.8% | | | | |
| | | |
| | | | | | Airlines—0.2% | | | | |
| | | 604 | | | UAL 1991 Equipment Trust AB,
Equipment Trust(i)
0.109%, 02/19/15 | | | 296,191 | |
| | | | | | | | | | |
| | | |
| | | | | | Banks—11.2% | | | | |
| | | 500 | | | Banco Santander Chile (Chile),
Sr. Unsec’d. Notes, 144A
3.750%, 09/22/15 | | | 515,138 | |
| | | 1,510 | | | Bank of America Corp.,
Sr. Unsec’d. Notes
5.625%, 10/14/16 | | | 1,647,942 | |
| | | 100 | | | 5.750%, 12/01/17 | | | 112,184 | |
| | | 235 | | | 6.500%, 08/01/16 | | | 259,022 | |
| | | 400 | | | Bank of America NA,
Sub. Notes
0.531%(c), 09/17/14 | | | 395,503 | |
| | | 1,000 | | | DNB Bank ASA (Norway),
Sr. Unsec’d. Notes, 144A
3.200%, 04/03/17 | | | 1,047,271 | |
| | | 100 | | | Eksportfinans ASA (Norway),
Sr. Unsec’d. Notes
2.000%, 09/15/15 | | | 99,878 | |
| | | 400 | | | 2.375%, 05/25/16 | | | 401,180 | |
| | | 100 | | | 5.500%, 05/25/16 | | | 105,850 | |
| | | 2,000 | | | Goldman Sachs Group, Inc. (The),
Sr. Unsec’d. Notes, MTN
7.500%, 02/15/19 | | | 2,412,558 | |
| | | 100 | | | JPMorgan Chase & Co.,
Sr. Unsec’d. Notes
3.150%, 07/05/16 | | | 104,094 | |
| | | 100 | | | 6.300%, 04/23/19 | | | 117,063 | |
See Notes to Financial Statements.
| | | | |
| 134 | | | The TARGET Portfolio Trust | |
| | | | | | | | | | |
PRINCIPAL
AMOUNT (000)# | | | DESCRIPTION | | VALUE (NOTE 1) | |
| | | | | | CORPORATE BONDS (continued) | | | | |
| | | |
| | | | | | Banks (continued) | | | | |
| EUR | | | 1,000 | | | JPMorgan Chase Bank NA,
Sub. Notes
0.859%(c), 05/31/17 | | $ | 1,337,038 | |
| EUR | | | 200 | | | 4.375%(c), 11/30/21 | | | 282,030 | |
| | | 700 | | | 6.000%, 10/01/17 | | | 790,140 | |
| | | 1,200 | | | Morgan Stanley,
Sr. Unsec’d. Notes
3.450%, 11/02/15 | | | 1,237,564 | |
| | | 1,100 | | | Royal Bank of Scotland Group PLC (United Kingdom),
Sub. Notes
5.050%, 01/08/15 | | | 1,120,163 | |
| | | 1,900 | | | Wells Fargo & Co.
Sr. Unsec’d. Notes
1.250%, 07/20/16 | | | 1,916,089 | |
| | | | | | | | | | |
| | | | | | | | | 13,900,707 | |
| | | | | | | | | | |
| | | |
| | | | | | Diversified Financial Services—5.4% | | | | |
| | | 1,100 | | | Ally Financial, Inc.,
Gtd. Notes
3.500%, 07/18/16 | | | 1,119,937 | |
| | | 2,500 | | | BNP Paribas Home Loan SFH (France),
Covered Bonds, 144A
2.200%, 11/02/15 | | | 2,548,740 | |
| | | 181 | | | Doric Nimrod Air Finance Alpha Ltd. 2012-1, Class A ,
Pass-Through Trust (Guernsey),
Pass-Through Certificates, 144A
5.125%, 11/30/22 | | | 193,514 | |
| | | 1,700 | | | Ford Motor Credit Co. LLC,
Sr. Unsec’d. Notes
2.375%, 01/16/18 | | | 1,725,869 | |
| | | 200 | | | 3.875%, 01/15/15 | | | 202,967 | |
| | | 1,800 | | | Lehman Brothers Holdings, Inc.,
Sr. Unsec’d. Notes, MTN(i)
2.851%, N/A | | | 355,500 | |
| | | 600 | | | 5.625%, N/A | | | 116,250 | |
| | | 350 | | | Navient LLC,
Sr. Unsec’d. Notes, MTN
6.250%, 01/25/16 | | | 369,691 | |
| | | | | | | | | | |
| | | | | | | | | 6,632,468 | |
| | | | | | | | | | |
| | | |
| | | | | | Diversified Telecommunication Services—0.1% | | | | |
| | | 100 | | | Verizon Communications, Inc.,
Sr. Unsec’d. Notes
4.500%, 09/15/20 | | | 108,860 | |
| | | | | | | | | | |
| | | |
| | | | | | Electric Utilities—2.7% | | | | |
| | | 1,200 | | | Entergy Corp.,
Sr. Unsec’d. Notes
3.625%, 09/15/15 | | | 1,233,519 | |
See Notes to Financial Statements.
| | | | |
| The TARGET Portfolio Trust | | | 135 | |
| | |
Intermediate-Term Bond Portfolio (continued) | | Portfolio of Investments
As of July 31, 2014 |
| | | | | | | | | | |
PRINCIPAL
AMOUNT (000)# | | | DESCRIPTION | | VALUE (NOTE 1) | |
| | | | | | CORPORATE BONDS (continued) | | | | |
| | | |
| | | | | | Electric Utilities (continued) | | | | |
| | | 600 | | | Orange & Rockland Utilities, Inc.,
Sr. Unsec’d. Notes, 144A
2.500%, 08/15/15 | | $ | 606,568 | |
| | | 1,300 | | | Public Service Electric & Gas Co.,
Sr. Sec’d. Notes, MTN
5.300%, 05/01/18 | | | 1,464,835 | |
| | | | | | | | | | |
| | | | | | | | | 3,304,922 | |
| | | | | | | | | | |
| | | |
| | | | | | Health Care Providers & Services—1.0% | | | | |
| | | 700 | | | HCA, Inc.,
Sr. Sec’d. Notes
3.750%, 03/15/19 | | | 694,750 | |
| | | 500 | | | 7.250%, 09/15/20 | | | 528,750 | |
| | | | | | | | | | |
| | | | | | | | | 1,223,500 | |
| | | | | | | | | | |
| | | |
| | | | | | Multi-Utilities—1.0% | | | | |
| | | 1,200 | | | CMS Energy Corp.,
Sr. Unsec’d. Notes
4.250%, 09/30/15 | | | 1,245,725 | |
| | | | | | | | | | |
| | | |
| | | | | | Oil, Gas & Consumable Fuels—2.2% | | | | |
| | | 400 | | | Florida Gas Transmission Co. LLC,
Sr. Unsec’d. Notes, 144A(g)
4.000%, 07/15/15 | | | 410,644 | |
| | | 600 | | | Sr. Unsec’d. Notes, 144A
5.450%, 07/15/20 | | | 669,434 | |
| | | 100 | | | Southwestern Energy Co.
Gtd. Notes
4.100%, 03/15/22 | | | 105,439 | |
| | | 1,500 | | | TransCanada Pipelines Ltd. (Canada),
Sr. Unsec’d. Notes
3.800%, 10/01/20 | | | 1,593,260 | |
| | | | | | | | | | |
| | | | | | | | | 2,778,777 | |
| | | | | | | | | | |
| | | |
| | | | | | Software—1.0% | | | | |
| | | 1,200 | | | Oracle Corp.,
Sr. Unsec’d. Notes
3.875%, 07/15/20 | | | 1,281,940 | |
| | | | | | | | | | |
| | | | | | TOTAL CORPORATE BONDS
(cost $29,662,197) | | | 30,773,090 | |
| | | | | | | | | | |
| | | |
| | | | | | FOREIGN GOVERNMENT BONDS—5.7% | | | | |
| BRL | | | 17,600 | | | Brazil Letras do Tesouro Nacional (Brazil),
Bills
11.741%(s), 01/01/18 | | | 5,313,326 | |
See Notes to Financial Statements.
| | | | |
| 136 | | | The TARGET Portfolio Trust | |
| | | | | | | | | | |
PRINCIPAL
AMOUNT (000)# | | | DESCRIPTION | | VALUE (NOTE 1) | |
| | | | | | FOREIGN GOVERNMENT BONDS (continued) | | | | |
| BRL | | | 500 | | | Brazil Notas do Tesouro Nacional (Brazil),
Series B, Notes
6.000%, 08/15/22 | | $ | 559,042 | |
| BRL | | | 1,400 | | | Series F, Notes
10.000%, 01/01/21 | | | 568,668 | |
| EUR | | | 400 | | | Slovenia Government International Bond (Slovenia),
Sr. Unsec’d. Notes
4.700%, 11/01/16 | | | 576,358 | |
| | | | | | | | | | |
| | | | | | TOTAL FOREIGN GOVERNMENT BONDS
(cost $7,024,173) | | | 7,017,394 | |
| | | | | | | | | | |
| | | |
| | | | | | MUNICIPAL BONDS—5.0% | | | | |
| | | |
| | | | | | California—0.8% | | | | |
| | | 800 | | | Tobacco Securitization Authority of Southern California,
Revenue Bonds
5.000%, 06/01/37 | | | 632,840 | |
| | | 325 | | | University of California,
Revenue Bonds, BABs
5.035%, 05/15/21 | | | 361,780 | |
| | | | | | | | | | |
| | | | | | | | | 994,620 | |
| | | | | | | | | | |
| | | |
| | | | | | Florida—0.7% | | | | |
| | | 800 | | | County of Broward Florida,
Revenue Bonds, BABs
6.206%, 10/01/30 | | | 913,848 | |
| | | | | | | | | | |
| | | |
| | | | | | Illinois—0.9% | | | | |
| | | 1,000 | | | Illinois State Toll Highway Authority,
Revenue Bonds, BABs
5.293%, 01/01/24 | | | 1,064,330 | |
| | | | | | | | | | |
| | | |
| | | | | | New York—2.0% | | | | |
| | | 1,200 | | | New York City Transitional Finance Authority,
Revenue Bonds
5.008%, 08/01/27 | | | 1,314,612 | |
| | | 1,100 | | | Revenue Bonds, BABs
4.075%, 11/01/20 | | | 1,173,238 | |
| | | | | | | | | | |
| | | | | | | | | 2,487,850 | |
| | | | | | | | | | |
| | | |
| | | | | | West Virginia—0.6% | | | | |
| | | 865 | | | Tobacco Settlement Financial Authority of West Virginia,
Revenue Bonds
7.467%, 06/01/47 | | | 740,440 | |
| | | | | | | | | | |
| | | | | | TOTAL MUNICIPAL BONDS
(cost $5,927,924) | | | 6,201,088 | |
| | | | | | | | | | |
See Notes to Financial Statements.
| | | | |
| The TARGET Portfolio Trust | | | 137 | |
| | |
Intermediate-Term Bond Portfolio (continued) | | Portfolio of Investments
As of July 31, 2014 |
| | | | | | | | | | |
PRINCIPAL
AMOUNT (000)# | | | DESCRIPTION | | VALUE (NOTE 1) | |
| | | | | | RESIDENTIAL MORTGAGE-BACKED SECURITIES—9.7% | | | | |
| | | 86 | | | American Home Mortgage Investment Trust,
Series 2004-4, Class 5A
2.322%(c), 02/25/45 | | $ | 85,911 | |
| | | 141 | | | Banc of America Funding Corp.,
Series 2006-A, Class 1A1
2.639%(c), 02/20/36 | | | 141,757 | |
| | | 698 | | | BCAP LLC Trust,
Series 2011-RR4, Class 7A1, 144A
5.250%, 04/26/37 | | | 655,645 | |
| | | 205 | | | Bear Stearns Adjustable Rate Mortgage Trust,
Series 2004-8, Class 11A2
2.654%(c), 11/25/34 | | | 207,916 | |
| | | 508 | | | Series 2004-8, Class 13A1
2.724%(c), 11/25/34 | | | 461,285 | |
| | | 253 | | | Series 2005-5, Class A2
2.250%(c), 08/25/35 | | | 256,525 | |
| | | 539 | | | Bear Stearns Alt-A Trust,
Series 2006-6, Class 31A1
2.874%(c), 11/25/36 | | | 398,063 | |
| | | 519 | | | Series 2006-6, Class 32A1
2.663%(c), 11/25/36 | | | 361,870 | |
| | | 135 | | | Citigroup Mortgage Loan Trust,
Series 2005-11, Class A2A
2.510%(c), 10/25/35 | | | 133,766 | |
| | | 819 | | | Series 2006-AR1, Class 1A1
2.500%(c), 10/25/35 | | | 803,780 | |
| | | 26 | | | Countrywide Alternative Loan Trust,
Series 2003-J3, Class 2A1
6.250%, 12/25/33 | | | 27,123 | |
| | | 497 | | | Countrywide Home Loan Mortgage Pass-Through Trust,
Series 2004-25, Class 1A1
0.485%(c), 08/25/14 | | | 467,843 | |
| | | 12 | | | Credit Suisse First Boston Mortgage Securities Corp.,
Series 2003-8, Class 5A1
6.500%, 04/25/33 | | | 11,795 | |
| EUR | | | 722 | | | EMF-NL (Netherlands),
Series 2008-APRX, Class A2
1.002%(c), 10/17/14 | | | 899,712 | |
| | | 1,500 | | | Fannie Mae REMICS,
Series 2007-114, Class A6
0.355%(c), 08/25/14 | | | 1,496,643 | |
| | | 180 | | | FHLMC Structured Pass-Through Securities,
Series T-59, Class 1A2
7.000%, 10/25/43 | | | 203,957 | |
| | | 400 | | | Series T-75, Class A1
0.195%, 12/25/36 | | | 397,911 | |
See Notes to Financial Statements.
| | | | |
| 138 | | | The TARGET Portfolio Trust | |
| | | | | | | | | | |
PRINCIPAL
AMOUNT (000)# | | | DESCRIPTION | | VALUE (NOTE 1) | |
| | | | | | RESIDENTIAL MORTGAGE-BACKED SECURITIES (continued) | | | | |
| | | 387 | | | Freddie Mac REMICS,
Series 3346, Class FA
0.382%(c), 02/15/19 | | $ | 387,115 | |
| | | 42 | | | Government National Mortgage Assoc.,
Series 2000-9, Class FG
0.752%(c), 02/16/30 | | | 42,668 | |
| | | 54 | | | Series 2000-9, Class FH
0.652%(c), 08/16/14 | | | 54,933 | |
| | | 525 | | | Series 2011-H21, Class FT
0.800%(c), 08/20/14 | | | 526,983 | |
| | | 436 | | | Series 2012-H29, Class SA
0.667%(c), 10/20/62 | | | 435,987 | |
| | | 63 | | | Granite Master Issuer PLC (United Kingdom),
Series 2006-3, Class A7
0.356%(c), 12/20/54 | | | 62,942 | |
| | | 295 | | | Greenpoint Mortgage Funding Trust,
Series 2005-AR2, Class A1
0.385%(c), 06/25/45 | | | 253,658 | |
| | | 183 | | | GSR Mortgage Loan Trust,
Series 2005-AR6, Class 2A1
2.657%(c), 09/25/35 | | | 184,210 | |
| | | 203 | | | Merrill Lynch Mortgage Investors Trust,
Series 2005-2, Class 3A
1.151%(c), 10/25/35 | | | 193,602 | |
| | | 238 | | | Series 2005-A10, Class A
0.365%(c), 02/25/36 | | | 218,716 | |
| | | 956 | | | NCUA Guaranteed Notes Trust,
Series 2010-R2, Class 1A
0.526%(c), 11/06/17 | | | 958,350 | |
| | | 84 | | | Reperforming Loan REMIC Trust,
Series 2003-R4, Class 2A, 144A
6.500%(c), 01/25/34 | | | 87,201 | |
| | | 133 | | | Sequoia Mortgage Trust,
Series 10, Class 2A1
0.913%(c), 10/20/27 | | | 124,910 | |
| | | 100 | | | Structured Asset Mortgage Investments II Trust,
Series 2005-AR5, Class A1
0.405%(c), 07/19/35 | | | 91,393 | |
| | | 17 | | | Structured Asset Securities Corp.,
Mortgage Pass-Through Certificates,
Series 2001-21A, Class 1A1
2.218%(c), 01/25/32 | | | 16,785 | |
| | | 198 | | | Washington Mutual, Inc.,
Mortgage Pass-Through Certificates,
Series 2002-AR6, Class A
1.523%(c), 06/25/42 | | | 192,147 | |
| | | 10 | | | Series 2002-AR9, Class 1A
1.523%(c), 08/25/42 | | | 9,932 | |
See Notes to Financial Statements.
| | | | |
| The TARGET Portfolio Trust | | | 139 | |
| | |
Intermediate-Term Bond Portfolio (continued) | | Portfolio of Investments
As of July 31, 2014 |
| | | | | | | | | | |
PRINCIPAL
AMOUNT (000)# | | | DESCRIPTION | | VALUE (NOTE 1) | |
| | | | | | RESIDENTIAL MORTGAGE-BACKED SECURITIES (continued) | | | | |
| | | 1,200 | | | Series 2005-AR13, Class A1A1
0.445%(c), 08/25/14 | | $ | 1,132,900 | |
| | | | | | | | | | |
| | | | | | TOTAL RESIDENTIAL MORTGAGE-BACKED SECURITIES
(cost $12,139,404) | | | 11,985,934 | |
| | | | | | | | | | |
| | | |
| | | | | | U.S. GOVERNMENT AGENCY OBLIGATIONS—1.6% | | | | |
| | | 7 | | | Federal National Mortgage Assoc.
2.261%(c), 07/01/25 | | | 7,334 | |
| | | 17 | | | 3.000%(c), 08/01/24 | | | 16,687 | |
| | | 959 | | | 4.500%, 08/01/40-04/01/41 | | | 1,038,925 | |
| | | 2 | | | 5.236%(c), 12/01/30 | | | 2,629 | |
| | | 450 | | | Government National Mortgage Assoc.
1.625%(c), 05/20/23-07/20/30 | | | 465,344 | |
| | | 85 | | | 2.000%(c), 10/20/24-06/20/27 | | | 88,032 | |
| | | 28 | | | 2.500%(c), 02/20/25 | | | 29,553 | |
| | | 112 | | | Small Business Administration Participation Certificates,
Series 2008-20A, Class 1
5.170%, 01/01/28 | | | 122,709 | |
| | | 241 | | | Series 2008-20D, Class 1
5.370%, 04/01/28 | | | 265,776 | |
| | | | | | | | | | |
| | | | | | TOTAL U.S. GOVERNMENT AGENCY OBLIGATIONS
(cost $1,987,897) | | | 2,036,989 | |
| | | | | | | | | | |
| | | |
| | | | | | U.S. TREASURY OBLIGATIONS—42.1% | | | | |
| | | 9,800 | | | U.S. Treasury Inflationary Indexed Bonds, TIPS
0.125%, 07/15/22-07/15/24 | | | 9,734,916 | |
| | | 200 | | | 2.000%, 01/15/26 | | | 281,870 | |
| | | 310 | | | 2.500%, 01/15/29 | | | 434,340 | |
| | | 60 | | | 3.875%, 04/15/29 | | | 127,034 | |
| | | 11,100 | | | U.S. Treasury Notes
1.375%, 07/31/18(k)(h) | | | 11,047,963 | |
| | | 2,100 | | | 1.625%, 04/30/19 | | | 2,090,649 | |
| | | 4,900 | | | 1.750%, 10/31/20 | | | 4,799,320 | |
| | | 1,400 | | | 2.000%, 09/30/20 | | | 1,393,766 | |
| | | 4,500 | | | 2.125%, 01/31/21 | | | 4,491,562 | |
| | | 3,700 | | | 2.500%, 05/15/24 | | | 3,682,077 | |
| | | 13,900 | | | 2.750%, 11/15/23-02/15/24 | | | 14,168,828 | |
| | | | | | | | | | |
| | | | | | TOTAL U.S. TREASURY OBLIGATIONS
(cost $52,334,390) | | | 52,252,325 | |
| | | | | | | | | | |
| | | | | | TOTAL LONG-TERM INVESTMENTS
(cost $116,519,666) | | | 118,029,807 | |
| | | | | | | | | | |
| | | |
| | | | | | SHORT-TERM INVESTMENTS—4.9% | | | | |
| | | |
| | | | | | FOREIGN TREASURY OBLIGATION(n)—0.1% | | | | |
| EUR | | | 126 | | | Hellenic Republic Treasury Bills (Greece)
(cost $172,762)
3.100%, 10/10/14 | | | 168,197 | |
| | | | | | | | | | |
See Notes to Financial Statements.
| | | | |
| 140 | | | The TARGET Portfolio Trust | |
| | | | | | | | | | |
| SHARES | | | DESCRIPTION | | VALUE (NOTE 1) | |
| | | | | | AFFILIATED MONEY MARKET MUTUAL FUND—0.5% | | | | |
| | | 553,285 | | | Prudential Investment Portfolios 2—Prudential Core Taxable
Money Market Fund (cost $553,285) | | $ | 553,285 | |
| | | | | | | | | | |
NOTIONAL
AMOUNT (000)# | | | OPTION PURCHASED* | | | |
| | | |
| | | | | | Call Option | | | | |
| | | 184,000 | | | 90 Day Euro Dollar
expiring 12/15/14, Strike Price $99.75
(cost $16,408) | | | 2,300 | |
| | | | | | | | | | |
PRINCIPAL
AMOUNT (000)# | | | | | | |
| | | |
| | | | | | REPURCHASE AGREEMENT(m)—4.3% | | | | |
| | | 5,300 | | | Morgan Stanley & Co. LLC, 0.13%, dated 7/31/14, due 08/01/14 in the amount of $5,300,019
(cost $5,300,000) | | | 5,300,000 | |
| | | | | | | | | | |
| | | | | | TOTAL SHORT-TERM INVESTMENTS
(cost $6,042,455) | | | 6,023,782 | |
| | | | | | | | | | |
| | | | | | TOTAL INVESTMENTS, BEFORE SECURITY SOLD SHORT AND
OPTIONS WRITTEN—100.0%
(cost $122,562,121; Note 5) | | | 124,053,589 | |
| | | | | | | | | | |
| | | |
| | | | | | SECURITY SOLD SHORT—(0.9%) | | | | |
| | | |
| | | | | | U.S. GOVERNMENT AGENCY OBLIGATION | | | | |
| | | 1,000 | | | Federal National Mortgage Assoc.
(proceeds received $1,079,844)
4.500%, TBA | | | (1,076,664 | ) |
| | | | | | | | | | |
NOTIONAL
AMOUNT (000)# | | | OPTIONS WRITTEN* | | | |
| | | |
| | | | | | Call Option | | | | |
| | | 184,000 | | | 90 Day Euro Dollar
expiring 12/15/14, Strike Price $99.00
(premiums received $19,871) | | | (460 | ) |
| | | | | | | | | | |
| | | | | | TOTAL INVESTMENTS, NET OF SECURITY SOLD SHORT AND OPTIONS WRITTEN—99.1%
(cost $121,462,406; Note 5) | | | 122,976,465 | |
| | | | | | Other assets in excess of liabilities(x)—0.9% | | | 1,081,464 | |
| | | | | | | | | | |
| | | | | | NET ASSETS—100.0% | | $ | 124,057,929 | |
| | | | | | | | | | |
| * | Non-income producing security. |
| # | Principal or notional amount is shown in U.S. dollars unless otherwise stated. |
| (c) | Variable rate instrument. The interest rate shown reflects the rate in effect at July 31, 2014. |
| (g) | Indicates a security or securities that has been deemed illiquid. |
| (h) | Represents security, or a portion thereof, segregated as collateral for swap agreements. |
| (i) | Represents issuer in default on interest payments. Non-income producing security. |
| (k) | Represents security, or a portion thereof, segregated as collateral for futures contracts. |
See Notes to Financial Statements.
| | | | |
| The TARGET Portfolio Trust | | | 141 | |
| | |
Intermediate-Term Bond Portfolio (continued) | | Portfolio of Investments
As of July 31, 2014 |
| (m) | Repurchase agreement is collateralized by U.S. Treasury Security (coupon rate 2.875%, maturity date 05/15/43) with the aggregate value, including accrued interest, of $5,398,308. Repurchase Agreements are subject to contractual netting arrangements. For further detail on individual repurchase agreements and the corresponding counterparty, see the Schedule of Investments. |
| (n) | Rate shown is the effective yield at purchase date. |
| (s) | Represents zero coupon bond or principal only securities. Rate represents yield to maturity at purchase date. |
| (x) | Includes net unrealized appreciation (depreciation) on the following derivative contracts held at reporting period end: |
Futures contracts outstanding at July 31, 2014:
| | | | | | | | | | | | | | | | |
Number of
Contracts | | Type | | Expiration
Date | | Value at
Trade Date | | | Value at
July 31,
2014 | | | Unrealized
Depreciation(1) | |
| Long Position: | | | | | | | | | | | | | | | | |
| 115 | | 10 Year U.S. Treasury Notes | | Sep. 2014 | | $ | 14,361,641 | | | $ | 14,330,078 | | | $ | (31,563 | ) |
| | | | | | | | | | | | | | | | |
| Short Positions: | | | | | | | | | | | | | | | | |
| 5 | | 30 Year USD Deliverable Interest Rate Swap | | Sep. 2014 | | | 554,375 | | | | 569,375 | | | | (15,000 | ) |
| 63 | | 10 Year Australian Treasury Bonds | | Sep. 2014 | | | 51,411,442 | | | | 51,578,841 | | | | (167,399 | ) |
| | | | | | | | | | | | | | | | |
| | | | | | | | | | | | | | | (182,399 | ) |
| | | | | | | | | | | | | | | | |
| | | | | | | | | | | | | | $ | (213,962 | ) |
| | | | | | | | | | | | | | | | |
| (1) | Cash of $162,000 and U.S. Treasury security, with a combined market value of $206,046 have been segregated with Morgan Stanley and Goldman Sachs & Co. to cover requirements for open futures contracts at July 31, 2014. |
Forward foreign currency exchange contracts outstanding at July 31, 2014:
| | | | | | | | | | | | | | | | | | |
Purchase Contracts | | Counterparty | | Notional
Amount
(000) | | | Value at
Settlement
Date
Payable | | | Current
Value | | | Unrealized
Appreciation
(Depreciation) | |
Brazilian Real, | | | | | | | | | | | | | | | | | | |
Expiring 08/04/14 | | Barclays Capital Group | | BRL | 466 | | | $ | 208,519 | | | $ | 205,167 | | | $ | (3,352 | ) |
Expiring 08/04/14 | | UBS AG | | BRL | 213 | | | | 94,000 | | | | 92,211 | | | | (1,789 | ) |
Expiring 08/04/14 | | UBS AG | | BRL | 5,715 | | | | 2,506,473 | | | | 2,515,834 | | | | 9,361 | |
Expiring 01/05/15 | | Citigroup Global Markets | | BRL | 7,784 | | | | 3,303,605 | | | | 3,284,133 | | | | (19,472 | ) |
British Pound, | | | | | | | | | | | | | | | | | | |
Expiring 08/05/14 | | Barclays Capital Group | | GBP | 70 | | | | 118,930 | | | | 118,176 | | | | (754 | ) |
Mexican Peso, | | | | | | | | | | | | | | | | | | |
Expiring 12/18/14 | | BNP Paribas | | MXN | 3,310 | | | | 252,046 | | | | 247,859 | | | | (4,187 | ) |
South Korean Won, | | | | | | | | | | | | | | | | | | |
Expiring 10/15/14 | | Deutsche Bank AG | | KRW | 1,285,856 | | | | 1,264,860 | | | | 1,246,327 | | | | (18,533 | ) |
| | | | | | | | | | | | | | | | | | |
| | | | | | | | $ | 7,748,433 | | | $ | 7,709,707 | | | $ | (38,726 | ) |
| | | | | | | | | | | | | | | | | | |
| | | | | |
Sale Contracts | | Counterparty | | Notional
Amount
(000) | | | Value at
Settlement
Date
Receivable | | | Current
Value | | | Unrealized
Appreciation
(Depreciation) | |
Brazilian Real, | | | | | | | | | | | | | | | | | | |
Expiring 08/04/14 | | JPMorgan Chase | | BRL | 5,564 | | | $ | 2,462,940 | | | $ | 2,449,424 | | | $ | 13,516 | |
Expiring 08/04/14 | | UBS AG | | BRL | 617 | | | | 272,902 | | | | 271,578 | | | | 1,324 | |
See Notes to Financial Statements.
| | | | |
| 142 | | | The TARGET Portfolio Trust | |
Forward foreign currency exchange contracts outstanding at July 31, 2014 (continued):
| | | | | | | | | | | | | | | | | | |
Sale Contracts (continued) | | Counterparty | | Notional
Amount
(000) | | | Value at
Settlement
Date
Receivable | | | Current
Value | | | Unrealized
Appreciation
(Depreciation) | |
Expiring 09/03/14 | | Barclays Capital Group | | BRL | 466 | | | $ | 206,753 | | | $ | 203,324 | | | $ | 3,429 | |
Expiring 10/02/14 | | Credit Suisse First Boston Corp. | | BRL | 484 | | | | 209,000 | | | | 209,481 | | | | (481 | ) |
Expiring 10/02/14 | | Goldman Sachs & Co. | | BRL | 316 | | | | 136,000 | | | | 136,713 | | | | (713 | ) |
Expiring 10/02/14 | | Goldman Sachs & Co. | | BRL | 316 | | | | 136,331 | | | | 136,532 | | | | (201 | ) |
Expiring 10/02/14 | | Goldman Sachs & Co. | | BRL | 127 | | | | 55,000 | | | | 54,846 | | | | 154 | |
Expiring 01/05/15 | | Citigroup Global Markets | | BRL | 877 | | | | 372,089 | | | | 369,896 | | | | 2,193 | |
Expiring 01/05/15 | | Hong Kong & Shanghai Bank | | BRL | 11,005 | | | | 4,671,646 | | | | 4,643,322 | | | | 28,324 | |
Expiring 01/05/15 | | UBS AG | | BRL | 5,957 | | | | 2,506,473 | | | | 2,513,167 | | | | (6,694 | ) |
Expiring 01/05/15 | | UBS AG | | BRL | 218 | | | | 94,000 | | | | 92,106 | | | | 1,894 | |
British Pound, | | | | | | | | | | | | | | | | | | |
Expiring 08/05/14 | | Deutsche Bank AG | | GBP | 70 | | | | 118,935 | | | | 118,176 | | | | 759 | |
Expiring 09/03/14 | | Barclays Capital Group | | GBP | 70 | | | | 118,903 | | | | 118,147 | | | | 756 | |
Euro, | | | | | | | | | | | | | | | | | | |
Expiring 08/21/14 | | Barclays Capital Group | | EUR | 30 | | | | 40,601 | | | | 40,174 | | | | 427 | |
Expiring 08/21/14 | | Barclays Capital Group | | EUR | 2,722 | | | | 3,717,414 | | | | 3,645,141 | | | | 72,273 | |
Expiring 08/21/14 | | Barclays Capital Group | | EUR | 880 | | | | 1,198,240 | | | | 1,178,444 | | | | 19,796 | |
Expiring 08/21/14 | | Citigroup Global Markets | | EUR | 63 | | | | 84,434 | | | | 84,366 | | | | 68 | |
Expiring 08/21/14 | | UBS AG | | EUR | 38 | | | | 51,738 | | | | 50,888 | | | | 850 | |
Japanese Yen, | | | | | | | | | | | | | | | | | | |
Expiring 08/05/14 | | Citigroup Global Markets | | JPY | 5,400 | | | | 53,294 | | | | 52,498 | | | | 796 | |
Mexican Peso, | | | | | | | | | | | | | | | | | | |
Expiring 08/25/14 | | Goldman Sachs & Co. | | MXN | 3,052 | | | | 231,695 | | | | 230,419 | | | | 1,276 | |
Expiring 10/22/14 | | Goldman Sachs & Co. | | MXN | 60 | | | | 4,567 | | | | 4,511 | | | | 56 | |
South Korean Won, | | | | | | | | | | | | | | | | | | |
Expiring 08/18/14 | | Goldman Sachs & Co. | | KRW | 67,412 | | | | 66,000 | | | | 65,519 | | | | 481 | |
Expiring 10/15/14 | | Barclays Capital Group | | KRW | 450,032 | | | | 440,000 | | | | 436,198 | | | | 3,802 | |
Expiring 10/15/14 | | Citigroup Global Markets | | KRW | 10,228 | | | | 10,000 | | | | 9,914 | | | | 86 | |
Expiring 10/15/14 | | UBS AG | | KRW | 746,571 | | | | 730,000 | | | | 723,620 | | | | 6,380 | |
| | | | | | | | | | | | | | | | | | |
| | | | | | | | $ | 17,988,955 | | | $ | 17,838,404 | | | $ | 150,551 | |
| | | | | | | | | | | | | | | | | | |
Interest rate swap agreements outstanding at July 31, 2014:
| | | | | | | | | | | | | | | | | | | | | | | | |
Notional
Amount
(000)# | | | Termination
Date | | | Fixed
Rate | | | Floating
Rate | | Value at
July 31,
2014 | | | Value at
Trade Date | | | Unrealized
Appreciation
(Depreciation)* | |
| | Exchange-traded swap agreements: | | | | | | | | | | | | |
| | 5,800 | | | | 04/16/24 | | | | 2.800% | | | 3 month LIBOR(1) | | $ | (73,155 | ) | | $ | — | | | $ | (73,155 | ) |
| | 3,900 | | | | 06/19/43 | | | | 2.750% | | | 3 month LIBOR(1) | | | 404,320 | | | | 367,614 | | | | 36,706 | |
| | 1,900 | | | | 12/17/44 | | | | 3.500% | | | 3 month LIBOR(1) | | | (52,532 | ) | | | (79,623 | ) | | | 27,091 | |
| | 1,600 | | | | 12/18/43 | | | | 3.500% | | | 3 month LIBOR(1) | | | (70,422 | ) | | | 51,560 | | | | (121,982 | ) |
| AUD | 60,600 | | | | 03/16/17 | | | | 3.500% | | | 6 month Australian Bank Bill rate(1) | | | 226,401 | | | | 102,806 | | | | 123,595 | |
| AUD | 17,600 | | | | 06/18/19 | | | | 4.000% | | | 6 month Australian Bank Bill rate(1) | | | 562,254 | | | | (28,276 | ) | | | 590,530 | |
| EUR | 1,200 | | | | 09/17/44 | | | | 2.750% | | | 6 month Euribor(1) | | | (248,562 | ) | | | (245,006 | ) | | | (3,556 | ) |
| JPY | 280,000 | | | | 09/18/23 | | | | 1.000% | | | 6 month LIBOR(1) | | | (109,865 | ) | | | (33,165 | ) | | | (76,700 | ) |
| | | | | | | | | | | | | | | | | | | | | | | | |
| | | | | | | | | | | | | | $ | 638,439 | | | $ | 135,910 | | | $ | 502,529 | |
| | | | | | | | | | | | | | | | | | | | | | | | |
| (1) | Portfolio pays the fixed rate and receives the floating rate. |
| # | Amount is shown in U.S. dollars unless otherwise stated. |
| * | Cash of $120,672 and U.S. Treasury Securities with a market value of $901,824 have been segregated with Barclays Capital Group, Credit Suisse First Boston Corp., Citigroup Global Markets, Deutsche Bank AG, and UBS AG to cover requirements for open exchange-traded interest rate swap contracts at July 31, 2014. |
See Notes to Financial Statements.
| | | | |
| The TARGET Portfolio Trust | | | 143 | |
| | |
Intermediate-Term Bond Portfolio (continued) | | Portfolio of Investments
As of July 31, 2014 |
Credit default swap agreements outstanding at July 31, 2014:
| | | | | | | | | | | | | | | | | | | | | | | | | | | | | | |
Reference
Entity/Obligation | | Termination
Date | | | Fixed
Rate | | | Notional
Amount
(000)(3)# | | | Implied
Credit
Spread at
July 31,
2014(4)
(Unaudited) | | | Fair
Value | | | Upfront
Premiums
Paid
(Received) | | | Unrealized
Appreciation | | | Counterparty |
| Over-the-counter credit default swaps on corporate and/ or sovereign issues—Sell Protection(1): |
| BP Capital Markets | | | 06/20/15 | | | | 5.000% | | | | 800 | | | | 0.114% | | | $ | 39,475 | | | $ | 2,129 | | | $ | 37,346 | | | Credit Suisse First Boston Corp. |
| BP Capital Markets | | | 06/20/15 | | | | 5.000% | | | | 700 | | | | 0.114% | | | | 34,539 | | | | 3,764 | | | | 30,775 | | | Goldman Sachs & Co. |
| Citigroup, Inc. | | | 09/20/14 | | | | 1.000% | | | | 2,700 | | | | 0.214% | | | | 6,210 | | | | (2,178 | ) | | | 8,388 | | | Credit Suisse First Boston Corp. |
| Finmeccanica Finance SA | | | 03/20/19 | | | | 5.000% | | | EUR | 300 | | | | 2.026% | | | | 55,710 | | | | 38,807 | | | | 16,903 | | | Barclays Bank PLC |
| Finmeccanica Finance SA | | | 03/20/19 | | | | 5.000% | | | EUR | 300 | | | | 2.026% | | | | 55,660 | | | | 43,707 | | | | 11,953 | | | Barclays Bank PLC |
| Finmeccanica Finance SA | | | 03/20/19 | | | | 5.000% | | | EUR | 200 | | | | 2.026% | | | | 37,108 | | | | 27,134 | | | | 9,974 | | | Credit Suisse First Boston Corp. |
| Finmeccanica Finance SA | | | 03/20/19 | | | | 5.000% | | | EUR | 100 | | | | 2.026% | | | | 18,570 | | | | 14,207 | | | | 4,363 | | | Credit Suisse First Boston Corp. |
| Japan Gov’t. Series 55 | | | 03/20/16 | | | | 1.000% | | | | 600 | | | | 0.128% | | | | 9,247 | | | | 1,436 | | | | 7,811 | | | Goldman Sachs & Co. |
| Lloyds TSB Bank | | | 09/20/17 | | | | 3.000% | | | EUR | 1,200 | | | | 0.388% | | | | 136,529 | | | | 6,100 | | | | 130,429 | | | Morgan Stanley |
| Lloyds TSB Bank | | | 09/20/17 | | | | 3.000% | | | EUR | 400 | | | | 0.388% | | | | 45,510 | | | | 2,419 | | | | 43,091 | | | Deutsche Bank AG |
| Republic of Italy | | | 06/20/17 | | | | 1.000% | | | EUR | 300 | | | | 0.664% | | | | 4,293 | | | | (32,194 | ) | | | 36,487 | | | Bank of America |
| Shell International | | | 09/20/15 | | | | 1.000% | | | | 200 | | | | 0.100% | | | | 2,269 | | | | 1,221 | | | | 1,048 | | | Credit Suisse First Boston Corp. |
| | | | | | | | | | | | | | | | | | | | | | | | | | | | | | |
| | | | | | | | | | | | | | | | | | $ | 445,120 | | | $ | 106,552 | | | $ | 338,568 | | | |
| | | | | | | | | | | | | | | | | | | | | | | | | | | | | | |
| | | | | | | | | | | | | | | | | | | | | | | | | | | | | | |
Reference
Entity/Obligation | | Termination
Date | | | Fixed
Rate | | | Notional
Amount
(000)(3)# | | | Fair
Value | | | Upfront
Premiums
Paid
(Received) | | | Unrealized
Depreciation | | | Counterparty |
| Over-the-counter credit default swaps—Buy Protection(2): | | | |
| Credit Agricole SA | | | 12/20/16 | | | | 1.000% | | | | EUR | | | | 500 | | | $ | (9,986 | ) | | $ | 24,141 | | | $ | (34,127 | ) | | Citigroup Global Markets |
| Credit Agricole SA | | | 12/20/16 | | | | 1.000% | | | | EUR | | | | 300 | | | | (6,002 | ) | | | 14,783 | | | | (20,785 | ) | | Goldman Sachs & Co. |
| | | | | | | | | | | | | | | | | | | | | | | | | | | | | | |
| | | | | | | | | | | | | | | | | | $ | (15,988 | ) | | $ | 38,924 | | | $ | (54,912 | ) | | |
| | | | | | | | | | | | | | | | | | | | | | | | | | | | | | |
The Portfolio entered into credit default swaps (“CDS”) to provide a measure of protection against defaults or to take an active long or short position with respect to the likelihood of a particular issuer’s default or the reference entity’s credit soundness. CDS contracts generally trade based on a spread which represents the cost a protection buyer has to pay the protection seller. The protection buyer is said to be short the credit as the value of the contract rises the more the credit deteriorates. The value of the CDS contract increases for the protection buyer if the spread increases.
| (1) | If the Portfolio is a seller of protection, it receives the fixed rate. When a credit event occurs, as defined under the terms of that particular swap agreement, the Portfolio will either (i) pay to the buyer of protection an amount equal to |
See Notes to Financial Statements.
| | | | |
| 144 | | | The TARGET Portfolio Trust | |
| | the notional amount of the swap and take delivery of the referenced obligation or underlying securities comprising the referenced index or (ii) pay a net settlement amount in the form of cash or securities equal to the notional amount of the swap less the recovery value of the referenced obligation or underlying securities comprising the referenced index. |
| (2) | If the Portfolio is a buyer of protection, it pays the fixed rate. When a credit event occurs, as defined under the terms of that particular swap agreement, the Portfolio will either (i) receive from the seller of protection an amount equal to the notional amount of the swap and make delivery of the referenced obligation or underlying securities comprising the referenced index or (ii) receive a net settlement amount in the form of cash or securities equal to the notional amount of the swap less the recovery value of the referenced obligation or underlying securities comprising the referenced index. |
| (3) | Notional amount represents the maximum potential amount the Portfolio could be required to pay as a seller of credit protection or receive as a buyer of credit protection if a credit event occurs as defined under the terms of that particular swap agreement. |
| (4) | Implied credit spreads, represented in absolute terms, utilized in determining the fair value of credit default swap agreements on corporate issues or sovereign issues of an emerging country as of the reporting date serve as an indicator of the current status of the payment/performance risk and represent the likelihood of risk of default for the credit derivative. The implied credit spread of a particular referenced entity reflects the cost of buying/selling protection and may include up-front payments required to be made to enter into the agreement. Wider credit spreads represent a deterioration of the referenced entity’s credit soundness and a greater likelihood of risk of default or other credit event occurring as defined under the terms of the agreement. |
| # | Notional Amount is shown in U.S. dollars unless otherwise stated. |
Various inputs are used in determining the value of the Portfolio’s investments. These inputs are summarized in the three broad levels listed below.
Level 1—quoted prices generally in active markets for identical securities.
Level 2—other significant observable inputs including, but not limited to, quoted prices for similar securities, interest rates and yield curves, prepayment speeds, foreign currency exchange rates, and amortized cost.
Level 3—significant unobservable inputs for securities valued in accordance with Board approved fair valuation procedures.
The following is a summary of the inputs used as of July 31, 2014 in valuing such portfolio securities:
| | | | | | | | | | | | |
| | | Level 1 | | | Level 2 | | | Level 3 | |
| Investments in Securities | | | | | | | | | | | | |
Asset-Backed Securities | | | | | | | | | | | | |
Collateralized Loan Obligations | | $ | — | | | $ | 956,062 | | | $ | — | |
Non-Residential Mortgage-Backed Security | | | — | | | | 1,301,609 | | | | — | |
Residential Mortgage-Backed Securities | | | — | | | | 2,625,430 | | | | — | |
Commercial Mortgage-Backed Securities | | | — | | | | 2,879,886 | | | | — | |
Corporate Bonds | | | — | | | | 30,773,090 | | | | — | |
Foreign Government Bonds | | | — | | | | 7,017,394 | | | | — | |
Municipal Bonds | | | — | | | | 6,201,088 | | | | — | |
Residential Mortgage-Backed Securities | | | — | | | | 11,985,934 | | | | — | |
U.S. Government Agency Obligations | | | — | | | | 2,036,989 | | | | — | |
U.S. Treasury Obligations | | | — | | | | 52,252,325 | | | | — | |
Foreign Treasury Obligation | | | — | | | | 168,197 | | | | — | |
Affiliated Money Market Mutual Fund | | | 553,285 | | | | — | | | | — | |
Option Purchased | | | 2,300 | | | | — | | | | — | |
Repurchase Agreement | | | — | | | | 5,300,000 | | | | — | |
Security Sold Short—U.S. Government Agency Obligation | | | — | | | | (1,076,664 | ) | | | — | |
Options Written | | | (460 | ) | | | — | | | | — | |
See Notes to Financial Statements.
| | | | |
| The TARGET Portfolio Trust | | | 145 | |
| | |
Intermediate-Term Bond Portfolio (continued) | | Portfolio of Investments
As of July 31, 2014 |
| | | | | | | | | | | | |
| | | Level 1 | | | Level 2 | | | Level 3 | |
| Other Financial Instruments:* | | | | | | | | | | | | |
Futures Contracts | | $ | (213,962 | ) | | $ | — | | | $ | — | |
Forward Foreign Currency Exchange Contracts | | | — | | | | 111,825 | | | | — | |
Credit Default Swap Agreements | | | — | | | | 283,656 | | | | — | |
Interest Rate Swap Agreements | | | — | | | | 502,529 | | | | — | |
| | | | | | | | | | | | |
Total | | $ | 341,163 | | | $ | 123,319,350 | | | $ | — | |
| | | | | | | | | | | | |
| * | Other financial instruments are derivative instruments not reflected in the Portfolio of Investments, such as futures, forwards and swaps contracts, which are recorded at the unrealized appreciation/depreciation of the instrument. |
The following is a reconciliation of assets in which significant unobservable inputs (Level 3) were used in determining fair value:
| | | | | | | | |
| | | Corporate Bonds | | | Residential Mortgage-
Backed Securities | |
| Balance as of 10/31/13 | | $ | 527,331 | | | $ | 1,881,072 | |
Accrued discounts/premiums | | | — | | | | — | |
Realized gain (loss) | | | — | | | | — | |
Change in unrealized appreciation (depreciation) | | | — | | | | — | |
Purchases | | | — | | | | — | |
Sales | | | — | | | | — | |
Transfers into Level 3 | | | — | | | | — | |
Transfers out of Level 3 | | | (527,331 | ) | | | (1,881,072 | ) |
| | | | | | | | |
| Balance as of 07/31/14 | | $ | — | | | $ | — | |
| | | | | | | | |
It is the Portfolio’s policy to recognize transfers in and transfers out at the fair value as of the beginning of the period. At the reporting period end, there were two Residential Mortgage-Backed securities and one Corporate Bond security transferred out Level 3 as a result of no longer being priced by a single broker.
The industry classification of investments and other assets in excess of liabilities shown as a percentage of net assets as of July 31, 2014 was as follows (unaudited):
| | | | |
U.S. Treasury Obligations | | | 42.1 | % |
Residential Mortgage-Backed Securities | | | 11.8 | |
Banks | | | 11.2 | |
Foreign Government Bonds | | | 5.7 | |
Diversified Financial Services | | | 5.4 | |
Municipal Bonds | | | 5.0 | |
Repurchase Agreement | | | 4.3 | |
Electric Utilities | | | 2.7 | |
Commercial Mortgage-Backed Securities | | | 2.3 | |
Oil, Gas & Consumable Fuels | | | 2.2 | |
U.S. Government Agency Obligations | | | 1.6 | |
Health Care Providers & Services | | | 1.0 | |
Multi-Utilities | | | 1.0 | |
Non-Residential Mortgage-Backed Securities | | | 1.0 | % |
Software | | | 1.0 | |
Collateralized Loan Obligations | | | 0.8 | |
Affiliated Money Market Mutual Fund | | | 0.5 | |
Airlines | | | 0.2 | |
Diversified Telecommunication Services | | | 0.1 | |
Foreign Treasury Obligation | | | 0.1 | |
U.S. Government Agency Obligation | | | (0.9 | ) |
| | | | |
| | | 99.1 | |
Other assets in excess of liabilities | | | 0.9 | |
| | | | |
| | | 100.0 | % |
| | | | |
See Notes to Financial Statements.
| | | | |
| 146 | | | The TARGET Portfolio Trust | |
Offsetting of over-the-counter (OTC) derivative assets and liabilities:
The Portfolio invested in OTC derivatives during the reporting period that are either offset in accordance with current requirements or are subject to enforceable master netting arrangements or similar agreements that permit offsetting. The information about offsetting and related netting arrangements for OTC derivatives, where the legal right to set-off exists, is presented in the summary below.
| | | | | | | | | | | | | | | | |
Counterparty | | Gross amounts of
recognized assets(1) | | | Gross amounts
available for offset | | | Collateral
Received(3) | | | Net Amount | |
Bank of America | | $ | 36,487 | | | $ | (32,194 | ) | | $ | — | | | $ | 4,293 | |
Barclays Capital Group | | | 211,853 | | | | (4,106 | ) | | | — | | | | 207,747 | |
BNP Paribas | | | — | | | | — | | | | — | | | | — | |
Citigroup Global Markets | | | 27,284 | | | | (27,284 | ) | | | — | | | | — | |
Credit Suisse First Boston Corp. | | | 105,810 | | | | (2,659 | ) | | | (30,002 | ) | | | 73,149 | |
Deutsche Bank AG | | | 46,269 | | | | (18,533 | ) | | | — | | | | 27,736 | |
Goldman Sachs & Co. | | | 60,536 | | | | (21,699 | ) | | | — | | | | 38,837 | |
Hong Kong & Shanghai Bank | | | 28,324 | | | | — | | | | — | | | | 28,324 | |
JPMorgan Chase | | | 13,516 | | | | — | | | | — | | | | 13,516 | |
Morgan Stanley | | | 136,529 | | | | — | | | | (12,002 | ) | | | 124,527 | |
UBS AG | | | 19,809 | | | | (8,483 | ) | | | — | | | | 11,326 | |
| | | | | | | | | | | | | | | | |
| | $ | 686,417 | | | | | | | | | | | | | |
| | | | | | | | | | | | | | | | |
| | | | | | | | | | | | | | | | |
| | | | |
Counterparty | | Gross amounts of
recognized liabilities(2) | | | Gross amounts
available for offset | | | Collateral
Pledged(3) | | | Net Amount | |
Bank of America | | $ | (32,194 | ) | | $ | 32,194 | | | $ | — | | | $ | — | |
Barclays Capital Group | | | (4,106 | ) | | | 4,106 | | | | — | | | | — | |
BNP Paribas | | | (4,187 | ) | | | — | | | | — | | | | (4,187 | ) |
Citigroup Global Markets | | | (53,599 | ) | | | 27,284 | | | | — | | | | (26,315 | ) |
Credit Suisse First Boston Corp. | | | (2,659 | ) | | | 2,659 | | | | — | | | | — | |
Deutsche Bank AG | | | (18,533 | ) | | | 18,533 | | | | — | | | | — | |
Goldman Sachs & Co. | | | (21,699 | ) | | | 21,699 | | | | — | | | | — | |
Hong Kong & Shanghai Bank | | | — | | | | — | | | | — | | | | — | |
JPMorgan Chase | | | — | | | | — | | | | — | | | | — | |
Morgan Stanley | | | — | | | | — | | | | — | | | | — | |
UBS AG | | | (8,483 | ) | | | 8,483 | | | | — | | | | — | |
| | | | | | | | | | | | | | | | |
| | $ | (145,460 | ) | | | | | | | | | | | | |
| | | | | | | | | | | | | | | | |
| (1) | Includes unrealized appreciation on swaps and forwards, premiums paid on swap agreements and market value of purchased options. |
| (2) | Includes unrealized depreciation on swaps and forwards, premiums received on swap agreements and market value of written options. |
| (3) | Amounts shown reflect actual collateral received or pledged by the Portfolio. Such amounts are applied up to 100% of the Portfolio’s OTC derivative exposure by counterparty. |
See Notes to Financial Statements.
| | | | |
| The TARGET Portfolio Trust | | | 147 | |
| | |
| Mortgage Backed Securities Portfolio | | Portfolio of Investments
As of July 31, 2014 |
| | | | | | | | |
PRINCIPAL
AMOUNT (000)# | | | DESCRIPTION | | VALUE (NOTE 1) | |
| | | | LONG-TERM INVESTMENTS—115.9% | | | | |
| | |
| | | | ASSET-BACKED SECURITIES—8.4% | | | | |
| | |
| | | | Collateralized Loan Obligations—3.4% | | | | |
| | 315 | | | Ares XXX CLO Ltd.,
Series 2014-30A, Class B, 144A
1.618%(c), 04/20/23 | | $ | 304,532 | |
| | 250 | | | Carlyle Global Market Strategies Ltd.,
Series 2014-1A, Class A, 144A
1.753%(c), 04/17/25 | | | 250,077 | |
| | 425 | | | Dryden Sr. Loan Fund,
Series 2014-33A, Class A, 144A
1.707%(c), 07/15/26 | | | 424,832 | |
| | 250 | | | ING IM CLO Ltd.,
Series 2013-3A, Class A1, 144A
1.686%(c), 01/18/26 | | | 249,573 | |
| | 250 | | | Magnetite CLO Ltd.,
Series 2014-9A, Class A2, 144A
2.230%(c), 07/25/26 | | | 247,201 | |
| | | | | | | | |
| | | | | | | 1,476,215 | |
| | | | | | | | |
| | |
| | | | Non-Residential Mortgage-Backed Securities—3.7% | | | | |
| | 200 | | | American Credit Acceptance Receivables Trust,
Series 2012-3, Class B, 144A
2.280%, 09/17/18 | | | 201,678 | |
| | 350 | | | AmeriCredit Automobile Receivables Trust,
Series 2012-2, Class D
3.380%, 04/09/18 | | | 361,930 | |
| | 55 | | | Carfinance Capital Auto Trust,
Series 2013-1A, Class A, 144A
1.650%, 07/17/17 | | | 54,766 | |
| | 326 | | | CPS Auto Receivables Trust,
Series 2013-A, Class A, 144A
1.310%, 06/15/20 | | | 325,962 | |
| | 290 | | | Credit Acceptance Auto Loan Trust,
Series 2014-1A, Class B, 144A
2.290%, 04/15/22 | | | 291,142 | |
| | 110 | | | Huntington Auto Trust,
Series 2012-2, Class B
1.070%, 02/15/18 | | | 110,505 | |
| | 180 | | | Springleaf Funding Trust,
Series 2014-AA, Class A, 144A
2.410%, 12/15/22 | | | 179,609 | |
| | 90 | | | World Omni Auto Receivables Trust,
Series 2012-B, Class B
1.060%, 09/16/19 | | | 89,947 | |
| | | | | | | | |
| | | | | | | 1,615,539 | |
| | | | | | | | |
See Notes to Financial Statements.
| | | | |
| 148 | | | The TARGET Portfolio Trust | |
| | | | | | | | |
PRINCIPAL
AMOUNT (000)# | | | DESCRIPTION | | VALUE (NOTE 1) | |
| | | | ASSET-BACKED SECURITIES (continued) | | | | |
| | |
| | | | Residential Mortgage-Backed Securities—1.3% | | | | |
| | 440 | | | Fannie Mae Connecticut Avenue Securities,
Series 2014-C03, Class 1M2
3.151%(c), 07/25/24 | | $ | 430,375 | |
| | 55 | | | GSAA Home Equity Trust,
Series 2006-19, Class A1
0.245%(c), 12/25/36 | | | 27,691 | |
| | 125 | | | Renaissance Home Equity Loan Trust,
Series 2005-2, Class AF4
4.934%, 08/25/35 | | | 121,387 | |
| | | | | | | | |
| | | | | | | 579,453 | |
| | | | | | | | |
| | | | TOTAL ASSET-BACKED SECURITIES
(cost $3,680,666) | | | 3,671,207 | |
| | | | | | | | |
| | |
| | | | COMMERCIAL MORTGAGE-BACKED SECURITIES—1.3% | | | | |
| | 244 | | | FREMF Mortgage Trust,
Series 2012-K501, Class C, 144A
3.490%(c), 11/25/46 | | | 248,659 | |
| | 300 | | | Wachovia Bank Commercial Mortgage Trust,
Series 2006-C25, Class A5
5.720%(c), 05/15/43 | | | 321,537 | |
| | | | | | | | |
| | | | TOTAL COMMERCIAL MORTGAGE-BACKED SECURITIES
(cost $585,302) | | | 570,196 | |
| | | | | | | | |
| | |
| | | | MUNICIPAL BOND—0.4% | | | | |
| | |
| | | | New York | | | | |
| | 180 | | | Utility Debt Securitization Authority,
Series T, Revenue Bonds
3.435%, 12/15/25
(cost $179,991) | | | 182,621 | |
| | | | | | | | |
| | |
| | | | RESIDENTIAL MORTGAGE-BACKED SECURITIES—11.0% | | | | |
| | 370 | | | Adjustable Rate Mortgage Trust,
Series 2005-5, Class 6A21
0.385%(c), 09/25/35 | | | 353,044 | |
| | 123 | | | Bear Stearns ARM Trust,
Series 2003-7, Class 6A
2.523%(c), 10/25/33 | | | 124,985 | |
| | 146 | | | Citigroup Mortgage Loan Trust,
Series 2006-AR1, Class 3A1
2.530%(c), 03/25/36 | | | 135,062 | |
| | 94 | | | Countrywide Alternative Loan Trust,
Series 2005-73CB, Class 1A7
5.500%, 01/25/36 | | | 89,928 | |
| | 265 | | | Series 2005-85CB, Class 2A2
5.500%, 02/25/36 | | | 247,243 | |
| | 194 | | | Series 2005-J11, Class 1A3
5.500%, 11/25/35 | | | 176,035 | |
See Notes to Financial Statements.
| | | | |
| The TARGET Portfolio Trust | | | 149 | |
| | |
Mortgage Backed Securities Portfolio (continued) | | Portfolio of Investments
As of July 31, 2014 |
| | | | | | | | |
PRINCIPAL
AMOUNT (000)# | | | DESCRIPTION | | VALUE (NOTE 1) | |
| | | | RESIDENTIAL MORTGAGE-BACKED SECURITIES (continued) | | | | |
| | 97 | | | Series 2007-HY5R, Class 2A1A
2.565%(c), 03/25/47 | | $ | 95,319 | |
| | 41 | | | Countrywide Home Loan Mortgage Pass-Through Trust,
Series 2006-14, Class A3
6.250%, 09/25/36 | | | 38,087 | |
| | 41 | | | Series 2006-J2, Class 1A6
6.000%, 04/25/36 | | | 39,050 | |
| | 184 | | | Fannie Mae Connecticut Avenue Securities,
Series 2013-C01, Class M1
2.155%(c), 10/25/23 | | | 187,170 | |
| | 6 | | | Federal Home Loan Mortgage Corp.,
Series 74, Class F
6.000%, 10/15/20 | | | 6,295 | |
| | 1 | | | Series 83, Class Z
9.000%, 10/15/20 | | | 1,018 | |
| | 8 | | | Series 186, Class E
6.000%, 08/15/21 | | | 8,409 | |
| | 2 | | | Series 1058, Class H
8.000%, 04/15/21 | | | 2,367 | |
| | 2 | | | Series 1116, Class I
5.500%, 08/15/21 | | | 2,300 | |
| | 14 | | | Series 1120, Class L
8.000%, 07/15/21 | | | 15,203 | |
| | 196 | | | Series 2809, Class UC
4.000%, 06/15/19 | | | 205,191 | |
| | 285 | | | Series 3787, Class AY
3.500%, 01/15/26 | | | 296,010 | |
| | 330 | | | Series 3840, Class HB
3.500%, 04/15/26 | | | 338,868 | |
| | 115 | | | Federal Home Loan Mortgage Corp. Structured Pass-Through Securities,
Series T-42, Class A5
7.500%, 02/25/42 | | | 133,523 | |
| | 4 | | | Federal National Mortgage Assoc.,
Series 56, Class 1, Interest Strip
6.000%, 04/25/19 | | | 3,862 | |
| | 3 | | | Series 1988-19, Class J
8.500%, 07/25/18 | | | 3,407 | |
| | 2 | | | Series 1990-10, Class L
8.500%, 02/25/20 | | | 2,217 | |
| | 4 | | | Series 1990-108, Class G
7.000%, 09/25/20 | | | 4,245 | |
| | 4 | | | Series 1991-21, Class J
7.000%, 03/25/21 | | | 4,580 | |
See Notes to Financial Statements.
| | | | |
| 150 | | | The TARGET Portfolio Trust | |
| | | | | | | | |
PRINCIPAL
AMOUNT (000)# | | | DESCRIPTION | | VALUE (NOTE 1) | |
| | | | RESIDENTIAL MORTGAGE-BACKED SECURITIES (continued) | | | | |
| | 8 | | | Series 1992-113, Class Z
7.500%, 07/25/22 | | $ | 9,104 | |
| | 106 | | | Series 1993-223, Class ZA
6.500%, 12/25/23 | | | 116,996 | |
| | 36 | | | Series 2001-51, Class QN
6.000%, 10/25/16 | | | 37,265 | |
| | 53 | | | Series 2003-33, Class PT
4.500%, 05/25/33 | | | 56,919 | |
| | 285 | | | Series 2011-67, Class BE
3.500%, 07/25/26 | | | 290,249 | |
| | 6 | | | Series G14, Class L
8.500%, 06/25/21 | | | 7,144 | |
| | 6 | | | Series G92-24, Class Z
6.500%, 04/25/22 | | | 6,183 | |
| | 31 | | | Series G92-59, Class D
6.000%, 10/25/22 | | | 35,278 | |
| | 101 | | | Series G94-4, Class PG
8.000%, 05/25/24 | | | 115,469 | |
| | 6 | | | First Boston Mortgage Securities Corp., Strip Coupon,
Series B, Class I-O, IO
8.985%, 04/25/17 | | | 419 | |
| | 6 | | | Series B, Class P-O, PO
1.000%(s), 04/25/17 | | | 5,670 | |
| | 35 | | | Government National Mortgage Assoc.,
Series 2006-35, Class LO, PO
5.400%(s), 07/20/36 | | | 31,032 | |
| | 60 | | | GSR Mortgage Loan Trust,
Series 2005-AR2, Class 1A2
2.783%(c), 04/25/35 | | | 58,457 | |
| | 164 | | | Series 2007-AR2, Class 1A1
2.722%(c), 05/25/37 | | | 138,489 | |
| | 95 | | | JPMorgan Mortgage Trust,
Series 2007-S2, Class 2A3
5.500%, 06/25/37 | | | 93,934 | |
| | 105 | | | Morgan Stanley Mortgage Loan Trust,
Series 2007-12, Class 3A22
6.000%, 08/25/37 | | | 95,534 | |
| | 320 | | | Residential Asset Securitization Trust,
Series 2004-A3, Class A7
5.250%, 06/25/34 | | | 332,295 | |
| | 160 | | | Springleaf Mortgage Loan Trust,
Series 2012-3A, Class A, 144A
1.570%(c), 12/25/59 | | | 159,471 | |
| | 175 | | | Series 2012-3A, Class M1, 144A
2.660%(c), 12/25/59 | | | 174,998 | |
| | 365 | | | Series 2013-1A, Class M1, 144A
2.310%(c), 06/25/58 | | | 357,186 | |
See Notes to Financial Statements.
| | | | |
| The TARGET Portfolio Trust | | | 151 | |
| | |
Mortgage Backed Securities Portfolio (continued) | | Portfolio of Investments
As of July 31, 2014 |
| | | | | | | | |
PRINCIPAL
AMOUNT (000)# | | | DESCRIPTION | | VALUE (NOTE 1) | |
| | | | RESIDENTIAL MORTGAGE-BACKED SECURITIES (continued) | | | | |
| | 91 | | | Washington Mutual Mortgage Pass-Through Certificates,
Series 2003-AR1, Class A5
2.142%(c), 03/25/33 | | $ | 91,162 | |
| | 107 | | | Wells Fargo Mortgage- Backed Securities Trust,
Series 2006-AR10, Class 5A2
2.612%(c), 07/25/36 | | | 104,194 | |
| | | | | | | | |
| | | | TOTAL RESIDENTIAL MORTGAGE-BACKED SECURITIES
(cost $4,730,756) | | | 4,830,866 | |
| | | | | | | | |
| | |
| | | | U.S. GOVERNMENT AGENCY OBLIGATIONS—94.8% | | | | |
| | 1,100 | | | Federal Home Loan Mortgage Corp.
3.000%, TBA | | | 1,131,455 | |
| | 400 | | | 3.500%, TBA | | | 420,502 | |
| | 200 | | | 3.500%, TBA | | | 203,427 | |
| | 1,700 | | | 4.000%, TBA | | | 1,784,309 | |
| | 700 | | | 4.500%, TBA | | | 752,790 | |
| | 700 | | | 4.500%, TBA | | | 751,094 | |
| | 594 | | | 5.000%, 10/01/35 | | | 654,717 | |
| | 300 | | | 5.000%, TBA | | | 329,730 | |
| | 62 | | | 5.500%, 06/01/34 | | | 68,851 | |
| | 464 | | | 6.000%, 01/01/15-02/01/21 | | | 495,520 | |
| | 28 | | | 6.500%, 01/01/18-06/01/22 | | | 31,776 | |
| | 13 | | | 7.500%, 06/01/28 | | | 14,440 | |
| | 1 | | | 8.500%, 04/01/18 | | | 524 | |
| | 6 | | | 11.500%, 03/01/16 | | | 5,966 | |
| | 5 | | | Federal National Mortgage Assoc.
2.290%, 10/01/22 | | | 4,860 | |
| | 5 | | | 2.440%, 01/01/23 | | | 4,848 | |
| | 800 | | | 2.500%, TBA | | | 803,163 | |
| | 700 | | | 2.500%, TBA | | | 704,244 | |
| | 5 | | | 2.660%, 09/01/22 | | | 4,844 | |
| | 45 | | | 2.760%, 05/01/21 | | | 45,538 | |
| | 5 | | | 2.780%, 04/01/22 | | | 5,011 | |
| | 5 | | | 2.980%, 01/01/22 | | | 4,897 | |
| | 100 | | | 3.000%, TBA | | | 103,094 | |
| | 6,800 | | | 3.000%, TBA | | | 6,663,788 | |
| | 5 | | | 3.200%, 04/01/22 | | | 5,036 | |
| | 40 | | | 3.210%, 05/01/23 | | | 41,063 | |
| | 25 | | | 3.340%, 04/01/24 | | | 25,843 | |
| | 10 | | | 3.450%, 01/01/24 | | | 10,414 | |
| | 10 | | | 3.470%, 01/01/24 | | | 10,355 | |
| | 7,400 | | | 3.500%, TBA | | | 7,539,560 | |
| | 20 | | | 3.670%, 08/01/23 | | | 21,091 | |
| | 5 | | | 3.700%, 10/01/23 | | | 5,301 | |
| | 10 | | | 3.760%, 03/01/24 | | | 10,524 | |
See Notes to Financial Statements.
| | | | |
| 152 | | | The TARGET Portfolio Trust | |
| | | | | | | | |
PRINCIPAL
AMOUNT (000)# | | | DESCRIPTION | | VALUE (NOTE 1) | |
| | | | U.S. GOVERNMENT AGENCY OBLIGATIONS (continued) | | | | |
| | 15 | | | 3.855%, 12/01/25 | | $ | 15,882 | |
| | 5 | | | 3.860%, 11/01/23 | | | 5,352 | |
| | 20 | | | 3.870%, 10/01/25 | | | 21,035 | |
| | 30 | | | 3.890%, 05/01/30 | | | 31,174 | |
| | 30 | | | 3.930%, 10/01/23 | | | 32,177 | |
| | 10 | | | 3.960%, 05/01/34 | | | 10,312 | |
| | 10 | | | 3.970%, 05/01/29 | | | 10,567 | |
| | 700 | | | 4.000%, TBA | | | 740,421 | |
| | 5,400 | | | 4.000%, TBA | | | 5,677,446 | |
| | 20 | | | 4.060%, 10/01/28 | | | 20,999 | |
| | 504 | | | 4.500%, 05/01/35 | | | 546,736 | |
| | 600 | | | 4.500%, TBA | | | 645,998 | |
| | 700 | | | 4.500%, TBA | | | 751,942 | |
| | 178 | | | 5.000%, 11/01/18 | | | 188,187 | |
| | 35 | | | 5.000%, 07/01/33(k) | | | 39,186 | |
| | 700 | | | 5.000%, TBA | | | 770,369 | |
| | 700 | | | 5.000%, TBA | | | 771,969 | |
| | 12 | | | 5.500%, 09/01/34-05/01/35 | | | 14,073 | |
| | 172 | | | 5.500%, 07/01/35(k) | | | 192,464 | |
| | 500 | | | 5.500%, TBA | | | 554,250 | |
| | 139 | | | 6.000%, 03/01/23-12/01/39 | | | 156,387 | |
| | 59 | | | 6.500%, 06/01/15-08/01/17 | | | 61,284 | |
| | 7 | | | 8.000%, 12/01/22 | | | 7,729 | |
| | 1,500 | | | Government National Mortgage Assoc.
3.500%, TBA | | | 1,544,854 | |
| | 600 | | | 3.500%, TBA | | | 618,973 | |
| | 255 | | | 4.000%, 04/15/43 | | | 270,681 | |
| | 1,000 | | | 4.500%, 06/15/41-09/20/41 | | | 1,088,004 | |
| | 1,700 | | | 4.500%, TBA | | | 1,846,466 | |
| | 97 | | | 5.000%, 06/15/40 | | | 106,672 | |
| | 200 | | | 5.000%, TBA | | | 218,957 | |
| | 12 | | | 5.500%, 12/15/38-04/15/39 | | | 13,260 | |
| | 466 | | | 6.000%, 07/15/24-12/15/40 | | | 523,579 | |
| | 530 | | | 6.500%, 06/15/23-12/15/35 | | | 598,525 | |
| | 542 | | | 7.000%, 11/15/31-11/15/33 | | | 632,100 | |
| | 8 | | | 7.500%, 12/20/23 | | | 9,363 | |
| | 125 | | | 8.000%, 03/15/17-11/15/30 | | | 133,571 | |
| | 11 | | | 8.250%, 06/20/17-07/20/17 | | | 11,599 | |
| | 20 | | | 8.500%, 04/20/17 | | | 20,410 | |
| | 19 | | | 9.000%, 01/15/20 | | | 21,658 | |
| | — | (r) | | 9.500%, 06/15/20 | | | 356 | |
| | | | | | | | |
| | | | TOTAL U.S. GOVERNMENT AGENCY OBLIGATIONS
(cost $41,244,924) | | | 41,583,542 | |
| | | | | | | | |
| | | | TOTAL LONG-TERM INVESTMENTS
(cost $50,421,639) | | | 50,838,432 | |
| | | | | | | | |
See Notes to Financial Statements.
| | | | |
| The TARGET Portfolio Trust | | | 153 | |
| | |
Mortgage Backed Securities Portfolio (continued) | | Portfolio of Investments
As of July 31, 2014 |
| | | | | | | | |
| SHARES | | | DESCRIPTION | | VALUE (NOTE 1) | |
| | | | SHORT-TERM INVESTMENT—64.8% | | | | |
| | |
| | | | AFFILIATED MONEY MARKET MUTUAL FUND | | | | |
| | 28,442,034 | | | Prudential Investment Portfolios 2—Prudential Core Taxable Money Market Fund
(cost $28,442,034) (Note 3)(w) | | $ | 28,442,034 | |
| | | | | | | | |
| | | | TOTAL INVESTMENTS, BEFORE SECURITIES SOLD SHORT—180.7%
(cost $78,863,673; Note 5) | | | 79,280,466 | |
| | | | | | �� | | |
PRINCIPAL
AMOUNT (000)# | | | SECURITIES SOLD SHORT—(9.0)% | | | |
| | |
| | | | U.S. GOVERNMENT AGENCY OBLIGATIONS | | | | |
| | 2,100 | | | Federal Home Loan Mortgage Corp.
3.000%, TBA | | | (2,056,376 | ) |
| | 100 | | | Federal National Mortgage Assoc.
3.500%, TBA | | | (105,389 | ) |
| | 800 | | | Government National Mortgage Assoc.
3.000%, TBA | | | (802,194 | ) |
| | 100 | | | 4.000%, TBA | | | (105,934 | ) |
| | 800 | | | 4.500%, TBA | | | (866,925 | ) |
| | | | | | | | |
| | | | TOTAL SECURITIES SOLD SHORT
(proceeds received $3,938,973) | | | (3,936,818 | ) |
| | | | | | | | |
| | | | TOTAL INVESTMENTS, NET OF SECURITIES SOLD SHORT—171.7%
(cost $74,924,700; Note 5) | | | 75,343,648 | |
| | | | Liabilities in excess of other assets(x)—(71.7%) | | | (31,464,683 | ) |
| | | | | | | | |
| | | | NET ASSETS—100.0% | | $ | 43,878,965 | |
| | | | | | | | |
| # | Principal amount is shown in U.S. dollars unless otherwise stated. |
| (c) | Variable rate instrument. The interest rate shown reflects the rate in effect at July 31, 2014. |
| (k) | Represents security, or a portion thereof, segregated as collateral for futures contracts. |
| (s) | Represents zero coupon bond or principal only securities. Rate represents yield to maturity at purchase date. |
| (w) | Prudential Investments LLC, the manager of the Portfolio, also serves as manager of the Prudential Investment Portfolios 2—Prudential Core Taxable Money Market Fund. |
| (x) | Includes net unrealized appreciation (depreciation) on the following derivative contracts held at reporting period end: |
Futures contracts outstanding at July 31, 2014:
| | | | | | | | | | | | | | | | |
Number of
Contracts | | Type | | Expiration
Date | | Value at
Trade Date | | | Value at
July 31, 2014 | | | Unrealized
Appreciation
(Depreciation)(1) | |
| Long Positions: | | | | | | | | | | | | | | | | |
| 8 | | 10 Year U.S. Treasury Notes | | Sep. 2014 | | $ | 1,000,906 | | | $ | 996,875 | | | $ | (4,031 | ) |
| 7 | | 20 Year U.S. Treasury Bonds | | Sep. 2014 | | | 964,797 | | | | 961,844 | | | | (2,953 | ) |
| | | | | | | | | | | | | | | | |
| | | | | | | | | | | | | | | (6,984 | ) |
| | | | | | | | | | | | | | | | |
See Notes to Financial Statements.
| | | | |
| 154 | | | The TARGET Portfolio Trust | |
Futures contracts outstanding at July 31, 2014 (continued):
| | | | | | | | | | | | | | | | |
Number of
Contracts | | Type | | Expiration
Date | | Value at
Trade Date | | | Value at
July 31, 2014 | | | Unrealized
Appreciation
(Depreciation)(1) | |
| Short Positions: | | | | | | | | | | | | | | | | |
| 4 | | 2 Year U.S. Treasury Notes | | Sep. 2014 | | $ | 878,875 | | | $ | 877,688 | | | $ | 1,187 | |
| 2 | | 5 Year U.S. Treasury Notes | | Sep. 2014 | | | 239,224 | | | | 237,672 | | | | 1,552 | |
| | | | | | | | | | | | | | | | |
| | | | | | | | | | | | | | | 2,739 | |
| | | | | | | | | | | | | | | | |
| | | | | | | | | | | | | | $ | (4,245 | ) |
| | | | | | | | | | | | | | | | |
| (1) | U.S. Government Agency Obligations, with a market value of $55,267 have been segregated with the broker Goldman Sachs & Co. to cover requirements for open futures contracts at July 31, 2014. |
Various inputs are used in determining the value of the Portfolio’s investments. These inputs are summarized in the three broad levels listed below.
Level 1—quoted prices generally in active markets for identical securities.
Level 2—other significant observable inputs including, but not limited to, quoted prices for similar securities, interest rates and yield curves, prepayment speeds, foreign currency exchange rates, and amortized cost.
Level 3—significant unobservable inputs for securities valued in accordance with Board approved fair valuation procedures.
The following is a summary of the inputs used as of July 31, 2014 in valuing such portfolio securities:
| | | | | | | | | | | | |
| | | Level 1 | | | Level 2 | | | Level 3 | |
| Investments in Securities | | | | | | | | | | | | |
Asset-Backed Securities | | | | | | | | | | | | |
Collateralized Loan Obligations | | $ | — | | | $ | 1,476,215 | | | $ | — | |
Non-Residential Mortgage-Backed Securities | | | — | | | | 1,615,539 | | | | — | |
Residential Mortgage-Backed Securities | | | — | | | | 579,453 | | | | — | |
Commercial Mortgage-Backed Securities | | | — | | | | 570,196 | | | | — | |
Municipal Bond | | | — | | | | 182,621 | | | | — | |
Residential Mortgage-Backed Securities | | | — | | | | 4,830,866 | | | | — | |
U.S. Government Agency Obligations | | | — | | | | 41,583,542 | | | | — | |
Affiliated Money Market Mutual Fund | | | 28,442,034 | | | | — | | | | — | |
Securities Sold Short—U.S. Government Agency Obligations | | | — | | | | (3,936,818 | ) | | | — | |
| Other Financial Instruments* | | | | | | | | | | | | |
Futures Contracts | | | (4,245 | ) | | | — | | | | — | |
| | | | | | | | | | | | |
Total | | $ | 28,437,789 | | | $ | 46,901,614 | | | $ | — | |
| | | | | | | | | | | | |
| * | Other financial instruments are derivative instruments not reflected in the Portfolio of Investments, such as futures, forwards and swaps contracts, which are recorded at the unrealized appreciation/depreciation of the instrument. |
The industry classification of investments and liabilities in excess of other assets shown as a percentage of net assets as of July 31, 2014 was as follows (unaudited):
| | | | |
U.S. Government Agency Obligations | | | 94.8 | % |
Affiliated Money Market Mutual Fund | | | 64.8 | |
Residential Mortgage-Backed Securities | | | 12.3 | |
Non-Residential Mortgage-Backed Securities | | | 3.7 | |
Collateralized Loan Obligations | | | 3.4 | |
Commercial Mortgage-Backed Securities | | | 1.3 | |
Municipal Bond | | | 0.4 | % |
U.S. Government Agency Obligations | | | (9.0 | ) |
| | | | |
| | | 171.7 | |
Liabilities in excess of other assets | | | (71.7 | ) |
| | | | |
| | | 100.0 | % |
| | | | |
See Notes to Financial Statements.
| | | | |
| The TARGET Portfolio Trust | | | 155 | |
| | |
| | Portfolio of Investments
As of July 31, 2014 |
Glossary:
The following abbreviations are used in the preceding Portfolios’ descriptions:
Currency
AUD—Australian Dollar
BRL—Brazilian Real
CAD—Canadian Dollar
EUR—Euro
GBP—British Pound
JPY—Japanese Yen
KRW—South Korean Won
MXN—Mexican Peso
NOK—Norwegian Krone
USD—United States Dollar
Exchange
Chi-X—European Equity Exchange
XLON—London Stock Exchange
Index
CDX—Credit Derivative Index
Other
144A—Security was purchased pursuant to Rule 144A under the Securities Act of 1933 and may not be resold subject to that rule except to qualified institutional buyers. Unless otherwise noted, 144A securities are deemed to be liquid.
ABS—Asset-Backed Security
ADR—American Depositary Receipt
BABs—Build America Bonds
bps—Basis Points
CLO—Collateralized Loan Obligation
CVA—Certificate Van Aandelen (Bearer)
EURIBOR—Euro Interbank Offered Rate
FHLMC—Federal Home Loan Mortgage Corp.
FREMF—Freddie Mac Mortgage Trust
IO—Interest Only
LIBOR—London Interbank Offered Rate
MTN—Medium Term Note
N/A—Not Applicable
PO—Principal Only
REMICS—Real Estate Mortgage Investment Conduit Security
SDR—Swedish Depositary Receipt
TBA—To Be Announced
TIPS—Treasury Inflation Protected Securities
See Notes to Financial Statements.
| | | | |
| 156 | | | The TARGET Portfolio Trust | |
Statement of Assets & Liabilities as of July 31, 2014
| | | | | | | | | | | | | | | | |
| | | LARGE
CAPITALIZATION
GROWTH
PORTFOLIO | | | LARGE
CAPITALIZATION
VALUE
PORTFOLIO | | | SMALL
CAPITALIZATION
GROWTH
PORTFOLIO | | | SMALL
CAPITALIZATION
VALUE
PORTFOLIO | |
| | | | |
| ASSETS | | | | | | | | | | | | | | | | |
Investments at value(C): | | | | | | | | | | | | | | | | |
Unaffiliated investments(B) | | $ | 279,025,801 | | | $ | 282,813,753 | | �� | $ | 133,225,277 | | | $ | 1,877,822,232 | |
Affiliated investments(A) | | | 22,698,987 | | | | 19,880,162 | | | | 22,957,087 | | | | 225,765,610 | |
Cash | | | 31,473 | | | | — | | | | — | | | | — | |
Receivable for investments sold | | | 490,945 | | | | 1,275,843 | | | | 2,165,304 | | | | 4,781,261 | |
Receivable for Trust shares sold | | | 208,829 | | | | 211,025 | | | | 111,486 | | | | 1,623,557 | |
Dividends and interest receivable | | | 81,463 | | | | 400,335 | | | | 34,657 | | | | 1,258,525 | |
Receivable for foreign tax reclaim | | | 5,528 | | | | 11,850 | | | | — | | | | — | |
Prepaid expenses and other assets | | | — | | | | 553 | | | | — | | | | — | |
Total assets | | | 302,543,026 | | | | 304,593,521 | | | | 158,493,811 | | | | 2,111,251,185 | |
| | | | |
| LIABILITIES | | | | | | | | | | | | | | | | |
Collateral for securities on loan | | | 14,192,964 | | | | 14,843,227 | | | | 19,159,676 | | | | 169,391,744 | |
Payable for investments purchased | | | 928,768 | | | | 1,842,573 | | | | 2,501,751 | | | | 11,456,076 | |
Management fee payable | | | 148,088 | | | | 149,416 | | | | 72,056 | | | | 1,024,256 | |
Payable for Trust shares reacquired | | | 144,802 | | | | 177,003 | | | | 48,857 | | | | 3,625,613 | |
Accrued expenses and other liabilities | | | 94,398 | | | | 78,182 | | | | 74,503 | | | | 255,689 | |
Due to broker for variation margin | | | — | | | | — | | | | — | | | | 137,300 | |
Distribution fee payable | | | 84,495 | | | | 85,795 | | | | 41,944 | | | | 63,270 | |
Affiliated transfer agent fee payable | | | 40,700 | | | | 43,200 | | | | 20,800 | | | | 92,341 | |
Payable to custodian | | | — | | | | — | | | | — | | | | 63,628 | |
Deferred trustees’ fees | | | 3,343 | | | | 3,343 | | | | 3,343 | | | | 3,343 | |
Total liabilities | | | 15,637,558 | | | | 17,222,739 | | | | 21,922,930 | | | | 186,113,260 | |
| | | | |
| NET ASSETS | | $ | 286,905,468 | | | $ | 287,370,782 | | | $ | 136,570,881 | | | $ | 1,925,137,925 | |
See Notes to Financial Statements.
| | | | |
| The TARGET Portfolio Trust | | | 157 | |
Statement of Assets & Liabilities as of July 31, 2014 (continued)
| | | | | | | | | | | | | | | | |
| | | LARGE
CAPITALIZATION
GROWTH
PORTFOLIO | | | LARGE
CAPITALIZATION
VALUE
PORTFOLIO | | | SMALL
CAPITALIZATION
GROWTH
PORTFOLIO | | | SMALL
CAPITALIZATION
VALUE
PORTFOLIO | |
Net assets were comprised of: | | | | | | | | | | | | | | | | |
Shares of beneficial interest, at par | | $ | 14,745 | | | $ | 18,431 | | | $ | 8,923 | | | $ | 72,077 | |
Paid-in capital in excess of par | | | 199,260,688 | | | | 243,993,752 | | | | 115,113,946 | | | | 1,379,283,947 | |
| | | 199,275,433 | | | | 244,012,183 | | | | 115,122,869 | | | | 1,379,356,024 | |
Undistributed net investment income (loss) | | | (1,257,927 | ) | | | 3,342,244 | | | | (1,280,607 | ) | | | 9,541,475 | |
Accumulated net realized gain (loss) | | | 7,895,315 | | | | (32,253,514 | ) | | | (2,577,586 | ) | | | 174,690,347 | |
Net unrealized appreciation (depreciation) | | | 80,992,647 | | | | 72,269,869 | | | | 25,306,205 | | | | 361,550,079 | |
Net assets, July 31, 2014 | | $ | 286,905,468 | | | $ | 287,370,782 | | | $ | 136,570,881 | | | $ | 1,925,137,925 | |
(A) Identified cost of affiliated investments | | $ | 22,698,987 | | | $ | 19,880,162 | | | $ | 22,957,087 | | | $ | 225,765,610 | |
(B) Identified cost of unaffiliated investments | | $ | 198,032,977 | | | $ | 210,543,884 | | | $ | 107,919,072 | | | $ | 1,516,041,688 | |
(C) Including securities on loan of | | $ | 13,575,423 | | | $ | 14,149,809 | | | $ | 17,946,398 | | | $ | 161,683,782 | |
| | | | |
| NET ASSET VALUE: | | | | | | | | | | | | | | | | |
Class A: | | | | | | | | | | | | | | | | |
Net Assets | | | — | | | | — | | | | — | | | $ | 12,564 | |
Shares Outstanding | | | — | | | | — | | | | — | | | | 470.6 | |
Net asset value and redemption price per share | | | — | | | | — | | | | — | | | $ | 26.70 | |
Maximum sales charge (5.50% of offering price) | | | — | | | | — | | | | — | | | | 1.55 | |
Maximum offering price to public | | | — | | | | — | | | | — | | | $ | 28.25 | |
Class R: | | | | | | | | | | | | | | | | |
Net Assets | | $ | 197,019,352 | | | $ | 198,729,242 | | | $ | 95,752,283 | | | $ | 143,654,719 | |
Shares Outstanding | | | 10,176,972 | | | | 12,765,963 | | | | 6,326,263 | | | | 5,419,121 | |
Net asset value, offering price and redemption price per share | | $ | 19.36 | | | $ | 15.57 | | | $ | 15.14 | | | $ | 26.51 | |
Class T: | | | | | | | | | | | | | | | | |
Net Assets | | $ | 89,886,116 | | | $ | 88,641,540 | | | $ | 40,818,598 | | | $ | 1,781,470,642 | |
Shares Outstanding | | | 4,568,092 | | | | 5,665,429 | | | | 2,596,885 | | | | 66,657,651 | |
Net asset value, offering price and redemption price per share | | $ | 19.68 | | | $ | 15.65 | | | $ | 15.72 | | | $ | 26.73 | |
See Notes to Financial Statements.
| | | | |
| 158 | | | The TARGET Portfolio Trust | |
Statement of Assets & Liabilities as of July 31, 2014 (continued)
| | | | | | | | | | | | | | | | |
| | | INTERNATIONAL
EQUITY
PORTFOLIO | | | TOTAL RETURN
BOND
PORTFOLIO | | | INTERMEDIATE-
TERM BOND
PORTFOLIO | | | MORTGAGE
BACKED
SECURITIES
PORTFOLIO | |
| | | | |
| ASSETS | | | | | | | | | | | | | | | | |
Investments at value(C): | | | | | | | | | | | | | | | | |
Unaffiliated investments(A) | | $ | 462,085,739 | | | $ | 425,317,308 | | | $ | 118,200,304 | | | $ | 50,838,432 | |
Repurchase agreements(E) | | | — | | | | 32,500,000 | | | | 5,300,000 | | | | — | |
Affiliated investments(B) | | | 25,912,369 | | | | 1,405,831 | | | | 553,285 | | | | 28,442,034 | |
Cash | | | — | | | | — | | | | 267 | | | | — | |
Deposit with broker | | | — | | | | 38,213 | | | | 267,000 | | | | 4,443 | |
Foreign currency, at value(D) | | | 4,255,094 | | | | 65,867 | | | | 365,242 | | | | — | |
Receivable for Trust shares sold | | | 420,220 | | | | 400,509 | | | | 100,904 | | | | 6,001 | |
Dividends and interest receivable | | | 190,346 | | | | 2,087,081 | | | | 652,150 | | | | 57,012 | |
Receivable for investments sold | | | 1,059,990 | | | | 33,473,773 | | | | 1,139,349 | | | | 8,250,989 | |
Receivable for foreign tax reclaim | | | 982,987 | | | | — | | | | — | | | | — | |
Due from broker for variation margin | | | — | | | | — | | | | 59,635 | | | | — | |
Payments paid for swap agreements | | | — | | | | 42,007 | | | | 179,848 | | | | — | |
Unrealized appreciation on over-the-counter swap agreements | | | — | | | | 590,241 | | | | 338,568 | | | | — | |
Unrealized appreciation on forward foreign currency exchange contracts | | | 598,106 | | | | 1,919,653 | | | | 168,001 | | | | — | |
Total assets | | | 495,504,851 | | | | 497,840,483 | | | | 127,324,553 | | | | 87,598,911 | |
| | | | |
| LIABILITIES | | | | | | | | | | | | | | | | |
Collateral for securities on loan | | | 8,780,409 | | | | — | | | | — | | | | — | |
Payable for Trust shares reacquired | | | 107,530 | | | | 410,300 | | | | 230,039 | | | | 12,605 | |
Payable for investments purchased | | | 1,541,071 | | | | 80,161,706 | | | | 1,600,870 | | | | 39,685,685 | |
Accrued expenses and other liabilities | | | 124,788 | | | | 149,373 | | | | 114,824 | | | | 59,187 | |
Management fee payable | | | 293,633 | | | | 158,405 | | | | 47,480 | | | | 16,643 | |
Affiliated transfer agent fee payable | | | 53,652 | | | | 53,741 | | | | 210 | | | | 113 | |
Deferred trustees’ fees | | | 3,343 | | | | 3,343 | | | | 3,343 | | | | 3,343 | |
Distribution fee payable | | | 108,722 | | | | 106,452 | | | | — | | | | — | |
Dividends payable | | | — | | | | 1,381 | | | | 5,274 | | | | 364 | |
Due to broker for variation margin | | | — | | | | 11,995 | | | | — | | | | 5,188 | |
Due to broker | | | — | | | | 895,000 | | | | 42,000 | | | | — | |
Options written(G) | | | — | | | | 146,268 | | | | 460 | | | | — | |
Payments received for swap agreements | | | — | | | | 439,849 | | | | 34,372 | | | | — | |
Unrealized depreciation on over-the-counter swap agreements | | | — | | | | 145,757 | | | | 54,912 | | | | — | |
Unrealized depreciation on forward foreign currency exchange contracts | | | — | | | | 561,854 | | | | 56,176 | | | | — | |
Securities sold short, at value(F) | | | — | | | | — | | | | 1,076,664 | | | | 3,936,818 | |
Total liabilities | | | 11,013,148 | | | | 83,245,424 | | | | 3,266,624 | | | | 43,719,946 | |
| | | | |
| NET ASSETS | | $ | 484,491,703 | | | $ | 414,595,059 | | | $ | 124,057,929 | | | $ | 43,878,965 | |
See Notes to Financial Statements.
| | | | |
| The TARGET Portfolio Trust | | | 159 | |
Statement of Assets & Liabilities as of July 31, 2014 (continued)
| | | | | | | | | | | | | | | | |
| | | INTERNATIONAL
EQUITY
PORTFOLIO | | | TOTAL RETURN
BOND
PORTFOLIO | | | INTERMEDIATE-
TERM BOND
PORTFOLIO | | | MORTGAGE
BACKED
SECURITIES
PORTFOLIO | |
Net assets were comprised of: | | | | | | | | | | | | | | | | |
Shares of beneficial interest, at par | | $ | 35,168 | | | $ | 37,667 | | | $ | 12,248 | | | $ | 4,103 | |
Paid-in capital in excess of par | | | 437,469,185 | | | | 406,431,519 | | | | 125,365,780 | | | | 45,954,404 | |
| | | 437,504,353 | | | | 406,469,186 | | | | 125,378,028 | | | | 45,958,507 | |
Undistributed net investment income (loss) | | | 6,460,944 | | | | (425,990 | ) | | | 416,114 | | | | 25,216 | |
Accumulated net realized gain (losses) | | | (21,553,593 | ) | | | 1,244,160 | | | | (3,757,120 | ) | | | (2,519,461 | ) |
Net unrealized appreciation (depreciation) | | | 62,079,999 | | | | 7,307,703 | | | | 2,020,907 | | | | 414,703 | |
Net assets, July 31, 2014 | | $ | 484,491,703 | | | $ | 414,595,059 | | | $ | 124,057,929 | | | $ | 43,878,965 | |
(A) Identified cost of unaffiliated investments | | $ | 400,559,419 | | | $ | 419,825,222 | | | $ | 116,708,836 | | | $ | 50,421,639 | |
(B) Identified cost of affiliated investments | | $ | 25,912,369 | | | $ | 1,405,831 | | | $ | 553,285 | | | $ | 28,442,034 | |
(C) Including securities on loan of | | $ | 8,128,312 | | | | — | | | | — | | | | — | |
(D) Identified cost of currency | | $ | 4,298,004 | | | $ | 63,692 | | | $ | 362,825 | | | | — | |
(E) Identified cost of repurchase agreements | | | — | | | $ | 32,500,000 | | | $ | 5,300,000 | | | | — | |
(F) Proceeds received from short sales | | | — | | | | — | | | $ | 1,079,844 | | | $ | 3,938,973 | |
(G) Premiums received from options written | | | — | | | $ | 201,671 | | | $ | 19,871 | | | | — | |
| | | | |
| NET ASSET VALUE: | | | | | | | | | | | | | | | | |
Class Q: | | | | | | | | | | | | | | | | |
Net Assets | | $ | 167,988,400 | | | | — | | | | — | | | | — | |
Shares Outstanding | | | 12,163,516 | | | | — | | | | — | | | | — | |
Net asset value, offering price and redemption price per share | | $ | 13.81 | | | | — | | | | — | | | | — | |
Class R: | | | | | | | | | | | | | | | | |
Net Assets | | $ | 251,907,920 | | | $ | 250,999,483 | | | | — | | | | — | |
Shares Outstanding | | | 18,324,204 | | | | 22,871,358 | | | | — | | | | — | |
Net asset value, offering price and redemption price per share | | $ | 13.75 | | | $ | 10.97 | | | | — | | | | — | |
Class T: | | | | | | | | | | | | | | | | |
Net Assets | | $ | 64,595,383 | | | $ | 163,595,576 | | | $ | 124,057,929 | | | $ | 43,878,965 | |
Shares Outstanding | | | 4,680,574 | | | | 14,795,458 | | | | 12,248,238 | | | | 4,103,293 | |
Net asset value, offering price and redemption price per share | | $ | 13.80 | | | $ | 11.06 | | | $ | 10.13 | | | $ | 10.69 | |
See Notes to Financial Statements.
| | | | |
| 160 | | | The TARGET Portfolio Trust | |
Statement of Operations
| | | | | | | | | | | | | | | | |
| | | LARGE CAPITALIZATION
GROWTH PORTFOLIO | | | LARGE CAPITALIZATION
VALUE PORTFOLIO | |
| | | Nine Months
Ended
July 31,
2014 | | | Year
Ended
October 31,
2013 | | | Nine Months
Ended
July 31,
2014 | | | Year
Ended
October 31,
2013 | |
| | | | |
| NET INVESTMENT INCOME (LOSS) | | | | | | | | | | | | | | | | |
Income | | | | | | | | | | | | | | | | |
Unaffiliated dividend income | | $ | 1,734,273 | | | $ | 2,625,292 | | | $ | 6,602,752 | | | $ | 6,103,233 | |
Affiliated income from securities lending, net | | | 14,129 | | | | 22,921 | | | | 13,802 | | | | 27,483 | |
Affiliated dividend income | | | 7,022 | | | | 9,844 | | | | 6,707 | | | | 8,617 | |
Interest | | | 9 | | | | — | | | | — | | | | — | |
Less: Foreign withholding taxes | | | (13,002 | ) | | | (29,639 | ) | | | (76,555 | ) | | | (59,738 | ) |
Total income | | | 1,742,431 | | | | 2,628,418 | | | | 6,546,706 | | | | 6,079,595 | |
Expenses | | | | | | | | | | | | | | | | |
Management fee | | | 1,256,763 | | | | 1,427,902 | | | | 1,257,140 | | | | 1,424,488 | |
Distribution fee—Class R | | | 1,052,935 | | | | 1,145,211 | | | | 1,064,679 | | | | 1,149,320 | |
Transfer agent’s fees and expenses(a) | | | 234,000 | | | | 255,000 | | | | 222,000 | | | | 251,000 | |
Custodian’s fees and expenses | | | 76,000 | | | | 104,000 | | | | 65,000 | | | | 81,000 | |
Reports to shareholders | | | 30,000 | | | | 37,000 | | | | 33,000 | | | | 32,000 | |
Registration fees | | | 27,000 | | | | 30,000 | | | | 20,000 | | | | 31,000 | |
Audit fees | | | 26,000 | | | | 25,000 | | | | 26,000 | | | | 25,000 | |
Trustees’ fees | | | 16,000 | | | | 14,000 | | | | 11,000 | | | | 14,000 | |
Legal fees | | | 13,000 | | | | 19,000 | | | | 13,000 | | | | 19,000 | |
Insurance fees | | | 3,000 | | | | — | | | | 3,000 | | | | — | |
Loan interest expense | | | 127 | | | | 588 | | | | 94 | | | | 214 | |
Miscellaneous | | | 12,205 | | | | 19,869 | | | | 8,449 | | | | 20,369 | |
Total expenses | | | 2,747,030 | | | | 3,077,570 | | | | 2,723,362 | | | | 3,047,391 | |
Less: Distribution fee waiver—Class R | | | (350,978 | ) | | | (381,737 | ) | | | (354,893 | ) | | | (383,107 | ) |
Net expenses | | | 2,396,052 | | | | 2,695,833 | | | | 2,368,469 | | | | 2,664,284 | |
| Net investment income (loss) | | | (653,621 | ) | | | (67,415 | ) | | | 4,178,237 | | | | 3,415,311 | |
| | | | |
| REALIZED AND UNREALIZED GAIN (LOSS) ON INVESTMENTS AND FOREIGN CURRENCIES | | | | | | | | | | | | | | | | |
Net realized gain (loss) on: | | | | | | | | | | | | | | | | |
Investment transactions | | | 10,374,476 | | | | 35,935,579 | | | | 20,691,600 | | | | 14,672,477 | |
Foreign currency transactions | | | (257 | ) | | | 3,155 | | | | — | | | | — | |
| Total net realized gain (loss) | | | 10,374,219 | | | | 35,938,734 | | | | 20,691,600 | | | | 14,672,477 | |
Net change in unrealized appreciation (depreciation) on: | | | | | | | | | | | | | | | | |
Investments | | | 8,827,633 | | | | 27,630,724 | | | | 5,182,497 | | | | 44,093,729 | |
Foreign currencies | | | (180 | ) | | | 25 | | | | — | | | | — | |
| Net change in unrealized appreciation (depreciation) | | | 8,827,453 | | | | 27,630,749 | | | | 5,182,497 | | | | 44,093,729 | |
| Net gain (loss) | | | 19,201,672 | | | | 63,569,483 | | | | 25,874,097 | | | | 58,766,206 | |
| | | | |
| NET INCREASE (DECREASE) IN NET ASSETS RESULTING FROM OPERATIONS | | $ | 18,548,051 | | | $ | 63,502,068 | | | $ | 30,052,334 | | | $ | 62,181,517 | |
(a) Including affiliated expense of | | $ | 179,300 | | | $ | 194,600 | | | $ | 182,000 | | | $ | 195,300 | |
See Notes to Financial Statements.
| | | | |
| The TARGET Portfolio Trust | | | 161 | |
Statement of Operations (continued)
| | | | | | | | | | | | | | | | |
| | | SMALL CAPITALIZATION
GROWTH PORTFOLIO | | | SMALL CAPITALIZATION
VALUE PORTFOLIO | |
| | | Nine Months
Ended
July 31,
2014 | | | Year
Ended
October 31,
2013 | | | Nine Months
Ended
July 31,
2014 | | | Year
Ended
October 31,
2013 | |
| | | | |
| NET INVESTMENT INCOME (LOSS) | | | | | | | | | | | | | | | | |
Income | | | | | | | | | | | | | | | | |
Unaffiliated dividend income | | $ | 419,340 | | | $ | 1,017,911 | | | $ | 24,027,521 | | | $ | 27,541,907 | |
Affiliated income from securities lending, net | | | 178,032 | | | | 189,626 | | | | 830,732 | | | | 1,177,417 | |
Affiliated dividend income | | | 2,666 | | | | 1,950 | | | | 73,511 | | | | 125,816 | |
Interest | | | — | | | | — | | | | 316 | | | | 551 | |
Less: Foreign withholding taxes | | | (1,385 | ) | | | (1,237 | ) | | | (44,896 | ) | | | (78,333 | ) |
Total income | | | 598,653 | | | | 1,208,250 | | | | 24,887,184 | | | | 28,767,358 | |
Expenses | | | | | | | | | | | | | | | | |
Management fee | | | 619,601 | | | | 700,480 | | | | 8,604,472 | | | | 8,655,977 | |
Distribution fee—Class A | | | — | | | | — | | | | 16 | | | | — | |
Distribution fee—Class R | | | 525,594 | | | | 567,017 | | | | 753,834 | | | | 747,512 | |
Transfer agent’s fees and expenses(a) | | | 126,000 | | | | 129,000 | | | | 616,000 | | | | 557,000 | |
Custodian’s fees and expenses | | | 52,000 | | | | 66,000 | | | | 252,000 | | | | 245,000 | |
Reports to shareholders | | | 32,000 | | | | 30,000 | | | | 137,000 | | | | 90,000 | |
Audit fees | | | 26,000 | | | | 25,000 | | | | 33,000 | | | | 33,000 | |
Registration fees | | | 23,000 | | | | 31,000 | | | | 42,000 | | | | 38,000 | |
Legal fees | | | 13,000 | | | | 16,000 | | | | 21,000 | | | | 24,000 | |
Trustees’ fees | | | 12,000 | | | | 12,000 | | | | 43,000 | | | | 31,000 | |
Insurance fees | | | 1,000 | | | | — | | | | 16,000 | | | | — | |
Loan interest expense | | | 32 | | | | 1,278 | | | | — | | | | — | |
Miscellaneous | | | 12,044 | | | | 13,583 | | | | 38,783 | | | | 46,397 | |
Total expenses | | | 1,442,271 | | | | 1,591,358 | | | | 10,557,105 | | | | 10,467,886 | |
Less: Distribution fee waiver—Class A | | | — | | | | — | | | | (3 | ) | | | — | |
Less: Distribution fee waiver—Class R | | | (175,198 | ) | | | (189,006 | ) | | | (251,278 | ) | | | (249,171 | ) |
Net expenses | | | 1,267,073 | | | | 1,402,352 | | | | 10,305,824 | | | | 10,218,715 | |
| Net investment income (loss) | | | (668,420 | ) | | | (194,102 | ) | | | 14,581,360 | | | | 18,548,643 | |
| | | | |
| REALIZED AND UNREALIZED GAIN (LOSS) ON INVESTMENTS AND FOREIGN CURRENCIES | | | | | | | | | | | | | | | | |
Net realized gain (loss) on: | | | | | | | | | | | | | | | | |
Investment transactions | | | 14,578,331 | | | | 8,909,751 | | | | 183,110,669 | | | | 125,552,495 | |
Futures transactions | | | — | | | | — | | | | 735,259 | | | | 1,416,103 | |
Foreign currency transactions | | | — | | | | — | | | | — | | | | — | |
| Total net realized gain (loss) | | | 14,578,331 | | | | 8,909,751 | | | | 183,845,928 | | | | 126,968,598 | |
Net change in unrealized appreciation (depreciation) on: | | | | | | | | | | | | | | | | |
Investments | | | (16,552,662 | ) | | | 24,945,841 | | | | (114,366,796 | ) | | | 284,942,247 | |
Futures | | | — | | | | — | | | | (253,185 | ) | | | 58,650 | |
Foreign currencies | | | — | | | | — | | | | — | | | | — | |
| Net change in unrealized appreciation (depreciation) | | | (16,552,662 | ) | | | 24,945,841 | | | | (114,619,981 | ) | | | 285,000,897 | |
| Net gain (loss) | | | (1,974,331 | ) | | | 33,855,592 | | | | 69,225,947 | | | | 411,969,495 | |
| | | | |
| NET INCREASE (DECREASE) IN NET ASSETS RESULTING FROM OPERATIONS | | $ | (2,642,751 | ) | | $ | 33,661,490 | | | $ | 83,807,307 | | | $ | 430,518,138 | |
(a) Including affiliated expense of | | $ | 91,200 | | | $ | 96,600 | | | $ | 370,400 | | | $ | 336,100 | |
See Notes to Financial Statements.
| | | | |
| 162 | | | The TARGET Portfolio Trust | |
Statement of Operations (continued)
| | | | | | | | | | | | | | | | |
| | | INTERNATIONAL EQUITY
PORTFOLIO | | | TOTAL RETURN BOND
PORTFOLIO | |
| | | Nine Months
Ended
July 31,
2014 | | | Year
Ended
October 31,
2013 | | | Nine Months
Ended
July 31,
2014 | | | Year
Ended
October 31,
2013 | |
| | | | |
| NET INVESTMENT INCOME (LOSS) | | | | | | | | | | | | | | | | |
Income | | | | | | | | | | | | | | | | |
Unaffiliated dividend income | | $ | 12,677,513 | | | $ | 12,171,019 | | | $ | — | | | $ | — | |
Interest | | | 1,771 | | | | — | | | | 6,292,293 | | | | 9,968,204 | |
Affiliated income from securities lending, net | | | 24,960 | | | | 455 | | | | — | | | | — | |
Affiliated dividend income | | | 15,421 | | | | 16,701 | | | | 2,174 | | | | 1,608 | |
Less: Foreign withholding taxes | | | (1,021,076 | ) | | | (891,914 | ) | | | — | | | | — | |
Total income | | | 11,698,589 | | | | 11,296,261 | | | | 6,294,467 | | | | 9,969,812 | |
Expenses | | | | | | | | | | | | | | | | |
Management fee | | | 2,428,341 | | | | 2,661,225 | | | | 1,378,250 | | | | 2,006,781 | |
Distribution fee—Class R | | | 1,329,858 | | | | 1,347,604 | | | | 1,320,613 | | | | 1,492,298 | |
Transfer agent’s fees and expenses(a) | | | 234,000 | | | | 280,000 | | | | 326,000 | | | | 457,000 | |
Custodian’s fees and expenses | | | 197,000 | | | | 267,000 | | | | 115,000 | | | | 175,000 | |
Audit fees | | | 33,000 | | | | 33,000 | | | | 65,000 | | | | 66,000 | |
Reports to shareholders | | | 42,000 | | | | 36,000 | | | | 55,000 | | | | 60,000 | |
Registration fees | | | 34,000 | | | | 46,000 | | | | 18,000 | | | | 37,000 | |
Trustees’ fees | | | 18,000 | | | | 13,000 | | | | 18,000 | | | | 19,000 | |
Legal fees | | | 15,000 | | | | 21,000 | | | | 15,000 | | | | 19,000 | |
Insurance fees | | | 4,000 | | | | — | | | | 5,000 | | | | — | |
Loan interest expense | | | — | | | | 740 | | | | — | | | | 2,992 | |
Miscellaneous | | | 56,081 | | | | 55,716 | | | | 14,677 | | | | 22,542 | |
Total expenses | | | 4,391,280 | | | | 4,761,285 | | | | 3,330,540 | | | | 4,357,613 | |
Less: Distribution fee waiver—Class R | | | (443,286 | ) | | | (449,201 | ) | | | (440,204 | ) | | | (497,433 | ) |
Net expenses | | | 3,947,994 | | | | 4,312,084 | | | | 2,890,336 | | | | 3,860,180 | |
| Net investment income (loss) | | | 7,750,595 | | | | 6,984,177 | | | | 3,404,131 | | | | 6,109,632 | |
| REALIZED AND UNREALIZED GAIN (LOSS) ON INVESTMENTS AND FOREIGN CURRENCIES | | | | | | | | | | | | | | | | |
Net realized gain (loss) on: | | | | | | | | | | | | | | | | |
Investment transactions | | | 8,452,008 | | | | 12,114,429 | | | | 5,795,050 | | | | (3,570,782 | ) |
Futures transactions | | | — | | | | — | | | | 1,405,338 | | | | 689,074 | |
Options written transactions | | | — | | | | — | | | | 590,859 | | | | 1,234,365 | |
Swap agreements transactions | | | — | | | | — | | | | (1,286,703 | ) | | | (2,227,534 | ) |
Foreign currency transactions | | | (161,004 | ) | | | 60,045 | | | | (556,852 | ) | | | 37,058 | |
Short sale transactions | | | — | | | | — | | | | — | | | | 149,863 | |
| Total net realized gain (loss) | | | 8,291,004 | | | | 12,174,474 | | | | 5,947,692 | | | | (3,687,956 | ) |
Net change in unrealized appreciation (depreciation) on: | | | | | | | | | | | | | | | | |
Investments | | | (7,643,363 | ) | | | 61,096,324 | | | | (3,570,868 | ) | | | (11,238,650 | ) |
Futures | | | — | | | | — | | | | (1,344,015 | ) | | | 1,544,202 | |
Swaps | | | — | | | | — | | | | 509,850 | | | | (1,722,057 | ) |
Foreign currencies | | | 748,958 | | | | (279,226 | ) | | | 1,743,020 | | | | 702,808 | |
Options written | | | — | | | | — | | | | 15,205 | | | | (70,459 | ) |
Short sales | | | — | | | | — | | | | 2,812 | | | | (7,499 | ) |
| Net change in unrealized appreciation (depreciation) | | | (6,894,405 | ) | | | 60,817,098 | | | | (2,643,996 | ) | | | (10,791,655 | ) |
| Net gain (loss) | | | 1,396,599 | | | | 72,991,572 | | | | 3,303,696 | | | | (14,479,611 | ) |
| NET INCREASE (DECREASE) IN NET ASSETS RESULTING FROM OPERATIONS | | $ | 9,147,194 | | | $ | 79,975,749 | | | $ | 6,707,827 | | | $ | (8,369,979 | ) |
(a) Including affiliated expense of | | $ | 226,100 | | | $ | 227,200 | | | $ | 228,000 | | | $ | 260,900 | |
See Notes to Financial Statements.
| | | | |
| The TARGET Portfolio Trust | | | 163 | |
Statement of Operations (continued)
| | | | | | | | | | | | | | | | |
| | | INTERMEDIATE-TERM
BOND PORTFOLIO | | | MORTGAGE BACKED
SECURITIES PORTFOLIO | |
| | | Nine Months
Ended
July 31,
2014 | | | Year
Ended
October 31,
2013 | | | Nine Months
Ended
July 31,
2014 | | | Year
Ended
October 31,
2013 | |
| | | | |
| NET INVESTMENT INCOME (LOSS) | | | | | | | | | | | | | | | | |
Income | | | | | | | | | | | | | | | | |
Interest | | $ | 2,847,350 | | | $ | 4,540,199 | | | $ | 496,674 | | | $ | 977,099 | |
Affiliated dividend income | | | 400 | | | | 747 | | | | 27,331 | | | | 29,526 | |
Total income | | | 2,847,750 | | | | 4,540,946 | | | | 524,005 | | | | 1,006,625 | |
Expenses | | | | | | | | | | | | | | | | |
Management fee | | | 428,627 | | | | 672,534 | | | | 143,603 | | | | 194,755 | |
Custodian’s fees and expenses | | | 93,000 | | | | 130,000 | | | | 54,000 | | | | 70,000 | |
Audit fees | | | 61,000 | | | | 61,000 | | | | 34,000 | | | | 33,000 | |
Transfer agent’s fees and expenses(a) | | | 68,000 | | | | 96,000 | | | | 19,000 | | | | 30,000 | |
Reports to shareholders | | | 36,000 | | | | 27,000 | | | | 17,000 | | | | 20,000 | |
Legal fees | | | 13,000 | | | | 17,000 | | | | 14,000 | | | | 16,000 | |
Trustees’ fees | | | 14,000 | | | | 13,000 | | | | 12,000 | | | | 11,000 | |
Registration fees | | | 13,000 | | | | 23,000 | | | | 12,000 | | | | 18,000 | |
Insurance fees | | | 2,000 | | | | — | | | | 1,000 | | | | — | |
Loan interest expenses | | | — | | | | 639 | | | | — | | | | — | |
Miscellaneous | | | 8,654 | | | | 14,728 | | | | 8,667 | | | | 10,887 | |
Total expenses | | | 737,281 | | | | 1,054,901 | | | | 315,270 | | | | 403,642 | |
| Net investment income (loss) | | | 2,110,469 | | | | 3,486,045 | | | | 208,735 | | | | 602,983 | |
| | | | |
| REALIZED AND UNREALIZED GAIN (LOSS) ON INVESTMENTS AND FOREIGN CURRENCIES | | | | | | | | | | | | | | | | |
Net realized gain (loss) on: | | | | | | | | | | | | | | | | |
Investment transactions | | | 23,289 | | | | 575,419 | | | | 1,224,321 | | | | (502,717 | ) |
Futures transactions | | | (192,911 | ) | | | 857,839 | | | | 134,348 | | | | 49,867 | |
Foreign currency transactions | | | (554,025 | ) | | | 383,949 | | | | — | | | | — | |
Options written transactions | | | 171,645 | | | | 234,456 | | | | — | | | | — | |
Swap agreements transactions | | | (1,984,793 | ) | | | (1,113,642 | ) | | | — | | | | (21,014 | ) |
Short sale transactions | | | — | | | | — | | | | — | | | | 79,036 | |
| Total net realized gain (loss) | | | (2,536,795 | ) | | | 938,021 | | | | 1,358,669 | | | | (394,828 | ) |
Net change in unrealized appreciation (depreciation) on: | | | | | | | | | | | | | | | | |
Investments | | | 408,208 | | | | (3,886,130 | ) | | | (513,438 | ) | | | (684,369 | ) |
Futures | | | (211,229 | ) | | | (2,733 | ) | | | 17,541 | | | | 12,967 | |
Swaps | | | 1,165,349 | | | | (2,648,081 | ) | | | — | | | | — | |
Foreign currencies | | | 320,430 | | | | (12,617 | ) | | | — | | | | — | |
Options written | | | (18,620 | ) | | | (4,154 | ) | | | — | | | | — | |
Short sales | | | 3,180 | | | | — | | | | 510 | | | | 4,153 | |
| Net change in unrealized appreciation (depreciation) | | | 1,667,318 | | | | (6,553,715 | ) | | | (495,387 | ) | | | (667,249 | ) |
| Net gain (loss) | | | (869,477 | ) | | | (5,615,694 | ) | | | 863,282 | | | | (1,062,077 | ) |
| | | | |
| NET INCREASE (DECREASE) IN NET ASSETS RESULTING FROM OPERATIONS | | $ | 1,240,992 | | | $ | (2,129,649 | ) | | $ | 1,072,017 | | | $ | (459,094 | ) |
(a) Including affiliated expense of | | $ | 1,900 | | | $ | 4,800 | | | $ | 680 | | | $ | 2,700 | |
See Notes to Financial Statements.
| | | | |
| 164 | | | The TARGET Portfolio Trust | |
Statement of Changes in Net Assets
| | | | | | | | | | | | |
| | | LARGE CAPITALIZATION
GROWTH PORTFOLIO | |
| | | Nine Months
Ended
July 31,
2014 | | | Year
Ended
October 31,
2013 | | | Year
Ended
October 31,
2012 | |
| | | |
| INCREASE (DECREASE) IN NET ASSETS | | | | | | | | | | | | |
Operations | | | | | | | | | | | | |
Net investment income (loss) | | $ | (653,621 | ) | | $ | (67,415 | ) | | $ | 303,897 | |
Net realized gain on investment and foreign currency transactions | | | 10,374,219 | | | | 35,938,734 | | | | 17,329,169 | |
Net change in unrealized appreciation (depreciation) on investments | | | 8,827,453 | | | | 27,630,749 | | | | 90,808 | |
Net increase in net assets resulting from operations | | | 18,548,051 | | | | 63,502,068 | | | | 17,723,874 | |
Dividends and Distributions (Note 1) | | | | | | | | | | | | |
Dividends from net investment income | | | | | | | | | | | | |
Class R | | | — | | | | (274,592 | ) | | | — | |
Class T | | | — | | | | (555,589 | ) | | | (302,875 | ) |
Total dividends from net investment income | | | — | | | | (830,181 | ) | | | (302,875 | ) |
Distributions from net realized gains | | | | | | | | | | | | |
Class R | | | (9,234,450 | ) | | | — | | | | — | |
Class T | | | (4,631,311 | ) | | | — | | | | — | |
Total distributions from net realized gains | | | (13,865,761 | ) | | | — | | | | — | |
Trust share transactions (Note 6) | | | | | | | | | | | | |
Net proceeds from shares sold | | | 42,012,208 | | | | 51,433,823 | | | | 44,120,638 | |
Net asset value of shares issued in reinvestment of dividends and distributions | | | 13,707,145 | | | | 809,020 | | | | 292,761 | |
Cost of shares reacquired | | | (41,885,200 | ) | | | (56,810,294 | ) | | | (55,953,976 | ) |
Net increase (decrease) in net assets from Trust share transactions | | | 13,834,153 | | | | (4,567,451 | ) | | | (11,540,577 | ) |
Total increase | | | 18,516,443 | | | | 58,104,436 | | | | 5,880,422 | |
| | | |
| NET ASSETS: | | | | | | | | | | | | |
Beginning of period | | | 268,389,025 | | | | 210,284,589 | | | | 204,404,167 | |
End of period | | $ | 286,905,468 | | | $ | 268,389,025 | | | $ | 210,284,589 | |
(a) Includes undistributed net investment income of | | $ | — | | | $ | — | | | $ | 290,135 | |
See Notes to Financial Statements.
| | | | |
| The TARGET Portfolio Trust | | | 165 | |
Statement of Changes in Net Assets (continued)
| | | | | | | | | | | | |
| | | LARGE CAPITALIZATION
VALUE PORTFOLIO | |
| | | Nine Months
Ended
July 31,
2014 | | | Year
Ended
October 31,
2013 | | | Year
Ended
October 31,
2012 | |
| | | |
| INCREASE (DECREASE) IN NET ASSETS | | | | | | | | | | | | |
Operations | | | | | | | | | | | | |
Net investment income | | $ | 4,178,237 | | | $ | 3,415,311 | | | $ | 3,568,756 | |
Net realized gain on investment and foreign currency transactions | | | 20,691,600 | | | | 14,672,477 | | | | 26,237,541 | |
Net change in unrealized appreciation (depreciation) on investments | | | 5,182,497 | | | | 44,093,729 | | | | (3,752,030 | ) |
Net increase in net assets resulting from operations | | | 30,052,334 | | | | 62,181,517 | | | | 26,054,267 | |
Dividends and Distributions (Note 1) | | | | | | | | | | | | |
Dividends from net investment income | | | | | | | | | | | | |
Class R | | | (1,990,700 | ) | | | (2,007,775 | ) | | | (1,713,677 | ) |
Class T | | | (1,392,070 | ) | | | (1,552,574 | ) | | | (1,696,624 | ) |
Total dividends from net investment income | | | (3,382,770 | ) | | | (3,560,349 | ) | | | (3,410,301 | ) |
Trust share transactions (Note 6) | | | | | | | | | | | | |
Net proceeds from shares sold | | | 41,168,660 | | | | 49,811,199 | | | | 42,277,824 | |
Net asset value of shares issued in reinvestment of dividends and distributions | | | 3,341,125 | | | | 3,507,985 | | | | 3,357,595 | |
Cost of shares reacquired | | | (48,448,223 | ) | | | (61,015,500 | ) | | | (55,169,925 | ) |
Net decrease in net assets from Trust share transactions | | | (3,938,438 | ) | | | (7,696,316 | ) | | | (9,534,506 | ) |
Total increase | | | 22,731,126 | | | | 50,924,852 | | | | 13,109,460 | |
| | | |
| NET ASSETS: | | | | | | | | | | | | |
Beginning of period | | | 264,639,656 | | | | 213,714,804 | | | | 200,605,344 | |
End of period(a) | | $ | 287,370,782 | | | $ | 264,639,656 | | | $ | 213,714,804 | |
(a) Includes undistributed net investment income of: | | $ | 3,342,244 | | | $ | 2,546,777 | | | $ | 2,691,815 | |
See Notes to Financial Statements.
| | | | |
| 166 | | | The TARGET Portfolio Trust | |
Statement of Changes in Net Assets (continued)
| | | | | | | | | | | | |
| | | SMALL CAPITALIZATION
GROWTH PORTFOLIO | |
| | | Nine Months
Ended
July 31,
2014 | | | Year
Ended
October 31,
2013 | | | Year
Ended
October 31,
2012 | |
| | | |
| INCREASE (DECREASE) IN NET ASSETS | | | | | | | | | | | | |
Operations | | | | | | | | | | | | |
Net investment loss | | $ | (668,420 | ) | | $ | (194,102 | ) | | $ | (712,023 | ) |
Net realized gain on investment and foreign currency transactions | | | 14,578,331 | | | | 8,909,751 | | | | 3,687,565 | |
Net change in unrealized appreciation (depreciation) on investments | | | (16,552,662 | ) | | | 24,945,841 | | | | 2,643,860 | |
Net increase (decrease) in net assets resulting from operations | | | (2,642,751 | ) | | | 33,661,490 | | | | 5,619,402 | |
Trust share transactions (Note 6) | | | | | | | | | | | | |
Net proceeds from shares sold | | | 28,105,679 | | | | 30,464,379 | | | | 25,728,775 | |
Cost of shares reacquired | | | (19,568,988 | ) | | | (33,289,863 | ) | | | (27,670,159 | ) |
Net increase (decrease) in net assets from Trust share transactions | | | 8,536,691 | | | | (2,825,484 | ) | | | (1,941,384 | ) |
Total increase | | | 5,893,940 | | | | 30,836,006 | | | | 3,678,018 | |
| | | |
| NET ASSETS: | | | | | | | | | | | | |
Beginning of period | | | 130,676,941 | | | | 99,840,935 | | | | 96,162,917 | |
End of period | | $ | 136,570,881 | | | $ | 130,676,941 | | | $ | 99,840,935 | |
See Notes to Financial Statements.
| | | | |
| The TARGET Portfolio Trust | | | 167 | |
Statement of Changes in Net Assets (continued)
| | | | | | | | | | | | |
| | | SMALL CAPITALIZATION
VALUE PORTFOLIO | |
| | | Nine Months
Ended
July 31,
2014 | | | Year
Ended
October 31,
2013 | | | Year
Ended
October 31,
2012 | |
| | | |
| INCREASE (DECREASE) IN NET ASSETS | | | | | | | | | | | | |
Operations | | | | | | | | | | | | |
Net investment income | | $ | 14,581,360 | | | $ | 18,548,643 | | | $ | 14,893,551 | |
Net realized gain on investment and foreign currency transactions | | | 183,845,928 | | | | 126,968,598 | | | | 34,081,657 | |
Net change in unrealized appreciation (depreciation) on investments | | | (114,619,981 | ) | | | 285,000,897 | | | | 48,128,206 | |
Net increase in net assets resulting from operations | | | 83,807,307 | | | | 430,518,138 | | | | 97,103,414 | |
Dividends and Distributions (Note 1) | | | | | | | | | | | | |
Dividends from net investment income | | | | | | | | | | | | |
Class R | | | (672,379 | ) | | | (776,701 | ) | | | (475,538 | ) |
Class T | | | (16,894,291 | ) | | | (15,186,130 | ) | | | (10,416,661 | ) |
Total dividends from net investment income | | | (17,566,670 | ) | | | (15,962,831 | ) | | | (10,892,199 | ) |
Distributions from net realized gains | | | | | | | | | | | | |
Class R | | | (8,544,731 | ) | | | (2,403,994 | ) | | | (2,289,461 | ) |
Class T | | | (116,938,940 | ) | | | (30,592,305 | ) | | | (28,632,649 | ) |
Total distributions from net realized gains | | | (125,483,671 | ) | | | (32,996,299 | ) | | | (30,922,110 | ) |
Trust share transactions (Note 6) | | | | | | | | | | | | |
Net proceeds from shares sold | | | 389,878,196 | | | | 421,010,529 | | | | 338,281,653 | |
Net asset value of shares issued in reinvestment of dividends and distributions | | | 128,409,001 | | | | 44,238,738 | | | | 37,439,503 | |
Cost of shares reacquired | | | (275,731,567 | ) | | | (268,940,864 | ) | | | (227,087,747 | ) |
Net increase in net assets from Trust share transactions | | | 242,555,630 | | | | 196,308,403 | | | | 148,633,409 | |
Total increase | | | 183,312,596 | | | | 577,867,411 | | | | 203,922,514 | |
| | | |
| NET ASSETS: | | | | | | | | | | | | |
Beginning of period | | | 1,741,825,329 | | | | 1,163,957,918 | | | | 960,035,404 | |
End of period(a) | | $ | 1,925,137,925 | | | $ | 1,741,825,329 | | | $ | 1,163,957,918 | |
(a) Includes undistributed net investment income of: | | $ | 9,541,475 | | | $ | 12,526,785 | | | $ | 9,770,053 | |
See Notes to Financial Statements.
| | | | |
| 168 | | | The TARGET Portfolio Trust | |
Statement of Changes in Net Assets (continued)
| | | | | | | | | | | | |
| | | INTERNATIONAL
EQUITY PORTFOLIO | |
| | | Nine Months
Ended
July 31,
2014 | | | Year
Ended
October 31,
2013 | | | Year
Ended
October 31,
2012 | |
| | | |
| INCREASE (DECREASE) IN NET ASSETS | | | | | | | | | | | | |
Operations | | | | | | | | | | | | |
Net investment income | | $ | 7,750,595 | | | $ | 6,984,177 | | | $ | 6,806,272 | |
Net realized gain (loss) on investment and foreign currency transactions | | | 8,291,004 | | | | 12,174,474 | | | | (7,188,625 | ) |
Net change in unrealized appreciation (depreciation) on investments | | | (6,894,405 | ) | | | 60,817,098 | | | | 18,376,721 | |
Net increase in net assets resulting from operations | | | 9,147,194 | | | | 79,975,749 | | | | 17,994,368 | |
Dividends and Distributions (Note 1) | | | | | | | | | | | | |
Dividends from net investment income | | | | | | | | | | | | |
Class Q | | | (2,853,716 | ) | | | (3,065,660 | ) | | | (2,649,607 | ) |
Class R | | | (2,935,682 | ) | | | (3,008,506 | ) | | | (1,926,777 | ) |
Class T | | | (1,203,254 | ) | | | (1,535,049 | ) | | | (1,679,297 | ) |
Total dividends from net investment income | | | (6,992,652 | ) | | | (7,609,215 | ) | | | (6,255,681 | ) |
Trust share transactions (Note 6) | | | | | | | | | | | | |
Net proceeds from shares sold | | | 92,099,433 | | | | 102,407,412 | | | | 88,238,519 | |
Net asset value of shares issued in reinvestment of dividends and distributions | | | 6,979,844 | | | | 7,582,919 | | | | 6,222,967 | |
Cost of shares reacquired | | | (49,641,561 | ) | | | (84,338,457 | ) | | | (63,003,945 | ) |
Net increase in net assets from Trust share transactions | | | 49,437,716 | | | | 25,651,874 | | | | 31,457,541 | |
Total increase | | | 51,592,258 | | | | 98,018,408 | | | | 43,196,228 | |
| | | |
| NET ASSETS: | | | | | | | | | | | | |
Beginning of period | | | 432,899,445 | | | | 334,881,037 | | | | 291,684,809 | |
End of period(a) | | $ | 484,491,703 | | | $ | 432,899,445 | | | $ | 334,881,037 | |
(a) Includes undistributed net investment income of: | | $ | 6,460,944 | | | $ | 5,703,001 | | | $ | 6,267,994 | |
See Notes to Financial Statements.
| | | | |
| The TARGET Portfolio Trust | | | 169 | |
Statement of Changes in Net Assets (continued)
| | | | | | | | | | | | |
| | | TOTAL RETURN
BOND PORTFOLIO | |
| | | Nine Months
Ended
July 31,
2014 | | | Year
Ended
October 31,
2013 | | | Year
Ended
October 31,
2012 | |
| | | |
| INCREASE (DECREASE) IN NET ASSETS | | | | | | | | | | | | |
Operations | | | | | | | | | | | | |
Net investment income | | $ | 3,404,131 | | | $ | 6,109,632 | | | $ | 9,360,151 | |
Net realized gain (loss) on investment and foreign currency transactions | | | 5,947,692 | | | | (3,687,956 | ) | | | 10,501,071 | |
Net change in unrealized appreciation (depreciation) on investments | | | (2,643,996 | ) | | | (10,791,655 | ) | | | 11,228,520 | |
Net increase (decrease) in net assets resulting from operations | | | 6,707,827 | | | | (8,369,979 | ) | | | 31,089,742 | |
Dividends and Distributions (Note 1) | | | | | | | | | | | | |
Dividends from net investment income | | | | | | | | | | | | |
Class R | | | (2,215,785 | ) | | | (2,944,697 | ) | | | (3,179,754 | ) |
Class T | | | (2,293,025 | ) | | | (5,049,096 | ) | | | (6,706,984 | ) |
Total dividends from net investment income | | | (4,508,810 | ) | | | (7,993,793 | ) | | | (9,886,738 | ) |
Distributions from net realized gains | | | | | | | | | | | | |
Class R | | | — | | | | (3,476,286 | ) | | | — | |
Class T | | | — | | | | (4,965,544 | ) | | | — | |
Total distributions from net realized gains | | | — | | | | (8,441,830 | ) | | | — | |
Trust share transactions (Note 6) | | | | | | | | | | | | |
Net proceeds from shares sold | | | 85,223,262 | | | | 143,822,780 | | | | 154,665,652 | |
Net asset value of shares issued in reinvestment of dividends and distributions | | | 4,491,087 | | | | 16,349,663 | | | | 9,803,845 | |
Cost of shares reacquired | | | (91,015,660 | ) | | | (170,098,165 | ) | | | (119,678,849 | ) |
Net increase (decrease) in net assets from Trust share transactions | | | (1,301,311 | ) | | | (9,925,722 | ) | | | 44,790,648 | |
Total increase (decrease) | | | 897,706 | | | | (34,731,324 | ) | | | 65,993,652 | |
| | | |
| NET ASSETS: | | | | | | | | | | | | |
Beginning of period | | | 413,697,353 | | | | 448,428,677 | | | | 382,435,025 | |
End of period(a) | | $ | 414,595,059 | | | $ | 413,697,353 | | | $ | 448,428,677 | |
(a) Includes undistributed net investment income of: | | $ | — | | | $ | 678,689 | | | $ | 2,029,705 | |
See Notes to Financial Statements.
| | | | |
| 170 | | | The TARGET Portfolio Trust | |
Statement of Changes in Net Assets (continued)
| | | | | | | | | | | | |
| | | INTERMEDIATE-TERM
BOND PORTFOLIO | |
| | | Nine Months
Ended
July 31,
2014 | | | Year
Ended
October 31,
2013 | | | Year
Ended
October 31,
2012 | |
| | | |
| INCREASE (DECREASE) IN NET ASSETS | | | | | | | | | | | | |
Operations | | | | | | | | | | | | |
Net investment income | | $ | 2,110,469 | | | $ | 3,486,045 | | | $ | 4,425,201 | |
Net realized gain (loss) on investment and foreign currency transactions | | | (2,536,795 | ) | | | 938,021 | | | | 2,311,507 | |
Net change in unrealized appreciation (depreciation) on investments | | | 1,667,318 | | | | (6,553,715 | ) | | | 7,094,009 | |
Net increase (decrease) in net assets resulting from operations | | | 1,240,992 | | | | (2,129,649 | ) | | | 13,830,717 | |
Dividends and Distributions (Note 1) | | | | | | | | | | | | |
Dividends from net investment income | | | | | | | | | | | | |
Class T | | | (2,614,268 | ) | | | (3,200,021 | ) | | | (7,110,257 | ) |
Distributions from net realized gains | | | | | | | | | | | | |
Class T | | | (795,042 | ) | | | (2,612,982 | ) | | | (972,354 | ) |
Trust share transactions (Note 6) | | | | | | | | | | | | |
Net proceeds from shares sold | | | 22,544,679 | | | | 25,377,628 | | | | 24,370,801 | |
Net asset value of shares issued in reinvestment of dividends and distributions | | | 3,325,977 | | | | 5,608,463 | | | | 7,862,089 | |
Cost of shares reacquired | | | (31,625,509 | ) | | | (60,255,240 | ) | | | (51,158,727 | ) |
Net decrease in net assets from Trust share transactions | | | (5,754,853 | ) | | | (29,269,149 | ) | | | (18,925,837 | ) |
Total decrease | | | (7,923,171 | ) | | | (37,211,801 | ) | | | (13,177,731 | ) |
| | | |
| NET ASSETS: | | | | | | | | | | | | |
Beginning of period | | | 131,981,100 | | | | 169,192,901 | | | | 182,370,632 | |
End of period(a) | | $ | 124,057,929 | | | $ | 131,981,100 | | | $ | 169,192,901 | |
(a) Includes undistributed net investment income of: | | $ | 416,114 | | | $ | 919,913 | | | $ | 186,813 | |
See Notes to Financial Statements.
| | | | |
| The TARGET Portfolio Trust | | | 171 | |
Statement of Changes in Net Assets (continued)
| | | | | | | | | | | | |
| | | MORTGAGE BACKED
SECURITIES PORTFOLIO | |
| | | Nine Months
Ended
July 31,
2014 | | | Year
Ended
October 31,
2013 | | | Year
Ended
October 31,
2012 | |
| | | |
| INCREASE (DECREASE) IN NET ASSETS | | | | | | | | | | | | |
Operations | | | | | | | | | | | | |
Net investment income | | $ | 208,735 | | | $ | 602,983 | | | $ | 1,138,388 | |
Net realized gain (loss) on investment and foreign currency transactions | | | 1,358,669 | | | | (394,828 | ) | | | 830,161 | |
Net change in unrealized appreciation (depreciation) on investments | | | (495,387 | ) | | | (667,249 | ) | | | (58,146 | ) |
Net increase (decrease) in net assets resulting from operations | | | 1,072,017 | | | | (459,094 | ) | | | 1,910,403 | |
Dividends and Distributions (Note 1) | | | | | | | | | | | | |
Dividends from net investment income | | | | | | | | | | | | |
Class T | | | (276,494 | ) | | | (917,467 | ) | | | (1,330,954 | ) |
Trust share transactions (Note 6) | | | | | | | | | | | | |
Net proceeds from shares sold | | | 7,279,189 | | | | 11,870,969 | | | | 18,518,112 | |
Net asset value of shares issued in reinvestment of dividends and distributions | | | 270,077 | | | | 885,344 | | | | 1,272,691 | |
Cost of shares reacquired | | | (6,683,545 | ) | | | (12,767,380 | ) | | | (12,045,966 | ) |
Net increase (decrease) in net assets from Trust share transactions | | | 865,721 | | | | (11,067 | ) | | | 7,744,837 | |
Total increase (decrease) | | | 1,661,244 | | | | (1,387,628 | ) | | | 8,324,286 | |
| | | |
| NET ASSETS: | | | | | | | | | | | | |
Beginning of period | | | 42,217,721 | | | | 43,605,349 | | | | 35,281,063 | |
End of period(a) | | $ | 43,878,965 | | | $ | 42,217,721 | | | $ | 43,605,349 | |
(a) Includes undistributed net investment income of: | | $ | 25,216 | | | $ | 92,975 | | | $ | 91,041 | |
See Notes to Financial Statements.
| | | | |
| 172 | | | The TARGET Portfolio Trust | |
Notes to Financial Statements
The TARGET Portfolio Trust (the “Trust”) is an open-end management investment company. The Trust was established as a Delaware business trust on July 29, 1992 and consists of eight separate portfolios (the “Portfolio” or “Portfolios”). All the Portfolios are diversified, as defined under the Investment Company Act of 1940, as amended (“1940 Act”). Investment operations commenced on January 5, 1993.
The Trust’s fiscal year has changed from an annual reporting period that ends October 31 to one that ends July 31. This change should have no impact on the way the Trust is managed. Shareholders will receive future annual and semi-annual reports on the new fiscal year-end schedule.
The Portfolios and their investment objectives are as follows:
| • | | Large Capitalization Growth Portfolio (“Large Capitalization Growth”)—long-term capital appreciation. |
| • | | Large Capitalization Value Portfolio (“Large Capitalization Value”)—total return consisting of capital appreciation and dividend income. |
| • | | Small Capitalization Growth Portfolio (“Small Capitalization Growth”)—maximum capital appreciation. |
| • | | Small Capitalization Value Portfolio (“Small Capitalization Value”)—above average capital appreciation. |
| • | | International Equity Portfolio (“International Equity”)—capital appreciation. |
| • | | Total Return Bond Portfolio (“Total Return Bond”)—total return consisting of current income and capital appreciation. |
| • | | Intermediate-Term Bond Portfolio (“Intermediate-Term Bond”)—current income and reasonable stability of principal. |
| • | | Mortgage Backed Securities Portfolio (“Mortgage Backed Securities”)—high current income primarily and capital appreciation secondarily, each to the extent consistent with the protection of capital. |
The ability of issuers of debt securities held by the Portfolios to meet their obligations may be affected by economic or political developments in a specific industry, region or country.
Note 1. Accounting Policies
The following is a summary of significant accounting policies followed by the Trust and the Portfolios in the preparation of its financial statements.
Security Valuation: The Portfolios hold securities and other assets that are fair valued at the close of each day the New York Stock Exchange (“NYSE”) is open for trading. Fair value is the price that would be received to sell an asset or paid to transfer a liability in an orderly transaction between market participants on the measurement date. The Board of Trustees (the “Board”) has adopted Valuation Procedures for security valuation under which fair valuation responsibilities have been delegated to Prudential Investments LLC (“PI” or “Manager”). Under the current Valuation Procedures, the established Valuation Committee is responsible for supervising the valuation of portfolio securities and other assets. The Valuation Procedures permit the Portfolios to utilize independent pricing vendor services, quotations from market makers, and
| | | | |
| The TARGET Portfolio Trust | | | 173 | |
alternative valuation methods when market quotations are either not readily available or not deemed representative of fair value. A record of the Valuation Committee’s actions is subject to the Board’s review, approval, and ratification at its next regularly-scheduled quarterly meeting.
Various inputs determine how the Portfolios’ investments are valued, all of which are categorized according to the three broad levels (Level 1, 2, or 3) detailed in the tables following each Portfolio of Investments.
Common stocks, exchange-traded funds, and derivative instruments that are traded on a national securities exchange are valued at the last sale price as of the close of trading on the applicable exchange. Securities traded via NASDAQ are valued at the NASDAQ official closing price. To the extent these securities are valued at the last sale price or NASDAQ official closing price, they are classified as Level 1 in the fair value hierarchy except for exchange-traded and cleared swaps which are classified as Level 2 in the fair value hierarchy, as the prices marked at the official settle are not public.
In the event that no sale or official closing price on valuation date exists, these securities are generally valued at the mean between the last reported bid and asked prices, or at the last bid price in the absence of an asked price. These securities are classified as Level 2 in the fair value hierarchy, as the inputs are observable and considered to be significant to the valuation.
Common stocks traded on foreign securities exchanges are valued using pricing vendor services that provide model prices derived using adjustment factors based on information such as local closing price, relevant general and sector indices, currency fluctuations, depositary receipts, and futures, as applicable. Securities valued using such model prices are classified as Level 2 in the fair value hierarchy, as the adjustment factors are observable and considered to be significant to the valuation. Securities not valued using such model prices are valued in accordance with exchange-traded common stocks discussed above.
Investments in open-end, non-exchange-traded mutual funds are valued at their net asset values as of the close of the NYSE on the date of valuation. These securities are classified as Level 1 in the fair value hierarchy since they may be purchased or sold at their net asset values on the date of valuation.
Fixed income securities traded in the over-the-counter market are generally valued at prices provided by approved independent pricing vendors. The pricing vendors provide these prices after evaluating observable inputs including, but not limited to yield curves, yield spreads, credit ratings, deal terms, tranche level attributes, default rates, cash flows, prepayment speeds, broker/dealer quotations, and reported trades. Securities valued using such vendor prices are classified as Level 2 in the fair value hierarchy.
Over-the-counter derivative instruments are generally valued using pricing vendor services, which derive the valuation based on inputs such as underlying asset prices, indices, spreads, interest rates, and exchange rates. These instruments are categorized as Level 2 in the fair value hierarchy.
Securities and other assets that cannot be priced according to the methods described above are valued based on pricing methodologies approved by the Board. In the event that significant unobservable inputs are used when determining such valuations, the securities will be classified as Level 3 in the fair value hierarchy.
When determining the fair value of securities, some of the factors influencing the valuation include: the nature of any restrictions on disposition of the securities; assessment of the general liquidity of the securities; the issuer’s financial condition and the markets in which it does business; the cost of the investment; the size of the holding and the capitalization of the issuer; the prices of any recent transactions or bids/offers for such securities or any comparable securities; any available analyst media or other reports or information deemed reliable by the investment adviser regarding the issuer or the markets or industry in which it operates. Using fair value to price securities may result in a value that is different from a security’s most recent closing price and from the price used by other mutual funds to calculate their net asset values.
| | | | |
| 174 | | | The TARGET Portfolio Trust | |
Repurchase Agreements: In connection with transactions in repurchase agreements with United States financial institutions, it is the Trust’s policy that its custodian or designated sub custodians under tri-party repurchase agreements, as the case may be, take possession of the underlying collateral securities, the value of which exceeds the principal amount of the repurchase transaction, including accrued interest. The value of the collateral is marked-to-market on a daily basis to ensure the adequacy of the collateral. If the seller defaults, and the value of the collateral declines or, if bankruptcy proceedings are commenced with respect to the seller of the security, realization of the collateral by the Trust may be delayed or limited.
Financial Futures Contracts: A financial futures contract is an agreement to purchase (long) or sell (short) an agreed amount of securities at a set price for delivery on a future date. Upon entering into a financial futures contract, the Portfolio is required to pledge to the broker an amount of cash and/or other assets equal to a certain percentage of the contract amount. This amount is known as the “initial margin.” Sub- sequent payments, known as “variation margin,” are made or received by the Portfolio each day, depending on the daily fluctuations in the value of the underlying security. Such variation margin is recorded for financial statement purposes on a daily basis as an unrealized gain or loss. When the contract expires or is closed, the gain or loss is realized and is presented in the Statements of Operations as a net realized gain or loss on financial futures contracts.
Certain Portfolios invested in financial futures contracts in order to hedge their existing portfolio securities, or securities the Portfolio intends to purchase, against fluctuations in value caused by changes in prevailing interest rates, value of equities or foreign currency exchange rates. The Portfolio may not achieve the anticipated benefits of the financial futures contracts and may realize a loss. Certain Portfolios entered into equity index futures contracts to gain market exposure. The use of futures transactions involves the risk of imperfect correlation in movements in the price of futures contracts, interest rates and the underlying hedged assets. With exchange-traded futures contracts, there is minimal counterparty credit risk to the Portfolios since the exchanges’ clearing house acts as counterparty to all exchange-traded futures and guarantees the futures contracts against default.
Foreign Currency Translation: The books and records of the Portfolios are maintained in U.S. dollars. Foreign currency amounts are translated into U.S. dollars on the following basis:
(i) market value of investment securities, other assets and liabilities—at the current daily rates of exchange;
(ii) purchases and sales of investment securities, income and expenses—at the rates of exchange prevailing on the respective dates of such transactions.
The Portfolios do not isolate that portion of the results of operations arising as a result of changes in the foreign exchange rates from the fluctuations arising from changes in the market prices of long-term securities held at period end. Similarly, the Portfolios do not isolate the effect of changes in foreign exchange rates from the fluctuations arising from changes in the market prices of long-term portfolio securities sold during the period. Accordingly, realized foreign currency gains or losses are included in the reported net realized gains or losses on investment transactions.
Net realized gains or losses on foreign currency transactions represent net foreign exchange gains or losses from holdings of foreign currencies and forward currency contracts, disposition of foreign currencies, currency gains or losses realized between the trade date and settlement date on securities transactions, and the difference between the amounts of dividends, interest and foreign withholding taxes recorded on the Portfolios’ books and the U.S. dollar equivalent amounts actually received or paid. Net unrealized currency gains or losses from valuing foreign currency denominated assets and liabilities (other than investments) at period-end exchange rates are reflected as a component of net unrealized appreciation (depreciation) on foreign currencies.
| | | | |
| The TARGET Portfolio Trust | | | 175 | |
Concentration of Risk: The ability of debt securities issuers (other than those issued or guaranteed by the U.S. Government) held by the Fund to meet its obligations may be affected by the economic or political developments in a specific industry, region or country. Foreign security and currency transactions may involve certain considerations and risks not typically associated with those of domestic origin as a result of, among other factors, the possibility of political and economic instability or the level of governmental supervision and regulation of foreign securities markets.
Forward Foreign Currency Contracts: A forward foreign currency contract is a commitment to purchase or sell a foreign currency at a future date at a negotiated forward rate. Certain Portfolios entered into forward foreign currency contracts in order to hedge their exposure to changes in foreign currency exchange rates on their foreign portfolio holdings or on specific receivables and payables denominated in a foreign currency and to gain exposure to certain currencies. The contracts are valued daily at current forward exchange rates and any unrealized gain or loss is included in net unrealized appreciation or depreciation on foreign currency transactions. Gains or losses are realized on the settlement date of the contract equal to the difference between the settlement value of the original and negotiated forward contracts. This gain or loss, if any, is included in net realized gain or loss on foreign currency transactions. Risks may arise upon entering into these contracts from the potential inability of the counterparties to meet the terms of their contracts. Forward currency contracts involve risks from currency exchange rate and credit risk in excess of the amounts reflected on the Statement of Assets and Liabilities. The Portfolio’s maximum risk of loss from counterparty credit risk is the net value of the cash flows to be received from the counterparty at the end of the contract’s life.
Options: Certain Portfolios purchased and wrote options in order to hedge against adverse market movements or fluctuations in value caused by changes in prevailing interest rates or foreign currency exchange rates, with respect to securities which the Portfolio currently owns or intends to purchase. The Portfolio’s principal reason for writing options is to realize, through receipt of premiums, a greater current return than would be realized on the underlying security alone. When the Portfolio purchases an option, it pays a premium and an amount equal to that premium is recorded as an asset. When the Portfolio writes an option, it receives a premium and an amount equal to that premium is recorded as a liability. The asset or liability is adjusted daily to reflect the current market value of the option. If an option expires unexercised, the Portfolio realizes a gain or loss to the extent of the premium received or paid. If an option is exercised, the premium received or paid is recorded as an adjustment to the proceeds from the sale or the cost of the purchase in determining whether the Portfolio has realized a gain or loss. The difference between the premium and the amount received or paid at the closing of a purchase or sale transaction is also treated as a realized gain or loss. Gain or loss on purchased options is included in net realized gain or loss on investment transactions. Gain or loss on written options is presented separately as net realized gain or loss on options written. The Portfolio, as writer of an option, may have no control over whether the underlying securities may be sold (called) or purchased (put). As a result, the Portfolio bears the market risk of an unfavorable change in the price of the security underlying the written option. The Portfolio, as purchaser of an over-the-counter option, bears the risk of the potential inability of the counterparties to meet the terms of their contracts.
With exchange-traded options contracts, there is minimal counterparty credit risk to the Portfolio since the exchanges’ clearinghouse acts as counterparty to all exchange-traded options and guarantees the options contracts against default.
Short Sales: Certain Portfolios may make short sales of securities as a method of hedging potential price declines in similar securities owned. The Portfolio may sell a security it does not own in anticipation of a decline in the market value of that security (short sale). When the Portfolio makes a short sale, it will borrow the security sold short and deliver it to the broker-dealer through which it made the short sale as
| | | | |
| 176 | | | The TARGET Portfolio Trust | |
collateral for its obligation to deliver the security upon conclusion of the sale. The Portfolio may have to pay a fee to borrow the particular security and may be obligated to return any interest or dividends received on such borrowed securities. A gain, limited to the price at which the Portfolio sold the security short, or a loss, unlimited as to dollar amount, will be recognized upon the termination of a short sale if the market price at termination is less than or greater than the proceeds originally received, respectively, and is presented in the Statement of Operations as net realized gain or loss on short sales. The Portfolio maintains a segregated account of securities or other liquid assets, the dollar value of which is at least equal to its obligation with respect to short sales.
Swap Agreements: Certain Portfolios may enter into credit default, interest rate, total return and other forms of swap agreements. A swap agreement is an agreement to exchange the return generated by one instrument for the return generated by another instrument. Swap agreements are negotiated in the over-the-counter market and may be executed either directly with a counterparty (“OTC-traded”) or through a central clearing facility, such as a registered commodities exchange (“Exchange-traded”). Swap agreements are valued daily at current market value and any change in value is included in the net unrealized appreciation or depreciation on investments. Upon entering into an exchange traded swap, the Portfolio pledges with the clearing broker an initial margin and thereafter, pays or receives an amount, known as “variation margin”, based on daily changes in valuation of the swap contract. Payments received or paid by the Portfolio are recorded as realized gains or losses upon termination or maturity of the swap. Risk of loss may exceed amounts recognized on the Statements of Assets and Liabilities. Swap agreements outstanding at period end, if any, are listed on the Portfolio of Investments.
Interest Rate Swaps: Interest rate swaps represent agreements between counterparties to exchange cash flows based on the difference between two interest rates, applied to a notional principal amount for a specified period. Certain Portfolios are subject to interest rate risk exposure in the normal course of pursuing their investment objectives. Certain Portfolios used interest rate swaps to generate steady cash flow by receiving a stream of fixed rate payments and to increase exposure to prevailing market rates by receiving floating rate payments. A Portfolio’s maximum risk of loss from counterparty credit risk is the discounted net value of the cash flows to be received from the counterparty over the contract’s remaining life.
Credit Default Swaps: Credit default swaps (“CDS”) involve one party (the protection buyer) making a stream of payments to another party (the protection seller) in exchange for the right to receive a specified payment in the event of a default or as a result of a default (collectively a “credit event”) for the referenced entity, typically corporate issues or sovereign issues of an emerging country, on its obligation; or in the event of a write-down, principal shortfall, interest shortfall or default of all or part of the referenced entities comprising a credit index.
Certain Portfolios are subject to credit risk in the normal course of pursuing their investment objectives. Certain Portfolios have entered into CDS contracts to provide a measure of protection against defaults or to take an active long or short position with respect to the likelihood of a particular issuer’s default or the reference entity’s credit soundness. CDS contracts generally trade based on a spread which represents the cost a protection buyer has to pay the protection seller. The protection buyer is said to be short the credit as the value of the contract rises the more the credit deteriorates. The value of the CDS contract increases for the protection buyer if the spread increases. A Portfolio’s maximum risk of loss from counterparty credit risk for purchased credit default swaps is the inability of the counterparty to honor the contract up to the notional value due to a credit event.
As a seller of protection on credit default swap agreements, a Portfolio will generally receive from the buyer of protection an agreed upon payment throughout the term of the swap provided that there is no credit event. As the seller, a Portfolio would effectively increase investment risk to its portfolio because, in addition to its total net assets, a Portfolio may be subject to investment exposure on the notional amount of the swap.
| | | | |
| The TARGET Portfolio Trust | | | 177 | |
The maximum amount of the payment that a Portfolio as a seller of protection could be required to make under a credit default swap agreement would be equal to notional amount of the underlying security or index contract as a result of a credit event. These potential amounts will be partially offset by any recovery values of the respective referenced obligations, or net amounts received from the settlement of buy protection credit default swap agreements entered into by the Portfolio for the same referenced entity or index. As a buyer of protection, the Portfolio generally receives an amount up to the notional value of the swap if a credit event occurs.
Implied credit spreads, represented in absolute terms, utilized in determining the market value of credit default swap agreements on corporate issues or sovereign issues of an emerging country as of period end are disclosed in the footnotes to the Portfolios of Investments and serve as an indicator of the current status of the payment/performance risk and represent the likelihood or risk of default for the credit derivative. The implied credit spread of a particular referenced entity reflects the cost of buying/selling protection and may include upfront payments required to enter into the agreement. For credit default swap agreements on asset-backed securities and credit indices, the quoted market prices and resulting values serve as the indicator of the current status of the payment and/or performance risk. Wider credit spreads and increasing market value in absolute terms, when compared to the notional amount of the swap, represent a deterioration of the referenced entity’s credit soundness and a greater likelihood or risk of default or other credit event occurring as defined under the terms of the agreement.
Master Netting Arrangements: Certain Portfolios are subject to various Master Agreements, or netting arrangements, with select counterparties. A master netting arrangement between a Portfolio and the counterparty permits a Portfolio to offset amounts payable by a Portfolio to the same counterparty against amounts to be received; and by the receipt of collateral from the counterparty by a Portfolio to cover a Portfolio’s exposure to the counterparty. However, there is no assurance that such mitigating factors are easily enforceable. The right to set-off exists when all the conditions are met such that each of the parties owes the other determinable amounts, the reporting party has the right to set-off the amount owed with the amount owed by the other party, the reporting party intends to set-off and the right of set-off is enforceable by law. During the reporting period, there were no instances where the right of set-off existed and management has not elected to offset.
Certain Portfolios are party to ISDA (International Swaps and Derivatives Association, Inc.) Master Agreements (Master Agreements) with certain counterparties that govern over-the-counter derivative and foreign exchange contracts entered into from time to time. The Master Agreements may contain provisions regarding, among other things, the parties’ general obligations, representations, agreements, collateral requirements, events of default and early termination. With respect to certain counterparties, in accordance with the terms of the Master Agreements, collateral posted to a Portfolio is held in a segregated account by a Portfolio’s custodian and with respect to those amounts which can be sold or re-pledged, is presented in the Portfolio of Investments. Collateral pledged by a Portfolio is segregated by a Portfolio’s custodian and identified in the Portfolio of Investments. Collateral can be in the form of cash or debt securities issued by the U.S. Government or related agencies or other securities as agreed to by a Portfolio and the applicable counterparty. Collateral requirements are determined based on a Portfolio’s net position with each counterparty. Termination events applicable to a Portfolio may occur upon a decline in a Portfolio’s net assets below a specified threshold over a certain period of time. Termination events applicable to counterparties may occur upon a decline in the counterparty’s long-term and short term credit ratings below a specified level. In each case, upon occurrence, the other party may elect to terminate early and cause settlement of all derivative and foreign exchange contracts outstanding, including the payment of any losses and costs resulting from such early termination, as reasonably determined by the terminating party. Any decision by one or more of a Portfolio’s counterparties to elect early termination could impact a Portfolio’s future derivative activity.
| | | | |
| 178 | | | The TARGET Portfolio Trust | |
In addition to each instrument’s primary underlying risk exposure (e.g. interest rate, credit, equity or foreign exchange, etc.), swap agreements involve, to varying degrees, elements of credit, market and documentation risk. Such risks involve the possibility that no liquid market for these agreements will exist, the counterparty to the agreement may default on its obligation to perform or disagree on the contractual terms of the agreement, and changes in net interest rates will be unfavorable. In connection with these agreements, securities in the portfolio may be identified or received as collateral from the counterparty in accordance with the terms of the respective swap agreements to provide or receive assets of value and to serve as recourse in the event of default or bankruptcy/insolvency of either party. Such over-the-counter derivative agreements include conditions which, when materialized, give the counterparty the right to cause an early termination of the transactions under those agreements. Any election by the counterparty for early termination of the contract(s) may impact the amounts reported on financial statements.
As of July 31, 2014, the Portfolios have not met conditions under such agreements which give the counterparty the right to call for an early termination.
Forward currency contracts, written options, short sales, swaps and financial futures contracts involve elements of both market and credit risk in excess of the amounts reflected on the Statement of Assets and Liabilities. Such risks may be mitigated by engaging in master netting arrangements.
Warrants and Rights: Certain Portfolios hold warrants and rights acquired either through a direct purchase, included as part of a private placement, or pursuant to corporate actions. Warrants and rights entitle the holder to buy a proportionate amount of common stock at a specific price and time through the expiration dates. Such warrants and rights are held as long positions by the Portfolio until exercised, sold or expired. Warrants and rights are valued at fair value in accordance with the Board of Trustees’ approved fair valuation procedures.
The Portfolios invested in various derivative instruments during the reporting period. The primary types of risk associated with these derivative instruments are credit risk, equity risk, foreign exchange risk and interest rate risk. The effect of such derivative instruments on each Portfolio’s financial position and financial performance as reflected in the Statement of Assets and Liabilities and Statement of Operations is presented in the summary below.
Fair values of derivative instruments as of July 31, 2014 as presented in the Statement of Assets and Liabilities:
| | | | | | | | | | | | |
| | | Asset Derivatives | | | Liability Derivatives | |
Derivatives not accounted
for as hedging instruments,
carried at fair value | | Balance Sheet Location | | Fair
Value | | | Balance Sheet Location | | Fair
Value | |
| Small Capitalization Growth | | | | | | | | | | | | |
Equity contracts | | Unaffiliated investments | | $ | 6,488 | | | — | | | — | |
| | | | | | | | | | | | |
| Small Capitalization Value | | | | | | | | | | | | |
Equity contracts | | — | | $ | — | | | Due to broker for variation margin | | $ | 230,465 | * |
| | | | | | | | | | | | |
| International Equity | | | | | | | | | | | | |
Foreign exchange contracts | | Unrealized appreciation on forward foreign currency exchange contracts | | $ | 598,106 | | | — | | | — | |
| | | | | | | | | | | | |
| | | | |
| The TARGET Portfolio Trust | | | 179 | |
| | | | | | | | | | | | |
| | | Asset Derivatives | | | Liability Derivatives | |
Derivatives not accounted
for as hedging instruments,
carried at fair value | | Balance Sheet Location | | Fair
Value | | | Balance Sheet Location | | Fair
Value | |
| Total Return Bond | | | | | | | | | | | | |
Interest rate contracts | | Due to broker for variation margin | | $ | 216,525 | * | | Due to broker for variation margin | | $ | 267,368 | * |
Interest rate contracts | | Payments made for swap agreements | | | 917 | | | Payments received for swap agreements | | | 11,801 | |
Interest rate contracts | | Unrealized appreciation on over-the-counter swaps | | | 101,128 | | | Unrealized depreciation on over-the-counter swaps | | | 135,083 | |
Interest rate contracts | | — | | | — | | | Options written | | | 138,606 | |
Foreign exchange contracts | | Unrealized appreciation on forward foreign currency exchange contracts | | | 1,919,653 | | | Unrealized depreciation on forward foreign currency exchange contracts | | | 561,854 | |
Foreign exchange contracts | | — | | | — | | | Options written | | | 7,662 | |
Credit contracts | | Due to broker for variation margin | | | 19,475 | * | | — | | | — | |
Credit contracts | | Payments made for swap agreements | | | 41,090 | | | Payments received for swap agreements | | | 428,048 | |
Credit contracts | | Unrealized appreciation on over-the-counter swaps | | | 489,113 | | | Unrealized depreciation on over-the-counter swaps | | | 10,674 | |
| | | | | | | | | | | | |
Total | | | | $ | 2,787,901 | | | | | $ | 1,561,096 | |
| | | | | | | | | | | | |
| Intermediate-Term Bond | | | | | | | | | | | | |
Interest rate contracts | | Due from broker for variation margin | | $ | 777,922 | * | | Due from broker for variation margin | | $ | 489,355 | * |
Interest rate contracts | | Unaffiliated investments | | | 2,300 | | | Options written | | | 460 | |
Foreign exchange contracts | | Unrealized appreciation on forward foreign currency exchange contracts | | | 168,001 | | | Unrealized depreciation on forward foreign currency exchange contracts | | | 56,176 | |
Credit contracts | | Unrealized appreciation on over-the-counter swaps | | | 338,568 | | | Unrealized depreciation on over-the-counter swaps | | | 54,912 | |
Credit contracts | | Payments made for swap agreements | | | 179,848 | | | Payments received for swap agreements | | | 34,372 | |
| | | | | | | | | | | | |
Total | | | | $ | 1,466,639 | | | | | $ | 635,275 | |
| | | | | | | | | | | | |
| Mortgage Backed Securities | | | | | | | | | | | | |
Interest rate contracts | | Due to broker for variation margin | | $ | 2,739 | * | | Due to broker for variation margin | | $ | 6,984 | * |
| | | | | | | | | | | | |
| * | Includes cumulative appreciation/depreciation as reported in schedule of open futures and exchange-trade swap contracts. Only unsettled variation margin receivable (payable) is reported within the Statement of Assets and Liabilities. |
| | | | |
| 180 | | | The TARGET Portfolio Trust | |
The effects of derivative instruments on the Statement of Operations for the nine months ended July 31, 2014 are as follows:
| | | | | | | | | | | | | | | | | | | | | | | | | | | | | | | | |
| Amount of Realized Gain or (Loss) on Derivatives Recognized in Income | |
| | | | | | | | |
Derivatives not
accounted for as
hedging instruments,
carried at fair value | | Rights | | | Warrants | | | Options
Purchased | | | Futures | | | Options
Written | | | Swaps | | | Forward
Currency
Contracts | | | Total | |
| Small Capitalization Value | | | | | | | | | | | | | | | | | | | | | | | | | | | | | | | | |
Equity contracts | | $ | — | | | $ | — | | | $ | — | | | $ | 735,259 | | | $ | — | | | $ | — | | | $ | — | | | $ | 735,259 | |
| | | | | | | | | | | | | | | | | | | | | | | | | | | | | | | | |
| International Equity | | | | | | | | | | | | | | | | | | | | | | | | | | | | | | | | |
Foreign exchange contracts | | $ | — | | | $ | — | | | $ | — | | | $ | — | | | $ | — | | | $ | — | | | $ | (183,326 | ) | | $ | (183,326 | ) |
Equity contracts | | | 224,744 | | | | — | | | | — | | | | — | | | | — | | | | — | | | | — | | | | 224,744 | |
| | | | | | | | | | | | | | | | | | | | | | | | | | | | | | | | |
Total | | $ | 224,744 | | | $ | — | | | $ | — | | | $ | — | | | $ | — | | | $ | — | | | $ | (183,326 | ) | | $ | 41,418 | |
| | | | | | | | | | | | | | | | | | | | | | | | | | | | | | | | |
| Total Return Bond | | | | | | | | | | | | | | | | | | | | | | | | | | | | | | | | |
Interest rate contracts | | $ | — | | | $ | — | | | $ | — | | | $ | 1,405,338 | | | $ | 588,901 | | | $ | (1,662,841 | ) | | $ | — | | | $ | 331,398 | |
Foreign exchange contracts | | | — | | | | — | | | | — | | | | — | | | | — | | | | — | | | | (514,186 | ) | | | (514,186 | ) |
Credit contracts | | | — | | | | — | | | | — | | | | — | | | | 1,958 | | | | 376,138 | | | | — | | | | 378,096 | |
| | | | | | | | | | | | | | | | | | | | | | | | | | | | | | | | |
Total | | $ | — | | | $ | — | | | $ | — | | | $ | 1,405,338 | | | $ | 590,859 | | | $ | (1,286,703 | ) | | $ | (514,186 | ) | | $ | 195,308 | |
| | | | | | | | | | | | | | | | | | | | | | | | | | | | | | | | |
| Intermediate-Term Bond | | | | | | | | | | | | | | | | | | | | | | | | | | | | | | | | |
Interest rate contracts | | $ | — | | | $ | — | | | $ | — | | | $ | (192,911 | ) | | $ | 171,645 | | | $ | (815,107 | ) | | $ | — | | | $ | (836,373 | ) |
Foreign exchange contracts | | | — | | | | — | | | | — | | | | — | | | | — | | | | — | | | | (421,955 | ) | | | (421,955 | ) |
Credit contracts | | | — | | | | — | | | | — | | | | — | | | | — | | | | (1,169,686 | ) | | | — | | | | (1,169,686 | ) |
| | | | | | | | | | | | | | | | | | | | | | | | | | | | | | | | |
Total | | $ | — | | | $ | — | | | $ | — | | | $ | (192,911 | ) | | $ | 171,645 | | | $ | (1,984,793 | ) | | $ | (421,955 | ) | | $ | (2,428,014 | ) |
| | | | | | | | | | | | | | | | | | | | | | | | | | | | | | | | |
| Mortgage Backed Securities | | | | | | | | | | | | | | | | | | | | | | | | | | | | | | | | |
Interest rate contracts | | $ | — | | | $ | — | | | $ | 3,437 | | | $ | 134,348 | | | $ | — | | | $ | — | | | $ | — | | | $ | 137,785 | |
| | | | | | | | | | | | | | | | | | | | | | | | | | | | | | | | |
| | | | | | | | | | | | | | | | | | | | | | | | | | | | | | | | |
| Change in Unrealized Appreciation or (Depreciation) on Derivatives Recognized in Income | |
| | | | | | | | |
Derivatives not
accounted for as
hedging instruments,
carried at fair value | | Rights | | | Warrants | | | Options
Purchased | | | Futures | | | Options
Written | | | Swaps | | | Forward
Currency
Contracts | | | Total | |
| Small Capitalization Growth | | | | | | | | | | | | | | | | | | | | | | | | | | | | | | | | |
Equity contracts | | $ | — | | | $ | (1,364 | ) | | $ | — | | | $ | — | | | $ | — | | | $ | — | | | $ | — | | | $ | (1,364 | ) |
| | | | | | | | | | | | | | | | | | | | | | | | | | | | | | | | |
| Small Capitalization Value | | | | | | | | | | | | | | | | | | | | | | | | | | | | | | | | |
Equity contracts | | $ | — | | | $ | — | | | $ | — | | | $ | (253,185 | ) | | $ | — | | | $ | — | | | $ | — | | | $ | (253,185 | ) |
| | | | | | | | | | | | | | | | | | | | | | | | | | | | | | | | |
| International Equity | | | | | | | | | | | | | | | | | | | | | | | | | | | | | | | | |
Foreign exchange contracts | | $ | — | | | $ | — | | | $ | — | | | $ | — | | | $ | — | | | $ | — | | | $ | 814,382 | | | $ | 814,382 | |
| | | | | | | | | | | | | | | | | | | | | | | | | | | | | | | | |
| | | | |
| The TARGET Portfolio Trust | | | 181 | |
| | | | | | | | | | | | | | | | | | | | | | | | | | | | | | | | |
| Change in Unrealized Appreciation or (Depreciation) on Derivatives Recognized in Income | |
| | | | | | | | |
Derivatives not
accounted for as
hedging instruments,
carried at fair value | | Rights | | | Warrants | | | Options
Purchased | | | Futures | | | Options
Written | | | Swaps | | | Forward
Currency
Contracts | | | Total | |
| Total Return Bond | | | | | | | | | | | | | | | | | | | | | | | | | | | | | | | | |
Interest rate contracts | | $ | — | | | $ | — | | | $ | — | | | $ | (1,344,015 | ) | | $ | 12,658 | | | $ | 270,017 | | | $ | — | | | $ | (1,061,340 | ) |
Foreign exchange contracts | | | — | | | | — | | | | — | | | | — | | | | 3,508 | | | | — | | | | 1,749,852 | | | | 1,753,360 | |
Credit contracts | | | — | | | | — | | | | — | | | | — | | | | (961 | ) | | | 239,833 | | | | — | | | | 238,872 | |
| | | | | | | | | | | | | | | | | | | | | | | | | | | | | | | | |
Total | | $ | — | | | $ | — | | | $ | — | | | $ | (1,344,015 | ) | | $ | 15,205 | | | $ | 509,850 | | | $ | 1,749,852 | | | $ | 930,892 | |
| | | | | | | | | | | | | | | | | | | | | | | | | | | | | | | | |
| Intermediate-Term Bond | | | | | | | | | | | | | | | | | | | | | | | | | | | | | | | | |
Interest rate contracts | | $ | — | | | $ | — | | | $ | (14,108 | ) | | $ | (211,229 | ) | | $ | (18,620 | ) | | $ | 287,036 | | | $ | — | | | $ | 43,079 | |
Foreign exchange contracts | | | — | | | | — | | | | — | | | | — | | | | — | | | | — | | | | 318,996 | | | | 318,996 | |
Credit contracts | | | — | | | | — | | | | — | | | | — | | | | — | | | | 878,313 | | | | — | | | | 878,313 | |
| | | | | | | | | | | | | | | | | | | | | | | | | | | | | | | | |
Total | | $ | — | | | $ | — | | | $ | (14,108 | ) | | $ | (211,229 | ) | | $ | (18,620 | ) | | $ | 1,165,349 | | | $ | 318,996 | | | $ | 1,240,388 | |
| | | | | | | | | | | | | | | | | | | | | | | | | | | | | | | | |
| Mortgage Backed Securities | | | | | | | | | | | | | | | | | | | | | | | | | | | | | | | | |
Interest rate contracts | | $ | — | | | $ | — | | | $ | — | | | $ | 17,541 | | | $ | — | | | $ | — | | | $ | — | | | $ | 17,541 | |
| | | | | | | | | | | | | | | | | | | | | | | | | | | | | | | | |
For the nine months ended July 31, 2014, the average volume of derivative activities are as follows:
| | | | | | | | | | | | | | | | | | | | |
Portfolio | | Options
Purchased(1) | | | Futures
Contracts - Long
Positions(2) | | | Futures
Contracts - Short
Positions(2) | | | Forward
foreign
currency
exchange
purchase
contracts(3) | | | Forward
foreign
currency
exchange sale
contracts(4) | |
Small Capitalization Value | | $ | — | | | $ | 4,714,678 | | | $ | — | | | $ | — | | | $ | — | |
International Equity | | | — | | | | — | | | | — | | | | 5,267,390 | | | | 32,543,077 | |
Total Return Bond | | | — | | | | 416,571,089 | | | | — | | | | 37,179,975 | | | | 91,108,781 | |
Intermediate-Term Bond | | | 12,306 | | | | 51,260,755 | | | | 33,252,674 | | | | 7,311,722 | | | | 16,057,698 | |
Mortgage Backed Securities | | | — | | | | 1,672,058 | | | | 2,962,030 | | | | — | | | | — | |
| | | | | | | | | | | | | | | | |
Portfolio | | Options
Written(5) | | | Interest rate
swap
agreements(5) | | | Credit default
swap
agreements - Buy
Protection(5) | | | Credit default
swap
agreements - Sell
Protection(5) | |
Small Capitalization Value | | $ | — | | | $ | — | | | $ | — | | | $ | — | |
International Equity | | | — | | | | — | | | | — | | | | — | |
Total Return Bond | | | 65,417,214 | | | | 103,272,490 | | | | — | | | | 39,850,000 | |
Intermediate-Term Bond | | | 147,150,000 | | | | 57,191,739 | | | | 11,948,559 | | | | 8,268,319 | |
Mortgage Backed Securities | | | — | | | | — | | | | — | | | | — | |
| (3) | Value at Settlement Date Payable. |
| (4) | Value at Settlement Date Receivable. |
| | | | |
| 182 | | | The TARGET Portfolio Trust | |
Securities Lending: The Portfolio may lend its portfolio securities to banks and broker-dealers. The loans are secured by collateral at least equal to the market value of the securities loaned. Collateral pledged by each borrower is invested in a highly liquid short-term money market fund and is marked to market daily, based on the previous day’s market value, such that the value of the collateral exceeds the value of the loaned securities. Loans are subject to termination at the option of the borrower or the Portfolio. Upon termination of the loan, the borrower will return to the lender securities identical to the loaned securities. Should the borrower of the securities fail financially, the Portfolio has the right to repurchase the securities using the collateral in the open market. The Portfolio recognizes income, net of any rebate and securities lending agent fees, for lending its securities, and any interest on the investment of any cash received as collateral. The Portfolio also continues to receive interest and dividends or amounts equivalent thereto on the securities loaned and recognizes any unrealized gain or loss in the market price of the securities loaned that may occur during the term of the loan.
When-Issued/Delayed Delivery Securities: Certain Portfolios may purchase or sell securities on a when-issued or delayed delivery basis. These transactions involve a commitment by the Portfolio to pur- chase or sell securities for a predetermined price or yield, with payment and delivery taking place beyond the customary settlement period. When delayed delivery purchases are outstanding, the Portfolio will set aside and maintain until the settlement date in a segregated account, liquid assets in an amount sufficient to meet the purchase price. When purchasing a security on a delayed delivery basis, the Portfolio assumes the rights and risks of ownership of the security, including the risk of price and yield fluctuations, and takes such fluctuations into account when determining its net asset value. The Portfolio may dispose of or renegotiate a delayed delivery transaction after it is entered into, and may sell when-issued securities before they are delivered, which may result in a capital gain or loss. When the Portfolio has sold a security on a delayed delivery basis, the Portfolio does not participate in future gains and losses with respect to the security.
Securities Transactions and Net Investment Income: Securities transactions are recorded on the trade date. Realized gains and losses from investment and currency transactions are calculated on the identified cost basis. Dividend income is recorded on the ex-dividend date. Interest income, including amortization of premium and accretion of discount of debt securities, as required, is recorded on the accrual basis. Expenses are recorded on an accrual basis, which may require the use of certain estimates by management, that may differ from actual. The Trust’s expenses are allocated to the respective Portfolios on the basis of relative net assets except for expenses that are charged directly at the Portfolio or class level.
Net investment income or loss (other than distribution fees which are charged directly to the respective class and transfer agency fees specific to Class Q shares which are charged to that share class), and unrealized and realized gains or losses are allocated daily to each class of shares based upon the relative proportion of adjusted net assets of each class at the beginning of the day.
Certain Portfolios invest in real estate investment trusts (“REITs”), which report information on the source of their distributions annually. Based on current and historical information, a portion of distributions received from REITs during the period is estimated to be dividend income, capital gain or return of capital and recorded accordingly. These estimates are adjusted when the actual source of distributions is disclosed by the REITs.
Dividends and Distributions: The Total Return Bond Portfolio, Intermediate-Term Bond Portfolio, and Mortgage Backed Securities Portfolio declare dividends of their net investment income daily and pay such dividends monthly. All other Portfolios declare and pay a dividend from net investment income, if any, at least annually. Each Portfolio declares and pays its net realized capital gains, if any, at least annually. Dividends and distributions to shareholders, which are determined in accordance with federal income tax regulations and which may differ from generally accepted accounting principles, are recorded on
| | | | |
| The TARGET Portfolio Trust | | | 183 | |
ex-dividend date. Permanent book/ tax differences relating to income and gains are reclassified amongst undistributed net investment income, accumulated net realized gain or loss and paid-in capital, in excess of par, as appropriate.
Taxes: For federal income tax purposes, each Portfolio in the Trust is treated as a separate tax-paying entity. It is each Portfolio’s policy to continue to meet the requirements of the Internal Revenue Code applicable to regulated investment companies and to distribute all of its taxable net investment income and capital gains, if any, to its shareholders. Therefore, no federal income tax provision is required.
The Portfolios have a tax year end of October 31st.
Withholding taxes on foreign interest and dividends are recorded net of reclaimable amounts, at the time the related income is earned.
Estimates: The preparation of the financial statements requires management to make estimates and assumptions that affect the reported amounts and disclosures in the financial statements. Actual results could differ from those estimates.
Note 2. Agreements
The Trust’s manager is Prudential Investments LLC (“PI”). PI manages the investment operations of the Trust, administers the Trust’s affairs and is responsible for the selection, subject to review and approval of the Trustees, of the sub-advisers. PI supervises the sub-advisers’ performance of advisory services and makes recommendations to the Trustees as to whether the sub-advisers’ contracts should be renewed, modified or terminated. PI pays for the costs pursuant to the advisory agreements, the cost of compensation of officers of the Trust, occupancy and certain clerical and accounting costs of the Trust. The Trust bears all other costs and expenses.
The sub-advisers noted below each furnished investment advisory services in connection with the management of the Portfolios. Each of the sub-advisers of the equity Portfolios—Large Capitalization Growth Portfolio, Large Capitalization Value Portfolio, Small Capitalization Growth Portfolio, Small Capitalization Value Portfolio and International Equity Portfolio—manages a portion of the assets of the respective Portfolios. In general, in order to maintain a division of assets between the advisers as deemed appropriate by PI, all daily cash inflows (i.e., subscriptions and reinvested distributions) and outflows (i.e., redemptions and expense items) are divided between the sub-advisers, as PI deems appropriate. In order to maintain an approximate allocation between the sub-advisers in the ratio deemed appropriate by PI, a periodic rebalancing of each sub-adviser’s share of Portfolio assets may occur to account for market fluctuations.
At July 31, 2014, the sub-advisers that provide subadvisory services are:
| | |
Portfolio | | Adviser |
Large Capitalization Growth | | Brown Advisory, LLC and Massachusetts Financial Services Company (MFS) |
Large Capitalization Value | | NFJ Investment Group LLC, Hotchkis and Wiley Capital Management, LLC and Epoch Investment Partners, Inc. |
Small Capitalization Growth | | Eagle Asset Management and Emerald Mutual Fund Advisers Trust |
Small Capitalization Value | | NFJ Investment Group LLC, EARNEST Partners, LLC, Lee Munder Capital Group LLC, J.P. Morgan Investment Management, Inc., Sterling Capital Management LLC (effective January 21, 2014) and Vaughan Nelson Investment Management, L.P. |
| | | | |
| 184 | | | The TARGET Portfolio Trust | |
| | |
Portfolio | | Adviser |
International Equity | | LSV Asset Management and Thornburg Investment Management, Inc. |
Total Return Bond and Intermediate-Term Bond | | Pacific Investment Management Company LLC |
Mortgage Backed Securities | | Wellington Management Company, LLP |
The management fee payable to PI is computed daily and paid monthly, at an annual rate of the average daily net assets of the Portfolios specified below and PI, in turn, pays each sub-adviser a fee for its services.
| | | | |
Portfolio | | Contracted & Effective
Management Fee | |
Large Capitalization Growth | | | 0.60 | % |
Large Capitalization Value | | | 0.60 | % |
Small Capitalization Growth | | | 0.60 | % |
Small Capitalization Value | | | 0.60 | % |
International Equity | | | 0.70 | % |
Total Return Bond | | | 0.45 | % |
Intermediate-Term Bond | | | 0.45 | % |
Mortgage Backed Securities | | | 0.45 | % |
The Trust has a distribution agreement with Prudential Investment Management Services LLC (“PIMS”) which acts as the distributor of the Class Q, Class R and Class T shares of the Trust. The Trust compensates PIMS for distributing and servicing the Trust’s Class R shares, pursuant to the plan of distribution (the “Class R Plan”), regardless of expenses actually incurred by PIMS. The distribution fee is accrued daily and payable monthly. No distribution or service fees are paid to PIMS as distributor of the Class Q and Class T shares of the Trust.
Pursuant to the Class A Plan for Small Capitalization Value, the Trust compensates PIMS for distribution related activities at an annual rate of up to 0.30% of the average daily net assets of the Class A shares. For the nine months ended July 31, 2014, PIMS has contractually agreed to limit such fees to 0.25% of the average daily net assets of the Class A shares through November 30, 2015.
Pursuant to the Class R Plan, the Trust compensates PIMS for distribution related activities at an annual rate of up to 0.75% of the average daily net assets of the Class R shares. For the nine months ended July 31, 2014, PIMS has contractually agreed to limit such fees to 0.50% of the average daily net assets of the Class R shares through November 30, 2015.
PIMS has advised the Trust that it received $100 in front-end sales charges resulting from sales of Small Capitalization Value Class A shares during the nine months ended July 31, 2014. From these fees, PIMS paid such sales charges to broker-dealers, which in turn paid commissions to salespersons and incurred other distributions costs.
PI and PIMS are indirect, wholly-owned subsidiaries of Prudential Financial, Inc. (“Prudential”).
Note 3. Other Transactions with Affiliates
Prudential Mutual Fund Services LLC (“PMFS”), an affiliate of PI and an indirect, wholly-owned subsidiary of Prudential, serves as the Trust’s transfer agent. Transfer agent fees and expenses in the Statement of Operations also include certain out-of-pocket expenses paid to non-affiliates where applicable.
| | | | |
| The TARGET Portfolio Trust | | | 185 | |
Prudential Investment Management, Inc. (“PIM”), an indirect, wholly-owned subsidiary of Prudential, is the Trust’s security lending agent. For the nine months ended July 31, 2014, PIM was compensated for these services by the following Portfolios of the Trust:
| | | | |
Portfolio | | PIM | |
Large Capitalization Growth | | $ | 4,208 | |
Large Capitalization Value | | | 4,112 | |
Small Capitalization Growth | | | 53,180 | |
Small Capitalization Value | | | 247,246 | |
International Equity | | | 7,482 | |
Certain Portfolios invest in the Prudential Core Taxable Money Market Fund (the “Core Fund”), a portfolio of the Prudential Investment Portfolios 2, registered under the 1940 Act, and managed by PI. Earnings from the Core Fund are disclosed on the Statement of Operations as affiliated dividend income.
Note 4. Portfolio Securities
Purchases and sales of portfolio securities, excluding short-term investments and U.S. Government securities, for the nine months ended July 31, 2014, were as follows:
| | | | | | | | |
Portfolio | | Purchases | | | Sales | |
Large Capitalization Growth . . . | | $ | 57,932,125 | | | $ | 62,035,916 | |
Large Capitalization Value . . . | | | 64,205,554 | | | | 69,637,092 | |
Small Capitalization Growth | | | 106,897,262 | | | | 99,517,260 | |
Small Capitalization Value . . . | | | 921,051,614 | | | | 773,603,780 | |
International Equity . . . | | | 143,076,569 | | | | 101,642,674 | |
Total Return Bond . . . | | | 1,546,067,610 | | | | 1,473,833,794 | |
Intermediate-Term Bond | | | 50,611,267 | | | | 71,607,875 | |
Mortgage Backed Securities | | | 454,021,365 | | | | 453,184,571 | |
Transactions in options written during the nine months ended July 31, 2014, were as follows:
| | | | | | | | |
Intermediate-Term Bond | | Notional Amount (000) | | | Premium Received | |
Options outstanding at October 31, 2013 | | | 20,400 | | | $ | 76,659 | |
Written options | | | 206,300 | | | | 114,869 | |
Expired options | | | (41,400 | ) | | | (168,726 | ) |
Closed options | | | (1,300 | ) | | | (2,931 | ) |
| | | | | | | | |
Options outstanding at July 31, 2014 | | | 184,000 | | | $ | 19,871 | |
| | | | | | | | |
| | |
Total Return Bond | | Notional Amount (000) | | | Premium Received | |
Options outstanding at October 31, 2013 | | | 55,100 | | | $ | 108,799 | |
Written options | | | 285,180 | | | | 609,080 | |
Expired options | | | (135,480 | ) | | | (515,548 | ) |
Closed options | | | (174,400 | ) | | | (660 | ) |
| | | | | | | | |
Options outstanding at July 31, 2014 | | | 30,400 | | | $ | 201,671 | |
| | | | | | | | |
| | | | |
| 186 | | | The TARGET Portfolio Trust | |
Note 5. Tax Information
The Portfolios have a tax year end of October 31st.
Distributions to shareholders, which are determined in accordance with federal income tax regulations, which may differ from generally accepted accounting principles, are recorded on the ex-dividend date. In order to present undistributed net investment income or loss, accumulated net realized gains or losses and paid-in capital in excess of par on the Statement of Assets and Liabilities that more closely represent their tax character, certain adjustments have been made to undistributed net investment income or loss, accumulated net realized gains or losses and paid-in capital in excess of par.
For the tax year ended October 31, 2013 the adjustments were as follows:
| | | | | | | | | | | | |
| | | Undistributed
Net Investment
Income or Loss | | | Accumulated
Net Gains
or Losses | | | Paid-In
Capital In
Excess of Par | |
Large Capitalization Growth(a) | | $ | 3,155 | | | $ | (3,155 | ) | | $ | — | |
Small Capitalization Growth(b),(h) | | | 210,624 | | | | 5,507 | | | | (216,131 | ) |
Small Capitalization Value(f),(g),(h) | | | 170,920 | | | | (170,920 | ) | | | — | |
International Equity(a) | | | 60,045 | | | | (60,045 | ) | | | — | |
Total Return Bond(a),(c),(d),(e),(g) | | | 533,145 | | | | (533,145 | ) | | | — | |
Intermediate-Term Bond(a),(c),(d),(e),(g) | | | 447,076 | | | | (447,076 | ) | | | — | |
Mortgage Backed Securities(c),(e) | | | 316,418 | | | | (316,418 | ) | | | — | |
| (a) | Reclassification of net foreign currency gain (loss). |
| (b) | Reclassification of net operating loss. |
| (c) | Reclassification of swap income. |
| (d) | Reclassification of income from defaulted securities. |
| (e) | Reclassification of paydowns. |
| (f) | Reclassification of PFIC adjustments. |
| (g) | Redesignation of dividends paid. |
| (h) | Other book to tax differences. |
Net investment income or loss, net realized gains or losses and net assets were not affected by these adjustments.
For the tax year ended October 31, 2013, the tax character of dividends paid as reflected in the Statement of Changes in Net Assets were as follows:
| | | | | | | | | | | | |
| | | Ordinary
Income | | | Long-Term
Capital Gains | | | Total Dividends
and Distributions | |
Large Capitalization Growth | | $ | 830,181 | | | $ | — | | | $ | 830,181 | |
Large Capitalization Value | | | 3,560,349 | | | | — | | | | 3,560,349 | |
Small Capitalization Value | | | 15,955,447 | | | | 33,003,683 | | | | 48,959,130 | |
International Equity | | | 7,609,215 | | | | — | | | | 7,609,215 | |
Total Return Bond | | | 16,435,623 | | | | — | | | | 16,435,623 | |
Intermediate-Term Bond | | | 5,813,003 | | | | — | | | | 5,813,003 | |
Mortgage Backed Securities | | | 917,467 | | | | — | | | | 917,467 | |
| | | | |
| The TARGET Portfolio Trust | | | 187 | |
For the tax year ended October 31, 2012, the tax character of dividends paid as reflected in the Statement of Changes in Net Assets were as follows:
| | | | | | | | | | | | |
| | | Ordinary
Income | | | Long-Term
Capital Gains | | | Total Dividends
and Distributions | |
Large Capitalization Growth | | $ | 302,875 | | | $ | — | | | $ | 302,875 | |
Large Capitalization Value | | | 3,410,301 | | | | — | | | | 3,410,301 | |
Small Capitalization Value | | | 12,448,988 | | | | 29,365,321 | | | | 41,814,309 | |
International Equity | | | 6,255,681 | | | | — | | | | 6,255,681 | |
Total Return Bond | | | 9,886,738 | | | | — | | | | 9,886,738 | |
Intermediate-Term Bond | | | 7,113,091 | | | | 969,520 | | | | 8,082,611 | |
Mortgage Backed Securities | | | 1,330,954 | | | | — | | | | 1,330,954 | |
For federal income tax purposes, dividends from net investment income and distributions from short-term capital gains are taxable as ordinary income. Long-term capital gain distributions are taxable as such.
As of the latest tax year ended October 31, 2013, the Portfolios had the following amounts of accumulated undistributed earnings on a tax basis:
| | | | | | | | |
| | | Undistributed
Ordinary
Income | | | Undistributed
Long-Term
Capital Gains | |
Large Capitalization Growth | | $ | — | | | $ | 13,856,393 | |
Large Capitalization Value | | | 2,550,851 | | | | — | |
Small Capitalization Value | | | 41,277,287 | | | | 95,536,357 | |
International Equity | | | 6,322,024 | | | | — | |
Total Return Bond | | | 1,086,358 | | | | — | |
Intermediate-Term Bond | | | 723,505 | | | | 792,783 | |
Mortgage Backed Securities | | | 98,351 | | | | — | |
These amounts may differ from the amounts shown on the Statement of Assets and Liabilities primarily due to cumulative timing differences between financial and tax reporting.
The differences between book basis and tax basis were primarily attributable to deferred losses on wash sales and other book to tax differences. The other cost basis adjustments were primarily attributable to appreciation (depreciation) on written options, futures, swaps, short sales, forward currency contracts and mark-to-market of receivables and payables.
Under the Regulated Investment Company Modernization Act of 2010 (the “Act”), the Portfolios are permitted to carryforward capital losses realized on or after November 1, 2011 (“post-enactment losses”) for an unlimited period. Post-enactment losses are required to be utilized before the utilization of losses incurred prior to the effective date of the Act. As a result of this ordering rule, capital loss carryforwards related to tax years ended before October 31, 2012 (“pre-enactment losses”) may have an increased likelihood to expire unused. Additionally, post-enactment capital losses that are carried forward will retain their character as either short-term or long-term capital losses rather than being considered all short-term as under previous law. The following Portfolios utilized capital loss carryforward to offset net taxable gains realized in the tax year ended October 31, 2013 of approximately:
| | | | |
Large Capitalization Growth | | $ | 20,877,000 | |
Large Capitalization Value | | | 13,191,000 | |
Small Capitalization Growth | | | 8,787,000 | |
International Equity | | | 12,049,000 | |
| | | | |
| 188 | | | The TARGET Portfolio Trust | |
No capital gains distributions are expected to be paid to shareholders until net gains have been realized in excess of such losses.
As of the latest tax year ended October 31, 2013, the pre and post-enactment losses were approximately:
| | | | |
| Post-Enactment Losses: | | | | |
Total Return Bond | | $ | 2,695,000 | |
Mortgage Backed Securities | | | 692,000 | |
| Pre-Enactment Losses: | | | | |
| | | | | | | | | | | | | | | | | | | | | | | | | | | | |
| | | Expiring October 31, | |
| | | 2014 | | | 2015 | | | 2016 | | | 2017 | | | 2018 | | | 2019 | | | Total | |
Large Capitalization Value | | $ | — | | | $ | — | | | $ | — | | | $ | 47,132,000 | | | $ | 221,000 | | | $ | — | | | $ | 47,353,000 | |
Small Capitalization Growth | | | — | | | | — | | | | — | | | | 16,815,000 | | | | — | | | | — | | | | 16,815,000 | |
International Equity | | | — | | | | — | | | | — | | | | 26,195,000 | | | | — | | | | 2,738,000 | | | | 28,933,000 | |
Mortgage Backed Securities | | | 807,000 | | | | 900,000 | | | | 531,000 | | | | 958,000 | | | | — | | | | — | | | | 3,196,000 | |
The Large Capitalization Growth and Small Capitalization Growth Portfolios elected to treat certain late-year ordinary income losses of approximately $600,000 and $501,000 as having been incurred in the following tax year (October 31, 2014).
The United States federal income tax basis of the Portfolios’ investments and the net unrealized appreciation/ depreciation as of July 31, 2014 were as follows:
| | | | | | | | | | | | | | | | |
| | | Tax Basis | | | Unrealized
Appreciation | | | Unrealized
Depreciation | | | Net
Unrealized
Appreciation | |
Large Capitalization Growth | | $ | 223,201,500 | | | $ | 80,344,934 | | | $ | (1,821,646 | ) | | $ | 78,523,288 | |
Large Capitalization Value | | | 236,016,167 | | | | 68,961,515 | | | | (2,283,767 | ) | | | 66,677,748 | |
Small Capitalization Growth | | | 131,299,624 | | | | 30,011,112 | | | | (5,128,372 | ) | | | 24,882,740 | |
Small Capitalization Value | | | 1,749,739,273 | | | | 403,170,912 | | | | (49,322,343 | ) | | | 353,848,569 | |
International Equity | | | 428,213,994 | | | | 81,284,072 | | | | (21,499,958 | ) | | | 59,784,114 | |
Total Return Bond | | | 455,034,068 | | | | 7,791,268 | | | | (3,602,197 | ) | | | 4,189,071 | |
Intermediate-Term Bond | | | 123,792,255 | | | | 1,704,176 | | | | (1,442,842 | ) | | | 261,334 | |
Mortgage Backed Securities | | | 78,875,900 | | | | 601,914 | | | | (197,348 | ) | | | 404,566 | |
Management has analyzed the Portfolios’ tax positions taken on federal income tax returns for all open tax years and has concluded that no provision for income tax is required in the Portfolios’ financial statements for the current reporting period. The Portfolios’ federal and state income and federal excise tax returns for tax years for which the applicable statutes of limitations have not expired are subject to examination by the Internal Revenue Service and state departments of revenue.
| | | | |
| The TARGET Portfolio Trust | | | 189 | |
Note 6. Capital
The Trust has authorized an unlimited number of beneficial interest at $.001 par value per share. As of July 31, 2014, Prudential through its affiliates owned 381 shares of Small Cap Value Class A shares and 85 shares of International Equity Class Q shares.
Transactions in shares of beneficial interest were as follows:
| | | | | | | | | | | | | | | | |
| | | Class R | | | Class T | |
| | | Shares | | | Amount | | | Shares | | | Amount | |
| Large Capitalization Growth | | | | | | | | | | | | | | | | |
Nine Months Ended July 31, 2014: | | | | | | | | | | | | | | | | |
Sold | | | 2,006,247 | | | $ | 38,474,347 | | | | 183,185 | | | $ | 3,537,861 | |
Reinvested | | | 500,784 | | | | 9,234,450 | | | | 239,310 | | | | 4,472,695 | |
Redeemed | | | (1,553,564 | ) | | | (29,767,160 | ) | | | (623,393 | ) | | | (12,118,040 | ) |
| | | | | | | | | | | | | | | | |
Net Increase (Decrease) | | | 953,467 | | | $ | 17,941,637 | | | | (200,898 | ) | | $ | (4,107,484 | ) |
| | | | | | | | | | | | | | | | |
Year Ended October 31, 2013: | | | | | | | | | | | | | | | | |
Sold | | | 2,704,253 | | | $ | 44,964,560 | | | | 382,770 | | | $ | 6,469,263 | |
Reinvested | | | 18,401 | | | | 274,592 | | | | 35,371 | | | | 534,428 | |
Redeemed | | | (2,263,017 | ) | | | (38,103,116 | ) | | | (1,125,910 | ) | | | (18,707,178 | ) |
| | | | | | | | | | | | | | | | |
Net Increase (Decrease) | | | 459,637 | | | $ | 7,136,036 | | | | (707,769 | ) | | $ | (11,703,487 | ) |
| | | | | | | | | | | | | | | | |
Year Ended October 31, 2012: | | | | | | | | | | | | | | | | |
Sold | | | 2,675,452 | | | $ | 38,594,842 | | | | 381,843 | | | $ | 5,525,796 | |
Reinvested | | | — | | | | — | | | | 22,196 | | | | 292,761 | |
Redeemed | | | (2,189,173 | ) | | | (32,018,220 | ) | | | (1,652,885 | ) | | | (23,935,756 | ) |
| | | | | | | | | | | | | | | | |
Net Increase (Decrease) | | | 486,279 | | | $ | 6,576,622 | | | | (1,248,846 | ) | | $ | (18,117,199 | ) |
| | | | | | | | | | | | | | | | |
| Large Capitalization Value | | | | | | | | | | | | | | | | |
Nine Months Ended July 31, 2014: | | | | | | | | | | | | | | | | |
Sold | | | 2,563,959 | | | $ | 38,384,401 | | | | 188,755 | | | $ | 2,784,259 | |
Reinvested | | | 137,860 | | | | 1,990,700 | | | | 93,326 | | | | 1,350,425 | |
Redeemed | | | (2,342,647 | ) | | | (35,285,786 | ) | | | (876,391 | ) | | | (13,162,437 | ) |
| | | | | | | | | | | | | | | | |
Net Increase (Decrease) | | | 359,172 | | | $ | 5,089,315 | | | | (594,310 | ) | | $ | (9,027,753 | ) |
| | | | | | | | | | | | | | | | |
Year Ended October 31, 2013: | | | | | | | | | | | | | | | | |
Sold | | | 3,508,690 | | | $ | 43,966,355 | | | | 466,834 | | | $ | 5,844,844 | |
Reinvested | | | 182,029 | | | | 2,007,775 | | | | 135,889 | | | | 1,500,210 | |
Redeemed | | | (3,252,888 | ) | | | (40,693,776 | ) | | | (1,649,737 | ) | | | (20,321,724 | ) |
| | | | | | | | | | | | | | | | |
Net Increase (Decrease) | | | 437,831 | | | $ | 5,280,354 | | | | (1,047,014 | ) | | $ | (12,976,670 | ) |
| | | | | | | | | | | | | | | | |
Year Ended October 31, 2012: | | | | | | | | | | | | | | | | |
Sold | | | 3,531,512 | | | $ | 37,077,078 | | | | 499,304 | | | $ | 5,200,746 | |
Reinvested | | | 180,008 | | | | 1,713,677 | | | | 172,499 | | | | 1,643,918 | |
Redeemed | | | (3,180,267 | ) | | | (33,167,122 | ) | | | (2,105,961 | ) | | | (22,002,803 | ) |
| | | | | | | | | | | | | | | | |
Net Increase (Decrease) | | | 531,253 | | | $ | 5,623,633 | | | | (1,434,158 | ) | | $ | (15,158,139 | ) |
| | | | | | | | | | | | | | | | |
| | | | |
| 190 | | | The TARGET Portfolio Trust | |
| | | | | | | | | | | | | | | | | | | | | | | | |
| | | | | | | | | Class R | | | Class T | |
| | | | | | | | | Shares | | | Amount | | | Shares | | | Amount | |
| Small Capitalization Growth | | | | | | | | | | | | | | | | | | | | | | | | |
Nine Months Ended July 31, 2014: | | | | | | | | | | | | | | | | | | | | | | | | |
Sold | | | | 1,586,487 | | | $ | 25,143,311 | | | | 180,333 | | | $ | 2,962,368 | |
Redeemed | | | | (857,638 | ) | | | (13,604,792 | ) | | | (362,048 | ) | | | (5,964,196 | ) |
| | | | | | | | | | | | | | | | | | | | | | | | |
Net Increase (Decrease) | | | | 728,849 | | | $ | 11,538,519 | | | | (181,715 | ) | | $ | (3,001,828 | ) |
| | | | | | | | | | | | | | | | | | | | | | | | |
Year Ended October 31, 2013: | | | | | | | | | | | | | | | | | | | | | | | | |
Sold | | | | 1,853,306 | | | $ | 25,101,360 | | | | 390,056 | | | $ | 5,363,019 | |
Redeemed | | | | (1,683,289 | ) | | | (23,198,872 | ) | | | (730,252 | ) | | | (10,090,991 | ) |
| | | | | | | | | | | | | | | | | | | | | | | | |
Net Increase (Decrease) | | | | 170,017 | | | $ | 1,902,488 | | | | (340,196 | ) | | $ | (4,727,972 | ) |
| | | | | | | | | | | | | | | | | | | | | | | | |
Year Ended October 31, 2012: | | | | | | | | | | | | | | | | | | | | | | | | |
Sold | | | | 2,145,277 | | | $ | 24,346,971 | | | | 118,408 | | | $ | 1,381,804 | |
Redeemed | | | | (1,487,832 | ) | | | (17,143,493 | ) | | | (900,516 | ) | | | (10,526,666 | ) |
| | | | | | | | | | | | | | | | | | | | | | | | |
Net Increase (Decrease) | | | | 657,445 | | | $ | 7,203,478 | | | | (782,108 | ) | | $ | (9,144,862 | ) |
| | | | | | | | | | | | | | | | | | | | | | | | |
| | | | | |
| | | Class A* | | | | | | | | | | | | | |
| | | Shares | | | Amount | | | | | | | | | | | | | |
| Small Capitalization Value | | | | | | | | | | | | | | | | | | | | | | | | |
Nine Months Ended July 31, 2014: | | | | | | | | | | | | | | | | | | | | | | | | |
Sold | | | 471 | | | $ | 12,400 | | | | 1,662,898 | | | $ | 44,575,334 | | | | 12,761,686 | | | $ | 345,290,462 | |
Reinvested | | | — | | | | — | | | | 356,699 | | | | 9,217,111 | | | | 4,591,367 | | | | 119,191,890 | |
Redeemed | | | — | | | | — | | | | (932,848 | ) | | | (25,049,614 | ) | | | (9,251,729 | ) | | | (250,681,953 | ) |
| | | | | | | | | | | | | | | | | | | | | | | | |
Net Increase (Decrease) | | | 471 | | | $ | 12,400 | | | | 1,086,749 | | | $ | 28,742,831 | | | | 8,101,324 | | | $ | 213,800,399 | |
| | | | | | | | | | | | | | | | | | | | | | | | |
Year Ended October 31, 2013: | | | | | | | | | | | | | | | | | | | | | | | | |
Sold | | | — | | | $ | — | | | | 1,560,059 | | | $ | 37,559,057 | | | | 16,009,439 | | | $ | 383,451,472 | |
Reinvested | | | — | | | | — | | | | 152,585 | | | | 3,180,695 | | | | 1,961,190 | | | | 41,058,043 | |
Redeemed | | | — | | | | — | | | | (1,362,581 | ) | | | (32,425,818 | ) | | | (9,886,028 | ) | | | (236,515,046 | ) |
| | | | | | | | | | | | | | | | | | | | | | | | |
Net Increase (Decrease) | | | — | | | $ | — | | | | 350,063 | | | $ | 8,313,934 | | | | 8,084,601 | | | $ | 187,994,469 | |
| | | | | | | | | | | | | | | | | | | | | | | | |
Year Ended October 31, 2012: | | | | | | | | | | | | | | | | | | | | | | | | |
Sold | | | — | | | $ | — | | | | 1,472,289 | | | $ | 30,253,286 | | | | 14,754,767 | | | $ | 308,028,367 | |
Reinvested | | | — | | | | — | | | | 144,011 | | | | 2,764,999 | | | | 1,799,403 | | | | 34,674,504 | |
Redeemed | | | — | | | | — | | | | (1,094,238 | ) | | | (22,327,838 | ) | | | (9,865,547 | ) | | | (204,759,909 | ) |
| | | | | | | | | | | | | | | | | | | | | | | | |
Net Increase (Decrease) | | | — | | | $ | — | | | | 522,062 | | | $ | 10,690,447 | | | | 6,688,623 | | | $ | 137,942,962 | |
| | | | | | | | | | | | | | | | | | | | | | | | |
| * | Commencement of operations was February 14, 2014. |
| | | | |
| The TARGET Portfolio Trust | | | 191 | |
| | | | | | | | | | | | | | | | | | | | | | | | |
| | | Class Q | | | Class R | | | Class T | |
| | | Shares | | | Amount | | | Shares | | | Amount | | | Shares | | | Amount | |
| International Equity | | | | | | | | | | | | | | | | | | | | | | | | |
Nine Months Ended July 31, 2014: | | | | | | | | | | | | | | | | | | | | |
Sold | | | 1,392,012 | | | $ | 19,186,040 | | | | 5,060,946 | | | $ | 69,540,605 | | | | 245,365 | | | $ | 3,372,788 | |
Reinvested | | | 215,537 | | | | 2,853,716 | | | | 221,896 | | | | 2,935,682 | | | | 89,913 | | | | 1,190,446 | |
Redeemed | | | (302,593 | ) | | | (4,168,378 | ) | | | (2,683,311 | ) | | | (37,025,127 | ) | | | (613,177 | ) | | | (8,448,056 | ) |
| | | | | | | | | | | | | | | | | | | | | | | | |
Net Increase (Decrease) | | | 1,304,956 | | | $ | 17,871,378 | | | | 2,599,531 | | | $ | 35,451,160 | | | | (277,899 | ) | | $ | (3,884,822 | ) |
| | | | | | | | | | | | | | | | | | | | | | | | |
Year Ended October 31, 2013: | | | | | | | | | | | | | | | | | | | | |
Sold | | | 1,344,682 | | | $ | 16,686,727 | | | | 6,394,524 | | | $ | 79,080,586 | | | | 540,350 | | | $ | 6,640,099 | |
Reinvested | | | 263,373 | | | | 3,065,660 | | | | 258,463 | | | | 3,008,506 | | | | 129,618 | | | | 1,508,753 | |
Redeemed | | | (1,308,008 | ) | | | (16,441,113 | ) | | | (4,031,434 | ) | | | (50,251,263 | ) | | | (1,447,300 | ) | | | (17,646,081 | ) |
| | | | | | | | | | | | | | | | | | | | | | | | |
Net Increase (Decrease) | | | 300,047 | | | $ | 3,311,274 | | | | 2,621,553 | | | $ | 31,837,829 | | | | (777,332 | ) | | $ | (9,497,229 | ) |
| | | | | | | | | | | | | | | | | | | | | | | | |
Year Ended October 31, 2012: | | | | | | | | | | | | | | | | | | | | |
Sold | | | 1,461,319 | | | $ | 15,723,472 | | | | 6,286,224 | | | $ | 67,415,282 | | | | 471,658 | | | $ | 5,099,765 | |
Reinvested | | | 257,744 | | | | 2,649,607 | | | | 187,430 | | | | 1,926,776 | | | | 160,173 | | | | 1,646,584 | |
Redeemed | | | (927,356 | ) | | | (10,043,345 | ) | | | (3,236,126 | ) | | | (35,320,778 | ) | | | (1,628,359 | ) | | | (17,639,822 | ) |
| | | | | | | | | | | | | | | | | | | | | | | | |
Net Increase (Decrease) | | | 791,707 | | | $ | 8,329,734 | | | | 3,237,528 | | | $ | 34,021,280 | | | | (996,528 | ) | | $ | (10,893,473 | ) |
| | | | | | | | | | | | | | | | | | | | | | | | |
| Total Return Bond | | | | | | | | | | | | | | | | | | | | | | | | |
Nine Months Ended July 31, 2014: | | | | | | | | | | | | | | | | | | | | |
Sold | | | | 5,902,908 | | | $ | 64,395,668 | | | | 1,897,396 | | | $ | 20,827,594 | |
Reinvested | | | | 203,409 | | | | 2,215,784 | | | | 207,127 | | | | 2,275,303 | |
Redeemed | | | | (3,362,520 | ) | | | (36,703,521 | ) | | | (4,945,713 | ) | | | (54,312,139 | ) |
| | | | | | | | | | | | | | | | | | | | | | | | |
Net Increase (Decrease) | | | | 2,743,797 | | | $ | 29,907,931 | | | | (2,841,190 | ) | | $ | (31,209,242 | ) |
| | | | | | | | | | | | | | | | | | | | | | | | |
Year Ended October 31, 2013: | | | | | | | | | | | | | | | | | |
Sold | | | | 8,477,418 | | | $ | 93,840,129 | | | | 4,437,394 | | | $ | 49,982,651 | |
Reinvested | | | | 572,923 | | | | 6,420,983 | | | | 879,544 | | | | 9,928,680 | |
Redeemed | | | | (4,674,691 | ) | | | (51,655,857 | ) | | | (10,705,223 | ) | | | (118,442,308 | ) |
| | | | | | | | | | | | | | | | | | | | | | | | |
Net Increase (Decrease) | | | | 4,375,650 | | | $ | 48,605,255 | | | | (5,388,285 | ) | | $ | (58,530,977 | ) |
| | | | | | | | | | | | | | | | | | | | | | | | |
Year Ended October 31, 2012: | | | | | | | | | | | | | | | | | |
Sold | | | | 7,506,147 | | | $ | 84,111,907 | | | | 6,238,035 | | | $ | 70,553,745 | |
Reinvested | | | | 283,381 | | | | 3,179,749 | | | | 585,596 | | | | 6,624,096 | |
Redeemed | | | | (3,718,301 | ) | | | (41,754,260 | ) | | | (6,894,779 | ) | | | (77,924,589 | ) |
| | | | | | | | | | | | | | | | | | | | | | | | |
Net Increase (Decrease) | | | | 4,071,227 | | | $ | 45,537,396 | | | | (71,148 | ) | | $ | (746,748 | ) |
| | | | | | | | | | | | | | | | | | | | | | | | |
| | | | |
| 192 | | | The TARGET Portfolio Trust | |
| | | | | | | | |
| | | Class T | |
| | | Shares | | | Amount | |
| Intermediate-Term Bond | | | | | | | | |
Nine Months Ended July 31, 2014: | | | | | | | | |
Sold | | | 2,219,687 | | | $ | 22,544,679 | |
Reinvested | | | 328,410 | | | | 3,325,977 | |
Redeemed | | | (3,113,343 | ) | | | (31,625,509 | ) |
| | | | | | | | |
Net Increase (Decrease) | | | (565,246 | ) | | $ | (5,754,853 | ) |
| | | | | | | | |
Year Ended October 31, 2013: | | | | | | | | |
Sold | | | 2,423,486 | | | $ | 25,377,628 | |
Reinvested | | | 530,434 | | | | 5,608,463 | |
Redeemed | | | (5,738,289 | ) | | | (60,255,240 | ) |
| | | | | | | | |
Net Increase (Decrease) | | | (2,784,369 | ) | | $ | (29,269,149 | ) |
| | | | | | | | |
Year Ended October 31, 2012: | | | | | | | | |
Sold | | | 2,304,922 | | | $ | 24,370,801 | |
Reinvested | | | 752,883 | | | | 7,862,089 | |
Redeemed | | | (4,835,106 | ) | | | (51,158,727 | ) |
| | | | | | | | |
Net Increase (Decrease) | | | (1,777,301 | ) | | $ | (18,925,837 | ) |
| | | | | | | | |
| Mortgage Backed Securities | | | | | | | | |
Nine Months Ended July 31, 2014: | | | | | | | | |
Sold | | | 690,515 | | | $ | 7,279,189 | |
Reinvested | | | 25,703 | | | | 270,077 | |
Redeemed | | | (634,522 | ) | | | (6,683,545 | ) |
| | | | | | | | |
Net Increase (Decrease) | | | 81,696 | | | $ | 865,721 | |
| | | | | | | | |
Year Ended October 31, 2013: | | | | | | | | |
Sold | | | 1,119,386 | | | $ | 11,870,969 | |
Reinvested | | | 83,488 | | | | 885,344 | |
Redeemed | | | (1,208,287 | ) | | | (12,767,380 | ) |
| | | | | | | | |
Net Increase (Decrease) | | | (5,413 | ) | | $ | (11,067 | ) |
| | | | | | | | |
Year Ended October 31, 2012: | | | | | | | | |
Sold | | | 1,720,443 | | | $ | 18,518,112 | |
Reinvested | | | 117,867 | | | | 1,272,691 | |
Redeemed | | | (1,115,271 | ) | | | (12,045,966 | ) |
| | | | | | | | |
Net Increase (Decrease) | | | 723,039 | | | $ | 7,744,837 | |
| | | | | | | | |
Note 7. Borrowings
The Trust, along with other affiliated registered investment companies (the “Funds”), is a party to a Syndicated Credit Agreement (“SCA”) with a group of banks. The purpose of the SCA is to provide an alternative source of temporary funding for capital share redemptions. The SCA provides for a commitment of $900 million for the period November 5, 2013 through November 4, 2014. The Funds pay an annualized commitment fee of .08% of the unused portion of the SCA. Prior to November 5, 2013, the Funds had another SCA with substantially similar terms. Interest on any borrowings under the SCA is paid at contracted market rates. The commitment fee for the unused amount is accrued daily and paid quarterly.
| | | | |
| The TARGET Portfolio Trust | | | 193 | |
The following Portfolios utilized the line of credit during the nine months ended July 31, 2014. The average balance outstanding is for the number of days that each Portfolio had an outstanding balance.
| | | | | | | | | | | | | | | | |
Portfolio | | Average Advances
Outstanding
During the Period | | | Average
Interest
Rate | | | Number of Days
Advances Outstanding
During the Period | | | Outstanding
Borrowings at
July 31, 2014 | |
Large Capitalization Growth | | $ | 538,000 | | | | 1.42 | % | | | 6 | | | $ | — | |
Large Capitalization Value | | | 352,000 | | | | 1.42 | % | | | 7 | | | | — | |
Small Capitalization Growth | | | 410,000 | | | | 1.42 | % | | | 2 | | | | — | |
| | | | |
| 194 | | | The TARGET Portfolio Trust | |
Financial Highlights
| | | | | | | | | | | | | | | | | | | | | | | | |
| | | LARGE CAPITALIZATION
GROWTH PORTFOLIO | |
| | | Class R | |
| | | Nine Months
Ended
July 31, 2014(b)(f) | | | Year Ended October 31, | |
| | | | 2013 | | | 2012(b) | | | 2011(b) | | | 2010(b) | | | 2009 | |
| | | | | | | |
| PER SHARE OPERATING PERFORMANCE: | | | | | | | | | | | | | | | | | | | | | | | | |
Net asset value, beginning of period | | $ | 19.10 | | | $ | 14.70 | | | $ | 13.56 | | | $ | 12.76 | | | $ | 10.85 | | | $ | 10.11 | |
Income (loss) from investment operations | | | | | | | | | | | | | | | | | | | | | | | | |
Net investment income (loss) | | | (.07 | ) | | | (.03 | ) | | | (.01 | ) | | | (.01 | ) | | | (.01 | ) | | | .05 | |
Net realized and unrealized gain on investments | | | 1.31 | | | | 4.46 | | | | 1.15 | | | | .81 | | | | 1.96 | | | | .76 | |
Total from investment operations | | | 1.24 | | | | 4.43 | | | | 1.14 | | | | .80 | | | | 1.95 | | | | .81 | |
Less dividends and distributions | | | | | | | | | | | | | | | | | | | | | | | | |
Dividends from net investment income | | | — | | | | (.03 | ) | | | — | | | | — | | | | (.04 | ) | | | (.07 | ) |
Distributions from net realized gains | | | (.98 | ) | | | — | | | | — | | | | — | | | | — | | | | — | |
Total dividends and distributions | | | (.98 | ) | | | (.03 | ) | | | — | | | | — | | | | (.04 | ) | | | (.07 | ) |
Net asset value, end of period | | $ | 19.36 | | | $ | 19.10 | | | $ | 14.70 | | | $ | 13.56 | | | $ | 12.76 | | | $ | 10.85 | |
| | | | | | |
| TOTAL RETURN(a) | | | 6.77 | % | | | 30.20 | % | | | 8.41 | % | | | 6.27 | % | | | 17.99 | % | | | 8.13 | % |
| | | | | | |
| RATIOS/SUPPLEMENTAL DATA: | | | | | | | | | | | | | | | | | | | | | | | | |
Net assets, end of period (000) | | $ | 197,019 | | | $ | 176,200 | | | $ | 128,828 | | | $ | 112,255 | | | $ | 99,676 | | | $ | 70,097 | |
Average net assets (000) | | $ | 187,703 | | | $ | 152,695 | | | $ | 121,998 | | | $ | 109,325 | | | $ | 84,636 | | | $ | 54,036 | |
Ratios to average net assets(c) | | | | | | | | | | | | | | | | | | | | | | | | |
Expenses after waivers and/or expense reimbursements | | | 1.31 | %(d) | | | 1.31 | % | | | 1.32 | % | | | 1.34 | % | | | 1.33 | % | | | 1.36 | % |
Expenses before waivers and/or expense reimbursements | | | 1.56 | %(d) | | | 1.56 | % | | | 1.57 | % | | | 1.59 | % | | | 1.58 | % | | | 1.61 | % |
Net investment income (loss) | | | (.48 | )%(d) | | | (.22 | )% | | | (.07 | )% | | | (.08 | )% | | | (.08 | )% | | | .28 | % |
Portfolio turnover rate | | | 21 | %(e) | | | 92 | % | | | 70 | % | | | 97 | % | | | 171 | % | | | 243 | % |
| (a) | Total return is calculated assuming a purchase of a share on the first day and a sale on the last day of each period reported and includes reinvestment of dividends and distributions. Total returns may reflect adjustments to conform to generally accepted accounting principles. Total returns for period less than one full year are not annualized. |
| (b) | Calculated based upon average shares outstanding during the period. |
| (c) | Does not include expenses of the underlying fund in which the Portfolio invests. |
| (f) | For the nine month period ended July 31, 2014. The Trust changed its fiscal year end from October 31 to July 31, effective July 31, 2014. |
See Notes to Financial Statements.
| | | | |
| The TARGET Portfolio Trust | | | 195 | |
Financial Highlights (continued)
| | | | | | | | | | | | | | | | | | | | | | | | |
| | | LARGE CAPITALIZATION
GROWTH PORTFOLIO | |
| | | Class T | |
| | | Nine Months
Ended
July 31, 2014(b)(f) | | | Year Ended October 31, | |
| | | | 2013 | | | 2012(b) | | | 2011(b) | | | 2010(b) | | | 2009 | |
| | | | | | | |
| PER SHARE OPERATING PERFORMANCE: | | | | | | | | | | | | | | | | | | | | | | | | |
Net asset value, beginning of period | | $ | 19.33 | | | $ | 14.87 | | | $ | 13.70 | | | $ | 12.86 | | | $ | 10.93 | | | $ | 10.19 | |
Income (loss) from investment operations | | | | | | | | | | | | | | | | | | | | | | | | |
Net investment income | | | — | (g) | | | .09 | | | | .06 | | | | .06 | | | | .05 | | | | .10 | |
Net realized and unrealized gain on investments | | | 1.33 | | | | 4.47 | | | | 1.16 | | | | .82 | | | | 1.97 | | | | .76 | |
Total from investment operations | | | 1.33 | | | | 4.56 | | | | 1.22 | | | | .88 | | | | 2.02 | | | | .86 | |
Less dividends and distributions | | | | | | | | | | | | | | | | | | | | | | | | |
Dividends from net investment income | | | — | | | | (.10 | ) | | | (.05 | ) | | | (.04 | ) | | | (.09 | ) | | | (.12 | ) |
Distributions from net realized gains | | | (.98 | ) | | | — | | | | — | | | | — | | | | — | | | | — | |
Total dividends and distributions | | | (.98 | ) | | | (.10 | ) | | | (.05 | ) | | | (.04 | ) | | | (.09 | ) | | | (.12 | ) |
Net asset value, end of period | | $ | 19.68 | | | $ | 19.33 | | | $ | 14.87 | | | $ | 13.70 | | | $ | 12.86 | | | $ | 10.93 | |
| | | | | | |
| TOTAL RETURN(a) | | | 7.17 | % | | | 30.89 | % | | | 8.92 | % | | | 6.83 | % | | | 18.55 | % | | | 8.64 | % |
| | | | | | |
| RATIOS/SUPPLEMENTAL DATA: | | | | | | | | | | | | | | | | | | | | | | | | |
Net assets, end of period (000) | | $ | 89,886 | | | $ | 92,189 | | | $ | 81,456 | | | $ | 92,149 | | | $ | 110,550 | | | $ | 124,122 | |
Average net assets (000) | | $ | 92,345 | | | $ | 85,289 | | | $ | 87,434 | | | $ | 102,690 | | | $ | 116,806 | | | $ | 123,629 | |
Ratios to average net assets(c) | | | | | | | | | | | | | | | | | | | | | | | | |
Expenses after waivers and/or expense reimbursements | | | .81 | %(d) | | | .81 | % | | | .82 | % | | | .84 | % | | | .83 | % | | | .86 | % |
Expenses before waivers and/or expense reimbursements | | | .81 | %(d) | | | .81 | % | | | .82 | % | | | .84 | % | | | .83 | % | | | .86 | % |
Net investment income | | | .03 | %(d) | | | .32 | % | | | .44 | % | | | .44 | % | | | .45 | % | | | .84 | % |
Portfolio turnover rate | | | 21 | %(e) | | | 92 | % | | | 70 | % | | | 97 | % | | | 171 | % | | | 243 | % |
| (a) | Total return is calculated assuming a purchase of a share on the first day and a sale on the last day of each period reported and includes reinvestment of dividends and distributions. Total returns may reflect adjustments to conform to generally accepted accounting principles. Total returns for period less than one full year are not annualized. |
| (b) | Calculated based upon average shares outstanding during the period. |
| (c) | Does not include expenses of the underlying fund in which the Portfolio invests. |
| (f) | For the nine month period ended July 31, 2014. The Trust changed its fiscal year end from October 31 to July 31, effective July 31, 2014. |
| (g) | Less than $0.005 per share. |
See Notes to Financial Statements.
| | | | |
| 196 | | | The TARGET Portfolio Trust | |
Financial Highlights (continued)
| | | | | | | | | | | | | | | | | | | | | | | | |
| | | LARGE CAPITALIZATION
VALUE PORTFOLIO | |
| | | Class R | |
| | | Nine Months
Ended
July 31, | | | Year Ended October 31, | |
| | | 2014(b)(f) | | | 2013(b) | | | 2012(b) | | | 2011(b) | | | 2010(b) | | | 2009(b) | |
| | | | | | |
| PER SHARE OPERATING PERFORMANCE: | | | | | | | | | | | | | | | | | | | | | | | | |
Net asset value, beginning of period | | $ | 14.15 | | | $ | 11.06 | | | $ | 9.92 | | | $ | 9.73 | | | $ | 8.79 | | | $ | 8.78 | |
Income (loss) from investment operations | | | | | | | | | | | | | | | | | | | | | | | | |
Net investment income | | | .20 | | | | .16 | | | | .16 | | | | .13 | | | | .11 | | | | .15 | |
Net realized and unrealized gain on investments | | | 1.38 | | | | 3.10 | | | | 1.13 | | | | .18 | | | | .98 | | | | .13 | |
Total from investment operations | | | 1.58 | | | | 3.26 | | | | 1.29 | | | | .31 | | | | 1.09 | | | | .28 | |
Less dividends from net investment income | | | (.16 | ) | | | (.17 | ) | | | (.15 | ) | | | (.12 | ) | | | (.15 | ) | | | (.27 | ) |
Net asset value, end of period | | $ | 15.57 | | | $ | 14.15 | | | $ | 11.06 | | | $ | 9.92 | | | $ | 9.73 | | | $ | 8.79 | |
| | | | | | |
| TOTAL RETURN(a) | | | 11.25 | % | | | 29.86 | % | | | 13.23 | % | | | 3.19 | % | | | 12.45 | % | | | 3.59 | % |
| | | | | | |
| RATIOS/SUPPLEMENTAL DATA: | | | | | | | | | | | | | | | | | | | | | | | | |
Net assets, end of period (000) | | $ | 198,729 | | | $ | 175,554 | | | $ | 132,434 | | | $ | 113,434 | | | $ | 97,308 | | | $ | 70,291 | |
Average net assets (000) | | $ | 189,796 | | | $ | 153,243 | | | $ | 121,917 | | | $ | 108,407 | | | $ | 84,613 | | | $ | 53,491 | |
Ratios to average net assets(c) | | | | | | | | | | | | | | | | | | | | | | | | |
Expenses after waivers and/or expense reimbursements | | | 1.29 | %(d) | | | 1.30 | % | | | 1.31 | % | | | 1.33 | % | | | 1.31 | % | | | 1.33 | % |
Expenses before waivers and/or expense reimbursements | | | 1.54 | %(d) | | | 1.55 | % | | | 1.56 | % | | | 1.58 | % | | | 1.56 | % | | | 1.58 | % |
Net investment income | | | 1.83 | %(d) | | | 1.25 | % | | | 1.53 | % | | | 1.30 | % | | | 1.21 | % | | | 1.96 | % |
Portfolio turnover rate | | | 23 | %(e) | | | 37 | % | | | 75 | % | | | 43 | % | | | 32 | % | | | 104 | % |
| (a) | Total return is calculated assuming a purchase of a share on the first day and a sale on the last day of each period reported and includes reinvestment of dividends and distributions. Total returns may reflect adjustments to conform to generally accepted accounting principles. Total returns for period less than one full year are not annualized. |
| (b) | Calculated based upon average shares outstanding during the period. |
| (c) | Does not include expenses of the underlying fund in which the Portfolio invests. |
| (f) | For the nine month period ended July 31, 2014. The Trust changed its fiscal year end from October 31 to July 31, effective July 31, 2014. |
See Notes to Financial Statements.
| | | | |
| The TARGET Portfolio Trust | | | 197 | |
Financial Highlights (continued)
| | | | | | | | | | | | | | | | | | | | | | | | |
| | | LARGE CAPITALIZATION
VALUE PORTFOLIO | |
| | | Class T | |
| | | Nine Months
Ended
July 31, | | | Year Ended October 31, | |
| | | 2014(b)(f) | | | 2013(b) | | | 2012(b) | | | 2011(b) | | | 2010(b) | | | 2009(b) | |
| | | | | | |
| PER SHARE OPERATING PERFORMANCE: | | | | | | | | | | | | | | | | | | | | | | | | |
Net asset value, beginning of period | | $ | 14.23 | | | $ | 11.12 | | | $ | 9.97 | | | $ | 9.78 | | | $ | 8.83 | | | $ | 8.82 | |
Income (loss) from investment operations | | | | | | | | | | | | | | | | | | | | | | | | |
Net investment income | | | .26 | | | | .22 | | | | .21 | | | | .18 | | | | .16 | | | | .20 | |
Net realized and unrealized gain on investments | | | 1.38 | | | | 3.11 | | | | 1.14 | | | | .18 | | | | .98 | | | | .12 | |
Total from investment operations | | | 1.64 | | | | 3.33 | | | | 1.35 | | | | .36 | | | | 1.14 | | | | .32 | |
Less dividends from net investment income | | | (.22 | ) | | | (.22 | ) | | | (.20 | ) | | | (.17 | ) | | | (.19 | ) | | | (.31 | ) |
Net asset value, end of period | | $ | 15.65 | | | $ | 14.23 | | | $ | 11.12 | | | $ | 9.97 | | | $ | 9.78 | | | $ | 8.83 | |
| | | | | | |
| TOTAL RETURN(a) | | | 11.68 | % | | | 30.48 | % | | | 13.86 | % | | | 3.62 | % | | | 13.00 | % | | | 4.15 | % |
| | | | | | |
| RATIOS/SUPPLEMENTAL DATA: | | | | | | | | | | | | | | | | | | | | | | | | |
Net assets, end of period (000) | | $ | 88,642 | | | $ | 89,086 | | | $ | 81,281 | | | $ | 87,171 | | | $ | 109,097 | | | $ | 128,187 | |
Average net assets (000) | | $ | 90,336 | | | $ | 84,172 | | | $ | 84,322 | | | $ | 99,621 | | | $ | 119,520 | | | $ | 129,379 | |
Ratios to average net assets(c) | | | | | | | | | | | | | | | | | | | | | | | | |
Expenses after waivers and/or expense reimbursements | | | .79 | %(d) | | | .80 | % | | | .81 | % | | | .83 | % | | | .81 | % | | | .83 | % |
Expenses before waivers and/or expense reimbursements | | | .79 | %(d) | | | .80 | % | | | .81 | % | | | .83 | % | | | .81 | % | | | .83 | % |
Net investment income | | | 2.35 | %(d) | | | 1.77 | % | | | 2.03 | % | | | 1.80 | % | | | 1.74 | % | | | 2.64 | % |
Portfolio turnover rate | | | 23 | %(e) | | | 37 | % | | | 75 | % | | | 43 | % | | | 32 | % | | | 104 | % |
| (a) | Total return is calculated assuming a purchase of a share on the first day and a sale on the last day of each period reported and includes reinvestment of dividends and distributions. Total returns may reflect adjustments to conform to generally accepted accounting principles. Total returns for period less than one full year are not annualized. |
| (b) | Calculated based upon average shares outstanding during the period. |
| (c) | Does not include expenses of the underlying fund in which the Portfolio invests. |
| (f) | For the nine month period ended July 31, 2014. The Trust changed its fiscal year end from October 31 to July 31, effective July 31, 2014. |
See Notes to Financial Statements.
| | | | |
| 198 | | | The TARGET Portfolio Trust | |
Financial Highlights (continued)
| | | | | | | | | | | | | | | | | | | | | | | | |
| | | SMALL CAPITALIZATION
GROWTH PORTFOLIO | |
| | | Class R | |
| | | Nine Months
Ended
July 31, | | | Year Ended October 31, | |
| | | 2014(f)(g) | | | 2013 | | | 2012 | | | 2011 | | | 2010 | | | 2009 | |
| | | | | | |
| PER SHARE OPERATING PERFORMANCE: | | | | | | | | | | | | | | | | | | | | | | | | |
Net asset value, beginning of period | | $ | 15.42 | | | $ | 11.56 | | | $ | 10.97 | | | $ | 9.66 | | | $ | 7.71 | | | $ | 7.17 | |
Income (loss) from investment operations | | | | | | | | | | | | | | | | | | | | | | | | |
Net investment loss | | | (.10 | ) | | | (.04 | ) | | | (.09 | ) | | | (.07 | ) | | | (.05 | ) | | | (.04 | ) |
Net realized and unrealized gain (loss) on investments | | | (.18 | ) | | | 3.90 | | | | .68 | | | | 1.38 | | | | 2.00 | | | | .58 | |
Total from investment operations | | | (.28 | ) | | | 3.86 | | | | .59 | | | | 1.31 | | | | 1.95 | | | | .54 | |
Capital Contributions | | | — | | | | — | | | | — | | | | — | | | | — | (c) | | | — | |
Net asset value, end of period | | $ | 15.14 | | | $ | 15.42 | | | $ | 11.56 | | | $ | 10.97 | | | $ | 9.66 | | | $ | 7.71 | |
| | | | | | |
| TOTAL RETURN(a) | | | (1.82 | )% | | | 33.39 | % | | | 5.38 | % | | | 13.56 | % | | | 25.29 | % | | | 7.53 | % |
| | | | | | |
| RATIOS/SUPPLEMENTAL DATA: | | | | | | | | | | | | | | | | | | | | | | | | |
Net assets, end of period (000) | | $ | 95,752 | | | $ | 86,336 | | | $ | 62,731 | | | $ | 52,325 | | | $ | 41,025 | | | $ | 28,129 | |
Average net assets (000) | | $ | 93,696 | | | $ | 75,602 | | | $ | 57,399 | | | $ | 47,547 | | | $ | 35,238 | | | $ | 22,037 | |
Ratios to average net assets(b) | | | | | | | | | | | | | | | | | | | | | | | | |
Expenses after waivers and/or expense reimbursements | | | 1.39 | %(d) | | | 1.38 | % | | | 1.42 | % | | | 1.44 | % | | | 1.46 | % | | | 1.52 | % |
Expenses before waivers and/or expense reimbursements | | | 1.64 | %(d) | | | 1.63 | % | | | 1.67 | % | | | 1.69 | % | | | 1.71 | % | | | 1.77 | % |
Net investment loss | | | (.81 | )%(d) | | | (.35 | )% | | | (.93 | )% | | | (.80 | )% | | | (.72 | )% | | | (.77 | )% |
Portfolio turnover rate | | | 74 | %(e) | | | 50 | % | | | 71 | % | | | 92 | % | | | 64 | % | | | 92 | % |
| (a) | Total return is calculated assuming a purchase of a share on the first day and a sale on the last day of each period reported and includes reinvestment of dividends and distributions. Total returns may reflect adjustments to conform to generally accepted accounting principles. Total returns for period less than one full year are not annualized. |
| (b) | Does not include expenses of the underlying fund in which the Portfolio invests. |
| (c) | Less than $0.005 per share. |
| (f) | For the nine month period ended July 31, 2014. The Trust changed its fiscal year end from October 31 to July 31, effective July 31, 2014. |
| (g) | Calculated based upon average shares outstanding during the period. |
See Notes to Financial Statements.
| | | | |
| The TARGET Portfolio Trust | | | 199 | |
Financial Highlights (continued)
| | | | | | | | | | | | | | | | | | | | | | | | |
| | | SMALL CAPITALIZATION
GROWTH PORTFOLIO | |
| | | Class T | |
| | | Nine Months
Ended
July 31, | | | Year Ended October 31, | |
| | | 2014(f)(g) | | | 2013 | | | 2012 | | | 2011 | | | 2010 | | | 2009 | |
| | | | | | |
| PER SHARE OPERATING PERFORMANCE: | | | | | | | | | | | | | | | | | | | | | | | | |
Net asset value, beginning of period | | $ | 15.96 | | | $ | 11.90 | | | $ | 11.24 | | | $ | 9.84 | | | $ | 7.82 | | | $ | 7.25 | |
Income (loss) from investment operations | | | | | | | | | | | | | | | | | | | | | | | | |
Net investment income (loss) | | | (.04 | ) | | | .03 | | | | (.04 | ) | | | (.02 | ) | | | (.01 | ) | | | (.02 | ) |
Net realized and unrealized gain (loss) on investments | | | (.20 | ) | | | 4.03 | | | | .70 | | | | 1.42 | | | | 2.03 | | | | .60 | |
Total from investment operations | | | (.24 | ) | | | 4.06 | | | | .66 | | | | 1.40 | | | | 2.02 | | | | .58 | |
Less dividends from net investment income | | | — | | | | — | | | | — | | | | — | | | | — | | | | (.01 | ) |
Capital Contributions | | | — | | | | — | | | | — | | | | — | | | | — | (c) | | | — | |
Net asset value, end of period | | $ | 15.72 | | | $ | 15.96 | | | $ | 11.90 | | | $ | 11.24 | | | $ | 9.84 | | | $ | 7.82 | |
| | | | | | |
| TOTAL RETURN(a) | | | (1.50 | )% | | | 34.12 | % | | | 5.87 | % | | | 14.23 | % | | | 25.83 | % | | | 8.06 | % |
| | | | | | |
| RATIOS/SUPPLEMENTAL DATA: | | | | | | | | | | | | | | | | | | | | | | | | |
Net assets, end of period (000) | | $ | 40,819 | | | $ | 44,341 | | | $ | 37,110 | | | $ | 43,838 | | | $ | 51,777 | | | $ | 52,671 | |
Average net assets (000) | | $ | 44,372 | | | $ | 41,144 | | | $ | 40,486 | | | $ | 50,339 | | | $ | 53,128 | | | $ | 51,109 | |
Ratios to average net assets(b) | | | | | | | | | | | | | | | | | | | | | | | | |
Expenses after waivers and/or expense reimbursements | | | .89 | %(d) | | | .88 | % | | | .92 | % | | | .94 | % | | | .96 | % | | | 1.02 | % |
Expenses before waivers and/or expense reimbursements | | | .89 | %(d) | | | .88 | % | | | .92 | % | | | .94 | % | | | .96 | % | | | 1.02 | % |
Net investment income (loss) | | | (.31 | )%(d) | | | .17 | % | | | (.44 | )% | | | (.29 | )% | | | (.18 | )% | | | (.26 | )% |
Portfolio turnover rate | | | 74 | %(e) | | | 50 | % | | | 71 | % | | | 92 | % | | | 64 | % | | | 92 | % |
| (a) | Total return is calculated assuming a purchase of a share on the first day and a sale on the last day of each period reported and includes reinvestment of dividends and distributions. Total returns may reflect adjustments to conform to generally accepted accounting principles. Total returns for period less than one full year are not annualized. |
| (b) | Does not include expenses of the underlying fund in which the Portfolio invests. |
| (c) | Less than $0.005 per share. |
| (f) | For the nine month period ended July 31, 2014. The Trust changed its fiscal year end from October 31 to July 31, effective July 31, 2014. |
| (g) | Calculated based upon average shares outstanding during the period. |
See Notes to Financial Statements.
| | | | |
| 200 | | | The TARGET Portfolio Trust | |
Financial Highlights (continued)
| | | | |
| | | SMALL CAPITALIZATION
VALUE PORTFOLIO | |
| | | Class A | |
| | | February 14(d)
through
July 31,
2014(b)(g) | |
| |
| PER SHARE OPERATING PERFORMANCE: | | | | |
Net asset value, beginning of period | | $ | 26.26 | |
Income (loss) from investment operations | | | | |
Net investment income | | | .09 | |
Net realized and unrealized gain on investments | | | .35 | |
Total from investment operations | | | .44 | |
Net asset value, end of period | | $ | 26.70 | |
| |
| TOTAL RETURN(a) | | | 1.68 | % |
| |
| RATIOS/SUPPLEMENTAL DATA: | | | | |
Net assets, end of period (000) | | $ | 13 | |
Average net assets (000) | | $ | 12 | |
Ratios to average net assets(c) | | | | |
Expenses after waivers and/or expense reimbursements | | | .93 | %(e) |
Expenses before waivers and/or expense reimbursements | | | .98 | %(e) |
Net investment income | | | .74 | %(e) |
Portfolio turnover rate | | | 42 | %(f) |
| (a) | Total return is calculated assuming a purchase of a share on the first day and a sale on the last day of each period reported and includes reinvestment of dividends and distributions. Total returns may reflect adjustments to conform to generally accepted accounting principles. Total returns for period less than one full year are not annualized. |
| (b) | Calculated based upon average shares outstanding during the period. |
| (c) | Does not include expenses of the underlying fund in which the Portfolio invests. |
| (d) | Commencement of operations. |
| (g) | For the period ended July 31, 2014. The Trust changed its fiscal year end from October 31 to July 31, effective July 31, 2014. |
See Notes to Financial Statements.
| | | | |
| The TARGET Portfolio Trust | | | 201 | |
Financial Highlights (continued)
| | | | | | | | | | | | | | | | | | | | | | | | |
| | | SMALL CAPITALIZATION
VALUE PORTFOLIO | |
| | | Class R | |
| | | Nine Months
Ended
July 31, | | | Year Ended October 31, | |
| | | 2014(b)(f) | | | 2013(b) | | | 2012(b) | | | 2011(b) | | | 2010(b) | | | 2009(b) | |
| | | | | | |
| PER SHARE OPERATING PERFORMANCE: | | | | | | | | | | | | | | | | | | | | | | | | |
Net asset value, beginning of period | | $ | 27.48 | | | $ | 21.21 | | | $ | 20.17 | | | $ | 18.80 | | | $ | 15.41 | | | $ | 14.10 | |
Income (loss) from investment operations | | | | | | | | | | | | | | | | | | | | | | | | |
Net investment income | | | .11 | | | | .20 | | | | .19 | | | | .11 | | | | .10 | | | | .13 | |
Net realized and unrealized gain on investments | | | .98 | | | | 6.87 | | | | 1.65 | | | | 1.35 | | | | 3.41 | | | | 1.42 | |
Total from investment operations | | | 1.09 | | | | 7.07 | | | | 1.84 | | | | 1.46 | | | | 3.51 | | | | 1.55 | |
Less dividends and distributions | | | | | | | | | | | | | | | | | | | | | | | | |
Dividends from net investment income | | | (.15 | ) | | | (.19 | ) | | | (.14 | ) | | | (.09 | ) | | | (.12 | ) | | | (.16 | ) |
Distributions from net realized gains | | | (1.91 | ) | | | (.61 | ) | | | (.66 | ) | | | — | | | | — | | | | (.08 | ) |
Total dividends and distributions | | | (2.06 | ) | | | (.80 | ) | | | (.80 | ) | | | (.09 | ) | | | (.12 | ) | | | (.24 | ) |
Net asset value, end of period | | $ | 26.51 | | | $ | 27.48 | | | $ | 21.21 | | | $ | 20.17 | | | $ | 18.80 | | | $ | 15.41 | |
| | | | | | |
| TOTAL RETURN(a) | | | 4.17 | % | | | 34.55 | % | | | 9.51 | % | | | 7.75 | % | | | 22.93 | % | | | 11.37 | % |
| | | | | | |
| RATIOS/SUPPLEMENTAL DATA: | | | | | | | | | | | | | | | | | | | | | | | | |
Net assets, end of period (000) | | $ | 143,655 | | | $ | 119,047 | | | $ | 84,483 | | | $ | 69,790 | | | $ | 52,587 | | | $ | 33,574 | |
Average net assets (000) | | $ | 134,383 | | | $ | 99,668 | | | $ | 76,205 | | | $ | 63,352 | | | $ | 43,680 | | | $ | 26,425 | |
Ratios to average net assets(c) | | | | | | | | | | | | | | | | | | | | | | | | |
Expenses after waivers and/or expense reimbursements | | | 1.18 | %(d) | | | 1.17 | % | | | 1.18 | % | | | 1.21 | % | | | 1.26 | % | | | 1.30 | % |
Expenses before waivers and/or expense reimbursements | | | 1.43 | %(d) | | | 1.42 | % | | | 1.43 | % | | | 1.46 | % | | | 1.51 | % | | | 1.55 | % |
Net investment income | | | .54 | %(d) | | | .83 | % | | | .92 | % | | | .55 | % | | | .57 | % | | | .96 | % |
Portfolio turnover rate | | | 42 | %(e) | | | 40 | % | | | 37 | % | | | 44 | % | | | 33 | % | | | 48 | % |
| (a) | Total return is calculated assuming a purchase of a share on the first day and a sale on the last day of each period reported and includes reinvestment of dividends and distributions. Total returns may reflect adjustments to conform to generally accepted accounting principles. Total returns for period less than one full year are not annualized. |
| (b) | Calculated based upon average shares outstanding during the period. |
| (c) | Does not include expenses of the underlying fund in which the Portfolio invests. |
| (f) | For the nine month period ended July 31, 2014. The Trust changed its fiscal year end from October 31 to July 31, effective July 31, 2014. |
See Notes to Financial Statements.
| | | | |
| 202 | | | The TARGET Portfolio Trust | |
Financial Highlights (continued)
| | | | | | | | | | | | | | | | | | | | | | | | |
| | | SMALL CAPITALIZATION
VALUE PORTFOLIO | |
| | | Class T | |
| | | Nine Months
Ended
July 31, | | | Year Ended October 31, | |
| | | 2014(b)(f) | | | 2013(b) | | | 2012(b) | | | 2011(b) | | | 2010(b) | | | 2009(b) | |
| | | | | | |
| PER SHARE OPERATING PERFORMANCE: | | | | | | | | | | | | | | | | | | | | | | | | |
Net asset value, beginning of period | | $ | 27.71 | | | $ | 21.39 | | | $ | 20.33 | | | $ | 18.95 | | | $ | 15.51 | | | $ | 14.21 | |
Income (loss) from investment operations | | | | | | | | | | | | | | | | | | | | | | | | |
Net investment income | | | .21 | | | | .32 | | | | .29 | | | | .22 | | | | .19 | | | | .20 | |
Net realized and unrealized gain on investments | | | 1.00 | | | | 6.91 | | | | 1.67 | | | | 1.34 | | | | 3.45 | | | | 1.41 | |
Total from investment operations | | | 1.21 | | | | 7.23 | | | | 1.96 | | | | 1.56 | | | | 3.64 | | | | 1.61 | |
Less dividends and distributions | | | | | | | | | | | | | | | | | | | | | | | | |
Dividends from net investment income | | | (.28 | ) | | | (.30 | ) | | | (.24 | ) | | | (.18 | ) | | | (.20 | ) | | | (.23 | ) |
Distributions from net realized gains | | | (1.91 | ) | | | (.61 | ) | | | (.66 | ) | | | — | | | | — | | | | (.08 | ) |
Total dividends and distributions | | | (2.19 | ) | | | (.91 | ) | | | (.90 | ) | | | (.18 | ) | | | (.20 | ) | | | (.31 | ) |
Net asset value, end of period | | $ | 26.73 | | | $ | 27.71 | | | $ | 21.39 | | | $ | 20.33 | | | $ | 18.95 | | | $ | 15.51 | |
| | | | | | |
| TOTAL RETURN(a) | | | 4.60 | % | | | 35.16 | % | | | 10.11 | % | | | 8.22 | % | | | 23.64 | % | | | 11.82 | % |
| | | | | | |
| RATIOS/SUPPLEMENTAL DATA: | | | | | | | | | | | | | | | | | | | | | | | | |
Net assets, end of period (000) | | $ | 1,781,471 | | | $ | 1,622,779 | | | $ | 1,079,475 | | | $ | 890,245 | | | $ | 800,761 | | | $ | 538,202 | |
Average net assets (000) | | $ | 1,782,968 | | | $ | 1,342,995 | | | $ | 1,000,086 | | | $ | 872,587 | | | $ | 674,452 | | | $ | 439,058 | |
Ratios to average net assets(c) | | | | | | | | | | | | | | | | | | | | | | | | |
Expenses after waivers and/or expense reimbursements | | | .68 | %(d) | | | .67 | % | | | .68 | % | | | .71 | % | | | .76 | % | | | .80 | % |
Expenses before waivers and/or expense reimbursements | | | .68 | %(d) | | | .67 | % | | | .68 | % | | | .71 | % | | | .76 | % | | | .80 | % |
Net investment income | | | 1.05 | %(d) | | | 1.32 | % | | | 1.42 | % | | | 1.06 | % | | | 1.07 | % | | | 1.46 | % |
Portfolio turnover rate | | | 42 | %(e) | | | 40 | % | | | 37 | % | | | 44 | % | | | 33 | % | | | 48 | % |
| (a) | Total return is calculated assuming a purchase of a share on the first day and a sale on the last day of each period reported and includes reinvestment of dividends and distributions. Total returns may reflect adjustments to conform to generally accepted accounting principles. Total returns for period less than one full year are not annualized. |
| (b) | Calculated based upon average shares outstanding during the period. |
| (c) | Does not include expenses of the underlying fund in which the Portfolio invests. |
| (f) | For the nine month period ended July 31, 2014. The Trust changed its fiscal year end from October 31 to July 31, effective July 31, 2014. |
See Notes to Financial Statements.
| | | | |
| The TARGET Portfolio Trust | | | 203 | |
Financial Highlights (continued)
| | | | | | | | | | | | | | | | |
| | | INTERNATIONAL
EQUITY PORTFOLIO | |
| | | Class Q | |
| | | Nine Months
Ended
July 31, | | | Year Ended October 31, | | | March 1,
2011(b),
through
October 31,
2011(e) | |
| | 2014(e)(g) | | | 2013(e) | | | 2012(e) | | |
| | | | |
| PER SHARE OPERATING PERFORMANCE: | | | | | | | | | | | | | | | | |
Net asset value, beginning of period | | $ | 13.77 | | �� | $ | 11.42 | | | $ | 11.10 | | | $ | 12.56 | |
Income (loss) from investment operations | | | | | | | | | | | | | | | | |
Net investment income | | | .26 | | | | .27 | | | | .27 | | | | .26 | |
Net realized and unrealized gain (loss) on investments | | | .04 | | | | 2.37 | | | | .32 | | | | (1.72 | ) |
Total from investment operations | | | .30 | | | | 2.64 | | | | .59 | | | | (1.46 | ) |
Less dividends from net investment income | | | (.26 | ) | | | (.29 | ) | | | (.27 | ) | | | — | |
Net asset value, end of period | | $ | 13.81 | | | $ | 13.77 | | | $ | 11.42 | | | $ | 11.10 | |
| | | | |
| TOTAL RETURN(a) | | | 2.26 | % | | | 23.57 | % | | | 5.60 | % | | | (11.62 | )% |
| | | | |
| RATIOS/SUPPLEMENTAL DATA: | | | | | | | | | | | | | | | | |
Net assets, end of period (000) | | $ | 167,988 | | | $ | 149,490 | | | $ | 120,574 | | | $ | 108,378 | |
Average net assets (000) | | $ | 159,618 | | | $ | 135,226 | | | $ | 110,908 | | | $ | 94,827 | |
Ratios to average net assets(f) | | | | | | | | | | | | | | | | |
Expenses after waivers and/or expense reimbursements | | | .81 | %(c) | | | .82 | % | | | .84 | % | | | .87 | %(c) |
Expenses before waivers and/or expense reimbursements | | | .81 | %(c) | | | .82 | % | | | .84 | % | | | .87 | %(c) |
Net investment income | | | 2.55 | %(c) | | | 2.15 | % | | | 2.51 | % | | | 3.21 | %(c) |
Portfolio turnover rate | | | 23 | %(d) | | | 26 | % | | | 16 | % | | | 19 | %(d) |
| (a) | Total return is calculated assuming a purchase of a share on the first day and a sale on the last day of each period reported and includes reinvestment of dividends and distributions. Total returns may reflect adjustments to conform to generally accepted accounting principles. Total returns for periods less than one full year are not annualized. |
| (b) | Commencement of offering. |
| (e) | Calculated based upon average shares outstanding during the period. |
| (f) | Does not include expenses of the underlying fund in which the Portfolio invests. |
| (g) | For the nine month period ended July 31, 2014. The Trust changed its fiscal year end from October 31 to July 31, effective July 31, 2014. |
See Notes to Financial Statements.
| | | | |
| 204 | | | The TARGET Portfolio Trust | |
Financial Highlights (continued)
| | | | | | | | | | | | | | | | | | | | | | | | |
| | | INTERNATIONAL
EQUITY PORTFOLIO | |
| | | Class R | |
| | | Nine Months
Ended
July 31, | | | Year Ended October 31, | |
| | | 2014(b)(f) | | | 2013(b) | | | 2012(b) | | | 2011(b) | | | 2010(b) | | | 2009(b) | |
| | | | | | |
| PER SHARE OPERATING PERFORMANCE: | | | | | | | | | | | | | | | | | | | | | | | | |
Net asset value, beginning of period | | $ | 13.69 | | | $ | 11.36 | | | $ | 11.02 | | | $ | 11.84 | | | $ | 10.78 | | | $ | 8.99 | |
Income (loss) from investment operations | | | | | | | | | | | | | | | | | | | | | | | | |
Net investment income | | | .20 | | | | .19 | | | | .21 | | | | .22 | | | | .14 | | | | .13 | |
Net realized and unrealized gain (loss) on investments | | | .04 | | | | 2.36 | | | | .32 | | | | (.90 | ) | | | 1.00 | | | | 2.08 | |
Total from investment operations | | | .24 | | | | 2.55 | | | | .53 | | | | (.68 | ) | | | 1.14 | | | | 2.21 | |
Less dividends from net investment income | | | (.18 | ) | | | (.22 | ) | | | (.19 | ) | | | (.14 | ) | | | (.11 | ) | | | (.42 | ) |
Capital Contributions(g) | | | — | | | | — | | | | — | | | | — | | | | .03 | | | | — | |
Net asset value, end of period | | $ | 13.75 | | | $ | 13.69 | | | $ | 11.36 | | | $ | 11.02 | | | $ | 11.84 | | | $ | 10.78 | |
| | | | | | |
| TOTAL RETURN(a) | | | 1.82 | % | | | 22.83 | % | | | 5.01 | % | | | (5.84 | )% | | | 10.93 | % | | | 26.13 | % |
| | | | | | |
| RATIOS/SUPPLEMENTAL DATA: | | | | | | | | | | | | | | | | | | | | | | | | |
Net assets, end of period (000) | | $ | 251,908 | | | $ | 215,215 | | | $ | 148,857 | | | $ | 108,715 | | | $ | 79,234 | | | $ | 57,184 | |
Average net assets (000) | | $ | 237,069 | | | $ | 179,681 | | | $ | 125,953 | | | $ | 93,879 | | | $ | 68,032 | | | $ | 43,233 | |
Ratios to average net assets(c) | | | | | | | | | | | | | | | | | | | | | | | | |
Expenses after waivers and/or expense reimbursements | | | 1.42 | %(d) | | | 1.44 | % | | | 1.45 | % | | | 1.48 | % | | | 1.54 | % | | | 1.51 | % |
Expenses before waivers and/or expense reimbursements | | | 1.67 | %(d) | | | 1.69 | % | | | 1.70 | % | | | 1.73 | % | | | 1.79 | % | | | 1.76 | % |
Net investment income | | | 1.97 | %(d) | | | 1.53 | % | | | 1.91 | % | | | 1.87 | % | | | 1.29 | % | | | 1.46 | % |
Portfolio turnover rate | | | 23 | %(e) | | | 26 | % | | | 16 | % | | | 19 | % | | | 41 | % | | | 38 | % |
| (a) | Total return is calculated assuming a purchase of a share on the first day and a sale on the last day of each period reported and includes reinvestment of dividends and distributions. Total returns may reflect adjustments to conform to generally accepted accounting principles. Total returns for periods less than one full year are not annualized. |
| (b) | Calculated based upon average shares outstanding during the period. |
| (c) | Does not include expenses of the underlying fund in which the Portfolio invests. |
| (f) | For the nine month period ended July 31, 2014. The Trust changed its fiscal year end from October 31 to July 31, effective July 31, 2014. |
| (g) | The Portfolio received payments related to an unaffiliated-third party’s settlement of regulatory proceeds involving allegations of improper trading in Portfolio shares during the fiscal year ended October 31, 2010. The Portfolio was not involved in the proceedings or in the calculation of the amount of the settlement. |
See Notes to Financial Statements.
| | | | |
| The TARGET Portfolio Trust | | | 205 | |
Financial Highlights (continued)
| | | | | | | | | | | | | | | | | | | | | | | | |
| | | INTERNATIONAL
EQUITY PORTFOLIO | |
| | | Class T | |
| | | Nine Months
Ended
July 31, | | | Year Ended October 31, | |
| | | 2014(b)(f) | | | 2013(b) | | | 2012(b) | | | 2011(b) | | | 2010(b) | | | 2009(b) | |
| | | | | | |
| PER SHARE OPERATING PERFORMANCE: | | | | | | | | | | | | | | | | | | | | | | | | |
Net asset value, beginning of period | | $ | 13.75 | | | $ | 11.41 | | | $ | 11.08 | | | $ | 11.90 | | | $ | 10.83 | | | $ | 9.03 | |
Income (loss) from investment operations | | | | | | | | | | | | | | | | | | | | | | | | |
Net investment income | | | .25 | | | | .25 | | | | .26 | | | | .30 | | | | .19 | | | | .17 | |
Net realized and unrealized gain (loss) on investments | | | .05 | | | | 2.37 | | | | .32 | | | | (.93 | ) | | | 1.01 | | | | 2.10 | |
Total from investment operations | | | .30 | | | | 2.62 | | | | .58 | | | | (.63 | ) | | | 1.20 | | | | 2.27 | |
Less dividends from net investment income | | | (.25 | ) | | | (.28 | ) | | | (.25 | ) | | | (.19 | ) | | | (.16 | ) | | | (.47 | ) |
Capital Contributions(g) | | | — | | | | — | | | | — | | | | — | | | | .03 | | | | — | |
Net asset value, end of period | | $ | 13.80 | | | $ | 13.75 | | | $ | 11.41 | | | $ | 11.08 | | | $ | 11.90 | | | $ | 10.83 | |
| | | | | | |
| TOTAL RETURN(a) | | | 2.22 | % | | | 23.39 | % | | | 5.52 | % | | | (5.36 | )% | | | 11.45 | % | | | 26.84 | % |
| | | | | | |
| RATIOS/SUPPLEMENTAL DATA: | | | | | | | | | | | | | | | | | | | | | | | | |
Net assets, end of period (000) | | $ | 64,595 | | | $ | 68,194 | | | $ | 65,450 | | | $ | 74,592 | | | $ | 98,978 | | | $ | 119,006 | |
Average net assets (000) | | $ | 67,125 | | | $ | 65,268 | | | $ | 67,572 | | | $ | 112,082 | | | $ | 106,108 | | | $ | 110,053 | |
Ratios to average net assets(c) | | | | | | | | | | | | | | | | | | | | | | | | |
Expenses after waivers and/or expense reimbursements | | | .92 | %(d) | | | .94 | % | | | .95 | % | | | .98 | % | | | 1.04 | % | | | 1.01 | % |
Expenses before waivers and/or expense reimbursements | | | .92 | %(d) | | | .94 | % | | | .95 | % | | | .98 | % | | | 1.04 | % | | | 1.01 | % |
Net investment income | | | 2.41 | %(d) | | | 2.02 | % | | | 2.39 | % | | | 2.47 | % | | | 1.75 | % | | | 1.94 | % |
Portfolio turnover rate | | | 23 | %(e) | | | 26 | % | | | 16 | % | | | 19 | % | | | 41 | % | | | 38 | % |
| (a) | Total return is calculated assuming a purchase of a share on the first day and a sale on the last day of each period reported and includes reinvestment of dividends and distributions. Total returns may reflect adjustments to conform to generally accepted accounting principles. Total returns for periods less than one full year are not annualized. |
| (b) | Calculated based upon average shares outstanding during the period. |
| (c) | Does not include expenses of the underlying fund in which the Portfolio invests. |
| (f) | For the nine month period ended July 31, 2014. The Trust changed its fiscal year end from October 31 to July 31, effective July 31, 2014. |
| (g) | The Portfolio received payments related to an unaffiliated-third party’s settlement of regulatory proceeds involving allegations of improper trading in Portfolio shares during the fiscal year ended October 31, 2010. The Portfolio was not involved in the proceedings or in the calculation of the amount of the settlement. |
See Notes to Financial Statements.
| | | | |
| 206 | | | The TARGET Portfolio Trust | |
Financial Highlights (continued)
| | | | | | | | | | | | | | | | | | | | | | | | |
| | | TOTAL RETURN BOND PORTFOLIO | |
| | | Class R | |
| | | Nine Months
Ended
July 31, | | | Year Ended October 31, | |
| | | 2014(i) | | | 2013 | | | 2012 | | | 2011 | | | 2010 | | | 2009 | |
| | | | | | |
| PER SHARE OPERATING PERFORMANCE: | | | | | | | | | | | | | | | | | | | | | | | | |
Net asset value, beginning of period | | $ | 10.92 | | | $ | 11.51 | | | $ | 10.94 | | | $ | 11.34 | | | $ | 10.93 | | | $ | 9.86 | |
Income (loss) from investment operations | | | | | | | | | | | | | | | | | | | | | | | | |
Net investment income | | | .07 | | | | .12 | | | | .21 | | | | .26 | | | | .30 | | | | .42 | |
Net realized and unrealized gain (loss) on investments | | | .08 | | | | (.33 | ) | | | .59 | | | | (.03 | ) | | | .68 | | | | 1.82 | |
Total from investment operations | | | .15 | | | | (.21 | ) | | | .80 | | | | .23 | | | | .98 | | | | 2.24 | |
Less dividends and distributions | | | | | | | | | | | | | | | | | | | | | | | | |
Dividends from net investment income | | | (.10 | ) | | | (.17 | ) | | | (.23 | ) | | | (.27 | ) | | | (.30 | ) | | | (.62 | ) |
Distributions from net realized gains | | | — | | | | (.21 | ) | | | — | | | | (.36 | ) | | | (.27 | ) | | | (.55 | ) |
Total dividends and distributions | | | (.10 | ) | | | (.38 | ) | | | (.23 | ) | | | (.63 | ) | | | (.57 | ) | | | (1.17 | ) |
Capital Contributions(b) | | | — | | | | — | | | | — | | | | — | | | | — | (f) | | | — | |
Net asset value, end of period | | $ | 10.97 | | | $ | 10.92 | | | $ | 11.51 | | | $ | 10.94 | | | $ | 11.34 | | | $ | 10.93 | |
| | | | | | |
| TOTAL RETURN(a) | | | 1.41 | % | | | (1.86 | )% | | | 7.42 | % | | | 2.24 | % | | | 9.33 | % | | | 24.57 | % |
| | | | | | |
| RATIOS/SUPPLEMENTAL DATA: | | | | | | | | | | | | | | | | | | | | | | | | |
Net assets, end of period (000) | | $ | 250,999 | | | $ | 219,719 | | | $ | 181,334 | | | $ | 127,837 | | | $ | 102,992 | | | $ | 71,457 | |
Average net assets (000) | | $ | 235,421 | | | $ | 198,973 | | | $ | 154,728 | | | $ | 117,927 | | | $ | 86,806 | | | $ | 56,103 | |
Ratios to average net assets(c) | | | | | | | | | | | | | | | | | | | | | | | | |
Expenses after waivers and/or expense reimbursements | | | 1.16 | %(g) | | | 1.14 | % | | | 1.13 | % | | | 1.15 | % | | | 1.17 | % | | | 1.32 | %(d) |
Expenses before waivers and/or expense reimbursements | | | 1.41 | %(g) | | | 1.39 | % | | | 1.38 | % | | | 1.40 | % | | | 1.42 | % | | | 1.57 | %(e) |
Net investment income | | | .91 | %(g) | | | 1.09 | % | | | 1.92 | % | | | 2.50 | % | | | 2.79 | % | | | 4.20 | % |
Portfolio turnover rate | | | 637 | %(h) | | | 500 | % | | | 308 | % | | | 243 | % | | | 369 | % | | | 657 | % |
| (a) | Total return is calculated assuming a purchase of a share on the first day and a sale on the last day of each period reported and includes reinvestment of dividends and distributions. Total returns may reflect adjustments to conform to generally accepted accounting principles. Total returns for periods less than one full year are not annualized. |
| (b) | The Portfolio received payments related to an unaffiliated-third party’s settlement of regulatory proceeds involving allegations of improper trading in Portfolio shares during the fiscal year ended October 31, 2010. The Portfolio was not involved in the proceedings or in the calculation of the amount of the settlement. |
| (c) | Does not include expenses of the underlying fund in which the Portfolio invests. |
| (d) | The annualized expense ratio without interest expense would have been 1.30% for the year ended October 31, 2009. |
| (e) | The annualized expense ratio without interest expense would have been 1.55% for the year ended October 31, 2009. |
| (f) | Less than $0.005 per share. |
| (i) | For the nine month period ended July 31, 2014. The Trust changed its fiscal year end from October 31 to July 31, effective July 31, 2014. |
See Notes to Financial Statements.
| | | | |
| The TARGET Portfolio Trust | | | 207 | |
Financial Highlights (continued)
| | | | | | | | | | | | | | | | | | | | | | | | |
| | | TOTAL RETURN BOND PORTFOLIO | |
| | | Class T | |
| | | Nine Months
Ended
July 31, | | | Year Ended October 31, | |
| | | 2014(h) | | | 2013 | | | 2012 | | | 2011 | | | 2010 | | | 2009 | |
| | | | | | |
| PER SHARE OPERATING PERFORMANCE: | | | | | | | | | | | | | | | | | | | | | | | | |
Net asset value, beginning of period | | $ | 11.00 | | | $ | 11.60 | | | $ | 11.02 | | | $ | 11.42 | | | $ | 11.01 | | | $ | 9.93 | |
Income (loss) from investment operations | | | | | | | | | | | | | | | | | | | | | | | | |
Net investment income | | | .11 | | | | .18 | | | | .28 | | | | .33 | | | | .36 | | | | .47 | |
Net realized and unrealized gain (loss) on investments | | | .09 | | | | (.35 | ) | | | .59 | | | | (.04 | ) | | | .68 | | | | 1.84 | |
Total from investment operations | | | .20 | | | | (.17 | ) | | | .87 | | | | .29 | | | | 1.04 | | | | 2.31 | |
Less dividends and distributions | | | | | | | | | | | | | | | | | | | | | | | | |
Dividends from net investment income | | | (.14 | ) | | | (.22 | ) | | | (.29 | ) | | | (.33 | ) | | | (.36 | ) | | | (.68 | ) |
Distributions from net realized gains | | | — | | | | (.21 | ) | | | — | | | | (.36 | ) | | | (.27 | ) | | | (.55 | ) |
Total dividends and distributions | | | (.14 | ) | | | (.43 | ) | | | (.29 | ) | | | (.69 | ) | | | (.63 | ) | | | (1.23 | ) |
Capital Contributions(e) | | | — | | | | — | | | | — | | | | — | | | | — | (d) | | | — | |
Net asset value, end of period | | $ | 11.06 | | | $ | 11.00 | | | $ | 11.60 | | | $ | 11.02 | | | $ | 11.42 | | | $ | 11.01 | |
| | | | | | |
| TOTAL RETURN(a) | | | 1.87 | % | | | (1.43 | )% | | | 8.01 | % | | | 2.76 | % | | | 9.82 | % | | | 25.15 | % |
| | | | | | |
| RATIOS/SUPPLEMENTAL DATA: | | | | | | | | | | | | | | | | | | | | | | | | |
Net assets, end of period (000) | | $ | 163,596 | | | $ | 193,978 | | | $ | 267,095 | | | $ | 254,598 | | | $ | 266,960 | | | $ | 217,784 | |
Average net assets (000) | | $ | 174,072 | | | $ | 246,978 | | | $ | 260,059 | | | $ | 249,230 | | | $ | 242,590 | | | $ | 198,247 | |
Ratios to average net assets(b) | | | | | | | | | | | | | | | | | | | | | | | | |
Expenses after waivers and/or expense reimbursements | | | .66 | %(f) | | | .64 | % | | | .63 | % | | | .65 | % | | | .67 | % | | | .82 | %(c) |
Expenses before waivers and/or expense reimbursements | | | .66 | %(f) | | | .64 | % | | | .63 | % | | | .65 | % | | | .67 | % | | | .82 | %(c) |
Net investment income | | | 1.39 | %(f) | | | 1.59 | % | | | 2.46 | % | | | 2.99 | % | | | 3.28 | % | | | 4.71 | % |
Portfolio turnover rate | | | 637 | %(g) | | | 500 | % | | | 308 | % | | | 243 | % | | | 369 | % | | | 657 | % |
| (a) | Total return is calculated assuming a purchase of a share on the first day and a sale on the last day of each period reported and includes reinvestment of dividends and distributions. Total returns may reflect adjustments to conform to generally accepted accounting principles. Total returns for periods less than one full year are not annualized. |
| (b) | Does not include expenses of the underlying fund in which the Portfolio invests. |
| (c) | The annualized expense ratio without interest expense would have been .80% for the year ended October 31, 2009. |
| (d) | Less than $0.005 per share. |
| (e) | The Portfolio received payments related to an unaffiliated-third party’s settlement of regulatory proceeds involving allegations of improper trading in Portfolio shares during the fiscal year ended October 31, 2010. The Portfolio was not involved in the proceedings or in the calculation of the amount of the settlement. |
| (h) | For the nine month period ended July 31, 2014. The Trust changed its fiscal year end from October 31 to July 31, effective July 31, 2014. |
See Notes to Financial Statements.
| | | | |
| 208 | | | The TARGET Portfolio Trust | |
Financial Highlights (continued)
| | | | | | | | | | | | | | | | | | | | | | | | |
| | | INTERMEDIATE-TERM BOND PORTFOLIO | |
| | | Class T | |
| | | Nine Months
Ended
July 31, | | | Year Ended October 31, | |
| | | 2014(h) | | | 2013 | | | 2012 | | | 2011 | | | 2010 | | | 2009 | |
| | | | | | |
| PER SHARE OPERATING PERFORMANCE: | | | | | | | | | | | | | | | | | | | | | | | | |
Net asset value, beginning of period | | $ | 10.30 | | | $ | 10.85 | | | $ | 10.50 | | | $ | 10.96 | | | $ | 10.85 | | | $ | 10.27 | |
Income (loss) from investment operations | | | | | | | | | | | | | | | | | | | | | | | | |
Net investment income | | | .17 | | | | .25 | | | | .27 | | | | .27 | | | | .27 | | | | .36 | |
Net realized and unrealized gain (loss) on investments | | | (.07 | ) | | | (.40 | ) | | | .56 | | | | — | (b) | | | .66 | | | | 1.27 | |
Total from investment operations | | | .10 | | | | (.15 | ) | | | .83 | | | | .27 | | | | .93 | | | | 1.63 | |
Less dividends and distributions | | | | | | | | | | | | | | | | | | | | | | | | |
Dividends from net investment income | | | (.21 | ) | | | (.22 | ) | | | (.42 | ) | | | (.36 | ) | | | (.28 | ) | | | (.42 | ) |
Distributions from net realized gains | | | (.06 | ) | | | (.18 | ) | | | (.06 | ) | | | (.37 | ) | | | (.54 | ) | | | (.63 | ) |
Total dividends and distributions | | | (.27 | ) | | | (.40 | ) | | | (.48 | ) | | | (.73 | ) | | | (.82 | ) | | | (1.05 | ) |
Capital Contributions(e) | | | — | | | | — | | | | — | | | | — | | | | — | (b) | | | — | |
Net asset value, end of period | | $ | 10.13 | | | $ | 10.30 | | | $ | 10.85 | | | $ | 10.50 | | | $ | 10.96 | | | $ | 10.85 | |
| | | | | | |
| TOTAL RETURN(a) | | | 1.01 | % | | | (1.41 | )% | | | 8.13 | % | | | 2.70 | % | | | 9.07 | % | | | 17.01 | % |
| | | | | | |
| RATIOS/SUPPLEMENTAL DATA: | | | | | | | | | | | | | | | | | | | | | | | | |
Net assets, end of period (000) | | $ | 124,058 | | | $ | 131,981 | | | $ | 169,193 | | | $ | 182,371 | | | $ | 248,817 | | | $ | 245,517 | |
Average net assets (000) | | $ | 127,349 | | | $ | 149,452 | | | $ | 177,149 | | | $ | 210,348 | | | $ | 247,716 | | | $ | 218,911 | |
Ratios to average net assets(c) | | | | | | | | | | | | | | | | | | | | | | | | |
Expenses after waivers and/or expense reimbursements | | | .77 | %(f) | | | .71 | % | | | .66 | % | | | .66 | % | | | .66 | %(d) | | | .74 | %(d) |
Expenses before waivers and/or expense reimbursements | | | .77 | %(f) | | | .71 | % | | | .66 | % | | | .66 | % | | | .66 | %(d) | | | .74 | %(d) |
Net investment income | | | 2.22 | %(f) | | | 2.33 | % | | | 2.50 | % | | | 2.61 | % | | | 2.53 | % | | | 3.47 | % |
Portfolio turnover rate | | | 234 | %(g) | | | 193 | % | | | 175 | % | | | 392 | % | | | 938 | % | | | 527 | % |
| (a) | Total return is calculated assuming a purchase of a share on the first day and a sale on the last day of each period reported and includes reinvestment of dividends and distributions. Total returns may reflect adjustments to conform to generally accepted accounting principles. Total returns for period less than one full year are not annualized. |
| (b) | Less than $0.005 per share. |
| (c) | Does not include expenses of the underlying fund in which the Portfolio invests. |
| (d) | The annualized expense ratio without interest expense would have been .64% and .69%, respectively, for the years ended October 31, 2010 and 2009. |
| (e) | The Portfolio received payments related to an unaffiliated-third party’s settlement of regulatory proceeds involving allegations of improper trading in Portfolio shares during the fiscal year ended October 31, 2010. The Portfolio was not involved in the proceedings or in the calculation of the amount of the settlement. |
| (h) | For the nine month period ended July 31, 2014. The Trust changed its fiscal year end from October 31 to July 31, effective July 31, 2014. |
See Notes to Financial Statements.
| | | | |
| The TARGET Portfolio Trust | | | 209 | |
Financial Highlights (continued)
| | | | | | | | | | | | | | | | | | | | | | | | |
| | | MORTGAGE BACKED
SECURITIES PORTFOLIO | |
| | | Class T | |
| | | Nine Months
Ended
July 31, | | | Year Ended October 31, | |
| | | 2014(g) | | | 2013 | | | 2012 | | | 2011 | | | 2010 | | | 2009 | |
| | | | | | |
| PER SHARE OPERATING PERFORMANCE: | | | | | | | | | | | | | | | | | | | | | | | | |
Net asset value, beginning of period | | $ | 10.50 | | | $ | 10.83 | | | $ | 10.68 | | | $ | 10.60 | | | $ | 9.96 | | | $ | 9.26 | |
Income (loss) from investment operations | | | | | | | | | | | | | | | | | | | | | | | | |
Net investment income | | | .05 | | | | .15 | | | | .29 | | | | .49 | | | | .54 | | | | .70 | |
Net realized and unrealized gain (loss)
on investments | | | .21 | | | | (.26 | ) | | | .20 | | | | .05 | | | | .64 | | | | .74 | |
Total from investment operations | | | .26 | | | | (.11 | ) | | | .49 | | | | .54 | | | | 1.18 | | | | 1.44 | |
Less dividends from net investment income | | | (.07 | ) | | | (.22 | ) | | | (.34 | ) | | | (.46 | ) | | | (.54 | ) | | | (.74 | ) |
Net asset value, end of period | | $ | 10.69 | | | $ | 10.50 | | | $ | 10.83 | | | $ | 10.68 | | | $ | 10.60 | | | $ | 9.96 | |
| | | | | | |
| TOTAL RETURN(a) | | | 2.47 | % | | | (.97 | )% | | | 4.64 | % | | | 5.26 | % | | | 12.13 | % | | | 16.20 | % |
| | | | | | |
| RATIOS/SUPPLEMENTAL DATA: | | | | | | | | | | | | | | | | | | | | | | | | |
Net assets, end of period (000) | | $ | 43,879 | | | $ | 42,218 | | | $ | 43,605 | | | $ | 35,281 | | | $ | 36,157 | | | $ | 41,112 | |
Average net assets (000) | | $ | 42,666 | | | $ | 43,290 | | | $ | 42,171 | | | $ | 34,208 | | | $ | 38,594 | | | $ | 44,081 | |
Ratios to average net assets(c) | | | | | | | | | | | | | | | | | | | | | | | | |
Expenses after waivers and/or expense reimbursements | | | .99 | %(e) | | | .93 | % | | | .93 | % | | | 1.03 | % | | | .88 | %(b) | | | 1.07 | %(b) |
Expenses before waivers and/or expense reimbursements | | | .99 | %(e) | | | .93 | % | | | .93 | % | | | 1.03 | % | | | .88 | %(b) | | | 1.07 | %(b) |
Net investment income | | | .65 | %(e) | | | 1.39 | % | | | 2.70 | % | | | 4.65 | % | | | 5.23 | % | | | 7.35 | % |
Portfolio turnover rate(d) | | | 936 | %(f) | | | 990 | % | | | 847 | % | | | 670 | % | | | 646 | % | | | 425 | % |
| (a) | Total return is calculated assuming a purchase of a share on the first day and a sale on the last day of each period reported and includes reinvestment of dividends and distributions. Total returns may reflect adjustments to conform to generally accepted accounting principles. Total returns for period less than one full year are not annualized. |
| (b) | The annualized expense ratio without interest expense would have been .87% and .79%, respectively, for the years ended October 31, 2010 and 2009. |
| (c) | Does not include expenses of the underlying fund in which the Portfolio invests. |
| (d) | The Portfolio accounts for mortgage dollar roll transactions as purchases and sales which, as a result, can increase its portfolio turnover rate. |
| (g) | For the nine month period ended July 31, 2014. The Trust changed its fiscal year end from October 31 to July 31, effective July 31, 2014. |
See Notes to Financial Statements.
| | | | |
| 210 | | | The TARGET Portfolio Trust | |
Report of Independent Registered Public Accounting Firm
The Board of Trustee and Shareholders
The Target Portfolio Trust:
We have audited the accompanying statements of assets and liabilities of The Target Portfolio Trust (comprised of Large Capitalization Growth Portfolio, Large Capitalization Value Portfolio, Small Capitalization Growth Portfolio, Small Capitalization Value Portfolio, International Equity Portfolio, Total Return Bond Portfolio, Intermediate-Term Bond Portfolio and Mortgage Backed Securities Portfolio, hereafter referred to as the “Funds”), including the portfolios of investments, as of July 31, 2014, and the related statements of operations for the nine-month period ended July 31, 2014 and the year ended October 31, 2013, the statements of changes in net assets for the nine-month period ended July 31, 2014 and for each of the years in the two-year period ended October 31, 2013 and the financial highlights for the nine-month period ended July 31, 2014 and each of the years in the five-year period ended October 31, 2013. These financial statements and financial highlights are the responsibility of the Funds’ management. Our responsibility is to express an opinion on these financial statements and financial highlights based on our audits.
We conducted our audits in accordance with the standards of the Public Company Accounting Oversight Board (United States). Those standards require that we plan and perform the audit to obtain reasonable assurance about whether the financial statements and financial highlights are free of material misstatement. An audit includes examining, on a test basis, evidence supporting the amounts and disclosures in the financial statements. Our procedures included confirmation of securities owned as of July 31, 2014, by correspondence with the custodian, transfer agent and brokers or by other appropriate auditing procedures when replies from brokers were not received. An audit also includes assessing the accounting principles used and significant estimates made by management, as well as evaluating the overall financial statement presentation. We believe that our audits provide a reasonable basis for our opinion.
In our opinion, the financial statements and financial highlights referred to above present fairly, in all material respects, the financial position of the Funds as of July 31, 2014, and the results of their operations for the nine-month period ended July 31, 2014 and the year ended October 31, 2013, the changes in their net assets for the nine-month period ended July 31, 2014 and for each of the years in the two-year period ended October 31, 2013 and the financial highlights for the nine-month period ended July 31, 2014 and each of the years in the five-year period ended October 31, 2013, in conformity with U.S. generally accepted accounting principles.

New York, New York
September 19, 2014
| | | | |
| The TARGET Portfolio Trust | | | 211 | |
INFORMATION ABOUT BOARD MEMBERS AND OFFICERS
(Unaudited)
Information about Board Members and Officers of the Portfolios is set forth below. Board Members who are not deemed to be “interested persons” of the Portfolios, as defined in the 1940 Act, are referred to as “Independent Board Members.” Board Members who are deemed to be “interested persons” of the Portfolios are referred to as “Interested Board Members.” The Board Members are responsible for the overall supervision of the operations of the Portfolios and perform the various duties imposed on the directors of investment companies by the 1940 Act. The Board in turn elects the Officers, who are responsible for administering the day-to-day operations of the Portfolios.
| | | | |
| Independent Board Members(1) | | |
| | | |
Name, Address, Age
Position(s)
Portfolios Overseen | | Principal Occupation(s) During Past Five
Years | | Other Directorships Held |
| | | |
Ellen S. Alberding (56)
Board Member
Portfolios Overseen: 67 | | President and Board Member, The Joyce Foundation (charitable foundation) (since 2002); Vice Chair, City Colleges of Chicago (community college system) (since 2011); Trustee, Skills for America’s Future (national initiative to connect employers to community colleges) (since 2011); Trustee, National Park Foundation (charitable foundation for national park system) (since 2009); Trustee, Economic Club of Chicago (since 2009). | | None. |
| | | |
Kevin J. Bannon (62)
Board Member
Portfolios Overseen: 67 | | Managing Director (since April 2008) and Chief Investment Officer (October 2008-November 2013) of Highmount Capital LLC (registered investment adviser); formerly Executive Vice President and Chief Investment Officer (April 1993-August 2007) of Bank of New York Company; President (May 2003-May 2007) of BNY Hamilton Family of Mutual Funds. | | Director of Urstadt Biddle Properties (equity real estate investment trust) (since September 2008). |
| | | |
Linda W. Bynoe (62)
Board Member
Portfolios Overseen: 67 | | President and Chief Executive Officer (since March 1995) and formerly Chief Operating Officer (December 1989-February 1995) of Telemat Ltd. (management consulting); formerly Vice President (January 1985-June 1989) at Morgan Stanley & Co (broker-dealer). | | Director of Simon Property Group, Inc. (retail real estate) (May 2003-May 2012); Director of Anixter International, Inc. (communication products distributor) (since January 2006); Director of Northern Trust Corporation (financial services) (since April 2006); Trustee of Equity Residential (residential real estate) (since December 2009). |
The TARGET Portfolio Trust
| | | | |
| Independent Board Members(1) | | |
| | | |
Name, Address, Age Position(s)
Portfolios Overseen | | Principal Occupation(s) During Past Five
Years | | Other Directorships Held |
| | | |
Keith F. Hartstein (57)
Board Member
Portfolios Overseen: 67 | | Retired; Formerly President and Chief Executive Officer (2005-2012), Senior Vice President (2004-2005), Senior Vice President of Sales and Marketing (1997-2004), and various executive management positions (1990-1997), John Hancock Funds, LLC (asset management); Chairman, Investment Company Institute’s Sales Force Marketing Committee (2003-2008). | | None. |
| | | |
Michael S. Hyland, CFA (68)
Board Member
Portfolios Overseen: 67 | | Retired (since February 2005); Formerly Senior Managing Director (July 2001-February 2005) of Bear Stearns & Co, Inc.; Global Partner, INVESCO (1999-2001); Managing Director and President of Salomon Brothers Asset Management (1989-1999). | | None. |
| | | |
Douglas H. McCorkindale (75) Board Member
Portfolios Overseen: 67 | | Retired; Formerly Chairman (February 2001-June 2006), Chief Executive Officer (June 2000-July 2005), President (September 1997-July 2005) and Vice Chairman (March 1984-May 2000) of Gannett Co. Inc. (publishing and media). | | Director of Lockheed Martin Corp. (aerospace and defense) (since May 2001). |
| | | |
Stephen P. Munn (72)
Board Member
Portfolios Overseen: 67 | | Lead Director (since 2007) and formerly Chairman (1993-2007) of Carlisle Companies Incorporated (manufacturer of industrial products). | | Lead Director (since 2007) of Carlisle Companies Incorporated (manufacturer of industrial products). |
| | | |
James E. Quinn (62)
Board Member
Portfolios Overseen: 67 | | Retired; Formerly President (2003-2012) and Director (2003-2008), and Vice Chairman and Director (1998-2003), Tiffany & Company (jewelry retailing); Director, Mutual of America Capital Management Corporation (asset management) (since 1996); Director, Hofstra University (since 2008); Vice Chairman, Museum of the City of New York (since 1994). | | Director of Deckers Outdoor Corporation (footwear manufacturer) (since 2011). |
| | | |
Richard A. Redeker (71)
Board Member &
Independent Chair
Portfolios Overseen: 67 | | Retired Mutual Fund Senior Executive (44 years); Management Consultant; Director, Mutual Fund Directors Forum (since 2014); Independent Directors Council (organization of 2,800 Independent Mutual Fund Directors)-Executive Committee, Chair of Policy Steering Committee, Governing Council. | | None. |
The TARGET Portfolio Trust
| | | | |
| Independent Board Members(1) | | |
| | | |
Name, Address, Age Position(s) Portfolios Overseen | | Principal Occupation(s) During Past Five Years | | Other Directorships Held |
| | | |
Robin B. Smith (74) Board Member Portfolios Overseen: 67 | | Chairman of the Board (since January 2003) of Publishers Clearing House (direct marketing); Member of the Board of Directors of ADLPartner (marketing) (since December 2010); formerly Chairman and Chief Executive Officer (August 1996-January 2003) of Publishers Clearing House. | | Formerly Director of BellSouth Corporation (telecommunications) (1992-2006). |
| | | |
Stephen G. Stoneburn (71) Board Member Portfolios Overseen: 67 | | Chairman, (since July 2011), President and Chief Executive Officer (since June 1996) of Quadrant Media Corp. (publishing company); formerly President (June 1995-June 1996) of Argus Integrated Media, Inc.; Senior Vice President and Managing Director (January 1993-1995) of Cowles Business Media; Senior Vice President of Fairchild Publications, Inc. (1975-1989). | | None. |
| | | | |
| Interested Board Members(1) | | |
| | | |
Name, Address, Age Position(s) Portfolios Overseen | | Principal Occupation(s) During Past Five Years | | Other Directorships Held |
| | | |
Stuart S. Parker (51) Board Member & President Portfolios Overseen: 67 | | President of Prudential Investments LLC (since January 2012); Executive Vice President of Prudential Investment Management Services LLC (since December 2012); Executive Vice President of Jennison Associates LLC and Head of Retail Distribution of Prudential Investments LLC (June 2005-December 2011). | | None. |
| | | |
Scott E. Benjamin (41) Board Member & Vice President Portfolios Overseen: 67 | | Executive Vice President (since June 2009) of Prudential Investments LLC; Executive Vice President (June 2009-June 2012) and Vice President (since June 2012) of Prudential Investment Management Services LLC; Executive Vice President (since September 2009) of AST Investment Services, Inc.; Senior Vice President of Product Development and Marketing, Prudential Investments (since February 2006); Vice President of Product Development and Product Management, Prudential Investments (2003-2006). | | None. |
The TARGET Portfolio Trust
| (1) | The year that each individual joined the Board of the Target Portfolio Trust is as follows: |
Ellen S. Alberding, 2013; Kevin J. Bannon, 2008; Linda W. Bynoe, 2005; Keith F. Hartstein, 2013; Michael S. Hyland, 2008; Douglas H. McCorkindale, 1996; Stephen P. Munn, 2008; James E. Quinn, 2013; Richard A. Redeker, 2003; Robin B. Smith, 2003; Stephen G. Stoneburn, 1999; Stuart S. Parker, Board Member and President since 2012; Scott E. Benjamin, Board Member since 2010 and Vice President since 2009.
| | | | |
| Fund Officers(a) | | |
| | | |
Name, Address and Age Position with Fund | | Principal Occupation(s) During Past Five Years | | Length of Service as Fund Officer |
| | | |
Raymond A. O’Hara (59) Chief Legal Officer | | Vice President and Corporate Counsel (since July 2010) of Prudential Insurance Company of America (Prudential); Vice President (March 2011-Present) of Pruco Life Insurance Company and Pruco Life Insurance Company of New Jersey; Vice President and Corporate Counsel (March 2011-Present) of Prudential Annuities Life Assurance Corporation; Chief Legal Officer of Prudential Investments LLC (since June 2012); Chief Legal Officer of Prudential Mutual Fund Services LLC (since June 2012) and Corporate Counsel of AST Investment Services, Inc. (since June 2012); formerly Assistant Vice President and Corporate Counsel (September 2008-July 2010) of The Hartford Financial Services Group, Inc.; formerly Associate (September 1980-December 1987) and Partner (January 1988–August 2008) of Blazzard & Hasenauer, P.C. (formerly, Blazzard, Grodd & Hasenauer, P.C.). | | Since 2012 |
| | | |
Chad A. Earnst (39) Chief Compliance Officer | | Chief Compliance Officer (September 2014-Present) of Prudential Investments LLC; Chief Compliance Officer (September 2014-Present) of the Prudential Investments Funds, Target Funds, Advanced Series Trust, The Prudential Series Fund, Prudential’s Gibraltar Fund, Inc., Prudential Global Short Duration High Yield Income Fund, Inc., Prudential Short Duration High Yield Fund, Inc. and Prudential Jennison MLP Income Fund, Inc.; formerly Assistant Director (March 2010-August 2014) of the Asset Management Unit, Division of Enforcement, U.S. Securities & Exchange Commission; Assistant Regional Director (January 2010-August 2014), Branch Chief (June 2006–December 2009) and Senior Counsel (April 2003-May 2006) of the Miami Regional Office, Division of Enforcement, U.S. Securities & Exchange Commission. | | Since 2014 |
| | | |
Deborah A. Docs (56) Secretary | | Vice President and Corporate Counsel (since January 2001) of Prudential; Vice President (since December 1996) and Assistant Secretary (since March 1999) of Prudential Investments LLC; formerly Vice President and Assistant Secretary (May 2003-June 2005) of AST Investment Services, Inc. | | Since 2004 |
|
| The TARGET Portfolio Trust |
| | | | |
| Fund Officers(a) | | |
| | | |
Name, Address and Age Position with Fund | | Principal Occupation(s) During Past Five Years | | Length of Service as Fund Officer |
| | | |
Jonathan D. Shain (56) Assistant Secretary | | Vice President and Corporate Counsel (since August 1998) of Prudential; Vice President and Assistant Secretary (since May 2001) of Prudential Investments LLC; Vice President and Assistant Secretary (since February 2001) of Prudential Mutual Fund Services LLC; formerly Vice President and Assistant Secretary (May 2003-June 2005) of AST Investment Services, Inc. | | Since 2005 |
| | | |
Claudia DiGiacomo (39) Assistant Secretary | | Vice President and Corporate Counsel (since January 2005) of Prudential; Vice President and Assistant Secretary of Prudential Investments LLC (since December 2005); Associate at Sidley Austin Brown & Wood LLP (1999-2004). | | Since 2005 |
| | | |
Andrew R. French (51) Assistant Secretary | | Vice President and Corporate Counsel (since February 2010) of Prudential; formerly Director and Corporate Counsel (2006-2010) of Prudential; Vice President and Assistant Secretary (since January 2007) of Prudential Investments LLC; Vice President and Assistant Secretary (since January 2007) of Prudential Mutual Fund Services LLC. | | Since 2006 |
| | | |
Amanda S. Ryan (36) Assistant Secretary | | Director and Corporate Counsel (since March 2012) of Prudential; Director and Assistant Secretary (since June 2012) of Prudential Investments LLC; Associate at Ropes & Gray LLP (2008-2012). | | Since 2012 |
| | | |
Theresa C. Thompson (52) Deputy Chief Compliance Officer | | Vice President, Compliance, Prudential Investments LLC (since April 2004); and Director, Compliance, Prudential Investments LLC (2001-2004). | | Since 2008 |
| | | |
Richard W. Kinville (46) Anti-Money Laundering Compliance Officer | | Vice President, Corporate Compliance, Anti-Money Laundering Unit (since January 2005) of Prudential; committee member of the American Council of Life Insurers Anti-Money Laundering and Critical Infrastructure Committee (since January 2007); formerly Investigator and Supervisor in the Special Investigations Unit for the New York Central Mutual Fire Insurance Company (August 1994-January 1999); Investigator in AXA Financial’s Internal Audit Department and Manager in AXA’s Anti-Money Laundering Office (January 1999-January 2005); first chair of the American Council of Life Insurers Anti-Money Laundering and Critical Infrastructure Committee (June 2007-December 2009). | | Since 2011 |
| | | |
M. Sadiq Peshimam (50) Treasurer and Principal Financial and Accounting Officer | | Assistant Treasurer of funds in the Prudential Mutual Fund Complex (2006-2014); Vice President (since 2005) of Prudential Investments LLC. | | Since 2006 |
| | | |
Peter Parrella (56) Assistant Treasurer | | Vice President (since 2007) and Director (2004-2007) within Prudential Mutual Fund Administration; formerly Tax Manager at SSB Citi Fund Management LLC (1997-2004). | | Since 2007 |
The TARGET Portfolio Trust
| | | | |
| Fund Officers(a) | | |
| | | |
| Name, Address and Age Position with Fund | | Principal Occupation(s) During Past Five Years | | Length of Service as Fund Officer |
| | | |
Lana Lomuti (47) Assistant Treasurer | | Vice President (since 2007) and Director (2005-2007), within Prudential Mutual Fund Administration; formerly Assistant Treasurer (December 2007-February 2014) of The Greater China Fund, Inc. | | Since 2014 |
| | | |
Linda McMullin (53) Assistant Treasurer | | Vice President (since 2011) and Director (2008-2011) within Prudential Mutual Fund Administration. | | Since 2014 |
(a) Excludes Mr. Parker and Mr. Benjamin, interested Board Members who also serve as President and Vice President, respectively.
Explanatory Notes to Tables:
| ¡ | Board Members are deemed to be “Interested,” as defined in the 1940 Act, by reason of their affiliation with Prudential Investments LLC and/or an affiliate of Prudential Investments LLC. |
| ¡ | Unless otherwise noted, the address of all Board Members and Officers is c/o Prudential Investments LLC, Gateway Center Three, 100 Mulberry Street, Newark, New Jersey 07102-4077. |
| ¡ | There is no set term of office for Board Members or Officers. The Board Members have adopted a retirement policy, which calls for the retirement of Board Members on December 31 of the year in which they reach the age of 75. |
| ¡ | “Other Directorships Held” includes only directorships of companies required to register or file reports with the SEC under the 1934 Act (that is, “public companies”) or other investment companies registered under the 1940 Act. |
| ¡ | “Portfolios Overseen” includes all investment companies managed by Prudential Investments LLC. The investment companies for which Prudential Investments LLC serves as manager include the Prudential Investments Mutual Funds, The Prudential Variable Contract Accounts, Target Mutual Funds, Prudential Short Duration High Yield Fund, Inc., Prudential Global Short Duration High Yield Fund, Inc., The Prudential Series Fund, Prudential’s Gibraltar Fund, Inc. and the Advanced Series Trust. |
|
| The TARGET Portfolio Trust |
Approval of Advisory Agreements
The Trust’s Board of Trustees
The Board of Trustees (the “Board”) of The Target Portfolio Trust (the “Trust”)1 consists of thirteen individuals, eleven of whom are not “interested persons” of the Trust, as defined in the Investment Company Act of 1940, as amended (the “1940 Act”) (the “Independent Trustees”). The Board is responsible for the oversight of the Trust and each of its Portfolios and their operations, and performs the various duties imposed on the directors of investment companies by the 1940 Act. The Independent Trustees have retained independent legal counsel to assist them in connection with their duties. The Chair of the Board is an Independent Trustee. The Board has established three standing committees: the Audit Committee, the Nominating and Governance Committee, and the Target Investment Committee. Each committee is chaired by, and composed of, Independent Trustees.
Annual Approval of the Trust’s Advisory Agreements
As required under the 1940 Act, the Board determines annually whether to renew the Trust’s management agreement with Prudential Investments LLC (“PI”) and each Portfolio’s subadvisory agreement. In considering the renewal of the agreements, the Board, including all of the Independent Trustees, met on June 9-11, 2014 and approved the renewal of the agreements through July 31, 2015, after concluding that the renewal of the agreements was in the best interest of each of the Trust’s Portfolios and their shareholders.
In advance of the meetings, the Trustees requested and received materials relating to the agreements, and had the opportunity to ask questions and request further information in connection with their consideration. Among other things, the Board considered comparative fee information from PI and the Trust’s subadvisers. Also, the Board considered comparisons with other mutual funds in relevant Peer Universes and Peer Groups, as is further discussed below.
In approving the agreements, the Trustees, including the Independent Trustees advised by independent legal counsel, considered the factors they deemed relevant, including the nature, quality and extent of services provided by PI and each subadviser, the performance of each Portfolio of the Trust, the profitability of PI and its affiliates, expenses and fees, and the potential for economies of scale that may be
| 1 | The Trust is comprised of the following series (each, a “Portfolio” and collectively, the “Portfolios”): Target Large Capitalization Value Portfolio, Target Large Capitalization Growth Portfolio, Target Small Capitalization Value Portfolio, Target Small Capitalization Growth Portfolio, Target International Equity Portfolio, Target Intermediate-Term Bond Portfolio, Target Mortgage-Backed Securities Portfolio and Target Total Return Bond Portfolio. |
The TARGET Portfolio Trust
Approval of Advisory Agreements (continued)
shared with each Portfolio and its shareholders. In their deliberations, the Trustees did not identify any single factor which alone was responsible for the Board’s decision to approve the agreements. In connection with its deliberations, the Board considered information provided by PI throughout the year at regular Board meetings, presentations from portfolio managers and other information, as well as information furnished at or in advance of the meetings on June 9-11, 2014.
The Trustees determined that the overall arrangements between the Trust and PI, which serves as the Trust’s investment manager pursuant to a management agreement, and between PI and each subadviser,2 each of which serve pursuant to the terms of subadvisory agreements with PI, are in the best interests of the Trust, each Portfolio and its shareholders in light of the services performed, fees charged and such other matters as the Trustees considered relevant in the exercise of their business judgment.
The material factors and conclusions that formed the basis for the Trustees’ determinations to approve the renewal of the agreements are discussed separately below.
Nature, Quality and Extent of services
The Board received and considered information regarding the nature, quality and extent of services provided to the Trust by PI and each subadviser. The Board considered the services provided by PI, including but not limited to the oversight of the subadvisers, as well as the provision of fund recordkeeping and compliance services to the Trust. With respect to PI’s oversight of the subadvisers, the Board noted that PI’s Strategic Investment Research Group (“SIRG”), a business unit of PI, is responsible for screening and recommending new subadvisers when appropriate, as well as monitoring and reporting to the Board on the performance and operations of the subadvisers. The Board also considered that PI pays the salaries of all of the officers and non-independent Trustees of the Trust. The Board also considered the
| 2 | The respective subadvisers for each Portfolio are as follows: |
| • | Target Large Capitalization Value Portfolio (Hotchkis and Wiley Capital Management, LLC, Epoch Investment Partners, Inc. and NFJ Investment Group LLC); |
| • | Target Large Capitalization Growth Portfolio (Massachusetts Financial Services Company and Brown Advisory, LLC); |
| • | Target Small Capitalization Value Portfolio (EARNEST Partners, LLC, J.P. Morgan Investment Management, Inc., Lee Munder Capital Group, LLC, NFJ Investment Group, LLC, Vaughan Nelson Investment Management, L.P., and Sterling Capital Management LLC); |
| • | Target Small Capitalization Growth Portfolio (Eagle Asset Management, Inc. and Emerald Mutual Fund Advisers Trust) |
| • | Target International Equity Portfolio (LSV Asset Management and Thornburg Investment Management, Inc.) |
| • | Target Intermediate-Term Bond Portfolio (Pacific Investment Management Company LLC), |
The TARGET Portfolio Trust
investment subadvisory services provided by each subadviser, as well as compliance with the Trust’s investment restrictions, policies and procedures. The Board considered PI’s evaluation of the subadvisers as well as PI’s recommendation, based on its review of the subadvisers, to renew the subadvisory agreements or to replace certain subadvisers, as applicable.
The Board considered the qualifications, backgrounds and responsibilities of PI’s senior management responsible for the oversight of the Trust and each subadviser, and also considered the qualifications, backgrounds and responsibilities of the subadvisers’ portfolio managers who are responsible for the day-to-day management of each Portfolio. The Board was provided with information pertaining to PI’s and each subadviser’s organizational structure, senior management, investment operations, and other relevant information pertaining to both PI and each subadviser. The Board also noted that it received favorable compliance reports from the Trust’s Chief Compliance Officer (“CCO”) as to both PI and each subadviser.
The Board concluded that it was satisfied with the nature, extent and quality of the investment management services provided by PI and the subadvisory services provided to the Portfolios by each subadviser, and that there was a reasonable basis on which to conclude that the Trust and its Portfolios benefit from the services provided by PI and each subadviser under the management and subadvisory agreements.
Costs of Services and Profits Realized by PI
The Board was provided with information on the profitability of PI in serving as the Trust’s investment manager. The Board discussed with PI the methodology utilized in assembling the information regarding profitability and considered its reasonableness. The Board recognized that it is difficult to make comparisons of profitability from fund management contracts because comparative information is not generally publicly available and is affected by numerous factors, including the structure of the particular adviser, the types of funds it manages, its business mix, numerous assumptions regarding allocations and the adviser’s capital structure and cost of capital. However, the Board considered that the cost of services provided by PI to certain of the Portfolios during the year ended December 31, 2013 exceeded the benefits gained by PI, resulting in an operating loss to PI. Taking these factors into account, the Board concluded that the profitability of PI in relation to the services rendered was not unreasonable.
| • | Target Mortgage-Backed Securities Portfolio (Wellington Management Company, LLP); |
| • | Target Total Return Bond Portfolio (Pacific Investment Management Company LLC). |
The TARGET Portfolio Trust
Approval of Advisory Agreements (continued)
The Board separately considered the profitability, to the extent available, of the Trust’s subadvisers. However, the Board noted that none of the Trust’s subadvisers was affiliated with PI, and concluded that the level of profitability of a subadviser not affiliated with PI may not be as significant as PI’s profitability given the arm’s length nature of the process by which the subadvisory fee rates were negotiated by PI and the unaffiliated subadvisers, as well as the fact that PI compensates the subadvisers out of its management fee.
Economies of Scale
In 2013, PI and the Board retained an outside business consulting firm, in order to assist the Board in its consideration of the renewal of the management and subadvisory agreements, by reviewing management fee breakpoint usage and trends in management fees across the mutual fund industry. The consulting firm’s analysis and conclusions with respect to the Portfolios’ management fee structures were presented to the Board and PI at the December 3-5, 2013 meeting, and were discussed extensively by the Board and PI over the following two quarters.
The Board noted that the advisory fee schedule for the Portfolios of the Trust does not contain breakpoints that would reduce the fee rate on assets above specified levels. The Board received and discussed information concerning whether PI realizes economies of scale as each Portfolio’s assets grow beyond current levels. However, because of the nature of PI’s business, the Board could not reach definitive conclusions as to whether PI might realize economies of scale on a particular Portfolio or how great they may be. The Board recognized the inherent limitations of any analysis of economies of scale, stemming largely from the Board’s understanding that most of PI’s costs are not specific to individual funds, but rather are incurred across a variety of products and services. In light of each Portfolio’s current size and fee rate, the Board concluded that the absence of breakpoints in each Portfolio’s fee schedule is acceptable at this time.
Other Benefits to PI and the Subadvisers
The Board considered potential ancillary benefits that might be received by PI, the subadvisers, and their affiliates as a result of their relationship with the Trust and its Portfolios. The Board concluded that potential benefits to be derived by PI included fees received by affiliates of PI for serving as the Portfolios’ securities lending agent, transfer agency fees received by the Trust’s transfer agent (which is affiliated with PI), as well as benefits to its reputation or other intangible benefits resulting from PI’s association with the Portfolios. The Board concluded that the potential benefits to be
The TARGET Portfolio Trust
derived by the subadvisers included the ability to use soft dollar credits, brokerage commissions received by affiliates of the subadvisers, as well as the potential benefits consistent with those generally resulting from an increase in assets under management, specifically, potential access to additional research resources and benefits to their reputations. The Board concluded that the benefits derived by PI and the subadvisers were consistent with the types of benefits generally derived by investment managers and subadvisers to mutual funds.
Performance of the Portfolios / Fees and Expenses
The Board considered certain additional specific factors and made related conclusions relating to the historical performance of each Portfolio for the one-, three-, five- and ten-year periods ended December 31, 2013.
The Board also considered each Portfolio’s actual management fee, as well as each Portfolio’s net total expense ratio, for the fiscal year ended October 31, 2013. The Board considered the management fee for each Portfolio as compared to the management fee charged by PI to other funds and the fee charged by other advisers to comparable mutual funds in a Peer Group. The actual management fee represents the fee rate actually paid by Portfolio shareholders and includes any fee waivers or reimbursements. The net total expense ratio for each Portfolio represents the actual expense ratio incurred by Portfolio shareholders.
The mutual funds included in the Peer Universe3 and the Peer Group for each Portfolio were objectively determined by Lipper Inc. (“Lipper”), an independent provider of mutual fund data. The comparisons placed each Portfolio in various quartiles, with the first quartile being the best 25% of the mutual funds (for performance, the best performing mutual funds and, for expenses, the lowest cost mutual funds).
The section below summarizes key factors considered by the Board and the Board’s conclusions regarding each Portfolio’s performance, fees and overall expenses. The
| 3 | Peer Universes for each Portfolio are denoted below: |
Large Capitalization Growth Portfolio: Lipper Large-Cap Growth Funds Performance Universe.
Large Capitalization Value Portfolio: Lipper Large-Cap Value Funds Performance Universe.
Small Capitalization Growth Portfolio: Lipper Small-Cap Growth Funds Performance Universe.
Small Capitalization Value Portfolio: Lipper Small-Cap Value Funds Performance Universe. Although Lipper classifies the Portfolio in its Small-Cap Core Funds Performance Universe, the Lipper Small-Cap Value Funds Performance Universe was utilized for performance comparisons, because PI believes that the funds included in this Universe provide a more appropriate basis for Portfolio performance comparisons.
The TARGET Portfolio Trust
Approval of Advisory Agreements (continued)
table sets forth gross performance comparisons (which do not reflect the impact on performance of any portfolio expenses, or subsidies, expense caps or waivers that may be applicable) with the Peer Universe, actual management fees with the Peer Group (which reflect the impact of any subsidies or fee waivers), and net total expenses with the Peer Group, each of which were key factors considered by the Board.
Large Capitalization Growth Portfolio
| | | | | | | | |
| Performance | | 1 Year | | 3 Years | | 5 Years | | 10 Years |
| | | 2nd Quartile | | 3rd Quartile | | 4th Quartile | | 4th Quartile |
| Actual Management Fees: 2nd Quartile |
| Net Total Expenses: 1st Quartile |
| | • | | The Board noted that the Portfolio outperformed its benchmark index over the one-year period, although it underperformed the benchmark index over the three-, five- and ten-year periods. |
| | • | | The Board considered that during 2012 the Portfolio added a new subadviser, noting the Portfolio’s recent performance had improved. |
| | • | | The Board concluded that it was reasonable to continue to monitor the Portfolio’s performance, and that in light of the recent subadvisory changes, it would be in the best interests of the Portfolio and its shareholders to renew the agreements. |
| | • | | The Board concluded that the management fees (including subadvisory fees) and total expenses were reasonable in light of the services provided. |
International Equity Portfolio: a custom blend of mutual funds included in the Lipper International Multi-Cap Core Funds and International Large-Cap Core Funds Performance Universes. Although Lipper classifies the Portfolio in its International Multi-Cap Core Funds Performance Universe, the custom blend was utilized for performance comparisons, because PI believes that the funds included in this custom blend provide a more appropriate basis for Portfolio performance comparisons.
Total Return Bond Portfolio: Lipper Core Bond Funds Performance Universe. Although Lipper classifies the Portfolio in its BBB-rated Corporate Debt Funds Performance Universe, the Lipper Core Bond Funds Performance Universe was utilized for performance comparisons, because PI believes that the funds included in this Universe provide a more appropriate basis for Portfolio performance comparisons.
Intermediate Term Bond Portfolio: Lipper Core Bond Funds Performance Universe.
Mortgage-Backed Securities Portfolio: Lipper U.S. Mortgage Funds Performance Universe.
The TARGET Portfolio Trust
Large Capitalization Value Portfolio
| | | | | | | | |
| Performance | | 1 Year | | 3 Years | | 5 Years | | 10 Years |
| | | 1st Quartile | | 2nd Quartile | | 4th Quartile | | 4th Quartile |
| Actual Management Fees: 2nd Quartile |
| Net Total Expenses: 1st Quartile |
| | • | | The Board noted that the Portfolio outperformed its benchmark index over the one-year, and it underperformed the benchmark index less than 1% over the three-, five- and ten-year periods. |
| | • | | The Board further noted that during 2012 the Portfolio added a new subadviser, noting that the Portfolio’s recent performance had improved. |
| | • | | The Board concluded that, in light of the recent change in subadvisers and competitive performance against its benchmark index, and against Peer Universe over the one-year period, it would be in the best interests of the Portfolio and its shareholders to renew the agreements. |
| | • | | The Board concluded that the management fees (including subadvisory fees) and total expenses were reasonable in light of the services provided. |
Small Capitalization Growth Portfolio
| | | | | | | | |
| Performance | | 1 Year | | 3 Years | | 5 Years | | 10 Years |
| | | 4th Quartile | | 4th Quartile | | 4th Quartile | | 4th Quartile |
| Actual Management Fees: 1st Quartile |
| Net Total Expenses: 1st Quartile |
| | • | | The Board noted that the Portfolio underperformed its benchmark index over all periods. |
| | • | | The Board further noted that a new subadviser was added in 2012, and therefore the Portfolio’s long-term performance did not reflect the change in subadvisers. |
| | • | | The Board further noted information provided by PI, which indicated that the Portfolio’s recent performance had improved, with the Portfolio ranked in the first quartile for the first quarter of 2014. |
| | • | | The Board concluded that, in light of the Portfolio’s recent subadviser addition, it would be in the best interests of the Portfolio and its shareholders to continue to closely monitor the Portfolio’s performance and to renew the agreements. |
| | • | | The Board concluded that the management fees (including subadvisory fees) and total expenses were reasonable in light of the services provided. |
The TARGET Portfolio Trust
Approval of Advisory Agreements (continued)
Small Capitalization Value Portfolio
| | | | | | | | |
| Performance | | 1 Year | | 3 Years | | 5 Years | | 10 Years |
| | | 3rd Quartile | | 2nd Quartile | | 3rd Quartile | | 1st Quartile |
| Actual Management Fees: 1st Quartile |
| Net Total Expenses: 1st Quartile |
| | • | | The Board noted that the Portfolio outperformed its benchmark index over all periods. |
| | • | | The Board concluded that, in light of the Portfolio’s competitive performance against its benchmark index, it would be in the best interests of the Portfolio and its shareholders to renew the agreements. |
| | • | | The Board concluded that the management fees (including subadvisory fees) and total expenses were reasonable in light of the services provided. |
International Equity Portfolio
| | | | | | | | |
| Performance | | 1 Year | | 3 Years | | 5 Years | | 10 Years |
| | | 2nd Quartile | | 3rd Quartile | | 2nd Quartile | | 2nd Quartile |
| Actual Management Fees: 1st Quartile |
| Net Total Expenses: 1st Quartile |
| | • | | The Board noted that the Portfolio outperformed its benchmark index over the three-, five- and ten-year periods, and it underperformed its benchmark index by less than 1% over the one-year period. |
| | • | | The Board concluded that, in light of the Portfolio’s competitive performance against its benchmark index and Peer Universe, it would be in the best interests of the Fund and its shareholders to renew the agreements. |
| | • | | The Board concluded that the management fees (including subadvisory fees) and total expenses were reasonable in light of the services provided. |
Total Return Bond Portfolio
| | | | | | | | |
| Performance | | 1 Year | | 3 Years | | 5 Years | | 10 Years |
| | | 4th Quartile | | 3rd Quartile | | 2nd Quartile | | 1st Quartile |
| Actual Management Fees: 3rd Quartile |
| Net Total Expenses: 2nd Quartile |
| | • | | The Board noted that the Portfolio outperformed its benchmark index over the three-, five- and ten-year periods, although it underperformed its benchmark index over the one-year period. |
The TARGET Portfolio Trust
| | • | | The Board noted that the Fund’s actual management fee ranked less than one basis point from its Peer Group median. |
| | • | | The Board concluded that, in light of the Portfolio’s competitive performance against its benchmark index and Peer Universe over longer periods, it would be in the best interests of the Portfolio and its shareholders to renew the agreements. |
| | • | | The Board concluded that the management fees (including subadvisory fees) and total expenses were reasonable in light of the services provided. |
Intermediate-Term Bond Portfolio
| | | | | | | | |
| Performance | | 1 Year | | 3 Years | | 5 Years | | 10 Years |
| | | 3rd Quartile | | 3rd Quartile | | 3rd Quartile | | 1st Quartile |
| Actual Management Fees: 3rd Quartile |
| Net Total Expenses: 1st Quartile |
| | • | | The Board noted that the Portfolio outperformed its benchmark index over the three-, five- and ten-year periods, although it underperformed its benchmark index over the one-year period. |
| | • | | The Board noted that the Fund’s actual management fee ranked less than one basis point from its Peer Group median. |
| | • | | The Board concluded that, in light of the Portfolio’s competitive performance against its benchmark index and Peer Universe over longer periods, it would be in the best interests of the Portfolio and its shareholders to renew the agreements. |
| | • | | The Board concluded that the management fees (including subadvisory fees) and total expenses were reasonable in light of the services provided. |
Mortgage-Backed Securities Portfolio
| | | | | | | | |
| Performance | | 1 Year | | 3 Years | | 5 Years | | 10 Years |
| | | 3rd Quartile | | 2nd Quartile | | 1st Quartile | | 1st Quartile |
| Actual Management Fees: 3rd Quartile |
| Net Total Expenses: 4th Quartile |
| | • | | The Board noted that the Portfolio outperformed its benchmark index over the three-, five- and ten-year periods, and it underperformed its benchmark index by one basis point over the one-year period. |
| | • | | The Board also noted information from PI indicating that performance had improved, with the Fund performing in the first quartile of its Peer Universe and outperforming its benchmark index for the year-to-date period ended April 30, 2014. |
The TARGET Portfolio Trust
Approval of Advisory Agreements (continued)
| | • | | The Board concluded that, in light of the Portfolio’s competitive performance against its benchmark index and Peer Universe, it would be in the best interests of the Portfolio and its shareholders to renew the agreements. |
| | • | | The Board concluded that the management fees (including subadvisory fees) and total expenses were reasonable in light of the services provided. |
* * *
After full consideration of these factors, the Board concluded that the approval of the agreements was in the best interests of each Portfolio and its shareholders.
The TARGET Portfolio Trust
| | | | |
n
nMAIL | | n TELEPHONE | | n WEBSITE |
Gateway Center Three 100 Mulberry Street Newark, NJ 07102 | | (800) 225-1852 | | www.prudentialfunds.com |
|
| PROXY VOTING |
| The Board of Trustees has delegated to the Trust’s investment subadvisers the responsibility for voting any proxies and maintaining proxy recordkeeping with respect to the Trust. A description of these proxy voting policies and procedures is available without charge, upon request, by calling (800) 225-1852. Information regarding how the Trust voted proxies relating to portfolio securities during the most recent 12-month period ended June 30 is available on the Trust’s website and on the Securities and Exchange Commission’s website at www.sec.gov. |
|
| TRUSTEES |
| Ellen S. Alberding • Kevin J. Bannon • Scott E. Benjamin • Linda W. Bynoe • Keith F. Hartstein • Michael S. Hyland • Douglas H. McCorkindale • Stephen P. Munn • Stuart S. Parker • James E. Quinn • Richard A. Redeker • Robin B. Smith • Stephen G. Stoneburn |
|
| OFFICERS |
| Stuart S. Parker, President • Scott E. Benjamin, Vice President • M. Sadiq Peshimam, Treasurer and Principal Financial and Accounting Officer • Raymond A. O’Hara, Chief Legal Officer • Chad A. Earnst, Chief Compliance Officer • Deborah A. Docs, Secretary • Theresa C. Thompson, Deputy Chief Compliance Officer • Richard W. Kinville, Anti-Money Laundering Compliance Officer • Jonathan D. Shain, Assistant Secretary • Claudia DiGiacomo, Assistant Secretary • Amanda S. Ryan, Assistant Secretary • Andrew R. French, Assistant Secretary • Peter Parrella, Assistant Treasurer • Lana Lomuti, Assistant Treasurer • Linda McMullin, Assistant Treasurer |
| | | | |
| MANAGER | | Prudential Investments LLC | | Gateway Center Three
100 Mulberry Street Newark, NJ 07102 |
|
| INVESTMENT SUBADVISERS | | Brown Advisory, LLC | | 901 S. Bond Street
Suite 400 Baltimore, MD 21231 |
|
| | Eagle Asset Management, Inc. | | 880 Carillon Parkway
St. Petersburg, FL 33716 |
|
| | EARNEST Partners, LLC | | 1180 Peachtree Street
Suite 2300 Atlanta, GA 30309 |
|
| | Emerald Mutual Fund
Advisers Trust | | 3175 Oregon Pike
Leola, PA 17540 |
|
| | Epoch Investment Partners,
Inc. | | 399 Park Avenue
New York, NY 10022 |
|
| | Hotchkis and Wiley Capital
Management, LLC | | 725 S. Figueroa Street
39th Floor Los Angeles, CA 90017 |
| | | | |
| | J.P. Morgan Investment
Management, Inc. | | 245 Park Avenue
New York, NY 10167 |
|
| | Lee Munder Capital Group, LLC | | 200 Clarendon Street
Boston, MA 02116 |
|
| | LSV Asset Management | | 155 North Wacker Drive
Suite 4600 Chicago, IL 60606 |
|
| | Massachusetts Financial
Services Company | | 111 Huntington Avenue
Boston, MA 02199 |
|
| | NFJ Investment Group LLC | | 2100 Ross Avenue
Dallas, TX 75201 |
|
| | Pacific Investment
Management Company LLC | | 650 Newport Center Drive
Newport Beach, CA 92660 |
|
| | Sterling Capital
Management LLC | | Two Morrocroft Centre
4064 Colony Road
Suite 300
Charlotte, NC 28211 |
|
| | Thornburg Investment
Management, Inc. | | 2300 North Ridgetop Road
Santa Fe, NM 87506 |
|
| | Vaughan Nelson Investment
Management, L.P. | | 600 Travis Street
Suite 6300 Houston, TX 77002 |
|
| | Wellington Management
Company, LLP | | 280 Congress Street
Boston, MA 02110 |
|
| DISTRIBUTOR | | Prudential Investment
Management Services LLC | | Gateway Center Three
100 Mulberry Street
Newark, NJ 07102 |
|
| CUSTODIAN | | The Bank of New York Mellon | | One Wall Street
New York, NY 10286 |
|
| TRANSFER AGENT | | Prudential Mutual Fund
Services LLC | | PO Box 9658
Providence, RI 02940 |
|
| INDEPENDENT REGISTERED PUBLIC ACCOUNTING FIRM | | KPMG LLP | | 345 Park Avenue
New York, NY 10154 |
|
| FUND COUNSEL | | Willkie Farr & Gallagher LLP | | 787 Seventh Avenue
New York, NY 10019 |
|
| An investor should consider the investment objectives, risks, charges, and expenses of the Trust carefully before investing. The prospectus and summary prospectuses contain this and other information about the Trust. An investor may obtain a prospectus and summary prospectuses by visiting our website at www.prudentialfunds.com or by calling (800) 225-1852. The prospectuses and summary prospectuses should be read carefully before investing. |
|
| E-DELIVERY |
| To receive your mutual fund documents online, go to www.prudentialfunds.com/edelivery and enroll. Instead of receiving printed documents by mail, you will receive notification via email when new materials are available. You can cancel your enrollment or change your email address at any time by visiting the website address above. |
|
| SHAREHOLDER COMMUNICATIONS WITH TRUSTEES |
| Shareholders can communicate directly with the Board of Trustees by writing to the Chair of the Board, The Target Portfolio Trust, Prudential Investments, Attn: Board of Trustees, 100 Mulberry Street, Gateway Center Three, Newark, NJ 07102. Shareholders can communicate directly with an individual Trustee by writing to the same address. Communications are not screened before being delivered to the addressee. |
|
| AVAILABILITY OF PORTFOLIO SCHEDULE |
| The Trust files its complete schedule of portfolio holdings with the Securities and Exchange Commission for the first and third quarters of each fiscal year on Form N-Q. The Trust’s Forms N-Q are available on the Commission’s website at www.sec.gov. The Trust’s Forms N-Q may also be reviewed and copied at the Commission’s Public Reference Room in Washington, D.C. Information on the operation and location of the Public Reference Room may be obtained by calling 1-800-SEC-0330. The Trust’s schedule of portfolio holdings is also available on the Trust’s website as of the end of each month. |
|
| The Trust’s Statement of Additional Information contains additional information about the Trust’s Trustees and is available without charge, upon request, by calling (800) 225-1852. |
Mutual Funds:
| | | | |
ARE NOT INSURED BY THE FDIC OR ANY
FEDERAL GOVERNMENT AGENCY | | MAY LOSE VALUE | | ARE NOT A DEPOSIT OF OR GUARANTEED
BY ANY BANK OR ANY BANK AFFILIATE |

| | | | | | | | | | |
| THE TARGET PORTFOLIO TRUST | | NASDAQ | | CUSIP | | | | NASDAQ | | CUSIP |
| Large Capitalization Growth (Class R) | | TLCRX | | 875921868 | | Total Return Bond (Class T) | | TATBX | | 875921884 |
| Large Capitalization Growth (Class T) | | TALGX | | 875921207 | | Mortgage-Backed Securities (Class T) | | TGMBX | | 875921702 |
| Small Capitalization Growth (Class R) | | TSCRX | | 875921835 | | Large Capitalization Value (Class R) | | TLVRX | | 875921850 |
| Small Capitalization Growth (Class T) | | TASGX | | 875921405 | | Large Capitalization Value (Class T) | | TALVX | | 875921108 |
| International Equity (Class Q) | | TIEQX | | 875921793 | | Small Capitalization Value (Class A) | | TSVAX | | 875921785 |
| International Equity (Class R) | | TEQRX | | 875921827 | | Small Capitalization Value (Class R) | | TSVRX | | 875921843 |
| International Equity (Class T) | | TAIEX | | 875921504 | | Small Capitalization Value (Class T) | | TASVX | | 875921306 |
| Total Return Bond (Class R) | | TTBRX | | 875921819 | | Intermediate-Term Bond (Class T) | | TAIBX | | 875921801 |
TMF158E 0266854-00001-00
| | | | |
| Item 2 | | – | | Code of Ethics — See Exhibit (a) |
As of the end of the period covered by this report, the registrant has adopted a code of ethics (the “Section 406 Standards for Investment Companies – Ethical Standards for Principal Executive and Financial Officers”) that applies to the registrant’s Principal Executive Officer and Principal Financial Officer; the registrant’s Principal Financial Officer also serves as the Principal Accounting Officer.
The registrant hereby undertakes to provide any person, without charge, upon request, a copy of the code of ethics. To request a copy of the code of ethics, contact the registrant 800-225-1852, and ask for a copy of the Section 406 Standards for Investment Companies - Ethical Standards for Principal Executive and Financial Officers.
Item 3 – Audit Committee Financial Expert –
The registrant’s Board has determined that Mr. Stephen P. Munn, member of the Board’s Audit Committee is an “audit committee financial expert,” and that he is “independent,” for purposes of this Item.
Item 4 – Principal Accountant Fees and Services –
(a) Audit Fees
For the fiscal period November 1, 2013 through July 31, 2014and the fiscal year ended October 31, 2014, KPMG LLP (“KPMG”), the Registrant’s principal accountant, billed the Registrant $302,290 and $300,500, respectively, for professional services rendered for the audit of the Registrant’s annual financial statements or services that are normally provided in connection with statutory and regulatory filings.
(b) Audit-Related Fees
None.
(c) Tax Fees
None.
(d) All Other Fees
None.
(e) (1) Audit Committee Pre-Approval Policies and Procedures
THE PRUDENTIAL MUTUAL FUNDS
AUDIT COMMITTEE POLICY
on
Pre-Approval of Services Provided by the Independent Accountants
The Audit Committee of each Prudential Mutual Fund is charged with the responsibility to monitor the independence of the Fund’s independent accountants. As part of this responsibility, the Audit Committee must pre-approve any independent accounting firm’s engagement to render audit and/or permissible non-audit services, as required by law. In evaluating a proposed engagement of the independent accountants, the Audit Committee will assess the effect that the engagement might reasonably be expected to have on the accountant’s independence. The Committee’s evaluation will be based on:
| | • | | a review of the nature of the professional services expected to be provided, |
| | • | | a review of the safeguards put into place by the accounting firm to safeguard independence, and |
| | • | | periodic meetings with the accounting firm. |
Policy for Audit and Non-Audit Services Provided to the Funds
On an annual basis, the scope of audits for each Fund, audit fees and expenses, and audit-related and non-audit services (and fees proposed in respect thereof) proposed to be performed by the Fund’s independent accountants will be presented by the Treasurer and the independent accountants to the Audit Committee for review and, as appropriate, approval prior to the initiation of such services. Such presentation shall be accompanied by confirmation by both the Treasurer and the independent accountants that the proposed services will not adversely affect the independence of the independent accountants. Proposed services shall be described in sufficient detail to enable the Audit Committee to assess the appropriateness of such services and fees, and the compatibility of the provision of such services with the auditor’s independence. The Committee shall receive periodic reports on the progress of the audit and other services which are approved by the Committee or by the Committee Chair pursuant to authority delegated in this Policy.
The categories of services enumerated under “Audit Services”, “Audit-related Services”, and “Tax Services” are intended to provide guidance to the Treasurer and the independent accountants as to those categories of services which the Committee believes are generally consistent with the independence of the independent accountants and which the Committee (or the Committee Chair) would expect upon the presentation of specific proposals to pre-approve. The enumerated categories are not intended as an exclusive list of audit, audit-related or tax services, which the Committee (or the Committee Chair) would consider for pre-approval.
Audit Services
The following categories of audit services are considered to be consistent with the role of the Fund’s independent accountants:
| | • | | Annual Fund financial statement audits |
| | • | | Seed audits (related to new product filings, as required) |
| | • | | SEC and regulatory filings and consents |
Audit-related Services
The following categories of audit-related services are considered to be consistent with the role of the Fund’s independent accountants:
| | • | | Accounting consultations |
| | • | | Fund merger support services |
| | • | | Agreed Upon Procedure Reports |
| | • | | Other Internal Control Reports |
Individual audit-related services that fall within one of these categories and are not presented to the Audit Committee as part of the annual pre-approval process will be subject to pre-approval by the Committee Chair (or any other Committee member on whom this responsibility has been delegated) so long as the estimated fee for those services does not exceed $50,000.
Tax Services
The following categories of tax services are considered to be consistent with the role of the Fund’s independent accountants:
| | • | | Tax compliance services related to the filing or amendment of the following: |
| | • | | Federal, state and local income tax compliance; and, |
| | • | | Sales and use tax compliance |
| | • | | Timely RIC qualification reviews |
| | • | | Tax distribution analysis and planning |
| | • | | Tax authority examination services |
| | • | | Tax appeals support services |
| | • | | Accounting methods studies |
| | • | | Fund merger support services |
| | • | | Tax consulting services and related projects |
Individual tax services that fall within one of these categories and are not presented to the Audit Committee as part of the annual pre-approval process will be subject to pre-approval by the Committee Chair (or any other Committee member on whom this responsibility has been delegated) so long as the estimated fee for those services does not exceed $50,000.
Other Non-audit Services
Certain non-audit services that the independent accountants are legally permitted to render will be subject to pre-approval by the Committee or by one or more Committee members to whom the Committee has delegated this authority and who will report to the full Committee any pre-approval decisions made pursuant to this Policy. Non-audit services presented for pre-approval pursuant to this paragraph will be accompanied by a confirmation from both the Treasurer and the independent accountants that the proposed services will not adversely affect the independence of the independent accountants.
Proscribed Services
The Fund’s independent accountants will not render services in the following categories of non-audit services:
| | • | | Bookkeeping or other services related to the accounting records or financial statements of the Fund |
| | • | | Financial information systems design and implementation |
| | • | | Appraisal or valuation services, fairness opinions, or contribution-in-kind reports |
| | • | | Internal audit outsourcing services |
| | • | | Management functions or human resources |
| | • | | Broker or dealer, investment adviser, or investment banking services |
| | • | | Legal services and expert services unrelated to the audit |
| | • | | Any other service that the Public Company Accounting Oversight Board determines, by regulation, is impermissible. |
Pre-approval of Non-Audit Services Provided to Other Entities Within the Prudential Fund Complex
Certain non-audit services provided to Prudential Investments LLC or any of its affiliates that also provide ongoing services to the Prudential Mutual Funds will be subject to pre-approval by the Audit Committee. The only non-audit services provided to these entities that will require pre-approval are those related directly to the operations and financial reporting of the Funds. Individual projects that are not presented to the Audit Committee as part of the annual pre-approval process will be subject to pre-approval by the Committee Chair (or any other Committee member on whom this responsibility has been delegated) so long as the estimated fee for those services does not exceed $50,000. Services presented for pre-approval pursuant to this paragraph will be accompanied by a confirmation from both the Treasurer and the independent accountants that the proposed services will not adversely affect the independence of the independent accountants.
Although the Audit Committee will not pre-approve all services provided to Prudential Investments LLC and its affiliates, the Committee will receive an annual report from the Fund’s independent accounting firm showing the aggregate fees for all services provided to Prudential Investments and its affiliates.
(e) (2) Percentage of services referred to in 4(b) – 4(d) that were approved by the audit committee –
Not applicable.
(f) Percentage of hours expended attributable to work performed by other than full time employees of principal accountant if greater than 50%.
The percentage of hours expended on the principal accountant’s engagement to audit the registrant’s financial statements for the most recent fiscal year that were attributed to work performed by persons other than the principal accountant’s full-time, permanent employees was 0%.
(g) Non-Audit Fees
Not applicable to Registrant for the fiscal period November 1, 2013 through July 31, 2014 and the fiscal year ended October 31, 2013. The aggregate non-audit fees billed by KPMG for services rendered to the registrant’s investment adviser and any entity controlling, controlled by, or under common control with the investment adviser that provides ongoing services to the registrant for the fiscal period November 1, 2013 through July 31, 2014 and the fiscal year ended October 31, 2013 was $0 and $0, respectively.
(h) Principal Accountant’s Independence
Not applicable as KPMG has not provided non-audit services to the registrant’s investment adviser and any entity controlling, controlled by, or under common control with the investment adviser that provides ongoing services to the registrant that were not pre-approved pursuant to Rule 2-01(c)(7)(ii) of Regulation S-X.
| | | | |
Item 5 | | – | | Audit Committee of Listed Registrants – Not applicable. |
| | |
Item 6 | | – | | Schedule of Investments – The schedule is included as part of the report to shareholders filed under Item 1 of this Form. |
| | |
Item 7 | | – | | Disclosure of Proxy Voting Policies and Procedures for Closed-End Management Investment Companies – Not applicable. |
| | |
Item 8 | | – | | Portfolio Managers of Closed-End Management Investment Companies – Not applicable. |
| | |
Item 9 | | – | | Purchases of Equity Securities by Closed-End Management Investment Company and Affiliated Purchasers – Not applicable. |
| | |
Item 10 | | – | | Submission of Matters to a Vote of Security Holders – Not applicable. |
| | |
Item 11 | | – | | Controls and Procedures |
| | (a) | It is the conclusion of the registrant’s principal executive officer and principal financial officer that the effectiveness of the registrant’s current disclosure controls and procedures (such disclosure controls and procedures having been evaluated within 90 days of the date of this filing) provide reasonable assurance that the information required to be disclosed by the registrant has been recorded, processed, summarized and reported within the time period specified in the Commission’s rules and forms and that the information required to be disclosed by the registrant has been accumulated and communicated to the registrant’s principal executive officer and principal financial officer in order to allow timely decisions regarding required disclosure. |
| | (b) | There has been no significant change in the registrant’s internal control over financial reporting that occurred during the registrant’s most recent fiscal quarter of the period covered by this report that has materially affected, or is likely to materially affect, the registrant’s internal control over financial reporting. |
| | | | |
| | (a) (1) | | Code of Ethics – Attached hereto as Exhibit EX-99.CODE-ETH |
| | |
| | (2) | | Certifications pursuant to Section 302 of the Sarbanes-Oxley Act – Attached hereto as Exhibit EX-99.CERT. |
| | |
| | (3) | | Any written solicitation to purchase securities under Rule 23c-1. – Not applicable. |
| |
| | (b) Certifications pursuant to Section 906 of the Sarbanes-Oxley Act – Attached hereto as Exhibit EX-99.906CERT. |
SIGNATURES
Pursuant to the requirements of the Securities Exchange Act of 1934 and the Investment Company Act of 1940, the registrant has duly caused this report to be signed on its behalf by the undersigned, thereunto duly authorized.
| | |
| Registrant: | | The Target Portfolio Trust |
| |
| By: | | /s/ Deborah A. Docs |
| | Deborah A. Docs |
| | Secretary |
| |
| Date: | | September 18, 2014 |
Pursuant to the requirements of the Securities Exchange Act of 1934 and the Investment Company Act of 1940, this report has been signed below by the following persons on behalf of the registrant and in the capacities and on the dates indicated.
| | |
| By: | | /s/ Stuart S. Parker |
| | Stuart S. Parker |
| | President and Principal Executive Officer |
| |
| Date: | | September 18, 2014 |
| |
| By: | | /s/ M. Sadiq Peshimam |
| | M. Sadiq Peshimam |
| | Treasurer and Principal Financial and Accounting Officer |
| |
| Date: | | September 18, 2014 |